agenda: dec. 14, 2007 cpe meeting - council on
TRANSCRIPT
CPE meeting materials are available on the Council Web site at http://cpe.ky.gov/about/cpe/meetings/.
AGENDA
Special Meeting Council on Postsecondary Education
December 14, 2007
9 a.m. (ET) 171 Capitol Annex
Frankfort, Kentucky
Page 1. Roll Call 2. Remarks by CPE President Brad Cowgill 3. Remarks by Kentucky Commissioner of Education Jon Draud 4. The Report of the Kentucky Chamber of Commerce Postsecondary Education
Task Force .......................................................................................................................................... 1 5. Action: NKU Regional Stewardship Program Stewardship Initiative
Grant Proposal .............................................................................................................................. 109 6. Adults with Some College Survey ........................................................................................... 157 7. GEAR UP Kentucky Update ....................................................................................................... 159 8. Action: Revised 2008 Meeting Calendar ............................................................................... 163 9. Other Business 10. Next Meeting – February 1, 2008, CPE Offices, Frankfort 11. Adjournment

CPE meeting materials are available on the Council Web site at http://cpe.ky.gov/about/cpe/meetings/.
Council on Postsecondary Education December 14, 2007
The Report of the Kentucky Chamber of Commerce Postsecondary Education Task Force
Last spring the Kentucky Chamber of Commerce convened a blue ribbon task force of business leaders to assess Kentucky’s progress toward achieving the goals established in the Postsecondary Education Improvement Act of 1997. Those goals included moving Kentucky to the national average of education attainment and per capita income by 2020, and improving the capacity, quality, and efficiency of Kentucky’s postsecondary system. The task force was chaired by Vic Staffieri, E.ON U.S. chairman, CEO, and president, and membership included 25 noted business leaders from across the state. The task force concluded its work December 4, 2007, with a higher education summit highlighted by the release of the report. Aims McGuinness, a nationally recognized expert on higher education policy and finance and chief consultant to the task force, will attend the December 14 Council meeting to provide an overview of the report and discuss findings and recommendations. Bill Lear, managing member, Stoll, Keenon, Ogden, PLLC, and member of the task force, will join Dr. McGuinness to introduce the report.
Staff preparation by Lee Nimocks
Kentucky Chamber of Commerce
Task Force on Postsecondary Education
December 4, 2007
Table of Contents
Page
Table of Contents............................................................................................................................ 1
List of Figures ................................................................................................................................. 4
Executive Summary ........................................................................................................................ 5
The Chamber Task Force Review............................................................................................. 6
Summary of Observations & Findings ..................................................................................... 7
Recommendations................................................................................................................... 11
To the Governor and General Assembly .......................................................................... 11
To the Kentucky Chamber of Commerce ......................................................................... 12
Background................................................................................................................................... 13
Introduction............................................................................................................................. 14
Postsecondary Education Reform: A Review.................................................................. 15
Task Force on Postsecondary Education .......................................................................... 16
The Legislation ................................................................................................................. 17
Goals of Reform................................................................................................................ 18
Policies to Achieve the Goals ........................................................................................... 20
Progress and Challenges ................................................................................................... 21
Observations and Findings............................................................................................................ 22
1. Has Kentucky made progress in building the capacity of its postsecondary institutions and system? .................................................................................................... 22
Increase in enrollments and degrees ........................................................................... 22 Progress toward institutional capacity goals............................................................... 23 Endowment Match Program (“Bucks for Brains”)..................................................... 26 Summary ..................................................................................................................... 28
2. Has performance improved in terms of preparing students for postsecondary education, ensuring their success throughout the education “pipeline”? ........................................................................................................................ 29
The education pipeline................................................................................................ 29 Kentucky’s education pipeline compared to other states............................................ 30 High school graduation ............................................................................................... 31 Postsecondary education participation........................................................................ 32 Preparation for postsecondary education .................................................................... 33 Degree completion...................................................................................................... 35 Transfers from KCTCS............................................................................................... 37 Summary ..................................................................................................................... 39
3. Has postsecondary education contributed to the ultimate goal (Goal B) of moving Kentucky’s educational attainment and per capita income closer to the national average?......................................................................................................... 39
Education attainment .................................................................................................. 39 International comparisons........................................................................................... 41 Per capita income........................................................................................................ 44 Earnings related to education level ............................................................................. 46 Net-migration related to education level and age ....................................................... 48 Mixed signals on the demand for an educated workforce .......................................... 49 Summary ..................................................................................................................... 50
4. Are the goals still valid? ............................................................................................... 51
Review of “Double the Numbers” rationale ............................................................... 52 Review of institutional capacity goals ........................................................................ 54 Summary ..................................................................................................................... 54
5. What are the barriers to progress? ................................................................................ 55
Alignment ......................................................................................................................... 57
Initiatives to improve preparation............................................................................... 58 Dual enrollment, advanced placement and transition to postsecondary education..................................................................................................................... 59 Conflicting signals from multiple assessments........................................................... 60 Financial disincentives for P-12 and postsecondary collaboration............................. 61 Summary ..................................................................................................................... 62
Links between postsecondary education and economic development/innovation.................................................................................................... 62
Statewide economic development............................................................................... 62 Connecting postsecondary education to regional innovation and economic development................................................................................................................ 63 Regional access to postsecondary programs............................................................... 66 Summary ..................................................................................................................... 67
Policy Coordination, Discipline, and Accountability ....................................................... 68
2
Council on Postsecondary Education.......................................................................... 69 CPE’s relationship to institutions................................................................................ 71 Need for state policy leadership and coordination...................................................... 72 Strategic Committee for Postsecondary Education..................................................... 73
Budget Discipline and Accountability .............................................................................. 73
Funding model prior to HB 1...................................................................................... 73 A new budgetary framework in HB 1......................................................................... 74 Moving away from the original HB 1 framework ...................................................... 74 Budget debate in 2006 Regular Session...................................................................... 76 Institutional business plans ......................................................................................... 76 Budgetary framework for 2008-2010 ......................................................................... 77 Summary ..................................................................................................................... 80
Affordability ..................................................................................................................... 81
Policy dimensions ....................................................................................................... 81 Increasing student and family share of postsecondary education costs...................... 82 Lack of an integrated budget strategy......................................................................... 83 Concerns about affordability....................................................................................... 84 Research findings on affordability in Kentucky ......................................................... 85 Alternatives for the future........................................................................................... 86 Summary ..................................................................................................................... 88
System and institutional productivity ............................................................................... 88
Summary ..................................................................................................................... 91 Kentucky Realities ........................................................................................................................ 92
Criteria for Policy Alternatives..................................................................................................... 93
Recommendations & Suggested Action Steps.............................................................................. 94
To the Governor and General Assembly .......................................................................... 94
To the Kentucky Chamber of Commerce ....................................................................... 100
APPENDIX I .............................................................................................................................. 102
APPENDIX II ............................................................................................................................. 105
3
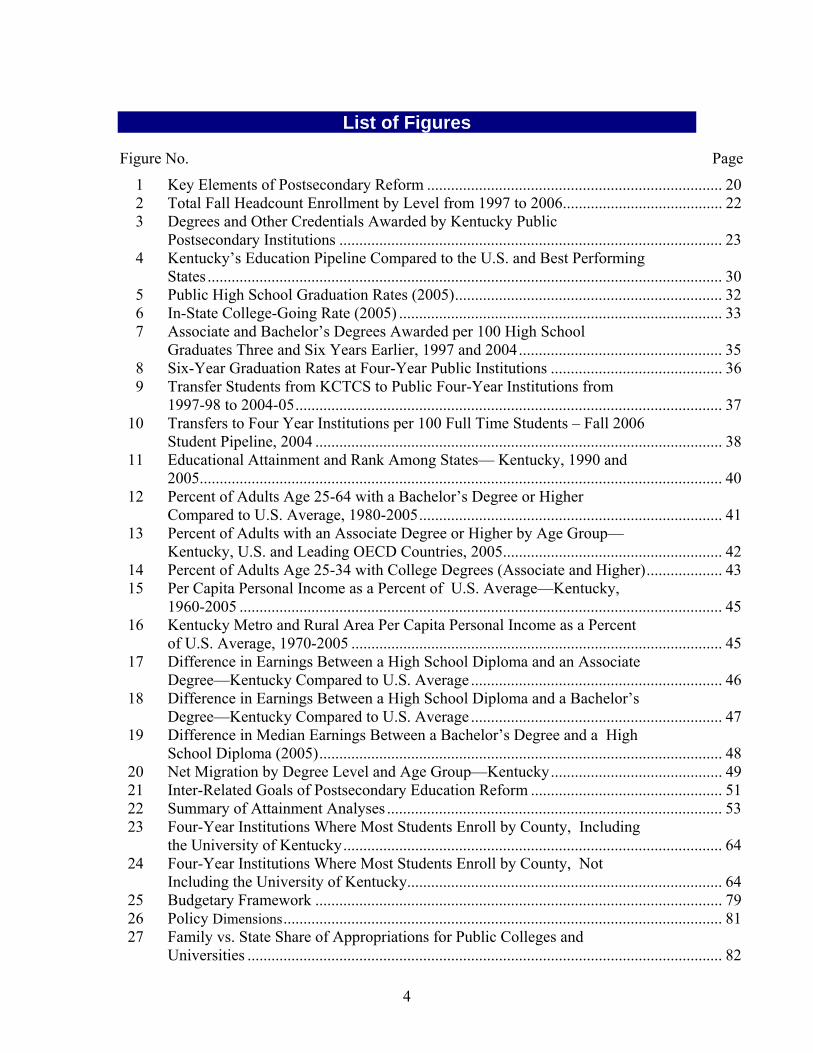
List of Figures
Figure No. Page
1 Key Elements of Postsecondary Reform .......................................................................... 20 2 Total Fall Headcount Enrollment by Level from 1997 to 2006........................................ 22 3 Degrees and Other Credentials Awarded by Kentucky Public
Postsecondary Institutions ................................................................................................ 23 4 Kentucky’s Education Pipeline Compared to the U.S. and Best Performing
States ................................................................................................................................. 30 5 Public High School Graduation Rates (2005)................................................................... 32 6 In-State College-Going Rate (2005) ................................................................................. 33 7 Associate and Bachelor’s Degrees Awarded per 100 High School
Graduates Three and Six Years Earlier, 1997 and 2004................................................... 35 8 Six-Year Graduation Rates at Four-Year Public Institutions ........................................... 36 9 Transfer Students from KCTCS to Public Four-Year Institutions from
1997-98 to 2004-05........................................................................................................... 37 10 Transfers to Four Year Institutions per 100 Full Time Students – Fall 2006
Student Pipeline, 2004 ...................................................................................................... 38 11 Educational Attainment and Rank Among States— Kentucky, 1990 and
2005................................................................................................................................... 40 12 Percent of Adults Age 25-64 with a Bachelor’s Degree or Higher
Compared to U.S. Average, 1980-2005............................................................................ 41 13 Percent of Adults with an Associate Degree or Higher by Age Group—
Kentucky, U.S. and Leading OECD Countries, 2005....................................................... 42 14 Percent of Adults Age 25-34 with College Degrees (Associate and Higher)................... 43 15 Per Capita Personal Income as a Percent of U.S. Average—Kentucky,
1960-2005 ......................................................................................................................... 45 16 Kentucky Metro and Rural Area Per Capita Personal Income as a Percent
of U.S. Average, 1970-2005 ............................................................................................. 45 17 Difference in Earnings Between a High School Diploma and an Associate
Degree—Kentucky Compared to U.S. Average ............................................................... 46 18 Difference in Earnings Between a High School Diploma and a Bachelor’s
Degree—Kentucky Compared to U.S. Average ............................................................... 47 19 Difference in Median Earnings Between a Bachelor’s Degree and a High
School Diploma (2005)..................................................................................................... 48 20 Net Migration by Degree Level and Age Group—Kentucky........................................... 49 21 Inter-Related Goals of Postsecondary Education Reform ................................................ 51 22 Summary of Attainment Analyses .................................................................................... 53 23 Four-Year Institutions Where Most Students Enroll by County, Including
the University of Kentucky............................................................................................... 64 24 Four-Year Institutions Where Most Students Enroll by County, Not
Including the University of Kentucky............................................................................... 64 25 Budgetary Framework ...................................................................................................... 79 26 Policy Dimensions.............................................................................................................. 81 27 Family vs. State Share of Appropriations for Public Colleges and
Universities ....................................................................................................................... 82
4
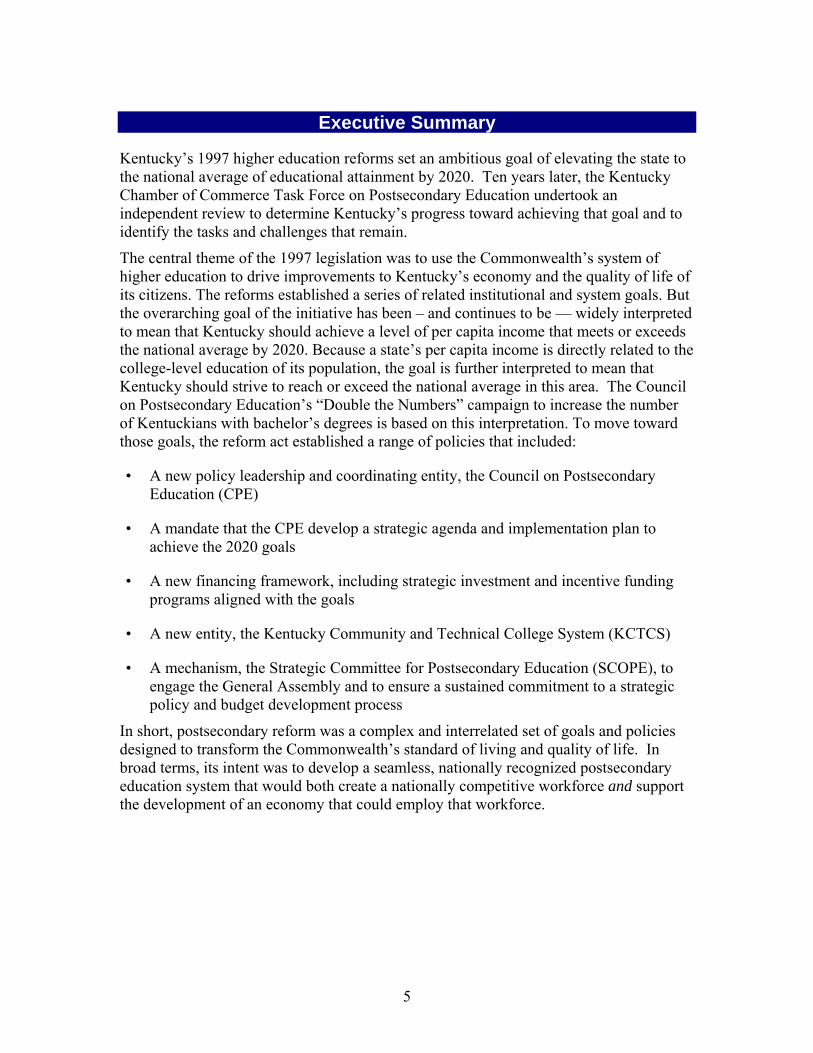
Executive Summary
Kentucky’s 1997 higher education reforms set an ambitious goal of elevating the state to the national average of educational attainment by 2020. Ten years later, the Kentucky Chamber of Commerce Task Force on Postsecondary Education undertook an independent review to determine Kentucky’s progress toward achieving that goal and to identify the tasks and challenges that remain.
The central theme of the 1997 legislation was to use the Commonwealth’s system of higher education to drive improvements to Kentucky’s economy and the quality of life of its citizens. The reforms established a series of related institutional and system goals. But the overarching goal of the initiative has been – and continues to be — widely interpreted to mean that Kentucky should achieve a level of per capita income that meets or exceeds the national average by 2020. Because a state’s per capita income is directly related to the college-level education of its population, the goal is further interpreted to mean that Kentucky should strive to reach or exceed the national average in this area. The Council on Postsecondary Education’s “Double the Numbers” campaign to increase the number of Kentuckians with bachelor’s degrees is based on this interpretation. To move toward those goals, the reform act established a range of policies that included:
• A new policy leadership and coordinating entity, the Council on Postsecondary Education (CPE)
• A mandate that the CPE develop a strategic agenda and implementation plan to achieve the 2020 goals
• A new financing framework, including strategic investment and incentive funding programs aligned with the goals
• A new entity, the Kentucky Community and Technical College System (KCTCS)
• A mechanism, the Strategic Committee for Postsecondary Education (SCOPE), to engage the General Assembly and to ensure a sustained commitment to a strategic policy and budget development process
In short, postsecondary reform was a complex and interrelated set of goals and policies designed to transform the Commonwealth’s standard of living and quality of life. In broad terms, its intent was to develop a seamless, nationally recognized postsecondary education system that would both create a nationally competitive workforce and support the development of an economy that could employ that workforce.
5
The Chamber Task Force Review
The Kentucky Chamber’s Postsecondary Education Task Force framed its work around a series of questions to gauge progress and continuing challenges and developed its findings by:
• Analyzing changes in demography, education attainment and the economy over the past decade and from a comparative perspective
• Analyzing changes within Kentucky’s postsecondary education system
• Reviewing the implementation of policies put in place by the 1997 reforms, especially the original House Bill 1 and subsequent related legislation
• Conducting interviews with current and former state policy leaders
• Gathering comments from Kentucky employers, educators and citizens in nine regional forums
6
Summary of Observations & Findings
The following is a summary of the report’s observations and findings, which are discussed in greater detail in subsequent sections. The Postsecondary Education Reform Act of 1997 represented the culmination of several decades of studies, debate and action to improve education in Kentucky. The most significant event was the 1990 enactment of the Kentucky Education Reform Act (KERA), in response to a state Supreme Court ruling that created a new system of elementary and secondary education. KERA is widely recognized as one of the nation’s most significant, state-level education reforms and marked the beginning of measurable progress in the academic achievement of Kentucky students. The documented need to expand the culture of improvement to the postsecondary level prompted the 1997 legislation. Approaching its assessment of the impact of the 1997 effort through a series of questions, the Chamber’s Task Force findings include the following.
1. Has Kentucky made progress in building the capacity of its postsecondary
institutions and system? Enrollments at all institutions have increased over the past 10 years, with growth ranging from 2.2 percent at Eastern Kentucky University to 28.3 percent at Western Kentucky University. KCTCS enrollment has grown by 106.1 percent. Degree production also has accelerated, with the most substantial increases recorded by Murray State, Northern Kentucky, Western Kentucky and KCTCS. Each of the institutions has also made significant progress toward its individual goals, although sustained attention will be required to ensure they achieve the performance expected by 2020. 2. Has performance improved in terms of preparing students for postsecondary
education, ensuring their success throughout the education “pipeline”? Kentucky continues to face considerable challenges here as its education pipeline leaks at every seam. Of 100 Kentucky 9th graders:
• Only 65 complete high school in four years1
• Only 37 directly enter college
• Only 24 enroll in a second year
1 The actual high school graduation rate as established by the Kentucky Department of Education is higher than this figure, at 71.1 percent. The data from higher education researcher Tom Mortenson, however, are based on data available for comparisons among states. Although work is in process to develop new data definitions and sources, as of today, there are no precise national data on graduation rates available that can be used for interstate comparisons.
7
• Only 12 complete either an associate degree in three years or a bachelor’s degree in six years
That final number for the nation as a whole is 18, and the top-performing states more than double (28 vs. 12) the number of Kentucky students who get through the pipeline in a timely manner.
The major leaks of Kentucky’s pipeline include low rates of high school completion; the gap between requirements for high school graduation and a GED and the level of preparation needed for postsecondary education study (more than 50 percent of college freshmen require remediation in at least one subject); the low rates of postsecondary degree completion; and the low rates of transfer from community and technical colleges and universities. There are vast disparities among Kentucky’s regions on these “leak points.”
3. Has postsecondary reform contributed to the goals of HB 1 and the ultimate goal of moving Kentucky’s educational attainment and per capita income closer to the national average? Kentucky has made progress toward the goals of HB 1 to develop the capacity of the state’s postsecondary institutions to serve the state’s needs. It has also made progress toward the ultimate goal of moving Kentucky’s educational attainment and per capita income closer to the national average. While Kentucky has made progress, other states have also improved. The result is that Kentucky’s position relative to the national average has changed little over the past decade (the state’s per capita income as a percent of the national average remains about 82.1 percent). The good news, however, is that since postsecondary reform was enacted in 1997, Kentucky has maintained its standing relative to the national average while the position of neighboring states such as Indiana and Ohio has declined. The state’s challenge is made even more difficult as other countries move ahead in the educational attainment of their younger populations. Educational attainment in the majority of Kentucky’s counties mirrors those of some of the least-educated member countries of the international Organisation of Economic Co-operation and Development (OECD), and only Fayette and Oldham counties are at or above the national average.
The state’s economy is providing mixed signals regarding the value of further postsecondary education in terms of employment opportunities. A report on regional forums conducted by KCTCS found significant shortages of candidates for employment in technical fields and several professions that require postsecondary education. Except for critical fields such as education and the health professions, most of the demand is at the associate degree level. Getting more education leads to better earnings in Kentucky, but not at the level of other states. Significant differences exist among the state’s regions in the demand for an educated workforce. Kentucky must give high priority to workplace development – creating jobs by linking higher education to a new innovation-based economy – as an essential complement to workforce development – getting more youth and adults through the education pipeline. Without an economy to employ a college-
8
educated workforce, it will not be possible for Kentucky either to retain its college graduates or attract college graduates through in-migration.
4. Are the goals of the 1997 reforms still valid? Yes, and they remain as important to the future of Kentucky as they were when adopted. Both the goals to develop institutional capacity and the ultimate goal to raise educational attainment and per capita income are critical to the Commonwealth’s competitiveness in the global innovation-based economy. Many pieces of the program are in place and doing well, but the state will need to work aggressively to reach the national average of educational attainment by 2020. Kentucky also must seamlessly integrate its education agenda at all levels—beginning with early childhood and preschool and continuing through secondary, postsecondary, adult and lifelong learning—to ensure success. Throughout the process, the linkages between education and economic growth must be clearly defined and supported by strategies to make the connections real and productive.
5. What are the barriers to progress? • Lack of alignment. Although progress has been made, appropriate
connections – also called alignment – do not exist between and among all levels of education to ensure the success of students. A striking example of this is the misalignment of the state assessment for high school students, the Commonwealth Accountability Testing System or CATS, with the expectations for postsecondary-level study. Another is inconsistent policies governing the transferability of credits earned at KCTCS institutions to universities.
• Weak links between postsecondary education and state and regional economic development. Kentucky can achieve its goals only if there is an intensified effort to develop a state economy that employs a highly educated population. In addition to getting more students through the education pipeline to degrees, the state must create jobs that keep and attract college-educated residents.
• Inadequate policy coordination, discipline and accountability. The state policy leadership and coordinating structure established in HB 1 is not working as intended, and the history of the budget process from 1997 through 2007 shows a steady drift away from a strategic alignment with the reform goals. If Kentucky is to achieve the goals of HB 1, coordination, discipline and accountability must be restored. There is widespread agreement that the re-establishment of the CPE as an effective entity is essential to the future of postsecondary reform. Most of those interviewed also agree that a new entity is needed to perform the intended purposes of SCOPE to ensure that the state’s elected leaders are fully engaged in the development of the strategic agenda and budgetary framework. To ensure alignment between funding and the pursuit of the reform goals, Kentucky must recommit to the principles of fiscal policy of HB 1.
9
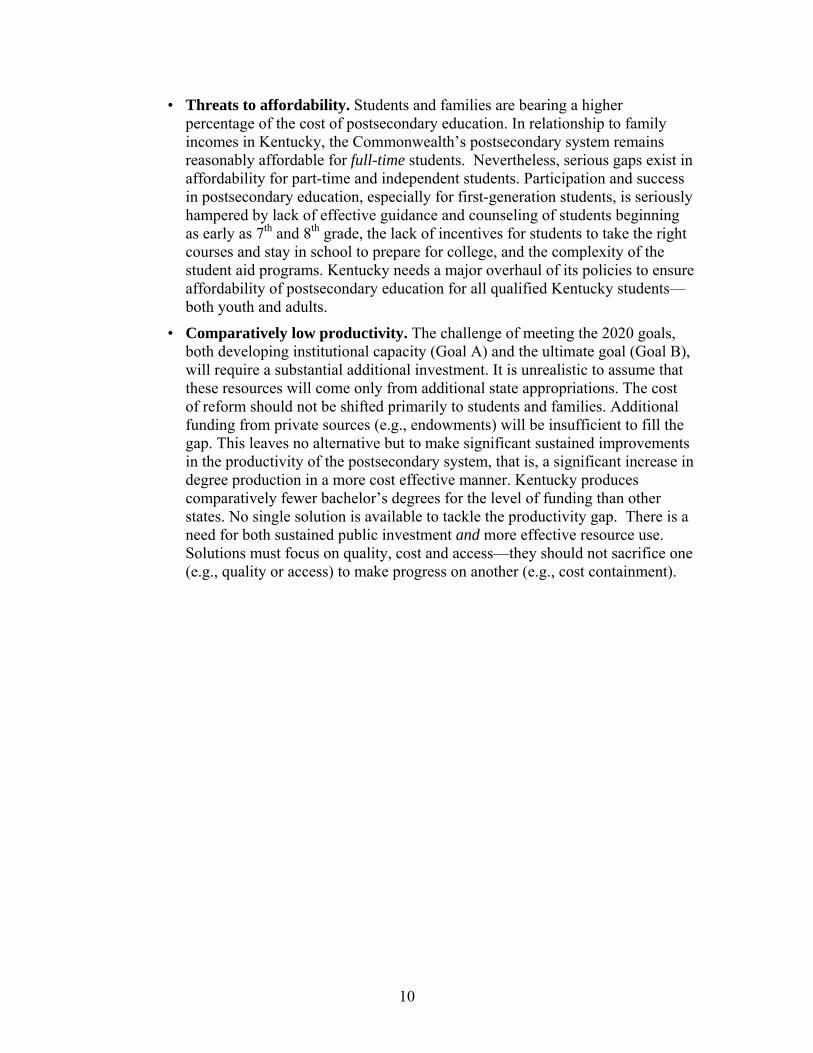
• Threats to affordability. Students and families are bearing a higher percentage of the cost of postsecondary education. In relationship to family incomes in Kentucky, the Commonwealth’s postsecondary system remains reasonably affordable for full-time students. Nevertheless, serious gaps exist in affordability for part-time and independent students. Participation and success in postsecondary education, especially for first-generation students, is seriously hampered by lack of effective guidance and counseling of students beginning as early as 7th and 8th grade, the lack of incentives for students to take the right courses and stay in school to prepare for college, and the complexity of the student aid programs. Kentucky needs a major overhaul of its policies to ensure affordability of postsecondary education for all qualified Kentucky students—both youth and adults.
• Comparatively low productivity. The challenge of meeting the 2020 goals, both developing institutional capacity (Goal A) and the ultimate goal (Goal B), will require a substantial additional investment. It is unrealistic to assume that these resources will come only from additional state appropriations. The cost of reform should not be shifted primarily to students and families. Additional funding from private sources (e.g., endowments) will be insufficient to fill the gap. This leaves no alternative but to make significant sustained improvements in the productivity of the postsecondary system, that is, a significant increase in degree production in a more cost effective manner. Kentucky produces comparatively fewer bachelor’s degrees for the level of funding than other states. No single solution is available to tackle the productivity gap. There is a need for both sustained public investment and more effective resource use. Solutions must focus on quality, cost and access—they should not sacrifice one (e.g., quality or access) to make progress on another (e.g., cost containment).
10
Recommendations
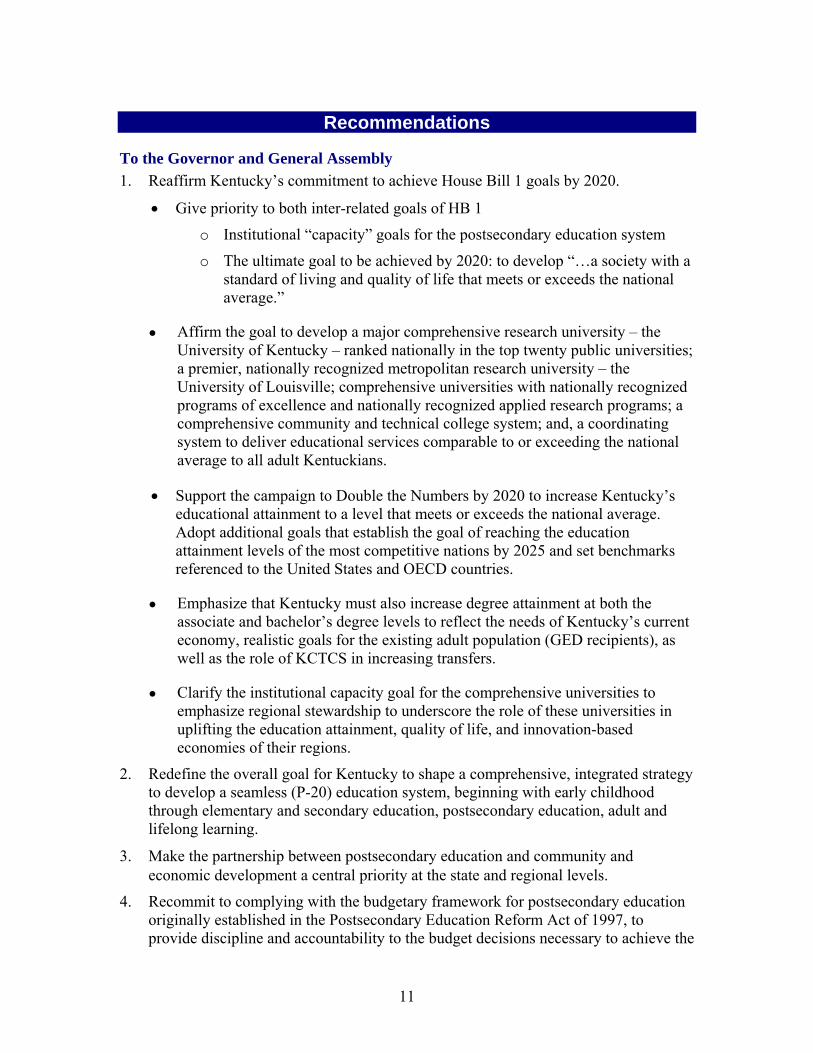
To the Governor and General Assembly 1. Reaffirm Kentucky’s commitment to achieve House Bill 1 goals by 2020.
• Give priority to both inter-related goals of HB 1
o Institutional “capacity” goals for the postsecondary education system
o The ultimate goal to be achieved by 2020: to develop “…a society with a standard of living and quality of life that meets or exceeds the national average.”
● Affirm the goal to develop a major comprehensive research university – the University of Kentucky – ranked nationally in the top twenty public universities; a premier, nationally recognized metropolitan research university – the University of Louisville; comprehensive universities with nationally recognized programs of excellence and nationally recognized applied research programs; a comprehensive community and technical college system; and, a coordinating system to deliver educational services comparable to or exceeding the national average to all adult Kentuckians.
• Support the campaign to Double the Numbers by 2020 to increase Kentucky’s educational attainment to a level that meets or exceeds the national average. Adopt additional goals that establish the goal of reaching the education attainment levels of the most competitive nations by 2025 and set benchmarks referenced to the United States and OECD countries.
● Emphasize that Kentucky must also increase degree attainment at both the associate and bachelor’s degree levels to reflect the needs of Kentucky’s current economy, realistic goals for the existing adult population (GED recipients), as well as the role of KCTCS in increasing transfers.
● Clarify the institutional capacity goal for the comprehensive universities to emphasize regional stewardship to underscore the role of these universities in uplifting the education attainment, quality of life, and innovation-based economies of their regions.
2. Redefine the overall goal for Kentucky to shape a comprehensive, integrated strategy to develop a seamless (P-20) education system, beginning with early childhood through elementary and secondary education, postsecondary education, adult and lifelong learning.
3. Make the partnership between postsecondary education and community and economic development a central priority at the state and regional levels.
4. Recommit to complying with the budgetary framework for postsecondary education originally established in the Postsecondary Education Reform Act of 1997, to provide discipline and accountability to the budget decisions necessary to achieve the
11
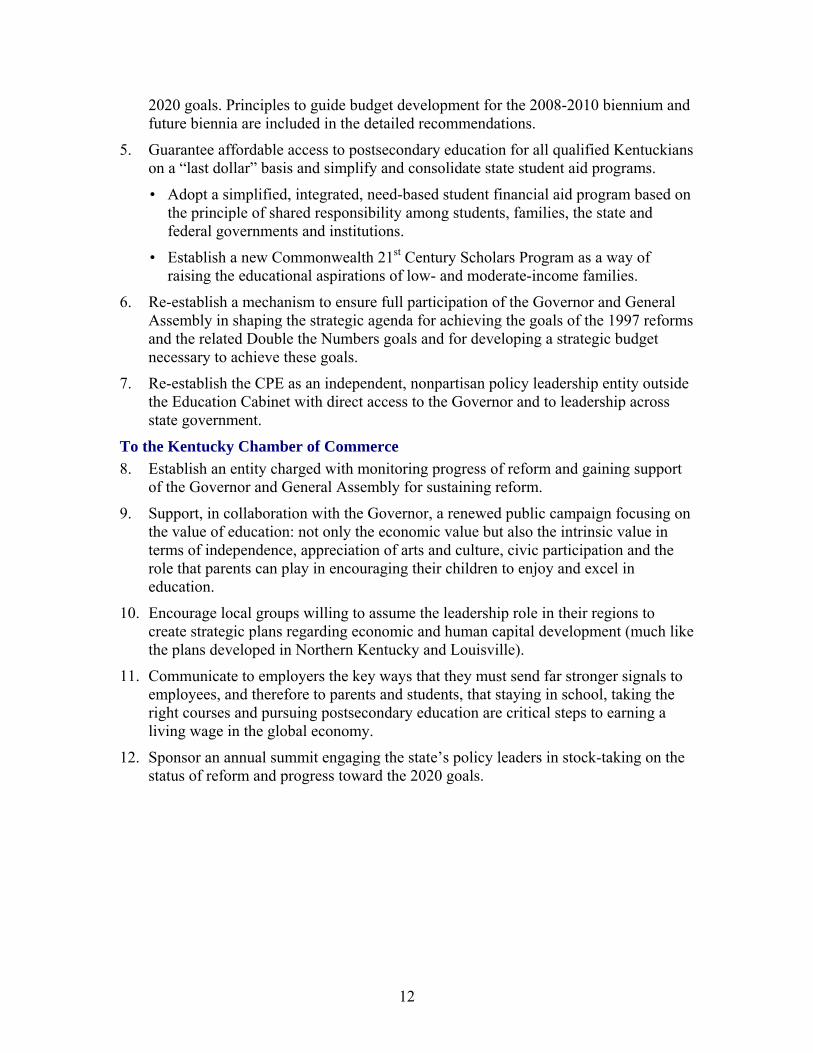
2020 goals. Principles to guide budget development for the 2008-2010 biennium and future biennia are included in the detailed recommendations.
5. Guarantee affordable access to postsecondary education for all qualified Kentuckians on a “last dollar” basis and simplify and consolidate state student aid programs.
• Adopt a simplified, integrated, need-based student financial aid program based on the principle of shared responsibility among students, families, the state and federal governments and institutions.
• Establish a new Commonwealth 21st Century Scholars Program as a way of raising the educational aspirations of low- and moderate-income families.
6. Re-establish a mechanism to ensure full participation of the Governor and General Assembly in shaping the strategic agenda for achieving the goals of the 1997 reforms and the related Double the Numbers goals and for developing a strategic budget necessary to achieve these goals.
7. Re-establish the CPE as an independent, nonpartisan policy leadership entity outside the Education Cabinet with direct access to the Governor and to leadership across state government.
To the Kentucky Chamber of Commerce 8. Establish an entity charged with monitoring progress of reform and gaining support
of the Governor and General Assembly for sustaining reform.
9. Support, in collaboration with the Governor, a renewed public campaign focusing on the value of education: not only the economic value but also the intrinsic value in terms of independence, appreciation of arts and culture, civic participation and the role that parents can play in encouraging their children to enjoy and excel in education.
10. Encourage local groups willing to assume the leadership role in their regions to create strategic plans regarding economic and human capital development (much like the plans developed in Northern Kentucky and Louisville).
11. Communicate to employers the key ways that they must send far stronger signals to employees, and therefore to parents and students, that staying in school, taking the right courses and pursuing postsecondary education are critical steps to earning a living wage in the global economy.
12. Sponsor an annual summit engaging the state’s policy leaders in stock-taking on the status of reform and progress toward the 2020 goals.
12

Background
13
Introduction
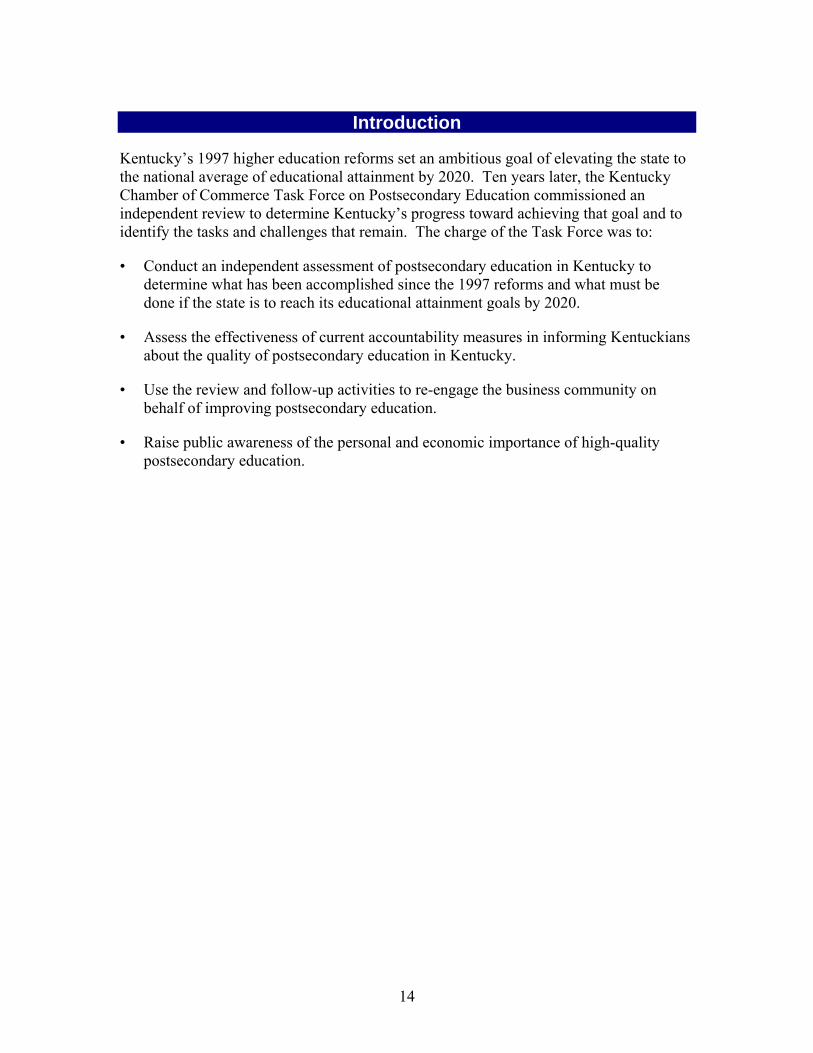
Kentucky’s 1997 higher education reforms set an ambitious goal of elevating the state to the national average of educational attainment by 2020. Ten years later, the Kentucky Chamber of Commerce Task Force on Postsecondary Education commissioned an independent review to determine Kentucky’s progress toward achieving that goal and to identify the tasks and challenges that remain. The charge of the Task Force was to:
• Conduct an independent assessment of postsecondary education in Kentucky to determine what has been accomplished since the 1997 reforms and what must be done if the state is to reach its educational attainment goals by 2020.
• Assess the effectiveness of current accountability measures in informing Kentuckians about the quality of postsecondary education in Kentucky.
• Use the review and follow-up activities to re-engage the business community on behalf of improving postsecondary education.
• Raise public awareness of the personal and economic importance of high-quality postsecondary education.
14
Postsecondary Education Reform: A Review Postsecondary reform was a complex and interrelated set of means and ends designed to transform the Commonwealth’s standard of living and quality of life. In broad terms, its intent was to develop a seamless, nationally recognized postsecondary education system that would both create a nationally competitive workforce and support the development of an economy that could employ that workforce.
The Postsecondary Education Reform Act of 1997, or House Bill 1, represented the culmination of several decades of studies, debate and action to improve education in Kentucky. The most significant event was the 1990 enactment of the Kentucky Education Reform Act (KERA) in response to a Kentucky Supreme Court decision declaring the state’s system of common schools unconstitutional. KERA is widely recognized as one of the most significant, far-reaching, state-level education reforms enacted in the United States in the past quarter century.
Following KERA’s enactment, several reports—including those by the Legislative Research Commission and the Kentucky Long-Term Policy Research Center—laid the foundation for the issues that House Bill 1 would address. Common themes emerged:
• The need for Kentucky to develop a high-quality, fully-integrated, seamless system of education and training to address the long-standing challenges of poverty and low income.
• Problems created by the lack of statewide coordination, unnecessary program duplication and barriers to credit transfers for students seeking to move from one postsecondary institution to another.
• The need to address the divided structure of community colleges and vocational-technical education.
• The negative impact of institutional end-runs of the existing Council on Higher Education and regional competition and institutional turf battles in the legislative process.
15
Task Force on Postsecondary Education A legislatively created task force, chaired by the Governor with legislative and executive branch members, began a review in mid-1996. An assessment prepared for the task force identified four barriers to raising the educational attainment and economic competitiveness of Kentuckians:
• Lack of leadership, especially from the existing Council on Higher Education. The Council was not sought as the principal source of advice on strategic budget issues by the Governor and General Assembly and was perceived as being unable to counter the political influence of the University of Kentucky and regional universities.
• Lack of strategic financial planning and a funding formula that:
o rewarded competition for the same students rather than collaboration among institutions.
o provided insufficient incentives for enhanced competitiveness in R&D, different missions or for resource sharing among the regional institutions.
• No statewide commitment to plan strategically for the deployment of technology.
• Financial barriers to students.
The assessment concluded that Kentucky’s postsecondary education system was not only ineffective in dealing with current demands, but also ill-prepared for the realities of the emerging global, knowledge-based economy.
16
The Legislation The 1997 Postsecondary Education Reform Act won passage with the broad support of a coalition of business, civic and education leaders. Its central theme was to use the Commonwealth’s system of higher education to drive improvements to Kentucky’s economy and the quality of life of its citizens. As the statute reads:
“The achievement of these goals will lead to the development of a society with a standard of living and quality of life that meets or exceeds the national average.”
Four other policy changes in 1998 and 2000 added significant dimensions to postsecondary education reform:
• The Kentucky Educational Excellence Scholarship (KEES), funded by lottery proceeds, provides postsecondary scholarships to students based on their academic performance in high school.
• The “Bucks-for-Brains” initiative matches state dollars with private donations to encourage higher education research activities. Endowment proceeds fund chairs, professorships, research scholars, research staff, fellowships, scholarships, infrastructure and mission support.
• The Kentucky Innovation Act of 2000 created the Kentucky Innovation Commission and established several special funds and programs to spur innovation and commercialization efforts.
• Senate Bill 1 (2000) substantially increased the state’s commitment to improve the educational attainment and adult literacy. The legislation transferred policy responsibility for adult education and literacy from the Cabinet for Workforce Development to the Council on Postsecondary Education.
17
Goals of Reform Two different but related kinds of goals (referred to as Goals A and B throughout this report) became part of Kentucky law:
• Goal A: Institutional “capacity” goals for the postsecondary education system. Within an overall goal to create a seamless, integrated system of postsecondary education strategically planned and adequately funded to enhance economic development and quality of life, the statute calls for five “institutional capacity goals”:
o A major comprehensive research university, the University of Kentucky, ranked nationally in the top 20 public universities.
o A premier, nationally recognized metropolitan research university, the University of Louisville.
o Regional universities with nationally recognized programs of excellence and nationally recognized applied research programs.
o A comprehensive community and technical college system.
o A coordinated system to deliver educational services, comparable to or exceeding the national average, to adult Kentuckians.2
• Goal B: The ultimate goal to be achieved by 2020: to develop “… a society with a standard of living and quality of life that meets or exceeds the national average.” This goal is widely interpreted to mean that Kentucky should achieve a level of per capita income that meets or exceeds the national average by 2020. Because the level of a state’s per capita income is directly related to the college-level education of its population, the goal is further interpreted to mean that Kentucky should strive to reach or exceed the national average in this area. This interpretation is the basis of the Council on Postsecondary Education’s Double the Numbers campaign.
2 The 2000 General Assembly added this goal in Senate Bill 1 on adult education.
18
The reform sponsors designed the goals to achieve a clear relationship between substantive means and ends as well as political balance:
• The substantive intent was that by developing strong, nationally competitive institutions and delivery systems (Goal A: the institutional capacity goals), Kentucky could achieve the ultimate goal (Goal B) by:
o Getting more of Kentucky’s population, both youth and adults, through the education pipeline to a postsecondary education degree. Developing a seamless system including KCTCS, adult education, strong universities and links with elementary and secondary education—was the means to achieve this end.
o Developing an economy that could attract, employ and retain a highly educated population. The goal related to developing the research competitiveness of the University of Kentucky as a top 20 public university and the University of Louisville as a nationally recognized metropolitan research university were means to develop a nationally competitive knowledge and innovation based economy.
• The political intent was to achieve a reasonable balance between the major sectors (the research universities, comprehensive universities and KCTCS) and the state’s regions: urban and rural, the so-called Golden Triangle and the state’s other metropolitan and more rural regions.
19
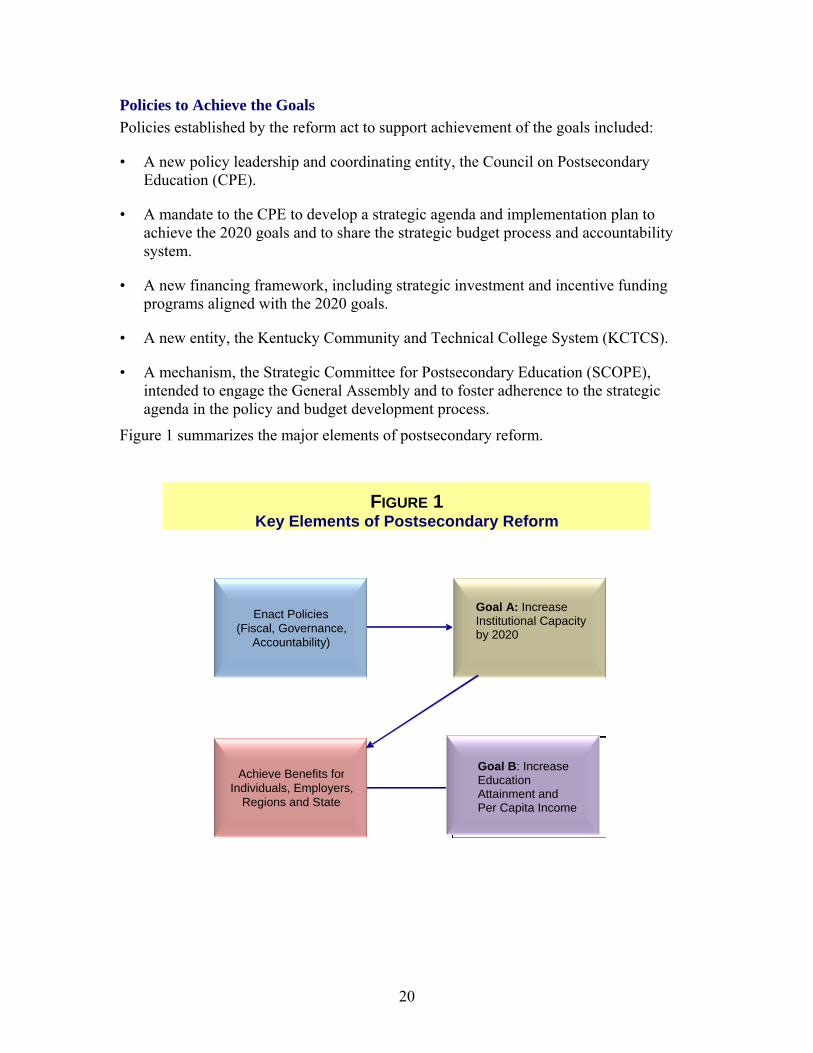
Policies to Achieve the Goals Policies established by the reform act to support achievement of the goals included:
• A new policy leadership and coordinating entity, the Council on Postsecondary Education (CPE).
• A mandate to the CPE to develop a strategic agenda and implementation plan to achieve the 2020 goals and to share the strategic budget process and accountability system.
• A new financing framework, including strategic investment and incentive funding programs aligned with the 2020 goals.
• A new entity, the Kentucky Community and Technical College System (KCTCS).
• A mechanism, the Strategic Committee for Postsecondary Education (SCOPE), intended to engage the General Assembly and to foster adherence to the strategic agenda in the policy and budget development process.
Figure 1 summarizes the major elements of postsecondary reform.
FIGURE 1
Key Elements of Postsecondary Reform
Goal B: Increase Education Attainment and Per Capita Income
Goal A: Increase Institutional Capacity by 2020
Enact P lGove
o icies r ance,(Fiscal, n
Accountability)
Achieve Benefits forIndividuals, E
Remployers,
tategions and S
20
Progress and Challenges
The Kentucky Chamber’s Postsecondary Education Task Force framed its work around a series of questions to gauge the progress that has been made in the past decade and to identify the challenges that remain. Its findings were developed by analyzing changes in demography, educational attainment, the economy over the past decade and, from a comparative perspective, by:
• Analyzing changes within Kentucky’s postsecondary education system.
• Reviewing the implementation of policies put in place by the 1997 reforms.
• Conducting interviews with current and former state policy leaders.
• Conducting interviews with institutional presidents.
• Gathering comments from Kentucky employers, educators and citizens in nine regional forums.
21
Observations and Findings
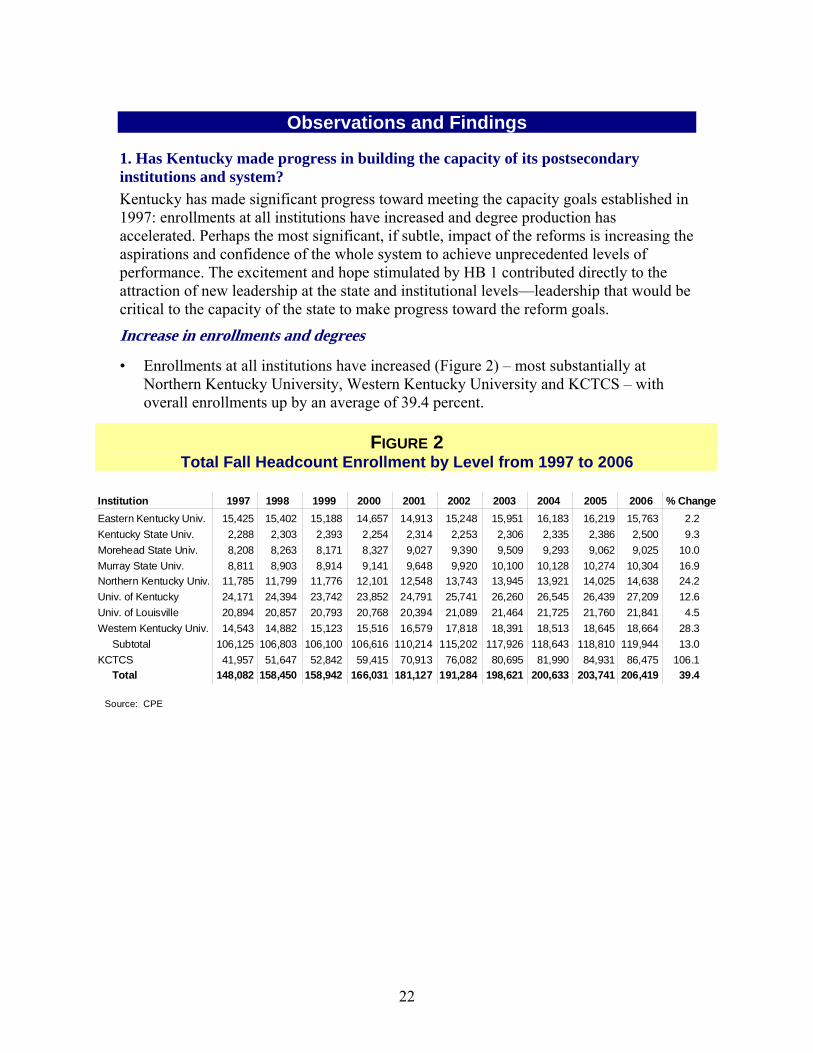
1. Has Kentucky made progress in building the capacity of its postsecondary institutions and system? Kentucky has made significant progress toward meeting the capacity goals established in 1997: enrollments at all institutions have increased and degree production has accelerated. Perhaps the most significant, if subtle, impact of the reforms is increasing the aspirations and confidence of the whole system to achieve unprecedented levels of performance. The excitement and hope stimulated by HB 1 contributed directly to the attraction of new leadership at the state and institutional levels—leadership that would be critical to the capacity of the state to make progress toward the reform goals.
Increase in enrollments and degrees
• Enrollments at all institutions have increased (Figure 2) – most substantially at Northern Kentucky University, Western Kentucky University and KCTCS – with overall enrollments up by an average of 39.4 percent.
FIGURE 2 Total Fall Headcount Enrollment by Level from 1997 to 2006
Institution 1997 1998 1999 2000 2001 2002 2003 2004 2005 2006 % ChangeEastern Kentucky Univ. 15,425 15,402 15,188 14,657 14,913 15,248 15,951 16,183 16,219 15,763 2.2Kentucky State Univ. 2,288 2,303 2,393 2,254 2,314 2,253 2,306 2,335 2,386 2,500 9.3Morehead State Univ. 8,208 8,263 8,171 8,327 9,027 9,390 9,509 9,293 9,062 9,025 10.0Murray State Univ. 8,811 8,903 8,914 9,141 9,648 9,920 10,100 10,128 10,274 10,304 16.9Northern Kentucky Univ. 11,785 11,799 11,776 12,101 12,548 13,743 13,945 13,921 14,025 14,638 24.2Univ. of Kentucky 24,171 24,394 23,742 23,852 24,791 25,741 26,260 26,545 26,439 27,209 12.6Univ. of Louisville 20,894 20,857 20,793 20,768 20,394 21,089 21,464 21,725 21,760 21,841 4.5Western Kentucky Univ. 14,543 14,882 15,123 15,516 16,579 17,818 18,391 18,513 18,645 18,664 28.3
Subtotal 106,125 106,803 106,100 106,616 110,214 115,202 117,926 118,643 118,810 119,944 13.0KCTCS 41,957 51,647 52,842 59,415 70,913 76,082 80,695 81,990 84,931 86,475 106.1
Total 148,082 158,450 158,942 166,031 181,127 191,284 198,621 200,633 203,741 206,419 39.4
Source: CPE
22
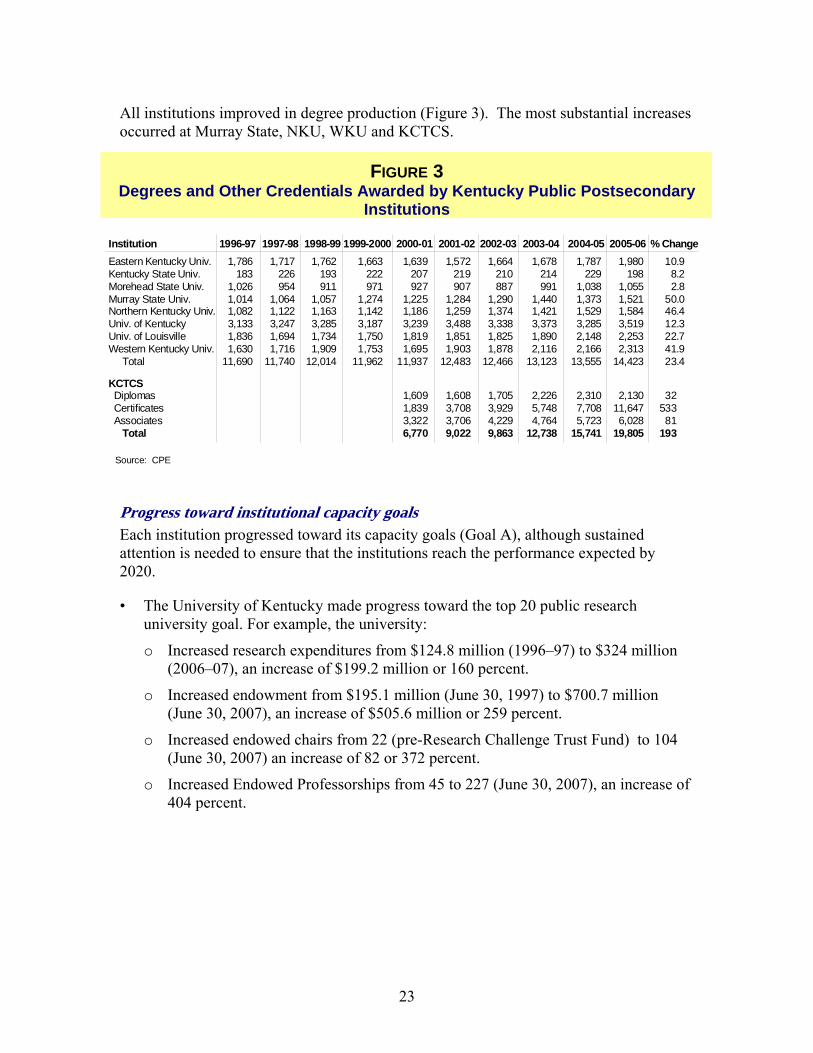
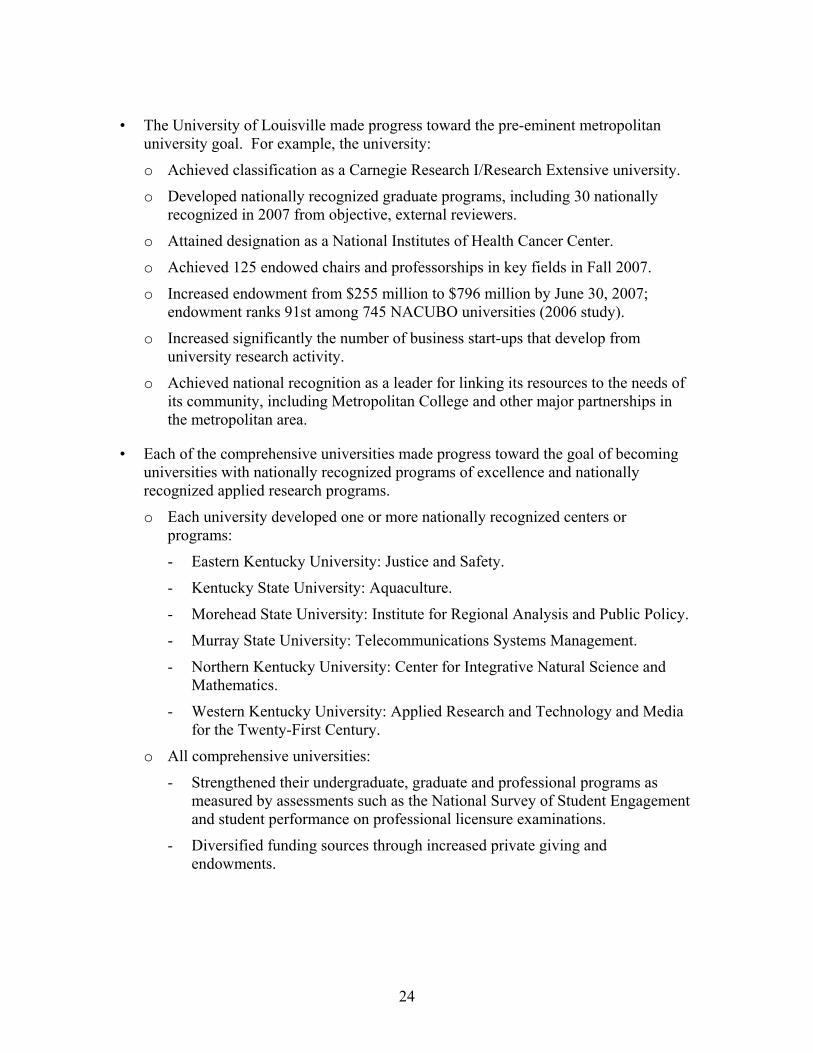
All institutions improved in degree production (Figure 3). The most substantial increases occurred at Murray State, NKU, WKU and KCTCS.
FIGURE 3 Degrees and Other Credentials Awarded by Kentucky Public Postsecondary
Institutions
Institution 1996-97 1997-98 1998-99 1999-2000 2000-01 2001-02 2002-03 2003-04 2004-05 2005-06 % ChangeEastern Kentucky Univ. 1,786 1,717 1,762 1,663 1,639 1,572 1,664 1,678 1,787 1,980 10.9Kentucky State Univ. 183 226 193 222 207 219 210 214 229 198 8.2Morehead State Univ. 1,026 954 911 971 927 907 887 991 1,038 1,055 2.8Murray State Univ. 1,014 1,064 1,057 1,274 1,225 1,284 1,290 1,440 1,373 1,521 50.0Northern Kentucky Univ. 1,082 1,122 1,163 1,142 1,186 1,259 1,374 1,421 1,529 1,584 46.4Univ. of Kentucky 3,133 3,247 3,285 3,187 3,239 3,488 3,338 3,373 3,285 3,519 12.3Univ. of Louisville 1,836 1,694 1,734 1,750 1,819 1,851 1,825 1,890 2,148 2,253 22.7Western Kentucky Univ. 1,630 1,716 1,909 1,753 1,695 1,903 1,878 2,116 2,166 2,313 41.9
Total 11,690 11,740 12,014 11,962 11,937 12,483 12,466 13,123 13,555 14,423 23.4
KCTCSDiplomas 1,609 1,608 1,705 2,226 2,310 2,130 32Certificates 1,839 3,708 3,929 5,748 7,708 11,647 533Associates 3,322 3,706 4,229 4,764 5,723 6,028 81
Total 6,770 9,022 9,863 12,738 15,741 19,805 193
Source: CPE
Progress toward institutional capacity goals Each institution progressed toward its capacity goals (Goal A), although sustained attention is needed to ensure that the institutions reach the performance expected by 2020.
• The University of Kentucky made progress toward the top 20 public research university goal. For example, the university:
o Increased research expenditures from $124.8 million (1996–97) to $324 million (2006–07), an increase of $199.2 million or 160 percent.
o Increased endowment from $195.1 million (June 30, 1997) to $700.7 million (June 30, 2007), an increase of $505.6 million or 259 percent.
o Increased endowed chairs from 22 (pre-Research Challenge Trust Fund) to 104 (June 30, 2007) an increase of 82 or 372 percent.
o Increased Endowed Professorships from 45 to 227 (June 30, 2007), an increase of 404 percent.
23
• The University of Louisville made progress toward the pre-eminent metropolitan university goal. For example, the university:
o Achieved classification as a Carnegie Research I/Research Extensive university.
o Developed nationally recognized graduate programs, including 30 nationally recognized in 2007 from objective, external reviewers.
o Attained designation as a National Institutes of Health Cancer Center.
o Achieved 125 endowed chairs and professorships in key fields in Fall 2007.
o Increased endowment from $255 million to $796 million by June 30, 2007; endowment ranks 91st among 745 NACUBO universities (2006 study).
o Increased significantly the number of business start-ups that develop from university research activity.
o Achieved national recognition as a leader for linking its resources to the needs of its community, including Metropolitan College and other major partnerships in the metropolitan area.
• Each of the comprehensive universities made progress toward the goal of becoming universities with nationally recognized programs of excellence and nationally recognized applied research programs.
o Each university developed one or more nationally recognized centers or programs:
- Eastern Kentucky University: Justice and Safety.
- Kentucky State University: Aquaculture.
- Morehead State University: Institute for Regional Analysis and Public Policy.
- Murray State University: Telecommunications Systems Management.
- Northern Kentucky University: Center for Integrative Natural Science and Mathematics.
- Western Kentucky University: Applied Research and Technology and Media for the Twenty-First Century.
o All comprehensive universities:
- Strengthened their undergraduate, graduate and professional programs as measured by assessments such as the National Survey of Student Engagement and student performance on professional licensure examinations.
- Diversified funding sources through increased private giving and endowments.
24
o The mission of all the comprehensive universities is now more focused on uplifting the education attainment and quality of life in their regions. The changes at each university reflect the unique needs and conditions within their regions. One of the more prominent examples is the national recognition gained by Northern Kentucky for “stewardship of place” – the partnership of the university with regional business, civic and educational leaders in shaping a new vision for the future of Northern Kentucky. Based on the NKU example, the 2006 General Assembly appropriated funds to support “regional stewardship” initiatives at all the comprehensive universities.
• The establishment of KCTCS is the most visible accomplishment of HB 1. Fourteen community colleges and 15 technical institutions have been consolidated into 16 comprehensive community and technical colleges to create a dynamic statewide system. KCTCS gets high marks for responsiveness to workforce and employer needs across the Commonwealth and is now the largest provider of postsecondary education and workforce training in Kentucky.
• Senate Bill 1 related to adult education, including the transfer of Kentucky Adult Education (KYAE) to the Council on Postsecondary Education, led to one of the most respected adult education programs in the nation:
o Enrollments in Kentucky Adult Basic Education increased from 31,685 in 1996 to 124,801 in 2005.
o Kentucky was third in the nation in the percentage change from 1990 to 2005 in GEDs awarded to students ages 16 to 18 (an indication of the significant role of adult education in serving high school dropouts).
o GED graduates enrolling in postsecondary education within two years increased from 12 percent in 1998 to 19 percent in 2002.3
3 Concerns about the need to ensure that students earning a GED are prepared for college have led Kentucky Adult Education within the Council on Postsecondary Education to introduce reforms in the New Framework.
25
Endowment Match Program (“Bucks for Brains”) Through the leadership of the governor, legislators and the Council on Postsecondary Education, the 1998 General Assembly established a new initiative, the Endowment Match Program (“Bucks for Brains”), within the Research Challenge Trust Fund and the Regional University Excellence Trust Fund. The purposes of Bucks for Brains were to provide incentives for significant increases in non-state funding to enhance research funding, increase the number of endowed chairs and professorships and expand the commercialization of research and related business development.4 The Bucks for Brains Program has never been codified as an ongoing statutory initiative but has been authorized by language in biennial appropriations. The funding, whether from general fund appropriations or the proceeds from bond sales, has been allocated through either the Research Challenge Trust Fund for UK and U of L or the Regional University Excellence Trust Fund for the comprehensive universities. Because the funds have been allocated through these trust funds, their distribution has been determined by statutory formulas established in HB 1 applicable to these funds. The formula for the Research Challenge Trust Fund is that two-thirds of the funds must go to the UK and one-third to the U of L. The formula for the Regional University Excellence Trust Fund establishes that funds must be allocated to each university based on the institution’s general fund appropriation as a percentage of total appropriations for these universities. Questions have been raised consistently about both of these formulas. The formula for the research universities is questioned because it does not reflect differences in performance and the capacity of the institutions to raise matching funds. The allocation formula for the comprehensive universities is questioned because the basis of general fund appropriations does not reflect significant differences in “public funds” (state appropriations and tuition revenue) among the universities.
No statutory limitations are in place for the distribution of “Bucks for Brains” between the research universities and comprehensive universities. A consistent concern is that including the comprehensive universities in the program—which was initially designed to enhance research capacity—indirectly encourages “mission creep” by the comprehensive institutions toward a research university mission.
In the biennium of “Bucks for Brains,” 1998-2000, the General Assembly appropriated $110 million: $100 to the research universities (distributed two-thirds to UK and one-third to U of L), and $10 million to the comprehensive universities. In 2000-2002, the General Assembly appropriated another $100 million for the research universities and $20 million for the comprehensive universities. Because of the budget impasse in the 2002-2004 biennium, no additional funds were made available for “Bucks for Brains” until the 2003 short legislative session. In this session, the General Assembly authorized the issuance of bonds in the amount of $120 million: $100 million for the research universities and $20 million for the comprehensive universities. Because funds remained in the trust funds that had yet to be matched, no additional requests for “Bucks for Brains” funding were considered until the proposals leading to the 2008-2010 biennium. 4 Council on Postsecondary Education, Ten Year Anniversary Assessment of Kentucky’s “Bucks for Brains” Initiative, Draft October 2007.
26
Meanwhile, the state’s investment of $350 million to date in “Bucks for Brains” has yielded $350 million in matching funds for a total increase of $700 million in the core capacity of the institutions. For the 2008-2010, the CPE is requesting an additional $200 million: $150 million for the research universities ($100 million for UK and $50 million for U of L), $40 million for the comprehensive universities, and for the first time, $10 million for KCTCS.
The results of “Bucks for Brains” are striking:
• Kentucky’s public universities raised significant private funds through the endowment match program. Institutional match funds from 1997 to 2007 were $282,220,481 (plus $28.5 million in additional pledges). These included:
o University of Kentucky: $153,722,882
o University of Louisville: $82,731,805
o Eastern Kentucky University: $10,213,837
o Kentucky State University: $1,745,683
o Morehead State University: $6,645,655
o Murray State University: $8,380,683
o Northern Kentucky University: $8,033,753
o Western Kentucky University: $10,746,183
• The market value of Kentucky’s public university endowments grew from $454 million in 1997 to $1.5 billion in 2006, a 230 percent increase.
• Kentucky’s public universities created 159 endowed chairs and 227 endowed professorships.
• Because of increased capacity, between 1997 and 2006, federal R & D expenditures at the research universities increased from $76 million to $222 million, or by 192 percent. Extramural R & D expenditures increased from $105 million to $327 million, or by 211 percent.
27
Summary There has been significant progress toward the institutional capacity goals defined by the 1997 reforms. However, with only 12 years until 2020, the institutions face significant gaps between current performance and reaching their specific goals. Even as Kentucky develops stronger, nationally recognized institutions, questions remain regarding the impact of this increased capacity on the education of the Commonwealth’s population and improvements in per capita income and quality of life.
28
2. Has performance improved in terms of preparing students for postsecondary education, ensuring their success throughout the education “pipeline”? In addition to setting capacity goals, the 1997 reforms established an objective of developing a seamless system of postsecondary education that would have a long-term, positive impact on Kentucky’s population and economy. More students would move successfully through the pieces of this system, or pipeline, to attainment of a postsecondary degree or credential. As the population’s education attainment improved, the state’s per capita income would increase to at or above the national average.
However, Kentucky continues to face considerable challenges in this area as its education pipeline leaks at every seam.
The Education Pipeline The success of postsecondary reform depends fundamentally on getting more students through the education pipeline. Evidence underscores that this pipeline begins at birth with the conditions of mother and child and continues with early care and education for children ages 0 to 3 and pre-school for children ages 3 to 5 to ensure that children arrive at first grade healthy and ready to learn. In terms of likelihood that a child will pursue postsecondary education, the transitions from elementary school to middle school and from middle school to high school are especially critical. This is when students and parents make important choices about staying in school and taking a rigorous curriculum, and gain greater understanding of the connection between doing well in school and pursuing postsecondary education and getting a good-paying job.
Other critical points in the pipeline include the transition from high school to postsecondary education, transfer from a two-year to a four-year institution, and, for an increasing number of students, pursuing a graduate or professional degree.
The pipeline is not necessarily linear: students who drop out of high school re-enter the system through adult education and job-specific training; students often stop-out of postsecondary education or reverse-transfer (return to a community college to complete an associate degree in a technical field even after completing a bachelor’s degree).
At a time when the state’s working age population is declining, the education of the remaining adults is even more important to the state’s ability to achieve its reform goals and sustain economic growth. Adult education is a critical means to overcome the consequences of leaks in the education pipeline. A high percentage of Kentucky’s adult population did not complete high school, completed some postsecondary education but did not obtain a degree, or requires additional training to meet workplace demands for improved high-level skills and knowledge.
The following analysis of Kentucky’s education pipeline emphasizes the transitions from grade nine through a postsecondary education degree and for adults without a high school diploma or equivalent through to a postsecondary education credential.
29
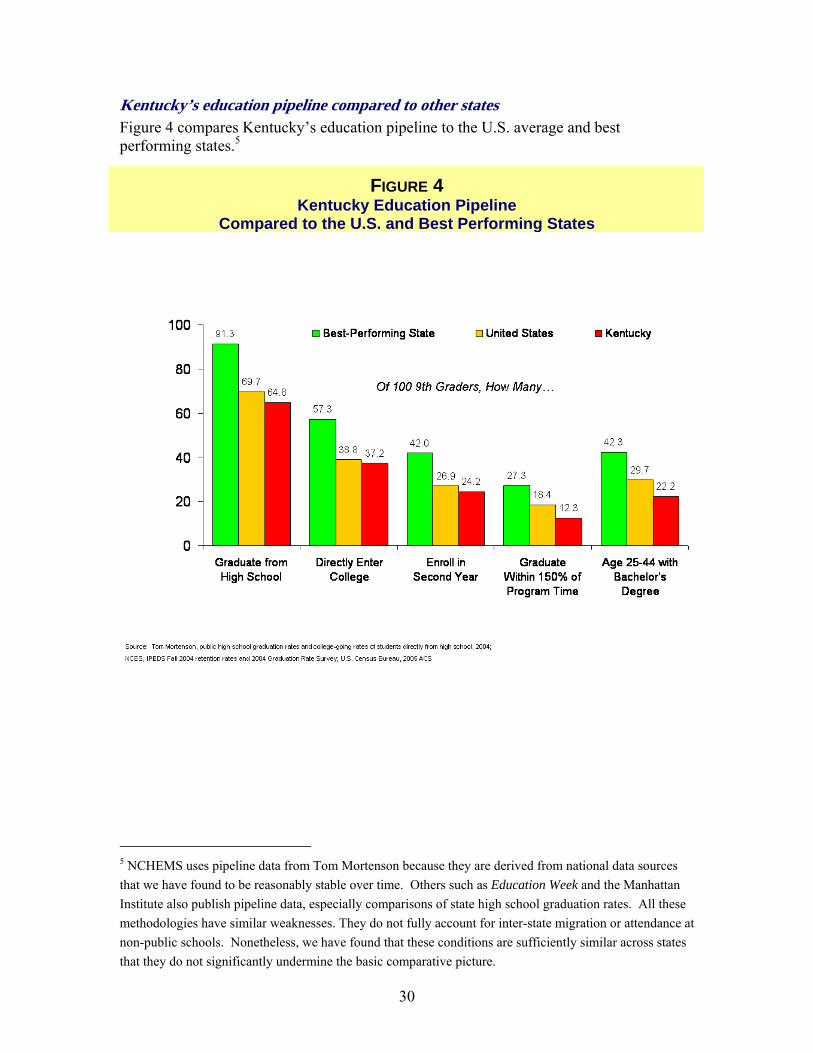
Kentucky’s education pipeline compared to other sta es tFigure 4 compares Kentucky’s education pipeline to the U.S. average and best performing states.5
FIGURE 4 Kentucky Education Pipeline
Compared to the U.S. and Best Performing States
5 NCHEMS uses pipeline data from Tom Mortenson because they are derived from national data sources that we have found to be reasonably stable over time. Others such as Education Week and the Manhattan Institute also publish pipeline data, especially comparisons of state high school graduation rates. All these methodologies have similar weaknesses. They do not fully account for inter-state migration or attendance at non-public schools. Nonetheless, we have found that these conditions are sufficiently similar across states that they do not significantly undermine the basic comparative picture.
30
Kentucky has a long way to reach the national average, much less the level of the best-performing states. Of 100 Kentucky 9th graders:
• Only 65 complete high school in four years.6
• Only 37 directly enter college.
• Only 24 enroll in a second year.
• Only 12 complete either an associate degree in three years or a bachelor’s degree in six years.
That final number for the nation as a whole is 18, and the top-performing states more than double (28 vs. 12) the number of Kentucky students who get through the pipeline in a timely manner.
High School Graduation The most basic measure of postsecondary preparation is high school graduation. Sixty-five percent of 9th graders in Kentucky graduate within four years, compared to 70 percent nationally. But there is even more variation across counties in Kentucky than across all 50 states (Figure 5). Less than half of the students in Magoffin and Lee counties graduate within four years compared to more than 90 percent in Calloway, Oldham and Union counties.
Kentucky was third in the nation in the percentage change from 1990 to 2005 in GEDs awarded to students ages 16 to 18—an indication of the significant role of adult education in serving high school dropouts.
GED graduates enrolling in postsecondary education within two years increased from 12 percent in 1998 to 19 percent in 2002.
6 The actual high school graduation rate as established by the Kentucky Department of Education is higher than this figure, or 71.1 percent. The data from higher education researcher Tom Mortenson, however, are based on data available for comparisons among states. Although work is in process to develop new data definitions and sources, as of today, there are no precise national data on graduation rates available that can be used for interstate comparisons.
31
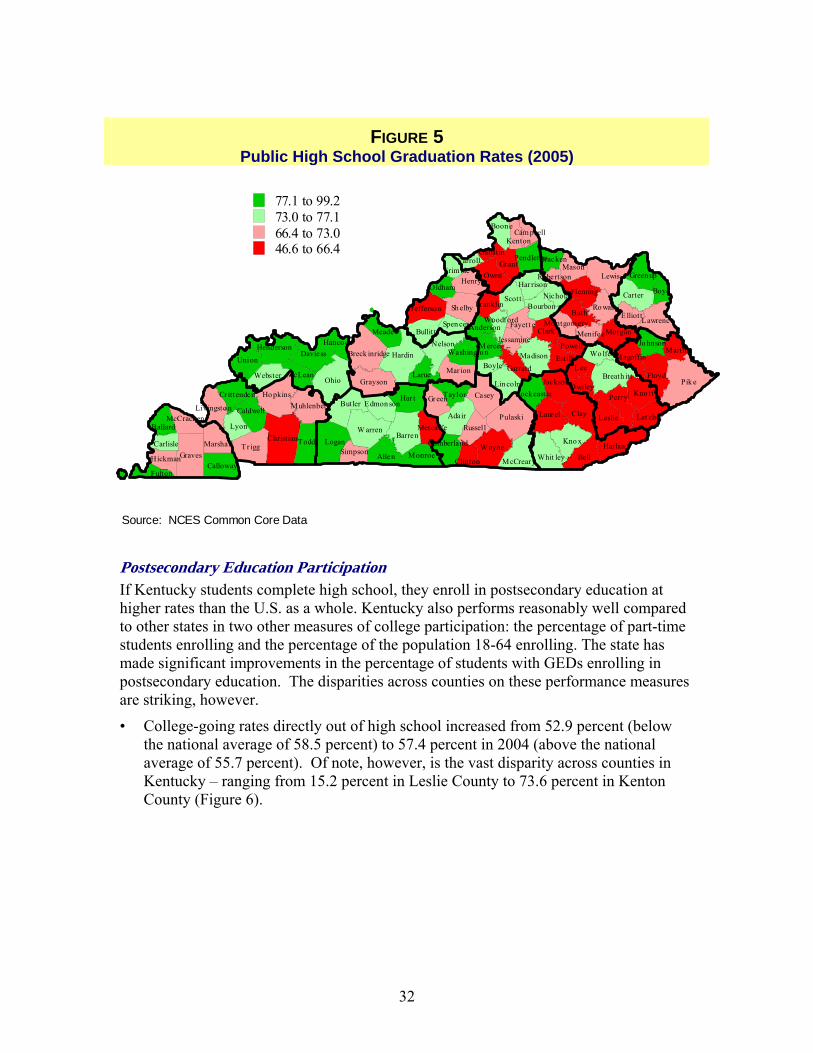
FIGURE 5 Public High School Graduation Rates (2005)
Barren
MonroeAllen
Cumberland
McCreary
W ayneWhit ley
Carlisle
Ballard
Hickman
Marshall
McCracken
WoodfordAnderson
Jessamine
Fleming
Green up
Washingto nNelson
Jackson
Garrard
Owsley
Let cher
Perry
Clinton
Magoffin
Morgan
Martin
Trim ble
Boon e
Kenton
Webster
Breck inridgeHanco ck
Meade
Larue
Fulton
CaldwellButler Edmon son
HarlanBell
Adair
BathBourbon
Boyd
Boyle
Bracken
Breath it t
Bullit t
Calloway
Cam pbell
Carroll
Carter
Casey
Christian
Clark
Clay
Cr ittenden
Daviess
E lliott
Estill
Fayett e
Floyd
Franklin
Gallat inGrant
Graves
Grayson
Green
Hardin
Har rison
Har t
Henderson
Henry
Ho pkins
Jefferso n
Jo hnson
Kno tt
Kno x
Laur el
Lawrence
Lee
Leslie
Lewis
Lin coln
Livingsto n
Logan
Lyon
Madison
Mar ion
Mason
McLean
MenifeeMercer
Metca lfe
Mo ntgom ery
Muhlenberg
Nicholas
Ohio
OldhamOwen
Pendleton
Pik e
Powell
Pulaski
Robertson
Rock castle
Ro wan
Russell
ScottSh elby
Simpson
Spen cer
Taylor
ToddTr igg
Union
W arren
Wo lfe
77.1 to 99.273.0 to 77.166.4 to 73.046.6 to 66.4
Source: NCES Common Core Data
Postsecondary Education Participation If Kentucky students complete high school, they enroll in postsecondary education at higher rates than the U.S. as a whole. Kentucky also performs reasonably well compared to other states in two other measures of college participation: the percentage of part-time students enrolling and the percentage of the population 18-64 enrolling. The state has made significant improvements in the percentage of students with GEDs enrolling in postsecondary education. The disparities across counties on these performance measures are striking, however.
• College-going rates directly out of high school increased from 52.9 percent (below the national average of 58.5 percent) to 57.4 percent in 2004 (above the national average of 55.7 percent). Of note, however, is the vast disparity across counties in Kentucky – ranging from 15.2 percent in Leslie County to 73.6 percent in Kenton County (Figure 6).
32
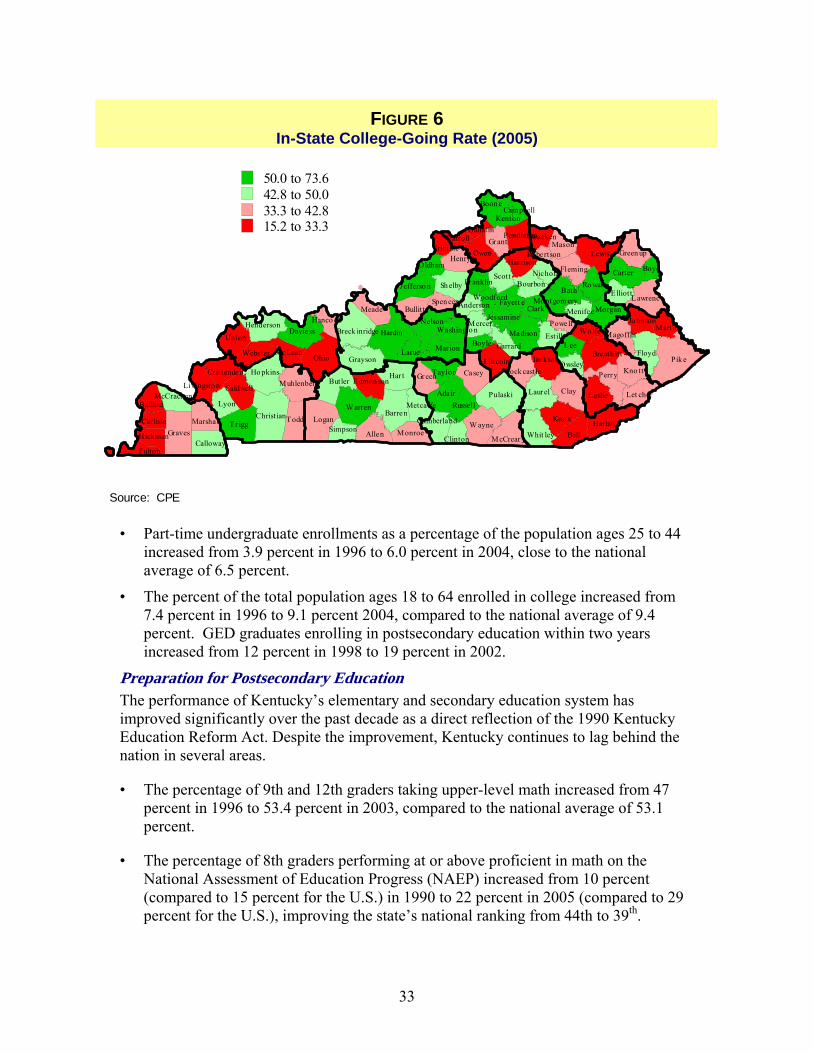
FIGURE 6 In-State College-Going Rate (2005)
Barren
MonroeAllen
Cumberland
McCrear y
W ayneWhit ley
Carlisle
Ballard
Hickman
Marsha ll
McCracken
WoodfordAnderson
Jessamine
Fleming
Green up
Washingto nNelson
Jackson
Garrard
Owsley
Let cher
Perry
Clinton
Magoffin
Morgan
Martin
Trim ble
Boon e
Kenton
Webster
Breck inridgeHanco ck
Meade
Larue
Fulton
CaldwellButler Edmon son
HarlanBell
Adair
BathBourbon
Boyd
Boyle
Bracken
Breath itt
Bullit t
Calloway
Cam pbell
Carroll
Carter
Casey
Christian
Clark
Clay
Cr ittenden
Daviess
E lliott
Estill
Fayett e
Floyd
Fr anklin
GallatinGrant
Graves
Grayson
Gr een
Hardin
Har rison
Har t
Henderson
Henry
Ho pkins
Jefferso n
Jo hnson
Kno tt
Kno x
Laurel
Lawrence
L ee
Leslie
Lewis
Lin coln
Livingsto n
Logan
Lyon
Madison
Mar ion
Mason
McLean
MenifeeMercer
Metcalfe
Mo ntgom ery
Muhlenberg
Nicholas
Ohio
OldhamOwen
Pendleton
Pik e
Powell
Pulaski
Robertson
Rock castle
Ro wan
Russell
ScottSh elby
Simpson
Spen cer
Taylor
ToddTr igg
Union
W arren
Wo lfe
50.0 to 73.642.8 to 50.033.3 to 42.815.2 to 33.3
Source: CPE
• Part-time undergraduate enrollments as a percentage of the population ages 25 to 44 increased from 3.9 percent in 1996 to 6.0 percent in 2004, close to the national average of 6.5 percent.
• The percent of the total population ages 18 to 64 enrolled in college increased from 7.4 percent in 1996 to 9.1 percent 2004, compared to the national average of 9.4 percent. GED graduates enrolling in postsecondary education within two years increased from 12 percent in 1998 to 19 percent in 2002.
Preparation for Postsecondary Education The performance of Kentucky’s elementary and secondary education system has improved significantly over the past decade as a direct reflection of the 1990 Kentucky Education Reform Act. Despite the improvement, Kentucky continues to lag behind the nation in several areas.
• The percentage of 9th and 12th graders taking upper-level math increased from 47 percent in 1996 to 53.4 percent in 2003, compared to the national average of 53.1 percent.
• The percentage of 8th graders performing at or above proficient in math on the National Assessment of Education Progress (NAEP) increased from 10 percent (compared to 15 percent for the U.S.) in 1990 to 22 percent in 2005 (compared to 29 percent for the U.S.), improving the state’s national ranking from 44th to 39th.
33
• The percentage of 8th graders performing at or above proficient in science on NAEP increased from 23 percent (compared to 27 percent for the U.S.) in 1996 to 29 percent in 2000 (close to 30 percent for the U.S.), improving Kentucky’s national ranking from 35th to 33rd.
• The percentage of 8th graders performing at or above proficient in reading on NAEP increased only slightly from 29 percent (compared to 31 percent for the U.S.) in 1996 to 31 percent in 2000, while the U.S. percentage dropped slightly to 29 percent.
Despite improvements in K-12 performance, recent high school graduates and returning adults are both significantly under-prepared for postsecondary education. Students who enter postsecondary under-prepared must enroll in developmental, or remediation, programs and are much less likely than well-prepared students to ever obtain a postsecondary degree.
• High scores on the ACT or SAT per 1,000 high school graduates increased from 129.7 in 1999 to 155.5 in 2005, but still trailed the U.S. average of 184.5.
• Fifty-four percent of all Kentucky public college entrants were under-prepared in one or more subjects in 2004, compared to 53 percent in 2002. Forty-six percent of recent high school graduates (three-fifths of all entrants) were under-prepared in one or more subjects in 2004, compared to 48 percent in 2002.
• More than 90 percent of adult students entering postsecondary education in 2004 after completing GEDs in Kentucky were under-prepared (scored less than 17 on one or more ACT subject exams in math, English or reading, well below the recommended ACT score for college readiness).7
7 CPE (2006). Development Education Update: The Preparation of Students Entering Kentucky’s Public Colleges and Universities in 2002 and 2004, October 5, 2006, pp. 1-2, 9.
34
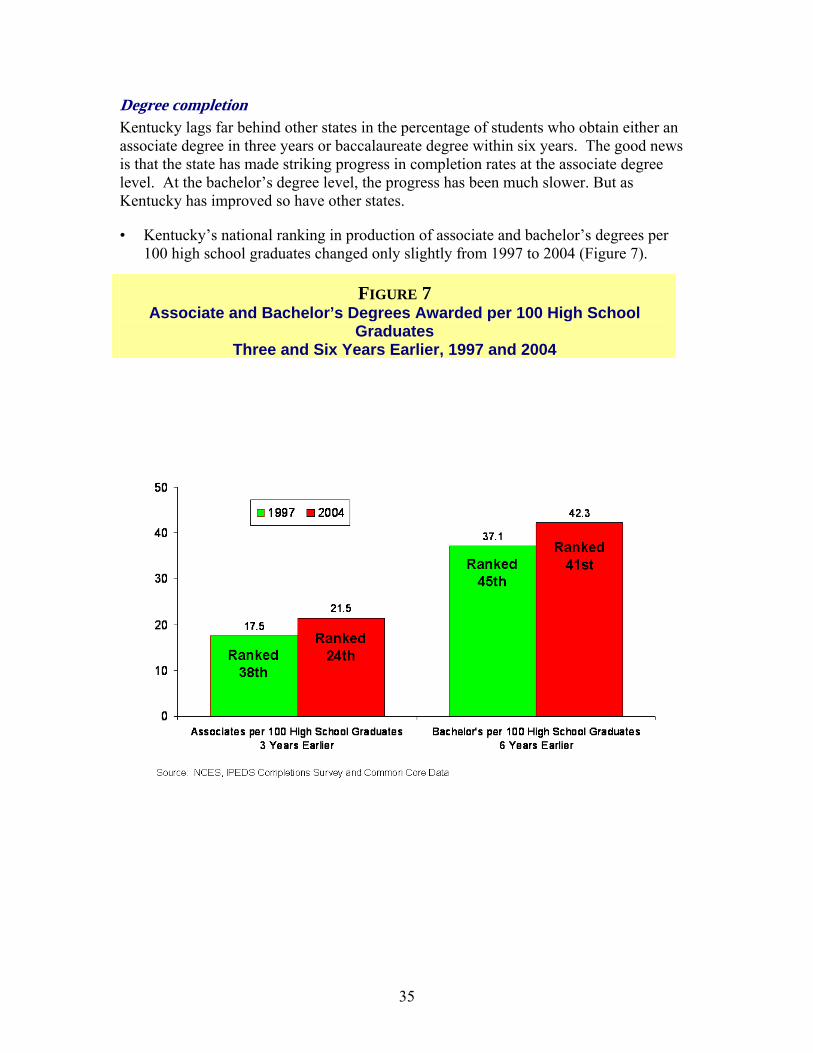
Degree completion Kentucky lags far behind other states in the percentage of students who obtain either an associate degree in three years or baccalaureate degree within six years. The good news is that the state has made striking progress in completion rates at the associate degree level. At the bachelor’s degree level, the progress has been much slower. But as Kentucky has improved so have other states.
• Kentucky’s national ranking in production of associate and bachelor’s degrees per 100 high school graduates changed only slightly from 1997 to 2004 (Figure 7).
FIGURE 7 Associate and Bachelor’s Degrees Awarded per 100 High School
Graduates Three and Six Years Earlier, 1997 and 2004
35
• The most striking change can be seen in completion rates at the associate degree level.
o Three-year associate degree graduation rates at KCTCS increased from 8.5 percent in 2001 to 16.7 percent in 2006 (below the national average of 29.3 percent).
o Associate degrees awarded per 100 students enrolled in two-year public colleges increased from 17.5 in 1996 to 21.5 in 2006, changing the national rank from 38th to 24th in the U.S.
o Retention rates for freshman returning the second year at two-year institutions increased from 55.1 percent in 1999 to 57.5 percent in 2006, above the U.S. average of 51.5 percent.
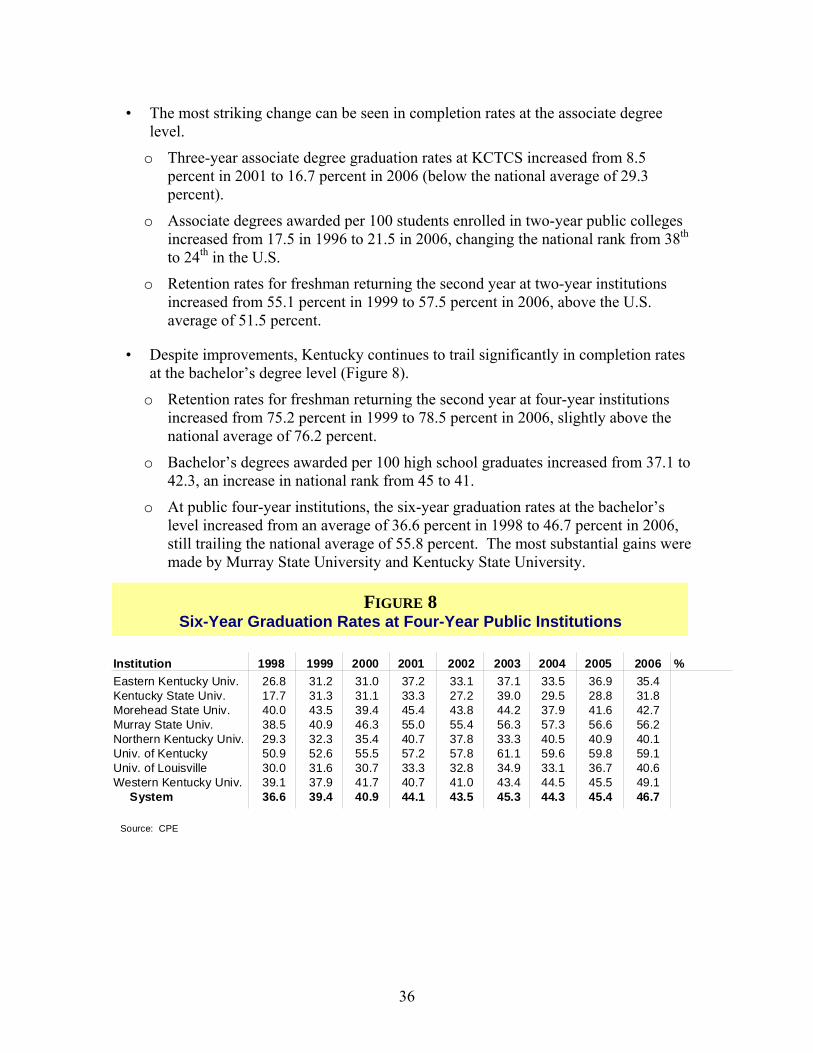
• Despite improvements, Kentucky continues to trail significantly in completion rates at the bachelor’s degree level (Figure 8).
o Retention rates for freshman returning the second year at four-year institutions increased from 75.2 percent in 1999 to 78.5 percent in 2006, slightly above the national average of 76.2 percent.
o Bachelor’s degrees awarded per 100 high school graduates increased from 37.1 to 42.3, an increase in national rank from 45 to 41.
o At public four-year institutions, the six-year graduation rates at the bachelor’s level increased from an average of 36.6 percent in 1998 to 46.7 percent in 2006, still trailing the national average of 55.8 percent. The most substantial gains were made by Murray State University and Kentucky State University.
FIGURE 8 Six-Year Graduation Rates at Four-Year Public Institutions
Institution 1998 1999 2000 2001 2002 2003 2004 2005 2006 % Eastern Kentucky Univ. 26.8 31.2 31.0 37.2 33.1 37.1 33.5 36.9 35.4Kentucky State Univ. 17.7 31.3 31.1 33.3 27.2 39.0 29.5 28.8 31.8Morehead State Univ. 40.0 43.5 39.4 45.4 43.8 44.2 37.9 41.6 42.7Murray State Univ. 38.5 40.9 46.3 55.0 55.4 56.3 57.3 56.6 56.2Northern Kentucky Univ. 29.3 32.3 35.4 40.7 37.8 33.3 40.5 40.9 40.1Univ. of Kentucky 50.9 52.6 55.5 57.2 57.8 61.1 59.6 59.8 59.1Univ. of Louisville 30.0 31.6 30.7 33.3 32.8 34.9 33.1 36.7 40.6Western Kentucky Univ. 39.1 37.9 41.7 40.7 41.0 43.4 44.5 45.5 49.1
System 36.6 39.4 40.9 44.1 43.5 45.3 44.3 45.4 46.7
Source: CPE
36
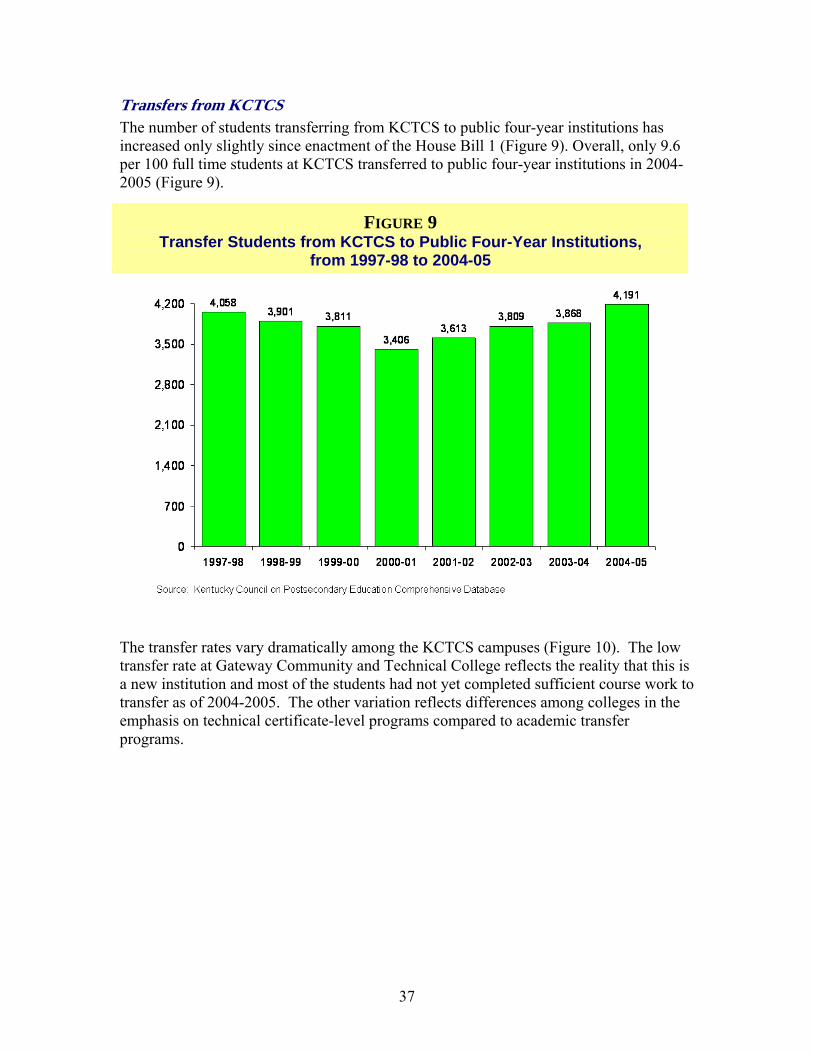
Transfers from KCTCS The number of students transferring from KCTCS to public four-year institutions has increased only slightly since enactment of the House Bill 1 (Figure 9). Overall, only 9.6 per 100 full time students at KCTCS transferred to public four-year institutions in 2004-2005 (Figure 9).
FIGURE 9 Transfer Students from KCTCS to Public Four-Year Institutions,
from 1997-98 to 2004-05
The transfer rates vary dramatically among the KCTCS campuses (Figure 10). The low transfer rate at Gateway Community and Technical College reflects the reality that this is a new institution and most of the students had not yet completed sufficient course work to transfer as of 2004-2005. The other variation reflects differences among colleges in the emphasis on technical certificate-level programs compared to academic transfer programs.
37
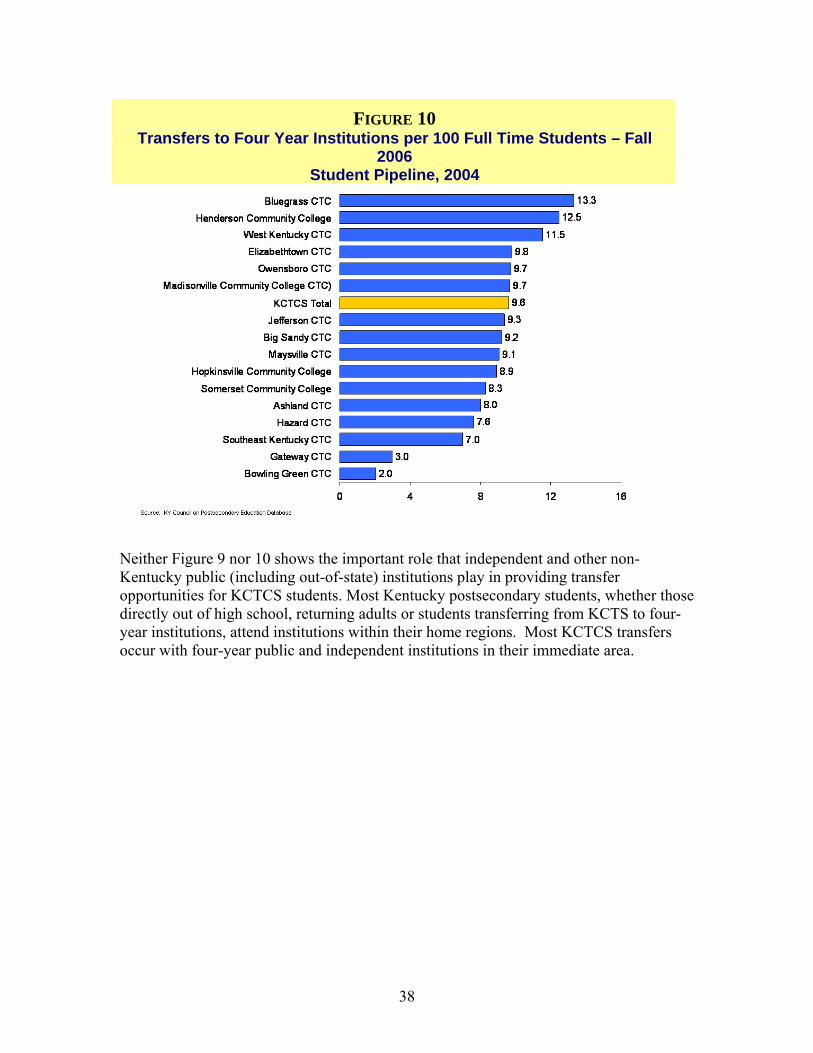
FIGURE 10 Transfers to Four Year Institutions per 100 Full Time Students – Fall
2006 Student Pipeline, 2004
Neither Figure 9 nor 10 shows the important role that independent and other non-Kentucky public (including out-of-state) institutions play in providing transfer opportunities for KCTCS students. Most Kentucky postsecondary students, whether those directly out of high school, returning adults or students transferring from KCTS to four-year institutions, attend institutions within their home regions. Most KCTCS transfers occur with four-year public and independent institutions in their immediate area.
38
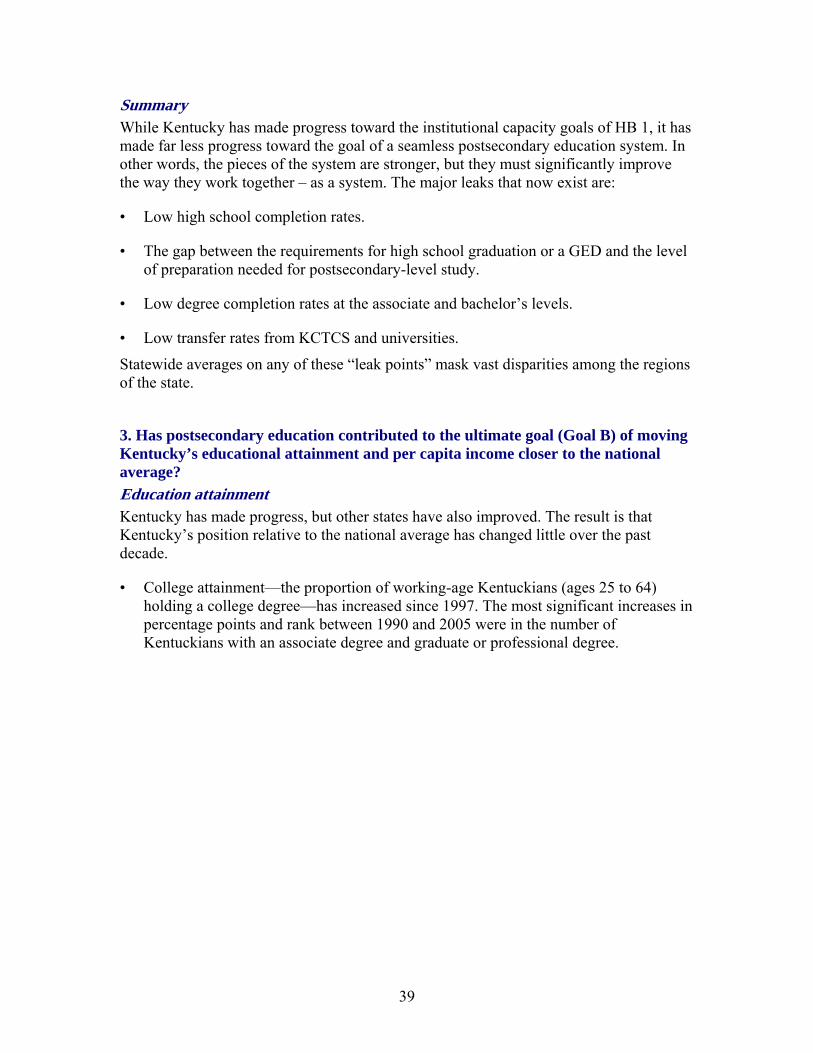
Summary While Kentucky has made progress toward the institutional capacity goals of HB 1, it has made far less progress toward the goal of a seamless postsecondary education system. In other words, the pieces of the system are stronger, but they must significantly improve the way they work together – as a system. The major leaks that now exist are:
• Low high school completion rates.
• The gap between the requirements for high school graduation or a GED and the level of preparation needed for postsecondary-level study.
• Low degree completion rates at the associate and bachelor’s levels.
• Low transfer rates from KCTCS and universities.
Statewide averages on any of these “leak points” mask vast disparities among the regions of the state.
3. Has postsecondary education contributed to the ultimate goal (Goal B) of moving Kentucky’s educational attainment and per capita income closer to the national average? Education attainment Kentucky has made progress, but other states have also improved. The result is that Kentucky’s position relative to the national average has changed little over the past decade.
• College attainment—the proportion of working-age Kentuckians (ages 25 to 64) holding a college degree—has increased since 1997. The most significant increases in percentage points and rank between 1990 and 2005 were in the number of Kentuckians with an associate degree and graduate or professional degree.
39
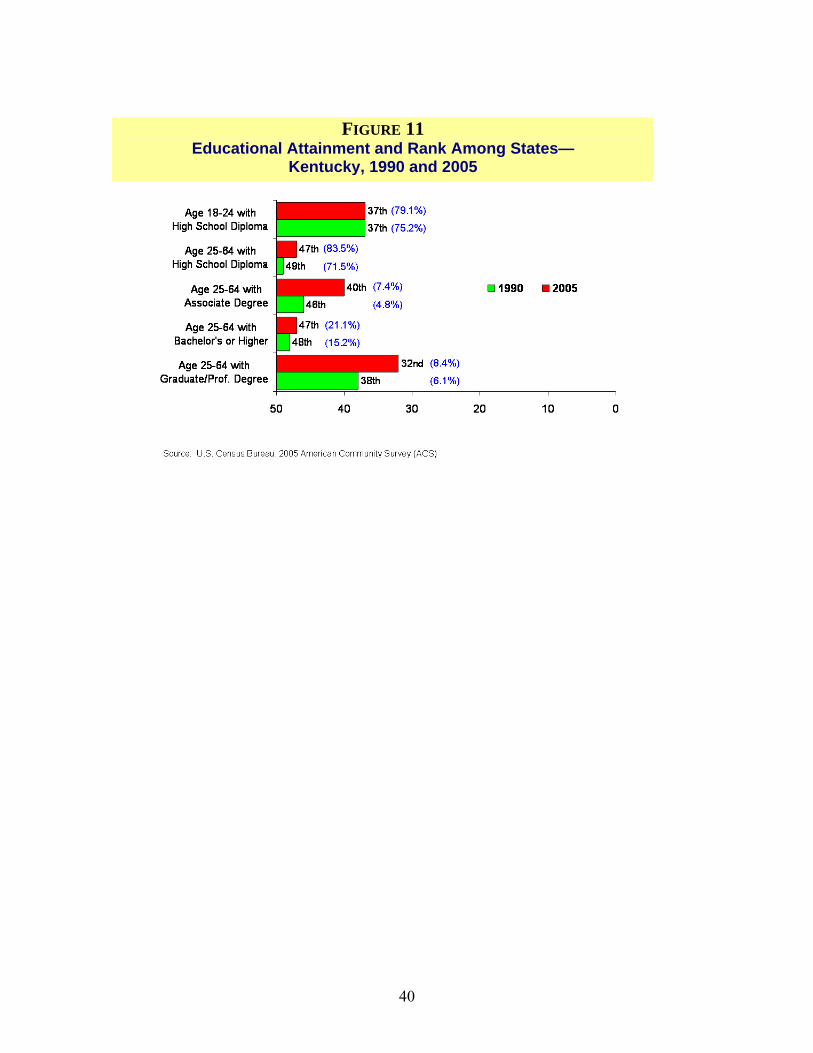
FIGURE 11
Educational Attainment and Rank Among States— Kentucky, 1990 and 2005
40
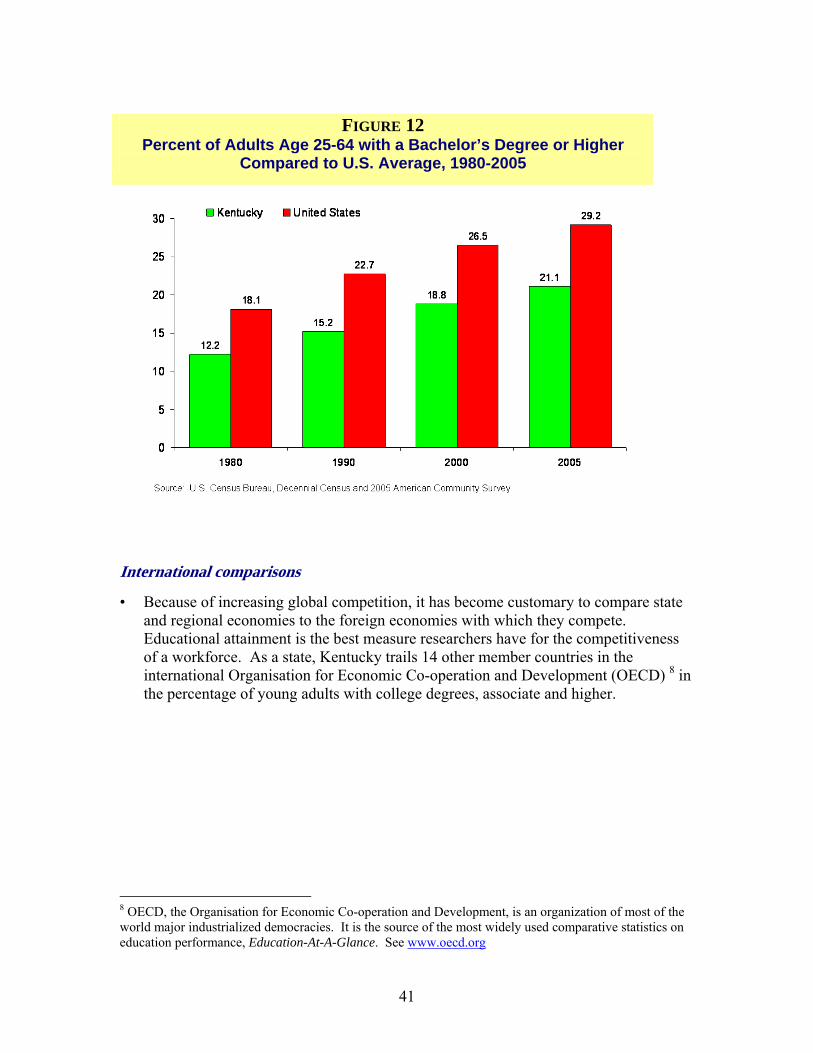
FIGURE 12
Percent of Adults Age 25-64 with a Bachelor’s Degree or Higher Compared to U.S. Average, 1980-2005
International comparisons
• Because of increasing global competition, it has become customary to compare state and regional economies to the foreign economies with which they compete. Educational attainment is the best measure researchers have for the competitiveness of a workforce. As a state, Kentucky trails 14 other member countries in the international Organisation for Economic Co-operation and Development (OECD) 8 in the percentage of young adults with college degrees, associate and higher.
8 OECD, the Organisation for Economic Co-operation and Development, is an organization of most of the world major industrialized democracies. It is the source of the most widely used comparative statistics on education performance, Education-At-A-Glance. See www.oecd.org
41
FIGURE 13 Percent of Adults with an Associate Degree or Higher by Age Group—
Kentucky, U.S. and Leading OECD Countries, 2005
The education levels in the majority of Kentucky’s counties mirror those of some of the least-educated OECD countries (Figure 14), and only Fayette and Oldham counties are at or above the U.S. average. The ability to attract new business and industry in many parts of the state is severely limited by the low education levels of the workforce.
42
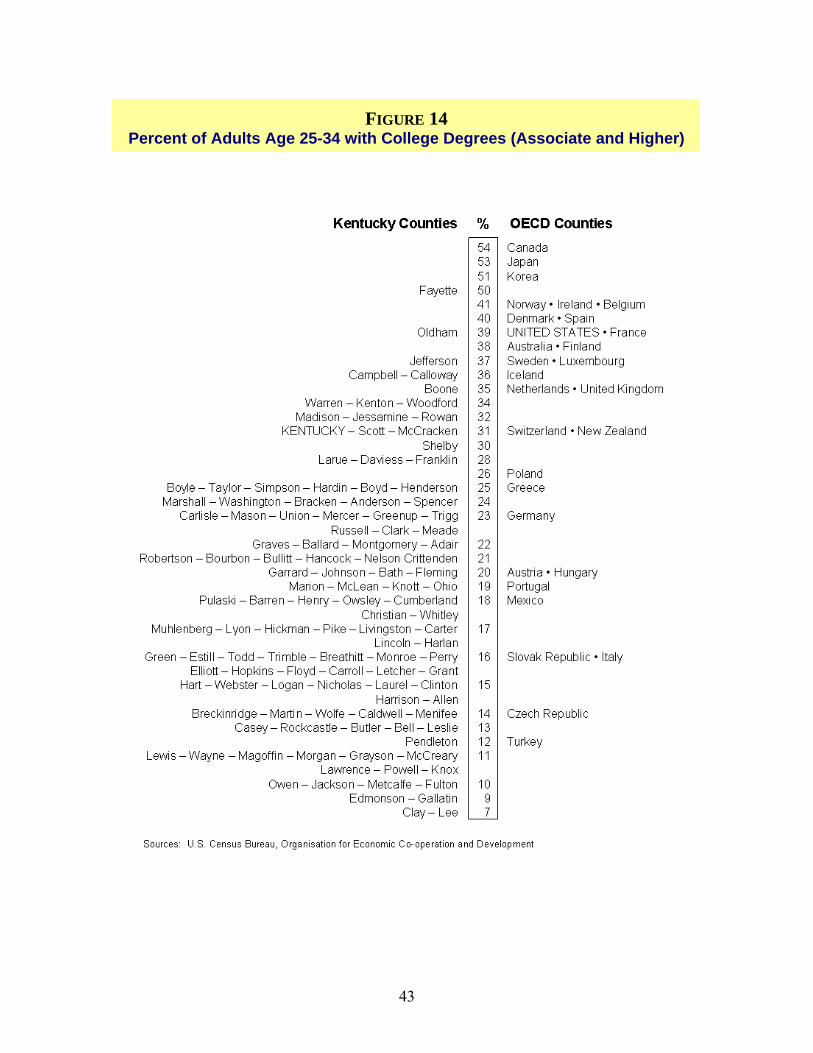
FIGURE 14 Percent of Adults Age 25-34 with College Degrees (Associate and Higher)
43
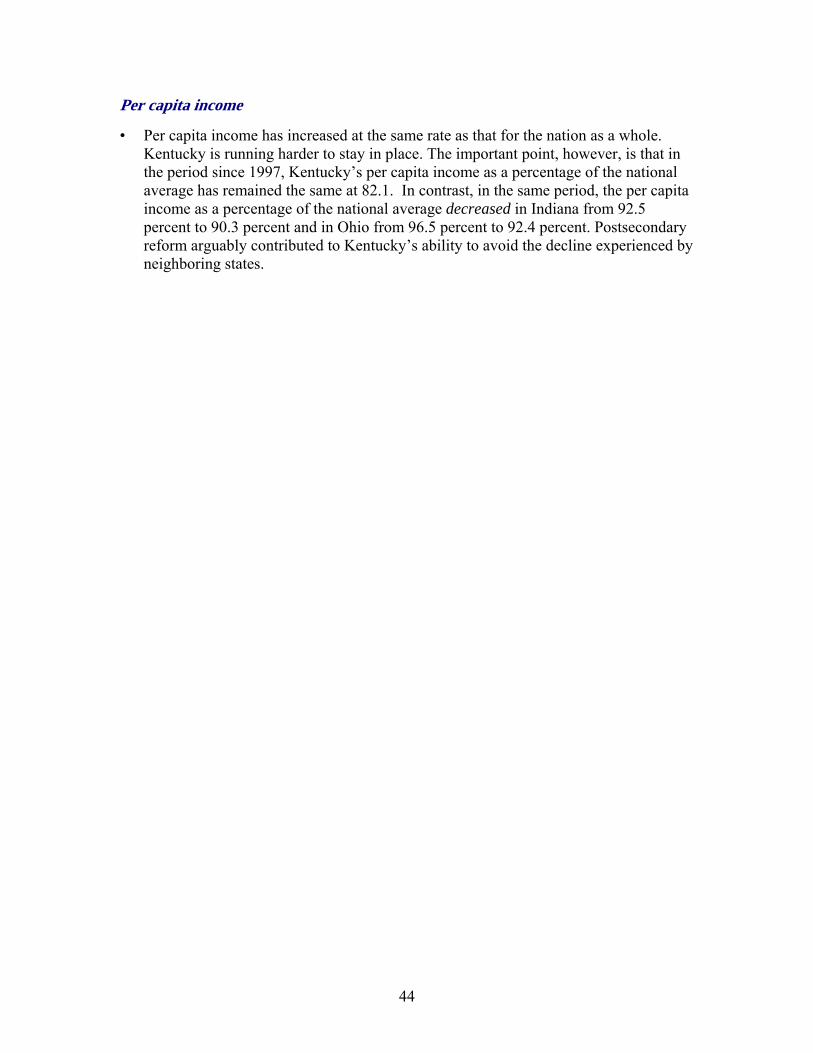
Per capita income
• Per capita income has increased at the same rate as that for the nation as a whole. Kentucky is running harder to stay in place. The important point, however, is that in the period since 1997, Kentucky’s per capita income as a percentage of the national average has remained the same at 82.1. In contrast, in the same period, the per capita income as a percentage of the national average decreased in Indiana from 92.5 percent to 90.3 percent and in Ohio from 96.5 percent to 92.4 percent. Postsecondary reform arguably contributed to Kentucky’s ability to avoid the decline experienced by neighboring states.
44
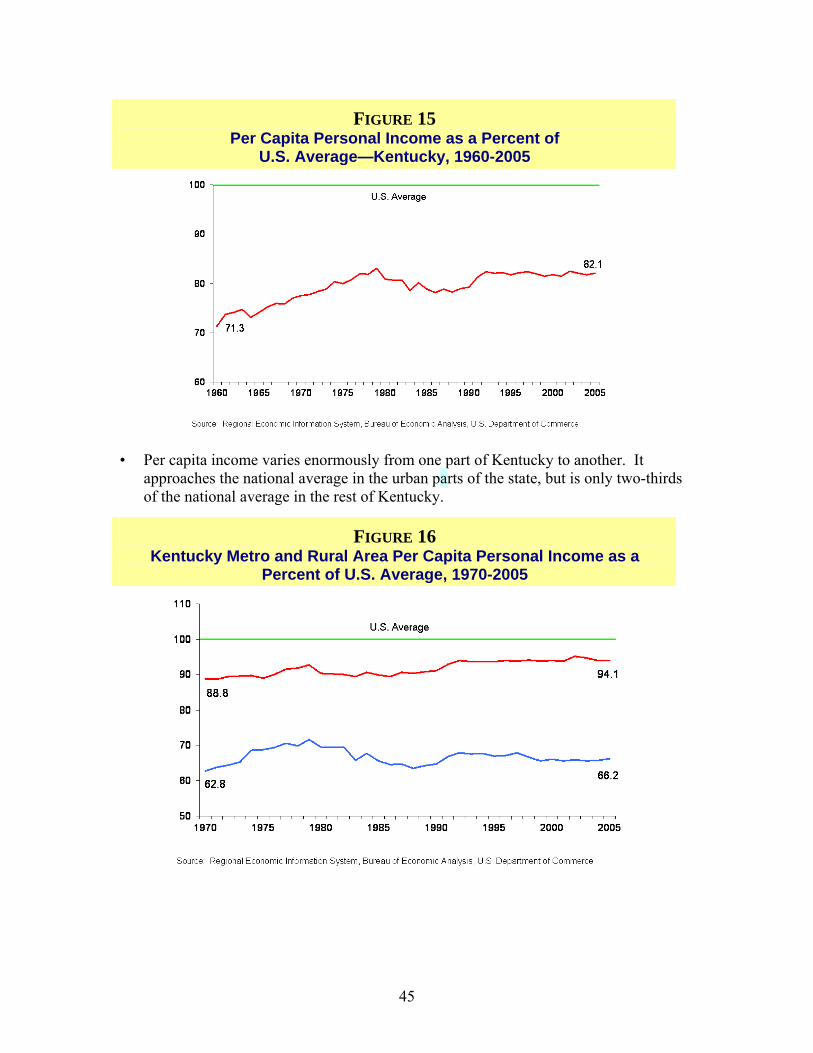
FIGURE 15 Per Capita Personal Income as a Percent of
U.S. Average—Kentucky, 1960-2005
• Per capita income varies enormously from one part of Kentucky to another. It approaches the national average in the urban parts of the state, but is only two-thirds of the national average in the rest of Kentucky.
FIGURE 16 Kentucky Metro and Rural Area Per Capita Personal Income as a
Percent of U.S. Average, 1970-2005
45
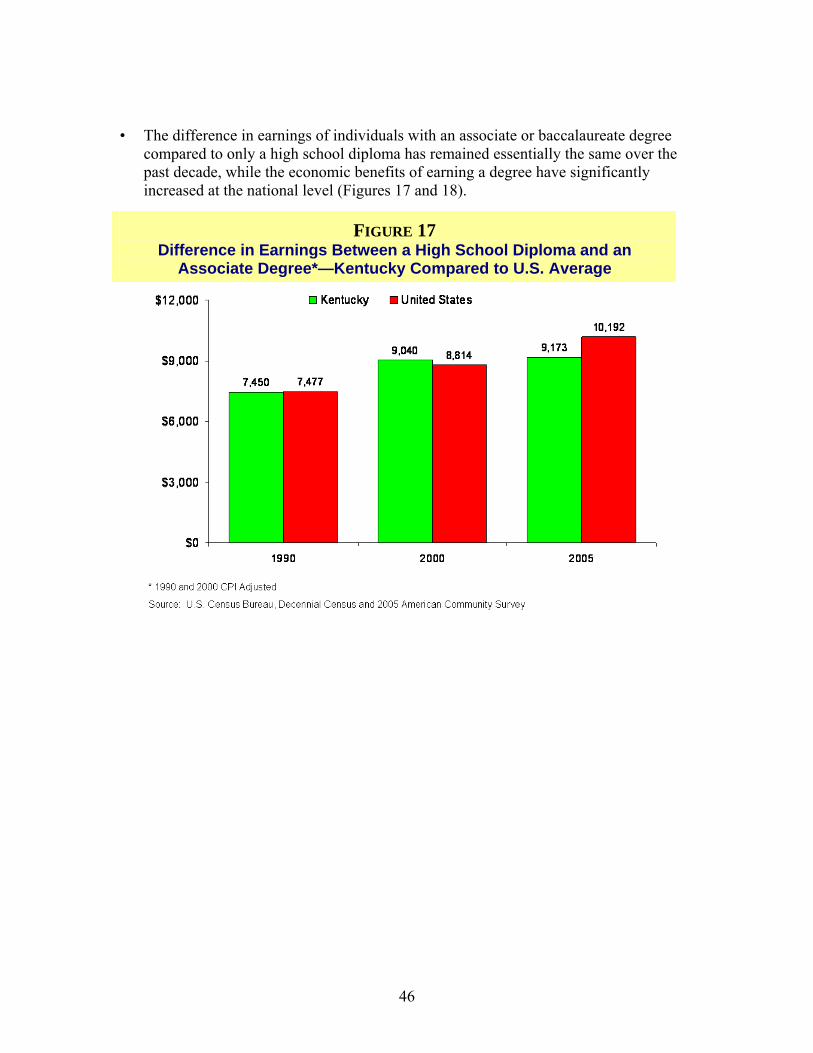
• The difference in earnings of individuals with an associate or baccalaureate degree compared to only a high school diploma has remained essentially the same over the past decade, while the economic benefits of earning a degree have significantly increased at the national level (Figures 17 and 18).
FIGURE 17 Difference in Earnings Between a High School Diploma and an
Associate Degree*—Kentucky Compared to U.S. Average
46
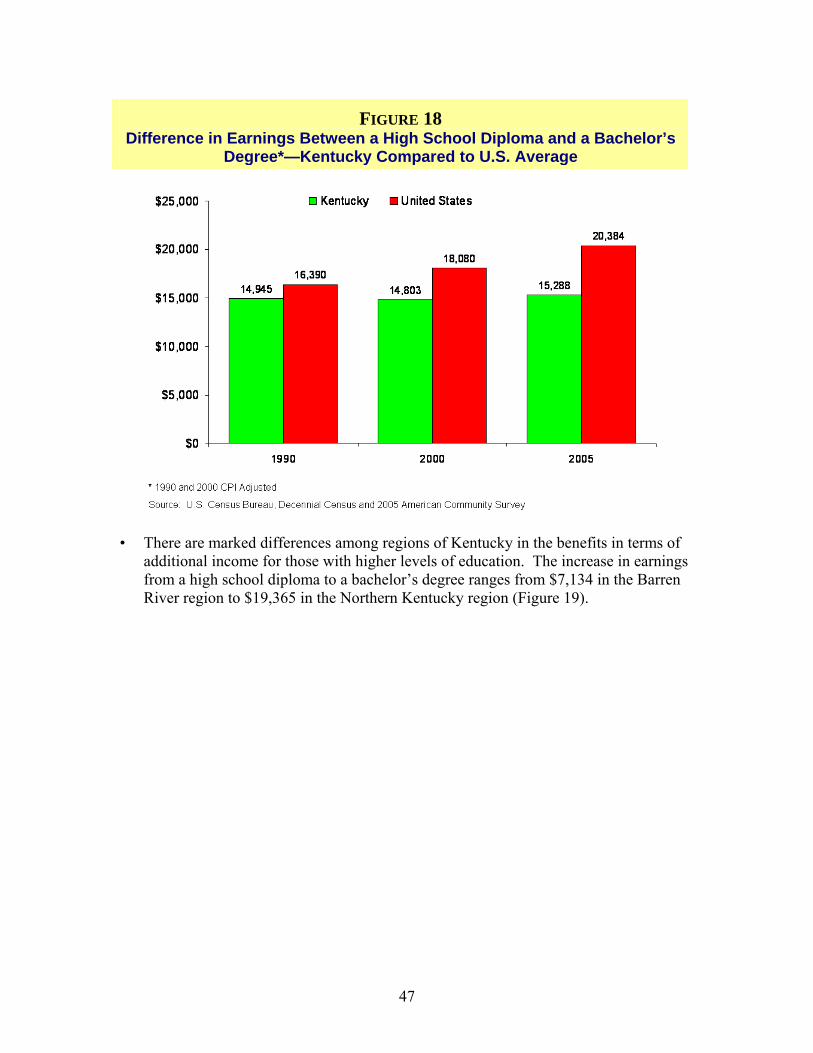
FIGURE 18 Difference in Earnings Between a High School Diploma and a Bachelor’s
Degree*—Kentucky Compared to U.S. Average
• There are marked differences among regions of Kentucky in the benefits in terms of additional income for those with higher levels of education. The increase in earnings from a high school diploma to a bachelor’s degree ranges from $7,134 in the Barren River region to $19,365 in the Northern Kentucky region (Figure 19).
47
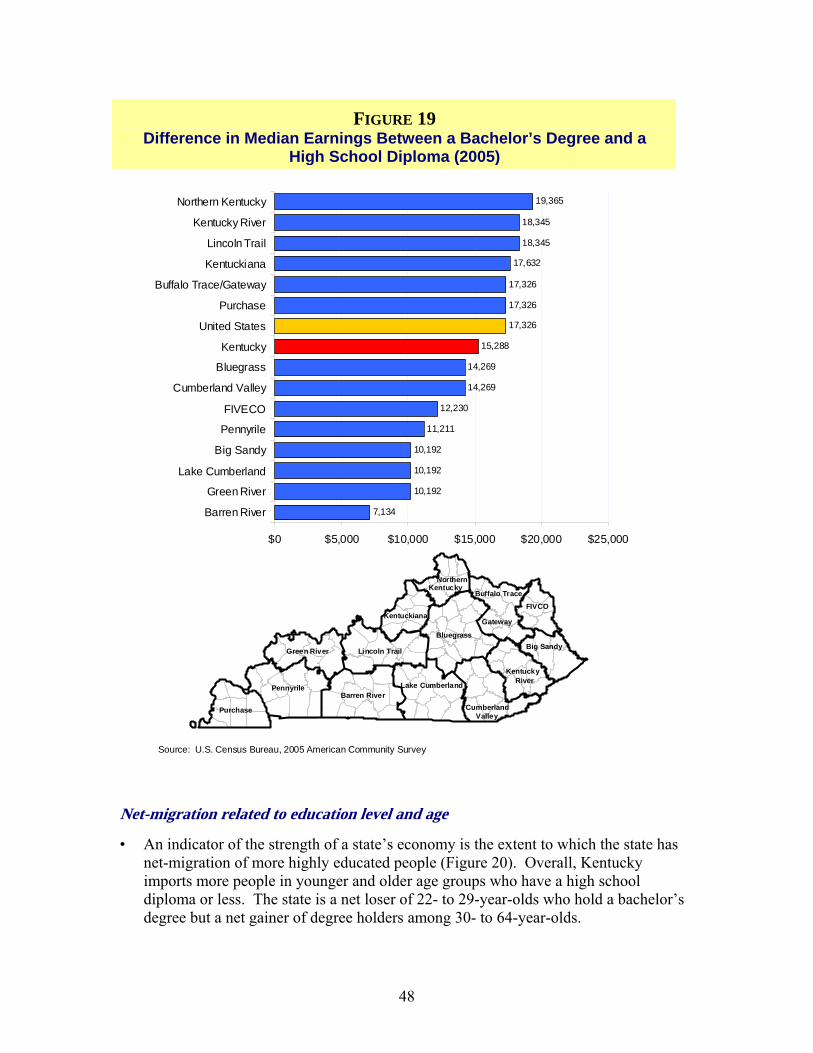
FIGURE 19 Difference in Median Earnings Between a Bachelor’s Degree and a
High School Diploma (2005)
Source: U.S. Census Bureau, 2005 American Community Survey
Green River
PennyrileBarren River
Lake Cumberland
Purchase
Buffalo Trace
Gateway
Lincoln Trail
CumberlandValley
Kentucky River
Big SandyBluegrass
FIVCOKentuckiana
Northern Kentucky
7,134
10,192
10,192
10,192
11,211
12,230
14,269
14,269
15,288
17,326
17,326
17,326
17,632
18,345
18,345
19,365
$0 $5,000 $10,000 $15,000 $20,000 $25,000
Barren River
Green River
Lake Cumberland
Big Sandy
Pennyrile
FIVECO
Cumberland Valley
Bluegrass
Kentucky
United States
Purchase
Buffalo Trace/Gateway
Kentuckiana
Lincoln Trail
Kentucky River
Northern Kentucky
Net-migration related to education level and age
• An indicator of the strength of a state’s economy is the extent to which the state has net-migration of more highly educated people (Figure 20). Overall, Kentucky imports more people in younger and older age groups who have a high school diploma or less. The state is a net loser of 22- to 29-year-olds who hold a bachelor’s degree but a net gainer of degree holders among 30- to 64-year-olds.
48
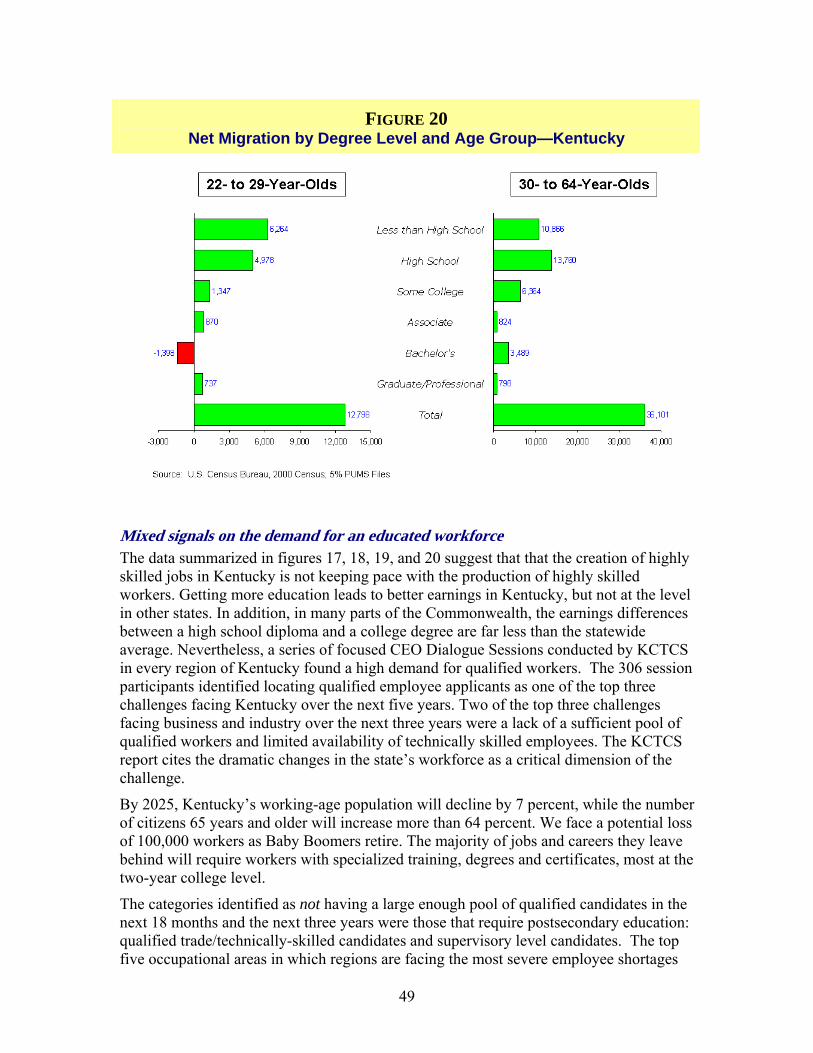
FIGURE 20 Net Migration by Degree Level and Age Group—Kentucky
Mixed signals on the demand for an educated workforce The data summarized in figures 17, 18, 19, and 20 suggest that that the creation of highly skilled jobs in Kentucky is not keeping pace with the production of highly skilled workers. Getting more education leads to better earnings in Kentucky, but not at the level in other states. In addition, in many parts of the Commonwealth, the earnings differences between a high school diploma and a college degree are far less than the statewide average. Nevertheless, a series of focused CEO Dialogue Sessions conducted by KCTCS in every region of Kentucky found a high demand for qualified workers. The 306 session participants identified locating qualified employee applicants as one of the top three challenges facing Kentucky over the next five years. Two of the top three challenges facing business and industry over the next three years were a lack of a sufficient pool of qualified workers and limited availability of technically skilled employees. The KCTCS report cites the dramatic changes in the state’s workforce as a critical dimension of the challenge.
By 2025, Kentucky’s working-age population will decline by 7 percent, while the number of citizens 65 years and older will increase more than 64 percent. We face a potential loss of 100,000 workers as Baby Boomers retire. The majority of jobs and careers they leave behind will require workers with specialized training, degrees and certificates, most at the two-year college level.
The categories identified as not having a large enough pool of qualified candidates in the next 18 months and the next three years were those that require postsecondary education: qualified trade/technically-skilled candidates and supervisory level candidates. The top five occupational areas in which regions are facing the most severe employee shortages
49
all require postsecondary education: nursing, medical technical professions, teachers/educators, skilled trades-electrical, HVAC, etc.; and information technology.9 Similarly, the CPE report, Kentucky’s Science, Technology, Engineering, Mathematics Imperative: Competing in the Global Economy, cites growing challenges in meeting the demand for highly qualified candidates in fields pertaining to science, technology, engineering and mathematics, especially teachers of math and science and health professionals.10
Kentucky faces both a workforce development problem and a workplace development problem. It must increase dramatically the quantity and quality of persons with postsecondary-level knowledge and skills to create a pool of qualified candidates necessary to meet the needs of employers seeking to gain a competitive edge in the knowledge and innovation-based economy. At the same time, the state needs to accelerate the growth of an economy in all regions that will employ a highly skilled workforce. Except in certain professional fields such as education and the health professions, the current demand is primarily at the associate degree and certificate level. The challenge in the quest to achieve the ultimate goal of HB 1 (Goal B) is to continue to grow an economy that will attract and retain a population educated at the bachelor’s degree level and above.
Summary Over the past 10 years, Kentucky’s education attainment and per capita income have improved, but the improvement has not happened quickly enough to make progress toward the goal of reaching or exceeding the national average. The challenge is made even more difficult as other OECD countries move further ahead of Kentucky in the education attainment of their younger populations.
On a positive note, however, since the enactment of postsecondary reform, Kentucky’s per capita income as a percentage of the national average has remained the same in contrast to the sharp declines in neighboring states.
There is growing evidence of increased demand for a better-educated workforce, but that demand is primarily for certificate and associate’s degrees rather than bachelor’s degrees and above. Kentucky must give high priority to workplace development – creating jobs by linking higher education to an innovation-based economy – as an essential complement to workforce development – getting more youth and adults through the education pipeline. Without an economy to employ a college-educated workforce, it will not be possible for Kentucky either to retain its college graduates or to attract college graduates through in-migration.
9 KCTCS (2007). In the Eye of the Storm: Confronting Kentucky’s Looking Workforce Crisis. 10 Council on Postsecondary Education (2007). Kentucky’s STEM Imperative Competing in the Global Economy.
50
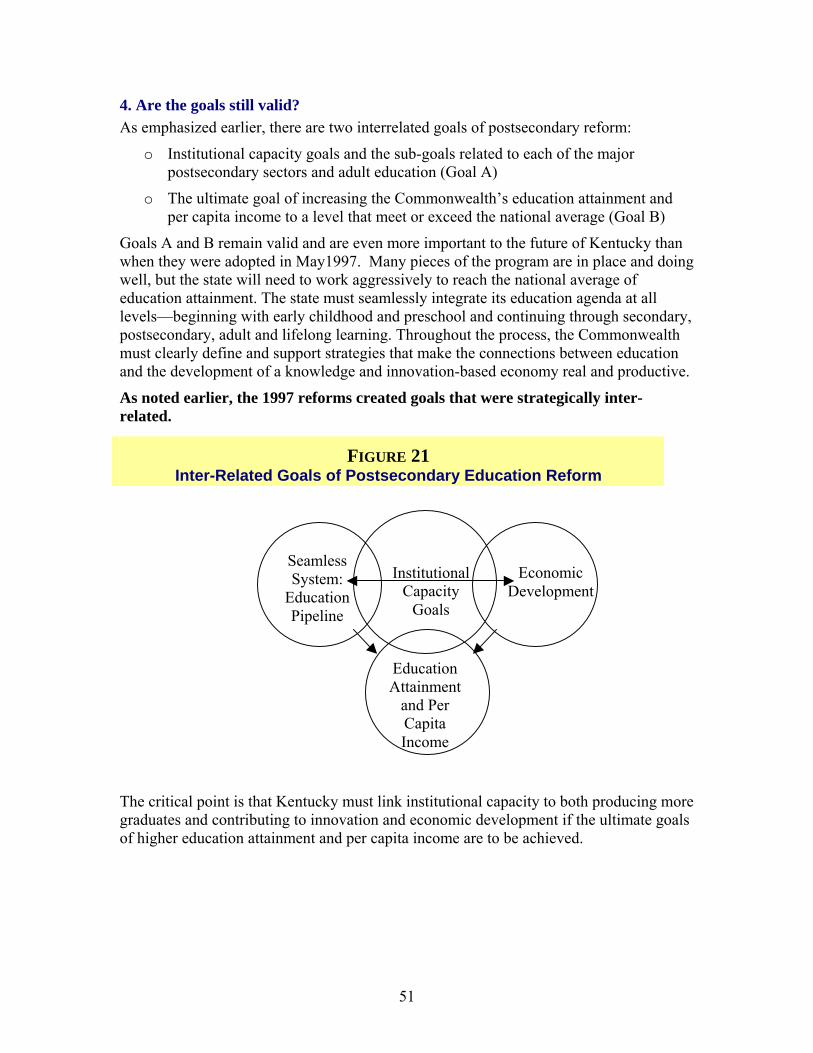
4. Are the goals still valid? As emphasized earlier, there are two interrelated goals of postsecondary reform:
o Institutional capacity goals and the sub-goals related to each of the major postsecondary sectors and adult education (Goal A)
o The ultimate goal of increasing the Commonwealth’s education attainment and per capita income to a level that meet or exceed the national average (Goal B)
Goals A and B remain valid and are even more important to the future of Kentucky than when they were adopted in May1997. Many pieces of the program are in place and doing well, but the state will need to work aggressively to reach the national average of education attainment. The state must seamlessly integrate its education agenda at all levels—beginning with early childhood and preschool and continuing through secondary, postsecondary, adult and lifelong learning. Throughout the process, the Commonwealth must clearly define and support strategies that make the connections between education and the development of a knowledge and innovation-based economy real and productive.
As noted earlier, the 1997 reforms created goals that were strategically inter-related.
FIGURE 21 Inter-Related Goals of Postsecondary Education Reform
Institutional Capacity
Goals
Economic Development
Seamless System:
Education Pipeline
Education Attainment
and Per Capita Income
The critical point is that Kentucky must link institutional capacity to both producing more graduates and contributing to innovation and economic development if the ultimate goals of higher education attainment and per capita income are to be achieved.
51
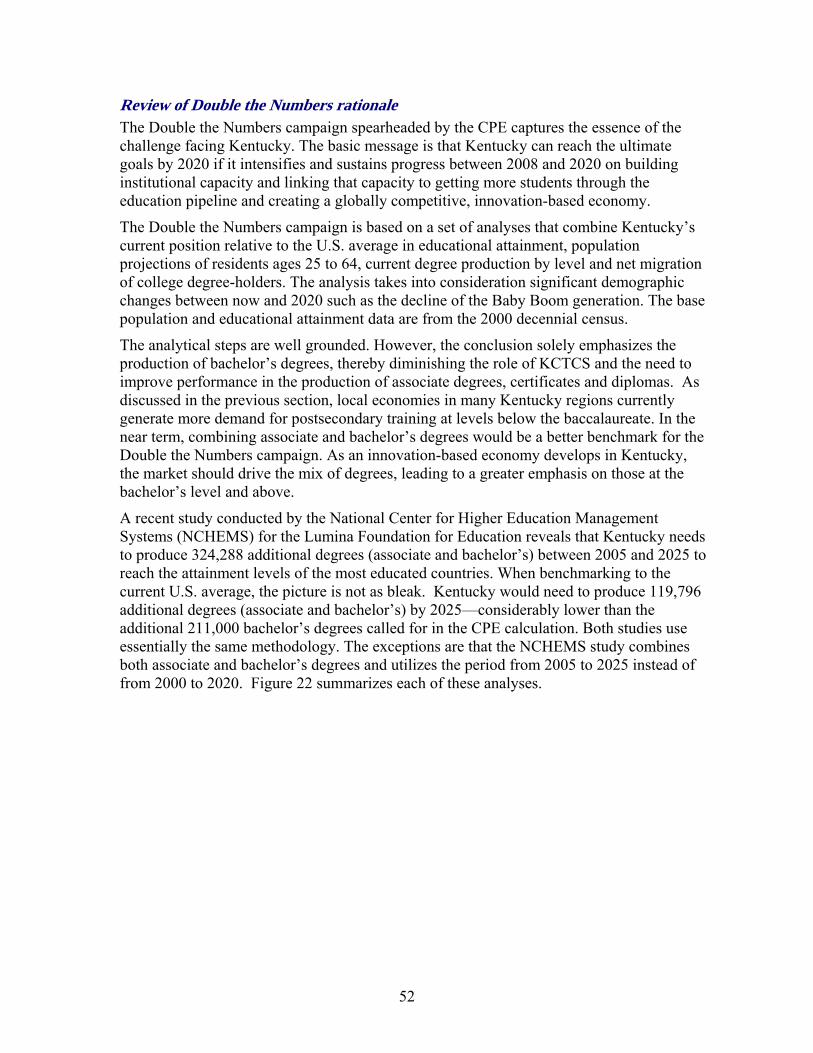
Review of Double the Numbers rationale The Double the Numbers campaign spearheaded by the CPE captures the essence of the challenge facing Kentucky. The basic message is that Kentucky can reach the ultimate goals by 2020 if it intensifies and sustains progress between 2008 and 2020 on building institutional capacity and linking that capacity to getting more students through the education pipeline and creating a globally competitive, innovation-based economy.
The Double the Numbers campaign is based on a set of analyses that combine Kentucky’s current position relative to the U.S. average in educational attainment, population projections of residents ages 25 to 64, current degree production by level and net migration of college degree-holders. The analysis takes into consideration significant demographic changes between now and 2020 such as the decline of the Baby Boom generation. The base population and educational attainment data are from the 2000 decennial census.
The analytical steps are well grounded. However, the conclusion solely emphasizes the production of bachelor’s degrees, thereby diminishing the role of KCTCS and the need to improve performance in the production of associate degrees, certificates and diplomas. As discussed in the previous section, local economies in many Kentucky regions currently generate more demand for postsecondary training at levels below the baccalaureate. In the near term, combining associate and bachelor’s degrees would be a better benchmark for the Double the Numbers campaign. As an innovation-based economy develops in Kentucky, the market should drive the mix of degrees, leading to a greater emphasis on those at the bachelor’s level and above.
A recent study conducted by the National Center for Higher Education Management Systems (NCHEMS) for the Lumina Foundation for Education reveals that Kentucky needs to produce 324,288 additional degrees (associate and bachelor’s) between 2005 and 2025 to reach the attainment levels of the most educated countries. When benchmarking to the current U.S. average, the picture is not as bleak. Kentucky would need to produce 119,796 additional degrees (associate and bachelor’s) by 2025—considerably lower than the additional 211,000 bachelor’s degrees called for in the CPE calculation. Both studies use essentially the same methodology. The exceptions are that the NCHEMS study combines both associate and bachelor’s degrees and utilizes the period from 2005 to 2025 instead of from 2000 to 2020. Figure 22 summarizes each of these analyses.
52
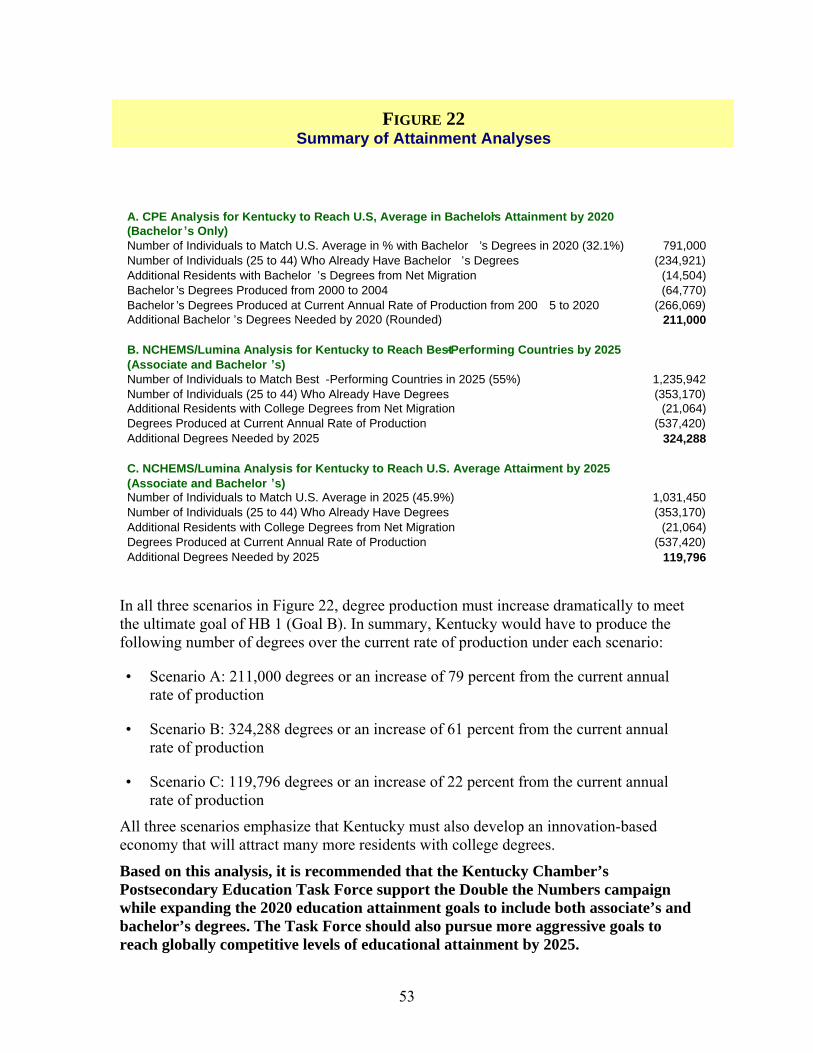
FIGURE 22 Summary of Attainment Analyses
1,031,450(353,170)
(21,064)(537,420)
119,796
1,235,942(353,170)
(21,064)(537,420)
324,288
791,000(234,921)
(14,504)(64,770)
(266,069)211,000
A. CPE Analysis for Kentucky to Reach U.S, Average in Bachelor’s Attainment by 2020 (Bachelor ’s O ynl )
acheloNumber of Individuals to Match U.S. Average in % with B r ’s Degrees in 2020 (32.1%)acheloNumber of Individuals (25 to 44) Who Already Have B r ’s Degrees
Additional Residents with Bachelor igrati’s Degrees from Net M onBachelor ’s Degrees Produced from 2000 to 2004Bachelor ’s Degrees Produced at Current Annual Rate of Production from 200 20 5 to 20Additional Bachelor ’s Degrees Needed by 2020 (Rounded)
es 025elo
B. NCHEMS/Lumina Analysis for Kentucky to Reach B t-Performing Countries by 2(Associate and Bach r ’s)
est 55%)egrees
Number of Individuals to Match B -Performing Countries in 2025 (Number of Individuals (25 to 44) Who Already Have DAdditional Residents with College Degrees from Net Migration
roductionDegrees Produced at Current Annual Rate of PAdditional Degrees Needed by 2025
ttain 025elo
ment by 2C. NCHEMS/Lumina Analysis for Kentucky to Reach U.S. Average A(Associate and Bach r ’s)
45.9%)egrees
Number of Individuals to Match U.S. Average in 2025 (Number of Individuals (25 to 44) Who Already Have DAdditional Residents with College Degrees from Net Migration
roductionDegrees Produced at Current Annual Rate of PAdditional Degrees Needed by 2025
In all three scenarios in Figure 22, degree production must increase dramatically to meet the ultimate goal of HB 1 (Goal B). In summary, Kentucky would have to produce the following number of degrees over the current rate of production under each scenario:
• Scenario A: 211,000 degrees or an increase of 79 percent from the current annual rate of production
• Scenario B: 324,288 degrees or an increase of 61 percent from the current annual rate of production
• Scenario C: 119,796 degrees or an increase of 22 percent from the current annual rate of production
All three scenarios emphasize that Kentucky must also develop an innovation-based economy that will attract many more residents with college degrees.
Based on this analysis, it is recommended that the Kentucky Chamber’s Postsecondary Education Task Force support the Double the Numbers campaign while expanding the 2020 education attainment goals to include both associate’s and bachelor’s degrees. The Task Force should also pursue more aggressive goals to reach globally competitive levels of educational attainment by 2025.
53
Review of institutional capacity goals
The institutional capacity goals (Goal A) remain critical to achieving the ultimate goal (Goal B) of postsecondary reform. Nevertheless, two changes are recommended to clarify and strength the goals.
The first would be a statutory change to focus the comprehensive universities on the mission of “regional stewardship.” The proposed mission of regional engagement, discussed later in this report, does not imply that these institutions should be narrow or parochial in their focus. It is important that they be “regionally engaged, but globally connected.” To more accurately reflect that mission, the statutory change would also replace the word “regional” with “comprehensive” as the legal description of these institutions.
The second change would be to establish metrics and a basis for public accountability of each sector and institution for progress toward the specific goal (Goal A) that the institution must achieve by the year 2020. The current statute gives only the University of Kentucky a clearly measurable target of becoming a top 20 public research university. Instead of making statutory changes, the development of these metrics should take place in the process of shaping the multi-year agreements between the CPE and each institution based in part on the institutional business plans.
Summary The goals of reform remain important to the future of Kentucky. The Commonwealth’s business, civic, education and policy leaders must continue to marshal and sustain support for both goals of postsecondary reform: Goal A, related to developing institutional capacity, and the ultimate goal, Goal B, related to education attainment and per capita income. Support for the Double the Numbers campaign is a critical means to achieving these goals, but the challenges facing Kentucky to achieve a competitive standing in the global, innovation-based economy are even more daunting than the CPE estimates. Nevertheless, perseverance and performance improvements across the system will enable Kentucky to meet these challenges.
54
5. What are the barriers to progress? Despite perceptions that reform has made a difference, the following barriers to achieving the goals of the 1997 reform have been identified:
• Lack of alignment. Although progress has been made, appropriate connections – also called alignment – do not exist between and among all levels of education to ensure the success of students. A striking example of this is the misalignment of the state assessment for high school students, the Commonwealth Accountability Testing System or CATS, with the expectations for postsecondary-level study. Another is inconsistent policies governing the transferability of credits earned at KCTCS institutions to universities.
• Weak links between postsecondary education and state and regional economic development. Kentucky can achieve its goals only if there is an intensified effort to develop a state economy that employs a highly educated population. In addition to getting more students through the education pipeline to degrees, the state must create jobs that keep and attract college-educated residents.
• Inadequate policy leadership and coordination. The state policy leadership and coordinating structure established in HB 1 is not working as intended, and the history of the budget process from 1997 through 2007 shows a steady drift away from a strategic alignment with the reform goals. If Kentucky is to achieve the goals of HB 1, coordination, discipline and accountability must be restored. There is widespread agreement that the re-establishment of the CPE as an effective entity is essential to the future of postsecondary reform. Most of those interviewed also agree that a new entity is needed to perform the intended purposes of SCOPE to ensure that the state’s elected leaders are fully engaged in the development of the strategic agenda and budgetary framework. To ensure alignment between funding and the pursuit of the reform goals, Kentucky must recommit to the principles of fiscal policy of HB 1.
• Threats to affordability. Students and families are bearing a higher percentage of the cost of postsecondary education. In relationship to family incomes in Kentucky, the Commonwealth’s postsecondary system remains reasonably affordable for full-time students. Nevertheless, serious gaps exist in affordability for part-time and independent students. Participation and success in postsecondary education, especially for first-generation students, is seriously hampered by lack of effective guidance and counseling of students beginning as early as 7th and 8th grade, the lack of incentives for students to take the right courses and stay in school to prepare for college, and the complexity of the student aid programs. Kentucky needs a major overhaul of its policies to ensure affordability of postsecondary education for all qualified Kentucky students—both youth and adults.
• Comparatively low productivity. The challenge of meeting the 2020 goals, both developing institutional capacity (Goal A) and the ultimate goal (Goal B), will require a substantial additional investment. It is unrealistic to assume that these resources will come only from additional state appropriations. The cost of reform should not be shifted primarily to students and families. Additional funding from private sources (e.g., endowments) will be insufficient to fill the gap. This leaves no alternative but to make significant sustained improvements in the productivity of the
55
postsecondary system, that is, a significant increase in degree production in a more cost-effective manner. Kentucky produces comparatively fewer bachelor’s degrees for the level of funding than other states. No single solution is available to tackle the productivity gap. There is a need for both sustained public investment and more effective resource use. Solutions must focus on quality, cost and access—they should not sacrifice one (e.g., quality or access) to make progress on another (e.g., cost containment).
A more detailed discussion of each of these barriers and strategies to address them follows.
56
Alignment The data summarized earlier underscore the significant gaps between what students are learning and the knowledge and skills needed for college-level study. But a snapshot at one point in time does not reflect the steady progress that has been made since the enactment of the Kentucky Education Reform Act. That progress has been gauged by, among other measures, the National Assessment of Education Progress, also known as the nation’s report card. It takes years for such a massive reform to have a measurable impact on preparation for college-level study. Only in 2003 did students who had completed the entirety of their educational experience under KERA begin to enter postsecondary education.
Kentucky is widely viewed as a leader in collaboration between P-12 and postsecondary education and is the only state that has included adult education in the educational alignment process. The state P-16 (preschool through postsecondary) Council was established in 1999 through the mutual agreement of the Kentucky Board of Education and the CPE to serve as an advisory body to the two boards. It is not a statutory agency and has no direct state general fund support or direct authority. The issues addressed by the P-16 Council include the preparation and professional development of teachers, the alignment of competency standards and the elimination of barriers that impeded successful transition from pre-school through college. Progress is slow, but it is happening. Implementation of the P-16 Council recommendations is dependent on willingness of the Department of Education and the CPE to take action. The perception of some is that the P-16 Council has served more as a debating and discussion forum than as an effective means to address critical, cross-agency issues.
In 2001, the General Assembly enacted legislation authorizing the CPE to encourage establishment of local P-16 councils. The 2002 Regular Session appropriated funding to support these councils, but since then no state funding has been provided specifically for this purpose. There are now 21 local councils in place, covering most of the state, but their effectiveness varies widely.
57
Initiatives to improve preparation A number of initiatives implemented in the past five years will have significant long-term effects on both high school and adult students’ preparation for college-level study. But it will take time for these changes to have an impact at the classroom level. The most significant initiatives include:
• Kentucky’s piloting of the American Diploma Project, a national effort to make the high school diploma and secondary assessments meaningful for college admission, college placement and the skilled workplace. Kentucky is part of a 30-state network whose members are to take policy actions on alignment of secondary and postsecondary curriculum, assessment standards and accountability for postsecondary student success.
• The Kentucky Board of Education (KBE)’s 2006 action to raise the minimum requirements for high school graduation effective for the class of 2012. These include the addition of algebra 2, mathematics every year, laboratory experience in every science course as appropriate, technology competence and the implementation of Individual Learning Plans beginning in middle school.
• The CPE’s Developmental Education task force report that recommended ways to address postsecondary developmental education placement policies, instruction and intervention at P-12 and postsecondary levels, a comprehensive cross-sector funding model, and the preparation and professional development of teachers.
• The CPE’s STEM (Science, Technology, Engineering, and Mathematics) Task Force’s development of a statewide strategic education and economic development action plan to accelerate Kentucky’s performance within the STEM disciplines.
• The high school feedback report that provides information to school districts on the level of preparation of their students for postsecondary education, comparative data on ACT schools and the success of the school district’s students in postsecondary education.
• The Kentucky Scholars Program, an initiative of the Partnership for Successful Schools that encourages middle school students to take more rigorous academic courses in high school to better prepare them for postsecondary success.
58
Dual enrollment, advanced placement and transition to postsecondary education Regional meetings and interviews revealed strong interest in finding ways to expedite the transition from high school to college, including dual enrollment, increased participation in advanced placement exams and making better use of the senior year in high school. Comments also focused on the need to find ways to let academically strong students complete secondary education and move on through the postsecondary education pipeline.
The number of high school students enrolling in college-level courses (dual enrollment) has increased dramatically in the past five years: from 6,366 in Fall 2001 to 17,282 in Fall 2006. Eighty-four percent of the enrollment is in KCTCS courses. The expectation was that dual enrollment would lead to students being better prepared for postsecondary education, thereby reducing the amount of time it takes them to earn a degree. So far, however, these expectations are not being realized. Most of the students enrolled in KCTCS are taking technical and occupational courses, and these students tend to matriculate in postsecondary education at a lower rate than students taking academic courses. Students who begin postsecondary education with credit from dual enrollment tend not to complete postsecondary education more quickly than other students—they simply graduate with more credits.
The number of students taking Advanced Placement (AP) exams increased from 6,202 in 1997-98 to 13,625 in 2005-2006. In August 2007, the National Math and Science Initiative (NMSI) awarded Kentucky a competitive grant to fund training and incentives for AP and pre-AP mathematics, science and English courses in Kentucky’s high schools. The grant will provide up to $13.2 million over six years to fund extensive training of teachers, identification and cultivation of lead teachers, extended time on tasks for students, and financing incentives based on academic performance. The Advanced Placement Enterprise of Kentucky (APEK) was formed by the Kentucky Science and Technology Corp. (KSTC) in partnership with the KDE, CPE and the Partnership for Successful Schools.
The 2005 Prichard Committee on Academic Excellence report, High Achieving High Schools, recommended actions to make better use of the high school senior year. The report also recommended making it possible for academically strong students to accelerate their progress in high school through programs that award course credit to students based on their proven proficiency or learning experiences other than in traditional classes, not on the amount of time they spend in a particular class, and expansion of dual credit programs.
Except for the expansion of students taking dual credit courses and AP exams, efforts to provide accelerated movement of academically strong students through the education pipeline seem to be only beginning in Kentucky.
59
Conflicting signals from multiple assessments One of the most consistent and strongly expressed concerns during the regional meetings addressed the conflicting pressures on schools and students from the multiple assessments used for accountability and the transition to postsecondary education. Schools are held accountable for student performance on the Commonwealth Accountability Testing System (CATS). However, the large number of students who need remedial/developmental work suggests no strong alignment exists between CATS and the assessments used for college entrance or placements.
The need to reform high-school standards, curricula and assessments and their alignment with college readiness has been the subject of intense debate in Kentucky, and the issues are far from resolved. For example, the Prichard Committee’s High Achieving High Schools report recommended the establishment of end-of-course or competency exams that could ultimately replace the high school assessment under CATS. The KDE began developing end-of-course assessments in mathematics in 2005. In 2006, the Kentucky General Assembly approved a pilot program for high school end-of-course assessments.
Meanwhile, the 2006 General Assembly passed Senate Bill 130 requiring diagnostic assessment of all eighth- and tenth-graders using the ACT Educational Progress Assessment System, administration of the ACT to all eleventh-graders, and the administration on a volunteer basis of three WorkKeys components of the Kentucky Employability Certificate (reading for information, locating information and applied mathematics). These assessments evaluate students’ readiness for high school, college, technical school and the workplace and call for appropriate and timely interventions.
The Council on Postsecondary Education strongly supported SB 130, while others, especially those deeply concerned about sustaining the momentum of education reform initiated by KERA, strongly opposed the imposition of a new norm-referenced assessment system on the existing system and urged that more emphasis be given to end-of-course exams.
The assessment picture is even further complicated by the reality that the assessments used for adult education, the test for adult basic education (TABE) and the assessment used for students seeking a GED are poorly aligned with both high school standards and curricula and preparation for college-level study. There is nationwide agreement that obtaining a GED is not a good indicator of a student’s preparation for either college-level study or employment in a living wage job.
Findings from the regional meetings indicate these state-level debates are sending mixed signals to schools and students and are seriously undermining the efforts of schools to improve the preparation of students for postsecondary education. Multiple overlapping and potentially conflicting state and federal testing requirements are clearly overwhelming many schools, especially those in the more challenged rural and urban school districts. Comments from the regional meetings and interviews prompt the conclusion that the current mechanisms (such as the state P-16 Council) are not working as effectively as they need to in order to address these alignment problems. However, there is evidence of encouraging and positive collaborative efforts under way at the regional level in
60
Kentucky to improve school-to-college transition in spite of the divisions at the state level. Financial disincentives for P-12 and postsecondary collaboration The disincentives in the funding systems for P-12 and postsecondary education present serious barriers to collaboration. As noted earlier, 21 local P-16 Councils are in place throughout Kentucky, but their effectiveness varies. The lack of funding for core staff and incentives for area teachers and faculty members to participate in joint projects is a significant barrier to the councils’ effectiveness.
Funding also serves as a disincentive to moving students through the pipeline more expeditiously. Since the state funds schools based on attendance, schools are reluctant to participate in projects that could take students out of their classrooms.
The disincentives for collaboration among postsecondary institutions are equally as strong. Sponsors of House Bill 1 were concerned that the funding formula in existence before the reform fostered intense competition as institutions vied to attract the same students instead of working to expand the overall pool of students. Although the funding methodology changed with the reform, Kentucky’s postsecondary institutions continue to compete intensely with each other for students. Although it would be logical to expect KCTCS schools to collaborate with the comprehensive university in their regions, the reality is that these institutions are competing for many of the same students. A gain for one is perceived as a loss for the other.
Accountability systems, existing and proposed, can also be significant barriers or positive incentives for collaboration depending on how they are designed. The regional meetings revealed serious concerns that the CPE’s proposed performance and accountability measures for increasing degree production as part of the Double the Numbers campaign would lead to institutional competition on the regional level for the best-prepared students—those most likely to attain a degree. Others suggested that the incentives could encourage institutions to meet enrollment and degree targets by recruiting out-of-state students while ignoring the more difficult task of reaching the less-prepared students in their immediate regions.
A positive suggestion made at several of the meetings was that the state should set performance expectations for a region and provide incentives for all the institutions in the region, public and independent, to collaborate in meeting these expectations. Shared goals could include increasing high school graduation rates, increasing college-participation rates, reducing the need for developmental education, or increasing retention, transfer and completion rates. If the region’s performance improved, all the institutions could be rewarded.
As stressed earlier, there are excellent examples of regional collaboration. The important point, however, is that this collaboration is taking place in spite of serious disincentives in finance policy. Fragmented and conflicting signals from the state level are not helpful.
61
Summary Concerns persist about the adequacy of students’ high school preparation for postsecondary work and employment, although progress has been made in student achievement and in the collaborative efforts between CPE and the state Department of Education. The most frequently cited problem is the misalignment of CATS with the expectations of postsecondary-level study. A key concern is that multiple and potentially overlapping assessment requirements are adding significant burdens to schools while sending mixed signals to schools, students and parents about the knowledge and skills needed for success in postsecondary education and a living wage job.
Because developing a seamless system is critical to the success of postsecondary reform, the state’s political and education leaders should re-establish methods on the state level to address problems that cut across P-12, adult education and postsecondary education. Kentucky has made progress on each of the levels through KERA, postsecondary reform and adult education reform. The next step is to establish a comprehensive, integrated P-20 framework for reform.
Links between postsecondary education and economic development/innovation Kentucky can achieve the goals of HB 1 only if there is an intensified effort to develop a state economy that employs a highly educated population. As discussed earlier, the current economy is sending mixed signals to the population about the importance of education.
Statewide economic development The postsecondary reform legislation charged the newly created Council on Postsecondary Education with the mission of forging connections across state government to advance the goals of postsecondary reform. That mission exceeded the traditional definition of education and led to the CPE’s creation as an independent entity. It was purposely not located within the Education Cabinet.
For a variety of reasons, strong ties between CPE and the Cabinet for Economic Development did not develop, although the council has pursued some specific responsibilities related to economic development. The Kentucky Innovation Act of 2000, intended to spur innovation through stronger links between postsecondary education and the state’s future economy, was only partially implemented.
The appointment of a new Cabinet Secretary for Economic Development in June 2007 is leading to a fundamental reshaping of the Cabinet and creating new partnership opportunities between that agency and the CPE. The new Secretary is focusing on several areas that demonstrate a strong connection between economic development and education:
• Encouraging high-tech job growth by pushing the mission of building and promoting technology-driven and research-intensive industries by recruiting, creating and retaining high-tech companies and jobs. The goal is to create high-tech and knowledge-based job opportunities and to cultivate an economic climate that encourages entrepreneurship and homegrown innovation.
62
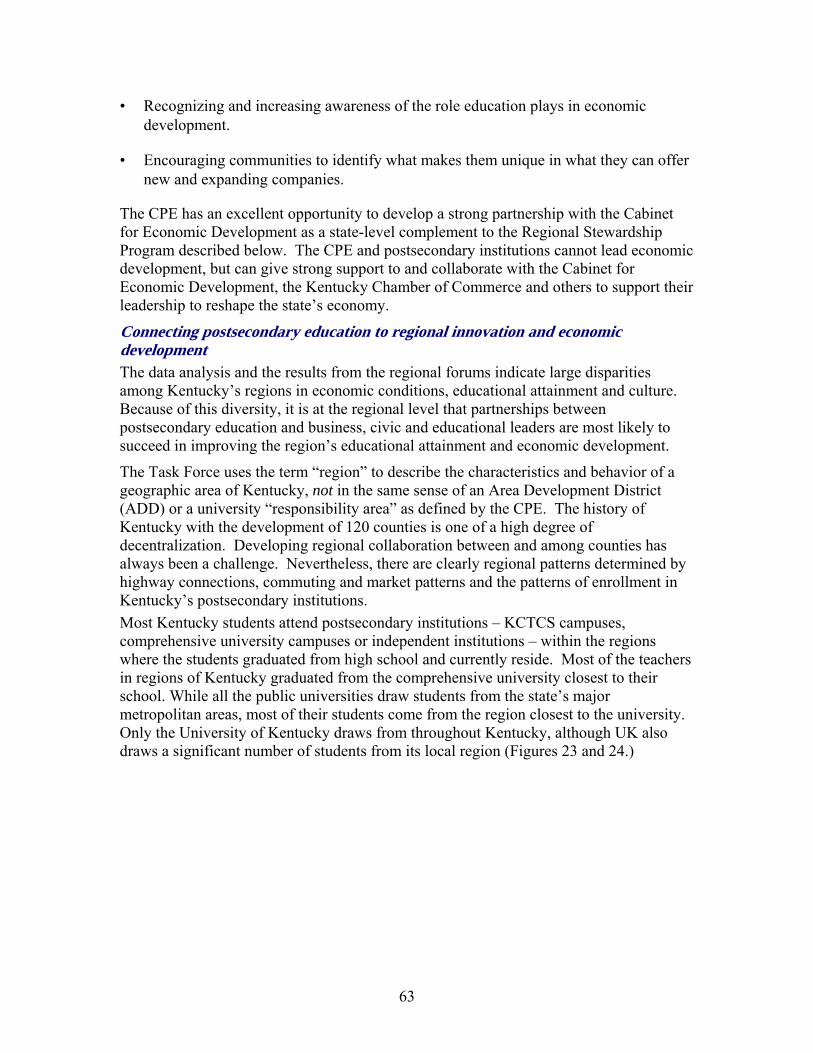
• Recognizing and increasing awareness of the role education plays in economic development.
• Encouraging communities to identify what makes them unique in what they can offer new and expanding companies.
The CPE has an excellent opportunity to develop a strong partnership with the Cabinet for Economic Development as a state-level complement to the Regional Stewardship Program described below. The CPE and postsecondary institutions cannot lead economic development, but can give strong support to and collaborate with the Cabinet for Economic Development, the Kentucky Chamber of Commerce and others to support their leadership to reshape the state’s economy.
Connecting postsecondary education to regional innovation and economic development The data analysis and the results from the regional forums indicate large disparities among Kentucky’s regions in economic conditions, educational attainment and culture. Because of this diversity, it is at the regional level that partnerships between postsecondary education and business, civic and educational leaders are most likely to succeed in improving the region’s educational attainment and economic development.
The Task Force uses the term “region” to describe the characteristics and behavior of a geographic area of Kentucky, not in the same sense of an Area Development District (ADD) or a university “responsibility area” as defined by the CPE. The history of Kentucky with the development of 120 counties is one of a high degree of decentralization. Developing regional collaboration between and among counties has always been a challenge. Nevertheless, there are clearly regional patterns determined by highway connections, commuting and market patterns and the patterns of enrollment in Kentucky’s postsecondary institutions. Most Kentucky students attend postsecondary institutions – KCTCS campuses, comprehensive university campuses or independent institutions – within the regions where the students graduated from high school and currently reside. Most of the teachers in regions of Kentucky graduated from the comprehensive university closest to their school. While all the public universities draw students from the state’s major metropolitan areas, most of their students come from the region closest to the university. Only the University of Kentucky draws from throughout Kentucky, although UK also draws a significant number of students from its local region (Figures 23 and 24.)
63
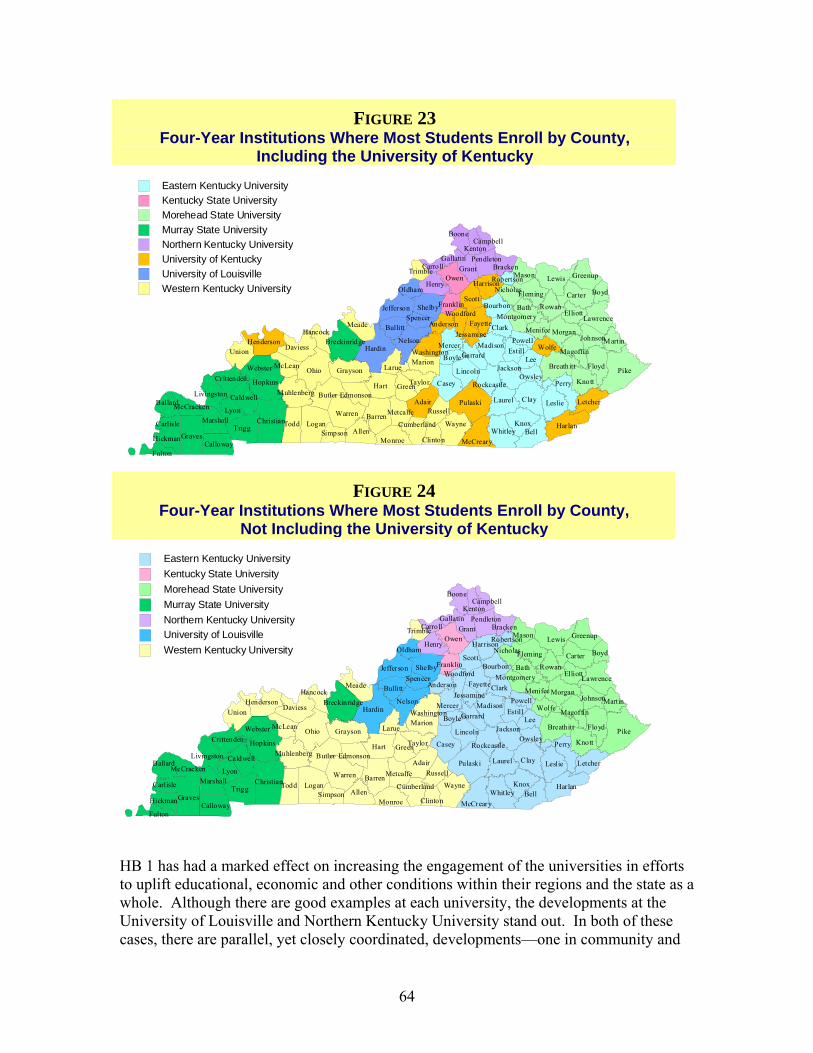
FIGURE 23 Four-Year Institutions Where Most Students Enroll by County,
Including the University of Kentucky
CrittendenLarue
Perry
Cumberland Wayne
ClintonMonroe
KentonPendleton
CampbellBoone
Montgomery
Nicholas
Bath
FayetteJessamine
WashingtonMercer Madison
NelsonHancock
Bracken
HarrisonMason
WoodfordSpencer
McCrackenBallard
Fulton
Hickman McCreary
Rockcastle
JacksonLincoln
Adair
Allen
Anderson
Barren
Bell
Bourbon
Boyd
BoyleBreathitt
Breckinridge
Bullitt
ButlerCaldwell
Calloway
Carlisle
Carroll
Carter
Casey
Christian
Clark
Clay
Daviess
Edmonson
Elliott
Estill
Fleming
Floyd
Franklin
Gallatin
Garrard
Grant
Graves
Grayson
Green
Greenup
Hardin
Harlan
Hart
Henderson
Henry
Hopkins
Jefferson
Johnson
Knott
Knox
Laurel
Lawrence
Lee
Leslie Letcher
Lewis
Livingston
Logan
Lyon
MagoffinMarion
Marshall
Martin
McLean
MeadeMenifee
Metcalfe
Morgan
Muhlenberg
Ohio
OldhamOwen
OwsleyPike
Powell
Pulaski
Robertson
Rowan
Russell
ScottShelby
Simpson
Taylor
ToddTrigg
Trimble
Union
Warren
Webster
Whitley
Wolfe
Eastern Kentucky UniversityKentucky State UniversityMorehead State UniversityMurray State UniversityNorthern Kentucky UniversityUniversity of KentuckyUniversity of LouisvilleWestern Kentucky University
FIGURE 24 Four-Year Institutions Where Most Students Enroll by County,
Not Including the University of Kentucky
RockcastleCrittenden
Larue
Perry
Cumberland Wayne
ClintonMonroe
KentonPendleton
CampbellBoone
Montgomery
Nicholas
Bath
FayetteJessamine
WashingtonMercer MadisonNelson
Hancock
Bracken
HarrisonMason
WoodfordSpencer
McCrackenBallard
Fulton
Hickman McCreary
JacksonLincoln
Adair
Allen
Anderson
Barren
Bell
Bourbon
Boyd
BoyleBreathitt
Breckinridge
Bullitt
ButlerCaldwell
Calloway
Carlisle
Carroll
Carter
Casey
Christian
Clark
Clay
Daviess
Edmonson
Elliott
Estill
Fleming
Floyd
Franklin
Gallatin
Garrard
Grant
Graves
Grayson
Green
Greenup
Hardin
Harlan
Hart
Henderson
Henry
Hopkins
Jefferson
Johnson
Knott
Knox
Laurel
Lawrence
Lee
Leslie Letcher
Lewis
Livingston
Logan
Lyon
MagoffinMarion
Marshall
Martin
McLean
MeadeMenifee
Metcalfe
Morgan
Muhlenberg
Ohio
OldhamOwen
OwsleyPike
Powell
Pulaski
Robertson
Rowan
Russell
ScottShelby
Simpson
Taylor
ToddTrigg
Trimble
Union
Warren
Webster
Whitley
Wolfe
Eastern Kentucky UniversityKentucky State UniversityMorehead State UniversityMurray State UniversityNorthern Kentucky UniversityUniversity of LouisvilleWestern Kentucky University
HB 1 has had a marked effect on increasing the engagement of the universities in efforts to uplift educational, economic and other conditions within their regions and the state as a whole. Although there are good examples at each university, the developments at the University of Louisville and Northern Kentucky University stand out. In both of these cases, there are parallel, yet closely coordinated, developments—one in community and
64
economic development, and the other in transforming the university. The key is the partnership that links both of these pillars of regional development together.
• In Louisville, the Boyle Report of 1996 led to a community action agenda to build the metropolitan region’s economy. This coincided with the enactment of HB 1 and challenged the university to strengthen its link with the region’s future. The action agenda coupled with strong business leadership resulted in dramatic changes including Metropolitan College, a partnership among Jefferson Community and Technical College, the University of Louisville and business partner UPS.
• In Northern Kentucky, the partnership between Northern Kentucky University and the Northern Kentucky Regional Plan, Vision 2015, is a national model for stewardship of place: postsecondary institutions that partner with business, civic and P-12 communities to solve local, regional and state problems.
Increasing innovation and improving quality of life of the Commonwealth are the ultimate goals of developing the University of Kentucky as a top-20 public research institution. A major research university contributes in several ways to its region’s economy, but the impact depends significantly on the incentives provided to researchers and faculty to solve regional problems, especially in regions outside the university’s immediate area. The university’s “Commonwealth Collaboratives” initiative fosters partnerships among UK’s researchers, K-12 educators, independent health care providers, entrepreneurs, industries, local government officials and private citizens who will participate in – and benefit from – these projects. Sustaining support for the “Top 20” goal will require statewide visibility of the impact of UK’s efforts to connect its research to regional problems. However, researchers are often reluctant to engage in work away from the main campus unless there are specified incentives to do so.
According to findings from the regional meetings, connections of the research capacity of UK and U of L to regional innovation and renewal could be much stronger, including alliances with other postsecondary institutions to share expertise in addressing regional problems related to health, the environment, energy and other fields. As a complement to the Commonwealth Collaboratives, the state might consider making funding incentives available to regions, perhaps through the Cabinet for Economic Development, to draw UK researchers into the field to collaborate in solving regional problems. The same approach could be employed to engage U of L researchers in projects beyond the Louisville metropolitan area.
The sponsors of the 1997 reform legislation intentionally balanced the emphasis on developing UK and U of L with an emphasis on strengthening the regional universities. The substantive reason was to develop the national distinction of the regional universities and their collaboration with other institutions as a means to better serve their regions. Regional did not mean “parochial.” Another way to express the idea is “regionally engaged, but nationally recognized.” Because of concerns that the word regional was too narrow, the universities are now called “comprehensive.”
The Kentucky General Assembly appropriated funding in 2006-2008 for a Regional Stewardship Program to engage the comprehensive universities in promoting regional economic development, livable communities, social inclusion, improved P-12 schools,
65
creative governance and civic participation. The CPE is in the process of reviewing and approving plans of each of the comprehensive universities as is required for funding to be approved.
The Regional Stewardship Program provides the framework for strengthening the goal (Goal A) for the comprehensive universities as expressed in HB 1. This enhanced mission would underscore the critical role that these universities play (in partnerships with KCTCS, the region’s independent institutions, and the public schools) in raising their region’s education attainment, developing a culture of innovation and economic renewal, and contributing to the long-term goals of the Double the Numbers campaign.
The new mission of the Cabinet for Economic Development and its emphasis on regional economic development linked with education is a critical parallel development to the Regional Stewardship Program. As emphasized earlier, the success of regional stewardship depends on leadership of postsecondary education and business and civic leaders. Statements from the regional meetings indicate that only three to five areas of Kentucky have comprehensive initiatives for regional economic and community development. In other areas, regional economic development, especially development that emphasizes innovation and jobs requiring higher education and skill levels, either is in a nascent stage or does not exist. The evidence further suggests the comprehensive universities in these regions will face a major challenge if they try to drive regional development without strong partners on the other side. For these under-developed areas, state investments must occur on two fronts: regional stewardship through CPE and regional economic development through the Cabinet for Economic Development. Regional access to postsecondary programs The establishment of postsecondary education centers throughout Kentucky is a controversial issue. The framework for the centers was established in 1998 legislation that encouraged collaboration among institutions in planning, design, utilization and operation. The CPE emphasized that the centers, other colleges and universities and the Kentucky Virtual University (now called the Kentucky Virtual Campus) all would meet the local needs. This occurred in a few cases, but in others, the centers primarily became extended campuses of the regional university, not multi-provider centers.
Increasing geographic accessibility to postsecondary education can be important for achieving the Double the Numbers goal. The regional meetings raised concerns that political pressures are leading to a proliferation of centers without a thorough analysis of local needs, the impact on other postsecondary institutions in the region and other alternatives (such as technology and distance delivery).
Another concern is that “responsibility areas” for each comprehensive university are being interpreted as the university’s exclusive service areas. In contrast, the CPE’s intent was that the comprehensive’s responsibility was “to see that the region was served,” not to claim the region as its exclusive area. This intent is apparently not being met consistently throughout the state.
CPE should give high priority to renewed leadership in this area. Models in other states provide for:
66
• Strong community leadership in defining needs.
• Incentives for communities interested in developing centers to obtain non-state funding to complement state funding for constructing any new facilities. Obtaining non-state funding for facilities should not be a condition for a community’s eligibility for a center. The aim of incentives should be to encourage local “ownership” in developing and maintaining the facility. Priority is given to use of existing facilities (e.g., community college or independent college facilities).
• State funding for core center capacity: technology and essential student services.
• An open-provider policy that may give the right of first refusal to the regional state university but allows the center to obtain needed programming from other providers. State funding is often available to give the local center leverage in “buying in” needed programs (e.g., cohort programs) in cases in which there is a high community need but with numbers and anticipated revenue insufficient to attract an institution willing to provide a complete program.
Based on this information, the CPE should assume a leadership role in shaping a similar approach for Kentucky and in seeking funding from the General Assembly to enable centers to develop local capacity and buy in programming as necessary.
Summary Kentucky can achieve the goals of HB 1 only if there is a concentrated effort to develop an innovation-based economy that employs a highly educated population. Kentucky cannot reach the 2020 goals on education attainment only by getting more students through the education pipeline to degrees. Kentucky must create stronger links between postsecondary institutions and economic development to create new jobs that attract and retain college-educated residents. Achieving this will require:
• A stronger partnership between the CPE and the Cabinet for Economic Development.
• Greater efforts to link the developing research capacity at UK and U of L to efforts to develop new jobs in all regions of Kentucky.
• Focusing the goal and mission of the comprehensive universities on the role of regional stewardship.
• Increased access through university centers to postsecondary opportunities at the bachelor’s degree and professional levels in regions distant from a public four-year institution.
The interviews and regional meetings revealed high levels of support for a region-by-region approach to developing stronger links between postsecondary education and economic development/innovation. These regional strategies should grow as relationships develop, not through formally imposed, top-down definitions of regions.
67
Policy Coordination, Discipline and Accountability The intent of the Council on Postsecondary Education and the Strategic Committee on Postsecondary Education was to keep the reforms focused on linking postsecondary education to the future economy and quality of life and to guard against institutional and regional competition that seemed endemic in Kentucky’s political culture.
The reform authors understood the need for balance among elements of the system and the state’s highly diverse regions:
• Between the statewide mission and political influence of the University of Kentucky and the developing University of Louisville in the state’s largest metropolitan area.
• Between the research universities and the comprehensive universities (then identified as regional universities), several of which had direct ties to key legislative leaders.
• Between the mission of universities and the developing community and technical college system.
• Between the power and influence of the state’s major metropolitan regions (the so-called Golden Triangle) and the more dispersed political power of the state’s other developing metropolitan areas and rural regions.
The intent of the original institutional goals was not only to achieve a diversified postsecondary education system, but also to reflect a Kentucky political reality: unless policy proposals respect the diversity of the state’s regions, it is exceptionally difficult to move them through the state legislature. The emphasis on the first goal of a “seamless system” underscored the need for statewide coordination, collaboration and strategic alliances statewide.
The sponsors kept foremost in their minds the understanding that the General Assembly has, under Kentucky’s Constitution, the final authority and responsibility to establish policy in the Commonwealth and that it cannot delegate that authority and responsibility to another entity. They chose to create a policy leadership and coordinating structure that would support the decision-making responsibilities of the General Assembly. The entity’s power to lead the strategic agenda and counter negative regional and institutional political pressures would depend ultimately on its capacity to gain the attention, respect and trust of the legislative leadership and the Governor.
The structure established to develop the relationship between a policy leadership and coordinating entity and the Governor and General Assembly included:
• The Council on Postsecondary Education (CPE), a new entity replacing the Council on Higher Education, charged with developing a strategic agenda to achieve the goals of HB 1 and recommending a strategic budget aligned with this agenda to the Governor and General Assembly.
68
• The Strategic Committee for Postsecondary Education (SCOPE) chaired by the chair of the Council on Postsecondary Education and comprised of the Governor, legislative leaders and other members from the legislature, executive branch and CPE.
The hope was that through the leadership of the CPE and participation in SCOPE legislative leaders would gain full ownership and support for the strategic agenda and related budget priorities so that, in the heat of the legislative process, they could keep the agenda on track. The basic message would be that, while it may inevitably be necessary to attend to constituent, regional and institutional priorities, in the end, legislative action should be consistent with the CPE strategic agenda to achieve the goals of HB 1.
Council on Postsecondary Education Within two years of HB 1’s passage, serious cracks opened in the structure. The CPE leadership took an uncompromising stand against what it saw as political end-runs directly to the legislature around the CPE priorities—and ultimately, progress toward the HB 1 goals. This stance ran directly into the strongly held view of some that reasonable accommodation of regional and institutional interests was essential to gain political support for postsecondary reform. The conflict between these positions led to the departure of the first CPE president.
There has been a steady drift from a strategic alignment between the goals of HB 1 and the biennial budget. The Governor and General Assembly must assume as much responsibility for this trend as the CPE. Nevertheless, it was the intent of HB 1 that the CPE play the central role, in coordination with SCOPE, in keeping the reform process on track.
Strong differences persist between those who believe that the CPE was correct in taking an unwavering stance against political battles in the early years of reform and those who believe in a willingness for reasonable compromise. The key, in this view, is to link legislators’ needs to respond to constituents to the overall agenda and to minimize, even if it is impossible to eliminate, end-runs.
From the perspective of some of the original proponents of the CPE, the entity’s failure in its early years to lead and manage the delicate political balance and to gain the trust and respect of the legislature damaged its ability to regain the original policy leadership and coordinating role anticipated in HB 1. However, most policy and educational leaders interviewed for this report said that having a CPE that fulfills is original role as defined in HB 1 is critical to the success of reform. It appears that returning to the “politics as usual” prior to the reform’s passage is unacceptable.
Under new leadership, the CPE made valiant efforts to regain the confidence of the legislature in pursuit of the HB 1 goals and the public agenda. Changes in political leadership, intensified divisions within the legislature and the tensions resulting from severe budget cuts in the recession of the early 2000s complicated the CPE’s efforts to regain its intended role.
In spite of obstacles, CPE continues to seek public and legislative support for the goals of HB 1 and actions necessary to accomplish these goals. In 2004, the CPE engaged a broad range of Kentucky’s political, business, education and civic leadership in a new strategic
69
agenda, Five Questions, One Mission: Better Lives for Kentucky’s People, A Public Agenda for Postsecondary and Adult Education, 2005-2010.
The Five Questions • Are more Kentuckians ready for postsecondary education?
• Is Kentucky postsecondary education affordable?
• Do more Kentuckians have certificates and degrees?
• Are college graduates prepared for life and work in Kentucky?
• Are Kentucky’s people, communities and economy benefiting?
This public agenda framed the Council’s budget recommendations for the 2006-2008 biennium and provided the impetus for the Double the Numbers campaign. Recognizing that SCOPE was not functioning as intended, the CPE used task forces involving key legislators to study developmental education and the severe shortages in STEM fields as ways to address concerns of key legislators and engage them in developing policy alternatives.
Even with these efforts, the CPE’s approach in shaping a budget framework and recommendations to the Governor and General Assembly has been an ongoing concern to both institutions and legislative leaders. These concerns came to a head in the 2006 legislative session. The resulting disarray led many to conclude that the conditions that HB 1 was designed to avoid had returned, placing the entire reform movement at risk. The conditions were disturbingly similar to those cited in the 1996 assessment as barriers to Kentucky’s progress.
In interviews conducted for this review, all the key legislative leaders, including current and former lawmakers, involved in the 1997 reforms expressed strong commitments to sustaining efforts to achieve the goals in HB 1. All agree that the only way Kentucky can progress is by countering the disarray of competing regional and institutional interests that undermine the long-term public agenda. Although their specific solutions differ, all agree that the alternative must recognize the ultimate authority and responsibility of the General Assembly and must gain legislative ownership of the public agenda and budgetary priorities.
Several of the policy and education leaders interviewed expressed serious disappointment with the leadership and performance of the CPE. Much of the concern stemmed from the seeming inability of the CPE to contain regional and institutional turf battles and end-runs to the General Assembly, although they acknowledged that the state’s political and institutional leaders shared some of the blame for these problems.
70
CPE’s relationship to institutions A fundamental tension in the implementation of HB 1 has been between the emphasis of the CPE on the goals in the public agenda—the Five Questions – focusing on the ultimate goal of HB 1 (Goal B) and the emphasis of the institutions on achieving the explicit institutional capacity goals in HB 1 (Goal A). Following the theme that HB 1 was about the future of Kentucky, not about the future of institutions, the CPE framed its agendas, priorities and biennial budget requests primarily in terms of achieving the goals related to the Five Questions. They did not include a deliberate focus on the institutional goals, except as these related to CPE’s public agenda. As emphasized earlier, the intent of HB 1 was that the Commonwealth should pursue the institutional goals as a means to achieve the long-term goals. In practice, however, the CPE focused primarily on the long-term goals. A consequence of that approach, however, was that institutions felt compelled to make the case directly to the legislature for the HB 1 institutional goals because of a feeling that the CPE would not do so.
More subtle concerns, however, stem from a sense among institutional leaders that the CPE has developed into a complex, bureaucratic entity pursuing its own agenda with insufficient sensitivity to the realities of institutional-level priorities and time constraints. A common observation was that the CPE had too many small, uncoordinated initiatives, many driven by external funding. As described earlier, the growth of CPE projects and initiatives is a result of special projects added by the General Assembly, a process that the CPE’s biennial budget requests seem to have encouraged.
Because of different roles and responsibilities, tensions between statewide coordination and institutional priorities can be expected and are a reality in states across the country. The challenge is to develop and maintain a delicate balance between statewide policy leadership and the need for effective institutional leadership and governance. Although CPE’s initiatives are well-intentioned and related to the goals of HB 1 and the Five Questions, they can have a fragmenting impact on institutional efforts to focus on their missions and carry out the day-to-day internal responsibilities. The interviews and regional meetings conducted for this review suggest that the role of the CPE has changed from policy leadership to project and program administration. In this view, the CPE approach to project implementation often turns into complex, top-down bureaucratic processes that undermine the goal of achieving institutional ownership and internal commitment to implementation. Part of the problem was attributed to lack of CPE staff experience in institutional leadership positions.
A consensus was that the CPE and the institutions could draw useful lessons from the recent business plan experience (described in the following section on budget discipline and accountability) to design a more focused, less complex process for its relationships with institutions. The vehicle for this process would be mutually negotiated two-way multi-year agreements between institutions and the CPE. The new process could (1) provide a systematic way to consolidate and coordinate CPE initiatives affecting an institution, and (2) serve as the basis for a substantive discussion of significant challenges facing the state and each institution. The agreement could specify how the CPE intended to hold each institution accountable for achieving state goals, and the CPE could agree to support the institution on its own strategic planning and priorities to meet the HB 1 institutional capacity goals (Goal A). In the budget process, the business plans or agreements could serve as the basis for state investments to increase institutional
71
capacity, including related goals and accountability measures. The agreement could then serve as a basis of annual face-to-face conversations between the CPE and institutional leaders, including the institutional governing board leadership, about how they could work together to achieve the goals of HB 1.
Need for state policy leadership and coordination Despite concerns that the CPE had drifted significantly away from the policy leadership mission intended by HB 1, most of those interviewed agreed that an entity such as the CPE is essential to sustain attention to the goals of HB 1, system and institutional accountability for progress toward these goals, and to maintain balance among diverse institutional missions and regions. They emphasized, however, that:
• CPE can only be effective if it gains the trust and respect of the General Assembly as an objective, nonpartisan, timely and relevant source of policy analysis and information to support decision-making by the legislature. Re-establishing the CPE as an independent entity relating directly to the Secretary of the Governor’s Executive Cabinet as originally intended by HB 1 would be a critical step in strengthening the CPE’s leadership role and its links with other entities, including the Cabinet for Economic Development.
• Leadership from the Governor is critical to the ability of the CPE to fulfill its statutory responsibilities as defined in HB 1:
o Ensuring the priorities as developed by the CPE (e.g., Double the Numbers) are priorities for the state, not only the CPE.
o Appointing the most prominent business and civic leaders in Kentucky to the CPE.
o Supporting CPE’s independent policy leadership role, especially as it seeks solutions to issues that may be politically sensitive.
o Facilitating connections and coordination between the CPE and across the state government including not only education entities but especially the Cabinet for Economic Development.
o Advancing clear communication among key parties (CPE, Governor’s Office and General Assembly) in the budget process.
The CPE must re-establish its focus on leading the statewide public agenda to achieve the HB 1 goals (Goal B) while consolidating and streamlining its projects and initiatives related to institutions. The CPE focus should be on leading the Double the Numbers campaign and on crosscutting issues such as P-20 initiatives carried out in partnership with the State Board of Education and statewide and regional education development/innovation in partnership with the Cabinet for Economic Development. To the extent feasible, the CPE should consolidate and streamline initiatives related to institutions within the framework of multi-year institutional agreements and the principal sector trust funds (research challenge, regional university excellence, postsecondary workforce development (KCTCS)) to support statewide priorities and the institutional
72
capacity goals (Goal A) of HB1. The agreements should also provide a framework for institutional accountability.
Strategic Committee for Postsecondary Education Within a short time after the enactment of HB 1, SCOPE evolved into what some characterized as a “show and tell Power Point” forum for the CPE to tell the legislature what they should know and do. Legislators did not perceive SCOPE as a forum for two-way communication, and it quickly lost credibility as a means to gain legislative ownership of the agenda.
Policy leaders interviewed for this study agreed that SCOPE has not worked and may not be able to work in its current configuration. Their views were that the committee is too large, too dominated by CPE’s agenda, and not structured or staffed in a way that will engender legislative ownership. The SCOPE meetings took place in a theater-style hearing room with the news media present, conditions that did not contribute to the intended face-to-face discussions. All agreed that it is essential that there be a better way to gain legislative understanding and ownership of the public agenda and budget necessary to achieve the HB 1 goals. But they did not see SCOPE, with its current structure, as that means. A smaller SCOPE, staffed by the Legislative Research Commission (LRC), focused explicitly on how to gain broad legislative understanding and support for the public agenda and budget priorities was one possible alternative. At critical times, such as the disagreements about the budgetary framework in 2000, subcommittees of SCOPE, including the Governor and executive branch leaders, legislators, institutional presidents and the CPE, have served an important function in reaching consensus on key policy principles. The experience of other states indicates that having representatives of the state’s business leaders at the table provides an important, independent voice to ensure that the focus remains on the ultimate goals of postsecondary education reform.
Budget Discipline and Accountability Funding model prior to HB 1 The postsecondary education funding model in place prior to HB 1 was fundamentally a “cost-reimbursement” mode: the formula determined budget recommendations and institutional allocations based on elaborate cost analysis and other variables intended to reflect the needs of the institutions. Common criticisms of the model were that it:
• Emphasized cost-reimbursement based on historic costs and therefore reinforced the status quo and provided few incentives for efficiency.
• Focused primarily on state appropriations and did not take into consideration other sources of revenue available to institutions.
• Stimulated competition rather than collaboration among institutions leading to program duplication and barriers to student transfer.
73
• Provided no incentives for performance, especially in meeting state priorities, although a performance component was added to the model in the biennia prior to HB 1.
• Was a “black box” so complicated and opaque that few people other than the institutional chief financial officers and the Council on Higher Education had a full understanding of its components.
Above all, the funding model had no credibility with the General Assembly. As a result, the Council’s budget recommendations were largely ignored. Institutional lobbying and regionalism, not a long-term plan for higher education in Kentucky, were the dominant forces in the biennial budget process.
A new budgetary framework in HB 1 HB 1 enacted fundamental changes in the financing model. The underlying design shifted from cost-reimbursement to the adequacy of revenue and took into consideration all sources of revenue (especially state appropriations and tuition—public funds) available to accomplish institutional missions. The CPE was given the responsibility to develop biennial budget requests for:
• Funding to be appropriated to the base budgets of the institutions, systems, agencies and programs.
• Funds for the Strategic Investment and Incentive Trust Funds that were to be used in support of the strategic agenda and provided a means to promote coherence as opposed to the multiple special projects previously included in the budget.
Rather than lapse at the end of each biennium, these funds and their interest earnings would be available when needed to be allocated by the CPE to achieve the HB 1 goals. The six trust funds were designed to reflect the different goals in HB 1: research challenge, regional university excellence, postsecondary workforce development (KCTCS), physical facilities, technology initiatives and student financial aid and advancement.
HB 1 added a critical element to the biennial budget process: SCOPE, with the intent of gaining the understanding and support of the state’s elected leaders of the strategic agenda and biennial budget prior to action by the General Assembly.
Moving away from the original HB 1 framework For the last year of the 1996-1998 biennium, the General Assembly appropriated funds directly in line with House Bill 1. (As noted earlier, the Bucks for Brains Endowment Matching Program was added in 1998.) The CPE’s first biennial budget request for 1998-2000 followed the HB 1 mandate. The Governor’s budget request and the General Assembly’s final appropriations for that biennium followed the CPE’s recommendations with few exceptions. In addition to recommending two new trust funds, the CPE recommended two key components:
• Benchmark funding, a request for funds to move each institution’s base funding closer to the funding levels of benchmark institutions in other states
74
• Performance funding in the form of an Enrollment Growth and Retention Program, designed to accelerate institutional performance toward the HB 1 goals
Cracks began appearing in the HB 1 funding approach as the institutions and legislators began work on the biennial budget. Technical flaws in the benchmark funding model spawned intense divisions among some of the comprehensive universities and their legislative advocates. In addition, institutions objected to the methodology of the performance funding component. This budget crisis was finally resolved before the opening of the 2000 session by a subcommittee of SCOPE, including representatives of the Governor, General Assembly, institutional presidents and the CPE. The consensus reached through this process stabilized the budget process and led to General Assembly action on the 2000-2002 budget that largely sustained commitment to the HB 1 goals. But the problems with benchmark funding would continue and, from the perspective of most observers, never be fully resolved.
Midway through the 2000-2002 biennium, the state descended into a protracted budget crisis that would last through the first year of the following budget cycle. Postsecondary education ultimately received significant budget cuts, and the budgetary framework of House Bill 1 could not be sustained. While the trust funds remained primarily as funding vehicles, the state withdrew the interest earnings to close the state’s budget deficit, thereby negating their use as a means to sustain attention to the long-term goals. Meanwhile, the first CPE president departed, in part because of the controversies related to the 2000-2002 budget.
As the state emerged from the recession under the leadership of a new Governor, the basic budgetary framework set forth in HB 1 no longer guided the biennial budget process. While the CPE packaged the budget request for 2004-2006 in the language of postsecondary reform, the request was understandably an effort to catch up on base funding, benchmark funding and special items.
In 2004, the CPE engaged in a full-scale effort to develop a new strategic agenda resulting the following year in Five Questions, One Mission: Better Lives for Kentucky’s People, a document widely admired and replicated around the U.S. as a model for linking higher education to the future of a state. A review of the CPE meeting agendas and work plans from 2005 through 2007 reveals a subtle but profound shift in CPE priority setting. Instead of focusing the CPE agenda on the goals of HB 1, the five questions seem to have become primarily categories under which the CPE could package an increasingly fragmented set of programs and initiatives. Everything seemed to be justified in terms of the goals of HB 1 without disciplined coordination and priority setting.
Meanwhile, the CPE was engaged in a protracted study and analysis of funding distribution models, especially benchmark funding. While some of the blame for the lack of resolution clearly rests with the institutions, the widespread perception is that the CPE’s approach to the funding model was far too complicated and technical to reflect the nuances of differences among institutional missions and funding constraints. More important, however, the CPE’s budget and finance deliberations appear to have shifted away from the central themes behind HB 1: the link between the budget and performance leading to the 2020 goals.
75
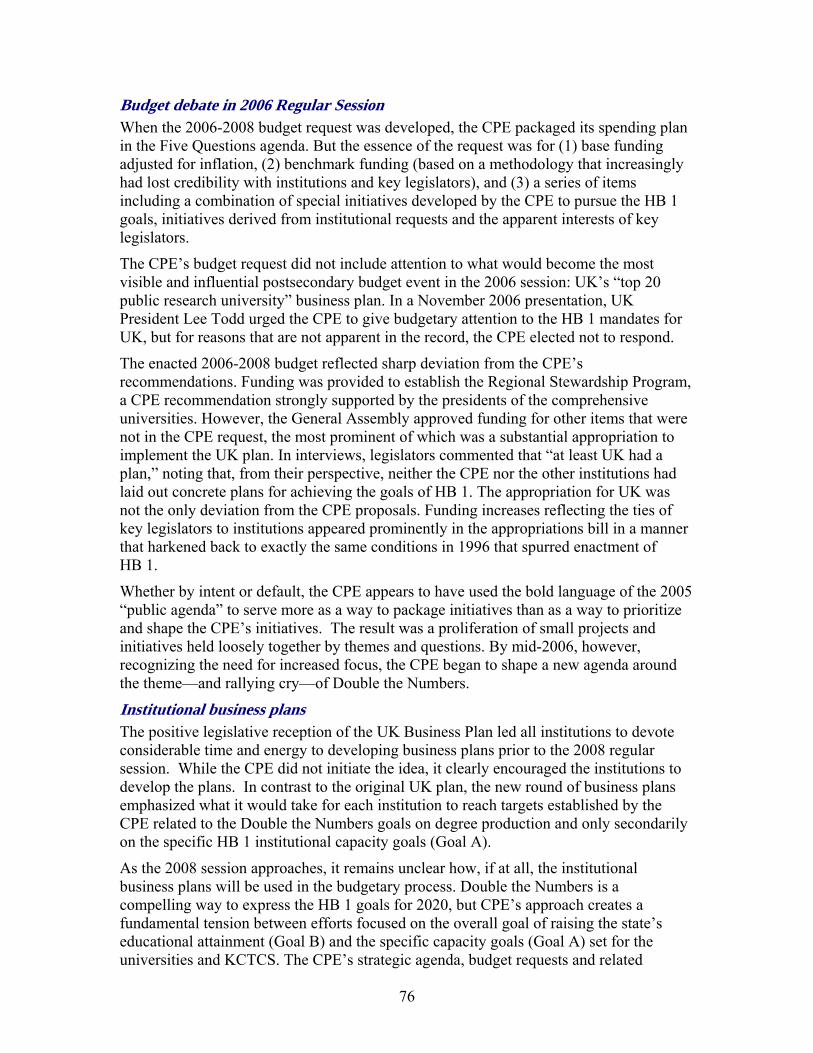
Budget debate in 2006 Regular Session When the 2006-2008 budget request was developed, the CPE packaged its spending plan in the Five Questions agenda. But the essence of the request was for (1) base funding adjusted for inflation, (2) benchmark funding (based on a methodology that increasingly had lost credibility with institutions and key legislators), and (3) a series of items including a combination of special initiatives developed by the CPE to pursue the HB 1 goals, initiatives derived from institutional requests and the apparent interests of key legislators.
The CPE’s budget request did not include attention to what would become the most visible and influential postsecondary budget event in the 2006 session: UK’s “top 20 public research university” business plan. In a November 2006 presentation, UK President Lee Todd urged the CPE to give budgetary attention to the HB 1 mandates for UK, but for reasons that are not apparent in the record, the CPE elected not to respond.
The enacted 2006-2008 budget reflected sharp deviation from the CPE’s recommendations. Funding was provided to establish the Regional Stewardship Program, a CPE recommendation strongly supported by the presidents of the comprehensive universities. However, the General Assembly approved funding for other items that were not in the CPE request, the most prominent of which was a substantial appropriation to implement the UK plan. In interviews, legislators commented that “at least UK had a plan,” noting that, from their perspective, neither the CPE nor the other institutions had laid out concrete plans for achieving the goals of HB 1. The appropriation for UK was not the only deviation from the CPE proposals. Funding increases reflecting the ties of key legislators to institutions appeared prominently in the appropriations bill in a manner that harkened back to exactly the same conditions in 1996 that spurred enactment of HB 1.
Whether by intent or default, the CPE appears to have used the bold language of the 2005 “public agenda” to serve more as a way to package initiatives than as a way to prioritize and shape the CPE’s initiatives. The result was a proliferation of small projects and initiatives held loosely together by themes and questions. By mid-2006, however, recognizing the need for increased focus, the CPE began to shape a new agenda around the theme—and rallying cry—of Double the Numbers.
Institutional business plans The positive legislative reception of the UK Business Plan led all institutions to devote considerable time and energy to developing business plans prior to the 2008 regular session. While the CPE did not initiate the idea, it clearly encouraged the institutions to develop the plans. In contrast to the original UK plan, the new round of business plans emphasized what it would take for each institution to reach targets established by the CPE related to the Double the Numbers goals on degree production and only secondarily on the specific HB 1 institutional capacity goals (Goal A).
As the 2008 session approaches, it remains unclear how, if at all, the institutional business plans will be used in the budgetary process. Double the Numbers is a compelling way to express the HB 1 goals for 2020, but CPE’s approach creates a fundamental tension between efforts focused on the overall goal of raising the state’s educational attainment (Goal B) and the specific capacity goals (Goal A) set for the universities and KCTCS. The CPE’s strategic agenda, budget requests and related
76
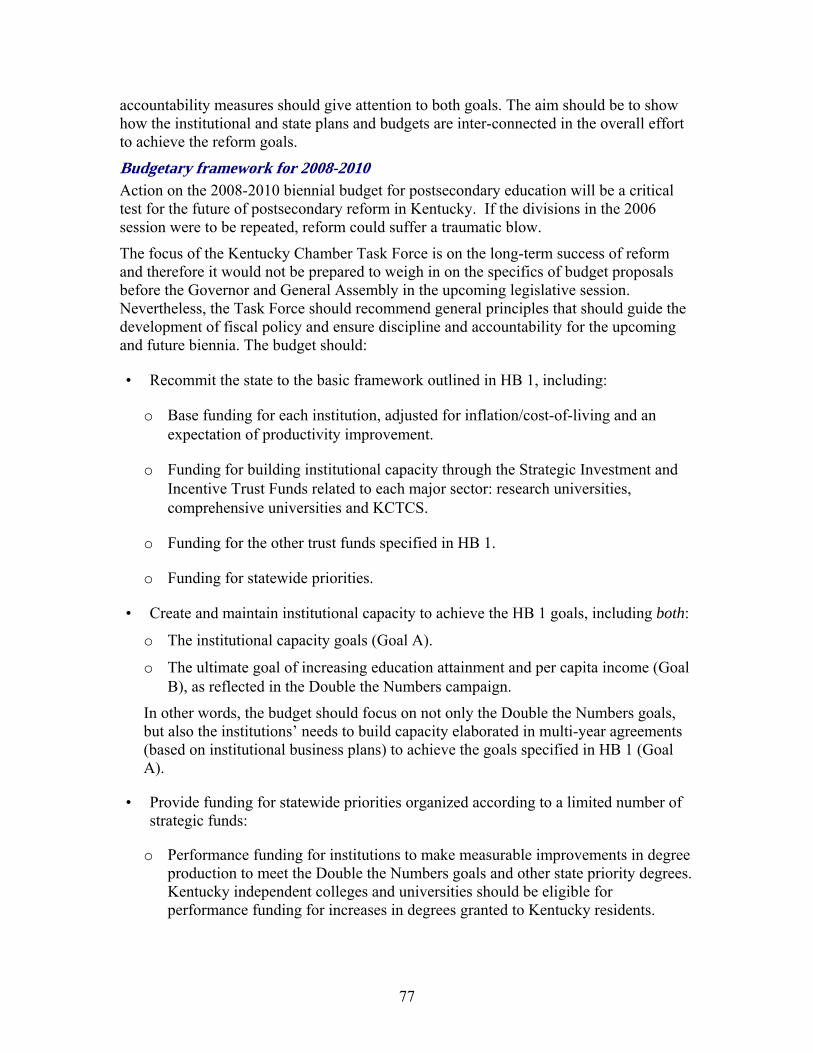
accountability measures should give attention to both goals. The aim should be to show how the institutional and state plans and budgets are inter-connected in the overall effort to achieve the reform goals.
Budgetary framework for 2008-2010 Action on the 2008-2010 biennial budget for postsecondary education will be a critical test for the future of postsecondary reform in Kentucky. If the divisions in the 2006 session were to be repeated, reform could suffer a traumatic blow.
The focus of the Kentucky Chamber Task Force is on the long-term success of reform and therefore it would not be prepared to weigh in on the specifics of budget proposals before the Governor and General Assembly in the upcoming legislative session. Nevertheless, the Task Force should recommend general principles that should guide the development of fiscal policy and ensure discipline and accountability for the upcoming and future biennia. The budget should:
• Recommit the state to the basic framework outlined in HB 1, including:
o Base funding for each institution, adjusted for inflation/cost-of-living and an expectation of productivity improvement.
o Funding for building institutional capacity through the Strategic Investment and Incentive Trust Funds related to each major sector: research universities, comprehensive universities and KCTCS.
o Funding for the other trust funds specified in HB 1.
o Funding for statewide priorities.
• Create and maintain institutional capacity to achieve the HB 1 goals, including both:
o The institutional capacity goals (Goal A).
o The ultimate goal of increasing education attainment and per capita income (Goal B), as reflected in the Double the Numbers campaign.
In other words, the budget should focus on not only the Double the Numbers goals, but also the institutions’ needs to build capacity elaborated in multi-year agreements (based on institutional business plans) to achieve the goals specified in HB 1 (Goal A).
• Provide funding for statewide priorities organized according to a limited number of strategic funds:
o Performance funding for institutions to make measurable improvements in degree production to meet the Double the Numbers goals and other state priority degrees. Kentucky independent colleges and universities should be eligible for performance funding for increases in degrees granted to Kentucky residents.
77
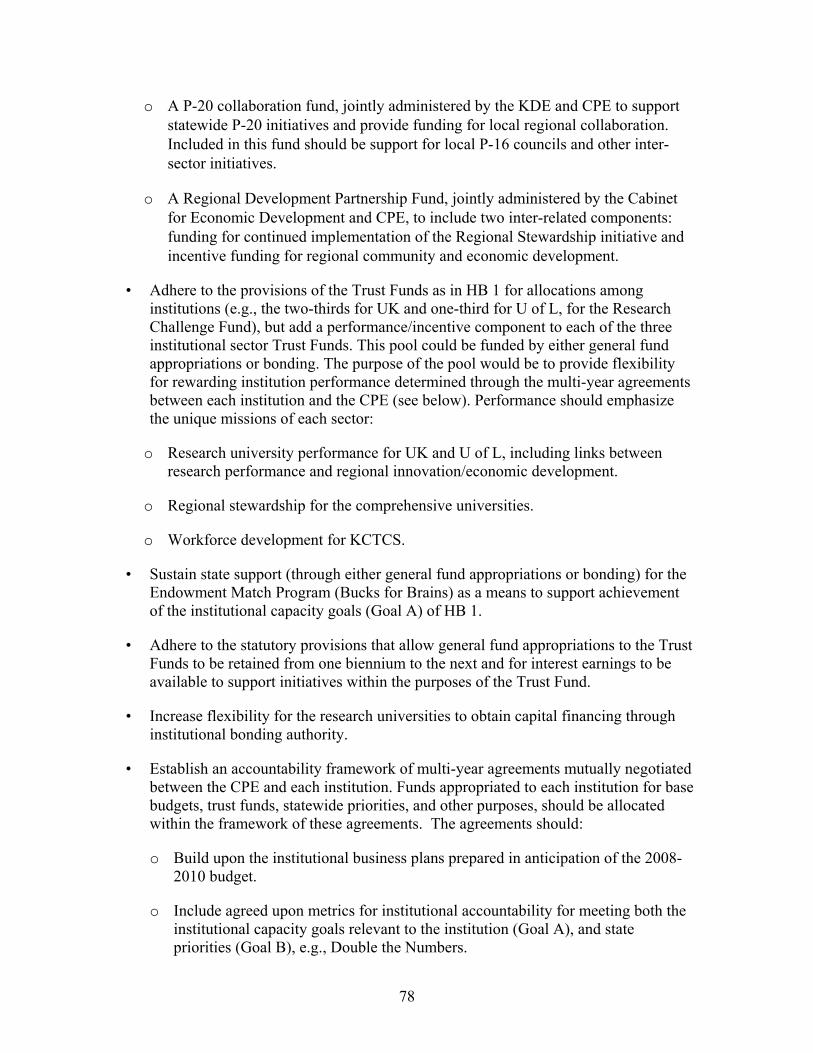
o A P-20 collaboration fund, jointly administered by the KDE and CPE to support statewide P-20 initiatives and provide funding for local regional collaboration. Included in this fund should be support for local P-16 councils and other inter-sector initiatives.
o A Regional Development Partnership Fund, jointly administered by the Cabinet for Economic Development and CPE, to include two inter-related components: funding for continued implementation of the Regional Stewardship initiative and incentive funding for regional community and economic development.
• Adhere to the provisions of the Trust Funds as in HB 1 for allocations among institutions (e.g., the two-thirds for UK and one-third for U of L, for the Research Challenge Fund), but add a performance/incentive component to each of the three institutional sector Trust Funds. This pool could be funded by either general fund appropriations or bonding. The purpose of the pool would be to provide flexibility for rewarding institution performance determined through the multi-year agreements between each institution and the CPE (see below). Performance should emphasize the unique missions of each sector:
o Research university performance for UK and U of L, including links between research performance and regional innovation/economic development.
o Regional stewardship for the comprehensive universities.
o Workforce development for KCTCS.
• Sustain state support (through either general fund appropriations or bonding) for the Endowment Match Program (Bucks for Brains) as a means to support achievement of the institutional capacity goals (Goal A) of HB 1.
• Adhere to the statutory provisions that allow general fund appropriations to the Trust Funds to be retained from one biennium to the next and for interest earnings to be available to support initiatives within the purposes of the Trust Fund.
• Increase flexibility for the research universities to obtain capital financing through institutional bonding authority.
• Establish an accountability framework of multi-year agreements mutually negotiated between the CPE and each institution. Funds appropriated to each institution for base budgets, trust funds, statewide priorities, and other purposes, should be allocated within the framework of these agreements. The agreements should:
o Build upon the institutional business plans prepared in anticipation of the 2008-2010 budget.
o Include agreed upon metrics for institutional accountability for meeting both the institutional capacity goals relevant to the institution (Goal A), and state priorities (Goal B), e.g., Double the Numbers.
78
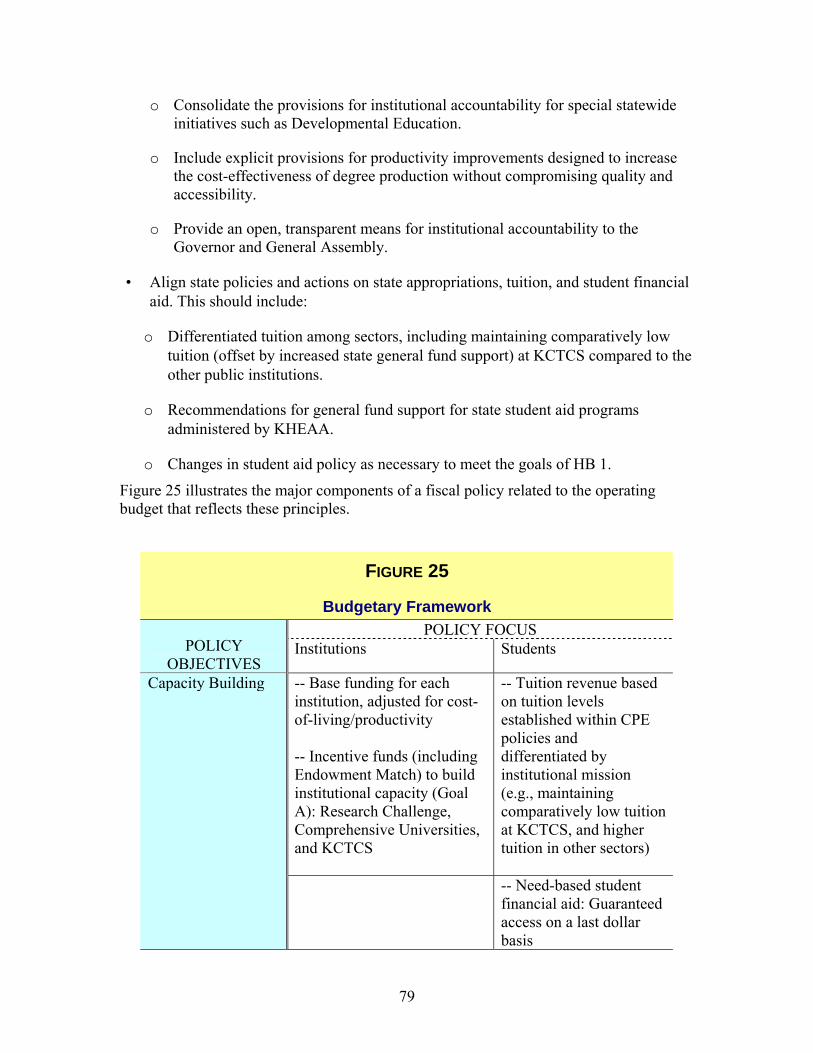
o Consolidate the provisions for institutional accountability for special statewide initiatives such as Developmental Education.
o Include explicit provisions for productivity improvements designed to increase the cost-effectiveness of degree production without compromising quality and accessibility.
o Provide an open, transparent means for institutional accountability to the Governor and General Assembly.
• Align state policies and actions on state appropriations, tuition, and student financial aid. This should include:
o Differentiated tuition among sectors, including maintaining comparatively low tuition (offset by increased state general fund support) at KCTCS compared to the other public institutions.
o Recommendations for general fund support for state student aid programs administered by KHEAA.
o Changes in student aid policy as necessary to meet the goals of HB 1.
Figure 25 illustrates the major components of a fiscal policy related to the operating budget that reflects these principles.
FIGURE 25
Budgetary Framework POLICY FOCUS
POLICY OBJECTIVES
Institutions Students
-- Base funding for each institution, adjusted for cost-of-living/productivity -- Incentive funds (including Endowment Match) to build institutional capacity (Goal A): Research Challenge, Comprehensive Universities, and KCTCS
-- Tuition revenue based on tuition levels established within CPE policies and differentiated by institutional mission (e.g., maintaining comparatively low tuition at KCTCS, and higher tuition in other sectors)
Capacity Building
-- Need-based student financial aid: Guaranteed access on a last dollar basis
79
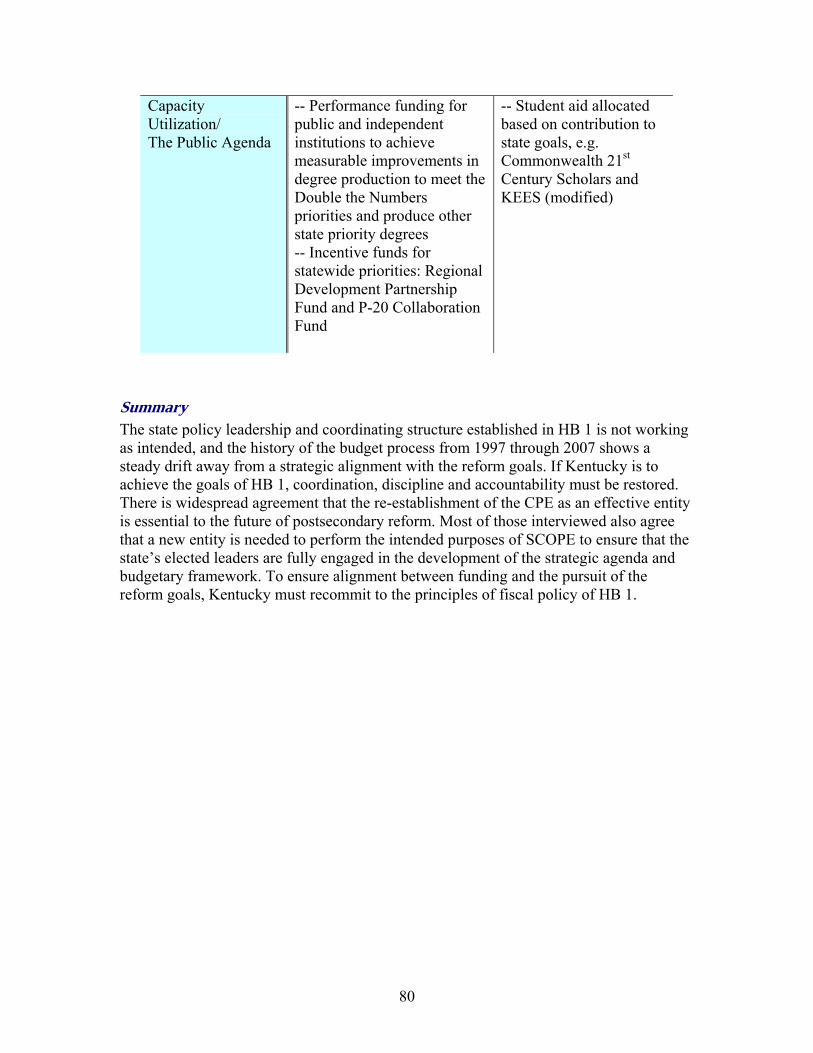
Capacity Utilization/ The Public Agenda
-- Performance funding for public and independent institutions to achieve measurable improvements in degree production to meet the Double the Numbers priorities and produce other state priority degrees -- Incentive funds for statewide priorities: Regional Development Partnership Fund and P-20 Collaboration Fund
-- Student aid allocated based on contribution to state goals, e.g. Commonwealth 21st Century Scholars and KEES (modified)
Summary The state policy leadership and coordinating structure established in HB 1 is not working as intended, and the history of the budget process from 1997 through 2007 shows a steady drift away from a strategic alignment with the reform goals. If Kentucky is to achieve the goals of HB 1, coordination, discipline and accountability must be restored. There is widespread agreement that the re-establishment of the CPE as an effective entity is essential to the future of postsecondary reform. Most of those interviewed also agree that a new entity is needed to perform the intended purposes of SCOPE to ensure that the state’s elected leaders are fully engaged in the development of the strategic agenda and budgetary framework. To ensure alignment between funding and the pursuit of the reform goals, Kentucky must recommit to the principles of fiscal policy of HB 1.
80
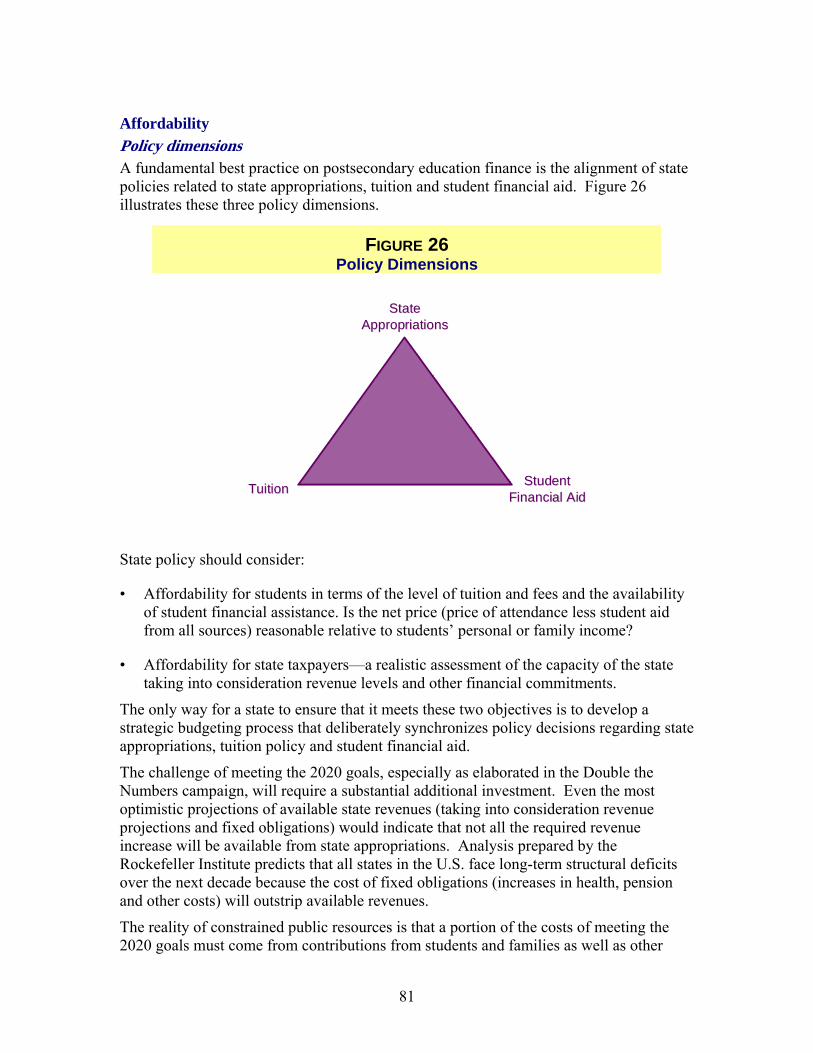
Affordability Policy dimensions A fundamental best practice on postsecondary education finance is the alignment of state policies related to state appropriations, tuition and student financial aid. Figure 26 illustrates these three policy dimensions.
FIGURE 26 Policy Dimensions
State State AppropriationsAppropriations
TuitionTuition Student Student Financial AidFinancial Aid
State policy should consider:
• Affordability for students in terms of the level of tuition and fees and the availability of student financial assistance. Is the net price (price of attendance less student aid from all sources) reasonable relative to students’ personal or family income?
• Affordability for state taxpayers—a realistic assessment of the capacity of the state taking into consideration revenue levels and other financial commitments.
The only way for a state to ensure that it meets these two objectives is to develop a strategic budgeting process that deliberately synchronizes policy decisions regarding state appropriations, tuition policy and student financial aid.
The challenge of meeting the 2020 goals, especially as elaborated in the Double the Numbers campaign, will require a substantial additional investment. Even the most optimistic projections of available state revenues (taking into consideration revenue projections and fixed obligations) would indicate that not all the required revenue increase will be available from state appropriations. Analysis prepared by the Rockefeller Institute predicts that all states in the U.S. face long-term structural deficits over the next decade because the cost of fixed obligations (increases in health, pension and other costs) will outstrip available revenues.
The reality of constrained public resources is that a portion of the costs of meeting the 2020 goals must come from contributions from students and families as well as other
81
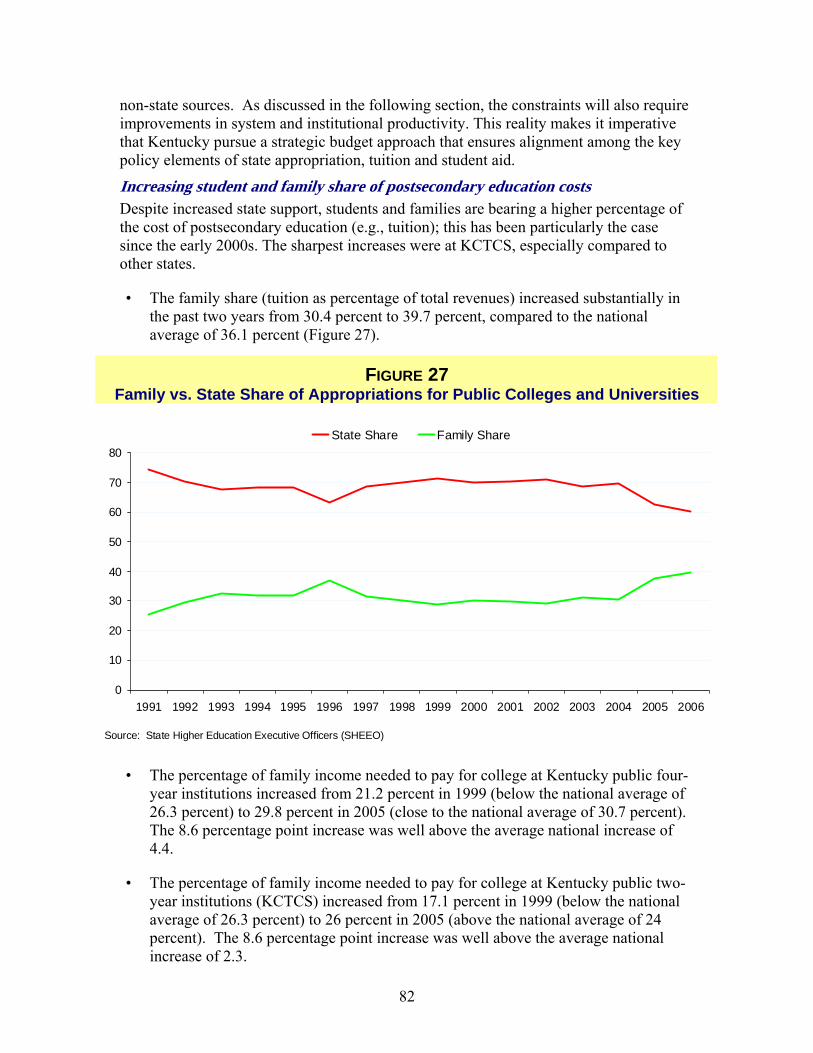
non-state sources. As discussed in the following section, the constraints will also require improvements in system and institutional productivity. This reality makes it imperative that Kentucky pursue a strategic budget approach that ensures alignment among the key policy elements of state appropriation, tuition and student aid.
Increasing student and family share of postsecondary education cos tsDespite increased state support, students and families are bearing a higher percentage of the cost of postsecondary education (e.g., tuition); this has been particularly the case since the early 2000s. The sharpest increases were at KCTCS, especially compared to other states.
• The family share (tuition as percentage of total revenues) increased substantially in the past two years from 30.4 percent to 39.7 percent, compared to the national average of 36.1 percent (Figure 27).
FIGURE 27 Family vs. State Share of Appropriations for Public Colleges and Universities
0
10
20
30
40
50
60
70
80
1991 1992 1993 1994 1995 1996 1997 1998 1999 2000 2001 2002 2003 2004 2005 2006
State Share Family Share
Source: State Higher Education Executive Officers (SHEEO)
• The percentage of family income needed to pay for college at Kentucky public four-year institutions increased from 21.2 percent in 1999 (below the national average of 26.3 percent) to 29.8 percent in 2005 (close to the national average of 30.7 percent). The 8.6 percentage point increase was well above the average national increase of 4.4.
• The percentage of family income needed to pay for college at Kentucky public two-year institutions (KCTCS) increased from 17.1 percent in 1999 (below the national average of 26.3 percent) to 26 percent in 2005 (above the national average of 24 percent). The 8.6 percentage point increase was well above the average national increase of 2.3.
82
• The share of income of the poorest families needed to pay tuition at the state’s lowest priced public colleges (KCTCS) increased from 13.6 percent in 1999 (close to the national average of 13.3 percent) to 24.1 percent in 2004 (significantly about the national average of 15.9 percent). The increase of 10.5 percentage points was well above the average national increase of 2.6.
• To offset some of the rising tuition costs, Kentucky significantly increased funding for state need-based student financial aid. From 1999 to 2005, Kentucky funding of state need-based student grants increased from 28.1 percent of federal Pell grant funding to 41.5 percent of Pell grant funding, above the national average of 39.8 percent.
Lack of an integrated budget strategy Evidence from the past decade indicates that Kentucky has largely failed to pursue such an integrated, aligned postsecondary education budget strategy:
• The CPE decision in 2000 to delegate authority to set tuition to the institutions coupled with the sharp down-turn in state funding contributed to widely varying tuition increases that bore little relationship to differences in institutional mission or state policies for access and opportunity. In 2006-2007, the CPE reassumed authority to establish the parameters for tuition increases and intends to take a more aggressive role in this area for the 2008-2010 biennial budget.
• State decisions regarding need-based student aid are currently made apart from decisions regarding state appropriations. Nevertheless, the CPE has consistently made an effort to work closely with Kentucky Higher Education Assistance Authority (KHEAA) and to recommend increased funding of need-based student financial aid. KHEAA is the principal source of budget recommendations to the Governor and General Assembly regarding student financial aid, and these recommendations are not made through or in coordination with CPE’s recommendations. KHEAA also is able to allocate proceeds from the loan programs operated by its companion organization, the Student Loan People, for operational support and to provide additional funding for student aid programs.11
• In recent years, each of the public institutions has substantially increased funding for student financial aid programs from institutional and private resources. These commitments are laudable, but they are not substitutes for a statewide commitment to a well-designed and funded need-based student financial aid program.
• Since lottery proceeds were made available for student aid in the late 1990s, the state has not increased general fund support for need-based student aid. With questions being raised about the adequacy of lottery proceeds to meet the student aid funding obligations, the need for general fund support will increase. The General Assembly will then be faced with the need to balance the appropriations for institutions with funding for student financial aid.
11 Recent changes in federal policy are leading to significant changes in the ability of student loan agencies such as KHEAA to use the proceeds from loan operations to support other functions.
83
It is recommended that the CPE develop and recommend to the Governor and General Assembly a strategic budget to achieve the goals of postsecondary reform that encompasses an integrated set of recommendations regarding state appropriations, tuition, and student financial aid. The CPE budget recommendations should also include:
• Decisions to implement differentiated tuition levels, especially lower tuition at KCTCS compared to the research and comprehensive universities. Lower tuition at KCTCS will require offsetting state appropriations to increase the state’s share of funding in that sector.
• Recommendations for funding state student financial aid programs that are administered by KHEAA. The Governor and General Assembly should look to the CPE to develop and recommend a strategic budget to include state student financial aid. In other words, KHEAA should make budget recommendations to the Governor and General Assembly through the CPE much as the recommendations for funding of institutions are made through CPE. KHEAA should remain a separate corporate entity, but CPE should be responsible for overall policy leadership and coordination for all dimensions of postsecondary education, including student aid policy.
Concerns about affordability Participants in regional meetings and interviews consistently expressed several concerns:
• Escalating tuition and fees at the state’s public institutions. As indicated above, tuition and fees at KCTCS have risen sharply and the price to attend KCTCS, the lowest-priced option in the state, has also increased dramatically as a percent of the income of the poorest students.
• The tendency of many Kentucky students and families to under-value the importance of education, especially the value of completing high school and pursuing postsecondary education.
• The need for greatly expanded and coordinated initiatives for outreach, counseling and related services, targeted especially at students and families beginning as early as the 7th grade at the beginning of middle school.
• The need to simplify, consolidate and focus the state’s student financial aid programs in a way that:
o Provides clear and consistent expectations to each of the major partners in financing—students, families, institutions and the state.
o Addresses the needs of independent and part-time students.
o Provides incentives for students, both youth and adults, to be prepared for postsecondary education (for youth to stay in school, take a rigorous high school curriculum and plan for postsecondary education).
• The merit-based KEES scholarship program provides insufficient incentives for students to take a rigorous high school curriculum. Because eligibility is limited to
84
five years after a student’s high school graduation, many adults returning to postsecondary education are ineligible.
Research findings on affordability in Kentucky As indicated earlier, Kentucky has increased significantly the funding for need-based student financial aid since the 1997 Postsecondary Education Reform Act. Much of this increase can be attributed to the decision in the late 1990s to allow proceeds of the Kentucky Lottery to be used for not only the KEES program, but also the state’s need-based program, the College Access Program. The challenge in the future is that proceeds from the lottery may not be able to keep pace with the demands for student aid funding. A 2005 report, College Affordability in Kentucky, came to several important conclusions. Key excerpts follow:
• Based on data for those Kentucky students who completed the Free Application for Federal Student Aid (FAFSA), Kentucky higher education is within reasonable range of affordability for most full-time students (emphasis added).
• The biggest exception to this is lower-income independent students who do not receive as much state aid as dependent students and face a higher net price, which requires more borrowing. Independent students face the most daunting financial barriers when they enroll in college full-time. Generally, they are older, often have family obligations and are more likely to work full-time compared with traditional-age students. Most are not eligible for the KEES program because of age. The result is that independent students are more likely to attend college part-time than are younger students. Independent students are most likely to attend community colleges, but represent a significant share of enrollment in all sectors.
• High school students significantly over-estimate college costs. For example, most students over-estimated the cost of going to KCTCS at 173 percent of the actual cost and of going to the University of Kentucky at 209 percent of actual cost.
• Outreach and information are important factors in helping students and families make postsecondary plans. Special efforts are needed to help students, especially those from lower-income backgrounds, gain a better understanding of what going to college requires. This includes academic preparation, paying for education and succeeding at the college level.
• Students often undermine their potential to succeed in college by the choices they make about how to save money. These money-saving decisions include putting off enrolling in college to earn money, attending part-time and working full-time and living at home while going to college. Research shows that these choices all reduce a student’s chance of graduating. These enrollment decisions represent compromises that many older students find necessary in order to support their families.
Several initiatives are under way to address at least some of the concerns raised by the study. To address the needs related to outreach and information, the CPE in 2000 initiated Go Higher Kentucky (www.gohigherky.org), a public access campaign and web site. In 2006, the General Assembly appropriated $800,000 to expand Go Higher
85
Kentucky. The next phase is targeting adults in Kentucky with some college but no bachelor’s degree, potential transfer students currently enrolled in a KCTCS institution, at-risk middle and high school students and recent GED completers. In August 2007, the Lumina Foundation awarded a $500,000 grant to the CPE and the Prichard Committee for Academic Excellence for the Kentucky College Access Network (KentuckyCAN), a statewide network to promote college-going throughout Kentucky. Members of the network include local business, civic and faith-based organizations and leaders and P-20 education partners.
The General Assembly appropriated funds to KHEAA for a pilot program to assist part-time, independent students. The new Go Higher Grant gives adults age 24 or older with no previous college experience up to $1,000 for one academic year when they enroll in a participating Kentucky college or university less than half-time, which is usually one or two courses. The award covers tuition and a book allowance of $50 per credit hour.
Alternatives for the future Despite many efforts to address elements of the affordability issue, the findings from data analysis, interviews and regional meetings conclude that Kentucky needs a major overhaul of its policies to ensure affordability of postsecondary education to all qualified Kentucky students, youth and adults. Elements of a new plan that emerged from the discussions include:
• Consider the adoption of a simplified, integrated need-based student financial aid program based on the principle of shared responsibility among students, families, the state and federal governments and institutions. The plan would employ a Shared Responsibility Model, based on similar programs in Minnesota and Oregon, in which students make the initial contribution to their education, and the program then ensures affordability through a combination of aid from families and taxpayers through both federal and state student financial aid.
o In contrast to the current College Access Program, the new program would first ask students to contribute to their own education an amount per academic year equal to what they could earn from a 40 hour work-week during the summer and 10 to 15 hours per week during the school year at a minimum wage job or borrow without incurring significant debt (e.g., $4,000 to $4,500 per academic year).
o The expected family contribution as determined by the Free Application for Federal Student Aid (FAFSA), and federal student aid (Pell grants) would then be added to the student contribution.
o The Commonwealth of Kentucky would then assure all students that the state would make up the remaining difference between the sum of student contribution, family contribution, and Pell grant, and the cost of attendance at KCTCS or a public university.
o The CPE would establish the “cost-of-attendance” by public sector based on average tuition and fees established with CPE policy guidelines and an allowance for cost of attendance (adjust for different costs at community colleges compared to universities).
86
o Students attending Kentucky independent institutions would be eligible for an amount based on the “cost of attendance” at a public comprehensive university. Consideration might be given to integrating the Kentucky Tuition Grant program, the current program for students attending independent institutions.
o Students would be able to “earn” their student contribution through a KEES Scholarship or participation in the proposed Commonwealth 21st Century Scholars Program.
o The new program would replace the College Access Program (the state’s need-based student aid program).
• Consider the establishment of a new Commonwealth 21st Century Scholars Program as a way of raising the educational aspirations of low- and moderate-income families.
o The goals of the new initiative would be to:
- Help more students continue their educations.
- Reduce the high school dropout rate.
- Prepare students for the workforce.
- Decrease the use of drugs and alcohol among middle and high school students.
- Improve individual economic productivity and the quality of life for all residents.
o Income-eligible 7th- and 8th-graders who enroll in the program, take a specified core curriculum designed to prepare students for postsecondary education and a living-wage job, and fulfill a pledge of good citizenship to the state are assured the cost of four years of undergraduate college tuition at any participating public college or university in Kentucky. If the student attends a private institution, the state will award an amount comparable to that of a public institution. If the student attends a participating proprietary school, the state could award a tuition scholarship equal to the expected student contribution under the new Shared Responsibility program (see above).
• Modify state student financial aid policy to increase the eligibility of part-time and independent students.
• Consider changes in KEES to:
o Require students to take a rigorous curriculum aligned with preparation for postsecondary education as a condition for eligibility.
o Increase the minimum ACT score required to receive a scholarship to the levels established by the CPE for placement in credit-bearing courses (19 in math and 21 in English).
o Extend the period of eligibility to ensure that young adults who have been out of high school for more than five years are eligible for KEES scholarships based on ACT scores and postsecondary performance.
87
• Provide incentives for acceleration through the system: dual or concurrent enrollment; completion in less than usual program time.
• Consider alternatives to provide incentives for students to complete postsecondary education expeditiously. For example, the state could forgive loans for students who are eligible for the federal SMART program (a program for students who are Pell-grant eligible in their junior and senior years who are pursuing STEM fields) provided the student completes a bachelor’s degree in less than five years (10 semesters). The maximum loan forgiveness could be an amount equal to half the state subsidy that would be required for a year of study.
Summary Students and families are bearing a higher percentage of the cost of postsecondary education. In relationship to family incomes in Kentucky, the Commonwealth’s postsecondary system remains reasonably affordable for full-time students. Nevertheless, serious gaps exist in affordability for part-time and independent students. Participation and success in postsecondary education, especially for first-generation students, is seriously hampered by lack of effective guidance and counseling of students beginning as early as 7th and 8th grade, the lack of incentives for students to take the right courses and stay in school to prepare for college and the complexity of the student aid programs. Kentucky needs a major overhaul of its policies to ensure affordability of postsecondary education for all qualified Kentucky students—both youth and adults.
System and institutional productivity As discussed in the previous section, the challenge of meeting the 2020 goals, both developing institutional capacity (Goal A) and the ultimate goal (Goal B), will require substantial additional investment. It is unrealistic to assume that these resources will come only from additional state appropriations. It would also be a serious mistake to shift the additional costs to students or to expect sufficient additional funding to come from private sources (e.g., endowments). This leaves no alternative but to make significant sustained improvements in the productivity of the postsecondary system, that is, a significant increase in degree production in a more cost effective manner.
The intent of the sponsors of HB 1 was that the postsecondary education reforms would achieve significant productivity gains through a more seamless education system. Nevertheless, evidence suggests that Kentucky has a more severe “productivity gap” than many other states. Figure 28 displays the relationship between state performance in terms of bachelor’s degrees as a percent of high school graduates six years earlier and total state funding per full-time equivalent student. The figure shows that Kentucky produces comparatively fewer bachelor’s degrees for the level of funding than other states. These data include degrees granted by both public and independent institutions in Kentucky and total funding includes revenue from state and local funding plus required tuition and fees.
88
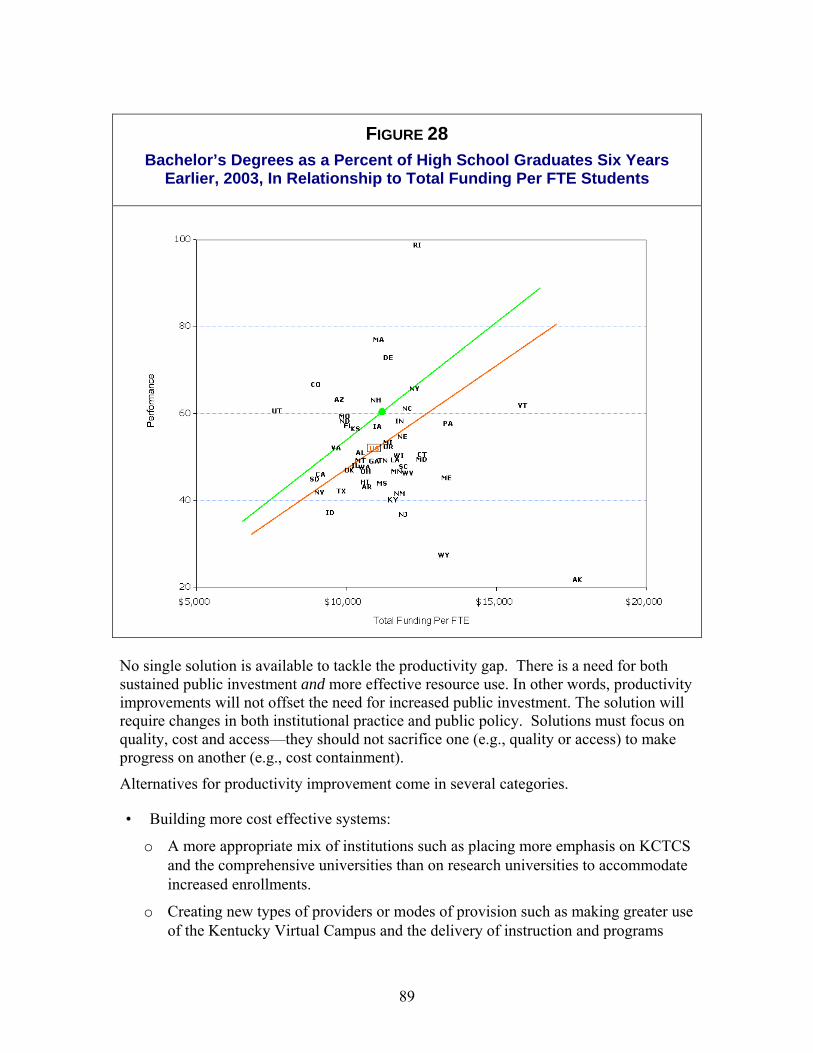
FIGURE 28 Bachelor’s Degrees as a Percent of High School Graduates Six Years
Earlier, 2003, In Relationship to Total Funding Per FTE Students
No single solution is available to tackle the productivity gap. There is a need for both sustained public investment and more effective resource use. In other words, productivity improvements will not offset the need for increased public investment. The solution will require changes in both institutional practice and public policy. Solutions must focus on quality, cost and access—they should not sacrifice one (e.g., quality or access) to make progress on another (e.g., cost containment).
Alternatives for productivity improvement come in several categories.
• Building more cost effective systems:
o A more appropriate mix of institutions such as placing more emphasis on KCTCS and the comprehensive universities than on research universities to accommodate increased enrollments.
o Creating new types of providers or modes of provision such as making greater use of the Kentucky Virtual Campus and the delivery of instruction and programs
89
through a combination of on-line instruction and on-site mediation at higher education centers.
o Increased collaboration among institutions.
o Taking full advantage of the contributions of Kentucky’s independent colleges and universities as means to reach the state’s degree production goals and other state and regional priorities.
• Changing the academic production function, either within individual institutions or between and among institutions:
o Creating programs of cost-effective size through elimination of programs in some cases and collaboration to achieve economies of scale.
o Re-engineering curricula and course delivery.
o Changing the composition and deployment of human resources, e.g., faculty.
• Reducing the demands that each student places on the system:
o Increasing the preparation of students for college-level study, e.g., reducing the need for developmental education and minimizing the need for “rework” as students transfer among institutions and move through the system.
o Accelerating learning, e.g., through advanced placement, dual enrollment and other means to accelerate the transition from secondary education to higher education, competency-based certification of prior learning, expedited transfer among institutions.
o Incentives for improved rates of course completion.
o Reducing credit hours required to attain degrees.
• Reducing leaks in the education pipeline. As emphasized throughout this report, strategies include:
• Alignment of standards, curricula and assessments between secondary and postsecondary education, between KCTCS and transfer institutions, and between adult education and postsecondary education.
• Incentives in the student financial aid system as recommended in the previous section of this report.
• Programs such as the Commonwealth 21st Century Scholars proposal that combine early information about requirements for college-level learning, requirements for students to stay in school, take the right courses, and make progress through the education pipeline to a degree.
Several policy tools are available to spur action on these alternatives at the institutional and system levels in Kentucky:
• Each institution should be held accountable for achieving productivity gains through the multi-year institutional agreements recommended earlier in this report.
90
• State budget recommendations should include an assumed “productivity improvement” in the allowance for inflationary/cost-of-living increases in base budgets.
• When feasible, state funding for special initiatives should require an institutional “match” in the form of reallocation of existing resources toward state and institutional priorities (e.g., the institutional capacity goals of HB 1).
• State financing policy should provide incentives for statewide and regional collaboration between K-12 and postsecondary education and among postsecondary institutions, public and independent, at the regional level.
• The CPE should take the lead in advancing system wide productivity improvements, drawing on the examples listed above.
Summary The challenge of meeting the 2020 goals, both developing institutional capacity (Goal A) and the ultimate goal (Goal B), will require a substantial additional investment. It is unrealistic to assume that these resources will come only from additional state appropriations. The cost of reform should not be shifted primarily to students and families. Additional funding from private sources (e.g., endowments) will be insufficient to fill the gap. This leaves no alternative but to make significant sustained improvements in the productivity of the postsecondary system, that is, a significant increase in degree production in a more cost-effective manner.
Kentucky produces comparatively fewer bachelor’s degrees for the level of funding than other states. No single solution is available to tackle the productivity gap. There is a need for both sustained public investment and more effective resource use. Solutions must focus on quality, cost and access—they should not sacrifice one (e.g., quality or access) to make progress on another (e.g., cost containment).
91
Kentucky Realities
The interviews and regional meetings underscored certain Kentucky “realities” that efforts to achieve the 2020 goals must consider:
• The General Assembly sets policy in Kentucky and firmly guards this responsibility. It will not delegate this responsibility to any agency.
• Regionalism in Kentucky is both a strength and a political reality.
o Kentucky is a collection of regions each with a distinct economy, culture and relationships.
o Regions can be the “communities of solutions,” given the high degree of interdependence among education levels within a region: Most students graduating from high school attend colleges within their region; students transfer from community colleges to four-year public and independent institutions in their region. Teachers within a region generally graduated from a comprehensive institution in their region. Adults completing their GEDs attend community and technical colleges within their region.
o Regions are also a political reality: Given the composition of the legislature, a reasonable political balance among the state’s regions is essential for successful policy development.
92
Criteria for Policy Alternatives
• Engage the General Assembly in the effort to sustain progress toward the goals of HB 1 (KRS 164.003(2)).
• Develop regional strategies to address the unique needs of different parts of Kentucky.
• Balance regional strategies with statewide policy frameworks and policies and incentives for strategic alliances across regions and between major institutions such as UK and U of L and every region in the state.
• Take advantage of all available resources, including the capacity of Kentucky’s independent colleges and universities, to achieve the HB 1 goals.
• Re-engage the business community as a critical force in mobilizing public support for reform, sustaining attention to reform by the Governor and General Assembly, and increasing the understanding of students of the economic and intrinsic value of education.
93
Recommendations & Suggested Action Steps
To the Governor and General Assembly 1. Reaffirm Kentucky’s commitment to achieve the HB 1 goals by 2020
• Give priority to both inter-related goals:
o Goal A: Institutional “capacity” goals for the postsecondary education system.
o Goal B: The ultimate goal to be achieved by 2020: to develop “… a society with a standard of living and quality of life that meets or exceeds the national average.”
• Affirm the goal to develop a major comprehensive research university – the University of Kentucky – ranked nationally in the top twenty public universities; a premier, nationally recognized metropolitan research university – the University of Louisville; comprehensive universities with nationally recognized programs of excellence and nationally recognized applied research programs; a comprehensive community and technical college system; and, a coordinating system to deliver educational services comparable to or exceeding the national average to all adult Kentuckians.
• Support the campaign to Double the Numbers by 2020 to increase Kentucky’s educational attainment to a level that meets or exceeds the national average.
o Adopt additional goals that establish the goal of reaching the education attainment levels of the most competitive nations by 2025 and set benchmarks referenced to the U.S. and OECD countries.
o Emphasize that Kentucky must also increase degree attainment at both the associate and bachelor’s degree levels to reflect the needs of Kentucky’s current economy, realistic goals for the existing adult population (GED recipients), as well as the role of KCTCS in increasing transfers.
• Clarify the institutional capacity goal for the comprehensive universities to emphasize regional stewardship to underscore the role of these universities in uplifting the education attainment, quality of life and innovation-based economies of their regions.
2. Redefine the overall goal for Kentucky to shape a comprehensive, integrated strategy to develop a seamless education system, Preschool through 20, beginning with early childhood through elementary and secondary education, postsecondary education, adult and lifelong learning.
• Establish long-term goals, benchmarks and indicators to monitor and report on progress at each level of the system (readiness for school, readiness for middle
94
school, readiness for high school, readiness for college and work in a living-wage job, etc.).
• Establish a new P-20 Trust Fund, to be jointly administered by the Kentucky State Board of Education and the Council for Postsecondary Education. The fund would:
o Support statewide projects to ensure alignment of standards, curriculum and assessments between secondary education, adult education and postsecondary education.
o Provide incentives for regional strategies (involving P-12 and public and independent postsecondary representatives) to achieve measurable improvements in the movement of students through the education pipeline to postsecondary education degrees (This could provide funding for local P-16 councils.)
• Call upon the Governor to establish a panel to define the specific tasks and policy changes needed to develop a seamless P-20 system.
o Charge the panel to:
- Make recommendations for improved alignment of the assessments currently being used or proposed for secondary education with the transition to postsecondary education and the workforce. Use the state’s participation in the American Diploma Project as a means for external analysis and advice on alternatives. Consider options for Kentucky’s participation in international assessments of student learning to enable benchmarking of Kentucky’s performance at a global level.
- Make recommendations on structures and policies needed to sustain statewide and regional P-20 leadership and initiatives.
o Include in the membership the leadership of the General Assembly, business and civic leaders and state education representatives.
3. Make the partnership between postsecondary education and community and economic development a central priority at the state and regional levels
• Support the new leadership of the Cabinet for Economic Development in the efforts to change the focus of economic development to emphasize high-skill, high-wage jobs, and to link community and economic development to education throughout the state.
• Give priority to linking higher education to the future economy and quality of life of the diverse needs of each of Kentucky’s regions.
• Establish a new Regional Development Partnership Fund to include two inter-related initiatives:
o The current Regional Stewardship Program for comprehensive universities.
95
o A regional community and economic development incentive program, administered by the Cabinet for Economic Development (CED) in collaboration with the Council on Postsecondary Education (CPE). The program would provide incentive funding to regions to undertake community and economic development planning in partnership with postsecondary education. The conditions for regional participation would be set jointly by the CPE and the CED.
• Ensure access to programs leading to bachelor’s degrees through higher education centers in regions without an existing public university within commuting distance. Call upon the CPE to assume its statutory responsibility for ensuring access to postsecondary education through higher education centers in a manner that provides for:
o Strong community leadership in defining needs.
o Incentives for communities interested in developing centers to obtain non-state funding to complement state funding for constructing any new facilities. Obtaining non-state funding for facilities should not be a condition for a community’s eligibility for a center. The aim of incentives should be to encourage local “ownership” in developing and maintaining the facility. Priority is given to use of existing facilities (e.g., community college or independent college facilities).
o State funding for core center capacity: technology and essential student services.
o An open-provider policy that may give the right of first refusal to the regional state university but allows the center to obtain needed programming from other providers. Consider providing state general fund appropriations to the CPE to allocate to regions/centers to provide leverage in “buying in” needed programs (e.g., cohort programs) in cases in which there is a high community need but with numbers and anticipated revenue insufficient to attract an institution willing to provide a complete program.
4. Recommit to complying with the budgetary framework for postsecondary education originally established by HB 1, to provide discipline and accountability in the budget decisions necessary to meet the 2020 goals. Follow these principles:
• Recommit the state to the basic framework outlined in HB 1, including:
o Base funding for each institution, adjusted for inflation/cost-of-living and an expectation of productivity improvement.
o Funding for building institutional capacity through the Strategic Investment and Incentive Trust Funds related to each major sector: research universities, comprehensive universities and KCTCS.
96
o Funding for the other trust funds specified in HB 1.
o Funding for statewide priorities.
• Create and maintain institutional capacity to achieve the HB 1 goals, including both:
o The institutional capacity goals (Goal A).
o The ultimate goal of increasing education attainment and per capita income (Goal B), as reflected in the Double the Numbers campaign.
In other words, the budget should focus on not only the Double the Numbers goals, but also the institutions’ needs to build capacity elaborated in multi-year agreements (based on institutional business plans) to achieve the goals specified in HB 1 (Goal A).
• Provide funding for statewide priorities organized according to a limited number of strategic funds:
o Performance funding for institutions to make measurable improvements in degree production to meet the Double the Numbers goals and other state priority degrees. Kentucky independent colleges and universities should be eligible for performance funding for increases in degrees granted to Kentucky residents.
o A P-20 collaboration fund, jointly administered by the KDE and CPE, to support statewide P-20 initiatives and provide funding for local regional collaboration. Included in this fund should be support for local P-16 councils and other inter-sector initiatives.
o A Regional Development Partnership Fund, jointly administered by the Cabinet for Economic Development and CPE, to include two inter-related components: funding for continued implementation of the Regional Stewardship initiative and incentive funding for regional community and economic development.
• Adhere to the provisions of the Trust Funds as in HB 1 for allocations among institutions (e.g., two-thirds for UK and one-third for U of L, for the Research Challenge Fund), but add a performance/incentive component to each of the three institutional sector Trust Funds. This pool could be funded by either general fund appropriations or bonding. The purpose of the pool would to be to provide flexibility for rewarding institution performance determined through the multi-year agreements between each institution and the CPE. Performance should emphasize the unique missions of each sector:
o Research university performance for UK and U of L, including links between research performance and regional innovation/economic development.
97
o Regional stewardship for the comprehensive universities.
o Workforce development for KCTCS.
• Sustain state support (through either general fund appropriations or bonding) for the Endowment Match Program (Bucks for Brains) as a means to support achievement of the institutional capacity goals (Goal A) of HB 1.
• Adhere to the statutory provisions that allow general fund appropriations to the Trust Funds to be retained from one biennium to the next and for interest earnings to be available to support initiatives within the purposes of the Trust Fund.
• Increase flexibility for the research universities to obtain capital financing through institutional bonding authority.
• Establish an accountability framework of multi-year agreements mutually negotiated between the CPE and each institution. Funds appropriated to each institution for base budgets, trust funds, statewide priorities, and other purposes, should be allocated within the framework of these agreements. The agreements should:
o Build upon the institutional business plans prepared in anticipation of the 2008-2010 budget.
o Include agreed upon metrics for institutional accountability for meeting both the institutional capacity goals relevant to the institution (Goal A), and state priorities (Goal B), e.g., Double the Numbers.
o Consolidate the provisions for institutional accountability for special statewide initiatives such as Developmental Education.
o Include explicit provisions for productivity improvements designed to increase the cost-effectiveness of degree production without compromising quality and accessibility.
o Provide an open, transparent means for institutional accountability to the Governor and General Assembly.
• Align state policies and actions on state appropriations, tuition and student financial aid. This should include:
o Differentiated tuition among sectors, including maintaining comparatively low tuition (offset by increased state general fund support) at KCTCS compared to the other public institutions.
o Recommendations for general fund support for state student aid programs administered by KHEAA.
o Changes in student aid policy as necessary to meet the goals of HB 1.
98
5. Guarantee affordable access to postsecondary education for all qualified Kentuckians on a “last dollar” basis, and simplify and consolidate state student aid programs. Specific alternatives to implement this recommendation include:
• Adopt a simplified, integrated, need-based student financial aid program based on the principle of shared responsibility among students, families, the state and federal governments and institutions. The plan would employ a Shared Responsibility Model in which students make the initial contribution to their education, and the program then ensures affordability through a combination of aid from families and taxpayers through both federal and state student financial aid.
• Establish a new Commonwealth 21st Century Scholars Program targeted at low-income 7th- and 8th-graders who enroll in the program, take a specified core curriculum designed to prepare students for postsecondary education and a living-wage job, and fulfill a pledge of good citizenship to the state. These students would be guaranteed the cost of four years of undergraduate college tuition at any participating public college or university in Kentucky. The program would be designed to reach all eligible Kentucky students and would be informed by elements of such existing efforts as GEAR UP and the Kentucky Scholars project.
• Modify state student financial aid policy to increase the eligibility of part-time and independent students.
• Make changes in KEES to:
o Require students to take a rigorous curriculum aligned with preparation for postsecondary education as a condition for eligibility.
o Increase the minimum ACT score required to receive a scholarship to the levels established by the CPE for placement in credit-bearing courses (19 in math and 21 in English).
o Extend the period of eligibility to ensure that young adults who have been out of high school for more than five years are eligible for KEES scholarships based on ACT scores and postsecondary performance.
• Provide incentives for acceleration through system: dual or concurrent enrollment; completion in less than usual program time.
6. Re-establish a mechanism to ensure full participation of the Governor and General Assembly in shaping the strategic agenda for achieving the goals of HB 1 (Goals A and B) and the related Double the Numbers goals, and for developing a strategic budget necessary to achieve these goals.
• Replace the Strategic Committee on Postsecondary Education (SCOPE) with a smaller entity, the Postsecondary Planning and Budget Committee. Include in the membership:
o The Governor and executive branch representatives including the State Budget Director and Secretary of the Economic Development Cabinet.
99
o Legislative Leaders, including leaders from the Senate and House education and appropriations and revenue committees.
• Provide for the Governor to serve as chair.
• Provide for the Committee to be staffed by the Legislative Research Commission (LRC).
• Provide for the Postsecondary Planning and Budget Committee to approve the CPE Strategic Agenda to Achieve the Goals of HB 1, an updated Strategic Agenda for each biennium.
• Authorize the Postsecondary Planning and Budget Committee to appoint subcommittees to address specific issues. Depending on the issue to be addressed, these subcommittees could include institutional presidents, representatives from the CPE and business and civic leaders.
7. Re-establish the CPE as an independent, non-partisan policy leadership entity outside the Education Cabinet with direct access to the Governor and to the leadership across state government as intended by HB 1.
• Establish a direct link with the Cabinet for Economic Development by placing the President of the CPE on the Economic Development Policy Board.
• Call upon the Governor to make appointments to the CPE that represent the most prominent business and civic leaders across the diversity of the state’s population.
• Consolidate and streamline multiple initiatives relating to institutions within the framework of the negotiated multi-year agreements and the Strategic Investment and Incentive Funds relevant to each institution (see budget process principles).
• Authorize the Council to establish salaries and compensation of senior professional staff (e.g., Vice Presidents) at levels competitive with comparable positions at the public universities.
• Make clear the CPE role in shaping policy and budget recommendations for student financial aid in collaboration with KHEAA.
To the Kentucky Chamber of Commerce 8. Establish an entity charged with monitoring progress of reform and gaining support
of the Governor and General Assembly for sustaining reform.
9. Support, in collaboration with the Governor, a renewed public campaign focusing on the value of education: not only the economic value but also the intrinsic value in terms of independence, appreciation of arts and culture, civic participation and the role that parents can play in encouraging their own children to enjoy and excel in education.
100
10. Encourage local groups willing to assume the leadership role in their regions to create strategic plans regarding economic and human capital development (much like the plans developed in Northern Kentucky and Louisville).
11. Communicate to employers the key ways that they must send far stronger signals to employees, and therefore to parents and students, that staying in school, taking the right courses, and pursuing postsecondary education are critical steps to earning a living wage in the global economy:
• Requiring a high school diploma or equivalent for employment, or employer-supported education to get a GED.
• Use of ACT WorkKeys.
• Recognition of the Kentucky Employability Certificate.
• Commitment to continuous training and upgrading of employees.
12. Sponsor an annual summit engaging the state’s policy leaders in stock-taking on the status of reform and progress toward the 2020 goals.
101
APPENDIX I
Members of the Kentucky Chamber of Commerce Postsecondary Education Task Force
Chairman Victor A. Staffieri Chairman, CEO and President E.ON U.S. LLC Louisville Norma B. Adams Attorney (retired) Adams & Venters Somerset James P. Campbell President and CEO GE Consumer & Industrial Louisville Joan Coleman President – Kentucky AT&T Louisville Luther Deaton Chairman / President / CEO Central Bank & Trust Co. Lexington Charles P. Denny President and CEO National City – Kentucky Banking Louisville Bryan A. Galli President, COALSALES Peabody Energy Corporation St. Louis, MO John W. Gamble, Jr. Executive Vice President and CFO Lexmark International Lexington
102
C. Edward Glasscock Co-Managing Partner Frost Brown Todd LLC Louisville Jean Hale Chairman, President and CEO Community Trust Bancorp, Inc. Pikeville Paula C. Hanson CPA, Shareholder Dean, Dorton & Ford, PSC Lexington Alice K. Houston President Houston-Johnson, Inc. Louisville William M. Lear, Jr. Managing Member Stoll Keenon Ogden PLLC Lexington Robert L. Lekites Vice President, UPS Airlines & International Operations UPS Louisville Michael B. McCallister President and CEO Humana Inc. Louisville Timothy C. Mosher President and Chief Operating Officer Kentucky Power Frankfort Helen Mountjoy Executive Vice President Greater Owensboro Economic Development Corp. Owensboro
103
Jim O’Brien Chairman & CEO Ashland Inc. Covington Michael A. Owsley Partner English, Lucas, Priest & Owsley LLP Bowling Green Benjamin K. Richmond President and Chief Executive Officer Louisville Urban League Louisville T. William Samuels Jr. President / CEO Maker's Mark Distillery, Inc. Louisville Steve St. Angelo President Toyota Motor Manufacturing of Kentucky, Inc. Georgetown Kelly Swartz Site President Citi Cards Citicorp Credit Services, Inc. Florence Jude Thompson President, Individual Business Anthem Blue Cross and Blue Shield Louisville Paul C. Varga President and Chief Executive Officer Brown-Forman Louisville John Williams Chairman Computer Services, Inc. Paducah
104
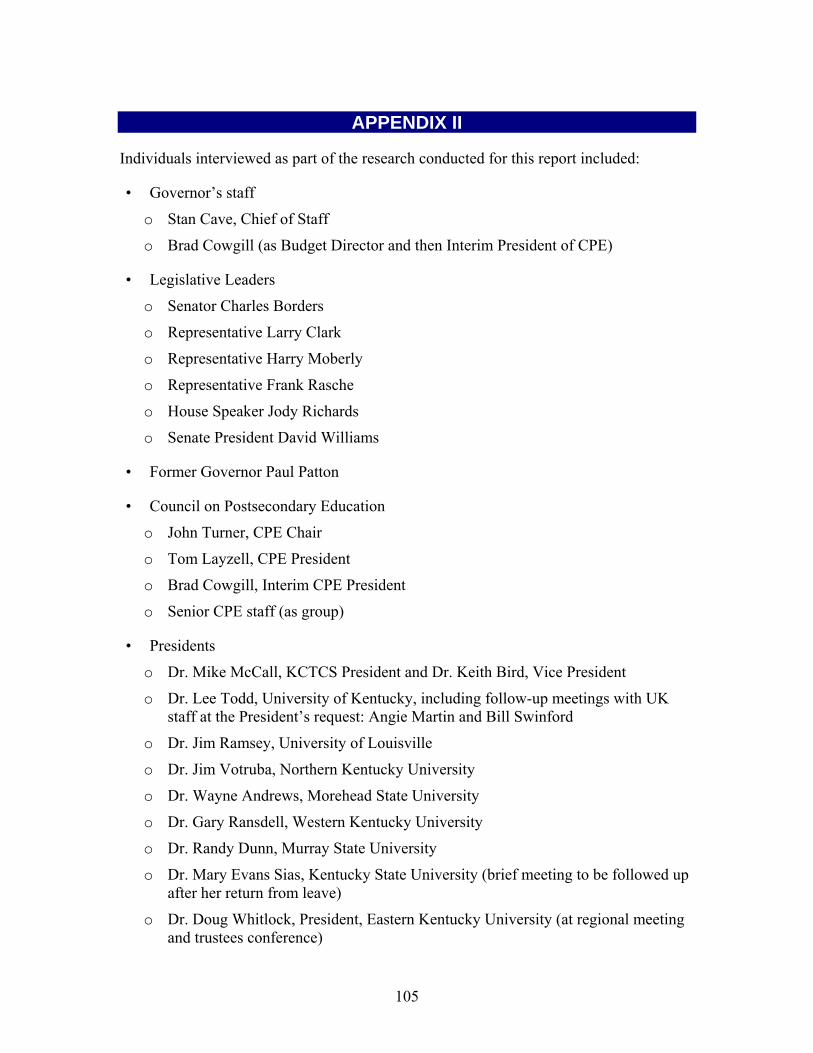
APPENDIX II
Individuals interviewed as part of the research conducted for this report included:
• Governor’s staff
o Stan Cave, Chief of Staff
o Brad Cowgill (as Budget Director and then Interim President of CPE)
• Legislative Leaders
o Senator Charles Borders
o Representative Larry Clark
o Representative Harry Moberly
o Representative Frank Rasche
o House Speaker Jody Richards
o Senate President David Williams
• Former Governor Paul Patton
• Council on Postsecondary Education
o John Turner, CPE Chair
o Tom Layzell, CPE President
o Brad Cowgill, Interim CPE President
o Senior CPE staff (as group)
• Presidents
o Dr. Mike McCall, KCTCS President and Dr. Keith Bird, Vice President
o Dr. Lee Todd, University of Kentucky, including follow-up meetings with UK staff at the President’s request: Angie Martin and Bill Swinford
o Dr. Jim Ramsey, University of Louisville
o Dr. Jim Votruba, Northern Kentucky University
o Dr. Wayne Andrews, Morehead State University
o Dr. Gary Ransdell, Western Kentucky University
o Dr. Randy Dunn, Murray State University
o Dr. Mary Evans Sias, Kentucky State University (brief meeting to be followed up after her return from leave)
o Dr. Doug Whitlock, President, Eastern Kentucky University (at regional meeting and trustees conference)
105
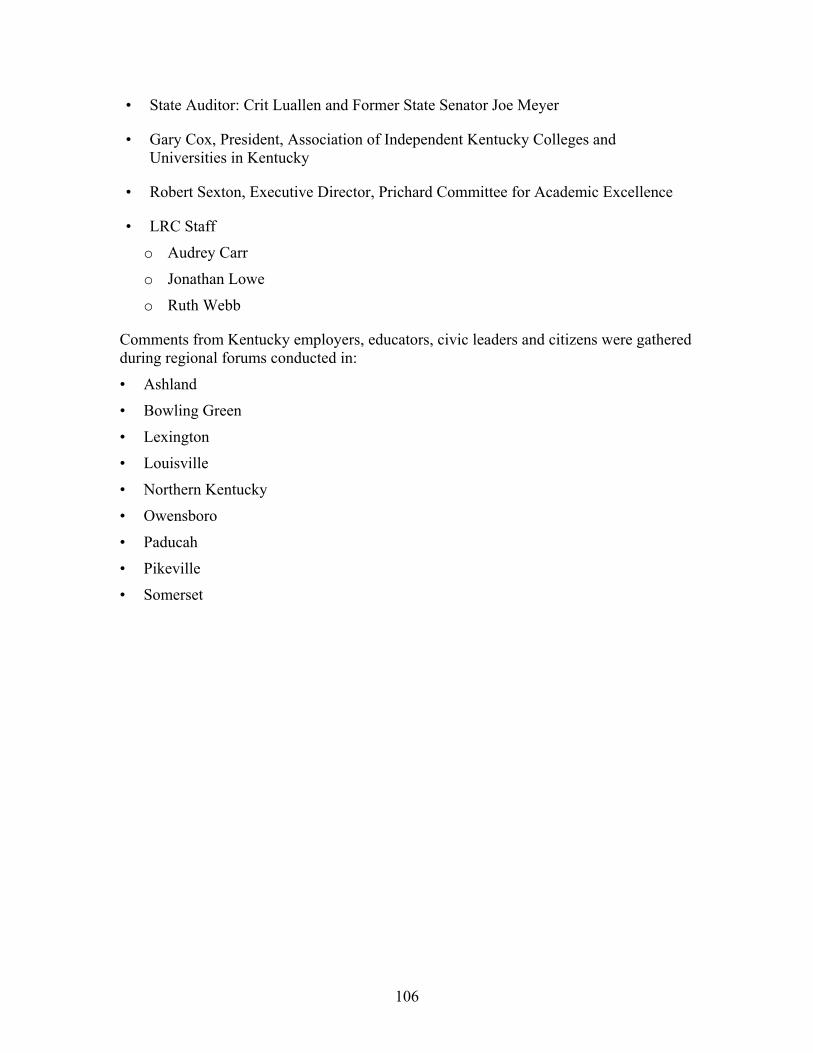
• State Auditor: Crit Luallen and Former State Senator Joe Meyer
• Gary Cox, President, Association of Independent Kentucky Colleges and Universities in Kentucky
• Robert Sexton, Executive Director, Prichard Committee for Academic Excellence
• LRC Staff
o Audrey Carr
o Jonathan Lowe
o Ruth Webb
Comments from Kentucky employers, educators, civic leaders and citizens were gathered during regional forums conducted in:
• Ashland
• Bowling Green
• Lexington
• Louisville
• Northern Kentucky
• Owensboro
• Paducah
• Pikeville
• Somerset
106
A Summary of the Kentucky Chamber of Commerce Report
on Postsecondary Education ReformAims McGuinness
Presented to the
Council on Postsecondary Education
Frankfort, Kentucky –
December 14, 2007
National Center for Higher Education Management SystemsNational Center for Higher Education Management Systems3035 Center Green Drive, Suite 150 Boulder, Colorado 80301-2251
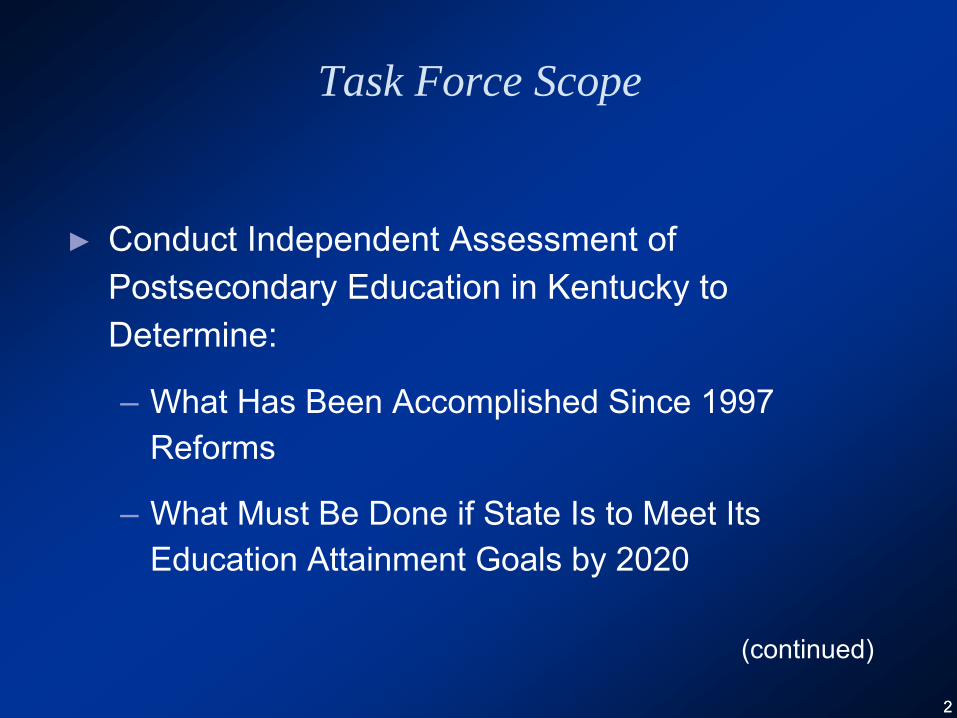
22
Task Force Scope
►
Conduct Independent Assessment of Postsecondary Education in Kentucky to Determine:
–
What Has Been Accomplished Since 1997 Reforms
–
What Must Be Done if State Is to Meet Its Education Attainment Goals by 2020
(continued)
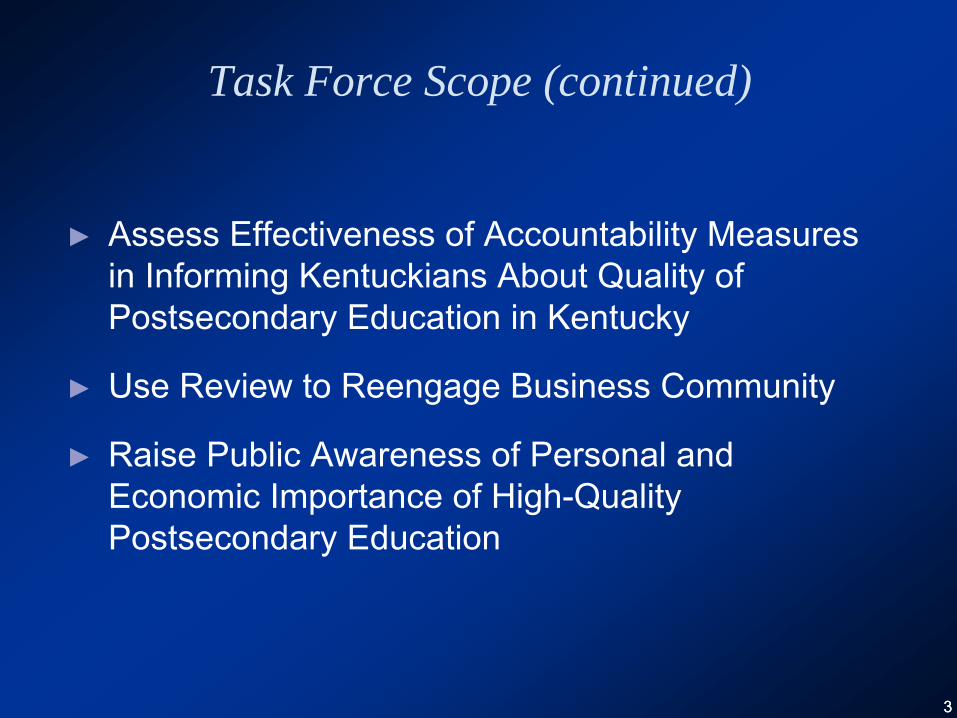
33
Task Force Scope (continued)
►
Assess Effectiveness of Accountability Measures in Informing Kentuckians About Quality of Postsecondary Education in Kentucky
►
Use Review to Reengage Business Community
►
Raise Public Awareness of Personal and Economic Importance of High-Quality Postsecondary Education
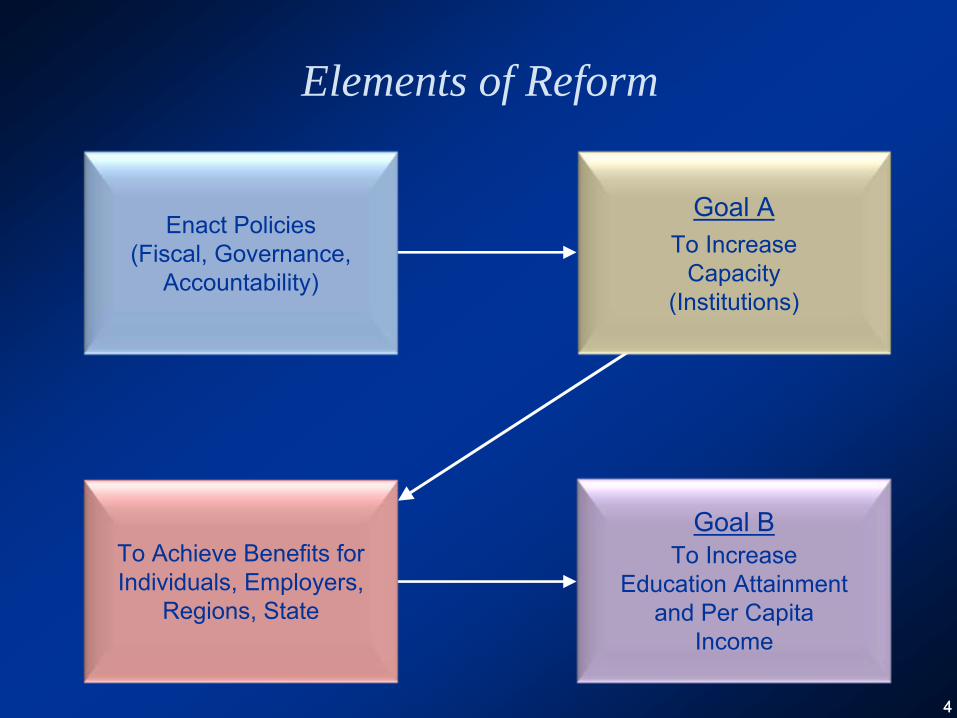
44
Elements of Reform
Goal BTo Increase
Education Attainment
and Per Capita Income
To Achieve Benefits for Individuals, Employers,
Regions, State
Goal ATo Increase
Capacity
(Institutions)
Enact Policies (Fiscal, Governance,
Accountability)
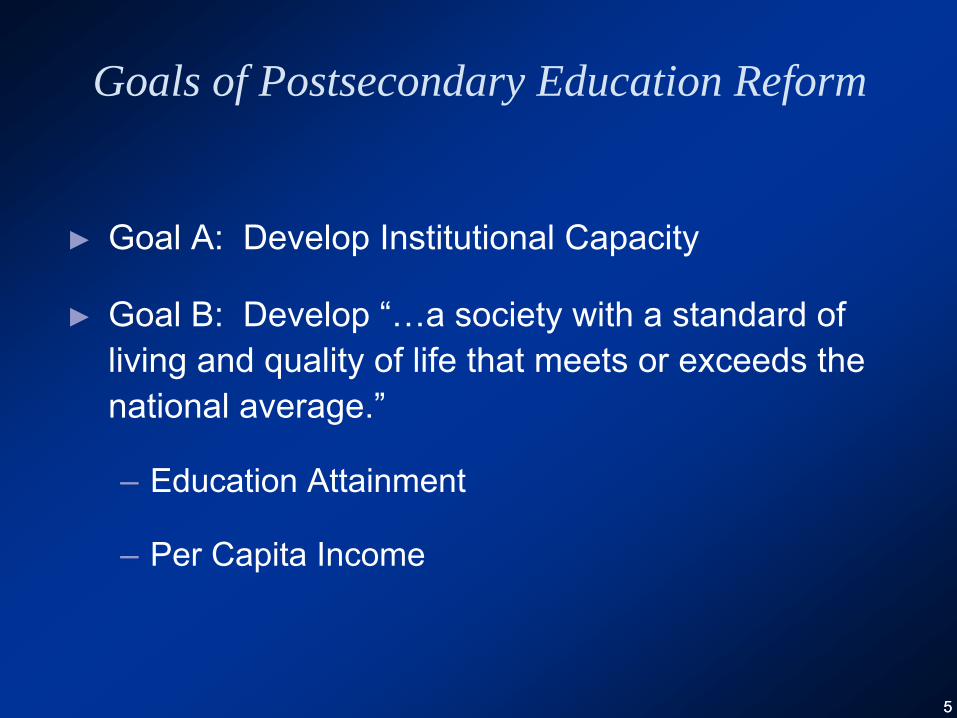
55
Goals of Postsecondary Education Reform
►
Goal A: Develop Institutional Capacity
►
Goal B: Develop “…a society with a standard of living and quality of life that meets or exceeds the national average.”
–
Education Attainment
–
Per Capita Income
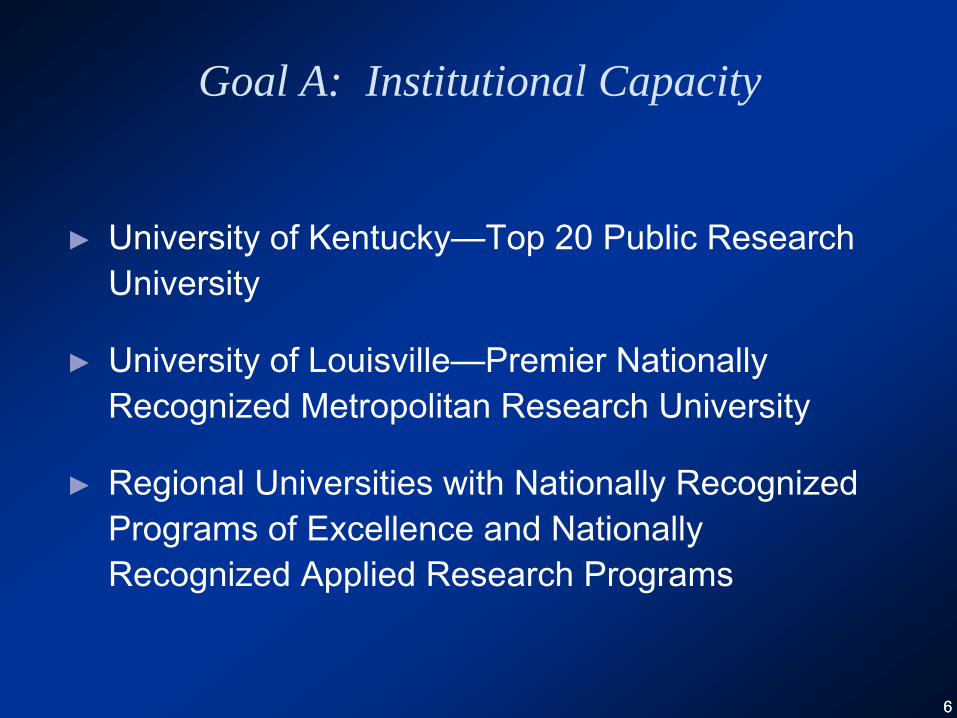
66
Goal A: Institutional Capacity
►
University of Kentucky—Top 20 Public Research University
►
University of Louisville—Premier Nationally Recognized Metropolitan Research University
►
Regional Universities with Nationally Recognized Programs of Excellence and Nationally Recognized Applied Research Programs
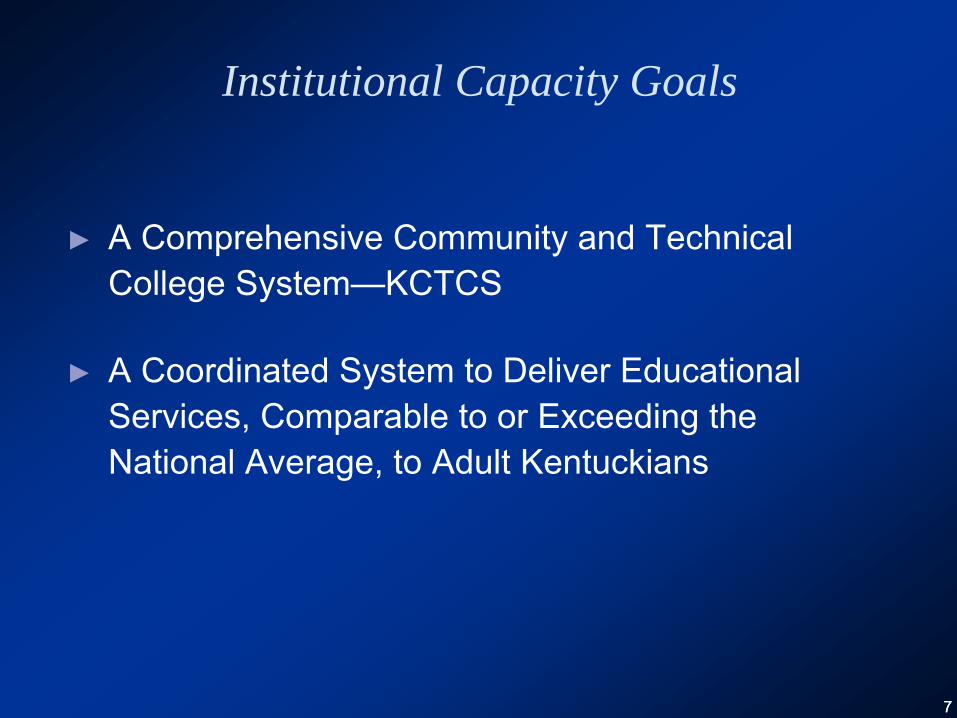
77
Institutional Capacity Goals
►
A Comprehensive Community and Technical College System—KCTCS
►
A Coordinated System to Deliver Educational Services, Comparable to or Exceeding the National Average, to Adult Kentuckians

88
Observations and Findings
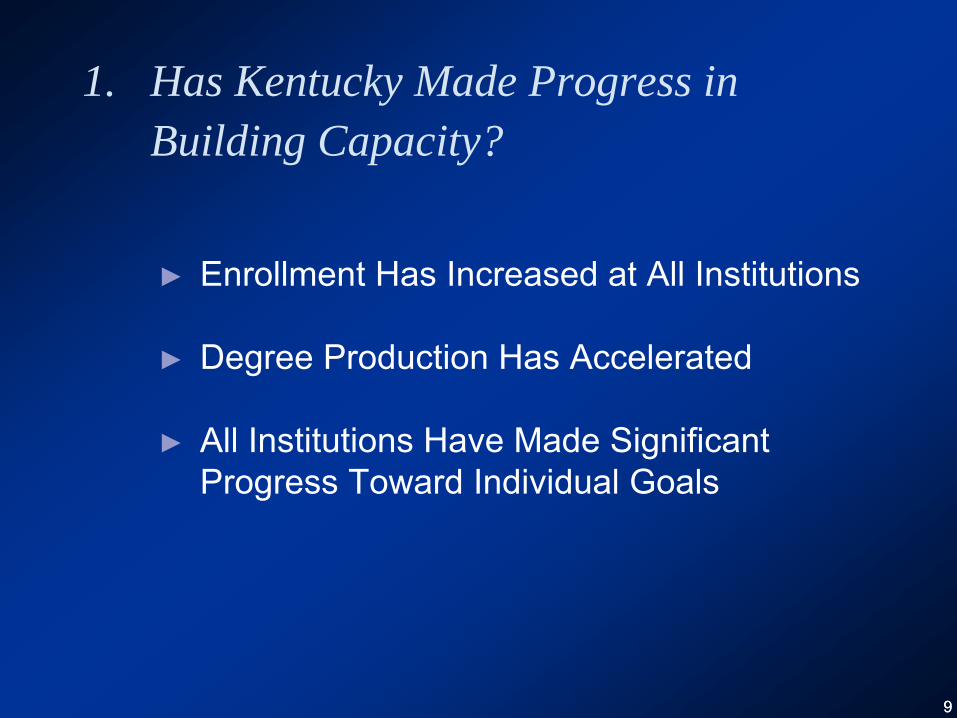
99
1. Has Kentucky Made Progress in Building Capacity?
►
Enrollment Has Increased at All Institutions
►
Degree Production Has Accelerated
►
All Institutions Have Made Significant Progress Toward Individual Goals
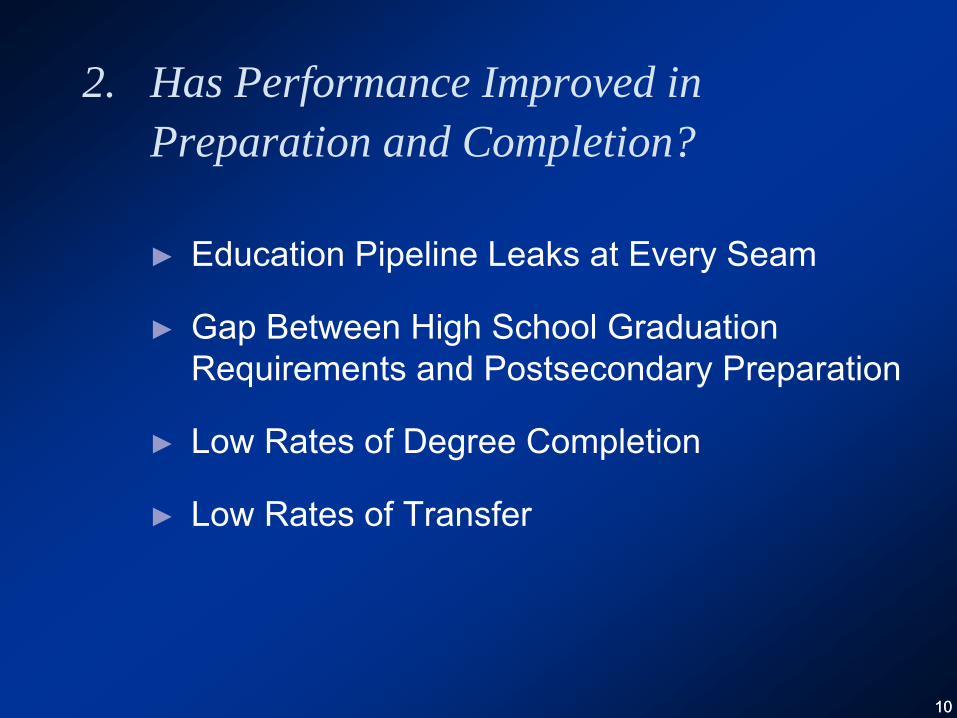
1010
2. Has Performance Improved in Preparation and Completion?
►
Education Pipeline Leaks at Every Seam
►
Gap Between High School Graduation Requirements and Postsecondary Preparation
►
Low Rates of Degree Completion
►
Low Rates of Transfer
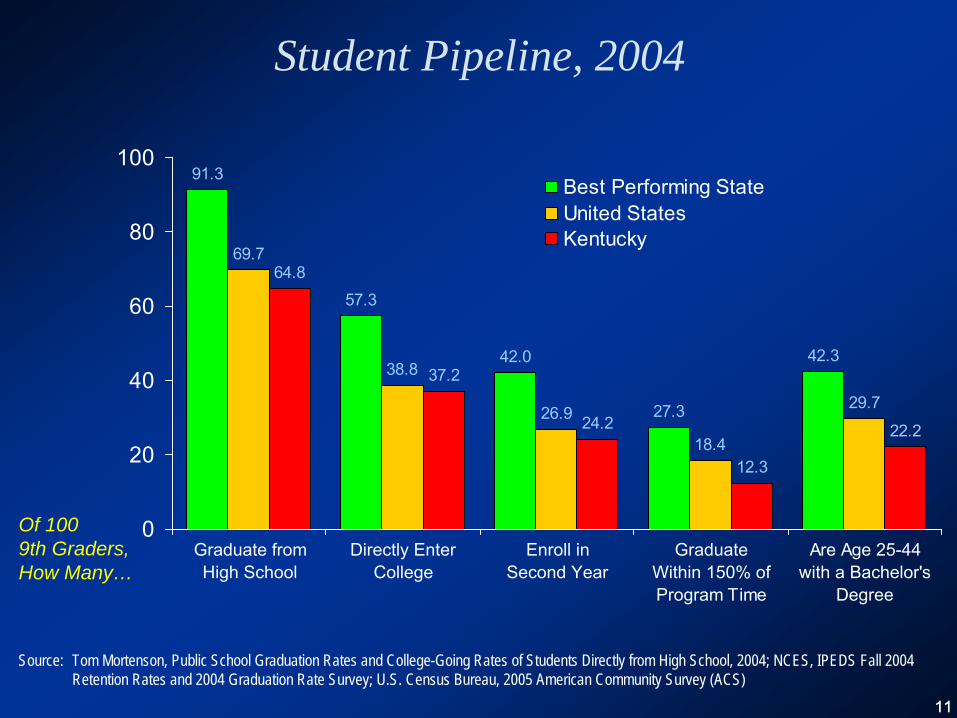
1111
Student Pipeline, 2004
Source: Tom Mortenson, Public School Graduation Rates and College-Going Rates of Students Directly from High School, 2004; NCES, IPEDS Fall 2004 Retention Rates and 2004 Graduation Rate Survey; U.S. Census Bureau, 2005 American Community Survey (ACS)
91.3
57.3
42.0
27.3
69.7
38.8
26.9
18.4
64.8
37.2
24.2
12.3
42.3
29.7
22.2
0
20
40
60
80
100
Graduate fromHigh School
Directly EnterCollege
Enroll inSecond Year
GraduateWithin 150% ofProgram Time
Are Age 25-44with a Bachelor's
Degree
Best Performing StateUnited StatesKentucky
Of 100 9th Graders, How Many…
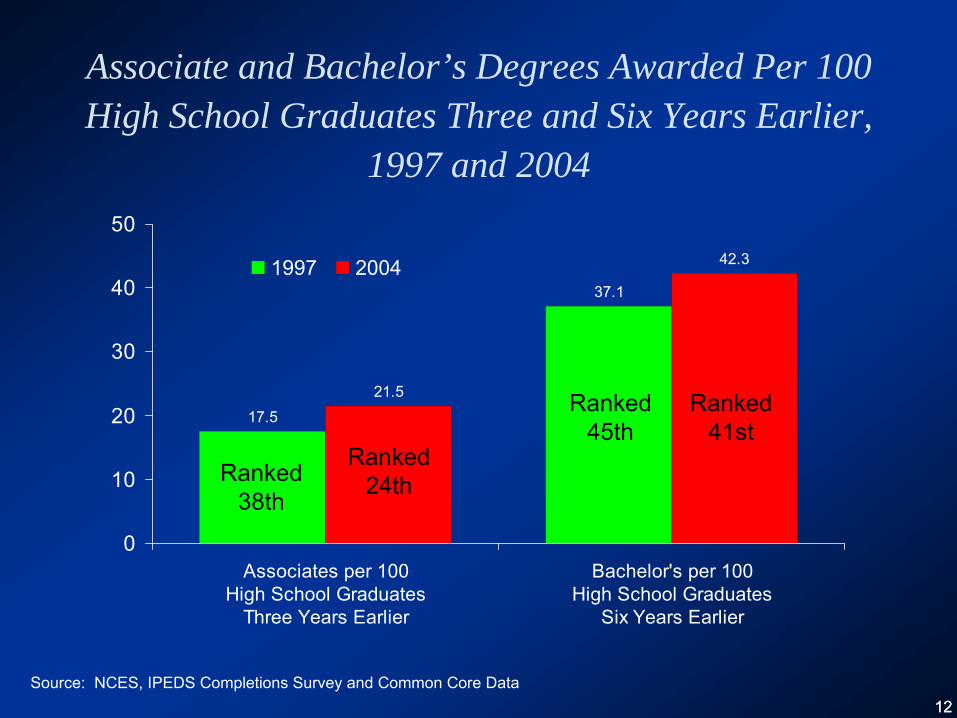
1212
Associate and Bachelor’s Degrees Awarded Per 100 High School Graduates Three and Six Years Earlier,
1997 and 2004
Source: NCES, IPEDS Completions Survey and Common Core Data
17.5
37.1
21.5
42.3
0
10
20
30
40
50
Associates per 100High School Graduates
Three Years Earlier
Bachelor's per 100High School Graduates
Six Years Earlier
1997 2004
Ranked 38th
Ranked 45th
Ranked 24th
Ranked 41st
1313
3. Has Reform Contributed to Higher Educational Attainment and Income?
►
Kentucky’s National Position Has Changed Little, but Neighbor States’
Position
Declined
►
Attainment in Most Counties Mirror that of Least-Educated OECD Countries
(continued)
1414
3. Has Reform Contributed to Higher Educational Attainment and Income? (continued)
►
Lack of Strong Demand from Economy for Better-Educated Workforce
►
Emphasis Needed on Workplace Development as Well as Workforce Development
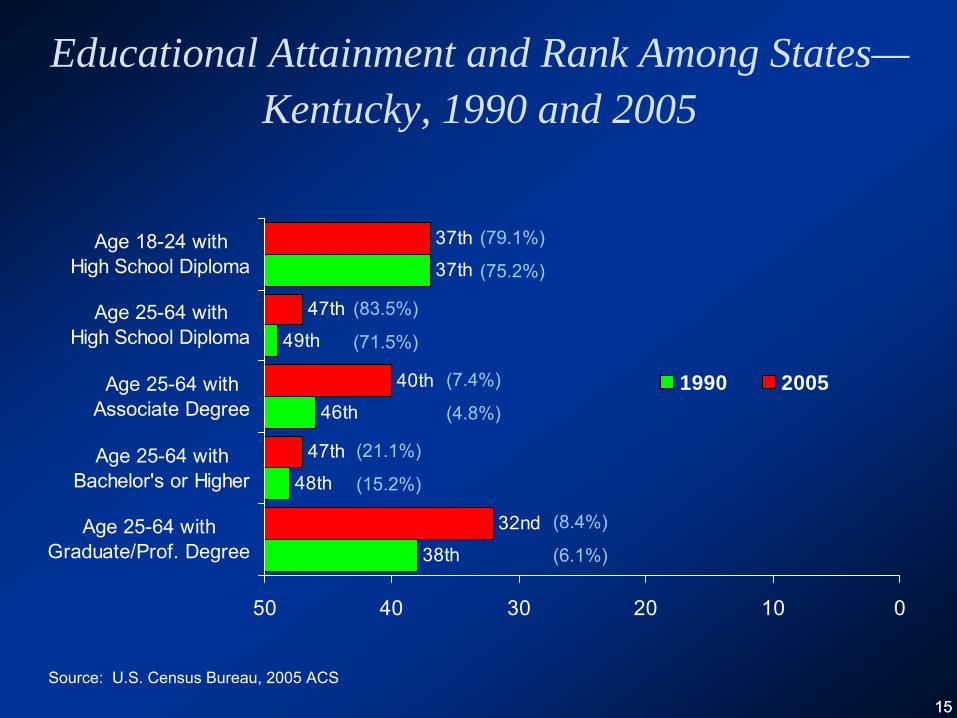
1515
Educational Attainment and Rank Among States— Kentucky, 1990 and 2005
Source: U.S. Census Bureau, 2005 ACS
38th
48th
46th
49th
37th
32nd
47th
40th
47th
37th
01020304050
Age 25-64 withGraduate/Prof. Degree
Age 25-64 withBachelor's or Higher
Age 25-64 withAssociate Degree
Age 25-64 withHigh School Diploma
Age 18-24 withHigh School Diploma
1990 2005
(79.1%)
(75.2%)
(83.5%)
(71.5%)
(7.4%)
(4.8%)
(21.1%)
(15.2%)
(8.4%)
(6.1%)
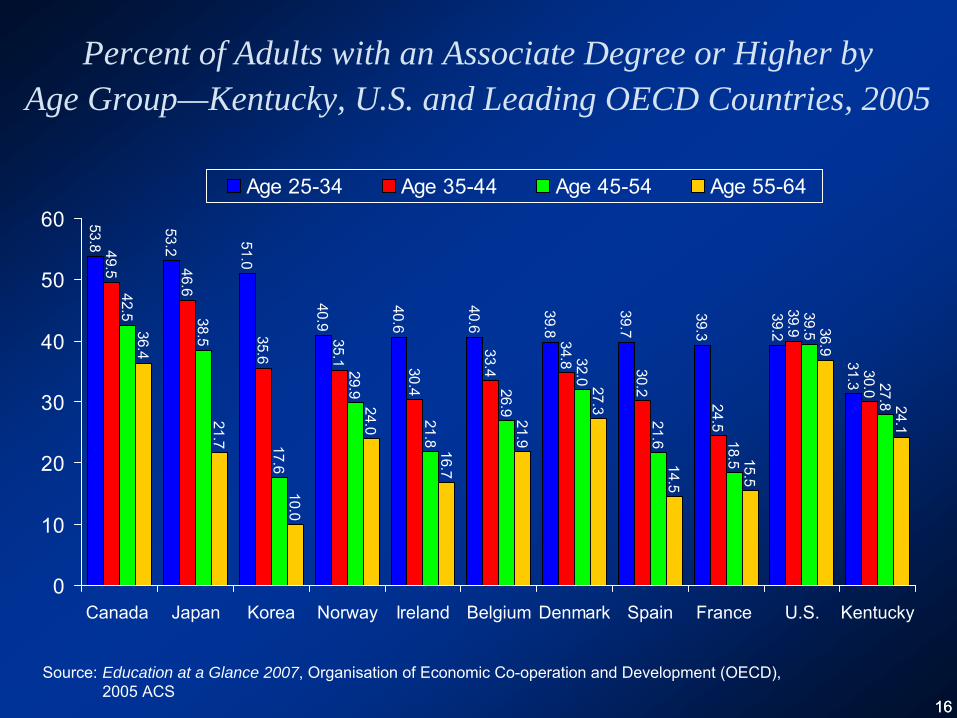
1616
Percent of Adults with an Associate Degree or Higher by Age Group—Kentucky, U.S. and Leading OECD Countries, 2005
Source:
Education at a Glance 2007, Organisation of Economic Co-operation and Development (OECD), 2005 ACS
53.8
53.2 51.0
40.9
40.6
40.6
39.8
39.7
39.3
39.2
31.3
49.5 46.6
35.6
35.1 30.4
33.4
34.8 30.2
24.5
39.9
30.0
42.5 38.5
17.6
29.9
21.8
26.9
32.0
21.6 18.5
39.5
27.8
36.4
21.7
10.0
24.0
16.7
21.9
27.3
14.5
15.5
36.9
24.1
0
10
20
30
40
50
60
Canada Japan Korea Norway Ireland Belgium Denmark Spain France U.S. Kentucky
Age 25-34 Age 35-44 Age 45-54 Age 55-64
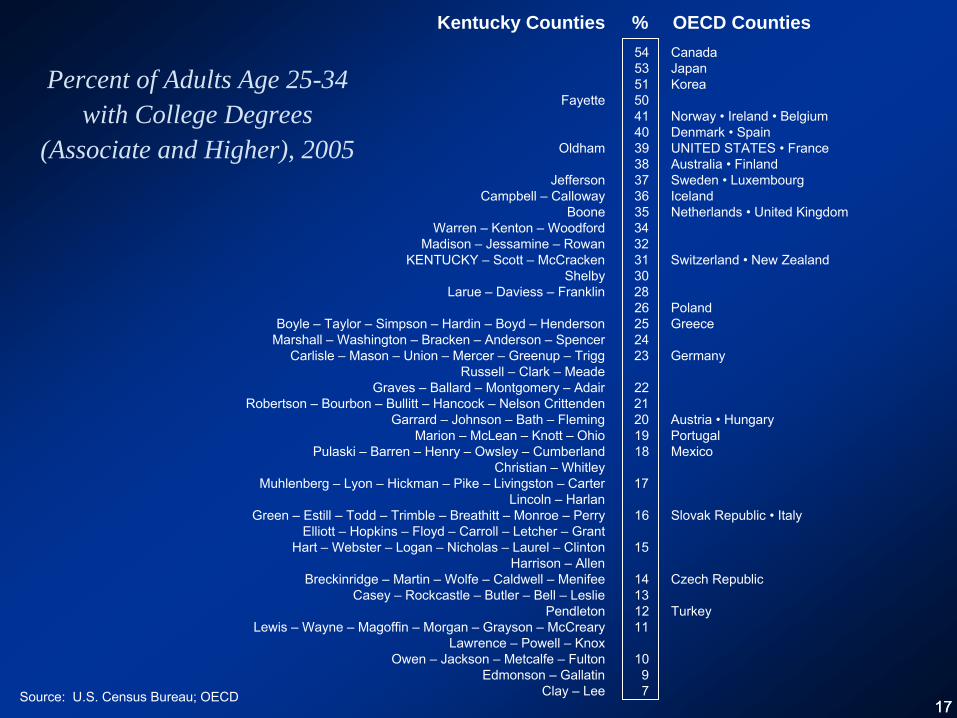
1717Source: U.S. Census Bureau; OECD
Percent of Adults Age 25-34 with College Degrees
(Associate and Higher), 2005
54
Canada53
Japan51
KoreaFayette
5041
Norway •
Ireland •
Belgium40
Denmark •
SpainOldham
39
UNITED STATES •
France38
Australia •
FinlandJefferson
37
Sweden •
LuxembourgCampbell –
Calloway
36
IcelandBoone
35
Netherlands •
United KingdomWarren –
Kenton –
Woodford
34Madison –
Jessamine –
Rowan
32KENTUCKY –
Scott –
McCracken
31
Switzerland •
New ZealandShelby
30Larue –
Daviess –
Franklin
2826
PolandBoyle –
Taylor –
Simpson –
Hardin –
Boyd –
Henderson
25
GreeceMarshall –
Washington –
Bracken –
Anderson –
Spencer
24Carlisle –
Mason –
Union –
Mercer –
Greenup –
Trigg
23
GermanyRussell – Clark – Meade
Graves –
Ballard –
Montgomery –
Adair
22Robertson –
Bourbon –
Bullitt –
Hancock –
Nelson Crittenden
21Garrard –
Johnson –
Bath –
Fleming
20
Austria •
HungaryMarion –
McLean –
Knott –
Ohio
19
PortugalPulaski –
Barren –
Henry –
Owsley –
Cumberland
18
MexicoChristian –
WhitleyMuhlenberg –
Lyon –
Hickman –
Pike –
Livingston –
Carter
17Lincoln –
HarlanGreen –
Estill –
Todd –
Trimble –
Breathitt –
Monroe –
Perry
16
Slovak Republic •
ItalyElliott –
Hopkins –
Floyd –
Carroll –
Letcher –
GrantHart –
Webster –
Logan –
Nicholas –
Laurel –
Clinton
15Harrison –
AllenBreckinridge –
Martin –
Wolfe –
Caldwell –
Menifee
14
Czech RepublicCasey – Rockcastle – Butler – Bell – Leslie
13Pendleton
12
TurkeyLewis –
Wayne –
Magoffin –
Morgan –
Grayson –
McCreary
11Lawrence –
Powell –
KnoxOwen –
Jackson –
Metcalfe –
Fulton
10Edmonson –
Gallatin
9Clay –
Lee
7
Kentucky Counties % OECD Counties
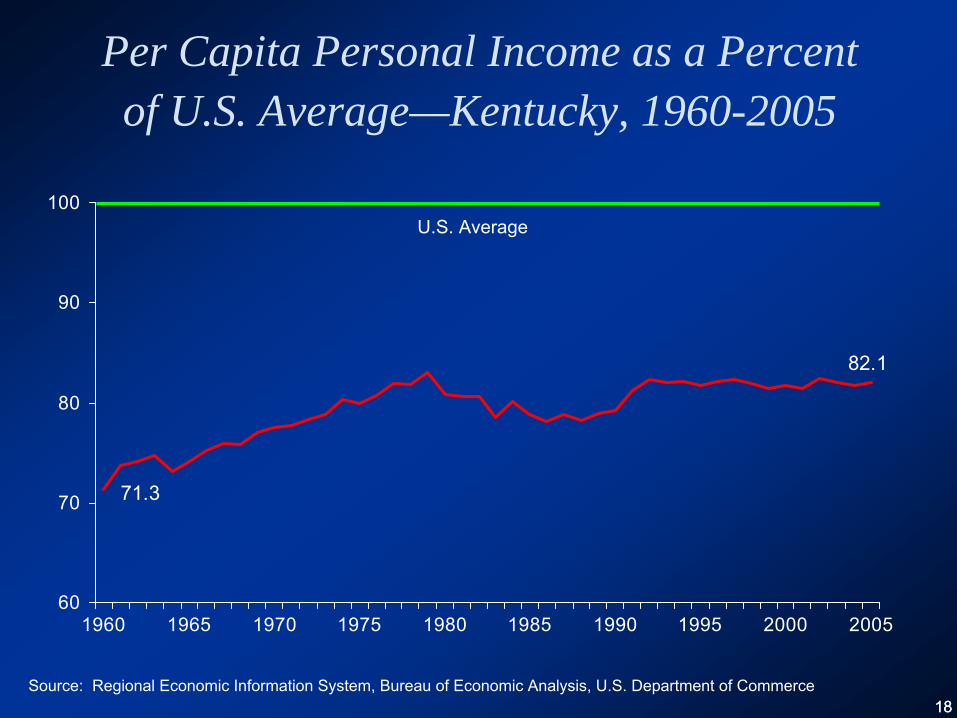
1818
Per Capita Personal Income as a Percent of U.S. Average—Kentucky, 1960-2005
Source: Regional Economic Information System, Bureau of Economic Analysis, U.S. Department of Commerce
71.3
82.1
60
70
80
90
100
1960 1965 1970 1975 1980 1985 1990 1995 2000 2005
U.S. Average
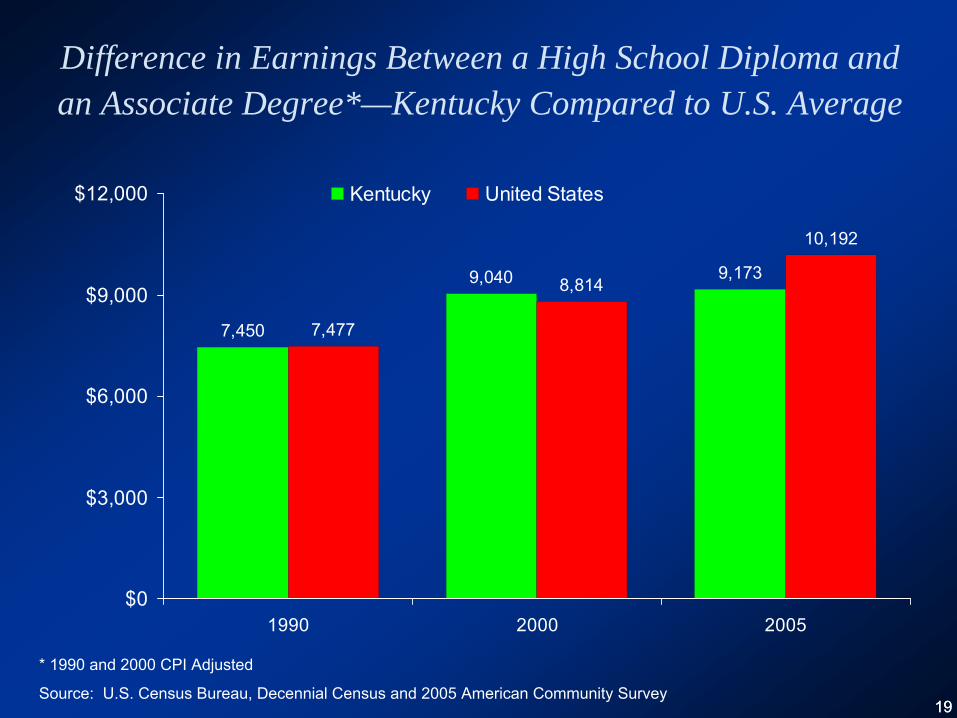
1919
Difference in Earnings Between a High School Diploma and an Associate Degree*—Kentucky Compared to U.S. Average
7,450
9,040 9,173
7,477
8,814
10,192
$0
$3,000
$6,000
$9,000
$12,000
1990 2000 2005
Kentucky United States
* 1990 and 2000 CPI Adjusted
Source: U.S. Census Bureau, Decennial Census and 2005 American Community Survey
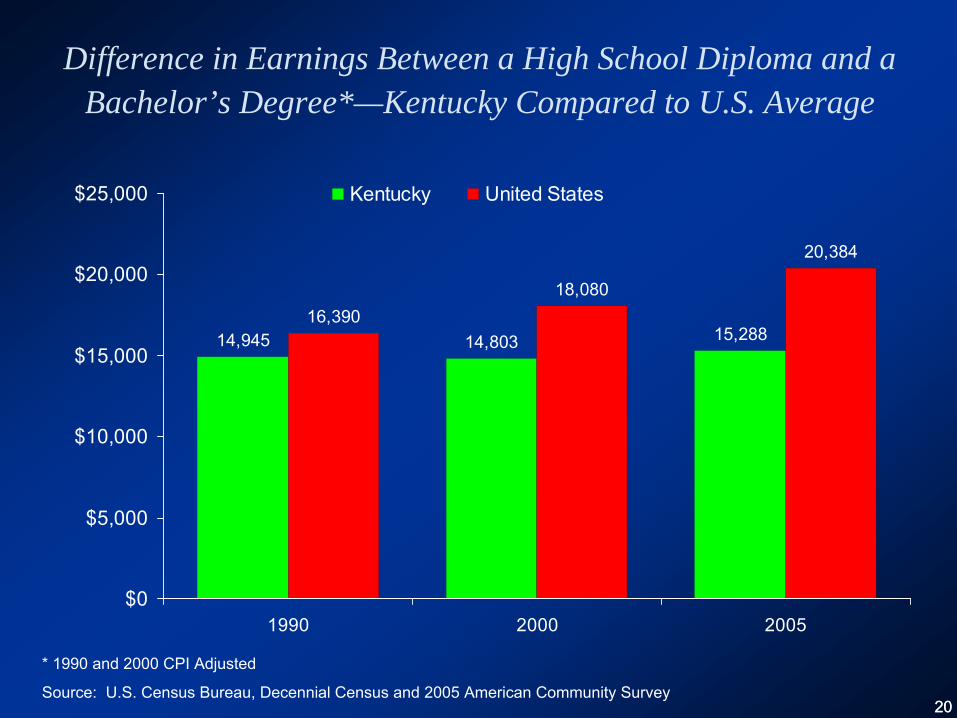
2020
Difference in Earnings Between a High School Diploma and a Bachelor’s Degree*—Kentucky Compared to U.S. Average
14,945 14,803 15,28816,390
18,080
20,384
$0
$5,000
$10,000
$15,000
$20,000
$25,000
1990 2000 2005
Kentucky United States
* 1990 and 2000 CPI Adjusted
Source: U.S. Census Bureau, Decennial Census and 2005 American Community Survey
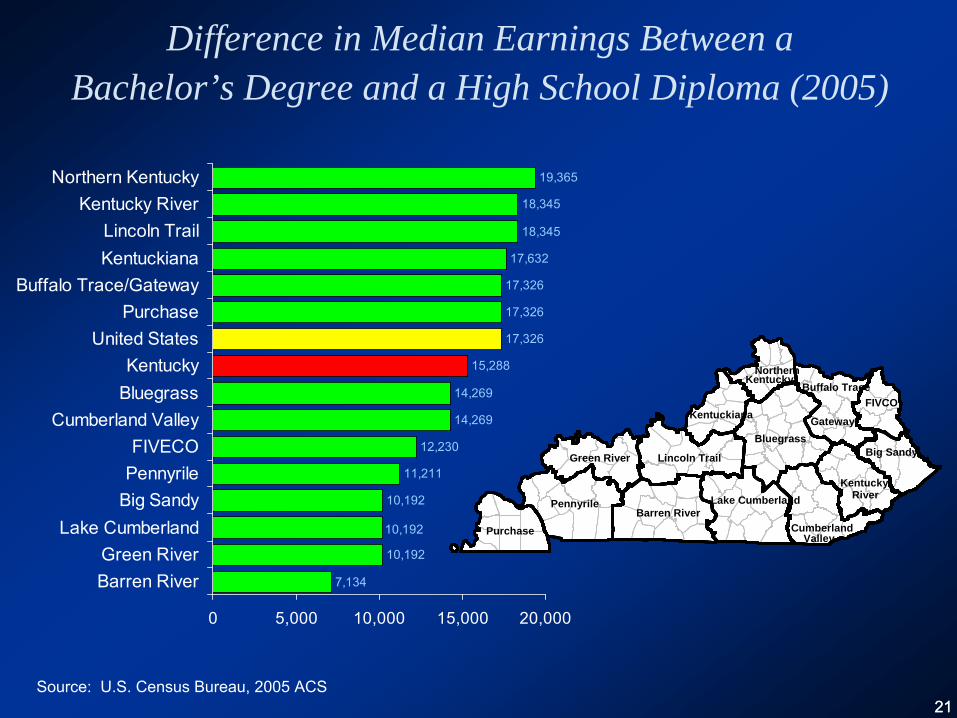
2121
Difference in Median Earnings Between a Bachelor’s Degree and a High School Diploma (2005)
Green River
PennyrileBarren River
Lake Cumberland
Purchase
Buffalo Trace
Gateway
Lincoln Trail
CumberlandValley
Kentucky River
Big SandyBluegrass
FIVCOKentuckiana
Northern Kentucky
Source: U.S. Census Bureau, 2005 ACS
10,192
10,192
11,211
12,230
14,269
14,269
15,288
17,326
17,326
17,326
17,632
18,345
18,345
19,365
10,192
7,134
0 5,000 10,000 15,000 20,000
Barren RiverGreen River
Lake CumberlandBig SandyPennyrileFIVECO
Cumberland ValleyBluegrassKentucky
United StatesPurchase
Buffalo Trace/GatewayKentuckianaLincoln Trail
Kentucky RiverNorthern Kentucky
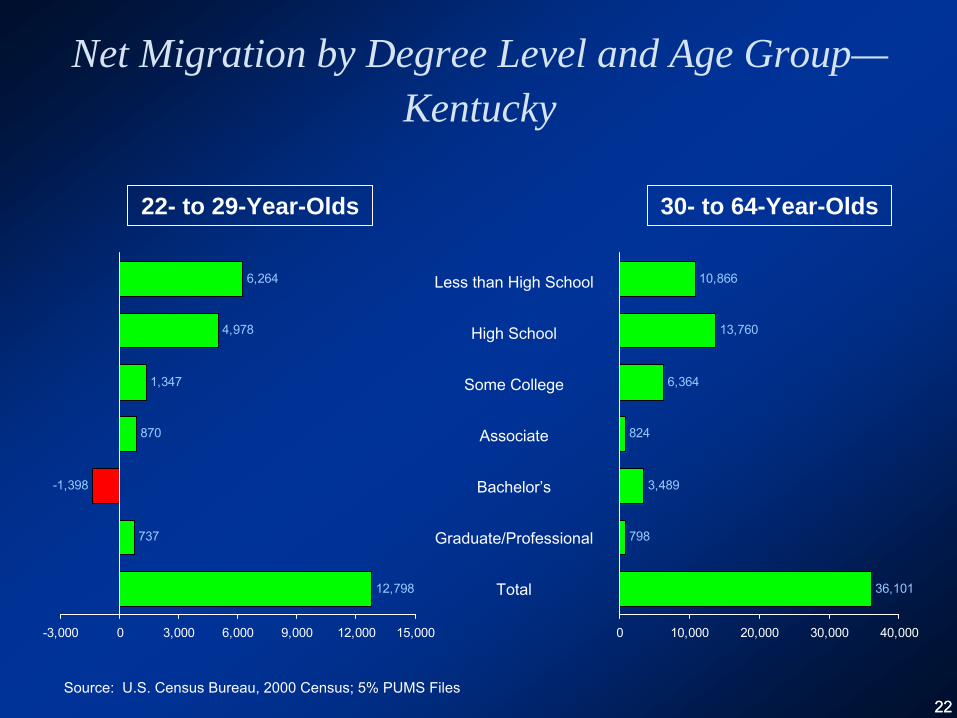
2222
Net Migration by Degree Level and Age Group— Kentucky
Source: U.S. Census Bureau, 2000 Census; 5% PUMS Files
22- to 29-Year-Olds 30- to 64-Year-Olds
12,798
737
-1,398
870
1,347
4,978
6,264
-3,000 0 3,000 6,000 9,000 12,000 15,000
36,101
798
3,489
824
6,364
13,760
10,866
0 10,000 20,000 30,000 40,000
Less than High School
High School
Some College
Associate
Bachelor’s
Graduate/Professional
Total
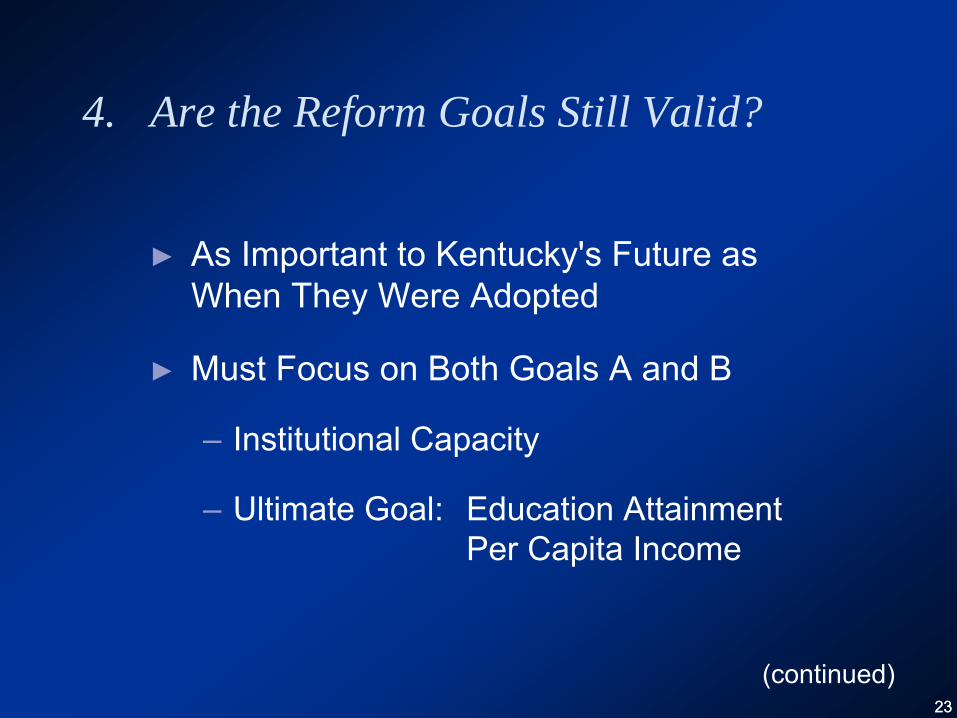
2323
4. Are the Reform Goals Still Valid?
►
As Important to Kentucky's Future as When They Were Adopted
►
Must Focus on Both Goals A and B
–
Institutional Capacity
–
Ultimate Goal:
Education Attainment Per Capita Income
(continued)
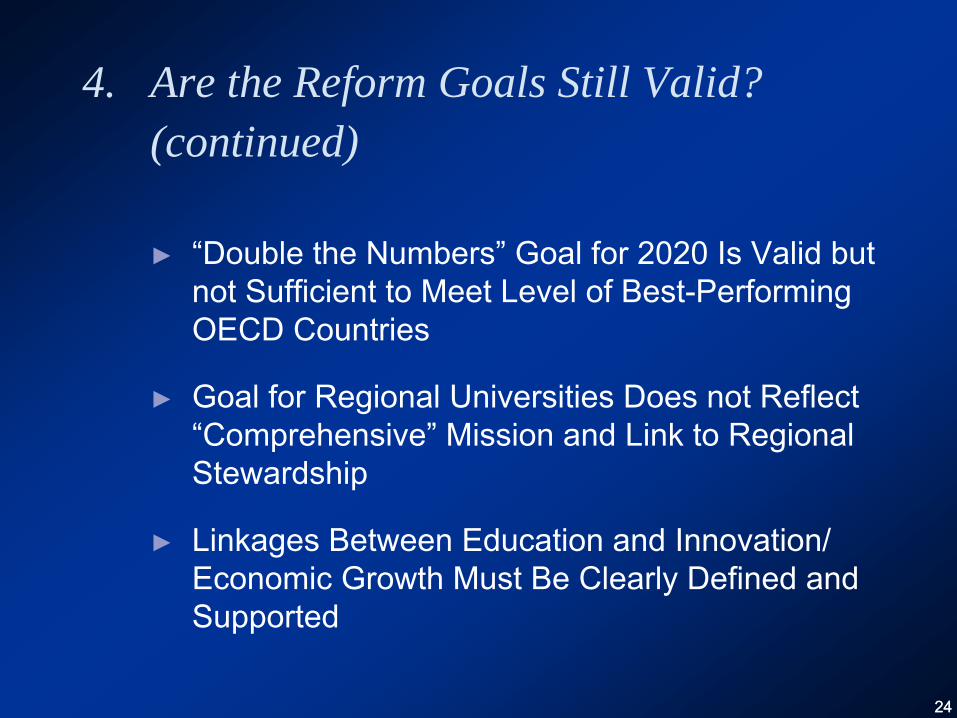
2424
4. Are the Reform Goals Still Valid? (continued)
►
“Double the Numbers”
Goal for 2020 Is Valid but not Sufficient to Meet Level of Best-Performing OECD Countries
►
Goal for Regional Universities Does not Reflect “Comprehensive”
Mission and Link to Regional
Stewardship
►
Linkages Between Education and Innovation/ Economic Growth Must Be Clearly Defined and
Supported
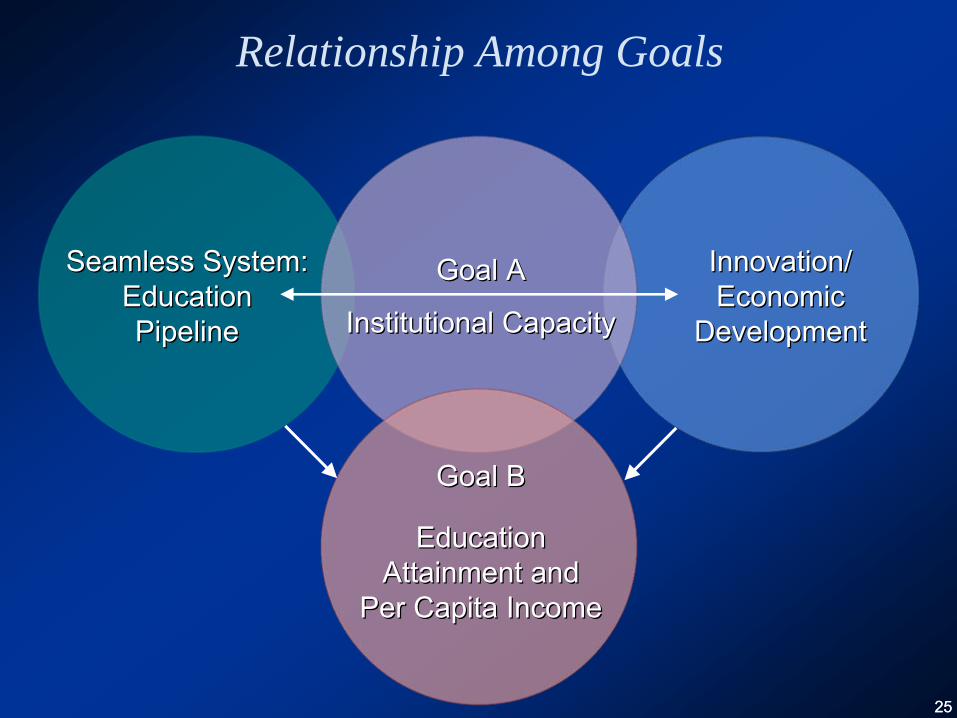
2525
Relationship Among Goals
Seamless System:Seamless System:EducationEducation
PipelinePipeline
Goal AGoal A
Institutional CapacityInstitutional Capacity
Innovation/Innovation/Economic Economic
DevelopmentDevelopment
Goal BGoal B
EducationEducationAttainment and Attainment and
Per Capita IncomePer Capita Income
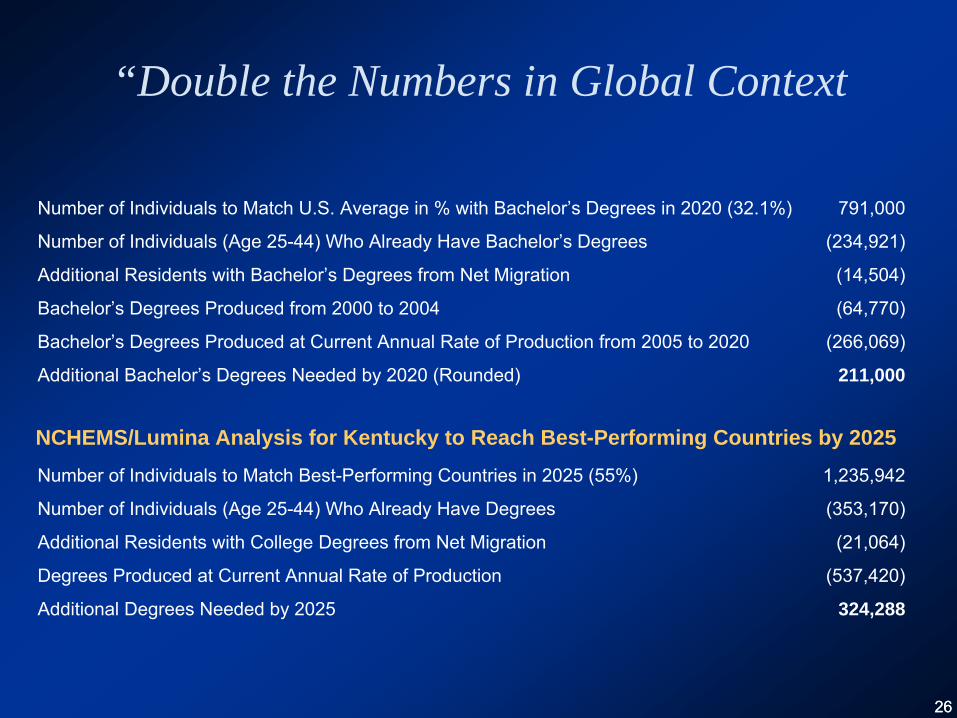
2626
“Double the Numbers in Global Context
Number of Individuals to Match U.S. Average in % with Bachelor’s Degrees in 2020 (32.1%)
791,000
Number of Individuals (Age 25-44) Who Already Have Bachelor’s Degrees
(234,921)
Additional Residents with Bachelor’s Degrees from Net Migration
(14,504)
Bachelor’s Degrees Produced from 2000 to 2004
(64,770)
Bachelor’s Degrees Produced at Current Annual Rate of Production from 2005 to 2020
(266,069)
Additional Bachelor’s Degrees Needed by 2020 (Rounded)
211,000
Number of Individuals to Match Best-Performing Countries in 2025 (55%)
1,235,942
Number of Individuals (Age 25-44) Who Already Have Degrees
(353,170)
Additional Residents with College Degrees from Net Migration
(21,064)
Degrees Produced at Current Annual Rate of Production
(537,420)
Additional Degrees Needed by 2025
324,288
NCHEMS/Lumina Analysis for Kentucky to Reach Best-Performing Countries by 2025
2727
5. What Are the Barriers to Progress?
►
Lack of Alignment among Levels of Education
►
Weak Links Between Postsecondary and State and Regional Innovation/Economic Development
(continued)
2828
5. What Are the Barriers to Progress? (continued)
►
Inadequate Policy Leadership and Coordination
►
Inadequate Budget Discipline and Accountability
(continued)
2929
5. What Are the Barriers to Progress? (continued)
►
Threats to Affordability
►
Comparatively Low Productivity
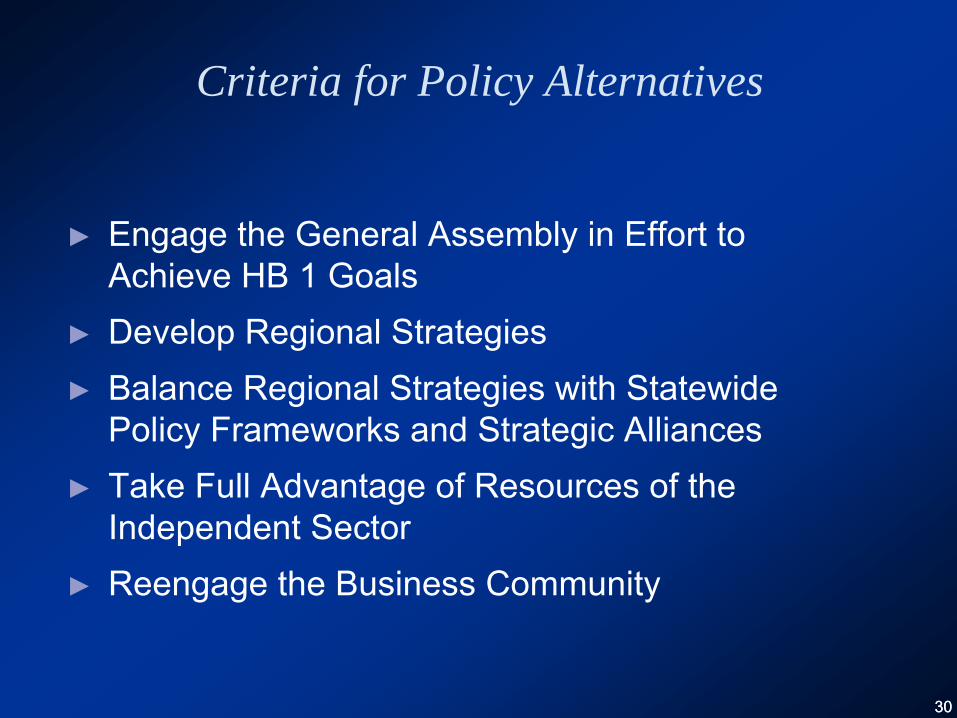
3030
Criteria for Policy Alternatives
►
Engage the General Assembly in Effort to Achieve HB 1 Goals
►
Develop Regional Strategies►
Balance Regional Strategies with Statewide Policy Frameworks and Strategic Alliances
►
Take Full Advantage of Resources of the Independent Sector
►
Reengage the Business Community

3131
Recommendations
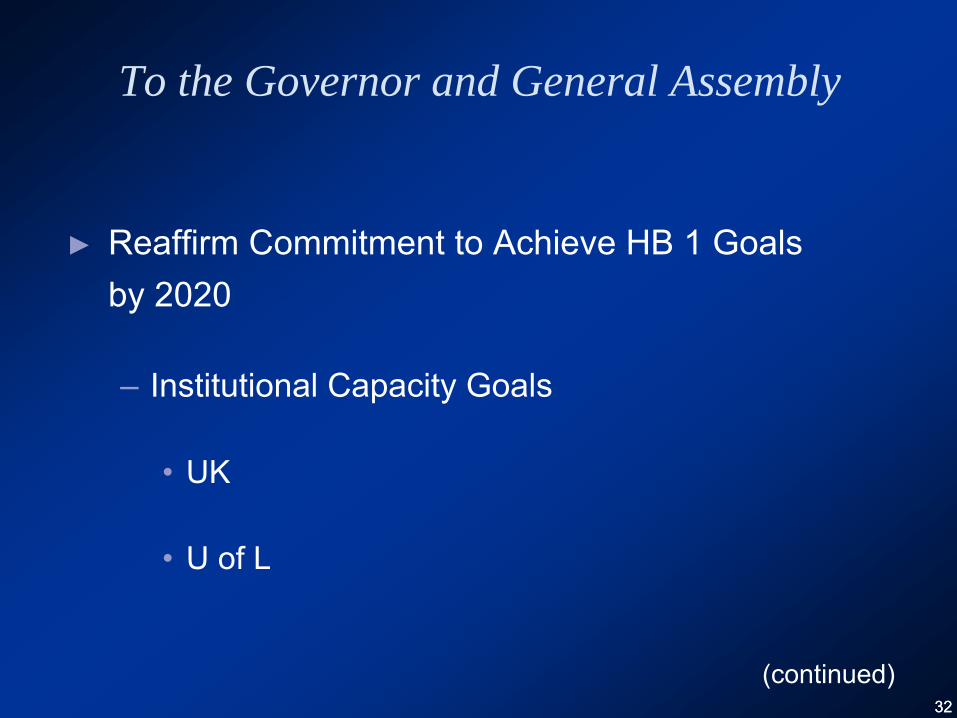
3232
To the Governor and General Assembly
►
Reaffirm Commitment to Achieve HB 1 Goals by 2020
–
Institutional Capacity Goals
•
UK
•
U of L
(continued)
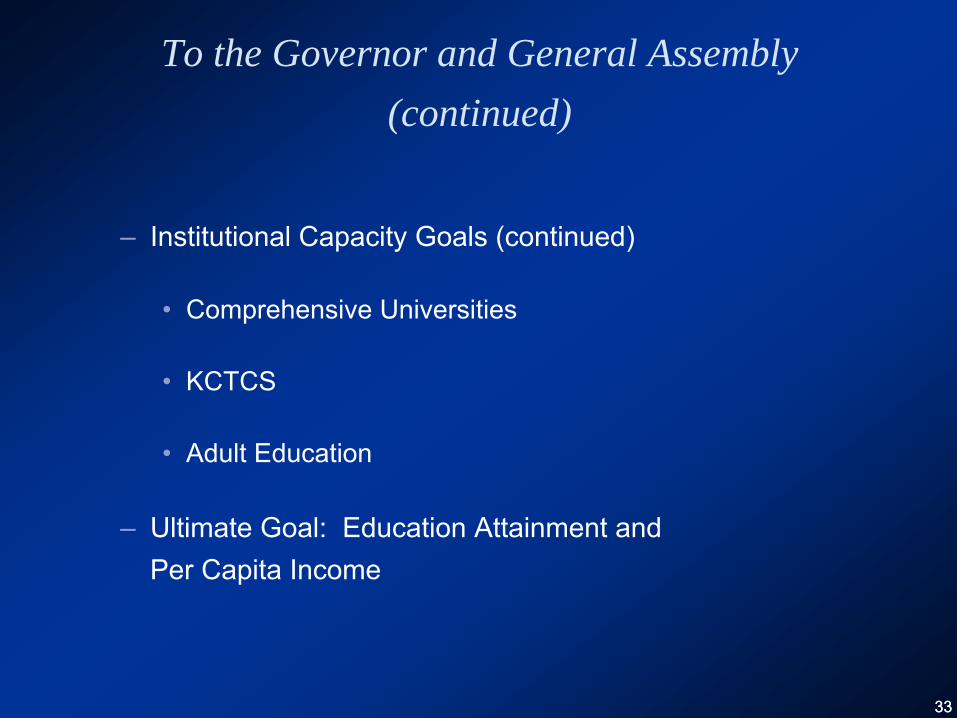
3333
To the Governor and General Assembly (continued)
–
Institutional Capacity Goals (continued)
•
Comprehensive Universities
•
KCTCS
•
Adult Education
–
Ultimate Goal: Education Attainment and Per Capita Income

3434
To the Governor and General Assembly (continued)
►
Support the “Double the Numbers”
campaign but:
–
Emphasize Degree Attainment at Both Associate and Bachelor’s Degree Levels
–
Adopt Broader Goals to Achieve Level of Most Competitive Nations by 2025
–
Recognize Independent Sector As Important Contributor (continued)
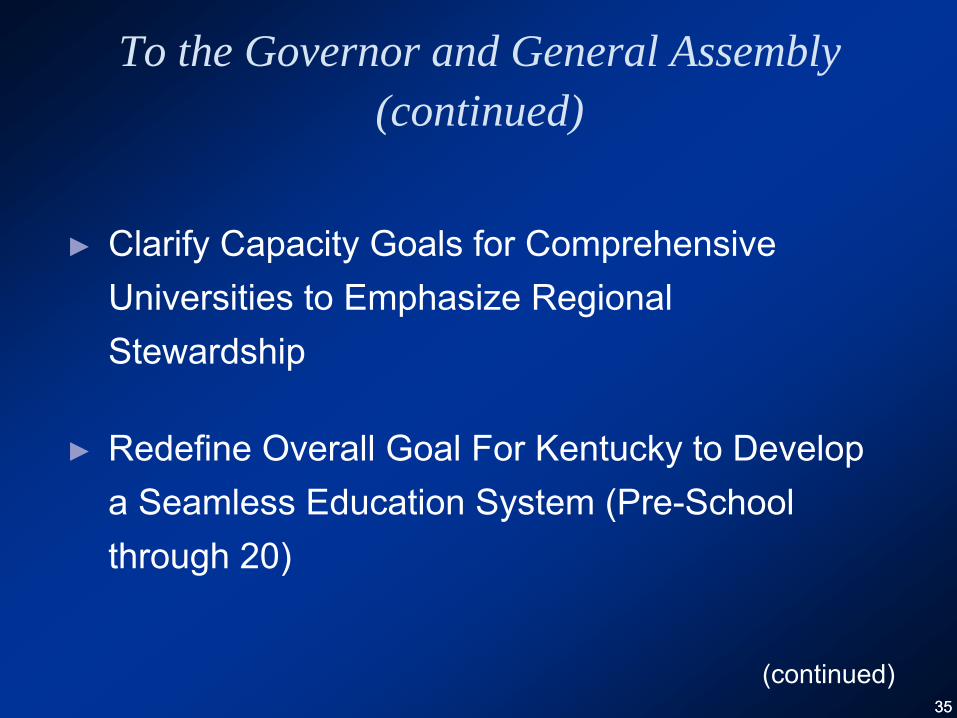
3535
To the Governor and General Assembly (continued)
►
Clarify Capacity Goals for Comprehensive Universities to Emphasize Regional Stewardship
►
Redefine Overall Goal For Kentucky to Develop a Seamless Education System (Pre-School through 20)
(continued)
3636
To the Governor and General Assembly (continued)
►
Make Partnership Between Postsecondary Education and Economic Development a Central Priority
►
Recommit to Complying with Budgetary Framework Established in 1997 Reform
(continued)
3737
To the Governor and General Assembly (continued)
►
Guarantee Affordable Access to Postsecondary Education for All Qualified Kentuckians
–
Adopt Simplified, Integrated Need-Based Student Aid Program Based on “Shared Responsibility”
of
Students, Families and Taxpayers
–
Establish Commonwealth 21st
Century Scholarship Program
(continued)
3838
To the Governor and General Assembly (continued)
►
Reestablish Mechanism to Ensure Full Participation of Governor and General Assembly in Shaping Strategic Agenda
►
Reestablish CPE as Independent Policy Leadership Entity
3939
To the Kentucky Chamber of Commerce
►
Establish Entity to Monitor Progress of Reform and Gain Governor and General Assembly Support
►
Support Renewed Public Campaign Focusing on Value of Education
►
Encourage Local Groups to Create Strategic Plans on Economic and Workforce Development
►
Communicate Need for Stronger Employer Signals on Education
►
Sponsor Annual Summit on Progress in Postsecondary Education
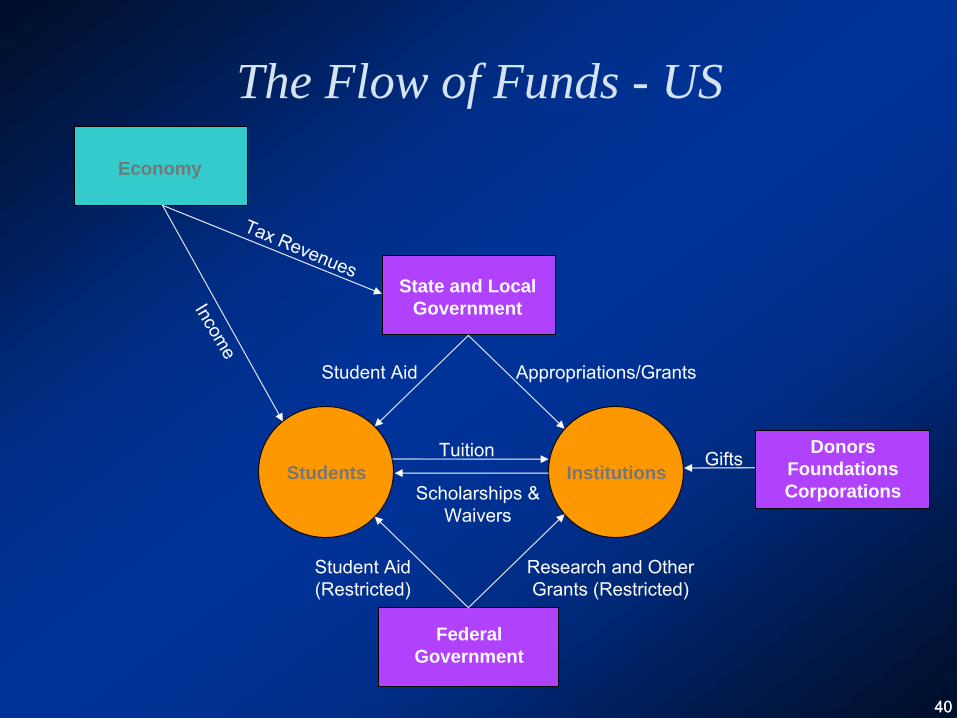
4040
The Flow of Funds - US
Tax Revenues
Appropriations/GrantsStudent Aid
Tuition
Scholarships &
Waivers
Research and Other Grants (Restricted)
Student Aid
(Restricted)
Gifts
Economy
State and Local Government
Federal Government
Donors Foundations Corporations
Income
Students Institutions
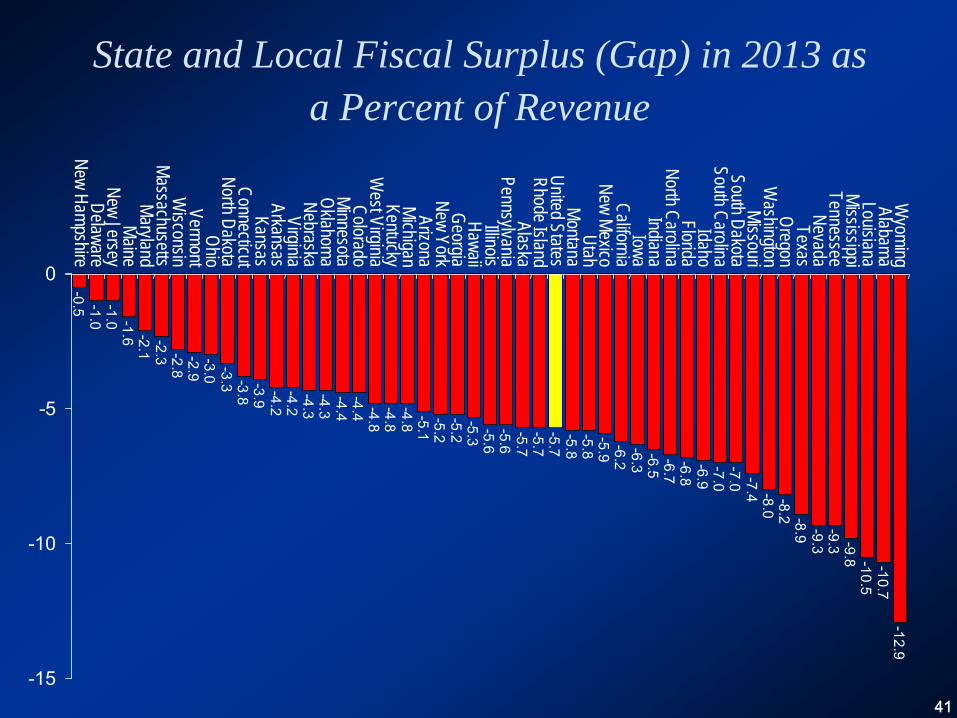
4141
State and Local Fiscal Surplus (Gap) in 2013 as a Percent of Revenue
-0.5 -1.0-1.0 -1.6 -2.1
-2.3 -2.8-2.9-3.0 -3.3 -3.8
-3.9 -4.2-4.2-4.3-4.3-4.4-4.4 -4.8
-4.8-4.8 -5.1
-5.2-5.2-5.3 -5.6-5.6-5.7-5.7-5.7-5.8-5.8-5.9 -6.2
-6.3-6.5-6.7-6.8-6.9-7.0-7.0 -7.4 -8.0
-8.2 -8.9 -9.3-9.3 -9.8 -10.5
-10.7-12.9
-15
-10
-5
0
New HampshireDelaware
New JerseyMaine
MarylandMassachusetts
WisconsinVermont
OhioNorth Dakota
ConnecticutKansas
ArkansasVirginia
NebraskaOklahomaMinnesota
ColoradoW
est VirginiaKentuckyMichigan
ArizonaNew York
GeorgiaHawaiiIllinois
PennsylvaniaAlaska
Rhode IslandUnited States
MontanaUtah
New MexicoCalifornia
IowaIndiana
North CarolinaFloridaIdaho
South CarolinaSouth Dakota
MissouriW
ashingtonOregon
TexasNevada
TennesseeMississippiLouisianaAlabamaW
yoming
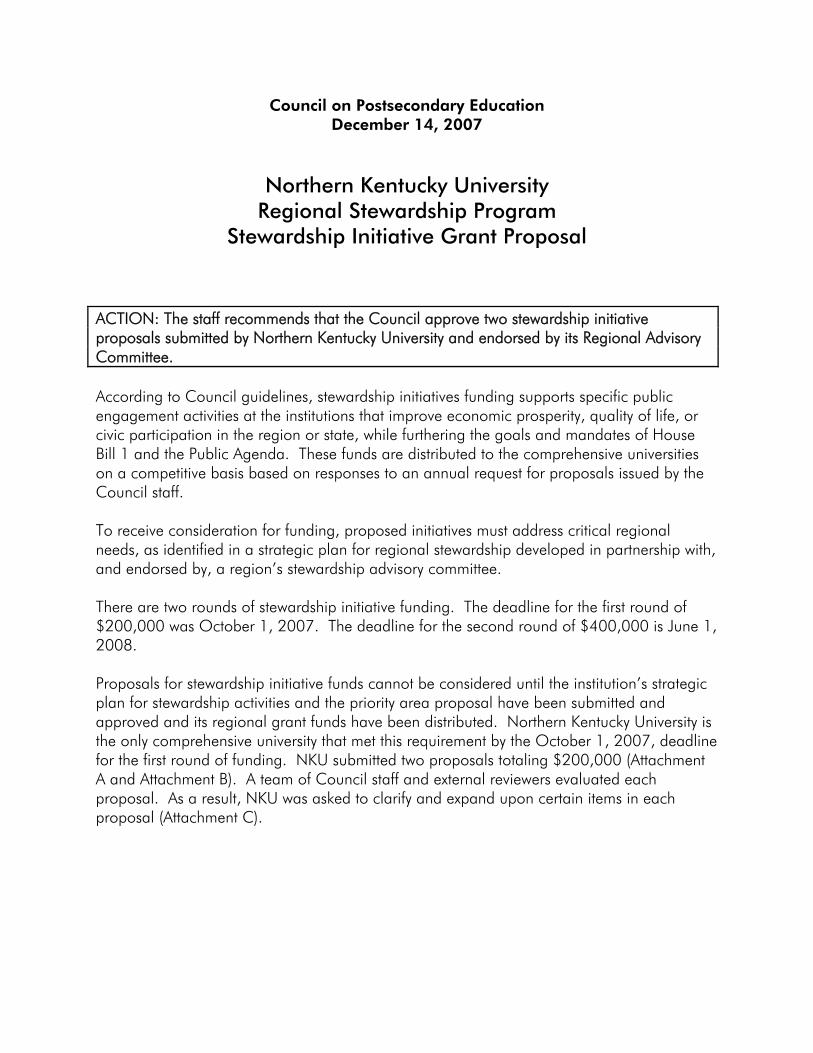
Council on Postsecondary Education December 14, 2007
Northern Kentucky University Regional Stewardship Program
Stewardship Initiative Grant Proposal
ACTION: The staff recommends that the Council approve two stewardship initiative proposals submitted by Northern Kentucky University and endorsed by its Regional Advisory Committee. According to Council guidelines, stewardship initiatives funding supports specific public engagement activities at the institutions that improve economic prosperity, quality of life, or civic participation in the region or state, while furthering the goals and mandates of House Bill 1 and the Public Agenda. These funds are distributed to the comprehensive universities on a competitive basis based on responses to an annual request for proposals issued by the Council staff. To receive consideration for funding, proposed initiatives must address critical regional needs, as identified in a strategic plan for regional stewardship developed in partnership with, and endorsed by, a region’s stewardship advisory committee. There are two rounds of stewardship initiative funding. The deadline for the first round of $200,000 was October 1, 2007. The deadline for the second round of $400,000 is June 1, 2008. Proposals for stewardship initiative funds cannot be considered until the institution’s strategic plan for stewardship activities and the priority area proposal have been submitted and approved and its regional grant funds have been distributed. Northern Kentucky University is the only comprehensive university that met this requirement by the October 1, 2007, deadline for the first round of funding. NKU submitted two proposals totaling $200,000 (Attachment A and Attachment B). A team of Council staff and external reviewers evaluated each proposal. As a result, NKU was asked to clarify and expand upon certain items in each proposal (Attachment C).
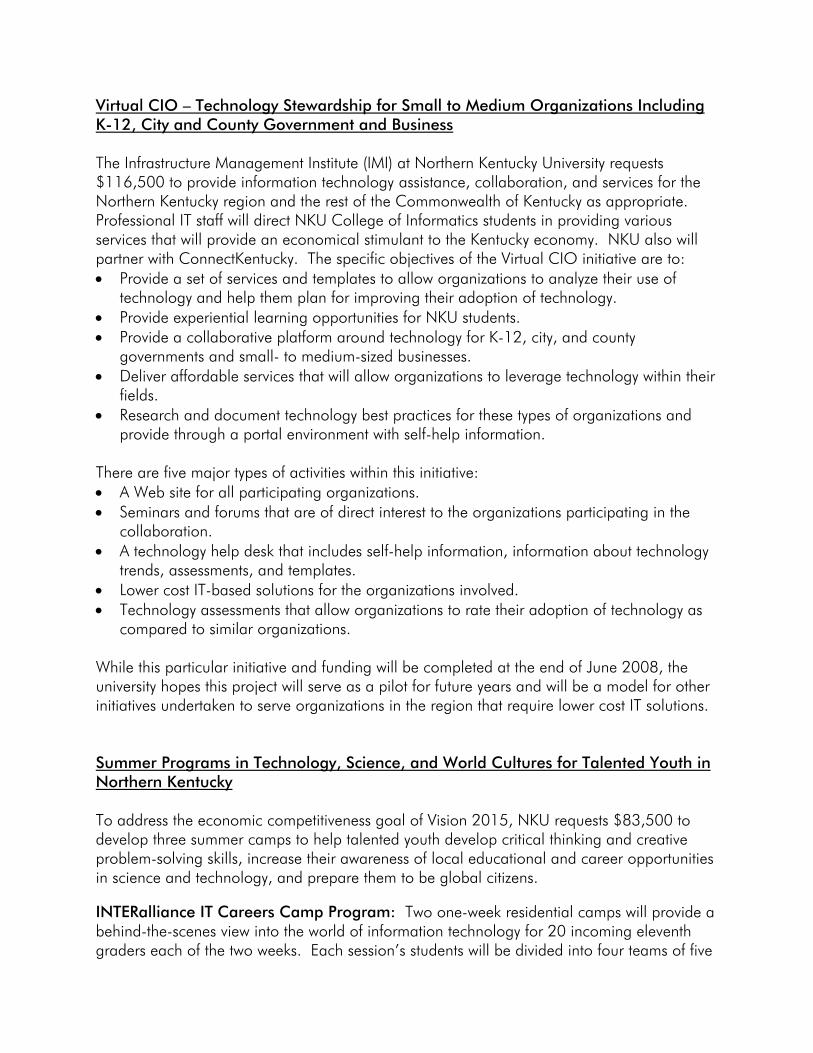
Virtual CIO – Technology Stewardship for Small to Medium Organizations Including K-12, City and County Government and Business The Infrastructure Management Institute (IMI) at Northern Kentucky University requests $116,500 to provide information technology assistance, collaboration, and services for the Northern Kentucky region and the rest of the Commonwealth of Kentucky as appropriate. Professional IT staff will direct NKU College of Informatics students in providing various services that will provide an economical stimulant to the Kentucky economy. NKU also will partner with ConnectKentucky. The specific objectives of the Virtual CIO initiative are to: • Provide a set of services and templates to allow organizations to analyze their use of
technology and help them plan for improving their adoption of technology. • Provide experiential learning opportunities for NKU students. • Provide a collaborative platform around technology for K-12, city, and county
governments and small- to medium-sized businesses. • Deliver affordable services that will allow organizations to leverage technology within their
fields. • Research and document technology best practices for these types of organizations and
provide through a portal environment with self-help information. There are five major types of activities within this initiative: • A Web site for all participating organizations. • Seminars and forums that are of direct interest to the organizations participating in the
collaboration. • A technology help desk that includes self-help information, information about technology
trends, assessments, and templates. • Lower cost IT-based solutions for the organizations involved. • Technology assessments that allow organizations to rate their adoption of technology as
compared to similar organizations. While this particular initiative and funding will be completed at the end of June 2008, the university hopes this project will serve as a pilot for future years and will be a model for other initiatives undertaken to serve organizations in the region that require lower cost IT solutions. Summer Programs in Technology, Science, and World Cultures for Talented Youth in Northern Kentucky To address the economic competitiveness goal of Vision 2015, NKU requests $83,500 to develop three summer camps to help talented youth develop critical thinking and creative problem-solving skills, increase their awareness of local educational and career opportunities in science and technology, and prepare them to be global citizens.
INTERalliance IT Careers Camp Program: Two one-week residential camps will provide a behind-the-scenes view into the world of information technology for 20 incoming eleventh graders each of the two weeks. Each session’s students will be divided into four teams of five
students, with each team sponsored by a local corporate sponsor. The high schools with participating students will nominate a teacher to serve as advisor for one of the teams. The teams will compete for medals throughout the week in a variety of problem-solving exercises, teamwork challenges, and design projects, all of which will raise the awareness of the role of IT in business and the available careers in IT with local employers. The program is a collaboration among the university, the INTERalliance of Greater Cincinnati, four to eight corporate sponsors, and northern Kentucky high schools. The INTERalliance IT Careers Camp program will accomplish the following objectives: • Raise student awareness of the significant role of IT in various career pathways and the
value of IT skills for future employment. • Raise student awareness of the critical role IT plays in the problem-solving methodologies
and processes of employers in all sectors. • Raise student awareness of educational programs in IT and information management
offered by NKU’s College of Informatics. • Increase student understanding of the importance of developing and utilizing a
professional network. • Provide students with a service learning experience that benefits a nonprofit organization
by meeting an IT-related need. Emerging Technologies Camp Program: The university’s Center for Integrative Natural Science and Mathematics (CINSAM) will offer two one-week day camps. One camp will be geared toward students entering grades seven through nine, and the other camp will focus on students entering grades ten and eleven. Each camp will have 15 to 20 high-ability students chosen from northern Kentucky schools. Students will engage in a variety of scientific investigations lasting several days each, utilizing the most sophisticated equipment available at the university under the supervision and direction of NKU faculty. CINSAM will partner with GEAR UP Kentucky schools and other local schools to identify talented students who will benefit from the opportunity to participate in these camps. After the research topics of the camps are finalized, NKU will establish partnerships with regional corporations or organizations to provide site visit opportunities for the students. The objectives of the Emerging Technologies Camp are to: • Develop creative problem-solving skills in middle and high school students in the context
of innovative approaches to problems in science and technology. • Motivate these students to pursue the study of advanced topics in science and
mathematics.
World Cultures Camp: NKU will offer two one-week day camps for students entering grades three through six for up to 25 students per week. Northern Kentucky elementary schools will nominate gifted students to attend these programs. The camp activities will include films, demonstrations, computer activities, and creative learning activities. Topics will include world location, physical geography, climate, sports, dress, food, language, music, and dance. The students will be introduced to simple words and meanings of people, places,
and things in the language of each country studied. The students will be linked to international e-mail pals to encourage further communications across cultures. The World Cultures Camp will be hosted by the university’s College of Education and Human Services in partnership with local elementary schools, which will identify and nominate gifted students to attend. The Global Center of Greater Cincinnati will serve as a regional partner for the project, providing educational program materials for the camps. The Global Center is a nonprofit, nonpartisan organization that frequently partners with area universities and schools on projects involving global issues. The purposes of the World Cultures Camp are to: • Increase student knowledge about other cultures. • Cultivate in the youngest students an appreciation for cultural diversity. Based on assessment of the outcomes of the camps, NKU will work with the regional partners involved to create a sustained initiative for multiple cohorts of students and track the impact of the camps over time.
Staff preparation by Melissa Bell
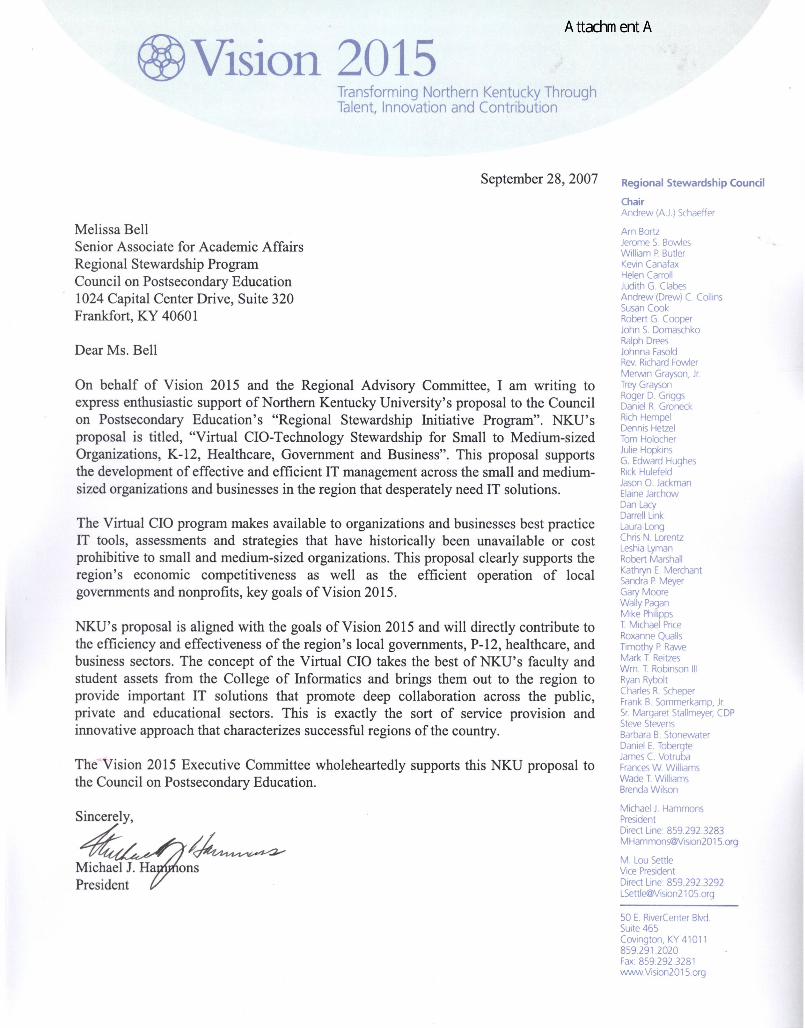
Page 1 of 16
REGIONAL STEWARDSHIP PROGRAM STEWARDSHIP INITIATIVE PROPOSAL
Virtual CIO – Technology Stewardship for Small to Medium Organizations Including K-12, City & County
Government and Business
Page 2 of 16
NORTHERN KENTUCKY UNIVERSITY
September 28, 2007
Project Abstract
This initiative will further our strategic priority to “engage in effective regional stewardship” by supporting the economic and social progress of our region. The Infrastructure Management Institute (IMI) at Northern Kentucky University (NKU) proposes providing Information Technology (IT) stewardship, collaboration and services for the Northern Kentucky Region and rest of the Commonwealth of Kentucky as appropriate. Professional IT staff will direct NKU College of Informatics students in providing various services that will provide an economical stimulant to the Kentucky economy. These students will gain valuable experience in
Page 3 of 16
the latest technology advancements and the various organizations that are engaged will receive lower cost effective solutions. These innovative solutions will accelerate the economic growth of these organizations and have a tremendous impact on the region. The organizations that will be targeted include K-12 school systems, city and county governments, and small to medium businesses. The stewardship with these entities will increase NKU’s presence in the region and the Commonwealth. In particular, technology collaboration with the K-12 school systems will not only provide a key resource to these organizations but will accelerate the impact that technology has on the organization.
Page 4 of 16
Project Narrative
1. Analysis of Needs
The proposed Virtual CIO initiative for small to medium organizations(SMOs) in the Northern Kentucky region and perhaps across the state will address several significant regional needs identified in Vision 2015, the region’s 10-year strategic plan that positions our region to compete in a global, knowledge-based economy. The university continues to use the Vision 2015 document as a guide for its regional stewardship work. Economic competitiveness is a major focus of Vision 2015. The Virtual CIO technology initiative will also further the Strategic Priority “Educational Excellence”. NKU students will be directly engaged in providing the services to the organizations allowing them to gain experience in a complex and ever changing environment. These College of Informatics students will be exposed to real world experiences that will propel their success and the impact on the Commonwealth. The small to medium organizations who are struggling to meet the technology needs of their business will find a closely aligned ally in leveraging technology.
This initiative will also assist in promoting a “Competitive Economy”. Competition in a global economy presents many challenges for most organizations and they need assistance to maintain a competitive edge. This project will provide many resources directed at solving technology focused problems that all of these organizations face. The Vision 2015 Report states:
Competitive Economy: The Northern Kentucky region will reinvent its economy and create new jobs that insure continued growth and prosperity. Connectivity, clusters, and inclusion are the linchpins of reinvention in a globally competitive environment. Northern Kentucky must capitalize on digital advances to reinforce international and local opportunities for economic and social synergies. We must support homegrown talent and encourage innovation and entrepreneurship to attract high wage, advanced technology sectors and the jobs they create. Additionally, we must become a culturally literate community of inclusion that welcomes and respects people of talent, ambition, and aspirations.
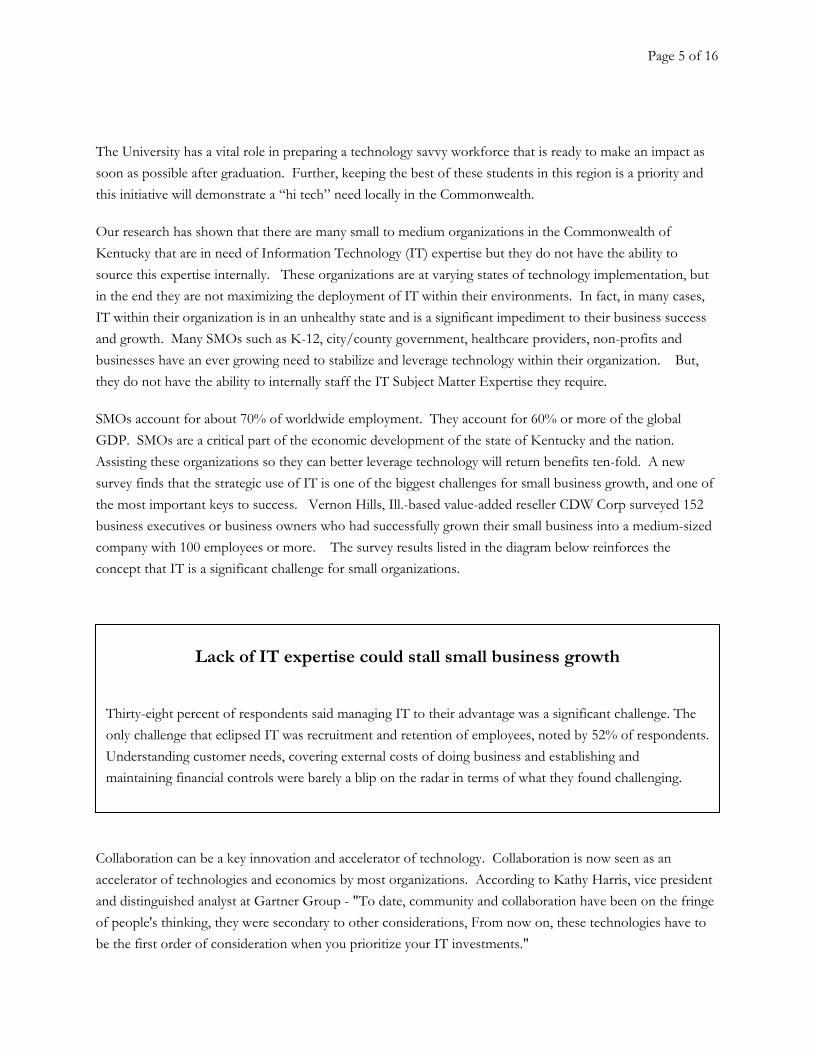
Page 5 of 16
The University has a vital role in preparing a technology savvy workforce that is ready to make an impact as soon as possible after graduation. Further, keeping the best of these students in this region is a priority and this initiative will demonstrate a “hi tech” need locally in the Commonwealth.
Our research has shown that there are many small to medium organizations in the Commonwealth of Kentucky that are in need of Information Technology (IT) expertise but they do not have the ability to source this expertise internally. These organizations are at varying states of technology implementation, but in the end they are not maximizing the deployment of IT within their environments. In fact, in many cases, IT within their organization is in an unhealthy state and is a significant impediment to their business success and growth. Many SMOs such as K-12, city/county government, healthcare providers, non-profits and businesses have an ever growing need to stabilize and leverage technology within their organization. But, they do not have the ability to internally staff the IT Subject Matter Expertise they require.
SMOs account for about 70% of worldwide employment. They account for 60% or more of the global GDP. SMOs are a critical part of the economic development of the state of Kentucky and the nation. Assisting these organizations so they can better leverage technology will return benefits ten-fold. A new survey finds that the strategic use of IT is one of the biggest challenges for small business growth, and one of the most important keys to success. Vernon Hills, Ill.-based value-added reseller CDW Corp surveyed 152 business executives or business owners who had successfully grown their small business into a medium-sized company with 100 employees or more. The survey results listed in the diagram below reinforces the concept that IT is a significant challenge for small organizations.
Collaboration can be a key innovation and accelerator of technology. Collaboration is now seen as an accelerator of technologies and economics by most organizations. According to Kathy Harris, vice president and distinguished analyst at Gartner Group - "To date, community and collaboration have been on the fringe of people's thinking, they were secondary to other considerations, From now on, these technologies have to be the first order of consideration when you prioritize your IT investments."
Lack of IT expertise could stall small business growth
Thirty-eight percent of respondents said managing IT to their advantage was a significant challenge. The only challenge that eclipsed IT was recruitment and retention of employees, noted by 52% of respondents. Understanding customer needs, covering external costs of doing business and establishing and maintaining financial controls were barely a blip on the radar in terms of what they found challenging.
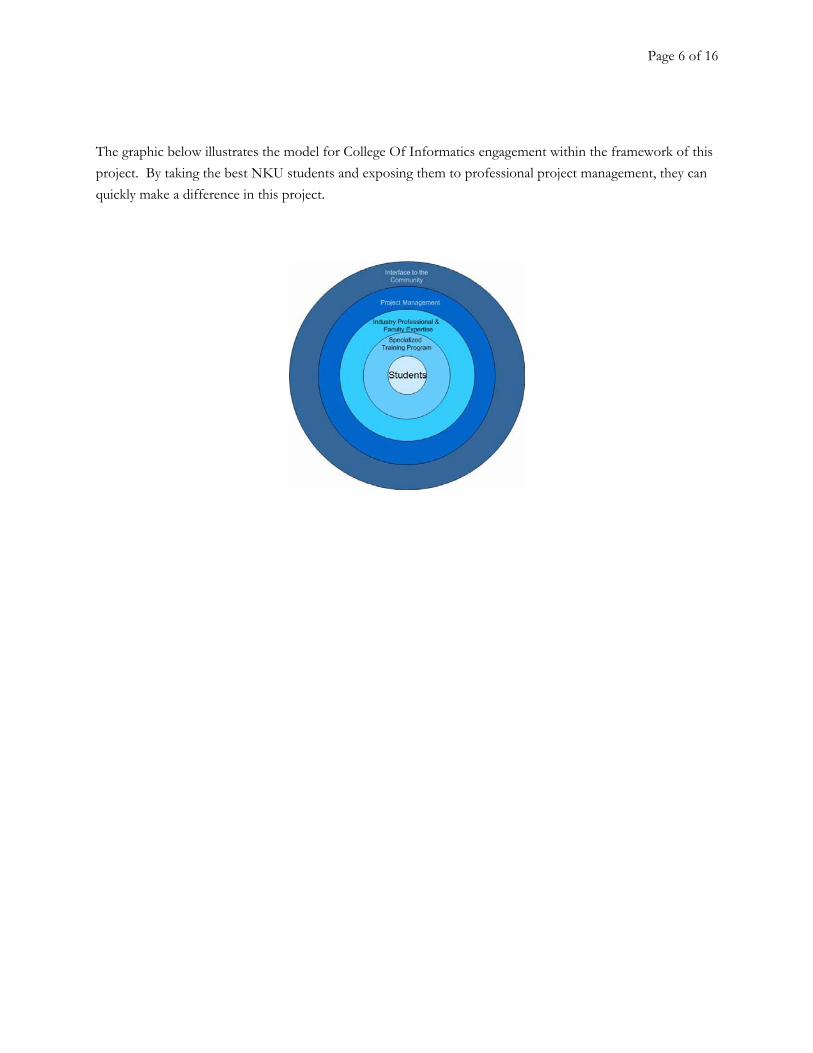
Page 6 of 16
The graphic below illustrates the model for College Of Informatics engagement within the framework of this project. By taking the best NKU students and exposing them to professional project management, they can quickly make a difference in this project.
Page 7 of 16
2. Project Objectives
The ultimate goal of this project is to provide a collaborative technology platform for K-12, city & county governments and small to medium businesses. This collaborative model would be incorporated into the overall Regional Stewardship mission of NKU. Students and faculty would be involved as appropriate in carrying out this mission.
The specific objectives of the Virtual CIO initiative are to:
• Provide a set of services and templates to allow organizations to analyze their use of technology today and help them plan for improving their adoption of technology. For example, a K-12 organization would have tools to do an assessment of where they are and work towards developing a road map to where they want to be
• Provide experiential learning opportunities for NKU students through a well defined technology model
• Provide a collaborative platform around technology for K-12, city & county government and small to medium businesses within the Commonwealth
• Deliver affordable services to the organizations that will allow them to leverage technology within their field
• Research and document technology best practices for these types of organizations and provide through a portal environment with self help information
The objectives listed relate to the region’s strategic plan to grow economic competitiveness within the region and state. The overriding purpose of the region’s strategic plan is to ensure that Northern Kentucky is capable of competing in a global economy, with our citizens benefiting from the prosperity and opportunity this creates. Technology exploitation is as vital as any other issue when it comes to economic competitiveness in a global economy. As part of the process, this initiative will improve the educational process within the region as well as expose IT students to the opportunities within the Commonwealth.
Page 8 of 16
3. Description of Activities
Technology Collaboration Website: We will develop a portal via the internet to all the information available for the organizations participating. This website will provide for a community based collaboration model to further increase its effectiveness.
Technology Educational Semiars and Forums: We will develop and host technology forums that are of direct interest to the organizations that are participating in the collaboration. These events will provide direct value to the organizations adoption of technology.
Technology Service Center: A Technology Help Desk will be provided based upon the research of needs in this area. This will include self help information as well as information about technology trends, etc. This will include assessments and templates.
Technology Services: The initiative will provide lower cost IT based solutions for the organizations involved. A workflow process will be identified and a ITIL based service book of offerings will be adopted and posted. These services will be provided to the various organizations.
Technology Assessments: Self help and other value added assessment methodologies will be developed that will allow an organization to rate their adoption of technology as compared to others in a similar “business”.
While this particular initiative and funding will be completed at the end of June 2008, the university hopes this project will serve as a “pilot” for future years and will be the first of many initiatives undertaken to serve organizations in our region that require lower cost IT solutions. The belief is that this collaborative model can become a self sustaining initiative over time.
Page 9 of 16
4. Partnerships
The university’s College of Informatics will be the home of this initiative via the Infrastructure Management Institute(IMI). IMI and the College of Informatics will collaborate on the overall implementation of this project and various individuals from these organizations will be engaged. Faculty and students will be directly involved in the projects allowing them to directly participate in the regional stewardship initiative.
The Office of Information Technology(OIT) at the university will play an active role in this initiative as well. The outreach and stewardship activities will be able to leverage the talented staff that the university has internally to both educate and collaborate with members of the community. In particular, the university will identify specific individuals from OIT to work with the regional K-12 organizations as well as the city and county government personnel.
The IMI also is partnering with ConnectKentucky as these organizations have similar missions when it comes to furthering the success of the region and state. The partnership will be focused on the delivery of technology solutions to the organizations that are in need of assistance.
About The Infrastructure Management Institute
The Infrastructure Management Institute (IMI) at Northern Kentucky University offers a new center of excellence, providing research and collaboration for best practice implementation, automation technology and operations processes for streamlining infrastructure management.
About The College of Informatics
The name informatics embraces the modern concept of information in all its aspects: information management, infrastructure, processing, presentation, dissemination, design, and analysis. It is deeply integrative in approach. In practice, it ranges from the development of information technologies in the service of specific fields, to broader scholarly investigations of the representation, processing and communication of information in its full social context. The college unites faculty, students and outreach programs from the Department of Communication (with programs ranging from journalism and media to speech communication), the Department of Computer Science (offering degrees both in traditional computer science and in information technology), and the Department of Business Informatics (offering the business perspective on the management of information). The IMI, currently under development, provides an access
Page 10 of 16
point for the private and public sectors to connect to the entire range of intellectual and physical resources available at NKU in the area of information science.
About ConnectKentucky
By leveraging the latest in technology and networking, ConnectKentucky is ensuring Kentucky remains the place of choice to work, live, and raise a family. ConnectKentucky's mission is to accelerate the growth of technology in support of community and economic development, improved healthcare, enhanced education, and more effective government.
Page 11 of 16
5. Resources and Sustainability
The Virtual CIO project team willl utilize facilities within the College of Informatics and the Office of Information Technology(OIT). The College and OIT will provide general support for the program. Additional resources will be available through the networking already developed with the IMI. IMI has spent the last 12 months networking within the region and state and has identified many key individuals that are concerned and excited about the missions described in this initiative. One example of such a resource is Frank Caccamo. Frank is a retired former Chief Information Officer from Proctor & Gamble. He has been valuable in sharing how he provided leadership to IT organization at Proctor & Gamble and managed a true Global Enterprise entity. Frank has engaged directly with the University staff and students in our outreach mission.
Dr. Douglas Perry, Dean of the College of Informatics will be intimately involved in the success of this program. Dr. Perry has 33 years experience in higher education. In 1999, Dr. Perry helped found the Indiana University School of Informatics, the first entirely new school of its kind in the country. Dr. Perry came to NKU as founding dean of the College of Informatics in July 2006.
Vincent Scheben is the Project Coordinator for the Infrastructure Management Institute at Northern Kentucky University’s College of Informatics. In this role, Vincent manages and coordinates projects within the Student Advanced Technology Program which assists regional business with technology needs, while giving Informatics students opportunities to apply classroom taught skills to real world scenarios. Vincent graduated with honors from Southern Ohio College in 1997 with an Associates of Science in Computer Science with a minor in Business Administration.
David Hirsch is the Program Director for the Infrastructure Management Institute at Northern Kentucky University’s College of Informatics. In this role, David performs development and execution of strategic programs for the organization. David joined NKU in February of 2006 to assist in developing the Infrastructure Management Institute’s programs. Prior to joining NKU, David was an Assistant Vice President at Computer Associates where he performed multiple roles including heading up project management for the flagship product line, building and managing a regional technical support team, software design and development, development and delivery of technical training, and customer facing pre and post sales engagements. David graduated with honors from NKU with a Bachelor of Science in Computer Science with areas of concentration in Mathematics and Business Administration.
Frank Braun is a faculty member in the Department of Business Informatics at Northern Kentucky University. He specializes in IT governance, IT security, IT strategy and Project Management. Mr. Braun has
Page 12 of 16
over 20 years of executive level IT management and consulting experience. He is a founding board member of the Entrepreneurship Institute and Infrastructure Management Institute at Northern Kentucky University. His research areas include information security, business continuity planning, knowledge management and organizational leadership. He earned his BS from Miami University and MBA from Xavier University. He is currently an Executive Doctor of Management candidate at Case Western Reserve University.
Tim Ferguson, the Chief Information Officer at the University will directly lead this initiative. Tim is a 1985 Graduate of the Computer Science and Math programs at NKU and has over 20 years of professional IT experience dealing directly with organizations and adoption of technology. Tim spent the last several years as the SVP for the Enterprise Systems Management division at Computer Associates where he led business unit including R&D for a multi-billion dollar software product line.
Page 13 of 16
6. Evaluation Plan
The Virtual CIO Initiative will be evaluated based upon its overall impact on the organizations that participate. A detailed survey will be executed with organizations prior to engagement and follow ups will be performed at the appropriate times to measure the program’s success. These surveys will provide a metric level collection point for the success of the initiative. The summary of this data will be posted to the project website.
As part of the evaluation plan, a scale representing an organization’s Implementation of Technology will be developed and this will be used in an ongoing basis to track success of the initiative. A detailed study at the end of the project will result in a Executive Report that will document the first 12 months of the program and its overall performance.
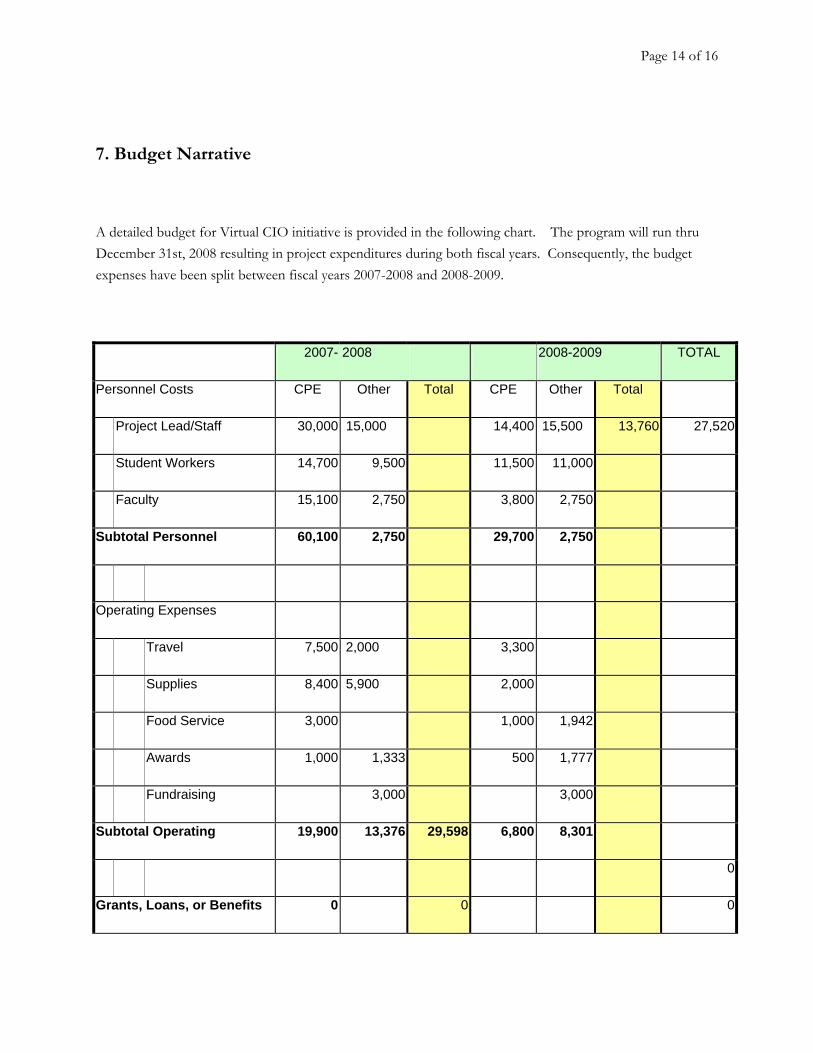
Page 14 of 16
7. Budget Narrative
A detailed budget for Virtual CIO initiative is provided in the following chart. The program will run thru December 31st, 2008 resulting in project expenditures during both fiscal years. Consequently, the budget expenses have been split between fiscal years 2007-2008 and 2008-2009.
2007- 2008 2008-2009 TOTAL
Personnel Costs CPE Other Total CPE Other Total
Project Lead/Staff 30,000 15,000 14,400 15,500 13,760 27,520
Student Workers 14,700 9,500 11,500 11,000
Faculty 15,100 2,750 3,800 2,750
Subtotal Personnel 60,100 2,750 29,700 2,750
Operating Expenses
Travel 7,500 2,000 3,300
Supplies 8,400 5,900 2,000
Food Service 3,000 1,000 1,942
Awards 1,000 1,333 500 1,777
Fundraising 3,000 3,000
Subtotal Operating 19,900 13,376 29,598 6,800 8,301
0
Grants, Loans, or Benefits 0 0 0
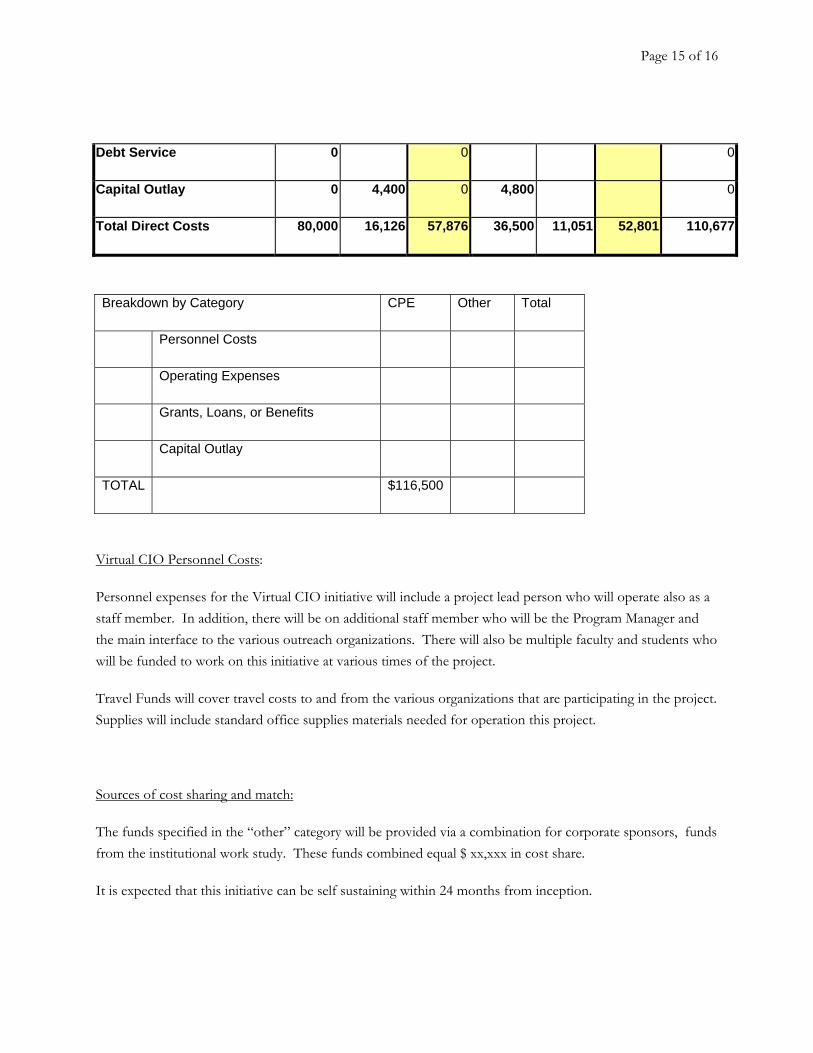
Page 15 of 16
Debt Service 0 0 0
Capital Outlay 0 4,400 0 4,800 0
Total Direct Costs 80,000 16,126 57,876 36,500 11,051 52,801 110,677
Breakdown by Category CPE Other Total
Personnel Costs
Operating Expenses
Grants, Loans, or Benefits
Capital Outlay
TOTAL $116,500
Virtual CIO Personnel Costs:
Personnel expenses for the Virtual CIO initiative will include a project lead person who will operate also as a staff member. In addition, there will be on additional staff member who will be the Program Manager and the main interface to the various outreach organizations. There will also be multiple faculty and students who will be funded to work on this initiative at various times of the project.
Travel Funds will cover travel costs to and from the various organizations that are participating in the project. Supplies will include standard office supplies materials needed for operation this project.
Sources of cost sharing and match:
The funds specified in the “other” category will be provided via a combination for corporate sponsors, funds from the institutional work study. These funds combined equal $ xx,xxx in cost share.
It is expected that this initiative can be self sustaining within 24 months from inception.

Page 16 of 16
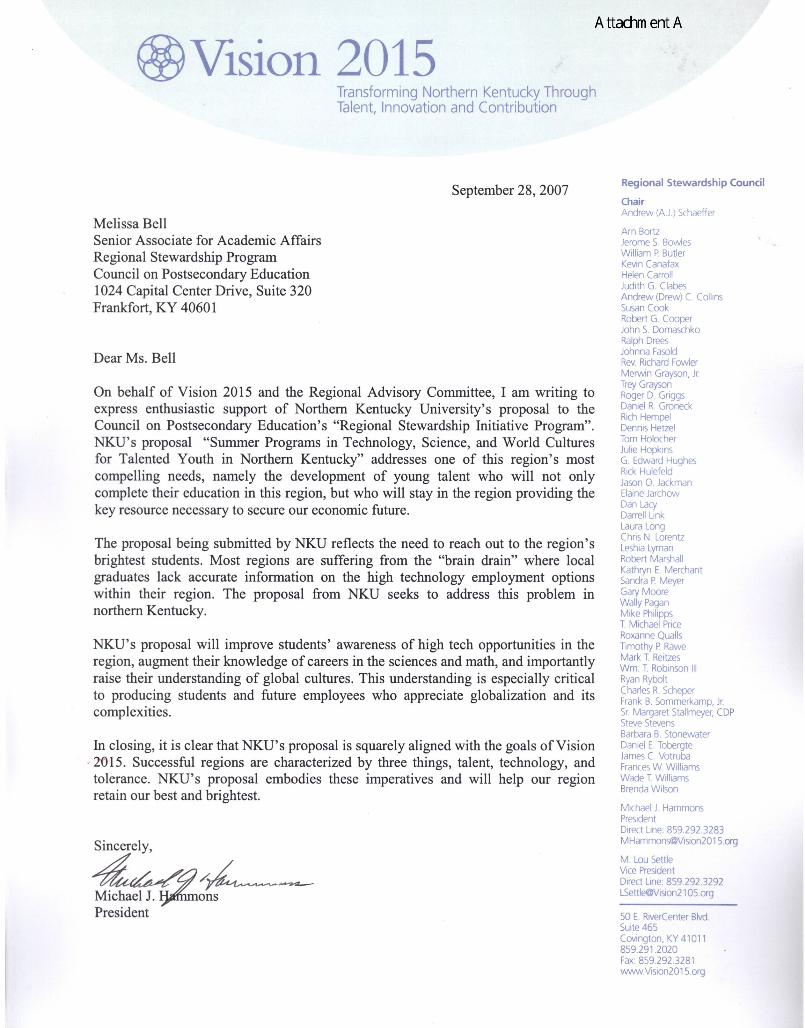
REGIONAL STEWARDSHIP PROGRAM STEWARDSHIP INITIATIVES PROPOSAL
SUMMER PROGRAMS IN TECHNOLOGY, SCIENCE, AND WORLD CULTURES FOR
TALENTED YOUTH IN NORTHERN KENTUCKY
NORTHERN KENTUCKY UNIVERSITY RESEARCH FOUNDATION
September 28, 2007
2
Project Abstract To further our strategic priority to “engage in effective regional stewardship” by supporting the economic and social progress of our region, Northern Kentucky University proposes offering summer programs for talented youth that focus on information technology careers, emerging scientific technologies, and cultural awareness. These summer 2008 programs will advance the university’s commitment to develop talent to meet the expanding needs of our region in the areas of economic competitiveness and multicultural understanding. These reflect significant needs identified in Vision 2015, the region’s 10-year strategic plan that positions our region to compete in the global economy. Our most extensive proposed summer program, the INTERalliance IT Careers Camp, represents a collaborative effort of NKU’s College of Informatics, the INTERalliance of Greater Cincinnati, corporate sponsors, and Northern Kentucky area high schools. This residential camp experience will ignite interest among talented Northern Kentucky high school students in careers in information technology through service learning activities, corporate site visits, and competitive team challenges. NKU’s program of distinction, the Center for Integrative Natural Science and Mathematics, will offer a program for high ability high school and middle school students, focusing on emerging technologies. A third program, geared to gifted elementary school students, will promote multicultural awareness.
3
Project Narrative
1. Analysis of Needs The proposed summer programs for talented youth in Northern Kentucky address several significant regional needs identified in Vision 2015, the region’s 10-year strategic plan that positions our region to compete in a global, knowledge-based economy. The university continues to use the Vision 2015 document as a guide for its regional stewardship work. Economic competitiveness is a major focus of Vision 2015. The Vision 2015 report states:
Talented and skilled workers are fundamental to the ability of regions like Northern Kentucky to retain and attract high technology companies, advanced manufacturing, and advanced services firms. . . . .Northern Kentucky must take advantage of opportunities to create high wage jobs in high technology businesses as one way to increase the region’s wealth.
The university has a vital role in preparing a talented workforce to fill technology jobs that will contribute significantly to the region’s economic growth and stability. But unfortunately, students in the Northern Kentucky region and across the United States are not pursing careers in technology, despite compelling evidence that these careers will serve them well. U.S. Bureau of Labor Statistics data show that three of the top ten fastest growing occupations through 2014 are in information technology, seven of the ten top careers are computer related, while four of this decade’s top ten fastest wage/salary growth positions are in IT. (Bureau of Labor Statistics, March 2004 and Occupational Projections and Training Data, 2006-07 edition, Bulletin 2602.) There is a misconception among students and their parents that “all the good IT jobs are going to India and China.” While many of the “coding” jobs are being outsourced, these low paying jobs are not the jobs we want for our students. Management level jobs, such as project managers, database managers, business or systems analysts, are rarely outsourced off-shore. U.S. companies consistently require multi-culturally adept and highly skilled American workers to fill these positions. They report a shortage of such workers, especially in the high tech sector. Consequently, our region needs to encourage students to pursue careers in technology and then retain them in the local workforce. Our region has experienced the exodus of our best and brightest high school students, as they leave the area for college, stay away for graduate school, and then begin their early careers in cities such as Boston, Atlanta, Austin, Chicago, or San Francisco. To attract and retain the best of the “young professionals,” we need to make high school students aware of the educational and career
4
opportunities available in Northern Kentucky. The summer programs relating to emerging technologies and careers in IT that the university will offer will begin to address these needs and contribute to our region’s long term goal of economic competitiveness. Regions that hope to compete for talent must also offer an attitude of openness that welcomes diversity. In our region, only a small portion of our population is racially or ethnically diverse, which presents a growing concern considering that the world economy is diverse, multi-lingual and multi-cultural. The world cultures camp that the university will offer for Northern Kentucky elementary students will begin to open the minds of our younger students to embrace diversity and prepare them for their futures in the global society. 2. Project Objectives The overall objectives of the summer programs for talented youth are to:
• Develop critical thinking and creative problem solving skills; • Expose high ability Northern Kentucky youth to local educational and career
opportunities in science and technology; and • Prepare Northern Kentucky youth for lives in the global society.
The INTERalliance IT Careers Camp program will accomplish the following objectives: • Raise students’ awareness of the significant role of IT in various career pathways
and the value of IT skills for future employment; • Raise students’ awareness of the critical role IT plays in the problem-solving
methodologies and processes of employers in all sectors; • Raise students’ awareness of educational programs in IT and Information
Management offered by NKU’s College of Informatics; • Raise students’ understanding of the importance of developing and utilizing a
professional network; and • Provide students with a service learning experience that benefits a non-profit
organization by meeting an IT related need. The Emerging Technologies camp will accomplish the following objectives:
• Develop creative problem solving skills in middle and high school students in the context of innovative approaches to problems in science and technology; and
• Motivate these students to pursue the study of advanced topics in science and mathematics.
The World Cultures Camp will accomplish the following objectives:
• Increase student’s knowledge about other cultures; and • Cultivate in our youngest students an appreciation for cultural diversity.
5
The foregoing objectives relate to the region’s strategic plan to achieve economic competitiveness in a region that welcomes diversity, as previously discussed in the Analysis of Needs section. The overriding purpose of the region’s strategic plan is to ensure that Northern Kentucky is capable of competing in a global economy, with our citizens benefiting from the prosperity and opportunity this creates. These objectives further the mandate of HB 1 by instilling enthusiasm for learning and better preparedness for postsecondary education which will enhance economic development and quality of life. These objectives further the goals of Questions 1 and 5 of the public agenda, by helping prepare more Kentuckians for higher education and by benefiting Kentucky communities with a pipeline of talented workers who are prepared for the global economy. 3. Description of Activities INTERalliance IT Careers Camp Program: Two one-week residential camp programs will provide a behind-the-scenes view into the world of information technology for twenty incoming 11th graders each of the two weeks. Students will be nominated by local Northern Kentucky high schools based on high ability and aptitude and will be selected by the university’s program leadership. Participants will pay a student fee of $35 to attend. Each session’s students will be divided into four teams of five students, with each team sponsored by a local corporate sponsor who contributes a $5,000 team sponsorship fee to support the costs of the program. The high schools with participating students nominate a teacher to serve as team advisor for one of the teams. The teams compete for medals throughout the week in a variety of problem solving exercises, teamwork challenges, and design projects, all of which will raise the awareness of the role of IT in business and the available careers in IT with local employers. Each Monday, the teams will explore the world of IT at NKU, which includes the data center, computer labs, wireless environment, and university business systems. Tuesday through Friday mornings, the students visit the four corporate team sponsors and engage in problem solving activities. The students are joined for lunch by the CIO and senior IT management team of the host corporate sponsor, for discussion about educational and career opportunities. The CIOs view these sessions as an early recruiting opportunity during which they can encourage these high ability students to consider employment with them after college. Each afternoon the teams engage in a design competition to conceive an IT solution for a local non-profit organization, such as a website or a technology design that addresses an important business need of that organization. Each day the students explore the next facet of the “solution development lifecycle,” starting with assessment and traversing through the design, build, test, and deployment phases. After dinner and evening recreational activities, the teams return to work on their projects back at the dorms, experiencing a taste of the “real world” deliverables crunch so typical in IT. On Friday, representatives of the non-profit organizations serve as a panel of judges reviewing the competing teams’ presentations, offering critiques, and selecting the winning designs.
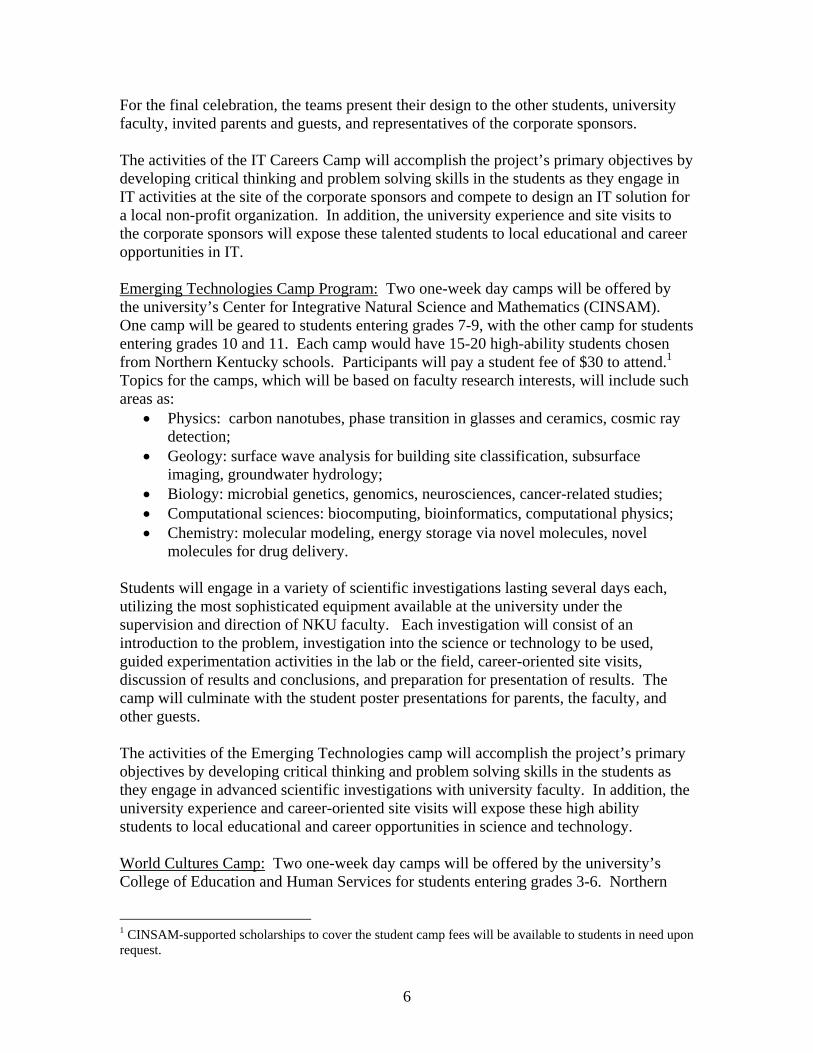
6
For the final celebration, the teams present their design to the other students, university faculty, invited parents and guests, and representatives of the corporate sponsors. The activities of the IT Careers Camp will accomplish the project’s primary objectives by developing critical thinking and problem solving skills in the students as they engage in IT activities at the site of the corporate sponsors and compete to design an IT solution for a local non-profit organization. In addition, the university experience and site visits to the corporate sponsors will expose these talented students to local educational and career opportunities in IT. Emerging Technologies Camp Program: Two one-week day camps will be offered by the university’s Center for Integrative Natural Science and Mathematics (CINSAM). One camp will be geared to students entering grades 7-9, with the other camp for students entering grades 10 and 11. Each camp would have 15-20 high-ability students chosen from Northern Kentucky schools. Participants will pay a student fee of $30 to attend.1 Topics for the camps, which will be based on faculty research interests, will include such areas as:
• Physics: carbon nanotubes, phase transition in glasses and ceramics, cosmic ray detection;
• Geology: surface wave analysis for building site classification, subsurface imaging, groundwater hydrology;
• Biology: microbial genetics, genomics, neurosciences, cancer-related studies; • Computational sciences: biocomputing, bioinformatics, computational physics; • Chemistry: molecular modeling, energy storage via novel molecules, novel
molecules for drug delivery. Students will engage in a variety of scientific investigations lasting several days each, utilizing the most sophisticated equipment available at the university under the supervision and direction of NKU faculty. Each investigation will consist of an introduction to the problem, investigation into the science or technology to be used, guided experimentation activities in the lab or the field, career-oriented site visits, discussion of results and conclusions, and preparation for presentation of results. The camp will culminate with the student poster presentations for parents, the faculty, and other guests. The activities of the Emerging Technologies camp will accomplish the project’s primary objectives by developing critical thinking and problem solving skills in the students as they engage in advanced scientific investigations with university faculty. In addition, the university experience and career-oriented site visits will expose these high ability students to local educational and career opportunities in science and technology. World Cultures Camp: Two one-week day camps will be offered by the university’s College of Education and Human Services for students entering grades 3-6. Northern
1 CINSAM-supported scholarships to cover the student camp fees will be available to students in need upon request.
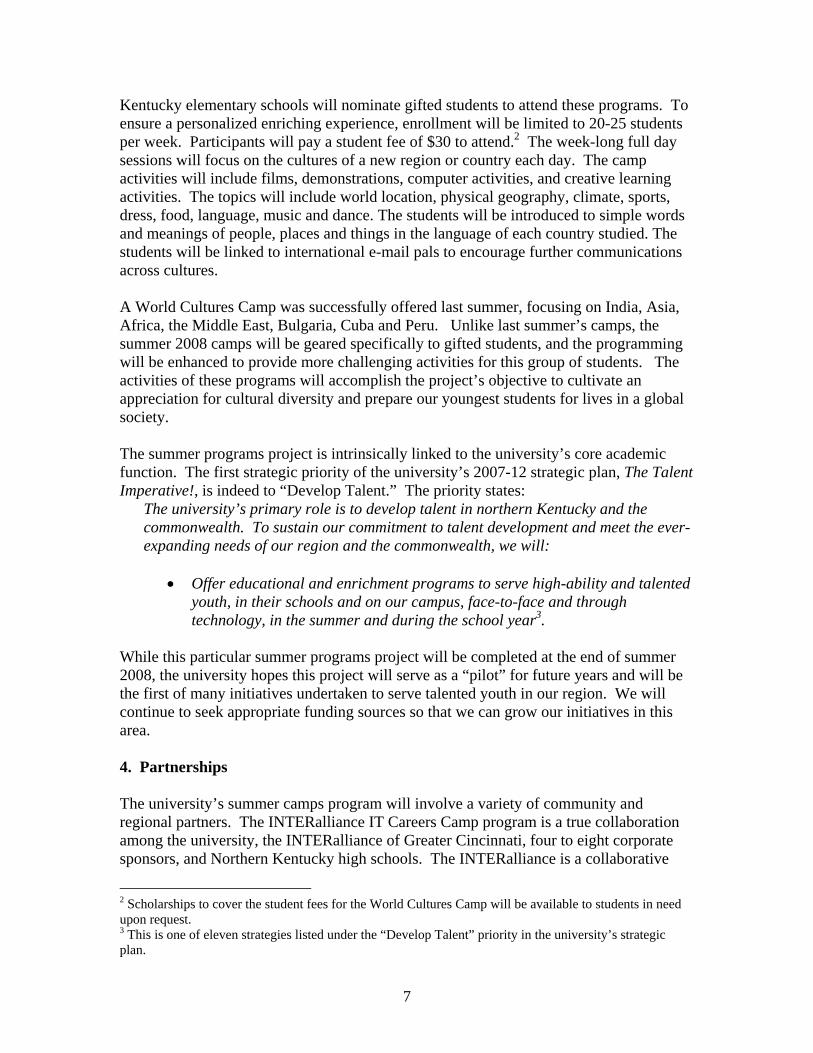
7
Kentucky elementary schools will nominate gifted students to attend these programs. To ensure a personalized enriching experience, enrollment will be limited to 20-25 students per week. Participants will pay a student fee of $30 to attend.2 The week-long full day sessions will focus on the cultures of a new region or country each day. The camp activities will include films, demonstrations, computer activities, and creative learning activities. The topics will include world location, physical geography, climate, sports, dress, food, language, music and dance. The students will be introduced to simple words and meanings of people, places and things in the language of each country studied. The students will be linked to international e-mail pals to encourage further communications across cultures. A World Cultures Camp was successfully offered last summer, focusing on India, Asia, Africa, the Middle East, Bulgaria, Cuba and Peru. Unlike last summer’s camps, the summer 2008 camps will be geared specifically to gifted students, and the programming will be enhanced to provide more challenging activities for this group of students. The activities of these programs will accomplish the project’s objective to cultivate an appreciation for cultural diversity and prepare our youngest students for lives in a global society. The summer programs project is intrinsically linked to the university’s core academic function. The first strategic priority of the university’s 2007-12 strategic plan, The Talent Imperative!, is indeed to “Develop Talent.” The priority states:
The university’s primary role is to develop talent in northern Kentucky and the commonwealth. To sustain our commitment to talent development and meet the ever-expanding needs of our region and the commonwealth, we will:
• Offer educational and enrichment programs to serve high-ability and talented youth, in their schools and on our campus, face-to-face and through technology, in the summer and during the school year3.
While this particular summer programs project will be completed at the end of summer 2008, the university hopes this project will serve as a “pilot” for future years and will be the first of many initiatives undertaken to serve talented youth in our region. We will continue to seek appropriate funding sources so that we can grow our initiatives in this area. 4. Partnerships The university’s summer camps program will involve a variety of community and regional partners. The INTERalliance IT Careers Camp program is a true collaboration among the university, the INTERalliance of Greater Cincinnati, four to eight corporate sponsors, and Northern Kentucky high schools. The INTERalliance is a collaborative
2 Scholarships to cover the student fees for the World Cultures Camp will be available to students in need upon request. 3 This is one of eleven strategies listed under the “Develop Talent” priority in the university’s strategic plan.
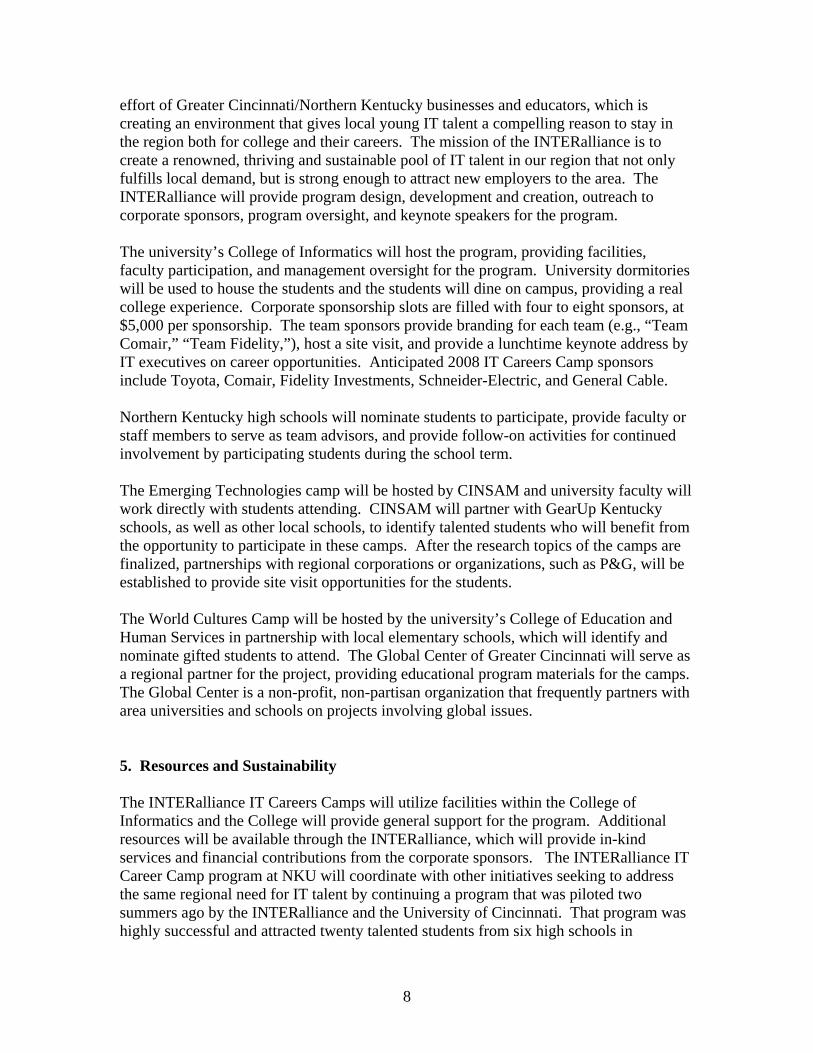
8
effort of Greater Cincinnati/Northern Kentucky businesses and educators, which is creating an environment that gives local young IT talent a compelling reason to stay in the region both for college and their careers. The mission of the INTERalliance is to create a renowned, thriving and sustainable pool of IT talent in our region that not only fulfills local demand, but is strong enough to attract new employers to the area. The INTERalliance will provide program design, development and creation, outreach to corporate sponsors, program oversight, and keynote speakers for the program. The university’s College of Informatics will host the program, providing facilities, faculty participation, and management oversight for the program. University dormitories will be used to house the students and the students will dine on campus, providing a real college experience. Corporate sponsorship slots are filled with four to eight sponsors, at $5,000 per sponsorship. The team sponsors provide branding for each team (e.g., “Team Comair,” “Team Fidelity,”), host a site visit, and provide a lunchtime keynote address by IT executives on career opportunities. Anticipated 2008 IT Careers Camp sponsors include Toyota, Comair, Fidelity Investments, Schneider-Electric, and General Cable. Northern Kentucky high schools will nominate students to participate, provide faculty or staff members to serve as team advisors, and provide follow-on activities for continued involvement by participating students during the school term. The Emerging Technologies camp will be hosted by CINSAM and university faculty will work directly with students attending. CINSAM will partner with GearUp Kentucky schools, as well as other local schools, to identify talented students who will benefit from the opportunity to participate in these camps. After the research topics of the camps are finalized, partnerships with regional corporations or organizations, such as P&G, will be established to provide site visit opportunities for the students. The World Cultures Camp will be hosted by the university’s College of Education and Human Services in partnership with local elementary schools, which will identify and nominate gifted students to attend. The Global Center of Greater Cincinnati will serve as a regional partner for the project, providing educational program materials for the camps. The Global Center is a non-profit, non-partisan organization that frequently partners with area universities and schools on projects involving global issues. 5. Resources and Sustainability The INTERalliance IT Careers Camps will utilize facilities within the College of Informatics and the College will provide general support for the program. Additional resources will be available through the INTERalliance, which will provide in-kind services and financial contributions from the corporate sponsors. The INTERalliance IT Career Camp program at NKU will coordinate with other initiatives seeking to address the same regional need for IT talent by continuing a program that was piloted two summers ago by the INTERalliance and the University of Cincinnati. That program was highly successful and attracted twenty talented students from six high schools in
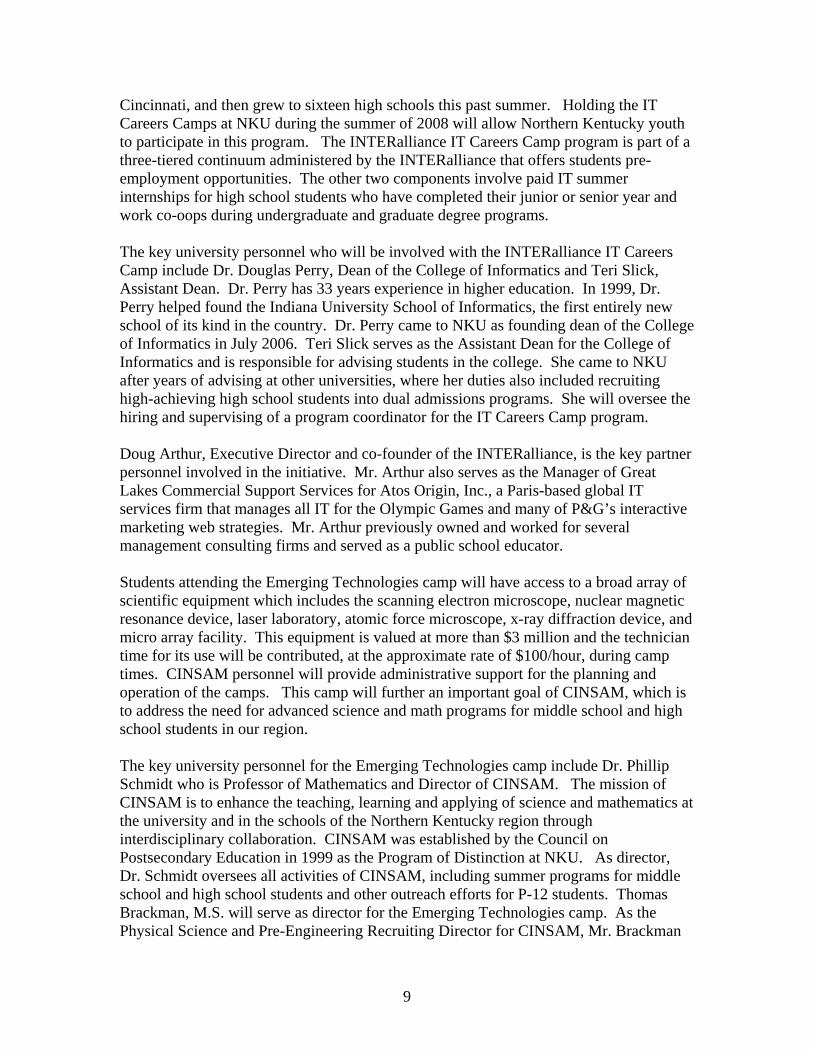
9
Cincinnati, and then grew to sixteen high schools this past summer. Holding the IT Careers Camps at NKU during the summer of 2008 will allow Northern Kentucky youth to participate in this program. The INTERalliance IT Careers Camp program is part of a three-tiered continuum administered by the INTERalliance that offers students pre-employment opportunities. The other two components involve paid IT summer internships for high school students who have completed their junior or senior year and work co-oops during undergraduate and graduate degree programs. The key university personnel who will be involved with the INTERalliance IT Careers Camp include Dr. Douglas Perry, Dean of the College of Informatics and Teri Slick, Assistant Dean. Dr. Perry has 33 years experience in higher education. In 1999, Dr. Perry helped found the Indiana University School of Informatics, the first entirely new school of its kind in the country. Dr. Perry came to NKU as founding dean of the College of Informatics in July 2006. Teri Slick serves as the Assistant Dean for the College of Informatics and is responsible for advising students in the college. She came to NKU after years of advising at other universities, where her duties also included recruiting high-achieving high school students into dual admissions programs. She will oversee the hiring and supervising of a program coordinator for the IT Careers Camp program. Doug Arthur, Executive Director and co-founder of the INTERalliance, is the key partner personnel involved in the initiative. Mr. Arthur also serves as the Manager of Great Lakes Commercial Support Services for Atos Origin, Inc., a Paris-based global IT services firm that manages all IT for the Olympic Games and many of P&G’s interactive marketing web strategies. Mr. Arthur previously owned and worked for several management consulting firms and served as a public school educator. Students attending the Emerging Technologies camp will have access to a broad array of scientific equipment which includes the scanning electron microscope, nuclear magnetic resonance device, laser laboratory, atomic force microscope, x-ray diffraction device, and micro array facility. This equipment is valued at more than $3 million and the technician time for its use will be contributed, at the approximate rate of $100/hour, during camp times. CINSAM personnel will provide administrative support for the planning and operation of the camps. This camp will further an important goal of CINSAM, which is to address the need for advanced science and math programs for middle school and high school students in our region. The key university personnel for the Emerging Technologies camp include Dr. Phillip Schmidt who is Professor of Mathematics and Director of CINSAM. The mission of CINSAM is to enhance the teaching, learning and applying of science and mathematics at the university and in the schools of the Northern Kentucky region through interdisciplinary collaboration. CINSAM was established by the Council on Postsecondary Education in 1999 as the Program of Distinction at NKU. As director, Dr. Schmidt oversees all activities of CINSAM, including summer programs for middle school and high school students and other outreach efforts for P-12 students. Thomas Brackman, M.S. will serve as director for the Emerging Technologies camp. As the Physical Science and Pre-Engineering Recruiting Director for CINSAM, Mr. Brackman
10
has developed and implemented a program designed to foster and build the interest of high school students in obtaining a degree in the physical sciences and/or pre-engineering. He has assisted in the development and coordination of the CINSAM summer Engineering Camp, Women in Engineering Camp, and forensic science camps. Prior to working at CINSAM, Mr. Brackman operated his own construction company and worked as an environmental hydrogeologist. The World Cultures Camp will utilize campus facilities, and will be staffed by university faculty as well as undergraduate and graduate international students. By partnering with the Global Center on this project, the camp will coordinate with other educational initiatives that seek to address global issues and cultural awareness in our region. The World Cultures Camp will be co-directed by Dr. Elaine Jarchow, Dean of the College of Education and Human Services, Dr. Mary Rozier, College of Education and Human Services faculty, and Ms. Viki Kimball, director of International Student Affairs for the university. Dr. Jarchow has extensive experience teaching and traveling abroad, and currently is spearheading an initiative to internationalize the university. Dr. Rozier has been an educator for over 40 years. Prior to joining NKU in 1999 as a full time faculty member, she worked as a teacher of grades 1-6, an administrator, principal and educational consultant. Dr. Rozier currently teaches in NKU’s Instructional Leadership Program. Viki Kimball oversees international student admissions and international student programming. In addition, her office aids international students with their general welfare and guides them in their relations within and outside of the university community so that they can be successful in achieving their educational goals. Ms. Kimball will direct the graduate and undergraduate international students who will participate in camp activities. 6. Evaluation Plan All of the summer camp programs will engage in formative evaluation on a daily basis. A daily student feedback form will provide information about which activities were considered most effective to the students. Daily staff debriefs and discussions at the end of each camp day will review each day’s activities to identify areas needing improvement, individual students requiring more attention, and successful activities that deserve retention in the camp programs. The outputs associated with the summer camps program will be student projects completed by participants in each of the respective camps. Students in the INTERalliance IT Careers Camp will design and deliver an IT solution for the “client” non-profit organization. The students will prepare a corresponding PowerPoint presentation that communicates the design, the business case, value proposition, and information about the development team. The “solutions” developed by the students will be evaluated based on the clients’ satisfaction and appropriateness for possible deployment and use in their organization. Students in the Emerging Technologies camp will complete a number of scientific investigations and present their findings during a
11
poster presentation celebration. The projects will be evaluated by CINSAM faculty and the students’ satisfaction with their projects will be measured. Students in the World Cultures Camp will present an international festival for their parents and invited guests on the closing day of the camp. At the festival, the students will share projects completed during the week and teach their parents some international greetings. While these projects will be more difficult to evaluate, parents’ satisfaction with the festival and presentations will be measured. Expected outcomes from the INTERalliance IT Careers Camp are changes in student attitudes, expectations, and understanding of the educational and career opportunities in IT available to the Northern Kentucky/Greater Cincinnati area. Testimonials from students who attended the IT Careers Camp last summer at the University of Cincinnati demonstrate that many of the student participants came to view IT as a possible career choice and saw the opportunities for employment in this region after participating in the camp. These expected outcomes will be evaluated through short and long term surveys to assess students’ attitudes toward careers in IT as well as their likelihood of pursuing educational and career opportunities in IT in the Northern Kentucky region. These outcomes are clearly linked to the region’s need to develop talent to meet the workforce demands of high technology businesses. Expected outcomes from the Emerging Technologies camp include increased knowledge for high ability students about advanced topics in science and math and changes in their attitudes about pursuing the study of these subjects in college. In addition to using attitude surveys given to students before and after the camp, the Emerging Technologies camp will design longitudinal studies of course-taking patterns and eventual college and major choices. These outcomes are clearly linked to the region’s need to develop talent in the disciplines of science and technology. Students in the World Cultures Camp will be expected to gain an intellectual curiosity about other cultures. Participating students as well as their parents will be surveyed to assess changes in students’ understanding and appreciation of the cultures studied during the camp. Teachers from the students’ school will be surveyed in the fall to determine changes in students’ enthusiasm for international topics and attitudes towards cultural diversity. The expected impacts of the project include increased enrollment in science, math and IT related undergraduate and graduate programs at NKU and other universities and colleges in the region as well as increased numbers of students pursuing science and technology careers in the Northern Kentucky region. Other expected impacts include an increased interest by younger students in our region in other cultures as well as a greater tolerance for diversity in our own region. These impacts will further the goals of Vision 2015 to achieve economic competitiveness in a region that welcomes diversity, The key indicators that will help monitor progress toward objectives are as follows:
1) INTERalliance IT Careers Camp: Student projects will receive direct feedback from their non-profit “clients” and actual use of the work products by these non-profit clients will be encouraged to the degree practicable. Corporate sponsors
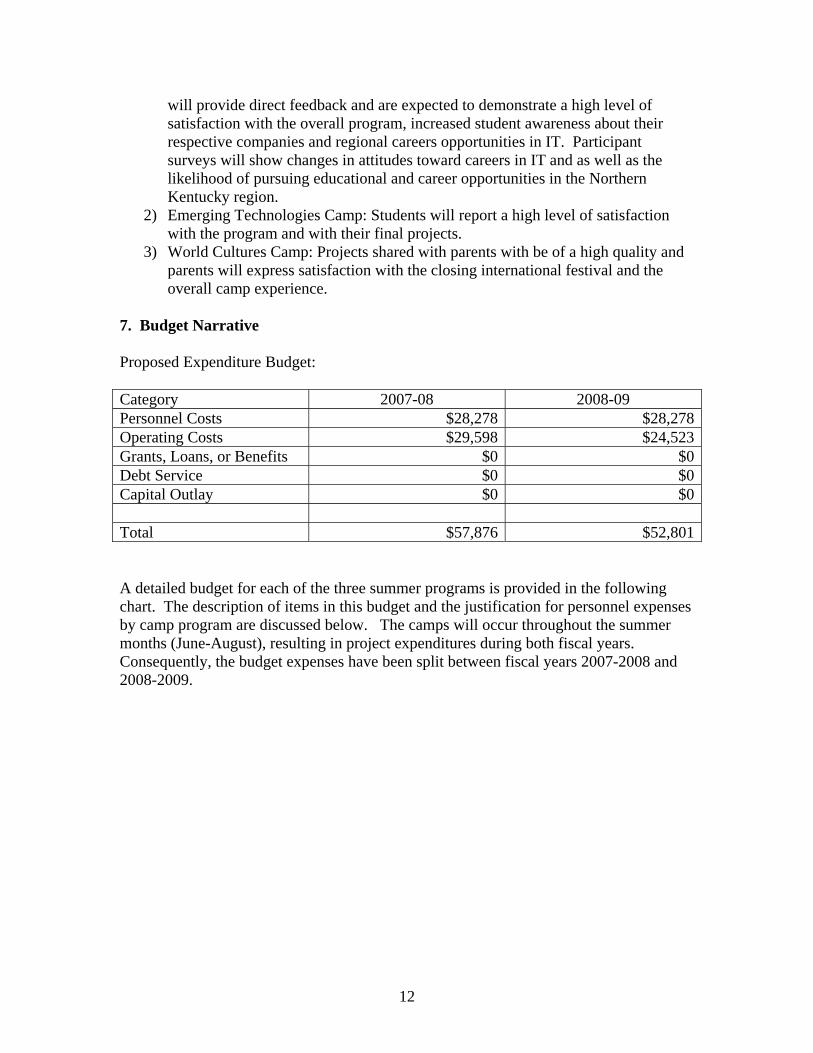
12
will provide direct feedback and are expected to demonstrate a high level of satisfaction with the overall program, increased student awareness about their respective companies and regional careers opportunities in IT. Participant surveys will show changes in attitudes toward careers in IT and as well as the likelihood of pursuing educational and career opportunities in the Northern Kentucky region.
2) Emerging Technologies Camp: Students will report a high level of satisfaction with the program and with their final projects.
3) World Cultures Camp: Projects shared with parents with be of a high quality and parents will express satisfaction with the closing international festival and the overall camp experience.
7. Budget Narrative Proposed Expenditure Budget: Category 2007-08 2008-09 Personnel Costs $28,278 $28,278Operating Costs $29,598 $24,523Grants, Loans, or Benefits $0 $0Debt Service $0 $0Capital Outlay $0 $0 Total $57,876 $52,801 A detailed budget for each of the three summer programs is provided in the following chart. The description of items in this budget and the justification for personnel expenses by camp program are discussed below. The camps will occur throughout the summer months (June-August), resulting in project expenditures during both fiscal years. Consequently, the budget expenses have been split between fiscal years 2007-2008 and 2008-2009.
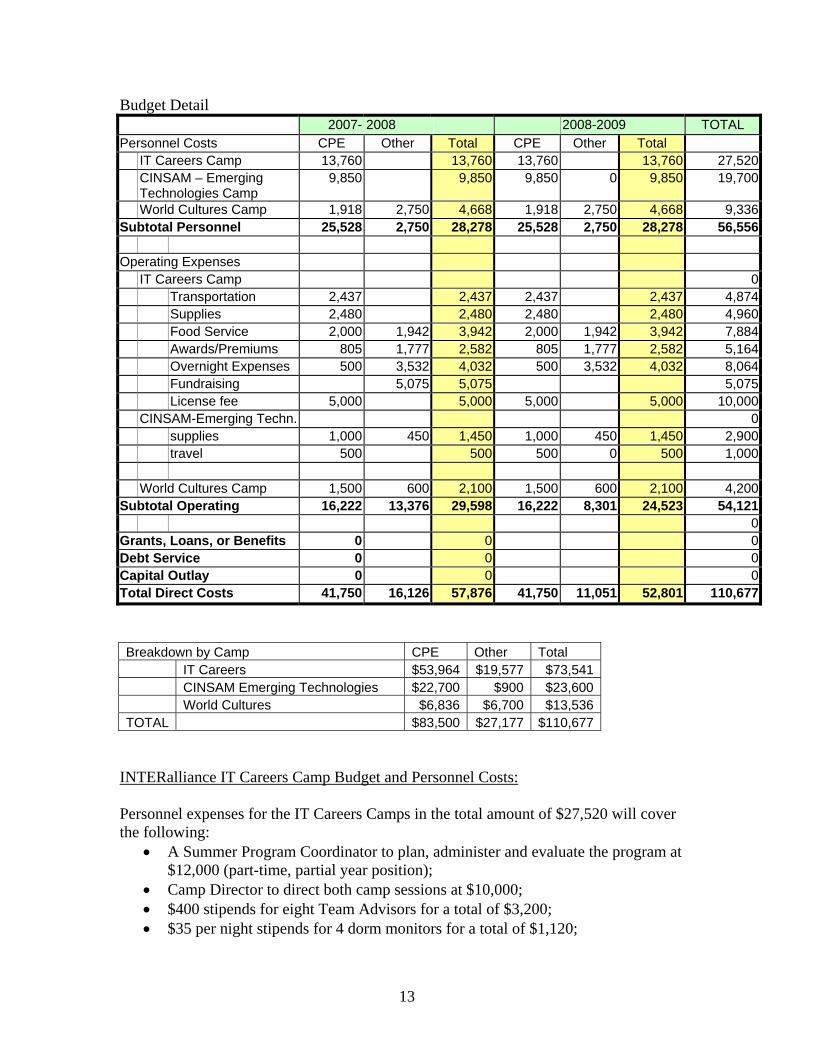
13
Budget Detail 2007- 2008 2008-2009 TOTAL
Personnel Costs CPE Other Total CPE Other Total IT Careers Camp 13,760 13,760 13,760 13,760 27,520 CINSAM – Emerging Technologies Camp
9,850 9,850 9,850 0 9,850 19,700
World Cultures Camp 1,918 2,750 4,668 1,918 2,750 4,668 9,336Subtotal Personnel 25,528 2,750 28,278 25,528 2,750 28,278 56,556
Operating Expenses
IT Careers Camp 0 Transportation 2,437 2,437 2,437 2,437 4,874 Supplies 2,480 2,480 2,480 2,480 4,960 Food Service 2,000 1,942 3,942 2,000 1,942 3,942 7,884 Awards/Premiums 805 1,777 2,582 805 1,777 2,582 5,164 Overnight Expenses 500 3,532 4,032 500 3,532 4,032 8,064 Fundraising 5,075 5,075 5,075 License fee 5,000 5,000 5,000 5,000 10,000 CINSAM-Emerging Techn. 0 supplies 1,000 450 1,450 1,000 450 1,450 2,900 travel 500 500 500 0 500 1,000 World Cultures Camp 1,500 600 2,100 1,500 600 2,100 4,200
Subtotal Operating 16,222 13,376 29,598 16,222 8,301 24,523 54,121 0
Grants, Loans, or Benefits 0 0 0Debt Service 0 0 0Capital Outlay 0 0 0Total Direct Costs 41,750 16,126 57,876 41,750 11,051 52,801 110,677 Breakdown by Camp CPE Other Total IT Careers $53,964 $19,577 $73,541 CINSAM Emerging Technologies $22,700 $900 $23,600 World Cultures $6,836 $6,700 $13,536 TOTAL $83,500 $27,177 $110,677
INTERalliance IT Careers Camp Budget and Personnel Costs: Personnel expenses for the IT Careers Camps in the total amount of $27,520 will cover the following:
• A Summer Program Coordinator to plan, administer and evaluate the program at $12,000 (part-time, partial year position);
• Camp Director to direct both camp sessions at $10,000; • $400 stipends for eight Team Advisors for a total of $3,200; • $35 per night stipends for 4 dorm monitors for a total of $1,120;
14
• One-day training of program development staff by Doug Arthur of INTERalliance plus eight hours of follow-up consulting work with sponsors to plan site activities for a total of $800 (16 hours at $50/hour);
• One-day training by Doug Arthur of INTERalliance of Program Director and staff who will work with the high school Team Advisors for a total of $400 (8 hours at $50/hour);
Operating expenses for the IT Careers Camp in the amount of $ 40,946 will cover the following:
• Transportation expense for site visits bus rental, parking and mileage reimbursement at $4,874;
• Supplies, which include binders, art supplies, student t-shirts, staff and sponsor polo shirts, banner and team flags, slideshow scrapbook/video editing supplies, copying, mailing supplies, and postage at $4,960;
• Food service expense for student meals, snacks, staff training dinner, Friday banquet lunches at $7,884;
• Awards/premiums, which include backpacks, flash memory sticks, medals, frames for certificates of participation, design contest plaques and director gifts/awards at $5,164.
• Overnight expense for student housing at $8,064; • Fundraising expenses related to corporate sponsorships at $5,075 (Regional
Stewardship grant funds will not be used to cover these expenses); • One- year license fee in the amount of $10,000 for use of all templates,
checklists, program materials necessary for operating the INTERalliance IT Careers Camp program, including registration forms, release forms, planning documents, vendor contracts, parent, school and sponsor communication templates, activity plan templates, award certificate templates.
Emerging Technologies (CINSAM) Camp Budget and Personnel Costs: Personnel expenses for the CINSAM Camps in the total amount of $19,700 will cover the following:
• Faculty salary for 6 hours work/per camp day at $50-65/hour (depending on annual salary);
• Student assistant salary for 4 hours/day at $12/hour; • School teacher assistant for 4 hours/day at $30/hour; • Camp director at a cost of one month summer salary of $4,250.
Operating expenses for the CINSAM Camps in the amount of $3,900 will cover the following:
• Supplies and food at $2,900; • Travel to field and/or career/related sites at $1,000.
15
World Cultures Camp Budget and Personnel Costs: Personnel expenses for the World Cultures camp in the amount of $3,836 will cover the faculty salary of Dr. Mary Rozier to coordinate the camp. Personnel expenses in the amount of $5,500 for student workers assisting with the camps will be covered by university institutional work study funding. Operating expenses for the World Cultures Camp in the amount of $4,200 will cover supplies, food and all expenses related to the international festival on the closing day of the camp. Sources of cost sharing and match: Corporate sponsors will provide $18,177 in operating costs for the INTERalliance IT Careers Camp. Student participant fees for all three camps will contribute $3,500 toward the total budget expenses. The university will contribute $5,500 of institutional work study funds to cover student worker salaries. These funds combined equal $27,177 in cost share.
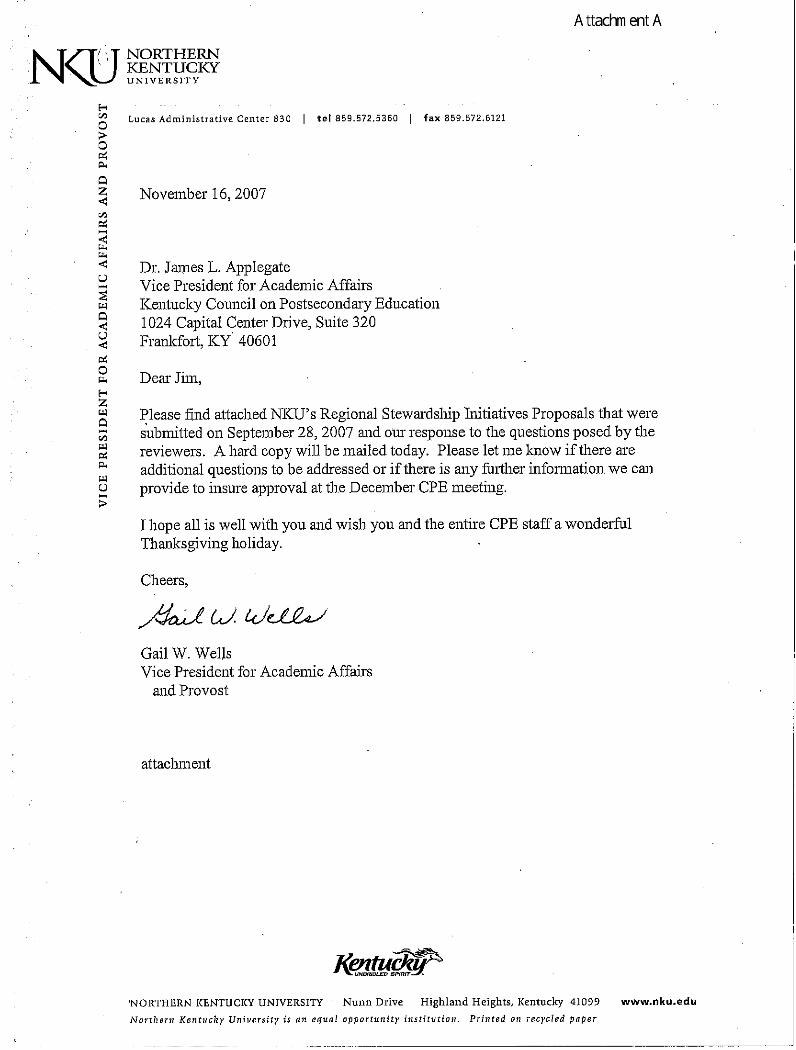
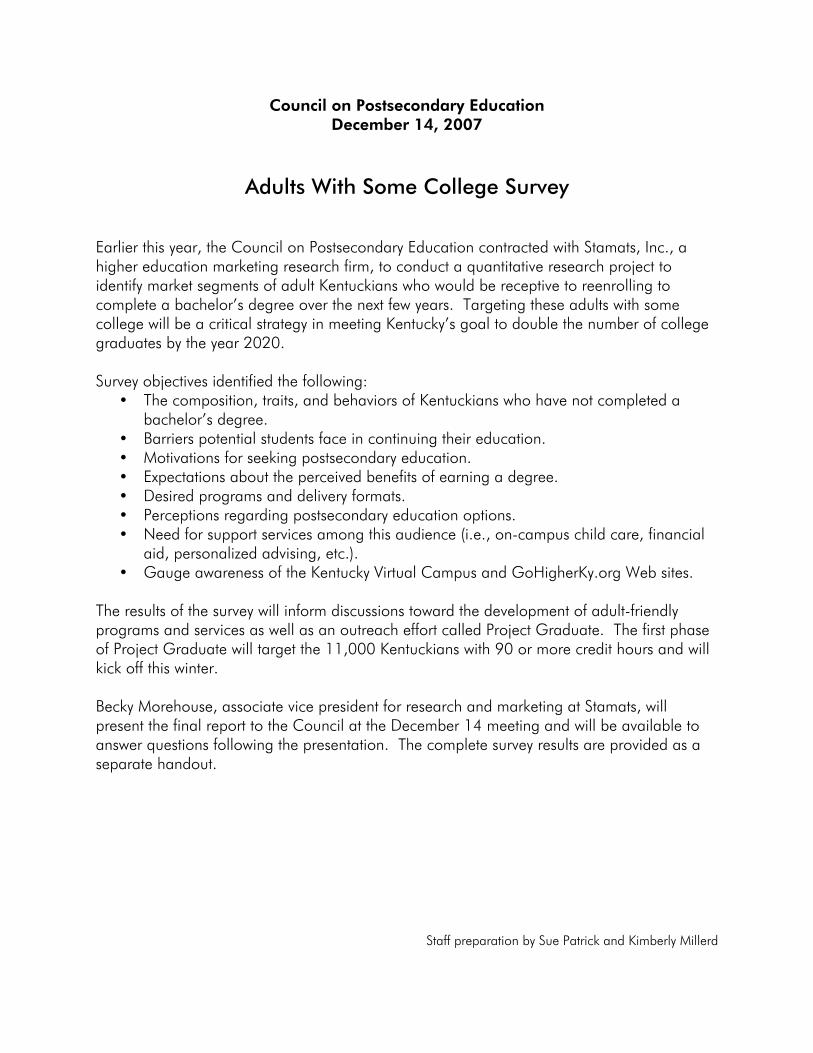
Council on Postsecondary Education December 14, 2007
Adults With Some College Survey
Earlier this year, the Council on Postsecondary Education contracted with Stamats, Inc., a higher education marketing research firm, to conduct a quantitative research project to identify market segments of adult Kentuckians who would be receptive to reenrolling to complete a bachelor’s degree over the next few years. Targeting these adults with some college will be a critical strategy in meeting Kentucky’s goal to double the number of college graduates by the year 2020. Survey objectives identified the following:
The composition, traits, and behaviors of Kentuckians who have not completed a bachelor’s degree.
Barriers potential students face in continuing their education. Motivations for seeking postsecondary education. Expectations about the perceived benefits of earning a degree. Desired programs and delivery formats. Perceptions regarding postsecondary education options. Need for support services among this audience (i.e., on-campus child care, financial
aid, personalized advising, etc.). Gauge awareness of the Kentucky Virtual Campus and GoHigherKy.org Web sites.
The results of the survey will inform discussions toward the development of adult-friendly programs and services as well as an outreach effort called Project Graduate. The first phase of Project Graduate will target the 11,000 Kentuckians with 90 or more credit hours and will kick off this winter. Becky Morehouse, associate vice president for research and marketing at Stamats, will present the final report to the Council at the December 14 meeting and will be available to answer questions following the presentation. The complete survey results are provided as a separate handout.
Staff preparation by Sue Patrick and Kimberly Millerd
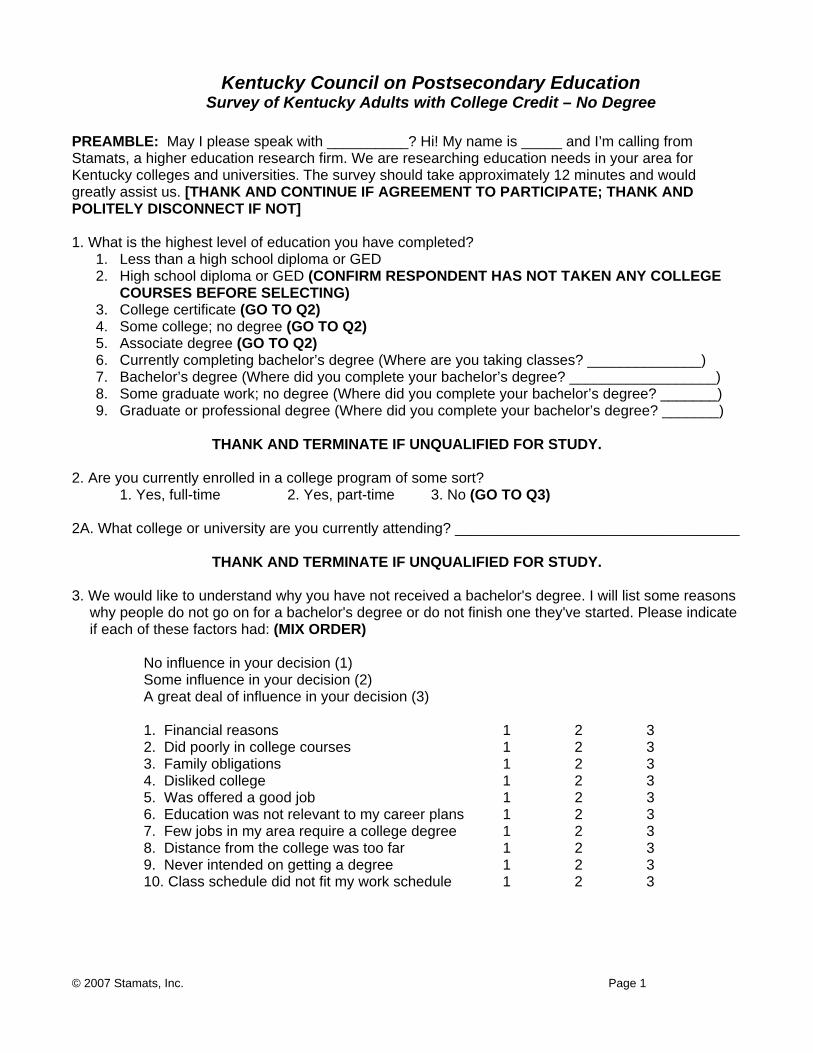
© 2007 Stamats, Inc. Page 1
Kentucky Council on Postsecondary Education Survey of Kentucky Adults with College Credit – No Degree
PREAMBLE: May I please speak with __________? Hi! My name is _____ and I’m calling from Stamats, a higher education research firm. We are researching education needs in your area for Kentucky colleges and universities. The survey should take approximately 12 minutes and would greatly assist us. [THANK AND CONTINUE IF AGREEMENT TO PARTICIPATE; THANK AND POLITELY DISCONNECT IF NOT] 1. What is the highest level of education you have completed?
1. Less than a high school diploma or GED 2. High school diploma or GED (CONFIRM RESPONDENT HAS NOT TAKEN ANY COLLEGE
COURSES BEFORE SELECTING) 3. College certificate (GO TO Q2) 4. Some college; no degree (GO TO Q2) 5. Associate degree (GO TO Q2) 6. Currently completing bachelor’s degree (Where are you taking classes? ______________) 7. Bachelor’s degree (Where did you complete your bachelor’s degree? __________________) 8. Some graduate work; no degree (Where did you complete your bachelor’s degree? _______) 9. Graduate or professional degree (Where did you complete your bachelor’s degree? _______)
THANK AND TERMINATE IF UNQUALIFIED FOR STUDY.
2. Are you currently enrolled in a college program of some sort? 1. Yes, full-time 2. Yes, part-time 3. No (GO TO Q3) 2A. What college or university are you currently attending? ___________________________________
THANK AND TERMINATE IF UNQUALIFIED FOR STUDY. 3. We would like to understand why you have not received a bachelor's degree. I will list some reasons
why people do not go on for a bachelor's degree or do not finish one they've started. Please indicate if each of these factors had: (MIX ORDER)
No influence in your decision (1) Some influence in your decision (2) A great deal of influence in your decision (3)
1. Financial reasons 1 2 3 2. Did poorly in college courses 1 2 3 3. Family obligations 1 2 3 4. Disliked college 1 2 3 5. Was offered a good job 1 2 3 6. Education was not relevant to my career plans 1 2 3 7. Few jobs in my area require a college degree 1 2 3 8. Distance from the college was too far 1 2 3 9. Never intended on getting a degree 1 2 3 10. Class schedule did not fit my work schedule 1 2 3
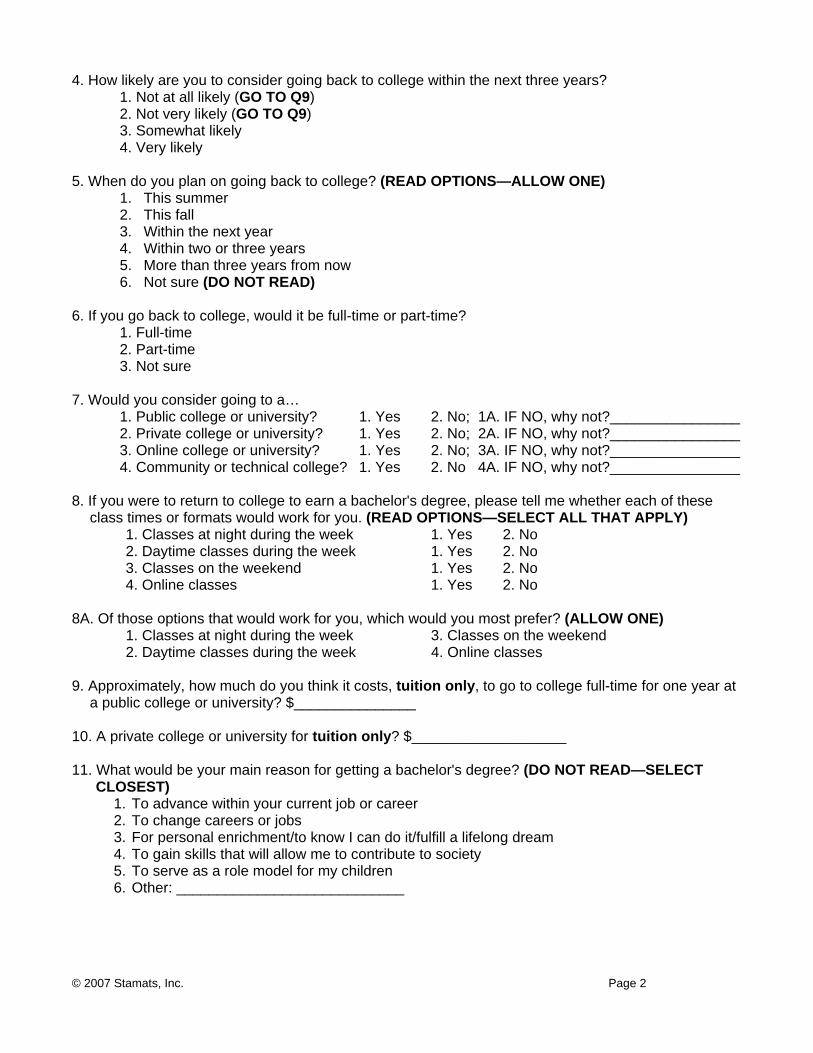
© 2007 Stamats, Inc. Page 2
4. How likely are you to consider going back to college within the next three years? 1. Not at all likely (GO TO Q9) 2. Not very likely (GO TO Q9) 3. Somewhat likely 4. Very likely 5. When do you plan on going back to college? (READ OPTIONS—ALLOW ONE)
1. This summer 2. This fall 3. Within the next year 4. Within two or three years 5. More than three years from now 6. Not sure (DO NOT READ)
6. If you go back to college, would it be full-time or part-time? 1. Full-time 2. Part-time 3. Not sure 7. Would you consider going to a… 1. Public college or university? 1. Yes 2. No; 1A. IF NO, why not?________________ 2. Private college or university? 1. Yes 2. No; 2A. IF NO, why not?________________ 3. Online college or university? 1. Yes 2. No; 3A. IF NO, why not?________________ 4. Community or technical college? 1. Yes 2. No 4A. IF NO, why not?________________ 8. If you were to return to college to earn a bachelor's degree, please tell me whether each of these
class times or formats would work for you. (READ OPTIONS—SELECT ALL THAT APPLY) 1. Classes at night during the week 1. Yes 2. No 2. Daytime classes during the week 1. Yes 2. No 3. Classes on the weekend 1. Yes 2. No 4. Online classes 1. Yes 2. No
8A. Of those options that would work for you, which would you most prefer? (ALLOW ONE)
1. Classes at night during the week 3. Classes on the weekend 2. Daytime classes during the week 4. Online classes
9. Approximately, how much do you think it costs, tuition only, to go to college full-time for one year at
a public college or university? $_______________ 10. A private college or university for tuition only? $___________________ 11. What would be your main reason for getting a bachelor's degree? (DO NOT READ—SELECT
CLOSEST) 1. To advance within your current job or career 2. To change careers or jobs 3. For personal enrichment/to know I can do it/fulfill a lifelong dream 4. To gain skills that will allow me to contribute to society 5. To serve as a role model for my children 6. Other: ____________________________
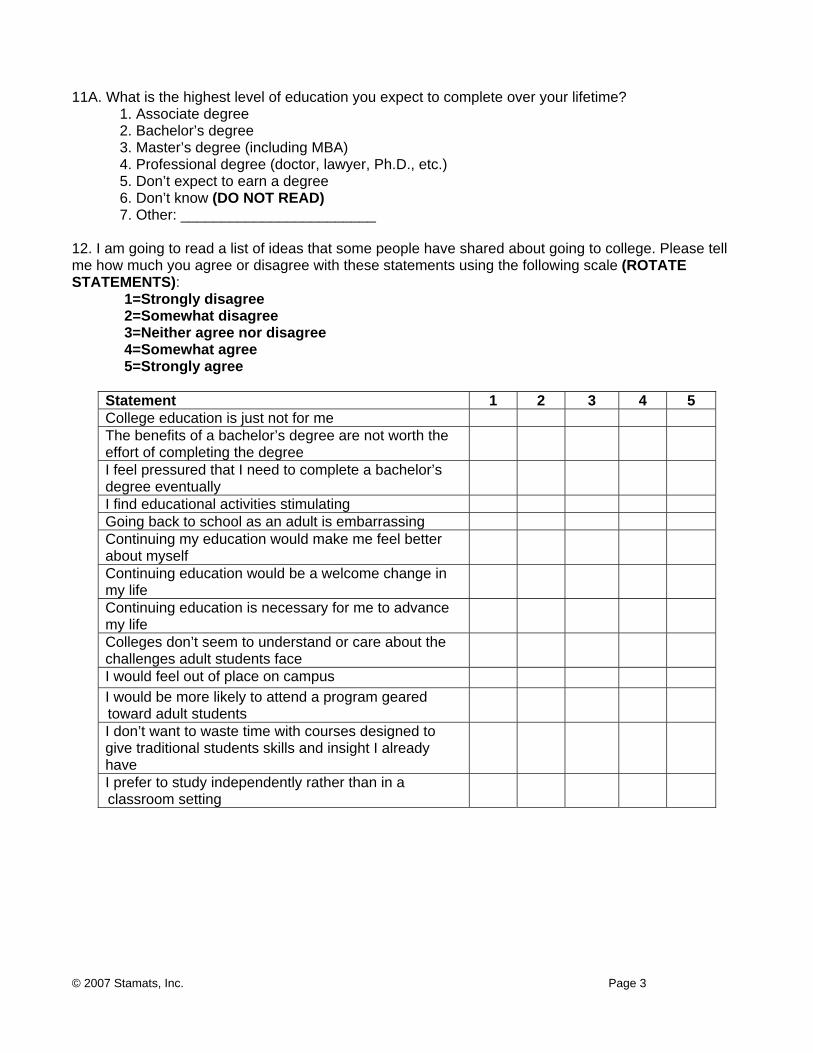
© 2007 Stamats, Inc. Page 3
11A. What is the highest level of education you expect to complete over your lifetime?
1. Associate degree 2. Bachelor’s degree 3. Master’s degree (including MBA) 4. Professional degree (doctor, lawyer, Ph.D., etc.) 5. Don’t expect to earn a degree 6. Don’t know (DO NOT READ) 7. Other: ________________________
12. I am going to read a list of ideas that some people have shared about going to college. Please tell me how much you agree or disagree with these statements using the following scale (ROTATE STATEMENTS):
1=Strongly disagree 2=Somewhat disagree 3=Neither agree nor disagree 4=Somewhat agree 5=Strongly agree
Statement 1 2 3 4 5 College education is just not for me The benefits of a bachelor’s degree are not worth the effort of completing the degree
I feel pressured that I need to complete a bachelor’s degree eventually
I find educational activities stimulating Going back to school as an adult is embarrassing Continuing my education would make me feel better about myself
Continuing education would be a welcome change in my life
Continuing education is necessary for me to advance my life
Colleges don’t seem to understand or care about the challenges adult students face
I would feel out of place on campus I would be more likely to attend a program geared toward adult students
I don’t want to waste time with courses designed to give traditional students skills and insight I already have
I prefer to study independently rather than in a classroom setting
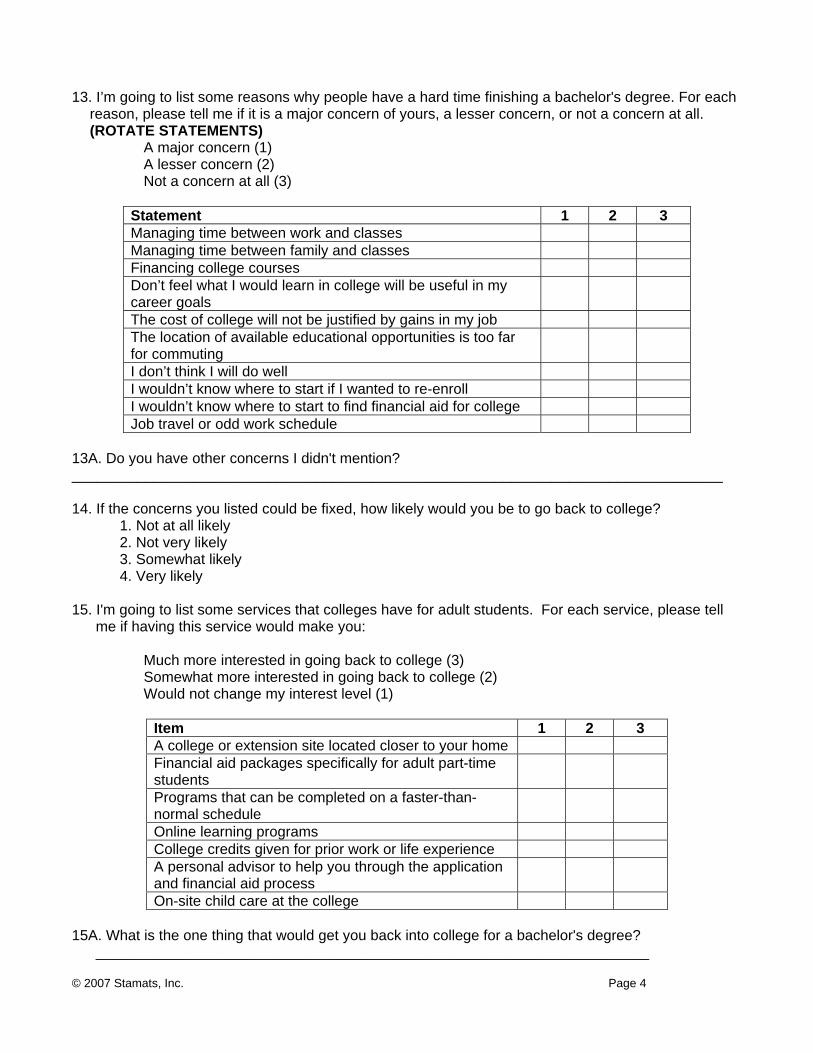
© 2007 Stamats, Inc. Page 4
13. I’m going to list some reasons why people have a hard time finishing a bachelor's degree. For each
reason, please tell me if it is a major concern of yours, a lesser concern, or not a concern at all. (ROTATE STATEMENTS)
A major concern (1) A lesser concern (2) Not a concern at all (3)
Statement 1 2 3 Managing time between work and classes Managing time between family and classes Financing college courses Don’t feel what I would learn in college will be useful in my career goals
The cost of college will not be justified by gains in my job The location of available educational opportunities is too far for commuting
I don’t think I will do well I wouldn’t know where to start if I wanted to re-enroll I wouldn’t know where to start to find financial aid for college Job travel or odd work schedule
13A. Do you have other concerns I didn't mention? ________________________________________________________________________________ 14. If the concerns you listed could be fixed, how likely would you be to go back to college? 1. Not at all likely 2. Not very likely 3. Somewhat likely 4. Very likely 15. I'm going to list some services that colleges have for adult students. For each service, please tell
me if having this service would make you: Much more interested in going back to college (3) Somewhat more interested in going back to college (2) Would not change my interest level (1)
Item 1 2 3 A college or extension site located closer to your home Financial aid packages specifically for adult part-time students
Programs that can be completed on a faster-than-normal schedule
Online learning programs College credits given for prior work or life experience A personal advisor to help you through the application and financial aid process
On-site child care at the college
15A. What is the one thing that would get you back into college for a bachelor's degree? ____________________________________________________________________
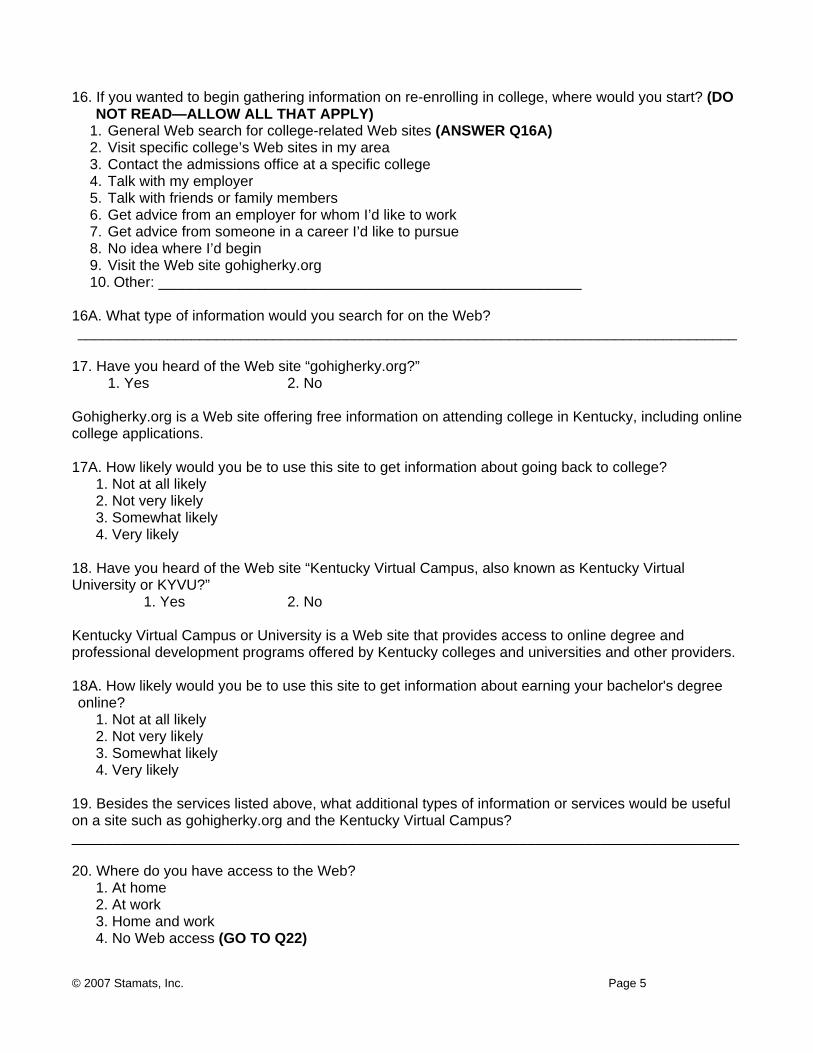
© 2007 Stamats, Inc. Page 5
16. If you wanted to begin gathering information on re-enrolling in college, where would you start? (DO
NOT READ—ALLOW ALL THAT APPLY) 1. General Web search for college-related Web sites (ANSWER Q16A) 2. Visit specific college’s Web sites in my area 3. Contact the admissions office at a specific college 4. Talk with my employer 5. Talk with friends or family members 6. Get advice from an employer for whom I’d like to work 7. Get advice from someone in a career I’d like to pursue 8. No idea where I’d begin 9. Visit the Web site gohigherky.org 10. Other: ____________________________________________________
16A. What type of information would you search for on the Web? _________________________________________________________________________________
17. Have you heard of the Web site “gohigherky.org?” 1. Yes 2. No Gohigherky.org is a Web site offering free information on attending college in Kentucky, including online college applications. 17A. How likely would you be to use this site to get information about going back to college? 1. Not at all likely 2. Not very likely 3. Somewhat likely 4. Very likely 18. Have you heard of the Web site “Kentucky Virtual Campus, also known as Kentucky Virtual University or KYVU?” 1. Yes 2. No Kentucky Virtual Campus or University is a Web site that provides access to online degree and professional development programs offered by Kentucky colleges and universities and other providers. 18A. How likely would you be to use this site to get information about earning your bachelor's degree online?
1. Not at all likely 2. Not very likely 3. Somewhat likely 4. Very likely 19. Besides the services listed above, what additional types of information or services would be useful on a site such as gohigherky.org and the Kentucky Virtual Campus? __________________________________________________________________________________ 20. Where do you have access to the Web? 1. At home
2. At work 3. Home and work 4. No Web access (GO TO Q22)
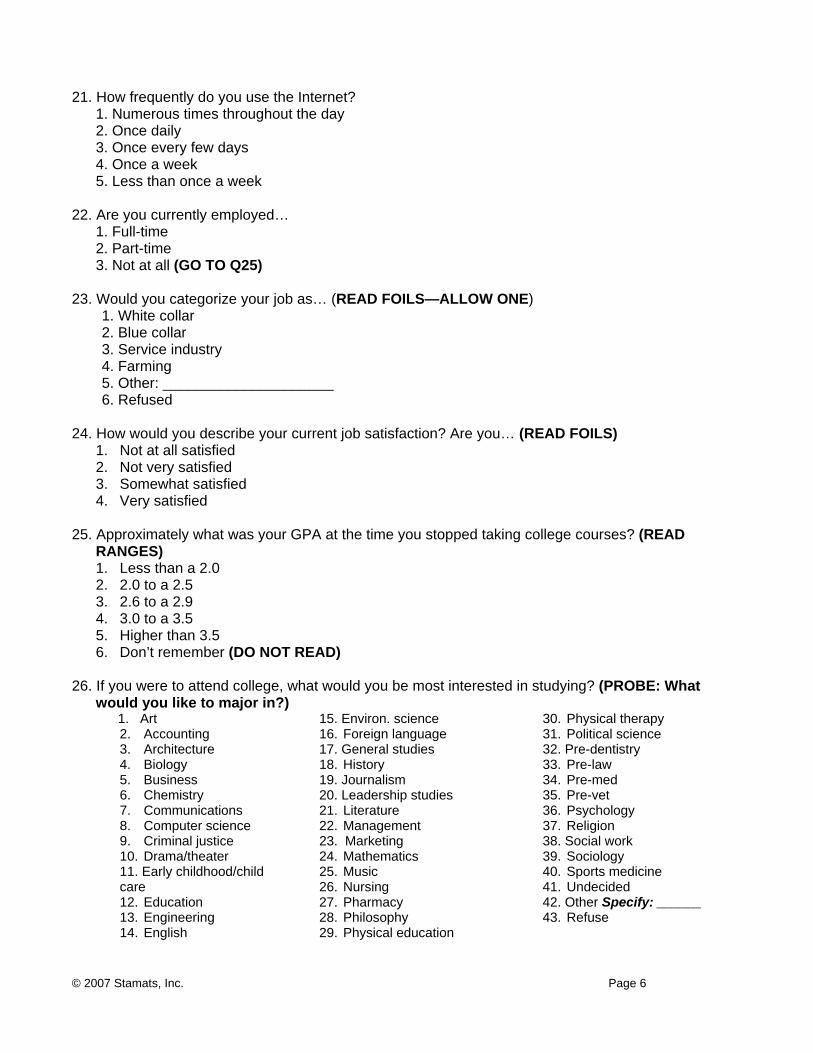
© 2007 Stamats, Inc. Page 6
21. How frequently do you use the Internet? 1. Numerous times throughout the day 2. Once daily 3. Once every few days 4. Once a week 5. Less than once a week 22. Are you currently employed… 1. Full-time 2. Part-time 3. Not at all (GO TO Q25)
23. Would you categorize your job as… (READ FOILS—ALLOW ONE)
1. White collar 2. Blue collar 3. Service industry 4. Farming 5. Other: _____________________ 6. Refused
24. How would you describe your current job satisfaction? Are you… (READ FOILS)
1. Not at all satisfied 2. Not very satisfied 3. Somewhat satisfied 4. Very satisfied
25. Approximately what was your GPA at the time you stopped taking college courses? (READ
RANGES) 1. Less than a 2.0 2. 2.0 to a 2.5 3. 2.6 to a 2.9 4. 3.0 to a 3.5 5. Higher than 3.5 6. Don’t remember (DO NOT READ)
26. If you were to attend college, what would you be most interested in studying? (PROBE: What
would you like to major in?) 1. Art 30. Physical therapy
2. Accounting 31. Political science 3. Architecture 32. Pre-dentistry 4. Biology 33. Pre-law 5. Business 34. Pre-med 6. Chemistry 35. Pre-vet 7. Communications 36. Psychology 8. Computer science 37. Religion 9. Criminal justice 38. Social work 10. Drama/theater 39. Sociology 11. Early childhood/child care 12. Education 42. Other Specify: ______13. Engineering 43. Refuse 14. English
15. Environ. science 16. Foreign language 17. General studies 18. History 19. Journalism 20. Leadership studies 21. Literature 22. Management 23. Marketing 24. Mathematics 25. Music 26. Nursing 27. Pharmacy 28. Philosophy 29. Physical education
40. Sports medicine41. Undecided

© 2007 Stamats, Inc. Page 7
27. What is your marital status?
1. Single – never married 2. Married (ANSWER Q27A) 3. Divorced 4. Widow 5. Other: ________________ 6. Refused to answer
27A. What is the highest level of education held by your spouse?
1. High school diploma or less 2. Some college; no degree 3. Associate degree 4. Currently completing bachelor’s degree 5. Bachelor’s degree 6. Some graduate work; no degree 7. Graduate or professional degree
28. How many children under the age of 18 do you have living in your household? ________
29. Approximately what is your annual household income? (READ OPTIONS—ALLOW ONE)
1. Less than $25,000 2. $25,000 to less than $50,000 3. $50,000 to less than $75,000 4. $75,000 to less than $100,000
5. $100,000 to $150,000 6. More than $150,000 7. Don’t wish to reveal (DO NOT READ)
30. What is your age? _________
31. Finally, do you have additional comments you would like to share with us? ______________________________________________________________________________________________________________________________________________________________
Thank you for your time and help!
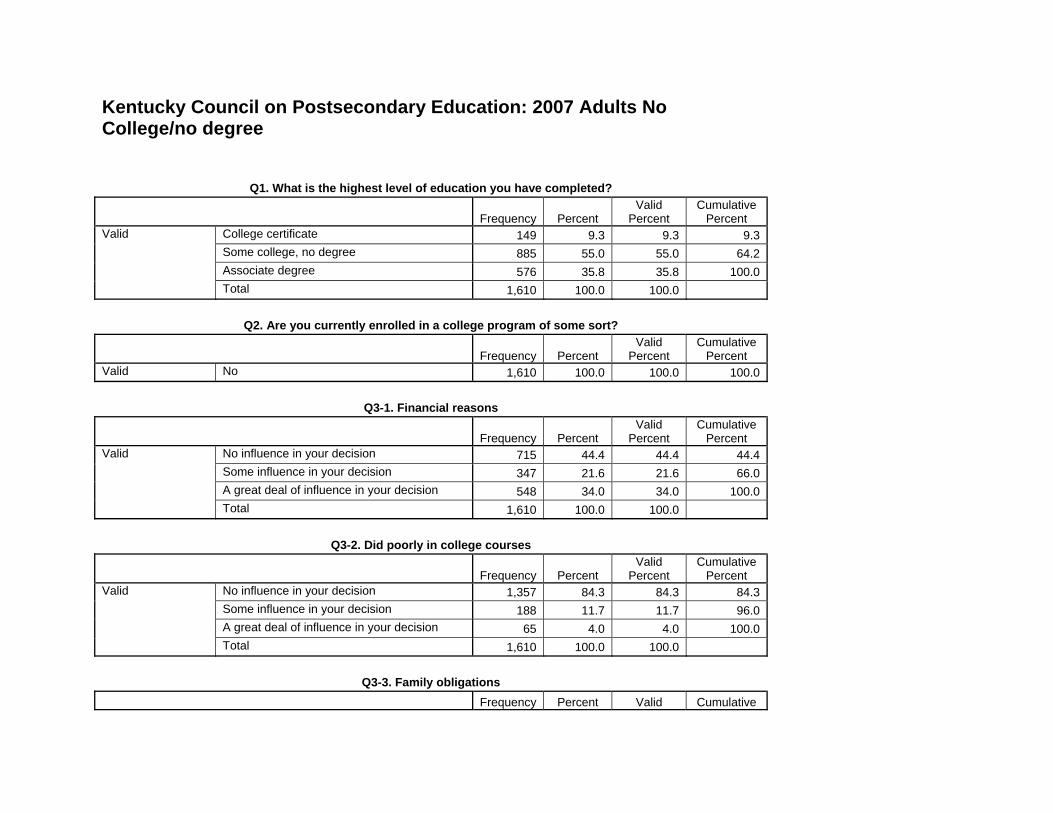
Kentucky Council on Postsecondary Education: 2007 Adults No College/no degree
Q1. What is the highest level of education you have completed?
Frequency Percent Valid
Percent Cumulative
Percent College certificate 149 9.3 9.3 9.3Some college, no degree 885 55.0 55.0 64.2Associate degree 576 35.8 35.8 100.0
Valid
Total 1,610 100.0 100.0
Q2. Are you currently enrolled in a college program of some sort?
Frequency Percent Valid
Percent Cumulative
Percent Valid No 1,610 100.0 100.0 100.0
Q3-1. Financial reasons
Frequency Percent Valid
Percent Cumulative
Percent No influence in your decision 715 44.4 44.4 44.4Some influence in your decision 347 21.6 21.6 66.0A great deal of influence in your decision 548 34.0 34.0 100.0
Valid
Total 1,610 100.0 100.0
Q3-2. Did poorly in college courses
Frequency Percent Valid
Percent Cumulative
Percent No influence in your decision 1,357 84.3 84.3 84.3Some influence in your decision 188 11.7 11.7 96.0A great deal of influence in your decision 65 4.0 4.0 100.0
Valid
Total 1,610 100.0 100.0
Q3-3. Family obligations Frequency Percent Valid Cumulative
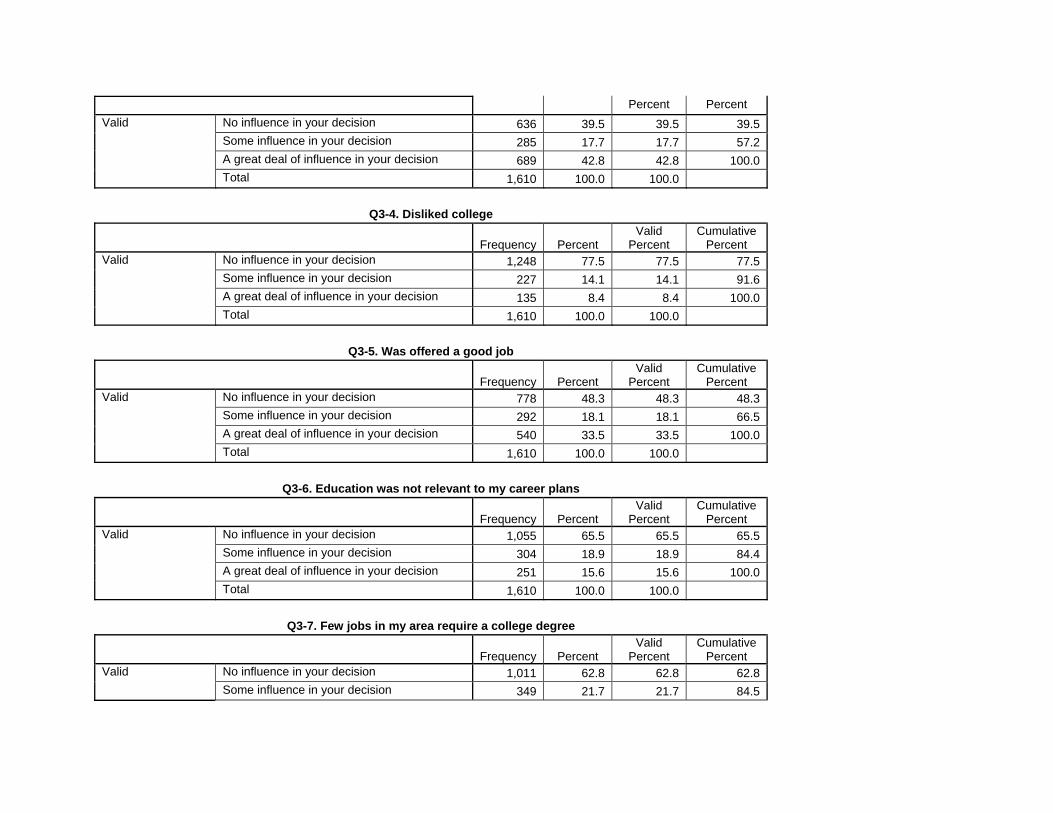
Percent Percent No influence in your decision 636 39.5 39.5 39.5Some influence in your decision 285 17.7 17.7 57.2A great deal of influence in your decision 689 42.8 42.8 100.0
Valid
Total 1,610 100.0 100.0
Q3-4. Disliked college
Frequency Percent Valid
Percent Cumulative
Percent No influence in your decision 1,248 77.5 77.5 77.5Some influence in your decision 227 14.1 14.1 91.6A great deal of influence in your decision 135 8.4 8.4 100.0
Valid
Total 1,610 100.0 100.0
Q3-5. Was offered a good job
Frequency Percent Valid
Percent Cumulative
Percent No influence in your decision 778 48.3 48.3 48.3Some influence in your decision 292 18.1 18.1 66.5A great deal of influence in your decision 540 33.5 33.5 100.0
Valid
Total 1,610 100.0 100.0
Q3-6. Education was not relevant to my career plans
Frequency Percent Valid
Percent Cumulative
Percent No influence in your decision 1,055 65.5 65.5 65.5Some influence in your decision 304 18.9 18.9 84.4A great deal of influence in your decision 251 15.6 15.6 100.0
Valid
Total 1,610 100.0 100.0
Q3-7. Few jobs in my area require a college degree
Frequency Percent Valid
Percent Cumulative
Percent No influence in your decision 1,011 62.8 62.8 62.8Valid Some influence in your decision 349 21.7 21.7 84.5
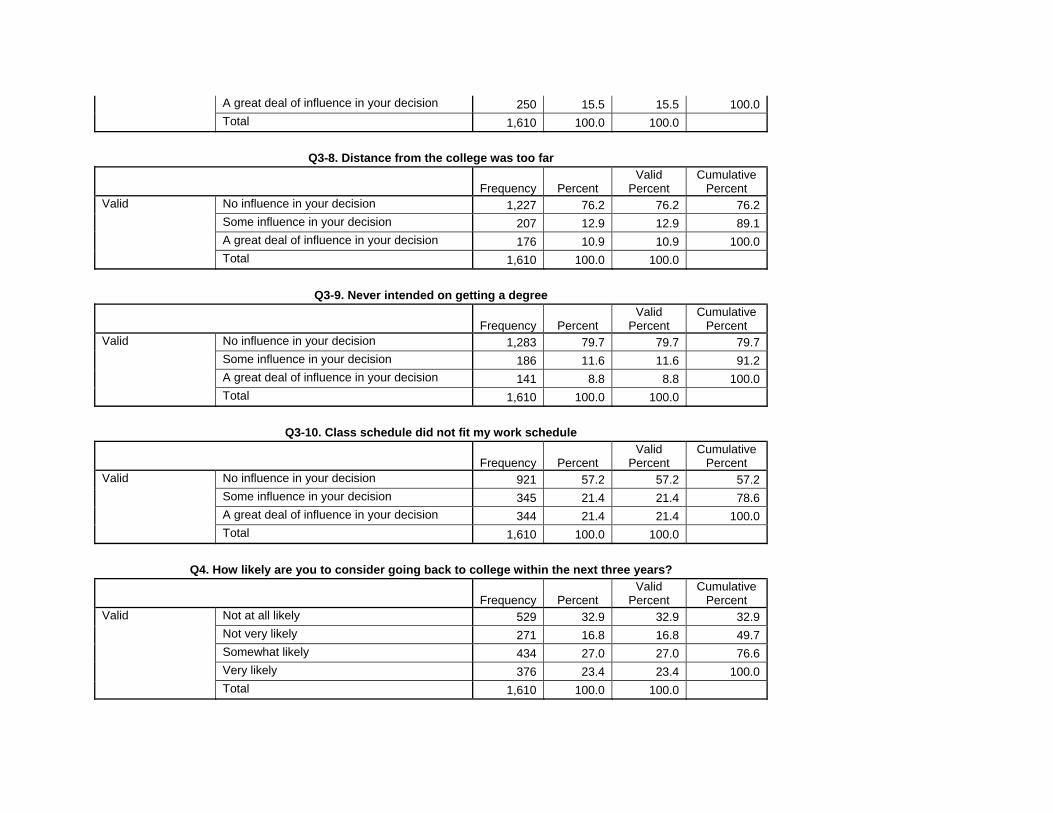
A great deal of influence in your decision 250 15.5 15.5 100.0Total 1,610 100.0 100.0
Q3-8. Distance from the college was too far
Frequency Percent Valid
Percent Cumulative
Percent No influence in your decision 1,227 76.2 76.2 76.2Some influence in your decision 207 12.9 12.9 89.1A great deal of influence in your decision 176 10.9 10.9 100.0
Valid
Total 1,610 100.0 100.0
Q3-9. Never intended on getting a degree
Frequency Percent Valid
Percent Cumulative
Percent No influence in your decision 1,283 79.7 79.7 79.7Some influence in your decision 186 11.6 11.6 91.2A great deal of influence in your decision 141 8.8 8.8 100.0
Valid
Total 1,610 100.0 100.0
Q3-10. Class schedule did not fit my work schedule
Frequency Percent Valid
Percent Cumulative
Percent No influence in your decision 921 57.2 57.2 57.2Some influence in your decision 345 21.4 21.4 78.6A great deal of influence in your decision 344 21.4 21.4 100.0
Valid
Total 1,610 100.0 100.0
Q4. How likely are you to consider going back to college within the next three years?
Frequency Percent Valid
Percent Cumulative
Percent Not at all likely 529 32.9 32.9 32.9Not very likely 271 16.8 16.8 49.7Somewhat likely 434 27.0 27.0 76.6Very likely 376 23.4 23.4 100.0
Valid
Total 1,610 100.0 100.0
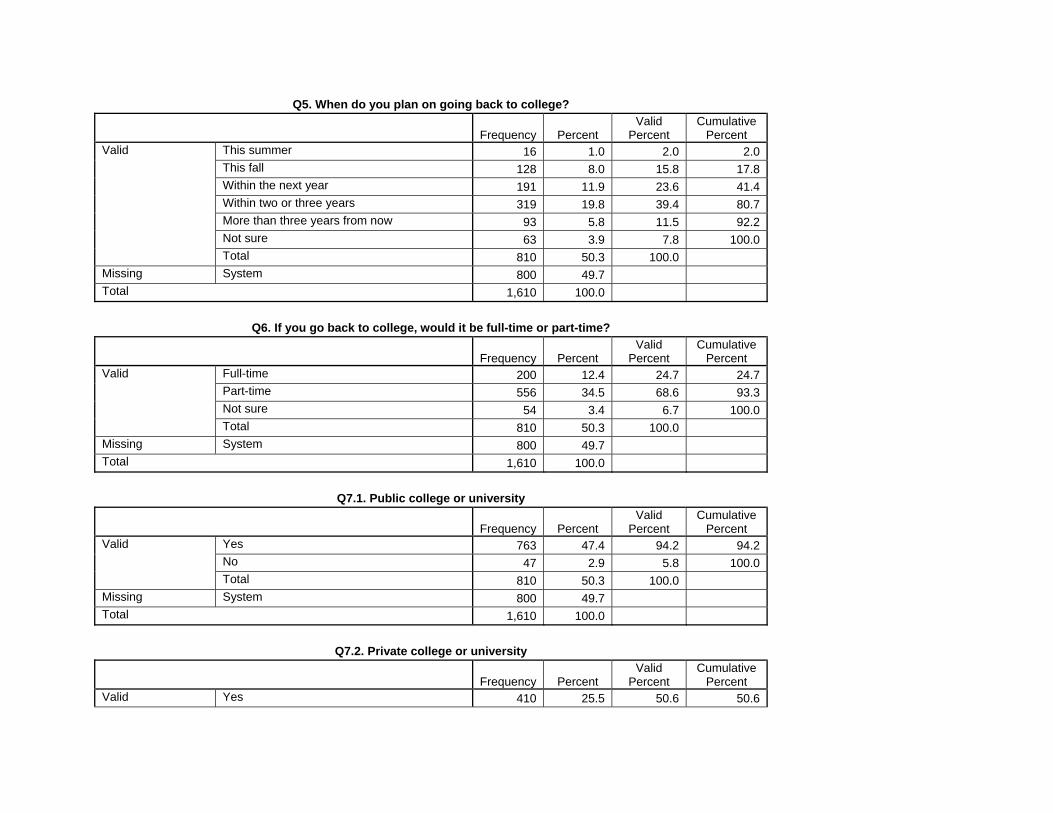
Q5. When do you plan on going back to college?
Frequency Percent Valid
Percent Cumulative
Percent This summer 16 1.0 2.0 2.0This fall 128 8.0 15.8 17.8Within the next year 191 11.9 23.6 41.4Within two or three years 319 19.8 39.4 80.7More than three years from now 93 5.8 11.5 92.2Not sure 63 3.9 7.8 100.0
Valid
Total 810 50.3 100.0 Missing System 800 49.7 Total 1,610 100.0
Q6. If you go back to college, would it be full-time or part-time?
Frequency Percent Valid
Percent Cumulative
Percent Full-time 200 12.4 24.7 24.7Part-time 556 34.5 68.6 93.3Not sure 54 3.4 6.7 100.0
Valid
Total 810 50.3 100.0 Missing System 800 49.7 Total 1,610 100.0
Q7.1. Public college or university
Frequency Percent Valid
Percent Cumulative
Percent Yes 763 47.4 94.2 94.2No 47 2.9 5.8 100.0
Valid
Total 810 50.3 100.0 Missing System 800 49.7 Total 1,610 100.0
Q7.2. Private college or university
Frequency Percent Valid
Percent Cumulative
Percent Valid Yes 410 25.5 50.6 50.6
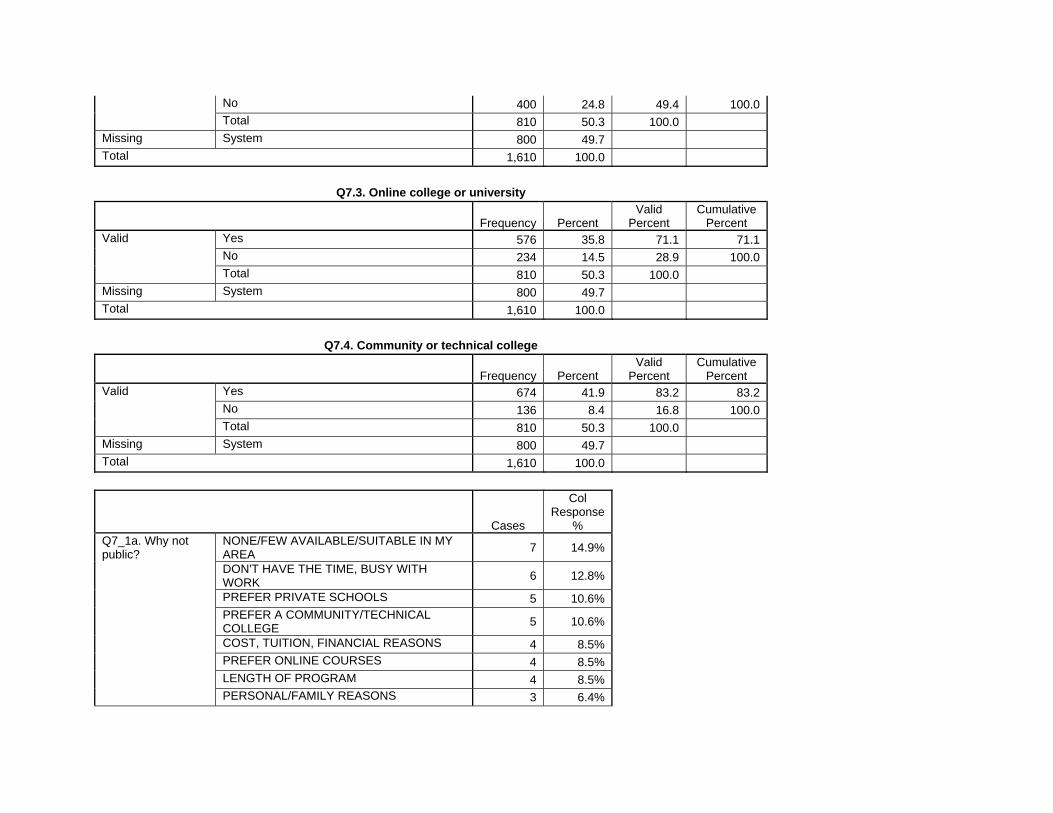
No 400 24.8 49.4 100.0Total 810 50.3 100.0
Missing System 800 49.7 Total 1,610 100.0
Q7.3. Online college or university
Frequency Percent Valid
Percent Cumulative
Percent Yes 576 35.8 71.1 71.1No 234 14.5 28.9 100.0
Valid
Total 810 50.3 100.0 Missing System 800 49.7 Total 1,610 100.0
Q7.4. Community or technical college
Frequency Percent Valid
Percent Cumulative
Percent Yes 674 41.9 83.2 83.2No 136 8.4 16.8 100.0
Valid
Total 810 50.3 100.0 Missing System 800 49.7 Total 1,610 100.0
Cases
Col Response
% NONE/FEW AVAILABLE/SUITABLE IN MY AREA 7 14.9% DON'T HAVE THE TIME, BUSY WITH WORK 6 12.8% PREFER PRIVATE SCHOOLS 5 10.6% PREFER A COMMUNITY/TECHNICAL COLLEGE 5 10.6% COST, TUITION, FINANCIAL REASONS 4 8.5% PREFER ONLINE COURSES 4 8.5% LENGTH OF PROGRAM 4 8.5%
Q7_1a. Why not public?
PERSONAL/FAMILY REASONS 3 6.4%
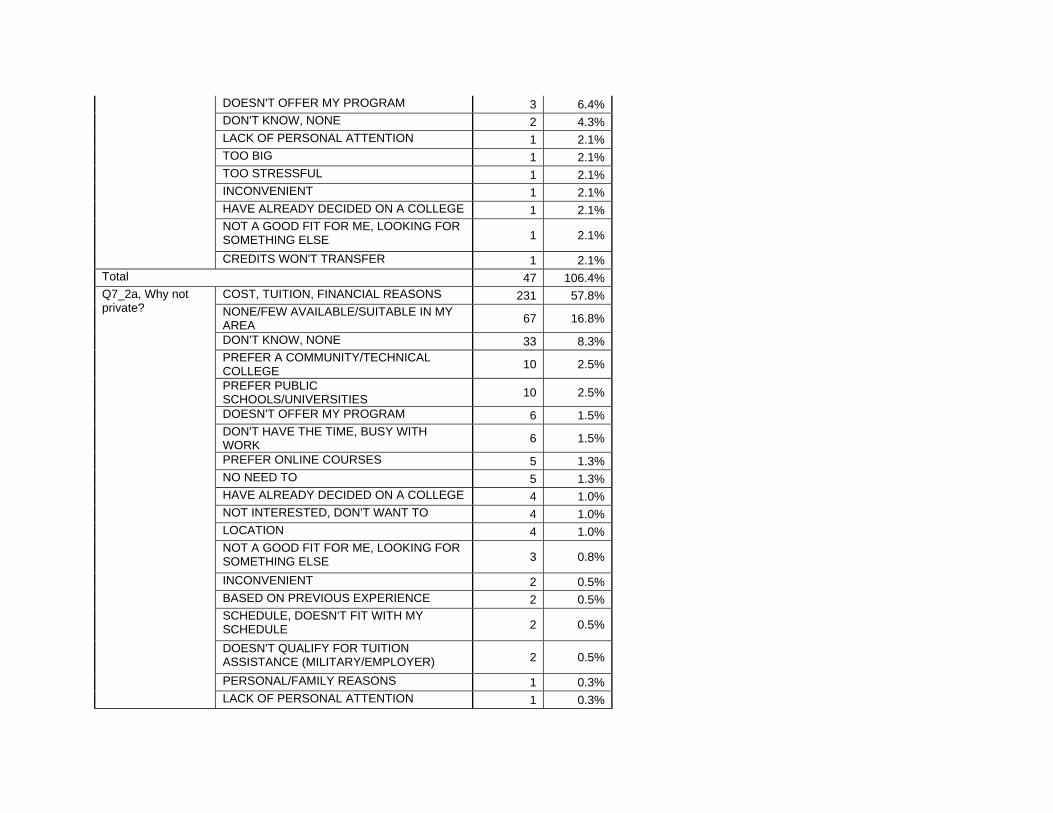
DOESN'T OFFER MY PROGRAM 3 6.4% DON'T KNOW, NONE 2 4.3% LACK OF PERSONAL ATTENTION 1 2.1% TOO BIG 1 2.1% TOO STRESSFUL 1 2.1% INCONVENIENT 1 2.1% HAVE ALREADY DECIDED ON A COLLEGE 1 2.1% NOT A GOOD FIT FOR ME, LOOKING FOR SOMETHING ELSE 1 2.1% CREDITS WON'T TRANSFER 1 2.1%
Total 47 106.4% COST, TUITION, FINANCIAL REASONS 231 57.8% NONE/FEW AVAILABLE/SUITABLE IN MY AREA 67 16.8% DON'T KNOW, NONE 33 8.3% PREFER A COMMUNITY/TECHNICAL COLLEGE 10 2.5% PREFER PUBLIC SCHOOLS/UNIVERSITIES 10 2.5% DOESN'T OFFER MY PROGRAM 6 1.5% DON'T HAVE THE TIME, BUSY WITH WORK 6 1.5% PREFER ONLINE COURSES 5 1.3% NO NEED TO 5 1.3% HAVE ALREADY DECIDED ON A COLLEGE 4 1.0% NOT INTERESTED, DON'T WANT TO 4 1.0% LOCATION 4 1.0% NOT A GOOD FIT FOR ME, LOOKING FOR SOMETHING ELSE 3 0.8% INCONVENIENT 2 0.5% BASED ON PREVIOUS EXPERIENCE 2 0.5% SCHEDULE, DOESN'T FIT WITH MY SCHEDULE 2 0.5% DOESN'T QUALIFY FOR TUITION ASSISTANCE (MILITARY/EMPLOYER) 2 0.5% PERSONAL/FAMILY REASONS 1 0.3%
Q7_2a, Why not private?
LACK OF PERSONAL ATTENTION 1 0.3%
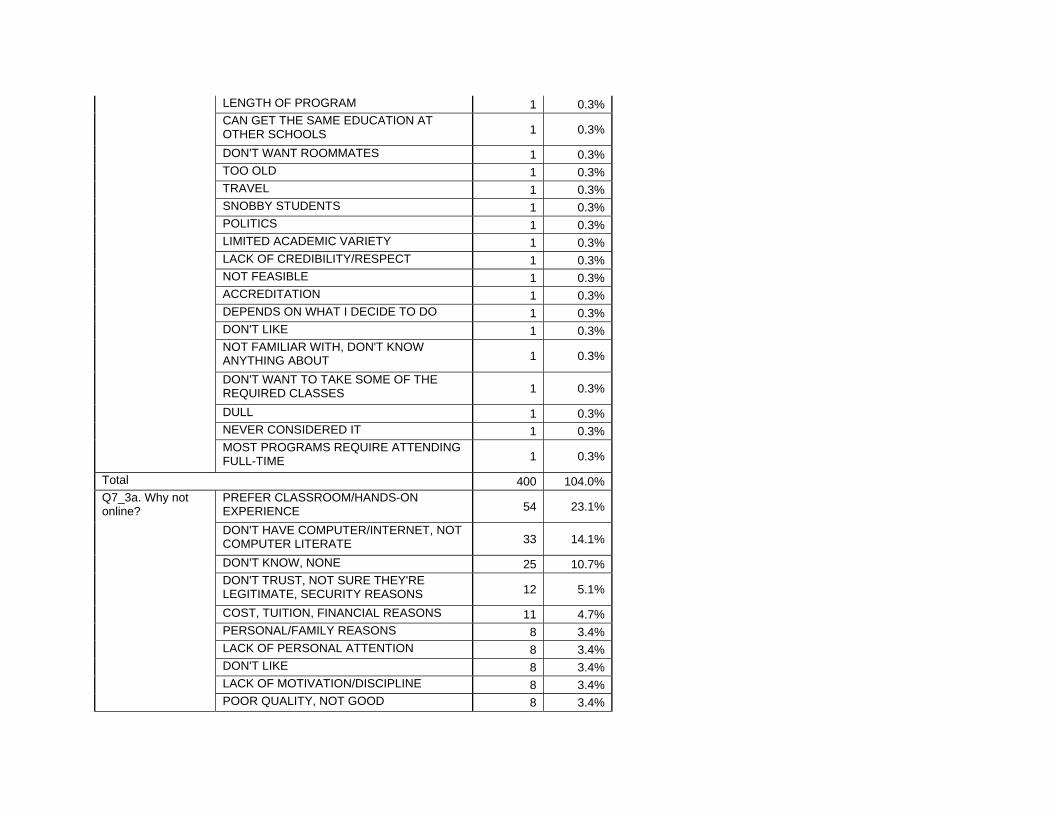
LENGTH OF PROGRAM 1 0.3% CAN GET THE SAME EDUCATION AT OTHER SCHOOLS 1 0.3% DON'T WANT ROOMMATES 1 0.3% TOO OLD 1 0.3% TRAVEL 1 0.3% SNOBBY STUDENTS 1 0.3% POLITICS 1 0.3% LIMITED ACADEMIC VARIETY 1 0.3% LACK OF CREDIBILITY/RESPECT 1 0.3% NOT FEASIBLE 1 0.3% ACCREDITATION 1 0.3% DEPENDS ON WHAT I DECIDE TO DO 1 0.3% DON'T LIKE 1 0.3% NOT FAMILIAR WITH, DON'T KNOW ANYTHING ABOUT 1 0.3% DON'T WANT TO TAKE SOME OF THE REQUIRED CLASSES 1 0.3% DULL 1 0.3% NEVER CONSIDERED IT 1 0.3% MOST PROGRAMS REQUIRE ATTENDING FULL-TIME 1 0.3%
Total 400 104.0% PREFER CLASSROOM/HANDS-ON EXPERIENCE 54 23.1% DON'T HAVE COMPUTER/INTERNET, NOT COMPUTER LITERATE 33 14.1% DON'T KNOW, NONE 25 10.7% DON'T TRUST, NOT SURE THEY'RE LEGITIMATE, SECURITY REASONS 12 5.1% COST, TUITION, FINANCIAL REASONS 11 4.7% PERSONAL/FAMILY REASONS 8 3.4% LACK OF PERSONAL ATTENTION 8 3.4% DON'T LIKE 8 3.4% LACK OF MOTIVATION/DISCIPLINE 8 3.4%
Q7_3a. Why not online?
POOR QUALITY, NOT GOOD 8 3.4%
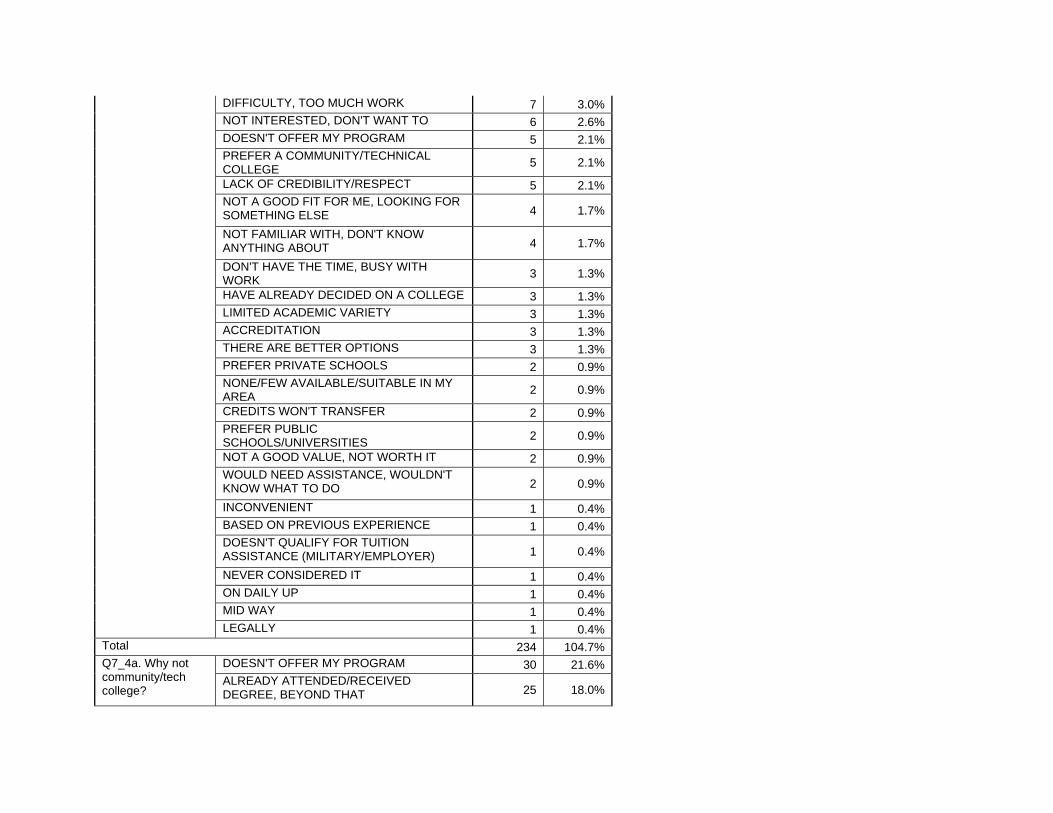
DIFFICULTY, TOO MUCH WORK 7 3.0% NOT INTERESTED, DON'T WANT TO 6 2.6% DOESN'T OFFER MY PROGRAM 5 2.1% PREFER A COMMUNITY/TECHNICAL COLLEGE 5 2.1% LACK OF CREDIBILITY/RESPECT 5 2.1% NOT A GOOD FIT FOR ME, LOOKING FOR SOMETHING ELSE 4 1.7% NOT FAMILIAR WITH, DON'T KNOW ANYTHING ABOUT 4 1.7% DON'T HAVE THE TIME, BUSY WITH WORK 3 1.3% HAVE ALREADY DECIDED ON A COLLEGE 3 1.3% LIMITED ACADEMIC VARIETY 3 1.3% ACCREDITATION 3 1.3% THERE ARE BETTER OPTIONS 3 1.3% PREFER PRIVATE SCHOOLS 2 0.9% NONE/FEW AVAILABLE/SUITABLE IN MY AREA 2 0.9% CREDITS WON'T TRANSFER 2 0.9% PREFER PUBLIC SCHOOLS/UNIVERSITIES 2 0.9% NOT A GOOD VALUE, NOT WORTH IT 2 0.9% WOULD NEED ASSISTANCE, WOULDN'T KNOW WHAT TO DO 2 0.9% INCONVENIENT 1 0.4% BASED ON PREVIOUS EXPERIENCE 1 0.4% DOESN'T QUALIFY FOR TUITION ASSISTANCE (MILITARY/EMPLOYER) 1 0.4% NEVER CONSIDERED IT 1 0.4% ON DAILY UP 1 0.4% MID WAY 1 0.4% LEGALLY 1 0.4%
Total 234 104.7% DOESN'T OFFER MY PROGRAM 30 21.6% Q7_4a. Why not
community/tech college?
ALREADY ATTENDED/RECEIVED DEGREE, BEYOND THAT 25 18.0%
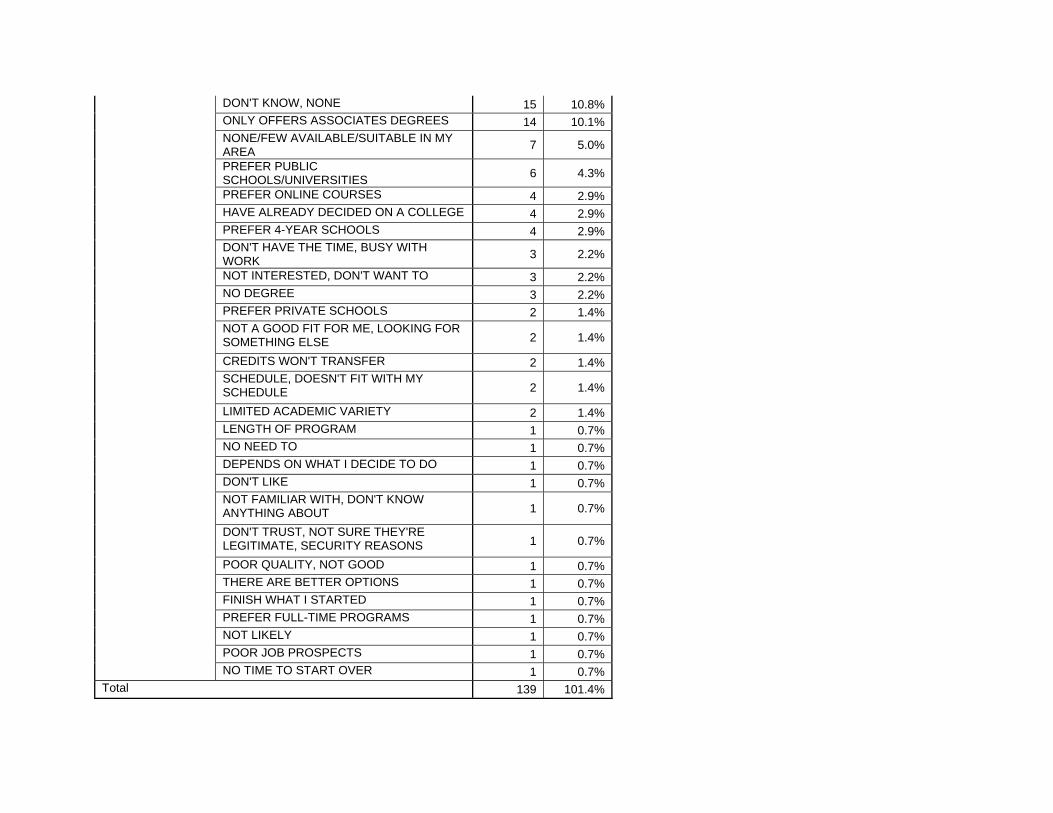
DON'T KNOW, NONE 15 10.8% ONLY OFFERS ASSOCIATES DEGREES 14 10.1% NONE/FEW AVAILABLE/SUITABLE IN MY AREA 7 5.0% PREFER PUBLIC SCHOOLS/UNIVERSITIES 6 4.3% PREFER ONLINE COURSES 4 2.9% HAVE ALREADY DECIDED ON A COLLEGE 4 2.9% PREFER 4-YEAR SCHOOLS 4 2.9% DON'T HAVE THE TIME, BUSY WITH WORK 3 2.2% NOT INTERESTED, DON'T WANT TO 3 2.2% NO DEGREE 3 2.2% PREFER PRIVATE SCHOOLS 2 1.4% NOT A GOOD FIT FOR ME, LOOKING FOR SOMETHING ELSE 2 1.4% CREDITS WON'T TRANSFER 2 1.4% SCHEDULE, DOESN'T FIT WITH MY SCHEDULE 2 1.4% LIMITED ACADEMIC VARIETY 2 1.4% LENGTH OF PROGRAM 1 0.7% NO NEED TO 1 0.7% DEPENDS ON WHAT I DECIDE TO DO 1 0.7% DON'T LIKE 1 0.7% NOT FAMILIAR WITH, DON'T KNOW ANYTHING ABOUT 1 0.7% DON'T TRUST, NOT SURE THEY'RE LEGITIMATE, SECURITY REASONS 1 0.7% POOR QUALITY, NOT GOOD 1 0.7% THERE ARE BETTER OPTIONS 1 0.7% FINISH WHAT I STARTED 1 0.7% PREFER FULL-TIME PROGRAMS 1 0.7% NOT LIKELY 1 0.7% POOR JOB PROSPECTS 1 0.7% NO TIME TO START OVER 1 0.7%
Total 139 101.4%
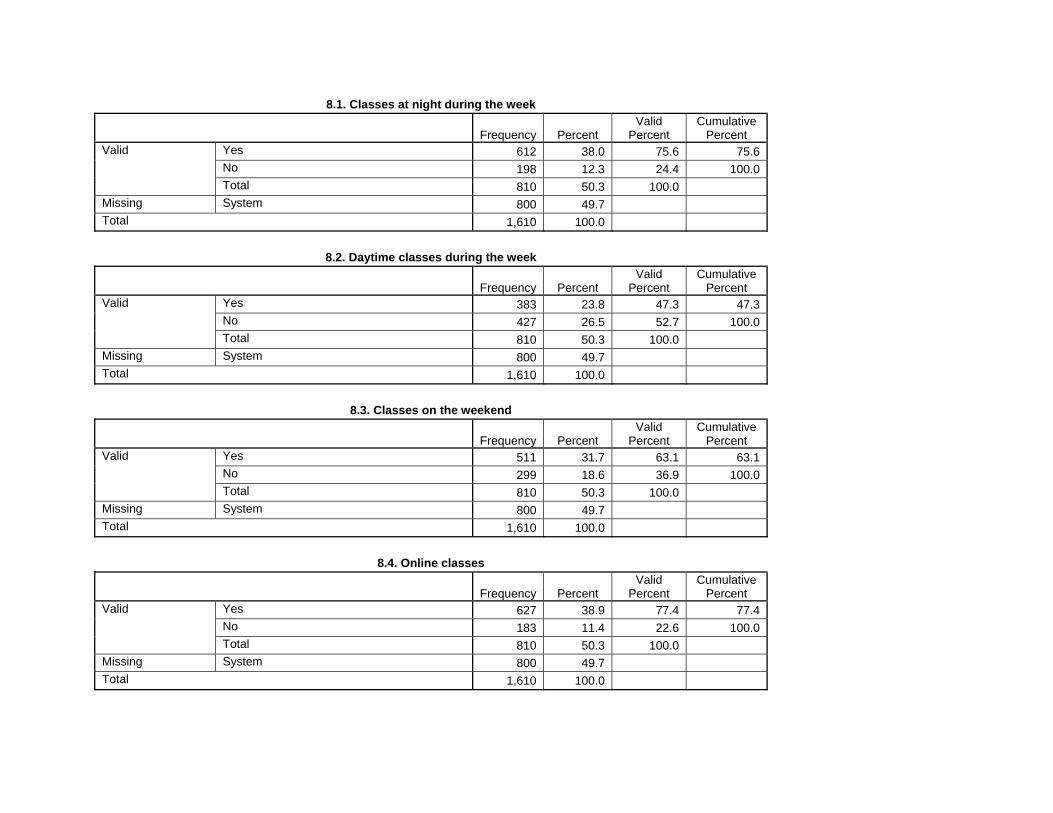
8.1. Classes at night during the week
Frequency Percent Valid
Percent Cumulative
Percent Yes 612 38.0 75.6 75.6No 198 12.3 24.4 100.0
Valid
Total 810 50.3 100.0 Missing System 800 49.7 Total 1,610 100.0
8.2. Daytime classes during the week
Frequency Percent Valid
Percent Cumulative
Percent Yes 383 23.8 47.3 47.3No 427 26.5 52.7 100.0
Valid
Total 810 50.3 100.0 Missing System 800 49.7 Total 1,610 100.0
8.3. Classes on the weekend
Frequency Percent Valid
Percent Cumulative
Percent Yes 511 31.7 63.1 63.1No 299 18.6 36.9 100.0
Valid
Total 810 50.3 100.0 Missing System 800 49.7 Total 1,610 100.0
8.4. Online classes
Frequency Percent Valid
Percent Cumulative
Percent Yes 627 38.9 77.4 77.4No 183 11.4 22.6 100.0
Valid
Total 810 50.3 100.0 Missing System 800 49.7 Total 1,610 100.0
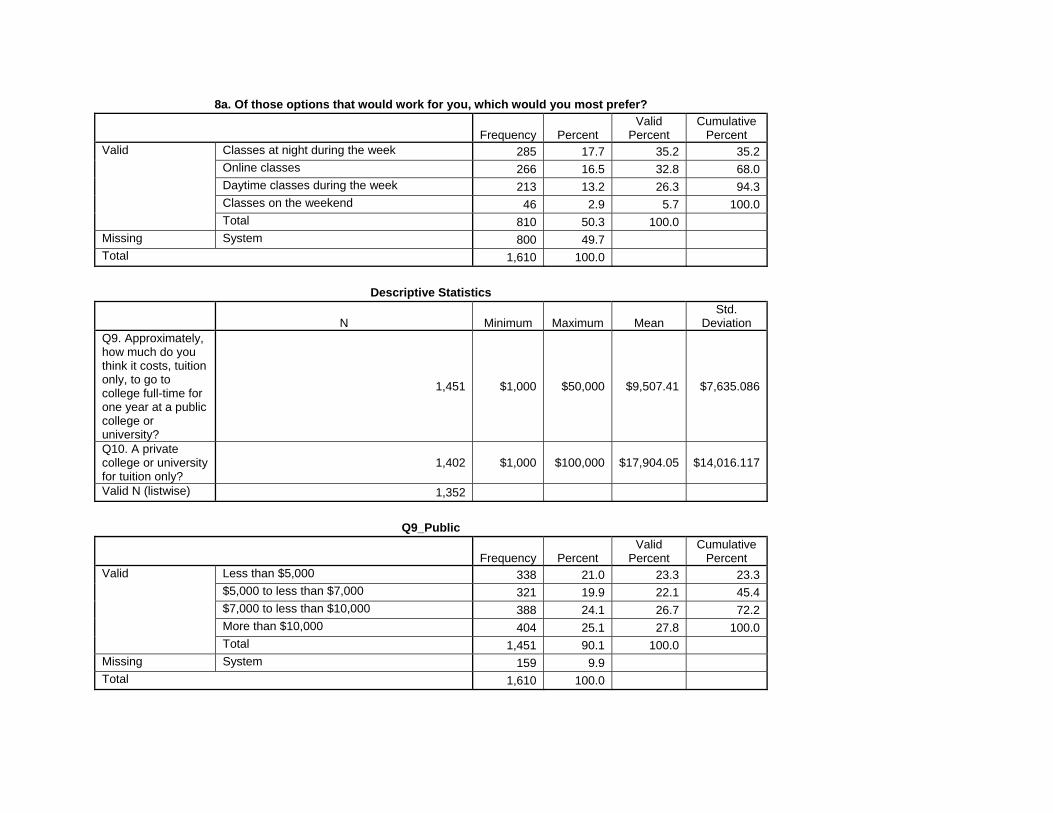
8a. Of those options that would work for you, which would you most prefer?
Frequency Percent Valid
Percent Cumulative
Percent Classes at night during the week 285 17.7 35.2 35.2Online classes 266 16.5 32.8 68.0Daytime classes during the week 213 13.2 26.3 94.3Classes on the weekend 46 2.9 5.7 100.0
Valid
Total 810 50.3 100.0 Missing System 800 49.7 Total 1,610 100.0
Descriptive Statistics
N Minimum Maximum Mean Std.
Deviation Q9. Approximately, how much do you think it costs, tuition only, to go to college full-time for one year at a public college or university?
1,451 $1,000 $50,000 $9,507.41 $7,635.086
Q10. A private college or university for tuition only?
1,402 $1,000 $100,000 $17,904.05 $14,016.117
Valid N (listwise) 1,352
Q9_Public
Frequency Percent Valid
Percent Cumulative
Percent Less than $5,000 338 21.0 23.3 23.3$5,000 to less than $7,000 321 19.9 22.1 45.4$7,000 to less than $10,000 388 24.1 26.7 72.2More than $10,000 404 25.1 27.8 100.0
Valid
Total 1,451 90.1 100.0 Missing System 159 9.9 Total 1,610 100.0
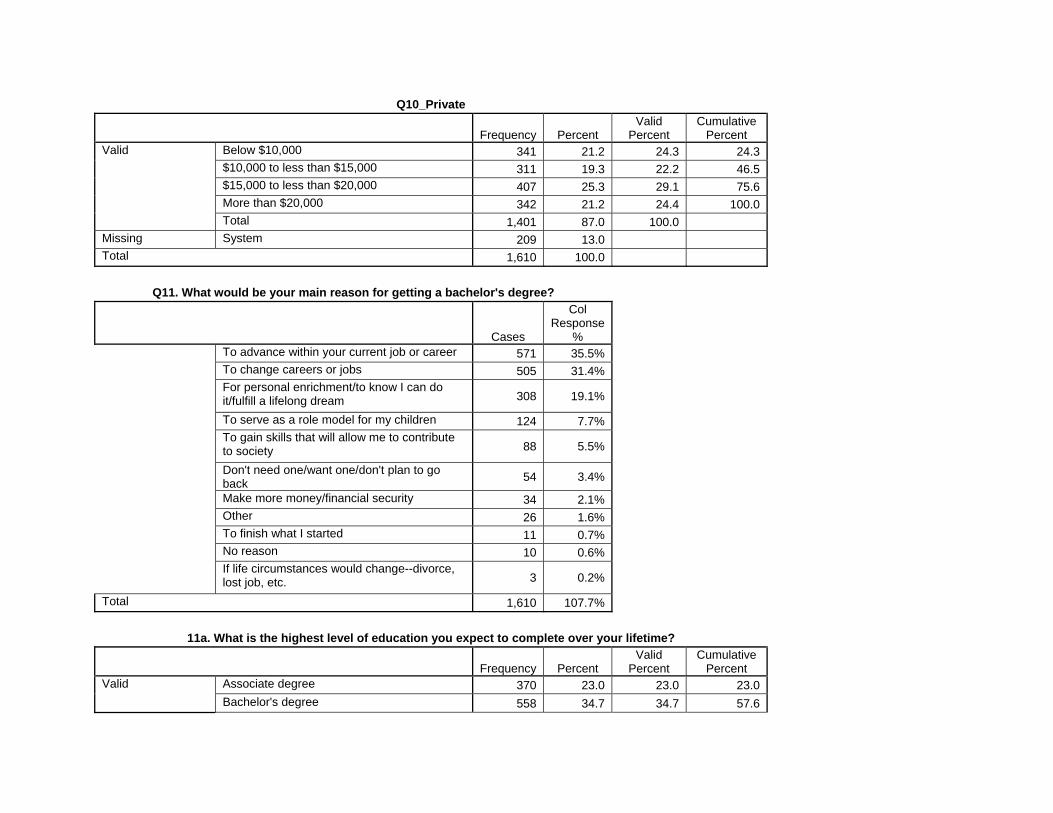
Q10_Private
Frequency Percent Valid
Percent Cumulative
Percent Below $10,000 341 21.2 24.3 24.3$10,000 to less than $15,000 311 19.3 22.2 46.5$15,000 to less than $20,000 407 25.3 29.1 75.6More than $20,000 342 21.2 24.4 100.0
Valid
Total 1,401 87.0 100.0 Missing System 209 13.0 Total 1,610 100.0
Q11. What would be your main reason for getting a bachelor's degree?
Cases
Col Response
% To advance within your current job or career 571 35.5% To change careers or jobs 505 31.4%
For personal enrichment/to know I can do it/fulfill a lifelong dream 308 19.1%
To serve as a role model for my children 124 7.7%
To gain skills that will allow me to contribute to society 88 5.5%
Don't need one/want one/don't plan to go back 54 3.4%
Make more money/financial security 34 2.1% Other 26 1.6% To finish what I started 11 0.7% No reason 10 0.6%
If life circumstances would change--divorce, lost job, etc. 3 0.2%
Total 1,610 107.7%
11a. What is the highest level of education you expect to complete over your lifetime?
Frequency Percent Valid
Percent Cumulative
Percent Associate degree 370 23.0 23.0 23.0Valid Bachelor's degree 558 34.7 34.7 57.6
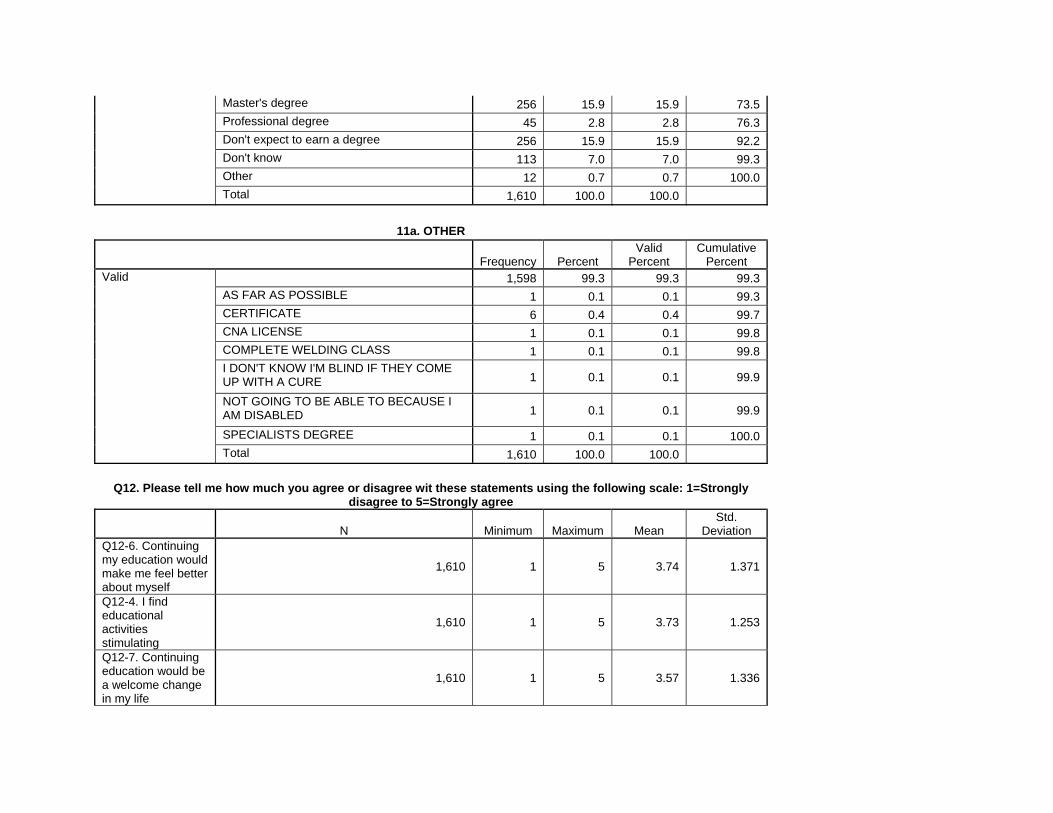
Master's degree 256 15.9 15.9 73.5Professional degree 45 2.8 2.8 76.3Don't expect to earn a degree 256 15.9 15.9 92.2Don't know 113 7.0 7.0 99.3Other 12 0.7 0.7 100.0Total 1,610 100.0 100.0
11a. OTHER
Frequency Percent Valid
Percent Cumulative
Percent 1,598 99.3 99.3 99.3AS FAR AS POSSIBLE 1 0.1 0.1 99.3CERTIFICATE 6 0.4 0.4 99.7CNA LICENSE 1 0.1 0.1 99.8COMPLETE WELDING CLASS 1 0.1 0.1 99.8I DON'T KNOW I'M BLIND IF THEY COME UP WITH A CURE 1 0.1 0.1 99.9
NOT GOING TO BE ABLE TO BECAUSE I AM DISABLED 1 0.1 0.1 99.9
SPECIALISTS DEGREE 1 0.1 0.1 100.0
Valid
Total 1,610 100.0 100.0
Q12. Please tell me how much you agree or disagree wit these statements using the following scale: 1=Strongly disagree to 5=Strongly agree
N Minimum Maximum Mean Std.
Deviation Q12-6. Continuing my education would make me feel better about myself
1,610 1 5 3.74 1.371
Q12-4. I find educational activities stimulating
1,610 1 5 3.73 1.253
Q12-7. Continuing education would be a welcome change in my life
1,610 1 5 3.57 1.336
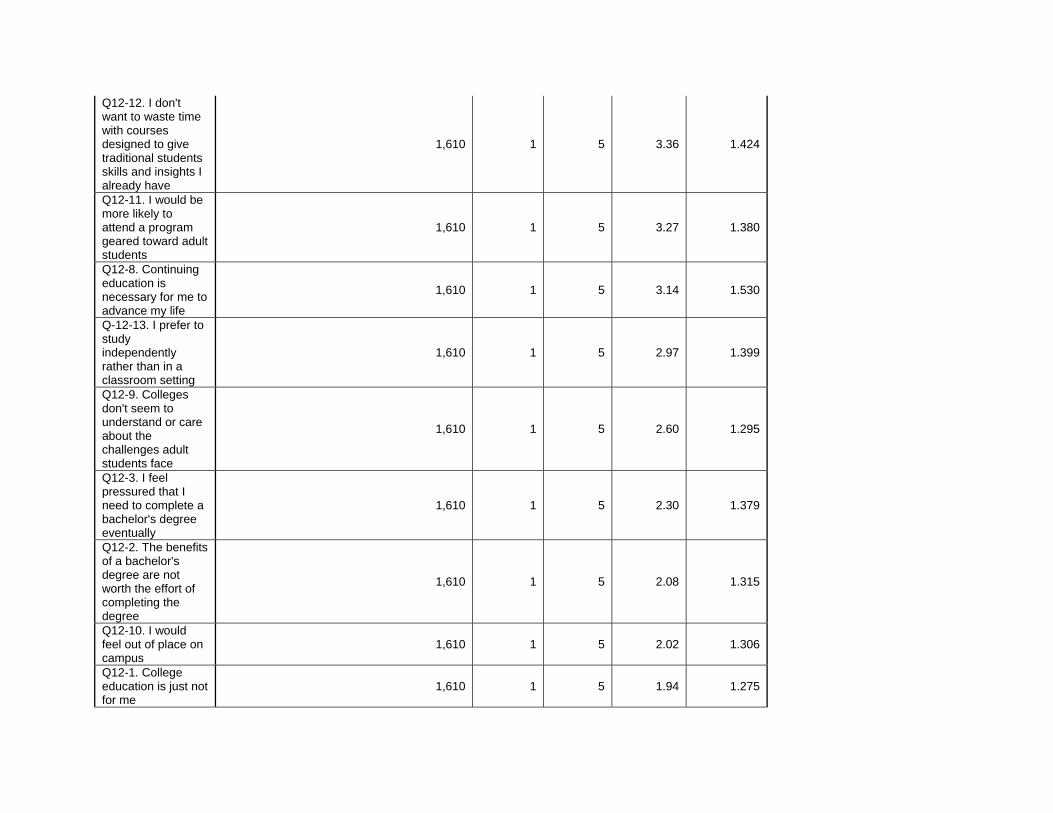
Q12-12. I don't want to waste time with courses designed to give traditional students skills and insights I already have
1,610 1 5 3.36 1.424
Q12-11. I would be more likely to attend a program geared toward adult students
1,610 1 5 3.27 1.380
Q12-8. Continuing education is necessary for me to advance my life
1,610 1 5 3.14 1.530
Q-12-13. I prefer to study independently rather than in a classroom setting
1,610 1 5 2.97 1.399
Q12-9. Colleges don't seem to understand or care about the challenges adult students face
1,610 1 5 2.60 1.295
Q12-3. I feel pressured that I need to complete a bachelor's degree eventually
1,610 1 5 2.30 1.379
Q12-2. The benefits of a bachelor's degree are not worth the effort of completing the degree
1,610 1 5 2.08 1.315
Q12-10. I would feel out of place on campus
1,610 1 5 2.02 1.306
Q12-1. College education is just not for me
1,610 1 5 1.94 1.275
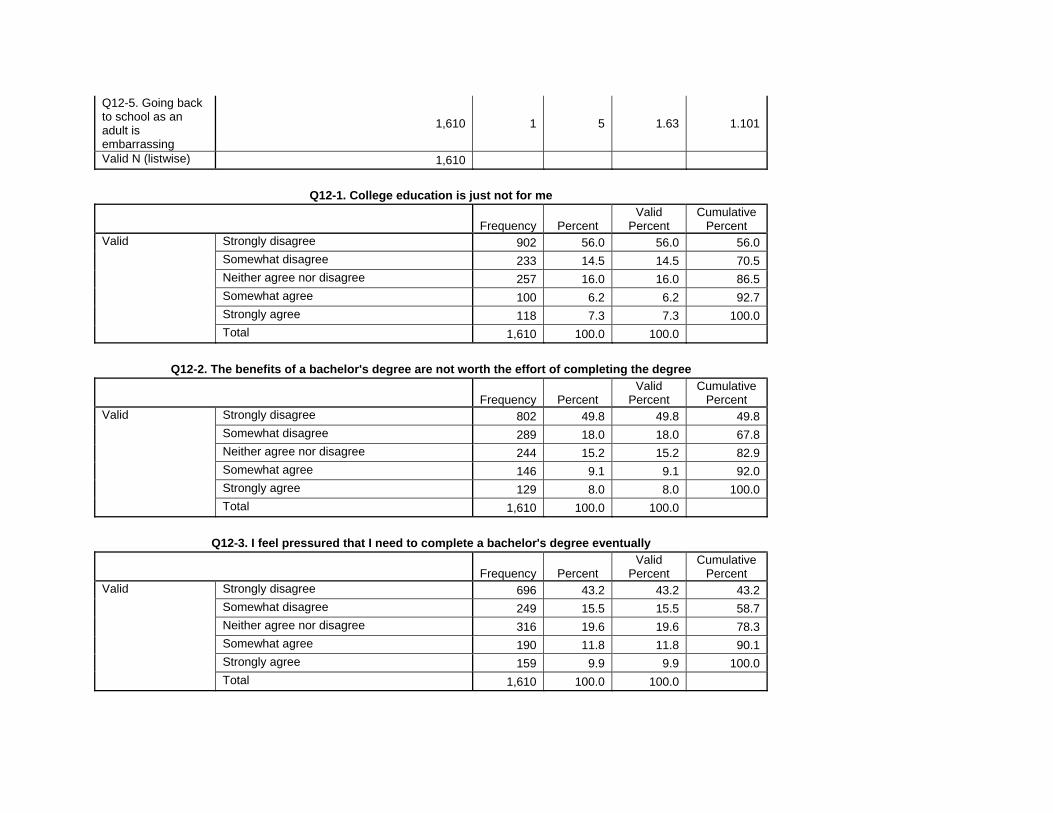
Q12-5. Going back to school as an adult is embarrassing
1,610 1 5 1.63 1.101
Valid N (listwise) 1,610
Q12-1. College education is just not for me
Frequency Percent Valid
Percent Cumulative
Percent Strongly disagree 902 56.0 56.0 56.0Somewhat disagree 233 14.5 14.5 70.5Neither agree nor disagree 257 16.0 16.0 86.5Somewhat agree 100 6.2 6.2 92.7Strongly agree 118 7.3 7.3 100.0
Valid
Total 1,610 100.0 100.0
Q12-2. The benefits of a bachelor's degree are not worth the effort of completing the degree
Frequency Percent Valid
Percent Cumulative
Percent Strongly disagree 802 49.8 49.8 49.8Somewhat disagree 289 18.0 18.0 67.8Neither agree nor disagree 244 15.2 15.2 82.9Somewhat agree 146 9.1 9.1 92.0Strongly agree 129 8.0 8.0 100.0
Valid
Total 1,610 100.0 100.0
Q12-3. I feel pressured that I need to complete a bachelor's degree eventually
Frequency Percent Valid
Percent Cumulative
Percent Strongly disagree 696 43.2 43.2 43.2Somewhat disagree 249 15.5 15.5 58.7Neither agree nor disagree 316 19.6 19.6 78.3Somewhat agree 190 11.8 11.8 90.1Strongly agree 159 9.9 9.9 100.0
Valid
Total 1,610 100.0 100.0
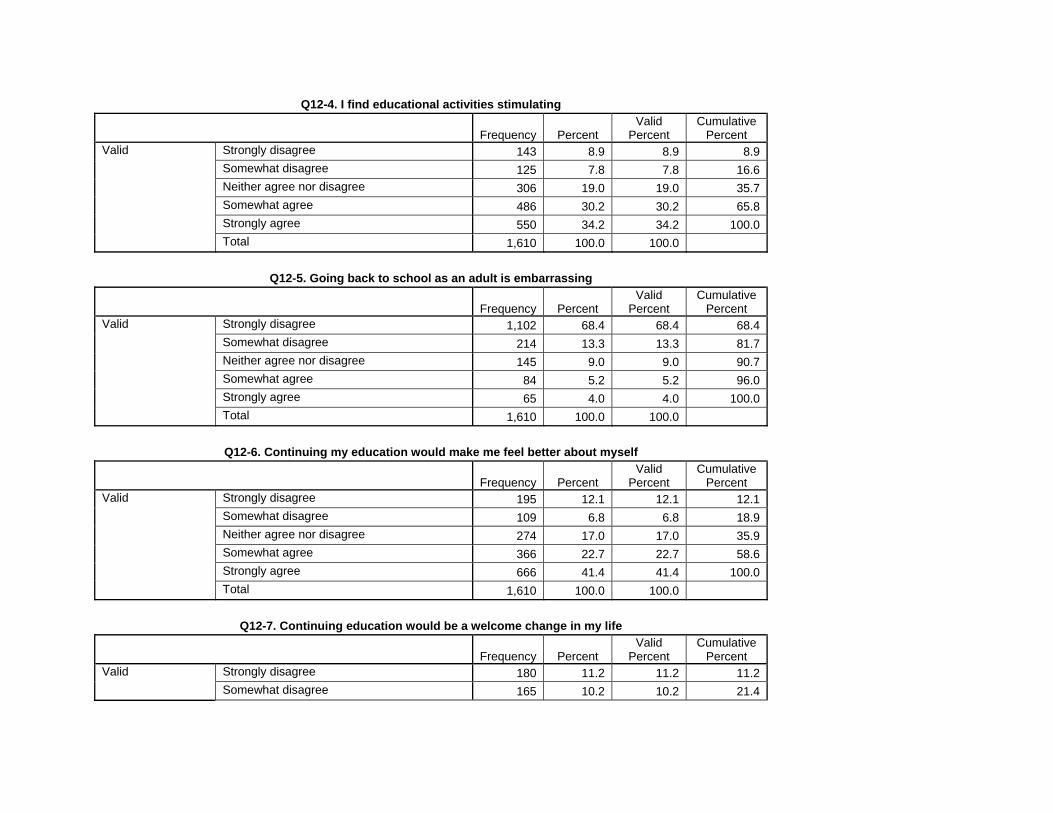
Q12-4. I find educational activities stimulating
Frequency Percent Valid
Percent Cumulative
Percent Strongly disagree 143 8.9 8.9 8.9Somewhat disagree 125 7.8 7.8 16.6Neither agree nor disagree 306 19.0 19.0 35.7Somewhat agree 486 30.2 30.2 65.8Strongly agree 550 34.2 34.2 100.0
Valid
Total 1,610 100.0 100.0
Q12-5. Going back to school as an adult is embarrassing
Frequency Percent Valid
Percent Cumulative
Percent Strongly disagree 1,102 68.4 68.4 68.4Somewhat disagree 214 13.3 13.3 81.7Neither agree nor disagree 145 9.0 9.0 90.7Somewhat agree 84 5.2 5.2 96.0Strongly agree 65 4.0 4.0 100.0
Valid
Total 1,610 100.0 100.0
Q12-6. Continuing my education would make me feel better about myself
Frequency Percent Valid
Percent Cumulative
Percent Strongly disagree 195 12.1 12.1 12.1Somewhat disagree 109 6.8 6.8 18.9Neither agree nor disagree 274 17.0 17.0 35.9Somewhat agree 366 22.7 22.7 58.6Strongly agree 666 41.4 41.4 100.0
Valid
Total 1,610 100.0 100.0
Q12-7. Continuing education would be a welcome change in my life
Frequency Percent Valid
Percent Cumulative
Percent Strongly disagree 180 11.2 11.2 11.2Valid Somewhat disagree 165 10.2 10.2 21.4
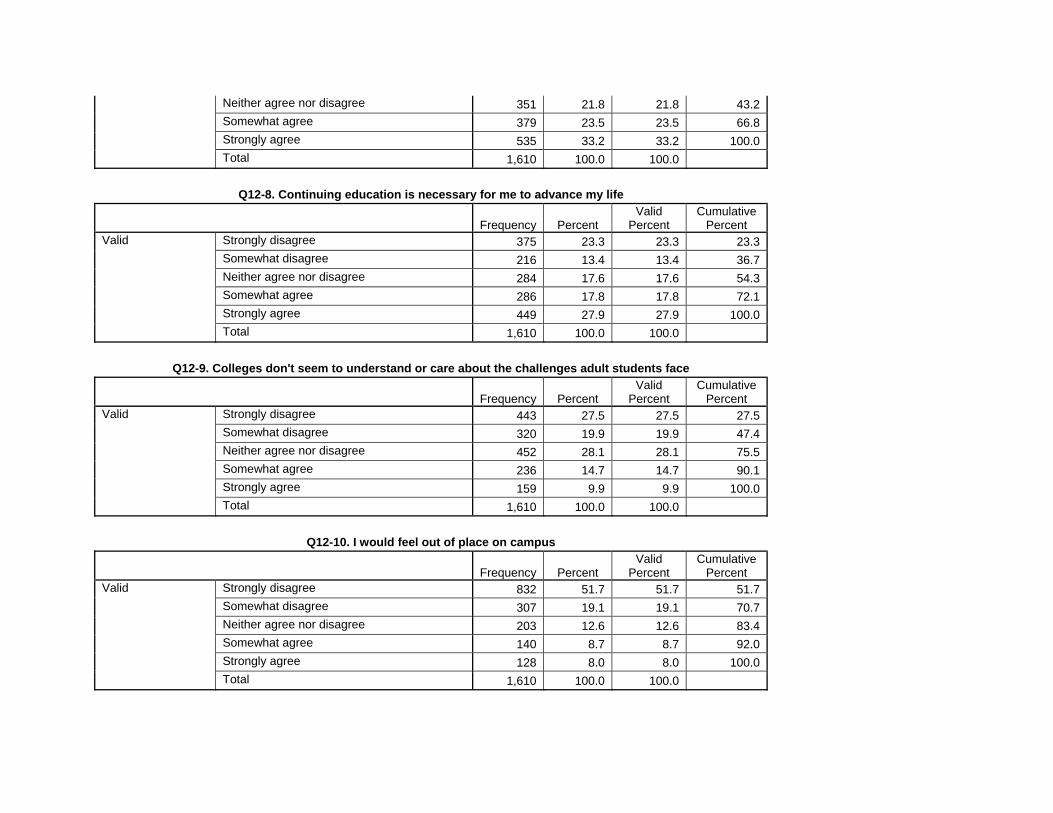
Neither agree nor disagree 351 21.8 21.8 43.2Somewhat agree 379 23.5 23.5 66.8Strongly agree 535 33.2 33.2 100.0Total 1,610 100.0 100.0
Q12-8. Continuing education is necessary for me to advance my life
Frequency Percent Valid
Percent Cumulative
Percent Strongly disagree 375 23.3 23.3 23.3Somewhat disagree 216 13.4 13.4 36.7Neither agree nor disagree 284 17.6 17.6 54.3Somewhat agree 286 17.8 17.8 72.1Strongly agree 449 27.9 27.9 100.0
Valid
Total 1,610 100.0 100.0
Q12-9. Colleges don't seem to understand or care about the challenges adult students face
Frequency Percent Valid
Percent Cumulative
Percent Strongly disagree 443 27.5 27.5 27.5Somewhat disagree 320 19.9 19.9 47.4Neither agree nor disagree 452 28.1 28.1 75.5Somewhat agree 236 14.7 14.7 90.1Strongly agree 159 9.9 9.9 100.0
Valid
Total 1,610 100.0 100.0
Q12-10. I would feel out of place on campus
Frequency Percent Valid
Percent Cumulative
Percent Strongly disagree 832 51.7 51.7 51.7Somewhat disagree 307 19.1 19.1 70.7Neither agree nor disagree 203 12.6 12.6 83.4Somewhat agree 140 8.7 8.7 92.0Strongly agree 128 8.0 8.0 100.0
Valid
Total 1,610 100.0 100.0
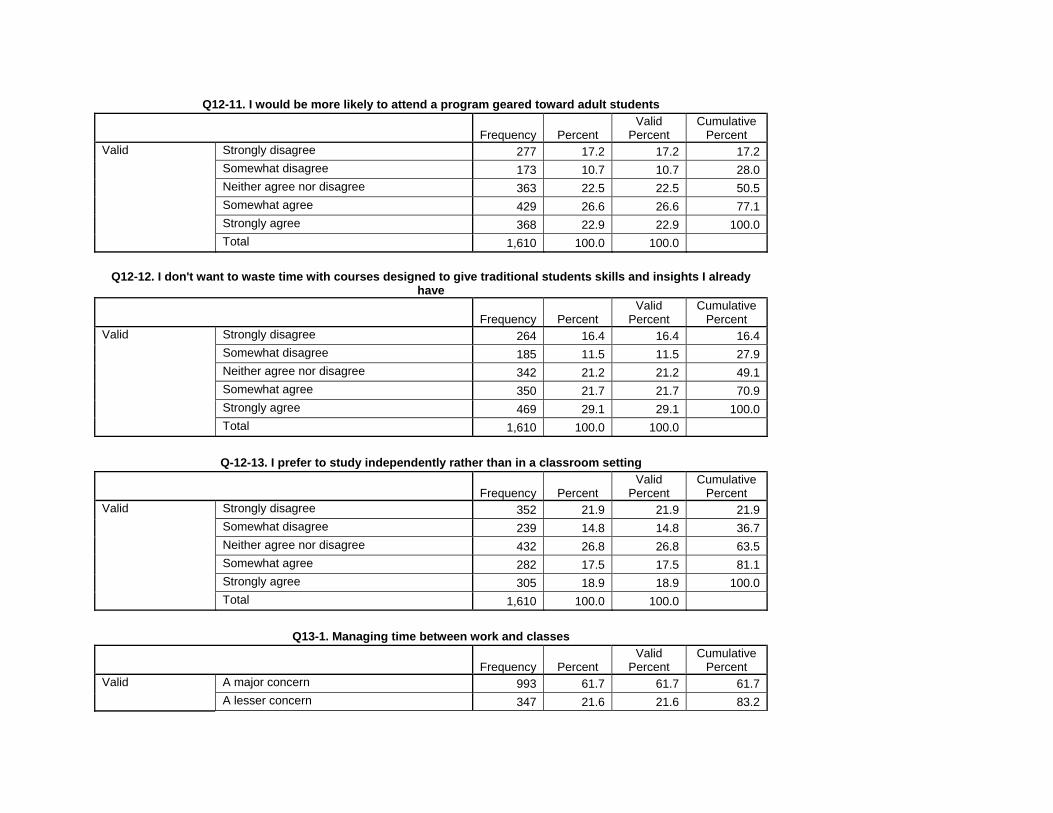
Q12-11. I would be more likely to attend a program geared toward adult students
Frequency Percent Valid
Percent Cumulative
Percent Strongly disagree 277 17.2 17.2 17.2Somewhat disagree 173 10.7 10.7 28.0Neither agree nor disagree 363 22.5 22.5 50.5Somewhat agree 429 26.6 26.6 77.1Strongly agree 368 22.9 22.9 100.0
Valid
Total 1,610 100.0 100.0
Q12-12. I don't want to waste time with courses designed to give traditional students skills and insights I already have
Frequency Percent Valid
Percent Cumulative
Percent Strongly disagree 264 16.4 16.4 16.4Somewhat disagree 185 11.5 11.5 27.9Neither agree nor disagree 342 21.2 21.2 49.1Somewhat agree 350 21.7 21.7 70.9Strongly agree 469 29.1 29.1 100.0
Valid
Total 1,610 100.0 100.0
Q-12-13. I prefer to study independently rather than in a classroom setting
Frequency Percent Valid
Percent Cumulative
Percent Strongly disagree 352 21.9 21.9 21.9Somewhat disagree 239 14.8 14.8 36.7Neither agree nor disagree 432 26.8 26.8 63.5Somewhat agree 282 17.5 17.5 81.1Strongly agree 305 18.9 18.9 100.0
Valid
Total 1,610 100.0 100.0
Q13-1. Managing time between work and classes
Frequency Percent Valid
Percent Cumulative
Percent A major concern 993 61.7 61.7 61.7Valid A lesser concern 347 21.6 21.6 83.2
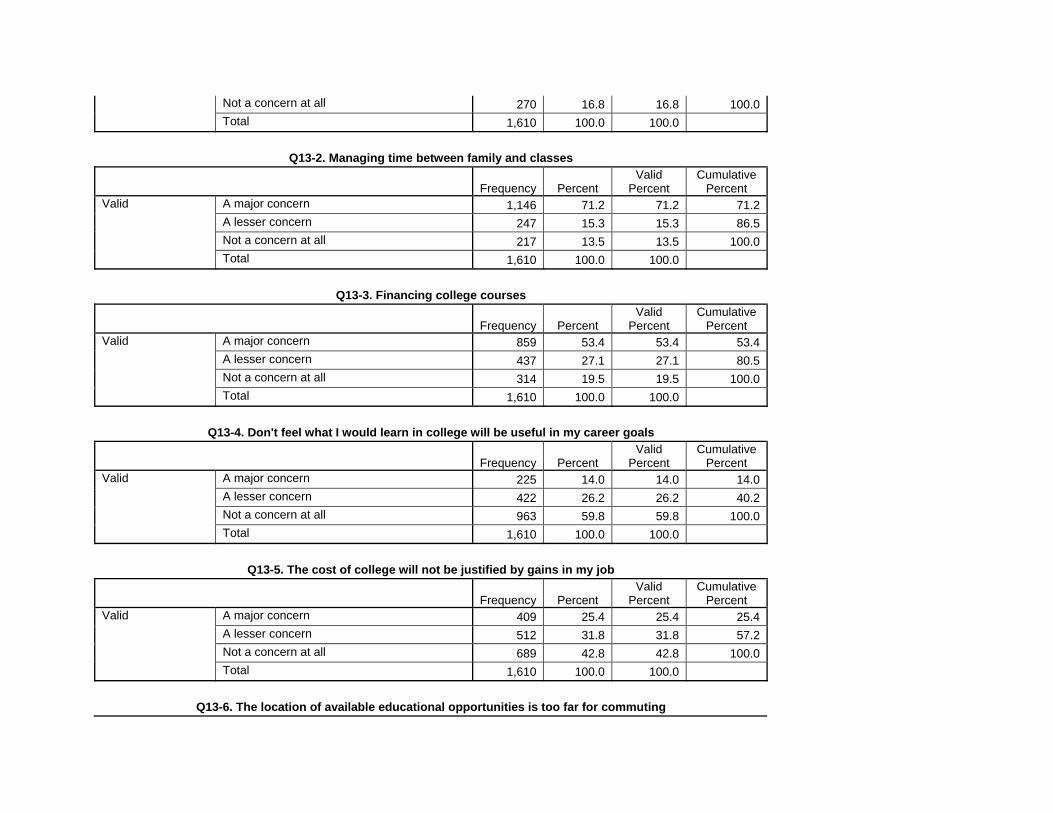
Not a concern at all 270 16.8 16.8 100.0Total 1,610 100.0 100.0
Q13-2. Managing time between family and classes
Frequency Percent Valid
Percent Cumulative
Percent A major concern 1,146 71.2 71.2 71.2A lesser concern 247 15.3 15.3 86.5Not a concern at all 217 13.5 13.5 100.0
Valid
Total 1,610 100.0 100.0
Q13-3. Financing college courses
Frequency Percent Valid
Percent Cumulative
Percent A major concern 859 53.4 53.4 53.4A lesser concern 437 27.1 27.1 80.5Not a concern at all 314 19.5 19.5 100.0
Valid
Total 1,610 100.0 100.0
Q13-4. Don't feel what I would learn in college will be useful in my career goals
Frequency Percent Valid
Percent Cumulative
Percent A major concern 225 14.0 14.0 14.0A lesser concern 422 26.2 26.2 40.2Not a concern at all 963 59.8 59.8 100.0
Valid
Total 1,610 100.0 100.0
Q13-5. The cost of college will not be justified by gains in my job
Frequency Percent Valid
Percent Cumulative
Percent A major concern 409 25.4 25.4 25.4A lesser concern 512 31.8 31.8 57.2Not a concern at all 689 42.8 42.8 100.0
Valid
Total 1,610 100.0 100.0
Q13-6. The location of available educational opportunities is too far for commuting
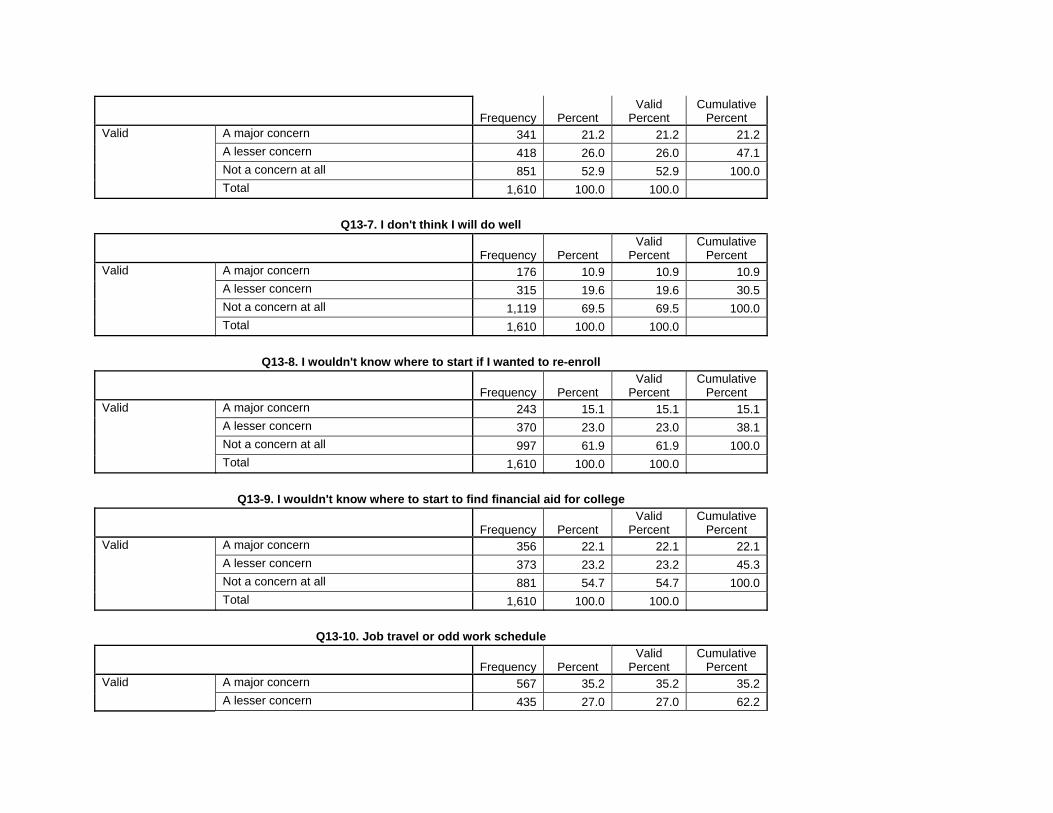
Frequency Percent Valid
Percent Cumulative
Percent A major concern 341 21.2 21.2 21.2A lesser concern 418 26.0 26.0 47.1Not a concern at all 851 52.9 52.9 100.0
Valid
Total 1,610 100.0 100.0
Q13-7. I don't think I will do well
Frequency Percent Valid
Percent Cumulative
Percent A major concern 176 10.9 10.9 10.9A lesser concern 315 19.6 19.6 30.5Not a concern at all 1,119 69.5 69.5 100.0
Valid
Total 1,610 100.0 100.0
Q13-8. I wouldn't know where to start if I wanted to re-enroll
Frequency Percent Valid
Percent Cumulative
Percent A major concern 243 15.1 15.1 15.1A lesser concern 370 23.0 23.0 38.1Not a concern at all 997 61.9 61.9 100.0
Valid
Total 1,610 100.0 100.0
Q13-9. I wouldn't know where to start to find financial aid for college
Frequency Percent Valid
Percent Cumulative
Percent A major concern 356 22.1 22.1 22.1A lesser concern 373 23.2 23.2 45.3Not a concern at all 881 54.7 54.7 100.0
Valid
Total 1,610 100.0 100.0
Q13-10. Job travel or odd work schedule
Frequency Percent Valid
Percent Cumulative
Percent A major concern 567 35.2 35.2 35.2Valid A lesser concern 435 27.0 27.0 62.2
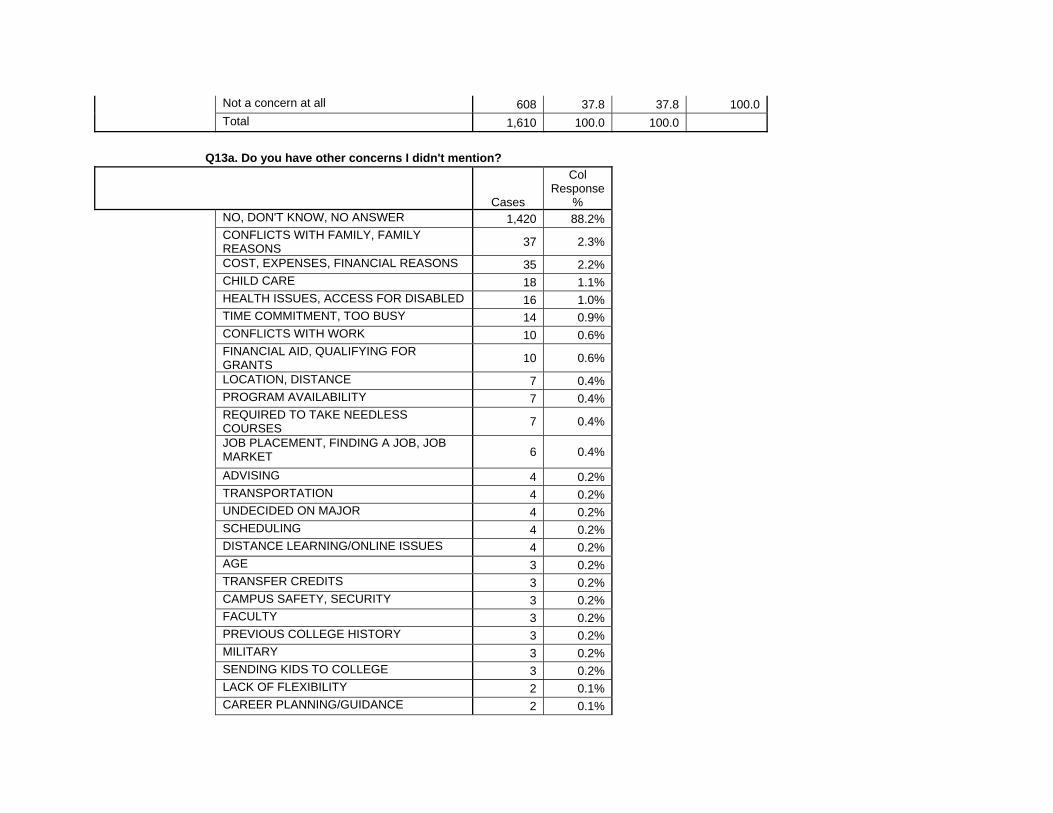
Not a concern at all 608 37.8 37.8 100.0Total 1,610 100.0 100.0
Q13a. Do you have other concerns I didn't mention?
Cases
Col Response
% NO, DON'T KNOW, NO ANSWER 1,420 88.2%
CONFLICTS WITH FAMILY, FAMILY REASONS 37 2.3%
COST, EXPENSES, FINANCIAL REASONS 35 2.2% CHILD CARE 18 1.1% HEALTH ISSUES, ACCESS FOR DISABLED 16 1.0% TIME COMMITMENT, TOO BUSY 14 0.9% CONFLICTS WITH WORK 10 0.6%
FINANCIAL AID, QUALIFYING FOR GRANTS 10 0.6%
LOCATION, DISTANCE 7 0.4% PROGRAM AVAILABILITY 7 0.4%
REQUIRED TO TAKE NEEDLESS COURSES 7 0.4%
JOB PLACEMENT, FINDING A JOB, JOB MARKET 6 0.4%
ADVISING 4 0.2% TRANSPORTATION 4 0.2% UNDECIDED ON MAJOR 4 0.2% SCHEDULING 4 0.2% DISTANCE LEARNING/ONLINE ISSUES 4 0.2% AGE 3 0.2% TRANSFER CREDITS 3 0.2% CAMPUS SAFETY, SECURITY 3 0.2% FACULTY 3 0.2% PREVIOUS COLLEGE HISTORY 3 0.2% MILITARY 3 0.2% SENDING KIDS TO COLLEGE 3 0.2% LACK OF FLEXIBILITY 2 0.1% CAREER PLANNING/GUIDANCE 2 0.1%
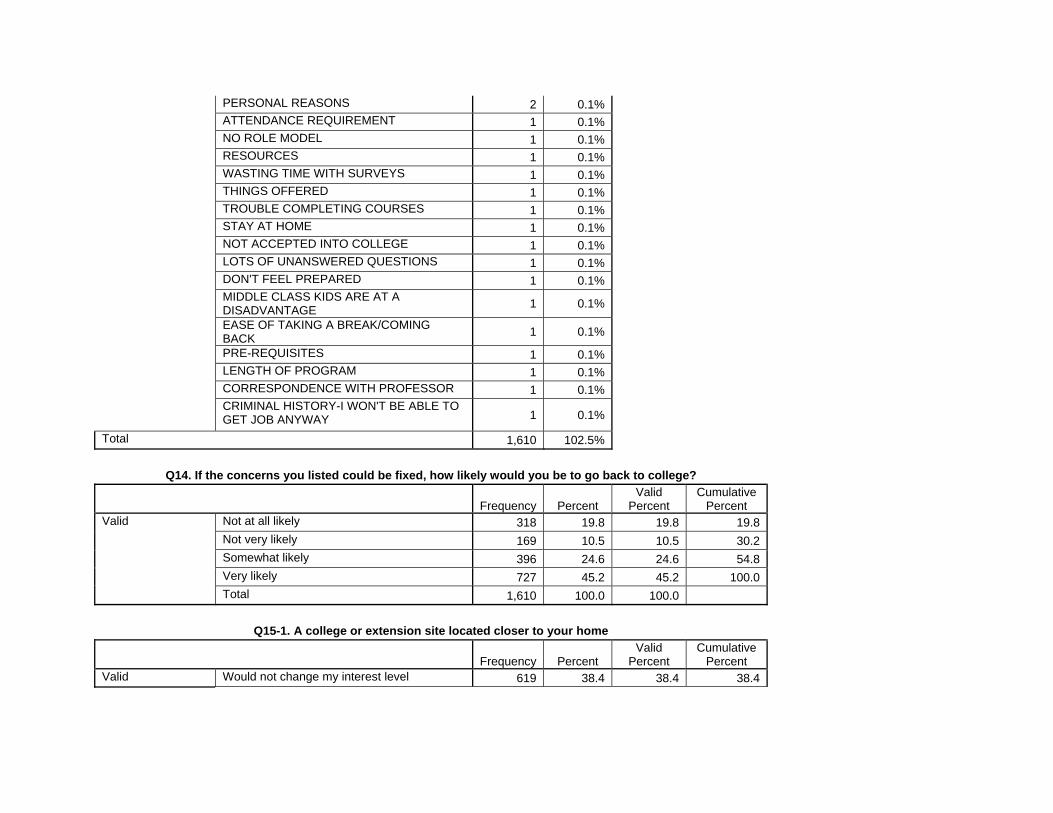
PERSONAL REASONS 2 0.1% ATTENDANCE REQUIREMENT 1 0.1% NO ROLE MODEL 1 0.1% RESOURCES 1 0.1% WASTING TIME WITH SURVEYS 1 0.1% THINGS OFFERED 1 0.1% TROUBLE COMPLETING COURSES 1 0.1% STAY AT HOME 1 0.1% NOT ACCEPTED INTO COLLEGE 1 0.1% LOTS OF UNANSWERED QUESTIONS 1 0.1% DON'T FEEL PREPARED 1 0.1%
MIDDLE CLASS KIDS ARE AT A DISADVANTAGE 1 0.1%
EASE OF TAKING A BREAK/COMING BACK 1 0.1%
PRE-REQUISITES 1 0.1% LENGTH OF PROGRAM 1 0.1% CORRESPONDENCE WITH PROFESSOR 1 0.1%
CRIMINAL HISTORY-I WON'T BE ABLE TO GET JOB ANYWAY 1 0.1%
Total 1,610 102.5%
Q14. If the concerns you listed could be fixed, how likely would you be to go back to college?
Frequency Percent Valid
Percent Cumulative
Percent Not at all likely 318 19.8 19.8 19.8Not very likely 169 10.5 10.5 30.2Somewhat likely 396 24.6 24.6 54.8Very likely 727 45.2 45.2 100.0
Valid
Total 1,610 100.0 100.0
Q15-1. A college or extension site located closer to your home
Frequency Percent Valid
Percent Cumulative
Percent Valid Would not change my interest level 619 38.4 38.4 38.4
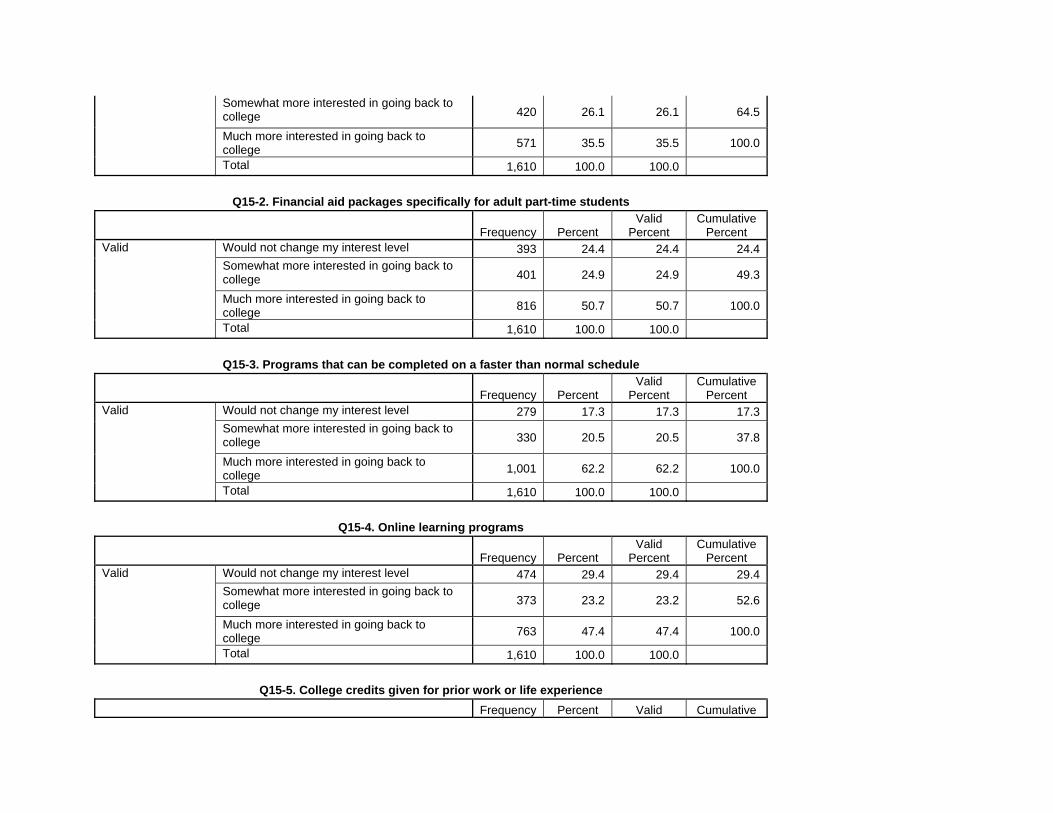
Somewhat more interested in going back to college 420 26.1 26.1 64.5
Much more interested in going back to college 571 35.5 35.5 100.0
Total 1,610 100.0 100.0
Q15-2. Financial aid packages specifically for adult part-time students
Frequency Percent Valid
Percent Cumulative
Percent Would not change my interest level 393 24.4 24.4 24.4Somewhat more interested in going back to college 401 24.9 24.9 49.3
Much more interested in going back to college 816 50.7 50.7 100.0
Valid
Total 1,610 100.0 100.0
Q15-3. Programs that can be completed on a faster than normal schedule
Frequency Percent Valid
Percent Cumulative
Percent Would not change my interest level 279 17.3 17.3 17.3Somewhat more interested in going back to college 330 20.5 20.5 37.8
Much more interested in going back to college 1,001 62.2 62.2 100.0
Valid
Total 1,610 100.0 100.0
Q15-4. Online learning programs
Frequency Percent Valid
Percent Cumulative
Percent Would not change my interest level 474 29.4 29.4 29.4Somewhat more interested in going back to college 373 23.2 23.2 52.6
Much more interested in going back to college 763 47.4 47.4 100.0
Valid
Total 1,610 100.0 100.0
Q15-5. College credits given for prior work or life experience Frequency Percent Valid Cumulative
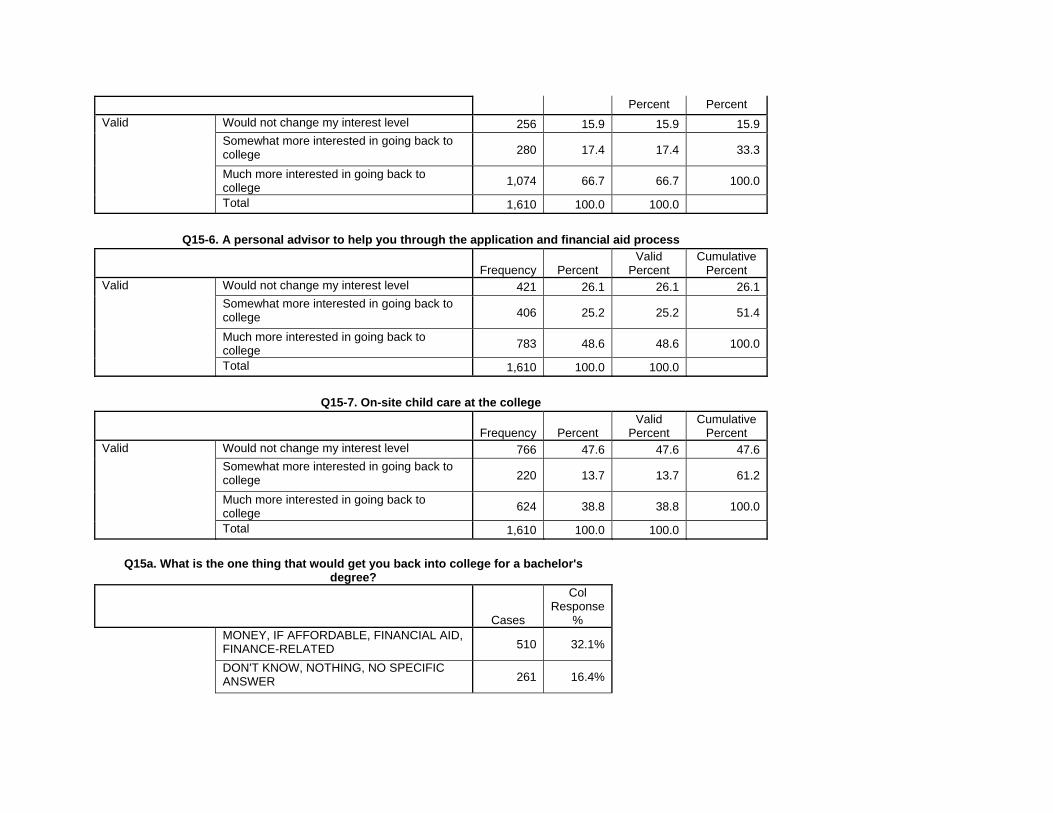
Percent Percent Would not change my interest level 256 15.9 15.9 15.9Somewhat more interested in going back to college 280 17.4 17.4 33.3
Much more interested in going back to college 1,074 66.7 66.7 100.0
Valid
Total 1,610 100.0 100.0
Q15-6. A personal advisor to help you through the application and financial aid process
Frequency Percent Valid
Percent Cumulative
Percent Would not change my interest level 421 26.1 26.1 26.1Somewhat more interested in going back to college 406 25.2 25.2 51.4
Much more interested in going back to college 783 48.6 48.6 100.0
Valid
Total 1,610 100.0 100.0
Q15-7. On-site child care at the college
Frequency Percent Valid
Percent Cumulative
Percent Would not change my interest level 766 47.6 47.6 47.6Somewhat more interested in going back to college 220 13.7 13.7 61.2
Much more interested in going back to college 624 38.8 38.8 100.0
Valid
Total 1,610 100.0 100.0
Q15a. What is the one thing that would get you back into college for a bachelor's degree?
Cases
Col Response
%
MONEY, IF AFFORDABLE, FINANCIAL AID, FINANCE-RELATED 510 32.1%
DON'T KNOW, NOTHING, NO SPECIFIC ANSWER 261 16.4%
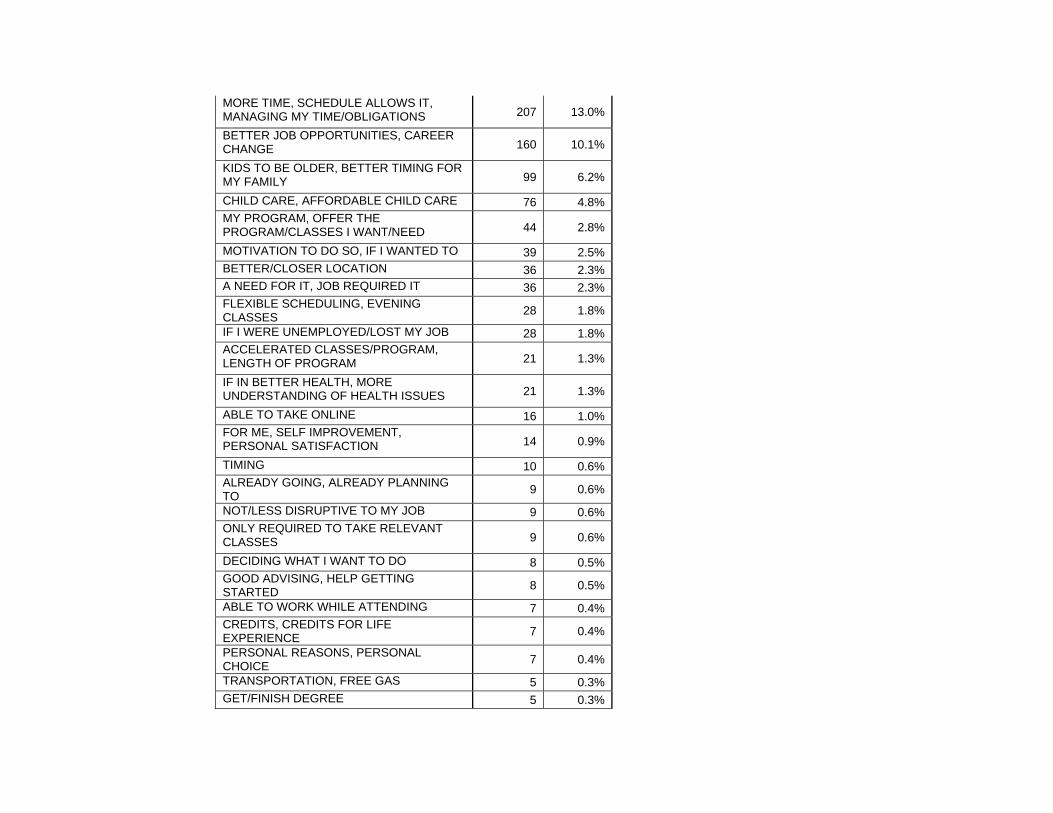
MORE TIME, SCHEDULE ALLOWS IT, MANAGING MY TIME/OBLIGATIONS 207 13.0%
BETTER JOB OPPORTUNITIES, CAREER CHANGE 160 10.1%
KIDS TO BE OLDER, BETTER TIMING FOR MY FAMILY 99 6.2%
CHILD CARE, AFFORDABLE CHILD CARE 76 4.8%
MY PROGRAM, OFFER THE PROGRAM/CLASSES I WANT/NEED 44 2.8%
MOTIVATION TO DO SO, IF I WANTED TO 39 2.5% BETTER/CLOSER LOCATION 36 2.3% A NEED FOR IT, JOB REQUIRED IT 36 2.3%
FLEXIBLE SCHEDULING, EVENING CLASSES 28 1.8%
IF I WERE UNEMPLOYED/LOST MY JOB 28 1.8%
ACCELERATED CLASSES/PROGRAM, LENGTH OF PROGRAM 21 1.3%
IF IN BETTER HEALTH, MORE UNDERSTANDING OF HEALTH ISSUES 21 1.3%
ABLE TO TAKE ONLINE 16 1.0%
FOR ME, SELF IMPROVEMENT, PERSONAL SATISFACTION 14 0.9%
TIMING 10 0.6%
ALREADY GOING, ALREADY PLANNING TO 9 0.6%
NOT/LESS DISRUPTIVE TO MY JOB 9 0.6%
ONLY REQUIRED TO TAKE RELEVANT CLASSES 9 0.6%
DECIDING WHAT I WANT TO DO 8 0.5%
GOOD ADVISING, HELP GETTING STARTED 8 0.5%
ABLE TO WORK WHILE ATTENDING 7 0.4%
CREDITS, CREDITS FOR LIFE EXPERIENCE 7 0.4%
PERSONAL REASONS, PERSONAL CHOICE 7 0.4%
TRANSPORTATION, FREE GAS 5 0.3% GET/FINISH DEGREE 5 0.3%
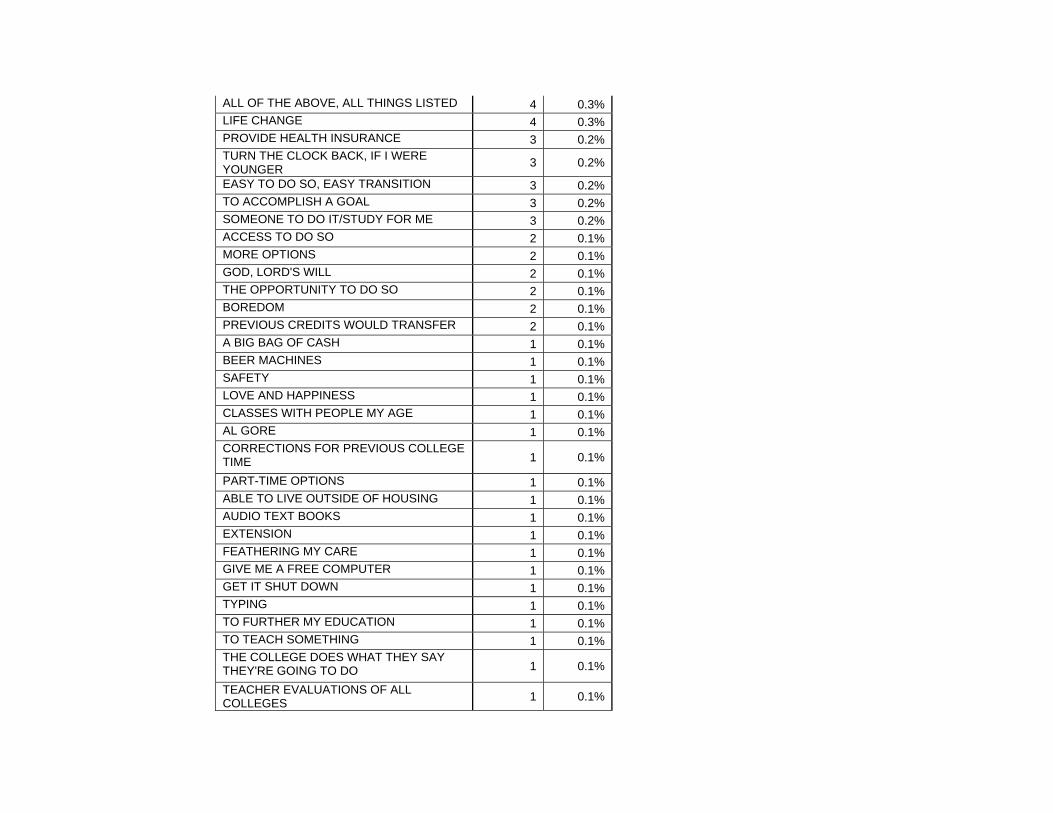
ALL OF THE ABOVE, ALL THINGS LISTED 4 0.3% LIFE CHANGE 4 0.3% PROVIDE HEALTH INSURANCE 3 0.2%
TURN THE CLOCK BACK, IF I WERE YOUNGER 3 0.2%
EASY TO DO SO, EASY TRANSITION 3 0.2% TO ACCOMPLISH A GOAL 3 0.2% SOMEONE TO DO IT/STUDY FOR ME 3 0.2% ACCESS TO DO SO 2 0.1% MORE OPTIONS 2 0.1% GOD, LORD'S WILL 2 0.1% THE OPPORTUNITY TO DO SO 2 0.1% BOREDOM 2 0.1% PREVIOUS CREDITS WOULD TRANSFER 2 0.1% A BIG BAG OF CASH 1 0.1% BEER MACHINES 1 0.1% SAFETY 1 0.1% LOVE AND HAPPINESS 1 0.1% CLASSES WITH PEOPLE MY AGE 1 0.1% AL GORE 1 0.1%
CORRECTIONS FOR PREVIOUS COLLEGE TIME 1 0.1%
PART-TIME OPTIONS 1 0.1% ABLE TO LIVE OUTSIDE OF HOUSING 1 0.1% AUDIO TEXT BOOKS 1 0.1% EXTENSION 1 0.1% FEATHERING MY CARE 1 0.1% GIVE ME A FREE COMPUTER 1 0.1% GET IT SHUT DOWN 1 0.1% TYPING 1 0.1% TO FURTHER MY EDUCATION 1 0.1% TO TEACH SOMETHING 1 0.1%
THE COLLEGE DOES WHAT THEY SAY THEY'RE GOING TO DO 1 0.1%
TEACHER EVALUATIONS OF ALL COLLEGES 1 0.1%
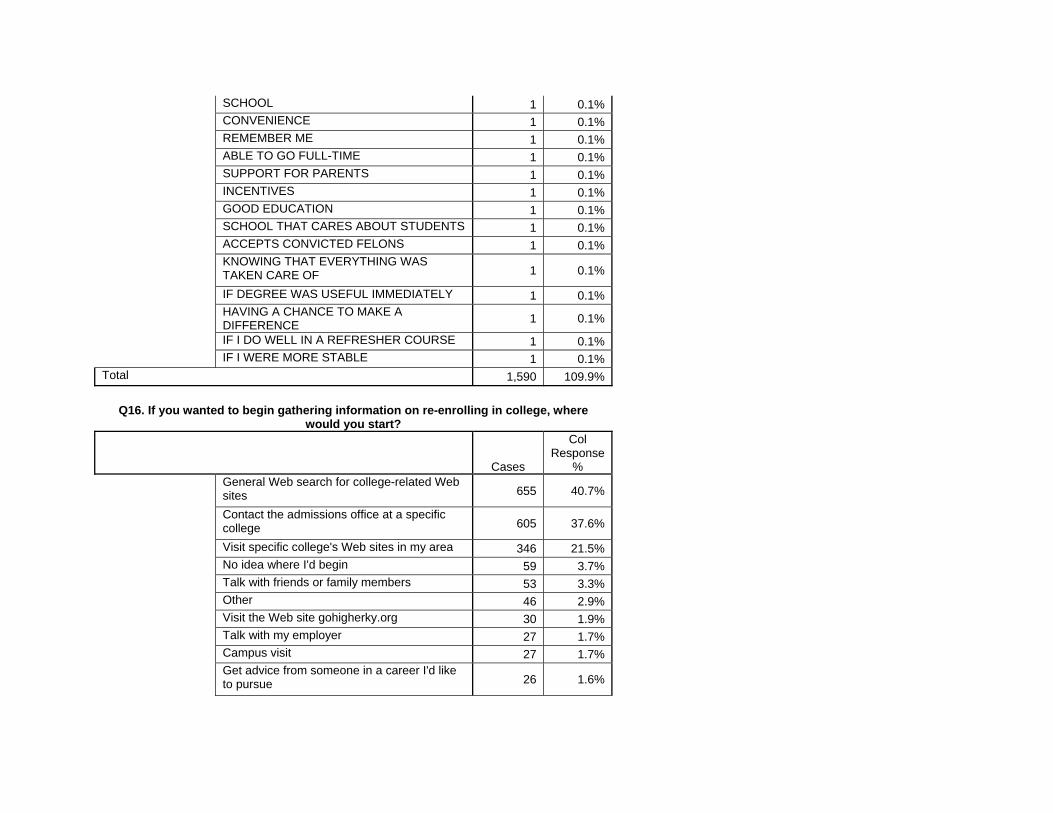
SCHOOL 1 0.1% CONVENIENCE 1 0.1% REMEMBER ME 1 0.1% ABLE TO GO FULL-TIME 1 0.1% SUPPORT FOR PARENTS 1 0.1% INCENTIVES 1 0.1% GOOD EDUCATION 1 0.1% SCHOOL THAT CARES ABOUT STUDENTS 1 0.1% ACCEPTS CONVICTED FELONS 1 0.1%
KNOWING THAT EVERYTHING WAS TAKEN CARE OF 1 0.1%
IF DEGREE WAS USEFUL IMMEDIATELY 1 0.1%
HAVING A CHANCE TO MAKE A DIFFERENCE 1 0.1%
IF I DO WELL IN A REFRESHER COURSE 1 0.1% IF I WERE MORE STABLE 1 0.1% Total 1,590 109.9%
Q16. If you wanted to begin gathering information on re-enrolling in college, where would you start?
Cases
Col Response
%
General Web search for college-related Web sites 655 40.7%
Contact the admissions office at a specific college 605 37.6%
Visit specific college's Web sites in my area 346 21.5% No idea where I'd begin 59 3.7% Talk with friends or family members 53 3.3% Other 46 2.9% Visit the Web site gohigherky.org 30 1.9% Talk with my employer 27 1.7% Campus visit 27 1.7%
Get advice from someone in a career I'd like to pursue 26 1.6%
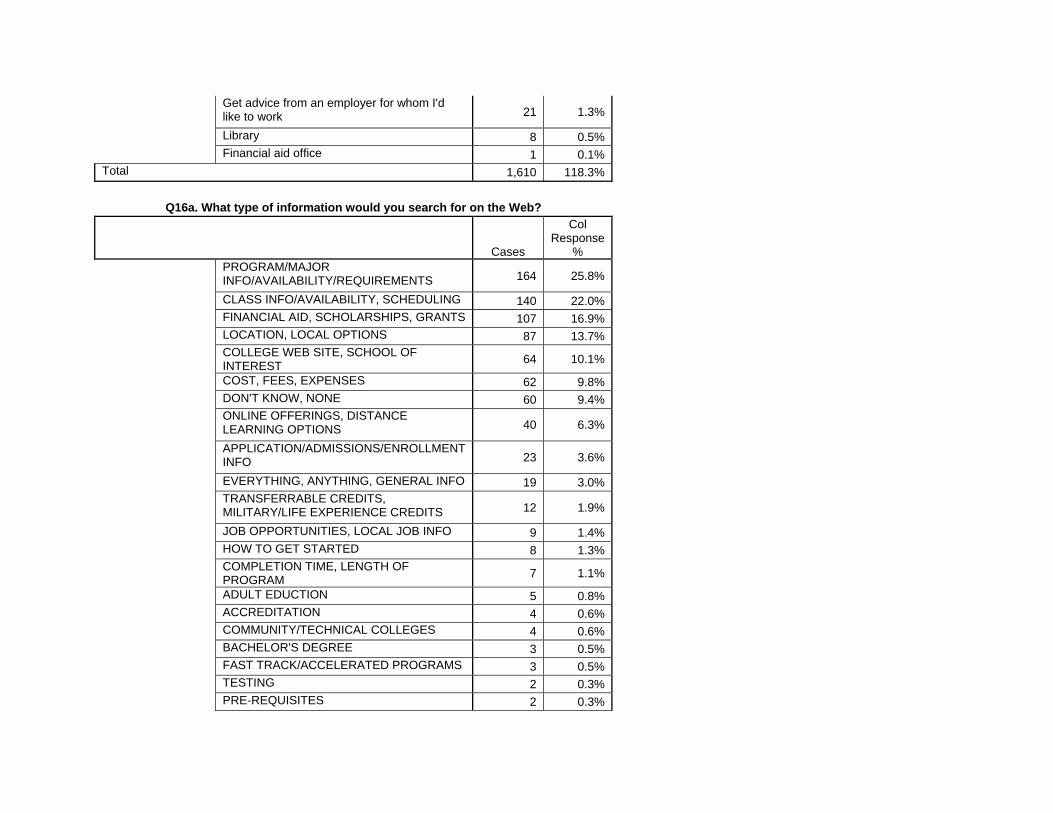
Get advice from an employer for whom I'd like to work 21 1.3%
Library 8 0.5% Financial aid office 1 0.1% Total 1,610 118.3%
Q16a. What type of information would you search for on the Web?
Cases
Col Response
%
PROGRAM/MAJOR INFO/AVAILABILITY/REQUIREMENTS 164 25.8%
CLASS INFO/AVAILABILITY, SCHEDULING 140 22.0% FINANCIAL AID, SCHOLARSHIPS, GRANTS 107 16.9% LOCATION, LOCAL OPTIONS 87 13.7%
COLLEGE WEB SITE, SCHOOL OF INTEREST 64 10.1%
COST, FEES, EXPENSES 62 9.8% DON'T KNOW, NONE 60 9.4%
ONLINE OFFERINGS, DISTANCE LEARNING OPTIONS 40 6.3%
APPLICATION/ADMISSIONS/ENROLLMENT INFO 23 3.6%
EVERYTHING, ANYTHING, GENERAL INFO 19 3.0%
TRANSFERRABLE CREDITS, MILITARY/LIFE EXPERIENCE CREDITS 12 1.9%
JOB OPPORTUNITIES, LOCAL JOB INFO 9 1.4% HOW TO GET STARTED 8 1.3%
COMPLETION TIME, LENGTH OF PROGRAM 7 1.1%
ADULT EDUCTION 5 0.8% ACCREDITATION 4 0.6% COMMUNITY/TECHNICAL COLLEGES 4 0.6% BACHELOR'S DEGREE 3 0.5% FAST TRACK/ACCELERATED PROGRAMS 3 0.5% TESTING 2 0.3% PRE-REQUISITES 2 0.3%
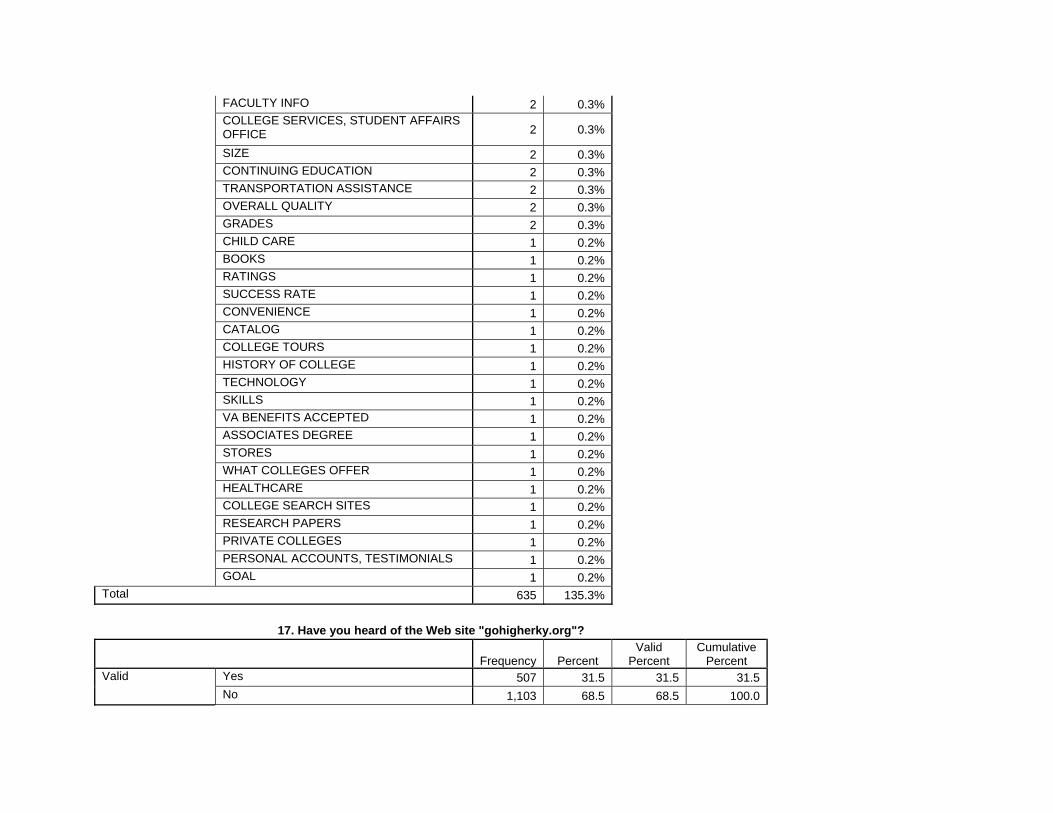
FACULTY INFO 2 0.3%
COLLEGE SERVICES, STUDENT AFFAIRS OFFICE 2 0.3%
SIZE 2 0.3% CONTINUING EDUCATION 2 0.3% TRANSPORTATION ASSISTANCE 2 0.3% OVERALL QUALITY 2 0.3% GRADES 2 0.3% CHILD CARE 1 0.2% BOOKS 1 0.2% RATINGS 1 0.2% SUCCESS RATE 1 0.2% CONVENIENCE 1 0.2% CATALOG 1 0.2% COLLEGE TOURS 1 0.2% HISTORY OF COLLEGE 1 0.2% TECHNOLOGY 1 0.2% SKILLS 1 0.2% VA BENEFITS ACCEPTED 1 0.2% ASSOCIATES DEGREE 1 0.2% STORES 1 0.2% WHAT COLLEGES OFFER 1 0.2% HEALTHCARE 1 0.2% COLLEGE SEARCH SITES 1 0.2% RESEARCH PAPERS 1 0.2% PRIVATE COLLEGES 1 0.2% PERSONAL ACCOUNTS, TESTIMONIALS 1 0.2% GOAL 1 0.2% Total 635 135.3%
17. Have you heard of the Web site "gohigherky.org"?
Frequency Percent Valid
Percent Cumulative
Percent Yes 507 31.5 31.5 31.5Valid No 1,103 68.5 68.5 100.0
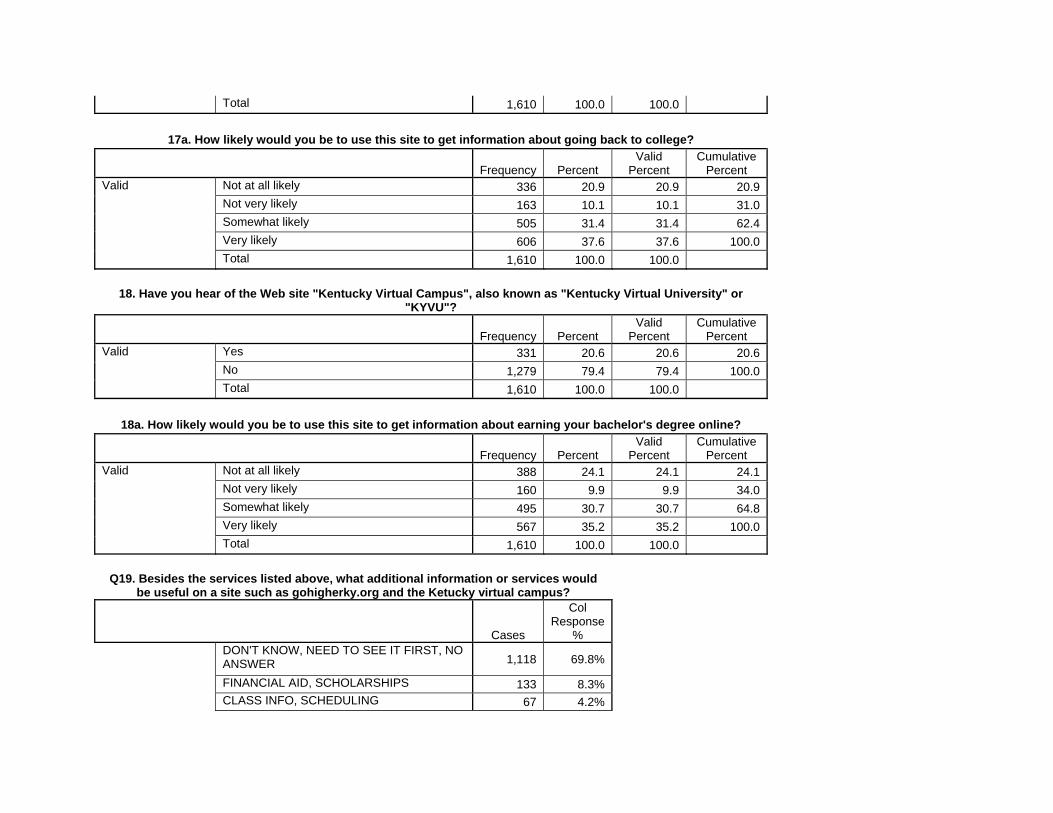
Total 1,610 100.0 100.0
17a. How likely would you be to use this site to get information about going back to college?
Frequency Percent Valid
Percent Cumulative
Percent Not at all likely 336 20.9 20.9 20.9Not very likely 163 10.1 10.1 31.0Somewhat likely 505 31.4 31.4 62.4Very likely 606 37.6 37.6 100.0
Valid
Total 1,610 100.0 100.0
18. Have you hear of the Web site "Kentucky Virtual Campus", also known as "Kentucky Virtual University" or "KYVU"?
Frequency Percent Valid
Percent Cumulative
Percent Yes 331 20.6 20.6 20.6No 1,279 79.4 79.4 100.0
Valid
Total 1,610 100.0 100.0
18a. How likely would you be to use this site to get information about earning your bachelor's degree online?
Frequency Percent Valid
Percent Cumulative
Percent Not at all likely 388 24.1 24.1 24.1Not very likely 160 9.9 9.9 34.0Somewhat likely 495 30.7 30.7 64.8Very likely 567 35.2 35.2 100.0
Valid
Total 1,610 100.0 100.0
Q19. Besides the services listed above, what additional information or services would be useful on a site such as gohigherky.org and the Ketucky virtual campus?
Cases
Col Response
%
DON'T KNOW, NEED TO SEE IT FIRST, NO ANSWER 1,118 69.8%
FINANCIAL AID, SCHOLARSHIPS 133 8.3% CLASS INFO, SCHEDULING 67 4.2%
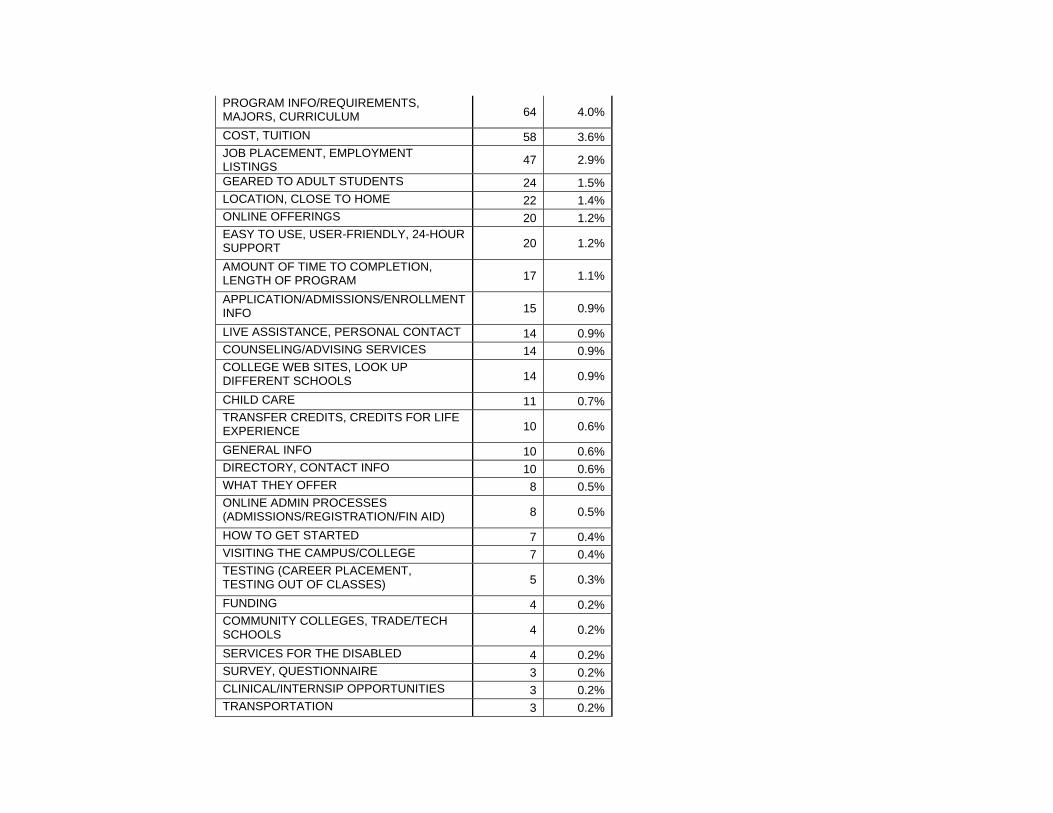
PROGRAM INFO/REQUIREMENTS, MAJORS, CURRICULUM 64 4.0%
COST, TUITION 58 3.6%
JOB PLACEMENT, EMPLOYMENT LISTINGS 47 2.9%
GEARED TO ADULT STUDENTS 24 1.5% LOCATION, CLOSE TO HOME 22 1.4% ONLINE OFFERINGS 20 1.2%
EASY TO USE, USER-FRIENDLY, 24-HOUR SUPPORT 20 1.2%
AMOUNT OF TIME TO COMPLETION, LENGTH OF PROGRAM 17 1.1%
APPLICATION/ADMISSIONS/ENROLLMENT INFO 15 0.9%
LIVE ASSISTANCE, PERSONAL CONTACT 14 0.9% COUNSELING/ADVISING SERVICES 14 0.9%
COLLEGE WEB SITES, LOOK UP DIFFERENT SCHOOLS 14 0.9%
CHILD CARE 11 0.7%
TRANSFER CREDITS, CREDITS FOR LIFE EXPERIENCE 10 0.6%
GENERAL INFO 10 0.6% DIRECTORY, CONTACT INFO 10 0.6% WHAT THEY OFFER 8 0.5%
ONLINE ADMIN PROCESSES (ADMISSIONS/REGISTRATION/FIN AID) 8 0.5%
HOW TO GET STARTED 7 0.4% VISITING THE CAMPUS/COLLEGE 7 0.4%
TESTING (CAREER PLACEMENT, TESTING OUT OF CLASSES) 5 0.3%
FUNDING 4 0.2%
COMMUNITY COLLEGES, TRADE/TECH SCHOOLS 4 0.2%
SERVICES FOR THE DISABLED 4 0.2% SURVEY, QUESTIONNAIRE 3 0.2% CLINICAL/INTERNSIP OPPORTUNITIES 3 0.2% TRANSPORTATION 3 0.2%
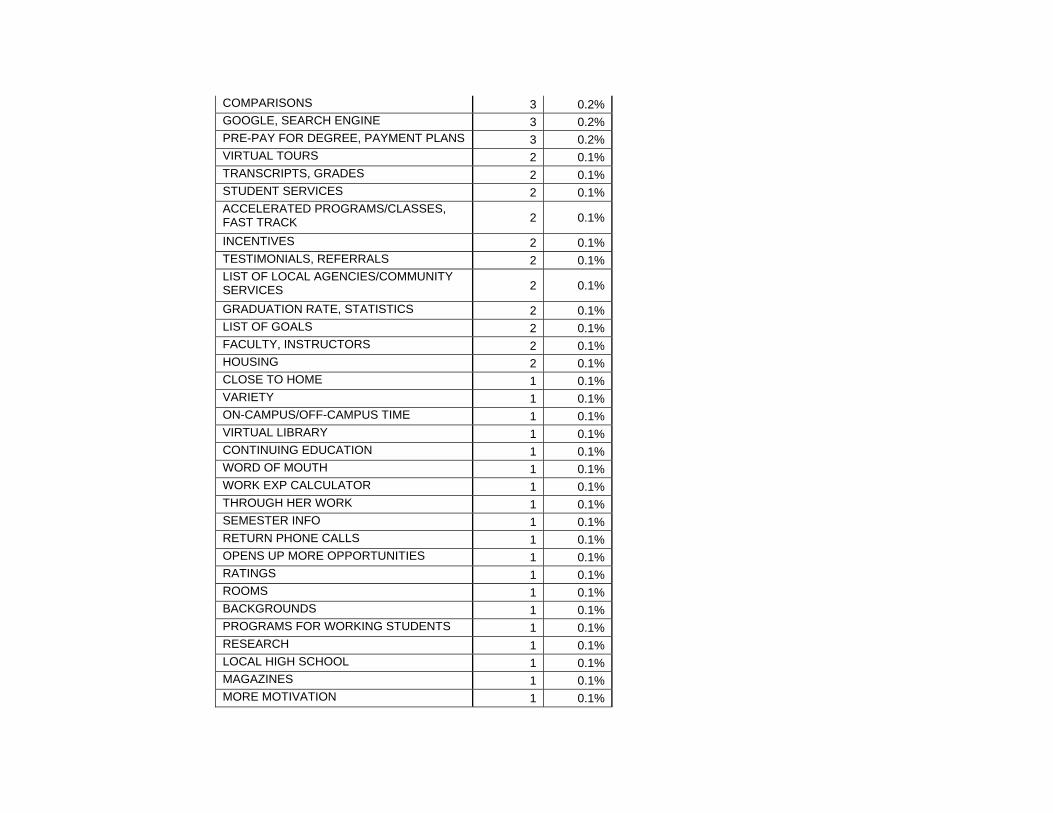
COMPARISONS 3 0.2% GOOGLE, SEARCH ENGINE 3 0.2% PRE-PAY FOR DEGREE, PAYMENT PLANS 3 0.2% VIRTUAL TOURS 2 0.1% TRANSCRIPTS, GRADES 2 0.1% STUDENT SERVICES 2 0.1%
ACCELERATED PROGRAMS/CLASSES, FAST TRACK 2 0.1%
INCENTIVES 2 0.1% TESTIMONIALS, REFERRALS 2 0.1%
LIST OF LOCAL AGENCIES/COMMUNITY SERVICES 2 0.1%
GRADUATION RATE, STATISTICS 2 0.1% LIST OF GOALS 2 0.1% FACULTY, INSTRUCTORS 2 0.1% HOUSING 2 0.1% CLOSE TO HOME 1 0.1% VARIETY 1 0.1% ON-CAMPUS/OFF-CAMPUS TIME 1 0.1% VIRTUAL LIBRARY 1 0.1% CONTINUING EDUCATION 1 0.1% WORD OF MOUTH 1 0.1% WORK EXP CALCULATOR 1 0.1% THROUGH HER WORK 1 0.1% SEMESTER INFO 1 0.1% RETURN PHONE CALLS 1 0.1% OPENS UP MORE OPPORTUNITIES 1 0.1% RATINGS 1 0.1% ROOMS 1 0.1% BACKGROUNDS 1 0.1% PROGRAMS FOR WORKING STUDENTS 1 0.1% RESEARCH 1 0.1% LOCAL HIGH SCHOOL 1 0.1% MAGAZINES 1 0.1% MORE MOTIVATION 1 0.1%
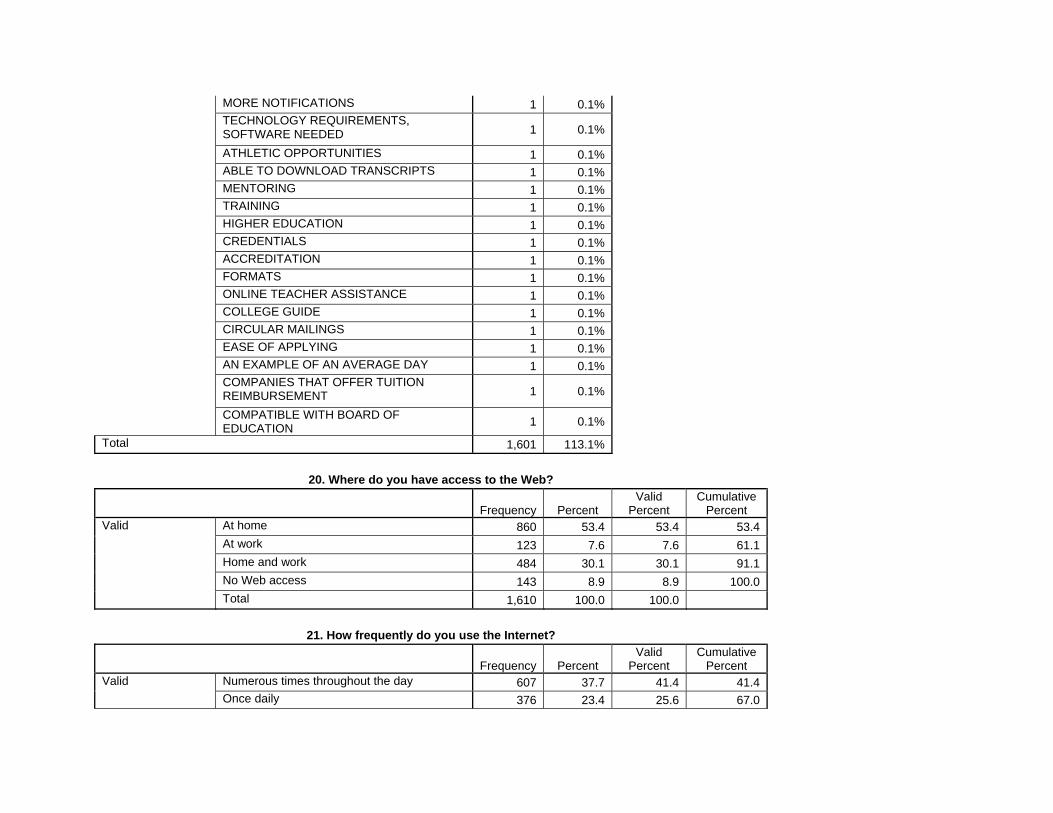
MORE NOTIFICATIONS 1 0.1%
TECHNOLOGY REQUIREMENTS, SOFTWARE NEEDED 1 0.1%
ATHLETIC OPPORTUNITIES 1 0.1% ABLE TO DOWNLOAD TRANSCRIPTS 1 0.1% MENTORING 1 0.1% TRAINING 1 0.1% HIGHER EDUCATION 1 0.1% CREDENTIALS 1 0.1% ACCREDITATION 1 0.1% FORMATS 1 0.1% ONLINE TEACHER ASSISTANCE 1 0.1% COLLEGE GUIDE 1 0.1% CIRCULAR MAILINGS 1 0.1% EASE OF APPLYING 1 0.1% AN EXAMPLE OF AN AVERAGE DAY 1 0.1%
COMPANIES THAT OFFER TUITION REIMBURSEMENT 1 0.1%
COMPATIBLE WITH BOARD OF EDUCATION 1 0.1%
Total 1,601 113.1%
20. Where do you have access to the Web?
Frequency Percent Valid
Percent Cumulative
Percent At home 860 53.4 53.4 53.4At work 123 7.6 7.6 61.1Home and work 484 30.1 30.1 91.1No Web access 143 8.9 8.9 100.0
Valid
Total 1,610 100.0 100.0
21. How frequently do you use the Internet?
Frequency Percent Valid
Percent Cumulative
Percent Numerous times throughout the day 607 37.7 41.4 41.4Valid Once daily 376 23.4 25.6 67.0
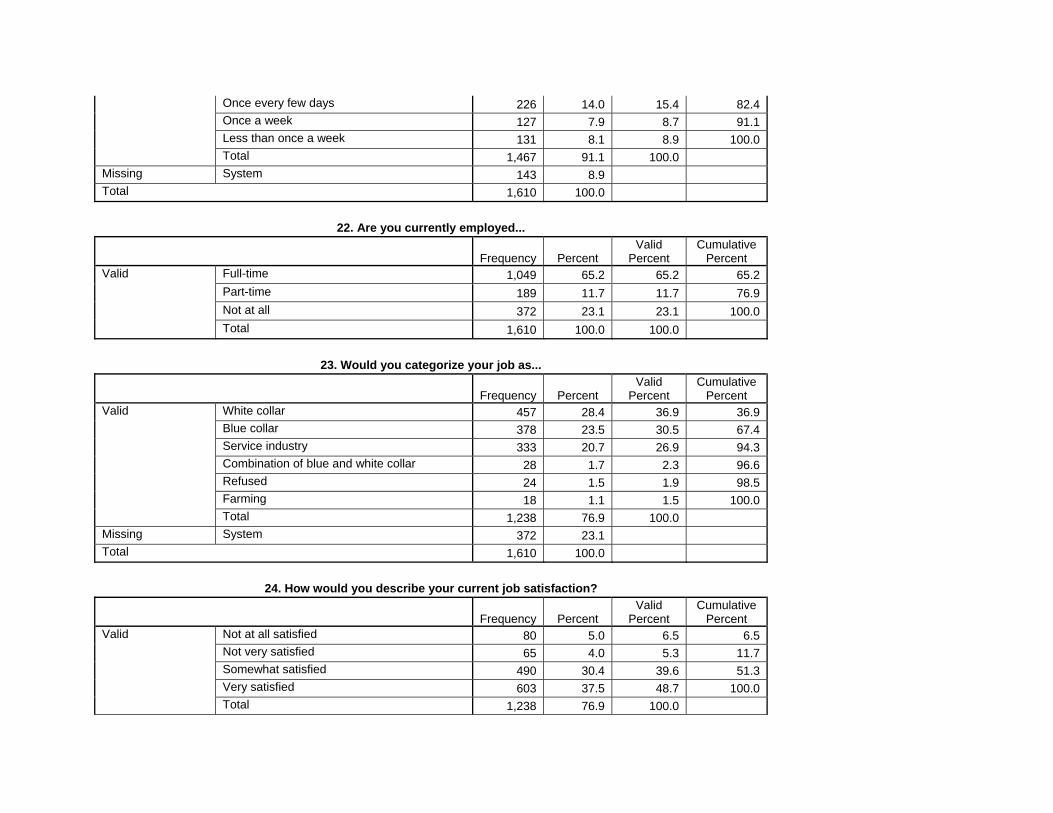
Once every few days 226 14.0 15.4 82.4Once a week 127 7.9 8.7 91.1Less than once a week 131 8.1 8.9 100.0Total 1,467 91.1 100.0
Missing System 143 8.9 Total 1,610 100.0
22. Are you currently employed...
Frequency Percent Valid
Percent Cumulative
Percent Full-time 1,049 65.2 65.2 65.2Part-time 189 11.7 11.7 76.9Not at all 372 23.1 23.1 100.0
Valid
Total 1,610 100.0 100.0
23. Would you categorize your job as...
Frequency Percent Valid
Percent Cumulative
Percent White collar 457 28.4 36.9 36.9Blue collar 378 23.5 30.5 67.4Service industry 333 20.7 26.9 94.3Combination of blue and white collar 28 1.7 2.3 96.6Refused 24 1.5 1.9 98.5Farming 18 1.1 1.5 100.0
Valid
Total 1,238 76.9 100.0 Missing System 372 23.1 Total 1,610 100.0
24. How would you describe your current job satisfaction?
Frequency Percent Valid
Percent Cumulative
Percent Not at all satisfied 80 5.0 6.5 6.5Not very satisfied 65 4.0 5.3 11.7Somewhat satisfied 490 30.4 39.6 51.3Very satisfied 603 37.5 48.7 100.0
Valid
Total 1,238 76.9 100.0
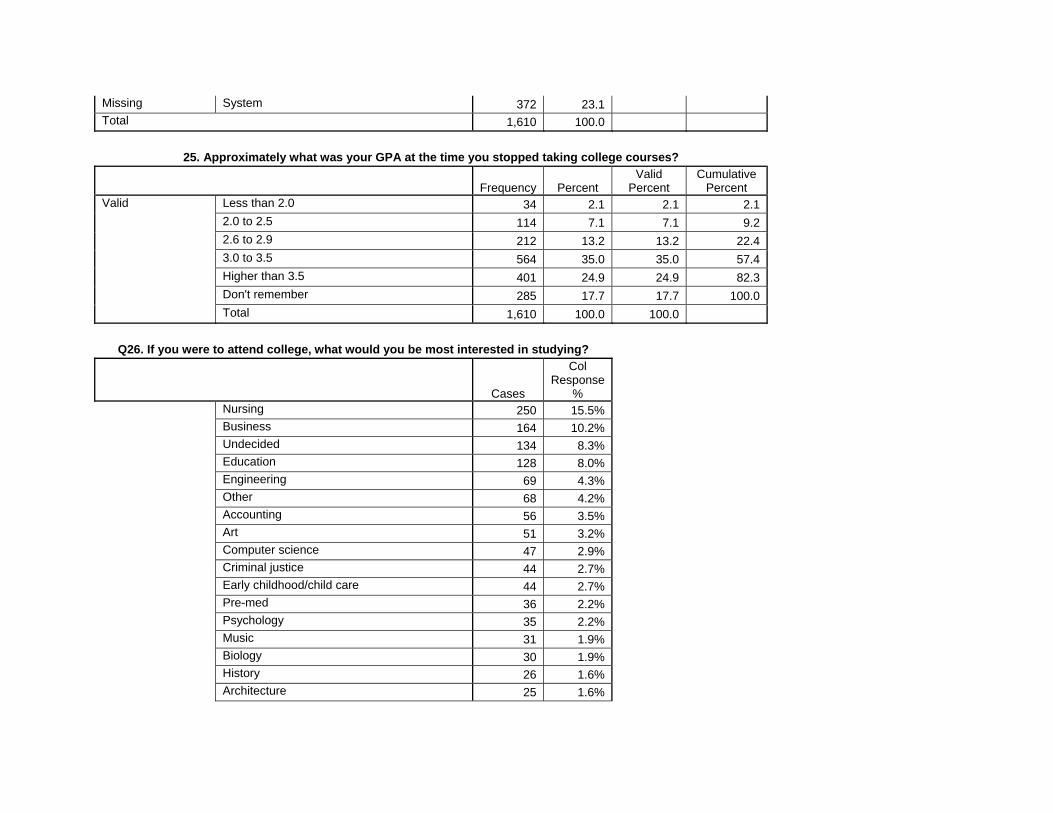
Missing System 372 23.1 Total 1,610 100.0
25. Approximately what was your GPA at the time you stopped taking college courses?
Frequency Percent Valid
Percent Cumulative
Percent Less than 2.0 34 2.1 2.1 2.12.0 to 2.5 114 7.1 7.1 9.22.6 to 2.9 212 13.2 13.2 22.43.0 to 3.5 564 35.0 35.0 57.4Higher than 3.5 401 24.9 24.9 82.3Don't remember 285 17.7 17.7 100.0
Valid
Total 1,610 100.0 100.0
Q26. If you were to attend college, what would you be most interested in studying?
Cases
Col Response
% Nursing 250 15.5% Business 164 10.2% Undecided 134 8.3% Education 128 8.0% Engineering 69 4.3% Other 68 4.2% Accounting 56 3.5% Art 51 3.2% Computer science 47 2.9% Criminal justice 44 2.7% Early childhood/child care 44 2.7% Pre-med 36 2.2% Psychology 35 2.2% Music 31 1.9% Biology 30 1.9% History 26 1.6% Architecture 25 1.6%
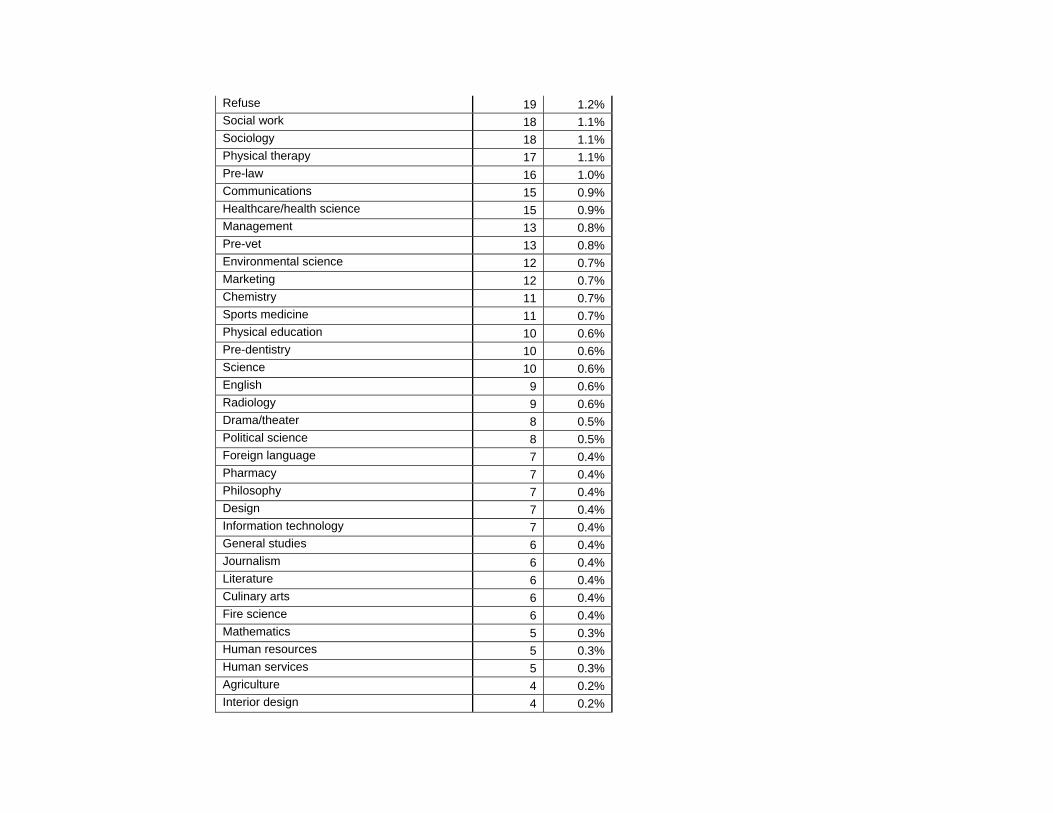
Refuse 19 1.2% Social work 18 1.1% Sociology 18 1.1% Physical therapy 17 1.1% Pre-law 16 1.0% Communications 15 0.9% Healthcare/health science 15 0.9% Management 13 0.8% Pre-vet 13 0.8% Environmental science 12 0.7% Marketing 12 0.7% Chemistry 11 0.7% Sports medicine 11 0.7% Physical education 10 0.6% Pre-dentistry 10 0.6% Science 10 0.6% English 9 0.6% Radiology 9 0.6% Drama/theater 8 0.5% Political science 8 0.5% Foreign language 7 0.4% Pharmacy 7 0.4% Philosophy 7 0.4% Design 7 0.4% Information technology 7 0.4% General studies 6 0.4% Journalism 6 0.4% Literature 6 0.4% Culinary arts 6 0.4% Fire science 6 0.4% Mathematics 5 0.3% Human resources 5 0.3% Human services 5 0.3% Agriculture 4 0.2% Interior design 4 0.2%
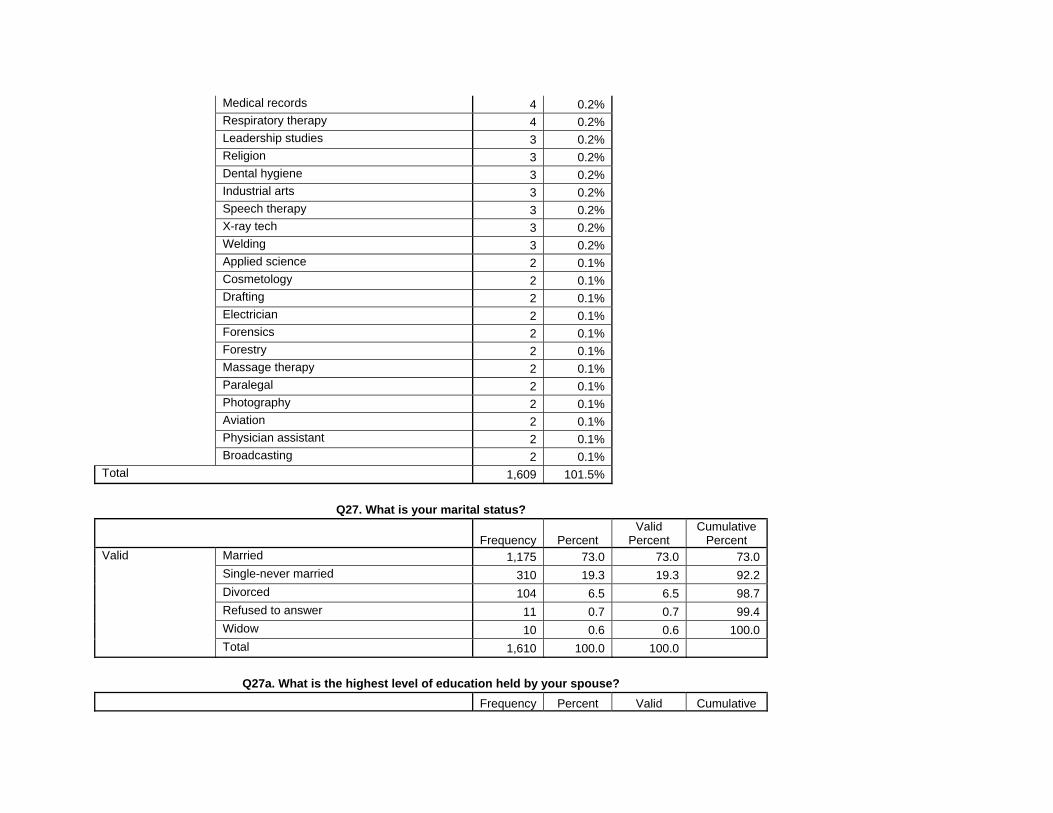
Medical records 4 0.2% Respiratory therapy 4 0.2% Leadership studies 3 0.2% Religion 3 0.2% Dental hygiene 3 0.2% Industrial arts 3 0.2% Speech therapy 3 0.2% X-ray tech 3 0.2% Welding 3 0.2% Applied science 2 0.1% Cosmetology 2 0.1% Drafting 2 0.1% Electrician 2 0.1% Forensics 2 0.1% Forestry 2 0.1% Massage therapy 2 0.1% Paralegal 2 0.1% Photography 2 0.1% Aviation 2 0.1% Physician assistant 2 0.1% Broadcasting 2 0.1% Total 1,609 101.5%
Q27. What is your marital status?
Frequency Percent Valid
Percent Cumulative
Percent Married 1,175 73.0 73.0 73.0Single-never married 310 19.3 19.3 92.2Divorced 104 6.5 6.5 98.7Refused to answer 11 0.7 0.7 99.4Widow 10 0.6 0.6 100.0
Valid
Total 1,610 100.0 100.0
Q27a. What is the highest level of education held by your spouse? Frequency Percent Valid Cumulative
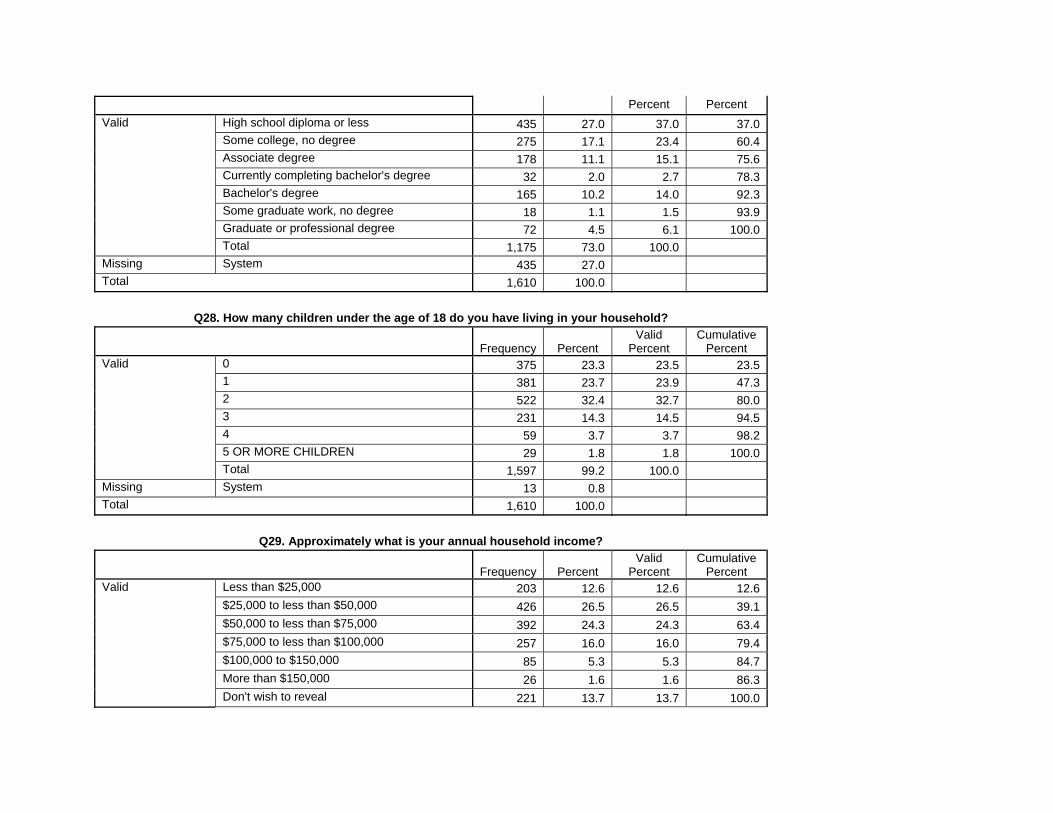
Percent Percent High school diploma or less 435 27.0 37.0 37.0Some college, no degree 275 17.1 23.4 60.4Associate degree 178 11.1 15.1 75.6Currently completing bachelor's degree 32 2.0 2.7 78.3Bachelor's degree 165 10.2 14.0 92.3Some graduate work, no degree 18 1.1 1.5 93.9Graduate or professional degree 72 4.5 6.1 100.0
Valid
Total 1,175 73.0 100.0 Missing System 435 27.0 Total 1,610 100.0
Q28. How many children under the age of 18 do you have living in your household?
Frequency Percent Valid
Percent Cumulative
Percent 0 375 23.3 23.5 23.51 381 23.7 23.9 47.32 522 32.4 32.7 80.03 231 14.3 14.5 94.54 59 3.7 3.7 98.25 OR MORE CHILDREN 29 1.8 1.8 100.0
Valid
Total 1,597 99.2 100.0 Missing System 13 0.8 Total 1,610 100.0
Q29. Approximately what is your annual household income?
Frequency Percent Valid
Percent Cumulative
Percent Less than $25,000 203 12.6 12.6 12.6$25,000 to less than $50,000 426 26.5 26.5 39.1$50,000 to less than $75,000 392 24.3 24.3 63.4$75,000 to less than $100,000 257 16.0 16.0 79.4$100,000 to $150,000 85 5.3 5.3 84.7More than $150,000 26 1.6 1.6 86.3
Valid
Don't wish to reveal 221 13.7 13.7 100.0
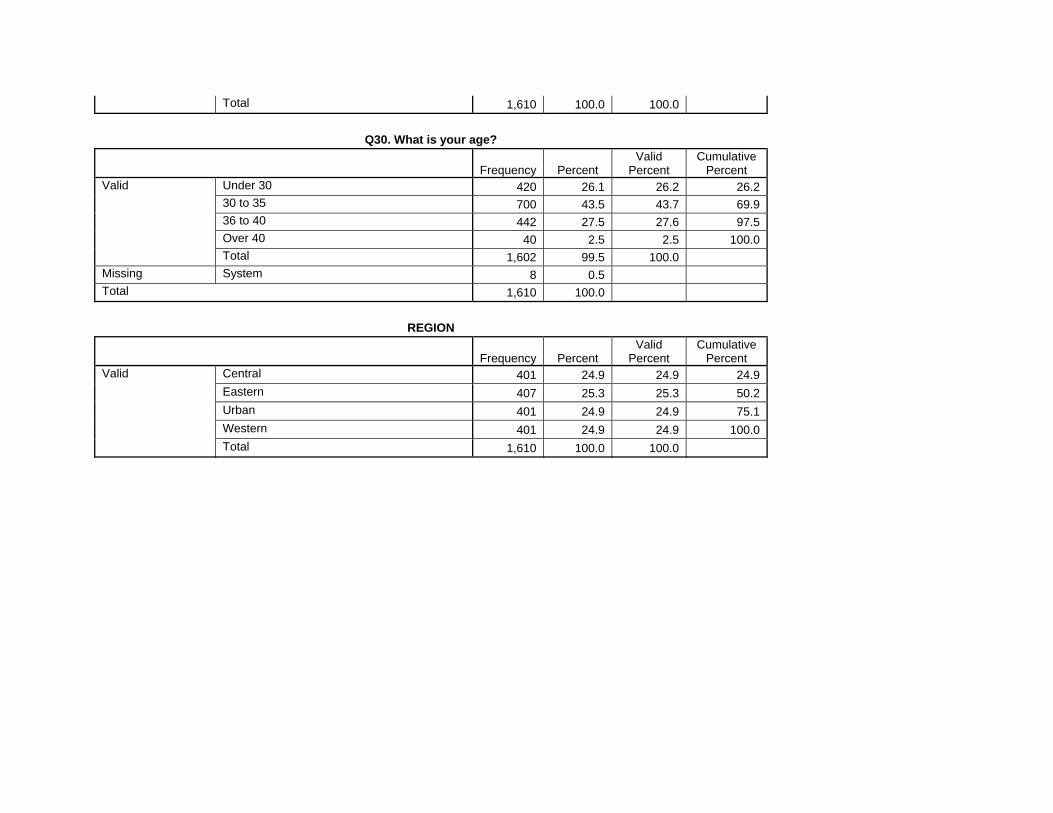
Total 1,610 100.0 100.0
Q30. What is your age?
Frequency Percent Valid
Percent Cumulative
Percent Under 30 420 26.1 26.2 26.230 to 35 700 43.5 43.7 69.936 to 40 442 27.5 27.6 97.5Over 40 40 2.5 2.5 100.0
Valid
Total 1,602 99.5 100.0 Missing System 8 0.5 Total 1,610 100.0
REGION
Frequency Percent Valid
Percent Cumulative
Percent Central 401 24.9 24.9 24.9Eastern 407 25.3 25.3 50.2Urban 401 24.9 24.9 75.1Western 401 24.9 24.9 100.0
Valid
Total 1,610 100.0 100.0
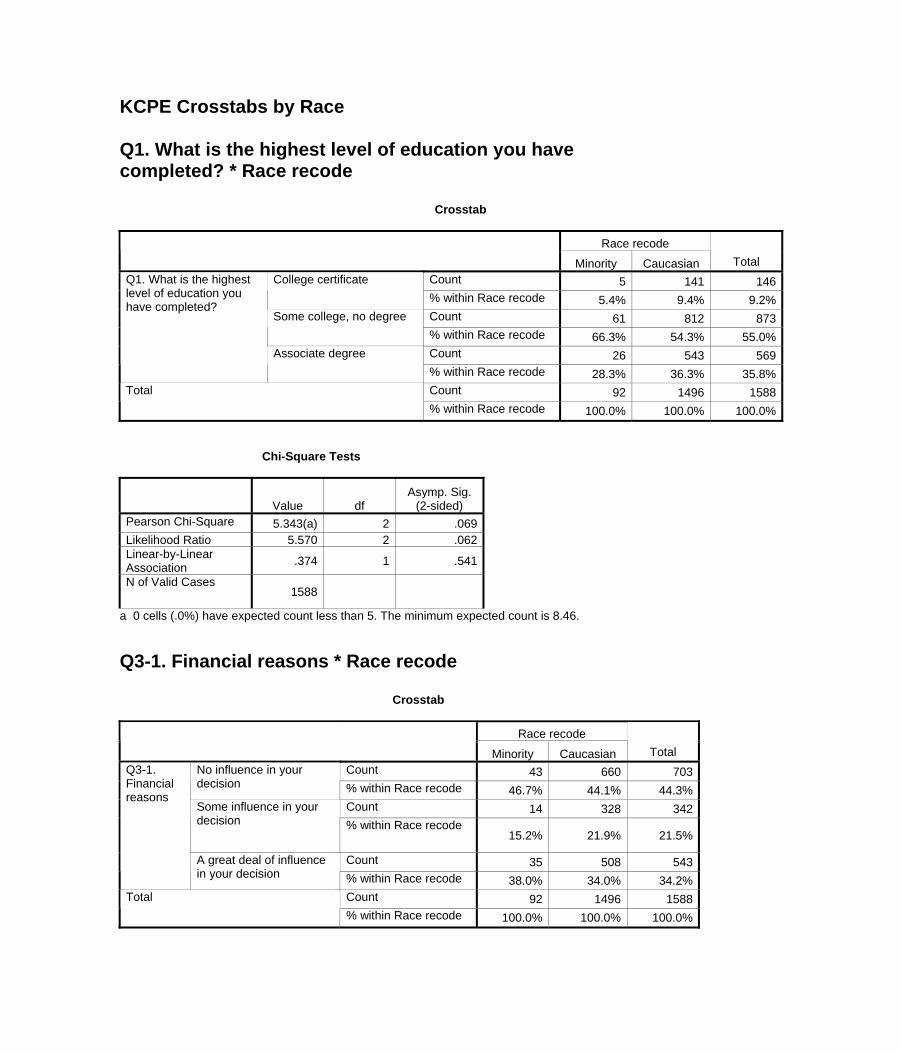
KCPE Crosstabs by Race Q1. What is the highest level of education you have completed? * Race recode Crosstab
Race recode Minority Caucasian Total
Count 5 141 146College certificate % within Race recode 5.4% 9.4% 9.2%Count 61 812 873Some college, no degree % within Race recode 66.3% 54.3% 55.0%Count 26 543 569
Q1. What is the highest level of education you have completed?
Associate degree % within Race recode 28.3% 36.3% 35.8%Count 92 1496 1588Total % within Race recode 100.0% 100.0% 100.0%
Chi-Square Tests
Value df Asymp. Sig.
(2-sided) Pearson Chi-Square 5.343(a) 2 .069Likelihood Ratio 5.570 2 .062Linear-by-Linear Association .374 1 .541
N of Valid Cases 1588
a 0 cells (.0%) have expected count less than 5. The minimum expected count is 8.46. Q3-1. Financial reasons * Race recode Crosstab
Race recode Minority Caucasian Total
Count 43 660 703No influence in your decision % within Race recode 46.7% 44.1% 44.3%
Count 14 328 342Some influence in your decision % within Race recode
15.2% 21.9% 21.5%
Count 35 508 543
Q3-1. Financial reasons
A great deal of influence in your decision % within Race recode 38.0% 34.0% 34.2%
Count 92 1496 1588Total % within Race recode 100.0% 100.0% 100.0%
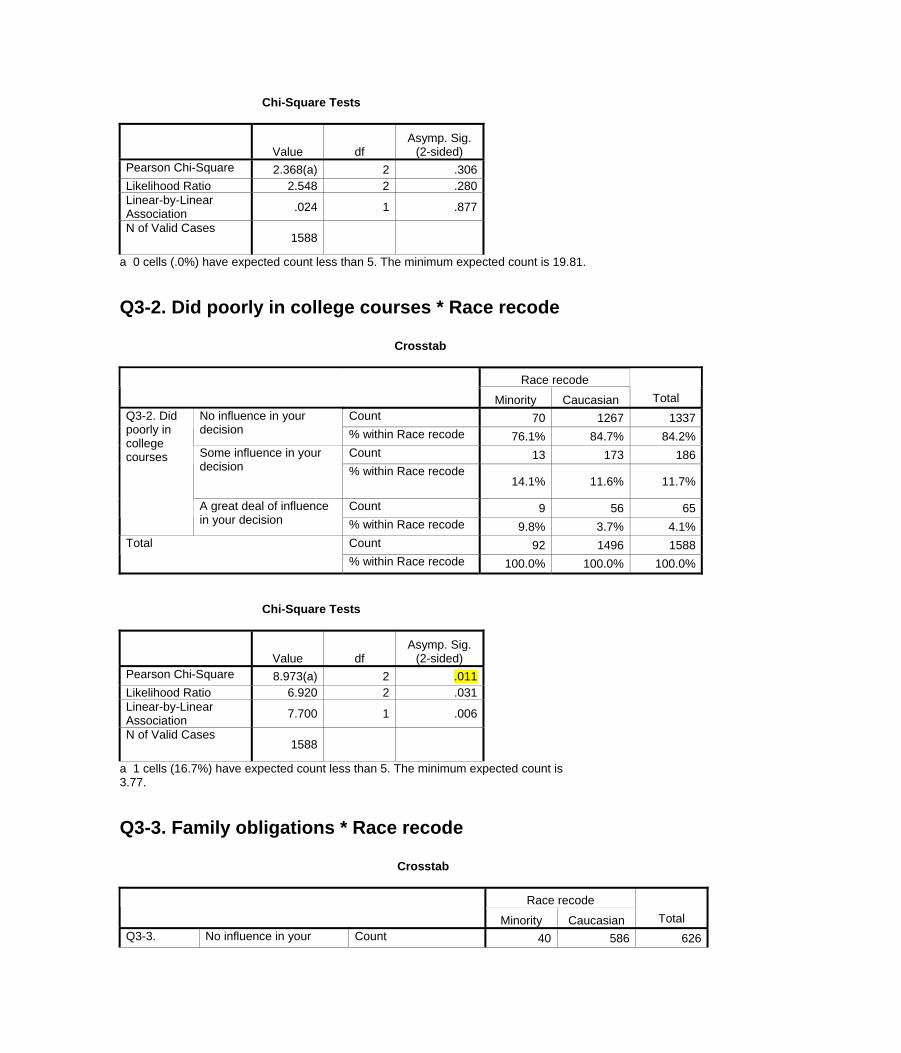
Chi-Square Tests
Value df Asymp. Sig.
(2-sided) Pearson Chi-Square 2.368(a) 2 .306Likelihood Ratio 2.548 2 .280Linear-by-Linear Association .024 1 .877
N of Valid Cases 1588
a 0 cells (.0%) have expected count less than 5. The minimum expected count is 19.81. Q3-2. Did poorly in college courses * Race recode Crosstab
Race recode Minority Caucasian Total
Count 70 1267 1337No influence in your decision % within Race recode 76.1% 84.7% 84.2%
Count 13 173 186Some influence in your decision % within Race recode
14.1% 11.6% 11.7%
Count 9 56 65
Q3-2. Did poorly in college courses
A great deal of influence in your decision % within Race recode 9.8% 3.7% 4.1%
Count 92 1496 1588Total % within Race recode 100.0% 100.0% 100.0%
Chi-Square Tests
Value df Asymp. Sig.
(2-sided) Pearson Chi-Square 8.973(a) 2 .011Likelihood Ratio 6.920 2 .031Linear-by-Linear Association 7.700 1 .006
N of Valid Cases 1588
a 1 cells (16.7%) have expected count less than 5. The minimum expected count is 3.77. Q3-3. Family obligations * Race recode Crosstab
Race recode Minority Caucasian Total Q3-3. No influence in your Count 40 586 626
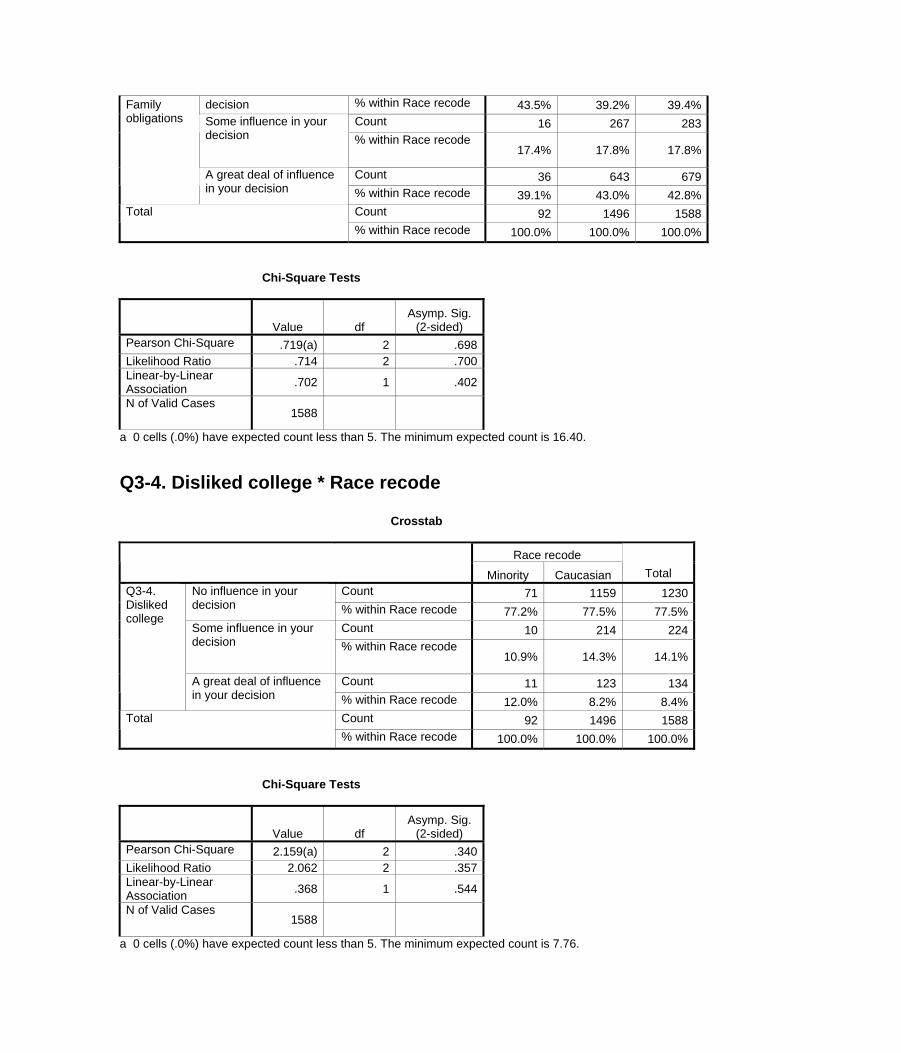
decision % within Race recode 43.5% 39.2% 39.4%Count 16 267 283Some influence in your
decision % within Race recode 17.4% 17.8% 17.8%
Count 36 643 679
Family obligations
A great deal of influence in your decision % within Race recode 39.1% 43.0% 42.8%
Count 92 1496 1588Total % within Race recode 100.0% 100.0% 100.0%
Chi-Square Tests
Value df Asymp. Sig.
(2-sided) Pearson Chi-Square .719(a) 2 .698Likelihood Ratio .714 2 .700Linear-by-Linear Association .702 1 .402
N of Valid Cases 1588
a 0 cells (.0%) have expected count less than 5. The minimum expected count is 16.40. Q3-4. Disliked college * Race recode Crosstab
Race recode Minority Caucasian Total
Count 71 1159 1230No influence in your decision % within Race recode 77.2% 77.5% 77.5%
Count 10 214 224Some influence in your decision % within Race recode
10.9% 14.3% 14.1%
Count 11 123 134
Q3-4. Disliked college
A great deal of influence in your decision % within Race recode 12.0% 8.2% 8.4%
Count 92 1496 1588Total % within Race recode 100.0% 100.0% 100.0%
Chi-Square Tests
Value df Asymp. Sig.
(2-sided) Pearson Chi-Square 2.159(a) 2 .340Likelihood Ratio 2.062 2 .357Linear-by-Linear Association .368 1 .544
N of Valid Cases 1588
a 0 cells (.0%) have expected count less than 5. The minimum expected count is 7.76.
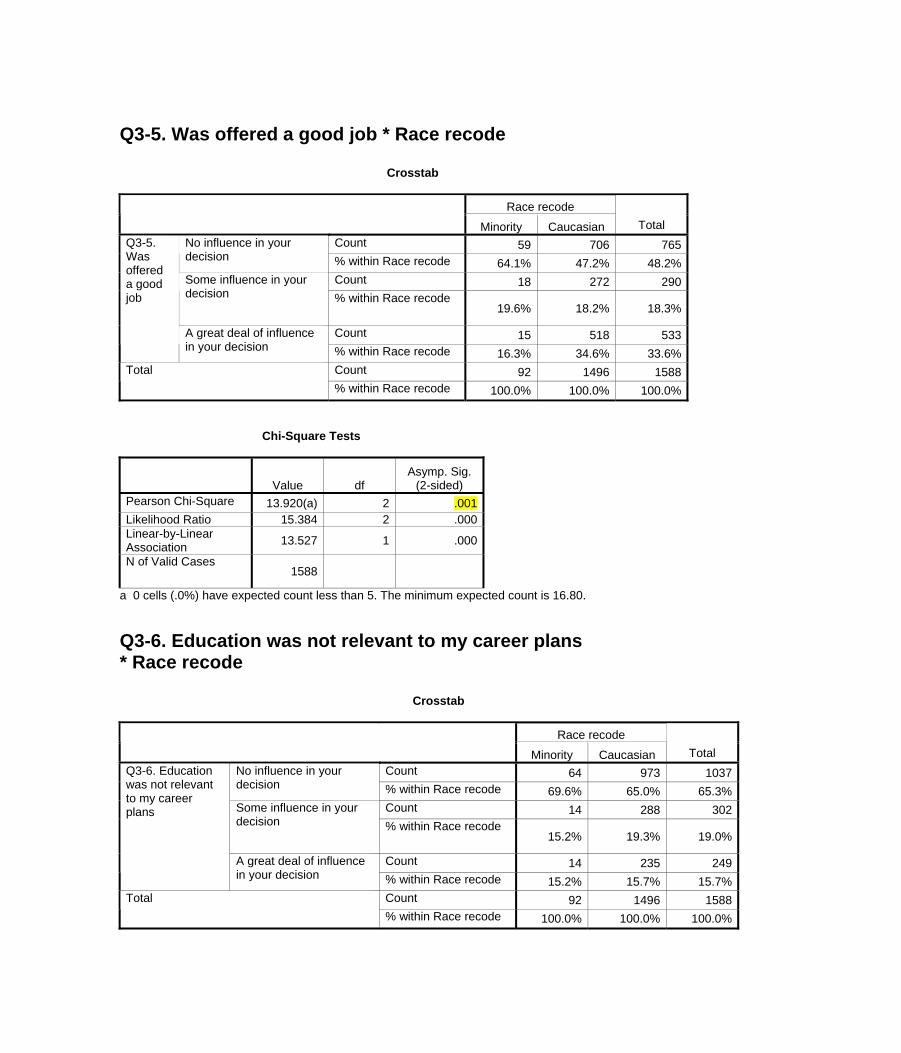
Q3-5. Was offered a good job * Race recode Crosstab
Race recode Minority Caucasian Total
Count 59 706 765No influence in your decision % within Race recode 64.1% 47.2% 48.2%
Count 18 272 290Some influence in your decision % within Race recode
19.6% 18.2% 18.3%
Count 15 518 533
Q3-5. Was offered a good job
A great deal of influence in your decision % within Race recode 16.3% 34.6% 33.6%
Count 92 1496 1588Total % within Race recode 100.0% 100.0% 100.0%
Chi-Square Tests
Value df Asymp. Sig.
(2-sided) Pearson Chi-Square 13.920(a) 2 .001Likelihood Ratio 15.384 2 .000Linear-by-Linear Association 13.527 1 .000
N of Valid Cases 1588
a 0 cells (.0%) have expected count less than 5. The minimum expected count is 16.80. Q3-6. Education was not relevant to my career plans * Race recode Crosstab
Race recode Minority Caucasian Total
Count 64 973 1037No influence in your decision % within Race recode 69.6% 65.0% 65.3%
Count 14 288 302Some influence in your decision % within Race recode
15.2% 19.3% 19.0%
Count 14 235 249
Q3-6. Education was not relevant to my career plans
A great deal of influence in your decision % within Race recode 15.2% 15.7% 15.7%
Count 92 1496 1588Total % within Race recode 100.0% 100.0% 100.0%
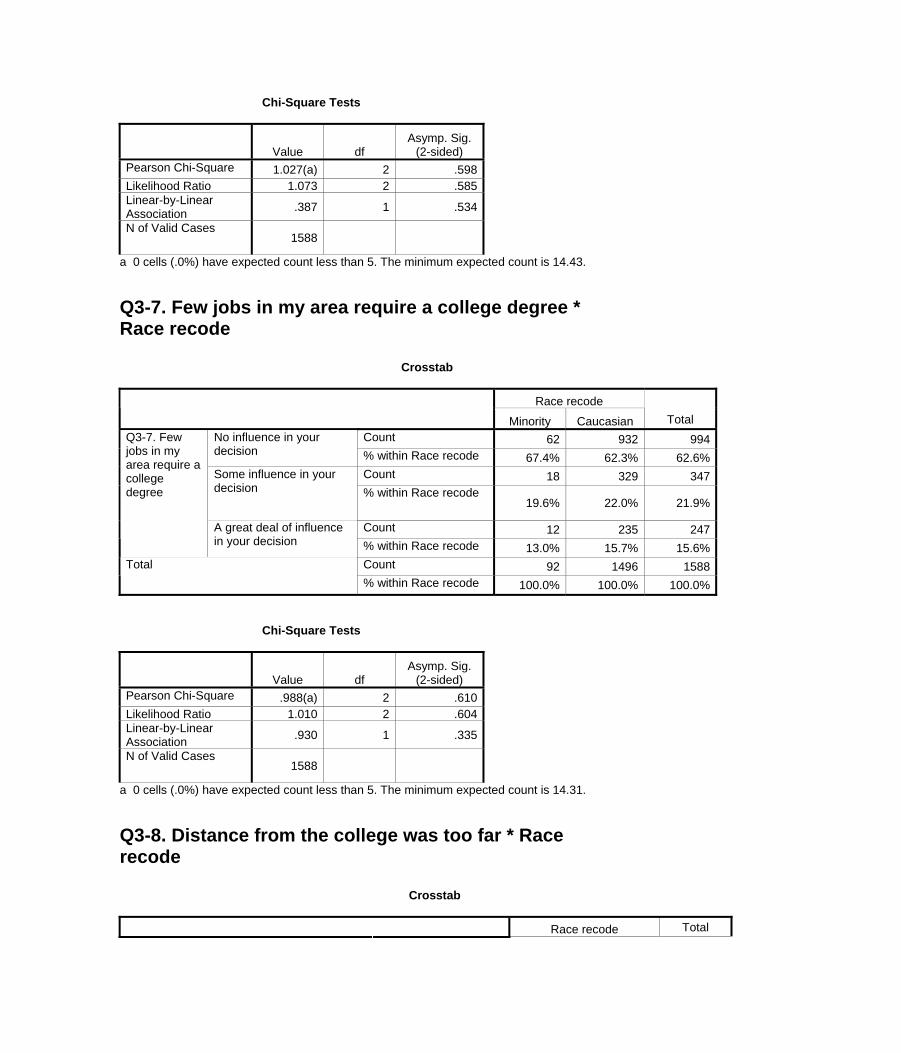
Chi-Square Tests
Value df Asymp. Sig.
(2-sided) Pearson Chi-Square 1.027(a) 2 .598Likelihood Ratio 1.073 2 .585Linear-by-Linear Association .387 1 .534
N of Valid Cases 1588
a 0 cells (.0%) have expected count less than 5. The minimum expected count is 14.43. Q3-7. Few jobs in my area require a college degree * Race recode Crosstab
Race recode Minority Caucasian Total
Count 62 932 994No influence in your decision % within Race recode 67.4% 62.3% 62.6%
Count 18 329 347Some influence in your decision % within Race recode
19.6% 22.0% 21.9%
Count 12 235 247
Q3-7. Few jobs in my area require a college degree
A great deal of influence in your decision % within Race recode 13.0% 15.7% 15.6%
Count 92 1496 1588Total % within Race recode 100.0% 100.0% 100.0%
Chi-Square Tests
Value df Asymp. Sig.
(2-sided) Pearson Chi-Square .988(a) 2 .610Likelihood Ratio 1.010 2 .604Linear-by-Linear Association .930 1 .335
N of Valid Cases 1588
a 0 cells (.0%) have expected count less than 5. The minimum expected count is 14.31. Q3-8. Distance from the college was too far * Race recode Crosstab Race recode Total
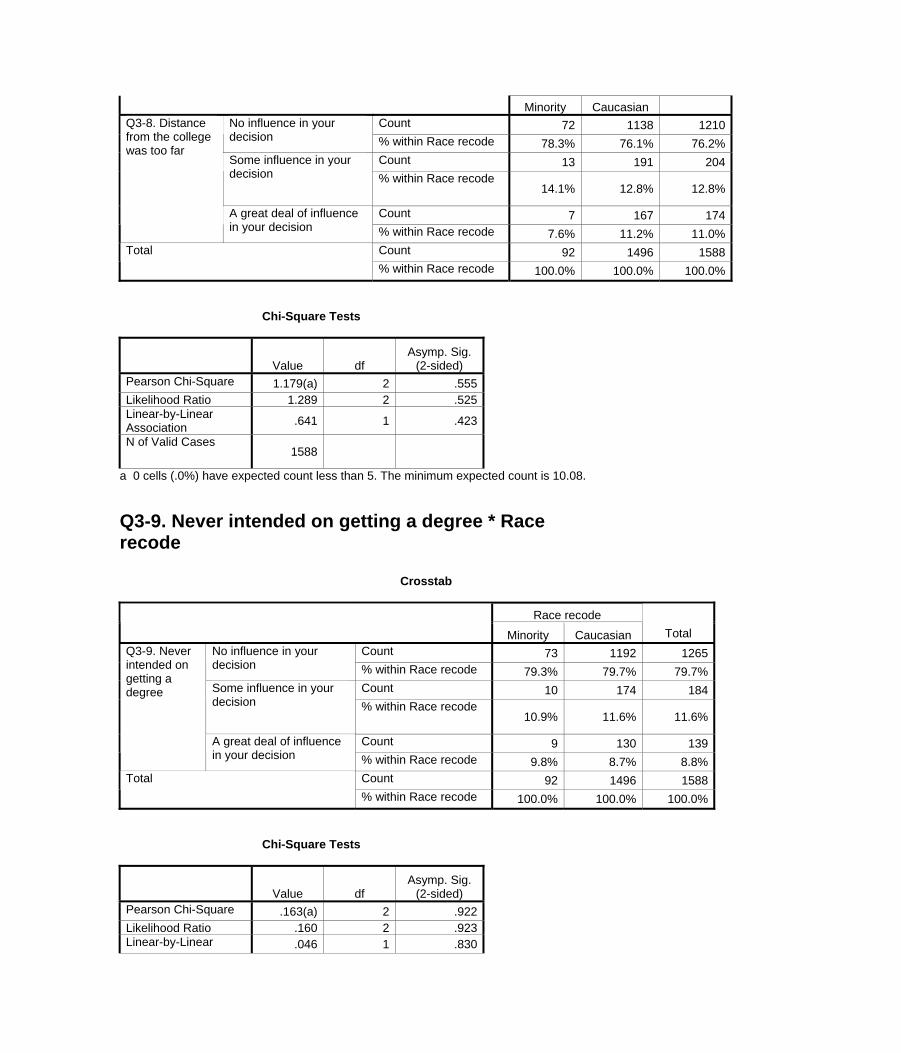
Minority Caucasian Count 72 1138 1210No influence in your
decision % within Race recode 78.3% 76.1% 76.2%Count 13 191 204Some influence in your
decision % within Race recode 14.1% 12.8% 12.8%
Count 7 167 174
Q3-8. Distance from the college was too far
A great deal of influence in your decision % within Race recode 7.6% 11.2% 11.0%
Count 92 1496 1588Total % within Race recode 100.0% 100.0% 100.0%
Chi-Square Tests
Value df Asymp. Sig.
(2-sided) Pearson Chi-Square 1.179(a) 2 .555Likelihood Ratio 1.289 2 .525Linear-by-Linear Association .641 1 .423
N of Valid Cases 1588
a 0 cells (.0%) have expected count less than 5. The minimum expected count is 10.08. Q3-9. Never intended on getting a degree * Race recode Crosstab
Race recode Minority Caucasian Total
Count 73 1192 1265No influence in your decision % within Race recode 79.3% 79.7% 79.7%
Count 10 174 184Some influence in your decision % within Race recode
10.9% 11.6% 11.6%
Count 9 130 139
Q3-9. Never intended on getting a degree
A great deal of influence in your decision % within Race recode 9.8% 8.7% 8.8%
Count 92 1496 1588Total % within Race recode 100.0% 100.0% 100.0%
Chi-Square Tests
Value df Asymp. Sig.
(2-sided) Pearson Chi-Square .163(a) 2 .922Likelihood Ratio .160 2 .923Linear-by-Linear .046 1 .830
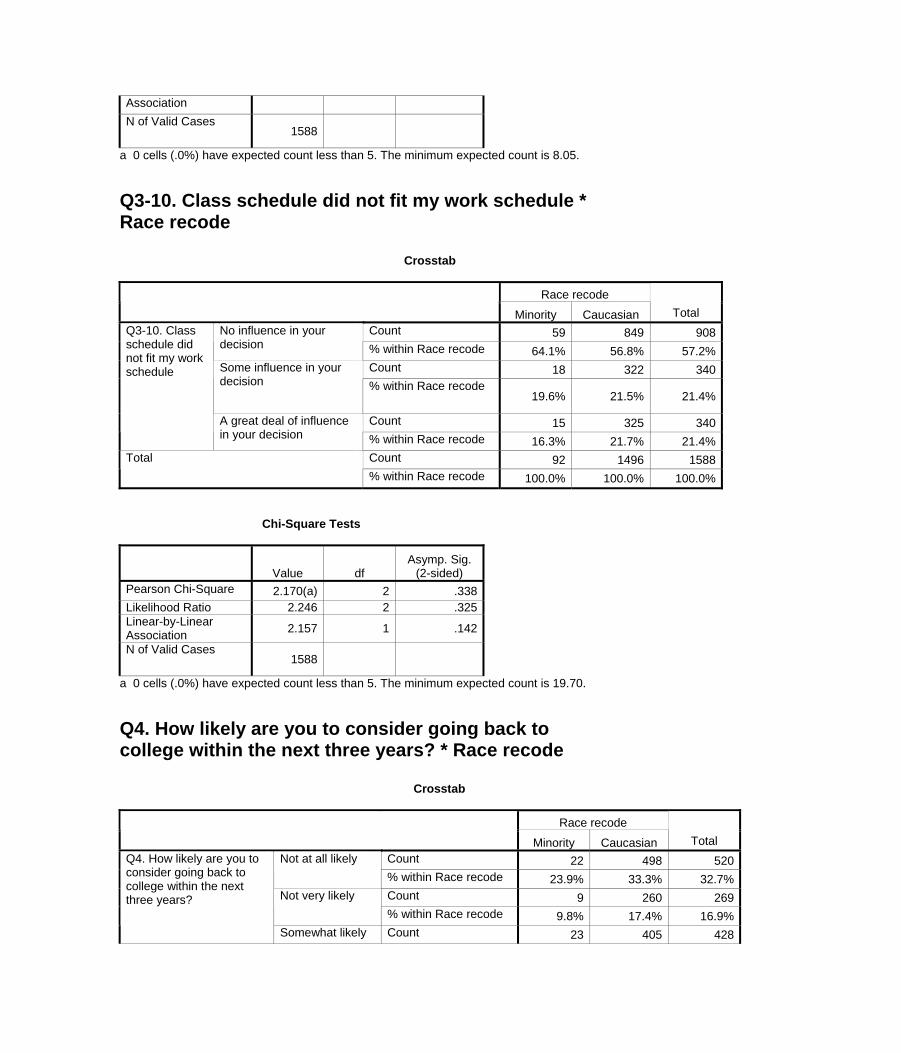
Association N of Valid Cases
1588
a 0 cells (.0%) have expected count less than 5. The minimum expected count is 8.05. Q3-10. Class schedule did not fit my work schedule * Race recode Crosstab
Race recode Minority Caucasian Total
Count 59 849 908No influence in your decision % within Race recode 64.1% 56.8% 57.2%
Count 18 322 340Some influence in your decision % within Race recode
19.6% 21.5% 21.4%
Count 15 325 340
Q3-10. Class schedule did not fit my work schedule
A great deal of influence in your decision % within Race recode 16.3% 21.7% 21.4%
Count 92 1496 1588Total % within Race recode 100.0% 100.0% 100.0%
Chi-Square Tests
Value df Asymp. Sig.
(2-sided) Pearson Chi-Square 2.170(a) 2 .338Likelihood Ratio 2.246 2 .325Linear-by-Linear Association 2.157 1 .142
N of Valid Cases 1588
a 0 cells (.0%) have expected count less than 5. The minimum expected count is 19.70. Q4. How likely are you to consider going back to college within the next three years? * Race recode Crosstab
Race recode Minority Caucasian Total
Count 22 498 520Not at all likely % within Race recode 23.9% 33.3% 32.7%Count 9 260 269Not very likely % within Race recode 9.8% 17.4% 16.9%
Q4. How likely are you to consider going back to college within the next three years?
Somewhat likely Count 23 405 428
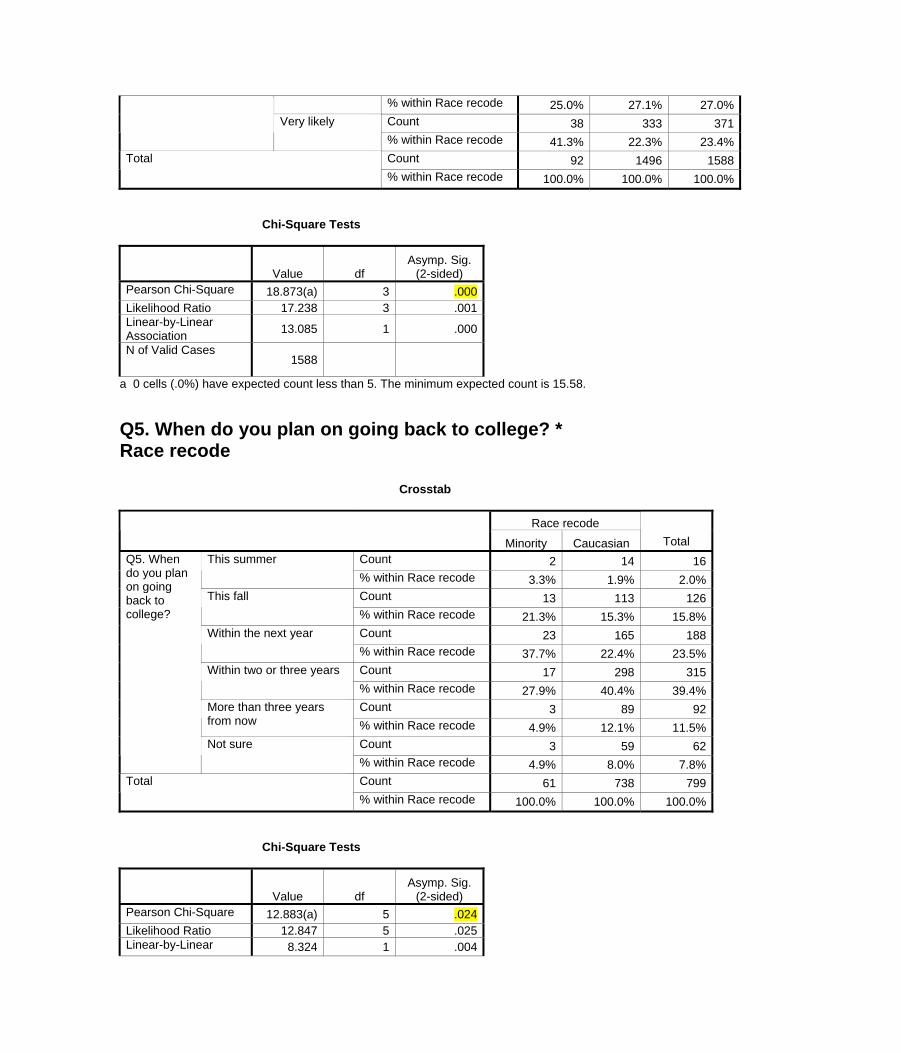
% within Race recode 25.0% 27.1% 27.0%Count 38 333 371Very likely % within Race recode 41.3% 22.3% 23.4%Count 92 1496 1588Total % within Race recode 100.0% 100.0% 100.0%
Chi-Square Tests
Value df Asymp. Sig.
(2-sided) Pearson Chi-Square 18.873(a) 3 .000Likelihood Ratio 17.238 3 .001Linear-by-Linear Association 13.085 1 .000
N of Valid Cases 1588
a 0 cells (.0%) have expected count less than 5. The minimum expected count is 15.58. Q5. When do you plan on going back to college? * Race recode Crosstab
Race recode Minority Caucasian Total
Count 2 14 16This summer % within Race recode 3.3% 1.9% 2.0%Count 13 113 126This fall % within Race recode 21.3% 15.3% 15.8%Count 23 165 188Within the next year % within Race recode 37.7% 22.4% 23.5%Count 17 298 315Within two or three years % within Race recode 27.9% 40.4% 39.4%Count 3 89 92More than three years
from now % within Race recode 4.9% 12.1% 11.5%Count 3 59 62
Q5. When do you plan on going back to college?
Not sure % within Race recode 4.9% 8.0% 7.8%Count 61 738 799Total % within Race recode 100.0% 100.0% 100.0%
Chi-Square Tests
Value df Asymp. Sig.
(2-sided) Pearson Chi-Square 12.883(a) 5 .024Likelihood Ratio 12.847 5 .025Linear-by-Linear 8.324 1 .004
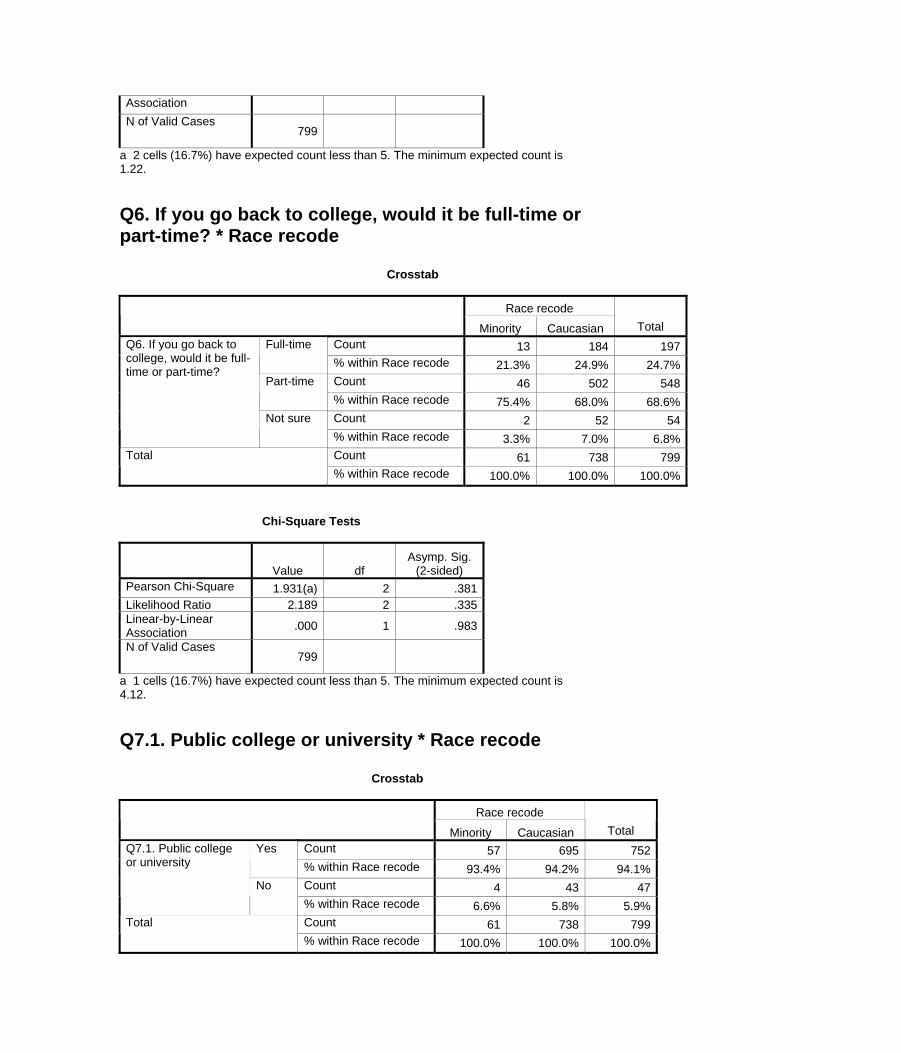
Association N of Valid Cases
799
a 2 cells (16.7%) have expected count less than 5. The minimum expected count is 1.22. Q6. If you go back to college, would it be full-time or part-time? * Race recode Crosstab
Race recode Minority Caucasian Total
Count 13 184 197Full-time % within Race recode 21.3% 24.9% 24.7%Count 46 502 548Part-time % within Race recode 75.4% 68.0% 68.6%Count 2 52 54
Q6. If you go back to college, would it be full-time or part-time?
Not sure % within Race recode 3.3% 7.0% 6.8%Count 61 738 799Total % within Race recode 100.0% 100.0% 100.0%
Chi-Square Tests
Value df Asymp. Sig.
(2-sided) Pearson Chi-Square 1.931(a) 2 .381Likelihood Ratio 2.189 2 .335Linear-by-Linear Association .000 1 .983
N of Valid Cases 799
a 1 cells (16.7%) have expected count less than 5. The minimum expected count is 4.12. Q7.1. Public college or university * Race recode Crosstab
Race recode Minority Caucasian Total
Count 57 695 752 Yes % within Race recode 93.4% 94.2% 94.1% Count 4 43 47
Q7.1. Public college or university
No % within Race recode 6.6% 5.8% 5.9% Count 61 738 799 Total % within Race recode 100.0% 100.0% 100.0%
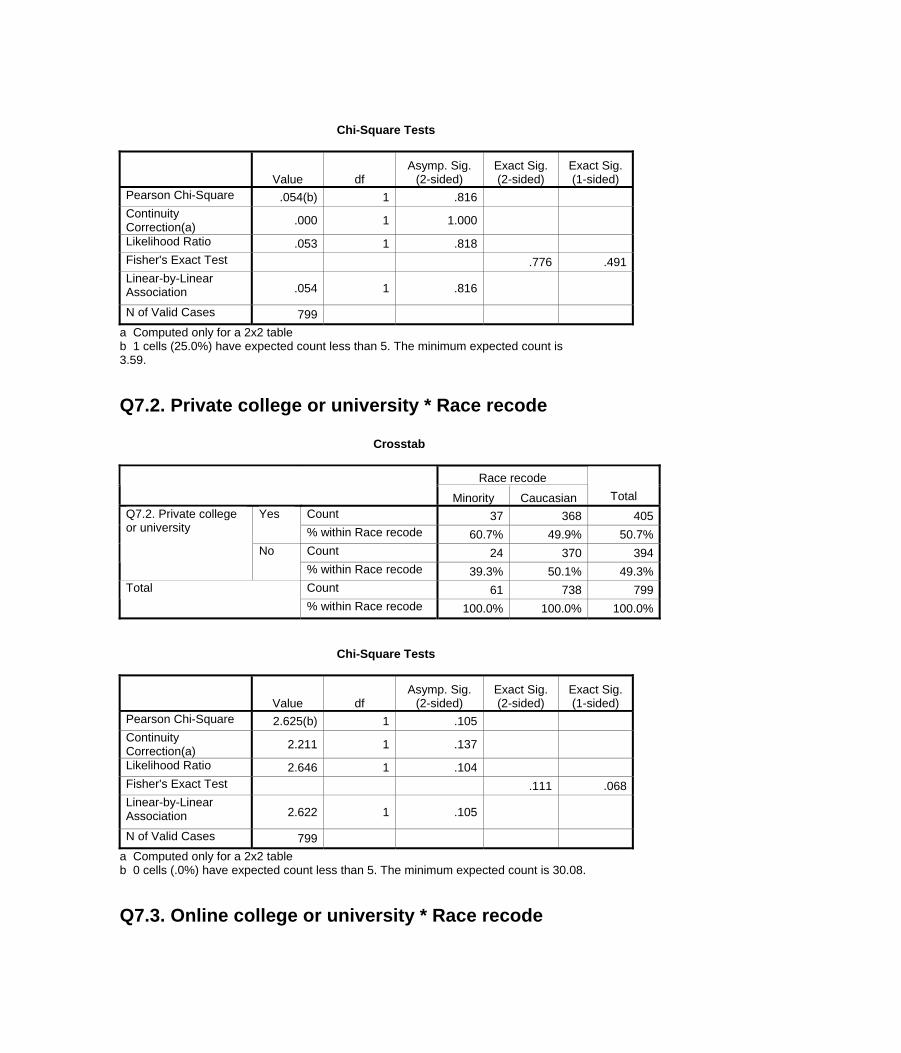
Chi-Square Tests
Value df Asymp. Sig.
(2-sided) Exact Sig. (2-sided)
Exact Sig. (1-sided)
Pearson Chi-Square .054(b) 1 .816 Continuity Correction(a) .000 1 1.000
Likelihood Ratio .053 1 .818 Fisher's Exact Test .776 .491 Linear-by-Linear Association .054 1 .816
N of Valid Cases 799 a Computed only for a 2x2 table b 1 cells (25.0%) have expected count less than 5. The minimum expected count is 3.59. Q7.2. Private college or university * Race recode Crosstab
Race recode Minority Caucasian Total
Count 37 368 405 Yes % within Race recode 60.7% 49.9% 50.7% Count 24 370 394
Q7.2. Private college or university
No % within Race recode 39.3% 50.1% 49.3% Count 61 738 799 Total % within Race recode 100.0% 100.0% 100.0%
Chi-Square Tests
Value df Asymp. Sig.
(2-sided) Exact Sig. (2-sided)
Exact Sig. (1-sided)
Pearson Chi-Square 2.625(b) 1 .105 Continuity Correction(a) 2.211 1 .137
Likelihood Ratio 2.646 1 .104 Fisher's Exact Test .111 .068 Linear-by-Linear Association 2.622 1 .105
N of Valid Cases 799 a Computed only for a 2x2 table b 0 cells (.0%) have expected count less than 5. The minimum expected count is 30.08. Q7.3. Online college or university * Race recode
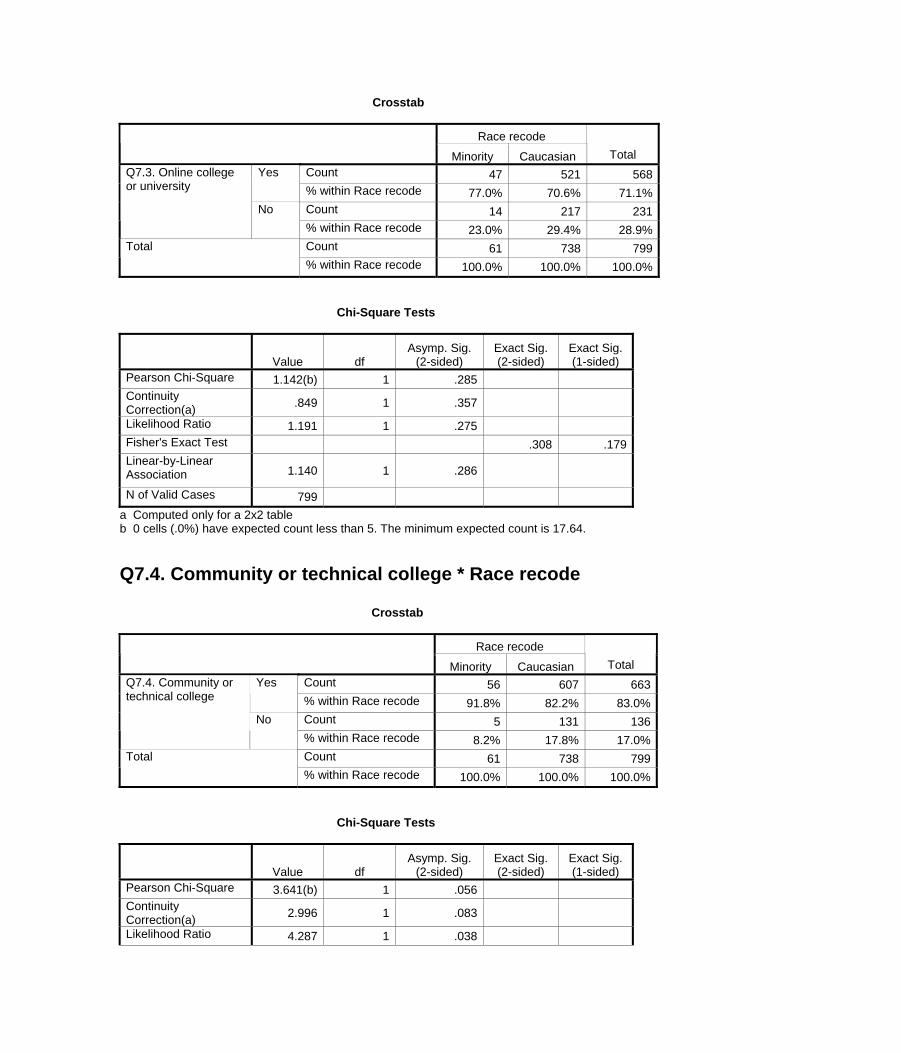
Crosstab
Race recode Minority Caucasian Total
Count 47 521 568 Yes % within Race recode 77.0% 70.6% 71.1% Count 14 217 231
Q7.3. Online college or university
No % within Race recode 23.0% 29.4% 28.9% Count 61 738 799 Total % within Race recode 100.0% 100.0% 100.0%
Chi-Square Tests
Value df Asymp. Sig.
(2-sided) Exact Sig. (2-sided)
Exact Sig. (1-sided)
Pearson Chi-Square 1.142(b) 1 .285 Continuity Correction(a) .849 1 .357
Likelihood Ratio 1.191 1 .275 Fisher's Exact Test .308 .179 Linear-by-Linear Association 1.140 1 .286
N of Valid Cases 799 a Computed only for a 2x2 table b 0 cells (.0%) have expected count less than 5. The minimum expected count is 17.64. Q7.4. Community or technical college * Race recode Crosstab
Race recode Minority Caucasian Total
Count 56 607 663 Yes % within Race recode 91.8% 82.2% 83.0% Count 5 131 136
Q7.4. Community or technical college
No % within Race recode 8.2% 17.8% 17.0% Count 61 738 799 Total % within Race recode 100.0% 100.0% 100.0%
Chi-Square Tests
Value df Asymp. Sig.
(2-sided) Exact Sig. (2-sided)
Exact Sig. (1-sided)
Pearson Chi-Square 3.641(b) 1 .056 Continuity Correction(a) 2.996 1 .083
Likelihood Ratio 4.287 1 .038
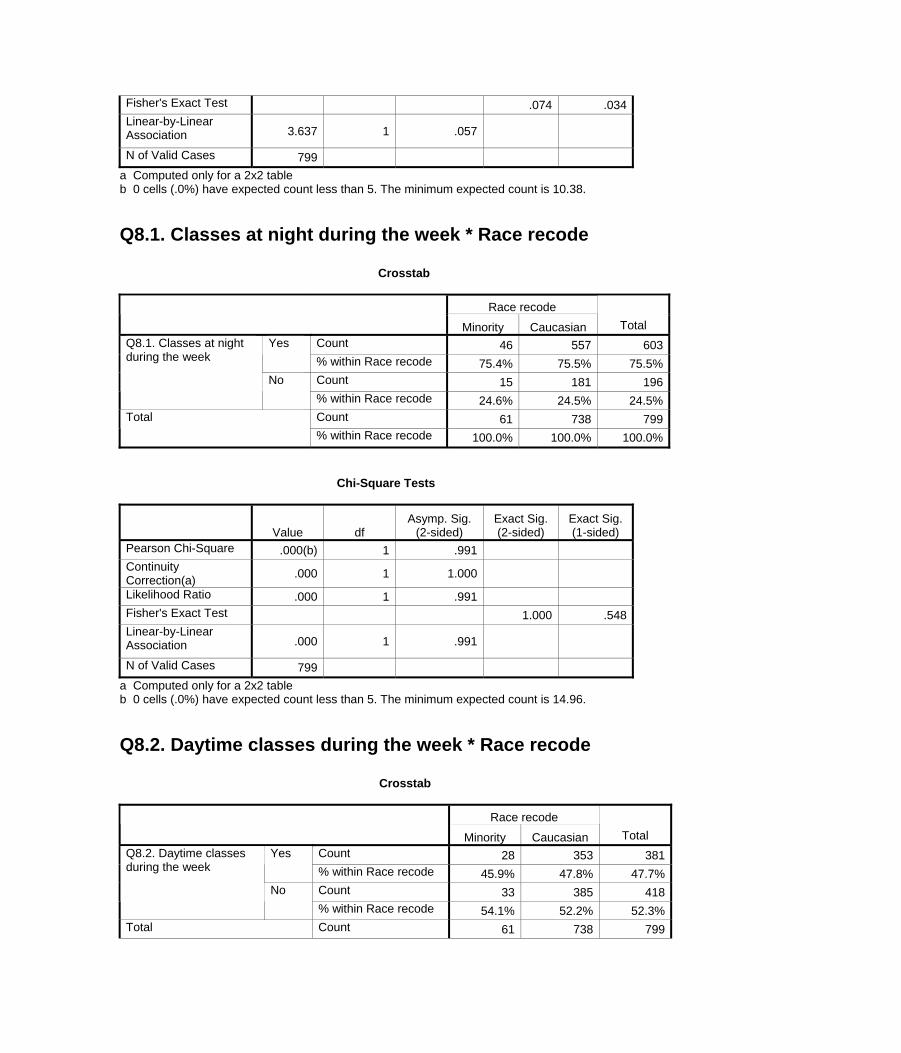
Fisher's Exact Test .074 .034 Linear-by-Linear Association 3.637 1 .057
N of Valid Cases 799 a Computed only for a 2x2 table b 0 cells (.0%) have expected count less than 5. The minimum expected count is 10.38. Q8.1. Classes at night during the week * Race recode Crosstab
Race recode Minority Caucasian Total
Count 46 557 603Yes % within Race recode 75.4% 75.5% 75.5%Count 15 181 196
Q8.1. Classes at night during the week
No % within Race recode 24.6% 24.5% 24.5%Count 61 738 799Total % within Race recode 100.0% 100.0% 100.0%
Chi-Square Tests
Value df Asymp. Sig.
(2-sided) Exact Sig. (2-sided)
Exact Sig. (1-sided)
Pearson Chi-Square .000(b) 1 .991 Continuity Correction(a) .000 1 1.000
Likelihood Ratio .000 1 .991 Fisher's Exact Test 1.000 .548 Linear-by-Linear Association .000 1 .991
N of Valid Cases 799 a Computed only for a 2x2 table b 0 cells (.0%) have expected count less than 5. The minimum expected count is 14.96. Q8.2. Daytime classes during the week * Race recode Crosstab
Race recode Minority Caucasian Total
Count 28 353 381Yes % within Race recode 45.9% 47.8% 47.7%Count 33 385 418
Q8.2. Daytime classes during the week
No % within Race recode 54.1% 52.2% 52.3%
Total Count 61 738 799
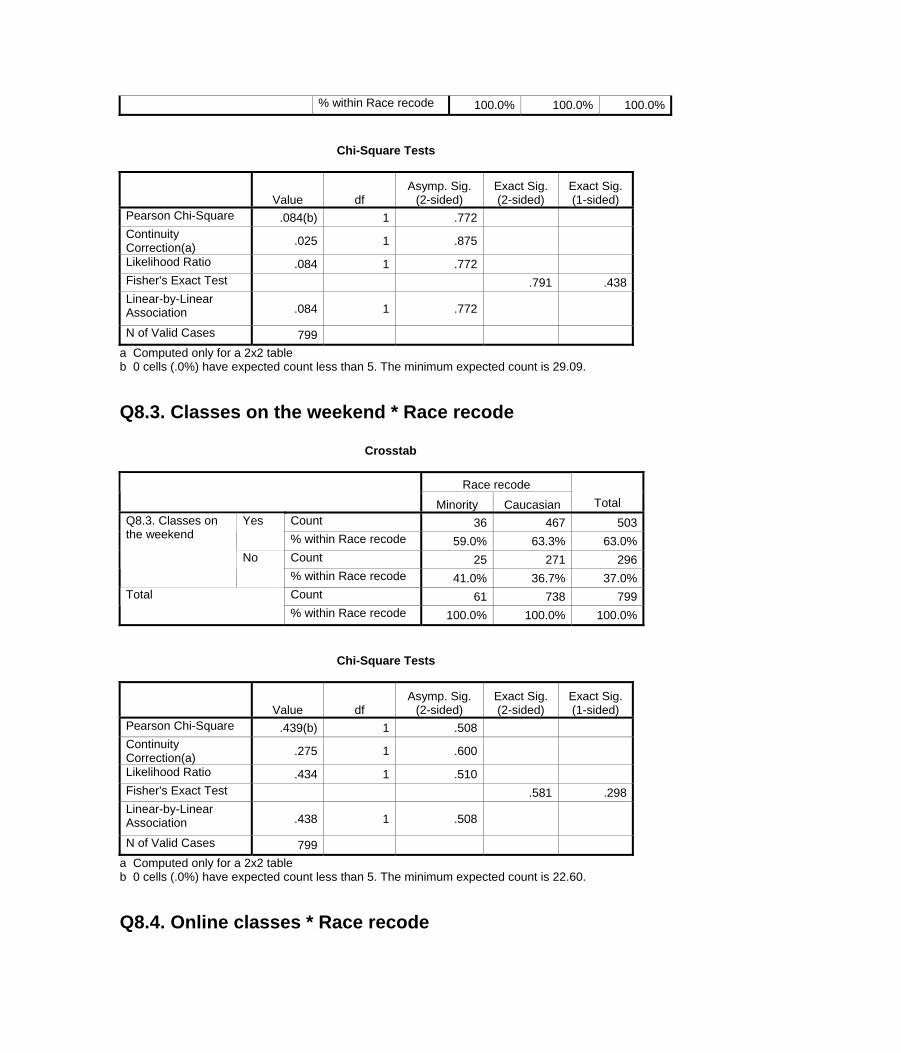
% within Race recode 100.0% 100.0% 100.0% Chi-Square Tests
Value df Asymp. Sig.
(2-sided) Exact Sig. (2-sided)
Exact Sig. (1-sided)
Pearson Chi-Square .084(b) 1 .772 Continuity Correction(a) .025 1 .875
Likelihood Ratio .084 1 .772 Fisher's Exact Test .791 .438 Linear-by-Linear Association .084 1 .772
N of Valid Cases 799 a Computed only for a 2x2 table b 0 cells (.0%) have expected count less than 5. The minimum expected count is 29.09. Q8.3. Classes on the weekend * Race recode Crosstab
Race recode Minority Caucasian Total
Count 36 467 503 Yes % within Race recode 59.0% 63.3% 63.0% Count 25 271 296
Q8.3. Classes on the weekend
No % within Race recode 41.0% 36.7% 37.0% Count 61 738 799 Total % within Race recode 100.0% 100.0% 100.0%
Chi-Square Tests
Value df Asymp. Sig.
(2-sided) Exact Sig. (2-sided)
Exact Sig. (1-sided)
Pearson Chi-Square .439(b) 1 .508 Continuity Correction(a) .275 1 .600
Likelihood Ratio .434 1 .510 Fisher's Exact Test .581 .298 Linear-by-Linear Association .438 1 .508
N of Valid Cases 799 a Computed only for a 2x2 table b 0 cells (.0%) have expected count less than 5. The minimum expected count is 22.60. Q8.4. Online classes * Race recode
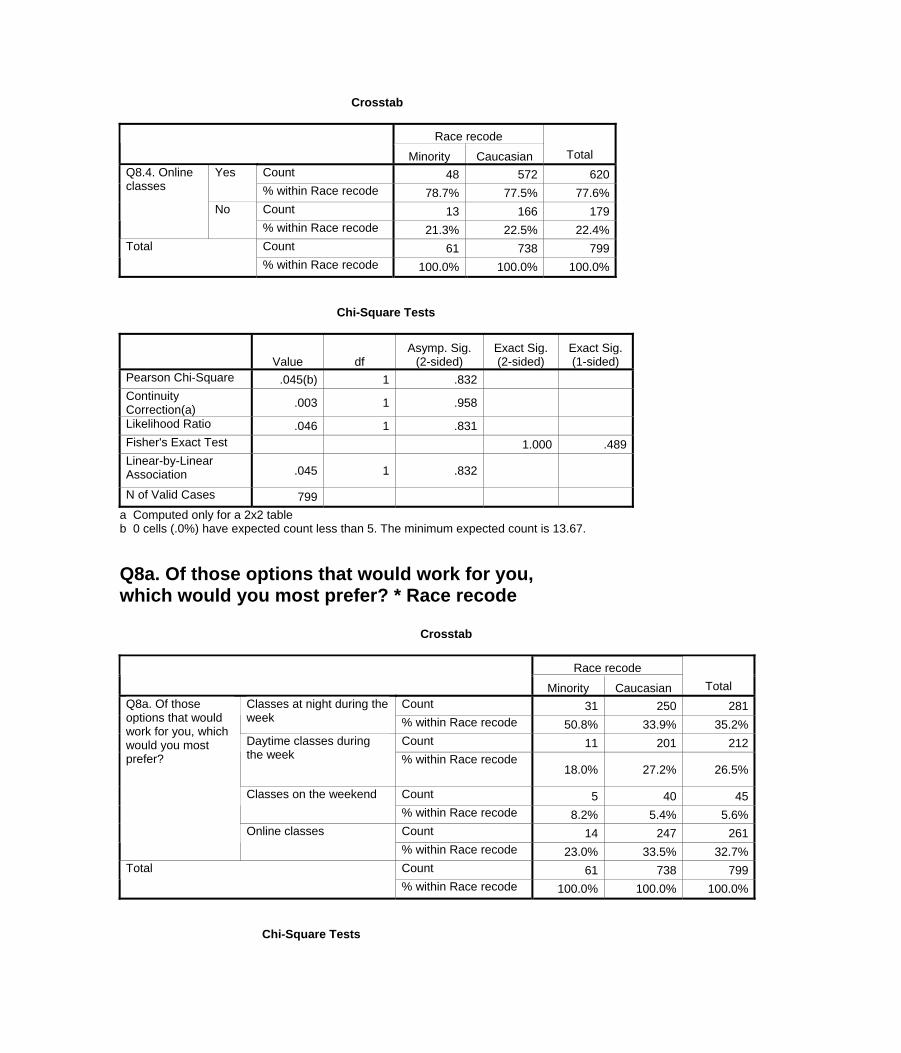
Crosstab
Race recode Minority Caucasian Total
Count 48 572 620 Yes % within Race recode 78.7% 77.5% 77.6% Count 13 166 179
Q8.4. Online classes
No % within Race recode 21.3% 22.5% 22.4% Count 61 738 799 Total % within Race recode 100.0% 100.0% 100.0%
Chi-Square Tests
Value df Asymp. Sig.
(2-sided) Exact Sig. (2-sided)
Exact Sig. (1-sided)
Pearson Chi-Square .045(b) 1 .832 Continuity Correction(a) .003 1 .958
Likelihood Ratio .046 1 .831 Fisher's Exact Test 1.000 .489 Linear-by-Linear Association .045 1 .832
N of Valid Cases 799 a Computed only for a 2x2 table b 0 cells (.0%) have expected count less than 5. The minimum expected count is 13.67. Q8a. Of those options that would work for you, which would you most prefer? * Race recode Crosstab
Race recode Minority Caucasian Total
Count 31 250 281Classes at night during the week % within Race recode 50.8% 33.9% 35.2%
Count 11 201 212Daytime classes during the week % within Race recode
18.0% 27.2% 26.5%
Count 5 40 45Classes on the weekend % within Race recode 8.2% 5.4% 5.6%Count 14 247 261
Q8a. Of those options that would work for you, which would you most prefer?
Online classes % within Race recode 23.0% 33.5% 32.7%Count 61 738 799Total % within Race recode 100.0% 100.0% 100.0%
Chi-Square Tests

Value df Asymp. Sig.
(2-sided) Pearson Chi-Square 9.078(a) 3 .028Likelihood Ratio 8.892 3 .031Linear-by-Linear Association 4.396 1 .036
N of Valid Cases 799
a 1 cells (12.5%) have expected count less than 5. The minimum expected count is 3.44. 9. Public education cost estimates * Race recode Crosstab
Race recode Minority Caucasian Total
Count 26 310 336Less than $5,000 % within Race recode 32.1% 22.9% 23.4%Count 20 297 317$5,000 to less than
$7,000 % within Race recode 24.7% 21.9% 22.1%
Count 8 164 172$7,000 to less than $10,000 % within Race recode 9.9% 12.1% 12.0%
Count 27 584 611
Public cost estimates
$10,000 or more % within Race recode 33.3% 43.1% 42.5%Count 81 1355 1436Total % within Race recode 100.0% 100.0% 100.0%
Chi-Square Tests
Value df Asymp. Sig.
(2-sided) Pearson Chi-Square 5.073(a) 3 .167Likelihood Ratio 4.940 3 .176Linear-by-Linear Association 4.845 1 .028
N of Valid Cases 1436
a 0 cells (.0%) have expected count less than 5. The minimum expected count is 9.70. 10. Private education cost estimate * Race recode Crosstab
Race recode Minority Caucasian Total Private Less than $10,000 Count 28 310 338
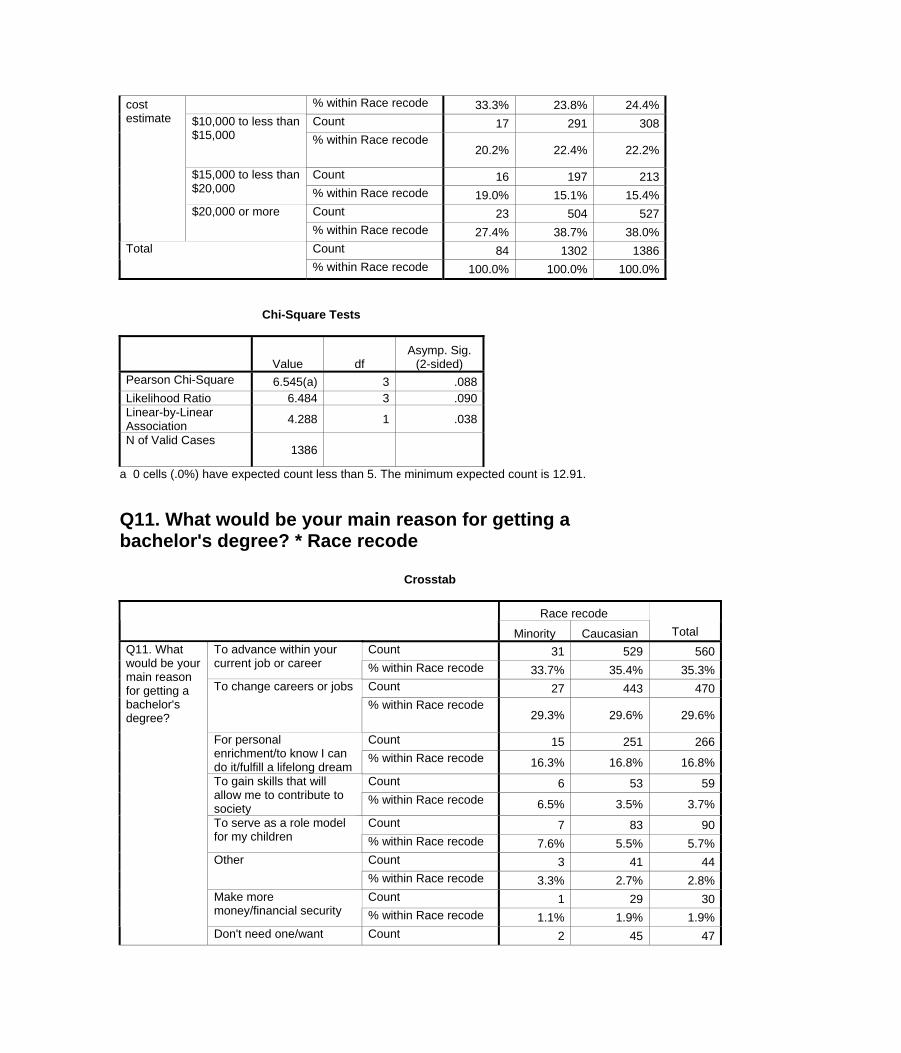
% within Race recode 33.3% 23.8% 24.4%Count 17 291 308$10,000 to less than
$15,000 % within Race recode 20.2% 22.4% 22.2%
Count 16 197 213$15,000 to less than $20,000 % within Race recode 19.0% 15.1% 15.4%
Count 23 504 527
cost estimate
$20,000 or more % within Race recode 27.4% 38.7% 38.0%Count 84 1302 1386Total % within Race recode 100.0% 100.0% 100.0%
Chi-Square Tests
Value df Asymp. Sig.
(2-sided) Pearson Chi-Square 6.545(a) 3 .088Likelihood Ratio 6.484 3 .090Linear-by-Linear Association 4.288 1 .038
N of Valid Cases 1386
a 0 cells (.0%) have expected count less than 5. The minimum expected count is 12.91. Q11. What would be your main reason for getting a bachelor's degree? * Race recode Crosstab
Race recode Minority Caucasian Total
Count 31 529 560To advance within your current job or career % within Race recode 33.7% 35.4% 35.3%
Count 27 443 470To change careers or jobs % within Race recode
29.3% 29.6% 29.6%
Count 15 251 266For personal enrichment/to know I can do it/fulfill a lifelong dream
% within Race recode 16.3% 16.8% 16.8%Count 6 53 59To gain skills that will
allow me to contribute to society
% within Race recode 6.5% 3.5% 3.7%Count 7 83 90To serve as a role model
for my children % within Race recode 7.6% 5.5% 5.7%Count 3 41 44Other % within Race recode 3.3% 2.7% 2.8%Count 1 29 30Make more
money/financial security % within Race recode 1.1% 1.9% 1.9%
Q11. What would be your main reason for getting a bachelor's degree?
Don't need one/want Count 2 45 47
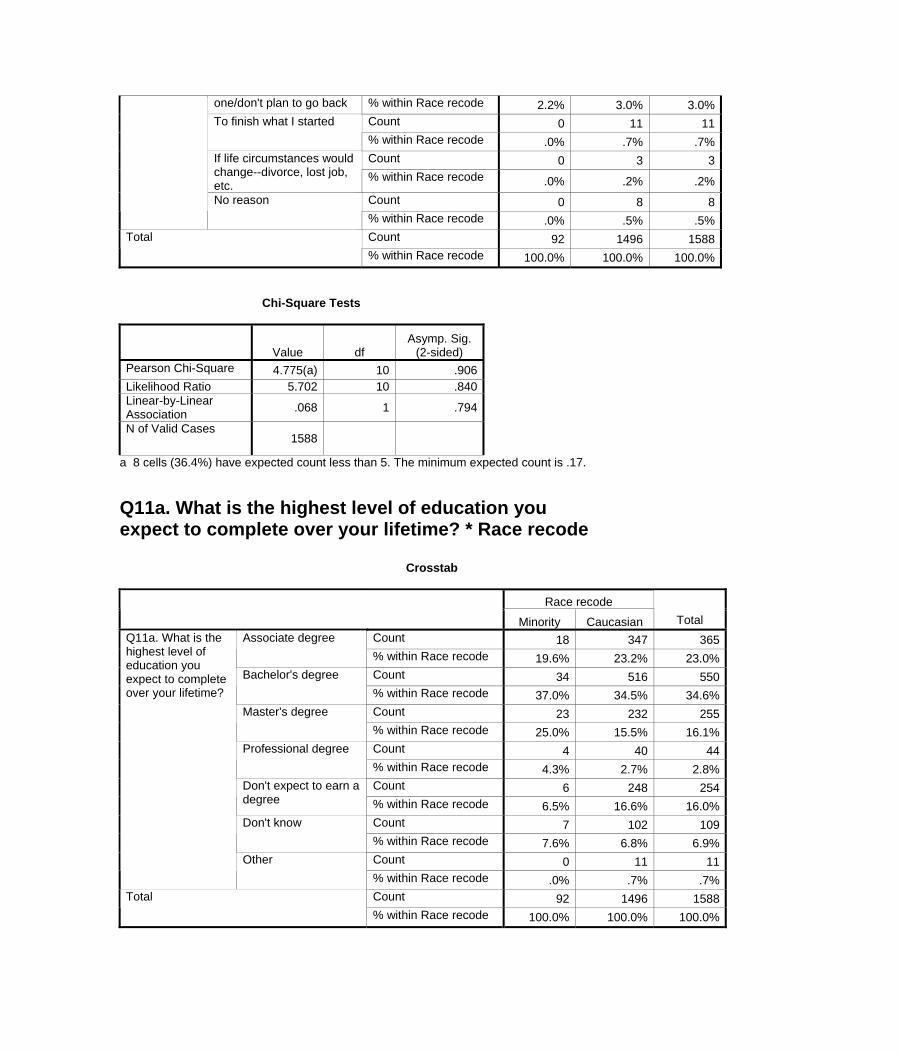
one/don't plan to go back % within Race recode 2.2% 3.0% 3.0%Count 0 11 11To finish what I started % within Race recode .0% .7% .7%Count 0 3 3If life circumstances would
change--divorce, lost job, etc.
% within Race recode .0% .2% .2%Count 0 8 8No reason % within Race recode .0% .5% .5%Count 92 1496 1588Total % within Race recode 100.0% 100.0% 100.0%
Chi-Square Tests
Value df Asymp. Sig.
(2-sided) Pearson Chi-Square 4.775(a) 10 .906Likelihood Ratio 5.702 10 .840Linear-by-Linear Association .068 1 .794
N of Valid Cases 1588
a 8 cells (36.4%) have expected count less than 5. The minimum expected count is .17. Q11a. What is the highest level of education you expect to complete over your lifetime? * Race recode Crosstab
Race recode Minority Caucasian Total
Count 18 347 365Associate degree % within Race recode 19.6% 23.2% 23.0%Count 34 516 550Bachelor's degree % within Race recode 37.0% 34.5% 34.6%Count 23 232 255Master's degree % within Race recode 25.0% 15.5% 16.1%Count 4 40 44Professional degree % within Race recode 4.3% 2.7% 2.8%Count 6 248 254Don't expect to earn a
degree % within Race recode 6.5% 16.6% 16.0%Count 7 102 109Don't know % within Race recode 7.6% 6.8% 6.9%Count 0 11 11
Q11a. What is the highest level of education you expect to complete over your lifetime?
Other % within Race recode .0% .7% .7%Count 92 1496 1588Total % within Race recode 100.0% 100.0% 100.0%
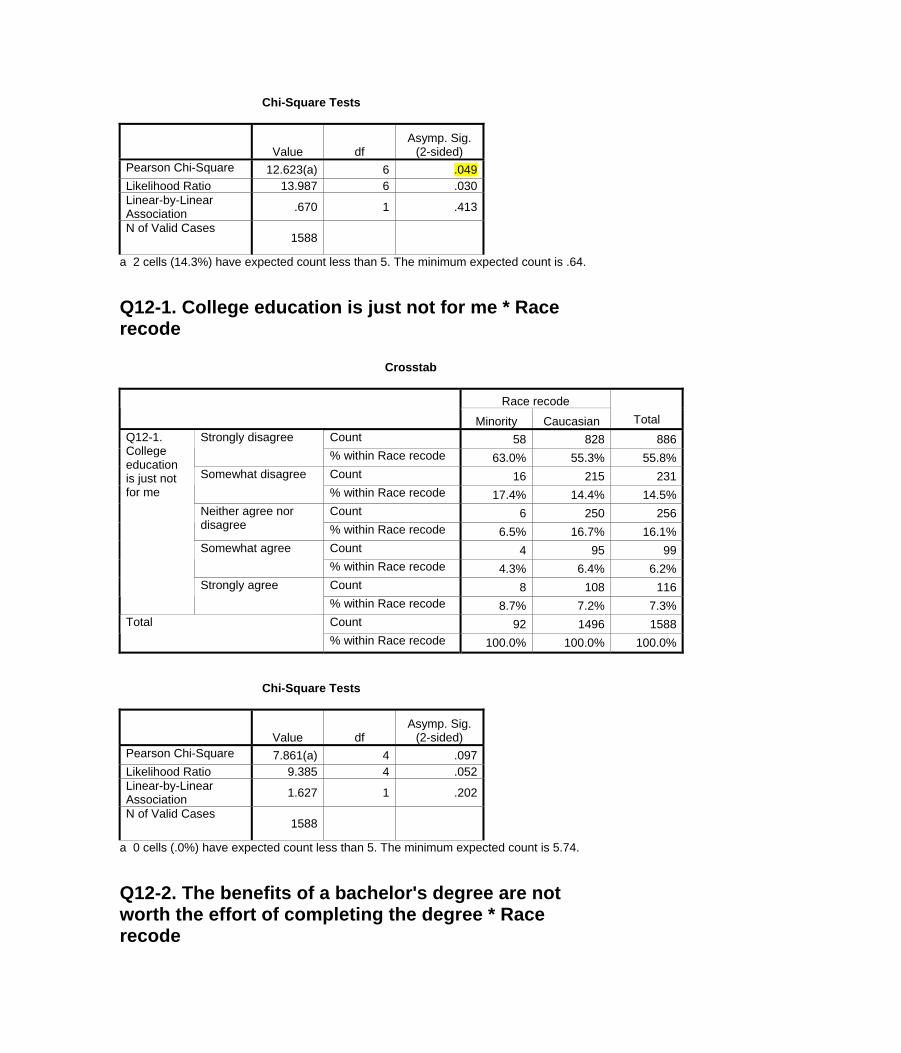
Chi-Square Tests
Value df Asymp. Sig.
(2-sided) Pearson Chi-Square 12.623(a) 6 .049Likelihood Ratio 13.987 6 .030Linear-by-Linear Association .670 1 .413
N of Valid Cases 1588
a 2 cells (14.3%) have expected count less than 5. The minimum expected count is .64. Q12-1. College education is just not for me * Race recode Crosstab
Race recode Minority Caucasian Total
Count 58 828 886Strongly disagree % within Race recode 63.0% 55.3% 55.8%Count 16 215 231Somewhat disagree % within Race recode 17.4% 14.4% 14.5%Count 6 250 256Neither agree nor
disagree % within Race recode 6.5% 16.7% 16.1%Count 4 95 99Somewhat agree % within Race recode 4.3% 6.4% 6.2%Count 8 108 116
Q12-1. College education is just not for me
Strongly agree % within Race recode 8.7% 7.2% 7.3%Count 92 1496 1588Total % within Race recode 100.0% 100.0% 100.0%
Chi-Square Tests
Value df Asymp. Sig.
(2-sided) Pearson Chi-Square 7.861(a) 4 .097Likelihood Ratio 9.385 4 .052Linear-by-Linear Association 1.627 1 .202
N of Valid Cases 1588
a 0 cells (.0%) have expected count less than 5. The minimum expected count is 5.74. Q12-2. The benefits of a bachelor's degree are not worth the effort of completing the degree * Race recode
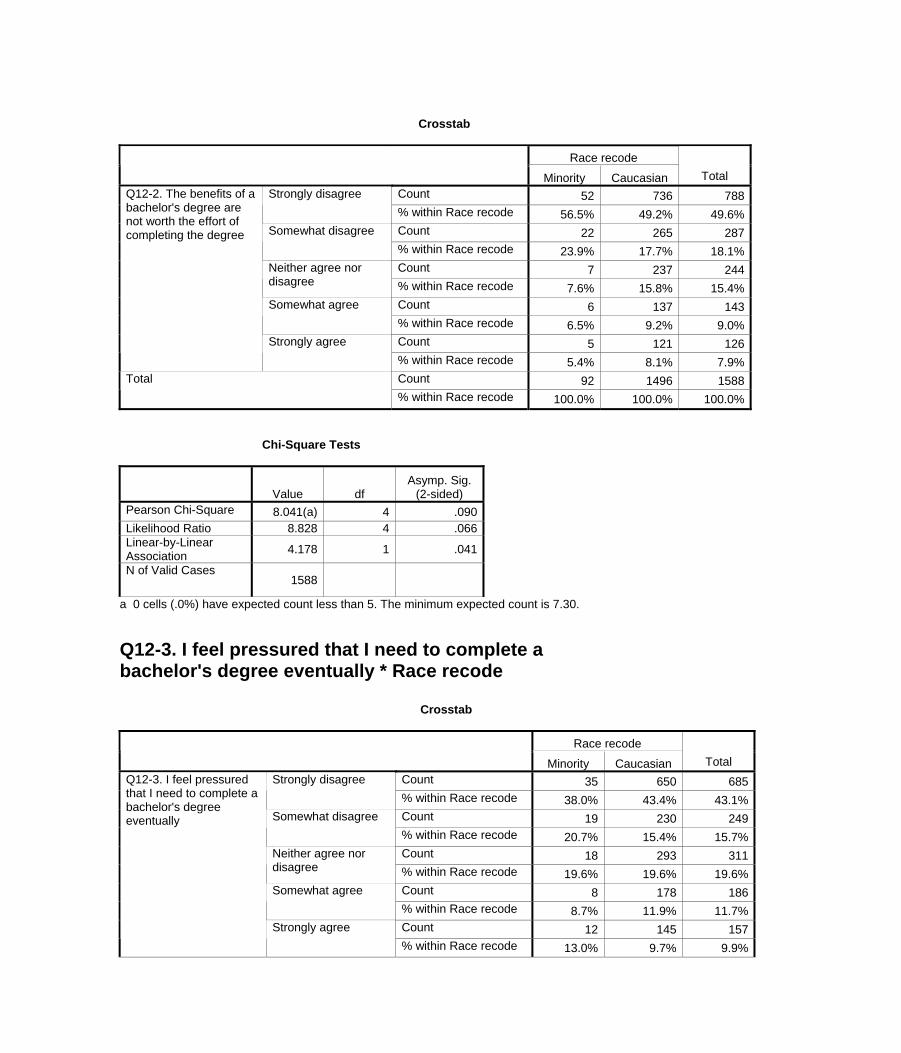
Crosstab
Race recode Minority Caucasian Total
Count 52 736 788Strongly disagree % within Race recode 56.5% 49.2% 49.6%Count 22 265 287Somewhat disagree % within Race recode 23.9% 17.7% 18.1%Count 7 237 244Neither agree nor
disagree % within Race recode 7.6% 15.8% 15.4%Count 6 137 143Somewhat agree % within Race recode 6.5% 9.2% 9.0%Count 5 121 126
Q12-2. The benefits of a bachelor's degree are not worth the effort of completing the degree
Strongly agree % within Race recode 5.4% 8.1% 7.9%Count 92 1496 1588Total % within Race recode 100.0% 100.0% 100.0%
Chi-Square Tests
Value df Asymp. Sig.
(2-sided) Pearson Chi-Square 8.041(a) 4 .090Likelihood Ratio 8.828 4 .066Linear-by-Linear Association 4.178 1 .041
N of Valid Cases 1588
a 0 cells (.0%) have expected count less than 5. The minimum expected count is 7.30. Q12-3. I feel pressured that I need to complete a bachelor's degree eventually * Race recode Crosstab
Race recode Minority Caucasian Total
Count 35 650 685Strongly disagree % within Race recode 38.0% 43.4% 43.1%Count 19 230 249Somewhat disagree % within Race recode 20.7% 15.4% 15.7%Count 18 293 311Neither agree nor
disagree % within Race recode 19.6% 19.6% 19.6%Count 8 178 186Somewhat agree % within Race recode 8.7% 11.9% 11.7%Count 12 145 157
Q12-3. I feel pressured that I need to complete a bachelor's degree eventually
Strongly agree % within Race recode 13.0% 9.7% 9.9%
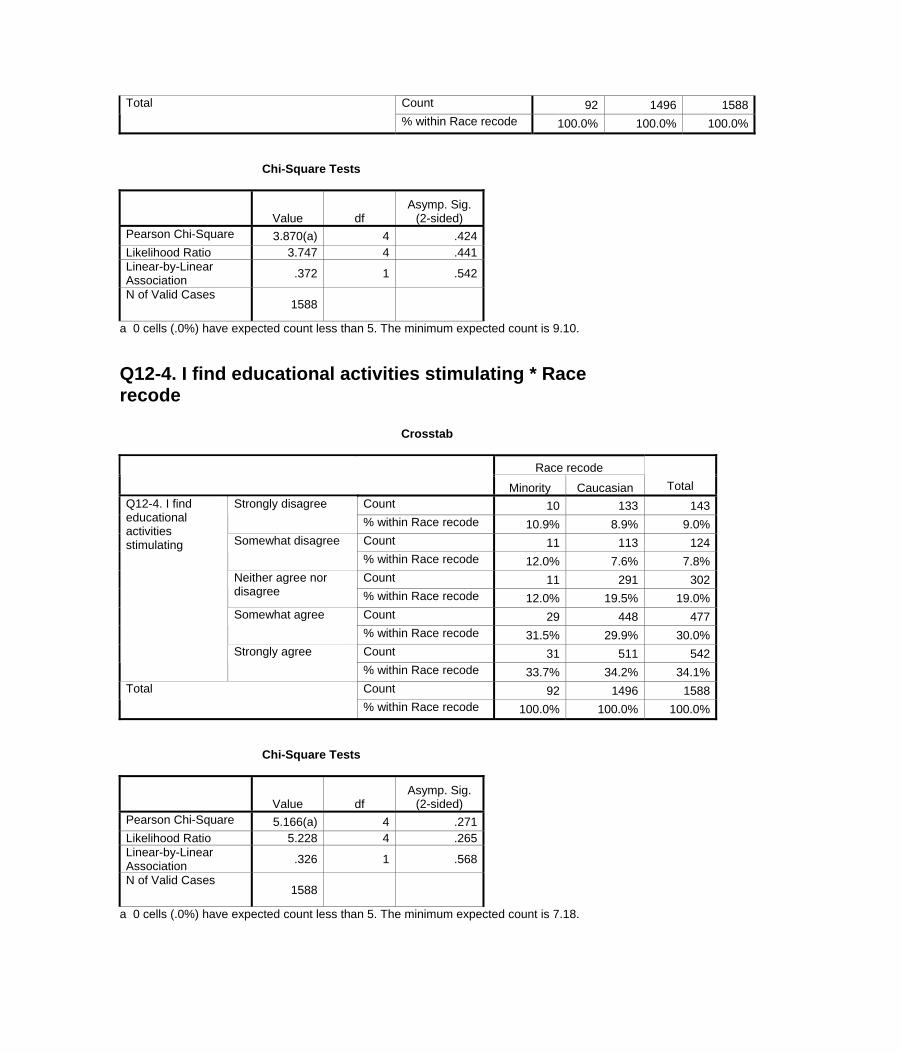
Count 92 1496 1588Total % within Race recode 100.0% 100.0% 100.0%
Chi-Square Tests
Value df Asymp. Sig.
(2-sided) Pearson Chi-Square 3.870(a) 4 .424Likelihood Ratio 3.747 4 .441Linear-by-Linear Association .372 1 .542
N of Valid Cases 1588
a 0 cells (.0%) have expected count less than 5. The minimum expected count is 9.10. Q12-4. I find educational activities stimulating * Race recode Crosstab
Race recode Minority Caucasian Total
Count 10 133 143Strongly disagree % within Race recode 10.9% 8.9% 9.0%Count 11 113 124Somewhat disagree % within Race recode 12.0% 7.6% 7.8%Count 11 291 302Neither agree nor
disagree % within Race recode 12.0% 19.5% 19.0%Count 29 448 477Somewhat agree % within Race recode 31.5% 29.9% 30.0%Count 31 511 542
Q12-4. I find educational activities stimulating
Strongly agree % within Race recode 33.7% 34.2% 34.1%Count 92 1496 1588Total % within Race recode 100.0% 100.0% 100.0%
Chi-Square Tests
Value df Asymp. Sig.
(2-sided) Pearson Chi-Square 5.166(a) 4 .271Likelihood Ratio 5.228 4 .265Linear-by-Linear Association .326 1 .568
N of Valid Cases 1588
a 0 cells (.0%) have expected count less than 5. The minimum expected count is 7.18.
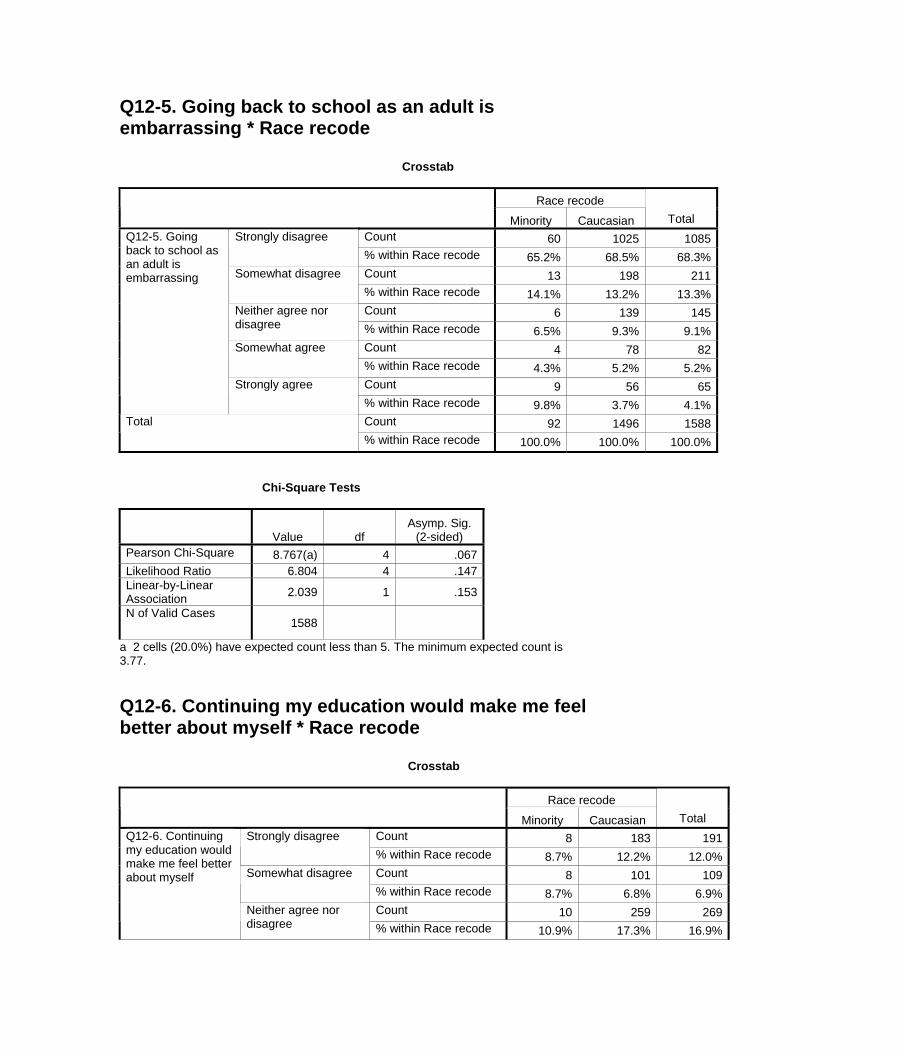
Q12-5. Going back to school as an adult is embarrassing * Race recode Crosstab
Race recode Minority Caucasian Total
Count 60 1025 1085Strongly disagree % within Race recode 65.2% 68.5% 68.3%Count 13 198 211Somewhat disagree % within Race recode 14.1% 13.2% 13.3%Count 6 139 145Neither agree nor
disagree % within Race recode 6.5% 9.3% 9.1%Count 4 78 82Somewhat agree % within Race recode 4.3% 5.2% 5.2%Count 9 56 65
Q12-5. Going back to school as an adult is embarrassing
Strongly agree % within Race recode 9.8% 3.7% 4.1%Count 92 1496 1588Total % within Race recode 100.0% 100.0% 100.0%
Chi-Square Tests
Value df Asymp. Sig.
(2-sided) Pearson Chi-Square 8.767(a) 4 .067Likelihood Ratio 6.804 4 .147Linear-by-Linear Association 2.039 1 .153
N of Valid Cases 1588
a 2 cells (20.0%) have expected count less than 5. The minimum expected count is 3.77. Q12-6. Continuing my education would make me feel better about myself * Race recode Crosstab
Race recode Minority Caucasian Total
Count 8 183 191Strongly disagree % within Race recode 8.7% 12.2% 12.0%Count 8 101 109Somewhat disagree % within Race recode 8.7% 6.8% 6.9%Count 10 259 269
Q12-6. Continuing my education would make me feel better about myself
Neither agree nor disagree % within Race recode 10.9% 17.3% 16.9%
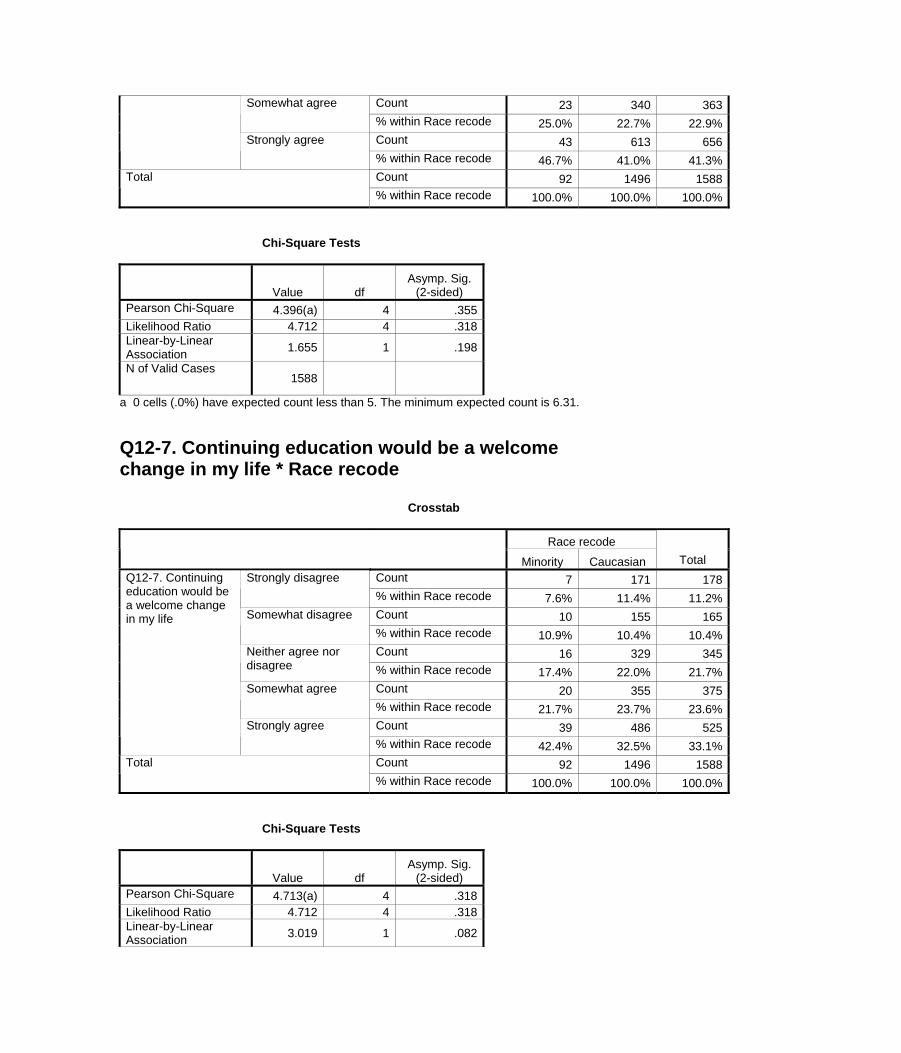
Count 23 340 363Somewhat agree % within Race recode 25.0% 22.7% 22.9%Count 43 613 656Strongly agree % within Race recode 46.7% 41.0% 41.3%Count 92 1496 1588Total % within Race recode 100.0% 100.0% 100.0%
Chi-Square Tests
Value df Asymp. Sig.
(2-sided) Pearson Chi-Square 4.396(a) 4 .355Likelihood Ratio 4.712 4 .318Linear-by-Linear Association 1.655 1 .198
N of Valid Cases 1588
a 0 cells (.0%) have expected count less than 5. The minimum expected count is 6.31. Q12-7. Continuing education would be a welcome change in my life * Race recode Crosstab
Race recode Minority Caucasian Total
Count 7 171 178Strongly disagree % within Race recode 7.6% 11.4% 11.2%Count 10 155 165Somewhat disagree % within Race recode 10.9% 10.4% 10.4%Count 16 329 345Neither agree nor
disagree % within Race recode 17.4% 22.0% 21.7%Count 20 355 375Somewhat agree % within Race recode 21.7% 23.7% 23.6%Count 39 486 525
Q12-7. Continuing education would be a welcome change in my life
Strongly agree % within Race recode 42.4% 32.5% 33.1%Count 92 1496 1588Total % within Race recode 100.0% 100.0% 100.0%
Chi-Square Tests
Value df Asymp. Sig.
(2-sided) Pearson Chi-Square 4.713(a) 4 .318Likelihood Ratio 4.712 4 .318Linear-by-Linear Association 3.019 1 .082
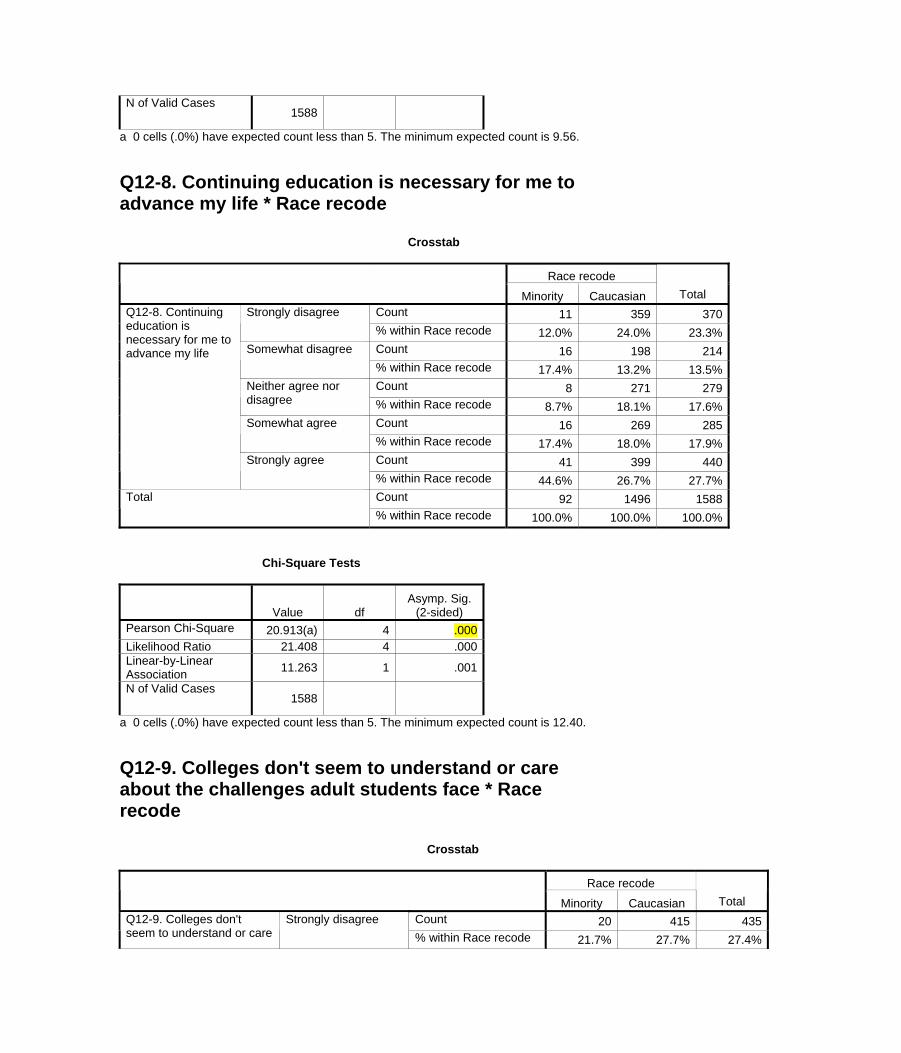
N of Valid Cases 1588
a 0 cells (.0%) have expected count less than 5. The minimum expected count is 9.56. Q12-8. Continuing education is necessary for me to advance my life * Race recode Crosstab
Race recode Minority Caucasian Total
Count 11 359 370Strongly disagree % within Race recode 12.0% 24.0% 23.3%Count 16 198 214Somewhat disagree % within Race recode 17.4% 13.2% 13.5%Count 8 271 279Neither agree nor
disagree % within Race recode 8.7% 18.1% 17.6%Count 16 269 285Somewhat agree % within Race recode 17.4% 18.0% 17.9%Count 41 399 440
Q12-8. Continuing education is necessary for me to advance my life
Strongly agree % within Race recode 44.6% 26.7% 27.7%Count 92 1496 1588Total % within Race recode 100.0% 100.0% 100.0%
Chi-Square Tests
Value df Asymp. Sig.
(2-sided) Pearson Chi-Square 20.913(a) 4 .000Likelihood Ratio 21.408 4 .000Linear-by-Linear Association 11.263 1 .001
N of Valid Cases 1588
a 0 cells (.0%) have expected count less than 5. The minimum expected count is 12.40. Q12-9. Colleges don't seem to understand or care about the challenges adult students face * Race recode Crosstab
Race recode Minority Caucasian Total
Count 20 415 435Q12-9. Colleges don't seem to understand or care
Strongly disagree % within Race recode 21.7% 27.7% 27.4%
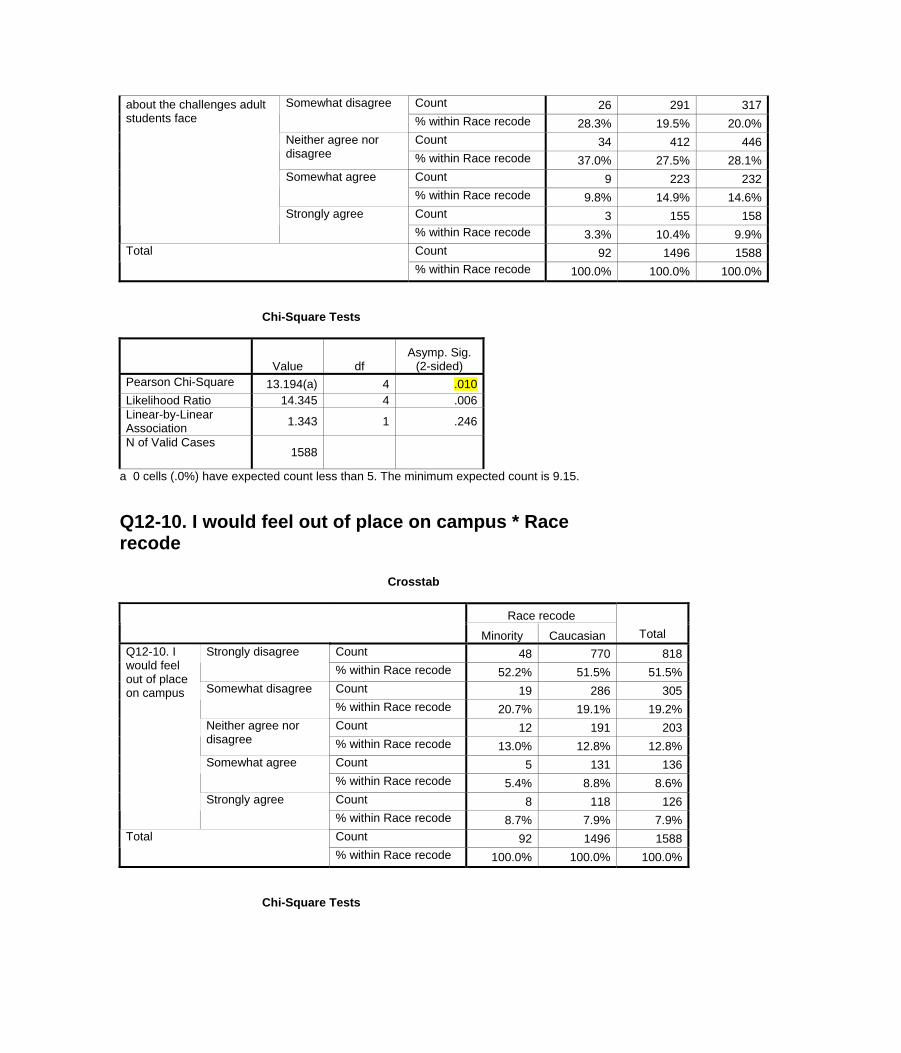
Count 26 291 317Somewhat disagree % within Race recode 28.3% 19.5% 20.0%Count 34 412 446Neither agree nor
disagree % within Race recode 37.0% 27.5% 28.1%Count 9 223 232Somewhat agree % within Race recode 9.8% 14.9% 14.6%Count 3 155 158
about the challenges adult students face
Strongly agree % within Race recode 3.3% 10.4% 9.9%Count 92 1496 1588Total % within Race recode 100.0% 100.0% 100.0%
Chi-Square Tests
Value df Asymp. Sig.
(2-sided) Pearson Chi-Square 13.194(a) 4 .010Likelihood Ratio 14.345 4 .006Linear-by-Linear Association 1.343 1 .246
N of Valid Cases 1588
a 0 cells (.0%) have expected count less than 5. The minimum expected count is 9.15. Q12-10. I would feel out of place on campus * Race recode Crosstab
Race recode Minority Caucasian Total
Count 48 770 818Strongly disagree % within Race recode 52.2% 51.5% 51.5%Count 19 286 305Somewhat disagree % within Race recode 20.7% 19.1% 19.2%Count 12 191 203Neither agree nor
disagree % within Race recode 13.0% 12.8% 12.8%Count 5 131 136Somewhat agree % within Race recode 5.4% 8.8% 8.6%Count 8 118 126
Q12-10. I would feel out of place on campus
Strongly agree % within Race recode 8.7% 7.9% 7.9%Count 92 1496 1588Total % within Race recode 100.0% 100.0% 100.0%
Chi-Square Tests
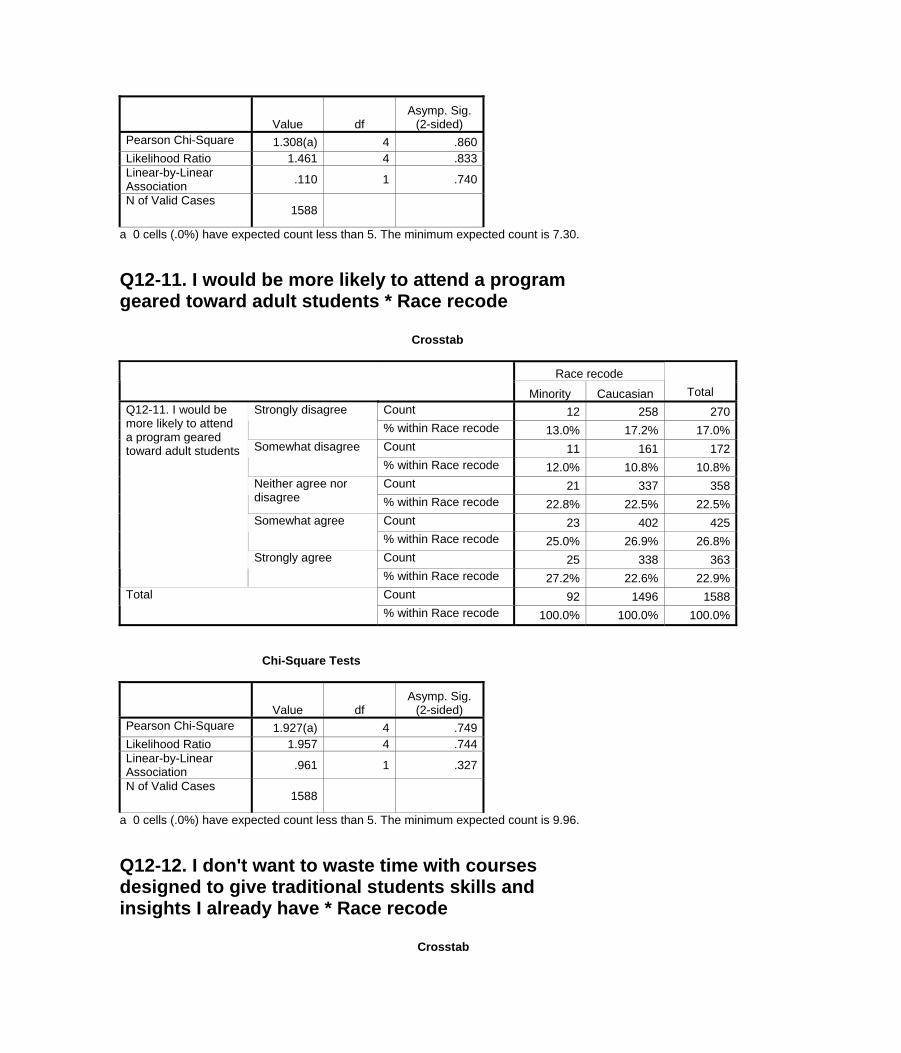
Value df Asymp. Sig.
(2-sided) Pearson Chi-Square 1.308(a) 4 .860Likelihood Ratio 1.461 4 .833Linear-by-Linear Association .110 1 .740
N of Valid Cases 1588
a 0 cells (.0%) have expected count less than 5. The minimum expected count is 7.30. Q12-11. I would be more likely to attend a program geared toward adult students * Race recode Crosstab
Race recode Minority Caucasian Total
Count 12 258 270Strongly disagree % within Race recode 13.0% 17.2% 17.0%Count 11 161 172Somewhat disagree % within Race recode 12.0% 10.8% 10.8%Count 21 337 358Neither agree nor
disagree % within Race recode 22.8% 22.5% 22.5%Count 23 402 425Somewhat agree % within Race recode 25.0% 26.9% 26.8%Count 25 338 363
Q12-11. I would be more likely to attend a program geared toward adult students
Strongly agree % within Race recode 27.2% 22.6% 22.9%Count 92 1496 1588Total % within Race recode 100.0% 100.0% 100.0%
Chi-Square Tests
Value df Asymp. Sig.
(2-sided) Pearson Chi-Square 1.927(a) 4 .749Likelihood Ratio 1.957 4 .744Linear-by-Linear Association .961 1 .327
N of Valid Cases 1588
a 0 cells (.0%) have expected count less than 5. The minimum expected count is 9.96. Q12-12. I don't want to waste time with courses designed to give traditional students skills and insights I already have * Race recode Crosstab
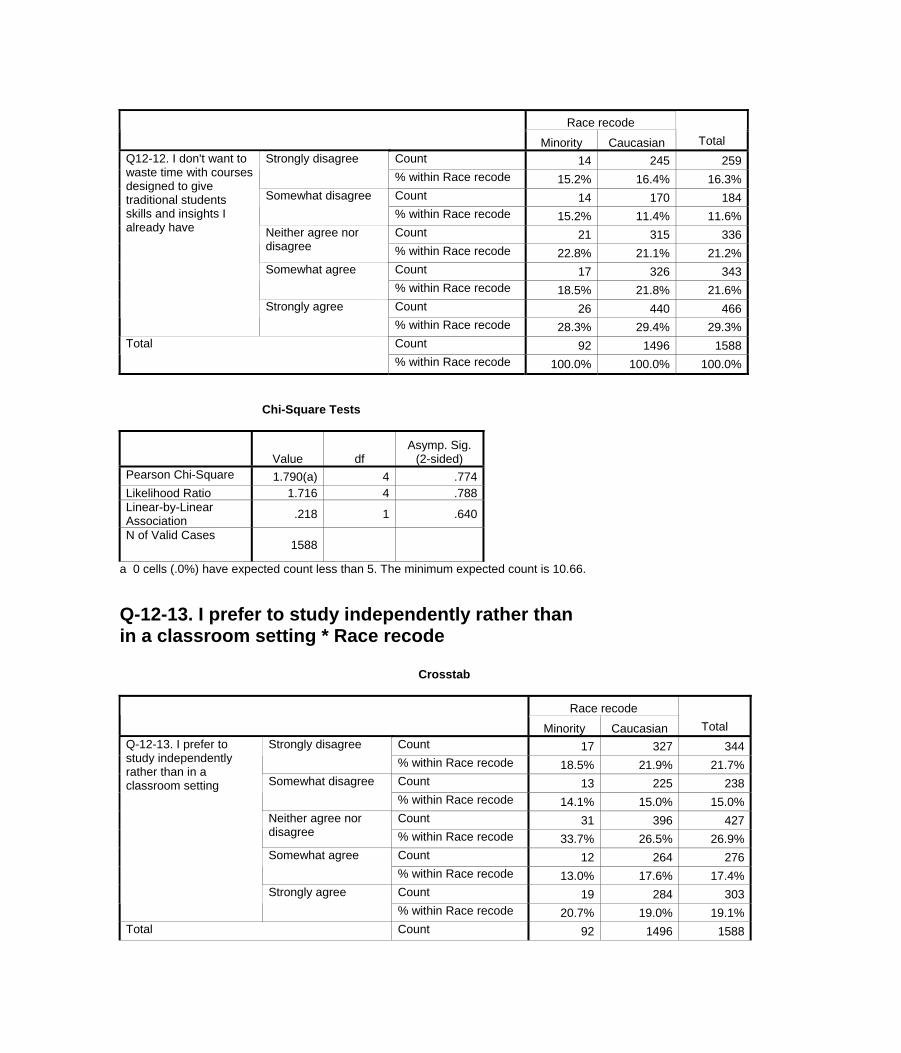
Race recode
Minority Caucasian Total Count 14 245 259Strongly disagree % within Race recode 15.2% 16.4% 16.3%Count 14 170 184Somewhat disagree % within Race recode 15.2% 11.4% 11.6%Count 21 315 336Neither agree nor
disagree % within Race recode 22.8% 21.1% 21.2%Count 17 326 343Somewhat agree % within Race recode 18.5% 21.8% 21.6%Count 26 440 466
Q12-12. I don't want to waste time with courses designed to give traditional students skills and insights I already have
Strongly agree % within Race recode 28.3% 29.4% 29.3%Count 92 1496 1588Total % within Race recode 100.0% 100.0% 100.0%
Chi-Square Tests
Value df Asymp. Sig.
(2-sided) Pearson Chi-Square 1.790(a) 4 .774Likelihood Ratio 1.716 4 .788Linear-by-Linear Association .218 1 .640
N of Valid Cases 1588
a 0 cells (.0%) have expected count less than 5. The minimum expected count is 10.66. Q-12-13. I prefer to study independently rather than in a classroom setting * Race recode Crosstab
Race recode Minority Caucasian Total
Count 17 327 344Strongly disagree % within Race recode 18.5% 21.9% 21.7%Count 13 225 238Somewhat disagree % within Race recode 14.1% 15.0% 15.0%Count 31 396 427Neither agree nor
disagree % within Race recode 33.7% 26.5% 26.9%Count 12 264 276Somewhat agree % within Race recode 13.0% 17.6% 17.4%Count 19 284 303
Q-12-13. I prefer to study independently rather than in a classroom setting
Strongly agree % within Race recode 20.7% 19.0% 19.1%
Total Count 92 1496 1588
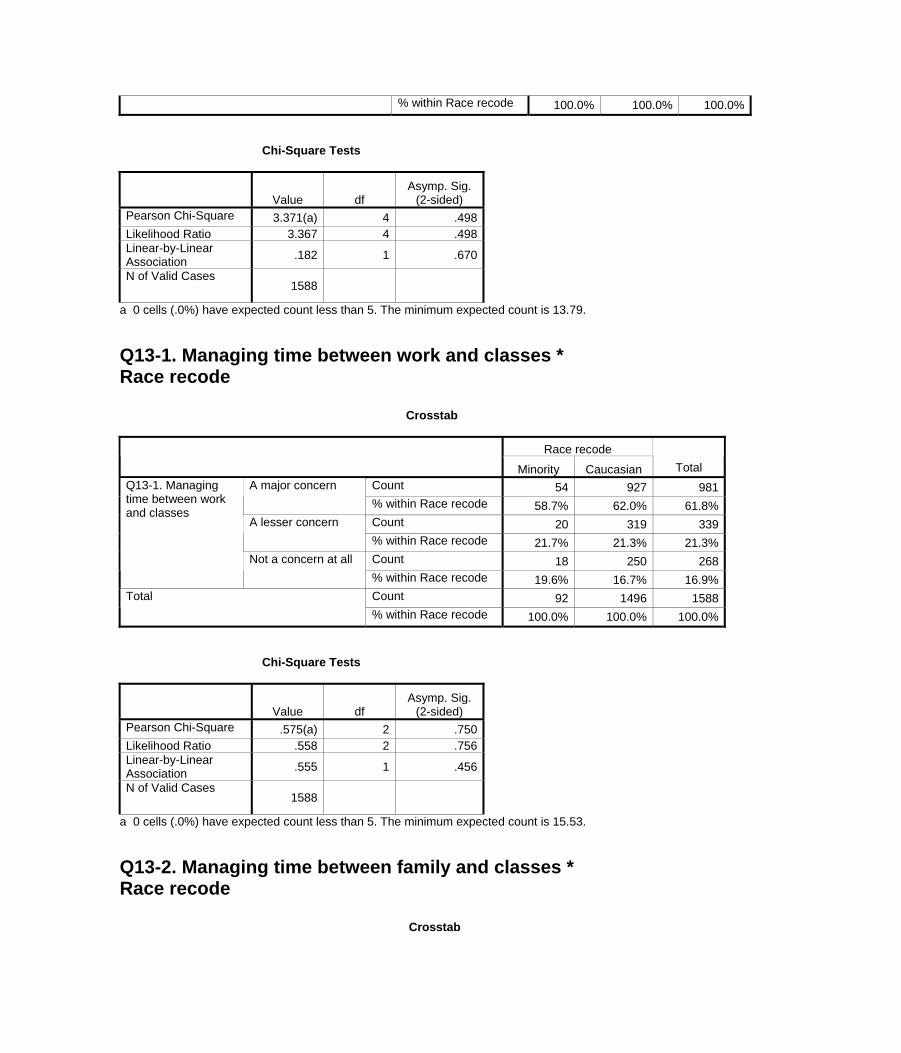
% within Race recode 100.0% 100.0% 100.0% Chi-Square Tests
Value df Asymp. Sig.
(2-sided) Pearson Chi-Square 3.371(a) 4 .498Likelihood Ratio 3.367 4 .498Linear-by-Linear Association .182 1 .670
N of Valid Cases 1588
a 0 cells (.0%) have expected count less than 5. The minimum expected count is 13.79. Q13-1. Managing time between work and classes * Race recode Crosstab
Race recode Minority Caucasian Total
Count 54 927 981A major concern % within Race recode 58.7% 62.0% 61.8%Count 20 319 339A lesser concern % within Race recode 21.7% 21.3% 21.3%Count 18 250 268
Q13-1. Managing time between work and classes
Not a concern at all % within Race recode 19.6% 16.7% 16.9%Count 92 1496 1588Total % within Race recode 100.0% 100.0% 100.0%
Chi-Square Tests
Value df Asymp. Sig.
(2-sided) Pearson Chi-Square .575(a) 2 .750Likelihood Ratio .558 2 .756Linear-by-Linear Association .555 1 .456
N of Valid Cases 1588
a 0 cells (.0%) have expected count less than 5. The minimum expected count is 15.53. Q13-2. Managing time between family and classes * Race recode Crosstab
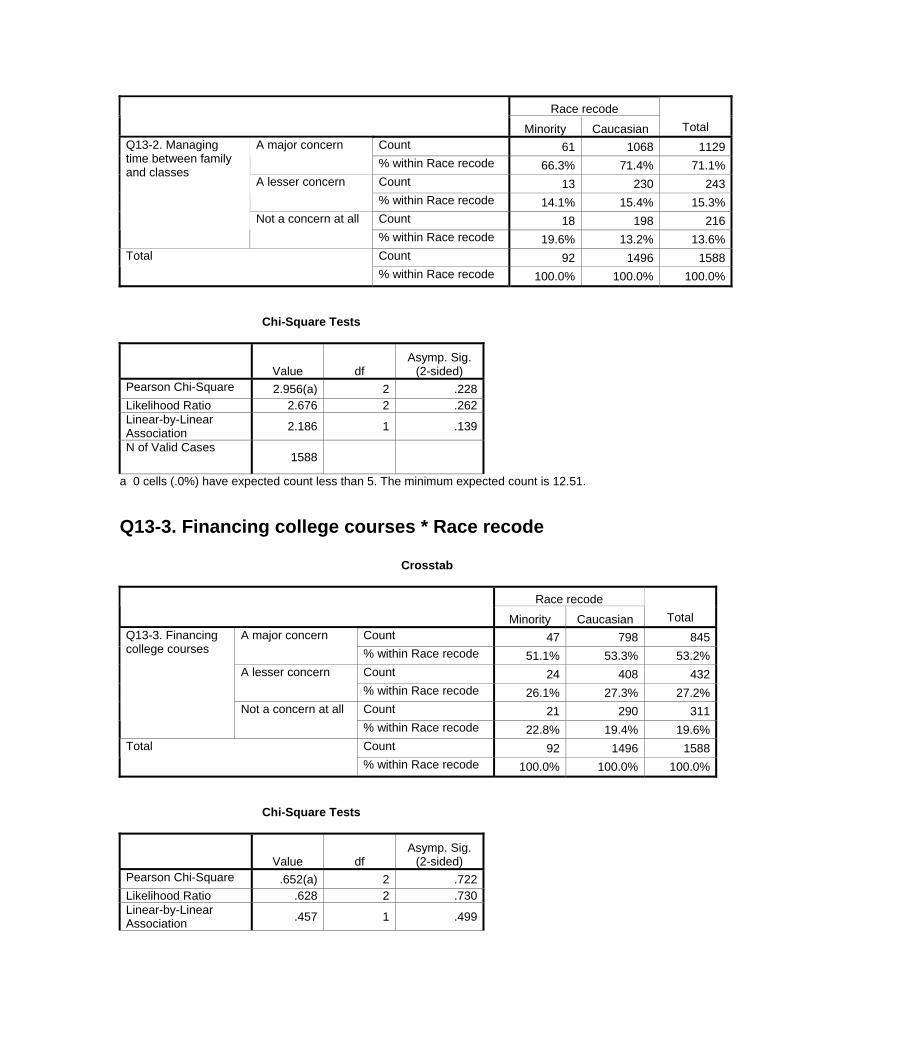
Race recode Minority Caucasian Total
Count 61 1068 1129A major concern % within Race recode 66.3% 71.4% 71.1%Count 13 230 243A lesser concern % within Race recode 14.1% 15.4% 15.3%Count 18 198 216
Q13-2. Managing time between family and classes
Not a concern at all % within Race recode 19.6% 13.2% 13.6%Count 92 1496 1588Total % within Race recode 100.0% 100.0% 100.0%
Chi-Square Tests
Value df Asymp. Sig.
(2-sided) Pearson Chi-Square 2.956(a) 2 .228Likelihood Ratio 2.676 2 .262Linear-by-Linear Association 2.186 1 .139
N of Valid Cases 1588
a 0 cells (.0%) have expected count less than 5. The minimum expected count is 12.51. Q13-3. Financing college courses * Race recode Crosstab
Race recode Minority Caucasian Total
Count 47 798 845A major concern % within Race recode 51.1% 53.3% 53.2%Count 24 408 432A lesser concern % within Race recode 26.1% 27.3% 27.2%Count 21 290 311
Q13-3. Financing college courses
Not a concern at all % within Race recode 22.8% 19.4% 19.6%Count 92 1496 1588Total % within Race recode 100.0% 100.0% 100.0%
Chi-Square Tests
Value df Asymp. Sig.
(2-sided) Pearson Chi-Square .652(a) 2 .722Likelihood Ratio .628 2 .730Linear-by-Linear Association .457 1 .499
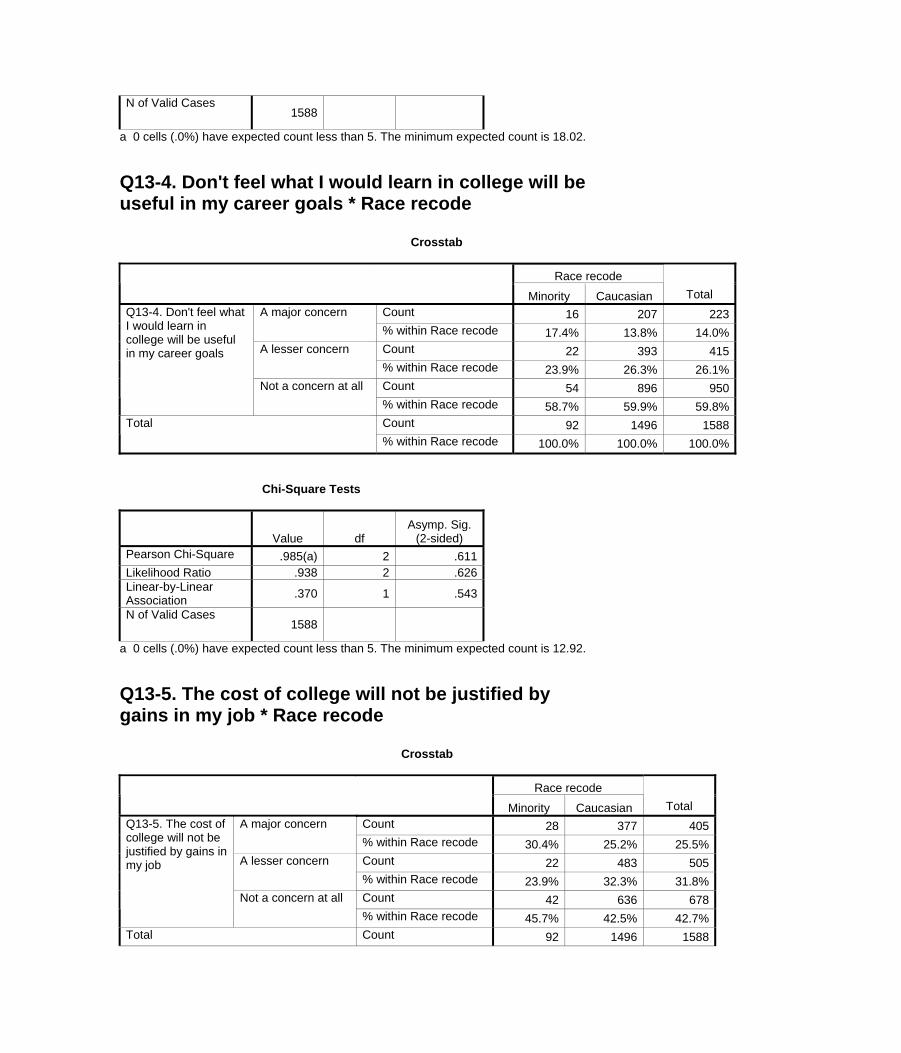
N of Valid Cases 1588
a 0 cells (.0%) have expected count less than 5. The minimum expected count is 18.02. Q13-4. Don't feel what I would learn in college will be useful in my career goals * Race recode Crosstab
Race recode Minority Caucasian Total
Count 16 207 223A major concern % within Race recode 17.4% 13.8% 14.0%Count 22 393 415A lesser concern % within Race recode 23.9% 26.3% 26.1%Count 54 896 950
Q13-4. Don't feel what I would learn in college will be useful in my career goals
Not a concern at all % within Race recode 58.7% 59.9% 59.8%Count 92 1496 1588Total % within Race recode 100.0% 100.0% 100.0%
Chi-Square Tests
Value df Asymp. Sig.
(2-sided) Pearson Chi-Square .985(a) 2 .611Likelihood Ratio .938 2 .626Linear-by-Linear Association .370 1 .543
N of Valid Cases 1588
a 0 cells (.0%) have expected count less than 5. The minimum expected count is 12.92. Q13-5. The cost of college will not be justified by gains in my job * Race recode Crosstab
Race recode Minority Caucasian Total
Count 28 377 405A major concern % within Race recode 30.4% 25.2% 25.5%Count 22 483 505A lesser concern % within Race recode 23.9% 32.3% 31.8%Count 42 636 678
Q13-5. The cost of college will not be justified by gains in my job
Not a concern at all % within Race recode 45.7% 42.5% 42.7%
Total Count 92 1496 1588
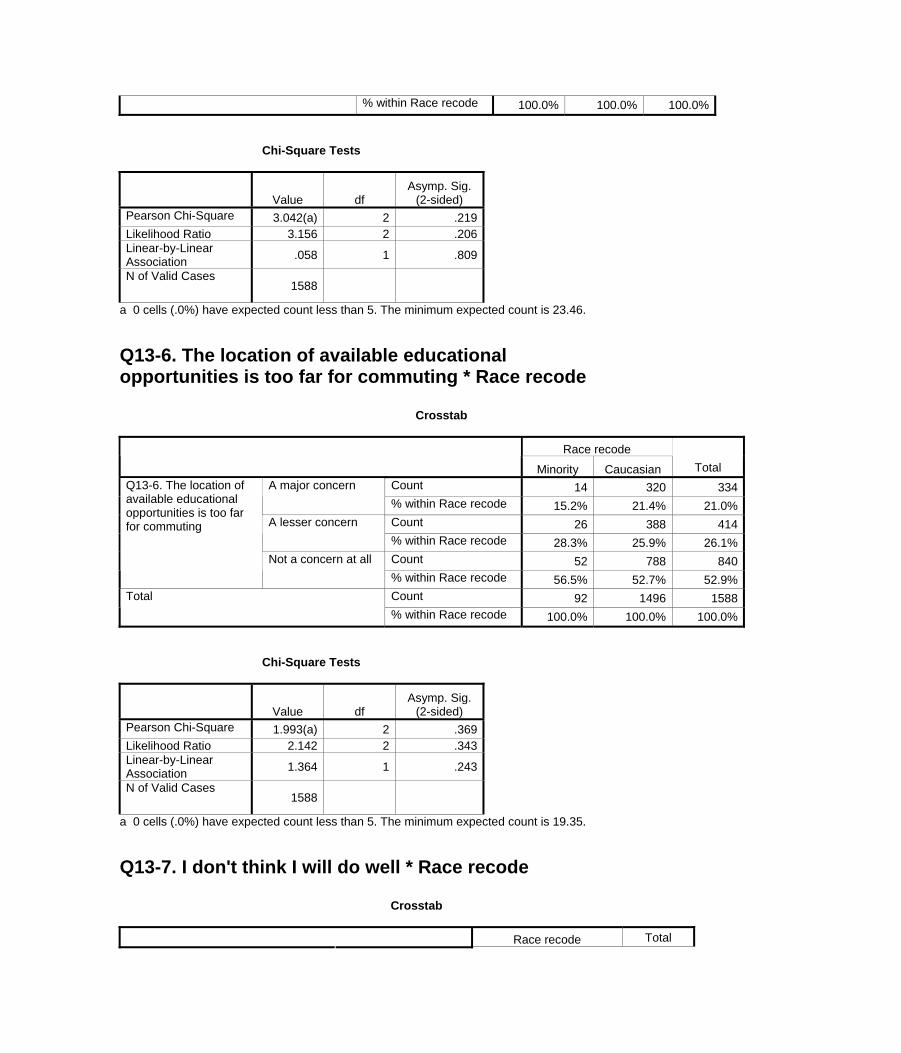
% within Race recode 100.0% 100.0% 100.0% Chi-Square Tests
Value df Asymp. Sig.
(2-sided) Pearson Chi-Square 3.042(a) 2 .219Likelihood Ratio 3.156 2 .206Linear-by-Linear Association .058 1 .809
N of Valid Cases 1588
a 0 cells (.0%) have expected count less than 5. The minimum expected count is 23.46. Q13-6. The location of available educational opportunities is too far for commuting * Race recode Crosstab
Race recode Minority Caucasian Total
Count 14 320 334A major concern % within Race recode 15.2% 21.4% 21.0%Count 26 388 414A lesser concern % within Race recode 28.3% 25.9% 26.1%Count 52 788 840
Q13-6. The location of available educational opportunities is too far for commuting
Not a concern at all % within Race recode 56.5% 52.7% 52.9%Count 92 1496 1588Total % within Race recode 100.0% 100.0% 100.0%
Chi-Square Tests
Value df Asymp. Sig.
(2-sided) Pearson Chi-Square 1.993(a) 2 .369Likelihood Ratio 2.142 2 .343Linear-by-Linear Association 1.364 1 .243
N of Valid Cases 1588
a 0 cells (.0%) have expected count less than 5. The minimum expected count is 19.35. Q13-7. I don't think I will do well * Race recode Crosstab Race recode Total
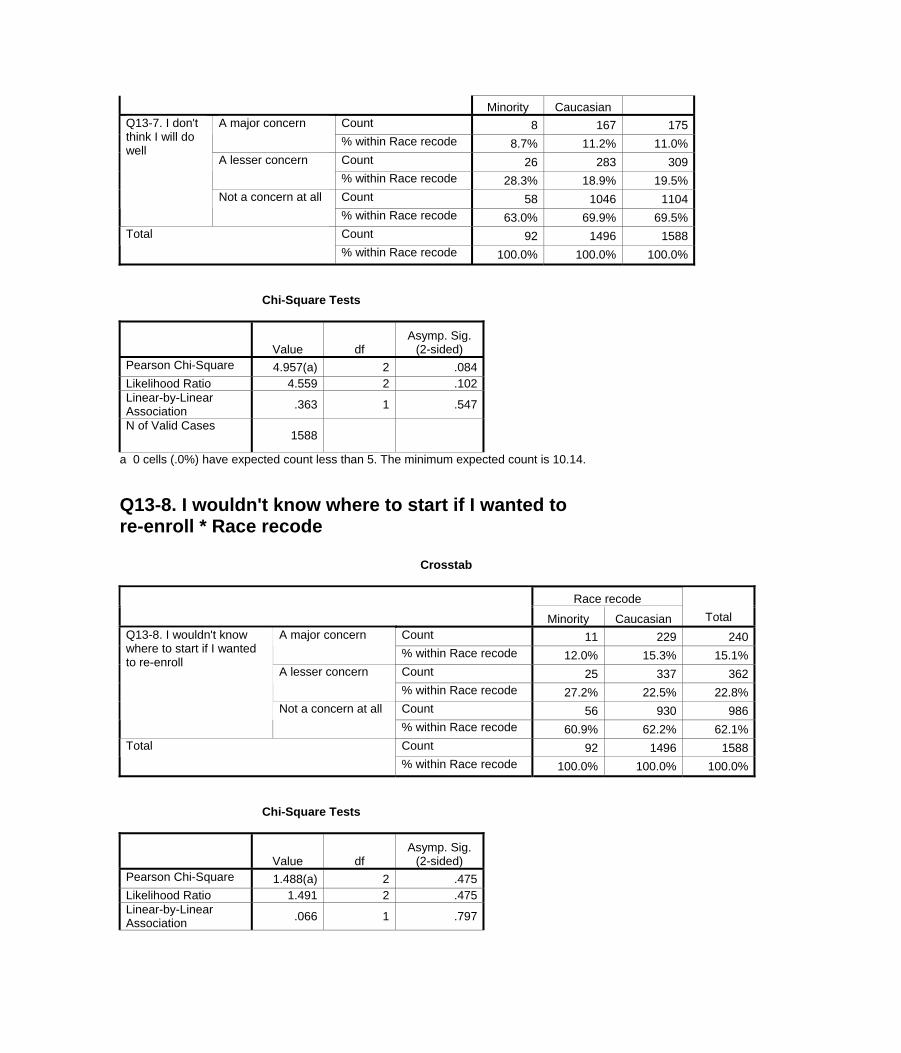
Minority Caucasian Count 8 167 175A major concern % within Race recode 8.7% 11.2% 11.0%Count 26 283 309A lesser concern % within Race recode 28.3% 18.9% 19.5%Count 58 1046 1104
Q13-7. I don't think I will do well
Not a concern at all % within Race recode 63.0% 69.9% 69.5%Count 92 1496 1588Total % within Race recode 100.0% 100.0% 100.0%
Chi-Square Tests
Value df Asymp. Sig.
(2-sided) Pearson Chi-Square 4.957(a) 2 .084Likelihood Ratio 4.559 2 .102Linear-by-Linear Association .363 1 .547
N of Valid Cases 1588
a 0 cells (.0%) have expected count less than 5. The minimum expected count is 10.14. Q13-8. I wouldn't know where to start if I wanted to re-enroll * Race recode Crosstab
Race recode Minority Caucasian Total
Count 11 229 240A major concern % within Race recode 12.0% 15.3% 15.1%Count 25 337 362A lesser concern % within Race recode 27.2% 22.5% 22.8%Count 56 930 986
Q13-8. I wouldn't know where to start if I wanted to re-enroll
Not a concern at all % within Race recode 60.9% 62.2% 62.1%Count 92 1496 1588Total % within Race recode 100.0% 100.0% 100.0%
Chi-Square Tests
Value df Asymp. Sig.
(2-sided) Pearson Chi-Square 1.488(a) 2 .475Likelihood Ratio 1.491 2 .475Linear-by-Linear Association .066 1 .797
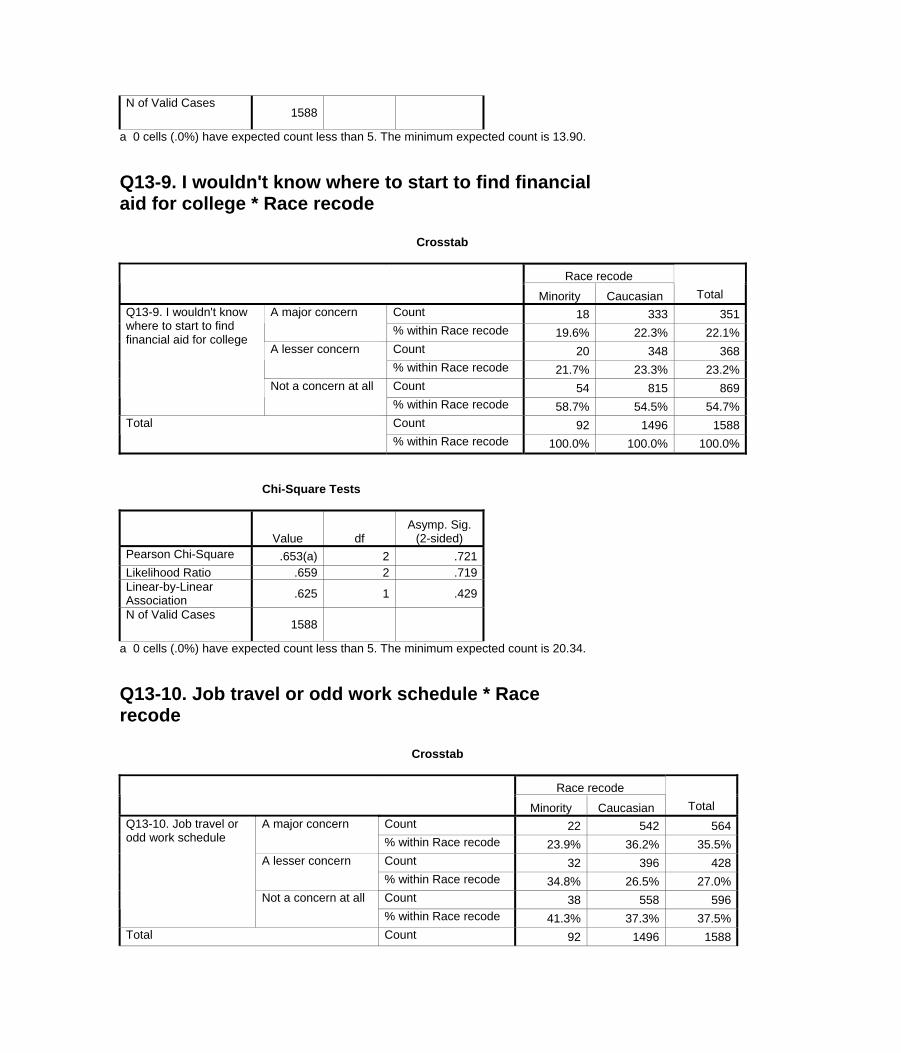
N of Valid Cases 1588
a 0 cells (.0%) have expected count less than 5. The minimum expected count is 13.90. Q13-9. I wouldn't know where to start to find financial aid for college * Race recode Crosstab
Race recode Minority Caucasian Total
Count 18 333 351A major concern % within Race recode 19.6% 22.3% 22.1%Count 20 348 368A lesser concern % within Race recode 21.7% 23.3% 23.2%Count 54 815 869
Q13-9. I wouldn't know where to start to find financial aid for college
Not a concern at all % within Race recode 58.7% 54.5% 54.7%Count 92 1496 1588Total % within Race recode 100.0% 100.0% 100.0%
Chi-Square Tests
Value df Asymp. Sig.
(2-sided) Pearson Chi-Square .653(a) 2 .721Likelihood Ratio .659 2 .719Linear-by-Linear Association .625 1 .429
N of Valid Cases 1588
a 0 cells (.0%) have expected count less than 5. The minimum expected count is 20.34. Q13-10. Job travel or odd work schedule * Race recode Crosstab
Race recode Minority Caucasian Total
Count 22 542 564A major concern % within Race recode 23.9% 36.2% 35.5%Count 32 396 428A lesser concern % within Race recode 34.8% 26.5% 27.0%Count 38 558 596
Q13-10. Job travel or odd work schedule
Not a concern at all % within Race recode 41.3% 37.3% 37.5%
Total Count 92 1496 1588
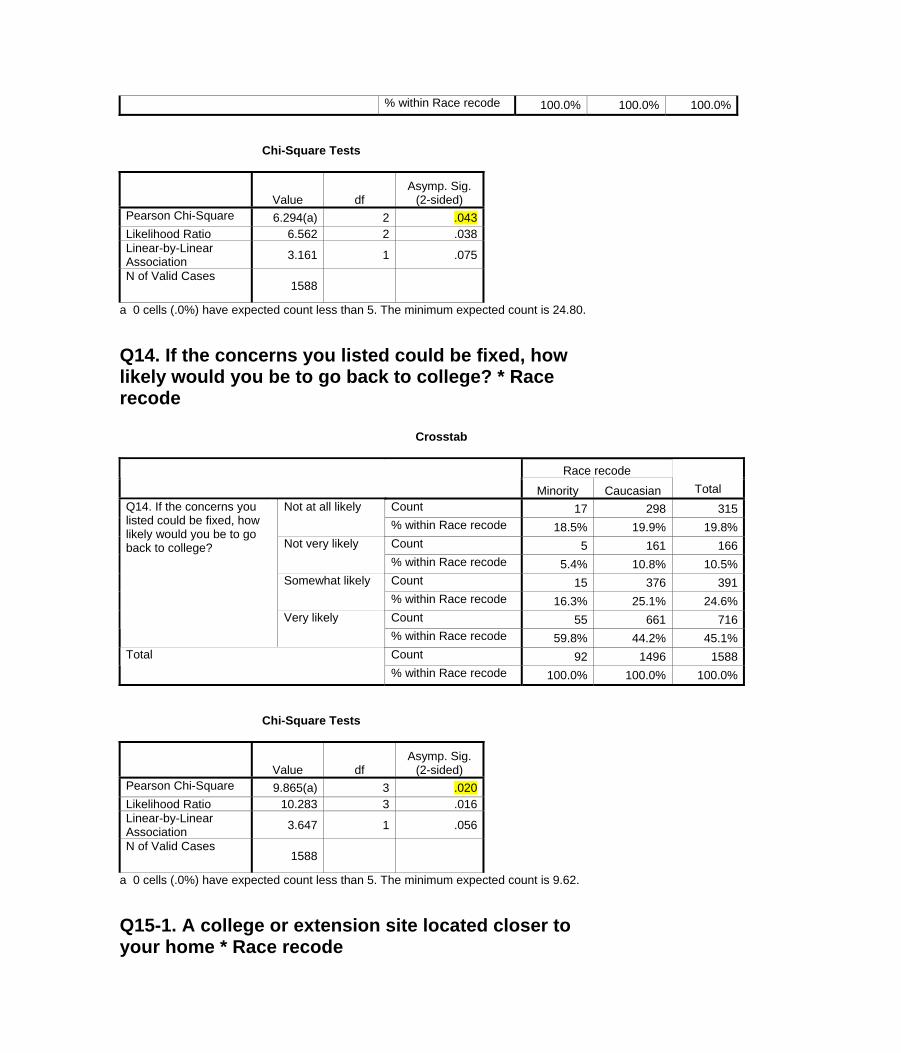
% within Race recode 100.0% 100.0% 100.0% Chi-Square Tests
Value df Asymp. Sig.
(2-sided) Pearson Chi-Square 6.294(a) 2 .043Likelihood Ratio 6.562 2 .038Linear-by-Linear Association 3.161 1 .075
N of Valid Cases 1588
a 0 cells (.0%) have expected count less than 5. The minimum expected count is 24.80. Q14. If the concerns you listed could be fixed, how likely would you be to go back to college? * Race recode Crosstab
Race recode Minority Caucasian Total
Count 17 298 315Not at all likely % within Race recode 18.5% 19.9% 19.8%Count 5 161 166Not very likely % within Race recode 5.4% 10.8% 10.5%Count 15 376 391Somewhat likely % within Race recode 16.3% 25.1% 24.6%Count 55 661 716
Q14. If the concerns you listed could be fixed, how likely would you be to go back to college?
Very likely % within Race recode 59.8% 44.2% 45.1%Count 92 1496 1588Total % within Race recode 100.0% 100.0% 100.0%
Chi-Square Tests
Value df Asymp. Sig.
(2-sided) Pearson Chi-Square 9.865(a) 3 .020Likelihood Ratio 10.283 3 .016Linear-by-Linear Association 3.647 1 .056
N of Valid Cases 1588
a 0 cells (.0%) have expected count less than 5. The minimum expected count is 9.62. Q15-1. A college or extension site located closer to your home * Race recode
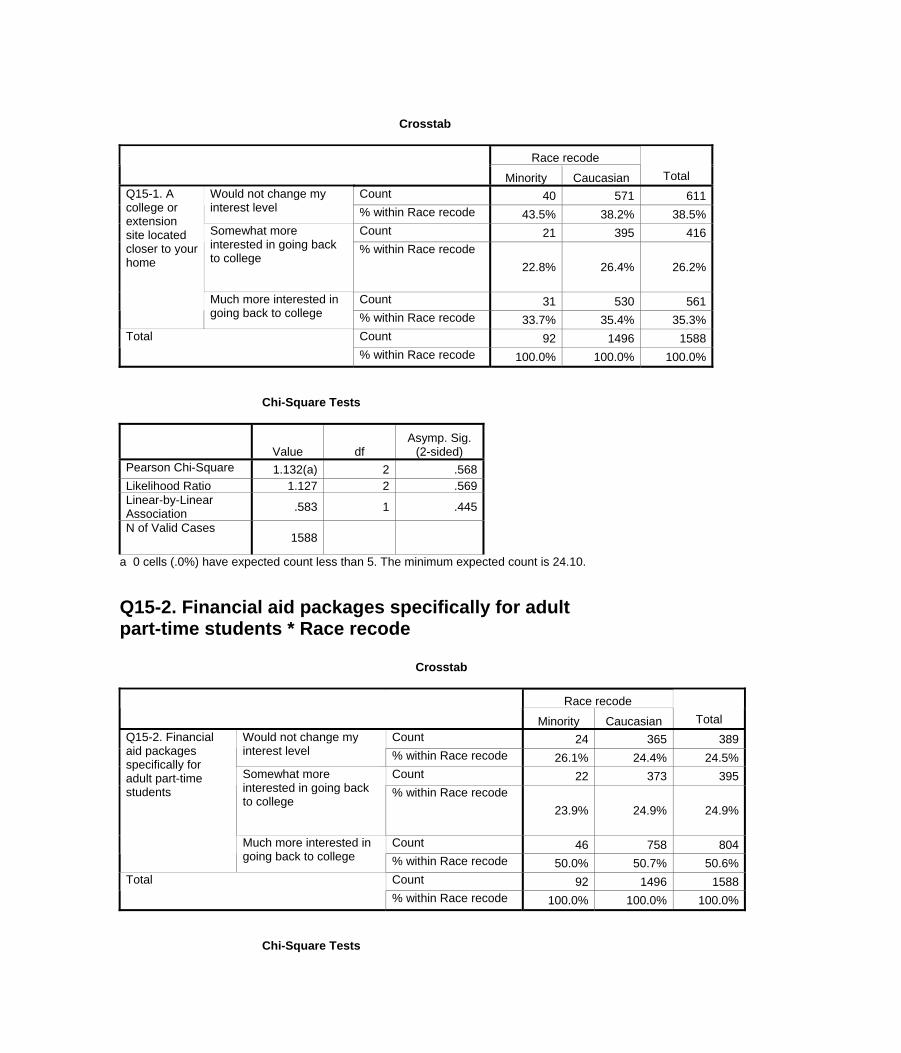
Crosstab
Race recode Minority Caucasian Total
Count 40 571 611Would not change my interest level % within Race recode 43.5% 38.2% 38.5%
Count 21 395 416Somewhat more interested in going back to college
% within Race recode 22.8% 26.4% 26.2%
Count 31 530 561
Q15-1. A college or extension site located closer to your home
Much more interested in going back to college % within Race recode 33.7% 35.4% 35.3%
Count 92 1496 1588Total % within Race recode 100.0% 100.0% 100.0%
Chi-Square Tests
Value df Asymp. Sig.
(2-sided) Pearson Chi-Square 1.132(a) 2 .568Likelihood Ratio 1.127 2 .569Linear-by-Linear Association .583 1 .445
N of Valid Cases 1588
a 0 cells (.0%) have expected count less than 5. The minimum expected count is 24.10. Q15-2. Financial aid packages specifically for adult part-time students * Race recode Crosstab
Race recode Minority Caucasian Total
Count 24 365 389Would not change my interest level % within Race recode 26.1% 24.4% 24.5%
Count 22 373 395Somewhat more interested in going back to college
% within Race recode 23.9% 24.9% 24.9%
Count 46 758 804
Q15-2. Financial aid packages specifically for adult part-time students
Much more interested in going back to college % within Race recode 50.0% 50.7% 50.6%
Count 92 1496 1588Total % within Race recode 100.0% 100.0% 100.0%
Chi-Square Tests
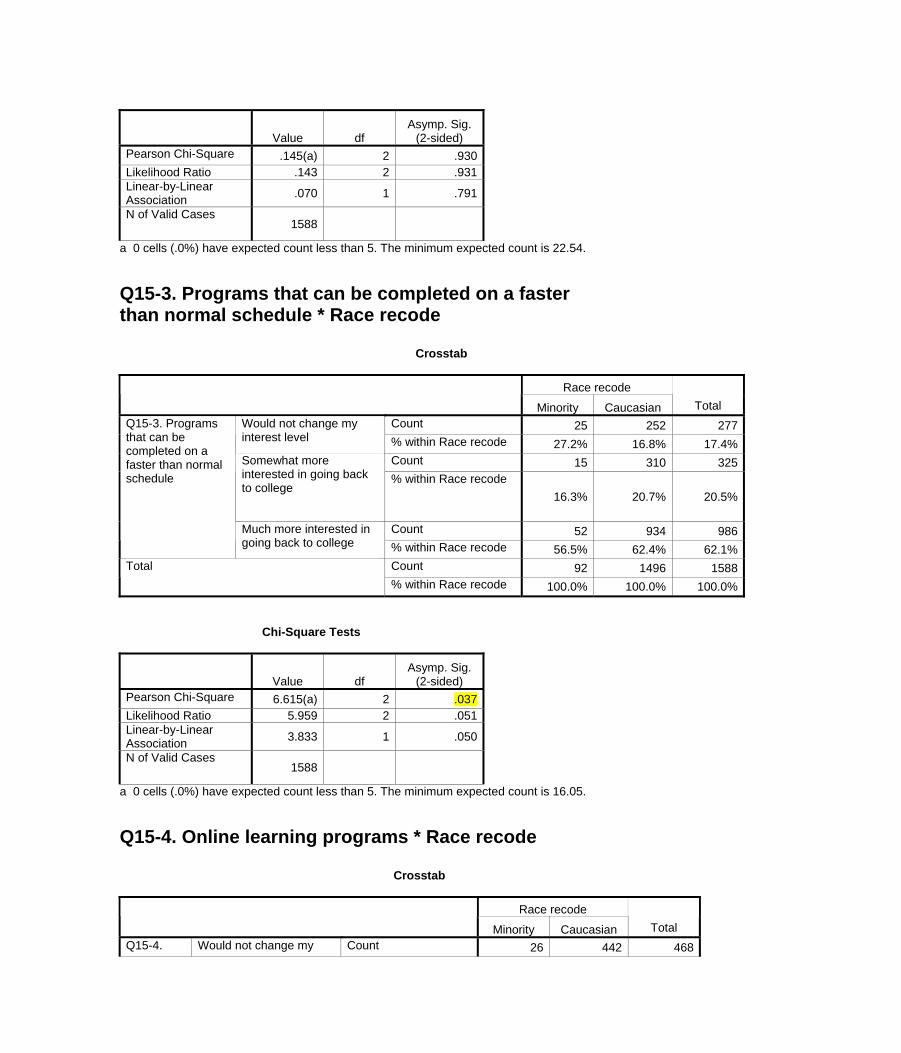
Value df Asymp. Sig.
(2-sided) Pearson Chi-Square .145(a) 2 .930Likelihood Ratio .143 2 .931Linear-by-Linear Association .070 1 .791
N of Valid Cases 1588
a 0 cells (.0%) have expected count less than 5. The minimum expected count is 22.54. Q15-3. Programs that can be completed on a faster than normal schedule * Race recode Crosstab
Race recode Minority Caucasian Total
Count 25 252 277Would not change my interest level % within Race recode 27.2% 16.8% 17.4%
Count 15 310 325Somewhat more interested in going back to college
% within Race recode 16.3% 20.7% 20.5%
Count 52 934 986
Q15-3. Programs that can be completed on a faster than normal schedule
Much more interested in going back to college % within Race recode 56.5% 62.4% 62.1%
Count 92 1496 1588Total % within Race recode 100.0% 100.0% 100.0%
Chi-Square Tests
Value df Asymp. Sig.
(2-sided) Pearson Chi-Square 6.615(a) 2 .037Likelihood Ratio 5.959 2 .051Linear-by-Linear Association 3.833 1 .050
N of Valid Cases 1588
a 0 cells (.0%) have expected count less than 5. The minimum expected count is 16.05. Q15-4. Online learning programs * Race recode Crosstab
Race recode Minority Caucasian Total Q15-4. Would not change my Count 26 442 468
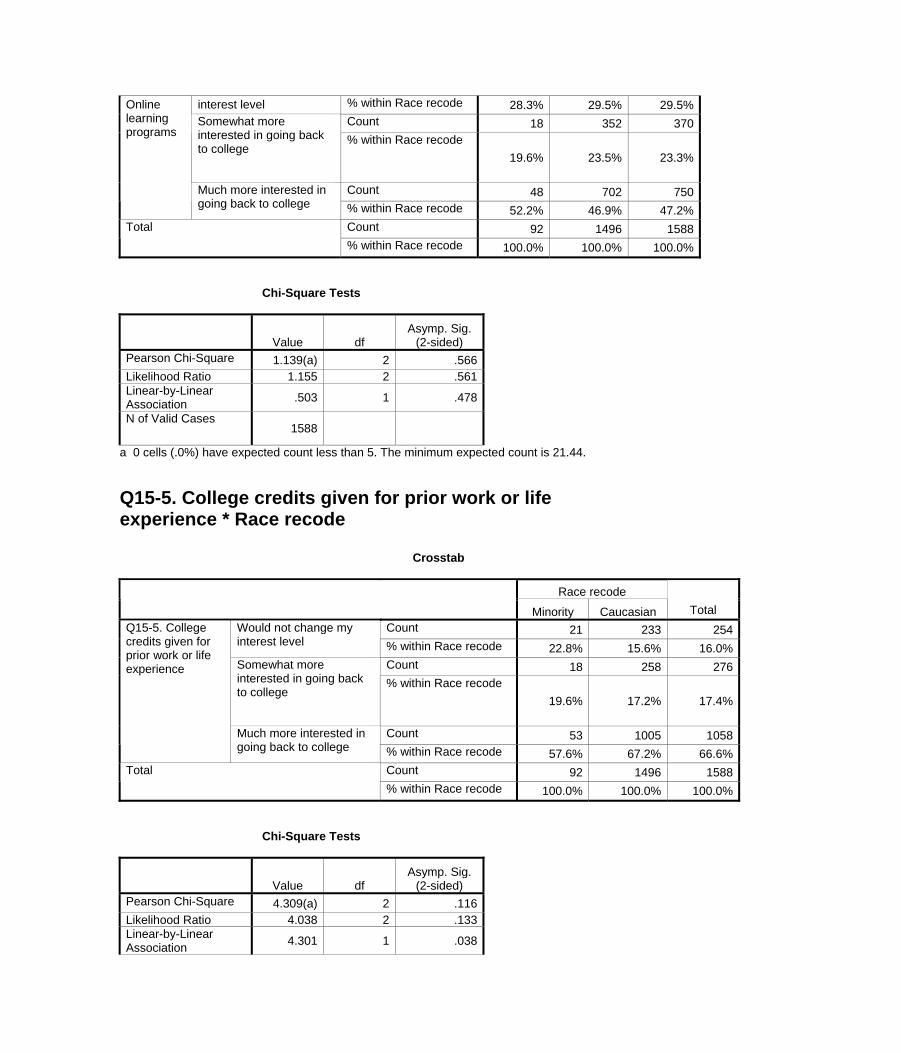
interest level % within Race recode 28.3% 29.5% 29.5%Count 18 352 370Somewhat more
interested in going back to college
% within Race recode 19.6% 23.5% 23.3%
Count 48 702 750
Online learning programs
Much more interested in going back to college % within Race recode 52.2% 46.9% 47.2%
Count 92 1496 1588Total % within Race recode 100.0% 100.0% 100.0%
Chi-Square Tests
Value df Asymp. Sig.
(2-sided) Pearson Chi-Square 1.139(a) 2 .566Likelihood Ratio 1.155 2 .561Linear-by-Linear Association .503 1 .478
N of Valid Cases 1588
a 0 cells (.0%) have expected count less than 5. The minimum expected count is 21.44. Q15-5. College credits given for prior work or life experience * Race recode Crosstab
Race recode Minority Caucasian Total
Count 21 233 254Would not change my interest level % within Race recode 22.8% 15.6% 16.0%
Count 18 258 276Somewhat more interested in going back to college
% within Race recode 19.6% 17.2% 17.4%
Count 53 1005 1058
Q15-5. College credits given for prior work or life experience
Much more interested in going back to college % within Race recode 57.6% 67.2% 66.6%
Count 92 1496 1588Total % within Race recode 100.0% 100.0% 100.0%
Chi-Square Tests
Value df Asymp. Sig.
(2-sided) Pearson Chi-Square 4.309(a) 2 .116Likelihood Ratio 4.038 2 .133Linear-by-Linear Association 4.301 1 .038
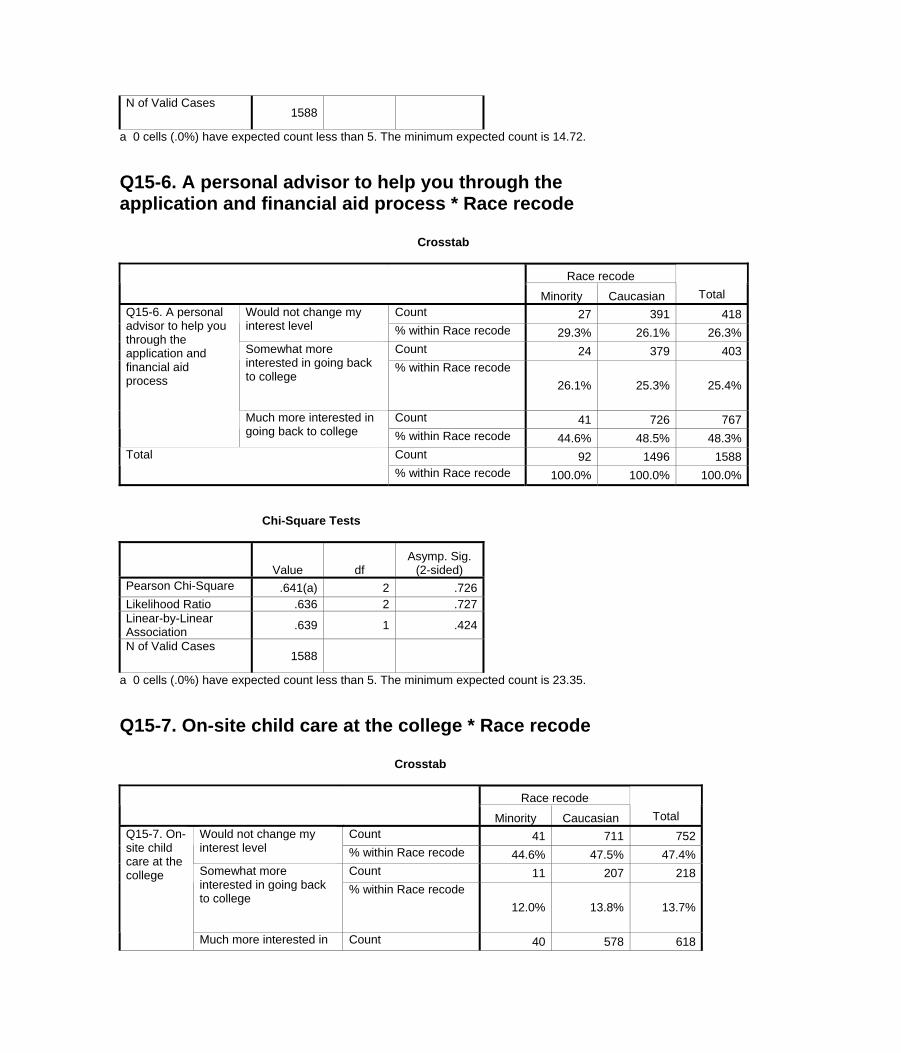
N of Valid Cases 1588
a 0 cells (.0%) have expected count less than 5. The minimum expected count is 14.72. Q15-6. A personal advisor to help you through the application and financial aid process * Race recode Crosstab
Race recode Minority Caucasian Total
Count 27 391 418Would not change my interest level % within Race recode 29.3% 26.1% 26.3%
Count 24 379 403Somewhat more interested in going back to college
% within Race recode 26.1% 25.3% 25.4%
Count 41 726 767
Q15-6. A personal advisor to help you through the application and financial aid process
Much more interested in going back to college % within Race recode 44.6% 48.5% 48.3%
Count 92 1496 1588Total % within Race recode 100.0% 100.0% 100.0%
Chi-Square Tests
Value df Asymp. Sig.
(2-sided) Pearson Chi-Square .641(a) 2 .726Likelihood Ratio .636 2 .727Linear-by-Linear Association .639 1 .424
N of Valid Cases 1588
a 0 cells (.0%) have expected count less than 5. The minimum expected count is 23.35. Q15-7. On-site child care at the college * Race recode Crosstab
Race recode Minority Caucasian Total
Count 41 711 752Would not change my interest level % within Race recode 44.6% 47.5% 47.4%
Count 11 207 218Somewhat more interested in going back to college
% within Race recode 12.0% 13.8% 13.7%
Q15-7. On-site child care at the college
Much more interested in Count 40 578 618
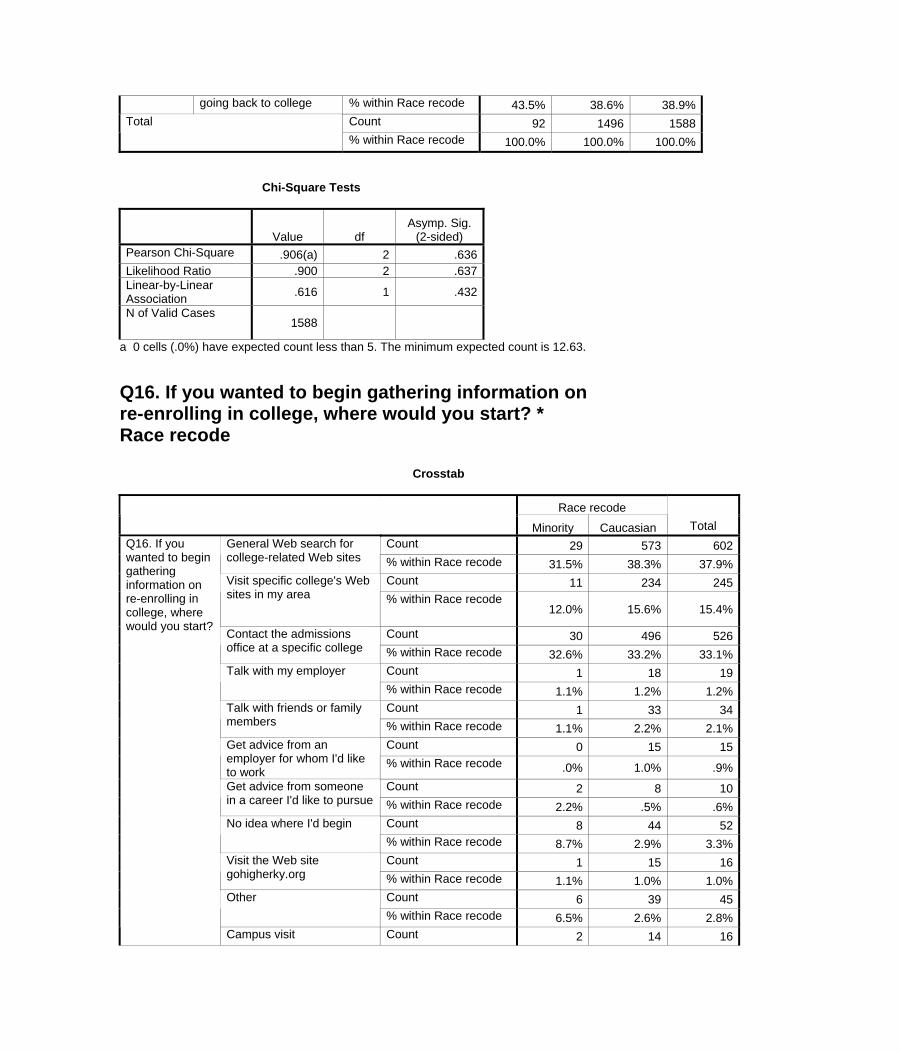
going back to college % within Race recode 43.5% 38.6% 38.9%Count 92 1496 1588Total % within Race recode 100.0% 100.0% 100.0%
Chi-Square Tests
Value df Asymp. Sig.
(2-sided) Pearson Chi-Square .906(a) 2 .636Likelihood Ratio .900 2 .637Linear-by-Linear Association .616 1 .432
N of Valid Cases 1588
a 0 cells (.0%) have expected count less than 5. The minimum expected count is 12.63. Q16. If you wanted to begin gathering information on re-enrolling in college, where would you start? * Race recode Crosstab
Race recode Minority Caucasian Total
Count 29 573 602General Web search for college-related Web sites % within Race recode 31.5% 38.3% 37.9%
Count 11 234 245Visit specific college's Web sites in my area % within Race recode
12.0% 15.6% 15.4%
Count 30 496 526Contact the admissions office at a specific college % within Race recode 32.6% 33.2% 33.1%
Count 1 18 19Talk with my employer % within Race recode 1.1% 1.2% 1.2%Count 1 33 34Talk with friends or family
members % within Race recode 1.1% 2.2% 2.1%Count 0 15 15Get advice from an
employer for whom I'd like to work
% within Race recode .0% 1.0% .9%Count 2 8 10Get advice from someone
in a career I'd like to pursue % within Race recode 2.2% .5% .6%Count 8 44 52No idea where I'd begin % within Race recode 8.7% 2.9% 3.3%Count 1 15 16Visit the Web site
gohigherky.org % within Race recode 1.1% 1.0% 1.0%Count 6 39 45Other % within Race recode 6.5% 2.6% 2.8%
Q16. If you wanted to begin gathering information on re-enrolling in college, where would you start?
Campus visit Count 2 14 16
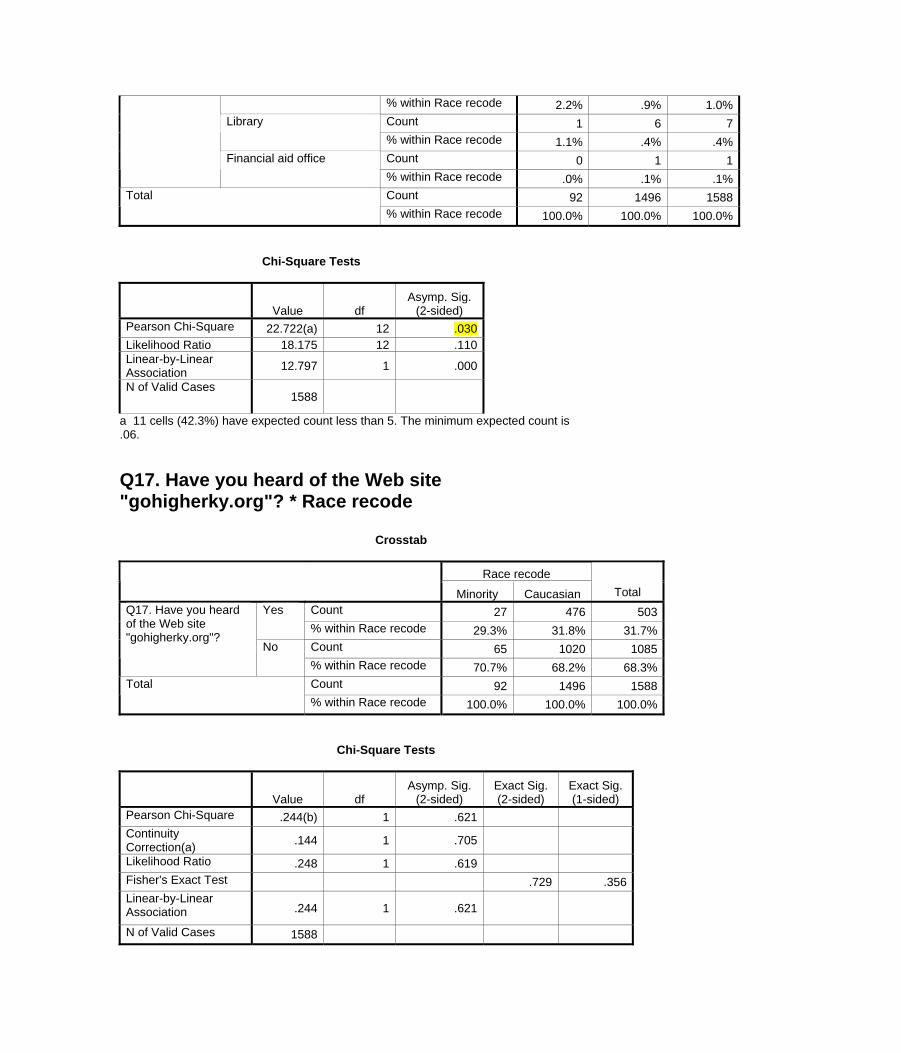
% within Race recode 2.2% .9% 1.0%Count 1 6 7Library % within Race recode 1.1% .4% .4%Count 0 1 1Financial aid office % within Race recode .0% .1% .1%Count 92 1496 1588Total % within Race recode 100.0% 100.0% 100.0%
Chi-Square Tests
Value df Asymp. Sig.
(2-sided) Pearson Chi-Square 22.722(a) 12 .030Likelihood Ratio 18.175 12 .110Linear-by-Linear Association 12.797 1 .000
N of Valid Cases 1588
a 11 cells (42.3%) have expected count less than 5. The minimum expected count is .06. Q17. Have you heard of the Web site "gohigherky.org"? * Race recode Crosstab
Race recode Minority Caucasian Total
Count 27 476 503Yes % within Race recode 29.3% 31.8% 31.7%Count 65 1020 1085
Q17. Have you heard of the Web site "gohigherky.org"?
No % within Race recode 70.7% 68.2% 68.3%Count 92 1496 1588Total % within Race recode 100.0% 100.0% 100.0%
Chi-Square Tests
Value df Asymp. Sig.
(2-sided) Exact Sig. (2-sided)
Exact Sig. (1-sided)
Pearson Chi-Square .244(b) 1 .621 Continuity Correction(a) .144 1 .705
Likelihood Ratio .248 1 .619 Fisher's Exact Test .729 .356 Linear-by-Linear Association .244 1 .621
N of Valid Cases 1588
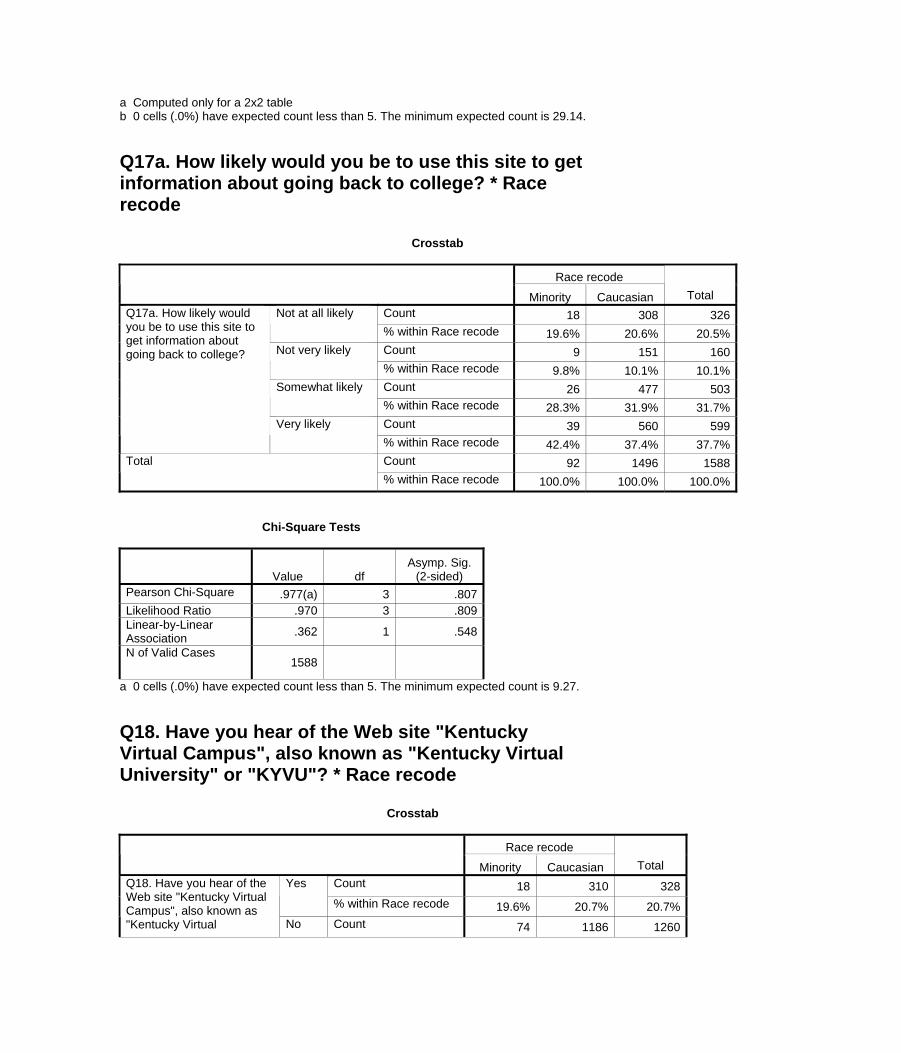
a Computed only for a 2x2 table b 0 cells (.0%) have expected count less than 5. The minimum expected count is 29.14. Q17a. How likely would you be to use this site to get information about going back to college? * Race recode Crosstab
Race recode Minority Caucasian Total
Count 18 308 326Not at all likely % within Race recode 19.6% 20.6% 20.5%Count 9 151 160Not very likely % within Race recode 9.8% 10.1% 10.1%Count 26 477 503Somewhat likely % within Race recode 28.3% 31.9% 31.7%Count 39 560 599
Q17a. How likely would you be to use this site to get information about going back to college?
Very likely % within Race recode 42.4% 37.4% 37.7%Count 92 1496 1588Total % within Race recode 100.0% 100.0% 100.0%
Chi-Square Tests
Value df Asymp. Sig.
(2-sided) Pearson Chi-Square .977(a) 3 .807Likelihood Ratio .970 3 .809Linear-by-Linear Association .362 1 .548
N of Valid Cases 1588
a 0 cells (.0%) have expected count less than 5. The minimum expected count is 9.27. Q18. Have you hear of the Web site "Kentucky Virtual Campus", also known as "Kentucky Virtual University" or "KYVU"? * Race recode Crosstab
Race recode Minority Caucasian Total
Count 18 310 328Yes
% within Race recode 19.6% 20.7% 20.7%
Q18. Have you hear of the Web site "Kentucky Virtual Campus", also known as "Kentucky Virtual No Count 74 1186 1260
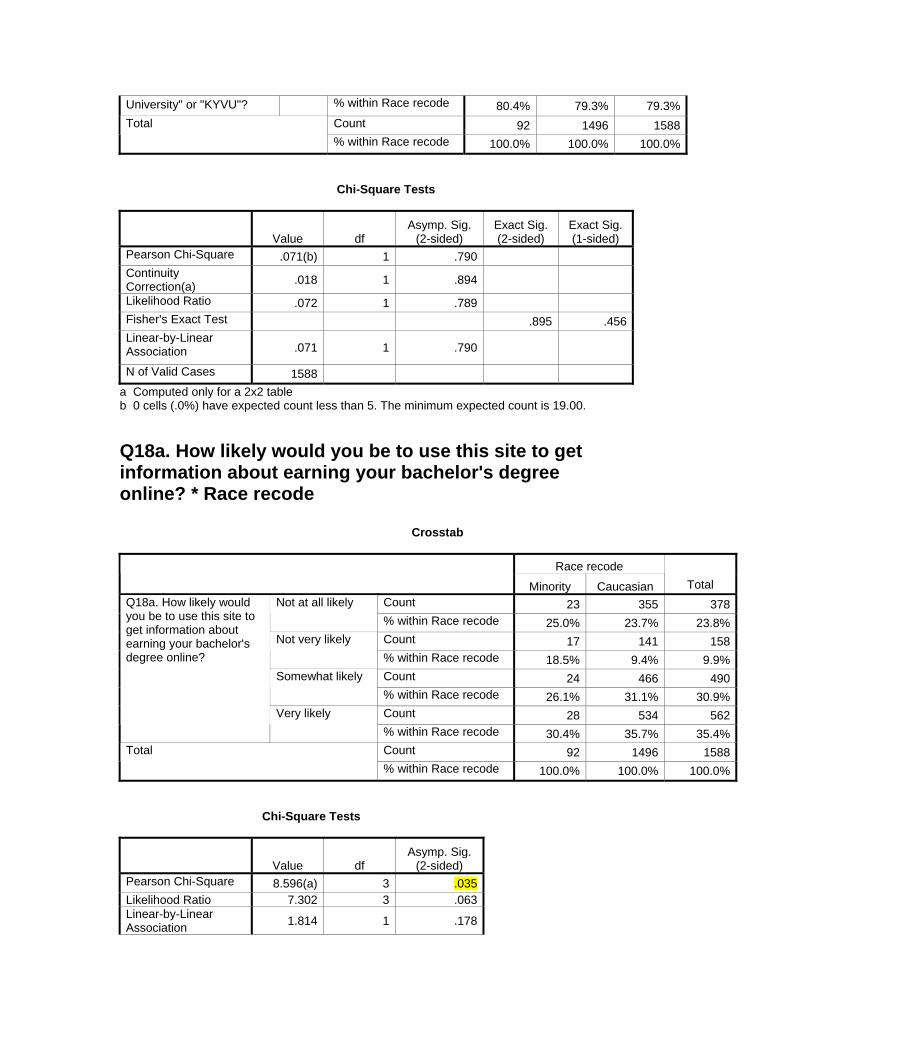
University" or "KYVU"? % within Race recode 80.4% 79.3% 79.3%Count 92 1496 1588Total % within Race recode 100.0% 100.0% 100.0%
Chi-Square Tests
Value df Asymp. Sig.
(2-sided) Exact Sig. (2-sided)
Exact Sig. (1-sided)
Pearson Chi-Square .071(b) 1 .790 Continuity Correction(a) .018 1 .894
Likelihood Ratio .072 1 .789 Fisher's Exact Test .895 .456 Linear-by-Linear Association .071 1 .790
N of Valid Cases 1588 a Computed only for a 2x2 table b 0 cells (.0%) have expected count less than 5. The minimum expected count is 19.00. Q18a. How likely would you be to use this site to get information about earning your bachelor's degree online? * Race recode Crosstab
Race recode Minority Caucasian Total
Count 23 355 378Not at all likely % within Race recode 25.0% 23.7% 23.8%Count 17 141 158Not very likely % within Race recode 18.5% 9.4% 9.9%Count 24 466 490Somewhat likely % within Race recode 26.1% 31.1% 30.9%Count 28 534 562
Q18a. How likely would you be to use this site to get information about earning your bachelor's degree online?
Very likely % within Race recode 30.4% 35.7% 35.4%Count 92 1496 1588Total % within Race recode 100.0% 100.0% 100.0%
Chi-Square Tests
Value df Asymp. Sig.
(2-sided) Pearson Chi-Square 8.596(a) 3 .035Likelihood Ratio 7.302 3 .063Linear-by-Linear Association 1.814 1 .178
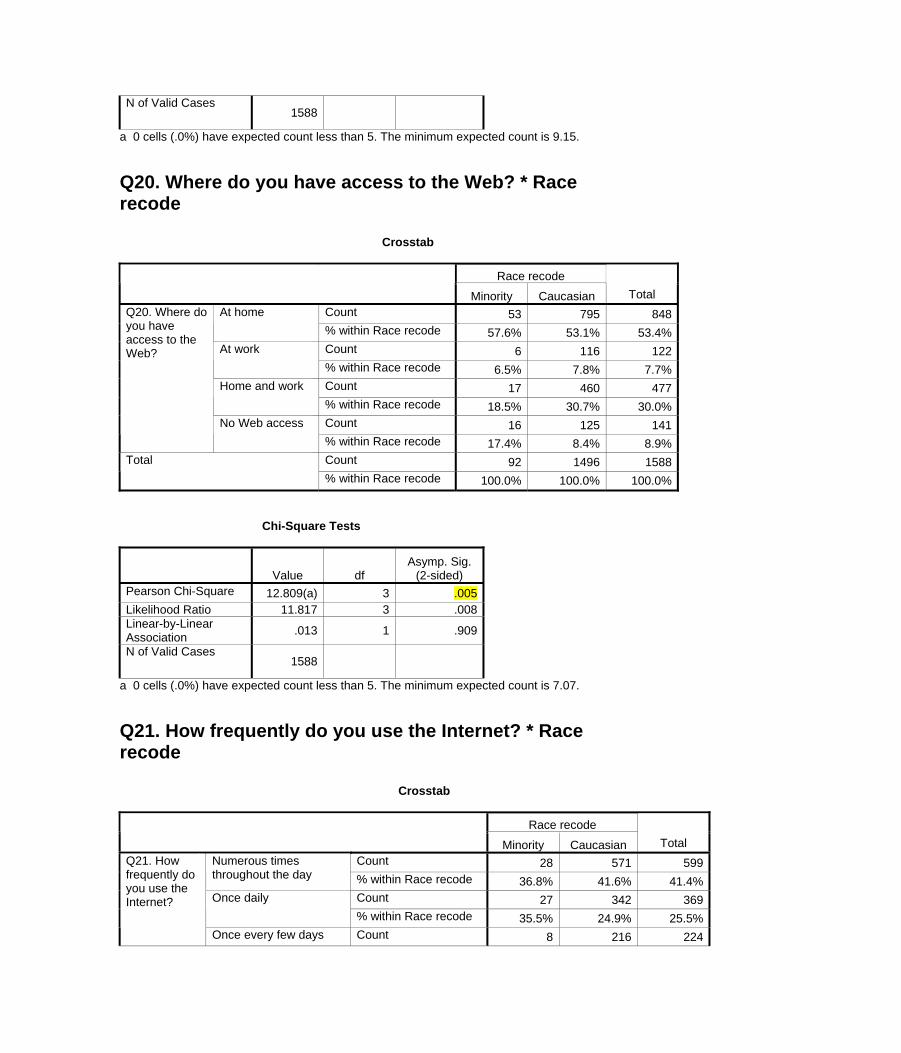
N of Valid Cases 1588
a 0 cells (.0%) have expected count less than 5. The minimum expected count is 9.15. Q20. Where do you have access to the Web? * Race recode Crosstab
Race recode Minority Caucasian Total
Count 53 795 848At home % within Race recode 57.6% 53.1% 53.4%Count 6 116 122At work % within Race recode 6.5% 7.8% 7.7%Count 17 460 477Home and work % within Race recode 18.5% 30.7% 30.0%Count 16 125 141
Q20. Where do you have access to the Web?
No Web access % within Race recode 17.4% 8.4% 8.9%Count 92 1496 1588Total % within Race recode 100.0% 100.0% 100.0%
Chi-Square Tests
Value df Asymp. Sig.
(2-sided) Pearson Chi-Square 12.809(a) 3 .005Likelihood Ratio 11.817 3 .008Linear-by-Linear Association .013 1 .909
N of Valid Cases 1588
a 0 cells (.0%) have expected count less than 5. The minimum expected count is 7.07. Q21. How frequently do you use the Internet? * Race recode Crosstab
Race recode Minority Caucasian Total
Count 28 571 599Numerous times throughout the day % within Race recode 36.8% 41.6% 41.4%
Count 27 342 369Once daily % within Race recode 35.5% 24.9% 25.5%
Q21. How frequently do you use the Internet?
Once every few days Count 8 216 224
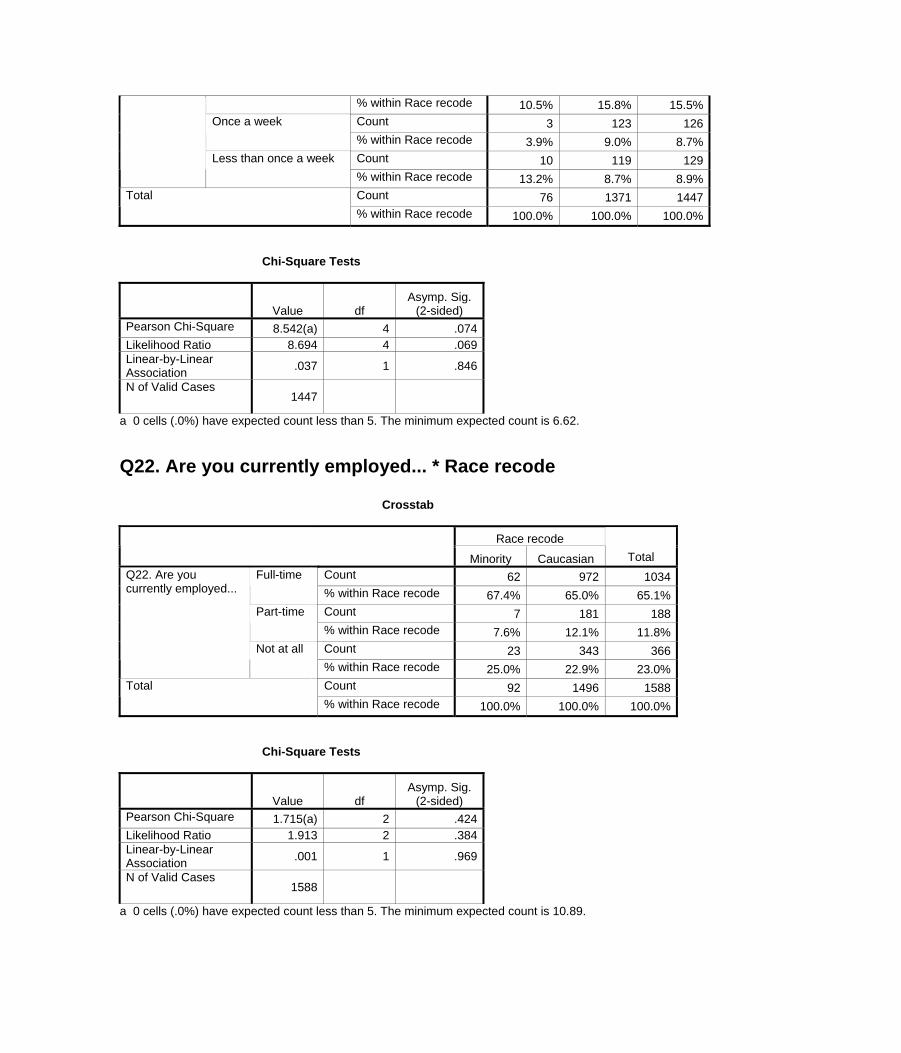
% within Race recode 10.5% 15.8% 15.5%Count 3 123 126Once a week % within Race recode 3.9% 9.0% 8.7%Count 10 119 129Less than once a week % within Race recode 13.2% 8.7% 8.9%Count 76 1371 1447Total % within Race recode 100.0% 100.0% 100.0%
Chi-Square Tests
Value df Asymp. Sig.
(2-sided) Pearson Chi-Square 8.542(a) 4 .074Likelihood Ratio 8.694 4 .069Linear-by-Linear Association .037 1 .846
N of Valid Cases 1447
a 0 cells (.0%) have expected count less than 5. The minimum expected count is 6.62. Q22. Are you currently employed... * Race recode Crosstab
Race recode Minority Caucasian Total
Count 62 972 1034Full-time % within Race recode 67.4% 65.0% 65.1%Count 7 181 188Part-time % within Race recode 7.6% 12.1% 11.8%Count 23 343 366
Q22. Are you currently employed...
Not at all % within Race recode 25.0% 22.9% 23.0%Count 92 1496 1588Total % within Race recode 100.0% 100.0% 100.0%
Chi-Square Tests
Value df Asymp. Sig.
(2-sided) Pearson Chi-Square 1.715(a) 2 .424Likelihood Ratio 1.913 2 .384Linear-by-Linear Association .001 1 .969
N of Valid Cases 1588
a 0 cells (.0%) have expected count less than 5. The minimum expected count is 10.89.
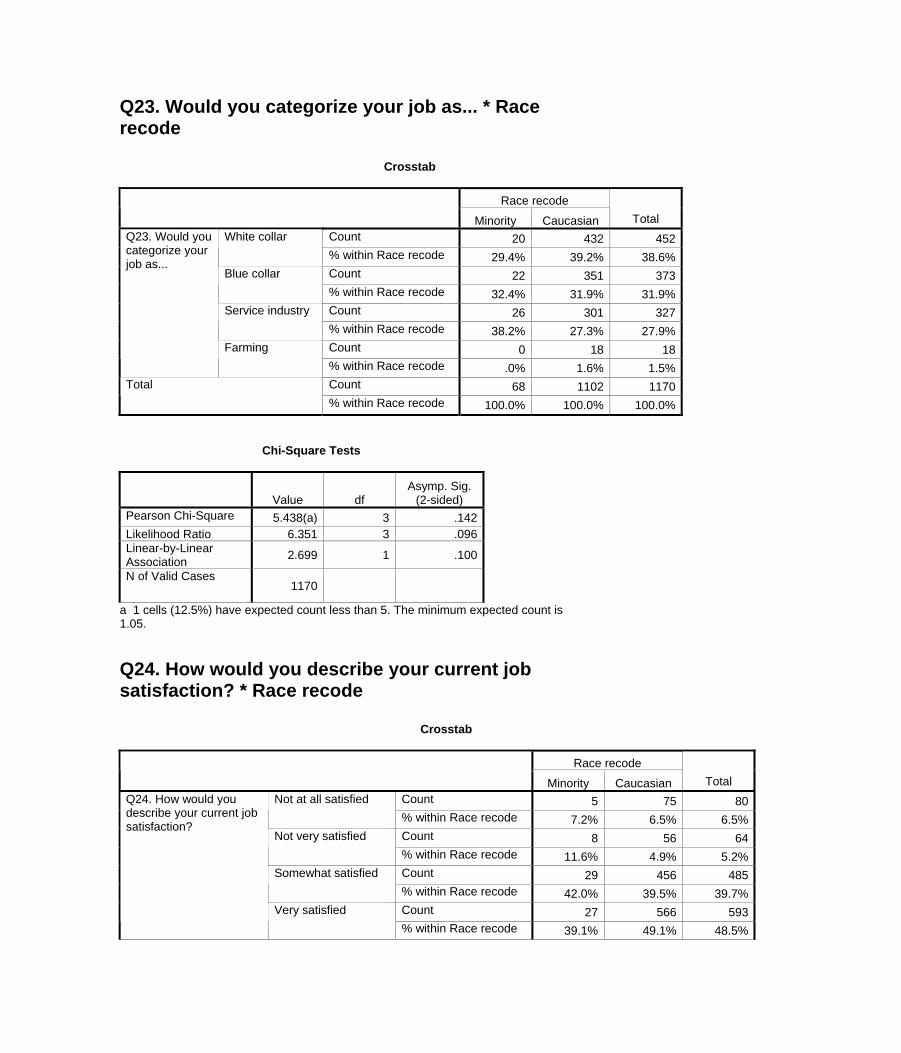
Q23. Would you categorize your job as... * Race recode Crosstab
Race recode Minority Caucasian Total
Count 20 432 452White collar % within Race recode 29.4% 39.2% 38.6%Count 22 351 373Blue collar % within Race recode 32.4% 31.9% 31.9%Count 26 301 327Service industry % within Race recode 38.2% 27.3% 27.9%Count 0 18 18
Q23. Would you categorize your job as...
Farming % within Race recode .0% 1.6% 1.5%Count 68 1102 1170Total % within Race recode 100.0% 100.0% 100.0%
Chi-Square Tests
Value df Asymp. Sig.
(2-sided) Pearson Chi-Square 5.438(a) 3 .142Likelihood Ratio 6.351 3 .096Linear-by-Linear Association 2.699 1 .100
N of Valid Cases 1170
a 1 cells (12.5%) have expected count less than 5. The minimum expected count is 1.05. Q24. How would you describe your current job satisfaction? * Race recode Crosstab
Race recode Minority Caucasian Total
Count 5 75 80Not at all satisfied % within Race recode 7.2% 6.5% 6.5%Count 8 56 64Not very satisfied % within Race recode 11.6% 4.9% 5.2%Count 29 456 485Somewhat satisfied % within Race recode 42.0% 39.5% 39.7%Count 27 566 593
Q24. How would you describe your current job satisfaction?
Very satisfied % within Race recode 39.1% 49.1% 48.5%
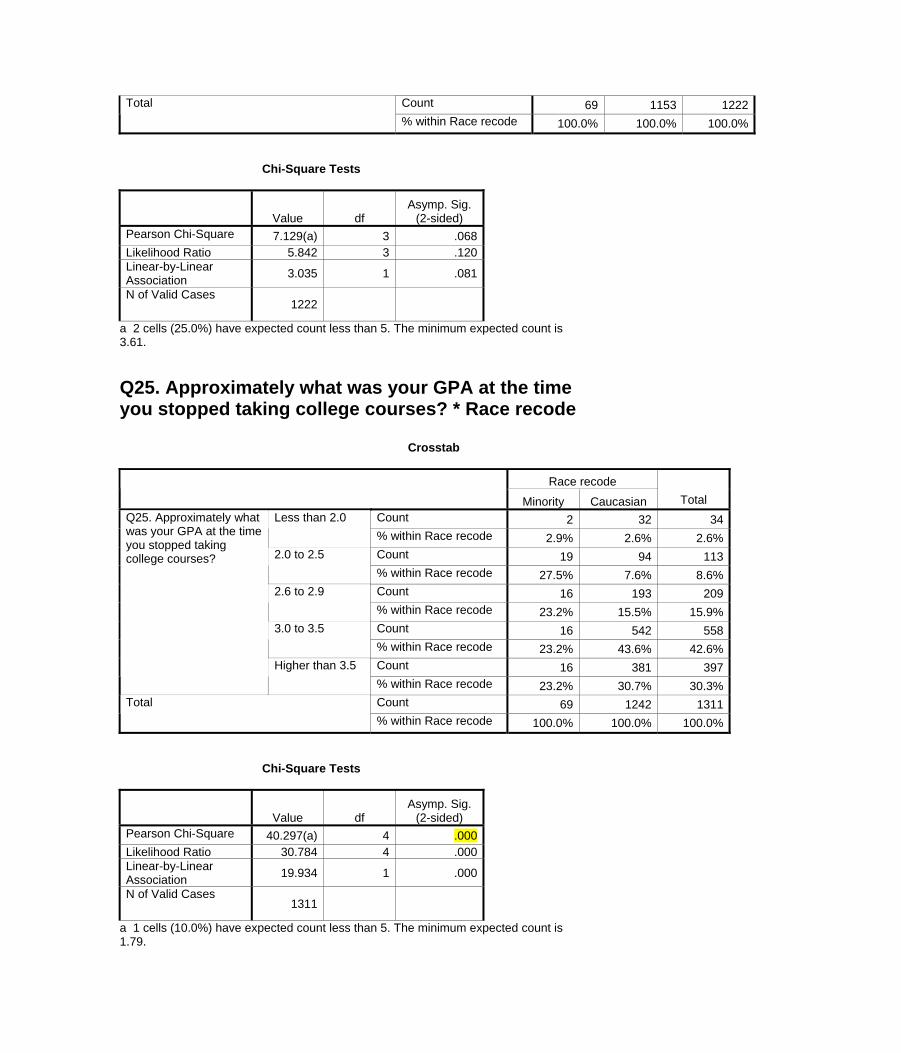
Count 69 1153 1222Total % within Race recode 100.0% 100.0% 100.0%
Chi-Square Tests
Value df Asymp. Sig.
(2-sided) Pearson Chi-Square 7.129(a) 3 .068Likelihood Ratio 5.842 3 .120Linear-by-Linear Association 3.035 1 .081
N of Valid Cases 1222
a 2 cells (25.0%) have expected count less than 5. The minimum expected count is 3.61. Q25. Approximately what was your GPA at the time you stopped taking college courses? * Race recode Crosstab
Race recode Minority Caucasian Total
Count 2 32 34Less than 2.0 % within Race recode 2.9% 2.6% 2.6%Count 19 94 1132.0 to 2.5 % within Race recode 27.5% 7.6% 8.6%Count 16 193 2092.6 to 2.9 % within Race recode 23.2% 15.5% 15.9%Count 16 542 5583.0 to 3.5 % within Race recode 23.2% 43.6% 42.6%Count 16 381 397
Q25. Approximately what was your GPA at the time you stopped taking college courses?
Higher than 3.5 % within Race recode 23.2% 30.7% 30.3%Count 69 1242 1311Total % within Race recode 100.0% 100.0% 100.0%
Chi-Square Tests
Value df Asymp. Sig.
(2-sided) Pearson Chi-Square 40.297(a) 4 .000Likelihood Ratio 30.784 4 .000Linear-by-Linear Association 19.934 1 .000
N of Valid Cases 1311
a 1 cells (10.0%) have expected count less than 5. The minimum expected count is 1.79.

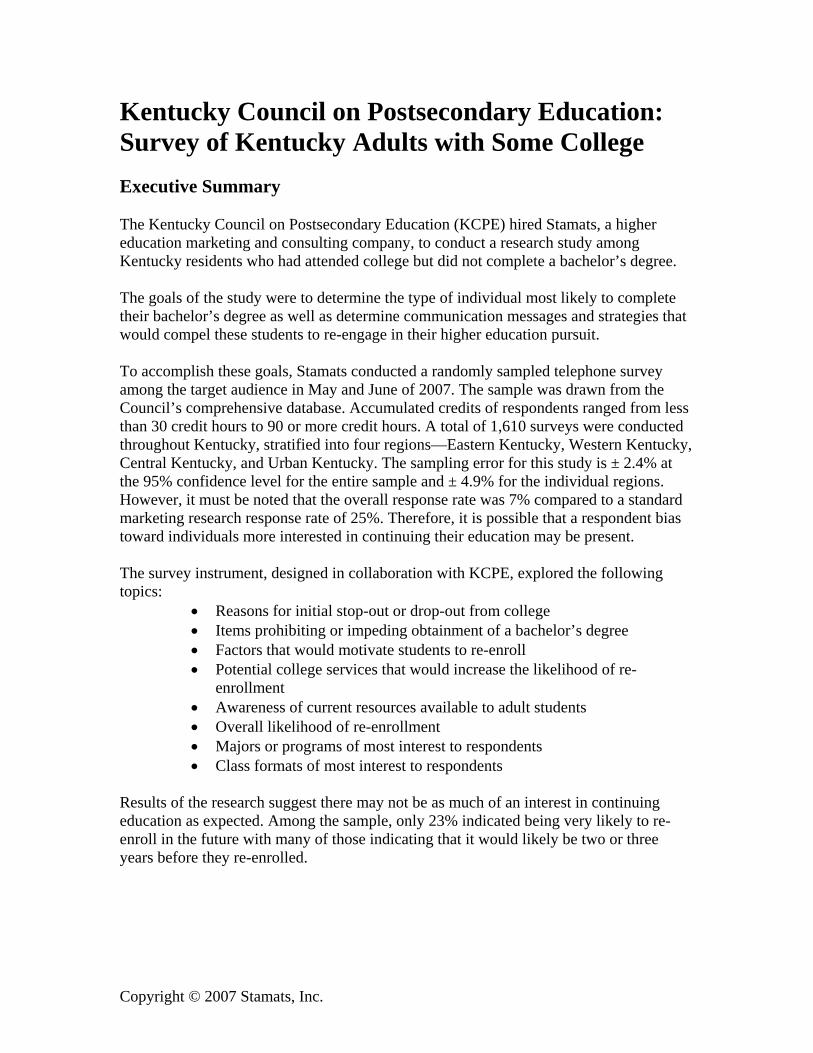
Kentucky Council on Postsecondary Education: Survey of Kentucky Adults with Some College Executive Summary The Kentucky Council on Postsecondary Education (KCPE) hired Stamats, a higher education marketing and consulting company, to conduct a research study among Kentucky residents who had attended college but did not complete a bachelor’s degree. The goals of the study were to determine the type of individual most likely to complete their bachelor’s degree as well as determine communication messages and strategies that would compel these students to re-engage in their higher education pursuit. To accomplish these goals, Stamats conducted a randomly sampled telephone survey among the target audience in May and June of 2007. The sample was drawn from the Council’s comprehensive database. Accumulated credits of respondents ranged from less than 30 credit hours to 90 or more credit hours. A total of 1,610 surveys were conducted throughout Kentucky, stratified into four regions—Eastern Kentucky, Western Kentucky, Central Kentucky, and Urban Kentucky. The sampling error for this study is ± 2.4% at the 95% confidence level for the entire sample and ± 4.9% for the individual regions. However, it must be noted that the overall response rate was 7% compared to a standard marketing research response rate of 25%. Therefore, it is possible that a respondent bias toward individuals more interested in continuing their education may be present. The survey instrument, designed in collaboration with KCPE, explored the following topics:
• Reasons for initial stop-out or drop-out from college • Items prohibiting or impeding obtainment of a bachelor’s degree • Factors that would motivate students to re-enroll • Potential college services that would increase the likelihood of re-
enrollment • Awareness of current resources available to adult students • Overall likelihood of re-enrollment • Majors or programs of most interest to respondents • Class formats of most interest to respondents
Results of the research suggest there may not be as much of an interest in continuing education as expected. Among the sample, only 23% indicated being very likely to re-enroll in the future with many of those indicating that it would likely be two or three years before they re-enrolled.
Copyright © 2007 Stamats, Inc.
However, three groups emerged as being more receptive to continuing their education: • Blacks and Hispanics (though the small sample size must be considered) • Those that entered college within the last 10 years that are currently
working in a white-collar profession • Unmarried individuals with 85 or more total credit hours
Among students likely to re-enroll in the near future, top programs of interest include nursing, business, and education. As expected, the greatest barriers to re-entry are time and money. It is important to communicate how a college education can fit in with personal and professional obligations, as well as how an education can be financed. Encouragingly, additional expected deterrents did not arise as major concerns. Specifically, respondents do not appear to be worried about being able to fit in at college or do well. Additionally, access to a college or university is not a barrier. Even if it was, more than two-thirds of respondents indicated they would consider an online education. Creating a sense of urgency appears to be the key to getting any segment of this population back to college. Currently, this does not exist as a large percentage do not feel pressured to earn their degree. Rather, it is an altruistic goal. Potential messages that may resonate with this target market include:
• You’ve done it before – you can do it again. Most of the respondents had solid academic standing in their first college experience.
• A bachelor’s degree can dramatically increase your potential for higher
income and career advancement. • You need a change. Nearly one-third of respondents reported that their main
reason for getting a bachelor’s degree is to change their current job. • Completing your degree is not as expensive as you think. Many respondents
overestimated the cost of college in Kentucky, particularly the cost of a public education.
• Continuing your degree will “make me feel better about myself.” Two-
thirds of respondents somewhat or strongly agree with this statement. • Time management – home, work, and school – is possible and here’s how
these people have done it (and how you can too).
Copyright © 2007 Stamats, Inc.
When this population is ready to consider re-enrolling in college, Web sites such as GoHigherKY.org and the Kentucky Virtual Campus will be useful information sources. Roughly 70% of respondents indicate they would be likely to visit these sites if looking for information on college options. Additional top resources include general Web searches, self-initiated direct contact with an institution, and visits to specific institutional Web sites. Finally, the research study discovered specific services that colleges and universities could offer to adult students that would increase their likelihood of completing a bachelor’s degree. These include:
• Receiving college credit for work experience. • Accelerated degree programs. • Financial aid programs specifically for adult part-time students. • Online learning programs.
Copyright © 2007 Stamats, Inc.
Table of Contents Executive Summary Survey Results Primary Objectives…………….…………………………………..….. Method………………………….……………………………………... Current Level of Education…….…………………………………...… Institution Attending/Attended…………………………….…..……... Demographic Overview…………………………………….…..…….. Geographic Distribution of Respondents………………….….………. GPA at Time of Stop-out……………………………………………… Current Job Satisfaction………………………………………………. Reasons for Not Receiving a Bachelor’s……………………………… Reasons for Getting a Bachelor’s Degree…………………………….. Top Majors of Interest………………………………………………… Highest Level of Education Anticipated……………………………… Likelihood of Returning to College…………………………………… Discussion……………………………………………………………… Job Satisfaction and Likelihood to Enroll……………………………... Timeframe in Returning to College……………………………………. Full-Time vs. Part-Time……………………………………………….. College Types Considered……………………………………………... Reasons for Not Considering…………………………………………... College Types Considered by Region…………………………………. Class Format…………………………………………………………… Perceived Cost to Attend a Public……………………………………... Hard Numbers on the “Costs” of Not Attending College……………... Perceived Cost to Attend a Private…………………………………….. Agreement Statements—Positive Influencers…………………………. Agreement Statements—Negative Influencers………………………... Concerns in Completing a Bachelor’s………………………………… Likelihood if Concerns Were Alleviated……………………………… Interest in College Services……………………………………………. Ways to Get Adults to Return to College……………………………… Top Sources of Information on Re-Enrolling………………………….. Web Search Terms…………………………………………………….. Understanding Web Usage in College Search………………………… Web Usage…………………………………………………………….. Awareness of “GoHigherKy.org”……………………………………. Awareness of Kentucky Virtual Campus……………………………… Useful Information on KCPE Web Sites………………………………. Additional Comments………………………………………………….. Summary Conclusions…………………………………………………. Top Potential Target Niches/Segments……………………………….. Top Messages………………………………………………………….
Page 2 Page 3 Page 4 Page 5 Page 6 Page 7 Page 8 Page 9 Page 10 Page 14 Page 15 Page 16 Page 17 Page 20 Page 21 Page 22 Page 23 Page 24 Page 25 Page 26 Page 27 Page 28 Page 29 Page 30 Page 31 Page 32 Page 33 Page 35 Page 36 Page 38 Page 39 Page 40 Page 41 Page 42 Page 43 Page 44 Page 45 Page 46 Page 47 Page 50 Page 51
Top Mediums………………………………………………………….. Top Programs………………………………………………………….. Top Services and Offerings…………………………………………….
Page 52 Page 53 Page 54
Cross Cuts by Age……………………………………………………..Page 55 Respondents Over the Age of 40……………………………………….. Likelihood of Going Back to College…………………………………... Likelihood of Returning if Concerns Were Alleviated………………….
Page 56 Page 57 Page 58
Additional Requested Crosscuts…………………………………...Page 59 Geographic Distribution of Respondents Non-White…………………... Currently Completing BA: Institution Attending………………………. Completing BA: Institution Attended………………………………….. Nursing Interest: GPA at Time of Stop-out……………………………. Nursing Interest: Number of Children Under 18……………………….. Nursing Interest: Age..………………………………………………….. “Very Likely” to Return: Top Majors of Interest………………………..“Somewhat Likely” to Return: Top Majors……………………………..
Page 60 Page 61 Page 62 Page 63 Page 64 Page 65 Page 66 Page 67
Appendix A (Survey Instrument)……………………………...…..Page 68 Appendix B (Data Tabulations)……………………………………Page 69 Appendix C (Cross Tabulations by Race)……………………….Page 70 Secondary Research
© 2007 Stamats Inc. – 1
August 2007
Prepared by
Becky MorehouseAssociate Vice President, Research & Marketing
Denton DeSotelResearch Director
Kentucky Council on Postsecondary
Education
Survey Results of Kentucky Adults With Some College
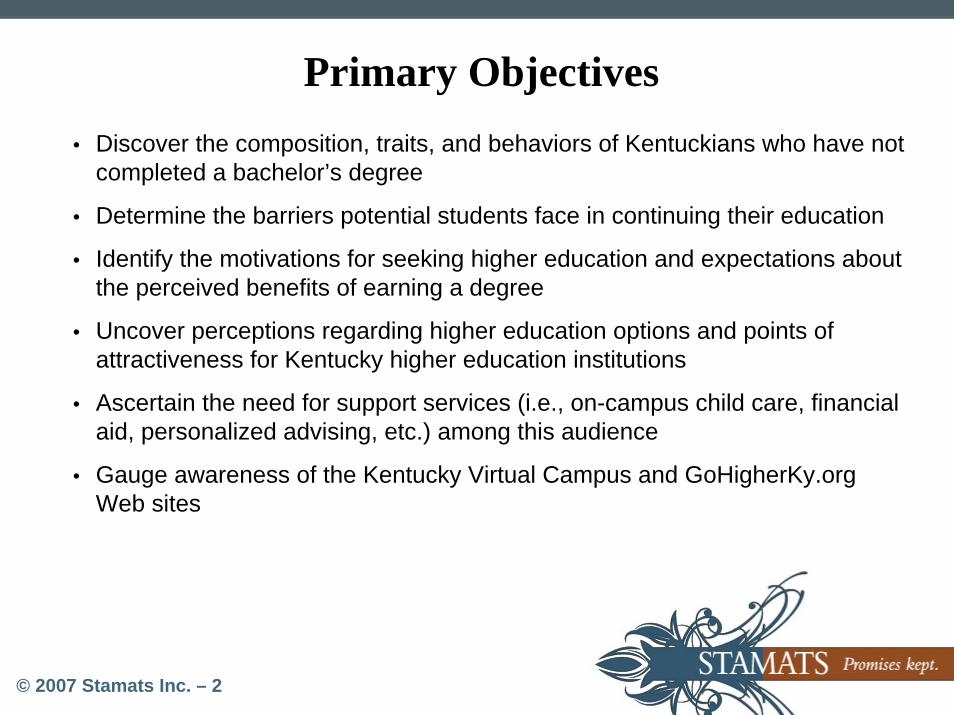
© 2007 Stamats Inc. – 2
Primary ObjectivesDiscover the composition, traits, and behaviors of Kentuckians who have not completed a bachelor’s degree
Determine the barriers potential students face in continuing their education
Identify the motivations for seeking higher education and expectations about the perceived benefits of earning a degree
Uncover perceptions regarding higher education options and points of attractiveness for Kentucky higher education institutions
Ascertain the need for support services (i.e., on-campus child care, financial aid, personalized advising, etc.) among this audience
Gauge awareness of the Kentucky Virtual Campus and GoHigherKy.org Web sites
© 2007 Stamats Inc. – 3
Method• Stamats completed a total of 1,610 telephone surveys among Kentucky residents who had
attended college but did not complete a bachelor’s degree. Respondents were distributed in the following geographies (by sampling design):
– 407 Eastern Kentucky – 401 Western Kentucky– 401 Central Kentucky – 401 Urban Kentucky
• The sample was drawn from the Council’s comprehensive database—accumulated credits ranged from less than 30 to 90 or more
• It is important to note that the overall response rate for this study was 7%, compared to an average telephone study response rate of 25%. The lower incidence rate suggests that the sample may be biased toward individuals with a higher propensity to consider continuing higher education in the future
• Sampling error of ±2.4% at the 95% confidence level for the entire sample. The individual regions have a sampling error of ±4.9%
• Throughout the report, the findings are presented in aggregate for the entire state. Where noteworthy, and statistically and practically significant, geographic differences are presented and discussed
Note: Due to rounding, some percentages may not equal 100% for some questions.
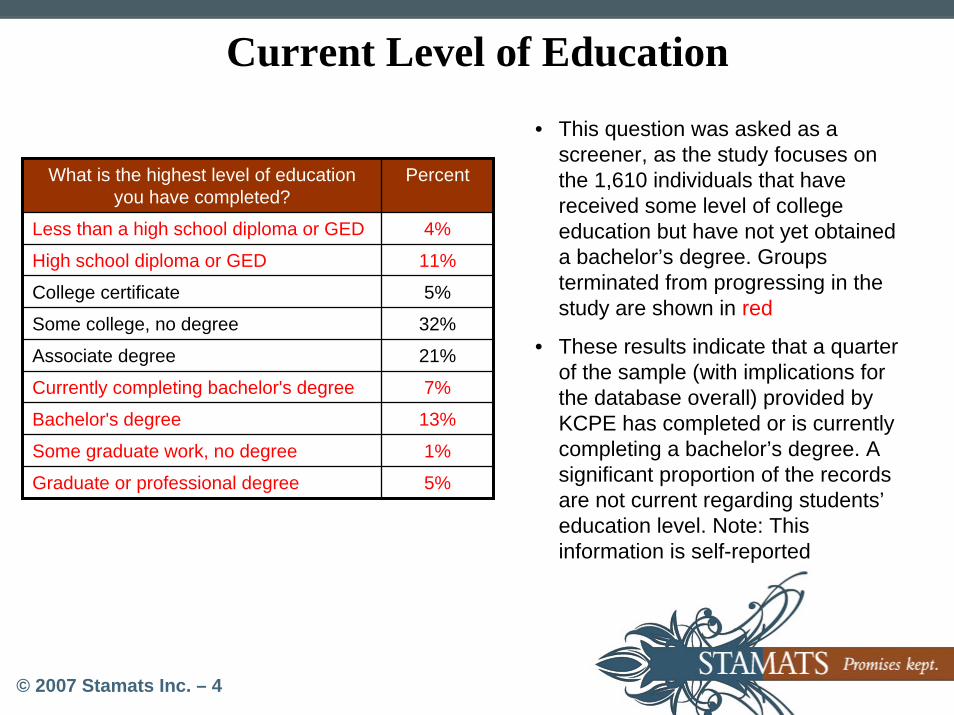
© 2007 Stamats Inc. – 4
Current Level of Education• This question was asked as a
screener, as the study focuses on the 1,610 individuals that have received some level of college education but have not yet obtained a bachelor’s degree. Groups terminated from progressing in the study are shown in red
• These results indicate that a quarter of the sample (with implications for the database overall) provided by KCPE has completed or is currently completing a bachelor’s degree. A significant proportion of the records are not current regarding students’education level. Note: This information is self-reported
What is the highest level of education you have completed?
Percent
Less than a high school diploma or GED 4%
High school diploma or GED 11%
College certificate 5%Some college, no degree 32%
Associate degree 21%
Currently completing bachelor's degree 7%
Bachelor's degree 13%
Some graduate work, no degree 1%
5%Graduate or professional degree
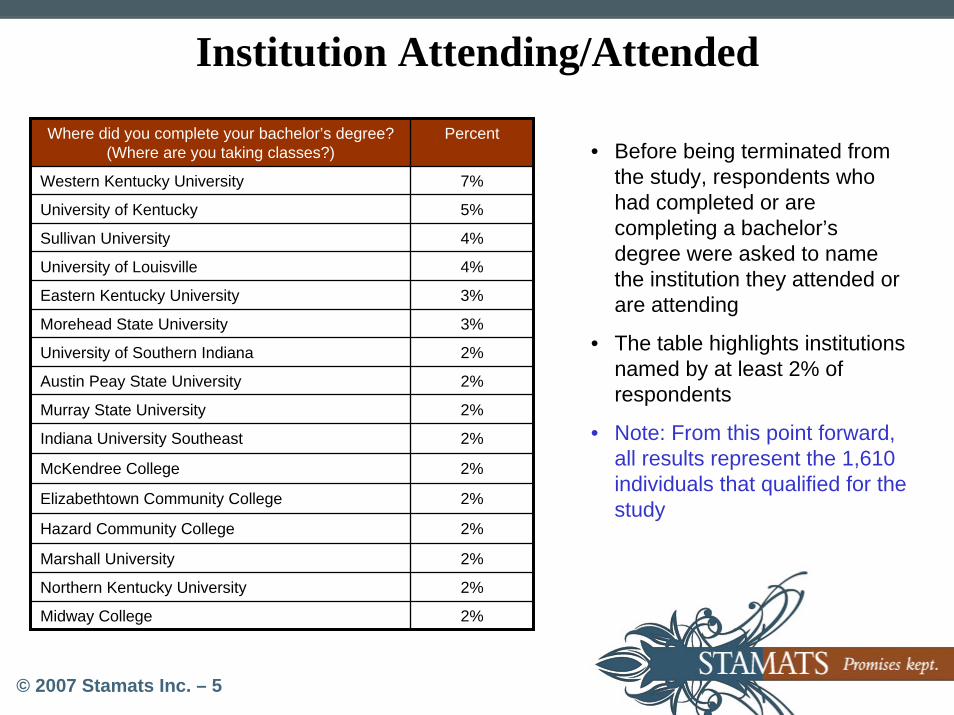
© 2007 Stamats Inc. – 5
Institution Attending/Attended
Where did you complete your bachelor’s degree? (Where are you taking classes?)
Percent
Western Kentucky University 7%
University of Kentucky 5%
Sullivan University 4%
University of Louisville 4%
Eastern Kentucky University 3%
Morehead State University 3%
Indiana University Southeast 2%
McKendree College 2%
Elizabethtown Community College 2%
Northern Kentucky University 2%
University of Southern Indiana 2%
Austin Peay State University 2%
Murray State University 2%
2%
Marshall University 2%
Midway College 2%
Hazard Community College
• Before being terminated from the study, respondents who had completed or are completing a bachelor’s degree were asked to name the institution they attended or are attending
• The table highlights institutions named by at least 2% of respondents
• Note: From this point forward, all results represent the 1,610 individuals that qualified for the study
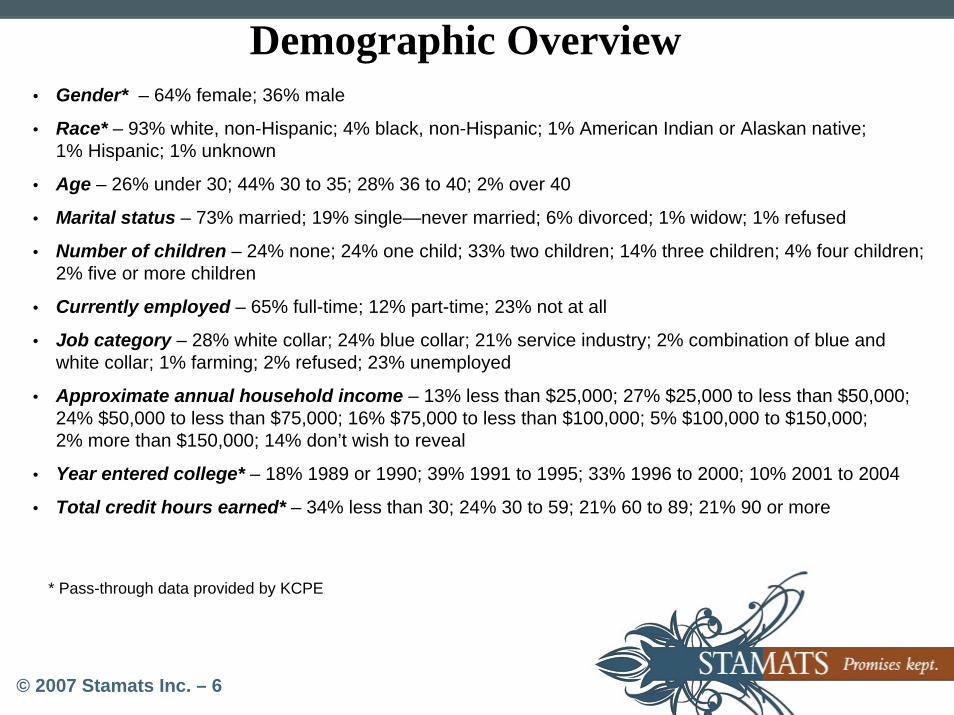
© 2007 Stamats Inc. – 6
Demographic Overview Gender* – 64% female; 36% male
Race* – 93% white, non-Hispanic; 4% black, non-Hispanic; 1% American Indian or Alaskan native; 1% Hispanic; 1% unknown
Age – 26% under 30; 44% 30 to 35; 28% 36 to 40; 2% over 40
Marital status – 73% married; 19% single—never married; 6% divorced; 1% widow; 1% refused
Number of children – 24% none; 24% one child; 33% two children; 14% three children; 4% four children; 2% five or more children
Currently employed – 65% full-time; 12% part-time; 23% not at all
Job category – 28% white collar; 24% blue collar; 21% service industry; 2% combination of blue and white collar; 1% farming; 2% refused; 23% unemployed
Approximate annual household income – 13% less than $25,000; 27% $25,000 to less than $50,000; 24% $50,000 to less than $75,000; 16% $75,000 to less than $100,000; 5% $100,000 to $150,000; 2% more than $150,000; 14% don’t wish to reveal
Year entered college* – 18% 1989 or 1990; 39% 1991 to 1995; 33% 1996 to 2000; 10% 2001 to 2004
Total credit hours earned* – 34% less than 30; 24% 30 to 59; 21% 60 to 89; 21% 90 or more
* Pass-through data provided by KCPE
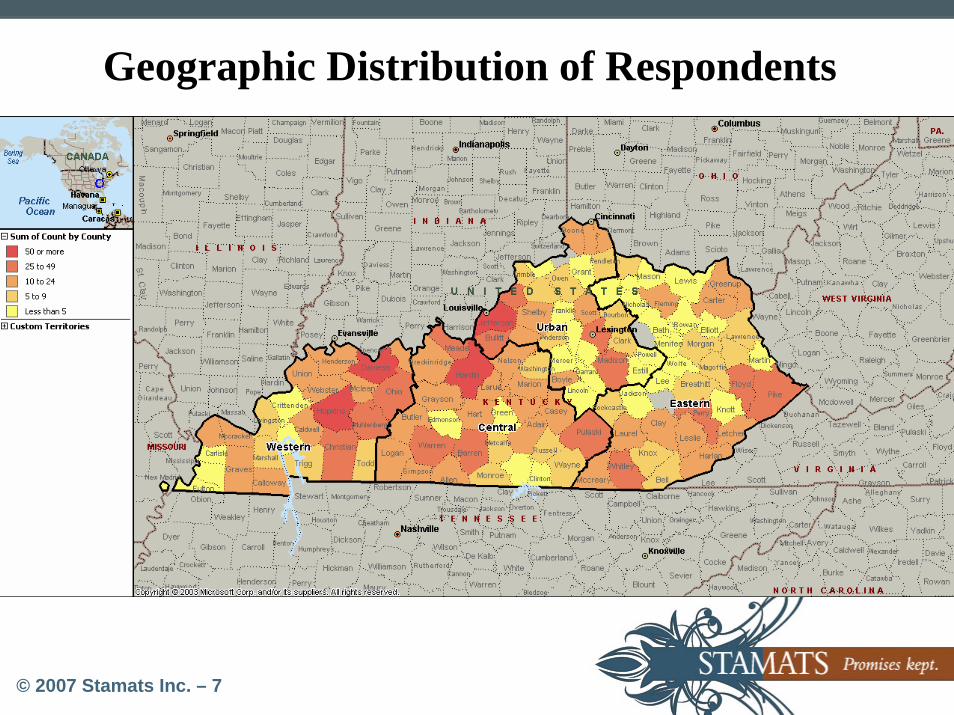
© 2007 Stamats Inc. – 7
Geographic Distribution of Respondents
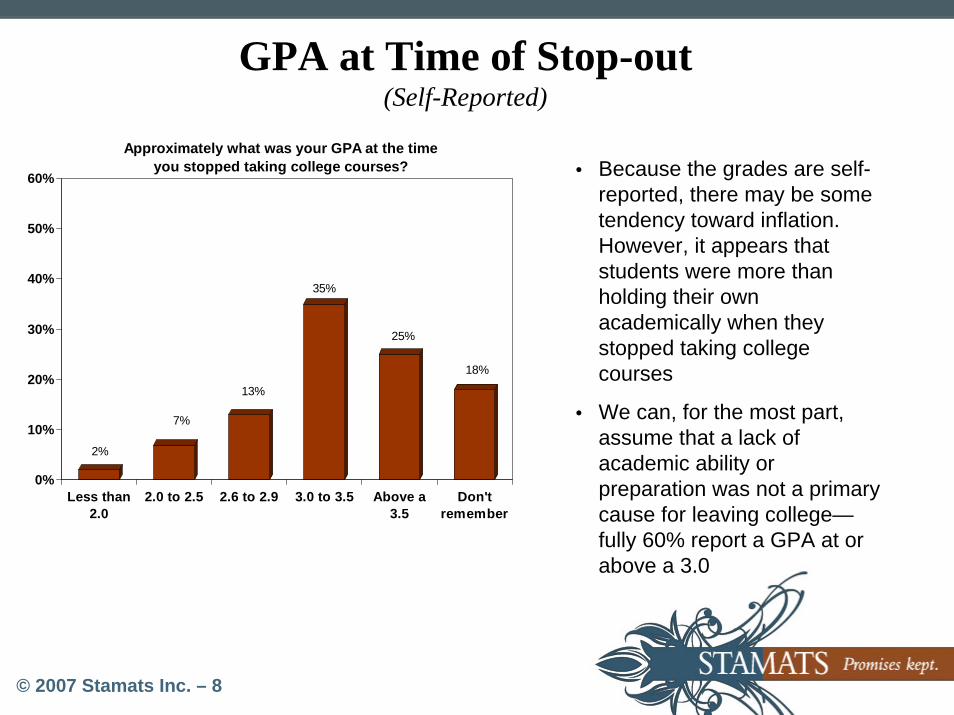
© 2007 Stamats Inc. – 8
GPA at Time of Stop-out(Self-Reported)
Because the grades are self-reported, there may be some tendency toward inflation. However, it appears that students were more than holding their own academically when they stopped taking college courses
We can, for the most part, assume that a lack of academic ability or preparation was not a primary cause for leaving college—fully 60% report a GPA at or above a 3.0
2%
7%
13%
35%
25%
18%
0%
10%
20%
30%
40%
50%
60%
Less than2.0
2.0 to 2.5 2.6 to 2.9 3.0 to 3.5 Above a3.5
Don'tremember
Approximately what was your GPA at the time you stopped taking college courses?
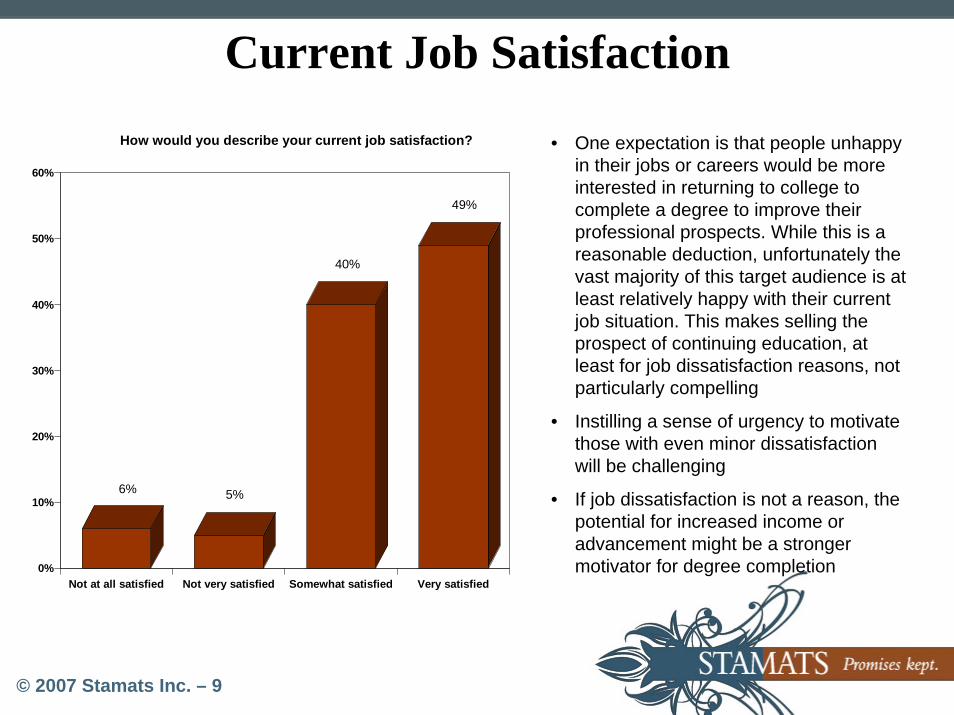
© 2007 Stamats Inc. – 9
Current Job Satisfaction
6% 5%
40%
49%
0%
10%
20%
30%
40%
50%
60%
Not at all satisfied Not very satisfied Somewhat satisfied Very satisfied
How would you describe your current job satisfaction? • One expectation is that people unhappy in their jobs or careers would be more interested in returning to college to complete a degree to improve their professional prospects. While this is a reasonable deduction, unfortunately the vast majority of this target audience is at least relatively happy with their current job situation. This makes selling the prospect of continuing education, at least for job dissatisfaction reasons, not particularly compelling
• Instilling a sense of urgency to motivate those with even minor dissatisfaction will be challenging
• If job dissatisfaction is not a reason, the potential for increased income or advancement might be a stronger motivator for degree completion
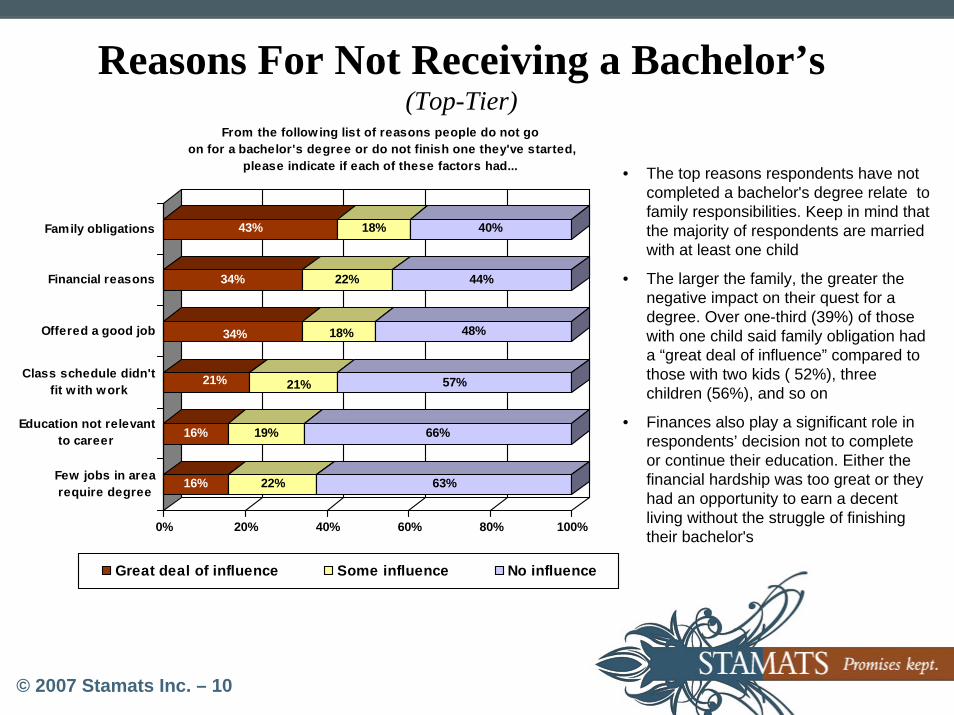
© 2007 Stamats Inc. – 10
Reasons For Not Receiving a Bachelor’s(Top-Tier)
16% 22% 63%
16% 19% 66%
21% 21% 57%
34% 18% 48%
34% 22% 44%
43% 18% 40%
0% 20% 40% 60% 80% 100%
Family obligations
Financial reasons
Offered a good job
Class schedule didn'tfit w ith work
Education not relevantto career
Few jobs in arearequire degree
From the following list of reasons people do not go on for a bachelor's degree or do not finish one they've started,
please indicate if each of these factors had...
Great deal of influence Some influence No influence
• The top reasons respondents have not completed a bachelor's degree relate to family responsibilities. Keep in mind that the majority of respondents are married with at least one child
• The larger the family, the greater the negative impact on their quest for a degree. Over one-third (39%) of those with one child said family obligation had a “great deal of influence” compared to those with two kids ( 52%), three children (56%), and so on
• Finances also play a significant role in respondents’ decision not to complete or continue their education. Either the financial hardship was too great or they had an opportunity to earn a decent living without the struggle of finishing their bachelor's
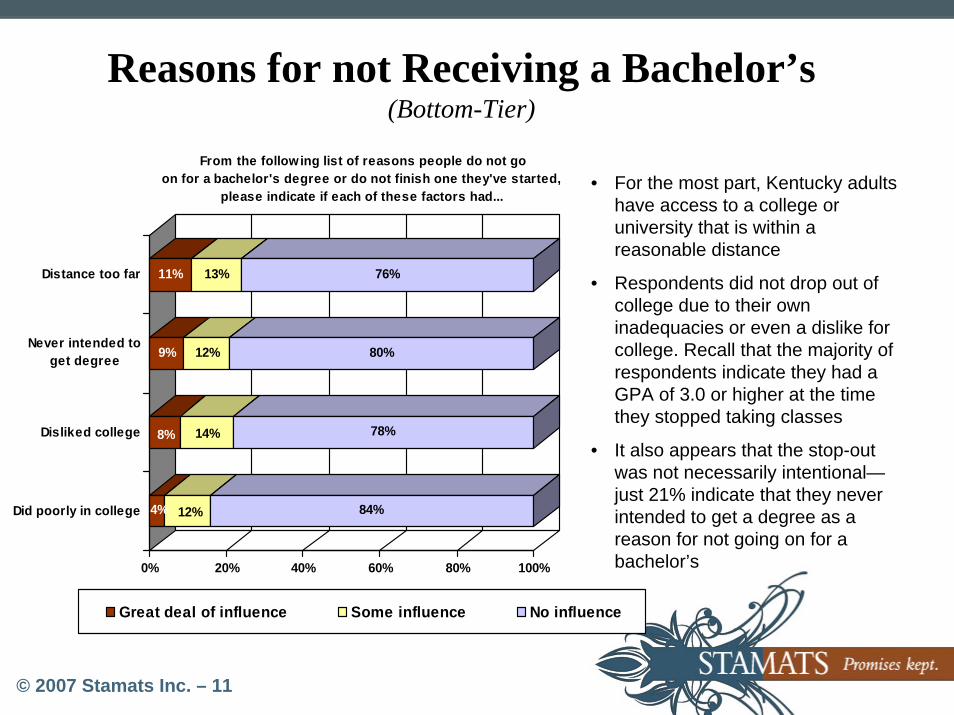
© 2007 Stamats Inc. – 11
Reasons for not Receiving a Bachelor’s(Bottom-Tier)
4% 12% 84%
8% 14% 78%
9% 12% 80%
11% 13% 76%
0% 20% 40% 60% 80% 100%
Distance too far
Never intended toget degree
Disliked college
Did poorly in college
From the following list of reasons people do not go on for a bachelor's degree or do not finish one they've started,
please indicate if each of these factors had...
Great deal of influence Some influence No influence
• For the most part, Kentucky adults have access to a college or university that is within a reasonable distance
• Respondents did not drop out of college due to their own inadequacies or even a dislike for college. Recall that the majority of respondents indicate they had a GPA of 3.0 or higher at the time they stopped taking classes
• It also appears that the stop-out was not necessarily intentional—just 21% indicate that they never intended to get a degree as a reason for not going on for a bachelor’s
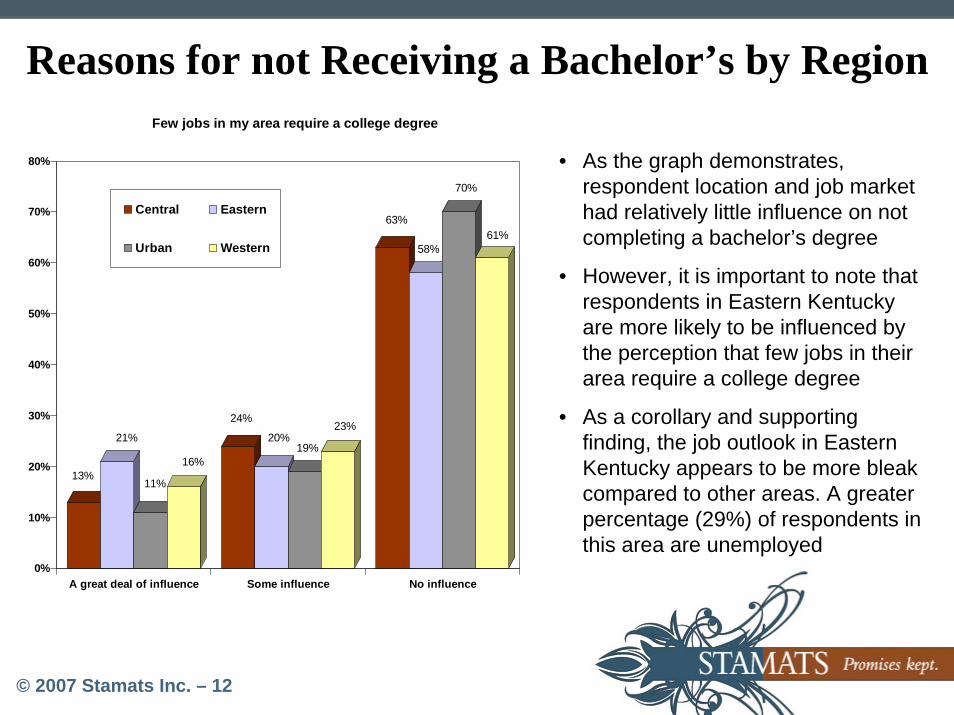
© 2007 Stamats Inc. – 12
13%
21%
11%
16%
24%
20%19%
23%
63%
58%
70%
61%
0%
10%
20%
30%
40%
50%
60%
70%
80%
A great deal of influence Some influence No influence
Few jobs in my area require a college degree
Central Eastern
Urban Western
• As the graph demonstrates, respondent location and job market had relatively little influence on not completing a bachelor’s degree
• However, it is important to note that respondents in Eastern Kentucky are more likely to be influenced by the perception that few jobs in their area require a college degree
• As a corollary and supporting finding, the job outlook in Eastern Kentucky appears to be more bleak compared to other areas. A greater percentage (29%) of respondents in this area are unemployed
Reasons for not Receiving a Bachelor’s by Region
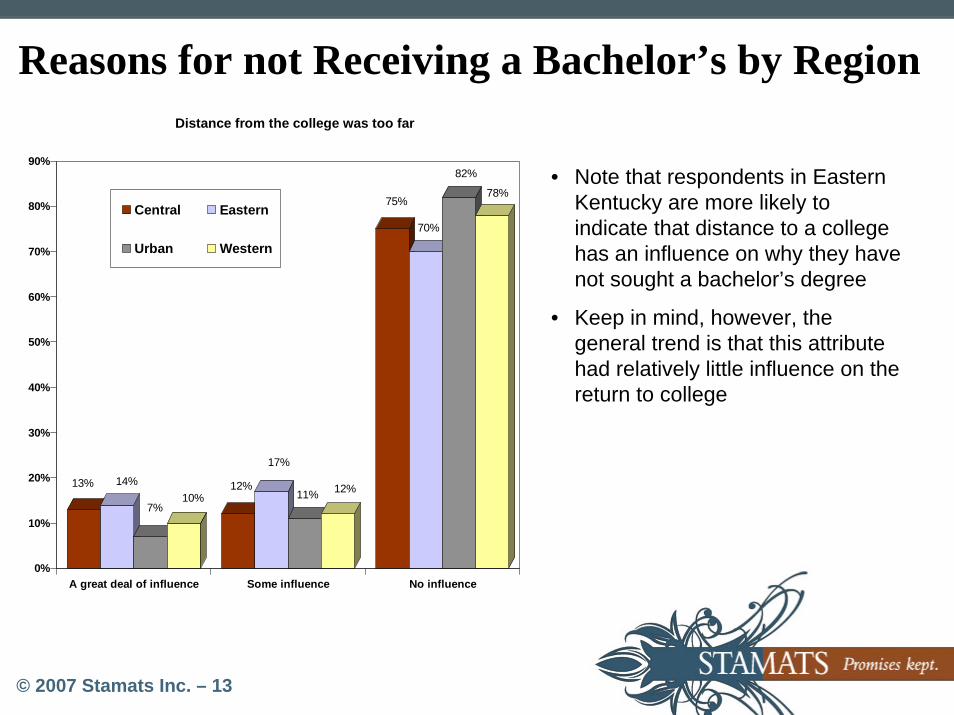
© 2007 Stamats Inc. – 13
13% 14%
7%10%
12%
17%
11% 12%
75%
70%
82%
78%
0%
10%
20%
30%
40%
50%
60%
70%
80%
90%
A great deal of influence Some influence No influence
Distance from the college was too far
Central Eastern
Urban Western
• Note that respondents in Eastern Kentucky are more likely to indicate that distance to a college has an influence on why they have not sought a bachelor’s degree
• Keep in mind, however, the general trend is that this attribute had relatively little influence on the return to college
Reasons for not Receiving a Bachelor’s by Region
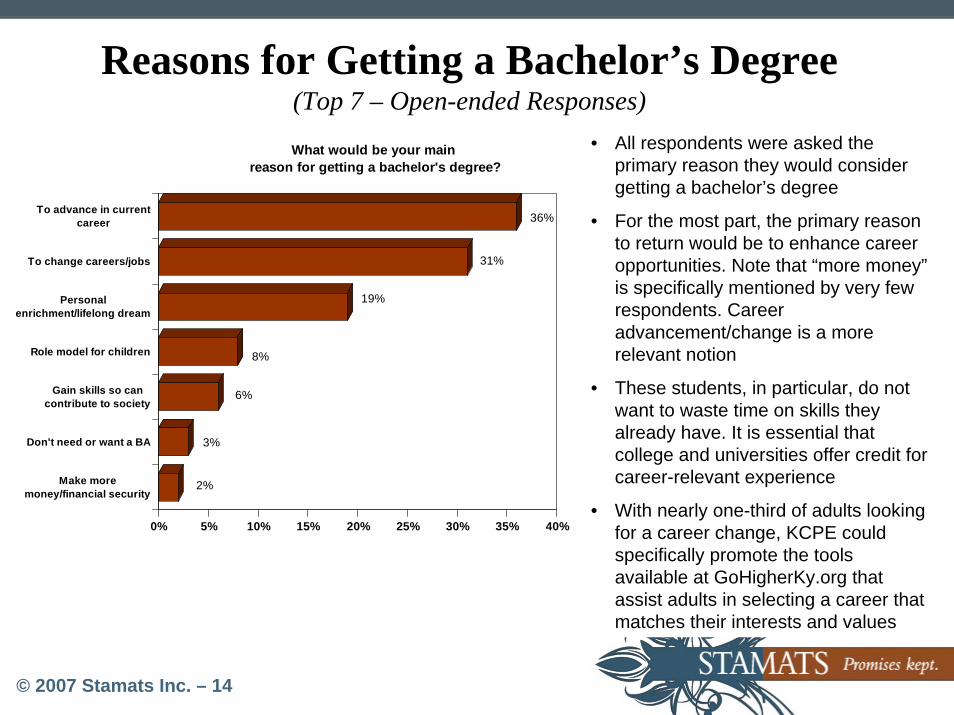
© 2007 Stamats Inc. – 14
2%
3%
6%
8%
19%
31%
36%
0% 5% 10% 15% 20% 25% 30% 35% 40%
To advance in currentcareer
To change careers/jobs
Personalenrichment/lifelong dream
Role model for children
Gain skills so cancontribute to society
Don't need or want a BA
Make moremoney/financial security
What would be your main reason for getting a bachelor's degree?
Reasons for Getting a Bachelor’s Degree (Top 7 – Open-ended Responses)
• All respondents were asked the primary reason they would consider getting a bachelor’s degree
• For the most part, the primary reason to return would be to enhance career opportunities. Note that “more money”is specifically mentioned by very few respondents. Career advancement/change is a more relevant notion
• These students, in particular, do not want to waste time on skills they already have. It is essential that college and universities offer credit for career-relevant experience
• With nearly one-third of adults looking for a career change, KCPE could specifically promote the tools available at GoHigherKy.org that assist adults in selecting a career that matches their interests and values
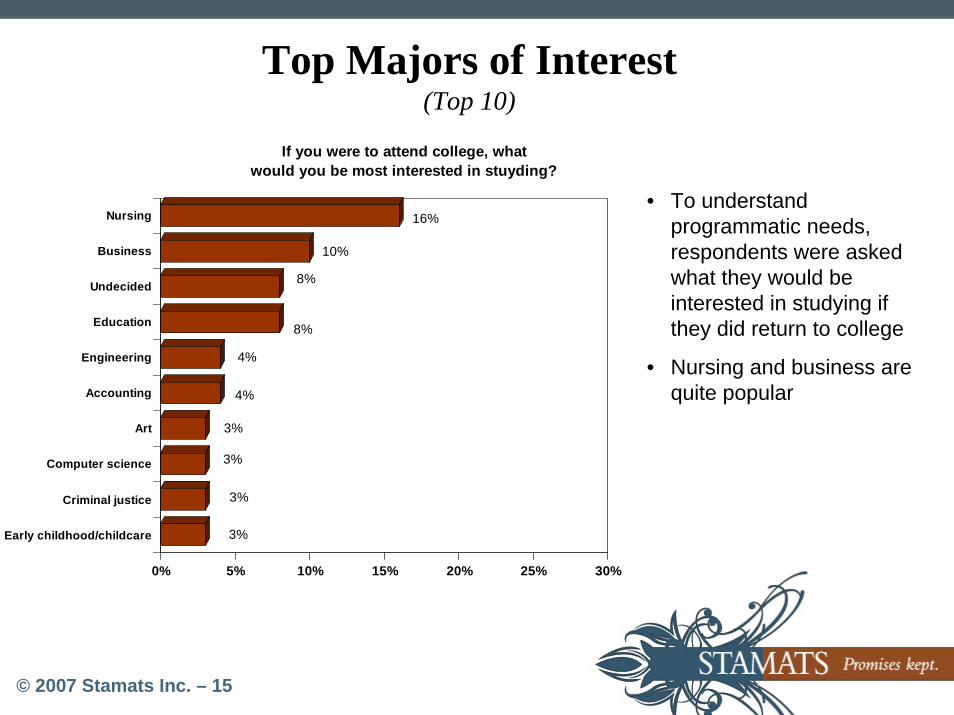
© 2007 Stamats Inc. – 15
Top Majors of Interest(Top 10)
• To understand programmatic needs, respondents were asked what they would be interested in studying if they did return to college
• Nursing and business are quite popular
3%
3%
3%
3%
4%
4%
8%
8%
10%
16%
0% 5% 10% 15% 20% 25% 30%
Nursing
Business
Undecided
Education
Engineering
Accounting
Art
Computer science
Criminal justice
Early childhood/childcare
If you were to attend college, what would you be most interested in stuyding?
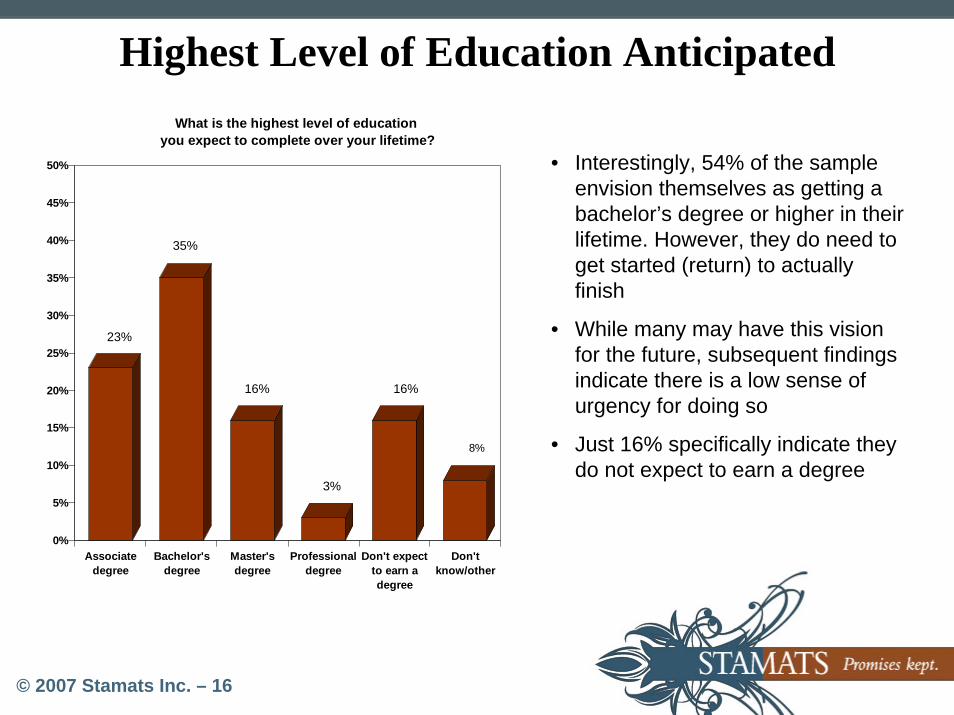
© 2007 Stamats Inc. – 16
Highest Level of Education Anticipated
23%
35%
16%
3%
16%
8%
0%
5%
10%
15%
20%
25%
30%
35%
40%
45%
50%
Associatedegree
Bachelor'sdegree
Master'sdegree
Professionaldegree
Don't expectto earn adegree
Don'tknow/other
What is the highest level of education you expect to complete over your lifetime?
• Interestingly, 54% of the sample envision themselves as getting a bachelor’s degree or higher in their lifetime. However, they do need to get started (return) to actually finish
• While many may have this vision for the future, subsequent findings indicate there is a low sense of urgency for doing so
• Just 16% specifically indicate they do not expect to earn a degree
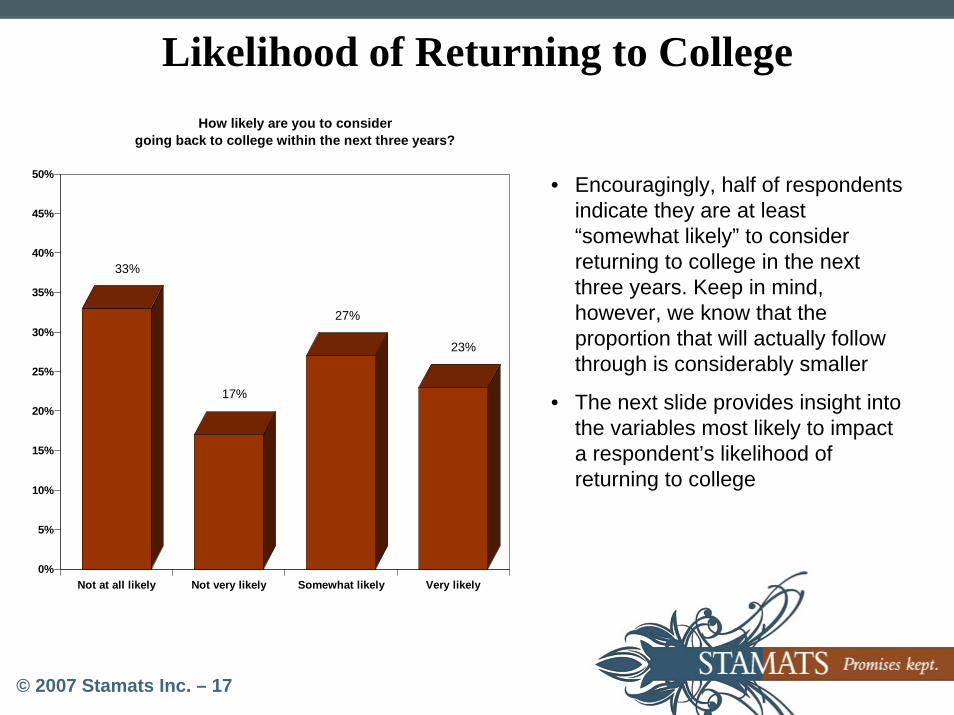
© 2007 Stamats Inc. – 17
Likelihood of Returning to College
33%
17%
27%
23%
0%
5%
10%
15%
20%
25%
30%
35%
40%
45%
50%
Not at all likely Not very likely Somewhat likely Very likely
How likely are you to consider going back to college within the next three years?
• Encouragingly, half of respondents indicate they are at least “somewhat likely” to consider returning to college in the next three years. Keep in mind, however, we know that the proportion that will actually follow through is considerably smaller
• The next slide provides insight into the variables most likely to impact a respondent’s likelihood of returning to college
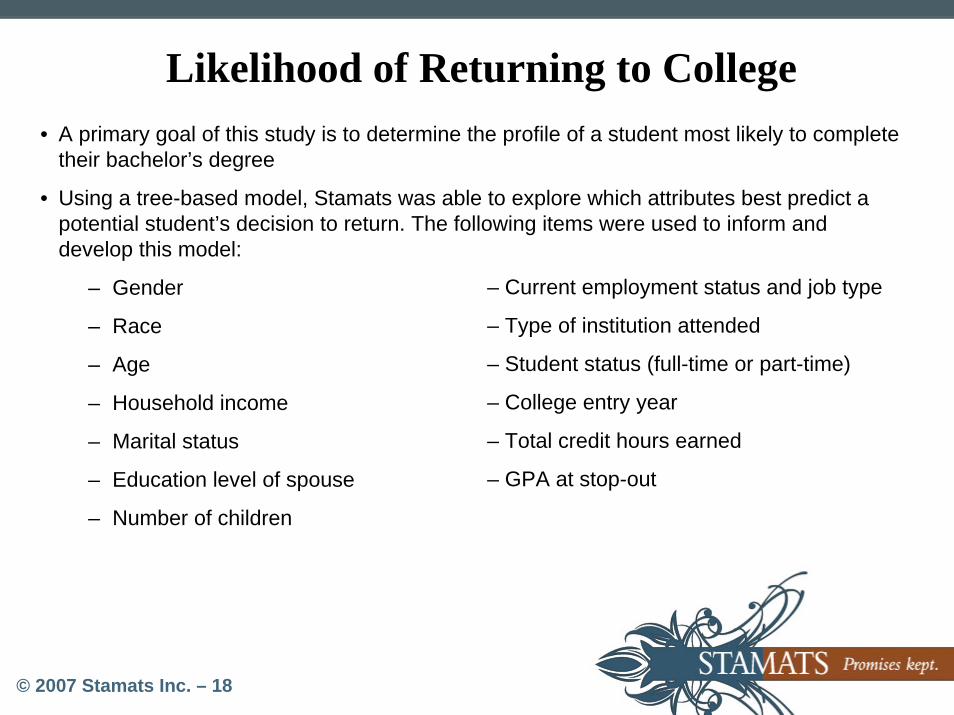
© 2007 Stamats Inc. – 18
Likelihood of Returning to College• A primary goal of this study is to determine the profile of a student most likely to complete
their bachelor’s degree
• Using a tree-based model, Stamats was able to explore which attributes best predict a potential student’s decision to return. The following items were used to inform and develop this model:
– Gender
– Race
– Age
– Household income
– Marital status
– Education level of spouse
– Number of children
– Current employment status and job type
– Type of institution attended
– Student status (full-time or part-time)
– College entry year
– Total credit hours earned
– GPA at stop-out
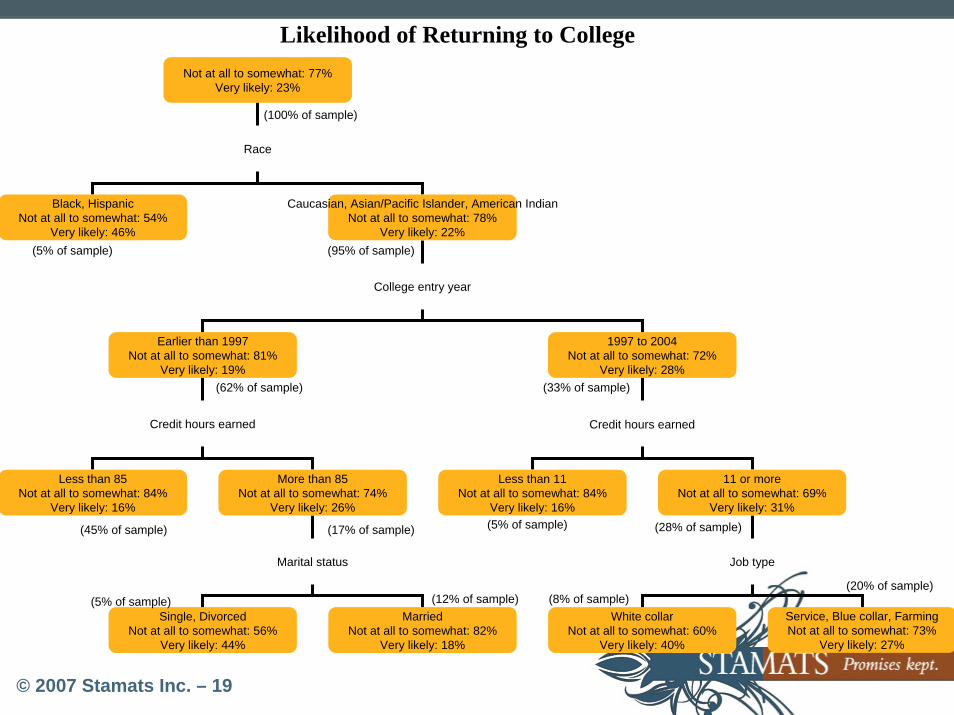
© 2007 Stamats Inc. – 19
Likelihood of Returning to CollegeNot at all to somewhat: 77%
Very likely: 23%
Race
Black, HispanicNot at all to somewhat: 54%
Very likely: 46%
Caucasian, Asian/Pacific Islander, American IndianNot at all to somewhat: 78%
Very likely: 22%
College entry year
Earlier than 1997Not at all to somewhat: 81%
Very likely: 19%
1997 to 2004Not at all to somewhat: 72%
Very likely: 28%
Credit hours earned
Less than 11Not at all to somewhat: 84%
Very likely: 16%
11 or moreNot at all to somewhat: 69%
Very likely: 31%
Job type
White collarNot at all to somewhat: 60%
Very likely: 40%
Service, Blue collar, FarmingNot at all to somewhat: 73%
Very likely: 27%
Credit hours earned
Less than 85Not at all to somewhat: 84%
Very likely: 16%
More than 85Not at all to somewhat: 74%
Very likely: 26%
Marital status
Single, DivorcedNot at all to somewhat: 56%
Very likely: 44%
MarriedNot at all to somewhat: 82%
Very likely: 18%
(95% of sample)
(33% of sample)(62% of sample)
(28% of sample)(5% of sample)(17% of sample)(45% of sample)
(5% of sample) (12% of sample) (8% of sample)(20% of sample)
(100% of sample)
(5% of sample)
© 2007 Stamats Inc. – 20
Discussion• While this is merely an exploratory technique, it does provide helpful insight into potential
audience segments for KCPE attention
• First, we discovered that black, non-Hispanic and Hispanics are more likely than respondents of other ethnic backgrounds to indicate they will consider continuing their education. Yet, it is important to note that the sample size for these segments are low (n=76, or 5% of the total sample). Therefore, we cannot generalize these findings to the entire black, non-Hispanic and Hispanic population. This does, however, provide directional information worthy of additional exploration
• Among the remaining sample (which is predominantly Caucasian), a group more likely to re-enroll in college are those who entered college after 1996, have earned at least 11 credit hours, and currently work in a white-collar position (8% of the total sample)
• Among those that have been out of college longer (began attending prior to 1996), the best audience to target are those with more than 85 total credit hours and those that do not have a spouse to help generate household income
• While not a predictive model, this tree-based model does give KCPE directional information regarding types of potential students to target
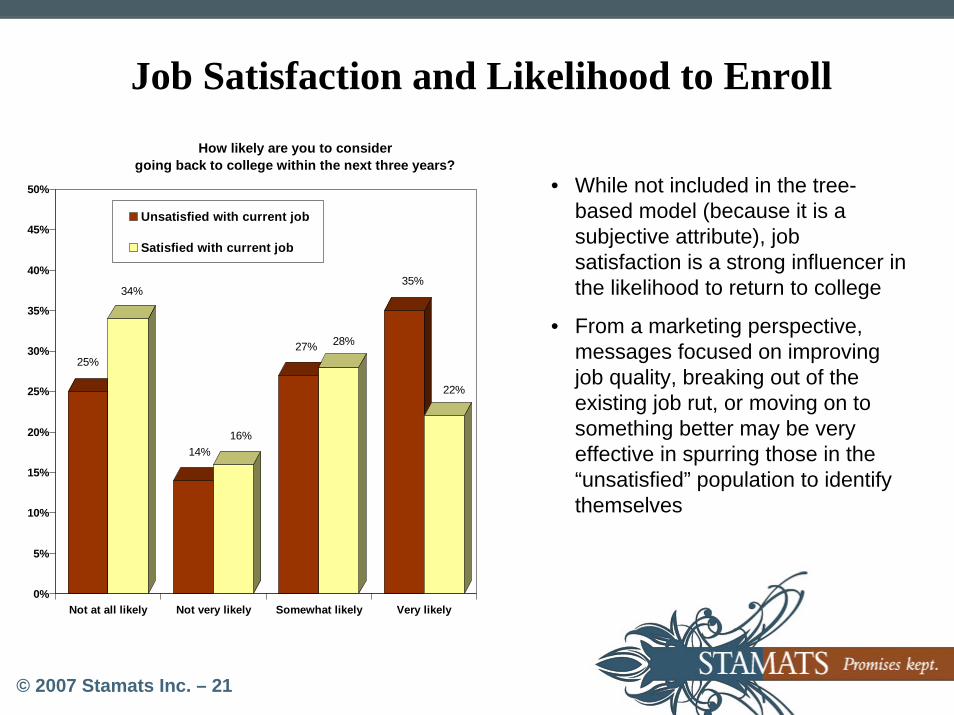
© 2007 Stamats Inc. – 21
Job Satisfaction and Likelihood to Enroll
25%
34%
14%16%
27% 28%
35%
22%
0%
5%
10%
15%
20%
25%
30%
35%
40%
45%
50%
Not at all likely Not very likely Somewhat likely Very likely
How likely are you to consider going back to college within the next three years?
Unsatisfied with current job
Satisfied with current job
• While not included in the tree-based model (because it is a subjective attribute), job satisfaction is a strong influencer in the likelihood to return to college
• From a marketing perspective, messages focused on improving job quality, breaking out of the existing job rut, or moving on to something better may be very effective in spurring those in the “unsatisfied” population to identify themselves
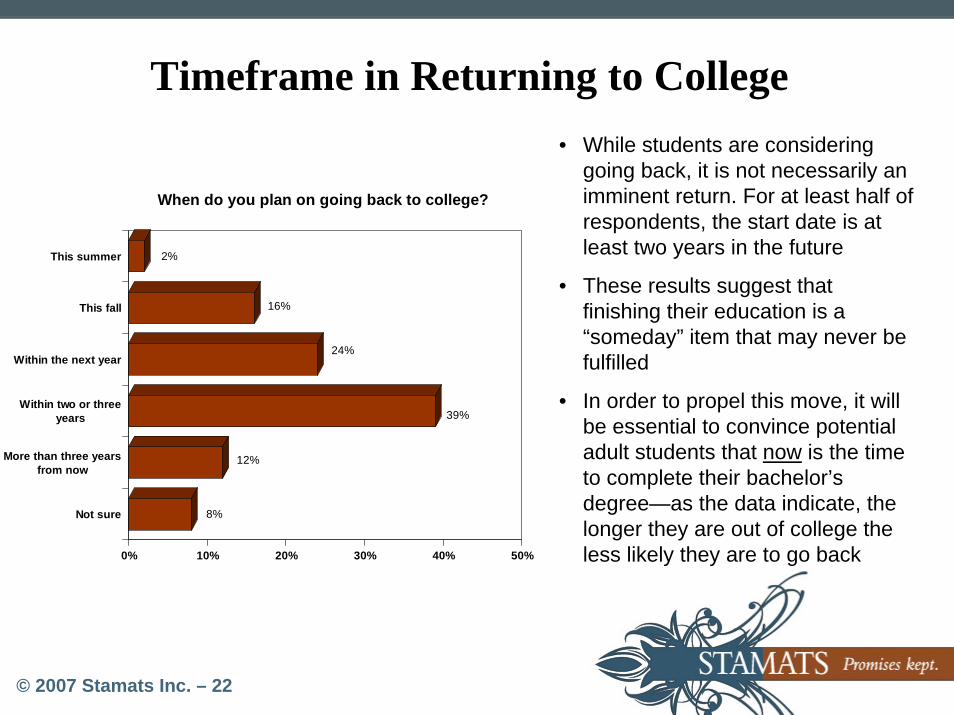
© 2007 Stamats Inc. – 22
8%
12%
39%
24%
16%
2%
0% 10% 20% 30% 40% 50%
This summer
This fall
Within the next year
Within two or threeyears
More than three yearsfrom now
Not sure
When do you plan on going back to college?
• While students are considering going back, it is not necessarily an imminent return. For at least half of respondents, the start date is at least two years in the future
• These results suggest that finishing their education is a “someday” item that may never be fulfilled
• In order to propel this move, it will be essential to convince potential adult students that now
Timeframe in Returning to College
is the time to complete their bachelor’s degree—as the data indicate, the longer they are out of college the less likely they are to go back
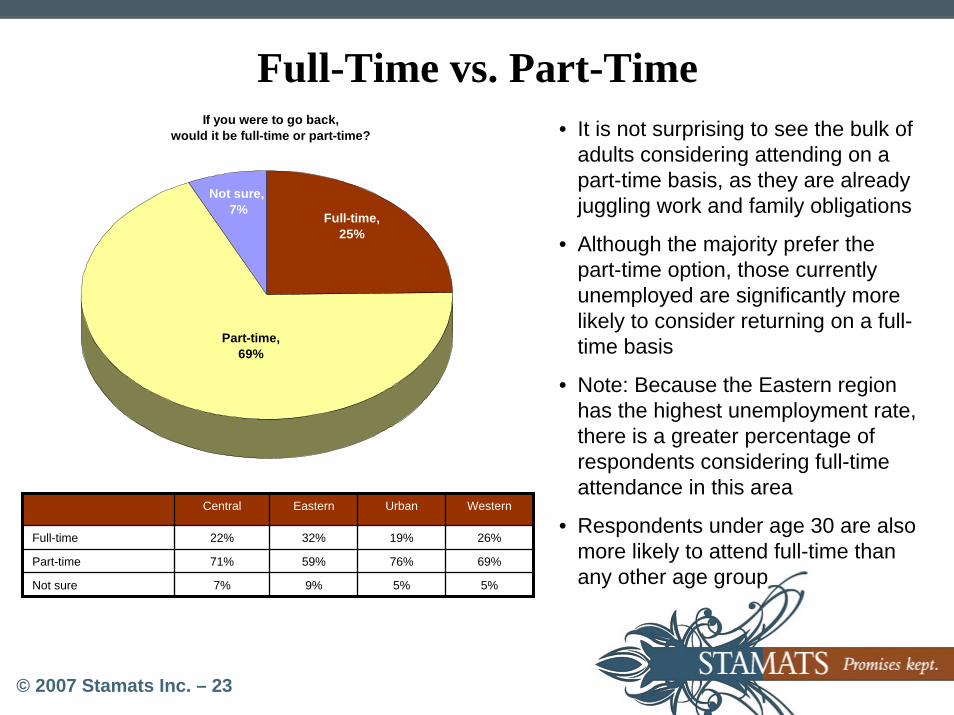
© 2007 Stamats Inc. – 23
Full-Time vs. Part-Time• It is not surprising to see the bulk of
adults considering attending on a part-time basis, as they are already juggling work and family obligations
• Although the majority prefer the part-time option, those currently unemployed are significantly more likely to consider returning on a full-time basis
• Note: Because the Eastern region has the highest unemployment rate, there is a greater percentage of respondents considering full-time attendance in this area
• Respondents under age 30 are also more likely to attend full-time than any other age group
If you were to go back, would it be full-time or part-time?
Full-time, 25%
Part-time, 69%
Not sure, 7%
Central Eastern Urban
22% 32%
59%
9%
Part-time 71%
19%
76% 69%
Not sure 7% 5% 5%
Full-time
Western
26%
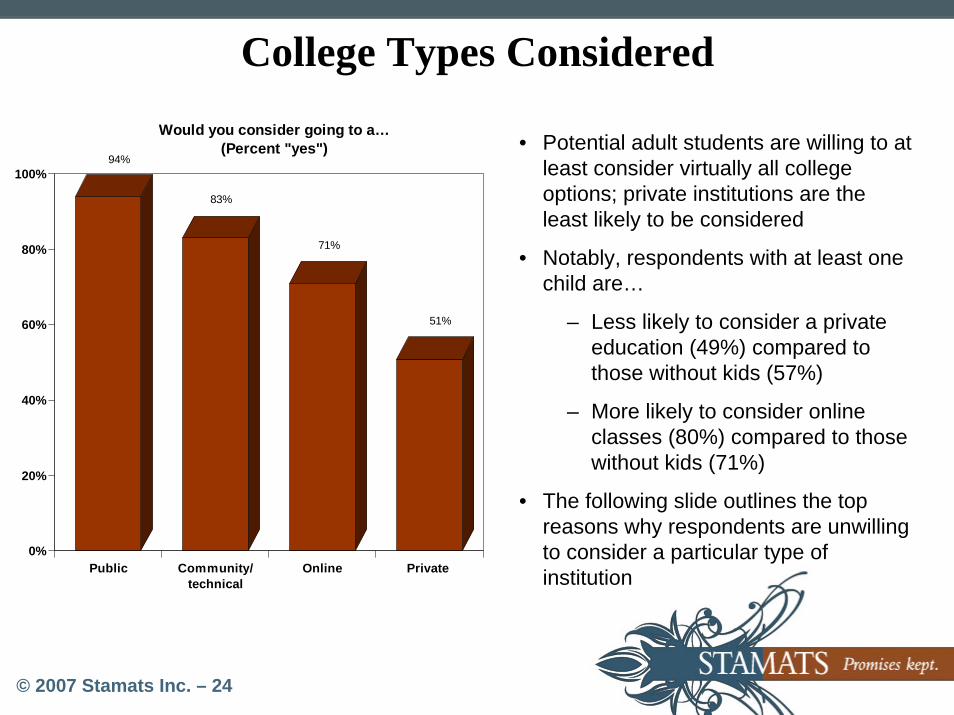
© 2007 Stamats Inc. – 24
College Types Considered
94%
83%
71%
51%
0%
20%
40%
60%
80%
100%
Public Community/technical
Online Private
Would you consider going to a…(Percent "yes") • Potential adult students are willing to at
least consider virtually all college options; private institutions are the least likely to be considered
• Notably, respondents with at least one child are…
– Less likely to consider a private education (49%) compared to those without kids (57%)
– More likely to consider online classes (80%) compared to those without kids (71%)
• The following slide outlines the top reasons why respondents are unwilling to consider a particular type of institution
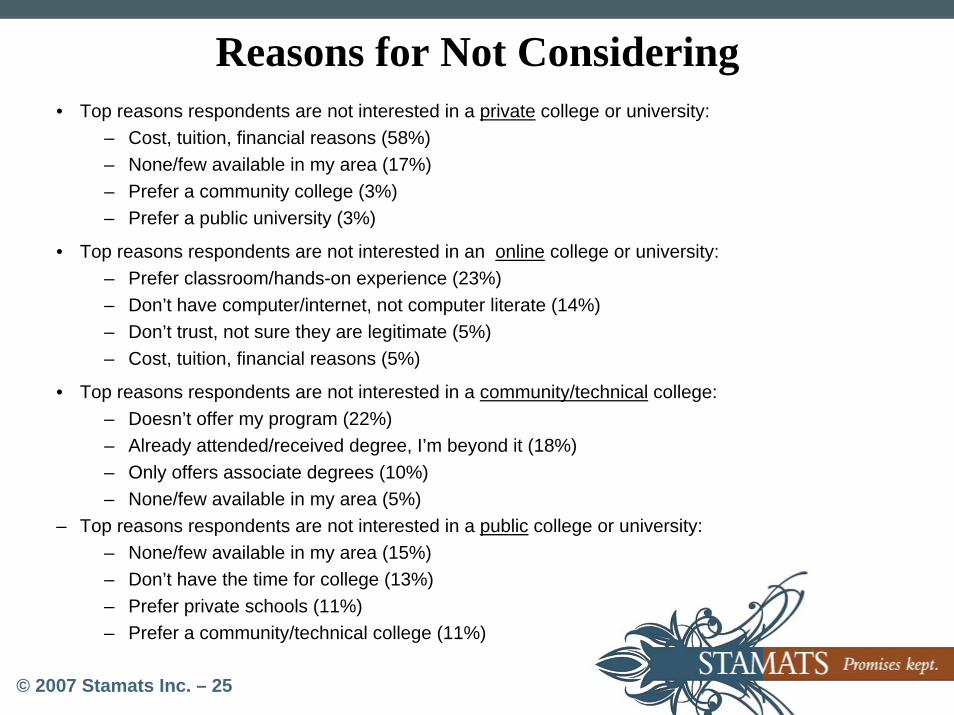
© 2007 Stamats Inc. – 25
Reasons for Not Considering• Top reasons respondents are not interested in a private college or university:
– Cost, tuition, financial reasons (58%)– None/few available in my area (17%)– Prefer a community college (3%)– Prefer a public university (3%)
• Top reasons respondents are not interested in an online college or university:– Prefer classroom/hands-on experience (23%)– Don’t have computer/internet, not computer literate (14%)– Don’t trust, not sure they are legitimate (5%)– Cost, tuition, financial reasons (5%)
• Top reasons respondents are not interested in a community/technical college:– Doesn’t offer my program (22%)– Already attended/received degree, I’m beyond it (18%)– Only offers associate degrees (10%)– None/few available in my area (5%)
– Top reasons respondents are not interested in a public college or university:– None/few available in my area (15%)– Don’t have the time for college (13%)– Prefer private schools (11%)– Prefer a community/technical college (11%)
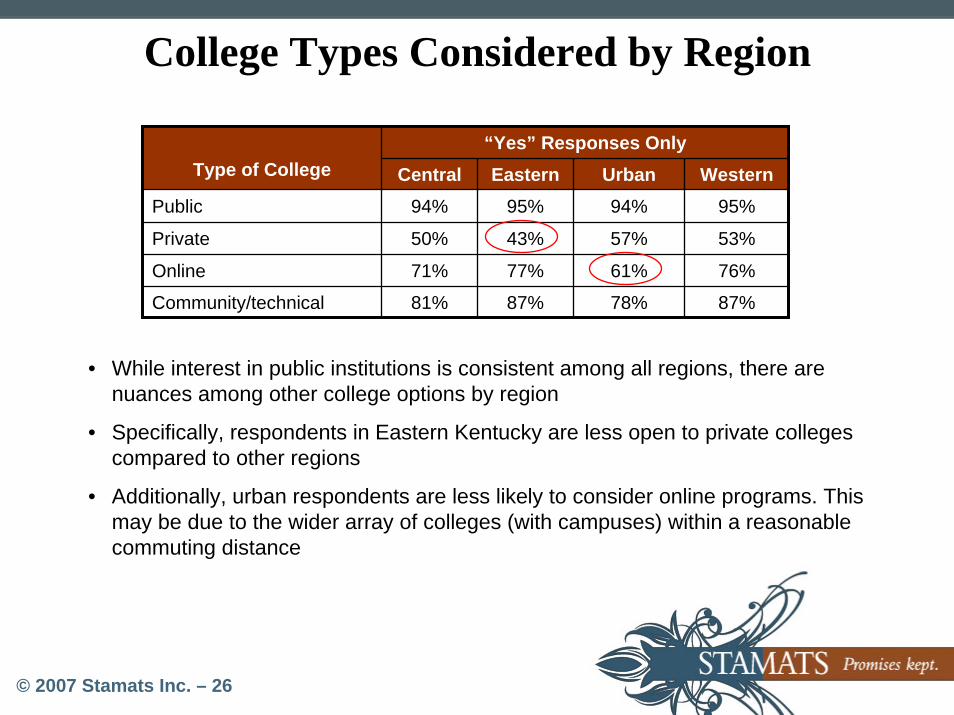
© 2007 Stamats Inc. – 26
College Types Considered by Region
• While interest in public institutions is consistent among all regions, there are nuances among other college options by region
• Specifically, respondents in Eastern Kentucky are less open to private colleges compared to other regions
• Additionally, urban respondents are less likely to consider online programs. This may be due to the wider array of colleges (with campuses) within a reasonable commuting distance
“Yes” Responses OnlyType of College Central Eastern Urban
Public 94% 95% 94% 95%
Private 50% 43% 57% 53%
77%
87%
61%
78%
Online 71% 76%
Community/technical 81% 87%
Western
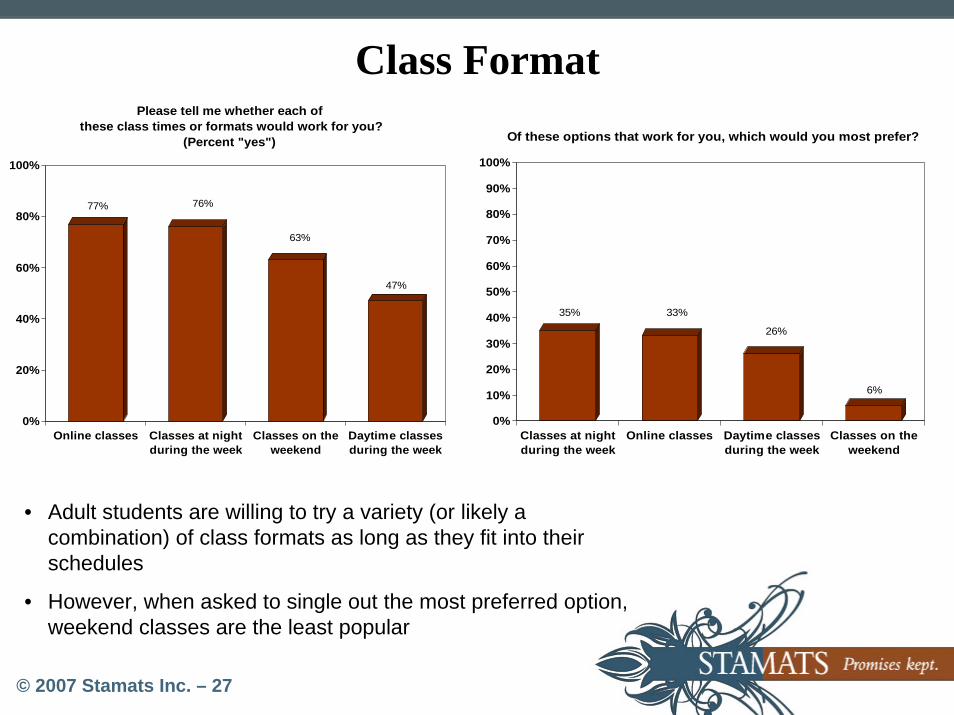
© 2007 Stamats Inc. – 27
Class Format
35% 33%
26%
6%
0%
10%
20%
30%
40%
50%
60%
70%
80%
90%
100%
Classes at nightduring the week
Online classes Daytime classesduring the week
Classes on theweekend
Of these options that work for you, which would you most prefer?
77% 76%
63%
47%
0%
20%
40%
60%
80%
100%
Online classes Classes at nightduring the week
Classes on theweekend
Daytime classesduring the week
Please tell me whether each of these class times or formats would work for you?
(Percent "yes")
• Adult students are willing to try a variety (or likely a combination) of class formats as long as they fit into their schedules
• However, when asked to single out the most preferred option, weekend classes are the least popular
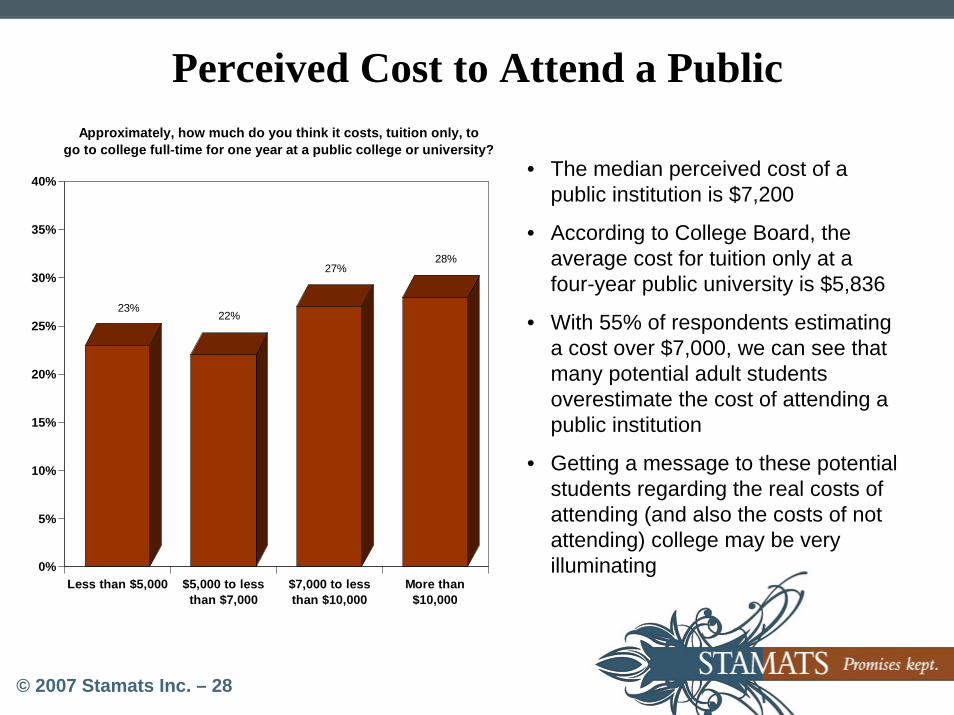
© 2007 Stamats Inc. – 28
Perceived Cost to Attend a Public
23%22%
27%28%
0%
5%
10%
15%
20%
25%
30%
35%
40%
Less than $5,000 $5,000 to lessthan $7,000
$7,000 to lessthan $10,000
More than$10,000
Approximately, how much do you think it costs, tuition only, to go to college full-time for one year at a public college or university?
• The median perceived cost of a public institution is $7,200
• According to College Board, the average cost for tuition only at a four-year public university is $5,836
• With 55% of respondents estimating a cost over $7,000, we can see that many potential adult students overestimate the cost of attending a public institution
• Getting a message to these potential students regarding the real costs of attending (and also the costs of not attending) college may be very illuminating
© 2007 Stamats Inc. – 29
Hard Numbers on the “Costs” of Not Attending College
• In their survey, "Education Pays 2006," the College Board analyzed the benefits in lifetime earnings trends of those who’ve earned a college degree
• The data showed a big earnings gap between high school and college graduates
– In 2005, women aged 25-34 with bachelor's degrees earned 70% more than those with high school diplomas, up from 47% in 1985. For men, that gap was 63%, up from 37% in 1985
– Full-time workers aged 25-34 with college degrees make an average of $14,000 a year more than those with high school diplomas
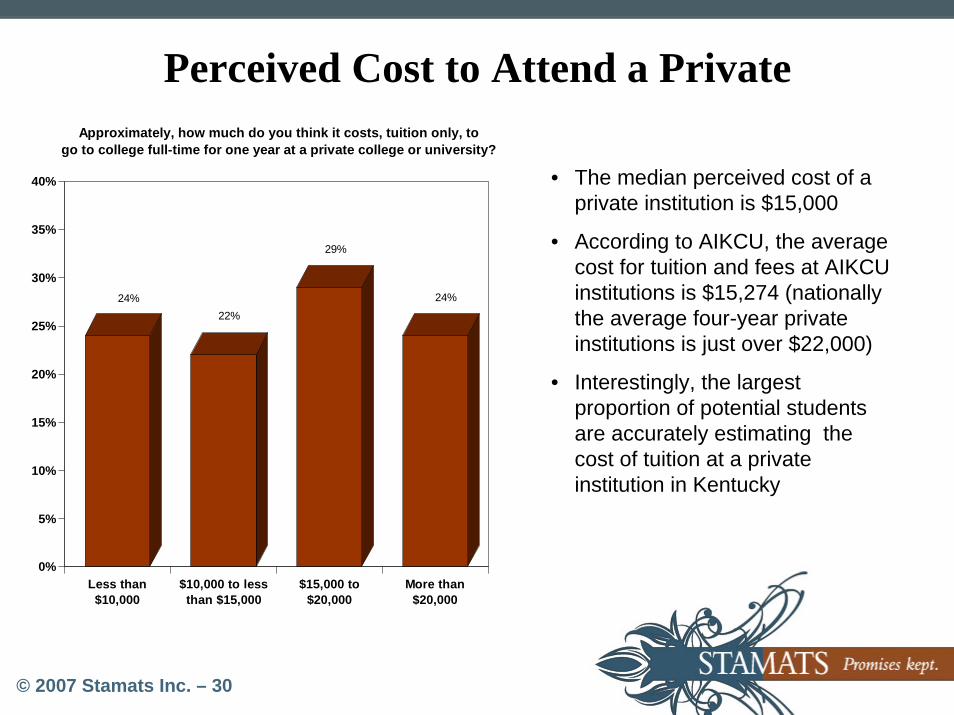
© 2007 Stamats Inc. – 30
Perceived Cost to Attend a Private
24%22%
29%
24%
0%
5%
10%
15%
20%
25%
30%
35%
40%
Less than$10,000
$10,000 to lessthan $15,000
$15,000 to$20,000
More than$20,000
Approximately, how much do you think it costs, tuition only, to go to college full-time for one year at a private college or university?
• The median perceived cost of a private institution is $15,000
• According to AIKCU, the average cost for tuition and fees at AIKCU institutions is $15,274 (nationally the average four-year private institutions is just over $22,000)
• Interestingly, the largest proportion of potential students are accurately estimating the cost of tuition at a private institution in Kentucky
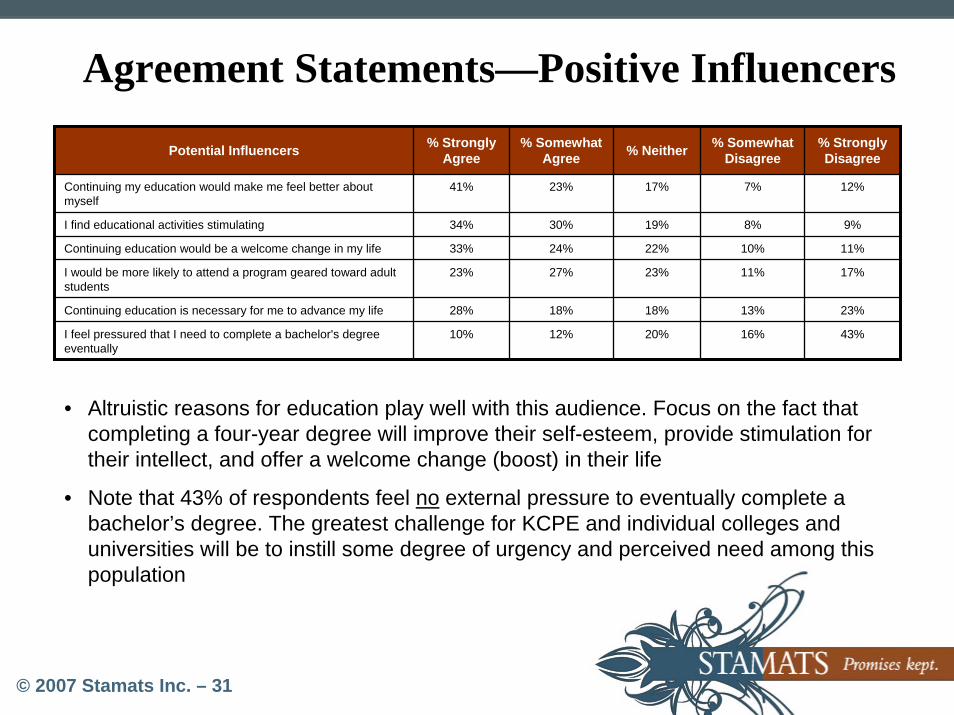
© 2007 Stamats Inc. – 31
Agreement Statements—Positive Influencers
Potential Influencers % Strongly Agree
% Somewhat Agree % Neither % Somewhat
Disagree% Strongly Disagree
Continuing my education would make me feel better about myself
41% 23% 17% 7% 12%
I find educational activities stimulating 34% 30% 19% 8% 9%
33%
23%
28%
10%
24%
27%
18%
12%
22%
23%
18%
20%
10%
11%
13%
16%
11%
17%
23%
43%
I would be more likely to attend a program geared toward adult students
Continuing education is necessary for me to advance my life
I feel pressured that I need to complete a bachelor's degree eventually
Continuing education would be a welcome change in my life
• Altruistic reasons for education play well with this audience. Focus on the fact that completing a four-year degree will improve their self-esteem, provide stimulation for their intellect, and offer a welcome change (boost) in their life
• Note that 43% of respondents feel no external pressure to eventually complete a bachelor’s degree. The greatest challenge for KCPE and individual colleges and universities will be to instill some degree of urgency and perceived need among this population
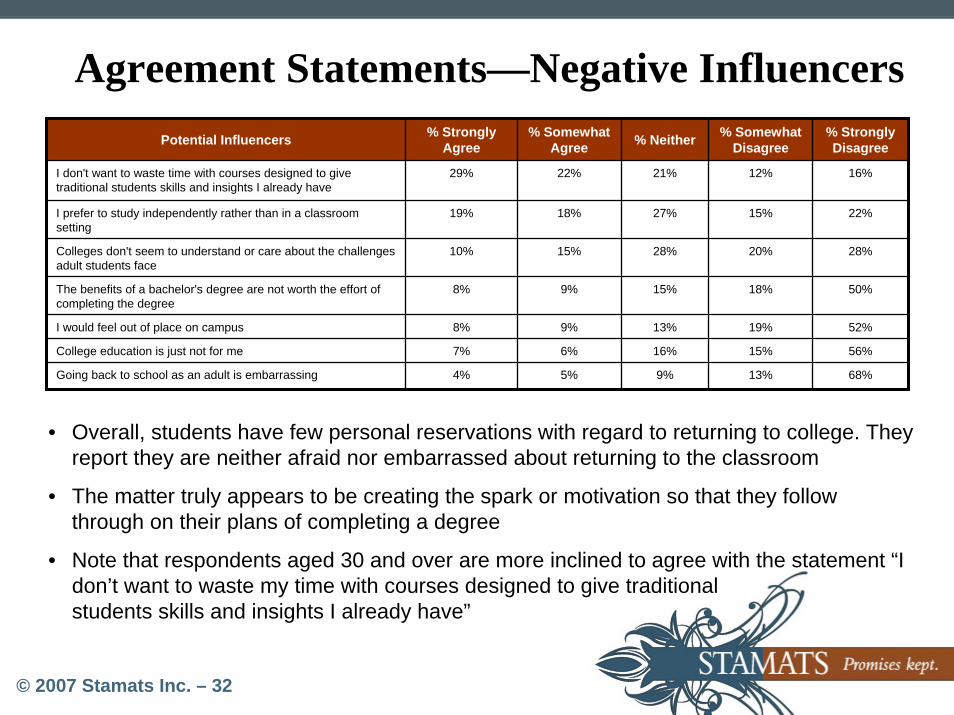
© 2007 Stamats Inc. – 32
Agreement Statements—Negative InfluencersPotential Influencers % Strongly
Agree% Somewhat
Agree % Neither
29%
19%
10%
8%
8%
7%
22%
4%
18%
21%
27%
28%
15%
13%
16%
15%
9%
9%
6%
9%5%
% Somewhat Disagree
% Strongly Disagree
I don't want to waste time with courses designed to give traditional students skills and insights I already have
12%
15%
20%
18%
19%
15%
13%
I prefer to study independently rather than in a classroom setting
16%
22%
28%
50%
52%
56%
Colleges don't seem to understand or care about the challenges adult students face
The benefits of a bachelor's degree are not worth the effort of completing the degree
I would feel out of place on campus
College education is just not for me
Going back to school as an adult is embarrassing 68%
• Overall, students have few personal reservations with regard to returning to college. They report they are neither afraid nor embarrassed about returning to the classroom
• The matter truly appears to be creating the spark or motivation so that they follow through on their plans of completing a degree
• Note that respondents aged 30 and over are more inclined to agree with the statement “I don’t want to waste my time with courses designed to give traditional students skills and insights I already have”
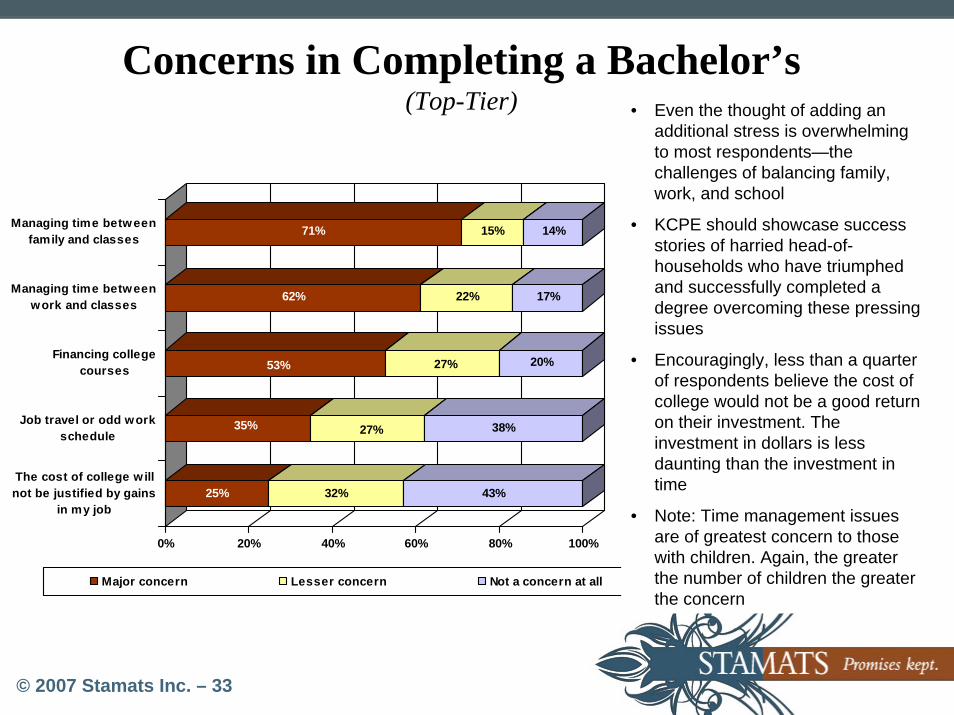
© 2007 Stamats Inc. – 33
Concerns in Completing a Bachelor’s(Top-Tier)
25% 32% 43%
35% 27% 38%
53% 27% 20%
62% 22% 17%
71% 15% 14%
0% 20% 40% 60% 80% 100%
Managing time betweenfamily and classes
Managing time betweenwork and classes
Financing collegecourses
Job travel or odd workschedule
The cost of college w illnot be justified by gains
in my job
Major concern Lesser concern Not a concern at all
• Even the thought of adding an additional stress is overwhelming to most respondents—the challenges of balancing family, work, and school
• KCPE should showcase success stories of harried head-of-households who have triumphed and successfully completed a degree overcoming these pressing issues
• Encouragingly, less than a quarter of respondents believe the cost of college would not be a good return on their investment. The investment in dollars is less daunting than the investment in time
• Note: Time management issues are of greatest concern to those with children. Again, the greater the number of children the greater the concern
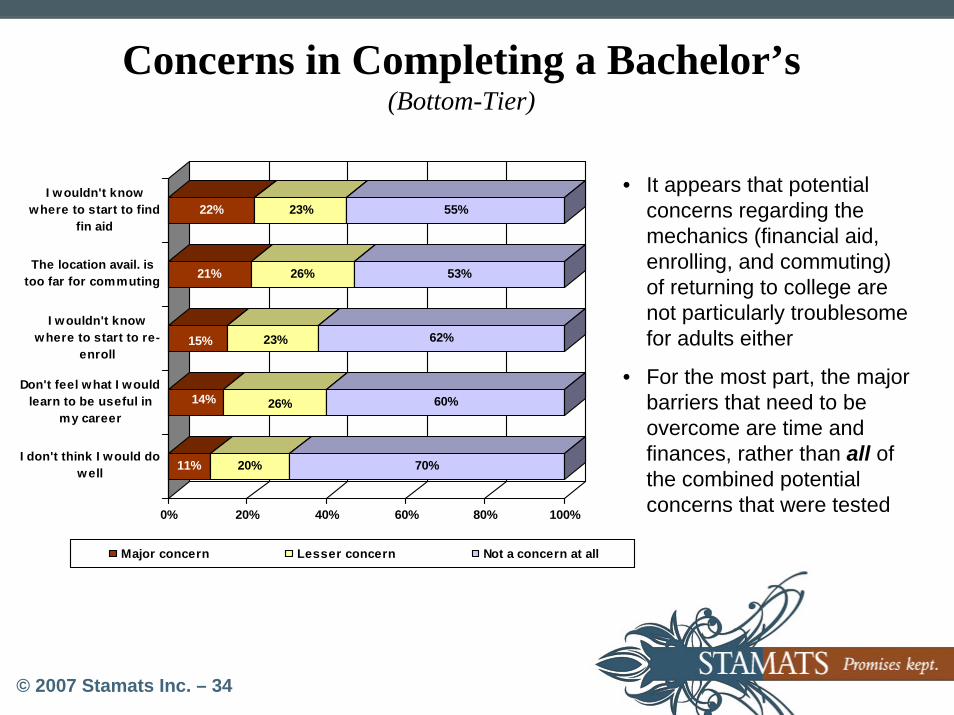
© 2007 Stamats Inc. – 34
Concerns in Completing a Bachelor’s(Bottom-Tier)
11% 20% 70%
14% 26% 60%
15% 23% 62%
21% 26% 53%
22% 23% 55%
0% 20% 40% 60% 80% 100%
I wouldn't knowwhere to start to find
fin aid
The location avail. istoo far for commuting
I wouldn't knowwhere to start to re-
enroll
Don't feel what I wouldlearn to be useful in
my career
I don't think I would dowell
Major concern Lesser concern Not a concern at all
• It appears that potential concerns regarding the mechanics (financial aid, enrolling, and commuting) of returning to college are not particularly troublesome for adults either
• For the most part, the major barriers that need to be overcome are time and finances, rather than all of the combined potential concerns that were tested
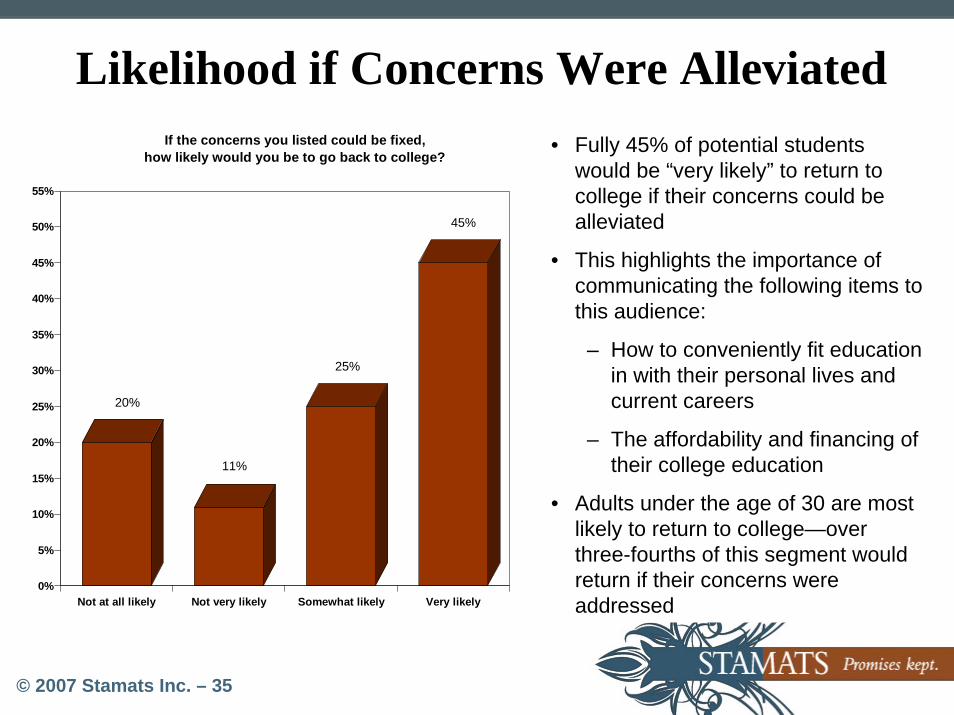
© 2007 Stamats Inc. – 35
Likelihood if Concerns Were Alleviated
20%
11%
25%
45%
0%
5%
10%
15%
20%
25%
30%
35%
40%
45%
50%
55%
Not at all likely Not very likely Somewhat likely Very likely
If the concerns you listed could be fixed, how likely would you be to go back to college?
• Fully 45% of potential students would be “very likely” to return to college if their concerns could be alleviated
• This highlights the importance of communicating the following items to this audience:
– How to conveniently fit education in with their personal lives and current careers
– The affordability and financing of their college education
• Adults under the age of 30 are most likely to return to college—over three-fourths of this segment would return if their concerns were addressed
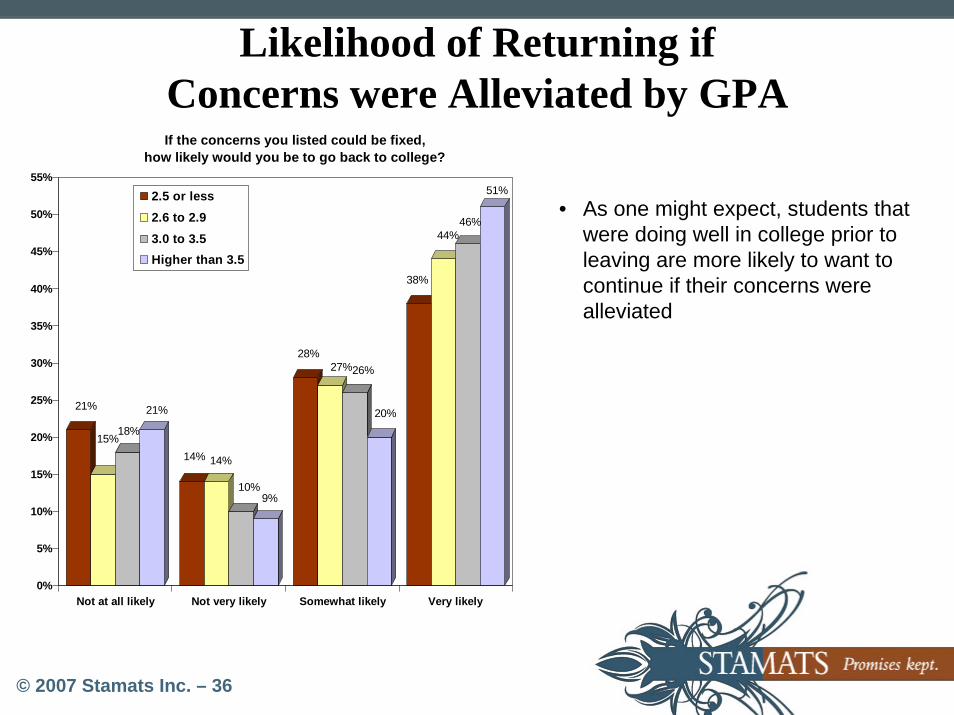
© 2007 Stamats Inc. – 36
Likelihood of Returning if Concerns were Alleviated by GPA
21%
15%18%
21%
14% 14%
10%9%
28%27%26%
20%
38%
44%46%
51%
0%
5%
10%
15%
20%
25%
30%
35%
40%
45%
50%
55%
Not at all likely Not very likely Somewhat likely Very likely
If the concerns you listed could be fixed, how likely would you be to go back to college?
2.5 or less2.6 to 2.93.0 to 3.5Higher than 3.5
• As one might expect, students that were doing well in college prior to leaving are more likely to want to continue if their concerns were alleviated
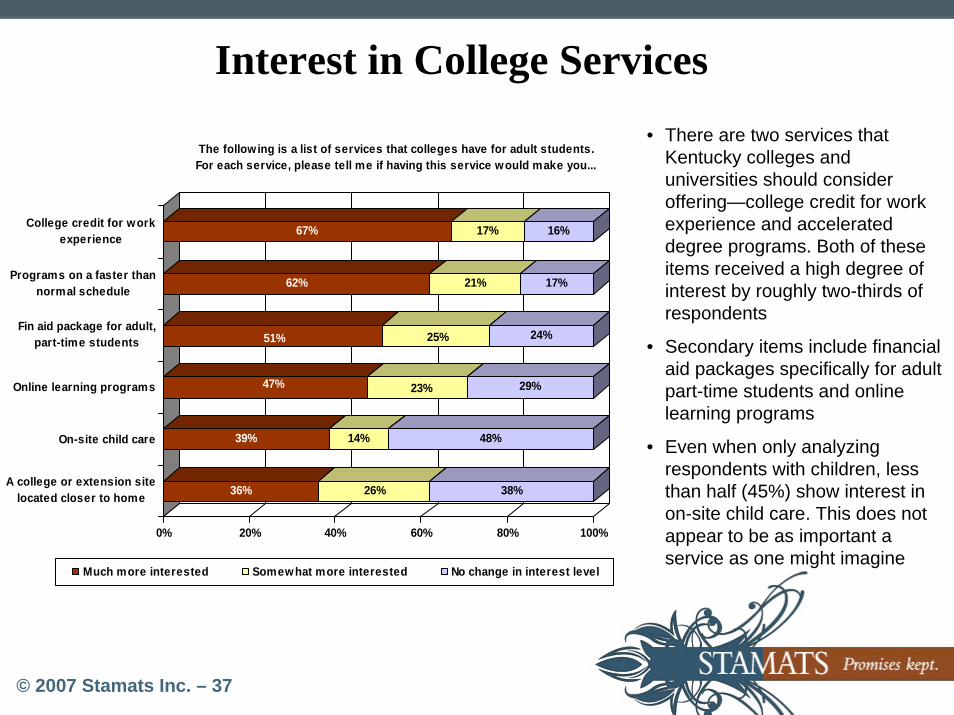
© 2007 Stamats Inc. – 37
Interest in College Services
36% 26% 38%
39% 14% 48%
47% 23% 29%
51% 25% 24%
62% 21% 17%
67% 17% 16%
0% 20% 40% 60% 80% 100%
College credit for workexperience
Programs on a faster thannormal schedule
Fin aid package for adult,part-time students
Online learning programs
On-site child care
A college or extension sitelocated closer to home
The following is a list of services that colleges have for adult students. For each service, please tell me if having this service would make you...
Much more interested Somewhat more interested No change in interest level
• There are two services that Kentucky colleges and universities should consider offering—college credit for work experience and accelerated degree programs. Both of these items received a high degree of interest by roughly two-thirds of respondents
• Secondary items include financial aid packages specifically for adult part-time students and online learning programs
• Even when only analyzing respondents with children, less than half (45%) show interest in on-site child care. This does not appear to be as important a service as one might imagine
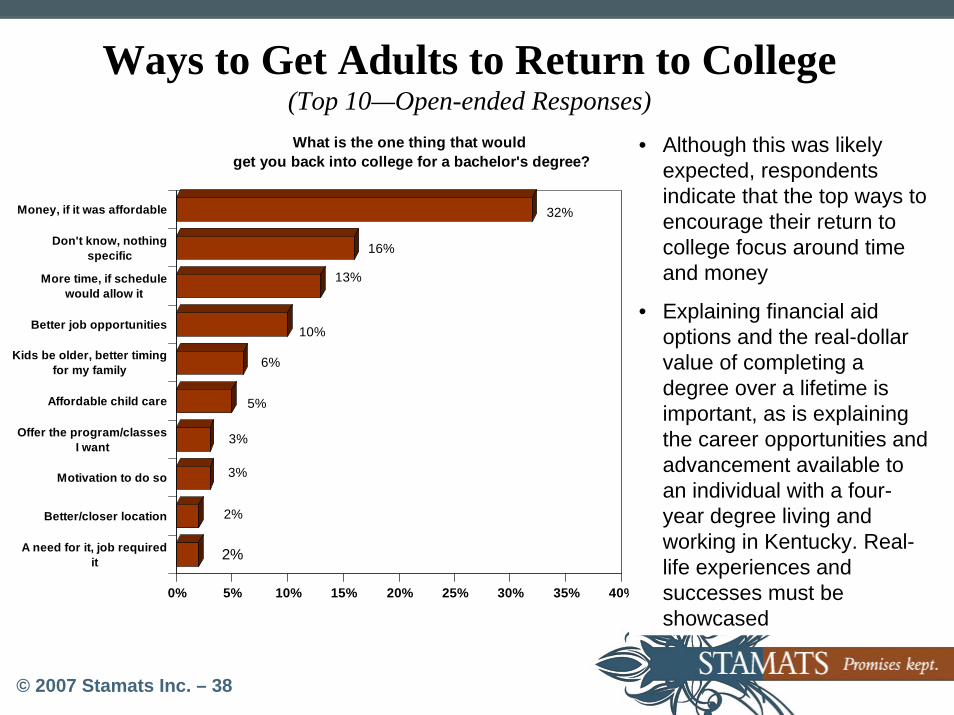
© 2007 Stamats Inc. – 38
2%
2%
3%
3%
5%
6%
10%
13%
16%
32%
0% 5% 10% 15% 20% 25% 30% 35% 40%
Money, if it was affordable
Don't know, nothingspecific
More time, if schedulewould allow it
Better job opportunities
Kids be older, better timingfor my family
Affordable child care
Offer the program/classesI want
Motivation to do so
Better/closer location
A need for it, job requiredit
What is the one thing that would get you back into college for a bachelor's degree?
Ways to Get Adults to Return to College(Top 10—Open-ended Responses)
• Although this was likely expected, respondents indicate that the top ways to encourage their return to college focus around time and money
• Explaining financial aid options and the real-dollar value of completing a degree over a lifetime is important, as is explaining the career opportunities and advancement available to an individual with a four-year degree living and working in Kentucky. Real-life experiences and successes must be showcased
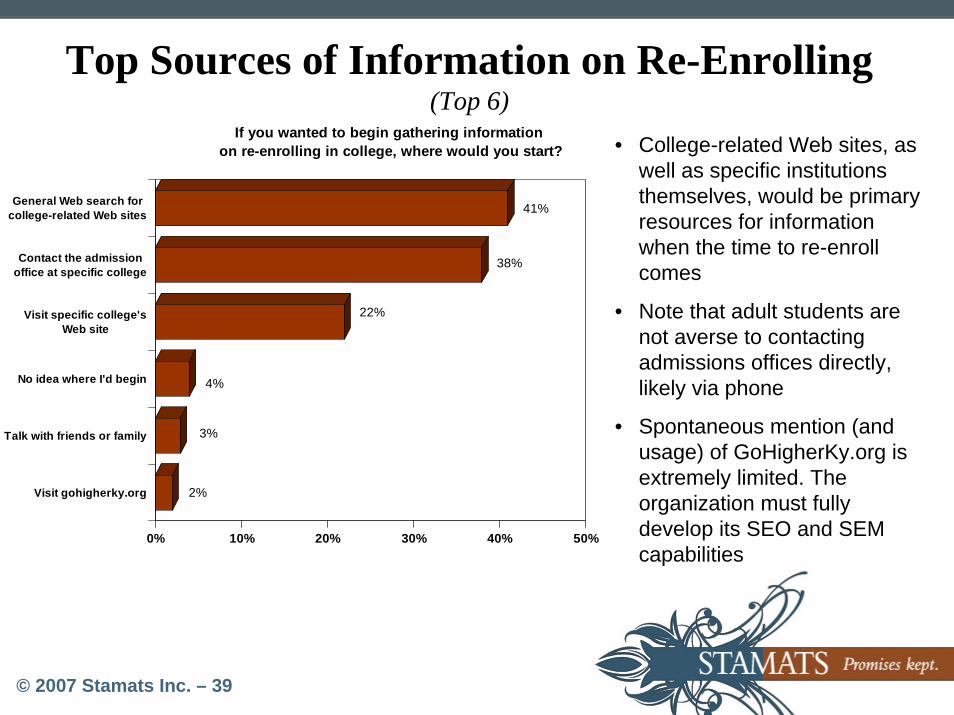
© 2007 Stamats Inc. – 39
Top Sources of Information on Re-Enrolling(Top 6)
• College-related Web sites, as well as specific institutions themselves, would be primary resources for information when the time to re-enroll comes
• Note that adult students are not averse to contacting admissions offices directly, likely via phone
• Spontaneous mention (and usage) of GoHigherKy.org is extremely limited. The organization must fully develop its SEO and SEM capabilities
2%
3%
4%
22%
38%
41%
0% 10% 20% 30% 40% 50%
General Web search forcollege-related Web sites
Contact the admissionoffice at specific college
Visit specific college'sWeb site
No idea where I'd begin
Talk with friends or family
Visit gohigherky.org
If you wanted to begin gathering information on re-enrolling in college, where would you start?
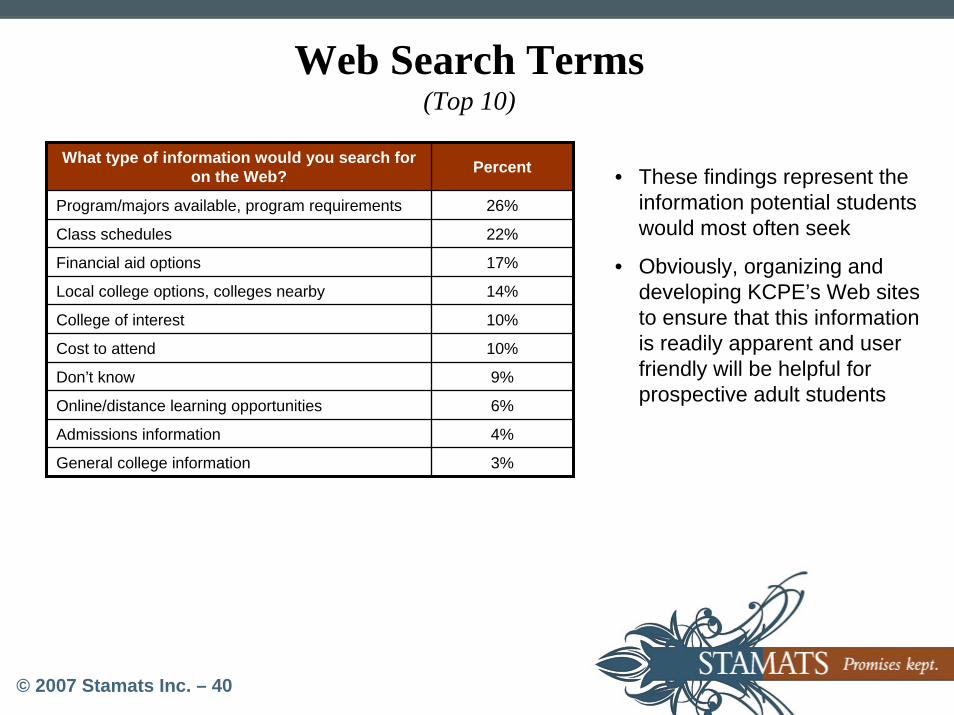
© 2007 Stamats Inc. – 40
Web Search Terms(Top 10)
• These findings represent the information potential students would most often seek
• Obviously, organizing and developing KCPE’s Web sites to ensure that this information is readily apparent and user friendly will be helpful for prospective adult students
What type of information would you search for on the Web? Percent
Program/majors available, program requirements 26%
Class schedules 22%
Financial aid options 17%
Local college options, colleges nearby 14%
College of interest 10%
Cost to attend 10%
9%
6%
4%
3%
Online/distance learning opportunities
Admissions information
General college information
Don’t know
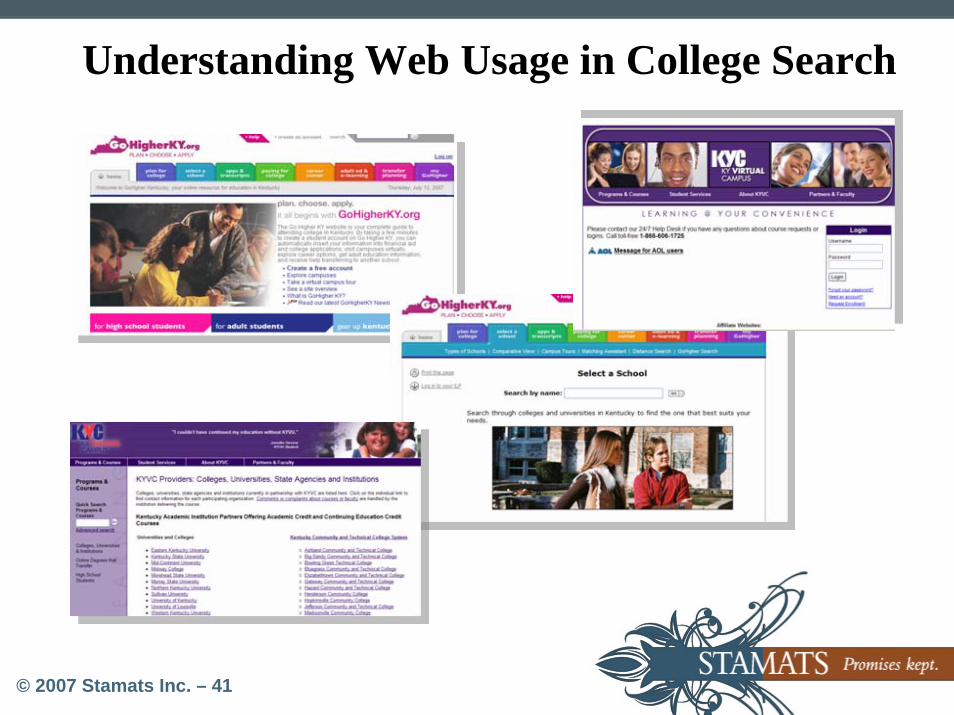
© 2007 Stamats Inc. – 41
Understanding Web Usage in College Search
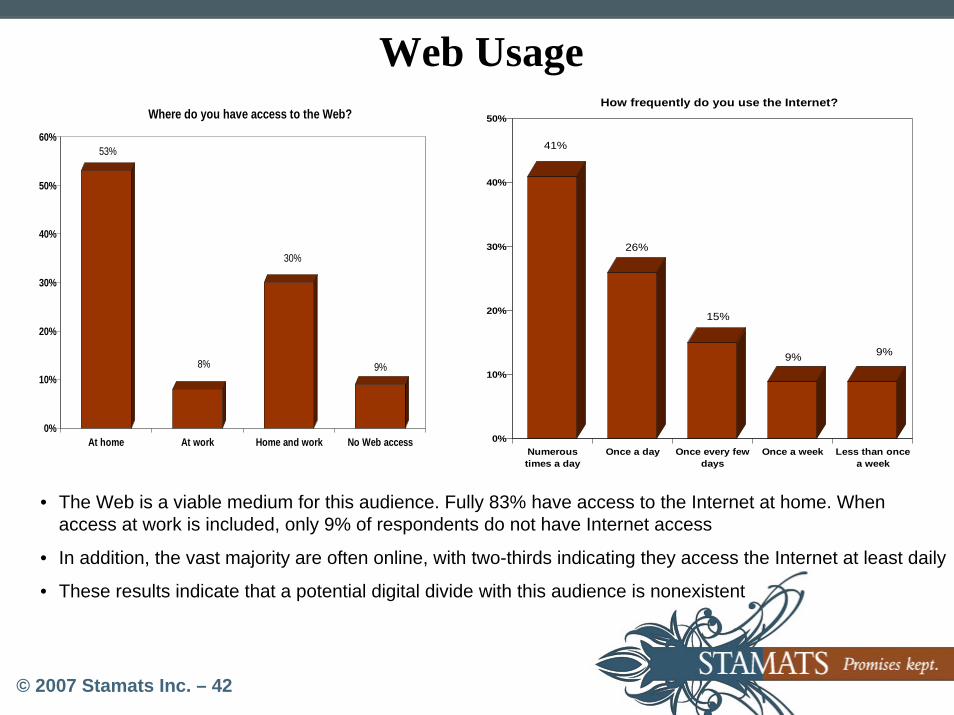
© 2007 Stamats Inc. – 42
Web Usage
53%
8%
30%
9%
0%
10%
20%
30%
40%
50%
60%
At home At work Home and work No Web access
Where do you have access to the Web?
• The Web is a viable medium for this audience. Fully 83% have access to the Internet at home. When access at work is included, only 9% of respondents do not have Internet access
• In addition, the vast majority are often online, with two-thirds indicating they access the Internet at least daily
• These results indicate that a potential digital divide with this audience is nonexistent
41%
26%
15%
9% 9%
0%
10%
20%
30%
40%
50%
Numeroustimes a day
Once a day Once every fewdays
Once a week Less than oncea week
How frequently do you use the Internet?
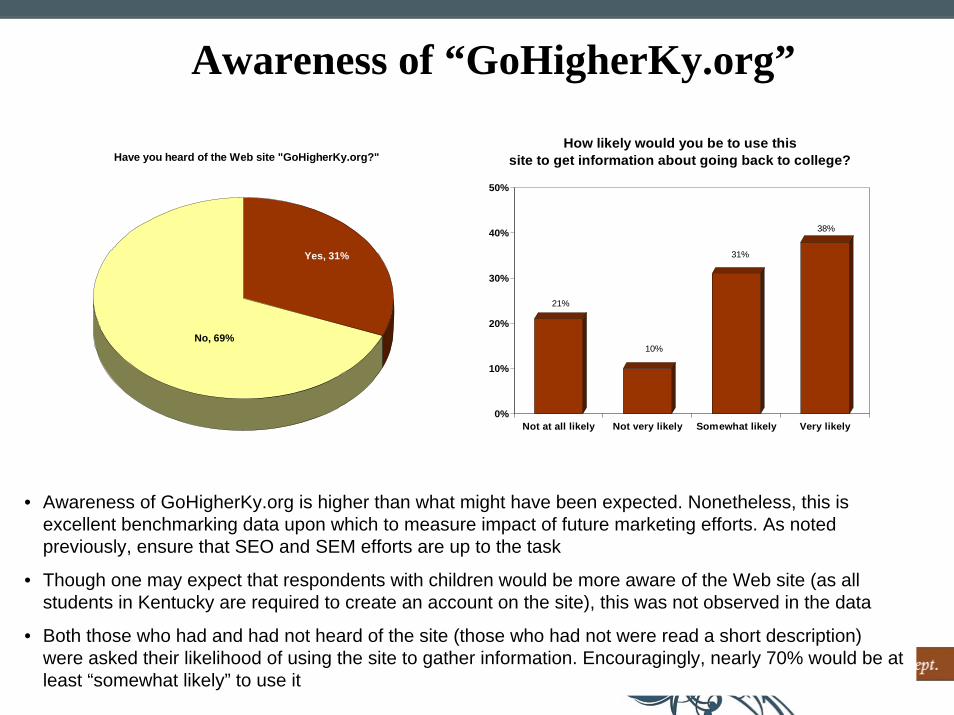
© 2007 Stamats Inc. – 43
Awareness of “GoHigherKy.org”
Have you heard of the Web site "GoHigherKy.org?"
Yes, 31%
No, 69%
• Awareness of GoHigherKy.org is higher than what might have been expected. Nonetheless, this is excellent benchmarking data upon which to measure impact of future marketing efforts. As noted previously, ensure that SEO and SEM efforts are up to the task
• Though one may expect that respondents with children would be more aware of the Web site (as all students in Kentucky are required to create an account on the site), this was not observed in the data
• Both those who had and had not heard of the site (those who had not were read a short description) were asked their likelihood of using the site to gather information. Encouragingly, nearly 70% would be at least “somewhat likely” to use it
21%
10%
31%
38%
0%
10%
20%
30%
40%
50%
Not at all likely Not very likely Somewhat likely Very likely
How likely would you be to use this site to get information about going back to college?
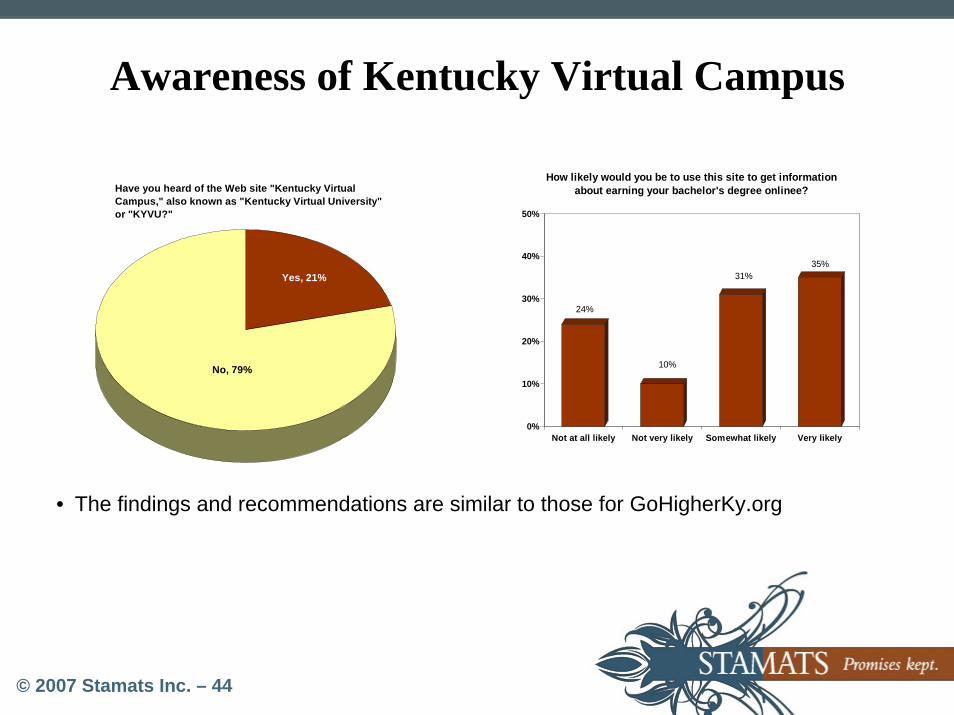
© 2007 Stamats Inc. – 44
Awareness of Kentucky Virtual Campus
Have you heard of the Web site "Kentucky Virtual Campus," also known as "Kentucky Virtual University" or "KYVU?"
Yes, 21%
No, 79%
• The findings and recommendations are similar to those for GoHigherKy.org
24%
10%
31%35%
0%
10%
20%
30%
40%
50%
Not at all likely Not very likely Somewhat likely Very likely
How likely would you be to use this site to get information about earning your bachelor's degree onlinee?
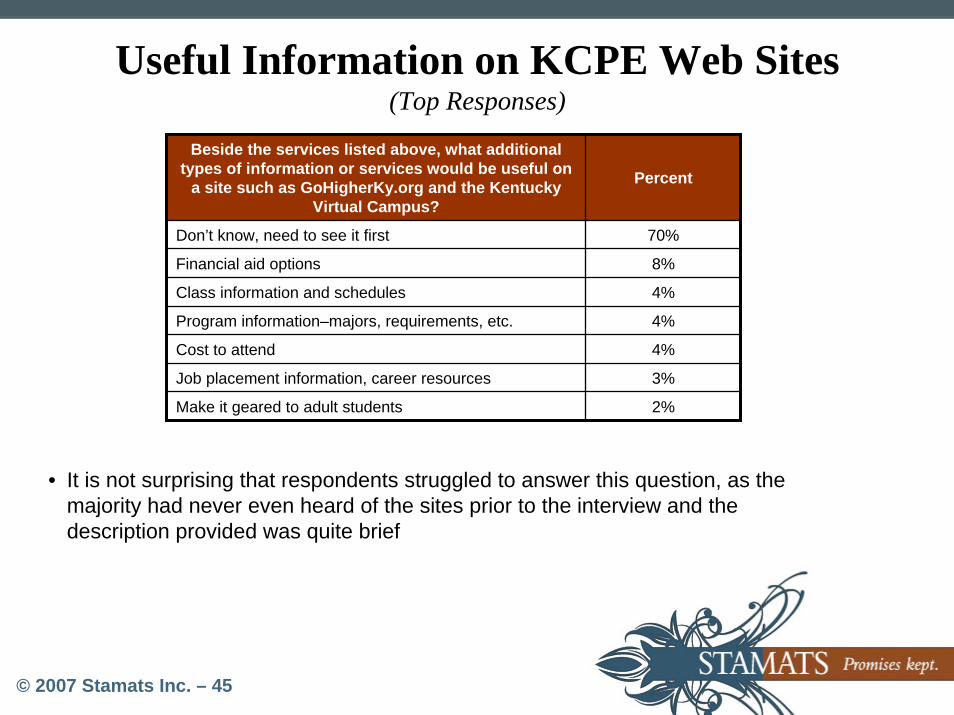
© 2007 Stamats Inc. – 45
Useful Information on KCPE Web Sites(Top Responses)
Beside the services listed above, what additional types of information or services would be useful on
a site such as GoHigherKy.org and the Kentucky Virtual Campus?
Percent
Don’t know, need to see it first 70%
Financial aid options 8%
Class information and schedules 4%
Program information–majors, requirements, etc. 4%
Cost to attend 4%
Job placement information, career resources 3%
2%Make it geared to adult students
• It is not surprising that respondents struggled to answer this question, as the majority had never even heard of the sites prior to the interview and the description provided was quite brief
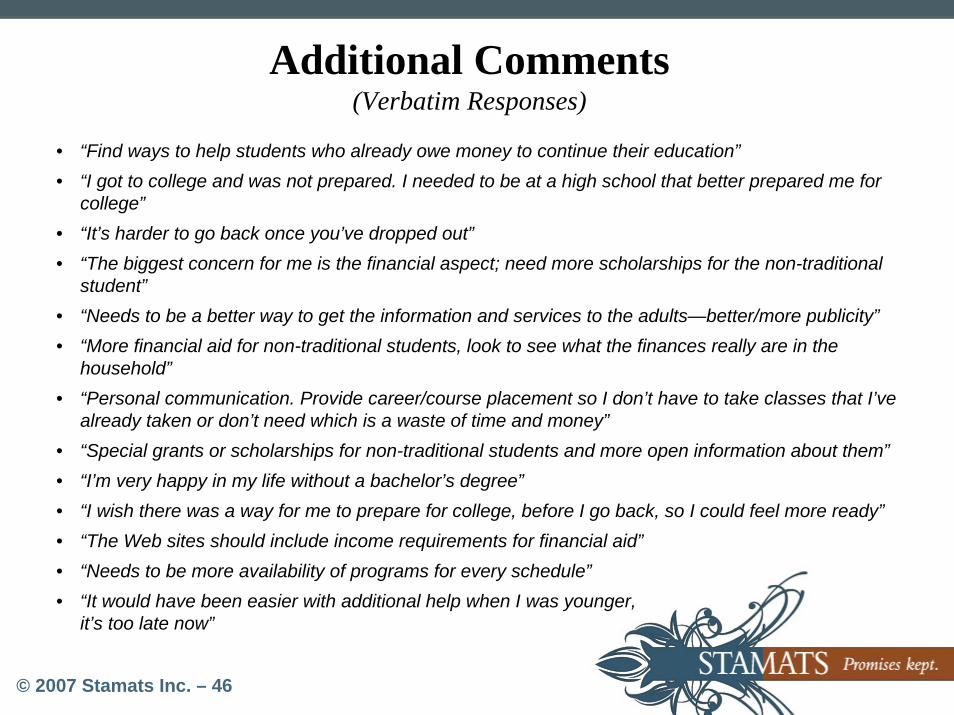
© 2007 Stamats Inc. – 46
Additional Comments(Verbatim Responses)
• “Find ways to help students who already owe money to continue their education”• “I got to college and was not prepared. I needed to be at a high school that better prepared me for
college”• “It’s harder to go back once you’ve dropped out”• “The biggest concern for me is the financial aspect; need more scholarships for the non-traditional
student”• “Needs to be a better way to get the information and services to the adults—better/more publicity”• “More financial aid for non-traditional students, look to see what the finances really are in the
household”• “Personal communication. Provide career/course placement so I don’t have to take classes that I’ve
already taken or don’t need which is a waste of time and money”• “Special grants or scholarships for non-traditional students and more open information about them”• “I’m very happy in my life without a bachelor’s degree”• “I wish there was a way for me to prepare for college, before I go back, so I could feel more ready”• “The Web sites should include income requirements for financial aid”• “Needs to be more availability of programs for every schedule”• “It would have been easier with additional help when I was younger,
it’s too late now”
© 2007 Stamats Inc. – 47
Summary Conclusions• Overall, there is not as much of an interest in continuing education as we might have
expected or hoped. This is evidenced in that just 23% are “very likely” to re-enroll in the future, with many of those indicating that it would likely be two or three years into the future. Additionally, the low response rate for the study indicates that most individuals who could fit the bachelor’s degree completion segment have little interest in college education overall
• However, three groups emerged as being more receptive to continuing their education:– Blacks and Hispanics (though consider the low sample size)
– Those that entered college within the last 10 years that are currently working in a white-collar job
– Unmarried individuals with 85 or more total credit hours. Among those that attended college more than 10 years ago
• Creating more of a sense of urgency appears to be the key to getting any segment of this population back to college. Currently this does not exist, as a large percentage do not feel pressured to eventually earn their degree. Rather, it would be more of an altruistic goal, which are typically the lifetime (“me”) goals least likely to be made a priority. With many of these respondents married and with children, “me-time” has given way to “we-time”
© 2007 Stamats Inc. – 48
Summary Conclusions• One group (not included in this assessment) to target communication may be Kentucky
employers. If the drive is not intrinsic or within a family, perhaps the added weight of a colleague, supervisor, or mentor could help create a sense of urgency among potential returners
• As would be expected, the greatest barriers to entry are time and money. It is important to communicate how a college education can be fit in with personal and professional obligations as well as how an education can be financed
• Encouragingly, expected deterrents did not rise to the top as concerns among this audience. Specifically, these students do not appear to be worried being able to fit in at college or do well. In fact, the majority indicated they were doing well in college before leaving
• Additionally, access to a college or university is not much of a barrier. Even if it were, more than two-thirds would consider an online education
• In fact, the Web is a large part of where this audiences “lives.” More than 80% have access to the Web at home and 67% are online daily. Furthermore, 40% said they would first turn to the Web to gather information on college options
© 2007 Stamats Inc. – 49
Summary Conclusions• Web sites such as GoHigherKy.org and the Kentucky Virtual Campus will be useful
information sources for this audience. Roughly 70% of respondents indicate they would be likely to visit these sites if looking for information on college options. Moving forward, it is important to increase the awareness of these Web sites among this audience
• The research indicates some potential services that colleges and universities in Kentucky could offer adult learners that may enhance their likelihood of re-enrolling. Students are most interested in receiving college credit for work experience and accelerated degree programs. These are followed by strong interest for financial aid programs specifically for adult part-time students as well as online learning programs
© 2007 Stamats Inc. – 50
Top Potential Target Niches/Segments • Stop-outs within the last decade with at least 11 credit hours working in white-collar jobs
• Stop-outs prior to 1996 with more than 85 credits who are not currently married
• Small but interested audience—black and Hispanic adults
© 2007 Stamats Inc. – 51
Top Messages • You’ve done it before—you can do it again
– Most had solid academic standing in their first college experience
• A bachelor’s degree can dramatically increase your potential for higher income and career advancement
• You need a change– 31% report their main reason for getting a bachelor’s degree is to change their
career/job
• Completing that degree is not as expensive as you think– Many overestimate the cost, particularly of public education
• Continuing your degree will “make me feel better about myself”– Two-thirds somewhat or strongly agree with this statement
• Time management—home, work, and school—is possible and here’s how these people have done it (and how you can too)
© 2007 Stamats Inc. – 52
Top Mediums • General Web search for college-related sites
– Search engine marketing is an essential consideration– Looking for programs/majors and requirements, class schedules, and financial aid
options– 91% of adult potential returners have Internet access
• Self-initiated direct contact with an institution (calls, Web, e-mail, etc.)
• Specific institutional (college/university) Web sites
© 2007 Stamats Inc. – 53
Top Programs • Nursing
• Business
• Education
© 2007 Stamats Inc. – 54
Top Services and Offerings • Receiving college credit for work experience
• Accelerated degree programs
• Financial aid programs specifically for adult part-time students
• Online learning programs
© 2007 Stamats Inc. – 55
Crosscuts by Age
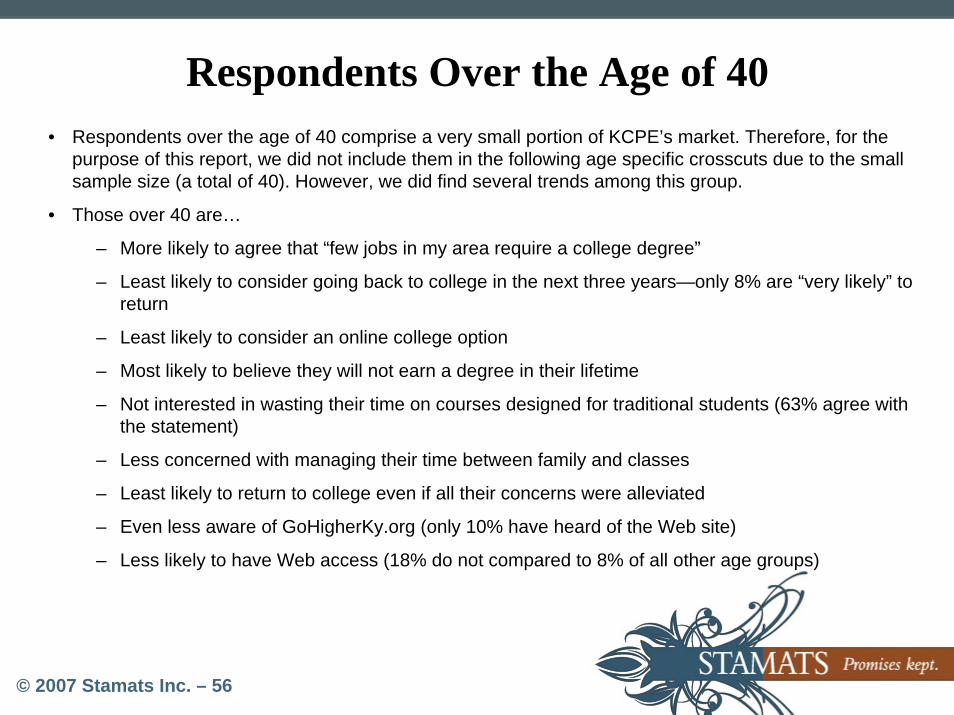
© 2007 Stamats Inc. – 56
Respondents Over the Age of 40• Respondents over the age of 40 comprise a very small portion of KCPE’s market. Therefore, for the
purpose of this report, we did not include them in the following age specific crosscuts due to the small sample size (a total of 40). However, we did find several trends among this group.
• Those over 40 are…
– More likely to agree that “few jobs in my area require a college degree”
– Least likely to consider going back to college in the next three years—only 8% are “very likely” to return
– Least likely to consider an online college option
– Most likely to believe they will not earn a degree in their lifetime
– Not interested in wasting their time on courses designed for traditional students (63% agree with the statement)
– Less concerned with managing their time between family and classes
– Least likely to return to college even if all their concerns were alleviated
– Even less aware of GoHigherKy.org (only 10% have heard of the Web site)
– Less likely to have Web access (18% do not compared to 8% of all other age groups)
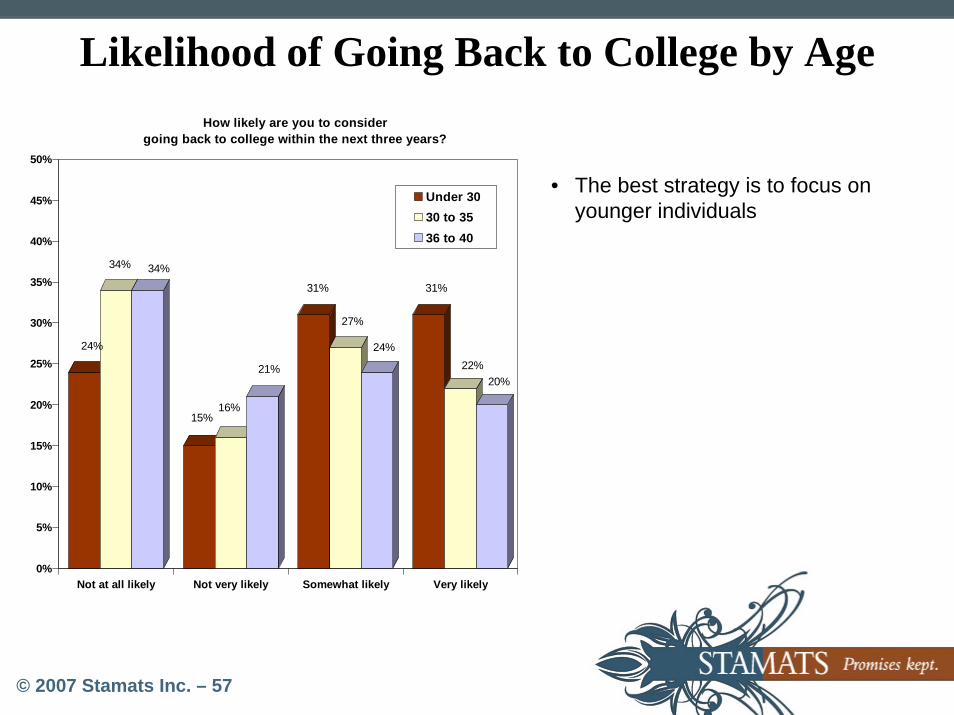
© 2007 Stamats Inc. – 57
Likelihood of Going Back to College by Age
24%
34% 34%
15%16%
21%
31%
27%
24%
31%
22%20%
0%
5%
10%
15%
20%
25%
30%
35%
40%
45%
50%
Not at all likely Not very likely Somewhat likely Very likely
How likely are you to consider going back to college within the next three years?
Under 3030 to 3536 to 40
• The best strategy is to focus on younger individuals
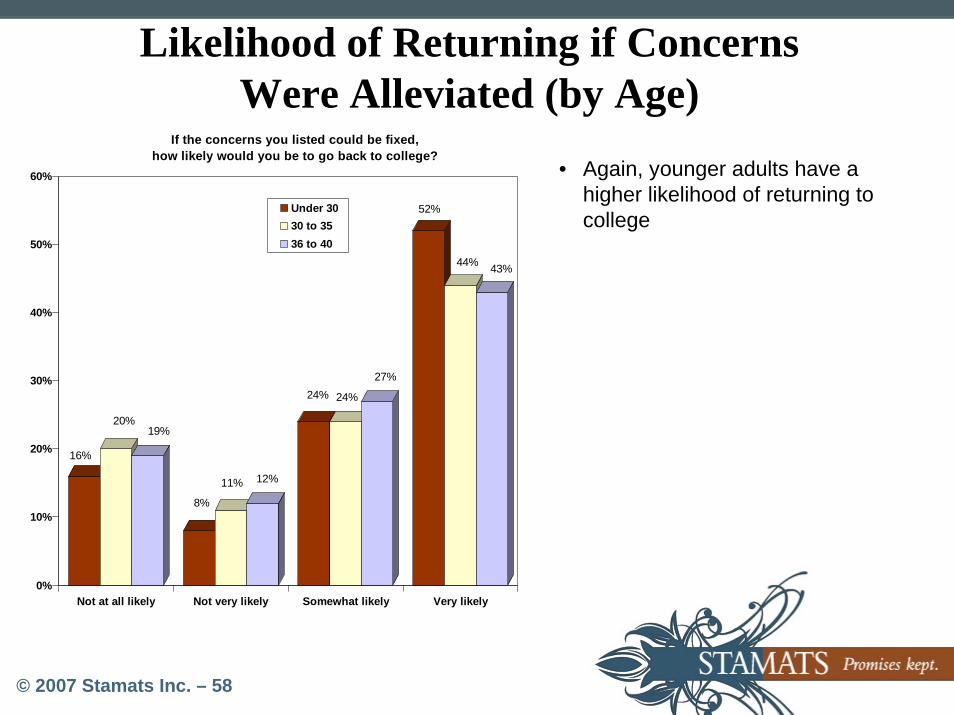
© 2007 Stamats Inc. – 58
Likelihood of Returning if Concerns Were Alleviated (by Age)
16%
20%19%
8%
11% 12%
24% 24%
27%
52%
44% 43%
0%
10%
20%
30%
40%
50%
60%
Not at all likely Not very likely Somewhat likely Very likely
If the concerns you listed could be fixed, how likely would you be to go back to college?
Under 3030 to 3536 to 40
• Again, younger adults have a higher likelihood of returning to college
© 2007 Stamats Inc. – 59
Additional Requested Crosscuts
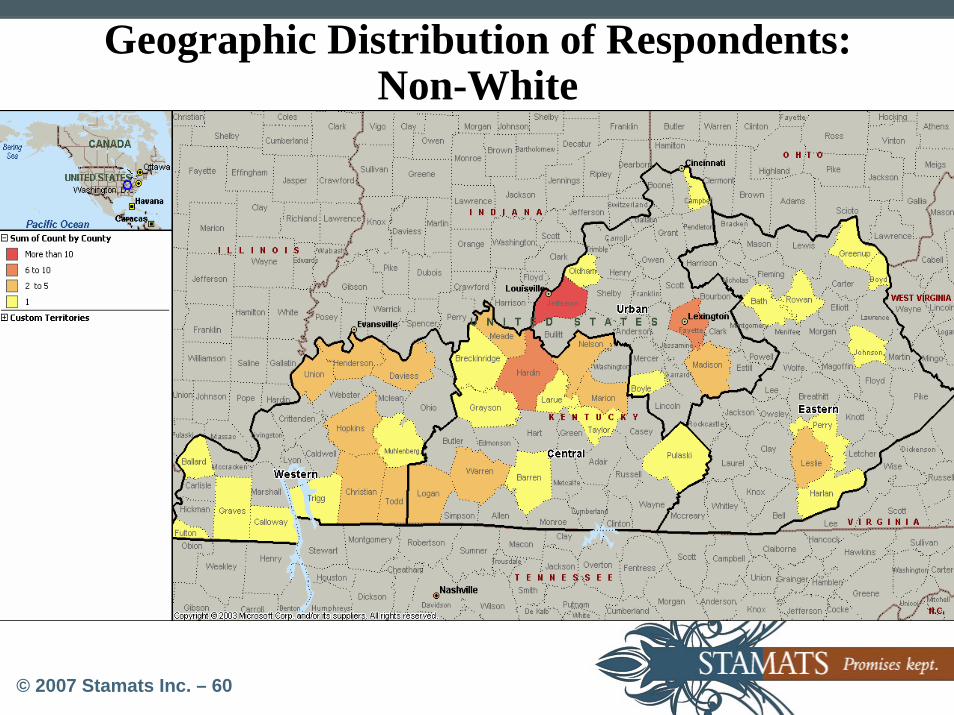
© 2007 Stamats Inc. – 60
Geographic Distribution of Respondents: Non-White
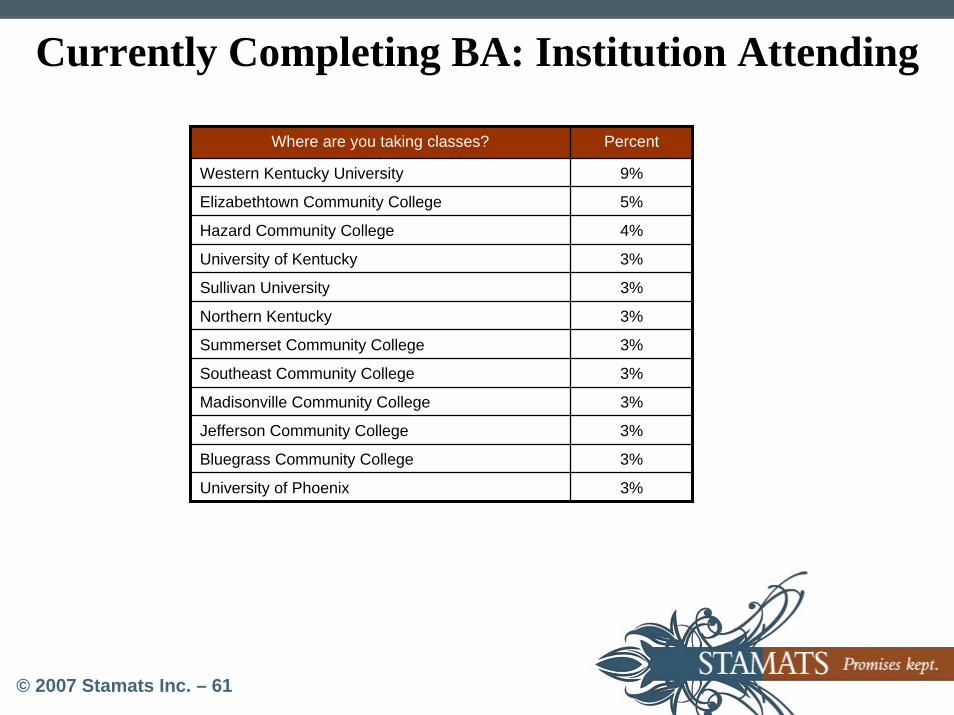
© 2007 Stamats Inc. – 61
Currently Completing BA: Institution Attending
Where are you taking classes? Percent
Western Kentucky University 9%
Elizabethtown Community College 5%
Hazard Community College 4%
University of Kentucky 3%
Sullivan University 3%
Northern Kentucky 3%
Summerset Community College 3%
Southeast Community College 3%
Bluegrass Community College 3%
Madisonville Community College 3%
Jefferson Community College 3%
University of Phoenix 3%
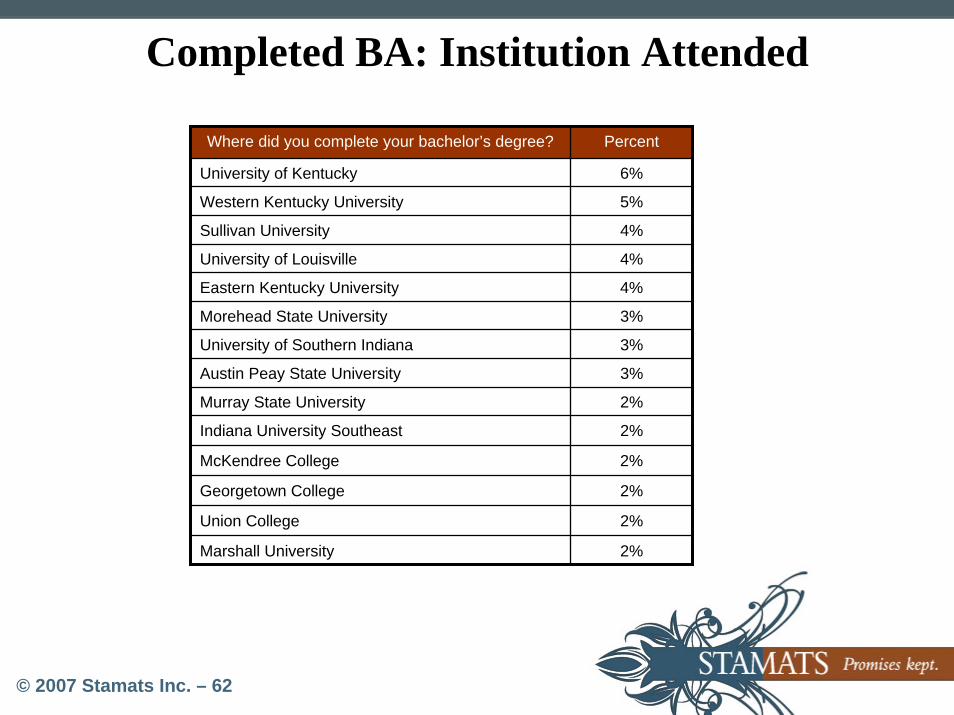
© 2007 Stamats Inc. – 62
Completed BA: Institution Attended
Where did you complete your bachelor’s degree? Percent
University of Kentucky 6%
Western Kentucky University 5%
Sullivan University 4%
University of Louisville 4%
Eastern Kentucky University 4%
Morehead State University 3%
Indiana University Southeast 2%
McKendree College 2%
Georgetown College 2%
University of Southern Indiana 3%
Austin Peay State University 3%
Murray State University 2%
2%
Marshall University 2%
Union College
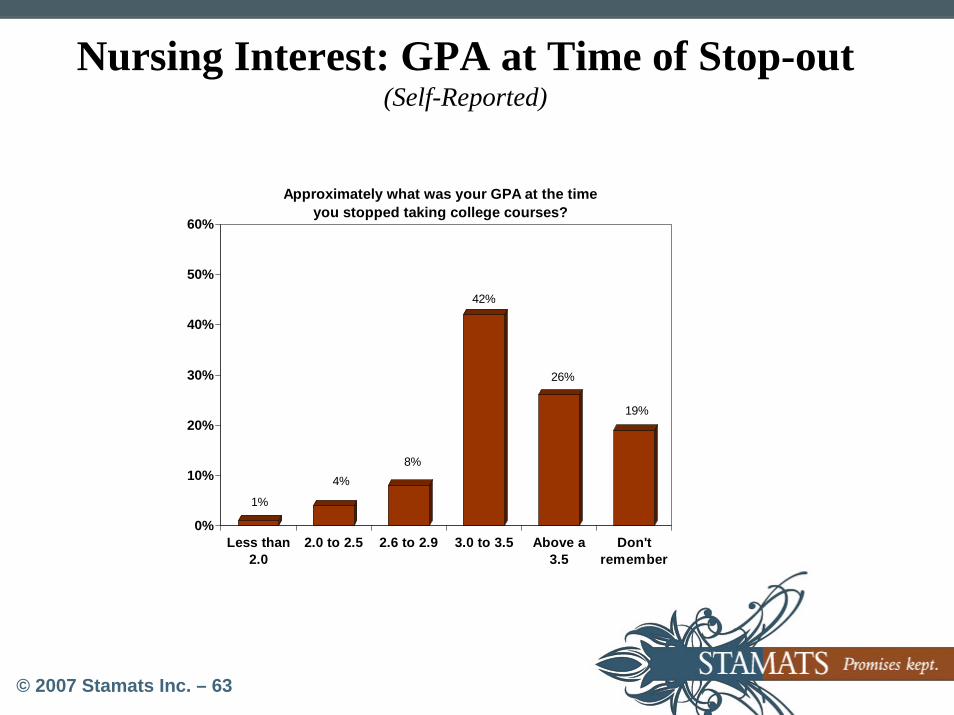
© 2007 Stamats Inc. – 63
Nursing Interest: GPA at Time of Stop-out(Self-Reported)
1%
4%8%
42%
26%
19%
0%
10%
20%
30%
40%
50%
60%
Less than2.0
2.0 to 2.5 2.6 to 2.9 3.0 to 3.5 Above a3.5
Don'tremember
Approximately what was your GPA at the time you stopped taking college courses?
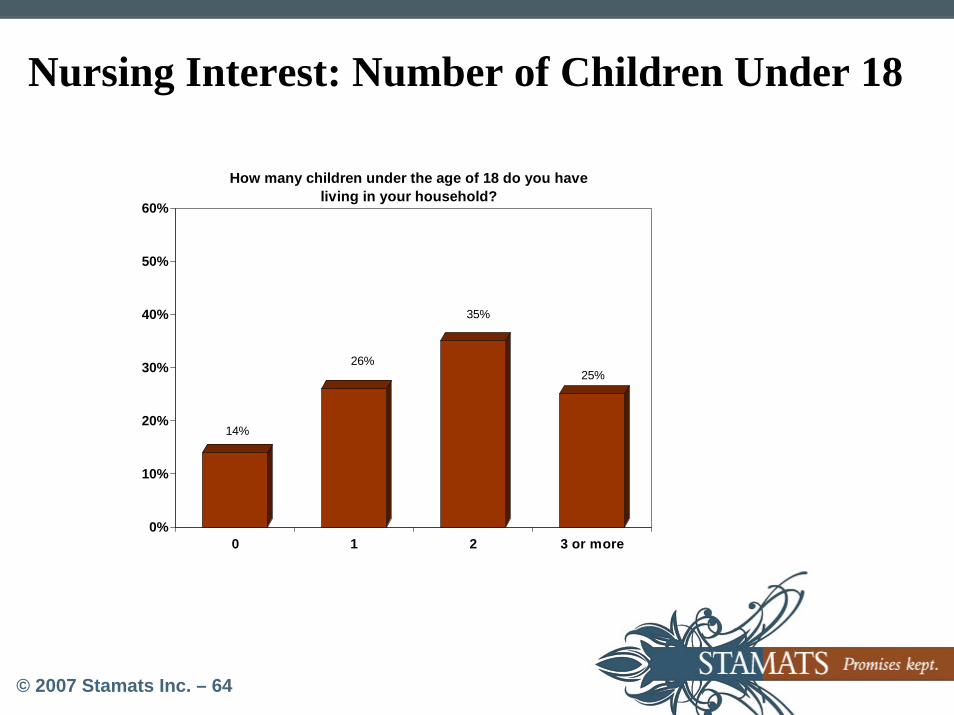
© 2007 Stamats Inc. – 64
Nursing Interest: Number of Children Under 18
14%
26%
35%
25%
0%
10%
20%
30%
40%
50%
60%
0 1 2 3 or more
How many children under the age of 18 do you have living in your household?
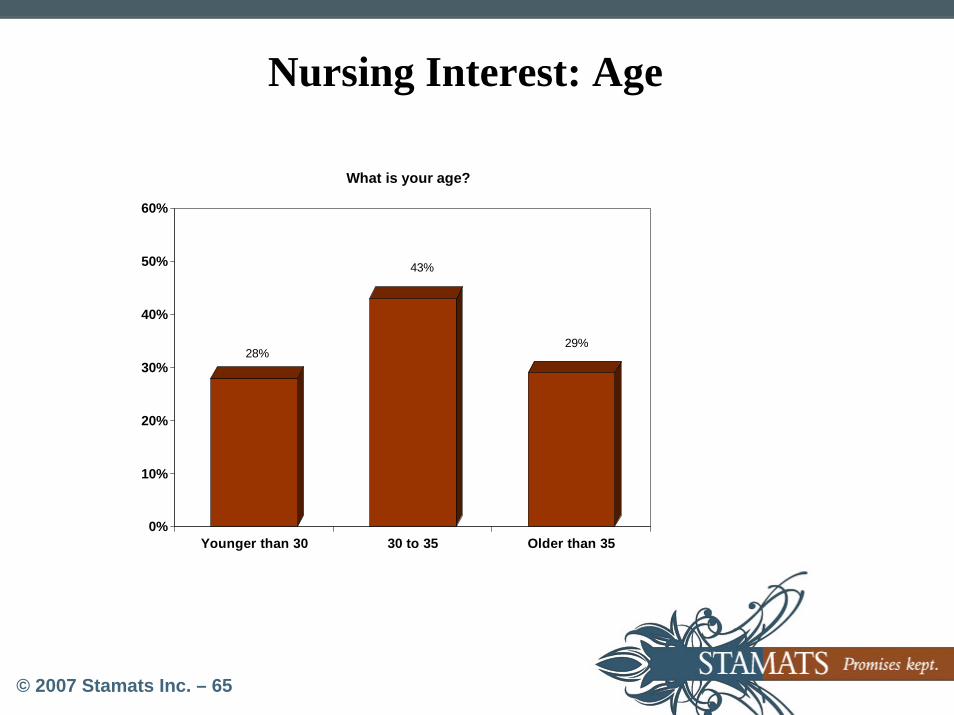
© 2007 Stamats Inc. – 65
Nursing Interest: Age
28%
43%
29%
0%
10%
20%
30%
40%
50%
60%
Younger than 30 30 to 35 Older than 35
What is your age?
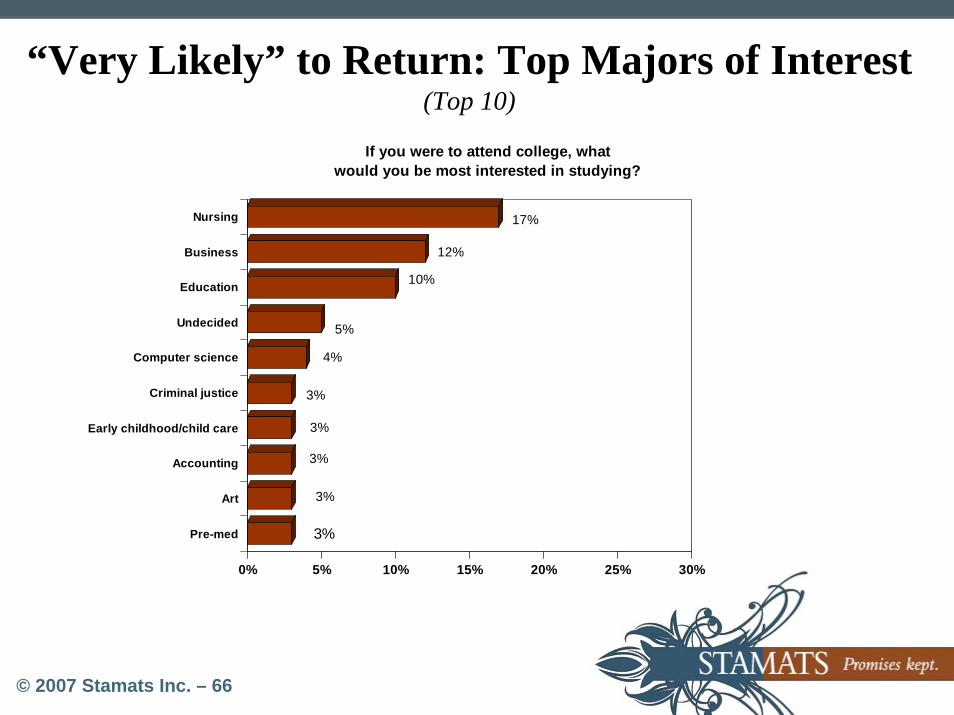
© 2007 Stamats Inc. – 66
“Very Likely” to Return: Top Majors of Interest(Top 10)
3%
3%
3%
3%
3%
4%
5%
10%
12%
17%
0% 5% 10% 15% 20% 25% 30%
Nursing
Business
Education
Undecided
Computer science
Criminal justice
Early childhood/child care
Accounting
Art
Pre-med
If you were to attend college, what would you be most interested in studying?
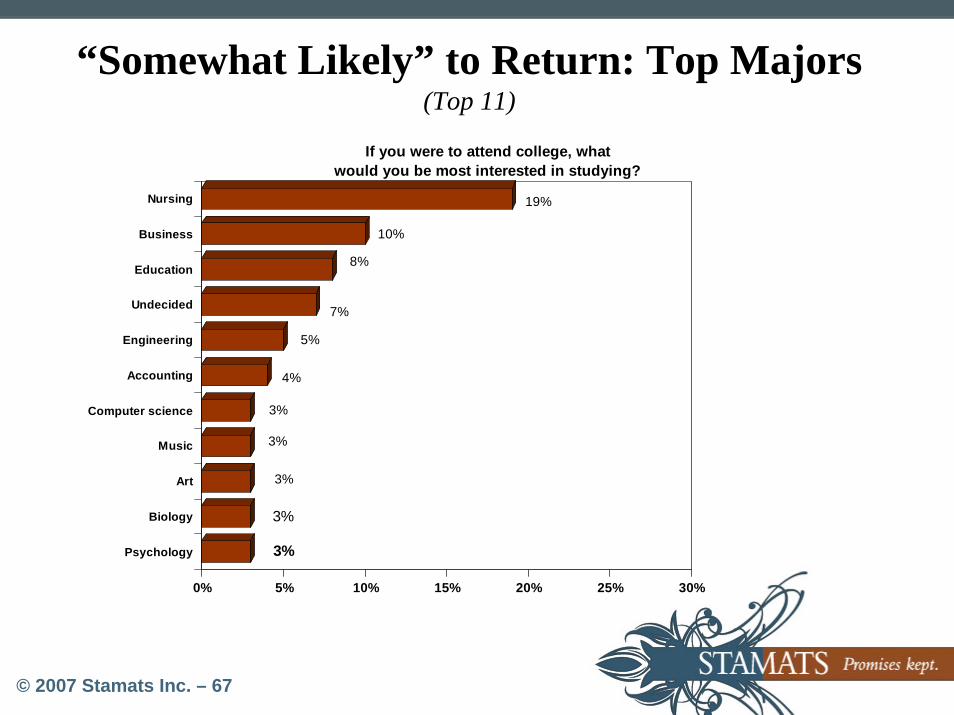
© 2007 Stamats Inc. – 67
“Somewhat Likely” to Return: Top Majors (Top 11)
3%
3%
3%
3%
3%
4%
5%
7%
8%
10%
19%
0% 5% 10% 15% 20% 25% 30%
Nursing
Business
Education
Undecided
Engineering
Accounting
Computer science
Music
Art
Biology
Psychology
If you were to attend college, what would you be most interested in studying?
© 2007 Stamats Inc. – 68
Appendix ASurvey Instrument
© 2007 Stamats Inc. – 69
Appendix BData Tabulations
© 2007 Stamats Inc. – 70
Appendix CCross Tabulations by Race
© 2007 Stamats Inc. – 1
December 14, 2007
Presented by
Becky MorehouseAssociate Vice President, Research & Marketing
Kentucky Council on Postsecondary
Education
Executive Summary: Study of Kentucky Adults With Some College
© 2007 Stamats Inc. – 2
OverviewKCPE partnered with Stamats, a higher education marketing and consulting company, to conduct a research study among Kentucky residents who had attended college but did not complete a bachelor’s degree
Primary goals:
– Determine the type of individual most likely to complete a bachelor’s degree
– Identify compelling communication messages and strategies
© 2007 Stamats Inc. – 3
Method• Stamats conducted a randomly sampled telephone survey (drawn from the
Council’s comprehensive database) in May and June of 2007
– Includes individuals with accumulated credits ranging from less than 30 to 90 or more
• A total of 1,610 surveys were conducted throughout Kentucky, stratified into four regions—Eastern, Western, Central, and Urban
– The sampling error is ± 2.4% at the 95% confidence level for the entire sample and ± 4.9% for the individual regions
• Note that response rate was slightly lower than typical for a telephone survey—completing a survey about “education needs for Kentucky colleges and universities”
© 2007 Stamats Inc. – 4
Questioning• The survey instrument, designed in collaboration with KCPE, explored the
following topics:
– Reasons for initial stop-/drop-out from college
– Factors prohibiting/impeding obtainment of a bachelor’s degree
– Motivations for students to re-enroll
– Potential college services that would increase the likelihood of re-enrollment
– Awareness of current resources available to adult students
– Overall likelihood of re-enrollment
– Majors/programs of most interest to respondents
– Class formats of most interest to respondents
© 2007 Stamats Inc. – 5
Interest in Returning to College
Results of the study suggest that there is a viable returning-to-college adult student market, but they will need convincing (and it will take time)
– Among the sample, 23% indicated they were “very likely” to re-enroll in the future—many noting it would likely be two to three years before they made the move
Another 27% said they are “somewhat likely” to re-enroll within this time frame
© 2007 Stamats Inc. – 6
Pockets of Interest
• Three segments emerged as being more receptive to continuing their education:
– Black and Hispanic adults—though the sample size must be considered
– Those that entered college within the last 10 years and that arecurrently working a white-collar profession
– Unmarried individuals with 85 or more total credit hours

© 2007 Stamats Inc. – 7
Top Majors of Interest(Top 10)
• Among students likely to re-enroll in the near future, top programs of interest include nursing, business, and education.
3%
3%
3%
3%
4%
4%
8%
8%
10%
16%
0% 5% 10% 15% 20% 25% 30%
Nursing
Business
Undecided
Education
Engineering
Accounting
Art
Computer science
Criminal justice
Early childhood/childcare
If you were to attend college, what would you be most interested in stuyding?
© 2007 Stamats Inc. – 8
Barriers
• The greatest barriers to re-entry are time and money
• Additional expected deterrents did not arise as major concerns
– Not concerned about being able to fit in at college or do well
– Access is not a barrier either. Even if it was, more than two-thirds of respondents indicated they would consider online education
© 2007 Stamats Inc. – 9
Motivators• More than 40% of respondents feel no external pressure to eventually
complete a bachelor’s degree
– Consider targeting communication to Kentucky employers. If the drive is not intrinsic to a prospective student or within their family, perhaps the added weight of a colleague, supervisor, or mentor could help create a sense of urgency among potential returners
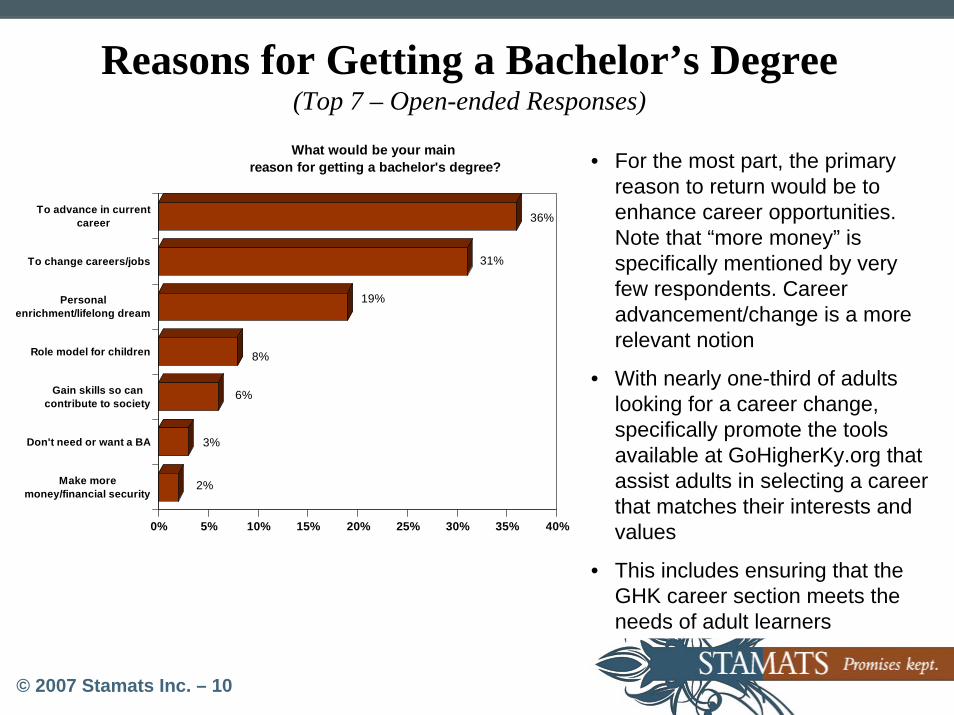
© 2007 Stamats Inc. – 10
2%
3%
6%
8%
19%
31%
36%
0% 5% 10% 15% 20% 25% 30% 35% 40%
To advance in currentcareer
To change careers/jobs
Personalenrichment/lifelong dream
Role model for children
Gain skills so cancontribute to society
Don't need or want a BA
Make moremoney/financial security
What would be your main reason for getting a bachelor's degree?
Reasons for Getting a Bachelor’s Degree (Top 7 – Open-ended Responses)
• For the most part, the primary reason to return would be to enhance career opportunities. Note that “more money” is specifically mentioned by very few respondents. Career advancement/change is a more relevant notion
• With nearly one-third of adults looking for a career change, specifically promote the tools available at GoHigherKy.org that assist adults in selecting a career that matches their interests and values
• This includes ensuring that the GHK career section meets the needs of adult learners
© 2007 Stamats Inc. – 11
Key Messages • You’ve done it before—you can do it again
– Most had solid academic standing in their first college experience
• A bachelor’s degree can dramatically increase your potential for higher income and career advancement
• You need a change– 31% say the main reason for getting a bachelor’s degree is to change their career/job
• Completing that degree is not as expensive as you think– Many overestimate, particularly of public education
• Continuing your degree will “make me feel better about myself”– Two-thirds somewhat or strongly agree with this statement
• Time management—home, work, and school—is possible and here’s how these people have done it (and how you can too)
© 2007 Stamats Inc. – 12
Most Used Mediums • General Web search for college-related sites
– Search engine marketing is an essential consideration (40% would first go to the Web to gather information about college)
– Looking for programs/majors and requirements, class schedules, and financial aid options
– 91% of adult potential returners have Internet access (67% are online daily)
• Direct contact to an institution (phone, Web, e-mail, etc.)
• Visit specific college and university Web sites
© 2007 Stamats Inc. – 13
Most Requested Services and Offerings • Receiving college credit for work experience
• Accelerated degree programs
• Financial aid programs specifically for adult part-time students
• Online learning programs
© 2007 Stamats Inc. – 14
Verbatim Comments• “Find ways to help students who already owe money to continue their education”• “It’s harder to go back once you’ve dropped out”• “The biggest concern for me is the financial aspect; they need more scholarships for the
non-traditional student”• “More financial aid for non-traditional students, look to see what the finances really are
in the household”• “Personal communication. Provide career/course placement so I don’t have to take
classes that I’ve already taken or don’t need which is a waste of time and money”• “Special grants or scholarships for non-traditional students and more open information
about them”• “I’m very happy in my life without a bachelor’s degree”• “Needs to be more availability of programs for every schedule”• “It would have been easier with additional help when I was younger, it’s too late now”
© 2007 Stamats Inc. – 15
Thank You
© 2007 Stamats Inc. – 16
We are an award-winning, nationally recognized higher education research, planning, and marketing communications company. Our mission is to help college and university
leaders achieve their most important marketing, recruiting, and fundraising goals through the creation of customized integrated marketing solutions.
Research, Planning, and Consulting Services• Image and competitive positioning studies • Tuition price elasticity studies• Alumni and donor studies• Marketing communication audits• Recruiting audits• Campus visit audits • Integrated marketing plans• Brand clarification and communication plans• Recruiting plans • Strategy development and strategic plans • Board presentations • Project-specific consulting
Creative Services• Recruiting and fundraising publications• Web site development• Virtual tours• Direct marketing strategies (search, annual fund)• Targeted e-mail marketing systems• Advertising • Creative concepting • Content management systems• Dynamic news and events calendars• Message boards/chats
About Stamats
• Offices: Richmond, San Francisco, and Cedar Rapids
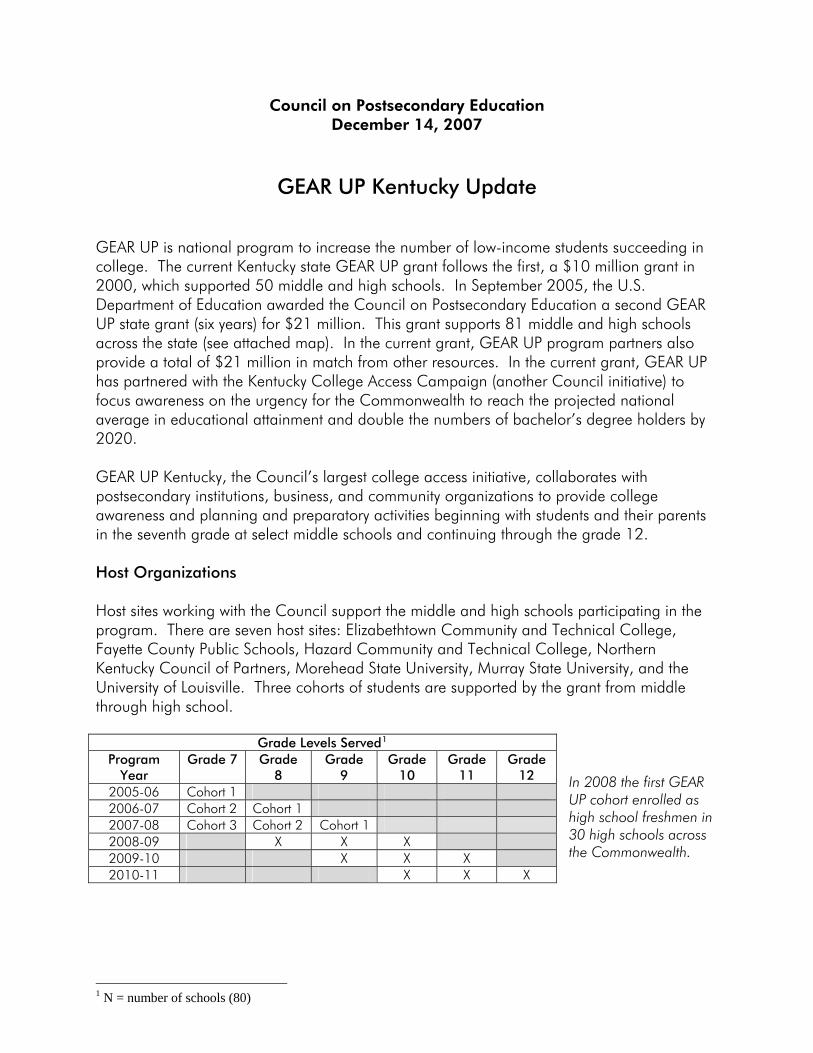
Council on Postsecondary Education December 14, 2007
GEAR UP Kentucky Update
GEAR UP is national program to increase the number of low-income students succeeding in college. The current Kentucky state GEAR UP grant follows the first, a $10 million grant in 2000, which supported 50 middle and high schools. In September 2005, the U.S. Department of Education awarded the Council on Postsecondary Education a second GEAR UP state grant (six years) for $21 million. This grant supports 81 middle and high schools across the state (see attached map). In the current grant, GEAR UP program partners also provide a total of $21 million in match from other resources. In the current grant, GEAR UP has partnered with the Kentucky College Access Campaign (another Council initiative) to focus awareness on the urgency for the Commonwealth to reach the projected national average in educational attainment and double the numbers of bachelor’s degree holders by 2020. GEAR UP Kentucky, the Council’s largest college access initiative, collaborates with postsecondary institutions, business, and community organizations to provide college awareness and planning and preparatory activities beginning with students and their parents in the seventh grade at select middle schools and continuing through the grade 12. Host Organizations Host sites working with the Council support the middle and high schools participating in the program. There are seven host sites: Elizabethtown Community and Technical College, Fayette County Public Schools, Hazard Community and Technical College, Northern Kentucky Council of Partners, Morehead State University, Murray State University, and the University of Louisville. Three cohorts of students are supported by the grant from middle through high school.
Grade Levels Served1
Program In 2008 the first GEAR UP cohort enrolled as high school freshmen in 30 high schools across the Commonwealth.
Year Grade 7 Grade
8 Grade
9 Grade
10 Grade
11 Grade
12 2005-06 Cohort 1 2006-07 Cohort 2 Cohort 1 2007-08 Cohort 3 Cohort 2 Cohort 1 2008-09 X X X 2009-10 X X X 2010-11 X X X
1 N = number of schools (80)
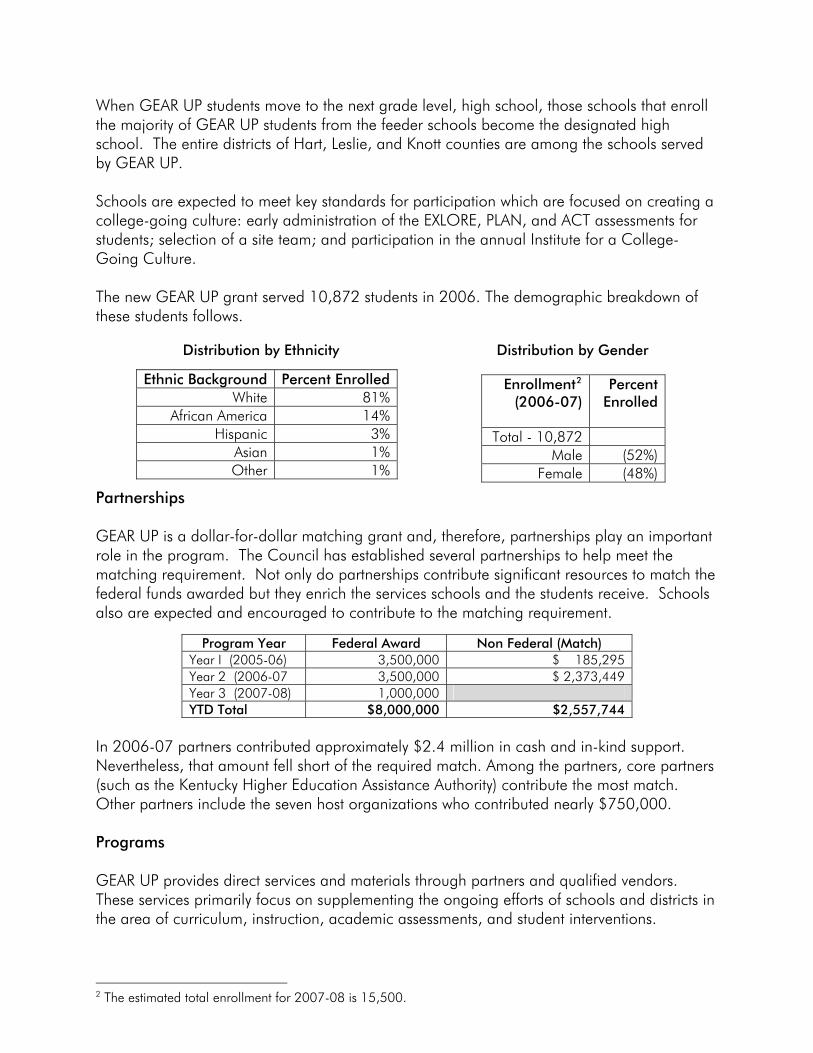
When GEAR UP students move to the next grade level, high school, those schools that enroll the majority of GEAR UP students from the feeder schools become the designated high school. The entire districts of Hart, Leslie, and Knott counties are among the schools served by GEAR UP. Schools are expected to meet key standards for participation which are focused on creating a college-going culture: early administration of the EXLORE, PLAN, and ACT assessments for students; selection of a site team; and participation in the annual Institute for a College-Going Culture. The new GEAR UP grant served 10,872 students in 2006. The demographic breakdown of these students follows. Distribution by Ethnicity Distribution by Gender
Ethnic Background Percent Enrolled
White 81% African America 14%
Hispanic 3% Asian 1% Other 1%
Enrollment2 (2006-07)
Percent Enrolled
Total - 10,872 Male (52%)
Female (48%)
Partnerships GEAR UP is a dollar-for-dollar matching grant and, therefore, partnerships play an important role in the program. The Council has established several partnerships to help meet the matching requirement. Not only do partnerships contribute significant resources to match the federal funds awarded but they enrich the services schools and the students receive. Schools also are expected and encouraged to contribute to the matching requirement.
Program Year Federal Award Non Federal (Match) Year I (2005-06) 3,500,000 $ 185,295 Year 2 (2006-07 3,500,000 $ 2,373,449 Year 3 (2007-08) 1,000,000 YTD Total $8,000,000 $2,557,744
In 2006-07 partners contributed approximately $2.4 million in cash and in-kind support. Nevertheless, that amount fell short of the required match. Among the partners, core partners (such as the Kentucky Higher Education Assistance Authority) contribute the most match. Other partners include the seven host organizations who contributed nearly $750,000. Programs GEAR UP provides direct services and materials through partners and qualified vendors. These services primarily focus on supplementing the ongoing efforts of schools and districts in the area of curriculum, instruction, academic assessments, and student interventions.
2 The estimated total enrollment for 2007-08 is 15,500.
Sample projects include: • Math and Science Partnership (University of Louisville): A project to implement new
mathematics curriculum (Bridges to Algebra and Algebra I) and student intervention (Cognitive Tutor).
• Mathematics coaching: Intensive mentoring and onsite consultation with mathematics teachers (district wide). Hart and Knott counties.
• EXPLORE and PLAN assessments administered to ninth grade students: Used to plan interventions to address specific academic weaknesses for targeted students. All GEAR UP schools administer these assessments. Teachers are provided assistance in using assessments to develop appropriate student interventions.
GEAR UP host organizations administer the project locally, providing direct services and activities for students and parents and customized instructional support in some schools. These sites provide support services for students and address specific needs identified on the assessments. GEAR UP offers a variety of enrichment activities for students to encourage and entice them to seek assistance and plan for college. The feature enrichment activities are: (1) a newly implemented e-mentoring project (a curriculum and mentor training was developed by Eastern Kentucky University), (2) health careers expositions developed by the Area Health Education Centers at UofL and the University of Kentucky, (3) College 101 workshops, and (4) the entrepreneurship after-school programs designed to connect academic learning to applications involving business startups.
Staff preparation by Yvonne Lovell
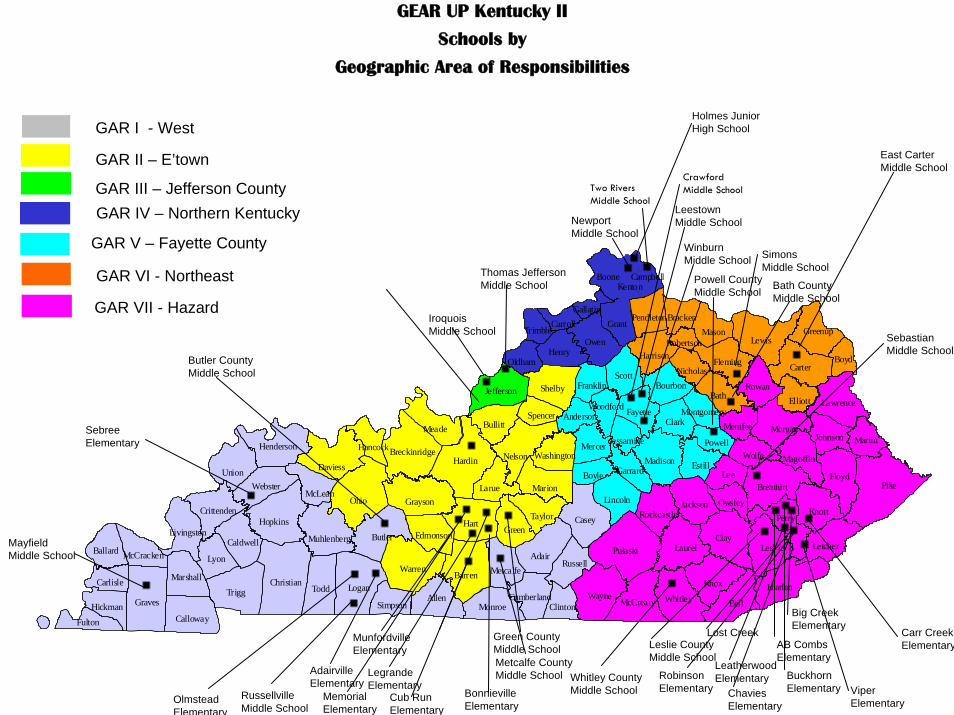
PikeOhio
ClayHart
Pulaski
Hardin
Logan
BellTrigg
Lewis
Christian
Graves
Casey
BarrenWarren
Adair
Todd Knox
Butler
Floyd
WayneH arlan
Laurel Lesl ie
Carter
Hopkins Perry
Allen
KnottGrayson
Daviess
Bath
Nelson
Owen
Union LeeBreathitt
Shelby
Whitley
Scott
Madison
Lyon
Estill
MorganMeade Bullitt
Marion
Green
Henry
Clark
Grant
Larue
Breckinridge
Letcher
Lincoln Jackson
Jefferson
Calloway
Henderson
Lawrence
McCreary
Fleming
Monroe
Taylor
Greenup
Rowan
Webster
Fayette
Boone
MuhlenbergCaldwell
RussellMarshall
Elliott
Ballard
Mason
Wolfe
Harrison
Crittenden
MercerMartin
Bourbon
Metcalfe
Magoffin
Johnson
Livingston
Fulton
McLean
Boyle Garrard
Boyd
Rockcastle
Edmonson
Pendleton
Hickman ClintonSimpson
Owsley
Powell
Carlisle
Franklin
Cumberland
Bracken
Washington
Menifee
Oldham
Spencer
McCracken
Kenton
Hancock
Nicholas
Anderson
TrimbleCarroll
Woodford
Jessamine
Campbell
Montgomery
Gallatin
Robertson
GEAR UP Kentucky II
Schools by
Geographic Area of Responsibilities
GAR I - West
GAR II – E’town
GAR III – Jefferson CountyGAR IV – Northern Kentucky
GAR V – Fayette County
GAR VI - Northeast
GAR VII - Hazard
SebastianMiddle School
Leslie CountyMiddle School
AB CombsElementary
Big CreekElementary
Buckhorn ElementaryChavies
Elementary
LeatherwoodElementary
Lost Creek
RobinsonElementary Viper
Elementary
Carr CreekElementary
Bath CountyMiddle School
East CarterMiddle School
SimonsMiddle School
Powell CountyMiddle School
Butler CountyMiddle School
Green CountyMiddle School
BonnievilleElementary
Cub RunElementary
LegrandeElementary
Memorial Elementary
MunfordvilleElementary
AdairvilleElementary
OlmsteadElementary
MayfieldMiddle School
Metcalfe CountyMiddle School
RussellvilleMiddle School
SebreeElementary
IroquoisMiddle School
Thomas JeffersonMiddle School
Two RiversMiddle School
NewportMiddle School
CrawfordMiddle School
LeestownMiddle School
WinburnMiddle School
Whitley CountyMiddle School
Holmes JuniorHigh School
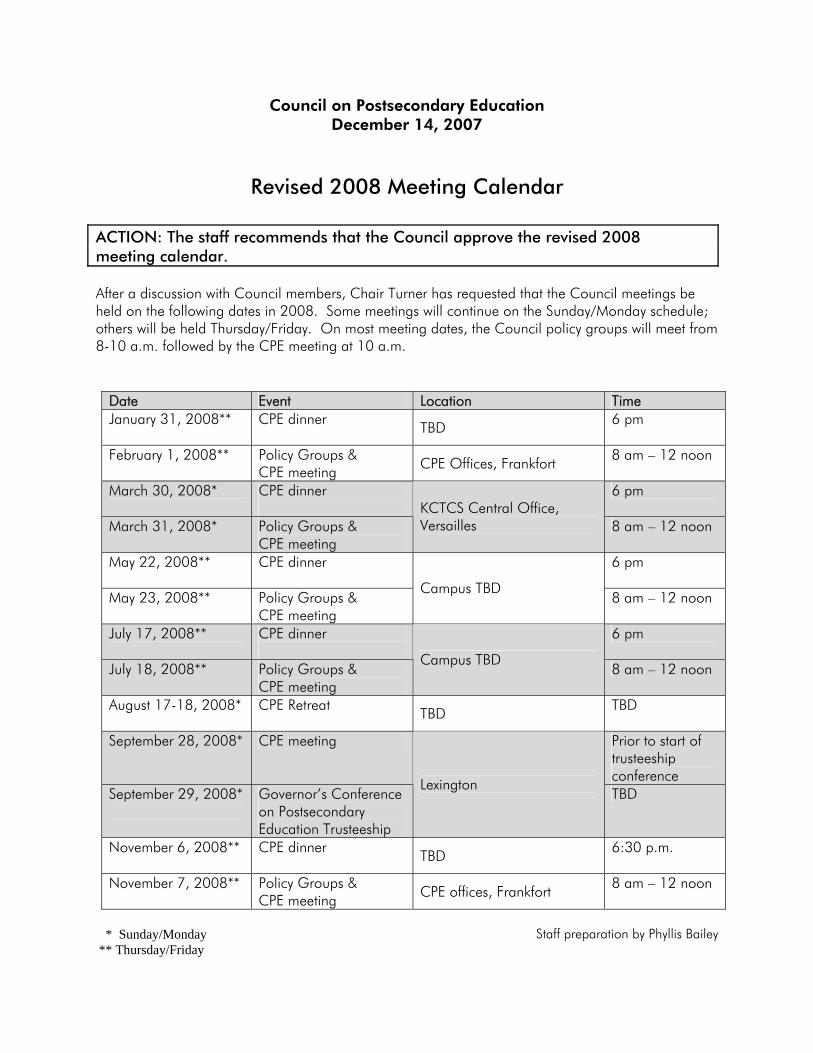
Council on Postsecondary Education December 14, 2007
Revised 2008 Meeting Calendar
ACTION: The staff recommends that the Council approve the revised 2008 meeting calendar. After a discussion with Council members, Chair Turner has requested that the Council meetings be held on the following dates in 2008. Some meetings will continue on the Sunday/Monday schedule; others will be held Thursday/Friday. On most meeting dates, the Council policy groups will meet from 8-10 a.m. followed by the CPE meeting at 10 a.m.
Date Event Location Time January 31, 2008** CPE dinner
TBD
6 pm
February 1, 2008** Policy Groups & CPE meeting CPE Offices, Frankfort
8 am – 12 noon
March 30, 2008* CPE dinner
6 pm
March 31, 2008* Policy Groups & CPE meeting
KCTCS Central Office, Versailles 8 am – 12 noon
May 22, 2008** CPE dinner
6 pm
May 23, 2008** Policy Groups & CPE meeting
Campus TBD 8 am – 12 noon
July 17, 2008** CPE dinner
6 pm
July 18, 2008** Policy Groups & CPE meeting
Campus TBD 8 am – 12 noon
August 17-18, 2008* CPE Retreat
TBD TBD
September 28, 2008* CPE meeting Prior to start of trusteeship conference
September 29, 2008*
Governor’s Conference on Postsecondary Education Trusteeship
Lexington TBD
November 6, 2008** CPE dinner
TBD 6:30 p.m.
November 7, 2008** Policy Groups & 8 am – 12 noon CPE offices, Frankfort
CPE meeting
* Sunday/Monday Staff preparation by Phyllis Bailey ** Thursday/Friday