age-related changes in total and high-density-lipoprotein cholesterol in elderly dutch men
TRANSCRIPT

Age-Related Changes in Total andHigh-Density-Lipoprotein Cholesterolin Elderly Dutch Men
Maty P. Weijenberg Msc, Edith J. M. Feskens, PhD, andDaan Kromhout, PhD, MPH
IntroductionThe importance of total and high-
density-lipoprotein (HDL) cholesterolconcentrations for coronary heart diseasein the elderly is still a subject of debate.1-9Part of the controversy may be due tochanging cholesterol concentrations withadvancing age.'0 Concentrations mea-sured in old age may not be representativeof a lifetime exposure and may thereforeattenuate associations. Total cholesteroldeclines with advancing age in elderlymen both on a cross-sectional and on alongitudinal basis."''5 It is still unclearwhether this observed decline is a conse-quence of selective survival,16 clinical orsubclinical disease,'2-'4 other unknownfactors associated with age and choles-terol concentrations,'7"8 or the agingprocess itself. HDL cholesterol concentra-tions do not seem to vary with age on across-sectional basis in elderly men.'92'Longitudinal changes in HDL cholesterolhave not specifically been reported forelderly subjects.
We studied changes in total andHDL cholesterol concentrations with agein older Dutch men both in a cross-sectional and a longitudinal setting andinvestigated whether these changes wereindependent of secular trends, selectivemortality, loss to follow-up, or changes inhealth status.
1960 cohort were still alive. In addition tothis group, a new random sample (two outof three) of all men who were bornbetween 1900 and 1920, who lived inZutphen, and who were not part of the1960 cohort were selected to take part inthe study. Both total and HDL cholesterolconcentrations were measured four timesbetween 1977/78 and 1993 (Table 1).
Lipid MeasurementsClinical examinations took place be-
tween March and June of each examina-tion year. During the 1977/78 examina-tion, information from the participantswas collected during the same months inone of either of the years. In all examina-tion years, nonfasting venous bloodsamples were taken for the analysis oftotal and HDL cholesterol. Analyses werecarried out in the standardized lipidlaboratory of the Department of HumanNutrition, Agricultural University, Wa-geningen, The Netherlands. HDL choles-terol was isolated after precipitation ofapo-lipoprotein B-containing particles byheparin-Mn2+ in 1977/7823 and by dex-tran sulphate-Mg2+ in the other years.24In 1977/78, cholesterol was determinedwith Huang's method,25 which was cali-brated on Abell-Kendall standardizedsera. In 1985, 1990, and 1993, cholesterol
Methods
Study CohortThe Zutphen Study is a longitudinal
investigation of chronic-disease risk fac-tors initiated in 1960 among middle-agedmen, born between 1900 and 1919, as theDutch contribution to the Seven Coun-tries Study.22 In 1985, 555 men from the
The authors are with the Department ofChronic Diseases and Environmental Epidemi-ology, National Institute of Public Health andEnvironmental Protection, Bilthoven, TheNetherlands.
Requests for reprints should be sent toMatty P. Weijenberg, Msc, Department ofChronic Diseases and Environmental Epidemi-ology, National Institute of Public Health andEnvironmental Protection, PO Box 1, 3720 BABilthoven, The Netherlands.
This paper was accepted October 9, 1995.
June 1996, Vol. 86, No. 6

Cholesterel and Aging
was determined enzymatically with theCHOD-PAP mono-testkit from Boeh-ringer Mannheim, Germany.2627 For totalcholesterol, standardization was realizedby using calibration sera from the LipidStandardization Laboratory, Centers forDisease Control and Prevention (Atlanta,Ga, USA) in 1977/78 and from theFoundation of Chemical Analysis QualityControl (The Netherlands) since 1985.For HDL cholesterol, calibration sera
prepared according to van der Haar andcoworkers28were used since 1985. In allfour examination rounds the deviations oftotal cholesterol concentrations from thecontrol sera were below the internationalnorm of 3%. For HDL cholesterol thedeviations from control sera were alwayslower than 10%. The combined within-and between-run coefficient of variationfor control sera was lower than 3% forboth total and high-density cholesterol atthe time of the analyses in all fourexamination periods. In 1977/78, 1985,and 1990 cholesterol concentrations weremeasured in serum and in 1993 in EDTAplasma. Plasma values were multiplied by1.03029 to make them comparable to theserum values in the other examinationyears, because plasma may be diluted bythe addition of the anticoagulant EDTA.29Because of the systematic lower concentra-tions of total cholesterol in 1993 com-
pared with the concentrations in the otherexamination years, even after adjustmentof the values, plasma from a randomsample of 50 men was reanalyzed in July1994 with the same method used in the1985, 1990, and 1993 examinations.
Measurement ofOther Varables
In 1985 and 1990 extensive informa-tion on use of cholesterol-lowering medi-cation and prescribed diets for a highcholesterol concentration was obtainedthrough a standardized questionnaire. In1993 information was only collected on
prescribed diets. In 1977/78, no suchinformation was collected. Note that onlyvery few men were on cholesterol-lowering therapy during the examinations(25 in 1985, 10 in 1990, and 8 in 1993).
In 1977/78, 1985, and 1990 informa-tion on the presence or a history of anginapectoris or myocardial infarction was
obtained through the Dutch translation ofthe Rose questionnaire23 History of diabe-tes mellitus and any form of cancer was
reported with a standardized question-naire. All the information was verifiedwith hospital discharge data and informa-tion from the subjects' general practitio-
ners. In 1993 additional information on
the presence or history of these diseaseswas obtained with a self-administeredquestionnaire.
Information on self-rated health wascollected in 1985, 1990, and 1993 with thequestion: "How do you feel?" The fouranswer categories were "healthy," "ratherhealthy," "moderately healthy," and "nothealthy." This information was not col-lected in 1977/78. Low self-rated healthhas been associated with an increased riskof mortality independent of traditionalrisk factors and a history of chronic
diseases.31 It is thought to be an indicatorof underlying (subclinical) disease, whichmay in turn be accompanied by loweredtotal cholesterol concentrations.
Statistical Methods
To account for selective survival or
selective participation and the possibilitythat the total cholesterol concentration is
lowered in diseased people,12 we analyzedthree subgroups of participants. The first
group comprised the total populationof men who participated in at least one
American Journal of Public Health 799
TABLE 1-Population Size and Participation Rate, by Examination Year: TheZutphen Study, 1977/78 through 1993
1977/78 1985 1990 1993
No. men invited 671 1266 721 544No. participated 611 939 560 390Participation rate, % 91 74 78 72No. men wih total and HDL 571 a 885 555 345
cholesterol measurements
aHDL cholesterol concentrations were available for 570 men.
TABLE 2-Mean Values for Baseline Characteristics in All Men and in Subgroupsof the Total Study Population, by Examination Period: The ZutphenStudy, 1977/78 through 1993
Mean (SD) Values
"Healthy"Men Who Men Who
Participated ParticipatedExamination Maximum in Each Exam- in Each Exam-
Year No. Men All Mena ination (n = 135) inationb (n = 64)
Age, y
1977/78 571 66.3 (5.2) 63.7 (4.1) 63.5 (4.2)1985 885 71.5 (5-3) 70.7 (4.1) 70.5 (4.2)1990 555 75.1 (4.7) 75.7 (4.1) 75.5 (4.2)1993 345 77.8 (4.4) 78.7 (4.1) 78.5 (4.2)
Total cholesterol, mmol/L1977/78 571 5.90 (1.06) 5.94 (0.97) 5.96 (1.00)1985 885 6.10 (1.11) 6.10 (0.99) 6.13 (1.06)1990 555 6.07 (1.13) 6.08 (1.01) 6.07 (1.05)1993 345 5.56 (1.06) 5.43 (1.06) 5.47 (1.00)
HDL cholesterol, mmol/L1977/78 570 1.23 (0.31) 1.20 (0.28) 1.26 (0.29)1985 885 1.12 (0.29) 1.10 (0.27) 1.12 (0.27)1990 555 1.16(0.31) 1.10(0.30) 1.13(0.31)1993 345 1.20 (0.35) 1.13 (0.35) 1.18 (0.36)
aMean values are based on the maximum number of men.bThese men did not have and had never had angina pectoris, myocardial infarction, diabetes
mellitus, or cancer; did not use and had never used cholesterol-lowerng medication or been on aprescribed diet; and rated themselves to be "healthy" or "rather healthy."
June 1996, Vol. 86, No. 6

WeUenberg et al.
of the examination periods (n = 1118).Another group consisted of those men
who participated in each examination(n = 135). Finally we selected a "healthy"group, defined as those men from theformer group who did not have a historyof myocardial infarction, angina pectoris,diabetes mellitus, or cancer; had never
been on cholesterol-lowering medicationor a prescribed diet; and rated themselvesas "healthy" or "rather healthy" (n = 64).
Statistical analyses were carried outwith the SAS program (version 6.09,1989). All tests were two sided. A paired ttest was conducted to evaluate the differ-ence between newly analyzed total choles-terol values and the original values fromthe random sample of 50 men. Cross-sectional analyses were performed withlinear regression analysis of total or HDLcholesterol on age in each of the examina-tion years. The assumption of linearitywas checked visually by using the plots ofthe residuals by age. To perform thelongitudinal analyses the repeated mea-
sures of cholesterol were related to ageand time effects with a model that allowedfor two sources of error: (1) withinsubjects between occasions and (2) be-tween subjects. Age- and time-relatedchanges in total and HDL cholesterolwere estimated from the model. This wasdone with the SAS Proc Mixed Proce-dure, which deals with unbalanced dataand assumes missing observations are
missing at random.32
Results
Total cholesterol concentrations in-creased between 1977/78 and 1985 andthereafter decreased with the largest dropobserved in the last 3 years (Table 2). Thisprogression was observed for all men, as
well as for men who participated in eachexamination and for the healthy men whoparticipated in each examination. Thedrop in total cholesterol between 1990and 1993 was not due to measurementerror. New analyses for plasma totalcholesterol from a random sample of 50men in 1994 revealed that the mean
concentration in 1994 was not significantlydifferent from the mean concentration oftotal cholesterol analyzed in 1993 (5.54mmol/L [SD = 0.90] in 1994 vs 5.51mmol/L [SD = 0.88] in 1993; P = .15).HDL cholesterol exhibited a decreasebetween 1977/78 and 1985 and a slightincrease over the later examination years
(Table 2). These results were similaramong the three groups ofmen. When thebirth cohorts were examined separately,the changes in total and HDL cholesterolbetween examination years were gener-ally similar with the exception of an
earlier drop in total cholesterol for theoldest birth cohort compared with the twoyounger cohorts (Figures 1 and 2).Whether this is an age-related change or a
secular change with time cannot bededucted from the figure.
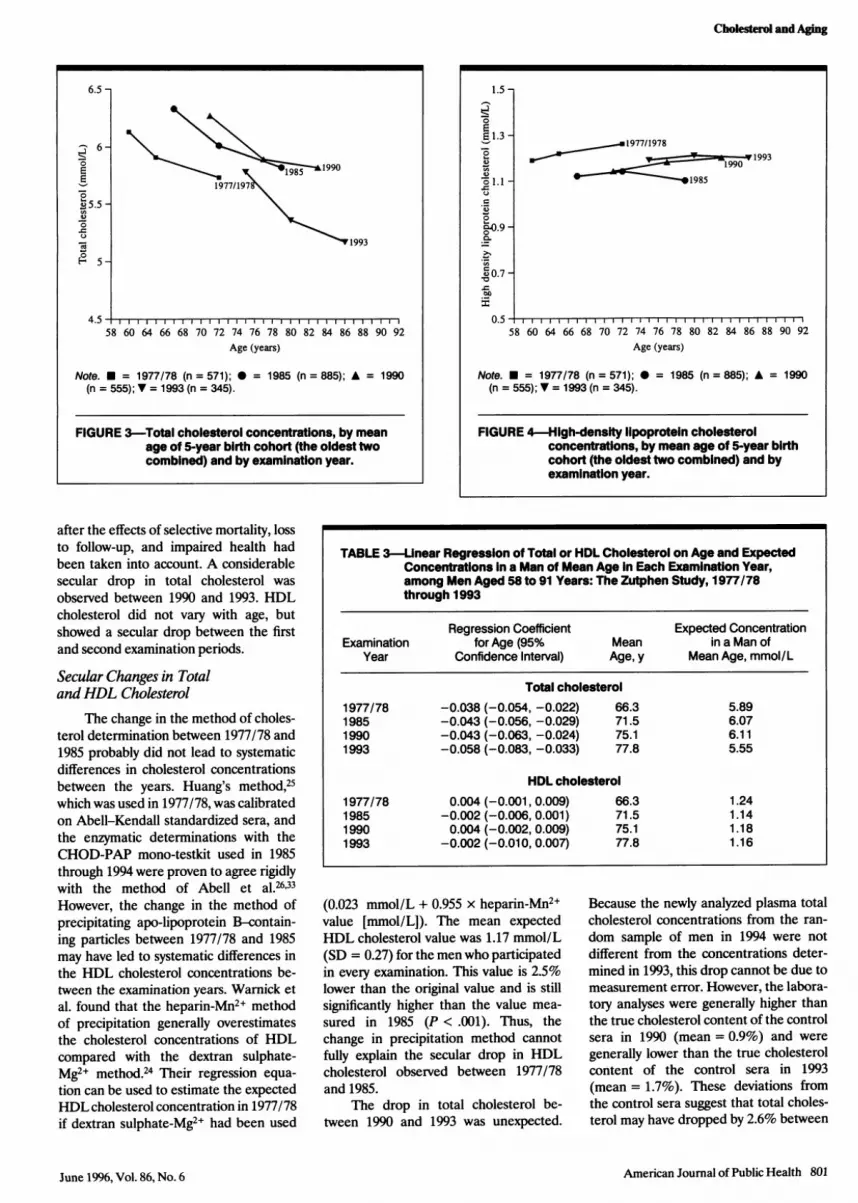
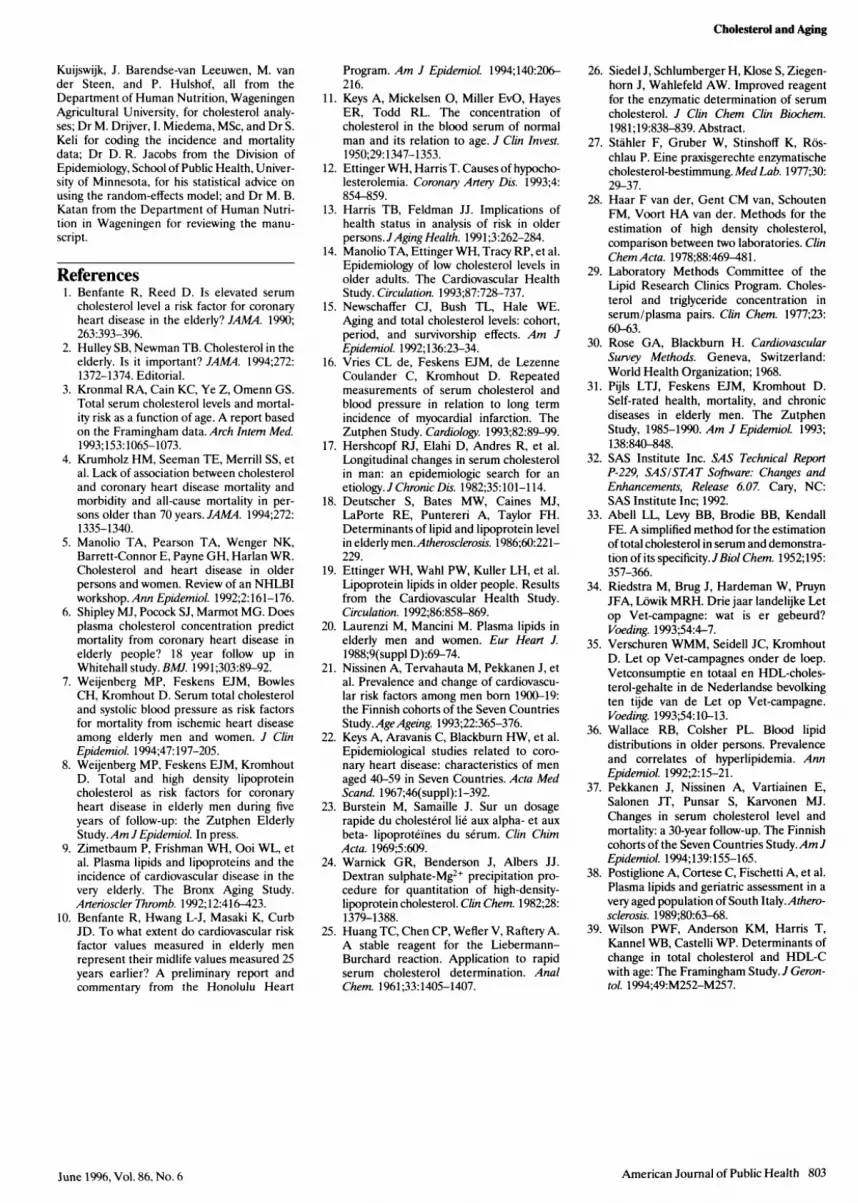
On a cross-sectional basis, total cho-lesterol diminished significantly with age
in every examination year (Figures 3 and 4and Table 3). The decrease tended to bestronger in the more recent examinations;it ranged from a decrease of 0.04 mmol/La year in 1977/78 to a decrease of 0.06mmol/L a year in 1993. High-density-lipoprotein cholesterol did not changeconsistently with age in any of the exami-nation rounds.
On a longitudinal basis, total choles-terol decreased by 0.04 mmol/L a year
with increasing age of the men (Table 4).There was no evidence for a strongerage-related change in the older birthcohorts compared with the younger ones
(not shown). Total cholesterol increasedbetween 1977/78 and 1985 and between1985 and 1990. Between 1990 and 1993total cholesterol decreased by 0.14mmol/L a year solely due to a periodeffect. HDL cholesterol did not changewith age. Between 1977/78 and 1985HDL cholesterol decreased by 0.02mmol/L a year. These results were essen-
tially the same for the healthy men whoparticipated in every examination period.
DiscussionAmong men aged 58 to 91 years in
our study, total cholesterol decreased withage by 0.04 mmol/L a year, and thisdecrease was observed in both cross-
sectional and longitudinal analyses even
800 American Journal of Public Health
6.5
6 -
0
.0
0
45.
1977/1978 1985 1990 1993Examination period
Note. M = 1915 through 1920 (n = 59); 0 = 1910 through 1914(n = 50); A = 1900 through 1909 (n = 26).
FIGURE 1-Total cholesterol concentrations, byexamination year and by birth cohort(n = 135).
1.5 -
02E 1.3 -
.0
C
00.7uQ
0.51977/1978 1985 1990 1993
Examination period
Note. U = 1915 through 1920 (n = 59); 0 = 1910 through 1914(n = 50); A = 1900 through 1909 (n = 26).
FIGURE 2-HIgh-density lipoprotein cholesterolconcentrations, by examination year and bybirth cohort (n = 135).
June 1996, Vol. 86, No. 6
Cholesterol and Aging
after the effects of selective mortality, lossto follow-up, and impaired health hadbeen taken into account. A considerablesecular drop in total cholesterol was
observed between 1990 and 1993. HDLcholesterol did not vary with age, butshowed a secular drop between the firstand second examination periods.
Secular Changes in TotalandHDL Cholesterol
The change in the method of choles-terol determination between 1977/78 and1985 probably did not lead to systematicdifferences in cholesterol concentrationsbetween the years. Huang's method,25which was used in 1977/78, was calibratedon Abell-Kendall standardized sera, andthe enzymatic determinations with theCHOD-PAP mono-testkit used in 1985through 1994 were proven to agree rigidlywith the method of Abell et al.26'33However, the change in the method ofprecipitating apo-lipoprotein B-contain-ing particles between 1977/78 and 1985may have led to systematic differences inthe HDL cholesterol concentrations be-tween the examination years. Wamick etal. found that the heparin-Mn2+ methodof precipitation generally overestimatesthe cholesterol concentrations of HDLcompared with the dextran sulphate-Mg2+ method.24 Their regression equa-tion can be used to estimate the expectedHDL cholesterol concentration in 1977/78if dextran sulphate-Mg2+ had been used
(0.023 mmol/L + 0.955 x heparin-Mn2+value [mmol/L]). The mean expectedHDL cholesterol value was 1.17 mmol/L(SD = 0.27) for the men who participatedin every examination. This value is 2.5%lower than the original value and is stillsignificantly higher than the value mea-
sured in 1985 (P < .001). Thus, thechange in precipitation method cannotfully explain the secular drop in HDLcholesterol observed between 1977/78and 1985.
The drop in total cholesterol be-tween 1990 and 1993 was unexpected.
Because the newly analyzed plasma totalcholesterol concentrations from the ran-
dom sample of men in 1994 were notdifferent from the concentrations deter-mined in 1993, this drop cannot be due tomeasurement error. However, the labora-tory analyses were generally higher thanthe true cholesterol content of the controlsera in 1990 (mean = 0.9%) and were
generally lower than the true cholesterolcontent of the control sera in 1993(mean = 1.7%). These deviations fromthe control sera suggest that total choles-terol may have dropped by 2.6% between
American Journal of Public Health 801June 1996, Vol. 86, No. 6
6.5 -
01 19901977/197
±5.5-
1993
5.
4.5 l
58 60 64 66 68 70 72 74 76 78 80 82 84 86 88 90 92Age (years)
Note. = 1977/78 (n = 571); 0 = 1985 (n = 885); A = 1990(n = 555); v = 1993 (n = 345).
FIGURE 3-Total cholesterol concentrations, by meanage of 5-year birth cohort (the oldest twocombined) and by examination year.
1.5 -
0
1.3 -....1977/1978Q w0,99 9 3
0~0.-
00.70.
._
58 60 64 66 68 70 72 74 76 78 80 82 84 86 88 90 92
Age (years)
Note. * = 1977/78 (n = 571); * = 1985 (n = 885); A = 1990(n = 555); V = 1993 (n = 345).
FIGURE 4-High-density lipoprotein cholesterolconcentrations, by mean age of 5-year birthcohort (the oldest two combined) and byexamination year.
TABLE 3-Unear Regression of Total or HDL Cholesterol on Age and ExpectedConcentrations In a Man of Mean Age In Each Examination Year,among Men Aged 58 to 91 Years: The Zutphen Study, 1977/78through 1993
Regression Coefficient Expected ConcentrationExamination for Age (95% Mean in a Man of
Year Confidence Interval) Age, y Mean Age, mmol/L
Total cholesterol1977/78 -0.038 (-0.054, -0.022) 66.3 5.891985 -0.043 (-0.056, -0.029) 71.5 6.071990 -0.043 (-0.063, -0.024) 75.1 6.111993 -0.058 (-0.083, -0.033) 77.8 5.55
HDL cholesterol1977/78 0.004 (-0.001, 0.009) 66.3 1.241985 -0.002 (-0.006,0.001) 71.5 1.141990 0.004 (-0.002,0.009) 75.1 1.181993 -0.002 (-0.010,0.007) 77.8 1.16

WeUenberg et al.
1990 and 1993 due to measurement error
alone. The cholesterol determinations forthe high-density lipoproteins were suscep-
tible to the same measurement errors as
the total cholesterol determinations. Be-cause there were no changes in HDLcholesterol concentrations between 1990and 1993, this implies that measurementerror alone cannot explain the drop intotal cholesterol concentrations in thesame period. Dietary changes among menof the cohort during 1990 and 1993 mayalso partly explain the decline in the totalcholesterol concentration in the men. In1991, 1992, and 1993 Fat Watch cam-
paigns were carried out on a national levelin The Netherlands.34 Although it remainsdifficult to establish the effect of suchmass media community intervention pro-grams, it has been estimated that thisprogram may have caused a drop of 3.5%in total cholesterol from 5.7 mmol/L to5.5 mmol/L in the Dutch populationbetween 1987 and 1992.35 If we assume
that possible changes in diet in thepresent cohort also resulted in a 3.5%decline in total cholesterol, together withthe possible difference in measurement oftotal cholesterol (3.5% + 2.6% = 6.1%),this may explain most of the 6.7% (0.135mmol/L per year) secular drop in thetotal cholesterol concentration observedin just 3 years in the present study.
Age-Related Changes in TotalandHDL Cholesterol
Our cross-sectional analyses re-
vealed that among men over 58 years of
age total cholesterol diminished withincreasing age. The percent decline intotal cholesterol estimated from regres-
sion analysis amounted to 20% for menaged 72 to 92 years. Newschaffer et al.observed a 21% drop among both men
and women between 75 and 95 years ofage.'5 An increased age-related drop withadvancing age was observed in otherstudies among elderly men.'5"W21A In thepresent study, the effect also tended to bestronger in the later examination periodsand possibly with increasing age of thepopulation. These cross-sectional observa-tions of declining total cholesterol concen-trations with age may, however, have beenconfounded by selective survival of oldermen with lower cholesterol concentra-tions.'6
Our longitudinal analyses also showedthat total cholesterol decreases with age.The magnitude of the decline was compa-rable to the cross-sectional one (0.04mmol/L per year), and the percent de-cline was 15%. The results were similarfor men who participated in at least oneexamination and for men who partici-pated in every examination, which showsthat selective survival or participation didnot affect our results. Newschaffer et al.reported a longitudinal decline of 9%among men and women between 75 and95 years of age.'5
Total cholesterol concentrations are
known to be reduced in people withclinical or subclinical disease, and there isevidence that this is a consequence of a
host's inflammatory response.'2 Because
there is generally increasing morbiditywith advancing age in older people,'3,37 itis plausible that clinical or subclinicaldisease led to the decrease in totalcholesterol with age in this study. How-ever, the decline in total cholesterol withage was still of the same magnitude in thesubgroup ofmen who appeared to be andfelt healthy, were not on cholesterol-lowering medication or prescribed diet,and participated in every examinationyear. Similar observations were made inthe Honolulu Heart Program cohort ofmen aged 70 to 90 years.'0 Possibly otherfactors are involved. Metabolic and hor-monal changes with advancing age may
play a role by reducing the absorption ofdietary determinants of cholesterol, thusleading to reduced cholesterol concentra-tions in the blood.'8
Confirming earlier findings fromcross-sectional studies,'921,36,38 HDL cho-lesterol did not vary with age in thecross-sectional analyses. Wilson and co-
workers39 recently reported that HDLcholesterol declined by 0.07 mmol/Lbetween 1979 and 1983 among men
initially aged 65 to 79 years in theFramingham Study. However, they didnot take into account possible time-related changes in cholesterol concentra-tions. Moreover, the aim of their studywas to investigate the determinants ofchange in cholesterol concentrations andnot to specifically described longitudinalchanges with advancing age. Our report isthe first on longitudinal changes in HDLcholesterol concentrations with age inelderly men in which time- and age-related changes have been disentangled.It shows no longitudinal changes in HDLcholesterol with increasing age.
Conclusion
Our study shows that total choles-terol diminishes with age in elderly menboth on a cross-sectional and on a
longitudinal basis, whereas HDL choles-terol does not vary with age in any way. Asecular drop in total cholesterol wasobserved between 1990 and 1993, and thisgroup will be followed to see whether thissecular reduction is sustained. O
AcknowledgmentsThis study was supported by grants from TheNetherlands Prevention Foundation and theNational Institute on Aging, Bethesda, Md.
We thank the field-work team in Zut-phen, especially Dr E. B. Bosschieter and DrB. P. M. Bloemberg; C. de Lezenne Coulander,MSc, for data management; H. Verheij, Z.
802 American Journal of Public Health
TABLE 4-Estimated Mean Changes In Total and HDL Cholesterol per Year withAge and between Examination Rounds, for All Men Aged 58 to 91Years and "Healthy" Men: The Zutphen Study, 1977/78 through 1993
Mean Change (95% Confidence Interval)
All Men Who Parti- "Healthy" Men Whocipated in at Least Participated in Each
Period of Change One Examinationa Examination (n = 64)b
Total cholesterolWith age -0.043 (-0.054, -0.032) -0.040 (-0.094, 0.014)Between 1977/78 and 1985 0.066 (0.052, 0.081) 0.065 (0.005, 0.124)Between 1985 and 1990 0.029 (0.012, 0.045) 0.028 (-0.037, 0.092)Between 1990 and 1993 -0.135 (-0.164, -0.106) -0.159 (-0.239, -0.079)
HDL cholesterolWith age -0.000 (-0.003, 0.003) 0.010 (-0.007, 0.026)Between 1977/78 and 1985 -0.016 (-0.020, -0.011) -0.029 (-0.047, 0.011)Between 1985 and 1990 0.007 (0.003, 0.012) -0.007 (-0.027, 0.190)Between 1990 and 1993 0.011 (0.003, 0.019) 0.007 (-0.018, 0.032)
aFor number of participants, see Table 2.bFor definition of "healthy," see Table 2.
June 1996, Vol. 86, No. 6
Cholesterol and Aging
Kuijswijk, J. Barendse-van Leeuwen, M. vander Steen, and P. Hulshof, all from theDepartment of Human Nutrition, WageningenAgricultural University, for cholesterol analy-ses; Dr M. Drijver, I. Miedema, MSc, and Dr S.Keli for coding the incidence and mortalitydata; Dr D. R. Jacobs from the Division ofEpidemiology, School of Public Health, Univer-sity of Minnesota, for his statistical advice onusing the random-effects model; and Dr M. B.Katan from the Department of Human Nutri-tion in Wageningen for reviewing the manu-script.
References1. Benfante R, Reed D. Is elevated serum
cholesterol level a risk factor for coronaryheart disease in the elderly? JAMA. 1990;263:393-396.
2. Hulley SB, Newman TB. Cholesterol in theelderly. Is it important? JAMA. 1994;272:1372-1374. Editorial.
3. Kronmal RA, Cain KC, Ye Z, Omenn GS.Total serum cholesterol levels and mortal-ity risk as a function of age. A report basedon the Framingham data. Arch Intem Med.1993;153:1065-1073.
4. Krumholz HM, Seeman TE, Merrill SS, etal. Lack of association between cholesteroland coronary heart disease mortality andmorbidity and all-cause mortality in per-sons older than 70 years. JAAL4. 1994;272:1335-1340.
5. Manolio TA, Pearson TA, Wenger NK,Barrett-Connor E, Payne GH, Harlan WR.Cholesterol and heart disease in olderpersons and women. Review of an NHLBIworkshop. Ann Epidemiol. 1992;2:161-176.
6. Shipley MJ, Pocock SJ, Marmot MG. Doesplasma cholesterol concentration predictmortality from coronary heart disease inelderly people? 18 year follow up inWhitehall study. BMJ. 1991;303:89-92.
7. Weijenberg MP, Feskens EJM, BowlesCH, Kromhout D. Serum total cholesteroland systolic blood pressure as risk factorsfor mortality from ischemic heart diseaseamong elderly men and women. J ClinEpidemiol. 1994;47:197-205.
8. Weijenberg MP, Feskens EJM, KromhoutD. Total and high density lipoproteincholesterol as risk factors for coronaryheart disease in elderly men during fiveyears of follow-up: the Zutphen ElderlyStudy.Am JEpidemiol. In press.
9. Zimetbaum P, Frishman WH, Ooi WL, etal. Plasma lipids and lipoproteins and theincidence of cardiovascular disease in thevery elderly. The Bronx Aging Study.Arterioscler Thromb. 1992;12:416-423.
10. Benfante R, Hwang L-J, Masaki K, CurbJD. To what extent do cardiovascular riskfactor values measured in elderly menrepresent their midlife values measured 25years earlier? A preliminary report andcommentary from the Honolulu Heart
Program. Am J Epidemiol. 1994;140:206-216.
11. Keys A, Mickelsen 0, Miller EvO, HayesER, Todd RL. The concentration ofcholesterol in the blood serum of normalman and its relation to age. J Clin Invest.1950;29:1347-1353.
12. Ettinger WH, Harris T. Causes of hypocho-lesterolemia. Coronary Artery Dis. 1993;4:854-859.
13. Harris TB, Feldman JJ. Implications ofhealth status in analysis of risk in olderpersons.JAging Health. 1991;3:262-284.
14. Manolio TA, Ettinger WH, Tracy RP, et al.Epidemiology of low cholesterol levels inolder adults. The Cardiovascular HealthStudy. Circulation. 1993;87:728-737.
15. Newschaffer CJ, Bush TL, Hale WE.Aging and total cholesterol levels: cohort,period, and survivorship effects. Am JEpidemiol. 1992;136:23-34.
16. Vries CL de, Feskens EJM, de LezenneCoulander C, Kromhout D. Repeatedmeasurements of serum cholesterol andblood pressure in relation to long termincidence of myocardial infarction. TheZutphen Study. Cardiology. 1993;82:89-99.
17. Hershcopf RJ, Elahi D, Andres R, et al.Longitudinal changes in serum cholesterolin man: an epidemiologic search for anetiology.J Chronic Dis. 1982;35:101-114.
18. Deutscher S, Bates MW, Caines MJ,LaPorte RE, Puntereri A, Taylor FH.Determinants of lipid and lipoprotein levelin elderly men.Atherosclerosis. 1986;60:221-229.
19. Ettinger WH, Wahl PW, Kuller LH, et al.Lipoprotein lipids in older people. Resultsfrom the Cardiovascular Health Study.Circulation. 1992;86:858-869.
20. Laurenzi M, Mancini M. Plasma lipids inelderly men and women. Eur Heart J.1988;9(suppl D):69-74.
21. Nissinen A, Tervahauta M, Pekkanen J, etal. Prevalence and change of cardiovascu-lar risk factors among men born 1900-19:the Finnish cohorts of the Seven CountriesStudy.AgeAgeing. 1993;22:365-376.
22. Keys A, Aravanis C, Blackburn HW, et al.Epidemiological studies related to coro-nary heart disease: characteristics of menaged 40-59 in Seven Countries. Acta MedScand. 1967;46(suppl):1-392.
23. Burstein M, Samaille J. Sur un dosagerapide du cholesterol lie aux alpha- et auxbeta- lipoproteines du serum. Clin ChimActa. 1969;5:609.
24. Warnick GR, Benderson J, Albers JJ.Dextran sulphate-Mg2+ precipitation pro-cedure for quantitation of high-density-lipoprotein cholesterol. Clin Chem. 1982;28:1379-1388.
25. Huang TC, Chen CP, Wefler V, Raftery A.A stable reagent for the Liebermann-Burchard reaction. Application to rapidserum cholesterol determination. AnalChem. 1961;33:1405-1407.
26. Siedel J, Schlumberger H, Klose S, Ziegen-horn J, Wahlefeld AW. Improved reagentfor the enzymatic determination of serumcholesterol. J Clin Chem Clin Biochem.1981;19:838-839. Abstract.
27. Stahler F, Gruber W, Stinshoff K, Ros-chlau P. Eine praxisgerechte enzymatischecholesterol-bestimmung. MedLab. 1977;30:29-37.
28. Haar F van der, Gent CM van, SchoutenFM, Voort HA van der. Methods for theestimation of high density cholesterol,comparison between two laboratories. ClinChemActa. 1978;88:469-481.
29. Laboratory Methods Committee of theLipid Research Clinics Program. Choles-terol and triglyceride concentration inserum/plasma pairs. Clin Chem. 1977;23:60-63.
30. Rose GA, Blackburn H. CardiovascularSurvey Methods. Geneva, Switzerland:World Health Organization; 1968.
31. Pijls LTJ, Feskens EJM, Kromhout D.Self-rated health, mortality, and chronicdiseases in elderly men. The ZutphenStudy, 1985-1990. Am J EpidemioL 1993;138:840-848.
32. SAS Institute Inc. SAS Technical ReportP-229, SAS/STAT Software: Changes andEnhancements, Release 6.07. Cary, NC:SAS Institute Inc; 1992.
33. Abell LL, Levy BB, Brodie BB, KendallFE. A simplified method for the estimationof total cholesterol in serum and demonstra-tion of its specificity.JBiol Chem. 1952;195:357-366.
34. Riedstra M, Brug J, Hardeman W, PruynJFA, Lowik MRH. Drie jaar landelijke Letop Vet-campagne: wat is er gebeurd?Voeding. 1993;54:4-7.
35. Verschuren WMM, Seidell JC, KromhoutD. Let op Vet-campagnes onder de loep.Vetconsumptie en totaal en HDL-choles-terol-gehalte in de Nederlandse bevolkingten tijde van de Let op Vet-campagne.Voeding. 1993;54:10-13.
36. Wallace RB, Colsher PL. Blood lipiddistributions in older persons. Prevalenceand correlates of hyperlipidemia. AnnEpidemiol. 1992;2:15-21.
37. Pekkanen J, Nissinen A, Vartiainen E,Salonen JT, Punsar S, Karvonen MJ.Changes in serum cholesterol level andmortality: a 30-year follow-up. The Finnishcohorts of the Seven Countries Study.Am JEpidemiol. 1994;139:155-165.
38. Postiglione A, Cortese C, Fischetti A, et al.Plasma lipids and geriatric assessment in avery aged population of South Italy.Athero-sclerosis. 1989;80:63-68.
39. Wilson PWF, Anderson KM, Harris T,Kannel WB, Castelli WP. Determinants ofchange in total cholesterol and HDL-Cwith age: The Framingham Study. J Geron-tol. 1994;49:M252-M257.
June 1996, Vol. 86, No. 6 American Journal of Public Health 803