advertising effectiveness
TRANSCRIPT
ADVERTISING EFFECTIVENESS: THE ROLE OF CONTENT
Inauguraldissertation
zur
Erlangung des Doktorgrades
der
Wirtschafts- und Sozialwissenschaftlichen Fakultät
der
Universität zu Köln
2017
vorgelegt von
M. Sc. Maren Becker
aus
Aachen

Referent : Prof. Dr. Werner Reinartz
Korreferent : Prof. Dr. Hernán A. Bruno
Tag der Promotion : 19. Mai 2017
I
CONTENTS
LIST OF FIGURES ....................................................................................................................... IV
LIST OF TABLES .......................................................................................................................... V
Introduction .............................................................................................................................. 1
Summary of Dissertation Projects ......................................................................................... 4
References Introduction and Summaries .................................................................................... 9
PAPER I: COMMUNICATING BRANDS IN TV ADVERTISING ..................................... 11
Abstract ................................................................................................................................... 11
2.1 Advertising Effectiveness........................................................................................... 15
2.2 Impact of Content on Advertising Effectiveness ....................................................... 16
3.1 Customer-Based Brand Equity ................................................................................... 17
3.2 Brand Communication in Advertising ....................................................................... 18
4.1 Dynamic Advertising Response Model ...................................................................... 21
4.2 Composition of Branding Components ...................................................................... 23 4.3 Controlling for Endogeneity: Advertising and Price .................................................. 24
6.1 Advertising Model Data ............................................................................................. 27
6.2 Advertising Campaign Data ....................................................................................... 28
7.1 Advertising Response Model ..................................................................................... 32 7.2 Importance of Branding Cues and Identifying Branding Components ...................... 33 7.3 Moderating Effect of Brand Communication on Advertising Effectiveness ............. 37 7.4 Analyzing the Brand Communication Strategy of Different Brands ......................... 38 7.5 Robustness Checks ..................................................................................................... 41
REFERENCES PAPER I ................................................................................................................ 47
APPENDIX PAPER I ................................................................................................................... 51
II
PAPER II: DOES IT PAY TO BE REAL? UNDERSTANDING AUTHENTICITY IN TV
ADVERTISING .................................................................................................. 57
Abstract ................................................................................................................................... 57
2.1 The Effect of Advertising on Sales ............................................................................ 61 2.2 Effects of Advertising Content ................................................................................... 61
4.1 Preserving the Brand Essence .................................................................................... 65
4.2 Honoring Brand Heritage ........................................................................................... 66 4.3 Showing a Realistic Plot............................................................................................. 66
4.4 Presenting a Credible, Unexaggerated Advertising Message .................................... 68
5.1 Market Data ................................................................................................................ 69
5.2 Operationalization ...................................................................................................... 71 5.3 Coding Procedure ....................................................................................................... 73
6.1 Step I: Measuring Dynamic Advertising Effectiveness ............................................. 75 6.2 Controlling for Endogeneity in Advertising and Price ............................................... 76
6.3 Step II: Measuring the Impact of Authenticity ........................................................... 78
7.1 Short- and Long-Term Effects of Advertising on Sales (1st step) .............................. 79
7.2 Explaining the Magnitude of Advertising Effectiveness (2nd step) ............................ 81
9.1 Discussion .................................................................................................................. 91 9.2 Managerial Implications ............................................................................................. 94
9.3 Limitations.................................................................................................................. 95
REFERENCES PAPER II ............................................................................................................... 96
APPENDIX PAPER II ............................................................................................................... 102
PAPER III: EXECUTIONAL CUES IN ADVERTISING- AN OVERVIEW ................... 109
Abstract ................................................................................................................................. 109
2.1 Laboratory Studies ................................................................................................... 113 2.2 Field Studies ............................................................................................................. 114
III
4.1 Rational Appeals ...................................................................................................... 118 4.2 Emotional Appeals ................................................................................................... 120
5.1 Complexity ............................................................................................................... 126 5.2 Creativity .................................................................................................................. 129
5.3 Authenticity .............................................................................................................. 133
REFERENCES PAPER III ............................................................................................................ 147
IV
LIST OF FIGURES
INTRODUCTION
Figure 1: Sales and Advertising Spending for Two Established Chocolate Bar Brands ........... 1
PAPER I: COMMUNICATING BRANDS IN TV ADVERTISING
Figure 1: Conceptual Model ..................................................................................................... 21
Figure 2: Mean Ad Campaign Effectiveness ........................................................................... 33
Figure 3: Distribution of Ad Campaign Elasticities ................................................................. 33
Figure 4: Examples of Combinations of Brand Association Cues in Ads ............................... 36
Figure 5: Two-Dimensional Map,Yogurt Category ................................................................. 39
Figure 6: Two-Dimensional Map, Small vs. Large Brands ..................................................... 40
Figure 7: One-Step-Ahead Sales Forecast (1000 Euros) for 12 Brands .................................. 42
Figure 8: Illustration of Model-Based Results ......................................................................... 44
PAPER II: DOES IT PAY TO BE REAL? UNDERSTANDING AUTHENTICITY IN TV
ADVERTISING
Figure 1: Brand Essence, Long- and Short-Term Ad Effectiveness ........................................ 83
Figure 2: Realistic Plot, Long- and Short Term Ad Effectiveness ........................................... 84
Figure 3: Mean Elasticity, High vs. Low Message Credibility ................................................ 85
Figure 4: Moderating Effect, Hedonic Product Categories ...................................................... 87
Figure 5: Moderating Effect, Brand Size ................................................................................. 89
PAPER III: EXECUTIONAL CUES IN ADVERTISING - AN OVERVIEW
Figure 1: Examples of Successful Campaigns ....................................................................... 110
Figure 2: Framework of Different Executional Cues ............................................................ 117
Figure 3: Classification of Emotional Appeals ...................................................................... 121
V
LIST OF TABLES
INTRODUCTION
Table 1: Overview of Dissertation Projects ............................................................................... 2
PAPER I: COMMUNICATING BRANDS IN TV ADVERTISING
Table 1: Operationalization, Time-Series Data ........................................................................ 27
Table 2: Data Summary, Time-Series Data ............................................................................. 28
Table 3: Data Summary, Ad Campaign Data ........................................................................... 28
Table 4: Operationalization, Branding Cues ............................................................................ 29
Table 5: Descriptive Statistics, Branding Cues ........................................................................ 31
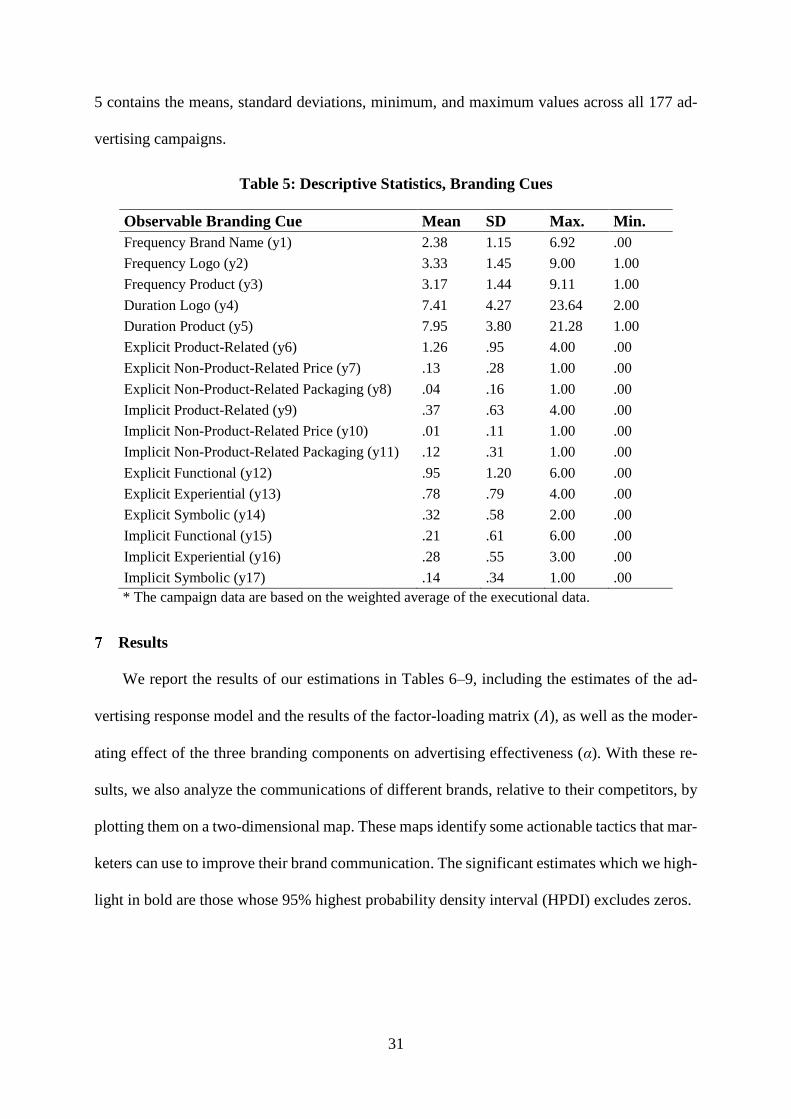
Table 6: Effect of Control Variables on Sales .......................................................................... 32
Table 7: Factor Loading Matrix ............................................................................................... 34
Table 8: Factor Loadings, Control Variables ........................................................................... 37
Table 9: Influence of Brand Communication on Ad Effectiveness ......................................... 38
Table 10: Alternative Models ................................................................................................... 42
Table B1: Operationalization, Control Variables ..................................................................... 54
Table C1: Krippendorff’s Alpha, Brand Associations ............................................................. 56
Table C2: Krippendorff’s Alpha, Control Variables ................................................................ 56
PAPER II: DOES IT PAY TO BE REAL? UNDERSTANDING AUTHENTICITY IN TV
ADVERTISING
Table 1: Time Series Data ........................................................................................................ 70
Table 2: Advertising Data ........................................................................................................ 70
Table 3: Operationalization, Authenticity Dimensions ............................................................ 72
Table 4: Descriptive Statistics, Authenticity Dimensions ........................................................ 74
Table 5: Correlation, Authenticity Dimensions ....................................................................... 74
Table 6: Results, Advertising Response Model (Step 1) ......................................................... 80
Table 7: Results, Moderating Analysis (Step 2) ...................................................................... 82
Table 8: Moderated Moderation, Brand Size ........................................................................... 90
Table 9: Implications Depending on Brand Type .................................................................... 95
Table A1: Operationalization, Control Variables .................................................................. 103
VI
Table C1: Mean Values Hedonic vs. Utilitarian .................................................................... 105
Table D1: Moderated Moderation, Single Regression ........................................................... 106
Table E1: Operationalization, Alternative Measures of Authenticity Dimensions ................ 107
Table E2: Alternative Measures of Authenticity Dimensions, Results .................................. 108
PAPER III: EXECUTIONAL CUES IN ADVERTISING - AN OVERVIEW
Table 1: Overview of the Relevant Literature, Rational and Emotional Appeals .................. 124
Table 2: Creativity Cues ......................................................................................................... 130
Table 3: Overview of the Relevant Literature, Conceptual Approach ................................... 137
Table 4: Overview of the Relevant Literature, Branding Strategy ........................................ 142
Table 5: Classification of the Different Content Factors ....................................................... 143
1
Introduction
In today’s competitive market environment, firms invest significant sums in advertising to
build their brands and generate sales. For example, Unilever spent $8.9 billion on advertising
in 2015, and its main competitor P&G invested $10.4 billion (Advertising Age 2017). At the
same time, marketers are more and more under pressure to justify their advertising spending
and to quantify the return on marketing investment (Rust et al. 2004).
Consequently, extensive research has investigated the effectiveness of advertising for var-
ious performance indicators, such as brand sales or market share (e.g., Assmus, Farley, and
Lehmann 1984; Sethuraman, Tellis, and Briesch 2011). Overall, we have learned that on aver-
age advertising has a positive, significant effect on sales even if the magnitude of this effect is
rather small. We also know that the effectiveness differs substantially across advertising cam-
paigns. Some studies even suggest that only 50% of all advertisings manage to achieve an
effect that is significantly different from zero (Lodish et al. 1995; Sethuraman, Tellis, and
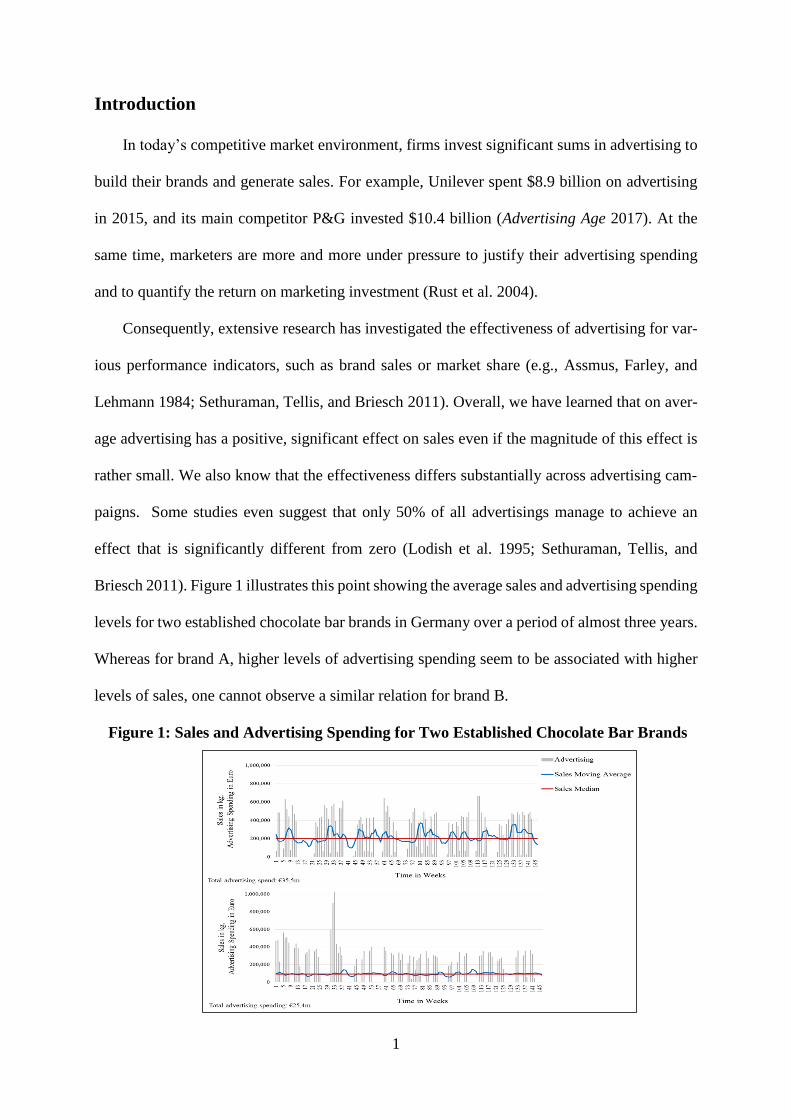
Briesch 2011). Figure 1 illustrates this point showing the average sales and advertising spending
levels for two established chocolate bar brands in Germany over a period of almost three years.
Whereas for brand A, higher levels of advertising spending seem to be associated with higher
levels of sales, one cannot observe a similar relation for brand B.
Figure 1: Sales and Advertising Spending for Two Established Chocolate Bar Brands
2
Thus, the question arises why some ad campaigns are more successful than others.
One important driver of advertising effectiveness is its content. In a well-known field
experiment, Eastlack and Rao (1989) demonstrate that changes in ad content have a stronger
impact on sales than changes in ad spending. Lodish et al. (1995) support these results reinforc-
ing the relevance of content when analyzing advertising effectiveness. However, due to the
cluttered media environment (Danaher, Bonfrer, and Dhar 2008), consumers’ limited cognitive
capacity (Burke and Srull 1988), and the increasing consumer skepticism toward advertising
(Darke and Ritchie 2007), choosing appropriate advertising content cues that grab consumers’
attention and persuade them becomes more and more difficult. Thus, it is of utmost relevance
for marketers to understand the effectiveness of different content cues.
Accordingly, this dissertation investigates the moderating influence of selected content
cues on advertising effectiveness in the context of TV ads1. Table 1 presents an overview of the
three papers including author and publication-status information.
Table 1: Overview of Dissertation Projects
Paper Title Author(s)
I Communicating Brands in TV
Advertising Maren Becker,
Norris I. Bruce, and
Werner Reinartz
II Does It Pay to Be Real? Understanding
Authenticity in TV Advertising
Maren Becker,
Werner Reinartz,
and Monika
Käuferle
III Executional Cues in Advertising – An
Overview
Maren Becker
Note: Being the lead author of all three papers, Maren Becker contributed significantly to each one of
them.
1 Despite recent strong growth of mobile- and internet-advertising the largest share of investment is still spend
on television advertising, especially in the context of FMCG brands (ZAW, 2016). In fact, companies continu-
ously increase spending on television advertising each year and this trend is expected to continue (Horizont,
2017).
3
The first two papers are empirical studies that examine the moderating influence of relevant
content cues on the relationship between advertising and sales. Specifically, the first paper,
titled “Communicating Brands in TV Advertising”, co-authored by Maren Becker, Norris I.
Bruce, and Werner Reinartz, explores how firms may communicate their brands in TV adver-
tising to improve sales. The authors measure seventeen branding cues (e.g., frequency of men-
tions of the brand name, duration of time the logo appears, number of functional attributes)
commonly used within ads that should reinforce branding components (salience, benefits, and
attributes) and investigate their influence on ad effectiveness. The empirical study is based on
a unique dataset of 177 ad campaigns aired by 62 brands across six fast-moving consumer good
(FMCG) categories and 4 years.
The second paper titled “Does It Pay to Be Real? Understanding Authenticity in TV Ad-
vertising” co-authored by Maren Becker, Werner Reinartz, and Monika Käuferle investigates
the influence of authenticity, one of the most prevalent buzzwords in the modern advertising
industry, on advertising effectiveness. The authors therefore identify four dimensions by which
authenticity can be conveyed in advertising and analyze their effects on the sales performance
of advertised products. The study is based on the same dataset as the first paper.
Finally, the third essay, titled “Executional Cues in Advertising – An Overview” (by Maren
Becker), develops a conceptual framework that structures and classifies the different execu-
tional2 content cues. Specifically, the author proposes that advertising execution is comprised
of three dimensions: ad appeals, the conceptual approach, and brand salience, which can be
further divided into different sub-dimensions and single cues. For each dimension, she provides
an overview of the relevant literature of the last twenty years discusses the results and identifies
literature gaps. The author finds that most prior work focused on advertising appeals whereas
less is done on the other two dimensions. The two empirical papers of this dissertation thus
2 The ad execution is the part of the advertising content that focuses on “how the advertising message should be
communicated within the ad”.
4
relate to the latter two. The next section summarizes motivation, research objectives, main re-
sults, and implications of each dissertation project.
Summary of Dissertation Projects
Paper I: Communicating Brands in TV Advertising
An important goal of advertising is to build strong brands, as they positively affect sales
(Aaker 1997; Keller 2007). However, previous research has argued that advertising often “does
not brand well” (Keller 2007, p. 63), noting that most advertisements fail to establish strong
brand links. A reason could be that marketers do not know how to communicate about their
brand through advertising, which would likely produce a weak relationship between advertising
and sales (Bass et al. 2007). In the first essay, the authors, therefore, explore how firms may
communicate their brands in TV advertising to improve sales.
They address this issue in the context of TV advertising drawing from Keller’s (1993)
widely accepted customer-based brand equity (CBBE) framework. Based on this framework,
marketers can build strong brands by creating brand salience (i.e. emphasizing the brand) and
communicating favorable attributes and benefits (i.e. brand associations). However, prior stud-
ies are unclear about the extent to which the CBBE framework applies to real market environ-
ments; that is, whether the three branding components (i.e., brand salience, attributes, and ben-
efits) actually influence advertising effectiveness. Therefore, the authors investigate their
influence on the relationship between advertising spending and sales and identify which quan-
tifiable branding cues embedded in the ads drive these effects.
To do so, they employed several trained experts to observe, evaluate and code 17 branding
cues commonly embedded in advertising; and use the resulting cues in a factor model to identify
the salience, attributes, and benefits components as latent factors. They then build a dynamic
model of the ad-sales relationship and model the effectiveness of advertising as a function of
5
these three factors. To calibrate this model, they use panel and media data from the Nielsen
Company for 62 brands and 177 ad campaigns across six product categories sold in the German
market. The authors innovate methodologically to estimate the (factor and ad-sales) models
jointly using the Bayesian approach to the Kalman filter along with Markov chain Monte Carlo
(MCMC) ideas.
Results show that salience and attributes significantly influence ad effectiveness, whereas
benefits only do when combined with specific attribute cues. The latter finding challenges the
conventional wisdom that managers should communicate benefits rather than attributes. The
findings also reveal which branding cues drive these effects, thereby providing managers with
specific ideas on how to improve their brand communication. Moreover, the authors show that
improving the brand communication within advertisements based on these results would pro-
duce an average sales bump of 2.7%. Finally, a key aspect of this study is that the authors
measure the brand content of actual TV ads. Thus, they are able to investigate how managers
should design TV ads with regard to different branding cues to impact brand equity, ad effec-
tiveness and in turn sales.
Paper II: Does it Pay to Be Real? Understanding Authenticity in TV Advertising
Marketing managers and creatives alike are convinced that authenticity, a prevalent
buzzword in the modern advertising industry, is essential for advertising effectiveness. (e.g.,
Beverland, Lindgreen, and Vink 2008; Morhart et al. 2015). Specifically, they believe that au-
thenticity stimulates brand trust (Anderberg and Morris 2006) and helps overcome the increas-
ing consumer skepticism (Darke and Ritchie 2007). However, these beliefs are primarily based
on anecdotal evidence. That is, no empirical study analyzed the influence of authenticity on
advertising performance, yet. Along with the lack of clear evidence, there is also no common
understanding of what constitutes an authentic ad execution. Prior literature refers to authentic
6
ads in varied contexts. For example, some studies link authenticity to a spokesperson’s trust-
worthiness (Stern 1994), a realistic ad plot (Deighton, Romer and MacQueen 1989), or an ac-
curate representation of the brand (Brown, Kozinets, and Sherry 2003). This indicates that there
might be different possibilities (dimensions) of how to design an authentic ad execution. This
paper aims to identify these dimensions and to determine their influences on advertising effec-
tiveness in terms of sales.
Drawing from existing literature and a qualitative study, the authors identify four dimen-
sions of authenticity in ads: (1) preserving the brand essence, (2) honoring brand heritage, (3)
showing a realistic plot, and (4) presenting a credible and unexaggerated advertising message.
The first two dimensions relate to the ad’s representation of the brand (i.e., how it preserves
and sustains the brand’s values, essence, or heritage); the latter two dimensions pertain to the
ad’s execution (how truthful and realistic it is in conveying information). Afterward, they in-
vestigate the effect of each dimension on the relationship between ad spending and sales. To do
so, they follow a two-step approach similar to Chandy et al. (2001). In the first step, the authors
model the effect of each ad on brand sales using an error correction model (ECM) and in the
second step they systematically regress the short- and long-term advertising coefficients on the
four authenticity dimensions while controlling for other content cues (e.g., emotional content,
complexity). Furthermore, since the impact of authenticity might also depend on different brand
characteristics, the authors also analyze how the influence of the authenticity dimensions vary
with brand size or across hedonic and utilitarian products.
The analysis is based on a unique dataset of weekly scanner, retail panel, and media data
for 68 brands and 340 television ads3, related to six fast-moving consumer good (FMCG) cate-
gories sold on the German market, over a period of almost four years. To be able to quantify
3 In the second paper, we use single ad executions as the level of analysis whereas in the first paper we focus on
ad campaigns (ad campaigns usually comprise several executions).
7
the effects of the different authenticity dimensions and some control variables, several inde-
pendent experts evaluated all ads in the sample.
The results reveal several interesting findings. In contrast to popular beliefs, designing an
authentic ad does not generally increase the advertising’s effect on sales. Rather, authenticity
effects reflect specific dimension and brand characteristics. Specifically, the results show that
preserving the brand’s essence has a positive influence on advertising effectiveness. This indi-
cates that managers must carefully communicate their brands’ values, image, and style to any
advertising agency they hire. This effect is especially strong for less known brands. Further-
more, the authors find a negative effect for realistic plots, whereas absurd and unrealistic plots
can catch consumers’ attention and enhance ad memorability. This effect is driven by large
brands. Surprisingly, the results also reveal a negative effect for credibility indicating that a
more exaggerated message prompts a stronger sales response. A possible reason might be that
consumers expect advertising messages to be exaggerated. Thus, rather than neglecting over-
stated messages, they simply discount them, which leads to an inflated brand evaluation (Cow-
ley 2006; Gatignon and Le Nagard 2015). The negative influence of presenting a credible mes-
sage is especially prevalent for hedonic products and less known brands. Overall, the results
should help managers design more appropriate ads depending on the type of brand they are
selling.
Paper III: Executional Cues in Advertising – An Overview
The last essay aims to provide an overview of the different executional cues managers have
to consider when designing an ad. Advertising execution, or the manner in which the advertis-
ing conveys its message, is an important driver of ad effectiveness and thus a central topic in
marketing. Consequently, numerous studies analyzed the moderating influence of selected ex-
ecutional cues on some form of advertising effectiveness in the last decades (e.g., Chandy et al.
2001; Dahl, Sengupta, and Vohs 2009; Jain, Agrawal, and Maheswaran 2006). This paper
8
provides an overview of the most relevant studies in this field. To do so, the author systemati-
cally structures and classifies the different executional cues in a comprehensive framework.
Specifically, she proposes that advertising execution is comprised of three dimensions: ad ap-
peals (i.e., how to attract consumers’ interest in the ad’s message), the conceptual approach
(i.e., how to convey the appeals and ad message), and brand salience (i.e., how to integrate the
brand).
For each dimension, the author provides an overview of the relevant literature of the last
twenty years, discusses the results, and identifies various contextual factors that moderate the
effectiveness of the executional cues. Afterward, she formulates several research questions that
further research may address. In the end, the author summarizes the findings by highlighting
the most important literature gaps. Generally, there has been extensive research concerning
advertising appeals. By contrast, there has been less research directed toward the other two
dimensions of the advertising execution, conceptual approach and brand salience. Furthermore,
in terms of methodology, considerable efforts have been devoted to laboratory studies (often
with student samples), whereas only a few researcher analyzed the effect of executional cues in
field studies.
9
REFERENCES INTRODUCTION AND SUMMARIES
Aaker, Jennifer L. (1997), "Dimensions of Brand Personality," Journal of Marketing Research,
34 (August), 347-56.
Advertising Age (2017), “Ranking der Top 5 werbungtreibenden Unternehmen weltweit nach
Werbeinvestitionen im Jahr 2015 (in Milliarden US-Dollar),“ Statista - The Statistic-Portal,
( accessed Feburary 25, 2017) [available at https://de.statista.com/statis-
tik/daten/studie/646505/umfrage/unternehmen-mit-den-hoechsten-werbeausgaben-welt-
weit/].
Anderberg, Johan and John Morris (2006), “Authenticity and Transparency in the Advertising
Industry: An Interview with John Morris,” The Journal of Management Development, 25
(10), 1021-23.
Assmus Gert, John U. Farley, and Donald R. Lehmann (1984), "How Advertising Affects Sales:
Meta-analysis of Econometric Results," Journal of Marketing Research, 21 (1), 65-74.
Bass, Frank M., Norris I. Bruce, Sumit Majumdar, and B.P.S. Murthi (2007), “Wearout Effects
of Different Advertising Themes: A Dynamic Bayesian Model of the Advertising-Sales
Relationship,” Marketing Science, 26 (2), 179-95.
Beverland, Michael, Adam Lindgreen, and Michiel W. Vink (2008), “Projecting Authenticity
Through Advertising: Consumer Judgments of Advertisers' Claims,” Journal of
Advertising, 37 (1), 5-15.
Brown, Stephen, Robert V. Kozinets, and John F. Sherry Jr. (2003), “Teaching Old Brands New
Tricks: Retro Branding and the Revival of Brand Meaning,” Journal of Marketing, 67 (3),
19-33.
Burke, Raymond R. and Thomas K. Srull (1988), “Competitive Interference and Consumer
Memory for Advertising,” Journal of Consumer Research, 15 (1), 55–68.
Chandy, Rajesh K., Gerard J. Tellis, Deborah J. MacInnis, and Pattana Thaivanich (2001),
“What to Say When: Advertising Appeals in Evolving Markets,” Journal of Marketing
Research, 38 (4), 399-414.
Cowley, Elizabeth (2006), “Processing Exaggerated Advertising Claims,” Journal of Business
Research, 59 (6), 728-34.
Dahl, Darren W., Jaideep Sengupta, and Kathleen D. Vohs (2009), “Sex in Advertising: Gender
Differences and the Role of Relationship Commitment,” Journal of Consumer Research,
36 (2), 215–31.
Danaher, Peter J., Andre Bonfrer, and Sanjay Dhar (2008), “The Effect of Competitive
Advertising Interference on Sales for Packaged Goods,” Journal of Marketing Research, 45
(2), 211-25.
Darke, Peter R. and Robin J. B. Ritchie (2007), “The Defensive Consumer: Advertising
Deception, Defensive Processing, and Distrust,” Journal of Marketing Research, 44 (1),
114-27.
10
Deighton, John, Daniel Romer, and Josh MacQueen (1989), "Using Drama to Persuade,"
Journal of Consumer Research, 16 (3), 335-43.
Eastlack, Joseph O. Jr. and Ambar G. Rao (1989), “Advertising Experiments at the Campbell
Soup Company,” Marketing Science, 8 (1), 57-71.
Gatignon, Hubert and Emmanuelle Le Nagard (2015), “Manipulating Consumers is Not
Marketing: A Commentary on Cass R. Sunstein's ‘Fifty Shades of Manipulation,'”
Working Paper, Department of Marketing, The Business School of the World, France.
Horizont (2017), “Ausgaben für Werbung in den einzelnen Werbemedien in Deutschland in
den Jahren 2014 und 2015 sowie eine Prognose bis 2019 (in Milliarden Euro),“ Statista -
The Statistic-Portal, ( accessed Feburary 25, 2017) [available at
https://de.statista.com/statistik/daten/studie/538527/umfrage/werbeausgaben-nach-
medien-in-deutschland/].
Jain, Shailendra P., Charles Lindsey, Nidhi Agrawal, and Durairaj Maheswaran (2007), “For
Better or For Worse? Valenced Comparative Frames and Regulatory Focus,” Journal of
Consumer Research, 34 (1), 57–65.
Keller, Kevin Lane (1993), "Conceptualizing, Measuring, and Managing Customer-Based
Brand Equity," Journal of Marketing, 57 (January), 1-22.
——— (2007), “Advertising and Brand Equity,” in The SAGE Handbook of Advertising,
Gerhard J. Tellis and Tim Ambler, eds. London: Sage Publications, 54-70.
Lodish, Leonard M., Magid Abraham, Stuart Kalmenson, Jeanne Livelsberger, Beth Lubetkin,
Bruce Richardson, and Mary E. Stevens (1995), “How TV Advertising Works: A Meta-
Analysis of 389 Real World Split Cable TV Advertising Experiments,” Journal of
Marketing Research, 32 (2), 125–39.
Morhart, Felicitas, Lucia Malär, Amelie Guèvremont, Florent Girardin, and Bianca Grohmann
(2015), “Brand Authenticity: An Integrative Framework and Measurement Scale,” Journal
of Consumer Psychology, 25 (2), 200-18.
Rust, Roland T., Tim Ambler, Gregory Carpenter, V. Kumar, and Rajendra Srivastava, (2004)
“Measuring Marketing Productivity: Current Knowledge and Future Directions,” Journal
of Marketing, 68 (Oct), p76-89.
Sethuraman, Raj, Gerard J. Tellis, and Richard A. Briesch (2011), “How well Does Advertising
Work? Generalizations from Meta-analysis of Brand Advertising Elasticities,” Journal of
Marketing Research, 48 (3), 457-71.
Stern, Barbara (1994), “Authenticity and the Textual Persona: Postmodern Paradoxes in
Advertising Narrative,” International Journal of Research in Marketing, 11 (4), 387-400.
ZAW (2016), “Nettowerbeeinnahmen der erfassbaren Werbeträger in Deutschland in den Jahren
2014 und 2015 (in Millionen Euro),“ Statista - The Statistic-Portal, ( accessed February 25,
2017) [available at https://de.statista.com/statistik/daten/studie/162377/umfrage/werbung-
%25E2%2580%2593-werbeeinnahmen-der-werbetraeger-in-deutschland/].
11
PAPER I: COMMUNICATING BRANDS IN TV ADVERTISING
Authors: Maren Becker, Norris I. Bruce, and Werner Reinartz
ABSTRACT
Firms spend billions on advertising to build their brands and generate sales, yet the average
effect of advertising on sales remains relatively low. It is thus essential to show how firms may
more effectively communicate brands within their campaigns. To do so, this study adopts a
customer-based brand equity framework, which proposes that advertising can build brands by
emphasizing brand salience and communicating favorable attributes or benefits. The authors
then measure seventeen branding cues used within ads that should reinforce branding compo-
nents (salience, benefits, and attributes) and investigate their influence on ad effectiveness. For-
mally, the study builds a dynamic model to quantify the effects of advertising on sales; and a
factor model to integrate multiple, potentially correlated branding cues while accounting for
measurement noise; and then models the effect of advertising as a function of the brand com-
ponents identified by these cues. From an analysis of 177 ad campaigns aired by 62 brands
across six FMCG product categories, results show that salience and attributes moderate adver-
tising effectiveness whereas benefits only do when combined with some attribute cues. The
findings also reveal which branding cues drive these effects, thereby providing managers with
ideas on how to improve their brand communication.
Keywords: Advertising effectiveness, advertising content, customer-based brand equity,
brand communication, state space model, factor model
12
Introduction
An important goal of advertising is to build strong brands, for they in turn can positively
affect product sales (Aaker 1997; Keller 2007). Thus, it is unsurprising that Unilever spent $8.9
billion on advertising in 2014, while its main competitor P&G invested almost $10.4 billion
(Advertising Age 2017). Yet, the various research efforts undertaken to quantify the effects of
advertising on brand sales (e.g., Assmus, Farley, and Lehmann 1984; Sethuraman, Tellis, and
Briesch 2011) suggest that the average sales effect of advertising is relatively low. Only half of
all advertisings exert an effect that is significantly different from zero (Lodish, Abraham, and
Kalmenson 1995). Scholars thus have argued that advertising often “does not brand well” (Kel-
ler 2007, p. 63), noting that most advertisements simply fail to establish strong brand links. A
reason could be that marketers do not know how to communicate their brand within advertising,
which would likely produce a weak relationship between advertising and sales (Bass et al.
2007). So how should marketers communicate their brands in advertising, to build strong brands
and thereby generate sales?
In an initial attempt to address this question, we draw on Keller’s (1993) well-accepted
customer-based brand equity (CBBE) framework, which indicates that marketers can build
strong brands by creating brand salience (i.e. emphasizing the brand) and communicating fa-
vorable attributes or benefits (i.e. brand associations). However, prior studies are unclear about
the extent to which the CBBE framework applies to real market environments; that is, whether
the three branding components (i.e., brand salience, attributes, and benefits) actually influence
advertising effectiveness. For example, strong brand salience seemingly should enhance the
likelihood that consumers recognize the brand and thus reinforce brand awareness (Keller 2007;
Elliott and Percy 2007), but consumers also might become annoyed by an overly prominent
brand in an advertisement, such that they engage in counterarguments or ad avoidance
(Teixeira, Wedel, and Pieters 2010). To create brand salience, marketers can apply different
13
branding cues, such as frequent mentions of the brand name or integrating the logo and product.
If salience enhances advertising effectiveness, then marketers need to know which branding
cues drive this effect. Similarly, the CBBE framework suggests that marketers should com-
municate favorable attributes and benefits (i.e., brand associations) to persuade consumers and
strengthen the brand’s image; but for low involvement brands, it is unclear whether consumers
are motivated to process such information. Furthermore, there are several types of branding
cues with respect to the brand associations (e.g., product- vs. non-product–related, functional,
experiential, symbolic) that marketers can communicate within their advertisings. However,
they may need to choose among these, because of the increasing advertising clutter, consumers’
limited cognitive capacity, and short time spans for advertising. As a result, they need to know
which associations are the most effective.
Guided by these issues, we consider the following research questions:
Does brand salience increase advertising effectiveness, and if so, which branding cues
embedded in advertisements (e.g., frequency of mentions of the brand name, duration
of time the logo appears) drive this effect?
Does an emphasis on brand associations enhance advertising effectiveness? If so, should
the focus be on attributes or benefits (or both)? What branding cues (e.g., product-re-
lated, non-product–related, functional, experiential, symbolic) are most effective for at-
tributes and benefits?
How can managers use the results of this analysis to improve the brand communication
in their advertisings and in turn their effectiveness?
We address these questions, by first building a state-space model that captures the effect of
advertising on sales while accounting for endogeneity and then modeling the effect of advertis-
ing as a function of the three branding components: salience, attributes, and benefits. The la-
tency of these three components, however, requires us to extract them from several observable
14
but potentially correlated and noisy (e.g., due to measurement error) branding cues (e.g.,
frequency of mentions of the brand name, duration logo is shown, number of integrated prod-
uct-related or functional cues). Thus, we specify a factor model, which provides a parsimonious
way to capture all cues while accounting for measurement noise (Bruce, Peters, and Naik 2012).
We estimate the proposed (factor and ad-sales) models jointly using a Bayesian approach to the
Kalman filter (e.g., Bass et al. 2007; Bruce, Peters, and Naik 2012) along with Markov chain
Monte Carlo (MCMC) methods.
To implement our model, we first obtained weekly scanner retail panel and media data
from the Nielsen Company for 62 brands and 177 advertising campaigns across six fast-moving
consumer good (FMCG) categories sold on the German market for a period of almost four
years. This data set contains weekly sales and corresponding marketing mix information, in-
cluding price, in-store promotions, and advertising spending across four media types (i.e., tele-
vision, Internet, billboard, and print). We then employed several trained experts to evaluate,
and code all ads in the above campaigns in terms of the different branding cues and other rele-
vant control variables (e.g., emotional appeal). These measures are inputs to the factor model,
which help recover the latent brand components (factors) and account for errors in the coding
process.
To the best of our knowledge, this is the first study to investigate the effect of brand com-
munication embedded in TV advertising using the Keller CBBE framework. We distinguish
three branding components based upon that framework: brand salience, attributes, and benefits.
To measure their effects, we identify 17 objectively quantifiable branding cues, commonly used
in advertising, and find that brand communication influences the effect of advertising on sales.
Prior studies have largely focused on the effects of selected branding cues (e.g., frequency or
timing of the brand name) on mindset measures, such as recall, attitude, or purchase intentions
(Baker, Honea, and Russell 2004; Romaniuk 2009; Stewart and Furse 1986), using laboratory
15
experiments that exclude real market forces. Our study, by contrast, considers several branding
cues at once, as well as their combined influence on sales. Furthermore, while other studies
have quantified the effect of advertising on brand equity and sales, to the best of our knowledge,
none of these provided managers with actionable implications or tactics to help improve their
brand communication (e.g., Draganska, Hartmann, and Stanglein 2014). Methodologically, we
develop a factor model to incorporate multiple, potentially correlated, noisy branding cues and
embed that model into a dynamic model of advertising, such that we can estimate the factor and
advertising sales models simultaneously. Results show that salience and attributes significantly
influence advertising effectiveness, whereas benefits only do when combined with relevant at-
tribute cues. The latter finding challenges the conventional belief that managers should com-
municate benefits rather than attributes (e.g., Sheth and Mittal 2004, Peter and Olson 2010).
Overall, our study should help managers track and potentially improve their brand communi-
cation. In the next section, we provide a brief review of the advertising literature, focusing on
relevant streams pertaining to advertising effectiveness and the moderating effect of advertising
content. After we present the conceptual model, which draws on the CBBE, we describe our
empirical model, estimation method, and data. The estimated results then lead to several man-
agerial implications. This article concludes with a summary of the most important results and
some study limitations.
Literature Review
2.1 Advertising Effectiveness
Many studies have investigated the effects of advertising on measures such as brand sales
or market share. Overall, we have learned that advertising has a positive, significant effect on
sales, even if the magnitude of this effect is relatively small. With a meta-analysis, Sethuraman,
Tellis, and Briesch (2011) find a mean, short (long)-term elasticity of .12 (.24), based on 751
(402) observations. Focusing on established FMCG brands, both Srinivasan, Vanhuele, and
16
Pauwels (2010) and van Heerde et al. (2013) report even smaller long-term advertising elastic-
ities, of .036 and .013, respectively. Effectiveness also differs substantially across advertising
campaigns. According to Sethruaman, Tellis, and Briesch (2011), only about half of the elas-
ticities in their meta-analysis differed significantly from zero. For marketers, it is thus of utmost
importance to examine which factors drive advertising-effectiveness. In a field experiment,
Eastlack and Rao (1989) show that increasing the level of spending does not necessarily en-
hance advertising effectiveness, whereas changes in the advertisement’s content have strong
impacts on sales. Lodish, Abraham, and Kalmenson (1995) affirm these results, reinforcing the
relevance of content for analyzing advertising effectiveness.
2.2 Impact of Content on Advertising Effectiveness
The studies that examine the effects of selected content cues on mindset metrics tend to
rely on laboratory experiments (e.g., Chattopadhyay and Basu 1990; Loewenstein,
Raghunathan, and Heath 2011; Morales, Wu, and Fitzsimons 2012), which creates some limi-
tations. First, they do not take competition or other marketplace constraints into account, so it
is unclear whether the findings apply to real market environments. Second, it is infeasible to
test many content cues within a single study. Third, these studies force respondents to process
the advertisements actively, whereas in a real market environment, consumers tend to process
advertising information passively.
Moreover, few studies analyze the effect of advertising content on actual sales. They
generally concur that advertising content moderates the effect of advertising spending on sales;
specifically, they suggest that for established product categories, creative and emotional cues
appear more effective than informational ones (e.g., Bass et al. 2007; Chandy et al. 2001;
MacInnis, Rao, and Weiss 2002; Reinartz and Saffert 2013). Thus, they primarily investigate
different advertising appeals which should generate interest or grab consumers’ attention (Belch
and Belch 2009; Teixeira, Picard, and Kaliouby 2016). Even though appeals are of the utmost
17
importance for marketers, they are not the only content cues that moderate advertising effec-
tiveness; in particular, brand managers need to know how to communicate their brand within
an advertisement.
So far, to the best of our knowledge, no study has focused on the branding aspects of ad
content on sales. One interesting study is that of Teixeira, Wedel, and Pieters (2010) which
analyzes the effect of several branding cues on advertising avoidance, using eye tracking. It
shows that brand salience increases avoidance, whereas pulsing (i.e., showing the brand fre-
quently for a short time) can reduce this effect. This study is one of the few attempts to study
several branding cues in advertising. However, it focuses exclusively on salience, neglecting
associations (attributes and benefits) and does not consider the sales effect. Another notable
study is that of Bruce, Peters, and Naik (2012), who employed mind share measures to quantify
the intermediate effects of ads (i.e., cognition, affect, and experience) on the sales of a single
brand. The novelty of our study, however, is that we focus on the brand content of actual TV
advertising. Thus, we are able to investigate how managers should design an ad with regard to
different branding cues to impact customer based brand equity and hence advertising effective-
ness.
Conceptual Model
Previous literature suggests that advertising spending positively influences CBBE, which
in turn enhances sales (e.g., Shankar, Azar, and Fuller 2008; Srinivasan, Vanhuele, and Pauwels
2010; Stahl et al. 2012), yet the actual effect on CBBE must depend on the advertising content.
In this section, we therefore propose a conceptual model in which content, or the branding cues
embedded in advertisements moderate the effect of advertising spending on sales.
3.1 Customer-Based Brand Equity
Defined as the “differential effect of brand knowledge on consumers’ response to the mar-
keting of the firm” (Keller 2008, p. 48), CBBE is thus determined by consumers’ brand
18
knowledge, which is a function of brand awareness and brand image (Keller 1993). Awareness
entails customers’ ability to recall and recognize the brand, or how salient it is in their memory,
and image is best described as the set of associations that consumers link to the brand (Herzog
1963; Keller 2008), which consist of attributes, benefits, and attitudes toward the brand. The
evoked associations should be favorable and unique. Therefore, effective brand communication
should increase salience and communicate favorable associations.
3.2 Brand Communication in Advertising
Brand salience. Advertisements can reinforce brand salience and thus awareness by incor-
porating different brand elements (e.g., logo, brand name) and by emphasizing the product, to
ensure that customers identify the category in which the brand competes. The more frequently
consumers hear, see, or think about the brand, the more salient it becomes in their memory
(Elliot and Percy 2007). However, prior literature does not make clear whether increased sali-
ence also improves advertising effectiveness (e.g., Rossiter and Bellman 2005; Teixeira, Wedel,
and Pieters 2010). On the one hand, advertisers need to make their brands more salient to rise
above the vast clutter of advertising (D’ Souza and Rao 1995; Baker, Honea, and Russell 2004;
Danaher, Bonfrer, and Dhar, 2008). On the other hand, greater salience could annoy consumers
and prompt them to generate counterarguments or even avoid the advertisement (Teixeira,
Wedel, and Pieters 2010). Furthermore, for established brands a focus on salience might be less
important, because consumers can effortlessly activate existing knowledge about these familiar
brands (Elliot and Percy 2007). Therefore, we will investigate whether salience indeed enhances
advertising effectiveness and if so which branding cues drive this effect.
19
Brand associations. The associations that consumers link to the brand (Elliott and Percy
2007, Stewart and Furse 1986) include product attributes and benefits4. Attributes reflect ob-
jective characteristics. Specifically, product-related attributes denote any features that relate
directly to the product’s performance, such as ingredients (e.g., 100% organic, fresh oranges);
non–product-related attributes are those features that do not directly affect performance but
relate to the general product experience, such as price or packaging. Benefits are “the personal
values consumers attach to the product attributes” (Keller 1993, p. 4), and they can be func-
tional, experiential, or symbolic. Functional benefits highlight the inherent advantages of prod-
uct consumption and address consumers’ problem-solving needs (e.g., cleans, removes dan-
druff) (Park, Jaworski, and MacInnis 1986). Experiential benefits describe the sensory pleasure
that consumers can derive from the product consumption (e.g., fragrance or taste); they describe
how it feels to use the product (Keller 1993). Symbolic benefits pertain to the extrinsic ad-
vantages of product usage, such as prestige, personal expression, or social approval (e.g., shiny
hair, attractive to women, enhances self-esteem). All these associations can help highlight a
brand’s advantage, relative to its competitors’ (Elliot and Percy 2007).
However, the composition of CBBE in reality may differ. For example, brand salience
might be sufficient to enhance advertising effectiveness (MacInnis, Rao, and Weiss 2002), es-
pecially for low involvement brands, for which consumers are less motivated to process specific
product information. In addition, attributes and benefits are strongly related, so it might be re-
dundant to integrate both components into an advertisement (Wu, Day, and MacKay 1988).
Also, marketers can adopt several different brand association cues (product-related, non–
product-related, functional, experiential, symbolic), implicitly or explicitly, but providing too
4 According to Keller (1993), brand associations consist of attributes, benefits, and consumers’ general attitudes
toward the brand. We exclude the latter element, because it is impossible to translate consumers’ attitudes into
objective branding cues in advertisements. We also assume that all brand associations that advertisers communi-
cate within ads have a positive connotation.
20
many cues might overwhelm consumers (Cowan 2001), especially considering advertising clut-
ter. Thus, it is important to know which of them are most effective and how they play together.
In the standard CBBE model, we would expect to see that brand elements identify only salience,
whereas product related cues, price and packaging identify attributes and functional, experien-
tial and symbolic identify benefits. However, in the real world a single branding cue can be
related to several components of the CBBE model, for brands might (say) integrate product
cues not only to enhance salience but also to visualize the product's features.
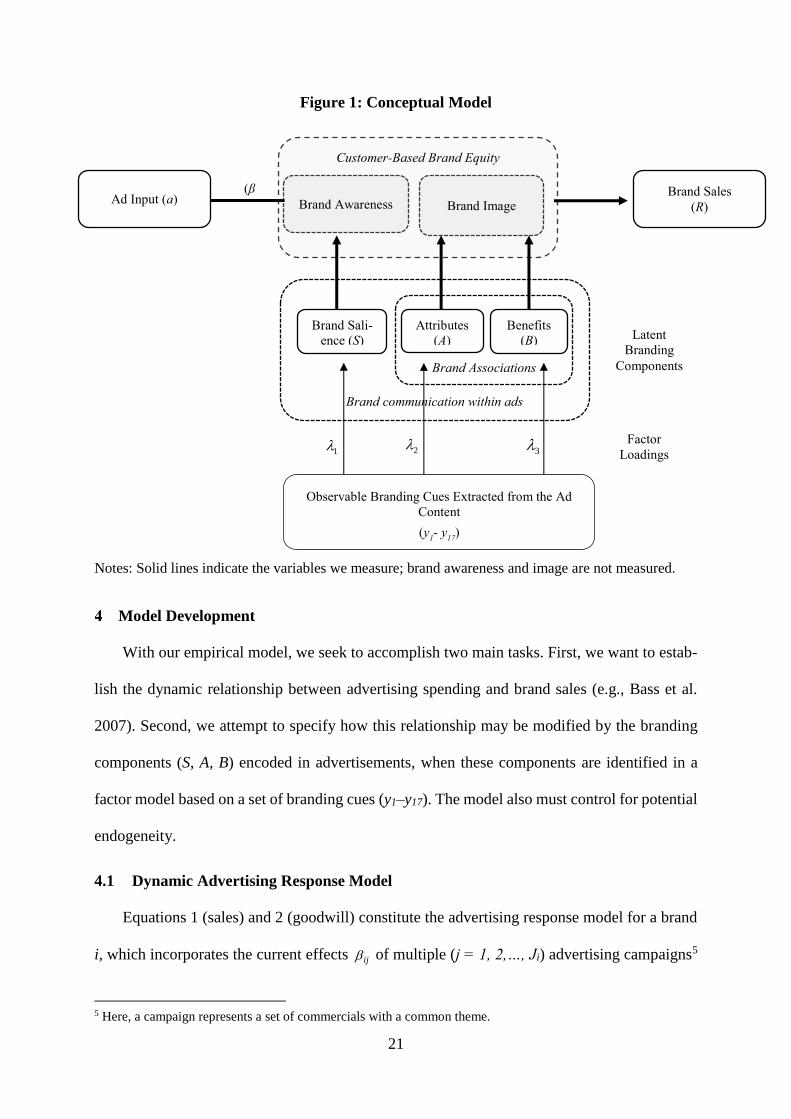
To address these issues, we propose an empirical model; Figure 1 depicts its conceptual
version. Different observable branding cues embedded in advertising content (y1–y17) will iden-
tify the three branding components of the CBBE framework Salience (S), Attributes (A) and
Benefits (B). These components are latent, so we construct a factor model to extract them from
the branding cues, allowing all cues to potentially load onto each component (S, A, B). Then we
analyze their moderating influence on the effect (β) of advertising input (a) on sales (R). With
this empirical model, we can identify which variables are most relevant for which factors, as
well as which branding components influence advertising effectiveness (ß).
21
Figure 1: Conceptual Model
Notes: Solid lines indicate the variables we measure; brand awareness and image are not measured.
Model Development
With our empirical model, we seek to accomplish two main tasks. First, we want to estab-
lish the dynamic relationship between advertising spending and brand sales (e.g., Bass et al.
2007). Second, we attempt to specify how this relationship may be modified by the branding
components (S, A, B) encoded in advertisements, when these components are identified in a
factor model based on a set of branding cues (y1–y17). The model also must control for potential
endogeneity.
4.1 Dynamic Advertising Response Model
Equations 1 (sales) and 2 (goodwill) constitute the advertising response model for a brand
i, which incorporates the current effects ij of multiple (j = 1, 2,…, Ji) advertising campaigns5
5 Here, a campaign represents a set of commercials with a common theme.
Brand Associations
Brand communication within ads
Ad Input (a) Brand Sales
(R)
Brand Sali-
ence (S)
(S)
Attributes
(A)
Customer-Based Brand Equity
Brand Awareness Brand Image
Benefits
(B)
(β
)
Observable Branding Cues Extracted from the Ad
Content
(y1- y
17)
1 32
Latent
Branding
Components
Factor
Loadings
22
and the carryover i from past advertising on the brand’s goodwill itG , which in turn affects
brands sales itR . The variables z in the goodwill Equation 2 capture the effects of other forces
on goodwill, such as the focal brand’s price, promotion, and other marketing communication
activities, as well as the price and advertising spending of competitive brands. Several variables,
including own price, could be endogenous; we return to this issue subsequently. To specify the
diminishing returns to advertising, we use )1log( ijtijt aag , and the measures itw0 and
itw
represent the specification errors in the sales and goodwill equations, respectively. Thus, we
have
ititit wGR 0 (1)
itiit
J
j
ijtijitiit wagGGi
ηz1
1 (2)
where i = 1, …, N brands; j = 1, …, J campaigns t = 1, …, T weeks; ),0(~ 2
iit Nw ; and
),0(~ 2
00 iit Nw .
Next, to specify how components of a brand’s equity, embedded in its advertising, ulti-
mately affect brand performance, we draw on e.g., Keller (1993) and focus on the key latent
components that influence CBBE -- brand salience (S), attributes (A), and benefits (B). We thus
capture their moderating influences by specifying the effectiveness of an advertising campaign,
as follows:
ijijijijij vBAS 0321 (3)
That is, we model the effectiveness of brand i’s campaign j as a linear combination of the brand-
ing components (S, A, B) and normal distributed random noiseijv0. Because the salience, attrib-
ute, and benefits factors are latent, we must specify a model to identify them that relies on
branding cues (y1–y17).
23
4.2 Composition of Branding Components
To identify these components from potentially noisy data, we draw upon the vector of the
measured branding cues ijy
iJjni ,..,1;,..,1
to specify a factor model (Equation 4). The
factor approach provides a parsimonious way to incorporate many variables (cues) into the
model represented by Equations 1 and 2; it also addresses measurement error, which may arise
because our data collection is not infallible, and some measures may identify more than one
factor, though the standard CBBE model suggests otherwise. Therefore, we have:
ijijiijij vXf y (4)
where:
i) the factors ijijijij BASf ,, are independent with INfij
,0~ ;
ii) is a factor loading matrix;
321
131211
kkk
and
iii) ),0(~),( 0 Σvv Nijij (e.g., Lopes and West 2004), where k is the number of
branding cues
Equation 3 must be further constrained to define a unique model without identification
issues. We therefore restrict some {…} to zeros and ones (see, e.g., Basilevsky 1994, p. 415;
Bruce, Peters, and Naik 2012); and for interpretability, we set an entire row to zeros for each
factor, except for one element set to unity. This step also facilitates the naming of the factor
(see Thurstone 1927) and establishes a link to Keller (1993). Equations 3 and 4 then produce
the complete factor model:
00 ij
ij
ij
iji
ij
ij
v
vf
X
y
(5)
Finally, we control for two other content variables (X), emotional appeal and line exten-
sions, in the factor model to exclude their influence from the branding components.
24
Thus, equations 1–5 constitute our model of advertising effectiveness. The novelty here is
that we can now model the effects of a vast number of branding cues, extracted from the content
of real advertisements, structure them into a set of branding variables consistent with prior the-
ory (CBBE model) and then determine how they moderate advertising performance. The results
in turn should help managers monitor and improve their brand communication strategies.
4.3 Controlling for Endogeneity: Advertising and Price
As noted, ad spending and price are two potential sources of endogeneity, even though the
case for ad endogeneity in our data is not as strong. If managers allocate their advertising stra-
tegically (e.g., based on sales), advertising spending might be endogenous; yet our estimation
relies on weekly data and so endogeneity might not be a major concern (Sethuraman, Tellis,
and Briesch 2011). Firms usually determine the media budgets for their brands in annual meet-
ings (Leeflang et al. 2000); based on the performance of individual brands, some minor changes
might occur during the year. However, they cannot change the media budget within a single
week. To verify this budgeting process, we conducted industry interviews with two global me-
dia/brand managers working for major FMCG companies that represent several brands in our
data set, as well as a manager of a major media-planning agency. These interviews confirmed
our sense that it would be nearly impossible to adjust the media spending level within a week;
the experts indicated that the soonest companies would be able to adjust would be one month,
for several reasons. First, television networks plan and cut commercial breaks some days in
advance, so they simply will not accept short-term changes. Most slots (especially for popular
shows) sell well in advance (Belch and Belch 2009), such that it is almost impossible for brand
managers to find a reasonable slot on short notice. The cancellation period usually ends six
weeks before an advertisement airs; beyond this point, companies may increase but not decrease
their spending levels. Second, the many parties involved (e.g., media planning agency, network,
advertising company) make it difficult to coordinate on a short time notice. Third, marketing
25
research companies often supply observed sales metrics one week after their advertising spend-
ing is determined6. For our weekly data set, endogeneity with regard to advertising spending
thus should not be a concern.
Price endogeneity could be a major concern though, in that it may arise due to omitted
variables or its dependence on unobserved demand increases. For example, Ma et al. (2011)
suggest that retailers might adjust their prices depending on local demand shocks. To control
for price endogeneity, we use an instrumental variable (IV) approach, in which the average
price of other product categories functions as the instruments (e.g., van Heerde et al. 2013; Ma
et al. 2011). For example, for a yogurt brand, we use the average prices of chocolate bars,
shampoos, shower gels, household detergents, and razors as instrumental variables (see the
“Data” section). A concern for any IV measurement model for price is that firms are unlikely
to generate new prices every week; price levels instead emerge from changes during previous
intervals. Therefore, we conducted a Durbin-Watson test of the residuals obtained from a re-
gression of price against the IVs; the results show that we cannot reject the autocorrelation of
these residuals for 94% of the brands in our sample (p < .05). Accordingly, we specify the
following model to account for endogeneity:
p
it
IV
ititit vθp ηP , and (6)
ititiit vθθ 1 , (7)
where
2
22 and ,,0~,),,0(~
ii
iiiit
pitiit wvNv
HHN .
Thus, Equations 6 and 7 model price across brands as functions of (1) IV covariates IVitP , or
the average weekly prices of other product categories; (2) a random measurement and system
noise, p
jtv and jtv , respectively; and (3) a latent, time-varying component jt that is governed
by an AR(1) process (Bruce, Murthi, and Rao 2016; Sonnier, Rutz, and McAlister 2011). The
6 Promotion schedules generally are even less flexible than media schedules.
26
latter reflects the persistence of weekly prices. To control for potential endogeneity (which is
relevant when 0, jjtpjt wvCov ), we condition the analysis of Equations 1 and 2 on p
jtv (see
e.g., Rossi, Allenby, and McCullough 2005).
Model Estimation
A Bayesian approach offers versatility for addressing both the time-varying parameters and
brand heterogeneity. The estimation involves two major steps: iterative simulation of the joint
posterior of the time-varying parameters ,),,,( jjtitjtjt pRGp followed by the simulation of
the main posterior of the factor model ),,( ijijij yfp , according to the previously established
factor identification requirements. The parameter j is a collection of all fixed brand and cam-
paign parameters in the advertising goodwill (Equations 1–2) and measurement (Equations 6–
7) time-varying models. Furthermore, we can recover the complex joint distribution
,),,,( jjtitjtjt pRGp by sampling the conditionals, ,..)( jtjt Gp and ,..)( jtjtGp . For exam-
ple, conditional on jtG , brand sales itR provide no further information for estimating jt , which
means it is possible to recover jt from the linear state space model defined by Equations 2, 6,
and 7. We can thus apply the basic Kalman Filter/Smoother Algorithm to estimate
),,,( jjtitjtjt pRGp and MCMC to its related fixed parameters in j (Carter and Kohn
1994; Fruhwirth-Schnatter 1994). Similarly, the other conditional distribution
),,( jjtitjt pRGp is also linear in the goodwill parameter jtG , and so we can again apply the
Kalman Filter algorithm, but with the conditional variance pjtjt vw , which controls for price en-
dogeneity. Now, conditional on goodwill jtG , we can use basic MCMC ideas to recover the
fixed parameters, including brand campaign effectivenessij . With ij , Equation 5 thus be-
comes a fully identified, linear factor model. That is, with the identification assumption, we can
27
recover the joint distribution ),,( ijijij yfp of the main parameter (factors and factor loading
matrix), again using familiar MCMC methods.
Data and Identification
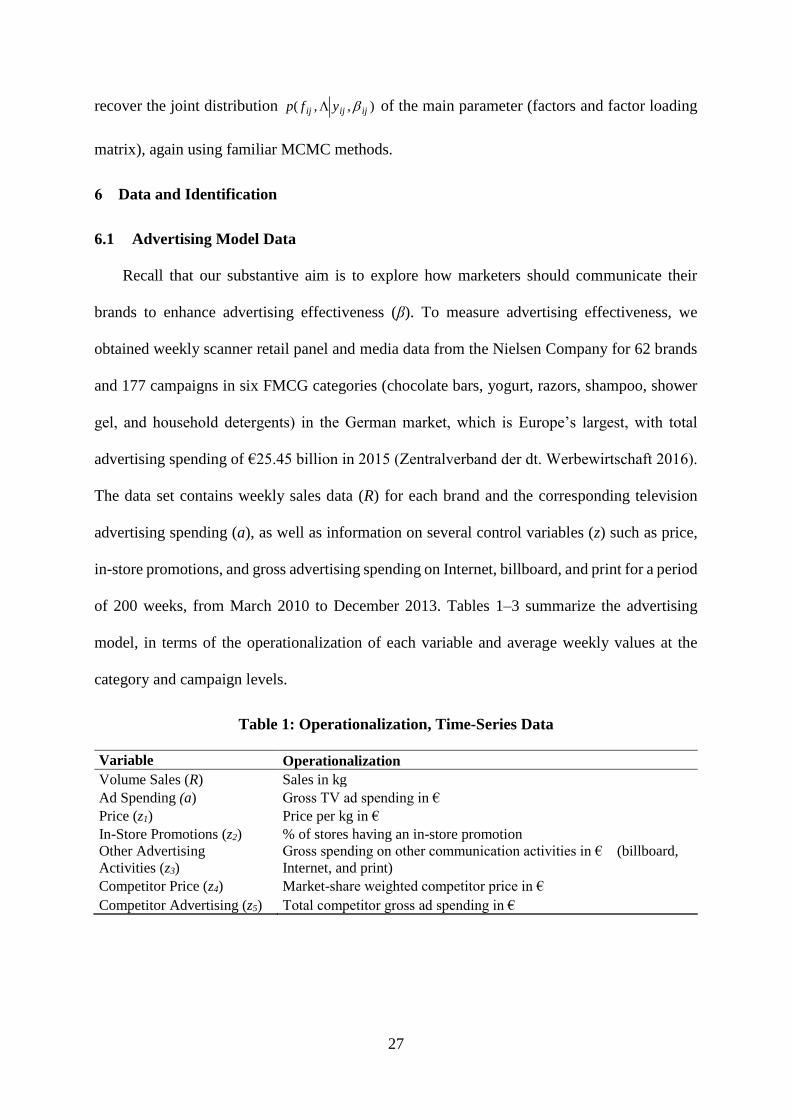
6.1 Advertising Model Data
Recall that our substantive aim is to explore how marketers should communicate their
brands to enhance advertising effectiveness (β). To measure advertising effectiveness, we
obtained weekly scanner retail panel and media data from the Nielsen Company for 62 brands
and 177 campaigns in six FMCG categories (chocolate bars, yogurt, razors, shampoo, shower
gel, and household detergents) in the German market, which is Europe’s largest, with total
advertising spending of €25.45 billion in 2015 (Zentralverband der dt. Werbewirtschaft 2016).
The data set contains weekly sales data (R) for each brand and the corresponding television
advertising spending (a), as well as information on several control variables (z) such as price,
in-store promotions, and gross advertising spending on Internet, billboard, and print for a period
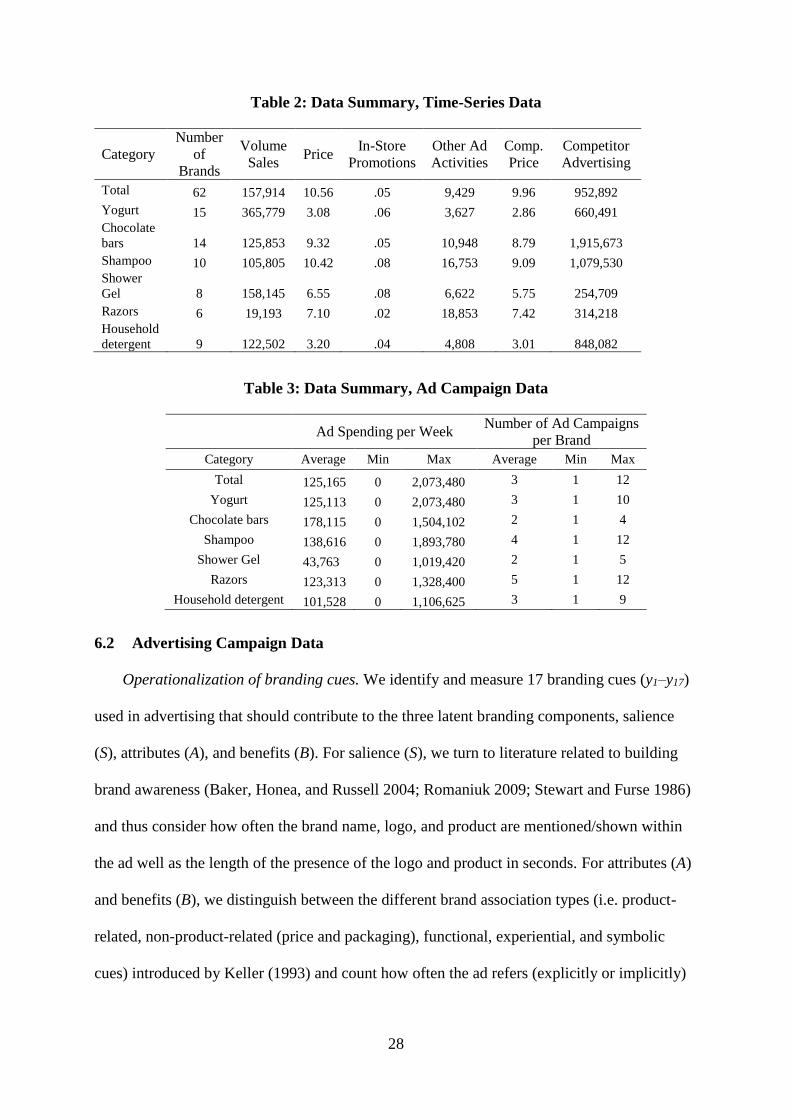
of 200 weeks, from March 2010 to December 2013. Tables 1–3 summarize the advertising
model, in terms of the operationalization of each variable and average weekly values at the
category and campaign levels.
Table 1: Operationalization, Time-Series Data
Variable Operationalization
Volume Sales (R) Sales in kg
Ad Spending (a) Gross TV ad spending in €
Price (z1) Price per kg in €
In-Store Promotions (z2) % of stores having an in-store promotion
Other Advertising
Activities (z3)
Gross spending on other communication activities in € (billboard,
Internet, and print)
Competitor Price (z4) Market-share weighted competitor price in €
Competitor Advertising (z5) Total competitor gross ad spending in €
28
Table 2: Data Summary, Time-Series Data
Category
Number
of
Brands
Volume
Sales Price
In-Store
Promotions
Other Ad
Activities
Comp.
Price
Competitor
Advertising
Total 62 157,914 10.56 .05 9,429 9.96 952,892
Yogurt 15 365,779 3.08 .06 3,627 2.86 660,491
Chocolate
bars 14 125,853 9.32 .05 10,948 8.79 1,915,673
Shampoo 10 105,805 10.42 .08 16,753 9.09 1,079,530
Shower
Gel 8 158,145 6.55 .08 6,622 5.75 254,709
Razors 6 19,193 7.10 .02 18,853 7.42 314,218
Household
detergent 9 122,502 3.20 .04 4,808 3.01 848,082
Table 3: Data Summary, Ad Campaign Data
Ad Spending per Week
Number of Ad Campaigns
per Brand
Category Average Min Max Average Min Max
Total 125,165 0 2,073,480 3 1 12
Yogurt 125,113 0 2,073,480 3 1 10
Chocolate bars 178,115 0 1,504,102 2 1 4
Shampoo 138,616 0 1,893,780 4 1 12
Shower Gel 43,763 0 1,019,420 2 1 5
Razors 123,313 0 1,328,400 5 1 12
Household detergent 101,528 0 1,106,625 3 1 9
6.2 Advertising Campaign Data
Operationalization of branding cues. We identify and measure 17 branding cues (y1–y17)
used in advertising that should contribute to the three latent branding components, salience
(S), attributes (A), and benefits (B). For salience (S), we turn to literature related to building
brand awareness (Baker, Honea, and Russell 2004; Romaniuk 2009; Stewart and Furse 1986)
and thus consider how often the brand name, logo, and product are mentioned/shown within
the ad well as the length of the presence of the logo and product in seconds. For attributes (A)
and benefits (B), we distinguish between the different brand association types (i.e. product-
related, non-product-related (price and packaging), functional, experiential, and symbolic
cues) introduced by Keller (1993) and count how often the ad refers (explicitly or implicitly)
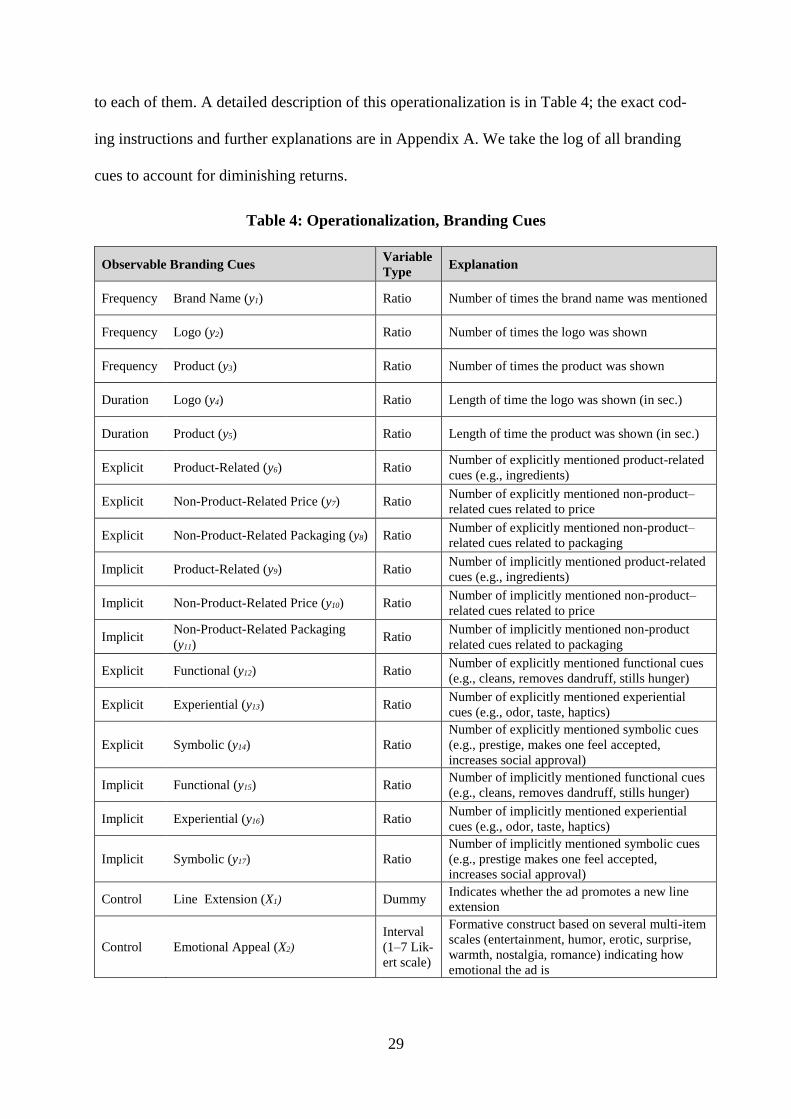
29
to each of them. A detailed description of this operationalization is in Table 4; the exact cod-
ing instructions and further explanations are in Appendix A. We take the log of all branding
cues to account for diminishing returns.
Table 4: Operationalization, Branding Cues
Observable Branding Cues Variable
Type Explanation
Frequency Brand Name (y1) Ratio Number of times the brand name was mentioned
Frequency Logo (y2) Ratio Number of times the logo was shown
Frequency Product (y3) Ratio Number of times the product was shown
Duration Logo (y4) Ratio Length of time the logo was shown (in sec.)
Duration Product (y5) Ratio Length of time the product was shown (in sec.)
Explicit Product-Related (y6) Ratio Number of explicitly mentioned product-related
cues (e.g., ingredients)
Explicit Non-Product-Related Price (y7) Ratio Number of explicitly mentioned non-product–
related cues related to price
Explicit Non-Product-Related Packaging (y8) Ratio Number of explicitly mentioned non-product–
related cues related to packaging
Implicit Product-Related (y9) Ratio Number of implicitly mentioned product-related
cues (e.g., ingredients)
Implicit Non-Product-Related Price (y10) Ratio Number of implicitly mentioned non-product–
related cues related to price
Implicit Non-Product-Related Packaging
(y11) Ratio
Number of implicitly mentioned non-product
related cues related to packaging
Explicit Functional (y12) Ratio Number of explicitly mentioned functional cues
(e.g., cleans, removes dandruff, stills hunger)
Explicit Experiential (y13) Ratio Number of explicitly mentioned experiential
cues (e.g., odor, taste, haptics)
Explicit Symbolic (y14) Ratio
Number of explicitly mentioned symbolic cues
(e.g., prestige, makes one feel accepted,
increases social approval)
Implicit Functional (y15) Ratio Number of implicitly mentioned functional cues
(e.g., cleans, removes dandruff, stills hunger)
Implicit Experiential (y16) Ratio Number of implicitly mentioned experiential
cues (e.g., odor, taste, haptics)
Implicit Symbolic (y17) Ratio
Number of implicitly mentioned symbolic cues
(e.g., prestige makes one feel accepted,
increases social approval)
Control Line Extension (X1) Dummy Indicates whether the ad promotes a new line
extension
Control Emotional Appeal (X2)
Interval
(1–7 Lik-
ert scale)
Formative construct based on several multi-item
scales (entertainment, humor, erotic, surprise,
warmth, nostalgia, romance) indicating how
emotional the ad is
30
Control variables. We measure two control variables (X) that prior literature suggests
might significantly influence advertising effectiveness; namely, emotional appeal and whether
the advertised product is a line extension (Tellis 2004). Emotional appeal is determined by the
maximum value of five commonly used emotions (humor, erotic, romance, warmth, and nos-
talgia) that we measured on established, multi-item, 7-point scales (Chattopadhyay and Basu
1990; Edell and Burke 1987). For the line extension variable, we used a dummy (1 = line ex-
tension; 0 = no line extension). Further information about the control variables appears in Ap-
pendix B.
Coding procedure. Consistent with previous research (MacInnis, Rao, and Weiss 2002),
we paid independent experts to evaluate the content of each advertisement, in terms of the
branding cues and two control variables. These experts—graduate students of a large German
university—are regular users of the advertised product categories. Groups of two to seven ex-
perts evaluated each variable/cue, depending on the task (e.g., two coders evaluated whether
the product was a line extension, but seven coders evaluated the emotional appeals). In addition,
all the experts underwent a two-day training session, in which we discussed each variable and
clarified any wording problems (see Appendix C). After the training, we provided each expert
with a USB stick that contained all advertisements and the coding instructions, so that they
could conduct the ratings at their own pace, at home. However, we advised them to rate no
more than five advertisements per day and to take a break after watching two advertisements in
a row. The coders needed between 25 minutes and 2 hours to code each entry; however, coding
efficiency also improved as they coded more commercials. Overall, this coding procedure took
four months. The sequence of advertisements differed for each expert, to avoid order biases.
We assessed their intercoder reliability using Krippendorff’s (1980) alpha, to ensure the quality
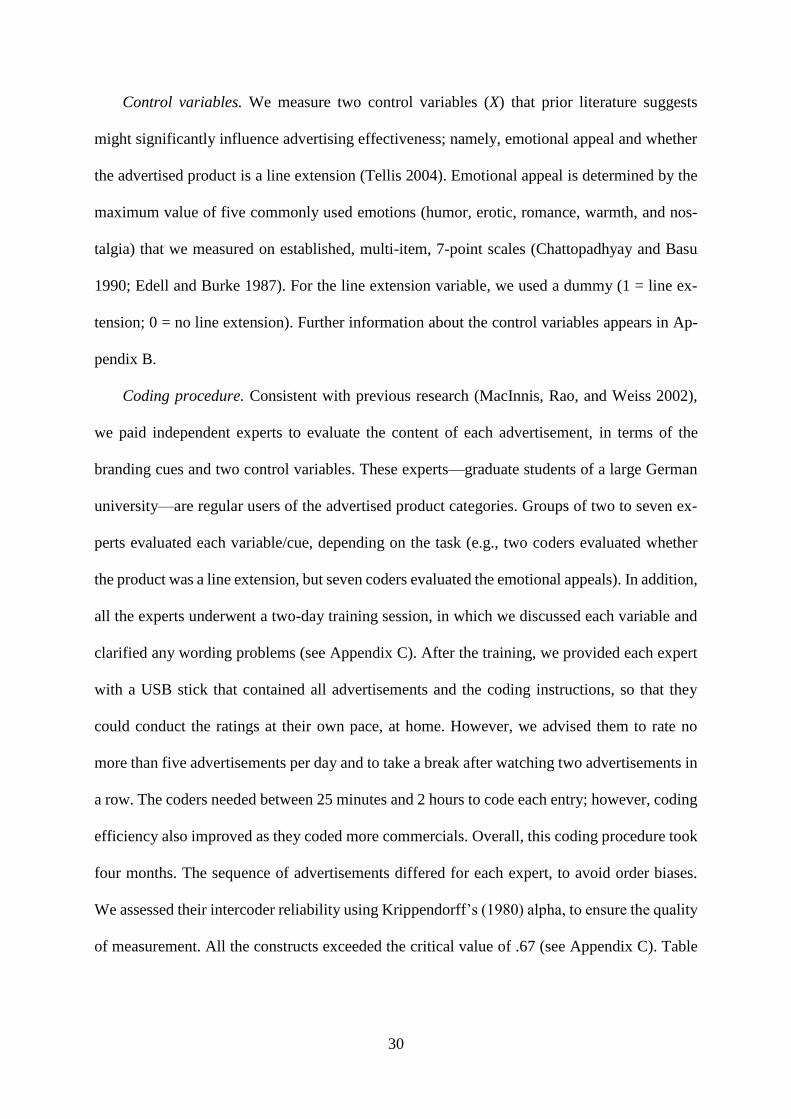
of measurement. All the constructs exceeded the critical value of .67 (see Appendix C). Table
31
5 contains the means, standard deviations, minimum, and maximum values across all 177 ad-
vertising campaigns.
Table 5: Descriptive Statistics, Branding Cues
Observable Branding Cue Mean SD Max. Min.
Frequency Brand Name (y1) 2.38 1.15 6.92 .00
Frequency Logo (y2) 3.33 1.45 9.00 1.00
Frequency Product (y3) 3.17 1.44 9.11 1.00
Duration Logo (y4) 7.41 4.27 23.64 2.00
Duration Product (y5) 7.95 3.80 21.28 1.00
Explicit Product-Related (y6) 1.26 .95 4.00 .00
Explicit Non-Product-Related Price (y7) .13 .28 1.00 .00
Explicit Non-Product-Related Packaging (y8) .04 .16 1.00 .00
Implicit Product-Related (y9) .37 .63 4.00 .00
Implicit Non-Product-Related Price (y10) .01 .11 1.00 .00
Implicit Non-Product-Related Packaging (y11) .12 .31 1.00 .00
Explicit Functional (y12) .95 1.20 6.00 .00
Explicit Experiential (y13) .78 .79 4.00 .00
Explicit Symbolic (y14) .32 .58 2.00 .00
Implicit Functional (y15) .21 .61 6.00 .00
Implicit Experiential (y16) .28 .55 3.00 .00
Implicit Symbolic (y17) .14 .34 1.00 .00
* The campaign data are based on the weighted average of the executional data.
Results
We report the results of our estimations in Tables 6–9, including the estimates of the ad-
vertising response model and the results of the factor-loading matrix (𝛬), as well as the moder-
ating effect of the three branding components on advertising effectiveness (α). With these re-
sults, we also analyze the communications of different brands, relative to their competitors, by
plotting them on a two-dimensional map. These maps identify some actionable tactics that mar-
keters can use to improve their brand communication. The significant estimates which we high-
light in bold are those whose 95% highest probability density interval (HPDI) excludes zeros.
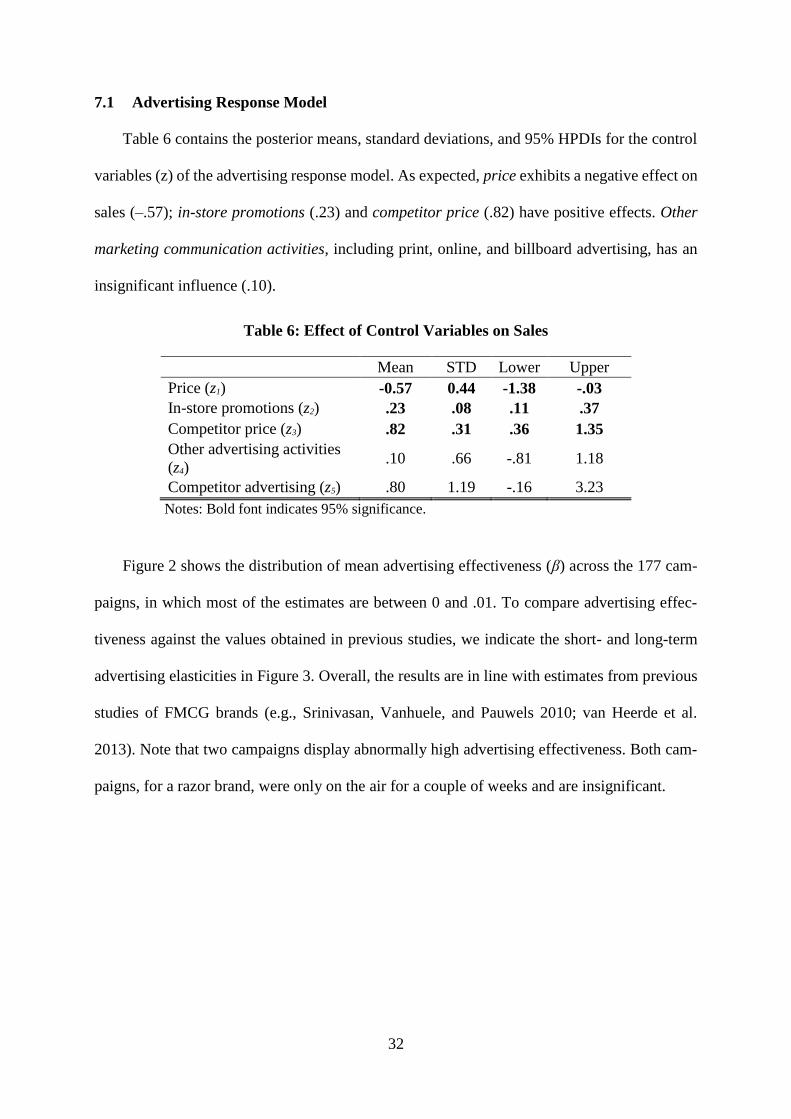
32
7.1 Advertising Response Model
Table 6 contains the posterior means, standard deviations, and 95% HPDIs for the control
variables (z) of the advertising response model. As expected, price exhibits a negative effect on
sales (–.57); in-store promotions (.23) and competitor price (.82) have positive effects. Other
marketing communication activities, including print, online, and billboard advertising, has an
insignificant influence (.10).
Table 6: Effect of Control Variables on Sales
Mean STD Lower Upper
Price (z1) -0.57 0.44 -1.38 -.03
In-store promotions (z2) .23 .08 .11 .37
Competitor price (z3) .82 .31 .36 1.35
Other advertising activities
(z4) .10 .66 -.81 1.18
Competitor advertising (z5) .80 1.19 -.16 3.23
Notes: Bold font indicates 95% significance.
Figure 2 shows the distribution of mean advertising effectiveness (β) across the 177 cam-
paigns, in which most of the estimates are between 0 and .01. To compare advertising effec-
tiveness against the values obtained in previous studies, we indicate the short- and long-term
advertising elasticities in Figure 3. Overall, the results are in line with estimates from previous
studies of FMCG brands (e.g., Srinivasan, Vanhuele, and Pauwels 2010; van Heerde et al.
2013). Note that two campaigns display abnormally high advertising effectiveness. Both cam-
paigns, for a razor brand, were only on the air for a couple of weeks and are insignificant.
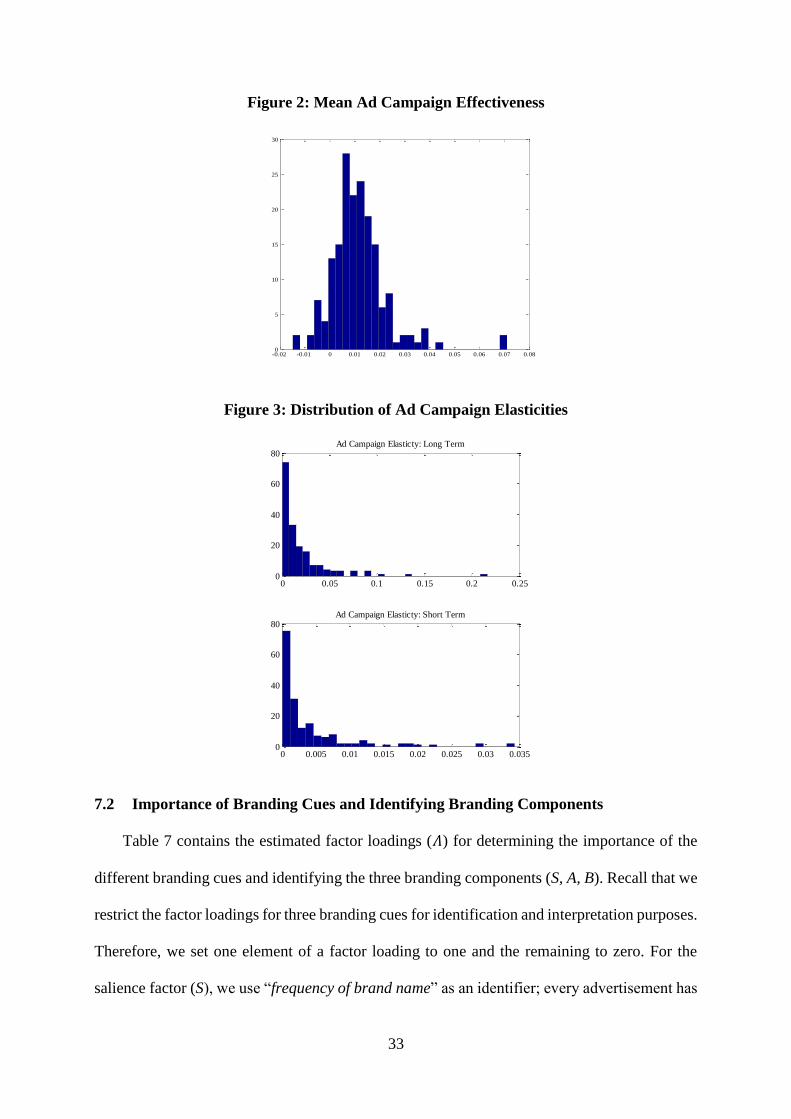
33
Figure 2: Mean Ad Campaign Effectiveness
Figure 3: Distribution of Ad Campaign Elasticities
7.2 Importance of Branding Cues and Identifying Branding Components
Table 7 contains the estimated factor loadings (𝛬) for determining the importance of the
different branding cues and identifying the three branding components (S, A, B). Recall that we
restrict the factor loadings for three branding cues for identification and interpretation purposes.
Therefore, we set one element of a factor loading to one and the remaining to zero. For the
salience factor (S), we use “frequency of brand name” as an identifier; every advertisement has
0 0.05 0.1 0.15 0.2 0.250
20
40
60
80Ad Campaign Elasticty: Long Term
0 0.005 0.01 0.015 0.02 0.025 0.03 0.0350
20
40
60
80Ad Campaign Elasticty: Short Term
-0.02 -0.01 0 0.01 0.02 0.03 0.04 0.05 0.06 0.07 0.080
5
10
15
20
25
30
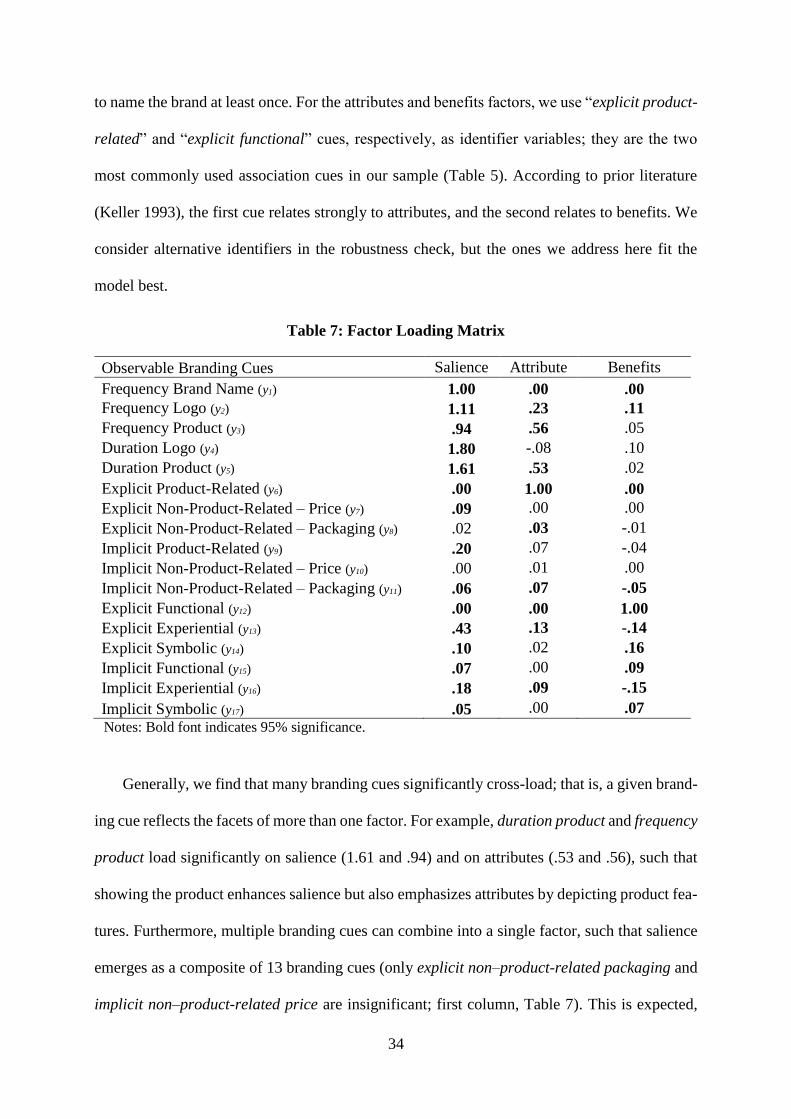
34
to name the brand at least once. For the attributes and benefits factors, we use “explicit product-
related” and “explicit functional” cues, respectively, as identifier variables; they are the two
most commonly used association cues in our sample (Table 5). According to prior literature
(Keller 1993), the first cue relates strongly to attributes, and the second relates to benefits. We
consider alternative identifiers in the robustness check, but the ones we address here fit the
model best.
Table 7: Factor Loading Matrix
Observable Branding Cues Salience Attribute Benefits
Frequency Brand Name (y1) 1.00 .00 .00
Frequency Logo (y2) 1.11 .23 .11
Frequency Product (y3) .94 .56 .05
Duration Logo (y4) 1.80 -.08 .10
Duration Product (y5) 1.61 .53 .02
Explicit Product-Related (y6) .00 1.00 .00
Explicit Non-Product-Related – Price (y7) .09 .00 .00
Explicit Non-Product-Related – Packaging (y8) .02 .03 -.01
Implicit Product-Related (y9) .20 .07 -.04
Implicit Non-Product-Related – Price (y10) .00 .01 .00
Implicit Non-Product-Related – Packaging (y11) .06 .07 -.05
Explicit Functional (y12) .00 .00 1.00
Explicit Experiential (y13) .43 .13 -.14
Explicit Symbolic (y14) .10 .02 .16
Implicit Functional (y15) .07 .00 .09
Implicit Experiential (y16) .18 .09 -.15
Implicit Symbolic (y17) .05 .00 .07
Notes: Bold font indicates 95% significance.
Generally, we find that many branding cues significantly cross-load; that is, a given brand-
ing cue reflects the facets of more than one factor. For example, duration product and frequency
product load significantly on salience (1.61 and .94) and on attributes (.53 and .56), such that
showing the product enhances salience but also emphasizes attributes by depicting product fea-
tures. Furthermore, multiple branding cues can combine into a single factor, such that salience
emerges as a composite of 13 branding cues (only explicit non–product-related packaging and
implicit non–product-related price are insignificant; first column, Table 7). This is expected,
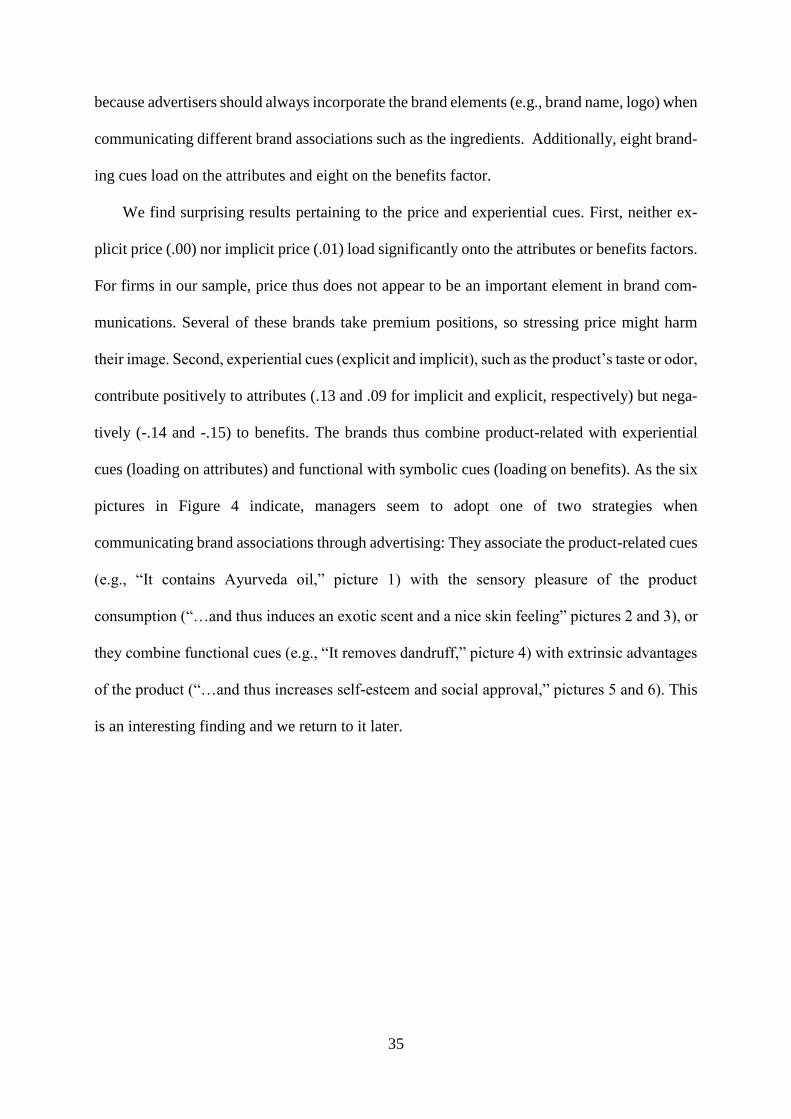
35
because advertisers should always incorporate the brand elements (e.g., brand name, logo) when
communicating different brand associations such as the ingredients. Additionally, eight brand-
ing cues load on the attributes and eight on the benefits factor.
We find surprising results pertaining to the price and experiential cues. First, neither ex-
plicit price (.00) nor implicit price (.01) load significantly onto the attributes or benefits factors.
For firms in our sample, price thus does not appear to be an important element in brand com-
munications. Several of these brands take premium positions, so stressing price might harm
their image. Second, experiential cues (explicit and implicit), such as the product’s taste or odor,
contribute positively to attributes (.13 and .09 for implicit and explicit, respectively) but nega-
tively (-.14 and -.15) to benefits. The brands thus combine product-related with experiential
cues (loading on attributes) and functional with symbolic cues (loading on benefits). As the six
pictures in Figure 4 indicate, managers seem to adopt one of two strategies when
communicating brand associations through advertising: They associate the product-related cues
(e.g., “It contains Ayurveda oil,” picture 1) with the sensory pleasure of the product
consumption (“…and thus induces an exotic scent and a nice skin feeling” pictures 2 and 3), or
they combine functional cues (e.g., “It removes dandruff,” picture 4) with extrinsic advantages
of the product (“…and thus increases self-esteem and social approval,” pictures 5 and 6). This
is an interesting finding and we return to it later.
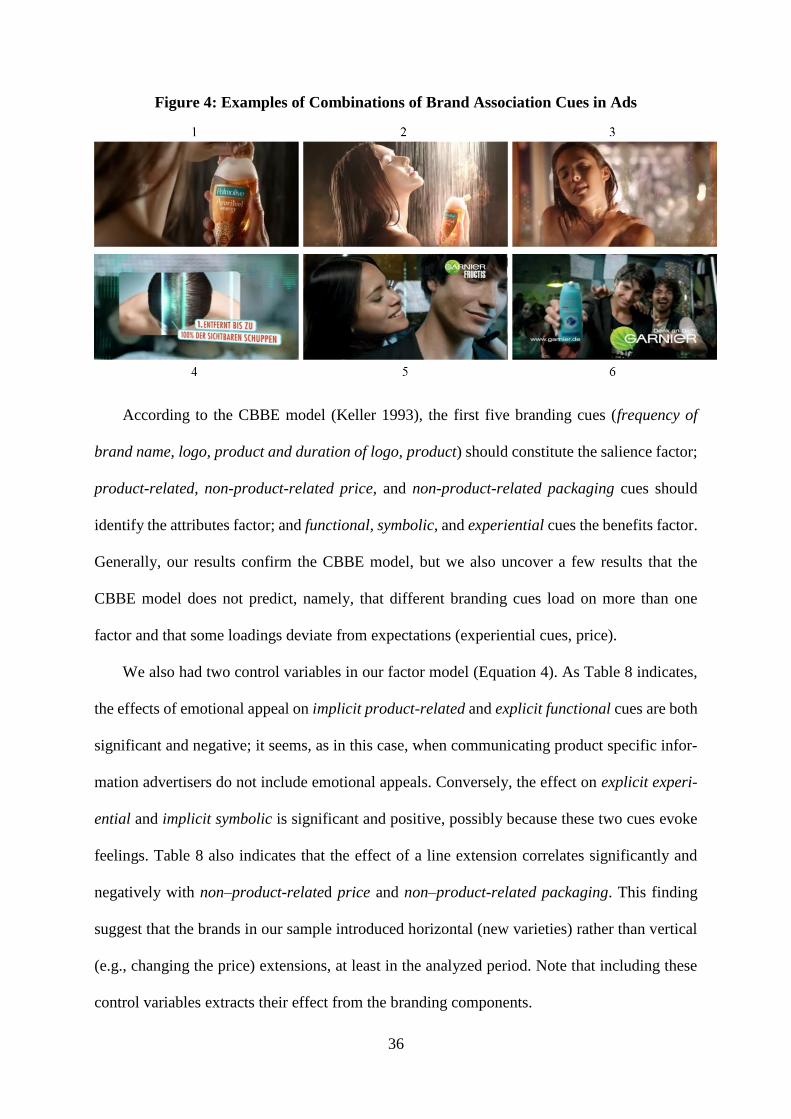
36
Figure 4: Examples of Combinations of Brand Association Cues in Ads
According to the CBBE model (Keller 1993), the first five branding cues (frequency of
brand name, logo, product and duration of logo, product) should constitute the salience factor;
product-related, non-product-related price, and non-product-related packaging cues should
identify the attributes factor; and functional, symbolic, and experiential cues the benefits factor.
Generally, our results confirm the CBBE model, but we also uncover a few results that the
CBBE model does not predict, namely, that different branding cues load on more than one
factor and that some loadings deviate from expectations (experiential cues, price).
We also had two control variables in our factor model (Equation 4). As Table 8 indicates,
the effects of emotional appeal on implicit product-related and explicit functional cues are both
significant and negative; it seems, as in this case, when communicating product specific infor-
mation advertisers do not include emotional appeals. Conversely, the effect on explicit experi-
ential and implicit symbolic is significant and positive, possibly because these two cues evoke
feelings. Table 8 also indicates that the effect of a line extension correlates significantly and
negatively with non–product-related price and non–product-related packaging. This finding
suggest that the brands in our sample introduced horizontal (new varieties) rather than vertical
(e.g., changing the price) extensions, at least in the analyzed period. Note that including these
control variables extracts their effect from the branding components.
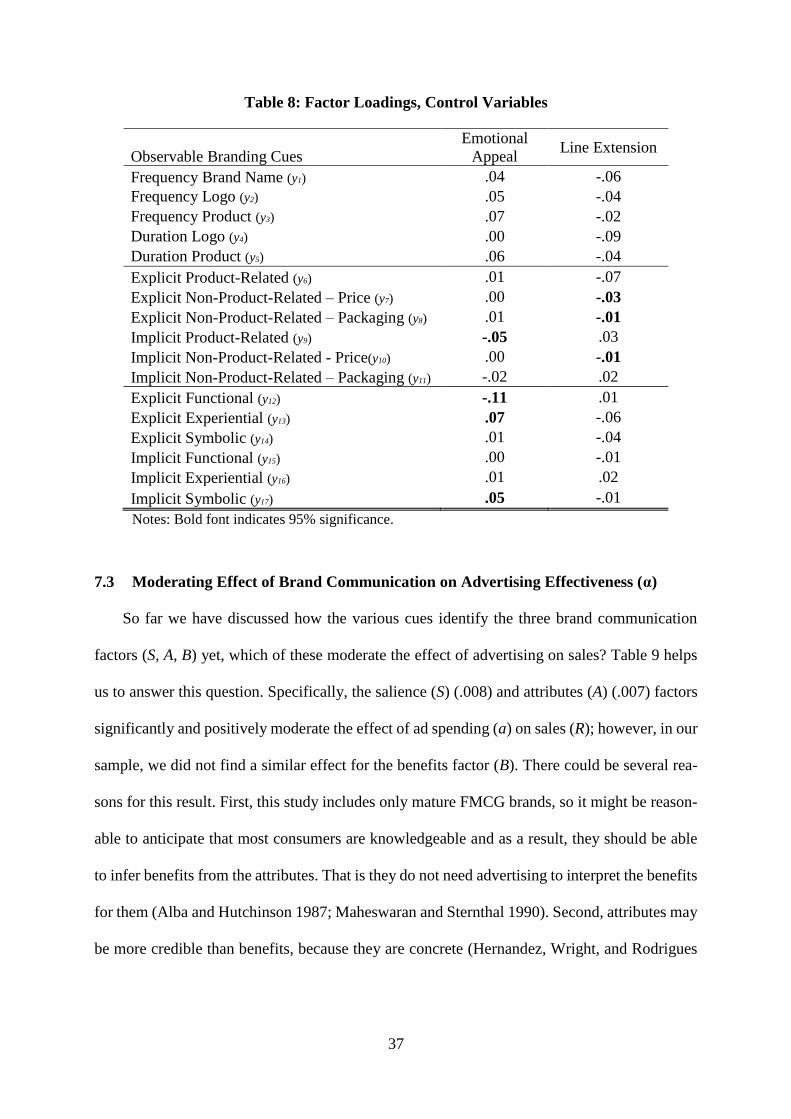
37
Table 8: Factor Loadings, Control Variables
Observable Branding Cues
Emotional
Appeal Line Extension
Frequency Brand Name (y1) .04 -.06
Frequency Logo (y2) .05 -.04
Frequency Product (y3) .07 -.02
Duration Logo (y4) .00 -.09
Duration Product (y5) .06 -.04
Explicit Product-Related (y6) .01 -.07
Explicit Non-Product-Related – Price (y7) .00 -.03
Explicit Non-Product-Related – Packaging (y8) .01 -.01
Implicit Product-Related (y9) -.05 .03
Implicit Non-Product-Related - Price(y10) .00 -.01
Implicit Non-Product-Related – Packaging (y11) -.02 .02
Explicit Functional (y12) -.11 .01
Explicit Experiential (y13) .07 -.06
Explicit Symbolic (y14) .01 -.04
Implicit Functional (y15) .00 -.01
Implicit Experiential (y16) .01 .02
Implicit Symbolic (y17) .05 -.01
Notes: Bold font indicates 95% significance.
7.3 Moderating Effect of Brand Communication on Advertising Effectiveness (α)
So far we have discussed how the various cues identify the three brand communication
factors (S, A, B) yet, which of these moderate the effect of advertising on sales? Table 9 helps
us to answer this question. Specifically, the salience (S) (.008) and attributes (A) (.007) factors
significantly and positively moderate the effect of ad spending (a) on sales (R); however, in our
sample, we did not find a similar effect for the benefits factor (B). There could be several rea-
sons for this result. First, this study includes only mature FMCG brands, so it might be reason-
able to anticipate that most consumers are knowledgeable and as a result, they should be able
to infer benefits from the attributes. That is they do not need advertising to interpret the benefits
for them (Alba and Hutchinson 1987; Maheswaran and Sternthal 1990). Second, attributes may
be more credible than benefits, because they are concrete (Hernandez, Wright, and Rodrigues
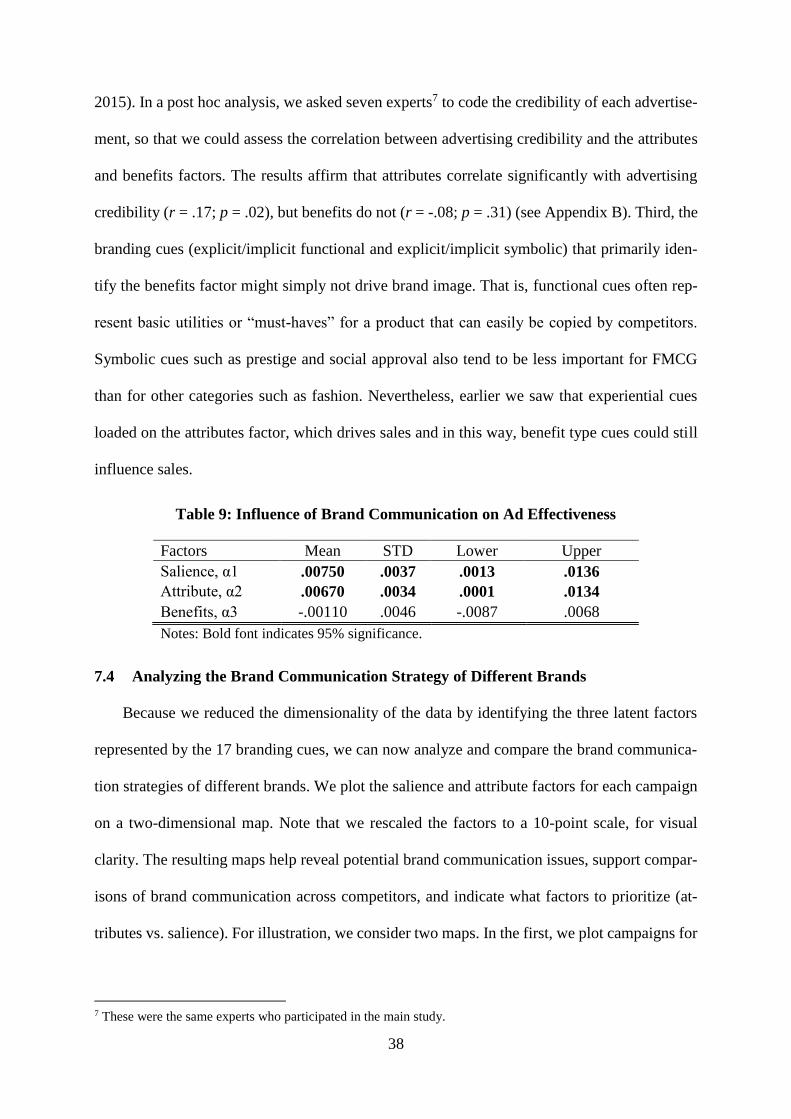
38
2015). In a post hoc analysis, we asked seven experts7 to code the credibility of each advertise-
ment, so that we could assess the correlation between advertising credibility and the attributes
and benefits factors. The results affirm that attributes correlate significantly with advertising
credibility (r = .17; p = .02), but benefits do not (r = -.08; p = .31) (see Appendix B). Third, the
branding cues (explicit/implicit functional and explicit/implicit symbolic) that primarily iden-
tify the benefits factor might simply not drive brand image. That is, functional cues often rep-
resent basic utilities or “must-haves” for a product that can easily be copied by competitors.
Symbolic cues such as prestige and social approval also tend to be less important for FMCG
than for other categories such as fashion. Nevertheless, earlier we saw that experiential cues
loaded on the attributes factor, which drives sales and in this way, benefit type cues could still
influence sales.
Table 9: Influence of Brand Communication on Ad Effectiveness
Factors Mean STD Lower Upper
Salience, α1 .00750 .0037 .0013 .0136
Attribute, α2 .00670 .0034 .0001 .0134
Benefits, α3 -.00110 .0046 -.0087 .0068
Notes: Bold font indicates 95% significance.
7.4 Analyzing the Brand Communication Strategy of Different Brands
Because we reduced the dimensionality of the data by identifying the three latent factors
represented by the 17 branding cues, we can now analyze and compare the brand communica-
tion strategies of different brands. We plot the salience and attribute factors for each campaign
on a two-dimensional map. Note that we rescaled the factors to a 10-point scale, for visual
clarity. The resulting maps help reveal potential brand communication issues, support compar-
isons of brand communication across competitors, and indicate what factors to prioritize (at-
tributes vs. salience). For illustration, we consider two maps. In the first, we plot campaigns for
7 These were the same experts who participated in the main study.
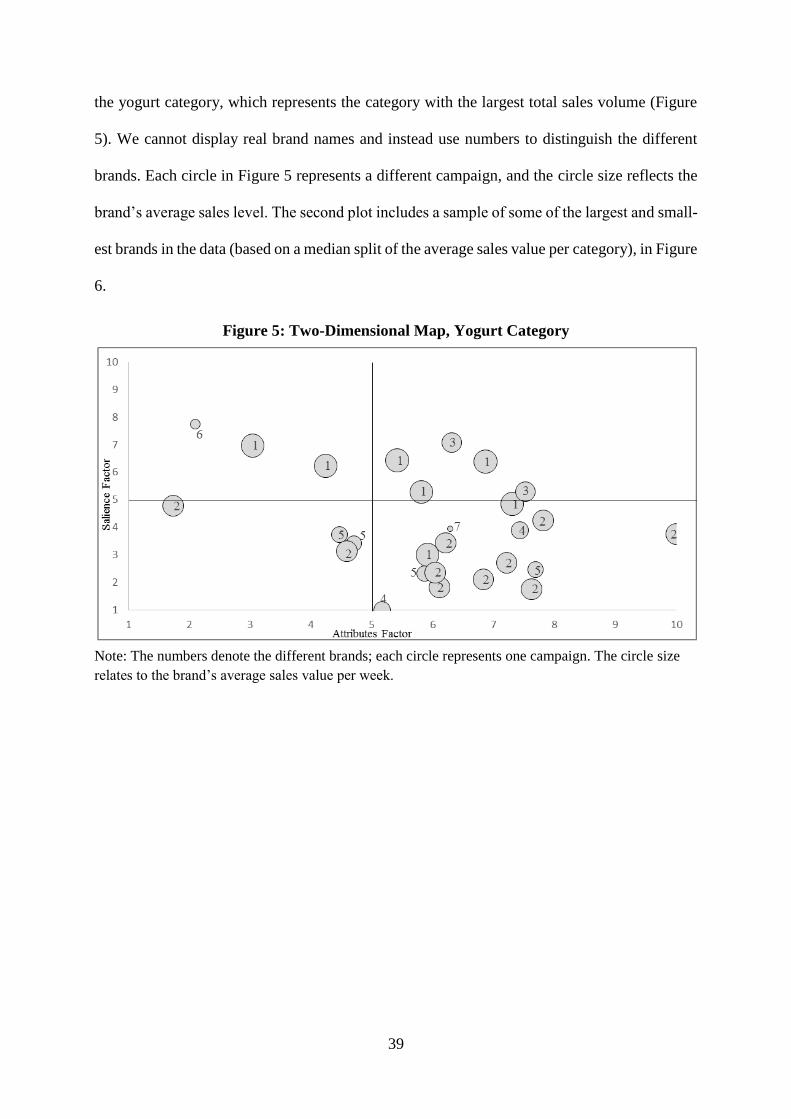
39
the yogurt category, which represents the category with the largest total sales volume (Figure
5). We cannot display real brand names and instead use numbers to distinguish the different
brands. Each circle in Figure 5 represents a different campaign, and the circle size reflects the
brand’s average sales level. The second plot includes a sample of some of the largest and small-
est brands in the data (based on a median split of the average sales value per category), in Figure
6.
Figure 5: Two-Dimensional Map, Yogurt Category
Note: The numbers denote the different brands; each circle represents one campaign. The circle size
relates to the brand’s average sales value per week.
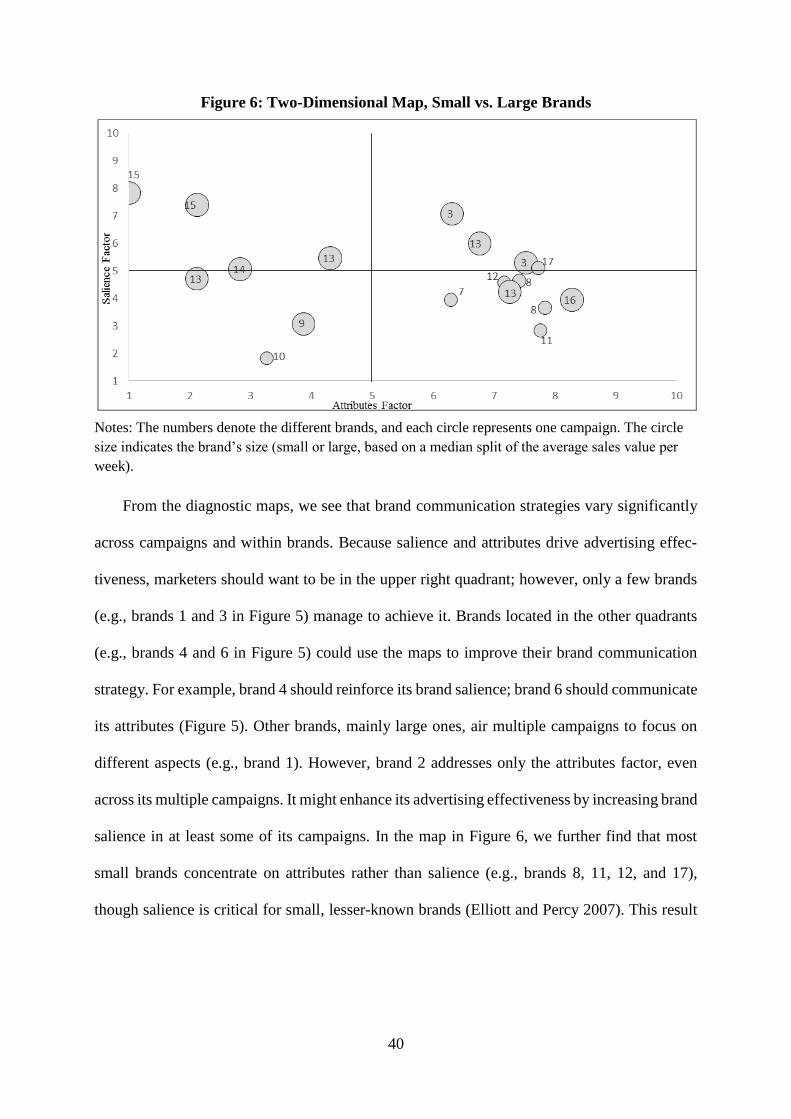
40
Figure 6: Two-Dimensional Map, Small vs. Large Brands
Notes: The numbers denote the different brands, and each circle represents one campaign. The circle
size indicates the brand’s size (small or large, based on a median split of the average sales value per
week).
From the diagnostic maps, we see that brand communication strategies vary significantly
across campaigns and within brands. Because salience and attributes drive advertising effec-
tiveness, marketers should want to be in the upper right quadrant; however, only a few brands
(e.g., brands 1 and 3 in Figure 5) manage to achieve it. Brands located in the other quadrants
(e.g., brands 4 and 6 in Figure 5) could use the maps to improve their brand communication
strategy. For example, brand 4 should reinforce its brand salience; brand 6 should communicate
its attributes (Figure 5). Other brands, mainly large ones, air multiple campaigns to focus on
different aspects (e.g., brand 1). However, brand 2 addresses only the attributes factor, even
across its multiple campaigns. It might enhance its advertising effectiveness by increasing brand
salience in at least some of its campaigns. In the map in Figure 6, we further find that most
small brands concentrate on attributes rather than salience (e.g., brands 8, 11, 12, and 17),
though salience is critical for small, lesser-known brands (Elliott and Percy 2007). This result
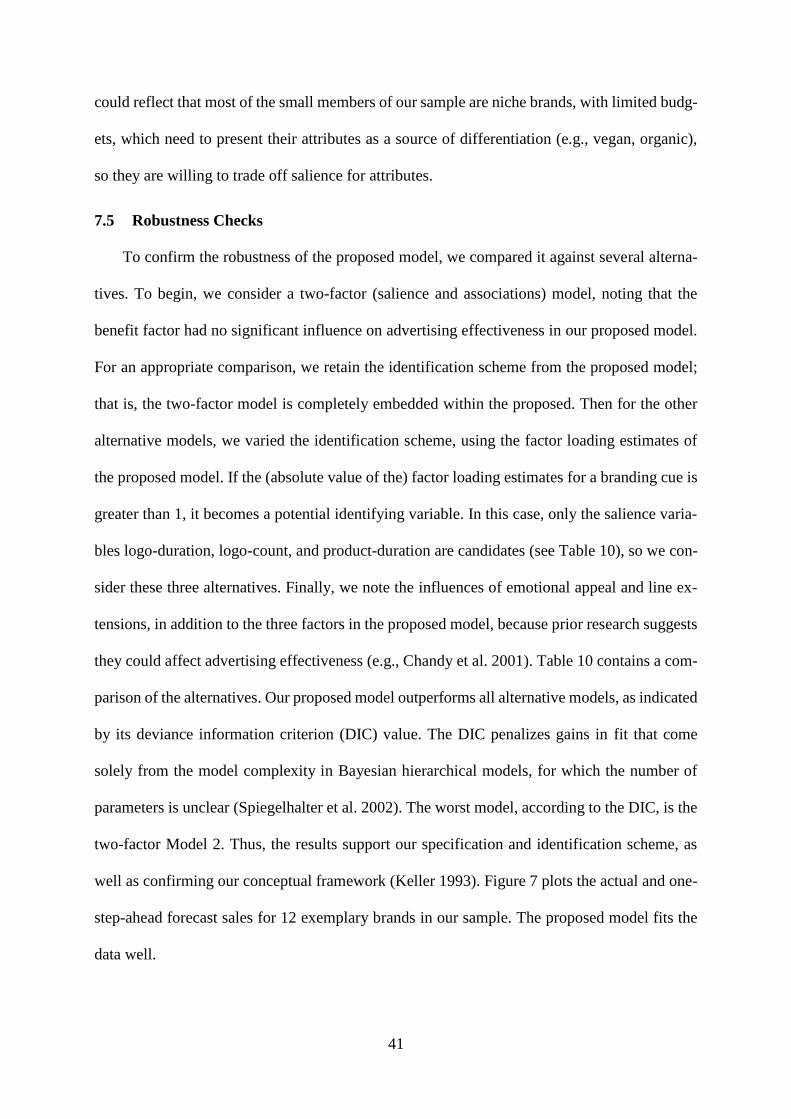
41
could reflect that most of the small members of our sample are niche brands, with limited budg-
ets, which need to present their attributes as a source of differentiation (e.g., vegan, organic),
so they are willing to trade off salience for attributes.
7.5 Robustness Checks
To confirm the robustness of the proposed model, we compared it against several alterna-
tives. To begin, we consider a two-factor (salience and associations) model, noting that the
benefit factor had no significant influence on advertising effectiveness in our proposed model.
For an appropriate comparison, we retain the identification scheme from the proposed model;
that is, the two-factor model is completely embedded within the proposed. Then for the other
alternative models, we varied the identification scheme, using the factor loading estimates of
the proposed model. If the (absolute value of the) factor loading estimates for a branding cue is
greater than 1, it becomes a potential identifying variable. In this case, only the salience varia-
bles logo-duration, logo-count, and product-duration are candidates (see Table 10), so we con-
sider these three alternatives. Finally, we note the influences of emotional appeal and line ex-
tensions, in addition to the three factors in the proposed model, because prior research suggests
they could affect advertising effectiveness (e.g., Chandy et al. 2001). Table 10 contains a com-
parison of the alternatives. Our proposed model outperforms all alternative models, as indicated
by its deviance information criterion (DIC) value. The DIC penalizes gains in fit that come
solely from the model complexity in Bayesian hierarchical models, for which the number of
parameters is unclear (Spiegelhalter et al. 2002). The worst model, according to the DIC, is the
two-factor Model 2. Thus, the results support our specification and identification scheme, as
well as confirming our conceptual framework (Keller 1993). Figure 7 plots the actual and one-
step-ahead forecast sales for 12 exemplary brands in our sample. The proposed model fits the
data well.
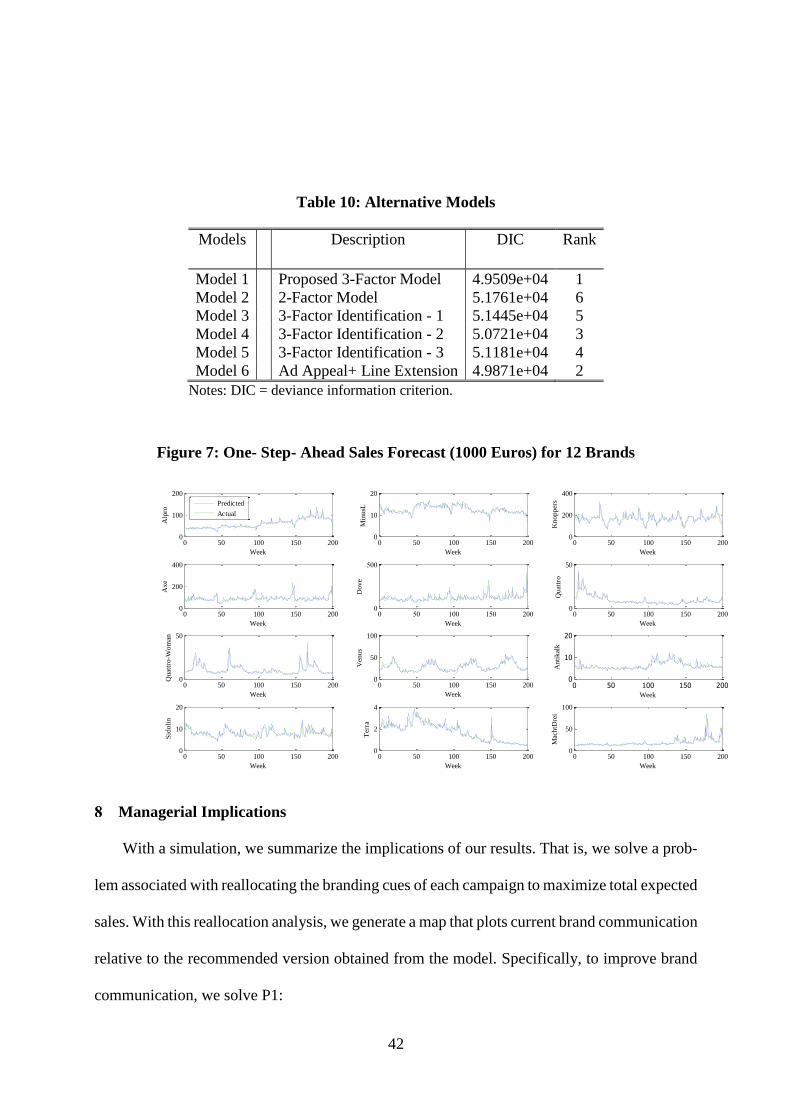
42
Table 10: Alternative Models
Models Description DIC Rank
Model 1 Proposed 3-Factor Model 4.9509e+04 1
Model 2 2-Factor Model 5.1761e+04 6
Model 3 3-Factor Identification - 1 5.1445e+04 5
Model 4 3-Factor Identification - 2 5.0721e+04 3
Model 5 3-Factor Identification - 3 5.1181e+04 4
Model 6 Ad Appeal+ Line Extension 4.9871e+04 2
Notes: DIC = deviance information criterion.
Figure 7: One- Step- Ahead Sales Forecast (1000 Euros) for 12 Brands
Managerial Implications
With a simulation, we summarize the implications of our results. That is, we solve a prob-
lem associated with reallocating the branding cues of each campaign to maximize total expected
sales. With this reallocation analysis, we generate a map that plots current brand communication
relative to the recommended version obtained from the model. Specifically, to improve brand
communication, we solve P1:
0 50 100 150 2000
100
200
Week
Alp
ro
Predicted
Actual
0 50 100 150 2000
10
20
Week
Min
usL
0 50 100 150 2000
200
400
Week K
no
pper
s
0 50 100 150 2000
200
400
Week
Axe
0 50 100 150 2000
500
Week
Dove
0 50 100 150 2000
50
Week
Quat
tro
0 50 100 150 2000
50
Week
Quat
tro
-Wom
an
0 50 100 150 2000
50
100
Week
Ven
us
0 50 100 150 2000
10
20
Week
An
tikal
k
0 50 100 150 2000
10
20
Week
Sid
oli
n
0 50 100 150 2000
2
4
Week
Ter
ra
0 50 100 150 2000
50
100
Week
Mac
htD
rei
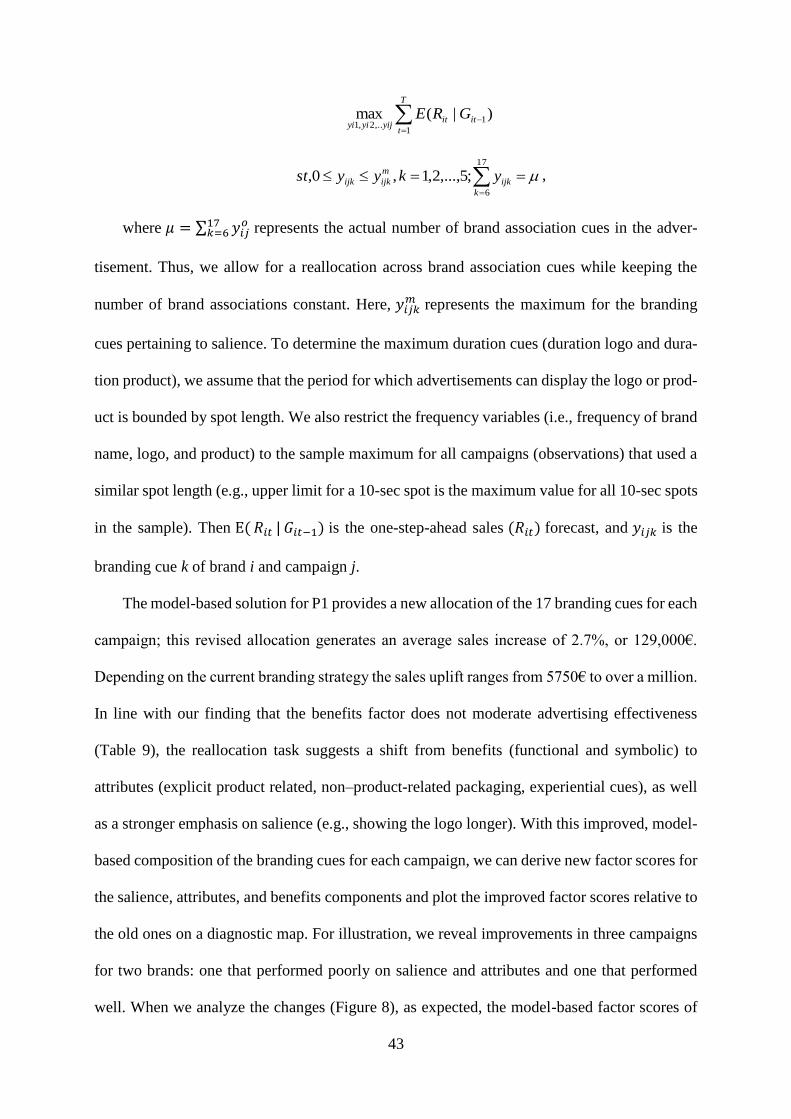
43
)|(max 1
1,..2,1
it
T
t
ityijyiyi
GRE
17
6
;5,...,2,1,0,k
ijk
m
ijkijk ykyyst ,
where 𝜇 = ∑ 𝑦𝑖𝑗𝑜17
𝑘=6 represents the actual number of brand association cues in the adver-
tisement. Thus, we allow for a reallocation across brand association cues while keeping the
number of brand associations constant. Here, 𝑦𝑖𝑗𝑘𝑚 represents the maximum for the branding
cues pertaining to salience. To determine the maximum duration cues (duration logo and dura-
tion product), we assume that the period for which advertisements can display the logo or prod-
uct is bounded by spot length. We also restrict the frequency variables (i.e., frequency of brand
name, logo, and product) to the sample maximum for all campaigns (observations) that used a
similar spot length (e.g., upper limit for a 10-sec spot is the maximum value for all 10-sec spots
in the sample). Then E( 𝑅𝑖𝑡 | 𝐺𝑖𝑡−1) is the one-step-ahead sales (𝑅𝑖𝑡) forecast, and 𝑦𝑖𝑗𝑘 is the
branding cue k of brand i and campaign j.
The model-based solution for P1 provides a new allocation of the 17 branding cues for each
campaign; this revised allocation generates an average sales increase of 2.7%, or 129,000€.
Depending on the current branding strategy the sales uplift ranges from 5750€ to over a million.
In line with our finding that the benefits factor does not moderate advertising effectiveness
(Table 9), the reallocation task suggests a shift from benefits (functional and symbolic) to
attributes (explicit product related, non–product-related packaging, experiential cues), as well
as a stronger emphasis on salience (e.g., showing the logo longer). With this improved, model-
based composition of the branding cues for each campaign, we can derive new factor scores for
the salience, attributes, and benefits components and plot the improved factor scores relative to
the old ones on a diagnostic map. For illustration, we reveal improvements in three campaigns
for two brands: one that performed poorly on salience and attributes and one that performed
well. When we analyze the changes (Figure 8), as expected, the model-based factor scores of
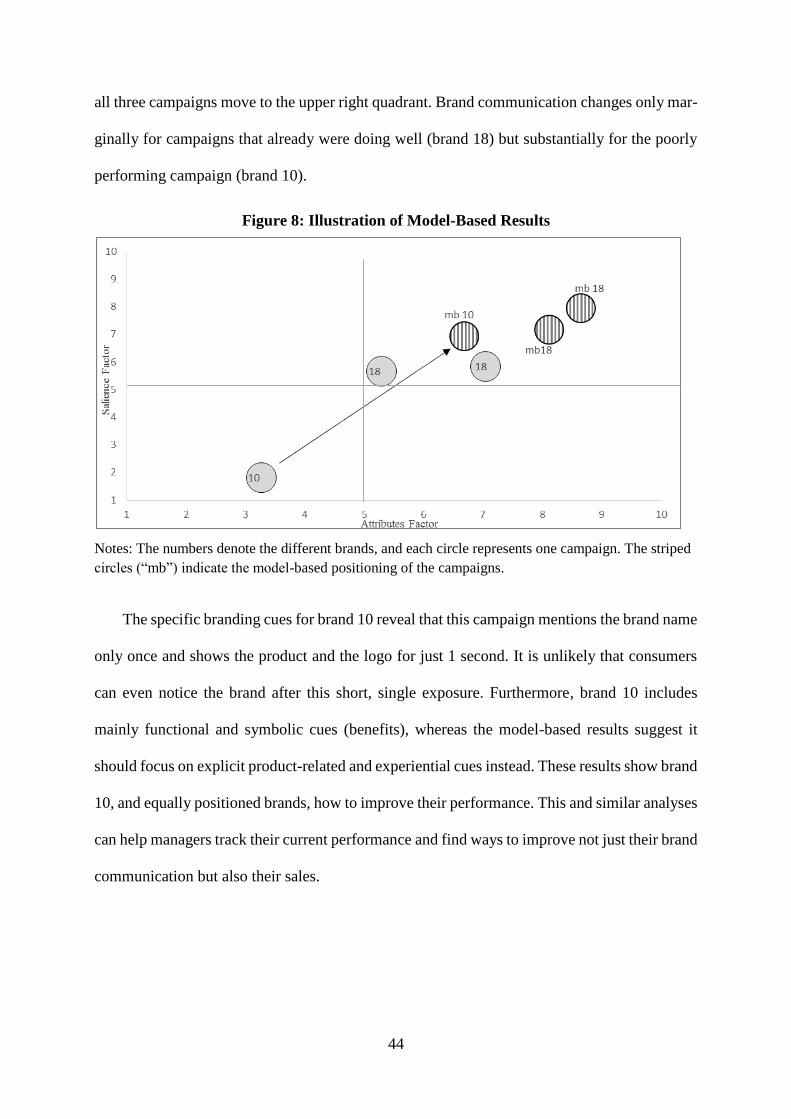
44
all three campaigns move to the upper right quadrant. Brand communication changes only mar-
ginally for campaigns that already were doing well (brand 18) but substantially for the poorly
performing campaign (brand 10).
Figure 8: Illustration of Model-Based Results
Notes: The numbers denote the different brands, and each circle represents one campaign. The striped
circles (“mb”) indicate the model-based positioning of the campaigns.
The specific branding cues for brand 10 reveal that this campaign mentions the brand name
only once and shows the product and the logo for just 1 second. It is unlikely that consumers
can even notice the brand after this short, single exposure. Furthermore, brand 10 includes
mainly functional and symbolic cues (benefits), whereas the model-based results suggest it
should focus on explicit product-related and experiential cues instead. These results show brand
10, and equally positioned brands, how to improve their performance. This and similar analyses
can help managers track their current performance and find ways to improve not just their brand
communication but also their sales.
45
Conclusions and Limitations
This study sought to explore how marketers should communicate their brands in advertis-
ing to generate more sales. Prior literature argues that firms can build strong brands and conse-
quently enhance advertising effectiveness by emphasizing brand salience and communicating
favorable brand associations (attributes and/or benefits) (Keller 1993). To test these assump-
tions, we measure 17 branding cues commonly embedded in advertising and use them to iden-
tify the salience, attributes, and benefits components. We then model the effect of advertising
as a function of these. To calibrate this model, we use panel and media data from the Nielsen
Company for 62 brands and 177 campaigns across six product categories sold in the German
market.
The findings indicate several substantive results. First, the factor analysis reveals that
branding cues significantly cross-load and contribute to more than one component. For exam-
ple, brands include product-related cues in advertisements to enhance both salience and attrib-
utes. Furthermore, price did not contribute to either of the brand association factors; perhaps
brand managers do not believe that price reinforces their brand’s image. Interestingly, market-
ers seem to follow two strategies when communicating brand associations, in which they either
combine product-related cues with the sensory pleasure of the product consumption, or they
relate the functional cues to the extrinsic advantages of the product. Second, we show that the
brand communication indeed moderates advertising effectiveness. Specifically, salience and
attributes positively influence the effect of advertising on sales, though we do not find a similar
effect for benefits. We offer several explanations for this result: (1) Knowledgeable consumers
can derive relevant benefits from attributes by themselves, (2) consumers perceive attributes as
more credible than benefits, or (3) the main drivers of the benefits factor, functional and sym-
bolic cues, might not strengthen the brand’s image. Nevertheless, some benefit type cues can
still influence advertising effectiveness because experiential benefits load onto attributes. As
46
mentioned before, this is, because advertisers combine product related attributes with experi-
ential benefits (see figure 4), it is in this way that benefit type cues can affect brand sales. This
result also shows that the first strategy regarding the brand associations (combining product-
related cues with the sensory pleasure of the product consumption) is superior. Maybe because
attributes provide the required “reason why” for the experiential benefits. Third, marketers can
use our findings to monitor their brand communication relative to competitors’ and identify
directions for improvement. Our model-based results suggest that improving brand communi-
cation within advertisements can produce an average sales bump of 2.7%.
Our study also has a few limitations that additional studies might address. First, some of
our findings may not generalize to other contexts. We base our analysis on established FMCG
brands; in other product categories, the effect of the branding components might differ. For
example, symbolic cues relating to prestige likely are more important for luxury products. Sim-
ilarly, our data come from a single country, though Germany has the highest advertising spend-
ing in Europe and is culturally similar to other Western countries. Second, though our study
focuses on 17 different branding cues, there might be still more that are important (e.g., slogan,
jingles, brand character). In our sample, these alternative branding cues are characterized by
very low variance (i.e., almost all advertisements use slogans, and virtually none of them inte-
grate a brand character), so we excluded them. Third, we focus on the 1993 version of Keller’s
CBBE model, rather than the more recent brand pyramid, because advertising is designed es-
pecially to enhance awareness and image. However, incorporating other aspects of the brand
pyramid could be an interesting venture for further studies.
47
REFERENCES PAPER I
Aaker, Jennifer L. (1997), "Dimensions of Brand Personality," Journal of Marketing Research,
34 (August), 347-56.
Advertising Age (2017), “Ranking der Top 5 werbungtreibenden Unternehmen weltweit nach
Werbeinvestitionen im Jahr 2015 (in Milliarden US-Dollar),“ Statista - The Statistic-Portal,
( accessed Feburary 25, 2017) [available at https://de.statista.com/statis-
tik/daten/studie/646505/umfrage/unternehmen-mit-den-hoechsten-werbeausgaben-welt-
weit/].
Alba, Joseph W., and J. Wesley Hutchinson (1987), "Dimensions of Consumer Expertise,"
Journal of Consumer Research, 13 (March), 411-54.
Assmus, Gert, John U. Farley, and Donald R. Lehmann (1984), "How Advertising Affects
Sales: Meta-Analysis of Econometric Results," Journal of Marketing Research, 21 (1), 65-
74.
Bass, Frank M., Norris I. Bruce, Sumit Majumdar, and B.P.S. Murthi (2007), “Wearout Effects
of Different Advertising Themes: A Dynamic Bayesian Model of the Advertising-Sales
Relationship,” Marketing Science, 26 (2), 179-95.
Baker, William E., Heather Honea, and Christel A. Russell (2004), “Do Not Wait to Reveal the
Brand Name,” Journal of Advertising, 33 (3), 77-85.
Basilevsky, Alexander (1994), Statistical Factor Analysis and Related Methods–Theory and
Applications. New York: John Wiley & Sons.
Belch, Georg E. and Michael A. Belch, (2009), Advertising and Promotion, 8th ed., New York:
McGraw‐Hill International Edition.
Bruce, Norris I., Kay Peters, and Prasad A. Naik (2012), “Discovering How Advertising Grows
Sales and Builds Brands,” Journal of Marketing Research, 49 (6), 793-806.
Bruce, Norris I., B.P.S Murthi and R. Rao (2016), “A Dynamic Model for Digital Advertising:
The Effects of Creative Formats, Message Content, and Targeting Engagement,” Journal of
Marketing Research, Forthcoming.
Carter, C., and R. Kohn (1994), “On Gibbs Sampling for State Space Models,” Biometrika, 81,
541-553.
Chandy, Rajesh K., Gerard J. Tellis, Deborah J. MacInnis, and Pattana Thaivanich (2001),
“What to Say When: Advertising Appeals in Evolving Markets,” Journal of Marketing
Research, 38 (November), 399-414.
Chattopadhyay, Amitava, and Kunal Basu (1990), "Humor in Advertising: The Moderating
Role of Prior Brand Evaluation," Journal of Marketing Research, 27 (November), 466-76.
Cowan, Nelson (2001), “Metatheory of Storage Capacity Limits,” Behavioral and Brain
Sciences, 24 (1), 154-76.
48
Danaher, Peter J., André Bonfrer, and Sanjay Dhar (2008), "The Effect of Competitive
Advertising Interference on Sales for Packaged Goods," Journal of Marketing Research, 45
(2), 211-25.
D’Souza, Giles and Ram C. Rao (1995), “Can Repeating an Advertisement More Frequently
Than the Competition Affect Brand Preference in a Mature Market?,” Journal of Marketing,
59 (April), 32-42.
Draganska, Michaela, Wesley R. Hartmann, and Gena Stanglein (2014), “Internet Versus
Television Advertising: A Brand-Building Comparison,“ Journal of Marketing Research,
51 (October), 578-90.
Eastlack, Joseph O. Jr. and Ambar G. Rao (1989), “Advertising Experiments at the Campbell
Soup Company,” Marketing Science, 8 (1), 57-71.
Edell, Julia A. and Marian Chapman Burke (1987), “The Power Feelings in Understanding
Advertising Effects,” Journal of Consumer Research, 14 (December), 421-433.
Elliott, Richard, and Larry Percy (2007), Strategic Brand Management. New York: Oxford
University Press Inc.
Fruhwirth-Schnatter, Sylvia (1994), “Data Augmentation and Dynamic Linear Models,”
Journal of Time Series Analysis, 15, 183-202.
Hernandez, José Mauro da Costa, Scott A. Wright, and Filipe Ferminiano Rodrigues (2015),
"Attributes versus Benefits: The Role of Construal Levels and Appeal Type on the
Persuasiveness of Marketing Messages," Journal of Advertising, 44 (3), 243-53.
Herzog, Herta (1963), "Behavioral Science Concepts for Analyzing the Consumer," Marketing
and the Behavioral Sciences, 76-86.
Keller, Kevin Lane (1993), "Conceptualizing, Measuring, and Managing Customer-Based
Brand Equity," Journal of Marketing, 57 (January), 1-22.
——— (2007), “Advertising and Brand Equity,” in The SAGE Handbook of Advertising,
Gerhard J. Tellis and Tim Ambler, eds. London: Sage Publications, 54-70.
——— (2008), Strategic Brand Management, 3rd ed. Englewood Cliffs, NJ: Pearson Prentice
Hall.
Krippendorff, K. (1980), Content Analysis: An Introduction to its Methodology. Beverly Hills,
CA: Sage Publications.
Leeflang, Peter S. H., Dick R. Wittink, Michel Wedel, and Philippe A. Naert (2000), Building
Models for Marketing Decisions. Dordrecht: Kluwer Academic Publishers.
Lodish, Leonard M., Magid Abraham, and Stuart Kalmenson (1995), “How TV Advertising
Works: A Meta-Analysis of 389 Real World Split Cable TV Advertising Experiments,”
Journal of Marketing Research, 32 (May), 125-39.
49
Loewenstein, Jeffrey, Rajagopal Raghunathan, and Chip Heath (2011), "The Repetition-Break
Plot Structure Makes Effective Television Advertisements," Journal of Marketing, 75 (5),
105-19.
Lopes, Hedibert F. and Mike West (2004), “Bayesian Model Assessment in Factor Analysis,”
Statistica Sinica, 14 (1), 41–67.
Luo, Xueming, and Naveen Donthu (2006), "Marketing's Credibility: A Longitudinal
Investigation of Marketing Communication Productivity and Shareholder Value," Journal
of Marketing, 70 (4), 70-91.
Ma, Yu, Kusum L. Ailawadi, Dinseh K. Gauri, and Dhruv Grewal (2011), "An Empirical
Investigation of the Impact of Gasoline Prices on Grocery Shopping Behavior," Journal of
Marketing, 75 (2), 18-35.
MacInnis, Deborah J., Ambar G. Rao, and Allen M. Weiss (2002), “Assessing When Increased
Media Weight of Real-World Advertisements Helps Sales,” Journal of Marketing Research,
39 (November), 391-407.
Maheswaran, Durairaj, and Brian Sternthal (1990), "The Effects of Knowledge, Motivation,
and Type of Message on Ad Processing and Product Judgments," Journal of Consumer
Research, 17 (1), 66-73.
Morales, Andrea C., Eugenia C. Wu, and Gavan J. Fitzsimons (2012), "How Disgust Enhances
the Effectiveness of Fear Appeals," Journal of Marketing Research, 49 (3), 383-93.
Park, C. Whan, Bernard J. Jaworski, and Deborah J. Maclnnis (1986), "Strategic Brand
Concept-Image Management," Journal of Marketing, 50 (October), 135-45.
Peter, J. Paul and Jerry D. Olson (2010), Consumer Behavior and Marketing Strategy, 9th ed.
New York: MacGraw-Hill Irwin.
Reinartz, Werner and Peter Saffert (2013), “Creativity in Advertising: When It Works and
When It Doesn't,” Harvard Business Review, 91 (6), 106-12.
Romaniuk, Jenni (2009), “The Efficacy of Brand–Execution Tactics in TV Advertising, Brand
Placement, and Internet Advertising,” Journal of Advertising Research, 49 (2), 143-50.
Rossi, Peter, Greg Allenby, and Rob McCullough (2005), Bayesian Statistics and Marketing.
Hoboken, NJ: Wiley.
Rossiter, John R. and Steven Bellman (2005), Marketing Communications: Theory and
Applications. Upper Saddle River, NJ: Pearson Education.
Sethuraman, Raj, Tellis, Gerard J., and Richard A. Briesch, (2011), “How Well Does
Advertising Work? Generalizations from Meta-Analysis of Brand Advertising Elasticities,”
Journal of Marketing Research, 48 (3), 457-71.
Shankar, Venkathesh, Pablo Azar, and Matthew Fuller (2008, “BRAN*EQT: A Multicategory
Brand Equity Model and Its Application at Allstate,” Marketing Science, 27 (4),567-584.
50
Sheth Jagdish N. and Banwari Mittal (2004) Customer Behavior: A Managerial Perspective.
Mason, OH: Thomson South-Western.
Sonnier, Garret P., Oliver Rutz and Leigh McAlister (2011), “A Dynamic Model of the Effect
of Online Communications on Firm Sales,” Marketing Science, 30, 702-16.
Spiegelhalter, David J., Nicola G. Best, Bradley P.Carlin, and Angelika Van Der Linde, (2002),
“Bayesian Measures of Model Complexity and Fit,” Journal of the Royal Statistical Society:
Series B (Statistical Methodology), 64(4), 583-639.
Srinivasan, Shuba, Marc Vanhuele, and Koen Pauwels (2010), "Mind-Set Metrics in Market
Response Models: An Integrative Approach," Journal of Marketing Research, 47 (4), 672-
84.
Stahl, Florian, Mark Heitmann, Donald R. Lehmann, and Scott A. Neslin (2012), "The Impact
of Brand Equity on Customer Acquisition, Retention, and Profit Margin," Journal of
Marketing, 76 (4),44-63.
Stewart, David W. and David H. Furse (1986), Effective Television Advertising: A Study of
1000 Commercials. Lexington, MA: Lexington Books.
Teixeira, Thales S., Rosalind Picard, and Rana el Kaliouby (2016), “Why, When, and How
Much to Entertain Consumers in Advertisements? A Web-Based Facial Tracking Field
Study,” Marketing Science, 33 (6), 809-27.
Teixeira, Thales S., Michel Wedel, and Rik Pieters (2010), “Moment-to-Moment Optimal
Branding in TV Commercials: Preventing Avoidance by Pulsing,” Marketing Science, 29
(5),783-804.
Tellis, Gerard J. (2004), Effective Advertising: How, When, and Why Advertising Works.
Thousand Oaks, CA: Sage Publications.
Thurstone, Louis L. (1927), “Psychophysical Analysis,” American Journal of Psychology, 38
(3), 368–89.
Van Heerde Harald J., Maarten J. Gijsenberg, Marnik Dekimpe, and Jan-Benedict E.M.
Steenkamp (2013), “Price and Advertising Effectiveness over the Business Cycle,” Journal
of Marketing Research, 50 (2), 177-93.
Wu, Tsung Wen, Ralph L. Day, and David B. MacKay (1988), "Consumer Benefits versus
Product Attributes: An Experimental Test," Quarterly Journal of Business and Economics,
27 (3), 88-113.
Zentralverband der deutschen Werbewirtschaft (2016),“Wirtschaft und Werbung 2015,“
(accessed at June 19, 2016), [available at www.zaw.de/zaw/branchendaten/wirtschaft-und-
werbung/?navid=986495986495]
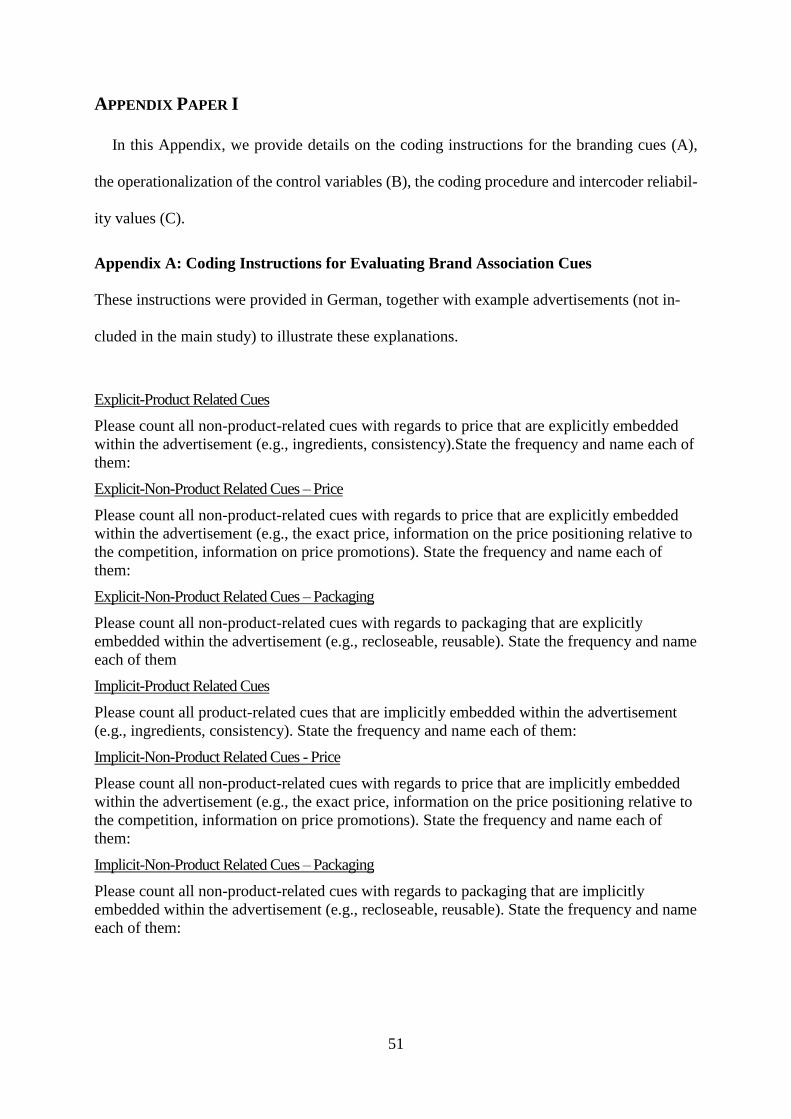
51
APPENDIX PAPER I
In this Appendix, we provide details on the coding instructions for the branding cues (A),
the operationalization of the control variables (B), the coding procedure and intercoder reliabil-
ity values (C).
Appendix A: Coding Instructions for Evaluating Brand Association Cues
These instructions were provided in German, together with example advertisements (not in-
cluded in the main study) to illustrate these explanations.
Explicit-Product Related Cues
Please count all non-product-related cues with regards to price that are explicitly embedded
within the advertisement (e.g., ingredients, consistency).State the frequency and name each of
them:
Explicit-Non-Product Related Cues – Price
Please count all non-product-related cues with regards to price that are explicitly embedded
within the advertisement (e.g., the exact price, information on the price positioning relative to
the competition, information on price promotions). State the frequency and name each of
them:
Explicit-Non-Product Related Cues – Packaging
Please count all non-product-related cues with regards to packaging that are explicitly
embedded within the advertisement (e.g., recloseable, reusable). State the frequency and name
each of them
Implicit-Product Related Cues
Please count all product-related cues that are implicitly embedded within the advertisement
(e.g., ingredients, consistency). State the frequency and name each of them:
Implicit-Non-Product Related Cues - Price
Please count all non-product-related cues with regards to price that are implicitly embedded
within the advertisement (e.g., the exact price, information on the price positioning relative to
the competition, information on price promotions). State the frequency and name each of
them:
Implicit-Non-Product Related Cues – Packaging
Please count all non-product-related cues with regards to packaging that are implicitly
embedded within the advertisement (e.g., recloseable, reusable). State the frequency and name
each of them:

52
Explanation
Product-related attributes: All attributes that belong to the physical composition of the
product and are directly relate to the product’s performance such as the product’s ingredi-
ents or consistency.
Non-product related attributes: Refer to any features that do not directly affect the perfor-
mance but relate to the general product experience such as the price and packaging.
1. Price: Information on the product’s price (e.g., the exact price, price positioning
relative to the competition, price promotions)
2. Packaging: information on the product’s packaging (e.g., functionality of the
packaging (reclose able or reusable)
Implicit means that it is implied (e.g., visually) rather than expressly stated
Explicit Functional Cues
Please count the number of all functional cues that are explicitly mentioned within the adver-
tisement (e.g., strengthens the immune system, clears the skin, removes dandruff). State the
frequency and name each of them:
Explicit Experiential Cues
Please count the number of all experiential cues that are explicitly mentioned within the ad-
vertisement (e.g., fragrance, taste, haptics, skin feeling). State the frequency and name each of
them:
Explicit Symbolic Cues
Please count the number of all symbolic cues that are explicitly mentioned to within the ad-
vertisement (e.g., prestige, increases attractiveness to women, enhances self-esteem etc.) State
the frequency and name each of them:
Implicit Functional Cues
Please count the number of all functional cues that are implicitly mentioned within the adver-
tisement (e.g., strengthens the immune system, clears the skin, removes dandruff). State the
frequency and name each of them:
Implicit Experiential Cues
Please count the number of all experiential cues that are implicitly mentioned within the ad-
vertisement (e.g., fragrance, taste, haptics, skin feeling). State the frequency and name each of
them:
Implicit Symbolic Cues
Please count the number of all symbolic cues that are implicitly mentioned to within the ad-
vertisement (e.g., prestige, increases attractiveness to women, enhances self-esteem, etc.).
State the frequency and name each of them:
Explanation
1. Functional benefits: refer to the inherent advantages of the product consumption and ad-
dress consumers’ problem-solving needs (e.g., cleans, removes dandruff etc.).
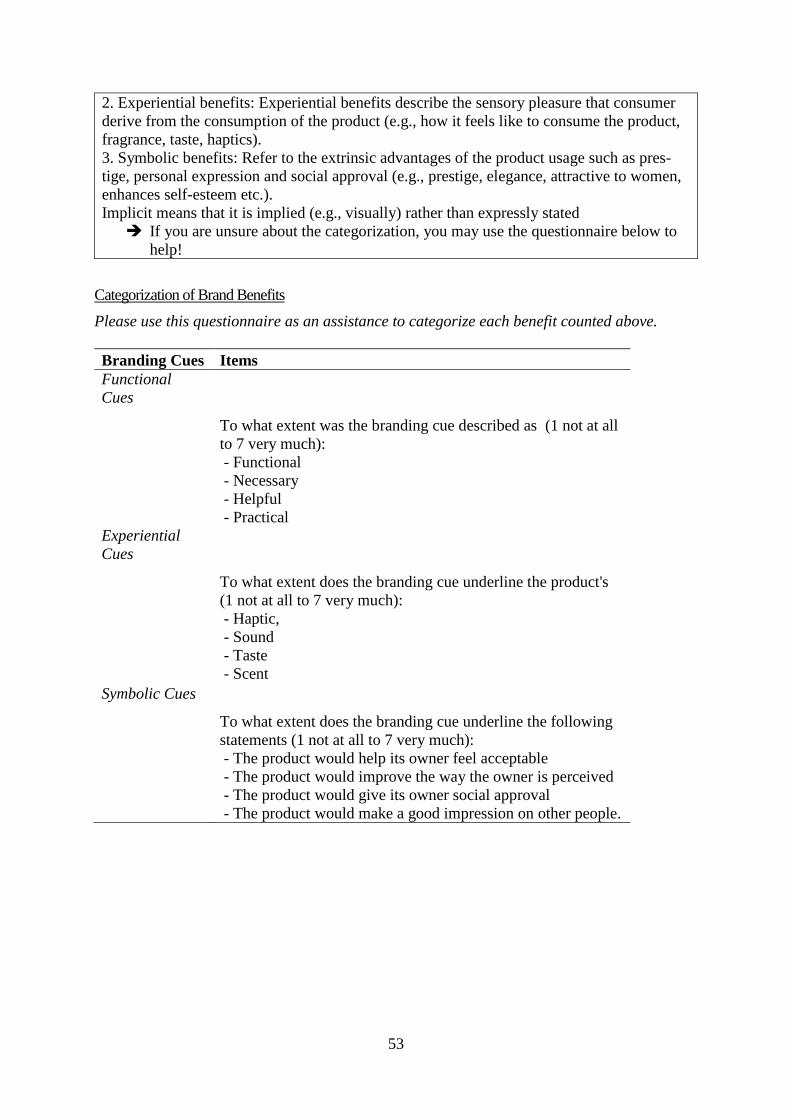
53
2. Experiential benefits: Experiential benefits describe the sensory pleasure that consumer
derive from the consumption of the product (e.g., how it feels like to consume the product,
fragrance, taste, haptics).
3. Symbolic benefits: Refer to the extrinsic advantages of the product usage such as pres-
tige, personal expression and social approval (e.g., prestige, elegance, attractive to women,
enhances self-esteem etc.).
Implicit means that it is implied (e.g., visually) rather than expressly stated
If you are unsure about the categorization, you may use the questionnaire below to
help!
Categorization of Brand Benefits
Please use this questionnaire as an assistance to categorize each benefit counted above.
Branding Cues Items
Functional
Cues
To what extent was the branding cue described as (1 not at all
to 7 very much):
- Functional
- Necessary
- Helpful
- Practical
Experiential
Cues
To what extent does the branding cue underline the product's
(1 not at all to 7 very much):
- Haptic,
- Sound
- Taste
- Scent
Symbolic Cues
To what extent does the branding cue underline the following
statements (1 not at all to 7 very much):
- The product would help its owner feel acceptable
- The product would improve the way the owner is perceived
- The product would give its owner social approval
- The product would make a good impression on other people.
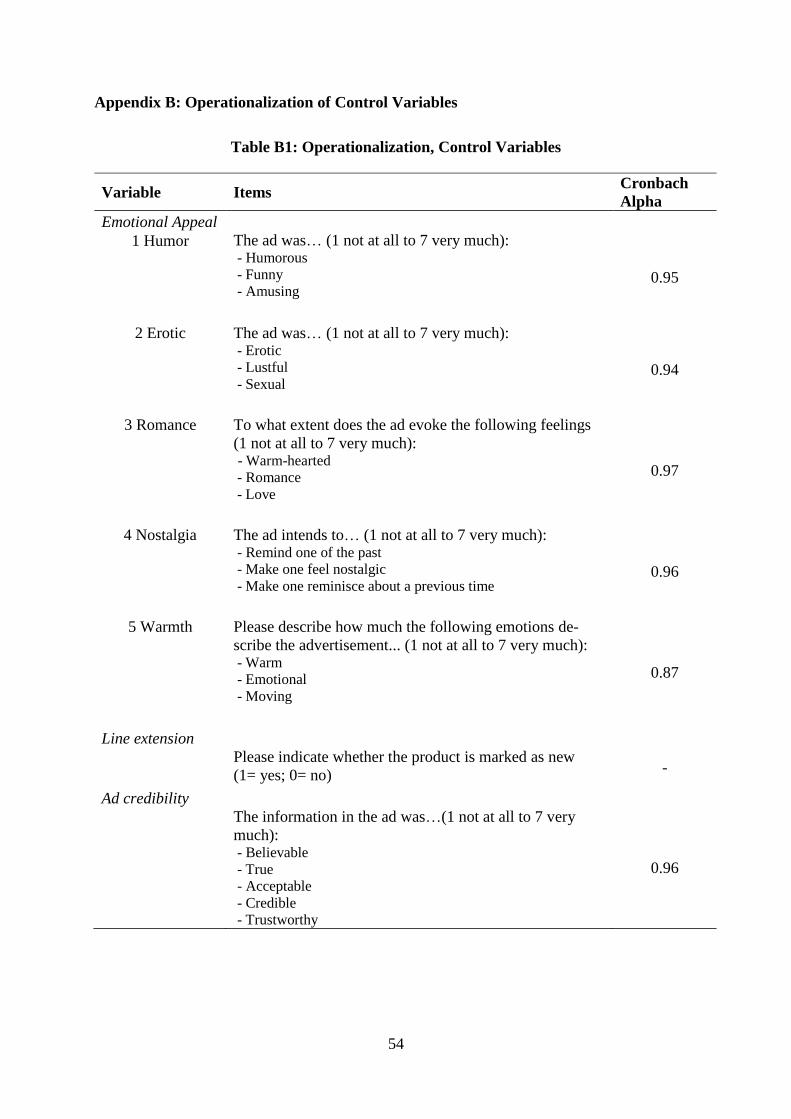
54
Appendix B: Operationalization of Control Variables
Table B1: Operationalization, Control Variables
Variable Items Cronbach
Alpha
Emotional Appeal
1 Humor
The ad was… (1 not at all to 7 very much): - Humorous
- Funny
- Amusing 0.95
2 Erotic
The ad was… (1 not at all to 7 very much): - Erotic
- Lustful
- Sexual 0.94
3 Romance
To what extent does the ad evoke the following feelings
(1 not at all to 7 very much): - Warm-hearted
- Romance
- Love
0.97
4 Nostalgia
The ad intends to… (1 not at all to 7 very much): - Remind one of the past
- Make one feel nostalgic
- Make one reminisce about a previous time 0.96
5 Warmth
Please describe how much the following emotions de-
scribe the advertisement... (1 not at all to 7 very much): - Warm
- Emotional
- Moving
0.87
Line extension
Please indicate whether the product is marked as new
(1= yes; 0= no) -
Ad credibility
The information in the ad was…(1 not at all to 7 very
much): - Believable
- True
- Acceptable
- Credible
- Trustworthy
0.96
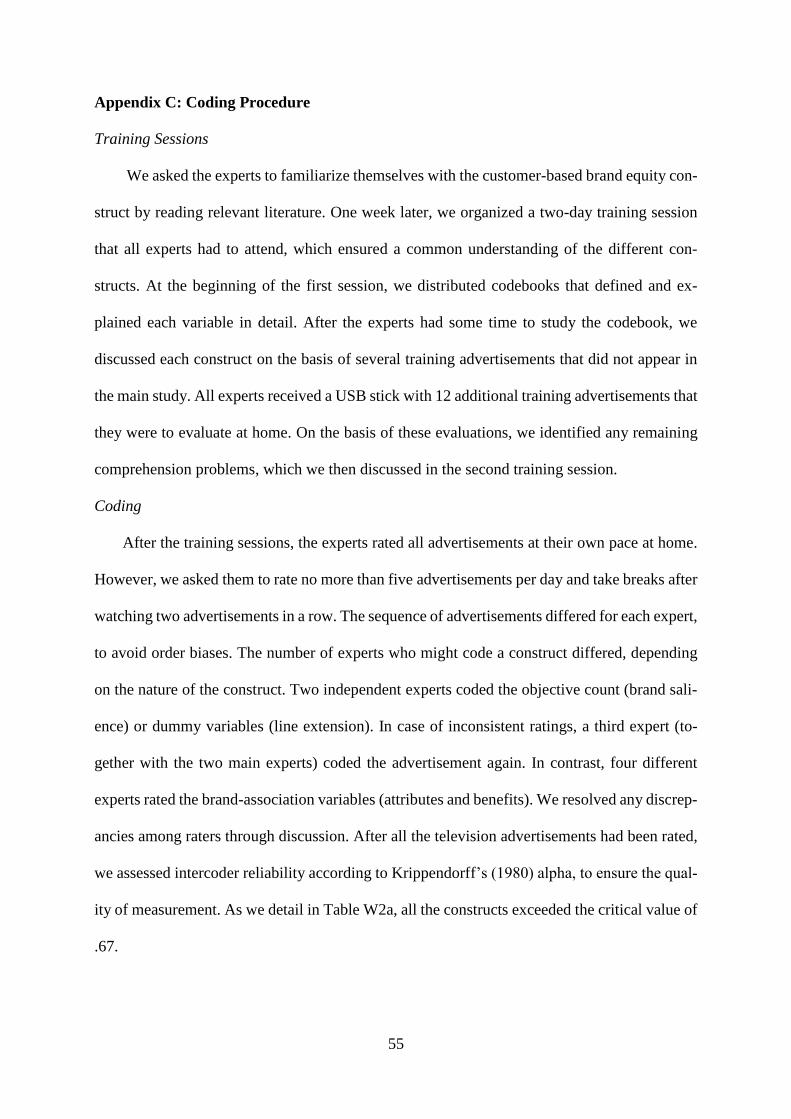
55
Appendix C: Coding Procedure
Training Sessions
We asked the experts to familiarize themselves with the customer-based brand equity con-
struct by reading relevant literature. One week later, we organized a two-day training session
that all experts had to attend, which ensured a common understanding of the different con-
structs. At the beginning of the first session, we distributed codebooks that defined and ex-
plained each variable in detail. After the experts had some time to study the codebook, we
discussed each construct on the basis of several training advertisements that did not appear in
the main study. All experts received a USB stick with 12 additional training advertisements that
they were to evaluate at home. On the basis of these evaluations, we identified any remaining
comprehension problems, which we then discussed in the second training session.
Coding
After the training sessions, the experts rated all advertisements at their own pace at home.
However, we asked them to rate no more than five advertisements per day and take breaks after
watching two advertisements in a row. The sequence of advertisements differed for each expert,
to avoid order biases. The number of experts who might code a construct differed, depending
on the nature of the construct. Two independent experts coded the objective count (brand sali-
ence) or dummy variables (line extension). In case of inconsistent ratings, a third expert (to-
gether with the two main experts) coded the advertisement again. In contrast, four different
experts rated the brand-association variables (attributes and benefits). We resolved any discrep-
ancies among raters through discussion. After all the television advertisements had been rated,
we assessed intercoder reliability according to Krippendorff’s (1980) alpha, to ensure the qual-
ity of measurement. As we detail in Table W2a, all the constructs exceeded the critical value of
.67.
56
Table C1: Krippendorff’s Alpha, Brand Associations
Brand Equity
Component Branding Cue Krippendorff’s Alpha Value
Attributes
Explicit
Product-Related 0.79
Non-Product-Related - Price 0.81
Non-Product-Related - Packaging 0.87
Implicit
Product-Related 0.69
Non-Product-Related - Price 0.78
Non-Product-Related - Packaging 0.67
Benefits
Explicit
Functional 0.80
Experiential 0.77
Symbolic 0.75
Implicit
Functional 0.86
Experiential 0.83
Symbolic 0.81
Furthermore, seven independent experts rated all multi-item control variables (emotional ap-
peals and credibility). Again, any discrepancies in the ratings were resolved through discussion,
and all Krippendorff’s alpha values exceeded the critical value (Table W2b). We mean-centered
the variables for the analysis.
Table C2: Krippendorff’s Alpha, Control Variables
Variable Krippendorff's Alpha
Value
Humor 0.84
Erotic 0.82
Nostalgia 0.86
Romance 0.90
Warmth 0.72
Credibility 0.71
57
PAPER II: DOES IT PAY TO BE REAL? UNDERSTANDING AUTHENTICITY IN TV
ADVERTISING
Author: Maren Becker, Werner Reinartz, and Monika Käuferle
ABSTRACT
Authenticity is one of the most prevalent buzzwords in the advertising industry. Marketing
managers and creatives alike believe that authenticity is an essential element for effective
advertising. However, authenticity in advertising is used in different contexts, in both research
and practice. The current study identifies four dimensions by which authenticity can be
conveyed in advertising and investigates their effects on the sales performance of advertised
products. The impact of authenticity might also depend on different brand characteristics, so
the authors analyze how the effects vary with brand size or across hedonic and utilitarian
products. The study is conducted in a consumer goods context, covering 340 television ads
across 68 brands and 4 years. The objective is to pinpoint whether and when authenticity
enhances advertising effectiveness, relative to other content cues, in order to help managers
increase their return on advertising investments.
Keywords: Advertising effectiveness, advertising content, authenticity
58
Introduction
Truth is beautiful without doubt, but so are lies.
—Ralph Waldo Emerson (1835)
Authenticity has become one of the most prevalent buzzwords in the advertising industry.
Marketing managers and creatives are both convinced that an authentic ad execution8 is a key
driver of effective advertising (Beverland, Lindgreen, and Vink 2008; Morhart et al. 2015,
Poetzsch 2014). Amir Kassaei (2006), chief creative officer of DDB9, asserts that even if “an
authentic ad might be less likely to win a Cannes Lion, it is very likely to win consumers’
hearts.” Specifically, advertisers believe that authentic advertising stimulates brand trust (An-
derberg and Morris 2006), helps consumers connect with the brand (Grayson and Martinec
2004), and triggers feelings of sympathy or empathy (Stern 1994). Moreover, they assume that
authentic ads help overcome consumer skepticism (Darke and Ritchie 2007; Poetzsch 2014) -
an effect that is especially important, given that consumers become increasingly skeptical
towards ads because of the improved information transparency in the digital age and
consumers’ clearer understanding of marketers’ persuasive tactics (Campbell and Kirmani
2000). However, these beliefs are primarily based on anecdotal evidence. In other words, there
is no empirical proof for the role of authenticity, yet. Thus, the question arises does authenticity
really increase advertising effectiveness?
Along with the lack of clear evidence, there is no common understanding of what consti-
tutes an authentic ad execution. Prior literature, both academic and managerial, refers to au-
thentic ads in varied contexts. For example, some studies link authenticity to a spokesperson’s
trustworthiness (Stern 1994), others to a realistic ad plot (Deighton, Romer and MacQueen
1989), and yet others to an accurate representation of the brand (Beverland, Lindgreen, and
8 For the purposes of this study, terms such as “authentic ad execution,” “authentic advertising,” and “authentic-
ity in ads” are used interchangeably. 9 DDB Worldwide Communications Group Inc. is a global marketing communications network.
59
Vink 2008; Brown, Kozinets, and Sherry 2003). In other words, there seem to be different pos-
sibilities (dimensions) of how to design an authentic ad execution. Guided by these issues, we
consider the following research questions: What are the different dimensions of authenticity in
advertising? What influence do these dimensions have on advertising effectiveness? Do these
effects depend on different brand or product characteristics?
We address these questions in the context of TV advertising. Drawing from existing liter-
ature and a qualitative study, we identify four dimensions of authenticity in ads: (1) preserving
the brand essence, (2) honoring brand heritage, (3) showing a realistic plot, and (4) presenting
a credible and unexaggerated advertising message. The first two dimensions relate to the ad’s
representation of the brand (i.e., how it preserves and sustains the brand’s values, essence, or
heritage) whereas the latter two dimensions pertain to the ad’s execution (i.e., how truthful,
genuine, and realistic the information conveyed by the ad is). Next, we investigate the effect of
each dimension on the relationship between ad spending and sales, controlling for other content
cues (e.g., emotional content, brand presence, informativeness). We also investigate whether
these effects might vary across different brands and product categories. To conduct our analysis,
we obtained weekly scanner, retail panel, and media data from the Nielsen Company for 68
brands and 340 television ads, related to six fast-moving consumer good (FMCG) categories
sold on the German market, over a period of almost four years. The data set comprises weekly
sales data and corresponding marketing mix information, including price, in-store promotions,
and advertising spending across four media types (i.e., television, Internet, billboard, and print).
To be able to quantify the effects of the different authenticity dimensions and further control
variables, several independent experts evaluated all ads in our sample in an extensive coding
task.
With these combined efforts, the current study makes several contributions to extant re-
search. First, it is the first to assess the effect of authenticity on actual consumer behavior in
60
terms of sales. Most previous authenticity research adopts a conceptual or a qualitative approach
(e.g., Beverland 2005; Grayson and Martinec 2004; Rose and Wood 2005; Stern 1994); we
explicitly measure the level of authenticity in ads and quantify its short- and long-term impacts
on sales of the advertised brand. Second, whereas previous studies tend to focus on only one
selected dimension, such as the brand’s heritage (Beverland, Lindgreen, and Vink 2008), the
spokesperson (Stern 1994), or the plot (Deighton, Romer, and MacQueen 1989), we distinguish
four dimensions that can convey authenticity in advertising. This holistic approach in turn pro-
vides a clear framework for further research in this field. Third, we extend the limited quanti-
tative literature on ad content by investigating its effect across multiple brands of six different
product categories. Prior work on ad content tends to focus on one (Bass et al. 2007; Chandy et
al. 2001) or a few brands only (MacInnis, Rao, and Weiss 2002). Fourth, we examine to what
extent consumers’ responses to the different authenticity dimensions depend on brand and prod-
uct characteristics. We thereby provide managers with precise advice on how to improve their
ad content.
The results show that the effect of authenticity depends on the dimension and the brand
and product characteristics. Across all brands, preserving the brand’s essence increases ad ef-
fectiveness, whereas honoring brand heritage is not significant. A realistic plot and a credible
message even exert negative effects. The magnitude of these effects also depends on the type
of brand or product category. For example, the negative influence of a credible message is
especially powerful for hedonic products and less known brands. Our results thus may help
managers design more appropriate ads, depending on the type of brand they are selling.
In the next section, we provide a brief review of advertising literature, and in particular the
relevant streams pertaining to advertising effectiveness and the moderating effect of advertising
content. After we discuss the concept of authenticity, we present our data and empirical model.
61
The article concludes with a discussion of the most important results, valuable implications for
research and managers, and some study limitations.
Advertising Effects
2.1 The Effect of Advertising on Sales
Extensive research on the effectiveness of advertising examines the impact of advertising
weight (e.g., spending, GRP) on different performance indicators, such as brand sales or market
share. We thus know that, overall, advertising has a positive and significant effect on sales,
even if its magnitude is rather small. For example, among established FMCG brands, Sriniva-
san, Vanhuele, and Pauwels (2010) as well as van Heerde et al. (2013) find long-term advertis-
ing elasticities of .036 and .013, respectively. Yet, advertising effectiveness also differs widely
across campaigns. In a meta-analysis, Sethuraman, Tellis, and Briesch (2011) find that only
about 50% of the included elasticities differ significantly from zero. For marketers it is thus of
utmost importance to identify which factors drive advertising effectiveness. With their famous
Campbell’s soup experiment, Eastlack and Rao (1989) show that increasing the level of ad
spending does not necessarily enhance ad effectiveness, but changes in the ad’s content exhibit
strong impacts on sales. Lodish et al. (1995) affirm these results, reinforcing the relevance of
ad content for analyzing ad effectiveness.
2.2 Effects of Advertising Content
Most of the studies aimed at identifying the influence of ad content on measures of ad
effectiveness are lab experiments that test for the effect of selected content cues on different
mindset metrics, such as recall, attitude, or purchase intent (e.g., Loewenstein, Raghunathan,
and Heath 2011; Morales, Wu, and Fitzsimons 2012). However, such laboratory studies cannot
account for competitive aspects or other marketplace constraints, nor can they feasibly test a
62
combination of several content cues within one study. Moreover, they force consumers to pro-
cess the ads actively, whereas in real market environments, advertising clutter likely leads con-
sumers to process ad information more passively.
Only a few studies have analyzed the effect of ad content on actual sales performance (Tel-
lis 2009). MacInnis, Rao, and Weiss (2002) find that emotional ads are more likely to generate
sales than ads based on informative content, and Chandy et al. (2001) compare the effects of
different content cues (e.g., argument, appeal prominence, emotion, expert sources, framing)
on consumer behavior (i.e., referrals) for a medical service company across different markets.
They conclude that argument-based appeals, expert sources, and negatively framed messages
work best in new markets, whereas in established markets, emotion-based appeals and posi-
tively framed messages are more effective. Moreover, Bass et al. (2007) find that marketers can
defer advertising wear-out effects, or the “decreasing response to an ad with increasing repeti-
tion of exposure to the ad” (Tellis 2004, p. 100), by offering emotional content. Collectively,
these studies support the notion that appropriate ad content moderates the effect of ad spending
on sales. While these studies contribute significantly to our understanding, they also tend to
focus on a limited number of brands and generally ignore the effect of authenticity—a key
content feature. Therefore, we seek to build on extant studies by a) examining the effect of ad
content across multiple brands and product categories, to increase the generalizability of the
results, and b) including authenticity as another important content cue that presumably influ-
ences advertising effectiveness
Concept of Authenticity
Authenticity is central to marketing as an antidote to the phoniness that seems to dominate
many marketing practices (Costa 1998; Grayson and Martinec 2004; Holt 2002); it may even
represent the “cornerstone of contemporary marketing” (Brown, Kozinets, and Sherry 2003, p.
21) and a key means to overcome increasing skepticism toward marketing activities. Despite
63
widespread agreement about the importance of authenticity as a concept, there is no commonly
accepted definition. Rather, “what is consistent across the literature is that authenticity encap-
sulates what is genuine, real, and/or true” (Beverland and Farelly 2010, p. 839). Grayson and
Martinec (2004) show that consumers evaluate the authenticity of an object on the basis of two
types of cues: indexical and iconic. Indexical cues provide evidence that the objective is real or
original, whereas iconic cues simply resemble the real thing (Ewing, Allen, and Ewing 2012).
Thus, authenticity is not necessarily inherent in an object (indexical) but can be constructed by
marketers (iconic).
Prior studies on authenticity in marketing generally focus on one of two research streams.
The first stream aims to explain and measure the general concept of authenticity (Beverland
and Farelly 2010; Grayson and Martinec 2004; Morhart et al. 2015; Rose and Wood 2005),
whereas the second stream focuses on brand-related aspects, including why brands (Beverland
2005; Newman and Dhar 2014) or brand communities (Leigh, Peters, and Shelton 2006) might
be perceived as authentic or how authenticity influences the performance of brand extensions
(Brown, Kozinets, and Sherry Jr. 2003; Spiggle, Nguyen, and Caravella 2012). Such studies,
mostly qualitative in approach, support the notion that authenticity is important to marketing
and that it is a multilayered, polysemous concept. However, we know of no research that has
examined the effect of authenticity on actual consumer behavior (e.g., sales).
Furthermore, research on authenticity in an advertising context remains sparse, despite its
assumed role as a determinant of advertising effectiveness, and mainly focuses on general con-
cepts of authenticity in ads. For example, Stern (1994) deliberates on the relationship between
authenticity and the ads’ persona or spokesperson while Beverland, Lindgreen, and Vink
(2008), investigate, through structured interviews, whether ads can reinforce a brand’s authen-
64
ticity claims by honoring its brand heritage. The current study offers an initial attempt to dis-
tinguish different dimensions of authentic advertising and quantify their influences on adver-
tising effectiveness in terms of sales.
Different Dimensions of Authenticity in Advertising
An authentic ad is one that is genuine, real, and true with regard to a specific aspect or
dimension. Following previous work (Spiggle, Nguyen, and Caravella 2012), we derive these
dimensions from a rigorous study of related literature, such that we conducted a keyword search
(“authenticity,” “authentic”) in several academic online databases (e.g., EBSCO, Google
Scholar) and scanned the Internet for practitioner articles using Google and Bing. We also con-
ducted a manual search of leading interdisciplinary journals for academics and practitioners
(e.g., The Wall Street Journal, Harvard Business Review). To identify the different dimensions,
we first generated a list of all aspects that prior literature indicates should contribute to or reflect
authenticity. From this list, we deleted any redundancies (e.g., nostalgia, heritage, traditional)
and any aspects that would be inapplicable to an advertising context.10 That is, we searched
journals from various disciplines, so the initial list included facets of authenticity related to, for
example, interpersonal relationships, leadership (e.g., integrity), tourism (e.g., deserted, natu-
ral), and branding (e.g., avoid exploitation). Finally, we retained only those elements that were
under the control of the marketer.
Given that marketers invest in ads to promote the brand and provide information, most
articles link advertising authenticity to one of two broad concepts: brand authenticity (i.e., how
the ad preserves and conveys the brand’s uniqueness, heritage, values, or essence) or
executional authenticity (i.e., how truthful, genuine, and realistic the information conveyed by
the ad is; Brown, Kozinets, and Sherry 2003; Gilmore and Pine 2007; Grayson and Martinec
10 To identify redundant, inapplicable elements, we discussed all of them with three independent (student) con-
sumers.
65
2004; Spiggle, Nguyen, and Caravella 2012). These two concepts in turn can be divided into
four dimensions. The first two dimensions relate to brand authenticity (1) preserving the brand
essence and (2) honoring brand heritage, whereas the latter two dimensions relate to executional
authenticity (3) showing a realistic plot that is close to everyday life and (4) presenting a cred-
ible and unexaggerated advertising message. To test the validity of these four dimensions, we
conducted a post hoc analysis, in which we asked 60 independent consumers to explain, in their
own words, what they perceived as an authentic ad. The results confirmed our proposed dimen-
sions. We discuss each of them in more detail next.
4.1 Preserving the Brand Essence
To convey authenticity within ads, marketers should preserve the brand essence and main-
tain the brand’s style and standards (Spiggle, Nguyen, and Caravella 2012). Keller (1998) refers
to brand essence as the “core values for which a brand stands,” or the brand’s “marketing
DNA”. Thus, authentic ad executions should reflect a brand’s image and personality, as well as
use a consistent ad design (e.g., same slogan, layout, ad theme, colors). An ad should represent
the brand as what it is, true to itself (Gilmore and Pine 2007; Trilling 1972). This dimension
also relates closely to the “continuity” dimension of authenticity described in the branding lit-
erature (Beverland 2005; Beverland 2006; Morhart et al. 2015).
We argue that preserving the brand essence should increase ad effectiveness. First, it can
create and reinforce a unique and memorable brand image for consumers (Brown, Kozinets,
and Sherry Jr. 2003; Keller 1998), which helps them position the brand. Second, communi-
cating a consistent brand image may increase the perceived reliability and sincerity of the brand
(Elliott and Wattanasuwan 1998; Park, Jaworski, and MacInnis 1986). Third, when ads preserve
the brand essence, consumers should be more likely to recognize the brand, which is important;
if consumers fail to register the advertised brand correctly, or even worse incorrectly attribute
66
the ad to a competing brand, huge marketing investments will be wasted, without any positive
effect on sales (Franzen 1994; Rossiter and Bellman 2005).
4.2 Honoring Brand Heritage
Marketing managers can evoke authenticity by referring to the brand’s heritage. Various
branding studies show that consumers perceive brands that commit to their history and tradition
as more authentic (e.g., Beverland 2006; Brown, Kozinets, and Sherry 2003; Spiggle, Nguyen,
and Caravella 2012). To reflect heritage, advertising might establish links to the brand’s tradi-
tions, history, place of origin, or traditional production methods (Beverland 2005; Spiggle,
Nguyen, and Caravella 2012).
Previous work identifies a positive effect of honoring brand heritage on advertising effec-
tiveness (Brown, Kozinets, and Sherry 2003; Merchant and Rose 2013). It helps legitimize the
brand, providing evidence that it is the “original” and not a counterfeit (Newman and Dhar
2014; Peñaloza 2000). Reminding consumers of the brand’s many years of experience also may
enhance its perceived reliability and competence (Beverland 2006). In addition, Newman and
Dhar (2014) suggest that heritage associations can provide brands with a special aura and
increase consumers’ emotional commitment to those brands, such as when historical
connections in an advertisement remind consumers of their own past or stimulate their longing
for earlier times (Leigh, Peters, and Shelton 2006). However, this effect also might depend on
the product category; for low involvement or standardized product categories, brand heritage
might be less important, or even lead consumers to perceive the heritage claims as silly. Still,
we expect brand heritage to increase ad effectiveness.
4.3 Showing a Realistic Plot
Advertising is perceived as authentic when it depicts a realistic plot, reflecting an everyday
situation, mostly presented by ordinary, non-idealized characters (e.g., Deighton, Romer, and
MacQueen 1989; Stern 1994). Stern (1994, p. 388) describes this ad authenticity dimension as
67
“conveying the illusion of ordinary life in reference to a consumption situation.” It relates to
the concept of verisimilitude (i.e., “events depicted in an ad mirror the viewers’ understanding
of the world” Boyd 2006, p. 84) and is iconic, in the sense that the ad refers to something that
may not be the “real thing” but that is similar to real life (Grayson and Martinec 2004). In other
words, consumers accept the ad as authentic because of its resemblance to reality, even though
they know the ad is staged (Stern 1994). A realistic plot may thus be referred to as “contrived”
or “staged” authenticity (Beverland 2005; Beverland and Luxton 2005; Rose and Wood 2005).
From prior literature, it is unclear whether a realistic plot positively influences ad effec-
tiveness. On the one hand, it helps consumers identify with the ad’s character, because the por-
trayed situation is familiar and likely reflects their own experiences (Stern 1994). Consumers
who identify with a character tend to engage in self-referencing, such that they process the
advertising information by relating it to him- or herself (Burnkrant and Unnava 1995; Rose and
Wood 2005). A realistic plot depicting a familiar situation also should be easier to comprehend,
which may increase consumers’ ability to identify and correctly interpret the product benefits
communicated by the ad (Warlaumont 1997). Deighton, Romer, and MacQueen (1989) further
argue that realistic plots evoke feelings of sympathy and empathy,11 which could improve con-
sumers’ attitudes toward the ad (Escalas and Stern 2003). On the other hand, consumers might
perceive realistic plots as too boring, such that they are unlikely to attract consumers’ attention.
Given the increasing ad clutter, grabbing consumers’ attention, for example with an unrealistic,
absurd plot should be one of the main goals of advertising (Belch and Belch 2015; Woltman
Elpers, Wedel, and Pieters 2003). A highly unrealistic plot also could distract consumers from
11 Sympathy is consciousness of the characters’ experienced emotions; empathy refers to the capacity to under-
stand and share these emotions (Escalas and Stern 2003; Langfeld 1967).
68
forming counterarguments, thereby reducing their resistance to persuasion. Considering in-
creasing ad clutter and consumers’ generally low levels of attention to ads (Tellis 2004), we
predict that a realistic plot relates negatively to ad effectiveness.
4.4 Presenting a Credible, Unexaggerated Advertising Message
The fourth option to convey authenticity is to promote the brand with a realistic, non-
exaggerated message. Previous literature shows that consumers associate authentic brands with
a high level of credibility. Authentic brands should be “what they claim to be”, not the result of
exaggeration (Brown, Kozinets, and Sherry 2003; Grayson and Martinec 2004; Morhart et al.
2015). In advertising settings, credibility is “the extent to which the consumer perceives claims
made about the brand in the ad to be truthful” and not exaggerated (MacKenzie and Lutz 1989,
p. 51). Even though in most countries advertisers must be able to substantiate their advertising
messages, some forms of exaggeration remain legal and frequently used, such as puffery, im-
plied superiority, and vague or subjective claims.
According to previous literature, message credibility is a key element of persuasion (Choi
and Rifon 2002). As Leo Burnett, the famous ad executive, claimed, “the greatest thing to
achieve in advertising is believability” (Atkin and Beltramini 2007). Message credibility should
improve consumers’ attitudes toward the ad, increase brand trust, and strengthen emotional
commitment to the brand (Cotte, Coulter and Moore 2005; Grayson and Martinec 2004; Mac-
Kenzie, Lutz, and Belch 1986; Morhart et al. 2015). Furthermore, it may help overcome the
increasing ad-skepticism of marketing savvy consumers (Calfee and Ringold 1994). Yet,
because consumers have grown accustomed to exaggerated messages (Calfee and Ringold
1994), they might expect some form of overstatement. Thus, Cowley (2006) argues that exag-
gerated messages may inflate brand evaluations, even when consumers recognize the overstate-
ment. Furthermore, given that consumers usually pay limited attention to ads, especially for
low involvement products, consumers might not even notice an exaggeration let alone elaborate
69
on it (Cacioppo and Petty 1984). Overall, though, we expect message credibility to exhibit a
positive influence on ad effectiveness.
Data and Identification
5.1 Market Data
To measure advertising effectiveness, we obtained an extensive set of weekly scanner, re-
tail panel, and media data from the Nielsen Company for 68 brands and 340 ads in six FMCG
categories (chocolate bars, yogurt, razors, shampoo, shower gel, and household detergents) sold
on the German market. Germany is Europe’s largest advertising market, with total advertising
spending of €25.45 billion in 2015 (Zentralverband der dt. Werbewirtschaft 2016). The data set
contains weekly sales data for each brand and the corresponding television advertising spend-
ing, as well as information on several control variables, such as price, in-store promotions, and
gross advertising spending on Internet, billboard, and print for a period of 200 weeks, from
March 2010 to December 2013. Table 1 provides the average values per week, aggregated at
the category level. Table 2 contains descriptive statistics on the advertising data.
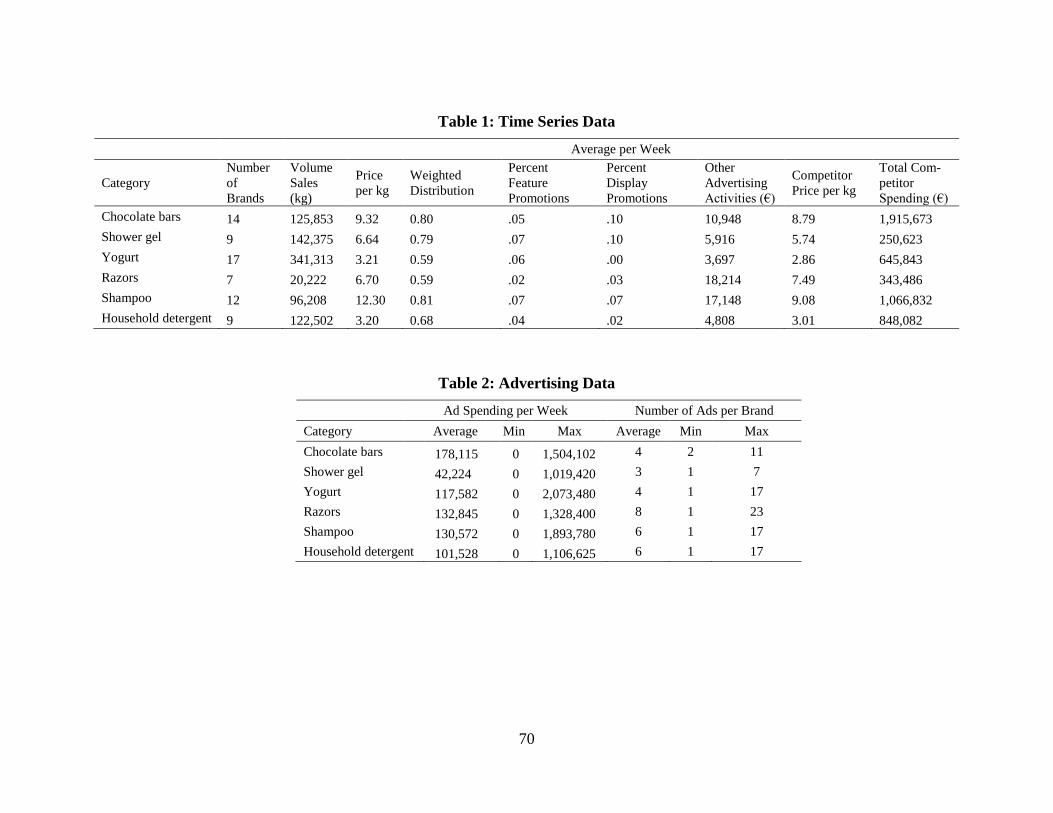
70
Table 1: Time Series Data
Average per Week
Category
Number
of
Brands
Volume
Sales
(kg)
Price
per kg
Weighted
Distribution
Percent
Feature
Promotions
Percent
Display
Promotions
Other
Advertising
Activities (€)
Competitor
Price per kg
Total Com-
petitor
Spending (€)
Chocolate bars 14 125,853 9.32 0.80 .05 .10 10,948 8.79 1,915,673
Shower gel 9 142,375 6.64 0.79 .07 .10 5,916 5.74 250,623
Yogurt 17 341,313 3.21 0.59 .06 .00 3,697 2.86 645,843
Razors 7 20,222 6.70 0.59 .02 .03 18,214 7.49 343,486
Shampoo 12 96,208 12.30 0.81 .07 .07 17,148 9.08 1,066,832
Household detergent 9 122,502 3.20 0.68 .04 .02 4,808 3.01 848,082
Table 2: Advertising Data
Ad Spending per Week Number of Ads per Brand
Category Average Min Max Average Min Max
Chocolate bars 178,115 0 1,504,102 4 2 11
Shower gel 42,224 0 1,019,420 3 1 7
Yogurt 117,582 0 2,073,480 4 1 17
Razors 132,845 0 1,328,400 8 1 23
Shampoo 130,572 0 1,893,780 6 1 17
Household detergent 101,528 0 1,106,625 6 1 17
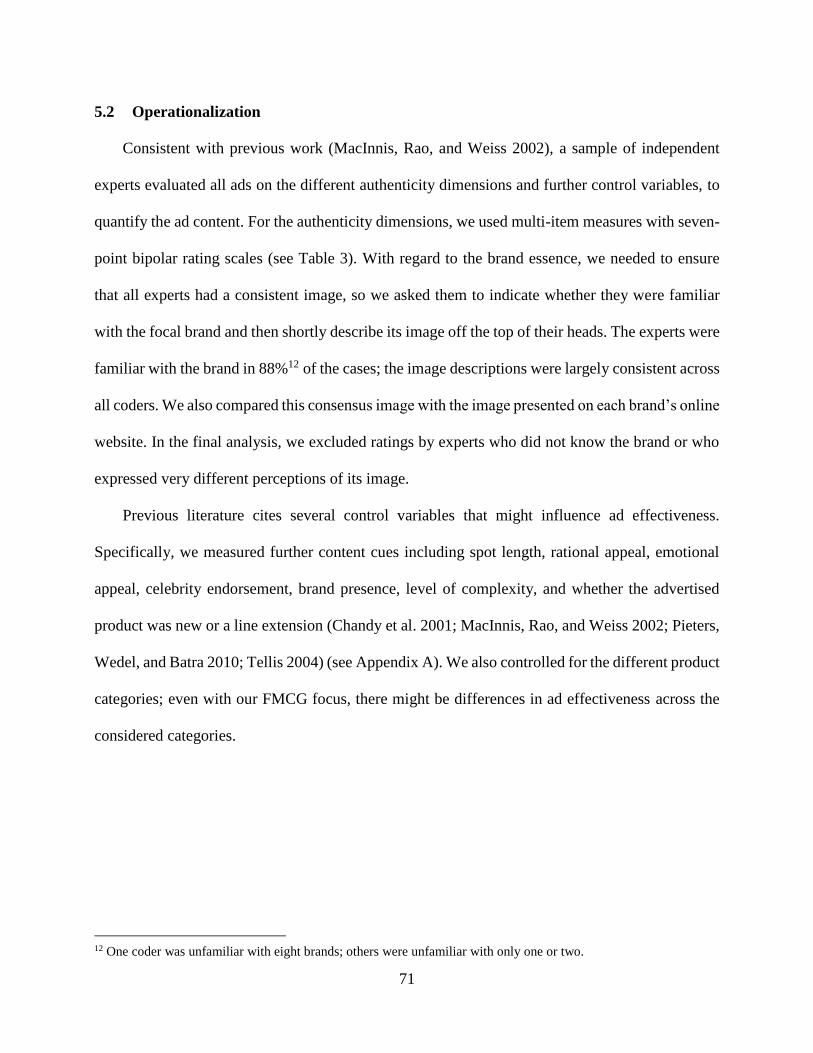
71
5.2 Operationalization
Consistent with previous work (MacInnis, Rao, and Weiss 2002), a sample of independent
experts evaluated all ads on the different authenticity dimensions and further control variables, to
quantify the ad content. For the authenticity dimensions, we used multi-item measures with seven-
point bipolar rating scales (see Table 3). With regard to the brand essence, we needed to ensure
that all experts had a consistent image, so we asked them to indicate whether they were familiar
with the focal brand and then shortly describe its image off the top of their heads. The experts were
familiar with the brand in 88%12 of the cases; the image descriptions were largely consistent across
all coders. We also compared this consensus image with the image presented on each brand’s online
website. In the final analysis, we excluded ratings by experts who did not know the brand or who
expressed very different perceptions of its image.
Previous literature cites several control variables that might influence ad effectiveness.
Specifically, we measured further content cues including spot length, rational appeal, emotional
appeal, celebrity endorsement, brand presence, level of complexity, and whether the advertised
product was new or a line extension (Chandy et al. 2001; MacInnis, Rao, and Weiss 2002; Pieters,
Wedel, and Batra 2010; Tellis 2004) (see Appendix A). We also controlled for the different product
categories; even with our FMCG focus, there might be differences in ad effectiveness across the
considered categories.
12 One coder was unfamiliar with eight brands; others were unfamiliar with only one or two.
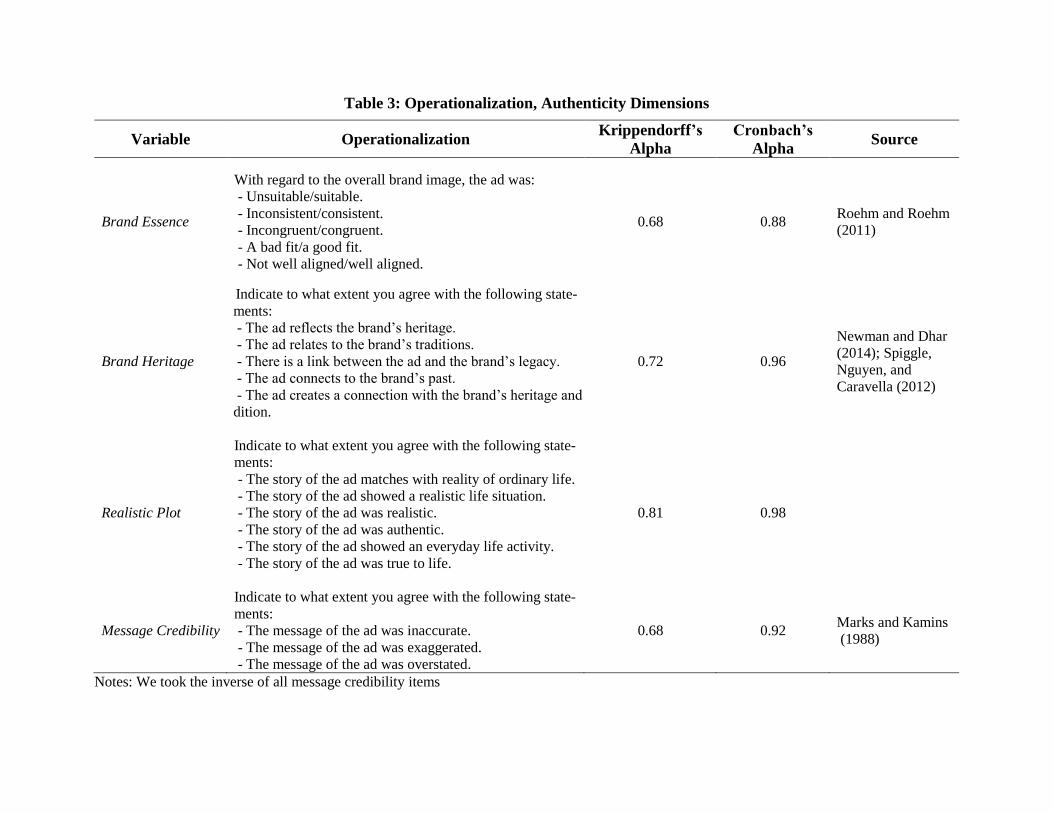
Table 3: Operationalization, Authenticity Dimensions
Variable Operationalization Krippendorff’s
Alpha
Cronbach’s
Alpha Source
Brand Essence
With regard to the overall brand image, the ad was:
- Unsuitable/suitable.
- Inconsistent/consistent.
- Incongruent/congruent.
- A bad fit/a good fit.
- Not well aligned/well aligned.
0.68 0.88 Roehm and Roehm
(2011)
Brand Heritage
Indicate to what extent you agree with the following state-
ments:
- The ad reflects the brand’s heritage.
- The ad relates to the brand’s traditions.
- There is a link between the ad and the brand’s legacy.
- The ad connects to the brand’s past.
- The ad creates a connection with the brand’s heritage and tra-
dition.
0.72 0.96
Newman and Dhar
(2014); Spiggle,
Nguyen, and
Caravella (2012)
Realistic Plot
Indicate to what extent you agree with the following state-
ments:
- The story of the ad matches with reality of ordinary life.
- The story of the ad showed a realistic life situation.
- The story of the ad was realistic.
- The story of the ad was authentic.
- The story of the ad showed an everyday life activity.
- The story of the ad was true to life.
0.81 0.98
Message Credibility
Indicate to what extent you agree with the following state-
ments:
- The message of the ad was inaccurate.
- The message of the ad was exaggerated.
- The message of the ad was overstated.
0.68 0.92 Marks and Kamins
(1988)
Notes: We took the inverse of all message credibility items
73
5.3 Coding Procedure
We hired a sample of independent experts to evaluate the content of each ad, in terms of
the four authenticity dimensions and the control variables. These experts, graduate students of
a large German university, were all regular users of the advertised product categories. Groups
of two to seven experts evaluated each variable, depending on the task (e.g., two coders evalu-
ated whether the product was a line extension, but seven coders evaluated the emotional ap-
peals). Before these evaluations, all the experts underwent a two-day training session, in which
we discussed each variable and clarified any wording problems. For a more detailed description
of the training sessions and coding instructions, please refer to Appendix B. After the training,
we provided each expert with a USB stick that contained all ads and the coding instructions,
such that they could rate the ads at their own pace at home. However, we advised them to rate
no more than five ads per day and to take a break after watching two ads in a row. The experts
needed between 25 minutes and two hours to code each ad; their coding efficiency improved
with the number of commercials coded. Note that the sequence of ads differed for each expert,
to avoid order biases. We assessed intercoder reliability using Krippendorff’s alpha, which af-
firmed measurement quality (Krippendorff 1980). All the constructs exceeded the critical value
of .67. Furthermore, we tested the discriminant validity of our authenticity dimensions in an
exploratory factor analysis using Varimax rotation. The results suggest a four-factor solution
that explains 93% of the total variance, with a minimum factor loading of .74. The correlations
of the three constructs range from -.10 to .13. Thus, discriminant validity is established (Fornell
and Larcker 1981). Tables 4 and 5 display some descriptive statistics and the correlations of the
dimensions, respectively.
74
Table 4: Descriptive Statistics, Authenticity Dimensions
All Brands
Brand Essence Brand Heritage Realistic Plot Message Credibility
Mean 4.97 1.55 3.06 5.42
Maximum 6.38 5.78 6.01 7.00
Minimum 1.13 1.00 1.00 2.90
Std. Dev. .88 0.83 1.36 .83
Observations 340 340 340 340
Table 5: Correlation, Authenticity Dimensions
Across all Brands
Brand
Essence Brand Heritage Realistic Plot
Message
Credibility
Brand Essence 1 -.10 .13 -.00
Brand Heritage 1 .05 .06
Realistic Plot 1 .13
Message Credibility 1
Methodology
To investigate the effect of the four authenticity dimensions, we follow a two-step approach
similar to Chandy et al. (2001). This approach is characterized by a parsimonious model set up
and allows for the inclusion of a range of control variables. In the first step, we model the effect
of each ad on brand sales while controlling for other marketing mix variables. In the second
step, we then regress the pooled short- and long-term estimated advertising coefficients on the
four authenticity dimensions and other control variables. This approach allows us to identify
the key determinants of variability in advertising effectiveness. To increase estimation
efficiency, it might be possible to combine the two stages and estimate a single reduced model.
However, with our many variables, this kind of estimation would be difficult to execute and
interpret (Greene 2000).
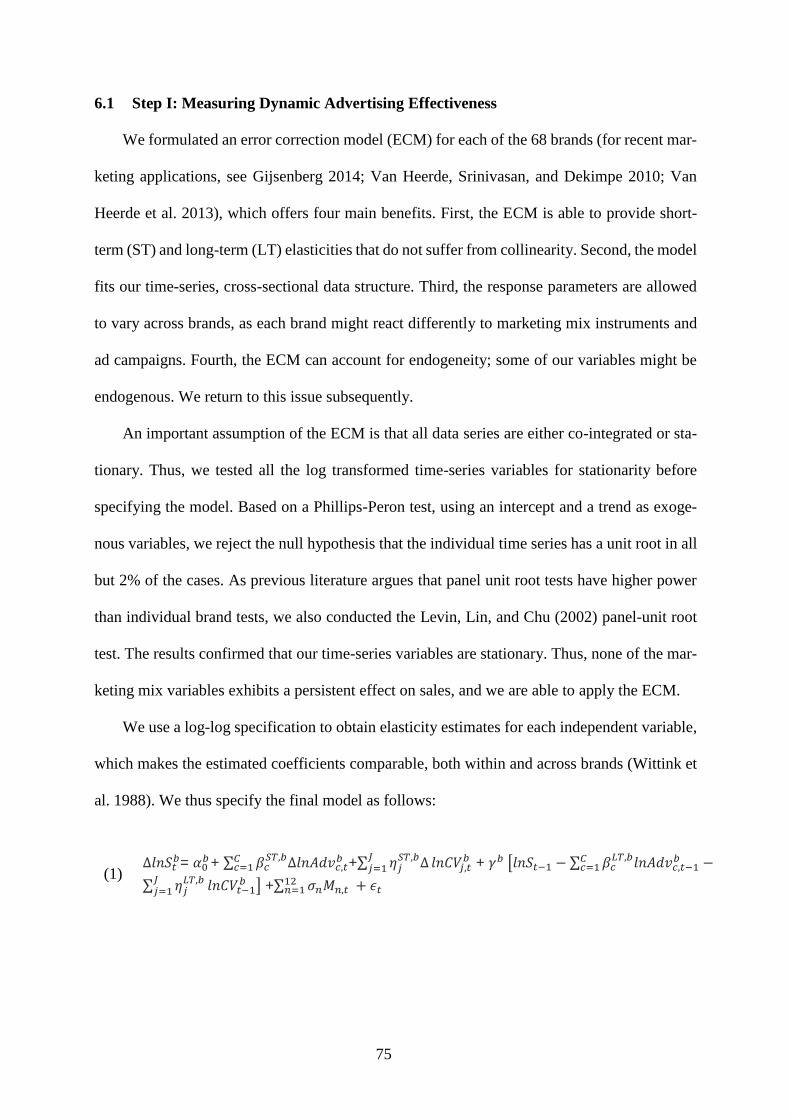
75
6.1 Step I: Measuring Dynamic Advertising Effectiveness
We formulated an error correction model (ECM) for each of the 68 brands (for recent mar-
keting applications, see Gijsenberg 2014; Van Heerde, Srinivasan, and Dekimpe 2010; Van
Heerde et al. 2013), which offers four main benefits. First, the ECM is able to provide short-
term (ST) and long-term (LT) elasticities that do not suffer from collinearity. Second, the model
fits our time-series, cross-sectional data structure. Third, the response parameters are allowed
to vary across brands, as each brand might react differently to marketing mix instruments and
ad campaigns. Fourth, the ECM can account for endogeneity; some of our variables might be
endogenous. We return to this issue subsequently.
An important assumption of the ECM is that all data series are either co-integrated or sta-
tionary. Thus, we tested all the log transformed time-series variables for stationarity before
specifying the model. Based on a Phillips-Peron test, using an intercept and a trend as exoge-
nous variables, we reject the null hypothesis that the individual time series has a unit root in all
but 2% of the cases. As previous literature argues that panel unit root tests have higher power
than individual brand tests, we also conducted the Levin, Lin, and Chu (2002) panel-unit root
test. The results confirmed that our time-series variables are stationary. Thus, none of the mar-
keting mix variables exhibits a persistent effect on sales, and we are able to apply the ECM.
We use a log-log specification to obtain elasticity estimates for each independent variable,
which makes the estimated coefficients comparable, both within and across brands (Wittink et
al. 1988). We thus specify the final model as follows:
(1)
∆𝑙𝑛𝑆𝑡𝑏= 𝛼0
𝑏 + ∑ 𝛽𝑐𝑆𝑇,𝑏∆𝑙𝑛𝐴𝑑𝑣𝑐,𝑡
𝑏𝐶𝑐=1 +∑ 𝜂𝑗
𝑆𝑇,𝑏∆𝐽𝑗=1 𝑙𝑛𝐶𝑉𝑗,𝑡
𝑏 + 𝛾𝑏 [𝑙𝑛𝑆𝑡−1 − ∑ 𝛽𝑐𝐿𝑇,𝑏𝑙𝑛𝐴𝑑𝑣𝑐,𝑡−1
𝑏 −𝐶𝑐=1
∑ 𝜂𝑗𝐿𝑇,𝑏𝐽
𝑗=1 𝑙𝑛𝐶𝑉𝑡−1𝑏 ] +∑ 𝜎𝑛𝑀𝑛,𝑡 12
𝑛=1 + 𝜖𝑡
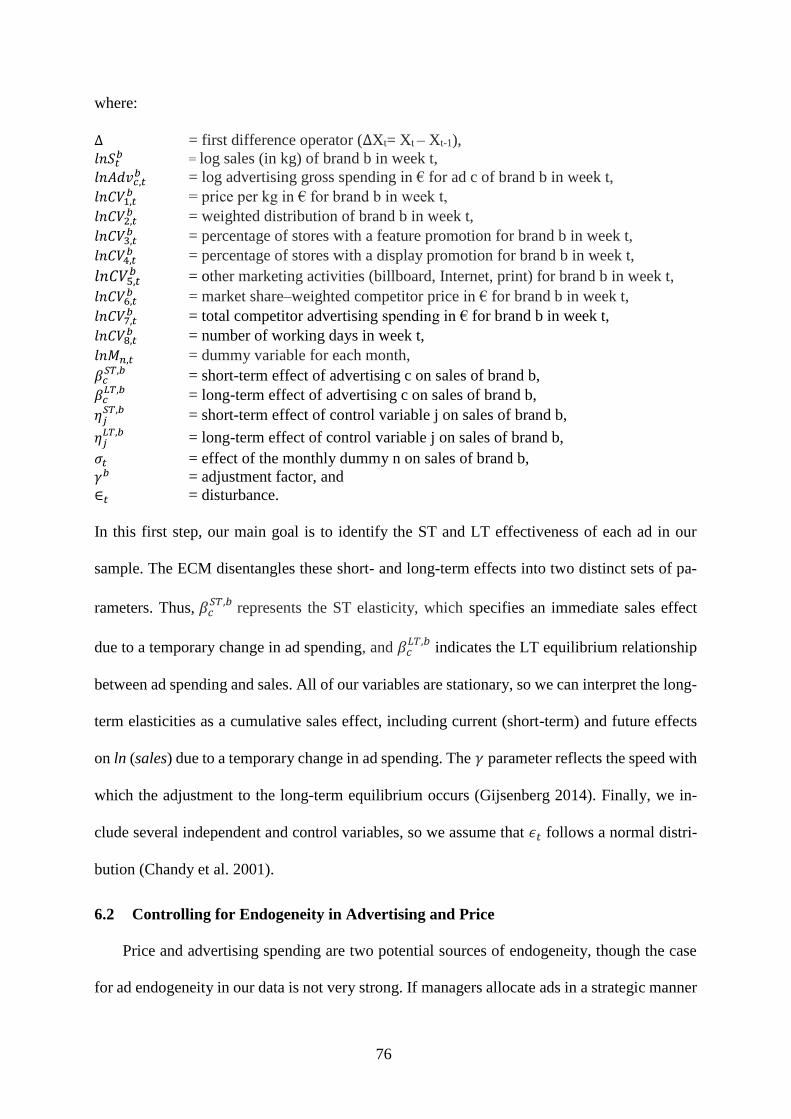
76
where:
∆ = first difference operator (∆Xt= Xt – Xt-1),
𝑙𝑛𝑆𝑡𝑏 = log sales (in kg) of brand b in week t,
𝑙𝑛𝐴𝑑𝑣𝑐,𝑡𝑏 = log advertising gross spending in € for ad c of brand b in week t,
𝑙𝑛𝐶𝑉1,𝑡𝑏 = price per kg in € for brand b in week t,
𝑙𝑛𝐶𝑉2,𝑡𝑏 = weighted distribution of brand b in week t,
𝑙𝑛𝐶𝑉3,𝑡𝑏 = percentage of stores with a feature promotion for brand b in week t,
𝑙𝑛𝐶𝑉4,𝑡𝑏 = percentage of stores with a display promotion for brand b in week t,
𝑙𝑛𝐶𝑉5,𝑡𝑏 = other marketing activities (billboard, Internet, print) for brand b in week t,
𝑙𝑛𝐶𝑉6,𝑡𝑏 = market share–weighted competitor price in € for brand b in week t,
𝑙𝑛𝐶𝑉7,𝑡𝑏 = total competitor advertising spending in € for brand b in week t,
𝑙𝑛𝐶𝑉8,𝑡𝑏 = number of working days in week t,
𝑙𝑛𝑀𝑛,𝑡 = dummy variable for each month,
𝛽𝑐𝑆𝑇,𝑏
= short-term effect of advertising c on sales of brand b,
𝛽𝑐𝐿𝑇,𝑏 = long-term effect of advertising c on sales of brand b,
𝜂𝑗𝑆𝑇,𝑏 = short-term effect of control variable j on sales of brand b,
𝜂𝑗𝐿𝑇,𝑏 = long-term effect of control variable j on sales of brand b,
𝜎𝑡 = effect of the monthly dummy n on sales of brand b,
𝛾𝑏 = adjustment factor, and
∈𝑡 = disturbance.
In this first step, our main goal is to identify the ST and LT effectiveness of each ad in our
sample. The ECM disentangles these short- and long-term effects into two distinct sets of pa-
rameters. Thus, 𝛽𝑐𝑆𝑇,𝑏
represents the ST elasticity, which specifies an immediate sales effect
due to a temporary change in ad spending, and 𝛽𝑐𝐿𝑇,𝑏
indicates the LT equilibrium relationship
between ad spending and sales. All of our variables are stationary, so we can interpret the long-
term elasticities as a cumulative sales effect, including current (short-term) and future effects
on ln (sales) due to a temporary change in ad spending. The 𝛾 parameter reflects the speed with
which the adjustment to the long-term equilibrium occurs (Gijsenberg 2014). Finally, we in-
clude several independent and control variables, so we assume that 𝜖𝑡 follows a normal distri-
bution (Chandy et al. 2001).
6.2 Controlling for Endogeneity in Advertising and Price
Price and advertising spending are two potential sources of endogeneity, though the case
for ad endogeneity in our data is not very strong. If managers allocate ads in a strategic manner
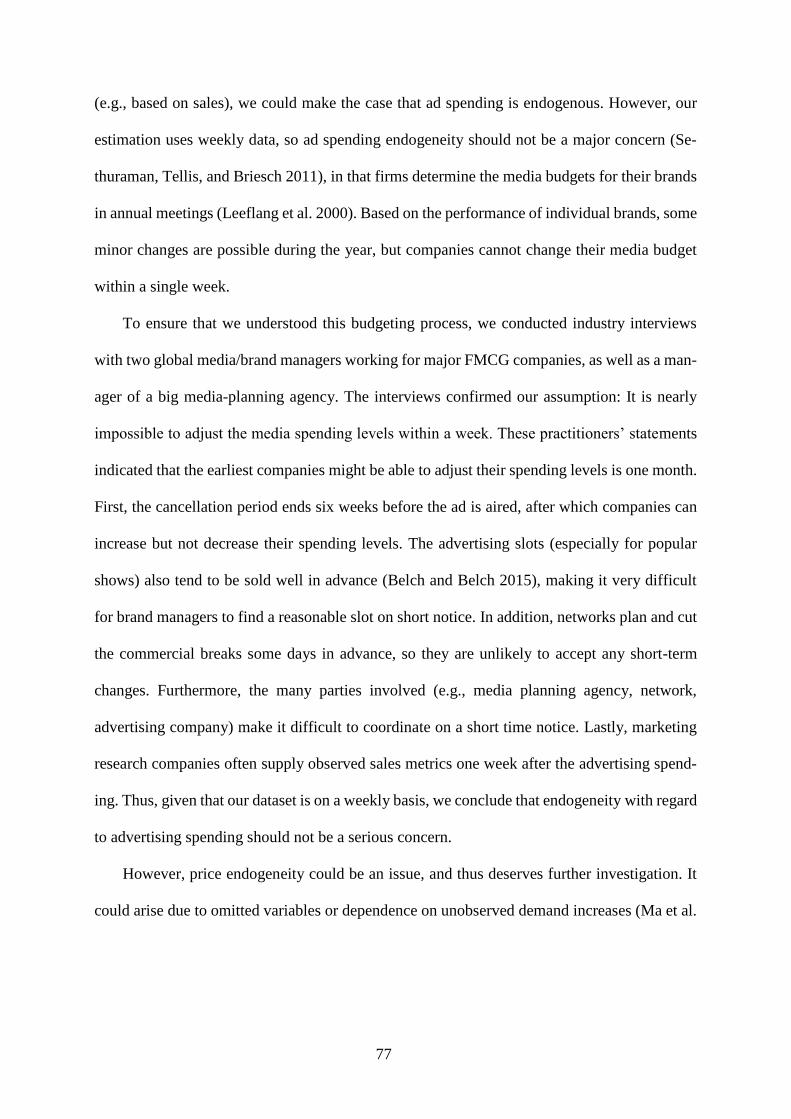
77
(e.g., based on sales), we could make the case that ad spending is endogenous. However, our
estimation uses weekly data, so ad spending endogeneity should not be a major concern (Se-
thuraman, Tellis, and Briesch 2011), in that firms determine the media budgets for their brands
in annual meetings (Leeflang et al. 2000). Based on the performance of individual brands, some
minor changes are possible during the year, but companies cannot change their media budget
within a single week.
To ensure that we understood this budgeting process, we conducted industry interviews
with two global media/brand managers working for major FMCG companies, as well as a man-
ager of a big media-planning agency. The interviews confirmed our assumption: It is nearly
impossible to adjust the media spending levels within a week. These practitioners’ statements
indicated that the earliest companies might be able to adjust their spending levels is one month.
First, the cancellation period ends six weeks before the ad is aired, after which companies can
increase but not decrease their spending levels. The advertising slots (especially for popular
shows) also tend to be sold well in advance (Belch and Belch 2015), making it very difficult
for brand managers to find a reasonable slot on short notice. In addition, networks plan and cut
the commercial breaks some days in advance, so they are unlikely to accept any short-term
changes. Furthermore, the many parties involved (e.g., media planning agency, network,
advertising company) make it difficult to coordinate on a short time notice. Lastly, marketing
research companies often supply observed sales metrics one week after the advertising spend-
ing. Thus, given that our dataset is on a weekly basis, we conclude that endogeneity with regard
to advertising spending should not be a serious concern.
However, price endogeneity could be an issue, and thus deserves further investigation. It
could arise due to omitted variables or dependence on unobserved demand increases (Ma et al.
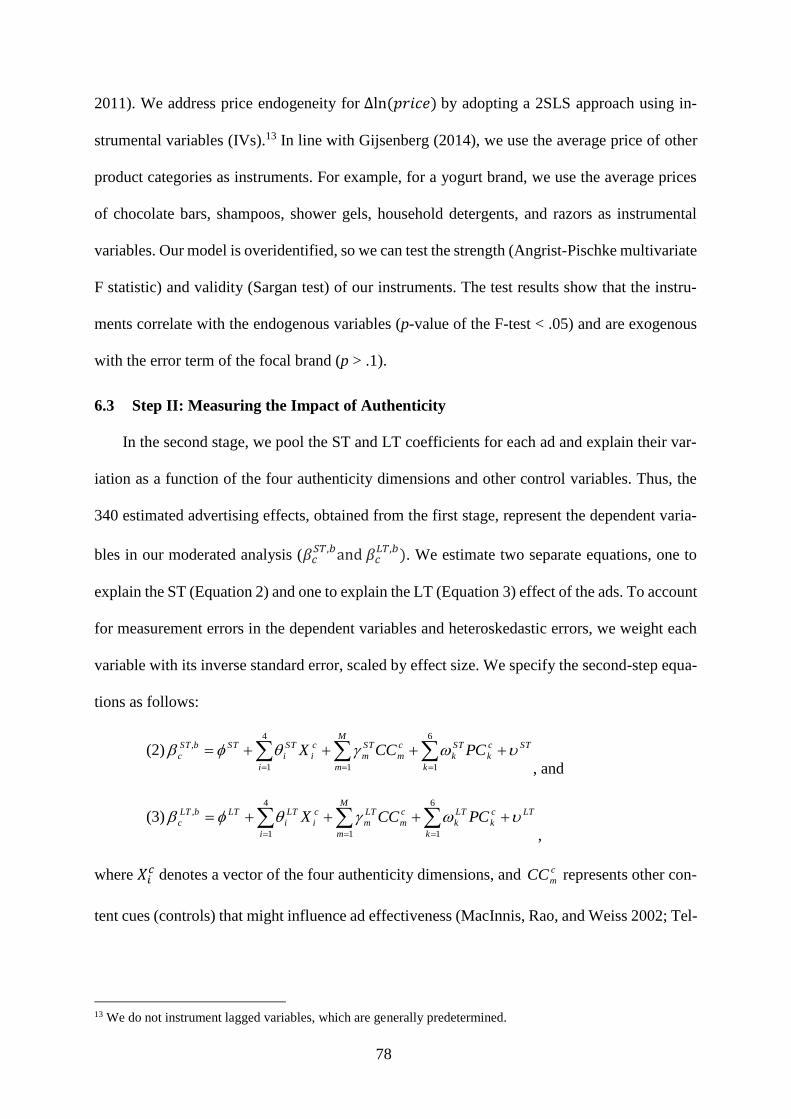
78
2011). We address price endogeneity for ∆ln (𝑝𝑟𝑖𝑐𝑒) by adopting a 2SLS approach using in-
strumental variables (IVs).13 In line with Gijsenberg (2014), we use the average price of other
product categories as instruments. For example, for a yogurt brand, we use the average prices
of chocolate bars, shampoos, shower gels, household detergents, and razors as instrumental
variables. Our model is overidentified, so we can test the strength (Angrist-Pischke multivariate
F statistic) and validity (Sargan test) of our instruments. The test results show that the instru-
ments correlate with the endogenous variables (p-value of the F-test < .05) and are exogenous
with the error term of the focal brand (p > .1).
6.3 Step II: Measuring the Impact of Authenticity
In the second stage, we pool the ST and LT coefficients for each ad and explain their var-
iation as a function of the four authenticity dimensions and other control variables. Thus, the
340 estimated advertising effects, obtained from the first stage, represent the dependent varia-
bles in our moderated analysis (𝛽𝑐𝑆𝑇,𝑏and 𝛽𝑐
𝐿𝑇,𝑏). We estimate two separate equations, one to
explain the ST (Equation 2) and one to explain the LT (Equation 3) effect of the ads. To account
for measurement errors in the dependent variables and heteroskedastic errors, we weight each
variable with its inverse standard error, scaled by effect size. We specify the second-step equa-
tions as follows:
(2) STc
k
k
ST
k
c
m
M
m
ST
m
c
i
i
ST
i
STbST
c PCCCX
6
11
4
1
,
, and
(3) LTc
k
k
LT
k
c
m
M
m
LT
m
c
i
i
LT
i
LTbLT
c PCCCX
6
11
4
1
,
,
where 𝑋𝑖𝑐 denotes a vector of the four authenticity dimensions, and c
mCC represents other con-
tent cues (controls) that might influence ad effectiveness (MacInnis, Rao, and Weiss 2002; Tel-
13 We do not instrument lagged variables, which are generally predetermined.
79
lis 2004). Moreover, c
kPC denotes the dummy variables (fixed effects) representing the differ-
ent product categories; ST and
LT are intercepts; and ST and LT represent the error terms.
We assume the error terms to be normally distributed with heteroskedastic variance. Further-
more, because we cannot exclude any curvilinear effects, we included squared terms for all the
continuous variables in Equations 2 and 3. However, we only keep and report the significant
ones. Further note that we mean-centered all the explanatory variables to avoid multicollinear-
ity.14
Results
7.1 Short- and Long-Term Effects of Advertising on Sales (1st step)
The main objective of this study is to explain the variance in ad effectiveness, due to au-
thenticity and other content factors. Thus, we primarily use the ad elasticities as input for the
second equation. However, to compare the consistency of the parameter estimates with previous
research, we summarize the effect sizes across all brands using Rosenthal’s (1991) method of
added Zs, with the results in Table 6. Note that we derived the standard errors for the LT effects
of all marketing mix variables by the Delta method (Greene 2000, p. 330-31).
The results indicate that the influence of advertising on sales, with a ST effect of .0024 and
LT effect of .003, is significant but small. We analyze mature FMCG brands, such that we
expect minimal ad elasticities (Sethuraman, Tellis, and Briesch 2011).
14 Note that the variance inflation factor values are all below 5, so multicollinearity is not a concern.
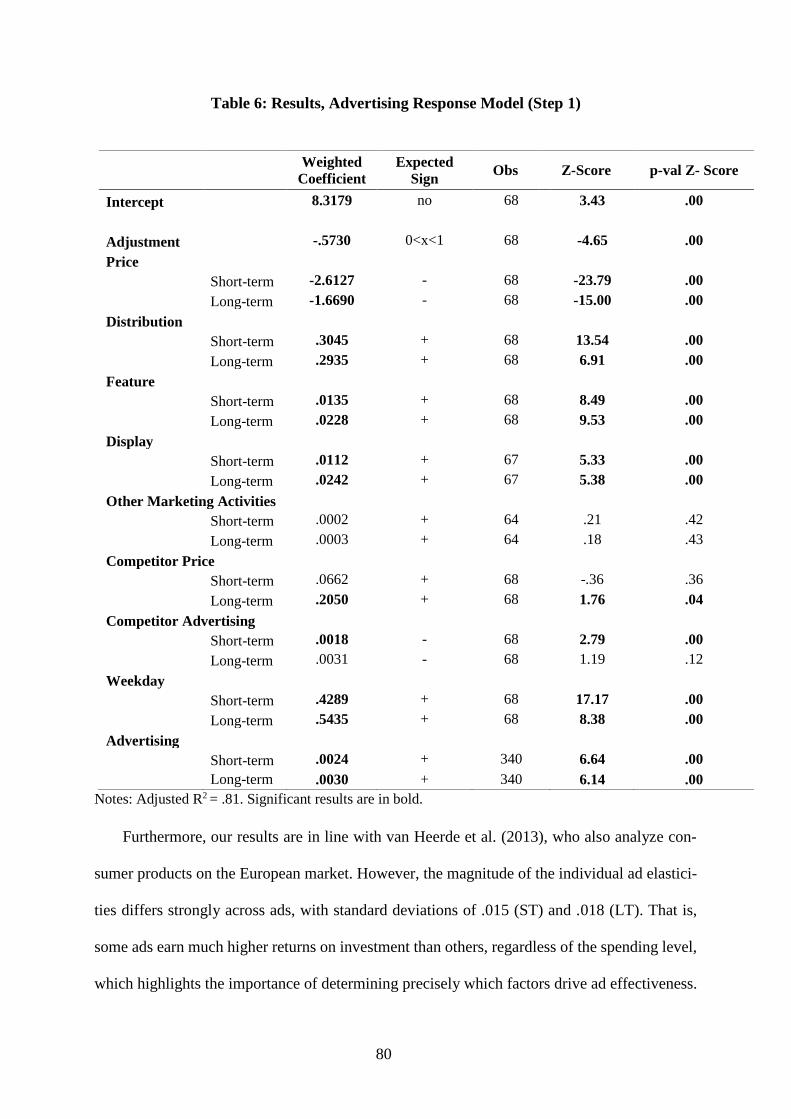
80
Table 6: Results, Advertising Response Model (Step 1)
Notes: Adjusted R2 = .81. Significant results are in bold.
Furthermore, our results are in line with van Heerde et al. (2013), who also analyze con-
sumer products on the European market. However, the magnitude of the individual ad elastici-
ties differs strongly across ads, with standard deviations of .015 (ST) and .018 (LT). That is,
some ads earn much higher returns on investment than others, regardless of the spending level,
which highlights the importance of determining precisely which factors drive ad effectiveness.
Weighted
Coefficient
Expected
Sign Obs Z-Score p-val Z- Score
Intercept 8.3179 no 68 3.43 .00
Adjustment -.5730 0<x<1 68 -4.65 .00
Price
Short-term -2.6127 - 68 -23.79 .00
Long-term -1.6690 - 68 -15.00 .00
Distribution
Short-term .3045 + 68 13.54 .00
Long-term .2935 + 68 6.91 .00
Feature
Short-term .0135 + 68 8.49 .00
Long-term .0228 + 68 9.53 .00
Display
Short-term .0112 + 67 5.33 .00
Long-term .0242 + 67 5.38 .00
Other Marketing Activities
Short-term .0002 + 64 .21 .42
Long-term .0003 + 64 .18 .43
Competitor Price
Short-term .0662 + 68 -.36 .36
Long-term .2050 + 68 1.76 .04
Competitor Advertising
Short-term .0018 - 68 2.79 .00
Long-term .0031 - 68 1.19 .12
Weekday
Short-term .4289 + 68 17.17 .00
Long-term .5435 + 68 8.38 .00
Advertising
Short-term .0024 + 340 6.64 .00
Long-term .0030 + 340 6.14 .00
81
The adjustment and LT parameter enable us to determine the average duration of the influence
of ads on sales by simulating an impulse response function. In our data set, average ad effec-
tiveness duration is three weeks. Moreover, 79% of the LT effect is achieved within the first
week. That is, for FMCG, the strongest effect appears in the same week in which the ad airs.
The average elasticities for Other Marketing Activities is not significant. Thus, for FMCG
brands TV still seems to be the most important advertising medium. The influence of control
variables such as Price and Distribution are more or less in line with prior research (Hanssens
2015). The average adjusted R-squared (.81) indicates very good model fit, as confirmed by the
average mean absolute percentage error (MAPE) of 1.45.
7.2 Explaining the Magnitude of Advertising Effectiveness (2nd step)
Effects of the four authenticity dimensions. Table 7 displays the effects of the different
authenticity dimensions and control variables on the ST and LT relationships between ad spend-
ing and sales. Both models are statistically significant (F (ST) = 11.02, p = .000; F (LT) = 5.79,
p = .000) and explain considerable variation in the ST (adjusted R2 = 36%) and LT (adjusted
R2 = 21%) sales responses. We will describe the results for each dimension subsequently.
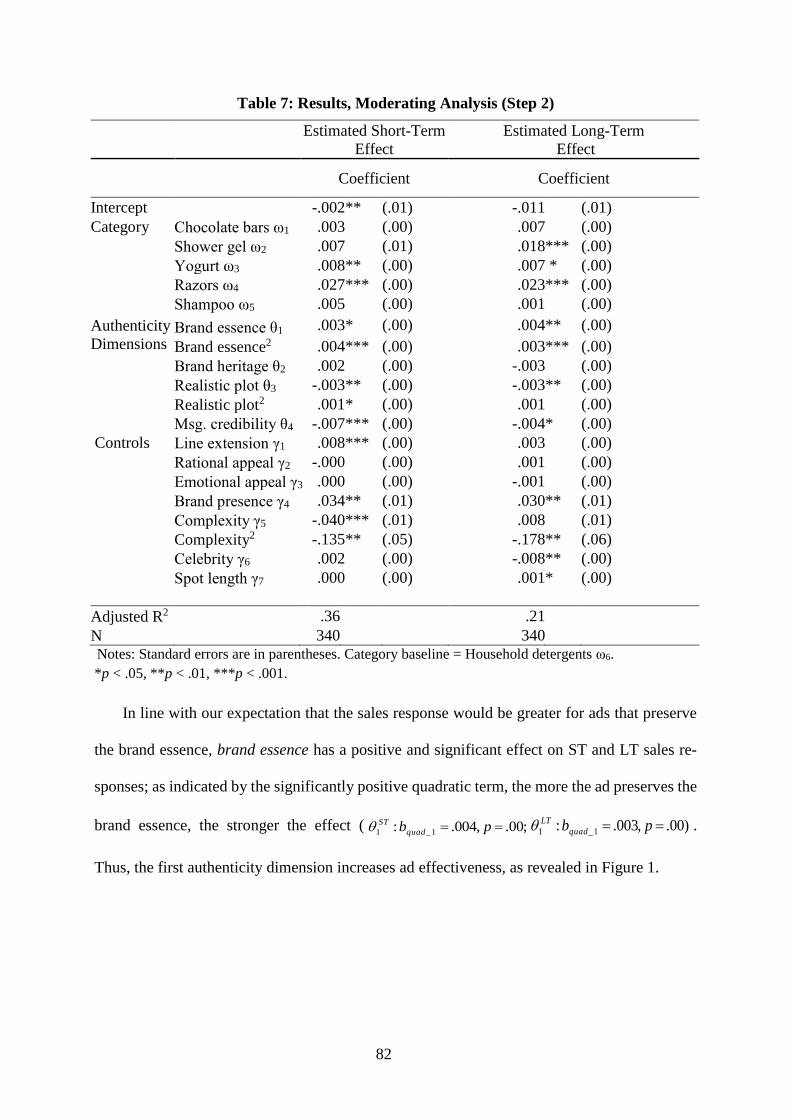
82
Table 7: Results, Moderating Analysis (Step 2)
Estimated Short-Term
Effect
Estimated Long-Term
Effect
Coefficient Coefficient
Intercept -.002 ** (.01) -.011 (.01)
Category Chocolate bars ω1 .003 (.00) .007 (.00)
Shower gel ω2 .007 (.01) .018 *** (.00)
Yogurt ω3 .008 ** (.00) .007 * (.00)
Razors ω4 .027 *** (.00) .023 *** (.00)
Shampoo ω5 .005 (.00) .001 (.00)
Authenticity
Dimensions Brand essence θ1 .003 * (.00) .004 ** (.00)
Brand essence2 .004 *** (.00) .003 *** (.00)
Brand heritage θ2 .002 (.00) -.003 (.00)
Realistic plot θ3 -.003 ** (.00) -.003 ** (.00)
Realistic plot2 .001 * (.00) .001 (.00)
Msg. credibility θ4 -.007 *** (.00) -.004 * (.00)
Controls Line extension γ1 .008 *** (.00) .003 (.00)
Rational appeal γ2 -.000 (.00) .001 (.00)
Emotional appeal γ3 .000 (.00) -.001 (.00)
Brand presence γ4 .034 ** (.01) .030 ** (.01)
Complexity γ5 -.040 *** (.01) .008 (.01)
Complexity2 -.135 ** (.05) -.178 ** (.06)
Celebrity γ6 .002 (.00) -.008 ** (.00)
Spot length γ7 .000 (.00) .001 * (.00)
Adjusted R2 .36 .21
N 340 340
Notes: Standard errors are in parentheses. Category baseline = Household detergents ω6.
*p < .05, **p < .01, ***p < .001.
In line with our expectation that the sales response would be greater for ads that preserve
the brand essence, brand essence has a positive and significant effect on ST and LT sales re-
sponses; as indicated by the significantly positive quadratic term, the more the ad preserves the
brand essence, the stronger the effect ( ;00.,004.: 1_1 pbquad
ST )00.,003.: 1_1 pbquad
LT .
Thus, the first authenticity dimension increases ad effectiveness, as revealed in Figure 1.
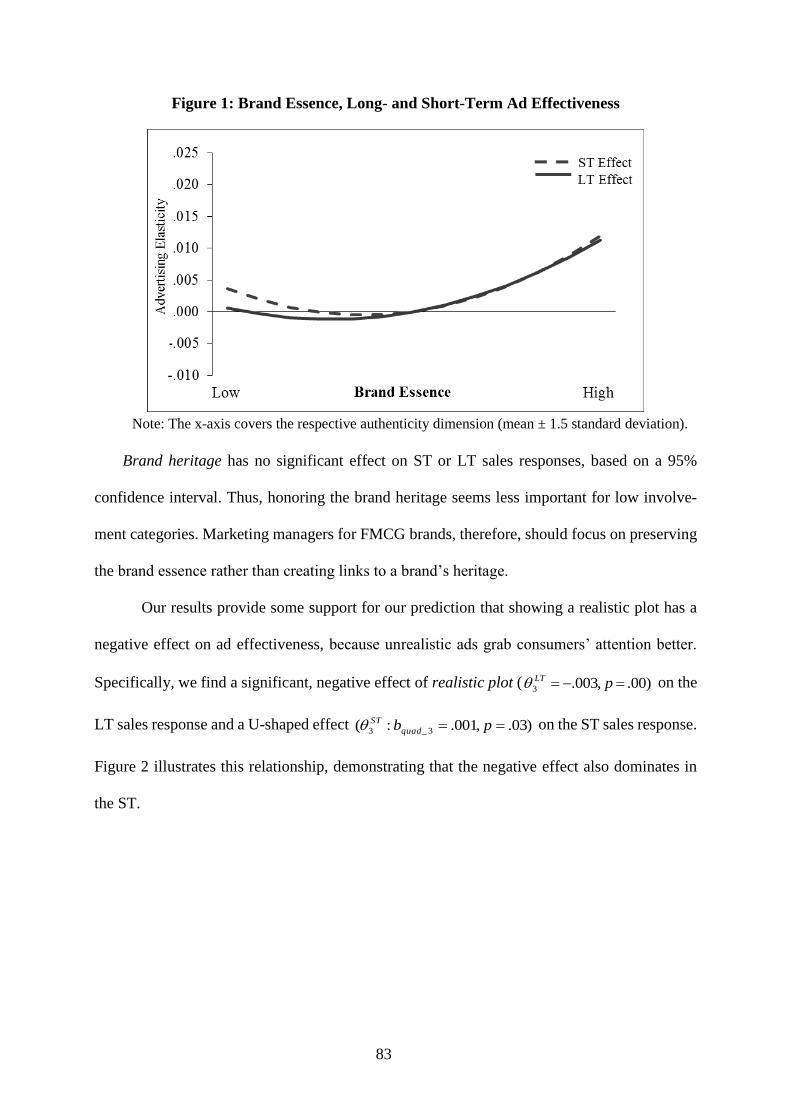
83
Figure 1: Brand Essence, Long- and Short-Term Ad Effectiveness
Note: The x-axis covers the respective authenticity dimension (mean ± 1.5 standard deviation).
Brand heritage has no significant effect on ST or LT sales responses, based on a 95%
confidence interval. Thus, honoring the brand heritage seems less important for low involve-
ment categories. Marketing managers for FMCG brands, therefore, should focus on preserving
the brand essence rather than creating links to a brand’s heritage.
Our results provide some support for our prediction that showing a realistic plot has a
negative effect on ad effectiveness, because unrealistic ads grab consumers’ attention better.
Specifically, we find a significant, negative effect of realistic plot ( )00.,003.3 pLT on the
LT sales response and a U-shaped effect )03.,001.:( 3_3 pbquad
ST on the ST sales response.
Figure 2 illustrates this relationship, demonstrating that the negative effect also dominates in
the ST.
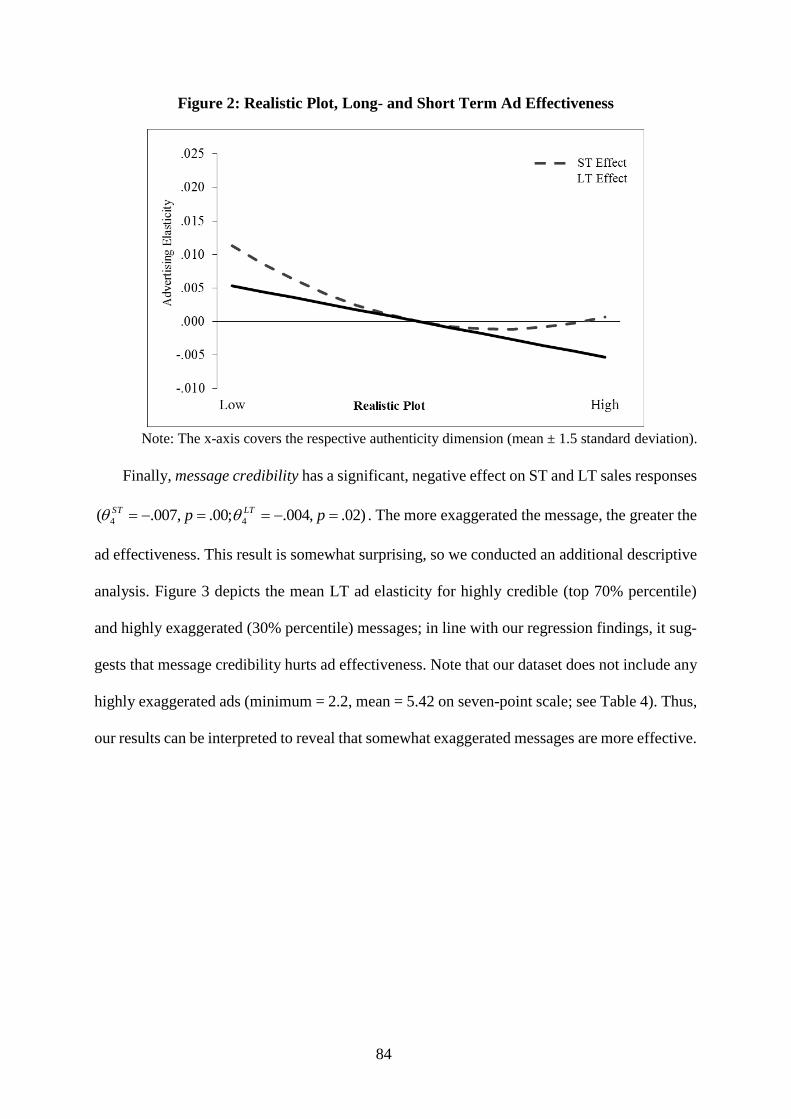
84
Figure 2: Realistic Plot, Long- and Short Term Ad Effectiveness
Note: The x-axis covers the respective authenticity dimension (mean ± 1.5 standard deviation).
Finally, message credibility has a significant, negative effect on ST and LT sales responses
)02.,004.;00.,007.( 44 pp LTST . The more exaggerated the message, the greater the
ad effectiveness. This result is somewhat surprising, so we conducted an additional descriptive
analysis. Figure 3 depicts the mean LT ad elasticity for highly credible (top 70% percentile)
and highly exaggerated (30% percentile) messages; in line with our regression findings, it sug-
gests that message credibility hurts ad effectiveness. Note that our dataset does not include any
highly exaggerated ads (minimum = 2.2, mean = 5.42 on seven-point scale; see Table 4). Thus,
our results can be interpreted to reveal that somewhat exaggerated messages are more effective.
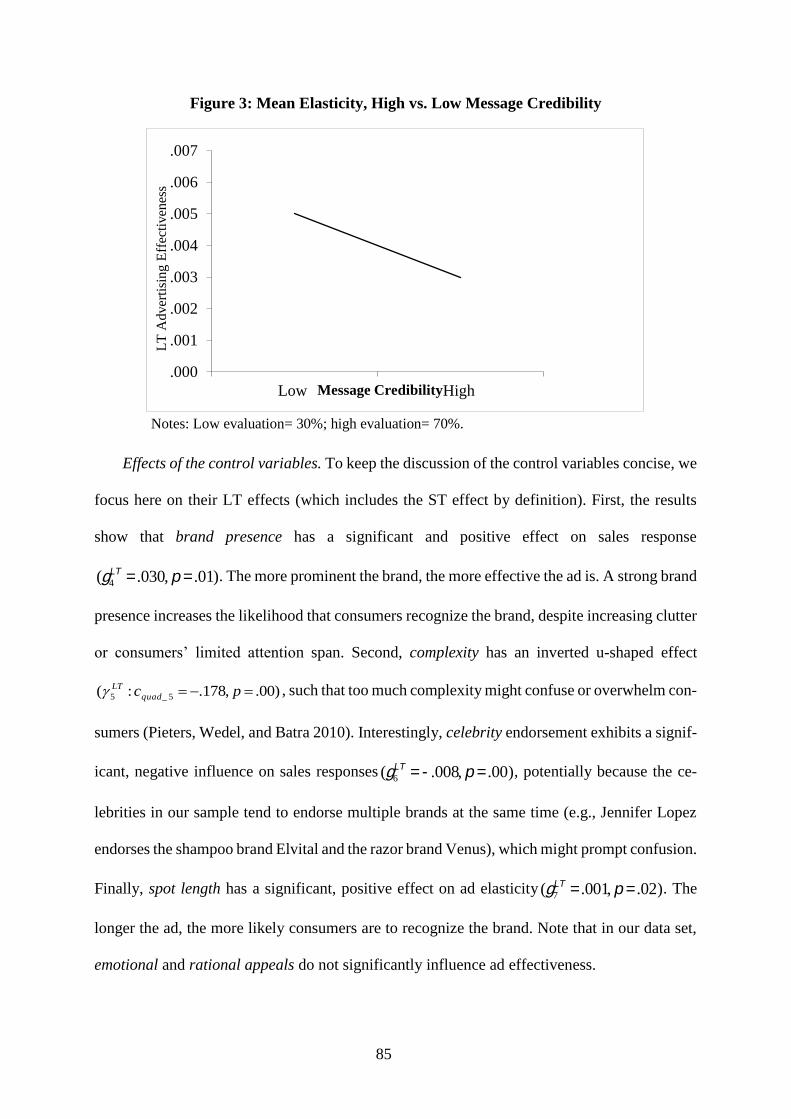
85
Figure 3: Mean Elasticity, High vs. Low Message Credibility
Notes: Low evaluation= 30%; high evaluation= 70%.
Effects of the control variables. To keep the discussion of the control variables concise, we
focus here on their LT effects (which includes the ST effect by definition). First, the results
show that brand presence has a significant and positive effect on sales response
(g4
LT = .030, p= .01). The more prominent the brand, the more effective the ad is. A strong brand
presence increases the likelihood that consumers recognize the brand, despite increasing clutter
or consumers’ limited attention span. Second, complexity has an inverted u-shaped effect
)00.,178.:( 5_5 pcquad
LT , such that too much complexity might confuse or overwhelm con-
sumers (Pieters, Wedel, and Batra 2010). Interestingly, celebrity endorsement exhibits a signif-
icant, negative influence on sales responses (g6
LT = -.008, p= .00), potentially because the ce-
lebrities in our sample tend to endorse multiple brands at the same time (e.g., Jennifer Lopez
endorses the shampoo brand Elvital and the razor brand Venus), which might prompt confusion.
Finally, spot length has a significant, positive effect on ad elasticity (g7
LT = .001, p= .02). The
longer the ad, the more likely consumers are to recognize the brand. Note that in our data set,
emotional and rational appeals do not significantly influence ad effectiveness.
.000
.001
.002
.003
.004
.005
.006
.007
Low High
LT
Ad
ver
tisi
ng
Eff
ecti
ven
ess
Message Credibility
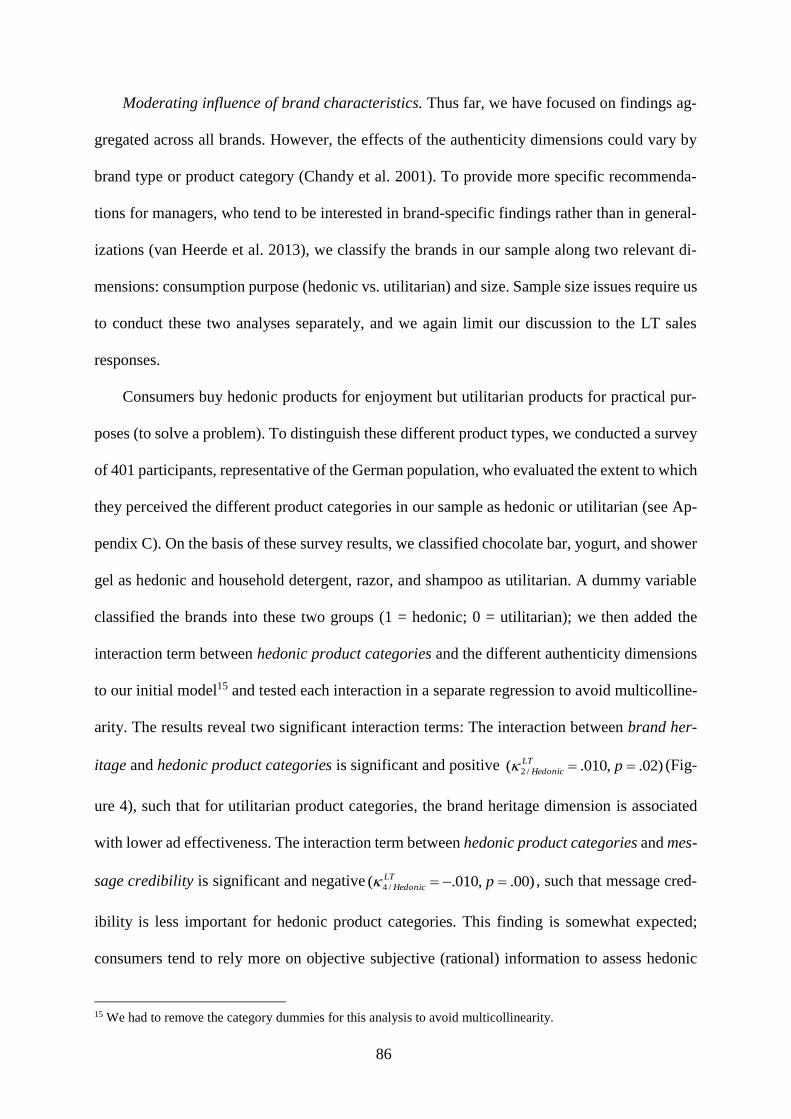
86
Moderating influence of brand characteristics. Thus far, we have focused on findings ag-
gregated across all brands. However, the effects of the authenticity dimensions could vary by
brand type or product category (Chandy et al. 2001). To provide more specific recommenda-
tions for managers, who tend to be interested in brand-specific findings rather than in general-
izations (van Heerde et al. 2013), we classify the brands in our sample along two relevant di-
mensions: consumption purpose (hedonic vs. utilitarian) and size. Sample size issues require us
to conduct these two analyses separately, and we again limit our discussion to the LT sales
responses.
Consumers buy hedonic products for enjoyment but utilitarian products for practical pur-
poses (to solve a problem). To distinguish these different product types, we conducted a survey
of 401 participants, representative of the German population, who evaluated the extent to which
they perceived the different product categories in our sample as hedonic or utilitarian (see Ap-
pendix C). On the basis of these survey results, we classified chocolate bar, yogurt, and shower
gel as hedonic and household detergent, razor, and shampoo as utilitarian. A dummy variable
classified the brands into these two groups (1 = hedonic; 0 = utilitarian); we then added the
interaction term between hedonic product categories and the different authenticity dimensions
to our initial model15 and tested each interaction in a separate regression to avoid multicolline-
arity. The results reveal two significant interaction terms: The interaction between brand her-
itage and hedonic product categories is significant and positive )02.,010.( /2 pLT
Hedonic (Fig-
ure 4), such that for utilitarian product categories, the brand heritage dimension is associated
with lower ad effectiveness. The interaction term between hedonic product categories and mes-
sage credibility is significant and negative )00.,010.( /4 pLT
Hedonic , such that message cred-
ibility is less important for hedonic product categories. This finding is somewhat expected;
consumers tend to rely more on objective subjective (rational) information to assess hedonic
15 We had to remove the category dummies for this analysis to avoid multicollinearity.
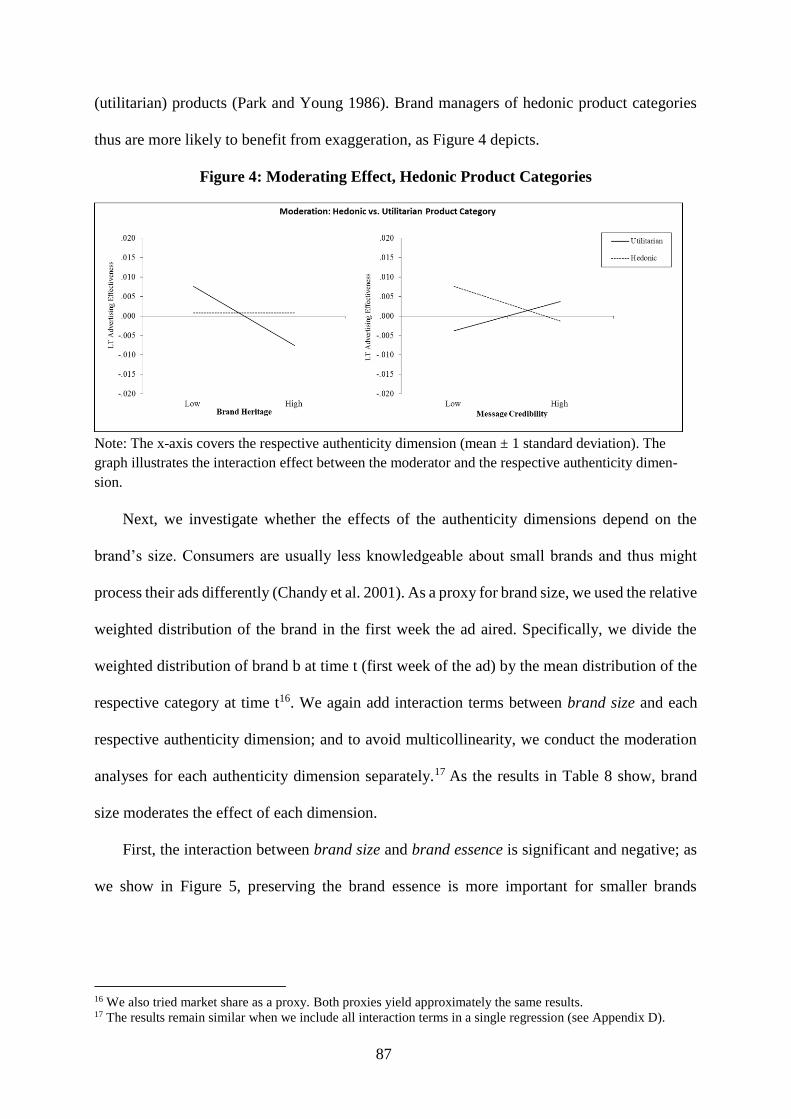
87
(utilitarian) products (Park and Young 1986). Brand managers of hedonic product categories
thus are more likely to benefit from exaggeration, as Figure 4 depicts.
Figure 4: Moderating Effect, Hedonic Product Categories
Note: The x-axis covers the respective authenticity dimension (mean ± 1 standard deviation). The
graph illustrates the interaction effect between the moderator and the respective authenticity dimen-
sion.
Next, we investigate whether the effects of the authenticity dimensions depend on the
brand’s size. Consumers are usually less knowledgeable about small brands and thus might
process their ads differently (Chandy et al. 2001). As a proxy for brand size, we used the relative
weighted distribution of the brand in the first week the ad aired. Specifically, we divide the
weighted distribution of brand b at time t (first week of the ad) by the mean distribution of the
respective category at time t16. We again add interaction terms between brand size and each
respective authenticity dimension; and to avoid multicollinearity, we conduct the moderation
analyses for each authenticity dimension separately.17 As the results in Table 8 show, brand
size moderates the effect of each dimension.
First, the interaction between brand size and brand essence is significant and negative; as
we show in Figure 5, preserving the brand essence is more important for smaller brands
16 We also tried market share as a proxy. Both proxies yield approximately the same results. 17 The results remain similar when we include all interaction terms in a single regression (see Appendix D).
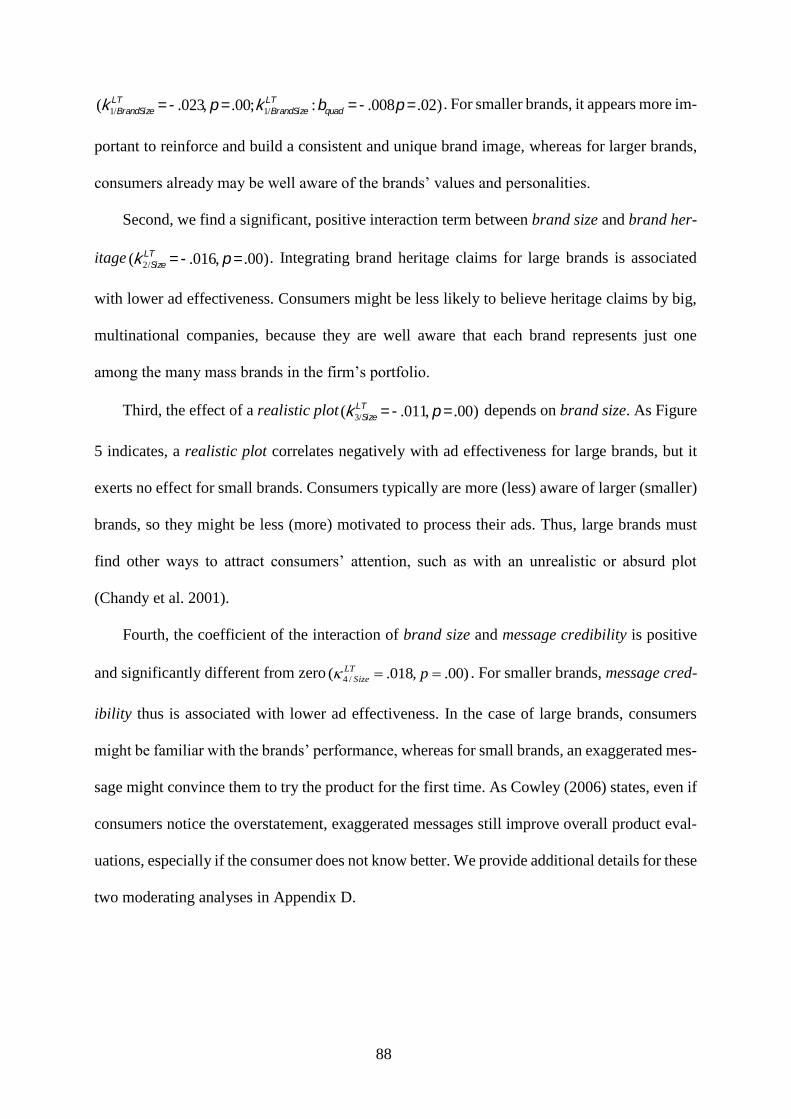
88
(k1/BrandSize
LT = -.023, p= .00;k1/BrandSize
LT :bquad = -.008p= .02) . For smaller brands, it appears more im-
portant to reinforce and build a consistent and unique brand image, whereas for larger brands,
consumers already may be well aware of the brands’ values and personalities.
Second, we find a significant, positive interaction term between brand size and brand her-
itage (k2/Size
LT = -.016, p= .00). Integrating brand heritage claims for large brands is associated
with lower ad effectiveness. Consumers might be less likely to believe heritage claims by big,
multinational companies, because they are well aware that each brand represents just one
among the many mass brands in the firm’s portfolio.
Third, the effect of a realistic plot (k3/Size
LT = -.011, p= .00) depends on brand size. As Figure
5 indicates, a realistic plot correlates negatively with ad effectiveness for large brands, but it
exerts no effect for small brands. Consumers typically are more (less) aware of larger (smaller)
brands, so they might be less (more) motivated to process their ads. Thus, large brands must
find other ways to attract consumers’ attention, such as with an unrealistic or absurd plot
(Chandy et al. 2001).
Fourth, the coefficient of the interaction of brand size and message credibility is positive
and significantly different from zero )00.,018.( /4 pLT
Size . For smaller brands, message cred-
ibility thus is associated with lower ad effectiveness. In the case of large brands, consumers
might be familiar with the brands’ performance, whereas for small brands, an exaggerated mes-
sage might convince them to try the product for the first time. As Cowley (2006) states, even if
consumers notice the overstatement, exaggerated messages still improve overall product eval-
uations, especially if the consumer does not know better. We provide additional details for these
two moderating analyses in Appendix D.
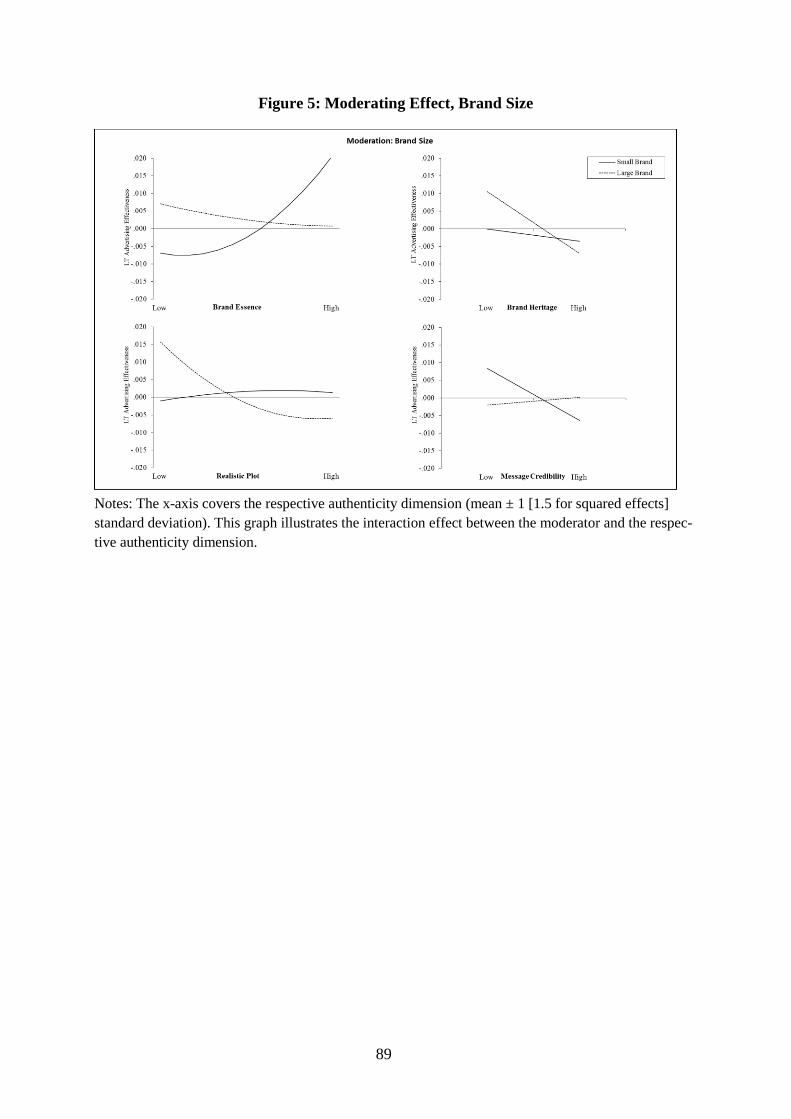
89
Figure 5: Moderating Effect, Brand Size
Notes: The x-axis covers the respective authenticity dimension (mean ± 1 [1.5 for squared effects]
standard deviation). This graph illustrates the interaction effect between the moderator and the respec-
tive authenticity dimension.
90
Table 8: Moderated Moderation, Brand Size
Model 1 Model 2 Model 3 Model 4
Variable Coefficient Coefficient Coefficient Coefficient
Intercept -.008 (.01) -.009 (.01) -.012 * (.01) -.008 (.01)
Category Chocolate bars ω1 .006 (.00) .005 (.00) .009 * (.00) .007 (.00)
Shower gel ω2 .018 *** (.00) .017 *** (.00) .019 *** (.00) .017 *** (.00)
Yogurt ω3 .006 (.00) .004 (.00) .009 * (.00 .007 (.00)
Razors ω4 .020 *** (.00) .022 *** (.00) .020 *** (.00) .022 *** (.00)
Shampoo ω5 -.001 (.00) .002 (.00) .000 (.00) .002 (.00)
Authenticity Brand essence θ1 .004 ** (.00) .005 ** (.00) .003 * (.00) .005 ** (.00)
Dimensions Brand essence2 .003 ** (.00) .003 ** (.00) .003 *** (.00) .003 *** (.00)
Brand heritage θ2 -.002 (.00) -.007 ** (.00) -.001 (.00) -.003 (.00)
Realistic plot θ3 -.003 *** (.00) -.002 * (.00) -.002 ** (.00) -.002 ** (.00)
Realistic plot2 .001 (.00) .001 * (.00) .001 (.00) .001 (.00)
Message credibility θ4 -.004 * (.00) -.004 * (.00) -.004 * (.00) -.004 * (.00)
Controls Line extension γ1 .003 (.00) .004 (.00) .002 (.00) .002 (.00)
Rational appeal γ2 .001 (.00) .001 (.00) .001 (.00) .002 (.00)
Emotional appeal γ3 .000 (.00) -.002 (.00) -.001 (.00) -.001 (.00)
Brand presence γ4 .026 * (.01) .025 * (.01) .024 * (.01) .029 ** (.01)
Complexity γ5 .009 (.01) .002 (.01) .005 (.01) .005 (.01)
Complexity2 -.201 *** (.06) -.201 *** (.06) -.184 ** (.06) -.168 ** (.06)
Celebrity γ6 -.007 * (.00) -.008 ** (.00) -.006 * (.00) -.008 ** (.00)
Spot length γ7 .000 * (.00) .000 * (.00) .001 ** (.00) .000 (.00)
Brand size .009 (.01) .006 (.00) -.006 (.01) -.003 (.00)
Interaction
Terms
Brand size Brand essence κ1 -.023 *** (.01) -.016 *** (.00) -.011 *** (.00) .018 ** (.01)
Brand size Brand essence2 -.008 * (.00) (.00) .003 (.00)
Brand size Brand heritage κ2 -.016 *** (.00)
Brand size Realistic plot κ3 -.011 *** (.00)
Brand size Realistic plot2 .003 (.00)
Brand size Msg. credibility κ4 .018 ** (.01)
Adjusted R2 .25 .25 .25 .23
N 340 340 340 340
Notes: Standard errors are in parentheses. Category baseline = Household. Based on the LT ad effectiveness.
*p < .05, **p < .01, ***p <0.001
91
Robustness Checks
We now investigate if our findings are robust for different measurements of the four au-
thenticity dimensions. Toward this end, we measure each authenticity dimension with an alter-
native operationalization. To increase the reliability of this task, we solicited the help of differ-
ent experts than we used in the main study. For brand essence, we measured the extent to which
the ads’ style was consistent with previous ads, because prior research argues that consistency
is strongly related to authenticity and brand essence (Beverland 2005; Morhart et al. 2015). For
brand heritage, we use a dummy variable that indicates whether the ad establishes a link to the
brand’s traditions, history, place of origin, or traditional production method (Beverland 2005;
Spiggle, Nguyen, and Caravella 2012). The inverse of absurdity offered the alternative meas-
urement for our third authenticity dimension, because unrealistic plots should be perceived as
more absurd. Finally, we used an established believability scale to test message credibility.
Using the alternative measures did not change our results, as we detail in Appendix E.
Furthermore, it is possible to argue that we should have used a fixed or random effects
model in the second stage to account for heterogeneity across brands. To investigate this cri-
tique, we conducted a Breusch-Pagan test (random effects) and an F-test (fixed effects), but in
neither case can we reject the null hypothesis. That is, neither the fixed effects nor the variance
across brands differs significantly from zero. Therefore, weighted least squares is an appropri-
ate model choice for the second stage.
Discussion and Summary
9.1 Discussion
To determine how authentic ad executions affect advertising sales responses, we
conceptualize four different authenticity dimensions, two of which (preserving the brand
essence and honoring the brand’s heritage) refer to an authentic representation of the brand
within the ad, and two others (showing a realistic plot and presenting a credible message) that
92
pertain to an authentic ad execution. To determine their influence on advertising effectiveness
in terms of sales, we obtain weekly sales data and corresponding marketing mix information
for 68 brands in six product categories and evaluate the content of 340 ads in an extensive
coding task.
In contrast to popular beliefs, designing an authentic ad does not generally increase the
advertising’s effect on sales. Rather, authenticity effects reflect specific dimensions and brand
characteristics. Across all brands, only preserving the brand essence has a positive effect on the
relationship between ad spending and sales. Such ads reinforce a distinctive brand image,
whereas ads that fail to preserve the brand essence dilute its positioning in consumers’ minds
(Kelly 1998; Meenaghan 1995). Preserving the brand essence is especially important for
smaller, less familiar brands, because they have yet to build a unique brand image (Park, Ja-
worski, and MacInnis 1986).
In contrast with findings of a positive effect of brand heritage on consumer attitudes (Mer-
chant and Rose 2013; Newman and Dhar 2014), we do not find any significant effect. This
difference might arise because we analyze low involvement brands, for which brand heritage
claims might be less important or even seem trivial. It is also possible that the positive effect of
brand heritage on various mindset metrics does not translate into an actual sales effect (Bem-
maor 1995). According to the moderation analysis, for utilitarian products and large brands,
brand heritage claims even are associated with lower ad effectiveness.
Realistic plots exert a negative effect, whereas absurd and unrealistic plots can catch
consumers’ attention and enhance ad memorability (Arias-Bolzmann, Chakraborty, and
Mowen 2000; Reinartz and Saffert 2013), which is especially important in cluttered advertising
environments in which consumers pay limited attention to ads (Danaher, Bonfrer, and Dhar
2008; Tellis 2004). The negative effect of realistic plots is driven by large brands. Consumers
93
tend to pay less attention to ads of well-known brand as they are already familiar with them.
Thus, brand managers need to do more to grab consumers’ attention.
The negative effect of message credibility indicates that a more exaggerated message
prompts a stronger sales response. We offer several potential reasons for this finding. First,
consumers pay only limited attention to ads, such that they might not even notice or simply not
elaborate on the exaggeration. Second, consumers might expect advertising messages to be
exaggerated. Rather than neglecting overstated messages, they simply discount them, which
leads to an inflated brand evaluation (Cowley 2006; Gatignon and Le Nagard 2015). Such a
process could explain why message credibility is negatively associated with sales responses for
smaller brands, for which consumers are less aware of actual performance. Third, even if con-
sumers recognize the overstatement, they might choose to believe it. As Charles Revson, the
founder of Revlon, put it, “in the factory we make cosmetics. In the drugstore we sell hope.”
Generally, the results for the last two dimensions indicate that consumers want ads to transport
them beyond the real world, to a make-believe or fantasy experience. In this sense, ads function
as a form of entertainment, rather than a channel to receive information.
We also find some interesting effect for our control variables. First, we show that a strong
brand presence increases advertising effectiveness. The more often the brand is shown, the
higher the chance that consumer recognize it. This finding is in line with previous literature by
Romaniuk (2009) as well as Akpinar and Berger (2016) but contrasts the findings of Teixeira,
Wedel, and Pieters (2010). Thus, further research is needed to examine the effect of brand sa-
lience on ad effectiveness more systematically. We also find a negative effect for celebrity
endorsement, possibly because the celebrities in our sample promote several brands. As the
number of products endorsed increases, consumers' attitudes toward the celebrity become less
favorable (Tripp, Jensen, and Carlson 1994), which in turn also negatively influences consum-
94
ers’ attitude towards the ad. Finally, in contrast with previous studies (Chandy et al. 2001; Mac-
Innis, Rao, and Weiss 2002), we find no significant effect for emotional content, possibly due
to the additional variables in the model or the different variable operationalizations.
9.2 Managerial Implications
Our results offer several insights for marketers and ad agencies. First, we provide support
for the notion that preserving the brand essence is critical for ad effectiveness. Brand managers
must carefully communicate their brands’ values, image, style, and standards to any advertising
agency they hire. Moreover, the overall ad design (e.g., color, main theme, slogan) should re-
main constant over time and campaigns. Even if new creative efforts might help grab consum-
ers’ attention (Lodish et al. 1995), marketers should retain the general ad style, which enhances
the likelihood that consumers recognize the brand. For example, plots might vary across cam-
paigns, to reduce wear-out, but the design should remain the same.
In contrast with the conventional wisdom that ads should portray regular, everyday situa-
tions to help consumers relate to the advertised story, increase their connection to the brand,
and overcome skepticism, our results show that, for FMCG brands at least, unrealistic and ab-
surd ads are more effective. Consumers want to be entertained by ads. The challenge for ad
agencies is thus to design a creative ad that captures consumers’ attention while still preserving
the brand essence. Furthermore, marketers may (within the legal scope) exaggerate; that is they
may use evaluative, vague, or subjective messages to promote their brands (e.g., “This is the
best chocolate bar, according to this spokesperson!”). Such tactics are especially helpful for
hedonic products that consumers buy for enjoyment and whose performance is based on sub-
jective rather than objective features, as well as for less known brands. In this sense, our find-
ings represent good news for marketers and ad agencies, because they provide more room for
differentiation and freedom in ad designs.
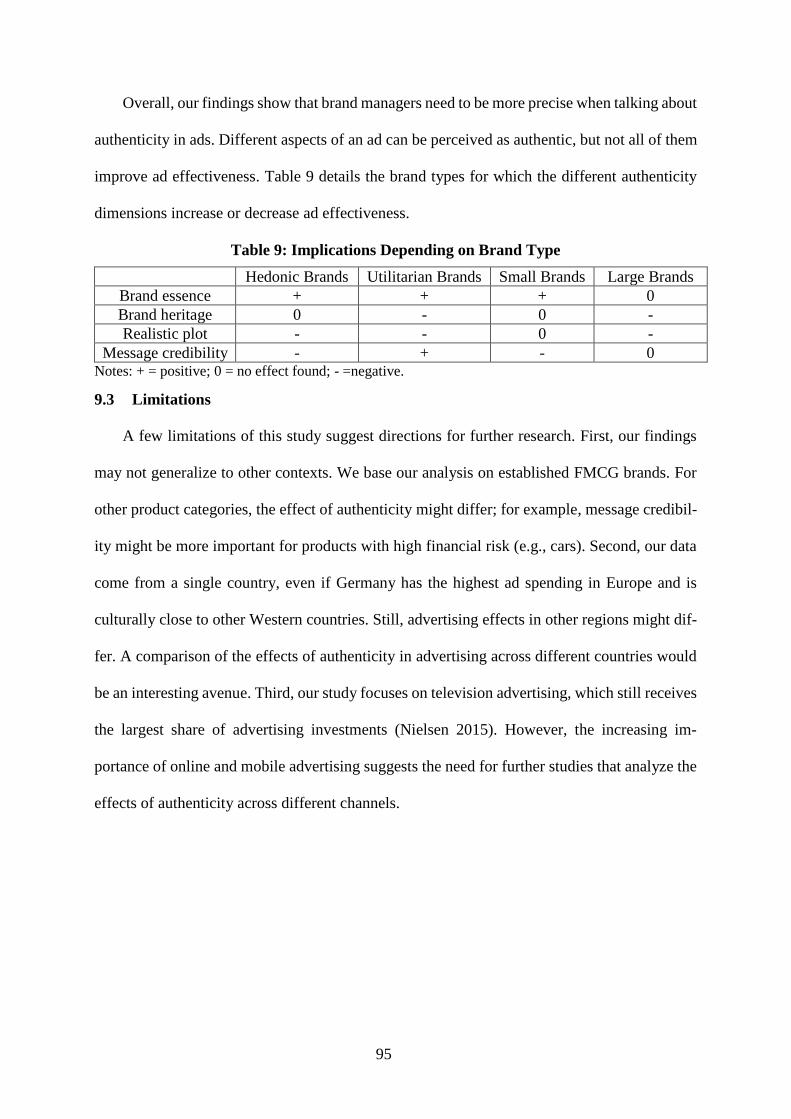
95
Overall, our findings show that brand managers need to be more precise when talking about
authenticity in ads. Different aspects of an ad can be perceived as authentic, but not all of them
improve ad effectiveness. Table 9 details the brand types for which the different authenticity
dimensions increase or decrease ad effectiveness.
Table 9: Implications Depending on Brand Type
Hedonic Brands Utilitarian Brands Small Brands Large Brands
Brand essence + + + 0
Brand heritage 0 - 0 -
Realistic plot - - 0 -
Message credibility - + - 0 Notes: + = positive; 0 = no effect found; - =negative.
9.3 Limitations
A few limitations of this study suggest directions for further research. First, our findings
may not generalize to other contexts. We base our analysis on established FMCG brands. For
other product categories, the effect of authenticity might differ; for example, message credibil-
ity might be more important for products with high financial risk (e.g., cars). Second, our data
come from a single country, even if Germany has the highest ad spending in Europe and is
culturally close to other Western countries. Still, advertising effects in other regions might dif-
fer. A comparison of the effects of authenticity in advertising across different countries would
be an interesting avenue. Third, our study focuses on television advertising, which still receives
the largest share of advertising investments (Nielsen 2015). However, the increasing im-
portance of online and mobile advertising suggests the need for further studies that analyze the
effects of authenticity across different channels.
96
REFERENCES PAPER II
Akpinar, Ezgi and Jonah Berger (2016), “Valuable Virality,” Journal of Marketing Research,
Forthcoming.
Anderberg, Johan and John Morris (2006), “Authenticity and Transparency in the Advertising
Industry: An Interview with John Morris,” The Journal of Management Development, 25
(10), 1021-23.
Arias-Bolzmann, Leopoldo, Goutam Chakraborty, and John C. Mowen (2000), "Effects of
Absurdity in Advertising: The Moderating Role of Product Category Attitude and the
Mediating Role of Cognitive Responses," Journal of Advertising, 29 (1), 35-49.
Atkin, Joann L. and Richard F. Beltramini (2007), “Exploring the Perceived Believability of
DTC Advertising in the US,” Journal of Marketing Communications, 13 (Sept), 169-80.
Bass, Frank M., Norris I. Bruce, Sumit Majumdar, and B.P.S. Murthi (2007), “Wearout Effects
of Different Advertising Themes: A Dynamic Bayesian Model of the Advertising-Sales
Relationship,” Marketing Science, 26 (2), 179-95.
Belch, George E. and Michael A. Belch (2015), Advertising and Promotion: An Integrated
Marketing Communications Perspective. (10th ed.). New York: McGraw‐Hill International
Edition.
Bemmaor, Albert C. (1995), “Predicting Behavior from Intention-to-Buy Measures: The
Parametric Case,” Journal of Marketing Research, 32 (May), 176–91.
Beverland, Michael B. (2005), “Crafting Brand Authenticity: The Case of Luxury Wines,”
Journal of Management Studies, 42 (5), 1003-29.
——— (2006), “The ‘real thing’: Branding Authenticity in the Luxury Wine Trade,” Journal
of Business Research, 59 (2), 251-58.
——— and Francis J. Farelly (2010), “The Quest for Authenticity in Consumption:
Consumers’ Purposive Choice of Authentic Cues to Shape Experienced Outcomes,” Journal
of Consumers Research, 36 (5), 838-56.
——— and Sandra Luxton (2005), “Managing Integrated Marketing Communication (IMC)
Through Strategic Decoupling,” Journal of Advertising, 34 (4), 103-16.
——— ,Adam Lindgreen, and Michiel W. Vink (2008), “Projecting Authenticity Through
Advertising: Consumer Judgments of Advertisers' Claims,” Journal of Advertising, 37 (1),
5-15.
Boyd, Henry C. (2006), "Persuasive Talk: Is It What You Say or How You Say It?" Journal of
Advertising Research, 46 (1), 84-92.
Brown, Stephen, Robert V. Kozinets, and John F. Sherry Jr. (2003), “Teaching Old Brands
New Tricks: Retro Branding and the Revival of Brand Meaning,” Journal of Marketing, 67
(3), 19-33.
97
Burnkrant, Robert E. and H. Rao Unnava (1995), “Effects of Self-Referencing on Persuasion,”
Journal of Consumer Research, 22 (June), 17-26.
Cacioppo, John T. and Richard E. Petty (1984), "The Elaboration Likelihood Model of
Persuasion," in NA-Advances in Consumer Research, Vol. 11, Thomas C. Kinnear, ed.
Provo, UT: Association for Consumer Research, 11, 673-75.
Calfee, John E. and Debra Jones Ringold (1994), “The 70% Majority: Enduring Consumer
Beliefs about Advertising,” Journal of Public Policy and Marketing, 13 (2), 228-38.
Campbell, Margaret C. and Amna Kirmani (2000), “Consumers’ Use of Persuasion
Knowledge: The Effects of Accessibility and Cognitive Capacity on Perceptions of an
Influence Agent,” Journal of Consumer Research, 27 (1), 69-83.
Chandy, Rajesh K., Gerard J. Tellis, Deborah J. MacInnis, and Pattana Thaivanich (2001),
“What to Say When: Advertising Appeals in Evolving Markets,” Journal of Marketing
Research, 38 (4), 399-414.
Choi, Sejung M. and Nora J. Rifon (2002), “Antecedents and Consequences of Web
Advertising Credibility: A Study of Consumer Response to Banner Ads,” Journal of
Interactive Advertising, 3 (1), 12-24.
Costa, Janeen Arnold (1998), “Paradisal Discourse: A Critical Analysis of Marketing and
Consuming Hawaii,” Consumption, Markets and Culture, 1 (4), 303-46.
Cotte, June, Robin A. Coulter, and Melissa Moore (2005), “Enhancing or Disrupting Guilt: The
Role of Ad Credibility and Perceived Manipulative Intent,” Journal of Business Research,
58 (3), 361-68.
Cowley, Elizabeth (2006), “Processing Exaggerated Advertising Claims,” Journal of Business
Research, 59 (6), 728-34.
Danaher, Peter J., Andre Bonfrer, and Sanjay Dhar (2008), “The Effect of Competitive
Advertising Interference on Sales for Packaged Goods,” Journal of Marketing Research, 45
(2), 211-25.
Darke, Peter R. and Robin J. B. Ritchie (2007), “The Defensive Consumer: Advertising
Deception, Defensive Processing, and Distrust,” Journal of Marketing Research, 44 (1),
114-27.
Deighton, John, Daniel Romer, and Josh MacQueen (1989), "Using Drama to Persuade,"
Journal of Consumer Research, 16 (3), 335-43.
Eastlack, Joseph O. Jr. and Ambar G. Rao (1989), “Advertising Experiments at the Campbell
Soup Company,” Marketing Science, 8 (1), 57-71.
Elliott, Richard and Kritsadarat Wattanasuwan (1998), “Brands as Symbolic Resources for the
Construction of Identity,” International Journal of Advertising, 17 (2), 131-44.
Escalas, Jennifer Edson and Barbara B. Stern (2003), “Sympathy and Empathy: Emotional
Responses to Advertising Dramas,” Journal of Consumer Research, 29 (March), 566-78.
98
Ewing, Douglas R., Chris T. Allen, and Randall L. Ewing (2012), “Authenticity as Meaning
Validation: An Empirical Investigation of Iconic and Indexical Cues in a Context of “Green”
Products,” Journal of Consumer Behaviour, 11 (5), 381-90.
Fornell, Claes and David F. Larcker (1981), “Structural Equation Models with Unobservable
Variables and Measurement Error: Algebra and Statistics,” Journal of Marketing Research,
18 (Aug), 382-88.
Franzen, Giep (1994), Advertising Effectiveness: Findings from Empirical Research. London:
NTC Publications Limited.
Gatignon, Hubert and Emmanuelle Le Nagard (2015), “Manipulating Consumers is Not
Marketing: A Commentary on Cass R. Sunstein's ‘Fifty Shades of Manipulation,'” Working
Paper, Department of Marketing, The Business School of the World, France.
Gijsenberg, Maarten J. (2014), “Going for Gold: Investigating the (Non)Sense of Increased
Advertising Around Major Sports Events,” International Journal of Research in Marketing,
31 (1), 2-15.
Gilmore, James H. and Joseph B. Pine (2007), Authenticity: What Consumers Really Want.
Boston: Harvard Business School Press.
Grayson, Kent and Radan Martinec (2004), “Consumer Perceptions of Iconicity and
Indexicality and Their Influence on Assessments of Authentic Market Offerings,” Journal
of Consumer Research, 31 (2), 296-312.
Greene, William H. (2000), Econometric Analysis. (5th ed.). New Jersey: Prentice Hall.
Hanssens, Dominique M. (2015), Empirical Generalizations about Marketing Impact: What we
have learned from academic research. Cambridge, MA: Marketing Science Institute.
Holt, Douglas B. (2002), "Why Do Brands Cause Trouble? A Dialectical Theory of Consumer
Culture and Branding," Journal of Consumer Research, 29 (1), 70-90.
Kassaei, Amir (2006), “Echt? Ein Plädoyer für mehr Authentizität!: Die Welt des Konsumenten
hat nichts mit der von der Werbung präsentierten Traumwelt zu tun,“ (accessed December
29, 2016), [available at http://www.berliner-zeitung.de/echt--ein-plaedoyer-fuer-mehr-
authentizitaet---die-welt-des-konsumenten-hat-nichts-mit-der-von-der-werbung-
praesentierten-traumwelt-zu-tun--15572970].
Keller, Kevin Lane (1998), Strategic Brand Management: Building, Measuring, and Managing
Brand Equity. New Jersey: Prentice Hall.
Kelly, Tim (1998), "Brand Essence - Making Our Brands Last Longer," Journal of Brand
Management, 5 (6), 390-91.
Krippendorff, Klaus (1980), Content Analysis: An Introduction to its Methodology. Beverly
Hills, CA: Sage Publications.
Langfeld, Herbert Sidney (1967), The aesthetic attitude. New York: Harcourt, Brace.
99
Leeflang, Peter S. H., Jaap E. Wieringa, Tammo H. A. Bijmolt, and Koen H. Pauwels (2000),
Modeling Markets: Analyzing Marketing Phenomena and Improving Marketing Decision
Making. New York: Springer.
Leigh, Thomas W., Cara Peters, and Jeremy Shelton (2006), "The Consumer Quest for
Authenticity: The Multiplicity of Meanings Within the MG Subculture of Consumption,"
Journal of the Academy of Marketing Science, 34 (4), 481-93.
Levin, Andrew, Chien-Fu Lin, and Chia-Shang James Chu (2002), " Unit Root Tests in Panel
Data: Asymptotic and Finite-Sample Properties," Journal of Econometrics, 108 (May), 1-
24.
Lodish, Leonard M., Magid Abraham, Stuart Kalmenson, Jeanne Livelsberger, Beth Lubetkin,
Bruce Richardson, and Mary Ellen Stevens (1995), “How TV Advertising Works: A Meta-
Analysis of 389 Real World Split Cable T.V. Advertising Experiments,” Journal of
Marketing Research, 32 (May), 125-39.
Loewenstein, Jeffrey, Rajagopal Raghunathan, and Chip Heath (2011), "The Repetition-Break
Plot Structure Makes Effective Television Advertisements," Journal of Marketing, 75 (5),
105-19.
Ma, Yu, Kusum L. Ailawadi, Dinseh K. Gauri, and Dhruv Grewal (2011), "An Empirical
Investigation of the Impact of Gasoline Prices on Grocery Shopping Behavior," Journal of
Marketing, 75 (2), 18-35.
MacInnis, Deborah J., Ambar G. Rao, and Allen M. Weiss (2002), “Assessing When Increased
Media Weight of Real-World Advertisements Helps Sales,” Journal of Marketing Research,
39 (4), 391-407.
MacKenzie, Scott B., Richard J. Lutz and George E. Belch (1986), “The Role of Attitude
Toward the Ad as a Mediator of Advertising Effectiveness: A Test of Competing
Explanations,” Journal of Marketing Research, 23 (2), 130-43.
——— and Richard J. Lutz (1989), “An Empirical Examination of the Structural Antecedents
of Attitude Toward the Ad in an Advertising Pretesting Context,” Journal of Marketing, 53
(2), 48-65.
Marks, Lawrence J. and Michael A. Kamins (1988), "The Use of Product Sampling and
Advertising: Effects of Sequence of Exposure and Degree of Advertising Claim
Exaggeration on Consumers' Belief Strength, Belief Confidence, and Attitudes," Journal of
Marketing Research, 25 (3), 266-81.
Meenaghan, Tony (1995), "The Role of Advertising in Brand Image Development," Journal of
Product and Brand Management, 4 (4), 23-24
Merchant, Altaf and Gregory M. Rose (2013), "Effects of Advertising-Evoked Vicarious
Nostalgia on Brand Heritage," Journal of Business Research, 66 (December), 2619-25.
Morales, Andrea C., Eugenia C. Wu, and Gavan J. Fitzsimons (2012), "How Disgust Enhances
the Effectiveness of Fear Appeals," Journal of Marketing Research, 49 (3), 383-93.
100
Morhart, Felicitas, Lucia Malär, Amelie Guèvremont, Florent Girardin, and Bianca Grohmann
(2015), “Brand Authenticity: An Integrative Framework and Measurement Scale,” Journal
of Consumer Psychology, 25 (2), 200-18.
Newmann, George E. and Ravi Dhar (2014), “Authenticity is Contagious: Brand Essence and
the Orginal Source of Production,” Journal of Marketing Research, 51 (3), 371-86.
Nielsen Media Research (2015), “The Total Audience Report: Q2 2015,” (accessed November
30, 2015), [available at http://www.nielsen.com/us/en/insights/reports/2015/the-total-
audience-report-q2-2015.html].
Park, C. Whan, Bernard J. Jaworski, and Deborah J. Maclnnis (1986), "Strategic Brand
Concept-Image Management," The Journal of Marketing, 50 (October), 135-45.
——— and S. Mark Young (1986), "Consumer Response to Television Commercials: The
Impact of Involvement and Background Music on Brand Attitude Formation," Journal of
Marketing Research, 23 (1), 11-24.
Peñaloza, Lisa (2000), "The Commodification of the American West: Marketers' Production of
Cultural Meanings at the Trade Show," Journal of Marketing, 64 (4), 82-109.
Pieters, Rik, Michel Wedel, and Rajeev Batra (2010), "The Stopping Power of Advertising:
Measures and Effects of Visual Complexity," Journal of Marketing, 74 (5), 48-60.
Poetzsch, Britta (2014), “’Echt Authentisch,” (accessed December 28, 2016), [available at
http://www.handelsblatt.com/unternehmen/dienstleister/werber-rat/der-werber-rat-echt-
authentisch/10361450.html].
Reinartz, Werner and Peter Saffert (2013), “Creativity in Advertising: When It Works and
When It Doesn't,” Harvard Business Review, 91 (6), 106-11.
Roehm, Michelle L. and Harper A. Roehm (2011), "The Influence of Redemption Time Frame
on Responses to Incentives," Journal of the Academy of Marketing Science, 39 (3), 363-75.
Romaniuk, Jenni (2009), “The Efficacy of Brand-Execution Tactics in TV Advertising, Brand
Placements, and Internet Advertising,” Journal of Advertising Research, 49 (2), 143-50.
Rose, Randall L. and Stacy L. Wood (2005), “Paradox and the Consumption of Authenticity
Through Reality Television,” Journal of Consumer Research, 32 (2), 284-96.
Rosenthal, Robert (1991), Meta-Analytic Procedures for Social Research. Sage Publications.
Rossiter, John R. and Steven Bellman (2005), Marketing Communications: Theory and
Applications. Frenchs Forest: Prentice-Hall.
Sethuraman, Raj, Gerard J. Tellis, and Richard A. Briesch (2011), “How well Does Advertising
Work? Generalizations from Meta-analysis of Brand Advertising Elasticities,” Journal of
Marketing Research, 48 (3), 457-71.
Spiggle, Susan, Hang T. Nguyen, and Mary Caravella (2012), “More than Fit: Brand Extension
Authenticity,” Journal of Marketing Research, 49 (6), 967-83.
101
Srinivasan, Shuba, Marc Vanhuele, and Koen Pauwels (2010), "Mind-Set Metrics in Market
Response Models: An Integrative Approach," Journal of Marketing Research, 47 (4), 672-
84.
Stern, Barbara (1994), “Authenticity and the Textual Persona: Postmodern Paradoxes in
Advertising Narrative,” International Journal of Research in Marketing, 11 (4), 387-400.
Tellis, Gerard J. (2004), Effective Advertising: Understanding When, How, and Why
Advertising Works. Thousand Oaks, California.
——— (2009), “Generalizations About Advertising Effectiveness in Markets,” Journal of
Advertising Research, 49 (June), 240-45.
Teixeira, Thales S., Michel Wedel, and Rik Pieters (2010), “Moment-to-Moment Optimal
Branding in TV Commercials: Preventing Avoidance by Pulsing,” Marketing Science, 29
(5), 783-804.
Trilling, Lionel (1972), Sincerity and Authenticity. London: Harvard University Press.
Tripp, Carolyn, Thomas D. Jensen, and Les Carlson (1994), "The Effects of Multiple Product
Endorsements by Celebrities on Consumers' Attitudes and Intentions," Journal of Consumer
Research, 20 (Mar), 535-47.
Van Heerde, Harald J., Shuba Srinivasan, and Marnik G. Dekimpe (2010), “Estimating
Cannibalization Rates for Pioneering Innovations,” Marketing Science, 29 (6), 1024-39.
———, Maarten J. Gijsenberg, Marnik G. Dekimpe, and Jan-Benedict E.M. Steenkamp
(2013), “Price and Advertising Effectiveness Over the Business Cycle,” Journal of
Marketing Research, 50 (2), 177-93.
Warlaumont, Hazel G. (1997), "Appropriating Reality: Consumers' Perceptions of Schema-
Inconsistent Advertising," Journalism & Mass Communication Quarterly, 74 (1), 39-54.
Wittink, Dick R., Michael J. Addona, William J. Hawkes, and John C. Porter (1988),
“SCAN*PRO: The Estimation, Validation, and Use of Promotional Effects Based on
Scanner Data,” working paper, Cornell University.
Woltman Elpers, Josephine L.C.M., Michel Wedel, and Rik G.M. Pieters (2003), “Why Do
Consumers Stop Viewing Television Commercials? Two Experiments on the Influence of
Moment-to-Moment Entertainment and Information Value,” Journal of Marketing
Research, 40 (4), 437-53.
Zentralverband der deutschen Werbewirtschaft (2016), „Wettbewerb braucht Werbung,“
(accessed December 29, 2016), [available at http://www.zaw.de/zaw/wert-der-
werbung/fakten-und-zusammenhaenge/?navid=792160792160

102
APPENDIX PAPER II
In this Appendix, we provide the details of the operationalization of the control varia-
bles (A), the coding instructions for the content variables (B), the consumer survey (C), the
moderation analysis (D), and the alternative measurements and robustness checks (E).
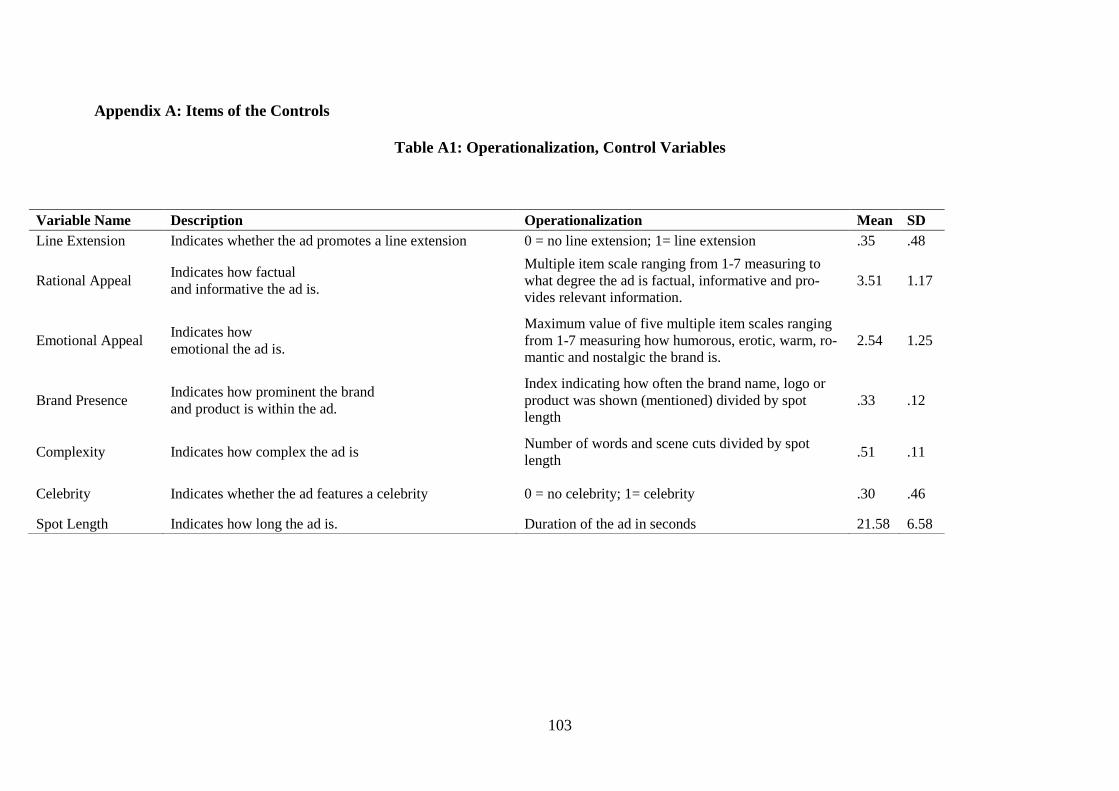
103
Appendix A: Items of the Controls
Table A1: Operationalization, Control Variables
Variable Name Description Operationalization Mean SD
Line Extension Indicates whether the ad promotes a line extension 0 = no line extension; 1= line extension .35 .48
Rational Appeal Indicates how factual
and informative the ad is.
Multiple item scale ranging from 1-7 measuring to
what degree the ad is factual, informative and pro-
vides relevant information.
3.51 1.17
Emotional Appeal Indicates how
emotional the ad is.
Maximum value of five multiple item scales ranging
from 1-7 measuring how humorous, erotic, warm, ro-
mantic and nostalgic the brand is.
2.54 1.25
Brand Presence Indicates how prominent the brand
and product is within the ad.
Index indicating how often the brand name, logo or
product was shown (mentioned) divided by spot
length
.33 .12
Complexity Indicates how complex the ad is Number of words and scene cuts divided by spot
length .51 .11
Celebrity Indicates whether the ad features a celebrity 0 = no celebrity; 1= celebrity .30 .46
Spot Length Indicates how long the ad is. Duration of the ad in seconds 21.58 6.58
104
Appendix B: Coding Procedure
Training Sessions
We organized a two-day training session that all experts had to attend, which ensured a
common understanding of the different constructs. At the beginning of the first session, we
distributed codebooks that defined and explained each variable in detail. After the experts had
some time to study the codebook, we discussed each construct on the basis of several training
advertisements that did not appear in the main study. All experts received a USB stick with 12
additional training advertisements that they were to evaluate at home. On the basis of these
evaluations, we identified any remaining comprehension problems, which we then discussed in
the second training session.
Coding
After the training sessions, the experts rated all advertisements at their own pace at home.
During coding, the experts could watch, pause, and rewind the ad as many times as needed.
However, we asked them to rate no more than five advertisements per day to avoid fatigue and
take breaks after watching two advertisements in a row. The sequence of advertisements dif-
fered for each expert, to avoid order biases. The number of experts who might code a construct
differed, depending on the nature of the construct. Two independent experts coded the objective
counts and dummy variables (e.g., celebrity endorsement, line extension). In case of incon-
sistent ratings, a third expert (together with the two main experts) coded the advertisement
again. In contrast, seven different experts rated the Likert scale variables (e.g., emotional ap-
peal, realistic plot). We resolved any discrepancies among raters through discussion.
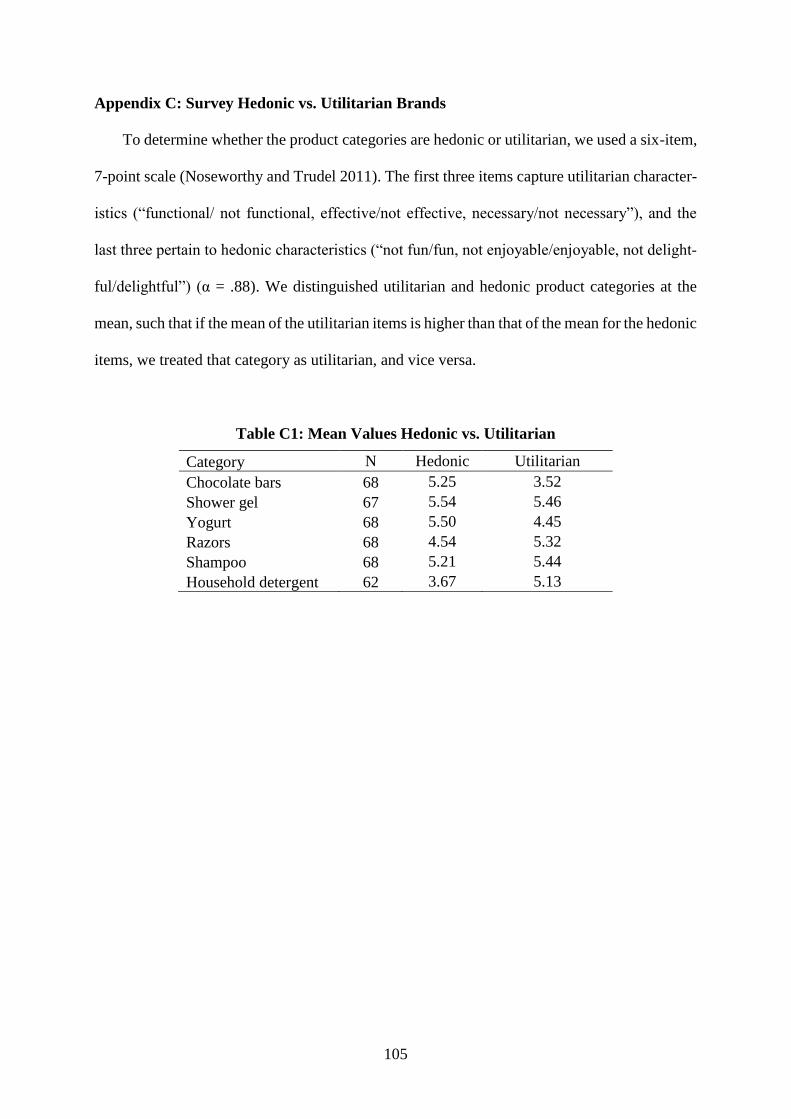
105
Appendix C: Survey Hedonic vs. Utilitarian Brands
To determine whether the product categories are hedonic or utilitarian, we used a six-item,
7-point scale (Noseworthy and Trudel 2011). The first three items capture utilitarian character-
istics (“functional/ not functional, effective/not effective, necessary/not necessary”), and the
last three pertain to hedonic characteristics (“not fun/fun, not enjoyable/enjoyable, not delight-
ful/delightful”) (α = .88). We distinguished utilitarian and hedonic product categories at the
mean, such that if the mean of the utilitarian items is higher than that of the mean for the hedonic
items, we treated that category as utilitarian, and vice versa.
Table C1: Mean Values Hedonic vs. Utilitarian
Category N Hedonic Utilitarian
Chocolate bars 68 5.25 3.52
Shower gel 67 5.54 5.46
Yogurt 68 5.50 4.45
Razors 68 4.54 5.32
Shampoo 68 5.21 5.44
Household detergent 62 3.67 5.13
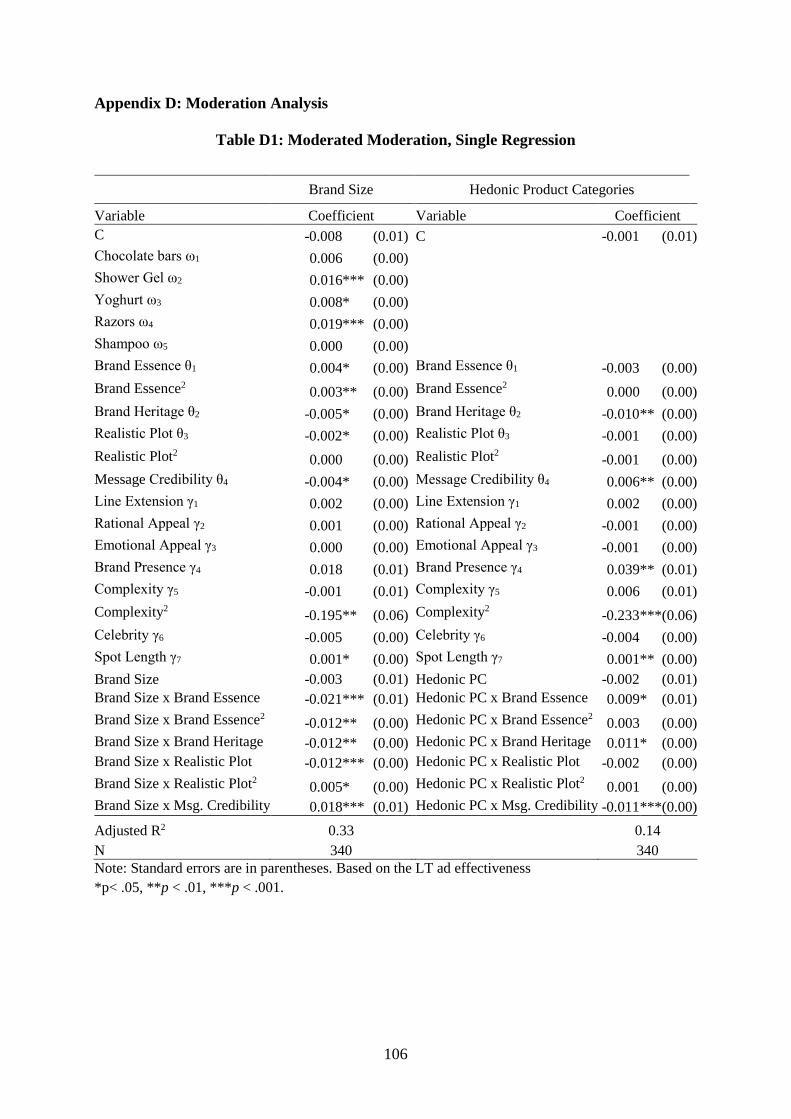
106
Appendix D: Moderation Analysis
Table D1: Moderated Moderation, Single Regression
Brand Size Hedonic Product Categories
Variable Coefficient Variable Coefficient
C -0.008 (0.01) C -0.001 (0.01)
Chocolate bars ω1 0.006 (0.00)
Shower Gel ω2 0.016 *** (0.00)
Yoghurt ω3 0.008 * (0.00)
Razors ω4 0.019 *** (0.00)
Shampoo ω5 0.000 (0.00)
Brand Essence θ1 0.004 * (0.00) Brand Essence θ1 -0.003 (0.00)
Brand Essence2 0.003 ** (0.00) Brand Essence2 0.000 (0.00)
Brand Heritage θ2 -0.005 * (0.00) Brand Heritage θ2 -0.010 ** (0.00)
Realistic Plot θ3 -0.002 * (0.00) Realistic Plot θ3 -0.001 (0.00)
Realistic Plot2 0.000 (0.00) Realistic Plot2 -0.001 (0.00)
Message Credibility θ4 -0.004 * (0.00) Message Credibility θ4 0.006 ** (0.00)
Line Extension γ1 0.002 (0.00) Line Extension γ1 0.002 (0.00)
Rational Appeal γ2 0.001 (0.00) Rational Appeal γ2 -0.001 (0.00)
Emotional Appeal γ3 0.000 (0.00) Emotional Appeal γ3 -0.001 (0.00)
Brand Presence γ4 0.018 (0.01) Brand Presence γ4 0.039 ** (0.01)
Complexity γ5 -0.001 (0.01) Complexity γ5 0.006 (0.01)
Complexity2 -0.195 ** (0.06) Complexity2 -0.233 *** (0.06)
Celebrity γ6 -0.005 (0.00) Celebrity γ6 -0.004 (0.00)
Spot Length γ7 0.001 * (0.00) Spot Length γ7 0.001 ** (0.00)
Brand Size -0.003 (0.01) Hedonic PC -0.002 (0.01)
Brand Size x Brand Essence -0.021 *** (0.01) Hedonic PC x Brand Essence 0.009 * (0.01)
Brand Size x Brand Essence2 -0.012 ** (0.00) Hedonic PC x Brand Essence2 0.003 (0.00)
Brand Size x Brand Heritage -0.012 ** (0.00) Hedonic PC x Brand Heritage 0.011 * (0.00)
Brand Size x Realistic Plot -0.012 *** (0.00) Hedonic PC x Realistic Plot -0.002 (0.00)
Brand Size x Realistic Plot2 0.005 * (0.00) Hedonic PC x Realistic Plot2 0.001 (0.00)
Brand Size x Msg. Credibility 0.018 *** (0.01) Hedonic PC x Msg. Credibility -0.011 *** (0.00)
Adjusted R2 0.33 0.14
N 340 340
Note: Standard errors are in parentheses. Based on the LT ad effectiveness
*p< .05, **p < .01, ***p < .001.
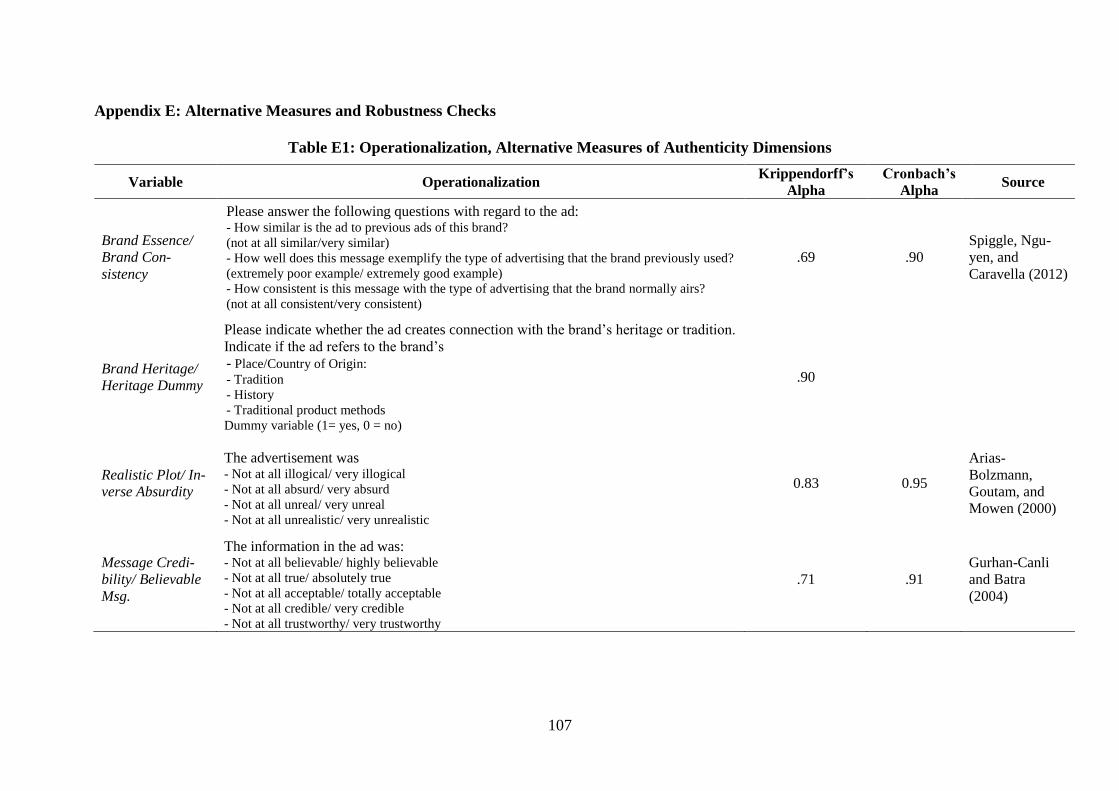
107
Appendix E: Alternative Measures and Robustness Checks
Table E1: Operationalization, Alternative Measures of Authenticity Dimensions
Variable Operationalization Krippendorff’s
Alpha
Cronbach’s
Alpha Source
Brand Essence/
Brand Con-
sistency
Please answer the following questions with regard to the ad: - How similar is the ad to previous ads of this brand?
(not at all similar/very similar)
- How well does this message exemplify the type of advertising that the brand previously used?
(extremely poor example/ extremely good example)
- How consistent is this message with the type of advertising that the brand normally airs?
(not at all consistent/very consistent)
.69 .90
Spiggle, Ngu-
yen, and
Caravella (2012)
Brand Heritage/
Heritage Dummy
Please indicate whether the ad creates connection with the brand’s heritage or tradition.
Indicate if the ad refers to the brand’s
- Place/Country of Origin:
- Tradition
- History
- Traditional product methods
Dummy variable (1= yes, 0 = no)
.90
Realistic Plot/ In-
verse Absurdity
The advertisement was - Not at all illogical/ very illogical
- Not at all absurd/ very absurd
- Not at all unreal/ very unreal
- Not at all unrealistic/ very unrealistic
0.83 0.95
Arias-
Bolzmann,
Goutam, and
Mowen (2000)
Message Credi-
bility/ Believable
Msg.
The information in the ad was: - Not at all believable/ highly believable
- Not at all true/ absolutely true
- Not at all acceptable/ totally acceptable
- Not at all credible/ very credible
- Not at all trustworthy/ very trustworthy
.71 .91
Gurhan-Canli
and Batra
(2004)
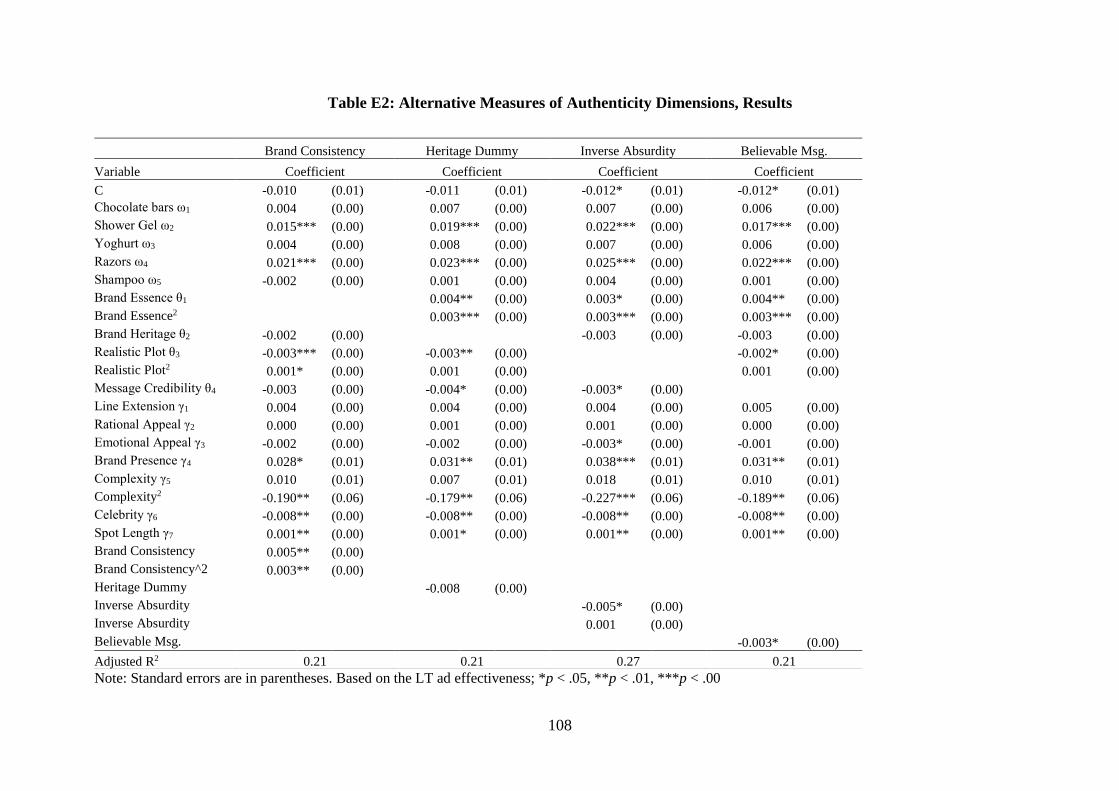
108
Table E2: Alternative Measures of Authenticity Dimensions, Results
Note: Standard errors are in parentheses. Based on the LT ad effectiveness; *p < .05, **p < .01, ***p < .00
Brand Consistency Heritage Dummy Inverse Absurdity Believable Msg.
Variable Coefficient Coefficient Coefficient Coefficient
C -0.010 (0.01) -0.011 (0.01) -0.012 * (0.01) -0.012 * (0.01)
Chocolate bars ω1 0.004 (0.00) 0.007 (0.00) 0.007 (0.00) 0.006 (0.00)
Shower Gel ω2 0.015 *** (0.00) 0.019 *** (0.00) 0.022 *** (0.00) 0.017 *** (0.00)
Yoghurt ω3 0.004 (0.00) 0.008 (0.00) 0.007 (0.00) 0.006 (0.00)
Razors ω4 0.021 *** (0.00) 0.023 *** (0.00) 0.025 *** (0.00) 0.022 *** (0.00)
Shampoo ω5 -0.002 (0.00) 0.001 (0.00) 0.004 (0.00) 0.001 (0.00)
Brand Essence θ1 0.004 ** (0.00) 0.003 * (0.00) 0.004 ** (0.00)
Brand Essence2 0.003 *** (0.00) 0.003 *** (0.00) 0.003 *** (0.00)
Brand Heritage θ2 -0.002 (0.00) -0.003 (0.00) -0.003 (0.00)
Realistic Plot θ3 -0.003 *** (0.00) -0.003 ** (0.00) -0.002 * (0.00)
Realistic Plot2 0.001 * (0.00) 0.001 (0.00) 0.001 (0.00)
Message Credibility θ4 -0.003 (0.00) -0.004 * (0.00) -0.003 * (0.00)
Line Extension γ1 0.004 (0.00) 0.004 (0.00) 0.004 (0.00) 0.005 (0.00)
Rational Appeal γ2 0.000 (0.00) 0.001 (0.00) 0.001 (0.00) 0.000 (0.00)
Emotional Appeal γ3 -0.002 (0.00) -0.002 (0.00) -0.003 * (0.00) -0.001 (0.00)
Brand Presence γ4 0.028 * (0.01) 0.031 ** (0.01) 0.038 *** (0.01) 0.031 ** (0.01)
Complexity γ5 0.010 (0.01) 0.007 (0.01) 0.018 (0.01) 0.010 (0.01)
Complexity2 -0.190 ** (0.06) -0.179 ** (0.06) -0.227 *** (0.06) -0.189 ** (0.06)
Celebrity γ6 -0.008 ** (0.00) -0.008 ** (0.00) -0.008 ** (0.00) -0.008 ** (0.00)
Spot Length γ7 0.001 ** (0.00) 0.001 * (0.00) 0.001 ** (0.00) 0.001 ** (0.00)
Brand Consistency 0.005 ** (0.00)
Brand Consistency^2 0.003 ** (0.00)
Heritage Dummy -0.008 (0.00)
Inverse Absurdity -0.005 * (0.00)
Inverse Absurdity 0.001 (0.00)
Believable Msg. -0.003 * (0.00)
Adjusted R2 0.21 0.21 0.27 0.21
109
PAPER III: EXECUTIONAL CUES IN ADVERTISING – AN OVERVIEW
Author: Maren Becker
ABSTRACT
Advertising execution is an important driver of ad effectiveness and thus a central topic in
marketing. It is therefore not surprising that numerous studies analyzed the effect of selected
executional cues on various advertising effectiveness measures. This chapter aims to provide
an overview of the most relevant studies on this topic. The author therefore, (a) develops a
comprehensive framework that structures and classifies the different executional cues
marketing managers and ad agencies have to consider when designing a new campaign, (b)
reviews the literature for each group of cues, (c) identifies contextual factors that moderate their
effects and (d) proposes avenues for further research.
Key Words: Advertising effectiveness, advertising content, advertising execution
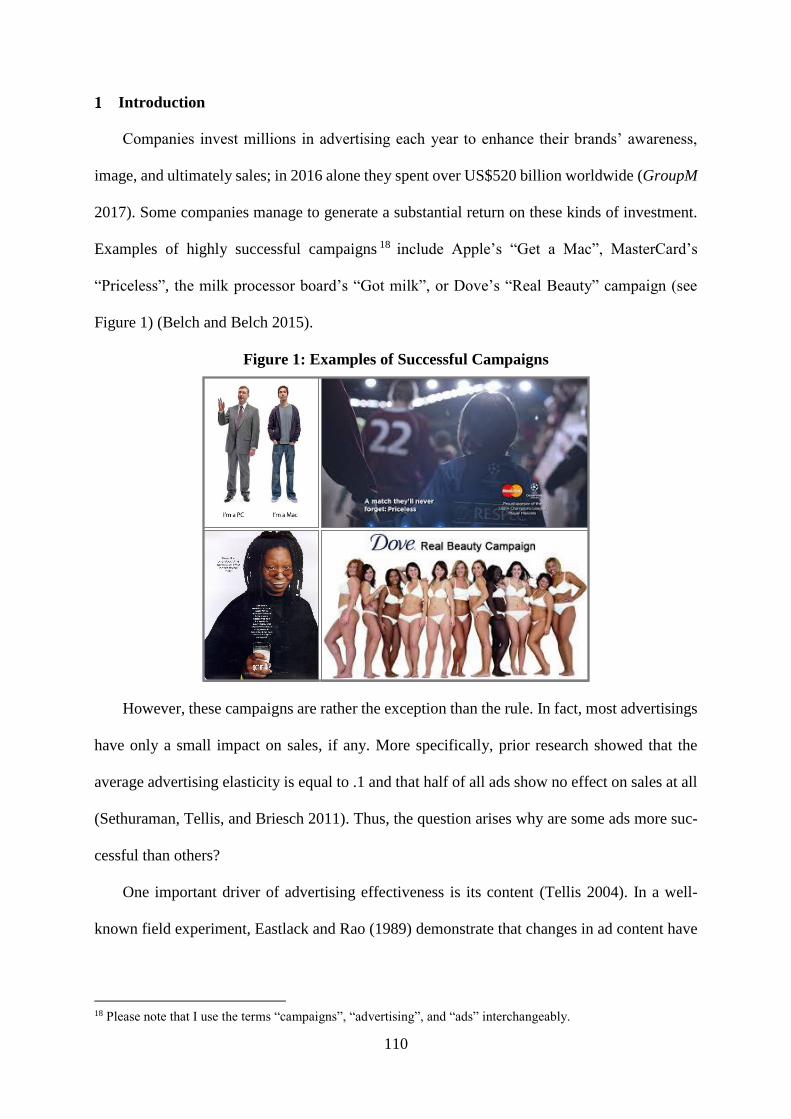
110
Introduction
Companies invest millions in advertising each year to enhance their brands’ awareness,
image, and ultimately sales; in 2016 alone they spent over US$520 billion worldwide (GroupM
2017). Some companies manage to generate a substantial return on these kinds of investment.
Examples of highly successful campaigns 18 include Apple’s “Get a Mac”, MasterCard’s
“Priceless”, the milk processor board’s “Got milk”, or Dove’s “Real Beauty” campaign (see
Figure 1) (Belch and Belch 2015).
Figure 1: Examples of Successful Campaigns
However, these campaigns are rather the exception than the rule. In fact, most advertisings
have only a small impact on sales, if any. More specifically, prior research showed that the
average advertising elasticity is equal to .1 and that half of all ads show no effect on sales at all
(Sethuraman, Tellis, and Briesch 2011). Thus, the question arises why are some ads more suc-
cessful than others?
One important driver of advertising effectiveness is its content (Tellis 2004). In a well-
known field experiment, Eastlack and Rao (1989) demonstrate that changes in ad content have
18 Please note that I use the terms “campaigns”, “advertising”, and “ads” interchangeably.
111
a stronger impact on sales than changes in ad spending. Lodish et al. (1995) support these results
in another field experiment, reinforcing the relevance of content when analyzing advertising
effectiveness. In fact, advertising content has become even more important over time. The
cluttered media environment and consumers’ limited cognitive capacities (Burke and Srull
1988) make it increasingly difficult for ads to catch consumers’ attention (Danaher, Bonfrer,
and Dhar 2008; Sethuraman, Tellis, and Briesch 2011). It is thus essential for companies to
employ an effective advertising content strategy.
According to the literature, advertising content strategies consist of two separate parts - the
message strategy and the ad execution (Belch and Belch 2015; Percy, Rossiter, and Elliott 2001)
(see Figure 2). Message strategy, on the one hand, focuses on “what should be communicated
within the ad” and comprises informational key elements (cues) of the brand. These include the
target group, the central message, as well as the overall communication objectives. Marketers
usually base these content cues on the brand’s overall strategy- that is its segmentation, posi-
tioning, and budgeting decisions. The ad execution, on the other hand, focuses on “how the
message should be communicated (visually, verbally, and conceptually)”; the manner in which
the advertiser conveys the message. Contrary to the message strategy, which usually remains
constant across different campaigns, advertisers adjust the ad execution for each one of them.
Thus, when designing a new campaign, brand managers and ad agencies have to develop a new
ad execution whereas the message strategy cues are already predetermined. In this chapter, we
thus focus on the executional cues of advertising content.
Numerous studies analyzed the moderating influence of different executional cues in the
last fifty years (e.g., Chandy et al. 2001; Dahl, Sengupta, and Vohs 2009; Jain, Agrawal, and
Maheswaran 2006; Smith et al. 2007; Teixeira, Picard, and el Kaliouby 2014). However, most
of them focus on only one selected executional cue even though campaigns are a composition
of multiple cues (e.g., its creativity, its visual and verbal complexity, or the brand’s salience).
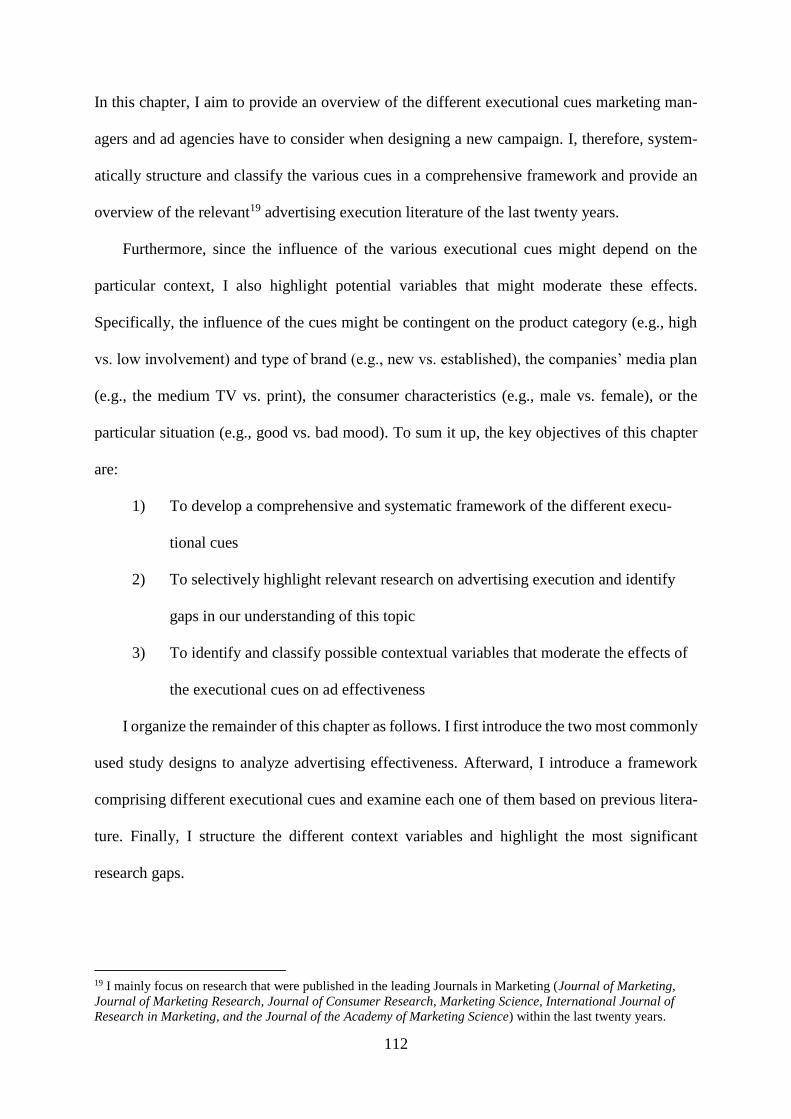
112
In this chapter, I aim to provide an overview of the different executional cues marketing man-
agers and ad agencies have to consider when designing a new campaign. I, therefore, system-
atically structure and classify the various cues in a comprehensive framework and provide an
overview of the relevant19 advertising execution literature of the last twenty years.
Furthermore, since the influence of the various executional cues might depend on the
particular context, I also highlight potential variables that might moderate these effects.
Specifically, the influence of the cues might be contingent on the product category (e.g., high
vs. low involvement) and type of brand (e.g., new vs. established), the companies’ media plan
(e.g., the medium TV vs. print), the consumer characteristics (e.g., male vs. female), or the
particular situation (e.g., good vs. bad mood). To sum it up, the key objectives of this chapter
are:
1) To develop a comprehensive and systematic framework of the different execu-
tional cues
2) To selectively highlight relevant research on advertising execution and identify
gaps in our understanding of this topic
3) To identify and classify possible contextual variables that moderate the effects of
the executional cues on ad effectiveness
I organize the remainder of this chapter as follows. I first introduce the two most commonly
used study designs to analyze advertising effectiveness. Afterward, I introduce a framework
comprising different executional cues and examine each one of them based on previous litera-
ture. Finally, I structure the different context variables and highlight the most significant
research gaps.
19 I mainly focus on research that were published in the leading Journals in Marketing (Journal of Marketing,
Journal of Marketing Research, Journal of Consumer Research, Marketing Science, International Journal of
Research in Marketing, and the Journal of the Academy of Marketing Science) within the last twenty years.
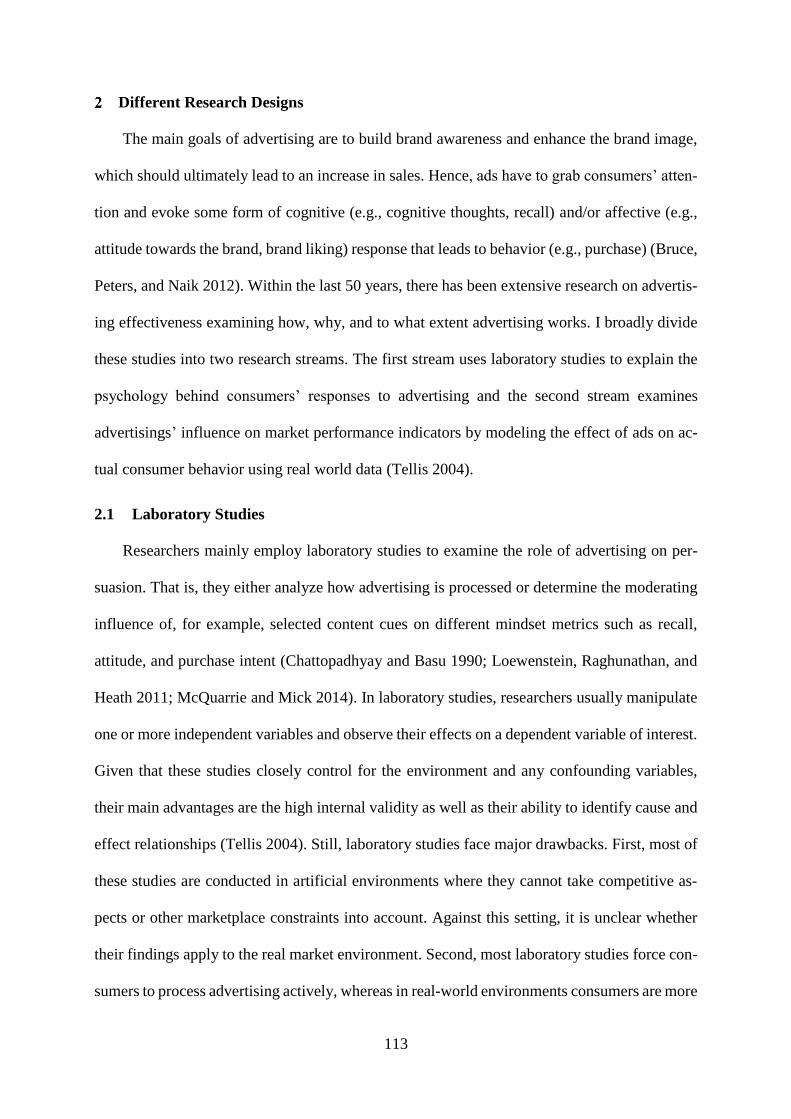
113
Different Research Designs
The main goals of advertising are to build brand awareness and enhance the brand image,
which should ultimately lead to an increase in sales. Hence, ads have to grab consumers’ atten-
tion and evoke some form of cognitive (e.g., cognitive thoughts, recall) and/or affective (e.g.,
attitude towards the brand, brand liking) response that leads to behavior (e.g., purchase) (Bruce,
Peters, and Naik 2012). Within the last 50 years, there has been extensive research on advertis-
ing effectiveness examining how, why, and to what extent advertising works. I broadly divide
these studies into two research streams. The first stream uses laboratory studies to explain the
psychology behind consumers’ responses to advertising and the second stream examines
advertisings’ influence on market performance indicators by modeling the effect of ads on ac-
tual consumer behavior using real world data (Tellis 2004).
2.1 Laboratory Studies
Researchers mainly employ laboratory studies to examine the role of advertising on per-
suasion. That is, they either analyze how advertising is processed or determine the moderating
influence of, for example, selected content cues on different mindset metrics such as recall,
attitude, and purchase intent (Chattopadhyay and Basu 1990; Loewenstein, Raghunathan, and
Heath 2011; McQuarrie and Mick 2014). In laboratory studies, researchers usually manipulate
one or more independent variables and observe their effects on a dependent variable of interest.
Given that these studies closely control for the environment and any confounding variables,
their main advantages are the high internal validity as well as their ability to identify cause and
effect relationships (Tellis 2004). Still, laboratory studies face major drawbacks. First, most of
these studies are conducted in artificial environments where they cannot take competitive as-
pects or other marketplace constraints into account. Against this setting, it is unclear whether
their findings apply to the real market environment. Second, most laboratory studies force con-
sumers to process advertising actively, whereas in real-world environments consumers are more
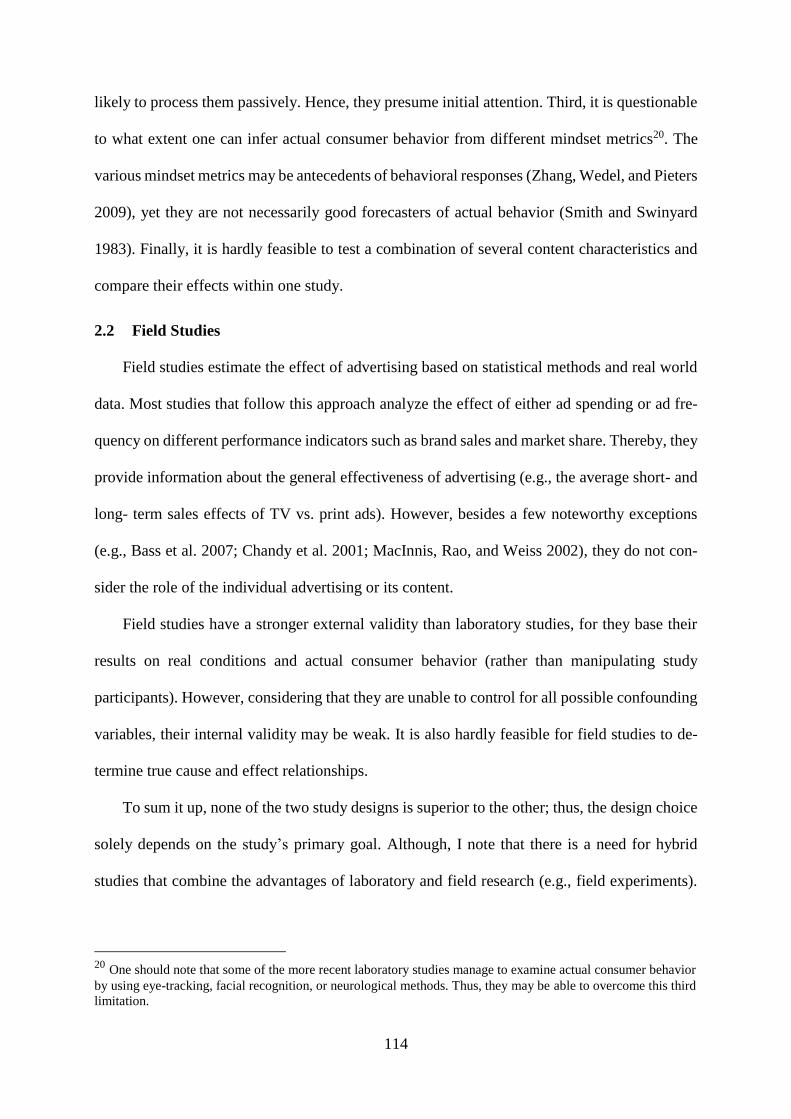
114
likely to process them passively. Hence, they presume initial attention. Third, it is questionable
to what extent one can infer actual consumer behavior from different mindset metrics20. The
various mindset metrics may be antecedents of behavioral responses (Zhang, Wedel, and Pieters
2009), yet they are not necessarily good forecasters of actual behavior (Smith and Swinyard
1983). Finally, it is hardly feasible to test a combination of several content characteristics and
compare their effects within one study.
2.2 Field Studies
Field studies estimate the effect of advertising based on statistical methods and real world
data. Most studies that follow this approach analyze the effect of either ad spending or ad fre-
quency on different performance indicators such as brand sales and market share. Thereby, they
provide information about the general effectiveness of advertising (e.g., the average short- and
long- term sales effects of TV vs. print ads). However, besides a few noteworthy exceptions
(e.g., Bass et al. 2007; Chandy et al. 2001; MacInnis, Rao, and Weiss 2002), they do not con-
sider the role of the individual advertising or its content.
Field studies have a stronger external validity than laboratory studies, for they base their
results on real conditions and actual consumer behavior (rather than manipulating study
participants). However, considering that they are unable to control for all possible confounding
variables, their internal validity may be weak. It is also hardly feasible for field studies to de-
termine true cause and effect relationships.
To sum it up, none of the two study designs is superior to the other; thus, the design choice
solely depends on the study’s primary goal. Although, I note that there is a need for hybrid
studies that combine the advantages of laboratory and field research (e.g., field experiments).
20 One should note that some of the more recent laboratory studies manage to examine actual consumer behavior
by using eye-tracking, facial recognition, or neurological methods. Thus, they may be able to overcome this third
limitation.
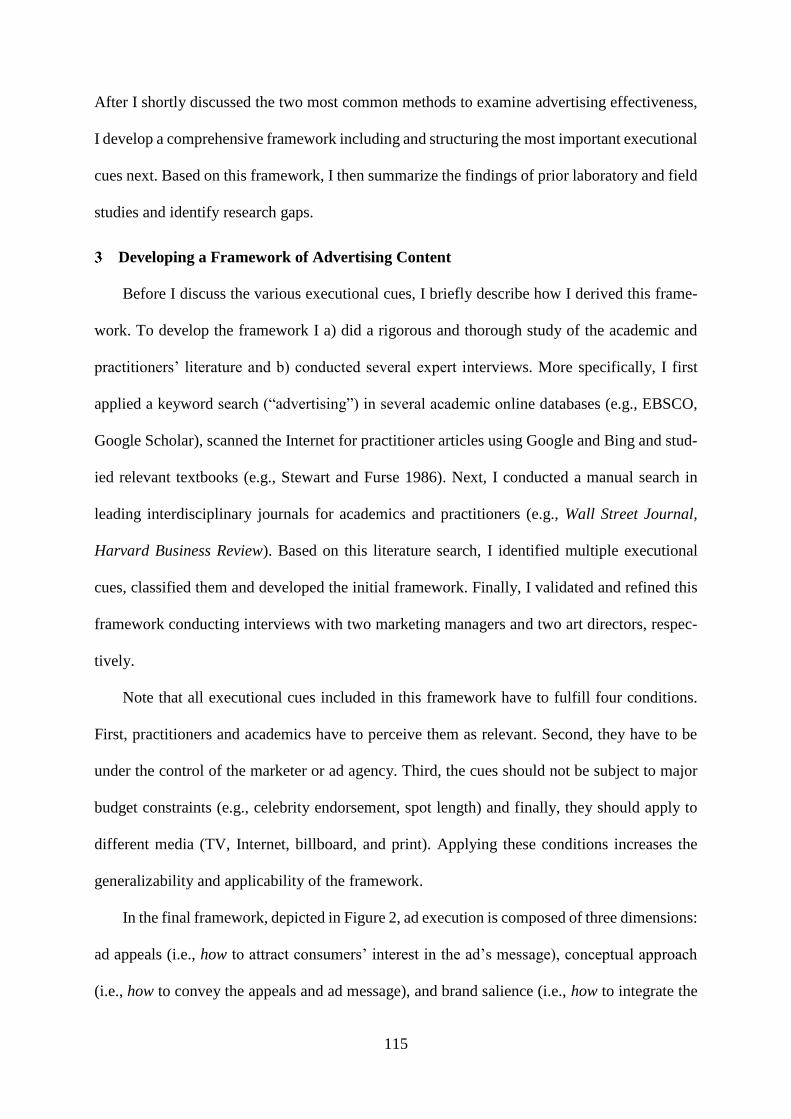
115
After I shortly discussed the two most common methods to examine advertising effectiveness,
I develop a comprehensive framework including and structuring the most important executional
cues next. Based on this framework, I then summarize the findings of prior laboratory and field
studies and identify research gaps.
Developing a Framework of Advertising Content
Before I discuss the various executional cues, I briefly describe how I derived this frame-
work. To develop the framework I a) did a rigorous and thorough study of the academic and
practitioners’ literature and b) conducted several expert interviews. More specifically, I first
applied a keyword search (“advertising”) in several academic online databases (e.g., EBSCO,
Google Scholar), scanned the Internet for practitioner articles using Google and Bing and stud-
ied relevant textbooks (e.g., Stewart and Furse 1986). Next, I conducted a manual search in
leading interdisciplinary journals for academics and practitioners (e.g., Wall Street Journal,
Harvard Business Review). Based on this literature search, I identified multiple executional
cues, classified them and developed the initial framework. Finally, I validated and refined this
framework conducting interviews with two marketing managers and two art directors, respec-
tively.
Note that all executional cues included in this framework have to fulfill four conditions.
First, practitioners and academics have to perceive them as relevant. Second, they have to be
under the control of the marketer or ad agency. Third, the cues should not be subject to major
budget constraints (e.g., celebrity endorsement, spot length) and finally, they should apply to
different media (TV, Internet, billboard, and print). Applying these conditions increases the
generalizability and applicability of the framework.
In the final framework, depicted in Figure 2, ad execution is composed of three dimensions:
ad appeals (i.e., how to attract consumers’ interest in the ad’s message), conceptual approach
(i.e., how to convey the appeals and ad message), and brand salience (i.e., how to integrate the

116
brand). These can be further divided into several sub-dimensions (e.g., rational vs. emotional),
aspects (e.g., visual vs. verbal) and cues21 (e.g., humor). Even though some dimensions/ sub-
dimensions might interact with each other (e.g., emotional appeals and creativity), advertisers
should still consider each of them individually when designing an ad. I will discuss each di-
mension next.
21 Note that I focus only on the most relevant executional cues. Thus, there could be additional cues (e.g., dis-
gust) that I did not list in figure 2.
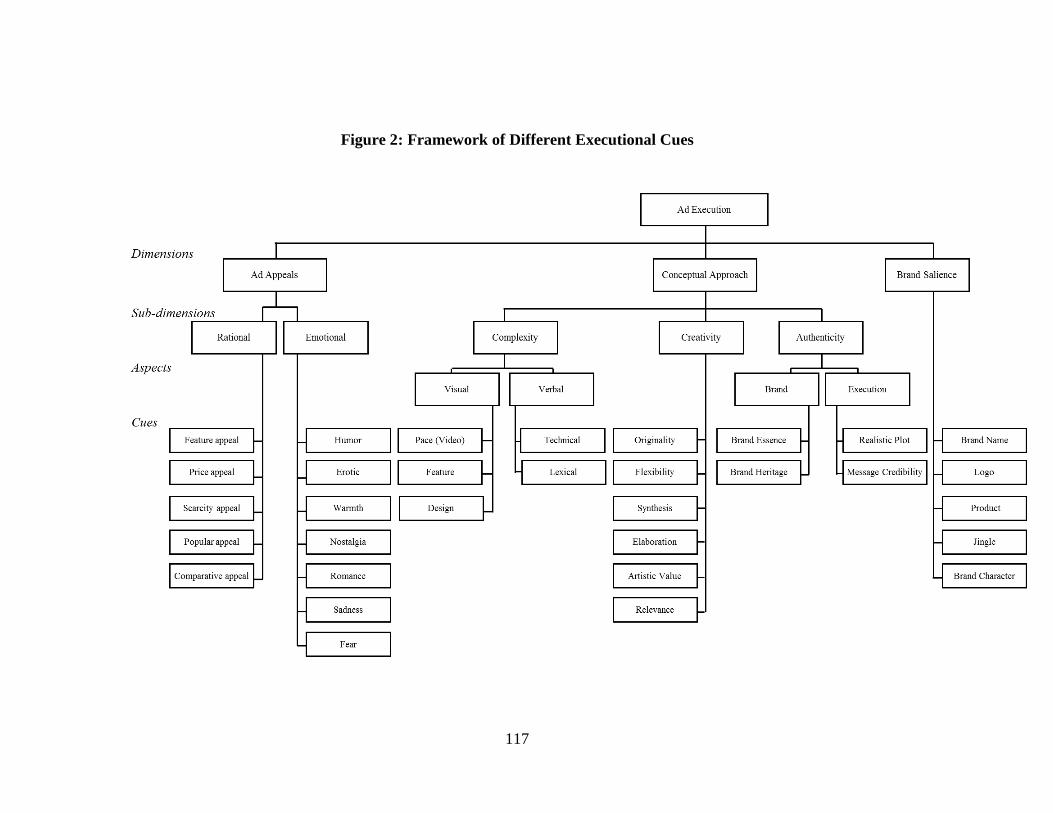
117
Figure 2: Framework of Different Executional Cues
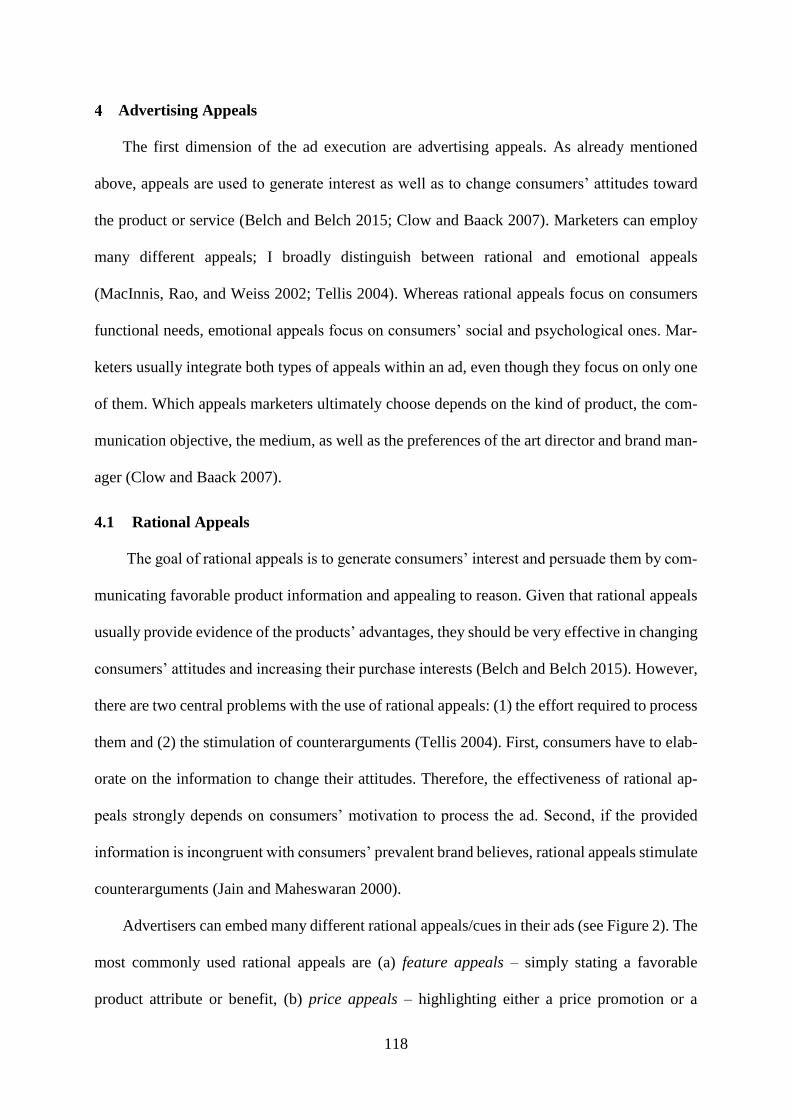
118
Advertising Appeals
The first dimension of the ad execution are advertising appeals. As already mentioned
above, appeals are used to generate interest as well as to change consumers’ attitudes toward
the product or service (Belch and Belch 2015; Clow and Baack 2007). Marketers can employ
many different appeals; I broadly distinguish between rational and emotional appeals
(MacInnis, Rao, and Weiss 2002; Tellis 2004). Whereas rational appeals focus on consumers
functional needs, emotional appeals focus on consumers’ social and psychological ones. Mar-
keters usually integrate both types of appeals within an ad, even though they focus on only one
of them. Which appeals marketers ultimately choose depends on the kind of product, the com-
munication objective, the medium, as well as the preferences of the art director and brand man-
ager (Clow and Baack 2007).
4.1 Rational Appeals
The goal of rational appeals is to generate consumers’ interest and persuade them by com-
municating favorable product information and appealing to reason. Given that rational appeals
usually provide evidence of the products’ advantages, they should be very effective in changing
consumers’ attitudes and increasing their purchase interests (Belch and Belch 2015). However,
there are two central problems with the use of rational appeals: (1) the effort required to process
them and (2) the stimulation of counterarguments (Tellis 2004). First, consumers have to elab-
orate on the information to change their attitudes. Therefore, the effectiveness of rational ap-
peals strongly depends on consumers’ motivation to process the ad. Second, if the provided
information is incongruent with consumers’ prevalent brand believes, rational appeals stimulate
counterarguments (Jain and Maheswaran 2000).
Advertisers can embed many different rational appeals/cues in their ads (see Figure 2). The
most commonly used rational appeals are (a) feature appeals – simply stating a favorable
product attribute or benefit, (b) price appeals – highlighting either a price promotion or a
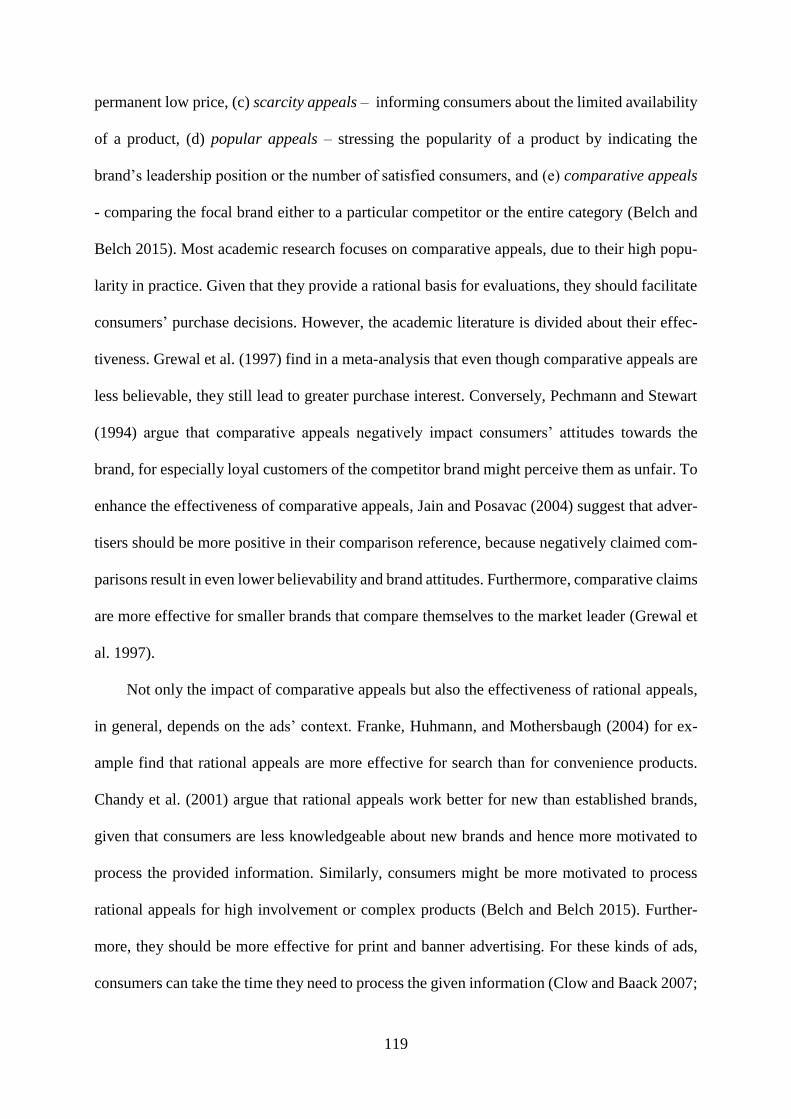
119
permanent low price, (c) scarcity appeals – informing consumers about the limited availability
of a product, (d) popular appeals – stressing the popularity of a product by indicating the
brand’s leadership position or the number of satisfied consumers, and (e) comparative appeals
- comparing the focal brand either to a particular competitor or the entire category (Belch and
Belch 2015). Most academic research focuses on comparative appeals, due to their high popu-
larity in practice. Given that they provide a rational basis for evaluations, they should facilitate
consumers’ purchase decisions. However, the academic literature is divided about their effec-
tiveness. Grewal et al. (1997) find in a meta-analysis that even though comparative appeals are
less believable, they still lead to greater purchase interest. Conversely, Pechmann and Stewart
(1994) argue that comparative appeals negatively impact consumers’ attitudes towards the
brand, for especially loyal customers of the competitor brand might perceive them as unfair. To
enhance the effectiveness of comparative appeals, Jain and Posavac (2004) suggest that adver-
tisers should be more positive in their comparison reference, because negatively claimed com-
parisons result in even lower believability and brand attitudes. Furthermore, comparative claims
are more effective for smaller brands that compare themselves to the market leader (Grewal et
al. 1997).
Not only the impact of comparative appeals but also the effectiveness of rational appeals,
in general, depends on the ads’ context. Franke, Huhmann, and Mothersbaugh (2004) for ex-
ample find that rational appeals are more effective for search than for convenience products.
Chandy et al. (2001) argue that rational appeals work better for new than established brands,
given that consumers are less knowledgeable about new brands and hence more motivated to
process the provided information. Similarly, consumers might be more motivated to process
rational appeals for high involvement or complex products (Belch and Belch 2015). Further-
more, they should be more effective for print and banner advertising. For these kinds of ads,
consumers can take the time they need to process the given information (Clow and Baack 2007;
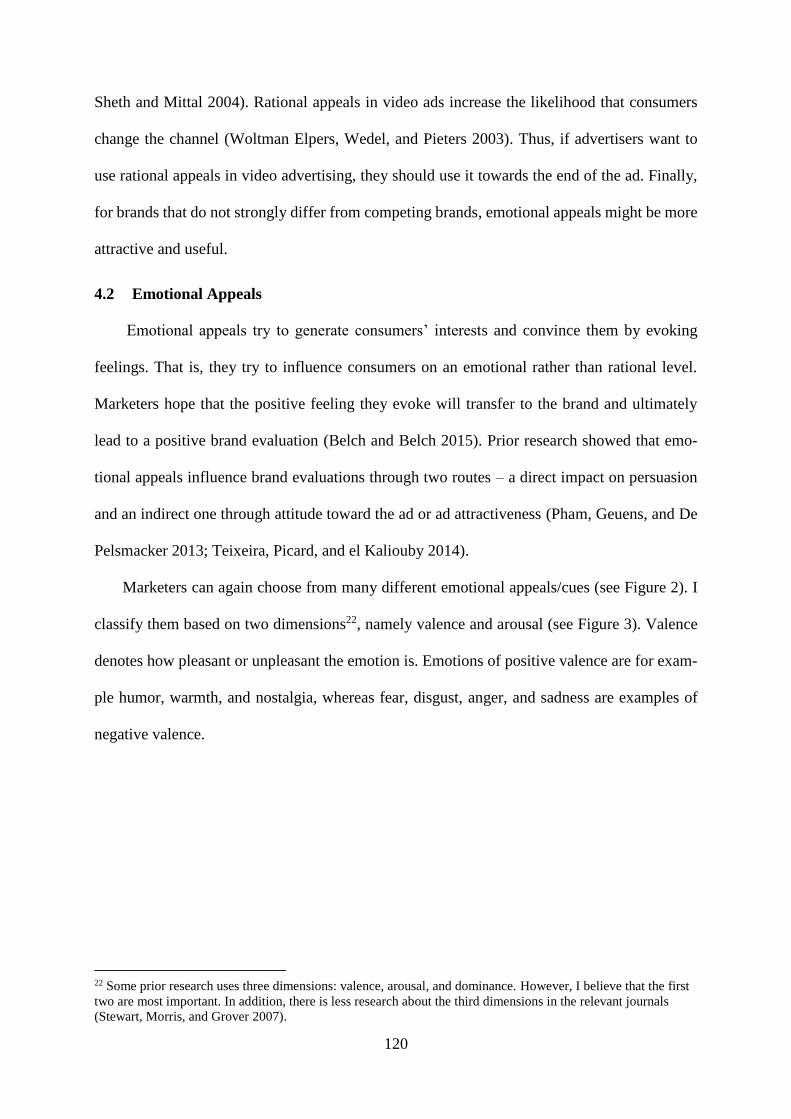
120
Sheth and Mittal 2004). Rational appeals in video ads increase the likelihood that consumers
change the channel (Woltman Elpers, Wedel, and Pieters 2003). Thus, if advertisers want to
use rational appeals in video advertising, they should use it towards the end of the ad. Finally,
for brands that do not strongly differ from competing brands, emotional appeals might be more
attractive and useful.
4.2 Emotional Appeals
Emotional appeals try to generate consumers’ interests and convince them by evoking
feelings. That is, they try to influence consumers on an emotional rather than rational level.
Marketers hope that the positive feeling they evoke will transfer to the brand and ultimately
lead to a positive brand evaluation (Belch and Belch 2015). Prior research showed that emo-
tional appeals influence brand evaluations through two routes – a direct impact on persuasion
and an indirect one through attitude toward the ad or ad attractiveness (Pham, Geuens, and De
Pelsmacker 2013; Teixeira, Picard, and el Kaliouby 2014).
Marketers can again choose from many different emotional appeals/cues (see Figure 2). I
classify them based on two dimensions22, namely valence and arousal (see Figure 3). Valence
denotes how pleasant or unpleasant the emotion is. Emotions of positive valence are for exam-
ple humor, warmth, and nostalgia, whereas fear, disgust, anger, and sadness are examples of
negative valence.
22 Some prior research uses three dimensions: valence, arousal, and dominance. However, I believe that the first
two are most important. In addition, there is less research about the third dimensions in the relevant journals
(Stewart, Morris, and Grover 2007).
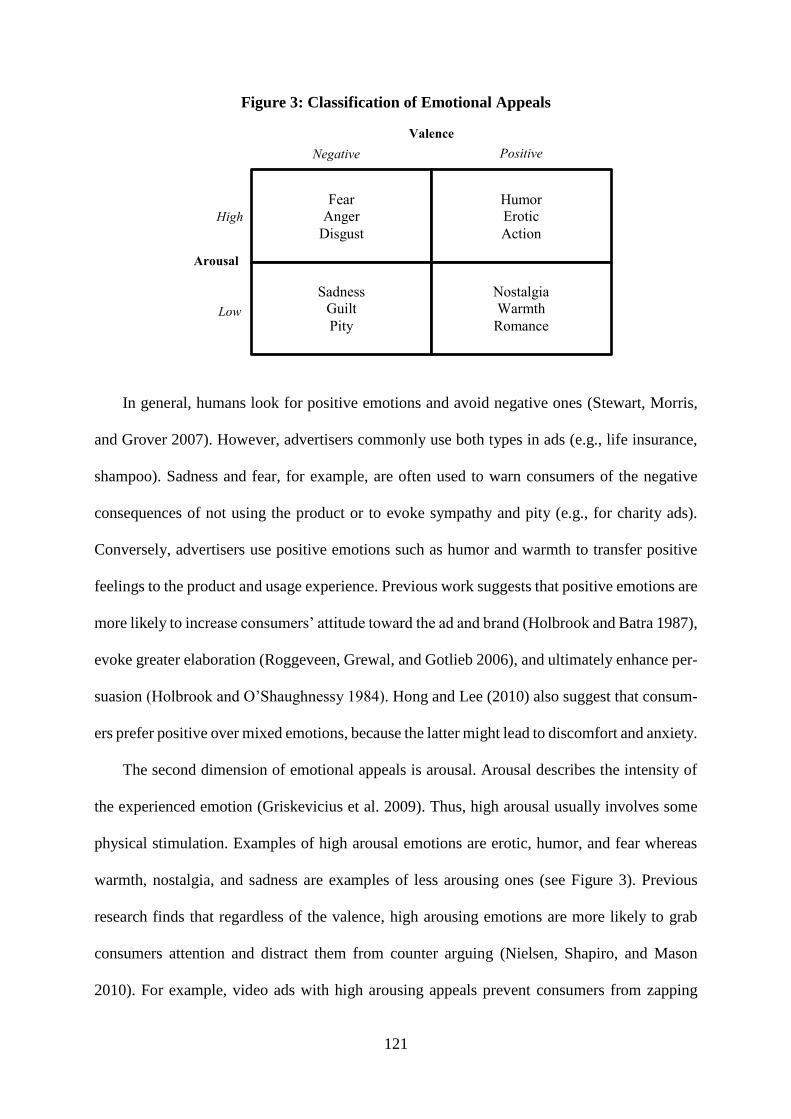
121
Figure 3: Classification of Emotional Appeals
In general, humans look for positive emotions and avoid negative ones (Stewart, Morris,
and Grover 2007). However, advertisers commonly use both types in ads (e.g., life insurance,
shampoo). Sadness and fear, for example, are often used to warn consumers of the negative
consequences of not using the product or to evoke sympathy and pity (e.g., for charity ads).
Conversely, advertisers use positive emotions such as humor and warmth to transfer positive
feelings to the product and usage experience. Previous work suggests that positive emotions are
more likely to increase consumers’ attitude toward the ad and brand (Holbrook and Batra 1987),
evoke greater elaboration (Roggeveen, Grewal, and Gotlieb 2006), and ultimately enhance per-
suasion (Holbrook and O’Shaughnessy 1984). Hong and Lee (2010) also suggest that consum-
ers prefer positive over mixed emotions, because the latter might lead to discomfort and anxiety.
The second dimension of emotional appeals is arousal. Arousal describes the intensity of
the experienced emotion (Griskevicius et al. 2009). Thus, high arousal usually involves some
physical stimulation. Examples of high arousal emotions are erotic, humor, and fear whereas
warmth, nostalgia, and sadness are examples of less arousing ones (see Figure 3). Previous
research finds that regardless of the valence, high arousing emotions are more likely to grab
consumers attention and distract them from counter arguing (Nielsen, Shapiro, and Mason
2010). For example, video ads with high arousing appeals prevent consumers from zapping
Fear
Anger
Disgust
Humor
Erotic
Action
Sadness
Guilt
Pity
Nostalgia
Warmth
Romance
Valence
Arousal
High
Low
Negative Positive
122
(Woltman Elpers, Wedel, and Pieters 2003) and are much more likely to be shared (Berger and
Milkman 2012; Tucker 2015). Teixeira, Picard, and el Kaliouby (2014) suggest that arousal has
an inverted u-shaped effect. That is, an intermediate level of arousal grabs consumers’ attention
whereas too much arousal distracts consumers from the brand and thus hinders brand recall.
Also, too little arousal is insufficiently engaging. In summary, the effect of different emotional
appeals is determined by its valence and level of arousal.
Similar to rational cues, the effectiveness of emotional cues also depends on the ads’ con-
text. Prior research, for example, showed that emotional appeals work especially well for es-
tablished fast moving consumer goods, because consumers are familiar with this kind of prod-
ucts and thus less motivated to process any rational appeals (Chandy et al. 2001; MacInnis,
Rao, and Weiss 2002). Pham, Geuens, and De Pelsmacker (2013) also showed that the effec-
tiveness of emotional appeals depends on consumers’ consumption motivation. Specifically,
emotions are more effective for hedonic than utilitarian products. Moreover, emotional appeals
are more suitable for video ads, since the ability to use sound and sight facilitates the transpor-
tation of emotions (Clow and Baack 2007). Some context factors also influence the effect of
selected emotional appeals. Puccinelli et al. (2015) for example show that when consumers are
deactivated (e.g., through a sad movie), they are much less likely to pay attention to highly
arousing ads. The effect of erotic appeals also depend on the consumers’ gender. Whereas erotic
ads have a positive effect on the attitude towards the ad for males, they have a negative influence
for females (e.g., Dahl, Sengupta, and Vohs 2009; Ma and Gal 2015).
Overall, rational and emotional appeals are the most extensively studied aspects of the ad-
vertising execution. In Table 1, I provide an overview of the relevant literature over the last 20
years. Despite the fact that prior research extensively analyzed various appeals, there are still
some knowledge gaps, for example:
123
(1) What are the most important appeals/cues for different media types and brands? Given
that prior work focused mainly on one selected appeal, further research should com-
pare the effect of different appeals within one study. In addition, what is an effective
combination of different appeals?
(2) Teixeira, Picard, and Kaliouby (2014) suggest that arousal follows an inverted-u shape.
Given that some emotional appeals are more arousing than others are, it would be in-
teresting to investigate which emotions evoke an effective level of arousal. I believe
that especially neuromarketing studies could provide valuable insights on this topic.
(3) How did the Internet change the effectiveness of different appeals? Advertising used
to be a primary source of information. However, nowadays the Internet is the most
important information provider, which might change the influence of rational appeals.
(4) Since most research is based on laboratory studies, field studies are needed to validate
these findings.
(5) How does culture influence the effectiveness of different appeals? Most studies were
conducted in the USA or other western countries. However, some appeals could have
very different effects in Arabic or Asian countries. Hong and Lee (2010), for example,
show that consumers of different cultures (American vs. Chinese) react differently to
arousal. The effect of comparative appeals might also depend on culture. For instance,
in highly individualistic countries (e.g., USA), compared to highly collectivistic coun-
tries (e.g., China), comparative claims might be perceived as less “unfair”.
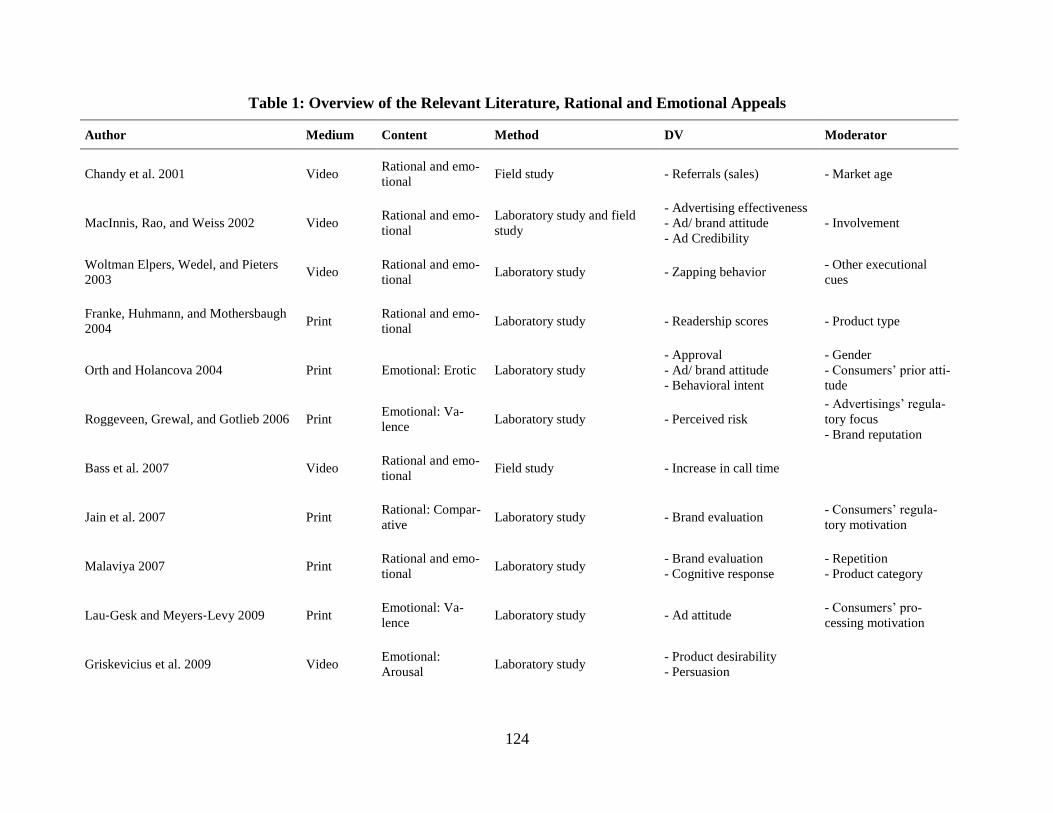
124
Table 1: Overview of the Relevant Literature, Rational and Emotional Appeals
Author Medium Content Method DV Moderator
Chandy et al. 2001 Video Rational and emo-
tional Field study - Referrals (sales) - Market age
MacInnis, Rao, and Weiss 2002 Video Rational and emo-
tional
Laboratory study and field
study
- Advertising effectiveness
- Ad/ brand attitude
- Ad Credibility
- Involvement
Woltman Elpers, Wedel, and Pieters
2003 Video
Rational and emo-
tional Laboratory study - Zapping behavior
- Other executional
cues
Franke, Huhmann, and Mothersbaugh
2004 Print
Rational and emo-
tional Laboratory study - Readership scores - Product type
Orth and Holancova 2004 Print Emotional: Erotic Laboratory study
- Approval
- Ad/ brand attitude
- Behavioral intent
- Gender
- Consumers’ prior atti-
tude
Roggeveen, Grewal, and Gotlieb 2006 Print Emotional: Va-
lence Laboratory study - Perceived risk
- Advertisings’ regula-
tory focus
- Brand reputation
Bass et al. 2007 Video Rational and emo-
tional Field study - Increase in call time
Jain et al. 2007 Print Rational: Compar-
ative Laboratory study - Brand evaluation
- Consumers’ regula-
tory motivation
Malaviya 2007 Print Rational and emo-
tional Laboratory study
- Brand evaluation
- Cognitive response
- Repetition
- Product category
Lau‐Gesk and Meyers‐Levy 2009 Print Emotional: Va-
lence Laboratory study - Ad attitude
- Consumers’ pro-
cessing motivation
Griskevicius et al. 2009 Video Emotional:
Arousal Laboratory study
- Product desirability
- Persuasion
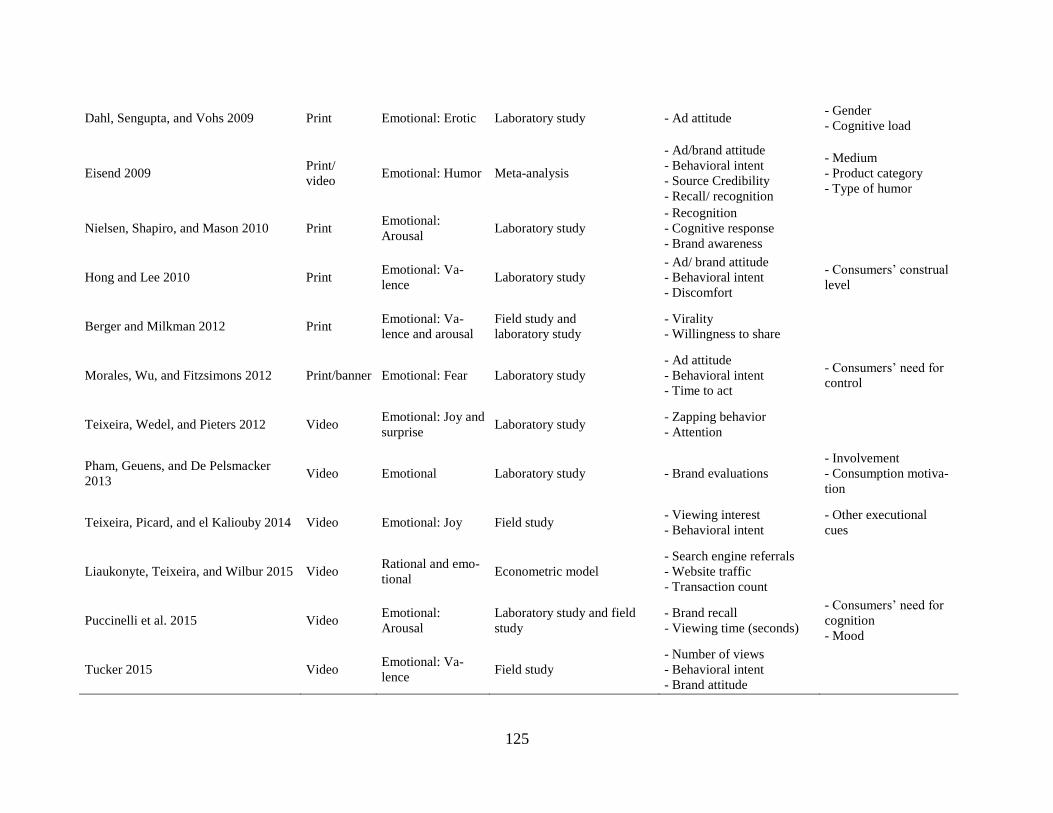
125
Dahl, Sengupta, and Vohs 2009 Print Emotional: Erotic Laboratory study - Ad attitude - Gender
- Cognitive load
Eisend 2009 Print/
video Emotional: Humor Meta-analysis
- Ad/brand attitude
- Behavioral intent
- Source Credibility
- Recall/ recognition
- Medium
- Product category
- Type of humor
Nielsen, Shapiro, and Mason 2010 Print Emotional:
Arousal Laboratory study
- Recognition
- Cognitive response
- Brand awareness
Hong and Lee 2010 Print Emotional: Va-
lence Laboratory study
- Ad/ brand attitude
- Behavioral intent
- Discomfort
- Consumers’ construal
level
Berger and Milkman 2012 Print Emotional: Va-
lence and arousal
Field study and
laboratory study
- Virality
- Willingness to share
Morales, Wu, and Fitzsimons 2012 Print/banner Emotional: Fear Laboratory study
- Ad attitude
- Behavioral intent
- Time to act
- Consumers’ need for
control
Teixeira, Wedel, and Pieters 2012 Video Emotional: Joy and
surprise Laboratory study
- Zapping behavior
- Attention
Pham, Geuens, and De Pelsmacker
2013 Video Emotional Laboratory study - Brand evaluations
- Involvement
- Consumption motiva-
tion
Teixeira, Picard, and el Kaliouby 2014 Video Emotional: Joy Field study - Viewing interest
- Behavioral intent
- Other executional
cues
Liaukonyte, Teixeira, and Wilbur 2015 Video Rational and emo-
tional Econometric model
- Search engine referrals
- Website traffic
- Transaction count
Puccinelli et al. 2015 Video Emotional:
Arousal
Laboratory study and field
study
- Brand recall
- Viewing time (seconds)
- Consumers’ need for
cognition
- Mood
Tucker 2015 Video Emotional: Va-
lence Field study
- Number of views
- Behavioral intent
- Brand attitude
126
Conceptual Approach
The second dimension of the ad execution is the conceptual approach. It describes the way
in which advertisers convey the ads’ message and appeals. I divide the conceptual approach
into three sub-dimensions: complexity, authenticity, and creativity, which I will subsequently
discuss. An overview of the relevant literature (see Table 3) concludes this section.
5.1 Complexity
Complexity is the degree of variability in a stimulus pattern (Berlyne 1960). There are two
schools of thoughts on how complexity influences advertising effectiveness (Pieters, Wedel,
and Batra 2010). The first one believes that ads should be simple and straightforward. Specifi-
cally, they argue that simple ads facilitate comprehension and are less likely to distract consum-
ers from the brand (Anderson and Jolson 1980; Macklin, Bruvold, and Shea 1985; Rossiter and
Percy 1983). Comprehension should be a prerequisite for effective advertising, for ads can only
change consumers’ attitudes when they understood the message (Jacoby, Nelson, and Hoyer
1982). Additionally, given that consumers can only process a limited amount of information,
complex and cluttered ads may negatively influence recall (Stewart and Furse 1986).
Conversely, the second school of thought believes that ads should be more complex. They
argue that complexity makes the ad more interesting and entertaining (Berlyne 1970). Further-
more, Morrison and Dainoff (1972) propose that consumers spend more time looking at
complex ads and Phillips (1997) suggests that they evoke deeper ad processing. Finally, com-
plexity might also defer advertising wear-out. Considering that complex ads require more
processing and have a higher level of inherent uncertainty, they should benefit from repeated
exposures (Gatignon 1984), whereas for simple ads additional exposures might be perceived as
repetitive and boring (Cox and Cox 1988).
Some previous work suggests that both schools of thought – in their present form – may
indeed be incorrect. Rather, complexity should have an inverted u-shape effect. The argument
127
is that simple ads might be perceived as too boring whereas very complex ones might over-
whelm the consumer (Geissler, Zinkhan, and Watson 2006; Morrison and Dainoff 1972). Thus,
an intermediate level of complexity should be most effective.
Also, the actual effectiveness of complexity might ultimately depend on its context. First,
complex ads might be more effective under high involvement. Highly involved consumers are
more motivated to process the ad and are thus more likely to comprehend even complex ads
(Lowrey 1998). Similarly, complex ads might be more effective for consumers with a high need
for cognition, because for this kind of consumers, simple ads might be insufficiently challeng-
ing (Putrevu, Tan, and Lord 2004). The effect of complexity might also depend on which aspect
of the ad is complex. In this chapter, I distinguish between two aspects: visual and verbal com-
plexity.
Visual complexity. “Visual complexity refers to all non-representational perceptual mate-
rial, such as different colors, lines, and luminance contrasts, in the ad with more material in-
creasing the visual complexity“ (Teixeira, Wedel, and Pieters 2010, p. 786). Analyzing 249
magazine ads, Pieters, Wedel, and Batra (2010) differentiate between two cues that cause visual
complexity – variability in the ads’ features and variability in the ads’ design. Variability in
features, on the one hand, refers to the level of detail and variation of the ads’ visual objects.
The higher the number of objects and the stronger the variation in colors the more feature com-
plex the ad is. Variability in design, on the other hand, refers to the level of elaboration in terms
of the visual objects’ shapes and patterns. The results show that feature variability decreases
consumers’ attention and attitude towards the ad. These findings are in line with the results of
Pracejus, Olsen, and O’Guinn (2006) who find that visual clutter in ads negatively influences
brand attitude. Yet, design variability has a positive effect on attention and attitude towards the
ad, most likely because design variability increases consumers’ engagement. Moreover, Pieters,
128
Wedel, and Batra (2010) show that neither of these two visual complexity cues hinder compre-
hension. Thus, comprehension of the main message is independent of visual complexity (at
least in print ads). Furthermore, for video advertising visual complexity is also determined by
the pace of the scenes (Germeys and D’Ydewalle 2007). Pacing relates to the number of scene
cuts and edits in an ad (changing camera positions within scenes) (Lang 2000); the faster the
pace, the more information consumers have to process. Teixeira, Wedel, and Pieters (2010) find
that there is an optimum level of visual complexity for video ads. Specifically, they argue that
an intermediate level of visual complexity engages consumers and is thus more effective.
Verbal complexity. Verbal complexity refers to the language components of the ad. Prior
research distinguishes between two cues that can cause verbal complexity. First, the integration
of terminology or technical jargon (this is often the case for car or computer ads) and second
the use of a difficult syntactic style (e.g., more syllables, longer sentences). Prior research also
refers to this as technical and lexical complexity (Geissler, Zinkhan, and Watson 2006). Ander-
son and Jolson (1980) propose that technical jargon has a negative influence on attention. Fur-
thermore, consumers perceive products that use technical jargon in their ads as having a higher
price and being harder to operate. However, the effect of technical complexity is moderated by
consumers’ experiences with the product. The more experienced the consumer, the more likely
that he or she appreciates technical jargon. Furthermore, Macklin, Bruvold, and Shea (1985)
find that a more complex syntactic style can lead to positive beliefs and enhances consumers
attitude toward the ad. Lowrey (1998) argues that the specific effect depends on the medium as
well as consumers’ motivation to process the ad. For video advertising, a complex syntactic
style enhances recall, whereas for print advertising it enhances persuasion. Thus, the effect of
complexity is difficult to determine, for it not only depends on the context of the ad but also on
the specific cue. There are some open research questions and literature gaps pertaining to com-
plexity:
129
(1) What is the sales effect of complexity? Most studies on complexity are laboratory
studies. Thus, the moderating effect of complexity on the relationship between ad
spending and sales is still unclear.
(2) The limited literature in this field focused either on visual or verbal complexity. There-
fore, further research should investigate the interaction between visual and verbal com-
plexity.
(3) According to Gatignon (1984), the effectiveness of complex ads increases with repe-
tition. This implies that the influence of executional cues might depend on the ads’
timing strategy (i.e., scheduling). For example, complex ads might be more effective
under continuous scheduling, whereas simple ads might be more effective under
flighting (an advertising timing strategy where ads run for a short period followed by
a period of no advertising). Further research should thus combine these two literature
streams to investigate whether the effect of complexity (or executional cues in general)
depends on the advertisings’ scheduling.
5.2 Creativity
The second sub-dimension of the conceptual execution is creativity. Creativity is probably
the most commonly used term in advertising. Many practitioners firmly believe that it is essen-
tial for an effective advertising (Nyilasy and Reid 2009). It is therefore not surprising that
companies often choose advertising agencies based on how many creativity awards they won.
Creative ads are believed to break through the advertising clutter and to enhance the ad effec-
tiveness (e.g., Pieters, Warlop, and Wedel 2002; Smith et al. 2007). However, designing a
creative copy does not guarantee a positive ad response, as evident by the various advertisings
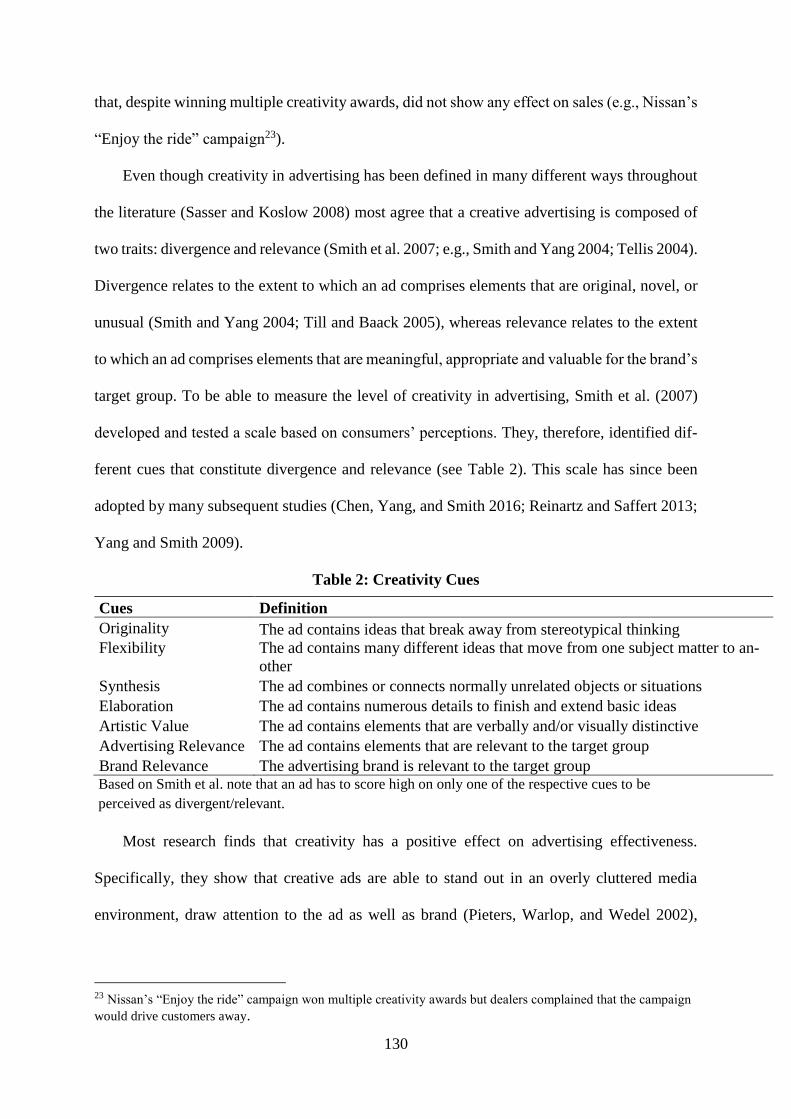
130
that, despite winning multiple creativity awards, did not show any effect on sales (e.g., Nissan’s
“Enjoy the ride” campaign23).
Even though creativity in advertising has been defined in many different ways throughout
the literature (Sasser and Koslow 2008) most agree that a creative advertising is composed of
two traits: divergence and relevance (Smith et al. 2007; e.g., Smith and Yang 2004; Tellis 2004).
Divergence relates to the extent to which an ad comprises elements that are original, novel, or
unusual (Smith and Yang 2004; Till and Baack 2005), whereas relevance relates to the extent
to which an ad comprises elements that are meaningful, appropriate and valuable for the brand’s
target group. To be able to measure the level of creativity in advertising, Smith et al. (2007)
developed and tested a scale based on consumers’ perceptions. They, therefore, identified dif-
ferent cues that constitute divergence and relevance (see Table 2). This scale has since been
adopted by many subsequent studies (Chen, Yang, and Smith 2016; Reinartz and Saffert 2013;
Yang and Smith 2009).
Table 2: Creativity Cues
Cues Definition
Originality The ad contains ideas that break away from stereotypical thinking
Flexibility
The ad contains many different ideas that move from one subject matter to an-
other
Synthesis The ad combines or connects normally unrelated objects or situations
Elaboration The ad contains numerous details to finish and extend basic ideas
Artistic Value The ad contains elements that are verbally and/or visually distinctive
Advertising Relevance The ad contains elements that are relevant to the target group
Brand Relevance The advertising brand is relevant to the target group Based on Smith et al. note that an ad has to score high on only one of the respective cues to be
perceived as divergent/relevant.
Most research finds that creativity has a positive effect on advertising effectiveness.
Specifically, they show that creative ads are able to stand out in an overly cluttered media
environment, draw attention to the ad as well as brand (Pieters, Warlop, and Wedel 2002),
23 Nissan’s “Enjoy the ride” campaign won multiple creativity awards but dealers complained that the campaign
would drive customers away.
131
enhance consumers’ motivation to process the ad (Yang and Smith 2009), positively influence
consumers brand attitude (Ang and Low 2000), and increase the ad’s memorability (Till and
Baack 2005). Yang and Smith (2009) also show that creativity reduces consumers resistance to
persuasion and Chen, Yang, and Smith (2016) suggest that the positive effect persists even after
several repetitions. However, based on the literature it is not clear whether these results also
translate into (intended) behavior. Whereas some studies find a positive effect of creativity on
purchase intent (Ang and Low 2000; Kover, Goldberg, and James 1995; Smith et al. 2007)
others find no effect at all (Smith, Chen, and Yang 2008; Till and Baack 2005).
Thus, the effect of creativity might again depend on the context. This could also explain
why award-winning ads like the campaign of Nissan failed to increase sales. Reinartz and Saf-
fert (2013) made a first attempt to examine the effect of creativity on actual consumers’ behav-
ior in terms of sales. Even though they find an overall positive effect, they also show that the
magnitude of this effect depends on the product category. They, for example, suggest that cre-
ativity has only a minor impact for categories that already employ high levels of creativity in
their ads (e.g., soft drinks) and even harms advertising effectiveness for certain utilitarian prod-
ucts (e.g., skin lotion). Moreover, Reinartz and Saffert (2013) claim that some divergence cues
are more effective than others. Thus, the effect of creativity might not only depend on contex-
tual factors but also on the specific cue. Yang and Smith (2009), for example, propose that for
high and low involvement brands different creativity cues might be more effective. On the one
hand, divergence cues closely related to cognition such as synthesis and elaboration might be
more effective for high involvement brands, because consumers are more likely to elaborate on
their ads. On the other hand, divergence cues closely related to affect such as artistic value and
originality might be more effective for low involvement brands.
Two noteworthy studies in the context of creativity are the ones from Baack, Wilson, and
Till (2009) and Wilson, Baack, and Till (2015). These studies show that creativity alone might
132
not attract consumers’ attention to ads, especially when consumers face scarce cognitive re-
sources. In their research, the positive effect of creativity was only present when attention was
presumed for example through the size or salience of the ad. Thus, they suggest that creativity
does not improve advertising effectiveness unless the ad receives direct attention. This finding
challenges the results of prior laboratory studies that force consumers’ attention to ads. Thus,
further field studies like the one from Reinartz and Saffert (2013) and Wilson, Baack, and Till
(2015) are needed to verify the positive effects of creativity. Some concrete research gaps are:
(1) What is the general sales effect of creativity for different types of product categories
and brands? Reinartz and Saffert (2013) show that the influence of creativity varies
across different product categories. Further research should determine what causes this
effect.
(2) What is the most important divergence cue for different types of product categories
and brands? Yang and Smith (2009) propose that different creativity dimensions
should work for different product categories. However, they do not test their assump-
tion.
(3) What is the most effective combination of the different divergence cues?
(4) Reinartz and Saffert (2013) suggest that creativity has only a minor impact for
categories that already employ high levels of creativity in their ads. Thus, it might be
possible that not the absolute level but the relative level of creativity (compared to the
category average) influences advertising effectiveness. Further research should thus
compare these two (absolute vs. relative level of creativity) levels.
(5) As mentioned before the different executional cues might interact with each other. For
example, prior research finds that creativity has a positive effect on consumers’ atti-
tude toward the ad (Ang and Low 2000) whereas comparative appeals have a negative
133
effect on ad attitude but a positive influence on purchase interest (Pechmann and Stew-
art 1994). Thus, the question arises, what is the effect, if marketers combine these
cues? It might be possible that the effects cancel each other out or it might also be
possible that they amplify each other. In other words, based on the literature the effect
of combining different cues for example creativity and comparative appeals, is still
unclear.
5.3 Authenticity
The last sub-dimension of the conceptual execution is authenticity. Within the last decade,
authenticity has become one of the most prevalent buzzwords in the advertising industry. Mar-
keting managers and creatives are both convinced that an authentic ad execution is a key driver
of effective advertising (e.g., Beverland, Lindgreen, and Vink 2008; Morhart et al. 2013). Spe-
cifically, authentic ads should stimulate brand trust (Anderberg and Morris 2006), help con-
sumers connect to the brand (Grayson and Martinec 2004), and convey a feeling of sympathy
and empathy depicting an actual problem that consumers can relate to (Stern 1994). Moreover,
marketers believe that authentic ads overcome consumers’ increasing skepticism (Darke and
Ritchie 2007). The latter is especially important, given that consumers become ever more skep-
tical toward ads because of the improved information transparency in the digital age (Campbell
and Kirmani 2000).
Despite the perceived importance of the concept, there is neither an overall accepted defi-
nition nor a common understanding of what constitutes an authentic ad execution. I define an
authentic ad as one that is genuine, real, and true with regard to a particular aspect of the ad
(Beverland and Farrelly 2010). Reviewing the literature, I observe that academics, as well as
practitioners, refer to authentic ads in various contexts. For example, some link authenticity to
the trustworthiness of the spokesperson (Stern 1994), others to a realistic ad plot (Deighton,
Romer, and McQueen 1989), and yet others to an accurate representation of the brand
134
(Beverland, Lindgreen, and Vink 2008; Brown, Kozinets, and Sherry 2003). However, most
relate authenticity either to the presentation of the brand or the execution, given that marketers
invest in ads to (a) promote the brand and (b) provide information. Thus, in this chapter, I also
distinguish between these two aspects.
Brand authenticity. Brand authenticity relates to how the ad preserves and sustains the
brand’s uniqueness, heritage, values and essence (Brown, Kozinets, and Sherry 2003; Grayson
and Martinec 2004; Spiggle, Nguyen, and Caravella 2012). I identify two cues that advertisers
can use to evoke brand authenticity. The first possibility for marketers to convey brand authen-
ticity within ads is to preserve the brand essence and maintain the brand’s styles and standards
(Spiggle, Nguyen, and Caravella 2012). Keller (1998) refers to brand essence as the “core val-
ues for which a brand stands,” the brand’s “marketing DNA”. Thus, authentic ad executions
should reflect the brand's image and personality as well as use a consistent ad design (e.g.,
layout, ad theme, colors). Brand essence should build and reinforce a unique and memorable
brand image within the mind of consumers (Brown, Kozinets, and Sherry 2003; Keller 1998).
Communicating a consistent brand image should also increase the perceived reliability and sin-
cerity of the brand (Elliott and Wattanasuwan 1998). Furthermore, when ads preserve the brand
essence, consumers might be more likely to recognize the advertised brand.
The second possibility to evoke brand authenticity is to refer to the brand’s heritage. Vari-
ous studies on branding show that consumers perceive brands that commit to their history and
tradition as more authentic (e.g., Beverland 2006; Brown, Kozinets, and Sherry 2003; Spiggle,
Nguyen, and Caravella 2012). Previous work argues that honoring the brand heritage should
have a positive influence on ad effectiveness (Brown, Kozinets, and Sherry 2003; Merchant
and Rose 2013). First, it should legitimize the brand, providing evidence that it is the “original”
and not a counterfeit (Newman and Dhar 2014; Peñaloza 2000). Second, reminding consumers
135
of the brand’s many years of experience should enhance its perceived reliability and compe-
tence (Beverland 2006). Third, Newman and Dhar (2014) suggest that heritage associations
might provide brands with a unique aura and increase the emotional commitment by adding
sentimental value (Leigh, Peters, and Shelton 2006). However, for low involvement brands,
consumers might perceive heritage claims as trivial and silly.
Executional authenticity. Executional authenticity relates to how truthful, genuine, and re-
alistic the information conveyed by the ad is (Spiggle, Nguyen, and Caravella 2012; Stern
1994). Again, there are two cues that may evoke executional authenticity. First, advertisers can
convey executional authenticity by showing a realistic plot that reflects an everyday situation,
presented by ordinary non-idealized characters (e.g., Deighton, Romer, and McQueen 1989;
Stern 1994). Stern (1994, p.388) defines this cue as “conveying the illusion of ordinary life in
reference to a consumption situation.” Thus, a realistic plot refers to something that may not be
the “real thing,” but that is similar to real life (Grayson and Martinec 2004). Based on the
literature it is unclear whether a realistic plot indeed positively influences ad effectiveness. On
the one hand, a realistic plot allows consumers to identify with the ad’s character, because the
portrayed situation is familiar to them and relates to their’ own experiences (Stern 1994).
Consumers who identify with the character are more likely to engage in self-referencing; that
is, they process the ads’ information by relating it to his or herself (Rose and Wood 2005). On
the other hand, consumers might perceive realistic plots as too boring. Thus, they are less likely
to attract consumers’ attention.
The other possibility to convey executional authenticity is to promote the brand with a
realistic, non-exaggerated message. Previous literature shows that consumers associate authen-
tic brands with a high level of credibility. Authentic brands should be “what they claim to be,”
not the result of exaggeration (Brown, Kozinets, and Sherry 2003; Grayson and Martinec 2004;
Morhart et al. 2013). According to previous literature, message credibility is one of the main
136
elements of persuasion (Choi and Rifon 2002). Message credibility should positively influence
consumers’ attitude toward the ad, increase brand trust and strengthen the emotional commit-
ment towards the brand (Cotte, Coulter, and Moore 2005; Grayson and Martinec 2004; Morhart
et al. 2013). Furthermore, it should help overcome the increasing ad-skepticism of marketing
savvy consumers (Calfee and Ringold 1994). However, because consumers have grown accus-
tomed to exaggerated messages (Calfee and Ringold 1994), they might expect some form of
overstatement. Cowley (2006) even argues that exaggerated messages inflate brand evaluations,
even when consumers recognize the overstatement. Thus, the effect of message credibility is
unclear.
Overall, research on authenticity in the context of advertising is sparse, despite the fact that
authenticity is believed to be an essential element of effective advertising (Anderberg and
Morris 2006; Beverland, Lindgreen, and Vink 2008). Thus, I again discovered multiple gaps in
the literature:
(1) Previous work on authenticity in advertising either followed a qualitative or conceptual
approach. Thus, it is unclear, how consumers process authenticity and if authenticity
indeed reduces the increasing consumer skepticism?
(2) What is the effect of authenticity on the relationship between ad spending and sales?
(3) What is the effect of the different authenticity cues? For example, previous literature
is unclear about the effect of a realistic plot or a credible message.
(4) Again, not much is known about potential context factors. Thus, future research should
analyze the effect of context factors on the four authenticity dimensions. The effect of
authenticity, for example, might differ for large, well-known brands and small less-
known ones.
Table 3 summarizes the relevant literature on the conceptual approach of the last 20 years.
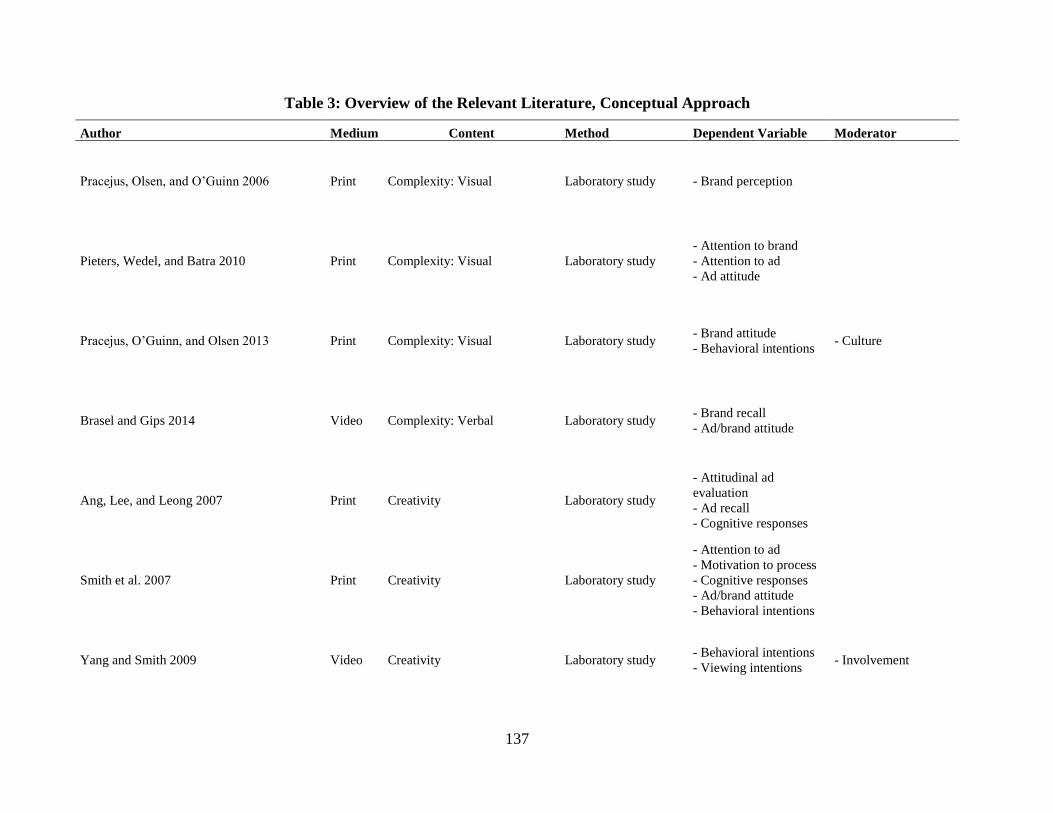
137
Table 3: Overview of the Relevant Literature, Conceptual Approach
Author Medium Content Method Dependent Variable Moderator
Pracejus, Olsen, and O’Guinn 2006 Print Complexity: Visual Laboratory study - Brand perception
Pieters, Wedel, and Batra 2010 Print Complexity: Visual Laboratory study
- Attention to brand
- Attention to ad
- Ad attitude
Pracejus, O’Guinn, and Olsen 2013 Print Complexity: Visual Laboratory study - Brand attitude
- Behavioral intentions - Culture
Brasel and Gips 2014 Video Complexity: Verbal Laboratory study - Brand recall
- Ad/brand attitude
Ang, Lee, and Leong 2007 Print Creativity Laboratory study
- Attitudinal ad
evaluation
- Ad recall
- Cognitive responses
Smith et al. 2007 Print Creativity Laboratory study
- Attention to ad
- Motivation to process
- Cognitive responses
- Ad/brand attitude
- Behavioral intentions
Yang and Smith 2009 Video Creativity Laboratory study - Behavioral intentions
- Viewing intentions - Involvement
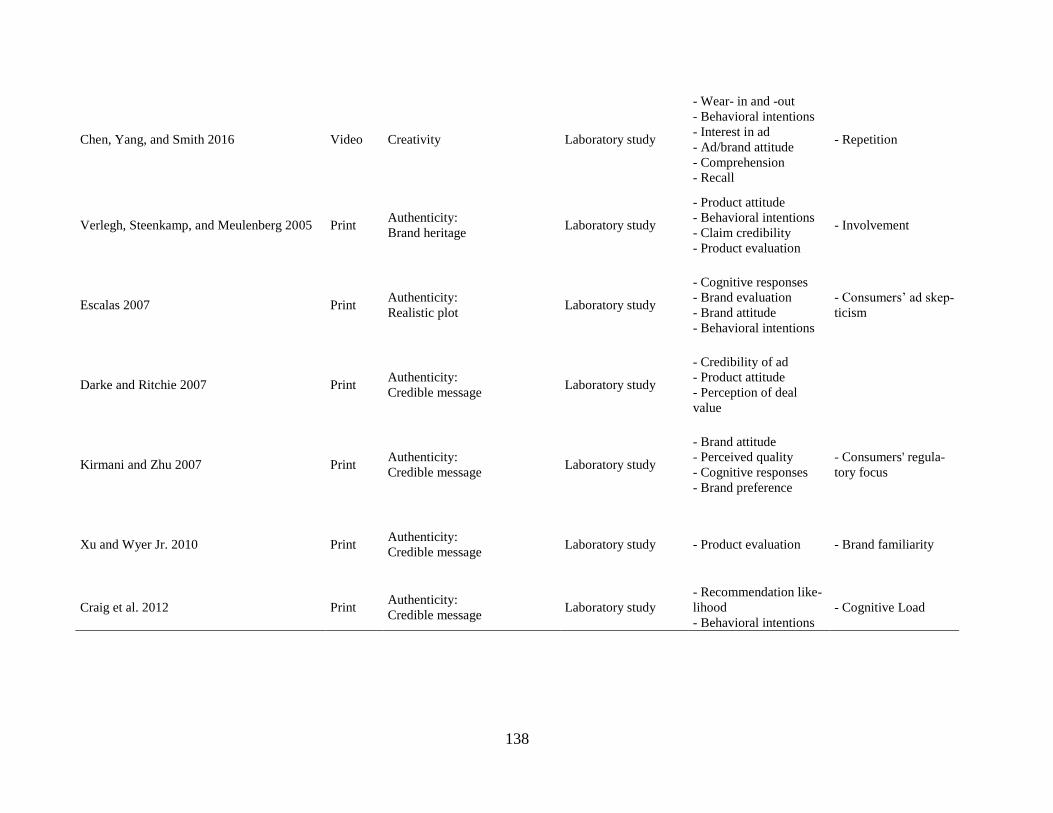
138
Chen, Yang, and Smith 2016 Video Creativity Laboratory study
- Wear- in and -out
- Behavioral intentions
- Interest in ad
- Ad/brand attitude
- Comprehension
- Recall
- Repetition
Verlegh, Steenkamp, and Meulenberg 2005 Print Authenticity:
Brand heritage Laboratory study
- Product attitude
- Behavioral intentions
- Claim credibility
- Product evaluation
- Involvement
Escalas 2007 Print Authenticity:
Realistic plot Laboratory study
- Cognitive responses
- Brand evaluation
- Brand attitude
- Behavioral intentions
- Consumers’ ad skep-
ticism
Darke and Ritchie 2007 Print Authenticity:
Credible message Laboratory study
- Credibility of ad
- Product attitude
- Perception of deal
value
Kirmani and Zhu 2007 Print Authenticity:
Credible message Laboratory study
- Brand attitude
- Perceived quality
- Cognitive responses
- Brand preference
- Consumers' regula-
tory focus
Xu and Wyer Jr. 2010 Print Authenticity:
Credible message Laboratory study - Product evaluation - Brand familiarity
Craig et al. 2012 Print Authenticity:
Credible message Laboratory study
- Recommendation like-
lihood
- Behavioral intentions
- Cognitive Load
139
Brand Salience
Brand salience or the integration of the brand within the ad (logo, brand name, product etc.)
represents the third dimension of the ad execution. Existing studies combining advertising and
branding mainly fall in one of two research streams. The first stream focuses on how different
types of advertisings strategically contribute to the brand-building process (e.g., Bruce, Peters,
and Naik 2012; Draganska, Hartmann, and Stanglein 2014; Keller 2007). Draganska,
Hartmann, and Stanglein (2014) for example show that online and traditional TV ads have
similar brand building effects. Whereas these studies provide valuable insights into the general
influence of advertising on brand equity, they do not provide managers with concrete and ac-
tionable implications or tactics on how to communicate or integrate their brand within ads. That
is they do not focus on the different executional cues of the branding strategy. The second
research stream examines the effect of selected branding elements (e.g., the frequency or timing
of the brand name) on various mindset metrics such as recall, attitude and purchase intent (e.g.,
Baker, Honea, and Russell 2004; Romaniuk 2009; Stewart and Furse 1986). In the following, I
will concentrate on the results of the latter literature stream.
Brand salience refers to the extent to which brand managers integrate different branding
cues such as the brand name, logo, product, jingle or slogan within an ad. The more prominent
the brand is, compared to the other advertising objects, the stronger the brand salience (Teixeira,
Wedel, and Pieters 2010). Establishing a minimum level of brand salience should be a prereq-
uisite for every advertising. However, given that advertisers need to balance sales, creativity,
and other objectives there is an ongoing debate on how salient the brand should be.
One stream of literature argues for strong brand salience. Their main reasoning is that if
consumers fail to correctly register the advertising brand or even worse incorrectly attribute the
ad to a competing brand, advertisers waste their marketing investments without any return on
sales. This is an important point given that around half of the consumers watching an ad fail to
140
identify the brand name afterward (Franzen 1994; Rossiter and Bellman 2005). The increasing
number of ads aired per day and consumers’ limited cognitive capacity (Burke and Srull 1988)
makes it even harder for consumers to correctly identify which ad belongs to which brand
(Baker, Honea, and Russel 2004; Danaher, Bonfrer, and Dhar 2008; Jewell and Unnava 2003).
Furthermore, Stewart and Furse (1986) find that for video ads, frequent mentioning of the brand
name and showing the product or logo for a longer time significantly enhances recall. The more
consumers see, hear or think about the brand, the more prominent is the brand in consumers’
memory (Elliott and Percy 2007; Keller 2007). Other studies argue for an early disclosure of
the brand (Baker, Honea, and Russell 2004; Elsen, Pieters, and Wedel 2016). According to
Baker, Honea, and Russell (2004) revealing the brand at the end of a video ad inhibits consum-
ers’ ability to associate the brand with the ads’ content. Additionally, Teixeira, Picard and el
Kalibouy (2014) suggest that positive emotions caused by the ads emotional content are signif-
icantly less effective when advertisers place the brand after the emotional appeal. Pieters,
Wedel, and Zhang (2007) also find a positive effect of brand salience for print ads. Specifically,
they show that a bigger surface size of the brand elements favors attention.
Conversely, some studies argue that consumers might be annoyed, if the brand elements
are too prominent within the ad. For example, Teixera, Wedel, and Pieters (2010) find that
brand salience enhances ad avoidance. Even though, pulsing, showing the brand frequently for
only a short time reduces this effect. Furthermore, strong salience might remind consumers that
they should be manipulated and thus evokes counter-arguments. Finally, brand salience de-
creases the ad’s “soft-sell” character and increases its less favorable “hard-sell” character
(Aaker and Bruzzone 1985).
Given the discussion above, I conclude that further research on the influence of brand
salience is needed. Table 4 provides and overview of the relevant literature over the last 20
years.

141
(1) Does brand salience increase advertising effectiveness in terms of sales? What is the
optimal level of brand salience?
(2) It should also be interesting to find out which branding cues (e.g., logo vs. brand name)
are most effective in enhancing brand salience without causing annoyance and/or ad
avoidance. In other words, which branding cues should marketers integrate within ads?
(3) Which context factors moderate the effect of brand salience? For example, it might be
reasonable to assume that brand salience should be stronger for new or less known
brands.
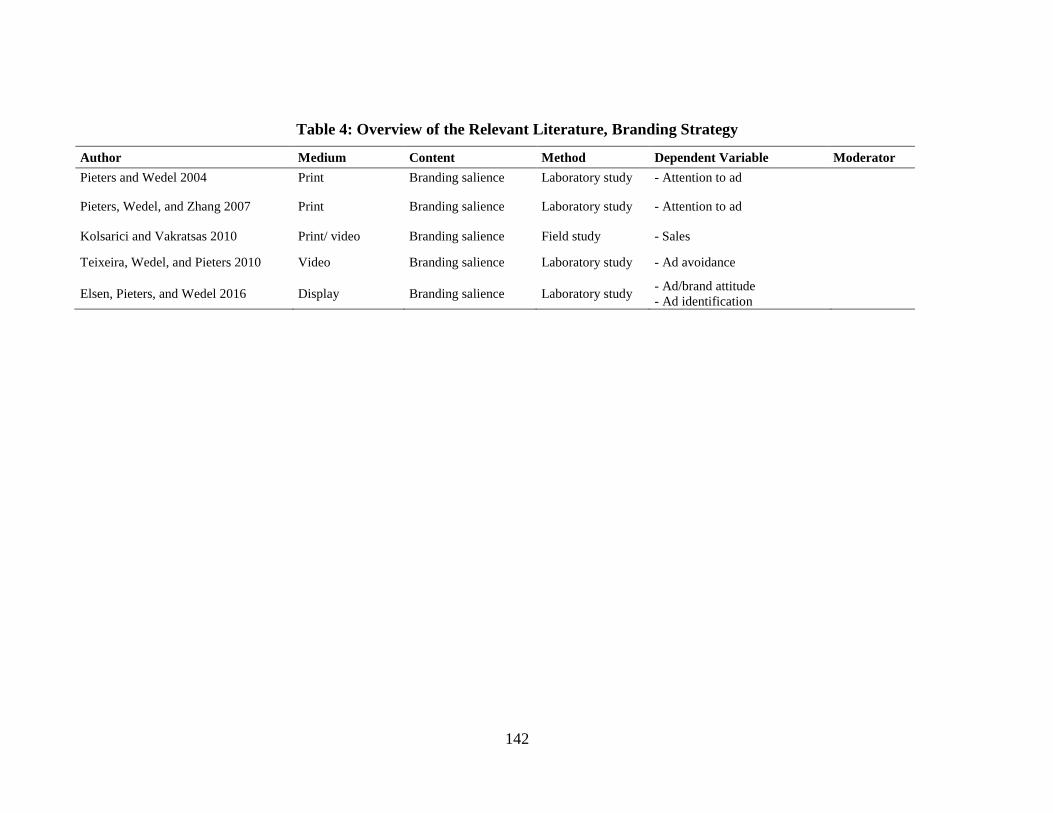
142
Table 4: Overview of the Relevant Literature, Branding Strategy
Author Medium Content Method Dependent Variable Moderator
Pieters and Wedel 2004 Print Branding salience Laboratory study - Attention to ad
Pieters, Wedel, and Zhang 2007 Print Branding salience Laboratory study - Attention to ad
Kolsarici and Vakratsas 2010 Print/ video Branding salience Field study - Sales
Teixeira, Wedel, and Pieters 2010 Video Branding salience Laboratory study - Ad avoidance
Elsen, Pieters, and Wedel 2016 Display Branding salience Laboratory study - Ad/brand attitude
- Ad identification
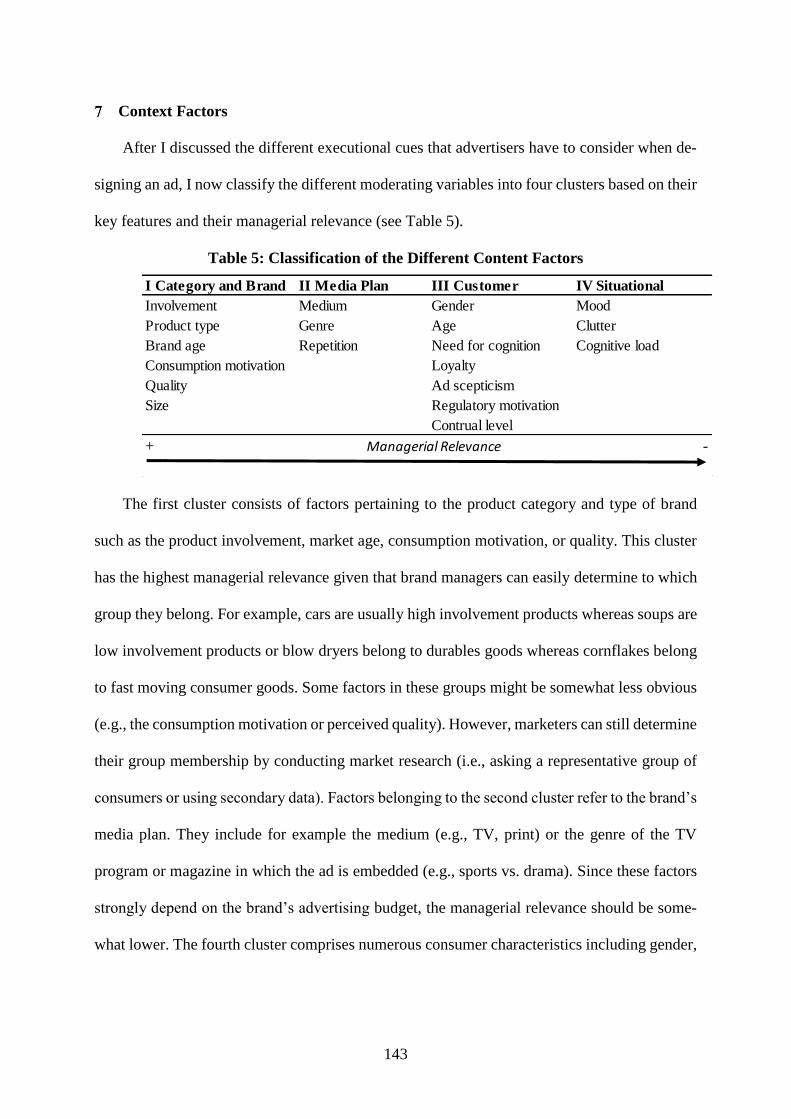
143
Context Factors
After I discussed the different executional cues that advertisers have to consider when de-
signing an ad, I now classify the different moderating variables into four clusters based on their
key features and their managerial relevance (see Table 5).
Table 5: Classification of the Different Content Factors
The first cluster consists of factors pertaining to the product category and type of brand
such as the product involvement, market age, consumption motivation, or quality. This cluster
has the highest managerial relevance given that brand managers can easily determine to which
group they belong. For example, cars are usually high involvement products whereas soups are
low involvement products or blow dryers belong to durables goods whereas cornflakes belong
to fast moving consumer goods. Some factors in these groups might be somewhat less obvious
(e.g., the consumption motivation or perceived quality). However, marketers can still determine
their group membership by conducting market research (i.e., asking a representative group of
consumers or using secondary data). Factors belonging to the second cluster refer to the brand’s
media plan. They include for example the medium (e.g., TV, print) or the genre of the TV
program or magazine in which the ad is embedded (e.g., sports vs. drama). Since these factors
strongly depend on the brand’s advertising budget, the managerial relevance should be some-
what lower. The fourth cluster comprises numerous consumer characteristics including gender,
I Category and Brand II Media Plan III Customer IV Situational
Involvement Medium Gender Mood
Product type Genre Age Clutter
Brand age Repetition Need for cognition Cognitive load
Consumption motivation Loyalty
Quality Ad scepticism
Size Regulatory motivation
Contrual level
+ -Managerial Relevance
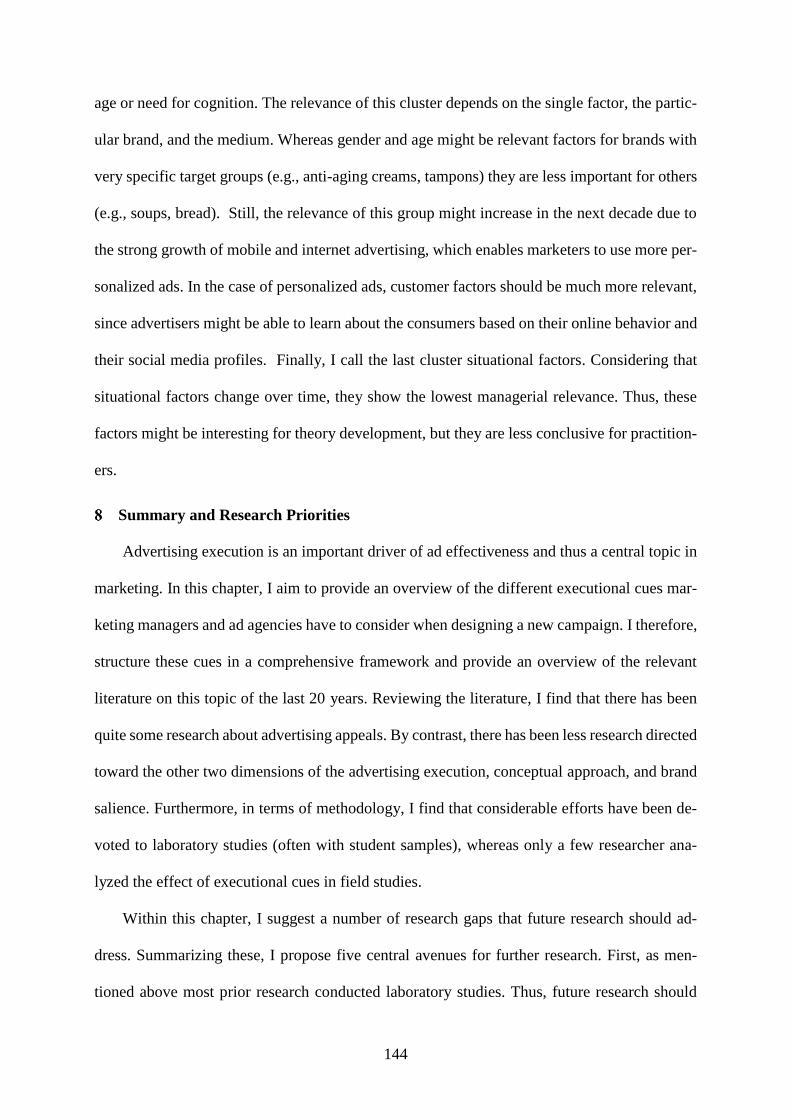
144
age or need for cognition. The relevance of this cluster depends on the single factor, the partic-
ular brand, and the medium. Whereas gender and age might be relevant factors for brands with
very specific target groups (e.g., anti-aging creams, tampons) they are less important for others
(e.g., soups, bread). Still, the relevance of this group might increase in the next decade due to
the strong growth of mobile and internet advertising, which enables marketers to use more per-
sonalized ads. In the case of personalized ads, customer factors should be much more relevant,
since advertisers might be able to learn about the consumers based on their online behavior and
their social media profiles. Finally, I call the last cluster situational factors. Considering that
situational factors change over time, they show the lowest managerial relevance. Thus, these
factors might be interesting for theory development, but they are less conclusive for practition-
ers.
Summary and Research Priorities
Advertising execution is an important driver of ad effectiveness and thus a central topic in
marketing. In this chapter, I aim to provide an overview of the different executional cues mar-
keting managers and ad agencies have to consider when designing a new campaign. I therefore,
structure these cues in a comprehensive framework and provide an overview of the relevant
literature on this topic of the last 20 years. Reviewing the literature, I find that there has been
quite some research about advertising appeals. By contrast, there has been less research directed
toward the other two dimensions of the advertising execution, conceptual approach, and brand
salience. Furthermore, in terms of methodology, I find that considerable efforts have been de-
voted to laboratory studies (often with student samples), whereas only a few researcher ana-
lyzed the effect of executional cues in field studies.
Within this chapter, I suggest a number of research gaps that future research should ad-
dress. Summarizing these, I propose five central avenues for further research. First, as men-
tioned above most prior research conducted laboratory studies. Thus, future research should
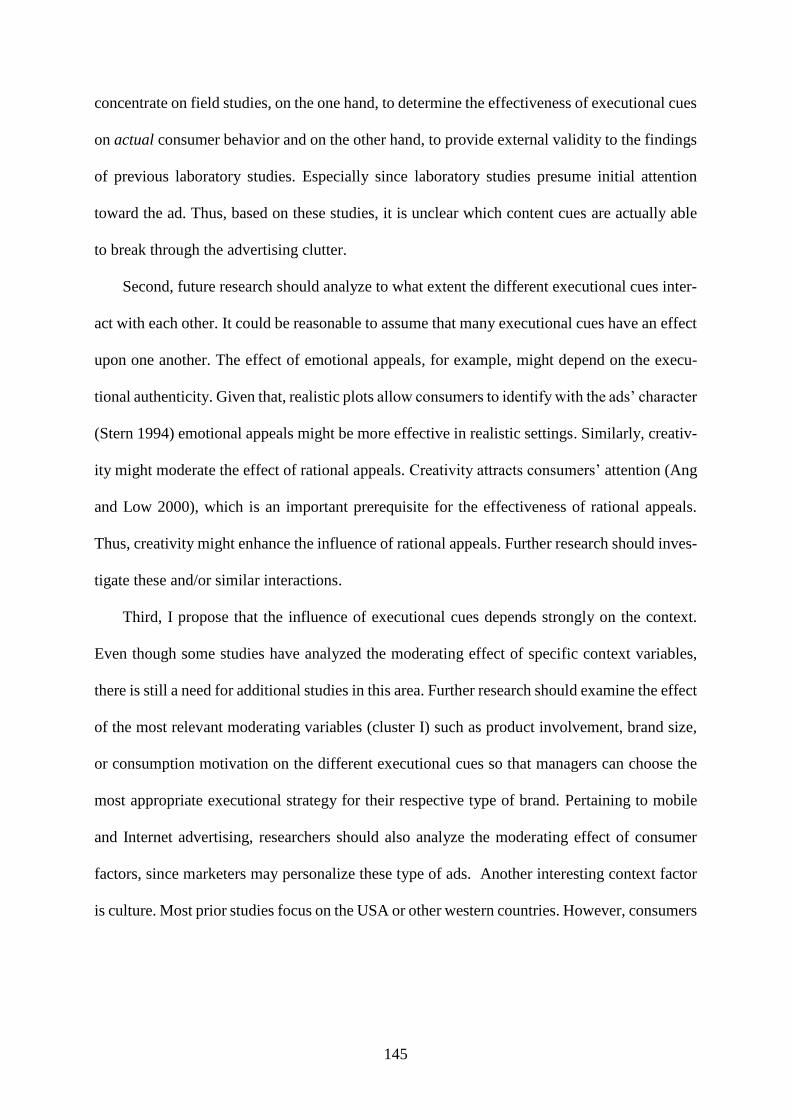
145
concentrate on field studies, on the one hand, to determine the effectiveness of executional cues
on actual consumer behavior and on the other hand, to provide external validity to the findings
of previous laboratory studies. Especially since laboratory studies presume initial attention
toward the ad. Thus, based on these studies, it is unclear which content cues are actually able
to break through the advertising clutter.
Second, future research should analyze to what extent the different executional cues inter-
act with each other. It could be reasonable to assume that many executional cues have an effect
upon one another. The effect of emotional appeals, for example, might depend on the execu-
tional authenticity. Given that, realistic plots allow consumers to identify with the ads’ character
(Stern 1994) emotional appeals might be more effective in realistic settings. Similarly, creativ-
ity might moderate the effect of rational appeals. Creativity attracts consumers’ attention (Ang
and Low 2000), which is an important prerequisite for the effectiveness of rational appeals.
Thus, creativity might enhance the influence of rational appeals. Further research should inves-
tigate these and/or similar interactions.
Third, I propose that the influence of executional cues depends strongly on the context.
Even though some studies have analyzed the moderating effect of specific context variables,
there is still a need for additional studies in this area. Further research should examine the effect
of the most relevant moderating variables (cluster I) such as product involvement, brand size,
or consumption motivation on the different executional cues so that managers can choose the
most appropriate executional strategy for their respective type of brand. Pertaining to mobile
and Internet advertising, researchers should also analyze the moderating effect of consumer
factors, since marketers may personalize these type of ads. Another interesting context factor
is culture. Most prior studies focus on the USA or other western countries. However, consumers
146
of different cultural backgrounds (e.g., individualistic vs. collectivistic countries) might re-
spond differently to executional cues. Thus, conducting cross-cultural studies would also be an
interesting avenue to pursue.
Fourth, the effectiveness of executional cues might also depend on the executional strategy
of competitor brands. Brands of a given category often employ similar executional cues (e.g.,
most soft drink brands rely on creativity, most facial cream brands rely on rational appeals, and
most perfume brands rely on emotional appeals). However, given the cluttered media environ-
ment, it might be more effective for brands to differentiate themselves by means of a distinct
execution. The use of similar executional cues might be one reason why consumers fail to
identify the advertising brand correctly. Still, it might be possible that some brands actually
benefit from similar campaigns (e.g., the market leader). Thus, further research should inves-
tigate how and under which conditions the effectiveness of executional cues depends on com-
petitors’ execution.
Five, further research should analyze the role of executional cues in integrated advertising
campaigns. More and more marketers adopt integrated marketing campaigns using multiple
media channels (print, Internet, video) to communicate with their consumers (Naik and Raman
2003). However, based on the literature it is unclear whether they should use the same or dif-
ferent executional cues across all channels. On the one hand, the media channel moderates the
effectiveness of executional cues. This implies that marketers should use different cues depend-
ing on the channel and target audience (e.g., rational appeals for print, emotional appeals for
video ads, technical complexity for trade journals). On the other hand, using the same execu-
tional cues across all channels might enhance consumers’ recall and recognition and allow mar-
keters to leverage synergies. Thus, further research should investigate to which extent marketers
should use the same executional cues in integrated marketing campaigns.
147
REFERENCES PAPER III
Aaker, David A. and Donald E. Bruzzone (1985), “Causes of Irritation in Advertising,” Journal
of Marketing, 49 (2), 47–57.
Anderberg, Johan and John Morris (2006), “Authenticity and Transparency in the Advertising
Industry: An Interview with John Morris,” Journal of Management Development, 25 (10),
1021–23.
Anderson, Rolph E. and Marvin A. Jolson (1980), “Technical Wording in Advertising:
Implications for Market Segmentation,” Journal of Marketing, 44 (1), 57–66.
Ang, Swee. and Sharon Y. M. Low (2000), “Exploring the Dimensions of Ad Creativity,”
Psychology & Marketing, 17 (10), 835–54.
Ang, Swee H., Yih H. Lee, and Siew M. Leong (2007), “The Ad Creativity Cube:
Conceptualization and Initial Validation,” Journal of the Academy of Marketing Science, 35
(2), 220–32.
Baack, Daniel W., Rick T. Wilson, and Brian D. Till (2009), “Creativity and Memory Effects:
Recall, Recognition, and an Exploration of Nontraditional Media,” Journal of Advertising,
37 (4), 85–94.
Baker, William E., Heather Honea, and Cristel A. Russell (2004), “Do Not Wait to Reveal the
Brand Name: The Effect of Brand-Name Placement on Television Advertising
Effectiveness,” Journal of Advertising, 33 (3), 77–85.
Bass, Frank M., Norris Bruce, Sumit Majumdar, and B. P. S. Murthi (2007), “Wearout Effects
of Different Advertising Themes: A Dynamic Bayesian Model of the Advertising-Sales
Relationship,” Marketing Science, 26 (2), 179–95.
Belch, George E. and Michael A. Belch (2015), Advertising and Promotion - an Integrated
Marketing Communications Perspective, New York: McGraw-Hill/Irwin.
Berger, Jonah and Katherine L. Milkman (2012), “What Makes Online Content Viral?,”
Journal of Marketing Research, 49 (2), 192–205.
Berlyne, Daniel E. (1960), Conflict, Arousal, and Curiosity, New York: MacGraw-Hill.
——— (1970), “Novelty, Complexity, and Hedonic Value,” Perception and Psychophysics, 8
(November), 279–86.
Beverland, Michael (2006), “The ‘Real Thing’: Branding Authenticity in the Luxury Wine
Trade,” Journal of Business Research, 59 (2), 251–58.
Beverland, Michael B. and Francis J. Farrelly (2010), “The Quest for Authenticity in
Consumption: Consumers’ Purposive Choice of Authentic Cues to Shape Experienced
Outcomes,” Journal of Consumer Research, 36 (5), 838–56.
———, Adam Lindgreen, and Michiel W. Vink (2008), “Projecting Authenticity through
Advertising,” Journal of Advertising, 37 (1), 5–15.
148
Brasel, S. Adam and James Gips (2014), “Enhancing Television Advertising: Same-Language
Subtitles can Improve Brand Recall, Verbal Memory, and Behavioral Intent,” Journal of the
Academy of Marketing Science, 42 (3), 322–36.
Brown, Stephen, Robert V. Kozinets, and John F. Sherry (2003), “Teaching Old Brands New
Tricks: Retro Branding and the Revival of Brand Meaning,” Journal of Marketing, 67 (3),
19–33.
Bruce, Norris I., Kay Peters, and Prasad A. Naik (2012), “Discovering How Advertising Grows
Sales and Builds Brands.,” Journal of Marketing Research, 49 (6), 793–806.
Burke, Raymond R. and Thomas K. Srull (1988), “Competitive Interference and Consumer
Memory for Advertising,” Journal of Consumer Research, 15 (1), 55–68.
Calfee, John E. and Debra J. Ringold (1994), “The 70% Majority: Enduring Consumer Beliefs
about Advertising,” Journal of Public Policy & Marketing, 228–38.
Campbell, Margaret C. and Amna Kirmani (2000), “Consumers’ Use of Persuasion
Knowledge: The Effects of Accessibility and Cognitive Capacity on Perceptions of an
Influence Agent,” Journal of Consumer Research, 27 (1), 69–83.
Chandy, Rajesh K., Gerard J. Tellis, Deborah J. MacInnis, and Pattana Thaivanich (2001),
“What to Say When: Advertising Appeals in Evolving Markets,” Journal of Marketing
Research, 38 (4), 399–414.
Chattopadhyay, Amitava and Kunal Basu (1990), “Humor in Advertising: The Moderating
Role of Prior Brand Evaluation,” Journal of Marketing Research, 27 (4), 466–76.
Chen, Jiemiao, Xiaojing Yang, and Robert E. Smith (2016), “The Effects of Creativity on
Advertising Wear-in and Wear-out,” Journal of the Academy of Marketing Science, 44 (3),
334–49.
Choi, Sejung M. and Nora J. Rifon (2002), “Antecedents and Consequences of Web
Advertising Credibility: A Study of Consumer Response to Banner Ads Article,” Journal of
Interactive Advertising, 3 (1), 12–24.
Clow, Kenneth E. and Donald Baack (2007), Integrated Advertising, Promotion, and Marketing
Communications, New Jersey: Pearson Prentice Hall.
Cotte, June, Robin A. Coulter, and Melissa Moore (2005), “Enhancing or Disrupting Guilt: The
Role of Ad Credibility and Perceived Manipulative Intent,” Journal of Business Research,
58 (3), 361–68.
Cowley, Elizabeth (2006), “Processing Exaggerated Advertising Claims,” Journal of Business
Research, 59 (6), 728–34.
Cox, Dena S. and Anthony D. Cox (1988), “What Does Familiarity Breed? Complexity as a
Moderator of Repetition Effects in Advertisement Evaluation,” Journal of Consumer
Research, 15 (1), 111.
149
Craig, Adam W., Yuliya K. Lourerio, Stacy Wood, and Jennifer M. C. Vendemia (2012),
“Suspicious Minds: Exploring Neural Processes During Exposure to Deceptive
Advertising,” Journal of Marketing Research, 49 (3), 361–72.
Dahl, Darren W., Jaideep Sengupta, and Kathleen D. Vohs (2009), “Sex in Advertising: Gender
Differences and the Role of Relationship Commitment,” Journal of Consumer Research, 36
(2), 215–31.
Danaher, Peter J., André Bonfrer, and Sanjay Dhar (2008), “The Effect of Competitive
Advertising Interference on Sales for Packaged Goods,” Journal of Marketing Research, 45
(2), 211–25.
Darke, Peter R. and Robin J.B. Ritchie (2007), “The Defensive Consumer: Advertising
Deception, Defensive Processing, and Distrust,” Journal of Marketing Research, 44 (1),
114–27.
Deighton, John, Daniel Romer, and Josh McQueen (1989), “Using Drama to Persuade,”
Journal of Consumer Research, 16 (3), 335.
Draganska, Michaela, Wesley R. Hartmann, and Gena Stanglein (2014), “Internet Versus
Television Advertising: A Brand-Building Comparison,” Journal of Marketing Research,
51 (5), 578–90.
Eastlack, Joseph O. and Ambar G. Rao (1989), “Advertising Experiments at the Campbell Soup
Company,” Marketing Science, 8 (1), 57–71.
Eisend, Martin (2009), “A Meta-Analysis of Humor in Advertising,” Journal of the Academy
of Marketing Science, 37 (2), 191–203.
Elliott, Richard and Larry Percy (2007), Strategic Brand Management, Oxford: Oxford
University Press.
——— and Kritsadarat Wattanasuwan (1998), “Brands as Symbolic Resources for the
Construction of Identity,” International Journal of Advertising, 17 (2), 131–44.
Elsen, Millie, Rik Pieters, and Michel Wedel (2016), “Thin Slice Impressions: How Advertising
Evaluation Depends on Exposure Duration,” Journal of Marketing Research, 53 (4), 563–
79.
Escalas, Jennifer Edson (2007), “Self-Referencing and Persuasion: Narrative Transportation
versus Analytical Elaboration,” Journal of Consumer Research, 33 (4), 421–29.
Franke, George R., Bruce A. Huhmann, and David L. Mothersbaugh (2004), “Information
Content and Consumer Readership of Print Ads: A Comparison of Search and Experience
Products,” Journal of the Academy of Marketing Science, 32 (1), 20–31.
Franzen, Giep (1994), Advertising Effectiveness: Findings from Empirical Research, NTC
Publications Limited.
Gatignon, Hubert (1984), “Toward a Methodology for Measuring Advertising Copy Effects,”
Marketing Science, 3 (4), 308–26.
150
Geissler, Gary L., George M. Zinkhan, and Richard T. Watson (2006), “The Influence of Home
Page Complexity on Consumer Attention, Attitudes, and Purchase Intent,” Journal of
Advertising, 35 (2), 69–80.
Germeys, Filip and Géry D’Ydewalle (2007), “The Psychology of Film: Perceiving Beyond the
Cut,” Psychological Research, 71 (4), 458–66.
Grayson, Kent and Radan Martinec (2004), “Consumer Perceptions of Iconicity and
Indexicality and Their influence on Assessments of Authentic Market Offerings,” Journal
of Consumer Research, 31 (2), 296–313.
Grewal, Dhruv, Sukumar Kavanoor, Edward F. Fern, Carolyn Costley, and James Barnes
(1997), “Comparative Versus Noncomparative Advertising: A meta-Analysis,” Journal of
Marketing, 61 (4), 1–15.
Griskevicius, Vladas, Noah Goldstein, Chad Mortensen, Jill Sundie, Robert Cialdini, and
Douglas Kenrick (2009), “Fear and Loving in Las Vegas: Evolution, Emotion, and
Persuasion.,” Journal of Marketing Research, 46 (3), 384–95.
GroupM (2017), “Prognose zu den Werbeausgaben weltweit nach Regionen in den Jahren 2016
und 2017 (in Milliarden US-Dollar),” Statista - Das Statistik-Portal, (accessed February
28,2017),[available at
https://de.statista.com/statistik/daten/studie/194137/umfrage/prognose-der-entwicklung-
der-werbeausgaben-weltweit/].
Holbrook, Morris B. and Rajeev Batra (1987), “Assessing the Role of Emotions as Mediators
of Responses to Advertising,” Journal of Consumer Research, 14 (3), 404–20.
——— and John O’Shaughnessy (1984), “The Role of Emotion in Advertising.,” Psychology
& Marketing, 1 (2), 45–64.
Hong, Jiewen and Angela Y. Lee (2010), “Feeling Mixed but Not Torn: The Moderating Role
of Construal Level in Mixed Emotions Appeals,” Journal of Consumer Research, 37 (3),
456–72.
Jacoby, Jacob, Margaret C. Nelson, and Wayne D. Hoyer (1982), “Corrective Advertising and
Affirmative Disclosure Statements: Their Potential for Confusing and Misleading the
Consumer,” Journal of Marketing, 46 (1), 61–72.
Jain, Shailendra P., Nidhi Agrawal, and Durairaj Maheswaran (2006), “When More May Be
Less: The Effects of Regulatory Focus on Responses to Different Comparative Frames,”
Journal of Consumer Research, 33 (1), 91–98.
——— and Durairaj Maheswaran (2000), “Motivated Reasoning : A Depth-of-Processing
Perspective,” Journal of Consumer Research, 26 (4), 358–71.
Jain, Shailendra P., Charles Lindsey, Nidhi Agrawal, and Durairaj Maheswaran (2007), “For
Better or For Worse? Valenced Comparative Frames and Regulatory Focus,” Journal of
Consumer Research, 34 (1), 57–65.
——— and Steven S. Posavac (2004), “Valenced Comparisons,” Journal of Marketing
Research, 41 (1), 46–58.
151
Jewell, Robert D. and Rao H. Unnava (2003), “When Competitive Interference Can Be
Beneficial,” Journal of Consumer Research, 30 (2), 283–91.
Keller, Kevin L. (1998), Strategic Brand Management: Building, Measuring, and Managing
Brand Equity, New Jersey: Prentice Hall.
——— (2007), “Advertising and Brand Equity,” in The SAGE Handbook of Advertising, G.
J. Tellis and T. Ambler, eds., London: SAGE Publications, 54–70.
Kirmani, Amna and Rui J. Zhu (2007), “Vigilant Against Manipulation: The Effect of
Regulatory Focus on the Use of Persuasion Knowledge,” Journal of Marketing Research,
44 (4), 688–701.
Kolsarici, Ceren and Demetrios Vakratsas (2010), “Category- versus Brand-Level Advertising
Messages in a Highly Regulated Environment,” Journal of Marketing Research, 47 (6),
1078–89.
Kover, Arthur J., Stephen M. Goldberg, and William L. James (1995), “Creativity vs.
Effectiveness?,” Journal of Advertising, 35 (6), 29–38.
Lang, Annie (2000), “The Limited Capacity Model of Mediated Message Processing,” Journal
of Communication, 50 (1), 46–70.
Lau‐Gesk, Loraine and Joan Meyers‐Levy (2009), “Emotional Persuasion: When the Valence
versus the Resource Demands of Emotions Influence Consumers’ Attitudes,” Journal of
Consumer Research, 36 (4), 585–99.
Leigh, Thomas W., Cara Peters, and Jeremy Shelton (2006), “The Consumer Quest for
Authenticity : The Multiplicity of Meanings Within the MG Subculture of Consumption,”
Journal of the Academy of Marketing Science, 34 (4), 481–93.
Liaukonyte, Jura, Thales S. Teixeira, and Kenneth C. Wilbur (2015), “Television Advertising
and Online Shopping,” Marketing Science, 34 (3), 311–30.
Lodish, Leonard M., Magid Abraham, Stuart Kalmenson, Jeanne Livelsberger, Beth Lubetkin,
Bruce Richardson, and Mary E. Stevens (1995), “How TV Advertising Works: A Meta-
Analysis of 389 Real World Split Cable TV Advertising Experiments,” Journal of Marketing
Research, 32 (2), 125–39.
Loewenstein, Jeffrey, Rajagopal Raghunathan, and Chip Heath (2011), “The Repetition-Break
Plot Structure Makes Effective Television Advertisements,” Journal of Marketing, 75 (5),
105–19.
Lowrey, Tina M. (1998), “The Effects of Syntactic Complexity on Advertising
Persuasiveness,” Journal of Consumer Psychology, 7 (2), 187–206.
Ma, Jingjing and David Gal (2015), “When Sex and Romance Conflict: The Effect of Sexual
Imagery in Advertising on Preference for Romantically-Linked Products and Services,”
Journal of Marketing Research, 53 (4), 479–96.
152
MacInnis, Deborah J., Ambar G. Rao, and Allen M. Weiss (2002), “Assessing When Increased
Media Weight of Real-World Advertisements Helps Sales,” Journal of Marketing Research,
39 (4), 391–407.
Macklin, Carole M., Norman T. Bruvold, and Carol L. Shea (1985), “Is It Always as Simple as
‘Keep It Simple!’?,” Journal of Advertising, 14 (4), 28–35.
Malaviya, Prashant (2007), “The Moderating Influence of Advertising Context on Ad
Repetition Effects: The Role of Amount and Type of Elaboration,” Journal of Consumer
Research, 34 (1), 32–40.
McQuarrie, Edward F. and David G. Mick (2014), “Re-Inquiries Visual and Verbal Rhetorical
Figures under Exposure to Advertising,” Journal of Consumer Research, 29 (4), 579–87.
Merchant, Altaf and Gregory M. Rose (2013), “Effects of Advertising-Evoked Vicarious
Nostalgia on Brand Heritage,” Journal of Business Research, 66 (12), 2619–25.
Morales, Andrea C., Eugenia C. Wu, and Gavan J. Fitzsimons (2012), “How Disgust Enhances
the Effectiveness of Fear Appeals,” Journal of Marketing Research, 49 (3), 383–93.
Morhart, Felicitas, Lucia Malär, Amélie Guèvremont, Florent Girardin, and Bianca Grohmann
(2013), “Brand Authenticity: An Integrative Framework and Measurement Scale,” Journal
of Consumer Psychology, 25 (2), 200–218.
Morrison, Bruce J. and Marvin J. Dainoff (1972), “Advertisement Complexity and Looking
Time,” Journal of Marketing Research, 4 (Nov), 396–400.
Naik, Prasad A. and Kalyan Raman (2003), “Understanding the Impact of Synergy in Multi-
media Communications,” Journal of Marketing Research, 40 (4), 375-88.
Newman, George E. and Ravi Dhar (2014), “Authenticity Is Contagious : Brand Essence and
the Original Source of Production,” Journal of Marketing Research, 51 (June), 371–86.
Nielsen, Jesper H., Stewart A. Shapiro, and Charlotte H. Mason (2010), “Emotionality and
Semantic Onsets: Exploring Orienting Attention Responses in Advertising,” Journal of
Marketing Research, 47 (6), 1138–50.
Nyilasy, Gergely, and Leonard N. Reid (2009), “Agency Practitioner Theories of How
Advertising Works,” Journal of Advertising, 38 (3), 81–96.
Orth, Ulrich R. and Denisa Holancova (2004), “Men’s and Women’s Responses to Sex Role
Portrayals in Advertisements,” International Journal of Research in Marketing, 21 (1), 77–
88.
Pechmann, Cornelia and David W. Stewart (1994), “The Development and Partial Validation
of a Contingency Model of Comparative Advertising,” Attention, Attitude and Affect in
Response to Advertising, 79–96.
Peñaloza, Lisa (2000), “The Commodification of the American West: Marketers’ Production
of Cultural Meanings at the Trade Show,” Journal of Marketing, 64 (4), 82–109.
153
Percy, Larry, John R. Rossiter, and Richard Elliott (2001), Strategic Advertising Management,
Oxford: Oxford University Press.
Pham, Michel T., Maggie Geuens, and Patrick De Pelsmacker (2013), “The Influence of Ad-
evoked Feelings on Brand Evaluations: Empirical Generalizations from Consumer
Responses to more than 1000 TV Commercials,” International Journal of Research in
Marketing, 30 (4), 383–94.
Phillips, Barbara J. (1997), “Thinking Into It: Consumer Interpretation of Complex Advertising
Images,” Journal of Advertising, 26 (2), 77–87.
Pieters, R., M. Wedel, and J. Zhang (2007), “Optimal Feature Advertising Design Under
Competitive Clutter,” Management Science, 53 (11), 1815–28.
Pieters, Rik, Luk Warlop, and Michel Wedel (2002), “Breaking Through the Clutter: Benefits
of Advertisement Originality and Familiarity for Brand Attention and Memory,”
Management Science, 48 (6), 765–81.
——— and Michel Wedel (2004), “Attention Capture and Transfer in Advertising: Brand,
Pictorial, and Text-Size Effects,” Journal of Marketing, 36 (68), 36–50.
———, ———, and Rajeev Batra (2010), “The Stopping Power of Advertising: Measures and
Effects of Visual Complexity,” Journal of Marketing, 74 (5), 48–60.
Pracejus, John W., Thomas C. O’Guinn, and Douglas G. Olsen (2013), “When White Space is
more than ‘Burning Money’: Economic Signaling Meets Visual Commercial Rhetoric,”
International Journal of Research in Marketing, 30 (3), 211–18.
———, G. Douglas Olsen, and Thomas C. O’Guinn (2006), “How Nothing Became
Something: White Space, Rhetoric, History, and Meaning,” Journal of Consumer Research,
33 (1), 82–90.
Puccinelli, Nancy M., Keith Wilcox, Dhruv Grewal, Lauren S. Grewal, Daniel Gilbert, Nalini
Ambady, Rohit Deshpandé, Jane Ebert, Richard Hackman, Thomas Kramer, Richard
Mcnally, Vanessa Patrick, Anne Roggeveen, and Robert Rosenthal (2015), “Consumers’
Response to Commercials: When the Energy Level in the Commercial Conflicts with the
Media Context,” Journal of Marketing, 79 (March), 1–18.
Putrevu, Sanjay, Joni Tan, and Kenneth R. Lord (2004), “Consumer Responses to Complex
Advertisements: The Moderating Role of Need for Cognition, Knowledge, and Gender,”
Journal of Current Issues & Research in Advertising, 26 (1), 9–24.
Reinartz, Werner and Peter Saffert (2013), “Creativity in Advertising: When It Works and
When It Doesn’t,” Harvard Business Review, 91 (6), 106–11.
Roggeveen, Anne L., Dhruv Grewal, and Jerry Gotlieb (2006), “Does the Frame of a
Comparative Ad Moderate the Effectiveness of Extrinsic Information Cues?,” Journal of
Consumer Research, 33 (1), 115–22.
Romaniuk, Jenni (2009), “The Efficacy of Brand-Execution Tactics in TV Advertising, Brand
Placements, and Internet Advertising,” Journal of Advertising Research, 49 (2), 143–50.
154
Rose, Randall L. and Stacy L. Wood (2005), “Paradox and the Consumption of Authenticity
through Reality Television,” Journal of Consumer Research, 32 (September), 284–97.
Rossiter, John R. and Steven Bellman (2005), Marketing Communications: Theory and
Applications, Upper Saddle River: Pearson Education.
——— and Larry Percy (1983), Visual Communication in Advertising, Hillsdale, NJ:
Columbia University, Graduate School of Business.
Sasser, Sheila L. and Scott Koslow (2008), “Desperately Seeking Advertising Creativity,”
Journal of Advertising, 37 (4), 5–19.
Sethuraman, Raj, Gerard J. Tellis, and Richard A. Briesch (2011), “How Well Does Advertising
Work? Generalizations from Meta-Analysis of Brand Advertising Elasticities,” Journal of
Marketing Research, 48 (3), 457–71.
Sheth, Jagdish N. and Banwari Mittal (2004), Customer Behavior: A Managerial Perspective,
Mason: Thomson South-Western.
Smith, Robert E., Jiemiao Chen, and Xiaojing Yang (2008), “The Impact of Advertising
Creativity on the Hierarchy of Effects,” Journal of Advertising, 37 (4), 47–61.
———, Scott B. MacKenzie, Xiaojing Yang, Laura M. Buchholz, and William K. Darley
(2007), “Modeling the Determinants and Effects of Creativity in Advertising,” Marketing
Science, 26 (6), 819–33.
——— and William R. Swinyard (1983), “Attitude-Behavior Consistency: The Impact of
Product Trial versus Advertising,” Journal of Marketing Research, 20 (3), 257–67.
——— and Xiaojing Yang (2004), “Toward a General Theory of Creativity in Advertising:
Examining the Role of Divergence,” Marketing Theory, 4 (1–2), 31–58.
Spiggle, Susan, Hang T. Nguyen, and Mary Caravella (2012), “More Than Fit : Brand
Extension Authenticity,” Journal of Marketing, 49 (December), 967–83.
Stern, Barbara B. (1994), “Authenticity and the Textual Persona: Postmodern Paradoxes in
Advertising Narrative,” International Journal of Advertising, 11 (4), 387–400.
Stewart, David W. and David H. Furse (1986), Effective Television Advertising A Study of
1000 Commercials, Massachusetts/Toronto: D.C. Heath and Company/Lexington.
———, Jon Morris, and Aditi Grover (2007), “Emotions in Advertising,” in The Sage
Handbook of Advertising, G. J. Tellis and T. Ambler, eds., London: SAGE Publications,
120–34.
Teixeira, Thales S., Rosalind Picard, and Rana el Kaliouby (2014), “Why, When and How
Much to Entertain Consumers in Advertisements? A Web-based Facial Tracking Field
Study,” Marketing Science, 33 (6), 809–27.
———, Michel Wedel, and Rik Pieters (2010), “Moment-to-Moment Optimal Branding in TV
Commercials: Preventing Avoidance by Pulsing,” Marketing Science, 29 (5), 783–804.
155
———, ———, and ——— (2012), “Emotion-Induced Engagement in Internet Video
Advertisements,” Journal of Marketing Research, 49 (2), 144–59.
Tellis, Gerard J. (2004), Effective Advertising Understanding When, How, and Why
Advertising Works, Thousand Oaks, California: SAGE Publications.
Till, Brian D. and Daniel W. Baack (2005), “Recall and Persuasion: Does Creative Advertising
Matter?,” Journal of Advertising, 34 (3), 47–57.
Tucker, Catherine E. (2015), “The Reach and Persuasiveness of Viral Video Ads,” Marketing
Science, 34 (2), 281–96.
Verlegh, Peter W. J., Jan Benedict E. M. Steenkamp, and Matthew T. G. Meulenberg (2005),
“Country-of-Origin Effects in Consumer Processing of Advertising Claims,” International
Journal of Research in Marketing, 22 (2), 127–39.
Wilson, Rick T., Daniel W. Baack, and Brian D. Till (2015), “Creativity, Attention and the
Memory for Brands: An Outdoor Advertising Field Study,” International Journal of
Advertising, 34 (2), 232–61.
Woltman Elpers, Josephine L.C.M., Michel Wedel, and Rik Pieters (2003), “Why Do
Consumers Stop Viewing Television Commercials? Two Experiments on the Influence of
Moment-to-Moment Entertainment and Information Value,” Journal of Marketing
Research, 40 (4), 437–53.
Xu, Alison Jing and Robert S. Wyer Jr. (2010), “Puffery in Advertisements: The Effects of
Media Context, Communication Norms, and Consumer Knowledge,” Journal of Consumer
Research, 37 (2), 329–43.
Yang, Xiaojing and Robert E. Smith (2009), “Beyond Attention Effects: Modeling the
Persuasive and Emotional Effects of Advertising Creativity,” Marketing Science, 28 (5),
935–49.
Zhang, Jie, Michel Wedel, and Rik Pieters (2009), “Sales Effects of Attention to Feature
Advertisements: A Bayesian Mediation Analysis,” Journal of Marketing Research, 46 (5),
669–81.