adsorption studies on the removal of coloring agent phenol
TRANSCRIPT
Journal of Colloid and Interface Science 337 (2009) 345–354
brought to you by COREView metadata, citation and similar papers at core.ac.uk
provided by King Fahd University of Petroleum and Minerals
Contents lists available at ScienceDirect
Journal of Colloid and Interface Science
www.elsevier .com/locate / jc is
Adsorption studies on the removal of coloring agent phenol redfrom wastewater using waste materials as adsorbents
Alok Mittal a, Dipika Kaur a, Arti Malviya a, Jyoti Mittal a, V.K. Gupta b,c,*
a Department of Applied Chemistry, Maulana Azad National Institute of Technology, Bhopal 462 007, Indiab Department of Chemistry, Indian Institute of Technology Roorkee, Roorkee 247 777, Indiac Department of Chemistry, College of Science, P.O. Box 5057, King Fahad University of Petroleum and Mines, Dhahran 31261, Saudi Arabia
a r t i c l e i n f o
Article history:Received 3 April 2009Accepted 12 May 2009Available online 19 May 2009
Keywords:AdsorptionBottom ashDeoiled soyaPhenol redDye
0021-9797/$ - see front matter � 2009 Elsevier Inc. Adoi:10.1016/j.jcis.2009.05.016
* Corresponding author. Address: Department of CTechnology Roorkee, 22/2 Niti Nagar, IIT, Roorkee 24273560.
E-mail address: [email protected] (V.K. Gupta).
a b s t r a c t
Bottom ash, a waste of thermal power plants, and deoiled soya, an agricultural waste material, wereemployed for successful removal and recovery of hazardous phenol red dye from wastewaters. Theadsorption characteristics and operational parameters were determined by monitoring different param-eters such as effect of pH, effect of concentration of the dye, amount of adsorbents, contact time, and tem-perature. The equilibrium data were analyzed on the basis of various adsorption isotherm models,namely Langmuir, Freundlich, Tempkin, and Dubinin–Radushkevich. The highest monolayer adsorptioncapacity has been obtained for the phenol red-bottom ash system (2.6 � 10�5 mol/g) at 50 �C. Differentthermodynamic parameters such as free energy, enthalpy, and entropy have been calculated and itwas concluded that with the increase in temperature adsorption increases, indicating the endothermicnature of the process for both adsorbent materials. Kinetic parameters were derived from pseudo-first-order and pseudo-second-order kinetics. Differentiation between particle and film diffusion mechanismsoperative in the present study has been carried out. The column regeneration characteristic has been alsoinvestigated and recovery percentage greater than 90% was obtained for both adsorbents by utilizingacidic eluent.
� 2009 Elsevier Inc. All rights reserved.
1. Introduction
Due to rapid industrial development, pollution of water bodiesby industries is an issue of major concern. It is estimated that ahuge amount of dyes (nearly 20%) of global production isdischarged by textile industries due to incomplete exhaustion ofcoloring material and washing operations [1]. The effluents gener-ated by these industries are highly visible even at very low concen-trations. The disposal of such materials into water bodies not onlydestructs the esthetic nature but also interferes with the penetra-tion of sunlight, thus affecting the food web existing in water eco-systems [2]. The majority of the dyes dumped into the waterbodies by industries are toxic and even carcinogenic to both ani-mals and humans. The problem becomes graver due to the fact thatthe complex aromatic structures of the dyes render them ineffec-tive in the presence of heat, light, microbes, and even oxidizingagents and degradation of the dyes becomes difficult [3]. Hencethese pose a serious threat to human health and water quality,thereby becoming a matter of vital concern. Keeping the essential-
ll rights reserved.
hemistry, Indian Institute of7 777, India. Fax: +91 1332
ity of color removal, concerned industries are required to treat thedye-bearing effluents before dumping them into the water bodies.Thus the scientific community shoulders the responsibility ofcontributing in the waste treatment by developing effective dye-removal techniques.
The conventional physicochemical and biological methods suchas oxidation and filtration [4–6] are not efficient enough to be uti-lized for large streams due to their less cost effectiveness and dif-ficult operational conditions [7]. Among the various availablewater treatment techniques adsorption is the most reliable andefficient technique for decoloration, in which the recovery andrecycling of the adsorbent materials can be achieved along withthe distinct advantages of nonproduction of any toxic sludge andcost effectiveness. This has encouraged the development of adsor-bents that are abundantly available and economical. Nowadaysnumerous low cost adsorbents are available including productsof agricultural origin such as wood dust, sugarcane, fruit peel [8],wheat straw, and apple pomance [9]. Certain other low cost adsor-bent materials of industrial origin such as activated slag [10] andbagasse fly ash [11] have also been employed in the recent past.However, still there arises a great need to explore new low costadsorbent materials with high adsorption capacity.
The present research deals with the applicability of adsorptiontechniques in the removal of the dye phenol red from wastewaters.
346 A. Mittal et al. / Journal of Colloid and Interface Science 337 (2009) 345–354
Phenol red is a highly water-soluble textile dye belonging to theclass of triphenylmethane dyes. It exists as a red crystal and is sta-ble in air with solubility of 0.77 g/L in water [12]. At 20 �C the pKa
value has been found to be 8.00. It is frequently used as a reagentdye for measuring the pH of water in a range from 6.8 to 8.2. Itchanges color from yellow to purple as the pH goes from 6.7 to8.2. It is thus widely employed as a pH indicator in cell biology lab-oratories and for water testing applications.
Toxicity data reveal that phenol red inhibits the growth of renalepithelial cells [13]. Direct or indirect contact with the dye leads toirritation to the eyes, respiratory system, and skin [14]. Phenol reddye is toxic to muscle fibers [15] and its mutagenic effects are alsoreported [16]. Thus keeping the toxic effects of the dye in viewattempts have been made to develop an efficient and cost effectivetechnique for the removal of dye from wastewaters by employingtwo waste materials, namely bottom ash and deoiled soya. Bothadsorbent materials are easily and abundantly available. Bottomash is obtained from coal-fired stations, whose disposal is alwaysa problem for the industrialists and environmentalists. Deoiledsoya is a by-product obtained after complete processing of soya-bean. Its use as animal feed is banned nowadays due to formationof antimetabolites which block enzymatic activities in living sys-tems [17]. In the past few years, our laboratory has developedthese materials as efficient adsorbents or removal of various dyesfrom wastewaters [18–24].
2. Experimental
2.1. Materials and methods
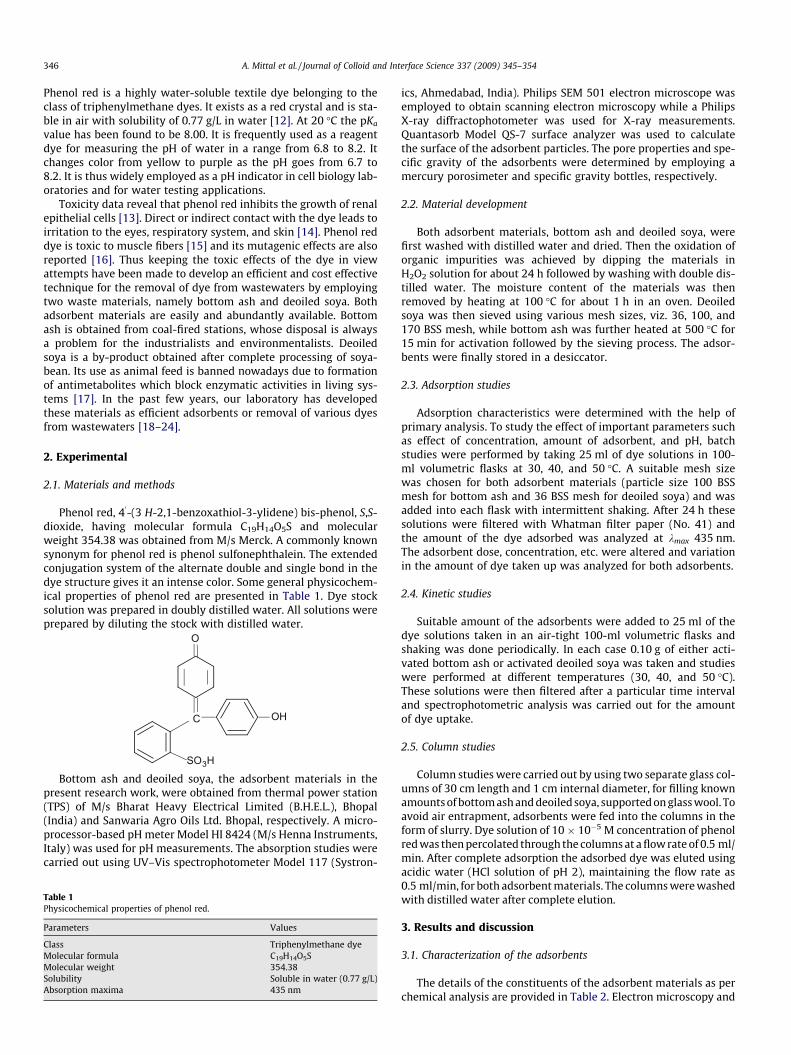
Phenol red, 40-(3 H-2,1-benzoxathiol-3-ylidene) bis-phenol, S,S-
dioxide, having molecular formula C19H14O5S and molecularweight 354.38 was obtained from M/s Merck. A commonly knownsynonym for phenol red is phenol sulfonephthalein. The extendedconjugation system of the alternate double and single bond in thedye structure gives it an intense color. Some general physicochem-ical properties of phenol red are presented in Table 1. Dye stocksolution was prepared in doubly distilled water. All solutions wereprepared by diluting the stock with distilled water.
SO3H
OH
O
C
Bottom ash and deoiled soya, the adsorbent materials in thepresent research work, were obtained from thermal power station
(TPS) of M/s Bharat Heavy Electrical Limited (B.H.E.L.), Bhopal(India) and Sanwaria Agro Oils Ltd. Bhopal, respectively. A micro-processor-based pH meter Model HI 8424 (M/s Henna Instruments,Italy) was used for pH measurements. The absorption studies werecarried out using UV–Vis spectrophotometer Model 117 (Systron-Table 1Physicochemical properties of phenol red.
Parameters Values
Class Triphenylmethane dyeMolecular formula C19H14O5SMolecular weight 354.38Solubility Soluble in water (0.77 g/L)Absorption maxima 435 nm
ics, Ahmedabad, India). Philips SEM 501 electron microscope wasemployed to obtain scanning electron microscopy while a PhilipsX-ray diffractophotometer was used for X-ray measurements.Quantasorb Model QS-7 surface analyzer was used to calculatethe surface of the adsorbent particles. The pore properties and spe-cific gravity of the adsorbents were determined by employing amercury porosimeter and specific gravity bottles, respectively.
2.2. Material development
Both adsorbent materials, bottom ash and deoiled soya, werefirst washed with distilled water and dried. Then the oxidation oforganic impurities was achieved by dipping the materials inH2O2 solution for about 24 h followed by washing with double dis-tilled water. The moisture content of the materials was thenremoved by heating at 100 �C for about 1 h in an oven. Deoiledsoya was then sieved using various mesh sizes, viz. 36, 100, and170 BSS mesh, while bottom ash was further heated at 500 �C for15 min for activation followed by the sieving process. The adsor-bents were finally stored in a desiccator.
2.3. Adsorption studies
Adsorption characteristics were determined with the help ofprimary analysis. To study the effect of important parameters suchas effect of concentration, amount of adsorbent, and pH, batchstudies were performed by taking 25 ml of dye solutions in 100-ml volumetric flasks at 30, 40, and 50 �C. A suitable mesh sizewas chosen for both adsorbent materials (particle size 100 BSSmesh for bottom ash and 36 BSS mesh for deoiled soya) and wasadded into each flask with intermittent shaking. After 24 h thesesolutions were filtered with Whatman filter paper (No. 41) andthe amount of the dye adsorbed was analyzed at kmax 435 nm.The adsorbent dose, concentration, etc. were altered and variationin the amount of dye taken up was analyzed for both adsorbents.
2.4. Kinetic studies
Suitable amount of the adsorbents were added to 25 ml of thedye solutions taken in an air-tight 100-ml volumetric flasks andshaking was done periodically. In each case 0.10 g of either acti-vated bottom ash or activated deoiled soya was taken and studieswere performed at different temperatures (30, 40, and 50 �C).These solutions were then filtered after a particular time intervaland spectrophotometric analysis was carried out for the amountof dye uptake.
2.5. Column studies
Column studies were carried out by using two separate glass col-umns of 30 cm length and 1 cm internal diameter, for filling knownamounts of bottom ash and deoiled soya, supported on glass wool. Toavoid air entrapment, adsorbents were fed into the columns in theform of slurry. Dye solution of 10 � 10�5 M concentration of phenolred was then percolated through the columns at a flow rate of 0.5 ml/min. After complete adsorption the adsorbed dye was eluted usingacidic water (HCl solution of pH 2), maintaining the flow rate as0.5 ml/min, for both adsorbent materials. The columns were washedwith distilled water after complete elution.
3. Results and discussion
3.1. Characterization of the adsorbents
The details of the constituents of the adsorbent materials as perchemical analysis are provided in Table 2. Electron microscopy and
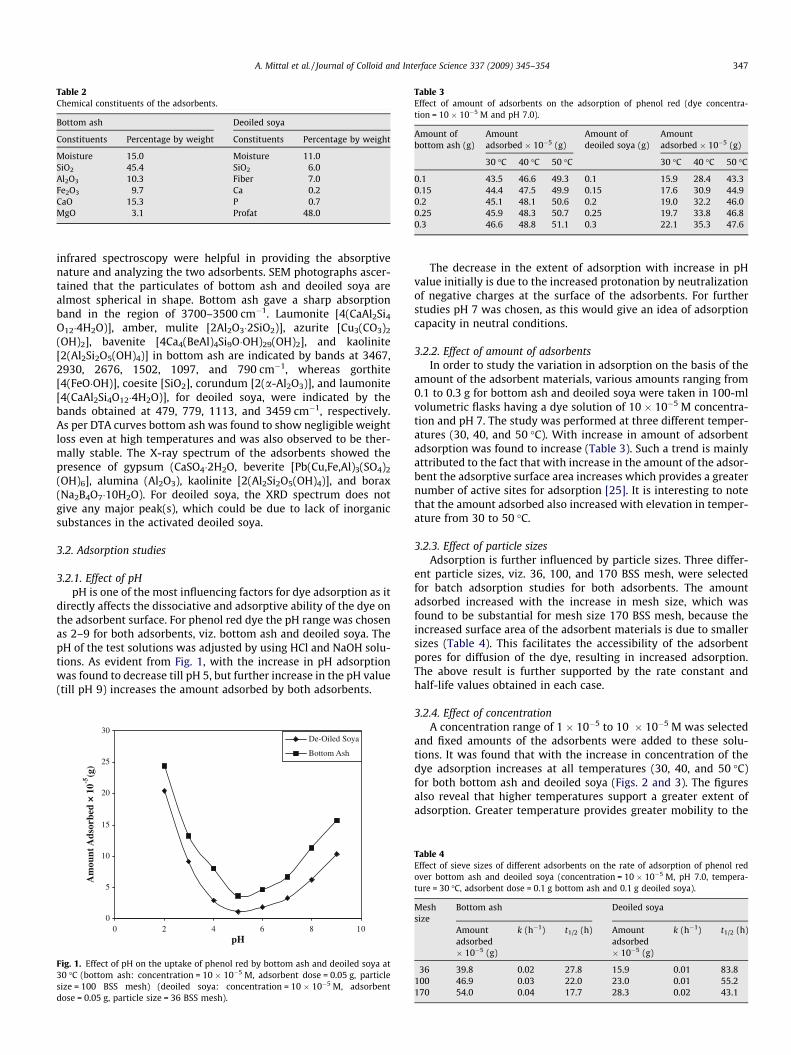
Table 2Chemical constituents of the adsorbents.
Bottom ash Deoiled soya
Constituents Percentage by weight Constituents Percentage by weight
Moisture 15.0 Moisture 11.0SiO2 45.4 SiO2 6.0Al2O3 10.3 Fiber 7.0Fe2O3 9.7 Ca 0.2CaO 15.3 P 0.7MgO 3.1 Profat 48.0
Table 3Effect of amount of adsorbents on the adsorption of phenol red (dye concentra-tion = 10 � 10�5 M and pH 7.0).
Amount ofbottom ash (g)
Amountadsorbed � 10�5 (g)
Amount ofdeoiled soya (g)
Amountadsorbed � 10�5 (g)
30 �C 40 �C 50 �C 30 �C 40 �C 50 �C
0.1 43.5 46.6 49.3 0.1 15.9 28.4 43.30.15 44.4 47.5 49.9 0.15 17.6 30.9 44.90.2 45.1 48.1 50.6 0.2 19.0 32.2 46.00.25 45.9 48.3 50.7 0.25 19.7 33.8 46.80.3 46.6 48.8 51.1 0.3 22.1 35.3 47.6
A. Mittal et al. / Journal of Colloid and Interface Science 337 (2009) 345–354 347
infrared spectroscopy were helpful in providing the absorptivenature and analyzing the two adsorbents. SEM photographs ascer-tained that the particulates of bottom ash and deoiled soya arealmost spherical in shape. Bottom ash gave a sharp absorptionband in the region of 3700–3500 cm�1. Laumonite [4(CaAl2Si4
O12�4H2O)], amber, mulite [2Al2O3�2SiO2)], azurite [Cu3(CO3)2
(OH)2], bavenite [4Ca4(BeAl)4Si9O�OH)29(OH)2], and kaolinite[2(Al2Si2O5(OH)4)] in bottom ash are indicated by bands at 3467,2930, 2676, 1502, 1097, and 790 cm�1, whereas gorthite[4(FeO�OH)], coesite [SiO2], corundum [2(a-Al2O3)], and laumonite[4(CaAl2Si4O12�4H2O)], for deoiled soya, were indicated by thebands obtained at 479, 779, 1113, and 3459 cm�1, respectively.As per DTA curves bottom ash was found to show negligible weightloss even at high temperatures and was also observed to be ther-mally stable. The X-ray spectrum of the adsorbents showed thepresence of gypsum (CaSO4�2H2O, beverite [Pb(Cu,Fe,Al)3(SO4)2
(OH)6], alumina (Al2O3), kaolinite [2(Al2Si2O5(OH)4)], and borax(Na2B4O7�10H2O). For deoiled soya, the XRD spectrum does notgive any major peak(s), which could be due to lack of inorganicsubstances in the activated deoiled soya.
3.2. Adsorption studies
3.2.1. Effect of pHpH is one of the most influencing factors for dye adsorption as it
directly affects the dissociative and adsorptive ability of the dye onthe adsorbent surface. For phenol red dye the pH range was chosenas 2–9 for both adsorbents, viz. bottom ash and deoiled soya. ThepH of the test solutions was adjusted by using HCl and NaOH solu-tions. As evident from Fig. 1, with the increase in pH adsorptionwas found to decrease till pH 5, but further increase in the pH value(till pH 9) increases the amount adsorbed by both adsorbents.
0
5
10
15
20
25
30
0 2 4 6 8 10pH
Am
ount
Ads
orbe
d ×
10-5
(g)
De-Oiled Soya
Bottom Ash
Fig. 1. Effect of pH on the uptake of phenol red by bottom ash and deoiled soya at30 �C (bottom ash: concentration = 10 � 10�5 M, adsorbent dose = 0.05 g, particlesize = 100 BSS mesh) (deoiled soya: concentration = 10 � 10�5 M, adsorbentdose = 0.05 g, particle size = 36 BSS mesh).
The decrease in the extent of adsorption with increase in pHvalue initially is due to the increased protonation by neutralizationof negative charges at the surface of the adsorbents. For furtherstudies pH 7 was chosen, as this would give an idea of adsorptioncapacity in neutral conditions.
3.2.2. Effect of amount of adsorbentsIn order to study the variation in adsorption on the basis of the
amount of the adsorbent materials, various amounts ranging from0.1 to 0.3 g for bottom ash and deoiled soya were taken in 100-mlvolumetric flasks having a dye solution of 10 � 10�5 M concentra-tion and pH 7. The study was performed at three different temper-atures (30, 40, and 50 �C). With increase in amount of adsorbentadsorption was found to increase (Table 3). Such a trend is mainlyattributed to the fact that with increase in the amount of the adsor-bent the adsorptive surface area increases which provides a greaternumber of active sites for adsorption [25]. It is interesting to notethat the amount adsorbed also increased with elevation in temper-ature from 30 to 50 �C.
3.2.3. Effect of particle sizesAdsorption is further influenced by particle sizes. Three differ-
ent particle sizes, viz. 36, 100, and 170 BSS mesh, were selectedfor batch adsorption studies for both adsorbents. The amountadsorbed increased with the increase in mesh size, which wasfound to be substantial for mesh size 170 BSS mesh, because theincreased surface area of the adsorbent materials is due to smallersizes (Table 4). This facilitates the accessibility of the adsorbentpores for diffusion of the dye, resulting in increased adsorption.The above result is further supported by the rate constant andhalf-life values obtained in each case.
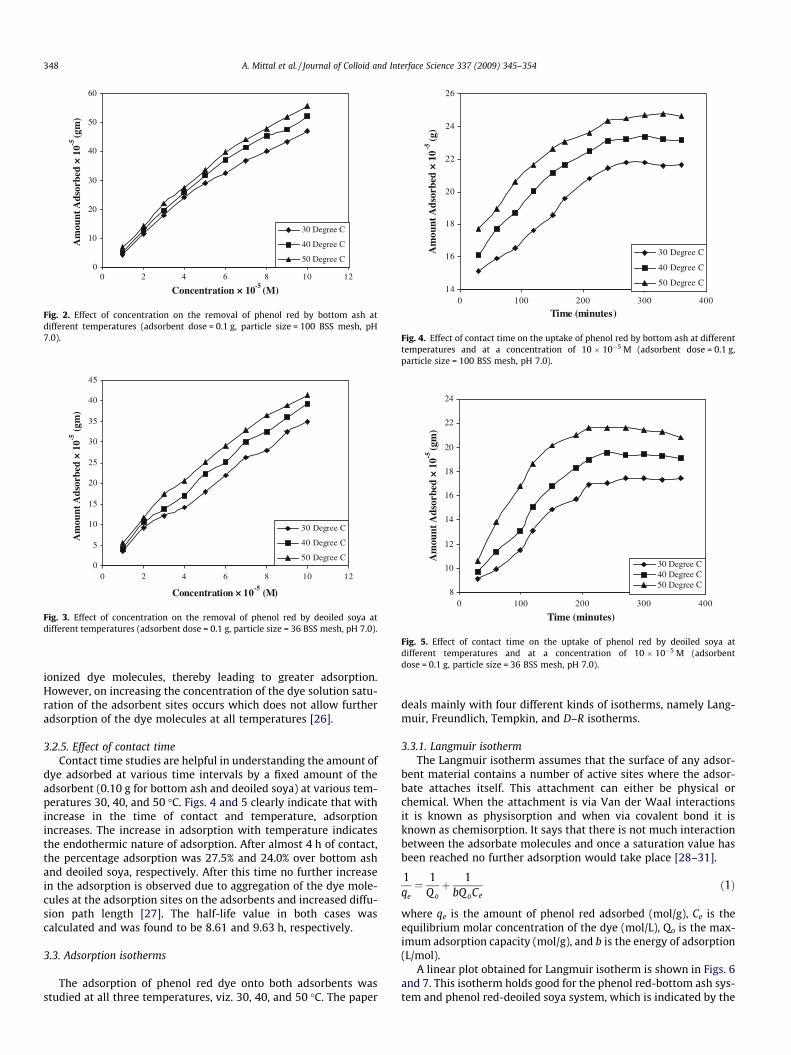
3.2.4. Effect of concentrationA concentration range of 1 � 10�5 to 10 � 10�5 M was selected
and fixed amounts of the adsorbents were added to these solu-tions. It was found that with the increase in concentration of thedye adsorption increases at all temperatures (30, 40, and 50 �C)for both bottom ash and deoiled soya (Figs. 2 and 3). The figuresalso reveal that higher temperatures support a greater extent ofadsorption. Greater temperature provides greater mobility to the
Table 4Effect of sieve sizes of different adsorbents on the rate of adsorption of phenol redover bottom ash and deoiled soya (concentration = 10 � 10�5 M, pH 7.0, tempera-ture = 30 �C, adsorbent dose = 0.1 g bottom ash and 0.1 g deoiled soya).
Meshsize
Bottom ash Deoiled soya
Amountadsorbed� 10�5 (g)
k (h�1) t1/2 (h) Amountadsorbed� 10�5 (g)
k (h�1) t1/2 (h)
36 39.8 0.02 27.8 15.9 0.01 83.8100 46.9 0.03 22.0 23.0 0.01 55.2170 54.0 0.04 17.7 28.3 0.02 43.1
0
10
20
30
40
50
60
0 2 4 6 8 10 12
Concentration × 10-5 (M)
Am
ount
Ads
orbe
d ×
10-5 (
gm)
30 Degree C
40 Degree C
50 Degree C
Fig. 2. Effect of concentration on the removal of phenol red by bottom ash atdifferent temperatures (adsorbent dose = 0.1 g, particle size = 100 BSS mesh, pH7.0).
0
5
10
15
20
25
30
35
40
45
0 2 4 6 8 10 12
Concentration × 10-5 (M)
Am
ount
Ads
orbe
d ×
10-5
(gm
)
30 Degree C
40 Degree C
50 Degree C
Fig. 3. Effect of concentration on the removal of phenol red by deoiled soya atdifferent temperatures (adsorbent dose = 0.1 g, particle size = 36 BSS mesh, pH 7.0).
14
16
18
20
22
24
26
0 100 200 300 400
Time (minutes)
Am
ount
Ads
orbe
d ×
10-5
(g)
30 Degree C
40 Degree C
50 Degree C
Fig. 4. Effect of contact time on the uptake of phenol red by bottom ash at differenttemperatures and at a concentration of 10 � 10�5 M (adsorbent dose = 0.1 g,particle size = 100 BSS mesh, pH 7.0).
8
10
12
14
16
18
20
22
24
0 100 200 300 400
Time (minutes)
Am
ount
Ads
orbe
d ×
10-5 (
gm)
30 Degree C40 Degree C50 Degree C
Fig. 5. Effect of contact time on the uptake of phenol red by deoiled soya atdifferent temperatures and at a concentration of 10 � 10�5 M (adsorbentdose = 0.1 g, particle size = 36 BSS mesh, pH 7.0).
348 A. Mittal et al. / Journal of Colloid and Interface Science 337 (2009) 345–354
ionized dye molecules, thereby leading to greater adsorption.However, on increasing the concentration of the dye solution satu-ration of the adsorbent sites occurs which does not allow furtheradsorption of the dye molecules at all temperatures [26].
3.2.5. Effect of contact timeContact time studies are helpful in understanding the amount of
dye adsorbed at various time intervals by a fixed amount of theadsorbent (0.10 g for bottom ash and deoiled soya) at various tem-peratures 30, 40, and 50 �C. Figs. 4 and 5 clearly indicate that withincrease in the time of contact and temperature, adsorptionincreases. The increase in adsorption with temperature indicatesthe endothermic nature of adsorption. After almost 4 h of contact,the percentage adsorption was 27.5% and 24.0% over bottom ashand deoiled soya, respectively. After this time no further increasein the adsorption is observed due to aggregation of the dye mole-cules at the adsorption sites on the adsorbents and increased diffu-sion path length [27]. The half-life value in both cases wascalculated and was found to be 8.61 and 9.63 h, respectively.
3.3. Adsorption isotherms
The adsorption of phenol red dye onto both adsorbents wasstudied at all three temperatures, viz. 30, 40, and 50 �C. The paper
deals mainly with four different kinds of isotherms, namely Lang-muir, Freundlich, Tempkin, and D–R isotherms.
3.3.1. Langmuir isothermThe Langmuir isotherm assumes that the surface of any adsor-
bent material contains a number of active sites where the adsor-bate attaches itself. This attachment can either be physical orchemical. When the attachment is via Van der Waal interactionsit is known as physisorption and when via covalent bond it isknown as chemisorption. It says that there is not much interactionbetween the adsorbate molecules and once a saturation value hasbeen reached no further adsorption would take place [28–31].
1qe¼ 1
Q oþ 1
bQoCeð1Þ
where qe is the amount of phenol red adsorbed (mol/g), Ce is theequilibrium molar concentration of the dye (mol/L), Qo is the max-imum adsorption capacity (mol/g), and b is the energy of adsorption(L/mol).
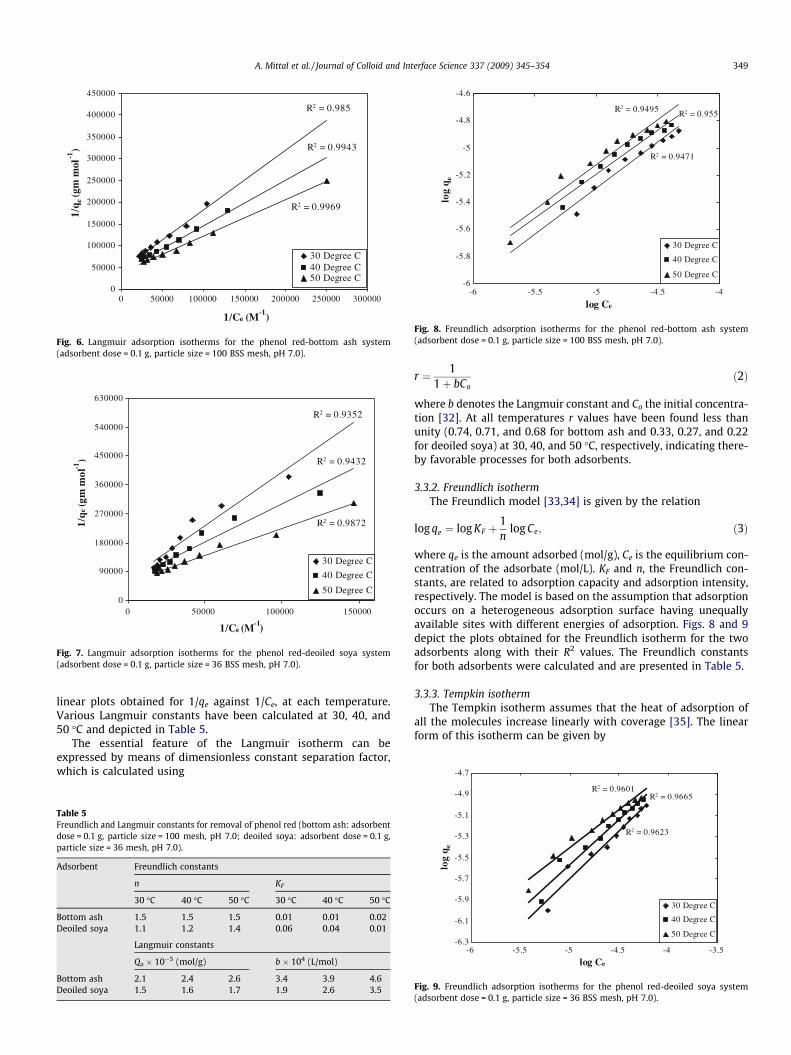
A linear plot obtained for Langmuir isotherm is shown in Figs. 6and 7. This isotherm holds good for the phenol red-bottom ash sys-tem and phenol red-deoiled soya system, which is indicated by the
R2 = 0.985
R2 = 0.9943
R2 = 0.9969
0
50000
100000
150000
200000
250000
300000
350000
400000
450000
0 50000 100000 150000 200000 250000 300000
1/Ce (M-1)
1/q e
(gm
mol
-1)
30 Degree C40 Degree C50 Degree C
Fig. 6. Langmuir adsorption isotherms for the phenol red-bottom ash system(adsorbent dose = 0.1 g, particle size = 100 BSS mesh, pH 7.0).
R2 = 0.9352
R2 = 0.9432
R2 = 0.9872
0
90000
180000
270000
360000
450000
540000
630000
0 50000 100000 150000
1/Ce (M-1)
1/qe
(gm
mol
-1)
30 Degree C
40 Degree C
50 Degree C
Fig. 7. Langmuir adsorption isotherms for the phenol red-deoiled soya system(adsorbent dose = 0.1 g, particle size = 36 BSS mesh, pH 7.0).
R2 = 0.9471
R2 = 0.955R2 = 0.9495
-6
-5.8
-5.6
-5.4
-5.2
-5
-4.8
-4.6
-6 -5.5 -5 -4.5 -4
log Ce
log
q e
30 Degree C
40 Degree C
50 Degree C
Fig. 8. Freundlich adsorption isotherms for the phenol red-bottom ash system(adsorbent dose = 0.1 g, particle size = 100 BSS mesh, pH 7.0).
-4.7
A. Mittal et al. / Journal of Colloid and Interface Science 337 (2009) 345–354 349
linear plots obtained for 1/qe against 1/Ce, at each temperature.Various Langmuir constants have been calculated at 30, 40, and50 �C and depicted in Table 5.
The essential feature of the Langmuir isotherm can beexpressed by means of dimensionless constant separation factor,which is calculated using
Table 5Freundlich and Langmuir constants for removal of phenol red (bottom ash: adsorbentdose = 0.1 g, particle size = 100 mesh, pH 7.0; deoiled soya: adsorbent dose = 0.1 g,particle size = 36 mesh, pH 7.0).
Adsorbent Freundlich constants
n KF
30 �C 40 �C 50 �C 30 �C 40 �C 50 �C
Bottom ash 1.5 1.5 1.5 0.01 0.01 0.02Deoiled soya 1.1 1.2 1.4 0.06 0.04 0.01
Langmuir constants
Qo � 10�5 (mol/g) b � 104 (L/mol)
Bottom ash 2.1 2.4 2.6 3.4 3.9 4.6Deoiled soya 1.5 1.6 1.7 1.9 2.6 3.5
r ¼ 11þ bCo
ð2Þ
where b denotes the Langmuir constant and Co the initial concentra-tion [32]. At all temperatures r values have been found less thanunity (0.74, 0.71, and 0.68 for bottom ash and 0.33, 0.27, and 0.22for deoiled soya) at 30, 40, and 50 �C, respectively, indicating there-by favorable processes for both adsorbents.
3.3.2. Freundlich isothermThe Freundlich model [33,34] is given by the relation
log qe ¼ log KF þ1n
log Ce; ð3Þ
where qe is the amount adsorbed (mol/g), Ce is the equilibrium con-centration of the adsorbate (mol/L). KF and n, the Freundlich con-stants, are related to adsorption capacity and adsorption intensity,respectively. The model is based on the assumption that adsorptionoccurs on a heterogeneous adsorption surface having unequallyavailable sites with different energies of adsorption. Figs. 8 and 9depict the plots obtained for the Freundlich isotherm for the twoadsorbents along with their R2 values. The Freundlich constantsfor both adsorbents were calculated and are presented in Table 5.
3.3.3. Tempkin isothermThe Tempkin isotherm assumes that the heat of adsorption of
all the molecules increase linearly with coverage [35]. The linearform of this isotherm can be given by
R2 = 0.9623
R2 = 0.9601R2 = 0.9665
-6.3
-6.1
-5.9
-5.7
-5.5
-5.3
-5.1
-4.9
-6 -5.5 -5 -4.5 -4 -3.5
log Ce
log
q e
30 Degree C
40 Degree C
50 Degree C
Fig. 9. Freundlich adsorption isotherms for the phenol red-deoiled soya system(adsorbent dose = 0.1 g, particle size = 36 BSS mesh, pH 7.0).
R2 = 0.9951
R2 = 0.9954
R2 = 0.9894-0.000005
0
0.000005
0.00001
0.000015
0.00002
-13 .5 -12 .5 -11 .5 -10 .5 -9 .5
ln Ce
q e (m
ol g
-1)
30 Degree C
40 Degree C
50 Degree C
Fig. 10. Tempkin isotherms for the phenol red-bottom ash system at differenttemperatures.
Table 7Tempkin and D–R constants for phenol red-deoiled soya system.
Temperature (�C) Deoiled soya
Tempkin constant D–R constants
k2 b (mol2/J2) Xm (lmol/g) E (kJ/mol)
30 2.7 � 105 7 � 10�9 5.8 8.540 2.7 � 105 6 � 10�9 5.1 9.150 2.7 � 105 4 � 10�9 4.6 11.2
R2 = 0.9558R2 = 0.9651
R2 = 0.963
0.5
1
1.5
2
2.5
3
ds
30 Degree C
40 Degree C
50 Degree C
350 A. Mittal et al. / Journal of Colloid and Interface Science 337 (2009) 345–354
qe ¼ k1 ln k2 þ k1 ln Ce: ð4Þ
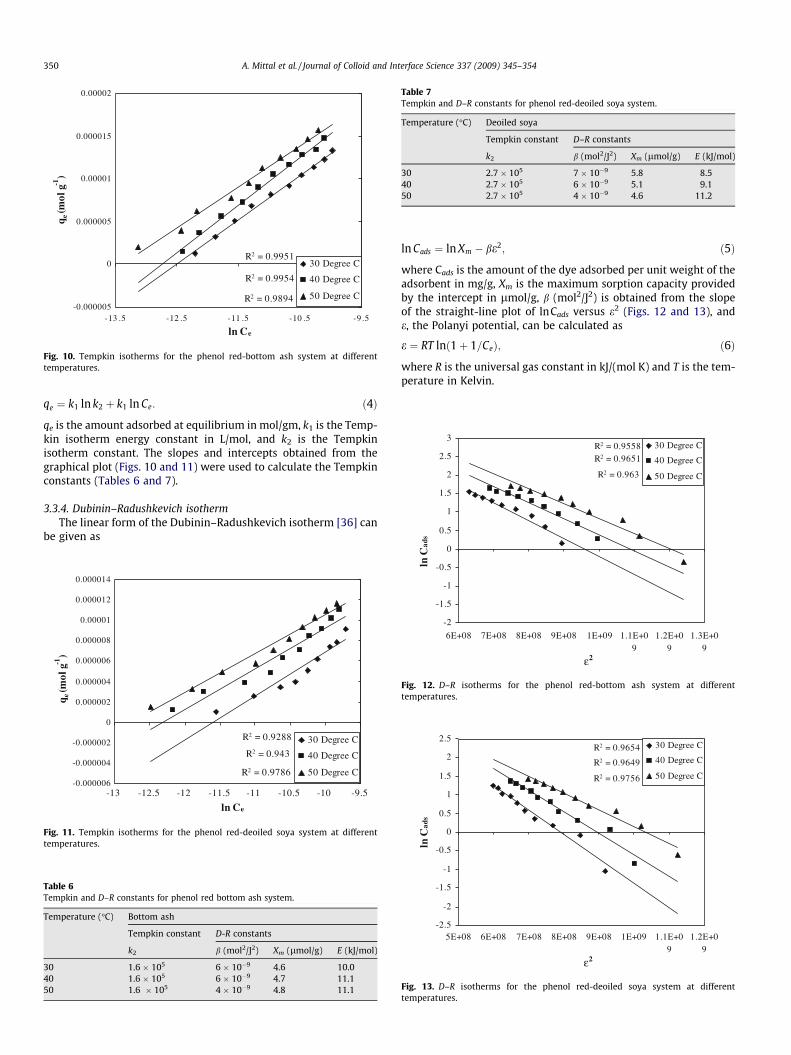
qe is the amount adsorbed at equilibrium in mol/gm, k1 is the Temp-kin isotherm energy constant in L/mol, and k2 is the Tempkinisotherm constant. The slopes and intercepts obtained from thegraphical plot (Figs. 10 and 11) were used to calculate the Tempkinconstants (Tables 6 and 7).
3.3.4. Dubinin–Radushkevich isothermThe linear form of the Dubinin–Radushkevich isotherm [36] can
be given as
R2 = 0.9288
R2 = 0.943
R2 = 0.9786-0.000006
-0.000004
-0.000002
0
0.000002
0.000004
0.000006
0.000008
0.00001
0.000012
0.000014
-13 -12.5 -12 -11.5 -11 -10.5 -10 -9.5
ln Ce
q e (m
ol g
-1)
30 Degree C
40 Degree C
50 Degree C
Fig. 11. Tempkin isotherms for the phenol red-deoiled soya system at differenttemperatures.
Table 6Tempkin and D–R constants for phenol red bottom ash system.
Temperature (�C) Bottom ash
Tempkin constant D-R constants
k2 b (mol2/J2) Xm (lmol/g) E (kJ/mol)
30 1.6 � 105 6 � 10�9 4.6 10.040 1.6 � 105 6 � 10�9 4.7 11.150 1.6 � 105 4 � 10�9 4.8 11.1
ln Cads ¼ ln Xm � be2; ð5Þ
where Cads is the amount of the dye adsorbed per unit weight of theadsorbent in mg/g, Xm is the maximum sorption capacity providedby the intercept in lmol/g, b (mol2/J2) is obtained from the slopeof the straight-line plot of lnCads versus e2 (Figs. 12 and 13), ande, the Polanyi potential, can be calculated as
e ¼ RT lnð1þ 1=CeÞ; ð6Þ
where R is the universal gas constant in kJ/(mol K) and T is the tem-perature in Kelvin.
R2 = 0.9654
R2 = 0.9649
R2 = 0.9756
-2.5
-2
-1.5
-1
-0.5
0
0.5
1
1.5
2
2.5
5E+08 6E+08 7E+08 8E+08 9E+08 1E+09 1.1E+09
1.2E+09
ln C
ads
30 Degree C
40 Degree C
50 Degree C
ε2
Fig. 13. D–R isotherms for the phenol red-deoiled soya system at differenttemperatures.
-2
-1.5
-1
-0.5
0
6E+08 7E+08 8E+08 9E+08 1E+09 1.1E+09
1.2E+09
1.3E+09
ln C
a
ε2
Fig. 12. D–R isotherms for the phenol red-bottom ash system at differenttemperatures.
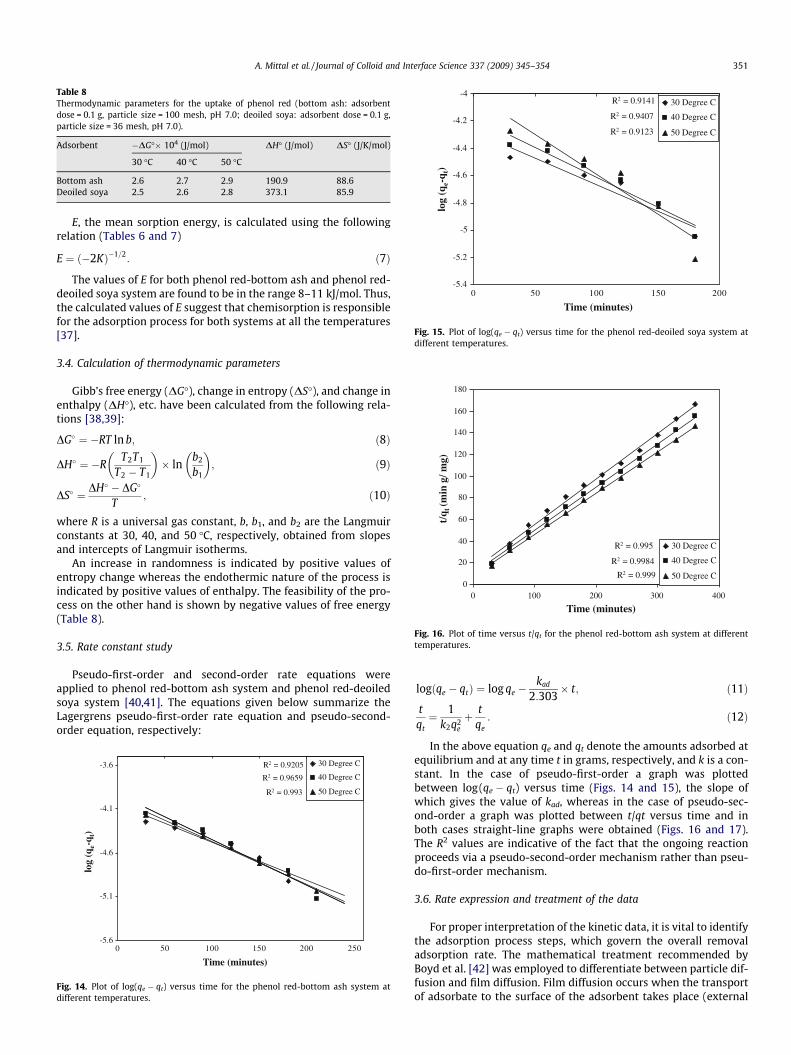
Table 8Thermodynamic parameters for the uptake of phenol red (bottom ash: adsorbentdose = 0.1 g, particle size = 100 mesh, pH 7.0; deoiled soya: adsorbent dose = 0.1 g,particle size = 36 mesh, pH 7.0).
Adsorbent �DG�� 104 (J/mol) DH� (J/mol) DS� (J/K/mol)
30 �C 40 �C 50 �C
Bottom ash 2.6 2.7 2.9 190.9 88.6Deoiled soya 2.5 2.6 2.8 373.1 85.9
R2 = 0.9141
R2 = 0.9407
R2 = 0.9123
-5.4
-5.2
-5
-4.8
-4.6
-4.4
-4.2
-4
0 50 100 150 200
Time (minutes)
log
(qe-
q t)
30 Degree C
40 Degree C
50 Degree C
Fig. 15. Plot of log(qe � qt) versus time for the phenol red-deoiled soya system atdifferent temperatures.
R2 = 0.995
R2 = 0.9984
R2 = 0.9990
20
40
60
80
100
120
140
160
180
0 100 200 300 400
Time (minutes)
t/q t
(min
g/ m
g)
30 Degree C
40 Degree C
50 Degree C
Fig. 16. Plot of time versus t/qt for the phenol red-bottom ash system at differenttemperatures.
A. Mittal et al. / Journal of Colloid and Interface Science 337 (2009) 345–354 351
E, the mean sorption energy, is calculated using the followingrelation (Tables 6 and 7)
E ¼ ð�2KÞ�1=2: ð7Þ
The values of E for both phenol red-bottom ash and phenol red-deoiled soya system are found to be in the range 8–11 kJ/mol. Thus,the calculated values of E suggest that chemisorption is responsiblefor the adsorption process for both systems at all the temperatures[37].
3.4. Calculation of thermodynamic parameters
Gibb’s free energy (DG�), change in entropy (DS�), and change inenthalpy (DH�), etc. have been calculated from the following rela-tions [38,39]:
DG� ¼ �RT ln b; ð8Þ
DH� ¼ �RT2T1
T2 � T1
� �� ln
b2
b1
� �; ð9Þ
DS� ¼ DH� � DG�
T; ð10Þ
where R is a universal gas constant, b, b1, and b2 are the Langmuirconstants at 30, 40, and 50 �C, respectively, obtained from slopesand intercepts of Langmuir isotherms.
An increase in randomness is indicated by positive values ofentropy change whereas the endothermic nature of the process isindicated by positive values of enthalpy. The feasibility of the pro-cess on the other hand is shown by negative values of free energy(Table 8).
3.5. Rate constant study
Pseudo-first-order and second-order rate equations wereapplied to phenol red-bottom ash system and phenol red-deoiledsoya system [40,41]. The equations given below summarize theLagergrens pseudo-first-order rate equation and pseudo-second-order equation, respectively:
R2 = 0.9205
R2 = 0.9659
R2 = 0.993
-5.6
-5.1
-4.6
-4.1
-3.6
0 50 100 150 200 250
Time (minutes)
log
(qe-
q t)
30 Degree C
40 Degree C
50 Degree C
Fig. 14. Plot of log(qe � qt) versus time for the phenol red-bottom ash system atdifferent temperatures.
logðqe � qtÞ ¼ log qe �kad
2:303� t; ð11Þ
tqt¼ 1
k2q2eþ t
qe: ð12Þ
In the above equation qe and qt denote the amounts adsorbed atequilibrium and at any time t in grams, respectively, and k is a con-stant. In the case of pseudo-first-order a graph was plottedbetween log(qe � qt) versus time (Figs. 14 and 15), the slope ofwhich gives the value of kad, whereas in the case of pseudo-sec-ond-order a graph was plotted between t/qt versus time and inboth cases straight-line graphs were obtained (Figs. 16 and 17).The R2 values are indicative of the fact that the ongoing reactionproceeds via a pseudo-second-order mechanism rather than pseu-do-first-order mechanism.
3.6. Rate expression and treatment of the data
For proper interpretation of the kinetic data, it is vital to identifythe adsorption process steps, which govern the overall removaladsorption rate. The mathematical treatment recommended byBoyd et al. [42] was employed to differentiate between particle dif-fusion and film diffusion. Film diffusion occurs when the transportof adsorbate to the surface of the adsorbent takes place (external
R2 = 0.9954
R2 = 0.9981
R2 = 0.99710
50
100
150
200
250
0 100 200 300 400
Time (minutes)
t/q t
(min
g/m
g)
30 Degree C
40 Degree C
50 Degree C
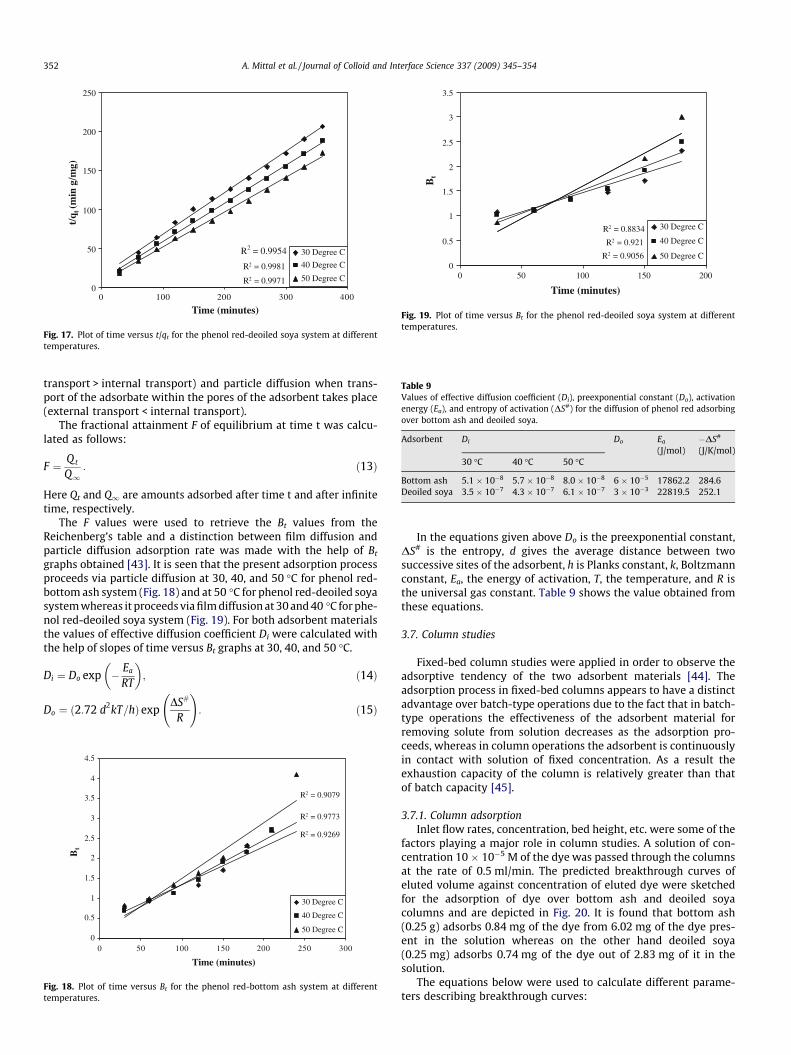
Fig. 17. Plot of time versus t/qt for the phenol red-deoiled soya system at differenttemperatures.
R2 = 0.8834
R2 = 0.921
R2 = 0.90560
0.5
1
1.5
2
2.5
3
3.5
0 50 100 150 200
Time (minutes)
Bt
30 Degree C
40 Degree C
50 Degree C
Fig. 19. Plot of time versus Bt for the phenol red-deoiled soya system at differenttemperatures.
Table 9Values of effective diffusion coefficient (Di), preexponential constant (Do), activationenergy (Ea), and entropy of activation (DS#) for the diffusion of phenol red adsorbingover bottom ash and deoiled soya.
Adsorbent Di Do Ea
(J/mol)�DS#
(J/K/mol)30 �C 40 �C 50 �C
Bottom ash 5.1 � 10�8 5.7 � 10�8 8.0 � 10�8 6 � 10�5 17862.2 284.6Deoiled soya 3.5 � 10�7 4.3 � 10�7 6.1 � 10�7 3 � 10�3 22819.5 252.1
352 A. Mittal et al. / Journal of Colloid and Interface Science 337 (2009) 345–354
transport > internal transport) and particle diffusion when trans-port of the adsorbate within the pores of the adsorbent takes place(external transport < internal transport).
The fractional attainment F of equilibrium at time t was calcu-lated as follows:
F ¼ Q t
Q1: ð13Þ
Here Qt and Q1 are amounts adsorbed after time t and after infinitetime, respectively.
The F values were used to retrieve the Bt values from theReichenberg’s table and a distinction between film diffusion andparticle diffusion adsorption rate was made with the help of Bt
graphs obtained [43]. It is seen that the present adsorption processproceeds via particle diffusion at 30, 40, and 50 �C for phenol red-bottom ash system (Fig. 18) and at 50 �C for phenol red-deoiled soyasystem whereas it proceeds via film diffusion at 30 and 40 �C for phe-nol red-deoiled soya system (Fig. 19). For both adsorbent materialsthe values of effective diffusion coefficient Di were calculated withthe help of slopes of time versus Bt graphs at 30, 40, and 50 �C.
Di ¼ Do exp � Ea
RT
� �; ð14Þ
Do ¼ ð2:72 d2kT=hÞ expDS#
R
!: ð15Þ
R2 = 0.9269
R2 = 0.9773
R2 = 0.9079
0
0.5
1
1.5
2
2.5
3
3.5
4
4.5
0 50 100 150 200 250 300
Time (minutes)
Bt
30 Degree C
40 Degree C
50 Degree C
Fig. 18. Plot of time versus Bt for the phenol red-bottom ash system at differenttemperatures.
In the equations given above Do is the preexponential constant,DS# is the entropy, d gives the average distance between twosuccessive sites of the adsorbent, h is Planks constant, k, Boltzmannconstant, Ea, the energy of activation, T, the temperature, and R isthe universal gas constant. Table 9 shows the value obtained fromthese equations.
3.7. Column studies
Fixed-bed column studies were applied in order to observe theadsorptive tendency of the two adsorbent materials [44]. Theadsorption process in fixed-bed columns appears to have a distinctadvantage over batch-type operations due to the fact that in batch-type operations the effectiveness of the adsorbent material forremoving solute from solution decreases as the adsorption pro-ceeds, whereas in column operations the adsorbent is continuouslyin contact with solution of fixed concentration. As a result theexhaustion capacity of the column is relatively greater than thatof batch capacity [45].
3.7.1. Column adsorptionInlet flow rates, concentration, bed height, etc. were some of the
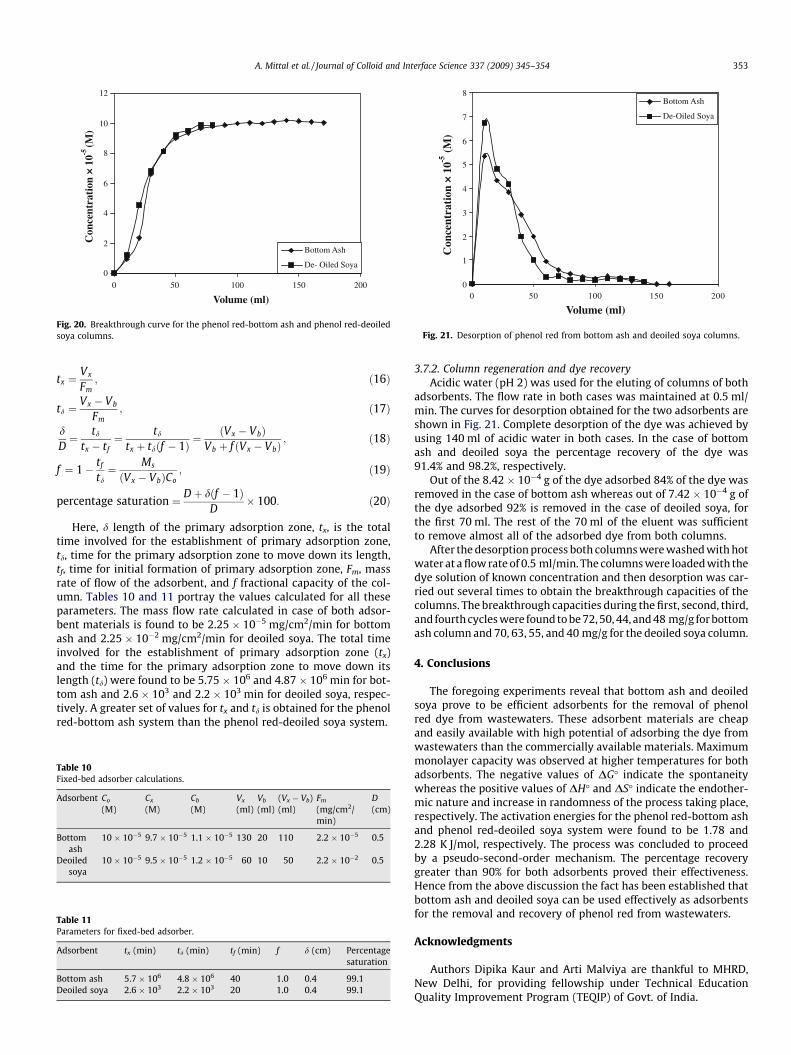
factors playing a major role in column studies. A solution of con-centration 10 � 10�5 M of the dye was passed through the columnsat the rate of 0.5 ml/min. The predicted breakthrough curves ofeluted volume against concentration of eluted dye were sketchedfor the adsorption of dye over bottom ash and deoiled soyacolumns and are depicted in Fig. 20. It is found that bottom ash(0.25 g) adsorbs 0.84 mg of the dye from 6.02 mg of the dye pres-ent in the solution whereas on the other hand deoiled soya(0.25 mg) adsorbs 0.74 mg of the dye out of 2.83 mg of it in thesolution.
The equations below were used to calculate different parame-ters describing breakthrough curves:
0
2
4
6
8
10
12
0 50 100 150 200
Volume (ml)
Con
cent
rati
on ×
10-5
(M
)
Bottom Ash
De- Oiled Soya
Fig. 20. Breakthrough curve for the phenol red-bottom ash and phenol red-deoiledsoya columns.
0
1
2
3
4
5
6
7
8
0 50 100 150 200
Volume (ml)
Con
cent
rati
on ×
10-5
(M
)
Bottom Ash
De-Oiled Soya
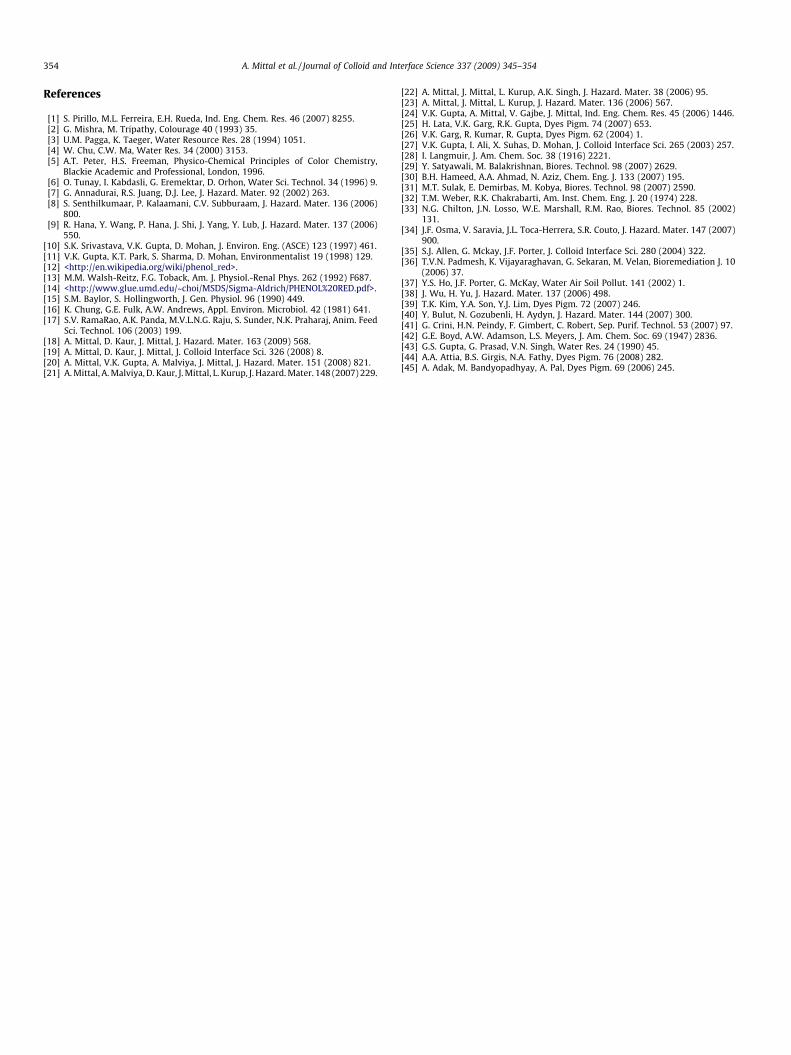
Fig. 21. Desorption of phenol red from bottom ash and deoiled soya columns.
A. Mittal et al. / Journal of Colloid and Interface Science 337 (2009) 345–354 353
tx ¼Vx
Fm; ð16Þ
td ¼Vx � Vb
Fm; ð17Þ
dD¼ td
tx � tf¼ td
tx þ tdðf � 1Þ ¼ðVx � VbÞ
Vb þ f ðVx � VbÞ; ð18Þ
f ¼ 1� tf
td¼ Ms
ðVx � VbÞCo; ð19Þ
percentage saturation ¼ Dþ dðf � 1ÞD
� 100: ð20Þ
Here, d length of the primary adsorption zone, tx, is the totaltime involved for the establishment of primary adsorption zone,td, time for the primary adsorption zone to move down its length,tf, time for initial formation of primary adsorption zone, Fm, massrate of flow of the adsorbent, and f fractional capacity of the col-umn. Tables 10 and 11 portray the values calculated for all theseparameters. The mass flow rate calculated in case of both adsor-bent materials is found to be 2.25 � 10�5 mg/cm2/min for bottomash and 2.25 � 10�2 mg/cm2/min for deoiled soya. The total timeinvolved for the establishment of primary adsorption zone (tx)and the time for the primary adsorption zone to move down itslength (td) were found to be 5.75 � 106 and 4.87 � 106 min for bot-tom ash and 2.6 � 103 and 2.2 � 103 min for deoiled soya, respec-tively. A greater set of values for tx and td is obtained for the phenolred-bottom ash system than the phenol red-deoiled soya system.
Table 10Fixed-bed adsorber calculations.
Adsorbent Co
(M)Cx
(M)Cb
(M)Vx
(ml)Vb
(ml)(Vx � Vb)(ml)
Fm
(mg/cm2/min)
D(cm)
Bottomash
10 � 10�5 9.7 � 10�5 1.1 � 10�5 130 20 110 2.2 � 10�5 0.5
Deoiledsoya
10 � 10�5 9.5 � 10�5 1.2 � 10�5 60 10 50 2.2 � 10�2 0.5
Table 11Parameters for fixed-bed adsorber.
Adsorbent tx (min) td (min) tf (min) f d (cm) Percentagesaturation
Bottom ash 5.7 � 106 4.8 � 106 40 1.0 0.4 99.1Deoiled soya 2.6 � 103 2.2 � 103 20 1.0 0.4 99.1
3.7.2. Column regeneration and dye recoveryAcidic water (pH 2) was used for the eluting of columns of both
adsorbents. The flow rate in both cases was maintained at 0.5 ml/min. The curves for desorption obtained for the two adsorbents areshown in Fig. 21. Complete desorption of the dye was achieved byusing 140 ml of acidic water in both cases. In the case of bottomash and deoiled soya the percentage recovery of the dye was91.4% and 98.2%, respectively.
Out of the 8.42 � 10�4 g of the dye adsorbed 84% of the dye wasremoved in the case of bottom ash whereas out of 7.42 � 10�4 g ofthe dye adsorbed 92% is removed in the case of deoiled soya, forthe first 70 ml. The rest of the 70 ml of the eluent was sufficientto remove almost all of the adsorbed dye from both columns.
After the desorption process both columns were washed with hotwater at a flow rate of 0.5 ml/min. The columns were loaded with thedye solution of known concentration and then desorption was car-ried out several times to obtain the breakthrough capacities of thecolumns. The breakthrough capacities during the first, second, third,and fourth cycles were found to be 72, 50, 44, and 48 mg/g for bottomash column and 70, 63, 55, and 40 mg/g for the deoiled soya column.
4. Conclusions
The foregoing experiments reveal that bottom ash and deoiledsoya prove to be efficient adsorbents for the removal of phenolred dye from wastewaters. These adsorbent materials are cheapand easily available with high potential of adsorbing the dye fromwastewaters than the commercially available materials. Maximummonolayer capacity was observed at higher temperatures for bothadsorbents. The negative values of DG� indicate the spontaneitywhereas the positive values of DH� and DS� indicate the endother-mic nature and increase in randomness of the process taking place,respectively. The activation energies for the phenol red-bottom ashand phenol red-deoiled soya system were found to be 1.78 and2.28 K J/mol, respectively. The process was concluded to proceedby a pseudo-second-order mechanism. The percentage recoverygreater than 90% for both adsorbents proved their effectiveness.Hence from the above discussion the fact has been established thatbottom ash and deoiled soya can be used effectively as adsorbentsfor the removal and recovery of phenol red from wastewaters.
Acknowledgments
Authors Dipika Kaur and Arti Malviya are thankful to MHRD,New Delhi, for providing fellowship under Technical EducationQuality Improvement Program (TEQIP) of Govt. of India.
354 A. Mittal et al. / Journal of Colloid and Interface Science 337 (2009) 345–354
References
[1] S. Pirillo, M.L. Ferreira, E.H. Rueda, Ind. Eng. Chem. Res. 46 (2007) 8255.[2] G. Mishra, M. Tripathy, Colourage 40 (1993) 35.[3] U.M. Pagga, K. Taeger, Water Resource Res. 28 (1994) 1051.[4] W. Chu, C.W. Ma, Water Res. 34 (2000) 3153.[5] A.T. Peter, H.S. Freeman, Physico-Chemical Principles of Color Chemistry,
Blackie Academic and Professional, London, 1996.[6] O. Tunay, I. Kabdasli, G. Eremektar, D. Orhon, Water Sci. Technol. 34 (1996) 9.[7] G. Annadurai, R.S. Juang, D.J. Lee, J. Hazard. Mater. 92 (2002) 263.[8] S. Senthilkumaar, P. Kalaamani, C.V. Subburaam, J. Hazard. Mater. 136 (2006)
800.[9] R. Hana, Y. Wang, P. Hana, J. Shi, J. Yang, Y. Lub, J. Hazard. Mater. 137 (2006)
550.[10] S.K. Srivastava, V.K. Gupta, D. Mohan, J. Environ. Eng. (ASCE) 123 (1997) 461.[11] V.K. Gupta, K.T. Park, S. Sharma, D. Mohan, Environmentalist 19 (1998) 129.[12] <http://en.wikipedia.org/wiki/phenol_red>.[13] M.M. Walsh-Reitz, F.G. Toback, Am. J. Physiol.-Renal Phys. 262 (1992) F687.[14] <http://www.glue.umd.edu/~choi/MSDS/Sigma-Aldrich/PHENOL%20RED.pdf>.[15] S.M. Baylor, S. Hollingworth, J. Gen. Physiol. 96 (1990) 449.[16] K. Chung, G.E. Fulk, A.W. Andrews, Appl. Environ. Microbiol. 42 (1981) 641.[17] S.V. RamaRao, A.K. Panda, M.V.L.N.G. Raju, S. Sunder, N.K. Praharaj, Anim. Feed
Sci. Technol. 106 (2003) 199.[18] A. Mittal, D. Kaur, J. Mittal, J. Hazard. Mater. 163 (2009) 568.[19] A. Mittal, D. Kaur, J. Mittal, J. Colloid Interface Sci. 326 (2008) 8.[20] A. Mittal, V.K. Gupta, A. Malviya, J. Mittal, J. Hazard. Mater. 151 (2008) 821.[21] A. Mittal, A. Malviya, D. Kaur, J. Mittal, L. Kurup, J. Hazard. Mater. 148 (2007) 229.
[22] A. Mittal, J. Mittal, L. Kurup, A.K. Singh, J. Hazard. Mater. 38 (2006) 95.[23] A. Mittal, J. Mittal, L. Kurup, J. Hazard. Mater. 136 (2006) 567.[24] V.K. Gupta, A. Mittal, V. Gajbe, J. Mittal, Ind. Eng. Chem. Res. 45 (2006) 1446.[25] H. Lata, V.K. Garg, R.K. Gupta, Dyes Pigm. 74 (2007) 653.[26] V.K. Garg, R. Kumar, R. Gupta, Dyes Pigm. 62 (2004) 1.[27] V.K. Gupta, I. Ali, X. Suhas, D. Mohan, J. Colloid Interface Sci. 265 (2003) 257.[28] I. Langmuir, J. Am. Chem. Soc. 38 (1916) 2221.[29] Y. Satyawali, M. Balakrishnan, Biores. Technol. 98 (2007) 2629.[30] B.H. Hameed, A.A. Ahmad, N. Aziz, Chem. Eng. J. 133 (2007) 195.[31] M.T. Sulak, E. Demirbas, M. Kobya, Biores. Technol. 98 (2007) 2590.[32] T.M. Weber, R.K. Chakrabarti, Am. Inst. Chem. Eng. J. 20 (1974) 228.[33] N.G. Chilton, J.N. Losso, W.E. Marshall, R.M. Rao, Biores. Technol. 85 (2002)
131.[34] J.F. Osma, V. Saravia, J.L. Toca-Herrera, S.R. Couto, J. Hazard. Mater. 147 (2007)
900.[35] S.J. Allen, G. Mckay, J.F. Porter, J. Colloid Interface Sci. 280 (2004) 322.[36] T.V.N. Padmesh, K. Vijayaraghavan, G. Sekaran, M. Velan, Bioremediation J. 10
(2006) 37.[37] Y.S. Ho, J.F. Porter, G. McKay, Water Air Soil Pollut. 141 (2002) 1.[38] J. Wu, H. Yu, J. Hazard. Mater. 137 (2006) 498.[39] T.K. Kim, Y.A. Son, Y.J. Lim, Dyes Pigm. 72 (2007) 246.[40] Y. Bulut, N. Gozubenli, H. Aydyn, J. Hazard. Mater. 144 (2007) 300.[41] G. Crini, H.N. Peindy, F. Gimbert, C. Robert, Sep. Purif. Technol. 53 (2007) 97.[42] G.E. Boyd, A.W. Adamson, L.S. Meyers, J. Am. Chem. Soc. 69 (1947) 2836.[43] G.S. Gupta, G. Prasad, V.N. Singh, Water Res. 24 (1990) 45.[44] A.A. Attia, B.S. Girgis, N.A. Fathy, Dyes Pigm. 76 (2008) 282.[45] A. Adak, M. Bandyopadhyay, A. Pal, Dyes Pigm. 69 (2006) 245.