adsorption of poly(ethylene oxide)- b -poly(ε-caprolactone) copolymers at the silica−water...
TRANSCRIPT

Adsorption of Poly(ethylene oxide)-b-poly(E-caprolactone)Copolymers at the Silica-Water Interface
P. Vangeyte,† B. Leyh,‡ O. J. Rojas,§ P. M. Claesson,|,⊥ M. Heinrich,#L. Auvray,¶,+ N. Willet,† and R. Jerome*,†
Center for Education and Research on Macromolecules (CERM), University of Liege,Sart-Tilman B6a, B-4000 Liege, Belgium, Laboratoire de Dynamique Moleculaire, Universityof Liege, Sart-Tilman B6c, B-4000 Liege, Belgium, Department of Wood and Paper Science,North Carolina State University, Box 8005, Raleigh, North Carolina 27695, Department ofChemistry, Surface Chemistry, Royal Institute of Technology, Drottning Kristinas vag 51,
SE-100 44 Stockholm, Sweden, Institute for Surface Chemistry, Box 5607, SE-114 86Stockholm, Sweden, Forschungszentrum Julich, Institut fur Festkorperforschung, Postfach
1913, D-52425 Julich, Germany, Laboratoire Leon Brillouin (CEA-CNRS), Saclay,91 191 Gif sur Yvette, France, and Laboratoire Materiaux Polymeres aux Interfaces (MPI),
University of Evry, Bat. des Sciences, 91 025 Evry Cedex, France
Received October 19, 2004. In Final Form: January 27, 2005
The adsorption of amphiphilic poly(ethylene oxide)-b-poly(ε-caprolactone) and poly(ethylene oxide)-b-poly(γ-methyl-ε-caprolactone) copolymers in aqueous solution on silica and glass surfaces has beeninvestigated by flow microcalorimetry, small-angle neutron scattering (SANS), surface forces, andcomplementary techniques. The studied copolymers consist of a poly(ethylene oxide) (PEO) block of Mn) 5000 and a hydrophobic polyester block of poly(ε-caprolactone) (PCL) or poly(γ-methyl-ε-caprolactone)(PMCL) of Mn in the 950-2200 range. Compared to homoPEO, the adsorption of the copolymers issignificantly increased by the connection of PEO to an aliphatic polyester block. According to calorimetricexperiments, the copolymers interact with the surface mainly through the hydrophilic block. At low surfacecoverage, the PEO block interacts with the surface such that both PEO and PCL chains are exposed tothe aqueous solution. At high surface coverage, a dense copolymer layer is observed with the PEO blocksoriented toward the solution. The structure of the copolymer layer has been analyzed by neutron scatteringusing the contrast matching technique and by tapping mode atomic force microscopy. The experimentalobservations agree with the coadsorption of micelles and free copolymer chains at the interface.
Introduction
Polymer adsorption at solid/liquid interfaces is a topicof great interest, which in addition to scientific relevancefinds application in very important technological andbiological fields, including stabilization of colloidal disper-sions (painting, detergency, and drug delivery) and surfacemodification (biocompatibility of artificial implants, wet-ting agents, etc.).1,2 In this respect, diblock copolymersplay a major role because one constitutive block may havehigh affinity for the surface, whereas the other block, withless or no affinity toward the surface, may protrude intosolution. These copolymers can therefore act as stabilizers
for solid dispersions3 and, as a rule, provide the surfacewith new properties.
Theoretical4-6 and experimental investigations7-14 havecontributed to the understanding of the adsorption of blockcopolymers. In aqueous solution, amphiphilic block co-polymers are known to self-assemble into micelles in orderto minimize the contact of water with the hydrophobiccomponent. In the presence of a hydrophobic surface,adsorption of amphiphilic diblock copolymers can be drivenby hydrophobic interactions.2,8-11 When the surface ishydrophilic, the way the copolymer interacts is lessobvious, as exemplified by the possible competitionbetween water and hydrophilic silica for interaction with
* To whom correspondence should be addressed: fax (32)4-3663497; e-mail [email protected].
† Center for Education and Research on Macromolecules (CERM),University of Liege.
‡ Laboratoire de Dynamique Moleculaire, University of Liege.§ Department of Wood and Paper Science, North Carolina State
University.| Department of Chemistry, Surface Chemistry, Drottning Kris-
tinas vag 51, Royal Institute of Technology.⊥ Institute for Surface Chemistry.# Forschungszentrum Julich, Institut fur Festkorperforschung.¶ Laboratoire Leon Brillouin (CEA-CNRS).+ Laboratoire Materiaux Polymeres aux Interfaces (MPI), Uni-
versity of Evry.(1) Goddard, E. D. Applications of Polymer-Surfactant Systems. In
Interactions of Surfactants with polymers and Proteins; Goddard, E. D.,Ananthapadmanabhan, K. P., Eds.; CRC Press: Boca Raton, FL, 1993;Chapter 10.
(2) Jonsson, B.; Lindman, B.; Holmberg, K.; Kronberg, B. Surfactantsand Polymers in Aqueous Solution; Wiley & Sons Ltd.: Chichester,1998; Chapter 14.
(3) Bijsterbosch, H. D.; Cohen Stuart, M. A.; Fleer, G. J. Macro-molecules 1998, 31, 9281.
(4) Schillen, K.; Claesson, P. M.; Malmsten, M.; Linse, P.; Booth, C.J. Phys. Chem. B 1997, 101, 4238.
(5) Marques, C. M.; Joanny, J. F.; Leibler, L. Macromolecules 1988,21, 1051.
(6) Evers, O. A.; Scheutjens, J. M. H. M.; Fleer, G. J. J. Chem. Soc.,Faraday Trans. 1990, 86, 1333.
(7) Yu, K.; Brinker, C. J.; Hurd, A. J.; Eisenberg, A. Polym. Prepr.2001, 42, 659.
(8) Abraham, T.; Giasson, S.; Gohy, J. F.; Jerome, R.; Muller, B.;Stamm, M. Macromolecules 2000, 33, 6051.
(9) Balastre, M.; Li, F.; Schorr, P.; Yang, J.; Mays, J. W.; Tirrell, M.V. Macromolecules 2002, 35, 9480.
(10) Lin, Y.; Alexandridis, P. J. Phys. Chem. B 2002, 106, 10834.(11) Shar, J. A.; Obey, T. M.; Cosgrove, T. Colloids Surf., A 1998,
136, 21.(12) Eskilsson, K.; Grant, L. M.; Hansson, P.; Tiberg, F. Langmuir
1999, 15, 5150.(13) McDermott, D. C.; Lu, J. R.; Lee, E. M.; Thomas, R. K.; Rennie,
A. R. Langmuir 1992, 8, 1204.(14) Gellan, A.; Rochester, C. H. J. Chem. Soc., Faraday Trans. 1
1985, 81, 2235.
2930 Langmuir 2005, 21, 2930-2940
10.1021/la047425+ CCC: $30.25 © 2005 American Chemical SocietyPublished on Web 03/04/2005

the hydrophilic block.15,16 Depending on the relative lengthof the two blocks, the copolymer can form either amonolayer with the hydrophilic blocks anchored to thesurface or adsorbed micelles (or a bilayer) as a result ofthe dominating hydrophobic interaction of the nonpolarblocks.13,14,17-19 It may also happen that the hydrophobicblocks prefer to be in contact with the hydrophilic surfacerather than to interact with the aqueous phase, leadingto the formation of a polymer monolayer.
As a rule, the solution properties of the copolymer andthe copolymer-surface interactions markedly influencethe conformation of the adsorbed chains. For instance,PEO-b-PPO-b-PEO copolymers (where PPO stands forpoly(propylene oxide)), known as Pluronics, are eithernonassociated or they form micelles in water dependingon the molecular structure, concentration, and temper-ature. The whole set of adsorbed structures can accordinglybe observed at the solid surface, i.e., monolayer, micelle,and bilayer.10,11,20
This work is devoted to the adsorption of amphiphilicdiblock copolymers from an aqueous solution onto glassand silica surfaces. These diblocks consist of a hydrophilicpoly(ethylene oxide) (PEO) block associated to a hydro-phobic block which can be either semicrystalline poly(ε-caprolactone) (PCL) or amorphous poly(γ-methyl-ε-caprolactone) (PMCL). These copolymers, particularlyPEO-b-PCL, are biocompatible and partly biodegrad-able.21,22 Because of the hydrophobicity of PCL,23 organiccosolvents are usually used to dissolve these amphiphilicdiblocks in water.24-26 This is one of the reasons why theirbehavior at water/solid interfaces has not been extensivelystudied. Tanodekaew27 studied PCL-b-PEO-b-PCL co-polymers with very short (PCL) hydrophobic blocks inaqueous solution after direct dissolution in water. Vang-eyte et al.28 reported recently on the methods for thepreparation of aqueous solutions of PEO-b-PCL copoly-mers.
Muller et al. studied the behavior of similar copolymers,i.e., poly(ethylene oxide)-b-poly(D,L-lactide) (PEO-b-PLA),
at the surface of both hydrophilic and hydrophobicsilica.29-31 To the best of our knowledge, no report hasbeen published on the adsorption of PEO-b-P(M)CLcopolymers at solid surfaces.
In this study, four PEO-b-P(M)CL copolymers with thesame PEO block (Mn ) 5000) and shorter P(M)CL blockshave been studied at the silica/water or glass/waterinterfaces. They have been dissolved directly in water andthen adsorbed on these hydrophilic surfaces. The extentof adsorption has been quantified by a total concentrationdepletion method and by flow microcalorimetry. Theadsorbed layer has been characterized by contact angleand surface force measurements. Finally, small-angleneutron scattering (SANS) and atomic force microscopy(AFM) have been used to analyze the conformation of thechains at the hydrophilic surface.
Experimental Section
Materials. The four diblock copolymers listed in Table 1 weresynthesized according to a two-step procedure detailed else-where.32 Briefly, a hydroxyl-terminated poly(ethylene oxide) ofMn ) 5000 (Polyscience) was used as a macroinitiator for thering-opening polymerization of (γ-methyl)-ε-caprolactone. Thehydroxyl end group was previously converted into an Al alkoxide,and the lactone/macroinitiator molar ratio was changed in orderto control the Mn of the polyester block.
Aqueous solutions of the copolymers (0.01-1 wt %) wereprepared in bidistilled water by heating at 82 °C for 12 minunder vigorous stirring, followed by stirring at room temperaturefor 18 h before analysis.28 For SANS experiments, a mixture ofH2O/D2O (40/60 wt/wt) was used for matching the contrastbetween the solvent mixture and silica. No measurement wascarried out with solutions older than 10 days.
In the case of the surface-force measurements, a 0.4 wt %stock solution in water was prepared under stirring at 80 °C for10 min. It was then sonicated and kept at rest overnight, beforeuse. Water was pretreated with a Millipore Milli-Q purificationsystem, which includes a reverse osmosis unit, a mixed-bed ionexchanger, an activated carbon cartridge, and a 0.2 µm filter.
Porous silica X015 M, supplied by Biosepra (France), was usedto measure the adsorption isotherms and to conduct flowmicrocalorimetry (FMC) and SANS experiments. According tothe manufacturer, the particle size was in the 40-110 µm range,and the average pore size and specific area were 1260 Å and 31m2/g, respectively.
Contact angles of ethylene glycol were measured at the surfaceof Vel glass slides (26 × 76 mm), after rinsing of the surface withtoluene, acetone, and bidistilled water, respectively, and thendrying at room temperature for 24 h before use. Silicon wafers(Infineon) with a 2 nm thick native silicon oxide layer were usedfor AFM measurements. Prior to use, they were washed withtoluene, acetone, hydrochloric acid (1 mol/L), and bidistilled waterand dried for 24 h at room temperature.
(15) Mathur, S.; Moudgil, B. M. J. Colloid Interface Sci. 1997, 196,92.
(16) Fu, Z.; Santore, M. Macromolecules 1998, 31, 7014.(17) Grant, L. M.; Ederth, T.; Tiberg, F. Langmuir 2000, 16, 2285.(18) Cummins, P. G.; Staples, E.; Penfold, J. J. Phys. Chem. 1990,
94, 3740.(19) Tiberg, F.; Jonsson, B.; Lindman, B. Langmuir 1994, 10, 3714.(20) Malmsten, M.; Linse, P.; Cosgrove, T. Macromolecules 1992, 25,
2474.(21) Zhao, Y.; Hu, T.; Wang, S.; Wu, C. J. Polym. Sci. Polym. Phys.
1999, 37, 3288.(22) Tjong, S. C.; Xu, Y.; Meng, Y. Z. Polymer 1999, 40, 3703.(23) Booth, C.; Attwood, D. Macromol. Rapid Commun. 2000, 21,
501.(24) Zhao, Y.; Liang, H.; Wang, S.; Wu, C. J. Phys. Chem. B 2001,
105, 848.(25) Kim, S. Y.; Lee, Y. M. Biomaterials 2001, 22, 1697.(26) Allen, C.; Maysinger, D.; Eisenberg, A. Colloids Surf., B 1999,
16, 3.(27) Martini, L.; Attwood, D.; Collett, J. H.; Nicholas, C. V.;
Tanodekaew, S.; Deng, N.; Heatley, F.; Booth, C. J. Chem. Soc., FaradayTrans. 1994, 90, 1961.
(28) Vangeyte, P.; Leyh, B.; Heinrich, M.; Grandjean, J.; Bourgaux,C.; Jerome, R. Langmuir 2004, 20, 8442.
(29) Muller, D.; Malmsten, M.; Tanodekaew, S.; Booth, C. J. ColloidInterface Sci. 2000, 228, 317.
(30) Muller, D.; Malmsten, M.; Tanodekaew, S.; Booth, C. J. ColloidInterface Sci. 2000, 228, 326.
(31) Muller, D.; Carlsson, F.; Malmsten, M. J. Colloid Interface Sci.2001, 236, 116.
(32) Vangeyte, P.; Jerome, R. J. Polym. Sci., Part A: Polym. Chem.2004, 42, 1132.
Table 1. Molecular Characteristics of PEO-b-PCL and PEO-b-PMCL Block Copolymers
samplePEOx-b-P(M)CLy
MnPEOa
Mn PCLb
(or PMCL) NAc NB
cEO/CL(mol %)
EO/CL(wt %) Mw/Mn
PEO114-b-PCL8 5000 950 114 8 93/17 83/17 1.10PEO114-b-PCL16 5000 1850 114 16 88/12 73/27 1.15PEO114-b-PCL19 5000 2200 114 19 86/14 69/31 1.15PEO114-b-PMCL12 5000 1500 114 12 90/10 77/23 1.12
a Determined by SEC with PEO standards. b Calculated from Mn PEO and the copolymer composition determined by 1H NMR. c NA andNB: number of monomer units in the PEO and PCL blocks, respectively.
Adsorption of Poly(ε-caprolactone) Containing Diblocks Langmuir, Vol. 21, No. 7, 2005 2931

Bare (hydrophilic) glass was used in the surface-force experi-ments. The glass surface was prepared by melting one end of aborosilicate glass rod in a butane-oxygen burner until the tipformed a sphere with a diameter of approximately 4 mm. It wasshown that flame-polished glass surfaces have a typical root meansquare roughness of 0.10 nm,33 which allows for the accuratemeasurement of interaction forces.
MethodsAdsorption Isotherms. The adsorption isotherms
were measured according to the classical total concentra-tion depletion method. One hundred milligrams of silicawas dispersed in 2 mL of copolymer aqueous solutions ofvarious concentrations and gently shaken for 48 h, whichwas long enough for the adsorption to reach equilibrium.The amounts of silica and copolymer solution werebalanced for a large enough depletion to be measured.The silica particles were separated by sedimentation, andthe PEO-b-P(M)CL concentration was determined by 1HNMR, using a calibration curve based on the protonresonance for ethylene oxide at 3.65 ppm and methylenechloride (at 0.15 wt % constant concentration) at 5.3 ppm.The relaxation delay between pulses was 5 s, i.e., fivetimes longer than T1.
Flow Microcalorimetry (FMC). Adsorption experi-ments were performed with a Microscal flow micro-calorimeter, equipped with a calorimetric cell (0.17 mLvolume) and a downstream refractometer as detailed byGroszek.34 The cell was filled with 0.06 g (accuratelyweighed) of silica and eluted with either water or a blockcopolymer solution of known concentration at a constantflow rate of 3 mL/h. Heat exchanges in the cell weredetected by two adjacent thermistors and recorded as afunction of time. The peak area was proportional to thetotal heat released or absorbed and compared to a referencepeak recorded under similar conditions as a result of aknown current flowing through a resistance. The experi-mental adsorption heat was reproducible with a standarddeviation of ∼5%.
Because the preadsorbed solvent was displaced by theflowing copolymer solution, the enthalpy of displacementwas measured rather than the enthalpy of adsorption.35
The heat of displacement, ∆Hdis, was calculated from theexperimental calorimetric peak, Q, according to eq 1
where ∆Ηdil is thedilutionenthalpy,whichwasdeterminedby flowing the copolymer solution (blank experiment)through the cell filled with Teflon (poly(tetrafluoroeth-ylene)) rather than with silica (Figure 3, bottom).
The amount of compound adsorbed onto silica wascalculated as follows. The concentration of the effluentwas monitored as a function of time by the downstreamrefractive index detector. The same experiment wasrepeated with the cell filled with Teflon instead of silica.Because of the very low surface area (0.1 m2/g) of Teflonand its low affinity for hydrocarbons, it was assumed thatthe copolymer was not adsorbed at all. The amount ofsolute retained on silica was then calculated from thedifference between the refractive index signals in the twoexperiments (Figure 3, top).
Contact Angle. The contact angle of ethylene glycolwas measured on precoated glass. Water was not usedbecause of the possible solubilization of the adsorbed
copolymer. Ethylene glycol has a polar component ofsurface energy (21.3 mN/m) lower than that of water (46.8mN/m), and its viscosity at ambient conditions facilitatesdrop formation and deposition. The experimental deviceconsisted of a camera (Electronic Shutter C 800) for thecapture of the drop image and software (PC-scope SceneVersion 1.01) for the calculation of the contact angle fromthe height and diameter of the drop. The glass slides werecoated by immersing them (for 1 or 48 h) in concentrated(0.6 wt %) or diluted (0.015 wt %) copolymer solutionsusing water (for PEO and PEO-b-PCL) or toluene (for PCL)as a solvent. The slides were finally dried and stored atroom temperature. The values reported for contact angleswere the average of at least 20 measurements.
Surface Interaction Forces. Forces were measuredwith a noninterferometric surface-force apparatus knownas MASIF.36 A bimorph force/deflection sensor measuredinteraction forces versus surface separation between twospherical surfaces. One of the surfaces (the bottom surface)was mounted on the tip of the bimorph and the other one(the upper surface) on a piezoelectric tube. The assemblywas placed in a stainless steel cell of ∼10 mL and mountedon a translation stage isolated from electrical and soundnoise. In a typical force measurement, the upper surfacewas driven by applying a triangular voltage wave to thepiezo crystal. The charge triggered by any deflection ofthe bimorph (that held the lower surface), as a result ofrepulsive or attractive forces, was recorded simulta-neously. Once the surfaces came into hard-wall contact,the motion of the piezo directly deflected the bimorphallowing the force sensor to be calibrated against theknown piezo crystal expansion (and contraction) asmeasured by a linear variable differential transformer(LVDT). From the deflection and the spring constant ofthe bimorph, the data were converted into force-distancecurves by application of Hooke’s law. It must be notedthat the noninterferometric surface-force apparatus wasnot suited to the absolute determination of the zero surfaceseparation and thus of the layer thickness. The distancereported in the figures was calculated from the hard wallcontact.
The normal radii of curvature (r1 and r2) for each surfacewere measured at the end of the experiment with amicrometer, and the local harmonic mean radius ofinteraction, R, was calculated as R ) 2r1r2/(r1 + r2). Thespring constant of the bimorph (typically 100 N/m) wasalso determined at the end of each experiment from thedeflection produced by placing known weights on thesensor. The force (F) was normalized by the harmonicmean radius of the surfaces (F/R).
The measurement chamber was assembled, and thesolutions were prepared in a laminar flow cabinet. Beforeeach series of experiments, the interaction profiles weredetermined in air to ensure that the system was free fromcontamination. Water was then added into the chamber,and the interaction profile was recorded. A concentratedstock polymer solution was then added until the desiredconcentration in the chamber was attained. To changethe polymer concentration, part of the volume of thechamber was drained and replaced by a polymer solutionof appropriate composition. Therefore, each solution wasin contact with a surface preequilibrated with the previous(more diluted) solution rather than with a bare surface.
In some cases, the experimental forces were analyzedby the classical Derjaguin-Landau-Verwey-Overbeektheory,37,38 taking into account the double-layer and
(33) Ederth, T.; Claesson, P. M.; Lindberg, B. Langmuir 1998, 14,4782.
(34) Groszek, A. J. Thermochim. Acta 1998, 312, 133.(35) Rouquerol, J. Pure Appl. Chem. 1985, 57, 69.
(36) Parker, J. L.; Claesson, P. M. Langmuir 1994, 10, 635.(37) Dejarguin, B.; Landau, L. Acta Physiochem. 1941, 14, 633.
∆Hdis ) Q - ∆Hdil (1)
2932 Langmuir, Vol. 21, No. 7, 2005 Vangeyte et al.

attractive van der Waals forces. The double-layer forcewas calculated according to the nonlinear Poisson-Boltzmann model, under conditions of constant surfacecharge boundary, which usually provides a better ap-proximation of the measured forces than those calculatedunder constant potential boundary conditions. The vander Waals forces between the block-copolymer-coatedinterfaces were estimated on the basis of a three-layer(surface-polymer layer-solvent) model.39
Small-Angle Neutron Scattering (SANS). SANSexperiments were performed at the FRJ-2 reactor (For-schungszentrum Julich, Germany) using the KWS-1instrument and at the Orphee reactor of the LaboratoireLeon Brillouin (Saclay, France) with the PACE instru-ment. The samples were kept in quartz cells of 1 mm(KWS-1) or 2 mm (PACE) path length.
Samples were prepared in the same way as for themeasurement of the adsorption isotherms. After silica wasmixed with the copolymer solution, the supernatant waseliminated, and the silica particles were rinsed two timeswith the solvent in order to eliminate the interstitialcopolymer solution.
The KWS-1 small-angle spectrometer was equippedwith a two-dimensional area detector of 60 × 60 cm2 witha space resolution of 0.8 × 0.8 cm2. The neutron wave-length, λ, was set at 7 Å with a resolution (∆λ/λ) of 20%.The beam cross section was 6 × 6 mm2. The measurementswere performed at two sample-to-detector distances (8and 2 m) corresponding to the scattering vector (q) rangesof 0.006-0.04 and 0.024-0.15 Å-1, respectively. Radialaveraging led to a one-dimensional scattering functionI(q). Measurements on the PACE instrument were per-formed at a neutron wavelength of 5 Å, with a resolutionof 10%, a beam diameter of 10 mm, and a range ofscattering vector, q, extending from 0.004 to 0.044 Å-1
(sample-detector distance of 4.7 m) and from 0.014 to0.15 Å-1 (distance of 2.8 m). The data were collected witha two-dimensional area detector made of 30 concentricrings of 1 cm width.
Parasitic contributions of the electronic and ambientbackground and the sample holder were eliminated bystandard data handling procedures. The scattering in-tensities were converted to macroscopic scattering crosssections per unit volume, dΣ/dΩ (unit: length-1), basedon a calibration with either low-density polyethylene(LUPOLEN) (KWS-1) or the incoherent scattering of water(PACE). The polymer contribution to the scattering crosssection was determined by subtracting the cross sectionfor wet bare silica, weighted by its volume fraction.
Whenever the inverse (q-1) of the scattering vector issmall compared to the radius of curvature of the solid-liquid interface, the latter is considered as flat at this qscale (Porod’s condition). Because the largest q-1 valuesampled in the experiments, q-1 ) (0.004 Å-1)-1 ) 250 Å,was much smaller than the typical silica dimensions(particle diameter of 40-110 µm and pore size of 1260 Å),the condition for this approximation was fulfilled. More-over, the interface was randomly oriented with respect tothe scattering vector.
For an isotropic and incompressible three-componentsystem (polymer/solid/solvent), the macroscopic crosssection per sample unit volume, dΣ/dΩ is given by eq 240
where np, ng, and ns, are the scattering length densitiesof the scattering units of the polymer (p), the solid grain
(g), and the solvent (s), respectively. The three partialstructure factors correspond to the polymer-polymer (Spp),polymer-solid (Spg), and solid-solid (Sgg) correlations. Thecontrast of silica (ng) and the solvent (ns) was matched byusing a 60/40 wt/wt D2O/H2O mixture.41 Equation 2 wasthen reduced to
The coherent scattering cross section then depended onlyon the characteristics of the layer adsorbed at the interface(adsorbed mass per surface unit, layer thickness, andstructure) and on the specific interfacial area, S/V (S isthe total surface area at the solid/liquid interface and Vis the sample volume). As reported in the results anddiscussion section, different adsorption models wereconfronted with the experimental data.
Atomic Force Microscopy (AFM). AFM experimentswere carried out with a Nanoscope III microscope (DigitalInstrument Inc.) operated in air at room temperature inthe Tapping Mode. The instrument with the ExtenderElectronics Module provided height and phase imagessimultaneously. Samples were prepared by dipping thesilicon wafer in a copolymer aqueous solution of appropri-ate concentration (0.7 or 0.015 wt %) for 2 h. The excesssolution was eliminated by gravity drainage, followed bywashing with a small amount of bidistilled water anddrying at room temperature for 24 h.
Results and DiscussionAdsorption of PEO-b-P(M)CL. Figure 1 compares
the adsorption isotherms for homoPEO and the PEO-b-P(M)CL copolymers under investigation (Table 1) onhydrophilic silica, as measured by the total concentrationdepletion method. PEO (Mn ) 5000) exhibits a highadsorption affinity with a plateau value of ∼0.31 mg/m2,in good agreement with reported data.42-44 This observa-tion validates the experimental method.
(38) Verwey, E. G. W.; Overbeek, J. T. G. The Theory of the Stabilityof Liophobic Colloids; Elsevier: Amsterdam, 1948.
(39) Ninham, B. W.; Parsegian, V. A. J. Chem. Phys. 1970, 52, 4578.(40) Auvray, L. Scattering by Polymers at Interfaces, In Neutron,
X-ray and Light Scattering; Lindner, P., Zemb, T., Eds.; North-Holland: Amsterdam, 1991.
(41) Merzbacher, C. I.; Barker, J. G.; Swider, K. E.; Rolison, D. R.J. Non-Cryst. Solids 1998, 224, 92.
(42) Dijt, J. C.; Cohen Stuart, M. A.; Fleer, G. J. Macromolecules1994, 27, 3219.
(43) Linse, P.; Hatton, T. A. Langmuir 1997, 13, 4066.(44) Rippner, B.; Boschkova, K.; Claesson, P. M.; Arnebrant, T.
Langmuir 2002, 18, 5213.
Figure 1. Adsorption isotherms for the PEO114-b-PCL8 (2),PEO114-b-PCL16 (/), PEO114-b-PCL19 (4), and PEO114-b-PMCL12(0) copolymers and PEO (O) on silica, as measured by theconcentration depletion method (lines are a guide for eyes).
dΣdΩ
(q) ) (np - ns)2Spp(q) (3)
dΣdΩ
(q) ) (np - ns)2Spp(q) + (ng - ns)
2Sgg(q) +
2(np - ns)(ng - ns)Spg(q) (2)
Adsorption of Poly(ε-caprolactone) Containing Diblocks Langmuir, Vol. 21, No. 7, 2005 2933

The adsorbed amount is higher for the PEO-b-P(M)CLcopolymers than for PEO of similar molecular weight.Moreover, the maximum adsorption increases with thehydrophobic block length, which indicates that this blockplays an important role in the adsorption mechanism.
The adsorption isotherm of PEO is typical of the highaffinity type, i.e., a high adsorbed amount even at lowconcentrations. In contrast, the shape of the adsorptionisotherms for the block copolymers is sigmoidal, which isindicative of a cooperative adsorption mechanism. Quitecomparable adsorption isotherms were reported for PEO-containing surfactants of low molecular weight on silica.45
At a critical concentration, usually lower than the bulkcritical micelle concentration (cmc), these surfactants arecommonly adsorbed cooperatively as micelles at theinterface and the adsorbed amount levels off at the cmc.46
A similar behavior was reported for block copolymers,29,30
although there is no clear relationship between the bulkcmc and the onset of the cooperative adsorption at theinterface.
Eskilsson et al.12 studied the adsorption of triblockcopolymers of PEO and polytetrahydrofuran (PTHF)(PEO-b-PTHF-b-PEO) on hydrophilic silica. The onset ofcooperative adsorption occurs at a concentration ap-proximately 2 orders of magnitude lower than the bulkcmc. The lower aggregation number at the interfacecompared to micelles in the bulk solution suggests apreferential interface-induced micellization prior to theusual bulk micellization. Muller et al.29 studied theadsorption of PEO-b-PLA on hydrophilic silica and acooperative adsorption process was reported, although atconcentrations exceeding the cmc. The experimentalresults were not consistent for copolymers of differentmolecular weights, such that no direct correlation betweenadsorption and bulk micellization could be drawn.
In this work, the cooperative adsorption (Figure 1) startsat a concentration higher than the cmc estimated fromsurface tension measurements.28 Table 2 compares thecooperative adsorption concentration (Cc) and the bulkmicellization concentration (cmc). Figure 1 shows thatthe cooperative adsorption regime occurs over a largeconcentration range, similarly to the broad discontinuityin the surface tension data at the cmc. This observationis probably related to a polydispersity effect and the fasterdepletion of the more surface active components from thebulk solution.43 Therefore, the cmc for block copolymersmay be underestimated when extracted from surfacetension measurements.44 Direct comparison of the onsetof bulk micellization and cooperative binding to the solidsurfaces is thus unreliable.
The amounts of PEO114-b-PCL19 and PEO114-b-PCL8copolymers adsorbed on silica upon increasing concentra-
tion in solution were determined by flow microcalorimetry(Figure 2). Even though the shape of the adsorptionisotherms measured by FMC and by the total depletionmethod (Figure 1) is not the same (static vs dynamicmethods), the maximum adsorbed amount is similar inthe two cases (Table 2).
The heat exchange upon adsorption was measured forboth silica and Teflon. Figure 3 shows that the adsorptionof PEO-b-PCL block copolymers is exothermic on silica,whereas no heat is exchanged when Teflon is substitutedfor silica, which indicates that the copolymer adsorptionon Teflon and ∆Hdil (dilution enthalpy variation) arenegligible. The heat exchanged upon adsorption of PEO114-b-PCL19, PEO114-b-PCL8, and PEO was measured as afunction of their concentration. A small increase isobserved from ∼10 to ∼13 mJ/m2 with increased concen-tration from 0.2 to 1.5 wt %. Below 0.2 wt %, theexperimental data fluctuate as a result of slow adsorptionwhich makes determination of the end of the adsorptionpeak difficult. Experiments were also conducted forcopolymers at a constant concentration (0.3 wt %) as afunction of the hydrophobic block length. This structuralparameter has no significant effect on ∆Hdis, at least inthe investigated range (Mn PCL < 2500). This observationindicates that the hydrophobic PCL block does not interactdirectly with silica at this copolymer concentration.
Elution of the adsorbed copolymer with pure watershows a very weak endothermic (desorption) peak (∼0.2
(45) Levitz, P. Langmuir 1991, 7, 1595.(46) Clunie, J. S.; Ingram, B. T. Adsorption of Nonionic Surfactants.
In Adsorption from Solution at the Solid/Liquid Interface; Parfitt, G.D., Rochester, C. H., Eds.; Academic Press: London, 1983; Chapter 3.
Table 2. cmc in Water and Adsorption Properties of PEOand PEOx-b-P(M)CLy Copolymers at the Hydrophilic
Silica-Water Interface
samplecmca
(wt %)Cc
b
(wt %)Γmax (AI)(mg/m2)
Γmax (FMC)(mg/m2)
PEO114 0.31 0.35PEO114-b-PCL8 0.0045 0.078 1.09 1.19PEO114-b-PCL16 0.0015 0.022 1.63PEO114-b-PCL19 0.0011 0.026 1.58 1.65PEO114-b-PMCL12 0.0023 0.042 1.42
a From ref 28. b Concentration at which the cooperative adsorp-tion occurs, as determined from the adsorption isotherms (AI).
Figure 2. Adsorbed amount of PEO114-b-PCL8 (O), PEO114-b-PCL19 ([), and PEO (4) on hydrophilic silica as a function ofconcentration in water, measured by FMC at a flow rate of 3mL/h.
Figure 3. Simultaneous record of the heat exchanged onadsorption (bottom) on silica (full line) and Teflon (dashed line)and the amount of PEO114-b-PCL19 copolymer adsorbed by FMC(top) from a 0.3 wt % PEO114-b-PCL19 aqueous solution on at25 °C. Flow rate ) 3 mL/h.
2934 Langmuir, Vol. 21, No. 7, 2005 Vangeyte et al.

mJ/m2) (Figure 3, bottom), and the refractometric mea-surements indicate that a very small amount of copolymeris actually desorbed. The copolymer adsorption is thusbasically irreversible.47
Surface Behavior. The contact angle of ethylene glycolwas measured at the surface of glass slides previouslydipped in aqueous solutions of PEO114-b-PCL19 and PEO114-b-PCL8, with a 0.015 and 0.6 wt % concentration, for either1 or 48 h. AFM images of the surface (vide infra) confirmedthat a copolymer layer was deposited on the glass slideafter dipping and drying.
The data reported in Table 3 show that the contactangles measured for films deposited from high concentra-tion solutions (0.6 wt %) are independent of the adsorptiontime (the differences are in the limits of the experimentalerror) except for the diblock polymer with the higher PCLcontent. As a rule, the contact angles for the two diblocksare very close to that of PEO at long equilibration time.This indicates that PCL is buried within the film. However,when the Mn of the PCL block is higher, it seems that atleast part of PCL is initially exposed to water and that ittakes time for it to reorganize beneath the surface.
At low surface coverage (adsorption from dilute co-polymersolution), thecontact angle for thePEO114-b-PCL19copolymer is much higher even for a long dipping periodof time. At this concentration (lower than Cc), thecopolymer forms micelles in equilibrium with free chains.Upon adsorption, the nonassociated copolymer chains arealso adsorbed in such a way that PCL chains contributeto the contact angle, which accordingly is higher thanthat of PEO (and bare silica surfaces). Although the PCLchains strive to avoid contact with water, they do not wantto interact with silica, as shown by FMC. Therefore, thesehydrophobic chains have to adopt a conformation suchthat they minimize their presence at the two interfacesas extensively as possible.
Surface-force measurements were performed first withbare glass surfaces. The interaction forces between twobare glass surfaces across water is shown in Figure 4. Theforce-distance relationship fits the DLVO profile downto a separation of ca. 5 nm. At shorter separation distances,extra repulsion forces dominate. Short-range repulsiveforces between glass or silica surfaces in aqueous solutionhave been reported previously48,49 and rationalized interms of dehydration of polar silanol groups (hydrationforces)50 or compression of short polysialic acid chains(steric repulsion).48 The apparent surface potential at largeseparation distances and the area per surface chargeextracted from the curve fitting on the assumption ofconstant surface charge boundary conditions are -71 mV(1.85 × 10⁻³ C/m2) and 86.5 nm2, respectively.
Figure 5 shows that the addition of PEO114-b-PCL19 upto concentration of 0.01 wt % results in a remarkablechange in the surface-force profile. The long-range double-
layer repulsive force observed in the case of the baresurfaces is replaced by repulsive steric interactions.Furthermore, the force profile on retraction shows amoderately strong adhesion that was originally absent.This observation confirms that adsorption occurs at thislow polymer concentration in agreement with the adsorp-tion isotherm shown in Figure 1. It must be noted thatupon separation, the force profile does not show the typicaljump out of contact. This situation occurs when the appliednegative force exceeds the adhesion force and the forcegradient exceeds the spring constant. In the present case,the attractive forces decay gradually up to an apparentsurface separation of approximately 80-100 nm. Despite
(47) Cohen Stuart, M. A.; Fleer, G. J.; Scheutjens, J. M. H. M. J.Colloid Interface Sci. 1984, 97, 515.
(48) Vigil, G.; Xu, Z.; Steinberg, S.; Israelachvili, J. J. Colloid InterfaceSci. 1994, 165, 367.
(49) Yaminsky, V. V.; Ninham, B. W.; Pashley, R. M. Langmuir 1998,14, 3223.
(50) Chapel, J. P. Langmuir 1994, 10, 4237.
Table 3. Contact Angles of Ethylene Glycol at the Silica Surface after Adsorption of PEO, PCL, and PEOx-b-PCLyCopolymers
contact angles (deg)incubationtime (h)
concn(wt %) silica PEO PCL PEO114-b-PCL19 PEO114-b-PCL8
48 0.6 15.0 ( 2.0 30.8 ( 3.8 52.4 ( 3.2 28.9 ( 4.1 33.2 ( 4.60.015 40.2 ( 5.1
1 0.6 30.1 ( 3.6 55 ( 4.2 37.3 ( 3.3 36.7 ( 5.6
Figure 4. Interaction force normalized by the radius as afunction of the separation distance of glass spheres across water.The inward and outward runs overlap. A semilogarithmic plotis shown in the inset, with a DLVO fitting with an apparentsurface potential Ψ0 ) -71 mV, a Debye lengthκ-1 ) 37 nm and a Hamaker constant A ) 0.7 × 10⁻²⁰ J. Dataare collected with the bimorph surface force apparatus (MASIF)at 22 °C.
Figure 5. Force normalized by the radius as a function of theseparation distance of glass spheres across 0.01 wt % PEO114-b-PCL19 aqueous solution. The filled black circles curve is theapproach curve and the open circles curve is the separation(outward) one after equilibrium. The data were collected withthe bimorph surface force apparatus (MASIF) at 22 °C.
Adsorption of Poly(ε-caprolactone) Containing Diblocks Langmuir, Vol. 21, No. 7, 2005 2935

the fact that during the approach no polymer bridgingtakesplace, itappears thatafter thesurfaces reachcontact,polymer chains interpenetrate the adsorbed layers of bothsurfaces. As a result, polymer bridging is established, andthe adhesion observed during retraction of the surfacesinvolves the gradual unfolding and extension of polymerchains.
It must be noted that the adhesion force is higher thanthat between PEO-coated surfaces51 and significantlysmaller than that between nonpolar surfaces.52 Thisobservation is consistent with the contact angle datareported at low polymer concentrations.
Figure 6 shows the interaction force profile at the higherpolymer concentration of 0.1 wt %. The long-range forceprofile on approach monitored after 2-5 h of equilibrationis comparable to the one measured at the lower polymerconcentration. However, a lower repulsive force is observedat short distances, which indicates that the layer structurepartially collapses as the surfaces are forced together.Finally, a strong repulsion is observed at very shortdistances. On retraction, the adhesion is noticeably lowerthan at the 0.01 wt % concentration. In reference to theprevious explanation for the origin of the adhesion, it mightbe concluded that the partial availability of PCL at thesurface after 5 h of incubation (see contact angle data inTable 3) is a plausible explanation. The hydrophobicinteraction and layer entanglements can account for thelayer structure relaxation during separation, as stronglysuggested by the fact that the surfaces come apart at afinite distance with respect to the hard wall contact (thiswas not the case at the lower polymer concentration).
After equilibrium adsorption, i.e., after more than 22h of incubation, the force profile changes significantly.Both the layers collapse on approach and the adhesionobserved under decompression disappears, which is
indicative of slow structural changes in the adsorbed layer,more likely leading to a surface layer of PEO in contactwith water. It should be noted that the same behaviorwasobservedatdifferent contactareasafter the incubationtime, which rules out possible effects due to experimentalconditions or the way the surfaces were probed. Theinteraction profile depends on the rate of approach andseparation as illustrated in the inset of Figure 6. Whenthe driving rate is increased from 6 to 56 nm/s, increasedrepulsion upon compression and adhesion upon separationare noted, consistent with more important hydrodynamicinteractions at higher driving rates.
No sudden change in the force profile is observed eitherupon approach or retraction, which supports that thepolymer layer remains adsorbed as is the case for a denselypacked adsorbed layer.
Substitution of water and later of a NaCl solution (upto 10 mM concentration) for the polymer solution does notsignificantly change the force profile, which also suggeststhat no desorption occurs, as was observed by FMC. Thisobservation is in contrast to the adsorption of diblockcopolymers of PEO and polylactide on hydrophilic silica,29
which were partially desorbed under similar conditions.Structure of the Adsorbed Layer. SANS Experi-
mental Data and Layer Models. Small-angle neutronscattering experiments were performed with the copoly-mers adsorbed on hydrophilic silica, at the saturationregime (i.e., concentration at the maximum of the adsorp-tion isotherms) and the half-saturation regime (i.e.,concentration at the onset of the cooperative adsorption).
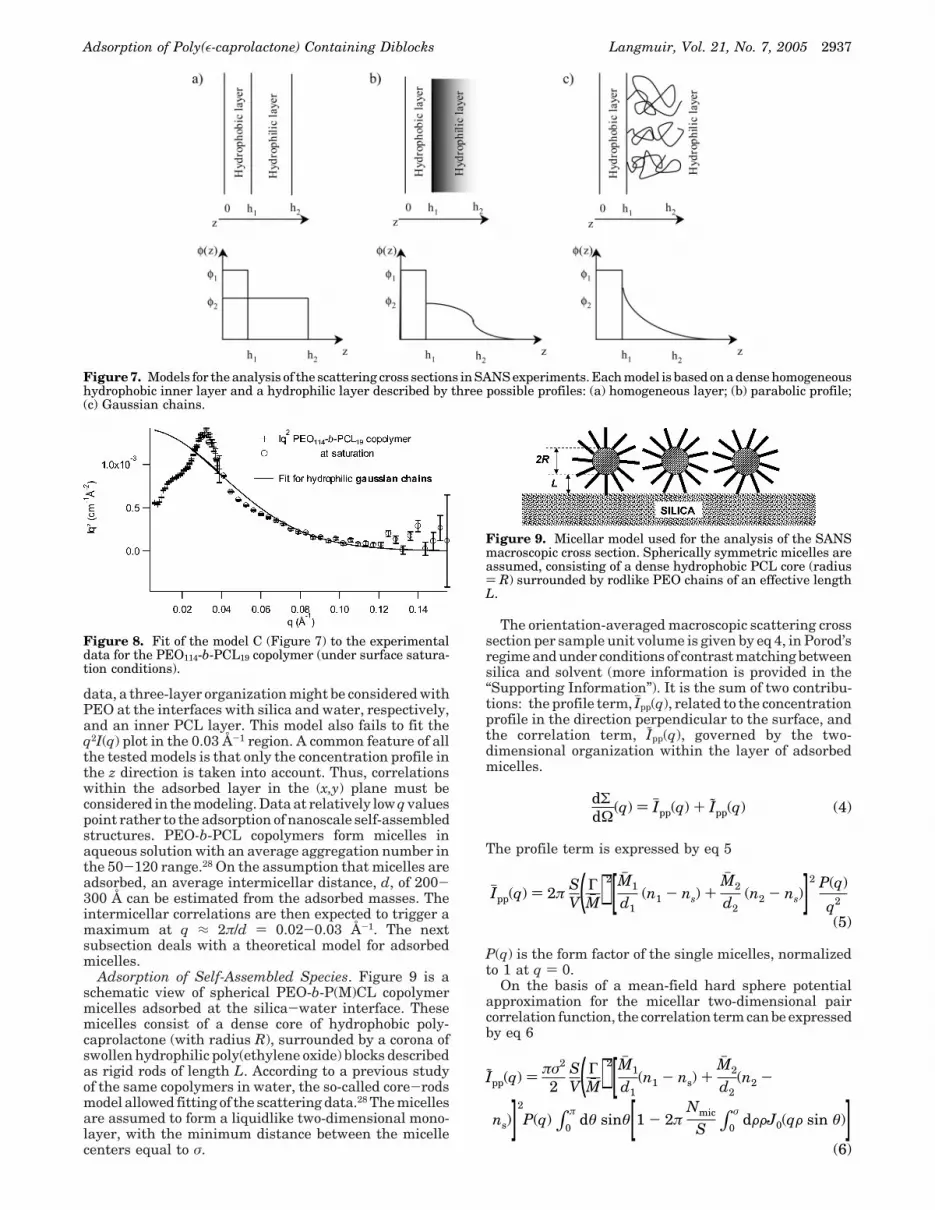
In the Porod’s regime, the scattered intensity dependson the concentration profile in the direction perpendicularto the interface, φ(z), and on the concentration fluctuationswithin the adsorbed layer in the directions parallel to theinterface (x and y directions).40,53 However, if the averagedistance between two adjacent adsorbed chains is smallcompared to 2π/q, the layer can be considered as homo-geneous along x and y, so that the scattering cross sectionis governed by φ(z) only. On the basis of the depletionmethod measurements, adsorbed quantities lie in the1-1.6 mg/m2 range. In the case of single chain adsorption,the average interchain distance within the (x,y) plane, a,is smaller than 30 Å. Correlation within the plane is thusexpected to be observed for q > 2π/30 ) 0.2 Å-1, i.e., abovethe q range sampled. Analytical models assuming differentconcentration profiles, φ(z), have been confronted withthe experimental data. The adsorbed copolymer has beenmodeled by two superimposed sublayers: a homogeneousdense hydrophobic layer in contact with the silica interface,covered by a hydrophilic layer with three possible con-centration profiles: (i) a homogeneous step concentrationprofile (Figure 7a); (ii) a homogeneous parabolic concen-tration profile (Figure 7b); (iii) Gaussian chains anchoredto the hydrophobic layer and spread according to a squarebidimensional network all over the surface (Figure 7c).The standard way to derive the scattering cross sectionfor such models can be found, e.g., in ref 40.
According to Auvray et al.,40,53 plotting the data as q2I(q)vs q is a useful representation. However, the three modelsare unable to account for the maximum observed in thelow q range (around q ) 0.03 Å-1), as illustrated by thefit of the model based on Gaussian chains anchored to thehydrophobic layer to the experimental data for the PEO114-b-PCL19 copolymer (Figure 8). Therefore, models basedon the superposition of homogeneous sublayers have tobe disregarded at least for the experimental conditions ofthis work. With reference to the contact angle and MASIF(51) Claesson, P. M.; Golander, C. G. J. Colloid Interface Sci. 1987,
117, 366.(52) Claesson, P. M.; Blom, C. E.; Herder, P. C.; Ninham, B. W. J.
Colloid Interface Sci. 1986, 114, 234. (53) Auroy, P.; Auvray, L.; Leger, L. Macromolecules 1991, 24, 2523.
Figure 6. Force normalized by the radius as a function of theseparation distance of glass spheres across 0.1 wt % PEO114-b-PCL19 aqueous solution. The filled gray circles curve (a) isthe approach curve after 5 h of incubation and the gray opencircles curve (a′) is the separation (outward) one. In both casesthe driving rate was 18 nm/s. The black circles curves are theforce profiles after 22 h of equilibration. The filled (b) and theopen symbols (b′) correspond to the inward and outward runs,respectively. The driving rate was 6 nm/s. Inset: comparisonof force after 22 h of equilibration recorded at a driving rate of6 and 56 nm/s, (b, b′) and (a, a′), respectively. The data werecollected with the bimorph surface force apparatus (MASIF) at22 °C.
2936 Langmuir, Vol. 21, No. 7, 2005 Vangeyte et al.
data, a three-layer organization might be considered withPEO at the interfaces with silica and water, respectively,and an inner PCL layer. This model also fails to fit theq2I(q) plot in the 0.03 Å-1 region. A common feature of allthe tested models is that only the concentration profile inthe z direction is taken into account. Thus, correlationswithin the adsorbed layer in the (x,y) plane must beconsidered in the modeling. Data at relatively low q valuespoint rather to the adsorption of nanoscale self-assembledstructures. PEO-b-PCL copolymers form micelles inaqueous solution with an average aggregation number inthe 50-120 range.28 On the assumption that micelles areadsorbed, an average intermicellar distance, d, of 200-300 Å can be estimated from the adsorbed masses. Theintermicellar correlations are then expected to trigger amaximum at q ≈ 2π/d ) 0.02-0.03 Å-1. The nextsubsection deals with a theoretical model for adsorbedmicelles.
Adsorption of Self-Assembled Species. Figure 9 is aschematic view of spherical PEO-b-P(M)CL copolymermicelles adsorbed at the silica-water interface. Thesemicelles consist of a dense core of hydrophobic poly-caprolactone (with radius R), surrounded by a corona ofswollen hydrophilic poly(ethylene oxide) blocks describedas rigid rods of length L. According to a previous studyof the same copolymers in water, the so-called core-rodsmodel allowed fitting of the scattering data.28 The micellesare assumed to form a liquidlike two-dimensional mono-layer, with the minimum distance between the micellecenters equal to σ.
The orientation-averaged macroscopic scattering crosssection per sample unit volume is given by eq 4, in Porod’sregime and under conditions of contrast matching betweensilica and solvent (more information is provided in the“Supporting Information”). It is the sum of two contribu-tions: the profile term, Ihpp(q), related to the concentrationprofile in the direction perpendicular to the surface, andthe correlation term, Ipp(q), governed by the two-dimensional organization within the layer of adsorbedmicelles.
The profile term is expressed by eq 5
P(q) is the form factor of the single micelles, normalizedto 1 at q ) 0.
On the basis of a mean-field hard sphere potentialapproximation for the micellar two-dimensional paircorrelation function, the correlation term can be expressedby eq 6
Figure 7. Models for the analysis of the scattering cross sections in SANS experiments. Each model is based on a dense homogeneoushydrophobic inner layer and a hydrophilic layer described by three possible profiles: (a) homogeneous layer; (b) parabolic profile;(c) Gaussian chains.
Figure 8. Fit of the model C (Figure 7) to the experimentaldata for the PEO114-b-PCL19 copolymer (under surface satura-tion conditions).
Figure 9. Micellar model used for the analysis of the SANSmacroscopic cross section. Spherically symmetric micelles areassumed, consisting of a dense hydrophobic PCL core (radius) R) surrounded by rodlike PEO chains of an effective lengthL.
dΣdΩ
(q) ) Ihpp(q) + Ipp(q) (4)
Ihpp(q) ) 2π SV( Γ
Mh )2[Mh 1
d1(n1 - ns) +
Mh 2
d2(n2 - ns)]2 P(q)
q2
(5)
Ipp(q) ) πσ2
2SV( Γ
Mh )2[Mh 1
d1(n1 - ns) +
Mh 2
d2(n2 -
ns)]2
P(q) ∫0
πdθ sinθ[1 - 2π
Nmic
S ∫0
σdFFJ0(qF sin θ)]
(6)
Adsorption of Poly(ε-caprolactone) Containing Diblocks Langmuir, Vol. 21, No. 7, 2005 2937
J0(x) is the zero-order Bessel function. Nmic/S is the numberof micelles adsorbed per unit surface. The indices 1 and2 refer to the hydrophobic and hydrophilic blocks, re-spectively. Γ is the adsorbed copolymer mass per unitsurface. Mh , Mh 1, and Mh 2 are the molar masses of thecopolymer, the hydrophobic block, and the hydrophilicblock, respectively. di is the density and ni the scatteringlength density of the block i.
The form factor for the core-rigid rods model is givenby eq 728
where
and
z1 and z2 are the polymerization degrees of the hydrophobicand hydrophilic blocks, respectively. The excess scatteringlengths of the scatterers are denoted as b1 and b2. Nagg isthe aggregation number.
At q ) 0, eqs 4-7 are reduced to
The scattering intensity at q ) 0 is expectedly determinedby the adsorbed copolymer amount, thus a macroscopicquantity.
There are four unknown parameters in eqs 5-7: theadsorbed amount of copolymer, Γ, the intermicellardistance, σ, and the structural parameters of the micelles(R and L) which govern the form factor P(q). Althoughthese parameters can be determined by fitting eq 4 to theexperimental data taking eqs 5-7 into account, a simpli-fied approach was used first. At q e 0.04 Å-1, the micellarform factor was approximated by Guinier’s equation, inrelation to the radius of gyration of the micelles, Rg
54
ø2, i.e., the sum of the squares of the differences between
the experimental and fitted intensities, was minimizedby combining Rg, σ, and Γ adequately. In a second step,the full q range was considered, and the form factor wasapproximated by a core-rods model (eq 7). The ø2 criterionwas also used to extract the best combination of R, L, σ,and Γ. In both cases, no black-box fitting algorithm wasused. To make sure that the global minimum of the ø2
hypersurface was found, the latter was mapped system-atically as a function of the different parameters. A firstcoarse investigation was followed by a finer mesh inspec-tion. A moderate micellar size polydispersity was intro-duced using a Gaussian distribution for the core radiuswith a standard deviation of 0.5 nm, as in ref 28.
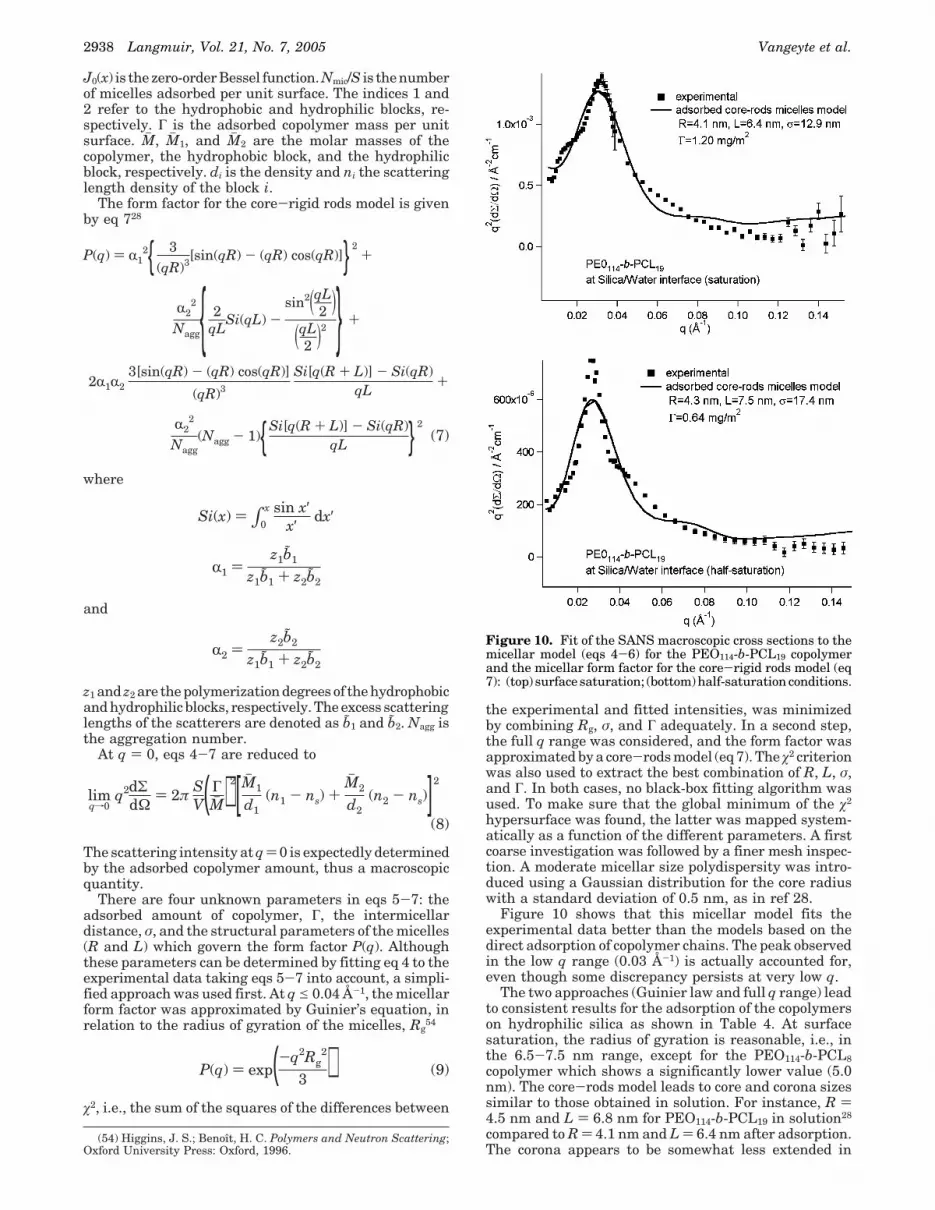
Figure 10 shows that this micellar model fits theexperimental data better than the models based on thedirect adsorption of copolymer chains. The peak observedin the low q range (0.03 Å-1) is actually accounted for,even though some discrepancy persists at very low q.
The two approaches (Guinier law and full q range) leadto consistent results for the adsorption of the copolymerson hydrophilic silica as shown in Table 4. At surfacesaturation, the radius of gyration is reasonable, i.e., inthe 6.5-7.5 nm range, except for the PEO114-b-PCL8copolymer which shows a significantly lower value (5.0nm). The core-rods model leads to core and corona sizessimilar to those obtained in solution. For instance, R )4.5 nm and L ) 6.8 nm for PEO114-b-PCL19 in solution28
compared to R ) 4.1 nm and L ) 6.4 nm after adsorption.The corona appears to be somewhat less extended in
(54) Higgins, J. S.; Benoıt, H. C. Polymers and Neutron Scattering;Oxford University Press: Oxford, 1996.
P(q) ) R12 3
(qR)3[sin(qR) - (qR) cos(qR)]2
+
R22
Nagg 2qL
Si(qL) -sin2(qL
2 )(qL
2 )2 +
2R1R23[sin(qR) - (qR) cos(qR)]
(qR)3
Si[q(R + L)] - Si(qR)qL
+
R22
Nagg(Nagg - 1)Si[q(R + L)] - Si(qR)
qL 2(7)
Si(x) ) ∫0
x sin x′x′ dx′
R1 )z1b1
z1b1 + z2b2
R2 )z2b2
z1b1 + z2b2
limqf0
q2dΣdΩ
) 2π SV( Γ
Mh )2[Mh 1
d1(n1 - ns) +
Mh 2
d2(n2 - ns)]2
(8)
P(q) ) exp(-q2Rg2
3 ) (9)
Figure 10. Fit of the SANS macroscopic cross sections to themicellar model (eqs 4-6) for the PEO114-b-PCL19 copolymerand the micellar form factor for the core-rigid rods model (eq7): (top) surface saturation; (bottom) half-saturation conditions.
2938 Langmuir, Vol. 21, No. 7, 2005 Vangeyte et al.

adsorbed micelles at saturation compared to solution.Moreover, the relative size of the micelles with respect totheir center-to-center separation, σ, indicates that themicelles are adsorbed in a rather close-packed layer, withpartial entanglement of the corona chains of adjacentmicelles. However, the PEO chains remain hydrated inthe surface layer as the degree of water in the corona isclose to that in aqueous solution (φ = 0.15 at the interfaceand in solution28). SANS analysis based on the micellarmodel leads to slightly lower amounts of adsorbedcopolymer compared to the total depletion method, whichmight indicate the concomitant adsorption of free copoly-mer chains.
The radius of gyration, the core radius, and the coronathickness tend to be slightly larger at half saturation thanat saturation (Table 4). For all the copolymers, theadsorbed amount is found to be close to half the value atsaturation, which is consistent with the depletion method.Finally, the available area per micelle, which scales to σ2,is approximately twice as large as that seen undersaturation conditions. The larger micellar sizes areconsistent with less steric constraints at lower surfacecoverage.
AFM Data. The morphology of the PEO114-b-PCL19copolymer adsorbed on hydrophilic silica was investigatedby atomic force microscopy at two different concentrations.For this purpose, the adsorbed copolymer layer was dried(as was the case for the contact angle measurements),which may modify the structure of the micellar-likeaggregates. Nevertheless, the AFM images are consistentwith the persistence of micellar-like structures afterdrying.
At high concentration (0.6 wt %, thus in the adsorptionplateau) a very rough surface is observed (Figure 11a).The very large variations in height (24-30 nm) are typicalof adsorbed layers exceeding a monolayer and consistingof randomly adsorbed aggregates, with free chains possiblyadsorbed between them.
At low concentration (initial copolymer solution of 0.015wt %), the silicon wafer is no longer saturated. Figure 11bshows coexistence of spherical and poorly defined (moreflat) objects, which suggests that copolymer micellescoexist with free chains. The size of these micelles,measured on height and phase images, is in the 15-20nm range, thus of the same order of magnitude asdetermined by SANS.
Overall Interpretation. The experimental data re-ported in this paper provide information on the way PEO-b-P(M)CL copolymers are adsorbed at the hydrophilicsilica/water interface. First of all, substitution of theε-caprolactone units by a methyl group in γ position of thecarbonyl has no significant effect on the adsorption process.When a hydrophobic P(M)CL block is attached to PEO,the adsorption isotherm of the copolymer on silica changesfrom a monolayer adsorption to a cooperative adsorption,at least above a critical copolymer concentration in water.
In this concentration regime, SANS data are reasonablywell fitted by a model of adsorption of micellar aggregates,which is confirmed by AFM observations.
Dissolved in water, the PEO-b-P(M)CL copolymers formmicelles28 with an average diameter of ∼22 nm which arein equilibrium (slow exchange) with unimers. From SANSanalysis and AFM observations, the size (diameter) forthe adsorbed micelles is estimated at 12-20 nm.
The smaller micellar size at the interface compared tosolution is consistent with the packing of the micelles ontosilica, which also explains that the average micellar sizeat half saturation is slightly larger than that observed atcomplete coverage. The packing effects are confirmed bythe PEO corona which is less extended on the surfacethan in bulk solution. The values of σ that govern theavailable surface area for the micelles, AFM topographicalimages of copolymer adsorbed from concentrated solutions(Figure 11a), and surface-force profiles all indicate a highcopolymer density at saturation.
Several observations support the direct adsorption ofthe micelles formed in water: (i) the slow kinetics ofadsorption, (ii) the comparable size of the micelles insolution and adsorbed on silica, and (iii) the cooperativeadsorption which occurs at high concentrations (clearlybeyond the cmc as determined from surface tensionmeasurements). The PCL hydrophobicity and weak in-
Table 4. Fit of the Micelle Adsorption Model to the Experimental SANS Macroscopic Cross Sectionsa
Guinier regime core-rods model
copolymer Rg (nm) σ (nm) Γ (mg/m2) R (nm) L (nm) σ (nm) Γ (mg/m2)
saturation PEO114-b-PCL8 5.0 9.5 0.92 2.3 4.4 8.0 1.02PEO114-b-PCL16 6.7 12.7 1.28 3.9 7.3 12.5 1.31PEO114-b-PCL19 6.4 13.7 1.14 4.1 6.4 12.9 1.20PEO114-b-PMCL12 7.5 14.2 1.29 4.0 9.6 16.0 1.24
half-saturation PEO114-b-PCL8 5.5 10.3 0.54 2.4 6.0 9.0 0.56PEO114-b-PCL16 7.1 20.1 0.62 4.0 7.9 17.5 0.63PEO114-b-PCL19 7.0 19.8 0.60 4.3 7.5 17.4 0.64PEO114-b-PMCL12 7.4 20.8 0.58 4.0 8.2 18.6 0.62
a Either the Guinier law (low q range) or the core-rigid rods model (full q range) have been used to describe the micellar form factor.
Figure 11. AFM images for the PEO114-b-PCL19 copolymeradsorbed on hydrophilic silica after 1 h from (a) 0.6 wt % and(b) 0.015 wt % aqueous solution.
Adsorption of Poly(ε-caprolactone) Containing Diblocks Langmuir, Vol. 21, No. 7, 2005 2939

teraction with silica can account for micellization beforeadsorption, which is driven by the well-established PEO-silica interactions (see calorimetric data). It howeverappears, in particular at low surface coverage, that freecopolymer chains also participate in the adsorptionprocess. Adsorption isotherms show a significant amountof adsorbed copolymer before the onset of cooperativeadsorption. Contact angle and surface force measurementsshow that PCL is initially exposed to water and thenrearranges as a consequence of free copolymer chains eagerto adopt a conformation of lower free energy.
Despite lack of interaction between P(M)CL and hy-drophilic silica, the adsorbed amount of copolymer in-creaseswith thehydrophobic molecular weight. Inaqueoussolution, the aggregation number increases with thehydrophobic block length, whereas the size of the micellesremains nearly constant.28 Therefore the micellar volumefraction increases with the size of the hydrophobic block,which explains why the adsorbed amount is larger forlonger P(M)CL blocks.
ConclusionsThis study dealt with the adsorption of PEO-b-P(M)CL
block copolymers consisting of a hydrophilic PEO blockand various (shorter) hydrophobic P(M)CL blocks on glassand silica. Compared to homoPEO, the P(M)CL blockenhances the adsorption as confirmed by a transition froma monolayer adsorption for PEO to a cooperative adsorp-tion of micellar aggregates and by a substantial increaseof the adsorbed mass above the cmc.
In aqueous solution, the copolymers form, above thecmc, micelles that are in equilibrium with slowly ex-changing free chains (unimers). Below the concentrationat which the cooperative adsorption occurs (Cc), there isa preference for the adsorption of unimers, which exposePCL, at least partly, to contact with water. Above Cc, themicelles are then adsorbed without significant modifica-
tion of their size, except for a small contraction due totheir packing on the surface. The unimers have to organizein the presence of these bulkier objects, resulting in theremoval of some PCL/water contacts after a slow reor-ganization process. This picture is qualitatively supportednot only by the techniques that probe the adsorbed layerin aqueous medium (FMC, SANS, MASIF) but also bytechniques that analyze the copolymer layer after separa-tion of the silica substrate from water and subsequentdrying. Therefore, the system that reorganizes slowly inwater is not able to do the same in air during the shortdrying time. The main reasons are likely the low mobilityof the polymer chains and the small driving force for P(M)-CL blocks to migrate and expose themselves to air at theexpense of PEO.
Acknowledgment. The authors are grateful to Dr. G.Broze for access to the FMC equipment at Colgate-Palmolive R&D (Liege, Belgium). They are very muchindebted to the “Fonds pour la Formation a la Recherchedans l’Industrie et l’Agriculture” (F.R.I.A.) for a fellowshipto P.V., to the “Politique Scientifique Federale" for generalsupport to CERM in the frame of the “PAI V/03: Su-pramolecular Chemistry and Supramolecular Catalysis”,and to the European Commission Access to ResearchInfrastructures Action of the Improving Human PotentialProgram (HPRI) for financial support and access to theForschungszentrum (Julich) (“Julich Neutrons forEurope”) and the Laboratoire Leon Brillouin (Saclay,France) (Contract HPRI-CT-1999-00032).
Supporting Information Available: Derivation of themacroscopic scattering cross section for spherically symmetricmicelles adsorbed onto a randomly oriented solid surface and afigure showing the vectors used to define the locations of thescatterers in eq A2. This material is available free of charge viathe Internet at http://pubs.acs.org.
LA047425+
2940 Langmuir, Vol. 21, No. 7, 2005 Vangeyte et al.