adsorption of co 2+, ni 2+, cu 2+, and zn 2+ onto amorphous hydrous manganese dioxide from simple...
TRANSCRIPT
om a fixedtitration
s atrogeneousween 0.3of cationsaluesvariation
are foundon exhibits
Journal of Colloid and Interface Science 269 (2004) 11–21www.elsevier.com/locate/jcis
Adsorption of Co2+, Ni2+, Cu2+, and Zn2+ onto amorphous hydrousmanganese dioxide from simple (1–1) electrolyte solutions
Sukriti Bhusan Kanungo,1 Sushree Swarupa Tripathy,∗ Santosh Kumar Mishra,Biswanath Sahoo, and Rajeev
Regional Research Laboratory, Bhubaneswar 751013, Orissa, India
Received 17 March 2003; accepted 24 July 2003
Abstract
The adsorption of Co2+, Ni2+, Cu2+, and Zn2+ onto amorphous hydrous manganese dioxide (δ-MnO2) has been studied using twmethods, viz., isotherms at constant pH in the presence of buffer solution and pH variation in the absence of buffer solution frometal ion concentration. While the adsorption isotherm experiments were carried out in 0.5 M NaCl only, pH variation or batchexperiments were carried out in 0.5 M NaCl, 0.01 M NaCl, and 0.01 M KNO3 solutions. The complex nature of adsorption isothermconstant pH values indicates that adsorption of all the cations is non-Langmuirian (Freundlich) and takes place on the highly heteoxide surface with different binding energies. The proton stoichiometry derived from isotherms at two close pH values varies betand 0.8. The variation of fractional adsorption with pH indicates that the background electrolyte solution influences the adsorptionthrough either metal-like or ligand-like complexes with Cl−, the former showing a low adsorption tendency. The proton stoichiometry vderived from the Kurbatov-type plot varies not only with the electrolyte solution but also with the adsorbate/adsorbent ratio. Theof fractional adsorption with pH can be modeled either with the formation of the SOM+ type or with a combination of SOM+ and SOMOHtype complexes, depending upon the cation and electrolyte medium. The equilibrium constants obtained from Kurbatov-type plotsto be most suitable in these model calculations. Adsorption calculated on the basis of ternary surface metal–chlorocomplex formativery low values. 2003 Elsevier Inc. All rights reserved.
Keywords: Adsorption; Metal ions;δ-MnO2; Simple electrolyte medium
iox-ofthe
s aread-hile
ortertermhernat-id
235,
eo-
trialdis-eco-ing
s ineno-uch
un-rface,dingcar-e
enye of
1. Introduction
Adsorption of trace metals on hydrous manganese dide is a widely studied topic of research from the pointview of environmental and geochemical aspects. Thoughphysicochemical phenomena involved in both the aspectthe same, the main difference is the period for which thesorbate and adsorbent are in the state of equilibrium. Wthe environmental chemists are more interested in shperiods, geochemical processes generally involve long-interaction or dynamic states of equilibrium, where eitadsorbent or adsorbate is in continuous supply in theural environment [1,2]. However, the distinction is not rig
* Corresponding author.E-mail address: [email protected] (S.S. Tripathy).
1 Present address: Flat No. A7/2, Konnagar Abasan, Konnagar 712District Hooghly, West Bengal, India.
0021-9797/$ – see front matter 2003 Elsevier Inc. All rights reserved.doi:10.1016/j.jcis.2003.07.002
and environmental chemistry also deals with long-term gchemical interaction.
Despite many regulatory measures, various induswaste products, both inorganic and organic, are beingcharged into natural water systems, mainly because ofnomic compulsions. To understand either the self-cleanor the induced cleaning capacity of particulate matternatural water systems we need to know the phenomlogical behavior of solute–adsorbent interaction in ssystems. Basically, the same approach is also applied toderstand the geochemical processes at the mineral subut the system is more complex because of the surrounconditions such as Eh, pH, atmospheric oxygen, andbon dioxide, which play important roles in controlling thprocesses [1–3].
Amorphousδ-MnO2, either detrital or authigenic, is onof the important constituents of particulate matter in manatural water systems, especially in sea water. Becaus
12 S.B. Kanungo et al. / Journal of Colloid and Interface Science 269 (2004) 11–21
gthagh
hathy-noeusiron
d in
stud
aad-turerentaceun-for
xidean
avethes so-
-mlin-pHby
H.up
pHownddeing
perkenK),terliq-in.
er-ar-ofith
ionolytenkout
onsaluee, ex-
ineretantr,ired
iallyn ofrmso-cialac-
lun-
ade
is-aAif-
pre-and
its high surface charge, hydrous MnO2 has high scavenginpower for trace metals. It has been generally observedtransition metal ions adsorb onto this oxide mainly throuspecific chemical interaction, even by releasing Mn2+ insolution from its disordered lattice [4–8]. This shows tunlike other oxide substrates adsorption of cations ontodrous MnO2 is reasonably complicated and thereforesimple proton stoichiometry is likely to follow over a widrange of pH. The situation is further complicated if hydroMnO2 is associated with other oxide substrates such asoxide, aluminum oxide, silica, clay minerals etc. as founnatural environments.
In the present paper an attempt has been made tothe sorption of Co2+, Ni2+, Cu2+, and Zn2+ onto hydrousMnO2 (δ-MnO2) in simple 1–1 electrolyte media withview to examining (i) adsorption isotherms (increasingsorbate concentration) at constant pH values, (ii) the naof solute–adsorbent interaction in the presence of diffeelectrolyte media, and (iii) the extent to which the surfcomplexation models that form the basis of our presentderstanding of the adsorption of inorganics are validthe present system involving hydrous manganese diowhose surface is generally more heterogeneous than mcommon adsorbents like, iron oxide or aluminum oxide.
2. Experimental
2.1. Materials
The method of preparation of theδ-MnO2 sample and itscharacterization by different physicochemical methods hbeen described in our previous communication [9]. Allchemicals used were of analytical grade. All the aqueoulutions were prepared in all-glass double distilled water.
2.2. Adsorption procedure (batch titration in presence ofmetal ions)
To a series of thoroughly cleaned and dried 125polypropylene bottles, 45 ml of electrolyte solution containg a known quantity of metal ion was transferred. Thevalues of the solutions were first adjusted from 2 to 8adding known volumes of either 0.1 M HCl or 0.1 M NaOThe total volume of solution in each bottle was then madeto 50 ml by adding the relevant electrolyte solution. Thevalues of the solutions were then noted accurately. A knamount (0.01–0.02 g) of adsorbent sample was then ato each bottle. The suspensions were bubbled with flownitrogen gas (99%) at the flow rate of about 50–60 mlminute for about 5 min and immediately capped, shawell, and left to equilibrate at room temperature (300during which the bottles were shaken intermittently. Af72 h of equilibration about 15 ml of clear supernatantuid was carefully decanted off and centrifuged for 15 m
t
y
,y
d
Metal contents including Mn were estimated in the supnatant liquid by atomic absorption spectrophotometry (Vian AA+) using air–acetylene flame. The final pH valuethe equilibrated solution in each bottle was determined wthe help of EDT (England) pH/ion meter. Standard metalsolutions were prepared in the same background electrsolution in which batch titration was carried out. A blatitration was also carried out in the similar manner withadding any metal ion.
2.3. Adsorption isotherm
Adsorption experiments with increasing concentratiof metal ion at a constant temperature (300 K) and pH vwere carried out in the same manner as described abovcept that instead of a fixed quantity of metal ion solutioneach bottle, varying quantities of metal ion solutions wadded. Initially, an attempt was made to maintain conspH by adding either 0.1 M NaOH or 0.1 M HCl. Howevethis procedure was not successful in maintaining the despH value, which always tended to drop gradually, especat high metal ion concentrations even after the additiolarge quantities of alkali solution. Therefore, all the isotheexperiments were carried out in 50 ml of universal bufferlutions at different pH values [10]. Because of the spenature of the work, the buffer solutions were preparedcording to slightly modified procedure as follows.
2.4. Solution of mixed acids (solution A)
A sample of 4.6 ml of 17.4 N CH3COOH, 5.84 ml of41.1 N H3PO4, and 4.95 g of H3BO3 (M.W. 61.83 g) wastaken in a 2-L volumetric flask into which 1 L of 1 N NaCsolution was added. The solution was thoroughly shakentil clear solution was obtained. The total volume was mup to 2 L with distilled water.
2.5. Solution with 0.2 M NaOH (solution B)
A sample of 16 g of sodium hydroxide pellets was dsolved in 0.5 M NaCl and after cooling diluted to 2 L involumetric flask with 0.5 M NaCl solution. The solutionsand B were mixed as follows to make buffer solution of dferent pH values:
pH Volume of Volume of Totalsolution A solution B volume
(ml) (ml) (ml)
4.04 600 165 7654.49 600 210 8105.05 600 255 8555.60 600 270 8706.05 600 300 9007.00 600 390 990
The standard solutions of trace metal ions were alsopared in the corresponding buffer solutions. The initialfinal pH values remain almost the same (±0.5 unit) in the
S.B. Kanungo et al. / Journal of Colloid and Interface Science 269 (2004) 11–21 13
tion
totheent
forhish the
in
-of
jec-ow
d forenssa
ature offer-
ates,iumsat-
.13.pHby
rast,ust-uany
ioniteorp-peare-theent
presence of buffer solution even at the highest concentraof metal.
2.6. Data accuracy
All the adsorption data were obtained with respectthe original concentration of metal (control) prepared insame medium used in the relevant adsorption experimThis procedure of using control solution was followedevery experimental determination of metal by AAS. Treduces considerably the absolute error associated witAAS method from±8.0% to ±5.0%. This relative error isfurther reduced (< ±3.0%) when adsorption is expressedrelative term such as percent adsorption.
3. Results and discussion
3.1. Adsorption isotherm
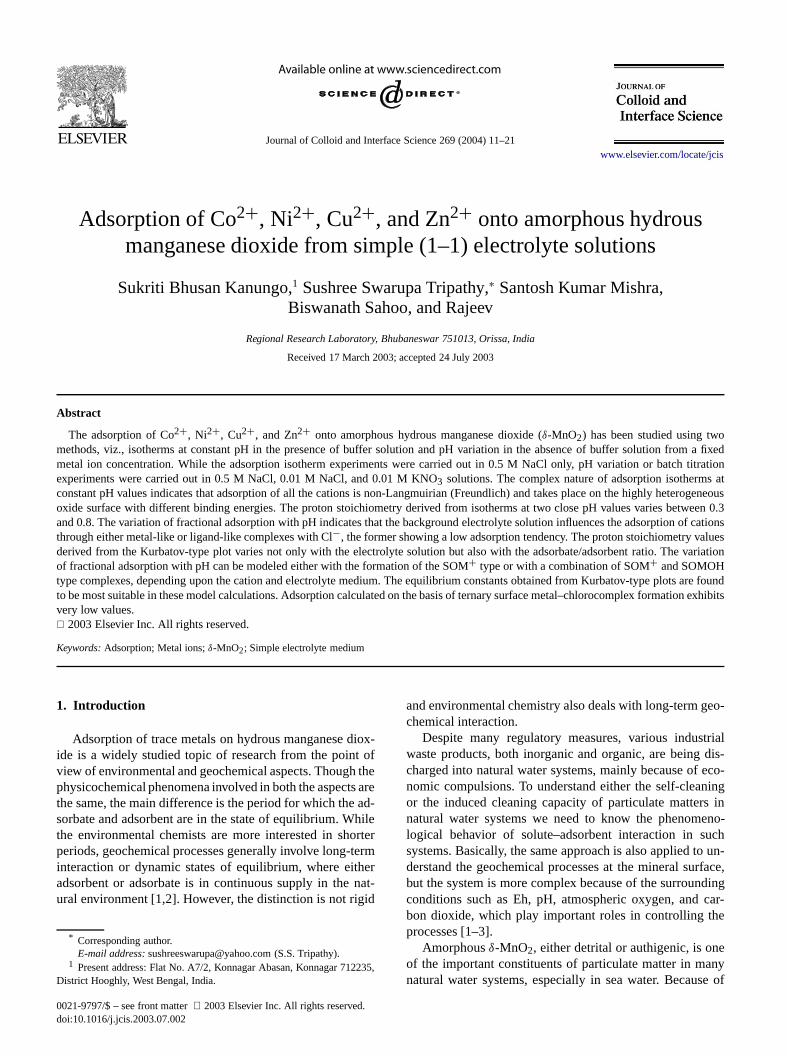
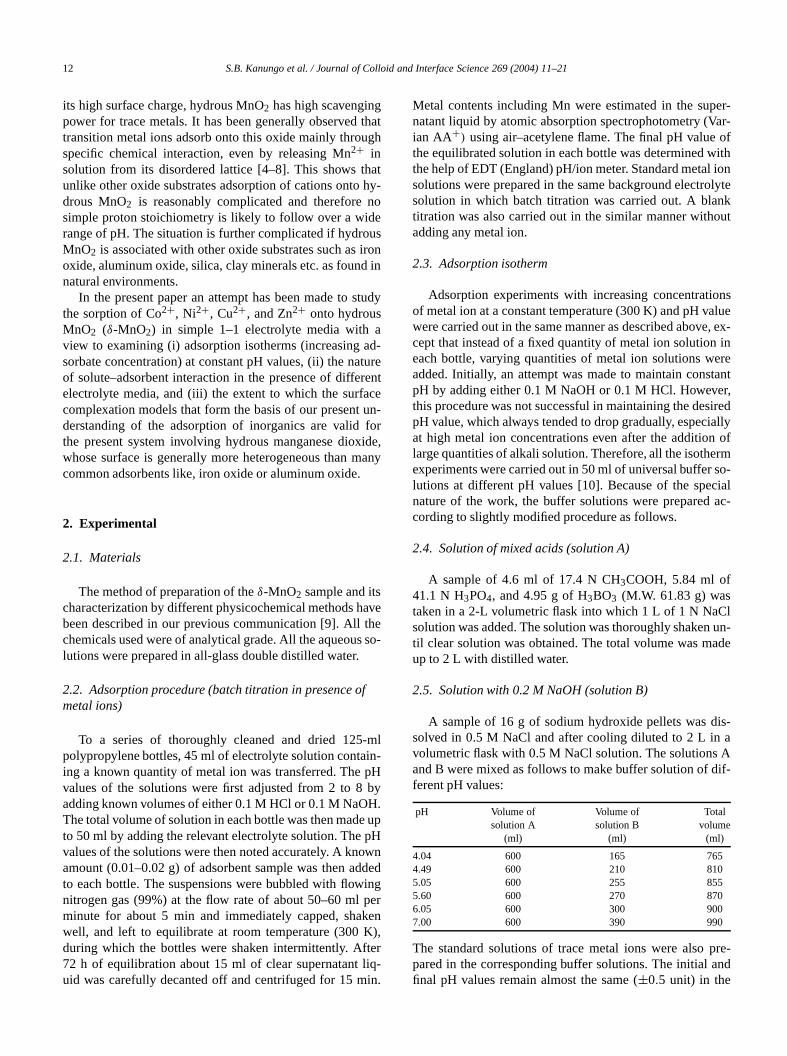
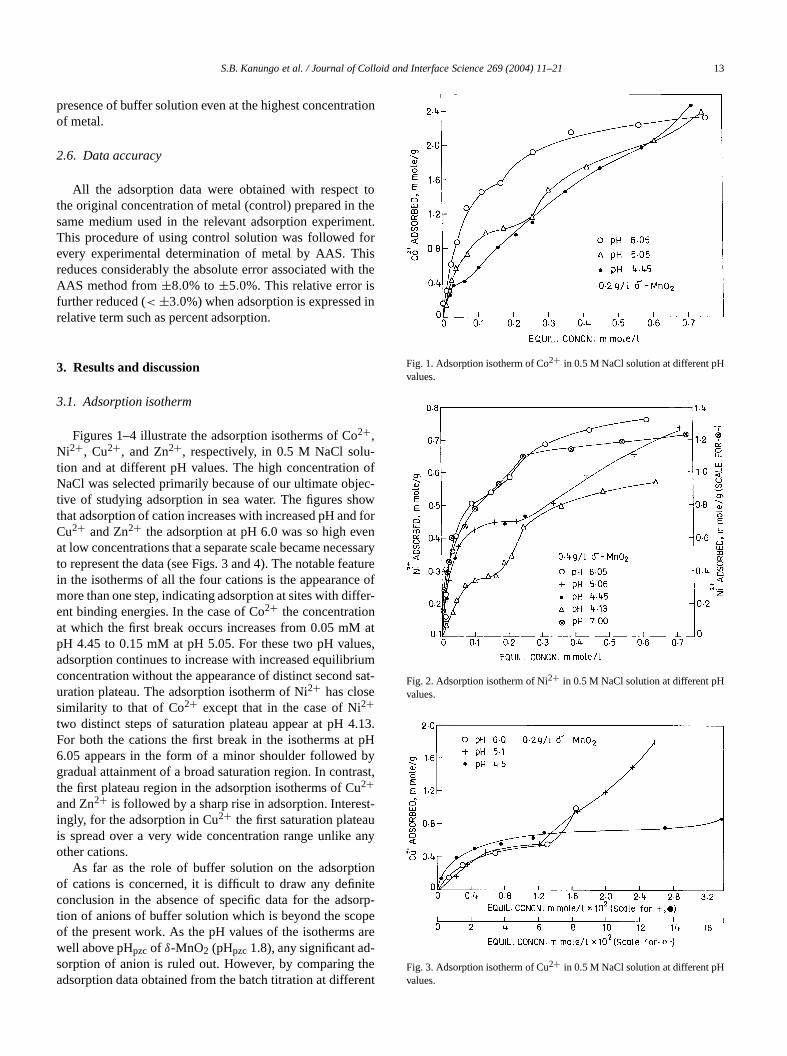
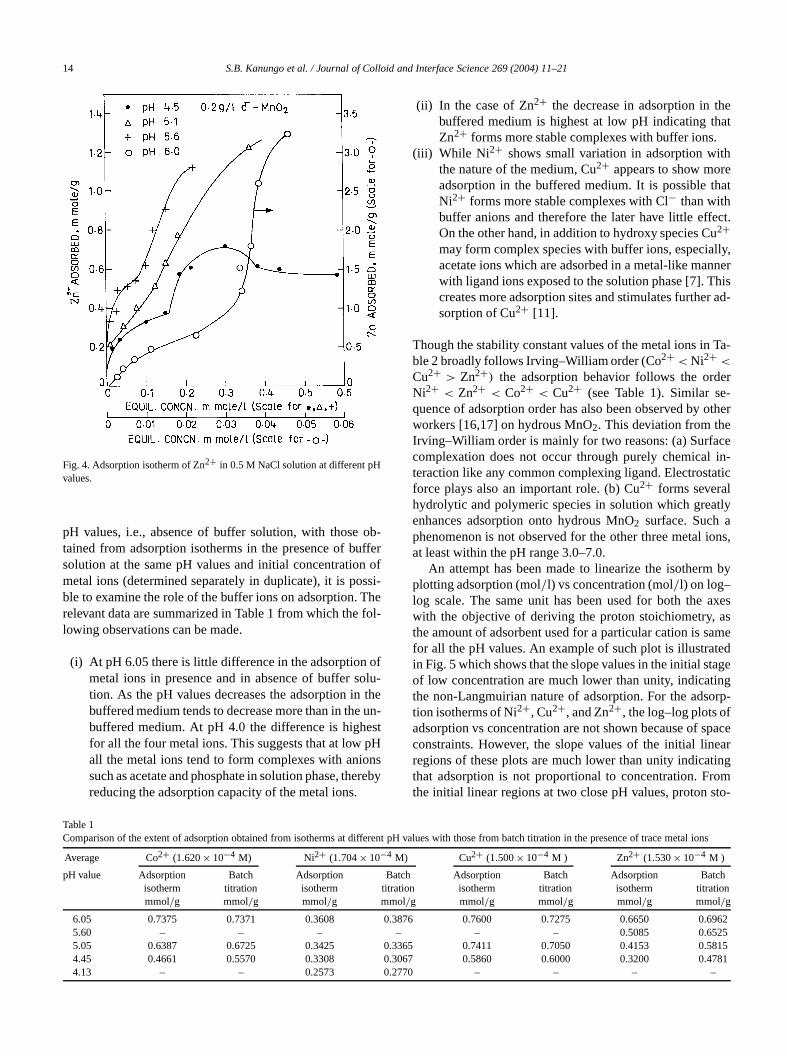
Figures 1–4 illustrate the adsorption isotherms of Co2+,Ni2+, Cu2+, and Zn2+, respectively, in 0.5 M NaCl solution and at different pH values. The high concentrationNaCl was selected primarily because of our ultimate obtive of studying adsorption in sea water. The figures shthat adsorption of cation increases with increased pH anCu2+ and Zn2+ the adsorption at pH 6.0 was so high evat low concentrations that a separate scale became neceto represent the data (see Figs. 3 and 4). The notable fein the isotherms of all the four cations is the appearancmore than one step, indicating adsorption at sites with difent binding energies. In the case of Co2+ the concentrationat which the first break occurs increases from 0.05 mMpH 4.45 to 0.15 mM at pH 5.05. For these two pH valuadsorption continues to increase with increased equilibrconcentration without the appearance of distinct seconduration plateau. The adsorption isotherm of Ni2+ has closesimilarity to that of Co2+ except that in the case of Ni2+two distinct steps of saturation plateau appear at pH 4For both the cations the first break in the isotherms at6.05 appears in the form of a minor shoulder followedgradual attainment of a broad saturation region. In contthe first plateau region in the adsorption isotherms of C2+and Zn2+ is followed by a sharp rise in adsorption. Intereingly, for the adsorption in Cu2+ the first saturation plateais spread over a very wide concentration range unlikeother cations.
As far as the role of buffer solution on the adsorptof cations is concerned, it is difficult to draw any definconclusion in the absence of specific data for the adstion of anions of buffer solution which is beyond the scoof the present work. As the pH values of the isothermswell above pHpzc of δ-MnO2 (pHpzc 1.8), any significant adsorption of anion is ruled out. However, by comparingadsorption data obtained from the batch titration at differ
.
rye
Fig. 1. Adsorption isotherm of Co2+ in 0.5 M NaCl solution at different pHvalues.
Fig. 2. Adsorption isotherm of Ni2+ in 0.5 M NaCl solution at different pHvalues.
Fig. 3. Adsorption isotherm of Cu2+ in 0.5 M NaCl solution at different pHvalues.
14 S.B. Kanungo et al. / Journal of Colloid and Interface Science 269 (2004) 11–21
ob-ffer
n ofssi-Thefol-
ofolu-theun-
estpHns
ereb
heat
thehat
ct.ully,nnerhisr ad-
Ta-
er-other
cein-tic
ltly
ions,
by
axesasameedageingorp-
paceeartingomto-
Fig. 4. Adsorption isotherm of Zn2+ in 0.5 M NaCl solution at different pHvalues.
pH values, i.e., absence of buffer solution, with thosetained from adsorption isotherms in the presence of busolution at the same pH values and initial concentratiometal ions (determined separately in duplicate), it is poble to examine the role of the buffer ions on adsorption.relevant data are summarized in Table 1 from which thelowing observations can be made.
(i) At pH 6.05 there is little difference in the adsorptionmetal ions in presence and in absence of buffer stion. As the pH values decreases the adsorption inbuffered medium tends to decrease more than in thebuffered medium. At pH 4.0 the difference is highfor all the four metal ions. This suggests that at lowall the metal ions tend to form complexes with aniosuch as acetate and phosphate in solution phase, threducing the adsorption capacity of the metal ions.
y
(ii) In the case of Zn2+ the decrease in adsorption in tbuffered medium is highest at low pH indicating thZn2+ forms more stable complexes with buffer ions.
(iii) While Ni 2+ shows small variation in adsorption withe nature of the medium, Cu2+ appears to show moradsorption in the buffered medium. It is possible tNi2+ forms more stable complexes with Cl− than withbuffer anions and therefore the later have little effeOn the other hand, in addition to hydroxy species C2+may form complex species with buffer ions, especiaacetate ions which are adsorbed in a metal-like mawith ligand ions exposed to the solution phase [7]. Tcreates more adsorption sites and stimulates furthesorption of Cu2+ [11].
Though the stability constant values of the metal ions inble 2 broadly follows Irving–William order (Co2+ < Ni2+ <
Cu2+ > Zn2+) the adsorption behavior follows the ordNi2+ < Zn2+ < Co2+ < Cu2+ (see Table 1). Similar sequence of adsorption order has also been observed byworkers [16,17] on hydrous MnO2. This deviation from theIrving–William order is mainly for two reasons: (a) Surfacomplexation does not occur through purely chemicalteraction like any common complexing ligand. Electrostaforce plays also an important role. (b) Cu2+ forms severahydrolytic and polymeric species in solution which greaenhances adsorption onto hydrous MnO2 surface. Such aphenomenon is not observed for the other three metalat least within the pH range 3.0–7.0.
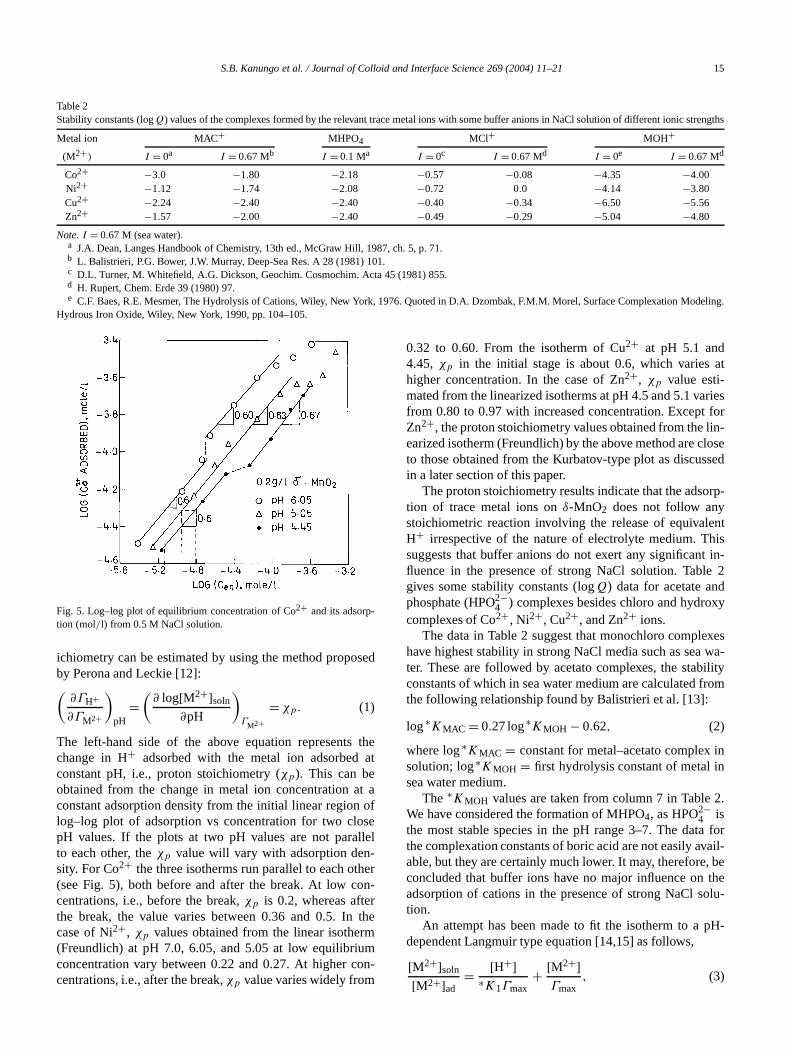
An attempt has been made to linearize the isothermplotting adsorption (mol/l) vs concentration (mol/l) on log–log scale. The same unit has been used for both thewith the objective of deriving the proton stoichiometry,the amount of adsorbent used for a particular cation is sfor all the pH values. An example of such plot is illustratin Fig. 5 which shows that the slope values in the initial stof low concentration are much lower than unity, indicatthe non-Langmuirian nature of adsorption. For the adstion isotherms of Ni2+, Cu2+, and Zn2+, the log–log plots ofadsorption vs concentration are not shown because of sconstraints. However, the slope values of the initial linregions of these plots are much lower than unity indicathat adsorption is not proportional to concentration. Frthe initial linear regions at two close pH values, proton s
l io
tchion
962
815781
Table 1Comparison of the extent of adsorption obtained from isotherms at different pH values with those from batch titration in the presence of trace metans
Average Co2+ (1.620× 10⁻⁴ M) Ni2+ (1.704× 10⁻⁴ M) Cu2+ (1.500× 10⁻⁴ M ) Zn2+ (1.530× 10⁻⁴ M )
pH value Adsorption Batch Adsorption Batch Adsorption Batch Adsorption Baisotherm titration isotherm titration isotherm titration isotherm titratmmol/g mmol/g mmol/g mmol/g mmol/g mmol/g mmol/g mmol/g
6.05 0.7375 0.7371 0.3608 0.3876 0.7600 0.7275 0.6650 0.65.60 – – – – – – 0.5085 0.65255.05 0.6387 0.6725 0.3425 0.3365 0.7411 0.7050 0.4153 0.54.45 0.4661 0.5570 0.3308 0.3067 0.5860 0.6000 0.3200 0.44.13 – – 0.2573 0.2770 – – – –
S.B. Kanungo et al. / Journal of Colloid and Interface Science 269 (2004) 11–21 15
trengths
odeling.
Table 2Stability constants (logQ) values of the complexes formed by the relevant trace metal ions with some buffer anions in NaCl solution of different ionic s
Metal ion MAC+ MHPO4 MCl+ MOH+
(M2+) I = 0a I = 0.67 Mb I = 0.1 Ma I = 0c I = 0.67 Md I = 0e I = 0.67 Md
Co2+ −3.0 −1.80 −2.18 −0.57 −0.08 −4.35 −4.00Ni2+ −1.12 −1.74 −2.08 −0.72 0.0 −4.14 −3.80Cu2+ −2.24 −2.40 −2.40 −0.40 −0.34 −6.50 −5.56Zn2+ −1.57 −2.00 −2.40 −0.49 −0.29 −5.04 −4.80
Note. I = 0.67 M (sea water).a J.A. Dean, Langes Handbook of Chemistry, 13th ed., McGraw Hill, 1987, ch. 5, p. 71.b L. Balistrieri, P.G. Bower, J.W. Murray, Deep-Sea Res. A 28 (1981) 101.c D.L. Turner, M. Whitefield, A.G. Dickson, Geochim. Cosmochim. Acta 45 (1981) 855.d H. Rupert, Chem. Erde 39 (1980) 97.e C.F. Baes, R.E. Mesmer, The Hydrolysis of Cations, Wiley, New York, 1976. Quoted in D.A. Dzombak, F.M.M. Morel, Surface Complexation M
Hydrous Iron Oxide, Wiley, New York, 1990, pp. 104–105.
sed
theat
t aof
sellel-heron-rthe
mmon-
at
riesfor
lin-losesed
orp-
enthist in-e 2dxy
xeswa-ilityrom
inn
2.
a forail-
, betheolu-
pH-
Fig. 5. Log–log plot of equilibrium concentration of Co2+ and its adsorp-tion (mol/l) from 0.5 M NaCl solution.
ichiometry can be estimated by using the method propoby Perona and Leckie [12]:
(1)
(∂ΓH+
∂ΓM2+
)pH
=(
∂ log[M2+]soln
∂pH
)ΓM2+
= χp.
The left-hand side of the above equation representschange in H+ adsorbed with the metal ion adsorbedconstant pH, i.e., proton stoichiometry (χp). This can beobtained from the change in metal ion concentration aconstant adsorption density from the initial linear regionlog–log plot of adsorption vs concentration for two clopH values. If the plots at two pH values are not parato each other, theχp value will vary with adsorption density. For Co2+ the three isotherms run parallel to each ot(see Fig. 5), both before and after the break. At low ccentrations, i.e., before the break,χp is 0.2, whereas aftethe break, the value varies between 0.36 and 0.5. Incase of Ni2+, χp values obtained from the linear isother(Freundlich) at pH 7.0, 6.05, and 5.05 at low equilibriuconcentration vary between 0.22 and 0.27. At higher ccentrations, i.e., after the break,χp value varies widely from
0.32 to 0.60. From the isotherm of Cu2+ at pH 5.1 and4.45, χp in the initial stage is about 0.6, which varieshigher concentration. In the case of Zn2+, χp value esti-mated from the linearized isotherms at pH 4.5 and 5.1 vafrom 0.80 to 0.97 with increased concentration. ExceptZn2+, the proton stoichiometry values obtained from theearized isotherm (Freundlich) by the above method are cto those obtained from the Kurbatov-type plot as discusin a later section of this paper.
The proton stoichiometry results indicate that the adstion of trace metal ions onδ-MnO2 does not follow anystoichiometric reaction involving the release of equivalH+ irrespective of the nature of electrolyte medium. Tsuggests that buffer anions do not exert any significanfluence in the presence of strong NaCl solution. Tablgives some stability constants (logQ) data for acetate anphosphate (HPO2−
4 ) complexes besides chloro and hydrocomplexes of Co2+, Ni2+, Cu2+, and Zn2+ ions.
The data in Table 2 suggest that monochloro complehave highest stability in strong NaCl media such as seater. These are followed by acetato complexes, the stabconstants of which in sea water medium are calculated fthe following relationship found by Balistrieri et al. [13]:
(2)log∗KMAC = 0.27 log∗KMOH − 0.62,
where log∗KMAC = constant for metal–acetato complexsolution; log∗KMOH = first hydrolysis constant of metal isea water medium.
The ∗KMOH values are taken from column 7 in TableWe have considered the formation of MHPO4, as HPO2−
4 isthe most stable species in the pH range 3–7. The datthe complexation constants of boric acid are not easily avable, but they are certainly much lower. It may, thereforeconcluded that buffer ions have no major influence onadsorption of cations in the presence of strong NaCl stion.
An attempt has been made to fit the isotherm to adependent Langmuir type equation [14,15] as follows,
(3)[M2+]soln
2+ = [H+]∗ + [M2+]
,
[M ]ad K1Γmax Γmax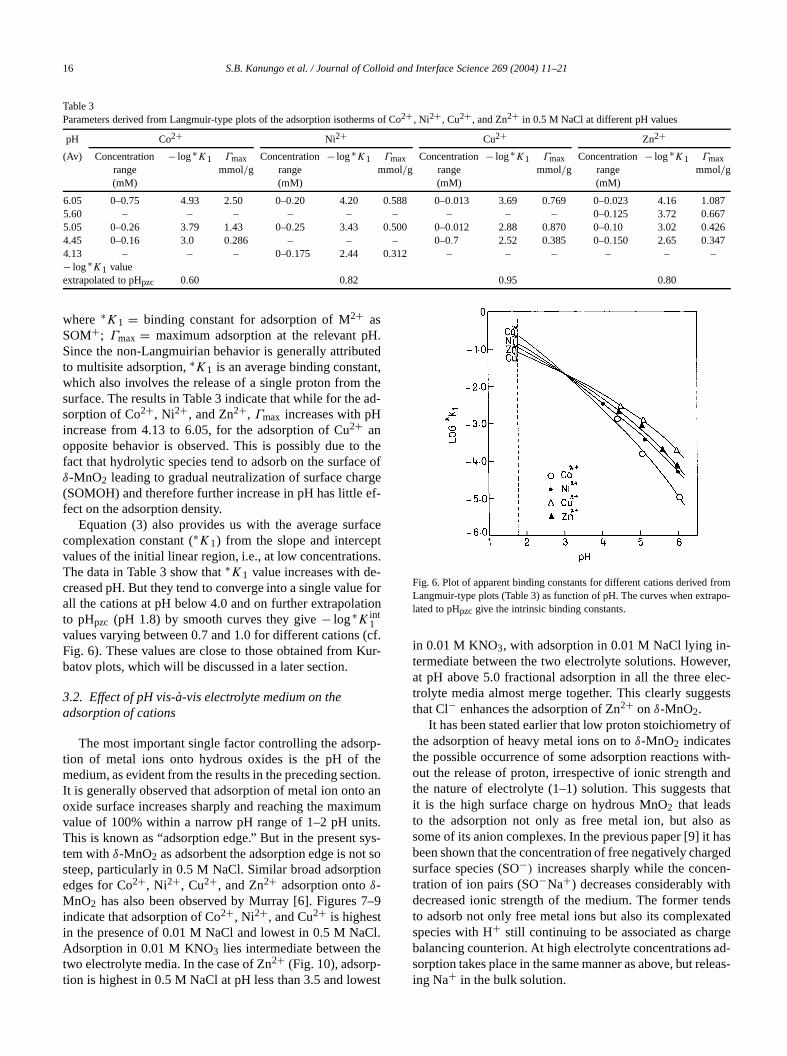
16 S.B. Kanungo et al. / Journal of Colloid and Interface Science 269 (2004) 11–21
Table 3Parameters derived from Langmuir-type plots of the adsorption isotherms of Co2+ , Ni2+ , Cu2+ , and Zn2+ in 0.5 M NaCl at different pH values
pH Co2+ Ni2+ Cu2+ Zn2+
(Av) Concentration − log∗K1 Γmax Concentration− log∗K1 Γmax Concentration− log∗K1 Γmax Concentration− log∗K1 Γmaxrange mmol/g range mmol/g range mmol/g range mmol/g(mM) (mM) (mM) (mM)
6.05 0–0.75 4.93 2.50 0–0.20 4.20 0.588 0–0.013 3.69 0.769 0–0.023 4.16 1.0875.60 – – – – – – – – – 0–0.125 3.72 0.6675.05 0–0.26 3.79 1.43 0–0.25 3.43 0.500 0–0.012 2.88 0.870 0–0.10 3.02 0.4264.45 0–0.16 3.0 0.286 – – – 0–0.7 2.52 0.385 0–0.150 2.65 0.3474.13 – – – 0–0.175 2.44 0.312 – – – – – –− log∗K1 valueextrapolated to pHpzc 0.60 0.82 0.95 0.80
H.ted
nt,thead-
thee ofrgeef-
facet
ns.-for
tion
(cf.Kur-
rp-thetion.an
mumits.ys-t soion
7–9
Cl.e
-est
fromapo-
-ver,lec-ests
y of
ith-andthat
ashasrgedn-thndsted
rgead-leas-
where ∗K1 = binding constant for adsorption of M2+ asSOM+; Γmax = maximum adsorption at the relevant pSince the non-Langmuirian behavior is generally attributo multisite adsorption,∗K1 is an average binding constawhich also involves the release of a single proton fromsurface. The results in Table 3 indicate that while for thesorption of Co2+, Ni2+, and Zn2+, Γmax increases with pHincrease from 4.13 to 6.05, for the adsorption of Cu2+ anopposite behavior is observed. This is possibly due tofact that hydrolytic species tend to adsorb on the surfacδ-MnO2 leading to gradual neutralization of surface cha(SOMOH) and therefore further increase in pH has littlefect on the adsorption density.
Equation (3) also provides us with the average surcomplexation constant (∗K1) from the slope and intercepvalues of the initial linear region, i.e., at low concentratioThe data in Table 3 show that∗K1 value increases with decreased pH. But they tend to converge into a single valueall the cations at pH below 4.0 and on further extrapolato pHpzc (pH 1.8) by smooth curves they give− log∗K int
1values varying between 0.7 and 1.0 for different cationsFig. 6). These values are close to those obtained frombatov plots, which will be discussed in a later section.
3.2. Effect of pH vis-à-vis electrolyte medium on theadsorption of cations
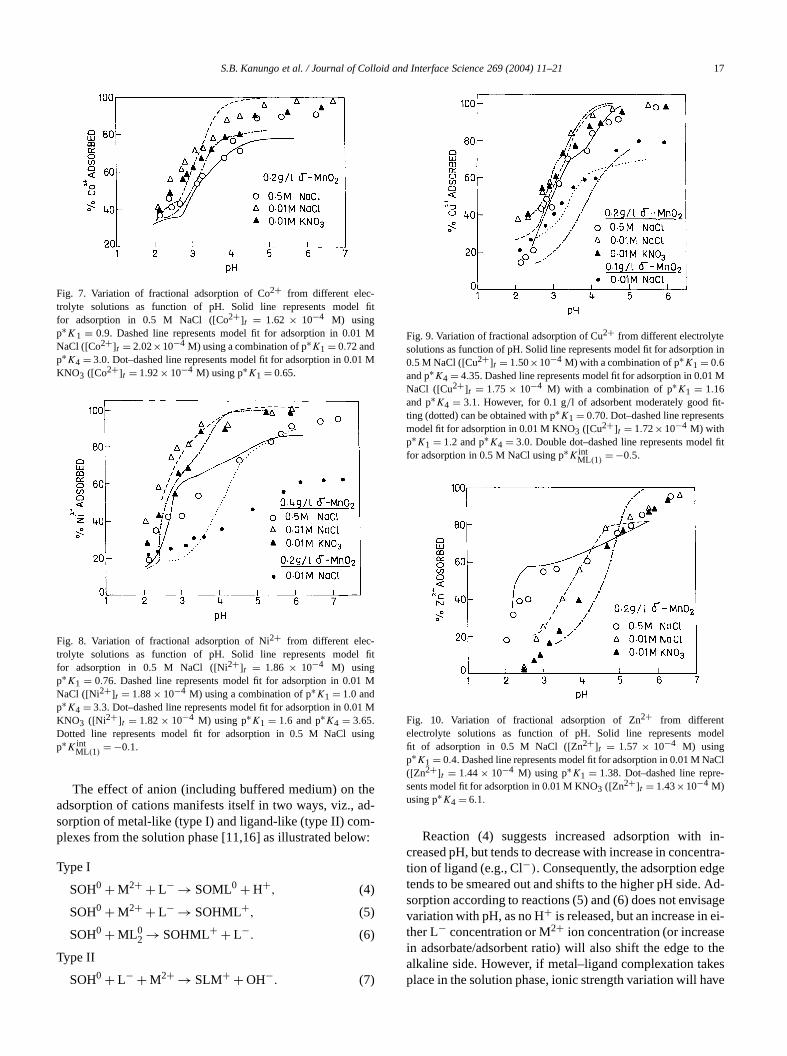
The most important single factor controlling the adsotion of metal ions onto hydrous oxides is the pH ofmedium, as evident from the results in the preceding secIt is generally observed that adsorption of metal ion ontooxide surface increases sharply and reaching the maxivalue of 100% within a narrow pH range of 1–2 pH unThis is known as “adsorption edge.” But in the present stem withδ-MnO2 as adsorbent the adsorption edge is nosteep, particularly in 0.5 M NaCl. Similar broad adsorptedges for Co2+, Ni2+, Cu2+, and Zn2+ adsorption ontoδ-MnO2 has also been observed by Murray [6]. Figuresindicate that adsorption of Co2+, Ni2+, and Cu2+ is highestin the presence of 0.01 M NaCl and lowest in 0.5 M NaAdsorption in 0.01 M KNO3 lies intermediate between thtwo electrolyte media. In the case of Zn2+ (Fig. 10), adsorption is highest in 0.5 M NaCl at pH less than 3.5 and low
Fig. 6. Plot of apparent binding constants for different cations derivedLangmuir-type plots (Table 3) as function of pH. The curves when extrlated to pHpzc give the intrinsic binding constants.
in 0.01 M KNO3, with adsorption in 0.01 M NaCl lying intermediate between the two electrolyte solutions. Howeat pH above 5.0 fractional adsorption in all the three etrolyte media almost merge together. This clearly suggthat Cl− enhances the adsorption of Zn2+ on δ-MnO2.
It has been stated earlier that low proton stoichiometrthe adsorption of heavy metal ions on toδ-MnO2 indicatesthe possible occurrence of some adsorption reactions wout the release of proton, irrespective of ionic strengththe nature of electrolyte (1–1) solution. This suggestsit is the high surface charge on hydrous MnO2 that leadsto the adsorption not only as free metal ion, but alsosome of its anion complexes. In the previous paper [9] itbeen shown that the concentration of free negatively chasurface species (SO−) increases sharply while the concetration of ion pairs (SO−Na+) decreases considerably widecreased ionic strength of the medium. The former teto adsorb not only free metal ions but also its complexaspecies with H+ still continuing to be associated as chabalancing counterion. At high electrolyte concentrationssorption takes place in the same manner as above, but reing Na+ in the bulk solution.
S.B. Kanungo et al. / Journal of Colloid and Interface Science 269 (2004) 11–21 17
fit
M
1 M
fit
M
1 M
ing
head--w:
n in
1 M
t-ts
l fit
del
aCl-
in-ntra-geAd-age
ei-ethe
kesave
Fig. 7. Variation of fractional adsorption of Co2+ from different elec-trolyte solutions as function of pH. Solid line represents modelfor adsorption in 0.5 M NaCl ([Co2+]t = 1.62 × 10⁻⁴ M) usingp∗K1 = 0.9. Dashed line represents model fit for adsorption in 0.01NaCl ([Co2+]t = 2.02×10⁻⁴ M) using a combination of p∗K1 = 0.72 andp∗K4 = 3.0. Dot–dashed line represents model fit for adsorption in 0.0KNO3 ([Co2+]t = 1.92× 10⁻⁴ M) using p∗K1 = 0.65.
Fig. 8. Variation of fractional adsorption of Ni2+ from different elec-trolyte solutions as function of pH. Solid line represents modelfor adsorption in 0.5 M NaCl ([Ni2+]t = 1.86 × 10⁻⁴ M) usingp∗K1 = 0.76. Dashed line represents model fit for adsorption in 0.01NaCl ([Ni2+]t = 1.88× 10⁻⁴ M) using a combination of p∗K1 = 1.0 andp∗K4 = 3.3. Dot–dashed line represents model fit for adsorption in 0.0KNO3 ([Ni2+]t = 1.82× 10⁻⁴ M) using p∗K1 = 1.6 and p∗K4 = 3.65.Dotted line represents model fit for adsorption in 0.5 M NaCl usp∗K int
ML(1)= −0.1.
The effect of anion (including buffered medium) on tadsorption of cations manifests itself in two ways, viz.,sorption of metal-like (type I) and ligand-like (type II) complexes from the solution phase [11,16] as illustrated belo
Type I
(4)SOH0 + M2+ + L− → SOML0 + H+,
(5)SOH0 + M2+ + L− → SOHML+,
(6)SOH0 + ML02 → SOHML+ + L−.
Type II
(7)SOH0 + L− + M2+ → SLM+ + OH−.
Fig. 9. Variation of fractional adsorption of Cu2+ from different electrolytesolutions as function of pH. Solid line represents model fit for adsorptio0.5 M NaCl ([Cu2+]t = 1.50×10⁻⁴ M) with a combination of p∗K1 = 0.6and p∗K4 = 4.35. Dashed line represents model fit for adsorption in 0.0NaCl ([Cu2+]t = 1.75 × 10⁻⁴ M) with a combination of p∗K1 = 1.16and p∗K4 = 3.1. However, for 0.1 g/l of adsorbent moderately good fiting (dotted) can be obtained with p∗K1 = 0.70. Dot–dashed line represenmodel fit for adsorption in 0.01 M KNO3 ([Cu2+]t = 1.72×10⁻⁴ M) withp∗K1 = 1.2 and p∗K4 = 3.0. Double dot–dashed line represents modefor adsorption in 0.5 M NaCl using p∗K int
ML(1)= −0.5.
Fig. 10. Variation of fractional adsorption of Zn2+ from differentelectrolyte solutions as function of pH. Solid line represents mofit of adsorption in 0.5 M NaCl ([Zn2+]t = 1.57 × 10⁻⁴ M) usingp∗K1 = 0.4. Dashed line represents model fit for adsorption in 0.01 M N([Zn2+]t = 1.44× 10⁻⁴ M) using p∗K1 = 1.38. Dot–dashed line represents model fit for adsorption in 0.01 M KNO3 ([Zn2+]t = 1.43×10⁻⁴ M)using p∗K4 = 6.1.
Reaction (4) suggests increased adsorption withcreased pH, but tends to decrease with increase in concetion of ligand (e.g., Cl−). Consequently, the adsorption edtends to be smeared out and shifts to the higher pH side.sorption according to reactions (5) and (6) does not envisvariation with pH, as no H+ is released, but an increase inther L− concentration or M2+ ion concentration (or increasin adsorbate/adsorbent ratio) will also shift the edge toalkaline side. However, if metal–ligand complexation taplace in the solution phase, ionic strength variation will h
18 S.B. Kanungo et al. / Journal of Colloid and Interface Science 269 (2004) 11–21
(6)ad-tor
ernglyated
anto
aseto benal–
ener
erMlex
d-
ce
ethe[6].
iced
ad-
theof
s tohtha
eehile
tionof
eter
tionerytion
ther
theon-ains
sta-er,elp-thsid-the
f allorp-
ioning
onay
ing
theH
ountfaceonsichay
ased
O
en-
Matcificdi-ase.r ins en-
neavydd in
little effect on adsorption [16]. In the case of reactionincreased ligand concentration will drastically reduce thesorption, as its concentration term will be in the numeraof the equilibrium constant.
Adsorption according to reaction (7) is favored at lowpH values where the ligand tends to adsorb more strothan the metal ion. Additional adsorption sites are crewhere the ligand acts as a bridge between the surfacethe cation (type II). Formation of such a complex tendsincrease the metal ion adsorption at lower pH, but decrewith increase in pH and therefore adsorption edge tendsbroad. This is what observed for the adsorption edge of Z2+in 0.5 M NaCl solution. The stability sequence of metchlorocomplex (MCl+) is as follows [17]: Ni2+ > Co2+ >
Cu2+ > Zn2+. Therefore, Ni2+ and Co2+ form strongerchlorocomplexes in 0.5 M NaCl than in 0.01 M NaCl. Givthat nitrate ion does not form any complex in solution, lowadsorption of Ni2+ and Co2+ in 0.5 M NaCl is due to theformation of such complex in solution which exhibits lowadsorption than free metal ions [16]. However, in 0.01NaCl solution free metal ion outcompetes solution compdue to its relatively lower stability, resulting in high asorption. This is further reflected in the adsorption of Zn2+,where the Cl− forms ligand-like complexes with the surfadue to lower stability of the ZnCl+ complex in NaCl solu-tion. The adsorption of Cu2+ is somewhat different as unlikother metal ions, it forms various hydrolytic species inpH range 3–6 that can enhance its adsorption greatlyTherefore, not much difference in adsorption can be notin all the three electrolyte solutions.
Two experiments have also been carried out for thesorption of Ni2+ and Cu2+ in 0.01 M NaCl solution bydoubling the adsorbate/adsorbent ratio, i.e., using halfamount ofδ-MnO2. It can be seen that whereas in caseNi2+ the adsorption edge is more flattened and shifthigher pH side, in case of Cu2+ the adsorption edge althougshifts to alkaline side is reasonably steep. This suggestsin case of Cu2+ there is little or no competition between frCu2+ and complexated species for the surface sites, win case of Ni2+ metal–chlorocomplex outcompetes Ni2+ forthe surface sites. However, precise prediction of adsorpin such a complex situation is still very difficult becauseother effects such as manganese ion release, surface hgeneity, etc.
3.3. Determination of surface binding constants of cations
The proton stoichiometry as determined from adsorpisotherm experiments at different pH values, though not vprecise, are no doubt low in order to suggest that adsorpdoes not take place entirely through the formation of eimonodentate-complex-like SOM+ or hydrolytic-complex-like SOMOH. Initially, an attempt was made to estimateintrinsic constant by plotting the logarithm of apparent cstant for the formation of the above surface species agthe fraction of surface covered by adsorbed cation (Γad/Ns )
d
s
t
o-
t
and extrapolating to zero adsorption, where the electrotic factor is considered to be negligibly small [14]. Howevthe intrinsic constants obtained in this manner were not hful to obtain a good fit of the experimental data for bofree and complexated metal ions. It was, therefore, conered that a binding constant such as the one derived fromKurbatov-type plot [18], which represents the average othe processes involved, would be appropriate in this adstion system.
The general equation for the interaction of the metalwith an oxide substrate may be expressed by the followequation:
(8)Mn+ + x(SOH)Ke
� [M(SOH)x](n−x)+ + xH+.
Neglecting the activity coefficient not only for the metal ibut also its surface complex the equilibrium constants mbe expressed as follows:
(9)Ke = [M(SOH)x](n−x)+[H+]x[Mn+][SOH]x .
Taking logarithm and rearranging one obtains the followrelationship:
(10)log[Mn+]ad
[Mn+]soln= logKe + x
{pH+ log[SOH]}.
A plot of left hand side vs{pH + log[SOH]} should yieldlinear relationship, the slope and intercept of which givevalues ofx andKe, respectively. We have taken free SOinto consideration in the present calculation as the amadsorbed is not very small compared to the total sursites. The results obtained for different electrolyte solutifrom the linear relationships are shown in Table 4. Whreveal some interesting features. The first thing that mbe noted is that, except Co2+, the proton coefficient (x) in-creases as the concentration of NaCl solution is decrefrom 0.5 to 0.01 M. In the case of Ni2+, Cu2+, and Zn2+adsorption, this value is further increased in 0.01 M KN3,which is more indifferent than NaCl solution.
On the other hand,Ke decreases with decreased conctration of NaCl and also in 0.01 M KNO3 solution. For theadsorption of Cu2+, Ke value remains unchanged in 0.01NaCl and 0.01 M KNO3. It may be mentioned here thwhen the mode of adsorption changes from more of spechemical interaction to more of coulombic interaction (inlute electrolyte solution), binding constant tends to decreThis does not necessarily imply that adsorption is lowethe later case and indeed, adsorption in most cases ihanced.
3.4. Modeling of adsorption with respect to pH
Unlike hydrous iron oxide very little work has been doon the modeling of adsorption of cations, especially hemetal ions, onto hydrous MnO2 surface [19–21]. The citepapers do not deal with the effect of anions, either adde
S.B. Kanungo et al. / Journal of Colloid and Interface Science 269 (2004) 11–21 19
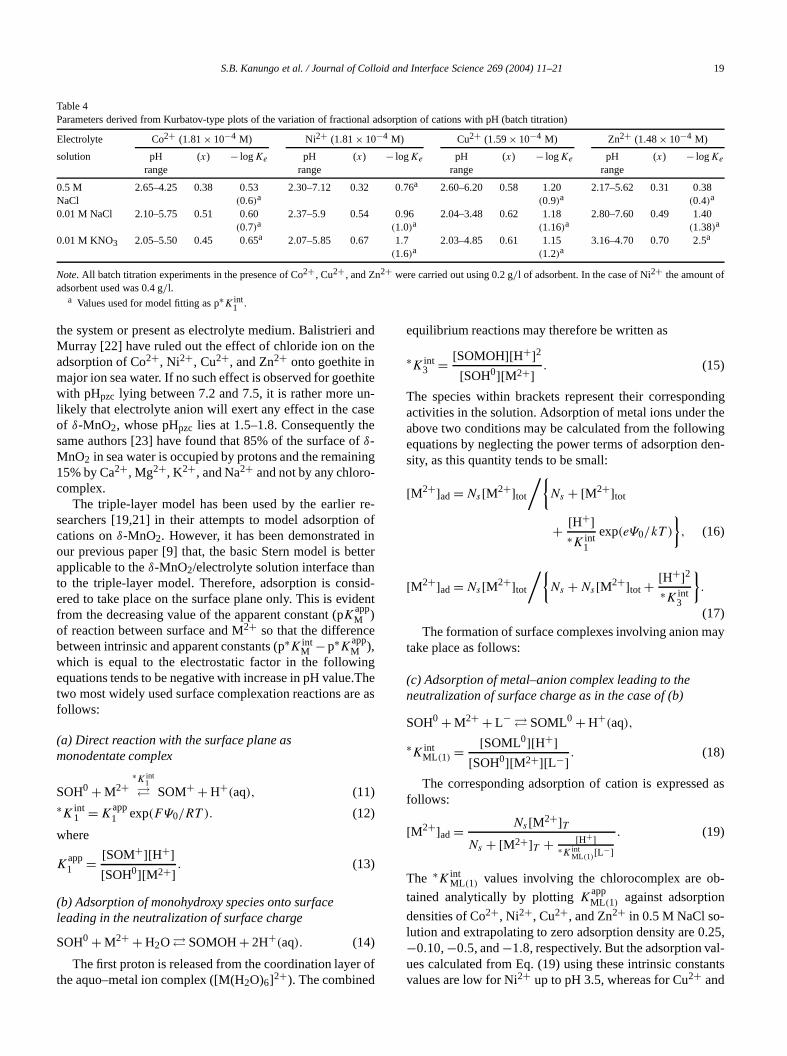
Table 4Parameters derived from Kurbatov-type plots of the variation of fractional adsorption of cations with pH (batch titration)
Electrolyte Co2+ (1.81× 10⁻⁴ M) Ni2+ (1.81× 10⁻⁴ M) Cu2+ (1.59× 10⁻⁴ M) Zn2+ (1.48× 10⁻⁴ M)
solution pH (x) − logKe pH (x) − logKe pH (x) − logKe pH (x) − logKe
range range range range
0.5 M 2.65–4.25 0.38 0.53 2.30–7.12 0.32 0.76a 2.60–6.20 0.58 1.20 2.17–5.62 0.31 0.38NaCl (0.6)a (0.9)a (0.4)a
0.01 M NaCl 2.10–5.75 0.51 0.60 2.37–5.9 0.54 0.96 2.04–3.48 0.62 1.18 2.80–7.60 0.49 1.40(0.7)a (1.0)a (1.16)a (1.38)a
0.01 M KNO3 2.05–5.50 0.45 0.65a 2.07–5.85 0.67 1.7 2.03–4.85 0.61 1.15 3.16–4.70 0.70 2.5a
(1.6)a (1.2)a
Note. All batch titration experiments in the presence of Co2+ , Cu2+ , and Zn2+ were carried out using 0.2 g/l of adsorbent. In the case of Ni2+ the amount ofadsorbent used was 0.4 g/l.
a Values used for model fitting as p∗K int.
1andhe
hiten-seefing
-
re-n ofintternid-
dent
ng.Thee as
r of
dingtheingen-
ay
d as
b-
.25,l-
ants
the system or present as electrolyte medium. BalistrieriMurray [22] have ruled out the effect of chloride ion on tadsorption of Co2+, Ni2+, Cu2+, and Zn2+ onto goethite inmajor ion sea water. If no such effect is observed for goetwith pHpzc lying between 7.2 and 7.5, it is rather more ulikely that electrolyte anion will exert any effect in the caof δ-MnO2, whose pHpzc lies at 1.5–1.8. Consequently thsame authors [23] have found that 85% of the surface oδ-MnO2 in sea water is occupied by protons and the remain15% by Ca2+, Mg2+, K2+, and Na2+ and not by any chlorocomplex.
The triple-layer model has been used by the earliersearchers [19,21] in their attempts to model adsorptiocations onδ-MnO2. However, it has been demonstratedour previous paper [9] that, the basic Stern model is beapplicable to theδ-MnO2/electrolyte solution interface thato the triple-layer model. Therefore, adsorption is consered to take place on the surface plane only. This is evifrom the decreasing value of the apparent constant (pK
appM )
of reaction between surface and M2+ so that the differencebetween intrinsic and apparent constants (p∗K int
M − p∗KappM ),
which is equal to the electrostatic factor in the followiequations tends to be negative with increase in pH valuetwo most widely used surface complexation reactions arfollows:
(a) Direct reaction with the surface plane asmonodentate complex
(11)SOH0 + M2+∗K int
1� SOM+ + H+(aq),
(12)∗K int1 = K
app1 exp(FΨ0/RT ).
where
(13)Kapp1 = [SOM+][H+]
[SOH0][M2+] .
(b) Adsorption of monohydroxy species onto surfaceleading in the neutralization of surface charge
(14)SOH0 + M2+ + H2O� SOMOH+ 2H+(aq).
The first proton is released from the coordination layethe aquo–metal ion complex ([M(H2O)6]2+). The combined
equilibrium reactions may therefore be written as
(15)∗K int3 = [SOMOH][H+]2
[SOH0][M2+] .
The species within brackets represent their corresponactivities in the solution. Adsorption of metal ions underabove two conditions may be calculated from the followequations by neglecting the power terms of adsorption dsity, as this quantity tends to be small:
[M2+]ad= Ns [M2+]tot
/{Ns + [M2+]tot
(16)+ [H+]∗K int
1
exp(eΨ0/kT )
},
(17)
[M2+]ad= Ns [M2+]tot
/{Ns + Ns [M2+]tot + [H+]2
∗K int3
}.
The formation of surface complexes involving anion mtake place as follows:
(c) Adsorption of metal–anion complex leading to theneutralization of surface charge as in the case of (b)
SOH0 + M2+ + L− � SOML0 + H+(aq),
(18)∗K intML (1) = [SOML0][H+]
[SOH0][M2+][L−] .
The corresponding adsorption of cation is expressefollows:
(19)[M2+]ad= Ns [M2+]TNs + [M2+]T + [H+]
∗K intML (1)
[L−].
The ∗K intML (1) values involving the chlorocomplex are o
tained analytically by plottingKappML (1) against adsorption
densities of Co2+, Ni2+, Cu2+, and Zn2+ in 0.5 M NaCl so-lution and extrapolating to zero adsorption density are 0−0.10,−0.5, and−1.8, respectively. But the adsorption vaues calculated from Eq. (19) using these intrinsic constvalues are low for Ni2+ up to pH 3.5, whereas for Cu2+ and
20 S.B. Kanungo et al. / Journal of Colloid and Interface Science 269 (2004) 11–21
the
n ofng
en(d)
ore,ctorngthd-
w on
-
od-enail-
utionthe
forh
is ofally-
c-ma-itht ra-d-t
ex
essM
as
odel
t-ous
tesd-its
iple-
tals
ein-
ofery
lottheandtioni-
ob-ge.hout
owen-ialhens
ndM
.0;los-
bitnheur-H.the
a-ing
Co2+ the values are very low for the entire pH range. Incase of Zn2+, the calculated values are negligibly small.
An attempt has also been made to model adsorptiothe four metal ions in 0.5 M NaCl according to the followireactions:
(d) Surface reaction of metal–anion complex withoutreleasing H+ in solution
SOH0 + M2+ + L− � SOHML+,
(20)∗K intML (2) = [SOHML+]
[SOH0][M2+][L−] exp(FΨ0/RT ).
(e) Adsorption of metal–anion complex already formed inthe solution phase
SOH0 + ML+ � SOHML+,
(21)∗K intML (3) = [SOHML+]
[SOH0][ML+] exp(FΨ0/RT ).
Both the models yield very low values of adsorption evat pH above 5.0. Even the combination of models (c) andor (c) and (e) does not make good fit of the data. Therefanion complexation is not considered as a significant fafor the decrease in adsorption with increase in ionic streof the electrolyte medium. In view of this observation, asorption of heavy metal ions has been discussed belothe basis of model reactions (a) and (b).
While adsorption of Ni2+ from 0.5 M NaCl may be modeled as a monodentate surface complex (SONi+) with p∗K int
1value of 0.76 without the necessity of adding Mn2+ release,adsorption from 0.01 M NaCl and 0.01 M KNO3 can bemodeled satisfactorily with the combination of SONi+ andSONiOH surface complexes. However, no satisfactory meling is possible for the adsorption from 0.01 M NaCl wh0.2 g/l of adsorbent is used. This is possibly because avable sites are restricted compared to the competing solspecies, which is contrary to the basic requirement ofsurface complexation model.
In the case of adsorption of Zn2+ from NaCl solution,moderate to satisfactory fitting of data can be achievedthe formation of SOZn+ surface complex together witMn2+ release in solution. However, in 0.01 M KNO3 so-lution fractional adsorption values calculated on the basSOZnOH formation are lower than those of experimentfound values even after taking Mn2+ release into consideration.
In case of Cu2+ the adsorption data in all the three eletrolyte solutions are best fitted using the combined fortion of SOCu+ and SOCuOH surface complexes along wMn2+ release in solution. At higher adsorbate/adsorbentio, i.e., using 0.1 g/l δ-MnO2, adsorption data can be moeled with the formation of SO−Cu+ surface complex. Buat pH above 4.0 the calculated values are lower than theperimental values. Modeling of the adsorption of Co2+ onδ-MnO2 in all the three electrolyte solutions has been lsatisfactory compared to other metal ions. While in 0.5
-
NaCl and 0.01 M KNO3, solution adsorption takes placeSOCo+, in 0.01 M NaCl solution, combination of SOCo+and SOCoOH appears to be the most appropriate for mfitting.
Hydrous MnO2 is not an ideal substrate for model fiting of adsorption data, because of highly heterogenenature of surface arising from different oxidation staof Mn, a low-order of crystallinity, and occurrence of asorbed/occluded alkali metal ion on the surface duringpreparation. Previous attempts [19,21] based on the trlayer model are not better than the present work.
4. Conclusions
From the present work on the adsorption of trace meon δ-MnO2 the following conclusions can be drawn.
1. Adsorption isotherms of Co2+, Ni2+, Cu2+, and Zn2+onto δ-MnO2 surface from 0.5 M NaCl solution in thpresence of buffer solution show that adsorptioncreases with increase in pH. For Cu2+ and Zn2+ adsorp-tion is very high at pH 6.0. The adsorption isothermsall the four cations are non-Langmuirian even at vlow concentrations.
2. The proton stoichiometry derived from the log–log pof adsorption vs equilibrium concentration usingmethod of Perona and Leckie varies between 0.30.8 depending upon the cations and their concentrarange up to which linear behavior is followed. Simlar low-proton stoichiometry values have also beentained from Kurbatov-type plots of adsorption edThis suggests that some adsorption takes place witreleasing proton into the solution.
3. The Langmuir-type plots of adsorption isotherm shbreaks in the linear behavior after a certain conctration. The binding constants derived from the initlinear region increase with decrease in pH and wextrapolated to pHpzc of the oxide sample give valuecloser to those obtained from Kurbatov-type plots.
4. The adsorption of Co2+, Ni2+ and to some extent Cu2+with respect to pH is generally lowest in 0.5 M NaCl ahighest, in 0.01 M NaCl, while the adsorption in 0.01KNO3 lies between them. In the case of Zn2+ the ad-sorption in 0.5 M NaCl is highest, at least up to pH 4in 0.01 M KNO3 it is the lowest, while in 0.01 M NaCthe adsorption is intermediate between them. It is ptulated that in the case of adsorption of Co2+ and Ni2+in 0.5 M NaCl, relatively stable chlorocomplexes exhiweak metal-like adsorption, whereas in the case of Z2+poor stability of chlorocomplex in solution leads to tadsorption of Cl−, which acts as a bridge between sface and metal ion (ligand-like), especially at lower p
5. The adsorption of cations can be modeled either byformation of SOM+ type complex or as a combintion of SOM+ and SOMOH type complexes, depend
S.B. Kanungo et al. / Journal of Colloid and Interface Science 269 (2004) 11–21 21
m.of
ula-
oflf adof
ted
i-r hisorsrd
pli-
Sur-
79.
73)
.
241
ir,
.
81)
51)
2)
2)
upon the cation and the nature of electrolyte mediuThe binding constants obtained from the interceptsthe Kurbatov-type plots are used in such model calction.
6. Attempts made to model adsorption on the basissurface reaction with metal–chlorocomplexes (MC+)
have not been successful, as the calculated values osorption are too low. It is concluded that adsorptioncations in such a manner occurs only to a very limiextent compared to free metal ion.
Acknowledgments
The authors are thankful to Dr. Vibhuti N. Mishra, Drector, Regional Research Laboratory, Bhubaneswar, fokind permission to publish the paper. One of the auth(S.S.T.) is grateful to the CSIR, New Delhi, for the awaof Senior Research Fellowship.
References
[1] J.J. Morgan, in: S.D. Faust, J.V. Hunter (Eds.), Principles and Apcation in Water Chemistry, Wiley, New York, 1967, p. 561.
-
[2] J.A. Davis, K.F. Hayes (Eds.), Geochemical Processes at Mineralfaces, American Chemical Society, Washington, DC, 1986.
[3] D.A. Crerar, H.L. Barnes, Geochim. Cosmochim. Acta 38 (1974) 2[4] R.M. Mckenzie, Aust. J. Soil Sci. 8 (1970) 97.[5] P. Loganathan, R.G. Burau, Geochim. Cosmochim. Acta 37 (19
1277.[6] J.W. Murray, Geochim. Cosmochim. Acta 39 (1975) 505.[7] S.B. Kanungo, K.M. Parida, J. Colloid Interface Sci. 98 (1984) 252[8] R.G. Burns, Geochim. Cosmochim. Acta 40 (1976) 95.[9] S.S. Tripathy, S.B. Kanungo, S.K. Mishra, J. Colloid Interface Sci.
(2001) 112.[10] J. Lurie, Hand Book of Analytical Chemistry (English transl.), M
Moscow, 1973, p. 263.[11] M.M. Benjamin, J.O. Leckie, Environ. Sci. Technol. 16 (1982) 162[12] M.J. Perona, J.O. Leckie, J. Colloid Interface Sci. 106 (1985) 64.[13] L.S. Balistrieri, P.G. Bower, J.W. Murray, Deep-Sea Res. A 28 (19
101.[14] S.B. Kanungo, J. Colloid Interface Sci. 162 (1994) 93.[15] B. Muller, L. Sigg, J. Colloid Interface Sci. 148 (1992) 517.[16] L.J. Criscenti, D.A. Sverjensky, Am. J. Sci. 299 (1999) 828.[17] H. Ruppert, Chem. Erde 39 (1980) 97.[18] M.H. Kurbatov, G.B. Wood, J.D. Kurbatov, J. Phys. Chem. 56 (19
258.[19] J.G. Catts, D. Langmuir, Appl. Geochem. 1 (1986) 255.[20] G. Fu, H.E. Allen, C.E. Cowan, Soil Sci. 152 (1991) 72.[21] P.J. Pretorius, P.W. Linder, Appl. Geochem. 16 (2001) 1067.[22] L.S. Balistrieri, J.W. Murray, Geochim. Cosmochim. Acta 46 (198
1253.[23] L.S. Balistrieri, J.W. Murray, Geochim. Cosmochim. Acta 46 (198
1041.