adsorption and fluorescence quenching of 5,5′-disulfopropyl-3,3′-dichlorothiacyanine dye on gold...
TRANSCRIPT
This journal is c The Royal Society of Chemistry and the Centre National de la Recherche Scientifique 2013 New J. Chem., 2013, 37, 743--751 743
Cite this: NewJ.Chem.,2013,37, 743
Adsorption and fluorescence quenching of5,50-disulfopropyl-3,30-dichlorothiacyaninedye on gold nanoparticles
Ana Vujacic,a Vesna Vodnik,a Sofija P. Sovilj,b Miroslav Dramicanin,a Natasa Bibic,a
Slobodan Milonjica and Vesna Vasic*a
The aim of the work was to investigate the adsorption of negatively charged cyanine dye
5,50-disulfopropyl-3,30-dichlorothiacyanine (TC) on the surface of borate capped gold nanoparticles
(AuNPs) with average core sizes of 6 and 10 nm. The characterization of AuNPs in the presence and
absence of TC was performed by measurements of the absorption, fluorescence and Raman spectra,
TEM, DLS and zeta potential. The measurements of fluorescence of the NPs–TC assembly in the
presence of low TC concentration clearly indicated that the fluorescence of TC was quenched by AuNPs
in the concentration dependent manner. This process was found to be quantitatively related to the
surface coverage of AuNPs by TC molecules. NPs surface coverage by TC was obtained from the
dependence of TC fluorescence on NPs or TC concentration, keeping the concentration of one of
the components of the NPs–TC assembly constant. The calculated values were obtained under the
assumption that the monolayer of TC molecules, which were in direct contact with the NPs surface, was
adsorbed. The experimentally obtained values were in accordance with the calculated ones for TC
orientation along the vertical short side. The formation of TC J-aggregates was evident only in the
presence of 6 nm NPs, when TC concentration was high. In this case the experimentally obtained value
for C6 concentration needed to completely quench TC dyes’ fluorescence was much lower than the
calculated, indicating that the dye was accommodated on the surface of these NPs in more than one
layer, and most probably in the slanted configuration.
Introduction
Cyanine dyes, compounds which have strong absorption in thevisible region, are highly fluorescent in monomers and aggregates,both in solution and organized media.1–3 H- and J-aggregates,4,5
which are composed of many thousands of dye monomers are ofgreat interest, both from the scientific and practical point of view.Self-organization of these molecules mediated by nanoparticles(NPs) is especially interesting because of their application fornanoelectronics,6 medical diagnostics,7,8 drug delivery,9 chemicalsensing10–12 and catalysis.13,14 It is also well known that theaddition of metal ions to the cyanine dyes solution may also resultin the production of J-aggregates.2,3 J-aggregation of some cyaninedyes of various structures on the surface of gold and silver NPs waswidely studied.15–18 Thereby, larger AuNPs did not induce any kind
of dyes aggregation on their surfaces. On the other hand, smallerAuNPs (o10 nm) stimulated J-aggregation of dye molecules.15–17
As it is well known that an efficient fluorescence quenchingcan occur in a system of the chemisorbed chromophore on theNPs surface,15,19,20 it is necessary to understand the inter-particle molecular interactions and reactivity. To provide thisinsight, the fluorescence properties of the number of NPs–dyeassemblies were investigated, considering that the maximuminteraction between the dye and the metal NPs occurs when thedye molecules are adsorbed on their surface.21 The adsorptionof negatively charged cyanine dyes is then only possible due tothe Coulombic interactions between the positively chargedthiazole moiety of the dye and the negatively charged groupsadsorbed on the surface of NPs.18 Due to the energy and/orelectron transfer,20,22 an increased nonradiative relaxation ofthe excited state induced the fluorescence quenching of the dyeadsorbed on the surface of NPs. Quenching efficiency wasusually dependent on the distance between the chromophoresand NPs, and also on the NPs size.23,24
a Vinca Institute of Nuclear Sciences, University of Belgrade, P.O. Box 522, Belgrade,
Serbia. E-mail: [email protected]; Fax: +381 112447207; Tel: +381 113408287b Faculty of Chemistry, University of Belgrade, P.O. Box 118, 11158 Belgrade, Serbia
Received (in Montpellier, France)24th September 2012,Accepted 12th December 2012
DOI: 10.1039/c2nj40865a
www.rsc.org/njc
NJC
PAPER
Dow
nloa
ded
by U
nive
rsity
of
Bel
grad
e on
23
Febr
uary
201
3Pu
blis
hed
on 1
4 D
ecem
ber
2012
on
http
://pu
bs.r
sc.o
rg |
doi:1
0.10
39/C
2NJ4
0865
A
View Article OnlineView Journal | View Issue

744 New J. Chem., 2013, 37, 743--751 This journal is c The Royal Society of Chemistry and the Centre National de la Recherche Scientifique 2013
In our previous paper25 we investigated the kinetics ofJ-aggregate formation of 5,50-disulfopropyl-3,3 0-dichlorothia-cyanine (TC) on the surface of AuNPs prepared using NaBH4
as a reducing agent. This study indicated that TC dye J-aggregateformation in the hybrid dye–AuNPs system consisted of a two-step process, i.e. a fast initial formation of the dye surface layerfollowed by the slower growth of J-aggregate assemblies.Considering that TC is negatively charged, it seems that theorientation of TC molecules on the NPs surface is a key factor indriving J-aggregates formation, since thiazole sulfur carriespartial positive charge which allows electrostatic interactionwith the negatively charged NPs surface.
The aim of this work was to further investigate the inter-action of TC with negatively charged borate capped AuNPs, as acontinuation of our previous work.25 For this purpose, twotypes of AuNPs were prepared, with average core sizes of6 nm and 10 nm, denoted C6 and C10. In order to elucidatethe differences in the behavior of these two kinds of NPs inthe presence of TC dye, a detailed characterization of NPs–dye assemblies was performed using various experimentaltechniques, such as UV-Vis spectrophotometry, fluorimetry,Raman spectroscopy TEM, DLS and zeta potential measure-ments. Since the dye sorption on the NPs surface was the pre-step in J-aggregates formation,25 special attention was paid onmeasuring fluorescence in AuNPs–dye systems, in order toclarify the process of sorption and the orientation of theadsorbed dye.
ExperimentalChemicals
Potassium tetrachloroaurate (KAuCl4, 99%), sodium borohydride(NaBH4, 99%), potassium chloride (KCl), all from Aldrich, wereused as received. Thiacyanine dye (TC) (5,50-disulfopropyl-3,30-dichlorothiacyanine sodium salt), the structure illustrated inScheme 1, was purchased from Hayashibara Biochemical Labora-tories, Okayama, Japan. Water purified with a Millipore Milli-Qwater system was used for preparing all solutions. 50 mM aqueousTC stock solution, containing 1 mM KCl was prepared by dissol-ving the solid TC. KCl presence in TC solution was necessary toassist in J-aggregate formation. The dye working solutions wereprepared by appropriate dilution of 50 mM TC stock solution,immediately before measurements.
Synthesis of AuNPs
AuNPs (colloidal dispersions C6 and C10 with the averageparticle diameters of 6 nm and 10 nm, respectively) wereprepared using sodium borohydride as a reducing agent. 100 mLof 0.2 mM aqueous solution of KAuCl4 was reduced by 5.3 mMof NaBH4 at room temperature, to yield a ruby-red solution(colloid C10). Furthermore, Au colloidal dispersion C6 wasprepared by the reduction of 1 mM KAuCl4 in aqueous solutionwith freshly prepared 0.1 M NaBH4 solution under icy conditions(4 1C).26 Milli-Q water (30 mL) was cooled with ice and then330 mL of freshly prepared NaBH4 solution and 10 mL of KAuCl4
solution were added to it under vigorous stirring, resulting in thewine-red Au colloidal dispersion. These colloidal dispersionswere stored at room temperature up to seven days.
The concentrations of stock dispersions of AuNPs C6 andC10 (7.4 � 10�8 M and 2.8 � 10�9 M, respectively) weredetermined from the absorbance at lmax, i.e. 520 nm for C6and 518 nm for C10, and extinction coefficient for Au colloids(1.1 � 107 for C627 and 2.4 � 108 for C1028) with known averagecore size obtained from TEM measurements of the particles.
Here it should be noted that, for all experiments presentedhere, solutions were prepared by mixing 1 mL of TC dye and upto 2 mL of colloidal dispersion. The final volume of solutionswas adjusted to 3 mL by adding water.
Instrumentation
The Perkin Elmer Lambda 35 UV-Vis spectrophotometer wasused for measuring the absorption spectra in a quartz cuvettewith a path length of 1 cm.
Transmission electron microscopy (TEM) measurements ofthe samples without TC and with TC-coated Au colloids werecarried out using a JEOL 100CX microscope instrument at anoperating voltage of 100 kV. Samples were prepared by placing adrop of the solution onto a carbon-coated copper grid. Afterdrying, the sample was examined by TEM. For each sample, thesize of more than 200 particles in the TEM images wasmeasured to obtain the average particles size.
Dynamic Light Scattering (DLS) measurements were performedusing Zeta-sizer Nano, ZS with 633 nm He–Ne laser, equipped witha MPT-2 Autotitrator, Malvern, UK. The experimental data were theaverage of at least eight runs. Each curve/run presents an averageresult of 14 measurements. The latter instrument can measureparticle sizes from 0.6 nm to 6 mm, and was also used to determinezeta potentials of the AuNPs and the NPs–dye assemblies.
Photoluminescence emission was measured using a Fluorolog-3Model FL3-221 spectrofluorometer (HORIBA Jobin-Yvon). Excitationand emission monochromators were double grating, with a disper-sion of 2.1 nm mm�1 (1200 grooves per mm), blazed at 406 nm forexcitation and 420–600 nm for emission. Xenon lamp providedexcitation and a fast TBX detector was used for emission measure-ments in a right angle configuration with a 1 cm path cuvette.
Raman spectra excited with a diode-pumped solid statehigh-brightness laser (532 nm) were collected on a DXR Ramanmicroscope (Thermo Scientific, USA), equipped with an Olympusoptical microscope and a CCD detector. The powdered sampleScheme 1 TC dye structure.
Paper NJC
Dow
nloa
ded
by U
nive
rsity
of
Bel
grad
e on
23
Febr
uary
201
3Pu
blis
hed
on 1
4 D
ecem
ber
2012
on
http
://pu
bs.r
sc.o
rg |
doi:1
0.10
39/C
2NJ4
0865
AView Article Online

This journal is c The Royal Society of Chemistry and the Centre National de la Recherche Scientifique 2013 New J. Chem., 2013, 37, 743--751 745
was placed on an X–Y motorized sample stage. The sample wasprepared by putting the drop of Au dispersion in the presenceof TC on a glass slide previously cleaned with ethanol andwater. The water was evaporated in air and the procedure wasrepeated three times. The laser beam was focused on thesample using an objective magnification 50�. The scatteredlight was analyzed by the spectrograph with a grating of1800 lines mm�1. Laser power was kept at 10 mW. Acquisitiontime was 10 s with 10 scans.
Results and discussionCharacterization of AuNPs in the presence of TC dye
The absorption spectrum of 1.67 � 10�5 M TC dye in aqueoussolution (Fig. 1, line 1) shows a short-wavelength maximum at409 nm denoted the D-band which is assigned to the dimer(TC2
2�) and a long-wavelength maximum (M-band) at 429 nmassigned to the monomer (TC�).16 The dye is present as anequilibrated mixture of monomers and dimers.29 A majorconsideration in the choice of this dye was its absorptionspectrum, far enough into the blue and thus well separatedfrom the absorption spectra of AuNPs.
As it can be seen in Fig. 1 (curves 2 and 3), Au colloids C6and C10 have the surface plasmon resonance (SPR) band withthe maximum at 517 nm and 518 nm, respectively, whoseposition is usually dependent on the size, shape, interparticledistance, the synthesis procedure, and surrounding dielectricmedium constant.30–32
The absorption spectra of NPs–TC assemblies (Fig. 1, lines 4and 5), containing 1.67 � 10�5 M TC and 5 � 10�8 M NPs C6 or1.87� 10�9 M NPs C10, clearly indicated that only in the case ofsmaller AuNPs (C6) the sharp dip at 475 nm appeared,17,33
followed by the red shifted position of the SPR band from 517to 535 nm (Fig. 1, line 4). To the best of our knowledge, thesharp absorption minimum at 475 nm is characteristic only forthe J-aggregates formation which is clearly accelerated bythe spherical AuNPs with an average particle diameter of5–10 nm.16,33 In accordance with the previous publications,16,33
the presence of the dip in the AuNPs–TC assembly has beeninterpreted as a result of the strong electrostatic interactionbetween molecular exciton of J-aggregates and surface plasmonof metal NPs.
The behavior of C10 NPs was rather different from that of C6NPs when the same concentration of the dye was present insolution. The absorption spectra of this colloid before (Fig. 1,line 3) and after the addition of TC dye (Fig. 1, line 5) did notindicate any observable reactivity, except the red shift (3 nm) ofthe SPR band due to the change in the refractive index aroundthe particles in the presence of TC dye. The higher stability ofthese particles can be explained by the stabilization of theparticles in the presence of an excess of borohydride, where thesecond stabilization factor takes place – the charge effect.34 It iswell known that the products of the hydrolysis of sodiumborohydride are borate species which adsorb to the particlessurfaces, resulting in a negative particle charge and stabilizingeffect.35 The size and the surface of these AuNPs may not besuitable for the spontaneous formation of cyanine dye J-aggregates.Thus, it was concluded that, in the case of C10 colloid, theadsorption of TC dye occurred predominantly by weak inter-action between TC and ions adsorbed on the surface of theparticles. Furthermore, the J-aggregation was favored in thecase of small NPs, C6, with suitable surfaces, where the dyemolecules could disrupt the compact diffuse double layer ofions and solvating molecules around the particles.
TEM, DLS and zeta potential measurements of NPs–TCassemblies
The AuNPs size and morphology in the presence and absence ofTC were examined by TEM. Typical TEM images of colloidaldispersion C6 and C10 before and after the addition of TC withthe corresponding particle size distributions (PSD) are pre-sented in Fig. 2.
Based on TEM measurements, the AuNPs (Fig. 2a and c) arenearly spherical in shape with a relatively narrow size distribu-tion. The average diameter (dav) was found to be 6 nm and10 nm for C6 and C10, respectively (Fig. 2a and c). Micrograph(b) in Fig. 2 shows the TEM image of the C6 NPs–TC assemblywhich has been ascribed to the multiple core borate capped C6NPs in which AuNPs are ‘‘glued’’ together via TC dye adsorbedon their surfaces and the size of these assemblies is in therange of 21–47 nm. The formation of such ‘‘connected’’ NPswas most probably enabled due to the small size of the particles(higher surface energy than in the case of bigger ones) and theformation of J-aggregates. From this result it was clear that thediffuse layer repulsion between the negatively charged AuNPswas reduced upon the adsorption of the dye, thereby facilitatingthe formation of such assemblies. These changes were alsosupported by the UV-Vis spectrum presented in Fig. 1, as a redshift of the SPR band of colloid C6. However, the TEM image ofthe C10 NPs–TC assembly (Fig. 2d) indicated that the averagesize of NPs was not changed in the presence of the dye.
The particle size distribution measurements by the DLSmethod were also performed, using NPs dispersions beforeand after the addition of TC. The obtained average values for
Fig. 1 The absorption spectra of: 1 – TC dye (1.67� 10�5 M), 2 – 5 � 10�8 M C6,3 – 1.87 � 10�9 M C10 and solutions containing 1.67 � 10�5 M TC upon theaddition of AuNPs: 4 – colloid C6, 5 – colloid C10.
NJC Paper
Dow
nloa
ded
by U
nive
rsity
of
Bel
grad
e on
23
Febr
uary
201
3Pu
blis
hed
on 1
4 D
ecem
ber
2012
on
http
://pu
bs.r
sc.o
rg |
doi:1
0.10
39/C
2NJ4
0865
AView Article Online

746 New J. Chem., 2013, 37, 743--751 This journal is c The Royal Society of Chemistry and the Centre National de la Recherche Scientifique 2013
NPs diameters (dav) are presented in Table 1, together with thevalues obtained by TEM analysis, for comparison. It must betaken into account that the values obtained by DLS measure-ments represent the hydrodynamic diameter of a sphere (i.e.diameter of particle with hydratation shell), having the samevolume as the particle. The comparison of results obtained byTEM and DLS measurements indicated that particle sizesobtained by DLS were larger than that obtained by TEM, sincethe particle size obtained by DLS measurements included theadded solvent or stabilizer moving with the particle. This is
evident by comparing the DLS results obtained in the presenceof TC for both NPs. Briefly, DLS results showed larger values ofTC coated NPs, especially in the case of C6 which is inaccordance with TEM measurements.
In addition, zeta potential and conductivity for initial Aucolloidal dispersions in the absence and presence of TC dyewere measured under the same experimental conditions asdescribed above. The results are given in Table 2.
These results confirmed that AuNPs C6 and C10 hadnegatively charged surfaces, as well as AuNPs–TC assemblies.It has been well established that AuNPs consist of an elementalAu core surrounded by a negative ionic double layer of charges.These charges are determined by the zeta potential of theparticle in each system.
It can be noticed that the values of zeta potential in the caseof C10 AuNPs were higher comparing to that obtained for C6AuNPs, due to the larger amount of negatively charged borateanions adsorbed on the surface of C10 NPs. The addition of TCdye to colloidal dispersions did not change the pH values,but a slight decrease in the absolute values of zeta potential
Fig. 2 TEM analysis of AuNPs C6 and C10 without (a and c) and with TC (b and d). The insets show the particle size distributions.
Table 1 The average values of NPs diameter (dav) obtained by TEM and DLSmeasurements for AuNPs C6 and C10 in the absence and presence of 1.67 �10�5 M TC
AuNPs
dav (nm)
C6 C10
Without TC With TC Without TC With TC
TEM 6 0.5 21–47 2.5 10 1.0 11 1.5DLS 10 1.0 35 2.0 15 1.5 16 1.3
Paper NJC
Dow
nloa
ded
by U
nive
rsity
of
Bel
grad
e on
23
Febr
uary
201
3Pu
blis
hed
on 1
4 D
ecem
ber
2012
on
http
://pu
bs.r
sc.o
rg |
doi:1
0.10
39/C
2NJ4
0865
AView Article Online

This journal is c The Royal Society of Chemistry and the Centre National de la Recherche Scientifique 2013 New J. Chem., 2013, 37, 743--751 747
can be noticed. This led us to the conclusion that smaller particlesize (C6) and surface conditions (lower amount of negativelycharged borates on the particle surface i.e. lower absolute valueof zeta potential) were suitable to induce the aggregation of thedye. Taking into account that the dye is negatively charged, theorientation of the dye on the NPs surface is dependent onelectrostatic interaction between trivalent borate anions andpositively charged thiazole moiety of the TC dye. As mentionedin our previously published work,25 these electrostatic argumentssupport the slanted orientation of TC molecules on the C6 NPssurface in more than one layer. The result of this interaction isalso the partial neutralization of the zeta potential of these AuNPs.
In addition to the previous results, the presence of organiccompounds, which do not dissociate into ions in water solu-tions, decreases conductivity, as it can be seen in the case ofcolloid C10 after the addition of TC (Table 2). On the otherhand, the increase in conductivity was observed for the colloidC6 NPs–TC assembly comparing to C6, most probably due tothe TC dye J-aggregate formation on the surface of C6 NPs.36,37
Raman spectra of NPs–TC dye assemblies
In further experiments, the measurements of Raman spectra ofTC in the absence and presence of AuNPs C6 and C10 were
performed (Fig. 3b and c). For comparison, the Raman spec-trum of powdered TC is also shown in Fig. 3a.
Peak frequencies in the Raman spectra of TC dye adsorbed onAuNPs C6 were almost the same as those in the Raman spectrumof the TC dye powder, in which the out-of-plane vibration modesof J-aggregates were observed.38 This finding enabled us toconclude that TC J-aggregates were formed on the NPs surface.The identification of J-aggregates in the AuNPs–TC assembly wasprincipally based on comparison between the obtained spectraand known Raman spectra of J-aggregates of thiacyanine dyesin the low wave number region (1000–400 cm�1).39,40 This is inagreement with the recently published results concerningidentification of thiacyanine J-aggregates adsorbed on singleAg nanoaggregates by SERS.40 Briefly, the Raman spectra of asingle Ag nanoaggregate adsorbed from dye solution are similarto the powdered TC and TC–Cl2 Raman spectra.40 This simi-larity is consistent with the fact that powdered ionic dyemolecules like TC and TC–Cl2 are most likely stacked inJ-aggregates, like it was also found for pseudoisocyanine (PIC)bromide.41 Thus, the Raman spectra of TC coated AuNPsconfirmed that TC molecules were adsorbed on negatively-charged Au surfaces by Coulomb attraction through theirpartially positively charged thiazole ring.
Table 2 Zeta potential, pH and conductivity for Au colloids C6 and C10 in the absence and presence of 1.67 � 10�5 M TC dye
Colloid NPs concentration (M) pH
Zeta potential (mV) Conductivity (mS cm�1)
Without TC With TC Without TC With TC
C6 7.4 � 10�8 M 6.54 �36.0 0.2 �32.0 0.3 221 9 286 8C10 0.28 � 10�8 M 9.18 �38.3 0.3 �34.1 0.4 479 1 383 9
Fig. 3 Raman spectra of TC dye powder (a); TC J-aggregates adsorbed on C6 (b) and TC adsorbed on C10 (c); excitation at 532 nm.
NJC Paper
Dow
nloa
ded
by U
nive
rsity
of
Bel
grad
e on
23
Febr
uary
201
3Pu
blis
hed
on 1
4 D
ecem
ber
2012
on
http
://pu
bs.r
sc.o
rg |
doi:1
0.10
39/C
2NJ4
0865
AView Article Online

748 New J. Chem., 2013, 37, 743--751 This journal is c The Royal Society of Chemistry and the Centre National de la Recherche Scientifique 2013
In contrast, in the presence of C10 (Fig. 3c) no peaks wereobserved in the 1000–400 cm�1 region. Thus, the lack of thebackground emission and Raman peaks in the 1000–400 cm�1
region means the absence of TC J-aggregates on the surfaceof AuNPs C10. Moreover, the presence of peaks in the1000–1600 cm�1 region allowed us to consider the possibilityof detecting a mixture of monomers and dimers of TC40 on theNPs surface. This led us to the conclusion that at low TCconcentration the dissolution of TC J-aggregates into monomersor dimers occurred. These observations are consistent withpreviously published theoretical and experimental work.42–46
Fluorescence quenching of TC dye by AuNPs
In aqueous solution TC dye exhibits a strong fluorescence withmaximum at B485 nm. As an example, the fluorescence spectralchanges for a solution containing 1.0 � 10�6 M TC before andafter the addition of Au colloidal solutions (colloid C10) areshown in Fig. 4.
In the presence of Au colloids the intensity of fluorescencecomparing to the fluorescence of the neat TC dye becameweaker, indicating that the AuNPs–TC assembly displayedfluorescence quenching properties. Energy transfer to the metalsurface, as a result of quenching of the excited state by theconductive metal surface, was observed earlier.33,47 However,another important effect which could lead to a decrease influorescence intensity must be taken into account. That is theinner filter effect (photon reabsorption by the mixture compo-nents). To account for inner filter effects, the simple correctionfactor proposed by Lakowicz48 was applied to the measuredfluorescent spectra, according to the equation:
Fcorr = Fobs10(Aex+Aem)/2 (1)
where Fx are the fluorescence intensities for the corrected andobserved signals, and Aex and Aem are the solution absorbancesat the excitation and emission wavelengths, respectively.
For the study of influence of AuNPs on the fluorescence ofTC dye, two series of experiments were performed by mixing TC
dye and colloidal dispersions C6 or C10. In the first set ofmeasurements the final TC dye concentration was keptconstant (1.0 � 10�6 M). The dependence of the correctedfluorescence intensity at 485 nm on NPs concentration isshown in Fig. 5.
To obtain the experimental titration end points, the curveswere extrapolated by straight lines to zero. The obtained finalconcentrations of NPs needed to achieve the titration end pointwere about 6.90 � 10�9 M (1.24 � 1013 NPs in 3 mL) and 2.78 �10�9 M (4.9 � 1012 NPs in 3 mL) for C6 and C10, respectively.
In addition, the first set of measurements for the colloidaldispersion C6 was performed in the presence of TC dye in thegreat excess (1.67 � 10�5 M) while the NPs concentration wasvaried. It should be noted that under these experimentalconditions the formation of J-aggregates was noticed only inthe case of C6 (Fig. 1). The corresponding fluorescence spectralchanges are presented in Fig. 6.
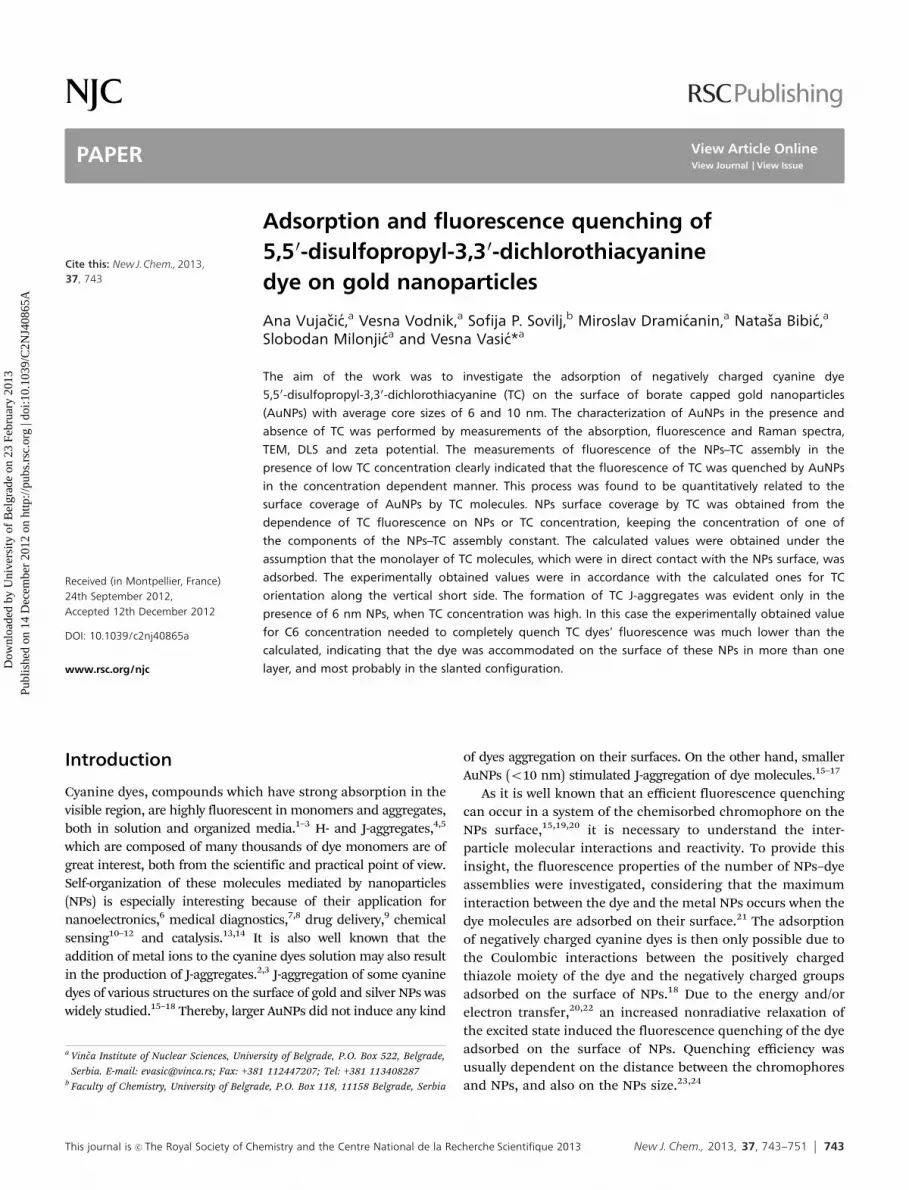
The dependence of fluorescence intensity of the C6 NPs–TCassembly at B485 nm on C6 NPs concentration is presented inFig. 7.
Fig. 4 Change of fluorescence spectra at B485 nm of 1 � 10�6 M TC(1) after the addition of C10 colloid as the dependence on AuNPs concentration:0.19 � 10�9 M (2); 0.56 � 10�9 M (3); 0.93 � 10�9 M (4); 1.40 � 10�9 M (5);1.68 � 10�9 M (6).
Fig. 5 Dependence of corrected fluorescence intensity of the solution containing1� 10�6 M TC and C6 or C10 on NPs concentration at B485 nm. Results representthe mean value of two experiments performed in duplicate.
Fig. 6 Change of fluorescence spectra of 1.67 � 10�5 M TC (1) upon theaddition of C6 colloid at B485 nm as the dependence on AuNPs concentration:2.5 � 10�9 M (2); 4.9 � 10�9 M (3); 9.9 � 10�9 M (4); 1.5 � 10�8 M (5); 2.0 �10�8 M (6); 2.5 � 10�8 M (7); 3 � 10�8 M (8); 3.5 � 10�8 M (9); 3.9 � 10�8 M(10); 4.4 � 10�8 M (11); 5.0 � 10�8 M (12).
Paper NJC
Dow
nloa
ded
by U
nive
rsity
of
Bel
grad
e on
23
Febr
uary
201
3Pu
blis
hed
on 1
4 D
ecem
ber
2012
on
http
://pu
bs.r
sc.o
rg |
doi:1
0.10
39/C
2NJ4
0865
AView Article Online
This journal is c The Royal Society of Chemistry and the Centre National de la Recherche Scientifique 2013 New J. Chem., 2013, 37, 743--751 749
The experimental titration end point was not reached, but couldbe obtained by extrapolation of the straight line to zero. Theobtained concentration of C6 NPs needed to quench the fluores-cence of 1.67� 10�5 TC was 1.5� 10�7 M (2.7� 1014 NPs in 3 mL).
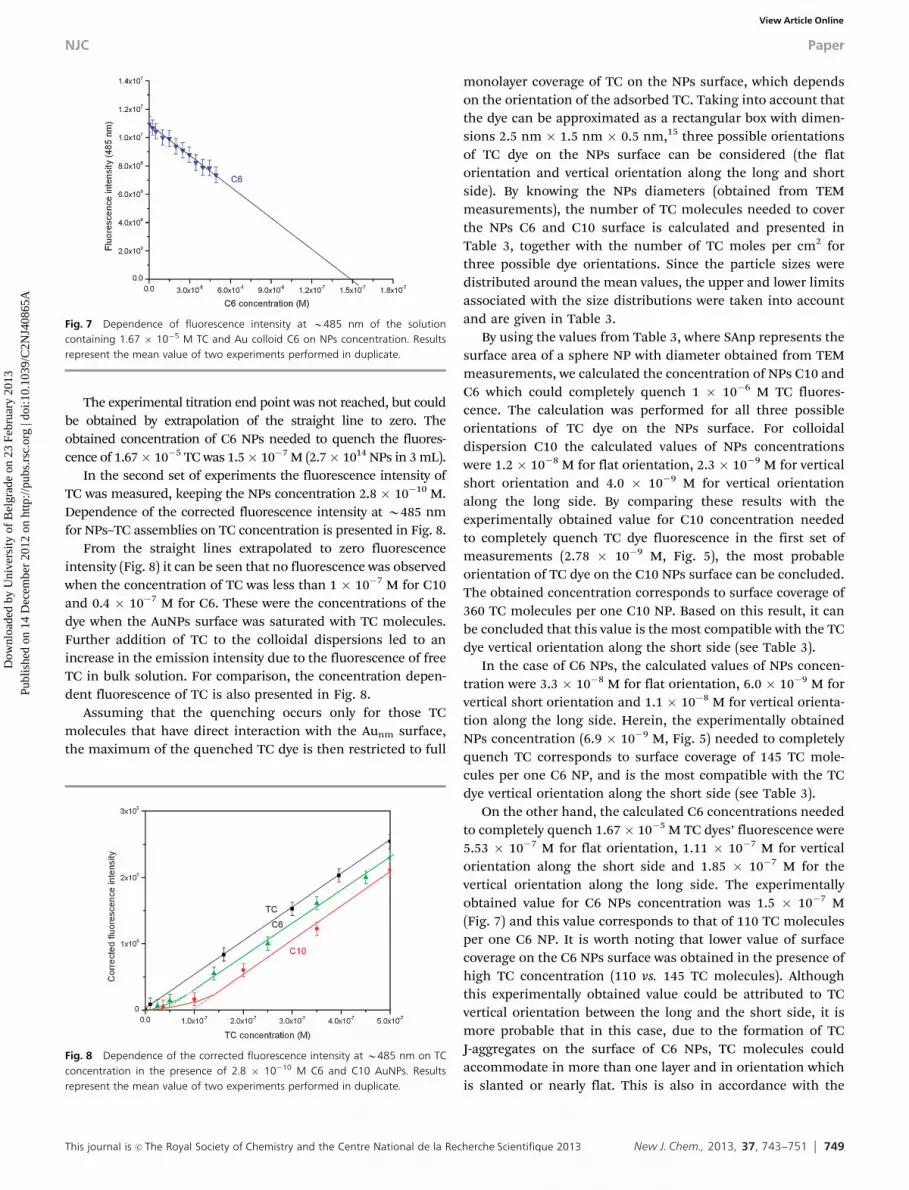
In the second set of experiments the fluorescence intensity ofTC was measured, keeping the NPs concentration 2.8 � 10�10 M.Dependence of the corrected fluorescence intensity at B485 nmfor NPs–TC assemblies on TC concentration is presented in Fig. 8.
From the straight lines extrapolated to zero fluorescenceintensity (Fig. 8) it can be seen that no fluorescence was observedwhen the concentration of TC was less than 1 � 10�7 M for C10and 0.4 � 10�7 M for C6. These were the concentrations of thedye when the AuNPs surface was saturated with TC molecules.Further addition of TC to the colloidal dispersions led to anincrease in the emission intensity due to the fluorescence of freeTC in bulk solution. For comparison, the concentration depen-dent fluorescence of TC is also presented in Fig. 8.
Assuming that the quenching occurs only for those TCmolecules that have direct interaction with the Aunm surface,the maximum of the quenched TC dye is then restricted to full
monolayer coverage of TC on the NPs surface, which dependson the orientation of the adsorbed TC. Taking into account thatthe dye can be approximated as a rectangular box with dimen-sions 2.5 nm � 1.5 nm � 0.5 nm,15 three possible orientationsof TC dye on the NPs surface can be considered (the flatorientation and vertical orientation along the long and shortside). By knowing the NPs diameters (obtained from TEMmeasurements), the number of TC molecules needed to coverthe NPs C6 and C10 surface is calculated and presented inTable 3, together with the number of TC moles per cm2 forthree possible dye orientations. Since the particle sizes weredistributed around the mean values, the upper and lower limitsassociated with the size distributions were taken into accountand are given in Table 3.
By using the values from Table 3, where SAnp represents thesurface area of a sphere NP with diameter obtained from TEMmeasurements, we calculated the concentration of NPs C10 andC6 which could completely quench 1 � 10�6 M TC fluores-cence. The calculation was performed for all three possibleorientations of TC dye on the NPs surface. For colloidaldispersion C10 the calculated values of NPs concentrationswere 1.2 � 10�8 M for flat orientation, 2.3 � 10�9 M for verticalshort orientation and 4.0 � 10�9 M for vertical orientationalong the long side. By comparing these results with theexperimentally obtained value for C10 concentration neededto completely quench TC dye fluorescence in the first set ofmeasurements (2.78 � 10�9 M, Fig. 5), the most probableorientation of TC dye on the C10 NPs surface can be concluded.The obtained concentration corresponds to surface coverage of360 TC molecules per one C10 NP. Based on this result, it canbe concluded that this value is the most compatible with the TCdye vertical orientation along the short side (see Table 3).
In the case of C6 NPs, the calculated values of NPs concen-tration were 3.3 � 10�8 M for flat orientation, 6.0 � 10�9 M forvertical short orientation and 1.1 � 10�8 M for vertical orienta-tion along the long side. Herein, the experimentally obtainedNPs concentration (6.9 � 10�9 M, Fig. 5) needed to completelyquench TC corresponds to surface coverage of 145 TC mole-cules per one C6 NP, and is the most compatible with the TCdye vertical orientation along the short side (see Table 3).
On the other hand, the calculated C6 concentrations neededto completely quench 1.67 � 10�5 M TC dyes’ fluorescence were5.53 � 10�7 M for flat orientation, 1.11 � 10�7 M for verticalorientation along the short side and 1.85 � 10�7 M for thevertical orientation along the long side. The experimentallyobtained value for C6 NPs concentration was 1.5 � 10�7 M(Fig. 7) and this value corresponds to that of 110 TC moleculesper one C6 NP. It is worth noting that lower value of surfacecoverage on the C6 NPs surface was obtained in the presence ofhigh TC concentration (110 vs. 145 TC molecules). Althoughthis experimentally obtained value could be attributed to TCvertical orientation between the long and the short side, it ismore probable that in this case, due to the formation of TCJ-aggregates on the surface of C6 NPs, TC molecules couldaccommodate in more than one layer and in orientation whichis slanted or nearly flat. This is also in accordance with the
Fig. 7 Dependence of fluorescence intensity at B485 nm of the solutioncontaining 1.67 � 10�5 M TC and Au colloid C6 on NPs concentration. Resultsrepresent the mean value of two experiments performed in duplicate.
Fig. 8 Dependence of the corrected fluorescence intensity at B485 nm on TCconcentration in the presence of 2.8 � 10�10 M C6 and C10 AuNPs. Resultsrepresent the mean value of two experiments performed in duplicate.
NJC Paper
Dow
nloa
ded
by U
nive
rsity
of
Bel
grad
e on
23
Febr
uary
201
3Pu
blis
hed
on 1
4 D
ecem
ber
2012
on
http
://pu
bs.r
sc.o
rg |
doi:1
0.10
39/C
2NJ4
0865
AView Article Online

750 New J. Chem., 2013, 37, 743--751 This journal is c The Royal Society of Chemistry and the Centre National de la Recherche Scientifique 2013
Raman spectra obtained in the presence of C6 NPs (Fig. 3b).Moreover, the study of behaviour of the AgNPs–TC assembly39
pointed out that the number of TC J-aggregates on the NPssurface decreased in the presence of low TC concentration dueto their dissolution in surrounding water. Because of dissolu-tion monomers and dimers are formed and monomers aresorbed on the NPs surface.
For the second set of measurements, we calculated theconcentration of TC needed to cover the NPs surface formonolayer surface coverage and be completely quenched, forall three possible orientations. For colloidal dispersion C10, thevalues 2.3 � 10�8 M, 1.2 � 10�7 M and 7 � 10�8 M werecalculated for horizontal, vertical along the short side andvertical along the long side orientations, respectively. Com-parison of these values with the experimentally obtained value,1 � 10�7 M (360 TC molecules per one C10 NP, Fig. 8),indicated that the orientation of TC on the NPs C10 surface isvertical along the short side. On the other hand, the calculatedvalues for colloidal dispersion C6 were 8.3 � 10�9 M TC forhorizontal, 4.2 � 10�8 M for vertical short and 2.5 � 10�8 M forvertical orientation along the long side. Comparison of theseresults with the experimentally obtained value of 4� 10�8 M TC(144 TC molecules per one C6 NP, Fig. 8) indicated that theorientation of TC dye molecules on the surface of C6 NPs is alsocompatible with the vertical orientation along the short side.
Conclusions
We investigated the adsorption of cyanine dye 5,50-disulfo-propyl-3,30-dichlorothiacyanine (TC) on the surface of boratecapped AuNPs with different average core sizes of 6 nm and10 nm (obtained from TEM measurements) denoted C6 andC10. The adsorption of TC dye on the surface of both AuNPsinvolved electrostatic interactions between the negativelycharged borates on the surface of AuNPs and the positivelycharged thiazole moiety of the TC dye. The result of thisinteraction is the partial neutralization of the zeta potentialof AuNPs. The formation of TC J-aggregates in the presence ofC6 NPs and higher TC concentration was confirmed spectro-photometrically, by the existence of sharp dip at 475 nm.Moreover, the Raman spectra also suggested TC J-aggregationin the case of C6.
The measurements of fluorescence of the NPs–TC assem-blies clearly indicated the fluorescence quenching properties ofAuNPs. The fluorescence quenching of the dye showed lineardependence on NPs concentration. The concentrations of TC or
NPs needed to completely quench the fluorescence of theNPs–TC assembly were obtained experimentally and comparedto the calculated ones. In our calculations we assumed that thefluorescence quenching occurred only for those molecules thathad direct contact with the NPs surface. Based on the com-parison of the experimentally obtained values with the calcu-lated ones, the conclusion was drawn that in the presence oflower TC concentrations, the dye orientation on the surface ofC6 and C10 NPs was vertical along the short side. On the otherhand, in the case of C6 NPs when the dye was present insolution in great excess, the J-aggregation of TC on the NPssurface occurred and dye molecules were accommodated inmore than one layer, most probably in the slanted orientation.
Acknowledgements
The authors would like to thank the Ministry of Education andScience of the Republic of Serbia (Project No. 172023) for theirfinancial support. We are also grateful to Dr Jasmina Hranisavljevicand Dr Gary P. Wiederrecht for providing us with TC dye andfor useful discussion. We also thank Prof. Ivanka Holclajtner-Antunovic and Danica Bajuk-Bogdanovic for performing Ramanspectroscopy measurements.
Notes and references
1 R. C. Benson and H. A. Kues, J. Chem. Eng. Data, 1977, 22,379–383.
2 T. D. Slavnova, A. K. Chibisov and H. Gorner, J. Phys. Chem.A, 2005, 109, 4758–4765.
3 A. K. Chibisov, T. D. Slavnova and H. Gorner, Nanotechnology(Russia), 2008, 3, 19–34.
4 T. Kobayashi, ed. J-Aggregates, World Scientific Publishing,Singapore, 1996.
5 K. C. Hannah and B. A. Armitage, Acc. Chem. Res., 2004, 37,845–853.
6 J. F. Hicks, F. P. Zamborini, A. Osisek and R. W. Murray,J. Am. Chem. Soc., 2001, 123, 7048–7053.
7 W. X. Zheng, M. M. Maye, F. L. Leibowitz and C. J. Zhong,Analyst, 1999, 125, 17–20.
8 T. A. Taton, R. C. Mucic, C. A. Mirkin and R. L. Letsinger,J. Am. Chem. Soc., 2000, 122, 6305–6306.
9 R. Hong, G. Han, J. M. Fernandez, B. J. Kim, N. S. Forbesand V. M. Rotello, J. Am. Chem. Soc., 2006, 128, 1078–1079.
10 W. X. Zheng, M. M. Maye, F. L. Leibowitz and C. J. Zhong,Anal. Chem., 2000, 72, 2190–2199.
Table 3 Calculated number of TC molecules adsorbed on NPs C6 and C10
Colloid SAnp (nm2)
Number of TC dye molecules needed to coverthe NPs surface per 3 different orientations G0 (mol cm�2)
FlatVertical alongthe long side
Vertical alongthe short side
Averagenumber Flat
Vertical alongthe long side
Vertical alongthe short side
C6 95–133 25–35 76–106 127–177 91 4.4 � 10�11 1.3 � 10�10 2.2 � 10�10
C10 254–380 68–101 203–304 339–507 254
SAnp – surface area of a sphere NP. G0 – maximum monolayer surface coverage (mol cm�2).
Paper NJC
Dow
nloa
ded
by U
nive
rsity
of
Bel
grad
e on
23
Febr
uary
201
3Pu
blis
hed
on 1
4 D
ecem
ber
2012
on
http
://pu
bs.r
sc.o
rg |
doi:1
0.10
39/C
2NJ4
0865
AView Article Online

This journal is c The Royal Society of Chemistry and the Centre National de la Recherche Scientifique 2013 New J. Chem., 2013, 37, 743--751 751
11 L. Han, D. R. Daniel, M. M. Maye and C. J. Zhong, Anal.Chem., 2001, 73, 4441–4449.
12 F. P. Zamborini, M. C. Leopold, J. F. Hicks, P. J. Kulesza,M. A. Malik and R. W. Murray, J. Am. Chem. Soc., 2002, 124,8958–8964.
13 R. Narayanan and M. A. El-Sayed, J. Am. Chem. Soc., 2004,126, 7194–7195.
14 C. J. Zhong and M. M. Maye, Adv. Mater., 2001, 13, 1507–1511.15 I. I. S. Lim, F. Goroleski, D. Mott, N. Kariuki, W. Ip, J. Luo
and C. J. Zhong, J. Phys. Chem. B, 2006, 110, 6673–6682.16 N. Kometani, M. Tsubonishi, T. Fujita, K. Asami and
Y. Yonezawa, Langmuir, 2001, 17, 578–580.17 J. Hranisavljevic, N. M. Dimitrijevic, G. A. Wurtz and
G. P. Wiederrecht, J. Am. Chem. Soc., 2002, 124, 4536–4537.18 L. Jeunieau, V. Alin and J. B. Nagy, Langmuir, 2000, 16,
597–606.19 N. Nerambourg, M. H. Werts, M. Charlot and M. Blanchard-
Desce, Langmuir, 2007, 23, 5563–5570.20 E. Dulkeith, M. Ringler, T. A. Klar, J. Feldmann, A. Munoz
Javier and W. J. Parak, Nano Lett., 2005, 5, 585–589.21 T. H. James, The Theory of the Photographic Process, Macmillan
Publishing Co, New York, 4th edn 1977.22 E. Dulkeith, A. C. Morteani, T. Niedereichholz, T. A. Klar,
J. Feldmann, S. A. Levi, F. C. van Veggel, D. N. Reinhoudt,M. Moller and D. I. Gittins, Phys. Rev. Lett., 2002, 89, 203002/1–203002/4.
23 H. Imahori, Y. Kashiwagi, Y. Endo, T. Hanada, Y. Nishimura,I. Yamazaki, Y. Araki, O. Ito and S. Fukuzumi, Langmuir, 2004,20, 73–81.
24 Z. Gueroui and A. Libchaber, Phys. Rev. Lett., 2004, 93,166108/I–166108/IV.
25 A. Vujacic, V. Vasic, M. Dramicanin, S. P. Sovilj, N. Bibic,J. Hranisavljevic and G. P. Wiederrecht, J. Phys. Chem. C,2012, 116, 4655–4661.
26 J. A. Creighton, C. G. Blatchford and M. G. Albrecht, J. Chem.Soc., Faraday Trans. 2, 1979, 75, 790–798.
27 M. M. Maye, L. Han, N. N. Kariuki, N. K. Ly, W. B. Chan,J. Luo and C. J. Zhong, Anal. Chim. Acta, 2003, 496, 17–27.
28 J. Y. Kim, D. H. Lee, S. J. Kim and D. J. Jang, J. ColloidInterface Sci., 2008, 326, 387–391.
29 A. K. Chibisov, H. Gorner and T. D. Slavnova, Chem. Phys.Lett., 2004, 390, 240–245.
30 M. M. Maye, I. I. S. Lim, J. Luo, Z. Rab, D. Rabinovich,T. B. Liu and C. J. Zhong, J. Am. Chem. Soc., 2005, 127,1519–1529.
31 I. I. S. Lim, M. M. Maye, J. Luo and C. J. Zhong, J. Phys.Chem. B, 2005, 109, 2578–2583.
32 S. Link and M. A. El-Sayed, J. Phys. Chem. B, 1999, 103,4212–4217.
33 G. P. Wiederrecht, G. A. Wurtz and J. Hranisavljevic, NanoLett., 2004, 4, 2121–2125.
34 D. H. Everett, Royal Society of Chemistry, Cambridge,London, 1988, p. 45.
35 V. V. Vodnik and J. M. Nedeljkovic, J. Serb. Chem. Soc., 2000,65, 195–200.
36 M. Sugi and S. Lizima, Thin Solid Films, 1980, 68, 199–204.37 K. Iriyama, F. Mizutani and M. Yoshiura, Chem. Lett., 1980,
9, 1399–1402.38 D. L. Akins, J. Phys. Chem., 1986, 90, 1530–1534.39 Y. Kitahama, Y. Tanaka, T. Itoh and Y. Ozaki, Chem. Lett.,
2009, 38, 54–55.40 Y. Kitahama, Y. Tanaka, T. Itoh, M. Ishikawa and Y. Ozaki,
Bull. Chem. Soc. Jpn., 2009, 82, 1126–1132.41 H. von Berlepsch, S. Moller and L. Dahne, J. Phys. Chem. B,
2001, 105, 5689–5699.42 H. Yao, T. Isohashi and K. Kimura, Chem. Phys. Lett., 2004,
396, 316–322.43 H. Yao, S. Kitamura and K. Kimura, Phys. Chem. Chem.
Phys., 2001, 3, 4560–4565.44 H. Yao, Y. Kagoshima, S. Kitamura, T. Isohashi, Y. Ozawa
and K. Kimura, Langmuir, 2003, 19, 8882–8887.45 H. Yao, C. A. Michaels, S. J. Stranick, T. Isohashi and
K. Kimura, Lett. Org. Chem., 2004, 1, 280–287.46 D. M. Coles, A. J. Meijer, W. C. Tsoi, M. D. Charlton,
J. S. Kim and D. G. Lidzey, J. Phys. Chem. A, 2010, 114,11920–11927.
47 P. Manikandan and V. Ramakrishnan, J. Fluoresc., 2011, 21,693–699.
48 J. R. Lakowicz, Principles of Fluorescence Spectroscopy,Kluwer Academic/Plenum Press, New York, 2nd edn 1999.
NJC Paper
Dow
nloa
ded
by U
nive
rsity
of
Bel
grad
e on
23
Febr
uary
201
3Pu
blis
hed
on 1
4 D
ecem
ber
2012
on
http
://pu
bs.r
sc.o
rg |
doi:1
0.10
39/C
2NJ4
0865
AView Article Online