adilabad - ground water brochure
TRANSCRIPT
For Official Use Only
CENTRAL GROUND WATER BOARD MINISTRY OF WATER RESOURCES
GOVERNMENT OF INDIA
GROUND WATER BROCHURE ADILABAD DISTRICT, ANDHRA PRADESH
SOUTHERN REGION HYDERABAD September 2013
CENTRAL GROUND WATER BOARD MINISTRY OF WATER RESOURCES
GOVERNMENT OF INDIA
GROUND WATER BROCHURE ADILABAD DISTRICT, ANDHRA PRADESH
(AAP-2012-13)
BY
DR. PANDITH MADHNURE SCIENTIST-C
SOUTHERN REGION BHUJAL BHAWAN, GSI Post, Bandlaguda NH.IV, FARIDABAD -121001 Hyderabad-500068 HARYANA, INDIA Andhra Pradesh Tel: 0129-2418518 Tel: 040-24225201 Gram: Bhumijal Gram: Antarjal
GROUND WATER BROCHURE ADILABAD DISTRICT, ANDHRA PRADESH
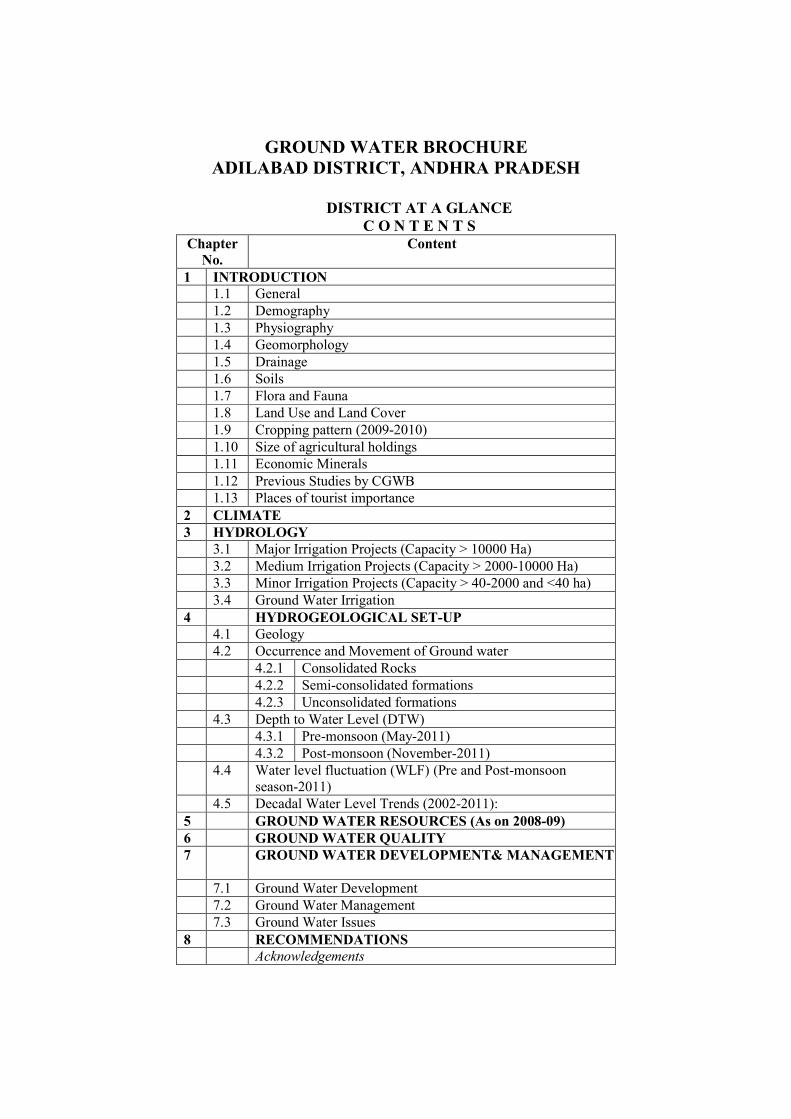
DISTRICT AT A GLANCE
C O N T E N T S Chapter
No. Content
1 INTRODUCTION 1.1 General 1.2 Demography 1.3 Physiography 1.4 Geomorphology 1.5 Drainage 1.6 Soils 1.7 Flora and Fauna 1.8 Land Use and Land Cover 1.9 Cropping pattern (2009-2010) 1.10 Size of agricultural holdings 1.11 Economic Minerals 1.12 Previous Studies by CGWB 1.13 Places of tourist importance 2 CLIMATE 3 HYDROLOGY 3.1 Major Irrigation Projects (Capacity > 10000 Ha) 3.2 Medium Irrigation Projects (Capacity > 2000-10000 Ha) 3.3 Minor Irrigation Projects (Capacity > 40-2000 and <40 ha) 3.4 Ground Water Irrigation 4 HYDROGEOLOGICAL SET-UP 4.1 Geology 4.2 Occurrence and Movement of Ground water 4.2.1 Consolidated Rocks 4.2.2 Semi-consolidated formations 4.2.3 Unconsolidated formations 4.3 Depth to Water Level (DTW) 4.3.1 Pre-monsoon (May-2011) 4.3.2 Post-monsoon (November-2011) 4.4 Water level fluctuation (WLF) (Pre and Post-monsoon
season-2011) 4.5 Decadal Water Level Trends (2002-2011): 5 GROUND WATER RESOURCES (As on 2008-09) 6 GROUND WATER QUALITY 7 GROUND WATER DEVELOPMENT& MANAGEMENT
7.1 Ground Water Development 7.2 Ground Water Management 7.3 Ground Water Issues 8 RECOMMENDATIONS Acknowledgements
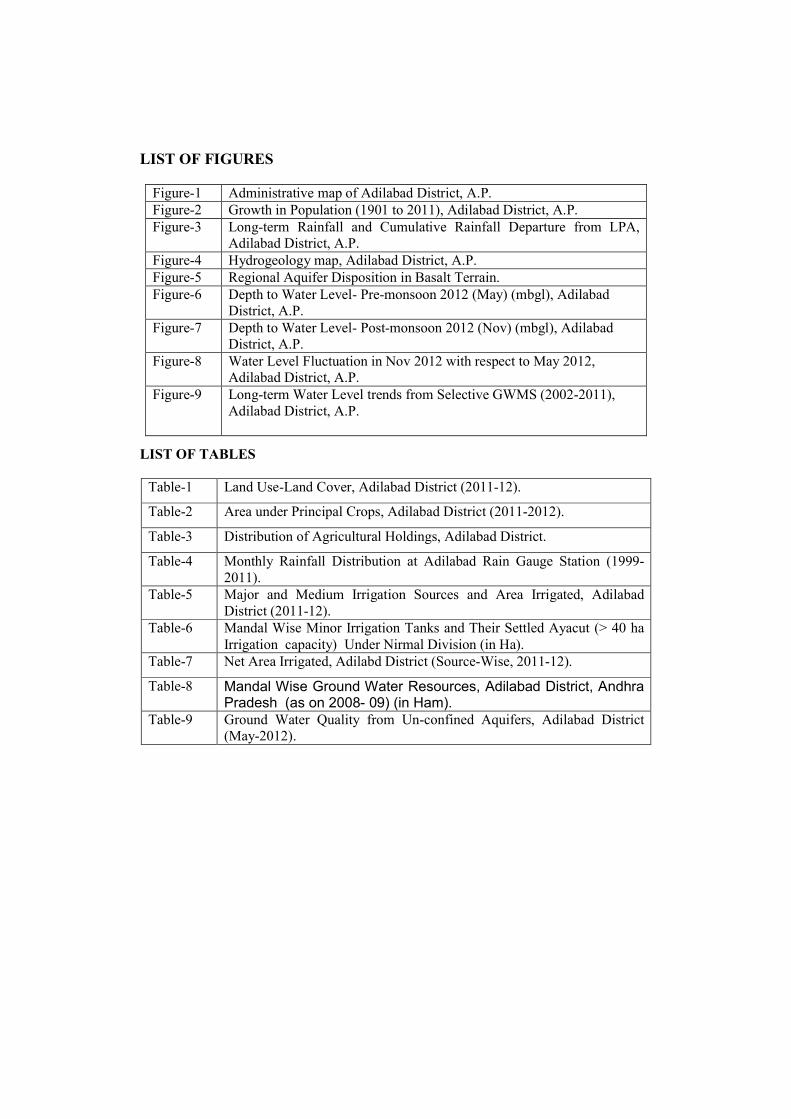
LIST OF FIGURES
LIST OF TABLES
Table-1 Land Use-Land Cover, Adilabad District (2011-12).
Table-2 Area under Principal Crops, Adilabad District (2011-2012).
Table-3 Distribution of Agricultural Holdings, Adilabad District.
Table-4 Monthly Rainfall Distribution at Adilabad Rain Gauge Station (1999-2011).
Table-5 Major and Medium Irrigation Sources and Area Irrigated, Adilabad District (2011-12).
Table-6 Mandal Wise Minor Irrigation Tanks and Their Settled Ayacut (> 40 ha Irrigation capacity) Under Nirmal Division (in Ha).
Table-7 Net Area Irrigated, Adilabd District (Source-Wise, 2011-12).
Table-8 Mandal Wise Ground Water Resources, Adilabad District, Andhra Pradesh (as on 2008- 09) (in Ham).
Table-9 Ground Water Quality from Un-confined Aquifers, Adilabad District (May-2012).
Figure-1 Administrative map of Adilabad District, A.P. Figure-2 Growth in Population (1901 to 2011), Adilabad District, A.P. Figure-3 Long-term Rainfall and Cumulative Rainfall Departure from LPA,
Adilabad District, A.P. Figure-4 Hydrogeology map, Adilabad District, A.P. Figure-5 Regional Aquifer Disposition in Basalt Terrain. Figure-6 Depth to Water Level- Pre-monsoon 2012 (May) (mbgl), Adilabad
District, A.P. Figure-7 Depth to Water Level- Post-monsoon 2012 (Nov) (mbgl), Adilabad
District, A.P. Figure-8 Water Level Fluctuation in Nov 2012 with respect to May 2012,
Adilabad District, A.P. Figure-9 Long-term Water Level trends from Selective GWMS (2002-2011),
Adilabad District, A.P.
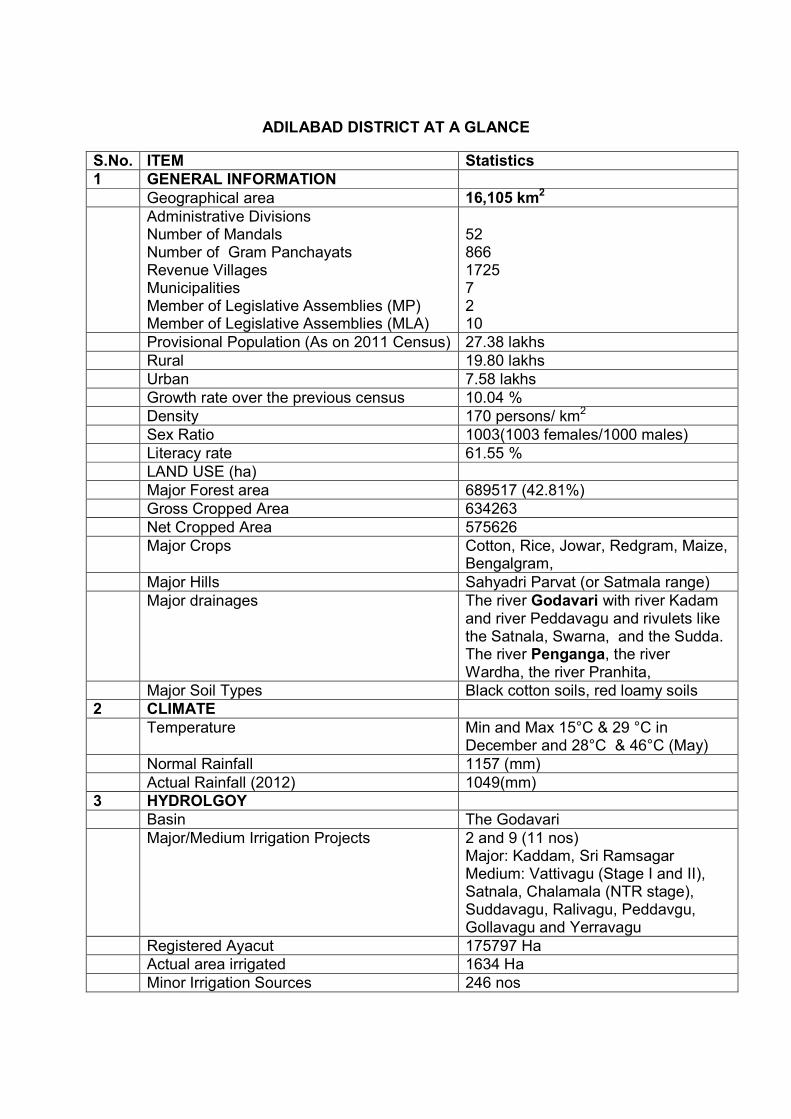
ADILABAD DISTRICT AT A GLANCE
S.No. ITEM Statistics 1 GENERAL INFORMATION Geographical area 16,105 km2 Administrative Divisions
Number of Mandals Number of Gram Panchayats Revenue Villages Municipalities Member of Legislative Assemblies (MP) Member of Legislative Assemblies (MLA)
52 866 1725 7 2 10
Provisional Population (As on 2011 Census) 27.38 lakhs Rural 19.80 lakhs Urban 7.58 lakhs Growth rate over the previous census 10.04 % Density 170 persons/ km2 Sex Ratio 1003(1003 females/1000 males) Literacy rate 61.55 % LAND USE (ha) Major Forest area 689517 (42.81%) Gross Cropped Area 634263 Net Cropped Area 575626 Major Crops Cotton, Rice, Jowar, Redgram, Maize,
Bengalgram, Major Hills Sahyadri Parvat (or Satmala range) Major drainages The river Godavari with river Kadam
and river Peddavagu and rivulets like the Satnala, Swarna, and the Sudda. The river Penganga, the river Wardha, the river Pranhita,
Major Soil Types Black cotton soils, red loamy soils 2 CLIMATE Temperature Min and Max 15°C & 29 °C in
December and 28°C & 46°C (May) Normal Rainfall 1157 (mm) Actual Rainfall (2012) 1049(mm) 3 HYDROLGOY Basin The Godavari Major/Medium Irrigation Projects 2 and 9 (11 nos)
Major: Kaddam, Sri Ramsagar Medium: Vattivagu (Stage I and II), Satnala, Chalamala (NTR stage), Suddavagu, Ralivagu, Peddavgu, Gollavagu and Yerravagu
Registered Ayacut 175797 Ha Actual area irrigated 1634 Ha Minor Irrigation Sources 246 nos
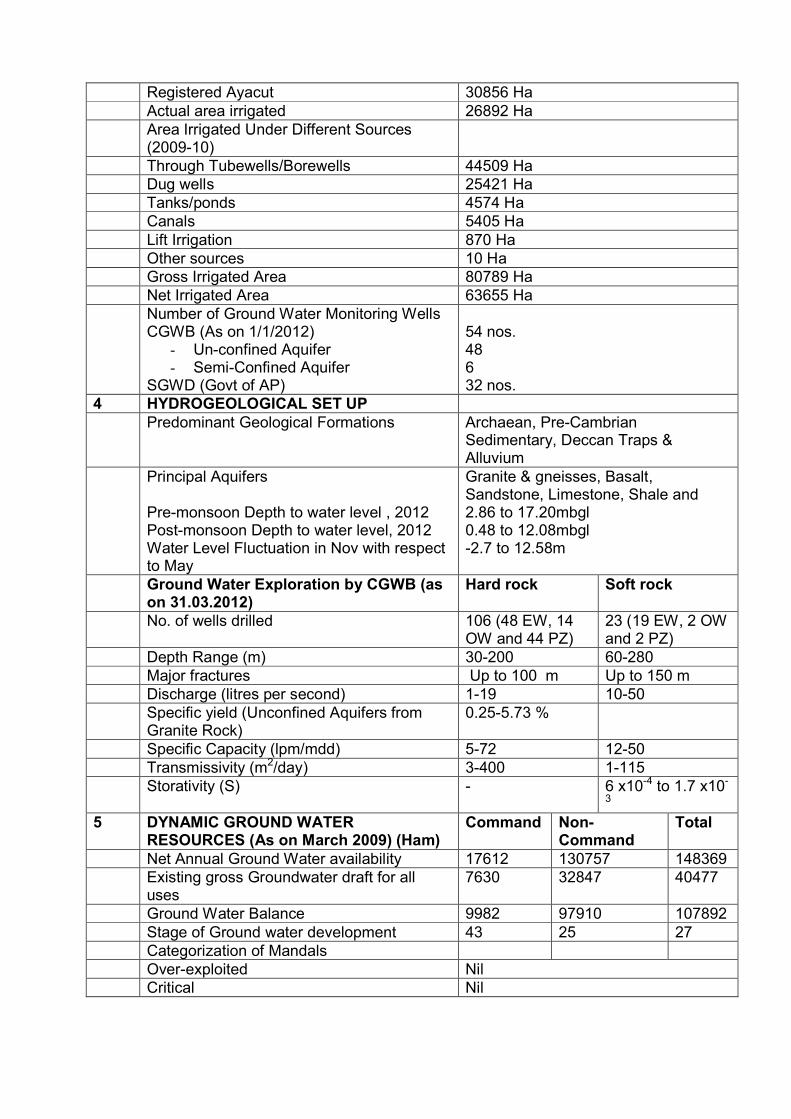
Registered Ayacut 30856 Ha Actual area irrigated 26892 Ha Area Irrigated Under Different Sources
(2009-10)
Through Tubewells/Borewells 44509 Ha Dug wells 25421 Ha Tanks/ponds 4574 Ha Canals 5405 Ha Lift Irrigation 870 Ha Other sources 10 Ha Gross Irrigated Area 80789 Ha Net Irrigated Area 63655 Ha Number of Ground Water Monitoring Wells
CGWB (As on 1/1/2012) - Un-confined Aquifer - Semi-Confined Aquifer
SGWD (Govt of AP)
54 nos. 48 6 32 nos.
4 HYDROGEOLOGICAL SET UP Predominant Geological Formations Archaean, Pre-Cambrian
Sedimentary, Deccan Traps & Alluvium
Principal Aquifers Pre-monsoon Depth to water level , 2012 Post-monsoon Depth to water level, 2012 Water Level Fluctuation in Nov with respect to May
Granite & gneisses, Basalt, Sandstone, Limestone, Shale and 2.86 to 17.20mbgl 0.48 to 12.08mbgl -2.7 to 12.58m
Ground Water Exploration by CGWB (as on 31.03.2012)
Hard rock Soft rock
No. of wells drilled 106 (48 EW, 14 OW and 44 PZ)
23 (19 EW, 2 OW and 2 PZ)
Depth Range (m) 30-200 60-280 Major fractures Up to 100 m Up to 150 m Discharge (litres per second) 1-19 10-50 Specific yield (Unconfined Aquifers from
Granite Rock) 0.25-5.73 %
Specific Capacity (lpm/mdd) 5-72 12-50 Transmissivity (m2/day) 3-400 1-115 Storativity (S) - 6 x10⁻⁴ to 1.7 x10-
3 5 DYNAMIC GROUND WATER
RESOURCES (As on March 2009) (Ham) Command Non-
Command Total
Net Annual Ground Water availability 17612 130757 148369 Existing gross Groundwater draft for all
uses 7630 32847 40477
Ground Water Balance 9982 97910 107892 Stage of Ground water development 43 25 27 Categorization of Mandals Over-exploited Nil Critical Nil
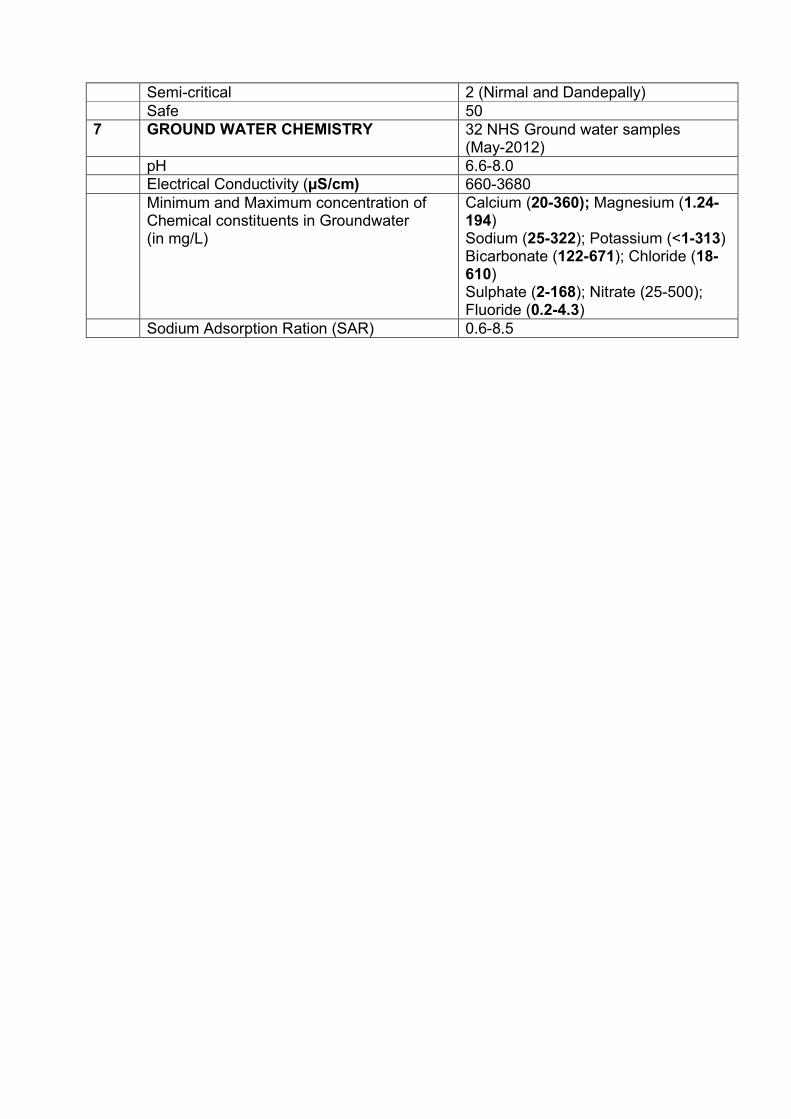
Semi-critical 2 (Nirmal and Dandepally) Safe 50 7 GROUND WATER CHEMISTRY 32 NHS Ground water samples
(May-2012) pH 6.6-8.0 Electrical Conductivity (µS/cm) 660-3680 Minimum and Maximum concentration of
Chemical constituents in Groundwater (in mg/L)
Calcium (20-360); Magnesium (1.24-194) Sodium (25-322); Potassium (<1-313) Bicarbonate (122-671); Chloride (18-610) Sulphate (2-168); Nitrate (25-500); Fluoride (0.2-4.3)
Sodium Adsorption Ration (SAR) 0.6-8.5
1. INTRODUCTION
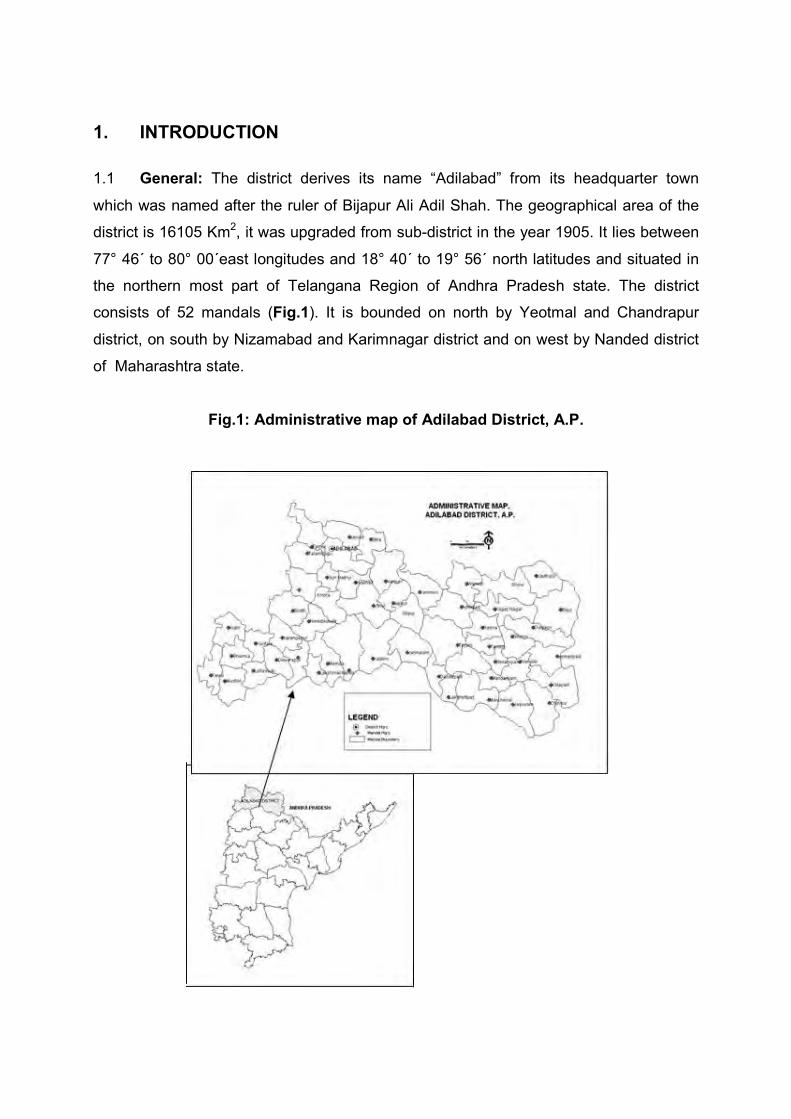
1.1 General: The district derives its name “Adilabad” from its headquarter town
which was named after the ruler of Bijapur Ali Adil Shah. The geographical area of the
district is 16105 Km2, it was upgraded from sub-district in the year 1905. It lies between
77° 46´ to 80° 00´east longitudes and 18° 40´ to 19° 56´ north latitudes and situated in
the northern most part of Telangana Region of Andhra Pradesh state. The district
consists of 52 mandals (Fig.1). It is bounded on north by Yeotmal and Chandrapur
district, on south by Nizamabad and Karimnagar district and on west by Nanded district
of Maharashtra state.
Fig.1: Administrative map of Adilabad District, A.P.
2
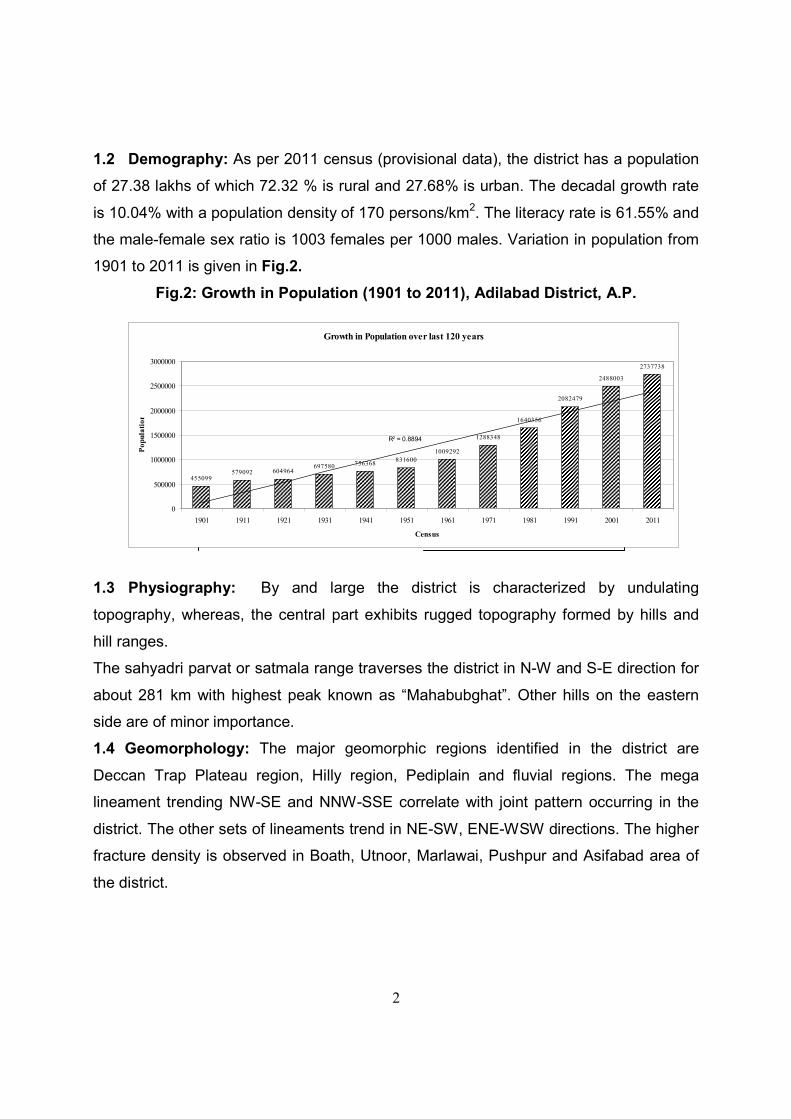
1.2 Demography: As per 2011 census (provisional data), the district has a population
of 27.38 lakhs of which 72.32 % is rural and 27.68% is urban. The decadal growth rate
is 10.04% with a population density of 170 persons/km2. The literacy rate is 61.55% and
the male-female sex ratio is 1003 females per 1000 males. Variation in population from
1901 to 2011 is given in Fig.2.
Fig.2: Growth in Population (1901 to 2011), Adilabad District, A.P.
1.3 Physiography: By and large the district is characterized by undulating
topography, whereas, the central part exhibits rugged topography formed by hills and
hill ranges.
The sahyadri parvat or satmala range traverses the district in N-W and S-E direction for
about 281 km with highest peak known as “Mahabubghat”. Other hills on the eastern
side are of minor importance.
1.4 Geomorphology: The major geomorphic regions identified in the district are
Deccan Trap Plateau region, Hilly region, Pediplain and fluvial regions. The mega
lineament trending NW-SE and NNW-SSE correlate with joint pattern occurring in the
district. The other sets of lineaments trend in NE-SW, ENE-WSW directions. The higher
fracture density is observed in Boath, Utnoor, Marlawai, Pushpur and Asifabad area of
the district.
Growth in Population over last 120 years
455099579092 604964
697580 756368831600
1009292
1288348
1640356
2082479
2488003
2737738
R2 = 0.8894
0
500000
1000000
1500000
2000000
2500000
3000000
1901 1911 1921 1931 1941 1951 1961 1971 1981 1991 2001 2011
Census
Po
pu
lati
on
3
1.5 Drainage: River Godavari, which enters Andhra Pradesh state at Basar, is the most
important river that drains the district with its tributaries such as river Kadam, river
Peddavagu and rivulets like the Satnala, Swarna and Sudda. The other rivers are
Penganga, Wardha and Pranhita.
1.6 Soils: Red loamy soils are the main soils, which are derived from country rocks.
The other soils are black cotton soils mainly derived from basalt rock. In sedimentary
formations the soils are deep up to 5 m and in other formations up to 1.5 m.
1.7 Flora and Fauna: The forests cover about 42.8% of the geographical area of the
district. Teak, ebony, sandalwood, rosewood, bilgu, jittigi, dhanra, tamarind, mango are
major trees. The fauna includes tiger, leopard, hyena, wolf, jackal, fox, sloth beer, black-
buck, Indian bison, antelopes, gazelles, deer, nilgai. The common birds are peafowl,
peacock, parrots, myna and game sanctuary called “Kawal Sanctuary” exists in the
district. The forests from the district earned revenue of 2130.85 lakhs during the year
2009-10. Forest produce has generated revenue of 2131 lakhs in the district during the
year 2009-10.
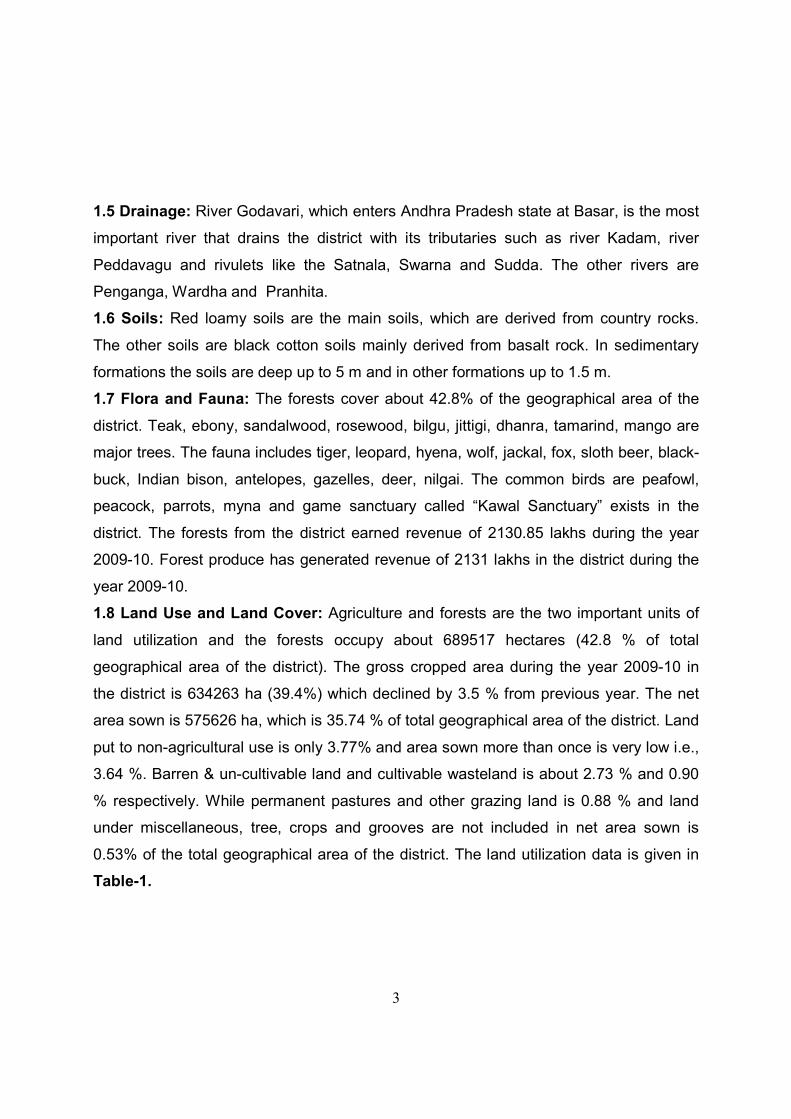
1.8 Land Use and Land Cover: Agriculture and forests are the two important units of
land utilization and the forests occupy about 689517 hectares (42.8 % of total
geographical area of the district). The gross cropped area during the year 2009-10 in
the district is 634263 ha (39.4%) which declined by 3.5 % from previous year. The net
area sown is 575626 ha, which is 35.74 % of total geographical area of the district. Land
put to non-agricultural use is only 3.77% and area sown more than once is very low i.e.,
3.64 %. Barren & un-cultivable land and cultivable wasteland is about 2.73 % and 0.90
% respectively. While permanent pastures and other grazing land is 0.88 % and land
under miscellaneous, tree, crops and grooves are not included in net area sown is
0.53% of the total geographical area of the district. The land utilization data is given in
Table-1.
4
Table 1: Land Use-Land Cover, Adilabad District (2011-12).
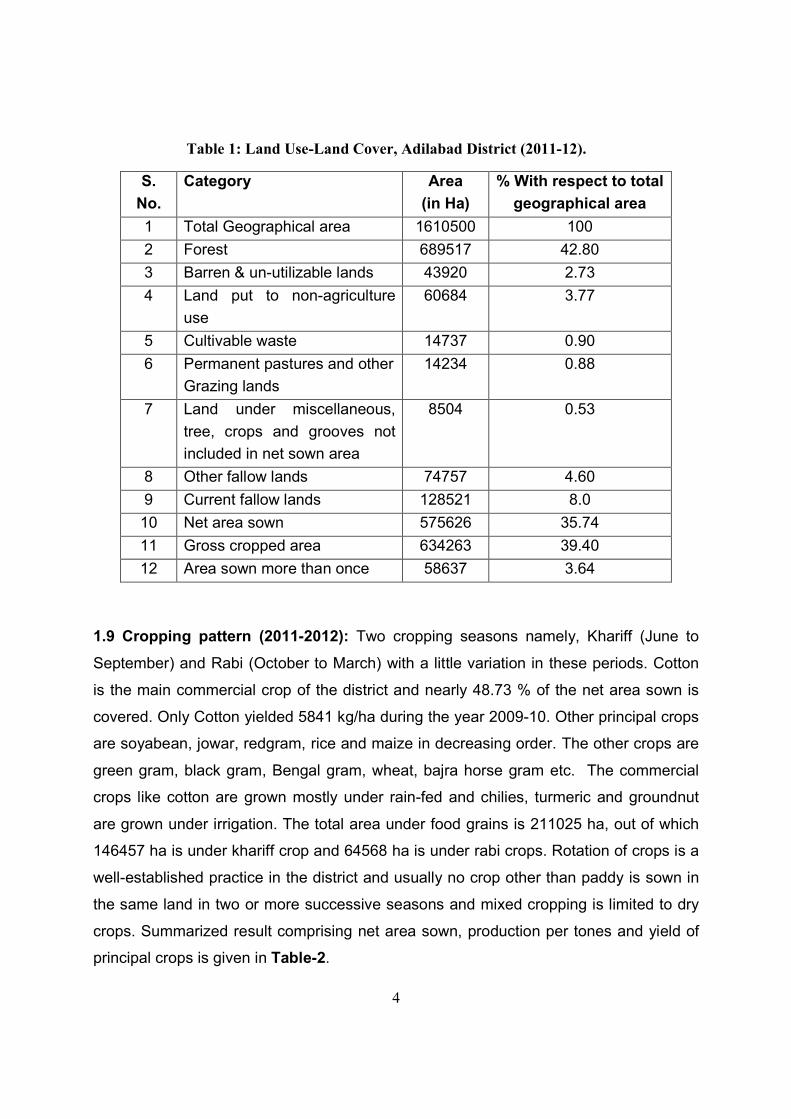
1.9 Cropping pattern (2011-2012): Two cropping seasons namely, Khariff (June to
September) and Rabi (October to March) with a little variation in these periods. Cotton
is the main commercial crop of the district and nearly 48.73 % of the net area sown is
covered. Only Cotton yielded 5841 kg/ha during the year 2009-10. Other principal crops
are soyabean, jowar, redgram, rice and maize in decreasing order. The other crops are
green gram, black gram, Bengal gram, wheat, bajra horse gram etc. The commercial
crops like cotton are grown mostly under rain-fed and chilies, turmeric and groundnut
are grown under irrigation. The total area under food grains is 211025 ha, out of which
146457 ha is under khariff crop and 64568 ha is under rabi crops. Rotation of crops is a
well-established practice in the district and usually no crop other than paddy is sown in
the same land in two or more successive seasons and mixed cropping is limited to dry
crops. Summarized result comprising net area sown, production per tones and yield of
principal crops is given in Table-2.
S.
No.
Category Area
(in Ha)
% With respect to total
geographical area
1 Total Geographical area 1610500 100
2 Forest 689517 42.80
3 Barren & un-utilizable lands 43920 2.73
4 Land put to non-agriculture
use
60684 3.77
5 Cultivable waste 14737 0.90
6 Permanent pastures and other
Grazing lands
14234 0.88
7 Land under miscellaneous,
tree, crops and grooves not
included in net sown area
8504 0.53
8 Other fallow lands 74757 4.60
9 Current fallow lands 128521 8.0
10 Net area sown 575626 35.74
11 Gross cropped area 634263 39.40
12 Area sown more than once 58637 3.64
5
Table-2: Area under Principal Crops, Adilabad District (2011-2012).
S.
No.
Crops 2009-10
Net area (in Ha) Production in tones Yield in Kgs/ha
1 Cotton 280536 1638660 5841
2 Soyabean 92093 52677 572
3 Jowar 58316 70743 1213
4 Redgram 48728 27434 563
5 Rice 48118 98499 2047
6 Maize 17899 68468 3825
7 Greengram 12376 2311 187
8 Blackgram 10482 3700 353
9 Bengalgram 9536 14342 1504
10 Turmeric 5701 20809 3650
11 Chillies 4662 4263 914
12 Wheat 3392 4566 1346
13 Groundnut 2225 4131 1857
14 Mangoes 22731 109455 5109
15 Tomatoes 3928 33411 8506
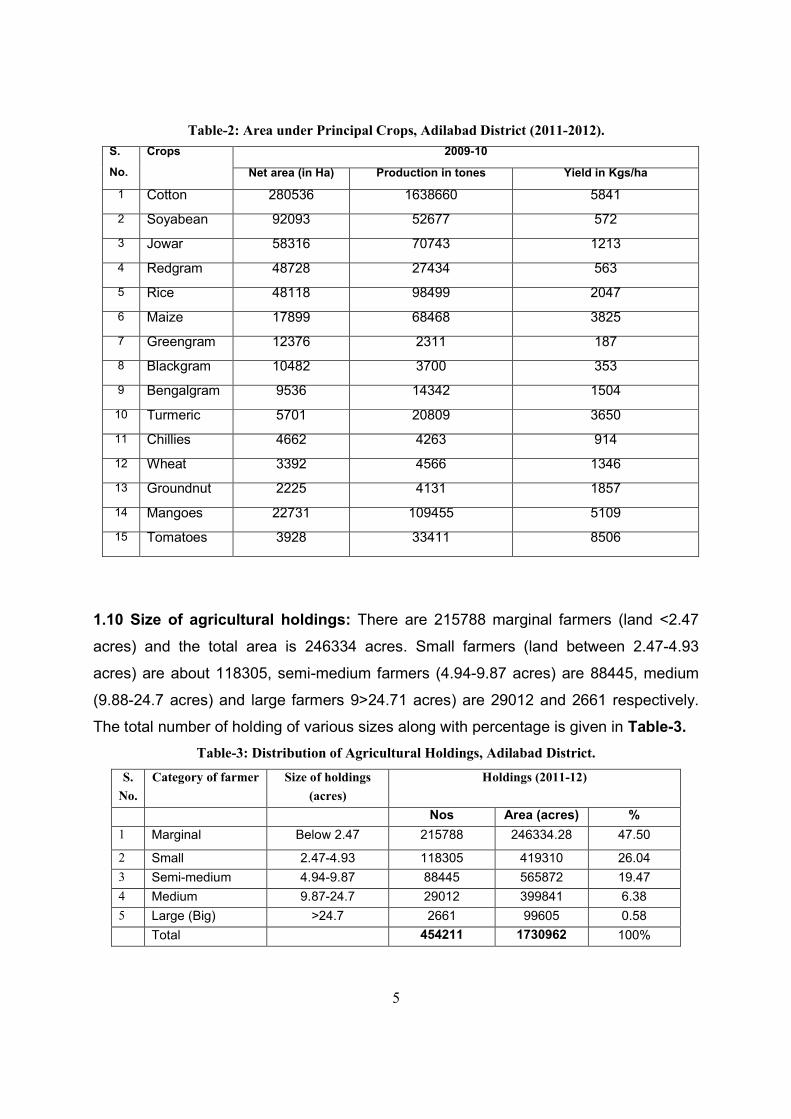
1.10 Size of agricultural holdings: There are 215788 marginal farmers (land <2.47
acres) and the total area is 246334 acres. Small farmers (land between 2.47-4.93
acres) are about 118305, semi-medium farmers (4.94-9.87 acres) are 88445, medium
(9.88-24.7 acres) and large farmers 9>24.71 acres) are 29012 and 2661 respectively.
The total number of holding of various sizes along with percentage is given in Table-3.
Table-3: Distribution of Agricultural Holdings, Adilabad District.
S.
No.
Category of farmer Size of holdings
(acres)
Holdings (2011-12)
Nos Area (acres) %
1 Marginal Below 2.47 215788 246334.28 47.50
2 Small 2.47-4.93 118305 419310 26.04
3 Semi-medium 4.94-9.87 88445 565872 19.47
4 Medium 9.87-24.7 29012 399841 6.38
5 Large (Big) >24.7 2661 99605 0.58
Total 454211 1730962 100%
6
1.11 Economic Minerals: Major minerals are coal, which is extensively found in
Asifabad, Tandur, Chennur and north Godavari valley and actively mined by Singareni
Collaries Company Ltd (SCCL), Limestone of cement grade belonging to Penganga
series occur in NW of Mancherial and Asifabad town. Low-grade iron ore occur in
Kadam Lakshettipet and Utnur mandals. Extensive deposits of clay from Gondwana
formation occur in Asifabad area.
1.12 Previous Studies by CGWB: The Central Ground Water Board (CGWB) has
carried out systematic hydrogeological surveys in 1961-62 and completed entire district
in 1987.
1. Exploratory drilling for ground water for the first time carried out in the year 1974-
75 with the construction of 10 deposit wells down to 200 m under Rehabilitation
Project areas of Sirpur-Kagaznagar in soft rock formations. Exploration in
sedimentary rock was carried out during 1975-76 with construction of 9
exploratory wells and 2 observation wells of 280.5 m depth. Exploratory drilling
was taken up in the hard rock areas and 24 exploratory wells, 14 observation
wells and 1 slim hole were drilled down to a maximum depth of 200 m. In
order to help the drinking water needs of tribal people, exploration was taken up
again during the year 1987 and total 24 wells were drilled. Under Hydrology
Project 18 piezometer wells were constructed for continuous water level
monitoring. In order to determine specific yield of un-confined aquifer total 26
shallow pz down to 40 m were drilled during the AAP 2010-11. Thus so for in the
district thus 129 bore wells were drilled till 31-03-2010.
2. The Board also carried out geophysical surveys and profiling to locate the
favorable sites for ground water exploration.
3. The water levels from 54 observation wells are monitored 4 times a year and
ground water quality is also observed during pre-monsoon season (May).
4. To educate people on availability of ground water resources, its occurrence,
development and conservation, etc. training on ground water management and
mass awareness programmes were also conducted at Adilabad, Nirmal and
Utnoor town.
1.13 Places of tourist importance: Temple dedicated to the Goddess Saraswati at
Basar, Prakrit Stone inscriptions at Jainad, highest water fall in A.P. at Kuntala on
7
Kadam river, Famous Nagoba temple at Keslapur (Bk) village (Indervelly mandal),
Nirmal Painting at Nirmal are famous.
2. CLIMATE
The climate of the district is characterized by hot summer and is generally dry except
during the S-W monsoon season. The year may be divided into 4 seasons namely cold
season (Dec-Feb), summer season (March-May), Southwest monsoon season (June-
September) and followed by post-monsoon season (Oct-Nov). In the year December is
the coldest month and May is the hottest month of the year. The mean daily minimum
and maximum temperature is 15°C & 29 °C, during December and 28°C & 46°C during
May month are observed. The normal annual rainfall in the district is 1157 mm and
during the year 2012, it received 1049 mm of rainfall. The rainfall increases from S-W
towards N-E direction. Monthly rainfall distribution of long period average is given in
Table-4 and seasonal rainfall along with percentage and departure from long period
average in Table-5 and in Fig.-3.
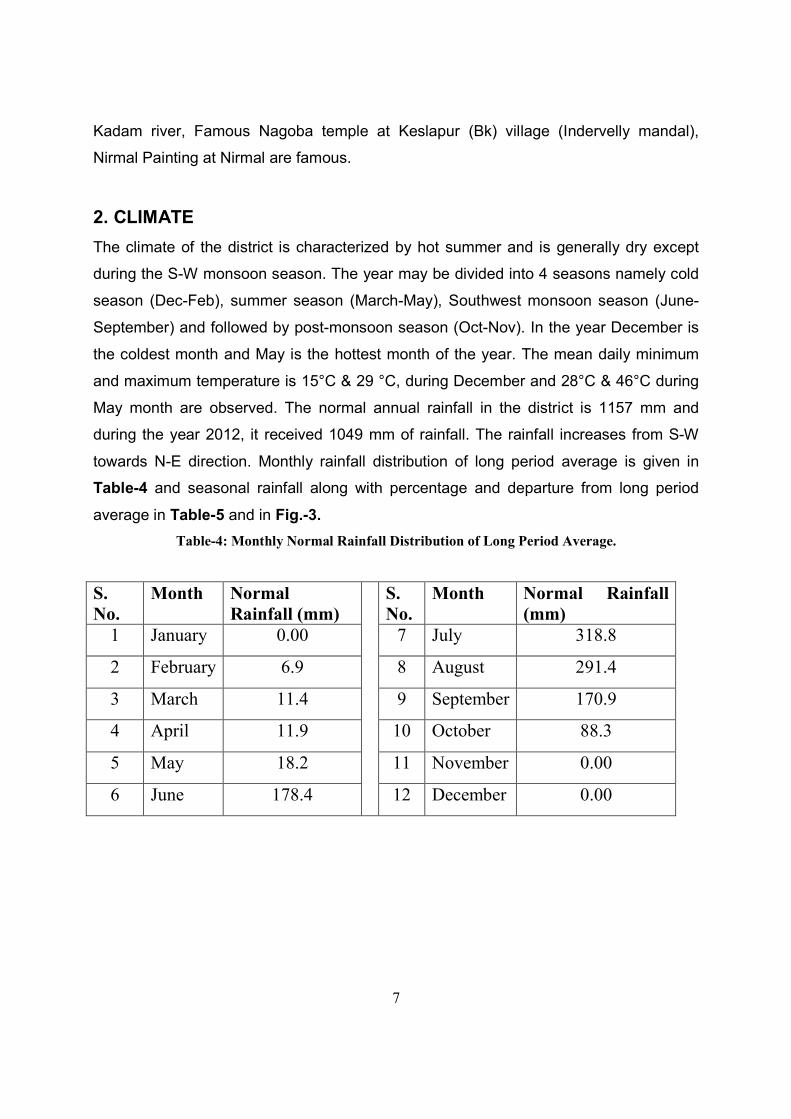
Table-4: Monthly Normal Rainfall Distribution of Long Period Average.
S. No.
Month Normal Rainfall (mm)
S. No.
Month Normal Rainfall (mm)
1 January 0.00 7 July 318.8
2 February 6.9 8 August 291.4
3 March 11.4 9 September 170.9
4 April 11.9 10 October 88.3
5 May 18.2 11 November 0.00
6 June 178.4 12 December 0.00
8
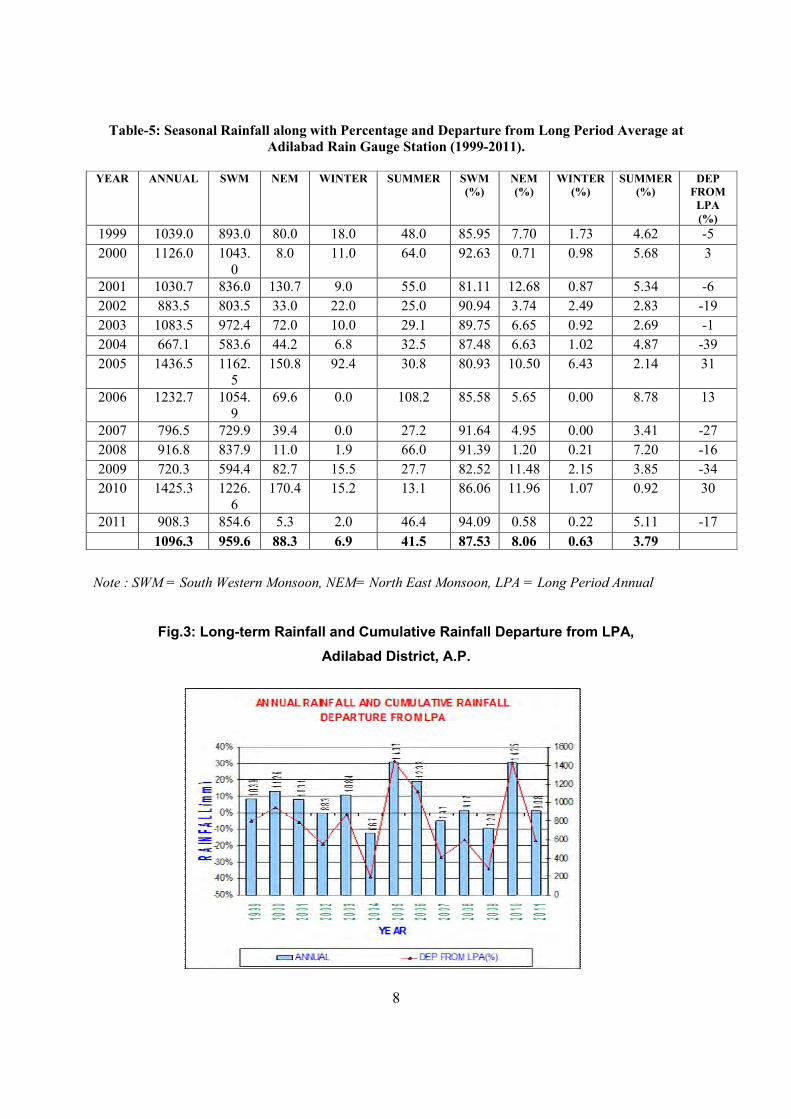
Table-5: Seasonal Rainfall along with Percentage and Departure from Long Period Average at Adilabad Rain Gauge Station (1999-2011).
YEAR ANNUAL SWM NEM WINTER SUMMER SWM
(%) NEM (%)
WINTER (%)
SUMMER (%)
DEP FROM
LPA (%)
1999 1039.0 893.0 80.0 18.0 48.0 85.95 7.70 1.73 4.62 -5
2000 1126.0 1043.0
8.0 11.0 64.0 92.63 0.71 0.98 5.68 3
2001 1030.7 836.0 130.7 9.0 55.0 81.11 12.68 0.87 5.34 -6
2002 883.5 803.5 33.0 22.0 25.0 90.94 3.74 2.49 2.83 -19
2003 1083.5 972.4 72.0 10.0 29.1 89.75 6.65 0.92 2.69 -1
2004 667.1 583.6 44.2 6.8 32.5 87.48 6.63 1.02 4.87 -39
2005 1436.5 1162.5
150.8 92.4 30.8 80.93 10.50 6.43 2.14 31
2006 1232.7 1054.9
69.6 0.0 108.2 85.58 5.65 0.00 8.78 13
2007 796.5 729.9 39.4 0.0 27.2 91.64 4.95 0.00 3.41 -27
2008 916.8 837.9 11.0 1.9 66.0 91.39 1.20 0.21 7.20 -16
2009 720.3 594.4 82.7 15.5 27.7 82.52 11.48 2.15 3.85 -34
2010 1425.3 1226.6
170.4 15.2 13.1 86.06 11.96 1.07 0.92 30
2011 908.3 854.6 5.3 2.0 46.4 94.09 0.58 0.22 5.11 -17
1096.3 959.6 88.3 6.9 41.5 87.53 8.06 0.63 3.79
Note : SWM = South Western Monsoon, NEM= North East Monsoon, LPA = Long Period Annual
Fig.3: Long-term Rainfall and Cumulative Rainfall Departure from LPA,
Adilabad District, A.P.
9
3. HYDROLOGY
Hydrological point of view the entire district falls under Godavari basin and is divided
into 38 major watersheds.
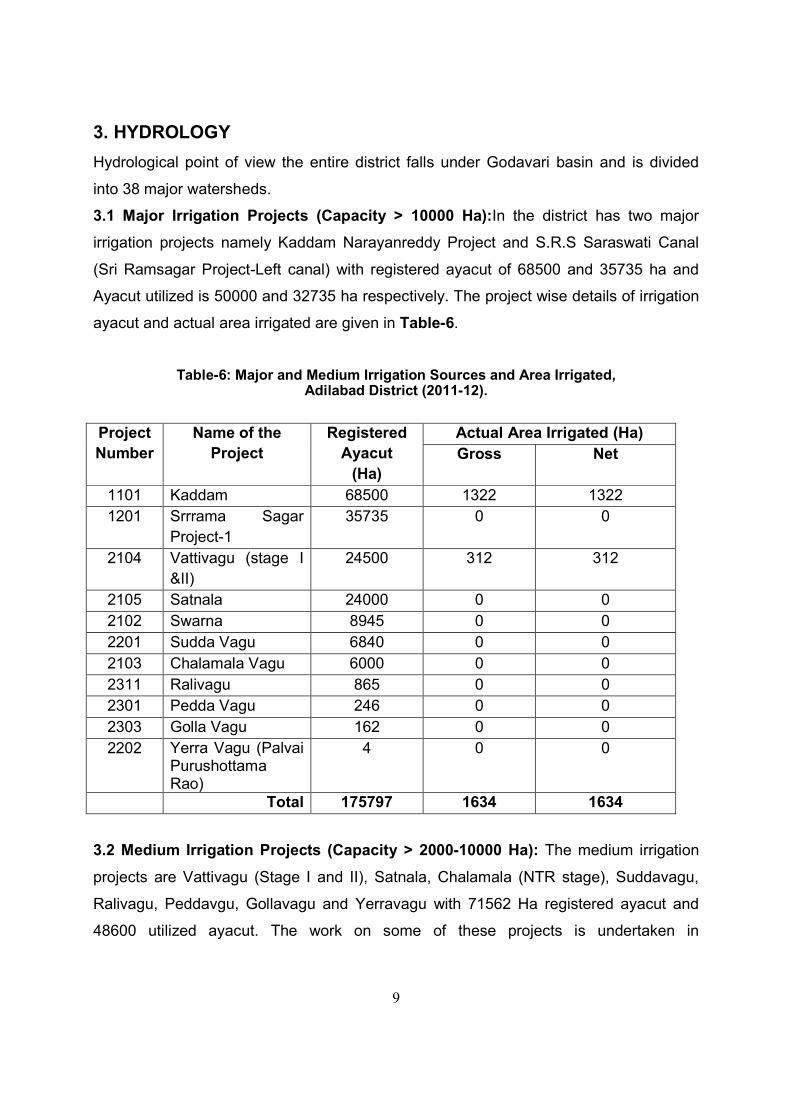
3.1 Major Irrigation Projects (Capacity > 10000 Ha):In the district has two major
irrigation projects namely Kaddam Narayanreddy Project and S.R.S Saraswati Canal
(Sri Ramsagar Project-Left canal) with registered ayacut of 68500 and 35735 ha and
Ayacut utilized is 50000 and 32735 ha respectively. The project wise details of irrigation
ayacut and actual area irrigated are given in Table-6.
Table-6: Major and Medium Irrigation Sources and Area Irrigated, Adilabad District (2011-12).
Project
Number
Name of the
Project
Registered
Ayacut
(Ha)
Actual Area Irrigated (Ha)
Gross Net
1101 Kaddam 68500 1322 1322
1201 Srrrama Sagar
Project-1
35735 0 0
2104 Vattivagu (stage I
&II)
24500 312 312
2105 Satnala 24000 0 0
2102 Swarna 8945 0 0
2201 Sudda Vagu 6840 0 0
2103 Chalamala Vagu 6000 0 0
2311 Ralivagu 865 0 0
2301 Pedda Vagu 246 0 0
2303 Golla Vagu 162 0 0
2202 Yerra Vagu (Palvai Purushottama Rao)
4 0 0
Total 175797 1634 1634
3.2 Medium Irrigation Projects (Capacity > 2000-10000 Ha): The medium irrigation
projects are Vattivagu (Stage I and II), Satnala, Chalamala (NTR stage), Suddavagu,
Ralivagu, Peddavgu, Gollavagu and Yerravagu with 71562 Ha registered ayacut and
48600 utilized ayacut. The work on some of these projects is undertaken in
10
“Jalayagnam Programme”. The details of major and medium irrigation sources along
with area irrigated are given in Table-6.
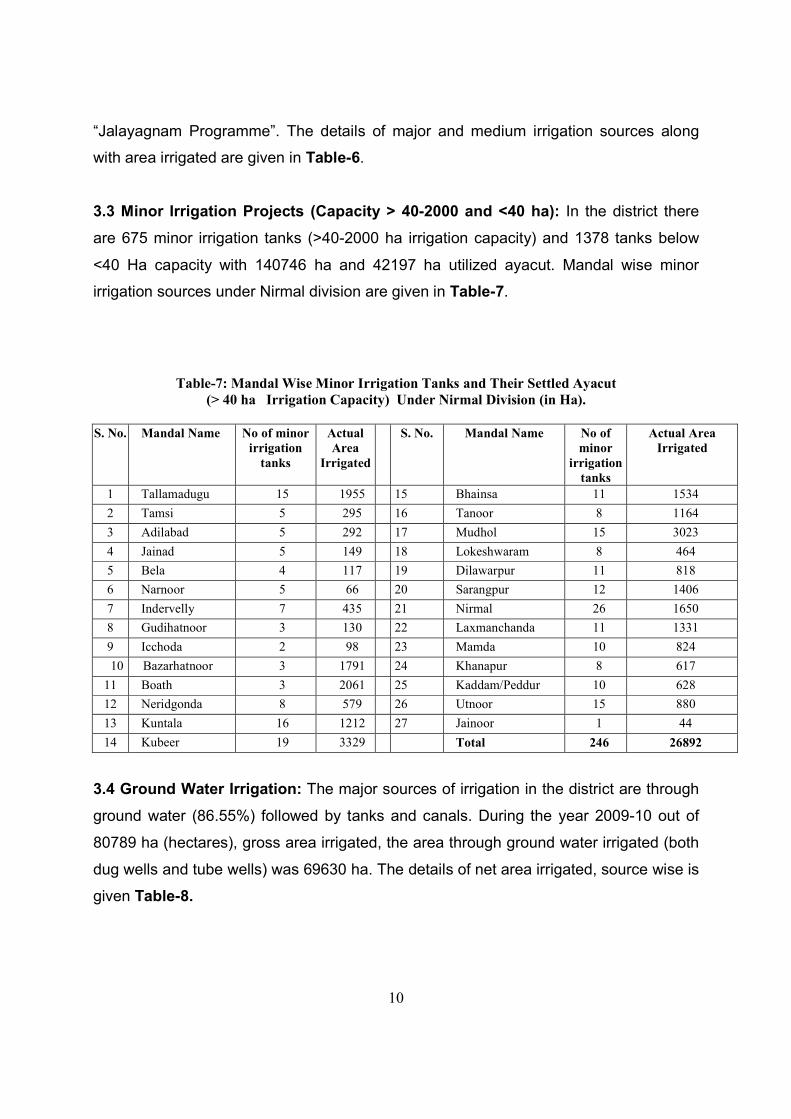
3.3 Minor Irrigation Projects (Capacity > 40-2000 and <40 ha): In the district there
are 675 minor irrigation tanks (>40-2000 ha irrigation capacity) and 1378 tanks below
<40 Ha capacity with 140746 ha and 42197 ha utilized ayacut. Mandal wise minor
irrigation sources under Nirmal division are given in Table-7.
Table-7: Mandal Wise Minor Irrigation Tanks and Their Settled Ayacut (> 40 ha Irrigation Capacity) Under Nirmal Division (in Ha).
S. No. Mandal Name No of minor
irrigation tanks
Actual Area
Irrigated
S. No. Mandal Name No of minor
irrigation tanks
Actual Area Irrigated
1 Tallamadugu 15 1955 15 Bhainsa 11 1534
2 Tamsi 5 295 16 Tanoor 8 1164
3 Adilabad 5 292 17 Mudhol 15 3023
4 Jainad 5 149 18 Lokeshwaram 8 464
5 Bela 4 117 19 Dilawarpur 11 818
6 Narnoor 5 66 20 Sarangpur 12 1406
7 Indervelly 7 435 21 Nirmal 26 1650
8 Gudihatnoor 3 130 22 Laxmanchanda 11 1331
9 Icchoda 2 98 23 Mamda 10 824
10 Bazarhatnoor 3 1791
24 Khanapur 8 617
11 Boath 3 2061 25 Kaddam/Peddur 10 628
12 Neridgonda 8 579 26 Utnoor 15 880
13 Kuntala 16 1212 27 Jainoor 1 44
14 Kubeer 19 3329 Total 246 26892
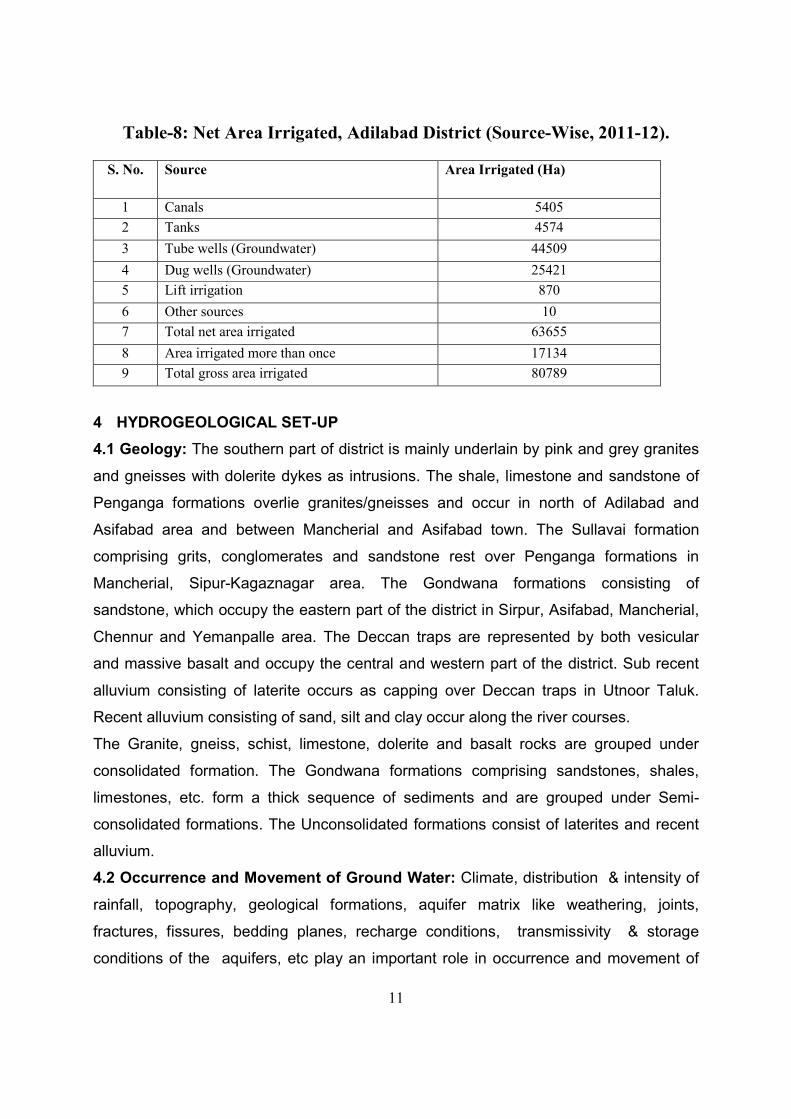
3.4 Ground Water Irrigation: The major sources of irrigation in the district are through
ground water (86.55%) followed by tanks and canals. During the year 2009-10 out of
80789 ha (hectares), gross area irrigated, the area through ground water irrigated (both
dug wells and tube wells) was 69630 ha. The details of net area irrigated, source wise is
given Table-8.
11
Table-8: Net Area Irrigated, Adilabad District (Source-Wise, 2011-12).
S. No. Source Area Irrigated (Ha)
1 Canals 5405
2 Tanks 4574
3 Tube wells (Groundwater) 44509
4 Dug wells (Groundwater) 25421
5 Lift irrigation 870
6 Other sources 10
7 Total net area irrigated 63655
8 Area irrigated more than once 17134
9 Total gross area irrigated 80789
4 HYDROGEOLOGICAL SET-UP
4.1 Geology: The southern part of district is mainly underlain by pink and grey granites
and gneisses with dolerite dykes as intrusions. The shale, limestone and sandstone of
Penganga formations overlie granites/gneisses and occur in north of Adilabad and
Asifabad area and between Mancherial and Asifabad town. The Sullavai formation
comprising grits, conglomerates and sandstone rest over Penganga formations in
Mancherial, Sipur-Kagaznagar area. The Gondwana formations consisting of
sandstone, which occupy the eastern part of the district in Sirpur, Asifabad, Mancherial,
Chennur and Yemanpalle area. The Deccan traps are represented by both vesicular
and massive basalt and occupy the central and western part of the district. Sub recent
alluvium consisting of laterite occurs as capping over Deccan traps in Utnoor Taluk.
Recent alluvium consisting of sand, silt and clay occur along the river courses.
The Granite, gneiss, schist, limestone, dolerite and basalt rocks are grouped under
consolidated formation. The Gondwana formations comprising sandstones, shales,
limestones, etc. form a thick sequence of sediments and are grouped under Semi-
consolidated formations. The Unconsolidated formations consist of laterites and recent
alluvium.
4.2 Occurrence and Movement of Ground Water: Climate, distribution & intensity of
rainfall, topography, geological formations, aquifer matrix like weathering, joints,
fractures, fissures, bedding planes, recharge conditions, transmissivity & storage
conditions of the aquifers, etc play an important role in occurrence and movement of
12
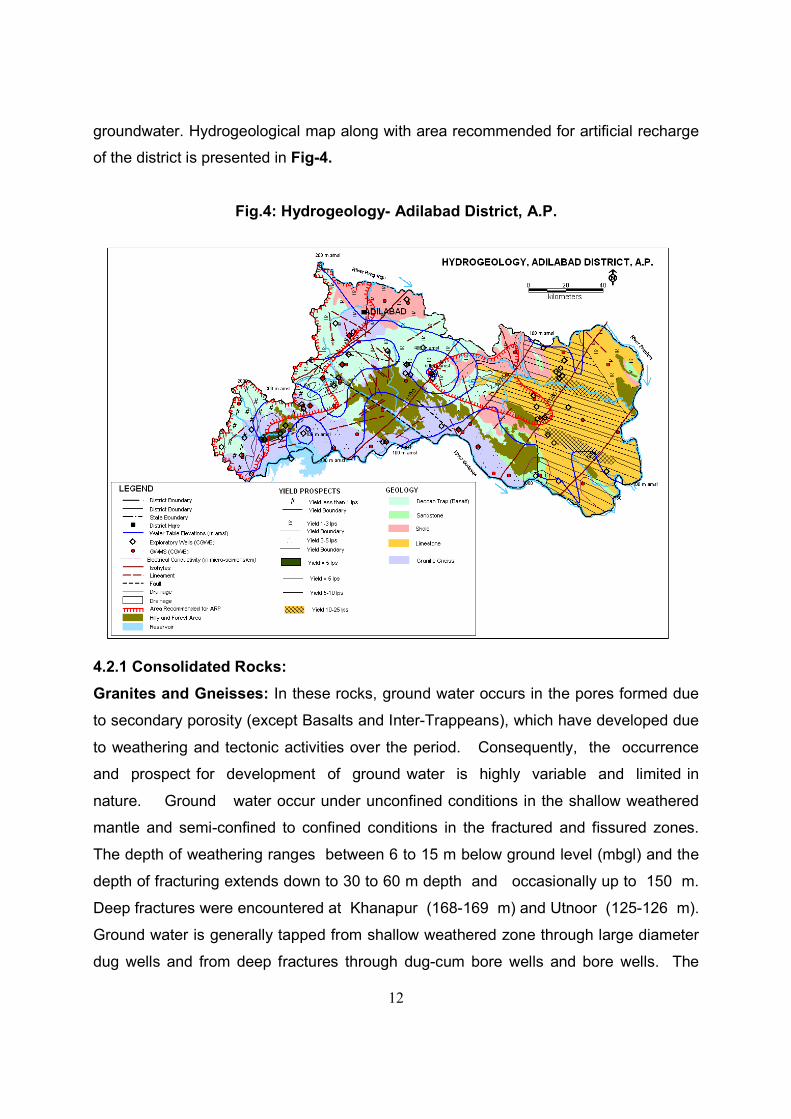
groundwater. Hydrogeological map along with area recommended for artificial recharge
of the district is presented in Fig-4.
Fig.4: Hydrogeology- Adilabad District, A.P.
4.2.1 Consolidated Rocks:
Granites and Gneisses: In these rocks, ground water occurs in the pores formed due
to secondary porosity (except Basalts and Inter-Trappeans), which have developed due
to weathering and tectonic activities over the period. Consequently, the occurrence
and prospect for development of ground water is highly variable and limited in
nature. Ground water occur under unconfined conditions in the shallow weathered
mantle and semi-confined to confined conditions in the fractured and fissured zones.
The depth of weathering ranges between 6 to 15 m below ground level (mbgl) and the
depth of fracturing extends down to 30 to 60 m depth and occasionally up to 150 m.
Deep fractures were encountered at Khanapur (168-169 m) and Utnoor (125-126 m).
Ground water is generally tapped from shallow weathered zone through large diameter
dug wells and from deep fractures through dug-cum bore wells and bore wells. The
13
depth of open wells are in the range of 4 to 16 m bgl, with depth to water level between
2 to 5 mbgl. The yield of open wells in the consolidated rocks varies from 40 to 277
m3/day.
Schists: Presence of foliation planes, fractures and fissures, forms potential aquifers in
these rocks and fractures are observed down to a depth of 60 to 70 m bgl. The
occurrence of fractures at deeper levels below weathered zone enhances the
chances of development of ground water by dug-cum-bore wells. The depth of open
wells varies between 3 to 27 m bgl with a yield range of 10 to 30 m3/day.
Compact Sandstone, Limestone and Shale: The sandstone, limestone and shale
of Penganga and Sulliavai formations are of sedimentary origin, but are mostly hard
and compact due to which the rocks behave similar to consolidated crystalline rocks
and the aquifers are formed due to weathering and fracturing. The limestones form
good aquifers due to development of solution channels except in areas, where they
are siliceous. Though the shales are splintery in nature, having fractures and well
developed joints favoring the movement of ground water. Wells penetrating these
formations usually get dried up in summer. The average yield of dug wells from these
formations varies between 30 to 60 m3/day. Bore wells drilled by Ground Water
Department, Government of Andhra Pradesh, down to 80 m depth yielded 70 to 180
liters per minute (lpm). The specific capacity varied from 6.4 to 12 lpm/m of drawdown
and transmissivity from 1.2 to 34 m3/day.
Deccan Traps (Basalts): Basalt rock occurring in the western and central part of the
district, forms the fringe areas of the vast Deccan Plateau of Central India. Successive
lava flows both “aa” and “pahoehoe” resulted in a layered crystalline rock with
intervening beds of clay (red bole/black bole, ash beds, etc. The contact zones
between successive flows and inter-trappean beds form good aquifers in addition
to the top weathered and fractured zones. The vesicles present in top portion of
the each lava flows also form potential aquifer. This unique set-up in basalt
presents a multi- aquifer system (Fig.-5). Sometimes, this multi-aquifer system with wide
variation in its compaction poses problems in construction of production wells. Under
ground water exploration programme of CGWB, these multi aquifers were explored
in backward and tribal areas during 1987-1997. The depth of open wells ranges
between 9 to 26 m bgl. In general, depth of open wells in massive basalts, varies
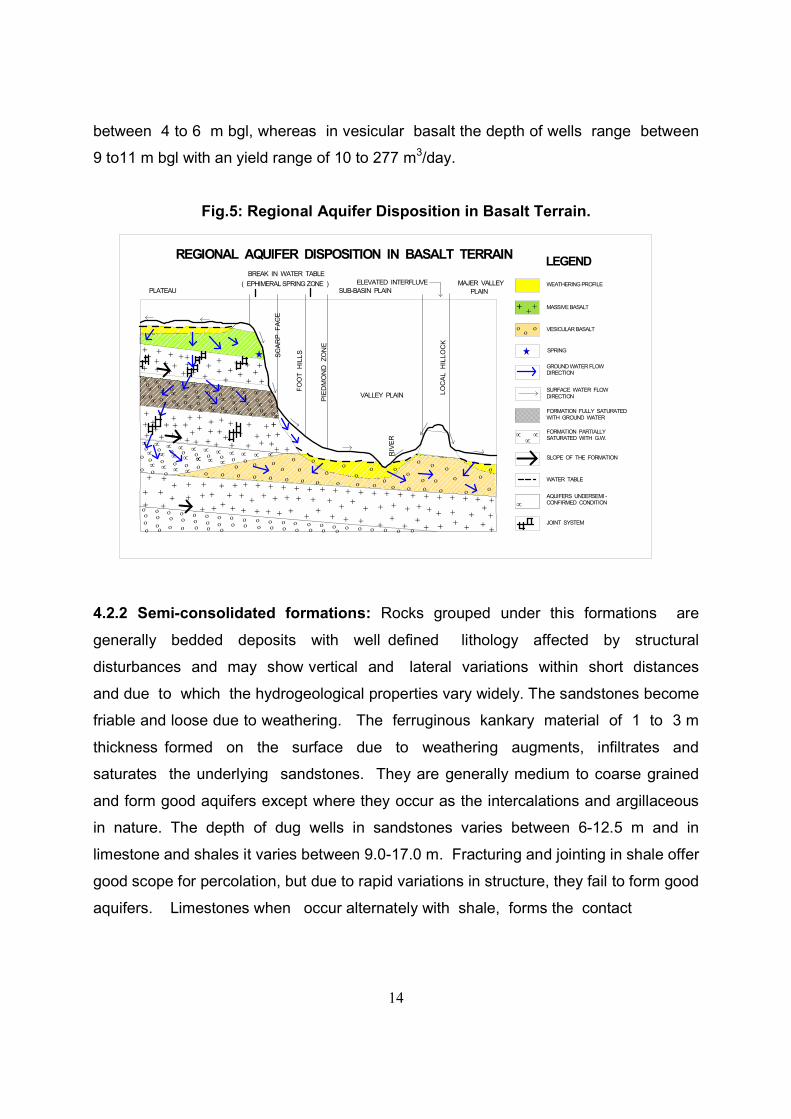
14
FORMATION PARTIALLYSATURATED WITH G.W.
FORMATION FULLY SATURATEDWITH GROUND WATER
SLOPE OF THE FORMATION
WATER TABLE
AQUIFERS UNDERSEMI -CONFIRMED CONDITION
JOINT SYSTEM
VESICULAR BASALT
SPRING
GROUND WATER FLOW DIRECTION
SURFACE WATER FLOWDIRECTION
WEATHERING PROFILE
MASSIVE BASALT
LEGEND
REGIONAL AQUIFER DISPOSITION IN BASALT TERRAIN
VALLEY PLAIN
PIE
DM
ON
D
ZO
NE
FO
OT
H
ILL
SSC
AR
P
FA
CE
LO
CA
L H
ILLO
CK
PLATEAU SUB-BASIN PLAINMAJER VALLEY
PLAIN
ELEVATED INTERFLUVE
BREAK IN WATER TABLE
( EPHIMERAL SPRING ZONE )
RIV
ER
between 4 to 6 m bgl, whereas in vesicular basalt the depth of wells range between
9 to11 m bgl with an yield range of 10 to 277 m3/day.
Fig.5: Regional Aquifer Disposition in Basalt Terrain.
4.2.2 Semi-consolidated formations: Rocks grouped under this formations are
generally bedded deposits with well defined lithology affected by structural
disturbances and may show vertical and lateral variations within short distances
and due to which the hydrogeological properties vary widely. The sandstones become
friable and loose due to weathering. The ferruginous kankary material of 1 to 3 m
thickness formed on the surface due to weathering augments, infiltrates and
saturates the underlying sandstones. They are generally medium to coarse grained
and form good aquifers except where they occur as the intercalations and argillaceous
in nature. The depth of dug wells in sandstones varies between 6-12.5 m and in
limestone and shales it varies between 9.0-17.0 m. Fracturing and jointing in shale offer
good scope for percolation, but due to rapid variations in structure, they fail to form good
aquifers. Limestones when occur alternately with shale, forms the contact
15
between the formations acts as a good conduit for ground water movement. Dug
wells tapping these formations are reported yield between 30 to100 m3/day.
4.2.3 Unconsolidated formations: In this group of formations, ground water occurs
in primary pores. Because of primary porosity and pore-connectivity, these
formations form very good aquifers. Laterite is formed, as a product of weathering
and leaching process, over the basaltic rocks. Though the thickness of the
formation is limited, it forms potential aquifer system, wherever favourable
conditions exists. The average yield of dug wells in laterite is in the range of 18-180
m3/day. The loose and unconsolidated formation of alluvium comprises mainly gravel,
sand and silt, occurring along the river courses. Ground water occurs under phreatic
and confined conditions in these formations and generally developed through small
diameter dug wells, filter point wells and tube wells. Wells tapping these aquifers on an
average yield about 40 m3/hr. Dug wells constructed in these formation yield
between 36 to 60 m3/hr and can sustain 8 to 10 hours of pumping in a day.
4.3 Depth to Water Level (DTW): Ground water levels are being monitored by CGWB
in the district since 1969 and presently 54 observation and piezometers wells are
monitored 4 times a year (both water levels and one time water quality). Apart from
CGWB, State Ground Water Department also monitors 32 Piezometers monthly.
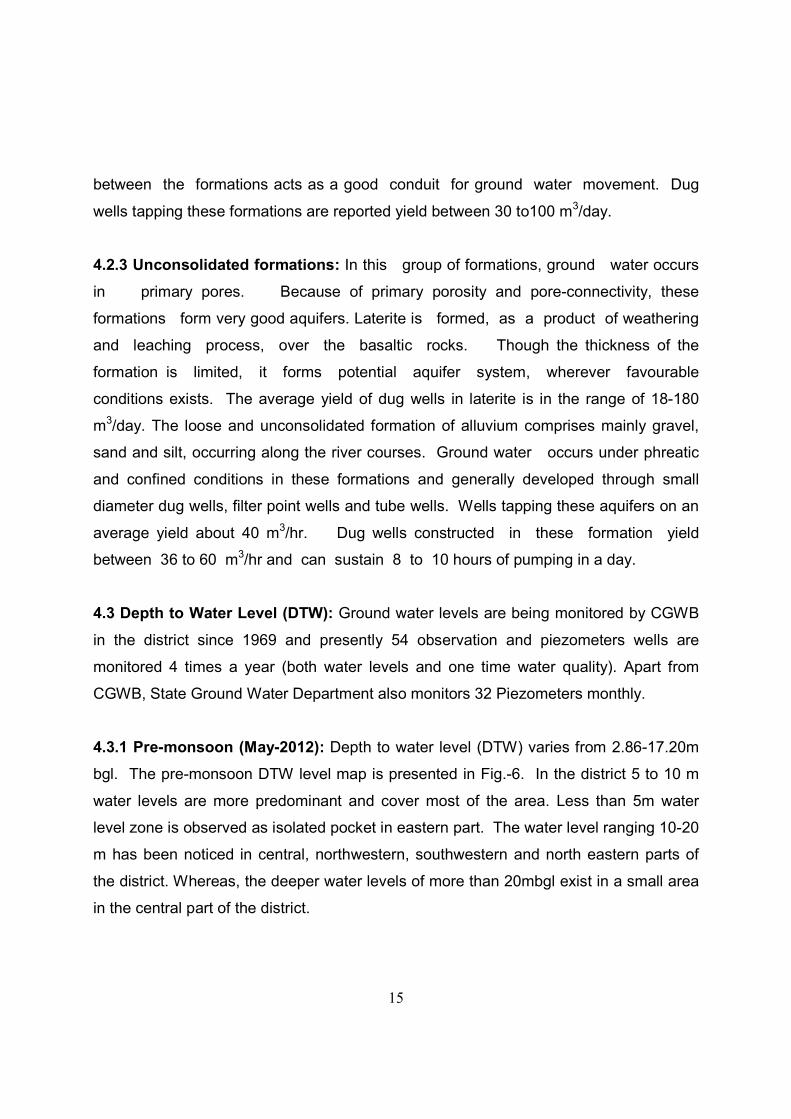
4.3.1 Pre-monsoon (May-2012): Depth to water level (DTW) varies from 2.86-17.20m
bgl. The pre-monsoon DTW level map is presented in Fig.-6. In the district 5 to 10 m
water levels are more predominant and cover most of the area. Less than 5m water
level zone is observed as isolated pocket in eastern part. The water level ranging 10-20
m has been noticed in central, northwestern, southwestern and north eastern parts of
the district. Whereas, the deeper water levels of more than 20mbgl exist in a small area
in the central part of the district.
16
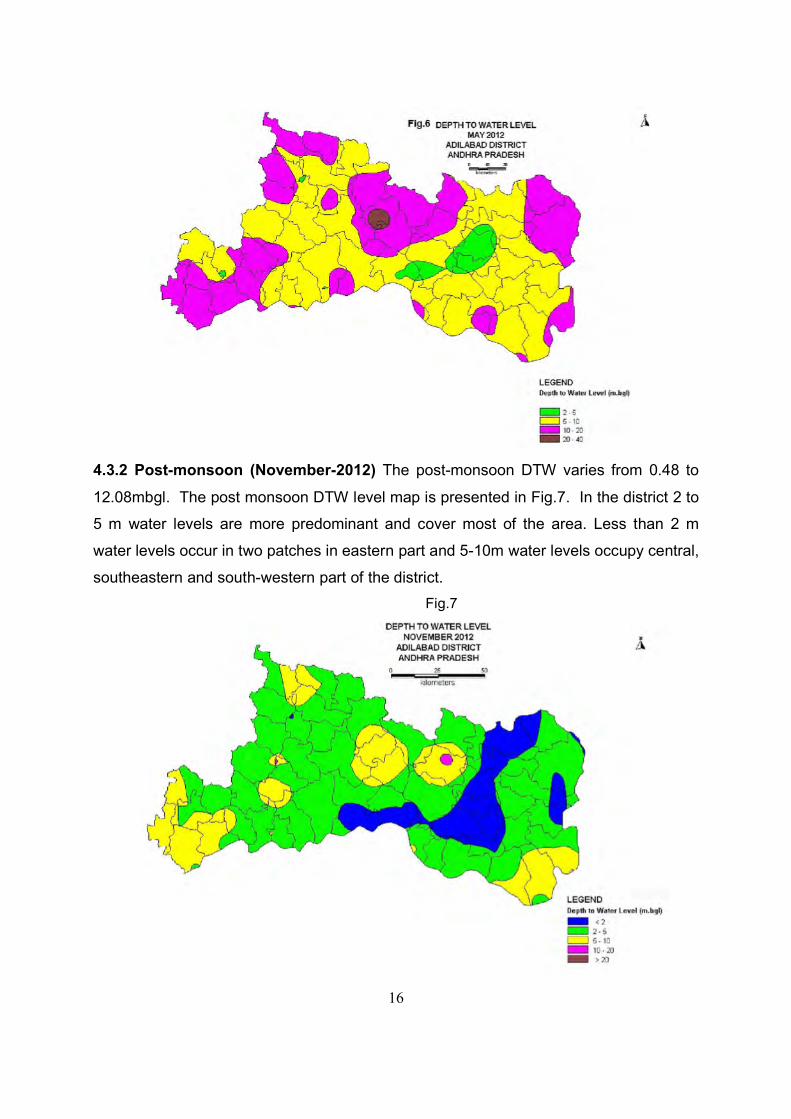
4.3.2 Post-monsoon (November-2012) The post-monsoon DTW varies from 0.48 to
12.08mbgl. The post monsoon DTW level map is presented in Fig.7. In the district 2 to
5 m water levels are more predominant and cover most of the area. Less than 2 m
water levels occur in two patches in eastern part and 5-10m water levels occupy central,
southeastern and south-western part of the district.
Fig.7
17
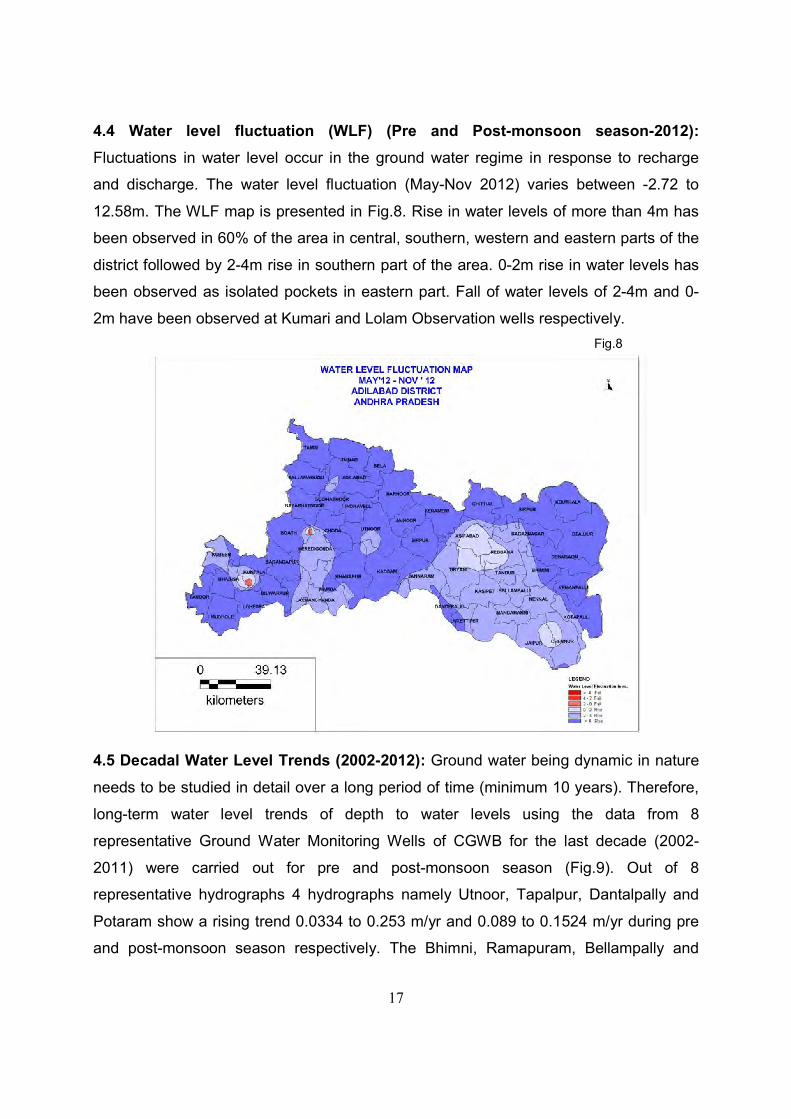
4.4 Water level fluctuation (WLF) (Pre and Post-monsoon season-2012):
Fluctuations in water level occur in the ground water regime in response to recharge
and discharge. The water level fluctuation (May-Nov 2012) varies between -2.72 to
12.58m. The WLF map is presented in Fig.8. Rise in water levels of more than 4m has
been observed in 60% of the area in central, southern, western and eastern parts of the
district followed by 2-4m rise in southern part of the area. 0-2m rise in water levels has
been observed as isolated pockets in eastern part. Fall of water levels of 2-4m and 0-
2m have been observed at Kumari and Lolam Observation wells respectively.
Fig.8
4.5 Decadal Water Level Trends (2002-2012): Ground water being dynamic in nature
needs to be studied in detail over a long period of time (minimum 10 years). Therefore,
long-term water level trends of depth to water levels using the data from 8
representative Ground Water Monitoring Wells of CGWB for the last decade (2002-
2011) were carried out for pre and post-monsoon season (Fig.9). Out of 8
representative hydrographs 4 hydrographs namely Utnoor, Tapalpur, Dantalpally and
Potaram show a rising trend 0.0334 to 0.253 m/yr and 0.089 to 0.1524 m/yr during pre
and post-monsoon season respectively. The Bhimni, Ramapuram, Bellampally and
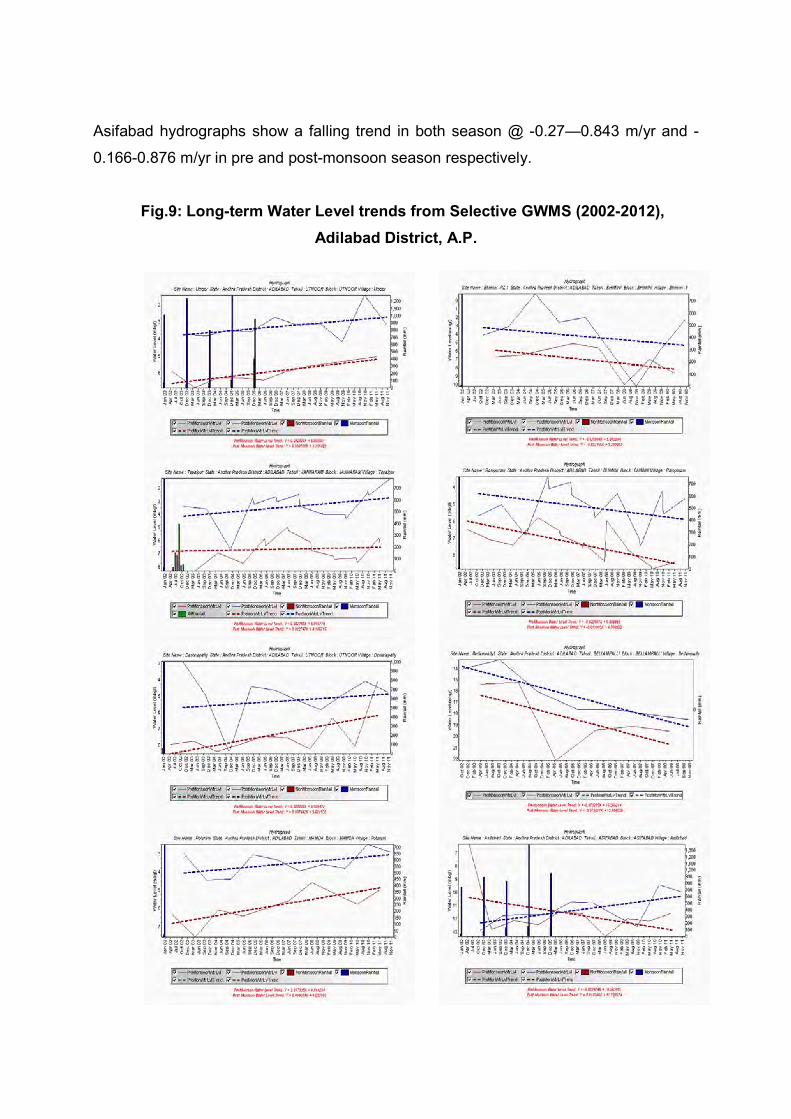
18
Asifabad hydrographs show a falling trend in both season @ -0.27—0.843 m/yr and -
0.166-0.876 m/yr in pre and post-monsoon season respectively.
Fig.9: Long-term Water Level trends from Selective GWMS (2002-2012),
Adilabad District, A.P.
19
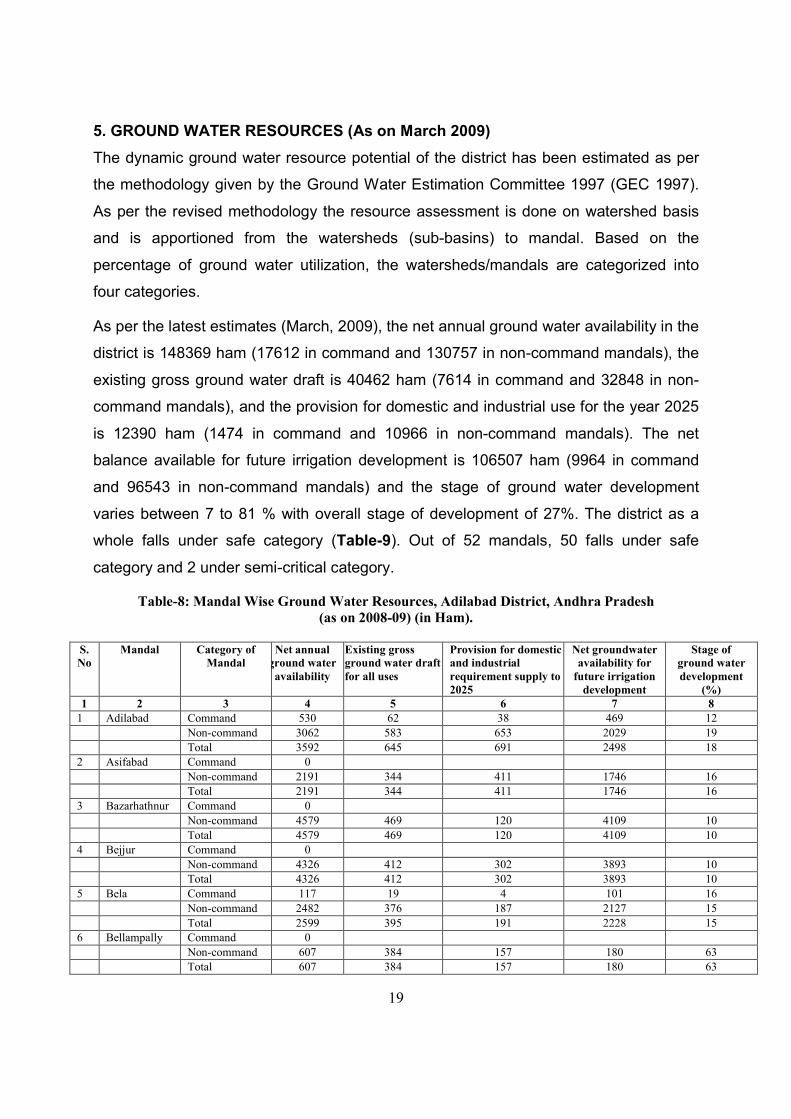
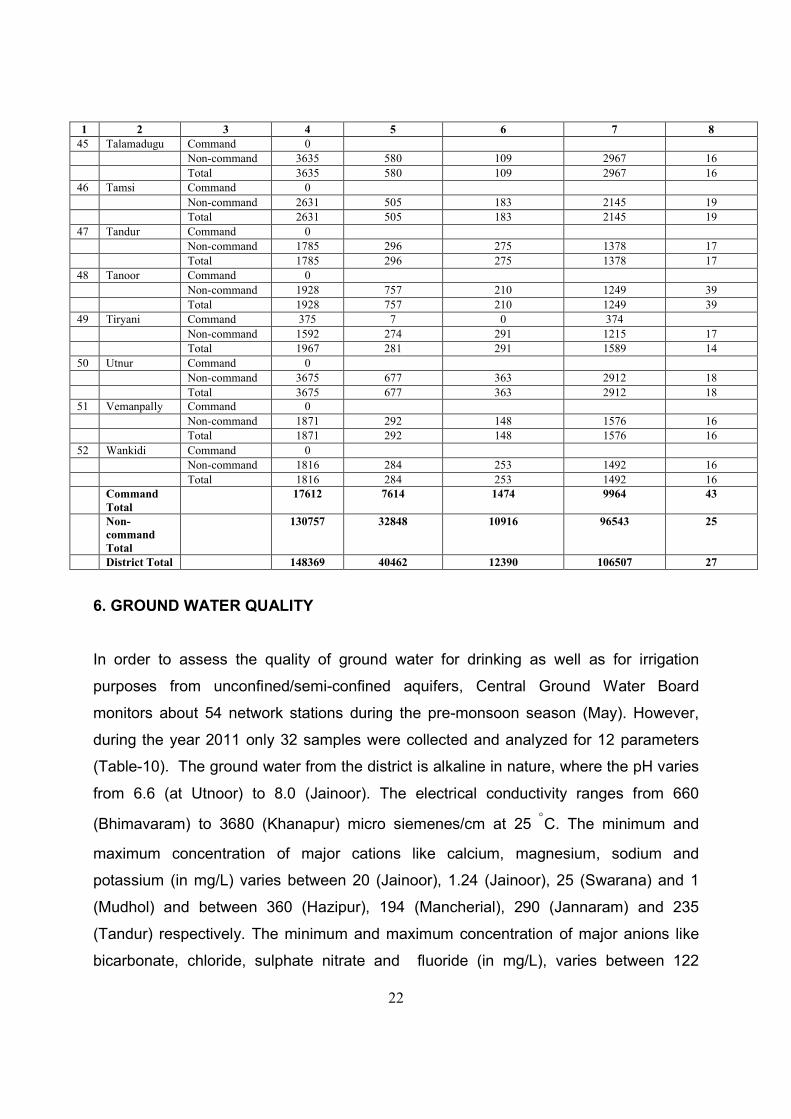
5. GROUND WATER RESOURCES (As on March 2009)
The dynamic ground water resource potential of the district has been estimated as per
the methodology given by the Ground Water Estimation Committee 1997 (GEC 1997).
As per the revised methodology the resource assessment is done on watershed basis
and is apportioned from the watersheds (sub-basins) to mandal. Based on the
percentage of ground water utilization, the watersheds/mandals are categorized into
four categories.
As per the latest estimates (March, 2009), the net annual ground water availability in the
district is 148369 ham (17612 in command and 130757 in non-command mandals), the
existing gross ground water draft is 40462 ham (7614 in command and 32848 in non-
command mandals), and the provision for domestic and industrial use for the year 2025
is 12390 ham (1474 in command and 10966 in non-command mandals). The net
balance available for future irrigation development is 106507 ham (9964 in command
and 96543 in non-command mandals) and the stage of ground water development
varies between 7 to 81 % with overall stage of development of 27%. The district as a
whole falls under safe category (Table-9). Out of 52 mandals, 50 falls under safe
category and 2 under semi-critical category.
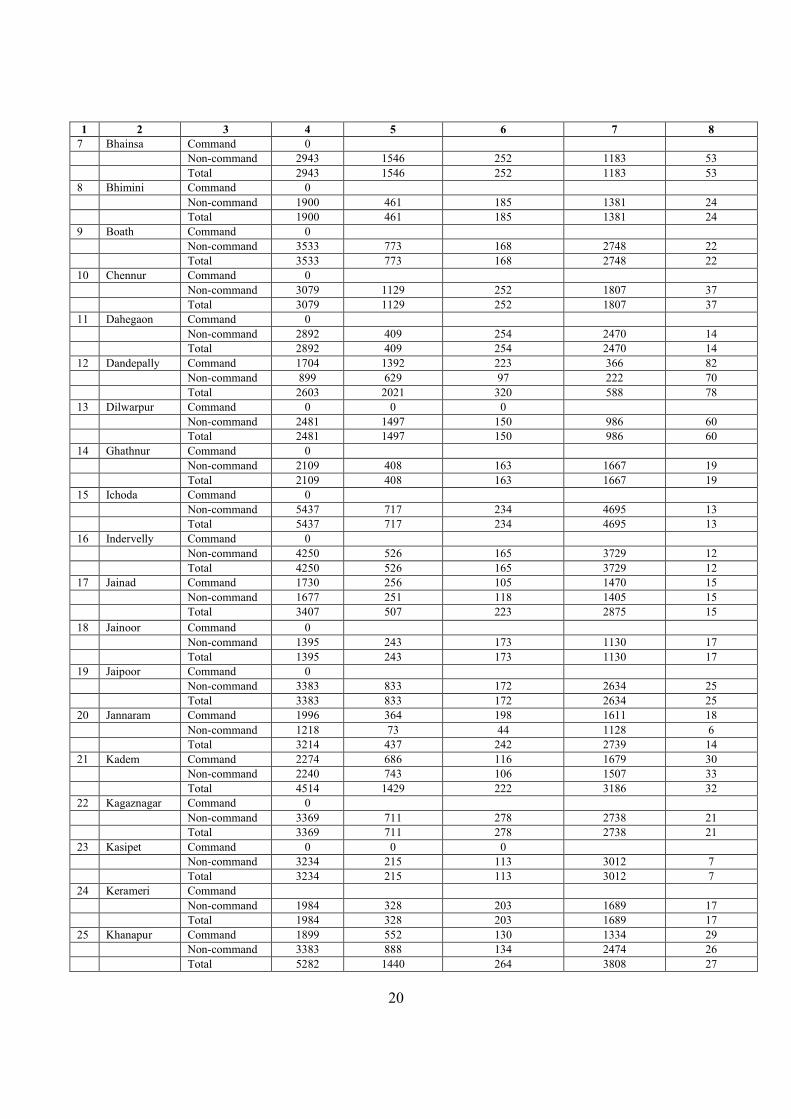
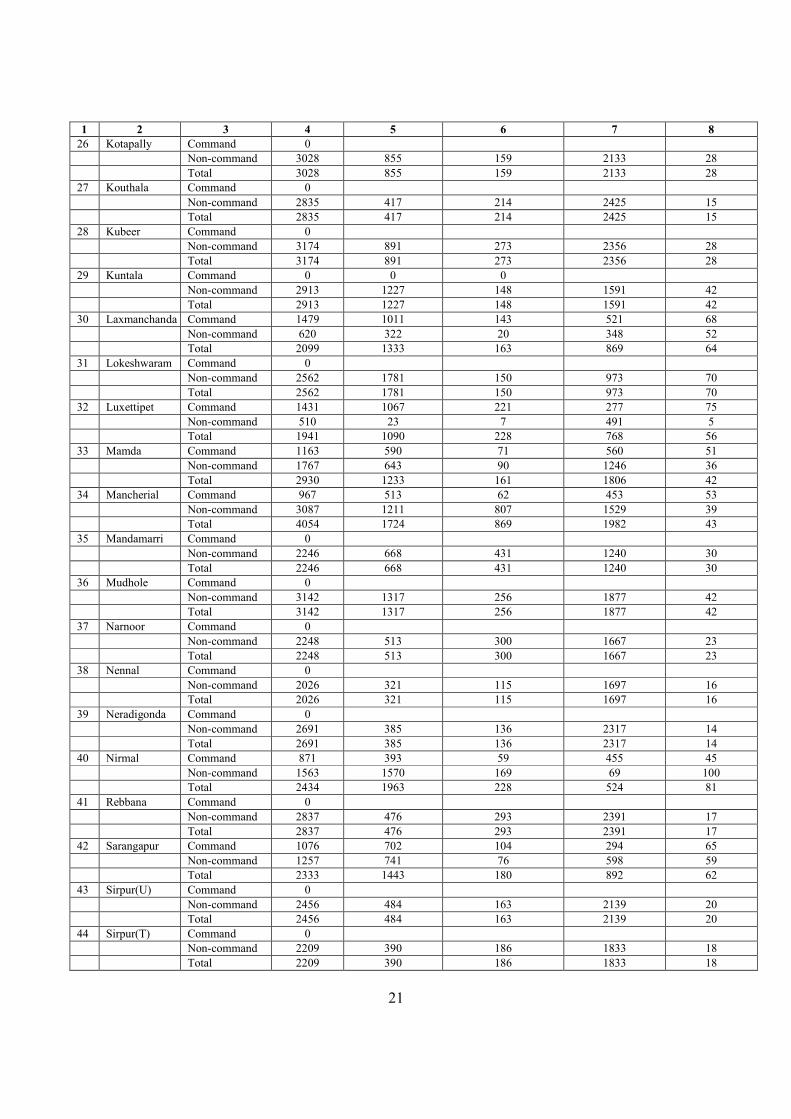
Table-8: Mandal Wise Ground Water Resources, Adilabad District, Andhra Pradesh (as on 2008-09) (in Ham).
S. No
Mandal Category of Mandal
Net annual ground water
availability
Existing gross ground water draft for all uses
Provision for domestic and industrial requirement supply to 2025
Net groundwater availability for
future irrigation development
Stage of ground water development
(%) 1 2 3 4 5 6 7 8
1 Adilabad Command 530 62 38 469 12
Non-command 3062 583 653 2029 19
Total 3592 645 691 2498 18 2 Asifabad Command 0
Non-command 2191 344 411 1746 16 Total 2191 344 411 1746 16
3 Bazarhathnur Command 0
Non-command 4579 469 120 4109 10
Total 4579 469 120 4109 10 4 Bejjur Command 0
Non-command 4326 412 302 3893 10 Total 4326 412 302 3893 10
5 Bela Command 117 19 4 101 16
Non-command 2482 376 187 2127 15
Total 2599 395 191 2228 15 6 Bellampally Command 0
Non-command 607 384 157 180 63 Total 607 384 157 180 63
20
1 2 3 4 5 6 7 8 7 Bhainsa Command 0 Non-command 2943 1546 252 1183 53
Total 2943 1546 252 1183 53 8 Bhimini Command 0
Non-command 1900 461 185 1381 24 Total 1900 461 185 1381 24
9 Boath Command 0 Non-command 3533 773 168 2748 22
Total 3533 773 168 2748 22 10 Chennur Command 0
Non-command 3079 1129 252 1807 37
Total 3079 1129 252 1807 37 11 Dahegaon Command 0
Non-command 2892 409 254 2470 14 Total 2892 409 254 2470 14
12 Dandepally Command 1704 1392 223 366 82
Non-command 899 629 97 222 70
Total 2603 2021 320 588 78 13 Dilwarpur Command 0 0 0
Non-command 2481 1497 150 986 60 Total 2481 1497 150 986 60
14 Ghathnur Command 0
Non-command 2109 408 163 1667 19
Total 2109 408 163 1667 19 15 Ichoda Command 0
Non-command 5437 717 234 4695 13 Total 5437 717 234 4695 13
16 Indervelly Command 0
Non-command 4250 526 165 3729 12
Total 4250 526 165 3729 12 17 Jainad Command 1730 256 105 1470 15
Non-command 1677 251 118 1405 15 Total 3407 507 223 2875 15
18 Jainoor Command 0
Non-command 1395 243 173 1130 17
Total 1395 243 173 1130 17 19 Jaipoor Command 0 Non-command 3383 833 172 2634 25
Total 3383 833 172 2634 25 20 Jannaram Command 1996 364 198 1611 18
Non-command 1218 73 44 1128 6 Total 3214 437 242 2739 14
21 Kadem Command 2274 686 116 1679 30 Non-command 2240 743 106 1507 33
Total 4514 1429 222 3186 32 22 Kagaznagar Command 0
Non-command 3369 711 278 2738 21 Total 3369 711 278 2738 21
23 Kasipet Command 0 0 0 Non-command 3234 215 113 3012 7
Total 3234 215 113 3012 7 24 Kerameri Command
Non-command 1984 328 203 1689 17 Total 1984 328 203 1689 17
25 Khanapur Command 1899 552 130 1334 29 Non-command 3383 888 134 2474 26
Total 5282 1440 264 3808 27
21
1 2 3 4 5 6 7 8 26 Kotapally Command 0 Non-command 3028 855 159 2133 28
Total 3028 855 159 2133 28 27 Kouthala Command 0
Non-command 2835 417 214 2425 15 Total 2835 417 214 2425 15
28 Kubeer Command 0 Non-command 3174 891 273 2356 28
Total 3174 891 273 2356 28 29 Kuntala Command 0 0 0
Non-command 2913 1227 148 1591 42
Total 2913 1227 148 1591 42 30 Laxmanchanda Command 1479 1011 143 521 68
Non-command 620 322 20 348 52 Total 2099 1333 163 869 64
31 Lokeshwaram Command 0
Non-command 2562 1781 150 973 70
Total 2562 1781 150 973 70 32 Luxettipet Command 1431 1067 221 277 75
Non-command 510 23 7 491 5 Total 1941 1090 228 768 56
33 Mamda Command 1163 590 71 560 51
Non-command 1767 643 90 1246 36
Total 2930 1233 161 1806 42 34 Mancherial Command 967 513 62 453 53
Non-command 3087 1211 807 1529 39 Total 4054 1724 869 1982 43
35 Mandamarri Command 0
Non-command 2246 668 431 1240 30
Total 2246 668 431 1240 30 36 Mudhole Command 0
Non-command 3142 1317 256 1877 42 Total 3142 1317 256 1877 42
37 Narnoor Command 0
Non-command 2248 513 300 1667 23
Total 2248 513 300 1667 23 38 Nennal Command 0
Non-command 2026 321 115 1697 16 Total 2026 321 115 1697 16
39 Neradigonda Command 0
Non-command 2691 385 136 2317 14
Total 2691 385 136 2317 14 40 Nirmal Command 871 393 59 455 45
Non-command 1563 1570 169 69 100 Total 2434 1963 228 524 81
41 Rebbana Command 0
Non-command 2837 476 293 2391 17
Total 2837 476 293 2391 17 42 Sarangapur Command 1076 702 104 294 65
Non-command 1257 741 76 598 59 Total 2333 1443 180 892 62
43 Sirpur(U) Command 0
Non-command 2456 484 163 2139 20 Total 2456 484 163 2139 20
44 Sirpur(T) Command 0 Non-command 2209 390 186 1833 18
Total 2209 390 186 1833 18
22
1 2 3 4 5 6 7 8 45 Talamadugu Command 0 Non-command 3635 580 109 2967 16
Total 3635 580 109 2967 16 46 Tamsi Command 0
Non-command 2631 505 183 2145 19 Total 2631 505 183 2145 19
47 Tandur Command 0 Non-command 1785 296 275 1378 17
Total 1785 296 275 1378 17 48 Tanoor Command 0
Non-command 1928 757 210 1249 39
Total 1928 757 210 1249 39 49 Tiryani Command 375 7 0 374
Non-command 1592 274 291 1215 17 Total 1967 281 291 1589 14
50 Utnur Command 0
Non-command 3675 677 363 2912 18
Total 3675 677 363 2912 18 51 Vemanpally Command 0
Non-command 1871 292 148 1576 16 Total 1871 292 148 1576 16
52 Wankidi Command 0 Non-command 1816 284 253 1492 16
Total 1816 284 253 1492 16 Command
Total 17612 7614 1474 9964 43
Non-command Total
130757 32848 10916 96543 25
District Total 148369 40462 12390 106507 27
6. GROUND WATER QUALITY
In order to assess the quality of ground water for drinking as well as for irrigation
purposes from unconfined/semi-confined aquifers, Central Ground Water Board
monitors about 54 network stations during the pre-monsoon season (May). However,
during the year 2011 only 32 samples were collected and analyzed for 12 parameters
(Table-10). The ground water from the district is alkaline in nature, where the pH varies
from 6.6 (at Utnoor) to 8.0 (Jainoor). The electrical conductivity ranges from 660
(Bhimavaram) to 3680 (Khanapur) micro siemenes/cm at 25 C. The minimum and
maximum concentration of major cations like calcium, magnesium, sodium and
potassium (in mg/L) varies between 20 (Jainoor), 1.24 (Jainoor), 25 (Swarana) and 1
(Mudhol) and between 360 (Hazipur), 194 (Mancherial), 290 (Jannaram) and 235
(Tandur) respectively. The minimum and maximum concentration of major anions like
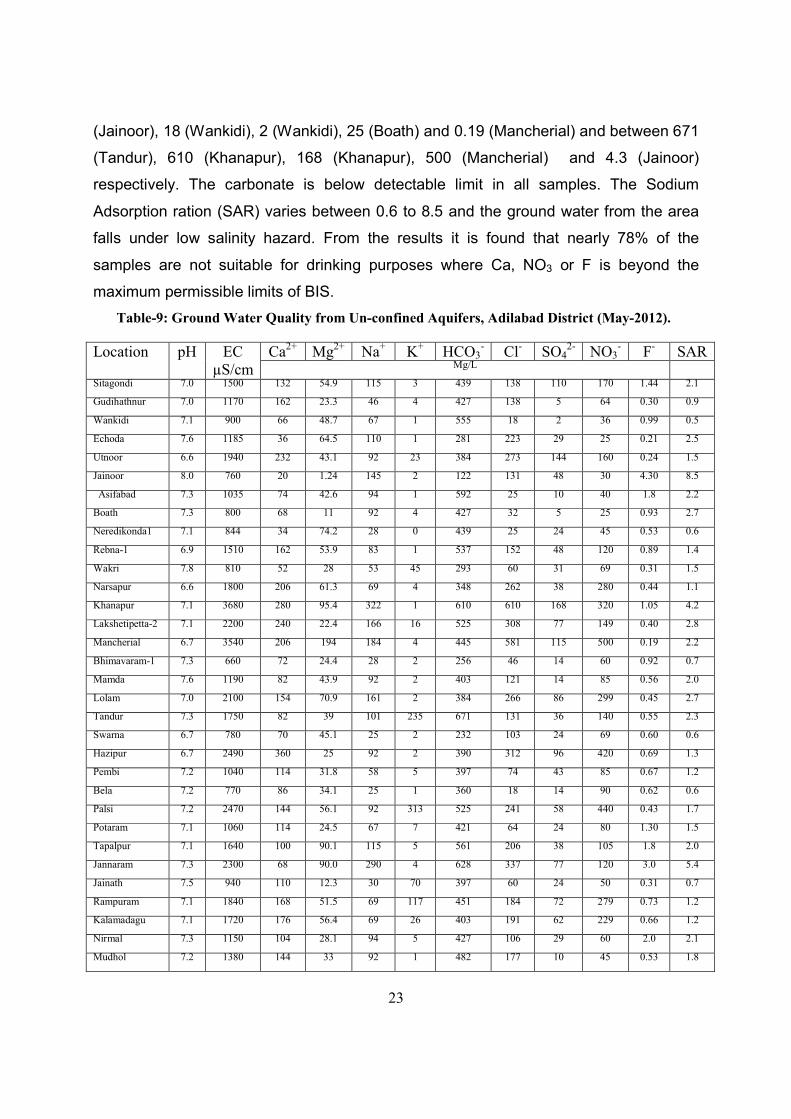
bicarbonate, chloride, sulphate nitrate and fluoride (in mg/L), varies between 122
23
(Jainoor), 18 (Wankidi), 2 (Wankidi), 25 (Boath) and 0.19 (Mancherial) and between 671
(Tandur), 610 (Khanapur), 168 (Khanapur), 500 (Mancherial) and 4.3 (Jainoor)
respectively. The carbonate is below detectable limit in all samples. The Sodium
Adsorption ration (SAR) varies between 0.6 to 8.5 and the ground water from the area
falls under low salinity hazard. From the results it is found that nearly 78% of the
samples are not suitable for drinking purposes where Ca, NO3 or F is beyond the
maximum permissible limits of BIS.
Table-9: Ground Water Quality from Un-confined Aquifers, Adilabad District (May-2012).
Location pH EC µS/cm
Ca2+ Mg2+ Na+ K+ HCO3- Cl- SO4
2- NO3- F- SAR
Mg/L
Sitagondi 7.0 1500 132 54.9 115 3 439 138 110 170 1.44 2.1
Gudihathnur 7.0 1170 162 23.3 46 4 427 138 5 64 0.30 0.9
Wankidi 7.1 900 66 48.7 67 1 555 18 2 36 0.99 0.5
Echoda 7.6 1185 36 64.5 110 1 281 223 29 25 0.21 2.5
Utnoor 6.6 1940 232 43.1 92 23 384 273 144 160 0.24 1.5
Jainoor 8.0 760 20 1.24 145 2 122 131 48 30 4.30 8.5
Asifabad 7.3 1035 74 42.6 94 1 592 25 10 40 1.8 2.2
Boath 7.3 800 68 11 92 4 427 32 5 25 0.93 2.7
Neredikonda1 7.1 844 34 74.2 28 0 439 25 24 45 0.53 0.6
Rebna-1 6.9 1510 162 53.9 83 1 537 152 48 120 0.89 1.4
Wakri 7.8 810 52 28 53 45 293 60 31 69 0.31 1.5
Narsapur 6.6 1800 206 61.3 69 4 348 262 38 280 0.44 1.1
Khanapur 7.1 3680 280 95.4 322 1 610 610 168 320 1.05 4.2
Lakshetipetta-2 7.1 2200 240 22.4 166 16 525 308 77 149 0.40 2.8
Mancherial 6.7 3540 206 194 184 4 445 581 115 500 0.19 2.2
Bhimavaram-1 7.3 660 72 24.4 28 2 256 46 14 60 0.92 0.7
Mamda 7.6 1190 82 43.9 92 2 403 121 14 85 0.56 2.0
Lolam 7.0 2100 154 70.9 161 2 384 266 86 299 0.45 2.7
Tandur 7.3 1750 82 39 101 235 671 131 36 140 0.55 2.3
Swarna 6.7 780 70 45.1 25 2 232 103 24 69 0.60 0.6
Hazipur 6.7 2490 360 25 92 2 390 312 96 420 0.69 1.3
Pembi 7.2 1040 114 31.8 58 5 397 74 43 85 0.67 1.2
Bela 7.2 770 86 34.1 25 1 360 18 14 90 0.62 0.6
Palsi 7.2 2470 144 56.1 92 313 525 241 58 440 0.43 1.7
Potaram 7.1 1060 114 24.5 67 7 421 64 24 80 1.30 1.5
Tapalpur 7.1 1640 100 90.1 115 5 561 206 38 105 1.8 2.0
Jannaram 7.3 2300 68 90.0 290 4 628 337 77 120 3.0 5.4
Jainath 7.5 940 110 12.3 30 70 397 60 24 50 0.31 0.7
Rampuram 7.1 1840 168 51.5 69 117 451 184 72 279 0.73 1.2
Kalamadagu 7.1 1720 176 56.4 69 26 403 191 62 229 0.66 1.2
Nirmal 7.3 1150 104 28.1 94 5 427 106 29 60 2.0 2.1
Mudhol 7.2 1380 144 33 92 1 482 177 10 45 0.53 1.8
24
7. GROUND WATER DEVELOPMENT & MANAGEMENT
7.1 Ground Water Development: Irrigation and drinking water needs in the district are
mainly met through ground water. Out of 80,789 ha area irrigated during 2009-10,
nearly 86.55% (69,630 ha) is met through ground water. The main ground water
abstraction structures used for domestic purposes are dug wells and borewells / tube
wells. Small diameter dug wells of 1 to 4 m with a depth of 5 to 33 m (average 15 m) are
in vogue. The water from these wells is lifted by means of bucket and rope and by
electric motors of 1 to 2 HP for domestic purposes. For irrigation purposes, large
diameter dug wells/dug-cum-bore wells, especially in non-command areas are in
operation. In hard rock areas, depth of dug well varies between 4 to 22 m with a yield of
10 to 277 m3/day with a general yield range of 50 to 80 m3/day. The bore wells/tube
wells are operated by electric motors fitted with submersible pumps of 5 to 10 HP. In
soft rocks, depth of open wells varies between 6 to 16.75 m with yield in the range
of 30 to 100 m3/day (average of 50 m3/day). In alluvium (un-consolidated formation),
depth of open wells varies between 5 to 10 m with a yield a 100 to 300 m3/day. The
dug/dug-cum-bore wells are operated mostly by 3-7.5 HP pumps and also by diesel
engines fitted with centrifugal pumps. The weathered and fractured zones are
tapped by bore wells of 30-100 m depth with discharge varying between 3.6 to 18
m3/hr. The maximum depth of potential aquifers identified by CGWB in hard rock areas
is down to a depth of 125 m. The depth of tube wells constructed in semi-consolidated
rocks vary between 70 to 200 m with a yield of 10-50 m3/hr. The filter point wells
constructed in alluvium formations are of 5 to 10 m depth, with an yield rate of 25 to 50
m3/hr.
7.2 Ground Water Management: The entire district excluding two mandals falls under
safe category with overall stage of ground water development being 27%. But, these
resources are not distributed uniformly; therefore these resources are to be managed
carefully and judiciously on scientific basis in a phased manner to avoid over-
exploitation.
Ground Water Recharge Plan: There is a scope for harnessing rainwater in Nirmal
mandal covering an area of 206.3 km2. The monsoon rainfall in this mandal is 1.04 m
and the percentage of runoff to rainfall is 28.8 with 61.81 MCM volume of water. After
25
leaving 70% of the volume of water to the existing structures 18.54 MCM is available for
further development (30% of 61.81 MCM) of which 9.27 MCM each is allotted for
percolation tanks (PT) and check dams (CD). Total 31 percolation tanks and 206 check
dams are proposed (allotting 0.5 MCM for each PT and 0.045 for each CD). The total
cost of these structures is worked out to be 1304.1 lakhs including maintenance &
impact assessment studies cost (15% of the total cost).
Spacing between Wells: Spacing between two wells is made mandatory by
Government of India while sanctioning the loan. The spacing between 2 dug wells is
100 m in ayacut and 160 m in non-ayacut area. Between two filter points/shallow tube
wells it is 160 m and 120 m in ayacut and non-ayacut area respectively. Between two
bore/tube wells,300 to 500 m spacing is recommended in ayacut and non-ayacut area
respectively.
Water Conservation Practices: In the district sprinklers and drip irrigation projects are
in use and during the year 2009-10 the total number of sprinklers and drip irrigation are
2499 and 4360 in operations, irrigating about 2499 and 2493 ha respectively.
Government of Andhra Pradesh (under S.C. action plan) has also assisted 651
beneficiaries with a subsidy of 44.58 lakhs. These funds were utilized under
construction of bore wells/ enerigization of pump sets as per APWALTA-Act. Various
banks also given the subsidy to about 106619 farmers for construction of bore wells on
patta lands. District Water Management Agency also taken up various activities under
their programme.
7.3 Ground Water Issues
Farmers Distress Condition: In recent past suicide cases are reported due to failure
of bore wells, mostly in semi-critical area of the district. In these areas, the success rate
of bore wells is reported to be 40-60% and about 80% of the failures of bore wells are
accounted to selection of sites on non-scientific lines like water divining methods.
Drinking Water Facilities: In the district almost all villages are having the adequate
drinking water facilities except 19 villages (Including 4 fluoride endemic villages and 5
with no drinking water facility is available). The fluoride endemic villages lie in
Bazarhatnur (2 nos), Neredigonda (1), Jannaram (3), Kaddam (Peddur) (2), Dandepalli
(1) and Chennur (5).
26
8. RECOMMENDATIONS
1. In non-command area, where further development of groundwater is possible the
sites should be selected on scientific basis.
2. In non-command area, ground water resources are scarce, therefore, less water
intensive crops be raised and alternative irrigation methods like drip and sprinkler
irrigation may be encouraged and farmers may be given loans with enhanced
subsidy. Technical guidance has to be provided to the illiterate farmers in
maintaining these irrigation equipment.
3. To stop surface run off and to enhance ground water storage, ground water conservation
and artificial recharge structures must be taken up, on suitable locations.
4. Watershed management plans with people’s participation must be adopted and impact
assessment studies should be carried out on scientific basis.
5. Peoples Participatory Programme along mass awareness programmes must be
conducted widely on regular basis in the rural areas to educate the farmers
regarding the water management and to update their knowledge.
6. Training for local government functionaries, NGOs, voluntary organizations
engaged in watershed development activity to be given in scientific selection of
sites, design of structures, for construction of rainwater harvesting and artificial
recharge structures.
7. There should be a complete institutional credit cover to the small and marginal
farmers for drilling deep bore wells in ground water potential areas, for procuring
water saving equipment like drip and sprinkler systems, etc. Insurance facility
should be provided to cover the health of farmers and their families, damaged
crops due to severe drought conditions, unforeseen loss, market rates for the
agriculture produce, etc.
8. To minimize the dependence solely on agriculture, the government should provide
loan facility with enhanced subsidy to the farmers to initiate dairy and poultry farm
for supplementary income.
9. In order to impart education to the farmers, regarding cropping pattern, hybrid
varieties, pesticides, irrigation techniques etc., ‘Agri-clinics’ may be established in
rural areas for every five villages in non-command areas.
27
10. Construction of additional 31 percolation tanks and 206 check dams proposed in
Semi-critical, Nirmal mandal may be taken with a cost of 1304.1 lakhs.
11. The spacing norms between two adjacent bore wells, as per the norms of
APWALTA act, should be strictly implemented.
Acknowledgements: The author is thankful to Shri G. Sudarshan, Head of the Office,
Southern Region for giving the opportunity to write this report and to Dr. P.N.Rao,
Scientist-D for his tireless guidance from time to time and for carefully scrutinizing the
report. The data provided by the State Ground Water Department, Panchayat Raj
Department, Agriculture Department, Irrigation Department and Directorate of Economics
& Statistics, Govt. of Andhra Pradesh, for preparation of the report, is gratefully
acknowledged.