ad-a278, 165 i. - dtic
TRANSCRIPT

E•dited by ... •,.Janusz Gorski •, :
AD-A278, 165 i.
•4• 94-11252S• 44
,.... .... .. |

SAFECOMP '93The 12th International Conference on
Computer Safety, Reliability and Security
Poznari-Kiekrz, Poland27-29 October 1993
Edited bv
Janusz G6rski
sty
Sponsor
European Workshop on Industrial Computer SystemsTechnical Committee 7 (EWICS TC7)
Co-Sponsored byIFIP Technical Committee 5 WG 5.4. -Accesion For
Franco-Polish School of New Information and NTIS CRA&ICommunication Technologies DTIC TAB
Polish Council for Scientific Research UnannouncedEuropean Research Office, USARDSG-UK Justificatio
OCG, the Austrian Computer Society
Organized by
Franco-Polish School of New Information and Distribution /
Communication Technologies Avatability Codi Avail and/or
Dist Special
Springer-VerlagLondon Berlin Heidelberg New York
Paris Tokyo Hong KongBarcelona Budapest

Janusz G6rskiFranco-Polish School of New Information andCommunication Technology60-854 PoznafnPoland
ISBN 3-540-19838-5 Springer-Verlag Berlin Heidelberg New YorkISBN 0-387-19838-5 Springer-Verlag New York Berlin Heidelberg
British Library Cataloguing in Publication DataA catalogue record for this book is available from the British Library
Library of Congress Cataloging-in-publication DataA catalogue record for this book is available from the Library of Congress
Apart from any fair dealing for the purposes of research or private study, orcriticism or review, as permitted under the Copyright, Designs and Patents Act1988, this publication may only be reproduced, stored or transmitted, in any formor by any means, with the prior permission in writing of the publishers, or in thecase of reprographic reproduction in accordance with the terms of licences issuedby the Copyright Licensing Agency. Enquiries concerning reproduction outsidethose terms should be sent to the publishers.
V Springer-Verlag London Limited 1993Printed in Great Britain
The use of registered names, trademarks etc. in this publication does not imply,even in the absence of a specific statement, that such names are exempt from therelevant laws and regulations and therefore free for general use.
The publisher makes no representation, express or implied, with regard to theaccuracy of the information contained in this book and cannot accept any legalresponsibility or liability for any errors or omissions that may be made.
Typesetting: camera-ready by authorPrinted and bound by Antony Rowe Ltd., Chippenham, Wiltshire34/3830-543210 Printed on acid-free paper

SAFECOMP '93

INTERNATIONAL PROGRAM COMMITTEE
J. G6rski (Chairman) PLR. E. Bloomfield UK J. Lindeberg NS. Bologna I S. L.-Hansen DKW. Cellary PL M. J. P. van der Meulen NLG. Cleland UK G. Rabe DB. Cronhjort S F. Redmill UKP. Daniel UK M. Rodd UKB. K. Daniels UK B. Runge DKG. Dahl N C. H. Schildt AW. Ehrenberger D E. Schoitsch AH. Frey CH I. C. Smith UKK. Kanoun F A. Toola SFF. Koornneef NL W. M. Turski PLH. Krawczyk PL U. Voges DR. Lauber D W. Zamojski PL
National Organizing Committee
J. G6rski (Chairman),T. Doroszewski, L. Gimzicka, K. Ratajczak, E. Roslanowski

Preface
The safe operation of computer systems continues to be a key issuein many applications where people, environment, investment, orgoodwill can be at risk. Such applications include medical, railways,power generation and distribution, road transportation, aerospace,process industries, mining, military and many others.
This book represents the proceedings of the 12th InternationalConference on Computer Safety, Reliability and Security, held inPoznafi, Poland, 27-29 October 1993. The conference reviews thestate of the art, experiences and new trends in the areas of computersafety, reliability and security. It forms a platform for technologytransfer between academia, industry and research institutions. Inan expanding world-wide market for safe, secure and reliablecomputer systems SAFECOMP'93 provides an opportunity fortechnical developers, users, and legislators to exchange and reviewthe experience, to consider the best technologies now available andto identify the skills and technologies required for the future. Thepapers were carefully selected by the International Program Com-mittee of the Conference. The authors of the papers come from 16different countries. The subjects covered include formal methodsand models, safety assessment and analysis, verification andvalidation, testing, reliability issues and dependable software tech-nology, computer languages for safety related systems, reactivesystems technology, security and safety related applications. As toits wide international coverage, unique way of combining partici-pants from academia, research and industry and topical coverage,SAFECOMP is outstanding among the other related events in thefield.
The reader will get insight into the basic status of computer safety,reliability and security (through invited presentations) and willreceive a representative sample of recent results and problems inthose fields presented by experts from both industrial and academicinstitutions.
The response to the Call for Papers produced many more goodpapers than could be included in the programme. I must thank allthe authors who submitted their work, the presenters of the papers,

vi Preface
the International Program Committee and National OrganisingCommittee, the Sponsor and Co-sponsors for their efforts andsupport. Through their strong motivation and hard work theConference and this book have been enabled.
Janusz G6rski Poznafi, PolandAugust 1993
. A 'f"

Contents
Invited paper. T. Anderson(UK): Safety-Status andPerspectives ............................................................... 3
Session 1: Formal Methods and Models ...................... 7Chair: G. Cleland (UK)C. Bernardeschi,L. Simoncini, A. Bondavalli (I): Data Flow
Control Systems: an Example of Safety Validation ............ 9G. Bruns, S. Anderson (UK): Validating Safety Models with
Fault Trees ................................................................ 21Z. Liu (UK), J. Nordahl, E. V. Sorensen (DK): Composition and
Refinement of Probabilistic Real-Time Systems ................ 31P. Collinson, S. Oppert, S. Hughes (UK): The Application of
Formal Methods for the Redevelopment of a LaboratoryInformation Managment System .................................. 41
Session 2: Applications ............................................... 51Chair: I. C. Smith (UK)W.A. Halang, (D) J. Scheepstra (NL): PLC-Implementation of
Emergency Shut-Down Systems .................................... 53G. A. Mutone (USA), M. Rothfelder (D): The Fast Cost
Effective Design and Concurrent Certification of the SafeComputer for a Real Time Train Control Application ........ 63
H.E. Rhody (USA), V. Manoni (), J.R. Hoelscher (USA): Designand Analysis of a Failsafe Algorithm for Solving BooleanEquations ................................................................ 73
Session 3: Safety Assessment ..................................... 83Chair: G. Rabe (D)M.J.P. van der Meulen (NL), T. Stdlhane (N), B. Cole (UK):
Programmable Electronic System Analysis Technique inSafety Critical Applications ......................................... 85
C. 1. Goring (UK): Safety Assessment-The Critical SystemSuppliers View ........................................................... 91
1k + i" i I

viii Contents
M. Chudleigh (UK): Hazard Analysis Using HAZOP: A CaseStudy ..................................................................... 99
Session 4: Safety Analysis ........................................... 109Chair: F. Koornneef (NL)
S.S. Dhanjal, R. Fink (UK): Safety Analysis of ClinicalLaboratory System s .................................................... 111
M.F. Chudleigh, J.N. Clare (UK): The Benefits of SUSI: SafetyAnalysis of User System Interaction ............................... 123
Panel Session: Technology Transfer Between
Academ ia and Industry ............................................ 133Moderator: F. Redmill (UK)
F. Redmill (UK): Issues Affecting Technology Transfer andExperience with a Community Club .............................. 135
J.-P. Bandtre (F): Subsidiaries and Start-up Spin-offCom panies of Inria ..................................................... 142
W. Cellary (PL): Human Medium in Technology Transfer ..... 145
B. Malcolm (UK): Technology Transfer-from Purpose toPractice ..................................................................... 147
Invited Paper: J.-C. Laprie (F): Dependability: from
Concepts to Lim its ...................................................... 157
Session 5: Verification and Validation ......................... 169Chair: B. Runge (DK)
N. J. Ward (UK): The Rigorous Retrospective Static Analysisof the Sizewell 'B' Primary Protection System Software ..... 171
B. Stamm, R. Baumann, M. Kiindig-Herzog (CH): A SafetyCritical Computer System in a Railway Application .......... 182
Session 6: Testing ....................................................... 195Chair: B. Cronhjort (S)
f. M. Voas, C. C. Michael, K. W. Miller (USA): ConfidentlyAssessing a Zero Probability of Software Failure .............. 197
I. M. Galkin (Belarus): A Knowledge-Based Approach toProgram Testing and Analysis ...................................... 207
Session 7: Dependable Software ................................. 217Chair: W. Ehrenberger (D)
A. Saeed, R. de Lemos, T. Anderson (UK): Robust RequirementsSpecifications for Safety-Critical Systems ........................ 219

Contents ix
M. Kadniche, K. Kanoun (F): Software Failure Data Analysis oftwo Successive Generations of a Switching System .......... 230
J. Rainer (A): Software validation with CASE-TOOLS ........... 240
Session 8: Reliability Issues ........................................ 251Chair: A. Weinert (D)
W. Kuhn, E. Schoitsch (A): Dependability of Scaleable,Distributed Systems: Communication Strategies forRedundant Processes .................................................. 253
R. E. Seviora (Canada): Real-Time Detection of Failures ofReactive System s ........................................................ 265
H. Krawczyk, S. Al-Karaawy (PL): Reliability and SafetyAnalysis of Hierarchical Voting Schemes ........................ 276
Session 9: Languages .................................................. 287Chair: W.M. Turski (PL)
G. Sen (India), J. Brummer (D): Designing a High-levelLanguage for Safety Systems ........................................ 289
P. Molinaro, 0. H. Roux (F): Oreste: a Reliable Reactive Real-Tim e Language .......................................................... 302
Invited Paper: C.E. Landwehr (USA): How Far Can YouTrust a Com puter? ................................................... 313
Session 10: Security .................................................... 327Chair: P. Daniel (UK)
L. M6 (F): Security Audit Trail Analysis Using GeneticA lgorithm s ................................................................ 329
R. Posch (A): MRSA-a New Public Key Encription Method .. 341
M. Witte, W.A. Halang (D): A Virus-Resistant NetworkInterface ................................................................... 349
Session 11: Reactive Systems ...................................... 359Chair: E. Schoitsch (A)
H. Fierz, H. Mailer, S. Netos (CH): CIP - CommunicatingInteracting Processes: A Formal Method for theDevelopment of Reactive Systems ................................. 361
M. Colnaric (Slovenia), W.A. Halang (D): Exception Handlingand Predictability in Hard Real-Time Systems ................. 371
M.B. Schrdnen, M.R. Inggs (South Africa): Development of aFail-Safe Data Transmission System for Use in Life-CriticalA pplications .............................................................. 379
A uthor Index ................................................................ 389

List of Contributors
S. AI-Karaawy J. BrummerFaculty of Electronics Institute for SafetyTechnical University of Technology (IST)Gdaiisk Gesellschaft fiir Anlagen- undPoland Reaktorsicherheit (GRS)mbH
S. Anderson Garching, GermanyDepartment of Computer G. BrunsScience Deparu nsUniversity of Edinburgh Department of ComputerEdinburgh EH9 3JZ, UK Science
University of EdinburghT. Anderson Edinburgh EH9 3JZ, UKDepartment of ComputingScience W. CellaryUniversity of Newcastle Franco-Polish School of NewNewcastle upon Tyne Information andNE1 7RU, UK Communication Technology
J.-P. Ban~tre 60-854 Poznaii, PolandInria-Rennes/IrisaCampus de Beaulieu M.F. Chudleigh35042 Rennes cedex, France Cambridge Consultants
R. Baumann LimitedSiemens Integra Science Park, Milton RoadVerkehrstechnik AG Cambridge CB4 4DW, UK8304 Wallisellen, SwitzerlandC. BenardschiJ.N. ClareC. Bernardeschi Cambridge ConsultantsDepartment of Information LimitedEngineering Science Park, Milton RoadUniversity of Pisa Cambridge CB4 4DW, UKVia Diotisalvi 256100 Pisa, Italy B. Cole
A. Bondavalli Software Metrics LaboratoryCNUCE-CNR Glasgow CaledonianVia S. Maria 36 University56126 Pisa, Italy Glasgow, Scotland, UK

xii List of Contributors
P. Collinson J. R. HoelscherDepartment of Chemical General Railway SignalPathology CorporationMayday University Hospital Rochester, NY 14620, USACroydonSurrey CR7 7YE, UK S. F ughes
Lloyd's Register of Shipping
M. Coinarit 29 Wellesley RoadFaculty of Technical Sciences CroydonUniversity of Maribor Surrey CR0 2AJ, UKMaribor, Slovenia M.R. Inggs
S.S. Dhanjal Department of Electrical
Lloyd's Register of Shipping Engineering
29 Wellesley Road University of Cape Town
Croydon Private Bag Rondebosch
Surrey CR0 2AJ, UK South Africa, 7700
M. KadnicheH. Fierz LAAS-CNRSInstitut ffir Technische 7 Avenue du Colonel RocheInformatik und 31077 Toulouse Cedex, FranceKommunikationsnetze 3CETH-Zentrum K. KanounCH-8092 Zurich, Switzerland LAAS-CNRS
7 Avenue du Colonel RocheR. Fink 31077 Toulouse Cedex, FranceWest Middlesex University H. KrawczykHospital FaczykTwickenham Road Faculty of ElectronicsIsleworth Technical University ofMiddlesex TW7 6AF, UK GdadskPoland
I. M. Galkin M. Kuindig-HerzogComputer Center Siemens IntegraAcademy of Sciences Verkehrstechnik AGMinsk 8304 Wallisellen25 Scorina str. SwitzerlandRepublic of Belarus 220072 StrnW. KuhnC.J. Goring Austrian Research CenterAugust Systems Limited SeibersdorfJenner Road Department of InformationCrawley TechnologyWest Sussex RH1O 2GA, UK A-2444 Seibersdorf
V' A. Halang Austria
Fern Universitat C. E. LandwehrDepartment of Electrical Center for High AssuranceEngineering Computing SystemsP.O. Box 940 Naval Research LaboratoryD-58084 Hagen, Germany Washington D.C., USA

List of Contributors xiii
J.-C. Laprie C. C. MichaelLAAS-CNRS Reliable Software7 Avenue du Colonel Roche Technologies Corporation31077 Toulouse Cedex, France Penthouse Suite
R. de Lemos 1001 North Highland Street
Department of Computing Arlington, VA 22201 USA
ScienceUniversity of Newcastle K. W. MillerNewcastle upon Tyne Department of ComputerNE1 7RU, UK ScienceZ. Liu College of William & MaryDepartment of Computer Williamsburg, VA 23187 USA
ScienceUniversity of Warwick P. MolinaroCoventry CV4 7AL, UK Ecole Centrale de Nantes
Universit6 de NantesB. Malcolm Laboratoire d'Automatique deMalcolm Associates Ltd. Nantes
Savoy Hill Nantes
London, UK URA 823Nantes, France
V. ManoniSASIB Signalamento G.A. MutoneFerroviario AEG Transportation Systems,40128 Bologna, Italy Inc.
L. M6 Pittsburgh, PA, USALaboratoire d'InformatiqueSUPELEC S. NetosAvenue de la Boulaie Institut fur TechnischeB.P. 28 Informatik undF-35511 Cesson Scvign6 KommunikationsnetzeCedex ETH-ZentrumFrance CH-8092 Zurich, Switzerland
M.J.P. van der MeulenDepartment of Industrial J. NordahlSafety Department of ComputerInstitute for Environmental Scienceand Energy Research Technical University ofThe Netherlands DenmarkOrganization for Applied DK-2800 Lyngby, DenmarkScientific Research TNOApeldoorn, The Netherlands S. OppertH. Muiller Department of ClinicalInstitut ffir Technische BiochemistryInformatik und West Middlesex UniversityKommunikationsnetze HospitalETH-Zentrum IsleworthCH-8092 Zurich, Switzerland Middlesex, UK

xiv List of Contributors
R. Posch A. SaeedInstitute for Applied Department of ComputingInformation Processing ScienceGraz University of University of NewcastleTechnology Newcastle upon Tyne NE1Klosterwiesgasse 32/I A-8010 7RU, UKGraz, Austria
J. ScheepstraJ. Rainer Rijksuniversiteit GroningenAustrian Federal Test & Department of ComputingResearch Centre Arsenal Science(BVFA) P.O. Box 800Department System NL-9700 AV GroningenReliability & Traffic The NetherlandsElectronicsA-1030 Vienna E. SchoitschFaradaygasse 3, Austria Austrian Research Center
SeibersdorfF. Redmill Department of InformationRedmill Consultancy Technologyand Co-ordinator of the A-2444 Seibersdorf, AustriaSafety-Critical Systems Club22 Onslow Gardens M.B. Schr6nenLondon N10 311j, UK Department of Electrical
Engineering
H.E. Rhody University of Cape TownRIT Research Corporation Private Bag RondeboschRochester Institute of South Africa, 7700
TechnologyRochester, NY 14623, USA G. SenReactor Control Division
Bhabha Atomic ResearchM. Rothfelder CentreInstitute for Software, Bombay, IndiaElectronics,Railroad Technology (ISEB) of R. E. SevioraTUV Rheinland Department of Electrical andP.O. Box 9109 37 Computer EngineeringCologne University of WaterlooD-5000 Koeln 91, Germany Ontario,
Canada N2L 3G10. H. RouxEcole Centrale de Nantes L. SimonciniUniversits de Nantes Department of InformationLaboratoire d'Automatique de EngineeringNantes University of PisaURA 823 Via Diotisalvi, 2Nantes, France 56100 Pisa, Italy

List of Contributors xv
E. V. Sorensen J. M. VoasDepartment of Computer Reliable SoftwareScience Technologies CorporationTechnical University of Penthouse SuiteDenmark 1001 North Highland StreetDK-2800 Lyngby, Denmark Arlington, VA 22201 USA
T. Sthlhane N.J. WardSINTEF DELAB TA Consultancy Services Ltd
O.S. Bragstads Plass The BarbicanNTHN-7034 Trondheim East Street
FarnhamNorway Surrey GU9 7TB, UK
B. Stamm M. WitteSiemens Integra Fern UniversitAtVerkehrstechnik AG Department of ElectricalK517 EngineeringIndustriestr. 24 P.O. Box 9408304 Wallisellen, Switzerland D-58084 Hagen, Germany
I,,.-.,

INVITED PAPER

Safety - status and perspectives
Tom AndersonDepartment of Computing Science
Mw University of Newcastle upon Tyne, NEI 7RU, UK
AbstractSafety can be all things to all men - that is, different people indifferent situations will, quite legitimately, interpret the term"safety" in different ways. This paper expresses a personalperspective on safey as an engineering concern.
1 IntroductionDelegates will be aware that this is the 12th occasion of presenting SAFECOMP, aconference which, under the auspices of EWICS Technical Committee 7, has laidstress on the importance of safety in the context of computing systems since thevery first SAFECOMP in 1979. Consequently, the event has an enviable lineagewith respect to a topic that is recognised to be of rapidly increasing significance,commensurate with the growth in automatic control of critical applications. Itseems inevitable that these trends will continue and accelerate, given currentprojections for the semiconductor and telecommunication industries. Over the past15 years, work on both research and system development has enhanced ourunderstanng of the issues and techniques relating to safety in computing systems.However, much remains to be done, in further advancing the discipline and in morewidely promulgating the current state of the art. In this brief perspective I havetaken the opportunity to make some elementary observations on the tenets of safecomputing systems; if any of these are considered provocative or unsound Iwelcome correction.
2 DefinitionBecause "safe" and "safety" are words in everyday use, they have dictionarydefinitions and popular interpretations. These interpretations can differ widely: forthe general public, for politicians, for professionals (lawyers, engineers, regulatorsetc), across industrial sectors, and over time (especially after a major accident). Ascientist or engineer recognises the range of interpretations, but must neverthelessadopt a specific working definition - and thus accepts the consequence that becauseothers may select an alternative definition, conflicts may need to be resolved ifconfusion is to be avoided.The usual starting point for a definition of safety is that a system is safe if it willnot kill anyone. However, numerous points then need clarification, such as "whatabout multiple deaths?", "what about injuries, severe and minor?", "what aboutenvironmmen damage, with implications for human well-being?", "what about vast

4financial losses, with implications for the well-being of some?". An (inadequate)escape route is to assert that a system is safe if it will not harm anyone. But doesthis mean never harm anyone, under any possible circumstances? Only when these,and other, questions are answered would we have a semblance of a definition.(There is, of course, no single "correct" definition, so these questions will not beanswered here!) One way forward is to define a system to be safe if it will not causean accident, thereby postponing (albeit briefly) the definition of what constitutes anaccident. Even given an agreed definition of a safe system, it is then vital toexamine how degrees of unsafeness should be characterised, which leads on to thenotion of risk to capture the likelihood and magnitude of losses incurred throughuse of the system.From an engineer's viewpoint, ensuring that these issues are addressed and resolvedis much more important than the details of their resolution in a particular case.
3 MisconceptionsDespite, or perhaps because of, the widespread use of safety concepts, a number ofmisconceptions are frequently encountered in the wider computing community -SAFECOMP delegates will, I trust, concur with my critique of the followingaberrant assertions.(a) Safety is paramount. If this were true, then in almost all cases, the proper
course of action would be not to implement the system, or at least not tooperate it. Safety is an attribute of a system which frequently conflicts withother desirable attributes. The design engineer has the difficult task of strivingto achieve the optimum compromise between safety and the other requiredcharacteristics for the system, all within budgetary and other resourceconstraints.
(b) Safety is an absolute. The notion of absolute safety can be formulated anddiscussed if necessary, but the real engineering issues concern levels of safetyand tradeoffs between safety and other system properties. Consider thefollowing questions: How safe should the system be designed to be? Howunsafe could the system be and still be considered adequately safe? How safe isthe implemented system? How safe has the system been during operation? Bycomparison the question "Is the system absolutely safe?" seems poiktless.
(c) Safety can't be quantified (less extreme versions: safety ought not to bequantified; avoid quantification in safety analyses). On the contrary, it isessential that safety be quantified - to the extent that this is feasible, and fullyacknowledging the limitations and imprecision of measurement techniques.Quantified analysis of safety should be viewed as the normal engineering goal,and consequently the inability to quantify safety should be recognised as adeficiency - in which case subjective rankings or objective comparisons may beemployed as a weaker alternative.
(d) Safety must be guaranteed. Since safety does not equate to death or taxes such aguarantee must be regarded as a forlorn hope, other than in the sense of awarranty establishing corporate liability.

5
(e) Safety is unique. Safety is a highly significant system attribute because of theimportance we rightly attach to the lives of others. Nevertheless, it has verymuch in common with other system attributes such as reliability and security,and safety engineering can and does benefit greatly from the techniquesdeveloped for other aspects of dependability in systems - and vice-versa ofcourse. [A personal aside. At SAFECOMP'83 in Cambridge I asserted (as apanellist) that the concepts of safety and reliability were essentially identical,differing only in the criterion which specified success. Although I still believethis to be true, I have learned a little in the last ten years, and do not expect toreiterate this academic and potentially misleading observation in Poznan atSAFECOMP'93.]
4 AxiomsIn contrast to the above, the following truths are held to be self-evident.(a) Safety is a system attribute. This is sometimes taken to imply that safety is
solely a property of the overall application system (e.g. nuclear power plant)operating in the real-world environment; a very narrow interpretation thenmisleads by inferring that subsystems do not have this property (contradictedby axioms b and c below). A more generic use of the term system is much tobe preferred, encompassing subsystems, units, modules, components etc., inwhich case axiom a is almost tautological.
(b) Computing systems can kill. See Leveson and Turner [2].(c) Software can kill. See Leveson and Turner [2]. Obviously, the software directs
the computing system which in turn acts via the controlled equipment -analogously, most murderers make use of a weapon.
(d) Perfection is unattainable. Samuel Butler advised "Strive for imperfection -there's some change of getting it". Dijkstra warned "Testing can show thepresence, but never the absence of faults". Lebesgue cautions "Logic makes usreject certain arguments, but it cannot make us believe any argument". Juvenalasked "But who is to guard the guards themselves?". Brookes summed it all up- '"here is inherently no silver bullet".
(e) There's safety in numbers. Although this is a well known English phrase it isperhaps a little too ambiguous to be axiomatic. A literal interpretation isunusual and the benefits of quantification have already been suggested; here Iwish to take the standard usage, which suggests that members within a groupare less exposed to attack than isolated individuals, and thereby make thestandard argument in favour of redundancy. Any single entity can fail, and toavoid a single point of failure alternative mechanisms should be available (eg.retry, or a spare, or diversity, or fail-safe).
5 Engineering Safe Computing SystemsThe tasks of safety engineering are clearly manifold: to establish the safetyrequirements for the system and its subsystems, to formulate safety policies,specifications and strategies, to design for safety, to conduct hazard and safetyanalyses, to compose the safety case and gain certification for the system, to

6
implement, install, operate and maintain the system in accordance with all of thepreceding. All are of vital importance (literally), which makes prioritisation ratherdifficult. I would place particular emphasis on achieving safety, and feel that thespecific topics of requirements, validation and fault-tolerance deserve specialmention - but this may merely be a consequence of personal prejudice. In any case,the above list of topics is driven by system life-cycle stages, and we should alsoinclude management, procedures, documentation, standards, human factors and reai-time considerations.My position in 1989 was stated as:
"I would commend three attributes to those involved in the construction of[safe] computing systems. First, vigilance, in avoiding and eliminatingfaults; second, diversity, to provide protection against the consequences offaults; and third, simplicity, the hand-maiden of dependability" [1].
Almost five years on, the only change I wish to make is to reverse the ordering.Lastly, I would like to refer readers to the most enjoyable text on system safety Ihave encountered [3), which happens to be in the domain of railway safety and thelessons to be learnt from accidents; as well as being highly instructive, the bookprovides this closing quotation to emphasise that even safety engineers can learnfrom their mistakes:
Out of this nettle, DangerWe pluck this flower, Safety
Henry IV (Part I)
References1. Anderson T (ed). Safe & Secure Computing Systems - Preface. Blackwell
Scientific, Oxford, 19892. Leveson NG, Turner CS. An Investigation of the Therac-25 Accidents. IEEE
Computer 1993; 26,7:18-413. Rolt LTC. Red for Danger (3rd edition). Pan Books, London, 1976
• . . I L|

Session 1
FORMAL METHODSAND
MODELS
Chair: G. ClelandUniversity of Edinburgh, UK
i• iI l I i I I I I I I i I i Ii ,...

Data Flow Control Systems: an Example ofSafety Validation
Cinzia Bemardeschi, Luca SimonciniDepartment of Information Engineering, University of Pisa
Pisa, Italy
Andrea BondavalliCNUCE-CNR
Pisa, Italy
Abstract
In this paper a methodology to develop safety-critical controlsystems is proposed. These systems continuously interact withthe physical environment, and those admitting at least one failurecausing a catastrophe are classified as safety-critical. Ourmethodology takes into account both the control system(controller) and the physical environment (plant). After therequirements analysis, the system is developed following dataflow model, i.e., described as a static data flow network of nodesexecuting concurrently and communicating asynchronously. Theplant is used as the test case for the validation of the controllerand their composition is analysed to show whether hazards arereached. To this purpose we apply a transformation from dataflow networks to LOTOS specifications. The transformationpreserves the semantics of the original network and data flownetwork properties can be derived and proved on the LOTOSspecification using available support tools. A train set examplefor the contact-free moving of trains on a circular track dividedinto sections is shown as an application of the methodology.
1 Introduction
Control systems are computing systems which continuously interact with thephysical environment, e.g. traffic control or industrial process control systems.Many control systems are safety-critical, i.e. systems for which at least one failureexists that can cause a catastrophe. Therefore, in addition to their functionalcapabilities, these systems require specified levels of dependability. In the frameworkof safety-critical systems, one approach to improve the level of dependability is touse formal specification and verification in conjunction with other methods ofsoftware development such as testing and fault tolerance. The analysis of the criticalissues of a control system plays a vital role in the development of safety-criticalsystems. Critical issues address what the system should not do and allow toconcentrate on the elimination and control of the hazards. The study of the critical

10
issues of the system, allows us to derive the constraints necessary to guarantee asafe behaviour of the system (safety constraints) and the strategies to realise it(safety strategies) [I]. The validation phase is as important as requirements analysis.Validation is the activity that aims to check that the actual behaviour of thedeveloped system is as expected.
Data flow is a paradigm for concurrent computations. A data flow network iscomposed by a set of nodes (or processes) all executing concurrently andasynchronously. They communicate by exchanging messages, representing dataitems, over asynchronous communication channels (following a FIFO policy). Thecomputation proceeds in a data driven manner: a node of the network is ready toexecute as soon as the required data tokens are available. Data flow is receiving greatattention being known for its suitability for achieving a high degree of executionparallelism, thus allowing to improve performance, but has other usefulcharacteristics as well. A data flow network is usually very close to the intuitiverepresentation of a control system, that is the translation from the conceived systemto a data flow graph is straightforward, as well as to inspect the data flow graph todetermine which aspects of the system are represented [2], [3]. This makes data flowgenerally recognised as a convenient programming paradigm for the development ofcontrol systems. The referential transparency property admitted when nodes computefunctions, by which two executions of the same node with the same input dataproduce equal output results, makes data flow "inherently fault tolerant": it ispossible to tolerate simple failures by re-evaluating the same function on the sameinput data [4], [5]. If a non deterministic behaviour of nodes is allowed, still thestrong isolation and information hiding enforces a good confinement useful forsetting error confinement areas around modules by means of appropriate consistencychecks. The property of composability which puts in direct relation the generalbehaviour of a system from its constituent parts [6], [7] helps verification andvalidation. Lastly, structural models for software reliability assessment can beapplied since all data necessary to their use can be obtained by a simpleinstrumentation of software code [8].
In this paper a systems development methodology is proposed. After therequirements analysis, the system is developed following the computational modelbased on the Jonsson's formalism [7]. In the validation phase, the specification ofthe physical environment is assumed as the test case for the control system: theplant and the controller are composed and the resulting behaviour is analysed to besure that hazards are never reached in the system. To this purpose, we apply atransformation from data flow networks to LOTOS (Language Of TemporalOrdering Specification) [9] specifications. The transformation maintains the dataflow network properties which can be derived and proved on the LOTOSspecification. Available LOTOS software support tools are then used [10]. Theadequacy of the proposed methodology is shown through the design and thevalidation of a simple control system: a train set example for the contact-freemoving of trains on a circular track divided into sections [1], [11]. The rest of thispaper is as follows. Section 2 is devoted to the definition of our methodology,including a description of the data flow formalism adopted, the transformation andits properties. Section 3 develops the example of the train set to show how themethodology can be applied. Lastly, Section 4 contains our conclusion.

11
2 System Development Methodology
The proposed development methodology takes into account the parallel interactionbetween a plant and a controller which must eliminate unsatisfactory behaviours ofthe plant. The interface between the plant and the controller contains sensors andactuators. Sensors detect events in the plant and send signals to the controller. Uponreception of the signals the controller can take actions by issuing appropriate controlcommands through actuators. The analysis of the critical issues addressing what thesystem should not do, allow to define the hazards for the system into considerationand their elimination and control. The analysis is performed in two phases: the firstphase to identify the real world properties relevant to the critical behaviour of thesystem and the second phase to specify the system behaviour required at the interfacewith the environment, i.e. the sensors and actuators. Thus the constraints necessaryto guarantee a safe behaviour of the system (safety constraints) and the strategies torealise it (safety strategies) may be derived.
Then the system realising the safety strategy is developed following a data flowcomputational model. Since we shall use the specification of the physicalenvironment as the test case for the control system in the validation, we shall modelalso the plant. As previously mentioned we adopt the formalism for thespecification of data flow network proposed in [7] in which the semantics of thenetworks is based on traces. Here we give some definitions and a brief explanationon this model. Given a data flow network N, let V be the set of data itemsexchanged over the channels. We denote by V* the set of finite sequences on V andby <> the empty sequence.
Definition: A data flow node P is a tuple <Ip, Op, Sp, sop, Rp, FAIRp>where:Ip is the set of input channels;Op is the set of output channels with (IprFOp) = 0;
Sp is the set of states; sOp is the initial state, s0 pe Sp;
Rp is the set of firings. A firing F is a tuple F=<s, Xin, s', Xout> where s, s'c Sp,
Xin is a mapping from Ip to V* and Xout is a mapping from Op to V*.
FAIRp a ? (Rp) is a finite collection of fairness sets. If FAIRp=Rp, then thenode executes firings until no more data are present on the input channels.
For the sake of this paper, the meaning of a firing <s, Xin, s', Zout> can be
assumed as follows: when the node is in state s and for each input channel inpl Ip
the sequence Xin(inp) is a prefix of the content of the channel (i.e. the firing isexecutable), then these sequences may be consumed, while the node changes its state
to s' and the sequence Xout(out) is produced on each output channel oute Op. Notethat the empty sequence <> is a prefix of each sequence of data.
A data flow network N consists of a set PN of data flow nodes such that in PNeach channel occurs at most once as an input channel and at most once as an output
' !. .. IIll i• MI n lit •Jfl IW u•A

12
channel. The network is obtained connecting input channels Lo output channels withthe same name and a network transition can be generated by the firing of a node orby a communication event, where a communication event can be either aninput event or an output event. Communication events occur when a data item isinserted (removed) into (from) an input (output) channel of the network. CN denor "sthe set of all the channels of the network. A computation of the network is asequence of transitions of the network. Informally a computation of the network is acomplete run of the network in which all nodes perform fiings according to theirdefinition and all channels behaves like unbounded FIFO channels. The semantics ofthe network is the set of its traces; a trace represents the interleaving of thecommunication events during a computation.
The use of information about the presence/absence of data items and the data drivenasynchronous execution of data flow nodes in data flow networks, make reasoningabout these networks and their semantics very difficult. To perform the semanticanalysis of data flow networks, we apply a transformation from data flow networksto process algebras specifications using the LOTOS formal specification language[9]. LOTOS represents recent work on the combination of CCS (with someextension) [12] to describe the behaviour of the system and an algebraic formalismfor the definition of data types. Software support tools have been developed allowingthe simulation, the compilation and the proof of properties of a LOTOSspecification [10].
The transformation is obtained by mapping each node and each channel of thenetwork into a process in the process algebras and then all the processes arecomposed in parallel with synchronisation on the proper set of actions to realise theglobal behaviour of the network [13]. The names of gates in the specification aredirectly derived from the names of the channels. For each channel "a"e CN, "a#" isthe gate corresponding to get a data from the channel "a" while "a" is the gatecorresponding to put a data on the same channel "a". Let CP be the process whichsimulates the behaviour of a channel "a" of N (CP behaves like a FIFO buffer) andnodeP be the process that realises the behaviour of the data flow node P, thespecification of the network is:Mification netN[EgatesN] : noexit
<data type definition>
hie I[Cgatesq-EgatesN]I In(CP[a, a#] "I ...<VcE CN>... III CP[b, b#])
I[CgatesN-EgatesN]I (nodeP[Flp#, Op] III ...<VQE PN>... III nodeQ[IR#, OR])a (* net*)where CgatesN are the gates corresponding to get (put) from (onto) the whole sets ofchannels of N, EgatesN are the gates corresponding to get (put) from (onto) theinput (output) external channels of N. Furthermore, the notation Ip# (Op) is used todenote the set of "a#" ("a") gates for the input (output) channels of the node P. Theset of processes associated to channels execute disjoint actions, so they are put inparallel with an empty set of synchronisation gates (111 operator). The same appliesto the set of processes associated to the nodes. These two sets of processes
13
synchronise on the set of all the actions defined for the two behaviour expressions.The network specification has the same behaviour of the original data flow networkand the formal verification methods of the process algebras can be applied to proveproperties of the original network. Interested readers may find more details on thetransformation itself and a prove that the transformation preserves the data flownetwork properties, i.e., the LOTOS specification has the same behaviour of thenetwork from which it has been derived, in [13]. The previous transformation isdefined for a class of data flow networks in which the firings of the nodes do notrequire sophisticated synchronisation mechanisms between the processes associatedto the channels and the processes which simulates the behaviour of the nodes. Thetransformation for general networks is described in [14].
To summarise, our methodology is based on:"* modelling the physical environment as a part of the overall system (plant);"* executing the requirements analysis for both the mission and the -ritical
issues of the system;"• specifying safety constraints and a safety strategy for the system to eliminate
hazads* developing the control system in the data flow computational model;• applying the transformation to the data flow specification of the system (both
the control system and the plant) obtaining a LOTOS specification whichmaintains all the relevant properties (and doing some expressiontransformation if necessary for their automatic analysis);
* verifying the correct behaviour of the system composed by the plant and thecontroller through an automatic analysis of the LOTOS resulting expressionusing the available tools.
3 The Train Set Example
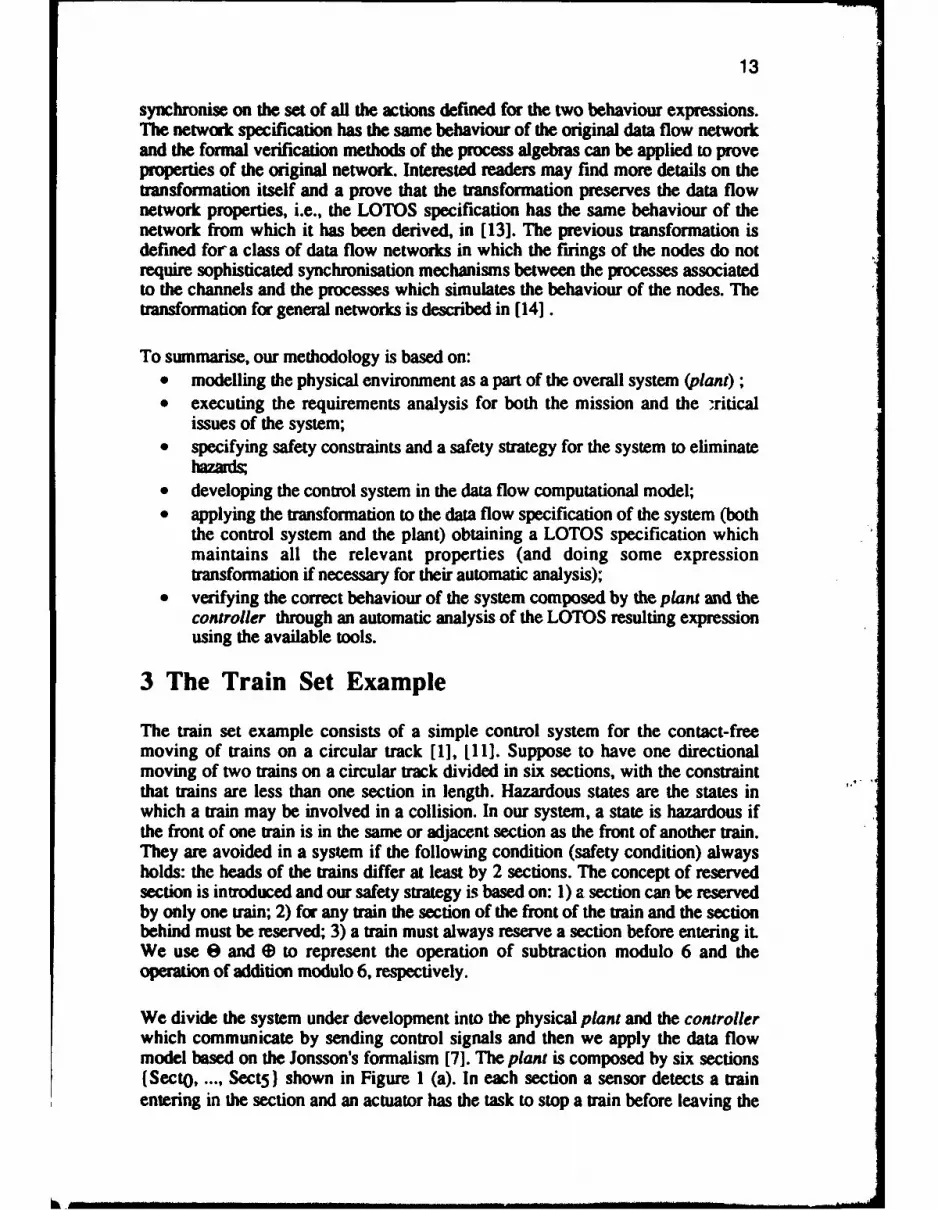
The train set example consists of a simple control system for the contact-freemoving of trains on a circular track [1], [11]. Suppose to have one directionalmoving of two trains on a circular track divided in six sections, with the constraintthat trains are less than one section in length. Hazardous states are the states inwhich a train may be involved in a collision. In our system, a state is hazardous ifthe front of one train is in the same or adjacent section as the front of another train.They are avoided in a system if the following condition (safety condition) alwaysholds: the heads of the trains differ at least by 2 sections. The concept of reservedsection is introduced and our safety strategy is based on: 1) a section can be reservedby only one train; 2) for any train the section of the front of the train and the sectionbehind must be reserved; 3) a train must always reserve a section before entering it.We use 0 and ( to represent the operation of subtraction modulo 6 and theoperation of addition modulo 6, respectively.
We divide the system under development into the physical plant and the controllerwhich communicate by sending control signals and then we apply the data flowmodel based on the Jonsson's formalism [7]. The plant is composed by six sections(Secto, ..., Sect5) shown in Figure 1 (a). In each section a sensor detects a trainentering in the section and an actuator has the task to stop a train before leaving the

14
section when necessary. We model the flow of the train by messages scant by onesection to the next (channel sni). On receipt of this message the section sends asignal to the conuoler to notify the passage of a train (channel esi). Then before thetrain is allowed to move on the section, it waits for a message from the controllerwith the meaning that the train is allowed to leave the section (channel goi). Onreceipt of this message, the section sends a message to the next section in thecircular track to simulate the movement of the train (channel sni. 1).
Plant Controller
00 $0 CI0I0 akB
0I 10 CNTIOk RES20 0
9001
.as .
3
M S04].o CN4 RSo5
05d as55
(a) (b)Figure 1: The Data Flow Network of the Train Set System.
The controller interacts with the plant and is composed by the data flow nodesrepor ed in Figure 1 (b): six CNTi nodes and six RESi nodes. Each CNTi realisesthe communication with the section Secti of the plant while each RESi implementsthe correct reservation mechanism of the corresponding section Secti. The CNTinode, after having received a signal from section Secti that a train has arrived(channel esij, sends a signal to RESio2 to mark section Sectie2 as free (channelVie2), and then it tries to book the section (iAl) for the train sending a signal toRESiql (channel Piql). CNTi waits for a positive answer from RESiqI (the nextsection has been reserved) (channel okiql); and then it sends a signal to Secti forallowing the train to leave section Secti (channel goi). Each RESi node controls thestatus of the corresponding section which can be reserved for one train or free. Itreceives signals from the CNTie1 (channel Pi) and reserves the section by sendingan acknowledgement (channel oki). After the section has been reserved it accepts

15
only a signal through the channel Vi to free the section before accepting (andmaking) any further reservation.The resulting data flow network N, composed by the controller and the plant, isshown in Figure 1. Let A and B be natural numbers representing the identifiers forthe trains running over the track, we suppose an initial state with train A in sectionSectl and train B in section SectS; it follows that the sections I and 0 (for train A)and the sections 5 and 4 (for train B) must be reserved. The initialisation is used todefine the initial state of the data flow nodes. For those communications which aresignals we associate the dummy value 1 in defining of the firings of the nodes(another way is to allow any data value). The definition of the data flow nodes is:
Section node SectiISeci=(sni, goi) Osecti= (esi, sn(il)) SSecti=(s. Sa, Sb)
Rsecti=(Fl, F2, F3, F4) FAIRsecti=Rsecti
Fli<s, [sni->A], sa, [esi->l]> F3=<Sa, [goi->l], S, [sn(il)->A]>F2,.--<s, [sni->B], Sb, [esi->l> F4--<sb, [goi-A], s, [sn(i~l)->B]>
sOsectl-S,, s0 Sect5=Sb and s0Secti--s for i=(0,2,3,4).
Controller node CNTiIkNri--'esi, ok(iwl)} OcNTi={goi, P(iml), V(i@2)} SCNTi=[s, s-)
RCNTi=[F5, F6) FAINTi=RCNTi
F5=<s, [esi->l], s', [V(i@2)->l, P(il)->l]> F6=<s', [ok(il)->l], s, [goi->1]>
s0CNTi=S, for i=( 1,5) and S0CNTi=S for i=(0,2,3,4).
Controller node REStIRESIPi--PiVi} ORESi= {oki} SRESi--{s, S-)
RRESi-= (F7, F8) FAIRREsi=RRESi
F7=<s, [Pi -> 1], s', [oki -> I]> F8='<s', [Vi -> 1], s, [>sORESi=s' for i--(0, 1, 4, 5) and S0RESi=s for i=(2,3).
To apply the transformation we specify the maximum size of the channels whichmay be assumed equal to two, while the signal communications can be transformedin pure synchronisation action in LOTOS. We give here the LOTOS processdefinition for the single data flow nodes obtained applying the transformationdescribed in Section 2. The process definitions for the Sect, CNT and RES nodesand that for the CP which simulates a FIFO buffer of length two are:
Mg= nodeSect[sn, es, go, nextsn](actsate: state) : noexit:-([actstate=s] -> (sn?X:nat [X=A]; i; es! 1; nodeSect[sn, es, go, nextsn](sa)
0 sn?X:nat [X=B]; i; es! 1; nodeSect[sn, es, go, nextsn](sb))0 [actstatesa] -> go?X:nat; i; nextsn!A; nodeSect[sn, es, go, nextsn](s)O [actstate=sb] -> go?X:nat; i; nextsn!B; nodeSect[sn, es, go, nextsn](s))
(nodeSect

16
nodoCNT[es, P, ok, V, go(actstate:stt) : noexit :-([actstatems] -> es?X:nat; i; Vii; P!1; nxoedNT[es, P, ok, V. go](s)0 [actstate-s' -> ok?X:nat; i; gol1; nodCNT[es, P. ok, V. go](s))
-2-- (0 noeCT*)
SnodeRES[PokV](ac sM a :sut e): noexit :=([acs ]=sJ -> P?X:at i; okl 1; nodeRES[Pok,VJ(s)oI [ac]stat&W' -> V?X:nat i; nodeRES[P~ok,V](s))
and= (* nodeRES *Uaa CP[inp, out]: noexit
h&id mid in oneslotfinp, mid] I[mid]l oneslot[mid, out]
p oneslot[a, b] : noexit:= a?X:nat ; b!X; oneslot[a, b]oft= (* oneslot *)
md (* CP*)
Since LOTOS specifications belonging to the subset of LOTOS without data (basicLOTOS) can be completely analysed by the verification tools, while forspecifications with data values we can only simulate and/or compile and run them,we will restrict ourselves to basic LOTOS whenever possible without loosingproperties. The LOTOS behaviour analyser AUTO [15], allows us to build theautomaton of a basic LOTOS specification to prove strong and weak bisimulationbetween specifications. Although it fails when running on large specifications,simple ones like ours can be successfully run and the LOGIC CHECKER tool [161can be used to prove action-based logic formulas ACTL, over the specification. Tothis purpose we make some manipulations of the specification obtained directly bythe data flow to LOTOS transformation, trying to synchronise processes and to hideactions as soon as possible. This allows AUTO to reduce the number of the statesduring the generation of the automaton of the specification. The LOTOS"Regrouping Parallel Processes" correctness preserving transformation can beapplied automatically by the LOTOS structure editor to regroup processesdifferently. The transformation preserves the strong bisimulation equivalence. All ,,the previous tools are included in the LOTOS integrated tool environment Lite [10]developed inside the LOTOSPHERE ESPRIT project. Since all the nodeSect,nodeCNT and nodeRES processes execute all the actions in state s and then theactions in the state s' (nodeSect executes actions either in sa or sb) before repeating,we assume s as the initial state and rewrite the processes as:
Ma nodeSect[sn, es, go, nextsn]: noexit :=(sn?X:nat [X=A]; i; es!l; go?X:nat; i; nextsn!A; nodeSect[sn, es, go, nextsn]a sn?X:nat [X=B]; i; es! 1; go?X:nat; i; nextsntB; nodeSect[sn, es, go, nextsn])
uidmi (* nodeSect *)a. nodeCNT[es, P, ok, V, go]: noexit :=
zs?X:amt; i; V!I; 1I1; ok?X:nat; i; go!l; nodeCNT[es, P, ok, V, go]cdft (* nodeCNT

17
n nodeRES[P,okV): noexit :fP?X.nat i; ok!l; V?X.nat; i; nodeRES[Pok,V]
Md=• (* n *)
To keep into account the initial position of trains, the corresponding processes mustcontain a prefix behaviour expression representing the action to be performed atsystmn start. This lead to the definition of the following processes: nodeSectA andnodeSectB for the sections where train A and train B are at the beginning,respectively; nodeICNT for the controllers that have to reserve the next section forallowing the trains to move (1 and 5 in our case) and nodeIRES for the sections thatare reserved at the beginning (0, 1, 4 and 5 in our case). We have:
c nodeSectA[sn, es, go, es, nextsn]: noexit :=go?X:nat; i; nextsn!A; nodeSect[sn, es, go, nextsn]
oft= (* nodeSectA *)mm nodeSectB[sn, es, go, es, nextsn]: noexit
go?X:nat; i; nextsn!B; nodeSect[sn, es, go, nextsn]md= (* nodeSectB *)
m nodelCNT[es, P, ok, V, go]: noexit :=PU1; ok?X:nat; i; gol1; nodeCNT[es, P, ok, V, go]
ad= (* nodelCNT *)zmm nodelRES[P,ok,V]: noexit:=
V?X:nat; i; nodeRES[Pok,V]mWWM (0 nodem*ES
We can now map our specification into basic LOTOS. Lite, provides manymappings from a full LOTOS specification onto a basic LOTOS one. They differfor the data value information that are removed. We can apply the simplesttransformation named "transnp0" where all data are dropped, keeping simply theoriginal gate identifiers as basic LOTOS actions. The transformation can be directlyinvoked by the behaviour analysis menu entry. In order to apply this mappingwithout loosing information, we modify the specification defining one gate for trainA and another one for train B when they run over the track (i.e. substituting eachaction sni with two actions asni and bsni). The new process nodeSect is simply anon deterministic choice between the actions corresponding to the passage of thetwo trains. This is the only communication channel where data are important, in allthe others the value of the data are not significant and can be dropped. The basicLOTOS specification of the section is:
Wga nodeSect [an, bsn, es, go, nextasn, nextbsn] :noexit:=(an; i; es; go; i; nextasn; nodeSect (asn, bsn, es, go, nextasn, nextbsn]' bsn; i; es; go; i; nextbsn; nodeSect [an, bsn, es, go, nextasn, nextbsn])- -(* *de

The behaviour expression of the whole specification of the system is reported in the
Appendix; where the observable actions are the actions corresponding to themovement of the trains over the track (gates asni# and bsni#). Note that there arenot external channels of the network and the set of processes associated to the nodesmust synchronise with the set of channel processes on the whole set of gates. TheLOTOS behavioural analyser AUTO can be run over the specification allowing toeasily prove our safety strategy. The automaton (considering the weak bisimulationequivalence) has 18 states and 24 transitions and it is deadlock free. We provedautomatically, by using the LOGIC CHECKER over the automaton, the followinglogic formulas to be true for train A:1) train A can enter any section: A[true(true)U(asni#)}nae];2) train A can only move from section i to section il:AG([asni#]A[tre(cond)U(-asn(i1l)#)true]);
where cond=((-as#)&(-asl#)&(-wn2#)&(-3#)&(-asn4#)&(-a5#));3) for each path such that train A enters section i, train B cannot enter section (iOI)until train A enters section (iMl):AG([asni#]A[rue(-bsn(iOl)#)U(bsn(il)#)A[rue(-bsn(igl)#)U(asn(i@l)#)true]]).The same formulas can be proved to be true for the train B.From these we have that when train A is in section i, train B is never in sectioniel, i, i~l. This holds also for train B, thus satisfying the safety condition.
4 Conclusions
In this paper we have presented a methodology which can be used for the design ofsafety-critical systems and for the validation of the design. Quite apart the modellingof the physical environment as a part of the overall system which can be used as testcase for the control system, the use of the data flow computational model for thedescription of the system specification allows the designer to use notations whichare very natural and which can be made even more user friendly by the use ofdevelopment tools like a graphical editor [4]. The transformation into processalgebras specification allows the use of the analysis tools available in LOTOS,making the entire process from specification to verification and validation fullyautomated.The proposed approach has been applied to a simple control system where advantagecould be taken by the use of the basic LOTOS tools like the behavioural analyserAUTO for the generation of the automaton and the LOGIC CHECKER. Theextension of the proposed approach to the validation of control systems LOTOSspecifications with data value involves the use of the simulator tool [10] and thecompiler available in the full LOTOS environment, which allows to derive thepossible traces of execution of the original data flow network. This extension isanyway limited by the fact that tracing the behaviour of a general network may bevery lengthy and unfeasible in case of infinite input sequences. Nevertheless forcontrol systems where the possible input sequences are constrained either on datavalue or on periodicity, the proposed approach can be used for problems of largersize than that presented in this paper.

19
References
1. Sated A, de Lemos R, Anderson T. The role of formal methods in therequirements analysis of safety-critical systems: a train set example. Proc. ofFrCS-21. Montreal, Canada, 1991, pp. 478-485
2. Kavi K, Buckles B, Bhat U. Isomorphism between Petri nets and data flowgraphs. IEEE TSE 1987; SE-13:1127-1134
3. Bondavalli A, Strigini L, Simoncini L. Data-flow like languages for real-timesystems: issues of computational models and notation. Proc. of SRDS- 11, 1 IthSymposium on Reliable Distributed Systems, Houston, Texas, USA, 1992,pp. 214-221
4. Bondavalli A, Simoncini L. Functional paradigm for designing dependablelarge-scale parallel computing systems. Proc. of ISADS 93 InternationalSymposium on Autonomous Decentralized Systems, Kawasaki, Japan, 1993,pp. 108-114
5. Jagannathan R, Ashcroft E A. Fault tolerance in parallel implementations offunctional languages. Proc. of FTCS-21, Montreal, Canada, 1991, pp. 256-263
6. Kahn G. The semantics of a simple language for parallel programming. Proc. ofIFIP 74, 1974, pp. 471-475
7. Jonsson B. A fully abstract trace model for data flow networks. Journal of ACM1989; 36: 155-165
8. Mellor P. Modular structured software reliability modelling. Privatecommunication, 1992
9. Bolognesi T, Brinskma E. Introduction to the ISO specification languageLOTOS. In: The Formal Description Technique LOTOS. Elsevier SciencePublishers B.V. (North-Holland), 1989, pp. 23-73
10. van Eijk P. The Lotosphere integrated tool environment LITE. Proc. of IFIPTC6/WG6.1 4th International Conference on Formal Description Techniques forDistributed Systems and Communication Protocols - FORTE 91, Sydney,Australia, 1991, pp. 473-476
11. Genrich H J. Predicate/transition nets. In: LNCS 254. Springer Verlag, 1986,pp. 207-247
12. Milner R. Communication and concurrency. Prentice Hall, Englewood Cliffs,NJ, 1989
13. Bernardeachi C. An approach to the analysis of data flow networks by LOTOS.Proc. of Congresso annuale AICA'93 (to appear), Lecce, Italy, 1993
14. Bernardeschi C, Bondavalli A, Simoncini L. From data flow networks toprocess algebras. Proc. of PARLE 93, Munchen, Germany, 1993.

20
15. Madeleine E, Vergamini D. AUTO: a verification tool for distributed systemsusing reduction of finite automata networks. Proc. of IFIP TC6 2ndInternational Conference on Formal Description Tecniques for DistributedSystems and Communication Protocols - FORTE 89, Vancouver, B.C.,Canada, 1989, pp. 61-66
16. De Nicola R, Fantechi A, Gnesi S, Ristori 0. An action-based framework forverifying logical and behavioural properties of concurrent systems. ComputerNetworks and ISDN Systems 1993; 25: 761-778
AppendixUnification SYSTEM [asn0#, asnl#, asn2#, asn3#, asn4#, asn5#,
bsn0#, bsnl#, bsn2#, bsn3#, bsn4#, bsn5#] noexit
asnO, asni, asn2, asn3, asn4, asn5, bsn0, bsnl, bsn2, bsn3, bsn4, bsn5, esO, esi,es2, es3, es4, es5, es0#, esl#, es2#, es3#, es4#, es5#, goO, gol, go2, go3, go4,go5, goO#, gol#, go2#, go3#, go4#, go5#, P0, P1, P2, P3, P4, P5, PO#, PiN,P2#, P3#, P4#. P5#, okO, oki, ok2, o60, ok4, ok5, okO#, okl#, ok2#, ok3#,ok4#, ok5#,VO, V1, V2, V3, V4, V5, VON, ViJ#, V2#, V3# V4#, V5#in(nodeSect[asnO#,bsn0,esO,goO#,as 1,bsnl 11II nodeCNT[esONPO,okO#,VO,goO] HIInodeSectAllasnlN~bsl#,esl,goi#,asn2,bsn2) 1l1 nodeICNT~esl#,PIokl#,Vl~gol) HIInodeSect~asn2#,bsn2#,es2,go2#,as3,bsn3] III nodeCNT[es2#,P2,ok2#,V2,go2] IIInodeScct[asn3#,bsn3#,es3,go3#,as4,bsn4] III nodeCNT[es3#,P3,ok3#,V3,go3] IIInodeSect[asn4#,bsni4#,es4,go4#,as5,bsn5] III nodeCNT[es4#,P4,ok4#,V4,go4] IIInodeSectB~asn5#,bsn5#,es4,goO#,asnl1,bsnl 111I nodeICNT[es5#,P5,ok5#,V5,go5] IIInodeIRES[PONokO,VO#] III nodeIRE[P1#,okl,V1#] III nodeRES[P2#,ok2,V2#] IIInodeRES[P3,ok3,V3#] III nodelRES[P4#,ok4,V4#] III nodeWIRES[P5#,ok5,V5#])11 (* full synchronisation *(CP[asn0,asn0#] III CP[asnl~asnl#] III CPI~asn2,asn2#] III CPI~asn3,asn3#] IIICP~asn4,asn4#J III CP[asn5,asn5#] III CP[bsnO,bsnO#J III CP[bsnl,bsnl#] IIICP[bsn2,bsn2#] III CPtbsn3,bsn3#I III CP~bsn4,bsn4#] III CP[bsn5,bsn5#] IIICP~es0,esON] III CP[esl~esl#] III CP[es2,es2#] III CP[es3,es3#] III CP[es4,es4#] IIICP~es5,es5#] III CP[go0,goON] III CP[gol,gol#] III CPI~go2,go2#] III CP[go3,go3#]III CP[go4,go4#] III CP~go5,go5#] III CP[POIPON III CP[PIP1#] III CP[P2,P2#] IIICP[P3,P3] III CP[P4,P4#] III CP[P5,P5#] III CP[ok0,okONJ III CP~okl,okl#] IIICP[ok2,ok2#] III CP[ok3,ok3#] III CP[ok4,ok4#] III CP[ok5,ok5#] III CP[VO,VON] IIICP[VI,V I#] III CP[V2,V2#1 III CP[V3,V3#1 III CP[V4,V4N] III CP(V5,V5#3)
<process definitions>ad=~ (* SYSTEM)

Validating Safety Models with Fault Trees
Glenn Bruns and Stuart Anderson
Department of Computer ScienceUniversity of Edinburgh
Edinburgh EH9 3JZ, UK
Abstract. In verifying a safety-critical system, one usually begins bybuilding a model of the basic system and of its safety mechanisms. If thebasic system model does not reflect reality, the verification results aremisleading. We show how a model of a system can be compared with thesystem's fault trees to help validate the failure behaviour of the model.To do this, the meaning of fault trees are formalised in temporal logicand a consistency relation between models and fault trees is defined. Animportant practical feature of the technique is that it allows models andfault trees to be compared even if some events in the fault tree are notfound in the system model.
1 Introduction
Safety-critical systems often have mechanisms designed to prevent, detect, ortolerate system system faults. To ensure that these mechanisms work as intended,a model of the system can be built from two parts: a model of the basic systemand a model of the safety mechanisms (see Figure 1). Important properties ofthe system are then verified of the model. For example, if a component failureoccurs, then it is detected.
e Baic sstemSafetymodel Me
Fig. 1. A Model of a Safety-Critical System
For the verification results to be valid, the basic part of the model shouldreflect the true connection between component failures and system faults inthe system. We are aware of a study of a rail interlocking system in which thepreliminary system model allowed only one train per track section, thus makingcollisions impossible. Less obvious problems may be harder to discover, such aswhen a particular combination of failures leads to a system fault in the realsystem but not the system model.

22
We propose a validation technique in which a system model is compared toits fault trees. If a system model and its fault trees are not consistent in a sensethat we will define, then the system model may not be valid. Fault trees arewell suited for this purpose because they are specifically intended to capture therelationship between component failure and system faults.
The two main sections of the paper cover the precise meaning of fault treesand our proposed relationship between fault trees and system models. First,however, we present an example.
2 Example
To make discussion of the problem more concrete, we present a simple boilersystem example (see Figure 2).
Bodap
water wawr
Conto.
Symmapump nputPump
Si-d
SCOW I,' Sm
Fig. 2. A Simple Boiler System
Steam is produced by water contained in the boiler vessel. The water level inthe vessel is read by two sensors, which pass their readings to a control system.If the readings are below a certain value, the pump is turned on, delivering waterto the vessel. If the level readings are above a certain value, the pump is turnedoff.
One safety-critical fault of the system is a boiler level that is too high. Afault tree for this fault is given in Figure 2.
A fault tree represents how events in a system can lead to a particular systemfault. The event symbols used here are either basic events (which are drawnas circles and represent component failures) or intermediate events (which aredrawn as rectangles and represent events which occur because of lower-levelto th . .. ... .. If the lee edng rbvacranv lue the pum is turne

I- 23
Bad Is e*Vd ~ ab >flak a uo
b+
Feig. 3. A Fault Tree for the Boiler System ,
events). The system fault ii shown as the event at the root of the tree. Eventsymbols are connected in the tree by gate symbols, which are either and-gatesor .s-gates.
The full fault tree notation has many more event and gate symbols, but ifwe do not consider the probabilistic meaning of fault trees then the symbols we
have described are enough.

24
3 Fault Tree Semantics
If we are to compare fault trees and system models, we need to understandprecisely what a fault tree means. Unfortunately, even the most definitive sources(e.g., the Fault Tree Handbook [5]) are vague on some critical points.
One issue is the nature of events. Are they to be regarded as conditionshaving duration or as instantaneous occurrences? The example event "contactsfail to open" from the Fault Tree Handbook suggests the former, but the example"timer reset" suggests the latter.
The second issue is the gate condition: does "and" mean that both inputevents happen at once, or only that one happens and then the other?
A third issue is the nature of causality. A gate models a sufficient cause ifthe output must occur if the gate condition is satisfied by the inputs. A gatemodels a necessary cause if the gate condition must be satisfied by the inputsif the output occurs. According to the Fault Tree Handbook, fault trees modelsufficient and necessary causes. However, Figure IX-10 of the Handbook showsan event labelled "wire faults in K3 relay & comp. circuitry" as a cause of "K3relay contacts fail to close", but one can imagine circumstances in which wirefaults occur in such a way that the relay contacts do not fail to close. Thereforethe cause as stated is not a sufficient one.
Causes of an event are also supposed to be immediate. This term seemsrelated to the notion of flow, and may not be relevant in systems that cannot becaptured easily with flow models. All examples in the Fault Tree Handbook areillustrated with flow diagrams. Immediacy ako suggests time. For our purposes,a gate models an immediate cause if no time passes between a cause and itseffect.
We now present a formal semantics for fault trees. Events are treated asconditions having duration, and the gate condition is taken to be that bothinputs to an and-gate must occur at once. Three different formalisations of gatesare given, corresponding to different stances on the issue of gate causality.
Formally, fault trees are interpreted as formulas of temporal logic. We usethe modal mu-calculus (see Appendix A), but nearly all temporal logics are ex-pressive enough for our purposes. Similarly, the kinds of structures that temporallogics are interpreted over are very general. We assume only that a system modelcan be represented as a transition system or as a set of sequences of states.
Events are formalised as atomic propositions, which are interpreted as sets ofstates. For example, the event "sensor failure" could be modelled as the atomicproposition SF, which is interpreted as all states in which the sensor has failed.This formalisation of events fits with most of the examples of the Fault TreeHandbook, and is consistent with the meaning of the term "event" in probabilitytheory. Since fault tree are subject to probabilistic analysis, a consistent view ofevents is desireable.
Next we will formalise the meaning of gates. We will let +(inr, in2, out) standfor an or-gate with inputs in1 and in2 and output out. Similarly, *(in,, in2, out)stands for an and-gate. The semantics of a gate g, denoted [g], gives the logicalrelationship between the input and output events of g.

r 25
3.1 A Propositional Semantics for Gates
Formalising gates with propositional logic is a simple approach that is reasonablyclose to the informal description of gates in the Fault Tree Handbook. In termsof the issues just discussed, this interpretation requires and-gate inputs to occurat the same time for the gate condition to be satisfied, and takes causality to benecessary, sufficient, and immediate. The subscript p on the semantic functionstands for "propositional".
[+(inl,in2, out)]p d=f out 4* in, V in2
[*(inl,in2, out)Ip Lei out 4* in, A in2
Informally, the first statement says that the output of an and-gate is truewhenever both inputs are true. Remembering that events are treated as sets ofstates, the statement alternatively says that the set of states denoted by out isthe intersection of the sets denoted by in, and in 2. The concept of causality here Iis truly immediate: whenever both causes are present the effect is also present.
3.2 Two Temporal Semantics for Gates
The greatest weakness of the propositional interpretation of fault trees is theassumption that no time can pass between cause and effect. This assumptionviolates a common intuition about causality. Since the examples in the Fault TreeHandbook mostly concern examples in which flow is virtually instantaneous (asin an electric circuit), the problem rarely arises there. In cases where flow is notinstantaneous, events are modelled so that causes can be made immediate, albeitsomewhat unnaturally. For example, in the pressure tank analysis of Chapter VIIcontinuous pump operation can lead to a pump failure. This cause is modelledas the event "tank ruptures due to internal over-pressure caused by continuouspump operation for t > 60 sec". Since the idea of a cause leading to an event isnatural, it is worthwhile to try to view fault trees in this way.
Our first temporal semantics requires that and-gate inputs occur at the sametime to satisfy the gate condition, and takes causality to be only sufficient, notnecessary or immediate. This means that once the gate condition is satisfied, thegate output must eventually occur. The temporal logic operator even is usedto express the temporal condition of eventuality. Thus even(o) means that theproperty expressed by formula 4 will hold in the future.
The temporal relation between input and output events for gates can bedefined as
[+(in1,in2,out)jl, 4Y (in, V in22. o even(out)
[.(in,,in2,out)j l= (in1 A in2) =, even(out)
The first definition says that it is always the case that if input events in, andin2 occur together, then eventually output event out will occur.

26
Our second temporal semantics treats causality as only necessary. The tem-poral operator prev(qS) means that the property expressed by formula 0 held inthe past.
[+(in,, in2,Out)] 2 =e_ out =• prev(in1 V in2 )
[*(ini,in2,out)1 2 40-f out = prev(in1 A in 2 )
However, these definitions allows the gate output out to occur many timesfor a single occurrence of in, A in 2. A better interpretation might require thatif out happens, then in1 A in2 must have happened at least as recently as theprevious occurrence of out.
There are other possible interpretations based on other choices about thebasic semantic issues. For example, combining the two temporal semantics wehave presented would give one modelling sufficient and necessary causality.
Fault tree gates have been interpreted temporally before (see [1]), but theuse of temporal logic here allows much simpler semantics. This simplicity makescomparison between alternative interpretations easier.
3.3 Putting Gates Together
We now present the semantics of a fault tree t based on the set of gates contained .7in the tree (written as gates(t)) . We use the temporal operator always(O), whichmeans that the property expressed by 0 holds in every state.
it] always( A [g&gEgates(t)
In English, this definition says that it is always the case that every gatecondition is satisfied. Note that the meaning of a fault tree is given in terms ofthe meaning of its gates.
The propositional semantics has some great advantages over the temporalones. Because a gate output is defined in the propositional case to be logicallyequivalent to the disjunction or conjunction of its inputs, the fault tree can bemanipulated according to the laws of propositional logic. This property allowsinternal events of a fault tree to be removed by simplification, giving a relationbetween only the primary failures and the system fault (as is found in minimalcut set interpretations of fault trees [5]).
A further advantage of the propositional interpretation of fault trees is thatthe meaning is given as an invariant property - a property that can be checked bylooking at states in isolation. Invariant properties are an easy class of temporallogic formulas to prove.
The main advantage of the temporal semantics is their ability to model richernotions of causality. Unfortunately, it is no longer possible to eliminate internalevents by simplification, and thus minimal cut sets cannot generally be obtained.Furthermore, this formalisation of fault trees uses the temporal property of even-tuality, and is therefore a liveness property. This class of temporal logic formulasare generally more difficult to prove than invariant formulas.

27
The best interpretation of a fault tree probably depends on the system beingstudied. In some cases one might want to choose different interpretations fordifferent kinds of gates. For example, or-gates could be interpreted proposition-ally and and-gates interpreted temporally. Alternatively, a wider variety of gatetypes could be defined, and their use mixed in a single fault tree.
The material in the next section can be applied independently of choice ofsemantics for fault trees.
4 Relating Fault Trees to System Models
The last section showed that a fault tree expresses a property of failure events ina system. We might therefore expect a model of the system to have the propertiesexpressed by its fault trees. We will attempt to make this relationship precise.
Let F stand for the set of system faults for which fault trees have beendeveloped, and let f t(F) be the fault trees for fault F. Given a system model Mwith an initial state so, we write so ý,•,0 if the system model has the propertyexpressed by formula 0. The condition expressing that a model M of a systemis consistent with the set of fault trees for the system is
so 8m A [ft(F)IPE"
This condition is too strong, however, because usually a system model willcapture only certain aspects of a system. One way to weaken the relation aboveis to require a system model to satisfy the property expressed by a fault tree onlyif the system fault of the tree is found in the system model. Letting faults(M)stand for the system faults in a model M, the new consistency condition is
so k0 A if t(F)]FE nflaulta(m)
This relation is still quite strong, however. If a system model only capturescertain failures, then it probably would not satisfy this condition. It would beuseful to know the weakest relation that should definately be expected to holdbetween a model of a system and the fault trees of a system. Our approach isto asbume that we know nothing about events not given in a system model. Asan example, suppose that we have a single or-gate, +(B, C, A), which by thepropositional interpretation gives the relation A 4* B V C between events A, B,and C. Also suppose that we know nothing about event B. Then we will stillexpect that C =: A. Logically this amounts to the projection of the relationA * B V C onto the atomic propositions A and C. The projected relation isarrived at by taking the disjunction of the cases where B is true and B is false.In other words, the disjunction of A c* true V C and A 4* false V C is equivalentto the formula C =* A. In the general case, where more than one event mightbe missing, we need to consider all combinations of possibilities for the missingevents.

28
To formalise this idea, let 0[0'/Q] be the formula 0 with every occurrence ofatomic proposition Q within 0 replaced by 4'. For example, AVB[false/B] givesA V false. For multiple substitutions, let 0[01/Qi,... , 4,I/Q,] be the formula4 with occurrences of Q.,..., Q, in 4 simultaneously replaced by 41i,... 1,(no atomic proposition is allowed to occur twice in the substitution list). Forexample, A V B 4* C[true/A, false/C] gives true V B €* false. We will write
S1 x S2 for the cross product of sets S1 and S2, i.e., S x S2 =__d {(z,y) Iz ES1 and y E 52).
Let Boot be the set {true, false) of boolean constants, and let Boolt be then-fold product of Bool. The interpretation of a fault tree in the absence of a setof events C = (a,,... ,a,) is defined to be:
it -e d__= V [tl[bl/ai,...,bn/an](b ,...,b,}EBool"
Let events(M) be the set of events in the system model M, and let events(t)be the set of events in fault tree t. Then events(t)\events(M) is the set of eventsfound in the fault tree t but not the model M. The condition expressing that amodel M of a system is consistent with the set of fault trees for the system isnow
so A [f t(F) - (events(ft(F)) \ events(M))]FEn~fjaulta(m)
5 Conclusions
This paper contains three contributions to the study of safety-critical systems.First, it presents the idea that fault trees can be used to check the validityof safety-critical system models. Second, it contains three formal semantics forfault trees. These semantics are an improvement on earlier work by expressingthe meaning of fault trees with temporal logic, by expressing events as sets ofstates, and by identifying four elements of the meaning of gates: gate condition,sufficiency, necessity, and immediacy. Finally, the paper defines a consistencycondition between a model of a system and the system's fault trees that workseven for models that contain only some of the failure events in the their faulttrees.
Tool support for checking the consistency condition exists in the form ofmodel checkers, which automatically show whether a finite-state model satisfiesa temporal logic formula [3]. Proof tools (such as [2]) are available in case themodel is not finite-state.
The work described here should be regarded as a first step towards a completeunderstanding of fault trees and their relation to system models. As mentionedin the section on the semantics of gates, the formalisation here of necessarycauses may be too simplistic. The consistency condition given might need tobe strengthened to ensure that an event representing a component failure canalways occur provided it has not already occurred. Our consistency condition

29
handle the case in which a single failure event in a system model representsseveral failure events in a fault tree.
A A Temporal Logic
We use an extended form of the modal mu-calculus [4, 6] as a temporal logicto express behavioural properties. The syntax of the extended mu-calculus is asfollows, where L ranges over sets of actions, Q ranges over atomic sentences, andZ ranges over variables:
0::= Q I -4 101 A 02 1 [L]O I Z I JZ.0
The operator 'Z binds free occurrences of Z in 4), with the syntactic re-striction that free occurrences of Z in a formula 4) lie within an even number ofnegations.
Let S be a set of states and Act a set of actions. A formula 0 is interpretedas the set 11,011r of states, defined relative to a a fixed transition system T -(S, {- a E Act)) and a valuation V, which maps variables to sets of states.The notation V[S'/Z] stands for the valuation V which agrees with V exceptthat V*(Z) = •'. Since the transition system is fixed we usually drop the stateset and write simply I[4[[v. The definition of II01Iv is as follows:
IIQIlh = V(Q)Ih-011V = S - 111llv
1101 A 0211v = II011v n 110211vII[L])llV = {s E S I ifs -- s' and a E L then 8' E 11•)10)
IIZ1kV = V(ZIIVZ.4llv = U{s' C S I si' II)llvts[,/Zl}
A state s satisfies a formula relative to a model M = (T, V), written s =M4,if s E I110 . '11
Informally, [L]4) holds of a state s if 4) holds for all states s' that can be reachedfrom s through an action a in L. A fixed point formula can be understood bykeeping in mind that YZ.4) can be replaced by its "unfolding": the formula 0 withZ replaced by vZ.0 itself. Thus, vZ.10 A [{a}]Z = 0' A [{a}](vgZ4 A [{a}]Z) =1^ A [{a}]( A [f {a}](vZ.P A [{a}]Z)) = ... holds of any process for which 1& holdsalong any execution path of a actions.
The operators V, (a), and pZ are defined as duals to existing operators (whereO[Ik/Z] is the property obtained by substituting io for free occurrences of Z in4):
0)1 V 02 Le= 1-1 12
def(L)O4)'e = []-
sZ.42 = -w'Z.-,O[-'Z/ZJ
L , .. . ..

30
These additional basic abbreviations are also convenient:[ a, ,-*]• ff[{i,... ,-.
[_]o d--= [Act]Odd
true =- vZ.Z
false -- -ntrue
Common operators of temporal logic can also be defined as abbreviations:
alWS(O) = 4 Z.0 A [-]Z
even(o) ITF Iz.0 V ((-)true A [-]Z)
To define a previously operator, a reverse modal operator [LI must be addedto the logic.
II[lIlv = {I E S I if s' a s and a E L then 8' E 110110}The previously operator is just the reverse version of even:
prev(0) = pZ.0 V (-treA ̂ Z)
References
1. RlE. Bloomfield, J.H. Cheng, and J. Gorski. Towards a common safety descriptionmodel. In J.F. Lindeberg, editor, SAFECOMP '91, 1991.
2. J.C. Bradfield. A proof assistand for symbolic model checking. In Proceedings ofCAV '92, 1992.
3. Rance Cleaveland, Joachim Parrow, and Bernhard Steffen. The concurrency work-bench: A semantics based tool for the verification of concurrent systems. TechnicalReport ECS-LFCS-89-83, Laboratory for Foundations of Computer Science, Uni-versity of Edinburgh, 1989.
4. D. Kosen. Results on the propositional mu-calculus. Theoretical Computer Science,27:333-354, 1983.
5. N.H. Roberts, W.E. Vesely, D.F. Haasl, and F.F. Goldberg. Fault Tree Handbook.U.S. Nuclear Regulatory Commission, 1981.
6. C. Stirling. Temporal logics for CCS. In J.W. de Bakker, W.-P. de Roever, andG. Rosenberg, editors, Linear Time, Branching Time and Partial Order in Logicsand Models. Springer Verlag, 1989. Lecture Notes in Computer Science, 354.
6 , - . .... I •I 1 1 I- ]

Composition and Refinement ofProbabilistic Real-Time Systems *
Zhiming Liu1 , Jens Nordahl2 and Erling Vagn Sorensen2
1 Department of Computer Science, University of Warwick, England2 Department of Computer Science, Technical University of Denmark
Abstract. In this paper we illustrate, by way of examples, composition,analysis and refinement of systems modelled by means of probabilisticautomata behaving as Markov chains over discrete time. For a formalisedand general treatment of these ideas the reader is referred to [6].
1 Introduction
Dependability analysis of failure-prone real-time systems or performance anal-ysis of real-time systems interacting with stochastic environments is frequentlybased on the use of Probabilistic Automata, PA's, with Markov properties ascomputation models.
A recent formalism using this approach is Probabilistic Duration CalculusPDC [5], an extension of Duration Calculus, DC, which in turn was developedfor specification and verification of embedded real-time systems [7, 1].
For a given discrete-time PA representing a design PDC makes it possible tocalculate and reason about the probability that the PA satisfies a DC-formula(expressing a requirement or design decision) during the first t time units.
In this paper we consider parallel composition of component PA's into largercomponent PA's or into a system PA. Each component PA may depend on statesin the other components, (the PA is then said to be open), but the system PAis independent of external states (the PA is then said to be closed). Closednessis a condition for analysis by means of PDC.
We also consider probabilistic refinement with respect to a DC formula. Thismeans that with two consecutive system designs, if for all t > 0 the second designsatisfies the requirement with higher probability than the first design, then thesecond design is said to refine the first design with respect to the requirement.Simple examples of probabilistic refinement are included.
Compositionality has also been treated in probabilistic extensions of CSP-and CCS-like process algebras [4, 2], but none of these approaches cover the
• This research was supported by the Danish Technical Research Council under project
Co-design. The research of Zhimning Liu was also supported in part by research grantGR/H39499 from the Science and Engineering Research Council of UK.

32
dependencies between components referred to above. A notion of probabilisticrefinement different from ours is described in [3]. In this work probabilisticspecifications prescribe permissible intervals for the target probabilities, andrefinement refers to the narrowing of these intervals in subsequent specifications.
2 Probabilistic Automata Over Discrete Time
The behaviour of probabilistic systems having a finite number of states is con-veniently modelled by means of finite probabilistic automata over discrete time.These automata are defined by the set of states, the set of initial state proba-bilities and the set of transition probabilities per time unit.
As a running example we consider a Gas Burner consisting of a Burner (anabstraction of the gas-valve, the ignition device and the control box) and aDetector (an abstraction of the mechanism for detection of unburnt gas). Weassume that the gas is turned on at t = 0 and remains on.
2.1 States
The Burner and Detector components are characterised by disjoint sets of prim- 'itive Boolean states. For simplicity these sets, denoted AB and AD respectively,are assumed to be the singleton sets
AB = {Flame} and AD = {Act}
where Flame asserts that the flame exists and Act asserts that the Detector isable to detect unburnt gas. (If the gas was not permanently on, we would haveto define AR as {Gas, Flame} where the additional primitive state Gas asserts,that gas is released.)
The set of component states SB and SD are defined as subsets of the set ofminterms over AB and AD respectively.
SB = {-,Flame, Flame} Cg 2A0 and SD = {-'Act, Act} C 2AD
(where, in this case, all minterms are possible states). Accordingly the Burnermakes transitions between the states -,Flame and Flame (corresponding toalternation between successful flame ignitions and unintended flame extinctions)while the Detector makes transitions between Act and -,Act (corresponding toalternation between failure and repair).
For the composed system we have:
A = AB U AD = {Flame, Act}S =SB XSD =
{-,Flame A Act, Flame A Act, ,Flame A -,Act, Flame A -Act} C_ 2 A
Lj.... .w~mmmmd~wmlm~m-~ a•l

33
2.2 Dependency of External States
In a composite system a component can only change its own primitive states.However, the local transition probabilities may depend on external states, i.e.states which are local to other components in the composition.
This is exemplified by the Burner. For example, given that the Burner is instate -"Flame at time t, the probability that it will be in state Flame at timet + 1 is zero if the Detector is non-active and non-zero if it is active. In the lattercase the actual value depends on the quality of the ignition mechanism in theBurner.
2.3 Open and Closed Probabilistic Automata
The previous discussion suggests that a component, which depends upon envi-ronmental states, should be modelled by a collection of sub-models, one for eachenvironmental state. This is illustrated by the transition graphs for the Burnerautomaton in Figure la according to which:
- The Burner starts from state -,Flame with probability pi = 1.
- With the Detector in state Act the Burner behaves as follows
"* Given that it is in state -,Flame, it remains in that state with prob-ability plu per time unit or it goes to state Flame with probabilityP12 per time unit where P11 + P12 = 1.
"* Given that it is in state Flame, it remains in that state with proba-bility P22 per time unit or it goes to state -,Flame with probabilityp21 per time unit where P22 + P21 - 1.
- With the Detector in state -'Act the Burner behaves as follows
"• Given that it is in state -,Flame, it remains in that state with proba-bility pi I = 1 per time unit. This implies that P12 = 0, i.e. the Burnercan never go to state Flame.
"* Given that it is in state Flame, it remains in that state with proba-bility p22 per time unit or it goes to state -,Flame with probabilityP21 per time unit where P22 and p21 are the same as when the detectoris in state Act.
Plh and P12 depend on the detector state because they characterise the abilityof the Burner to establish Flame. In contrast to this p22 and P21 are entirelyindependent of the detector state because they characterise the stability of theflame.
A PA in which some transition probabilities depend on external states willbe called an open PA.
For the Detector automaton we assume the transition graph shown in Figurelb according to which:

34
- The Detector starts from state Act with probability qi or from state -,Actwith probability q2 (- 1 - qi).
- Given that it is in state Act, it remains in that state with probability qjIper time unit or it goes to state -,Act with probability q12 per time unitwhere q11 + q12 = 1.
- Given that it is in state -,Act, it remains in that state with probabilityq22 per time unit or it goes to state Act with probability q2I per time unitwhere q22 + q21 = 1.
The transition probabilities of the Detector are independent of the Burner state.This reflects that the probabilities of failure or repair of the Detector are con-sidered to be unaffected by flame- or ignition failures occurring in the Burner.
A PA in which no transition probabilities depend on external states will becalled a closed PA.
Cond. Adt Cond. -,Act
P22 P;22
Flame Flame
P12 P21 P21 Ad A
b: Detector (Closed automaton)PH1 1
a: Burner (Open automaton)
Fig. 1. The probabilistic component automata: Burner and Detector
3 Parallel Composition of PA'sThe PA for the Gas Burner is determined by parallel composition of the PA's
for the Burner and the Detector.
Gas-Burner = Burner 11 Detector
This operation is fully formalised and generalised in [6]. The resulting PA for theGas Burner is shown in Figure 2, (where the state numbering is arbitrary andintroduced for later use). The reasoning behind this construction is illustratedinformally be means of a few examples.
h•• m ugu m una mm mu manm nmn m ,, m..

The probability that the Gas Burner starts in, say, state 3: --Flame A -,Actis the product of the probability that the Burner starts in state -,Flame and theprobability that the Detector starts in state -,Act. According to Figure 1 thisproduct is p, * q2 = 1 * q2 = qý. Similarly we find that the initial probabilitiesof states 1, 2 and 4 are qj, 0 and 0 respectively.
The probability that the Gas Burner transits from e.g. state 1: -,Flame A Actto state 2: FlameAAct within one time unit is the product of the probability thatthe Burner transits from -,Flame to Flame, given that the Detector is active,and the probability that the Detector transits from Act to Act, both withinone time unit. This product is p12 * qn1. On the other hand, the probabilitythat the Gas Burner transits from state 3 to state 4 is zero because it requiresa transition of the Burner from -,Flame to Flame while the Detector is non-active, but according to Figure 1 this is impossible.
The other composite transition probabilities can be determined in a similarway.
qiqj q2 2q I
SState 2: P2q2State 4:
Flame A Act , P22q2I Flame A -,Act
p~lq2l
p12qI2p12qn1 p21qil P21q22
qlp q12
-,Flame A Ad q -,Flame A -,Act ''"
Fig. 2. The closed automaton GasBurner = Burner 11 Detector
We observe that even though the Burner PA is open, the composition of theBurner and the Detector PA's is a closed PA. This illustrates, that when wecompose two component PA's the dependencies of one PA on primitive statesin the other will be hidden in the resulting PA3.
3 This resembles the hiding of a communication between two processes in parallel composition.
A

36
In [6] the formalisation of such constructions is based on a representation ofa PA as a tuple (S, C, To,•r) where S is the set of states, C is a set of primi-tive external states which is sufficient for definition of openness, r0 is the initialprobability function and r is the transition probability function, which is param-eterised by the elements in the condition space 2 C. A PA is closed if no transitionprobability depends on the conditions in 2c. C can then be eliminated from thetuple.
The parallel operator 11 constructs a well formed tuple (Sc, C,, T7oc, Tc) fromtwo well formed tuples (S., Ca, To., T.) and (Sb, Cb, rob, n) such that
S -= S, x Sb C 2A-UAb and Cc = (Ca \ Ab) U (Cb \ Aa)
where A. and Ab are the sets of primitive states for components a and b.
4 Requirements and Satisfaction Probabilities
The Gas Burner has critical states characterised by release of gas while the flameis absent. The disjunction of these states is a state called Leak. Since the gasis permanently on in our example, Leak is identical to -,Flame which is thedisjunction of states 1 and 3 on Figure 2
One of the design decisions could be that whenever Leak occurs, it shouldbe detected and eliminated within one time unit. In [7] this constraint, calledDes-i, is expressed as the following formula in Duration Calculus:
Des-i: O(rLeak] ==* I < 1)
This formula reads:
o1 "For any subinterval of the observation interval,"fLeakl ==* "if there is Leak in that subinterval then"I < 1 "its length should not exceed one time unit".
Duration Calculus, DC, is an interval logic for the interpretation of Booleanstates over time (a logic for timing diagrams). Its distinctive feature is reasoningabout durations of states within any time interval without explicit reference toabsolute time. It is used to specify and verify real-time requirements. The readeris referred to [7, 1]. for further details.
For a real design with failure-prone components we can not in general expecta duration formula (expressing some requirement) to hold for all times. Thequestion is then: does it hold with sufficiently high probability over a specifiedobservation interval [0, t]. This question is answered as follows.
Let G denote the closed PA modelling the design and D denote the formula.Then we must compute the probability that G satisfies D in the time interval[0, t]. This probability is called the satisfaction probability of D by G and isdenoted io(D)[t].

37
Satisfaction probabilities are computed or reasoned about by means of Prob-abilistic Duration Calculus, PDC [5], a recent extension of Duration Calculus'.
The DC formula for Des-1 belongs to a class for which the satisfactionprobability can be expressed explicitly in PDC by means of the initial probabilityvector p and the the transition probability matrix P of G, [51. These matricesare well known from the theory of Markov chains. For the PA of the compositeGas Burner, Figure 2, they are given by:
( piiqll p12qj p11q12 MAUp=(q1,O, q2,0) and P= p21qjl p22qjj P2012 P22q12
q21 0 q22 0P21q21 P22021 P21022 P22022
with row- and column ordering according to the chosen state numbering. It iseasy to see, that for p as well as for each row of P the sum of elements is 1 (thisis a well-formedness condition for probability matrices).
With D denoting a DC formula of the class referred to above, the explicitexpression for /G(D)[t + 1] is a scalar product of the form [5]:
/AG(D)[t + 1] = p'-(pt)t lC
where p' and P' are obtained from p and P, respectively, by replacement ofcertain entries (depending on D) by zeros, (P,)t denotes the t'th power of P'and Ic denotes a column vector in which all elements are 1.
For G representing the composite Gas Burner and with D given as the DCformula for Des-1 above, p' = p, (i.e. no entries in p needs to be zeroed) andP' is obtained from from P by changing the entries in P with (row,column)numbers (1,1), (1,3), (3,1) and (3,3) to zero. Accordingly:
P(G(o(rLeakl =. I < 1))[t + 1] = p'. (p,)t l- =( 0 P12%,1 0 P12q121(ql 0, q2,0). P2iqi1 P22q11 p2 1q12 P22q12 1'q 1 'q~ ) 0 0 0 0
P21q21 P22q21 P21q22 P22q22
Informally the rules for obtaining the primed matrices from the unprimedones (i.e. for the zeroing of entries) are as follows:
If D is violated by behaviours which have state i as the initial state (thestate in the first time unit), then the i'th entry of p should be zeroed in the
4 The semantic model of PDC is the finite probability space (Vt, ,) induced by G, whereVt is the set of behaviours (state sequences of G) of length t and p is the probabilitymeasure which assigns a probability to each behaviour. This probability is the product ofthe initial probability and the transition probabilities involved in the behaviour. PG(D)[t]is then defined as the sum of the behaviour probabilities for the subset of behaviours whichsatisfy D over the first t time units.

38
matrix expression for p(D)[t + 1]. If D is violated by a transition from state ito state j, then the entry at location (i,j) in P should be zeroed.
The DC formula for Des-1 places no restriction on the choice of initialstate, and accordingly no entry of p needs to be zeroed. However, the formulais violated for all transitions such that there is Leak before as well as afterthe transition. This is because such transitions imply existence of Leak stateslasting for at least two time units, whereas the formula only tolerate Leak stateslasting for at most one time unit. As previously observed, Leak (= -,Flame)holds for the composite states 1 and 3 on Figure 2. This implies that the offensivetransitions are those associated with entries (1,1), (1,3), (3,1) and (3,3) in P.
5 Probabilistic Refinement
Let G, and G 2 be the closed PA's representing two designs andiet D representa common requirement for these designs. Then G 2 is said to refine G, withrespect to D if, and only if:
Vto > 0*. a2 (D)[to] > IAG, (D)[to]
We shall now examine this for various Gas Burner designs and for Des-i.First we notice that if to - 0, then Des-1 will be trivially satisfied for any
design G, i.e. JAG(Des-1)[0] = 1. The reason for this is that in the formula forDes-1 the left side of the implication, i.e. rLeakl, is false for a point interval(a leak state must last for at least one time unit).
For to > 0 we make the substitution to = t + 1, t > 0 and compute/A(Des-1)[t + 1] from the matrix expression p'- ( 1,)t.
As previuosly explained, with Des-1 as the D formula, p' = p. This, in turn,implies that the matrix expression will evaluate to 1 for t = 0. The reason forthis is that the sum of entries in p is 1 and (P') 0 is the identity matrix. Thisresult reflects that the initial Leak state (caused by the necessary gas releasebefore the first ignition) lasts for (at least) one time unit and does not violateDes-I during the first time unit.
We will compare four designs of the Gas Burner .2
- Design 1 is a poor design. It has a Burner but no Detector (or the Detectoris permanently non-active). The PA: G1 for this design is shown in Fig 3a.The probability matrices are
It is easy to prove (and intuitively clear), that AG (Des-1)[t + 1] = 0 fort > 0. This reflects that the Gas Burner never will be able to establishflame, i.e. to eliminate the initial Leak caused by gas release.
k.. |

39
P22 22 ;;22
a) Design 1. b) Design 3 c) Design 4.
Fig. 3. Various designs of the Gas Burner. (Design 2 is defined by Figure 2.)
Design 2 is thtel Gas Burner: (Burner m Detector) modelled
and analysed in the previous sections. Intuitively G2 (defined by Figure 2)refies G, because it uses a detector which is not permanently failed. Thiscan be validated by computation of the matrix expressions for a suitablerange of t's.
Design 3 is the composite gasburner with a permanently active Detector.
Leak is detected immediately, but Ignition may still fail with probabilityP11 within one time unit. The PA: G3 for this design is shown in Fig 3b.Since Act is always true, there are only two states -,Flame and Flame toconsider. The probability matrices are
p-(1,0) p,=p p P11P12) I 0 P12)P21 P22 P21 P22
Intuitively G3 refines G 2 because it uses a permanently active detector.This can also be validated by computation of the U's over a suitable timerange.
Design 4 is the ideal composite Gas Burner. The Detector is perfect andthe ignition always succeeds within one time unit. The PA: G 4 for thisdesign is shown in Fig 3c.
The probability matrices are
p =(1,0) p' = p 0 p Op ,1 P,=p
FRom a theorem in [5] it follows, that with p' = p and P' = P thematrix expression p'. (P,)t1. lc evaluates to 1 for all values of t. Thereforepa4 (Des-1)[t + 1] = 1 independent of t and accordingly G4 refines allother Gas Burner designs with respect to Des-1 (but of cause Design 4 isnot implementable).

40
Verification is stronger than validation. However, proof of probabilistic re-finement is a difficult area, and so far we can only offer the following theoremapplicable under rather special conditions [6].
For D-formulas such that pi(D)o[t + 1] = p'. (P,)t. 1, and for two designsGA and GB with the same number of states, if all elements in p' are greaterthan or equal to the corresponding elements in pA, and the same property holdsfor P'B and P'A then GB refines GA with respect to D.
This theorem is applicable to Designs 1, 3 and 4 and proves that Design 4refines Design 3 which in turn refines Design 1.
6 Conclusion
We have presented new results concerning composition, analysis and refinementof probabilistic real time systems. The technique needs further consolidationwith regard to tools and theorems for validation and verification, and its prac-tical applicability to realistic dependability problems remains to be tested.
References
1. A.P.Ravn, H.Rischel, and K.M.Hansen. Specifying and verifying requirements ofreal-time systems. IEEE Trans. Software Eng., 19(1), 1993.
2. J.C.M. Baeten, J.A. Bergstra, and S.A. Smolka. Axiomatizing probabilistic pro-cesses: Acp with generative probabilities. In Lecture Notes in Computer Science,volume 630, pages 472-485. Springer Verlag, 1992.
3. B. Jonsson and K. Larsen. Specification and refinement of probabilistic processes.In Proc. 6th Annual Syump. on Logics in Computer Science, pages 226-277, 1991.
4. K. G. Larsen and A. Skou. Compositional verification of probabilistic processes. InLecture Notes in Computer Science, volume 630, pages 456-471. Springer Verlag,1992.
5. Z. Liu, E.V. Sorensen, A.P. Ravn, and C.C. Zhou. Towards a calculus of systemsdependability. Technical report, Department of Computer Science, Technical Uni-versity of Demark, 1993. To appear in Journal of High Integrity Systems, OxfordUniversity Press.
6. Zhiming Liu, J. Nordahl, and E. V. Sorensen. 'Compositional design and refinementof probabilistic real time systems. Technical report, Institute of Computer Science,Technical University of Denmark, DK-2800 Lyngby, Denmark, 1993.
7. C.C. Zhou, C.A.R. Hoare, and A.P. Ravn. A calculus of durations. InformationProcessing Letters, 40(5):269-276, 1992.

The Application of Formal Methods for theRedevelopment of a Laboratory Information
Management System
Dr. Paul CollinsonDept of Chemical Pathology, Mayday University Hospital
Croydon, England
Susan OppertDept. of Clinical Biochemistry, West Middlesex University Hospital
lsleworth, Middlesex, England
Steven HughesUoyd's Register of Shipping
Croydon, England
1. Introduction
The overall goal of a clinical laboratory is to analyse samples of blood and otherbodily fluids received from a patient, and to return the correct results to thepatient's doctor within a suitable period. Automated analysers are used in mostlaboratories to analyse the various samples. Computer systems (LIMSl) are widelyused in laboratories to control, support and monitor the work done in thelaboratory, keeping pace with the increased analytical capability provided by theseanalysers. In particular, a LIMS is typically used to control and monitor (at least):
* the working of the analysers, deciding what tests need to be done foreach sample by each analyser,
* the collating of requests and results, and* the printing of the results.
The results of an analysis will directly influence the treatment of a patient -treatment that can have potentially life-threatening consequences. For example, insome types of suspected heart attacks, treatment is largely based on the results ofthe analysis. The patient can die if the wrong treatment is administered. In a recentcase in the United Kingdom, a bank's computer system sent payments to the wrong
Laboratory Information Management System

42
accounts. Consider what might happen (in the equivalent scenario) if the wrongresults were sent to a patient by the LUMS.
Consequently, although a LIMS is fundamentally an information system, itmust be classed as a safety critical system and developed as such. In the main,however, these safety implications have not been considered in the development ofLIMS's. Furthermore, in contrast to other disciplines, little effort has been spent onthe standardisation and classification of the safety aspects of using computer-basedsystems for medical care.
These problems will become more acute when LIMS's are linked to generalhospital information systems. In the long-term, this will make the laboratory resultsaccessible from wards in the hospital and from local GP surgeries. The aim of thisis to improve patient care. However, as more and more people have (instant) accessto the results, it is essential to ensure the integrity and correctness of any resultsthat are accessible from outside the laboratory.
This paper discusses the re-development of the LIMS at the WM, 2
undertaken as part of the MORSE 3 project and carried out jointly by WMH andLloyd's Register. The MORSE project uses a multi-disciplinary approach to thedevelopment of safety critical systems, based on those proposed in the draftMinistry of Defence standards 00-55 [1] and 00-56 [2]. This approach combines theuse of safety analysis with the use of formal development methods. This paperdescribes the overall approach, and concentrates on the application of RAISE [3], aparticular formal development method, in the re-development of the LIMS. Asspace will not allow a full description of the work, the use of RAISE will beillustrated by describing the specification of certain key areas.
2. Simplified LIMS
A simplified layout of a LIMS is shown in Figure 1. This shows a completeanalytical loop, with the LIMS controlling a single analyser. It indicates how:
"* test requests are entered using a terminal,"* the analyser receives the samples and requests, analyses the samples
and returns the appropriate results, and"* the results are printed before being dispatched to the patient.
This is only one of many possible layouts, and in practice the LIMS would becontrolling several analysers. However, by using a single analyser, the descriptionof the LIMS is simplified as all test requests wili go to the one analyser. As afurther simplification, the validation and archiving of results is not shown here.
2 West Middlesex University Hospital3 Method for Object Re-use in Safety-critical Environments

43
"gTum- Si As.iCOMfqgM
S
Figure 1: The layout of a wn[d LIMS
3. Approach used to analyse the LIMS
The data handling in the laborary as a whole (including the LIMS) was described
and modelled before starting the safety analysis. The safety analysis produced anasesument of the safety of the data handling, and an associated list of hazr. Thesafety analysis of the UIMS is described in an accompanying pap and in [4]. Thisdescripon of the LIMS and the list of hazards was used as the basis for the formal
specification and re-development of the LIMS.The entire LIMS was formally specified using RAISE. Safety prope•es that
emove or at least constrain the hazards identified by the safety analysis, were alsodescribed and captured in the pe a . Thes properties can be thought of asfoninag a sfety cae for the LIMS. As RAISE is mathematically based, thesesafety properties ae described as constraints on the behaviour of the LIMS.
Several components of the sysm, identified in the specification, have beenselec ad for further development. The selection, based on the safety assessmnent ofthe labortory, will redevelop a complete analytical loop of the LIMS - from theinput of requests to the printing of results. Th development will be (rigorously)veii to ensure that the safety properties identified in the specification aremaintained. It is intended that another safety analysis of the LIMS be carried out

44-
after the development to assess whether the re-development of the LIMS hasimproved the safety of the LIMS.
3.1. Additional safety considerations
Ensuring that the LIMS functions correctly and preserving the integrity of the dataentrusted to it, is only part of what is done to ensure that the laboratory will meet itgoal. The reliability of the LIMS and of the laboratory as a whole must beconsidered, ensuring that results will be returned to patients in time. This willinclude the backing up of data, the presence of standby machines, contingencyplans for staff illness, etc.
The accuracy of the chemical analysis must also be considered. In the UK, thisis independently assessed by a central body. In this paper, however, only the LIMSand its workings will be considered.
4. Some results of the safety analysis
In the safety analysis, several key areas were identified. Two of these will bediscussed here: the identification of patients from information on the request forms,and the identification and collation of requests, samples and results.
4.1. Identification of patients
A database of all the patients who have been to the hospital is kept on a centralpatient administration system. Each patient in this database has a unique hospitalnumber. If a request for a patient that has been to the hospital before, or is currentlyin the hospital, is received, the patient's details are retrieved from the database. Ifthe patient's details cannot be found - if the patient has not been to the hospital, orno match can be made - a new number is assigned to the patient.
It is extremely important that this matching of details is accurate. If the wrongmatch is made, wrong details will be used. Consequently, the criteria for matchingdetails are (and must be) strict. If a satisfactory match cannot be made, the patientis treated as new, rather allowing wrong details to be used.
4.2. Identification and collation of requests, samples and results
Samples and requests are assigned a unique label or identifier when they arereceived at the laboraory. This label makes it possible to distinguish samples fromdifferent patients, and is used to track requests and samples in the laboratory and

45
for matching up results with the appropriate requests. This labelling is essential to
the working of the laboratory.
5. Spedfication of the system
The main activities carried out in a laboratory are described below: receivingrequests, analysing samples, and collation and printing results. A simple model ofthe LIMS is defined, describing how the LIMS supports these activities. Using thismodel of a LIMS, we will introduce some constraints on the system. Theseconstraints will capture some of the safety properties of a LIMS.
This model will contain a simple information model, detailing the minimumamount of information that is needed for a LIMS to work effectively. Considerabledetail is omitted by using under-specification, while still defining the essentialpropes of the LIMS.
In this paper, the model of the LIMS will be sketched out using RAISE,defining only the signatures of functions for the most part. The RAISE is notcomplete, and not all the modules have been included.
Several activities carried out in the laboratory have not been described here. Inparticular, the validation of the results has been omitted. During validation, theaccuracy, completeness (no results missing), and internal consistency of the resultsis checked. The archiving of results has also been omitted. This is in no wayintended to imply that these activities are not essential in the laboratory.
5.1. Receiving requests and samples
When samples and requests are received at the laboratory, they are assigned aunique label. A request will contain at least the patient details, and a list of thetests to be carried out on the sample, as described in DATAMODELO.
scheme DATAMODELO = clmatype
PatientDetails, Sample, Testld,Request --
_(patient detail : PatientDetails, testrequests : Testld*)end
Normally, requests will also contain: the name of the referring doctor, thelocation for of the doctor, the time and date of sampling, any relevant clinicalinformation, the type of the specimen, and any special information or precautionrelevant to specimen collection or handling.
We will also assume that each request is related to a single sample. In practicethis is not be the case and a request can relate to several different samples.

46
5.1.1. Ideuutifyng the patient
When a request is received, it will normally contain the patient's surname, initias,date of birth and possibly a hospital number. For this paper, a matc can be made,match-jound, if the patient's hospital number and surname match, or if thesurname, initials and date of birth math
schemne DATA-IODEL1 = extend DATA-MOOELO with class,t4p HoepitalNum, Date, Name, Initialsvalue no~num: HospitalNumvalue patientjd: Request -*HospktaNum
valuesurname: PatientDetaflt- Name,initials: PatientDetails -* Initials,dob : PatientDetails -* Date
endno-numn is used to denote no hospital number on the request form. The patientdatabase is represented as a mapping from HospitalNum to PatientDetails.
eche--e LIMS1 (D: DATAMOOELI) = classvarIkle patientdcb : D.HospitalNum -m-+4 D.PatientDotailsvalueP* Match using hospital number.7matchjid: D.Requeet -+ reaid any Badlmatchid(r) -mlet i = D.patient-id(r) In
let req..detals = D.patienk-details(r), dbdetails = patiencdb(i) InD.sumame(req-details) = D.sumame(db-details)
end endpre D.patientjd(r) e dorm patient-jib,
PMatch using patient deftaiWmatch...deails : D. Request -+ read any Boolmatch...details(r) = (3Hi: D.HospitalNum * i e damn patient-db A
let req-detail = D.patient.details(r), ib-detail = patientAb(i) InD.sumamne(req...details) = D.sumame(db...details) A
D~nintials(req..details) = D.Imitial(Odb.etails) A
D.dob(db...details) =D.dob(req..Aetails) end)pro D~patientjd(r) =D.nojtnum V D.pateentjd(r) it dorm patienft~d

matchjound: D.Request -~read anyi Boolmatch-jou 'nd(r) a
Nf D.pafentijd(r) e dom patient-cdb then match-id(r)lebe match...detaids(r) end
axiom [abase-consistencyn D.no...num i domnpatient-db
For the database to be consistent, no-num cannot be used to identify a patient's
5.1.2 Identifying the requests and the samples
For each request and accompanying sample that is received, a new label is createdand assigned to that request The details of the request with this label are enteredinto the LIMS, entertest. As the collation of results with requests depends on thelabel being unique, the LIMS must guarantee that different requests with the smlabel canno be entered.
theor THUIMS2: axiom/I Assuming no duplicat.% enter-test wil not create a labelled/I request which has the same label as another request. .In class object D: DATAMODEL2, L: LIMS2(D)
value P* Check that no two requests have the same label.7no..duplicates: Unit -+ read any Bool
end I-VI : D.Label, r : D. Request * L~enterjtest(I, r) ; no...duplicateso
Lenter..test(I, r) ; true pre no...uplicates() A LlabeLused(I)end
5.2. Analysing the samples
Afte the samples are labelled, they are prepared for analysis and are passed to theanalyser. For each sample received by the analyser, it must:
"* identify the sample, using the label on the sample,"* get the list of tests required for the sample,"* performn the necessary tests, and" reurn the results of the tests.
The result of a test must contain details of what test was done. Furthennore eachresult must also be labelled with the same label as the request so that the two can becollated.

48
scheme DATAMODEL3 = extend DATAMODEL2 with class typeAnalyserRequWet -= .-(label : Label, testid : Tetid),TestResult .= _(testid : Testid),AnalyserResult == jlabel: Label, testjresult : TestResult)
end
5.3. Collating and prindng the resuits
After the samples are analysed, the results must be collated with the tests to ensurethat- all the tests have been performed, and that only the tests wanted have beendone. Th results of the tests are then collated with the patient details into a report.This report is printed and is sent to the patient's doctor. This report must containthe same label as the request to check that the request has been completed.
It cam be shown in this model that once a label has been assigned to a request,it is never changed. Furthermore, the same label is assigned to each test and eachresult associated with that request.
sh-eme DATA_MODEL4 = extend DATA.MODEL3 with clas typeReport -= jabel: Label, patientdetails: PatientDetails,
test_results : TestResult* ) endIn this model, it is assumed that reports are only printed when all the tests havebeen completed. In practice this is not the case as some results may be neededurgently and these will be sent to the patient's doctor as soon as they are completed.However, it can be shown for this model (proved formally if necessary) that reportsare only printed after all the tests have been completed.
theory TH_LIMS4_I : axomIn clahs object D: DATA_MODEL4, L: LIMS4(D) end I-
VI: D.Label e L.report-ispDdnted(l) :* L.tests_completed(l) endA further safety property of the LIMS is that spurious reports are not generated -only reports for requests received by the laboratory will be printed.
theory THLIMS4_2 axWomIn clss objec D : DATAMODEL4, L: LIMS4(D) end I-{ D.label(x) I x: D.Report * x e L.printed I C4 D.label(y) I y : D.LabelledRequet * y e L.requests ) end
6. Concluding comments
"Thnis paper describes how the multi-disciplanary approach advocated by theMORSE project has been applied in re-developing the UMS at the WMIL Inparticular, the use of the formal method RAISE is demonstrated by defining amodel of a simplified LIMS. In this model, both the information and the

49
functionality required by the LIMS to support the work done in the laboratory aredefined
By using RAISE, the properties of the LIMS can be investigated at thespefication stage of the re-development (as shown here), rather at later stages ofthe developmnea Some safety properties of the LIMS are also defined, showinghow hazards can be removed (or at least reduced). Furthermore, by using RAISE,one can prove that these safety properties are maintained throughout the re-development of the LIMS - from its specification to its implementation. Thisensures that hazards removed in the specification of the LIMS are removed fromthe implementation of the LIMS. The effectiveness of this approach will bemessed after the second safety analysis is carried out after the re-development iscompleted.
References
1. Ministry of Defence. The Procurement of Safety Critical Software in Defence Systems.Interim Defence Standard 00-55. April, 1991.
2. Ministry of Defenuc. Hazard Analysis and Safety Classification of the Computer andProgrnmmable Electronic System Elements of Defence Equipment. Interim DefenceStandard 00-56. April, 1991.
3. The RAISE Language Group. The RAISE Specification Language. The BCS PractitionerSeries. Prentice Hall, London, 1992
4 Fink R, et at: Data Management in Clinical Laboratory Information Systems. In:Directions in Safety Critical Systems. Redmill F and Anderson T (eds). Springer-Verlag,1993.
i jW"
:• •" mmum u m mumimm mmmma mmmmmm mmmmmm m I

Session 2
"APPLICATIONS
Chair: I. C. SmithAEA Technology, UK

PLC-Implementation ofEmergency Shut-Down Systems
Wolfgang A. HalangFernUniversitat, Department of Electrical Engineering
D-58084 Hagen, Germany
Johan ScheepstraRijksuniversiteit Groningen, Department of Computing Science
P. 0. Box 800, NL-9700 AV Groningen, The Netherlands
Abstract
The task of safeguarding systems is to bring processes from dan-gerous into safe states. A special class of safeguarding systems areemergency shut-down systems (ESD), which, until now, are onlyimplemented in inherently fail safe hard wired forms. Despite theirhigh reliability, there is an urgent industrial need to replace themby more flexible systems. Therefore, a low complexity, fault detect-ing computer architecture was designed, on which a programmablelogic controller for ESD applications can be based. Functional logicdiagrams, the traditional graphical specification tool of ESDs, aredirectly supported by the architecture as appropriate user orientedprogramming paradigm. Thus, by design, there is no semantic gapbetween the programming and machine execution levels enablingthe safety licensing of application software by formal methods orback translation. The concept was proven feasible by a workingdemonstration model.
1 Introduction
Many technical systems have the potential of disastrous effects on, for instance,the environment, equipment, employees, or the general public in case of mal-functions. An important objective of the design, construction, and commis-sioning of such systems is, therefore, to minimise the chances that hazardsoccur. One possibility to achieve this goal is the installation of a system whoseonly function is to supervise a process and to take appropriate action if any-thing in the process turns dangerous. So, to prevent hazards, many processesare guarded by these so called safeguarding systems. A special kind of themsystems are Emergency Shut-Down systems (ESD), which are defined as:

54
A system that monitors a process, and only acts - i.e., guides theprocess to a static safe state (generally, a process shut-down) - ifthe safety of either human beings, the environment, or investmentsis at stake.
The mentioned monitoring consists of observing whether certain physical quan-tities such as temperatures or pressures stay within given bounds and to super-vise Boolean quantities for value changes. Typical ESD actions are opening orclosing valves, operating switches etc. Structurally, ESDs are functions com-posed of Boolean operators and delays. The latter are required, because instart-up and shut-down sequences often some monitoring or actions need to bedelayed. Originally, safeguarding systems were constructed pneumatically andlater, e.g., in railway signaling, with electromagnetical relays. Nowadays, mostsystems installed are based on integrated electronics and there is a tendencyto use microcomputers.
The current (electrical) systems used for emergency shut-down purposes arehard wired and each family makes use of a certain principle of inherently failsafe logic. The functionality of an ESD system is directly implemented inhardware out of building blocks for the Boolean operators and delays by in-terconnecting them with wires. These building blocks are fail safe, i.e., any '
internal failure causes the outputs to assume the logically false state. Unlessimplemented wrongly, this results in a logically false system output, which inturn causes a shut-down. Thus, any failure of the ESD system itself will leadto a safe state of the process (generally a process shut-down). This technol-ogy, used successfully for decades now, has some very strong advantages. Thesimplicity of the design makes the hardware very reliable. The one-to-one map-ping of the client's specification expressed as functional logic diagrams (FLD) tohardware modules renders implementation mistakes virtually impossible. The"programming" consists of connecting basic modules by means of wires, stress-ing the static nature of such systems. Finally, the fail safe character of hardwired systems is a very strong advantage. But there are also disadvantagesthat gave rise to the work reported here.
Economical considerations impose stringent boundary conditions on the de-velopment and utilisation of technical systems. This holds for safety relatedsystems as well. Since manpower is becoming increasingly expensive, also safetyrelated systems need to be highly flexible, in order to be able to adjust themto changing requirements at low costs within short times. In other words,safety related systems such as ESDs must be program controlled in order torelinquish hard wired logic from taking care of safety functions in industrialprocesses. Owing to their simplicity, the most promising alternative to hardwired logic in ESD systems are programmable logic controllers (PLC), whichcan provide the same functionality. However, although a reasonable hardwarereliability can be obtained by redundancy, constructing dependable softwareconstitutes a serious, still unsolved problem.

55
There is already a number of established methods and guidelines, which have
proven their usefulness for the development of highly dependable software em-ployed for the control of safety critical technical processes. Prior to its ap-plication, such software is further subjected to appropriate measures for itsverification and validation. However, according to the present state of theart, these measures cannot guarantee the correctness of larger programs withmathematical rigour. Prevailing legal requirements demand that object codemust be considered for the correctness proofs of software, since compilers arethemselves far too complex software systems, as that their correct operationcould be verified. Depending on national legislation and practice, the licens-ing authorities are still very reluctant or even refuse to approve safety relatedsystems, whose behaviour is exclusively program controlled.
In order to provide a remedy for this unsatisfactory situation, it was the pur-pose of the work reported here to develop a special - and necessarily simple- computer system in the form of a programmable logic controller, which cancarry out safety related functions as required in emergency shut-down systems.The leading idea followed throughout this design was to combine already ex-isting software engineering and verification methods with novel architecturalsupport. Thus, the semantic gap between software requirements and hardwarecapabilities is closed, relinquishing the need for not safety licensable compilersand operating systems. By keeping the complexity of each component in thesystem as low as possible, the safety licensing of the hardware in combinationwith application software is enabled on the basis of well established and proventechniques.
2 The Software Building Blocks
All emergency shut-down systems can be constructed from a set of functionmodules containing just four elements, viz., the three Boolean operators And,Or, Not and a timer. For reasons of simplicity we restrict the number of inputs ,.,
for both And and Or to two. The functionality is not effected, since any multipleinput function can be described with a finite number of the two input gates.It is also sufficient to use only one type of timer. All other forms of timersused in hard wired logic can be implemented by, if need be, adding inverters.The timer has one Boolean input, I, one Boolean output, 0, an adjustabledelay time, t, and an internal state, d, with 0 < d < t. Its functionality can beinformally described as follows:
"* Initially, the input is false, the output is false, and the internal counter,d, has assumed its maximum (as set), so d = t.
"* As the input becomes true, the output remains false and the counter, d,decreases, i.e., the timer starts counting down.

56
Counter Input Outputd = t true false
O < d < t true falsed = 0 true trued = t false false
0 < d < t false falsed = 0 false false
Table 1: The timer output as function of input and counter value
"* As soon as the counter becomes zero and the input is still true, the outputturns true.
"* If the input is false, after having been true for less than the preset delaytime t, then the timer is reset. That is, the output becomes false and thedelay time assumes its initial (maximum) value.
"* If the input becomes false after d is 0 and, thus, the output has becometrue, also a reset operation is performed.
We observe that there are two values that may have to be changed. First,obviously, the logical output could change as a function of the input and theinternal state. Secondly, the interrel state may need updating, depending onboth the logical input and the internal state.
Although the number of internal states of the timer is numerous, three interest-ing ones can be extracted, viz., d = t, d = 0 and 0 < d < t. They are displayedin Table 1.
The functionality of the timer can be represented by a simple Boolean expres-sion for its output: ..
o - (d = t) A I
What the module still lacks is a realisation of time. Hence, we define time,with to < time < 0o. In a system time can be implemented in both hardware ior software. For accuracy reasons, we have chosen a hardware solution: timeis implemented in form of a counter triggered by a quartz stabilised time base.
An implementation of the four functions modules discussed above has beenproven correct using predicate calculus [1]. This was trivial in the case of theBoolean functions. The correctness proof of the timer was straightforward,but took a few pages. The interested reader is referred to [2], because sizerestrictions prohibit to include the proof into this article.

57
3 The Software Engineering Paradigm
The analysis of functional logic diagrams suggests to introduce a new pro-gramming paradigm, viz., to compose software out of high level user orientedbuilding blocks instead out of low level machine oriented ones. Whereas a singlemachine instruction taken out of a program context does not reveal its purpose,the occurrence of a certain function module instance usually gives already aclue about the problem, its solution, and the module's r6le in it.
The development of ESD software is carried out by process engineers in the tra-ditional way of drawing FLDs. The latter describe the mapping from Booleaninputs to Boolean outputs as functions of time such as, e.g.,
if a pressure is too high then a valve should be opened and anindicator should light up after 5 seconds.
In Figure 1 an example of a FLD is given. The FLD describing the functionalityof an average ESD system contains thousands of blocks, laid out over manydrawing sheets.
Figure 1: An example of a FLD (with dyadic Boolean operators only)
This specification level programming method consists of graphically intercon-necting instances of the above mentioned four basic function modules with eachother by lines, i.e., single basic functions are invoked one after the other and, inthe course of this, they pass parameters. The interconnections between func-tion blocks have to meet just one restriction: each input must be connected toexactly one output. Besides the provision of constants as external input pa-rameters, the basic functions' instances and the parameter flows between them

58
are the only language elements required by this programming paradigma.
A compiler transforms the graphically represented program logic into objectcode. Owing to the simple structure, this logic is only able to assume, the gen-erated programs contain no other features than sequences of procedure callsand some internal moves of data. The verification of the compiler transform-ing the graphical software representation into object code is still impossible -
but also not necessary, because for FLD software only the module interconnec-tions need to be verified. As outlined below, for this task the architecturallysupported method of back translation is employed.
4 The Architectural Concept
In order to facilitate the conceivability of the implemented software and of itsexecution process, we design an architecture for an ESD oriented programmablelogic contioller with, conceptually, two processors:
"* a control flow processor (master) and
"* a basic function block processor (slave).
Thus, we achieve a clear and physical separation of concerns: execution of thebasic function modules in the slave processor and all other tasks, i.e., executioncontrol, sequential function chart processing, and function module invocation,assigned to the master. This concept implies that the application code is re-stricted to the control flow processor, on which the project specific safety li-censing can concentrate. Special architectural support for the cyclic operatingmode of programmable logic controllers is implemented in the master processor.To enable the detection of faults in the hardware, a dual channel configurationhas been chosen, which supports diversity in form of different master processorsand different slave processors.
At least one of the master processors should have the most simple organisationpossible for the considered application requiring only two instructions, one ofwhich is MOVE. The other one implements a special architectural support forthe cyclic operating mode of PLCs. Since only one step is active at any giventime, a memory protection mechanism prevents the erroneous access to theprogram code of the inactive steps. The STEP instruction is the only means toperform a branch. It solely allows to return to the initial address of the activestep's program code if the corresponding transition condition is not fulfilled.
The capabilities of the slave need to be somewhat more complex and are impliedby the operations of the four basic function modules. The objective of a PLCfor ESDs suggested to employ the VIPER [3] chip in the slave, because itis the only available microprocessor whose design has been formally provencorrect. The slave processor performs all data manipulations and takes care

59
of the communication with the environment. It has no program RAM, butonly executes the basic function modules whose code is contained in firmwareROMs.
To recognise hardware faults, all processing is simultaneously performed ontwo master/slave pairs. A number of c.>mparators checking the outputs fromthe master processors before they reach the slaves and vice versa completesa fault detecting two-channel configuration. The master and slave processorscommunicate with each other through two FIFO-queues. They execute pro-grams in co-ordination with each other as follows. The master processor letsthe slave execute a function block by sending the latter's identification and thecorresponding parameters and, if need be, also the block's internal state valuesvia one of the FIFO-queues to the slave processor. Here the object programimplementing the function block is performed and the generated results andnew internal states are sent to the master processor through the other FIFO-queue. The elaboration of the function block ends with fetching these datafrom the output FIFO-queue and storing them in the master's memory. Toavoid faults during operation, the function modules' object code is put in theslave's read-only program memory, after the correctness of the code has beenestablished. The master/slave configuration has been chosen to physically sep-arate two system parts from one another: one whose software only needs tobe verified once, and the other one performing the application specific part ofthe software. Needless to say, that the latter requires indvidual safety licens-ing. This concept implies that FLDs are solely mapped onto the control flowprocessor, to which project specific safety licensing can be restricted. Figure 2gives a conceptual diagram of the master/slave PLC architecture.
PROM
RMaster Processor A
M
SW-IC-ROM
Figure 2: Configuration of a PLC with master/slave processors
In available PLCs, the execution time for a step generally varies from one cycleto the next depending upon the program logic performed and the external con-ditions evaluated each time. Therefore, the measurement of external signals

60
and the output of values to the process is usually not carried out at equidis-tantly spaced points in time, although this may be intended in the controlsoftware. To achieve full determinism of the time behaviour of programmablelogic controllers, a basic cycle is introduced. The length of the cycle is selectedin a way as to accommodate during its duration the execution of the mosttime-consuming step occurring in an application. It is supervised that the exe-cution time of a step does not exceed this cycle period by awaiting, at the endof the step's program processing and after the evaluation of the correspondingtransition condition(s), the occurrence of a clock signal, which marks the beginof the next cycle. An overload situation or a run time error, respectively, isencountered when the clock signal interrupts an active application program. Inthis case a suitable error handling has to be carried through. Although the in-troduction of the basic cycle exactly determines a priori the cyclic execution ofthe single steps, the processing instants of the various operations within a cycle,however, may still vary and, thus, remain undetermined. Since a precisely pre-dictable timing behaviour is only important for input and output operations,temporal predictability is achieved as follows. All inputs occurring in a stepare performed en bloc at the beginning of the cycle and the thus obtained dataare buffered until they will be processed. Likewise, all output data are firstbuffered and finally sent out together at the end of the cycle.
5 Safety Licensing
With the implementations of all four basic function blocks employed in FLDshaving been proven correct and, as parts of the architecture, being invisiblefrom the application programming point of view, for any new ESD projectonly the proper mapping of a particular interconnection pattern of invokedfunction block instances on object code needs to be verified. For this purposewe subject the object code loaded into the master processor to back translation,a safety licensing method [4] which was developed in the course of the Haldennuclear power plant project and which is - although rigorous - essentiallyinformal, easily conceivable, and immediately applicable without any training.Thus, it is extremely well suited to be used on the application programminglevel by people with the most heterogeneous educational backgrounds. Theease of understanding and use inherently fosters error free application of themethod. It consists of reading machine programs out of computer memory andgiving them to a number of teams working without any mutual contact. All byhand, these teams disassemble and decompile the code, from which they finallytry to regain the specification. The software is granted a safety license if theoriginal specification agrees with the inversely obtained re-specifications. Ofcourse, in most circumstances the method is extremeiy cumbersome, time con-suming, and expensive. This is due to the semantic gap between a specificationformulated in terms of user functions and the usual machine instructions carry-ing them out. Applying the programming paradigm of basic function modules,

61
however, the specification is directly mapped onto sequences of module invoca-tions. The object code consists of just these calls and parameter passing. Theimplementation details of the function modules are part of our architecture.Thus, they are invisible from the application programming point of view anddo not require safety licensing in this context. Consequently, back translationcan lead, in one easy step, from machine code back to the problem specification,which is given in the form of FLDs. For our architecture, the effort required toutilise the method of back translation is by several orders of magnitude lowerthan for the von Neumann architecture.
Back translation is a verification method to the carried out with diverse redun-dancy. Originally, this called for different teams of human inspectors. Since inthe case considered here there is only one rather simple inverse analysis step,we are optimistic that the licensing authorities will eventually accept the fol-lowing procedure. Verification by inverse analysis is carried out by a numberof different programs, which should be proven in practice but do not need tobe formally verified. Such programs are to yield graphical outputs. An officiallicensor performs the inverse documentation as well, compares his results withthe ones of the verification programs and with the original graphical applica-tion program under inspection and, upon coincidence, issues a safety license.Such a procedure is in line with the dependability requirements for diverselyredundant programs demanded by the licensing authorities and necessitatesonly the minimum of highly expensive human involvement, viz., one licensor,who is always indispensable to take the legal responsibility for issuing a safetylicense.
In order to prevent any modification by a malfunction, in our safety orientedarchitecture all programs must be provided in ROMs. For practical reasons,generally there are two types of these memories. The code of the basic func-tion modules resides in mask programmed ROMs. On the other hand, thecode representing FLDs is written into (E)PROMs by the user. This part ofthe software is subject to project specific verification to be performed by thelicensing authorities, which finally still need to install and seal the (E)PROMsin the target PLCs.
6 Conclusion
In our society there is a growing concern for safety (which goes hand in handwith the increasing awareness for the environment). This has important con-sequences for the assessment of program controlled systems. One has begun torealise the inherent safety problems associated with software. Since it appearsunrealistic to abandon the use of computers for safety critical control purposes- on the contrary, there is no doubt that their utilisation in such applicationsis going to increase considerably - the problem of software dependability isexacerbating.

62
In a constructive way, and using presently available methods and hardwaretechnology only, in this paper for the first time an architecture was defined,which enables the safety licensing of a complete programmable electronic sys-tem including the software. The measures to achieve this objective were:
* using hardware as much as possible, but not necessarily in the most(hardware-) cost efficient way, since now there is cheap hardware in abun-dance (the additional hardware costs are equivalent to the cost of a soft-ware engineers for about half a day),
* utilisation of a high level, graphical software engineering method,
* closing of the semantic gap between architecture and user programmingby basing the software development on a set of function blocks with ap-plication specific semantics,
* removal of compilers from the chain of items requiring safety licensing,
* avoiding the need for a complex operating system, and
* by providing a feasible application level and architectural support for thesoftware licensing method of back translation.
Employing VIPER microprocessors, we have built a prototype of the PLC ar-chitecture described. Its utilisation in practice showed that implementing thefunctionality of a hard wired ESD system with our PLC architecture is feasi-ble, and that the programming paradigm based on formally verified functionmodules can render error free software. We hope that the concept presentedhere will lead to the replacement of hard wired systems safeguarding industrialprocesses by programmable ones executing safety licensed and, thus, highlydependable software.
References
1. Dijkstra EW, Feijen WHJ. Een methode van programmeren. Academicservice cop., 1984
2. Scheepstra J. PLC-Implementation of Emergency Shut-Down Systems.Master's thesis, University of Groningen, 1992
3. Kershaw J. The VIPER Microprocessor. Report No. 87014, Royal Signaland Radar Establishment, Malvern, England, 1987
4. Krebs H, Haspel U. Ein Verfahren zur Software-Verifikation. Regelungs-technische Praxis 1984; 28: 73 - 78

The Fast Cost Effective Design and Concurrent
Certification of the Safe Computer for aReal Time Train Control Application
G. A. MutoneAEG Transportation Systems, Inc.,
Pittsburgh, PA, USAM. Rothfelder
Institute for Software, Electronics,Railroad Technology (ISEB) of TUV Rheinland,
Cologne, Germany
Abstract
This paper starts with a general description of the AEG Transpor-tation Systems, Inc. Automatic People Mover System. Subse-quently, the specific safety requirements of the ATP, and the con-sequent design features to meet these requirements are described.Following this introduction, details of the relationship betweendesigner and certifier, the utilization of embedded rules-basedsystems, the concurrence of the design and certification process,and the de-coupling of the safety functions from the hardware aregiven. It is described how the dramatic improvements in the tradi-tional large costs and long schedules normally associated withboth the design and certification of safe computer systems aremade possible.
1 General Description of the Automatic People Mover
1.1 Overview
The AEG Automatic People Mover System consists of driverless operated trainswhich usually run on a guideway with a concrete surface. The trains are guided byan I-Beam and may be configured as consists of one, two or more vehicles. Theaccess of passengers to the guideway is prohibited by automatically operated stationdoors, which are normally closed. They open in synchronism with correspondingvehicle doors for passenger exchange only when the train is in the station and thedoors on both sides (vehicle and station) are properly aligned. The operation of theAutomatic People Mover System is controlled and supervised by the AutomaticTrain Control System (ATCS). At Frankfurt Airport the headway is designed to bedown to 90 seconds. The Frankfurt Airport Passenger Transfer System will be the

64
first application of the new Automatic Train Protection system design which isdescribed in this paper.
1.2 Automatk Train Control System
1.2.1 General Overview
The Automatic Train Control System consists of three major computer-basedsubcomponents with different functions. The Automatic Train Protection (ATP)ensures the safety of operation such as the safety of moving trains or passengerexchange in stations. The ATP does not allow unsafe system states. The AutomaticTrain Operation (ATO) provides operational control of train speeds, programmedstation stopping, station and vehicle door operation, as well as passenger audio andvisual information. The third function, the Automatic Train Supervision (ATS), isresponsible for the supervision of the Automatic People Mover systems, route andheadway control, and reporting of alarms.
The Automatic Train Protection system consists of two major sub-systems, theWayside ATP and the Vehicle ATP. Each is based on vital dual channel cross-checked computers and other vital 1/0 hardware. The safety functions of these twosubsystems satisfy specific safety requirements on the ATP as identified in theSafety Requirements Catalog (see chapter 2 Safety Requirements). Below, theallocation of safety functions to either Wayside or Vehicle ATP is given.
1.2.2 Wayside ATP
The Wayside ATP fulfils the following major safety functions:* Detection of Trains• Provision of Safe Speed Codes (Selection and Transmission)* Safe Switch Operation* Safe Station Door Operation• Vital Inputs and Indications for the Central Control Operator* Protection of Maintenance Vehicle
1.2.3 Vehicle ATP
The Vehicle ATP serves, among others, the following purposes:"* Reception of Speed Commands"* Supervision of Actual Train Speed"* Supervision of Safe Travel Direction"• Safe Vehidle Door Operation"• Safe Station Stopping"* Safe Reaction on Unintentional Train Separation

65
2 Safety Requirements
2.1 Analyses of Potential Hazards and their Causes
As comprehensive as possible all potential hazards and their causes are identified bymeans of a Safety Analysis. In the early phases, this analysis : )mprises the HighLevel Fault Tree Analysis (HLFTA) and the Preliminary Hazards Analysis (PHA).Hazards such as collisions with switches or other trains, end-of-line run-through,passengers gaining access to the guideway, or overspeed in curves are consideredcarefully in the HLFTA and the PHA. These analyses provide the designers of theATP with very detailed information on the possible causes of potential hazardswhich, in turn, provide all necessary means and measures to protect against thesehazards. The necessity of these means and measures is documented in the SafetyRequirements Catalog (SFRC). This document states all requirements for safetyfunctions which need to be fulfilled by the ATP in order to ensure safe operation ofthe Automatic People Mover System. The Safety Requirements Catalog is the basisfor all further ATP-related development and certification steps.
Correcting the problems early in the design and development process usually ismuch less expensive than fixing them later in the process. As the hazards areidentified very early in the design and development process by the above-mentionedSafety Analysis, the requirements are determined very early and hence additionalcosts in order to fix problems later are minimized.
2.2 Results of Safety Analysis and Consequent Design Principles
Most of the potential hazards identified during the safety analysis might lead toinjury or death of persons or damage to equipment. Generally speaking, the worsethe potential consequences of the hazards are the more rigorous the measures toavoid them must be.
One might have the idea to differentiate between each safety relevant functionaccording to its potential damages in order to engage different means and measuresto protect against the respective risk. But many of the functions are implemented bythe use of software. This makes it difficult to ensure that functions of a lowerintegrity level do not have any unsafe impact on those functions which protectagainst higher risks.
Due to these difficulties, each function of the ATP is considered to be of highsafety relevance and hence is designed in a vital fashion. Functions which have nosafety relevance are allocated to the Automatic Train Operation System (ATO). Forinstance, while the ATO controls the doors such that station and vehicle doors opensynchronously, the ATP ensures safety by not allowing the vehicle to move if eitherthe station or the vehicle doors are not closed and locked. Both computers areseparated such that the non-vital ATO can not interfere with the vital ATP. Thisstrict separation of vital and non-vital functions minimizes the verification,validation and certification effort necessary for the vital ATP and for the entireAuton-tic Train Control System.

66
The very fundamental regulations for the certification of the Frankfurt AirportAutomatic People Mover are BOStrab [1] and DIN VDE 0831 [2]. As far asDIN VDE 0831-the German standard for electrical railway signalling systems-isapplicable, all ATP functions are designed to be signal-safe. In other cases, whereneither BOStrab nor DIN VDE 0831 are immediately applicable-in case of softwarefor instance-other German or international standards which represent the currentstate of the technology are applied. This is required by BOStrab. For instance,DIN V 19250 [3], DIN V VDE 0801 [4] or MU 8004 [51 are applied. According toDIN V 19250 [3], the ATP is categorized as of Anwendungsklasse (Integrity Level)7. Consequently, applicable recommendations of DIN V VDE 0801 are followed.
All the components of the PTS are designed with an inherent high level of reliabi-lity so as to deliver an overall system availability of 99.65% or higher. This level,demonstrated quantitatively, is established by contract and consistent with actual le-vels reached in numerous operating installations of the AEG people movers.
2.3 Design of Vital Hardware-Examples
The safety of a computer-based train control system depends directly on thereliability of the underlying hardware. The hardware must fulfil its specifiedfunctions correctly and safely. Failures must not lead to unsafe states [2]. Hence,failures of hardware components need to be considered carefully.
Some failures can be excluded by the application of vital design properties. Otherfailures cannot be excluded and need to be detected to ensure that the system goes toa safe state in case of such failures. The following sections describe these vital de-sign principles by means of examples taken from the Automatic Train Protectionsystem.
2.3.1 Dual Channel Cross-Checked ATP Computers
The ATP computers which have to ensure the safety of operation are designed asdual channel cross-checked computers. Both computers cross-check each othercontinually. Each single computer channel compares the inputs and outputs to and ' -
from the actual process with the equivalent data from the other channel before itallows the transition from one safe state to another state. If one computer detects amismatch of cross-checked data, immediately appropriate actions are taken totransfer the system to a safe state, which is the shut-down of the concernedguideway portion. All vehicles in this section will come to a stop and any furthermovement is prohibited by the ATP until personnel has fixed the problem and theATP checked and confirmed that safe operation is restored.
2.3.2 Occupancy Detection and Speed Code Distribution (TX/RX System)
The Occupancy Detection of the Automatic People Mover System is based on TrackCircuits. A Track Circuit is occupied through 'short-circuit' by multiple shunts oneach vehicle. The Wayside ATP sends the appropriate speed commands to each ve-hicle via the Track Circuits and the Transmit/Receive System is used to transmit the

67
speed codes to the Track Circuits. Each Track Circuit is fed with speed commandseven when there is no train currently occupying it. If there is no train, the sent speedcodes are read back by the Wayside ATP. They are then compared against the trans-mitted codes. If they do not match, a failure in the Transmit/Receive System isassumed and a shutdown is initiated. This ensures a periodic test and failure detec-tion of the Wayside ATP components engaged in the Speed Code Distribution andOccupancy Detection. Here, the fulfilment of Failure Detection PeriodRequirements is designed into the system.
2.3.3 Failure Detection Periods
Other components may not be guaranteed to be tested within their specific failuredetection period by the above-mentioned approach. Here, other measures need to betaken to ensure the necessary periodic tests.
One approach to test these components, for instance, is that the ATP performs pe-riodic checks of their operation. Since the respective outputs are verified by a read-back, the component can be considered tested if it is operated and no failures areencountered. If that is not the case, the ATP alarms this fact to the Central ControlOperator in order to take appropriate action.
2.3.4 Failure Exclusions and Fail-Safe Design
In other cases, failures are excluded by the use of special design properties, such asGerman signal relays and so-called gravity drop-out relays. Here, the correctfunction of the relay is ensured by the chosen mechanical design, weights and gravi-ty. Other components are designed in such a way that all failures which are to beassumed will always lead to a safe state.
2.4 Development of Safety Relevant Software
The safety relevant ATP software is developed using the high-level language Pascal.The compiler used to generate the object code is validated and proven. It supports amodule concept. Hence, the ATP software is designed according to industry-accep-ted design principles of Information Hiding, Data Abstractions, High Cohesion, andLow Coupling. This ensures low complexity and highly comprehensible modules.Consequently, generation and verification of the source code is less error-prone.Additionally, these design principles improve the maintainability which in turnmakes changes less error-prone and results in less effort. The verification and va-lidation of the ATP software involves rigorous methods which are described inSection 4.4.
3 Rules-Based Interlocking Engine
Conventional interlocking systems usually are designed for specific applications. Inthe past, different guideway layouts or extensions to existing systems led to conside-

68
rable effort to customize and certify each separate configuration of the wayside trainprotection system. Furthermore-in case of extensions to existing systems-this ap-proach led to additional system outages during the exchange of components. TheRules-Based Interlocking Engine (RBIE) [61 has been designed to circumvent theseproblems.
3.1 Overview
The basic principle of the Rules-Based Interlocking Engine is to make the imple-mentation of safety functions independent from the underlying hardware and coresoftware of the ATP. The ATP becomes a generic means to realize safety functions.This is accomplished by the following way. A description of the actual system withapplication-specific information is supplied to the application-independent WaysideATP. To achieve this, a description of the system's layout and other details is crea-ted. This description is called the Guideway Definition File. The Guideway Defini-tion File is placed in the ATP (See Figure 1). The information in the Guideway De-finition File is then transformed (parsed) into an internal representation suitable forinterpretation by the Rules-Based Interlocking Engine software. During runtime thevital decisions of the Vital ATP Computer are based on generic interlocking rules.These rules are evaluated by the Rules-Based Interlocking Engine regarding theapplication specific relations as defined in the Guideway Definition File.
th WWg ARg P
abm ImmAl ~Preserow
type.nce te Ruls-Basdof ntRulesin Engin i ascrifiedacrigtth
aATP Rad
Figure 1: Simplified Architecture of the ATP Computer with focus on the RBIE
Because of this strict separation of application-specific information in the Guide-way Definition File from the generic Rules-Based Interlocking Engine embedded inthe Wayside AT?, the generic Rules-Based Interlocking Engine is certifiable as atype. Once the Rules-Based Interlocking Engine is certified according to theapplicable standards and regulations, the effort for the development and certification

69
of the interlocking of new systems is reduced to efforts related to the generation andcertification of a valid guideway definition file.
3.2 Guideway Definition File
As mentioned above, the application specific information on the people moverapplication which the ATP is intended for is laid down in the Guideway DefinitionFile in a comprehensible and easy-to-read manner. Among others, the GuidewayDefinition File gives information on the guideway layout, arrangement of stations,allowable speeds and application-specific obstacles which might violate theclearance profiles such as facade washers.
3.3 Validation of Guideway Definition File
The Guideway Definition File is a well-structured plain text and easy-to-read ASCIIfile. The language is especially designed to be comprehensible to people moverexperts without any special software knowledge. Hence the validation of the Guide-way Definition File may concentrate on the railroad aspects. Validation may besupported through the graphical exercise of the information contained in the Guide-way Definition File.
3.4 Advantages
The approach of the Rules-Based Interlocking Engine leads to improvements withrespect to safety as well as economics. The validation of application-specific designcharacteristics is much less error-prone compared to conventional approaches.Besides the safety aspects this approach is very cost-effective. Once the ATP withits Rules-Based Interlocking Engine is type certified, time and efforts spent in theconfiguration and certification of other ATP applications are reduced dramatically.
4 Project-Accompanying Safety Certification
4.1 Relevant Regulations and Standards
The first application of the described Automatic Train Protection system is theFrankfurt Airport Passenger Transfer System (PTS). The system has been designedaccording to German regulations, like the BOStrab [1], DIN VDE 0831 [2].
In cases where these regulations do not provide sufficient detail regarding thesafety requirements other standards are engaged that represent the state of technolo-gy such as DIN V VDE 0801 [3] and MU 8004 [5].
4.2 Certification Process
The certification process conducted by the certifier Institute for Software,Electronics and Railroad Technology (ISEB) within TUV Rheinland Sicherheit und

70
Umweltschutz GmbH, consists of five major steps which concur with themanufacturers development process:"* Set-up of a Certification Plan"* Review of manufacturer's Quality Assurance System"* Adaptation of the certifier's configuration and documentation management
system to the manufacturer's documentation structure"* Verification and Validation"* Safety Trials"* Compilation of a Final Report on the system's safety
In close cooperation with the manufacturer the Certification Plan defines kind andscope of certification steps to be conducted by the certifier such as reviews, inspec-tions, audits, analyses, and tests. The depth and thoroughness of the certifier's activi-ties depend immediately on those activities which are planned and performed by themanufacturer and on the insight and understanding which the certifier gains fromthese activities.
Firstly, the basic steps of the certification process are defined in principle.Concurrent to the certification process these basic steps are refined as the develop-ment phases emerge. This process leads to a common understanding of the set ofrelevant items which are subject to certification such as documents, processes, soft-ware, and hardware components. For each relevant item, it is determined which ac-tivities need to be performed by the certifier. The certifier then adjusts his configura-tion and documentation management system to the set of relevant documents.Furthermore, a schedule is agreed upon which defines the dates of the submittal ofcertification relevant items as well as the duration of each certification activity.
The more rigorous and comprehensive the QA measures of the manufacturer areand the better these measures are documented, the more the certifier may limit hisefforts to minimal measures to gain confidence in the manufacturer's QA measures.For this reason the manufacturer's intended QA system is reviewed in the earlyphases of the certification in close cooperation between the manufacturer and thecertifier. This is done based on appropriate documentation, e.g. Software QualityAssurance Plans and Software Verification and Validation Plans taken from formerprojects. Guidelines for documentation, design methods, coding standards, andproject management as well as the structure of test plans are established in theseearly phases. The actual certification activities then consist of the following mainsteps which are often similar even in different projects:"* Review of Concept Descriptions"* Validation of System Requirements"* Validation, Verification and Certification of Hardware and Software"* Integration Tests• Safety Trials
In each phase of the certification process a close contact hetween certifier anddevelopers makes it possible to communicate emerging problem., as soon as possibleand hence fix them as early as possible.
The following sections describe the methods engaged during the development ofthe Automatic Train Protection system. This only provides an impression of the cer-

71
tification process. A detailed description would have exceeded the boundaries of this
paper.
4.3 Hardware Certification
The hardware certification consists of the review of documentation pertinent to allATP hardware components. Among others, Lower Level Fault Tree Analyses, Envi-ronmental Analyses, Descriptions and Specifications, Detailed Hazards Analyses,FMEA, Worst Case Analyses, Test Plans and Test Results for each component areinspected and, when necessary, supplemented. Boards and other components areinspected thoroughly. For instance, the creepage distances are examined carefully.Some components such as relays are tested thoroughly by the certifier. Theexecution of tests of other components by the manufacturer are witnessed.
4.4 Software Validation and Verification
4.4.1 Software Life Cycle and QA System
The software is developed by the manufacturer according to a software life cyclemodel consisting of a Concept Phase, Requirements Phase, Design Phase,Implementation Phase, Test Phase (Unit Tests through System Integration Tests),Installation and Checkout Phase, Operations and Maintenance Phase. For eachphase, the Software Quality Assurance Plan and Software Verification andValidation Plan exactly define the specific tasks of design, verification andvalidation. The entity (development or V&V) responsible for performing aparticular task, as well as the means for documenting the task results, are defined. Agroup of engineers is assigned by the manufacturer to be responsible for all V&Veffort . These engineers are independent from the development engineers. This leadsto a high quality of items submitted to the certifier and consequently lesscertification effort.
Besides the definition of V&V tasks, the manufacturer's Quality AssuranceSystem takes into account further regulations such as Coding Standards,Documentation Guidelines, or Software Requirements Specification Procedures.Each component of the Quality Assurance System is assessed by the certifier.
4.4.2 Validation and Verification Methods
All documents have been validated and verified thoroughly by the certifier withmethods like walk through, reviews, inspections, and static analysis. The manufactu-rer conducts comprehensive tests on units, during software integration, and duringsystem integration. These tests are witnessed by the certifier. Prior to the actual testexecution, the certifier reviews the test plans generated by the manufacturer's V&VGroup in order to ensure that all relevant system states are tested. When necessarythe certifier supplements these test cases. In order to achieve a comprehensive set oftest cases the Cause-Effect Graph Method is used by the manufacturer's V&V groupto define the requirements-based Black Box test cases. Black Box tests are executed

72
first and branch coverage achieved by these cause-effect graph based test cases ismeasured. If this coverage does not reach 100% branch coverage, additional WhiteBox tests are conducted. This systematic test approach leads to comprehensive testsof the ATP software.
4.4.3 Type Certification
As soon as certain components (sub-components, boards, computers, software com-ponents like the Rules-Based Interlocking Engine) are type certified they may beregarded as building blocks. The certification of a specific application may thenfocus on the correct application of these building blocks and the validation ofapplication-specific configuration data.
5 Conclusions
The chosen approach leads to improvements in costs, scheduling and safety. Theseimprovements are made possible mainly by the flexibility and reusability of theRules-Based Interlocking Engine, the flexible and effective concurrent certificationprocess, and the manufacturer's development-independent Quality Assuranceactivities. In turn, as shown above, the rigorous verification and validation measuresensure the safety of the Automatic Train Control system with the above-mentionedsignificant cost improvements.
References
I. Verordnung Ober den Bau und Betrieb der StraBenbahnen (StraBenbahn-Bau-und Betriebsordnung - BOStrab) vom 11. Dezember 1987, BundesgesetzblattTeil I Nr. 58 vom 18. Dezember 1987
2. DIN VDE 0831/08.90 Elektrische Bahn-Signalanlagen3. DIN V 19250/01.89 Messen-Steuern-Regeln: Grundlegende Sicherheitsbetrach-
tungen fuir MSR-Schutzeinrichtungen4. DIN V VDE 0801/01.90 Grundsatze ffir Rechner in Systemen mit Sicherheits-
aufgaben5. Grundsditze zur technischen Zulassung in der Signal- und Nachrichtentechnik
(Mu 8004), Deutsche Bundesbahn, Bundesbahn-Zentralamt Mfinchen,01.02.1993
6. G. A. Mutone, J. Daubner, Vital Automatic Control of Guided Transports withReal-Time Expert Systems, ITTG '93, Lille, France, September 1993

Design and Analysis of a Failsafe Algorithm forSolving Boolean Equations
Harvey E. Rhody, Ph. D.RIT Research Corporation
Rochester Institute of TechnologyRochester, NY (USA) 14623
Vittorio ManoniSASIB Signalamento Ferroviario
40128 Bologna, Italy
James R. HoelscherGeneral Railway Signal Corporation
Rochester, NY (USA) 14620
1 Introduction
Since the installation of the first mechanical interlocking in 1856, railway signalengineers have developed a set of rules which define the essential requirementsfor safe train movement. In the majority of cases this set of rules can beexpressed as a closed set of boolean equations which, when implemented aswritten, yield a safe operating system. The boolean equation set will varydepending upon the particular requirements of each application. The set ofgeneral rules are imposed on the specific requirements of each application toyield a closed set of boolean equations which completely describe the safetyand operational requirements of that application.
By implementing the set of equations with hardware elements which haveknown failure modes it is possible to not only create a safe operating systembut also a failsafe operating system. For the past 50 years, this has beenaccomplished using the 'safety relay.' The 'safety relay' has a known set offailure modes. More importantly, it has by design eliminated some failuremodes which are common in general purpose relays. This relay is designed,such that its front contacts will not be closed unless the relay's coil is properlyenergized. While this allows the signal engineer to implement a safe system,

74
designing a relay to have a particular set of failure characteristics results in
relays which are costly and physically large (GRS B1 relay is approximately16 cm x 2.5 cm x 8.6 cm. and weights about 4 kg). Even a simple applicationmay use in excess of 100 relays and have more than 1000 wire connections.
While relay based systems are very robust, they are also very inflexible.Changes to the control system requires the addition, deletion or modificationof relays and interconnecting wires. This is labor intensive and in many casesit requires physical space that is not available. The microprocessor on theother hand offers extreme flexibility, small size, and low cost. However, it alsooffers hardware with a set of failure modes which cannot be totally defined,and, therefore, cannot be used to achieve a failsafe system based on failurecharacteristics. Thus, the challenge is to develop an algorthm that will allowthe microprocessor to be used to solve boolean expressions in a way that insuresthat any and all failures which might affect the attainment of correct resultsare rvealed and used to force the system to a known safe state.
One approach that has been implemented in safety critical applicationsis the use of multiple processors checking each other. This approach is im-plemented in various ways including: two or more identical processors withidentical software, two or more identical processors with diverse software andtwo or more different processors with diverse software. In each case process re-sults are checked for agreement, and the lack of agreement is used to force thesystem to a safe state. Each of these implementation methodologies has areaswhich must be thoroughly analyzed before they can be accepted as producinga failsafe system.
The identical processors using identical software approach requires that theinitial software be proven to be completely error free. This technique is onlyeffective in revealing independent hardware failures which cause the checkedresults to differ. It does not protect against software design errors. If bothsystems have the same embedded flaw then they will both act on it the same andthe flaw will not be revealed. Proving that the software contains no embeddedflaws or is error free is difficult if not impossible [1].
The use of identical processors with diverse software requires proof that thesoftware is actually diverse. If the software is written to the same specificationfor the same processor, using the same command set the level of diversity ofthe final set of software appears questionable. Also, it appears to be difficultto prove that the software is actually diverse enough to reveal all embeddederrors and/or hardware failures.
The approach of using diverse hardware and diverse software would appearto solve the problems of these other approaches, but it actually requires twocomplete developments, two complete sets of hardware and two complete setsof installation tests. This is costly, and hardware dependent. Also, in all ofthese cases the voting or checking algorithm must be developed and analyzedto prove that it provides the safe operation required.
These approaches, while not perfect, do offer the possibility that the micro-processor can be applied to safety critical systems. However, they suffer fromserious practical problems related to the cumbersome analysis that must be

75
done to validate the level of safety they provide in each installation. Much ofthe analysis must be repeated, in detail, for each system that is installed.
In order to use microprocessors in the rail industry we determined [2] thatthe solution must not only resolve the safety problem but it must also produce asystem that is; 1) analyzable and verifiable to some minimum level of safety, 2)hardware independent, 3) application independent (such that it does not haveto be safety verified for each new application), 4) easy to apply to differentsets of boolean equations, 5) not based on proving the software to be errorfree and 6) cost effective. The developed solution has been named NumericallyIntegrated Safety Assurance Logic (NISAL) [3]. This solution is effective inmeeting the stated goals and, because it is numerically based, it allows theupper bound of the probability of an unsafe event to be calculated [4]. Thisthen allows the lower bound of the mean time between unsafe events (MTBUE)to be calculated. These calculations can be done once because they are anintrinsic part of the system design. They do not need to be redone for eachapplication.
2 The Algorithm
The basic structure of a system that uses numerically integrated logic is shownin Figure 1. A set of sensors which have relay contacts that are either open orclosed provides information on the state of the railroad system. These sensorsare probed by the system to determine their values, and the TRUE or FALSEstate is used in primordially safe boolean expressions to determine the propersettings for the output devices.
Figure 1: Simplified structure of the system.
The safety of the process is assured by causing it to generate checkwordsthat are used in a validation step by an independent agent, described below.Each process step - evaluating a boolean expresion, verifying the state of aninput port, verifying the state of an output port setting, verifying that a sec-tion of computer memory was cleared, etc. - generates a checkword, and eachcheckword must satisfy the independent agent. In current implementations thecheckwords are thirty-two bit binary numbers. The operations are so structured

76
that the system generates each checkword by correctly doing the associated op-eration. If the operation is not done correctly then the checkword is effectivelya random pattern with only a small chance of being correct. Thus, incorrectcheckwords reveal inproperly done operations.
The independent agent consumes checkwords that are produced by the sys-tem and provides the energy to operate the output devices. If the agent is notsatisfied with the sequence of checkwords it is receiving, it removes energy fromthe system and causes it shut down in a known safe state.
Neither the system nor the agent "know" the correct checkwords in thesense that they are stored in memory to be looked up. This would lead to thepossibility of improper operation being unrevealed due to the correct check-word sequence being obtained from memory. As we have seen, the systemmust generate them by proper operations. Similarly, the agent responds veryselectively to its input binary pattern. If the pattern is not correct then theresponse will not support the continued flow of system energy. The responsecharacteristics are determined by the structure of the agent, which is matchedto the proper checkword pattern in a manner similar to the correspondence ofa matched filter to a particular signal.
The independent agent has two possible responses: (1) provide vital power,and (2) remove vital power. Providing vital power is a positive action thatdepends upon the correct input sequence. If the sequence is not correct, energyis removed from the system and it shuts down safely. The operation of providingor removing vital power can be accomplished in a number of ways, includingthe use of a vital power supply or a vital relay.
To illustrate the nature of the checking process, consider the simplest pos-sible situation - one in which there is a single expression to be evaluated.Suppose that the states of input devices are represented by A, B, etc. and thatthe logical value of the expression is represented by z as in the equation
z = ABC + DE + FGHI +-.. (1)
z will have the value TRUE if and only if all of the variables in at least one ofthe product terms are TRUE. (Values which should be false for the equation toevaluate to TRUE would be complemented in the equation.)
Suppose that the TRUE and FALSE values of z are represented by N-bitbinary patterns, and that the TRUE pattern is unknown by the evaluator. Theproper pattern is produced by scanning the expression until the first productterm that has proper values for a TRUE result is found. The parameters in thatterm are processed by the evaluator, in a manner described below, to producean N-bit pattern for z. If no product term is found that has proper values for aTRUE result, then the N-bit FALSE pattern is inserted for z. The system logicis designed so that no FALSE result can cause an unsafe condition.
A large system will have many boolean expressions, but the principle is thesame. Each expression is processed to produce a binary pattern, which is usedas a checkword. By making the binary patterns sufficiently long, it is highlyimprobable that they can be produced by chance. It is even more unlikely that

77
a system with a hidden failure will produce a correct sequence of checkwordsby random selection.
The input sensors are read by transmitting particular digital patterns to theinput test circuits and observing the returned patterns. A particular sensor istaken to have a TRUE reading only if the returned pattern is a codeword ina suitable error detecting code. This, however, does not produce the vitalinput sensor value. It only establishes a hypothesis about the setting of theinput port. Any TRUE setting is then verified by transmitting another patternthrough the port and using that pattern in the computations.
The settings of output devices are verified in a similar fashion. The state ofthe devices are set by sending commands based on the results of the booleanevaluations. The output states are then verified by transmitting state-dependentpatterns through the devices and using those results together with the intendedsettings to produce the signal for the independent agent.
To guard against the possibility that some internal system failure could beunrevealed by a particular checking algorithm, the system may be designed todo a second set of checking operations that are informationally redundant butalgorithmically diverse from the first set. The current implementation produces"a pair of checkword results for each operation, say z and x', each created by"a separate checkword algorithm implemented as a finite-state machine with aunique system matrix.
2.1 Structure of the Evaluation System
There are many ways to construct an evaluator which will produce a givenoutput pattern from a sequence of input patterns. A basic form is a finite-state machine, which is started in an initial state and then stepped througha state sequence. Each parameter in a boolean product term is representedby a binary pattern, and those patterns serve as the machine inputs. Eachpattern in the input sequence influences the next evaluator state. The finalstate is completely predictable from the initial state and the input sequence.The evaluator output, which is a function of the final system state, will be aproper binary pattern if it begins in the correct initial state and all of the inputparameter values have their expected patterns.
A table of initial conditions, one for each product term of each booleanexpression, is maintained. When a particular product term is to be evaluated,the initial condition for that product term is taken from memory and used asthe initial state vector of the finite-state machine. The machine is then cycledwith the parameter value patterns as inputs. When all of the parameters havebeen consumed the output is calculated as a function of the final state of themachine. An independent evaluation of each boolean expression is done witha second evaluator using parameters from the second input channel. The tworesults, z and z', form the diverse pair of binary patterns.
The state of a finite-state machine at a particular time i + 1 is determinedby its state at time i and the inpu+ at time i. If the inputs are representedby the sequence U = Jul, u2,..., uI} and if the states are represented by the
| :N:(a mwm mmmmmmmmar mmm I~mm mr .• mmmmlmmemm mmm ~ mM~m mm wmm m• ...... . .

78
sequence V ={v 1 ,v2,..., v , thfa
v =+1 = vT + ujU (2)
where T is thes stem matriz and U is the input matriz. If the system hasr internal states and . inputs, then T is r x r and U is a x r. The systembehavior is determined almost completely by the properties of T.
If the system is initialized to be in state vi, then the state vj+. can beshown to be
vi+1 = viTV + •-•uUT- (3) "j~!i
The state vj+ is a function only of the initial state v, and the sequence ofinputs Ul,.. us.
The checkword for the evaluation of a boolean expression is computed by(1) finding the first product term that has proper parameter values to producea TRUE result (or directly produce the FALSE checkword as the value for zif there is no such term); (2) selecting an initialization value for that productterm (the value of vi); (3) setting the initial value of the machine; (4) operatingthe machine with the product term i as input uj; (5) after the n parametersof that product term have all been entered, using vn÷1 as the system output.Thus, the output is determined by the initial state and the input sequence.For the algorithm to be useful for our purposes it must be possible to computethe initial condition to produce the target output value for each parameter setand it must be the case that an error in any bit of the initial condition or anyparameter will cause the system to produce a different output pattern.
It is a relatively simple matter to compute the initial condition requiredto produce a desired target output t for a given input sequence U. In (3) leti = n and set v,,l+- = t. Then sequentially step backwards through the statesby doing the calculation
Vi = (vi+l + uiU)T- 1 (4)
Multiplying by T- 1 is equivalent to stepping the machine backward. After nsteps we reach the desired value for the initial condition, vj.
The effect of an error in the initial condition or any of the inputs is relatedto the dynamics of the system when it is allowed to operate with zero input.Because the system described by (2) is linear, the effects of individual errorscan be found by superposition. The effect of an error in the initial conditionv1 can be seen by allowing the initial condition to be
411 = v1 + v1 (5)
where v, is the intended value, ve is the error, and ',1 is the initial conditionactually used. The final state from this state is
#"+, = #1T" + Eu 1 UT"n- (6)j=1

79
The difference between the actual final state and the intended final state canbe found by subtracting (modulo 2 addition) (3) with i = n from (6).
, = vn+1 +i = vTT" (7)
The above result shows that an error in the initial condition depends only onthe error value ve and the system matrix T. It does not depend upon theintended initial condition or any input value.
Similarly, suppose that there is an error in a particular input value, say urn,1 <m < n. Then im = un + u: replaces um in the computation of the finalstate. The result is
n,- = VlTn + E ujUT"' +u•UT- m (8)
j=1
The effect of the input error is given by the last term in the expression.
= u•UT- m (9)
Once again, the effect of the error does not depend upon the desired initialcondition or the desired input values. It is simply a product of the input error,the input matrix, and the system matrix raised to the power n - m. The sameresult would be achieved by starting the system in state u;U and steppingit n - m times with no other input. The mechanism for an individual erroraffecting the output is the system transient response, as determined by powersof T.
Errors in other input parameters can be treated similarly. The total errorin the final state is given by
et = viTn + E u•UTV- m (10)m=1
Each error causes a system transient response to be reproduced. The totalerror is the sum of the error transients set up by the individual errors. Thisobservation allows us to investigate the effects of errors on the system outputby examining the transient response, or the autonomous system response.
2.2 Autonomous System Response
An autonomous system has all inputs set to zero. If it is started in a state s thenthe sequence of internal states is (s, sT, sT2 ,.. .}. The powers of the matrix Tmust eventually begin to repeat, causing this to be a repeating state sequence.The fact that powers of T must repeat is a consequence of the Cayley-Hamiltontheorem, which says that a matrix must satisfy its own characteristic equation.
*(X) = IT + XI1 (11)

so
The characteristic equation is a polynomial in X. If T is r x r then the highestpower of X in *(X) is X'.
O(X) = ao + aiX +... + a,_iXr- + ax" (12)
where the coefficients are from the binary number field (0, 1} and, in particular,a = 1. Since T must satisfy this equation,
Tr = a0I + ajT +... + aG-,Tr-1 (13)
Every power of T can be represented as a polynomial in T with maximumdegree r- 1.
Tk = b0I + biT +... + br-iTr- 1 (14)
where the coefficients are binary numbers. There at most 2r- 1 distinct powersof T (excluding T = 0), so that the state sequence has a maximum length of2'-1 before repeating. This maximum length will be achieved for linear fininte-state machines in which the characteristic equation is a primitive polynomialof degree r.
A maximum-length LFS machine of order r can be constructed by buildinga linear feedback shift register with feedback connections determined by thecoefficients of a primitive polynomial t(X) of degree r. There are at leasttwo primitive polynomials of every degree, so this is always possible. A gooddiscussion of the shift-register implementation of finite-state machines and theirproperties is contained in Peterson and Weldon [5].
2.3 Error Effects
The independent agent "expects" a checkword sequence {z,}. Its design issuch that it will fail to provide system energy if this sequence is incorrect. Inthe current implementation each z, is a thirty-two bit binary number that isgenerated by the operation of the LFS machines as described above. To findthe probability that the independent agent will fail to shut the system down ...
in the event of a computational error, we need to compute the probability ofgetting the proper value of zi with an erroneous evaluation.
The effect of an individual error depends upon both its value and the time ofoccurrence. The effects of multiple errors combine by superposition, as shownby (10). A combination of errors will be invisible only if the effects sum to 0.This can occur only when there are two or more errors because no single errorcan produce the 0 state.
As an example, let us look at the requirements of a pair of errors, say attimes t - j and t = k with k > j, such that their combined effect is 0 at somelater time, say t = n. The requirement is
u UT"- + ueUT"-k =0 (15)
ueU = u UTJ j (16)
Moa

81
The right-hand side can be any nonzero pattern. In the current system inwhich r = 32, there are 2" -1 - 232 -1 -= 4,294,967,295 s 4.3.- 10 distinctpatterns. The left-hand side must match the pattern that is chosen by theright-hand side. Starting at a random initial state, produced for instance bya random error pattern combining with the shift-register contents at time j,the system is equally likely to be in any of the nonzero states k - j steps later.The probability of the error at time k just canceling out the random patterncaused by the error at time j is one in 21 - 1, which can be made as small asdesired by the choice of r. In the current implementation this probability isabout 2.33- 10-10.
An equivalent analysis applies to the case of more than two errors. Thechance that several errors will combine to produce a 0 result is approximately2-rY.
Recall that the system uses two channels for diversity in error checking.The probability that both channels produce a 0 response to two or more errorsis the product of the individual probabilities, or about 5.43- 10-20. In a systemin which there is an independent error opportunity about once every 100 mil-liseconds, the expected time between such occurrences (MBTUE) is 5.8. 1010years.
3 Applications
This algorithm has been applied in the Vital Processor Interlocking (VPI),the MicrocabmaticI and the Apparato Statico con Calcolatore Vitale (ASCV2)products. The VPI and ASCV products are used to control signals and switchesat interlockings (locations were multiple tracks are connected together to allowvarious train movements) and the Microcabmatic product is used on boardvehicles (locomotives and transit vehicles) to insure safe speed enforcement.These products have been applied in more than 350 installations and to datehave achieved over 3,000,000 hours of safe operation. There has not been afailure of the algorithm to insure safe operation. Furthermore, the systemshave proven to be reliable and have not suffered from unnecessary shut downs.For example, the average VPI system has demonstrated a mean time betweensystem shutdowns (assuming no systems utilize backup or standby redundancy)of over 50,000 hours due to hardware failures including those in the input andoutput interface circuitry.
The algorithm has been reviewed and analyzed by rail and/or transit au-thorities in at least 6 different countries, and all have found it to be acceptablefor their use. Since the algorithm is not application dependent, this equipmenthas found use in other rail applications were boolean equations are used, in-cluding speed limit selection control and highway crossing gate control. Also,since the algorithm is application independent it is easily used by countrieswhose signalling philosophies differ from that used in the USA.
1 VPI and Microcabmatic are registered trademarks of GRS Corporation.2 ASCV is a registered trademark of SASIB Signalamento Ferroviorio.

82
The power of the microprocessor has allowed these products to includeembedded diagnostics. These diagnostics have been instrumental in systemmaintenance and in reducing the time needed to restore a system after a fail-ure. A computer aided applications package has also been developed for theseproducts which allows the application process to be partially automated andallows the systems to be simulated before they are installed. The computerapplications package and simulator in conjunction with the flexibility of thisscheme has been instrumental in applications which progress through multiplestages as a result of changing track work.
4 Conclusion
The NISAL algorithm has proven to be both robust and flexible. It has provideda system which is analyzable and allows the maximum probability of an unsafeevent to be calculated independent of the hardware and the application. Itis easily applied and adapted to the different signalling philosophies found indifferent countries. It does not require a proof that the software is error free. Itsacceptance worldwide has allowed the power and advantages of microprocessorsto be applied to the rail industry while maintaining high safety standards.
References
[1] Butler, R. W. and Finelli, G. B. The Infeasibility of Quantifying the Relia-bility of Life-Critical Real-Time Software. IEEE Trans. on Software Engi-neering 1993; 19:3-12.
[21 Hoelscher, J. R. and Balliet, J. B. Microprocessor-Based Interlocking Con-trol - Concept to Application. 1986 APTA Rapid Transit Conference, June4,1986.
[3] Rutherford, D. B., Jr. Failsafe Microprocessor Interlocking - An Applica-tion of Numerically Integrated Safety Assurance Logic. Proc. Institute ofRailway Signal Engineers. London. Sept. 1984.
[4] Rutherford, D. B., Jr. A Vital Digital Control System with a CalculableProbability of an Unsafe Failure. IEEE CH2830-8/90/0000-0001. August,1990.
[51 Peterson, W. W. and Weldon, E. J., Jr. Error-Correcting Codes. The MITPress, Cambridge, 1972.

Session 3
SAFETY ASSESSMENT
Chair: G. RabeTUEV
Norddeutschland, D
~~~1t

Programmable Electronic SystemAnalysir Technique
in Safety Critical Applications
MJ.P. van der MeulenDepartment of Industrial Safety
Ustitute for Environmental and Energy ResearchThe Netherlands Organization for Applied Scientific Research TNO
Apeldoorn, The Netherlands
T. StilhaneSINTEF DELAB
Trondheim, Norway
B. ColeSoftware Metrics Laboratory
Glasgow Caledonian UniversityGlasgow, Scotland
Abstract
The PESANTE' project intends to arrive at an integral approachtowards PES2 assessment. Elicitation of knowledge on relationsbetween PES characteristic and functioning is the first step. Herecategorical analysis plays a major role. The results of this phasewill be used to tune a Bayesian inference network. This networkis able to assess PESs given an amount of information on thePES characteristics. The techniques chosen are able to cope withheterogeneous and missing data. PESANTE will cover softwareand hardware aspects, as well as the human factor. Also, it canindicate the value of information to be procured next; this makessure a balanced assessment is being made.
1 PES = Programmable Electronic System
2 PESANTE = Programmable Electronic System ANalysis TEchnique

86
1 Introduction
Before installing safety critical programmable electronic systems in industry, onewants to assess the dependability aspects of the system. This is done with thepurpose of- Choosing the right PES in the right application; balance of costs andperformance.- Balancing the overall dependability of a total system; the dependabilityrequirements for the PES are related to those of the total system.- Numerical assessment of plant dependability performance.
The problem with the available techniques is that they tend to be unbalanced, notusing as much data as would be possible, and arriving at unusable measures.- They are unbalanced. Most techniques only address hardware performance.Some address software performance and only few address the human factor.Experience has shown that all three of these are important to arrive at dependablesystems. Almost no technique addresses the combination of the three of them.- They ignore information. Each technique only includes data that fits in itsmathematical framework. From these, most techniques available at the momentdisregard much information. More specific: they only include numerical data ononly a few aspects of the system's characteristics.- They result in unusable measures. Unusability of measures happens in two ways:too much information on a small part of a system (e.g. MIL-HDBK-217calculation of hardware failure rate [1]), or information that is hard to handle (e.g.the number of remaining bugs in a program).
TNO has defined the PESANTE [2] project, in cooperation with SINTEF andNorsk Hydro, Dow Europe, and Glasgow Caledonian University's SoftwareMetrics Laboratory. The aim of the PESANTE is to measure dependabilitycharacteristics of programmable electronic systems in process industry. Themethod is to be used for highly rclable PESs in safety applications resulting in abalanced, complete and usable assessment.
2 Baseline of the Project
Dependability assessment of safety related systems is getting more crucial everyday. More and more, PESs control and guard critical processes. Nowadays theinsight has grown that dependability of electronics depends on three factors:- Hardware.- Software.- Human factor.All three of these have to be examined in order to arrive at a sound assessmentof a system. The following sections shortly describe the state of the art in thesefields relevant to PESANTE.

87
2.1 Hardware Dependability
As all dependability engineering, hardware dependability assessment can be donequalitatively and quantitatively. The first methods used were essentially qualitative(dependability by design). Then the quantitative approach emerged, amongstothers initiated by the US. Defence organizations: the MIL-HDBK-217 [1]. Thisapproach has gained much popularity and is used for almost all PESs at themoment. In spite of its popularity, much has been said against the applicability ofthe handbook [3]. By this, and the notion that safety has to be an integral part ofthe dcsign in highly dependable systems (making things impossible is better thanmaking them very improbable) the qualitative approach gains field again.
2.2 Software Dependability
In software dependability engineering, the most widely applied methods arequantitative. Most methods use data on debugging and failure times for estimatingfailure rates [4]. There is much discussion about the validity of the approach andits correlation to reality. Case studies have shown good results, but the questionremains whether the methods give valuable clues for the individual case.
2.3 The Human Factor
The notion that human dependability is a major factor in the functioning of allsystems is rapidly gaining field. Human factors play a role in all stages of a design:specification, implementation, debugging, maintenance, upgrading, and last but notleast use. The emphasis on quality assurance at all stages is one of the examplesof the effects of this notion. The other way around, the incorporation of data onthe human factor in an assessment of a system is in development. Numerouspublications [51 discuss the matter and try to find solutions to the problem. Theresults are promising. It has become clear that without assessment of the humanfactor dependability estimation of a system is incomplete.
2.4 Integral Approach Towards Dependability Assessment
All three of the aspects mentioned above play a role in dependability estimationof industrial electronics. This poses the following problems to the assessor:- Finding the right balance in assessment of the three aspects.- Combining findings on the three aspects into one assessment. The fmdings maybe of quite different nature. Also some information on an aspect may be lacking.Two examples may clarify this: sometimes information has to be discardedbecause the tool used cannot handle the kind of information, also sometimesanalysis methods demand data for arriving at an answer, even if the data is notavailable. Essentially, most information one can gather on a system isheterogeneous: having different units, scales, and importance. This poses harddemands on the assessor and also on his tools.

88
- Assessing the value of information. If a certain amount of information on asystem is available and one is not yet satisfied with the results: what informationshould be gathered next? What information is most valuable to the assessor inorder to improve his ordeal. E.g. if one has a lot of information on hardwaredependability, extra information on hardware dependability might not be veryvaluable as opposed to information on the human factor. How can an assessorchoose which information he should gather?
This tendency to try to balance can be found everywhere now. It is a type ofthinking towards a goal, rather than thinking from tools [6]. The goal is a validassessment of safety performance of a system. PESANTE integrates some of thesuggested approaches and is described in the following paragraphs. Based on theinsights gained in the course of the project tools will be developed.
3 Technical Description
The PESANTE project is a combination of mathematical and knowledgeelicitation techniques. The project is a synthesis of approaches from variousdisciplines: traditional software, hardware and human dependability analysis,categorical analysis, elicitation and Bayesian inference techniques.
To implement the technique, first knowledge elicitation will take place, usingproven techniques as the Delphi method. This will concern both objective andsubjective information on systems. The information originates from users and allothers familiar with the performance of the PESs. These people are askedquestions illuminating the quantities under study from different viewpoints. Theidea is that these people all have information, but cannot combine this data intothe metrics needed. PESANTE will systematically help them to do that.
Also input to the categorical analysis are the results of standard assessmenttechniques as MIL-HDBK-217 calculations, software dependability measures asMTTF estimations, and human factor assessment techniques. The techniqueproposed is to be a step beyond these methods: it is to combine all results intoone assessment.
3.1 Categorical Analysis
The technique to analyze the information is a categorical analysis [7]. This willquantitatively reveal correlations between (combinations of) characteristics. If byexample a certain test strategy is necessary to realize a certain maintainability, thiscorrelation will show up. Later these relations will be used the other way around:to asses the system from its characteristics [8,9].
In PESANTE categorical analysis will be used to elicit relations betweenheterogeneous data and dependability aspects. Categorical analysis is available

89
now for some time, and mainly used in psychology and sociology, where complexrelationships are common (as well as the need to unravel them). The techniqueis used to reveal those relationships.
Characteristic for categorical analysis is its ability to cope with heterogeneous andm s data. This enables PESANTE to include all sorts of data available onPESs in safety applications.
3.2 Bayes' Reasoning
For assessment the relations between PES characteristics and dependabilityaspects as found using categorical analysis will be implemented using Bayes'reasoning [10]. This tool will use Bayes' reasoning to conclude on dependabilityaspects based on given input. This input does not need to be complete, the toolwill be able to cope with missing data. As categorical analysis the technique usedis not new. It is used with success in other applications like fault diagnosis. Onlyfew attempts for using artificial intelligence in the field of dependabilityengineering have been done until now. The advantage of using Bayes' reasoningare:- It can cope with missing data.- It can give estimations of the value of data.- It can give an impression of the reasoning behind a result: how did the systemcome to this conclusion.
3.3 Combination of Categorical Analysis and Bayes' Reasoning
In short, the techniques mentioned above will be combined in PESANTE asfollows.
Procurement of information on PES functioning will be done using techniquesreadily available as the Delphi method and other expert opinion collectiontechniques.
Categorical analysis will be used to elicit relations between heterogeneous dataand dependability aspects.
After elicitation of the relations, a model based on Bayes' reasoning will be tunedaccordingly. The resulting tool will assess future PESs.

90
4 Conclusions
The PESANTE project will deliver an integral approach to dependabilityassessment of Programmable Electronic Systems. Valuable are the followingcharacteristics:- It will be able to combine heterogeneous data on the PES under considerationin order to arrive at a sound assessment.- It will be able to determine the value of data: what data is most valuable toarrive at a better assessment. This makes sure that a balanced assessment is beingmade.- It will be able to cope with missing data. In most cases, data on a PES areincomplete. Most methods demand input, available or not. PESANTE will basethe assessment on the data available.
References
1. MIL-HDBK-217, Military Handbook, Reliability Prediction of ElectronicEquipment, Rome Air Development Center, Griffiss Air Force Base,New York.
2. St~lhane, T., MJ.P. van der Meulen & B. Cole, Reliability Assessmentfor Programmable Electronic Systems using Subjective and ObjectiveCategorical Data, Proceedings PCPI '93, p101-8, Dfisseldorf, Germany.
3. O'Connor, P.D.T., Reliability Prediction: Help or Hoax? Solid StateTechnology, p59-61, August 1990.
4. Bendell, A. & P. Mellor, Software Reliability;, State of the Art Report,Pergamon Infotech Ltd., 1986.
5. A Resource Guide for the Process Safety Code of Management Practices,Responsible Care, Chemical Manufacturers Association, October 1990.
6. Majone, G. & E.S. Quade (ed.), Pitfalls of Analysis, John Wiley & Sons,New York, 1980. ISBN 0-471-27746-0.
7. Gifi, A., Nonlinear Multivariate Analysis, John Wiley & Sons, New York,1980, ISBN 0-471-92620-5.
8. Neil, M., Multivariate Assessment of Software Products. In: The Journalof Software Testing, Verification and Reliability, Vol. 1., (4) 17-37, 1992.
9. Bendell T., The Use of Exploratory Data Analysis Techniques forSoftware Reliability Assessment and Prediction.
10. Horvit7, EJ., J.S. Breese & M. Henrion, Decision Theory in ExpertSystems and Artificial Intelligence, Knowledge Systems Laboratory,Technical Report No. KSL-88-13, Stanford University, California, July1988.

Safety Assessment - The CriticalSystem Suppliers View
AuthorC J Goring
August Systems Limited (UK)
Abstract
This paper firstly analyses the decision making of a supplier inapplying for certification. The process of safety assessment as seenfrom the supplier side is described, in particular the experience ofbeing assessed by TUV to Safety Requirements Class 5/6 of DIN VVDE 0801.
By describing in detail the various phases of the assessment it ishoped that by this paper an aid to other would be applicants is givenin easing their assessment path. The paper firstly reviews othernational and international standards and schemes and looks forwardto the possibility of a unified ISO standard and assessment procedure.
In conclusion the paper briefly analyses the cost/benefit of assessmentand certification.
1. Introduction ,'
As a supplier of safety critical systems to both the Nuclear and Petrochemicalindustry, August Systems begun in early 1990 to review the case for independentsafety certification. From this review it was decided to proceed with safetycertification for a Triple Modular Redundant Software Implemented Fault TolerantSafety System. This paper analyses the reasons for this decision and seeks toprovide aid and guidance to other suppliers in the path of safety certification.
The path of independent safety certification is a costly and time consuming processand no vendor should set out on this path without the resolve and financialresources to see the process through to the end.

92
2. Assessor and Certification Choice
Worldwide there are a small number of authorities that will provide safetycertification to various national and application directed standard. Currently thereare no international standards for safety systems to be assessed too and therefore thefirst decision that any vendor must make relates to the choice of assessor and thechoice of standard to be assessed against.
The market to which the relevant safety system is targeted will often influence thechoice of assessor and standard. For nuclear installation each major country has itsown standards and regulatory organisation, eg. the National Nuclear Inspectorate(NNI) in the UK. This reliance on application and national standards limits thecommercial viability of a more generalised safety systems approval.
Other industrial safety conscience markets such as Petrochemicals rely on standardsof codes and practice such as the PES 1 and 2 guidelines issued by the Health andSafety Executive (HSE) of the UK and the Engineering Equipment and MaterialsUsers Association (EEMUA) guidelines, however more recently for programmablesystems an acceptance of TUV Certification to Class 5 and 6 has been consideredappropriate by a number of major operators in this field.
Industry specific standards and certifying authorities such as the Federal AviationAuthority (FAA) in the USA, and the Civil Aviation Authority (CAA) in the UK,have obtained international acceptance on a wide scale for flight safety. To a lessorextend the national certification authorities for railway signalling have also achievedsome international recognition.
As it can be seen the choice is wide and is normally governed by a combination ofboth the targeted industry and the national authority. In the international market ofpetrochemicals August Systems chose TUV as the certifying authority and DIN VVDE 0801 as the standard for safety systems. The choice was governed by acombination of major customer acceptance and international acceptability. The classof certification 5/6 was chosen to match the market for the majority of safetysystems for the petrochemical market. Higher classification systems such as 7/8may be readily obtained by a combination of diverse systems in highly critical plantareas (the references provide more information on high Integrity Protection System- HIPS where class 7/8 safety is required).
The DIN V VDE 0801 specification provides a risk graph aid to the user todetermine the class of safety for the application, this shown in Figure 1.
i : n mmm lmm~ lVH (llm~mm mmn mm• m .... Auk

93
Extent of damage Mo W wiS1 minorwinjry toone perso st$2 sSeous perfWNu•i injy to - _
one or more persons, death of 01 2 1
$3 deathoseveral pers oA 3S4 cattCphIconmsseno@ A 01 4 3 2
Frequty a( upon"l•t ohmd 0 s 4 '-Al seldom toquie oftenA2 pommWt IORM Al 1 5 4
Avoifg tde hasard A2GI poeabI under XapeCM WKoMddr 7 16G2 aknod kocsbb
Pmbebli of unwanted eent s 7 aW1 vey bwW2 bky --. -- --w3 rebvely•hi figure 1: Risk graph. rquement classes 14
3. Assessment to DIN V VDE 0801
The assessment covers three basic phases which are:
a) The Design Analysisb) The Hardware and Software Inspection and Testingc) The Certification
Each of the three phases has its own pre-requisite and imposes different work loadson both the vendor and the assessor.
3.1 The Design Analysis
The design analysis phase for DIN V VDE 0801 is called the concept review andconsists of three distinct parts; requirements class selection, documentationinspection and analysis of the safety concepts of the system.

94
3.1.1 Requirement Class Selection
By holding informal reviews with the vendor, basically enabling the TUV staff tounderstand the general concepts of the system that is being offered for certification,the suitable certification class is selected and agreed. From this point onwards allmeasurements and results will be interpieted in relation to the select.,d requirementsclass. The levels of the efficiency of the measures taken for safety and the typesof failure caused are simply defined by Table 1 which is given in DIN V VDE0801.
T"bl of Required Efficiency of Measures against failuresDepending on the Requiremnent Classes (according to DIN V VDE 0801)
___________nwf _______ hmftsaS 1 2 3 4 ý1 5 F6-T 1 8
of failu of failure of failurs f__ u_
mmmmald 0
extMod sofwar mvidnc"Vimati sdaw mr
table 1 ,.r-
3.1.2 Documentation Inspection
For a system to be capable of being accredited with a safety classification it mustbe thoroughly and accurately documented. The certifying authority uses this phaseto both validate the documentation and to give a further insight into the operationof the submitted system.
For the vendor this period will almost certainly result in documentation correctionsbeing instigated and if the system is not thoroughly documented, additional
documents will need to be produced to provide a complete documentation set.
The results of the section will confirm or otherwise that the system is capable ofproceeding to the next phase and being accredited to the appropriate class.
accuw~dmi

95
3.1.3 Analysis of Safety Concepts
The vendor will be required to submit a Safety Concepts Review Document thatcompletely describes all of the safety aspects and concepts of the submitted system.This document will almost certainly not exist within the vendor organisation,however the information to produ,:e this document would normally be readilyavailable from the vendors standard documentation packages.
This document plus all of the standard software and hardware documentation willallow the certifying authority to produce a system level failure mode effects analysisand will also provide an indication of the effectiveness of the measures taken toprevent system failure or fail to danger.
When the system has successfully passed through this first phase the indepth testing,inspection and validation can proceed.
3.2 Hardware and Software Inspection and Testing
This phase of the certification is probably the most intense for the certifyingauthority, it consists of Hardware Inspection and Validation, Software Inspectionand Validation, Systems Integration and Safety Concepts Validation.
3.2.1 Hardware Inspection
The certifying authority now completes a detailed inspection of every hardwareassembly. This inspection includes track thickness and track gaps on printed circuitboards as well as a complete analysis from documentation to final product.
Detailed failure mode effects analysis are carried out on all circuits where safety orfault tolerance are seen to be critical, this analysis encompasses all criticalcomponent tolerance analysis using CAE tools. ,.
The Mean Time Between Failure calculation provided by the vendor are checkedand finally the system is type tested to the vendor specification. This final exerciseis normally completed shortly before certification as by experience TUV have foundthat it is better to ensure full certification is achievable before type testing takesplace.
3.22 Software Inspection
It is at this stage that any short comings in the design approach of the software tobe accredited will become evident. For the rigorous designers, there will be littleto do but perhaps provide additional structure guide documentation.

96
If however the source code and structures are not well documented then there willbe a significant amount of back documentation to be completed before the assessingauthority can proceed. It must be remembered that the assessors will have little orno background knowledge about the design to be assessed.
The process of assessment indicates a thorough inspection of the documentation,data structures and data flows against quality criteria, programming codes ofpractice and consistency against the specification.
The software is analysed for measures taken to guard against faults and errors, suchtechniques as defensive programming, on-line software test routines and error trapsare confirmed to be present or otherwise, and this enables TUV to determine thecategory that the software design belongs to.
The software is also subjected to a computer aided white-box test which providesanalysis of coverage, run-time, data range and control flow.
3.23 Integration and System Test
By this time in the evaluation the authority will now have an intimate knowledgeof the detailed workings of the hardware and software system under review. Thiswill have been obtained not just by review of the thorough documentation but alsoby a series of meetings held with the vendors engineers. This acquired knowledgeplus the experience of the examiners enables the certification authority to completea large number of fault injection tests both on hardware and software.
The purpose of fault injections is to confirm the theory of operation for faultdetection, time of fault detection, fault tolerance, fail safety and reparability.Injected faults include simulated hardware failures, actual software corruption andsimulated fail to danger scenarios are carried out and each result logged andanalysed.
4. Application Specific Criteria and Final Report
With the results of the test complete it is now possible for the evaluating authorityto generate a final report which defines the process types that can be protected (eg.processors that have fail safe states), the main time that faults may be in the systemundetected and any special requirements of configuration.

97
5. Accreditation Standards
Currently there are no internationally accepted standards to which accreditation canbe achieved. In the authors opinion it will be several years before a fully acceptedinternational standard is available. Two national groups and one international grouphave been working towards producing an acceptable standard and the followingprovides a review of the current status of those standards.
5.1 Instrument Society of America ISA SP84
The ISA SP84 group is a process industry group that has been working ongenerating standards for safety control applications in the process industriesparticularly for programmable systems. The committee consists primarily of usersand a few selected ve'ndors and the standards are in advanced state of productionwith perhaps the - xception of software criteria. Because of its advanced status itis possible that these standards will be submitted for international recognition in thecoming two years, they are however currently limited to process applications.
5.2 DIN V VDE 0801
This specification is a German National standard which is not industry specific.The standard has been evolving over the last decade and its current status gives itacceptance both in germany and by certain international companies. I would expectthe German standard groups to push for DIN V VDE 0801 to be accepted as theinternational standard for safety accreditation. The standard certainly does providethe basic coverage that an international standard will need, however in the authorsopinion it does require further development, specifically in the area of safetymetrics.
5.3 EEC 65A Working Groups 9 and 10
These European/International working groups have been operating for a number ofyears in an attempt to produce an acceptable ISO standard. The two workinggroups have been contributing to different aspects of safety system WG1O providea generic system approach and WG9 concentrates on safety software.
It is hoped by the author that these standards will eventually become accepted byISO although my expectation is that at least 2-3 years of further work is requiredand probably a degree of amalgamation with both the SP84 and the VDE 0801standard are required.

98
6. Conclusion
With no one international standard to accredit against, the drive to invest inaccreditation by a safety system supplier will often be governed by his customers.If a sufficient number of customers continue to push for accreditation by arecognised authority then the supplier will need to make a commercial decision asto whether the investment in accreditation is necessary.
The cost of accreditation is of course dependent on the size and complexity of theequipment submitted, but will almost certainly fall within the range of $50,000 -$250,000.
Additionally there is the ongoing cost to ensure that modifications and updates arere-accredited.
From the suppliers viewpoint one internationally accepted standard withaccreditation authorities in all of the major industrial countries would be thepreferred outcome. Until this is achieved we will have to continue to makecommercial decisions on when and where accreditation is achieved.
References
4. EEMUA Publication No 160, Safety Related Instrument Systems for theProcess Industries
5. ISA SP84, Electrical/Electronic/Programmable Electronic Systems ForUse in Safety Applications (Draft Standard)
6. Qualification of Programmed process Control Systems for SafetyRequirements, H Gall and W Hammerschmidt (TUV)
7. Safety First - Applying Computer Based Safety Systems in the OffshoreEnvironment, C J Goring (August Systems)

Hazard Analysis Using HAZOP: A Case Study'
Mris ChudaleghCambridge Coultants I mited
Cambride England
1 Introduction
"There is an increasing use of computing in safety related applications and ensuringthat such systems ar conceive designed and produced wih appropriate attention tosafety is not easy. The process of identifying undesirable events and theirconsmquen is known as hazard analysis. Ckrying out a bawd analysis at varingsage during the t process is now being mandated in emerging standardsproduced by the itional Electrotcnica Commission (EC) [1] and the UJ..Mfinistry of Defence [2].
With computer based systems ther is th particular problem that desi faultstend to domi random hardwai faults and so identifying potential hazards early inthe desi process is crnial. Ther are well established methods for carrying outhazad analysis in many domains of engineering such as petno-chemical but it is notclear that such methods ae readily applicable to computing based systems. Further,tder is little advice available to assist with hazard analyses using computertechnology.
To address the above problem we have modified the Hazard And OPerability(HAZOP) technique [31 and used it successfully in the computing domain. Ourevolution of the HAZOP technique has taken place over a number of years and mostahave been Commercial in Confidence. However, a medical imagingapplcation is being studied as a collaborative research project and serves as anWV rg imecase study.
The remainder of this paper explains our concluion that a modified HAZOPis ma effective way to carry out hazard analysis on computer based systems. We findthat
" mThe HAZOP method is well established and fits well into overall safety
"* The nethod cma be extended to fth computer soflwm field"* The experience to date is that the approach is powerful and we illustrnat this
with the medical case study.
l.hem custady repomd here is pert of a collaborative project between The Centre forSoftwm Enghleeru Limited, Conbridge Consuluite Limited d The Hwr -ma eticsUnit of Thw Modl Research Council
IM . -I J na i llilill

100
To put the results in contex the enext section gives a description of the expe-imentalmedical system Subsequent sections deal with our efforts to develop a modifiedHAZOP and a case study of the results obtained through its application to the- medica system.
2 The Medical Diagnostics Application
There ar many laboratories worldwide which carry out cervical screening by expertmanual inspection of slides prepared from smear samples. The purpose of screeningis to recognise the presence of abnormal cells in a sample which may contain fewsuch cells, and is likely to contain possibly confusing other matter. Usually, thereview is manual and includes an assessment of the degree of abnormality, leading todiagnosis and treamente For screening of healthy patients on a regular basis, thereare likely to be few abnormal cells but for diagnostic screening of a sick patient,abnormal cells will be expected.
The U.L Medical Research Council Human Genetics Unit in Edinburgh(HIOU) has developed over a number of years a semi-automated screening system forcervical smears [4]. The basis of the automated system is the computer analysis ofa slide prepared from the smear sample. The first version of the system relied oncustom nhadware to capture and process images and the HGU we now in the processof r-eogineering the system to run on a modem computing platform without these of custom hardware. The collaborative project of which the work repored here
is pat involves the re-implementation of part of the new system currently underdevelopment.
The system relies on efficient imag processing and classification algorithmsto find the abnormal cells. An initial search at high speed is carried out at lowresolution to identify suspicious objects (an object is something that appears to thesoftware to have cell-like characteristics but may not in fact be a cell). A secondpass is then done at higher resolution so that a mom detailed analysis can filter andrank the objects. The kpanking objects ae classified and a decision made to classthem as normal, ask for a skilled human review, or pass for a full conventionalreview.
Outside the core imaging system, there are various preparatory and post-analysis processes to be taken into consideration. The former include administrativetasks to handle samples and accompanying paper-work sent from GeneralPractitioners and clinical agencies. This is then followed by slide preparation andthe transfer of slides to the automated imaging system. Configuration may then benecessary to initialise certain batch processing control parameters before theautomated process itself can be started. Once this has been completed, there followsa certain amount of tidying-up before results are passed for diagnostic review,signing out or some form of quality control check. Results of the analysis mustfinally be returned to the clinic which supplied the sample and the analyzed slideplaced in a long sum archive.
The core image processing part of this application forms the case study forour application of HAZOP to a software based system.

101
3 HAZOP Studies are an Effective Part of SafetyManagement
This sectio describes the process of ensuring that safety is considefe during allphaes of the life of a system, the safety lifecycle. It then gives an overview of owof do estblished ume for identifying hazards, the HAZOP, followed by some of
e dvantages of &C meod.
3.1 The Safety Lifecyde
In a number of established industries, particulady petrochemical, the possibility offailures having an adverse impact on safety has been recognised for many years.However, it was not until a number of accidents and near accidents had take placethat it was recognised that a systematic approach to ft•hle na t of safety wasrequired. The approach taken is independent of the industry. To clarify thefollowing, two defnitims are given, both taken from Ref [11:
A hazard is a physical situation with a potential for human injury.Rik is the combination of the frequency, or probability, and the consequence of a-weied hazaous evem.
The basic stepa in the overall safety lifecycle are:
". System definition generating an overall description of the system under review"* Hazard analysis to identify the potential for hazadous events"* Risk analysis to judge the safety risk of the defined system. This quatifies
fte potential for hazardous evems and evaluates teir c"* Judgement of the acceptaWity of the risk"* Activities, if necessary to reduce the risk to an acceptable level This might
be by modifying the architecture of the system, including extra measures toavoid or contain safety failures, or ensuring that the system is built tostandards that are apprpri to the level of risk.
" Implememing the system to the required standards, followed by effective-pdo and maintence
In recent years there has been a huge growth in the use of computers and, as we areall aware, all computer systems we liable to contain design mistakes. The fact offt fallibility of computer systems when used in safety critical situations is now
being addressed formally in standas worL Two new standards have been drafted.one from the In e tional Electrotechnical Commission addresses functional safetyof computer based systems [1] and the other from the U.. Ministry of Defence,
---eue- hazard analysis for computer based systems [2].Both te standards use the above safety lifecycle and stress the importance of
caying out hazard analysis. The tditional industrie have developed a numbe ofstructured methods to help enmure that the hazard analysis is complete and tomugh,

102
much meods include 'what if" analysis, failure modes and effects analysis (FMEA),and HAZOP. The next section introduces one of the most effective hazard analysismethods, HAZOP.
3.2 The Traditional HAZOP
The full name of HAZOP is Hazard and Operability, and this gives pointers to thetwo fets of its purpose. The HAZOP ensures both that features that could lead toundesirable outcomes (ie hazards) are avoided and that necessary features aninorporated into the design for safe operation. The method was developed in theUJL by ICI in the late 1960's and is well established in the petro-chemical sector.A reference for its use in that industry is given in [3].
In these industries, the plant design is normally described by piping andinstrumentation diagrams (P&IDs). The HAZOP study is carried out by a team ofknowledgeable engineers who carry out a systematic examination of the design.They postulate, for each element of the system design in the P&IDs, deviationsfrom the normal operating mode and then assess the consequences of thosedeviations with respect to any safety or operability pmblems.
For each deviation, the team asks 'can it happen?' and, if it can, is this likelyto lead to a hazard. The team will take into consideration any mitigating features,such as control valves, alarms etc, which might control the hazard. To formalisethe process, a series of guidewords am used to define particular deviations and theseam applied to each relevant parameter for each process componenL
Thus, for fluid flowing in a pipe, relevant parameters might be flow,pressure, temperature and deviations examined would include high, low, no,reverse, as well as. In theory, each guideword should be applied to each relevantparameter for each part of the process description. In practice, this is very time- ,tconsuming, and an experienced HAZOP leader will use judgement to control thecorrect detail of questioning in each area.
The results can be presented in a number of ways and we have found asoftware package developed by our parent company, Arthur D Little, running on apersonal computer to be effective [5]. Results am presented under the following
Item number - a simple count of items logged from the beginning of the HAZOPEquipment Item - a description of the area of plant for which a deviation hasbeen foundParameter - such as temperature, pressure, flow etc.Guldeword for Deviation - such as high, low etc.Cause - the circumstances that could give rise to the deviationComaequence - the effect on the plant that the deviation might lead toIndIcation/Protection - any feature that will either identify the deviation ormitigate it's effects (eg an alarm signal or a pressure relief valve).QuestionlRecommendation - questions arise from items considered a potentialhazard which cannot be resolved by the meeting. Recommdation am generallyfor changes to the design or particular actions to be take during operton.

103
Answers/Comments - This allows the laer" insertion of answers to questionsraisd or motes which the team consider relevant to the design but are not questionsor Pc a -uncd -
The HAZOP team is normally small, four to eight people. comprising a leader, ateam secretaty, people who understand the design intent. people who we experiencedin the operation of similar plant and specific technical experts as necessary.
3.3 Advantages of HAZOP
There are three main advantages of the HAZOP approach to doing hazard analysis: itis carried out by a team; it deals with the design in a systematic top-down manner,and it is capable of being applied during all phases of a system lifecycle.
The team approach allows a variety of expertise and viewpoints to be appliedto the system. Our experience is that many problems are caused by interactionsbetween parts of the system and by differing nderandings of designers andoperators. The team approach allows such issues to be explored and there is lessimpact to a mistake by one team member. Having key personnel on the teammeans that any problem areas are brought immediately to their attention.
Dealing with the system in a top-down manner allows concentration on thekey issues arising from the potential hazards and allows system-wide implications tobe assessed. Having a clear view of the whole system allows the team to explorenon-obvious interactions between parts of the system. This is in contrast withbottom-up approaches such as FMEA which must analyse every component to asimilar level of detail which is time-consuming and eror prone,. We have found thatthe HAZOP is useful in identifying which are the most critical areas to concentrateon in any later FMEA.
The approach may be used during all phases of the life of a system. We haveused it successully both at the conceptual design stage and for safety assessment oncompleted systems.
4 HAZOP Has Been Modified
The positive experience of Arthur D Little in using HAZOP made it their techniqueof choice for hazard analysis in the petro-chemical industry. In recent years theyhave worked with their subsidiary company, Cambridge Consultants, to explorewhether the HAZOP method could be extended to other domains, particularly thosewhere electronics and computers were involved. It became clear that work wasneeded in two different areas first to find appropriate epresentations and, second, toaee what were an appropriate set of pammete and deviation guidwords.
4.1 An Effective Representation Method is Needed
With computer based systems there is not, obviously, a P&ID to work from. Forelctoia designs there ae clear parallels with block diagrams and circuit diagrams

104
and there is much uniformity of representation. Transfer of the approach was thusstraightforward. This was not the case with software. There are manyrepresentatonal methods which involve diagrams and some, using mathematics,which have no pictorial epresetation. We have found that the HAZOP approach istractable with a variety of pictorial methods but that the dataflow representation ofstructured design is the most naturl to work with.
With our exemplar diagnostic image processitg system, utle in the way ofdesign documentaion was available and so we worked with the system designers tobuild a dataflow representation of the system using a CASE tool called Softwarethrough Pictures (6]. Figure I shows the first level of decomposition from the toplevel context diagram.
20 bkuh slides dd
Figure 1: Cervical Screening System
The asterisk in process 2 indicates that a lower level decomposition has beengeneated. The three processes show the activities of:
* Slide preparation - preparing slides from smear samples* Slide screening -de computer based imaging and diagnostic process* Full review - manual expert checking of slides recognised as
suspicious by the computer systemFigure 2 shows a simplified version of part of a lower level process, the
process of carrying out a scan of the slide at low resolution. One of the subprocesses, Bright Fuied, is used below to illustrate the HAZOP method so itsfunction will be described here. Four or five frames are captured by using amcroscope, digital camera and a special framestore supporting direct memory accessof reduced scale images (typically every 5th pixel). The process performs a logicalOR operation on the captured frames to determine maximum light intensity on a

105
phixl-by-pbixe basis. Tis data can then be used to correc object images for opdcaldesty (that is, making them invariant to lamp brightness and variation in field
Remt
Figure 2:W Pathfroweeostoholdc 8
the ~ ~ igr mai advntge of th aaLow approach wearhav fonSvra ubro
prjcsis tha the design is readily undersandable by all interested parties, eventonwishw mny computing background.
4.2 New Guidewords Have Been Derived
Since the software and domains differ sgicaty from Petro-dIIeMickawieqeering, we found tho the standard HAZOP guidewurds did not providearichenough set. Ovea anombof projecis [71 we have evolved aset which is
gewflyapplicable to software baoed sysems and exam~ples of thes are shown inTabl 1 below. ibe full vocabulary of guidewords was larger and included wordstdot wers only used on a few occasions. Thesea1 roseP thvog the complex mix of
Wch~ in Me P, U ýs ep *eowmm imaging system and the need to expresas a partiuladevatin.The sat is evolving as our experience increases and we believe that
hu=Vanuis mightd viEifwe diME-entiaed between diffarew data types.

datavalusn
- wrong -pficto
wrong algondunic
daturd. too hightoo low
wrog handshake
timing (Of actions) too Cadlytoolat.too slowtoo fantout of sequemic
Taze 1: Paamenesr and their Deviation Guidewards
5 The HAZOP Process Worked Well in Practice
5.1 Results
The HAZOP was carre owt by a tem of four people including an experiecededrmid one of do. desiner ofdhe re-nginerd diagom i sysem. The HAZ"
was of doe fuill compuwe based imag processg systm and some 100 itms werenosd *Min the wO&k
The EA"O was appl ieIn a top-dow manne so dot eah proces wasOim in doe nutei order in which it occurrd in the deataflw deopstoLfz&Sdeviatios of the input dataflows were expknd, foflowed by emntOf dof h
prc.itse which naftwaly define the possble deviatio and thimoseuneforte parocs outputs Many dat itms were used as input to mor than one
prcssad of cours they only needed to be addressed in deal once duing theH *OP Thus as mbc new level was examined the dat passed down from a
hihrlevel was nWke and only reviwed briefly to check tha possible cwauptionor fra nadosmain had not been overlooked. Some geneic conclusons from the
w tswill be given and then some of the specific iems from the proces Cfapr

107
Bright Field described above.The generic conclusions may be divided into three themes Frst. efficiency
led pins in processing speed have to be balanced agaist the potential for hazardsdue to incomplete sampling. To achieve the benefits of automati screening thesystem throughput must be high and the necessary use of complex image processingalgorthms and a series of filters means that not all a sample may be scanned.
Second, recognition of abnormal cells can ar from hardware faults andcurrnt software imp practice. Hazards may aise through data corruptioneither leading to overlooking of abnormal cells or through recognition of normalcells as abnoral. The ml approach to date has concentate on algorithmremerch using the most convenient tools and methods and has given less attentionto achieving high levels of safety integrity.
Thirdly, key data items for set-up and operaton must maintain their integrity.In particular, processing histories ae kept for a number of days on a rolling basisand classifier learning data is used by key algorithms: these and similar data mustmaintain their integrity so that consistent system operation and corre tracking ofpatient details ar ensured.
The process Bright Field shown in Fig 2 is used to illustrate the HAZOP.
Recommendation S9 Bright field high cell density could lead to incorrect ODcalculation, effect could be a 'blind spot'. Carry out sensibility check.Question 60 Bright field drift of lamp intensity could lead to missed objects.How can this be chckwd foi?Question 61 Bright field Depends on light maxima which could be too high ifslide sample acts as lens, forming ring on image. Can other algorithms be used?Question 62 Bright field if value too high, too low or randomly incorrect,subseqn OD crecte ages wil be corrupted. Can thisbe checked for?
It should be noted that this was a HAZOP of an experimental system,developed to show feasibility and it is not surprising that we found the systemlacking in a number of areas. The value for the design t•um is that they believeteam members are now well placed to address hazard concerns in order to mitigateareas of potential risk.
6 The Approach Has Advantages and Limitations
The advantages of using a HAZOP described in Section 3.3 above have been foundto be independent of the application domain and of the technologies involved. Forthe computing domain described in this paper the application of the method wasnovel to the HGU personnel involved. The combination of the dataflowrepresentation and the systematic approach to examining deviations that could leadto hazards worked effectively. Once the team became used to the method (ourexperience on this and other projects is that familiarisation takes about half a day)prduivit was high and the full HAZOP of the system took only a few days.This high productivity and early focusing on important issues is, we believe, a

108
mq* advantage of the HAZOP as contrasted with bottom-up approaches.There are, however, limitations to the approach. In the process industries
gfidewords for deviations from design intent ar well established and application isreasonably straightforward. With software based systems we have found thatapplication is less easy :0 The expertise of the HAZOP leader is crucial in focusing the discussion on
poueal hazards and not to cpoi 'interesting' areas.0 Slavish adherence to the guidewords is not sufficient. We have found that
significant flexibility and multi-disciplinary design experiece by the team isneessary to explore unusual interactions.
0 Independent technical experts, experienced in safety critical computer systemdesign awe necessary to pin full beneft"Thus we have found that the HAZOP approach provides an effective way to
cawy out a syseln=Rtc and cost-effective hazard analysis but that the use of technicale and design exprience is still required. We postulate t this is becaus ofthe inherent complexity of software based systems and their propensity for design
References
1 Funcdonal Safety of Electrical/lctronProgamnable Systems. GenericAspects. IC 65A (Secretariat) 123. 1991
2 Interim Dedtm 00-.56. Hazard Analysis and SaFe4y Classificaion of theComputer and Pogrammable Electronic System Elements of DefenceEquipment. U K Mnistry of Defence 1991.
3 A Guide to Hazard and Operability Studies Chemical Industries AssociationLimited, 1987.
4 Husain 0, Watts K, Lrriman F et aL Semi-Aumated Cervical Smear pre-screening system: an evaluation of the Cytoscan-1 10. Analytical and CellularPathology, 5: 49-68, 1993.
5 HAZOPfimizr. Arthur D Little, Safety and Risk M Cambridge,Massachusets
6 Software through Pictmues. Interactive Development EnviCaliform.
7 Cudleigh MK Catmur J. Safety Assessment of Computer Systems usingHAZOP and Audit Techniques. In: Frey (ed) Safety of Computer ControlSystems 1992 (Safecomp '92) pp 285-292.
L• n H i d B m i e a m ...

Session 4
SAFETY ANALYSIS
Chair: F. KoornneefDelft University of Technology, NL

Safety Analysis of Clinical Laboratory Systems
AuthorsS.S. Dhanjal - Lloyd's Register
R. Fink - West Middlesex University Hospital
1. Introduction
The Clinical Biochemistry Department (CBD) at the West Middlesex UniversityHospital (WMH) performs tests on constituents of body fluids to facilitate diagnosis,prognosis and monitoring of treatment. A rapid increase in the need for this servicein recent years has led to extensive automation of the analysis and data handlingoperations within the department. The automation and data handling have beenimplemented by integrating a computerised Laboratory Information ManagementSystem (IJMS) into the operations of the Laboratory.
Quality assurance of the analytical processes is well established. However, incommon with other safety related disciplines and applications, there is a concernabout the reliability of the computerised data management system and the lack ofgenerally accepted standards. These issues have been addressed as part of the DTIsponsored MORSE - (Methods for Object Reuse in Safety Critical Environments)project.
WMH is a member of the MORSE project consortium (Dowty Controls, Lloyd'sRegister, Transmitton Ltd, West Middlesex University Hospital and the Universityof Cambridge). The MORSE project has been inspired by recently proposedstandards and guidelines [1,2,3,4] which are at various stages of development.These standards and guidelines apply to safety critical systems and bring togethera range of existing procedures, methods and design practices which, in combination,are untried. These methods and guidelines include the application of safety analysistechniques at the system level and the use of formal specification methods for thedevelopment of software. The operations of the CBD have been the subject of acame study within the MORSE project aimed at gaining experience of developingsoftware according to the aforementioned standards and guidelines.
The recommendations resulting from the safety analysis on the CBD related to thesoftware are to be reimplemented using the RAISE [5,6] formal specificationmethod.
"This paper presents the experience gained in defining the CBD system and theapplication of hamrd identification techniques within the overall safety analysis.
SoA

112
2. Operations of the Clinical BiochemistryDepartment
The CBD provides clinical and laboratory services for a wide spectrum of on-siteand off-site users. A block diagram of the functions performed within the departmentis presented in Figure 1. Patient samples are received in one of two reception areaswhere they are given a unique reference number before being prepared for analysis.Details of the tests required and the patient demographics are entered into one ofthree terminals which are connected to a file server running the database andnetwork software programs.
The file server is connected to a number of work-stations, which are bilaterallyinterfaced to computers which in turn control large capacity (7000 tests/hr)analyzers. Patient details and test request information is transferred electronicallyfrom the work-stations to the analyzers which perform the analyses required alongwith quality control checks before returning validated results via the work stationsto the file server hard disk. Further quality and validity checks are performedbefore test results are printed on hard copy for dispatch to clinical staff. The dataare finally archived.
3. Safety Analysis within the Morse Project
An improvement in the safety of the overall laboratory operation was an importantobjective of the MORSE project. To this end, it was necessary to look at thelaboratory as a complete system made up of hardware, software and manualoperations.
Safety analysis at the system level can typically be carried out in the followingsages,- system definition,- hazard identification,- hazard analysis,- risk analysis and assessment.
The exact requiremets and degree of detail to which the analysis is conducted islikely to be affected by factors such as the safety criticality of the system beingconsidered, the financial and human resources available, the stage of developmentand the timumcale of the project.
The need for improvements to the system design and operation are usually identifiedduring all stages of the safety analysis.
The experience gained in the system definition and hazard identification stagu of theproject are discussed below.

113
4. System Definition
The first stage of the safety analysis of the CBD was to produce a clear definitionof the system under consideration, its boundaries and its intended mode of operation.Past experience of applying safety analysis techniques in other industries indicatesthat the techniques can be best applied if the system is described in terms of anumber of related modules (hardware or functional blocks) on a flow diagram. Theexisting documentation at the laboratory did not describe the system in this form andtherefore a new representation of the system was produced. This representation,aimed at capturing the main activities of the hardware installed, sample handlingprocedures etc. (human - computer, computer - computer, computer - black box,black box refers to a computer hardware and software package sold to the laboratoryby an external supplier).
A description of the CBD system was therefore produced in the form of,i) serum sample flow diagrams,ii) data flow diagrams,iii) functional block diagrams,iv) hardware interconnections,v) descriptive text (purpose of each module, inputs and outputs, description of
its function).
Example representations of the system are presented in Figures 1,2.
It was then necessary to investigate possible failures and potential consequences ina systematic manner. This was carried out through a Failure Modes, Effects andCriticality Analysis (FMECA), and Hazard and Operability (HAZOP) Study [7,8].The development and use of each of these techniques is discussed below.
5. Failure Modes, Effects and Criticality Analysis(FMECA)
FMECA is a technique that can be applied to a system which can be broken downinto individual components. The components can be hardware blocks or functionalblocks. The methodology requires the assessor to have a clear understanding of thefunction of each component along with all the inputs to and outputs from it.
The failure modes of each component can then be investigated in a systematic andrigorous manner to establish the causes and the effects of the failure. Thisinformaticn is recorded on a form which is designed to collect information toestablish,- how each component can fail,- what the causes of failure are,- what the effects of failure are,- how critical the effects are,

114
- how often the failure occurs.
5.1 Experience of Applying FMECA To the CBD System
Making a judgement about the criticality of an identified failure mode has been thesubject of further development within the project in order to ensure that the teamperforming the FMECA had a consistent approach. A criticality rating system wasdeveloped to score the attributes of data in a representative way. It was thought that"units of data" in the laboratory environment comprised integrity, flowrate and theeffects of these on the system as a whole. Account was not taken of factors externalto the laboratory such as the state of the patient and whether the doctor had madea correct diagnosis.
"The attributes of data were scored as follows,Integrity Rating (A) Degree to which integrity is lost for individual unit of
data (categories 0,1,2),Flowrate rating (B) Delay to flow of data through the component being
investigated caused by the failure of that component(Category 0, 1,2).
System Effects (C) Likely effect on data leaving the overall system takinginto account any recovery mechanism (Categories 0,1,2)
Failure rate (D) Frequency with which the failure is likely to occur (Category1,2,3)
The criteria for scoring 0,1, or 2 - was set such that any score representedapproximately equal importance within each of the attributes A,B or C.
All the above aspects have been combined together in the following manner toestablish a total criticality rating for the failure mode identified.
(A + B + Q)D
The appropriateness of the rating system can only be assessed through the use ofengineering judgement.
The criticality rating thus established was then used to prioritise the hazardsidentified and the recommendations made for improving the design and operation ofthe system.
5.2 Results From FMECA
Table 1 is an extract from the full FMECA that was undertaken and only shows thedetails of the criticality analysis. It refers to one of two external hard disks attachedto the file server, for which three failure modes are shown. The second entry isdescribed as follows: if one hard disk fails, due to hardware errur (failure cause),the affected drive cannot store data (local consequences) and since the disk is"mirrored" by an identical disk to which it is paired, information from the backup
L W=0 I I1

115
disk is used automatically. Consequently, there is no data corruption (integrityrating 0) and no impairment of data flow (flow rate rating 0). There are no systemconsequences and this failure occurs less than once per month (failure rate 1), givinga total rating of 0.
In example 2, sample tubes receive bar-code labels bearing critical information aboutthe identity of the patient from whom the sample was drawn. Four failure modesare shown only the first of which will be explained in some detail as follows. If thewrong label is attached (failure mode) due to human error (failure cause), the samplewill be wrongly identified (local consequences). The data is corrupted (integrityrating 2) but data flow through the component is unimpaired (flow-rate rating 0).The error may be identified at a later stage (system rating 1) and such problemsoccur approximately once a week (failure rate 3) resulting in a total rating of 9.
"These examples appear to reflect engineering intuition about the relative criticalityof the failure modes discussed.
6. Hazard and Operability (HAZOP) Study
The HAZOP study technique was initially developed in the 1960's and 1970's withinthe Mond Division of ICI for application within the process industries. Thetechnique consists of a critical and systematic review of the system underconsideration by a multi-disciplinary team. The review is coordinated by a chairmanwho leads the investigation into sections of the system with the aim of establishingtheir design intent and the ways in which that section can deviate from the defineddesign intent. The deviations from design intent are investigated in a systematicmanner by application of a number of guide words such as more, less, no. Theseare described in more fully in [8].
6.1 Experience of Applying HAZOP to the CBD System
Past experience in applying the HAZOP technique is primarily in the processindustry where the guide words are used to investigate deviations in parameters suchas temperature, pressure and flow. Clearly these parameters are not relevant to theoperations of the CBD. It was therefore necessary to apply the basic guide wordsto activities (e.g. input password) or functions (e.g. create Print file from Day file)being performed.
6.2 Results From HAZOP
Table 2 is an extract from the HAZOP study and presents an example of a hazardidentified within the electronic data transfer operations. This situation refers to thetransfer of test requests from the file server (Figure 2) to one of the analyzerworkstations. A program, called from DEI, copies records relevant to the analyzerto a print file. If the hard copy print-out is considered satisfactory by the analyzer

116
operator, a further transactional file is created from which the records aredownloaded to the appropriate analyzer workstation. Once the records have beendownloaded, all records pertaining to this analyzer are flagged in order to preventdownloading of duplicate records.
In the example presented in Table 2 the activity being considered is the flagging offields within the dayfile after the work has been accepted by the operator. Thepurpose of this activity is to prevent the same work requests being sent forward withfuture batch transfers.
A scenario has been identified where more records are flagged than should be whenthe operator accepts the printout of work. The cause of this is additional work forthe analyzer in question being added to the dayfile from the other data entry terminal(DE2) after the request for the printout has been initiated. This will mean that somesamples will remain untested.
The software to carry out the above operation can be easily modified to avoid theloss of work requests caused by this scenario.
Example 2 is an extract taken from the HAZOP on the LIMS hardware which isshown in Figure 3. All node terminals are connected by cables to a junction box(multi-function access unit) which is in turn connected to the file server computer.The file server is a stand alone PC with external hard disks which are mirrored byNovell networking software.
In this example the deviations from design intent of the junction box have beenconsidered. A scenario has been identified under the guide work "no" where thefailure of data flow through this section of the system would result in the wholenetwork becoming inoperable. Action has been recommended to investigatecontingency measures in place to recover from such a failure.
7. Discussion
It was found that the degree of scrutiny of the system possible as part a hazardidentification exercise depended on the amount of detail included in the systemdefinition. A number of revisions of the system definition were necessary to enableassessment to an adequate level of detail so that useful results could be obtainedfrom the study.
The importance of system definition is stressed particularly since the application ofsafety analysis in other such laboratories will require a considerable amount of effortto define the system in a form that will facilitate such analysis.
The application of FMECA and HAZOP to the operations of the CBD was generallyregarded to be a successful exercise. Each of the techniques has its advantages anddisadvantages which are discussed further below.

117
The main advantage of the FMECA as compared with the HAZOP was that itenabled a criticality rating to be applied to the hazards identified and hence easedprioratisation of the recommendations. In the case of the CBD the analysis wascarried out by a number of people working on their own. It was found that theprogress of the analysis and degree of scrutiny depended significantly on eachperson's understanding of the system. It may be possible to improve the progressrate and the degree of detail by employing small teams of personnel according totheir knowledge of the components being investigated.
The HAZOP study was performed by a team of people with varied knowledge aboutsafety analysis techniques and the CBD system. In this case it was found that thewritten system definition could be considerably enhanced by the knowledge of theteam members during the study. The HAZOP approach was found to allow muchmore free thought about potential failures and hence was better at picking up failuresresulting from combinations of events.
The role of the chairman in stimulating thought within the HAZOP team was seenas critical in the application of the technique. The lack of previous experience ofapplying HAZOP in a clinical laboratory environment resulted in a number ofteething problems to begin with. These were primarily caused by the use ofinappropriate guide words.
The approach of using the basic set of guide words applied to activities and functionsappeared to work well. This approach can be recommended as a good starting pointwhen applying HAZOP in an industry where its use is untried.
8. Where Next
The application of the safety analysis techniques has been very successful on theCBD. It is however recognised that a considerable amount of effort went into thepreparation stages where the system was defined in a form that would easilyfacilitate safety analysis.
With this constraint in mind it is felt that the use of safety analysis techniques canbe more readily accommodated in new developments where the system can bedefined in the required form at the outset as part of the overall documentation of theproject.
It is thought that the use of HAZOP is more conducive to existing systems wherethe system definition can be enhanced during the study by the knowledge of theHAZOP team members.

118
9. References
1. Ministry Of Defence. Hazard Analysis and Safety Classification of theComputer and Programmable Electronic System Elements of DefenceEquipment - Interim Defence Standard 00-56/1. UK Ministry of Defence,April 1991.
2. Ministry Of Defence. The Procurement of Safety Critical Software inDefence Equipment - Interim Defence Standard 00-55/1. Ministry ofDefence, April 1991.1
3. IEC/TC65A (Secretariat) 122. Software for Computers in the Applicationof Industrial Safety-Related Systems. Geneva 1992.
4. IEC/T665A (Secretariat) 123. Function Safety ofElectrical/Electronic/Programmable Electronic Systems: Generic Aspects.Part 1: General Requirements. Geneva 1992.
5. S. Brock and C.W. George. RAISE method manual. Technical ReportLACOS/CRI/DOC/3/vl, CRI, 1990.
6. K.E. Erikson and S. Preh. RAISE overview. Technical ReportLACOS/CRI/DOC/9/v2, CRI, 1990.
7. BSI. BS5760: Reliability of Systems, equipment and components, Part 5.Guide to failure modes, effects and criticality analysis (FMEA andFMECA). British Standards Institute, 1991.
8. A Guide to Hazard and Operability Reviews by the Chemical IndustriesAssociation (CIA).

119
Fialkes Mode Itagrity Fl4owrals 1 System Failure raft Totalratng rating J rating rating rating
OWdaets 0 0 0 10
Mecfmuilcdl awre 0 0 0 10
Dlvarbord fa~lure. 0 112
Wrong MMbattached. 2 0 1 3 9
flarcode printer faiure. 0 1 1 1 2
NolMW.attached. 2 0 1 2 6No number an tube.
No ial attached. 2 0 1 26Number w ~No on tube.
Table I - Example. of Hazards Identified by FMECA on the CBD.
I1e900 Guide Deviation causes Consequences ActbonOeecepUMe Word jRequired
-.aol .W.
Flag records More More flagging in Records entered after Some works requests Consider means ofin DAYULE IDAYFILE print sequence stafle will not be trasnferred preventing this.
but before Rlagging torward to the
.hwmco bai. No No Nlow Failure of star No communication Review procedurestopology Junction between nodes end for removingboxn. fio server end with connections from
each other. failed boxn to the otherjunction boxn that haspear ports. Reviewredundancy offunction box as Itstands.
Table 2 - Examplee of Hazads Identified by HAZOP on the COD.

120
1011011140FAFSWRPIN
r
TAL
Fanne Form IT~ ane Fanne CA af
C Al
IND
RECEPTION I RECEPTION 2 1111111011111 1
7-7 f 7Sarnpin ftoWied $Unpin Rechried
PRINTER 2.
8- ipl & Farm (SawAl") I Swriple & FormCheck i A 2A Check
- (awll* I&" -P WE* ernply -- PgLL- Propero wipty
is 28 Dab
DATA E I DATA ENTRY 21C Main Roe (Postalitecap.)
Fie Fame File Forrne
ewnpb Prep. Sarnple Prop.
MAN Results Store11TOM I 1(postall
DEI
WA f"LLT6STOM a I I PRINTER
@A01 (-UP FILE SERVER Work ListSDE'l 1.2.3
(NOVELL Fie Saver)
INIMPMA"M
------ AJ.-
PPww WORKSTATION WORKSTATION WORKSTATION PRINTER
(Local Dick
ff=AfNALYnSER 11.
ANALYSER 2. ANALYSER 3.
Work Lieu
Tape 100"M ardsewe~
ANJALYSEA A"ALYSER ANALYOER ANALY8ER PRINT1 2 32 3b
COMPUTER COMPUTER COMPUTE I COMPUTER
ANOLYM 3s M FM Ik
Figure I : Serum Sample Analysis Diagram Of Major Process Flow Routes.

121
ilist
1151r, I- z__va 1
. . . . ... . .
.. . ....
* I '~~.. ..............
to a.
X. "1 JUI
I~A I! _

122
PU ~ ~ ~ &E h2VRCOP
61C DM 2
Figure 3- Computer Network Hardware Arrangement

The Benefits of SUSI: Safety Analysis ofUser System Interaction
M F Chudleigh and J N ClareCambridge Cnsultants Limited
Cambidge, ngand
1 Introduction
The = of computer based systems has many advantages, including inceasedfu nlity, increased flexibility and, hopefully, ease of use. Because of theseadvanages their use is inceasing dramatically, including applications where failurecould have an advere impact on safety. It is important to remember that most suchsystems have comat with human users and are used in 1 Sit im where there amse prwed and ways of working.
For industries such as petro-chemical, rail transport and air transport thensequences of a failr could be catsophic and they have realised that evaluating
and conrolling the risk to humans arising from failures of such systems is vital.The process of evaluating the possible safety failures is known as hard analysis.One puacua method of caymg out hazard analysis is the Hazard and OperbilityStuy (HAMP) [1].
In recent yea thm has been an incresing asation ta considering the placeof the human in a system (human factors) should be an important part of the system"design. Tne critical isu is that as systems become more complex the humanoperator are increasingly prone to 'error'. In this case aror is used to describebehaviours that were not the designer's intent. In part, such behaviours occurbecause the operators an not able to comprehend their role with the system.However, a key part is that the operators choose to do smething different to thedesignes intent because of new working pwcedures, or because the system did notperform as the designers intended. However, once an incident occurs then wenrmally identify human ear as the root cause [2].
When we consider the design and implementation of such computer basedsystems we find that at least three specialists are involved: those who designfunctionality into systems (application designers); those who design the userIaerfim (humnm computer interaction (HC) specialists); and those human factorsspecialis who examine how paricular ta are canfied out.
In order to build effective, safe systems it is clear that all three specialists mustbe able to communicate with each other. However, the reality on most systems isthat the three areas all have their own specialist vocabulary and models of thesystm, and they tend to wor itl of each other. In addition, ind esriwhich have an established recmd of building safety critical systems are likely tohav specialists in safety. These pasonnel, apin, have their own pricular jaand often may not be familiar with the techniques of developing computer based 1

124
systems. This lack of co-ordinated coverage during system development has thepoential to lead to hazardous situations.
We have developed an approach that we believe shows promise in dealing withthe above problem. The approach is called SUSI, standing for Sfety analysis ofLIM System Interaction. SUSI comprises two parts:
" A common representation of all entities in a systems so that communicationbetween specialists is enabled; coupled with
" a structued, hazard analysis procedure which addresses features that am particularto human-machine interactions
Te remainder of this paper describes the approach and gives examples of its use intwo different applications at different points of the system lifecycle. One is of anew medical system design and the other is of an operational maritime system.
2 SUSI: A Common Representation
In describing our work in developing a common representation for systems weaddress three main areas. First, the key realisation that a common representation isboth necessary and possible: it underpins the majority of our work in user systeminemction. Second, the applicability and limitations of the chosen approach.
2.1 A Common Representation is Necessary andPossible
In building systems, a variety of expertise is necessary. Software applicationdesigners tend to treat the user as a separate entity from the system and leave anexternal msoucesin labelled HCL The building of user interfaces is then treated as asqmrate design activity given to HC specialists with particular techniques. HumanFactors specialists often work apart from system developers and concentrate on theactivities carried out by humans (task analysis) with its own vocabulary [3]. Thisanalysis may well be aimed at defining manning levels or training requirements.
In developing new systems, these specialists all tend to build their own modelsof the system which are not easy to correlate with the other models. In addition, thepeople who want the system, those who will use it and those who might have tojudge its safety all need to have an underanding of the system. However, they alldo need to communicate with each other to ensure they share a commonunderstanding of the systm. There needs to be a stable system view from each ofthe perspectives Gaining that understanding is not easy with a plurality of systemmodels and it is difficult to imagine the consequences to the rest of the system ofchanges in one representation.
An analysis of the features that need to be described in understanding humanactivities [4] and those used to describe a software system [5] show a commonalityof entitier
human task software process

125
human information now software dataflow4human interactions software control
human ocwnerafon software dambmWith the existing widespread use of software dataflow analysis and description
tools there would thus appear to be a basis for a common representation. Inadopting a dataflow and process model for the human components of a system wecan now generate an integrated representation of the overall system. Using this wecan explore the consequences of failure in a consistent manner across the wholesystem. In Figure 1. part of a medical imaging system is shown to illustrate theconvention used in this type of representation. The key components are circles toreprasent a process (human or machine), a solid line is a dataflow, a dashed line is acontrol flow (start, stop etc), and two parallel lines represent a data store (we showdisplays as data stoes because data may be written to a screen, but there has to be anexplicit human process to read the data).
• Jmaation
b•rcoded is hems priority side MW
unstained sliesile IRSPS outpu sides
p r ._emporary tOy
,A.
Fgure 1: Part of Decomposition of Preparation and Scanning Process
2.2 The Scope of the Modelling Approach is Wide, butThere are Limitations.
The approach works well as long as the human activity to be modelled is primarilyinformation intensive. Thus activities such as decision taking, information tranferand classifiaion/soring are good matches, such as in the medical example above.The vast majority of human work falls into this. information intensive, class butthere ae limitations. The approach is not effective when the human processes havesignificant motor skills or introspective reasoning components. An example wheremotor skills take a prominent part might be the interaction between the driver of aFormula I racing car and the active computer systems used to manage many of thecar mechanical fumcdons.

126
We have found'that a dataflow and process model for both the human and thecompuder parts of a system allows us to generate an integrated reprsetation of theoverall system. This model can then be used to explore various properties of thesystem. A major advantage we have found is that such models are easy tounderstand by non-computer specialists and that users of systems are able tocommamt on and critique designs at a very detailed level.
In the next section we show how the conequences of failure may be examinedin a consistent manner across the whole system.
3 SUSI: Hazard Analysis Using Amended HAZOP
An approsch to assuring safety of systems has been well established over manyyears. However, only in more recent years has the potential for computer systemsto fail in ways that might impact safety, been recognised formally in standards work[6,7]. To facilita the discussion two definitions from Refererne [6] are given:A hazard is a physical situation with a potential for human injury.Risk is the combination of the frequency, or probability, and the consequences of aspecified hazardous eveL
Both emerging standards and existing practice in established industries uses thesame basic lifecycle approach to addressing safety which may be summarised asfollows:"* System definition generating a concise and complete description of the system
underrenvew"* Hazard analysis to identify the potential for hazardous events"* Risk analysis to judge the safety risk of the system as defined"* Risk acceptability: detminaion of whether the risks are acceptable"* Activities, if necessary, to modify the system definition or include additional
measures in order to reduce the risk to an acceptable levelHazard analysis is thus a key step in the process and a number of structured
procedures have been developed to provide confidence that the hazard analysis iscomplete and thorough. This section introduces one of the main hazard analysismethods, HAZOP;, explains how we have extended the HAZOP to address usersystem interaction; and describes some advantages and limitations of the approach.
3.1 What is a HAZOP?
The full name of HAZOP, Hazard and Operability Study, says a great deal about itsp o It is to ensure both dat necessary features am ncrpormed in a design toprovide for sanf operation and that features are avoided which could give undesirableoulcnms (iCe hazards). The c•hnique was developed by ICI in the late 1960's andhas grown to be well established in the petrochemical industries. An excellentinmtodon to the technique is given in [1].
In the pvCem industries it is usual to describe plant designs in the form ofPiping and Instrumentation Diagrams (P&IDs). The HAZOP is carried out by asmall ma with the following members: eawn leader, team secreta, personnel whohave detailed knowledge of operation of similar systems; personnel who have

127
detailed knowledge of the design intent of the system; specific technical specialistsas necessary. The team work logically through the P & IDs examining deviationsfrom normal operation asking "can the deviation happen?" and if so. "would it causea hard?" (a hazard could be things such as a fire or release of toxic material). Toguide the process a series of guidewords and potential deviations are used. Thus forliquid in a pipe, a relevant guideword is "flow" and potential deviations are "high,low, no, revrse". For fluids another guideword is "pressure" with deviations "high,low". In theory, each guideword/deviation should be applied to each process lineand vessel. In practice, an experienced team leader will judge the correct detail ofquetioning for each area.
3.2 Modifying HAZOP for User System Interaction
A critical element of the HAZOP process is the choice of parameter keywords andguidewords for deviations. We believe the guidewords for petrochemical plant havelimitations when addressing computer based systems and user system interaction.Other work by Cambridge Consultants and their parent company Arthur D Little hasled to modifications of the HAZOP approach for computer based systems and this isrepotd in [8l and [9].
For our work with user system interaction we have developed a vocabulary ofdiscrete entities which have associated deviations. These are shown below
Eaft eviaton Qmmat
Process Failure Execution fails, data is used ilyEnor Process algorithms wrong or contain flaw(s)Wrong Process Wrong process selected or human short cutItrrupted Process not restarted appropriately
Data Flow Corrupted Data changed in transitNone Data does not existWrong sourceink Data takenwsent from/o wrong place
Dam Store Corrupted Data changed in storeNone Data not stored or not found
Control Flow Couted Wrong control signalNone Control does not existWrong souzvcsink Sent to/eceived from wrong place
We have found that the traditional HAZOP team struture and general approach canbe used without change. However, it has been found essential to have independenttechnical personnel who are experienced in system design and human factors as partof the HAZOP team.

128
3.3 Advantages and Limitations of the ModifiedHAZOP
The main advantages of the approach are: it is done by a team; it gives a top-downapproach to the system; and it can be used both on new system designs and onexstng systems.
The team approach brings a variety of expertise and viewpoints onto a commonIprblem and concentrating on hazard identification leads to productive session.Also, the team, by providing a variety of viewpoints helps to avoid excessiveivestgaton of non-credible hazards.
The top-down approach, examining the whole system first, allows the homingin to ky issues based on the potential hazards and is very good at assessing system-w implications. The approach of looking at deviations from design intent, thentheir causes and consequences encourages exploration of non-obvious interactionsboth of the user/operato with the automated system and of the automated systemwith its hardware environment. The use of a HAZOP provides guidance towards themost critical areas to concentra on in any subsequent low level investigation.
The HAZOP fits naturally at all stages of the life of a system, from conceptthrough to operation. In later sections we give an example of use during a medicalsystem conceptual design stage and another example of analysing an existingope•tional maritime system.
There are, however, limitations to the HAZOP approach. We have found thatstraight'orwad application of the deviation guidewonts is not sufficient the processrelies on the experience and intuition of the team members (especially of theindependent technkal exet). Futher, the choice of an experienced HAZOPis key. It is the leader who controls the pace of the analysis and it takes significantexperience to guide the team discussion to the most critical areas while stillensuring full coverage within usually tight time constraints.
4 The Use of SUSI in a New System Design: aMedical Laboratory System'
This section is divided into trme parts: first a brief description of the system topartly automate screening of cervical specimens, then an outline of the dataflowdescription and finally some of the results from the HAZOP analysis.
4.1 The Medical Imaging System
The Human Genetics Unit (HGU) of the Medical Research Council in EFdinburghhave produced an experimental version of a semi-automated system for screening ofcervical sme samples to identify abnormalities which might lead to cancer. The
1.The work carried out here was part of a collaborative project betwe The Comm forSoftware Engineering Limited, Cmnbridge Consultants Limited and the Human lneticsUnit of the Medical Research Council.

129
HOU have been working closely with the Department of Pathology of theUniversity of Edinburgh to carry out trials on the system and both parties wenrcosly involved in the work presented hre.
Within a cytology laboratory the equipment would consist of two major parts, arobot slide preparation system (RSPS) and a slide scanning system (SSS). TheRSPS takes in sample bottles submitted by clinics and transfers a part of thematerial as a monolayer sample onto slides.
The SSS is an image processing system which inspects objects on the slide andclassifies them into various categories. Where abnormal objects are identified, thesystem stores digitised images for subsequent human inspection. Both the abovesystems am supported by a computer based system providing overall administaionand interfces to the laboratory main computer which stores patient records.
4.2 Development of the Dataflow Description
The full system description is far too long to be included here: we give simplifiedversions of two levels of the description to illustrate the method. The systemcontext identifies the complete system under consideration and its principleinteractions with the external world. Here there are two external entities; the clinicsor surgeries which collect samples and have reports returned and, within thelaboratory, the archives where reports and samples are stored. Note that the totalscreening system includes the human administrators, technicians and medicalpersn nel who intract with the machine sub-systems.
4--- more iNfO p:to.._••.,,,,,,•r s--
-anamand
-rocesgor -om
r 2Tolelokson oM edal y s id 3
-boreports mn - , ro- ss
bbarcocie
bsample slides midscsIyig bors formsslides
am rstore 4Figure 2: Top Level Decomposition of Medica System

130
The top level system is then decomposed whilst preserving the external dataflows. Figure 2 shows the division into four processes: sample and form validation,prepuration and scanning, review process, and laboratory computer data vamet.Figure 1 (shown earlier) gives the decomposition of the preparation and scanningprocess. In discussing the design of the system it became clear that process 2.2Match items was a key and human intensive process. It was necessary to include anexplicit process because the automated part of the system had few opportunities tocross check for aros in the pairing of patient forms and patient sample bottles. Asthe design proceeded it was also recognised that there were other quality control andsorting processes that could also be carried out at this stage of the overall process.As a result the Match Items process is an intensive human process which achievesthe following: cross-checking, visual quality assessment of prepared slides,attachment of label to each slide and assignment of samples for priority processingwhere there are clinical indications. To aid the human carry out the process a snreenis used to display status information and a barcode reader pen is used to cross-checkbarcoded items against patient details.
The dataflow design was produced by a team of a consultant (one of theauthors), a cytopathologist and a member of the design team of an experimentalautomated system. The team approach ensured that the various viewpoints on thedesign were captured in an effective manner and partitioned activities between humanand machine in a way that was readily understandable to all those involved. Thislevel of common understanding had not been achieved previously despite regular anddetailed liaison.
4.3 Application of the modified HAZOP
The HAZOP team included representatives of both the design team and the intendedusers of the system. The HAZOP leader role was taken by a member of CambridgeConsultants who had no direct involvement in generation of the dataflow design butwas aware of the overall goals of the project. The design consultant provided thetechnical expertise in system design and human factors.
The HAZOP process focused on two types of issue. One of these related todesign aspects which would enhance operability and safety, the other was from theexperience of current staff who were able to identify practical and proceduralconstraints which would impact the viability or safety of the system. Below wegive some of the observations recorded during analysis of the Match Items process.
Recommendation 1. Bar coded form wrong through mismatch of names.Wrong patient gets matched to slide. Do double check.Recommendation 3. No report/label because detached. Leads to delay. Printreport and label on same form.Recommendation 4. Wrong slide pair because of incorrect location of slide.Wrong patient could be matched. Check barcode and accession number match.

131
5 The use of SUSI in an Existing System:Maritime Control
A hazwd analysis has been carried out on the navigation system for a vesseL Thiswas pat of a series of investigtios into hazards associated with coastal traffioperPain3 in crowded waters. The objec was to identify amea where hazards could beexpect� to have signifiant effects. The SUSI methodology was used as the basisfor the analysis. The firs stage was the prxdction of dataflow descriptions of theactivities of watch keeping officers. This was done on a series of sea voyagesduring which the dataflow models were constructed and reviewed by experienced,seaman officers. Figure 3 shows the first level decomposition of processes, mostexternal data flows have been omitted to aid intelligibility. As can be seen theprincipal processes are navigation, ensuring that you are where you should be;collision monitoring to identify other mobile hazards; and conning, giving ordersfor changes to ship speed and course. Each of these processes were decomposed tolowe levels for the actual analysis.
1._ . _ m- -chaI t _u_,n _.n...
avakldwic ~ tP
-vimud__i-.._ C a nR W d fe C h a n a mCM"~
- dfM Nawp~a -orwo
Figure 3 Decomposition of Ship Navigation
On completion of the data flow analysis a HAZOP team was assembledconsisting of a HAZOP leader, secremtary, dataflow/human factors expert andexperienced navigating officers. At the lowest level of each branch of theAft-- dgthe guide words were used for every data flow, process, data store andcontrol flow. The output was recorded using a HAZOP database tool. The HAZOPouput was mvised post team session in order to ensur consitency of responses andto cover areas that the HAZOP team were unable to detail at this time (a lack ofdeail knowledge of the operating prcedurn).

132
The next stage was to develop fault trees with top events of collision,grounding etc. The fault amees were constructed using available data on navigationaid failures and human error rates. Human error rates were factored by stress level,compexity and experience. The human ersor rates used were for single events and itwas noted that normal navigational procedures require multiple independentsightings. If errors are suspected then new sightings are taken. For example avisual fix requires the bearing at regular times of three fixed points. All three haveto coincide for an error free fix to be recorded. In many cases this would then becross checked with a radar fix or a navigational beacon.
The SUSI approach was both necessary and valuable for this task as there wereno simple descriptions of the navigation tasks or use of navigational aids. Therewere a series of operating procedure manuals, the training materials for shipsnavigation officers and various instructions to mariners issued by regulating bodies.In order for the HAZOP team to operate this mass of data had to be compiled into aneasily digestible form which could also be validated against actual operationalpractice. The development of the dataflow description provided a clear and easilyunderstood view of these activities (one training officer has decided to use them asnavigational training material).
The overall process of hazard analysis was completed in four weeks, fromboarding the first ship to delivering the final report.
References
I A Guide to Hazard and Operability Studies. Chemical Industries AssociationLimited, 1987.
2 Westrum R. Technologies and Society. Wadsworth Inc. 19913 Stammers R, Carey M, Astley J: Task Analysis. In: Wilson J, Corlett E (eds)
Evaluation of Human Work. Taylor & Francis 1990, pp 134-160.4 Wilson J, Corlett E (eds) Evaluation of Human Work. Taylor & Francis 19905 Hatley D, Pirbhai I. Strategies for real-time system specification. Dorset
House, 1988. ,,
6 Functional Safety of Electrical/Electronic/Programmable Systems. GenericAspects. IEC 65A (Secretariat) 123. 1991
7 Interim DefStan 00-56. Hazard Analysis and Safety Classification of theConputer and Programmable Electronic System Elements of Defence
8 Chudleigh M, Catmur J. Safety Assessment of Computer Systems usingHAZOP and Audit Techniques. In: Frey (ed) Safety of Computer ControlSystems 1992 (Safecomp '92) pp 285-292.
9 Chudleigh M. Hazard Analysis Using HAZOP:. A Case Study. In these

Panel Session
TECHNOLOGYTRANSFER BETWEEN
ACADEMIAAND
INDUSTRY
Moderator: F. RedmillSafety Critical Systems Club, UK

Issues Affecting Technology Transferand
Experience with a Community Club
Felix RedmillRedmill Consultancy
and Co-ordinator of the Safety-Critical Systems Club22 Onslow Gardens, London, N10 3JU, UK
1 INTRODUCTION
Achieving technology transfer isa perennial problem. Yet, without it, industry'sproblemscan remain unsolved, and solutions to one problem are not generalisedto more or broader applications.
There are two objectives of the paper. The first is to raise a number of issuesconcerning the transfer of technology from academia to industry. The secondis to show how a community club is helping to facilitate technology transfer.
2 ISSUES IN TECHNOLOGY TRANSFER
Some of the typical problems affecting the transfer of technology from academiato industry are listed, with brief notes.
2.1 Traditionally there is a delay between the development of a technologyin academia and its implementation in industry. Some say that this can be aslong as ten years. Many industries have no formal contacts in academia andthey do not know how to find out what new technologies are available.Moreover, academia is not noted for effective marketing of its prodtucts.
2.2 The terms in which academics typically present their findings are thoseunderstandable to other academics, and not to industrialists. This contributesto the delay in the recognition and implementation by industry of new tech-nologies.
2.3 Even when transfer does occur, it is usually to a small sector of industry,and the majority of those who need the technology do not receive its benefit.

136
2.4 Feedback from industry to academia is not standardised. It is seldomgood and almost always slow. Thus, potentially useful but flawed or unreadytechnologies are rarely corrected.
2.5 Communication between the users of a technology, particularly acrossindustrial sectors, is at best poor and often non-existent. Thus, the lessonslearned by one company, or industry, are not communicated, and others mustundergo the learning curve for themselves. When the technology is flawed,finding the problems and suffering their consequences must also be repeated.
2.6 When there is effective marketing of new technology, for example byconsultants, it is not uncommon for inappropriate technologies to be trans-ferred. Consultants often transfer their pet technologies rather than those mostsuitable to the problem in hand.
2.7 Typically, technologies are developed for specific applications in specificindustry sectors. Often, however, they are proposed as being effective over amuch wider range of applications. When they are found to be ineffective, thosewho have used them may be left suspicious of academic innovations.
2.8 Much technological development in academia is directed towards ob-taining degrees and preparing publications rather than to getting the technolo-gies right. The resulting technologies may then not be properly refined. Withluck, such technologies do not get transferred. When they are transferred, theyare often not suitable for use, and industry wastes time discovering this.
2.9 In the normal course of events, a great deal of technology transfer is ofproven technologies to new environments rather than of the introduction ofnew technologies.
3 THE SAFETY-CRITICAL SYSTEMS DOMAIN
Safety-critical computer systems are a relatively new phenomenon, but thedomain is expanding rapidly. Moreover, it is not growing out of nothing, butis the coming together of a number of other fields. The two main componentsare safety engineering which, though not new, has traditionally been restrictedto a small number of industry sectors, and software and systems engineering,which is itself a new field. In addition, safety-critical systems are expanding intoalmost every sector of industry, and demanding input from other specialisms,such as human factors and quality management. This leads to the followingobservations on the need for technology transfer in the safety-critical systemsdomain.

137
3.1 There is an urgent requirement for the development and transfer of newtechnologies to meet the particular safety demands of safety-critical systems.
32 Software and systems engineers are typically not familiar with safetyengineering, and there is a need for the transfer to them of existing safetytechnologies.
33 Similarly, there is a need for safety engineers to become familiar withcomputer systems and software technologies and practices.
3.4 The knowledge and technologies of the human factors domain, on suchissues as human dependability and human-computer interaction, urgentlyneed to be assimilated in the safety-critical systems community.
3.5 The need is urgent for an improved awareness, in all sectors of industry,of the application of safety-critical systems.
3.6 There is the need for the transfer of existing technologies and practicesbetween industries.
3.7 If the development and transfer of technologies is to keep pace withexpansion in the domain, there needs to be focused research, and easilyaccessible communication links between industry and academia. Improvedcommunication links would also allow transferred technologies to be im-proved and made fit for purpose.
3. Mechanisms are needed for communication across industry sectors, sothat experiences of new technologies can rapidly be communicated.
1,"
4 SETTING THE SCENE FOR A COMMUNITY CLUB
Technology transfer may take place in a number of ways. For example,individual companies may make contact with one or more universities orresearch establishments; more and more, universities are encouraging thesetting up of 'spin-off' companies for the purpose of marketing and selling theirtechnologies; professors and other researchers, in their roles as consultants, areactive in the transfer of technologies, and they carry considerable responsibilityin choosing what they recommend to their clients; reports and publicity maycatch the attention of industry. There is also the possibility of achievingtechnology transfer via a community club.
In 1991, in the UK, the British Computer Society (BCS) and the Institution of

138
Electrical Engineers (lEE) were contracted by the Department of Trade andIndustry (DTI) to set up a community dub for technology and informationtransfer, and for raising awareness, in the safety-critical systems domain. Thetwo Societies were assisted by the Centre for Software Reliability at theUniversity of Newcastle upon Tyne, who in turn engaged the current author tobe the dub's Co-ordinator. The dub was launched in May 1991 and the highlevel of interest in it was demonstrated by the attendance of 255 delegates at theinaugural meeting in July of that year. By May 1993, there were 1682 members,of whom 130 were from outside the UK.
5 THE CLUB'S OBJECTIVES
The dub exists to facilitate information and technology exchange, and toincrease awareness, in the safety-critical systems domain. It is recognised thatin order to be successful in this, the club must gain access not only to engineersand technicians but also to managers with decision-making responsibilities.
By facilitating communication across industry, the club's objectives are to:* Increase the rate of dissemination of useful technologies;* Prevent the spread of flawed technologies by the rapid communication
of experience;* Improve the industrial testing of new technologies;* Bring industrialists together to plan feedback to academia and to coordi-
nate the sponsorship of research.
By facilitating communication between academia and industry, the club'sobjectives are to:* Improve the choice and application of technology;
Accelerate the feedback to academia of experience in the use of technolo-gies;
Improve safety-critical computer systems which are supplied to indus-try;
* Facilitate the targetting of research;• Accelerate the correction and improvement of flawed but useful tech-
nologies.
It is also the club's objective to provide a platform for reporting on research intonew technologies and experience in their use in industry.

139
6 SUCCESS IN MEETING THE OBJECTIVES
6.1 Newsletter
A newsletter, of at least 10 pages, is published three times per year anddistributed to all members. Typical contents are:"* Feature articles on safety-critical systems matters;"* A calender of events on safety-critical systems;"* A calender of events on related issues;"* Calls for papers for future conferences;"* Reports on new products;* Reports on government studies or initiatives affecting safety-criticalsystems;0 Comments by members on safety-critical issues.
6.2 Seminars
By June 1993, theclub had held nine seminars. Of these, seven were one-day andtwo were two-day events. The topics covered were:"* Inaugural meeting and introduction to safety-critical systems;"* Requirements for safety-critical systems;"* Education and training for safety-critical systems professionals;"* Safety-critical software and technology in the medical sector;"* Standards for safety-critical software;"* Human factors in safety-critical systems;"* Design for safety and reliability;"* Safety-critical systems in the nuclear sector;"* The safety case.
In the interest of bringing industrialists of all sectors together, the majorityof the seminars are on topics which are of broad application. However, it hasalso been the club's policy to hold one sector-specific seminar each year. In 1992and 1993, these were devoted to the medical and nuclear sectors respectively.In each of these cases, and particularly in the latter, many other industrialistsand academics attended in order to learn the lessons of that industry. Thus, theobjective of cross-fertilisation is being achieved.
The speakers at the first five seminars were invited to prepare chapters,based on their presentations, for a book. Twenty-two speakers responded, andthe resulting book [11 was published by Chapman and Hall in 1993.
At the nine seminars held so far, the total attendance has been 1283. At eachevent, the delegates have been asked to complete questionnaires on the qualityand value of the seminar and, without exception, the feedback has beenpositive.
By the end of 1993, two further one-day seminars will have been held, on

140
"Testing and validation of safety-critical systems' and 'Measurement of safetyand reliability'.
6.3 Annual Symposium
The club has initiated an annual three-day symposium, the Safety-criticalSystems Symposium (SSS), to be held in February of each year. The first, SSS'93,held in Bristol, attracted 190 delegates. Thus, the total attendance at the first tendub events was 1473 - an average attendance of 147.3 delegates.
The 19 papers presented at the symposium covered a broad spectrum, manyreporting on research projects involving collaboration between industry andacademia. One of the goals of the club is to provide a forum for the reporting ofthe results of these projects, and in the years to come the Safety-critical SystemsSymposium will provide this platform. The proceedings of the symposium [21were published by Springer-Verlag.
SSS '94 will be held in Birmingham in February 1994.
6.4 Ad Hoc Activities
The principle of the club's existence is cooperation rather than competition.Thus, the dub has participated and assisted in activities not mentioned amongits principal objectives. In this respect, it has co-sponsored events, assisted in theorganisation of workshops, given advice on safety-critical issues, broughttogether potential participants of collaborative projects, and given publicity tosafety-critical matters. The dub continues to offer support whenever appropri-ate.
7 CONCLUSIONS
This short paper has listed a number of issues in the transfer of technologybetween academia and industry. It has also reported on the experience of howa community dub can contribute to technology transfer, effectively and over abroad spectrum.
In two years of operation, the Safety-Critical Systems Club in the UK hasattracted a large membership, staged ten successful events, published twobooks, and further facilitated technology transfer by the publication of a regularnewsletter, the co-sponsorship of events, and the provision of advice. It pro-vides a model which could be used in other parts of the world.
8 REFERENCES
[11 Redmill F and Anderson T (Eds): Safety-critical Systems - Current Issues,Techniques and Standards. Chapman and Hall, London, 1993.

141
[21 Redmill F and Anderson T (Eds): Directions in Safety-critical Systems - theProceedings of the First Safety-critical Systems Symposium. Springer-Verlag,London, 1993.
Information on the Safety-Critical Systems Club may be obtained from Mrs ]Atkinson, The Centre for Software Reliability, The University, 20 Windsor Terrace,Newcastle upon Tyne, UK.
I.""'

Subsidiaries and start-upSpin-off companies
of Inria
Panelist: Jean-Piem BauieInria.Renn/irisa.
Campus de Beaulieu - 35042 Renn cedex France
This document is a summy of Inra's policy for the creation of private m
as a phivileged means for the transfer of basic research results.
1 Inria
The National Institute for Research in Computer Science and Control Automation
(Innia) is a frieh scientific public instiume unde the r of the ministry
of research and technology and the ministry of industry. With its headquarterslocated at Rocquecourt near Versailles, Inia has five reseach centers located at
RSophia-Anmio Rennes, Gkenble and Nancy respectively.
lnia brings together 1000 scientists, including 250 permanent research staff and
more than 300 PhD students. Its budget in 1991 is of the orde of 450 MF (75
M$). Inria's activities is infornation processing and control thory encompass basic
and applied research, design of experimental systems, international scientific
exchange. cooperative interntiona programs and technology transfer. The latter isprbaby one of the most important ones in the context of information technology
whme changes h.ppeurdy.
2 Transfer of research is a must
IwLa Ins, over the last 10 yeas, encouraged the diss o of its research resultstd them In the Indusaial and scientific s. The transfer Is
organized t iw nfom~ation seminars, research conmnsti, recetion of wwrbersedmd engineers from industry in das research urns and detachment of Ilaa's staff
to ahkusid rIsnrh I nF.
I! mlmtmmmmmmmm m nmnm| "J

143
Ibis policy has been systematically a by a diffusion, as large as
posIbl~e, of results through publications and dsmnaonof software to parter(universities, public and industrial reseac c , industrial departments ofrsearCh, 64z.). M& diffusion allows for the evaluation of prototype and the feed-
bek by the users.
3 The creation of "high-tech" companies:a solution for transfer
Lare companies ae not always able to assunm a direct Mrsfer of research
prottyp especially for basic tools ; this simaion may be due to the rigidity of
large stractues, the diffUltes to manage the competition with internal as, the
difulties to adapt new tecnoogie to, the inurnal stmagy, the cost of knowledge
trase, but, mWnly, the traer of products witho•t the troader of Men.
Inria has been encouraging the creation of high tech companies by its ownresechers ; these companies remain dcose o reseawrh for the main remao that their
staff is composed almost exclusively of former researhers. Their business is
meover mainly product oried.
In this context, fourteen companies have been created up to now in the environmet
of Ima. They are either subsidiares or no, but their main goals are always the
transfer, exploitation and commercialization of know-how and prototypes
oginatinS from laria.
4 Subsidiary or spin-off ?
laua's legal status (Public Institute for Science and Technology) allows the
intitut to 3are in he capital of privale companis. In this context, Inria crealed
three mbsidiaies, (Simulog in 1984, hog in 1987, 02 Techology In 1990) wherei conaros the mjority of the captal, and Gipsi S.A. (coming from the goupmentGipsi SM 90) controlling a minority of the capital. The creation of such
re only occurs under the following conditions:
Ih• I WUI n IIIWIIml l MMMm

144
* alag hieseumatm I. resarch
* m aivuKmed mwmogy,
a a nw but attractive umaK* a very competitive hunatkna contxt,
* the ladk of motivated indutial parne
During hids tme, researdes, engieers or forme PhD stents of Inda havecreated fifteen companies. 'They represent one of the most dynamic vectors forransfer. The majority of thden dMutialz and exploit products originating from
Ima under liceuue. Tese licenses aw negociated on a nam-cxchuslve bais and
mytes dwe-Maited smowdiag to t min as M o IDuM l pI mner.
One of the fifty licenses for prototypes active in 1990, nely hlAf of thm involveWoD-off companies and subsidiaries. More tmn 70% of the toD amount ofroyalties an coming from thee companies and theprogression accelertes (onyly
25% in 1989).
Convearely, thse companies help Ima to undersnMd stratgic informtion
Wegalig mk=0 needs, help*ih I Dia O fatk strategic decisions concating resear
orienation.
IkI

Human Medium in Technology Transfer
W. CellaryFranco-Polish School of New Information and Communication Technologies
Poznan, Poland
To analyze problems of technology transfer between acadenia and industry, first, it isimportant to realize expectations of both sides. In my opinion, academia expectsmoney and problems to be solved, while industry expects problem solutions andpeople trained in research. A question is: what is the role of these people trained inresearch in technology transfer from academia to industry, and why they are expectedby industry? One may believe that a medium of technology transfer is paper, i.e.written documents describing problem solutions. I claim that to transfer a newtechnology a human medium is required. In a new technology (I emphasize wordnew, meaning here revolutionary) developed in academia, i.e. mostly at thetheoretical level, the main concept is established, but a lot of problems remainsunsolved. I mean here the research problems, not just implementation ones. If theconcept is revolutionary new, it is difficult to transfer it in its integrity to a foreignteam. Still more difficult is to transfer an idea how to solve the related problems insuch a way that the main concept is not violated or deviated. The most efficient wayto transfer technology is to use humans, i.e. the researchers who developed it, as amedium. This makes, however, a painful hole in academia, and thus is successful ifacademic research teams are relatively big and may be split.
Let us now analyze a career of a young, over average talented researcher in computerengineering, who prepared his PhD in collaboration with a team developing a newtechnology. Assume that he is 28 years old when he gets his PhD, and that he ishired by industry to transfer technology and develop a product based on this newtechnology. Nowadays, mean life duration of a software product is around twelveyears. If we add three years to develop the product, we get fifteen years. Assume thathalf of this time is creative, i.e., some scientific research needs to be performed,related with the product. We may call it an offensive phase. The second half, calledthe defensive phase is devoted mostly to maintenance and some development:moving to various platforms, integration with various software products available onthe market, etc. In this phase, innovations are restricted, because of compatibilitywith previous product versions. Our researcher is 35 years old at the end of theoffensive phase of the product. At this age he has a good potential of creativity and,moreover, he has good experience in development of industrial products, cooperativework in a team, etc. There is no reason to keep him to maintain the product during
r• n m mmmmm m mmmm ma ma m[]

146
its defensive phase which is not creative. He is at a good point of his professionalcareer to assume responsibility for a new advanced project. There are, however, twomenaces: first, that he will continue the old project in a new frame; second, that hewill create a new project, but his role will be reduced to the managerial aspects only.To avoid these menaces he has to be trained in new technologies developed inacademia during the time when he was occupied with his first product. Seven yearselapsed since his PhD is a very long period in so active scientific domain as computerengineering. During this period some new concepts and new research directionsappeared that are more suitable and more promising for new products that have todefend themselves against other products even ten years after. A challenge foracademia is to integrate and efficiently train such people, as a medium of advancedtechnology transfer. They need some special organizational solutions, because theycannot be simply mixed with postgraduate students. I think they need around twoyears of training: one year to study a new domain, and one year to start to produceoriginal results in this domain. A good solution would be a kind of sabbatical. Itsadvantages are the following. For industry, it is an investment in future productsusing the most advanced technologies. For academia, it is the growth of researchpotential, financed by industry, and feedback from practice and applications. In theFranco-Polish School of New Information and Communication Technologies we areencouraging industry to apply this solution.

Technology Transfer - from Purpose to Practice
Bob MalcolmMalcolm Associates Ltd.Savoy Hill, London, UK
Abstract
It is submitted that technology transfer between academia and industry is not amatter of academia telling industry how to do things better, but of industry better
understanding its own needs and being better able to evaluate academic work.
I Introduction - the purpose
One of the recommendations of the IEE-BCS report on "Software in safety-relatedsystems" [1] was that there should be a programme of awareness and disseminationof latest developments and of best practice, in parallel with a research programme.The research programme is now established, and there are now 35 projects, withover 130 industrial organizations, and over 30 academic institutions participating[2]. This present paper presents the considerations involved in establishing therelated technology transfer programme.
2 Policy
The first step in any government-led initiative must be to identify the policy whichboth guides and constrains any action. In the present case the relevant policy wasset out in a UK government policy paper concerned with innovation (a 'WhitePaper') from 1988 [3].
Frequently, technology transfer is discussed in the context of 'encouraging adoptionof best practice'. This sounds very reasonable at first hearing, but, if interpreted toosimplistically, it implies that someone knows what best practice is; that someonewill pick technological winners which they will inflict upon everyone else. Wouldyou trust any individual, or worse, a committee, to do this on your behalf?
An alternative approach was presented in the White Paper. This is that the rolefor any government-inspired technology transfer activity should be to make it easierfor suppliers to select the most appropriate technology for their business. (Note thatin this case 'suppliers' are users of technology.)
This policy is motivated by an economic argument. A government-led technologytransfer programme is, in effect, intervention in the free market. The economic casefor government support of any such action must be that there is some kind of failureof the free market to deliver an optimum product-price combination to end-users.However, a 'perfect' market requires 'perfect information'. It is not too difficult tomake a case here that those operating in this business do not have 'perfect information'about the latest technological developments.

148
3 Theory
A study was performed of the principles of technology transfer, so as to informthose in government responsible for establishing any initiative [4]. The study identifiedsome of the parameters to be considered in such an initiative, which were then usedto guide the selection of technology transfer mechanisms.
3.1 The role of technology transfer in innovation
Technology transfer is implicitly part of technologically fuelled industrial innovation.Note - innovation - the putting to work of new developments, which is distinguishedfrom their invention.
Taken literally, technology transfer is the actual transfer of the technology - theadoption by organizations of technology developed elsewhere, whether in academiaor industry. It can be achieved either by organic technological innovation within thefirm, or, for instance, by corporate acquisition of a company with new technologicalcapability.
The innovation process varies from sector to sector, at least in detail, because oftheir different structures. There are also differences in the way in which technologyis transferred across different groups of sectors - again due to different industrialstructures [5]. However, in general, innovation is a consequence of diffusion ofknowledge. Moreover, von Hippel proposes that a "significant mechanism"contributing to this diffusion is "informal know-how trading ", which is "essentiallya pattern of informal co-operative R&D. It involves routine and informal trading ofproprietary information between engineers working at different firms - sometimesdirect rivals. " [6]
Key players in this diffusion of knowledge are the industrial 'gate-keepers' [7].These are the personnel in companies who have the external contacts with emergingand prospective technologies, and who are respected by the decision-makers andbusiness managers, inside the company, who are able to use such technologycommercially. Such individuals will be familiar with trends in their applicationsectors which are likely to influence the development of technology, either throughmarket pressure for technological development or through constraints on the natureof such development coming from emerging regulatory changes or, again, the market.'Gatekeepers' are able to filter ideas and information and promulgate themappropriately. They are important nodes in a communication network which is itselfa vital part of technology transfer.
Technology transfer communication should be seen as two-way traffic. This isimportant because it appears that in many sectors invention as well as take-upinnovation often originates with the industrial technology users [6]. Indeed, recentresearch puts it more strongly: Successful technological change is more likely to bemarket-led than science-led. " [8]
S • I lllllllllll lml I !A

149
3.2 Leaders & followers, small & large
Companies which embrace innovation - the 'leaders' - see it as a necessary investment,while aware of the risks. And it is an ongoing investment, rather than a once-offtransfer of instances of presently available technology. "Companies who get therefirst do not benefit from a lasting loyalty from customers. Successful innovationmeans more than initiating a product or technique and bringing it to fruition. Itmeans constant improvement .... .[8]
However, many companies - the 'followers' - are not geared up to innovation.They do not positively adopt this as their route to future wealth [9]. The view theytake is that it is sufficient, and even best for the shareholders, to come second - to letsomeone else take the risks [10].
It is interesting that the present political climate is one in which emphasis isplaced on encouraging the economic growth of smaller companies. Perhapssurprisingly, the evidence indicates that small companies are not noticeably moreinnovative, on balance [11 ]. It is the large firms who are more likely to have theirown R&D activity, who are both easier to target and best equipped to take-up newtechnology, and who can make a bigger dent in the overall industry culture. As theyare also a source of innovations ripe for diffusion elsewhere, they are an importantcontributor to the technology transfer communication network. So, it would notmake sense to exclude such firms from any initiative.
3.3 Force or facilitate?
Any technology transfer initiative must be distinguished from the actual transferitself. Now, the role of a technology transfer initiative could have as its purposeeither the transfer itself, or the facilitation of the transfer.
At its most extreme, the former takes us back to the 'technology-push' approach,in which somebody decides what should be transferred. What must not happen isthat some central decision-making committee should pick winners from thetechnology-push supply side (even under the guise of 'consultation') and makeeveryone use their preferred technology. After all, who would believe that a centralcommittee could be both sufficiently competent and unbiassed by either lobbying orby having fixed ideas? And, anyway, however well it is done, any such prescriptionwill ultimately stifle innovation.
In this context, we should address the potential role of regulation as a means ofaccelerating take-up of new technology. This is certainly possible, but it must behandled very carefully and intelligently. The intention, once again, is not to enforcethe take-up of any particular technology. Such prescription is anti-competitive,restricts trade, and stultifies competition, innovation, and technological development-just the opposite effect, in the long term, to the effect which is sought.
Where regulation is necessary, Rothwell and Zegfeld refer to "the desirability,where possible, of formulating regulations that allow maximum freedom in developingtechnologyfor compliance." [7]. It is not too difficult to avoid constraining complianceto particular technologies. It is at least as important, and usually much more difficult,to frame regulation which does not presume certain classes of technological solution.

150
On the other hand, if it can be done properly, then tough, technology-free,targets can stimulate the development of a range of innovative solutions. It isimportant that the targets are indeed tough, else the inclination is to adopt 'bestpractice' targets, based on existing technology, which tend to be lowest common-denominator targets, thereby, once more, inhibiting competition and innovation ratherthan accelerating it.
Returning to the alternative of facilitation, any facilitation of technology transfermight either directly support the explicit adoption of new technology (while notprescribing what that should be, of course) or it can more indirectly attempt toovercome - or undermine - some of the barriers to innovation.
The two major barriers are, it seems, a lack of awareness of new developmentsand practice elsewhere - despite the availability of information for those that positivelylook for it - and an inability to assimilate change, primarily because of shortcomingsin "the strategic ability of management to integrate externally acquired technologyinto an overall business plan" [9]. It is fairly clear that a technology transferinitiative could address the first of these. It is less clear that problems with thestrategic ability of managements lie within the scope of technology transfer. Indeed,in the UK there is now a much more broadly-based attempt to inspire an innovatoryculture ([12], for example).
However, technology transfer actions of the right kind can help. It appears that'perceived performance gap', compared with fairly close competitors, is a majormotivator for innovation. "The technological strategy [of business units within firms]is to achieve the full potential of the product or process [around which they areorganised] in a way that at least matches the performance of rivals" [8] So informationabout what is happening elsewhere in industry is at least as important as informationabout technology. A technology transfer initiative can address both of these.
3.4 The players and their parts
In essence, the very much simplified technology transfer model in theBuxton-Malcolm paper [4] comprises:
* awareness - coupled with 'interest'* gatekeeping* in-depth economic evaluation* decision* acquisition of technology and capability in its use
Again simplifying very much, we identify a number of types of individual in anorganization. They play different roles in each of these stages, and require differenttypes of information in order to perform properly:
"* senior-managers - the 'decision-makers' as they are often called, except.."* middle management - who might well put this year's bottom line before
high-level highfalutin' ideas about change, and therefore, in reality, make thedecisions by default
"* gatekeepers* engineers - 'the workers'* researchers

151
Note the important requirement for 'interest' in any awareness activity. This isdifferent from the salesmen's 'attention' (which is necessary but not sufficient). A'perceived performance gap' referred to previously is one way to grab both theattention and interest of decision-makers and managers.
After awareness, assuming interest is aroused, we need to make sure thatgatekeepers have access - and have preferably already had it - to the sort of technicaland economic feasibility which they can believe, so that when asked, they do notblock the introduction of technology simply because of a lack of information.
And then, assuming that interest is held, organisations will need convincinginformation, from a reliable source, of the advantages and disadvantages of alternativetechnologies.
Should the decision be to proceed, there will be a need for back-up; informationon supply of tools, training, and so on. This must all be available well in advance ofany decision though, since availability and supply will be considered during theearlier deliberations of the organisation.
Note that the order of these stages is not necessarily linear, and, in particular,awareness is often stimulated by gatekeepers.
4 The practice - mission & mechanisms
4.1 The mission statement
Having studied the theory, the mission statement for the proposed technology transferprogramme was established. This is:
"To achieve, in the supply of safety-related programmable electronic systems,better informed application of safety engineering practices and better informedchoice and application of appropriate software technology."
4.2 A choice of mechanisms
Having identified different classes of information required by different people in thediffusion of innovation, Table 1 was a first attempt to help to identify which mechanismsprovide support for which of the different aspects, discussed previously. It does notpurport to be complete, and the 'more-blobs-the-better' ratings are entirely subjective,as a starting point for discussion.
Note that some of these mechanisms perform dual roles. For instance, collaborativeresearch, technology demonstrators, and 'application experiments' [13] are all meanswhereby technology can actually be transferred into participating organisations. Butto others they are perceived as sources of information, accessed through the associateddissemination activities.

152
Courtontoi t: Technical Awareness Economic Lfeasibility feasibility ..W Ail it
for': M 12 M M M E ca
collaborative research UL eee 0e 0 00 00 0
mailshots f• o• oo •press . 0 0 00 £gatekeeper clubs aoo oo o S Utechnical feasibility demos. o LUeconomic feasibility demos. 0 "° sO Ltechnology centres U S oo Ujourneyman schemes o .o £case studies 0 o• oo o• oo £ 00
sector clubs 0go 06g o• 00o 0 oo o• o00 @0
hazard analysis forum see *so ° 0 0 0 " 00 U°°
conferences 0°0 0 0U ° "
centres of excellence 90 "°° 0* 0 LUstandards *0 * a
certification 0 0o 0 LUteaching company scheme 0 0 * U
consultancy initiatives 0 0 0 0 0 U
management handbooks a 0 0 0 0 £manager forums 0° 0o LLinternal communications 0 0 0 £technology review 0.0.. U
directories * £technology survey reports 0 0 0 0 0 U£information centres 00 Uuser-groups ooo o0 see Usummer schools o* U 01acquisition, recruitment o0. ?
'KEY: R: Researchers; G: Gatekeepers; D: Decision-makers; M: Managers; E: Engineers
Table 1. Appropriat•nemss of various technology trusfer mechankiw
4.3 The Safety-Critical Systems Club
On the basis of all these considerations, and given the existence of the collaborativeresearch programme, we decided to combine the functions of gatekeeper clubs andsector clubs in a 'community club' - the Safety-Critical Systems Club.
The primary aim of the club is to facilitate the flow of information betweenpractitioners within industry - both between peers and between 'leaders' and'followers'. By enhancing awareness of current practices and of latest developments,the club accelerates agreement on what constitutes best practice, and enables evaluationof academic work.

153
Since one of the aims is to achieve greater consensus among both individualsand organisations, we must avoid proliferation of additional organisations, and ofactivities which overlap or compete with their activities. The club is thereforeintended to undertake new activities only where necessary, and to encourage, stimulate,and perhaps facilitate activities of existing technology transfer organisations whomay not be dealing with this subject at present, but who may be able to offer themost appropriate forum. Such existing organisations include trade associations,sectoral research associations, professional institutions, existing technology clubs,and publishing houses.
Such a club is, cheap, simple, informal, and, we believe, highly cost-effective.At the last count there were over 1600 members [14].
5 Effectiveness
The effectiveness of the club has yet to be proved. It is a requirement that allgovernment supported initiatives of this type be evaluated. For evaluation we mustdevelop some 'output measures' from the mission statement. This has yet to bedone, but for this kind of technology transfer activity we will, for instance, beseeking evidence that organisations
"* are better informed about safety engineering and software technology"* review their activities and technological needs more thoroughly"* are better able to judge whether changes in their practice are desirable and* make such changes, when they feel they are appropriate.
Referenmes1. Institution of Electrical Engineers. Software in safety related systems. IEE, London, 19892. Malcolm R. The JFIT Safety Critical Systems Research Programme: Origins & Intentions.
In: Redmill F and Anderson T (eds). Safety-critical systems - Current Issues, Techniquesand Standards. Chapman & Hall, London, 1993
3. Department of Trade & Industry. DTI - the department for Enterprise. HMSO, London,1988
4. Buxton IN, Malcolm R. Software technology transfer. Software Engineering Journal1991; pp 17-23
5. Pavitt K. Patterns of Technological Change -Evidence, Theory and Policy Implications.Science Policy Research Unit, University of Sussex, UK, 1983
6. von Hippel E. Sources of innovation. OUP, 19887. Rothwell R, Zegfeld W. Reindustrialization & technology. Longman, Harlow, 19858. Smith D. Innovation: a review of recent ESRC research. ESRC, Swindon, UK, 19929. Rothwell R, Beesley M. The Importance of Technology Transfer. In Barber J,
Metcalfe JS, Porteous M. Barriers to Growth in Small Firms. Routledge, London, 198910. Private communication from the managing dirctor of a 'high-tech' company.11. Rothwell R. The Role of Small Firms in the Emergence of New Technologies OMEGA
Vol IZ No. 1 (1984)12. Lilley P. Innovation: Competition & Culture. DTI, London, 199113. European Commission ESSI: The European System & Software Initative - Briefing Package
for Proposers. CEC, Bruxelles, 199314. Redmill F. Issues affecting Technology Transfer and Experience with a Community Club.
In these Proceedings.

INVITED PAPER

Dependability: from Concepts to Limits
Jean-claud LapriC
LAAS-CNRS, Toulouse, France
Abstract
Our society istfaced with an ever increasing dependence on computingsystems, which lead to question ourselves about the limits of theirdependability. In order to respond this question, a global conceptualand terminological framework is needed, which is first given. Theanalysis of the limits in dependability which is then conductedidentifies design faults as the major limiting factor, a consequence ofwhich is the concluding recommendation of applyi a fault toleranceapproach to the improvement of the production process.
IntroductionOur society has become increasingly dependent on computing systems and thisdependency is especially felt upon the occurrence of failures. Recent examples ofnation-wide computer-caused or -related failures are the 15 January 1990 telephoneoutage in the USA, or the 26-27 June 1993 credit card denial of authorization inFrance. The consequences of such events relate primarily to economics; however,some outages can lead to endangering human lives as second order effects, or evendirectly as in the London Ambulance Service failure of 26-27 November 1992. As aconsequence of such events, which can only be termed as disasters, theconsciousness of our vulnerability to computer failures is developing, as witnessedby the following quotation from the report Computing the Future: A BroaderAgenda for Computer Science and Engineering [COM 92]: "Finally, computing hasresulted in costs to society as well as benefits. Amidst growing concerns in somesectors of society with respect to issues such as unemployment, invasions ofprivacy, and reliance on fallible computer systems, ihe computer is no longer seenas an unalloyed positive force in the society".
Faced with this situation, a natural question is then "To which extent can we rely oncomputers?", or, more precisely, "What are the limits of computing systemsdependability?". Responses to these questions need a conceptual and terminologicalframework for dependability, which in turn is influenced by the analysis of the
This wock was partially supported by the ESPRIT Basic Resaerch Action PDCS(Predictably Computing Systems, project no. 6362)
L Ilmmmm m mmm mm mu. ...

158
limits in dependability. Such a framework can hardly be found in the many
standardization efforts: as a consequence of their specializa'on (telecommunications,avionics, rail transportation, nuclear plant control, etc.), they usually do notconsider all possible sources of failures which can affect computing systems, nor dothey consider all attributes of dependability.
The consideraions expressed in the above two paragraphs have guided the contentsof the paper, which is composed of two sections. The first section is devoted to themain definitions relating to the dependability concept; those definitions elaborate onthe definitions given in [Lap 92a]. The second section deals with the limits ofdependabilty.
1 The Dependability Concept
1.1 Basic definitionsDependability is defined as the trustworthiness of a computer system such thatreliance can justiiably be placed on the service it delivers. The service delivered by asystem is its behavior as it is perceptible by its user(s); a user is another system(human or physical) which inter¢a with the former.
Depending on the application(s) intended for the system, different emphasis may beput on different facets of dependability, i.e. dependability may be viewed accordingto different, but complementary, properties, which enable the attributes ofdependabity to be defined
"* the readiness for usage leads to availability,"* the continuity of service leads to reliability,"* the avoidance of catastrophic consequences on the environment leads to
safety,"* the avoidance of unauthorized disclosure of information leads to
confidentiality,"* the avoidance of improper alterations of information leads to Integrity,"* the ability to undergo repairs and evolutions leads to maintainability.
A system failure occurs when the delivered service is not up to fulfilling thesystem's function. An error is that part of the system state which is liable to leadto subsequent failure: an error affecting the service is an indication that a failureoccurs or has occurred. The adjudged or hypothesized cause of an error is a fault.
The development of a dependable computing system calls for the combinedutilization of a set of methods and techniques which can be classed into:
"* fault prevention: how to prevent fault occurrence or introduction,"* fault tolerance: how to ensure a service up to fulfilling the system's
function in the presence of faults,"* fault removal: how to reduce the presence of faults,"* fault forecasting: how to estimate the present number, the future incidence,
and the cn suc of fault

159
The notions introduced up to now can be grouped into three classes and aresummarized by figure 1:
"* the impairments to dependability: faults, errors, failures; they are undesired- but not in principle unexpected - circumstances causing or resulting fromun-dependability (whose definition is very simply derived from the definitionof dependability: reliance cannot, or will not any longer, be placed on theservie);
"* the means for dependability: fault prevention, fault tolerance, fault removal,fault forecasting; these are the methods and techniques enabling one a) toprovide the ability to deliver a service on which reliance can be placed, and b)to reach confidence in this ability;
"* the attributes of dependability: availability, reliability, safety,confidentiality, integrity, maintainability; these a) enable the properties whichare expected from the system to be expressed, and b) allow the system qualityresulting from the impairments and the means opposing to them to beassessed
AVAILABIUTY-RELIABILITY
ATTRIBUTES - SAFETYCONFIDENTIAUTY
INTEGRITYMAINTAINABIUTY
FAULT PREVENTIONFAULT TOLERANCE
DEPENDABlUTY-- MEANS FAULT REMOVAL
FAULT FORECASTING_•FAULTS
IMPAIRMENTS ERRORSFAILURES
Fig - The dependability tree
1.2 On the Attributes of DependabilityThe definition given for integrity - the avoidance of improper alterations ofinformation - generalizes the usual definitions (e.g., prevention of unauthorizedamendment or deletion of information [EEC 91], or ensuring approved alteration ofdata [Jac 91]) which are directly related to a specific class of faults, i.e. intentionalfaults, that is deliberately malevolent actions. Our definition e accidentalfaults as well (ie. faults which appear or are created fortuitously), and the use of theword information is aimed at not being restricted to data strictly speaking: integrityof programs is also an essential concern; regarding accidental faults, error recovery isindeed aimed at restoring the system's integrity. It is also noteworthy that ourdefinition can be interpreted by default in order to encompass subtle attacks againstintegrity, such as preventing suitable data updates. Integrity is a prerequisite for
S | B n [] iim iliMBM| mni Ii i-I i ... • A

160
availability, reliability and safety, but it may not always be so for confidentiality, asin the case of passive attacks using covert channels or wire-taping.
Confidentiality, not security, has been introduced as a basic attribute ofdependability. Security is usually defined (see e.g., [EEC 91]) as the combination ofconfidentiality, of integrity and of availability, where the latter are understood withrespect to unauthorized actions, whereas availability is not usually restricted to suchevents, nor is integrity according to the above discussion; in addition, as noted in[Gas 88], confidentiality is the most distinctive characteristic of security. Adefinition of security gathering the three aspects of [EEC 91] is: the prevention ofunauthorized access and/or handling of information; security issues are indeeddominated by intentional faults, but not restricted to them: an accidental (e.g.,physical) fault can cause an unexpected leakage of information.The definition given for maintainability - ability to undergo repairs and evolutions- deliberately goes beyond corrective maintenance, which relates to repairabilityonly. Evolvability clearly relates to the two other forms of maintenance, i.e. a)adaptive maintenance, which adjusts the system to environmental changes, and b)perfective maintenance, which improves the system's function by responding tocustomer, and designer, defined changes. It is noteworthy that the frontier betweenrepairability and evolvability is not always clear, for instance if the requested changeis aimed fixing a specification fault [Ghe 91]. Maintainability actually conditionsdependability when considering the whole operational life of a system: systemswhich do not undergo adaptive or perfective maintenance are likely to be exceptions.
From their definitions, availability and reliability emphasize the avoidance offailures, safety the avoidance of a specific class of failures (catastrophic failures), andsecurity the prevention of what can be viewed as a specific class of faults (theprevention of the unauthorized access and/or handling of information). Reliabilityand availability are thus closer to each other than they are to safety on one hand, andto security on the other; reliability and availability can thus be grouped together[Lap 92b, Jon 92], and be collectively defined via the property of avoiding orminimizing the service outages. However, this remark should not lead to considerthat reliability and availability do not depend on the system environment: it haslong been recognized that a computing system reliability/availability is highlycorrelated to its utilization profile, be the failures due to physical faults or to designfaults (see e.g., [lye 82]).
The properties enabling the definition of the dependability attributes may be more orless emphasized depending on the application intended for the computer systemunder consideration. For instance, availability is always required, although to avarying degree depending on the application, whereas reliability, safety,confidentiality may or may not be required according to the application. Thevariations in the emphasis to be put on the attributes of dependability have a directinfluence on the appropriate balance of the means to be employed in order that theresulting system be dependable. This is an all the more difficult problem as some ofthe attributes are antagonistic (e.g., availability and safety, availability andconfidentiality), necessitating that tradeoffs be performed. Considering the three

161
main design dimensions of a computer system, i.e. cost, performance anddependability, the problem is further exacerbated by the fact that the dependabilitydimension is less mastered than the cost-performance design space [Sic 921.
The discussion conducted in this section is summarized on figure 2.
DEPENDABILITY
AVALADIU1YI CONOETUUWpj~REUMUTY
iL
Fig= 2 - Relationship between the dependability attributes
2 Limits in DependabilityDependable computing systems are specified, developed, operated and maintainedaccording to assumptions which are relative a) to the function(s) to be fulfilled, b) tothe environment where the computing system is to be operated (load, perturbationsfrom the physical environment, behavior of the operators and maintainers), and c) tothe faults which are likely to manifest, in terms of their modes and frequencies. Theachieved dependability is crucially depending upon the validation a) of the actualsystem with respect to these assumptions, b) of the assumptions themselves withrespect to reality, and, recursively, c) of the assumptions of the validation itself(e.g., criteria according to which fault-removal is conducted). Limiting factors todependability can thus originate from a variety of sources, due to inadequacies of thedevelopment-operation assumptions, or to imperfections in the validation of thesystem and of those assumptions.
Dealing in details with all the above issues is clearly out of reach, all the more asthose issues are in fact closely related. In the sequel, we discuss the relationshipbetween function and failure, we investigate the effectiveness of fault tolerance withrespect to various types of faults, and we examine the distinction which has to beperformed between the dependability which is actually achieved and the estimateddependability.
2.1 Function and failure
The function of a system is what the system is inrendedfor [Kui 85]. The functionis usually first described, or specified, in terms of what should be fulfilled regardingthe system's primary aim(s) (e.g., performing transactions, controlling ormonitoring a plant, piloting an airplane or a rocket). When considering safety- or

162
security-related systems, this description needs to be supplemented with what shouldnot happen (e.g., the hazardous states from which a catastrophe may ensue, or thedisclosure of sensitive information). Such a description may in turn lead tospecifying additional functions that the system should fulfill in order to reduce thelikelihood of what should not happen (e.g., exhibiting a fail-safe behavior orauthenticating a user and checking his/her access rights).
The description of a system's function(s) can be performed at various levels ofdetails, according to several means of expression, from natural language tomathematics. A system may fail with respect to a given function, or with respect toa given level of detail, and still comply with the others.
Expressing a system's function(s) is an activity which is naturally conducted fromthe very first steps of a system's development. However, we all know thatspecifying a system's functions extends to the whole system's life, due to theinherent difficulty of eliciting a system's requirements. If the largest amount ofeffort devoted to this elicitation indeed takes place at the beginning of the system'sdevelopment, it does not end with what is traditionally called "requirements analysisand specification" in life-cycle models such as the waterfall or the V models; thiselicitation practically continues during all phases of a system's development, andduring operational life as well: perfective maintenance is often performed in order tocorrect what are finally specification faults, i.e. oversights, mistakes or omissions.This remark is all the more important when considering failures: an unacceptablebehavior can indeed be detected as such from its deviation from complying with thespecification, but it may happen that it complies with the specification and is felt asunacceptable by users, thus in fact uncovering a specification fault; leaving aside thequestion of the consequences of such a situation, it can be said that in fact it helpseliciting what the real function of the system ought to be. This type of problemshould not be minimized, for instance in advocating that systems generally exhibitmore frequently failures due to the subsequent phases of their development thanfailures traceable to imperfections in the definition of their requirements (see e.g.,[Gla 81]); however, besides the fact that severity has to be accounted for in additionto frequency, this frequency argument does not apply to safety-related systems: aconsequence of the extreme care put into their design and realization is thatspecification imperfections generally constitute a significant source of the problemsfaced with in operation.
2.2 Effectiveness of fault toleranceBefore discussing the effectiveness of fault tolerance, let us stress that from ourdefinition - ensuring a service up to fulfilling the system's finction in the presenceof faults, fault tolerance is a mean for providing a system with the ability to behaveas expected, be it fail-safe or fail-operational.
The imperfections of fault tolerance, i.e. the lack of fault tolerance coverage,constitute a severe limitation to the increase in dependability which can be obtained.Such imperfections of fault tolerance are due either a) to design faults affecting thefault tolerance mechanisms with respect to the fault assumptions made during the

163
design, the consequence of which is a lack of error and fault handling coverage, or b)to fault assumptions which differ from the faults really occurring in operation,resulting in a lack of fault assumption coverage, which can be in turn due to eitheri) failed component(s) not behaving as assumed, that is a lack of failure modecoverage, or ii) the occurrence of correlated failures, that is a lack of failureindependence coverage. The influence of a lack of error and fault handling coverage[Bou 69, Am 73] has been shown to be such that it not only drastically limits thedependability improvement, but that in some cases adding further redundancies canresult in lowering dependability (Dug 89]. Similar effects can result from the lack ofthe other forms of fault tolerance coverage: conservative failure mode assumptions(e.g., inconsistent, or Byzantine failure modes) will result in a higher failure modecoverage, at the expense of necessitating an increase in the redundancy which canlead to an overall decrease in the system dependability (Pow 92]; correlated failuresare known to defeat fault tolerance strategies based on the replication of identicalitems, either because of a) common design faults, or of b) identical sensitivity toworkload or externally-induced perturbations [Hec 87].
Another significant source of limit in dependability are temporary faults. They havelong been recognized as constituting the vast majority of hardware faults, and theprgresses in hardware integration can only emphasize this tendency (see e.g., thefield data from several sources in [Sic 92]). A direct consequence is that, although itis not always so [Geb 88], emphasis should be placed in the design of fault-tolerantsystems on discriminating between temporary and permanent faults: themisinterpretation of a temporary fault as a permanent fault results in an unnecessarydecrease in the available redundancies, thus in lowering dependability.
Temporary faults are not limited to hardware: the notion of temporary fault appliesto software as well. Although such a notion has been introduced a long time ago[Elm 72], and more recent studies have shown that most of the software faultspresent during operational life are temporary faults [Gra 86], the very notion oftemporary software fault is often felt as contradicting our perception of software. Infact, if it is not arguable that the ultimate cause of software faults are present aslong as they are not fixed, it has to be recognized that most software faultsmanifesting in operation in large, complex, software are subtle enough in order thattheir activation conditions depend on equally subtle combinations of internal stateand external solicitation, so that they can hardly be reproduced. Stated in otherterms, the failure domain of temporary software faults can vary with the conditionsof execution of the software, and be a null space under most operating conditions.Although it is generally recognized that software is the current bottleneck in termsof dependability [Gra 90, Cra 92], fault tolerance approaches aimed at temporarysoftware faults have been paid little attention [Gra 86, Hua 93] when compared tothe work devoted to tolerating permanent software faults, which necessitates designdiversity [Ran 75, Che 78, Lap 90]. Because of the high cost of design diversity,software fault tolerance is currently mostly limited to some safety-criticalapplications [Vog 88] such as avionics, and, to a lesser extent, railwaytransportation or nuclear plant monitoring. The main limiting factor of theundeniable improvement in dependability brought about by design diversity is
h Innuklmm mM mrm- - - ..

164
constituted by the unavoidable correlations between the software variants issuedfrom diversified designs [Eck 91], which are a form of lack of failure independencecoverae
This brief overview of the factors limiting dependability in terms of fault classeswould not be complete without mentioning the man-machine interaction faults,resulting from inappropriate interactions. Their importance is not new, and is notrestricted to safety-critical systems [Toy 78, Dav 81], although they are generallyfelt as a major source of failure in those systems, for the same reason as alreadymentioning regarding specification faults, i.e. the extreme care put into their designand realization. Recognizing that most of interaction faults are in fact design faultsof the system [Nor 83] should encourage the development of approaches for theirtolerance [Max 86, Rou 87].
Fault tolerance is not restricted to accidental faults, which have been dealt so far inthis section. Some mechanisms of error detection are directed towards bothintentional and accidental faults (e.g. memory access protection techniques) andschemes have been proposed for the tolerance to both intrusions (i.e. intentionalinteraction faults) and physical faults [Rab 89, Des 91], as well as for tolerance tomalicious logic (i.e. intentional design faults) [Jos 88]. However, fault tolerance isfar from being recognized as a viable approach to security issues, in spite of the factthat the continuously increasing cost of failures attributable to intentional faultsclearly show that the current approaches, mainly based on fault avoidance (i.e. faultprevention and fault removal), do not constitute a fully satisfactory answer.
2.3 Achieved dependability and estimated dependabilityIt is now widely admitted that performing dependability evaluation of hardware-fault-tolerant systems without accounting for the lack of fault tolerance coverage can onlylead to grossly overestimated evaluations of dependability. However, it isnoteworthy that if error and fault handling coverage has been devoted a largeattention due to the ability of estimating it via fault-injection (see e.g. [Gun 89,Arl 90, Cho 92]), it is not so for assumption coverage as it needs experience to beaccounted for in addition to fault-injection.
Regarding software reliability modeling and prediction, the vast majority of thepublished material focuses on the development and validation phases. Much lessstudies encompassing the operational phase appear in the open literature. As alreadymentioned in the previous section, a clear tendency in computing systems is to seesoftware becoming the major source of failure; there is thus a growing need forperforming, during their validation, reliability evaluations of software systems inorder to forecast their (future) reliability in operation.
The current approaches to software reliability evaluation cannot satisfy this need.The main reason lies in the fact that they consider products in isolation from theprocess which produced them: the reliability predictions performed for a givensoftware either a) from its successive times to failure for reliability growthmodeling, or b) from its execution times without failures for statistical testing, can

F 165
only be far below any reasonable reliability requirement (see e.g. [Par 90, The 91]for statistical testing). In addition, those predictions usually (and hopefully) are alsofar below what will be observed in operation (see e.g. [Kan 87, Gra 90]).Considering that software systems produced from scratch are exceptions, and that thecurrent usual approach is rather to make evolutions from existing software, a logicalconsequence is to enhance the predictions performed for a given product from datarelating to its validation with field data relative to previous, similar, softwareproducts [Lap 92c]. The corner stone of the approach is clearly the notion ofsimilarity between the various generations of a software family; however, inaddition to the usually mentioned negative dissimilarities resulting from addedfailure sources, we can expect positive dissimilarities to exist, resulting fromprogress in the development and validation methods and techniques.
3 ConclusionThe discussion conducted in the previous section clearly shows that design faultsconstitute the major limitation to dependability of computing systems, be theyfault-tolerant or not. This is not at all surprising: a computing system is a humanartifact and as such any fault in it or affecting it is ultimately human-made since itrepresents human inability to master all the phenomena which govern the behaviorof a system. As a direct consequence, pushing forward the limits of dependability ofcomputing systems can only be done via improving their production process.
Improvements in the production process can indeed be noticed, when looking at theevolutions between the successive editions of guidelines for the development andvalidation of computing systems (a noticeably good example is the recent newrelease of the guidelines for certifying airborne software, DO-178-B, as compared tothe previous release, DO-178-A). This is however a feedback loop which takes aconsiderable amount of time in order to make profit of experience. Some shorterfeedbacks are currently being explored, as the previously mentioned work we arecarrying out on software reliability evaluation (Lap 92c], or the recently publishedwork on employing accumulated knowledge in software testing [Wil 92]. Bothexamples relate to validation: they are aimed at improving fault removal and faultforecasting, but they are not directly and explicitly concerned with the progressivereduction of the faults created during the development and inserted in the developedsystem before fault removal takes place. This is where the most effective feedbackloop should exist, which would be nothing else than applying to the productionprocess a fault tolerance approach: detecting the errors in the development,diagnosing and removing the causes, i.e. the faults in the production process.
We have to be conscious that such an approach questions directly the veryorganization of the producers: carrying out, and making profit of, the necessaryexperience does not appear compatible with the project-oriented organizations whichcurrently prevail. It can only be hoped that the statistics on the continuouslygrowing costs of computer failures can be a strong enough incentive to moving theorganizational inertia. Let us just mention that the yearly computer failure cost isnow exceeding more than 10 Billions of Francs in France, both accidental and
___,___________n____________nn___________m____mnn________n_______I

166
intentional faults included (and has been constantly larger than the profit of thewhole computing industry in France, including construction, distribution andservices), and is close to 4 Billions of Dollars in the USA for accidental faults.
AcknowledgementsI would like to thank the conference organizers for giving me the opportunity topresent the ideas contained in the paper. Thanks also to Alain Costes and YvesDeswarte for their helpful comments and discussions.
ReferencesArl 90 J. Adat, M. Aguere, L Amat, Y. Crouzet J.C. Fabre, J.C. Laprie, B. Martins,
D. Powell, "Fault injection for dependability validation: a methodology andsome applications", IEEE Transactions on Software Engineering, SpecialIssue on Experimental Computer Science, vol. 16, no. 2, Feb. 1990, pp.166-182,
Arn 73 T.F. Arnold, "The concept of coverage and its effect on the reliability modelof repairable systems", IEEE Trans. on Computers, vol. C-22, June 1973, pp.251-254.
Bou 69 W.G. Bouricius, W.C. Carter, P.R. Schneider, "Reliability ModelingTechniques for Self-Repairing Computer Systems", Proc. 24th ACM NationalCouf., 1969, pp. 295-309.
COM 92 "Computing the Future", Report of the Committee to Asses the Scope andDirection of Computer Science and Technology of the National ResearchCouncil, Communictions of ACM, vol. 35, no. 11, Nov. 1992, pp. 30.40.
Che 78 L Chen, A. Avizienis, "N-version programming: a fault-tolerance approachto reliability of software operation", Proc. 8th IEEE Int. Symp. on FaultTolerant Computing (FTCS-8), Toulouse, France, June 1978, pp. 3-9.
Cho 92 G.S. Choi, R.K. Iyer, "FOCUS: an experimental environment for faultsensitivity analysis", IEEE Trans. on Computers, vol. 41, no. 12, Dec.1992, pp. 1515-1526.
Cra 92 R. Cramp, M.A. Vouk, W. Jones, "On operational availability of a largesoftware-based telecommunications system", Proc. 3rd Int. Symp. onSoftware Reliability Engineering, Research Triangle Park, North Carolina,Oct. 1992, pp. 358-366.
Day 31 E.A. Davis, P.K. Giloth, "No 4 ESS: performance objectives and serviceexperience", The Bell System Technical Journal, vol. 60, no. 6, July-Aug.1981, pp. 1203-1224.
Des 91 Y. Deswarte, L. Blain, J.C. Fabre, "Intrusion tolerance in distributedcomputing systems", Proc. 1991 IEEE Symposium on Resarch in Securityand Pivacy, Oakland (USA), 20-22 Mai 1991, pp.110-121
Dug 89 J.B. Dugan, K.S. Trivedi, "Coverage modeling for dependability analysis offault-tolerant systems", IEEE Trans. on Computers, vol. 38, no. 6, June1989, pp. 775-787.
Eck 91 D.F. Eckhardt, A.IC Caglayan, J.C. Knight, LD. Lee, D.F. McAllister, M.A.Vouk, J.P.J. Kelly, "An experimental evaluation of software redundancy as astrategy for Improving reliability", IEEE Trans. on Software Engineering,vol. 17, no. 7, July 1991, 692-702.
EEC 91 Information Technology Security Evaluation Criteria, ProvisionalHarmonised criteria, Office for Official Publications of the EuropeanCommunities, June 1991.

167
Mlm 72 W.R. Elmendorf, "Fault-tolerant programming", Proc. 2nd IEEE Int. S"mp.on Fault Tolerant Computing (FTCS-2), Newton, Massachusetts, June 1972,pp. 79-83.
Gas 88 M. Gasser, Building a Secure Computer System, Van Nostrand Reinhold,1988.
Geb 88 J. Gebman, D. Mclver, H. Shulman, "Faults with nonstationary observabilityare limiting avionics R&M", Proc. 8th AIA/IEEE Digital Systems AvionicsConf., San Jose, California, Oct. 1988, pp. 16-23.
Ghe 91 C. Ghezzi, M. Jazayeri, D. Mandrioli, Fundamentals of SoftwareEngineering, Prentice-Hall, 1991
Gla 81 R.L Glass, "Persistent software errors", IEEE Transactions on SoftwareEngineering, vol. SE-7, no. 2, March 1981, pp. 162-168.
Gra 86 J.N. Gray, "Why do computers stop and what can be done about it?", Proc.5th Symp. on Reliability in Distributed Software and Database Systems, LosAngeles, Jan. 1986, pp. 3-12.
Gra 90 L. Gray, "A census of Tandem system availability between 1985 and 1990",IEEE Trans. on Reliability, vol. 39, no. 4, Oct. 1990, pp. 409-418.
Gun 89 U. Gunneflo, J. Karlsson, J. Torin, "Evaluation of error detection schemesusing fault injection by heavy-ion radiation", Proc. 19th IEEE Int. Symp. onFault Tolerant Computing (FTCS-19), Chicago, June 1989, pp. 340-347.
Hec 87 H. Hecht, H. Dussault, "Correlated failures in fault-tolerant computers", IEEETrans. on Reliability, vol. R-36, no. 2, June 1987, pp. 171-175.
Raa 93 Y. Huang, C. Kintala, "Software implemented fault tolerance: technologiesand experience", Proc. 23rd IEEE Int. Symp. on Fault-Tolerant Computing(F1CS-23), Toulouse, June 1993, pp. 2-9.
lye 82 R.K. lyer, S.E. Butner, E.J. McCluskey, "A statistical failure/loadrelationship: results of a multi-computer study", IEEE Trans. on Computers,vol. C-31, July 1982, pp. 697-706.
Jac 91 J. Jacob, "The basic integrity theorem", Proe. IEEE International Symposiumon Security and Privacy, Oakland, May 1991, pp. 89-97.
Jon 92 E. Jonsson, T. Olovason, "On the Integration of Security and Dependabilityin Computer Systems", Proc. 1ASTED It. Conf. for Reliability, QualityControl and Risk Assessment, 1992.
Jos 88 M.K. Joseph, A. Avizienis, "A fault tolerance approach to computer viruses",Proc. 1988 Symp. on Security and Privacy, Oakland, April 1988, pp. 52-58.
Kan 87 K. Kanoun, T. Sabourin, "Software dependability of a telephone switchingsystem", Proc. 17th IEEE Int. Symp. on Fault-Tolerant Computing (FTCS-17), Pittsburgh, Pennsylvania, USA, June 1987, pp. 236-241.
Kul 85 B. Kuipers, "Commonsense reasoning about causality: deriving behaviorfrom structure", in Qualitative Reasoning about Physical Systems, D.G.Bobrow editor, MIT Press, 1985, pp. 169-203.
Lap 90 J.C. Laprie, J. Arlat, C. Beounes, K. Kanoun, "Definition and analysis ofhardware- and software-fault-tolerant architectures", IEEE Computer, vol. 23,no. 7, July 1990, pp. 39- 51.
Lap 92a J.C. Laprie, ed., Dependability: Basic Concepts and Terminology, Springer-Verlag, Vienna, 1992.
Lap 92b J.C. Laprie, "Dependability: a unifying concept for reliable, safe, securecomputing", Proc. 12th IFIP World Computer Congress, Madrid, Spain, Sept.1992, vol. 1, pp. 585-593

168
Lap 92c J.C. Laprie, "For a product-in-a-process approach to software reliabilityevaluation", Proc. 3rd Int. Symp. on Software Reliability Engineering,Research Triangle Park, NC, Oct. 1992, pp. 134-139.
Max 86 R.A. Maxion, "Towards fault-tolerant user interfaces", Proc. 5th IFACWorkshop on Safety of Computer Control Systems (SAFECOMP'86), Sarlat,France, Oct. 1986, pp. 117-122.
Nor 83 D.A. Norman, "Design rules based on analyses of human error",Communications of the ACM, vol. 26, no. 4, April 1983, pp. 254-258.
Par 90 D.L Parnas, A.J. van Schouwen, S.P. Kwan, "Evaluation of safety-criticalsoftware", Communications of the ACM, vol. 33, no. 4, June 1990, pp. 636-648.
Pow 92 D. Powell, "Failure Mode Assumptions and Assumption Coverage", Proc.22nd IEEE Int Symp. on Fault-Tolerant Computing (FrCS-22), Boston, July1992, pp.386-395.
Rab 89 M.O. Rabin, "Efficient dispersal of information for security, load balancingand fault tolerance", Jounal of the ACM, vol. 36, no. 2, April 1989, pp. 335-348.
Ran 75 B. Randell, "System Structure for Software Fault Tolerance", IEEE Trans. onSoftware Engineering, vol. SE-1, no. 2, 1975, pp.220-232,.
Rou 87 W.B. Rouse, N.M. Morris, "Conceptual design of a human error tolerantinterface for complex engineering systems", Automatica, vol. 23, no. 2,1987, pp. 231-235.
Sic 92 D.P. Siewiorck, R.S. Swarz, The Theory and Practice of Reliable SystemDesign, Digital Press, 1992.
The 91 P. Thvenod-Fosse, H. Waeselynck, "An investigation of statistical softwaretesting", Journal of Software Testing, Verification and Reliability, vol. 1,no. 2, 1991, pp. 5-25.
Toy 78 W.N. Toy, "Fault-tolerant design of local ESS processors", Proceedings ofthe IEEE, voL 66, no. 19, Oct. 1978, pp. 1126-1145.
Vog 88 U. Voges, ed., Application of design diversity in computerized controlsystems, Springer Verlag, Vienna, 1988.
Wil 92 C. Wild, S. Zeil, G. Feng, "Employing accumulated knowledge to refine testdescriptions", Software Testing, Verification and Reliability, vol. 2, no. 2,July 1992, pp. 53-68.
L . .. . . . . . . . . .. . . .

Session 5
VERIFICATIONAND
VALIDATION
Chair: B. RungeSTL Computer Automation, DK

The Rigorous Retrospective Static Analysisof the Sizeweli 'B' Primary Protection
System Software
N J WardTA Consultancy Services Ltd
Farnham Surrey, England
1. Introduction
Siznwell 'B' is a Westinghouse designed Nuclear Pressurised Water Reactor (PWR)currently being built in Sizewell, Suffolk in the UK. It possesses two diverseprotection systems whose role is to provide an automatic reactor trip when plantconditions reach safety limits and to actuate emergency safeguard features to limitcoseqluenes of a failure condition.
The Primary Protection System (PPS) is a microprocessor based system developedby Westinghouse in general agreement with EEC 880 [1]. The PPS is supportedby a nn-compute based Secondary Protection System (SPS), based on Laddictechnology, developed in the UK by GEC. However, despite the presence of theSPS, the software within the PPS is considered to be 'safety critical' since the PPSon its own is required to meet an integrity requirement of 104 failures per demand.
The UK Nuclear Installations Inspectorate (Nil), the regulatory body responsiblefor certificating the station, have two main criteria for software based safetysystems, namely excellence of production and independent assessment. The rigourof each of these is required to be consurate with the level of criticality andsafety depedence of the software.
As a result of this requirement for independent assessment, Nuclear Electric, theutility responsible for Sizewell 'B', have had a range of assessments conducted onthe PPS, independent of the equipment manufacturer. One of the main activitiesis the use of the static malysis tool MALPAS to rigorously verify the softwareagainst its specifications.
2. Scope of Independent Assessment Activities
The overall objectives of any rigorous independent software assessment are todemnstrate, to a high a level as is practicable, that the object code in the PROMsimplemnts the user requmnts, correctly, completely, safely and without sideeffects. However, with current software technology, no single activity is able todemonste this to the required level of confidence. Hence a range of activitiesare necessary, each providing assurance of individual steps in the softwaredevelopment life cycle such that, when taken together, the independent assessment

172
activities provide the required level of assurance that the last step in the processmeets the first.
On the Sizewell 'B' PPS five main activities are being conducted, as follows:* -aiginertn CoiEfhnnatoy Analysis conducted by NNC Ltd, involves the
manual review of all specifications, from the system design requirements downto the low level code specifications, and the review of all source code and data,to ensure overall consistency and progressive implementation of therequirements.
* indepmnduit Design Assessment conducted by Nuclear Electric's own team,ensures that all essential system functional requirements, including designprinciples derived from AGR reactor protection system experience, are correctlyincorporated into the System Design Specification and down through thedifferent stages of the software design.
"* MALPAS Analysis conducted by TA Consultancy Services Ltd, involves theformal verification of the source code against its specifications and is discussedin detail throughout the rest of this paper.
"* Object/Source Code Comparison conducted by Nuclear Electric's ownIndependent Design Assessment team and discussed in detail in reference [2],aims to eliminate the possibility of errors being introduced by the compiler andlinker, by formally demonstrating (again using MALPAS) equivalence betweenobject code in the PROMs and the source code from which it was generated.
"* Dynamic Testing conducted by Rolls Royce and Associates Ltd, involves theconduct of an extensive series of tests (approximately 55000 randomly generatedtest cases) on one of the four identical channels of the PPS.
In total these activities are expected to have involved around 250 man years ofeffort, an ammnt equivalent to that spent by the software manufacturer in their owndevelopment and verification work, by the time that the software is certificated atthe end of 1993. Although high, this level of effort is considered necessary, onereasm being because the PPS software design pre-dates the practical application ofthe latest formal software design methods. Consequently the secondary aim of thestatic analysis of source code has been to impose formalism on the overalldevelopment process....
The main aim of the MALPAS analysis of the software is to verify, as formallyas possible that the Sizewell 'B' software (source code) meets its specifications.This verification encompasses both the manual comparison of the analysis resultsagainst the design specifications and also the 'proof' of code against a mathematicalrepresentation of the detailed design specifications. However, it is important toappreciate from the above that, whilst the MALPAS analysis is the single largestactivity, it is still one of a number of independent assessment activities which, takentogether, are intended to provide comprehensive coverage and maximise confidencein the safety of the software.
3. Background to MALPAS Analysis
In 1988, following consideration of the activities necessary to demonstratecorrectness of the PPS software, Nuclear Electric concluded that analysis methodswere required which could demonstrate conformance with specifications and give

173
high levels of confidence in freedom from errors. It was considered that dynamictesting on its own would not be able to give the required level of confidencebecause of known limitations of testing, such as the inability to achieve completepath coverage on any non-trivial piece of software. These same concerns had beenaddressed a few years previously by the UK Ministry of Defence and it wastherefore decided by Nuclear Electric to follow the same approach adopted by theMoD, namely to use techniques known as Static Analysis.
The tool chosen by Nuclear Electric for the work was MALPAS [3] which itselforiginated from the UK MoD research in the 1970s and 1980s. MALPAS was 1chosen because it provided the level of formal analysis considered essential and was
considered to be the tool most suited to retrospective analysis of code that has notbeen developed with formal verification in mind. The tool consists of three mainsets of analysers, namely the Flow Analysers, the Semantic Analyser and theCompliance Analyser, each of which is able to provide a progressively morerigorous verification of the code against its specifications. It was Nuclear Electric'sdecision, right from the beginning, that all the MALPAS analysers should be usedon the PPS software, with the emphasis being on the Compliance Analyser.
4. PPS Software Description
The Primary Protection System consists of four identical guardlines (channels),physically and electrically separated from each other, which perform coincidence(2 out of 4) voting to determine the need for action. Each guardline contains anumber of sub-systems, providing facilities such as reactor trip, communications,engineering safety features, and auto test. Each subsystem comprises a generalpurpose 'host' processor and a number of slave processors. The host processorperforms the unique functions required by the subsystem and is supported in thisby the specialised slave processors which provide standard functions such ascommunications, analogue data acquisition and diagnostic monitoring.
The PPS software is primarily written in PL/M-86 with some ASM86 and smallamounts of PLiM-51 and ASM51 variant code. In total there are approximately100,000 lines of unique executable code with a typical host processor containing40,000 lines of source code and a typical slave processor 10,000 lines. Thesoftware is highly modular and has been written mostly as 'general purpose'reusable software providing a range of common functions, configured through theuse of configuration data. There is a relatively small amount of applications levelcode providing the particular functionality of the protection system.
The software is developed from two levels of specifications, namely a SoftwareDesign Requirements (SDR) which is a high level specification of the requiredfunctionality of each section of the code, and a Software Design Specification(SDS) which describes how the functional requirements are met by the design.Both of these sets of specifications are written in 'natural language' (AmericanEnglish). The SDS includes details of the precise functionality of each programsection, and also contains data flow tables providing details of all program sectionvariables and inputs and outputs.

174
5. Overview of MALPAS Analysis Process
The analysis of the PPS software is conducted on a procedure-by-procedure basisin a bottom-up manner. That is to say that the analysis commences with thoseprocedures that call no others and then progresses up the call hierarchy until the toplevel applications code is reached. All the MALPAS analysers are run on eachprocedure and the results verified against the two levels of specification. Thehigher level specification (SDR) is taken to be the primary document against whichthe code is verified, with supporting information provided by the lower level SDS.All of the code that can be accessed during on-line operation is being subjected toMALPAS analysis, irrespective of the perceived criticality of individual sectionsof code within the system.
The analysis process has not changed in concept since the work began at the startof 1989. However, the detail of how the work is conducted has changedsubstantially both as experience has been gained over the years and with theprogressive increase in the size of the analysis team. The following sectionsdiscuss various aspects of the analysis process.
6. Translation
It is necessary for source code to be translated into MALPAS's own inputlanguage, known as IL, before analysis can take place. IL is a strongly typedlanguage with many features similar to those of Ada. One feature in particular,similar to Ada packages, is that all IL procedures comprise separate bodies andspecifications (known as PROCSPECs). The advantage of this is that, followingthe analysis of the procedure body, all that is required for analysis of calls to thatprocedure is the procedure specification. This feature greatly facilitates bottom-upanalysis.
As has been mentioned above, the majority of the code in the PPS is written inPL/M-86 and an automatic translator to convert PL/M-86 into IL was developedby TA Consultancy Services specifically for this project. Considerable care wastaken in the derivation of the mappings between PL/M-86 and IL to ensure thatthey were a strictly correct representation of the semantics of the PL/M-86language and that they were at an appropriate level of abstraction/precision tofacilitate analysis. The translator was also designed to produce a number ofchecks, for example for exceeding array bounds or loop counter overflow, thatcould be formally checked during Semantic and Compliance Analysis.
The translator takes an input PL/M-86 source text, typically a module, along withother relevant inputs, such as PROCSPECs from previously analysed procedures,and automatically produces an IL translation. Error and warnmg messages aregiven where language features are encountered that the translator is unable toconvert to 1IL automatically. The analyst then has to take appropriate action,checking the accuracy of the particular part of the translation or making suitablem-uad -hang.
Pointers are one Pl/M-86 language feature that can cause such problems, firstly,becaue there is no concept of point m. within 1IL and, secondly, because, theyrepresent a source of aliasing which contradicts IL's philosophy of all variables

175
being distinct and disjoint with all assignments having no side effects.Unfortunately PL1M-86 is a pointer-based language with the use of pointers beingessential for a number of operations. The most significant of these concerns thepassing of OUT or INOUT parameters to procedures which must be performed byreference (ie pointers must be used to pass any item to a procedure that may bemodified by that procedure).
The solution adopted for the analysis is for all pointers to be 'dereferenced' (iethe pointer replaced by the item pointed at) during the translation process.Fortunately the use of pointers is fairly well constrained in the PPS software(through the application of Westinghouse's coding standards) and most pointers areused only at the procedure call stage and point to a single variable/memorylocation. The translator is therefore able to automatically dereference the majorityof pointers used within the code. Those that the translator is unable toautomatically dereference (for example pointers to templates) are brought to theattention of the analyst through error and warning messages and the analyst thenhas to implement an agreed (and subsequently reviewed) manual translation.
7. Analysis Process
Every program section/procedure in the source code is subjected to the three mainstages of MALPAS analysis in sequence, with the following particular activitiesbeing conducted under each one.
7.1 Flow Analysis
This involves the analysis of the flow of control, data and information through eachprocedure, in particular:"* Control Flow Analysis The verification of safe control flow through each
procedure (eg ensuring the absence of multi-entrant loops and black holes) andthe confirmation that the code is well structured.
"* Data Use Analysis The analysis of the use of all parameters and variables withineach procedure to ensure that this use agrees with that detailed in the codespecifications (SDS) and to ensure that the usage is safe and in accordance withgeneral software engineering good practice rules.
* Info--atio Flow Analysis The analysis of all dependencies between input andoutput parameters for each procedure to ensure that these a~ree with the codespecifications (SDR/SDS), and the identification of redundant statements.
7.2 Semantic Analysis
This analysis involves the confirmation both that the functionality of the codeconforms with the specifications (SDR and SDS) and is reasonable from anegineering knowledge of the system. The MALPAS Semantic Analyser convertsthe (potentially confusing) sequential logic of the code of each procedure into aclearer parallel form, giving a precise mathematical relationship between inputs andoutputs for each path through that procedure. The analyst is then able to check the

176
detailed semantics of every path through the program section and manually comparethis against the specification to verify one against the other.
7.3 Conplance Analysis
The purpose of the Compliance Analysis is to obtain the highest level of confidencein the correctness of the software by formally verifying the code against amathematical specification. Specific objectives are to demonstrate that the code ofeach procedure:* conforms to the functional aspects of its specification (SDR, supported by SDS),* respects any state invariants"* performs its specified functions without corrupting the computing environment
and without corrupting data owned by any other module or procedure"* conforms to the static semantics of the language in which it is written
The MALPAS Compliance Analyser requires the specification to be representedas PRE and POST conditions for each procedure, along with any necessaryASSERT statements within the body of the code, and the analyser will then showwhether the code meets the specification. The analyser identifies any differencesbetween the code and specifications as a 'Threat', expressing this as a mathematicalexpression which details the domain over which the code and the specificationdisagree. When the code and specification agree the tool shows that the Threat isfalse.
The Compliance Analysis is by far the most important part of the MALPASanalysis of the PPS software and also involves the majority of the effort. Thiseffort is expended partly in the derivation of the mathematical specification andpartly in the provision of guidance to the tool to aid simplification of the Threat.The analyst is also required to derive invariants for each loop, expressing these asASSERT statements, so that properties of each loop can be proven.
The first part of the Compliance Analysis work is the construction of themathematical specification from the natural language SDR and SDS. This workrepresents a substantial challenge to ensure both correct interpretation of theexisting specifications and that the important functionality and properties aremodelled in the mathematical specifications.
Ideally the analyst should be able to define a high level abstract mathematicalspecification from the SDR and then derive refinement detail from the SDS. Forexample, a functional relationship could be defined between an output andappropriate inputs, using information from the SDR, and detailed semantics canthen be defined (using an IL feature known as replacement rules - similar to OBJrewrite rules) from information in the SDS. In practice, due to the SDRs andSDSs being at varying levels of detail and precision, the ideal is rarely possible andanalyst skill and judgement is required to derive the mathematical specificationfrom both specification documents.
The second, and most time consuming, part of the analysis is the use oftechniques to assist the Compliance Analyser in its demonstration of whether thethreat is false. MALPAS contains a powerful Algebraic Simplifier for simplifyingexpressions but, like all such tools, it has its limitations, particularly with thesimplification of some forms of expressions. Analyst assistance may involve the

177
re-writing of mathematical specifications into forms more amenable tosimplification, the use of replacement rules to define additional theorems or the useof extra ASSERT statements. The derivation of a 'Threat False' statement istherefore an iterative process, involving running the tool, assessing the Threatcondition and then making appropriate changes to reduce the expression on amibsequent nrn of the tool.
8. Ensuring Correctness, Consistency andReproducibility
Despite using an automatic tool for the rigorous static analysis, it can beappreciated from the above description that substantial analyst skill and judgementis involved in interpreting the tool's output and in deriving the mathematicalspecifications. Because of this it is essential, given the size of the project, toensure that all analysts are performing the work to the same standard. It is alsoconsidered important to ensure that all analysis is reproducible and could be re-run,for example if a query was ever raised by the regulatory authority on a particularpiece of analysis.
Five main measures have been adopted by TA Consultancy Services to ensure thatthese requirements are met. The first, perhaps obvious one, is that all work isconducted within a defined quality system and to the requirements of BS5750(IS09001). The second, related, measure has been the derivation of a detailed'standards and procedures' document, approximately 200 pages long, which definesin great detail precisely how the analysis is to be conducted. This document,analogous to a coding code of practice for software development, is followed byall analysts and ensures uniformity of approach.
The third measure is to ensure comprehensive recording of all aspects of analysis.In addition to the MALPAS analysis results themselves, analysts are required to fillout a series of forms to summarise the results and to record their interpretation ofthe results, the background to their derivation of the mathematical specification,their assessment of the conformance of the code and specifications, and details ofall anomalies.
The fourth, and possibly most important measure, is the conduct of peer reviewsof all analysis work. The main aims of these reviews are to ensure that the definedprocesses have been followed for the analysis and to ensure that Compliance proofsare well founded, that loop termination has been demonstrated and that replacementrules are correct. In addition they help to distribute knowledge of different partsof the PPS software and experience of the range of analysis techniques and toganeraly ensure consistency between analysts. The reviews are conducted on acontrolled set of results, using a series of checklists and review deficiency forms.
The final measure is the enforcement of strict configuration control of alldocuments and analysis results, both in paper and magnetic media form. In termsof computeOVAX)-4b d configuration control a rigidly defined manual system isused involving controlled and frozen directories with a named librarian being theonly person authorised to move files from one status to another.

178
9. Technique Refinement
The analysis techniques used on the project have been continuously refined andimproved during the 41 years of the project. This has covered everything fromthe forms on which the interpretation of the results are recorded (despitestreamlining, there are still perpetual complaints about too much papecwork) to theformat and depth of reviews. However, changes in the techniques used arenecessarily slow to be implmnted, firstly to ensure compatibility with the analysisof lower level procedures, and, secondly, because of the inertia and diverse viewsof such a large team.
The area in which there has undoubtably been the most improvement isCompliance Analysis. Substantial experience has been gained in the most effectiveways to express mathematical specifications in order to be able to demonstrateconformance with the code. Numerous technical papers have been writteninternally to provide a series of hints and tips to all analysts on how to resolveparticular problems that arise during Compliance Analysis, either in the expressionof the mathematical specification, or in the resolution of the Threat expression tofalse.
It has also been of substantial benefit for TA Consultancy Services to themselvesbe the developers and suppliers of MALPAS, as well as the users of the tool onthis project. Analysts have had access to the implementors of the tool and havebeen able to obtain expert advice on the best way to represent specifications inorder to facilitate expression simplification. Furthermore, experience from theanalysis project has been fed into the development of the algebraic simplifier toimprove its performance with specific types of expressions, to the extent that speedimprovements in excess of two orders of magnitude have been made to theCompliance Analyser in some areas.
One interesting aspect is that new techniques continue to be required even after41h years. This is primarily because different areas of code are encountered thatpresent a new series of problems. One area that required considerable effort in thepast was the analysis of ASM86 code involving double-length arithmetic. Anotherarea where a whole range of new techniques has been necessary concerns theanalysis of the shared memory communication system used on the PPS. It ispossible that this could be the subject of a paper on its own at a later date.
10. Analysis Limitations
It is important to recognise that the technique being performed is Static Analysiswhich, by definition, is concerned with the non-dynamic aspects of the software.Although many dynamic and timing related aspects of the software are modelledand analysed in detail during the MALPAS work, others are not if it is consideredmore appropriate for them to be verified by other means. Where such cases arise,notification is given to Nuclear Electric that the specific aspects have not beenverified statically and that other means are required.
The aspects not verified statically relate primarily to those concerned with realtime operation and with interaction with hardware. For example the checking ofa commuications protocol with requirements of 'waits' of specified lengths of time

179
may be more appropriate through dynamic testing on the target hardware. This ispartly because testing of all paths through such procedures is likely to be possiblebut, more importantly, because dynamic testing will effectively also providevalidation of the specification and will reveal whether the design actually works in
11. Reporting and Resolving Results
The only deliverables to the customer (Nuclear Electric) resulting from theMALPAS analysis are comments detailing the anomalies (ic differences betweencode and specifications etc) found during the work. All comments are provisionallycategorised according to their criticality by TA Consultancy Services prior to thecomments being reported to Nuclear Electric. The following five categories areused for this reporting process:
Cat 1: Essential code change to address potential maloperation of the PPSCat 2: Specification or requirements change.Cat 3: Code change to remove non-critical anomalies or to address necessary
improvements.Cat 4: Comments for which no action is requiredCat U: Interim categorisation to be resolved at sentencing
This last category is intended to cover comments where the analyst hasinsufficient information regarding the rest of the system's operation to be able todetermine the severity of the anomaly.
Following the reporting of provisionally categorised comments a sentencingprocess is undergone between TA Consultancy Services, Nuclear Electric andWestinghouse (often also held with the Nil in attendance). During the sentencingprocess each comment is discussed and resolved and given a mutually agreed finalcategorisation (using categories 1-4 above) which determines the corrective action,if any.
12. Project Status and Results to Date
The MALlAS analysis work started in January 1989 and is scheduled to completeat the end of October 1993. Because of the size of the analysis task and becausethe 'production' version of the software was not going to be ready much more thana year before the required certification date, the analysis commenced on 'pre-production' versions of the software.
Obviously, there are re-analysis cost implications of analysing early softwareversions and the analysis team has been growing to optimise the costs of theanalysis and at the same time meet the required timescales. In particular thegrowth of the analysis team has been rapid since the start of 1992, when TAConsultancy Services had a team of 15 people working on the task, to the presenttime in May 1993 when the team has grown to in excess of 80 people working fulltime (including managers, analysts and dedicated support staff).
Considering the results, in terms of numbers of anomalies raised, the latestfigures available relate to April 1993 at which time analysis had been completedand comments sentenced for 55 % of the production version software. Just under

180
2000 comments had been raised from the analysis of this software, a rate of aroundone comment for every 30 lines of code. This rate compares well with other'traditionally' developed and verified safety critical software on which TAConsultancy Services have conducted similar retrospective MALPAS analyses.After senteadg the majority of the comments (52%) were classified as category4 (no action comment), 40% were category 2 (specification change) and 8% werecategory 3 (non-critical code change). There were no category 1 comments.
The no action comments cover a wide range of raised anomalies, some of whichare suggestions for code or design improvements, for example to make code moredefensive, but which are considered not to justify code changes. Others may relateto trivial specification deficiencies or points for clarification. Similarly the category3 comments cover a wide range of instances where it has been considered necessaryto make changes. Some have been because of straightforward deficiencies such astype mismatches at procedure calls and others relate to improvements in codedefensiveness.
13. Conclusions
The MALPAS Analysis work conducted on the Sizewell 'B' Primary Protectionsystem Software has shown the feasibility of conducting a rigorous retrospectiveanalysis on a large software system that has not been developed with this form ofanalysis in mind. The tools, methods and techniques used for the work have beenshown to be very suitable but the costs of their use in such a retrospective mannerare high.
At a more detailed level the project has demonstrated the benefits of bothCompliance Analysis and of in-depth reviews of all work. During ComplianceAnalysis, it has been found that the twin activities of deriving the mathematicalspecifications and directing the tool to show conformance, results in both the codeand specifications being scrutinised in the minutest detail, thereby leading to theidentification of subtle but potentially significant problems.
The benefits of the reviews in terms of the consistency and checking that theyprovide are considered to far outweigh their not insignificant cost (in terms of timetaken for the reviews and any necessary rework). Similarly with the ComplianceAnalysis, although the costs of Compliance Analysis are high in absolute terms theyare low in relation to the costs of any potential software malfunction.Consequently, the conduct of rigorous static analysis, including ComplianceAnalysis, is considered to be essential for software within systems of the criticalityand potential failure consequences of the Sizewell 'B' PPS.
Whilst not claiming that the analysis provides a formal proof of the safety of thesoftware, the analysis does provide a formal verification that the source code meetsits low level and intermediate level specifications. The analysis has increased theintegrity of the software through code and documentation modifications that havebeen made as a result of anomalies raised during the analysis. Furthermore,through its rigour, the analysis has greatly increased confidence in the correctnessof the software and it is hoped that this, taken along with the four IndependentAssessment activities will greatly contribute towards a successful certification of thesoftware by the UK NIL.

181
14. References
1. IEC 880. Software for Computers in the Safety Systems of Nuclear Power Stations.International Eiectroteehnial Commission. 1986.
2. Demostrating Equivalence of Source code and PROM Contents. Paper by DJ Pavey & L A Wineborrow of Nuclear Electric, presented at the FourthEuropean Workshop on Dependable Computing on April 8-10, 1992 in Prague,Czechoslovakia.
3. TACSI020117/2. MALPAS Management Guide. TA Consultancy Services Ltd.
Issue 3, February 1992.
0 TA Consultancy Services Ltd, 1993

A Safety Critical Computer System in a RailwayApplication
Benhard Stamm, RenM Baumann, Martin Ktlndig-HerzagSiemens Integra Vcrkehrstechnik AG
8304 Wallisellen, Switzerand
Abstract
This paper describes a safety critical computer system used forautomatic train controL It has been developed during the lastthree years and is currently in the phase of final testing andvalidation. After a short system overview, the paper willconcentat on safety aspects in system design and on thedescription of the verification and validation process that waschosen. This specifically includes the problems and aspects ofthe selection of applicable norms, the definition of a validationand verification plan and the upper levels of verification.
Keywords
automatic tain control verification & validation plan, fault treeanalyses, risk assessment, design rules
1 Introduction
In the past decade suburban public transportation has experienced an enormous risein popularity. In Switzerland, many existing railway companies are confrontedwith the need of increased train capacity and train frequency.
As many of these networks consist of mostly single track lines and are built indensely built areas, increasing the capacity of the existing lines is often the onlysolution to suiting these demands.
Railway safety has reached a very high standard. One of the biggest remainingsafety problems today is the supervision of train drivers. The above mentionedincreased train speeds and traffic density of today's railroading leads to anincreased pressure on the train drivers and therefore to an increased chance of

183
human euor. Also due to the mentioned factors the probability and consequencesof accidents in case of humau etroi have drastically increased.
Based on these circumstances four railway companies under co-ordination of theSwiss Federal Bureau of Tansportation defined a specification for a new,advanced automatic train control system.
2 System Overview
2.1 General System Requirements
A study of incidents in the past, and of the present safety situation led to a systemr equiremen specification. It is helpful for the general understanding of theproposed solution to summarise the major requirements.
"* Train Vcod has to be supervised continuously, based on signal aspects, trackconditions and permitted train speed. This superision has to include the brakecurves in order to maintain a speed permitted by these sometimes overlappingconstraints at any time.
"* A speed of 10 km/h in excess of the permitted value has to be prevented at anytime.
"* Trains must be prevented from unauo departures in both directions aswell as from overrnning of signals at danger ( e.g. stop indication).
"* Signalled stops must be adhered to within a limit of 10 m.
" Disturbance of train operation has to be kept to a minimum. Apart fromentering train data prior to the first departure train crews must not manipulatethe system during train operations.
" A change to a less restrictive signal aspect has to be recognised immediatelyby the system. The capacity of existing lines has to be utilised fully. Thisincludes the oeed profile given by track geometry.
" The proposed system has to be fail safe, e.g. a safety certification similar tothat for solid sta interlocking system is required.
As none of the currently produced ATC-systems fulfilled the given specificationnor had the capacity of getting modified up to an apppriate level it was decidedto develop a new system. This also allowed us to take benefit of the enonnousadvances in technology during last few years.

184
2.2 System Functionality
The following paragraphs will give a short description of te functionality of theATC-system.
The proposed new ATC-systemn is used to supervise train movements according tosignal aspects and track conditions and to prevent any uathorised exceeding ofthe given speed limits at any time.
It is based on a data base which contains a route map that describes the network ofa superviwd railway. This data base contains the track geometry ( distances,gradient, permitted track speed, points, track arrangement etc. ), the location ofsignals, level crossings etc. and general data like the braking characteristics ofvehicles etc..
This data base is stored in a data module on board of each vehicle. This module iseasily changeable in case of changes in die network data.
Signal indications and point positions of a certain area, usually a station, aretransmitted cyclically to any vehicle within this area. Individual addressing ofspecific vehicles as well as communication from train to track is not necessary. Apilot line was chosen as a transmission system but data radio or similar technologycould also be used.
Computers on board of the vehicles are permanently updating Utir position withinft network data with the aid of wheel rotation encoders. Wheel slip getssu essed by an algorithm similar to the oues used in wheel slip monitoringsystems. The position measurement is readjusted at certain locations with the aidof passive synchronisation points. Their exact location is recorded in the data base.
The on-board computer of each vehicle permanently evaluates its route based onthe current position of the vehicle, the direction of movement, the data base andthe received point positions. It searches the route for speed restricting elements likesignals, track speeds, speeds over points etc. and calculates the maximumpermitted s at any moment ( Figure 1 ). If the actual speed reaches thepermitted value, a warning is issued to the driver requiring him to reduce the trainspeed. When the speed exceeds the pennitted speed by a defined value (e.g. 5kinh) the computer actuates the regenerative/dmostatic brake. As soon as thespeed is below the limit of the speed curve the braking is discontinued. In ft eventof a speed excess greater than what is considered tolerable (e.g. 10 kmn/h) thecomputer actuates an emergency brake application. 7T1 latter should only occur ifa driver doesn't react properly to an issued warning and if the vehicle doesn't reactto the application of the regenerative/deostatic brake, whether due to insufficientadhesion or with older vehicles because they are not equipped with aregeerativ tatic brake.

185
Temporary restrictions ( e.g. construction sites etc. ) awe popoganned into thestationary computers and transmitted to the vehicles together with the signalindications and point positions.
trck speed envetop (permument)
max. vehicle* N monitored speed curves speed•,, --- (good Ibad brakes)
* - \ 'signal at'danger
M a
finare 1: Examples cl mouitored speed curves with ovbelapping restrictiofs
The actual system structure is shown In Figure 2. The stationary computer in thestation interlockng as welm as the computer on board of each vehicle are designedwith a 2 out of 3 structure.
Each sub-computer of the 2 out of 3 at contains the full system functionalityincluding all the necessary hafrdware and softwsre. While perfosming the,functionality of the system the three sub-computers interchange input data and
final results of their caculations. In case of diffen between the results of thethree, the one with the differing data gets switched off by the two others. Theremaining sub-computers continue as a 2 out of 2 system. In case of an additional
failure, the system shuts down entirely. In the case of the stationary cmnputer thismeaits that no telegrams are transmited. In the case of the on-board computer thisleads to an aplcto of the emergency brake.
Thee is of course a large number of additional functions like emulation of theexistin ATP-system, special modes for depots or industrial spurs, shunting mode,overriding of sigals at danger in case of an interlocking failure, exceptionhandling etc. but their description is neither needed for the general unestnigof the systen design notr for the description of the verification and validationprocess.

186
Th ecrbdAC-yta incuescb inlln o heprite sed.A
redbdac, theafolown saetMonet ascosn
Goy brakocam"
SA 2 o 3System strcturei dt da sadt
data inptiruiry. hi St m Atlectho sspodryadtoa el et.Otu
3 Safety Aspects of the System Design
The descibed ATC-system includes cab signalling of the ismitted speed. At alaw stage of t installation and usage of the system it is intended hd rmove theexisting conventional signalling. Tha is leads to the s equireme for a fad safesystem design, as the correct oservation of tine side signals by thea driver can nolonger be assumed. Together with the required functionality, reliability andredundancy, she following Safety concept was chosen.
A 2 out of 3 system structure is used to detect hardware failures and to givethe required level of tedancy. A data exchange between lie sub-computers onallows evaluation of rie correct fetiontoing of ate hardware including all ftrdata input circuitry. This method is suprsd by additional self tests. Outputcircuitry for safety re~levant outputs is designed based on conventional rules forfaig sale hardware ( relays etc. ). Otherwise. the use of hardware componentsdesigned after the classical rules for faid safe hardware is wherever possibleavoided. This allows the usage of industry standard hardware in most-II Ii , 1- a 1 and eases laser hardware upgrades.
Data trmanmission betwee track and tran is designed salting advantage of the2 out of 3 system structure. Each of the three: sub computers in the interlockringganmma dam telegram including dam encoding. Thesn telegranms wetranmitted by each of the tlhrm sub-comnputers in a cyclic manne. The on-bowrd compterms rnquire the reception of a least two identical telegrams ftmn

187
two different sources to accept the received data. This procedure tolerates thetransission of increct telegrams by one sub-computer. It is also immuneagainst the falificatimo of single telegrams into different but correctlyencoded telegrams.
9 The necessary correctness of the system software is ensured by the strictapplication of the chosen norms and by rigid testing. This includes modemtesting methods and procedures like for example static software analysis andpath coverage analyses.
0 Data entry of safety relevant data like train characteristics is secured by thechosen data entry procedure. This procedure includes the echoing of theentered data after validation by the three sub-computers. This echo getsdisplayed via an independent hardware channel for verification andconfirmation by the train driver. This procedure additionally allows thedetection of data distortion or hardware failures in the data entry channel.
0 The corretness of the route map is ensured with several indejendentprocedures. First, data collection is performed with the aid of a computerbased data collection software. This software ensures systematic workingprocedures by forcing the user to generate and to update the data basefollowing well defined paths. Second, the data collection software performs awhole set of data verification procedures. This includes boundary checking ofentered data elements and data consistency testing after data entry. Thesoftware automatically generates indices for new data relnses to ensure theexclusive use of valid data. Once a new version of the data base has beengenerated a back transformaion software regenerates a route map for anadditional visual data verification.
4 Norms and Standards used for System Verificationand Validation
Any new development has to consider the requirements set by the opening of theEuropean Market to international competition. This includes of course norms andstandards reonred for verification and validation. One of the major problems inthis field is the current lack of hannonisaionof standards.
In several European countries, national railway companies and industry have in thepast developed local norms, standards or rulebooks. Some of these are based onlong term experience with conventional relay based technology or with electronichardware.
Some norms for electronc systems including microprocessors and software arecurently under development, but they follow different approaches and

188
philosolhies. This depends ont the country from which they originate and on theunderstanding and the definition of the term safety on which they are based.
A study was carried out to compare the currently used norms in Great Britain,France and Germany with the ones used in Switzerland. The study also had a lookat the proposals in work in the different committees of the CEN/ENELEC. Thiscomprison showed that bigger differences between the philosophies of theproposed standards still have to be overcome. As a result of the study, thefollowing norms were chosen as a base of the verification and validation plan:
"* the British norm RIA 23 [1], which was based on the Draft IEC SC65A WG9,for the implementation of the safety analyses and the ri assessment,
"* the proposed DIN norm DIN V 19250 [2] for the evaluation of the requiredsafety level
* and the proposed DIN norm DIN V VDE 0801 [3] for the definition of thefurther implementation.
In the mean time the work groups WGAI and WGA2 of the CENELEC committeeSC9XA, which is responsible for the proposal of a new norm, chose two IECpapers [4], [5] as a base of their future standardisation work. These papers takereference to the chosen DIN norms.
5 The Verification and Validation Plan
Based on the chosen norms a verification and validation plan was defined. Thiswas done in close co-operation with the Swiss Federal Bureau of Transportation,which will be responsible for the final system approval. The verification andvalidation plan covers the following topics:
"* project management
"* development
" commissioning
* mainteutance
* documentation
• configuration management.

189
For each of the above mentioned topics individual chapters cover the followingtopis
"* Norms and standards to be applied for each of the defined steps.
"* Definition of a detailed plan for the verification and validation of each step toreach system approval.
"* Definition of the persons or offices responsible for the implementation,verification and validation of each of the defined steps.
"* Definition of the responsibilities of each of the participating persons or officesto perform the above mentioned steps.
Figure 3 shows as an example the proposed plan for the system development:
Proem Veifl o I t Vaidtion
ILaw Safety Analysis I IVu u & Vadation
rý - b (Procedu~dresn)
Sa mSystem Acceptace
I -. . . - -s - -tlnto mo/1F Dge .3: Vr o d Valdation Plan wystm,
wi fthte Hadefiedrues an acori toth hoennrmsof tHeavrifiatinenvaldaeSotio wlnand dou enedin ank iniiulpaper.ach Sof thaespaess
I eft Data Strctres ., I radon. D.,.m, S
I~~~~ Dno m e taio B mawarew, Wor.-,k 4 Fnkb , l /w '
SI • --,vn• I r, ,,aplmt emntation S°o - - -- v erntkao"
Figuare 3: Verirw~ation and Validation Pluan
Each step ( work flow ) of the development as shown in the plan above is verifiedwith the defined rules and according to the chosen norms of the verification andvalidation plan and documented In an individual paer•. Each of these papers as
preented individually to the supervisomy authority for approval. This procedureallows an early detection of disagreement about the contents of the safetycertification and also fast certification after final testing, even in the case of such afairly complex ATC-system.

190
6 Examples of Verification Procedures
This chapter gives a more detailed look into two of the large number of diffMerentareas of system verification. These examples got chosen to show the spectrum ofmeasures necessary to fully implement a verification and validation plan.
6.1 Example 1: Verification of the System Specification
he first example shows the safety analyses that were carried out to verify thesystem specification. It is based on a fault tree analyses of the current operations atthe participating railway companies. The fault trees were verified with theavailable accident statistics and with a review with railway experts from differentbranches.
Figure 4 shows as an example a fraction of one of the fault trees.
1A2
spemi illbreuce bwso stuop
Figure 4: Example of Fault Tree Amalyses
The different possible accidaits deducted frem this fault tree analyses gotweighted, based on die probability of occuence of the differet cases leading tothese scidents and the scale of the damage that could likely resul. Thisprocedure is based on the model of nA 23 [1], which again is based on the Draft
IBC SC65A W09 141. It led to tables like the one shown in Figure 5.

191
ofOeqO mr m ---- ------ - 9--
P huksh
L- --- - a- -aa a
I- I
V9,0i ~VII. V12,
V7T= 202 A 209 A 212 V10 = M2A 21 A 213V3S= 202 A209A 213 V11 = 202 A 211 A 212V9 = 202 A 210 A 212 V12 = 202 A211A 213
F~pr 5: Eample of Failur Chssifictio
The norm DIN V VDE 0801 [3] cotains more deailed rules for the
__i __of h veificati and v o pl compaed to do _A 23 [1)
and gor dwd'or chosen as a basn for further steps. To allow this. a - --- f-nnatioof the required safety level via DIN V 192.50 [2] got underaken. Some
.s ..io based on this norm had to be made. As the possible severity ofaccidents with ns in suburban tfic is limited, casuropic events were defined
to corrspn to S3. The probability remote was assignecd to W2. The assumptionled with the definition of a frequent to permanent collective stay within the ,.systems sphere to a safety reuiemn level 6.
With assumption on the possible effect of an addifimal safety system on theprbaility and the resultin damage of accidents, the system specifcto wasveiid This verification also led to die definition of the required integrity levelfor the system accoding to the chose nom [2].
6.2 Example 2: Software Ipleimentation
iMe seond extmato gives if ovicaw of dd o pnc edu t dii fRA 2 ea M iation asd on thst ng ofhtad o btwrme.
acienswthtaisi s "ura trafi is -mted caatiiceet wer Iefined

192
As already mentioned each step ( work flow ) of the development as shown in the%oreponding verification and validation plan is performed and verified accordingto a reviewed and approved guideline. The guideline for software implementationcovers the following topics:
Definition of the chosen progranmming language ( in this case Modula 2 ). Thisincludes rules, restrictions and recommendations for the use of languageelements which could lead to difficulties in the verification of the code, likepointers, variant records etc..
Definition of the structure and the look of source files to allow severalprogrammers to dsae code without the risk of misunderanding or miss-interpretations due to personal style.
* Definitions for the naming and the marking of language elements likevariables, constants, subroutines etc. for the same reasons.
* Definitions for the required documentation of program code including style,depth, volume etc..
* Definition of the procedures and tools used to verify the correctness of thecode including check lists. The tools used include for example: syntax checkof the source code including the above mentioned rules and restrictions, staticcode analyses including software metrics and path coverage analyses includingthe definition of the used tools and the registration of test cases and testresults.
7 Conclusions and Acknowledgements
The experience gained in the development of the described ATC-system in the lastthree years is summarised in the following list:
* As long as there is no harnonisation and standardisation for the verificationand validation of computer based safety systems in railway applications inEurope, a selection of the norms currently under development has to be madeindividually for new projects. Once a hannoisation has been reached thetransition time for the application of the new norms will be very shortcompared to the development cycle of a larger project. It is therefore advisableto already today use norms that will probably closely conform to the newnorms. Existing norms are only applicable in some countries and usuallyrepresent a country specific approach to safety. They are often not applicablein other countries.

193
* A verification and validation plan has to be defined, approved and followedfrom the very beginning of a new development to avoid later problems, delaysand cost for system approval.
"* The experience shows that with the application of the above mentioned plan adevelopment can get carried out in a shorter time due to a permanent co-ordination between developer, customer and supervisory authority.
"• The experience also shows that the application of the above mentioned planallows system validation at a significantly lower cost due to an earlyinvolvement of the supervisory authority. Wishes and requirements forchanges can get respected at the appropriate level of the development cycle.
As a final acknowledgement the authors would like to express special thanks to theSwiss Federal Office of Transport and to the participating railway companies,which with their knowledge, experience and openness to new proposals madesignificant contributions to the project.
References
1. R.I.A 23, Draft, Standard for Safety Related Software for Railways (Signalling),Version 1.0, Issued 23 January 1991
2. DIN V 19250, Grundlegende Sicherheitsbetrachtungen fUr MSR Schutz-einrichtungen, Vornorm, Januar 1989
3. DIN V VDE 0801, Grundsmtze fur Rechner in Systemen mit Sicherheitsaufgaben,Vornorm, Januar 1990
4. Draft IEC SC65A WG9, Software for Computers in the Application of IndustrialSafety-Related Systems, 1989
5. Draft IEC SC65A WGIO, Functional Safety of Electrical/Electronic/ProgrammableElectronic Systems: Generic Aspects, Part 1: General Requirements, 1989

Session 6
TESTING
Chair: B. CronhjortRoyal Institute of Technology, S

Confidently Assessing a Zero Probability ofSoftware Failure
Jeffrey M. Voas, Christoph C. Michael* Keith W. Millert
ABSTRACT
Randomly generated software tests are an established method of estimating soft-ware reliability [5, 7]. But as software applications require higher and higherreliabilities, practical difficulties with random testing have become increasinglyproblematic. These practical problems are particularly acute in life-critical appli-
cations, where requirements of 10-7 failures per hour of system reliability trans-late into a probability of failure (pof) of perhaps 10- or less for each individual
execution of the software [4]. We refer to software with reliability requirementsof this magnitude as ultra-reliable software.
This paper presents a method for assessing the confidence that the software
does not contain any faults given that software testing and software testabilityanalysis have been performed. In this method, it is assumed that software testing
of the current version has not resulted in any failures, and that software testinghas not been exhaustive. In previous publications, we have termed this method
of combining testability and testing to assess a confidence in correctness as the
"Squeeze Play" and "Reliability Amplification," [15, 13] however, we have notformally developed the mathematical foundation for quantifying a confidence that
the software is correct. We do so in this paper.
1 Introduction
The probability of failure of a program is conditioned on an input distribution.(Another term for an input distribution is "operational profile" [14].) An input
distribution is a probability density function that describes for each legal input
the probability that the input will occur during the use of the software. Given
an input distribution, the probability of failure (pof) is the probability that a
random input drawn from that distribution will cause the program to output anincorrect response to that input.
Software reliability is defined as the probability of failure-free operation of
the software in a fixed environment for a fixed period of time. Note the differ-
*Reliable Software Technologies Corporation, Penthouse Suite, 1001 North Highland Street,Arlington, VA 22201 USA, (703) 276-1219, e-mail: jmvoasmothra.isse.gmu.edu.
t Correspondence address is: Department of Computer Science, College of William & Mary,
Willianmburg, VA 23187 USA, (804) 221-3464, e-mail: milier~cs.wm.edu.

198
ence between the definition for reliability and that for software probability offailure: probability of failure is time independent. However, both reliability andprobability of failure are tied to a specific environment.
Even if ultra-reliable software can be in theory achieved, we cannot com-fortably depend on this achievement unless we can assess its reliability in aconvincing, systematic, and scientific manner. As pointed out in [2], black-boxtesting is impractical for establishing these very high reliabilities. In general,by executing T random tests, we can estimate a probability of failure in theneighborhood of 11T when none of the tests reveal a failure [3]. If the requiredreliability is in the ultra-reliable range, random testing would require decades oftesting before it could establish a reasonable confidence in this reliability, evenwith the most sophisticated hardware. Based on these impracticalities, someresearchers contend that very high reliabilities can not be quantified using sta-tistical techniques [1]. In dismissing all possible statistical techniques becauseof the practical problems with random testing, we think Butler and Finelli arebeing premature, and this paper describes how a statistical technique in ad-dition to random testing may be brought to bear on the problem of assessingultra-reliability.
Two purposes of software testing are establishing a reliability estimate andfinding software faults. When software does not fail during non-exhaustive test-ing, there is good news and bad news. The good news is that we suspect that thesoftware no longer has gross faults. The bad news is that testing is no longer aseffective at estimating reliability or at uncovering the remaining faults (if theyexist).
It is disheartening to realize that it is more difficult to assess the reliabilityof a program that has not failed than it is to assess the reliability of a programundergoing some proportion of failures. Previous work has tackled the problemof assessing the probability of failure of software that has not failed [3]. In thispaper, we consider a closely related problem using an approach that is distinctfrom traditional testing. We are interested in the confidence that the softwareis correct given that:
1. the program has not failed in T tests, and
2. we have a prediction of the minimum non-zero failure probability (fromtestability analysis that has been performed on the program).
We agree that testing, on its own, cannot be used to establish ultra-reliabilities.However, testing is not the only statistical technique possible for analyzing soft-ware reliability. We believe that software testability, as a quantifiable measureof software quality, can be used in conjunction with testing to assess reliability.
2 Software Testability Analysis
We now discuss "sensitivity analysis," a statistical technique complementary totesting. Sensitivity analysis is one algorithm for performing testability analysis.Used in conjunction with testing, sensitivity analysis may allow us to estimate
L . ii •i -•- u n nn,.°,=.,mnl n ui nmm ,, =. Ma,, .n.it

199
reliability to a much higher precision than was possible with testing alone. Apreliminary model for doing this reliability assessment was previously presentedat [131.
Sensitivity analysis uses program mutation, data state mutation, and re-peated executions to predict a minimum fault size [6]. The minimum fault sizeis the smallest probability of failure likely to be induced by a programming er-ror (with respect to the program, testing distribution, and simulated faults thatare injected). Sensitivity analysis does not use an oracle, and can therefore becompletely automated as implemented by the PISCES tool [18].
Testing establishes an upper limit on the software's probability of failure;sensitivity analysis establishes a lower limit on the probability of failure thatis likely to occur. Together, the estimate and the prediction can be used toestablish confidence that software does not contain any faults.
Sensitivity analysis is based on separating software failure into three phases:execution of a software fault, creation of an incorrect data state, and propagationof this incorrect data state to a discernible output. This three part model ofsoftware failure [8] will be referred to as PIE, for Propagation, Infection, andExecution. In this paper we examine how to apply PIE to the task of findinga realistic minimum non-zero probability of failure prediction, a, when randomtesting has discovered no errors.
If a location contains a fault, and if the location is executed, the data state ofthe execution may or may not be changed adversely by the fault. If the fault doeschange the data state into a data state that is incorrect for this input, we say thedata state is infected. To predict the probability of infection, the second phaseof sensitivity analysis performs a series of syntactic mutations on each location[91. After each mutation, the program is re-executed with random inputs; eachtime the monitored location is executed, the data state is immediately comparedwith the data state of the original (unmutated) program at that same point inthe execution. If the state differs, infection has taken place [121.
The third phase of the analysis estimates propagation. Again the location inquestion is monitored during random tests. After the location is executed, theresulting data state is changed by assigning a random value to one data itemusing a predetermined distribution. (Research is ongoing as to the best distribu-tion to use for this random selection. Current experiments use an equally likelydistribution over the range of values for this variable during random testing.)After the data state is changed, the program continues executing until an outputresults. The output that results from the changed data state is compared to theoutput that would have resulted without the change. If the outputs differ, errorpropagation has occurred.
Each phase produces a probability estimate based on the number of trialsdivided by the number of events (either execution, infection, or propagation).Execution, infection, and propagation must all occur to result in a failure atthis location. Thus the product of these estimates yields an estimate of theprobability of failure that would result if this location had a fault.
Sensitivity analysis is a new empirical technique. Since sensitivity analysisdoes not require an oracle, it can be completely automated. Preliminary resultsof the accuracy of the lower bounds produced by sensitivity analysis have been

200
encouraging [9, 11, 101.Sensitivity analysis produces 3 probability estimates for each location exam-
ined. In order to assess testability for a program or module, we must be ableto give one probability prediction: the "latent failure rate." The latent failurerate is a prediction of the minimum non-zero failure probability that can occurfrom any possible fault in the program given the fault classes that were sim-
ulated by sensitivity analysis. It is possible that an actual fault will induce alower failure probability than the latent failure rate. This occurs when the faultclasses simulated by SA do not include a particular fault, and that fault has alower failure rate associated with it than any of the faults that are simulated.This is an unavoidable possibility that is incurred by all fault-based techniques;fault-based techniques are only as powerful as the range of the fault classes thatthey simulate. However, in the experiments cited above, such "surprisingly smallfaults" were rare.
3 Hoeffding's Inequality
When we test a program randomly, success is defined by whether or not it per-forms correctly on all tests. However, since test cases are chosen randomly, thereis a certain probability of drawing a test sequence that fools us into believingthat a "bad" program is "good." An extreme example is the case in which the
same test case is drawn N times, an unlikely but possible outcome of N drawswith replacement. Although we can honestly say in this case that we have per-formed N random tests, in truth our testing has told us little about the qualityof the program.
Our analysis assumes that sampling is with replacement. However, it is nor-mally not likely that we will draw the same test N times, and we might hopethat there is only a small probability of drawing any sort of grossly unrepresen-tative set of tests. In fact, we can bound this probability as follows: we firstnote that if the probability of a program failure is c, then the proh, bility thatit will fail in exactly k out of N tests is given by a binomial distribution:
( k( I )N-k.
Therefore, the probability that the program will not fail on any test is obtainedby setting k = 0; (1) then becomes (1 - C)N, the confidence bound that we havealready used. To state this result in mathematical terms, let 4, be an empiricalestimate for the probability of an event (in this case the event is a programfailure), which is constructed by dividing the number of times the event occurred
by the number of tests that were made. Also let v be the true probability of theevent. Then we have just shown that
Pr(1, _- V 1> C) _< (1 _ IE)N
given that 4, is 0. In other words, we have shown that the difference betweenthe true probability of failure and the estimated probability of failure is greater
than or equal to c only with probability (1 - ()N.

201
In testability analysis we are faced with a problem that is similar to the onewe face in testing. We obtain an empirical estimate of the probability of someevent (in this case the event is no longer a program failure but a propagation,an infection, or an execution) and we wish to know how likely it is that we havedrawn an unrepresentative sequence of tests, and thus obtained an estimate thatis actually far off the mark. We require an upper bound on
Pr(I 0 - v I>ý c)
that applies in the general case, and not just when 0 = 0. One such bound wasgiven in [17] and is commonly known as Hoeffding's inequality. It states that
Pr(I - v I> c) _< 22N
(Note that this is only an upper bound. Even though Pr(I 4) - v 1[ c) is aprobability and cannot be greater than 1, the right side of (2) can be as largeas 2. But if 2e-2c2N were, say, 1.6, then (2) would not tell us anything new,because we already knew that Pr(I 4) - v 1Ž> c) is less than or equal to 1.0, andhence less than 1.6. In that case, however, (2) would not give us any confidencethat 1 - v I was less than c, because, as far as we could ascertain by lookingat (2), the probability that I ) - v 1_> c could be as large as 1.0.)
For the purposes of quantifying our confidence in a latent failure rate, weapply Hoeffding's inequality and get that
PrXD[I V-- V 1ŽC1] <_ 2e-2cN (1)
where
1. X is the space of mutants and perturbation functions used, i.e., X is thespace of programs based on P for which D was used during testing.
2. v is the true latent failure rate (unknown).
3. 4 is the predicted (empirical) latent failure rate found via sensitivity anal-ysis.
4. E is the "fudge factor" that we set for how much we believe we have mis-calculated 4.
For c, our intuition suggests the use of:
f -- 0 -- (10-1 • - (2)
Eqtuation 2 provides a fudge factor of one order-of-magnitude; although C isindependent of,0 it makes sense that c is near O)'s order-of-magnitude. As -2c 2 Ndecreases, 2e- 2( N increases; this undesirable situation will be fully explainedlater. For now, it is enough to know that c is the dominant argument in 2e-2e2 N,and for a small i, N must be enormous for 2e-2e2N to be small. (Tables 1 and2 show the relationship between the parameters of Equation 4.)

202
4 The "Squeeze Play"
As we have explained in Section 2, sensitivity analysis provides an empiricalprediction of the minimum non-zero failure probability. And from testing wehave an upper bound, 0, on the probability of failure. If the upper and lowerbounds hold, we have bracketed the true probability of failure. Note that boththe prediction and estimate must be based on the input distribution D.
To understand what this prediction and this estimate tell us, it is often easierto visualize these probabilities as fault sizes, meaning the upper bound can beviewed as the largest fault that is likely to still be remaining after testing Ttimes, and the latent failure rate can be viewed as the smallest fault that islikely to still be in the code. Again it is important to remember that we do notknow whether any faults exist in the code.
If we have done enough testing to be very confident that the true probabilityof failure is less than 0, the smallest fault we expect to see, then we believe thatthere are no remaining faults with respect to the fault classes that were simu-lated during sensitivity analysis using D. Section 5 presents the mathematicalconfidence that we have in this belief. This idea of increased testing to increaseour confidence that the true pof is less than 4 is termed the "Squeeze Play."[15, 13]. The same effect can be realized by increasing 4 via either softwaredesign-for-testability or removing those PIE estimates from the latent failurerate that are driving 4 down. We can confidently ignore PIE probability es-timates only when are sure that the location that they are associated with iscorrect. After all, if we know there is no fault at a location, then we do notcare what the predicted ability of that location is to hide a fault from us, sincenone is there. Such certainty for very small portions of code might be possiblein isolated cases using formal methods such as proof of correctness. Since suchproofs are more easily carried out for small code segments, the use of sensitivityanalysis may encourage future applications of formal techniques often dismissedas impractical today.
5 Quantifying Absolute Correctness
Testing down to the level of 4 - c as well as performing testability analysisfor 0 are processes that are statistically subject to error. As we have shown,Hoeffding's inequality provides a mechanism for quantifying this error.
Hamlet's probable correctness model [16] provides a mechanism for quanti-fying how likely testing is to give us a confidence that the true probability offailure is greater than 0:
Prob[Ei, > (0)] = (1 - (0)) T (3)
where the T successful tests are selected according to distribution D. Thisallows us to determine how much confidence we place in the results of testingthe program T times successfully.
The following equation gives us a lower bound on our confidence that thesoftware is correct. If the lower bound is less than zero, this means that we have
"L

203
zero confidence.Confidence[lD = O]XD = 1-
[(1 - (0))T + 2e-2eN] (4)
There are several aspects of Equation 4 that are noteworthy. First, in thecase where 9 < 4, the size of 4* impacts our confidence in correctness given fixedT and N. Equation 4, then, suggests that just having a cross-over of 8 and 4*is not enough; we also need a sufficiently large 4'. Second, as 4, decreases, therequired N to overcome a small c in order for 2e-2c2 N to be near zero becomesvirtually intractable. Thus if we are to have any confidence that our software iscorrect we will need 2e-2 2 N to be near zero and (1 - (0))T to be near zero.
6 Conclusions
We contend that the preliminary results of experiments in software sensitivity aresufficient to motivate research into quantifying sensitivity analysis. Although thetechnique will likely require revision, the ideas that motivate sensitivity analysisdispute the contention that random testing is the only method of experimentallyquantifying software reliability. We cannot guarantee that this new techniquewill make it possible to assess reliability to the precisions required for life-criticalsoftware. However, we do think it is premature to declare such an assessmentimpossible. In the preceding sections we have argued that if testability predic-tions can be quantified accurately, then it is plausible to combine random testingresults with testability results to assess reliability more precisely than is possiblewith testing alone.
Both random testing and testability analysis gather information about po&-sible probability of failure values for a program. However, the two techniquesgenerate information in distinct ways: random testing treats the program as asingle monolithic black box while sensitivity analysis examines the source codelocation by location; random testing requires an oracle to determine correctnessbut sensitivity analysis requires no oracle because it does not judge correctness;testing that reveals no failures focuses on the possibility of no faults existingwhile sensitivity analysis focuses on a "what if a fault exists in this location"analysis. The two techniques provide independent data about how frequentlythe program should fail if any faults exist.
This paper has primarily focused on the case where 0 < 4, because this is theeasiest situation in which to gain confidence in the software's correctness. Andas Tables 1 and 2 have shown, it is preferable that 0 < 4. Unfortunately, thissituation may be infrequent, and more frequently 0 > 0,. This situation makesit almost impossible to provide a confidence in the absolute correctness of thecode. Two main strategies can push 0 and , closer: decreasing 0 by increasingT, the number of tests; or increasing # by rewriting code locations that havelow sensitivity. Software design-for-testability is one avenue of research that weare exploring that we hope will generally cause systems to have higher 8s.
One interesting side-effect of Equation 4 has revealed that not all cross-overcases are equivalent in the derived confidence. This is because as c decreases

204
Confidence[eD = OIXD f T N 00 0.00009 10 1000000 0.001 0.00010 0.00009 100 1000000 0.001 0.00010 0.00009 1000 1000000 0.001 0.00010 0.00009 10000 1000000 0.001 0.00010 0.00009 100000 1000000 0.001 0.00010 0.00009 1000000 1000000 0.001 0.00010.009955 0.009 10 1000000 0.001 0.010.095 0.009 100 1000000 0.001 0.010.632 0.009 1000 1000000 0.001 0.010.999 0.009 10000 1000000 0.001 0.011.0 0.009 100000 1000000 0.001 0.011.0 0.009 1000000 1000000 0.001 0.010.00995 0.09 100 1000000 0.0001 0.10.0951 0.09 1000 1000000 0.0001 0.10.632 0.09 10000 1000000 0.0001 0.10.999 0.09 100000 1000000 0.0001 0.11.0 0.09 1000000 1000000 0.0001 0.11.0 0.09 10000000 1000000 0.0001 0.10.999955 0.0009 10000 1000000000 0.001 0.0010.604157 0.0009 10000 1000000 0.001 0.0010.0 0.0009 10000 100000 0.001 0.0010.236 0.0009 100000 1000000 0.00001 0.0010.468 0.0009 200000 1000000 0.00001 0.0010.5544 0.0009 300000 1000000 0.00001 0.0010.585 0.0009 400000 1000000 0.00001 0.0010.597 0.0009 500000 1000000 0.00001 0.0010.604 0.0009 1500000 1000000 0.00001 0.0010.604 0.0009 5000000 1000000 0.00001 0.0010.9216 0.0009 5000000 2000000 0.00001 0.0010.965 0.0009 5000000 2500000 0.00001 0.001
Table 1: Various Parameters for Equation 4

205
Confidence[ED = 0]XD f T N 0 100.604 0.0009 100000 1000000 0.001 0.0010.604 0.0009 200000 1000000 0.001 0.0010.604 0.0009 300000 1000000 0.001 0.0010.604 0.0009 400000 1000000 0.001 0.0010.604 0.0009 500000 1000000 0.001 0.0010.604 0.0009 1500000 1000000 0.001 0.0010.604 0.0009 5000000 1000000 0.001 0.0010.921 0.0009 5000000 2000000 0.001 0.0010.965 0.0009 5000000 2500000 0.001 0.0010.9844 0.0009 5000000 3000000 0.001 0.0010.993 0.0009 5000000 3500000 0.001 0.0010.997 0.0009 5000000 4000000 0.001 0.0010.001 0.05 100 10000 0.00001 0.10.095 0.05 10000 10000 0.00001 0.10.393 0.05 50000 10000 0.00001 0.10.632 0.05 100000 10000 0.00001 0.10.632 0.05 100000 20000 0.00001 0.10.864 0.05 200000 10000 0.00001 0.10.950 0.05 300000 10000 0.00001 0.1
Table 2: Additional Parameters for Equation 4
(when 4) increases), the required N to overcome this deficiency becomes in-tractable. Thus we have discovered a new argument for attaining a higher 4):not only does a higher 4 require fewer T tests but a higher 4 means a higher cwhich a greater confidence in 4) can be achieved with a smaller N. This is cru-cial to the success of Equation 4, since a tiny N will almost certainly destroy anychance of getting a greater than zero confidence in the software's correctness.
Acknowledgement
This work has been partially supported by NASA Grant NAG-1-884. The au-thors would like to thank Larry Leemis of the mathematics department of theCollege of William & Mary for reviewing a copy of this paper. Also, we thankJeffery Payne of RST for producing the tables.
References[1] R. Butler and G. Finelli. The infeasibility of experimental quantification of
life-critical software reliability. Proceedings of SIGSOFT '91: Software forCritical Systems (December 4-6, 1991), New Orleans, LA., 66-76.
[2] D. R. Miller. Making statistical inferences about software reliability. NASAContractor Report 4197 (December 1988).

206
[3] K. Miller, L. Morell, R. Noonan, S. Park, D. Nicol, B. Murrill, and J. Voas.Estimatirg the probability of failure when testing reveals no errors. IEEETrans. on Software Engineering 18(1):33-44, January, 1992.
[4] I. Peterson. Software failure: counting up the risks. Science News, Vol. 140,No. 24 (December 14, 1991), 140-141.
[5] T. A. Thayer, M. Lipow, and E. C. Nelson. Software Reliability (TRW Seriesof Software Technology, Vol. 2). New York: North-Holland, 1978.
[6] J. Voas, L. Morell, and K. Miller. Predicting where faults can hide fromtesting. IEEE Software (March 1991), 41-48.
[7] S. N. Weiss and E. J. Weyuker. An extended domain-based model of soft-ware reliability. IEEE Trans. on Software Engineering, Vol 14, No. 10 (Oc-tober 1988), 1512-1524.
[8] L. J. Morell. Theoretical Insights into Fault-Based Testing. Proc. of theSecond Workshop on Software Testing, Validation, and Analysis, July, 1988,45-62.
[9] J. Voas and K. Miller. The Revealing Power of a Test Case. Journal ofSoftware Testing, Verification, and Reliability 2(1), 1992.
[10] J. Voas and K. Miller. PA: A Dynamic Method for Debugging CertainClasses of Software Faults. To appear in Software Quality Journal, 1993.
[11] J. Voas. PIE: A Dynamic Failure-Based Technique. IEEE Transactions onSoftware Engineering 18(8):717-727, August, 1992.
[12] Richard A. DeMillo, Richard J. Lipton, and Frederick G. Sayward. Hints onTest Data Selection: Help for the Practicing Programmer. IEEE Computer,April, 1978, 11(4):34-41.
[13] J. Voas and K. Miller. Improving the Software Development Process UsingTestability Research. Proc. of the 3rd International Symposium on SoftwareReliability Engineering, October, 1992, Research Triangle Park, NC. -*
[14] John Musa. Operational Profiles in Software-Reliability Engineering. IEEESoftware, March, 1993, 10(2):14-32.
[15] R. Hamlet and J. Voas. Faults on Its Sleeve: Amplifying Software Reliabil-ity Testing. Proc. of the International Symposium on Software Testing andAnalysis, June 28-30, 1993.
[16] R. Hamlet. Probable Correctness Theory. Information Processing Letters,25(1):17-25, April, 1987.
[17] W. Hoeffding. Probability Inequalities for Sums of Bounded Random Vari-ables. American Statistical Association Journal, March, 1963, p.13-30.
[18] J. Voas, K. Miller, and J. Payne. PISCES: A Tool for Predicting SoftwareTestability. Proc. of the 2nd Symposium on Assessment of Quality SoftwareDevelopment Tools, May, 1992. IEEE Computer Society.

A Knowledge-Based Approachto Program Testing and Analysis
Igor M. GalkinComputer Center, Academy of Sciences
Minsk, Republic of Belarus
Abstract
An approach to computer support organization of program testingand analysis is considered. The approach is based on a semantic netrepresentation and usage of knowledge about a program. The pos-sibilities and benefits of this approach application in different kindsof program analysis and usage of the Prolog language as the toolof such analysis implementation are described. Also the possibil-ity of the approach spreading over different program representationsanalysis and other problem areas, connected with the program en-gineering, is indicated.
1 Introduction
It is known that important factors of software reliability and safety improve-ment are program testing and analysis. As objects of studying and analysis mayserve such program features as interrelations of program objects, properties ofones, control flow, data flow and structure, quality characteristics, results ofexecution. Models traditionally used for such analysis are control flow graph(c-graph), data flow graph, call graph. The offered approach envisages variousprogram features modeling by semantic nets and frame ones. Using of theseformalisms of knowledge representation allows to uniformly represent informa-tion about program features which is necessary for different kinds of programanalysis. This information is represented by a set of facts - instances of rela-tions (e.g. relations of calls, nesting, declaration, usage, location, precedence,characterization, edge coverage), existing or arising under program executionbetween entities of program (e.g. procedures, variables, constants, c-graphnodes) or between ones and their characteristics (as examples of the latter mayserve "coordinates" of location in the program for procedures, "coordinates"of declaration or usage for variables and arrays, quality metric values for pro-cedures and programs). Facts of these relations simulate a state (features) ofprogram and form its model; program analysis actions are described by a set of

208
appropriate rules and are based on construction and analysis of such models.The main tool of this approach implementation is Prolog.
Different papers have influenced the approach formation. First of all theseare [1-5], which are based on selection and usage of relations between programobjects, [6, 7], in which some aspects of the Prolog usage for program analysiswere considered, and also [8], in which the possibility of graphs and graphgrammars usage for program representation modeling was given.
2 Representation of Knowledge about ProgramFeatures
Discussing the modeling of program features it is useful to distinguish betweentwo levels of knowledge representation: "user" level, associated with descrip-tion, and "system" level, connected with implementation. On the former level,which corresponds to the requirements of convenience and simplicity of knowl-edge representation, the using of a simple semantic net formalism is preferable,on the latter level, which takes into consideration unambiguity of representa-tion of program objects in the model, model size and other realization aspects,frame net formalism is more adequate [9].
Semantic net formalism is based on the idea of knowledge representationin the form of the oriented graph with named nodes and edges, where nodescorrespond to the objects of the problem area studied, and edges to relationsbetween them. There is a sufficiently large number of kinds of semantic nets.Let us limit our consideration by non-homogeneous semantic nets, which con-tain different, not only one kind relations, and simple (non-hierarchical) ones,whose nodes don't have its own structure. From the logic view the main func-tional element of semantic net (relation and two nodes connected by it) isequivalent to predicate with two arguments. For this reason, semantic net maybe represented both in a graphic form and in a predicate form.
So, knowledge about some features of an imaginary Pascal program, con-taining procedure sample, on the "user" level may be represented by the nextfacts of semantic net relations (in infix predicate form):
sample uses-the-variable indexindex is-declared-in-line 52index has-type integerindex is-referred-to-in-line 56sample has-length-in-lines 8sample has-commentedness 0sample has-complexity 2
Frame formalism, which also implies a choice of objects and relations ofproblem area and in a certain sense may be considered as a particular case ofsemantic nets, is oriented towards the representation of stereotype situations.Frame is the composition of situation components (slots) having its own nameand value and united by a frame niame. As a slot value may be a name (in-

209
dividual label) of a frame, then a frame set turns into a frame net. Like thesemantic nets frame ones may be expressed in graphic and symbolic forms.
So, on the "system" level semantic net presented above may be transformedinto the frame set (in a symbolic form)
(TYPE object index procedure sample declaration-line 52 type integer)(REFERENCE object index line 56)(CHARACTERISTICS procedure sample length-in-lines 8
commentedness 0 complexity 2).
Prolog program consists of facts, rules and queries. Facts fix the existingof some relations between objects; rules set common dependencies for usingrelations and allow to get new facts from ones taking place; queries require toconfirm the existence of the relation between concrete* objects or point out theobjects connected by a certain relation with other objects. Objects may berepresented by ones' lists. For example, the frame set given above is compactlyrepresented by Prolog facts (here and below syntax and terminology [10] areused)
type (index sample 52 integer)reference (index 56)characteristics (sample 8 0 2),
relationships between frames are set by Prolog rules.Program testing and analysis actions are described by Prolog rules. Program
state models are analyzed by execution of Prolog program, which includes anappropriate set of rules and queries.
3 Contents and Ways of Forming of the Model
Apparently, treating program features modeling it is necessary to answer atleast three important questions: WHAT, HOW and WHY must be representedin the model? The model reflected features of some really existing program is,nevertheless, quite independent entity with own internal properties, physicallyseparated from modeling program, and itself is a possible object for investi-gations. Given above, the explanations of the common idea of the approachmainly answer a question HOW (how are program features represented in themodel?). Now let's try to answer a question WHAT (what program featuresmust be represented in the model?).
Purpose of the model is to reflect program features adequately to analysis re-quirements (having as experience shows tendency to permanent growing). Forthis reason, it has to contain maximum possible (but at the same time practi-cally acceptable) volume of useful information about various program features.Since Prolog allows to infer new knowledge from existing one, it is worthwhileto reveal some "base" (necessary) volume of knowledge about a program. Ina certain sense contents of the model is some compromise between require-ments of analysis execution effectiveness and memory economy. Intuitively itis clear that from program analysis and testing view the model must containinformation about all program modules and their relationships (such as calls

210
and parameter transmissions), about all places and contents of program dataobjects' declarations and usages, about control structure in a program, aboutvalues of some metrics (e.g. of a complexity), about coverage of program pathsby tests, etc.
Information about program module relationships, data objects' declarationsand usages and control structure may be extracted from program source codeunder its syntactic parsing; values of necessary metrics are computed on thebase of this parsing data; test run result data are obtained by instrumentedprogram execution.
4 Dependencies between Elements of the Model
To answer (naturally, not exhaustively) a question WHY (why just such kindof information must be represented in the model?) let's profit by mathematicalapparatus of relations, based on the set theory.
Let A and B be two sets, A x B is their cartesian product, then any itssubset R C A x B defines some binary relation between elements of A and B.Objects (elements) z and y are in a binary relation R that is denoted as zRy,if (z, y) E R.
Let's as a base relation set take the next collection:
R l ("begins-at") C M x P,R2 ("terminates-at") C M x P,R3("is-directly-nested-in") C M x M,R4("is-called-at") C M x P,Rs("is-declared-at") C V x P,R6("is-defined-at") C V x P,R7("is-referred-to-at") C V x P,Rs("is-undefined-at") C V x P,Rg("starts-at") C G x P,Rio("ends-at") C G x P,R11("is-directly-preceded-to") C G x G,
where M, V, P, G are non-intersected sets of the model elements, and besides M-elements represent program modules (relatively independent program entities,such as head modules, subprograms, procedures, functions, etc.), V-elementsrepresent data objects (e.g. variables and arrays) of a program, P-elements rep-resent points (placements) in a program, G-elements represent c-graph nodes;sense of the relations is clear from its linguistic meaning. Not concerning con-crete details of representation of program objects in the model, we shall con-fine ourselves to the requirement of unambiguity of this representation andregularity of P-elements for the possibility of its comparison (before-after, less-greater), that may be ensured by their number nature.
On the base of relations R1 - R11 and also common order relations "not-greater-than" (R 12 ) and "not-less-than" (R13 ), defined, in particular, on theset P x P, with the help of appropriate operations under relations it is possible

211
to define some auxiliary relations, promoting to the inference of existing depen-dencies between model elements (and accordingly, between program objects).So, with the help of relations
R14("is-used-at") g V x P,Ris("is-nested-in") _ M x M,Rle("belongs-to-the-module") g P x M,R17("is-declared-in-the-module") C V x M,Ris("is-used-in-the-module") C V x M,R1 g("is-known-in-the-module") C V x M,
defining asR14 = R6 U R7 U Rs,R15 = R3UR3u u...=4R6= ((R13 o R- 1) n (R12 o R,-)) \ (((R 13 o R-'1) (R12 0 R•l))o R-1),R1 7 = Rs o R16,Ris = R14 0 R16 ,Rig = R17 U (R17 o R-),
where U, n, \ and o mean union, intersection, difference and composition(product) of relations, respectively, Rk - kth power of a relation R, R-'1 -
the inverse relation to relation R, R+ - the transitive closure of a relation R,the rule of the obligatory declaring of data objects used within a program maybe written as the restriction Ris C Rig, and the rule of the obligatoryusage of data objects declared in a program - as the restriction
R17 C R1s U ((Ris o R15 ) \ (R17 o R15)).
By similar manner through the use of the relations from the base collectionsome useful auxiliary relations may be defined, in particular,
R20("belongs-to-the-node") C P x G,R2i("precedes") C G x G,R22("dominates-over") 9 G x G),R23(" belongs-to-s-node-preceding-to-a-node-containing-the-point") C_ P x P,
and with their help it is possible to formulate some dependencies peculiar to aprogram control and data flow. So, the rule of the obligatory initialization ofreferring data objects may be expressed by the restrictions
(R o R; o R7 o R2o)flR2 C R22,(R;1 oR 7)nR 23 C_ ((R; 1 o RP)nR 23) o ((Rj' oR 7)nR 23),
(it is assumed that undefinitions of data objects form separate c-graph nodes),and the sufficient condition of assignments' nonredundancy - by the restriction
(R; I (Re u Re)) n R 23 9 ((•R 1 R7 ) nR 23 ) 0 ((R71 0 (R6 U Rg)) n R2 3 )
(in present case it is assumed that c-graph of a program consists of nodes-statements, but not of nodes-blocks).
In the same way, by introducing new sets of model elements reflecting typesand the size of program data objects, and by determining relations on themreflecting characteristics of program data objects and their use as formal andactual parameters one can formulate the restrictions expressing requirements of

212
correspondence of some program elements' characteristics in certain situations,in particular, of correspondence of a type and length of formal and actualparameters, of a type of left and right assignment parts, etc. As the such setsmay be suggested the sets, say, C, F, E, T and S representing, respectively,constants, functions, expressions, and also possible types and sizes of programelements, and as the relations on them supplementing the base collection -
the relations
R24("has-type") C (V UCU FU E) x T,R2s("has-size") _ (V U C U F U E) x S,R26 ,(_is-the-ith-actual-parameter-in-the-call-at") C (V U C U F U E) x P,R2 7,("has-the-ith-formal-parameter") C M x V.
In the context of notions we introduced, many kinds of a static program anal-ysis are reduced to checking of formulated above correlations between elementsof respective models.
Let us illustrate the possibility of Prolog-implementation of checking modelrestrictions we introduced through the following example. Let relations of abase set, specifically, R1 - R11 be determined in a Prolog-program (via settinga respective number of facts). Then, for instance, the relations R14 - R19 aredetermined as:
"z is-used-at y if (either x is-defined-at yor (either x is-referred-to-at y
or x is-undefined-at y))"z is-nested-in y if (either z is-directly-nested-in /
or z is-directly-nested-in z andz is-nested-in y)
"z belongs-to-the-module y if y begins-at z andz not-less-than z andy terminates-at z1 andz not-greater-than z1 andnot (yl is-nested-in y and
z belongs-to-the-module yl)"z is-declared-in-the-module y if z is-declared-at z and
z belongs-to-the-module y"z is-used-in-the-module y if z is-used-at z and
z belongs-to-the-module y"z is-known-in-the-module y if either z is-declared-in-the-module y
or z is-declared-in-the-module z andy is-nested-in z)
(relations "not-greater-than" and "not-less-than" in Prolog program is deter-mined by means of rules using built-in arithmetic relation LESS, for example:
"z not-greater-than x"z not-greater-than y if z LESS y"z not-less-than z"z not-less-than y if y LESS z),

213
and checking of restriction Ris CZ R 19 , i.e. revealing of model elements (andconsequently, of program ones), not satisfying this restriction (in this case -used, but not declared program data objects), is implemented by the query
which (z : z is-used-in-the-module y and not z is-known-in-the-module y).
5 SAIL System
The considered approach is the basis of a static and dynamic program analysisin the SAIL system [11], which analyses programs written in Fortran-77 andconsists of three principle parts:
1) Fortran-program analyzer, making restricted parsing, construction of c-graph, instrumentation, extraction of information from specially organized in-troductory comments, cyclomatic complexity [12] and commentedness measure-ment and on its basis - construction of program state net model analyzed (infact, it is a translator of syntax correct Fortran-programs into Prolog-models);
2) program state net models analyzer, providing the solution of differenttasks in program analysis;
3) monitor, which is a mediator between user and above analyzers and pro-viding user-friendliness of the system.
Micro-Prolog [10] is the language of Fortran-program state models represen-tation and analysis and the one of monitor implementation, and Turbo-Pascalis the language used for Fortran-program analyzer implementation.
The implemented version of SAIL system defines infeasible parts of codeand latent cycles, reveals the usage of non-initiated variables and redundantassignments, checks up the usage of the variables declared and declaration ofones being used, reveals untested program parts and proposes available plansof testing, and also provides a user with various common information aboutprogram and its characteristics. So, it allows the users to get data aboutsize, number of entries and exits, complexity and commentedness by meansof requests including complex conjunctive ones setting different combinatorialvariants of program characteristics. An example of conjunctive request, formedby user with the selection and refining of corresponding menu lines is "Pointthe program module, which has length more than 100, complexity more than20 and commentedness less than 10".
Besides, a user of SAIL has the possibility of asking the system differentquestions connected with a program (in Russian), having simple or complex(conjunctive) conditions. The question form is fixed, though it avails some"liberties" (e.g. commas, prepositions, inflexional endings), which make itcloser to natural one. This possibility, which may make easier a task of programmaintenance, is based on user "understanding" of program representation athis level and ensured by simplicity of this representation, by its likeness tonatural language clauses and easiness of such clauses parsing implementationwith Prolog.
Examples of questions with simple conditions are: What is rl? What typedoes every variable have? Which module uses the variable index? What mod-

214 7ules use arrays? Which variables are declared implicitly? In which line is everyarray declared?
Examples of questions with complex conditions are: What type and lengthdoes the variable index have? What type, length and dimension does everyarray have? What module calls module sl and is called by module s2? Whatvariable has type real, length 4 and belongs to common block?
Form and contents of answers also are oriented to the support of natural lan-guage dialogue. So, the answer to the question similar to the first of ones givenabove will contain complete information about the program object mentioned,for example:
rl is the variable of the module def, whichis a formal parameter,is declared implicitly,has the type real,has length (in bytes) 4,is defined in lines 4 14 20,is referred to in lines 21 22,
rl is the variable of the module quad, whichis declared in line 40,has the type integer,
and the answer to the second question may be the following:
in the module def.:yes - character,i - integer,rI - real,r2 - real,
While typing a user question the system offers him a number of convenientprompts and while answering all the requests it makes the research area moreprecise, allowing the user to choose the names of modules in which he takesinterest from submenu, or to denote a search mode in all program modules.
6 Possible Fields of the Application
Fortran, due to its specific features, is the language traditionally selected forillustration of possibilities of program analysis systems [13], but most of theanalysis kinds implemented in SAIL system is common for a sufficiently largenumber of programming languages, in the first turn, for ones of a proceduraltype [14]. For this reason, many judgments given above are true for analysis ofprograms written in other languages.
Program life cycle usually includes its specification, design, coding, testingand maintenance. The principles of the approach, given above in application to

215
program code analysis, naturally spread over other representations (specifica-tion, project) analysis, used during the program life cycle. Besides, with suchrepresentations models it is possible also to analyze program representationsinterrelations in different stages of program life cycle for these interrelationsco-ordination support in the case, for example, of modifying some of them.
The main principles of this approach, which are based on semantic net modelconstruction in knowledge domain and on making available the intelligent inter-face with the given model, can be used for organization of support of differentprocesses attendant to program making and development [15]. Such processesare program development control, program configuration control, etc.
7 Conclusions and Future Work
The approach to computer support organization of program testing and anal-ysis has been considered.
Main advantages of the offered approach are:1) reflection of various program features in a uniform model and diversity of
supporting analysis kinds (including common ones for a sufficiently numerousset of programming languages);
2) possibility of spreading the main approach ideas over the other program-ming languages (by appropriate program analyzers' development) and over theother (specific for every language) analysis kinds, and also over the support ofanalysis of program representations differed from program code (i.e. specifica-tion, design);
3) ensured by Prolog use, the possibility of inference of new knowledge abouta program from the basic one represented in the model, that allows, on the onehand, to decrease (to some necessary minimum) a model size and, on the otherhand, to add new analysis kinds without model extending, in particular, to getnew quality appraisals when additional criteria are adopted;
4) based on the simplicity of knowledge representation at the "user" level,similarity of semantic net facts to natural language sentences and well knownProlog ability for such sentences parsing, possibility of organization question-answering dialogue of user and system with the help of some subset of naturallanguage.
Works on the SAIL project are still in progress. Main directions of thefurther developing of SAIL are:
1) increasing of the number of supporting programming languages (by ap-propriate program source code analyzers development and making more precisean analysis kinds totality for each concrete language);
2) increasing of the number of deciding tasks (by extending a set of the usedanalysis kinds, testing criteria and coding style metrics);
3) increasing of the number of languages for communication with the system;4) differentiation of the system for two directions, namely, its developing, on
the one hand, as analysis, testing and maintenance tool for programmers, and,on the other hand, as means of teaching students basic technological aspectsof high quality program development.

216
References
1. Ince DC. The provision of procedural and functional interfaces for themaintenance of program design and program language notations. SIG-PLAN Not 1984; 19, 2: 68-74.
2. Woodman M. A program design language for software engineering. SIG-PLAN Not 1984; 19, 8: 109-118.
3. Ince DC. A program design language based software maintenance tool.Softw Pract Exper 1985; 15, 6: 583-594.
4. Ince DC, Woodman M. The rapid generation of a class of software tools.Comput J 1986; 29, 2: 151-160.
5. Meier B. The software knowledge base. In: 8th Int. Conf. Softw. Eng.,London, August, 28-30, 1985. Proc. Washington, 1985, pp 158-165.
6. Ince DC. Module interconnection language and Prolog. SIGPLAN Not1984; 19, 8: 89-93.
7. Leung CHC, Choo QH. A knowledge-base for effective software specifica-tion and maintenance. In: 3-rd Int. Workshop -Softw. Specif. and Des.,London, Aug., 16-17, 1985, pp 139-142.
8. Yau SS, Nicholl RA, Tsai JJ, Liu SS. An integrated life-cycle model forsoftware maintenance. IEEE Trans Softw Eng 1988; 14, 8: 1128-1144.
9. Galkin IM. Net modeling, static and dynamic program analysis. Prepr.No.5(455), Minsk, The Inst. of Mathematics of Byelorussian Academy ofSciences, 1991; in Russian.
10. Clark KL, McCabe FG. Micro-Prolog: programming in logic. Prentice-Hall, 1984.
11. Galkin IM. Semantic nets in program analysis. In: Mixed computationsand transformation. Novosibirsk, 1991, pp 112-120; in Russian.
12. McCabe TJ. A complexity measure. IEEE Trans Softw Eng 1976; SE-2,4: 308-320.
13. DeMillo RA, McCracken WM, Martin RJ, Passafiume JF. Software testingand evaluation. Menlo Park, 1987.
14. Galkin IM. Usage of semantic nets in a process of program making andmaintenance. Prepr. No 32(432), Minsk, The Inst. of Mathematics ofByelorussian Academy of Sciences, 1990; in Russian.
15. Galkin IM. Usage of semantic nets for program modeling and analysis.USiM (Control Systems and Machines) 1991; 5: 55-61; in Russian.

Session 7
DEPENDABLESOFTWARE
Chair: W. EhrenbergerGRS Forschungsgelande, Garching, D ,
b I I I I I I I I I I • I I II I •m I'

`7
Robust Requirements Specifications for
Rb Safety-Critical SystemsAmer Saeed, Rog6rio de Lemos and Tom Anderson
Department of Computing Science, University of NewcastleNewcastle upon TIne, NE1 7RU, UK
Abstract
Experience in safety-critical systems has shown that deviationsfrom assumed behaviour can and do cause accidents. Thissuggests that the development of requirements specifications forsuch systems should be supported with a risk analysis. In thispaper we present an approach to the development of robustrequirements specifications (i.e. specifications that are adequatefor the risks involved), based on qualitative and quantitativeanalyses.
1 Introduction
During software development, the phase of requirements analysis provides thesystem context in which the software requirements must be considered. This is afundamental issue for safety-critical systems because "safety" is essentially anattribute of the system rather than just software. The work in this paper enhancesa methodology for the requirements analysis of safety-critical process controlsystems [1] by incorporating techniques for the production of robust requirementsspecifications, and by providing means to evaluate these specifications against thesystem risks. A robust requirements specification is constructed by modifying aspecification to take into account violations in the assumptions upon which thespecification is based, and the possibility of specifications being violated due tofaults that might be introduced during later stages of software development.System risk is related to the likelihood of a system entering into a hazard state, thelikelihood that the hazard will lead to an accident, and the expected potential lossassociated with such an accident [2].
Robust requirements specifications are obtained by conducting qualitative andquantitative analysis of the requirements. Analysis aims to provide confidencethat the level of risk is acceptable. The qualitative analysis seeks to identify thosecircumstances that can lead to violations of a specification, and subsequently takethe system into a hazard state. The quantitative analysis attaches probabilities tothe occurrence of the identified circumstances, in order to estimate the riskassociated with a specification. The risk estimates provide the basis forconducting risk assessments, that compare alternative specifications and judge ift! isk is acceptable. For the process of requirements analysis we adopt theappi-oach of analysing the system from different perspectives and using different

220
techniques [3]. This approach enables the extraction of different (andcomplementary) information concerning the robustness of the requirementsspecifications.
In summary, the enhancements proposed, in this paper, for the basicmethodology are as follows. For each level of abstraction at which the analysis isperformed, the assumptions are identified and recorded, and the fault analysis ofthe specifications is conducted, with the aim of analysing the circumstances inwhich the specifications are unable to maintain safe behaviour from the system.In other words, apart from checking how good the specifications are, the aim is toidentify their weakness, and modify the specifications, in to make them morerobust.
The methodology and its enhancements will be presented as follows. The nextsection describes a methodology for requirements analysis. Section 3 describeshow quality can be attained, in terms of risk, by performing qualitative andquantitative analysis using viewpoints. Finally, section 4 contributes someconcluding remarks.
2 A Methodology for Requirements Analysis
In this section we overview a methodology for requirements analysis; a moredetailed discussion is given elsewhere [11. The methodology consists of aframework with distinct phases of analysis, a graph that depicts the relationshipbetween the specifications produced during the analysis, and a set of formaltechniques appropriate for the issues to be analysed at each phase.
2.1 Framework for Requirements Analysis
The framework adopts the approach of separating the mission from the safetyrequirements during an initial phase, and then partitioning the analysis of thesafety requirements into distinct phases. Each phase of analysis is focused onto a "
specific domain, where the identification of the relevant domains follows directlyfrom the components (i.e. operator, plant and controller) of a general structurefor safety-critical systems, and the relationship between the phases is dictated bythe interactions between these components. The analysis of the phases will takeinto account non-standard behaviours of the entities of a domain; a basis for theanalysis is provided by establishing the standard, exceptional and failurebehaviours of the entities [4].
Conceptual Analysis. The objective of this phase is to produce an initialstatement of the aim and purpose of the system and determine those failurebehaviours of the system which constitute accidents. As a product of thisphase we obtain the Safety Requirements, enumerating the accidents. Theaccidents are the basis for separating mission from safety issues. Anotheractivity to be performed during this phase is the identification of the modes

221
of operation of the system; these are classes of states that group togetherrelated operational functions.
"Safety Plant Analysis. During this phase the plant properties relevant to theSafety Requirements, such as the physical laws and rules of operation thatgovern plant behaviour and potential hazards, are identified. The outcomeis the Safety Plant Specification which contains safety constraints (conditionsover the physical process that are the negations of hazards modified toincorporate safety margins) and safety strategies (schemes to maintain safetyconstraints defined as a set of conditions, in terms of controllable factors,over the physical process).
" Safety Interface Analysis. The objective of this phase is to delineate theplant interface, and specify the behaviour that must be exhibited at thatinterface. This phase leads to the production of the Safety InterfaceSpecification, containing the interface safety strategies (refinements of safetystrategies, incorporating properties of sensors and actuators).
" Safety Controd System Analysis. During this phase we establish a top levelorganization for the control system in terms of the properties of itscomponents, and their interactions. This phase leads to the production ofthe Safety Control System Specification, containing the control system safetystrategies (refinements of interface safety strategies incorporating thecomponents of the control system).
2.2 Safety Specification Graph
The specifications produced at the different phases of the requirements analysis,are organized into a Safety Specification Graph (SSG). The structure embodied inmodes of operations can be reflected in the organization of the requirementsspecifications by constructing a separate SSG for each mode. An SSG is adirected acyclic graph, in which the vertices represent the safety specifications(requirements specifications for safety) and the edges denotes relationshipsbetween the specifications. For a system with p accidents, the SSG consists of pcomponent graphs. Each component graph is an evolutionary graph [51; theevolution is related to the phases of the framework. At each phase a set of newspecifications is added to the graph of the previous phases, by connecting thespecifications to the terminal vertices (representing the specifications of theprevious phase) of the graph.
On completion (see figure 1) the top element of each component graph is anaccident (denoted by ACi) and is related to a set of hazards (HZij) that can lead toit. Each hazard is related to the safety constraint (SCij) that negates the hazard,and each safety constraint related to the safety strategies (SSijk) that maintainthe constraint. Then the safety strategies are related to their refinements intointerface safety strategies (ISSi,jk,i), and a similar relation is depicted for control

222
system strategies (CSSij,k,l,m). When more than one strategy is related to a
specification of a previous level either the strategies are exclusive and a choicehas to be made in later stages of development to implement a single strategy, orthe strategies complement each other and all are needed to attain the confidencerequired for the risk involved.
AC, ... AACp
H-I Z%2 HZ' q(i) -I Hr.i.(i)
/ 2 SCa~q(i)-1 S~q~i
5 il1.1 ISSil,2" ISSi2q(i),1,1 ISSiqQ),1,2
CSSui'lall, CSSLi,2.1.1 CSSi~q(i).l.l,1 CSS~qli),1,1,2
Figure 1. Example safety specification graph
The SSG of a system provides support in conducting a qualitative analysis andprovides the basis for a systematic approach to the modification of thespecifications. For the qualitative analysis, support is provided by establishing theconditions (which follow from the edges of the component graphs) that must beconfirmed to ensure that the specifications maintain safe behaviour. A keyconcern in modification is traccability, that is the ability to trace back from astrategy to its origins and to trace forward to the strategies which are derivedfrom the strategy. Support for traceability is provided by constructing reachabilityand adjacency matrices for the SSG. These matrices enable the localization of theside-effects of a modification and identification of the relationships that must bereconfirmed, thereby increasing the assurance that when changes are necessarythey will be complete and consistent.
2.3 Techniques for the Framework
For the application of formal notations and techniques, the approach adopted isto employ notations in accordance with the characteristics of the system to beanalysed during the different domains of analysis. Within the context of theframework, the relevant formalisms are grouped into two classes: descriptive andoperational. A descriptive formalism specifies the behaviour of a domain in termsof axioms (representing system properties) over a model of the domain, whereasan operational formalism is used to model the activities and interactions betweenthe entities of a domain. Real Time Temporal Logic and Timed History Logic areexamples of descriptive formalisms, and Statecharts and Predicate-TransitionNets are examples of operational formalisms. The extent to which each class of

223
formalism is applied in a specific domain depends on the level of abstraction at4| which the domain resides. At higher levels, descriptive formalisms should bemore prominent, however at the lower levels operational formalisms becomeincreasingly relevant.
In order to describe the behaviour of systems at different levels of abstraction, weadopt an event/action model (E/A model) [1]. The main features of the E/Amodel are that its primitive concepts (events, actions, states and the concept of atime line) can be expressed in both descriptive and operational formalisms, and itsupports both discrete and dense time structures. When employed in theframework, the models of system behaviour, constructed at the different phases,are built on top of a common foundation providing support for verificationbetween the different levels of abstraction
3 Quality Analysis of Safety Specifications
One important factor in determining the quality of the specifications forsafety-critical systems is the risk analysis of the safety specifications; this aims todetermine if the contribution of the software to the overall system risk isacceptable. In order to achieve this aim, a bridge has to be established betweenthe risk analysis of the system and the software. Within the context of themethodology, this bridge is established through the SSG by relating the systemrequirements to the software requirements. To perform the risk analysis, thosecircumstances which can violate a specification, and cause the system to enterinto a hazard state, have to be identified and their probability of occurringcalculated. Once the risk is quantified we are able to judge whether the riskassociated with a specification is acceptable or not (risk assessment). If not, thespecification has to be modified or combined with other specifications in order toreduce the risk. As a result, we obtain a robust safety specification which is aspecification that can be violated only within an acceptable risk. It should benoted that the risk analysis presented in this section does not take into accountthe consequences of an accident.
During the operation of the system, the occurrence of an initiating event (anevent which can lead the system into a hazard state) of an accident sequence [6]distinguishes two kinds of system state: safe and unsafe state. An unsafe state is astate which could lead the system into a hazard state in the absence of correctiveaction and in the absence of subsequent initiating events. If a state is not anunsafe state then it is said to be safc. These definitions ensure that a hazardcannot occur subsequent to a safe state if no initiating event occurs. In terms ofthe requirements specifications, the concept of initiating event refers to thosecircumstances which can lead to the violation of a safety specification.
The quality analysis of the requirements, in each domain of analysis, is performedfrom two different perspectives: qualitative and quantitative. The purpose of the

224
qualitative analysis is to identify those circumstances which can violate aspecificatioit, and analyse the impact of these violations upon the safety of thesystem. These circumstances are related to the violation of assumptions uponwhich a specification is based and to the violation of certain conditions of aspecification. The quantitative analysis complements the qualitative analysis byattaching occurrence probabilities to these circumstances. In order to ensure thatessential system behaviour is not precluded, the restrictions that a safetyspecification will impose on the mission must also be considered.
3.1. Qualitative Risk Analysis
At each level of abstraction, analysis is conducted over safety specifications(descriptions of safe behaviour at the level) and assumptions (propertiesassumed at the level). In the proposed approach the qualitative analysis isconducted in two stages; firstly we perform the preliminary analysis and secondlythe vulnerability analysis of the safety specifications.
3.1.1 Preliminary Analysis
In this paper, we consider the preliminary analysis to be the analysis that must beconducted prior to the risk analysis. This analysis will involve confirming that thespecifications at a particular layer of the SSG comply with those of the layer thatprecede it, and that the specifications in a layer are consistent. The relationshipsthat must be confirmed, to ensure compliance between the layers, follow from theedges of the SSG. Demonstrating compliance between the layers involvesemploying both verification (formal analysis) and validation (informal analysis)techniques. The hazards are validated against the accidents and the safetyconstraints are verified against the negation of the hazards. Subsequently thestrategies are verified against the specifications of the previous layer. At eachlayer, any assumptions required to confirm the relationships, depicted by theedges of the SSG, are recorded. As an example of the relations that must beverified, we examine the edge (from the SSG in figure 1) that connects the safetyconstraint SCi1 to the safety strategy SSi,1,1. Let us suppose that the strategy isbased upon assumption A (which represents a property of the physical process);the relationship to be confirmed is then:
A A SSi,jl =* SCij fl
A result of the preliminary analysis is that the circumstances under which safebehaviour is maintained, are clearly scoped and organised in accordance withtheir contribution to each phase of the analysis. This activity ensures that theknowledge gained during the development and validation/verification of thesafety specifications can be applied effectively during the risk analysis.
3.1.2 Vulnerability Analysis
After performing the preliminary analysis of the safety specifications, thequalitative risk analysis consists of performing the vulnerability analysis of the

225
specifications which probes the safety specification, and associated assumptions,to identify the circumstances under which the specification is unable to maintainsafe behaviour, i.e. the violation of a specification. Once these circumstances areidentified, the safety specifications can be modified to become more robustagainst possible violations. An initial step in the vulnerability analysis is to negatethe relationships obtained during the preliminary analysis and to identify thesystem states which can lead to the violation of the specification when the abovecircumstances occur.For the relationshipfl, the logical assertion is negated and those plant states (PS)which can lead to the violation of SCij are identified:
"-'SCi,1 (I SSi,l,! A PS) V(-A A PS) f2For this relationship, which is associated with the plant level, the subsequentvulnerability analysis of the safety strategy SSi,l,I will identify those conditionsthat can lead to the violation of SCij.Although logical formulae are useful in obtaining a high-level view of the
relationship between the specifications and assumptions, such formulae providelimited support for a failure analysis. A suitable representation, for such analysis, ,is one which supports the identification of possible failure behaviours that canlead to the identified hazardous states. In this paper, to perform the vulnerabilityanalysis of the safety specifications, we employ fault tree analysis (FTA) [7] whichhas been used extensively in the analysis of system safety and more recently in theanalysis of software safety [8]. A key feature of fault tree analysis that makes itsuitable for the analysis to be conducted here, is that the analysis is restricted tothe identification of system components and conditions that lead to oneparticular undesired system state.
To construct a fault tree for the relationship f2, the initial step is to identify theundesired state, in this case the negation of the safety constraint SCil, and then todetermine the set of possible causes which can lead to the undesired state (referto figure 2). For the logical formulaj2, we identify the violation of the assumptionand the violation of the safety strategy SSi,1,I. The latter has to be further refinedin order to identify its primary events.
Qualitative risk analysis provides a basis for obtaining more robust safetyspecifications which will lead to a risk abatement of the overall system. In theapproach adopted, the analysis is performed by employing both formal analysisand fault tree analysis in order to determine the weaknesses of the safetyspecifications. Once these weaknesses are identified the safety specifications canbe modified to incorporate mechanisms which aim to reduce their vulnerability.
3.2 Quantitative Risk Analysis
In this section we discuss how a quantitative analysis complements the qualitativeanalysis by introducing a measurement of confidence in the quality of the safety

226
A A PSI I SSI,.l APSl
PSA -A PS 'SS1 1,1AP
Figure 2. Fault tree for formula f2
specifications. While the latter identifies circumstances which can lead to theviolation of the specifications, the former associates probabilities to thesecircumstances.
Although the qualitative approach strives to achieve total assurance for the safetyspecifications, there are three basic limitations which indicate that this aim maynot be realised. A first limitation stems from the process of capturing userrequirements: some faults introduced during the requirements stage may not beremoved during the verification process, nor can it be guaranteed that all suchfaults will be removed during validation. A second limitation arises fromobserving past experience in the utilization of formal techniques, which showsthat a formal verification may itself contain faults [9]. The third limitation is
related to the confidence that can be placed on the assumptions upon which aspecification is based. From these limitations we infer that even after performingthe qualitative analysis we are still faced with uncertainties concerning the quality
of the safety specifications, hence the necessity to quantify the uncertainties inorder to obtain a level of confidence in the quality of the safety specifications. Inother words, the aim is to obtain an early prediction of the contribution of thesoftware to the risk of the system.
To associate occurrence probabilities to those circumstances which can lead tothe violation of the specification, such as plant states and violation of
assumptions, might not be a difficult task. On the other hand, associatingoccurrence probabilities to the violation of certain conditions that depend on asoftware implementation is more problematic because during the requirements
phase of software development sufficient design and implementationinformation is not yet available. Instead of estimating the probability of acondition to be violated, target probabilities demanded from the higher levelsafety specifications such as hazards, can be used. However, once a specification
L • ..

227
is sufficiently detailed, currently available techniques which attempt to make. early predictions of the software reliability can be used, such as: metrics [10],product-in-a-process [11], and execution of the specifications [12].
After conducting the quantitative risk analysis, the last stage of the quality (risk)analysis is to perform the risk assessment of the safety specifications. This is ajudgement based on the estimated risk which provides guidance for high leveldecisions, usually associated with the process of requirements analysis. Theresults obtained from the quantitative analysis should be considered as a relativemeasurement of how effective a given strategy is in reducing the risk of a hazard,compared to the results obtained for alternative strategies. Hence it is mostuseful in determining which strategy or combination of strategies is most suitablefor the risks involved (the choice of a strategy might also be influenced byconstraints imposed by the implementation, e.g. availability of sensors andactuators with the required properties). Also, if the utilization of more than onestrategy is required, this preliminary risk analysis facilitates the search for asuitable combination of the available strategies in order to avoid common modefailures.
3.3 Mission and Safety Analysis
The primary aim of the quality analysis presented in this paper is to reduce thesystem risk. However, it is usually impossible to maintain a complete dichotomybetween the mission and safety aspects, and it would be futile to impose safetyrequirements which were so stringent that the system could not satisfy its mission.To complement the risk analysis, the impact of the safety specifications on themission of the system must also be considered. Such an analysis involves relatingthe different safety specifications to the mission requirements that can beAffected by them. If analysis of the mission requirements follows the frameworkdescribed in section 2.1, leading to the construction of a Mission SpecificationGraph (MSG), a comparison between the safety specifications and missionspecifications (requirements specifications for the mission) is made possible.During the development of a robust safety specification it would be possible toidentify the mission specifications that may be influenced by inspecting thevariables that are restricted by the safety specifications and relating these to themission specifications at the same level of abstraction. Once the relevant missionspecifications have been identified an informal analysis of the restrictions thatthe safety specification imposes on the mission can be conducted. An example ofsuch an analysis is presented elsewhere [13].
4 Conclusions
This paper describes a systematic approach for the quality analysis of therequirements specifications, in the context of a methodology for the
requirements analysis of safety-critical systems. The approach is based on an
reurmet peiiatos i h cotx of a mehdlg fo the-

228
analysis, at each level of abstraction, of the risks introduced by the variousdecisions (that are based on assumptions) made in establishing the requirements.The quality analysis follows the structure of a traditional safety study andincorporates both qualitative and quantitative techniques.
The results of the risk analysis provide estimates of the risk associated with aspecification and predictions of the software's contribution to the system risk.These results are used to guide the construction of robust requirementsspecifications, increase the confidence (assurance) that the level of risk isacceptable and provide the basis for a feasibility study. The approach to riskanalysis brings the safety studies of the system and software closer together anddelineates the contribution of the software to the overall system risk. Someaspects of the approach have been applied to a train set example [14].
Acknowledgements
The authors would like to acknowledge the financial support of BAe (DCSC) andthe SERC (UK) SCHEMA project.
References
1. Anderson T, de Lemos R, Fitzgerald J S, Saeed A. On Formal Support forIndustrial-Scale Requirements Analysis. In: Ravn A P, Rischel H (eds)Proceedings of the Workshop on Theory of Hybrid Systems. Lyngby,Denmark. Springer-Verlag, 1993 (Lecture notes in computer science - toappear)
2. Leveson N G. Software Safety: Why, What and How. ACM ComputingSurveys 1986; 18: 125-163
3. Finkelstein A, Kramer J, Nuseibeh B, Finkelstein L, Goedicke, M.Viewpoints: A Framework for Integrating Multiple Perspectives in SystemDevelopment. International Journal of Software Engineering andKnowledge Engineering 1992; 1:31-57
4. de Lemos R, Saeed A, Waterworth A. Exception Handling in Real-TimeSoftware from Specification to Design. Proceedings of the 2nd InternationalWorkshop on Responsive Computer Systems. Saitama, Japan. October,1992. pp 108-121
5. Marshall C W Applied Graph Theory. Wiley-Interscience, 19716. Draft Interim Defence Standard 00-56. Hazards Analysis and Safety
Classification of the Computer and Programmable Electronic SystemElements of Defence Equipment. UK Ministry of Defence. London, UK,1991
7. Vesely W E, Goldberg F F, Roberts N H, Haawl, D E Fault Tree Handbook.US Nuclear Regulatory Commission NUREG-0492. Washington, DC, 1981
8. Leveson N G, Cha S S, Shimeall T J. Safety Verification of Ada Programsusing Software Fault Trees. IEEE Software 1991; 4:48-59

229
9. Miller D G. The Role of Statistical Modeling and Inference in SoftwareQuality Assurance. In: de Neumann B (ed) Software Certification ElsevierApplied Science, 1990, pp 135-152
10. Ramamoorthy C V, Tsai N-T, Yamura T, Bhide A. Metrics GuidedMethodology. Proceedings 9th International Computer Software andApplications Conference - COMPSAC'85. Chicago, IL. October, 1985. pp111-120
11. Laprie, J-C. For a Product-in-a-Process Approach to SoftwareReliability Evaluation. Proceedings of the 3rd International Symposium onSoftware Reliability Engineering. Research Park Triangle, NC. October,1992. pp 134-139
12. Wohlin C, Runeson, P. A Method for Early Software Reliability Estimation.Proceedings of the 3rd International Symposium on Software ReliabilityEngineering. Research Park Triangle, NC. October, 1992. pp 156-165
13. de Lemos R, Saeed A, Anderson T A Train set as a Case Study for theRequirements Analysis of Safety-Critical Systems. The Computer Journal1992; 35: 30-40
14. Saeed A, de Lemos R, Anderson T An Approach to the Assessment ofRequirements Specifications for Safety-Critical Systems. ComputingLaboratory TR 381. University of Newcastle upon 1Ine, UK, 1992
i, " ,

Software Failure Data Analysis of two SuccessiveGenerations of a Switching System
Mohamed Kaniche and Karama KanounLAAS-CNRS, 7 Avenue du Colonel Roche
31077 Toulouse Cedex - France
AbstractExperimental studies dealing with the analysis of data collected on families ofproducts are seldom reported. In this papa-, we analyse the failure data of twosuccessive products of a software switching system during validation andoperation. A comparative analysis is done with respect to: i) the modificationsperformed on system components, ii) the distribution of failures and correctedfaults in the components and the functions fulfilled by the system, and iii) theevolution of the failure intensity functions.
1 IntroductionMost current approaches to software reliability evaluations are based on datacollec Ld on a single generation of products. However, many applications, not to saythe great majority, result from evolutions of existing software: there are families ofproducts, the various generations resulting from evolutions for implementing newfunctionalities. A new approach that is aimed at the incorporation of past experiencein predicting the reliability of a new, but similar, software has recently beenproposed in [I]. This approach requires the identification of parameters whichcharacterize past experience to be incorporated in the evaluation of the softwarereliability. Clearly, the identification of these parameters will be based on theanalysis of data collected over the whole family of products. Experimental studiesdealing with the analysis of families of products are seldom reported [2, 3]. The dataconsidered in this paper were collected on the software of two successivegenerations of the Brazilian Electronic Switching System (ESS)-TROPICO."Throughout this paper, the two products will be identified as PRA and PRB. PRAwas first developed and allows connection of 1500 subscribers. The processingcapacity of the TROPICO system was subsequently increased with the release ofPRB which allows the processing of up to 4096 calls. Many PRA softwarecomponents have been reused for the development of PRB and additionalcomponents were developed.The failure data collected on each one of these products have been consideredrespecti% ely in [41 for PRA and [5] for PRB. While our previous work was mainlydevoted to reliability analysis and evaluation, this paper is concerned with thequalitative as well as quantitative analysis of the failure data. Our objective is to doa comparative analysis of the two successive products based on the data collectedduring the end of validation and the beginning of operation. Emphasis will be put onthe evolution of the software and the corresponding failures and corrected faults.This paper is composed of five sections. Section 2 gives a general overview of theTROPICO switching system. It describes the main functions performed by thesystem and presents some statistics about the evolution of PRB with respect to PRA.Section 3 describes the test environment and the failure data collected. Section 4presents some of the results derived from the collected data. Finally, Section 5outlines the main results obtained from the analysis of both products.

231
2 Software Description2.1 General descriptionThe TROPICO ESS software features a modular and distributed structure monitoredby microprocessors. The software can be decomposed into two main parts, that is,the applicative software and the executive software.Two categories of components can be distinguished in the TROPICO ESS software:i) elementary implementation blocks (EIB), which fulfil elementary functions andii) groups of elementary implementation blocks according to the main fourfunctions of the system. These groups are:"* Telephony (TEL): call processing, charge-metering, etc.* Defense (DER): on-line testing, iraffic measurement, enor detection, etc."* Interface (UNM: communication with local devices (memories, terminals),..."• Management (MAN): trunk and subscriber signalling tasks, communication with
external devices,...2.2 Evolution of PRB with respect to PRAThe development of PRB started while PRA was under validation. Many PRAcomponents have been reused for the development of PRB and additional ones weredeveloped. Three types of EIBs can be distinguisbed:"* new: specifically developed for PRB;" mod1fied: developed for PRA and modified to meet the requirements of PRB;" unchanged cornesponding to PRA EIBs included in PRB without modification.Figure 1 gives the number of EIBs and the size of the software for PRA and PRB.The software of PRA and PRB was coded in Assembly language. A 10 percentincrease of the PRB size can be noticed relative to PRA. Only 4 new EIBs weredeveloped for PRB. All the ElBs of PRA have been reused with or withoutmodifications for PRB.
#EIB size (kbytas)PRA •29 319.41eý
PRB 32 350.800Figure 1: Number of EIBs and size of PRA and PRB
Figure 2 shows the amount of modification performed on PRB with respect to thenumber of EIBs and to the size of the software. About 67% of PRB code resultsfrom the modification of the PRA code. About 75% of the modified EIB's belong tothe applicative software and 84% of unchanged Em's to the executive. Thus, theincrease of the TROPICO capacity mainly led to major modifications of theapplicative software with only minor modifications of the executive.When considering the four functions and the distribution of the three types of EIBof PRB, we notice that most of the unchanged modules belong to INT (about 60%).
121%
a) amwrdng tlo Uh nwubw of EIBa b) acoording to thi nas of EIB*
Figure 2: Distribution of unchanged, modified and new EIBs in PRIB

232
3 Test Environment and Failure Data
3.1 Test ProgramThe software test program for TROPICO consists of four steps: 1) unit test,2) integration test, 3) validation test, and 4) field trial test. The first three stepscorrespond to the test phases usually defined for the software life cycle. Field trialconsists of testing a prototype in a real environment, which is similar to the opera-tional environment. It uses a system configuration (hardware and software) that hasreached an acceptable level of quality after completing the Laboratory tests.The description of the whole quality control program for TROPICO is given in[6, 7]. The test program carried out during validation and field trial test isdecomposed into four kinds of test (functional, quality, performance and overloadtests). PRA and PRB validation were carried out according to this program. Figure 3shows, for the period of data collection on PRA and PRB, the length of validation inmonths, field trial and operation phases. As can be seen, no field trial tests wereperformed for PRB. This is because many PRA components were reused for thedevelopment of PRB, and PRB was put in operation while PRA had already beenoperating for several months.
validation field trie operatonPRA 10 4 13
PRB 8 0 24
Figure 3: Validation, field trial and operation length for the period of data collection (months)
During the operational phase, the number of PRAs and PRBs installed onoperational sites was progressively increased (see Figure 4). At the end of the datacollection period, up to 15 PRAs and 42 PRBs had been installed.
15. 46.40.36.
10. 30.26.20.
10.•~~ 1 -2 " "" " -'r " 4
Vhtml Oionat Re1 5 id V0162uo 4zS
a) PRA b) PRBFigure 4: Number of instaled sites verus time
3.2 Data CollectionHandling of failure data affecting the TROPICO ESS is through use of anappropriate failure report (FR) sheet containing the following:"* date of failure occurrence;"* origin of failure: description of system configuration in which the failure was
observed and of the conditions of failure occurrence;"* type of FR: hardware, software, documentation with indication of affected
elementary implementation blocks;"* analysis: identification and classification of the fault(s) which led to failure
(coding, specification, intaface,...);
LJ

233
•solutions:. the proposed solutions and those retained,
4 . modification control: control of the corrected elementary implementation blocks;regression testing: results of the tests applied to the corrected elementaryimplementation block(s).
Only one FR is kept per observed failure: rediscoveries are not recorded. In otherwords, if several FR's cover the same failure, only one (the list) is entered into thedatabase. In fact, an FR is both a failure report and a correction report since it alsocontains information on the fault(s) that resulted in failure.The results presented in the following sections are based on the analysis of the datacollected on the observed failures and on the corrections performed.
4 Relationships derived from the dataThis section presents and discusses some of the results obtained from the data.4.1 Statistics on failures and corrected faults in PRA and PRBFigure 5 gives the number of failures and corrected faults in PRA and PRB. It canbe seen that less failures occurred in PRB even though: i) the period of datacollection for PRB is longer than that of PRA (see Figure 3) and ii) a greaternumber of systems have been in use during the operation phase (see Figure 4).Furthermore, the number of corrected faults exceed the number of failures. This isdue to fact that some failures led to the modification of more than one EIB.
P FR # corrected faults
PRA 465 637PRB 210 289
Figure 5: nunber of failures and corrected faults in PRA and PRBFigure 6 shows the statistics concerning the number of EIBs that have beencorrected because of a software failure. As can be seen, the results for PRA andPRB are similar. For both products about 80% of the failures led to the correction ofonly one EIB. This is really in favor of software modularity and equally shows thatthere is little failure interdependence among EIBs.The analysis of the data corresponding to failures involving more than onecomponent allowed us to identify two pairs of EIBs that are strongly dependent withrespect to failure occurrence. For these two pairs, we noticed that the probability ofsimultaneous modification of both EIBs given that a failure was due to a faultlocated in one of them, exceeds 0.5. This result was obtained for both PRA andPRB. This type of analysis can be of a great help for software maintenance. Itallows software debuggers to identify the stochastically dependent components andto take into account this information when looking for the origin of failures.
# corrected ElBs I FR in PRA I #FR in PRB I1 362 .6% 165 8.6%)2 I 72 (15.5%) I 3 (15.7%) l
Z3 I 31 8.5%) 12 5.7%
Figure 6: Statistics on the number of BIBs affected by a failure
4.2 Distribution of failures and corrected faults per functionsFigure 7 gives the number of failures and corrected faults attributed to the fourfunctions: TEL, DEF, MIN and MAN (as defined in Section 2.1). The sum of failure

234
reports attributed to the functions is higher than the total number of failure reportsindicated in Figure 5: this is because when a failure is due to the activation of faultsin different functions, an FR is attributed to each of them.
- FR T # c # FR #- orrectedfaubt faults
MtE 146 190 TL 74 102
SDFf 138 164 D 67 71l 170 191INT 61 68MAN 78 2 1MAN 31 41Sum 532 637 1 Sum 233 282
a) PRA b) PRBFigure 7: Failure reports and corrected faults in TEL, DEF, INT and MAN
When looking at the distribution of corrected faults per functions (Figure 8), weobtain similar figures for both products, in particular DEF and INT. It can be seenthat most of the coecons were performed in TEL and INT. This can be explainedby the fact that these functions are more activated than DEF and MAN.
S30%•, % TEL24% lENT!
a) PRA b) PRBFigure 8: Fault distribution in TAP, DEF, INT and MAN
Furthermore, most of the failures reported led to the modification of only onefunction (90 %). Among the 465 FRs (resp. 210 FRs) recorded for PRA (resp.PRB), only 54 FRs: 31 during validation, 10 during field tests and 13 duringoperation (resp. 21 FRs: 10 during validation and 11 during operation) led to themodification of more than one function. This shows that the functions are not totallyindependent with respect to failure occurrence, although, only a weak dependencewas observed. Note that this result, compared to those reported in Section 4.1,shows that less dependence is observed between functions than between EIBs.4.3 Distribution of PRB faults per EIB typeFigure 9 shows the distribution of corrected faults in PRB when considering theunchanged, modified and new EfBs. Thus more than 80 percent of corrected faultswere attributed to modified EIBs. It is noteworthy that almost the same distributionwas obtained when considering data from validation or from operation only.
7% 10%
no p
Figue 9: Distribution of FRl per type

235
When reviewing the mean values of fault density (number of faults per Kbyte)* inthe three types of EIBs, we obtain the following figures: 0.95 for modified EIBs,0.75 for new ones and 0.49 for unchanged ones. One may think that the modifiedEIBs are more error prone than the new and unchanged ones, and world concludethat it is better to create new components than to modify already existing ones.However, we should be careful when analysing this type of result. In fact, as only 4new EIBs were developed for PRB, no significant conclusions with respect to thisparticular point could be derived from this analysis.An analysis of the average values of fault density presented in Figure 10 shows asignificant decrease of the fault density of PRB EIBs when compared to PRA. Also,it can be seen that the fault density of all unchanged and modified PRB EIBssignificantly decreased when compared to the values computed for PRA. Thisindicates an enhancment of the quality of the software. The experience cumulatedduring the validation and operational use of PRA leaded to a better understanding ofthe system and contributed to the improvement of the quality of PRB code.
43
-. *P,. Dp.11 ~ ~~
a) unchanged ElBa b) modified ElBa
Figure 10: Fault densities of PRB EIBs compared to PRA
4A EIB size and fault density in PRA and PRBScatter plots of fault density per EIB (number of faults per Kbyte) versus the size ofthe EIB were plotted for PRA and PRB. It was difficult to ascertain any trend withinthese plots. Our objective was to analyse a possible significant dependence betweenthe EIB fault density and their size.Figure 11 gives for PRA and PRB the fault density average values for threecategories of EIB size. The fault density is almost constant, it is around 2 faults perKbyte for PRA and 1 fault per Kbyte for PRB. This illustrates the improvement ofthe quality of PRB code with respect to PRA and thus confirms the results reportedin Section 4.3. As the size of PRA and PRB EIBs is measured in Kbytes and not inkilo lines of code, it is difficult to compare these values to other fault density valuesobtained which are reported for instance in [8, 9].
Size PRA PRBEIB size > 15 Kb 1.80 1.08
10 Kb <EIB sizec 15 Kb 2.02 0.685 Kb <EIB sizec 10 Kb 2.31 0.60
E EIB sizec 5 Kb 2.56 0.71
Figure 11: Average values of PRA & PRB fault density versus EIB size
Figure 12 shows that the PRB modified EIBs exhibit higher fault densities on
IN Note that the fault density as defined here is different from the commonly used one (i.e.,number of faults per kilo lines of code); the latter is not available for this application.
LJ

236
average than unchanged EIBs. However, it should be noticed that the number ofEIBs in each category of size is small. Also, it can be seen that most of unchangedEIBs have a small size (less than 5 kbytes) compared to modified EIBs.
EIB siz s15Kb W 1.25 6 EIBs 0.06 81 EIB)10 Kb <EIB size< 15 Kb F 0.86 (5 Els) 60.75 M (1EIB)5 Kb cEIB aim< 10 Kb 0.8 (4 EI 0.4 4 El I
EISsiz< 5SKb I 0.26 (1 EIB) 0.55 6Figure 12: Fulk density average values of modified and unchanged PRB EIBs versus size
4.5 Evolution of failure occurrences with respect to timeFigure 13 shows the evolution of the failure intensities of PRA and PRB during theperiod of data collection: for both products-even though the failure intensity isglobally decreasing during the operational phase-the trend is not monotone. Thelocal variations observed are due to the progressive installation of new systems (seeFigure 4). It is noteworthy that the'impact of the number of operational systems onthe evolution of the failure intensity has been reported in several papers, see forinstance [10, 11].In order to evaluate the reliability of PRA and PRB as usually perceived by theusers, we need to consider the failure intensities corresponding to an average system(i.e., the failure intensity divided by the number of systems in use). Figure 14 showsthe evolution of the failure intensities of PRA and PRB for an average system. It canbe seen that the failure intensities of both products decreased globally duringoperation thus exhibiting reliability growth.
sto tliy 26 WAkM b•iewiY
46 204036 1530 I2620 1016 6
6 lm
a) PRA b) PRBFigure 13: PRA and PR]) failhre intensities
602,
46
30 16,2520 10,1610 6,
6 mmehs O! rrF -",. o,..n
lb_ ---- (M E
a) PRA b) PRB
Figure 14: PRA and PRB failure intensities for an average system
so 26 ii i i a m m lm iia m i .,•i,.•-• q•

237
In order to compare the reliability of PRA and PRB, we plot in the same figure(Figure 15) the failure intensities observed for an average system during operation.Unexpectedly, the reliability of PRB is worse than that of PRA. The same holds forthe groups of functions TEL, DEF and INT (Figure 16). This is surprising because,as PRB has been developed from PRA which has been validated and extensivelyused one would anticipate that its reliability would be better than that of PRA. Thismay be explained by the fact that major modifications had been performed on PRAin order to adapt the system to the new specifications and no field trial test had beenperformed before the introduction of the system in the field. Note that about 80 % ofPRB failures recorded during operation occurred during the fist year of operation.
25 FAlm. iwisl
20
Is
10
cm4 *0aa F. amailmOw0
Figure 15: PRA and PRB failure intensities for an average system during operation*
9 7 Faibe hiftuiyS a76 R
4 4aa 2
2
1 0
TEL DEFFy*Fe Fwpne opstot.
7C 6
a4 LLPRO
2 21 1
0o 0r~~~~~~ ; --p -- ff
INT MAN
Figure 16: Component failure intensities for an average sy'stem1 during Operation
Typically, a new system experiences a maturing period during which its reliability isrelatively low but afterwards, reliability keeps improving and becomes better than
Note that for Figures 15 and 16, the X-axis indicates the number of months since thesystem was put in operation.

238
that of its predecessors. In fact, if we look at the long term evolution of the failureintensity functions of PRA and PRB (see Figure 17) it can be seen that the residualfailure rate of PRB evaluated by the hyperexponential model [12] is less than theresidual failure rate evaluated for PRA. Similar results are also obtained for TEL,DEF, and INT (Figure 18). For both products, the evaluations are based on the datacollected during the last year of operation.It is noteworthy that the same was noticed in [10] for successive releases of a wide-distribution software product and in [2] for three successive products of a family ofultra-available computers designed by AT&T Bell Laboratories.
14 Fam.hmly2. FdM haki1210. 2
* .minttd 1.S-
6 1.
2 0.
0, 01
Sa *3 a- ot t 9
a)PRA: Aq= 1.3 10-4/h b) PRB: -: 5. 7 1O'6/h
Figure 17: FEtimation of PRA & PRB failure intensities
PRA PR8
TEL 2.6 10"$/h 1.2 10-/hDEF 4.310.5 i 1.4 10-5)h
INT 4.2 lO'S/h 2.9 10.5 /hMAN 1.4 104 ih 8.5 10-6)h
Figure 18: Residual failure rates evaluated by the hyperexponential model
5 Concluding RemarksThe data considered in this paper allowed us to analyse the evolution of the softwareand the failures of two consecutive products of the TROPICO ESS. The mainresults derived are as follows:"* A high percentage of failures was attributed to modified EIBs."* For both products, about S0 % (resp. 90 %) of the failures led to the correction
of only one EIB (resp. function). Therefore, only a weak dependence withrespect to failure occurrence was observed between components.
"* The fault density of PRA and PRB is almost constant with respect to size. It isabout 2 faults per Kbyte for PRA and 1 fant per Kbyte for PRB.
"* TIe fault density values of all modified and unchanged PRB EIBs are lower thanthose of PRA EIBs. This shows an improvement of the quality of PRB code withrespect to PRA.
" Comparison of the PRA and PRB failure intensities during operation shows thatPRB experienced a maturing period during which its reliability was relativelylow but aWrwardl, its reliability improved and became better than that of PRA.
The comparative analysis provides insight into the evolution of the software and thereliability of two successive products of the TROPICO ESS. However, the resultsobtained did not allow us to identify the various factors that influence the evolution

239
of the reliability of a family of products. In order to reach this objective, additionalSinformation is needed concerning for instance: i) the development process and ii)
more than two successive generations of products. Furthermore the collection andanalysis of several failure data sets relative to different families of products will beof great help in this learning phase.
6 AcknowledgementsThis work was partially supported by the ESPRIT Basic Research Action onPredictably Dependable Computing Systems (Action no. 6362). The authors areindebted to Marta Bastos Martini and Jorge Moreira de Souza from CPqD for theircooperation in supplying the information needed for this study and their assistancein analysing the data. We also would like to thank Sylvain Metge for his help inprocessing the PRB data within the framework of a student's project, and Jean-Claude Laprie and Jean Paul Blanquart for their constructive comments.
7 References[1] Laprie J. C., "For a Product-in-a Process Approach to Software Reliability Evaluation",
in Proc. 3rd Int. Symp. on Software Reliability Engineering, pp.134-139, Raleigh, NC,USA, October 1992.
[2] Wallace J. J. and Barnes W. W., "Designing for Ultrahigh Availability: The Unix RTROperating System", Computer, pp31-39, August 1984.
[3] Sullivan M. and Chillarege R., "A Comparison of Software Defects in DatabaseManagement Systems and Operating Systems", in Proc. 22nd IEEE Int. Symp. onFault-Tolerant Computing (FTCS-22) pp.475-484, Boston, MA, USA, July 1992.
[4] Kanoun IL, Bastos Martini M. and Moreira de Souza J., "A Method for SoftwareReliability Analysis and Prediction--Application to The TROPICO-R SwitchingSystem", IEEE Trans. Software Engineering, SE-17 (4) April 1991.
[5] Kanoun K., Kalniche M. and Laprie J.-C., "Experience in Software Reliability:. FromData Collection to Quantitative Evaluation", in Proc. 4th Int. Symp. on SoftwareReliability Engineering (ISSRE93), Denver, CO, USA, November 1993.
[61 Vianna B., "R&D at TELEBRAS-CPqD: The TROPICO System", in Proc. Int. Cou.Communications (ICC 88) pp.622-626, Philadelphia, PA, USA, June 1988.
[7] Vianna B., Cunha E. C. and Boin F. F., "Hardware Quality Control in the TROPICOSystem", in Proc. Int. Conf. Communications (ICC 881 pp.632-636, Philadelphia, PA,USA, June 1988.
[8] Basili V. R. and Perricone B. T., "Software Errors and Complexity: An EmpiricalInvestigation", Communications of the ACM, 27 (1), pp.42-52, January 1984.
[9] Grady R. B. and Caswell D. L, Software Metrics: Ertablisuing a Company-WideProgram, 288p., Prentice-Hall, Inc., Englewood Cliffs, New Jersey, USA, 1987.
[10] Kenney G. Q. and Vouk M. A., "Measuring the Field Quality of Wide-DistributionCommercial Software", in Proc. 3rd Int. Symp. on Software Reliability Engineering(ISSRE'92), pp.351-357, Raleigh, NC, USA, October 1992.
[11] Musa J., Jannino A. and Okumoto K., Software Reliability: Measurement, Prediction,Application, Computa Science Series, McGraw-Hill, New-York, 1987.
[121 Lapde J. C., Kanoun K., Bdounes C. and Kalniche M., "The KAT (Knowledge-Action-Transformation) Approach to the Modeling and Evaluation of Reliability andAvailability Growth", IEEE Trans. Software Engineering, SE-17 (4), pp.370-382, April1991.

Software validation with CASE-TOOLS
Dipl.-Ing. Johannes RAINERAustrian Federal Test & Research Centre Arsenal (BVFA)
Dept. System Reliability & Traffic ElectronicsA-1030 Vienna, Faradaygasse 3, Austria
Abstract
For the software validation with CASE-tools this paper gives an overview aboutthe requirements for the software and the different validation methods for safetycritical software. The requirements and validation methods are discussed on acase study with CASE-tools. Also a critical assessment on the use of CASE-toolsis given.
1 Introduction
The department of the author works since a lot of years on the field of systemvalidation of electronic equipment used by the surface traffics (e.g. the railway).The complexity of control applications for many systems has nowadays grown up
so that conmpter systems are required and software is used in the system ele-ments. In safety critical system elements the implemented software has to be a"safe software". The efforts on achieving safety in software are going in differentdirections. Measures can be employed to avoid errors in the design process ofsoftware or to neutralize safety critical effects of possible errors. To discover er-rors in the software, validation methods are required. This paper will discuss on acase study of software validation with CASE-TOOLS the safety requirements for
the software and software validation methods.
2 Safety requirements of the software
Before speaking about the validation methods it should be clear what are the re-quirements for the safety relevant software. These requirements will be shortlydiscussed in this chapter. The requirements concern a big group of software attri-
butes. They could be split under different points of view, e.g. in the following
way:
Requirements for the software as a consequence of requirements for thecomplete computer system.
I]

241
- fr the structure of the software.- Requirements for the coding.- Requirements for the protective measures against errors.- Requirements for the documentation.- Other requirements.
Short examples for the requirements will be given in the following chapter. Theenumerated aspects for each subgroup of requirements are only exemplary.
2.1 Requirements for the software as a consequence of require-ments for the complete computer system.
The r ents for the complete computer system have a great influence onthe safety concept of the software. The following requirements result from thestructure of the whole system: 11 J[21
It should be clear if the computer system has a redundant structure, or di-versity, if the system concept is a fault tolerance or fault avoidance con-cept.The interfaces to other systems must be specified in a clear and simpleway.The safety relevant part of the software shall be separated from the noncritical software.
- The number of interrupts should be minimized to simplify the validation.
2.2 Requirements for the structure of the software.
The structure of the software has a great influence on the complexity of the vali-dation process and on the possibility of errors. Therefore the following require-ments should be considered:[l[21
The software shall consist of small modules for simplifying the valida-tion.
- The software elements shall only be sequences of statements, loops, con-dition clauses.
2.3 Requirements for coding.
The coding action is the transfer from a logical structured program (structurediagram Nassi Shneiderman diagram) into an executable program language. Atthis stage the errors that can occur would be systematic errors.

242
To avoid errors in this stage the following aspects shall be observed: [2]
- The variables must be clearly separated in output, input, output/inputvariable, global and local variables.
- The addressing of variables and jumps must be clear. Complex calculat-ing of the conditions and addresses for branches and jumps shall beavoided.
- Jumps (branches) shall only go to the beginning of a loop.- The next executed statement after the end of a loop or subroutine must be
the next statement after the call of the loop or subroutine.- Dynamic modifications of instructions in the operational programs shall
not be allowed.- It must be assured that used compilers do not generate new errors into
the code.
2.4 Requirements for the protective measures against errors.
This measures could help to reduce the error rate and can be used to detect er-rors in an early process stage:
- Use of diverse software- Using redundant bits for coding,- Mutual comparison of checksums from parallel channels.- The software module shall run automatic tests in specified time intervals.
2.5 Requirements for the documentation.
The fidfillment of the requirements for the documentation is important for theunderstanding and it supports the testability of the program. The documentationwill be also important for the reusability of software units. The most important re-quirements for the documentation are the following ones: [31
The minimum documentation for the code is the text of the equivalentstep in the structure diagramThe documentation of each statement must be clear, redundant informa-tion shall be avoided.The use of each variable shall be described exactly, which procedures usethese variables, and to which physical address do the variables corre-spond.
The structure diagrams for each software module shall be clearly ar-ranged, and the connection between the modules shall be obvious

.m ,4 • . • :--.-...•,_. ¸ . ..... .. .. . .-. -
243
The docmentation shall correspond to the newest version of the code.
2.6 Other requirements
The requirement which don't fit into the above enumerated classification are
for example: [4]- The requirements demanded by the shut down procedure of the system
and the restarting procedure.- The program segments shall have the same size if overlays are used. If
program segments require less memory, the unused memory shall befilled with a defined bit pattern.
- Critical bit patterns (e.g. all bit Os or Is) shall be avoided. The outputfrom defect pieces of hardware has these patterns.
3 Validation methods
In this chapter a short overview is given about the validation methods and aclassification of the different methods is carried out. However, the fulfillment ofthe above mentioned requirements does not give enough guarantee, that there areno errors in the software. Therefore each software product has to be validated.The validation methods are widely independent from the field of application. Themethods can be subdivided in two main subgroups: "black box" validation meth-ods (also called functional validation) and "white box" validation methods [5],which consist of qualitative and quantitative ones. Both subgroups include staticand dynamic validation methods. (The division of each subgroup into static anddynamic methods has been discussed in [6])
3.1 Black box testing ,.
The black box testing focuses on the reaction of the test object, which dependson the different external parameters of the test object. [7][81
Functions testsBoundary value tests
At this method the boundaries and extremes of the input do-mains are tested if there is a coincidence with the specifications.The use of the value zero (direct as well as in indirect transla-tion) shall be included in these tests.

244
Prtbl¢td tests
With this method the distribution of the input data shall be sim-ulated. At this test also data out of the specified domains shallbe included.
Input output requirements testsThe fulfillment of the input output requirements is proved bycomparing the output data with the specified data.
Interface testsWith this test method errors in subprograms and errors that canlead to failures in particular applications shall be found out.This is realized by boundary value tests and probabilistic tests.
Performance testsAt this test the boundary of the system efficiency is tested.
3.2 White box testing
At the white box methods the tests are focused on the structure and the internalparameters of the test object. [7] [8][9
Analytical methodsSemantic analysis
There a relationship between the output and input variables isdelivered.
Compliance analysisIt helps to find out differences in ise of functions, variables,procedures against the specifications in the program.
Structural analysisThe structural analysis is used to find out jumps into a loop thatare not allowed, or unreachable statements
Control flow analysisThis method is used to find out inaccessible code segments (un-conditional jumps that leaves statements unreachable)
Data flow analysisThe data flow analysis helps to find variables that are read be-fore written, or to find variables that are written more then oncewithout reading, or variables that are written but never read.
Listing inspectionAt the listing inspection the program is reviewed concerning in-consistency, incompleteness of development directions.

245
4 Walkthrough methodHence the test of the program focuses on finding out contradic-tions by carrying out the functions mentally in a group.
Syntax checkThis method is used to find out if the declarations of the vari-ables, types, functions, procedures, are correct andto find out if the sequence of variables (input/output) is correct.
Time testingWith this validation method the worst case in adjustment of runningtimes will be tested to find out collisions in running times.
Analysis of memory accessThis method shall find out if some software modules write to a memoryarea that is already reserved for a variable used by other procedures. Itcan also be usable for probabilistic analysis of the internal variables.
Specification testThis test proves the fulfillment of the specification.
Structural testThis test shall find out if the structure of the software is appropriate tothe structure of the specification.
4 Case study with CASE-tools
4.1 Preparation phase
The used CASE-tools cannot interpret an assembler language. They use a spe-cial language. The source code has to be translated into the CASE-tool specificlanguage. The translation process can be simplified by realizing a model of theprocessor (written in the CASE-tool specific language) that simulates the used in- -
structions.The input file needs some additional informations e.g. procedure specifications,
mainprogram specifications, function specifications, derive relationships, assertstatements. The derive relationships simplifies the analysis at a procedure call.The assert statements can be used for refining the analysis. These informationshave great influence to the results of the analysis.
4.2 Analysis phase
The output of the CASE-tool depends on the specification in the command line,(which keywords were used). The CASE-tools that have been used cover (see also3.1 White box testing) the control flow analysis, data use analysis, information

246
flow analysis, semantic analysis and compliance analysis. The information flowanalyser delivers as result the dependency of the variables from the used variablesand constants. For each variable the dependency from conditional nodes is stated.Also a list of possible errors and redundant statements is given.
At the compliance analysis the relations between input and output variables arecalculated and compared with the specifications at the begin and the end of theprogram block. These specifications have to be inserted by the operator of theCASE-tool. The quality of the result from this analysis depends on these specifi-cation statements. By implementing more conditions in the code the result of theanalysis can be simplified.
The control flow analysis is used to find out the structure of the code and to findout unreachable statements, multiple entries into loops. The control analyser sim-plifies the graph. The stage of simplification (if only sequences of nodes are re-moved, or also self loops) can be controlled by the used keywords.
The data use analysis shows how often a variable is read before written. Hencevariables which are written more then once without reading could indicate omit-ted code. Also the data use analysis shows if variables have been written and nev-er read. This could indicate redundant code. As result also possible errors are stat-ed, which have to be confirmed by the user of the CASE-tool.
The semantic analysis generates the relation between input and output variablesof each executable path. The user of the CASE-tool has to compare the results ofthe semantic analysis with the requirements specificz2ion.
4.3 Evaluation phase
This is the most difficult section of the validation with CASE tools. There theresults of the different analysis methods have to be compared and conclusionsmust be made.
Some problems about evaluating are given in this chapter. For example thecommunication between the individual subroutines of the tested software is real-ized for many times by using the accumulator and flag register. In this case theCASE-tools can deliver an error statement that the register is not defined. Thishandover procedure was not done randomly it was used systematically. There aviolation of the software requirements occurs. The main question here is now isthis violation acceptable or shall it be treated as a safety critical violation. The de-cision whether the use of a register as variable is acceptable or not, has to be madeby the proofing person and the orderer of the validation (contractor).
At a procedure the data use analyser indicated that a variable was writter. forsometimes with no intervening read. A review of the procedure showed that thesewriting actions to the variable were correct. The used processor model simulatesthe flag register by using boolean variables for each flag. According to the opera-

247
tion of the processor the flags have to be set. To avoid such results by the CASE-tool the variables which should be proved can be selected. This option simplifiesthe analysis results. It should be taken in account, that the selection of the vari-ables is a critical decision done by the user of the CASE-tool.
The software, that has been validated by the department of the author, has asdocumentation of the code only a structure diagram (Nassi Shneiderman Dia-gram) and an incomplete variable list. It is clear that the requirements concerningdocumentation of the software were not fulfilled. The question is, shall the soft-ware be treated as a safe software or as unsafe software. The incomplete docu-mentation will increase the necessary time for the validation. The presentation ofthe validation report has been discussed by G.List[101.
4.4 Advantages for the use of CASE-tools
The use of CASE-tools for software validation supports a formalizing of theanalysis results. This formalizing make the analysis of the code easier. To utilizethe simplification of the analysis the CASE-tool user has to investigate some timeinto the preparation of the code before using the CASE-tool (see also 4.1 prepara-tion phase). The time profit Tpr by using CASE-tools can be described mathe-matically as time profit margin
Tpr (t, tase) = t - t case.Where t is the required time for validation without CASE-tools and teas the re-quired time for validation with CASE-tools. The time profit depends mainly onthe efficiency use of the CASE-tools.
The use of CASE-tools has not only an influence on the validation time, it alsoinfluence the rest error rate of the validation. The rest error ratio of the validationwill be reduced by using CASE tools. This quality improvement depends mainlyon the person who carries out the preparation of the validation object and the as-sessment of the analysis results. The rest error ratio rr can be quantitatively de-scribd as
Nurr
N
where N is the number of all items and Nu is the number of all undetected errors.The quantitative view of the error ratio has been discussed in more detail by A.Sethy [111 [121. The quality improvement can be described as the ratio of the resterror ratio without CASE-tools and the rest error ratio with CASE-tools
rrV(rr ,r-caw-) =
rr-cafe
called also improvement factor V [131. The time profit and the quality improve-ment can also be seen in the economical view. The CASE-tools represent a big-

248
ger investment for firms. Therefore a economical justification for such investmentis required. The CASE-tools can be used for example 5 years. In this time intervalthe user has to do M numbers of validation.The costs per validation Cval are then
INVCval = -
Mwhere INV is the investment for the CASE-tool (including costs for training andprice for CASE-tool). This costs per validation can be transfered in a timeequivalent Tval as followed
Tvi = -
Cmnwhere Cman is used for the cost manpower per hour.The investment of the CASE-tool will be justified if following condition isfulfilled:
Tpr (t, tcase) > Tvalin words: the time profit has to be greater then the time equivalnt Tval. The
quality improvement of the rest error ratio can be quantified economically byusing the mean costs of error consequences. The quantification of these costsdepends on the user of the validation object and they can vary in a wide range.Discussing this proplem would go far byond this paper and cannot be done heretherefore.
For software metrics some usable results can be easily obtained by the use ofCASE-tools. The property of the analysis results are well specified, so that for ex-ample the complexity of the software can be determined reproducibly.
5 Conclusion
The use of CASE-tools makes the analysis of the code easier. As it has beenshown in this article, the use of CASE-tools for software validation delivers animprovement of the time- and the quality aspect. It should be considered that thetime for the analysis is reduced and the time for assessing of the results increase.The quality improvement of the validation results depends also on the person,who validates the software (see also chapter 4.4).
As it has been discussed above, the CASE-tools cover methods of the white boxtesting group. For a complete validation of a safety critical software some meth-ods of the black box testing group also must be carried out. The CASE-tools willpoint at possible errors in the code. These errors have to be confirmed by othervalidation methods. The use of CASE-tools may replace some parts of the con-ventional test methods. However, it must be clear that the understanding of the

249
code is still necessary.Heflly it was possible to show in this paper that the use of CASE-tools can
simplify the life of the validating person.
6 References
1 ORE A155.2/RP3 Software for safety systems - an overview. 1985
2 ORE A155.2/RP9 Software design for computer based safety systems. 1987
3 DB Md 8004 Allgemeine Richtlinien fbr signaltechnisch sichere Schaltungenund Einrichtungen der Elektronik ( General guidelines for signalling safe cir-cuits and equipments of electronics).
4 Keene S. "Assuring Software Safety" Reliability and Maintability Symposium1992 IEEE proceedings pp. 274-279, Las Vegas.
5 EEC 56 (sec) 307 Software test methods 1990
6 Sethy A. "Methodische Frage bei der PrOffung der Softwaresicherheit." e&iVerlag Springer New York Wien 1991/3 pp 80 - 82.
7 IEC 65 (sec) 122 Software for computer in application of industrial safety re-hed system. 1991
8 IEC 65 (sec) 123 Functional safety of programmable electronic systems: ge-neric aspects. May 1992
9 ORE A155.2/RPII On the proof of safety of computer based software systems.1987
10 List G. "Methodological aspects of critics during safety validation."Safe-comp'90 Gatwick Pergamon Press, Oxford, New York pp 99-103.
11 Sethy A. "The actual change in questions of proof of safety and availability inthe railway technics." IFAC Conference 1983/4 Baden-Baden, PreprintesVDE-Verlag, DIsseldorf pp 275-281.
12 Sethy A. "Connection between Reliability and Signalling-Safety in RailwayTechnology" Reliability and Maintability Symposium 1992 IEEE proceedingspp. 75-79, Las Vegas.
13 Sethy A. "ragen zur Messung der QualitAt von Daen#n."Nachrichtentechnische Zeitschrifi 1962/2, VDE-Verlag Berlin, pp 85 - 87.
hL ..

Session 8
NX.J RELIABILITY ISSUES
Chair: A. WeinertSiemens AG, D
i s. 1
1
'I

Dependability of Scaleable, Distributed Systems:Communication Strategies for
Redundant Processes
W. Kuhn, E. SchoitschAustrian Research Center Seibersdorf
Department of Information TechnologyA-2444 Seibersdorf, Austria
Abstract
The key element of dependable distributed systems is thecommunication strategy. Communication between distributedand/or redundant system components (processes) may usestandard network tools and protocols. The absence of amulticast-support in the ISO network model above the NetworkLayer requires special provisions for software that must distributedata over a network to an unknown number of network partners.A method is presented which combines the benefits of differentnetwork layers to cover the needs of such a distributed,dependable, and redundant system.
1 Introduction
The Austrian Research Center Seibersdorf (ARCS) has specified, designed andimplemented the distributed security, alarm and control system called CSS(Sfaleable security &ystem) for Philips Industry [1]. The task of this system is toprotect an area, a plant or a building complex from threats from. the environment(therefore is is sometimes called a "Risk Management System"). The properties ofsuch a system depend on its ability to get information about the environment and itsinner status (by peripheral subsystems, sensors, etc.) and the thrustworthiness of theCSS itself. The system has as primary goals high availability and scaleability (i.e.configurable freely within any topology, and network). One of the key ideas of theconcept is, that processes and processors may be distributed freely according to theprinciples enumerated above, and the configuration is scaleable from a singleworkstation to a redundant network of n processors. Dependability and faulttolerance [2, 31 are implemented via distributed, redundant (software-) processesusing a multilayer software structure for communication and message exchange andfunctional software interfaces between the various external subsystems. One topic isthe communication strategy chosen to support any redundant hardware and softwarestructure, fail-over strategies, and dynamic reconfiguration. The experiences with
• 1LI I I I t' l ,-

254
die of the communication mechanisms on different levels of the
undedying network protocol and the problems encountered during theimplementation and installation phase under hard real-time and load restrictions willbe discussedL
2 System Overview
The design and development of the CSS system started in 1988, when PhilipsIndustry decided to plan a new "Alarm and Control System" which should take theplace of the hitherto existing PDPll-based system XLSS (Extended LocalSupervisor station). The primary goal of such a system is to protect an area, a plantor a building complex reliably foxn break-in, fire and other undesired events. Inaddition, the system should be able to control parts of the building, plant, or area,a4d, of course, reflect (and show) the current state of the "outer world" as well as the"inner status" at any time.
The overall system is composed of the central CSS for processing, managing,visualization and operating, and the peripheral subsystems, which are partiallyautonomous sources of information (and control), provided by different vendors andfollowing different communications and control strategies. The overall systemdependability is limited by the dependability characteristics of the peripheralsubsystems; the goal of the design was, that peripheral subsystems as well as humanoperators, guards etc. can justifiably rely on the CSS services.
Several constraints concerning the environment and the target hardwarecomponents were given by Philips, so it was not possible to choose special reliablecomputing elements. The most important restrictions were the following:
RI The usage of standard off-the-shelf Digital Equipment Corporation hardwareand software, especially VAX computers running the VAX/VMS operatingsystem.
R2 The usage of a standard Ethernet Local Area Network (LAN), includingstandard network controllers and protocols (CSMA)CD).
R3 The usage of customer-defined and/or pre-installed subsystems (redundant ornon-redundant communication fines), which represent the interface to the realworld.
R4 The usage of standard software components wherever possible (e.g. astandard database system and the Graphical Kernel System GKS [4]).
R5 A restricted development budget and a target-date for completion.
Restriction R2 prevents the use of special (hardware) network attachmentcontrollers as described in [5], and it also implies the discussion of Ethernet beingadequate for real-time (e.g. [61), and dependability M.
Restriction R3 also means that some subsystems are not available for "off-line"(ab) software tests; the software for these subsystems must be carefully checked outi the "ing" system.
L:• °.. .. i l I ii l m'm i l aaIi a li M

255
All these limitations lead to the challenging task of designing and building achap, re-usable, and dependable system consisting only of standardc nnents [8).
. 2.1 Building Blocks
The main strategy for the system was to split up the software and the hardware into4 building blocks..
2.1.1 Software Building Blocks
The basic decision while designing the software was (i) to separate theCSS-software into an arbitrary number of processes (about 40 at the moment), and(ii) to provide a single logical communication path for inter-process communication.To avoid an uncontrolled information exchange between processes, primarycommunication paths have been introduced. These primary communication pathsdefine groups of processes that may exchange information. The processes aregrouped into two classes, namely central processes and peripheral processes. Centralprocesses are typically the Central Coordinator or the Database Access Module,peripheral processes are Human Interface processes or the Subsystem Accessjxprocesses [1). Communication can only take place (i) between a peripheral and acentral process, and (ii) between central processes. The main difference of centraland peripheral processes is, that central processes must be available in the system,and peripheral processes may be available in the system. So the peripheral processescan be seen as one of the "scaleable parts" of a CSS. Fig. I shows a simple structureof CSS processes in a single node and the primary communication paths.
Human luInm, fe I SuWbymt Aeomm Sulmyo I
Hu1man Inuwfam. II Subsyselm I
Protosol Pvdni t . Subsystem n
Figure I CSS Procsses in a Single Node
This structure has the following advantages:
Al The system may grow as completely new processes (e.g. new subsystems ornew human interfaces) can be added very easily.
A2 The processes may reside all on one node, or may be distributed over severalnetwork nodes as the process communication can be seen as remoteprocedure calls.
A3 Single (or all) processes may be replicated according to the needs of aspecific CSS installation.
t•I ill il ill ll lii I I ,

256
2.1.2 Hardware Building Blocks
As mentioned above, one of the main characteristics of the system is its scaleability.Thela are several ways in which this takes place. For the hardware, tworequirements had to be fulfilled, first the requirement to build a n-fold redundantsystem, and second to provide interfaces (typically RS232) to a conceptuallyunlimited number of subsystems. The first characteristic can simply be realized byconnecting n nodes to a network, where each node runs a CSS. The secondcharacteristic is of more interest, because it is not possible to put an arbitrarynumber of interfaces to a computer, so, Terminal Servers were used (Fig. 2).
t ~LAN Segment
RS232
Figure 2 Terminal Server
In addition to the benefit of having an arbitrary number of communication lines,Terminal Servers offer the advantage of being able to control a (server)communication port from several nodes. This feature makes a special line-switchinghardware obsolete. The switching of fines to different nodes can be controlled by thesoftware. Disadvantages are discussed in Sec. 5.1.
3 Process Communication
Process communication takes place by means of mailboxes. The principal idea formailbox communication between CSS processes is that each CSS process hasexactly one mailbox where it receives information (messages). The basic view oftwo communication CSS processes is show in Fig. 3.
Process A Proce" B
Figure 3 Basic Communication of Two CSS Processes
This kind of communication strategy ensures that each process has precisely oneinput channel. Handling messages in this way would cause some situations where aprocess may be blocked. For instance, when process A is busy (i.e. not ready toempty its own mailbox) and another process B would fill up the mailbox of processA. In this case, process B would be blocked because it cannot get rid of its messages.

257
3.1 Receive Queues
To avoid these situations, it must be guaranteed that a process is always able toempty its mailbox. This is done by splitting a CSS process into two (or more)pmrallel-working threads M9]. Thread 1 reads the mailbox asynchronously and putsthe message into into an arbitrary large FIFO queue, which is read in thread 0.Thread 0 (the application program) does not read from the mailbox, but from thereceive queue (Fig. 4).
Mailbox
Throw- I--ThreadO
IMaeeea EnvironmentApplication Program
Figure 4 Receive Queue of One CSS Process
Even if thread 0 is blocked (e.g. if the application program is doing somecalculation), thread I is still working.
A problem arises when the system must handle (soft) real-time events with thiskind of communication structure. Assuming that a burst of non-real-time eventsfollowed by a real-time event would cause the real-time event to be delayed. Asolution for this problem is to introduce several receive queues as shown in Fig. 5.
Mailbox
Thred II Thread 0
I an M -e EnvironmentSApplioon Program
Figure 5 Multiple Receive Queues of One CSS Process
The events (messages) in the CSS have assigned several priorities, and eachpiority has a separate receive queue. The receive part of the CSS message handlingenvironment first scans the the first receive queue (with priority 0, which means"real-time" priority) and delivers the message to the application program. Then allother queues are scanned. This method still requires the use of bounded loops(e.g. [O1).
LI

258
3.2 Real-World Interface
The previously described mechanisms are also used to implement a non-polling(event-driven) form of real-world communication. The communication layers areextended by an additional thread. This thread may handle different protocols, e.g.protocols for external devices, or the X-Protocol (Fig. 6). After completion ofprotocol handling in thread 2, the final "packet" is processed by the system as anyother message.
Externa Protocol (Redtundat)
Thread 2 S Application Thredd
Thread I Mailbox
.. .ea.. Message EnvironmentN _ _ _ __
Application Program
Figure 6 External Protocols
As mentioned above, this stack is used to build an interface to foreign protocols.These protocols are widely used in the CSS as a link to different subsystems, about30 at the moment.
4 Network
The principal communication layers of a CSS process are shown in Fig. 6. Thesending object S can be any other process or even the receiving process itself. So itis (or appears to be) very easy to expand the system for network usage by simplyadding a new sending object which performs a network operation. Networkcapability may be introduced to such a system for the following two reasons:
NI to build a client-server system
N2 to distribute data to process replicas
of which only N2 is of interest here.The main difference between these two items is that N2 requires (parallel)
communication with an usually unknown number of (network) partners. Severaltechniques have been introduced to perform these multicast communications[11, 12]. But due to some restrictions given in Sec. 2, it was not possible toimplement a complete reliable group, or multicast, communication protocol.

259
4.1 ISO Network Layers
The method described now tries to combine the benefits of different ISO networklayers to cover the needs of N2 and to minimize the expenditure of implementation.
The following prerequisites were given:
(i) An Ethernet Local Area Network, that provides multicast and broadcastfunctionality on the Data Link Layer.
(ii) An ISO network, that provides reliable communication above the NetworkLayer (with the Network Service Protocol NSP, "A protocol that providesreliable message transmission over virtual circuits. Its functions includeestablishing and destroying logical links, error control, flow control, andsegmentation and re-assembly of messages" [13]).
4.2 Simulated Multicasts
The idea now was to use these two network features, namely
"* real multicasts on the Data Link Layer,
"* and an ordered set of reliable unicasts on the Network Layer
together as simulated multicasts in the following manner. Each process transmits aunique "hello" multicast packet (unique means (i) a group-unique Ethernet ProtocolID, and (ii) a group-unique multicast address" both administrated by the CSS) on theData Link Layer periodically, which is :,,ponded to by the instances of thatprocesses on other nodes. The response to this real multicast packet (a unicastpacket) is used to build a list of network partners. Both activities are performed indifferent threads. Further network calls use this list to transmit data with the NSP assimulated multicasts, i.e. a sequence of unicasts, which are
(i) strictly sequential,
(ii) synchronous, and(iii) do not require any protocol handling.
If a process does not respond to subsequent "hello" packets, or if a call on theNetwork Layer fails, the process that caused that failure is assumed to be down andwill be removed from the list.
Since communication on the Data Link Layer is not reliable and packets may getlost during heavy network load, the receiving partner has to wait a certain timebefore he is allowed to assume a non-responding process being down. The CSSapplication process that uses the multicast mechanism has to call one MULTICASTroutine only which then performs all necessary processing steps.
An overview of the simulated multicast mechanisms is given in Fig. 7. Note thatthis figure does not show the relation to the CSS process communication asdescribed in Sec. 3, Fig. 6.
Voting is also performed on this level within segments (a) and (b). As a result ofthis voting, an appropriate message is delivered to the calling process.

260
Cll CSSMULTICAST(mg) Node
Aft node,
- --- (b) 1 Remove P-l ISO S"z Nor
(a)Ad ab
LAN
Figure 7 Simulated Multicasts
It is clear that the overall transmission time T for a simulated multicast packetincreases with the number of nodes n involved, with
T=o+i(te v,)/:=1
where to is the time consumed by the sender node, ti is the individual error-freetransmission (and receive) time to node i. and ci is an additional delay caused byretries due to network errors. t. and the individual transmission time ti depend on theCPU power only, Ti depends on the network load and the CPU power, with
-i = 0 Vi(i r I I ... n}) for an error-free transmission. Table 1 gives an overview ofindividual transmission rates (to + t + r, n = 1).
CPU PowerCPU Type R x a
CSS VUP SPECmark (Mbps)
VAXstation 2000 1.0 0.9 - 0.06 144 2.608
MicroVAX 3600 2.5 3.2 - 0.34 144 0.110
VAXstation 3100/76 10.0 7.6 - 0.67 144 0.252
VAXstation 4000/90 25.0. - 32.8 1.93 144 0.032
Table I Network Transmission Rates of Application Data
Data are based on the communication between two computers of the same typeover an Ethernet Local Area Network (10 Mbps). The transmission time T ofuser-level packets with a constant size of 128 octets of application data has beenconverted into the transmission rate R given in Mbps. (Note we have to distinguishbetween a user-level information packet and a LAN-level information packet!) The

261
CPU power is given in different tems (CSS = CSS-specific computing powermfative to a VAXstation 200(0 VUP - VAX Units of Processing -MIP), x is thenunber of measurements, a is the standard deviation.
S Experience and Field Data
The system is now installed at 6 sites with a sum of 10 system-years of operation.Experience and field data refer to these systems.
5.1 Terminal Servers
Terminal Servers as mentioned in Sec. 2.1.2 turned out to be the most problematicalcomponents in the CSS. The problems encountered were
(i) questionable real-time characteristics(ii) unmotivated "port stops"(iii) different behavior of different types of Serversof which w-- will discuss (i).
5.1.1 Timing Problems
Fig. 8 shows the typical 1/0 timing behavior of a Terminal Server with the followingsetups: DECserver 200/MC (V3.1 BL37, LAT V5.1, ROM BL20), RS232,
1200 baud transmit/receive speed, one start-bit, one stop-bit, even parity,23 characters message length, VAXstation 3100fl6, VAX/VMS V5.5-2.
I/O Time (e)
2.5
I - Electrical network failure2-
1.5
0.5
0 24
Observation Time (h)
Figure 8 1/0 Time on a Terminal Server
A "Schauer PDU/DCF77" clock was used as a data-generator. Every five minutesthis clock transmits a 23 character packet containing the current date and time over a

262
serial line. This time information was compared with the current system time, as theline clock was assumed to be accurate, and the system-clock was assumed to be a"good" clock [14]. The result of this measurement was that the transmission andprocessing time of a packet was between 0.2 seconds and 0.3 seconds during normalnetwork load (2%) and low CPU load (<1%). Heavy network load (50%) increasedthe transmission time up to 0.6 seconds, and electrical network failures causeddelays of over 2 seconds.
Using a direct communication link (UART) gives a constant transmission time of0.2 seconds (not shown in Fig. 8).
As the CSS was not designed to be a hard real-time system, is was possible tosolve these timing problems within the CSS software.
5.2 System Field Data
Table 2 gives an overview of the systems, nodes, disks, and Terminal Serverscurrently installed and operating in the field.
Systems Nodes Disks Servers
Number of elements 6 12 16 8
Operational years 10 22 30 14
Damages n/a 0 2 1
Table 2 CSS Elements
To date, three accidents have occurred, two head crashes on disks, and oneTerminal Server breakdown. The head crashes have been tolerated by the CSS sincethe VAX/VMS operating system automatically shut down and the CSS processesrunning on those nodes have been recognized as being unavailable. The TerminalServer breakdown has been tolerated for those subsystems with redundantcommunication lines to different Terminal Servers.
System Node
Down reasons downs UA (hours) downs
1. Power fails (test, service) 0 0 7
2. CSS software failures 1 24 8
3. VMS software failures 0 0 5
4. Hardware failures 0 0 2
5. Maintenance 21 3.3 61
1 22 27.3 83
Availability 99.95%
Table 3 CSS Downs

263
4 Table 3 shows the down-times of single nodes and the whole system. Theunavailability (UA) of the whole system had two reasons; first a fatal softwarefailure in a central CSS process that caused all nodes to be inoperable. The failurewas repaired within 24 hours. The second reason was (and is) the down time due tosystem maintenance and software upgrades. All other node failures have beentolerated by the CSS.
6 Conclusion
A system overview of a dependable, scaleable distributed system has been given (fora more broader description see [1]). The design goals of scaleability, flexibility ofconfiguration, ergonomy of human interfaces, flexibility to integrate new peripheralsubsystems and the application of standards as far as possible have been reached by"modularization through distribution", which includes the concept of hardware andsoftware building blocks, process replication and standard ISO network layers.System maintainability and the possibility of easy implementation of a variety offault tolerant architectures are further results of that concept. These goals cannot bereached by a single processor/single layer approach, although there are sometradeoffs with respect to some of the dependability attributes when a distributedsolution is chosen.
Dependable communication mechanisms have been identified as the key issue forproviding reliable services for process fail-over strategies and dynamicreconfiguration.
It has been shown, how on basis of standard hardware and software, by addingsome additional software using Ethernet multicasts to provide the validconfiguration status information, and simulated multicasts within the ISO stackframework, a reasonable dependable system with reasonable real-timecharacteristics has been implemented. Some figures and field data as well asrelevant implementation details have been presented.
Until the end of the year, the CSS system will be installed at ten sites, mainlylarge banks and museums (including WAN-networks connecting several buildingsand branches).
References
1. Schoitsch E, Kuhn W, Herzner W, Thuswald M. Experience in Design andDevelopment of a Highly Dependable and Scaleable Distributed Security,Alarm and Control System. Proc. of the IFAC/IFIP/EWICS/SRE Symposium,Trondheim, Norway, 1991, pp 141-147
2. Redmill FJ (ed). Dependability of Critical Computer Systems, Vol. 2. ElsevierApplied Science, London, New York, 1989
3. Bishop PG (ed). Dependability of Critical Computer Systems, Vol. 3, TechnicalDirectory. Elsevier Applied Science, London New York, 1990
I:m m Il i lli m lm in aaaaamaiim i . i l - i -.. . .•

264
4. ISO. Information Processing Systems - Computer Graphics - Graphical KernelSystem (GKS) Functional Description. Document no. ISO 7942, First edition1985-08-15
5. Powell D, Verissimo P. Distributed Fault-Tolerance. In: [15], pp 89-1246. Verissimo P. Real-Time Communication. In: [16], pp 335-3517. Pfis JF. Evaluating the Impacts of Network Partitions on Replicated Data
Availability. In: [17], pp 49-658. Schoitsch E. The Interaction between Practical Experience, Standardization and
the Application of Standards. Proc. of the IFAC/IFIP Workshop, Vienna.Austria, 1989, pp 17-24
9. Mullender SJ. Operating System Support for Distributed Computing. In [16],pp 233-260
10. Kopetz H, Fohler G, Grdnsteidl G, et al. The Programmer's View of MARS.In: [16], pp 443-458
11. Verfssimo P. Rodrigues L, Rufimo J. The Atomic Multicast protocol (AMp).In: [15], pp 267-294
12. Wybranietz D. Multicast-Kommunikation in verteilten Systemen (Infonnatik-Fachberichte 242). Springer-Verlag, Berlin, Heidelberg, 1990
13. Martin J, Leben J. DECnet Phase V: An OSI Implementation. Digital Press,Bedford MA, 1992
14. Di Vito BL, Butler RW. Formal Techniques for Synchronized Fault-TolerantSystems. Preprints of the 3rd IFIP International Working Conference on DCCA,Mondello, Italy, 1992, pp 85-97
15. Powell D (ed). Delta-4: A Generic Architecture for Dependable DistributedComputing. Springer-Verlag, 1991
16. Handouts of Lisboa '92. An Advanced Course on Distributed Systems. Estoril,Portugal, 29th June - 8th July 1992
17. Meyer JF, Schlichtinger RD (eds). Dependable Computing for CriticalApplications 2 (Dependable Computing and Fault-Tolerant Systems, Vol. 6).Springer-Verlag, Wien, 1992
I."

Real-Time Detection of Failures ofReactive Systems
Rudolph E. SevioraDepartment of Electrical and Computer Engineering
University of Waterloo, Waterloo, Ont., Canada N2L 3G01
1. Introduction
This paper addresses some issues involved in real-time detection of failures of re-active systems. The system architecture considered is shown in Figure 1. Externalbehavior of the reactive system is monitored by a supervisor, which may execute ona separate platform. The supervisor monitors the inputs and outputs of the systemand reports the failures that occur.
Real-time detection of failures has a number of benefits. Consider an applicationsuch as telecom switching:a) Early reporting of failures gives the operating company an opportunity to repair
the underlying fault before the users start filing complaints.b) Certain kinds of failures, such as those due to loss of shared resource units, are
visible only to an entity with global perspective. Early notification of such failuresmakes it possible to take corrective steps before its accumulated effects result inmajor service disruptions.
c) In many reactive systems, failures of control software do not have immediate ef-fect. Because of mechanical inertia etc., a long time interval may elapse before asoftware failure has detrimental impact on the controlled hardware. Real-time de-tection of failures provides a basis for subsequent retraction of their effects.
Supervision-based approaches to failure detection and retraction are becoming moreimportant as systems and their control programs are constructed from off-the-shelfcomponents.
In applications in which the external behavior of the reactive system is specifiedformally, it is attractive to have the supervisor execute (or interpret) a model derivedfrom system specification.
The paper considers the case when the external behavior of the target system isspecified by a model based on communicating, extended finite state machines (spec-ification processes). The formalism used is the CCITI' Specification and DescriptionLanguage (SDL)[ 1]. SDL is an international standard used in the telecommunicationindustry. SDL specification of external behavior is supplemented by the specificationof response times. The focus of the paper is on event-driven applications whose pro-cessing is relatively simple. A typical application is telecom switching.
Supervision-based failure detection has some similarities to automated test ora-cles [4]. However, automated oracles do not detect failures as they occur and usuallyassume a particular resolution of specification nondeterminisms. Real-time monitors
I= l l ! i I - . - • = < A

Inut REACTIVE output*
SUPERSO
Wl•ure report
Figure 1. Real-Time System Supervisor
(see, e.g. [5]) work in real-time, but are typically closely coupled with the programbeing monitored. Supervision-based failure detection also resembles approachessuch as the safety bag[6]. However, SB checks for violations of safety regulationsand aims to prevent failures from occurring in the first place. Specialized techniquesdeveloped to detect certain kinds of telephone exchange failures in real-time can befound in articles describing their maintenance software (see, e.g. [7]). The theory ofbeliefs, introduced in Section 3, was inspired by the truth maintenance systems andnonmonotonic reasoning[8].
This paper is organized as follows. Section 2 overviews the CCITT SDL. Section3 discusses the two basic strategies for failure detection in real-time (input and out-put-driven) and presents formulas that estimate their processing and memory re-quirements. Section 4 describes experience with input-driven supervisor which wasdeveloped to automatically collect failure data of a small exchange. Section 5 offersconcluding remarks.
2. Specification Formalism and IssuesStructurally, an SDL specification consists of a hierarchy of blocks. Blocks are inter-connected by channels. Channels carry signals between blocks. A leaf block containsone or more SDL processes, whose behavior is specified by an extended finite statemachine. Specification processes may contain local variables, which may be updatedand tested. Processes within a block communicate by exchanging signals over sig-nalroutes. SDL semantics is defined operationally, by the Abstract SDL Machine [1].
SDL is illustrated in Figure 2. This figure shows partial, SDL-based specificationof call processing for a small (and simplified) telephone exchange. Part (a) of the fig-ure shows the block diagram and part (b) gives a fragment of behavioral specifica-tion for the Line Handler, one of the processes in the block diagram.
Part (a) shows that the specification consists of two major blocks. One containsthe LineHandler processes, which are responsible for the external behavior of the ex-change seen by individual phones. The other contains a resource manager process.This process controls the sharing of exchange hardware resources needed to processa call. One resource class may be the touchtone receivers, which decode the digitfrom the tones sent by the phone when a key is pressed. For simplicity, Figure 2shows only one resource manager process.
Part (b) states that when the telephone is idle and goes offhook, a request signalfor the resources needed to handle the origination will be sent to the Resource Man-

267
1001mkspam -n~m"
HA_ NDLER Pw "
_ _ _ _ _ _ _ _(a)
GDLE
(iii~ RESOURCE 'a~w= REQUEST
E~ii
S•~WAIT FORX
k.•ns•(b)
Figure 2. Illustration of SDL Specifications "
ager. The Resource Manager may grant the resources by sending a Grant signal tothe Line Handler, in which case dial tone is applied to the phone. If the resources arenot granted (signal Resource NotAvailable), the phone gets the fast busy tone. If thephone goes onhook while its Line Handler is waiting for response, the OnHook sig-nal is kept (Save'd) until a subsequent state.
SDL specification of external behavior are complemented by performance speci-fication which give the maximum permissible time intervals between an input signaland the response(s) it triggers (for example, the time from OffHook to DialTone).Furthermore, some external signals may be communicated only indirectly, by a sig-nal carrier. For example, OffHook and OnHook are encoded in changes of loop cur-rent. The specification includes the definition of the minimum and maximum timefor which the signal carrier change must be present in order for the encoded signal tobe recognized.
A I It II lmmllllll ml llmm,.,rll umtlmlmmGRANT m

268
Several issues must be considered in the development of the supervisor. One isthe incorporation of specification of response times into the supervisor. A major is-sue arises out of the nondeterminisms permissible under the specification formalismused. SDL nondeterminisms fall into two major categories:- indeterminate delays in communication of signals over channels;- nondeterminisms in the specification of behavior of individual processes (sponta-
neous transition NONE and nondeterministic path selection ANY [3]).These nondeterminisms give rise to different but legitimate external behaviors. Thesupervisor must be able to properly deal with such behavioral alternatives; it shouldnot have a preconceived idea about how the nondeterminism should be resolved inthe target system and consider any other alternative as failure.
The supervisor must also be able to properly handle uncertainties arising out ofthe encoding of external signals in signal carriers. Over a short interval of time (be-tween the min and the max permissible signal recognition time), a state change ofsignal carrier may but need not be recognized as a valid signal.
3. Supervisor Strategies for Failure DetectionIn principle, there are two basic strategies for supervisor-based detection of failuresof reactive systems - the input-driven and the output-driven. These two strategies arediscussed below.
3.1. Input-Driven Failure Detection
In the input-driven strategy, when an input is observed, the supervisor precom-putes the possible system outputs triggered by it and stores them (Figure 3). Becauseof specification nondeterminisms, there may be more than one legitimate output.When an output from the target system is observed, the supervisor compares it tothose on the list. If a match is found, the supervisor removes from the list the alterna-tives not pursued by the target system and updates the supervisor model state. If nomatch is found, the supervisor concludes that a failure has occurred and reports it.The supervisor then attempt to re-synchronize with the target system so that does notreport the subsequent legitimate behavior of the target system as failures.
To properly handle the nondeterminisms present in the specification model, thesupervisor must be able to consider several behavioral alternatives simultaneously.The theory of beliefs has been developed for this purpose[9]. In this theory, a sepa-
REACTIVES:- ~SYSTEM
- - - - - - - - - - - - - - - - -. . . . . . . . . . . . . . .-
" '-/!
Figuret ;4Ur . nu-ronSpvIso
Figue 3.Inpu-Drien Spervsio

269
rate thread of a specification process (a belief about its behavior) is created to repre-sent a behavioral alternative. In the case of SDL, a major source of nondeterminismis the indeterminate propagation delay of signals over channels. In the belief theory,when a process sends a signal over a channel, the destination process is split into twothreads. One thread represents the alternative that the destination process has re-ceived the signal and the other that the signal is still in transit. The former thread willprocess the signal and, if appropriate, produce signals to other specification process-es or to the external world. The latter thread stores the signal in transit. This thread isneeded to properly handle the case when another process sends a signal to the desti-nation process at about the same time. Due to the indeterminate delays over chan-nels, the second signal might actually have arrived to the destination process earlierthan the first. The signal-in-transit thread is used to generate all possible signal arriv-al sequences at the destination process. The threads representing consistent behav-ioral alteratives of specification processes are linked into sets. Note that in thescenario discussed, the two threads of the destination process stand for mutually ex-clusive behavioral alternatives.
When an output from the system is observed, the behavioral alternatives (threadsets) disproved by it are terminated and their constituent threads deleted.
If the specification of behavior of a process includes a nondeterministic constructin the transition being executed, a separate thread must be created for each possibletransition path. As before, the alternatives invalidated by the subsequent, actuallyobserved external behavior are terminated.
Figure 4 presents a high level model of the processing involved in propagating aninput signal through D communicating processes before the output(s) it triggers areproduced. The small rectangles attached to processes represent the signals in transit.
0000 0
Figure 4. Processing of Inputs in Input-Driven Strategy
The processing time requirements of input-driven strategy can be estimated fromFigure 4. The processing time needed to pass a signal through a specification processPis
T, = N11 +Nf(ts +tc) (3.1)

270
whereNf- the mean forward nondetermininsm factor (the number of transitions that may
potentially be executed as a result of a given incoming signal),tt = the mean transition processing time,t, = the mean interprocess communication and context switch time,t, = the mean cost of creating a new thread (a clone) of a specification process and
storing its signal in transit.The output signal(s) produced by P are going to be processed by Nf specification
processes. (Note that the signal-in-transit thread does not process the signal; the sig-nal is merely stored.) This will repeat itself, until a specification process is reachedwhich generates an external output signal. If D is the mean number of processes theexternal input passes through before an external output is generated, the total cost ofprocessing of an input signal can be approximated as
Ci I+ +2-+D-)T (3.2)Note that the cost of matching (and of ensuing termination of invalidated threads)was not included in the above formula.
The additional memory needed for signal-in-transit threads can be estimated as
M = (I+N+N+...+N-i)mr (3.3)
where mr is the memory required for a thread (including its input port).In the model considered, each process along the input signal propagation path had
only one thread. However, under some circumstances, more than one thread maytemporarily co-exist. This is, for example, the case with the resource manager pro-cess of Figure 2, which is on several input-output paths. Consider the case when a re-quest signal Rp from process P is sent to a resource management process (M). Twothreads of M will co-exist for a brief time, until an external output is observed whichwill cause one to terminate. If another process, Q, sends request RQ to M before thetermination occurs, five threads will have to be created reflecting all signal arrivalpossibilities at M - RpRQ, RQRp, Rp received and RQ in transit, RQ received and Rp intransit, and both RQ and Rp in transit. In general, if r is the number of requests to M ,.
the effects of which have not yet been confirmed through external output, the numberof threads of Mis [10]
(3.4)
i=OEven for small r, the number of additional threads may be large. As a conse-
quence, the processing costs and memory requirements in the input-driven approachmay be subject to sudden surges.
To detect response-time failures, the input-driven strategy may take advantage ofthe form of response-time specifications, which are stated in terms of maximum timeinterval between a stimulus (external input) and a response (external output). Twocases are possible. When the same specification process receives the stimulus andproduces the response, it is sufficient for it to set up a timer upon the receipt of thestimulus. If the response arrives before the timer expires, it is canceled. If not, thetimer times out and performance failure is reported. This approach must be extended

271
in cases when the response is generated by a specification process different from theone that received the stimulus. Note that the cost of setting up and cancelation oftimers was not included in the above formulas.
3.2. Output-Driven Failure Detection
The output-driven strategy is an opposite of the input-driven one. It is feasiblewhen the processing done in state transitions can be easily reversed. In this strategy,the inputs to the target system are kept in a buffer (Figure 5). When an output fromthe target system is observed, it is propagated backward through the specificationmodel. The input signal(s) that caused it are determined. The input buffer is searchedfor the signal(s) expected. If a match is found, the supervisor updates the state of thespecification model and removes the input signals whose effects have been fully ac-counted for from the input buffer. If there is no match, the supervisor concludes thata failure must have occurred (there is no cause for the output observed). Note that thebackward tracing of an output signal may not necessarily reach a specification pro-cess that takes input from the environment. It may cease at an internal process whichis in a state that cannot produce the needed signal.
Figure 6 presents a high level model of the processing involved. The model takesinto account the possibility that the signal traced might have been produced by sever-al transitions emanating from the current specification state in the sending processand that there might have been several possible sources for the triggering signal.
The processing time requirements of output-driven strategy can be estimatedfrom Figure 6. The processing time needed to trace a signal backward through aspecification process P is
Tp = (Ntt +NN,,ts) (3.5)
wherett = the mean cost of (backward) transition processing,t, = the mean cost of backward signal propagation,Nt = the mean number of transitions in the current state of the specification process
that could have emitted the signal traced,N,= the mean number of processes that could have emitted the triggering signal.
The number of specification processes that must be visited after the trace-backthrough one specification process is N/N,. The overall cost of tracing back the output
REACTIVE SupeEMiin
VP "al•. MTCi• UPDV••
Figure 5. Ouput-Driven Supervision

272
00
Figure 6. Processing of Outputs In Output-Drive Strategy
produced through D process levels can then be expressed asCo I + NtIV, + (NtNe) 2 + ... + (]•NN) D-1 Tp (3.6)
In the processing model of Figure 6, no additional memory is required to processan output signal.
As observed earlier, a major advantage of output-driven strategy with respect tothe input-driven one is that it does not have to directly enumerate all possible behav-ioral alternatives. It waits to see which one will actually happen. However, the speci-fication nondeterminisms must be taken into account in explaining what hashappened. In particular, the indeterminate channel delays must be considered to cor-rectly explain the outputs observed. As in illustration, consider the scenario whenphone A and B call phone C almost simultaneously. Assume that B is going to besuccessful. If the ringing on phone C is the first output signal detected, it would beincorrect for the supervisor to stop its search as soon as it discovers that A has dialedC. For a brief interval of time, it has to consider both A and B. It is only when the ex-ternal outputs on phones A and B (i.e. busy and ring tone) are observed that the su-pervisor may eliminate the alternatives invalidated. The theory of beliefs can handlesuch scenarios by creating two Line Handler threads for each of A and B. However,at least in the application domain considered, such scenarios appeared to be relative-ly rare and the cost of thread creation was not included in the formulas given above.
The detection of response time failures in output-driven supervisor is rather diffi-cult, if it is to be done in real time (i.e. as soon as the response interval expires). Thisis because of the nature of output-driven approach, in which the work is deferred un-til until the output (the response) appears. If it is imperative that the detection of suchfailures be carried out in real time, it is usually necessary to separate the detection ofbehavioral and response time failures and use a separate checker for the latter.
4. Illustration and Experience
A supervisor based on the ideas discussed in this paper was implemented for detec-tion of failures in a small exchange. Real-time detection of failures was required for

273
automatic acquisition of failure data needed in the development and validation ofnew software reliability prediction models[12]. The exchange and its telephoneswere emulated on a Unix workstation. Programmable telephone traffic generatorswere employed to generate random telephone traffic with the specified distributions.
The specification of the exchange had the general form of Figure 2. Only POTScalls (plain, ordinary telephone service) were supported. The exchange served 60telephones. Call origination rates ranged from 8 to 15 originations/phone/hour. In-stead of monitoring the signals between the exchange and the telephones as shown inFigure 1, the supervisor was monitoring the hardware interface memory throughwhich the exchange control program sensed and controlled the exchange hardware.This eliminated uncertainties in output signal recognition (the detection of outputsignals did not suffer from signal recognition latencies), but it left input signal recog-nition uncertainties in place.
The analysis given in Section 3 was used to evaluate the tradeoffs involved and toselect the supervision strategy. For the input-driven strategy, the Nf factor was 1 andthe processing cost was dominated by tc. D ranged from 1 to 3. For the output-driv-en, the Nt factor was close to 1. However, for some output signals, the Ne factor waslarge. This was the case whenever more than one Line Handler is involved in back-ward propagation of outputs. For example, when ring tone to a phone is observed,the tone must be traced back to the Line Handler for the called phone and from thereback again to the Line Handler for the caller. For these signals, Ne is the number oftelephones served by the exchange. Even for a small exchange, Ne2 is a very largenumber. Although some heuristics could be built into the backward search, this alter-native was rejected because of concern of ending up with an ad-hoc, difficult tomaintain supervisor.
Based on these considerations, the input-driven strategy was chosen for the super-visor. To reduce the cost of implementation, the matcher of Figure 3 was combinedwith the processes that produce external outputs (i.e. Line Handlers). For example,the bottom half of the FSM of Figure 2b was converted into the segment of supervi-sor Line Handler process shown in Figure 7. (To reduce the size of this figure, thetreatment of the OnHook signal is not shown.)
This figure contains two extensions to the standard SDL [11]. *0 stands for 'any
F e ESOURCE[ anESOURC pe0 ,/,NOT AVAILI •GRANT
fWAIT FOR" FWAIT FOR•
FIgur 7.SegmeTON DALnendo TONE rio
I ~ ~ * TON TON II I*0I m-.

274
output from the target system pertaining to the line being supervised by this processinstance'. The crossed oval denotes the termination of the process thread. The threadis terminated when an external output indicate that the behavioral alternative repre-sented by the thread has not been pursued by the target system. (This is the case, forexample, when a different tone is sent to the phone).
Note that such combination of functionality is possible only if it can be guaran-teed that the external inputs are propagated through the supervisor model faster thanthey propagate through the target system. This was the case with the emulated ex-change. Alternative approaches are available for non-emulated applications.
Subsequent experience with the purely input-driven version of the supervisor hasshown that, during some intervals of operation of the target system, the supervisorran out of memory. This turned out to be due to the rapid growth in the number ofthreads of resource management processes. This occurred when the random varia-tions in telephone traffic resulted in a large number of almost simultaneous call orig-inations. In retrospect, this is not surprising in light of equation (3.4), but this pointwas only realized at a later time. What made this phenomenon worse was the posi-tive feedback in its dynamics - the heavier the load on the exchange, the longer thetime interval between an OffHook and the response (dial tone or fast-busy tone) andthe larger the number of threads that coexist before they can be terminated.
To resolve this difficulty, it was noted that the processing of call originating off-hooks typically results in dial tone output to the telephone. The product N1A, for thedial tone output signal was 1 in the exchange considered. This has led to the decisionto introduce a degree of output-driven processing into the input-driven supervisor.The output-driven processing only applied to the output signals that indicate whatthe outcome of resource request was. The boundary at which the input and outputdri -en processing for these signals (dial and fast-busy tone) tone met was moved intothe resource manager. The idea of combining the functionality of input-driven super-visor and -natcher was retained. In the implementation of the mixed strategy supervi-sor, the originating OffHooks were propagated only to the Resource Manager. Whendial tone is observed on a phone, the Line Handler sends a notification to the re-source manager. As a consequence, the number of behavioral alternatives that had tobe considered for the resource manager had become substantially smaller. The mem-ory overflows no longer occurred. The underlying theory is described in [10].
5. Concluding Remarks
The paper considered real-time detection of failures of reactive systems. Failures aredetected by the supervisor, a unit that monitors the inputs and outputs from the targetsystem. The supervisor executes a model obtained from the specification of the targetsystem. The paper dealt with the case when the target system is specified in CCITTSDL, a language based on communicating extended finite state machines. The focuswas on event-driven applications such as telecom switching.
A major issue in specification-based detection of failures are the nondeterminismsintrinsic to the specification formalism. The supervisor should have no preconceivedidea about how the nondeterminisms should be resolved and consider any other al-ternative as failure. The paper briefly overviewed the theory of beliefs which permits
S L• - •- ml ll l l lll l ll I lmnam•m m mm~~l

275
the supervisor to keep track of simultaneous behavioral alternatives.The paper discussed two basic strategies for real-time failure detection, thv input
and the output-driven one. In the former, when an input is observed, the supervisordetermines what may happen in the future at system outputs. In the latter, the super-visor tries to explain the system outputs from past inputs. The paper presented for-mulas that estimate the processing and memory requirements for the two strategies.The formulas were based on high-level model of the processing involved and giveonly a rough estimate of the quantities estimated. They are principally useful in de-termining the tradeoffs involved and in the choice of supervisor mode of operation.
The paper described an application of real-time failure detection to automatic col-lection of call processing failure data in a small telephone exchange. The exchangeand its phones were emulated on a workstation. A purely input-driven strategy wasinitially implemented. However, subsequent experience showed that this implemen-tation was subject to excessive surges in processing and memory requirements undercertain input scenarios. To gain insight, the models and formulas presented abovewere developed. A hybrid approach based on partly output-driven processing of cer-tain output signals was implemented. This implementation no longer exhibited thelarge surges in processing and memory requirements.
Acknowledgments
D. Hay, J. Li and F. Chan were the main contributors to the ideas underlying thispaper. The work presented was funded by Bell Canada and by the University Re-search Incentive Fund of Ontario.
References
(11 International Telegraph and Telephone Consultative Committee, Functional Specificationand Description Language, Recommendations Z.I 00-Z.I 04. Geneva: ITU, 1989.
[2] International Telegraph and Telephone Consultative Committee, Annex F.I to Recom-mendation Z.J00: SDL Formal Definition. Geneva: ITU, 1989.
131 F. Belina, D. Hogreffe and A. Sarma, SDL with Applications from Protocol Specification.Prentice-Hall, 1991.
[41 D. B. Brown et al., "An Automated Oracle for Software Testing", IEEE Trans. Reliabili-ty, vol. 41, no. 2, pp. 272-280, June 1992.
[51 S. Sankar and M. Mandal, "Concurrent Runtime Monitoring of Formally Specified Pro-grams," IEEE Computer, vol.26, no.3, pp. 32-41, March 1993.
(61 A. Erb, "Safety Measures of the Electronic Interlocking System ELEKTRA", Safety ofComputer Control Systems 1989, Pergamon Press, London, pp. 49-52.
[7] M. N. Myers, W. A. Routt and K. W. Yoder, "Maintenance Software," The Bell SystemTechnical Journal, vol. 56, No. 7, pp. 1139-1167, September 1977.
[81 E. Rich, Artificial Intelligence, McGraw-Hill, 1983.[9] D. B. Hay, A Belief Method for Detecting Operational Failures in Soft Real-Time Sys-
tems, MASc Thesis, Dept. Elect. and Comp. Engg., University of Waterloo, 1991.[101 J. Li and R. E. Seviora, "Real-Time Supervisor with Reduced Space and Tune Require-
ments," to appear, Proc. 1993 lEE System Engineering for Real-Time Applications, Lon-don, UK, 1993.
1111 J. Li and R. E. Seviora, "An Extension to SDL," submitted, 1993.[12] P.Lam, R.E.Seviora and F.C.L.Chan, "Invocation-Count Based Structural Prediction
Models," Proc. Second Belcore Symposium on Issues in Software Reliability Estimation,pp.113-129, Oct. 1992.

Reliability and Safety Analysisof
Hierarchical Voting Schemes
Henryk Krawczyk and Saleh AI-KaraawyFaculty of Electronics,Technical University of Gdansk
Gdansk/Poland
AbstractTo improve dependability various voting schemes are implemented in computersystems. The paper analyses reliability and safety of elementary and composedmajority voting systems. The tool for evaluation of such systems is also proposed.It allows to choose an architecture suitable for given reliability and safetyrequirements.
1 Introduction
To achieve higher reliability and fault tolerance of computer systems, high-qualitycomponents and strict quality control procedure during the assembly phase can beused, or some form of redundancy techniques can be implemented [1]. Both of thesecomplementary techniques lead to an increase in system cost. This is a price whichwe pay to satisfy dependability requirements that are needed. Moreover, anothermain point that faces the designers of computer systems is to detect errors at thesame time when the real-operations are performed. This means that a system doesnot need to be stopped to find out which resources are faulty. To satisfy thisdependability and time requirements, the majority voting schemes are implementedin computer systems. This means that a system must be composed of at least threenodes (modules) [2] which are performing the same job and are establishing thevalid result by majority voting. In general, we have two types of elementary votingschemes which will be named Centralized and Distributed Voting Architectures orbriefly CVA and DVA, respectively. Moreover, compositions of these fundamentalschemes can create more complex (hierarchical) systems which satisfy the highestdependability requirements.
In the literature only centralized voting systems were analyzed very attentively[1,31. Presently the importance of distributed systems is growing rapidly, so thedecentralized voting strategies should be considered and compared. Some ideasreferring to the hierarchical systems are given in [4], where some rollback recoverystrategies are analyzed. In [5] the matrix and channel voter based architectures areconsidered. Note that, the latter corresponds to DVAs defined above. In the paper

277
we concentrate on the dependability analysis of the basic architectures. We alsopropose the systematic approach to evaluate the reliability and safety of morecomplex voting architectures that are the composition of such elementary systems.
System reliability R(t) is the prubability of the correct system work (success)during a certain period of time. System safety S(t) is the probability that the systemwill survive for a certain period of time. To estimate these parameters, Markovmodels are used [3]. Based on these models, reliability and safety of system nodesare calculated in Section 2. Then elementary centralized and distributed votingschemes are analyzed and compared in Sections 3 and 4, respectively. Section 5 Iintroduces compositions of the elementary systems. The package program evaluatingdependability of different voting systems is presented in Section 6 and its functionsare given and discussed.
2 Dependability of System Nodes
Let consider that a computer system consists of n nodes (processing elements). Eachnode can communicate with some other nodes by interconnect lines. Most of studiesin dependability of computer voting system assume that a system remains operableas long as there exist suitable number of fault-free nodes. In consequence, thedependence of system nodes have direct impact on the total system dependability.In this section we concentrate on the dependability estimation of no-repairable andrepairable system nodes.
• Fault-free AFault-free
Detection Repair
Model- a Model- c
Fault-fr- eFault-free
P N I PI
Detection and Detection andrXa irX 2 repair
Fau iltw Detection and
repairNodel- b Nodel- d
Fig I Reliabilitw Nodels of:a) Non-repairable nods b) Partial self-repairable nodec) Self-direct repairable nods d) Self-indirect repairable node

278
Let nodes consist of processing unit, memory unit(s), and input/output unit. In caseof no-repairable node, each fault of these units can cause the failure of the wholenode (see Fig. 1-a). Thus we can assume that:
Rk(t) - e (")N, where ), = X, + X. + Xk. (1)Moreover, it is highly unreasonable to assume that each single node should totally
fail. Therefore we consider three types of self-repairable nodes. It is assumed thateither a node can survive some faults (see Fig 1-b) or full-success repair can takeplace (Fig. 1-c,d). These models can be described by the differential equations.Using Laplace transforms, the problem is reduced from a set of differential equationto a set of simultaneous linear equations. For the model given in Fig. 1-c, they areas follows:SP,(S) - 1 = -kPl(S) + AP 3 (S)SP 2(s) = XPI(S) - eP2(S)Sp3(s) EP2(S) - jP 3(S)
where:PI(O) + P2(O) + P3(O) - 1, and P1(O) = 1, P2(O) = P3(O) = 0.
R(t). 2(t) Noda1-b
Parin. Suggested Ialue
.% 0.008 /1000 hours"1, 2 0.004 /1000 hours.P 0.006 /1000 hours
Nodel-c
"-X 0.008 /1000 hours"•E 0.004 /1000 hoursp 0.006 /1000 hours
S•'•' SStM- Hodel_b ..
2(t)- Hodel-b
R(t)- NodLb
I I ttim*,0 5 10 15 30 25 30 35 x2000H
Fig 2 Raliabilitw and Safrtw Curwus For adInls b and c
Solving these equations we obtain expressions with variables P,(S), P2(S) and P3(S)which can be transformed directly to the time domain. Then we obtain:
PI(t) = A, el sin(cat+a,) + ki (2)P2(t) = A2 e" sin(wtt+a 2) + k2 (3)

279
whoemw- .5[2(X•+qt+M) - (X2+&&+e 2)]"a -
d,=/k- dl/(a2W+w)k2 = d21(a2+ 0)b = (a-w 2+ag+dl) 2
A, = (11W) [(12 + W(2a+g)2}/{a2 +Ow2}J%A2 = (11w) [{(a+1 2 + 2)I}{a 2 + 2 }]J'Aa, = arctan w(2a+g)/(ae-c+ag+d, ) - arctan (wia)a 2 = arctan w/(a+d2) - arctan (w/a)
Then the reliability and safety of a node can be expressed as follows:RN = P,(t) and SN=- P2 (t).
Fig. 2 shows some graphs for models b and c given in Fig. 1.
3 Centralized and Distributed Voting Architectures
CVA is the classical voting architecture (Fig 3) where each computing node (CN)is described by one of the reliability models shown in Fig 1. The Centralized Voter(CV) is made up of the Bus Interfacing Unit (BIU), which receives and sends someinformation to the CN, and Voting Unit (VU) which in turn performs a majorityvoting algorithm to establish valid results. It is assumed that the voter must be ahard-core unit to achieve reliable work of the whole system. Then the CVA maytolerate of maximum of f faulty CNs, where n > 2f+ 1. K out of n system is ageneralization of the voting architecture in which k of n nodes must work correctlyto perform system functions [3].
We assume that the reliability of the CVA can be determined as a function of thereliability of the CN - RcN(t) and the reliability of the CV - Rcv(t).
oig 3eutrin e Li- A
Oo~ut ng .1• iVoter -- Final
' ( UU) a OlU
Comut ire tMod-n
Fig 3 Centralizedl Voting Architecture (CUA)

LI280
Let us assume that all CNs are identical and have the same failure rates ?kN, andthe system can tolerate up to f < n-k faulty CNs, where k is the minimum numberof CNs that must be operational for a system to be reliable. The structure-basedreliability assessment of the system can be assessed by assuming a parallel-seriesstructural configuration. Then we define [1,3]:
p-k pRo^ t)=Rv(t) io RCN (t)'Pi) (1'RCN (t)Y= (4)
i-O ( if
where:Xcv - is the failure rate of CV (k-v = X•nj + Xvu)
The safety of the system ScvA(t) can be is determined similarly as follows:p-k p
SCVA (t) = SCV (t) E /SCN (t)(Pi) (1-Sos. (t))i (5)
i-O
Nodes Nod 2 Noden
..... ..... b- . . Bus I.-. Bus 2
Fig 4 Distributed Voting Architecture (lM)
1-l
DVA is ( as shown in Fig 4) composed of computing nodes (CNs) and redundantbuses. The nodes transmit data over the buses and each node can receive data fromall nodes including itself. The main difference between CVA and DVA architecturesis the type of voting. The nodes of DVAs contain BIU and VU, which are used forcommunication and distributed voting respectively. An example of such architectureis described in [5,6]. BIU modules arbitrate between two CNs when both of themwant to access the voter. It is also responsible for reconfiguring a faulty CN out ofthe system. Then each VU is programmed to perform voting, which is a morecomplex operation than a simple comparison of the received data from all of thenodes, and also to perform the error logging. When voting is performed, final resultis transferred to each node by its respective BIU. Whenever data from a particularnode do not agree with the data from the other nodes, an error condition is latchedin each node which detects such an error. The latched information specifies the

281
faulty node as well as the source of the faulty data. No hard-core is necessary4 because voting function is distributed among the nodes and to eliminate f faulty* CNs, n 2f+ 1. In case of Byzantine faults very popular in case of the distributed
voting n 3f + 1 [7]. Reliability of DVA is evaluated as follows:
p-k p
RA (t) =ý t)P' (I -1c (t))' (6)' (i)
The Safety of the system SDvA(t) is determined in the same way as follows:p-k p
•! SDvA (t) -- • [ •SCN (t)') (l-ScN (t))! (7)
4 Comparison of CVAs and DVAs
Let consider the reliability of the architectures presented in Sections 2 and 3. Weassume that a computing system consists of homogeneous nodes. This means that allreliability parameters are the same for each node. Reliability of buses is describedby the reliability of BIU. Fig. 5 plots the reliability curves for a system of n=5(then k=3) and for two different schemes (CVA and DVA). We assume that thereliability of the voting unit and bus interfacing unit are higher than the reliabilityof other units, i.e., the failure rate of a CN = the failure rate of the MU < thefailure rate of the VU < the failure rate of the BIU.
We restrict our analysis to mission time less than 5 years. The S-shaped curves areobtained which are typical for redundant systems [1,3]. Above the knee, then CVAand DVA have spare components that tolerate failures and keep the probability ofsystem access high. Once the system has exhausted its redundancy, however, thereis merely more hardware to fail. Because distributed voting systems have moreredundant components (except CNs) their reliability for the first period of time(nearly for one year) is higher, then is lower in comparison to the CVA. Thistendency is also true for safety of system.
5 Hierarchical Compositions of Voting Schemes
Complex systems are typically structured hierarchically in multi-levels organization.This means that such a system consists of smaller subsystems (each of which iseither CVA or DVA) and shared buses. We introduce a new class of votingarchitectures named composed voting architectures. They are defined on the baseof the composition operation [8]. The simplest composition is a cascaded series ofCVAs or DVAs [3]. Other examples are shown in Fig 6. The scheme made up of

' ~RMI) act)
Sit) -U
Paraneter Failure Rate Act)-
0. 0015/1000 hoursE 0.0008/1000 hoursP 0.0010/1000 hours'X 0.0005/1000 hours
i , i • i , time0 5 JA A5 20 215 30 35 XIO0 H
Fig. 5 Rmliabliit wnd Sefetw curvms when NIdli-cis inplmgwted as CUM A DUA Architectures
r distributed voting subsystems, where their signals are coupled by a centralizedvoter, is named Centralized - Distributed Voting Architecture and is denoted byCDVA. Another architecture, is made up of a set of r centralized votingarchitectures connected by redundant buses, is named Distributed - CentralizedVoting Architecture and denoted by DCVA. We assume that such a complex systemworks correctly if at least m of r subsystems are fault-free (m out of r).It is easy to note that for analysis of composed majority voting systems, we may
use the formulas given in Section 2 and 3 provided the node reliabilities formulasare replaced by the subsystem reliabilities formulas. Fig 7 shows the curves for thefirst two types of voting architectures discussed above and for model-c of nodereliability. In general, DCVAs are more reliable than CDVAs. The utilization ofself-repairing nodes leads to an increase of system reliability more significantly.
6 Reliability and Safety Estimation Package
Below, the newly developed program named "RASEP" is described. RASEP(Reliability And Safety Estimation Package) is dedicated to analysis and comparisonof hierarchical voting architectures. The main modelling objective is to provide theestinmates of reliability and safety of complex computer systems.
The prototype version of RASEP has been implemented in C programminglanguage and destined for a single processor environment of an IBM PC ATcomputer running under the DOS. The system structure of RASEP is given in Fig.

283
mmR-i OIM-i.
Centr-mal I Ixd Ci-a
12 ... r
(a) (b)
Fie 6 Examples of Composed lioting Architecturesa) CDUA b) DUAM
R(t), 2(t)
Pr Prameter Failure Rate11 0.0015/1000 hourso.ooMI0. wo hours
P 0.0010/1000 hours'I•V 0.000/1000 hours
T %Btu 0.000a/1000 hours\kU 0. 0002/1000 hours
M~~~ ~~ t) ""-- St OU
I -()t(t) -DIA
time0 5 L0 15 an 5 30 35 x3000 H
Fig? Reliability of Composed Uoting ArchitecturIn=5 Ck3) # r=3 (nxa) I
8. Presently, the program is working for reliability models of system units presentedin Fig 1. However, new models can be added, because the choice of a given modelis pointed by unique namu. The hierarchical system arcihitecture is described by thefollowing formula:
X [Y(U,), Y(U 2) ....... , Y(U)J (8)

284
Architecture Reliability Nodelof
Definition $ustan Nodes
Reliability an Saf~ety Model of
Hierarchical Voting Schemtes
AnIas is Parameters
Reliability and SafetyNetrics
Fig 8 The Structure of MSEP
where:X, Y - determine the type of architecture, e.g. CVA, DVA,U1, i = 1,2,...,r - denotes either the kind of a system node or recursively a formulalike (8) describing architecture of the subsystem,r - is the number of elements and it can be different on each level of the description.
For example architectures of Fig. 6 can be described in the following way:CVA(DVA,, DVA2 . . . . . .. , DVA), DVA(CVA,, CVA 2, ...... , CVA).
It is easy to note that different types of architectures can be used on the same levele.g.;DVA(CVAI, DVA2(CVA3, DVA4)).
Based on the formula (8) and the expressions (1 7), reliability and safety modelsare generated and concrete metrics are determined for given parameters of failureand repair rates. The all figures presented in the paper are obtained by the RASEP.
7 Conclusions
There are some real computing systems where majority voting schemes areimplemented [1,5,6,7]. The aim of this paper is to pay attention to a new possibilityof generation of various voting architectures and to show some methods of theirevaluation. In order to support modelling and evaluation of those architectures, aprogram "RASEP" has been built. Using this package, for a given reliabilityrequirements, we may choose the suitable architecture. Presently, the package is stillunder development. The fault coverage and error latency will be included into theprogram as well.

285
References
1. Holt C, Smith J. Fault tolerant & fault testable hardware design. Prentice HallInternational, Inc., London, 1985
2. Nelson V. Safety in numbers: Redundancy lets a system perform its intendedfunctions despite some number of faults. Byte, 1991; 16:175-184
3. Siewiorek D, Schwarz B. Theory and practice of reliability system design.Digital Press, 1982
4. Shieh Y-B, Ghosal D, Tripathi S. Modelling of fault tolerant techniquesin hierarchical systems. FTCS-19, 1989, pp 167-174
5. Somani A, Sarnaik T. Reliability analysis and comparison of two fail-op/fail-op/fail-safe architecture. FTCS-19, 1989, pp 566-573.
6. Kanekawa N, Maejima H, Kato H, hara H. Dependability onboard computersystems with a new method-stepwise negotiating voting. FTCS-19, 1989,pp 13-20
7. Laha J. A Byzantine resilient fault tolerant computer for nuclear power plantapplications. FTCS-16, 1986, pp 338-343
8. Krawczyk H, Kozlowski W. Fault diagnosis in distributed systems withincomplete test. Microprocessing and Microprogramming, 1987; 20:39-44

Session 9
LANGUAGES
Chair: W.M. Turski,Warsaw University, PL

Designing a High-level Language forSafety Systems
G. Sen1 , J. Brummer 2
'Reactor Control Division, Bhabha Atomic Research CentreBombay, India
2Institute for Safety Technology(IST), Gesellschaft flr Anlagen- undReaktorsicherheit (GRS) mbH
Garching, Germany
Abstract
As an alternative to the classical approach for system specification on thebasis of a formalised general purpose language a graphical andspecialised language for application to safety critical systems is outlined.The architecture of the language is constructed in accordance with thefunctional and timing requirements typically for operationality in safetysystems. The fundamental and generic elements of the language arepresented: the syntax and semantics of function and net diagrams. A widerange of operational behaviour (functional and timing) can be determinedby this graphical specification technique, several ways of specificationanalysis are opened. Some examples show how to benefit from thecombination of illustrative graphical demonstration and strictly definedrules for their interpretation.
1 Introduction: Universal versus Special Language
A main task in software technology is the computer based and (as far as possible)automatic development of complex software systems. The essential basis for that issettled in the early stages of the development process: The system's work has to bespecified in a way the computer can understand and operate with. For that reason and inorder to avoid severe misunderstandings, the elimination of which often requiresenormous efforts, a precise formulation of the intended system and its design isrequired. Formal methods for system definition have been suggested which fulfil theserequirements to some extent.
The classical approach for a high-level system specification is the formal languagerepresentation of its functionality. There are several language concepts [1,2,3], almostall based on the data type description of the system properties: The idea is that a datatype is not just a definition or enumeration of its admissible values, but the concept of

290
types also comprises of all operations that are meaningful for these data objects. Theway to the system's behaviour is opened by axiomatic rules regulating the relationshipbetween values and the admissible state transfers. The system 1roperties result fromrewriting sequences according to the stated rules and according to algebraictransformation principles [4].
Most of these languages do not have the feature to project operational behaviour withrespect to time constraints and synchronisation of different processes which constitutethe total system. Another difficulty with these formal languages arises because of theiruniversality: To cover a wide range of applications, the vocabulary of these languageshas to be very elementary (set-theoretic notation and predicate calculus teminology),and a system description normally consists of a complex set of relational rules. Becauseonly the relational structure of a system is formulated, even for relatively simplesystems the consequences of the stated rules and the final behaviour cannot be realisedimmediately. Therefore, for proving that the specified system meets the originalrequirements, extensive verification procedures have to be carried out [4].
The situation changes if the universality principle for the specification language isdropped and a formalisation for a restricted application area is taken into consideration:The language vocabulary for a special technical field can be adjusted to the particularsubjects, the combination rules (the grammar) can be arranged according to therequirements of the special field.
The safety system in nuclear power plants for example (or similar plant protection
systems) fulfills the prerequisites of structurally and conceptually restrictedoperational technique. The input quantities are regulated and the operational logics for Ithe safety functions are constituted from elementary functional units, because the safetyfunctions follow simple operational patterns: Data acquisition and preparation,accident control by evaluation and comparison of measurements and a few normedreaction schemes. Usually this operational procedure runs simultaneously andredundantly on different computers and is cyclically repeated. Therefore, asynchronisation mechanism has to be implemented and timing constraints have to beconsidered.
Along this operational paradigm a graphical language for specification and design ofsuch type of safety system is outlined in the next sections. For that, the proposals madein [5,6] for designing a graphical, high-level language are taken up and modified forspecial applications. In section 2 the architectural concept of the language is discussed:The two essential constituents of the language, functional and net constructors, areestablished. In section 3 a more detailed description of these two language features isgiven: The combination of functional units to function diagrams is defined, and aspecial class of time Petri nets is introduced for managing synchronisation andregarding timing aspects. In section 4 the system's analysis on this very early stage ofthe development and the possibilities of a direct implementation of the graphicallyspecified system is discussed. The main results of the report are summarised and a shortoutlook on the future work is given.

291
2 Global Architecture of a High-level Language forSafety Systems
A language for the specification of control and safety systems should be designed inaccordance with the operational and behavioural patterns of these systems. Thelanguage features have to be adapted to describe the functional and performancespecialities: The vocabulary and the rules for their combination has to reflect theproperties of the systems.
For that purpose, the basic functional elements for safety systems have to be isolated,the basic arrangments for building up complexer functions have to be identified and themain rules for integration and synchronisation of the usually distributed computationshave to be fixed.
As the main characteristics of typical safety system one can state:
- Mostly simple functional lines, starting with data acquisition, data examination andplausibility checks, and then performing data comparison and evaluation and a fewreaction schemes
- Standardised boolean or arithmetical operations with the data values (e.g. selection,sort, threshold comparison)
-A straightforward execution of control functions with few branches and carefullooping
- Execution of the same or of similar functionality on different computers (caused bythe requirements of redundancy/diversity)
-Rigorous requirements for integration and synchronisation of the distributedcomputer system
- Strict timing requirements and cyclical execution routines.
The specification language has to take t;are of these aspects: It should facilitate theformulation of linear functionality and provide constructs for the determination oftiming and performance constraints. In correspondence to these demands the languageinclude two graphical forms:
The hozoi •o.rnm, represented in functional diagrams (see section 3.1).The functional vocabulary consists of a set of predefined units (bricks) to the designer'sdisposal enabling the construction of a large class of complexer control functions. Inaddition to that, the open character of the language allows the integration of new, userdefined units for special applications.
The et fon, represented in net diagrams (see section 3.2),is used for the arrangement and management of distributed functionality, forexpressionof synchronisation and timing requirements.
With these language constructors a program for a distributed safety system is built up:For the different computers their tasks are formulated in separated function diagrams.

292
Depending on the complexity of these functions the functional specification can bedivided into several hierarchically ordered diagrams. The co-operation of thecomputers is co-ordinated by net diagrams which manage the right ordering and timingof the global computation. Out of the net process other functions may be called and acyclical execution procedure may be established.
3 Basic Elements of a High-level Language
3.1 The Function Form
The vocabulary of a safety language is a collection of simple functional units, fromwhich the more complex safety functions can be built up. For the definition of theproper words of the specification language one has to make a compromise betweensimplicity and complexity: The items should not be too elementary because then themore complex constructs loose their transparency; on the other hand they should not betoo extensive and should not contain too much information because then the languagelooses its flexibility and power.
A language for safety systems in nuclear power plants has to provide items
- for manipulation of safety indicators, for example
* simple Boolean operators
* simple numerical evaluators (threshold comparison, sort routines, max/mincheckers)
- for special technical features, as they may be
* particular controllers
• drivers for control equipment
- for operational strategies, as they are required for
"* process synchronisation and communication
"• process priority and access regulation to commonly used resources.
The single words of the language are introduced as graphical symbols, the combinationof which is ruled by the inherent properties of these functional units (number and type ofinput-output relations). The semantics of the language are given by small genericalgorithms or models connected to the single words (see below), the language power isdetermined by these functional bricks and their combination effects.
To specify a function, the input-output relation of that function has to be analyzed anddivided into smaller functional blocks (depending on the complexity of the system)revealing the constructive elements of the specific function. Then the functionaldiagram is built up using the functional units of the language as constituents andconnecting them in correspondence to the structure of the function.

293
This analysis and partition procedure aims at the reconstitution of the function fromwell-known and predefined, indivisible functional units. The verification process lateron is based on the complete verification of these constituents and is going along thecomposition rules used for the construction of the complexer function (To cover a largerrange of applications, there is the possibility to enhance the basic vocabulary by newgeneric, user defined elements).
A small (data acquisition and check) example should illustrate the construction processfor functional diagrams:
The values of two signals (received from different sensors) have to be checked forplausibility. Only if both of the values are realized as valid (not less than a fixedthreshold a and not larger than b), the larger one is selected for further evaluation;otherwise the failure of data acquisition process has to be announced.
A specification of this acquisition process is presented in the function diagram of figureI (where w stands for invalid value/failure in the acquisition process).
NUM .= range of possible values
1''Il:=NUM U foil
BOOL:= {g, I
I NUM -. •t• x BOOL A : BOOL x BOOL -- BOOL
(a :5 b 6 NUM) an usual boolean "AND"I(x,'T) ifasx b
S (0, ') else
RA: BOOL x RM X R× -- .
(b, X2) maxxx ifbm I{ else
Figure 1: Function diagram example

294
3.2 The Net Form
C ~ y.syncron.•af•Xland time constraints•
In general, the function diagrams are distributed on different processors or computersand executed independantly (according to the requirement of redundant/diversemeasurement acquisition and evaluation in safety critical systems). At special placesthe results of these calculations have to be assembled, compared and an adequatereaction has to be caused.
For the purpose of combination and synchronisation of originally separated activities,special language features have to be prepared enabling the integration and organisationof different computational procedures. So, there is a need forlanguage constructs whichallow one to express in a formal and unique way- which procedures (functional diagrams) should be combined, integrated and
worked up together- where and how a synchronisation of the independantly operating units has to be
achieved-what timing requirements have to be fulfilled (duration of calculation, cyclical
constraints)- when and how interrupts are allowed and how to continue afterwards
To meet with the requirements of assembling individual procedures and of timingconstraints a special feature is introduced into the language: the net form. The syntaxand semantics of these net constructs are borrowed from the well-known Petri netmodels adding timing facilities and modifying the rules for the dynamical behaviour ofthe classical Petri nets. These extended Petri nets, so-called time Petri nets, allow theexact specification of action sequencing in accordance with logical and timingconstraints (see below).
The arrangement and combination of function and net forms is roughly sketched infigure 2.
For synchronisation and combination of functions' results the outputs of the differentfunction diagrams are collected in a net diagram. The actual initiation of the net (leadingto an initial state, see example in figure 3 below) is caused by these function outputs. Tothe single transitions of the net there may be allocated "actions" (other functiondiagrams) which are executed in the case of transition's firing and which also may useoutput values of connected function diagrams (dashed line in figure 2). The sequencingof transitions' firing, i.e. the development of the system's activities, is determined bythe structure of the net.
In the following a detailed description of time Petri nets and their use within thelanguage is given.
Specification with time Petri nets (TPNI
In the following a formal definition of time Petri nets is given according to [7,8]. Fortreating the special requirements stated above some essential modifications to the firingrules and to the net behaviour are introduced.

295
IF
IoIiarm
ftmet l~alpm
FD1 FD 2 FD3
Time Petri Net
With action
net diagram
Figure 2: Integration of function and net diagrams
A TPN is a tuple (P, T(A), F, Mo, SIM, DIM), where
P p is a finite set of places, symbolized as circles
* T(A) is a finite set of transitions with possible actions, symbolized as rectangleswith action description
F FC P x TUT x P is a relation between places and transitions, symbolized asarcs
SM:P--*IN is an initial marking, symbolized as black tokens on thecorresponding net places
* SIM: T -- (time)intervals
* DIM: T -- (time)intervals
The SIM(t)-interval (a,, P, ) characterizes the time delay for transition firing and maybe used for the specification of synchronisation and time sequencing of transitions (andactions). These time values a, and #, are relative time indicators, relative to themoment at which the corresponding transition is enabled: Assume that transition t isenabled at absolute time T*,., then t may fire as soon as possible, but not beforeTa. +a, and not later than Tah. +fP,. These values are dynamically updated incorrespondence to the behaviour of the net (see firing rule below).
• lllll i ~l l 'll I I• II |-

296
If there is an action, added to a specific transition and the duration cannot be neglected,the DIM(t)-interval characterizes the minimal/maximal duration of this action. By thatduration value the net activities and the general behaviour may be influenced to someextent (see firing rules below).
Whereas in ordinary Petri nets the behaviour is ruled only by the markings, in TPNsadditional conditions concerning the time constraints have to be fulfilled forenabledness and firing of transitions. These conditions constitute, together with theusual marking, the state of the net and determine the next possible activity. In general, astate S of a TPN consists of a pair
S f (M,I), where
SM is a marking of the net
I, the firing domain, is the set of enabled transitions (by marking M) together withthe corresponding firing intervals (The number of entries of I will vary duringthe behaviour of the net according to the number of transitions enabled by thecurrent marking).
Now, let us assume the current state of the TPN be S = (M,I). The transitions in I areenabled by the marking M, but not all of them are allowed to fire immediately due to thetiming constraints (of the firing intervals). The "firability condition" for a transitioncontains a time parameter and expresses the fact that an enabled transition may not firebefore its left time interval value and must not fire after its right time interval value(unless another transition fires before and modifies marking M and so state S).
Accordingly, transition t is firable from state S = (M,I) at time T,, +,r iff
i) t is enabled by marking M at time Tb,.
ii) the relative time r is within the actual time interval for t
The firing rule itself is introduced by the definition of the follower state S' = (M',I')reached by firing an enabled transition t at time T.,. + r : ,.I
i) M' is computed according to the firing rule in ordinary Petri nets.
ii) The new firing domain I' is computed from I in three steps:
"* All transitions, which are disabled when t is fired, are removed from I
"* For a transition t which remains enabled by M' the new firing interval iscalculated as
a' = max {0,a-r-d)
fl' =f-r-d(for f' < 0 : SIM(t))
"* For a newly enabled transition t introduce as firing interval SIM(t)
In other terms, the first step corresponds to projecting the firing domain to thetransitions that remain enabled after t has fired. In the second step the time consumption

297
by the firing delay (and, eventually, a time duration of an action connected to t) isregarded: Time is incremented by the value r + d, which appears as an interval shiftingoperation. If the time interval has completely passed (fl' < 0 ), the transition interval isset to the original delay SIM(t).In the third step the domain of the new state issupplemented by the original firing intervals of the newly enabled transitions.
With the rule "firing transition t from state S at time ir "a relation on the set of possiblestates
STATES = I (MI):M marking,I firing domain)
is introduced and is denoted as
S --"(t) S'
A firing schedule, that means a sequence of pairs (t1,?r,), (tý,r,.) ( transitions, ?r
times), is feasible from a state S ifl there exist states S1, S2, ..., Sn such that:
S -(,t,, S1 --- (t2 ,'2 ) S2 ... .. ("ho Sn
A state S' is reachable from state S within time T' iff there is a firing schedule
(tl,jj,1 .... , (t,, rm) leading fr'om S to S' and • ri < T'TI
Therefore, the firing rule permits one to compute states and a reachability relationamong them. The set of states that are reachable from the initial state or the set of firingschedules feasible from the initial state characterize the behaviour of the TPN, in thesame way as the set of reachable markings and the firing sequences characterize thebehaviour of ordinary Petri nets.
For instance, let us consider a small example in order to illustrate the firing conditionsand the behaviour of a TPN (see figure 3a):The net is initiated providing a certain value and allowing an interruption demand (thenet is marked at the places I and 2 from an outside function). The further treatment ofthe value is delayed some time (0 , starting at the moment the net is initiated).If no interrupt is demanded within this time period 0, the transition I will fire after thattime.If an interrupt is demanded within this time period (a token appears at place 3), theinterrupt transition 2 is fired and a possibly connected action is started immediately. Inthis (interrupt) case the ongoing behaviour of the net depends on the duration of theinterrupt action:If the interrupt action is finished before 20, the transition I is still enabled and will fire,otherwise the token is removed from place I by transition 3 and the execution(transition 1) is omitted.In figure 3b the states are precisely noted and their relational combination is graphicallyplesented.

298
a bp3 mskod p3 not muked wiin
1 2 "T 6 o(.0) d meintu waj 10.0)
120,00) (20,00) tf2
t2 a r t2M T
[911,20) 00Stf
- tia 0 0
Places Transitions max I0,9-r-dl
1: value available 1: execution2: ready for in.errupt 2: inter•upt handling3: interrupt indicator 3,4: deletion
0) Marking (1,1,0)enabled transitions and intervalstl : [0, 20), t3, t4 : [20, wo
CD Marking (1,1,1)enabled transitions and intervalstl : [0-,r, 20- r), t2: [0,0],t3,tW: [20-r, co)
E) Marking (10,,0)enabled transitions and intervalstl : [max 10,0-r-d},20-r-d),t3: [220 -r-d, co)
El Marking (1.0,0)enabled transitions and intervalstl : (0, 26),t3: [max (0, 20-r-d), oo) = [0, cs)
Figure 3: Interrupt example (a: state graph, b: net specification)
In the following a more sophisticated example should give an impression about thefacilities of synchronisation and memory management by time Petri net integration ofdistributed systems:
Two values, received from different computers (output of different function diagrams),have to be compared,exactly at the time points 0, 20, 30 ,... (cyclicalsynchronisation). If the comparison indicates a critical situation, an exception handlerhas to be started, if the comparison indicates normal behaviour, the cyclical execution isstarted again. The exception handler also has to be called, if one of the values (or both)are not available right in time twice (in subsequent runs).
The net specification of this example is shown in figure 4. There, the synchronisation isestablished by the transition 5, which fires exactly at the moments 0 , 20 , 30 ,... After
that firing the evaluation trasition 4 is enabled for firing immediately, if both of thevalues are available (places I and 2 are masked in the meantime). If only one of the

299
values is missing at that moment, transition 6 (permanently enabled) gets the priorityfor firing: In that case it depends on the memory token, how to exit the net form (token atplace 9: there was no missing value before, token at place 10: there was already amissing value in the last computation cycle).
3
S(0,ca) 12
[0, wa 1
10-00
00-
25 (9,*1 [0,.)
Places Transitions
I: value I available 1/2: deletion of value 1/22: value 2 available 3: deletion synchronisation indicator3: timer 4: evaluation4: ready for evaluation 5: synchronizer5: missing value indicator 6: iniformation about missing value(&)6: values critical 7: information about criticality of values7: values not critical 7/9/10: demand for new cycling and memory update8: value(s) not available II: demand for exception handling9: memory: last evaluation successfull10: memory: last evaluation failed11: indicator for new cycling12: indicator ftor excepion andling
Figure 4: Synchronisation and evaluation example
4. Conclusions: Verification and Implementaion of theSafety Language
This paper presented an approach to formally specify software systems in a graphicallanguage - as an alternative to the classical formal approach where the relational

300
structure of a system is given in elememtary mathematical terms. The architecturalconcept for designing the graphical language by combining functional form ofrepresentation along with the net form (time Petri nets) has been described in somedetail. This composition feature allows the description of the functional evaluations aswell as the consideration of the operational behaviour of the distributed computation(concurrency, synchronisation, timing constraints).
Funion f oQrms are built up by the combination of a fixed set of basic functional unitsusing only simple composition rules. Some investigations revealed that about 50 units(most of them relatively short modules) are sufficient for the specification of the largemajority of the occuring automation problems in nuclear safety systems [9]. Because ofthe limited size of the basic units it should be possible to prove formally theircorrectness using for example the rules of the Hoare calculus [10]. For the verificationof complete function diagrams one has to consider following:
- Loops and condition branches are packed into the single functional units which canbe proven separately and in advance.
-The function diagrams themselves are constructed without any backward arcs.
With these prerequisites in general a function diagram can be translated into a(semantically) equivalent computation sequence consisting of the single functionalconstituents (linear ordering of the functional units). On the premises that the individualunits are proven to be correct, the verification process for function diagrams is limitedto the checking of the adequate transformation of the results along a linearcomputational sequence.
The net form enforces a careful construction of the system's concurrent parts anddemands an explicitely formulated schedule for the temporal patterns. Using andextending classical Petri nets or place-transition nets by adding time features allowsone to simultaneously model the behaviour and analyze the properties of timed systems.This technique is related to the reachability analysis method for usual Petri nets: Thefiring rule, modified with a timing condition, permits one to compute states and areachability relation among them. The set of states that are reachable (along firingschedules feasible from the initial state) characterize the behaviour of the time Petri netand determine in a rigorous way the actions of the system.
Using this set of states for analysis purposes, reasonable computational limits may beexceeded for complexer systems. Therefore, to find exhaustive and computationalanalysis methods for time Petri nets will be one of the main tasks for the future.Nevertheless, the examples presented in the figures 3 and 4 show that in many practicalsituations the TPN approach enables an exact definition and verification of the intendedsystem's activities.
Work carried out in this direction is in its early stage of development. Up to now thevocabulary of the graphical language is restricted to issues relevant to the operationalbehaviour of reactor safety systems. A graphical editor tool will be developed wherebyit will be possible to specify a system by generating functional diagrams and integratingthem into suitable net forms (on P graphical screen by selecting the different symbolsdisplayed on a separate window, connecting them by arcs).

301
For the purpose of analysis and simulation of the system specification the semanticalinformation about the constructed function and net forms are stored in the background.Finally, the ultimate goal will be to automatise code generation directly from the systemspecification.
References
1. Futatsugi K, Goguen J.A, Jouannaud J-P, Meseguer J. Principles of OBJ2. In:Proceedings ACM Princ. of Prog. Lang., 1985.
2. Jenes C.B. Systematic Software Development Using VDM. Prentice Hall, 1985
3. Spivey J.M. An Introduction to Z and Formal Specifications. Software Enginee-ring Journal 1989; 1
4. Bnum-nn -.r J. Representation and Verification of Discrete-Event Systems byMe ! of Petri Nets. In: Proceedings of the Third International Workshop onSoftware Engineering and its Application. Toulouse, France, 1990
5. Kaufmamn F, Schillinger D. Functional Language as User-Friendly Program-ming Aid. In: Brown Boveri Review, 1984
6. EEC SC65A/WG6/TF3(Coordinator)4. Discontinous Process Control, WorkingDraft: Standards for Programmable Controllers, Part 3: Programming Languages,1988
7. Merlin P, Faber D.J. Recoverability of communication protocols. IEEE Tram.Commun. 1976; 24:9
8. Berthomieu B, Diaz M. Modelling and Verification of Tune Dependent SystemsUsing Time Petri Nets. IEEE Trans. Software Engineering 1991; 17:3
9. Siemens AG. Sicherbeitsleittechnik, Konzeptbeschreibung Teil 1. KWU E45 1,1991 (in German)
10. Hoare C.A.R. An axiomatic basis for computer programming. Communicationsof the ACM 1969, 12
k .. . . . i m m m m I i al I II I I II mm, m•

Oreste : a Reliable ReactiveReal-Time Language
Pierre Molinaro et Olivier H. RouxEcole Centrale de Nantes / Universitt de NantesLaboratoire d'Automatique de Nantes, URA 823
Nantes, France
Abstract
The behavior during execution of an Oreste program is driven bydie application. To perform reliability, this behavior has to bealways defined. The failure of an Oreste's software componentexecution is either explicitly recovered, either implicitlypropagated to the caller of the component. This is performed by amulti-tasking extension of programming by contract, organizedpanic and/or resumption proposed for the Eiffel sequentiallanguage by B. Meyer.
1 Introduction
This work is based upon the French contribution to the Programming Language forRobots (PLR) [11 developed by the ISO working group 4 of TC 184 SC 2. Fromthis contribution, further work led to the definition of a general purpose reactive realtime language called Oreste for specifying distributed concurrence, i.e the behaviorduring execution is driven by the application; a program can be executed on amonoprocessor calculator or on calculator network without shared memory. Itrequires a real time executive on every station and an inter-station communicationmanager which provides a point-to-point communication with on-receivesynchronization. ,"
The main design goal of Oreste is security:
- the compiler should detect as many errors as possible : this is achievedthrough explicit declaration of every program entity, and strong typing ;furthermore, the behavior of programs written with a subset of the language can beexpressed by a finite states automaton ;
* always defined behavior during execution : based on a multi-taskingextension of Eiffel's programming by contract, an on-line deadlock detection, and aclean termination of concurrent execution.
An Oreste program is described by a hierarchical composition of softwarecomponents ; Oreste defines the following software components : function,

,303
procedure, task type and statements that include usual ones, and those dedicated tomulti-tasking : fork, accept, reply, request, wait and loopwait statements.
Every software component either succeeds, either fails and when its fails, the failureis either recovered, either propagated to its caller. This is performed by theprogramming by contract proposed in the Eiffel language by B. Meyer [2], [3]. Inthis paper, we describe in a first part the exception mechanism and the programmingby contract adopted by Oreste, then the Oreste's task and fork and the propagation ofa failure in a multi-tasking Oreste program, then in the last part the failure of thecommunication statement.
2 Failure, Exception and Contract
2.1 Introduction
Several languages introduce exception mechanisms for dealing with abnormal cases.Most of them (as in Ada [4], CLU [5]) are not safe, i.e. a computation can failwithout propagating the failure to the caller. By contrast, B. Meyer has defined forEiffel language [2,3] a clean and safe mechanism. In the following, we summarizeits main features.
2.2 Eiffel's Exceptions Mechanism
2.2.1 Default Mechanism
Eiffel defines the following software components : statements, routine (i.e procedureor function), and proposes the following definitions of exception and failure:
An exception is the occurrence of an abnormal condition during theexecution of a software component;
A failure is the inability of a software component to satisfy its purpose.
Every software component either succeeds or fails. Failure of a routine statementexecution implies the failure of the routine call statement execution, i.e. theexecution of the routine sequence of statements is aborted, and control is returned tothe caller. Routine call statement execution failure is just a particular case ofstatement execution failure: so, by this way, failure is implicitly propagated to thecaller, until the failure of the top-level routine that aborts execution. With thisdefault mechanism, the occurrence of an exception led to abort execution.
2.2.2 Rescue Mechanism
Eiffel introduces two ways for providing fault tolerance:"* organized panic;"* resumption.

304
Syntactically, fault tolerance is expressed at routine level by a rescue clause whichcontains a sequence of statements. Eiffel allows using a particular statement, theretry statement, only in rescue clauses. When a routine statement execution fails,the rescue clause sequence of statement is executed ; if this execution fails, theroutine call statement execution fails ; if it succeeds and the retry statement isinvoked, the routine is executed again from its first statement (resumption) ; if itsucceeds without invoking any retry statement, the routine call statement executionfails (organized panic).
Note that routine local variables are always set to their default values during routineinvocation, and resumption does not modify any variable : so re-execution is startedwith current values.
Organized panic is useful just for restoring a clean state, by example for allowingresumption at a higher level. In either case, note that the rescue clause does notperform the purpose of the routine.
2.23 Programming by Contract : Preconditions and Postconditions
An Eiffel routine can be completed by an optional precondition and an optionalpostcondition.
A precondition expresses condition that must be satisfied by the context and/or thevalues of effective routine call parameters before the execution of routine firststatement. Syntactically, a precondition is defined by a set of boolean expressions,which have to be evaluated true ; if evaluation fails, or if one of them is false, theroutine is not executed, and the routine call statement execution fails.
A postcondition expresses conditions that must be satisfied by the context and/orlocal variables values after the execution of the routine sequence of statements hassucceeded. Syntactically, a postcondition is defined by a set of boolean expressions,which have to be evaluated true ; if evaluation fails, or if one of them is false, therescue clause is executed as defined before.
Preconditions and postconditions are the basis of B. Meyer's programming bycontract [2]. It is essential to express this contract precisely. A contract representsthe service that a software component has to perform, and necessary conditions toexecute it.
Oreste has adopted Eiffel's exception mechanism and programming by contract;however, as Eiffel is a sequential language, the exception mechanism has to bextended.

305
3. Concurrency in Oreste
As many other concurrent languages, concurrency in Oreste is expressed throughparallel execution of sequential tasks ; we have adopted the Ada definition [4] : aprogram without any task is executed sequentially on a single logical processor.Tasks are entities whose executions proceed in parallel in the following sense : eachtask has its own logical processor; different tasks (different logical processors)proceed independently, except at point they synchronize. However, there are severaldifferences between Ada and Oreste tasks:
"* Oreste tasks can be described only through task types,"* an Oreste task has its own private variables (there is no shared data
between tasks) ;- tasks declaration, instantiation, and execution is handled by a new
dedicated statement, the fork statement.
3.1 Task types
In Oreste, we cannot describe directly a processing task but only a model of task wecall a task type. Every task type can be instanced in order to obtain a processingtask. A task type is described by a set of private variables, a set of ports and a set ofprivate procedures and functions ; ports defines communication/synchronizationpotentiality with other tasks ; one particular procedure is the main one ; executionof an instance consists of executing the main procedure. An Oreste application is aset of task types and its execution consists of instantiation of a particular task type,the root task type and to execute it.
As execution of a task is sequential, Eiffel's exception mechanism applies : so a task
execution either succeeds, either fails.
3.2 Basic Fork Statement
32.1 Presentation
The only way to express concurrency in Oreste is using the fork statement, whichdeclares a set of tasks, links between the tasks ports, and tasks scheduling throughthe scheduling clause. The scope of declared tasks is limited to the current forkstatement, so a concurrent execution is completely embedded within a forkstatement.
In the following example (figure 1), the fork statement declares three tasks : thetasks T1 and T2, insuaces of elsewhere defined task type tasktypel, and the taskT3 instance of elsewhere defined task type t askt ype 2. Theses task types define noport (i.e. there is no communication/synchronization between the tasks Ti, T2 andT 3) ; the scheduling clause specifies parallel execution between the execution of T 1and the sequential execution of T2 and T3.

306
forktask T1,T2 typetaskltask T3 : typetask2 ;
begInTi Ii ; T3)
end fork
Figr 1: Example of Fork Statement
More generally, the scheduling clause is an expression whose operands are thedeclared tasks and whose opemators are sequential and parallel operators. Parenthesiscan be used to show grouping. Each declared task must appear exactly once in thescheduling clause.
The sequential execution is expressed by the ";"operator which is associative•
A; (B;C) 4:* (A;B) ;C * A;B;C
The parallel execution is expressed by the "I I" operator which is associative andcommutative:
Al I (BI IC) €:* (Al JB) I IC 4-* Al JIe IC
Al IB 4 BI IA
The parallel operator has higher priority than the sequential operator:
Al IB;C 44 (Al JB) ;C
The execution of the basic fork statement consists of the following steps.* instancing all declared tasks, including setting the task private variables
to their default values ;"* concurrent execution, as specified by the scheduling clause;"* destructing all declared tasks.
322 Execution and Failure of Fork Scheduling Clause
Depending from the execution of the fork scheduling clause, a fork statementexecution either succeeds, either fails.
Scheduling clause execution is recursively described by the execution of sequentialexecution of its terms and parallel execution of its factors. Sequential execution ofA; B, where A and B are scheduling clause terms, is defined as follows:
- A is first sated ; when A has succeeded, B is started ; when B succeeds,the execution of A; B suceed;

3074€ fails; * if the execution of A fails, B is not executed, and the execution of A; B
- if the execution of B fails, the execution of A; B fails.
Parallel execution of A I I B, where A and B are scheduling clause factors, is definedas follows:
A and B are started in an order that is not defined to the language ; whenboth have succeeded, the execution of Al I B succeeds;
• if the execution of A fails, the execution of A IIB will fail when B willterminate its execution (by a success or by a failure) ;
•by symmetry, if the execution of B fails, the execution of A I I B will failwhen A will terminate its execution.
Note that failing of one task of a parallel expression does not directly influence theother one, because "different tasks proceed independently, except at point theysynchronize" ; so failing of a task affects the behavior of other tasks only whenthey wish to synchronize with it.
The propagation of the failure of a task can be abstracted as follows : failure of acomponent of a sequence causes the failure of the sequence ; failure of a componentof a parallel expression does not affect directly other components, however, when allother components have succeeded or failed, the parallel expression will fail.
3.23 Example
We go back to the scheduling clause of the figure 1:
Ti I I ( ; T3)
The propagation of the failure of a task to the failure of the fork scheduling clause isas following :
.if the execution of the task TI fails, the fork scheduling clausewill fail when the execution of T3 will terminate ;
- if the execution of the task T2 fails, the fork scheduling clausewill fail when the execution of the task T1 will terminate. The task T 3 is notexec-d;
* if the execution of the task T3 fails, the fork scheduling clausewill fail when the execution of Ti will terminate.
3.3 Fork Statement with Post Conditions and/or RescueClauses
A fork statement can be completed with an optional postcondition, and an optionalescueclause.
, n n

308
The post condition is evaluated only if the scheduling clause execution has
The rescue clause is executed when the scheduling clause has failed, or when the postcondition has failed. Oreste does not defines a Eiffel's retry statement (it acts as agoto), but uses a predefined boolean local variable, called DoRet ry. At the end of theexecution of the rescue clause, if the boolean variable DoRet ry is true, thescheduling clause is executed again.
As for an Eiffel routine, execution of a rescue clause leads to organized panic orresumption, which consists of executing again the fork declared tasks. Note that, asthe tasks are not destructing when the scheduling clause execution terminates, theyare not re-instanced, and the task private variables are not resetting to their defaultvalues.
Note that although a fork statement execution includes concurrent execution, postcondition evaluation and rescue clause execution are sequential.
The programming by contract and its multi-tasking extension provides both adebugging mechanism and a tool for fault tolerance and failure recovery.
Figure 2 shows a fork statement with a post condition and a rescue clause ; figure 3illustrates the effect of reutyng execution : Ti and T2 are first instanced, and thenstarted ; both tasks succeed ; but evaluation of post condition fails, leading executionof the rescue clause, that sets the 'DoRetry' variable to true; So Ti and T2 are re-executed ; both tasks succeed, also does post condition evaluation ; both tasks arethen destructed: fork statement execution has succeeded. If the second evaluation ofthe post condition should have failed, the second execution of the rescue clauseshould set the 'DoRetry' variable to false, leading to the failure of the fork statementexecution.
FirstAttempt true ;fork
task Ti typetaskl ;task T2 typetask2 ;
begin
T I I T2ensure
-- boolean expressionsres cue
DoRetry :- FirstAttempt ; FirstAttempt :- false ;end fork ;-- statement b
Figure 2: Example of Fork Statement with post condition and rescue clause

309
n is2 s aied RESCUE clause,creation of TI TI is started 'DoRemry' is set to true destruction of T7
Sychronizatn ad ,.conmmition I oa r condition txe c poon eptrof orTl
Task T2 ......
Fig=r 3 : Fork statment execution with retry
4. Failure of Communication Statements
Synchronization and communication in Oreste comes from the concept of "port"
introduced by Silberschatz [6]. It achieves synchronous message passing, withoutexplicit naming of the correspondent. Every port has one and only one owner, andone or more users. An Oreste port performs [7]:
- for users, synchronous sending-and-receiving by the request statement;- for the owner, synchronous receiving by the accept statement and
asynchronous sending by the reply statement ; every accept statement executionmust be balanced with a reply statement execution ; one or more accept statementscan appear in wait and loop wait statements, corresponding respectively to thealternative and repetitive commands of CSP [8, 9].
A task declares all the ports it owns and it uses ; theses declarations introduce localnames and specify the type of the transmitted information. In a fork statement, linkclauses define the links between the different ports of the tasks.
Note that using local names allows the writing of general type tasks : by contrast,Ada entry calls either explicitly names the corresponding task, either implicitnaming is resolved through visibility rules. Furthermore, as all potentialinteractions are declared in the fork statement, all potential correspondents are alwaysknown.As other statements, request, accept and reply statements either succeed or fail.If all users of a port are terminated when the owner invokes an accept or a replystatement, the communication statement fails. Also, if the owner of a port isterminated when an user invokes a request statement, the request statement fails.As for other statements, the communication statement execution failure causes therescue clause of current procedure to be executed. This ensures that a task neverwaits for a communication when all its potential correspondents are terminated andallows a clean and automatic termination of tasks.

310
5 Conclusions and Perspectives
The multi-tasking extension of programming by contract, organized panic andresumption provide both a debbugging mechanism and a mechanism for faulttolerance and failure recovery for real time application programs. Failure arerecovered or propagated on run-time, it allows an always defined behavior duringexecution of an Oreste program. Also, the communication lock, when all thepotential correspondent are terminated can be avoided by the failure of thecommunication statement. However, the problem remains in the case of deadlockbetween several tasks. The behavior of programs written in a subset of the languagecan be expressed by a finite states automaton, so that off-line deadlock detection canbe performed. For the full language, current work is in progress for providing an on-line deadlock detection mechanism.
References
1. ISO ITC 184 / SC 2 / WG 4 / N106 ISO /WD 11513.1 Manipuling Industrial Robots,"Programming Languages for Robots" (PLR) SepL 91.
2. B. Meyer, 'Applying "Design by Contract ", IEEE Computer, pp 40-51, october 1992.
3. B. Meyer, "Object-Oriented Software Construction", Prentice Hall, Englewood Cliffs,N.J., 534p., 1988.
4. Le Langage de programmation ADA. Norme AFNOR NF EN 28652, 1989.
5. Barbara Liskov, John Guttag, "Abstraction and Specification in ProgramDevelopment", MIT Press.
6. A. Silberschatz, "Port Directed Communication", The Computer Journal, Vol. 24, n0 l,pp 78-82, 1981.
7. O.H. Roux, P. Molinaro. "M6canismes de communication et de synchronisation dulangage Temps Reel Oreste", JJCSIR, Grenoble, France, pp 5-10, 14-16 April 1993.
8. C.A.R. Hoare, "Communicating Sequential Processes", Comm. of the ACM, Vol. 21,n°8, pp 666-677, 1978.
9. E.W. Dijkstra, "Guarded Commands, Nondeterminacy and Formal Derivation ofPrograms", Comm. of the ACM, Vol. 18, n08, pp 453-457, 1975.
" • l l iI ll ll ilH

S~INVITED PAPER

How Far Can You Trust A Computer?
Carl E. LandwehrCenter for High Assurance Computing Systems,
Naval Research LaboratoryWashington, D.C., U.S.A
Abstract
The history of attempts to secure computer systemsagainst threats to confidentiality, integrity, andavailability of data is briefly surveyed, and thedanger of repeating a portion of that history is noted.Areas needing research attention are highlighted, anda new approach to developing certified systems isdescribed.
1 Introduction
Concerns about the security of data processed by or stored in computers areprobably as old as computing, at least in the sense that some of the earliestmodern computing machines were built and used in sensitive applications -for example, the Polish "Bombe" and its British descendants that wereused to attack German ciphers during World War II [1. But it was onlywith the development of large-scale, shared multiprocessing systems thatcomputer security, in the sense that term is used today, began to be an issueof general concern. The advent of time-sharing systems in the late 1960'sand early 1970's brought the difficulties of protecting users from each otherwithin a single computing environment into sharper focus, because peopleexpected to store data for long periods in such systems, as well as to receivea fair share of interactive computing services. This paper will reviewbriefly some of the history of computer security work starting from thattime, summarize some of the lessons we have learned, sketch a recentlydeveloped approach to developing and certifying computer systems withsecurity requirements, and suggest some research directions.
F U nI i l mm m n l l m m l l lmll ...

314
Because words like "security" and "trust" are commonly, but imprecisely,used, we introduce a few definitions before proceeding. We say a computersystem is secure if it can preserve the confidentiality, integrity, andavailability of the data it processes and stores against some anticipatedset of threats. Preserving confidentiality has typically denoted protectingthe data against unauthorized disclosure; preserving integrity hasdenoted preventing its unauthorized modification; and preservingavailability has denoted preventing its unauthorized withholding. Thesedefinitions are perhaps narrower than the casual reader might expect, andindeed they have provoked some debate even within the computer securitycommunity. Integrity, in particular, continues to be a much-debated term[2]. A computer system or component is trusted if we rely on it to performsome critical function or preserve some critical property (such as security);it is only trustworthy if we have evidence to justify the trust we place in it.A computer system is called multilevel secure (MLS) if it is trusted toseparate users with different clearances from data with differentclassifications.
2 Penetrate and Patch
When, in the late 1960's and early 1970's, operating system developers(and their customers) began to discover that their operating systems weresomewhat less secure than they had thought, they treated security flawslike any other bugs, and installed fixes. Customers who were particularlyinterested in the security of their systems sometimes hired "tiger teams" totry to penetrate them, so that all holes might be found and patched. Oneproduct of such efforts was the flaw hypothesis methodology, whichsuggested an informal but systematic approach to this activity [3].
This approach to computer security was a victim of its own success - notits success in achieving secure computer systems, but its success inpenetrating insecure ones. Every time a new person or group attempted topenetrate a system, even one that had previously been penetrated andpatched, new holes were found [4]. Although records were sometimescollected concerning the holes found, they were not widely circulated, andmany of them have since been lost [5]. A forthcoming research reportcollects fifty surviving examples and proposes a taxonomy for organizingthis kind of data [6]. Figure 1 reproduces a chart from that reportcharacterizing the genesis, location, and time in the system life cyclewhere these flaws were introduced. The taxonomy and charts in thatreport are intended to provide a helpful method for abstracting currentflaw data so that future attempts to improve system security can build on astronger empirical base.

315
CL c
~~IL
e ------
.2 E
--- A___*.E3-L
0 0 i. 2 t
4D a
2
2
LW LS
SjSOUO!D MBI~j 0 0 x 0 4

316
3 Technology for Trustworthy Operating Systems
The discouraging results of penetrate and patch activities led to therealization that a more systematic approach to building secure systemswas needed. From the operating system notion of monitors as softwarecomponents that controlled access to critical system resources, computersecurity researchers developed the concept of a reference monitor thatwould validate that all references issued by subjects (executing programs)to objects (memory and files) were consistent with an access control policy[7]. If the hardware and software needed to perform the reference monitorfunctions could be isolated and encapsulated in a small and simple enoughpart of a system so that high confidence in its correctness could beestablished, that component would be called a security kernel [8]. For sometime, researchers labored to demonstrate prototype security kernelimplementations. The difficulty of actually isolating all of the code onwhich security-enforcement depended proved greater than had beensupposed, but it nevertheless seemed clear that much more trustworthysystems could be built using this approach than by the penetrate-and-patch method.
To persuade vendors to build more trustworthy systems and to make iteasier for users to purchase such systems, the U.S. government establisheda National Computer Security Evaluation Center in 1981. It was to producea set of computer security evaluation criteria and then evaluate productssubmitted voluntarily by vendors. Results would be maintained on anEvaluated Products List that could be used to qualify products forgovernment purchase; this qualification provided the incentive forvendors to submit their products for evaluation.
The Trusted Computer System Evaluation Criteria, better known as "theOrange Book," which defined seven different evaluation levels, appearedofficially in 1983. It defined a trusted computing base as the "totality ofprotection mechanisms within a computer system ... that is responsible forenforcing a security policy." Thus a system that had its securityenforcement mechanisms distributed throughout its software andhardware could be said to have a trusted computing base, but not a securitykernel. Only the highest two levels defined by the TCSEC (B3 and Al)require that the TCB be structured to exclude code not essential to securitypolicy enforcement - that is, to have a security kernel.
The Orange Book was tacitly based on an abstraction of the dominantcomputing model of the 1970's: a shared, central-server timesharingsystem. As the computing world shifted toward workstations and
, nmmnn inuuim lll uniunu n nIn ngi0

317
networks, it became clear that, at the very least, some additional thoughtwas required to see how to apply the Orange Book in this context. Oneresult of this re-thinking was the Trusted Network Interpretation of theTCSEC (the "Red Book"), published in 1987.
It also became clear that having an operating system that could separatedifferently classified information from differently cleared users was notthe same thing as having an application that provided a useful MLSinterface. The operating system might support a variety of applications,each operating at single security levels or it might support severalinstances of the same application, with each instance operating at adifferent (single) level. But to support a single application that operatedacross a range of security levels required that some of the securityenforcement be provided by the application - the product TCB would haveto be modified or extended to incorporate parts of the application in thiscase. To address this issue, particularly in the context of databasemanagement systems, the Trusted Database Interpretation was publishedin 1991.
The rest of the world did not sit still during this period. Toward the endof the 1980's, France, Germany, the Netherlands, and the United Kingdomproduced the Information Technology Security Evaluation Criteria (theITSEC) - a "harmonised" version of evaluation criteria created jointly byrepresentatives from all four countries. The ITSEC permit greaterflexibility than the TCSEC, in that vendors and customers can separatelyspecify functional requirements and assurance requirements, which arejoined in the Orange Book classes. The ITSEC also attempt to define astructure that supports both product and system evaluation, although theirutility for the latter role is not universally accepted. The CanadianTrusted Product Evaluation Criteria (CTCPEC) also permit separatingfunction and assurance, but (as their title indicates) is restricted to productevaluations. However, the CTCPEC have gone farthest in explicitlyaddressing integrity and denial-of-service (availability) issues.
4 What We Can Do Today
Many products have been built and submitted for evaluation in the decadesince the Orange Book first appeared. As of June 1992, the U.S. EvaluatedProducts List included over a dozen products rated C2, four rated BI, tworated B2, and one at B3; in addition there are two systems that have beenevaluated as network components under the TNI; one received a B2 ratingand the other an Al. Products have also been evaluated successfullyagainst the ITSEC and the CTCPEC.

318
On this basis, it seems fair to conclude that today we can specify, design,and build operating system products to meet the requirements reflected byOrange Book levels D through B3. We also know how to evaluate productsagainst those criteria, and there is some evidence that products satisfyingthe higher levels of the criteria are indeed more difficult to penetratethan those that don't.
These conclusions should be tempered with the understanding that theevaluation process is still typically long, arduous, and, particularly at thehigher assurance levels, expensive. This fact is partly attributable to theway that the evaluation process has evolved, as Steve Lipner noted in hisinsightful paper presented two years ago [91, but it is also attributable tothe fact that developing high assurance systems based on security kernelsrequires greater control and documentation of the system engineeringprocess, and particularly the software engineering process, than mostdevelopers customarily provide.
Something else that we can (and do) do today is plug together systemsfrom products, including workstations, local area networks, routers,gateways, and software from a wide variety of sources. Often thesesystems perform their functions quite effectively, but the security theyprovide is usually hard to determine and hard to control, even if thesecurity properties of the individual components are known.
5 Problems We Face
There are many problems that need to be solved before we will see thewidespread and effective application of trustworthy computingtechnology. A few of these problems are highlighted in this section; thefollowing section reports some recent advances in addressing the first ofthem.
We need less costly product evaluation/system certification techniquesthat can be applied more quickly, but with effectiveness at least equal tocurrent approaches. Problems with the current product evaluation processin the U.S., as described by Lipner [9], have stimulated attempts toimprove it. Unquestionably, better methods are needed, but there seems tobe an increasing tendency in some quarters to accept commercial off-the-shelf products, together with some form of testing, as sufficient to assurethe security of a product. We must be sure that this tendency does notsimply lead us back to the discredited "penetrate-anO patch" paradigm.Research areas relevant to this problem include techniques for assessingsoftware development methods, techniques for documenting and assessingsoftware specifications and designs, tools and methods for product testing,and reverse engineering methods.

319
We need better ways to understand the security provided by compositeand distributed systems. The only reason that we can build systems todayby plugging them together is that there is a degree of standardization atthe level of physical connectors and device protocols. These standardspermit the possibility of component-based system engineering. We are notlikely to be able to deduce much about the security provided by systemsbuilt this way, however, until at least a comparable level ofstandardization of the security functions and assurances provided bycomponents is achieved. Further, we must take into account the potentiallyworld-wide distribution of modem systems, which, particularly in thecommercial sphere, often means that reliable authentication of theoriginator and recipient of a message, rather than the confidentiality ofits contents, is the paramount security concern. Research areas thataddress this issue encompass abstract, formal work on security modelingtechniques that support composition and decomposition, methods and toolsfor reasoning about and finding flaws in cryptographic protocols, andconcrete approaches for standardizing security function and assurancerequirements.
We need better ways to control the security functions that current (andfuture) systems provide. Many actual security problems occur not becausesecurity controls are lacking but because the existing controls have not beenset up correctly. Steve Kent of BBN Communications has observed that theUS is a country of people who are unable to program their videotaperecorders, yet we are building interfaces to our security controls that aremuch more complex than the average VCR control panel. It is difficult tofind much research aimed at this problem presently, but work to identifycommon requirements for application-based security controls and todevelop user and administrator interfaces to them that are based on workin the area of human-computer interaction could lead to significantlyimproved security in practice.
We need to develop practical methods for building high assurancesystems. There are definite needs for systems that can provide very highconfidence that they will not have security failures. The leadingtechnology for developing high assurance software is to apply formaltechniques to its specification and development. Although a recent studyshows increased industrial application of formal methods [10], their use isstill seen as a significant cost factor, and there is uncertainty as to whetherthey can be successfully applied in large projects. Further, it is difficult toassess the cost-effectiveness of their application because it is hard toquantify the security provided by the resulting system. Imaginativeapproaches are needed to organize systems so that requirements for highassurance software are kept to a minimum. We need practicalmethodologies for exploiting formal methods on those portions of systems

320
that unavoidably require high assurance, and we need methods to estimate4 or measure the security actually provided.
We need to broaden the scope of "security" and to develop methods foraddressing security properties in conjunction with other critical systemproperties. Few systems are purchased strictly to provide security."lypically, a customer requires a system to perform some function -communication, record keeping, real-time control, etc. - and mayacknowledge that to perform the function properly, some securityrequirements must be met as well. In commercial applications,confidentiality may frequently take a back seat to integrity andauthenticity, and availability may be the strongest security concern. Incontrol systems, timely delivery of results may be paramount. If we are tobuild systems that incorporate security as well as the other propertiesusers require, we need techniques for developing designs that can meet avariety of critical requirements and that permit a system designer to makerational trade-offs among them. Research that permits quantification ofcovert channel bandwidths, for example, is a step in this direction to theextent that it permits us to quantify the rate at which a particular systemdesign permits information to leak [111. Work to model denial of serviceprotection is similarly relevant [121.
6 Developing and Certifying Trustworthy Systems:A New Approach
As noted above, we cannot at present develop and certify the securityproperties of integrated systems nearly as well as monolithic products. Inthis section, we briefly describe an informal, but structured, approach tosystem development and certification developed recently at the NavalResearch Laboratory. This approach has yet to be applied in sufficientdetail to a large example to permit us to make strong claims about itseffectiveness, but it is based on concepts proven in our earlier work [13,141.It has strong intuitive appeal, both as a way to address securityrequirements during system development and as a way to explain to theaccreditor (the person responsible for deciding whether to permit thesystem to be operated) what security the system provides and what risksits operation would pose. Certification denotes a technical assessment ofthe ability of a system to meet specified technical standards (e.g. forenforcing security requirements). A more comprehensive description of thisapproach has recently appeared [151.
The approach is based on recording assertions and assumptions thatcapture the system security requirements within the framework of adocumented assurance strategy. At the beginning of the project thisstrategy records both an initial, high-level, abstract version of the

321
assurance argument for the system as well as the plan for creating thefinal, more detailed and concrete assurance argument that will form theprimary technical basis for the certification decision. As the projectprogresses, the assurance strategy is elaborated to reveal the increasinglydetailed outline of the assurance argument, which demonstrates that thesystem as designed and built actually satisfies its security requirements.This argument will not exist as a separate document; the final assurancestrategy will in effect be an index to other parts of system documentation(software specification and design documents, test plans and results, etc.)that provide the "nuts and bolts" of the assurance argument. WNth thisapproach, certification of a trusted system can largely be accomplished asan audit of the development process.
For a given system, assertions are predicates that are enforced by thesystem, and assumptions are predicates that must be enforced in thesystem's environment. The system itself is unable to enforce itsassumptions, but must rely upon them. Together, assumptions and assertionsrepresent what must be true of the system and its environment to satisfythe security policy. If an assumption or an assertion is false, a securityviolation may occur.
For example, consider a medical information system used by physicians,nurses, and pharmacists within a single hospital to record the currentsymptoms, diagnosis, treatment plan, and billing information for eachpatient. Suppose that the system's security policy requires that (1) only anadministrator can create a new patient record or enter authorizations fordoctors, nurses, and pharmacists to use the system, (2) only physicians mayupdate the recorded diagnosis and treatment plan, (3) nurses may updatethe record of symptoms and medication administered, and (4) pharmacistsmay read the treatment plan but can only update the billing information.Finally, (5) patients are prohibited from any access to the system.
The architect of such a system has a number of security disciplinesavailable to help satisfy system security requirements, including personnelsecurity, physical security, procedural security, communications security,computer security, and others. The system architect typically seeks themost cost-effective combination of methods drawn from these disciplinesthat will satisfy the overall system security policy in the face ofanticipated threats.
If the system architect decided to rely primarily on the discipline ofcomputer security to enforce the security policy, most of the predicateswould be enforced by the medical information system software, and theywould be assertions about that software system. If the architect chose torely on personnel and procedural security measures (e.g., by training theusers in their roles and relying on them to invoke only the system functions
,•n~~~~~~~w
l In nlNI N IIIII
..

322
appropriate to those roles) then, from the standpoint of the informationsystem all of the predicates would be assumptions about the environmentin which it operates.
The assurance strategy provides a framework for recording the assertionsand assumptions according to a chosen system security architecture.Suppose a design is developed that requires the administrator to use, andto write down on paper, a password for authentication purposes. Figure 2
CO(MPUSEC
Assertions1. Onl admnistratr can Iauthorize physician.2. Ony pysician can updatedia nsis ndtreatment plan.[
1. Administrator assigns INsand roles for physicians,staff, etc. properly.
2. Adminis trator keeps
PERSONNEL SEC PHYSICAL SEC.
Assertion AssertionAdministrator receivesproper training in System Administrator has safe.
Assumption Assumptions1. Administrator doesn't J .Administrator keepsm safe locked.
-2. Safe meets specs fortamper-resistance.
Figure 2. Part of an assertion strategy.
illustrates part of an initial assurance strategy for the medicalinformation system example. Notice that each assumption is supported byan assertion from another discipline or else maps to the "vulnerabilities"symbol. In this representation, assertions do not map to other parts of theframework; they form a set of requirements to be satisfied by thediscipline in which they occur. The full assurance strategy for

323
COMPUSEC, for example, would have to explain what kind of assurancewould be provided that the COMPUSEC assertions are enforced (e.g.,through use of a trusted computing base supporting access controls).
A certifier can review the assurance strategy at the beginning of thedevelopment and decide at that time whether this strategy (if followed)is likely to produce an acceptable assurance argument at delivery. Theassurance strategy may be modified during the development, since asdesign trade-offs are made it may be appropriate to modify the kind ordegree of assurance (e.g., code reviews, formal verification, testing)required to support particular parts of the assurance argument that is beingcreated. It allows certifiers to assess the role various design decisionsplay in the overall assurance argument and to determine whether theproposed assurance techniques are effective for demonstrating the validityof the decision.
This approach is not a panacea; correctly defining the security policyand creating a complete assurance argument will continue to be achallenging task. But it does promote the integration of system andsecurity engineering, it can reduce the risk that unforeseen certificationissues will impede system development and delivery, and it can make therisks of operating the system more dearly visible to the accreditor.
7 Summary and Conclusion
We have reviewed briefly the development of trustworthy computingtechnology. Readers should particularly note the lessons of the "penetrateand patch" approach, so that we do not repeat the experiences of that era.We have noted needs for improvements in system certification methods, inunderstanding security implications of composite and distributed systems,in the control interfaces for security functions, in methods for developinghigh assurance systems, and in integrating security and other criticalproperties. Finally, we have glimpsed a new approach to systemcertification.
How far can we trust computers? We already trust them to fly ourairplanes and rockets, and it is certainly easier to purchase a computersystem and know its security properties now than it was ten years ago. Butwe still have far to go to before we can make rigorous statements about thetrustworthiness of the software in our trusted systems.
References
1. Hodges A. Alan Turing: the enigma. Simon and Schuster, New York,1983.

324
2. Sandhu R. On four definitions of data integrity. In: Keefe, T (ed) Proc.4 IFIP WGI1.3 seventh working conf. on database security, Sept., 1993 (toappear as Database Security VII: Status and Prospects, Elsevier, 1994).
3. Linde R. Operating system penetration. In: Proc. National ComputerConference, 1975. AFIPS Press, Montvale, N.J., 1975, pp 361-368.
4. Neumann P G. Computer security evaluation. In: Proc. NationalComputer Conference, 1978. AFIPS Press, Montvale, N.J., 1978, pp 1087-1095.
5. Bisbey R. Personal communication. 26 July 1990.
6. Landwehr C E, Bull A R, McDermott J P, Choi W S. A taxonomy ofcomputer program security flaws with examples. NRL Report(forthcoming), Naval Research Laboratory, Washington DC, 1993.
7. Anderson J P. Computer security technology planning study (vols I andII). ESD-TR-73-51, Hanscom Field, Bedford MA; NTIS AD 758 206,1972.
8. Gasser M. Building a secure computer system. Van Nostrand Reinhold,New York, 1988.
9. Lipner S B. Criteria, evaluation, and the international environment:where have we been, where are we going? In: Lindsay and Price (ed), Proc.IFIP-SEC 91, Brighton, England. Elsevier - North Holland, 1991.
10. Craigen D, Gerhart S, Ralston T. An international survey of industrialapplications of formal methods. NRL Report 9554, Naval ResearchLaboratory, Washington DC, 1993.
11. Gray J W. On introducing noise into the bus-contention channel. In: Proc.1993 IEEE CS Symp. on Research in Security and Privacy. IEEE ComputerSociety Press, 1993, pp 90-99.
12. Millen J K. A resource allocation model for denial of service. In: Proc.1992 IEEE CS Symp. on Research in Security and Privacy. IEEE ComputerSociety Press, 1992, pp 137-147.
13. Landwehr C E, Heitmeyer C L, McLean J. A security model for militarymessage systems. ACM Trans. on Computer Systems 1984; 2(3):198-222.
14. Froscher J N, Carroll J M. Security requirements of Navy embeddedcomputers. NRL Memorandum Report 5425, Naval Research Laboratory,Washington DC, 1984.

325
15. Payne C N, Froscher J N, Landwehr C E. Toward a comprehensiveINFOSEC certification methodology. In: Proc. 16th National ComputerSecurity Conference. National Institutes of Standards and Technology/National Computer Security Center, Baltimore, MD, Sept. 1993.
L

Session 10
SECURITY
Chair: P. DanielGEC Marconi Secure Systems, UK

Security Audit Trail Analysis UsingGenetic Algorithms*
Ludovic M6Laboratoire d'informatique, SUPELEC
Avenue de la BoulaieB.P. 28, F-35511 Cesson S~vign6 Cedex
France
Abstract
We propose a security audit trail analysis approach basedon predefined attack scenarios and using geneticalgorithms. This paper shows the validity of this approachand presents some o its problems.
1. Introduction
Several approaches exist in computer security: (i) enforcing users' respectto particular rules when they are using the system, (ii) identifying threatsto the system (COPS [1] is the best known tool in the UNIX world forsuch an identification) and (iii) recording some or all actions performedon the system in order to analyze the trail to detect some attacks (it is anafter-the-events detective control).
The third approach is known as "security audit trail analysis" (SATA)and seems especially important because 21 (i) even the most securesystems are vulnerabl to legal usersv misuses (audit trails may be the onlymeans of detecting authorized but abusive user activity), (ii) existingsystems have security flaws and thus are vulnerable to attacks, (iii)substitution of existing systems by secure ones is not easy to achieve foreconomic reasons and (iv) development, installation and management ofsecure systems is not an easy task.
So we need to record events in audit trails. However there are someproblems: (i) this approach is very expensive in terms of disk space, (ii)its impact on the systems performance is noticeable and (iii) its efficiencyis low because the security officer (SO) has to manage such a hugeamount of data recorded that it is not humanely possible.
Our objective is to design an automatic tool to increase the SATAefficiency. This paper presents our work with the following framework.Section 2 exposes two classical approaches for intrusion detection.Section 3 introduces an alternative approach based on attack scenarios.In section 4 we give our own vision of the security audit trail analysisproblem which is proved to be NP-complete. Section 5 proposes a briefsurvey of genetic algorithms (GA). In section 6 we derive a simplified butstill NP-complete version of SATA and show how to apply GAs to it.Section 7 discusses our experiments which exhibit fairly good results.Section 8 highlights some remaining problems of our approach andsection 9 concludes the paper.
Pierre Rolin (T6lcom Bretagne) supervises this PhD work.

330
2. Two Classical Approaches
4 Intruders can attack a system using either unknown or known techniques.In the first case, a possible strategy for the SO to detect intrusion is theuse of a statistical approach (reference [3] uses neural networks). The SOhas to respond to the question "is the users behavior normal according tothe past?". This approach is known as "the comportemental model" [2].In the second case, it is possible to provide attack detection rules whichenables the SO to use expert systems tools. The question is "does the userbehavior correspond to a known attack?". Some tools, and especially themost famous, IDES (Intrusion Detection Expert System) [4][5],implement both approaches. Others rely on expert systems exclusively.Some tools already provide quasi-real-time intrusion detection.
The statistical approach leads to some problems: (i) the choice of theparameters of the statistical model is tricky, (ii) the statistic model leadsto a flow of alarms in the case of a noticeable systems environmentmodification and (iii) a user can slowly change his behavior in order tocheat the system.
In the expert system approach, the SOs knowledge is encoded in a setof rules used to analyze the audit log. In practice, however, the SO hasonly gained limited expertise, essentially because the huge amounts ofdata recorded leads to an untractable duty.
3. An Alternative Approach
A third approach, "model-based reasoning", is recommended as anadditional intrusion detection system by Teresa Lunt and Thomas Garvey[61. It consists of designing attack scenarios as sequences of user
ehavior. These behavior sequences are then translated (depending onthe audit system used) into audit events' sequences (for example thepassword copy activity is translated into an execute access to / b i n / c pand a read access to /etc/passwd). Using attack scenarios has someadvantages:1. the SO can design the attack scenarios himself according to the
threats he is afraid of,2. the modification of an existing scenario or the addition of a new
scenario (e.g. after its detection by a statistical method) is easy,3. the events to be stored are only those present in at least one scenario,4. the SO can attribute to each scenario a weight, according to the
consequences of the corresponding attack.
We use this approach for our work. Let us consider the attackscenarios as sequences of audit events. A method to simplify the design ofthe scenarios must be found. We propose the following requirements forthis method:I. it should spare the designer the trouble of enumerating all the possible
variants of the same scenario2. it should allow the shortest expression of any scenario, especially
when it contains repetitive patterns (e.g. denial of service)3. it should be as general as possible in order to allow the design of any
scenario.
It is useful to refer to the works done in the field of pattern matching:the set of audit events can be seen as an alphabet, each audit event as acharacter, the audit trail as a main string and the scenarios as sub-strings

331
to locate in this main string. To reach the previous requirements, wechose regular expressions with back referencing (rewbr) [a.s a languageto design the attack scenario. The referencing operator allows the designof any scenario.
In this way, the "security audit trail analysis problem" (SATAP)becomes similar to a "finding a rewbr in a string" problem (FRSP). TheNP-Completeness of FRSP [7] makes classical algorithms quiteimpossible to apply to real audit logs (recall the huge amount of datarecorded).
4. A More Precise Expression of the SATA Problem
If the SATA was made attack by attack (i.e. rewbr by rewbr), exclusiveattacks could be declared present at the same time. To avoid thisproblem, we have to consider the whole set of attack scenarios in a singleanalysis. We have to determine, among all the possible attacks' sub-sets,the one which presents the greatest risk to the system. For this, wesuppose that the SO is able to evaluate the risk inherent in each scenario.Consequently we attribute to each scenario a weight proportional to thatrisk. By default, these weights are all equal to I and we simply look forthe biggest possible sub-set.
more formally, our approach of SATAP can be expressed by thefollowing statement: A is an alphabet whose letters are auditable events,S is a set of attack scenarios expressed by rewbr made with A's letters(each scenario Si is associated to a weight Wi), T is the audit trail which isto be analyzed and viewed as a string of A's letters; We have to find thesub-set S' of S so that the total weight is maximized and so that eachrewbr of S matches a different sub-string of T.
Theorem 1. SATAP is NP-complete.Proof. If there are n different rewbr in S, there are M possible non-emptysub-sets of S. If we ignore the order of the successive attacks, we have:
n 1 nM = C = 2 -1 (1)
i=1 n
The number of possible sub-sets increases exponentially with thenumber of potential attacks. Each sub-set relates to a hypothesiscorresponding to the attacks which would be actually present in the audittrail. However, not all the hypotheses are realistic. So for each of the 2n'- 1possible sub-sets, we must make a decision about the realism of thecorresponding hypothesis. For this we have to solve from 1 to n FRSPproblems (one for each element of the sub-set until there is no match in Tfor a particular element of the sub-set). To solve SATAP, it is necessaryto solve at least 2"-1 FRSPs. We have here linked NP-completeproblems.
5. A Search Algorithm for the SATA Problem
The NP-Completeness of SATAP makes it quite impossible classicalalgorithms to apply to real audit logs (recall the huge amount of datarecorded). So we propos7e to use an heuristic method, the so called"genetic algorithm',.
Genetic algorithms (GA) [81, proposed by Holland (1975) [9], are

332
optimum search algorithms based on the mechanism of natural selectionin a population.
A population is a set of artificial creatures (individuals orchromosomes). These creatures are strings of length 1 coding a potentialsolution to the problem to be solved, most often with a binary alphabet.The size L of the population is constant. The population is nothing but aset of points in a search space.
The population is randomly generated and then evolves: in everygeneration, a new set of artificial creatures is created using the fittest orpieces of the fittest individuals of the previous one. The fitness of eachindividual is simply the value of the function to be optimized (the fitnessfunction) for the point corresponding to the individual. The iterativeprocess of population creation is achieved by three basic geneticoperators [9]: selection (selects the fittest individuals), reproduction(promotes exploration of new regions of the search space by crossingover parts of individuals) and mutation (protects the population againstan irrecoverable loss of information). The general structure of a GA isthus the following:
Random generation of the first generationRepeat
Individual SelectionReproductionMutation
Until an individual outclasses others
Genetic operators are randomized ones but genetic algorithms are nosimple random walk: they efficiently exploit historical information tospeculate on new search points with expected improved performance.
Because of space constraint, we cannot expand this section. Formore developments, please refer to the literature [8] [91 [10] [11] [121.
6. Security Audit Trail Analysis Using Genetic Algorithms
Two sub-problems arise when applying GAs to a particular problem: (i)coding a solution for that problem with a stringof bits and (ii) finding afitness function to evaluate each individual of the population. To satisfythese two requirements, we had to simplify our vision of SATAP.
6.1 A Simplified Vision of SATAP
As seen previously, we have linked NP-complete problems: for eachpossible sub-set among 2"-1 and for each element of the sub-set find adifferent matched string in the audit trail. Our goal is to determine,among all the possible attacks' sub-sets, the one which presents thegreatest risk to the system: we adopt a simplified scheme which consistsof bypassing the matching problem.
To make a decision about the realism of the hypothesiscorresponding to a particular sub-set, we propose to work on the eventsrather than on the attacks. This means that we count, for a particularattacks' sub-set, the number of events of each type generated by all theattacks. If, for one or more types, this number is less than or equal to thenumber of recorded events of that type, then the hypothesiscorresponding to the sub-set is realistic. It is a way to achieve ahypothetico-deductive scheme [13], just like a human expert wouldprobably do for SATA: a hypothesis is made (e.g. among the set of 18

333
ossible attacks (figure 1), the attacks 3, 7 and 12 are present) and theeduction involves an evaluation of the hypothesis (in our approach,
deduction is enforced through the fitness function, as presented in theremainder of this paper). According to this evaluation, an improvedhypothesis is tried, until a solution is found.
This simplified vision of SATAP (SSATAP) implies the translation(with a linear one-pass algorithm) of the audit trail into an observed auditvector 0 (a rtal-time construction of 0 could be considered). Basically,Oi counts the number of i type events present in the audit trail. Thistranslation results in the loss of the time sequence. This presents somedifficulties but, in addition, avoids the problem of events reorderingwhich is not easy when timing information gained from the audit sub-system is not precise enough. In the case of network audit trail, where aglobal time does not exist, this could be an advantage. In some cases, itcould be useful to apply other building rules for 0. Oi then counts thenumber of sequences of particular events.
6.2 Proof of the NP-completeness of SSATAP
Formally, SSATAP can be expressed by the following statement:- let Ne be the number of audit events and N the number of
potential attacks- let AE be an N x N. attacks-events matrix which gives the set of
events generateA by each attack. AE U is the number of audit eventsof type i generated by the scenario j (AEij>O). (See section 7.2 foran example of such a matrix)
- let W be a Na-dimensional weight vector, where Wi (Wi>O) is theweight associated with the attack i (Wi is proportional to the riskinherent in the attack scenario i)
- let 0 be the N.-dimensional observed audit vector defined in theprevious section
- let H be a Na-dimensional hypothesis vector, where H. equals 1 ifthe attack i is present according to the hypothesis and ýIi equals 0otherwise (H describes a particular attacks' sub-set).
SSATAP consists in finding the H vector which maximizes the W.Hproduct, subject to the constraint (AE.H)i < Oi (l<i<Na).
Theorem 2. SSATAP is NP-complete.Proof. SSATAP can be polynomially reduced to the zero-one integerprogramming problem (ZOIP). ZOIP can be expressed by the followingstatement [14]:
Instance: A finite set S of pairs (X,b), where X is an m-tuple ofintegers and b is an integer, an m-tuple C of integers and an integerB.Question: Is there an m-tuple Y of integers such that X.Y<b for allpairs (X,b) and such that C.Y>B?
SSATAP can be directely reduced to ZOIP by writing:number of pairs (X,b) in the S set = N
C
m=N a
X = (aeil, aei2, ... aeiNa) (a line of the AE matrix)b=O.C=W
L

334
B = the extremum of the fitness functionY=H
ZOIP is NP-complete [14]. Therefore SSATAP is NP-complete.
6.3 GASSATA, a Genetic Algorithm for Simplified Security Audit TrailAnalysis
Reference [151 gives an example of a genetic algorithm solving anNP-complete problem similar to ZOIP, the set coverg problem (SCP).Liepins and Potter studied in 1991 a genetic approach for multiple-faultdiagnosis [161 based on SCP. We used these two papers as a startingpoint for GASSATA.
6.3.1 Coding a solution to SSA TA with a binary string
Recall that an individual is a 1 length string coding a potential solutionto the problem to be solved. In our case, the coding is straightforward:the length of an individual is N and each individual in the populationcorresponds to a particular H ve&or as defined in the previous section.
6.3.2 The Fitness Function
We have to search, among all the possible attacks' sub-sets, for the onewhich presents the greatest risk to the system. This results in themaximization of the product W.H. As GAs are optimum searchalgorithms for finding the maximum of a so-called fitness function, wecan easily conclude that in our case this function should be made equal tothe product W.H. So we have:
NaFitness = aWi * I (2)i=l
where I is an individual.This fitness function does not, however, pay attention to the
constraint feature of SSATA which implies that some hypotheses (i.e.some individuals) among the 2 Na- I possible ones are not realistic. This isthe case for some i type of events when (AE.H). > 0.. There are severalways to take a constraint into account with 6 As1 (i) modifying thegenetic operators so that they only generate "good" individuals (i.e. withrespect to the constraint), (ii) repeating each crossover or mutationprocess until a "good" individual is generated, (iii) penalizing the "bad"individuals by reducing their fitness value. When a large number ofindividuals do not respect the constraint (this is precisely our case) thethird solution is the best one.
To reduce the fitness value for a "bad" individual, we compute apenalty function (P) which increases as the realism of this individualdecreases: let T e be the number of types of events for which (AE. H)i > Oi,the penalty function applied to such an H individual is then:
P = Tep (3)
A quadratic penalty function (i.e. p=2) allows a good discriminationamong the individuals. The proposed fitness function is thus the

335
following:
R(IO) a + [ wa Wj.1 - Te' (4)i=1
The I parameter makes it possible to modify the slope of the penaltyfunction and a sets a threshold making the fitness positive. If a negativefitness value is found, it is equaled to 0 and the corresponding individualwill die. So the a parameter allows the elimination of unrealistichypotheses.
6.3.3 The genetic operatorsWe are using, at the moment, the three basic operators defined by
Holland [9].
7. Experimental Results
We give in this section a brief survey of the IBM' AIX 2 security auditsystem. Then, we describe the attacks-events matrix. Lastly, we presentour experiments and their results.
7.1 IBM AIX security audit system
The AIX security audit system [17] [18] [19] is designed to satisfy theC2 security requirements of the orange book [20]. Some audit events aregenerated by the AIX kernel subroutines. Other events can be defined bythe SO (some are proposed by default). These later events can beassociated with objects (files) for a write, a read or an execute access.Both types of events can be associated with subjects (users). For ourexperiments, we use 25 kernel or self-defined events [211.
Events are recorded in a protected trail. The audit trail recordsformat is the following: event name, status (OK or FAIL), real user id,login user id, program name (the command which generated the event),process id, parent process id, time in seconds, record tail (containsinformation depending on the event such as the file name in case of a fileopening event).
7.2 The Attacks-Events Matrix
In practice, we encounter problems designing consistent attacks and thuswe consider rather short ones. We add in the attacks set some "suspiciousactions" such as repeted use of the "who" command.
An attack is a non ordering set of audit events which happenedduring an audit session. We work with 30 minutes audit sessions. Thisrepresents about 85 kilo-octets for each audited user (users are softwaredevelopers for the moment). We translate the audit trail into user-by-useraudit vectors with a linear one-pass algorithm. Successive audit trails andaudit vectors should be archived on tapes for possible futureinvestigations.
Figure 1 shows the attacks-events matrix that we use for ourexperiments ("." taking the place of "0" for lisibility reasons). In that
1, 2. IBM and AIX are trademarks of International Business Machines Corporation.

336
matrix each column corresponds to an attack. For example, column 8corresponds to a browsing attack which can be characterized by a highrate of use for "Is" and "more" or "pg" commands (in our case 10 of eachduring the 30 minutes of the audit session) [21].
1 2 3 4 5 6 7 8 9 10 11 12 13 14 15 16 17 18
passwd read . .1.roup read 1osts read 1
opasswd read . . 1ogroup read . . 1fail sensitive
files write . . . 1fail day login 3night login...............su commandwho. w. df, .. . 16fail ls command. .....ls command ....... 10cp command .................... 30rm command .......................... 10whoami command .............. 50more or pg cmd. ....... 16passwd command. ......fail chmod cmd ...... 3fail chown cmd ...... 3fail file open. ......file deletion ........................ 300process creation ..................... .100process exec. ...................... 3006process priority....................... 100
modi fication
Figure 1. An Attacks-Events Matrix for GASSATA
7.3 Experiments and Results
All our experiments are made using the following parameters for thefitness function: a=50, 0=1 and p=2. Each experiment can becharacterized by a 5-tuple (Pc, Pm, L, •, a) where Pc is the crossover
probability, Pm is the mutation probability, L the population size, g thenumber of generations and a the number of attacks actually present inthe audit trail. The default values for these parameters are Pc=O.6,Pm=0.0083, L=100, g=100 (they correspond to classical values whenusing GAs) and a=2.
Because of their non-independence, we vary each parameterseparately by taking values from the following sets:
Pc... (0.5, 0.7, 0.8, 0.9, 1.0)Pm... (0, 0.00166, 0.00332, 0.00498, 0.00664, 0.00996,
0.01162, 0.01328, 0.01494, 0.0166)L .... (20. 50, 150)g .... (1000)a .... (0, 1, 5, 10, 15, 18)The 5-tuple (Pc, Pm, L, g, a) thus takes 25 different values. For each
of these values, we perform 10 runs (all the following results are averagesover the 10 runs):
- for each generation, we compute the minimum, maximum andaverage whole population fitness values
- when the GA stops, we count, for each bit position i along thestrings of the final population, the number of I values and computea rate ti by dividing this number by L. When di is greater than or

;i 337
equal to a given detection threshold 0, the ith attack is declaredS~present.
We define four rates T1, T2, T'1 and T' 2 as follow:- T I is the number of detected present attacks out of the number of
present attacks- 2 is the number of detected not present attacks out of the number
of not present attacks- T 1 is the number of individuals in which bits corresponding to
resent attacks are I out of the total number L of individuals- 2 is the number of individuals in which bits corresponding to not
present attacks are I out of the total number L of individualsT 1 and T2 are respectively the detection rate and the false alarm rate.
They depend on D. Our tool should present a high rate of detection and alow rate of false alarm. T' 1 and T' 2 qualify the results of the GA. T' 1should be equal to I and T' 2 to 0.
7.3.1 Minimum, Maximum and Average Fitness ValuesThe maximum fitness value converges quickly on the optimum (afterabout 20 generations with the default parameters, figure 2). Theremainder of the population follows and after 100 generations, theaverage fitness is about 9/10 of the maximum fitness. If Pc, Pm or L growsGASSATA converges more slowly but the risk to reach a local optimum(due to a so called "premature convergence" [8]) decreases. We observethat if a>15, the number of generations has to be increased in order toinsure G-A convergence.
so
. . . . .. ................................................................... . ...........
40
30
to
0 20 6 60 160
Figure 2. Average Min, Max and Avg Fitnesses for 10 Runs
(Pc--0.6, Pm=0. 0083, L=100, g=1-00 and a=2)
7.3.2 T1 and T2Figure 3 shows the evolution of T 1 and T 2 versus the detection thresholdD or the default parameters. It shows that 0.5 is a good value for D as wethen have T1=I and T2=O. We observe that it is always the case with th-idefault parameters. If Pc or Pm increases, the optimal 0 value decreases.If L or g increases, the optimal D value increases.
kI I / i i l l llia il ..

338
0.
1
00 0.2 0.6 0.4 0.6
gure3. Avrae TIandT2 for Runs
(Pc=O.6, Pm=. 0083, L=100, 4=100 and a=2)
7.3.3 T'V and T'2T' 1 is above 0.6 and T' 2 below 0. 15 (figure 4). This means that morethan 60% of the final populations individuals bits corresponding topresent attacks are 1 and that less than 15% of the bits corresponding tonot present attacks are 1. These results are better for higher values of L org but decrease when Pc or Pm increase.
0.6
0.7
0.6
S
0.2
S 0.2
------------- ------------------------------ ----------------------0.1
0 100 200 300 400 Soo 00 70oo 0oo 0oo 1o00
FMlure 4. Average Tl' Iand T"2 for 10 Runs(Pc=0.6, Pm=0.0083, L= 100, g=1000 and a=2)
8. Remaining Problems
We must mention some remaining problems, which arise due to the useof predifined attack scenarios or to the use of our simplified vision ofSATAP.

339
8.1 Problems due to the Predefined Attack Scenarios Approach
In practice, the design of consistent attack scenarios is difficult. Forsecurity reasons, information on the subject is often kept secret.Nevertheless, note that our approach allows an easy addition of anyscenario, according to the security officer's knowledge.
The translation of intrusive behavior into audit events' sequences orsets requires a very good knowledge of the system kernel. Sometimes, thisknowledge is not easy to gain.
8.2 Problems due to the Simplified Vision of SSATA
The translation of the audit trail into an observed audit vector implies theloss of the time sequence. It is a major problem that we must solve. Forthat we plan to formalize SATAP as a graph contractability problem. Nowork has been done in that area for the moment.
By using binary coding for the individuals, we cannot detect themultiple realization of a particular attack. As a consequence, we shouldtry non-binary GAs. In that case, the GA execution time should growbecause of the search space extension.
GASSATA finds the H vector which maximizes the W.H product,subject to (AE.H).< O. (1<i<N ). If the audit session is too long, thisconstraint is alhi3s 1 enfo~ce8 and GASSATA converges on theN -dimensional unit vector. To avoid this problem, the duration of theatdait session should be choosen carefully. In our case, we work with 30minutes audit session.
If the same event or group of events occurs in several attacks, anintruder realizing these attacks simultaneously does not duplicate thisevent or group of events. In that case, GASSATA fails to find the optimalH vector. We have no solution to that problem for the moment. Thismeans that we only consider independent attacks.
To end this section, it should also be stated that GASSATA does notlocate attacks in the audit trail. Just like statistical tools, it only gives apresumptive set of attacks and the audit trail must be investigated latterlyby the security officer to precisely locate the attacks.
9. Conclusion
The experiments (section 7) show good results for GASSATA whichvalidates the genetic approach for security audit trail analysis:
- if 0=0.5, then T1=1 and T2=0 in every cases: the high rate ofdetection and the low rate of false alarm requirements are satisfied
- the minimal value for T' 1 is about 0.6 and the maximum value forT' 2 is about 0.15 with the default configuration: it shows a quitegood convergence of the GA which explains the previous results.
If we let the GA run for a given number of generations, the executiontime is constant for any audit vector (note that this is not the case for theaudit-trail-into-audit-vector translation time). We observe that the GAalways converges if we let it run for 100 and if a<10: in this case theexecution time is 9 seconds with an IBM RS6000 11.77 Mflops. For highera values, we must increase the number ofgenerations.
Nevertheless, some problems remain (section 8) which motivatefuture studies especially for including timing aspects in GASSATA.
Let us finish by noting that we see GASSATA as nothing more thanan additional tool in the set of security officers intrusion detection tools.

340
Acknowledgments
The author would like to thank B.Picinbono and R.Baduel (SUPELEC)for allowing him to pursue this work, P.Rolin (T616com Bretagne) forsupervising it, V.Alanou (SUPELEC) for her help during theexperimental phase and V.Cazein and G.Pou~ssel (SUPELEC) forwriting a C results exploitation tool. Thanks to Martin Coy for correctingmy english language.
References
1. Salz R. Computer Oracle and Password System (COPS). Internet Newsgroup Article(comp.sources.unix), 1990
2. enning D.E. An Intrusion-Detection Model. IEEE transaction on SoftwareEngineering 1987; Vol.13, N°2
3. Debar H, Becker M, Siboni D. A Neural Network Component for an IntrusionDetection System. In: Proceedings of the IEEE Symposium of Research in ComputerSecurity and Privacy, 1992
4. Lunt T.F, Tamaru A, Gilham F, Jagannathan R, Jalali C, Javitz H.S, Valdes A,Neumann P.G. A real-Time Intrusion-Detection Expert System. SRI International,Technical Report, 1990
5. Lunt T.F, Tamaru A, Gilham F, Jagannathan R, Neumann P.G, Jalali C. IDES. AProgress Report. In: Computer Security Application, Proceedings, 1990
6. Garvey T. D, Lunt T.F. Model-based Intrusion Detection. In: Proceedings of the 14thNational Computer Security Conference, 1991
7. Aho A.V: Algorithms for Finding Patterns in Strings. In: Handbook of TheoreticalComputer Science. J. Van Leeuwen, 1990
8. Goldberg D.E. Genetic Algorithms in search, Optimization and Machine Learning.AddisonWesley, 1989
9. Holland J. Adaptation in Natural and Artificial Systems. University of MichiganPress, Ann Arbor, 1975
10. Lawrence Davis and al. Handbook of Genetic Algorithms. Lawrence Davis, 199111. Davidor Y. An Intuitive Introduction to Genetic Algorithms as Adaptative Optimizing
Procedures. Weizmann Institute of Science, Technical Report CS90-07, 199012. Md L. Algorithmes gendtiques. SUPELEC, Rapport interne 93-001, 199313. Peng Y, Reggia J.E. A Probabilistic Causal Model for Diagnostic Problem Solving -
Part 1: Integrating Symbolic Causal Inference with Numeric Probabilistic Inference.In: IEEE transaction on Systems, man and cybernetics, 1987; Vol. 17, N°2
14. Garey M. R, Johnson D. S. Computers and intractability: A Guide to the Theory ofNP-Completeness. W.H. Freeman, 1979
15. Liepings G.E, Hilliard M.R, RichardsonJ, Palmer M. Genetic algorithmsapplications to set covering and traveling salesman problems. In: OperationsResearch and Artificial Intelligence: The Integration of Problem Solving Strategie,1990
16. Liepins G.E, Potter W.D. A Genetic Algorithm Approach to Multiple-FaultDiagnosis. In: Handbook of genetic algorithms. Lawrence Davis, 1991
17. IBM. Elements of AIX Security. IBM Technical documentation GG24-3622-01, 199118. M6 L. Audit de s~curit6. SUPELEC, Rapport interne 92-002, 199219. Alanou V, M6 L. Une Expdrience d'audit de sdcuritd sous AIX R3. 1. In: TRIBUNIX,
1992; Vol. 8, N°4320. U.S. Dep. of Defense. Trusted Computer System Evaluation Criteria. DOD 5200.28-
STD, 198521. Alanou V, M6 L. Audit de s6curitt : Deuxidme partie. SUPPLEC, Rapport interne 93-
002, 1993

MRSA - a new public key encryption method
Reinhard PoachInstituit for Applied Inm 6 tion Processin Gmz Unw ity of Technology
KlostIg 32/I A-8010 Graz, Austriaemail: A.uIP-grac.at
Abstract
This paper focuses on the key generation problem for a modified RSApublic key a3cpto gaplhic system based on the RNS arithmetic. TheRNS based modifocatin af the well known RSA algorithm useshighly p cmutIn with the resriion tht only a subset ofkey triple (Dekey.ey) of a canyentional RSA system can beadote These restriimn result from the choice of base elementsuse& The p=ent work shows that the remaining set of possible ieysis still Iag enough to be used in a realistic caypto gra;hi system Theencryption machine under discussion can use parallelism and trushigh sped. A rather straight foward algorithm for the generation ofkeys can be givrn The resulting key spac can be viewed assafactmy. The method give an additional degree of freedom for theim••amon parale syte avoiding al betee
nn Systems
I Introduction
Parallel comp tation of the RSA algorithm is well known to be complicated 111.This results from the fact that the central operation involved (modulo arithmetic)demamns for intensive computation with extremely high rn"miication. From theteoical point of view some algorithms would outline a solution [2][3]. All thesemethods are too intensive in communication and not feasible as a parallel chipdesign since the chip area is limited. Available results therefore usually get stuckaround the 5OKb0sec. perfRmance range with a 512 bit key length, not consideringthe Chinese remainder theorem [4]. Using top tehnologie like silicon on insulatorin sub micron, designs can impre these results only by a fator of two. However,as can be seen in presented designs, parallelism is not extensively exploited [(5.The dilemma is twofold. First, highly parall designs on a single chip areimposMsb due to limited chip am . Second, cutting into many chips cannot bemanaged due to eOnm. cImmm n. I previous projects it has been shownthat both dellcincies em bebglht somehow. Scalable parallelism is om specialanswer that enables the de to use up availabfl chip area am to gan

342
ewayptio rates in the ara of 200 to 300 bit/sec. with 1Ip CMOS technology [61.RNS arithnetic could be an answer to the distribution of the processing power overmany chips [71. The second method also reliefs the heat dissipation problem whichwould also arise on highly parallel single chip designs for RSA. The technique thatbases mainly on RNS base extension can be used to constru a public keychiyptogap-cThis methodI is equivalent to RSA in terms of security.However it restricts on the key space that can be used.
Restriction on the key space is due to the RNS arithmetic and the restrictions thathave to be made on the RNS base elements to ensure efficient computation of thealgorithd. These restrictions are discussed in the presented paper and an algorithmto construct RNS base elements and key pairs is presented. The paper also containsa skech of the algorithm itself and of the underlying register oriented arithmetic.
2 The encryption machine
For the MA - like algorithm, cipher = plani*y MOD D has to be computed [9].This can be done using Knuth's square and multiply algorithm [101. This fac turnsthe mochdlo eintiati to break down to nodulo mutplication MMUL.Basically this would involve multiply and divide operations. For reasons ofperformance and umifomity of operations which is of prime importance in an VLSIdesign it is most desirable to avoid the divide operation. This can be done by theFASTMM fast modulo multipikton as described in 131. As described in moemdetail in [71 RNS can load a set of processing elements more equally and thus callfor less czm bon• on the single processing element when combined withiM" ome Is reduction [2]. The basic idea is to substitute the radix by a product
k
N = ] A- of RNS base deeuts This reduces the modulo m ication to twoi-II
base extensio as shown in figure 1.
The method which is described in full detail in [14] leaves an unprocessed factorwith each modulo multiplication step. As the number of multiplications is constantfor a given key this factor in total is also constant and compensaion can be achievedby a single multiplication. This multiplication is done with the scheme shown infigure 1. Again a factor would be intuoduced. Taking this last fact into account acorrecting factor can be precomnputed which if multiplied after the encyptionproce compensates for all errors.
Base extension itself is nontrimal and good methods in log time are known only ifcontrol base elemets are available. This is definitely not the case for the Z MOD Nstep of figure 1. In 1141 an approximation is prsented This approximation is exactif the initial value and thus the plain text offsets at least by some A from zeo. Thisin trn also means that restricting relations between D and the M and N valuesshMld hld:

343
(a) D(I+eD)<N<D+-D'i 3(b) 4D<M <4,44D.
(C) M=_4N; 4N<M
Resiction (a) results fxom the fact that modulo reduction is acieved, with resultsout oc [0,D( I+eD)J. Hen eD can be kept small but depends on the number of bitsused in the arithmetic. Typically eD < 1/1000 is easy to get. Thus, the assumptionD < N can be used for futher discussion. Restriction (b) and (c) result from the
val decision process during the reduction described in [141.
M N R=N=I'pI:"A A
11111 ZMODN Z=(AMOD N)D-'
Z2 I(1 MON)
(A - Z2)N1' ==+III
Figure 1: Boa extension as substitute for nodu mltiplication.
The roghly outlined method can be Prosse on the register level of the RNS baein all steps.
Building an encayption machine needs connecting then register oriented elemznts.Otizuum pamlelism would be neahld if a divide and conquer nmetdd would beinvolvd when compting the cowl sums. Covbition s-m are basicallyneeded in the base extensio process aud with this work [71. This hwever woulddmnd for many procssing elements. Therefe a bus connected processor set isaimund to be more practical still giving good results. The result is a technicallyA lprallelism. Convolution sums in this cotext have to be computed with
modulo arthnm c within the regie
D-Bus
I-Bus
Figure 2: A possible structure for a parallel cipheing machine.

344
A prctical felasible configuratn is outlined in figure 2. Serial connection andSn -ucation is assumed for distribution of constants and plain text feeding as
well as retrieval of the cipher text The main featunF of such a configuration is thepoaible dwtribuwon of processing over a set of chips. The key to this noutrvalissue is low coymucation as compared with other methods.
3 The modified algorithm with efficient registerarithmetic
Tihis paragraph focuses on the a.b+ c MOD p that has to be computed in eachprocessing element along with the convoluti It is included to point at thenecessity to restrict on the set of possible keys. The basic idea is to use only those p,elements that can easily be managed Besides the pi = 2r where modulomltiplicatim is just a cut on the binary digits, api that can be written aspi = 2r-P,with 4 having a low 1-it count, is convenient for processing as well.
Starting with the Wallace scheme the result is a redundant represented numbe andcan be processed as shown in figure 3 using the pi assumption in a first phasecutting the 2r bits down to r+0og2(4)+2.
r
I H(a L*b)' IHIaMbW" I a*b)"I
H H*ab)' L"*IH(a*b)" * u I
Figure 3: The first phase of aA +ci MOD pi.
A second phase is involved giving the unique result out of the interval [0,Pp). Figure4 shows the basic idea. At this point it has to be said that a relaxed residumn at theregister level will not work as both addition and multiplication will be performed onthe results. The idea bases on the same idea as in phase one and uses the fact that ghas only a fw bits equal to 1. In addition an evaluation of the two 2r1l bits of theredundant number reptesentation becomes necessary. Taking the constraints on thep, elements this results in an X out of the interval [0,2pi). At this point carryevaluation has to be performed. Since p,+ý4 = 2', a simple decision gives the resultXorX+ot2r as the final result at register level.

345
r-Izl [ fam+c)) MMOD W)'
z2l r--- ((a%•~)) MOD DO)"
S~2**(r-1)
(zz22**r)*u
x 10I Y=x+I IS
Figue4: The seond phase of A+ 4;MOD p,
4 The key generation algorithm
This section focuses on key generation within realistic ranges. As seen frm thecImmints (a),(b),(c) of figure I put mainly on the values NM and D it is notpo lto fill thetm for the adtrry case. The presented assumption and theppo algorithm allow only a restiteds mubse. Only D is key sensible N and MM only revant hw the processing plame. However, for realistic relations betweenthe uipe legth n of the minidual RNS registers, and the total length of the keylog2(D), be, do exist in a sadsfIcay vriety.
Foaragiven andMthee -a'otrai can be rewritten as:
(d) ±N D<N(4,4 I+IeD,
In the special situation, log2(D) is assmed to range from 512 to 1024 and n isasumed to be equal to 42. This value results from the fact that at the register level aWallace tree [11 is im plmented. Optimal regis lengths for the Waace treewould be 28, 42, 63 etc.
For further cr,-iIeris detailed calculations are given for log2(D)=672 and r=42.In this cae 32 suitable relative prmes pi, qj are needed. As sktdw above anuI-berp is quoWd to be suitable if it is close to 2 and difference 2rp has only fewo8m. Practical tests show that many moaP possible values for the p1,q1 would edst.But h restrictions for the registe orieted arithmetic show that all these values arevey cdone to 2r. Tis means for practical estimations that the existece of manysuh valum doe t help to ailarye the interval to choose D of The previous
11 are nt true for pl. mis value is chosen p, =- 2'-. This results in the

346
cistianon that 4N M N. TIe relations (e) and (I) show the restrictions on bane
k 15 15(e) N=nAp : *i- -l,• '•.2!,Fmý <4:i=2,k .
i-2 j.1 1=1
k Is .15 .fmm=flo: I=2AAj= *-5 L 4: i= 1, k
i-1 j-1 j-1
As already pointed out all p and q values are etmely close to 2r. This mean that
the folloing estimatioS M = 2 - AM, AM <<2kr, and N=2 -ANV, with4
AN << 2kr can be used.
With RSA D is a product of two large primes D = primel*prime2. The ustriction(e) on D allows the following procedure to select keys:
(1) Dm 4N4,4
(2) Dý N(1 + ED)
(3) Selectpnrel)< N--4
(4) Select prime2 such that Dis within the intervl[Lý,L ].
A short ",scuso on the availability of MRSA keys as coqnamp d to keys incoveItNwml RSA is aided. The restrictions on the selection of D are seen in (a),(b),and (c), gimsg ririctiam (d). This tells the key Iinkd, that for a given nuIP ofbits in N mnly a limted arma of tihe 1pr en values are availale for D. From (d)it can be so h this area covers a little less than l0%ofthe sptR e HaIfoftbisspace can be represented with one bit less so that effectively 18% can be used forkeys. This is al shown in figure 5. The number of bits in N can be easily decreasedby one by coning one of the RNS registers. Bowever it should be statd that in thecase of a ken" register oriented modulo reduction this does mean the use ofadditional hIdw&= or the prFdfinitm of the key space. As this resriction. allowsonly for twice the amount of the available k , and as there are sufficiently nnaykeys avaihie, this is asso ed for practical applications.

f' 347
2 n-2 2 n-I 2 n 2 n+1
Figure 5: Key space of MRSA in comparison to RSA.
It mdt also be•entioed that the size of D is ng to N and not to the blocksize of the plain text. As this nmthod assmes the plain text block to hold k bits lessthan N the relative key spac as compared to the size of the plain text blocks excedsby f&r cov 'ioal RSA. Finaly it should bestresse that there is no idea that thisstn ure of restricting on the iey space could influence the c Ia quality ofthe tystem to any extent As all the constraints on D just limit the interval wherefD may be choen this fact does not influence key quality at all as demanded by theRSA encryption sysm [131.
Due to the nature of the MRSA algorithm dVey and ekey need not to observecomnti and can theefore be chosen the same way as usual RSA keys. Thismeans that one of the two is a randomly chosen number and the second is computedby alcation of Bcrlecap algorithm [121 to find the m iplicative inverse with
Reference List
I. CAoe .IL, Patterson W.: R&A as a Benchmwu* for Muitiprocessor Machines,Proc. "Advances in Cryptology - AUSCRYPT '90" LNCS, Springer 1990, pp.356-359
2. Montgomery L.: Modular Multiplication Without Trial Division; Mathematicsof'Co a Vol. 44, No. 170, April 1985, pp. 519-521.
3. Poach K.C., Posch R.: Approaching encryption at ISDN speed using partialparallel modulus multiplication; Mir.r ig andNorth-Holland, 29, (1990), pp. 177-194.
4. Beeth TIL et aL.; Public key Cryptography, State of the Art and FutureDlrechonr, LNCS 578, Springer 1992

348
5. Ivey P.A., Walker S.N., Stern J.N, Davidson S.: An Ulbt-High Speed PublicKey EnO aton Processor, EEE Custom Itegrted Ciruits Conference, 1992,pp. 19.6.1-19.6.4
6. Lippitsch P., Posch KLC., Posch P., Schindler V.: A scalable RS4 design withencryption rates from 200 Kbit/sec to 1,5 Mbit'sec; Poster at CRYPTO '92
7. Posch R.: A Parallel Approach to Long Integer Register Oriented Arithmetic;Fifth International Conference on Parallel and Distributed Computing andSystems; Oct. L.-3. 1992, PitLumrgh, PA.
8. Schoenfeld L.: Sharper bounds for the Chebychev functions e(x) ans f(x); 11,Math. Comp. 30, (1976), pp 337-360.
9. Rivest P., Shamir A., Adlemann L.: A Method for Obtaining Digital Signaturesand Public-Key Cryptosystemr, Comm. of the ACM (Feb. 1978),pp. 120-126.
10. Knuth D.E.: The Art of Computer Programming, Vol 2, Addison Wesley,Reading, Mass., 1%9
11. Wallace C.S.: A suggestion for a fast multpier IEE Transaction onElectronic Computers, Vol. EC-13, Feb. 1964, pp. 14-17.
12. LUneburg, R: Vorlesungen tiber Zahlentheorie; Elenente der Mathematik vomh6heren Standpunkt aus, Band VIL ed. by E. Trost, BirkhluserVerlag, (basel,1978).
13. Denning D.E.: Cryptography and data security; Addison Wesley, Reading,Mass., 1983
14. Posch KLC, Posch IL: Residue number systems a key to parallelism in publickey cryptography, Fourth IEEE Symposiur on Parallel and DistributedProcessing; Dec. 1-4. 1992, Dallas.
lilUml IninHI • ll im il IHI |i

A Virus-Resistant Network InterfaceI
Martin Witte and Wolfgang A. HalangFernUniversitait, Department of Electrical Engineering
D-58084 Hagen, Germany
Abstract
The concept of an interface for electronic mail between a LAN (Lo-cal Area Network) within an organisation and an external networkis presented. The interface's design renders any external intrusionimpossible. The concept is based on a straightforward hardwaresolution and has already been validated by a prototype implemen-tation.
1 Introduction
The use of computer networks in all fields of business, government, and sci-ence is rapidly growing. Information interchange is often a decisive factor forcompetition. Nevertheless, owing to numerous cases of intrusion via the com-munication networks, organisations are becoming more and more concernedabout security and reluctant to extend their utilisation of external networkcommunication; some are even discontinuing network communication.
Computer "viruses" represent an enormous security risk. They endanger thefunctionality and integrity of computer systems and the permanent integrityof data by using more and more elaborate ways of manipulation. Apart fromintruding a system via exchangeable media such as floppy disks, the most fre-quent way of entering a computer system is from a computer network. To showhow computer "viruses" gain control over a computer system, we first give anoverview over the different kinds of "viruses" and their ways of intrusion.Computer "viruses" are non-self-acting parts of computer programs (host pro-grams) that are copied into memory by starting a host program. There are dif-ferent kinds of computer viruses, e.g., "Trojan horses', "time bombs?, "worms","boot sector viruses", and "hybrid viruses". The variety of kinds of compu-ter "viruses" is expected to grow further in the future. Generally speaking, acomputer "virus" consists of two parts:
* Program routines that have to look for further programs on the hostsystem to which the "virus" can copy itself. This is used to increase thenumber of the "virus" program's copies in a system

350
9 Program routines that have to execute one or more manipulating func-tions. Most of the manipulation is destruction or change of data whichmay cause great economical and financial harm.
There are two different ways of "infecting" a program. One way is to overwritethe host program code that is stored on a writable medium. Then, at least partsof the original program are destroyed and the "virus" may easily be detected asthe application is unable to run. The other way of infection is that the "virus"adds itself to the body of a program and adjusts the program's entry point andaddress tables.
file header file header md. file headeraddess table adds table ood, address table
aI addre= modfd ladg adess oinal Ila adress
jPm cd - ' -"vires" progmn code
w-u
jump to orig.loading aIddS
.& avidm b a
Figure 1: Structure of a proper and of corrupted program files
The "virus" code is loaded into memory together with the host program where W-it may stay resident and may "contaminate" further programs. A "contami-nation" may be detected by an extension of the host program's length in thedirectory. Many viruses keep cross-links to the host program and execute partsof the host program while simultaneously carrying through their manipulationsin a way not recognisable by the user.
In the next section we begin with an overview about computer "viruses" out-lining the ways of "infecting" computer systems and the different classes of"viruses" which can be distinguished. Next, the existing concepts to protectcomputer systems against manipulation by "viruses" are discussed. Most ofthem are software-based, but there are also a few hardware-orientated con-cepts. After a comparison of the von-Neumann computer architecture with theHarvard architecture, a hardware-based "virus-resistant" network interface isintroduced and details of the prototype implementation are presented.

351
2 Kinds of Computer "Viruses"
Computer "wormsrcan often be found in multi-user systems and computer net-works, as they keep busy with copying themselves all over the system, whichleads to performance reduction."Virus" programs that catch the user's interest and that start their destructionimmediately after being executed are called "Trojan horses"."Time bombs" or "logical bombs? are very similar to "Trojan horses", but theystart their manipulation when they detect a particular logical or temporal sta-tus. This can be a special time or date. The "Michelangelo Virus" is one ofthe "time bombs" as it starts its destruction at Michelangelo's birthday everyyear by reading the date from the system clock [2]."Boot sector viruses" are placed in the boot sector of a system disk in orderto gain control over a computer system already before the proper operatingsystem is loaded into memory. They can hardly be detected as they can keepcontrol over all protective devices and mechanisms that are offered by the ope-rating system and can bypass protection measures.The group of "hybrid viruses" is the latest variety of "viruses". They are resi-dent in memory (like "boot sector viruses") and, moreover, they exist in files ofcomputer systems. If only the "infected" files are removed from the system, thememory resident part of a "hybrid virus" is still active and may start infectingfiles anew.
3 Existing Concepts of "Virus" Prevention
3.1 Software-Based Solutions
As already mentioned, most of the protection measures are software-based.They can be classified into:
* Memory-resident "watchers", i.e., programs that guide (operating) sy-stem functions and interrupts. They try to secure a system of beingcorrupted.
* Secondary programs and utilities that have to be executed regularly toscan a system and its storage devices (e.g., floppy disks, hard disks etc.)and search for "infected" data, especially "infected" executable files.
The purpose of memory resident utility programs is to control a system, espe-cially its input and output (I/0) functions, as computer "viruses" have to readand write back the manipulated data. These utilities have to give a messageif there is a possible misuse of I/0. The problem is that the permanent func-tion control leads to a performance reduction or that the controlling programcannot decide on its own whether an I/0 request is intended or caused by a

352
"virus" manipulation.
The second group of software solutions are characterised by scanning systemsfor manipulated data and are, therefore, called "virus scanners". Corruptedprograms can be detected by sequences of characteristic bytes or string pat-terns that are supplied with each individual computer "virus". A scanner'squality depends on the number of known viruses that it can search for, andthis manifests its disadvantage: as the number of newly developed "viruses"is growing, the scanner has always to be updated. This makes it clear that ascanner can only react to known ways of manipulation and cannot be regardedas a preventive measure.
3.2 Hardware-Based Solutions
Some companies supply additional hardware devices in order to make compu-ter systems secure. This starts with simple mechanical barriers to lock floppydisk drives and to prevent new probably corrupted software from entering asystem via exchangeable floppy disks. Furthermore, there are extra boards andsmart cards equipped with cryptographic devices. They are used to encodeand decode data with user-dependent (e.g., the user identification in compu-ter networks, uid) keys to ensure that only authorised users can get access tosecurity sensitive data. These boards are individually designed and manufac-tured. Their use increases the economic and administrative costs and effortsfor computer support and maintenance.
4 Computer Architectures
4.1 The von Neumann Architecture
The classical von Neumann computer architecture makes it really easy for com-puter "viruses" to "infect" other programs and to take control over a computersystem after a manipulated host program is loaded into memory, since pro-gram code and data are stored in a common random access memory (RAM),and since any word in memory can be fetched and executed as an instruction.Abstractly speaking, this architecture consists of the central processing unit(CPU) with only a few internal memory cells (registers), external memory cellsin form of RAM, and external, peripheral devices. RAM is used to store pro-gram code that is successively loaded in the CPU's instruction register. Thecommunication between the CPU and its RAM is carried out via buses. Thevon Neumann architecture comprises an address bus and a data bus. Thereis only a separation between address and data. Whether a binary word inmemory is an instruction, a constant, or a data word can at runtime only beperceived from the context. In addition to this, modern operating systems donot offer any support to supervise the instruction fetch cycle of the CPU.
S ! Inan ] u Hi ailil I[] ~mO •A

353
Moreover, also the external storage media, from which programs are loaded intomain memory, can generally be rewritten. This means that a proper programonce stored into memory cannot prevent it from becoming corrupted.
CPU
data adressbus bus
RAM
Figure 2: The von Neumann architecture
4.2 The Harvard Architecture
The analysis of the reasons enabling the "virus" problem suggests a straightfor-ward and fully effective solution by hardware, such as the Harvard computerarchitecture physically separating program and data memories. The abovevon Neumann architecture is extended by two further buses, viz., one each forinstruction addresses and instruction data. This ensures that data and instruc-tions are accessed via two different non-multiplexed buses [3]. The instruction ,,,
bus (address and data bus) only offers physical access to the instruction regi-ster of the CPU, while the data bus exclusively serves the data and operandregisters.
Originally, this design was developed to increase performance, as for the inde-pendent buses the instruction cycle and the data fetch cycle can be executedsimultaneously. With regard to a security sensitive computer application, thisarchitecture represents the better design, because it can protect program codefrom corruption.

14 CPU
Figure 3: The Harvard architecture
5 Concepts of Protection
In order to prevent a "virus" from entering a system in the first place, andto ensure that (program-) files do not become manipulated and changed after-wards, it is sufficient to implement program memories exclusively as read onlymemories (ROMs). The possibility of any kind of manipulation and modifica-tion of binary program code is thus systematically disabled. Naturally, it hasto be made sure that any program code which is placed into ROM is free ofany destructive machine instructions.
The prototype for the network interface, which we have built, is structuredaccording to the above reasoning. It is based on the Z80 CPU. Though itsarchitecture corresponds to the von Neumann architecture it is suited for theprototype implementation with small additional feature added. The Z80 CPU "
works with eight bits for data and a sixteen bits wide address bus. The latteris physically realised by the CPU's sixteen address pins called AO to A15.
The software required for the purpose of a network interface, i.e., operatingsystem kernel, user interface, editor, and the KERMIT protocol, is provided ina ROM module occupying the lower 32 kB of the CPU's 64 kB physical addressspace. The upper 32 kB are used for data at runtime. To emulate the Harvardarchitecture with the Z80 we took advantage of a particular signal called ViTavailable at a pin of the CPU chip. V11 indicates the instruction fetch phasewithin the instruction execution cycle. We used the disjunction of M-I and theinverted address-line A15 as input at the RESET-pin of the Z80 CPU, i.e.,trying to read an instruction word in the data space of main memory results inthe immediate resetting of the CPU. This is an additional feature coping witherrors in the application software.

355
zBoCPU
Figure 4: Additional circuitry in the prototype implementation
Usually, private networks are directly and physically connected to public onesand allow for access from outside (remote login, ftp, telnet etc.). This bearsthe risk that "contaminations" can enter from outside. In contrast to this, ourinterface is designed to serve as a buffer between two communication networks.Owing to the alternate switches shown in the Figure 5, it can only communicatewith one network at a time, making direct links between internal and externalnetworks impossible. Furthermore, any communication is initiated and activelycarried through by the interface. Mail data are fetched in file transfer modefrom one of the two networks. They are then stored in the interface on disk andmay be manipulated with the editor. Not before turning the alternate switchthe data can be forwarded to the other network.

356
pubic 11m
1 na cffmun *Mon
r atokarIbm
Figure 5: Alternate switch to avoid a direct link in the communication line
6 Conclusion
Although based on the classical von Neumann architecture, with just a fewtechnical modification, the presented prototype implements a fully effectiveprotection against "virus" intrusion. This is achieved by the following features.
"* Program code is unchangeably stored in read only memory (ROM)
"* An additional circuit is used to reset the CPU in case a program tries tofetch an instruction from RAM.
"* A direct link between the local network and external devices is madeimpossible by means of an alternate switch box
In conclusion, it was constructively shown that the problem of "viruses" ente-ring private networks from public networks can easily be solved by hardwareat negligibly low cost in a fully effective way. Thus, the statement "Avoidanceof viruses seams to be impossible to attain by technical means since they canbe introduced into the system by a properly authorised user" found in [1] hasbeen refuted.

357
References
I. Gaj K, G6rski K, Kossowski R, Sobczyk J. Methods of Protection AgainstComputer Viruses. In: B. K. Daniels (Ed.): Proc. SAFECOMP '90Conference, pp. 43 - 48. IFAC Symposia Series, 1990, No. 17, PergamonPress, Oxford
2. Gleissner W, Grimm R, Herda S, Isselhorst H. Manipulation in Rechnernund Netzen. Addison-Wesley (Germany), 1989
3. Shiva SG. Computer Designs and Architecture. HyperCollins PublishersInc., New York 991
AA
, ,- . .

Session 11
"REACTIVE SYSTEMS
Chair: E. SchoitschAustrian Research Centre Seibersdorf, A
I...

CIP - Communicating Interacting Processes4 A Formal Method for the Developmentof Reactive Systems
Hugo Fierz, Hansruedi MUller, Spiros NetosInstitut ftr Technische Informatik und Kommunikationsnetze, ETH-Zentrum
CH-8092 ZMrich, Switzerland, E-mail: [email protected]
AbstractCIP is a formal method for the development of distributed reactivesystems. The compositional, real world oriented approach guides thedeveloper from an initial environment modelling step towards thecomplete definition of the reactive behaviour of a system. The descrip-tion technique of the method combines graphical and textual notations.
1 IntroductionAlthough it is well known that the use of formal methods supports the developmentof robust and reliable systems, there is still a great dislike in applying them inpractice. A main reason for the bad acceptance of formal methods is the missingsupport through constructive development concepts, guiding the user from the in-formal requirement description to the definition of the system [e.g. 3, 6, 11, 12, 13].
D. Harel and A. Pnueli have characterized reactive systems (process control,embedded and real-time systems) as follows: "A reactive system, in general, does notcompute or perform a function, but it is supposed to maintain a certain ongoingrelationship with its environment [10]." Many formal methods propose stepwiserefinement techniques. Concepts of modularity serve as guidelines for the difficulttask of structuring. Top-down approaches are suited for the development of trans-formational systems (functions, algorithms). The structure of a reactive system,however, must reflect the temporal behaviour of its environment, thus an outside-inapproach is more adequate. A developed reactive structure may then serve as a basisfor the specification of functional computation. A similar approach (applicative statetransition systems) has been proposed even in 1978 by Backus [1] for purelytransformational systems.
CIP bases the development of a system on an explicit model of its environment.The real world modelling approach to system development is well known from theJSD method (Jackson System Development) [4]. CIP differs from JSD mainly in thestate oriented view of processes, and by the possibility to specify instantaneousinteraction between synchronously cooperating system compenents.
2 The CIP Method2.1 System Description ConceptsOperational SpecificationThe operational approach to software engineering [14] has been proposed as analternative to the conventional approach (Analysis, Design, Coding). An operationalspecification is a problem oriented system description which is executable by asuitable interpreter.

362
Instantanteneous ReactivityA system description which allows the specification of system reactions dependenton the actual state of the environment, must abstract from the non-zero duration ofresponse times. Instantaneous reactivity is therefore the commonly acceptedhypothesis for the development of reactive systems [2,5, 11]. The assumptionstates that a system responds instantaneously to its inputs. A consumed event andthe generated actions compose thus a temporally atomic system reaction.Sequential ComponentsWe define a system, in contrast to process algebras or petri nets, as staticcomposition of sequential components. Sequential components cooperate syn-chronously or asynchronously. Synchronous cooperation is usefull for thedescription of instantaneous system reaction. Distributed environments howeverrequire a formalism including asynchronous cooperation.
System description based on statically composed sequential components is suitablefor the development of safe critical systems. Due to the time independent state spacestructure, such systems are much easier to treat than specifications based on moregeneral models of concurrency (non-conservative systems). Furthermore, the constantdegree of concurrency simplifies considerably the verification of the instantaneousreactivity assumption for implemented systems.
2.2 Development Steps:Real World Model, Correspondence and CompositionThe general task is always related to an environment composed of real objects:machines, chemical processes, lanes of traffic at an intersection, etc., but theenvironment may also include previously-developed software components. Thedeveloper is asked to construct a specific software interaction between these objects.CIP differs from most other methods in that its development process starts with anenvironment model and postpones the functional description to a second phase.
In the first phase, the environment objects are modeled in terms of state machines.For every modeled object a corresponding model process is specified. Theseprovisionally incomplete system components define in fact an interaction protocolfor the system and its environment. In an implemented system the correspondingsynchronisation takes place by means of transmitted events and actions.
The second phase of development involves the introduction of function processes,allowing for instantaneous interaction and asynchronous communication to takeplace between the established components. Here, the application of classical conceptsof modularity strategically supports the composition process. The result is a networkof interacting and communicating extended state machines that provide an operationaldescription of the system.
Specifications based on real world models are transparent and easy to understandbecause all elements are clearly related to the environment. In a running system, thecurrent states of the model processes always correspond to the current states of theassociated real objects. This is an important prerequisite for the development ofrobust and safe systems. The approach also has advantages as regards systemmaintenance, since a real world model is likely to be more robust than a set offunctional requirements.

363
3 CIP System DescriptionA CIP specification provides an operational description of how a system reacts toexternal events. The reactive behaviour is described by extended state machines thatcan influence each other. Data processing and algorithmic functions are carried out inthe transitions of the state machines. Transition structures and data flow networks aregraphically specified while functions and conditions are defined through annotationsin a functional language.SystemsA CIP System consists of several concurrent clusters. A cluster is a sequentialsubsystem composed of a set of synchronously cooperating processes. A statetransition of a cluster represents an instantaneous system transition, defined throughthe state transitions of its components. The processes of a cluster interact throughinstantaneous transmission of pulses (software events). All clusters may containprocesses, which communicate through asynchronous exchange of messages.ProcessesA process is an extended state machine which can carry out internal operationsthrough its transitions. We distinguish interaction driven processes (I-process) andcommunication driven processes (C-process). The state transitions of an I-process aretriggered by external events and by pulses emitted by other processes. Occurringevents must always be accepted while occurring pulses may be ignored. A singularoutput of an I-process can consist of a pulse for other I-processes of the cluster and ofan action for the system environment. Messages for other processes can betransmitted through specified outports. A transition of a C-process occursspontaneously when a message is pending at one of its inports. The output of a C-process may also consist of a pulse and of several messages.
The transition graph of a process may contain non-deterministic branchings, i.e. ina given state, several transitions are possible for the same input. In order to resolvethis ambiguity, switch conditions must be def'med that can be dependent on the statesand the variables of the processes within the same cluster. Compared to pulsetransmission, state inspection represents a much weaker coupling, because theinspected processes are not affected.
A process' local memory can be extended with variables. In order to support datatransmission for each event, action, pulse and message, corresponding record typesare declared. Transitions are annotated by sequences of operations, which are ideallydescribed in a functional language.Moderated ProcessesA moderated process consists of several alternative modes. The several modes of aprocess differ in their transition graphs. The state space and the interface, however,are the same for all modes of a given process. The dynamics of mode transitions isdefined through a further transition structure called moderator, which is built on themodes themselves. A mode transition may trigger a state transition of the new mode.Instantaneous InteractionThe static pulse flow structure of a cluster is specified trough an interaction net.Through pulse transmission every process which expects external input(events, messages) can cause instantaneous chain reactions. In order to prevent cyclic
;I IIIIIIl l lIIll Ilil-

364
chains, a cascade must be specified for every process with external input A cascade isa cyclefree partially ordered subnet of the interaction net which defines the possiblepaths of pulse transmission caused by its top process. The transitions of theprocesses activated in a cascade define a temporally atomic cluster transition.Asynchronous CommunicationThe message flow in a system is defined through networks of processes linked bydatastreams. A datastream is a FiFo-buffer which stores the messages arriving fromthe connected process outports. When the connected reader process awaits a newmessage, the oldest message is released to the corresponding inport. Externaldatastreams are connected to devices.
Denotational SemanticsThe meaning of language constructs describing synchronous cooperation has beendefined through SCSM-expressions [8]. SCSM is a formalism for the description ofsynchronous compositions of state machines [7]. The asynchronously cooperatingclusters are interpreted as petri net state machines coupled to petri nets which modelthe behaviour of the datastreams [9].Extension of the FormalismThe implicitly defined temporal properties of a system can be verified by automatedsystem execution. We are working on an extension of CIP by a logical language forthe decription of temporal properties of the controlled environment. The verificationof temporal predicates can be based on the common environment model.
4 A Complete Case StudyWe specify a simple system which can be described by pure state machines only.4.1 Requirement Description of the AccessControlSystem
Entrance DorReception
Fig. I System Environment,.An arriving visitor must insert his badge into the scanner in order to be identified.
For an accepted visitor the door is automatically opened and the possibly idleconveyor is started. The opened door closes as soon as the light barrier gets free. The
closing door reopens when the light barrier is interrupted again. The scanner is onlyenabled when the door is fully closed.
Entries are signalized to the reception desk inside the building where enteredvisitors have to register. If no more visitors are on the way to the reception desk, theconveyor of the entrance is turned off. There are at most three visitors allowed to beon the way for registering.
A switch allows to enable or disable the access control system. If the system isdisabled, an already accepted visitor is still allowed to enter. However, when the lightbarrier is interrupted, the eventually closing door is stopped without reopening. Atany time the system can be enabled to work again in its normal mode.
REMARK We suppose that every accepted visitor really enters the door.

365
4.2 AccessControlSystem First Phase: Model Processes4MTh p~rovisionally incomplete model processes behave like their corresponding realworld objects of the system environment. They are going to be completed in thesecond development phase (section 4.3), where asynchronous communication andinstataneous interaction with additional ftuncton processes are introduced.
I-PROCESS Scanner I-PROCESS UghtearrierEVENTS Done ACTIONS Enable, DIagA. EVENTS Entering, Passed
I-PROCESS ConveyorACTIONS MotOn, WoONf
I-PROCESS SwitchEVENTS On, Off
I-PROCESS DoorEVENTS Open, ClosedACTIONS MotOpn, WItCKs WoON
* Legend:doe, State
roan dotw'minsks
TransitionMýMEwnforpuisersquWe
Fig. 2 Incomnplete Model Processes

366
4.3 AccessControlSystem Second Phase: FunctionsConunents on doe grapica CTP specification below follow in section 4A.4
COMMUNICATION NET OF SYSTEM AccessControlSystxm
II IJ CLUSTER EnrneAatrp Sreepti9-0onar
I glire swtip M ~rirF
DoCor cnner Con$v eyo
CNEASCADN ES OF CLUSTER Entrancuper vvc Scne Sic
Visor Visor-
Contro ControCnlllreorrotrle
SanrConveyor oo Conveyor~ Scannrerl
Fig. 3 Interaction man Communication Networks

367
WMOCESSCMI-PROCESS UghtBanlgr
I-PROCESS Conveyor
I-PROCESS Switch
ROCESS Doordisabling aces nhbngMODERATUOR~ SUt
SWICH(oenngnOen
open nu (Uhirlr.TTngntrutd
L~gwda d~~cosing IF (UhtarirSTTEpn re
Fi. Mdl roese

368
IPMocSSCOnler allocatd IWdb:OURP ATOR (PmW#.tae Ir.¶x Pciesta
WRITES bootMee
MOD rA~ MDEnomaGn -Gu
(uwdmg oeeted) (enteig oed , entered
WRITES opS . ntry WRITES ap..SV.Entry
C-PROCESS Supervisor
(noEntries, OCtd.Eft, oneEntry) WRITES op..DeskAwak(oneEntry, l CtrIEntry, twoEntries) WRITES op~pesk.Awak
(twoEntrles, lpqlEnlry, thresEnrides) WRITES op eslLAwak
C-PROCESS DeokipK.(awakting, O KBAwaR, arvdLegend:
W WRITES qpSV.Alved
fG WRITES opScree.Disphky
allocated MooeFig. 5 Fumcion Processe
369
4.4 Comments on the specified AecessControlSystem
COMMUNICATION NETThe system consists of the two concurrent clusters Entrance and Reception.The cluster Entrance contains all model processes, the interaction driven processController and the communication driven process SuperVisor. The Controllerinforms the SuperVisor about entered visitors, while the SuperVisor is continouslyaware of the number of actual entries.The cluster Reception consist of the communication process Desk only. Deskprompts for information from the reception desk (devices) in order to inform theSuperVisor about arrived visitors.INTERACTION NET OF CLUSTER EntranceThe main function of the Controller consists of activating and deactivating theScanner, the Door and the Conveyor. The control depends on the behaviour of theScanner and the Door which in turn signalize occuring events to the Controllertrough correspondingly transmitted pulses. The control of the Conveyor depends onthe number of the actually entering visitors. The Controller obtains the necessaryinformation trough pulses stemming from the SuperVisor.
The influence of the LightBarrier on the Door is realized trough direct interactionbetween these two model processes. For every occuring event of the LightBarrier acorresponding pulse is sent to the Door.
Enabling and disabling of the system through the Switch process influences thebehaviour of the Controller and the Door.CASCADES OF CLUSTER EntranceThe cascades represent partially ordered and cycle free subnets of the interaction net.Every casacade defines the possible pulse flow caused by an occurring event or aconsumed message of its top process.PROCESSESThe Controller and the Door are specified as interactively moderated processes. Thestate transition stuctures of their shutting and normal modes describe the correspon-ding alternative dynamical behaviour. The moderators of these processes are stimu-lated by the shut and access pulses of the Switch process. Trough emitted triggers(shutTrg, accsTrg, continue), a mode transition can activate a state transition of thenew mode.
The non-deftrininstic branching (opening, Open) of the normal mode of the Doorprocess is resolved trough an associated switch, which inspects the current state ofthe LightBarrier.
The non-deterministic branching (enabled, Done) of the Scanner process is notresolved within this specification. A corresponding specification based on extendedstate machines would associate a switch depending on the record data transmitted bythe scanner event Done.REMARKFor expository reasons we identified sent and received pulses and messages by theirname. In order to support modularity, the CIP system description language associ-ates outputs to inputs trough explicit translation functions. Furthermore, abstractionfrom the state inspection mecanism is obtained through the encapsulation of statesand variables of inspected processes by specific state vector access procedures.
k ml sm m mmm l llmmm

370
CIP ToolA graphical specification tool has been developed which automatically tests recordedspecifications for consistency. A code generator provides modules, which can beanimated in the source code environment, or which can be ported on a targetcomputer. In order to complete an implementation it suffices to write I/O-drivers forthe transfer of physical events into logical ones and of logical actions into physicalones. In some instances communication links with the environment have to becreated.
References[1] Backus J. Can Programming Be Liberated from the von Neumann Style? A
Functional Style and Its Algebra of Programms. Comm. ACM 1978; 21, 8:613-641
[2] Berry G, Moisan S, Rigault J.P. ESTEREL: Towards a Synchronous andSemantically Sound High Level Language for Real Time Applications. Proc.IEEE Real-Time Systems Symposium 1983, pp 30-37
[3] Bolognesi T, Brinksma E. Introduction to the ISO Specification LanguageLOTOS. In: van Eijk P.HJ, Vissers L.A, Diaz M (eds) The FormalDescription Technique LOTOS. Elsevier Science Publishers B.V, NorthHolland, 1989, pp 23-73
[4] Cameron J.R. The modelling phase of JSD. In: Cameron J.R (ed) JSP andJSD: The Jackson Approach to Software Development. IEEE ComputerSociety Press, 1989, pp 282-292
[5] Caspi P, Pilaud D, Halbwachs N, Plaice J.A. LUSTRE: A declarativelanguage for programming synchronous systems. In: Fourteenth AnnualACM SIGACT-SIGPLAN Symposium on Principles of ProgrammingLanguages, Munich 1987, pp 178-188
[61 Dembinski P, Budkowski S. The Specification Language Estelle. In: Diaz Met al. (eds) The Formal Description Technique Estelle. Elsevier SciencePublishers B.V, North Holland, 1989, pp 35-76
[7] Fierz H. SCSM, a Synchronous Calculus on Sequential Machines.Submitted to Science of Computer Programming 1993.
[8] Fierz H. The Synchronous System Description language IPL. To bepublished.
[9] Fierz I-t The Formal Semantics of the CIP Specification Language. To bepublished.
[10] Harel D, Pnueli A. On the Development of Reactive Systems. In: Apt K.R(ed) Logics and Models of Concurrent Systems. Springer New York, 1985,pp 477-499
[11] Harel D. Statecharts: A Visual Formalism for Complex Systems. Science ofComputer Programming 1987; 8: 231-274.
[12] Jones C.B. Systematic Software Development using VDM. Prentice-HallInternational, Englewood Cliffs N. J, 1986
[13] Peterson J.L. Petri net theory and the modelling of systems. Prentice-HallPrentice-Hall International, Englewood Cliffs N. J, 1981
[14] Zave P. The Operational Approach versus the Conventional Approach toSoftware Development. Comm. ACM 1984; 27,2:104-118

Exception Handling and Predictabilityin Hard Real-Time Systems
Matjai ColnarikFaculty of Technical Sciences, University of Maribor
Maribor, Slovenia
Wolfgang A. HalangDepartment of Electrical Engineering, FernUniversitit Hagen
Hagen, Germany
Abstract
The objective of this paper is to give some reflections about handlingof exceptions in hard real-time environments, which is among the lesselaborated topics in this domain.
A classification of possible exceptions in real-time systems is done, toidentify the ones which can be prevented by certain design measures oravoided by specifying and servicing them within their contexts. A wayto survive the remaining ones in a well-structured and predictable way,and as painlessly as possible, is proposed.
1 Introduction
In his reference paper [14], Stankovic is unmasking several misconceptions inthe domain of hard real-time systems. It seems that the most characteristicone is that real-time computing is equal to fast computing. It is obvious thatcomputer speed itself can not guarantee that the specified timing requirementswill be met.Instead, a different ultimate objective was set: predictability of temporal be-haviour. Being able to assure that a process will be served within a predefinedtime frame is of utmost importance. In multiprogramming environments thiscondition can be expressed as schedulability: the ability to find a schedule suchthat each task will meet its deadline [16].For schedulability analysis, execution times of tasks must be known in advance.These, however, can only be determined if the system functions predictably.To assure overall predictability, all levels of system design must be predictablein temporal sense, from the processor to the system architecture, language,operating system, and exception handling (layer-by-layer predictability, [15)).In recent years, the domain of real-time systems substantially gained researchinterest. Certain sub-domains have been examined very thoroughly, such as

372
scheduling and analysis of program execution times. It is typical that most ofthe research done was dedicated to the higher level topics and presumes thatthe underlying ones are fully predictable.Exception handling is one of the most severe issues to be solved when a sys-tem is to behave predictably. By an exception, any intrusion in the normalprogram flow which can not be considered in schedulability analysis is meantand is usually related to residual specification and implementation errors, andfailures. Anticipated timing events and events from the environment, whichtrigger associated processes do not belong to this category. They should beimplemented in a way, which does not cause any non-deterministic delays inexecution of the running task. That can be done by migrating event recogni-tion and operating system services out of the main task processor, as is donein the Spring project [13], or proposed in [3].When an exception occurs in a program, the latter is inevitably delayed caus-ing a serious problem with respect to the a priori determined execution time.Therefore, exceptions should be prevented by all means, whenever and wher-ever it is possible [1]. If it is not possible to prevent them to happen, theyshould be handled in a consistent and safe way in conformity with the hardreal-time systems design guidelines. The urge for consistent solution of excep-tion problem is even increased by the fact that exceptions are often a resultof some critical state of the system, which is when the computer control aid isneeded most.
2 Classification of Exceptions
In this section we attempt to identify the exceptions appearing in the hardreal-time environments. For that reason we classify them in two ways withregard (a) to their origin and (b) to whether they can be prevented or not.
2.1 Origins of Exceptions in Hard Real-Time Environ-ments ..
Screening possible run-time errors in various programming environments andrelying on our experience in real-time programming, we established the follow-ing classification of exceptions according to their origin:
a) Exceptions caused by I/O operations
"* I/O device errors
"* Invalid device addressing (invalid unit identification, no such device)
"* Ezcepiions caused by the file management (where provided)
b) Exceptions caused by invalid data
* Traps and errors concerning irregular results of operations (overflow, un-derflow, undefined)

373
* Arithmetic functions with illegal run-time parameter values (square root,I logarithms etc.)* Format declaration/run-time value mismatch or conversion errors in I/O
operations
* Subscript (array or string index) out of range
* Invalid procedure parameter numbers or types
c) Errors preventable by imposing restrictions
* Errors connected with dynamic language features (insufficient memorydue to recursion or pointers, dynamic formatting, dynamic function callsetc.)
* Problems concerning virtual addressing
d) Problems in tasking
• conflict situations like terminating, suspending or resuming a non-existenttask etc.
e) System exceptions
o diagnostics, hardware and system alerts due to unit failures (e.g. buserror etc.)
In the sequel we classify exceptions according to the criterion whether they canbe prevented or not.
2.2 Preventable Exceptions
Some exceptions can be prevented by restricting the use of potentially dan-gerous features. Compliance with these restrictions must be checked by thecompiler.For example, only sequential file organisation and compile-time known filenames and other parameters may be used. No dynamic features like recur-sion, references, virtual addressing etc. are allowed.Another means to prevent exceptions is to implement strict type checking in thelanguage, so that possible irregular operations can be reported at the compiletime (as an example, see [6], supported by corresponding hardware [8]).Since strict type checking seems impractical, we suggest to extend the inputand output data types by two "irregular" values representing "signed infinity"to accommodate overflows and underflows, and "undefined" (a solution with"holes" in the domain and "bumps" in the range was already implementedin CLU [11]). The "undefined" value is used when a non-recoverable prob-lem occurred in a calculation or during an I/O process rendering the results

374
meaningless. A similar principle is followed in the IEEE 32-bit floating pointstandard [2] and implemented in the MC68881 co-processor [12], with a quietor signalling "not-a-number (NaN)".Thus, generated irregular values do not raise exceptions, but are propagated tothe subsequent or higher-level blocks, which may be able to handle them (seethe example of an implementation below). Any operation on irregular operandsalways yields a result of irregular type.Intelligent I/O interfaces should react in a predefined way, if a final result, whichis output to them, is irregular. Reactions on different irregular types can bedifferent. The interfaces may tolerate them, they may be able of a local gracefuldegradation of their performance (if the action to be taken is not vital or canbe pre-programmed for such cases) or, if inevitable, recognise a catastrophicsituation. E.g., if a regulating system as a reaction to a disturbance requires"as intensive counter-response as possible" (like a D-regulator) an "infinite"value may be produced, resulting in a maximal possible control signal whichmay depend on a type of the implemented actuator.
2.3 Non-Preventable Exceptions
In the sequel we further classify the non-preventable exceptions into anticipatedand non-anticipated ones. The former can be avoided, the latter, however, mustbe handled in a consistent and safe way. A reference study in the domain ofnon-preventable exceptions was done by Cristian [4, 5].
2.3.1 Anticipated Ezceptions
If the potential danger of irregularity can be recognised during the design time,it has to be taken care of in the specifications.For example, peripheral devices shall be intelligent, fault-tolerant and self-checking in order to be able to recognise their own malfunctions and to insulatethe effects of the latter in "watertight" compartments. They shall react rea-sonably in conflict situations. When the error is recoverable, they should tryto recover locally using fault- tolerance principles (self checking, redundancyetc.).A number of exceptions resulting from irregular data can be avoided by pro-phylactic run-time checks before entering critical operations. Many taskingerrors are also avoidable by previously using monadic operations to check thesystem state.An obvious and frequently used way of avoiding critical failures in hard real-time systems design is redundancy. Redundant system components must beimplemented according to thorough analysis of fault hypothesis. The lattershould beside the physical faults in the operation also include errors in thedesign and implementation of hardware and software components. E.g., inavionics implementations of redundant systems can be found, based on differentprocessors and done by different teams.An example of consistent implementation of redundancy is the MARS system

•, 375
[10]. Components possess self-checking properties and produce either correctI or no results (fail silently); in the latter case the redundant component's re-
sults are taken. To determine where and to what extent redundancy should beapplied, the Mars Reliability Predictor and Low-Cost Estimator (MARPLE)was implemented. Programs written in general-purpose design language for dis-tributed systems are translated into reliability models, which are then analysedby the Symbolic Hierarchical Automated Reliability and Performance Evalua-tor (SHARPE) and several parameters are produced. Based on these parame-ters, dependability can be estimated. However, if a system is extremely safetycritical, also the failure of redundant devices must be taken into account, inspite of the low probability of such an event.
2.3.2 Non Anticipated Exceptions
If there is no way to predict an error, the exception caused must be handledin order to survive it. These are situations when "the impossible happens" [1],in which programs do not follow their specifications due to hardware failures,residual software errors or wrong specifications. For example, failure of a partof memory can result in the change of constant values; an error in file man-agement or on a disk is usually unexpected. In safety-critical control systemsthe non-anticipated exceptions may have catastrophic consequences. There itis especially important to implement a mechanism for their safe and consistenthandling.In his early paper, -Goodenough [71 presented an idea of assigning default-or programmed exception handlers to every potentially dangerous operation.According to severity of the exception raised the running process was eitherterminated or suspended and resumed later. Similar mechanism although con-siderably more elaborated and adopted for use in hard real-time systems wasimplemented in Real-Time Euclid [9]. There, exception handlers were (op-tionally) located within block constructs and were executed in a case of anexception. If there were no exceptions they had no effect except for their im-pact on the block's execution time estimated by schedulability analyser thusmaking it more difficult to be scheduled. Exceptions may be raised by kill, ter-minate or except statements, to terminate a process entirely or only its frame,or to execute the handler without termination of the process, respectively.
3 Coping with Non-Preventable Exceptions
To handle catastrophes we propose a combination of preconditions, postcondi-tions and modified recovery blocks implementing both backward and forwardrecovery. Its syntax is following:
block ::= block-begin block-tail
block-begin ::= BEGIN I PROCEDURE parameters & attributes; ITASK parameters 8z attributes; I parameters REPEAT

376
block.tail ::= [declaration.sequence] [alternative -sequence] END;
alternative.-sequence ::= {[ALTERNATIVE [PRE bool-exp;] [POST bool-exp;]][RESTORE] statement-sequence)
A block (task, procedure or other block structure) consists of alternative se-quences of statements. Every alternative can have its own pre- and/or post-conditions, presented by Boolean expressions. When program flow enters thesurrounding block, the initial state of the system is stacked if there is at leastone alternative implementing backward recovery what is denoted by the key-word RESTORE. Then, the first alternative statement sequence, whose pre-condition (if it exists) is fulfilled, is executed. At the end, its post-condition ischecked, and if this is also fulfilled, execution of the block is successfully termi-nated. If the post-condition is not fulfilled the next alternative is checked forits pre-condition and eventually executed. If backward recovery is requested,the initial state is restored.The alternatives may contain independently designed and coded programs tocomply with specifications and to eliminate possible implementation problemsor residual software errors. They may also contain alternative design solutionsor redundant resources, when problems are expected. A further possibility is toassert less restrictive pre- and/or post-conditions and to degrade performancegracefully. By the means presented in [17] it is also possible to bound theexecution times of alternatives. If one of them fails to complete inside thepredefined period, a less demanding alternative is taken.If there is no alternative, whose pre- and post-conditions are fulfilled, the blockexecution was unsuccessful. If the block was nested inside an alternative on thenext higher level, this alternative fails as well and the control is given to thenext one, thus providing a chance to resolve the problem in a different way. Onthe highest level, the last alternative must not have any pre- or post-conditions.It must solve the problem by applying some conventional actions like employingfault tolerant measures or performing smooth power-down. Since the systemis in extreme and unrecoverable catastrophic conditions, different control andtiming policies may be in action, requesting safe termination of the process andpossibly post-mortem diagnostics.For embedded systems it is important to consider whether backward recovery ofcertain block is possible or not. If in an alternative block an action is triggeredlike commencing a peripheral process which causes an irreversible change ofinitial state, it cannot be restored for another try. In this case only forwardrecovery is possible, bringing the system to certain predefined, safe, and stablestate.The method inevitably yields pessimistic execution time estimation which is asum of execution times of all alternatives together with pre- and post-conditionevaluation times and administration overhead. However, this is not due to thisspecific method. In safety-critical hard real-time systems it is necessary toconsider the worst case execution time, which must also imply exceptionalconditions. Depending on the performance reserve of the system there maybe implemented more or less alternatives, performing more or less degraded

377
functions. In extremely time-critical systems there may be implemented asingle alternative on the highest level block only providing a safe and smoothpower-down.To cope with that problem some further solutions are possible. Each sub-sequent alternative may be bounded to a half of the execution time of theprevious one; thus, the block will terminate in at most double execution timeof the primary alternative. Also, from a failure of an alternative it is possi-ble to deduce which subsequent alternatives in next blocks are reasonable andwhich not, and accordingly set their pre-conditions. However, this requires asophisticated run-time analyser.
4 Conclusion
In order to assure a predictable behaviour of real-time systems, it is necessaryto determine a priori bounds for the task execution times. Exception handlingrepresents the most severe obstacle to this end. Therefore, exceptions wereinvestigated and classified with the objective of obtaining a remedy for thisproblem. It turned out that a large group of them can be either prevented byappropriate measures or avoided at run-time. The others are coped with ina well-structured environment by providing sequences of gradually more andmore evasive software reactions. In either case, the run-time behaviour of real-time tasks becomes fully predictable.
References
[1] Andrew P. Black. Exception handling: The case against. Technical ReportTR 82-01-02, Department Of Computer Science, University of Washing-ton, May 1983. (originally submitted as a PhD thesis, University of Oxford,January 1982).
[2] W.J. Cody, J.T. Coonen, D.M. Gay, K. Hanson, D. Hough, W. Kahan,R. Karpinski, J. Palmer, F.N. Bis, and D. Stevenson. A proposed radix-and word-length-independent standard for floating-point arithmetic. IEEEMicro, 4(4):86-100, August 1984.
[3] Matjai Colnariý and Wolfgang A. Halang. Architectural support forpredictability in hard real-time systems. Control Engineering Practice,1(1):51-59, February 1993.
[4] Flaviu Cristian. Exception handling and software fault tolerance. IEEETransactions on Computers, 31(6):531-540, June 1982.
[5] Flaviu Cristian. Correct and robust programs. IEEE Transactions onSoftware Engineering, 10(2):163-174, March 1984.
[6] Ian F. Currie. NewSpeak: a reliable programming language. In High-integrity Software, pages 122-158. Pitman Publishing, London, 1988.

378
[7] John. B. Goodenough. Exception handling: Issues and a proposed nota-tion. Communication of the ACM, 18(12):683-696, 1975.
[8] John Kershaw. The VIPER microprocessor. Technical Report 87014,Royal Signals And Radar Establishment, Malvern,Worcs, London: HerMajesties' Stationery Office, November 1987.
[9] Eugene Kligerman and Alexander Stoyenko. Real-time Euclid: A languagefor reliable real-time systems. IEEE Transactions on Software Engineer-ing, 12(9):941-949, September 1986.
[10] Hermann Kopetz, A. Damm, Ch. Koza, M. Mulazzani, W. Schwabl, Ch.Senft, and R. Zainlinger. Distributed fault-tolerant real-time systems: TheMARS approach. IEEE Micro, 9(1):25-40, February 1989.
[11] Barbara H. Liskov and Alan Snyder. Exception handling in CLU. IEEETransactions on Software Engineering, 5(6):546-558, November 1979.
[12] Motorola. MC68881 Floating-Point Coprocessor User's Manual, first edi-tion, 1985.
[13] Krithi Ramamritham and John A. Stankovic. Overview of the SPRINGproject. Real-Time Systems Newsletter, 5(1):79-87, Winter 1989.
[14] John A. Stankovic. Misconceptions about real-time computing. IEEEComputer, 21(10):10-19, October 1988.
[15] John A. Stankovic and Krithi Ramamritham. Editorial: What is pre-dictability for real-time systems. Real-Time Systems, 2(4):246-254,November 1990.
[16] Alexander Stoyenko. A Real-Time Language With A Schedulability Ana-lyzer. PhD thesis, University of Toronto, December 1987.
[17] Domen Verber and Matjai ColnariZ. A tool for estimation of real-timeprocess execution times. In Proceedings of Software Engineering for Real-Time Applications Workshop, Cirencester, September 1993. lEE.

Development of a Fail-Safe Data TransmissionSystem for use in Life-Critical Applications
M.B. Schr6nent and M.R. Inggs$Department of Electrical Engineering, University of Cape Town
Private Bag Rondebosch, South Africa, 7700
Abstract
It is essential that safe data transmission between systems in adistributed life-critical application occurs in a safe manner. To datethis transmission has occurred in a parallel form, however risingmaterial and labour costs have made this method of safe datatransmission expensive. In this paper a development of Fail-SafeData Transmission System (FSDTS), which can be used in thesedistributed applications, is presented.
1 Introduction
There are distributed life-critical applications that require safe data to be transmittedover large distances e.g. railway interlockings. To date, this transmission has usuallyoccurred in a parallel manner, which has become expensive. The advent ofmicroprocessors has made it possible to develop cost-effective solutions to overcomethis problem. There is however, an antipathy to using microprocessor based systemsin safety-critical applications because they introduce unidentified and often diversefactors which could result in life-threatening failures.
The aim of this paper is to introduce a FSDTS which was developed incorporatingtechniques that ensure safety when these complex devices are used in life or safety-critical applications.
1.1 Structure of Paper
The Fail-Safe Data Transmission Project (FSDTP) which includes the developmentof the FSDTS, has been broken up into a number of phases. This paper is dividedinto five sections, which correspond to the phases of the project that have beencompleted and are currently in progress. A breakdown of the paper is given below:
Section I (Introductlon) will introduce the FSDTP project, giving an overview ofthe FSDTS with emphasis on the operating requirements and constraints.
t email: [email protected]: miking(@eleceng.uct.ac.za

380
Section 2 (Safe Serial Data Transmission) delineates the method for achievingsafety in the transmission of safe-data over a serial channel in the presence of noise.Issues relating to error control mechanisms with emphasis on the code andcommunication scheme selection will be discussed.Section 3 (Development of a Fail-Safe Data Transceiver) describes how a Fail-SafeData Transceiver (FSDT) can be designed. Here hardware safety will be qualifiedand the architecture of the FSDT will be presented.Section 4 (Ensuring "Error-Free" Software) will give preliminary results of thisresearch. The aims of this phase of the project will be presented with comments onthe future research to be undertaken.Section 5 (Conclusions) gives an overview of the project to date, future plans andthe results from the FSDTs being monitored in the field.
1.2 FSDTP Background
The FSDTP was initiated to investigate a method of overcoming the heavy financialburden in maintaining the existing cabling infrastructure used to transmit safe databetween various interlockings within the train movement control system (TMCS).Contributing factors to this were: cost of new cables, degradation of the existingcables, cost of maintaining the existing cables and the theft of cables.
The aim of the project was to develop a microprocessor-based serial data trans-mission system which could be used to transmit this safe information. The systemwould initially be used to transmit small amounts of data between interlockingswithin the TMCS. After a successful evaluation phase the transceivers would beused to transmit control information within the interlocking and to the train itself.
1.3 System Overview
The FSDTS must have the ability to utilise a variety of serial channels and betransparent to the safety-system, in the sense that the safety systems must stillcommunicate in a parallel form.
SlSafSyste System System I
2 n
T - I
System Boundary
Figure 1: FSDT'S in Routing Configuration
The FSDTS can either be used in a store and feed forward configuration shown inFigure 1 above or in a master slave configuration illustrated below in Figure 2.

381
Figure 2: FSDTS in Master-Slave Configuration
1.4 FSDTS Requirements and Constraints
To offer the same safety as a parallel transmission system the FSDTS must adhereto the foliowing requirements and constraints:
* Safety must be guaranteed from when the data leaves the transmitting safesystem until it arrives at the receiving safe system.
* Due to the nature of the application, safe systems which are communicatingwith each other must ensure that the latest information is always transmitted tothe remote safe systems.
* If there is a break in data received by a FSDT, its outputs must be set to a safestate.
* The integrity of the channel must be monitored to ensure that the acceptablenoise level is not exceeded. If the level is exceeded the outputs of the receivingFSDT must be set to a safe state.
• Once a FSDT has shutdown, no safe data can be transmitted in the channel to , -•
which it is connected.
• All first faults which affect the safety of the system (including those of th• faultdetection circuitry) must be detected within approximately one second ofoccurrence. Faults which do not affect the safety or those which cause thesystem to revert to its safe state are also required to be detected within areasonable time to fulfil the requirements of maintainability.
T Having detected the first fault (affecting safety), the system must automaticallyrevert to safe (predetermined) state.
"* The safe state to which the system reverts after the detection of the first faultmust be irreversible i.e. the system must not be able to become unsafe even"after the occurrence of further faults.

382
2 Safe Serial Data Transmission
Noise which is inherent in the transmission system and noise from the environmentwill corrupt data transmitted over the communication channel. To achieve safe datatransmission it is necessary to combat the effects of this noise. In this section wewill demonstrate that it is possible to achieve safe data transmission over a serialchannel in the presence of noise, by incorporating an error control strategy. For thispurpose we will consider only one link of the FSDTS.
2.1 Selecting an Error Control Strategy
Two strategies which are used to control errors in a communication channel areautomatic repeat-request (ARQ) and forward-error correction (FEC). In this typeof application an ARQ strategy is preferred if a reverse channel is available [1,2].To implement effective coding techniques it is essential to obtain statistical datarelating to the types of errors, and also their occurrence rate [3]. Once an analysisof the errors occurring in the communication channel is complete, it is possible to-0d'.g t.'.CO channel and select a coding scheme that will be the most effective against
the predicted noise.
2.2 Expected Errors in Channel
Errors resulting from noise are classified into two main categories i.e. randomerrors and burst errors. Random errors result from random noise which isprimarily gaussian noise and shot noise. These errors are normally inherent in thecommunication system. On the other hand, burst errors occur due to natural causes(e.g. lightening) and man-made sources (e.g. power systems and electrical machinery)[1,41. As indicated by [5,61 both random and burst errors are expected to occur.There is strong evidence to suggest that long transmission periods will exist wherefew errors will occur (mainly random errors), followed by short periods where agreat number of mainly burst errors will occur. This might be due to loss ofsynchronisation or from some form of burst noise.
2.3 Channel Modelling
There are two approaches to modelling the channel. Collected statistical data can beused to determine the parameters of the channel model ("descriptive" modelling) ora mathematical model can be adapted to real measurements of the channel("generative" modelling) [31. It is apparent that in both instances substantialstatistical data is required to model the channel effectively.
Measured statistics of various channels are dependant on the type of equipment usedand the environment in which the channels operate. With the lack of availablestatistical data and vast amounts of different channel equipment and environments

383
found in the proximity of the trackside, it was impractical to gather sufficientSstatistical data to model all the channels with their associated equipment and
environment. It was thus decided to make the following assumptions:* The channel has no memory i.e. one bit inverted will not effect the next bit.* The channel is a binary symmetrical channel (BSC).0 Errors occur randomly and each bit has the same probability of being incorrectly
asserted.0 Messages are equiprobable i.e. each message has the same probability of
containing as many "I's" as "O's".
By ignoring the effects of burst noise the results obtained for the probability of errorwould be optimistic as illustrated by [7]. For this reason a random error detect-ing/correcting code with good random and burst error capabilities will be used toimplement the error coding in the error control system. Thereafter techniques toimproves the code's burst error capabilities will be implemented.
2.4 Selecting an Error Control Code
Error control codes are broken up into two main types, being block codes andconvolutional codes. In this application convolutional codes were not considered forreasons mentioned in [1,81. A block code or cyclic code with good random andburst error detection capabilities will be selected and thereafter the codes's burst errorcapabilities will be improved. The code evaluation will be based on the probabilityof an undetected error P,(E).
2.4.1 Error Capabilities of Linear Block Codes
The error control capabilities of a linear block code used for error detection isdetermined by the code's minimum distance (d.,.) known as the Hamming distance[9,10,11]. For a (n,k) linear block code, there are (2 k - 1) possible undetected errors.This occurs when a code-vector is corrupted in such a way that it becomes anothervalid code-vector. If the weight (Hamming Weight) of the code is known, it ispossible to calculate the probability of an undetected error for the code, if it is usedon a BSC. This can be calculated using equation (1), as described in [11, 12,13] as follows:
Ik
P(E) E A• p, (1--p)8' (1)
where A, is the number of code vectors of weight i in the code and p is the channelbit error rate (BER). For large values of n and k however, it becomes almostimpossible to calculate the weight distribution of a code. In some instances however,it is possible to calculate the weight distribution of the dual of the code. By usingMacWilliams identity [14], it is possible to calculate the probability of an undetectederror for the code. If this method is not possible, then equation (2) can be used.

P,(E) 2 "k) B(1-2p) - (1-p)* where B(1-2p) - B((1-2p)' (2)jul
where (B11 B,,...B) is the weight distribution of the dual code. Hf neither of theabove methods are possible the upper-bound as described in equation (3).
P3(E) % 2_' - k) (3)
where Po(E) is an upper bound for the average probability of an undetected error.It must be emphasized that this upper-bound is only valid for a few codes asillustrated in [15,16,171.
2.4.2 Code Evaluation
In order to satisfy the system safety requirement the code selected must improve thechannel BER from 10-5 to 1.32 x 10".1 (with a transmission rate 2400 bps). By usingthe MacWilliams identity and tables in [18,19], it was found that certain Bose,Chaudhuri and Hocquenghem (BCH) codes, the most powerful known class of binarycodes for correcting random errors [20], would satisfy the safety requirement.
2.4.3 Improving a Code's Burst noise Immunity
As a result of the assumptions made the theoretical values for P,(E) will beoptimistic. By using techniques such as bit stuffing, interleaving, concatenated codesand a second code it is possible to improve the code's burst error capabilities. Ofthese methods interleaving offers the best improvement for overhead as described in[21,221.
2.5 Error Control Implementation
The code selected in this application is a interleaved BCH(15,7,2) with an inter-leaving degree X of 5. In this application a modified ARQ communication schemeis used. Retransmissions are not required because the latest data is always trans-mitted. Received data that is corrupted is discarded. Encoding and decoding of thedata is done by a lookup table. There are 27 valid code-vectors requiring 128 bytesof memory. The time taken to lookup one code-vector is ± 4,us excluding thesoftware overhead.
3 Development of Fail-Safe Data Transceiver
When microprocessors are used in the design of equipment that is to be used in life-critical applications, it is not feasible to incorporate interlocking to detect all thepossible microprocessor failure modes. To overcome this problem, the system isdesigned to have either a voting or comparative architecture. In both approaches

385
designed to have either a voting or comparative architecture. In both approachessimilar or diverse hardware can be used. In this section we present the formulas toquantify the system safety, and, discuss the FSDT.
3.1 Determining the Hardware Safety
Hardware safety is expressed as the mean time between wrong side failures(MTIBWSF). The MTBWSF is derived from the mean time between failures(MTBF) of the components of the system. We will consider the two-out-of-twocomparative architecture. The following assumptions are made:
* components are used in their useful life period (ie random failures occur).* all first faults will result in an unsafe failure if undetected.
The instantaneous failure rate or hazard rate of a component is expressed as
f(t) (4)R~)="(t)
where f(t) is the failure probability density function and R(t) is the reliability of thecomponent. When using components during their useful life, X(t) is constant and isexpressed as L. The mean time between system failure (MTBSF) as calculated in[23] expressed in equation (5) where %<<4 and 1/# is the mean repair time.
MTBSF = (5)
Consider a two-processor system where the system output is controlled by aredundant management system which has the ability to shut the system down to asafe state should faults occur in either of the processors. The following assumptionsare made:
"• There are no design errors in the system which will render the redundantmanagement system unable to detect an unsafe failurem....
"* Failures in each of the two processors are independent."* Any failure occurring after the first undetected failure will result in the
management system unable to revert the system to a safe state.
The system safety can be quantified in terms of the MTBWSF by redefining fR(t) asthe probability density function of the fault detection process which has a faultdetection time of t. The safety can now be expressed as
MTBWSF - + 1 MTBF 2 (6)X 2x
When the two elements are configured as described above and used in a safeenvironment the two redundant elements together operate as a single element and the

7~386
It is thus possible to determine the safety of the system by calculating the MTBF ofeach system in a two-out-of-two comparative architecture. The MTBF of eachsystem is derived from the MTBF of the individual components that make up eachsystem.
3.2 Selecting the FSDT Architecture
After fault-tree and FMECA analyses were performed it was found that a two-out-of-two comparative architecture would meet the FSDT requirements. Similar asopposed to diverse hardware was selected. An illustration of the architecture is givenin Figure 3.
3.3 Description of the FSDT Hardware Implementation
The FSDT comprises of two identical sub-systems, which are electrically isolatedfrom each other to obtain statistical independent errors. The modules within the sub-system are microprocessor controlled and are configured in a master/slaveconfiguration. Each sub-system comprises an input, output, comms and displaymodule as illustrated in Figure 4. Each module can be configured as a master or aslave.
The slave performs only its primary function whereas a master performs its primaryfunction, data collection and distribution and rendezvous with the other sub-system,for data. The two sub-system are loosely synchronised and re-adjustment occurs ateach rendezvous.
u Fail-safe O•Dtaput rc
iAtuls & Detintbon Sub-system h thli st t d
J•€lrm Sub-system
B
Figure 3: Fail-Safe Data Transceiver Architecture
All of the modules in both sub-systems have the ability to shut the system down on
the detection of an error. This is done by blowing a fuse which isolates the FSDTfrom the safe system. Once the FSDT is shutdown, no data can pass between itselfand the safe system. The serial channels can still be used to transmit maintenance

r7,
387
information depending on the type of failure that caused the system to be shut down.
I PA, D I Q _. outpt C
Figure 4: FSDT Sub-System Components
4 Ensuring "Error-Free" Software
The FSDTS that is under evaluation at present has software which is functionallycorrect. By this is meant that the functions performed by the software are correct,but the software has not been verified and has not been proven to be correct. Thesoftware was written in assembler and no interrupts have been used. The validationand verification of the software is part of the research that is currently beingundertaken at the University of Cape Town. The following issues are beingaddressed:
* Use of fault-tree analysis and other methods to identify high risk areas andto provide input into the validation process.
* Generation of a mets language to facilitate the formulation of the systemrequirements into a formal specification.
* Using Statecharts to model and represent the system for input into asynchronous language such as Esterel. "
5 Conclusions
To date 5 systems have been manufactured and are currently being tested in Cape
Town. Three of the links used are leased telephone type circuits and the fourth isa microwave linkg The telephone links are 4-15ke" in length and the mirowave linkis +_ 100km in length. At present the FSD hs are monitored by Test GenerationModules (TGMs) and safety system simulators (ass). To date the FSDaTo hasoperated successfully and once the software research is completed the FSDTs willbe used in live applications. At this stage it is anticipated that the systems will beinready for installation early in 1994. v
" Genraton o a etalangageto aciltat th forulaionof te sste
requremets nto fomal pecficaion
" Usig Satehart tomodl an reresnt te sste forinpt ito
syncronos lnguae suh a Estrel

388
6 References
1. Shanmugan KS. Digital and Analog Communication Systems. John Wiley & Sons, NewYork, 1979, pp 443-504
2. Chien RT. "Block-Coding Techniques for Reliable Data Transmission". IEEE TransCommun Technol, Oct 1971; vol COM-19, no 5, pp 743-751
3. Kanal LN, Sastry ARK. "Models for Channels with Memory and Their Applications toError Control". Proc IEEE July 1978; vol 66, no 7, pp 724-744
4. Lawrence, Apperley, Auclair et al. "Errors in Digital Transmission Systems", OREReport RP5, 1985, pp 1-52
5. Fontaine AB, R.G. Gallager RG. "Error Statistics and Coding for Binary TransmissionOver Telephone Circuits". Proc IRE, Jun 1961; vol 49, no 6, pp 1059-1065
6. Reiffen B, Schmidt WG, Yudkin HL. "The Design of an Error-Free Data TransmissionSystem for Telephone Circuits", AIEE Trans Jul 1961; vol 80, Part 1, pp 224-231
7. Lawrence, Apperley, Auclair et al. "On proving the Safety of Transmissions Systems".ORE Report RP8, Apr 1986, pp 1-42
8. Berlekamp ER, Peile RE, Pope SP. "The Application of Error Control to Communica-tions". IEEE Commun Mag, Apr 1987; vol 25, no 4
9. Hamming RW. Coding and Information Theory. New Jersey. Prentice-Hall Inc 1980,pp 21-49
10. Roden MS. Digital and Data Communication Systems, New Jersey, Prentice-Hall Inc1982, pp 121-159
11. Peterson WW, Weldon EJ, Error-Correcting Codes 2nd Edition, Massachussets, MITPress, 1972, pp 64-70
12. Berlekamp ER. Algebraic Coding Theory, New York, McGraw-Hill, 1968, pp 397-43113. Peterson WW, Weldon EJ. Error-Correcting Codes 2nd Edition, Massachussets, MIT
Press, 1972, pp 64-7014. MacWilliams FJ, Sloane NJA, The Theory of Error-Correcting Codes. Amsterdam,
North-Holland Mathematical Library, 1977, pp 125-13215. Leung-Yan-Cheong SK, Hellman ME. "Concerning a Bound on Un-detected Error
Probability", IEEE Trans Inform Theory, Jan 1979; vol IT-25, no 1, pp 235-23716. Leung-Yan-Cheong SK, Barnes ER, Friedman DU. "On Some Properties of the
Undetected Error Probability of Linear Codes". IEEE Trans Inform Theory, Jan 1979;vol IT-25, no 1, pp 110-112
17. Wolf JK, Michelson AM, Levesque All. "On the Probability of Undetected Error forLinear Block Codes". IEEE Trans Commun Feb 1982; vol COM-30, no 2, pp 317-324
18. Costello Jr. DJ, Lin S. Error Control Coding: Fundamentals and Applications, NewYork, Prentice-Hall Inc, 1983, pp 141-183
19. MacWilliams FJ, Sloane NJA. The Theory of Error-Correcting Codes. Amsterdam,North-Holland Mathematical Library, 1977, pp 445-453
20. Wiggert D. Error Control Coding and Applications, Massachusetts, Artech House, 1975,pp 77-85
21. Costello Jr. DJ, Lin S. Error Control Coding: Fundamentals and Applications, NewYork, Prentice-Hall Inc, 1983, pp 271-272
22. Shanmugan KS. Digital and Analog Communication Systems, New York, John Wiley& Sons, 1979, pp 476-478
23. Liebowitz BH. Reliability Considerations for a Two Element Redundant System withGeneralised Repair Times. Oper Res, 1966, pp 233-241

Author Index
Al-Karaawy, S. 276 Liu, Z. 31Anderson, S. 21 Malcolm, B. 147Anderson, T. 3, 219 Manoni, V. 73Banitre, J.-P. 142 Md, L. 329Baumann, R. 182 van der Meulen, M.J.P. 85Bernardeschi, C. 9 Mfiller, H. 361Bondavalli, A. 9 Michael, C.C. 197Brummer, J. 289 Miller, K.W. 197Bruns, G. 21 Molinaro, P. 302Cellary, W. 145 Mutone, G.A. 63Chudleigh, M.F. 99, 123 Netos, S. 361Clare, J.N. 123 Nordahl, J. 31Cole, B. 85 Oppert, S. 41Collinson, P. 41 Posch, R. 341Colnaric, M. 371 Rainer, J. 240Dhanjal, S.S. III Redmill, F. 135Fierz, H. 361 Rhody, H.E. 73Fink, R. I 11 Rothfelder, M. 63Galdn, I.M. 207 Roux, O.H. 302Goring, C.J. 91 Saeed, A. 219Halang, W.A. 53, 349, 371 Scheepstra, J. 53Hoelscher, J.R. 73 Schoitsch, E. 253Hughes, S. 41 Schr6nen, M.B. 379Inggs, M.R. 379 Sen, G. 289Kafiniche, M. 230 Seviora, R.E. 265Kanoun, K. 230 Simoncini, L. 9Krawczyk, H. 276 Sorensen, E.V. 31Kfindig-Herzog, M. 182 St/Uhane, T. 85Kuhn, W. 253 Stamm, B. 182Landwehr, C.E. 313 Voas, J.M. 197Laprie, J.-C. 157 Ward, N.J. 171de Lemos, R. 219 Witte, M. 349

80.-cl)S
2L0
00
a. 20 0=
U -~ Ct 1.06R
C*, iC, M W- -4b
0g~ C0 n
0)

C6
431
00.!
.22
UU.5n
S 0 oA

The world-wide market for safe, s'eur'eand reliable computer
systems is rapidly expanding: safety is one of the top prioritiesfor many high technology applications. Among the industrialand business sectors which are especially concerned withsafety are: aerospace, manufacturing and machinery control,water treatment, mining, rail, military, medical, power, shipping,insurance, certification, and standards making.
SAFECOMP '93 is an opportunity for technical developers,users and legislators to exchange and review their experiences,
to conside, the best technologies now available, and to identifythe skills and technologies required for the future. It focuses oncritical computer applications, presenting current research and
new trends in computer safety, reliability and security, andproviding a platform for technology transfer between academia,industry and research institutions. It is outstanding for its
international breadth (authors from 16 different countries), itsway of combining participants from academia, research andindustry, and its wide topical coverage.
This book presents the proceedings of SAFECOMP '93: the12th International Conference on Computer Safety, Reliabilityand Security, held in Poznah, Poland, 27-29 October 1993. Thepapers cover a broad spectrum of subjects including formalmethods and models, safety assessment and analysis,verification and validation, testing, reliability issues anddependable software technology, computer languages forsafety related systems, reactive systems technology, securityand safety related applications.
SAFECOMP '93 is for all those in universities, researchinstitutions, industry and business who want to be well-informed about the current international state of the art in
computer safety, reliability and security. It provides arepresentative sample of recent research results andapplications problems, presented by experts from industrial and
academic institutions.
ISBN 3-540-19838-5ISBN 0-387-19838-5