Ácido docosahexaenoico (dha), un ácido graso esencial a nivel cerebral
TRANSCRIPT

Detection of Dopaminergic Neurotransmitter Activity using Pharmacologic MRI: Correlation with PET, Microdialysis, and Behavioral Data Yin Ching I. Chen, Wendy R. Galpern, Anna-Liisa Brownell, Russell T. Matthews, Mikhail Bogdanov, Ole Isacson, John R. Keltner, M. Flint Beal, Bruce R. Rosen, Bruce G. Jenkins
The metabolic activation resulting from direct dopaminergic stirnulation can be detected using auto-radiography, positron emission tomography (PET) or, potentially, fMRl techniques. To establish the validity of the latter possibility, we have per- formed a number of experiments. We measured the regional selectivity of two different dopaminergic ligands: the dopa- mine release compound D-amphetamine and the dopamine transporter antagonist 2P-carbomethoxy-3P-(4-fluoropheny) trolpane (CFT). Both compounds led to increased signal inten- sity in gradient echo images in regions of the brain with high dopamine receptor density (frontal cortex, striatum, cingulate cortex >> parietal cortex). Lesioning the animals with unilat- erally administered 6-hydroxydopamine (6-OHDA) led to abla- tion of the phMRl response on the ipsilateral side; control measurements of rCBV and rCBF using bolus injections of Gd,-DTPA showed that the baseline rCBV and rCBF values weire intact on the lesioned side. The time course of the BOLD signal changes paralleled the changes observed by microdi- alyisis measurements of dopamine release in the striatum for boih amphetamine and CFT; peaking at 20-40 min after in- jection and returning to baseline at about 70-90 min. Signal changes were not correlated with either heart rate, blood pressure or pC0,. Measurement of PET binding in the same animals showed an excellent correlation with the phMRl data wh'en compared by either measurements of the number of pix'els activated or percent signal change in a given region. The time course for the behavioral measurements of rotation in the 6-OHDA lesioned animals correlated with the phMRI. These experiments demonstrate that phMRl will become a valuable, noninvasive tool for investigation of neurotransmit- ter activity in vivo. Key words: fMRI; dopamine; amphetamine; CFT.
INTRODUCTION
The technique of functional magnetic resonance using either BOLD or TI-based techniques has led to a revolu- tion in brain mapping. These techniques are based upon the coupling between neuronal activity, metabolism and
MRM 38389398 (1997) From the MGH-NMR Center, Department of Radiology Massachusetts Gen- eral Hospital and Harvard Medical School (Y. I. C., J. R. K., B. R. R., B. C;. J.); PET Laboratory, Department of Radiology. (A.-L. B.); Neurochem- istry Laboratory, Department of Neurology (R. T. M., M. B., M. F. B.); Neu- roregeneration Laboratory, McLean Hospital (W. R. G., 0. I.), Belrnont, Massachusetts. Address correspondence to: Bruce G. Jenkins, Ph.D., MGH-NMR Center, Building 149 13th Street, Charlestown, MA 02129. Received December 12, 1996; revised July 8, 1997; accepted July 15, 1997. 1997 ISMRM Young Investigators' Rabi Award Finalist 07413-3194/97 $3.00 Copyright 0 1997 by Williams & Wilkins All rights of reproduction in any form reserved.
hemodynamics leading to changes in MR signal intensity sensitive to these parameters (1-3). Similar such studies have been performed previously using positron emission tomography (PET). In addition to neuronal activity in- duced by task activation, stimulation of neurons using pharmacologic ligands is also possible. Studies of recep- tor binding can be performed in vivo using PET imaging, or can be performed postmortem using autoradiography. These techniques allow one to use direct agonists or antagonists to map out the receptor density of these sites in the brain. Autoradiographic and PET studies have also examined metabolic changes (both blood flow and glu- cose utilization) after neurotransmitter stimulation us- ing, for example, amphetamine (4-7). The technique of fMRI is well-suited to study these metabolic changes. And several preliminary reports have appeared (8 -1 1).
The use of N R I to perform such experiments is tempt- ing due to its noninvasive repeatable nature. However, due to the large doses necessary to obtain a response measureable by MR techniques, compared with autora- diography or PET, it is necessary to ascertain that the measured response is due to activation of the neurotrans- mitter system in question. There are a number of issues that arise in this context that are relevant to understand- ing the coupling between neurotransmitter binding and hernodynamic response. The issue of whether the poten- tial fMRI response is due to direct neurotransmitter bind- ing or indirect effects (such as a change in pC0,) needs to be investigated. One approach to solving this problem would be delineation of the correlations between the hemodynamics, the receptor binding, neurotransmitter release and behavior. Several useful techniques exist for studying these events including PET imaging (12,13) and microdialysis (14).
In this communication we have chosen to study the dopamine system to examine the utility of fMRI for in- vestigation of neurotransmitter activation for a number of reasons. The dopamine system, unlike the glutamatergic, for instance, shows great regional specificity with high receptor density in the frontal cortex and basal ganglia. In addition, very reproducible animal models of dopamin- ergic binding and ablation exist. These models are of great interest in studying neurodegeneration (Parkinson's disease) as well as, for instance, drug abuse (cocaine addiction). The ability to selectively and unilaterally denervate the dopaminergic system using 6-hydroxydo- pamine (6-OHDA) also allows for a controlled experi- ment to measure the efficacy of whether or not the fMRI response is due directly to dopamine. There is a large
389

300 Chen et al.
body of autoradiographic data on the response of both rCBF and glucose utilization rates to dopaminergic li- gands such as amphetamine, as well as a wealth of be- havioral and autoradiographic data on the 6-OHDA model (15, 16). We have utilized two different dopamin- ergic ligands. Amphetamine is a dopamine release com- pound that appears to work by increasing the dopamine concentration in the synapse by release of dopamine from the transporter receptor (17). CFT is a dopamine transporter antagonist whose effects are much like co- caine, only more specific (18, 19). Thus, CFT and am- phetamine are like inverse operators. We demonstrate here that the fMRI response to pharmacological stimula- tion [hereafter dubbed phMRI) shows a tight coupling to tht: regional distribution of dopamine transporters using PET, to the release of dopamine as studied using micro- dialysis, and to behavioral measures.
METHODS
Animals
Sprague-Dawley rats were used for all studies. Control animals were studied as well as lesioned animals. For lesion studies rats were anesthetized with ketamine (50 mg/kg ketamine, 5 mg/kg xylazine, 2.5 mg/kg aceproma- ziiie). To restrict the effect of 6-OHDA to the dopaminer- gic neurons, animals received desipramine (20 mg/kg, intraperitoneally) 30 min before the 6-OHDA injection. The animals were then placed in a sterotaxic device and received unilateral injection of 6-OHDA into the medial forebrain bundle (Coordinate: [AP, ML, DV] = [-4.5, f1 .2 , -7.61, 8 pg/2 pl, iced and stabilized with ascorbic acid). After injection, animals were sent back to the animal facility and allowed to recover for at least 3 weeks. Behavior was assayed by rotational testing to screen out those rats with less then 90% dopaminergic neuronal loss in striatum. For this, 5 mg/kg amphetamine was given subcutaneously and the animal was placed in a computerized rotameter (San Diego Instruments, CA) to record the number of turns, ipsilaterally or cotralaterally to the lesioned side, for 90 min in 10-min intervals. The criterion for inclusion in the study was >600 ipsiversive turns per 90-min intervals. This has been shown to cor- relate with >go% loss of nigral-striatal dopaminergic innervation (15).
,4 control population of animals was studied on bench tops using halothane/N,O/O, anesthesia [ 1.5% halothane) and injections of either 3 mg/kg intravenously amphet- amine or 0.75 nig/kg CFT. At this time measurements of blood gases (PO, and pCO,), pH, heart rate, and blood pressure were obtained over 2-3 h time periods.
Microdialysis Measurements
Concentric dialysis probes (membrane: 18 KDa cutoff, 200 mm outer diameter, length 4 mm) were implanted into the right striatum 18-24 h before the perfusion. Rats were anesthetized with halothane and placed in a stereo- taxic frame with an incisor bar set at -3.3 mm below an interaural line. After a skull was exposed and a burr hole
drilled, the probe was slowly (2-3 min) lowered into the right striatum and secured to the skull bones. Coordi- nates of the probe's tip: AP + 0.5; ML 2.7; V-7.2 (Paxinos and Watson, 1986). The perfusion medium (145 mM NaCl, 2.7 mMKC1, 1.2 CaCl,, 1.0 mMMgCl,, pH 7.4) was delivered at 1 ml/min using a microperfusion pump (CMA/100, CMA, Acton, MA) and dialysate samples were collected every 20 min into 5 ml of 0.5M perchloric acid. Collection of basal dialysate samples started after at least 3-4 h of perfusion. After completion of the experi- ments, the rats were killed and location of the probes in the str iatum verified.
Striatal dialysates were assayed for DA content by HPLC/EC. The HPLC system consisted of a dual piston pump (Shimadzu 10AD); a CMA/200 refrigerated au- tosampler (CMA, Acton, MA); a 3-mm ODS 80 X 4.6 mm column (HR-80, ESA, Chelmsford, MA), and an ESA 5200A coulometric detector with an ESA 5014B dual- electrode analytical cell. The first electrode was set at -150 rnV, and the second, at +175 mV. The mobile phase (delivered at 1 ml/min was 0.1 M sodium dibasic phosphate buffer, containing 1 mM SDS, 15% (v/v) meth- anol and 1O0/o (v/v) acetonitrile, pH 5.6. Under these conditions the limit of sensitivity for DA standards (SNR =: 3) was about 0.2 fmole on the column.
MR Measurements
All MF1 measurements were performed on a 4.7 T GE Omega CSI imager (Fremont, CA). Animals were imaged using a 35-mm birdcage coil under halothane/N20/02 anesthesia (1.5%) halothane). All animals were tempera- ture-regulated using a circulating water blanket at 38OC and were monitored for arterial oxygen saturation using a Nonin pulse oximeter (Minneapolis, MN) during imag- ing. A number of animals were also monitored using arterial sampling of blood gases, and blood pressure dur- ing imaging as well. However, not all animals could be sampled during scanning due to the necessity of blood withdrawal for blood gas sampling (which requires an arterial line) and the need for survival to perform PET experiments.
Due i o the long time period necessary for performing the phhilRI imaging and the large magnetic susceptibility differences between rat brain cortex and air, a head holder was constructed to secure the rats in the coil and susceptibility matching between the brain and air was attained by using an agar pad made with D,O placed on the animals scalp.
The :successfully 6-OHDA lesioned rats and normal control rats were imaged using conventional gradient recalled echo images acquired repeatedly from the stria- tal area (TR/TE400 ms/15 ms, optimized Ernst angle RF, 3-5 slices with slice thickness 1.5 mm). At least 15 stable base line image sets were acquired before the pharmaco- logical stimulation. Three mg/kg D-amphetamine or 0.75 mg/kg CFT (2P-carbomethoxy-3P-(4-fluoropheny) tro- pane (CFT, or WIN 35,428 compound), RBI, Cambridge, MA) were then injected intravenously while the images were still being acquired and repeated for 90-180 min postinjection. For the control rats, an additional arterial line was connected to a cardiac monitor device (706

phMRI of Dopamine Stimulation 391
patient monitor, Ivy Biomedical System, Inc.) to record the mean blood pressure and heart rate. Blood gasses were sampled to check the blood pC0, level every 15 to 30 min.
Measurements of rCBV and rCBF were made using bolus injections of 0.2 mmol/kg Gd(DTPA) (Magnevist, Schering AG, Berlin) and rapid gradient echo imaging with 1.2 slimage temporal resolution (TR/TE 2017 ms; cy = 23"). Delta R2" values were calculated on a pixel by pixel basis and then integrated to measure rCBV. rCBF was determined using the peak drop after bolus injection.
PET Measurements
The same animals studied by phMRI were also scanned ulsing PET. Anesthetized animals were placed on an im- aging table. The head was secured in a customized acrylic plastic head holder equipped with ear and mouth bars designed to ensure reproducible head positioning in the PET scanner. Imaging studies of dopamine transport-
ers were performed using carbon-11 labeled CFT as a tracer. For PET imaging 0.8-1.2 mCi of the labeled com- pound (specific activity 800-1600 mCi/pmol) was ad- ministered into the tail vein. Serial dynamic imaging was acquired over the rat brain for 60-90 min using 5-mm steps and counts were block averaged for between 15-60 s intervals depending on how far along the 20-min half life "C decay curve the measurement occurred.
PET Imaging was performed using a home-built high resolution single ring tomograph, PCR-I describcd earlier (20). The resolution of PCR-I for a point source at the center is 4.5 mm and the sensitivity is 46,000 Hz for a source of 20 cm in diameter with a concentration of 1 pclcc. The overall efficiency is 64% of the theoretical maximum for a plane thickness corresponding to the 2-cm high crystals. The plane thickness of 4.5 mm used in this study was obtained by the use of cylindrical collimators which limit the effective height of the crys- tals. Imaging data were corrected for uniformity, attenu- ation, decay and acquisition time. Images were recon-
FIG. 1. Statistical maps of increased BOLD signal change after injection with a) 3 mg/kg amphetamine or b) 0.75 mg/kg CFT. Changes in blood pressure and pC02 as measured in the magnet are shown with the percent signal changes. Color bars represent the p values fair t h e activation maps determined from the Komolgorov-Srnirnov test. Use of T statistics led to essentially identical looking maps.

392
120 . . . , . . . , . . . L . . . , . . .
(C) 2 115 2 0) 8 $0
3 90
a - 8 3: E El00 105
m - d 95 cd
85
Chen et al.
, . . I . . . I . - . , . . . , . . - I . . . I . . .
(D)
Hd 40 : 30 .
2 0 - - . ' ' . . . . . . ' 1
structed using a ramp filter with a cut off value of 1.0 and convolution back projection.
Data Analysis
The activation maps of the phMRI data sets were gener- ated using Komolgorov-Smirnov statistics and overlayed on the gradient echo images. Two approaches were uti- lized to define the activation. Areas of activation as de- fined by the statistical maps were calculated using auto- mated segmentation of the maps at a predefined threshold of p < 0.01 (determined by requiring at least four activated pixels to be significant and including a modified Bonferroni correction adjusted for spatial cor- relations in the data). The percent signal changes were also measured in these areas as well. To determine spec- ificity, the anatomic structures were segmented using a rat brain atlas (21). The fraction of each structure acti- vated, as determined from the statistical maps, was then calculated. The differences between the ipsilateral and con tralateral hemispheres were then measured using both the percent signal change and the areas as (Con- tralateral-Ipsilateral)/Contralateral. These numbers were then compared with the PET data by averaging together the three 1.5-mm MRI slices to obtain the same slice thickness as in the PET studies.
For analysis of the PET data regions of interest (ROI), including left and right striatum and cerebellum were drawn and the percent activity of the injected dose was calculated. Binding ratios of 'lC-CFT into the dopamine transporter between striatum and cerebellum (the cere- bellum is assumed to have only background levels of dopamine transporter) were calculated according the fol-
lowing formula:
Percent Activity/Pixel,,,,,,,, - Percent Activity/Pixel,,,,,,,,,,, __ Percent Activity/Pixel,,.,,.b,ll.,,
Binding ratio =
The values of binding ratios were averaged between 55 and 65 min (so as not to include the initial activity due largely to flow) and compared with the values of hemo- dynamic indices from MR studies as well as to rotation.
RESULTS
The injection of either amphetamine or CFT causes an increase in signal intensity using BOLD imaging that is regionallly localized to areas of the brain that are high in dopaminergic receptor density as shown in Fig. 1 for typi- cal control animals. The signal increases in striatum in these rats are also plotted along with blood pressure, and pC0, values showing the time courses are not correlated. Shown in Fig. 2 are the effects of amphetamine and CFT on blood gasses and blood pressure in a larger group of ani- mals. It is clear that the time courses for these changes do not parallel those of the phMRI responses seen in Fig. 1. The effect is clearly not due to increased pC0, or the transient spike seen in the blood pressure curves.
Studies of the regional specificity showed activation in cingulatle and frontal cortex (but not parietal cortex) and striatum. Initially, we used higher doses of amphet- amine, which led to nonspecific increases in all areas of the brain. Similar increases (though with more regional selectivity) were also reported by Silva et al. using 20
Amphetamine 3mg/kg i.v. n = 4 Amphetamine 3mg/kg i.v. n=12
'50
40
30
20 -40 -20 0 20 40 60 80 -40 -20 0 20 40 60 80
Time Post Injection (min) Time Post Injection (min)
CFT 0.7Smg/kg i.v. n = 4 CFT 0.75 mg/kg, n = 7
Time Post Injection (min) Time Post Injection (min)
FIG. 2. Changes in blood pressure and pC02 for all the animals pooled for amphetamine and CFT
mg/kg amphetamine (22). The dose of 3 mg/kg intravenously of amphetamine produces a phMRI response, which is similar to that produced by 0.75 mg/kg of CFT. To deter- mine the brain areas most af- fected by the amphetamine and CFT, the regional specific- ity of brain activation was measured by automated seg- mentation analysis of the sta- tistical maps generated by analysis of the time courses and measuring the fraction of the anatomic structure acti- vated. These results are shown in Fig. 3 along with tht 1 aver- aged time courses for the cin- gulate, cortex, striatum, and parietal cortex. It is clear that the frontal cortex, cingulate, and the striatum are the areas that show the largest activa- tion, in keeping with their large dopaminergic innerva- tion. We believe a large frac- tion of the parietal activation was due to partial volume av-

phMRI of Dopamine Stimulation 393
Destruction of the dopaminergic input to the frontal cortex and striatum should lead to an ablation of the phMRI response. This is shown in Fig. 5 using both amphetamine and CFT. Responses typical of the greatest, average and least differences between the ipsilateral and contralateral sides are shown in this figure to get an indication of the reproducibility and range of responses measured. Two time courses of the signal changes seen in the animals in Fig. 5 are presented in Fig. 6 for amphet- amine and CFT. These curves represent data quality typ- ical of these studies. It is apparent that the response is much decreased on the ipsilateral side. To prove this was not due to an artifact, such as loss of regional blood flow or hemodynamics, we measured these latter parameters (rCBV and rCBF) using bolus injections of Cd(DTPA) (23, 24). There was no statistically significant difference in the resting rCBV or rCBF between the two hemispheres indicating that the decreased phMRI response is not due to a decrease in the prestimulus values of these parame- ters on the ipsilateral side. These data are presented, along with rCBV and rCBF images in Fig. 7.
Analysis of the time courses show that the response of the phMRI is transient, peaking at about 40 min and decreasing back to the baseline in about 70-90 min. This time course has the potential to reveal much about the nature of the effect. We thus performed a number of experiments. We measured the percent efflux of dopa- mine using microdialysis and CFT and also compared the dopamine efflux after amphetamine injection using previously published data (14, 26). The time courses for both the phMRI signal change and the percent release of dopamine from the presynamptic terminals were virtu- ally superposable with both parameters decreasing to baseline about 100 min after injection of the drug. We also examined the relationship between the percent sig- nal change using both CFT and amphetamine and the dopamine release measured using microdialysis. These curves are shown in Fig. 8. It is clear that the percent increase in signal intensity is greater for the CFT for a given percent change in dopamine efflux.
To investigate the relationship between the dopamine transporter receptor and the phMRI, we decided to run PET experiments on the exact same animals studied us- ing the phMRI techniques above. The comparison be- tween the PET results and the phMRI results was, ill FIG. 3. a) Bar graph showing the fraction Of anatomic area acti-
vated by either amphetamine (n = 18) or CFT (n = 12). Segmen- tation was performed as described in text. A schematic of the areas segmented is shown. Also shown are the average time courses after amphetamine stimulation from striatum, frontal and parietal cortex and cingulate cortex in seven animals (b). The mean signal change over the entire time course is also shown.
eraging with striatum. We quantified the degree of partial Mid- Posterior Overlap
slice slice 2 slices s triatal striatal of volume averaging by segmentation analysis of our ana-
tomic data with the 1.5-mm slices. The result is shown in Fig. 4. The parietal cortex was contaminated by about 10--15% by the adjacent slice’s striatum. This fact when cornbind with the point spread function for the activa- tion maps (which were spatially smoothed) leads to some activation in parietal cortex.
FIG. 4 Overlays of two contiguous slices covering striaturn and parletal cortex demonstrating the degree of partial volume aver- aging of parietal cortex with lateral striatum

394 Chen et al.
3 mg/kg D-amphetamine i.v. injection
C L C L
0.75 mg/kg CFT i.v. injection
c L C L c L FIG. 5. Activation maps of six different 6-OHDA lesioned animals representing the range of activation patterns shown. A) Amphetamine (3 mg/kg); 6) CFT (0.75 mg/kg). (L: Lesioned side; C: Control side). Color bars represent the p values for the activation maps determined from the Komolgorov-Smirnov test.
general, very consistent. In the lesioned animals a loss of "C-CFT uptake is noted in the ipsilateral striatum, corn- pared with in the unlesioned, control animals (Fig. 9).
The phMRI results faithfully reproduce this finding as is also seen in Fig. 9, although with much higher spatial resolution than the PET (the slice thickness and in plane

phMR1 of Dopamine Stimulation 395
* Contralateral 0 Ipsilateral
I
I
cd c M m .-
-1 II[ 0
-2 -50 0
Time Post Injection (min)
Contralateral a- Ipsilateral
I I 1
- 5 0 0 5 0 100 150 Time Post Injection (min)
FIG. 6. Typical time courses in the ipsilateral and contralateral striala in two 6-OHDA lesioned animals. The curves come from individual animals.
resolution in the PET study was 4.5-mm versus 0.4 X 0.2 mm in-plane resolution and a 1.5-mm slice thickness for the MRI). The average change in the parameter describing the percent difference between the ipsilateral and con- tralateral striatum ((contralateral-ipsilateral)/contralat- eral] was 41.7 2 3.9% for PET and the decrease in phMRI response to amphetamine or CFT stimulus was 45.4 ? 18.6% (n = 12; p < 0.001) and 47.8 ? 20.8% (n = 18; p < 0.001), respectively, when measured as change in areas. The good correlation with the PET images clearly indi- cate:; that the decreased binding of both CFT and amphet- amine to the dopamine transporter is well reflected by the metabolic response as shown by phMR1 (Fig. 10).
Although the rats were screened by rotational data to correspond to those with greater than 90% loss of do- paminergic nigral-striatal innervation, there were clear (differences in the number of rotations between animals. 'T'heae differences were manifest in the phMRI data. For mtamce, the correlation of CFT with rotational asymme- iry induced by amphetamine led to a straight line with a correlation coefficient of 0.7 (p < 0.05) as shown in Fig. 11.
DISCUSSION
We have demonstrated that the techniques commonly employed for fMRI studies of brain activation during task activation are also appropriate for examination of the effects of neurotransmitter receptor stimulation. We uti- lized a well characterized model of dopamine denerva- tion to show that the metabolic response resulting from stimulation of the dopamine system is circumscribed to those areas of the brain containing large dopamine inner- vation and that the response is ablated when the nigral striatal dopamine connections are denervated. There are a number of issues that need to be addressed before studies of this nature become routine both for the dopa- mine system in particular and other neurotransmitter systems in general. The fact that we are observing a metabolic response to neurotransmitter binding rather than the binding itself, as in PET, creates some problems. One proldem is that the large doses necessary to see an effect may lead to non-specific effects. This problem is especially acute in the dopamine system because of the possibility of stimulating other monoamine systems in the brain using a compound like amphetamine (4-7). In our hands, doses of amphetamine over 5 mglkg produced nonspecific activation. Silva et 01. (9) using a nearly lethal dose of 20 mg/kg did find regionally specific flow changes; however, they measured perfusion values di- rectly, whereas we only measured percent signal changes. Another problem is understanding the coupling between the changes in the hemodynamics with the changes in dopamine concentrations. If the metabolic response is only coupled by very indirect means to the neurotransmitter release then the phMRI technique is not as useful for this purpose then if there is a direct corre- lation.
Our results shed some light on these problems. First, the spatial specificity we observed in our phMRI results (Figs. 1 and 3 ) , and their correspondence with the areas of the brain with highest dopaminergic innervation is indicative that the effect is primarily due to dopamine and not other monoamine systems that would lead to more nonspecific cortical activity. The distribution of dopamine transporter protein is known to be highest in the sensorimotor areas of the dorsal lateral striatum and frontal cortex, but not the nucleus accumbens. (This is indeed what we observed with higher doses of amphet- amine and has also been seen in autoradiographic studies of CBF (4-7, 14).) Although we measured some activa- tion in parietal cortex, we believe this was due to partial volume averaging with striatum in our relatively thick 1.5-mm slices (Fig. 4). This is especially pronounced since the highest dopamine efflux is in the dorsal lateral striatum which overlaps parietal cortex. In this regard, future experiments on the dose-dependence of the spatial distribution should be revealing.
Second, we showed that the time course for the signal changes are not reflective of simple physiological changes like hypercapnia or blood pressure (Fig. 2), fur- ther indicating that the effect is due to a metabolic re- sponse to neurotransmitter binding. Denervation of the dopaminergic input to the striatum using the well known model of 6-OHDA also showed that the response was due

396 Chen et al.
in the ipsilateral and contra- lateral striatum. The mean val- ues of the percent differences c contralateral-Ipsilateral) / Contralateral) for both the PET binding and phMRI percent signal changes were identical. While it is not clear at this time how to turn PET binding measurements into blood flow changes, nonetheless the cou- pling between loss of CFT binding as measured by PET and loss of BOLD signal change using the 6-OHDA model indicates that the cou- pling between these two pa- rameters may be quantitative. Understanding the dynamics of how the dopamine trans- porter density changes after denervation may help shed light on this issue.
It would also be instructive to evaluate other pulse se- quences to examine rCBF us-
FIG. 7. Maps of rCBV and rCBF generated using bolus injection of Gd(DTPA) in the resting state ing TI-type techniques (2, 8, (no amphetamine or CFT) in 6-OHDA lesioned animals. Note there are no significant differences 25) as well as BOLD. If there between the lesioned and control sides indicating that 6-OHDA does not cause destruction of the
vascular bed. are dissociations between
to dopamine as the change in signal intensity was greatly diminished on the ipsilateral side for both amphetamine and CFT. Measurements of resting rCBV and rCBF using bolus injection of Gd-DTPA showed this was not due to impairment of vascularization or hemodynamics on the lesioned side (Fig. 7). The dopaminergic denervation in the ipsilateral striatum was also demonstrated using PET imaging of "C-labeled CFT, thus lending more credence to the origins of the phMRI signal differences
-t- Amphetamine + CFT
h
Amphetamine (3mgkg) :
CFT (0.75 mgkg): y = 1 S O + 0.001 Ix, R = 0.98 14
Y = -0.2 + 0.0069~, R = 0.9705 EE
I
0 500 1000 1500 2000 2500 3000 Percent [DA] Change (%)
FIG. 8. Percent signal changes for amphetamine (3 mg/kg) and CFT (0.75 mg/kg) versus the percent increase in extracellular dopamine concentration. The amphetamine microdialysis data wa:; taken from the literature (26). The CFT microdialysis data was determined in these experiments.
flow, oxygen consumption and glucose utilization these should show up as differ- ences in these two signals. We initially tried using IR and GE sequences in these experiments in an interleaved mode for amphetamine stimulation, but came to the con- clusion that the statistical power was not sufficient given the relatively low SNR (-35) of the images. Use of EPI techniques would alleviate this problem, but our current implementation of EPI involves a trade-off of spatial res- olution (1 vs. 0.25 mm in-plane resolution) which makes it difficult to adequately segment structures such as the cingulate and the accumbens.
The time course noted for the phMRI signal changes using amphetamine are quite similar to those seen using microdialysis measurements (14, 26, 27). In particular, the peak time for dopamine release measured using the same doses of amphetamine and CFT corresponds ex- actly to the peak of the phMRl response at about 40 min. This implies that the phMRI response is due to the re- lease of dopamine in the striatum. In addition, there is a high degree of correlation between the percent dopamine release measured via microdialysis and the percent sig- nal change (see Fig. 8). The implication of this finding is, again, a tight coupling between dopamine release and the metabolic response.
The sum of these facts, and the loss of phMRI response after 643HDA lesioning, strongly suggests that the meta- bolic response is due primarily to the release of dopa- mine in the striatum. In this regard it is instructive to compare the behavioral and PET data to the phMRI. As shown in Figs. 9-11, there was a good correlation be- tween the PET, rotation, and CFT phMRI results. This was somewhat surprising as according to the literature
phMRI of Dopamine Stimulation 397
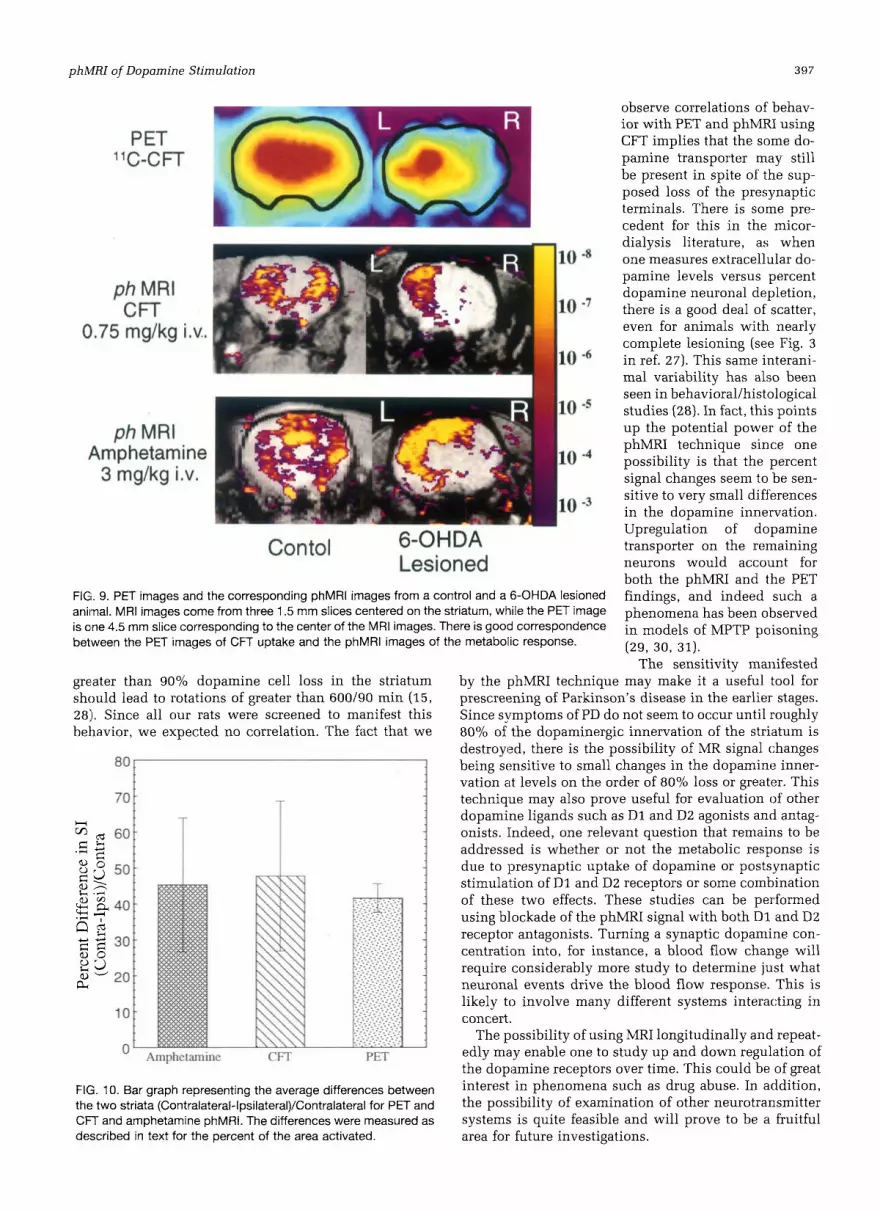
observe correlations of behav- ior with PET and phMRI using CFT implies that the some do- pamine transporter may still be present in spite of the sup- posed loss of the presynaptic terminals. There is some pre- cedent for this in the micor- dialysis literature, as when one measures extracellular do- pamine levels versus percent dopamine neuronal depletion, there is a good deal of scatter, even for animals with nearly complete lesioning (see Fig. 3 in ref. 27). This same interani- ma1 variability has also been seen in behaviorallhistological studies (28). In fact, this points up the potential power of the phMRI technique since one possibility is that the percent signal changes seem to be sen- sitive to very small differences in the dopamine innervation. Upregulation of dopamine transporter on the remaining neurons would account for both the phMRI and the PET findings, and indeed such a phenomena has been observed in of MPTP poisoning (29, 30, 31).
The sensitivity manifested by the phMRI technique may make it a useful tool for prescreening of Parkinson's disease in the earlier stages. Since symptoms of PD do not seem to occur until roughly 80% of the dopaminergic innervation of the striatum is destroyed, there is the possibility of MR signal changes being sensitive to small changes in the dopamine inner- vation at levels on the order of 80% loss or greater. This
FIG. 9. PET images and the corresponding phMRl images from a control and a 6-OHDA lesioned animal. MRI images come from three 1.5 mm slices centered on the striatum, while the PET image is cne 4.5 mm slice corresponding to the center of the MRI images. There is good correspondence between the PET images of CFT uptake and the phMRl images of the metabolic response.
greater than 90% dopamine cell loss in the striatum should lead to rotations of greater than 600190 min (15, 28). Since all our rats were screened to manifest this behavior, we expected no correlation. The fact that we
Y
technique may also prove useful for evaluation of other dopamine ligands such as D1 and D2 agonists and antag- onists. Indeed, one relevant question that remains to be addressed is whether or not the metabolic response is due to presynaptic uptake of dopamine or postsynaptic stimulation of D1 and D2 receptors or some combination of these two effects. These studies can be performed using blockade of the phMRI signal with both D 1 and DZ receptor antagonists. Turning a synaptic dopamine con- centration into, for instance, a blood flow change will require considerably more study to determine just what neuronal events drive the blood flow response. This is likely to involve many different systems interacting in concert.
The possibility of using MRI longitudinally and repeat- edly may enable one to study up and down regulation of the dopamine receptors over time. This could be of great interest in phenomena such as drug abuse. In addition, the Possibility of examination of other neurotransmitter systems is quite feasible and will prove to be a fruitful area for future investigations.
FIG. 10. Bar graph representing t h e average differences between t h e two striata (Contralateral-lpsilateral)/Contralateral for PET and CFl- and amphetamine phMRI. The differences were measured as described in text for the percent of the area activated.

39i3 Clien et al.
3
E
e 0 cd U
i
E
u, i c 0
y = -12 144 + 0 046307~ R= 0 68901
80 I - t
i 0 0
500 1000 1500 0 L I J L L _ _ 2 -- LL.I I I_Li
Rotation (Tums/90 min)
1
_j
2000
FIG. 11. Graph showing the correlation between the CFT phMRl results and the data for the rotational behavioral in the 6-OHDA lesiioned animals. The fit was significant (p < 0.05).
REFERENCES I. 1. W. Belliveau, D. N. Kennedy, R. C. McKinstry, B. R. Buchbinder,
R. M. Weisskoff, M. S. Cohen, J. M. Vevea, T. J. Brady, B. R. Rosen, Functional mapping of the human visual cortex by magnetic reso- nance imaging. Science 254, 716-719 (1991).
2. K. K. Kwong, J. W. Belliveau, D. A. Chester, I. E. Coldberg, R. M. Weisskoff, B. P., Poncelet, D. N. Kennedy, B. E. Hoppel, M. S. Cohen, R. Turner, H. M. Cheng, T. J. Brady, B. R. Rosen, Dynamic magnetic resonance imaging of human brain activity during primary sensory stimulation. Proc. Natl. Acad. Sci. 89, 5675-5679 (1992).
3. S. Ogawa, D. W. Tank, R. Menon, J. M. Ellermann, S-G. Kim, H. Merkle, K. Ugurbil, Intrinsic signal changes accompanying sensory stimulation: functional brain mapping with magnetic resonance im- aging. Proc. Natl. Acad. Sci 89, 5951-5955 (1992).
4. C. Carlsson, M. Hagerdal, B. K. Siesjo, Influence of amphetamine sulfate on cerebral blood flow and metabolism. Acta Physiol. Scand. 94, 128-129 [1975).
5. M. McCulloch, A. M. Harper, Cerebral circulatory and metabolism changes following amphetamine administration. Brain Res. 121, 196-199 (1977).
6. 1,. R. Wechsler, H. E. Savaki, L. Sokoloff, Effects of d- and l-amphet- anline on local cercbral glucose utilization in the conscious rat. J . Neurochem. 32, 15-22 (1979).
7. K. E. Russo, W. Hall, 0. 2. Chi, A. K. Sinha, H. R. Weiss, Effect of iimphetamine on cerebral blood flow and capillary perfusion. Brain Res. 542, 43-48 (1991).
8. C. A. Cuenod, M. C. J. Chang, T. Arai, L. Pannier. S. Posse, D. Despres, J. A. Frank, S. Rappoport. D. LeBihan, Local brain response to cho- linergic receptor siimulation detected by MRI, in “Proc., SMRM, 12th Annual Meeting, 1993,” p. 1387.
9. A. D. Silva, W. Zhang, D. S. Williams, A. P. Koretsky, Multislice MRI of rat brain during amphetamine stimulation using arterial spin la- belling. Magn. Re5on. Med. 33, 209-214 (1995).
10. Y . I. Chen, B. G. Jenkins, R. T. Matthews, K. K. Kwong, J. R. Keltner, S. J. Fink, B. R. liosen. Evaluation of Neuronal loss and striatal acti- vation in a rat model of Parkinson’s disease using MRS and fMRI, in “Proc., SMR, 3rd Annual Meeting, Nice, France, 1995,” p. 1357.
11. Q. Chen, A. H. Andersen, 2. Zhang, A. Ovadia, D. M. Gash, M. J. Avison, Nigrostriatai R2* changes in Hemiparkinsonian Rhesus in
response to L-DOPA, in “Proc., SMR, 3rd Annual Meeiing, Nice, France, 1995,” p. 1358.
12. C. J. .4ine, A conceptual overview and critique of functional neuro- imaging techniques in humans: I. MRVFMRI and PEr. Crit Rev. Neurobiol. 912-3), 229-309 (1995).
13. A. P. Wolf, J. S. Fowler, Positron emission tomography: biomedical research and clinical application. Neuroimaging Clin. N. Am. 5(1), 87-101 (1995).
14. G. W Arbuthnott, I. S. Fairbrother, S. P. Butcher, Doparnine release and metabolism in the rat striatum: an analysis by in vivo brain microdialysis. Pharmacol. Ther. 48(3), 281-293 (1990).
15. D. A. Perese, J. {Jlman, J. Viola, S. E. Ewing, K. S. Bankiewicz, A 6-hyclroxydopamine-induced selective parkinsonian rat model. Brain Res. 494, 285-293 (1989).
16. M. J. Zigmond, E. D. Abercrombie, T. W. Berger, A. A. Grace, E. M. Stricker, Compensations after lesions of central dopaminergic neu- rons: some clinical and basic implications, (1990).
17. B. Gi.ros, M. Jaber, S. R. Jones, R. M. Wightman, M. G. Cartm, Hyper- locomotion and indifference to cocaine and amphetamine in mice lacking the dopamine transporter. Nature 379, 606-612 ( I 996).
18. B. K. Madras, M. A. Fahey, J. Bergman, D. R. Canfield, R. D. Speal- man, Effects of cocaine and related drugs in nonhuman primates. I. [‘HI Cocaine binding sites in caudate-putamen. J. Pharmacol. Exp. Ther. 251(1), 131-141 (1989).
19. B. K. Madras, J. Bergman, M. A. Fahey, J. L. Neumeyer. 1. K. Saha, R. A. Milius, Cocaine receptors labeled by [3H]2P-carboniethoxy-3P- (4-fluoropheny1)tropane. Ma]. Pharmacol. 36, 518-524 (1989).
20. G. L. Brownell, C. A. Burnham, C. W. Sterns, D. A. Chesler, A-L. Brownell, M. R. Palmer, Developments in high-resolutioit positron emission tomography at MGH, Internatl. J. Imag. Sys. Technol. 1, 207-217 (1989).
21. G. Paxinos, C. Watson, “The rat brain in stereotaxic coordinates.” Acadsmic Press, San Diego, 1986.
22. A. D. Silva, W. Zhang, D. S. Williams, A. P. Koretsky, Multislice MRI of rat brain during amphetamine stimulation using arteriiil spin la- beling. Magn. Reson. Med. 33, 209-214 (1995).
23. A. Villringer, B. R. Rosen, J. W. Belliveau, J. L. Acernian, R. I3. Lauffer, R. B. Buxton, Y. S. Chao, V. J. Wedeen, T. J. Brady. Dynamic imaging with lanthanidechelates in normal brain: contrast due to magnetic susceptibility effects. Magn. Reson. Med. 6[2), 164-174 (1988).
24. L. M. Hamberg, R. Macfarlane, E. Tasdemiroglu, P. Bocc:alini. B. G. Hunter, J. W. Belliveau, M. A. Moskowitz, B. R. Rosen, Measurement of cerebrovascular changes in cats after transient ischemia using dynamic magnetic resonance imaging. Stroke 24(3), 444-450 (1993).
25. J. A. Iletre, J. S. Leigh, D. S. Williams, A. P. Koretsky, Perfusion Im- aging Magn. Reson. Med. 23, 37-45 (1992).
26. D. Kuczenski, D. Segal, Concomitant characterization of hehavioral and striatal neurotransmitter response to amphetamine using in vivo microdialysis. J. Neurosci. 9, 2051-2065 (1989).
27. T. E. Robinson, E Castaneda, I. Q. Whishaw, Compensatory changes in striatal dopamine neurons following recovery from injury induced by 6-OHDA or methamphetamine: a review of evidence frcim micro- dialysis studies. Can. J . Psychol. 44, 253-275 (1990).
28. L. S. Carman, F. H. Gage, C. W. Shults, Partial lesion of the substantia nigra: relation between extent of lesion and rotational bohavior. Brain Res. 553, 275-283 (1991).
29. U. Wullner, P. Pakzaban, A. L. Brownell, et al., Dopamini, terminal loss and onset of motor symptoms in MPTP-treated monkeys: a positron emission tomography study with 11C-CFT. E ~ J . Neurol. 126(2), 305-309 (1994).
30. S. N. Haber, H. Ryoo, C. Cox, W. Lu, Subsets of midbrain dopamin- ergic neurons in monkeys are distinguished by different levels of mRNA for the dopamine transporter: comparison with the mRNA for the D:! receptor, tyrosine hydroxylase and calbindin immunoreactiv- ity. 1. Comp. Neuro!. 362(3), 400-410 (1995).
31. V. Blanchard, R. Raisman-Vozari, S. Vyas, P. P. Michel, F. Javoy- Agid, G. Uhl, Y. Agid, Differential expression of tyrosinc hydroxylase and membrane dopamine transporter genes in subpopulations of dopanninergic neurons of the rat mesencephalon, Brain Rns. 22(1-4), 29-38 (1994).