abstract yuill, james joseph. defensive computer
TRANSCRIPT
ABSTRACT
YUILL, JAMES JOSEPH. Defensive Computer-Security Deception Operations:
Processes, Principles and Techniques. (Under the direction of Dr. Mladen Vouk and
Dr. Ana I. Antón.)
This dissertation is concerned with the processes, principles and techniques that are
involved in deception-operations for computer-security defense. In this work, computer
security deception-operations are defined as the planned actions taken to mislead hackers and
thereby cause them to take (or not take) specific actions that aid computer-security defenses.
Computer security researchers have investigated hackers’ use of deception to attack networks
and the deceptive honeypot systems used to defend networks. However, relatively little has
been done to systematically model and examine computer security deception-operations.
This work addresses these issues by focusing on deception for computer-security defense.
The four main contributions of this dissertation are:
1) A process model for deception operations: this model, which is based on military
deception theory and practice, provides deception planners with a framework for conducting
deception operations. The framework includes a set of processes, principles and techniques.
2) A process model of deceptive hiding: this model aids the defender in developing
new hiding techniques and in evaluating existing techniques. Deceptive hiding is modeled as
defeating the target’s discovery processes: direct observation, investigation based on
evidence, and learning from others.
3) Two novel deception-based intrusion detection systems: the two deception models
informed the design and evaluation of these systems. The Honeyfiles system extends the
network file system to provide bait files for hackers. These files trigger an alarm when
opened. The Net-Chaff system employs computer-impersonations to detect and contain
hacker’s network scans within an intranet.
4) Experiments and evaluation: a prototype Honeyfile system was implemented, and
the Net-Chaff system was simulated and modeled analytically. This work, and subsequent

experimentation, provide exploratory and confirmatory assessment of the two deception
models. The experimental portion of this work reveals that: (a) when the Honeyfiles
prototype is deployed on a deceptive network, and when subjected to hacking, it is observed
to be an effective means for intrusion detection, and (b) the Net-Chaff system can reliably
detect and contain intranet scans before they access vulnerable computers.

(c) 2006 James Joseph Yuill
DEFENSIVE COMPUTER-SECURITY DECEPTION OPERATIONS:
PROCESSES, PRINCIPLES AND TECHNIQUES
by
JAMES JOSEPH YUILL
A dissertation submitted to the Graduate Faculty of
North Carolina State University
in partial fulfillment of the
requirements for the Degree of
Doctor of Philosophy
COMPUTER SCIENCE
Raleigh
2006
APPROVED BY:
___________________________ ____________________________
Dr. Donald Bitzer Dr. Dorothy Denning
___________________________ ____________________________
Dr. Mladen Vouk Dr. Ana I. Antón
Co-chair of Advisory Committee Co-chair of Advisory Committee

ii
Dedicated to the Memory of Jim Settle, FBI (ret.)
in gratitude for his friendship, support and tutelage,
without which I could not have completed this work
iii
Biography
Jim Yuill has over twenty years of experience in computer-related work. He has a
B.S. in Computer Science from North Dakota State University and a Masters of Computer
Science from North Carolina State University. While at NCSU, Jim taught over a dozen
graduate and undergraduate courses. Jim also worked for IBM in operating-systems
development.

iv
Acknowledgements
This dissertation is the culmination of over eight years of research. I have long
awaited this opportunity to thank those who contributed to this work and made it possible.
I’d like to thank my PhD advisors and committee for working patiently with me over
these many years. I’d very much like to thank Dr. Vouk for all the time he generously spent
with me, especially given his busy schedule as department head. Also, I’m grateful that, as a
boss, Dr. Vouk is kind and forbearing. Dr. Vouk’s requirement for analytical models led to
the net-chaff research, and it was developed under his advising. Dr. Bitzer suggested the
rate-based models that were developed for net-chaff, as well as the Poisson model. Dr.
Antón’s advising greatly improved my writing skills, and helped me to be much better
focused. Dr. Felix Wu was my first advisor, before he left NCSU. He kindly allowed me
much freedom in my research, which led to this work in deception.
I owe a special note of thanks to Dr. Denning and Fred Feer for their contribution to
this research. The dissertation’s deception process-models were the result of collaboration
among Dr. Denning, Fred Feer and myself. Dr. Denning was the academic advisor for these
models. Her keen insights, and her exceptional analytical skills, greatly enhanced and
expanded these models. I’m also very grateful to Dr. Denning for serving on my PhD
committee.
Fred Feer is retired from a career in the DoD and U.S. intelligence agencies. Fred
kindly tutored me in deception and security. Fred’s insights on deception are profound and
go beyond the published literature. They had a formative influence on much of this
dissertation. The dissertation’ primary principle, the deception exploit, is Fred’s
contribution.
This dissertation was made possible by the research funding I received. Funding for
net-chaff, and the dissertation itself, was provided by my advisor Dr. Mladen Vouk. The
deception process-models were funded by the DoD, and a major source was Andy Marshall,
Director of Net Assessment at the Office of the Secretary of Defense. My initial research
was funded by Dr. Felix Wu through funding he received from NSA, DARPA, and Nortel.
v
Funding was also provided by Drs. Anton and Rappa, at NCSU.
I’ve been blessed to collaborate with, and be mentored by, several experts who work
outside of the NCSU Computer Science Department. Their instruction and advising was the
basis for most of this research. Their friendship, encouragement and support enabled me to
persevere and complete this work:
• Dr. Chris Bassford, National War College: this research began with Dr Bassford’s
suggestion to apply the Army’s deception manual to computer security. He also kindly
advised me in my studies of military theory.
• Dr. Bowyer Bell: funding for much of this research was obtained by Dr. Bell. His
untimely death prevented him from seeing the project’s completion. Dr. Bell was an
expert on terrorism, and the co-author of a seminal book on deception theory. The
dissertation’ flow-chart of the deception process is primarily from his research.
• Jim Settle, FBI, ret.: Jim’s tutelage greatly improved my understanding of real-world
computer security. Before Jim died from cancer last spring, I told him I would dedicate
the dissertation to him, in gratitude. Jim was chief of the FBI’s first computer crime
squad. His security savvy and wisdom were amazing.
• Colonel G. I. Wilson, USMC: my collaboration with Dr. Denning and Fred Feer was
brought about by Col. Wilson. He kindly made possible a number of my other research
accomplishments, such as a presentation we gave at the Office of the Secretary of
Defense, and instruction I received in maneuver warfare.
• Alvin Wallace, USAF CERT: some of the key funding for this research was facilitated
by Alvin. He also made possible several of the presentations I made, including the DoD
Cyber Crime Conference.
• Dr. E. C. Pasour, NCSU Agricultural Economics Department, emeritus: a key part of
my research has been in research methods, and I hope to publish these findings in the
near future. This work was based on Dr. Pasour’s advising in my study of Austrian
Economics.

vi
• Ken DeLavigne, IBM, ret.: this research is also based on prior study in software
engineering, quality, Austrian Economics, and writing. Ken was my mentor when I
worked at IBM, and he advised me in these studies. I have benefited much from his
wisdom.
Thanks are due to my father, Dr. Stuart Yuill, and to Dr. Allard at Duke University,
for reviewing the net-chaff math models. Dr. Allard also suggested the rationale used for the
Poisson distribution.
A note of thanks is due to my family and close friends, for their support and prayers.
My mom traveled to North Carolina on several occasions to help me prepare my tax filings,
when I was inundated with dissertation research. My friend Ed Trench kindly rebuilt my
car’s engine and front suspension, as a favor, and spared me student loans. In working on
this research, I’ve received help from many others, and wish I could acknowledge them all.
Above all, thanks is due to God. Anything good in this dissertation is ultimately from
Him!
vii
Table of Contents
List of Tables ........................................................................................................................... ix
List of Figures .......................................................................................................................... xi
Nomenclature......................................................................................................................... xiii
1 Introduction....................................................................................................................... 1
2 Background and related work ........................................................................................... 8
2.1 Deception processes.................................................................................................. 8
2.2 Scanning and scan defenses .................................................................................... 11
2.3 Deception use in honeypots and other tools ........................................................... 26
2.4 Summary................................................................................................................. 27
3 Deception framework...................................................................................................... 29
3.1 Deception operation process ................................................................................... 29
3.1.1 An overview of deception operations ............................................................. 29
3.1.2 Deception planning ......................................................................................... 35
3.1.3 The deception story......................................................................................... 39
3.1.4 Summary of the deception operations model.................................................. 45
3.2 Hiding model .......................................................................................................... 47
3.2.1 The process of deceptive hiding ..................................................................... 49
3.2.2 Direct observation........................................................................................... 50
3.2.3 Investigation.................................................................................................... 56
3.2.4 Learning from other people or agents ............................................................. 62
3.2.5 Summary of the hiding model......................................................................... 65
4 Deception-based intrusion detection systems ................................................................. 67
4.1 Net-Chaff: deception-based scan detection and containment................................. 67
4.1.1 Environment and assumptions ........................................................................ 68
4.1.2 Net-Chaff system ............................................................................................ 69
4.1.3 Requirements .................................................................................................. 78
4.1.4 Summary......................................................................................................... 93
4.2 Honeyfiles: deceptive files for intrusion detection ................................................. 94
5 Evaluation ....................................................................................................................... 95
5.1 Net-Chaff ................................................................................................................ 95
5.1.1 Analytical models ........................................................................................... 96

viii
5.1.2 Simulation..................................................................................................... 152
5.1.3 Hiding analysis.............................................................................................. 168
5.1.4 Limitations .................................................................................................... 171
5.1.5 Future research.............................................................................................. 173
5.1.6 Summary of the Net-Chaff analysis.............................................................. 176
5.2 Honeyfiles ............................................................................................................. 178
5.3 Deception process models..................................................................................... 179
6 Conclusion .................................................................................................................... 183
6.1 Main contributions of this work............................................................................ 183
6.2 Limitations of this work........................................................................................ 185
6.3 Future work........................................................................................................... 185
7 Bibliography ................................................................................................................. 187
8 Appendix....................................................................................................................... 198
ix
List of Tables
Table 3.2.2.2-1 : Hiding techniques that defeat the target's sensors ................................ 53
Table 3.2.2.2-2 : Hiding techniques that defeat the target's recognition ......................... 55
Table 3.2.3.2-1 : Hiding techniques that defeat the target's evidence collection............. 61
Table 3.2.3.2-2 : Hiding techniques that defeat the target's creation of discovery hypotheses ...................................................................................................................... 62
Table 3.2.4.2-1 : Techniques for hiding when the target learns from other people’s, or agents’, discoveries........................................................................................................ 64
Table 4.1.3.1.1-1 : Common types of scans, categorized by the scan objective ............... 80
Table 4.1.3.2.2-1 : Net-Chaff’s uses of deception for defending against scans ................ 91
Table 5.1.1.1.3-1 : Probe-response types........................................................................... 100
Table 5.1.1.2.4-1 : Computer distribution on network.................................................... 115
Table 5.1.1.2.4-2 : Probe-response type distribution on network................................... 115
Table 5.1.1.2.4-3 : Parameters for probe rate calculations ............................................. 116
Table 5.1.1.2.4-4 : Packets used in TCP scan-and-attack................................................ 116
Table 5.1.1.2.4-5 : Calculations for individual probe rates, for TCP scan-and-attack 117
Table 5.1.1.2.4-6 : Calculations for individual probe rates, for the web-server TCP ping-scan ............................................................................................................................... 117
Table 5.1.1.2.4-7 : Calculation for individual probe rate, for the UDP scan-and-attack....................................................................................................................................... 118
Table 5.1.1.2.4-8 : Calculations for individual probe rates, for the UDP filtering-scan with an attack .............................................................................................................. 119
Table 5.1.1.3.1-1 : Rates of compromise (computers per second) for the TCP scan-and-attack ............................................................................................................................ 121
Table 5.1.1.3.1-2 : Rates of compromise for the UDP scan-and-attack with a filtering-scan ............................................................................................................................... 123
Table 5.1.1.3.1-3 : Rates of discovery for the information-retrieval scan...................... 125
Table 5.1.2.1.2.1-1 : The simulation’s probe-response types .......................................... 156
Table 5.1.2.1.2.1-2 : Probe responses, as recorded in the RDB table ............................. 157
Table 5.1.2.1.2.1-3 : Probe arrival times at the Net-Chaff WAN server, as recorded in the RDB table .............................................................................................................. 158
Table 5.1.2.2.1-1 : Probe-response distributions for the three simulation runs............ 161

x
Table 5.1.2.2.1-2 : Containment-specifications for the simulation runs ........................ 162
Table 5.1.2.2.2-1 : Summary of comparison using ABS(Pvuln_C_S_sim - Pvuln_C_S_rate) ..... 167
xi
List of Figures
Figure 3.1.1-1 : Deception as a form of perception (adapted from [Wha82]) ................... 9
Figure 3.1.1.2-1 : The basic deception process ................................................................... 31
Figure 3.1.3-1 : The intellectual-property (IP) deception operation ................................ 40
Figure 3.2.2.1-1 : The process of direct observation, illustrated by a computer-security example .......................................................................................................................... 51
Figure 3.2.4.1-1 : How the target learns from other people’s, or agents’, discoveries ... 63
Figure 4.1.2.1-1 : Net-Chaff architecture............................................................................ 71
Figure 4.1.3.1-1 : Examples of probe types......................................................................... 79
Figure 4.1.3.1.2-1 : TCP scan-and-attack ........................................................................... 82
Figure 5.1.1.1.2-1 : Scan probes, from Net-Chaff's perspective ....................................... 98
Figure 5.1.1.1.3-1 : TCP scan-and-attack probes, using serial (non-interleaved) and parallel (interleaved) transmission ............................................................................ 102
Figure 5.1.1.3.1-1 : TCP scan-and-attack at 1Mbps ........................................................ 122
Figure 5.1.1.3.1-2 : TCP scan-and-attack at 100 Mbps ................................................... 122
Figure 5.1.1.3.1-3 : UDP scan-and-attack with filtering-scans ....................................... 124
Figure 5.1.1.3.1-4 : The information-retrieval scan ......................................................... 125
Figure 5.1.1.3.2-1 : Calculations of PVULN for the default networks............................... 128
Figure 5.1.1.4.1-1 : C̄VULN(b) .............................................................................................. 135
Figure 5.1.1.4.1-2 : C̄VULN(z) ............................................................................................... 136
Figure 5.1.1.4.1-3 : C̄VULN(r̄nc) ............................................................................................ 138
Figure 5.1.1.4.2-1 : x̄ as a function of (Nnc_imp / NNC) ................................................... 141
Figure 5.1.1.4.2-2 : C̄VULN as a function of (Nnc_imp / NNC) ........................................... 142
Figure 5.1.1.4.2-3 : x̄ as a function of (NNC / (NT - NR)) ................................................... 144
Figure 5.1.1.4.2-4 : C̄VULN as a function of (NNC / (NT - NR)) ........................................... 144
Figure 5.1.1.4.2-5 : x̄ as a function of NT.......................................................................... 146
Figure 5.1.1.4.2-6 : C̄VULN as a function of NT................................................................... 146
Figure 5.1.1.4.3-1 : r̄vuln as a function of the network size (NT) ...................................... 148
Figure 5.1.2.1.1-1 : Overall simulation process ................................................................ 154
Figure 5.1.2.1.2.2-1 : RDB table for storing scan outcomes ............................................ 158

xii
Figure 5.1.2.2.2-1 : Simulation results vs. analytical models for (C̄C_S_sim < 100).......... 164
Figure 5.1.2.2.2-2 : Simulation results vs. analytical models for (C̄C_S_sim ≥ 100).......... 165
Figure 5.1.2.2.2-3 : Simulation results vs. analytical models for Pvuln............................ 167
xiii
Nomenclature
CND computer network defense
computer security in this dissertation, the term refers to computer-security
defenses, unless stated otherwise
critical vulnerability an enemy vulnerability that permits friendly forces to destroy
an enemy capability that he needs to function effectively
deception exploit a statement of how the target-action will benefit CND. See
deception objective
deception objective the desired result of the deception operation; it consists of:
1) the intended target action, and 2) the deception exploit.
deception-operation for computer security, it is the planned actions taken to
mislead hackers and thereby cause them to take (or not take)
specific actions that aid computer-security defenses
deception story an outline of how the computer system will be portrayed so
as to cause the target to adopt the desired perception, and
take the intended target action
deception planner the person who plans, develops and carries out the deception
operation
denial see hiding
desired perception what the target must believe in order for it to take the
intended target action
footprinting a hacker’s use of publicly available information to learn
about an organization and its network
hiding we consider hiding to be deceptive if it intends to mislead,
and hiding that is not intended to mislead is referred to as
denial. See showing.
Honeyfiles a system that extends the network file system to provide bait
files for hackers. These files trigger an alarm when opened.
honeynet a network of honeypots
honeypots computer systems that are designed to be probed, attacked or
compromised by hackers
intelligence information and knowledge obtained through observation,
investigation, analysis, or understanding
intelligence source something that is used by the hacker to learn about the
network.
xiv
Net-Chaff a system that employs computer-impersonations to detect and
contain hacker’s network scans within an intranet
planner see deception planner
ruse a trick designed to deceive
scan-and-attack a type of scan, in which the scan probes include an attack
showing deception includes showing what is false and hiding what is
real. See hiding.
target the person the deception operation seeks to deceive
target action a statement of what the hacker is to do (or not do) at some
time and location. It is always stated in terms of specific
actions. See deception objective.
1
1 Introduction
The research reported in this thesis provides models for designing and conducting
defensive deception operations. The models are based on the underlying nature of deception
and were, as much as possible, made independent of the current technologies. The models
provide a framework for conducting deception operations and include a set of processes,
principles and techniques that were examined and validated as part of the current work. The
deception models informed the design and implementation of two deception-based intrusion
detection systems: Honeyfiles and Net-Chaff. The Honeyfiles system extends the network
file system to provide bait files for hackers and trigger an alarm when opened. The Net-Chaff
system impersonates computers at an intranet’s unused addresses. By using simple and large-
scale impersonations, Net-Chaff can effectively detect and contain hackers’ intranet scans. A
prototype Honeyfile system was implemented, and Net-Chaff was simulated and modeled
analytically. This work provides exploratory and confirmatory assessment of the two
deception models.
1.1 Problem statement
After many years of research and development, computer security remains an error-
prone task, and computer security’s chronic problems call for new approaches. One
component of tools and techniques for achieving security can be deception. In everyday
security, deception plays a relatively prominent role, e.g., leaving the living room lights on to
make burglars think someone is at home. However, in information technology, deception is
often not used, or it plays an implicit role rather than an explicit one. Deception works in a
fundamentally different way than conventional security methods. Conventional security tends
to work directly on, or against, the hacker’s actions, e.g., to detect them or to prevent them.
Deception works by manipulating the hacker’s thinking, to make him act in a way that is
advantageous to the defender. Being fundamentally different, deception can be strong where
conventional security is weak (and vice-versa). While deception is not always useful, it can
be an important and effective way of compensating for conventional security’s inherent
vulnerabilities, and it may be advantageous to combine the two explicitly.
2
In computer security, an advantage of deception is that it can pit the defender’s
strengths against the hacker’s weaknesses. Hackers often rely heavily, if not exclusively, on a
single source of information—data acquired via the network. Often, the network-based data
can be manipulated to the defender’s advantage. Furthermore, when a hacker first arrives at
the network, he 1 must learn about the network by investigating it. The investigation includes
scanning and perusing the network itself and computers attached to it. The hacker’s
investigation process, combined with this initial naiveté, can create an unavoidable and
predictable conduit for deception. Typically, the network defender has physical control of his
network, and he knows it well. The defender can exploit the hacker’s investigation process to
supply him with falsehood and thereby attack his decision-making process.
Deception is an integral part of human nature and experience. There are legitimate,
even necessary, reasons for deceiving others, as in sports and games. Deception is a frequent
theme of history, literature, drama, and marketing. Consumers routinely exercise counter-
deception. However, few people use deception in the calculated manner needed for computer
security. As the military deception literature reveals, effectively deceiving an adversary is a
job skill, and it requires an understanding of deception processes, principles and techniques
[JDD96, USA88, USM89]. Deception can be used to attack hackers’ decision-making
processes; thus deception provides an offensive security measure––something computer
security defenders sorely lack.
1.2 Scope of this research
Computer-security deception is defined as the planned actions taken to mislead
hackers and to thereby cause them to take (or not take) specific actions that aid computer-
security defenses.2 The deception aims to mislead the hacker into a predictable course of
action or inaction that can be exploited [Dew89]. Tricking a hacker, and making him think a
certain way, is important only as a step toward getting him to make the decision that will
result in the desired action [JDD96]. Thoughts without action are of little computer security
1 Unless stated otherwise, this paper’s masculine pronouns refer to both men and women.
2 This definition is adapted from the U.S. DoD definition of military deception [JDD96].
3
value. Deception includes showing what is false and hiding what is real [BW82, Wha82]. We
consider hiding to be deceptive if it intends to mislead, and hiding that is not intended to
mislead is referred to as denial.
In this dissertation, the term computer security refers to computer-security defenses,
unless stated otherwise. Some of this dissertation’s other terms are defined as: 1) deception
planner, or planner: the person who plans, develops and carries out the deception operation,
2) deception operation: the planned development and deployment of a deception-based
computer security measure, 3) target: the person the deception operation seeks to deceive, 4)
intelligence: information and knowledge obtained through observation, investigation,
analysis, or understanding, 5) ruse: a trick designed to deceive. (A glossary appears after the
table of contents.)
The scope of this research is deception-operations for computer-security defenses.
Deception can be used to provide or enhance computer-security, including incident response,
intelligence, detection, and prevention. The research focuses primarily on the design and
conduct of deception operations for thwarting attacks and for collecting intelligence.
Honeypots are currently one of the most widely used defensive deception technologies
[Spi02]. This work does not focus on honeypots, but it uses them to explore, illustrate, verify,
and validate principles. Additionally, counter deception (i.e., detecting hackers’ deceptions)
and legal issues concerning the use of deception are not addressed. Hackers’ use of deception
and deception for counter attacks (i.e., hacking hackers) are also out of scope. However,
using deception to thwart, or attack, the hacker’s decision-making process is one of the
research’s primary topics.
This research consists of three parts. Two parts are deception models, and an
overview of them is presented next. The third part are systems that use description,
experiments with them, and evaluation of their effectiveness.
4
1.3 Research overview
1.3.1 Deception process models
Two types of process models were developed for use in computer-security.
• Process models for deception operations:
A set of descriptive and predictive models was developed for use in computer-
security deception operations. These models are formed by synthesizing the principles in the
extensive and disparate military-deception literature, and by adapting them for use in
information technology and computer security. Two other sources are used in developing the
deception-operation models presented here. They are the computer security literature and this
research’s experimental and analytical findings. The contribution of these models is their
extensive coverage of the deception-operation process, their derivation from the stated
sources, and their application to computer security.
The principles of military deception are highly applicable to computer-security
deception. The principles are well documented in the military deception literature (as
described in Chapter 2), and they are based on millennia of experience and thought. The
military deception literature is extensive, and it is also disparate, as the sources cover
different aspects of deception. This research also draws upon the intelligence deception-
literature (also described in Chapter 2). An additional research source is private
communications and collaboration with a deception expert who has had extensive experience
in both military and intelligence deception. This expert has significant insights that do not
appear in the deception literature.
Deception operations vary in the purposes they serve, the networks on which they are
used, and the different types of hackers they target. Some deceptions are simple and reliable;
for example, ping scans can be easily and predictably deceived. In contrast, other deceptions
are complex and uncertain; for example, a honeynet can be large, and there can be many
servers with extensive false content. Although deception operations vary widely, there are
deception processes, principles and techniques that are applicable to many, or even all,
deception operations. Handel, a theoretician of military deception, has observed:
5
“The basic principles and objectives of reinforcing the desires and perceptions of the
deceived will not change, since human nature and the psychological mechanism of
human perception are ever the same. In terms of its forms and the means employed,
deception will, like war itself, change as new weapons and technologies appear
[Han85].”
For this research, the deception models describe how deception can be used to
advantage in computer security. The models describe the processes followed in deception
operations, and they describe the principles and techniques for developing and conducting
deception operations.
• A process model of deceptive hiding:
A second part of the research is a novel model of deceptive hiding. The model
addresses one component of deception operations, and it extends existing hiding models. The
model is intended for use in developing new hiding techniques and for evaluating existing
hiding techniques. It characterizes deceptive hiding in terms of how it defeats the underlying
processes that an adversary uses to discover a hidden item. An adversary’s process of
discovery can take three forms: direct observation (sensing and recognizing), investigation
(evidence collection and hypothesis formation), and learning from other people or agents.
Deceptive hiding works by defeating one or more elements of these processes.
1.3.2 Systems, experiments, and evaluation
A significant component of deception research requires analysis of human nature.
Often, human behavior and nature are not amenable to quantification, so qualitative analysis
needs to be applied, such as an appropriate non-quantitative deception process-model.
Further, although deception is an integral part of human life, computer-security deception
operations are not. Consequently, to learn more about deception operations, the third part of
the research involves the development of a prototype, simulation, and analytical models, as
well as their use in experiments and evaluation. 3
The two deception models informed the design and implementation of two deception-
based intrusion detection systems. These implementations, and subsequent experimentation,
3 These insights on research method are from F.A. Hayek, Nobel laureate [Hay52].
6
provide exploratory and some confirmatory assessment of the two deception models. One of
the systems is a deception-based intrusion detection system called Honeyfiles. A honeyfile is
a bait file that is intended for hackers to open, and when the file is opened, an alarm is set off.
For example, a file named passwords.txt could be used as a honeyfile on a workstation.
Hackers who gain unauthorized access to the workstation will be lured by the file’s name,
and when they open the file an alarm will be triggered. Honeyfiles are implemented as a file
server enhancement, and the file server’s users can make any of their files a honeyfile. A
prototype Honeyfile system was built. The system was tested by deploying it on a deceptive
network and, when subjected to hacking, was observed to be an effective means for intrusion
detection.
The second system impersonates computers on an intranet for the purpose of
detecting and stopping hackers’ port scans. The system is called Net-Chaff, and it
impersonates computers at the intranet’s unused addresses. Net-Chaff only impersonates
computers below the application layer, as this greatly simplifies the implementation, yet still
affords significant advantages over scanners. When Net-Chaff detects a scan, it blocks the
scanner’s network access via the intranet’s routers. Further, Net-Chaff’s use of deception can
significantly slow down scans, reduce the usefulness of scan findings, and lure follow-on
attacks against Net-Chaff’s impersonated computers. Net-Chaff uses concepts from existing
deception-based security systems (e.g., honeyd [Hon05]), and it combines and applies them
in a novel way.
Net-Chaff’s use of deception, and its ability to thwart scans, were assessed using
simulations and analytical models. They confirm that the Net-Chaff system can effectively
thwart scans and that deception plays a significant role in the process. In military theory, a
critical vulnerability is an enemy vulnerability that permits friendly forces to destroy an
enemy capability that he needs to function effectively [MC97]. Network scanning is a key
step in hackers’ reconnaissance, and this makes network scanning’s vulnerability to
deception a critical vulnerability for hackers.
7
1.4 Expected uses and benefits of this research
Although appealing, deception appears to be used only sparingly in computer
security. Furthermore, at present, the computer security literature does not appear to address,
in depth, the general processes and principles of deception operations. This research provides
such deception models, for developing deception skills and knowledge. Also, this research
presents two novel deception-based computer security tools that can be used for detecting
and preventing attacks.
The overarching expectation is that deception can significantly improve the current
state of computer security. Deception may even be essential in compensating for the intrinsic
limitations of conventional security. There is strong precedent for these expectations. In
adversarial contests observed throughout history—among both men and beasts—deception
plays a pervasive and significant role [BW82].
The rest of this dissertation is structured as follows. Chapter 2 discusses background
information and related work. Chapter 3 presents the deception framework, its process and
associated models. Chapter 4 discusses two deception-based security devices that aid in
intrusion detection: Honeyfiles and Net-Chaff. Chapter 5 discusses how this work has been
evaluated and presents the key lessons learned. Chapter 6 provides a summary of
contributions and limitations of this work, as well as plans for future work.
8
2 Background and related work
This chapter summarizes the deception and computer-security literature related to this
dissertation. This summary is based on extensive surveys of: 1) the literature on deception
processes for computer security, war fighting, and intelligence, 2) the prior work on
scanning and scan defenses, that is related to the Net-Chaff system, and 3) deception use in
honeypots and other computer security tools. The background and related work from these
surveys is presented in the following three subsections,.
2.1 Deception processes
This dissertation includes two models of deception processes. They are the models of
deceptive hiding and the models for designing computer-security deception operations. This
section surveys the prior work related to the general areas these models address.
2.1.1 An overview of deception processes
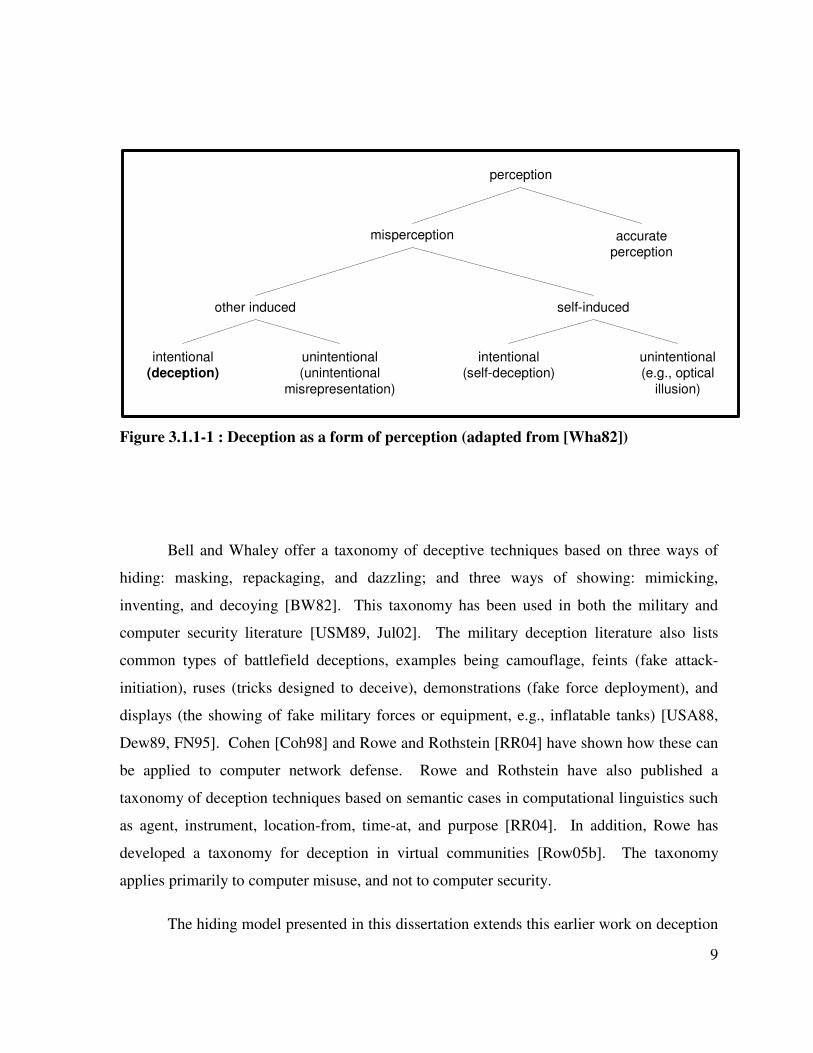
Deception is a form of perception in which a target is intentionally led to an incorrect
perception, through the actions of another [Wha82]. Deception, as illustrated in Figure
3.1.1-1, is distinguished from unintentional acts of misrepresentation and from self-induced
acts of misrepresentation (self-deception).
Hiding and showing are both present in any act of deception [BW82]. When showing
the false, the truth must also be hidden. When something is hidden, something else is shown
instead, even if only implicitly. Further, deceptions are often constructed of multiple ruses,
employing both hiding and showing. For example, a honeypot can deceptively impersonate
(i.e., show) a network server, while deceptively hiding a keystroke logger. When a deception
uses both hiding and showing, the deception may be characterized as hiding or showing,
according to the planner’s primary intent. For instance, a server’s banner is modified to
display a false model and version number. The banner is showing falsehood, but the primary
intent is hiding the server’s true model and version from hackers and worms.
9
perception
misperception accurateperception
other induced self-induced
intentional(deception)
unintentional(unintentional
misrepresentation)
intentional(self-deception)
unintentional(e.g., optical
illusion)
Figure 3.1.1-1 : Deception as a form of perception (adapted from [Wha82])
Bell and Whaley offer a taxonomy of deceptive techniques based on three ways of
hiding: masking, repackaging, and dazzling; and three ways of showing: mimicking,
inventing, and decoying [BW82]. This taxonomy has been used in both the military and
computer security literature [USM89, Jul02]. The military deception literature also lists
common types of battlefield deceptions, examples being camouflage, feints (fake attack-
initiation), ruses (tricks designed to deceive), demonstrations (fake force deployment), and
displays (the showing of fake military forces or equipment, e.g., inflatable tanks) [USA88,
Dew89, FN95]. Cohen [Coh98] and Rowe and Rothstein [RR04] have shown how these can
be applied to computer network defense. Rowe and Rothstein have also published a
taxonomy of deception techniques based on semantic cases in computational linguistics such
as agent, instrument, location-from, time-at, and purpose [RR04]. In addition, Rowe has
developed a taxonomy for deception in virtual communities [Row05b]. The taxonomy
applies primarily to computer misuse, and not to computer security.
The hiding model presented in this dissertation extends this earlier work on deception
10
taxonomies. The model shows how deceptive hiding can be understood in terms of
processes, mainly the discovery processes used by a target to acquire information. Particular
hiding techniques work by defeating elements of these processes.
2.1.2 Deception processes in computer science
Some computer-security literature addresses, at least in part, deception itself. Fred
Cohen led a major deception-research project at Livermore Labs [CLP01, CMS01, Coh98,
Coh00]. His research attempted to statistically characterize the general effectiveness of
deception [CMS01]. The results are of very limited applicability, since such results cannot
adequately address the wide variation in the causative effects in general deception-
operations. Cohen has also applied military deception principles to computer security,
though he only draws from one source on military history and a small collection of military
deception techniques [Coh98].
Rowe and Rothstein have built a probability model based on military deception
techniques. The model is intended for assessing the usefulness of those techniques [RR04].
Unfortunately, the deception model overly simplifies complex phenomena and the
probability model appears to be mathematically flawed. For example, the “appropriateness”
of a deception technique is assigned a number, and that number is used in an equation to rank
deceptions. However, that number is not a cardinal value, but an ordinal value, so its use in
an equation is not valid nor meaningful.
Two Australian researchers are addressing the process and principles of deception
[Hut04, HW00, HW01, HW02]. They present high-level conceptual models for
understanding deception, and the models include deception for both offense and defense.
The models are general and do not provide the level of detail needed for designing specific
deception operations.
2.1.3 Military deception processes
This dissertation presents a model for designing computer-security deception
operations. The model was developed by synthesizing the military and intelligence
11
deception literature, and applying it to computer security. Deception is a key focus of the
military and intelligence communities [YDF06]. Three U.S. military deception-manuals
provide deception models for different aspects of deception operations. The Joint manual
addresses deception planning for command and control warfare (C2W) [JDD96]; the Army
manual addresses tactical deception [USA78, USA88]; and the Marine Corps manual
addresses strategic deception [USM89]. Useful models are also found in books written by
soldiers and intelligence analysts with expertise in deception [Dew89, Heu81, Mur80].
Civilian researchers, from academia, intelligence contractors, and defense contractors, have
also provided deception models for warfighting [CIA80, DH82b, FN95, Han85]. In all of
this literature, each source addresses a subset of deception. Consequently, the literature
contains a disparate collection of deception processes and principles. Prior to this
dissertation, the only known attempt to synthesize this literature is by the author of the
Marine Corps manual, which addresses strategic deception, not tactical deception [USM89].
In contrast, this dissertation provides a comprehensive synthesis of the military and
intelligence literature’s disparate deception models, and its focus is primarily on the tactical
use of deception.
2.2 Scanning and scan defenses
A major component of this dissertation is the Net-Chaff system, the purpose of which
is scan defense. The related work for Net-Chaff is in the areas of scanning and scan
defenses. They are presented in the following two sections.
2.2.1 Scanning
Net-Chaff’s purpose is to defend against hackers’ active scans. An overview of
scanning is provided here, and it frames the aspects of scanning that are relevant to Net-
Chaff. Further details on scanning are provided with the Net-Chaff description in Chapter
four.
Arkin defines active scanning as, “a technology, which uses stimuli (packets) in order
to provoke a reaction from network elements. According to responses, or lack thereof,
received from the queried network elements, knowledge about a network and its elements
12
will be gathered” [Ark05]. Passive scanning is an alternative form of scanning. It learns
about network elements by observing network traffic. Research comparing active and
passive scanning indicates that the two techniques find largely disjoint sets of information
[WLZ06]. A major disadvantage of passive scanning is that a significant percentage of its
discoveries can take a very long time, e.g., weeks. Hereafter, active scanning will be referred
to as simply “scanning”, except when it must be differentiated from passive scanning.
There are three major applications of scanning, and each includes tools, techniques
and research that are relevant to Net-Chaff. 1) There are numerous stand-alone scanning
tools, and they are used by hackers and network administrators [MSK03]. One of the best-
known scanners is nmap [Fyo04]. 2) Scanning is also incorporated in programs that are used
to find vulnerable systems and break into them. These programs include vulnerability
scanners (such as Nessus [Nes06]) and worms [Naz04]. 3) Scanning is a topic of research
and development within the field of network management [TB98, VVZ02]. Scanners are
incorporated in network management tools, to perform network discovery. Scanning tools
and techniques will be described in chapter 4.
A number of studies have been conducted to analyze Internet hacking activity,
including the prevalence and content of scans. Monitoring any portion of the Internet
address space reveals incessant activity [PYB04]. There are on-going projects that
continuously monitor and report Internet hacking activity [DS06, ISC06]. On the Internet,
scanning occurs constantly, and in high volume [JPB04, PYB04]. For instance, traffic logs
from the Lawrence Berkeley National Laboratory (LBNL) were examined for an arbitrarily-
chosen day [JPB04]. It showed that 138 different remote hosts scanned LBNL addresses,
with a total of about 8 million connection attempts. A more detailed study found that 13,000
remote scanners had probed LBNL addresses on a particular day.
Other research of Internet scanning activity involves monitoring large numbers of
unused IP addresses on the Internet [HA05, PYB04, YBP04]. These monitoring systems
have been referred to by several names, including Internet sinks, network telescopes, Internet
motion sensors, and black holes. Hereafter, we will refer to systems that monitor large
numbers of IP addresses as sinks. The traffic sent to unused addresses has been termed
13
background radiation [PYB04]. It is nonproductive traffic that, in general, is either
malicious (from flooding, vulnerability scans, and worms) or benign (from
misconfigurations). Analysis of Internet background radiation shows that it is not only
incessant, but also “complex in structure, highly automated, frequently malicious, potentially
adversarial, and mutates at a rapid pace” [PYB04]. Internet background radiation poses
significant challenges for intrusion detection.
In contrast, Net-Chaff works within a secure intranet. This intranet has a secure
perimeter that provides good, though not perfect, protection from direct Internet access. Net-
Chaff is not intended for use on networks that are directly accessible from the Internet, e.g.,
typical campus networks. Scans on the Internet are incessant (part of the background
“noise”), and thus far, there appears to be little that can be done to stop them.
We are not aware of formal published research on the incidence of scans within such
secure intranets, although a lot of anecdotal evidence exists, as well as a number of internal
reports in a wider range of organizations However, it is reasonable to assume that within
this environment, unauthorized scans are relatively infrequent, and worthy of detection,
containment and investigation. Sources of scans within protected intranets include attacks
from authorized personnel (i.e., insiders), worm-infected laptops, and unintended network
paths through the perimeter [Naz04].
Insider attacks can come from employees and contractors, and also from trusted
networks (e.g., VPN connections from business partners). The Wall Street Journal reports
that “23% of 229 U.S. organizations with more than 1,000 employees had at least one
internal security breach in 2004, while another 27% didn't know whether or not their
networks had ever been compromised -- from inside or outside” [Yua05]. The Code Red and
Nimda worms were able to deeply penetrate protected networks [Naz04].
2.2.2 Scan defenses
In this section, Net-Chaff is compared and contrasted with the prior work on scan
defenses. The prior work is analyzed relative to Net-Chaff’s distinctive features. These are
the features that, collectively, make Net-Chaff unique. The prior work is presented in the
14
following three subsections. The first subsection compares and contrasts each of Net-Chaff’s
distinctive features with similar prior-work. Next, whole systems that are similar to Net-
Chaff are presented. The third subsection describes scan defenses that work differently than
Net-Chaff.
Before analyzing the prior work, a summary of Net-Chaff’s distinctive features is
needed. Net-Chaff is used within a secured intranet. It’s primary purpose is to detect and
contain scans, and its primary objective is to contain scans before they can access vulnerable
computers. The Net-Chaff system detects scans by monitoring traffic to a large number of
unused addresses within the intranet. There are two ways that Net-Chaff slows down scans,
to prevent them from accessing vulnerable computers before containment: 1) a relatively
large number of unused addresses, and 2) the Net-Chaff system’s low-level impersonations.
Net-Chaff’s performance is analyzed using analytical models and a simulation, and both are
based on detailed calculations of scanners’ probe rates. Most of Net-Chaff’s individual
features exist in prior work. Net-Chaff combines and applies these features in a novel way.
There is a tremendous amount of prior work on scan defenses. It comes from a
number of sources, and they are summarized here. This summary describes broad categories
of the prior work. For each of the categories, an example of the prior work is cited. In the
sections that follow, specific instances of the prior work are described and cited. For scan
defenses, research and development has been carried out in academia (e.g., [JX04]), industry
(e.g., [PSN04]) and in the open-source community (e.g., [Ras01]). Scan-defense systems
have been developed, including prototypes (e.g., [WOK05]), open-source systems (e.g.,
[Ras01]), and products (e.g., [PSN04]). Scan defenses include prevention (e.g., [WSM04]),
detection (e.g., [Ras01]), containment (e.g. [PSN04]), and also intelligence collection and
analysis (e.g., [YBP04]). The three primary areas in which scan-defense work has been
performed are: 1) defenses specifically for scans (e.g., [Ras01]), 2) worm defenses (e.g.,
[WOK05]), and 3) intrusion detection systems (e.g. [BFP03]).
Most worms use active scanning to find new victims [Naz04]. These worms are
referred to as scanning worms. Hereafter, scanning worms will be referred to as simply
worms, unless differentiation of worm types is needed. The exponential growth of worms

15
results in huge volumes of network scans. Many worm-defense systems detect worms via
their scanning (e.g., [PSN04]). However, worm detection involves more than scan detection,
since not all scanners are worms [GSX04]. Some worm-defense systems contain worms (e.g.,
[PSN04]). There are a number of intrusion detection systems that include scan detection (e.g.
[BFP03]). However, in general, intrusion detection systems are concerned with a wide
variety of attacks, and not just scans. Hereafter, the term scan defense will be used to refer to
any type of defense against scans, unless differentiation of the type of defense is needed.
2.2.2.1 Prior work related to Net-Chaff’s distinctive features
Each of Net-Chaff’s distinctive features are compared and contrasted with the related
prior work:
• Secure-intranet environment
Net-Chaff is designed for use within a secured intranet. Here, it is assumed that
unauthorized scans are infrequent and each warrants investigation. Also, the intranet
environment provides the centralized control needed to implement automated containment,
and to prevent source-address spoofing. Collectively, these attributes of secured intranets
provide significant opportunities for scan defenses. However, there appears to be little in-
depth research on these scan-defense opportunities. We are only aware of three systems that
focus on the opportunities for scan detection and containment for the secure intranet
environment. They are Arbor Network’s product Safe Quarantine [PSN04], and two LAN-
based products from Mirage Networks [MN06] and ForeScout [For04a, For04b]. These
systems are described in the next section.
Scan defense for the Internet is very different from scan defense for secure intranets.
This is due to the Internet’s much larger size, larger volumes of traffic and scans, and the
lack of centralized control. Research on the requirements for Internet worm-containment
show the problem is extremely difficult [MSV03]. These requirements are not applicable to
scan containment for Net-Chaff, as its environment is so different. Internet scan defenses
will be described later.
16
• Monitoring unused addresses to detect scans
Net-Chaff detects scans by monitoring traffic to unused addresses. Typically, many
of a scan’s probes are to unused addresses. Such probes can be used to detect scans, as the
traffic is anomalous relative to benign traffic. There are two ways that network traffic can be
monitored, to detect scanners’ probes of unused addresses: 1) unused addresses can be
assigned to a monitoring system. Packets sent to those addresses are delivered to the monitor
via network routing. Net-Chaff uses this technique, as do several other systems which will
be described shortly. 2) Alternatively, a system can sniff network links to monitor traffic to
unused addresses. To filter-out benign traffic, the system must know which addresses are
unused. They can be specified a priori, or the system can deduce which addresses are
unused. Unused addresses can be identified by their lack of traffic (e.g., they do not send
ARP broadcasts) and also by failed connections (e.g., ICMP host unreachable messages).
There are several systems that monitor traffic to unused addresses by sniffing network links,
and they are described later.
Network intrusion detection systems (NIDSs) typically monitor network links, and
attempt to identify intrusions from amidst the legitimate traffic. There are a number of
significant difficulties and challenges with this approach [Naz04, RSM03, Spi02].
Monitoring an entire network can be very difficult, as many links may need to be monitored.
The large volume of legitimate traffic makes it difficult to accurately detect intrusions: 1)
often, intrusions make-up a very small portion of the traffic. 2) The large volumes of traffic
make it difficult to examine events over long time-scales. (Hackers use slow scans to exploit
this weakness in NIDSs.) 3) When multiple links are monitored, it is difficult to aggregate
this data and obtain a network-wide view of events. (Hackers use distributed scans to exploit
this weakness in NIDSs.) Aggregation is difficult due to the huge volumes of data, the need
for real-time detection, and also, the asymmetric routing of full-duplex connections (e.g.,
TCP) [RSM03].
Net-Chaff performs monitoring by assigning a very large number of unused addresses
to its monitoring systems (the Net-Chaff WAN and LAN servers). This technique provides
significant advantages over monitoring network links: 1) the volume of traffic is much
17
smaller, 2) there is little or no legitimate traffic, and 3) network-wide surveillance is much
easier. Research in intrusion detection for high speed network links has found that real-time
monitoring becomes difficult, if not impossible, at very high speeds [LPV04]. As an
alternative, they recommend monitoring unused addresses because, there, the signal to noise
ratio is much higher.
There are other systems, in addition to Net-Chaff, that assign unused addresses to a
monitoring system, for the purpose of detecting scans. Spitzner discusses honeypot’s use of
unused addresses, for intrusion detection and for collecting intelligence on hackers [Spi02].
However, traditional honeypots typically use a small number of unused addresses. Also,
traditional honeypots typically require labor-intensive log reviews, which make them
unsuitable for a real-time IDS [DQG04]. Recently, researchers have developed a honeypot
system, called Honeystat, that uses many unused addresses for worm detection [DQG04].
As described earlier, Internet sinks monitor large numbers of unused Internet
addresses [HA05, PYB04, YBP04]. iSink is one such system, and it has the added feature of
providing deceptive replies to scanners’ probes of the unused addresses [YBP04]. iSink is
further described in the next section. There are other intrusion detection systems that
monitor a large number of unused addresses, and they include a distributed Internet IDS
[YBJ04] and two network worm-detection systems [JX04, WVG04].
As described earlier, traffic to unused addresses can also be monitored by sniffing
network links. There are scan and worm detection systems that attempt to learn, or deduce,
which addresses are unused [For04a, For04b, MN06, SJB04, PSN04]. honeyd is a honeypot
system that can learn unused addresses by monitoring a LAN for unanswered ARP requests
[Hon05]. honeyd has been adapted for use in detecting scans [YLM04]. It is further
described in the next section. There are other systems that monitor unused addresses, and the
addresses are specified by human operators [HC04, TK02].
• Slowing down scans
Net-Chaff uses a large number of unused addresses to slow down the rate at which
scans probe vulnerable computers. This helps reduce the average number of vulnerable
18
computers a scan can access prior to containment. We are not aware of any other scan-
defense systems that use a large number of unused addresses for these purposes, especially
for IPv4. However, the idea of thwarting scans via a large address space is not novel; others
have observed that the large address space in IPv6 makes scanning very difficult [ZGT05].
To slow down scans, Net-Chaff also uses low-level impersonations at the unused
addresses. There are a number of scan-defense systems that use deception at unused
addresses. However, most of them use deception to elicit responses from scanners, in order
to better identify them [DQG04, JX04, Spi02, YBJ04, YBP04, YLM04]. Some scan-
defense systems use deceptive replies to confuse and misinform scans [Bec01, HC04,
XDM01]. We know of two deception techniques that are used to slow down scans. One is La
Brea, an it is described in a later section [LaB05]. The other deception technique is used by
firewalls.
We have observed that firewalls can slow-down scans by dropping disallowed
packets. Nmap’s source code reveals that it interprets dropped packets as an indicator of
congestion [Fyo04]. The dropped packets can induce nmap to reduce its scanning rate,
retransmit packets, and delay probe transmission. However, if host-firewalls drop scan
packets, then those hosts can potentially be discovered by an “inverse scan” [Ark01].
Normally, routers send ICMP host-unreachable messages in response to packets that are sent
to unused IP addresses. An inverse scan works by sending probes and looking for addresses
that generate no reply. Routers can defeat inverse scans by not sending ICMP host-
unreachable messages. Alternatively, hosts can defeat inverse scans by using a host firewall
that sends false ICMP host-unreachable messages [Rus02].
Net-Chaff uses low-level deceptions in order to simply its use of deception. These
deceptions work below the application layer, and they also include a null server, which
accepts data, and provides random replies or no reply. Deception that provides application-
layer content can be much more complex, difficult, and costly, e.g., deceptive web-servers.
Spitzner classifies honeypot systems according to the degree of user interaction that they
support, and the categories range from high interaction to low interaction [Spi02]. A low
interaction system provides simple application-layer impersonations, and typically, the
19
impersonation can be easily detected by a hacker. We are not aware of other research that
focuses on the use of low-level deceptions, as a simple means for slowing-down scans.
• Scan containment
Net- chaff uses intranet routers to contain scans. Other systems that do this are Arbor
Network’s “Safe Quarantine” [PSN04] and CyberTrace [JX04]. PSAD is a firewall-based
system that detects scans, and contains them by blocking sources [Ras01]. There are also
systems that monitor intranet links for scans, and block scans over those links [HCL06,
WSP04]. There are two LAN-based products that detect worms, and they contain infected
hosts by sending them spoofed packets that disable communications, such as TCP RST and
ARP [For04a, For04b, MN06]. Similarly, La Brea replies to scanners with packets that can
potentially put them in a long wait-state [LaB05]. Systems have been proposed for worm
containment using host-based firewalls [TK02]. An alternative to containment is throttling,
which reduces scanning rates by dropping a portion of the packets sent [SJB04, Will02]
• Performance models
Another contribution of the Net-Chaff work is its performance analysis, which
includes both analytical models and simulations. There are systems that have features similar
to Net-Chaff’s. Among those systems, some have analytical models or simulations.
However, these analytical models and simulations do not appear to be applicable to Net-
Chaff [CGK03, GSX04, JX04, WKO05, WVG04, ZGT05]. The reason is that the modeled
systems work differently than Net-Chaff, or have different objectives.
There has been a substantial amount of research on modeling the growth of worms,
and the research includes analytical models and simulations [Naz04]. These models show
that worm growth is exponential and difficult to contain. They also show the need for
stopping scanning-worms before they can access a single vulnerable computer, which is Net-
Chaff’s objective.
2.2.2.2 Scan-defense systems similar to Net-Chaff
The prior section examined the prior work relative to Net-Chaff’s individual features.
This section describes scan-defense systems that, as a whole, are most similar to Net-Chaff.
20
There are two systems for worm detection and containment that are intended for use
on enterprise networks. Arbor Network’s product Safe Quarantine detects worms by
monitoring network links for signs of worm scanning and propagation [PSN04].4 It
automatically contains worms by blocking them at intranet routers. An important
contribution of this product is its emphasis on not inadvertently blocking critical operations.
To avoid this, it learns normal network traffic, to know what traffic should not be blocked.
Net-Chaff differs from Safe Quarantine in that Safe Quarantine does not use unused
addresses to slow down scans, nor does it use deception to slow-down scans.
Another enterprise network solution for worm detection and containment is
CyberTrace, and it is an academic research project [JX04]. It uses unused addresses to detect
worms. It automatically contains worms by blocking them at intranet routers. An important
contribution of this system is its use of intranet routers to create an Internet sink, using
unused Internet address-spaces. When worms within the enterprise network scan the
Internet, they are likely to probe these address spaces. CyberTrace differs from Net-Chaff in
that it assumes a network that is largely open to the Internet, such as a campus network.
Also, CyberTrace focuses exclusively on worms, and not scanning in general. It does not use
unused addresses to slow down scans, nor does it use deception to slow-down scans.
Researchers at the University of Wisconsin have developed an Internet sink, called
iSink, and it also provides deceptive replies [YBP04]. The system is intended for studying
Internet background radiation, so its purpose and functionality are very different from Net-
Chaff’s. However, it makes two significant contributions that can be applied to Net-Chaff’s
implementation and deployment. The iSink system includes requirements analysis and
system designs for providing deceptive replies to large volumes of scan probes. iSink’s
techniques for generating its rudimentary deceptions could be used by Net-Chaff in
generating its low level impersonations. iSink was deployed on several lightly populated
class B networks. Its routing techniques, for unused addresses, could also be used for Net-
Chaff deployments.
4 Currently, Arbor Networks does not sell this product. It appears the product may have been sold to ISS and
21
La Brea is a system that attempts to suspend scanners, including scanning worms
[LaB05]. It does this by providing deceptive replies to probes sent to unused addresses on a
LAN. It detects these probes by monitoring the LAN for unanswered ARP requests. La Brea
attempts to suspend a scanner by sending it a TCP packet that is crafted to put the scanner in
a long wait state. It appears that La Brea could be easily countered by scanners that detect
this unusual TCP packet, or by scanners that work asynchronously [MSV03]. Researchers
have investigated La Brea’s potential use for thwarting Internet worms [CGK03]. Net-Chaff
and La Brea are clearly differ in the environments in which they are used, the ways they
monitor unused addresses, and the ways they use deception.
honeyd is another system that provides deceptive replies to connections sent to
unused addresses [Hon05, Pro04]. honeyd can detect traffic sent to unused addresses by
monitoring a LAN for unanswered ARP requests. Alternatively, unused addresses can be
assigned to honeyd. honeyd simulates honeypots at the unused IP addresses, and it has the
potential for a diverse set of interactive responses. One proposed use of honeyd is to thwart
scanning by 1) providing deceptive replies that confuse and deter scanners, and 2) coupling
honeyd with an IDS for scan detection [Pro04]. However, no further details are provided
about this system. Another proposed use of honeyd is to counter-attack scanning worms on
the Internet, and thereby stop them from spreading [Pro04]. Math models are developed for
the proposed system. They show that stopping an Internet worm would require hundreds of
thousands of honeypots. A significant problem with this system is that it requires knowledge
of a vulnerability that can be exploited to counter-attack the worm. An exploit for the
vulnerability is also required. This would be especially difficult for new worms.
Researchers have extended the honeyd system for use in scan detection [YLM04].
Their system is called HPDS. It works at the LAN level and impersonates computers at five
fixed addresses. Researchers working on the iSink system found that honeyd, “has significant
scalability constraints that make it inappropriate for monitoring large IP address ranges”
[YBP04]. Net-Chaff differs from honeyd and HPDS in the scale of unused addresses that it
incorporated within its product Proventia Network ADS.
22
works with. A bigger difference with these honeyd-based systems is that they do not provide
containment of scans, in general, on an intranet.
There are two noteworthy LAN-based products that detect and contain worms. One
is from Mirage Networks [MN06] and the other from ForeScout [For04a, For04b]. These
systems sniff traffic on a LAN, and detect worms based on their traffic patterns, e.g., packets
sent to unused addresses. They implement containment by sending specially crafted packets
to infected hosts, such as TCP RST and spoofed ARP packets. An important contribution
from these systems is that they are designed to be installed on a LAN, with little or no
modification to the LAN. In contrast, Net-Chaff deployments can potentially require
significant changes to a network, e.g., converting to the 10.0.0.0 address space. We were
unable to find enough information on these products to adequately assess how they work, and
what their limitations are. A major difference between these products and Net-Chaff, is that
they only protect a LAN.
Researchers have experimented with systems that detect scans on a network link, and
send deceptive replies in response. CTCP is a system that works on an edge router that
proxies connections to the Internet [HC04]. Incoming connections to nonexistent or blocked
ports are redirected to a system that provides deceptive replies. The intention is to render
port scans useless by making it appear that all ports are open. There is a similar system,
called IEDP, that runs on a firewall [XDM01]. A major difference between these systems,
and Net-Chaff, is that they only work on network choke points that control network access.
2.2.2.3 Scan defenses different than Net-Chaff
There has been much research and development for scan-defenses, and the majority
of it is fundamentally different than Net-Chaff. This section describes the prior work on
scan-defenses that is dissimilar to Net-Chaff.
2.2.2.3.1 Monitoring operational network traffic
In the scan-detection work with which we are familiar, the majority of it involves
monitoring operational traffic. Operational traffic is the network traffic carried by normal
23
network links, and it includes legitimate and benign traffic, as well as scans and attacks. Net-
Chaff is distinguished from the scan-detection work for operational traffic, as that work must
deal with the problem of identifying scan traffic that is mixed in with legitimate traffic. This
section provides an overview of the scan-detection work that involves monitoring operational
traffic. This overview shows the types of problems and solutions that have been addressed.
Scan detection has been investigated for different volumes and types of operational
traffic. Research related to high-bandwidth environments includes scan detection on
backbone routers [RSM03, SBB04, SYB06] and on high-speed networks (i.e., 10s of Gbps)
[GZC06]. Scan detection research has also focused on networks [HCL06, SHM02, WKO05]
and smaller local networks (e.g., LANs) [JPB04, SJB04, WSP04]. For network scan
detection, the use of mobile agents has been investigated [FA04]. Researchers have also
focused on scan detection within Internet traffic [QH04, ZGT05].
A large assortment of scan detection techniques have been researched for operational
traffic. Much of the scan-detection research introduces novel detection techniques that
attempt to solve the problem of finding scans within large volumes of legitimate data. An
overview of that research follows.
Commercial and open-source intrusion detection systems (IDSs) typically detect
scans by using a threshold-based detection mechanism [JPB04, RSM03, SHM02]. This
detection mechanism works by looking for X probes in a rolling window of Y seconds.
Examples of such systems will be given in section 2.2.2.3.2 (page 24). Net-Chaff uses a
simple threshold-based detection mechanism, and its use of other detection techniques is left
as a topic for future research.
Another commonly-used means for scan detection is scans’ large number of failed
connections. There are systems that detect scans by monitoring traffic for failed connections
[JPB04, RSM03, WSP04]. There are also systems that detect scanning worms in this manner
[CR05, SJB04, TK02]. There is a similar technique for detecting worm growth, and it works
by monitoring network traffic for changes in volume, much of which is due to worm
scanning [ZGT05].
24
Researchers have investigated probabilistic techniques for scan detection. These
techniques have been used to rapidly detect scans [JPB04], to detect slow scans [SHM02],
and to achieve accurate detection in real-time [LK02]. Researchers have also investigated
scan detection techniques based on statistical analysis of network traffic [TRB06], and on the
use of fuzzy systems [DJK01].
There are other forms of anomalous traffic that are generated by scans, and that can
potentially be used to identify scans within operational traffic. Researchers have investigated
techniques for detecting scans based on anomalous sequences of connections [QH04],
asymmetries in traffic [HCL06], and anomalous numbers of half-open connections from a
source [SBB04]. Another technique detects scans by identifying connections for which no
host-name look-up was made via DNS [WKO05].
There are scanning techniques that use unusual or malformed packets for the purpose
of evading detection or for fingerprinting a host’s operating system [Ark01, Fyo97]. These
scan packets provide a signature that can be used to detect scans, and two systems that uses
this technique are Snort [BFP03] and psad [Ras01].
2.2.2.3.2 Scan detection systems
This section describes some of the most well-known scan detection systems that work
by monitoring operational traffic. Research in intrusion detection includes four systems
whose scan detection capabilities are often cited. The Network Security Monitor (NSM) was
the first NIDS, and it was also the first NIDS to detect scanning [SHM02]. It uses a
threshold-based detection mechanism. Another system is Bro. It uses a threshold-based
detection mechanism, and it also monitors failed connections [JPB04]. The Graph Based
Intrusion Detection System (GrlDS) detects scans by building graphs of activity where the
nodes represent hosts, and the edges represent traffic between hosts [SHM02]. The
EMERALD system constructs statistical profiles for subjects, and compares their short and
long-term behavior. One way it detects scans is a sudden increase in the volume of SYN
packets, for example, from a particular source IP-address [SHM02].
Levchenko, et al., list IDS products that detect scans, and the vendors include
25
Checkpoint, Cisco, ForeScout, Juniper, NetScreen, and Network Associates [LPV04].
They indicate that these products monitor operational traffic. In addition, there are a number
of open-source tools that perform scan detection. Two of the most prominent are Snort
[BFP03] and psad [Ras01]. Both use threshold-based detection mechanisms, and they can
also detect several known scan-packet signatures. Snort is a commonly used NIDS and the
de facto standard in small stub networks [SYB06]. Scan detection is just one of its intrusion
detection functions. psad focuses primarily on scan detection, and it works with Linux’s
iptables rule-sets, e.g., as part of a Linux firewall [Ras01].
McClure, et al., make the observation that most IDSs are configured by default to
detect only very noisy or clumsy port scans [MSK03]. They state that an IDS must be
“highly sensitized” and “fine-tuned”, or stealthy scans will “go completely unnoticed”.
2.2.2.3.3 Other scan defenses
Net-Chaff’s scan-defenses primarily involve detection and containment. There are
several other types of scan defenses that have been researched and/or used in practice.
Research has been performed on visualizing scans, and the purpose of visualization includes
rapid comparison and identification of large numbers of network scans [MMB05]. There are
a number of techniques used to prevent scanning [XDM01]. Firewalls and systems that
perform network-address-translation (NAT) are well known techniques for blocking
scanners. Another well known technique is to configure servers so they listen on
unconventional ports. Routers can be configured to limit or drop certain ICMP messages that
scanners elicit to learn about the network [Ark01, XDM01]. Beck describes techniques to
evade scanners’ attempts to fingerprint host operating systems [Bec01]. Protocol scrubbing
involves filtering and modifying traffic to ensure there are no malformed or unusual packets
[WSM04]. Such packets can be used by scanners to elicit information or evade intrusion
detection systems.
2.2.3 Summary of scanning and scan defenses
There is a large volume of work on scanning and scan defenses. The work on
scanning reveals how hackers work, and what Net-Chaff must defend against. Net-Chaff is
26
concerned with scanning within a protected intranet. The incidence of scanning on the
Internet is a topic of much past and current research. However, we are not aware of any in-
depth research on the incidence of scanning within a protected intranet.
Most of the prior work on scan defense is concerned with operational traffic. Net-
Chaff is differentiated from this work by its technique of monitoring traffic to large numbers
of unused addresses. Most of Net-Chaff’s distinctive features are found in prior work.
However, Net-Chaff combines and applies these features in a novel way. Of the systems that
are most similar to Net-Chaff, they all work differently and/or have different objectives. In
addition, there does not appear to be any in-depth prior work on two of Net-Chaff’s
distinctive features. They are Net-Chaff’s techniques for slowing down scans prior to
containing them, by using large numbers of unused addresses and by using deceptive replies.
This dissertation includes analytical models and a simulation for evaluating Net-Chaff’s
performance. There does not appear to be prior work on scan-defense that includes similar
analytical models or simulations.
2.3 Deception use in honeypots and other tools
Although appealing, deception appears to be used only sparingly for computer
security. The primary use of deception is with honeypots, and that work is summarized here.
A survey was made of deception use in other computer security tools, and that work is also
summarized. The use of deception for scan-defense systems was described in the prior
section. The dissertation’s Honeyfile system is a deception-based computer security tool,
and it does not appear to exist in the prior work.
An extensive survey of computer-security tools that use deception was conducted in
2003. The primary sources were two popular web-sites that disseminate security tools:
SecurityFocus 5 and Packet Storm
6. For each site, its tools database was searched using
deception-related terms such as trick, spoof, and hide. The search showed that aside from
5 http://www.securityfocus.com
6 http://www.packetstormsecurity.org
27
honeypots, deception did not appear to be widely used for computer security. Over 75 tools
were found. Many of them are public-source prototypes that do not appear to be widely used
nor known. However, some of the tools were very useful as examples in the dissertation’s
deception models. The tools provide concrete illustrations for the abstract models.
Honeypots are computer systems that are designed to be probed, attacked or
compromised by hackers [Spi02]. Typically, a honeypot contains servers and content that
are attractive to hackers. Also, the honeypot is typically placed on a network where hackers
will likely encounter it. Currently, the primary uses of honeypots are collecting intelligence
about hackers and detecting attacks. A honeynet is a network of honeypots. In the honeypot
literature, the primary topics include: design and construction [CDF04, Spi02], specific
honeypot devices [Cha04b, Hon05, LaB05], monitoring hackers [Bal04, HP04], deployment
[Góm04, Hoe04], incident investigations [JLG04, OL04, RBB04], legalities [Cha04a,
MW03, Row05a], hacker intelligence [Chu03, Fis04, HP04], hacker countermeasures to
honeypots [Cor04, DHK04, Kra04]. To date, there has been very little discussion of
deceptive data on honeypots. It appears that honeypots are typically deployed with stock
operating systems and servers, but with no user or application data. Aside from this
dissertation, there has been little discussion of general deception processes and principles for
honeypot operations.
2.4 Summary
This chapter provided a summary of the literature surveys and the surveys of prior
work that were conducted for this research. The initial finding is that there has been very
little work done on deception processes for computer security. The extensive military and
intelligence deception-literature was described. It provides a very useful starting point for
developing the two novel process-models. The use of deception in computer-security tools,
including honeypots, was also discussed. The Honeyfiles system is a novel contribution of
this dissertation, and it is discussed further in subsequent chapters. There has been a
tremendous amount of research and development in scanning and scan defenses. An
extensive review of that work was given, especially as it relates to Net-Chaff. Most of Net-
Chaff’s distinctive features are found in prior work. However, Net-Chaff combines and

28
applies these features in a novel way. This dissertation includes analytical models and a
simulation for evaluating Net-Chaff’s performance. There does not appear to be prior work
on scan-defense that includes similar analytical models or simulations.
29
3 Deception framework
This chapter introduces the deception framework, which is comprised of the
deception-operation process model and the hiding model.
3.1 Deception operation process
This section explains how deception can be used to advantage in computer security,
including incident response, intelligence, detection, and prevention. It describes the process
followed in deception operations, and it describes principles and techniques for developing
and conducting deception operations. This work focuses on deception principles that are of
enduring use, and independent of current technologies. For instance, honeypots are currently
one of the most widely used deceptions. Honeypots are employed in the discussion to
illustrate principles, but honeypots are not the primary focus.
Deception is an integral part of human nature and experience. However, few people
use deception in the calculated manner needed for computer security. As the military
deception-literature reveals, effectively deceiving an adversary is a job skill [JDD96, Mur80,
USA88]. The principles of military deception are well documented in the military deception-
literature, and they are based on millennia of experience and thought. Herein, we adapt
principles of military deception to computer security deception.
3.1.1 An overview of deception operations
In this section, basic deception concepts and terminology are presented, followed by a
description of the deception-operation process.
3.1.1.1 Basic concepts and terminology
Computer security deception is defined as being those actions taken to deliberately
mislead attackers (i.e., hackers) and to thereby cause them to take (or not take) specific
actions that aid computer security.7 Deception aims to mislead the hacker into a predictable
7 This definition is adapted from the U.S. DoD definition of military deception [JDD96].
30
course of action or inaction that can be exploited [Dew89]. Tricking the hacker, and making
him think a certain way, is important only as a step toward getting him to make the decision
that will result in the desired action [JDD96]. Thoughts without action are of little computer
security value.
The scope of this section is deception for computer security defense. It focuses on the
tactical use of deception for a computer network, including its assets. The key deception
terms (deception planner, deception operation, target, intelligence, and ruse) are defined in
Chapter 1 and in the glossary. An additional term employed in this section is CND (computer
network defense).
3.1.1.2 The deception-operation process
The deception-operation process involves complex adversarial relationships and
complex engineering systems. Although the overall process can be complex, there is a basic
deception-process that is followed in almost all operations. This basic deception-process is
shown in Figure 3.1.1.2-1, and it is described below.8 In this section, references to process
steps in the figure are bolded. Similarly, references to sub-steps are italicized. Due to the
complexity of deception operations, this basic process is a simplified conceptual model, and
it focuses on the components found in successful deception operations. The model is not
meant to provide a complete description of all deception operations’ elements and
interactions.
8 This basic deception-process was adapted from a draft written by our colleague Dr. Bowyer Bell.
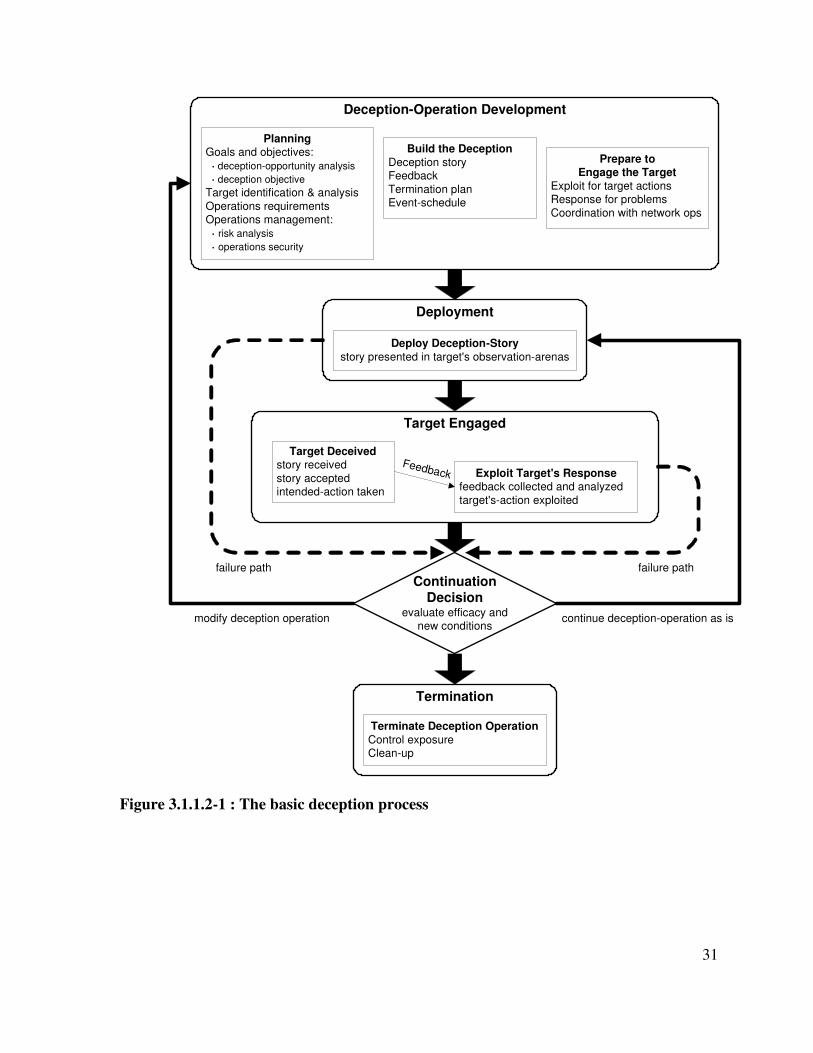
31
Deception-Operation Development
PlanningGoals and objectives:
· deception-opportunity analysis
· deception objective
Target identification & analysis
Operations requirementsOperations management:
· risk analysis
· operations security
Build the Deception
Deception storyFeedback
Termination planEvent-schedule
Prepare toEngage the Target
Exploit for target actionsResponse for problems
Coordination with network ops
ContinuationDecision
evaluate efficacy andnew conditions
modify deception operation continue deception-operation as is
Termination
Terminate Deception Operation
Control exposureClean-up
Target Engaged
Deployment
Deploy Deception-Story
story presented in target's observation-arenas
Target Deceivedstory received
story acceptedintended-action taken
Exploit Target's Responsefeedback collected and analyzed
target's-action exploited
Feedback
failure path failure path
Figure 3.1.1.2-1 : The basic deception process
32
• Deception-Operation Development
The deception operation begins with step 1: Deception-Operation Development
(top-most box in figure). The deception operation’s plan, deception, and means for engaging
the target are developed, roughly in that order. Planning is an iterative process that is
conducted throughout the deception operation. Its first step is recognition of the need or
opportunity to deceive a target. What must be done in deception planning, and often is not, is
to determine the result desired from the deception. Mere acceptance of the deception may not
be advantageous, and it may in fact prove costly. For example, a clever honeypot could
attract an unwanted horde of script kiddies, and hiding a host’s log files may make the hacker
uncertain of the evidence he’s left, prompting him to erase the entire file system, just to be
safe (e.g., “rm –rf /”). Thus deception is a means, not an end. The objective of a deception
operation is: 1) to induce the target to take some specific action—perhaps to do nothing, and
2) to exploit that action, or otherwise use it to advantage.
Deception operations are ultimately against individual hackers, so planning includes
identification of the deception targets, and analysis of their vulnerabilities to deception.
Planning also involves risk analysis and operations security to ensure the deception is not
revealed to the target.
To induce the target to take the intended action, a deception story is designed (step 1,
sub-step 2 in figure), and it is implemented using various ruses. The deception story is
presented to the target in his observation arenas. Typically, the most effective observation
arenas are the target’s intelligence sources. One of the primary ruses used in computer
security are honeypots, and they have proven useful for detecting attacks and for collecting
intelligence about hackers [Spi02]. A honeypot can contain servers and content that are
attractive to hackers, and it can be placed where hackers’ network scans (a hacker
intelligence source) are likely to encounter it.
• Deployment
The deception operation is deployed (step 2, second rounded box in figure) by
presenting the deception story to the target in his observation arenas. This is a key transition
33
in the deception process, as the deception operation is now out of the planner’s control until
the return of feedback that suggests an appropriate response. The deception story is
maintained until it is received by the target. This can occur almost immediately, as with
honeypots on a network’s so-called demilitarized zone (DMZ). Alternatively, the deception
story might be maintained for months or years before being received, as might occur with an
intranet honeypot used for detecting insider hacking.
• Target Engaged
The target is engaged (step 3, third rounded box in figure) once he receives the
deception story. The target is successfully deceived when he receives the deception story,
accepts it, and, as a consequence, takes the intended action.
Feedback channels provide information about the target’s reception of the deception
story and his response to it. The ultimate goal of deception operations is exploiting the
target’s response.9 This occurs after the feedback is collected and analyzed, and it is known
that the target has taken the intended action. For honeypots, feedback channels are an
essential feature. For example, Symantec’s ManTrap honeypot can record much of a hacker’s
activity, including network traffic, process activity, and keystrokes [Spi02]. ManTrap can
also detect hacker activity and send alerts.
The deception story exerts control on the target, manipulating him at a distance. Such
manipulation may be intended to have a very short existence. For instance, BackOfficer
Friendly (BOF) is a honeypot that can impersonate unauthorized remote-access servers, like
BO2K [Spi02]. Servers such as BO2K are installed by hackers via Trojan horses. BOF’s
impersonation is superficial and its ruse can quickly be discovered by the hacker, but not
before he is detected. Other deceptions may be intended to last indefinitely. For example, a
fake VPN interface can be used to draw attention away from a network’s real VPN interface.
The deception is intended to last indefinitely.
9 Thanks to Fred Feer for showing us how the exploit is the deception operation’s ultimate goal. In the military
deception literature that we have read, the exploit’s central role is under-emphasized.
34
• Continuation Decision and Termination
A continuation decision (step 4, diamond in figure) is made for the deception
operation, based on its efficacy and the current situation. The process can be terminated,
continued as-is, or modified, in which case the process returns to deception-operation
development. Termination (step 5, last box in figure), occurs when the deception story has
achieved its purpose and is no longer needed, or when the target discovers the ruse. The
target often discovers the ruse when his response to it is exploited. For example, hardware
keystroke-loggers are dongles that attach to the keyboard cable. Their effectiveness depends
on stealth: they are located behind the computer, appear to be a normal part of the cable, and
few people know about them. When a hacker is confronted with evidence from a keystroke
logger, the ruse will probably become apparent. Thus, it can no longer be used against him or
his accomplices. Terminating the deception involves controlling exposure of the ruse, so it
might be used again, as well as cleaning-up its affects upon computer systems and personnel.
• Complexities in the deception process
Real-world deception operations tend to be more complex than the basic deception-
process shown in Figure 3.1.1.2-1. Two of the major sources of complexity are: 1) multiple
deception stories and 2) operational failures. Such complexity can be understood in terms of
the basic deception-process.
Deception operations may involve multiple deception stories, and there can be
multiple actions intended for the target to take. The stories and actions may be inter-related,
requiring them to be conducted in parallel or serially. Furthermore, there can be multiple
targets. For such deception operations, the basic process portrayed in Figure 3.1.1.2-1 is
used, but its components may occur more than once: multiple deception stories are
developed; there are multiple deployments; and there are multiple target-engagements.
There are a plethora of problems that can cause a deception operation to fail. For
example, the deception will fail if: the deception story isn’t received; the target discovers the
ruse; the story is not interpreted as intended; or the intended action isn’t taken. Such
problems can be modeled as departures from a successful deception operation. Two types of
35
failure are shown by the dashed lines in Figure 3.1.1.2-1. If the target does not receive the
deception operation, then the leftmost failure path is taken. If the target receives the
deception, but he is not deceived, or the exploit fails, then the rightmost failure path is taken.
The remainder of this section focuses on deception-operation planning and on
building the deception story.
3.1.2 Deception planning
“A prince or general can best demonstrate his genius by managing a campaign exactly to
suit his objectives and his resources, doing neither too much nor too little.” [Cla32]
–– Carl von Clausewitz
Deception-operation planning provides direction for the operation by developing its
goals, objectives and requirements.10
In conjunction, the targets are analyzed to learn their
vulnerabilities to deception.
3.1.2.1 Deception opportunity analysis
Deception opportunity analysis identifies ways deception can be used to support
computer network defense (CND). For the deception operation to be effective, it should be
fully integrated with the overall CND effort. The deception operation must be compatible
with, and coordinated with, the network’s security and production operations. Deception is
not an end in itself, and it should not be used simply because there are clever ways to trick
hackers.
3.1.2.2 The deception objective
“...it became a creed [among deception planners] to ask a General, ‘What do you want the
enemy to do,’ and never, ‘What do you want him to think?’” [Mur80]
–– Dudley Clark, WWII deception planner
The deception objective is the desired result of the deception operation; it consists of:
1) the intended target action, and
10
This planning process is adapted from the U.S. Joint Forces’ deception process [JDD96].
36
2) the deception exploit.11
The target-action is a statement of what the hacker is to do (or not do) at some time
and location. It is always stated in terms of specific actions, such as, “cause the targets’
attacks against our server to be performed, instead, against the honeypot server”. A statement
such as “have the hacker think that the honeypot server is the real server” is not a target-
action, rather, it is a desired perception (described in section 3.1.3). Having the hacker think a
certain way is important only as a step toward getting him to make the decision that will
result in the intended action. Thoughts without action are of little security value.
The deception exploit is a statement of how the target-action will benefit CND, e.g.,
through attack detection, prevention, or response. The deception exploit may include actions
to be taken against the target, following the target-action. For instance, the prior example’s
deception exploit would be, “for successful attacks against the honeypot, the honeypot will
record the attack and send an alert.” Some deception exploits do not require taking action
against the target, e.g., when using a ruse to confound operating system (OS) fingerprinting,
the deception exploit is thwarting attacks that depend on accurate OS fingerprinting.
The deception operation’s ultimate goal is successful completion of the deception
exploit. The deception-story and ruses are just means for inducing the target-action. After the
story is deployed, feedback is analyzed to determine when the target-action is taken. The
deception exploit can go into effect after the action is taken.
3.1.2.3 Target identification and analysis
“It was so important to the deception work to be able to put oneself completely in the mind of
the enemy, to think as they would think on their information, and decide what they would
do.” [Mon78]
–– WWII deception planner
Deception attacks the target’s perception and his thinking process, so effective
deception requires intelligence on who the target is, how he works, and how he thinks.
11
The deception objective is adapted from the U.S. Joint Forces deception manual [JDD96]. However, its
deception objective only consists of the target action. We include the deception exploit with the deception-
objective, as it is the deception-operation’s ultimate objective.
37
Computer-security systems face a wide variety of threats. Howard classifies hackers
primarily by their intentions: professional criminals, corporate raiders, hackers, vandals,
terrorists, and spies [How98]. Hackers also vary widely in their capabilities and physical
locations. It is possible to create deceptions that are effective against a wide variety of
hackers. For example, Cohen, et al., have conducted experiments in which a particular
deception worked against both undergraduate neophyte-hackers and seasoned penetration-
testers [CMS01].12
However, for deception operations, if a specific type of target can be
identified, then its unique vulnerabilities to deception can be exploited. For example, script-
kiddies’ have a youthful naiveté that is vulnerable to deception.
An understanding of how hackers work reveals their vulnerabilities to deception and
how those vulnerabilities can be exploited. Fortunately, much is understood about how
hackers work, as the complexity of hacking compels hackers to use publicly available tools
and information. There are many books on hacking techniques [MP01, MSK03], and the
Honeynet Project has reported the findings from their extensive surveillance of hackers
[HP04].
Outsider hackers (non-insiders) are almost always naive about the networks they
hack. A hacker’s experience and skills are often asymmetric with the experience and skills
needed for the network he is hacking. For example, hackers typically have never legitimately
worked on a network, or in an organization, like the ones they are hacking. Even if a hacker
has a high degree of technical skill, he may be naive about the network’s topology and
operations, as well as the network personnel’s language and culture.
An understanding of how hackers think also reveals vulnerabilities to deception and
how those vulnerabilities can be exploited. The key elements of the hacker’s thinking are his:
1) intentions, 2) perceptions, 3) decision-making process, and 4) his psychological
vulnerabilities to deception. The hacker’s particular psychological vulnerabilities to
deception can also be used to advantage. For example, the hacker Matt Singer was reportedly
12
The experiments tested the efficacy of a device that apparently creates many imposter computers on a
network. However, the paper does not appear to describe the device in detail.
38
obsessive, compulsive and undisciplined in his hacking [FM97]. Such shortcomings
significantly limit a hacker’s ability to carefully and critically examine ruses. A number of
books provide insights into how hackers think: chronicles of prolific hackers [FM97, Sto89],
the aforementioned findings from the Honeynet Project’s surveillance [HP04], and a
sociologist’s study of hacker culture [Tho02].
3.1.2.4 The target’s intelligence sources
“Provided the enemy has an efficient intelligence service, provided he is capable of reacting
to what he sees, or thinks he sees, he can apparently be taken in again and again.” [Bar52]
–– WWII deception planner
“I wanted to watch the cracker’s keystrokes. . . The best solution was to lure him to a
sacrificial machine and tap the connection. . . [We] did construct such a machine, [but]
never managed to lure anyone interesting to it.” [Che92] 13
–– Bill Cheswick
When implementing the deception story, the planner’s goal is that the story be
received by the deception target (i.e., hacker), believed, and interpreted as intended. Such
manipulation of an adversary can be very difficult and problematic. Fortunately, the target
provides an opportunity the planner can exploit to achieve his goal: in the course of hacking,
the target eagerly seeks particular information, and this presents an opportunity for using the
target’s intelligence sources to communicate the deception story. Simply put, an intelligence
source is something that is used by the target to learn about the network. The U.S. DoD
defines an intelligence source as “the means or system that can be used to observe and
record information relating to the condition, situation, or activities of a targeted location,
organization, or individual. An intelligence source can be people, documents, equipment, or
technical sensors” [JDD01].
Hackers’ intelligence sources take a variety of forms, and two of the primary sources
are network-scanners and network sniffers. A web-site can be either an intelligence source,
or the object of an attack, depending upon how the target uses it. Some of the most useful
13
emphasis added
39
intelligence sources are network-administration tools such as traceroute and ping. Also, any
network client can be used as an intelligence source, e.g., telnet, FTP, and web clients. In
social engineering, insiders are used as unwitting intelligence sources. A description of
hackers’ intelligence sources can be found in books on hacking techniques. For example,
McClure, et al. list four types of hacker intelligence-sources: 1) footprinting, which is the use
of publicly available information to learn about an organization and its network, 2) scanning
to learn about the network topology and its devices, 3) enumeration, which is scanning for
particular computer-security vulnerabilities, and 4) pilfering, which involves searching
systems for passwords and exploitable trust relationships [MSK03].
Designing the deception story requires an understanding of the target’s intelligence
sources and observation arenas. The implemented parts of the deception story must be
observable by the target’s intelligence sources, e.g., a port scan. Otherwise, the target cannot
receive the story. Also, there are several types of vulnerabilities in the target’s intelligence
process that are helpful to know and exploit: 1) the single sources of information that he may
rely upon, as deception is easier when the ruse will not be cross-validated (e.g., remote
hackers often just rely upon network data), 2) the information he uses that is superficial and
easily misrepresented, as with a ping scan, 3) the investigations he performs when he is naive
and thus easily duped, as during his initial network reconnaissance, and 4) the intelligence
processing of the hackers’ automated agents, such as worms’ network scans, since their
simplicity and determinism may be easily duped.
3.1.3 The deception story
To induce the target to take the intended action, a deception story is designed, and it
is implemented using various ruses. The deception operation’s objective is to induce a
specific target-action that benefits CND. The desired perception is what the target must
believe in order for it to take the intended action [JDD96]. The deception story is an outline
of how the computer system will be portrayed so as to cause the target to adopt the desired
perception, and take the intended action. This section presents principles and techniques for
developing the deception story.
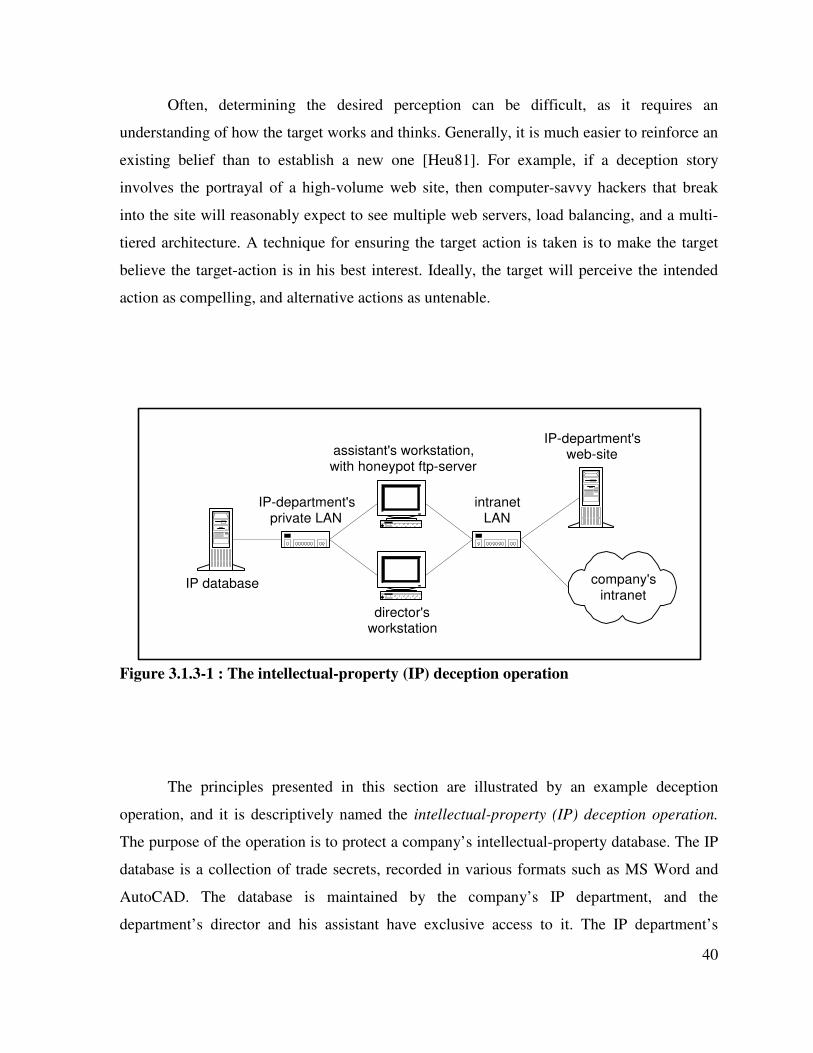
40
Often, determining the desired perception can be difficult, as it requires an
understanding of how the target works and thinks. Generally, it is much easier to reinforce an
existing belief than to establish a new one [Heu81]. For example, if a deception story
involves the portrayal of a high-volume web site, then computer-savvy hackers that break
into the site will reasonably expect to see multiple web servers, load balancing, and a multi-
tiered architecture. A technique for ensuring the target action is taken is to make the target
believe the target-action is in his best interest. Ideally, the target will perceive the intended
action as compelling, and alternative actions as untenable.
Figure 3.1.3-1 : The intellectual-property (IP) deception operation
The principles presented in this section are illustrated by an example deception
operation, and it is descriptively named the intellectual-property (IP) deception operation.
The purpose of the operation is to protect a company’s intellectual-property database. The IP
database is a collection of trade secrets, recorded in various formats such as MS Word and
AutoCAD. The database is maintained by the company’s IP department, and the
department’s director and his assistant have exclusive access to it. The IP department’s
assistant's workstation,with honeypot ftp-server
director'sworkstation
IP-department'sprivate LAN
IP database
intranetLAN
company'sintranet
IP-department'sweb-site
41
intranet web-site describes the department, and the procedure for employees to submit trade
secrets. Submissions are made by copying files to a shared folder on the assistant’s
workstation, and the assistant stores the files on the IP database. The database is kept on a
single computer, and the computer is on a private LAN that can only be accessed by the
director and his assistant. This example is illustrated in Figure 3.1.3-1.
The target of the IP deception operation is a hacker who attempts to gain
unauthorized access to the IP database. The intended target-action is one that reveals the
target’s presence and intent, but does not compromise computer security. The deception
exploit is attack detection and the recording of forensic evidence. The desired perception is
an exploitable vulnerability that provides access to the IP database. The deception story is a
vulnerable FTP server on the assistant’s workstation. The FTP server will appear to be a
particular make and version that has a buffer-overflow vulnerability.
3.1.3.1 Essential design-criteria
For a deception story, its essential design-criteria [DH82b, JDD96, USA78] are that it
be:
Plausible: the story must be plausible from the target’s perspective. Consequently, it
should appear appropriate from both an engineering and operations perspective. Also, it
must appear to be something the defender is capable of doing. The story should be consistent
with real systems and operations, as well as being internally consistent.
Receivable: The story must be something the target’s intelligence is capable of
receiving and interpreting as intended.
Verifiable: If the target will verify the story through multiple intelligence sources,
then the story should be portrayed through more than one source. For example, to avoid
honeypot web sites, a target can verify web sites he discovers by searching for links to them
from real web-sites.
Efficacious: For the story to be efficacious, it must be received, and it must
42
effectively induce the desired perception and target-action.
Implementable: The story must be something the deception planner is capable of
implementing.
The IP deception-operation example illustrates the above design-criteria: the
deception operation’s story is plausible to insiders because the IP assistant is capable of
installing an insecure FTP server. File transfers are consistent with the assistant’s job
responsibilities, as described on the IP web-site. Also, the FTP server’s vulnerability is
consistent with other security problems on the intranet. The vulnerable FTP server is visible
to a port scan, which is the target’s expected means of receiving intelligence. The IP web-
site’s description of the assistant’s file-transfer responsibilities helps to verify the story. The
story is potentially efficacious as the FTP server’s vulnerability is the target’s only known
means for accessing the IP database. The story can be implemented using a COTS
(commercial off-the-shelf software) honeypot, such as Specter [Spi02].
3.1.3.2 Design principles
For a deception story, some of the key design principles are:
Inducing the target-action. The target-action is easier to induce if it something the
target is predisposed to doing, such as: 1) something he is already planning to do, 2)
something he normally does, or 3) something he wants to do. In the IP deception operation,
the target is hackers who are seeking to steal intellectual property. It is expected that the
target will first locate and study the IP department’s web-site. From it he will learn that the
director and his assistant maintain a repository of intellectual property, and that their
computers are promising pathways to the repository. It is anticipated that the hacker will scan
these computers for vulnerabilities, and then attempt to exploit a vulnerability that provides
easy and stealthy root access. Both of the computers are kept very secure by their users and
by the IT department. The honeypot FTP server is expected to be the only vulnerability that
the target encounters, making it compelling to attack.
Making the story believable. In general, it is easiest to persuade the target to believe
43
something he already expects. Also, it can be easy to deceptively portray things that are
normally hidden from the target. Often, the target only expects to find limited information
about something that is hidden, in which case that is all that needs to be portrayed. In the IP
deception operation, the IP database is one of the company’s major assets. Hackers will
expect the database to be highly secure and difficult to access. The deception story would not
be very believable if it portrayed a fake IP database that could be accessed and compromised
in a trivial way, e.g., via a misconfigured readable file-share.
Preventing the target from uncovering the deceptions. The deception story’s
falsehood should be kept to a minimum. The truth is much stronger than a lie, and it can be
difficult to maintain a lie over time. Also, minimizing falsehood makes the deception story
easier to implement. Some techniques for minimizing falsehood are: 1) make the story
simple, 2) weave the story into the truth, 3) provide no more detail than is necessary, and 4)
impersonate things that are normally concealed from the target, as he will only expect to see
bits and pieces of information about them, and only those pieces of information need to be
portrayed. The IP deception operation illustrates these points: its deception story is a small
extension to real systems and operations (items 1 and 2, above). The story is implicitly
verified by information on the real IP web-site, and by the real workstation that runs the FTP
honeypot (item 2, above). Using a different example for items 3 and 4: when impersonating a
subnet that is protected by a stealthy firewall, only a few expected signatures may have to be
shown.
Another way to prevent the deception story from being uncovered is to minimize the
target’s scrutiny of the deceptions. Three techniques for doing this are: 1) the deceptions can
be communicated to the target via his less scrutinizing intelligence capabilities. If the target
cannot examine the deception closely, he will be less likely to detect it. 2) Deceptions can be
communicated to the target when he has little time to scrutinize them, and 3) the deceptions
can portray things of which the target has little understanding. A good example of when
hackers have little time to observe is during extensive port scanning. When many ports are to
be scanned, each scan must be quick, and thus superficial. Such scans are easy to deceive,
and the deception is fairly reliable. For example, ping scans can be easily and reliably
44
deceived by fake echo-reply packets.
Ensuring the target receives the story. In the course of hacking, the target eagerly
seeks particular information; this presents an opportunity for using the target’s intelligence
sources to communicate the deception story to him. In the IP deception operation, the IP
web-site is one of the target’s intelligence sources. Also, the deception story included a
vulnerable FTP server on the IP workstation because it is something the target can see, and is
likely to see. Designing the deception story requires an understanding of the target’s
intelligence sources and observation arenas.
Revealing the story. A technique for revealing the deception story is to provide the
story in bits and pieces and then let the target piece the story together by inference [Dew89,
USM89]. The technique is consistent with the target’s intelligence activities, as they
normally acquire information in bits and pieces. A weakness of the technique is the risk of
misinterpretation, as the small amounts of information might be reasonably interpreted in a
variety of different ways.
Implementing the story. Usually, only parts of the deception story will need to be
implemented. Some of the story will be tied to the truth and portrayed by real systems and
operations. Some of the story can be notional, implied by the parts of the story that are real
and that are implemented.
To determine what parts of the story to implement, one must understand how the
target receives the deception story, and what he expects to see [JDD96]. For the IP deception
operation, the target’s intelligence collection is expected to begin with the IP web-site. It will
be followed by a port-scan of the two IP workstations. The target will then investigate the
listening ports for vulnerable servers. Most likely, the target will not expect to be deceived
nor detected, so he will trust what he sees, and he will act boldly and quickly.
The target’s intelligence and investigative capabilities determine how he receives the
deception story. The deception planner must determine the things the target would expect to
see if the deception story was true. For the IP deception operation, the target will expect the
45
IP department’s workstations to be secure, but he will look for accidental vulnerabilities. The
target will use a port-scanner to find network servers on those workstations. He’ll examine
the servers for exploitable vulnerabilities, such as the buffer-overflow vulnerability on the
FTP server WUFtpd Version 2.5.0 [CER99]. The target will expect an FTP server to present
its login interface. A buffer-overflow attack normally crashes a server, or it provides access
to a root shell. The target will not expect the IP database itself to be easily accessible on the
intranet, due to its value and security.
Having determined how the target discovers the deception story, and what he expects
to see, the planner can then determine the parts of the story to implement. For the IP
deception operation, the real IP web-site and workstations will portray themselves. An FTP
honeypot will impersonate a vulnerable FTP server, as the target expects. However, the
honeypot does not need to simulate, nor provide, root-shell access. After several failed
attacks, the target will simply give up, and attribute the failures to system idiosyncrasies.
Nothing needs to be portrayed regarding the IP LAN. The target’s knowledge of it is
speculative, and he will expect it to be hidden and inaccessible.
Realism. For each part of the deception story that is implemented, the deception
planner will need to determine its degree of realism. The realism needed is a function of: 1)
the target’s intelligence capabilities, and 2) the time the target has available to analyze the
situation and take appropriate actions [FN95]. Often, minimal realism is needed for
deceptions that the target has little time to observe and analyze [FN95]. For example, hackers
have little time to observe during extensive port scanning. When many ports are to be
scanned, each probe must be quick, and thus superficial. Such scans are easy to deceive, and
the deception is fairly reliable. In general, it is best to design the deception story so that the
amount of realism needed is kept to a minimum.
3.1.4 Summary of the deception operations model
The deception process’ basic components are illustrated in Figure 3.1.1.2-1 (page 31).
In deception planning, we have observed that it is very easy for the deception operation’s
trickery to become enthralling and captivating, and cause the planner to lose sight of the real

46
objective. The deception objective is the desired result of the deception operation; it consists
of: 1) the intended target action, and 2) the deception exploit. The deception operation’s
ultimate goal is successful completion of the deception exploit. The deception operation’s
trickery is just a means for inducing the target-action. In particular, the desired perception is
what the target must believe in order for it to take the intended action. The deception story is
an outline of how the computer system will be portrayed so as to cause the target to adopt the
desired perception, and take the intended action.
For the deception operation to be successful, the deception story must be: received by
the target, believed, interpreted as intended, and the story must induce the target action. Such
manipulation of an adversary can be difficult and problematic. Fortunately, the target
provides an opportunity that the deception planner can exploit: in the course of hacking, the
target eagerly seeks particular information, and his intelligence processes can be used to
communicate the deception story to him. In addition, feedback channels are needed to
provide information about the target’s reception of the deception story, and his response to it.
47
3.2 Hiding model
Hiding things is common practice in computer security. Routinely, systems and files
are hidden using firewalls and access controls, and data are encrypted. These common forms
of hiding typically work by denying information to potential hackers. Another way to hide
things is by using deception. Deception is a promising means for computer security, as seen
with honeypots [Spi02]. This section examines the use of deception as a means of hiding
things from hackers.14
Deceptive hiding can be used in a wide variety of computer security applications. One
such application involves hiding information about a network’s topology, vulnerabilities, and
assets from hacker reconnaissance (e.g., scanning). The honeypot “honeyd,” for example,
intercepts connections to unused network addresses and impersonates computers at those
addresses [Spi02]. Its ruse makes it difficult for hackers to find real computers and to scan
the network without being detected. Deception can also be used to hide computer-security
devices, including firewalls, intrusion detection systems, keystroke loggers and honeypots.
For example, a firewall can send fake ICMP “host unreachable” messages in response to
disallowed packets, making it appear that the firewall, and computers behind it, are not on the
network.
We define computer security deception as the actions taken to deliberately mislead
hackers and to thereby cause them to take (or not take) specific actions that aid computer
security [JDD96]. Often, for deceptive hiding, the objective is to cause the hacker to not take
a particular action, such as accessing a server.
Furthermore, computer security deception aims to mislead a hacker into a predictable
course of action or inaction that can be exploited or otherwise used to advantage [Dew89]. In
general, one wants to avoid actions that cause the hacker to act dangerously or unpredictably.
For example, suppose a system administrator hides network logs to prevent hackers from
14
This section appears in a copyrighted journal paper [YDF06]. It is reprinted here by permission. There are
some minor differences between this section and that paper.
48
erasing their tracks. If a hacker does not find expected logs, he may erase the entire hard
drive, just to be safe. An important aspect of deception planning, therefore, is anticipating
such unintended consequences and taking actions to mitigate their effect.
We will refer to the thing being hidden as the hidden item. It includes anything that
needs to be hidden for computer security, such as assets, vulnerabilities, data, processes, and
even network agents, including people. Items are hidden from an agent, human or computer.
The agent whom the item is hidden from will be referred to as the target. In the context of
computer security, the target is a hacker or his automated agent (e.g., a worm). For deception
operations, the adversary who is being deceived is referred to as the deception target. For
deceptive hiding, the target of hiding is also the deception target.
This section explains how deceptive hiding works in terms of how it misleads, or
tricks, a particular target (i.e., hacker). However, the deception planner’s ultimate purpose is
not to mislead the target, but to improve computer security in some specific way. In the
experience of the author, deception’s trickery can be alluring and intriguing, making it is easy
to lose sight of the deception’s ultimate purpose.
This work describes deceptive hiding through a process model. The model’s purpose
is to provide a framework for understanding, comparing, and developing methods of
deceptive hiding. Although the model is based on general principles and techniques that are
domain-independent, the focus is on the model’s application to computer security. The goal
is to help the security professional evaluate, compare, configure, and use existing deceptive
hiding techniques (e.g., honeyd); and to help explore possibilities when creating new
techniques.
The model characterizes methods of deceptive hiding in terms of how they defeat the
underlying processes that a target uses to discover the hidden item. This process is
decomposed into three means of discovery: direct observation (sensing and recognizing),
investigation (evidence collection and hypothesis formation), and learning from other people
or agents. Although the focus is on deceptive hiding, many of the concepts are also relevant
to non-deceptive hiding.
49
The next section introduces the process of deceptive hiding. Subsequent sections
describe the three means of discovery and how they can be defeated; a final section
concludes.
3.2.1 The process of deceptive hiding
Bell and Whaley categorize deceptions as hiding and showing [BW82, Wha82].
Deceptive hiding conceals or obscures a thing’s existence or its attributes in a way that
intentionally misleads the target. It is distinguished from denial, which may also involve
hiding, but without the intent to mislead. Denial simply withholds information from the
target. Encryption, which overtly conceals a message but not its existence, is an example.
Steganography, on the other hand, which aims to hide the existence of a communication, is
deceptive, as it uses a misleading data carrier (e.g., text is hidden in the low-order bits of an
image file in such manner that the text is not visible to the naked eye).
Deceptive showing makes something that doesn't exist appear as if it does by
portraying one or more of its attributes. For example, after several unsuccessful logins, a
computer can continue to prompt for passwords, but ignore them and not permit login. The
computer is deceptively showing login prompts.
Hiding keeps the deception target from knowing about the hidden item’s existence or
its attributes. As a result, the target will be unaware of the item, certain it does not exist,
uncertain of its existence, or left with incomplete or inaccurate information about it. Hiding
can prevent discovery of the hidden item, or it can make discovery more difficult or time
consuming.
There are three different ways a target can discover a particular item:
1. direct observation of the item,
2. investigation based on evidence of the item, and
3. learning about the item from other people or agents.
These three means of discovery comprise the target’s discovery process. Hiding
works by defeating this process, which is driven by two elements: capabilities and a course of
50
action. The target’s discovery capabilities are defined as the resources, skills, and abilities he
has for discovery. The discovery course-of-action is the way he carries out the discovery
process; it includes how, when and where the target looks for things. This suggests that the
target’s discovery process can be defeated by affecting either the target’s capabilities or the
target’s course of action. For instance, installing a firewall can ensure a hacker’s port scan is
not capable of directly observing a computer’s servers. Alternatively, deploying an enticing
honeypot could divert the hacker’s course-of-action so that his port-scans reveal the honeypot
rather than the hidden servers.
We assume the deception target intends to discover the hidden item. Another way to
hide is to affect the target’s intentions. For example, a hacker may be deterred from scanning
for and attacking vulnerable systems if he believes he will be caught and punished. Hiding by
altering intentions is not addressed herein. We now examine each of the three discovery
processes and how they can be defeated.
3.2.2 Direct observation
When hacking a network, much of what the hacker knows about the network is
learned by direct observation. For example, a hacker’s port scan allows him to observe a
network’s computers and servers. Once a hacker gains access to a computer, he can use
system utilities to observe the computer’s resources, such as files, programs, and running
processes; and he can use application programs to observe business and user data. Also, the
hacker can use network clients to observe servers and their contents. We first describe the
discovery process and then examine how hiding can defeat that process.
3.2.2.1 The discovery process for direct observation
The discovery process for direct observation involves sensing and recognizing. The
process is illustrated in Figure 3.2.2.1-1. The deception target observes using his own human
sensors, e.g., his eyes. He may also rely upon one or more external sensors, such as a
network port scanner or packet sniffer. Information flows to and from the sensors over media
(e.g., network cables, routers, and computer monitors). The hidden item is observed within
the environment in which it resides (e.g., a private computer network). When a human target
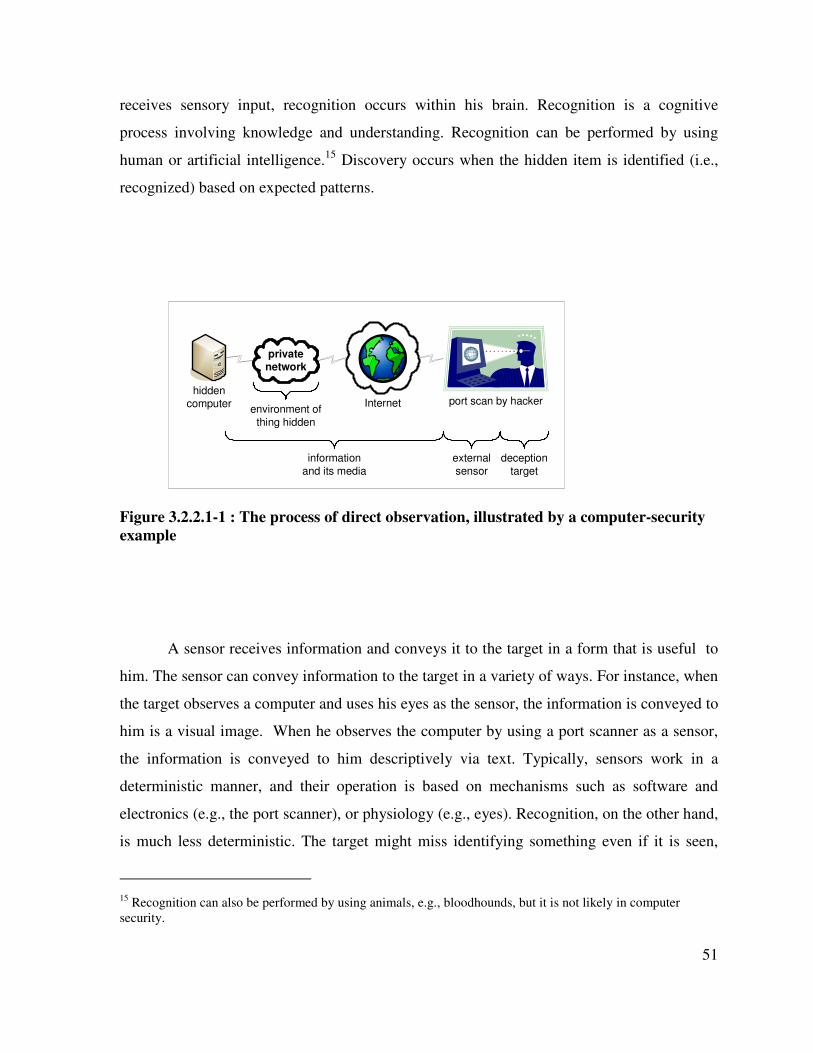
51
receives sensory input, recognition occurs within his brain. Recognition is a cognitive
process involving knowledge and understanding. Recognition can be performed by using
human or artificial intelligence.15
Discovery occurs when the hidden item is identified (i.e.,
recognized) based on expected patterns.
privatenetwork
deception
target
Internet
external
sensor
information
and its media
environment of
thing hidden
hiddencomputer port scan by hacker
Figure 3.2.2.1-1 : The process of direct observation, illustrated by a computer-security
example
A sensor receives information and conveys it to the target in a form that is useful to
him. The sensor can convey information to the target in a variety of ways. For instance, when
the target observes a computer and uses his eyes as the sensor, the information is conveyed to
him is a visual image. When he observes the computer by using a port scanner as a sensor,
the information is conveyed to him descriptively via text. Typically, sensors work in a
deterministic manner, and their operation is based on mechanisms such as software and
electronics (e.g., the port scanner), or physiology (e.g., eyes). Recognition, on the other hand,
is much less deterministic. The target might miss identifying something even if it is seen,
15
Recognition can also be performed by using animals, e.g., bloodhounds, but it is not likely in computer
security.
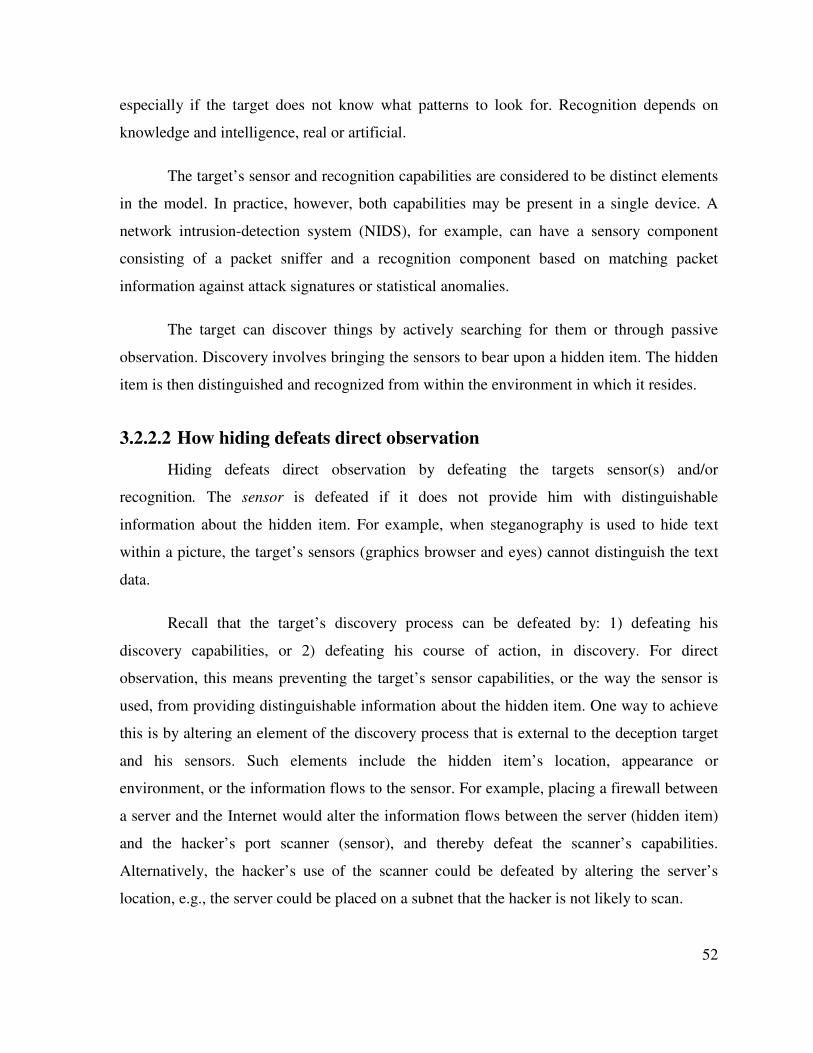
52
especially if the target does not know what patterns to look for. Recognition depends on
knowledge and intelligence, real or artificial.
The target’s sensor and recognition capabilities are considered to be distinct elements
in the model. In practice, however, both capabilities may be present in a single device. A
network intrusion-detection system (NIDS), for example, can have a sensory component
consisting of a packet sniffer and a recognition component based on matching packet
information against attack signatures or statistical anomalies.
The target can discover things by actively searching for them or through passive
observation. Discovery involves bringing the sensors to bear upon a hidden item. The hidden
item is then distinguished and recognized from within the environment in which it resides.
3.2.2.2 How hiding defeats direct observation
Hiding defeats direct observation by defeating the targets sensor(s) and/or
recognition. The sensor is defeated if it does not provide him with distinguishable
information about the hidden item. For example, when steganography is used to hide text
within a picture, the target’s sensors (graphics browser and eyes) cannot distinguish the text
data.
Recall that the target’s discovery process can be defeated by: 1) defeating his
discovery capabilities, or 2) defeating his course of action, in discovery. For direct
observation, this means preventing the target’s sensor capabilities, or the way the sensor is
used, from providing distinguishable information about the hidden item. One way to achieve
this is by altering an element of the discovery process that is external to the deception target
and his sensors. Such elements include the hidden item’s location, appearance or
environment, or the information flows to the sensor. For example, placing a firewall between
a server and the Internet would alter the information flows between the server (hidden item)
and the hacker’s port scanner (sensor), and thereby defeat the scanner’s capabilities.
Alternatively, the hacker’s use of the scanner could be defeated by altering the server’s
location, e.g., the server could be placed on a subnet that the hacker is not likely to scan.
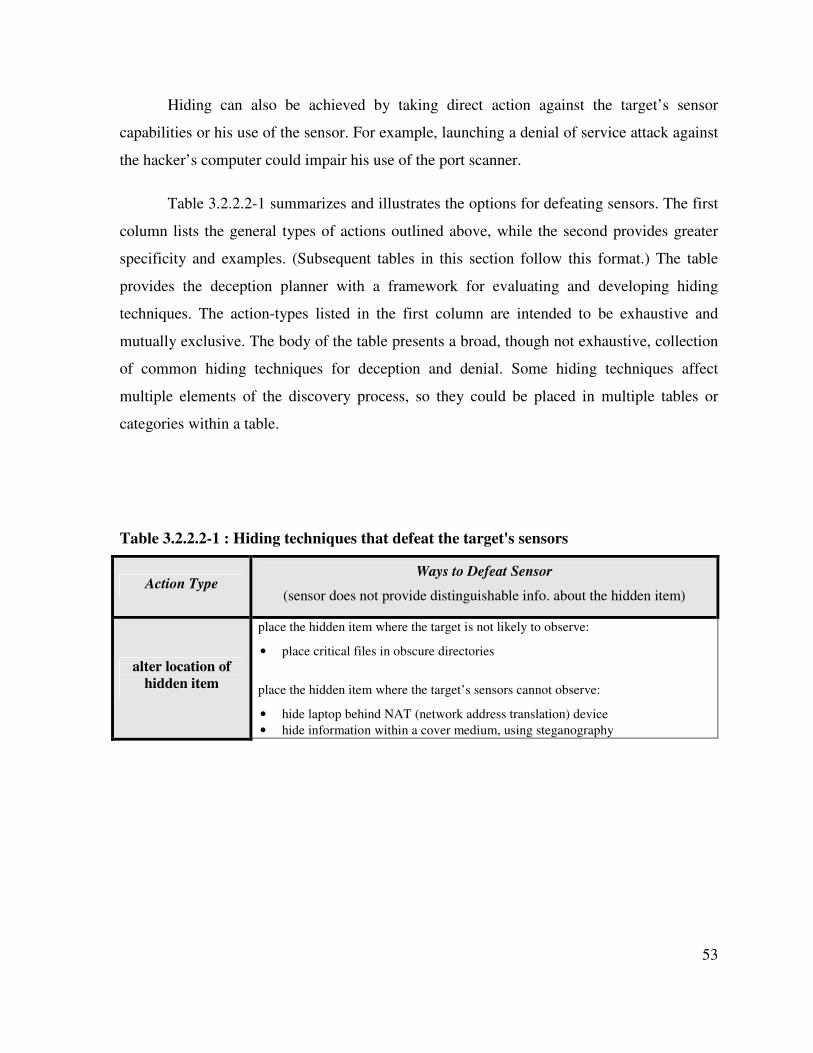
53
Hiding can also be achieved by taking direct action against the target’s sensor
capabilities or his use of the sensor. For example, launching a denial of service attack against
the hacker’s computer could impair his use of the port scanner.
Table 3.2.2.2-1 summarizes and illustrates the options for defeating sensors. The first
column lists the general types of actions outlined above, while the second provides greater
specificity and examples. (Subsequent tables in this section follow this format.) The table
provides the deception planner with a framework for evaluating and developing hiding
techniques. The action-types listed in the first column are intended to be exhaustive and
mutually exclusive. The body of the table presents a broad, though not exhaustive, collection
of common hiding techniques for deception and denial. Some hiding techniques affect
multiple elements of the discovery process, so they could be placed in multiple tables or
categories within a table.
Table 3.2.2.2-1 : Hiding techniques that defeat the target's sensors
Action Type Ways to Defeat Sensor
(sensor does not provide distinguishable info. about the hidden item)
alter location of
hidden item
place the hidden item where the target is not likely to observe:
• place critical files in obscure directories
place the hidden item where the target’s sensors cannot observe:
• hide laptop behind NAT (network address translation) device • hide information within a cover medium, using steganography
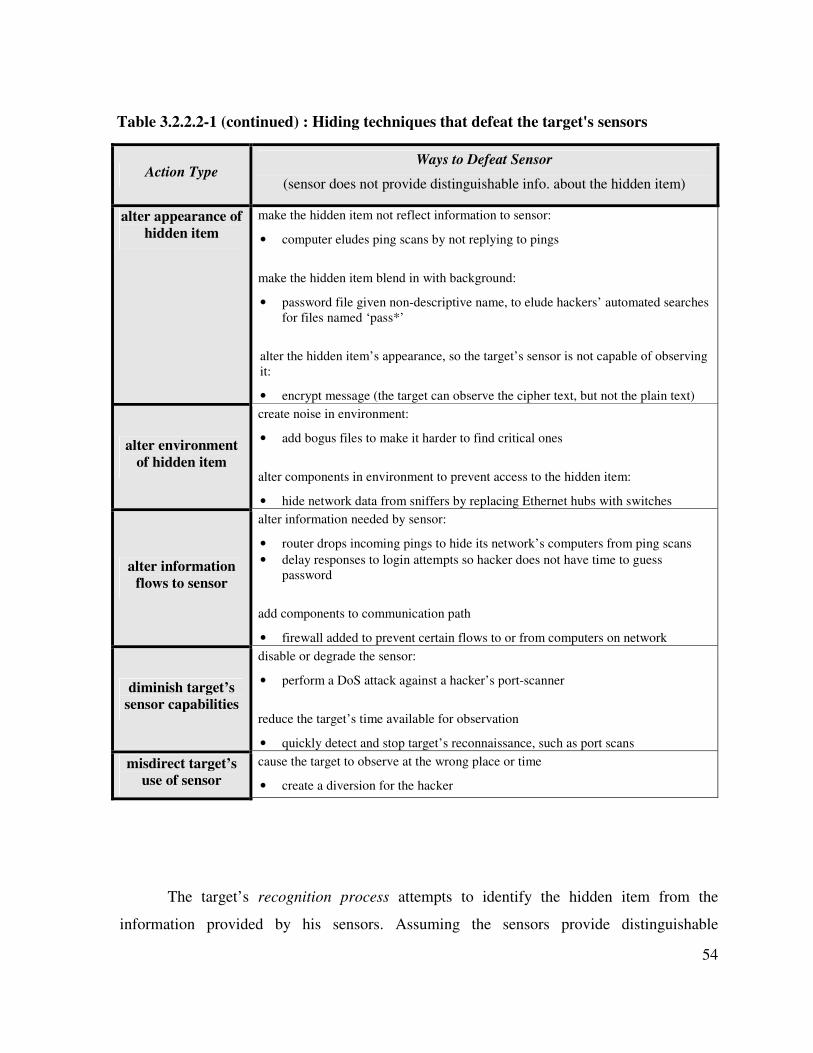
54
Action Type Ways to Defeat Sensor
(sensor does not provide distinguishable info. about the hidden item)
alter appearance of
hidden item
make the hidden item not reflect information to sensor:
• computer eludes ping scans by not replying to pings
make the hidden item blend in with background:
• password file given non-descriptive name, to elude hackers’ automated searches
for files named ‘pass*’
alter the hidden item’s appearance, so the target’s sensor is not capable of observing
it:
• encrypt message (the target can observe the cipher text, but not the plain text)
alter environment
of hidden item
create noise in environment:
• add bogus files to make it harder to find critical ones
alter components in environment to prevent access to the hidden item:
• hide network data from sniffers by replacing Ethernet hubs with switches
alter information
flows to sensor
alter information needed by sensor:
• router drops incoming pings to hide its network’s computers from ping scans • delay responses to login attempts so hacker does not have time to guess
password
add components to communication path
• firewall added to prevent certain flows to or from computers on network
diminish target’s sensor capabilities
disable or degrade the sensor:
• perform a DoS attack against a hacker’s port-scanner
reduce the target’s time available for observation
• quickly detect and stop target’s reconnaissance, such as port scans
misdirect target’s use of sensor
cause the target to observe at the wrong place or time
• create a diversion for the hacker
The target’s recognition process attempts to identify the hidden item from the
information provided by his sensors. Assuming the sensors provide distinguishable
Table 3.2.2.2-1 (continued) : Hiding techniques that defeat the target's sensors
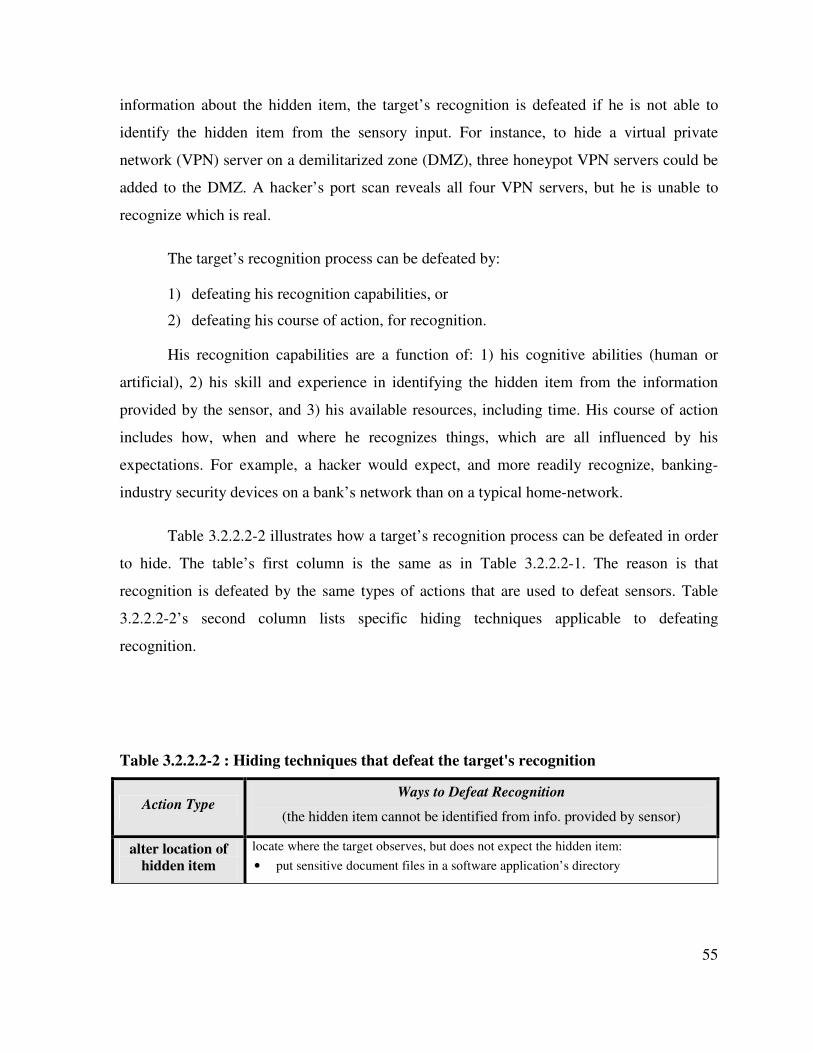
55
information about the hidden item, the target’s recognition is defeated if he is not able to
identify the hidden item from the sensory input. For instance, to hide a virtual private
network (VPN) server on a demilitarized zone (DMZ), three honeypot VPN servers could be
added to the DMZ. A hacker’s port scan reveals all four VPN servers, but he is unable to
recognize which is real.
The target’s recognition process can be defeated by:
1) defeating his recognition capabilities, or
2) defeating his course of action, for recognition.
His recognition capabilities are a function of: 1) his cognitive abilities (human or
artificial), 2) his skill and experience in identifying the hidden item from the information
provided by the sensor, and 3) his available resources, including time. His course of action
includes how, when and where he recognizes things, which are all influenced by his
expectations. For example, a hacker would expect, and more readily recognize, banking-
industry security devices on a bank’s network than on a typical home-network.
Table 3.2.2.2-2 illustrates how a target’s recognition process can be defeated in order
to hide. The table’s first column is the same as in Table 3.2.2.2-1. The reason is that
recognition is defeated by the same types of actions that are used to defeat sensors. Table
3.2.2.2-2’s second column lists specific hiding techniques applicable to defeating
recognition.
Table 3.2.2.2-2 : Hiding techniques that defeat the target's recognition
Action Type Ways to Defeat Recognition
(the hidden item cannot be identified from info. provided by sensor)
alter location of hidden item
locate where the target observes, but does not expect the hidden item:
• put sensitive document files in a software application’s directory
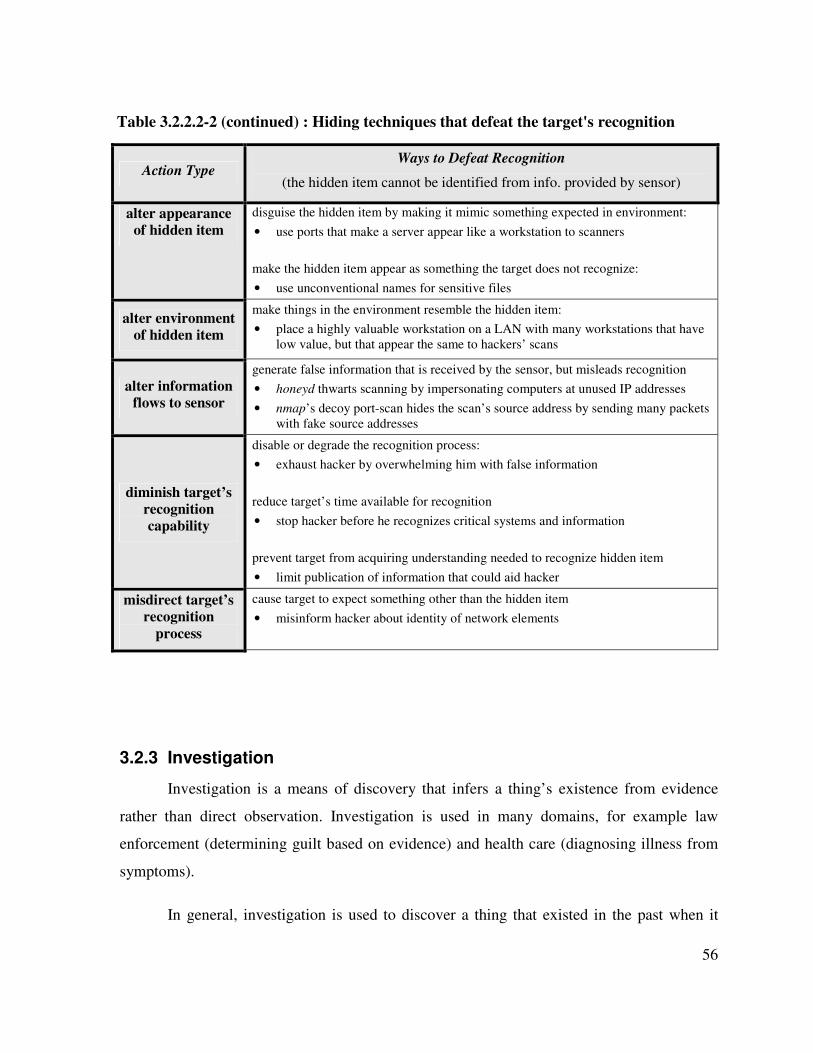
56
Action Type Ways to Defeat Recognition
(the hidden item cannot be identified from info. provided by sensor)
alter appearance of hidden item
disguise the hidden item by making it mimic something expected in environment:
• use ports that make a server appear like a workstation to scanners
make the hidden item appear as something the target does not recognize:
• use unconventional names for sensitive files
alter environment of hidden item
make things in the environment resemble the hidden item:
• place a highly valuable workstation on a LAN with many workstations that have
low value, but that appear the same to hackers’ scans
alter information flows to sensor
generate false information that is received by the sensor, but misleads recognition
• honeyd thwarts scanning by impersonating computers at unused IP addresses
• nmap’s decoy port-scan hides the scan’s source address by sending many packets
with fake source addresses
diminish target’s recognition capability
disable or degrade the recognition process:
• exhaust hacker by overwhelming him with false information
reduce target’s time available for recognition
• stop hacker before he recognizes critical systems and information
prevent target from acquiring understanding needed to recognize hidden item
• limit publication of information that could aid hacker
misdirect target’s recognition
process
cause target to expect something other than the hidden item
• misinform hacker about identity of network elements
3.2.3 Investigation
Investigation is a means of discovery that infers a thing’s existence from evidence
rather than direct observation. Investigation is used in many domains, for example law
enforcement (determining guilt based on evidence) and health care (diagnosing illness from
symptoms).
In general, investigation is used to discover a thing that existed in the past when it
Table 3.2.2.2-2 (continued) : Hiding techniques that defeat the target's recognition
57
was either not directly observed or a reliable recording of the observation is not available
(e.g., computer log, video tape, or witness’ testimony). Investigation is also used to discover
things that exist in the present, but which cannot be directly observed. Things in the future
can be anticipated based on indicators, but cannot be investigated because evidence of them
does not exist. The investigation process involves induction and deduction. Moreover,
investigations can be simple and ad hoc, or involve extensive application of scientific
methods (such as forensics to investigate crimes).
Hackers often use investigation to obtain information about the current state of a
victim network’s topology, as well as its defenses, vulnerabilities, and assets. For example:
By acquiring a network’s computer names, a hacker might be able to deduce which
computers are vulnerable [MSK99]. Computers with names containing “test” such as “test-
network-gateway,” may be indicative of systems that have not been configured securely.
A variety of techniques are available for obtaining evidence that reveals firewalls and
their access control lists (ACLs) [MSK99]. Firewalking can reveal which ports are open or
blocked by a firewall [GS98].16
Email sent to a public newsgroup can reveal the internal IP address of a sending
computer that is otherwise hidden by a NAT device.
Investigation is the first phase of most network attacks. Deceptive hiding can be used
to defeat these and other hacker investigations. When using deceptive hiding for computer
security, the hacker is the investigator and deception target. When hiding things from
investigation, the investigator is an adversary. Viewing an investigator as an adversary is
somewhat unusual, as investigators are normally the “good guys”, e.g., policemen and
scientists. Of course, when the hacker himself is hiding things, the cyber cops become the
investigators.
16
Firewalking sends a TCP packet with an IP TTL field set to one hop beyond the firewall. If the reply is the
ICMP error message “time to live exceeded in transit”, then it is evidence that the TCP port is open. If there is
no reply, or the reply is the ICMP error message “communication administratively prohibited”, then it is
evidence that the TCP port is blocked.
58
We first describe the process of investigation, and then turn to how that process can
be defeated. Our treatment of the investigation process is adapted from David Schum’s
excellent research on investigation for jurisprudence [Sch99].
3.2.3.1 The investigation process
Investigation is an iterative process of creating hypotheses and acquiring evidence
about the thing being investigated. Typically, the investigator works with incomplete
evidence, so there can be many plausible hypotheses that are consistent with the evidence. At
any point during the process, the investigator can either develop new hypotheses based upon
the available evidence or search for new evidence to answer questions relating to his current
evidence and hypotheses. As the investigation unfolds, each piece of new evidence reduces
the number of possible hypotheses and inspires the creation of more accurate and detailed
hypotheses. New evidence suggests new questions and hypotheses, and these in turn drive
the collection of further evidence. The information and understanding obtained is cumulative.
There are two types of hypotheses that the investigator develops and works with:
discovery hypotheses and collections hypotheses. Discovery hypotheses explain that which is
being investigated in terms of available evidence, and they culminate in the recognition or
discovery of the hidden item. Collections hypotheses explain where additional evidence
might be found, and they guide the investigator’s search for new evidence. New evidence can
be acquired through direct observation (section 3) or from other people or agents (section
3.2.4). The collected evidence may include false and irrelevant information that misleads the
investigator.
Investigations vary in the amount of evidence collected and hypotheses formed. Some
are simple and produce immediate results. For example, after breaking into a computer and
detecting evidence of a hidden keystroke logger, a hacker could immediately conclude that
the computer is a honeypot. Other investigations are more complex, requiring the investigator
to combine multiple pieces of evidence acquired over time. Instead of discovering a
keystroke logger, the hacker might observe that he cannot create outgoing connections and
that the computer contains no user data. By observing these conditions over time and
59
considering them together, he deduces the machine is a honeypot.
The process of investigation requires creativity. It also requires deliberate choices.
Investigation comes at a cost, so the investigator cannot follow every hypothesis and seek
evidence to answer every possible question. He will be limited by his resources, including his
available time, to collect, process, and retain evidence. How the investigation proceeds will
depend upon the investigator’s resources and the choices he makes about how the resources
are used. If his choices are bad, he will make false hypotheses, collect the wrong evidence,
and waste his resources on useless paths of investigation.
Evidence often has a temporary existence, which can pose significant problems
during the initial investigation. As time progresses, an increasing amount of evidence will no
longer be obtainable. For example, log files are eventually erased or destroyed, and peoples’
memory fades. The investigator needs to gather and preserve evidence before the opportunity
is lost. However, much useful evidence may not be discernable at the beginning of the
investigation. The discernment of evidence requires understanding of the case, and the
investigator acquires understanding over time. The investigator can reduce the loss of
temporarily-available evidence. By making many hypotheses, and very general hypotheses,
the investigator can collect a large amount of evidence that is potentially useful. However,
the investigator has limited resources for collecting and storing evidence.
Investigation is a necessary first phase of most network attacks. Further, the
investigation process is weakest at the beginning of an investigation, as just described. Thus,
in hackers’ network-attack process, their initial network investigation can be a critical
vulnerability 17
, and relatively easy for defenders to exploit.
3.2.3.2 How hiding defeats investigation
The inherent difficulties of investigation can be exploited through deception. If
evidence is hidden, the investigator may form false hypotheses, ask erroneous questions, and
17
A critical vulnerability is a vulnerability that permits us to destroy some capability without which the enemy
cannot function effectively [USM97].
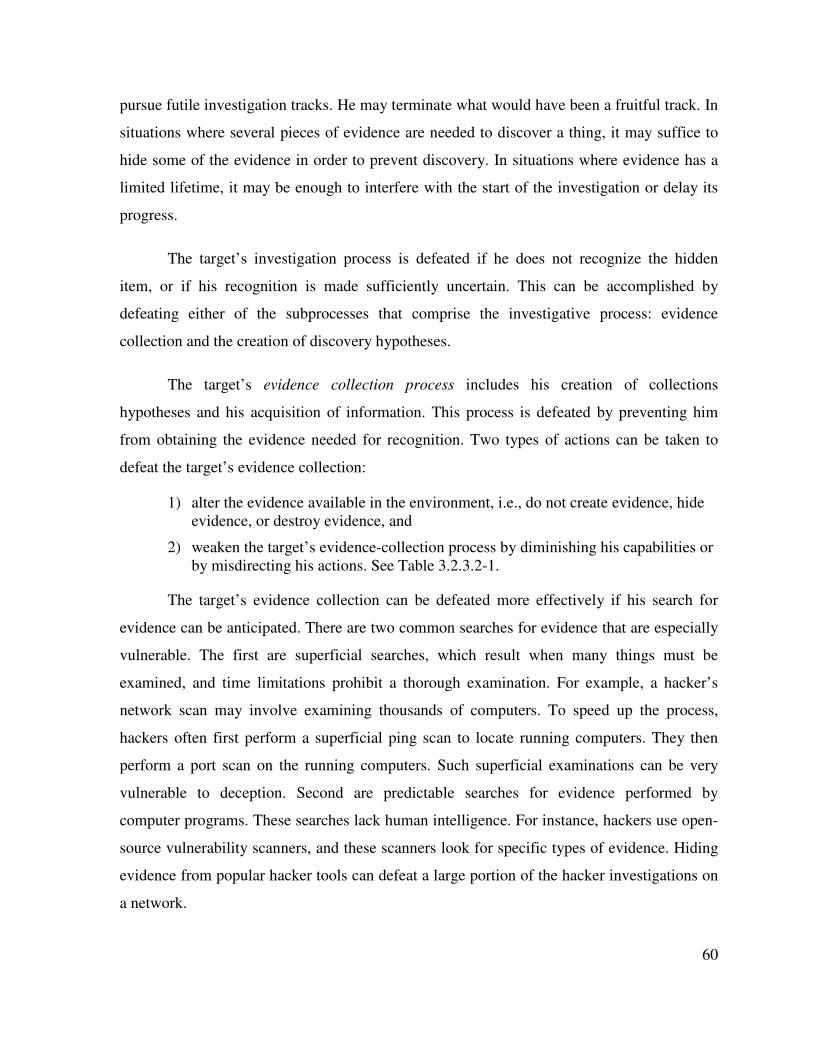
60
pursue futile investigation tracks. He may terminate what would have been a fruitful track. In
situations where several pieces of evidence are needed to discover a thing, it may suffice to
hide some of the evidence in order to prevent discovery. In situations where evidence has a
limited lifetime, it may be enough to interfere with the start of the investigation or delay its
progress.
The target’s investigation process is defeated if he does not recognize the hidden
item, or if his recognition is made sufficiently uncertain. This can be accomplished by
defeating either of the subprocesses that comprise the investigative process: evidence
collection and the creation of discovery hypotheses.
The target’s evidence collection process includes his creation of collections
hypotheses and his acquisition of information. This process is defeated by preventing him
from obtaining the evidence needed for recognition. Two types of actions can be taken to
defeat the target’s evidence collection:
1) alter the evidence available in the environment, i.e., do not create evidence, hide
evidence, or destroy evidence, and
2) weaken the target’s evidence-collection process by diminishing his capabilities or
by misdirecting his actions. See Table 3.2.3.2-1.
The target’s evidence collection can be defeated more effectively if his search for
evidence can be anticipated. There are two common searches for evidence that are especially
vulnerable. The first are superficial searches, which result when many things must be
examined, and time limitations prohibit a thorough examination. For example, a hacker’s
network scan may involve examining thousands of computers. To speed up the process,
hackers often first perform a superficial ping scan to locate running computers. They then
perform a port scan on the running computers. Such superficial examinations can be very
vulnerable to deception. Second are predictable searches for evidence performed by
computer programs. These searches lack human intelligence. For instance, hackers use open-
source vulnerability scanners, and these scanners look for specific types of evidence. Hiding
evidence from popular hacker tools can defeat a large portion of the hacker investigations on
a network.
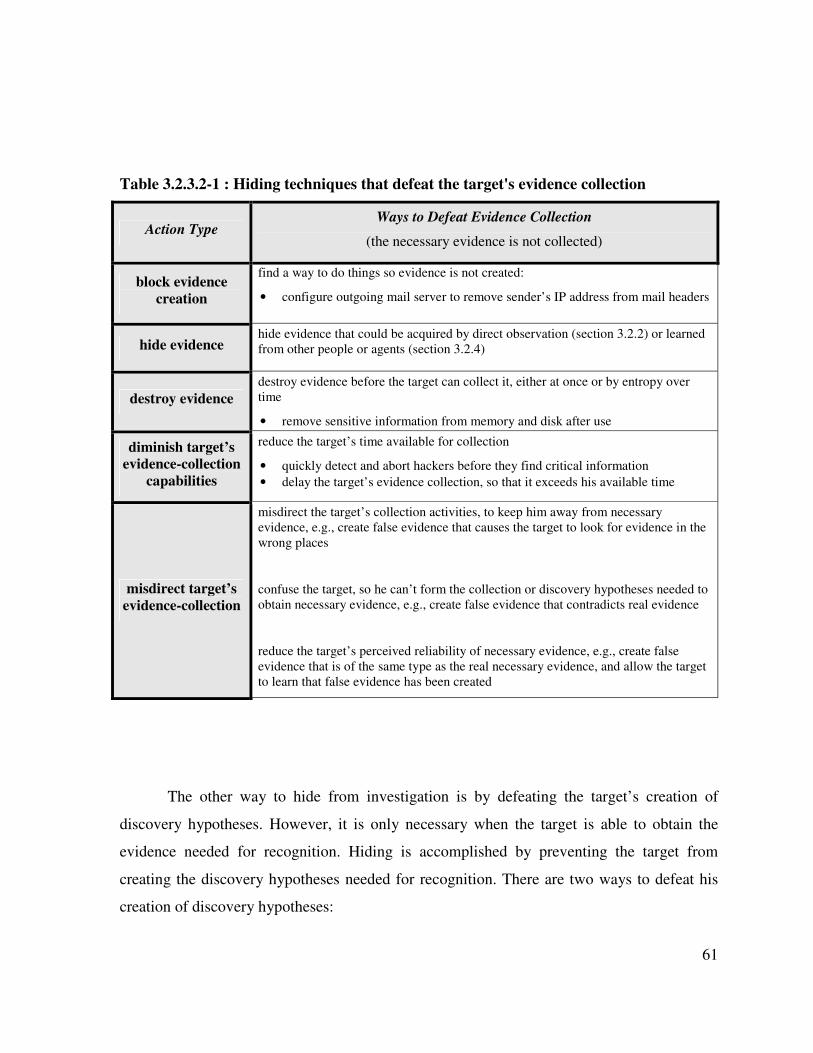
61
Table 3.2.3.2-1 : Hiding techniques that defeat the target's evidence collection
Action Type Ways to Defeat Evidence Collection
(the necessary evidence is not collected)
block evidence
creation
find a way to do things so evidence is not created:
• configure outgoing mail server to remove sender’s IP address from mail headers
hide evidence hide evidence that could be acquired by direct observation (section 3.2.2) or learned
from other people or agents (section 3.2.4)
destroy evidence
destroy evidence before the target can collect it, either at once or by entropy over
time
• remove sensitive information from memory and disk after use
diminish target’s evidence-collection
capabilities
reduce the target’s time available for collection
• quickly detect and abort hackers before they find critical information • delay the target’s evidence collection, so that it exceeds his available time
misdirect target’s
evidence-collection
misdirect the target’s collection activities, to keep him away from necessary
evidence, e.g., create false evidence that causes the target to look for evidence in the
wrong places
confuse the target, so he can’t form the collection or discovery hypotheses needed to
obtain necessary evidence, e.g., create false evidence that contradicts real evidence
reduce the target’s perceived reliability of necessary evidence, e.g., create false
evidence that is of the same type as the real necessary evidence, and allow the target
to learn that false evidence has been created
The other way to hide from investigation is by defeating the target’s creation of
discovery hypotheses. However, it is only necessary when the target is able to obtain the
evidence needed for recognition. Hiding is accomplished by preventing the target from
creating the discovery hypotheses needed for recognition. There are two ways to defeat his
creation of discovery hypotheses:
62
1) ensure the target is not capable of creating the necessary discovery hypotheses,
and
2) ensure the target’s process of creating discovery hypotheses does not lead him to
recognize the hidden item.
Table 3.2.3.2-2 elaborates.
Table 3.2.3.2-2 : Hiding techniques that defeat the target's creation of discovery
hypotheses
Action Type
Ways to Defeat the Creation of Discovery Hypotheses
(even if the target has the necessary evidence,
he cannot create the necessary discovery hypotheses)
diminish target’s capabilities
for creating discovery hypotheses
cause target’s capabilities to be insufficient, e.g., reduce target’s
available time
misdirect target’s creation of
discovery hypotheses
mislead target, e.g., create false evidence, or hide true evidence, and
thereby cause the target to form incorrect discovery hypotheses
confuse target, so he can’t form the necessary discovery hypotheses, e.g.,
create false evidence that contradicts real evidence
3.2.4 Learning from other people or agents
The third way a deception target can discover something is to learn about it from
another entity. This section describes the learning process and how it can be defeated.
3.2.4.1 The learning process
The learning process is a discovery process wherein the deception target learns of the
hidden item from a discovery agent. The discovery agent can be a person or a device with
sensor and recognition capabilities, such as a software agent. The agent discovers the hidden
item through its own discovery process, which can be direct observation, investigation, or
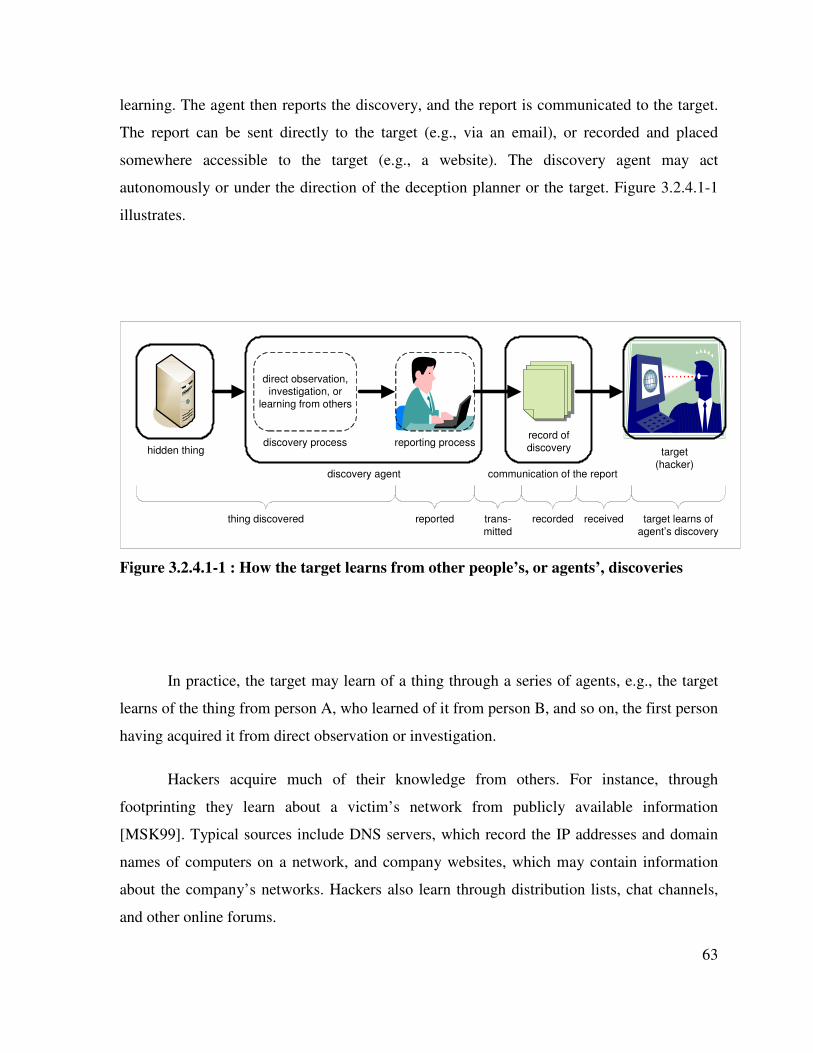
63
learning. The agent then reports the discovery, and the report is communicated to the target.
The report can be sent directly to the target (e.g., via an email), or recorded and placed
somewhere accessible to the target (e.g., a website). The discovery agent may act
autonomously or under the direction of the deception planner or the target. Figure 3.2.4.1-1
illustrates.
direct observation,investigation, or
learning from others
hidden thing
thing discovered
discovery agent
recorded received target learns of
agent’s discovery
target
(hacker)
trans-
mitted
discovery processrecord of
discoveryreporting process
reported
communication of the report
Figure 3.2.4.1-1 : How the target learns from other people’s, or agents’, discoveries
In practice, the target may learn of a thing through a series of agents, e.g., the target
learns of the thing from person A, who learned of it from person B, and so on, the first person
having acquired it from direct observation or investigation.
Hackers acquire much of their knowledge from others. For instance, through
footprinting they learn about a victim’s network from publicly available information
[MSK99]. Typical sources include DNS servers, which record the IP addresses and domain
names of computers on a network, and company websites, which may contain information
about the company’s networks. Hackers also learn through distribution lists, chat channels,
and other online forums.
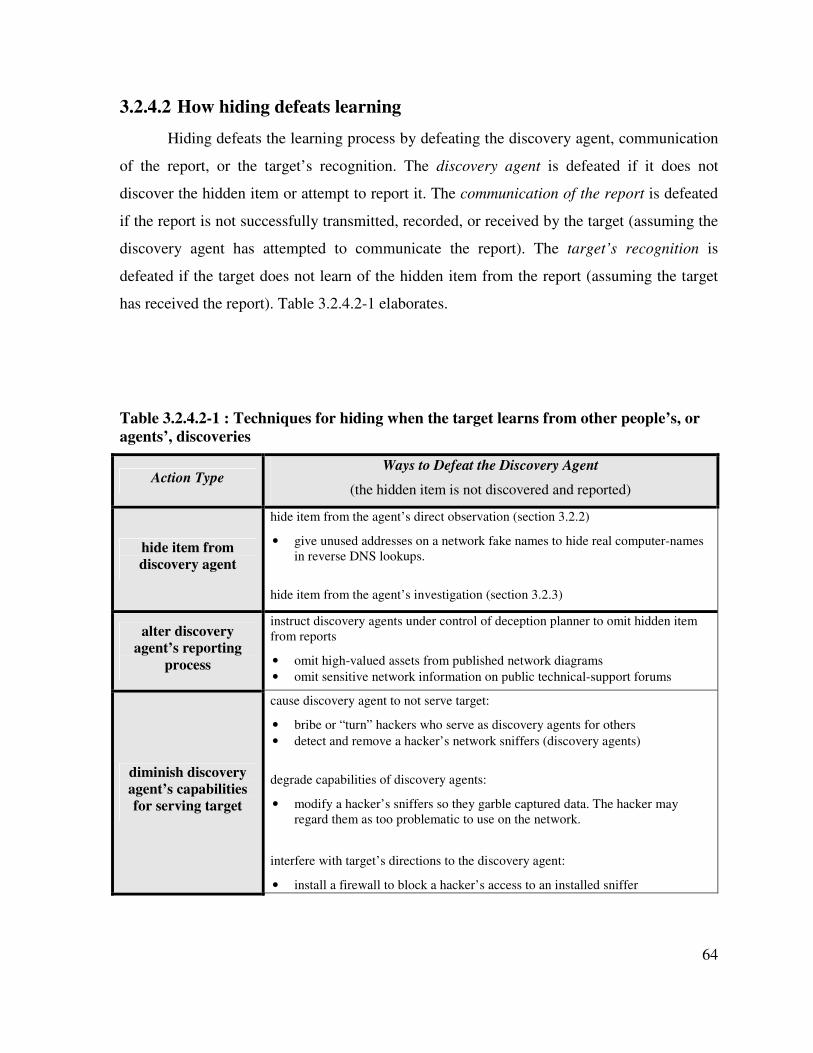
64
3.2.4.2 How hiding defeats learning
Hiding defeats the learning process by defeating the discovery agent, communication
of the report, or the target’s recognition. The discovery agent is defeated if it does not
discover the hidden item or attempt to report it. The communication of the report is defeated
if the report is not successfully transmitted, recorded, or received by the target (assuming the
discovery agent has attempted to communicate the report). The target’s recognition is
defeated if the target does not learn of the hidden item from the report (assuming the target
has received the report). Table 3.2.4.2-1 elaborates.
Table 3.2.4.2-1 : Techniques for hiding when the target learns from other people’s, or
agents’, discoveries
Action Type Ways to Defeat the Discovery Agent
(the hidden item is not discovered and reported)
hide item from discovery agent
hide item from the agent’s direct observation (section 3.2.2)
• give unused addresses on a network fake names to hide real computer-names
in reverse DNS lookups.
hide item from the agent’s investigation (section 3.2.3)
alter discovery agent’s reporting
process
instruct discovery agents under control of deception planner to omit hidden item
from reports
• omit high-valued assets from published network diagrams • omit sensitive network information on public technical-support forums
diminish discovery agent’s capabilities for serving target
cause discovery agent to not serve target:
• bribe or “turn” hackers who serve as discovery agents for others • detect and remove a hacker’s network sniffers (discovery agents)
degrade capabilities of discovery agents:
• modify a hacker’s sniffers so they garble captured data. The hacker may
regard them as too problematic to use on the network.
interfere with target’s directions to the discovery agent:
• install a firewall to block a hacker’s access to an installed sniffer
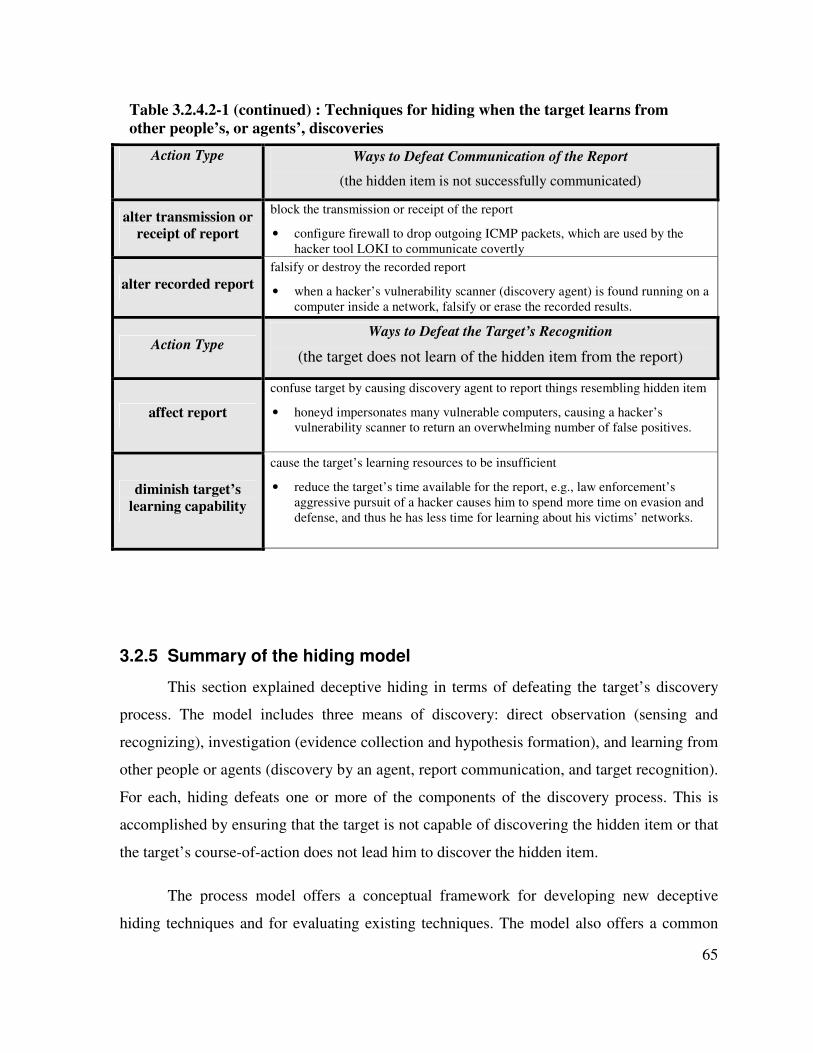
65
Action Type Ways to Defeat Communication of the Report
(the hidden item is not successfully communicated)
alter transmission or receipt of report
block the transmission or receipt of the report
• configure firewall to drop outgoing ICMP packets, which are used by the
hacker tool LOKI to communicate covertly
alter recorded report
falsify or destroy the recorded report
• when a hacker’s vulnerability scanner (discovery agent) is found running on a
computer inside a network, falsify or erase the recorded results.
Action Type Ways to Defeat the Target’s Recognition
(the target does not learn of the hidden item from the report)
affect report
confuse target by causing discovery agent to report things resembling hidden item
• honeyd impersonates many vulnerable computers, causing a hacker’s
vulnerability scanner to return an overwhelming number of false positives.
diminish target’s
learning capability
cause the target’s learning resources to be insufficient
• reduce the target’s time available for the report, e.g., law enforcement’s
aggressive pursuit of a hacker causes him to spend more time on evasion and
defense, and thus he has less time for learning about his victims’ networks.
3.2.5 Summary of the hiding model
This section explained deceptive hiding in terms of defeating the target’s discovery
process. The model includes three means of discovery: direct observation (sensing and
recognizing), investigation (evidence collection and hypothesis formation), and learning from
other people or agents (discovery by an agent, report communication, and target recognition).
For each, hiding defeats one or more of the components of the discovery process. This is
accomplished by ensuring that the target is not capable of discovering the hidden item or that
the target’s course-of-action does not lead him to discover the hidden item.
The process model offers a conceptual framework for developing new deceptive
hiding techniques and for evaluating existing techniques. The model also offers a common
Table 3.2.4.2-1 (continued) : Techniques for hiding when the target learns from
other people’s, or agents’, discoveries
66
frame of reference for collaboration among security professionals. When hiding a particular
thing, the deception planner can determine which discovery methods the target is likely to
use. For each method, the tables of hiding techniques can be used to consider the possible
ways to hide.
The hiding model is applicable to both deceptive hiding and non-deceptive hiding
(i.e., denial). Non-deceptive hiding defeats the target’s discovery process, but without
misleading him.
67
4 Deception-based intrusion detection systems
This chapter introduces two deception-based security devices: Honeyfiles and Net-
Chaff. The Honeyfiles system extends the network file system to provide bait files for
hackers. These files trigger an alarm when opened. The Net-Chaff system employs
computer-impersonations to detect and contain hacker’s network scans within an intranet.
4.1 Net-Chaff: deception-based scan detection and containment
A system for defending against scans was designed and then modeled analytically and
by simulation. The system is named Net-Chaff, as it uses deception-based countermeasures.
Its capabilities include: scan detection, automated scan containment, and a simple means for
monitoring the whole network. The Net-Chaff analysis (Chapter 5) indicates that the system
can provide substantial improvements over current scan defenses such as NIDSs [Naz04].
The Net-Chaff design uses, for the most part, existing computer-security components, but
Net-Chaff combines and applies them in a novel and strategic way.
Net-Chaff is intended to defend against hacker scans within a protected intranet, e.g.,
inside a corporate network. One condition for installation of Net-Chaff is that this intranet
must be comprised of routed LANs. Net-Chaff detects scans by monitoring traffic to the
intranet’s unused addresses. This monitoring technique provides significant benefits for
accurate and rapid scan detection. Net-Chaff also impersonates computers at the unused
addresses, which can impede scanner’s progress and improve Net-Chaff’s defensive
effectiveness. Once Net-Chaff detects the scan, it then attempts to isolate the scanner from
the network. This is done by locating the router interface for the scanner’s LAN, and setting
the router’s access control list (ACL) to block the scan packets. In addition, the router can be
directed to tunnel scanning packets back to Net-Chaff, which impersonates computers and
further monitors the scan.
This section describes how Net-Chaff works, and it frames Net-Chaff’s requirements
for defending against scans. This section’s scope is limited to Net-Chaff’s architecture and
requirements. The subsections that follow cover Net-Chaff’s environment (including

68
assumptions about scanners and intranets), its architecture, and its requirements (including
scanning-related requirements and performance objectives). The analysis of Net-Chaff’s
effectiveness, and its use of deception, is presented later, in Chapter 5.
4.1.1 Environment and assumptions
Net-Chaff is intended for defending intranets from hackers’ active scans. Active
scanning is one of the primary techniques hackers use to obtain information about a network
[MSK99]. Active scanning involves sending probes to network addresses, to determine if a
computer is at the address, and to obtain information such as the computer’s operating
system type and the services it is running [MSK99]. Hereafter, active scanning will be
referred to as simply scanning. Scans are also used to obtain network information, including
router topology and firewalls’ filtering-rules. When a scan probes a network address, the
probe may just collect information, or it may attempt to attack directly, in which case the
scan is referred to as a scan-and-attack. A scan-and-attack example is the Sapphire worm
that sends a single UDP attack packet to randomly chosen addresses [Naz04]. Hacker’s
scanners can be implemented as stand-alone programs (e.g., nmap), or as components of
hacking tools such as worms and vulnerability scanners (e.g., Nessus) [MSK99].
Scanning is an initial step in many, perhaps most, network attacks. Scanning can be
performed very quickly, and this enables hackers to rapidly find and exploit network
vulnerabilities and assets. For example, Internet worms can infect hundreds of thousands of
computers within hours [Naz04]. Their rapid spread is due to quick scanning and intrusion,
and because of their self-replicating nature, the growth of infection can be exponential. Net-
Chaff’s primary objective is to quickly detect and stop scans in order to prevent them from
obtaining information needed to carry out attacks. Net-Chaff has the potential for stopping
attacks before they start and for preventing worms from spreading. Additional information
on scanning, including references, is provided in section 4.1.3.1.
Net-Chaff is intended for use within a protected intranet, e.g., inside a corporate
network. A protected intranet has a secure perimeter that restricts access from the outside,
e.g., firewalls and DMZs protect the intranet from Internet attacks [CIS01]. It is assumed
69
that the perimeter is not impenetrable, but that it is fairly secure. Consequently, scanning is a
rare and significant event within this intranet, and these scans should be detected, contained,
and investigated rapidly. In contrast to secured intranets, scanning on the open Internet
occurs frequently. As an indicator, in 2003, researchers determined that intrusion attempts
on the Internet were on the order of 25 billion per day [YBU03]. Thus, scans from the
Internet will be frequent on a secure intranet’s perimeter. While most will not pass the
perimeter, those that do may cause considerable harm if they lead to compromise of an
internal machine, and from there, attack other internal machines, e.g., as with worms. Inside
a secure perimeter, individual computers may be less resistant to attack and infection, e.g.,
due to a false sense of security from the intranet perimeter.
One of the major assumptions we make about an intranet in which Net-Chaff operates
is that the intranet is routed, i.e., it consists of LANs that are connected by one or more
internal routers. This is not an unusual assumption. Most large enterprise networks have
such an architecture. In contrast, Net-Chaff is not designed for use on a flat switched
network (i.e., Ethernet) with a firewalled gateway. Net-Chaff could be extended for use on
such networks, but that is left for future research.
4.1.2 Net-Chaff system
This section describes the Net-Chaff system and how it works. Net-Chaff has four
functional roles: 1) impersonation, 2) scan detection, 3) scan containment, and 4) scan
surveillance.
4.1.2.1 Intranet use
Net-Chaff works by monitoring traffic to the intranet’s unused addresses, and by
impersonating computers at the unused addresses. While almost all of the traffic to unused
addresses is typically accidental, some of it may be from hackers, e.g., from scans and attacks
from compromised machines within the intranet [Spi02]. In a well controlled environment,
scans will make up a very small portion of the non-broadcast traffic sent to used addresses,
but they may make up a very large portion of the non-broadcast traffic to unused addresses.
Thus, it can be much easier to detect scans by monitoring traffic to unused addresses, rather
70
than to used addresses. By impersonating computers at the unused address, Net-Chaff can
also: slow down scans, reduce accuracy of scan findings, improve scan detection sensitivity,
bait hackers into follow-on attacks, and obtain information for incident response and
forensics. Net-Chaff’s deception objectives are further discussed in section 4.1.3.2
This work focuses on using Net-Chaff on IPv4 networks. However, many of the
concepts can be applied to IPv6 networks. In IPv4, an intranet can be a single large address
space, or it can be subdivided into any number of subnets, e.g., using Classless Internet
Domain Routing (CIDR). Also in IPv4, an intranet can use the reserved class A network
(10.0.0.0). For most intranets, this provides a large number of unused addresses and a high
ratio of unused to used addresses. For example, a large corporate intranet with 20K
computers would have over 16M unused addresses, and a ratio of 800 unused addresses for
every used address. Also, the subnets can be designed to spread-out the computers over the
address space. When using Net-Chaff, scans of such a network would likely encounter many
impersonated computers before finding a real computer.
Net-Chaff’s operation is illustrated in Figure 4.1.2.1-1, and its numbered items, e.g.,
(1), are referenced in the descriptions. In the figure, the intranet contains a gateway router
that is connected to the Internet. In this work, only a single gateway is considered and
solutions for multiple gateways are left for future research. The “clouds” in the figure
represent used subnets, i.e., subnets that contain real computers. Each used subnet is a local
area network (LAN), and the LANs are connected to intranet routers. In contrast to used
subnets, unused subnets contain no real computers. It is assumed that there is one LAN per
used subnet, and vice versa. Also, each LAN is connected to one router interface. It is
possible to adapt Net-Chaff for use on networks with different configurations of LANs,
subnets, and routers, but it is beyond the scope of this research.
Net-Chaff manages some or all of the intranet’s unused subnets. Traffic to the
unused subnets is routed to the Net-Chaff WAN server (1). There, Net-Chaff’s impersonation
component deceptively portrays computers on the unused subnets. In reality, the
impersonated computers are non-existent. Router manufacturers, and researchers working on
network-abuse monitoring, have developed a simple way of collecting packets destined to
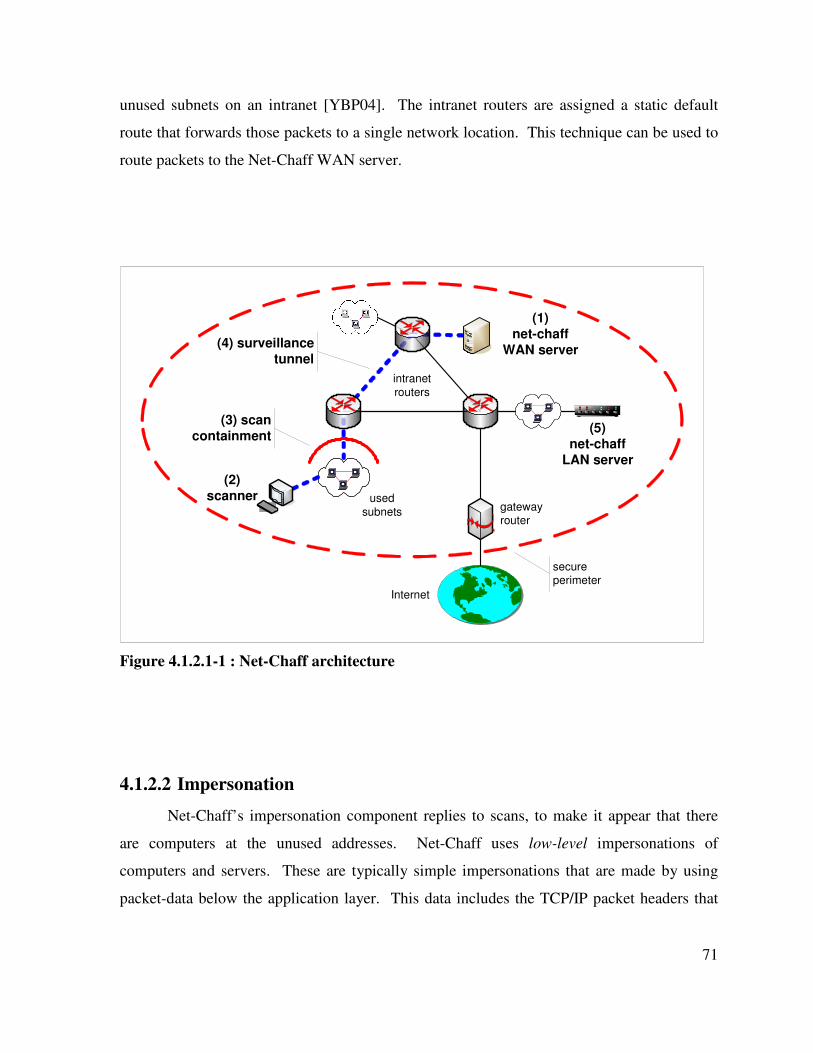
71
unused subnets on an intranet [YBP04]. The intranet routers are assigned a static default
route that forwards those packets to a single network location. This technique can be used to
route packets to the Net-Chaff WAN server.
used
subnets
intranet
routers
(1)net-chaff
WAN server
(2)scanner
(4) surveillancetunnel
(3) scancontainment
(5)net-chaff
LAN server
gatewayrouter
Internet
secureperimeter
Figure 4.1.2.1-1 : Net-Chaff architecture
4.1.2.2 Impersonation
Net-Chaff’s impersonation component replies to scans, to make it appear that there
are computers at the unused addresses. Net-Chaff uses low-level impersonations of
computers and servers. These are typically simple impersonations that are made by using
packet-data below the application layer. This data includes the TCP/IP packet headers that
72
establish communication between computers and that control routing. For instance, a
computer can be impersonated by sending a TCP ACK packet in response to a half-open
TCP scan [Fyo97]. In addition, Net-Chaff’s low-level impersonations would include a
rudimentary server that is referred to as a null server. It can be configured to return no data
or random data, and it can be implemented as a TCP or UDP server.
Low-level impersonations are used because they are relatively easy to implement and
they can effectively deceive many types of scans. To scan a large number of addresses, scans
must be fast. Thus, many scans’ probes use small amounts of data below the application
layer, and the probes’ interactions with computers are simple. Such probes can be easily
deceived; a good example is an ICMP ping scan. It probes an address by sending an echo-
request packet. A computer can be impersonated by simply sending a fake echo-reply packet
in response. In contrast to low-level impersonations, application-level impersonations can be
much more difficult to implement and a different impersonation would be needed for each
type of server, e.g., FTP and HTTP. When scans do probe at the application-layer, the low-
level impersonations are still effective for slowing down the scans and for obtaining
information about the scans.
4.1.2.3 Detection
In the Net-Chaff WAN server, the detection component monitors the incoming traffic
to the unused subnets, and it detects possible scans (2). Net-Chaff’s impersonation
component crafts replies to the incoming packets. To build Net-Chaff’s detection and
impersonation components, there are two problems that must be solved. First, scanners can
use fake source addresses in the packets they send, and such spoofing can prevent detection
of the scan source. Net-Chaff solves this problem by using known spoofing
countermeasures. To reduce spoofing from the Internet, the gateway router can drop packets
from the Internet if their source addresses is an address in the intranet space. To protect
against spoofing from within the intranet, one can use intranet routers. The intranet routers
can be configured so that a packet from a directly-attached subnet must have a source address
from that subnet, or the packet is dropped. This simple solution restricts spoofing to
addresses within the scanner’s subnet. Further steps can be taken to prevent spoofing from
73
individual intranet computers; however, these solutions are more complex and more
expensive [CIS04].
The second implementation problem is Net-Chaff’s performance requirements. The
Net-Chaff server can potentially receive a high rate of scan packets, and thus it needs to be
capable of generating impersonations at a high rate. Research in Internet abuse monitoring
has produced techniques for generating high rates of computer impersonations [YBP04].
Some of the impersonations are too simple for use with Net-Chaff, but the techniques could
be extended for use in the Net-Chaff WAN server.
4.1.2.4 Containment
There are two steps in the process of stopping a scan—detection and containment.
Once the scan is detected, it is necessary to isolate (or block) the scanner from the network,
to prevent further scanning and attacks. Isolating the scanner is carried out by Net-Chaff’s
containment component. For scans from within the intranet, Net-Chaff locates the router
interface for the subnet from which the scan originated. Net-Chaff then modifies the router’s
access control list (ACL) to block the scan packets (3). The router could drop packets from
the scanner’s IP address, or if fake source addresses are being used, the router could drop all
packets from the scanner’s subnet. Other possible containment techniques include
performing a denial-of-service attack against the scanner (e.g., a packet flood), and
instructing a managed (Ethernet) switch to block the scanner’s LAN or VLAN access. For
scans originating from the Internet, Net-Chaff can block them at the gateway router. Some,
or all, of the incoming Internet traffic could be blocked. If the Net-Chaff WAN server is
receiving scans from the Internet, there is likely to be serious problems in the intranet’s
perimeter security, e.g., its firewall.
A key attribute of Net-Chaff’s performance is its ability to prevent scans from finding
real computers. To discuss this, several terms must be defined. Net-Chaff’s detection time
is the time from when the scan starts until the time it is detected. Net-Chaff’s blocking time
is the time from when the scan is detected until the time it is isolated from the network. Net-
Chaff’s containment time is the time from when the scan starts until the time it is contained,
74
which is also the sum of the detection and blocking times. The scanner’s ability to get
information about real computers is primarily a function of: 1) Net-Chaff’s containment time,
2) the scan rate, and 3) within the network, the number of real computers, unused addresses,
and addresses managed by Net-Chaff.
Net-Chaff’s containment function also involves slowing-down scans, and it does this
in two ways. Net-Chaff uses a large number of unused addresses, and they reduce the rate at
which scanners probe real computers (i.e., real computers per probe). Net-Chaff also reduces
the scanners’ probe rates (i.e., probes per unit time). This is accomplished by using
impersonations that cause the scanner to send more data than it otherwise would for a probe.
Also, Net-Chaff can insert delays in the impersonations’ replies. The delays slow down
scans that suspend probe transmission when waiting for replies, e.g., scans that are serial, or
not fully parallel.
A drawback of automated containment is the risk of unwarranted service outages to
individual addresses, especially for critical network operations [PSN04]. Unwarranted
network service outages can be caused by false positives, and by containment of benign
scans. Net-Chaff can mitigate such risks. One solution is to use different containment
criteria, depending on the value of the contained computer. For instance, a critical system
could be contained only when scan detection is highly certain, or when dangerous scans are
detected, e.g., from malicious worms. Arbor Network’s worm-containment system employs
a different solution for mitigating unwarranted network outages. This system monitors router
logs to learn the network’s normal communication paths, and its containment rules do not
block those paths [PSN04].
4.1.2.5 Surveillance
Having contained the scan, Net-Chaff’s surveillance component will set-up and
conduct surveillance on the scan. For scans originating within the intranet, Net-Chaff builds
a network tunnel between the scanner’s subnet and the Net-Chaff server (4). For scans
originating from the Internet, Net-Chaff builds a network tunnel between the gateway router
and the Net-Chaff server. All of the scanner’s packets are sent over the tunnel to the Net-
75
Chaff WAN server, including attempted scans of real computers. The primary objectives of
surveillance are to confirm the scan and to collect intelligence for incident response and
forensics. During surveillance, Net-Chaff’s impersonation component will craft deceptive
replies that: aid surveillance, reduce scan accuracy, and waste the scanner’s time and other
resources. This dissertation focuses on Net-Chaff’s other components, and further design of
the surveillance component is left for future research.
4.1.2.6 Net-Chaff LAN servers
Net-Chaff can also defend against scans within used subnets. This is done by
deploying Net-Chaff LAN servers (5) on used subnets. A Net-Chaff LAN server is assigned
all, or a portion, of the unused addresses within a used subnet. To enhance Net-Chaff’s
capabilities, the intranet’s used subnets can be designed to be lightly populated by real
computers, thus leaving a large number of unused addresses. For example, an 8 bit subnet
has 254 addresses that can be assigned to computers. If half the addresses are used by real
computers, there will be 127 unused addresses.
When the intranet’s used addresses are grouped together in the address space, they are
vulnerable to rapid discovery by sequential scans. Also, the grouping of used addresses can
substantially reduce Net-Chaff’s scan detection capabilities, as a sequential scan could
encounter relatively few unused addresses. Ideally, for Net-Chaff, the intranet’s used
addresses would be randomly distributed within the entire address space, to avoid the
problems from grouping. However, such a distribution is generally impractical. A more
feasible solution might be for the used subnets to be randomly distributed within an address
space. Also, within each used subnet, its used addresses could be randomly distributed. The
distribution of used addresses is a topic left for future research.
When a Net-Chaff LAN server receives packets, it tunnels them to the Net-Chaff
WAN server (1) for use in scan detection. The Net-Chaff LAN server also contains an
impersonation component that crafts replies to the scanner. Containment and surveillance
are performed by the WAN server, as described earlier. It is not necessary for all used
subnets to have a Net-Chaff LAN server. However, if Net-Chaff LAN servers are not used,
76
then it can be easy to detect the unused subnets that are managed by Net-Chaff’s WAN
server, i.e., only those subnets will have Net-Chaff impersonations.
4.1.2.7 Expected uses and benefits
Net-Chaff’s expected uses and benefits fall into three categories: intrusion detection,
intrusion prevention and intrusion response. A secure intranet environment affords a number
of benefits for intrusion detection. Under our assumptions, monitoring traffic to unused
addresses amplifies Net-Chaff’s ability to detect scans, especially when the ratio of unused to
used addresses is large. It is expected that Net-Chaff would receive packets primarily from
five sources: hackers’ scans, scans used for network management, end-users’ addressing
mistakes, broadcast packets from routers and network servers, and possibly other benign
scans. The network management scans can be identified by restricting them to specific
source addresses. Addressing mistakes, broadcast packets and benign scans are assumed to
be low in volume and/or easily identified. The hackers’ scans may be of several types. Most
hacker scans are expected to be easily and accurately identified because of abnormalities
such as packet volume, distinctive access patterns to addresses and ports, or unique
signatures in the packets themselves (e.g., intentionally mal-formed packets) [Ark01, Naz04].
Of course, it is possible for hacker scans to be disguised to hide amongst the benign packets
that Net-Chaff sees, but this would greatly limit scan capabilities. The advantage of Net-
Chaff is that, by design, it filters out most of the legitimate traffic. This filtering amplifies
the relative occurrence of harmful traffic and makes it more conspicuous. It provides Net-
Chaff with a more sensitive anomaly detection mechanism and thus has a better chance of
detecting disguised packets.
In contrast to Net-Chaff’s monitoring of unused addresses, it is typical for network
intrusion detection systems (NIDS) to monitor traffic over active network links. On these
links, it can be very difficult to accurately identify malicious traffic from amidst the
relatively large volumes of legitimate traffic [Naz04]. As far as the author knows, there are
few systematic approaches that are constructed to deal comprehensively with intranet scans.
One such system is Arbor Network’s Safe Quarantine. Its detection mechanism faces the
same difficulties as typical NIDSs, as it monitors the network’s router logs [PSN04].
77
Another benefit from a secure intranet is that internal hacker scans are expected to be
relatively infrequent, which allows Net-Chaff to log and analyze (e.g., correlate) all scan
activity over long periods of time. The logs can be used for incident response and forensics,
including the identification of new types of scans. Of course, once a new type of scan is
identified, there are incident response concerns, such as where, why and how it occurred. In
addition, Net-Chaff’s long-term logs and log-analysis can also be used to detect slow scans.
Detecting slow scans has been difficult for NIDSs that monitor network links, as the high
volume of traffic limits logging capabilities [Naz04].
Net-Chaff is able to exploit scanning’s inherent weaknesses. Scanning is used to
explore unknown portions of the network. As a consequence, it is essentially impossible for
active scans to avoid the unused addresses monitored by Net-Chaff. Further, as mentioned
earlier, scans tend to use simple packets that can often be deceived to advantage. Also, Net-
Chaff should be able to detect many active scans based on their anomalous traffic volume
and traffic patterns. Many new and unknown scanners, including worms, should have these
same types of detectable traffic.
Net-Chaff’s secure intranet environment also affords advantages for intrusion
prevention and response. For many such intranets, scan containment and response would be
worthwhile, and even necessary, due to the potential losses associated with a scan, e.g., an
infected laptop or internal hacker. Automated containment, which carries its own perils,
should be possible due to: rapid and accurate detection, access to routers’ ACL’s, and
domain knowledge that can be used to reduce the risks of automated containment.
In a routed intranet, it is fairly straightforward for a single Net-Chaff server to
provide network-wide monitoring of traffic to the intranet’s unused addresses. In contrast, it
is difficult for an NIDS to provide network-wide monitoring of all network links, because of
the number of links that need to be “spanned” or “tapped”, and the volume of legitimate
traffic. In addition, the intranet provides opportunities to shape network traffic so that scans
are detectable, e.g., the use of router ACLs in preventing source-address spoofing.
Ultimately, Net-Chaff’s effectiveness must be assessed relative to its ability to thwart
78
hacking, both manual and automated. In the overall hacking process, scanning is often a key
initial step [MSK99]. Scanning has been one of hackers’ strengths, as it often allows them to
obtain useful network information quickly, accurately and stealthily. By rapidly detecting
and containing scans, Net-Chaff can stop scan-initiated hacking, when it first starts. This
makes scanning a critical vulnerability for hackers. In fact, Net-Chaff should be able to
prevent worms from spreading on an intranet because it not only detects scans, but also
contains the source. NIDS developers have identified three conditions that must be met to
stop worms, and Net-Chaff fulfills all of them: 1) “the worm must be detected and
characterized before it has a chance to infect a critical mass of hosts”, 2) “worm suppression
must be accomplished nearly automatically, without jeopardizing critical business
processes”, and 3) “detection and suppression must be applied to the internal network as a
whole, not just at the Internet perimeter” [PSN04].
One of the major benefits of the Net-Chaff concept is that it can increase intranet
security without affecting legitimate network operations. Intranets often have a highly-
secure network perimeter, but relatively low security within the perimeter. The internal
network is a trusted environment and its low security makes operations much easier, e.g., file
sharing. However, for commercial organizations, it is estimated that 50% of security
problems originate internally [Yua05]. Net-Chaff offers a means for countering such internal
threats without making legitimate operations more difficult or costly on daily basis. Of
course there is a cost for Net-Chaff itself, including: the deployment of appropriate routing
engines and network design, system installation, and on-going operating costs.
4.1.3 Requirements
This section presents Net-Chaff’s primary requirements. They provide the basis for
the Net-Chaff analysis, which is presented in Chapter 5. First, scanning is presented, from
Net-Chaff’s perspective. Then, Net-Chaff’s performance objectives are presented.
4.1.3.1 Scanning
This section describes hacker scanning, from the perspective of system requirements
for Net-Chaff. Arkin defines scanning as, “a technology, which uses stimuli (packets) in
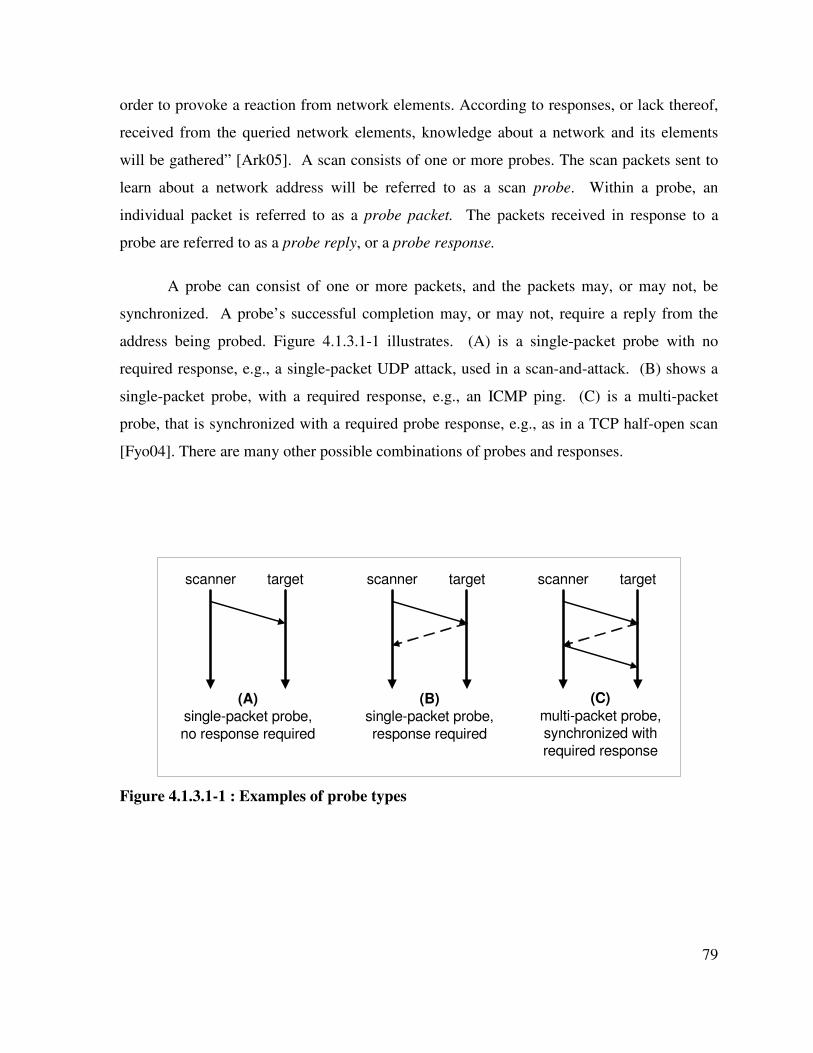
79
order to provoke a reaction from network elements. According to responses, or lack thereof,
received from the queried network elements, knowledge about a network and its elements
will be gathered” [Ark05]. A scan consists of one or more probes. The scan packets sent to
learn about a network address will be referred to as a scan probe. Within a probe, an
individual packet is referred to as a probe packet. The packets received in response to a
probe are referred to as a probe reply, or a probe response.
A probe can consist of one or more packets, and the packets may, or may not, be
synchronized. A probe’s successful completion may, or may not, require a reply from the
address being probed. Figure 4.1.3.1-1 illustrates. (A) is a single-packet probe with no
required response, e.g., a single-packet UDP attack, used in a scan-and-attack. (B) shows a
single-packet probe, with a required response, e.g., an ICMP ping. (C) is a multi-packet
probe, that is synchronized with a required probe response, e.g., as in a TCP half-open scan
[Fyo04]. There are many other possible combinations of probes and responses.
scanner target
(A)
single-packet probe,
no response required
scanner target
(C)
multi-packet probe,synchronized with
required response
scanner target
(B)
single-packet probe,
response required
Figure 4.1.3.1-1 : Examples of probe types
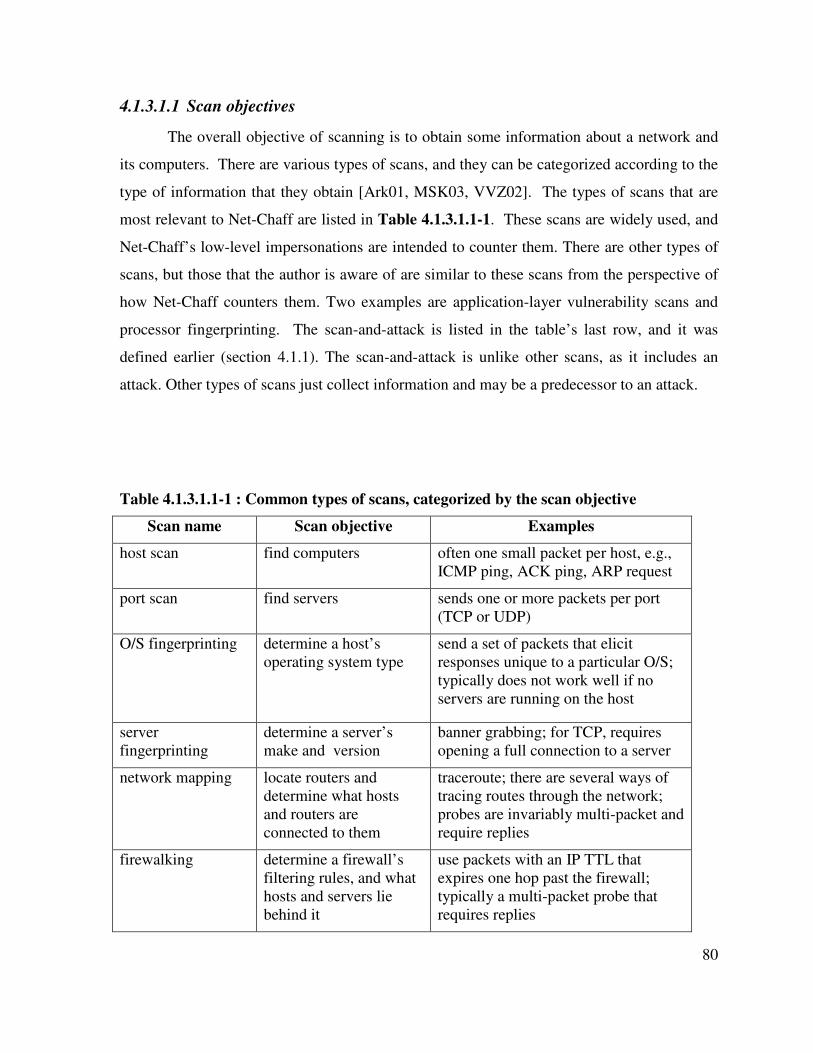
80
4.1.3.1.1 Scan objectives
The overall objective of scanning is to obtain some information about a network and
its computers. There are various types of scans, and they can be categorized according to the
type of information that they obtain [Ark01, MSK03, VVZ02]. The types of scans that are
most relevant to Net-Chaff are listed in Table 4.1.3.1.1-1. These scans are widely used, and
Net-Chaff’s low-level impersonations are intended to counter them. There are other types of
scans, but those that the author is aware of are similar to these scans from the perspective of
how Net-Chaff counters them. Two examples are application-layer vulnerability scans and
processor fingerprinting. The scan-and-attack is listed in the table’s last row, and it was
defined earlier (section 4.1.1). The scan-and-attack is unlike other scans, as it includes an
attack. Other types of scans just collect information and may be a predecessor to an attack.
Table 4.1.3.1.1-1 : Common types of scans, categorized by the scan objective
Scan name Scan objective Examples
host scan find computers often one small packet per host, e.g.,
ICMP ping, ACK ping, ARP request
port scan find servers sends one or more packets per port
(TCP or UDP)
O/S fingerprinting determine a host’s
operating system type
send a set of packets that elicit
responses unique to a particular O/S;
typically does not work well if no
servers are running on the host
server
fingerprinting
determine a server’s
make and version
banner grabbing; for TCP, requires
opening a full connection to a server
network mapping locate routers and
determine what hosts
and routers are
connected to them
traceroute; there are several ways of
tracing routes through the network;
probes are invariably multi-packet and
require replies
firewalking determine a firewall’s
filtering rules, and what
hosts and servers lie
behind it
use packets with an IP TTL that
expires one hop past the firewall;
typically a multi-packet probe that
requires replies
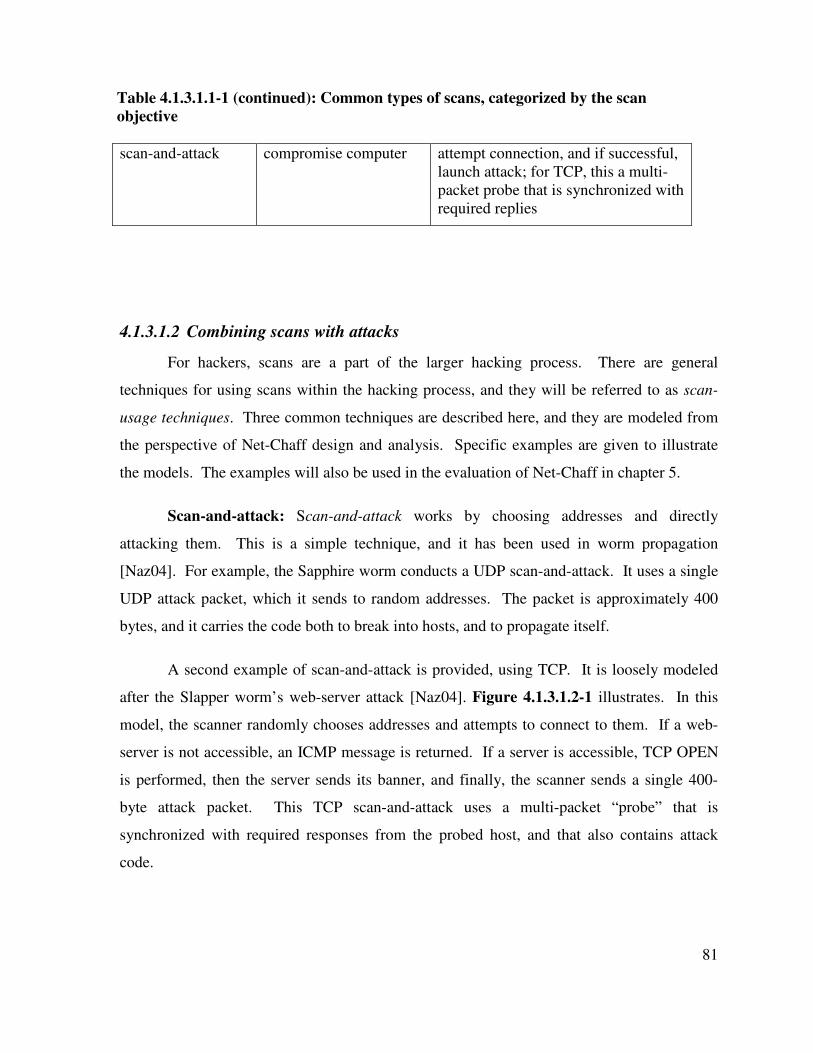
81
scan-and-attack compromise computer attempt connection, and if successful,
launch attack; for TCP, this a multi-
packet probe that is synchronized with
required replies
4.1.3.1.2 Combining scans with attacks
For hackers, scans are a part of the larger hacking process. There are general
techniques for using scans within the hacking process, and they will be referred to as scan-
usage techniques. Three common techniques are described here, and they are modeled from
the perspective of Net-Chaff design and analysis. Specific examples are given to illustrate
the models. The examples will also be used in the evaluation of Net-Chaff in chapter 5.
Scan-and-attack: Scan-and-attack works by choosing addresses and directly
attacking them. This is a simple technique, and it has been used in worm propagation
[Naz04]. For example, the Sapphire worm conducts a UDP scan-and-attack. It uses a single
UDP attack packet, which it sends to random addresses. The packet is approximately 400
bytes, and it carries the code both to break into hosts, and to propagate itself.
A second example of scan-and-attack is provided, using TCP. It is loosely modeled
after the Slapper worm’s web-server attack [Naz04]. Figure 4.1.3.1.2-1 illustrates. In this
model, the scanner randomly chooses addresses and attempts to connect to them. If a web-
server is not accessible, an ICMP message is returned. If a server is accessible, TCP OPEN
is performed, then the server sends its banner, and finally, the scanner sends a single 400-
byte attack packet. This TCP scan-and-attack uses a multi-packet “probe” that is
synchronized with required responses from the probed host, and that also contains attack
code.
Table 4.1.3.1.1-1 (continued): Common types of scans, categorized by the scan
objective
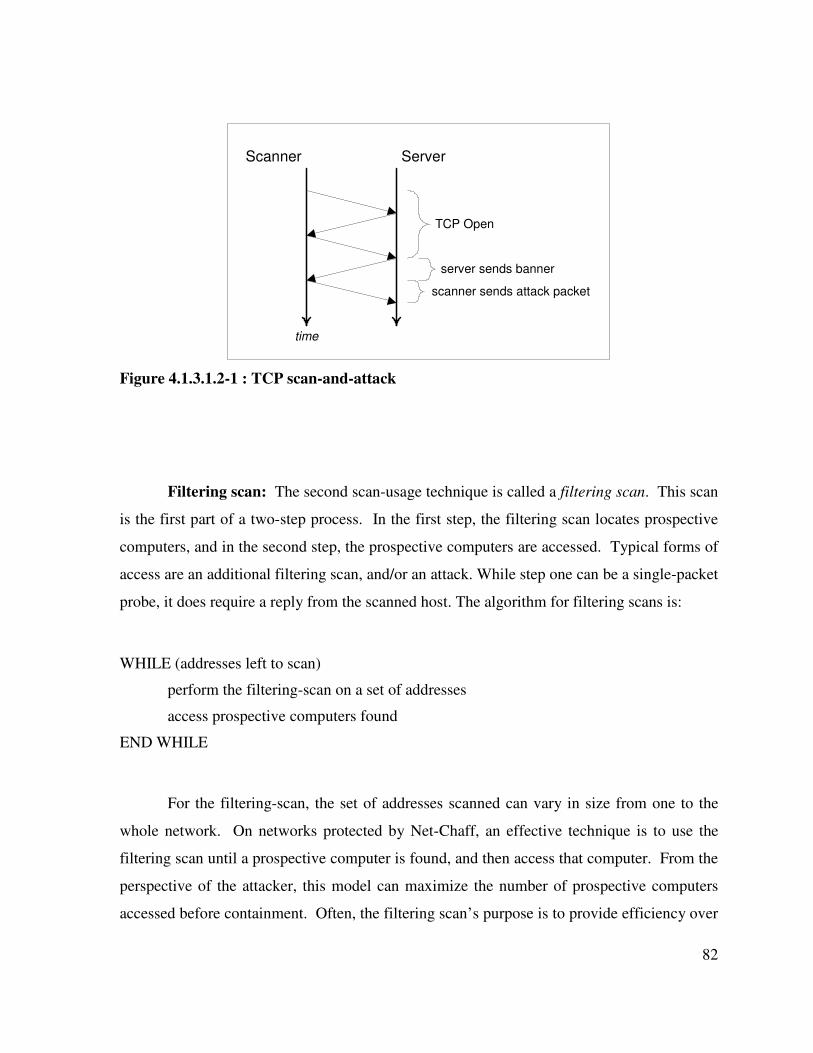
82
TCP Open
server sends banner
scanner sends attack packet
Scanner Server
time
Figure 4.1.3.1.2-1 : TCP scan-and-attack
Filtering scan: The second scan-usage technique is called a filtering scan. This scan
is the first part of a two-step process. In the first step, the filtering scan locates prospective
computers, and in the second step, the prospective computers are accessed. Typical forms of
access are an additional filtering scan, and/or an attack. While step one can be a single-packet
probe, it does require a reply from the scanned host. The algorithm for filtering scans is:
WHILE (addresses left to scan)
perform the filtering-scan on a set of addresses
access prospective computers found
END WHILE
For the filtering-scan, the set of addresses scanned can vary in size from one to the
whole network. On networks protected by Net-Chaff, an effective technique is to use the
filtering scan until a prospective computer is found, and then access that computer. From the
perspective of the attacker, this model can maximize the number of prospective computers
accessed before containment. Often, the filtering scan’s purpose is to provide efficiency over
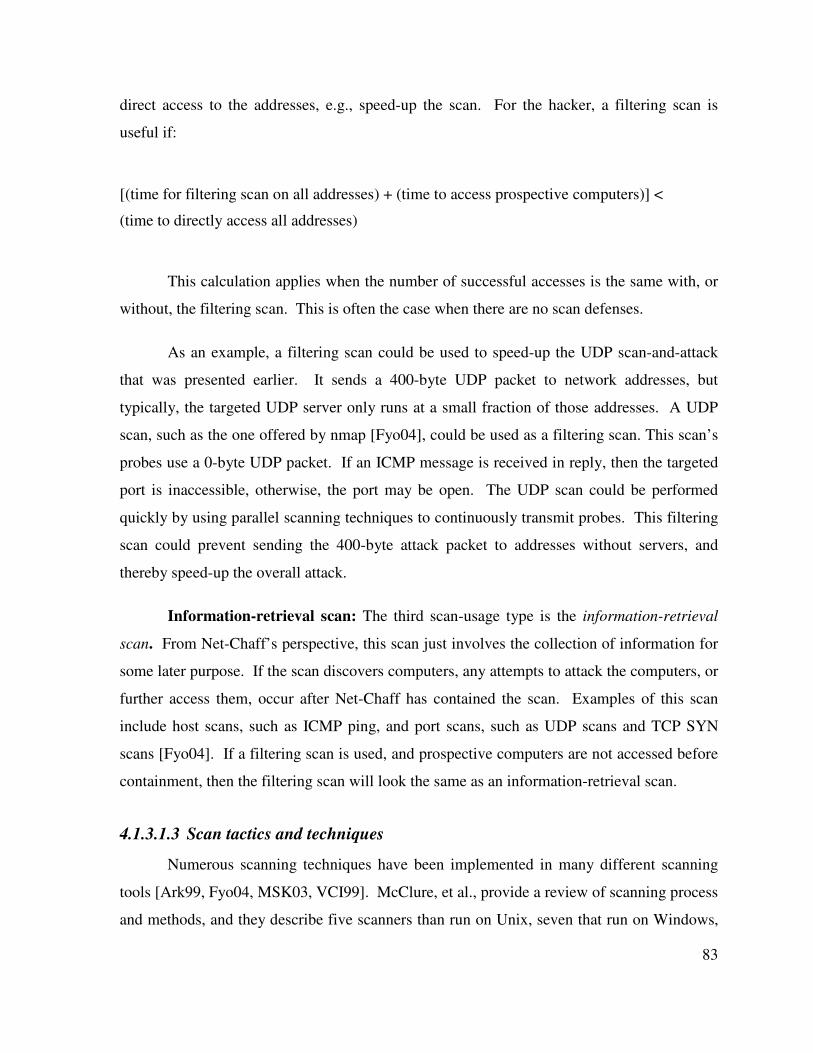
83
direct access to the addresses, e.g., speed-up the scan. For the hacker, a filtering scan is
useful if:
[(time for filtering scan on all addresses) + (time to access prospective computers)] <
(time to directly access all addresses)
This calculation applies when the number of successful accesses is the same with, or
without, the filtering scan. This is often the case when there are no scan defenses.
As an example, a filtering scan could be used to speed-up the UDP scan-and-attack
that was presented earlier. It sends a 400-byte UDP packet to network addresses, but
typically, the targeted UDP server only runs at a small fraction of those addresses. A UDP
scan, such as the one offered by nmap [Fyo04], could be used as a filtering scan. This scan’s
probes use a 0-byte UDP packet. If an ICMP message is received in reply, then the targeted
port is inaccessible, otherwise, the port may be open. The UDP scan could be performed
quickly by using parallel scanning techniques to continuously transmit probes. This filtering
scan could prevent sending the 400-byte attack packet to addresses without servers, and
thereby speed-up the overall attack.
Information-retrieval scan: The third scan-usage type is the information-retrieval
scan. From Net-Chaff’s perspective, this scan just involves the collection of information for
some later purpose. If the scan discovers computers, any attempts to attack the computers, or
further access them, occur after Net-Chaff has contained the scan. Examples of this scan
include host scans, such as ICMP ping, and port scans, such as UDP scans and TCP SYN
scans [Fyo04]. If a filtering scan is used, and prospective computers are not accessed before
containment, then the filtering scan will look the same as an information-retrieval scan.
4.1.3.1.3 Scan tactics and techniques
Numerous scanning techniques have been implemented in many different scanning
tools [Ark99, Fyo04, MSK03, VCI99]. McClure, et al., provide a review of scanning process
and methods, and they describe five scanners than run on Unix, seven that run on Windows,
84
and two fingerprinting tools [MSK03]. They also describe numerous scanning and
fingerprinting techniques. Some of the scanning tactics and techniques are especially
relevant in the Net-Chaff context, and they are summarized here.
4.1.3.1.3.1 Address-selection
For each scan probe, the scanner chooses an address from the network space. There
are several address-selection techniques used by hackers, including worms [Fyo04, Naz04].
The techniques that are most relevant to Net-Chaff are those that are effective on intranets.
Two types of address selection are sequential and random. For a given address range,
address selection can be made sequentially (i.e., address n+1 is selected after address n), or
addresses can be selected randomly.
There are two techniques for choosing random addresses. The most efficient
technique chooses addressees from among those that have not already been chosen.
Borrowing from probability theory, this selection technique will be referred to as sampling
without replacement. The other technique randomly selects addresses from within the entire
address space, which is sampling with replacement. The latter is less efficient because an
address can be selected more than once. In addition, when there are multiple simultaneous
scans (e.g., a distributed scan), an address can be probed more than once, unless the scanners’
use sampling without replacement in a coordinated way.
A technique that is used by worms is called island hopping. It selects addresses
randomly, but addresses near the scanner are more likely to be selected. This technique takes
advantage of the tendency for computers to be clustered in the Internet space. As the worm
propagates, its descendents will be more likely to select addresses near themselves. The
island hopping technique can also be adapted for use in scanners that do not propagate. The
scanner would randomly choose addresses, and once a computer is found, the scanner would
then choose addresses near that computer. Borrowing from the numerical optimization field,
if a successive set of addresses does not yield a result, an attacker may chose to “hop”
elsewhere by deliberately choosing random addresses at remote locations, to see if it can hit
another “island.”
85
4.1.3.1.3.2 Scan performance
Three scan performance-attributes are: speed, accuracy, and stealth. These attributes
typically counter each other, i.e., improving one may degrade another.
Speed: There are a number of known techniques for increasing scan speed. A single
scanner can send probes in parallel, rather than serially [Fyo04, VVZ02]. Further
parallelization can be achieved by using distributed scans [Ark05, VCI99]. Arkin presents
scanning techniques that reduce the amount of probe data needed for fingerprinting [Ark01].
Increasing scanning bandwidth, on the part of the attacker, can speed-up scans. However,
there is a risk of degrading network performance and dropping scan packets, which can cause
the scan to be detected or get incomplete information [Ark05, Fyo04, TB98].
To scan a large number of addresses quickly, it is advantageous for probes to use: a
small number of packets, small-sized packets, and packets that can be easily sent in parallel.
This makes simple host and port scans appealing, such as ICMP ping, and TCP SYN scans
[Fyo04]. In general, such fast scans will be vulnerable to Net-Chaff’s low-level
impersonations. Further, all scans that are not one-packet scan-and-attack probes do require
some response which can be delayed or made misleading, in order to provoke more dwell
time over an address.
Accuracy: For a particular type of scan, accuracy of the information that the scanner
receives back is affected by dropped packets, which can occur when the scan exceeds the
available bandwidth [Fyo04]. Another affect on scan accuracy is firewalls that intentionally
do not reply to scans [Rus02]. The lack of a reply has the same result as a dropped packet.
In addition, scanners can receive deceptive reply-packets that result in false positives and
false negatives. Honeypots can defend in this way, as well as individual hosts, through host-
firewalls and deceptive services such as Portsentry [Row06].
Flow-control is a challenging problem for scanners, and it can be used to the
defender’s advantage. The network capacity can vary unpredictably by time and location, so
for scans to be accurate, they typically need to be performed at a conservative rate [Fyo04].
The reduced scanning speeds will aid Net-Chaff’s containment process. Further, when Net-
86
Chaff does not reply to scan packets, the scanner is likely to suspect dropped packets and
retransmit them, as nmap does [Fyo04].18
Such retransmissions will reduce the effective
scan rate.
Stealth: Scan stealth has to do with avoiding detection. One way that an NIDS
detects scans is by their distinctive traffic patterns, such as a high data volume, or a high flow
rate of probes [e.g., Gof02, Ras04, Zhe04]. Stealth techniques for scan traffic include:
scanning from multiple sources, slow scans, the selection of random addresses and ports
(serial sequences are easily detected), etc. [Ark99, Naz04, Fyo04, VCI99]. Scans can also be
hidden by exploiting specific NIDS weaknesses, many of which have to do with resource
limitations in monitoring high volumes of traffic [e.g., Gof02]. Examples include the use of
fragmented packets (if not reassembled, then scan signatures are hidden), slow scans (exceed
the detection timeframe), invalid packets (may not be logged, e.g., if out of order, or the
header is incorrect) and so on [Ark99, Fyo04].
Decoy scans attempt to hide the scan’s true source address by sending many copies of
the real scan packets, but with fake source addresses [Ark99, Fyo04]. One basic stealth
technique is to not generate high volumes of traffic that visibly impact normal network
operations [Fyo04, TB98, Zhe04]. Another form of stealth is scanning techniques that pass
through network filters such as firewalls [Ark99, MSK03]. One thing in common for all
stealth techniques listed here is that they have little, or no, effect against Net-Chaff’s
detection and containment capabilities.
4.1.3.1.3.3 Scanning techniques
This section discusses scanning techniques that are especially relevant for Net-Chaff.
Scan scope: Scans can be differentiated by their scope on the network [Naz04]. A
host scan is a scan of multiple services or protocols on a single host; for example a scan of all
“Well Known Ports” ports (1-1024) on a particular web server. A network scan is a scan of
one or more services on multiple hosts; for example a scan for web servers at all intranet
18
See the nmap source code.
87
addresses. Scanning many ports on a single machine can be very time consuming [Wol02].
Thus host scans tend to be used on specific computers that are of particular interest. On the
other hand, network scans would typically be used to survey the network for particular
vulnerabilities or assets. Net-Chaff is intended primarily for use against network scans, as
there is little reason for performing host scans against most Net-Chaff managed addresses.
Banner grabbing: The Net-Chaff null server can be configured to return no data, or
random data. In either case, if the scanner connects to the server, as with banner grabbing,
then the scanner can potentially detect the impersonation. However, the purpose of the Net-
Chaff null server is not to be believed at the application layer, but to slow down the scan.
Firewalking: Firewalking uses ICMP and traceroute-like packets to attempt to
discover computers behind a firewall, and to discover the firewall’s filtering rules [Ark99,
Ark01]. This scanning technique presents opportunities for Net-Chaff to use its low-level
impersonations to impersonate both a firewall and the hosts that lie behind it. This follows
one of the deception principles from chapter 3: an item that is expected to be hidden can
often be impersonated by providing simple indicators of its existence. Within the intranet,
Net-Chaff can impersonate internal firewalls, and even perimeter firewalls—to defend
against external scans that have penetrated the perimeter.
O/S fingerprinting: Operating system fingerprinting works largely by detecting
peculiarities in the operating system’s networking stack [Ark01, Bec01, Fyo02, WWJ03].
Probes are sent to elicit replies that are unique to particular operating systems. Two causes
for these unique replies are ambiguities in network protocol specifications and optional
features of protocols. Another cause of unique replies is protocol implementation errors.
Whereas Net-Chaff’s low-level impersonations are relatively easy to implement, accurately
impersonating a particular network stack’s idiosyncrasies could be extremely difficult. One
solution is for Net-Chaff to use real operating systems to generate replies to O/S
fingerprinting scans. This problem is left for future research.
Inverse mapping: Firewalls are often configured to hide computers by not replying
to disallowed packets. On the other hand, routers are configured, by default, to send ICMP
88
messages in reply to undeliverable packets [Bar95]. When both of these conditions exist,
scanners can find hidden computers via probes for which there is no reply. This scan
technique is called inverse mapping [Ark01]. One way to prevent inverse mapping is to
configure routers so they do not send revealing ICMP messages. There is increasing appeal,
within intranets, to deliberately do this for security and to reduce unnecessary traffic. Net-
Chaff’s deceptions must take into account the network’s use of non-response for scan probes.
This problem is left for future research.
4.1.3.2 Performance objectives
This section describes Net-Chaff’s primary performance objectives: its tactical
objectives and its deception and hiding objectives. Net-Chaff defends against hackers’ active
scans. Net-Chaff’s tactics have to do with its interactions with hackers and their scans; these
tactics were described earlier, and examples include the techniques for scan detection and
containment. Net-Chaff’s tactical objectives are its specific goals for defending against
scans. For example, one goal of containment is to reduce scanner’s access to vulnerable
systems. An understanding of Net-Chaff’s tactical objectives is necessary for understanding
its design, evaluation and deployment.
Net-Chaff uses deception and hiding as a means to achieve its tactical objectives.
These uses of deception and hiding were described earlier, e.g., Net-Chaff’s low-level
impersonations. Also, deception and hiding are the focus of this dissertation. Net-Chaff’s
deception and hiding objectives are the specific goals for its uses of deception and hiding.
As an example, one objective of the low-level impersonations is to slow-down scans prior to
containment. An understanding of Net-Chaff’s deception and hiding objectives is necessary
for evaluating and employing these means for scan defense.
4.1.3.2.1 Tactical objectives
Net-Chaff’s tactical objectives fall into two categories:
• defending against scans, and
• defending Net-Chaff itself.
Net-Chaff’s objectives for defending against scans can be divided into three sub-
89
categories:
• detecting and containing scans,
• thwarting hackers after containment, and
• obtaining information needed for incident response.
In detecting and containing scans, Net-Chaff’s ultimate objectives are to reduce the
scanner’s access to the network, and especially access to high-valued and vulnerable systems.
As will be shown in the next chapter, calculations can be made to estimate the number, and
types, of computers that scanners can access before containment.
There are three ways that Net-Chaff thwarts hackers after containment. First, Net-
Chaff’s impersonations can insert false positives within the hacker’s scan results, and thereby
reduce the usefulness of the information obtained. Secondly, if hackers later act on these
false positives, then the access can be detected by Net-Chaff. Thirdly, Net-Chaff provides
information needed for incident response, including the scan source and scan techniques
used. Net-Chaff obtains this information through detection and surveillance, and its
impersonations induce the scanner to send more information than it would otherwise to
unused addresses.
Net-Chaff’s objectives for defending itself can be divided into two sub-categories.
Net-Chaff must thwart hackers in their attempts to:
• hack the Net-Chaff systems themselves, including the Net-Chaff WAN and
LAN servers, and the router containment functions, and
• detect or circumvent Net-Chaff’s deceptions.
Preventing hacking of the Net-Chaff systems involves standard host and network
security-measures, including protection from denial-of-service (DoS) attacks. For instance,
both the detection and containment capabilities can potentially be degraded by packet floods.
However, Net-Chaff’s system security, and protection from DoS attacks, are not being
addressed by this research. This research does address defenses for thwarting hacker’s
attempts to detect or circumvent Net-Chaff’s deceptions, as discussed in the following
section.
90
4.1.3.2.2 Deception and hiding objectives
This section discusses Net-Chaff’s deception and hiding objectives, as defined earlier.
Hiding includes both deceptive and non-deceptive hiding. Ultimately, deception and hiding
are used to achieve Net-Chaff’s tactical objectives.
Net-Chaff’s detection and containment functions rely upon a large number of unused
addresses. The unused addresses serve to hide real systems from the scanner. Even without
Net-Chaff and its deceptions, the unused addresses reduce the rate at which real computers
are probed (i.e., real computers per probe); we will refer to this effect as passive hiding
because it is independent of Net-Chaff. Assigning a large number of unused addresses to
Net-Chaff makes detection occur quickly, and it enables the impersonations to reduce the
scanners’ probe rate (i.e., probes per unit time). Net-Chaff’s active hiding techniques include
impersonation, detection, containment, and surveillance. The next chapter presents analytical
models that calculate the unused addresses’ contributions to Net-Chaff’s detection and
containment capabilities.
Deception planning was presented in chapter 3. In review, its key element is the
deception objective, which is the desired result of the deception operation; it consists of: 1)
the intended target action, and 2) the deception exploit, which explains how the target action
is used to advantage. The desired perception is what the target must believe in order for it to
take the intended action. The deception story is an outline of how the computer system will
be portrayed so as to cause the target to adopt the desired perception, and take the intended
action.
In deception-planning for Net-Chaff, a deception objective is needed for each of its
uses of deception. Table 4.1.3.2.2-1 lists Net-Chaff’s uses of deception for defending
against scans. Each row describes a particular use of deception. The first column states its
deception exploit. The deception exploit is described in terms of the tactical objectives that it
supports. The second column describes the target action that is to be exploited. The third
column gives an example deception (story) that is intended to induce the target action.
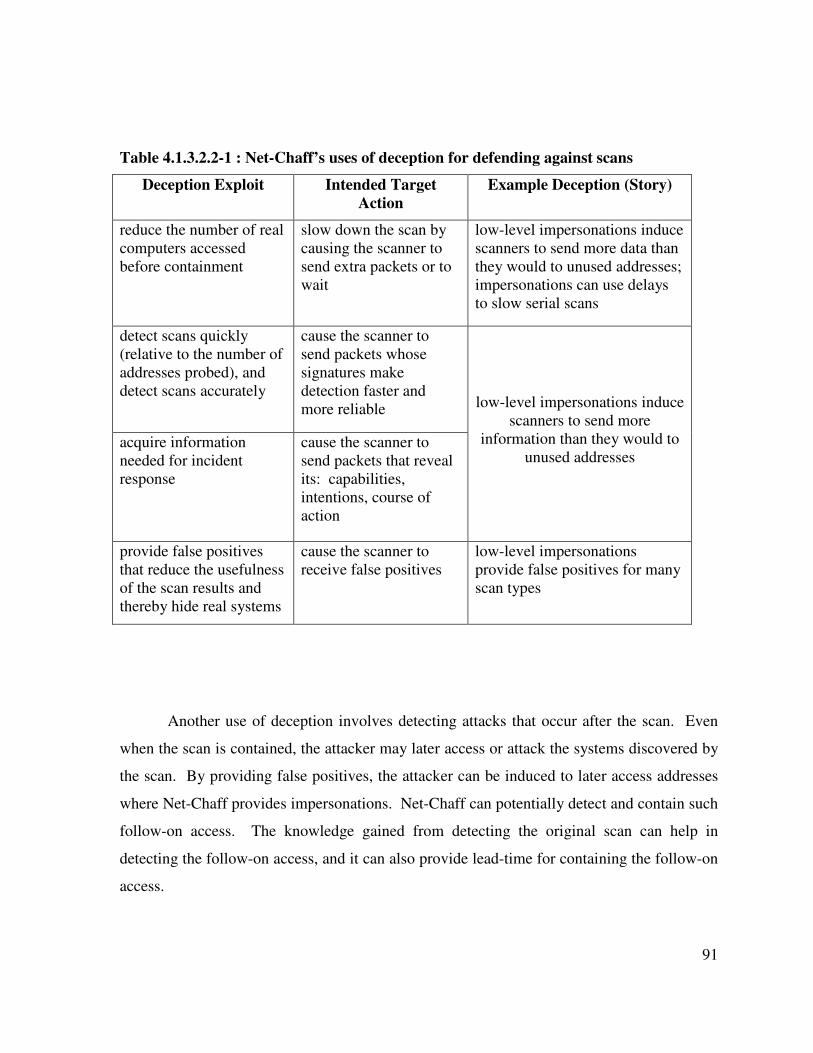
91
Table 4.1.3.2.2-1 : Net-Chaff’s uses of deception for defending against scans
Deception Exploit Intended Target
Action
Example Deception (Story)
reduce the number of real
computers accessed
before containment
slow down the scan by
causing the scanner to
send extra packets or to
wait
low-level impersonations induce
scanners to send more data than
they would to unused addresses;
impersonations can use delays
to slow serial scans
detect scans quickly
(relative to the number of
addresses probed), and
detect scans accurately
cause the scanner to
send packets whose
signatures make
detection faster and
more reliable
acquire information
needed for incident
response
cause the scanner to
send packets that reveal
its: capabilities,
intentions, course of
action
low-level impersonations induce
scanners to send more
information than they would to
unused addresses
provide false positives
that reduce the usefulness
of the scan results and
thereby hide real systems
cause the scanner to
receive false positives
low-level impersonations
provide false positives for many
scan types
Another use of deception involves detecting attacks that occur after the scan. Even
when the scan is contained, the attacker may later access or attack the systems discovered by
the scan. By providing false positives, the attacker can be induced to later access addresses
where Net-Chaff provides impersonations. Net-Chaff can potentially detect and contain such
follow-on access. The knowledge gained from detecting the original scan can help in
detecting the follow-on access, and it can also provide lead-time for containing the follow-on
access.
92
Net-Chaff’s tactical objectives include defending Net-Chaff itself, and deception is a
means for doing that. Specifically, deception is used to thwart hacker’s attempts to
prematurely discover:
• Net-Chaff impersonations, and
• unused portions of the network.
Deceptive hiding is used to prevent such discoveries. (This is a form of Net-Chaff’s
active hiding.) For instance, Net-Chaff uses low-level impersonations, and a scanner can
always discover such deceptions by connecting to the null server. However, making such
connections, for every Net-Chaff managed address, can be very time consuming. As a
countermeasure, hackers could find indicators that allow scanners to detect Net-Chaff
managed addresses, without connecting to every null server. For example, a routed intranet
is configured so that all used subnets have a gateway at host address 1 within the subnet.
Further, each gateway has UDP port 123 open for NTP (network time protocol). If the Net-
Chaff-managed subnets do not impersonate such a gateway at host address 1, then the entire
subnet can be detected as a fake, simply by probing port 123 at host address 1.
Net-Chaff must hide indicators that allow scanners to prematurely detect
impersonations and the unused portions of the network. We will refer to this as hiding Net-
Chaff. Deception is used to hide Net-Chaff, and the deception objective consists of: 1) the
target action is to not detect Net-Chaff impersonations prematurely, and 2) the deception
exploit is to allow Net-Chaff’s impersonations to work as intended, without being detected
prematurely. In fact, when it comes to using false positives to reduce the usefulness of
information-scan results, it is essential that the scanner does not recognize impersonations as
such before containment.
The scanner’s efforts to prematurely detect impersonations, and the unused portions
of the network, are referred to as Net-Chaff detection. The hiding model from Chapter 3 can
be used to understand how Net-Chaff can hide its impersonations. In general, to detect Net-
Chaff impersonations, the scanner will use the discovery process of investigation. The
hiding model explains how the scanner’s investigation process can be defeated in order to
hide Net-Chaff. The scanner cannot observe Net-Chaff directly, but it can potentially detect
93
evidence of impersonations. Net-Chaff can hide by simply not creating the evidence that the
scanner needs for Net-Chaff detection. This is accomplished by making the low-level
impersonations adequately realistic. The degree of realism needed depends on the scanners’
detection capabilities, and also, cost-benefit constraints.
The hiding of impersonations limits the amount of impersonation that can be used.
For example, to slow down all possible port scans, a Net-Chaff-managed subnet can
impersonate servers at every address and every port. However, such impersonations could be
detected by simply pinging a port that real servers are unlikely to use, e.g., 50383. Thus,
hiding Net-Chaff-managed subnets requires that most ports be closed. This limits the use of
impersonation and its benefits in detecting and slowing-down scans.
From the above we see that Net-Chaff’s hiding objectives can conflict with its other
objectives. However, many scanners will not attempt to detect Net-Chaff, so a portion of the
Net-Chaff-managed addresses could use impersonation without regard to detection. For
instance, some Net-Chaff managed subnets could be “tar-pits” that are maximized for
slowing down scans, without regard to detection. These subnets can use low-level
impersonations extensively, and also, other delay tactics such as those used by LaBrea
[LaB05]. To defend against scanners that attempt to detect Net-Chaff, the intranet’s other
subnets can be optimized for hiding Net-Chaff.
4.1.4 Summary
Net-Chaff is intended for defending against hacker scans within a protected intranet,
e.g., inside a corporate network. This chapter described how Net-Chaff works. Net-Chaff’s
major functions are scan detection, scan containment and scan surveillance. Net-Chaff works
by monitoring an intranet’s unused addresses. It also impersonates computers at the unused
addresses, which can impede scanner’s progress and improve Net-Chaff’s defensive
effectiveness. Net-Chaff appears to provide substantial improvements over current scan
defenses, including a simple and effective means for monitoring the whole network and
detecting scans. The Net-Chaff design uses, for the most part, existing computer-security
components, but Net-Chaff combines and applies them in a novel way. This section also
94
framed Net-Chaff’s requirements for scan defense. These requirements provide the basis for
the Net-Chaff analysis, which is presented in Chapter 5.
4.2 Honeyfiles: deceptive files for intrusion detection
The Honeyfiles system is described in a conference paper [YZD04]. The paper is in
the appendix.
95
5 Evaluation
This chapter presents evaluations of the two deception process-models discussed in
previous chapters, within the context of the two novel intrusion detection systems: Net-
chaff, and Honeyfiles.
5.1 Net-Chaff
This section analyzes Net-Chaff’s performance, including its use of deception. This
analysis will be referred to as the Net-Chaff analysis, and it includes analytical and
simulation models of Net-Chaff’s performance. In addition, Net-Chaff is analyzed from the
perspective of the hiding model presented in chapter 3. The model is used to understand the
role of hiding in Net-Chaff’s functionality and performance. This section also includes
discussion of Net-Chaff’s limitations and Net-Chaff-related future research.
Net-Chaff’s performance objectives were presented in chapter 4, and they include its
tactical objectives and its deception and hiding objectives. The Net-Chaff analysis presented
here addresses a subset of these objectives. The performance objectives addressed are:
• reduction in the scanner’s access to the network being protected, and especially access
to high-valued and vulnerable systems on that network. Net-Chaff does this by detecting
and containing scans. The analytical models focus on calculating the number, and types,
of computers that scanners can access before containment. The primary metric is the
number of vulnerable computers accessed by the scanner, before the scan is contained.
• the use of deception and hiding to achieve Net-Chaff’s tactical objectives. The Net-
Chaff analysis focuses on Net-Chaff’s primary uses of deception and hiding. They
include: 1) the use of low-level deceptions, and large numbers of unused addresses, to
slow-down scans, and 2) the use of low-level deceptions to provide false positives that
reduce the usefulness of the scan results.
Net-Chaff can be used in many different contexts, each with varying security
objectives, network topologies, and scanning threats. This analysis models one such context
for Net-Chaff deployment, but the models are adaptable to other contexts. This context
96
includes an enterprise network configuration and the three scan types described in chapter 4:
scan-and-attack, filtering scans, and information-retrieval scans.
The Net-Chaff analysis is presented in the following subsections. The analytical
models are presented first. The simulation is presented next, and it is used to verify the
analytical models. The hiding analysis is then presented. Net-Chaff’s limitations and future
research are also analyzed. A final section summarizes the findings from the Net-Chaff
analysis.
5.1.1 Analytical models
We next present the analytical models as they apply to Net-chaff’s performance, for
what this work considers typical networks and scans. The analytical models are based on the
scanners’ probe rates, so they are referred to as the rate-based models.
5.1.1.1 Definitions, assumptions, context and environment
This section presents assumptions and descriptive models that form the basis on
which the analytical models are constructed. The descriptive models build on the Net-Chaff
design and requirements presented in chapter 4.
5.1.1.1.1 Scanners
Scanner performance is modeled assuming a best-case, or very favorable,
environment for the attacker, in order to show worst-case outcomes for Net-Chaff.
Discussion here focuses on a single scanner rather than a group of scanners. Multiple
scanners are addressed in the next section.
A scanner is assumed to run on one attacking computer. The scanner uses one full-
duplex network connection. When the scanner sends or receives a packet, it does so at a
fixed rate, e.g., 1Mbps. This rate will be referred to as the scanner’s available bandwidth. It
is assumed the network link is symmetrical and operates in duplex mode, e.g., each direction
supports 1Mbps. It is assumed that the scanner can only send one packet at a time through its
network connection to the intranet under consideration.
97
It is also assumed that the scanner sends probes and receives probe replies, and these
two tasks occur in parallel (duplex mode). The scanner probes random addresses on the
intranet. The three scanning techniques of interest here are scan-and-attack, filtering scan,
and information retrieval scan. We consider two random-selection techniques: sampling with
replacement and sampling without replacement. Scanners can use other techniques for
address selection, but this is left to future research.
The scanner’s rate is measured in probes-per-second. An average probe transmission
rate is calculated, based on the number of packets sent and the bandwidth used. Definitions
and models of the scan rates and probes are further described in section 5.1.1.1.3.
The network in which scanning takes place is assumed to have no packet drops (ideal
router queues, no media limitations, etc.). However, scan targets may intentionally drop
probe packets. Packet delays are assumed to be finite and within acceptable ranges for
normal network operations. To model latency, an average value for the network is specified.
As used here, latency is defined as being the duration of the one-way trip: the time from just
after a packet is transmitted to the time when the packet’s last bit arrives at the destination’s
network interface. Packet transmission times are a function of the packet size and the
bandwidth used by the scanner. Round trip times, e.g., for ICMP ping, include the
transmission times of the outgoing packet and its reply packet, and also the latency to and
from the target.
5.1.1.1.2 Net-Chaff
This section describes models of the Net-Chaff system, including its scan-defense
mechanisms, performance, and environment. In this model, the Net-Chaff detection
mechanism functions by counting probes. Scan detection (by Net-Chaff) occurs once a
certain number of probes have been received from the scanner. This number is called the
detection threshold. In practice, Net-Chaff can use additional probe detection mechanisms
that provide an improvement over this simple threshold-based mechanism. For example,
some scans can be very quickly identified by a unique fingerprint in their packet headers,
such as the absence of TCP flags in nmap’s Null scans [Fyo04]. The threshold-based
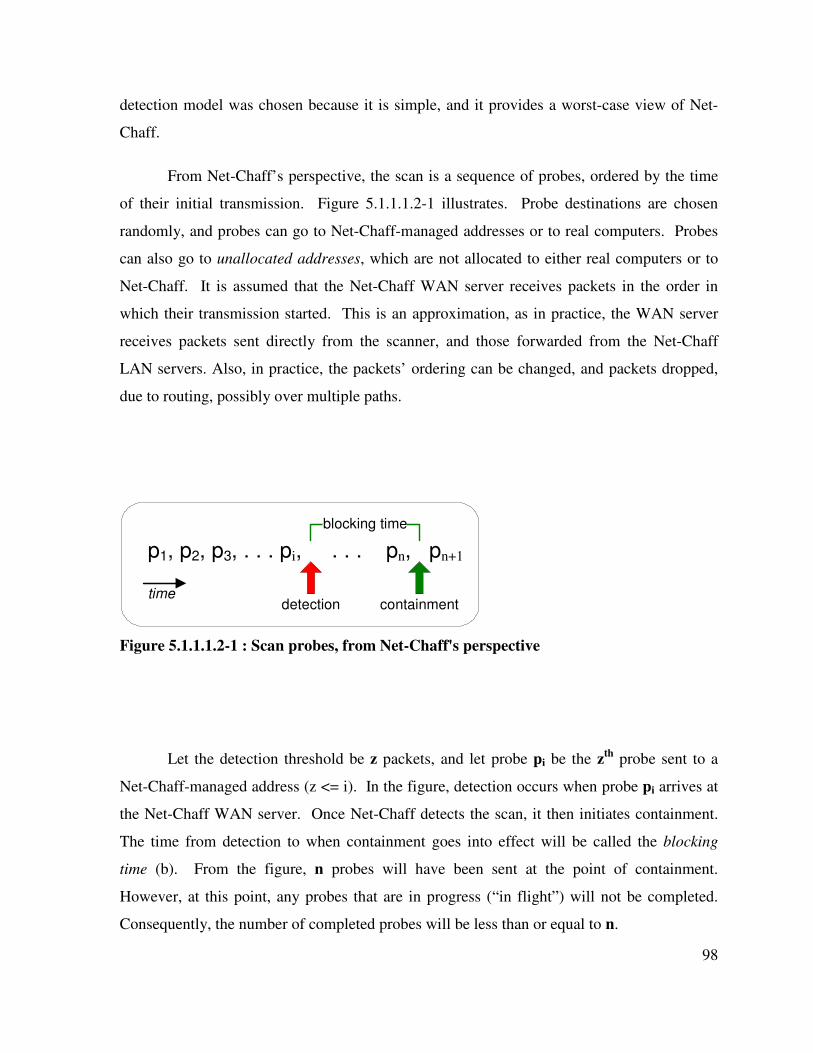
98
detection model was chosen because it is simple, and it provides a worst-case view of Net-
Chaff.
From Net-Chaff’s perspective, the scan is a sequence of probes, ordered by the time
of their initial transmission. Figure 5.1.1.1.2-1 illustrates. Probe destinations are chosen
randomly, and probes can go to Net-Chaff-managed addresses or to real computers. Probes
can also go to unallocated addresses, which are not allocated to either real computers or to
Net-Chaff. It is assumed that the Net-Chaff WAN server receives packets in the order in
which their transmission started. This is an approximation, as in practice, the WAN server
receives packets sent directly from the scanner, and those forwarded from the Net-Chaff
LAN servers. Also, in practice, the packets’ ordering can be changed, and packets dropped,
due to routing, possibly over multiple paths.
p1, p2, p3, . . . pi, . . . pn, pn+1
detection containment
blocking time
time
Figure 5.1.1.1.2-1 : Scan probes, from Net-Chaff's perspective
Let the detection threshold be z packets, and let probe pi be the zth
probe sent to a
Net-Chaff-managed address (z <= i). In the figure, detection occurs when probe pi arrives at
the Net-Chaff WAN server. Once Net-Chaff detects the scan, it then initiates containment.
The time from detection to when containment goes into effect will be called the blocking
time (b). From the figure, n probes will have been sent at the point of containment.
However, at this point, any probes that are in progress (“in flight”) will not be completed.
Consequently, the number of completed probes will be less than or equal to n.
99
The Net-Chaff analysis focuses on an individual scanner. It is assumed that this
scanner uses a single source-address. Multiple scanners can be modeled by repeated
application and interleaving of the model of an individual scanner. For each intranet subnet,
and for the Internet gateway, containment will be initiated by the first scan that is detected
there. When a scanner uses multiple source addresses, the scan will appear to Net-Chaff as
multiple scanners.19
When Net-Chaff detects multiple scanners, it could lower its detection
threshold, to better counter the threat. The analysis of Net-Chaff’s interactions with multiple
scanners is left for future research.
The following variables are used in this context. Of course, the true averages, or
mean values, are limits that are achieved as the number of network scans approaches infinity.
In practice all averages will be estimates of the mean value.
C̄ the average number of probes that a scan completes prior to containment
Ci¯ ¯ the average number of probes that a scan completes prior to containment, and
that have a probe response of type i. Probe-response types are discussed in the
next section.
Two important outcome variables are:
C̄VULN the average number of vulnerable computers that a scan accesses, prior to
containment
C̄AFF the average number of computers that respond affirmatively to the scan,
prior to containment; it is used for analysis of the information-retrieval
scan.
5.1.1.1.3 Probes
Analytical models shown here are for: a) the UDP and TCP scan-and-attacks, b) a
filtering scan with the UDP scan-and-attack, and c) an information retrieval scan that uses
ICMP ping (see chapter 4 for scan descriptions). These specific examples are used to
19
As described in chapter 4, the Net-Chaff design assumes that intranet routers drop packets from a directly
attached subnet if the packet’s source address is not from that subnet.
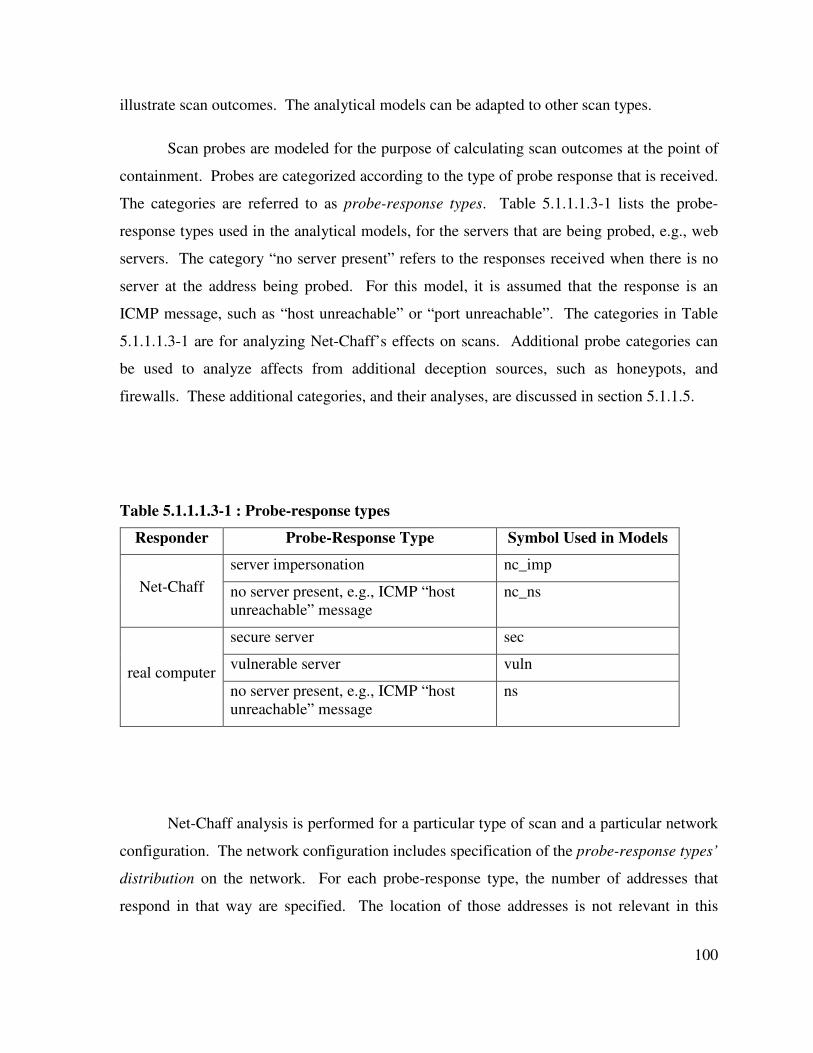
100
illustrate scan outcomes. The analytical models can be adapted to other scan types.
Scan probes are modeled for the purpose of calculating scan outcomes at the point of
containment. Probes are categorized according to the type of probe response that is received.
The categories are referred to as probe-response types. Table 5.1.1.1.3-1 lists the probe-
response types used in the analytical models, for the servers that are being probed, e.g., web
servers. The category “no server present” refers to the responses received when there is no
server at the address being probed. For this model, it is assumed that the response is an
ICMP message, such as “host unreachable” or “port unreachable”. The categories in Table
5.1.1.1.3-1 are for analyzing Net-Chaff’s effects on scans. Additional probe categories can
be used to analyze affects from additional deception sources, such as honeypots, and
firewalls. These additional categories, and their analyses, are discussed in section 5.1.1.5.
Table 5.1.1.1.3-1 : Probe-response types
Responder Probe-Response Type Symbol Used in Models
server impersonation nc_imp
Net-Chaff no server present, e.g., ICMP “host
unreachable” message
nc_ns
secure server sec
vulnerable server vuln real computer
no server present, e.g., ICMP “host
unreachable” message
ns
Net-Chaff analysis is performed for a particular type of scan and a particular network
configuration. The network configuration includes specification of the probe-response types’
distribution on the network. For each probe-response type, the number of addresses that
respond in that way are specified. The location of those addresses is not relevant in this
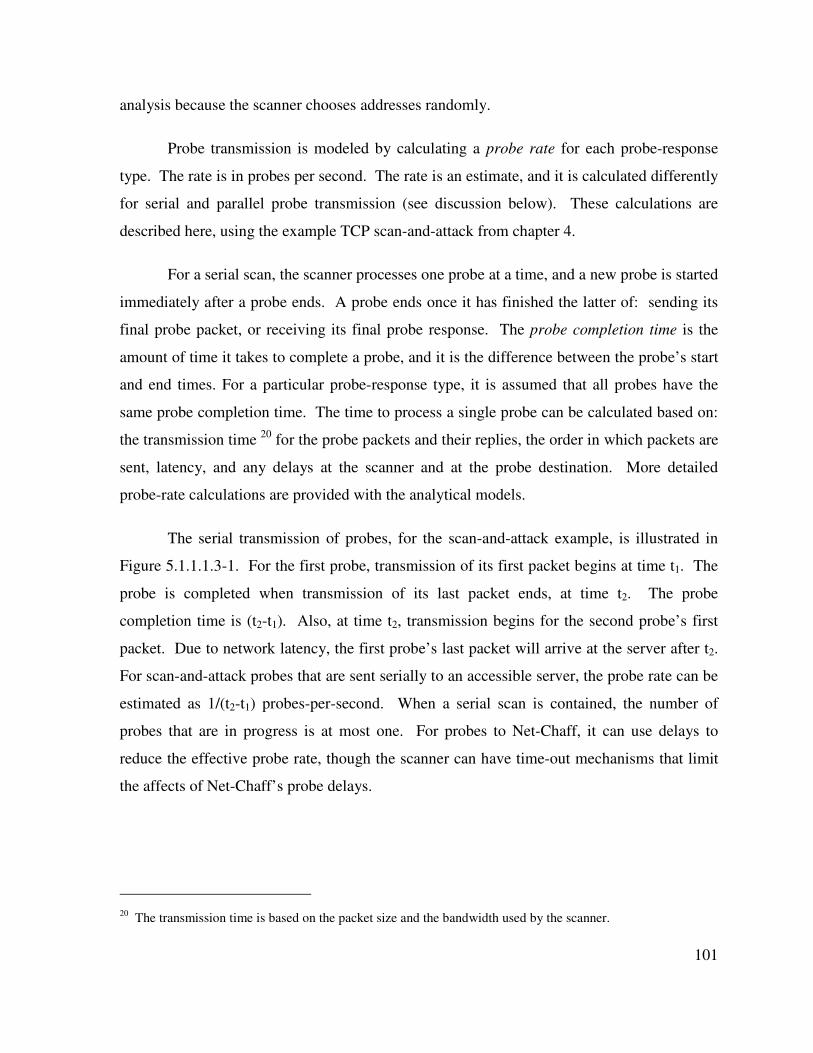
101
analysis because the scanner chooses addresses randomly.
Probe transmission is modeled by calculating a probe rate for each probe-response
type. The rate is in probes per second. The rate is an estimate, and it is calculated differently
for serial and parallel probe transmission (see discussion below). These calculations are
described here, using the example TCP scan-and-attack from chapter 4.
For a serial scan, the scanner processes one probe at a time, and a new probe is started
immediately after a probe ends. A probe ends once it has finished the latter of: sending its
final probe packet, or receiving its final probe response. The probe completion time is the
amount of time it takes to complete a probe, and it is the difference between the probe’s start
and end times. For a particular probe-response type, it is assumed that all probes have the
same probe completion time. The time to process a single probe can be calculated based on:
the transmission time 20
for the probe packets and their replies, the order in which packets are
sent, latency, and any delays at the scanner and at the probe destination. More detailed
probe-rate calculations are provided with the analytical models.
The serial transmission of probes, for the scan-and-attack example, is illustrated in
Figure 5.1.1.1.3-1. For the first probe, transmission of its first packet begins at time t1. The
probe is completed when transmission of its last packet ends, at time t2. The probe
completion time is (t2-t1). Also, at time t2, transmission begins for the second probe’s first
packet. Due to network latency, the first probe’s last packet will arrive at the server after t2.
For scan-and-attack probes that are sent serially to an accessible server, the probe rate can be
estimated as 1/(t2-t1) probes-per-second. When a serial scan is contained, the number of
probes that are in progress is at most one. For probes to Net-Chaff, it can use delays to
reduce the effective probe rate, though the scanner can have time-out mechanisms that limit
the affects of Net-Chaff’s probe delays.
20
The transmission time is based on the packet size and the bandwidth used by the scanner.
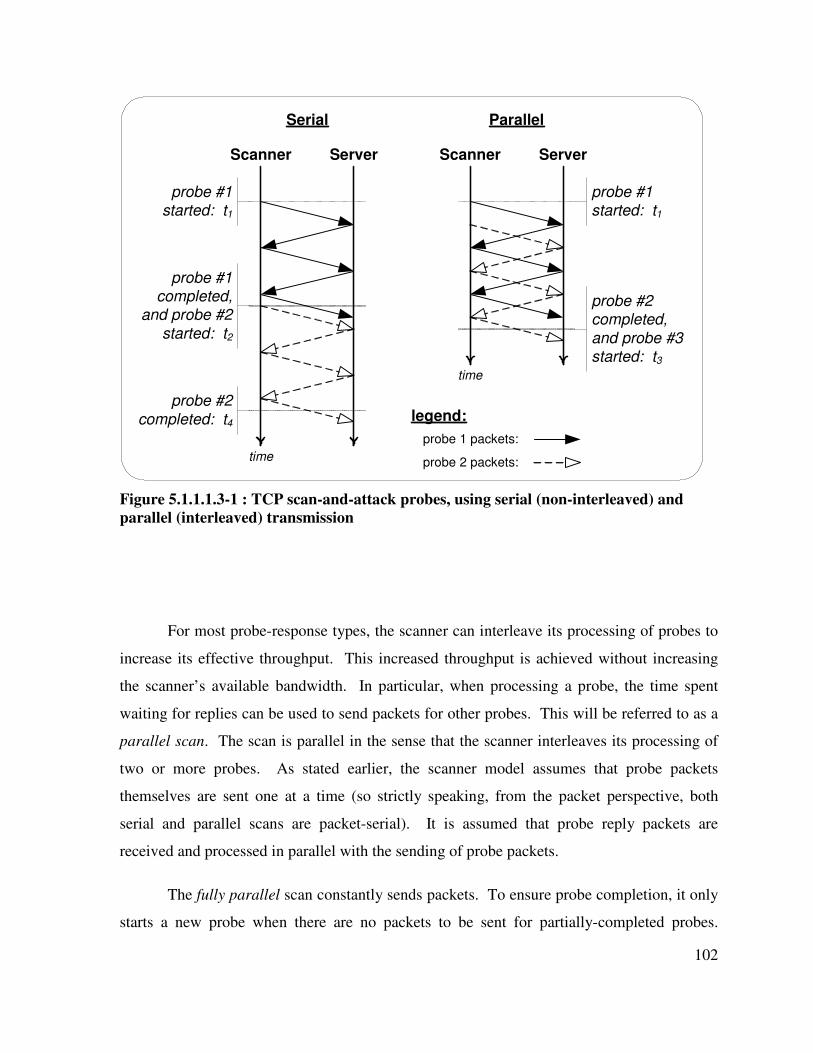
102
Scanner Server
time
probe #2
completed,
and probe #3
started: t3
probe #1
started: t1
Scanner Server
time
probe #2
completed: t4
probe #1
started: t1
Serial Parallel
legend:
probe 1 packets:
probe 2 packets:
probe #1
completed,
and probe #2
started: t2
Figure 5.1.1.1.3-1 : TCP scan-and-attack probes, using serial (non-interleaved) and
parallel (interleaved) transmission
For most probe-response types, the scanner can interleave its processing of probes to
increase its effective throughput. This increased throughput is achieved without increasing
the scanner’s available bandwidth. In particular, when processing a probe, the time spent
waiting for replies can be used to send packets for other probes. This will be referred to as a
parallel scan. The scan is parallel in the sense that the scanner interleaves its processing of
two or more probes. As stated earlier, the scanner model assumes that probe packets
themselves are sent one at a time (so strictly speaking, from the packet perspective, both
serial and parallel scans are packet-serial). It is assumed that probe reply packets are
received and processed in parallel with the sending of probe packets.
The fully parallel scan constantly sends packets. To ensure probe completion, it only
starts a new probe when there are no packets to be sent for partially-completed probes.
103
When there are packets to be sent for more than one partially-completed probe, then packets
for the oldest probe are sent first. For the Net-Chaff analysis involving parallel scans, fully
parallel scans will be modeled, as they provide upper-bound estimates of scanning rates.
The interleaving of probe processing, for the scan-and-attack example, is illustrated in
Figure 5.1.1.1.3-1. Two probes are interleaved. For the first probe, transmission of its first
packet begins at time t1. The second probe is completed when transmission of its last packet
ends, at time t3. For scan-and-attack probes that are sent in parallel to an accessible server,
an estimate of the probe rate is 2/(t3-t1) probes-per-second. This assumes all probes conform
to this duration.
When a parallel scan is contained, the number of probes in progress would be, at
most, the maximum number that are interleaved. For probes to Net-Chaff, Net-Chaff can use
delays to increase the number of interleaved probes, though the scanner can have time-out
mechanisms that limit the effects of Net-Chaff’s probe delay. For a fully parallel scan, Net-
Chaff’s delays will not alter the probe rate.
5.1.1.2 Rate-based models
This section presents the analytical models that were developed for the Net-Chaff
analysis. They are referred to as the rate-based models. The models are based on three
characteristics of the Net-Chaff environment: 1) the probe rates for each of the probe-
response types, 2) the ratios of the probe-response types on the network, and 3) the
scanner’s use of random address selection.
5.1.1.2.1 Average probe-rate
The rate-based models calculate scan outcomes based on the average network probe
rate (x̄). It is an estimate of the scanner’s probe rate for the network, and it is measured in
probes per unit time (the unit used here is seconds). The average is over the probe rates for
all probe-response types. The rate is estimated for a particular type of scan and a particular
network configuration. This section explains how x̄ is calculated, and it continues the
discussion of probe rates from section 5.1.1.1.3.
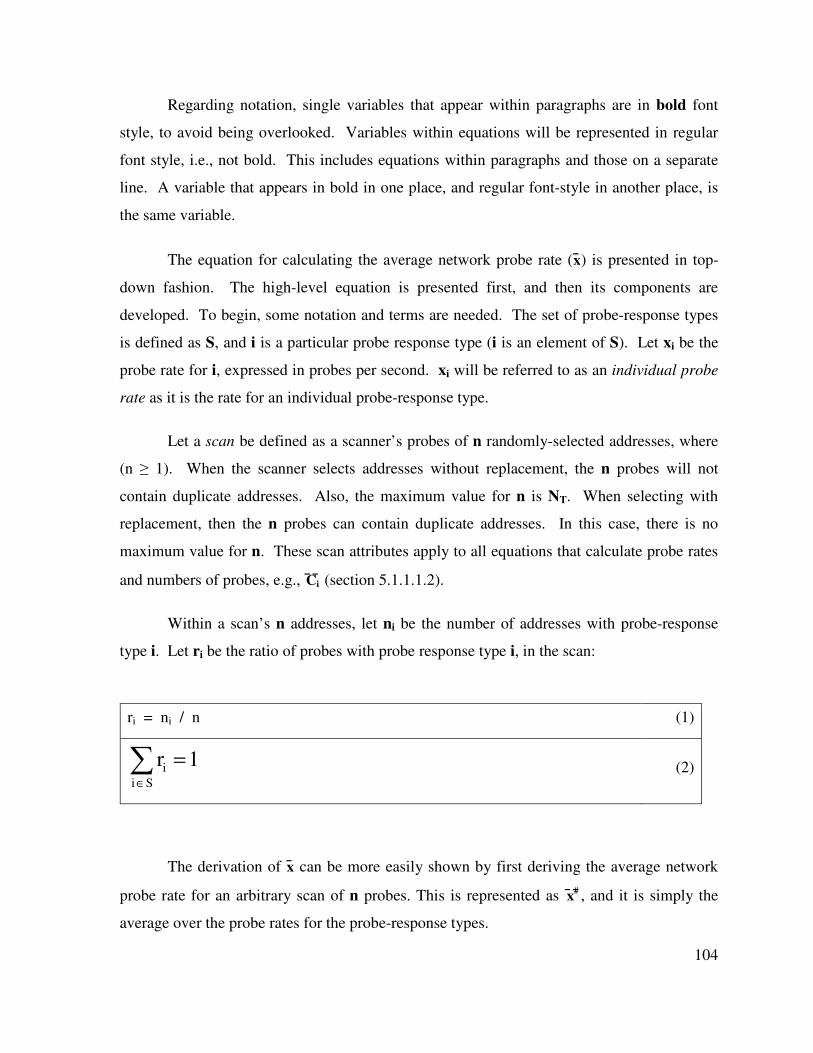
104
Regarding notation, single variables that appear within paragraphs are in bold font
style, to avoid being overlooked. Variables within equations will be represented in regular
font style, i.e., not bold. This includes equations within paragraphs and those on a separate
line. A variable that appears in bold in one place, and regular font-style in another place, is
the same variable.
The equation for calculating the average network probe rate (x̄) is presented in top-
down fashion. The high-level equation is presented first, and then its components are
developed. To begin, some notation and terms are needed. The set of probe-response types
is defined as S, and i is a particular probe response type (i is an element of S). Let xi be the
probe rate for i, expressed in probes per second. xi will be referred to as an individual probe
rate as it is the rate for an individual probe-response type.
Let a scan be defined as a scanner’s probes of n randomly-selected addresses, where
(n ≥ 1). When the scanner selects addresses without replacement, the n probes will not
contain duplicate addresses. Also, the maximum value for n is NT. When selecting with
replacement, then the n probes can contain duplicate addresses. In this case, there is no
maximum value for n. These scan attributes apply to all equations that calculate probe rates
and numbers of probes, e.g., Ci¯ ¯ (section 5.1.1.1.2).
Within a scan’s n addresses, let ni be the number of addresses with probe-response
type i. Let ri be the ratio of probes with probe response type i, in the scan:
ri = ni / n (1)
∑∈
=S i
i 1r (2)
The derivation of x̄ can be more easily shown by first deriving the average network
probe rate for an arbitrary scan of n probes. This is represented as x#¯ ¯ , and it is simply the
average over the probe rates for the probe-response types.
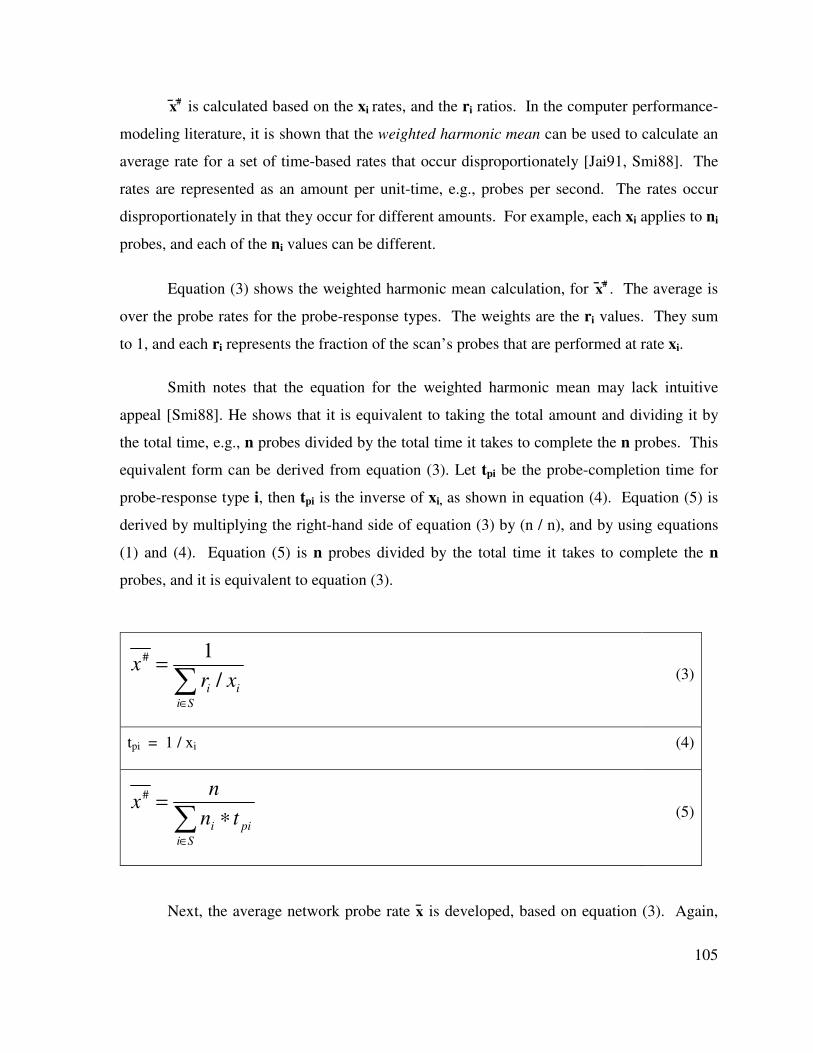
105
x#¯ ¯ is calculated based on the xi rates, and the ri ratios. In the computer performance-
modeling literature, it is shown that the weighted harmonic mean can be used to calculate an
average rate for a set of time-based rates that occur disproportionately [Jai91, Smi88]. The
rates are represented as an amount per unit-time, e.g., probes per second. The rates occur
disproportionately in that they occur for different amounts. For example, each xi applies to ni
probes, and each of the ni values can be different.
Equation (3) shows the weighted harmonic mean calculation, for x#¯ ¯ . The average is
over the probe rates for the probe-response types. The weights are the ri values. They sum
to 1, and each ri represents the fraction of the scan’s probes that are performed at rate xi.
Smith notes that the equation for the weighted harmonic mean may lack intuitive
appeal [Smi88]. He shows that it is equivalent to taking the total amount and dividing it by
the total time, e.g., n probes divided by the total time it takes to complete the n probes. This
equivalent form can be derived from equation (3). Let tpi be the probe-completion time for
probe-response type i, then tpi is the inverse of xi, as shown in equation (4). Equation (5) is
derived by multiplying the right-hand side of equation (3) by (n / n), and by using equations
(1) and (4). Equation (5) is n probes divided by the total time it takes to complete the n
probes, and it is equivalent to equation (3).
∑∈
=
Si
ii xrx
/
1#
(3)
tpi = 1 / xi (4)
∑∈
∗=
Si
pii tn
nx#
(5)
Next, the average network probe rate x̄ is developed, based on equation (3). Again,
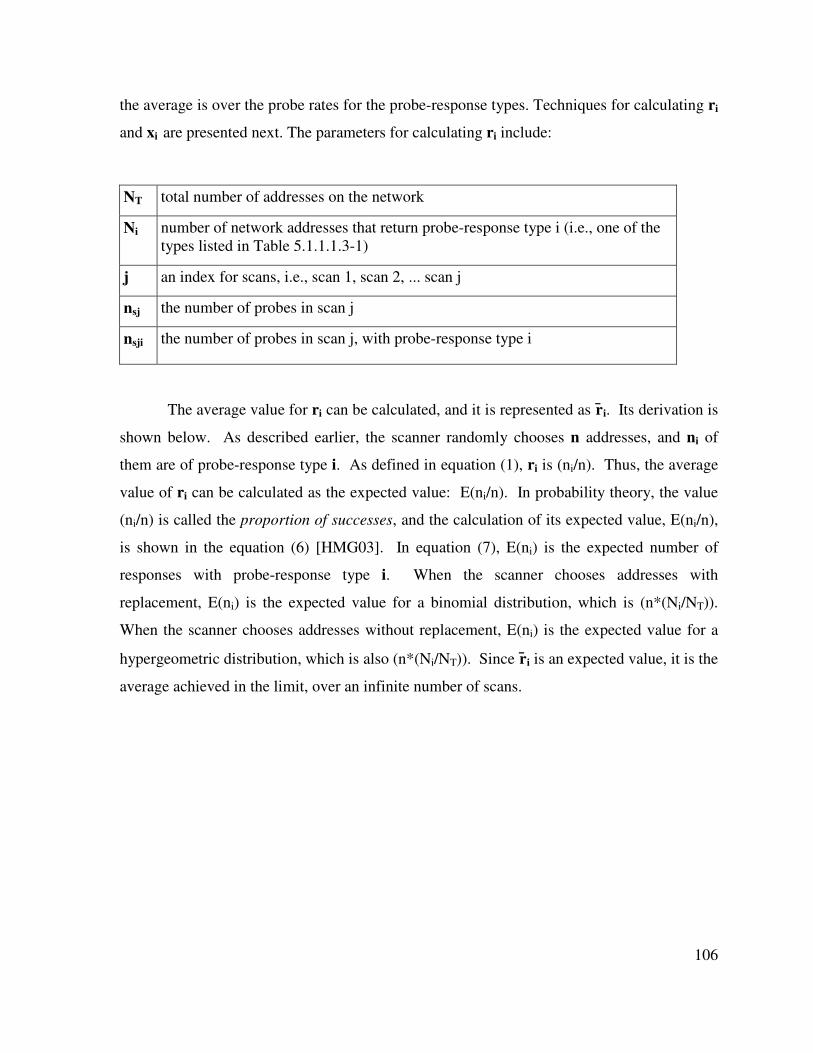
106
the average is over the probe rates for the probe-response types. Techniques for calculating ri
and xi are presented next. The parameters for calculating ri include:
NT total number of addresses on the network
Ni number of network addresses that return probe-response type i (i.e., one of the
types listed in Table 5.1.1.1.3-1)
j an index for scans, i.e., scan 1, scan 2, ... scan j
nsj the number of probes in scan j
nsji the number of probes in scan j, with probe-response type i
The average value for ri can be calculated, and it is represented as r̄i. Its derivation is
shown below. As described earlier, the scanner randomly chooses n addresses, and ni of
them are of probe-response type i. As defined in equation (1), ri is (ni/n). Thus, the average
value of ri can be calculated as the expected value: E(ni/n). In probability theory, the value
(ni/n) is called the proportion of successes, and the calculation of its expected value, E(ni/n),
is shown in the equation (6) [HMG03]. In equation (7), E(ni) is the expected number of
responses with probe-response type i. When the scanner chooses addresses with
replacement, E(ni) is the expected value for a binomial distribution, which is (n*(Ni/NT)).
When the scanner chooses addresses without replacement, E(ni) is the expected value for a
hypergeometric distribution, which is also (n*(Ni/NT)). Since r̄i is an expected value, it is the
average achieved in the limit, over an infinite number of scans.
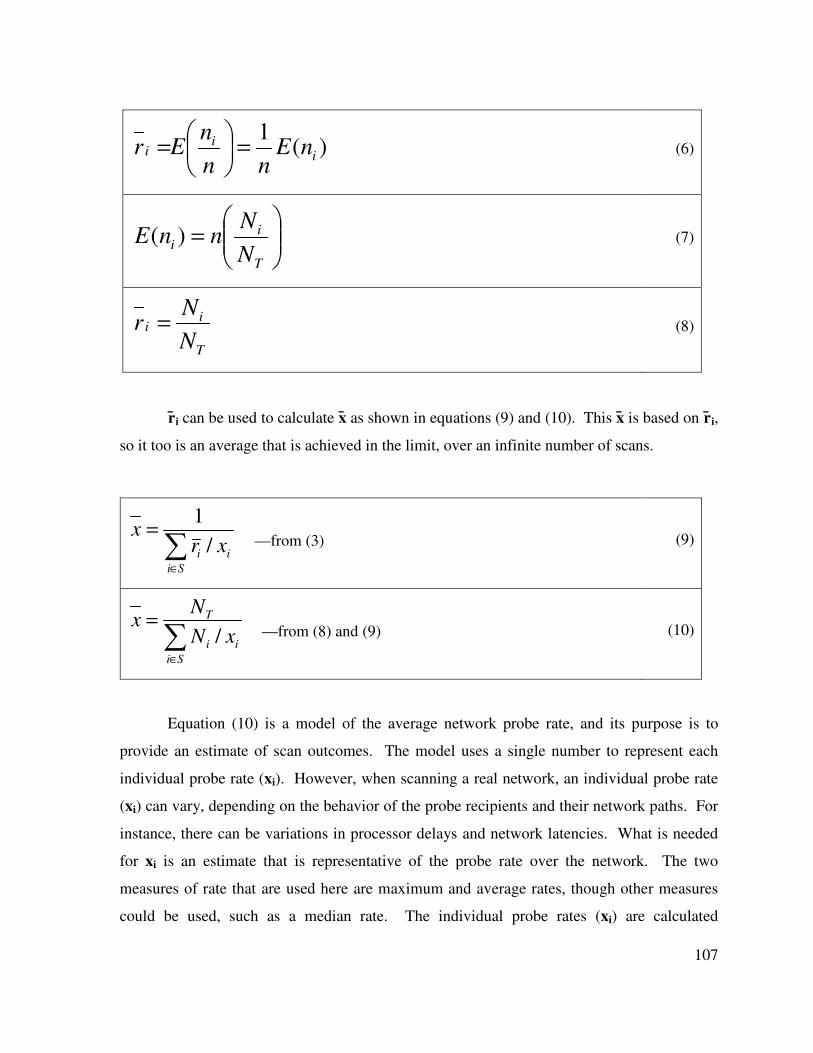
107
r̄i can be used to calculate x̄ as shown in equations (9) and (10). This x̄ is based on r̄i,
so it too is an average that is achieved in the limit, over an infinite number of scans.
∑∈
=
Si
ii xrx
/
1 —from (3) (9)
∑∈
=
Si
ii
T
xN
Nx
/ —from (8) and (9) (10)
Equation (10) is a model of the average network probe rate, and its purpose is to
provide an estimate of scan outcomes. The model uses a single number to represent each
individual probe rate (xi). However, when scanning a real network, an individual probe rate
(xi) can vary, depending on the behavior of the probe recipients and their network paths. For
instance, there can be variations in processor delays and network latencies. What is needed
for xi is an estimate that is representative of the probe rate over the network. The two
measures of rate that are used here are maximum and average rates, though other measures
could be used, such as a median rate. The individual probe rates (xi) are calculated
)(1
ii
i nEnn
nEr =
=
(6)
=
T
ii
N
NnnE )(
(7)
T
ii
N
Nr =
(8)
108
differently for serial and parallel scans, as explained in the following subsections.
5.1.1.2.1.1 Serial scans
This section shows how the individual probe rates can be estimated for serial scans.
The TCP scan-and-attack was described in chapter 4, and in section 5.1.1.1.3 of the present
chapter. The calculation of one of its individual probe rates is shown as an example. The
scan’s individual probe rates depend on whether there is a server at the probed address.
When there is no server, the probe sends the initial packet for TCP OPEN, and the response
is an ICMP reply. From Table 5.1.1.1.3-1, this applies to the probe-response types nc_ns and
ns. When there is a server at the probed address, the packet exchange will be as shown in
chapter 4. From Table 5.1.1.1.3-1, this applies to the probe-response types nc_imp, sec, and
vuln.
The probe rate will be shown for probes to Net-Chaff-managed addresses, where the
probe response is an ICMP reply (i.e., probe-response type nc_ns). A serial scan is assumed.
The probe completion time is the amount of time it takes to complete a probe (defined in
section 5.1.1.1.3), and in this case it consists of:
1) time for scanner to transmit initial packet for TCP OPEN +
2) latency from scanner to Net-Chaff server (WAN or LAN) +
3) intentional delay by the Net-Chaff server, if any +
4) time for Net-Chaff server to transmit reply packet +
5) latency between Net-Chaff server and scanner
The probe completion time is the sum of list-items 1 to 5, above. Not included in the
list is the internal processing conducted on the scanner and server hosts. This processing is
assumed to be negligible. It is also assumed that the probes to the Net-Chaff WAN and LAN
servers take the same amount of time, i.e., list-items 2 to 5 are the same. If they did not take
the same amount of time, then each server would need a different probe-response type (e.g.,
nc_ns_WAN and nc_ns_LAN).
An average individual probe rate (x̄i) can be estimated. The parameters needed are:
Ai the set of addresses on the network with probe-response type i
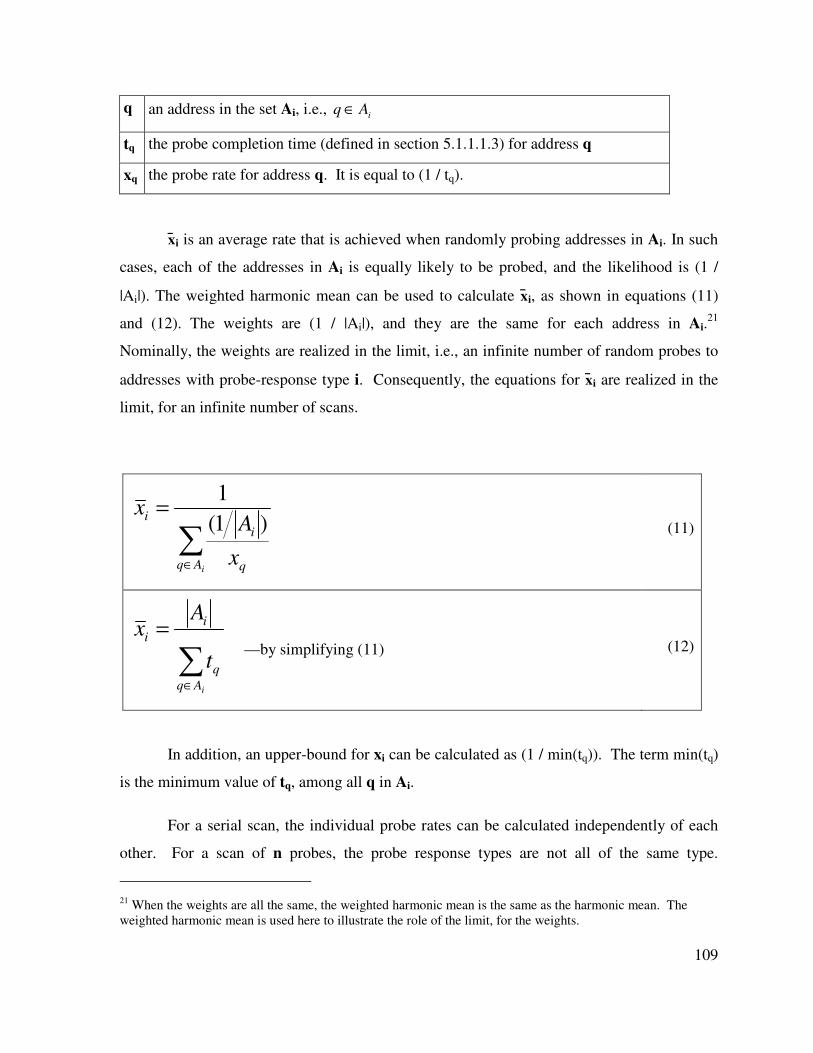
109
q an address in the set Ai, i.e., iAq ∈
tq the probe completion time (defined in section 5.1.1.1.3) for address q
xq the probe rate for address q. It is equal to (1 / tq).
x̄i is an average rate that is achieved when randomly probing addresses in Ai. In such
cases, each of the addresses in Ai is equally likely to be probed, and the likelihood is (1 /
|Ai|). The weighted harmonic mean can be used to calculate x̄i, as shown in equations (11)
and (12). The weights are (1 / |Ai|), and they are the same for each address in Ai.21
Nominally, the weights are realized in the limit, i.e., an infinite number of random probes to
addresses with probe-response type i. Consequently, the equations for x̄i are realized in the
limit, for an infinite number of scans.
In addition, an upper-bound for xi can be calculated as (1 / min(tq)). The term min(tq)
is the minimum value of tq, among all q in Ai.
For a serial scan, the individual probe rates can be calculated independently of each
other. For a scan of n probes, the probe response types are not all of the same type.
21
When the weights are all the same, the weighted harmonic mean is the same as the harmonic mean. The
weighted harmonic mean is used here to illustrate the role of the limit, for the weights.
∑∈
=
iAq q
i
i
x
Ax
)1(
1
(11)
∑∈
=
iAq
q
i
i
t
Ax
—by simplifying (11) (12)

110
However, for a serial scan, the individual probe rates (x̄i) are not affected when the probes
responses are of different types. The reason is that, for any given probe, its probe completion
time only depends on its response type. The completion time is independent of the probe-
response types of all prior and subsequent probes. (The context for this probe behavior is the
Net-Chaff analysis’ network model.)
5.1.1.2.1.2 Parallel scans
This section shows how the individual probe rates can be estimated for parallel scans.
Each individual probe rate (xi) is calculated as a maximum rate for a fully parallel scan, and
it is represented as xmax_i. Fully parallel scans were described in section 5.1.1.1.3
An estimate is made for the maximum possible rate (xmax_i), and it is based on the
bandwidth used by the scanner. The parameters used are:
W scanner bandwidth in bits per second (bps)
Yi the total number of bytes the scanner sends for a probe with response type i
xmax_i is estimated as:
xmax_i = W / (Yi * 8) (13)
It is assumed that the scanner receives probe-responses in parallel with probe
transmission. Also, it is assumed that Yi is greater than or equal to the number of bytes the
scanner receives for a probe with response type i. xmax_i is not affected by the probe
completion time (defined in section 5.1.1.1.3). However, lengthening the probe completion
time will increase the maximum number of probes that are “in progress” (i.e., partially
completed) at a given time.
For a fully parallel scan, the individual probe rates can be calculated independently of
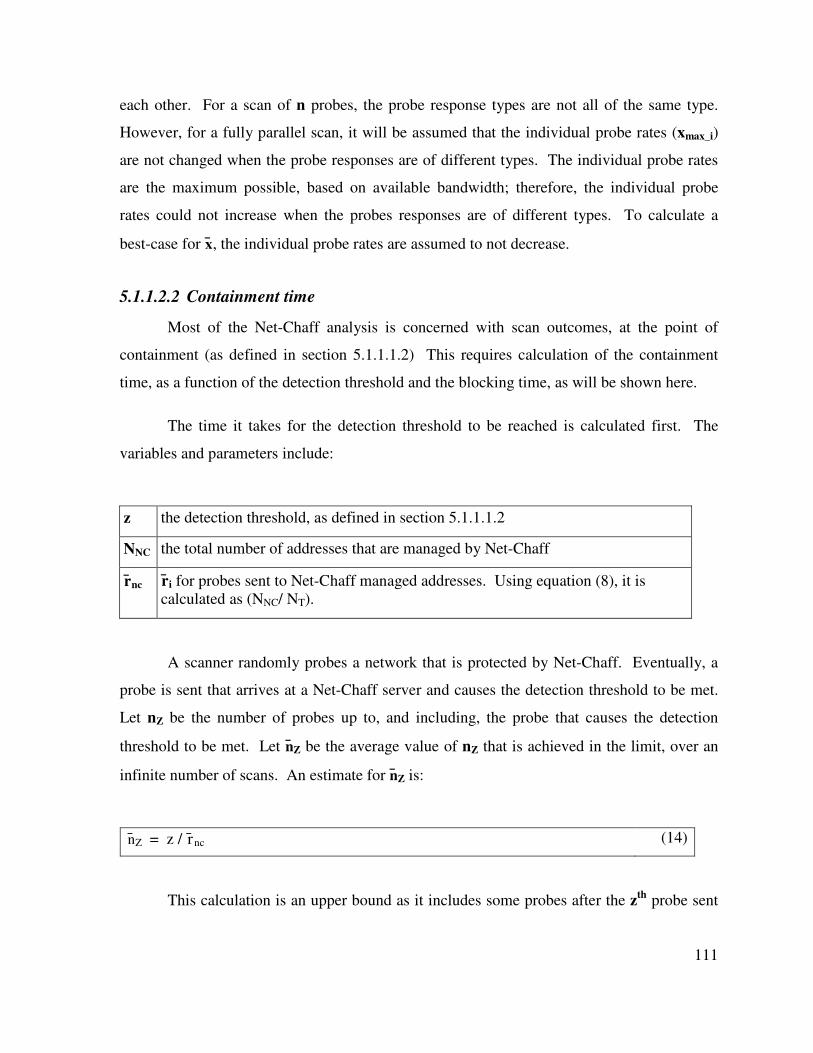
111
each other. For a scan of n probes, the probe response types are not all of the same type.
However, for a fully parallel scan, it will be assumed that the individual probe rates (xmax_i)
are not changed when the probe responses are of different types. The individual probe rates
are the maximum possible, based on available bandwidth; therefore, the individual probe
rates could not increase when the probes responses are of different types. To calculate a
best-case for x̄, the individual probe rates are assumed to not decrease.
5.1.1.2.2 Containment time
Most of the Net-Chaff analysis is concerned with scan outcomes, at the point of
containment (as defined in section 5.1.1.1.2) This requires calculation of the containment
time, as a function of the detection threshold and the blocking time, as will be shown here.
The time it takes for the detection threshold to be reached is calculated first. The
variables and parameters include:
z the detection threshold, as defined in section 5.1.1.1.2
NNC the total number of addresses that are managed by Net-Chaff
r̄nc r̄i for probes sent to Net-Chaff managed addresses. Using equation (8), it is
calculated as (NNC/ NT).
A scanner randomly probes a network that is protected by Net-Chaff. Eventually, a
probe is sent that arrives at a Net-Chaff server and causes the detection threshold to be met.
Let nZ be the number of probes up to, and including, the probe that causes the detection
threshold to be met. Let n̄Z be the average value of nZ that is achieved in the limit, over an
infinite number of scans. An estimate for n̄Z is:
n̄Z = z / r̄nc (14)
This calculation is an upper bound as it includes some probes after the zth
probe sent
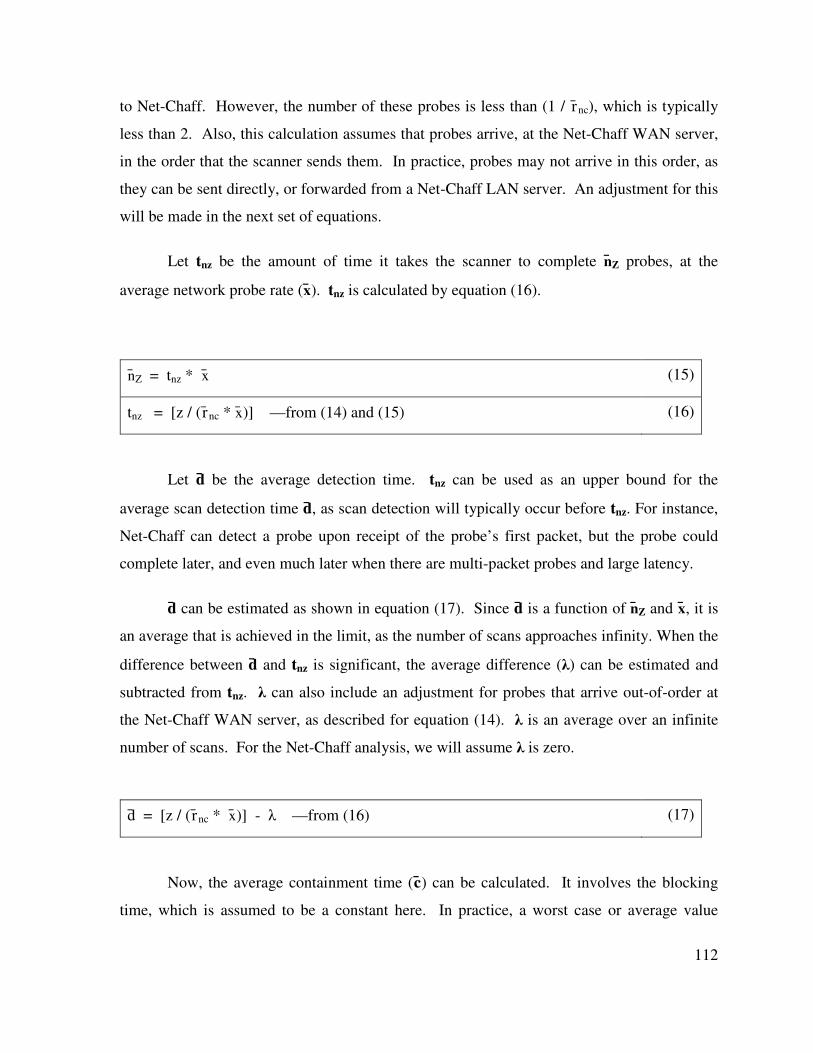
112
to Net-Chaff. However, the number of these probes is less than (1 / r̄nc), which is typically
less than 2. Also, this calculation assumes that probes arrive, at the Net-Chaff WAN server,
in the order that the scanner sends them. In practice, probes may not arrive in this order, as
they can be sent directly, or forwarded from a Net-Chaff LAN server. An adjustment for this
will be made in the next set of equations.
Let tnz be the amount of time it takes the scanner to complete n̄Z probes, at the
average network probe rate (x̄). tnz is calculated by equation (16).
n̄Z = tnz * x̄ (15)
tnz = [z / (r̄nc * x̄)] —from (14) and (15) (16)
Let d̄ be the average detection time. tnz can be used as an upper bound for the
average scan detection time d̄, as scan detection will typically occur before tnz. For instance,
Net-Chaff can detect a probe upon receipt of the probe’s first packet, but the probe could
complete later, and even much later when there are multi-packet probes and large latency.
d̄ can be estimated as shown in equation (17). Since d̄ is a function of n̄Z and x̄, it is
an average that is achieved in the limit, as the number of scans approaches infinity. When the
difference between d̄ and tnz is significant, the average difference (λ) can be estimated and
subtracted from tnz. λ can also include an adjustment for probes that arrive out-of-order at
the Net-Chaff WAN server, as described for equation (14). λ is an average over an infinite
number of scans. For the Net-Chaff analysis, we will assume λ is zero.
d̄ = [z / (r̄nc * x̄)] - λ —from (16) (17)
Now, the average containment time (c̄) can be calculated. It involves the blocking
time, which is assumed to be a constant here. In practice, a worst case or average value
113
could be used. Since c̄ is a function of d̄, it is an average over an infinite number of scans.
b the blocking time, as described in section 5.1.1.1.2
c̄ = d̄ + b —by definition of containment time, and from (17) (18)
When the scanner selects addresses without replacement, the maximum number of
probes is the network size (NT). Also, the maximum containment time is the time it takes to
probe the whole network. When the scanner selects addresses with replacement, there is no
limit to the number of probes, as any address can be selected multiple times. The time it
takes to probe NT addresses, on average, is represented as t̄_NT, and it can be calculated as
shown in (19). The average is over an infinite number of scans.
t̄ _NT = NT / x̄ —from definition of rate (19)
5.1.1.2.3 Primary performance model
As described in section 5.1.1.1.2, most of the calculations for the Net-Chaff analysis
are based on the following values:
C̄ the average number of probes that a scan completes prior to containment
Ci¯ ¯ the average number of probes that a scan completes prior to containment, and that
have a probe response of type i.
These values can now be estimated as shown below. Since they are based on c̄, x̄ and
r̄i, the averages are achieved in the limit, as the number of scans approaches infinity. There
can be partially completed probes at the point of containment. For a serial scan, there is at
most one. For a fully parallel scan, they are the probes that are currently “in progress”. In
114
the equations, ε is an estimate of the average number of partially completed probes. The
average is over an infinite number of scans. For the Net-Chaff analysis, we will assume ε is
zero, to calculate best-case outcomes for the scanner.
C̄ = (x̄ * c̄) - ε —from (10) and (20)
Ci¯ ¯ = r̄ i * ((x̄ * c̄) - ε) —from (8) and (20) (21)
5.1.1.2.4 Network and scan models
We next discuss Net-Chaff performance for representative networks and scanners. A
template for network and scanner configurations is used, and it’s described here. Also, there
are several default configurations that are used in the performance analysis, and they too are
described here.
Table 5.1.1.2.4-1 shows the template for the network’s distribution of real computers
and Net-Chaff-managed addresses. Under the column Symbol, Ni represents the total number
of addresses on the network, of type i. Default configurations are shown for class A and B
networks. They will be referred to as the default class A network and the default class B
network, respectively. These configurations represent large corporate networks with 20K
addresses assigned to real computers. The unassigned addresses are those that are not
assigned to real computers nor Net-Chaff.
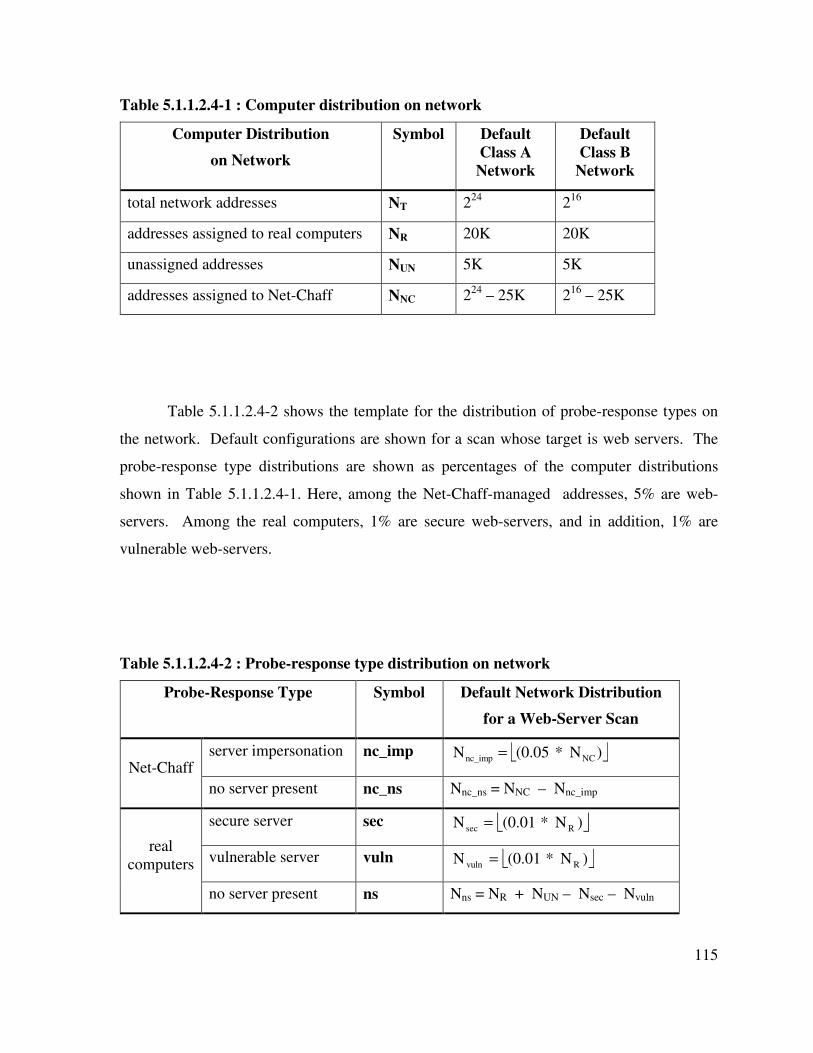
115
Table 5.1.1.2.4-1 : Computer distribution on network
Computer Distribution
on Network
Symbol Default
Class A
Network
Default
Class B
Network
total network addresses NT 224
216
addresses assigned to real computers NR 20K 20K
unassigned addresses NUN 5K 5K
addresses assigned to Net-Chaff NNC 224
– 25K 216
– 25K
Table 5.1.1.2.4-2 shows the template for the distribution of probe-response types on
the network. Default configurations are shown for a scan whose target is web servers. The
probe-response type distributions are shown as percentages of the computer distributions
shown in Table 5.1.1.2.4-1. Here, among the Net-Chaff-managed addresses, 5% are web-
servers. Among the real computers, 1% are secure web-servers, and in addition, 1% are
vulnerable web-servers.
Table 5.1.1.2.4-2 : Probe-response type distribution on network
Probe-Response Type Symbol Default Network Distribution
for a Web-Server Scan
server impersonation nc_imp )N * (0.05N NCnc_imp = Net-Chaff
no server present nc_ns Nnc_ns = NNC – Nnc_imp
secure server sec )N * (0.01N Rsec =
vulnerable server vuln )N * (0.01N Rvuln = real
computers
no server present ns Nns = NR + NUN – Nsec – Nvuln
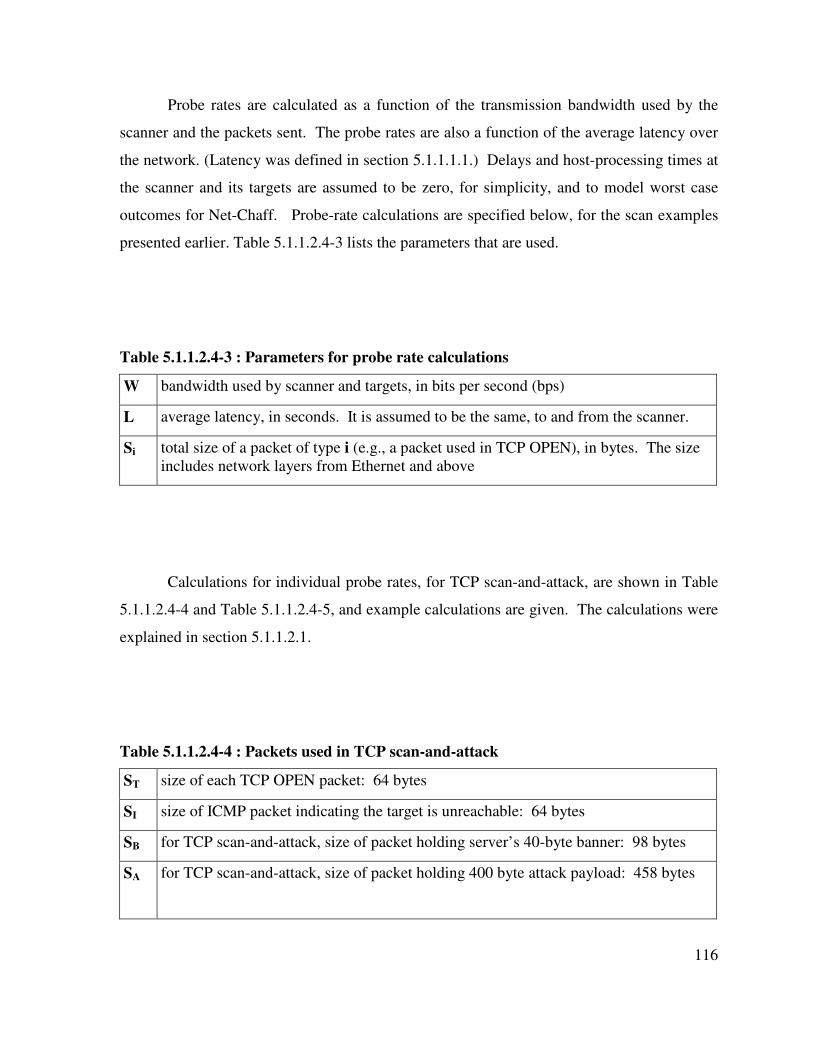
116
Probe rates are calculated as a function of the transmission bandwidth used by the
scanner and the packets sent. The probe rates are also a function of the average latency over
the network. (Latency was defined in section 5.1.1.1.1.) Delays and host-processing times at
the scanner and its targets are assumed to be zero, for simplicity, and to model worst case
outcomes for Net-Chaff. Probe-rate calculations are specified below, for the scan examples
presented earlier. Table 5.1.1.2.4-3 lists the parameters that are used.
Table 5.1.1.2.4-3 : Parameters for probe rate calculations
W bandwidth used by scanner and targets, in bits per second (bps)
L average latency, in seconds. It is assumed to be the same, to and from the scanner.
Si total size of a packet of type i (e.g., a packet used in TCP OPEN), in bytes. The size
includes network layers from Ethernet and above
Calculations for individual probe rates, for TCP scan-and-attack, are shown in Table
5.1.1.2.4-4 and Table 5.1.1.2.4-5, and example calculations are given. The calculations were
explained in section 5.1.1.2.1.
Table 5.1.1.2.4-4 : Packets used in TCP scan-and-attack
ST size of each TCP OPEN packet: 64 bytes
SI size of ICMP packet indicating the target is unreachable: 64 bytes
SB for TCP scan-and-attack, size of packet holding server’s 40-byte banner: 98 bytes
SA for TCP scan-and-attack, size of packet holding 400 byte attack payload: 458 bytes
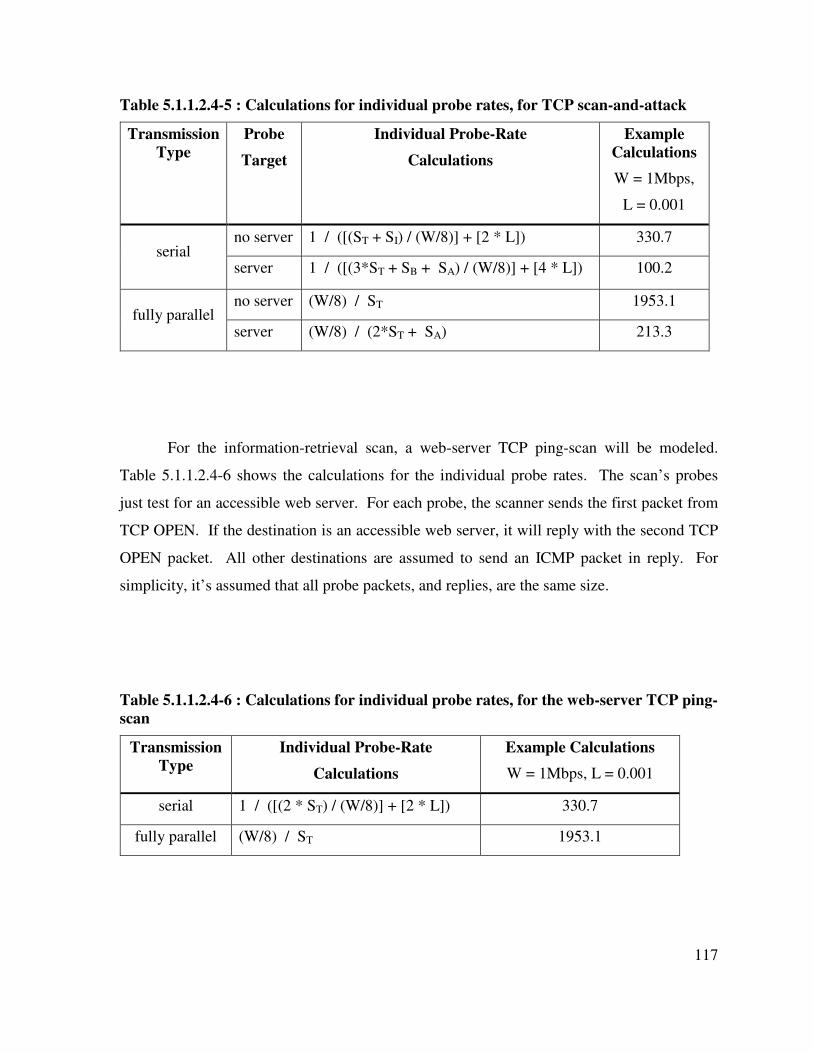
117
Table 5.1.1.2.4-5 : Calculations for individual probe rates, for TCP scan-and-attack
Transmission
Type
Probe
Target
Individual Probe-Rate
Calculations
Example
Calculations
W = 1Mbps,
L = 0.001
no server 1 / ([(ST + SI) / (W/8)] + [2 * L]) 330.7 serial
server 1 / ([(3*ST + SB + SA) / (W/8)] + [4 * L]) 100.2
no server (W/8) / ST 1953.1 fully parallel
server (W/8) / (2*ST + SA) 213.3
For the information-retrieval scan, a web-server TCP ping-scan will be modeled.
Table 5.1.1.2.4-6 shows the calculations for the individual probe rates. The scan’s probes
just test for an accessible web server. For each probe, the scanner sends the first packet from
TCP OPEN. If the destination is an accessible web server, it will reply with the second TCP
OPEN packet. All other destinations are assumed to send an ICMP packet in reply. For
simplicity, it’s assumed that all probe packets, and replies, are the same size.
Table 5.1.1.2.4-6 : Calculations for individual probe rates, for the web-server TCP ping-
scan
Transmission
Type
Individual Probe-Rate
Calculations
Example Calculations
W = 1Mbps, L = 0.001
serial 1 / ([(2 * ST) / (W/8)] + [2 * L]) 330.7
fully parallel (W/8) / ST 1953.1
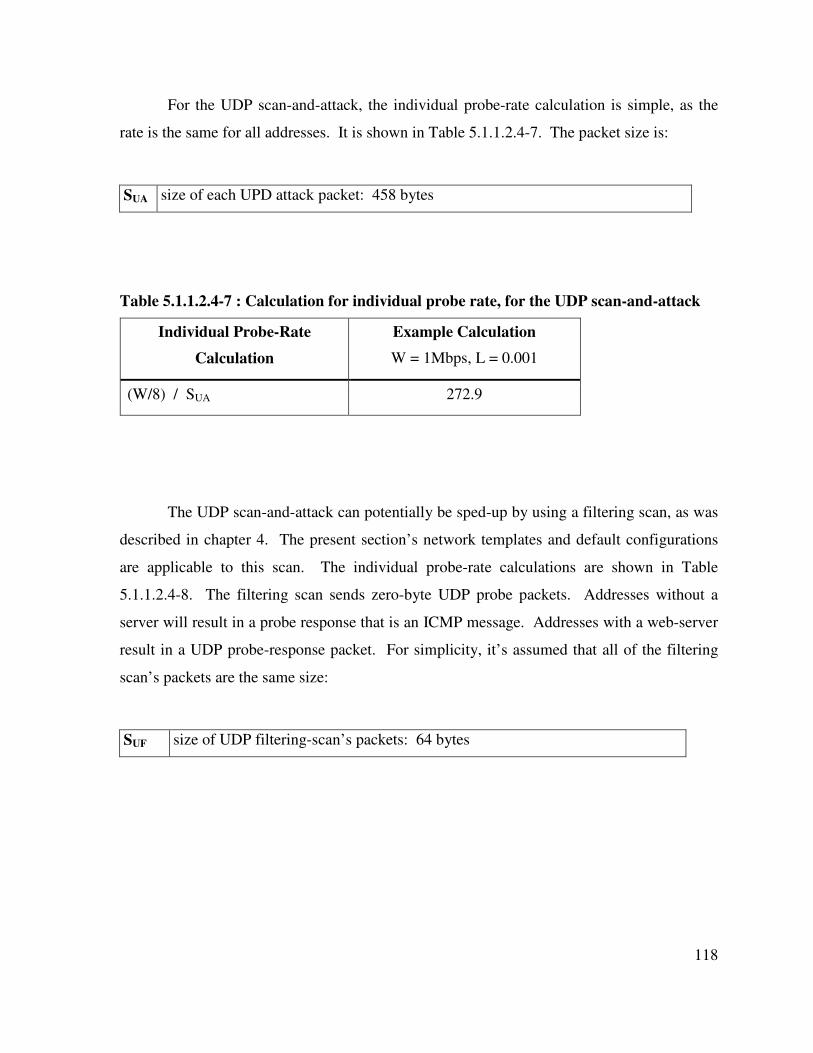
118
For the UDP scan-and-attack, the individual probe-rate calculation is simple, as the
rate is the same for all addresses. It is shown in Table 5.1.1.2.4-7. The packet size is:
SUA size of each UPD attack packet: 458 bytes
Table 5.1.1.2.4-7 : Calculation for individual probe rate, for the UDP scan-and-attack
Individual Probe-Rate
Calculation
Example Calculation
W = 1Mbps, L = 0.001
(W/8) / SUA 272.9
The UDP scan-and-attack can potentially be sped-up by using a filtering scan, as was
described in chapter 4. The present section’s network templates and default configurations
are applicable to this scan. The individual probe-rate calculations are shown in Table
5.1.1.2.4-8. The filtering scan sends zero-byte UDP probe packets. Addresses without a
server will result in a probe response that is an ICMP message. Addresses with a web-server
result in a UDP probe-response packet. For simplicity, it’s assumed that all of the filtering
scan’s packets are the same size:
SUF size of UDP filtering-scan’s packets: 64 bytes
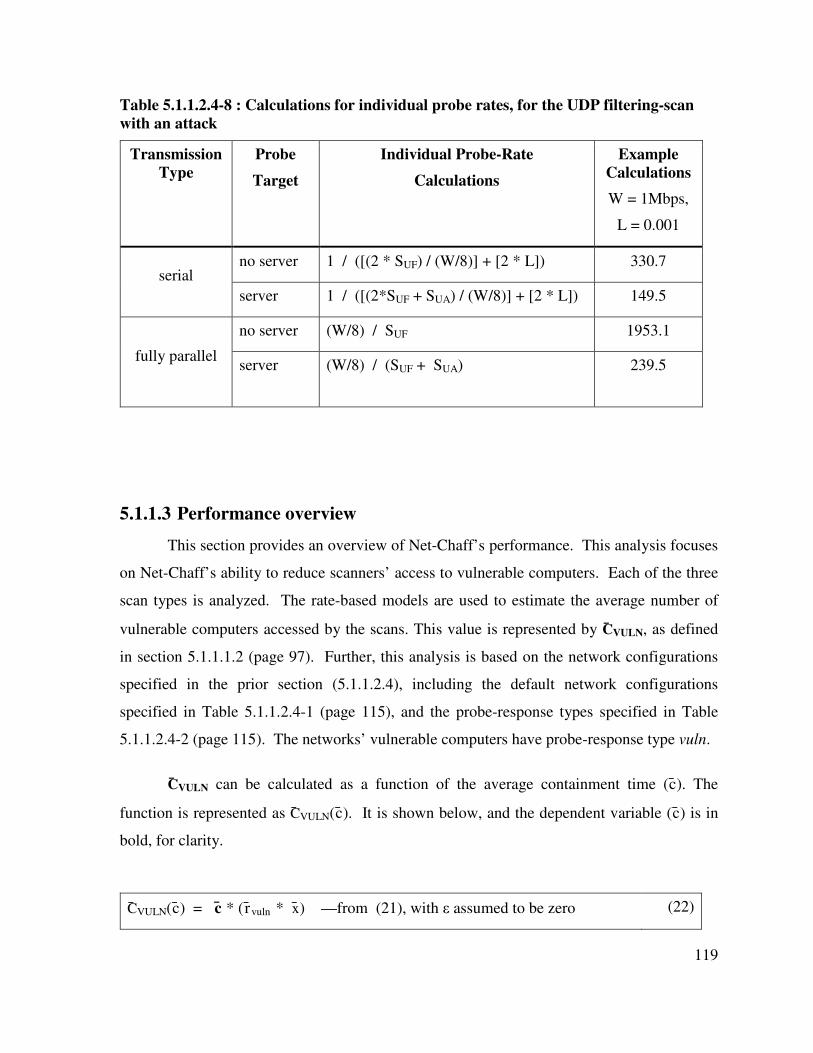
119
Table 5.1.1.2.4-8 : Calculations for individual probe rates, for the UDP filtering-scan
with an attack
Transmission
Type
Probe
Target
Individual Probe-Rate
Calculations
Example
Calculations
W = 1Mbps,
L = 0.001
no server 1 / ([(2 * SUF) / (W/8)] + [2 * L]) 330.7 serial
server 1 / ([(2*SUF + SUA) / (W/8)] + [2 * L]) 149.5
no server (W/8) / SUF 1953.1
fully parallel server (W/8) / (SUF + SUA) 239.5
5.1.1.3 Performance overview
This section provides an overview of Net-Chaff’s performance. This analysis focuses
on Net-Chaff’s ability to reduce scanners’ access to vulnerable computers. Each of the three
scan types is analyzed. The rate-based models are used to estimate the average number of
vulnerable computers accessed by the scans. This value is represented by C̄VULN, as defined
in section 5.1.1.1.2 (page 97). Further, this analysis is based on the network configurations
specified in the prior section (5.1.1.2.4), including the default network configurations
specified in Table 5.1.1.2.4-1 (page 115), and the probe-response types specified in Table
5.1.1.2.4-2 (page 115). The networks’ vulnerable computers have probe-response type vuln.
C̄VULN can be calculated as a function of the average containment time (c̄). The
function is represented as C̄VULN(c̄). It is shown below, and the dependent variable (c̄) is in
bold, for clarity.
C̄VULN(c̄) = c̄ * ( r̄vuln * x̄) —from (21), with ε assumed to be zero (22)
120
C̄VULN(c̄) is a linear equation with slope ( r̄vuln * x̄) and y-intercept 0. x̄ is calculated
for each scan type, as described in Table 5.1.1.2.4-3 (page 116) through Table 5.1.1.2.4-8
(page 119). The term ( r̄vuln * x̄) gives the average rate at which vulnerable computers are
accessed by the scan. The rate is in units of vulnerable computers per second, and the average
is over an infinite number of scans.
The next subsection shows Net-Chaff’s performance for each of the three scan types.
The subsequent subsection presents a model for calculating the likelihood that one or more
computers are compromised, for a given value of C̄VULN.
5.1.1.3.1 Analysis of the scan types
The performance of the TCP scan-and-attack, for the default network configurations,
is shown in Table 5.1.1.3.1-1. The serial and parallel transmission types are shown. The
parallel scan is fully parallel, as defined in section 5.1.1.1.3. Also, three different scanning
bandwidths are shown: 1Kbps represents a slow scan; 1Mbps is a relatively fast scan, and
1Gbps provides a practical upper-bound. The column heading ( r̄vuln * x) represents ( r̄vuln * x̄),
and the bar over the x is omitted due to type-setting limitations. Similarly, the column
heading t_NT represents t̄_NT. The column t̄_NT is the average time it takes to scan NT
addresses, and it is calculated using equation (19). Also, this is the average time it takes to
scan the whole network when selecting addresses without replacement. These table-heading
definitions apply to the following tables as well.
Table 5.1.1.3.1-1 shows that the rates of compromise ( r̄vuln * x̄) are directly
proportional to the bandwidth, for the fully parallel scans, e.g., the rate of compromise at
1Mbps is 1,000 times the rate at 1Kbps. This property does not hold for serial scans as they
are also governed by the network latency. The rate of compromise is high for the parallel
scan at 1Gbps on a class B network, and the rate is relatively low for the other scenarios.
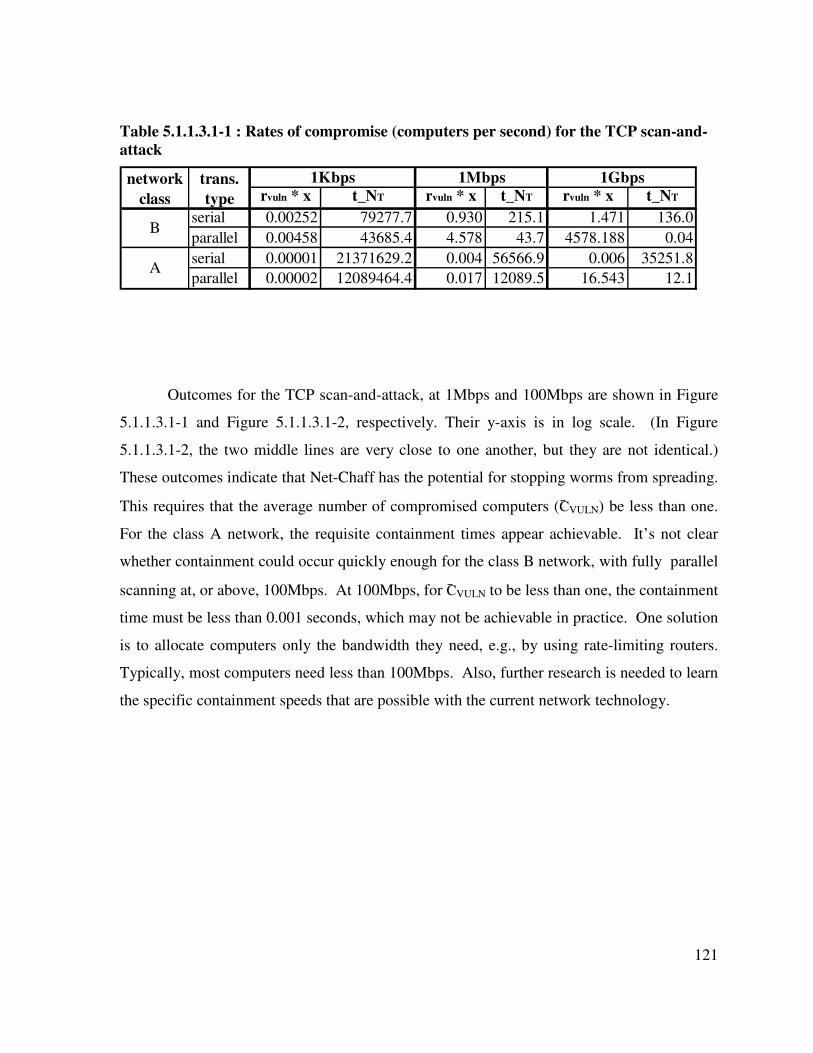
121
Table 5.1.1.3.1-1 : Rates of compromise (computers per second) for the TCP scan-and-
attack
rvuln * x t_NT rvuln * x t_NT rvuln * x t_NT
serial 0.00252 79277.7 0.930 215.1 1.471 136.0
parallel 0.00458 43685.4 4.578 43.7 4578.188 0.04
serial 0.00001 21371629.2 0.004 56566.9 0.006 35251.8
parallel 0.00002 12089464.4 0.017 12089.5 16.543 12.1
B
A
1Kbps 1Mbps 1Gbpsnetwork
class
trans.
type
Outcomes for the TCP scan-and-attack, at 1Mbps and 100Mbps are shown in Figure
5.1.1.3.1-1 and Figure 5.1.1.3.1-2, respectively. Their y-axis is in log scale. (In Figure
5.1.1.3.1-2, the two middle lines are very close to one another, but they are not identical.)
These outcomes indicate that Net-Chaff has the potential for stopping worms from spreading.
This requires that the average number of compromised computers (C̄VULN) be less than one.
For the class A network, the requisite containment times appear achievable. It’s not clear
whether containment could occur quickly enough for the class B network, with fully parallel
scanning at, or above, 100Mbps. At 100Mbps, for C̄VULN to be less than one, the containment
time must be less than 0.001 seconds, which may not be achievable in practice. One solution
is to allocate computers only the bandwidth they need, e.g., by using rate-limiting routers.
Typically, most computers need less than 100Mbps. Also, further research is needed to learn
the specific containment speeds that are possible with the current network technology.
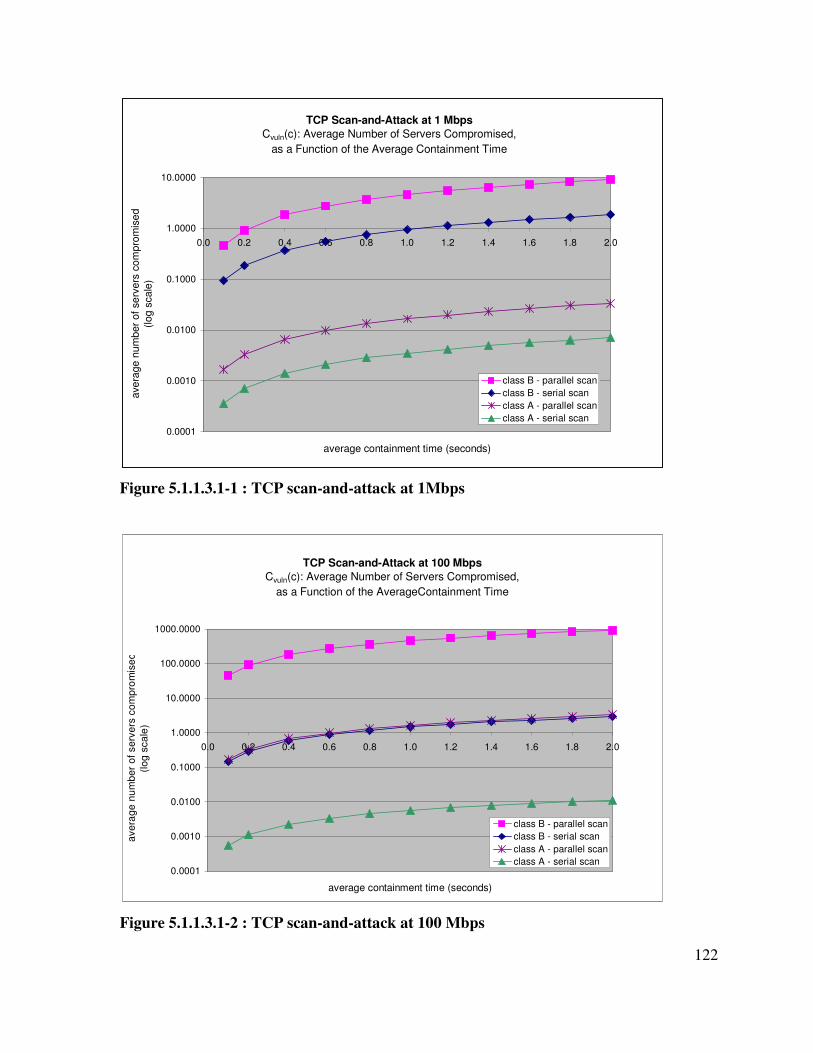
122
TCP Scan-and-Attack at 1 Mbps
Cvuln(c): Average Number of Servers Compromised,
as a Function of the Average Containment Time
0.0001
0.0010
0.0100
0.1000
1.0000
10.0000
0.0 0.2 0.4 0.6 0.8 1.0 1.2 1.4 1.6 1.8 2.0
average containment time (seconds)
ave
rage n
um
ber
of
se
rvers
com
pro
mis
ed
(log s
cale
)
class B - parallel scan
class B - serial scan
class A - parallel scan
class A - serial scan
Figure 5.1.1.3.1-1 : TCP scan-and-attack at 1Mbps
TCP Scan-and-Attack at 100 Mbps
Cvuln(c): Average Number of Servers Compromised,
as a Function of the AverageContainment Time
0.0001
0.0010
0.0100
0.1000
1.0000
10.0000
100.0000
1000.0000
0.0 0.2 0.4 0.6 0.8 1.0 1.2 1.4 1.6 1.8 2.0
average containment time (seconds)
ave
rag
e n
um
be
r o
f se
rve
rs c
om
pro
mis
ed
(lo
g s
ca
le)
class B - parallel scan
class B - serial scan
class A - parallel scan
class A - serial scan
Figure 5.1.1.3.1-2 : TCP scan-and-attack at 100 Mbps
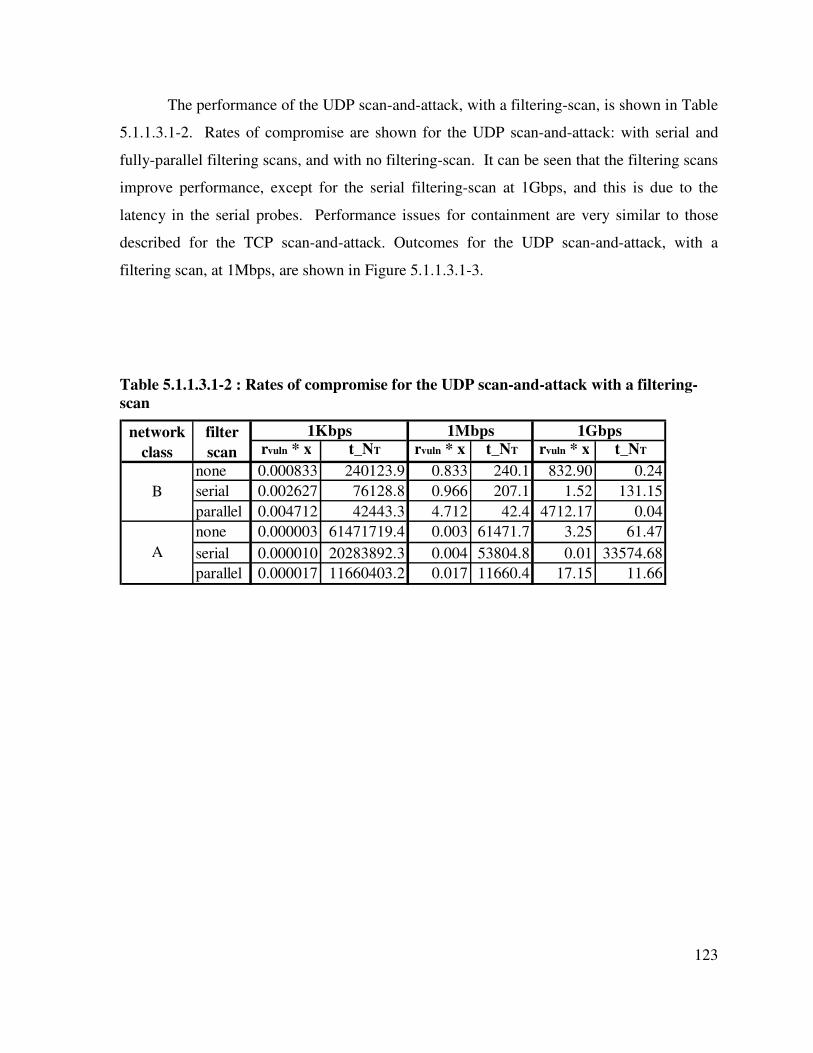
123
The performance of the UDP scan-and-attack, with a filtering-scan, is shown in Table
5.1.1.3.1-2. Rates of compromise are shown for the UDP scan-and-attack: with serial and
fully-parallel filtering scans, and with no filtering-scan. It can be seen that the filtering scans
improve performance, except for the serial filtering-scan at 1Gbps, and this is due to the
latency in the serial probes. Performance issues for containment are very similar to those
described for the TCP scan-and-attack. Outcomes for the UDP scan-and-attack, with a
filtering scan, at 1Mbps, are shown in Figure 5.1.1.3.1-3.
Table 5.1.1.3.1-2 : Rates of compromise for the UDP scan-and-attack with a filtering-
scan
rvuln * x t_NT rvuln * x t_NT rvuln * x t_NT
none 0.000833 240123.9 0.833 240.1 832.90 0.24
serial 0.002627 76128.8 0.966 207.1 1.52 131.15
parallel 0.004712 42443.3 4.712 42.4 4712.17 0.04
none 0.000003 61471719.4 0.003 61471.7 3.25 61.47
serial 0.000010 20283892.3 0.004 53804.8 0.01 33574.68
parallel 0.000017 11660403.2 0.017 11660.4 17.15 11.66
network
class
filter
scan
A
1Kbps 1Mbps 1Gbps
B
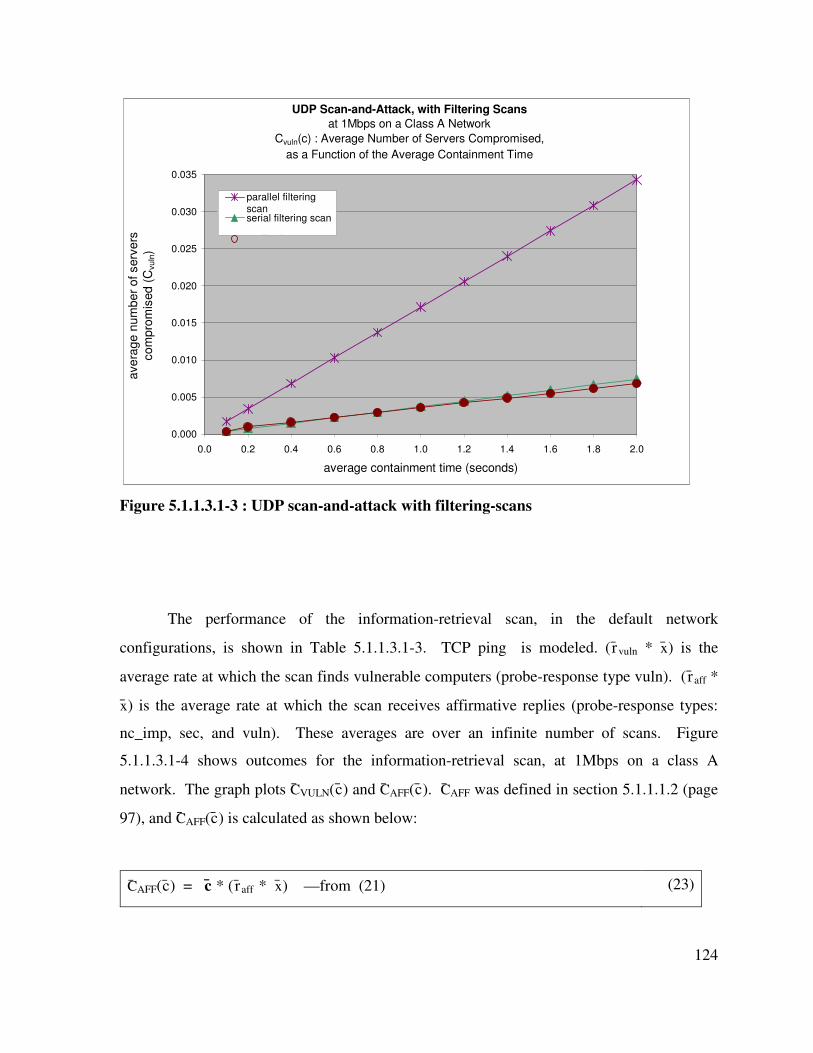
124
UDP Scan-and-Attack, with Filtering Scans
at 1Mbps on a Class A Network
Cvuln(c) : Average Number of Servers Compromised,
as a Function of the Average Containment Time
0.000
0.005
0.010
0.015
0.020
0.025
0.030
0.035
0.0 0.2 0.4 0.6 0.8 1.0 1.2 1.4 1.6 1.8 2.0
average containment time (seconds)
ave
rag
e n
um
be
r o
f serv
ers
co
mp
rom
ised
(C
vu
ln)
parallel filteringscanserial filtering scan
no filtering scan
Figure 5.1.1.3.1-3 : UDP scan-and-attack with filtering-scans
The performance of the information-retrieval scan, in the default network
configurations, is shown in Table 5.1.1.3.1-3. TCP ping is modeled. ( r̄vuln * x̄) is the
average rate at which the scan finds vulnerable computers (probe-response type vuln). ( r̄aff *
x̄) is the average rate at which the scan receives affirmative replies (probe-response types:
nc_imp, sec, and vuln). These averages are over an infinite number of scans. Figure
5.1.1.3.1-4 shows outcomes for the information-retrieval scan, at 1Mbps on a class A
network. The graph plots C̄VULN(c̄) and C̄AFF(c̄). C̄AFF was defined in section 5.1.1.1.2 (page
97), and C̄AFF(c̄) is calculated as shown below:
C̄AFF(c̄) = c̄ * ( r̄aff * x̄) —from (21) (23)
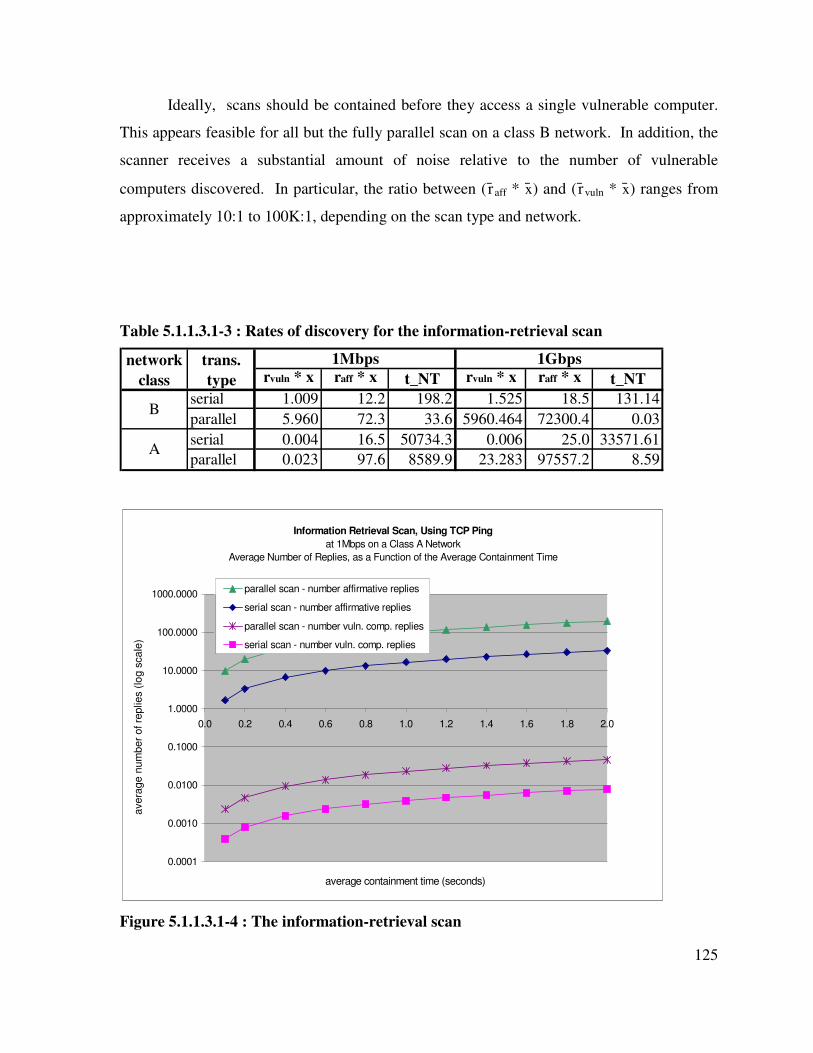
125
Ideally, scans should be contained before they access a single vulnerable computer.
This appears feasible for all but the fully parallel scan on a class B network. In addition, the
scanner receives a substantial amount of noise relative to the number of vulnerable
computers discovered. In particular, the ratio between ( r̄aff * x̄) and ( r̄vuln * x̄) ranges from
approximately 10:1 to 100K:1, depending on the scan type and network.
Table 5.1.1.3.1-3 : Rates of discovery for the information-retrieval scan
rvuln * x raff * x t_NT rvuln * x raff * x t_NT
serial 1.009 12.2 198.2 1.525 18.5 131.14
parallel 5.960 72.3 33.6 5960.464 72300.4 0.03
serial 0.004 16.5 50734.3 0.006 25.0 33571.61
parallel 0.023 97.6 8589.9 23.283 97557.2 8.59
B
A
1Mbps 1Gbpsnetwork
class
trans.
type
Information Retrieval Scan, Using TCP Ping
at 1Mbps on a Class A Network
Average Number of Replies, as a Function of the Average Containment Time
0.0001
0.0010
0.0100
0.1000
1.0000
10.0000
100.0000
1000.0000
0.0 0.2 0.4 0.6 0.8 1.0 1.2 1.4 1.6 1.8 2.0
average containment time (seconds)
avera
ge
num
ber
of re
plie
s (
log s
ca
le)
parallel scan - number affirmative replies
serial scan - number affirmative replies
parallel scan - number vuln. comp. replies
serial scan - number vuln. comp. replies
Figure 5.1.1.3.1-4 : The information-retrieval scan
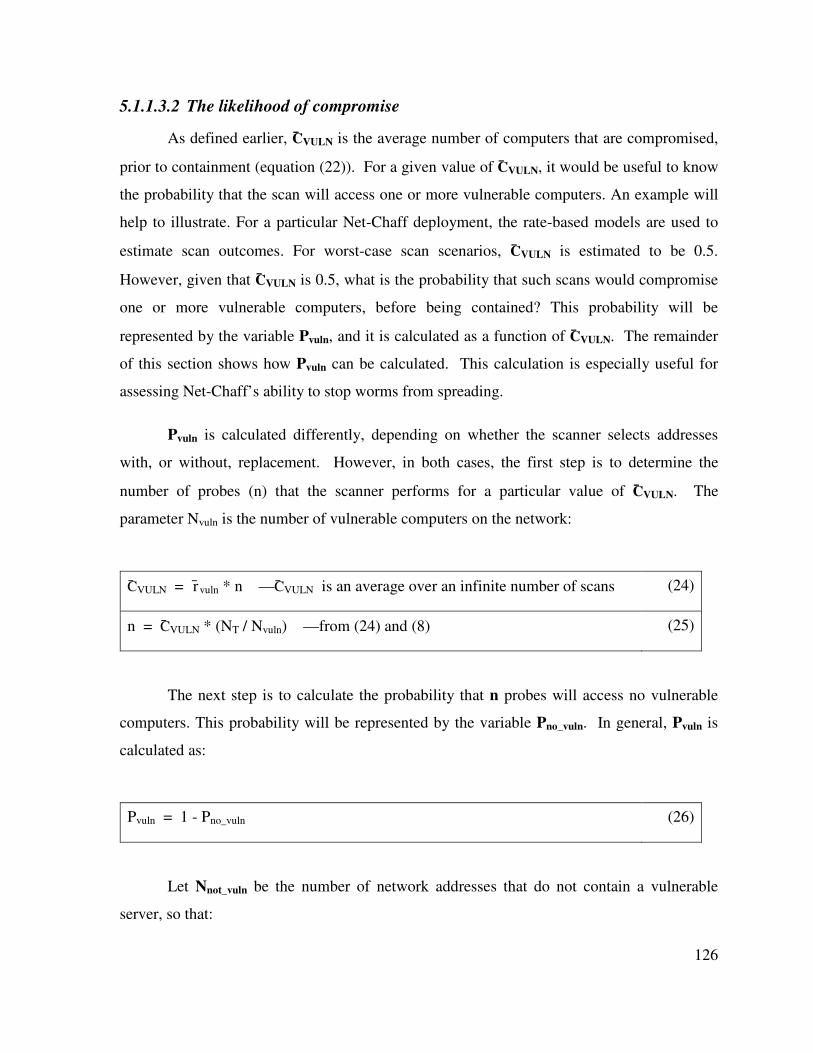
126
5.1.1.3.2 The likelihood of compromise
As defined earlier, C̄VULN is the average number of computers that are compromised,
prior to containment (equation (22)). For a given value of C̄VULN, it would be useful to know
the probability that the scan will access one or more vulnerable computers. An example will
help to illustrate. For a particular Net-Chaff deployment, the rate-based models are used to
estimate scan outcomes. For worst-case scan scenarios, C̄VULN is estimated to be 0.5.
However, given that C̄VULN is 0.5, what is the probability that such scans would compromise
one or more vulnerable computers, before being contained? This probability will be
represented by the variable Pvuln, and it is calculated as a function of C̄VULN. The remainder
of this section shows how Pvuln can be calculated. This calculation is especially useful for
assessing Net-Chaff’s ability to stop worms from spreading.
Pvuln is calculated differently, depending on whether the scanner selects addresses
with, or without, replacement. However, in both cases, the first step is to determine the
number of probes (n) that the scanner performs for a particular value of C̄VULN. The
parameter Nvuln is the number of vulnerable computers on the network:
C̄VULN = r̄vuln * n —C̄VULN is an average over an infinite number of scans (24)
n = C̄VULN * (NT / Nvuln) —from (24) and (8) (25)
The next step is to calculate the probability that n probes will access no vulnerable
computers. This probability will be represented by the variable Pno_vuln. In general, Pvuln is
calculated as:
Pvuln = 1 - Pno_vuln (26)
Let Nnot_vuln be the number of network addresses that do not contain a vulnerable
server, so that:
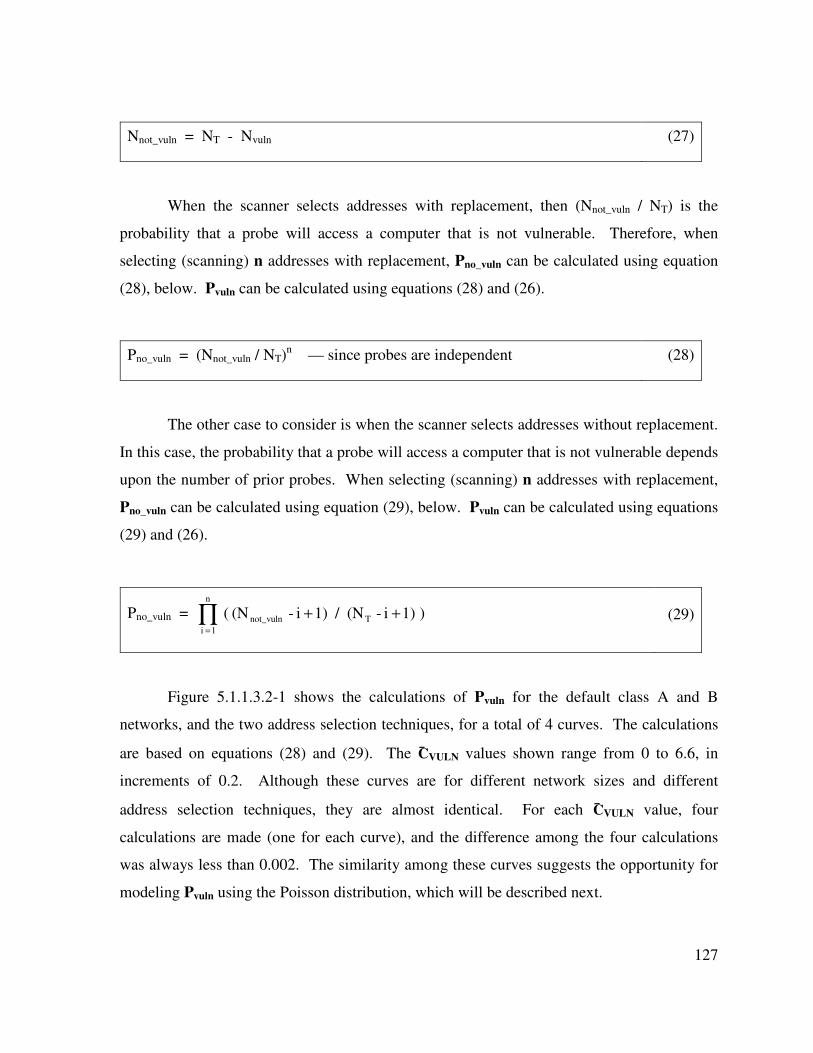
127
Nnot_vuln = NT - Nvuln (27)
When the scanner selects addresses with replacement, then (Nnot_vuln / NT) is the
probability that a probe will access a computer that is not vulnerable. Therefore, when
selecting (scanning) n addresses with replacement, Pno_vuln can be calculated using equation
(28), below. Pvuln can be calculated using equations (28) and (26).
Pno_vuln = (Nnot_vuln / NT)n — since probes are independent (28)
The other case to consider is when the scanner selects addresses without replacement.
In this case, the probability that a probe will access a computer that is not vulnerable depends
upon the number of prior probes. When selecting (scanning) n addresses with replacement,
Pno_vuln can be calculated using equation (29), below. Pvuln can be calculated using equations
(29) and (26).
Pno_vuln = ) 1) i - (N / 1) i - (N ( n
1 i
Tnot_vuln∏=
++ (29)
Figure 5.1.1.3.2-1 shows the calculations of Pvuln for the default class A and B
networks, and the two address selection techniques, for a total of 4 curves. The calculations
are based on equations (28) and (29). The C̄VULN values shown range from 0 to 6.6, in
increments of 0.2. Although these curves are for different network sizes and different
address selection techniques, they are almost identical. For each C̄VULN value, four
calculations are made (one for each curve), and the difference among the four calculations
was always less than 0.002. The similarity among these curves suggests the opportunity for
modeling Pvuln using the Poisson distribution, which will be described next.
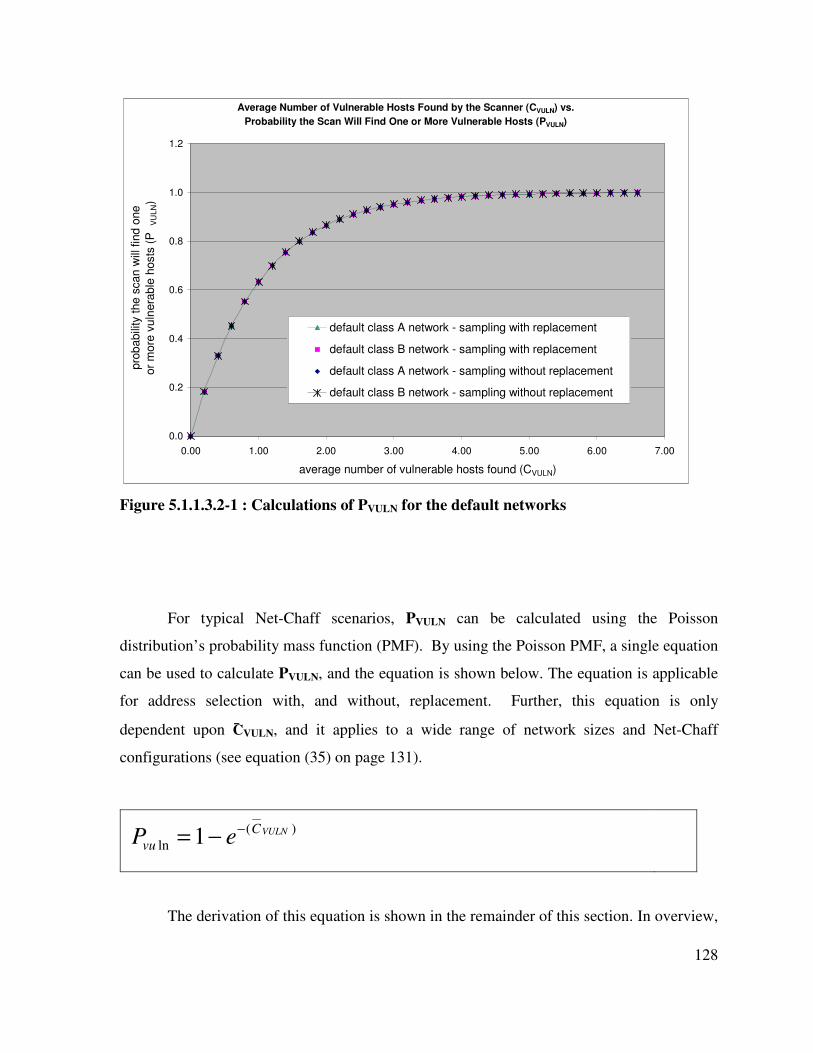
128
Average Number of Vulnerable Hosts Found by the Scanner (CVULN) vs.
Probability the Scan Will Find One or More Vulnerable Hosts (PVULN)
0.0
0.2
0.4
0.6
0.8
1.0
1.2
0.00 1.00 2.00 3.00 4.00 5.00 6.00 7.00
average number of vulnerable hosts found (CVULN)
pro
babili
ty t
he
scan
will
fin
d o
ne
or
more
vu
lnera
ble
hosts
(P
V
ULN)
default class A network - sampling with replacement
default class B network - sampling with replacement
default class A network - sampling without replacement
default class B network - sampling without replacement
Figure 5.1.1.3.2-1 : Calculations of PVULN for the default networks
For typical Net-Chaff scenarios, PVULN can be calculated using the Poisson
distribution’s probability mass function (PMF). By using the Poisson PMF, a single equation
can be used to calculate PVULN, and the equation is shown below. The equation is applicable
for address selection with, and without, replacement. Further, this equation is only
dependent upon C̄VULN, and it applies to a wide range of network sizes and Net-Chaff
configurations (see equation (35) on page 131).
)(
ln 1 VULNC
vu eP −−=
The derivation of this equation is shown in the remainder of this section. In overview,
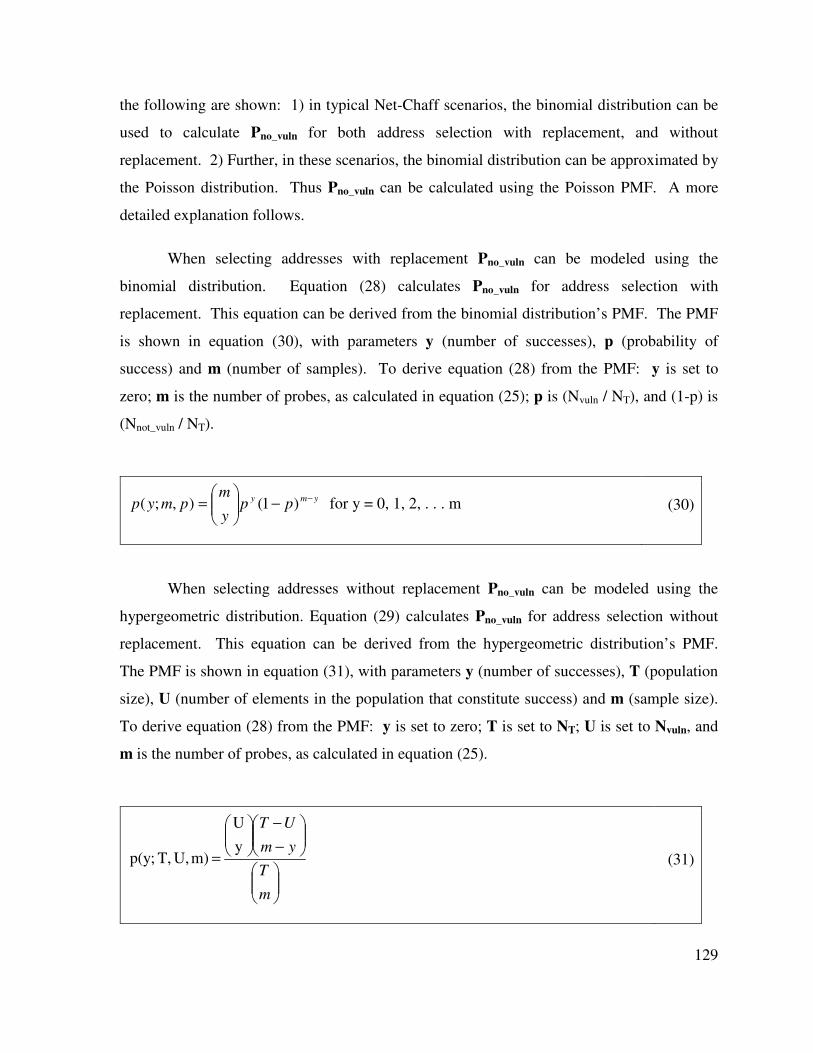
129
the following are shown: 1) in typical Net-Chaff scenarios, the binomial distribution can be
used to calculate Pno_vuln for both address selection with replacement, and without
replacement. 2) Further, in these scenarios, the binomial distribution can be approximated by
the Poisson distribution. Thus Pno_vuln can be calculated using the Poisson PMF. A more
detailed explanation follows.
When selecting addresses with replacement Pno_vuln can be modeled using the
binomial distribution. Equation (28) calculates Pno_vuln for address selection with
replacement. This equation can be derived from the binomial distribution’s PMF. The PMF
is shown in equation (30), with parameters y (number of successes), p (probability of
success) and m (number of samples). To derive equation (28) from the PMF: y is set to
zero; m is the number of probes, as calculated in equation (25); p is (Nvuln / NT), and (1-p) is
(Nnot_vuln / NT).
ymypp
y
mpmyp
−−
= )1(),;( for y = 0, 1, 2, . . . m (30)
When selecting addresses without replacement Pno_vuln can be modeled using the
hypergeometric distribution. Equation (29) calculates Pno_vuln for address selection without
replacement. This equation can be derived from the hypergeometric distribution’s PMF.
The PMF is shown in equation (31), with parameters y (number of successes), T (population
size), U (number of elements in the population that constitute success) and m (sample size).
To derive equation (28) from the PMF: y is set to zero; T is set to NT; U is set to Nvuln, and
m is the number of probes, as calculated in equation (25).
−
−
=
m
T
ym
UT
y
U
m)U,T, p(y; (31)
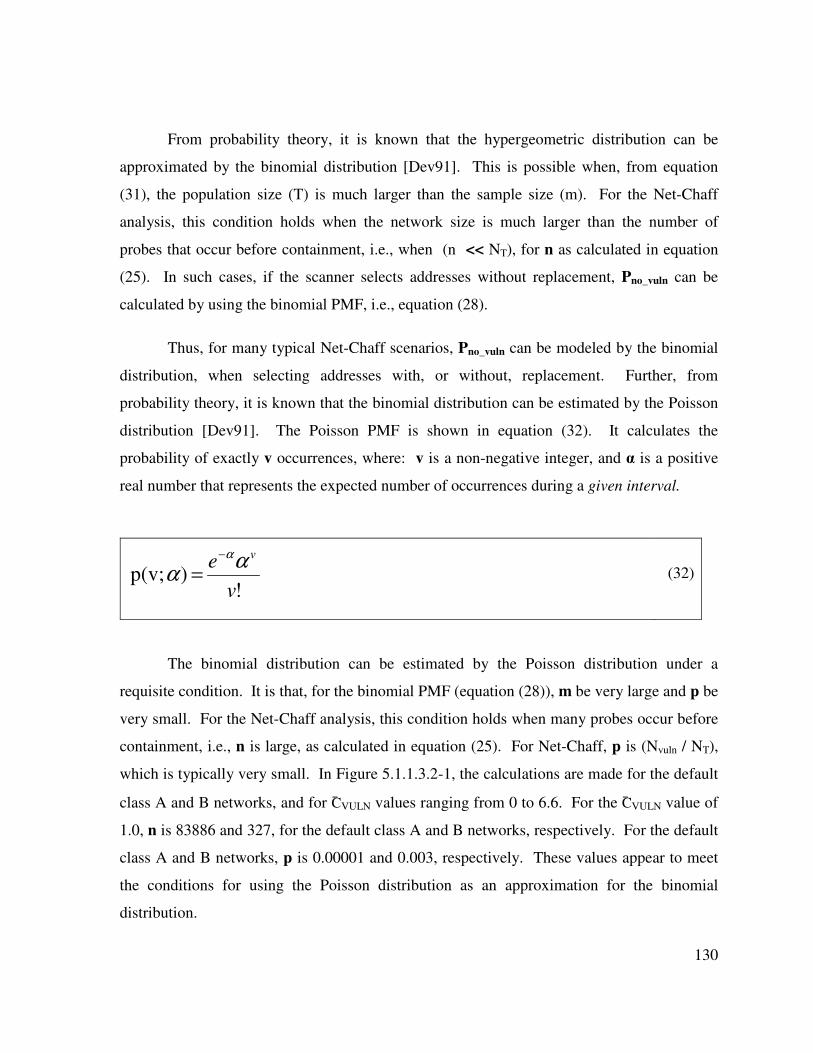
130
From probability theory, it is known that the hypergeometric distribution can be
approximated by the binomial distribution [Dev91]. This is possible when, from equation
(31), the population size (T) is much larger than the sample size (m). For the Net-Chaff
analysis, this condition holds when the network size is much larger than the number of
probes that occur before containment, i.e., when (n << NT), for n as calculated in equation
(25). In such cases, if the scanner selects addresses without replacement, Pno_vuln can be
calculated by using the binomial PMF, i.e., equation (28).
Thus, for many typical Net-Chaff scenarios, Pno_vuln can be modeled by the binomial
distribution, when selecting addresses with, or without, replacement. Further, from
probability theory, it is known that the binomial distribution can be estimated by the Poisson
distribution [Dev91]. The Poisson PMF is shown in equation (32). It calculates the
probability of exactly v occurrences, where: v is a non-negative integer, and α is a positive
real number that represents the expected number of occurrences during a given interval.
! ) p(v;
v
evα
αα−
= (32)
The binomial distribution can be estimated by the Poisson distribution under a
requisite condition. It is that, for the binomial PMF (equation (28)), m be very large and p be
very small. For the Net-Chaff analysis, this condition holds when many probes occur before
containment, i.e., n is large, as calculated in equation (25). For Net-Chaff, p is (Nvuln / NT),
which is typically very small. In Figure 5.1.1.3.2-1, the calculations are made for the default
class A and B networks, and for C̄VULN values ranging from 0 to 6.6. For the C̄VULN value of
1.0, n is 83886 and 327, for the default class A and B networks, respectively. For the default
class A and B networks, p is 0.00001 and 0.003, respectively. These values appear to meet
the conditions for using the Poisson distribution as an approximation for the binomial
distribution.
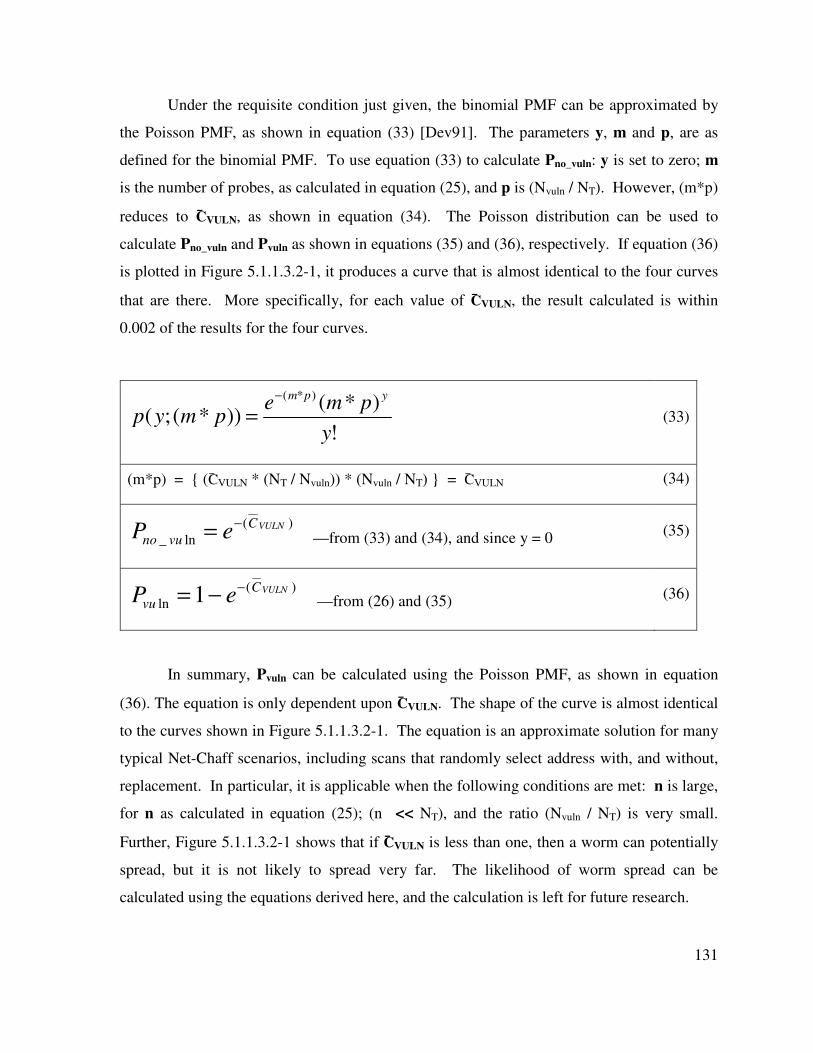
131
Under the requisite condition just given, the binomial PMF can be approximated by
the Poisson PMF, as shown in equation (33) [Dev91]. The parameters y, m and p, are as
defined for the binomial PMF. To use equation (33) to calculate Pno_vuln: y is set to zero; m
is the number of probes, as calculated in equation (25), and p is (Nvuln / NT). However, (m*p)
reduces to C̄VULN, as shown in equation (34). The Poisson distribution can be used to
calculate Pno_vuln and Pvuln as shown in equations (35) and (36), respectively. If equation (36)
is plotted in Figure 5.1.1.3.2-1, it produces a curve that is almost identical to the four curves
that are there. More specifically, for each value of C̄VULN, the result calculated is within
0.002 of the results for the four curves.
!
)*())*(;(
)*(
y
pmepmyp
ypm−
= (33)
(m*p) = { (C̄VULN * (NT / Nvuln)) * (Nvuln / NT) } = C̄VULN (34)
)(
ln_VULNC
vuno eP−
= —from (33) and (34), and since y = 0 (35)
)(
ln 1 VULNC
vu eP−
−= —from (26) and (35) (36)
In summary, Pvuln can be calculated using the Poisson PMF, as shown in equation
(36). The equation is only dependent upon C̄VULN. The shape of the curve is almost identical
to the curves shown in Figure 5.1.1.3.2-1. The equation is an approximate solution for many
typical Net-Chaff scenarios, including scans that randomly select address with, and without,
replacement. In particular, it is applicable when the following conditions are met: n is large,
for n as calculated in equation (25); (n << NT), and the ratio (Nvuln / NT) is very small.
Further, Figure 5.1.1.3.2-1 shows that if C̄VULN is less than one, then a worm can potentially
spread, but it is not likely to spread very far. The likelihood of worm spread can be
calculated using the equations derived here, and the calculation is left for future research.
132
5.1.1.3.3 Summary
This section used the rate-based models to estimate Net-Chaff’s performance. The
analysis focused on Net-Chaff’s ability to prevent scanners from accessing vulnerable
computers. Fast scanner performance was calculated by modeling scans with small-sized
probes, high bandwidth, and fully parallel probe transmission. A large corporate network
was modeled, with 20K computers and 200 vulnerable computers. Typical Net-Chaff
deployments were modeled, with a moderate amount of impersonations for slowing down
scans. In practice, scans could be further slowed by using more impersonations, and the “tar-
pits” described in chapter 4.
The analysis indicates that Net-Chaff can effectively contain scans for many typical
networks and scan types. The scan-and-attack analysis indicates that Net-Chaff has the
potential for stopping worms from spreading. To stop worms, a scan’s average number of
compromised computers (C̄VULN) must be less than one. For the class A network, the
requisite containment times appear to be achievable in practice, given current technology.
However, in many class B networks the requisite containment times may not be achievable
for fully parallel scans at, or above, 100Mbps. Further research is needed to learn the
specific containment speeds that are possible with the current network technology.
Net-Chaff’s performance in containing information-retrieval scans is similar to its
performance for containing scan-and-attack scans. In addition, information-retrieval scans
receive a substantial amount of noise from Net-Chaff, relative to the vulnerable computers
discovered.
For a given value of C̄VULN, it would be useful to know the probability that the scan
will access one or more vulnerable computers. This probability will be represented by the
variable Pvuln, and it is calculated as a function of C̄VULN. The Poisson PMF can be used to
calculate Pvuln. This calculation provides an approximate solution for many typical Net-
Chaff scenarios. It indicates that if C̄VULN is less than one, then a worm could potentially
spread, but not far.
133
5.1.1.4 Elements of Net-Chaff performance
One of Net-Chaff’s primary objectives is reducing the average number of vulnerable
computers that are accessed by scanners (C̄VULN). This section analyzes the elements of Net-
Chaff that determine C̄VULN. The purpose of the analysis is to understand: 1) how to
effectively configure Net-Chaff deployments, and 2) the role of deception in reducing C̄VULN.
An equation for estimating C̄VULN was given earlier (equation (22) on page 119), and
it is repeated below. As the equation shows, C̄VULN is determined by three factors: the
containment time (c̄), the average network scan rate (x̄), and the proportion of vulnerable
computers on the network ( r̄vuln). C̄VULN and each of its factors are an average achieved over
an infinite number of scans. Any percentage reduction in a factor will result in the same
reduction in C̄VULN, e.g., cutting c̄ in half will cut C̄VULN in half.
The following three subsections examine each of the three C̄VULN factors,
respectively. Most of the analysis is illustrated by showing outcomes for the fully-parallel
TCP scan-and-attack running at 100Mbps. The scan occurs on the default class A network.
(This scan and network were defined in section 5.1.1.2.4 on page 114.) This scenario
represents an effective Net-Chaff deployment vs. a fast scan. Also, the analysis focuses on
the example web-server scans, including Net-Chaff impersonations for web-servers (i.e.,
probe-response type nc_imp), and vulnerable web-servers (i.e., probe-response type vuln).
5.1.1.4.1 Containment time
An equation for estimating the average containment time (c̄) was given earlier
(equation on page 59), and it is repeated below. It is the sum of the average detection time
(d̄) and the blocking time (b). An equation for estimating the average detection time (d̄) was
given earlier (equation (17) on page 112), and it is also repeated here.
C̄VULN = c̄ * x̄ * r̄vuln (22)
134
c̄ = d̄ + b
d̄ = [z / (r̄nc * x̄)] - λ (17)
This section examines how C̄VULN can be reduced by altering the parameters in
equations (17) and . The blocking time can be reduced by technical means, e.g., speeding up
communication with the blocking routers. C̄VULN can be expressed as a function of the
blocking time, with all other parameters kept constant. The function is represented as C̄
VULN(b). It is shown below, and the dependent variable is in bold, for clarity. It is a linear
equation, with slope (x̄ * r̄vuln). For Net-Chaff deployments, this equation can be used to
asses the benefits of reducing the blocking time.
C̄VULN(b) = b * (x̄ * r̄vuln) + (d̄ * x̄ * r̄vuln) —from (22) and
Figure 5.1.1.4.1-1 shows C̄VULN(b) for a TCP Scan-and-Attack. (Due to type-setting
limitations, the graph’s labels omit the bar over C̄VULN.) A fully parallel scan is modeled,
using 100Mbps. The default class A network is used. The detection threshold (z) is
500 probes, and the slope is 1.654 . In this case, reducing b is a potentially
effective technique for reducing C̄VULN.
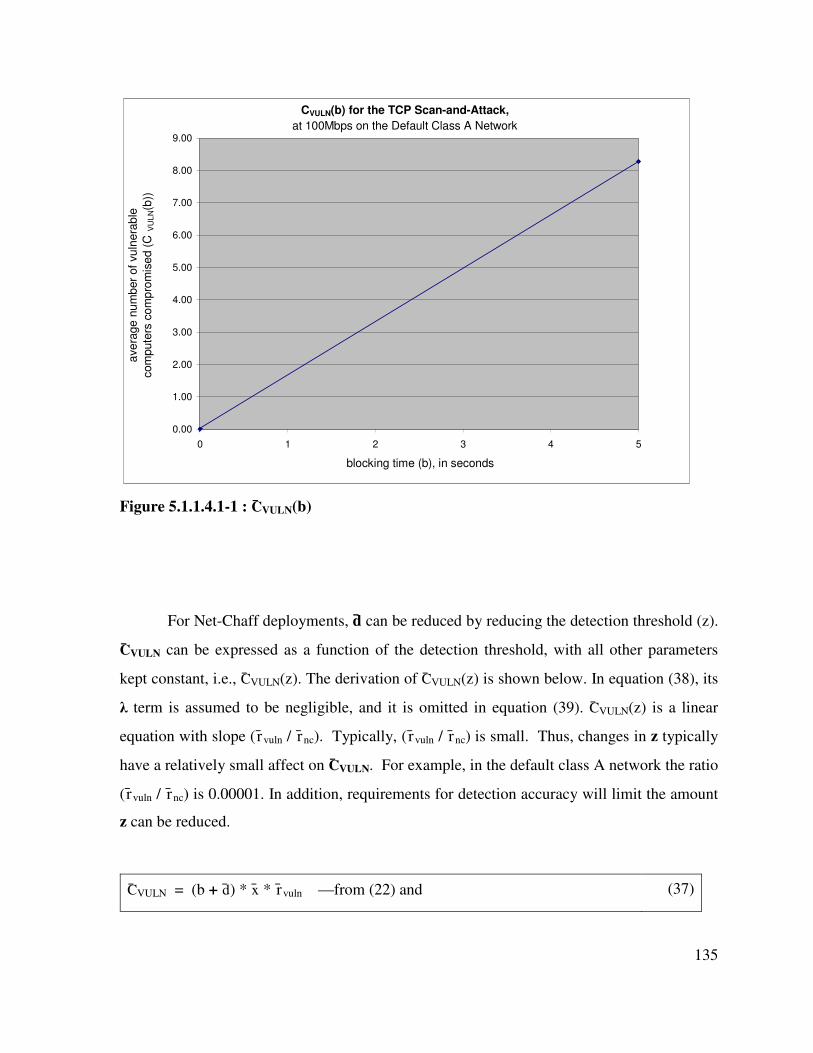
135
CVULN(b) for the TCP Scan-and-Attack,
at 100Mbps on the Default Class A Network
0.00
1.00
2.00
3.00
4.00
5.00
6.00
7.00
8.00
9.00
0 1 2 3 4 5
blocking time (b), in seconds
ave
rage
nu
mb
er
of
vu
lnera
ble
com
pute
rs c
om
pro
mis
ed (
C V
UL
N(b
))
Figure 5.1.1.4.1-1 : C̄VULN(b)
For Net-Chaff deployments, d̄ can be reduced by reducing the detection threshold (z).
C̄VULN can be expressed as a function of the detection threshold, with all other parameters
kept constant, i.e., C̄VULN(z). The derivation of C̄VULN(z) is shown below. In equation (38), its
λ term is assumed to be negligible, and it is omitted in equation (39). C̄VULN(z) is a linear
equation with slope ( r̄vuln / r̄nc). Typically, ( r̄vuln / r̄nc) is small. Thus, changes in z typically
have a relatively small affect on C̄VULN. For example, in the default class A network the ratio
( r̄vuln / r̄nc) is 0.00001. In addition, requirements for detection accuracy will limit the amount
z can be reduced.
C̄VULN = (b + d̄) * x̄ * r̄vuln —from (22) and (37)
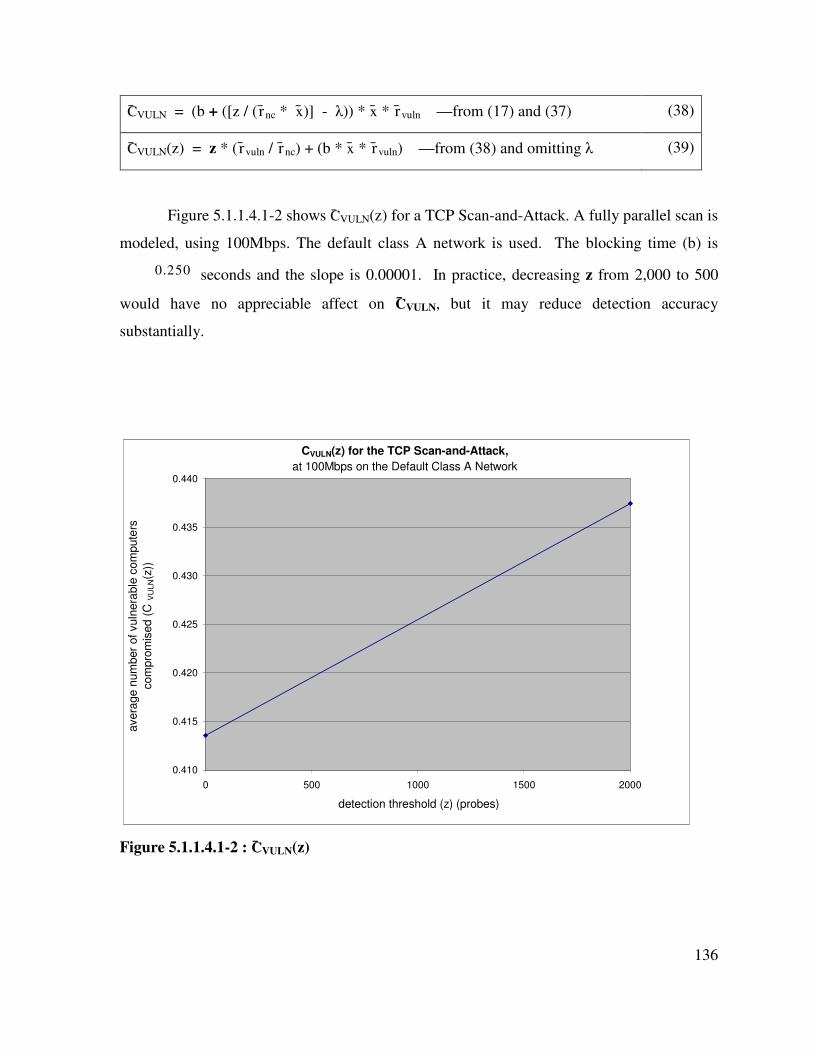
136
C̄VULN = (b + ([z / ( r̄nc * x̄)] - λ)) * x̄ * r̄vuln —from (17) and (37) (38)
C̄VULN(z) = z * ( r̄vuln / r̄nc) + (b * x̄ * r̄vuln) —from (38) and omitting λ (39)
Figure 5.1.1.4.1-2 shows C̄VULN(z) for a TCP Scan-and-Attack. A fully parallel scan is
modeled, using 100Mbps. The default class A network is used. The blocking time (b) is
0.250 seconds and the slope is 0.00001. In practice, decreasing z from 2,000 to 500
would have no appreciable affect on C̄VULN, but it may reduce detection accuracy
substantially.
CVULN(z) for the TCP Scan-and-Attack,
at 100Mbps on the Default Class A Network
0.410
0.415
0.420
0.425
0.430
0.435
0.440
0 500 1000 1500 2000
detection threshold (z) (probes)
avera
ge n
um
ber
of vuln
era
ble
com
pute
rs
com
pro
mis
ed
(C
VU
LN(z
))
Figure 5.1.1.4.1-2 : C̄VULN(z)
137
Net-Chaff detects scans by monitoring the probes sent to the addresses it manages. d̄
can also be reduced by increasing r̄nc, which is the ratio between the Net-Chaff managed
addresses and the total number of network addresses, i.e., (NNC / NT). C̄VULN can be
expressed as a function of r̄nc (i.e., C̄VULN( r̄nc)), with all other parameters kept constant:
C̄VULN(r̄nc) = (1/r̄nc) * (z * r̄vuln) + (b * x̄ * r̄vuln) —by reordering (39) (40)
Increasing r̄nc causes C̄VULN to decrease at a rate proportional to (1/ r̄nc), if all other
parameters remain constant. Thus, scan detection can be improved by increasing r̄nc, but this
provides diminishing marginal reductions in C̄VULN, i.e., the slope of (1/ r̄nc) is (-1 / ( r̄nc)2).
In practice, when r̄nc is changed, some of the other parameters in equation (40)
typically do not remain constant. For example, an increase in r̄nc will usually result in a
decrease in x̄, which also reduces C̄VULN. This will be further addressed in the next section.
Figure 5.1.1.4.1-3 shows C̄VULN( r̄nc) for a TCP Scan-and-Attack. r̄nc is the
independent variable, and all other parameters are kept constant. A fully parallel scan is
modeled, using 100Mbps. The blocking time (b) is 0.250 seconds and the detection
threshold (z) is 500 probes. The default class A network is used, with one exception.
In this case, Net-Chaff is not using impersonations, in order to make x̄ constant. r̄nc is
calculated as (NNC / NT). NT is fixed for the class A network, and NNC is varied. r̄nc ranges
from 0.1 up to the maximum value, which is close to 1.0.
This scenario and graph reveal design principles for Net-Chaff deployments. If the
Net-Chaff managed addresses do not appreciably slow down a scan, their usefulness lies
solely in scan detection (i.e., as calculated by d̄). Further, for the purpose of scan detection,
Net-Chaff may only need to monitor a small fraction of the network addresses. For example,
in Figure 5.1.1.4.1-3 increasing r̄nc beyong 0.2 provides relatively little reduction in C̄VULN.
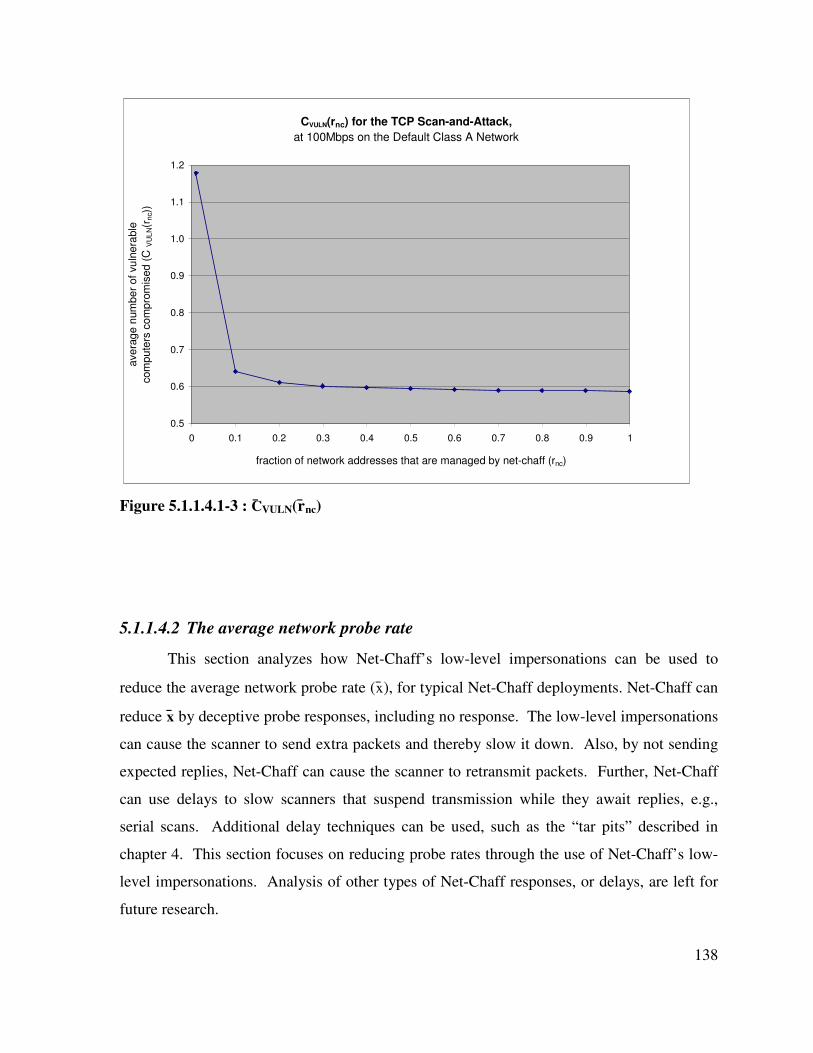
138
CVULN(rnc) for the TCP Scan-and-Attack,
at 100Mbps on the Default Class A Network
0.5
0.6
0.7
0.8
0.9
1.0
1.1
1.2
0 0.1 0.2 0.3 0.4 0.5 0.6 0.7 0.8 0.9 1
fraction of network addresses that are managed by net-chaff (rnc)
ave
rag
e n
um
be
r o
f vu
lne
rable
com
pu
ters
co
mp
rom
ise
d (
C V
UL
N(r
nc)
)
Figure 5.1.1.4.1-3 : C̄VULN(r̄nc)
5.1.1.4.2 The average network probe rate
This section analyzes how Net-Chaff’s low-level impersonations can be used to
reduce the average network probe rate (x̄), for typical Net-Chaff deployments. Net-Chaff can
reduce x̄ by deceptive probe responses, including no response. The low-level impersonations
can cause the scanner to send extra packets and thereby slow it down. Also, by not sending
expected replies, Net-Chaff can cause the scanner to retransmit packets. Further, Net-Chaff
can use delays to slow scanners that suspend transmission while they await replies, e.g.,
serial scans. Additional delay techniques can be used, such as the “tar pits” described in
chapter 4. This section focuses on reducing probe rates through the use of Net-Chaff’s low-
level impersonations. Analysis of other types of Net-Chaff responses, or delays, are left for
future research.
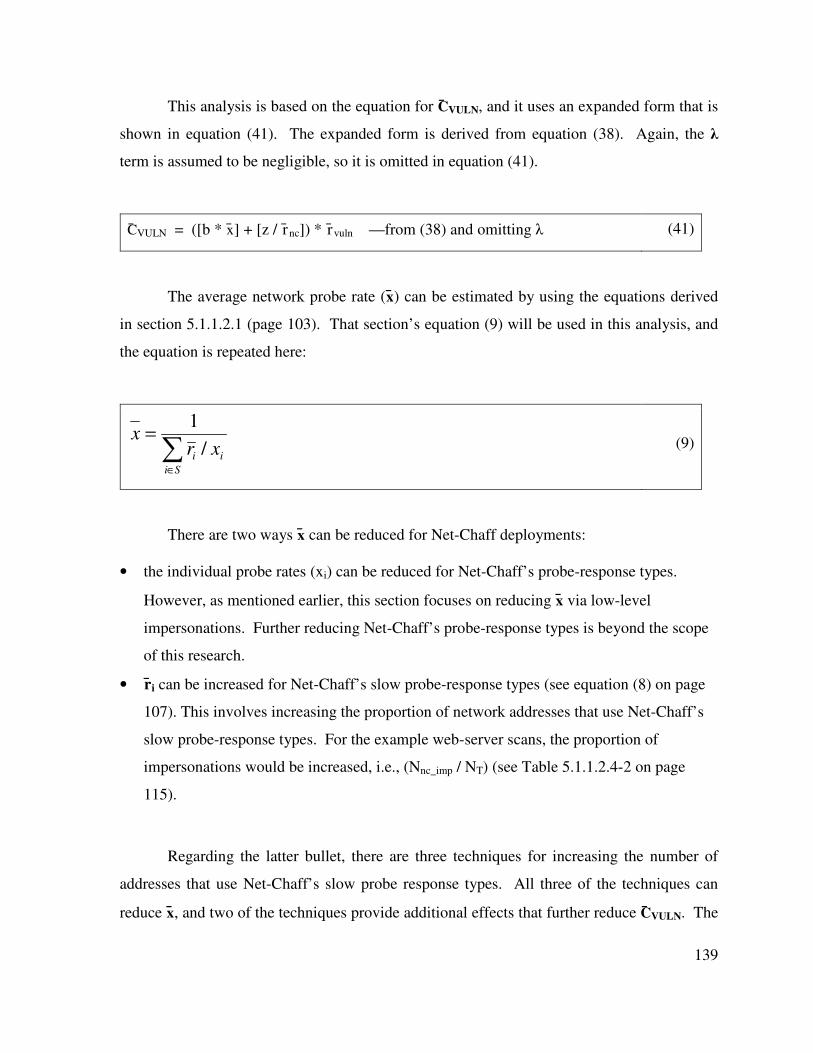
139
This analysis is based on the equation for C̄VULN, and it uses an expanded form that is
shown in equation (41). The expanded form is derived from equation (38). Again, the λ
term is assumed to be negligible, so it is omitted in equation (41).
C̄VULN = ([b * x̄] + [z / r̄nc]) * r̄vuln —from (38) and omitting λ (41)
The average network probe rate (x̄) can be estimated by using the equations derived
in section 5.1.1.2.1 (page 103). That section’s equation (9) will be used in this analysis, and
the equation is repeated here:
∑∈
=
Si
ii xrx
/
1 (9)
There are two ways x̄ can be reduced for Net-Chaff deployments:
• the individual probe rates (xi) can be reduced for Net-Chaff’s probe-response types.
However, as mentioned earlier, this section focuses on reducing x̄ via low-level
impersonations. Further reducing Net-Chaff’s probe-response types is beyond the scope
of this research.
• r̄i can be increased for Net-Chaff’s slow probe-response types (see equation (8) on page
107). This involves increasing the proportion of network addresses that use Net-Chaff’s
slow probe-response types. For the example web-server scans, the proportion of
impersonations would be increased, i.e., (Nnc_imp / NT) (see Table 5.1.1.2.4-2 on page
115).
Regarding the latter bullet, there are three techniques for increasing the number of
addresses that use Net-Chaff’s slow probe response types. All three of the techniques can
reduce x̄, and two of the techniques provide additional effects that further reduce C̄VULN. The
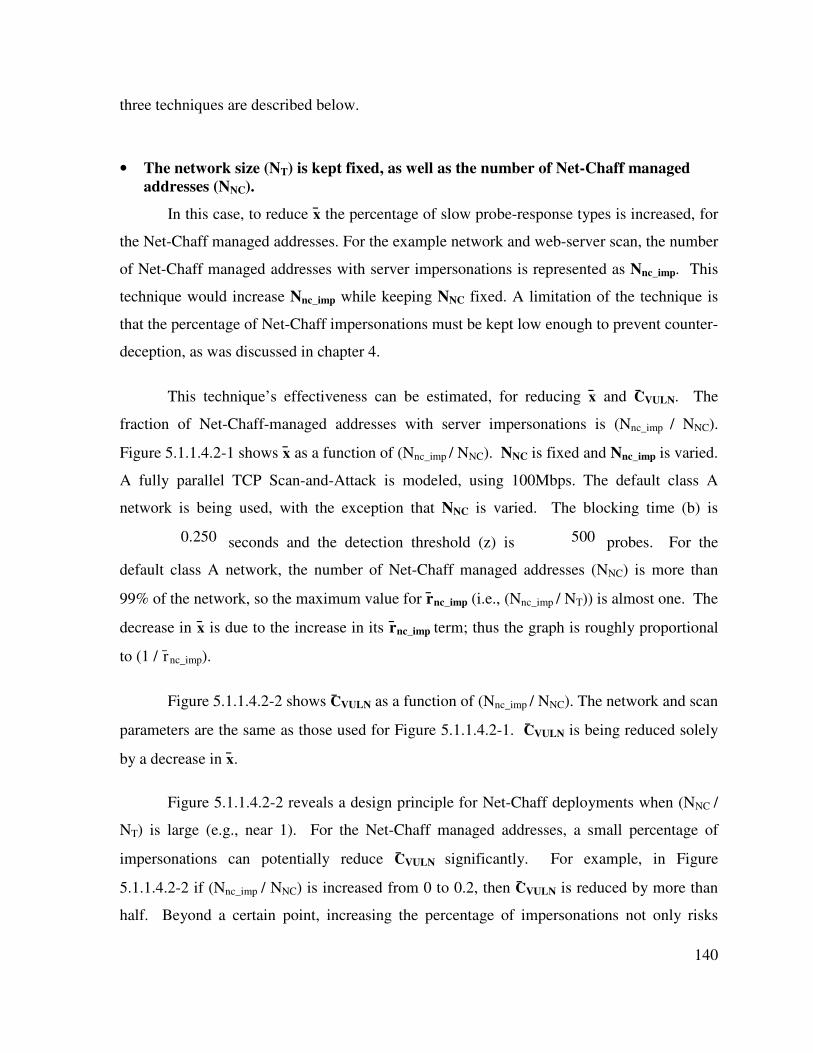
140
three techniques are described below.
• The network size (NT) is kept fixed, as well as the number of Net-Chaff managed
addresses (NNC).
In this case, to reduce x̄ the percentage of slow probe-response types is increased, for
the Net-Chaff managed addresses. For the example network and web-server scan, the number
of Net-Chaff managed addresses with server impersonations is represented as Nnc_imp. This
technique would increase Nnc_imp while keeping NNC fixed. A limitation of the technique is
that the percentage of Net-Chaff impersonations must be kept low enough to prevent counter-
deception, as was discussed in chapter 4.
This technique’s effectiveness can be estimated, for reducing x̄ and C̄VULN. The
fraction of Net-Chaff-managed addresses with server impersonations is (Nnc_imp / NNC).
Figure 5.1.1.4.2-1 shows x̄ as a function of (Nnc_imp / NNC). NNC is fixed and Nnc_imp is varied.
A fully parallel TCP Scan-and-Attack is modeled, using 100Mbps. The default class A
network is being used, with the exception that NNC is varied. The blocking time (b) is
0.250 seconds and the detection threshold (z) is 500 probes. For the
default class A network, the number of Net-Chaff managed addresses (NNC) is more than
99% of the network, so the maximum value for r̄nc_imp (i.e., (Nnc_imp / NT)) is almost one. The
decrease in x̄ is due to the increase in its r̄nc_imp term; thus the graph is roughly proportional
to (1 / r̄nc_imp).
Figure 5.1.1.4.2-2 shows C̄VULN as a function of (Nnc_imp / NNC). The network and scan
parameters are the same as those used for Figure 5.1.1.4.2-1. C̄VULN is being reduced solely
by a decrease in x̄.
Figure 5.1.1.4.2-2 reveals a design principle for Net-Chaff deployments when (NNC /
NT) is large (e.g., near 1). For the Net-Chaff managed addresses, a small percentage of
impersonations can potentially reduce C̄VULN significantly. For example, in Figure
5.1.1.4.2-2 if (Nnc_imp / NNC) is increased from 0 to 0.2, then C̄VULN is reduced by more than
half. Beyond a certain point, increasing the percentage of impersonations not only risks
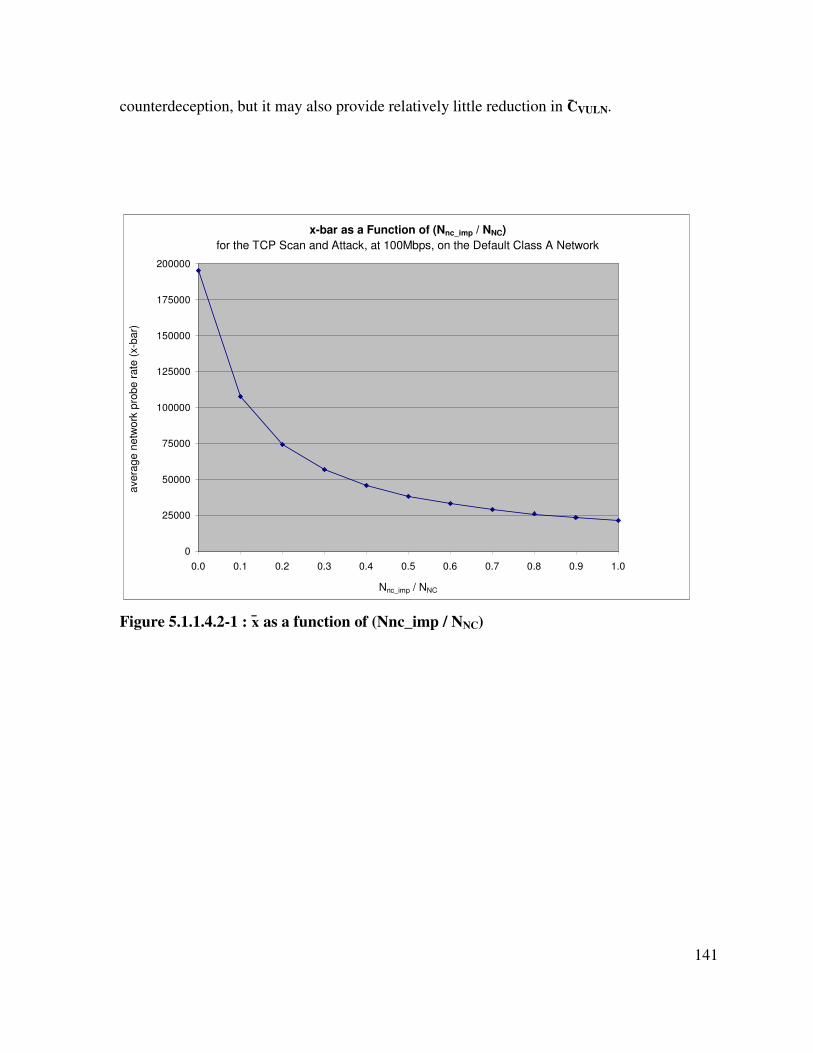
141
counterdeception, but it may also provide relatively little reduction in C̄VULN.
x-bar as a Function of (Nnc_imp / NNC)
for the TCP Scan and Attack, at 100Mbps, on the Default Class A Network
0
25000
50000
75000
100000
125000
150000
175000
200000
0.0 0.1 0.2 0.3 0.4 0.5 0.6 0.7 0.8 0.9 1.0
Nnc_imp / NNC
avera
ge n
etw
ork
pro
be
rate
(x-b
ar)
Figure 5.1.1.4.2-1 : x̄ as a function of (Nnc_imp / NNC)
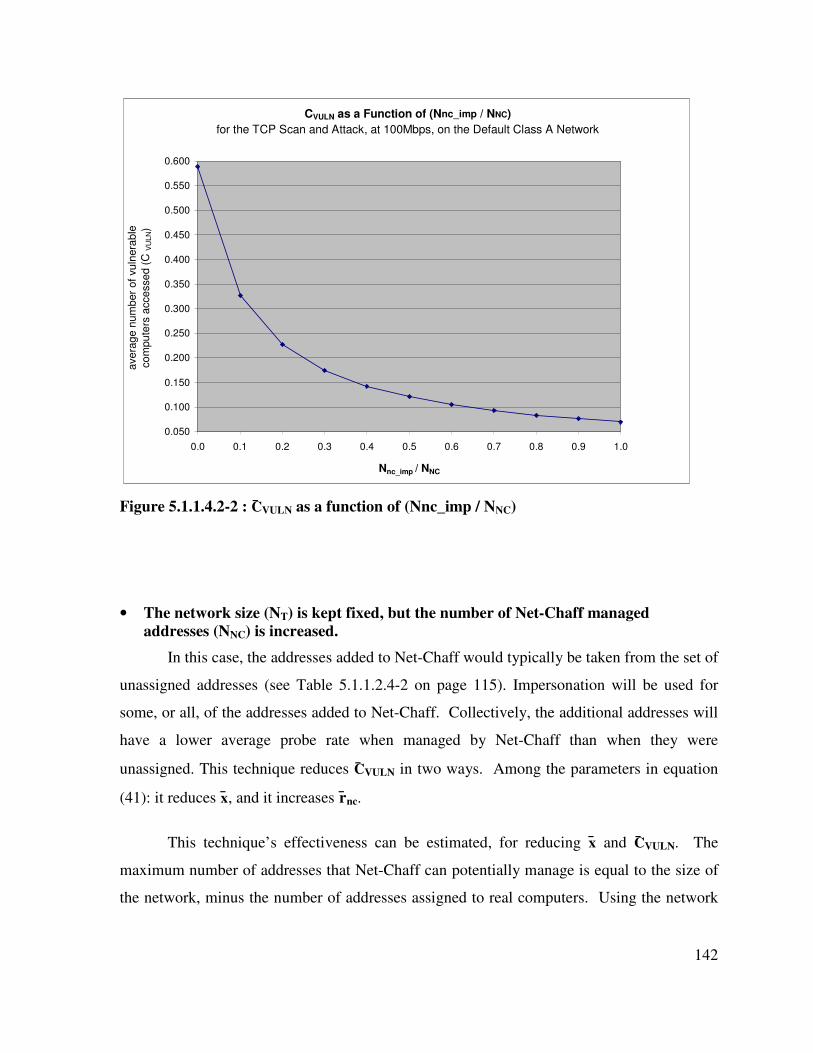
142
CVULN as a Function of (Nnc_imp / NNC)
for the TCP Scan and Attack, at 100Mbps, on the Default Class A Network
0.050
0.100
0.150
0.200
0.250
0.300
0.350
0.400
0.450
0.500
0.550
0.600
0.0 0.1 0.2 0.3 0.4 0.5 0.6 0.7 0.8 0.9 1.0
Nnc_imp / NNC
ave
rag
e n
um
ber
of
vu
lnera
ble
co
mpu
ters
acce
sse
d (
C V
ULN)
Figure 5.1.1.4.2-2 : C̄VULN as a function of (Nnc_imp / NNC)
• The network size (NT) is kept fixed, but the number of Net-Chaff managed addresses (NNC) is increased.
In this case, the addresses added to Net-Chaff would typically be taken from the set of
unassigned addresses (see Table 5.1.1.2.4-2 on page 115). Impersonation will be used for
some, or all, of the addresses added to Net-Chaff. Collectively, the additional addresses will
have a lower average probe rate when managed by Net-Chaff than when they were
unassigned. This technique reduces C̄VULN in two ways. Among the parameters in equation
(41): it reduces x̄, and it increases r̄nc.
This technique’s effectiveness can be estimated, for reducing x̄ and C̄VULN. The
maximum number of addresses that Net-Chaff can potentially manage is equal to the size of
the network, minus the number of addresses assigned to real computers. Using the network
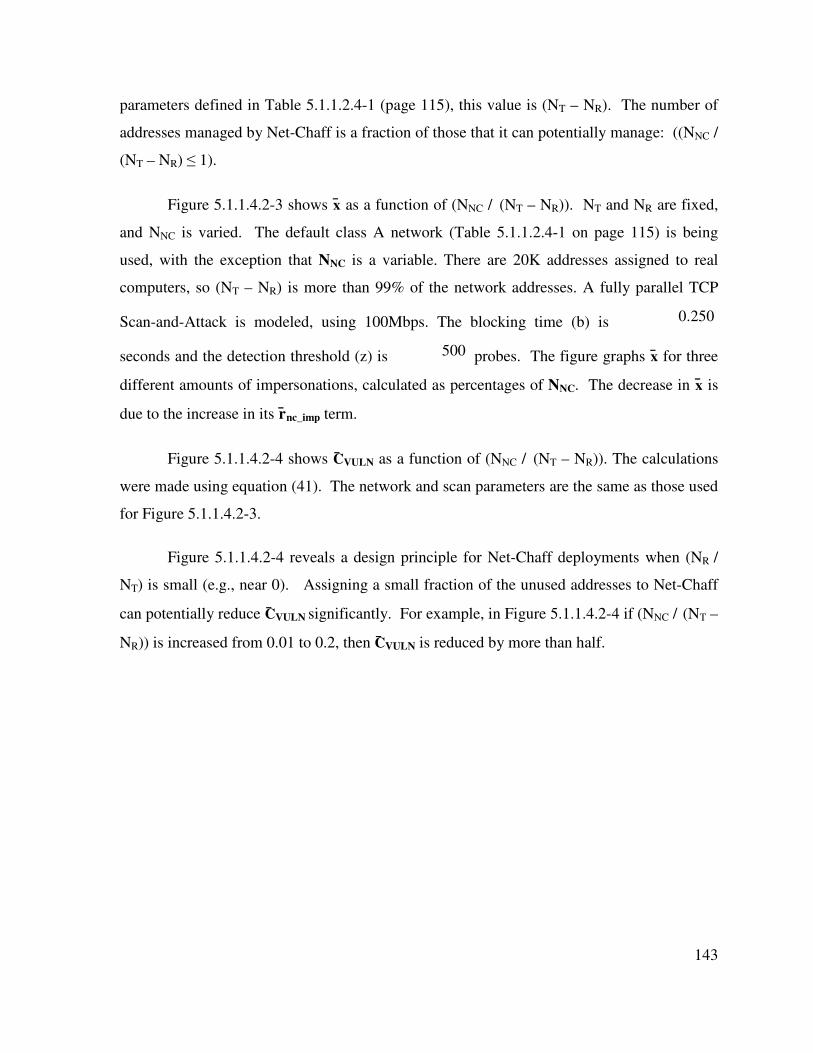
143
parameters defined in Table 5.1.1.2.4-1 (page 115), this value is (NT – NR). The number of
addresses managed by Net-Chaff is a fraction of those that it can potentially manage: ((NNC /
(NT – NR) ≤ 1).
Figure 5.1.1.4.2-3 shows x̄ as a function of (NNC / (NT – NR)). NT and NR are fixed,
and NNC is varied. The default class A network (Table 5.1.1.2.4-1 on page 115) is being
used, with the exception that NNC is a variable. There are 20K addresses assigned to real
computers, so (NT – NR) is more than 99% of the network addresses. A fully parallel TCP
Scan-and-Attack is modeled, using 100Mbps. The blocking time (b) is 0.250
seconds and the detection threshold (z) is 500 probes. The figure graphs x̄ for three
different amounts of impersonations, calculated as percentages of NNC. The decrease in x̄ is
due to the increase in its r̄nc_imp term.
Figure 5.1.1.4.2-4 shows C̄VULN as a function of (NNC / (NT – NR)). The calculations
were made using equation (41). The network and scan parameters are the same as those used
for Figure 5.1.1.4.2-3.
Figure 5.1.1.4.2-4 reveals a design principle for Net-Chaff deployments when (NR /
NT) is small (e.g., near 0). Assigning a small fraction of the unused addresses to Net-Chaff
can potentially reduce C̄VULN significantly. For example, in Figure 5.1.1.4.2-4 if (NNC / (NT –
NR)) is increased from 0.01 to 0.2, then C̄VULN is reduced by more than half.
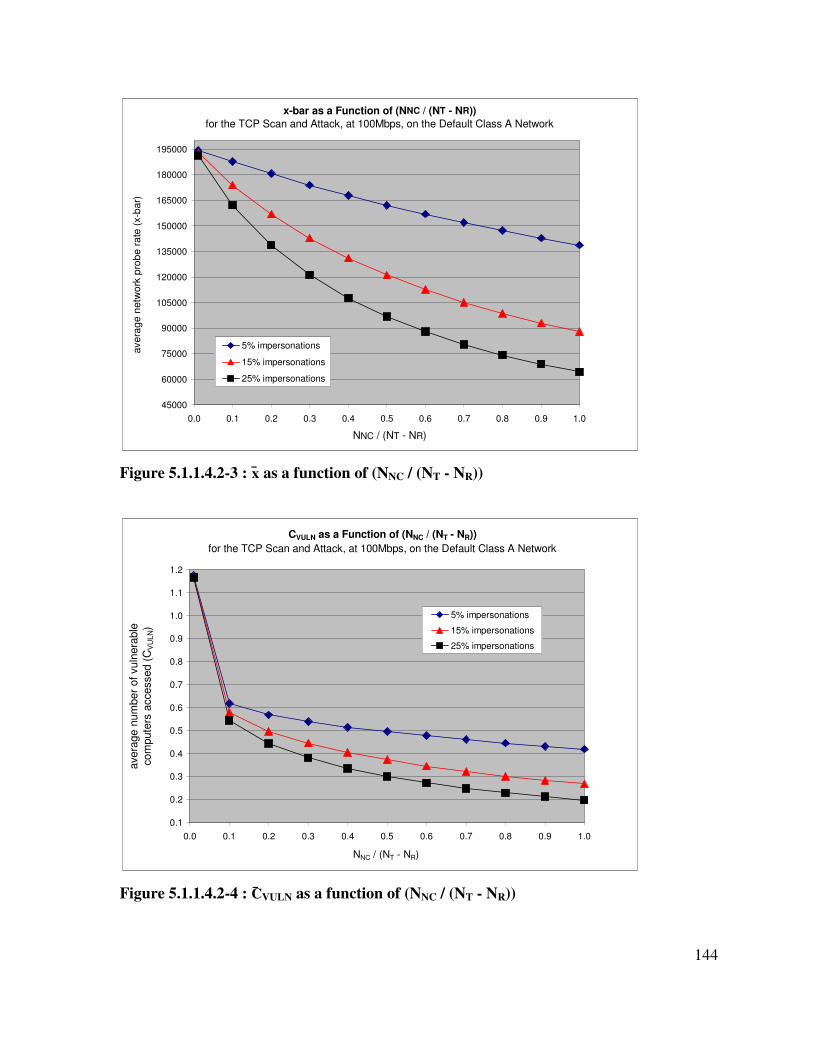
144
x-bar as a Function of (NNC / (NT - NR))
for the TCP Scan and Attack, at 100Mbps, on the Default Class A Network
45000
60000
75000
90000
105000
120000
135000
150000
165000
180000
195000
0.0 0.1 0.2 0.3 0.4 0.5 0.6 0.7 0.8 0.9 1.0
NNC / (NT - NR)
avera
ge
netw
ork
pro
be
ra
te (
x-b
ar)
5% impersonations
15% impersonations
25% impersonations
Figure 5.1.1.4.2-3 : x̄ as a function of (NNC / (NT - NR))
CVULN as a Function of (NNC / (NT - NR))
for the TCP Scan and Attack, at 100Mbps, on the Default Class A Network
0.1
0.2
0.3
0.4
0.5
0.6
0.7
0.8
0.9
1.0
1.1
1.2
0.0 0.1 0.2 0.3 0.4 0.5 0.6 0.7 0.8 0.9 1.0
NNC / (NT - NR)
avera
ge
num
ber
of
vuln
era
ble
com
pute
rs a
ccessed (
CV
UL
N)
5% impersonations
15% impersonations
25% impersonations
Figure 5.1.1.4.2-4 : C̄VULN as a function of (NNC / (NT - NR))
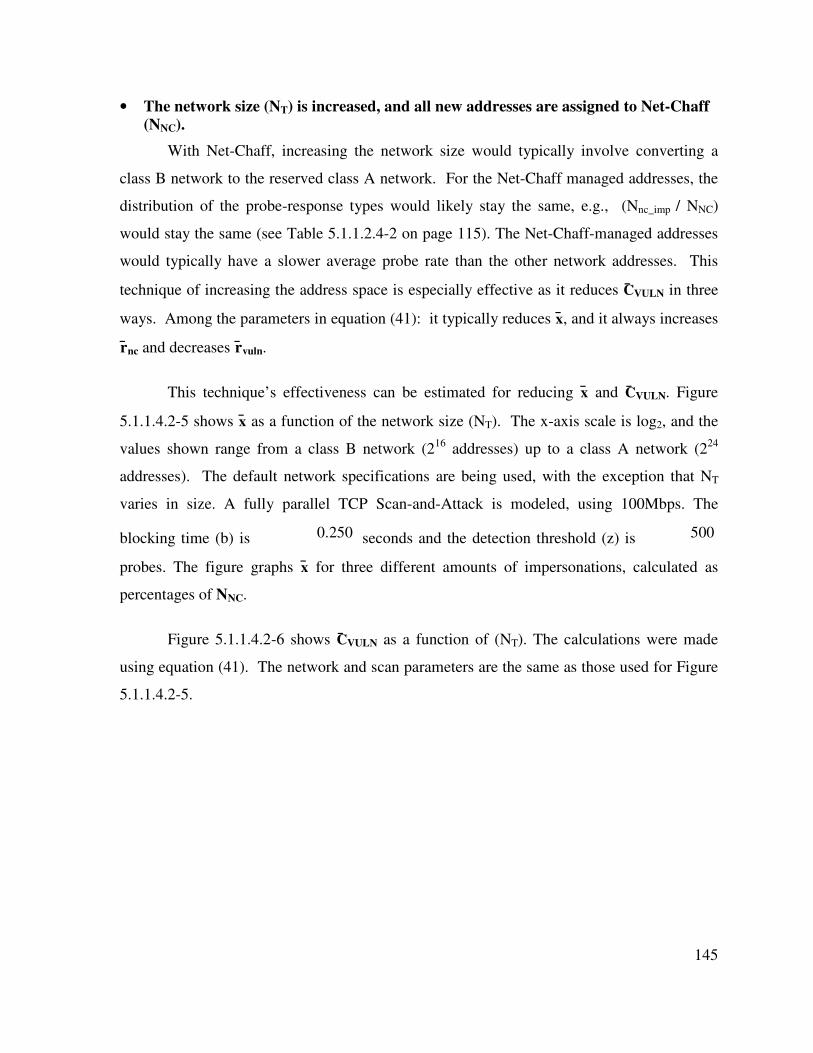
145
• The network size (NT) is increased, and all new addresses are assigned to Net-Chaff (NNC).
With Net-Chaff, increasing the network size would typically involve converting a
class B network to the reserved class A network. For the Net-Chaff managed addresses, the
distribution of the probe-response types would likely stay the same, e.g., (Nnc_imp / NNC)
would stay the same (see Table 5.1.1.2.4-2 on page 115). The Net-Chaff-managed addresses
would typically have a slower average probe rate than the other network addresses. This
technique of increasing the address space is especially effective as it reduces C̄VULN in three
ways. Among the parameters in equation (41): it typically reduces x̄, and it always increases
r̄nc and decreases r̄vuln.
This technique’s effectiveness can be estimated for reducing x̄ and C̄VULN. Figure
5.1.1.4.2-5 shows x̄ as a function of the network size (NT). The x-axis scale is log2, and the
values shown range from a class B network (216
addresses) up to a class A network (224
addresses). The default network specifications are being used, with the exception that NT
varies in size. A fully parallel TCP Scan-and-Attack is modeled, using 100Mbps. The
blocking time (b) is 0.250 seconds and the detection threshold (z) is 500
probes. The figure graphs x̄ for three different amounts of impersonations, calculated as
percentages of NNC.
Figure 5.1.1.4.2-6 shows C̄VULN as a function of (NT). The calculations were made
using equation (41). The network and scan parameters are the same as those used for Figure
5.1.1.4.2-5.
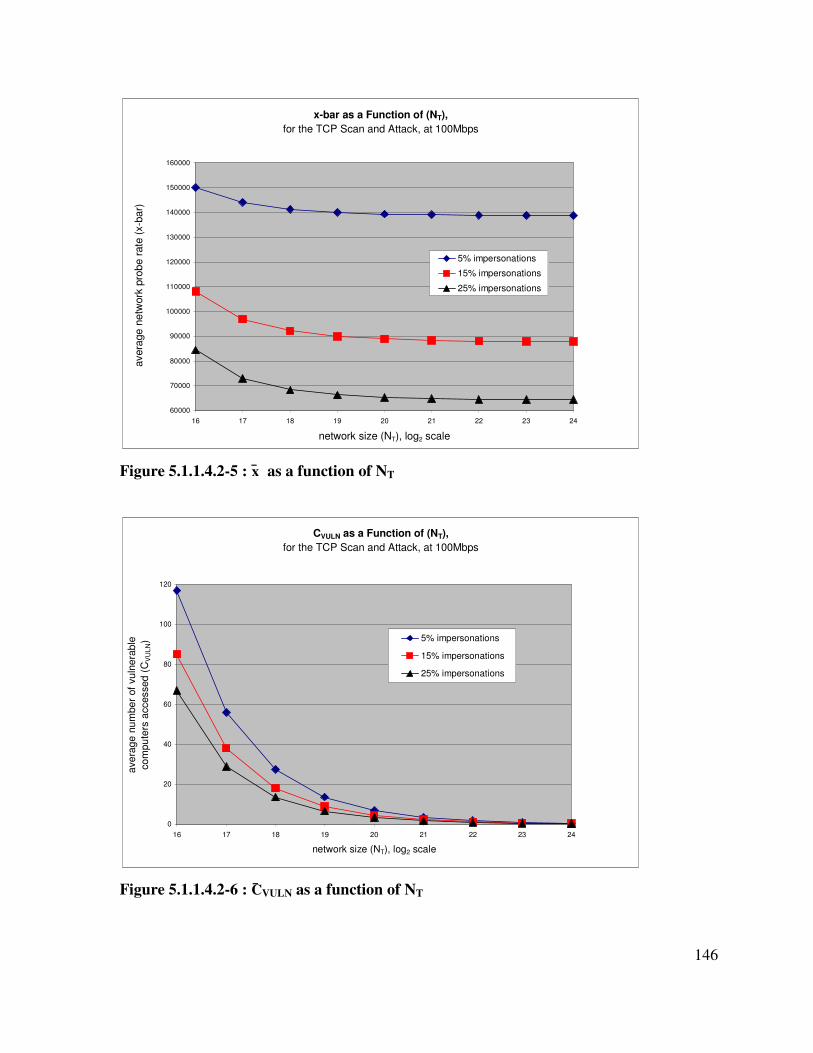
146
x-bar as a Function of (NT),
for the TCP Scan and Attack, at 100Mbps
60000
70000
80000
90000
100000
110000
120000
130000
140000
150000
160000
16 17 18 19 20 21 22 23 24
network size (NT), log2 scale
avera
ge
ne
twork
pro
be r
ate
(x-b
ar)
5% impersonations
15% impersonations
25% impersonations
Figure 5.1.1.4.2-5 : x̄ as a function of NT
CVULN as a Function of (NT),
for the TCP Scan and Attack, at 100Mbps
0
20
40
60
80
100
120
16 17 18 19 20 21 22 23 24
network size (NT), log2 scale
ave
rag
e n
um
be
r of
vu
lne
rab
le
co
mpu
ters
accessed
(C
VU
LN) 5% impersonations
15% impersonations
25% impersonations
Figure 5.1.1.4.2-6 : C̄VULN as a function of NT
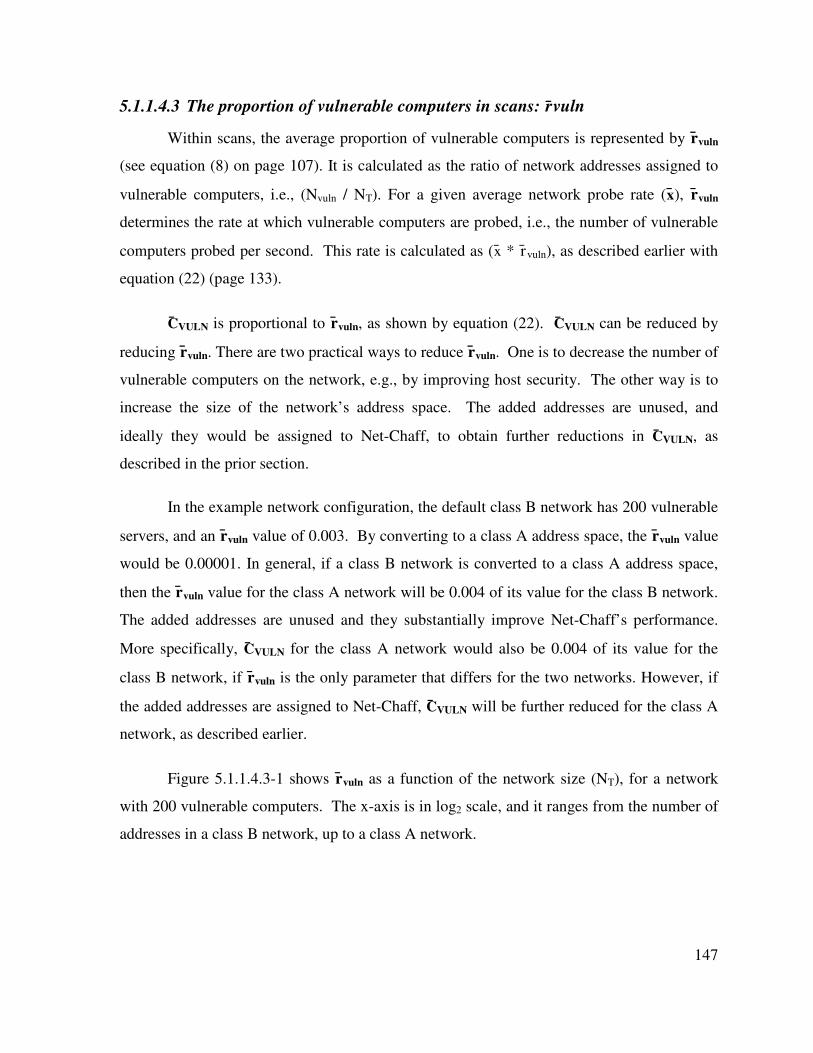
147
5.1.1.4.3 The proportion of vulnerable computers in scans: r̄vuln
Within scans, the average proportion of vulnerable computers is represented by r̄vuln
(see equation (8) on page 107). It is calculated as the ratio of network addresses assigned to
vulnerable computers, i.e., (Nvuln / NT). For a given average network probe rate (x̄), r̄vuln
determines the rate at which vulnerable computers are probed, i.e., the number of vulnerable
computers probed per second. This rate is calculated as (x̄ * r̄vuln), as described earlier with
equation (22) (page 133).
C̄VULN is proportional to r̄vuln, as shown by equation (22). C̄VULN can be reduced by
reducing r̄vuln. There are two practical ways to reduce r̄vuln. One is to decrease the number of
vulnerable computers on the network, e.g., by improving host security. The other way is to
increase the size of the network’s address space. The added addresses are unused, and
ideally they would be assigned to Net-Chaff, to obtain further reductions in C̄VULN, as
described in the prior section.
In the example network configuration, the default class B network has 200 vulnerable
servers, and an r̄vuln value of 0.003. By converting to a class A address space, the r̄vuln value
would be 0.00001. In general, if a class B network is converted to a class A address space,
then the r̄vuln value for the class A network will be 0.004 of its value for the class B network.
The added addresses are unused and they substantially improve Net-Chaff’s performance.
More specifically, C̄VULN for the class A network would also be 0.004 of its value for the
class B network, if r̄vuln is the only parameter that differs for the two networks. However, if
the added addresses are assigned to Net-Chaff, C̄VULN will be further reduced for the class A
network, as described earlier.
Figure 5.1.1.4.3-1 shows r̄vuln as a function of the network size (NT), for a network
with 200 vulnerable computers. The x-axis is in log2 scale, and it ranges from the number of
addresses in a class B network, up to a class A network.
148
rvuln as a Function of NT,
on a network with 200 vulnerable computers
0.0000
0.0005
0.0010
0.0015
0.0020
0.0025
0.0030
0.0035
16 17 18 19 20 21 22 23 24
NT, log2 scale
r vuln
Figure 5.1.1.4.3-1 : r̄vuln as a function of the network size (NT)
When a network has a large number of unused addresses, relative to the number of
vulnerable computers, then the unused addresses serve to hide the vulnerable computers.
This is the passive hiding that was described in chapter 4. Passive hiding’s affect on r̄vuln
and C̄VULN can be quantified. Without the unused addresses, r̄vuln would be (Nvuln / NR).
With the unused addresses, r̄vuln is (Nvuln / NT). For example, in the default class A network,
20K addresses are assigned to real computers, of which 200 addresses are assigned to
vulnerable computers. (Nvuln / NR) is 0.01, and (Nvuln / NT) is 0.00001. In general, r̄vuln with
the unused addresses is (NT / NR) times smaller than r̄vuln without the unused addresses. In
the example, (NT / NR) is approximately 1,000. r̄vuln is a factor in calculating C̄VULN, as
shown by equation (22). Therefore, passive hiding’s affect on r̄vuln will ultimately have the
same affect on C̄VULN.
149
5.1.1.4.4 Summary
This section analyzed the elements of Net-Chaff deployments that affect its
performance. The purpose of the analysis is to understand: 1) how to effectively configure
Net-Chaff deployments, and 2) the role of deception. The analysis focused on the example
web-server scan, which includes Net-Chaff impersonations and vulnerable web-servers. For
a Net-Chaff deployment, this analysis is applicable to other servers as well.
Net-Chaff’s performance is evaluated in terms of the average number of vulnerable
computers compromised by a scan (C̄VULN), and the equation is repeated below. Each term in
the equation was analyzed with respect to reducing C̄VULN.
C̄VULN = ([b * x̄] + [z / r̄nc]) * r̄vuln (41)
The average network probe rate (x̄) can be reduced by Net-Chaff’s deceptions. As
shown by equation (9) (page 107), x̄ can be reduced by slowing down the probe rate for Net-
Chaff’s probe-response types, i.e., decreasing xi for Net-Chaff’s probe-response types.
Alternatively, x̄ can be reduced by increasing the proportion of Net-Chaff’s slow probe-
response types on the network, i.e., increasing r̄i for Net-Chaff’s probe-response types. The
analysis focused on increasing the proportion of Net-Chaff’s low-level impersonations on the
network, i.e., increasing r̄nc_imp. Three techniques for increasing r̄nc_imp were examined. The
most effective technique was to increase the network size, and assign all new addresses to
Net-Chaff. This reduces C̄VULN in three ways: 1) it typically reduces x̄, 2) it always increases
r̄nc, and 3) it always decreases r̄vuln. Converting from a class B network to a class A network
can be the most effective way to reduce C̄VULN, as Net-Chaff’s performance is improved in
these three ways.
C̄VULN can also be reduced by reducing the containment time. There are three Net-
Chaff parameters that can be configured to reduce the containment time: 1) the blocking
time (b) can be reduced by technical means. The reduction in C̄VULN is proportional to (x̄ * r̄
vuln). 2) The detection threshold (z) can be reduced, but doing so may reduce detection
150
accuracy. Also, when r̄nc is large (e.g., near one), and r̄vuln is very small, then reductions in z
will cause relatively insignificant reductions in C̄VULN. These conditions are typical for
effective Net-Chaff deployments. 3) r̄nc is calculated as the ratio of Net-Chaff-managed
addresses to the total number of addresses (NNC/NT). r̄nc can be increased to speed-up scan
detection. The speed-up in scan detection provides diminishing marginal reductions in C̄
VULN, i.e., C̄VULN( r̄nc) is proportional to (1/ r̄nc).
C̄VULN is proportional to r̄vuln, as shown by equation (41). There are two practical
ways to reduce r̄vuln. One is to decrease the number of vulnerable computers on the network.
The other way is to increase the size of the network’s address space. The added addresses
are unused. When a network has a large number of unused addresses, relative to the number
of vulnerable computers, then the unused addresses serve to hide the vulnerable computers.
This passive hiding reduces C̄VULN to the same extent that r̄vuln is reduced, and the reduction
can be calculated, as shown earlier.
Net-Chaff’s deceptions serve to slow down scans. However, increasing the fraction
of Net-Chaff impersonations (Nnc_imp/NNC) provides diminishing marginal reductions in C̄
VULN. For instance, when almost all network addresses are managed by Net-Chaff (i.e., (NNC
/ NT) ≈ 1), then a small percentage of impersonations (e.g., (Nnc_imp/NNC) ≈ 0.2) may reduce C̄
VULN significantly. Beyond a certain point, increasing the percentage of impersonations can
not only risk counterdeception, but it may also provide relatively little reduction in C̄VULN.
5.1.1.5 Taxonomy of probe-response types
A central component of the rate-based models is the taxonomy of probe-responses.
The taxonomy’s categories are probe-response types. Such a taxonomy was presented in
section 5.1.1.1.3 (page 99). This taxonomy was developed for the example networks and
scans that are used for the Net-Chaff analysis. The rate-based models can also be used to
analyze other types of networks and scans. However, a different taxonomy of probe-
responses may be required. This section describes how the taxonomy of probe-response types
can be modified for use with other networks and scans. Also described are probe-response
151
types from deception-based security devices other than Net-Chaff, e.g., honeypots. In this
section, the taxonomy of probe-responses will be referred to as simply the taxonomy.
The taxonomy is used by the rate-based models, and it models the network and
scanner that are being analyzed. The rate-based models’ primary calculations are: 1) the
average number of vulnerable computers accessed by the scan (C̄VULN, e.g., see equation (22)
on page 119), and 2) the average number of affirmative responses received by the scan (C̄AFF,
e.g., see equation (23) on page 124). The former calculation is used for all three scan types:
scan-and-attack, filtering scans, and information-retrieval scans. The latter calculation is just
used for information-retrieval scans.
In general, the taxonomy must include the probe-response types needed to calculate C̄
i, where i is a probe-response type whose outcome is of interest, e.g., C̄VULN or C̄AFF (see
equation (21) on page 114). The probe-response types are modeled relative to the scanner’s
capabilities. For example, the probe-response type for vulnerable servers (e.g., vuln) only
includes servers that are vulnerable to attack by the scan that is being analyzed. Probe-
response types are also needed for calculating the average network probe-rate (x̄) (see section
5.1.1.2.1 on page 103).
In addition to Net-Chaff, there are other security devices that use deception. The
taxonomy will need to include probe responses from these devices if their scan outcomes are
of interest (i.e., C̄i), or if they affect x̄. For example, LaBrea is a deceptive device that can
potentially stop a serial scan [LaB05]. If LaBrea is deployed, and it significantly affects x̄,
then it will need its own probe-response type. As another example, a certain honeypot has a
vulnerable web-server that is used for collecting intelligence. Many of these honeypots are
deployed on the network being analyzed. To calculate the average number of honeypots
accessed by scans, the honeypots would need their own probe-response type.
Firewalls often use deceptive replies in response to disallowed packets. For example,
firewalls can simply not reply to disallowed packets [Rus02]. This can delay scanners in two
ways: 1) serial scanners can be slowed down if they wait a long time for a reply, and 2)
scanners may interpret the non-response as a dropped packet, and retransmit the probe,
152
perhaps multiple times. If this deception is used for many network addresses, it can reduce
scanners’ average network probe rate (x̄). Consequently, a probe response-type would be
needed for this deception. Another deception used by firewalls involves sending false-
negative replies to scanners [Rus02]. For example, the firewall can send an ICMP host-
unreachable message in response to a TCP ping. For the Net-Chaff analysis, its taxonomy is
sufficient for calculating x̄ (see Table 5.1.1.1.3-1 on page 100 ). The deceptive probe-
response would simply be included in the category “no server present” (ns).
5.1.2 Simulation
A simulation was used to verify the rate-based models. The simulation is a model of
scans on a network that is protected by Net-Chaff. A web-server TCP ping-scan was
simulated. This type of scan was also analyzed by the rate-based models in section 5.1.1.3.1
(page 120). The simulation model is packet-based, as it models the transmission and
reception of scan packets on the network. Overall, the simulation’s packet-based model is
slightly more accurate than the rate-based models. The simulation was implemented as a Java
program, and it consists of 1,600 lines of code.
Three different network-scan scenarios were modeled. For each of these scenarios,
both the simulation and rate-based models were used to calculate the Net-Chaff outcomes.
The Net-Chaff outcomes are defined as: 1) the average number of scanner probes that are
completed prior to containment (C̄), 2) the average number of affirmative replies received,
prior to containment (C̄AFF), 3) the average number of affirmative replies received from
vulnerable computers, prior to containment (C̄VULN), and 4) for a given value of C̄VULN, the
probability that a scan will probe one or more vulnerable computers (Pvuln). These outcomes
were described earlier for the rate-based models (in section 5.1.1.1.2 on page 97, and section
5.1.1.3.2 on page 126). The calculations made by the simulation and rate-based models were
compared. The results are very similar, which corroborates the rate-based models.
The Net-Chaff simulation is described in the following two subsections. The first
subsection describes the simulation’s design. The second subsection describes how the
simulation was used, and how it verifies the rate-based models.
153
5.1.2.1 Design
An overview of the simulation design is presented first, and further details follow.
5.1.2.1.1 Overview
The simulation contains parameters for configuring its models of the network, the
scanner, and Net-Chaff. The simulation is configured by specifying these parameters.
The network scan is simulated, and the simulation is carried out in two stages. In the
first stage, the scan itself is simulated. All of the network addresses are probed (Net-Chaff
does not contain the scan). For each probe, its outcome is recorded in a relational database
(RDB). The probe outcome is defined as: 1) the probe’s response type, 2) the response’s
arrival time at the scanner, and 3) as applicable, the probe’s arrival time at the Net-Chaff
WAN server.
In the second stage, the RDB is used to calculate scan outcomes that would occur
with Net-Chaff containment. Scan outcomes are calculated for a particular detection
threshold and blocking time. The scan outcomes are defined as: 1) the number of scanner
probes that are completed prior to containment (C), 2) the number of affirmative replies
received, prior to containment (CAFF), and 3) the number of affirmative replies received from
vulnerable computers, prior to containment (CVULN). These three scan outcomes are very
similar to the first three Net-Chaff outcomes. The difference between them is that scan
outcomes are calculated for a particular scan, and Net-Chaff outcomes are calculated as
averages over many scans, as will be explained.
In calculating scan outcomes, the detection threshold (z) and blocking time (b) are
referred to, collectively, as the containment parameters. A particular pair of z and b values
will be referred to, collectively, as a containment-specification. The simulation’s
configuration-parameters include a set of containment-specifications. The set consists of n
pairs of z and b values: ((z1,b1), (z2,b2), ... (zn,bn)). In the second stage of the simulated
network-scan, scan outcomes are calculated for each of the containment-specifications. The
scan outcomes are stored in an RDB.
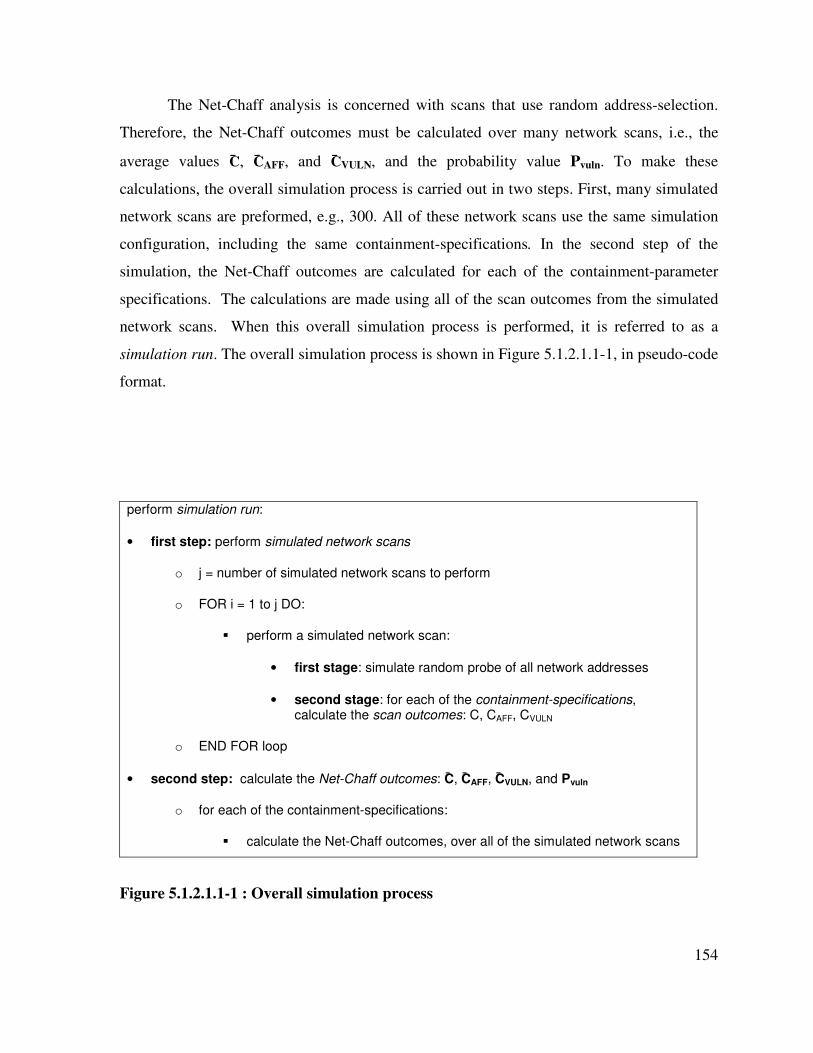
154
The Net-Chaff analysis is concerned with scans that use random address-selection.
Therefore, the Net-Chaff outcomes must be calculated over many network scans, i.e., the
average values C̄, C̄AFF, and C̄VULN, and the probability value Pvuln. To make these
calculations, the overall simulation process is carried out in two steps. First, many simulated
network scans are preformed, e.g., 300. All of these network scans use the same simulation
configuration, including the same containment-specifications. In the second step of the
simulation, the Net-Chaff outcomes are calculated for each of the containment-parameter
specifications. The calculations are made using all of the scan outcomes from the simulated
network scans. When this overall simulation process is performed, it is referred to as a
simulation run. The overall simulation process is shown in Figure 5.1.2.1.1-1, in pseudo-code
format.
Figure 5.1.2.1.1-1 : Overall simulation process
perform simulation run:
• first step: perform simulated network scans
o j = number of simulated network scans to perform
o FOR i = 1 to j DO:
� perform a simulated network scan:
• first stage: simulate random probe of all network addresses
• second stage: for each of the containment-specifications, calculate the scan outcomes: C, CAFF, CVULN
o END FOR loop
• second step: calculate the Net-Chaff outcomes: C̄, C̄AFF, C̄VULN, and Pvuln
o for each of the containment-specifications:
� calculate the Net-Chaff outcomes, over all of the simulated network scans
155
The simulation design is further described in the following two subsections. The first
subsection describes the network scan. The second subsection describes how the Net-Chaff
outcomes are calculated for a simulation run.
5.1.2.1.2 Network scan
The simulated network-scan is performed in two stages, and each stage is further
described:
5.1.2.1.2.1 First stage: probe all addresses
In the first stage of the simulated network-scan, the scan’s probes are simulated, as
well as their responses. The entire network is scanned (Net-Chaff does not contain the scan).
The simulation models three system components: the network, scanner, and Net-Chaff
servers. The simulation of these components is described below.
• The network simulation:
A class B network is simulated. The network is represented by an array, and each
array element models an address in the network. Thus, the array has 216
elements. Each
array element specifies an address and the type of probe-response from the address.
For a simulation run, its configuration-parameters specify the distribution of probe-
response types on the network. For each probe-response type, the specifications state how
many addresses are assigned that response type. These specifications are used to initialize
the network array. The location of the probe-response types in the network does not matter
because the scanner chooses addresses at random.
The simulation uses the probe-response types listed in Table 5.1.2.1.2.1-1. They are
similar to the probe-response types used for the rate-based models’ examples. However, for
the simulation, there are separate probe response-types for the Net-Chaff WAN and LAN
servers. The simulation models the Net-Chaff WAN and LAN servers separately, but the
rate-based models does not differentiate between them.
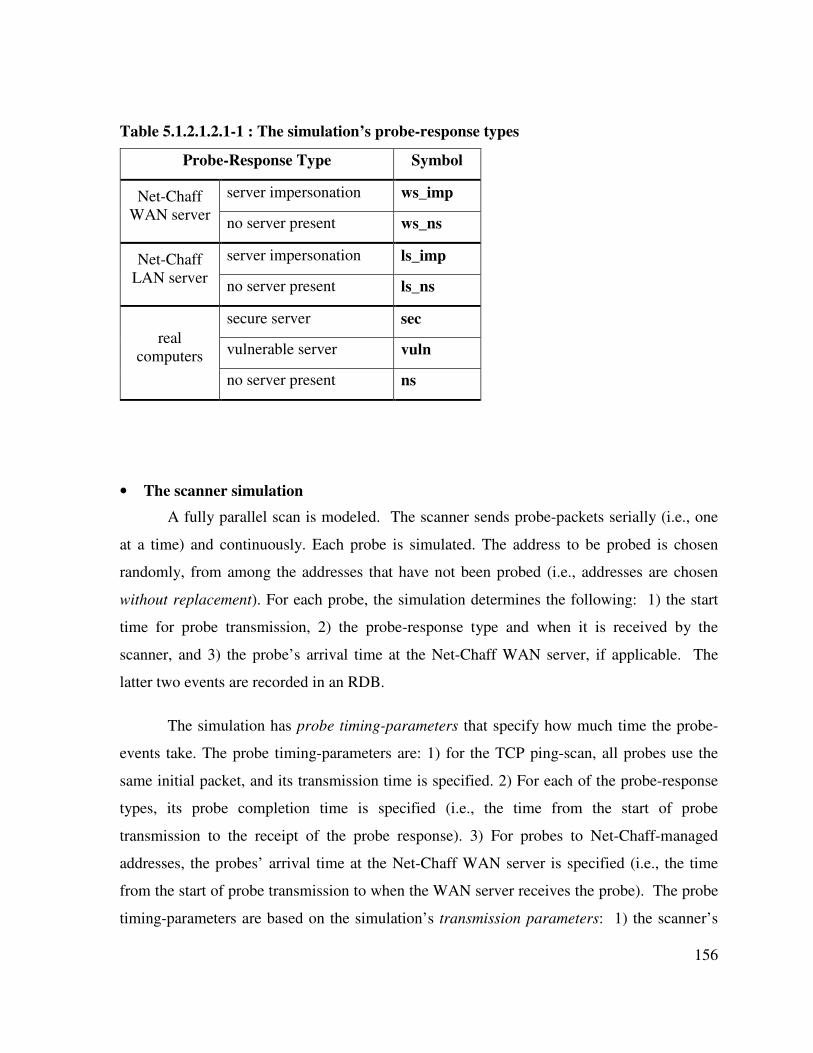
156
Table 5.1.2.1.2.1-1 : The simulation’s probe-response types
Probe-Response Type Symbol
server impersonation ws_imp Net-Chaff
WAN server no server present ws_ns
server impersonation ls_imp Net-Chaff
LAN server no server present ls_ns
secure server sec
vulnerable server vuln real
computers
no server present ns
• The scanner simulation
A fully parallel scan is modeled. The scanner sends probe-packets serially (i.e., one
at a time) and continuously. Each probe is simulated. The address to be probed is chosen
randomly, from among the addresses that have not been probed (i.e., addresses are chosen
without replacement). For each probe, the simulation determines the following: 1) the start
time for probe transmission, 2) the probe-response type and when it is received by the
scanner, and 3) the probe’s arrival time at the Net-Chaff WAN server, if applicable. The
latter two events are recorded in an RDB.
The simulation has probe timing-parameters that specify how much time the probe-
events take. The probe timing-parameters are: 1) for the TCP ping-scan, all probes use the
same initial packet, and its transmission time is specified. 2) For each of the probe-response
types, its probe completion time is specified (i.e., the time from the start of probe
transmission to the receipt of the probe response). 3) For probes to Net-Chaff-managed
addresses, the probes’ arrival time at the Net-Chaff WAN server is specified (i.e., the time
from the start of probe transmission to when the WAN server receives the probe). The probe
timing-parameters are based on the simulation’s transmission parameters: 1) the scanner’s
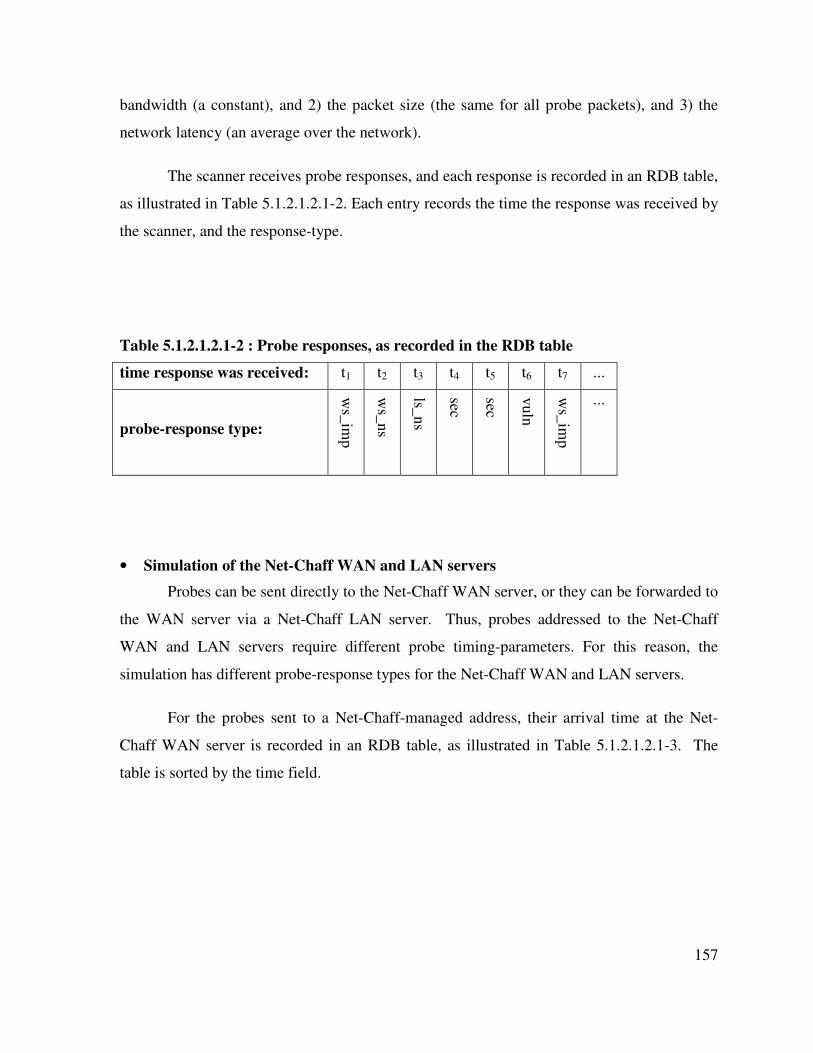
157
bandwidth (a constant), and 2) the packet size (the same for all probe packets), and 3) the
network latency (an average over the network).
The scanner receives probe responses, and each response is recorded in an RDB table,
as illustrated in Table 5.1.2.1.2.1-2. Each entry records the time the response was received by
the scanner, and the response-type.
Table 5.1.2.1.2.1-2 : Probe responses, as recorded in the RDB table
time response was received: t1 t2 t3 t4 t5 t6 t7 ...
probe-response type:
ws_
imp
ws_
ns
ls_ns
sec
sec
vuln
ws_
imp
...
• Simulation of the Net-Chaff WAN and LAN servers
Probes can be sent directly to the Net-Chaff WAN server, or they can be forwarded to
the WAN server via a Net-Chaff LAN server. Thus, probes addressed to the Net-Chaff
WAN and LAN servers require different probe timing-parameters. For this reason, the
simulation has different probe-response types for the Net-Chaff WAN and LAN servers.
For the probes sent to a Net-Chaff-managed address, their arrival time at the Net-
Chaff WAN server is recorded in an RDB table, as illustrated in Table 5.1.2.1.2.1-3. The
table is sorted by the time field.

158
Table 5.1.2.1.2.1-3 : Probe arrival times at the Net-Chaff WAN server, as recorded in
the RDB table
probe arrival time: tA tB tC ...
5.1.2.1.2.2 Second stage: calculate scan outcomes
In the second stage of the simulated network-scan, the scan outcomes are calculated.
As described earlier, these are the outcomes that would occur with Net-Chaff containment.
The scan outcomes are: C, CVULN, and CAFF. Scan outcomes are calculated for each of the
containment-specifications. The calculations are based on the probe outcomes from the first
stage.
An example calculation is provided using the example RDB tables in the prior
section. For the containment-specification, the detection threshold is 3, and the blocking time
is T. Table 5.1.2.1.2.1-3 shows the detection threshold is reached at time tC, and
consequently, containment occurs at time (tC+T). Table 5.1.2.1.2.1-2 is used to calculate the
scan outcomes. For instance, if t6 <= (tC+T) < t7, then C is 6, CVULN is 1, and CAFF is 4.
The scan outcomes are stored in an RDB table, as illustrated by Figure 5.1.2.1.2.2-1.
The first row contains the field names, and the second row contains the results from the prior
example. The table uses a composite key that consists of the table’s first three fields. The
network-scan ID is assigned sequentially for each of the j simulated network-scans, i.e., 1, 2,
3, . . . j.
network-scan ID detection threshold blocking time C CVULN CAFF
1 3 T 6 1 4
Figure 5.1.2.1.2.2-1 : RDB table for storing scan outcomes
The simulation’s containment model is slightly more accurate than the one used for
the rate-based models. For the rate-based models, the calculation of n̄Z (equation (14) on
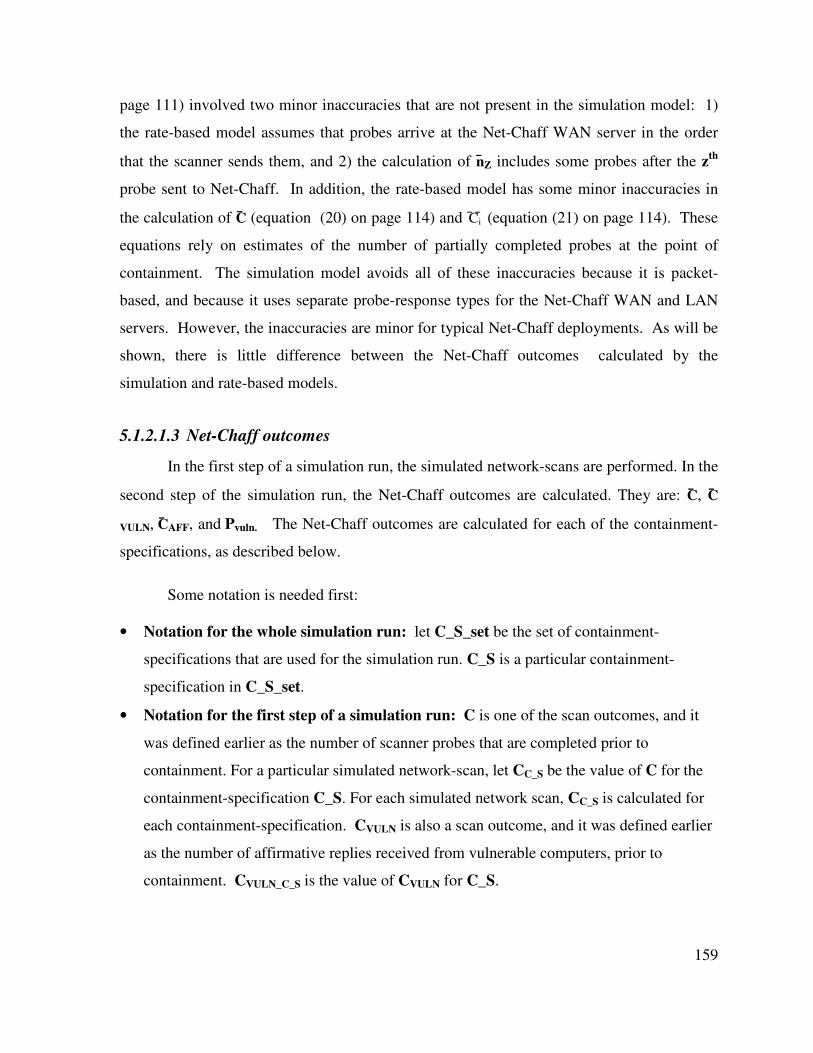
159
page 111) involved two minor inaccuracies that are not present in the simulation model: 1)
the rate-based model assumes that probes arrive at the Net-Chaff WAN server in the order
that the scanner sends them, and 2) the calculation of n̄Z includes some probes after the zth
probe sent to Net-Chaff. In addition, the rate-based model has some minor inaccuracies in
the calculation of C̄ (equation (20) on page 114) and Ci¯ ¯ (equation (21) on page 114). These
equations rely on estimates of the number of partially completed probes at the point of
containment. The simulation model avoids all of these inaccuracies because it is packet-
based, and because it uses separate probe-response types for the Net-Chaff WAN and LAN
servers. However, the inaccuracies are minor for typical Net-Chaff deployments. As will be
shown, there is little difference between the Net-Chaff outcomes calculated by the
simulation and rate-based models.
5.1.2.1.3 Net-Chaff outcomes
In the first step of a simulation run, the simulated network-scans are performed. In the
second step of the simulation run, the Net-Chaff outcomes are calculated. They are: C̄, C̄
VULN, C̄AFF, and Pvuln. The Net-Chaff outcomes are calculated for each of the containment-
specifications, as described below.
Some notation is needed first:
• Notation for the whole simulation run: let C_S_set be the set of containment-
specifications that are used for the simulation run. C_S is a particular containment-
specification in C_S_set.
• Notation for the first step of a simulation run: C is one of the scan outcomes, and it
was defined earlier as the number of scanner probes that are completed prior to
containment. For a particular simulated network-scan, let CC_S be the value of C for the
containment-specification C_S. For each simulated network scan, CC_S is calculated for
each containment-specification. CVULN is also a scan outcome, and it was defined earlier
as the number of affirmative replies received from vulnerable computers, prior to
containment. CVULN_C_S is the value of CVULN for C_S.
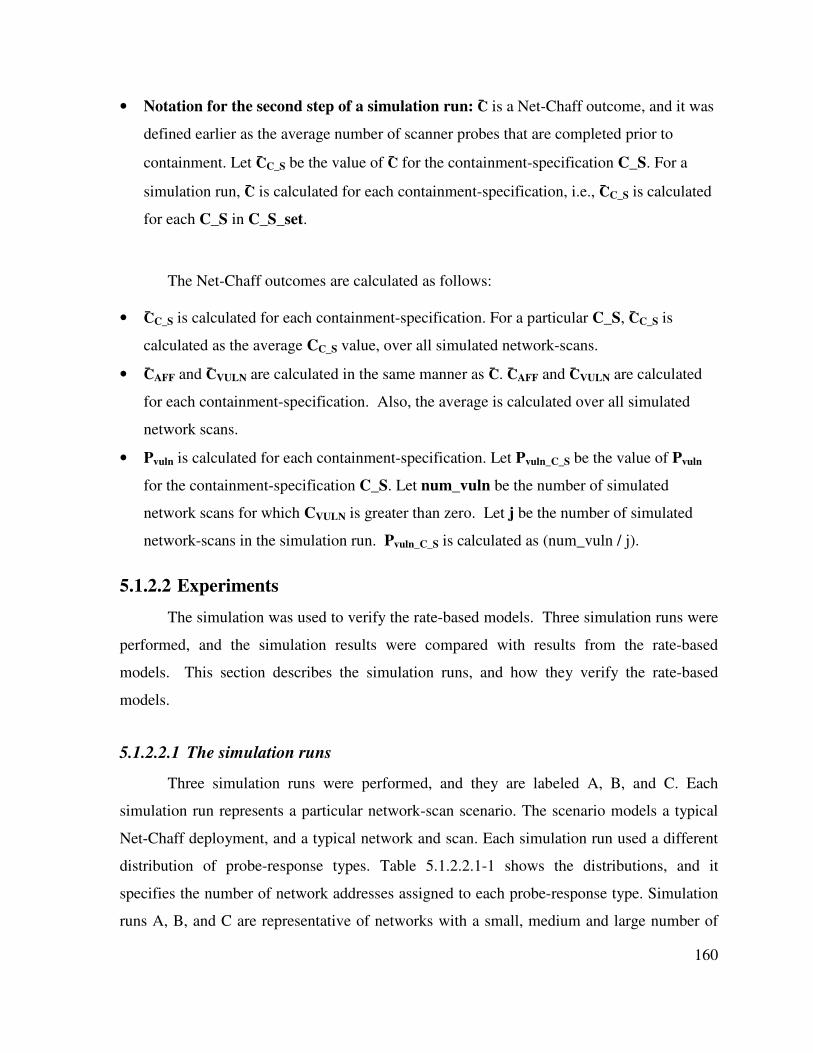
160
• Notation for the second step of a simulation run: C̄ is a Net-Chaff outcome, and it was
defined earlier as the average number of scanner probes that are completed prior to
containment. Let C̄C_S be the value of C̄ for the containment-specification C_S. For a
simulation run, C̄ is calculated for each containment-specification, i.e., C̄C_S is calculated
for each C_S in C_S_set.
The Net-Chaff outcomes are calculated as follows:
• C̄C_S is calculated for each containment-specification. For a particular C_S, C̄C_S is
calculated as the average CC_S value, over all simulated network-scans.
• C̄AFF and C̄VULN are calculated in the same manner as C̄. C̄AFF and C̄VULN are calculated
for each containment-specification. Also, the average is calculated over all simulated
network scans.
• Pvuln is calculated for each containment-specification. Let Pvuln_C_S be the value of Pvuln
for the containment-specification C_S. Let num_vuln be the number of simulated
network scans for which CVULN is greater than zero. Let j be the number of simulated
network-scans in the simulation run. Pvuln_C_S is calculated as (num_vuln / j).
5.1.2.2 Experiments
The simulation was used to verify the rate-based models. Three simulation runs were
performed, and the simulation results were compared with results from the rate-based
models. This section describes the simulation runs, and how they verify the rate-based
models.
5.1.2.2.1 The simulation runs
Three simulation runs were performed, and they are labeled A, B, and C. Each
simulation run represents a particular network-scan scenario. The scenario models a typical
Net-Chaff deployment, and a typical network and scan. Each simulation run used a different
distribution of probe-response types. Table 5.1.2.2.1-1 shows the distributions, and it
specifies the number of network addresses assigned to each probe-response type. Simulation
runs A, B, and C are representative of networks with a small, medium and large number of
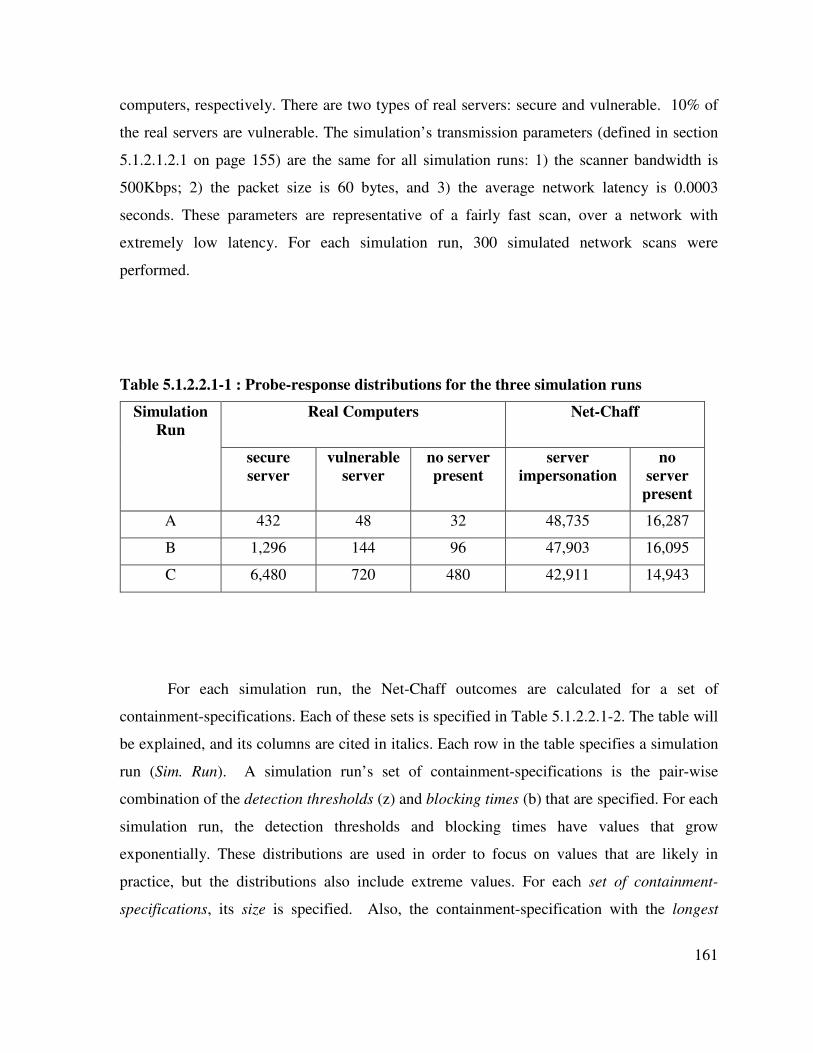
161
computers, respectively. There are two types of real servers: secure and vulnerable. 10% of
the real servers are vulnerable. The simulation’s transmission parameters (defined in section
5.1.2.1.2.1 on page 155) are the same for all simulation runs: 1) the scanner bandwidth is
500Kbps; 2) the packet size is 60 bytes, and 3) the average network latency is 0.0003
seconds. These parameters are representative of a fairly fast scan, over a network with
extremely low latency. For each simulation run, 300 simulated network scans were
performed.
Table 5.1.2.2.1-1 : Probe-response distributions for the three simulation runs
Real Computers Net-Chaff Simulation
Run
secure
server
vulnerable
server
no server
present
server
impersonation
no
server
present
A 432 48 32 48,735 16,287
B 1,296 144 96 47,903 16,095
C 6,480 720 480 42,911 14,943
For each simulation run, the Net-Chaff outcomes are calculated for a set of
containment-specifications. Each of these sets is specified in Table 5.1.2.2.1-2. The table will
be explained, and its columns are cited in italics. Each row in the table specifies a simulation
run (Sim. Run). A simulation run’s set of containment-specifications is the pair-wise
combination of the detection thresholds (z) and blocking times (b) that are specified. For each
simulation run, the detection thresholds and blocking times have values that grow
exponentially. These distributions are used in order to focus on values that are likely in
practice, but the distributions also include extreme values. For each set of containment-
specifications, its size is specified. Also, the containment-specification with the longest
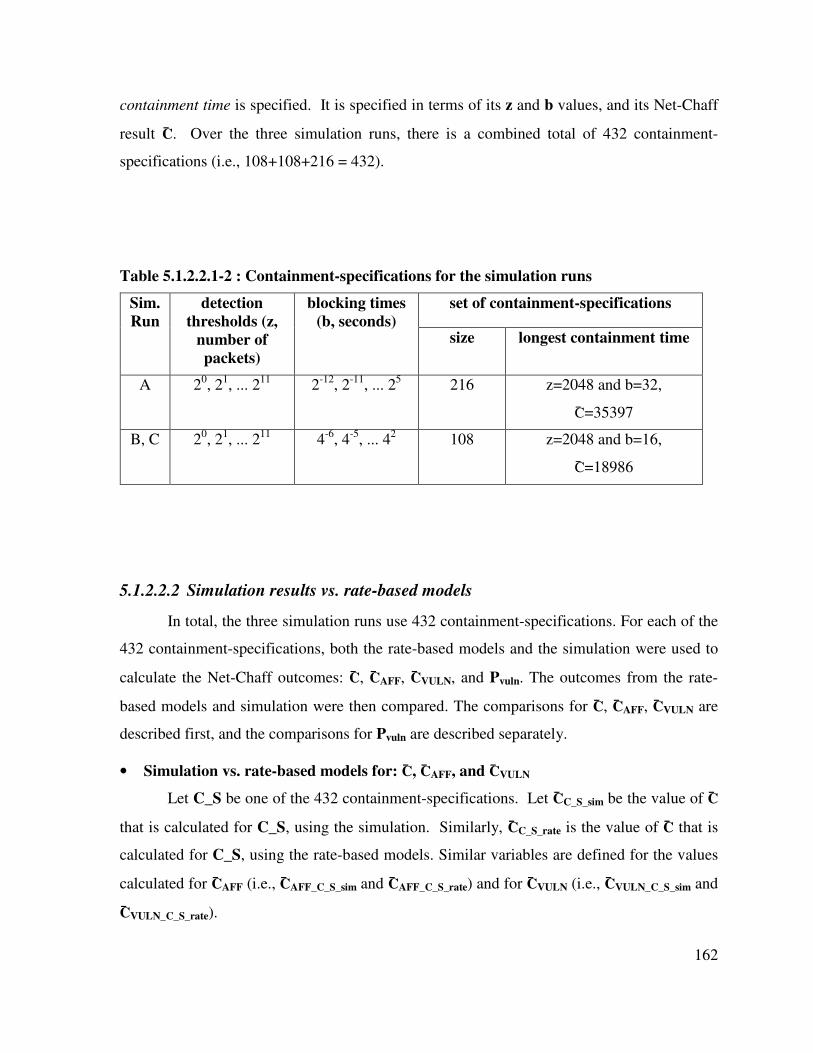
162
containment time is specified. It is specified in terms of its z and b values, and its Net-Chaff
result C̄. Over the three simulation runs, there is a combined total of 432 containment-
specifications (i.e., 108+108+216 = 432).
Table 5.1.2.2.1-2 : Containment-specifications for the simulation runs
set of containment-specifications Sim.
Run
detection
thresholds (z,
number of
packets)
blocking times
(b, seconds) size longest containment time
A 20, 2
1, ... 2
11 2
-12, 2
-11, ... 2
5 216 z=2048 and b=32,
C̄=35397
B, C 20, 2
1, ... 2
11 4
-6, 4
-5, ... 4
2 108 z=2048 and b=16,
C̄=18986
5.1.2.2.2 Simulation results vs. rate-based models
In total, the three simulation runs use 432 containment-specifications. For each of the
432 containment-specifications, both the rate-based models and the simulation were used to
calculate the Net-Chaff outcomes: C̄, C̄AFF, C̄VULN, and Pvuln. The outcomes from the rate-
based models and simulation were then compared. The comparisons for C̄, C̄AFF, C̄VULN are
described first, and the comparisons for Pvuln are described separately.
• Simulation vs. rate-based models for: C̄, C̄AFF, and C̄VULN
Let C_S be one of the 432 containment-specifications. Let C̄C_S_sim be the value of C̄
that is calculated for C_S, using the simulation. Similarly, C̄C_S_rate is the value of C̄ that is
calculated for C_S, using the rate-based models. Similar variables are defined for the values
calculated for C̄AFF (i.e., C̄AFF_C_S_sim and C̄AFF_C_S_rate) and for C̄VULN (i.e., C̄VULN_C_S_sim and
C̄VULN_C_S_rate).
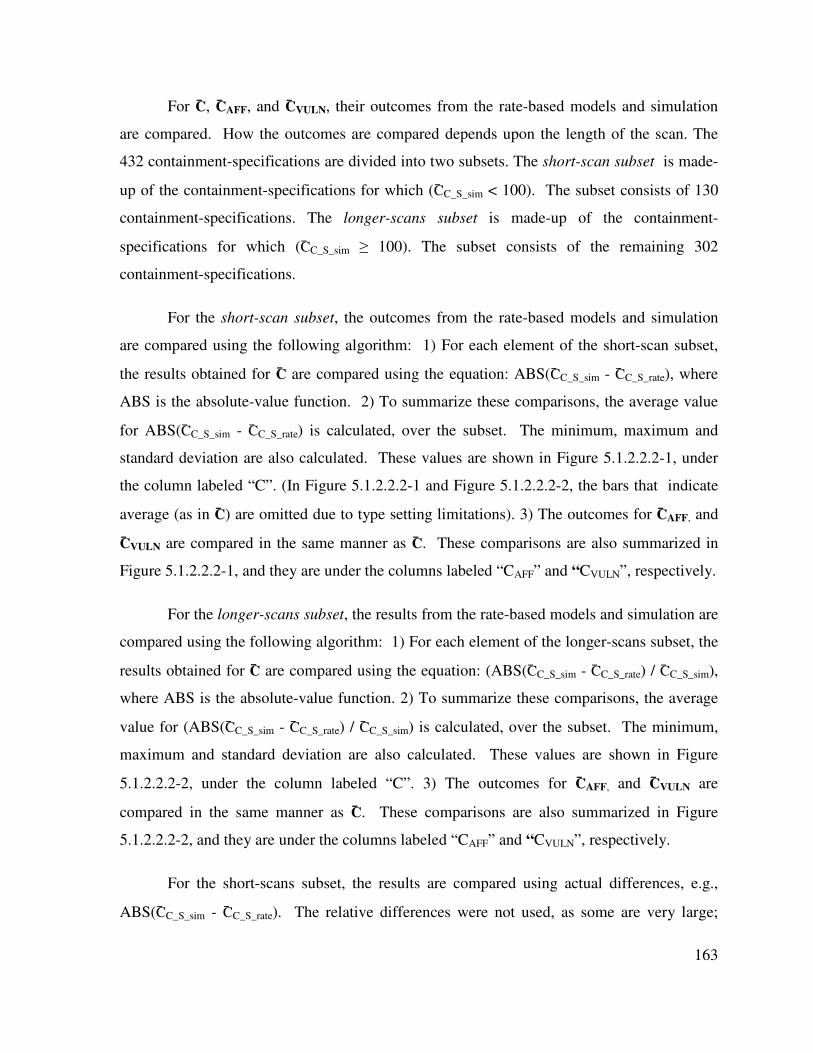
163
For C̄, C̄AFF, and C̄VULN, their outcomes from the rate-based models and simulation
are compared. How the outcomes are compared depends upon the length of the scan. The
432 containment-specifications are divided into two subsets. The short-scan subset is made-
up of the containment-specifications for which (C̄C_S_sim < 100). The subset consists of 130
containment-specifications. The longer-scans subset is made-up of the containment-
specifications for which (C̄C_S_sim ≥ 100). The subset consists of the remaining 302
containment-specifications.
For the short-scan subset, the outcomes from the rate-based models and simulation
are compared using the following algorithm: 1) For each element of the short-scan subset,
the results obtained for C̄ are compared using the equation: ABS(C̄C_S_sim - C̄C_S_rate), where
ABS is the absolute-value function. 2) To summarize these comparisons, the average value
for ABS(C̄C_S_sim - C̄C_S_rate) is calculated, over the subset. The minimum, maximum and
standard deviation are also calculated. These values are shown in Figure 5.1.2.2.2-1, under
the column labeled “C”. (In Figure 5.1.2.2.2-1 and Figure 5.1.2.2.2-2, the bars that indicate
average (as in C̄) are omitted due to type setting limitations). 3) The outcomes for C̄AFF, and
C̄VULN are compared in the same manner as C̄. These comparisons are also summarized in
Figure 5.1.2.2.2-1, and they are under the columns labeled “CAFF” and “CVULN”, respectively.
For the longer-scans subset, the results from the rate-based models and simulation are
compared using the following algorithm: 1) For each element of the longer-scans subset, the
results obtained for C̄ are compared using the equation: (ABS(C̄C_S_sim - C̄C_S_rate) / C̄C_S_sim),
where ABS is the absolute-value function. 2) To summarize these comparisons, the average
value for (ABS(C̄C_S_sim - C̄C_S_rate) / C̄C_S_sim) is calculated, over the subset. The minimum,
maximum and standard deviation are also calculated. These values are shown in Figure
5.1.2.2.2-2, under the column labeled “C”. 3) The outcomes for C̄AFF, and C̄VULN are
compared in the same manner as C̄. These comparisons are also summarized in Figure
5.1.2.2.2-2, and they are under the columns labeled “CAFF” and “CVULN”, respectively.
For the short-scans subset, the results are compared using actual differences, e.g.,
ABS(C̄C_S_sim - C̄C_S_rate). The relative differences were not used, as some are very large;
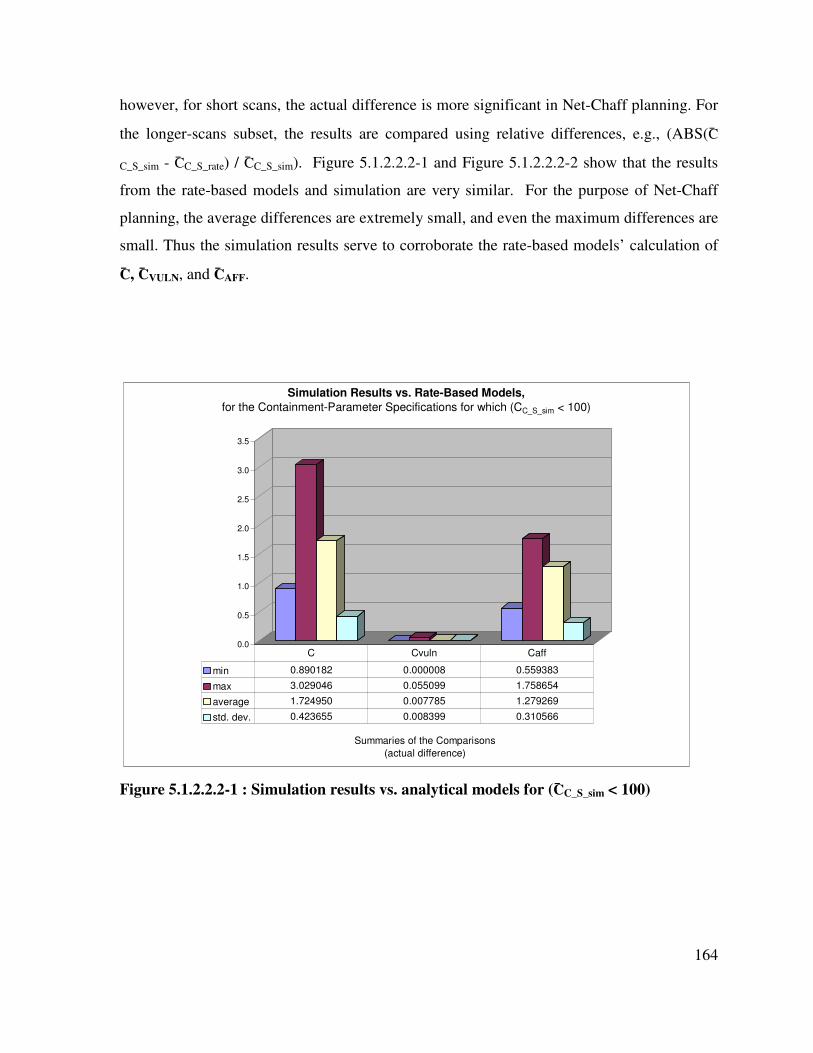
164
however, for short scans, the actual difference is more significant in Net-Chaff planning. For
the longer-scans subset, the results are compared using relative differences, e.g., (ABS(C̄
C_S_sim - C̄C_S_rate) / C̄C_S_sim). Figure 5.1.2.2.2-1 and Figure 5.1.2.2.2-2 show that the results
from the rate-based models and simulation are very similar. For the purpose of Net-Chaff
planning, the average differences are extremely small, and even the maximum differences are
small. Thus the simulation results serve to corroborate the rate-based models’ calculation of
C̄, C̄VULN, and C̄AFF.
0.0
0.5
1.0
1.5
2.0
2.5
3.0
3.5
Summaries of the Comparisons
(actual difference)
Simulation Results vs. Rate-Based Models,
for the Containment-Parameter Specifications for which (CC_S_sim < 100)
min 0.890182 0.000008 0.559383
max 3.029046 0.055099 1.758654
average 1.724950 0.007785 1.279269
std. dev. 0.423655 0.008399 0.310566
C Cvuln Caff
Figure 5.1.2.2.2-1 : Simulation results vs. analytical models for (C̄C_S_sim < 100)
165
0.00
0.02
0.04
0.06
0.08
0.10
0.12
Summaries of the Comparisons
(relative difference)
Simulation Results vs. Rate-Based Models,
for the Containment-Parameter Specifications for which (CC_S_sim >= 100)
min 0.000032 0.000065 0.000000
max 0.016348 0.114822 0.015656
average 0.002410 0.025139 0.002552
std. dev. 0.003274 0.025342 0.003415
C Cvuln Caff
Figure 5.1.2.2.2-2 : Simulation results vs. analytical models for (C̄C_S_sim ≥ 100)
• Simulation results vs. rate-based models for: Pvuln
The rate-based models and the simulation were also used to calculate Pvuln, which is
the probability that a scan will probe one or more vulnerable computers, for a given value of
C̄VULN. The outcomes from the rate-based models and simulation were compared, as
described below.
In the simulation, Pvuln was calculated for each of the 432 containment-specifications.
Pvuln values are plotted in Figure 5.1.2.2.2-3, for the containment-specifications whose Pvuln
value is less than or equal to 0.997. Larger values of Pvuln were not plotted as they are not
relevant for Net-Chaff planning. There are 325 containment-specifications whose Pvuln value
is less than or equal to 0.997.
From the rate-based models, Pvuln can be calculated using the Poisson distribution, as
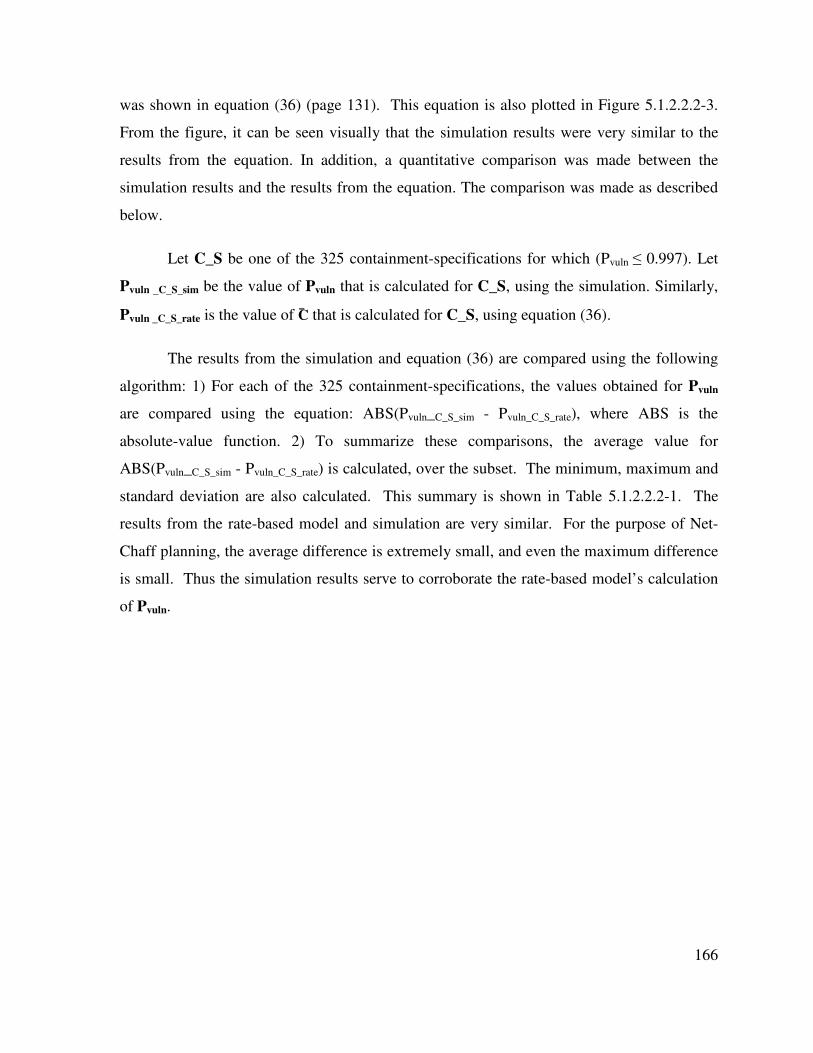
166
was shown in equation (36) (page 131). This equation is also plotted in Figure 5.1.2.2.2-3.
From the figure, it can be seen visually that the simulation results were very similar to the
results from the equation. In addition, a quantitative comparison was made between the
simulation results and the results from the equation. The comparison was made as described
below.
Let C_S be one of the 325 containment-specifications for which (Pvuln ≤ 0.997). Let
Pvuln _C_S_sim be the value of Pvuln that is calculated for C_S, using the simulation. Similarly,
Pvuln _C_S_rate is the value of C̄ that is calculated for C_S, using equation (36).
The results from the simulation and equation (36) are compared using the following
algorithm: 1) For each of the 325 containment-specifications, the values obtained for Pvuln
are compared using the equation: ABS(Pvuln_C_S_sim - Pvuln_C_S_rate), where ABS is the
absolute-value function. 2) To summarize these comparisons, the average value for
ABS(Pvuln_C_S_sim - Pvuln_C_S_rate) is calculated, over the subset. The minimum, maximum and
standard deviation are also calculated. This summary is shown in Table 5.1.2.2.2-1. The
results from the rate-based model and simulation are very similar. For the purpose of Net-
Chaff planning, the average difference is extremely small, and even the maximum difference
is small. Thus the simulation results serve to corroborate the rate-based model’s calculation
of Pvuln.
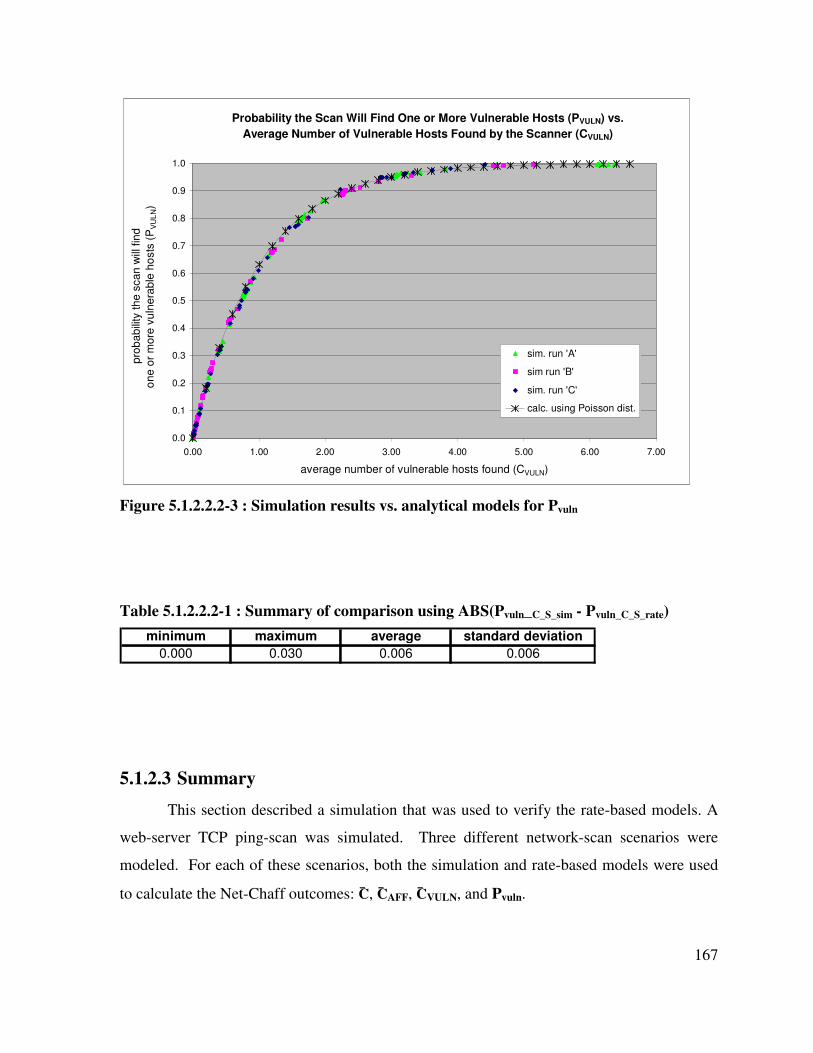
167
Probability the Scan Will Find One or More Vulnerable Hosts (PVULN) vs.
Average Number of Vulnerable Hosts Found by the Scanner (CVULN)
0.0
0.1
0.2
0.3
0.4
0.5
0.6
0.7
0.8
0.9
1.0
0.00 1.00 2.00 3.00 4.00 5.00 6.00 7.00
average number of vulnerable hosts found (CVULN)
pro
ba
bili
ty th
e s
ca
n w
ill fin
d
on
e o
r m
ore
vu
lne
rab
le h
osts
(P
VU
LN)
sim. run 'A'
sim run 'B'
sim. run 'C'
calc. using Poisson dist.
Figure 5.1.2.2.2-3 : Simulation results vs. analytical models for Pvuln
Table 5.1.2.2.2-1 : Summary of comparison using ABS(Pvuln_C_S_sim - Pvuln_C_S_rate)
minimum maximum average standard deviation
0.000 0.030 0.006 0.006
5.1.2.3 Summary
This section described a simulation that was used to verify the rate-based models. A
web-server TCP ping-scan was simulated. Three different network-scan scenarios were
modeled. For each of these scenarios, both the simulation and rate-based models were used
to calculate the Net-Chaff outcomes: C̄, C̄AFF, C̄VULN, and Pvuln.
168
The results from the rate-based model and simulation were compared by measuring
the differences between them. For the purpose of Net-Chaff planning, the average
differences were extremely small, and even the maximum differences were small. Thus the
simulation results serve to corroborate the rate-based model’s calculation of the Net-Chaff
outcomes.
5.1.3 Hiding analysis
Net-Chaff hides real computers from scanners. This section analyzes Net-Chaff from
the perspective of the hiding model presented in chapter 3. The model is used to understand
the role of hiding in Net-Chaff’s functionality and performance. From the perspective of the
hiding model, hackers’ scanning can be viewed as a discovery process, and Net-Chaff hides
real systems by defeating this process. Net-Chaff uses both deceptive and non-deceptive
hiding, and both are analyzed.
Ultimately, Net-Chaff uses hiding to achieve its tactical objectives. Net-Chaff’s
primary uses of hiding include: 1) scan containment is used to hide real systems from scans,
2) impersonations are used to hide real systems from information-retrieval scans, and 3) Net-
Chaff’s deceptions are hidden, to counter hackers’ counter-deception. These uses of hiding
involve one or more hiding techniques.
In the following subsections, each of these uses of hiding is analyzed. The hiding
model is used to categorize each of the hiding techniques according to how it defeats the
hacker’s discovery process. References to the model’s categories are in italics. As described
in the model, a hiding technique can affect multiple elements of the discovery process, so it
could be placed in multiple categories. For each hiding technique, only its primary affect is
categorized.
5.1.3.1 Hiding real systems via containment
Net-Chaff’s containment process hides real systems from scanners. The containment
process uses several different hiding techniques. This section analyzes these hiding
techniques from the perspective of the hiding model. These techniques hide real systems by

169
defeating the scanners’ direct observation. From the perspective of the hiding model, the
scanner is a sensor.
Net-Chaff’s primary hiding technique is the use of routers to block scanners’ access
to the intranet. From the perspective of the hiding model, this hiding technique defeats the
sensor (scanner) by altering the information flows to it.
Net-Chaff also hides real systems by slowing down the scan during the containment
time. Specifically, Net-Chaff reduces the rate at which vulnerable computers are probed, i.e.,
the number of vulnerable computers probed per second. This rate is calculated as (x̄ * r̄vuln),
as described earlier with equation (22) (page 133). Thus, decreasing either factor, x̄ or r̄vuln,
serves to hide real systems.
Net-Chaff’s low-level impersonations are used to decrease x̄ (as described in section
5.1.1.4.2 on page 138). The factor r̄vuln is decreased by configuring the network so that it has
a relatively large number of unused addresses (as described in section 5.1.1.4.3 on page 147).
Both of these hiding techniques defeat the sensor (scanner). They do so by altering the
environment of the hidden item, by creating noise in the environment.
Reducing Net-Chaff’s containment time also serves to hide real systems (as described
in section 5.1.1.4.1 on page 133). This hiding technique serves to defeat the sensor
(scanner). It diminishes the target’s sensor capabilities, by reducing the target’s time
available for observation.
5.1.3.2 Hiding real systems via false positives
Net-Chaff’s impersonations also help to hide real computers from information-
retrieval scans (as described in section 5.1.1.3.1 on page 120). In the scan results, the real
computers can be hidden by the voluminous false positives created by Net-Chaff’s
impersonations. How this hiding technique works depends upon the type of scan results and
how they are used by the hacker. A typical example is given.
A hacker uses a TCP ping-scan to find web servers. The scan returns ten network
170
addresses that respond affirmatively to the ping scan. In reality, nine of the responses are
impersonations. If the scan results are printed and perused by a hacker, he cannot distinguish
the real web-server from the impersonations. From the perspective of the hiding model, the
hacker uses the scanner for direct observation. In this case, the hacker’s direct observation is
defeated by defeating his recognition of the real web-server. More specifically, the hacker’s
recognition is defeated by the impersonations which alter the information flows to the
sensor.
5.1.3.3 Preventing counter-deception
Net-Chaff must hide indicators that allow scanners to prematurely discover
impersonations and the unused portions of the network. The hiding model can be used to
understand how Net-Chaff can hide these things. These issues were discussed with the Net-
Chaff system design in chapter 4. To recap, the hacker cannot directly observe Net-Chaff, but
he can potentially discover Net-Chaff by investigation. From the perspective of the hiding
model, Net-Chaff is hidden by defeating the hacker’s investigation process. Specifically,
Net-Chaff is hidden by not creating the evidence that the hacker needs for Net-Chaff
detection. This is accomplished by making the impersonations adequately realistic. The
degree of realism needed depends on the scanners’ detection capabilities, and also, cost-
benefit constraints. Examples are provided in chapter 4.
5.1.3.4 Summary
Ultimately, Net-Chaff uses hiding to achieve its tactical objectives. The hiding model
was used to analyze Net-Chaff’s uses of hiding, as well as its hiding techniques. Net-Chaff’s
primary uses of hiding include: 1) scan containment is used to hide real systems from scans,
2) impersonations are used to hide real systems from information-retrieval scans, and 3) Net-
Chaff’s deceptions are hidden, to counter hackers’ counter-deception. These uses of hiding
serve distinct and different purposes. The containment process is noteworthy, as it uses
several different hiding techniques.
The hiding analysis reveals the role of hiding in Net-Chaff’s functionality and
performance. These findings are incorporated in the Net-Chaff system design, and the Net-
171
Chaff performance analysis. Citations were given for the places in the dissertation where the
findings are incorporated.
5.1.4 Limitations
This section analyzes the limitations of the Net-Chaff system. It also analyzes the
limitations of the Net-Chaff evaluation. The dissertation’s Net-Chaff research, itself, has
limitations. The scope of the research is limited to the design and evaluation of the Net-
Chaff architecture. The results indicate that Net-Chaff can effectively detect and contain
scans. However, additional research is needed to further assess Net-Chaff’s viability. This
additional research will be discussed in the next section, which addresses Net-Chaff’s future
research.
• Limitations of the Net-Chaff system:
For the Net-Chaff system, there are limitations in the functions it provides and in the
types of networks it protects. Net-Chaff’s primary functions are to detect and block scans. A
limitation of Net-Chaff’s surveillance capabilities is that it only sees traffic sent to the unused
addresses that it manages. It does not see traffic sent to computers on the intranet, nor traffic
sent from the intranet to other networks. Net-Chaff is limited to detecting active scans that
access a sufficient number of unused addresses. Active scans that avoid unused addresses
will not be detected. An example is the scan of an address range that is densely populated by
computers, such as the lower addresses of a subnet. Net-Chaff cannot detect passive
scanning. Another limitation of Net-Chaff’s detection capabilities is the possibility of false
positives from benign scans. To prevent false positives, Net-Chaff must be provided with
signatures that identify benign scans, e.g., their source addresses. A limitation of Net-Chaff’s
blocking function is that it blocks whole subnets, rather than just scan traffic. This limitation
is related to Net-Chaff’s solution for scan probes with spoofed source addresses. Less
disruptive blocking systems are possible, but left for future research.
Another limitation of Net-Chaff is the types of networks it can protect. The network
requirements for using Net-Chaff were specified in chapter 4. To use Net-Chaff, a network
must already meet these requirements, or it must be modified to meet them. Some of these
172
requirements significantly limit the types of networks that can use Net-Chaff. In particular,
Net-Chaff is used on secured intranets in which scans can be accurately identified amidst the
traffic to unused addresses. Also, for containment to work, the intranet routers must support
the blocking function, and the consequences of automated containment must be acceptable.
Another limitation is that Net-Chaff requires a large number of unused addresses, and it must
be possible to route their traffic to the Net-Chaff servers. Further, the network’s used subnets
need to be tactically distributed among the unused subnets. The Net-Chaff performance
analysis shows the network parameters that affect Net-Chaff’s performance (see section
5.1.1.4). These parameters determine Net-Chaff’s suitability for a particular network. For
instance, Net-Chaff is only suitable for networks in which the scan bandwidth is sufficiently
low and the number of unused addresses sufficiently high. As an example, Net-Chaff may
not be useful on a class B network that can be scanned at a rate of 1 Gbps.
There are also limitations related to Net-Chaff’s installation and on-going operations.
Installing Net-Chaff may require modifying the network, so that Net-Chaff can be used
effectively, as just discussed. Installing a Net-Chaff LAN server at each, or many, LANs can
be costly. Also, the Net-Chaff installation requires configuring intranet routers to perform
several essential tasks: routing traffic to the Net-Chaff WAN server, blocking scans, and
dropping packets with spoofed source addresses. Maintaining the router configurations will
be an on-going administration task.
• Limitations of the Net-Chaff evaluation
The Net-Chaff evaluation uses analytical models and a simulation, and their primary
limitations are examined. Net-Chaff’s performance is dependent upon specific attributes of
networks and scans, so Net-Chaff’s performance analysis must be for specific network
topologies and types of scans. Consequently, the Net-Chaff evaluation was limited to a small
number of typical networks and typical scans. However, the analytical models can be
applied to other types of networks and scans.
There were limitations in the scan functions that were modeled. The Net-Chaff
analysis only considered random address selection. Scanners use several other types of
address selection techniques, as described in chapter 4. Sequential address selection was not
173
analyzed, but it is highly relevant, as networks can have sizable addresses-ranges that are
densely populated by computers. In addition, the Net-Chaff analysis only considered a single
scanner. However, the single-scanner model can be extended to analyze multiple scanners.
There are noteworthy limitations in the analytical models and simulation, themselves.
A major limitation is that their accuracy cannot yet be tested relative to actual Net-Chaff
deployments. Consequently, their accuracy is only as good as their untested assumptions. A
limitation of the analytical models is that their results are average values that apply in the
limit for an infinite number of scans. Consequently, the models do not calculate the outcome
for an individual scan, nor for a small number of scans. There is a limitation in the
simulation’s ability to verify the analytical model. The simulation models a scan whose
probe types all have the same individual probe rate (see section 5.1.1.2.1). Consequently, the
simulation’s verification of the analytical model does not cover cases in which there is
variation in the individual probe rates. There is also a noteworthy limitation in the Net-Chaff
performance analysis. Empirical data on actual blocking times was not available, and this
limits the conclusions that can be drawn regarding Net-Chaff’s effectiveness.
5.1.5 Future research
The dissertation’s Net-Chaff research is limited to the design and evaluation of its
architecture. The results indicate that Net-Chaff can effectively detect and contain scans.
However, there are additional design problems that must be solved before Net-Chaff can be
implemented. Its appears that viable solutions can be found for these design problems, but it
is not entirely certain. Those design problems are described here. In addition, this section
presents several optional features that could be added to enhance Net-Chaff.
Net-Chaff’s use of unused addresses has been described. However, further design is
needed, and there are several problems that must be solved. An intranet routing scheme is
needed for the unused addresses; this requires further investigation and the development of
specific solutions. There are two other systems that address intranet routing for unused
addresses, and their solutions may be useful [Pro04, YBP04]. A solution is also needed for
assigning unused addresses to the Net-Chaff LAN server. honeyd’s scheme of appropriating
174
addresses with unanswered ARP requests may be problematic [Pro04]; also, compatibility
with DHCP systems is necessary. Another problem that must be addressed is how to best
distribute a network’s unused addresses among the addresses assigned to computers. In
addition, Net-Chaff’s detection mechanism needs to be fully designed. A simple threshold-
based detection mechanism was proposed. However, the detection mechanism must provide
sufficient accuracy for automated containment. It must include capabilities for recognizing
and ignoring benign scans.
Net-Chaff’s servers generate low-level impersonations. Impersonation is a complex
problem and specific solutions must be designed. Analysis is needed to determine what
specific probes will be received and what specific responses will be provided. One of the
most challenging problems is providing responses for probes used for O/S fingerprinting, as
accurately impersonating network stacks could be extremely difficult. Another open problem
is scans that map the network topology, such as traceroute. However, it may be possible to
just drop those scan packets at the intranet routers. Solutions are also needed for an unused
subnet’s impersonation of a used subnet. Chapter 4 discussed counter-deception problems
for this type of impersonation.
In general, scanners’ counter-deception opportunities must be analyzed when
designing the impersonations. Scanner’s counter-deception can include the use of
information sources other than scans. For instance, reverse DNS look-ups could be used to
find a network’s unused addresses. In general, Net-Chaff’s impersonation requirements can
be reduced by using techniques that prevent scanners from obtaining information. For
example, DNS systems can be configured so they do not provide reverse look-ups. Also,
many forms of O/S fingerprinting can be prevented by having routers drop certain ICMP
packets [Ark01].
Further design is needed for the Net-Chaff WAN and LAN servers. This includes
capacity-planning and the processing of incoming and outgoing traffic. The iSink system has
a promising solution for handling large volumes of scan probes and for generating replies
[YBP04]. If the Net-Chaff servers can generate large volumes of replies, then network DoS
problems must be considered. Another Net-Chaff problem is that Net-Chaff LAN servers
175
are, collectively, expensive to purchase and administer. Future research should consider
alternative solutions that do not require a Net-Chaff device at each LAN, e.g., the use of IP
tunneling on the subnets’ routers. An additional design problem is the specific containment
techniques that will be used. Challenges include supporting different types of routers and
minimizing the blocking time. In general, Net-Chaff’s system-designs should include
defenses for possible scanner countermeasures and hacker attacks.
Net-Chaff was designed mostly from an academic perspective of how networks
should work. Additional investigation is needed to analyze Net-Chaff’s compatibility with a
wide variety of real-world networks, including their design and operations. Some of the
phenomenon that is of interest includes: routing, blocking capabilities, the availability of
unused addresses, potential access-control problems (e.g., firewalls), and vulnerabilities to
counter-deception. Empirical research is also needed to examine the contents of traffic sent
to unused addresses on secured intranets. This is necessary for testing Net-Chaff’s
hypothesis that secure intranets provide an environment where scanning: 1) occurs
infrequently, 2) can be accurately detected, and 3) warrants automated containment.
Empirical data on the performance of typical scans is needed, to make the analysis of Net-
Chaff’s performance more informed and accurate.
The research that was just proposed is intended to refine the design of the Net-Chaff
system that is described in this dissertation. In addition, there are a number of ways to
expand and enhance Net-Chaff’s functionality. The Net-Chaff architecture includes a
surveillance component, and its design is left for future research. Net-Chaff is intended for
use with a particular network topology, and it was specified in chapter 4. It includes LANs,
subnets, intranet routers and a single gateway. Net-Chaff could be extended for use in other
topologies, such as those with multiple gateways, or a single LAN protected by a firewall.
One of the most promising ways to improve Net-Chaff is to use large IPv6 networks and
thereby assign huge numbers of unused addresses to the Net-Chaff servers. There are other
researchers who have observed that the large address space in IPv6 makes scanning very
difficult [ZGT05].
A limitation of the existing Net-Chaff design is its simple threshold-based detection
176
mechanism. Additional detection mechanisms could be used to speed-up detection and to
improve detection accuracy. There has been much prior research on scan detection
mechanisms, as described in chapter 2, and it may be applicable to Net-Chaff. There are also
limitations in Net-Chaff’s blocking system, and there are a number of ways it can be
improved. The system currently blocks whole subnets, but techniques can be developed to
reduce the scope of blocking to individual addresses, or to a specific types of traffic. Another
way Net-Chaff can be improved is through the use of additional delaying techniques,
including the “tar pits” described in chapter 4.
5.1.6 Summary of the Net-Chaff analysis
This section summarizes the Net-Chaff analysis. Net-Chaff’s performance objectives
were presented in chapter 4, and they include its tactical objectives and its deception and
hiding objectives. The Net-Chaff analysis addresses a subset of these objectives:
• Net-Chaff’s ultimate objectives are to reduce the scanner’s access to the network, and
especially access to high-valued and vulnerable systems. The primary metric is the
number of vulnerable computers accessed by the scanner, before the scan is contained.
• Net-Chaff uses deception and hiding to achieve its tactical objectives. The Net-Chaff
analysis focuses on Net-Chaff’s primary uses of deception and hiding. They include: 1)
the use of low-level deceptions and large numbers of unused addresses, for slowing-down
scans, and 2) the use of low-level deceptions to provide false positives that reduce the
usefulness of the scan results.
Section 5.1.1 (page 96) presented a set of analytical models for estimating Net-
Chaff’s performance and for analyzing its use of deception. The models are based on the
scanners' probe rates, so they are referred to as the rate-based models. The primary metric is
stated as:
C̄VULN the average number of vulnerable computers that are accessed, prior to
containment
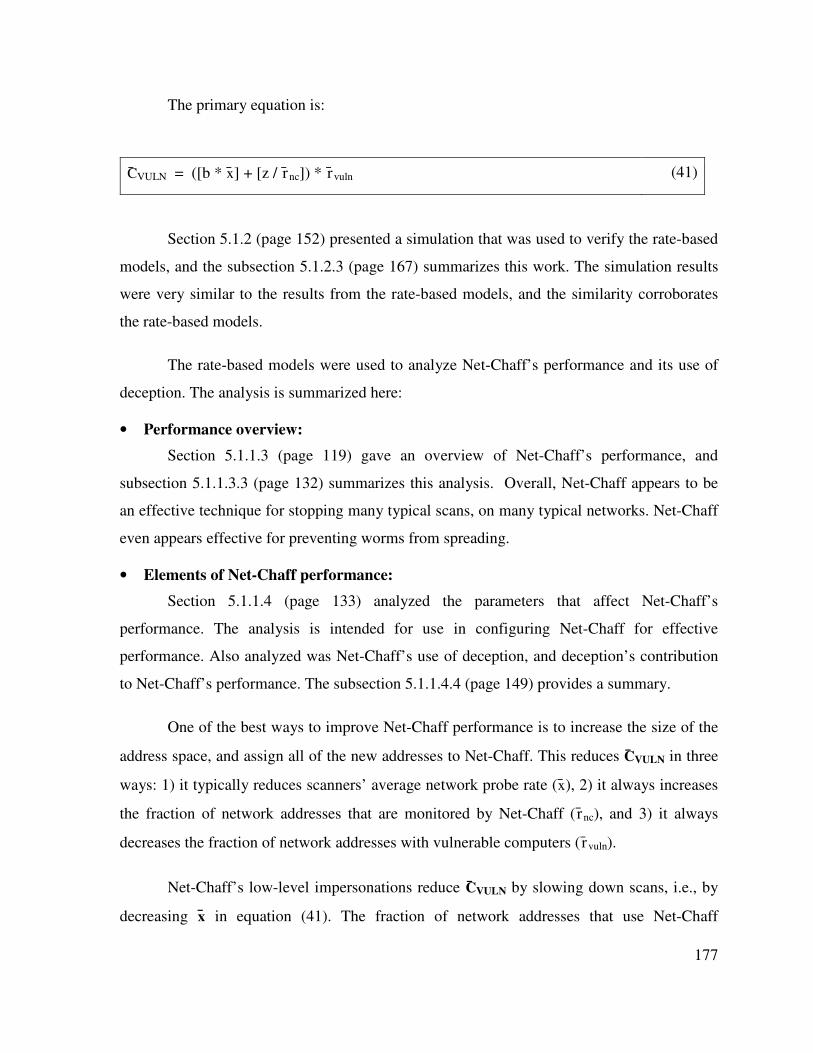
177
The primary equation is:
C̄VULN = ([b * x̄] + [z / r̄nc]) * r̄vuln (41)
Section 5.1.2 (page 152) presented a simulation that was used to verify the rate-based
models, and the subsection 5.1.2.3 (page 167) summarizes this work. The simulation results
were very similar to the results from the rate-based models, and the similarity corroborates
the rate-based models.
The rate-based models were used to analyze Net-Chaff’s performance and its use of
deception. The analysis is summarized here:
• Performance overview:
Section 5.1.1.3 (page 119) gave an overview of Net-Chaff’s performance, and
subsection 5.1.1.3.3 (page 132) summarizes this analysis. Overall, Net-Chaff appears to be
an effective technique for stopping many typical scans, on many typical networks. Net-Chaff
even appears effective for preventing worms from spreading.
• Elements of Net-Chaff performance:
Section 5.1.1.4 (page 133) analyzed the parameters that affect Net-Chaff’s
performance. The analysis is intended for use in configuring Net-Chaff for effective
performance. Also analyzed was Net-Chaff’s use of deception, and deception’s contribution
to Net-Chaff’s performance. The subsection 5.1.1.4.4 (page 149) provides a summary.
One of the best ways to improve Net-Chaff performance is to increase the size of the
address space, and assign all of the new addresses to Net-Chaff. This reduces C̄VULN in three
ways: 1) it typically reduces scanners’ average network probe rate (x̄), 2) it always increases
the fraction of network addresses that are monitored by Net-Chaff ( r̄nc), and 3) it always
decreases the fraction of network addresses with vulnerable computers ( r̄vuln).
Net-Chaff’s low-level impersonations reduce C̄VULN by slowing down scans, i.e., by
decreasing x̄ in equation (41). The fraction of network addresses that use Net-Chaff
178
impersonations is represented as r̄nc_imp. x̄ can be decreased by increasing r̄nc_imp. However,
beyond a certain point, increasing r̄nc_imp can not only risk counterdeception, but it may also
provide relatively little reduction in C̄VULN.
C̄VULN is proportional to r̄vuln, as shown by equation (41). When a network has a large
number of unused addresses, relative to the number of vulnerable computers, then the unused
addresses serve to hide the vulnerable computers. This is the passive hiding that was
described in Chapter 4. In equation (41), r̄vuln represents passive hiding’s affect on C̄VULN.
• Taxonomy of probe response types:
In practice, a network may use deceptions other than Net-Chaff, to thwart scans. An
example is a firewall that replies to scans with false ICMP messages stating the target is
unreachable. Section 5.1.1.5 (page 150) describes some of the common forms of these
deceptions. It also describes how the rate-based models can be extended to analyze the
affects of these deceptions.
The hiding model was also used to analyze Net-Chaff’s performance, and its use of
deception. In summary, Net-Chaff’s primary uses of hiding include: 1) its containment
process, 2) the use of impersonations to hide real systems from information-retrieval scans,
and 3) hiding Net-Chaff’s deceptions, to counter hackers’ counter-deception.
Finally, the Net-Chaff evaluation includes analysis of Net-Chaff’s limitations, and
also, topics for future research. The Net-Chaff system’s primary limitations include: 1) its
intrusive use of the network’s address space and routers, and 2) potential problems from
automated containment, including false positives and blocking whole subnets. The primary
limitations of the Net-Chaff research include: 1) its untested hypothesis regarding secured
intranet routers and the opportunity they present for accurately detecting scans, and 2)
remaining design work is needed in order to better assess Net-Chaff’s viability.
5.2 Honeyfiles
Extensive validation work was performed for the Honeyfiles system. That work is
179
described in the Honeyfiles conference paper [YZD04], which is included in the appendix.
The paper also has a section on the limitations of the Honeyfiles system. The paper gives a
synopsis of the validation work. A more thorough description of the validation work is
beyond the scope of this dissertation.
5.3 Deception process models
This section presents the evaluation performed for the deception process-models: the
deception-operations model and the hiding model (presented in chapter 3). The evaluation is
an informal case-study that is based on use of the models in developing and evaluating the
Net-Chaff and Honeyfiles systems. The systems are presented in chapter 4, and the
evaluation in chapter 5. The evaluation is informal in that it is based on the dissertation
author’s experience in using the models. Also, the analysis is limited to reporting the most
noteworthy findings. For each model, parts of it were not used with the two systems, so the
evaluation is limited to the parts that were used.
For each process-model, its use with each system is evaluated separately. In
particular, separate evaluations are made for the use of the deception-operation model with
the Honeyfiles system and the Net-Chaff system. An evaluation is made for the use of the
hiding model with the Net-Chaff system. The hiding model was not used with the
Honeyfiles system. The models are evaluated relative to their purpose of aiding deception
planning. Each evaluation examines and reports the following: 1) how the model was used,
2) the model’s usefulness (i.e., validation), 3) the model’s correctness (i.e., verification 22
),
and in particular, its self-consistency and veracity, 4) the parts of the model that were not
used, and thus not evaluated, 4) ways to improve the model, and 5) the model’s limitations.
• Deception-operations model:
The deception-operations model was used with Net-Chaff, to create, design and
evaluate the system. The model was not only useful, but essential, in developing Net-Chaff.
The model inspired the Net-Chaff design. The model reveals that the deception target’s
intelligence process is a key element of deception operations: the target’s intelligence
180
process can be used to reliably convey the deception to the target, and also, the target’s
intelligence process can be defeated by deception. Applying this to computer security led to
the observations that: 1) hackers’ scans can be easily deceived, 2) deception can have a
predictable and reliable effect on scans, and 3) that deception could help in containing scans.
The model also reveals the importance of minimizing falsehood in deception operations.
This principle inspired the design of Net-Chaff’s low-level impersonations.
The deception-operations model guided the Net-Chaff design process, and was key in
understanding how to effectively use deception. The model of the overall deception process
provided a very useful understanding of the deception-operation’s lifecycle. The model’s
deception objective was indispensable for identifying Net-Chaff’s specific uses of deception,
and in using the deceptions effectively. The Net-Chaff system is described in chapter 4, and
it includes a section on Net-Chaff’s deception objectives. The model also played a critical
role in evaluating Net-Chaff. The deception objectives revealed what to evaluate in assessing
Net-Chaff’s performance and the effectiveness of its deceptions.
Almost all of the deception-operations model is applicable to Net-Chaff. Only a
small part of it was not relevant, and an example is the process for terminating deception
operations. No errors were found in the model. However, a discovery was made that
improves the model. Each deception objective should include a description of the tactical or
strategic objectives it serves, and how it serves them. This was done with the Net-Chaff
design, in its sections on tactical and deception objectives. The primary limitation of the
deception-operations model is that it has not been used extensively, and its primary author
does not have extensive experience with computer-security deception operations. Additional
use of the model is needed to further test and improve it.
The deception-operations model was also used to design and evaluate the Honeyfiles
system. That use of the model was very similar to what was just described for Net-Chaff.
One exception is that the model did not inspire the creation of the Honeyfiles system, as that
22
Boehm elaborates on the distinction between validation and verification [Boe84].
181
occurred before the model was built. The model was especially helpful in understanding
how to deploy individual honeyfiles. For instance, an understanding of hackers’ intelligence
processes is needed to effectively place and name honeyfiles. Also, system users need to
understand their honeyfiles’ deception objective. The model was also helpful in
understanding the advantages of honeyfile deceptions: they are very simple, use little
falsehood, have almost no risk, and the system provides good feedback.
The Honeyfiles system was evaluated by deploying a prototype of it on a honeynet.
The deception-operations model played a key role in designing the honeynet, and especially
in designing the deception story. Three computer-security students were recruited to hack
the honeynet. Their hacking was observed, and they were each interviewed. The interviews
revealed that key parts of the deception story were not received by the hackers. The
deception-operations model was useful in understanding why this part of the deception
operation failed. The failure also revealed a limitation of the model. The model lacks
guidance regarding specific techniques that tend to work, and not work, based upon
experience. Providing such guidance would significantly enhance the model’s usefulness.
• Hiding model:
The hiding model is a taxonomy, and it was used to categorize the five hiding
techniques used by Net-Chaff. That analysis and categorization is documented in a section
within the Net-Chaff evaluation, in chapter 5. The purpose of that categorization was to test
the hiding model, and to better understand Net-Chaff’s use of hiding. The categorization was
performed after Net-Chaff was designed, and after Net-Chaff’s analytical models and
simulation were completed. Therefore, the categorization was not applied to that work.
To use the hiding model, it was first necessary to identify the hiding techniques. This
was the most useful information obtained. In categorizing the hiding techniques, the higher-
level categories were the most informative. For example, hiding Net-Chaff from counter-
deception involves defeating scanners’ discovery process of investigation. Overall, the
hiding model provided useful information about Net-Chaff’s hiding techniques, but not
essential information.
182
The categorization process was tedious and challenging. The categories were
adequately defined, but some of the hiding techniques were not easy to categorize. For
instance, one hiding technique that was difficult to categorize is Net-Chaff’s use of a large
number of unused addresses to reduce r̄vuln. Most of the difficulties in categorization may be
due to the nature of the problem—such analysis can simply be difficult. However, some of
the hiding model’s low-level categories probably need additional clarification. Each of the
five hiding techniques belongs to a different low-level category. The model has 26 low-level
categories, so only a small fraction of them were used and evaluated. Additional use and
evaluation of the hiding model is needed. Another intended application of the hiding model
is in discovering new or alternative hiding techniques. This application of the model may
prove to be more useful then applying the model to categorize known deception techniques,
as was done for Net-Chaff.
• Summary:
This section presents the evaluation performed for the deception process-models. The
evaluation is an informal case-study. The deception-operation model was extremely useful
for creating, designing and evaluating the Net-Chaff and Honeyfiles systems. The most
important parts of the model were found to be: 1) the model of the overall deception process,
2) the deception objective, 3) the role of the target’s intelligence process, and 4) minimizing
falsehood. The primary limitation of the deception-operations model is that it has not been
used extensively.
The hiding model was used to categorize and analyze Net-Chaff’s five hiding
techniques. The model of discovery by investigation was very helpful in understanding one
of the hiding techniques in particular. Although this was a very limited case-study, it
indicates that the model could be useful for understanding how particular hiding techniques
work. Additional use of the model is needed to further evaluate it.
183
6 Conclusion
This dissertation is concerned with the processes, principles and techniques that are
involved in deception-operations for computer security. After years of research and
development, computer security remains an error-prone task and, in some respects, perhaps a
loosing battle. Computer security’s chronic problems call for wholly new approaches.
Deception works in a fundamentally different way than conventional security. Conventional
security tends to work directly with the hacker’s actions, e.g., to prevent them or to detect
them. Deception manipulates the hacker’s thinking to make him act in a way that is
advantageous to the defender. Being fundamentally different, deception can be strong where
conventional security is weak.
6.1 Main contributions of this work
In computer security, relatively little has been done to systematically model and
examine deception operations. This work addresses these issues by focusing on deception for
computer-security defense. The four main contributions of this dissertation are:
1) A process model for deception operations: this model, which is based on military
deception theory and practice, provides deception planners with a framework for conducting
deception operations. The framework includes a set of processes, principles and techniques.
The model was extremely useful for creating, designing and evaluating the two novel
approaches to intrusion detection and defense: the Net-Chaff and Honeyfiles systems. The
most important parts of the model are: 1) the model of the overall deception process, 2) the
deception objective, 3) the role of the target’s intelligence process, and 4) the principle of
minimizing falsehood.
2) A process model of deceptive hiding: this model aids the defender in developing
new hiding techniques and in evaluating existing techniques. Deceptive hiding is modeled as
defeating the target’s discovery processes: direct observation, investigation based on
evidence, and learning from others. The hiding model was used to categorize and analyze
184
Net-Chaff’s five hiding techniques. The model of discovery by investigation was
particularly helpful in understanding one of the hiding techniques. Although this application
of the model was a very limited, it indicates that the model could be useful for understanding
how particular hiding techniques work.
3) Deception-based intrusion detection systems (IDSs): the two deception models
informed the design and evaluation of the two IDS systems. (a) The Net-Chaff system
employs computer-impersonations to detect and contain hacker’s network scans within an
intranet. Net-Chaff’s primary performance objective is to contain scans before they can
access vulnerable computers. The primary advantages of the system are: 1) it is deployed on
a secure intranet where scans are infrequent and warrant containment, 2) a large number of
unused addresses are used to rapidly and accurately detect scans, and to slow down them
down, 3) deception is also used to slow down scans, 4) automated containment.
(b) The Honeyfiles system extends the network file system to provide bait files for
hackers. These files trigger an alarm when opened. The primary advantages of the system
are: 1) honeyfiles can be difficult for hackers to avoid, 2) honeyfiles can detect unauthorized
access gained through unknown attacks, and 3) end-users can create honeyfiles and receive
alarms, and this can make false alarms infrequent and easy to handle.
4) Experiments: (a) the Net-Chaff system was evaluated by using analytical models
and a simulation. The simulation was used to verify the analytical models. The analytical
models were used to evaluate Net-Chaff’s performance. The evaluation included several
typical networks and several typical scans. Worst-case Net-Chaff performance was modeled.
For many typical network and scan scenarios, it appears that Net-Chaff could reliably contain
scans before they access a single vulnerable computer. This would prevent scanning worms
from spreading. The analytical models were also used to examine the parameters that affect
Net-Chaff’s performance. This application of the models can be used to configure Net-Chaff
deployments for good performance.
(b) A prototype of the Honeyfiles system was constructed. The prototype was
185
deployed on a deceptive network and subjected to hacking. There, the Honeyfiles system
was observed to be an effective means for intrusion detection.
6.2 Limitations of this work
The limitations of the two deception models and the two IDSs are analyzed in chapter
5. A short summary of that analysis is given here:
• The deception models: the primary limitation related to the deception models is the
limited time that was available for this work. This meant that the models have not been
extensively used nor evaluated as one would like.
There are also some practical limitations of the IDS solutions developed.
• Net-Chaff: the Net-Chaff system’s primary limitations include: 1) its intrusive use of
the network’s address space and routers, and 2) potential problems from automated
containment, including false positives and blocking whole subnets. The primary
limitations of the Net-Chaff research include: 1) its untested hypothesis regarding
secured intranet routers and the opportunity they present for accurately detecting scans,
and 2) remaining design work is needed in order to better assess Net-Chaff’s viability.
• Honeyfiles: the Honeyfiles system’s primary limitations include: 1) honeyfiles may not
be viable in file spaces that require regular searching, and 2) honeyfiles require end-user
involvement and skill.
6.3 Future work
Future work for the two deception models and the two IDSs is summarized here.
This work will address some of the limitations identified in the previous section, and it will
also explore new avenues related to deception-based IDSs:
• The deception models: additional use and evaluation of both models is needed. Further,
the deception-operations model lacks guidance regarding specific techniques that tend to
work, and not work, based upon experience. Providing such guidance would

186
significantly enhance the model’s usefulness. Future work for the hiding model is
discussed in chapter 3. One topic for future research is extending the discovery-process
models to deceptive showing. In this case, the discovery process would be manipulated
to portray something false.
• Net-Chaff: its future work is discussed in chapter 5. Most important is the design
problems that must be solved before Net-Chaff can be implemented. Its appears that
viable solutions can be found for these design problems, but it is not entirely certain.
Two such design problems are an intranet routing scheme for the unused addresses, and
specific impersonation solutions. Also, investigation is needed to analyze Net-Chaff’s
compatibility with a wide variety of real-world networks, including their design and
operations.
• Honeyfiles: the Honeyfiles system needs to be more fully implemented, and then
deployed on real networks where it can be evaluated.
187
7 Bibliography Note: unless stated otherwise, all URLs were verified on, or before, May 2006.
[Ark99] Arkin, O. “Network Scanning Techniques, Version 1.0”, The Sys-Security Group,
http://www.sys-security.com/index.php?page=papers, 1999.
[Ark01] Arkin, O. “ICMP Usage in Scanning – The Complete Know How, Version 3.0”,
The Sys-Security Group, http://www.sys-security.com/index.php?page=papers, 2001.
[Ark05] Arkin, O. “On the Deficiencies of Active Network Discovery Systems”, white
paper, Insightix, http://www.insightix.com/resources-currentwhitepaper.aspx, 2005.
[Bal04] Balas, E. “Honeynet Data Analysis: A Technique for Correlating Sebek and
Network Data”, Digital Forensic Research Workshop (DFRWS),
http://www.dfrws.org/bios/day2/Balas_Honeynets_for_DF.pdf, August 2004.
[Bar52] Barkas, G. The Camouflage Story, Cassell & Co. Ltd, 1952.
[Bar95] Baker, F. “RFC 1812 - Requirements for IP Version 4 Routers”, Network Working
Group, IETF, 1995.
[Bec01] Beck, R. “Passive-aggressive resistance: OS fingerprint evasion”, Linux Journal,
2001(89), http://www.linuxjournal.com/issue/89, September 2001.
[BFP03] Beale, J., J. Foster, and J. Posluns. Snort 2.0 Intrusion Detection, Syngress
Publishing, Inc. 2003.
[Boe84] Boehm, B. “Verifying and validating software requirements and design
specifications”, IEEE Software, 1(1):75-88, January 1984.
[BW82] Bell, J., B. Whaley. Cheating and Deception. Transaction Publishers, 1982.
[CDF04] Carella, C., J. Dike, N. Fox, and M. Ryan, “UML Extensions for Honeypots in the
ISTS Distributed Honeypot Project”, Proceedings of the 2004 IEEE Workshop on
Information Assurance, pp. 130-137, West Point, New York,
http://www.ists.dartmouth.edu/library/honeypots/uml0604.pdf, June 2004.
[CER99] “CERT Advisory CA-1999-13 Multiple Vulnerabilities in WU-FTPD”, CERT/CC,
http://www.cert.org/advisories/CA-1999-13.html, November 9, 1999.
[CGK03] Z. Chen, L. Gao, and K. Kwiat, “Modeling the Spread of Active Worms",
Proceedings of the IEEE INFOCOMM, vol. 3, pp. 1890-1900, 2003.
188
[Cha04a] Charles, K. “Decoy Systems: A New Player in Network Security and Computer
Incident Response”, International Journal of Digital Evidence, 2(3),
http://www.ijde.org/docs/04_winter_v2i3_art3.pdf, Winter 2004.
[Cha04b] Chamales, G. “The Honeywall CD-ROM”, IEEE Security & Privacy Magazine,
2(2):77-79, Mar-Apr 2004.
[Che92] Cheswick, B. "An evening with Berferd: In which a cracker is lured, endured and
studied," Proceedings of the Winter USENIX Conference, pp. 163-174, January 1992.
[Chu03] Chuvakin, A. “Days of the Honeynet: Attacks, Tools, Incidents”,
LinuxSecurity.com, http://www.linuxsecurity.com, April 22, 2003.
[CIA80] Deception Maxims: Fact and Folklore, Deception Research Program, Office of
Research and Development, Central Intelligence Agency, 1980.
[CIS01] “Network Security: An Executive Overview”, Cisco Systems, no longer on-line,
available on request from the dissertation author, 2001.
[CIS04] Catalyst 6500 Series Switch Software Configuration Guide—Release 8.4, Cisco
Systems, 2004.
[Cla32] von Clausewitz, C. On War, Princeton University Press, 1832.
[CLP01] Cohen, F., D. Lambert, C. Preston, et al. “A Framework for Deception”, Internet
published, http://www.all.net/journal/deception/Framework/Framework.html, July 2001.
[CMS01] Cohen, F., I. Marin, J. Sappington, C. Stewart, E. Thomas. “Red Teaming
Experiments with Deception Technologies”, internet-published manuscript,
http://all.net/journal/deception/experiments/experiments.html, November 2001.
[Coh98] Cohen, F. "A Note on the Role of Deception in Information Protection",
Computers & Security, 17(1998):483-506, 1998.
[Coh00] Cohen, F. “A Mathematical Structure of Simple Defensive Network Deceptions”,
Computers & Security, 19(2000):520-528,
http://www.all.net/journal/deception/mathdeception/mathdeception.html, August 2000.
[Cor04] Corey, J. “Advanced Honeypot Identification and Exploitation”, Phrack, Phrack
Inc., 0x0b(0x3f), http://www.phrack.org/fakes/p63/p63-0x09.txt, January 2004.
[CR05] Chen, S. and S. Ranka. “Detecting Internet Worms at Early Stage”, IEEE Journal on
Selected Areas in Communications, 23(10):2003-2012, October 2005.
[Dev91] Devore, J. Probability and Statistics for Engineering and the Sciences,
Brooks/Cole Publishing Company, 1991.
189
[Dew89] Dewar, M. The Art of Deception in Warfare, David & Charles, 1989.
[DH82a] Daniel, D., K. Herbig, editors. Strategic Military Deception, Pergamon Press,
1982.
[DH82b] Daniel, D., K. Herbig. “Propositions on Military Deception”, in [DH82a].
[DHK04] Dornseif, M., T. Holz, and C. Klein, “NoSEBrEaK - Attacking Honeynets”,
Proceedings of the 2004 IEEE Workshop on Information Assurance and Security, West
Point, NY, http://md.hudora.de/publications/2004-NoSEBrEaK.pdf, pp. 1-7, June 2004.
[DJK01] Dickerson, J., J. Juslin, and O. Koukousoula. “Fuzzy Intrusion Detection”,
Proceedings of the IFSA World Congress and 20th NAFIPS International Conference,
2001, pp. 1506-1510, 2001.
[DQG04] Dagon, D., X. Qin, G. Gu, W. Lee, J. Grizzard, J. Levine, and H. Owen.
”Honeystat: Local Worm Detection Using Honeypots”, Proceedings of the 7th
Symposium on Recent Advances in Intrusion Detection (RAID), September 2004.
[DS06] DShield.org, http://www.dshield.org, link active in October 2006.
[FA04] Foo, S. and M. Arradondo. “Mobile Agents for Computer Intrusion Detection”,
Proceedings of the Thirty-Sixth Southeastern Symposium on System Theory, 2004, pp.
517-521, 2004.
[Fis04] Fischbach, N. “Building an Early Warning System in a Service Provider Network”,
Black Hat Briefings Europe 2004, http://www.blackhat.com/presentations/bh-europe-
04/bh-eu-04-fischbach-up.pdf, May 2004.
[FM97] Freedman, D.H. and C.C. Mann. At Large: The Strange Case of the World's Biggest
Internet Invasion, Simon & Schuster, 1997.
[FN95] Fowler, C., R. Nesbit. “Tactical Deception in Air-Land Warfare”, Journal of
Electronic Defense, 18(6):37-44, June 1995.
[For04a] ForeScout. “WormScout Anti-Worm Solution”, ForeScout Technologies Inc., San
Mateo, CA, 2004.
[For04b] ForeScout, “ActiveResponse : Theory of Operations”, ForeScout Technologies
Inc., San Mateo, CA, 2004.
[Fyo97] Fyodor. “The Art of Port Scanning”, Phrack Magazine, 7(51), September 1997.
[Fyo02] Fyodor. “Remote OS detection via TCP/IP Stack FingerPrinting”, Internet
published, Insecure.Org, , http://www.insecure.org/nmap/nmap-fingerprinting-
article.html, 2002.
190
[Fyo04] Fyodor. “Nmap Reference Guide (Man Page)”, Insecure.Org,
http://www.insecure.org/nmap/man, 2004.
[Gof02] Brian Goff, "Distributed Resource Monitoring Tool and its Use in Security and
Quality of Service Evaluation,” NC State University M.S. Thesis, 2002.
[Góm04] Gómez, D., “Installing a Virtual Honeywall using VMware”, Spanish Honeynet
Project, Internet published, http://www.honeynet.org.es/papers/vhwall/, September 2004.
[GS98] Goldsmith, D., M. Schiffman. “Firewalking : A Traceroute-Like Analysis of IP
Packet Responses to Determine Gateway Access”, Internet published,
http://www.packetfactory.net/projects/firewalk, October 1998.
[GSX04] Gu, G., M. Sharif, Q. Xinzhou, D. Dagon, W. Lee, and G. Riley. “Worm
Detection, Early Warning and Response Based on Local Victim Information”,
Proceedings of the 20th Annual Computer Security Applications Conference
(ACSAC'04), pp. 136-145, 2004.
[GZC06] Gao, Y., L. Zhichun, and Y. Chen. “A DoS Resilient Flow-level Intrusion
Detection Approach for High-speed Networks”, Proceedings of the 26th IEEE
International Conference on Distributed Computing Systems, 2006, pp. 39-39, 2006.
[HA05] Harrop, W., and G. Armitage. “Defining and Evaluating Greynets (Sparse
Darknets)”, Proceedings of The IEEE Conference on Local Computer Networks 30th
Anniversary. pp. 344- 350, 2005.
[Han85] Handel, M. Military Deception in Peace and War, Magnes Press, 1985.
[HC04] Hsu, F.-H and T. Chiueh. “CTCP: a Transparent Centralized TCP/IP Architecture
for Network Security”, Proceedings of the 20th Annual Computer Security Applications
Conference, 2004, pp. 335-344, 2004.
[HCL06] Huang. C., K. Chen, and C. Lei. “Mitigating Active Attacks Towards Client
Networks Using the Bitmap Filter”, Proceedings of the International Conference on
Dependable Systems and Networks, 2006, pp. 403-412, 2006.
[Heu81] Heuer, R. “Cognitive Factors in Deception and Counterdeception”, in [DH82a].
[HMG03] Hines, W., D. Montgomery, D. Goldsman, C. Borror. Probability and Statistics
in Engineering, Wiley, 2003.
[Hoe04] Hoepers, C. “Honeynets and Honeypots: Companion Technology for Detection
and Response”, AusCERT Conference, http://www.honeynet.org.br/presentations/hnbr-
AusCERT2004.pdf, May 2004.
[Hon05] Honeyd web site, http://www.honeyd.org, 2005.
191
[How98] Howard, J. An Analysis of Security Incidents on the Internet : 1989-1995, PhD
dissertation, Carnegie Mellon University, August 1998.
[HP04] Know Your Enemy : Learning about Security Threats (2nd Edition), The Honeynet
Project, Addison-Wesley Professional, 2004.
[Hut04] Hutchinson, W. “The Role of Deception in Information Operations. From
Information Warfare to Information Operations”, Proceedings of the 5th Australian
Information Warfare and Security Conference, pp.76-83, Perth, November 2004.
[HW00] Hutchinson, W., Warren, M. “The use of deception in systems”, International
Conference on Systems Thinking in Management, Geelong, Australia, 2000.
[HW01] Hutchinson, W., Warren, M. “The Nature of Data: Illusions of Reality”, Informing
Science Conference, Challenges to Informing Clients: A Transdisciplinary Approach,
Krakow, Poland,
http://proceedings.informingscience.org/IS2001Proceedings/pdf/HutchinsonEBKTheNa.
pdf, June 2001.
[HW02] Hutchinson, W., Warren, M. “Truth, lies, reality, and deception: an issue for
electronic commerce”, International Journal of Services Technology and Management,
3(2):208-221, 2002.
[ISC06] Internet Storm Center, http://isc.sans.org/, link active on October, 2006.
[Jai91] Jain, R. The Art of Computer Systems Performance Analysis, John Wiley & Sons,
1991.
[JDD96] Joint Doctrine Division, Joint Doctrine for Military Deception, U.S. Joint
Command, http://www.dtic.mil/doctrine, 1996.
[JDD01] Joint Doctrine Division, DOD Dictionary of Military and Associated Terms, U.S.
Joint Command, http://www.dtic.mil/doctrine/jel/doddict/index.html, 2001.
[JLG04] Jackson, T., J. Levine, J. Grizzard, and H. Owen. “An Investigation of a
Compromised Host on a Honeynet Being Used to Increase the Security of a Large
Enterprise Network”, Proceedings of the 2004 IEEE Workshop on Information
Assurance, pp. 9-15, West Point, New York,
http://users.ece.gatech.edu/~owen/Research/Conference%20Publications/Jackson_IAW2
004.pdf, June 2004.
[JPB04] Jung, J., V. Paxson, A. Berger, and H. Balakrishman. “Fast Portscan Detection
Using Sequential Hypothesis Testing”, Proceedings of the IEEE Symposium on Security
and Privacy, pp. 211-225, Oakland, California, 2004.
192
[Jul02] Julian, D. Delaying-Type Responses for Use by Software Decoys, master’s degree
dissertation, Naval Postgraduate School, September 2002.
[JX04] Jiang, X., and D. Xu. "CyberTrap: Detecting and Quarantining Scanning Worms in
Enterprise Networks", Department of Computer Science Technical Report CSD TR 04-
0xx, Purdue University, August 2004.
[Kra04] Krawetz, N.; “Anti-honeypot technology”, IEEE Security & Privacy Magazine,
2(1):76-79 , Jan.-Feb. 2004.
[LaB05] LaBrea web site, http://labrea.sourceforge.net, 2005.
[LK02] Leckie, C. and R. Kotagiri. “A Probabilistic Approach to Detecting Network
Scans”, Proceedings of the Eighth IEEE Network Operations and Management
Symposium (NOMS 2002), pp. 359-372, 2002.
[LPV04] Levchenko, K., R. Paturi, and G. Varghese. “On the Difficulty of Scalably
Detecting Network Attacks”, Proceedings of the 11th ACM Conference on Computer
and Communications Security, pp. 12-20, 2004.
[MC97] Marine Corps Doctrine Division, MCDP 1-3 Tactics, U.S. Marine Corps, 1997.
[MMB05] Muelder, C., K. Ma, and T. Bartoletti., “A Visualization Methodology for
Characterization of Network Scans”, Proceedings of the IEEE Workshops on
Visualization for Computer Security, 2005.
[Mon78] Montagu, E. Beyond Top Secret Ultra, McCann & Geoghegan, 1978.
[MN06] Mirage Networks, http://www.miragenetworks.com, 2006.
[MP01] Mandia, K. and C. Prosise. Incident Response : Investigating Computer Crime,
Osborne Press, 2001.
[MSK99] McClure, S., J. Scambray, and G. Kurtz. Hacking Exposed : Network Security
Secrets and Solutions. Osborne/McGraw-Hill, 1999.
[MSK03] McClure, S., J. Scambray, and G. Kurtz. Hacking Exposed : Network Security
Secrets and Solutions. Osborne/McGraw-Hill, 2003.
[MSV03] Moore, D., C. Shannon, G. Voelker, and S. Savage. “Internet Quarantine:
Requirements for Containing Self-Propagating Code”, Proceedings of the 2003 IEEE
Infocom Conference, pp. 1901-1910, San Francisco, CA, 2003.
[Mur80] Mure, D. Master of Deception. William Kimber & Co. Ltd, 1980.
193
[MW03] Michael, J. and T. Wingfield. “Lawful Cyber Decoy Policy”, Proceedings of the
IFIP Eighteenth International Information Security Conference, pp. 483-488, Kluwer
Acad. Publishers, Athens, Greece, May 2003.
[Naz04] Nazario, J. Defense and detection strategies against Internet worms, Artech House,
2004.
[Nes06] The Nessus Project, http://www.nessus.org, link active on October, 2006.
[OL04] d’Orey Posser de Andrade Carbone, M., P. L´ıcio de Geus. “A Mechanism for
Automatic Digital Evidence Collection on High-Interaction Honeypots”, Proceedings of
the 2004 IEEE Workshop on Information Assurance and Security, pp. 1-8, West Point,
NY, http://www.dcc.unicamp.br/~ra002193/honeypots-en.pdf, June 2004.
[Pro04] Provos, N. “A Virtual Honeypot Framework”, Proceedings of the 13th USENIX
Security Symposium, pp. 1-14, USENIX, August, 2004.
[PSN04] Ptacek, T., D. Song, and J. Nazario, “Safe Quarantine: Automated Worm
Suppression”, whitepaper, Arbor Networks, no longer on-line, available on request from
the dissertation author, 2004.
[PYB04] Pang, R., V. Yegneswaran, P. Barford, V. Paxson, and L. Peterson,
“Characteristics of Internet Background Radiation”, Proceedings of the 4th ACM
SIGCOMM Conference on Internet Measurement, pp. 27–40, 2004.
[QH04] Qin, M. and K. Hwang. “Frequent Episode Rules for Internet Anomaly Detection”,
Proceedings of the Third IEEE International Symposium on Network Computing and
Applications, 2004, pp. 161-168, 2004.
[Ras01] Rash, M. “Paranoid Penguin: Detecting Suspect Traffic”, Linux Journal,
2001(91), November 2001.
[Ras04] Rash, M. Psad man page, CipherDyne,
http://www.cipherdyne.com/psad/docs/manpages/psad.html, 2004.
[RBB04] Raynal, F., Y. Berthier, P. Biondi, and D. Kaminsky, “Honeypot forensics”,
Proceedings of the 2004 IEEE Workshop on Information Assurance, pp. 22-29, West
Point, New York, http://www.security-labs.org/PubliSci/IAW04.pdf.gz, June 2004.
[Row05a] Neil C. Rowe, “The Ethics of Deception in Virtual Communities”, this article
appeared in the Encyclopedia of Virtual Communities and Technologies, Hershey, PA:
Idea Group, http://www.cs.nps.navy.mil/people/faculty/rowe/virtcomm161.htm, 2005.
[Row05b] Neil C. Rowe, “Types of Online Deception”, an article in the Encyclopedia of
Virtual Communities and Technologies, Hershey, PA: Idea Group,
http://www.cs.nps.navy.mil/people/faculty/rowe/virtcomm160.htm, 2005.
194
[Row06] Rowland, C. Sentry Tools, http://sourceforge.net/projects/sentrytools, 2006.
[RR04] Rowe, N. and H. Rothstein, “Two Taxonomies of Deception for Attacks on
Information Systems”, Journal of Information Warfare, 3(2):28 – 40, 2004.
[RSM03] Robertson, S., E. Siegel, M. Miller, and S. Stolfo, “Surveillance Detection in High
Bandwidth Environments”, Proceedings of the DARPA Information Survivability
Conference and Exposition, pp. 130-138, Washington, D.C., 2003.
[Rus02] Russell, R. “Linux 2.4 Packet Filtering HOWTO”, netfilter.org,
http://netfilter.org/documentation/index.html, 2002.
[SBB04] Shah, K., S. Bohacek, and A. Broido. “Feasibility of Detecting TCP-SYN Scanning
at a Backbone Router”, Proceedings of the 2004 American Control Conference, pp. 988-
995, 2004.
[Sch99] Schum, D. “Marshaling Thoughts and Evidence During Fact Investigation”, South
Texas Law Review, 40(2): 401-454, Summer 1999.
[SHM02] Staniford, S., J. Hoagland, and J. McAlerney. “Practical Automated Detection of
Stealthy Portscans”, Journal of Computer Security, 10(1-2):105-136, 2002.
[SJB04] Schechter, S., J. Jung, and A. Berger. “Fast Detection of Scanning Worm
Infections”, Proceedings of the Seventh International Symposium on Recent Advances in
Intrusion Detection, France, September 2004.
[Smi88] Smith, J. “Characterizing Computer Performance with a Single Number”,
Communications of the ACM, 3(10):1202-1206, October 1988.
[Spi02] Spitzner, L. Honeypots: Tracking Hackers, Addison-Wesley Professional, 2003.
[Sto89] Stoll, C. The cuckoo's egg, Doubleday, 1989.
[SYB06] Sridharan, A., T. Ye, and S. Bhattacharyya. “Connectionless Port Scan Detection
on the Backbone”, Proceedings of the 25th IEEE International Performance,
Computing, and Communications Conference, 2006, 10 pp., 2006.
[TB98] Tang, N. and S. Binay, “Netmap: A Network Discovery Tool”, technical report,
Lucent Technologies’ Network & Services Management Research Labs, no longer on-
line, available on request from the dissertation author, 1998.
[Tho02] Thomas, D. Hacker Culture, University of Minnesota Press, 2002.
[TK02] Toth, T. and C. Kruegel, “Connection-History Based Anomaly Detection,”
Proceedings of the IEEE Workshop on Information Assurance and Security, West Point,
NY, June 2002.
195
[TRB06] Tartakovsky, A., B. Rozovskii, R. Blazek, and H. Kim. “A Novel Approach to
Detection of Intrusions in Computer Networks via Adaptive Sequential and Batch-
Sequential Change-Point Detection Methods”, IEEE Transactions on Signal Processing,
54(9): 3372-3382, September 2006.
[USA78] FM 90-2 Tactical Deception, U.S. Army, 1978.
[USA88] FM 90-2 Battlefield Deception, U.S. Army, 1988.
[USM89] FM 15-6 Strategic and Operational Military Deception: U.S. Marines and the
Next Twenty Years, U.S. Marine Corps, 1989.
[VCI99] Vivo, M., E. Carrasco, G. Isern, and G. Vivo. “A review of port scanning
techniques”, ACM Computer Communications Review, 29(2):41-48, April 1999.
[VVZ02] Vigna, G., F. Valeur, J. Zhou, and R. Kemmerer. “Composable tools for network
discovery and security analysis”, Proceedings of the 18th Annual Computer Security
Applications Conference, pp. 14-24, IEEE Press, 2002.
[Wha82] Whaley, B. “Toward a General Theory of Deception”, The Journal of Strategic
Studies, Frank Cass, London, 5(1):178-192, March 1982.
[Will02] Williamson, M. "Throttling Viruses: Restricting Propagation to Defeat Malicious
Mobile Code," Proceedings of the 18th Annual Computer Security Applications
Conference (ACSAC '02), p. 61, Las Vegas, NV, 2002.
[WKO05] Whyte, D., E. Kranakis, and P. van Oorschot. “DNS-Based Detection of Scanning
Worms in an Enterprise Network”. In Proceedings of the 12th Annual Network and
Distributed System Security Symposium, 2005.
[WLZ06] Webster, S., R. Lippmann, and M. Zissman. “Experience Using Active and
Passive Mapping for Network Situational Awareness”, Proceedings of the Fifth IEEE
International Symposium on Network Computing and Applications, 2006, pp.19-26,
2006.
[WOK05] Whyte, D., P. van Oorschot, and E. Kranakis, “Detecting Intra-Enterprise
Scanning Worms Based on Address Resolution”, Proceedings of the 21st Annual
Computer Security Applications Conference, pp. 371-380, IEEE Computer Society,
2005.
[Wol02] Wolfgang, M. “Host Discovery with nmap”, Internet published,
http://moonpie.org/writings/discovery.pdf, November 2002.
[WSM04] Watson, D., M. Smart, G. Malan and F. Jahanian. “Protocol scrubbing: network
security through transparent flow modification”, IEEE/ACM Transactions on
Networking, 12(2):261-273, April 2004.
196
[WSP04] Weaver, N., S. Staniford, and V. Paxson. “Very Fast Containment of Scanning
Worms”, Proceedings of the 13th USENIX Security Symposium, pp. 29-44, San Diego,
CA, 2004.
[WVG04] Wu, J., S. Vangala, L. Gao, and K. Kwiat. “An Effective Architecture and
Algorithm for Detecting Worms with Various Scan Techniques”, Proceedings of the
11th Annual Network and Distributed System Security Symposium, NDSS 2004,
February 2004.
[WWJ03] Wei-hua, J., L. Wei-hua and D. Jun. “The application of ICMP protocol in
network scanning”, Proceedings of the Fourth International Conference on Parallel and
Distributed Computing, Applications and Technologies, pp. 904-906, IEEE Press, 2003.
[XDM01] Xiaobing, G., Q. Dlaepei, L. Min, et al. ”Detection and Protection Against
Network Scanning: IEDP”, Proceedings of the 2001 International Conference on
Computer Networks and Mobile Computing, pp. 487-493, 2001.
[YBJ04] Yegneswaran, V., P. Barford, and S. Jha. “Global Intrusion Detection in the
DOMINO Overlay System”, Proceedings of the Network and Distributed System
Security Symposium (NDSS), 2004.
[YBP04] Yegneswaran, V., P. Barford, and D. Plonka. “On the Design and Use of Internet
Sinks for Network Abuse Monitoring”, Proceedings of the 7th
Symposium on Recent
Advances in Intrusion Detection (RAID), 2004.
[YBU03] Yegneswaran, Vinod; Barford, Paul; Ullrich, Johannes. ”Internet Intrusions:
Global Characteristics and Prevalence”, in Proceedings of ACM SIGMETRICS, pp. 138-
147, June, 2003.
[YDF06] J.Yuill, D. Denning, and F. Feer, “Using Deception to Hide Things from Hackers:
Processes, Principles, and Techniques”, Journal of Information Warfare, 5(3):26-40,
November, 2006.
[YLM04] Yin, C., M. Li, J. Ma and J. Sun. “Honeypot and scan detection in intrusion
detection system”, Proceedings of the Canadian Conference on Electrical and Computer
Engineering, 2004. 2(2-5):1107-1110, 2004.
[Yua05] Yuan, L. “Companies Face System Attacks From Inside, Too”, The Wall Street
Journal, pg. B.1, June 1, 2005.
[YZD04] Yuill, J., M. Zappe, D. Denning, and F. Feer. “Honeyfiles: Deceptive Files for
Intrusion Detection”, Proceedings of the 2004 IEEE Workshop on Information
Assurance, pp. 116-122, West Point, NY, June 2004.

197
[ZGT05] Zou, C., W. Gong, D. Towsley, and L. Gao. “The Monitoring and Early Detection
of Internet Worms”, IEEE/ACM Transactions on Networking, 13(5):961-974, October,
2005.
[Zhe04] Erkang Zheng, "Interactive Assistance for Anomaly-Based Intrusion Detection,”
NC State University M.S. Thesis, 2004.

198
8 Appendix
199
The Honeyfiles system is described in a conference paper. The paper is reprinted
here, starting on the next page. The paper is copyrighted, and it is reprinted here by
permission. The paper’s bibliographic information is:
Yuill, J., M. Zappe, D. Denning, and F. Feer. “Honeyfiles: Deceptive Files for Intrusion
Detection”, Proceedings of the 2004 IEEE Workshop on Information Assurance, pp. 116-
122, West Point, NY, June 2004.
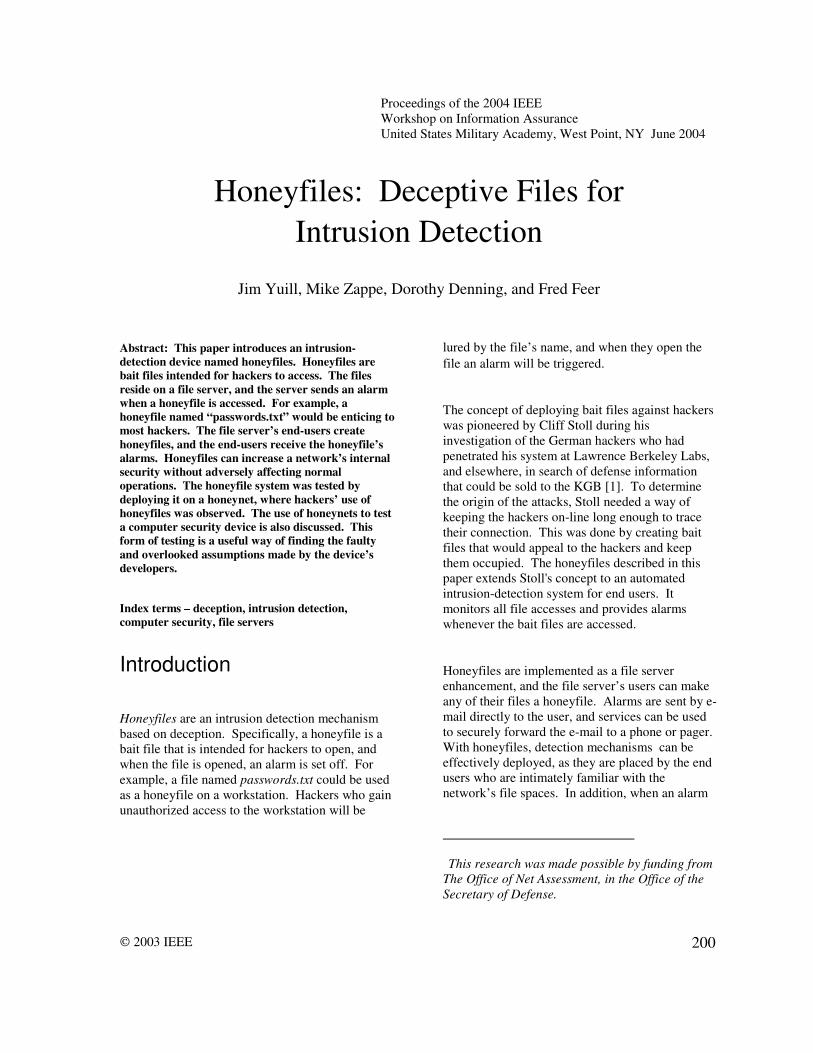
Proceedings of the 2004 IEEE
Workshop on Information Assurance
United States Military Academy, West Point, NY June 2004
2003 IEEE 200
Honeyfiles: Deceptive Files for
Intrusion Detection
Jim Yuill, Mike Zappe, Dorothy Denning, and Fred Feer
Abstract: This paper introduces an intrusion-detection device named honeyfiles. Honeyfiles are bait files intended for hackers to access. The files
reside on a file server, and the server sends an alarm when a honeyfile is accessed. For example, a honeyfile named “passwords.txt” would be enticing to most hackers. The file server’s end-users create
honeyfiles, and the end-users receive the honeyfile’s alarms. Honeyfiles can increase a network’s internal security without adversely affecting normal operations. The honeyfile system was tested by
deploying it on a honeynet, where hackers’ use of honeyfiles was observed. The use of honeynets to test a computer security device is also discussed. This form of testing is a useful way of finding the faulty
and overlooked assumptions made by the device’s developers.
Index terms – deception, intrusion detection, computer security, file servers
Introduction
Honeyfiles are an intrusion detection mechanism
based on deception. Specifically, a honeyfile is a
bait file that is intended for hackers to open, and
when the file is opened, an alarm is set off. For
example, a file named passwords.txt could be used
as a honeyfile on a workstation. Hackers who gain
unauthorized access to the workstation will be
lured by the file’s name, and when they open the
file an alarm will be triggered.
The concept of deploying bait files against hackers
was pioneered by Cliff Stoll during his
investigation of the German hackers who had
penetrated his system at Lawrence Berkeley Labs,
and elsewhere, in search of defense information
that could be sold to the KGB [1]. To determine
the origin of the attacks, Stoll needed a way of
keeping the hackers on-line long enough to trace
their connection. This was done by creating bait
files that would appeal to the hackers and keep
them occupied. The honeyfiles described in this
paper extends Stoll's concept to an automated
intrusion-detection system for end users. It
monitors all file accesses and provides alarms
whenever the bait files are accessed.
Honeyfiles are implemented as a file server
enhancement, and the file server’s users can make
any of their files a honeyfile. Alarms are sent by e-
mail directly to the user, and services can be used
to securely forward the e-mail to a phone or pager.
With honeyfiles, detection mechanisms can be
effectively deployed, as they are placed by the end
users who are intimately familiar with the
network’s file spaces. In addition, when an alarm
This research was made possible by funding from
The Office of Net Assessment, in the Office of the
Secretary of Defense.
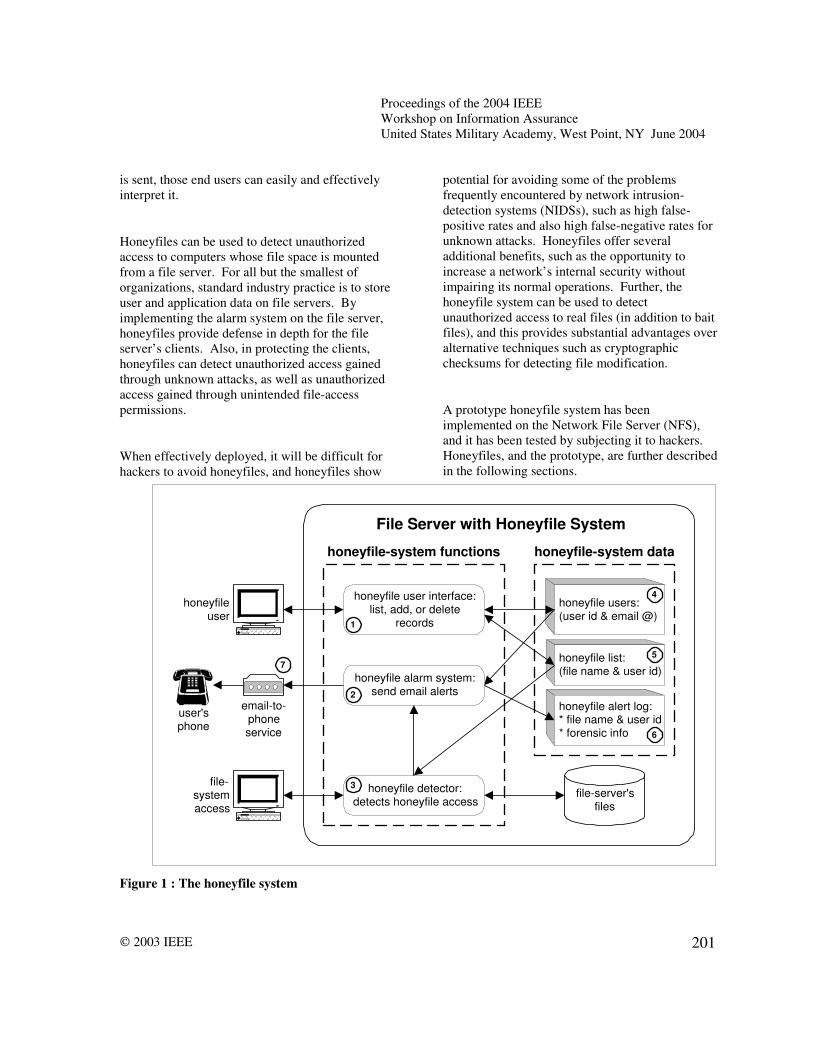
Proceedings of the 2004 IEEE
Workshop on Information Assurance
United States Military Academy, West Point, NY June 2004
2003 IEEE 201
is sent, those end users can easily and effectively
interpret it.
Honeyfiles can be used to detect unauthorized
access to computers whose file space is mounted
from a file server. For all but the smallest of
organizations, standard industry practice is to store
user and application data on file servers. By
implementing the alarm system on the file server,
honeyfiles provide defense in depth for the file
server’s clients. Also, in protecting the clients,
honeyfiles can detect unauthorized access gained
through unknown attacks, as well as unauthorized
access gained through unintended file-access
permissions.
When effectively deployed, it will be difficult for
hackers to avoid honeyfiles, and honeyfiles show
potential for avoiding some of the problems
frequently encountered by network intrusion-
detection systems (NIDSs), such as high false-
positive rates and also high false-negative rates for
unknown attacks. Honeyfiles offer several
additional benefits, such as the opportunity to
increase a network’s internal security without
impairing its normal operations. Further, the
honeyfile system can be used to detect
unauthorized access to real files (in addition to bait
files), and this provides substantial advantages over
alternative techniques such as cryptographic
checksums for detecting file modification.
A prototype honeyfile system has been
implemented on the Network File Server (NFS),
and it has been tested by subjecting it to hackers.
Honeyfiles, and the prototype, are further described
in the following sections.
file-server'sfiles
honeyfile users:(user id & email @)
honeyfile detector:detects honeyfile access
honeyfile list:(file name & user id)
honeyfile user interface:list, add, or delete
records
honeyfile alert log:* file name & user id* forensic info
email-to-phoneservice
file-systemaccess
honeyfileuser
user'sphone
honeyfile-system datahoneyfile-system functions
File Server with Honeyfile System
1
4
5
3
6
7
honeyfile alarm system:send email alerts2
Figure 1 : The honeyfile system
Proceedings of the 2004 IEEE
Workshop on Information Assurance
United States Military Academy, West Point, NY June 2004
2003 IEEE 202
The Honeyfile System
Honeyfiles are implemented by a honeyfile system,
and it provides the necessary file-system and alarm
functions. The file-system functions are
implemented as an enhancement to a network file
server, as illustrated in Figure 1. The system’s
components are numbered in the figure and their
descriptions follow.
Any file within the user’s file space can be a
honeyfile. The honeyfile system provides an
interface whereby file-server users specify their
honeyfiles (1). A file records the system’s
honeyfiles (5). Each record contains a file name
and user ID. Honeyfile alarms are sent as email
messages, so the user also provides an email
address to be used. The email messages are called
email alerts, or simply alerts. A file records the
system’s users (4). Each record contains a user ID
and email address.
To detect access to honeyfiles, the honeyfile
system monitors all file access on the file server
(3). When a honeyfile is accessed, an alert is sent
(2), and it is logged (6). The alert includes the
name of the opened honeyfile, and forensic
information for incident response, such as the IP
address of the computer that opened the file.
The network can be configured for the email alerts
to be sent in a secure manner. Ideally, they will be
sent to an automated service that will call the user’s
cell phone and digitally display the email message
(7). This ensures secure delivery of the alert
should the user’s mail client also be compromised.
Phone delivery also enables the user to be notified
while away from his computer. We implemented a
prototype honeyfile system for NFS, on RedHat
Linux 9. We plan to distribute the prototype as
open source. The prototype is working,
documented and tested. This paper is an
abridgement of the prototype’s documentation.
Using Honeyfiles
Honeyfiles can detect the hacker’s investigation
and copying of files, including:
• the hacker’s personal perusal of the file space.
Hackers can be tricked into opening files with
alluring names that indicate the file is of value.
• the hacker’s use of search tools to find
particular types of files, e.g., file names
containing the string “password”. These tools
can examine file names or contents.
Honeyfiles can be created to match common
hacker searches.
• the hacker’s use of tools like tar and zip, to
copy and steal the contents of entire
directories. Such copying can be detected by
placing honeyfiles in directories that are likely
to be stolen, and the honeyfile’s name will
blend in with the other files, e.g.,
“sysrun1.dll”.
There are four types of files that are generally of
interest to hackers, and that can often be used as
honeyfiles:
• files with information about accessing and
using other systems, such as password files
(passwords.txt), user manuals (customer-
accounts-system.pdf), and security
documentation (vpn- instructions.doc),
• system or application programs that the hacker
may run, but that authorized users would not
run, such as the gcc compiler,
• files that contain evidence of the attack, such
as log files, and
• files that contain information of use other than
hacking, such as credit card numbers,
intellectual property, expected stock market
prices, and military intelligence.
Proceedings of the 2004 IEEE
Workshop on Information Assurance
United States Military Academy, West Point, NY June 2004
2003 IEEE 203
A honeyfile should be named and located in such a
way that its owner will not be inclined to open it
accidentally. One technique is to give a honeyfile
a name that appears unusual only to its owner. The
unusual name can help jog the owner’s memory
and recognize the honeyfile. For example, a
honeyfile password file could be named complete-
passwords.txt. Its owner has no partial password
files, so the prefix “complete” will help him
recognize the honeyfile.1
Honeyfiles can contain deceptive content, such as
fake user-IDs and passwords. Deceptive file-
content can take on a plethora of uses and forms,
and it can be used independently of honeyfiles. In
order to concentrate on central honeyfile functions,
this paper does not address deceptive content in
honeyfiles. Instead, it focuses on honeyfile
deceptions involving just file system information,
i.e., the file’s location and its directory entry,
including its name.
Honeyfile Uses
This section addresses honeyfiles’ detection
capabilities, tactical capabilities, and ease of use.
Detection capabilities
Honeyfiles’ detection capabilities include the
following:
• Honeyfiles can detect unauthorized access to
computers and file systems:
The primary strength of honeyfiles is their ability
to detect unauthorized access to computers whose
1 Unless stated otherwise, this paper’s masculine
pronouns refer to both men and women.
file-space resides on a file server. For example, a
workstation stores its user file-space on a file
server, and the workstation automatically mounts
the file-space at boot time. If a hacker breaks into
the workstation, his presence will be detected if he
opens a honeyfile within the user file space.
In general, honeyfiles detect unauthorized access to
the file spaces on a file server, including: 1)
compromise of the file space’s user ID and
password, 2) compromise of weak or defective
authentication mechanisms on the file server, e.g.,
NFS’ notoriously weak authentication, and 3)
exploitation of errors made in granting file-space
permissions, e.g., accidentally making the file
space “world readable”.
• Honeyfiles can be used to detect unauthorized
access gained through unknown attacks:
Honeyfiles detect the hacker after he gains
unauthorized or unintended access. The detection
mechanism is independent of the specific
techniques used to gain access. This is one of
honeyfiles’ primary contributions. Honeyfiles
offer a unique opportunity for detecting attackers
who are able to defeat conventional defenses. This
makes honeyfiles especially useful for protecting
high-value systems that are subject to such skilled
attacks.
• Hackers can be highly vulnerable to honeyfile
deceptions:
Honeyfiles take advantage of several deception
vulnerabilities in most hackers’ intelligence
collection and analysis: 1) when hackers initially
access a file space, they must search it in order to
locate valuable data. If the hacker’s search can be
anticipated, honeyfiles can be placed where he is
likely to encounter them. 2) The hacker’s limited
knowledge of the file space makes it difficult for
him to discern what truly belongs there, and his
naiveté makes it easy to create deceptive
honeyfiles. 3) It can be very difficult for the
hacker to detect a honeyfile before opening it. The
Proceedings of the 2004 IEEE
Workshop on Information Assurance
United States Military Academy, West Point, NY June 2004
2003 IEEE 204
honeyfile deception is created using a small
amount of information, i.e., the file’s directory
entry, and usually, there is no way for the hacker to
cross-verify the information, and 4) In most
instances, if the target wants to know a honeyfile’s
contents, his only option is to open the file and
trigger the alarm.
• Honeyfiles can be used to protect a wide
variety of files and computer systems:
A honeyfile can be almost any file stored on a file
server. In addition to regular data files, they can be
files used by application programs, such as
attachments within a mail client. For example, a
company’s executive email discloses corporate
plans that will predictably affect the company’s
stock price. Such information could be extremely
valuable to hackers. Security personnel can work
with the executives to place honeyfiles within their
mail clients. Honeyfiles can also be used to protect
application programs. For example, a web-server’s
cgi-bin directory can be populated with empty
honeyfiles named after notoriously vulnerable
scripts.
• Honeyfiles show potential for avoiding some
of the problems encountered by network
intrusion-detection systems (NIDSs):
NIDSs are typically very weak at detecting
unknown attacks, whereas honeyfiles can detect
unknown attacks and even access gained through
unintentional file-access permissions. Also, NIDSs
can generate an exorbitant volume of false alarms.
In contrast, honeyfiles show the potential for
having a much lower false alarm rate. Further,
with NIDSs, false alarms are often investigated by
a centralized security group that does not work
directly with the protected data, making
investigation difficult. In contrast, honeyfile users
can accurately and easily dismiss many false
alarms because of their familiarity with the
protected data.
Honeyfiles make it possible for alarms to be
deployed by the personnel who create and manage
information assets. In contrast, when NIDSs are
deployed by a centralized security group, it can be
difficult for them to accurately understand the
network’s changing information assets.
• The honeyfile system can be used to detect
unauthorized access to real files, and it offers
some substantial advantages over
cryptographic checksums:
In addition to detecting access to deceptive
honeyfiles, the honeyfile system can be used to
detect access to real files. For example, when a
workstation user leaves work for the day, he could
use the honeyfile system to set alarms for all of his
files.
The honeyfile system can be easily extended to
provide alerts for honeyfiles when they are
changed. A popular technique for detecting file
changes involves creating and storing
cryptographic checksums. The files’ checksums
are periodically recalculated to detect changes to
the files. Tripwire is a commercial product that
uses this checksum technique.
For detecting changed files on a file server, the
extended honeyfile system provides two substantial
improvements over the use of checksums: 1) the
honeyfile system detects changes when they occur,
whereas the checksum technique detects changes
during periodic, and often infrequent, execution,
and 2) the honeyfile system is simpler than the
checksum technique. The honeyfile system resides
on the file server and an end user only has to
specify the honeyfiles. With the checksum
technique, the checksums must be periodically
calculated by the end user, or he must grant file
access to a separate system that calculates the
checksums. If the user calculates the checksums,
he must securely store the binaries and checksums.
Proceedings of the 2004 IEEE
Workshop on Information Assurance
United States Military Academy, West Point, NY June 2004
2003 IEEE 205
For a balanced assessment of checksums, it should
be noted that checksums can protect local file
systems, whereas honeyfiles can not. Also, the use
of both checksums and honeyfiles can provide
defense in depth for detecting file changes.
Tactical capabilities
Honeyfiles’ tactical capabilities stem mostly from:
1) decentralized deployment: the network’s end
users create and place alarms, and 2) centralized
implementation: the alarm mechanism resides on
the file server rather than on its clients.
• By enabling end-users to create alarms, the
detection mechanisms can be effectively
deployed and the alerts effectively interpreted:
If honeyfiles are created and placed well, it can be
difficult for hackers to avoid them, resulting in a
low false negative rate. End users are intimately
familiar with the data they create and manage.
Honeyfiles make it possible for users to create and
place alarms where they are most needed and
where they will be most effective. With some
basic instruction on security and honeyfile tactics,
users can effectively deploy honeyfiles. Also, end
users can evaluate and improve their alarms’
effectiveness because they receive alerts directly.
Further, end users can adapt their honeyfile use as
the network and its threats change.
Honeyfile users can accurately discern between
true and false positives because they create the
honeyfiles and receive the alerts. For instance, if a
user accidentally opens a honeyfile, the resultant
alert can be recognized as a false positive. If an
alert is sent when the user is not accessing his file
space, the alert can be recognized as a true positive.
• Honeyfiles support defense-in-depth for the
file server’s clients:
Honeyfiles provide the file server’s clients with an
alarm system that resides outside of the client
itself, and this adds a layer of depth to the client’s
defenses. When a hacker breaks into a client, the
honeyfile’s alarm mechanism is on the file server,
not on the client. If the honeyfile’s alarm
mechanism was on the client, the alarm would be
vulnerable to attack or detection by the hacker,
especially when the hacker has “rooted” the client
computer. Alerts are sent by e-mail, and they can
be made to travel over a secure channel.
• Honeyfiles can provide the security function of
deterrence, and they can support incident
response:
In addition to detecting attacks, honeyfiles can
deter attacks. Honeyfiles have an affect that is
similar to landmines: if hackers know honeyfiles
are being used, the use can dissuade them from
hacking, and the use can slow hackers down by
making them cautious and uncertain. Honeyfiles
are also useful for incident response. Investigators
can view all of the alerts for a network, and
collectively, they may reveal a hacker’s
capabilities, intentions, or courses of action.
Ease of use
Honeyfiles’ ease of use is advantageous to both
end users and security administrators:
• Honeyfiles can enhance a network’s internal
security without impairing normal operations:
Networks typically use a relatively low level of
internal security, as additional security is
burdensome and costly. For example, extra access
controls make resource sharing difficult, and
making IDSs more sensitive increases their false
alarm rates. Honeyfiles can provide a means of
increasing internal security without impairing
operations. Honeyfiles have little adverse affect on
legitimate computer use. Also, honeyfiles can be
an effective deterrent for insider hackers because
Proceedings of the 2004 IEEE
Workshop on Information Assurance
United States Military Academy, West Point, NY June 2004
2003 IEEE 206
they, like all other network users, will have been
informed of the honeyfiles’ availability and use.
• Honeyfiles are an effective deception because
they can be easily created, require little
falsehood, and involve little risk:
A honeyfile is integrated within a real file space,
and this real context makes the honeyfile deception
easy to create and difficult to detect. Also,
honeyfiles themselves involve little falsehood—
just a directory entry. Further, honeyfiles involve
little risk.
• Implementing the alarm system on the file
server makes honeyfiles available to almost all
network computers:
Honeyfiles can be created by any computer that
uses the file server. Honeyfiles can be used by
computers with a wide variety of operating systems
and file systems. The alarm system does not have
to be ported to the network’s various operating
systems, e.g., Windows and Unix. Also, having a
single alarm system makes it easier to train users.
• Implementing the alarm system on the file
server centralizes security management
functions:
Having a single alarm system makes the system’s
maintenance and defense easier, as the system
resides in one place, rather than on each of the
client computers. Further, having a single alarm
system makes it easier for network security
personnel to monitor the alarm system’s overall use
and effectiveness.
Enhanced Functions
Earlier sections described basic honeyfile
functions, and this section describes some
enhancements that greatly improve honeyfile use.
These improvements have to do with maintaining
realism and controlling alarms.
Operational systems change over time, and so too
must most honeyfiles if they are to be believable.
A file’s MAC times record when it was created,
last modified, and last accessed. Honeyfiles that
portray in-use files must have their MAC times
periodically updated. The honeyfile system can
solve this problem by periodically updating MAC
times, within user-defined parameters.
If deceptive content is being used, it may also need
to change over time. Although deceptive content is
not addressed here, there is a noteworthy technique
for automatically updating a file’s deceptive
content. The honeyfile’s contents can mirror a
source file that is hidden from the target, and the
honeyfile system can periodically update the
honeyfile from the source.
Honeyfile use can also be improved by providing
controls for selectively generating alerts. Some
processes and users must be permitted to open
honeyfiles without setting off alarms, such as tape-
backup processes and the root user.
Honeyfile Limitations
Honeyfiles’ primary limitations are as follows:
• Honeyfiles may not be viable in file spaces
that require regular searching:
Honeyfiles will not be viable if file search tools
generate frequent and unavoidable false alarms.
The honeyfile system could accommodate searches
by enabling users to temporarily suspend their
honeyfiles’ alerts. However, a suspension function
introduces vulnerabilities: users may forget to
resume honeyfile alerts, and the function could be
hacked.
Proceedings of the 2004 IEEE
Workshop on Information Assurance
United States Military Academy, West Point, NY June 2004
2003 IEEE 207
• Honeyfiles are appropriate for file spaces that
are accessible to one person or a small group:
Honeyfiles are likely to be problematic if placed in
a file space that is used by many people. Honeyfile
information would have to be communicated to the
group. Also, false alarms may be frequent and
difficult to investigate.
• Honeyfiles have tactical weaknesses that limit
their use:
Like most deceptions, honeyfiles provide uncertain
effectiveness against an individual attack. Many
other security measures, such as strong encryption,
are much more certain. Also, honeyfile use will be
limited if the target does not tend to explore the file
system.
There are some circumstances in which honeyfiles
can be defeated. There are ways in which a hacker
can identify real files, and if he opens only them,
he will avoid honeyfiles. For example, a hacker
can use a keystroke logger to learn what files are
being used, and then open only them. Another
honeyfile vulnerability is overloading of the alert
mechanism.
• Honeyfiles require end-user involvement and
skill:
Effective honeyfile deployment requires user
participation. It cognitively taxes users by
requiring them to manage and track honeyfiles.
Also, it requires users to have some security savvy
as well as adeptness with computers. Not all users
will have the time or skills needed to use
honeyfiles. However, security personnel can
provide some simple training that will be sufficient
for many users. Another potential cost of
honeyfiles is the inadvertent deception of friendly
personnel.
Using a Honeynet to Test Honeyfiles
The honeyfile system was tested by deploying it on
the honeynet and thereby subjecting it to hacking.
Three hacking incidents were observed, and each
involved a different hacker. The three hackers
were students from North Carolina State University
who are skilled in computer security. The hackers
accessed a honeyfile system containing error
reports and manuals for a mainframe system. Each
of the hackers was detected by at least one
honeyfile. The hackers did not find the file space
very interesting, and they did not search it
diligently. This suggests that honeyfiles are more
likely to be detected if they are near the file space’s
root, where the hacker will start searching.
Honeynets show much promise as a means for
testing security devices. They provide a realistic
setting in which hackers can test the device. The
testing can be performed unwittingly by real
hackers or by those recruited for the task. There is
a significant advantage in using testers from
outside of the security device’s development team.
Outside testers may reveal the developers’ faulty
and overlooked assumptions. Such errors are a
common source of security vulnerabilities, and
they are very difficult for developers to find
themselves.
Building the honeynet was non-trivial and
substantially more time consuming than we
expected. Constructing deceptive files, file
content, and system footprints (e.g., file time-
stamps) was especially challenging, as all the
falsehood had to be made consistent and
believable.
Conclusion
After years of research and development, computer
security remains an error-prone task and, in some
respects, a loosing battle. Computer security’s
Proceedings of the 2004 IEEE
Workshop on Information Assurance
United States Military Academy, West Point, NY June 2004
2003 IEEE 208
chronic problems call for wholly new approaches.
Deception works in a fundamentally different way
than conventional security. Conventional security
tends to work directly with the hacker’s actions,
e.g., to prevent them or to detect them. Deception
manipulates the hacker’s thinking to make him act
in a way that is advantageous to the defender.
Being fundamentally different, deception can be
strong where conventional security is weak.
Honeyfiles are a promising tool for intrusion
detection. They offer significant advantages where
conventional intrusion detection is weak. A
prototype honeyfile system has been constructed
and tested, and we plan to distribute it as open
source.
References
[1] Stoll, C. The Cuckoo's Egg, Doubleday, 1989.
Authors
Jim Yuill is a PhD student in the Computer
Science Department at North Carolina State
University. This paper is part of his thesis
research. Jim previously worked at IBM in
operating systems development. jimyuill-at-
pobox.com
Mike Zappe built the honeyfile prototype. He is
currently a Unix kernel developer at Seclarity.
zapman-at-zappe.us
Dr. Dorothy Denning is a Professor in the
Department of Defense Analysis at the Naval
Postgraduate School. She is an ACM Fellow, and
the recipient of several awards, including the
National Computer Systems Security Award.
dedennin-at-nps.navy.mil
Fred Feer is retired from a career with the U.S.
Army counterintelligence, CIA, RAND and
independent consulting. Deception has been an
interest and area of professional specialization for
over 40 years. ffeer-at-earthwave.net