abstract haji mirza tayeb, seyed ali. controlling the
TRANSCRIPT
ABSTRACT
HAJI MIRZA TAYEB, SEYED ALI. Controlling the Hydrophobic Interactions in
Papermaking Colloidal Systems by Soy Proteins and Lipoxygenases (under the direction of
Profs. Orlando J. Rojas and Martin A. Hubbe).
The strong interactions between hydrophobic colloids (stickies) and low energy surfaces
in papermaking, such as forming fabrics and felts, lead to a number of problems in the process.
The deposits that are generated translate into a decrease in production rate and product quality.
In turn, the economic consequences can be severe. Common strategies to avoid the
incorporation of natural hydrophobic materials, such as wood extractives, resins and pitch,
include seasoning of the wood used prior pulping. Also, in order to address the unwanted
deposition of wood-derived components as well as those derived from papermaking additives
and components present in recycled fibers (synthetic stickies), various chemical methods can
be applied. These include the use of cationic polymers and mineral particles, such as talc, which
prevent surface deposition.
In the present work, we propose a biotechnological approach to control the deposition of
hydrophobic substances in the papermaking process. We applied soy proteins and soybean-
derived lipoxygenases (LOX) to catalyze the oxidation of triglycerides and unsaturated fatty
acids in resinous and other hydrophobic materials. The different approaches to remove the
hydrophobic components were designed and applied under conditions similar to those
prevalent in papermaking. Soy proteins contained in flour, isolates and meals, were considered
as a less expensive sources of the enzyme and used as alternatives to the isolated LOX. Initially,
the possible interaction between pure enzyme and different hydrophobic substrates was
monitored at the colloidal level under and optimum conditions through UV-Vis spectrometry,
Nuclear Magnetic Resonance (NMR) and Fourier Transform Infrared (FTIR) techniques. The
experimental conditions were optimized in order to achieve the highest possible reaction yield.
The obtained results indicated the role of the enzyme in the degradation of the given substrate
via hydro-peroxidation reaction.
Subsequently, a set of experiments was conducted to evaluate the affinity of the treated
deposits with model surfaces that included nanofibrilated cellulose (NFC), polyethylene
terephthalate (PET) and polypropylene. Quartz crystal microbalance (QCM) and surface
plasmon resonance (SPR) techniques were used in these inquiries. As a result of the lower
hydrophobicity of the substrate upon enzyme treatment, they displayed significantly lower
affinity with the surfaces, especially in the case of the non-polar ones. The morphology of the
components that were deposited on the solids was determined via atomic forced microscopy
(AFM). The QCM energy dissipation analysis of the viscoelasticity revealed the possible
presence of a “soft adsorbed layer” with loose contacts between lipids and the non-polar
surfaces.
Tests were developed in order to further determine the deposition of resins extracted from
wood onto polypropylene mats and used as indication of the effects of unstable colloidal
particles in the papermaking process. Different treatment levels with proteins and LOX enzyme
were applied to the system, and the relative reduction of hydrophobic deposits was determined.
The lipoxygenase enzymes produced a remarkable reduction in deposition. A similar trend was
observed when soy proteins were used, but to a more limited extent.
A series of experiments were conducted with recycled fibers to test the performance of the
LOX enzyme and proteins. For this, a papermaking pilot machine was used. Given the fact that
talc is a typical detackifier, results from its addition were used as reference. Apart from
tackiness reduction, the proteins contributed to inter-fiber bonding and subsequent strength of
the paper. Analyses on the treated fibers confirmed synergistic effects of the proteins that
adsorbed on the fiber, changed the balance of electrostatic charges and produced changes in
the porosity and smoothness of the final paper product.
Pilot tests that were run under conditions similar to industrial operations further contributed
to unveiling the role of soy proteins as detackifier and dry strength agent, even in the presence
of additives that are typically used in the wet-end (fillers, retention/drainage aids, etc.). In
general, application of soy proteins reduced the deposition of sticky particles while increasing
paper strength. Also, the presence of protein slightly improved fiber formation. The most
promising data were obtained by application of 2% soy flour based on fiber under mild
agitation after 30 minute protein-slurry contact time. Finally, considering the various
experiments that were conducted, from the colloidal to the pilot scale, it is concluded that soy
proteins can be applied as an environmentally-sound additive in papermaking. They can reduce
the deposition of tacky contaminants on paper and papermaking surfaces and enhance the dry
strength of the paper.

© Copyright 2017 Seyed Ali Haji Mirza Tayeb
All Rights Reserved
Controlling the Hydrophobic Interactions in Papermaking Colloidal Systems by Soy Proteins
and Lipoxygenases
by
Seyed Ali Haji Mirza Tayeb
A dissertation submitted to the Graduate Faculty of
North Carolina State University
in partial fulfillment of the
requirements for the Degree of
Doctor of Philosophy
Forest Biomaterial
Raleigh, North Carolina
2017
APPROVED BY:
_______________________________ _______________________________
Dr. Orlando J. Rojas Dr. Martin A. Hubbe
Co-Chair of Advisory committee Co-Chair of Advisory Committee
_______________________________ _______________________________
Dr. Lokendra Pal Dr. Glenn Catts
Member of Advisory committee Member of Advisory committee
ii
DEDICATION
I dedicate this dissertation to my beloved and wonderful family; my father colonel Tayeb, my
mother Masi, and to my sister Pegah for their endless support, encouragement and
unconditional love all these years during the challenges of graduate school and life. You taught
me by working hard and having determination every impossible will become possible. I am
truly thankful for having you in my life.
I love you infinitely!

iii
BIOGRAPHY
I was born in Tehran, capital city of Iran which is also known as Persia where I grew up with
my lovely family. After finishing my high school, I was admitted to “Karaj University” in Iran
in wood and paper chemistry program and in February 2011, I was graduated with a Master’s
degree in this field.
A year after in August 2012, I moved to Raleigh, North Carolina to join the PhD program in
department of Forest Biomaterials at NC State University and I started my research in the
“Colloidal and Interfaces” group under the direction of Drs. Orlando Rojas and Martin Hubbe.

iv
ACKNOWLEDGEMNENT
I would like to take this opportunity and express my gratitude to certain people that I met
during my PhD studies at NC State University and their help was key to my success in this
chapter of my life.
First, I would like to extend my very sincere gratitude to my adviser and mentor, Dr. Orlando
Rojas for all his guidance, support and encouragement to accomplish my goals during my
doctoral studies. He has been a great role model, shared with me important keys to succeed
and helped me not only as an adviser but also as an individual. I cannot quantify how much I
have learned from him. Thank you for giving me this opportunity to work with you.
I also want to express my appreciation to Dr. Martin Hubbe, my co-adviser, for all his
invaluable guidance, lessons and prompt answers to my research questions.
Special thanks to my committee members Drs. Lokendra Pal and Glenn Catts for their
instruction, suggestions and discussions; especially at my preliminary examination. Also
thanks to Dr. Pal and his research group for helping me with the Pilot-Plant test.
United Soybean Board (USB) is acknowledged for funding support and in particular Dr. Keith
Wing, for his valuable suggestions, discussions and feedback about my research.
Many thanks to Dr. Stephan Kelley not only as a department head but also as a great mentor
that always helped me and pushed me to do my best.
I also would like to thank Drs. Lucian Lucia and Joel Pawlak, my great chemistry and physics
teachers who always were kind enough to give their time to answer my questions.
All the members of Bio-Based Colloids and material group are appreciated for their amazing
comradeship and valuable discussion during our weekly meeting. Also I thank Barbara White

v
for her supports and for providing a safe and secure working environment for all the graduate
students.
Many thanks to my best friends, Jason Witham, Zack miller, Adrienn Uzsak and Ben Jeuck for
their help and friendship. You are not only my friends but also my family in United States.
Finally, I want to thank my dear aunt, Dr. Monir Tayeb who has been always a great role model
since my early ages and supported me during my undergraduate studies. I love you and wish
you all the best.
Last but not least, I would like to thank the countless love given by my parents and my sister.
Even in the distance I could always feel your company and supports in many ways. There is
no word that can express my appreciation to you, I miss you every day.
vi
TABLE OF CONTENTS
1. Introduction ........................................................................................................................... 1
1.1 Pulp and paper mill .................................................................................................... 1
1.2 Deposits in paper making ........................................................................................... 2
1.3 Deposition mechanism ............................................................................................... 3
1.4 Issues with the stickies ............................................................................................... 5
1.5 Methods to detect the stickies .................................................................................... 7
1.5.1 Quantitative measurement and chemical analysis ............................................... 7
1.6 Common sticky control approaches ......................................................................... 10
1.6.1 Enzymes ............................................................................................................ 11
1.6.2 Soy protein ........................................................................................................ 15
1.7 Molecular-level study of deposit .............................................................................. 18
1.7.1 Nuclear Magnetic Resonance (NMR) ............................................................... 18
1.7.2 Fourier Transform Infrared (FTIR) ................................................................... 20
1.7.3 Ultraviolet-visible spectroscopy (UV-Vis) ....................................................... 21
1.8 Sticky-causing components adsorbtion on ultra-thin surfaces ................................. 22
1.8.1 Quartz crystal microbalance with dissipation (QCM-D) .................................. 23
1.8.2 Surface Plasmon Resonance (SPR) .................................................................. 25
1.8.3 Spin Coating...................................................................................................... 26
1.9 Atomic Force Microscopy (AFM) ........................................................................... 27
1.10 References ............................................................................................................ 29
2. Research objective .......................................................................................................... 38
2.1 Research Novelty ......................................................................................................... 40
3 Lipoxygenase-mediated peroxidation mechanism of unsaturated lipids studied by 13C/1H
NMR, FTIR and UV spectroscopy ......................................................................................... 42
3.1 Abstract .................................................................................................................... 42
3.2 Introduction .............................................................................................................. 43
3.3 Materials and Methods ............................................................................................. 46
3.3.1 Lipid oxidation by lipoxygenase ....................................................................... 47
3.3.2 LOX reaction followed by UV Spectrophotometry .......................................... 47
3.3.3 1H analysis of the lipids .................................................................................... 48
3.3.4 13C NMR analysis of the linoleic acid .............................................................. 48

vii
3.3.5 Fourier Transform Infrared Spectroscopy (FTIR) ............................................ 48
3.4 Results and Discussion ............................................................................................. 49
3.4.1 Characterization of pure lipids using proton NMR........................................... 49
3.4.2 Identification of hydroproxy groups in multiple substrates by proton NMR ... 53
3.4.3 Linoleic acid analysis by 13C NMR .................................................................. 57
3.4.4 Glycerol oxidation with soybean lipoxygenase ................................................ 60
3.4.3 FTIR analysis .................................................................................................... 64
3.5 Conclusion ................................................................................................................ 68
3.6 Reference .................................................................................................................. 69
4 Oxidation and removal of unsaturated fatty acids from nanofibrillated cellulose and
polyester surfaces by lipoxygenase treatment: A QCM/SPR study........................................ 75
4.1 Abstract .................................................................................................................... 75
4.2 Introduction .............................................................................................................. 76
4.2.1 Sorption properties ............................................................................................ 79
4.2.2 Quartz crystal microbalance (QCM)-D ............................................................ 80
4.2.3 Surface Plasmon Resonance (SPR) .................................................................. 81
4.3 Materials and Methods ............................................................................................. 82
4.3.1 Model films preparation .................................................................................... 83
4.3.2 NFC films.......................................................................................................... 83
4.3.3 Enzymatic treatment of model oils and wood extractives ................................ 83
4.3.4 QCM analysis.................................................................................................... 84
4.3.5 Surface Plasmon Resonance (SPR) .................................................................. 85
4.3.6 Atomic force microscopy imaging.................................................................... 86
4.4 Results and discussion .............................................................................................. 86
4.4.1 Dynamics of lipid adsorption ............................................................................... 86
4.4.2 Comparison of QCM and SPR .......................................................................... 88
4.4.3 Dissipation analysis .......................................................................................... 90
4.4.4 AFM images...................................................................................................... 93
4.5 Conclusions .............................................................................................................. 96
4.5 References ................................................................................................................ 99
5 Soy proteins and lipoxygenases to reduce deposits on polypropylene surfaces ........... 103
5.1 Abstract .................................................................................................................. 103

viii
5.2 Introduction ............................................................................................................ 104
5.2.1 Pitch Problem Solutions .................................................................................. 105
5.2.2 Lipoxygenase .................................................................................................. 107
5.2.3 Enzyme reaction mechanism .......................................................................... 108
5.3 Materials and method ................................................................................................ 109
5.3.1 Lipoxygenase Activity .................................................................................... 109
5.3.2 Lipoxygenase Solution Preparation ................................................................... 110
5.3.3 Pulp treatment with lipoxygenase ................................................................... 111
5.3.4 Extractives analysis and deposit test ............................................................... 111
5.3.5 Handsheet making ........................................................................................... 112
5.3.6 Handsheet brightness ...................................................................................... 113
5.4 Result and discussion ............................................................................................. 113
5.4.1 Lipoxygenase activity at different pH ............................................................. 113
5.4.2 Deposition test ................................................................................................ 115
5.4.3 Soy protein as a detackifier ............................................................................. 117
5.4.4 Deposit test after 5 adsorption cycles ............................................................. 119
5.4.5 Water contact angle (WCA) measurement ..................................................... 120
5.4.6 Lipoxygenase effect on the fibers optical properties ...................................... 121
5.5 Conclusion ................................................................................................................ 122
5.6 References .............................................................................................................. 124
6 Evaluation of soy protein application as a novel sticky-control additive in recycled pulps
127
6.1 Abstract .................................................................................................................. 127
6.2 Introduction ............................................................................................................ 128
6.3 Materials and Methods ........................................................................................... 134
6.3.1 Soy protein and enzyme preparation ............................................................... 134
6.3.2 Lipoxygenase and protein solution preparation ................................................. 135
6.3.3 Pulp treatment with lipoxygenase and protein ................................................ 135
6.3.4 Handsheet preparation .................................................................................... 135
6.3.5 Optical properties ............................................................................................ 136
6.3.6 Mechanical properties ..................................................................................... 136
6.3.7 Charge measurement ....................................................................................... 137
ix
6.3.8 Test of porosity ............................................................................................... 137
6.3.10 Stickies analysis .............................................................................................. 138
6.3.11 Peeling test & sample preparation .................................................................. 138
6.4 Result and Discussion ............................................................................................ 139
6.4.1 Internal strengths of soy-added handheets ...................................................... 139
6.4.2 Tensile and Burst indices ................................................................................ 140
6.4.3 Roughness and tear index ............................................................................... 141
6.4.4 Reduction in the overall basis weight ............................................................. 142
6.4.5 Effect of protein on paper brightness .............................................................. 143
6.4.6 Porosity and total charge ................................................................................. 144
6.4.7 Sticky and deposit analysis ............................................................................. 145
6.4.8 The measurement of handsheets tackiness ..................................................... 147
6.5 Conclusion .............................................................................................................. 149
6.6 References ................................................................................................................. 152
7 Soy Protein as a Sticky-Control and Strength Agent for Recycle Paper Furnish at Pilot-
Scale ...................................................................................................................................... 157
7.1 Abstract .................................................................................................................. 157
7.2 Introduction ............................................................................................................ 158
7.3 Materials and methods ........................................................................................... 163
7.3.1 Recycled pulp and Pilot plant conditions........................................................ 163
7.3.2 Filler and additives .......................................................................................... 164
7.3.3 Papermaking ................................................................................................... 165
7.3.4 Protein preparation .......................................................................................... 165
7.3.5 Optical properties ............................................................................................ 165
7.3.6 Paper dying and sticky content measurement ................................................. 166
7.3.7 Peeling Test ..................................................................................................... 167
7.3.8 Formation Analysis ......................................................................................... 167
7.3.9 Thermal Gravimetric Analysis (TGA) ............................................................ 168
7.3.10 Fourier Transform Infrared Spectroscopy (FTIR) .......................................... 168
7.3.11 Mechanical Properties ..................................................................................... 168
7.4 Results and Discussion ........................................................................................... 169
7.4.1 Filler Retention on the Fibers ......................................................................... 170
x
7.4.2 Identifying the Stickies in Papers ................................................................... 171
7.4.3 Image Analysis................................................................................................ 171
7.4.4 Test of sheets tackiness ................................................................................... 175
7.4.5 FTIR spectra of detackified papers ................................................................. 176
7.4.6 Sheet Formation Test ...................................................................................... 179
7.4.7 Sheets Strengths .............................................................................................. 181
7.4.8 Tensile and Burst Indices ................................................................................ 183
7.4.9 Roughness and Porosity .................................................................................. 185
7.5 Conclusion .............................................................................................................. 186
7.6 References .............................................................................................................. 188
8 Concluding remarks ...................................................................................................... 194
APPENDIX ........................................................................................................................... 196
Appendix A. Numerical values of mechanical strengths obtained in pilot-plant paper
making experiments .......................................................................................................... 196
xi
LIST OF TABLES
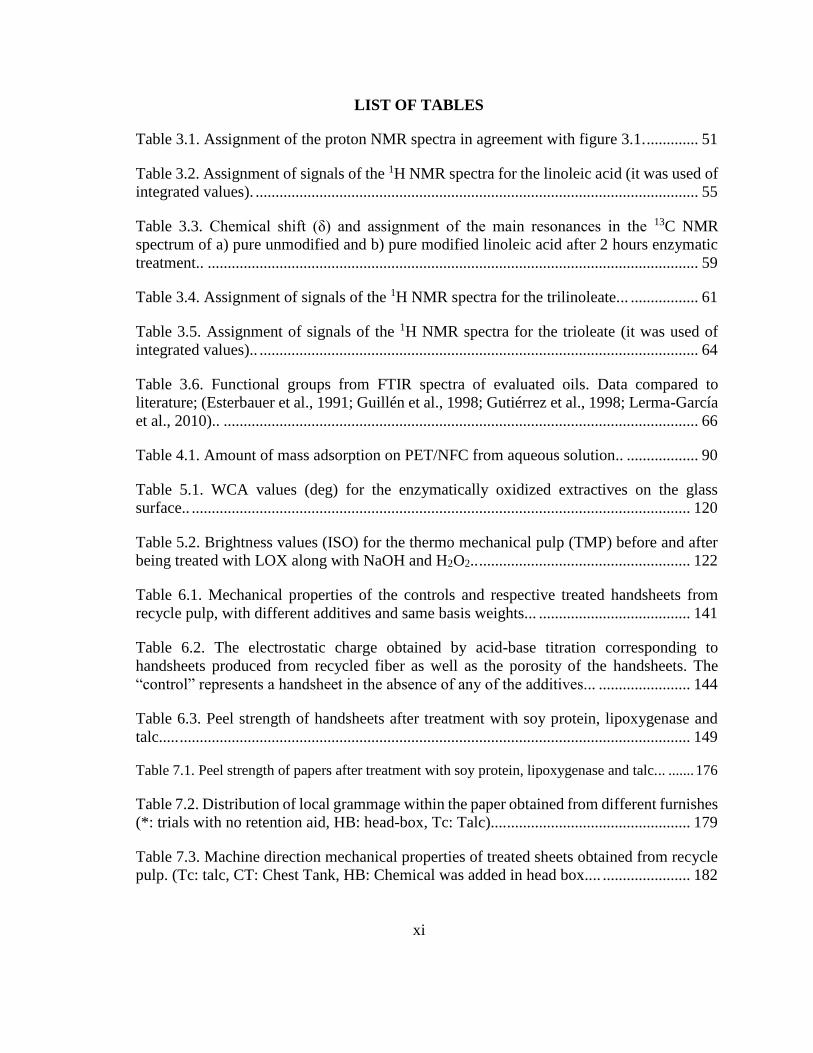
Table 3.1. Assignment of the proton NMR spectra in agreement with figure 3.1. ............. 51
Table 3.2. Assignment of signals of the 1H NMR spectra for the linoleic acid (it was used of
integrated values). ............................................................................................................... 55
Table 3.3. Chemical shift (δ) and assignment of the main resonances in the 13C NMR
spectrum of a) pure unmodified and b) pure modified linoleic acid after 2 hours enzymatic
treatment.. ........................................................................................................................... 59
Table 3.4. Assignment of signals of the 1H NMR spectra for the trilinoleate... ................. 61
Table 3.5. Assignment of signals of the 1H NMR spectra for the trioleate (it was used of
integrated values).. .............................................................................................................. 64
Table 3.6. Functional groups from FTIR spectra of evaluated oils. Data compared to
literature; (Esterbauer et al., 1991; Guillén et al., 1998; Gutiérrez et al., 1998; Lerma-García
et al., 2010).. ....................................................................................................................... 66
Table 4.1. Amount of mass adsorption on PET/NFC from aqueous solution.. .................. 90
Table 5.1. WCA values (deg) for the enzymatically oxidized extractives on the glass
surface.. ............................................................................................................................. 120
Table 5.2. Brightness values (ISO) for the thermo mechanical pulp (TMP) before and after
being treated with LOX along with NaOH and H2O2.. ..................................................... 122
Table 6.1. Mechanical properties of the controls and respective treated handsheets from
recycle pulp, with different additives and same basis weights... ...................................... 141
Table 6.2. The electrostatic charge obtained by acid-base titration corresponding to
handsheets produced from recycled fiber as well as the porosity of the handsheets. The
“control” represents a handsheet in the absence of any of the additives... ....................... 144
Table 6.3. Peel strength of handsheets after treatment with soy protein, lipoxygenase and
talc..... ................................................................................................................................ 149
Table 7.1. Peel strength of papers after treatment with soy protein, lipoxygenase and talc... ....... 176
Table 7.2. Distribution of local grammage within the paper obtained from different furnishes
(*: trials with no retention aid, HB: head-box, Tc: Talc).... .............................................. 179
Table 7.3. Machine direction mechanical properties of treated sheets obtained from recycle
pulp. (Tc: talc, CT: Chest Tank, HB: Chemical was added in head box.... ...................... 182
xii
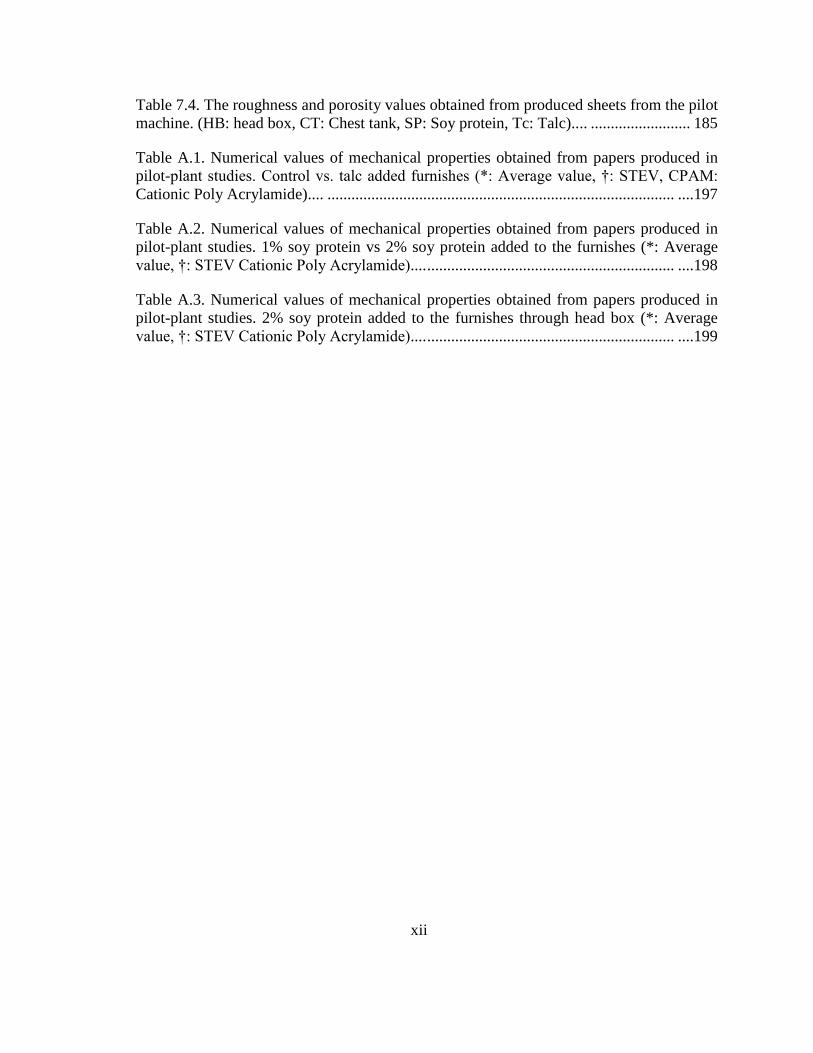
Table 7.4. The roughness and porosity values obtained from produced sheets from the pilot
machine. (HB: head box, CT: Chest tank, SP: Soy protein, Tc: Talc).... ......................... 185
Table A.1. Numerical values of mechanical properties obtained from papers produced in
pilot-plant studies. Control vs. talc added furnishes (*: Average value, †: STEV, CPAM:
Cationic Poly Acrylamide).... ....................................................................................... ....197
Table A.2. Numerical values of mechanical properties obtained from papers produced in
pilot-plant studies. 1% soy protein vs 2% soy protein added to the furnishes (*: Average
value, †: STEV Cationic Poly Acrylamide).... .............................................................. ....198
Table A.3. Numerical values of mechanical properties obtained from papers produced in
pilot-plant studies. 2% soy protein added to the furnishes through head box (*: Average
value, †: STEV Cationic Poly Acrylamide).... .............................................................. ....199
xiii
LIST OF FIGURES
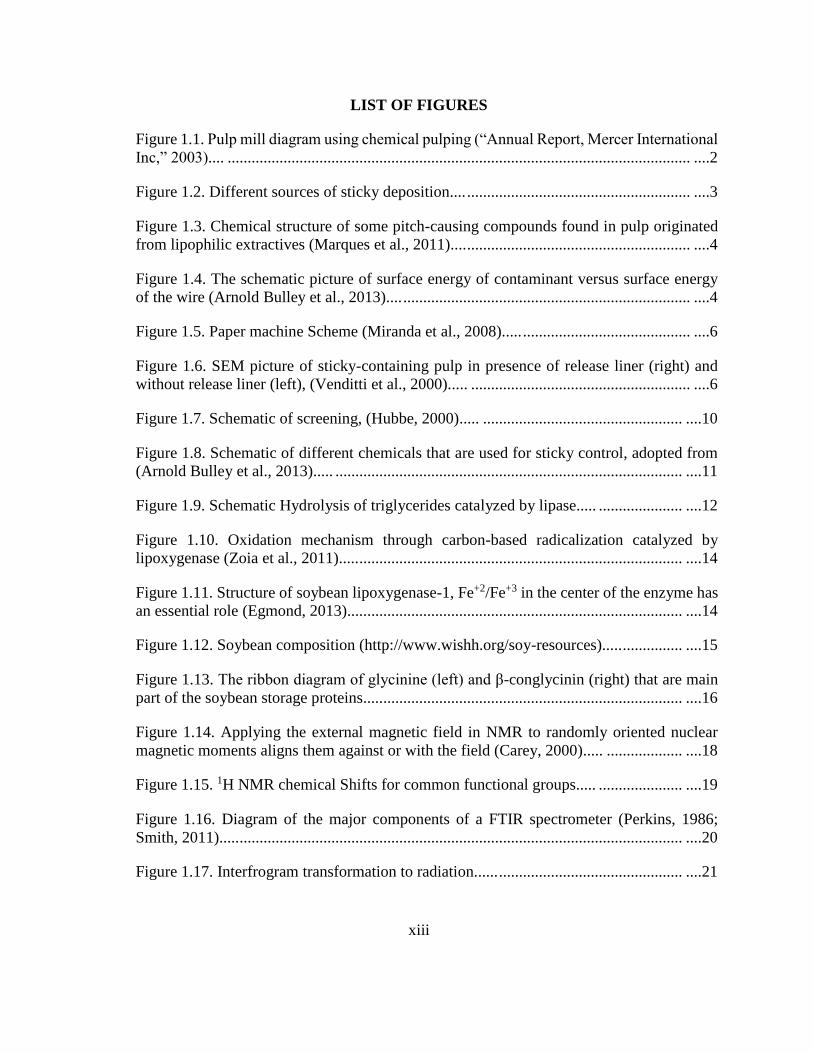
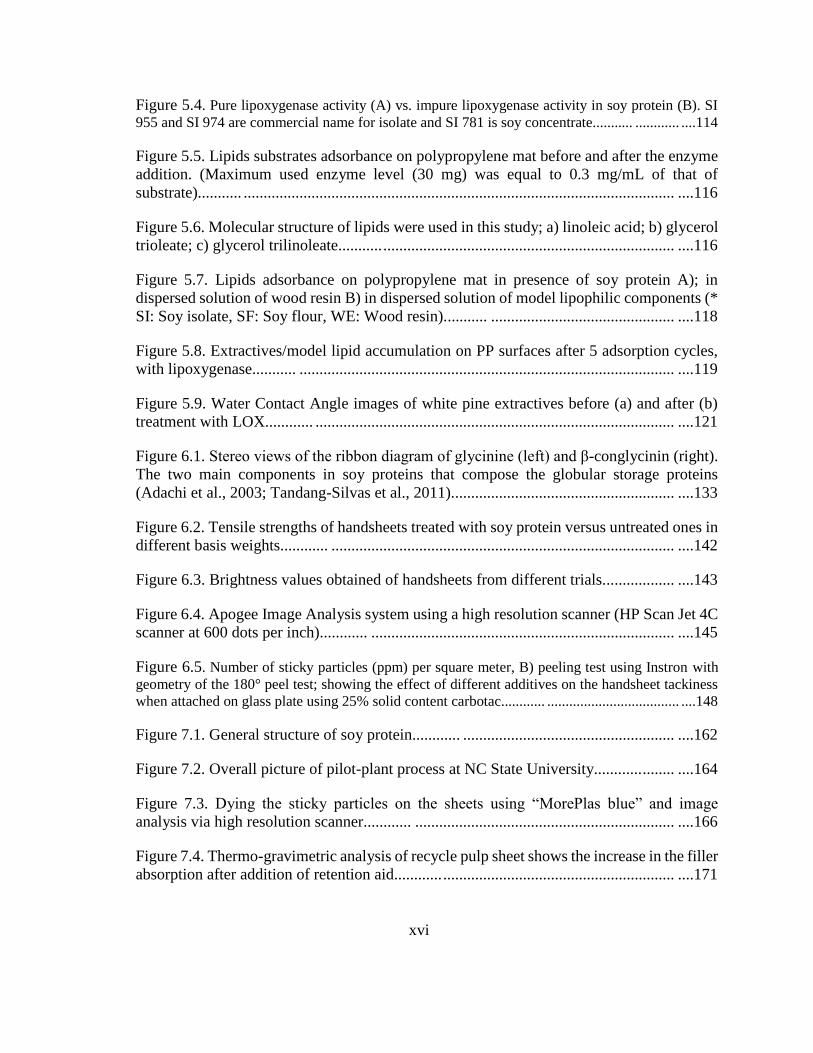
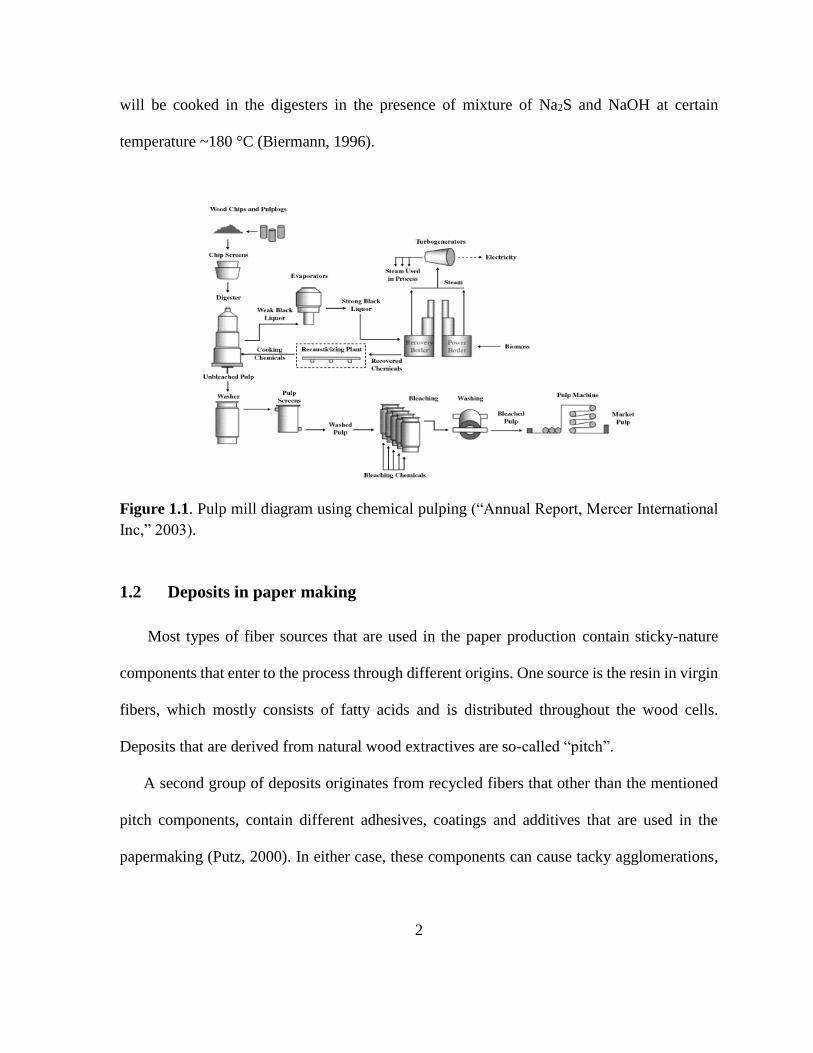
Figure 1.1. Pulp mill diagram using chemical pulping (“Annual Report, Mercer International
Inc,” 2003).... .................................................................................................................... ....2
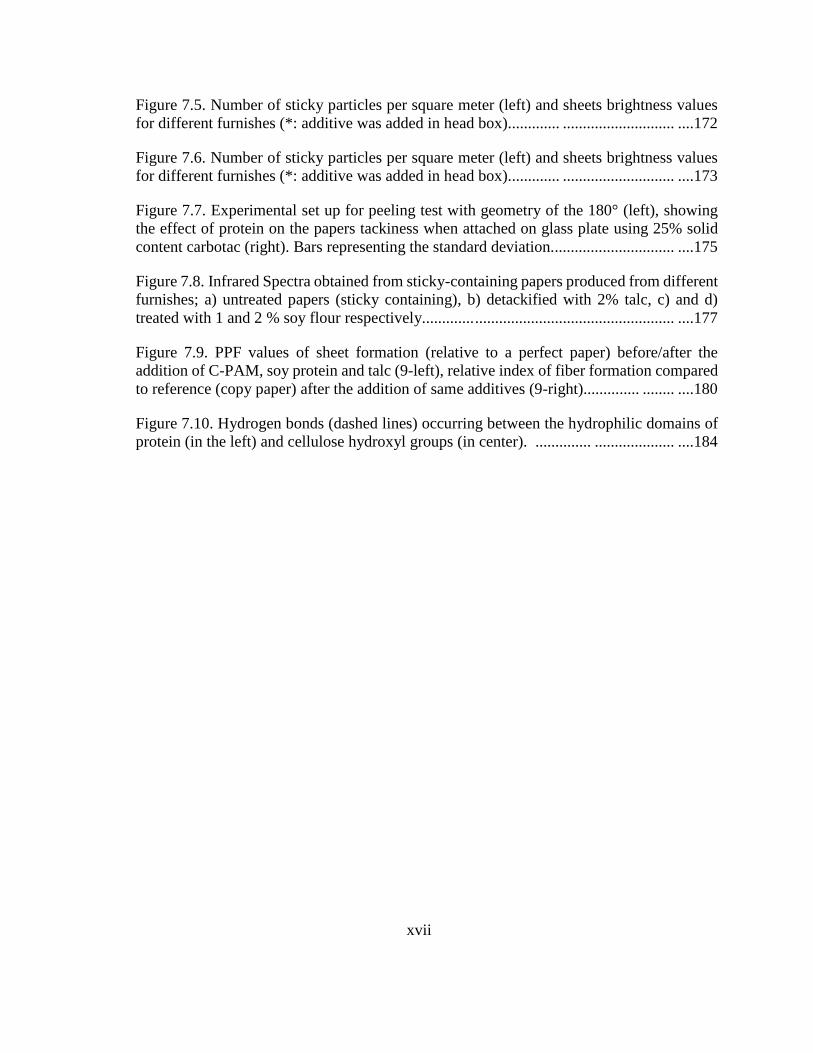
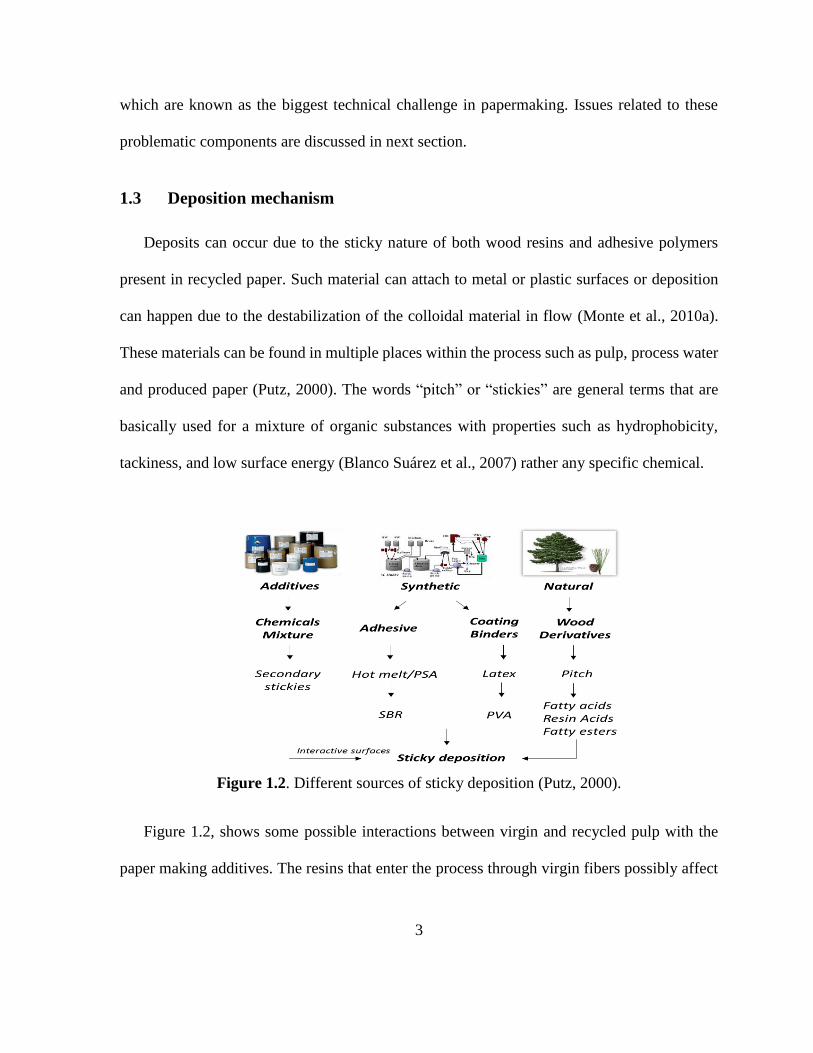
Figure 1.2. Different sources of sticky deposition.... ........................................................ ....3
Figure 1.3. Chemical structure of some pitch-causing compounds found in pulp originated
from lipophilic extractives (Marques et al., 2011).... ........................................................ ....4
Figure 1.4. The schematic picture of surface energy of contaminant versus surface energy
of the wire (Arnold Bulley et al., 2013).... ........................................................................ ....4
Figure 1.5. Paper machine Scheme (Miranda et al., 2008)..... .......................................... ....6
Figure 1.6. SEM picture of sticky-containing pulp in presence of release liner (right) and
without release liner (left), (Venditti et al., 2000)..... ....................................................... ....6
Figure 1.7. Schematic of screening, (Hubbe, 2000)..... .................................................. ....10
Figure 1.8. Schematic of different chemicals that are used for sticky control, adopted from
(Arnold Bulley et al., 2013)..... ....................................................................................... ....11
Figure 1.9. Schematic Hydrolysis of triglycerides catalyzed by lipase..... ..................... ....12
Figure 1.10. Oxidation mechanism through carbon-based radicalization catalyzed by
lipoxygenase (Zoia et al., 2011)..... ................................................................................. ....14
Figure 1.11. Structure of soybean lipoxygenase-1, Fe+2/Fe+3 in the center of the enzyme has
an essential role (Egmond, 2013)..... ............................................................................... ....14
Figure 1.12. Soybean composition (http://www.wishh.org/soy-resources)..... ............... ....15
Figure 1.13. The ribbon diagram of glycinine (left) and β-conglycinin (right) that are main
part of the soybean storage proteins................................................................................ ....16
Figure 1.14. Applying the external magnetic field in NMR to randomly oriented nuclear
magnetic moments aligns them against or with the field (Carey, 2000)..... ................... ....18
Figure 1.15. 1H NMR chemical Shifts for common functional groups..... ..................... ....19
Figure 1.16. Diagram of the major components of a FTIR spectrometer (Perkins, 1986;
Smith, 2011)..... ............................................................................................................... ....20
Figure 1.17. Interfrogram transformation to radiation...... .............................................. ....21

xiv
Figure 1.18. Schematic of a UV/Vis spectrophotometer and electron promotion...... .... ....22
Figure 1.19. Left: QCM cell with oscillating crystal, Right: variation of oscillation frequency
as a function of time...... .................................................................................................. ....24
Figure 1.20. Top left: Gold coated quartz crystal used in QCM. Bottom left: Change in
frequency when mass adsorbed, Right: The shearing stationary wave in quartz crystal and
its propagation...... ........................................................................................................... ....25
Figure 1.21. Schematic of optical configuration of SPR biosensing and the associated angle shift
and change in the resonance signal as a function of time (Mitchell et al., 2010)......................... ....26
Figure 1.22. Schematic of spin-coating process (Norrman et al., 2005)...... .................. ....27
Figure 3.1. 1H NMR spectra of pure A) linoleic acid, B) glycerol trilinoleate and C) glycerol trioleate
dissolved in deuterated solvent. (*: peaks are assigned to the residual solvent)....... ................... ....50
Figure 3.2. Substrate oxidation mechanism through carbon-based radicalization (left). The
UV spectrum of oxidized linoleic acid (right)........ ........................................................ ....52
Figure 3.3. Quantitative 1H NMR spectrum covering 0.0- 9.0 ppm of a) pure unmodified
linoleic dissolved in DMSO, b) extracted linoleic acid after being treated with LOX for 2
hours, c) after being treated for 24 hours, and d) after 1 week........ ............................... ....54
Figure 3.4. Enlargement of region between 3-7 ppm of the 1H NMR spectra of the figure 3,
a) pure unmodified linoleic acid, b) extracted lipid after being treated with LOX for 2 hours,
c) 24 h and d) 1 week. The peak assignment for the conjugated diene was seen at 6.0-6.5
ppm, the peak in 5.3 is representing the CH=CH which is weaker in the modified
sample........ ..................................................................................................................... ....56
Figure 3.5. 13C NMR spectrum covering of a) pure unmodified linoleic dissolved in DMSO,
b) extracted linoleic acid after treatment with LOX for 2 h and c) after treatment for 1 week
(*: Residual solvent)......... .............................................................................................. ....58
Figure 3.6. 1H NMR spectrum covering 0.0- 6.0 ppm of a) pure unmodified glycerol
trilinoleate dissolved in CDCl3, b) treated with LOX for 2 hours.................................. ....60
Figure 3.7. 1H NMR spectrum covering 0.0- 6.0 ppm of a) pure unmodified glycerol trioleate
dissolved in CDCl3, b) treated with LOX for 2 hours......... ........................................... ....63
Figure 3.8. FTIR spectra of linoleic acid (region between 500 and 4500 cm-1) before/after
treatment with LOX for 2h.......... ................................................................................... ....65
Figure 3.9. FTIR spectra of trilinoleate and trioleate, region between 500 and 4500 cm-1,
before/after treatment with LOX.......... .......................................................................... ....67
xv
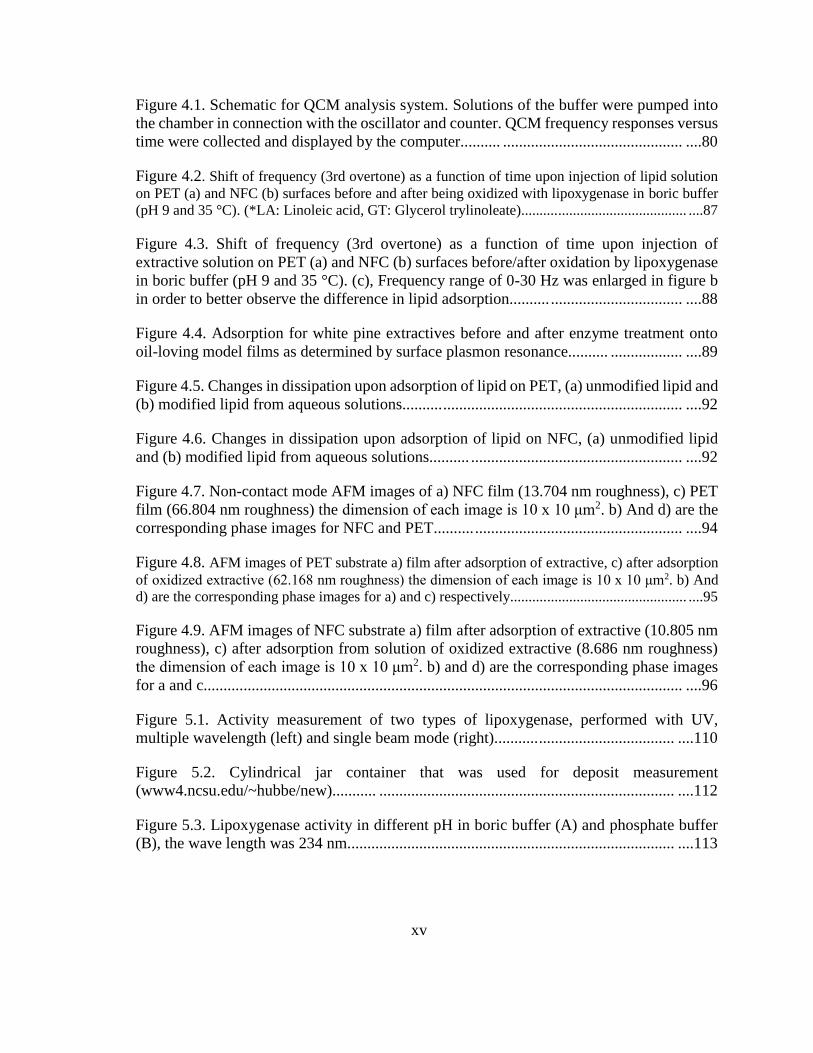
Figure 4.1. Schematic for QCM analysis system. Solutions of the buffer were pumped into
the chamber in connection with the oscillator and counter. QCM frequency responses versus
time were collected and displayed by the computer.......... ............................................. ....80
Figure 4.2. Shift of frequency (3rd overtone) as a function of time upon injection of lipid solution
on PET (a) and NFC (b) surfaces before and after being oxidized with lipoxygenase in boric buffer
(pH 9 and 35 °C). (*LA: Linoleic acid, GT: Glycerol trylinoleate).......... ................................... ....87
Figure 4.3. Shift of frequency (3rd overtone) as a function of time upon injection of
extractive solution on PET (a) and NFC (b) surfaces before/after oxidation by lipoxygenase
in boric buffer (pH 9 and 35 °C). (c), Frequency range of 0-30 Hz was enlarged in figure b
in order to better observe the difference in lipid adsorption.......... ................................. ....88
Figure 4.4. Adsorption for white pine extractives before and after enzyme treatment onto
oil-loving model films as determined by surface plasmon resonance.......... .................. ....89
Figure 4.5. Changes in dissipation upon adsorption of lipid on PET, (a) unmodified lipid and
(b) modified lipid from aqueous solutions.......... ............................................................ ....92
Figure 4.6. Changes in dissipation upon adsorption of lipid on NFC, (a) unmodified lipid
and (b) modified lipid from aqueous solutions.......... ..................................................... ....92
Figure 4.7. Non-contact mode AFM images of a) NFC film (13.704 nm roughness), c) PET
film (66.804 nm roughness) the dimension of each image is 10 x 10 μm2. b) And d) are the
corresponding phase images for NFC and PET.......... .................................................... ....94
Figure 4.8. AFM images of PET substrate a) film after adsorption of extractive, c) after adsorption
of oxidized extractive (62.168 nm roughness) the dimension of each image is 10 x 10 μm2. b) And
d) are the corresponding phase images for a) and c) respectively.......... ...................................... ....95
Figure 4.9. AFM images of NFC substrate a) film after adsorption of extractive (10.805 nm
roughness), c) after adsorption from solution of oxidized extractive (8.686 nm roughness)
the dimension of each image is 10 x 10 μm2. b) and d) are the corresponding phase images
for a and c........................................................................................................................ ....96
Figure 5.1. Activity measurement of two types of lipoxygenase, performed with UV,
multiple wavelength (left) and single beam mode (right)........... .................................. ....110
Figure 5.2. Cylindrical jar container that was used for deposit measurement
(www4.ncsu.edu/~hubbe/new)........... .......................................................................... ....112
Figure 5.3. Lipoxygenase activity in different pH in boric buffer (A) and phosphate buffer
(B), the wave length was 234 nm.................................................................................. ....113
xvi
Figure 5.4. Pure lipoxygenase activity (A) vs. impure lipoxygenase activity in soy protein (B). SI
955 and SI 974 are commercial name for isolate and SI 781 is soy concentrate........... ............ ....114
Figure 5.5. Lipids substrates adsorbance on polypropylene mat before and after the enzyme
addition. (Maximum used enzyme level (30 mg) was equal to 0.3 mg/mL of that of
substrate)........... ............................................................................................................ ....116
Figure 5.6. Molecular structure of lipids were used in this study; a) linoleic acid; b) glycerol
trioleate; c) glycerol trilinoleate........... ......................................................................... ....116
Figure 5.7. Lipids adsorbance on polypropylene mat in presence of soy protein A); in
dispersed solution of wood resin B) in dispersed solution of model lipophilic components (*
SI: Soy isolate, SF: Soy flour, WE: Wood resin)........... .............................................. ....118
Figure 5.8. Extractives/model lipid accumulation on PP surfaces after 5 adsorption cycles,
with lipoxygenase........... .............................................................................................. ....119
Figure 5.9. Water Contact Angle images of white pine extractives before (a) and after (b)
treatment with LOX............ .......................................................................................... ....121
Figure 6.1. Stereo views of the ribbon diagram of glycinine (left) and β-conglycinin (right).
The two main components in soy proteins that compose the globular storage proteins
(Adachi et al., 2003; Tandang-Silvas et al., 2011)........................................................ ....133
Figure 6.2. Tensile strengths of handsheets treated with soy protein versus untreated ones in
different basis weights............ ...................................................................................... ....142
Figure 6.3. Brightness values obtained of handsheets from different trials............ ...... ....143
Figure 6.4. Apogee Image Analysis system using a high resolution scanner (HP Scan Jet 4C
scanner at 600 dots per inch)............ ............................................................................ ....145
Figure 6.5. Number of sticky particles (ppm) per square meter, B) peeling test using Instron with
geometry of the 180° peel test; showing the effect of different additives on the handsheet tackiness
when attached on glass plate using 25% solid content carbotac............ .................................... ....148
Figure 7.1. General structure of soy protein............ ..................................................... ....162
Figure 7.2. Overall picture of pilot-plant process at NC State University............ ........ ....164
Figure 7.3. Dying the sticky particles on the sheets using “MorePlas blue” and image
analysis via high resolution scanner............ ................................................................. ....166
Figure 7.4. Thermo-gravimetric analysis of recycle pulp sheet shows the increase in the filler
absorption after addition of retention aid............ .......................................................... ....171
xvii
Figure 7.5. Number of sticky particles per square meter (left) and sheets brightness values
for different furnishes (*: additive was added in head box)............. ............................ ....172
Figure 7.6. Number of sticky particles per square meter (left) and sheets brightness values
for different furnishes (*: additive was added in head box)............. ............................ ....173
Figure 7.7. Experimental set up for peeling test with geometry of the 180° (left), showing
the effect of protein on the papers tackiness when attached on glass plate using 25% solid
content carbotac (right). Bars representing the standard deviation............................... ....175
Figure 7.8. Infrared Spectra obtained from sticky-containing papers produced from different
furnishes; a) untreated papers (sticky containing), b) detackified with 2% talc, c) and d)
treated with 1 and 2 % soy flour respectively............. .................................................. ....177
Figure 7.9. PPF values of sheet formation (relative to a perfect paper) before/after the
addition of C-PAM, soy protein and talc (9-left), relative index of fiber formation compared
to reference (copy paper) after the addition of same additives (9-right).............. ........ ....180
Figure 7.10. Hydrogen bonds (dashed lines) occurring between the hydrophilic domains of
protein (in the left) and cellulose hydroxyl groups (in center). .............. .................... ....184

1
1. Introduction
The focus of this work is to propose an effective green approach to tackle the stickies and
pitch issue in paper mills by using soy bean enzyme (lipoxygenase) and soy protein to control
the problematic hydrophobic interactions. This aim can be achieved through reducing the
sticky agglomerations in the process of producing paper to avoid the related pitch issues as
well as achieving the lower production cost. In this chapter the concept of pitch and stickies,
as well as common methods and chemicals that are usually used to tackle this problem, are
introduced. Later on, we will talk about the characterization methods that were employed in
the present work (explained in different chapters) to identify and measure the stickies in
different systems and scales. Finally, different soy protein types and their enzyme contents are
introduced, since some of the chapters are fully dedicated to the use of soy protein as pitch
control as well as dry strength agent.
1.1 Pulp and paper mill
Pulp mill is where fibers are extracted from wood chips for the pulp and paper production
through different processes. In general, there are three main pulping process: mechanical,
thermomechanical and chemical pulping. In the mechanical pulping there is no or very little
chemical employed during the pulping and no delignification is performed. By contrast, in
chemical pulps there is delignification step and optional bleaching steps in which the majority
of lignin is removed by the help of various chemicals. For example in the Kraft process, pulp
2
will be cooked in the digesters in the presence of mixture of Na2S and NaOH at certain
temperature ~180 °C (Biermann, 1996).
Figure 1.1. Pulp mill diagram using chemical pulping (“Annual Report, Mercer International
Inc,” 2003).
1.2 Deposits in paper making
Most types of fiber sources that are used in the paper production contain sticky-nature
components that enter to the process through different origins. One source is the resin in virgin
fibers, which mostly consists of fatty acids and is distributed throughout the wood cells.
Deposits that are derived from natural wood extractives are so-called “pitch”.
A second group of deposits originates from recycled fibers that other than the mentioned
pitch components, contain different adhesives, coatings and additives that are used in the
papermaking (Putz, 2000). In either case, these components can cause tacky agglomerations,
3
which are known as the biggest technical challenge in papermaking. Issues related to these
problematic components are discussed in next section.
1.3 Deposition mechanism
Deposits can occur due to the sticky nature of both wood resins and adhesive polymers
present in recycled paper. Such material can attach to metal or plastic surfaces or deposition
can happen due to the destabilization of the colloidal material in flow (Monte et al., 2010a).
These materials can be found in multiple places within the process such as pulp, process water
and produced paper (Putz, 2000). The words “pitch” or “stickies” are general terms that are
basically used for a mixture of organic substances with properties such as hydrophobicity,
tackiness, and low surface energy (Blanco Suárez et al., 2007) rather any specific chemical.
Figure 1.2. Different sources of sticky deposition (Putz, 2000).
Figure 1.2, shows some possible interactions between virgin and recycled pulp with the
paper making additives. The resins that enter the process through virgin fibers possibly affect
4
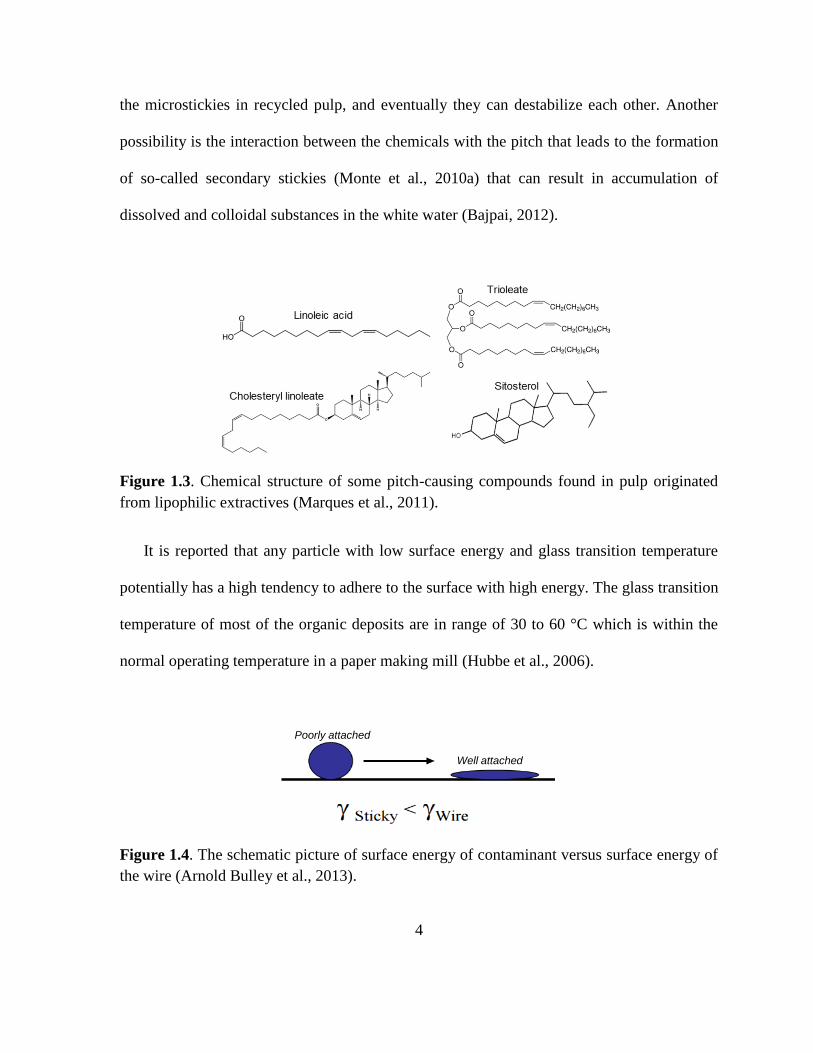
the microstickies in recycled pulp, and eventually they can destabilize each other. Another
possibility is the interaction between the chemicals with the pitch that leads to the formation
of so-called secondary stickies (Monte et al., 2010a) that can result in accumulation of
dissolved and colloidal substances in the white water (Bajpai, 2012).
Figure 1.3. Chemical structure of some pitch-causing compounds found in pulp originated
from lipophilic extractives (Marques et al., 2011).
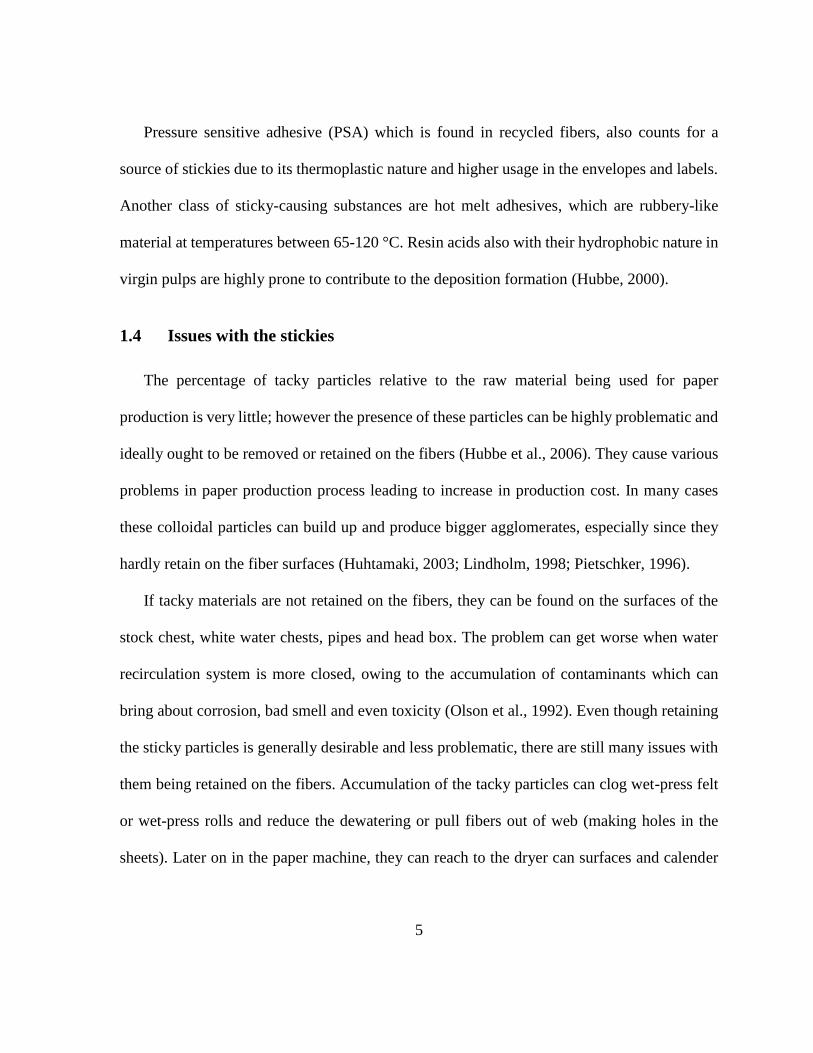
It is reported that any particle with low surface energy and glass transition temperature
potentially has a high tendency to adhere to the surface with high energy. The glass transition
temperature of most of the organic deposits are in range of 30 to 60 °C which is within the
normal operating temperature in a paper making mill (Hubbe et al., 2006).
Figure 1.4. The schematic picture of surface energy of contaminant versus surface energy of
the wire (Arnold Bulley et al., 2013).
Poorly attached
Well attached
5
Pressure sensitive adhesive (PSA) which is found in recycled fibers, also counts for a
source of stickies due to its thermoplastic nature and higher usage in the envelopes and labels.
Another class of sticky-causing substances are hot melt adhesives, which are rubbery-like
material at temperatures between 65-120 °C. Resin acids also with their hydrophobic nature in
virgin pulps are highly prone to contribute to the deposition formation (Hubbe, 2000).
1.4 Issues with the stickies
The percentage of tacky particles relative to the raw material being used for paper
production is very little; however the presence of these particles can be highly problematic and
ideally ought to be removed or retained on the fibers (Hubbe et al., 2006). They cause various
problems in paper production process leading to increase in production cost. In many cases
these colloidal particles can build up and produce bigger agglomerates, especially since they
hardly retain on the fiber surfaces (Huhtamaki, 2003; Lindholm, 1998; Pietschker, 1996).
If tacky materials are not retained on the fibers, they can be found on the surfaces of the
stock chest, white water chests, pipes and head box. The problem can get worse when water
recirculation system is more closed, owing to the accumulation of contaminants which can
bring about corrosion, bad smell and even toxicity (Olson et al., 1992). Even though retaining
the sticky particles is generally desirable and less problematic, there are still many issues with
them being retained on the fibers. Accumulation of the tacky particles can clog wet-press felt
or wet-press rolls and reduce the dewatering or pull fibers out of web (making holes in the
sheets). Later on in the paper machine, they can reach to the dryer can surfaces and calender
6
rolls and reduce the heat transfer that causes tearing the sheets (Barnett et al., 1989; Blanco et
al., 2002; Delagoutte, 2005).
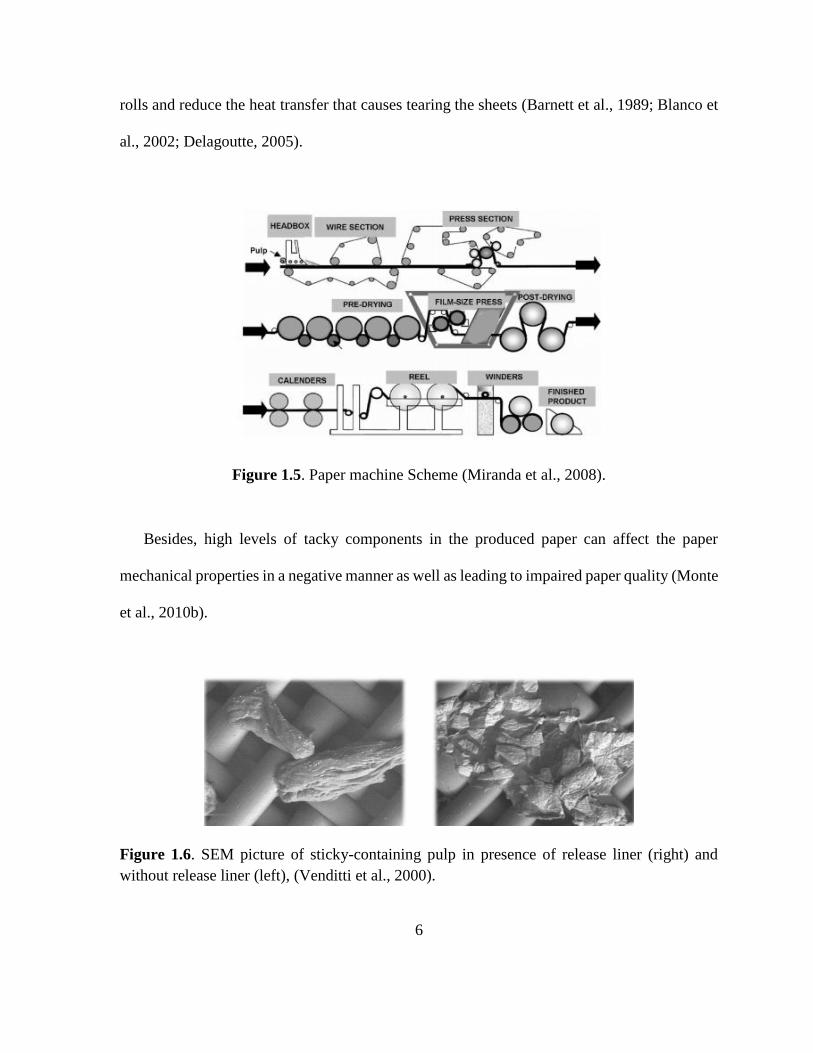
Figure 1.5. Paper machine Scheme (Miranda et al., 2008).
Besides, high levels of tacky components in the produced paper can affect the paper
mechanical properties in a negative manner as well as leading to impaired paper quality (Monte
et al., 2010b).
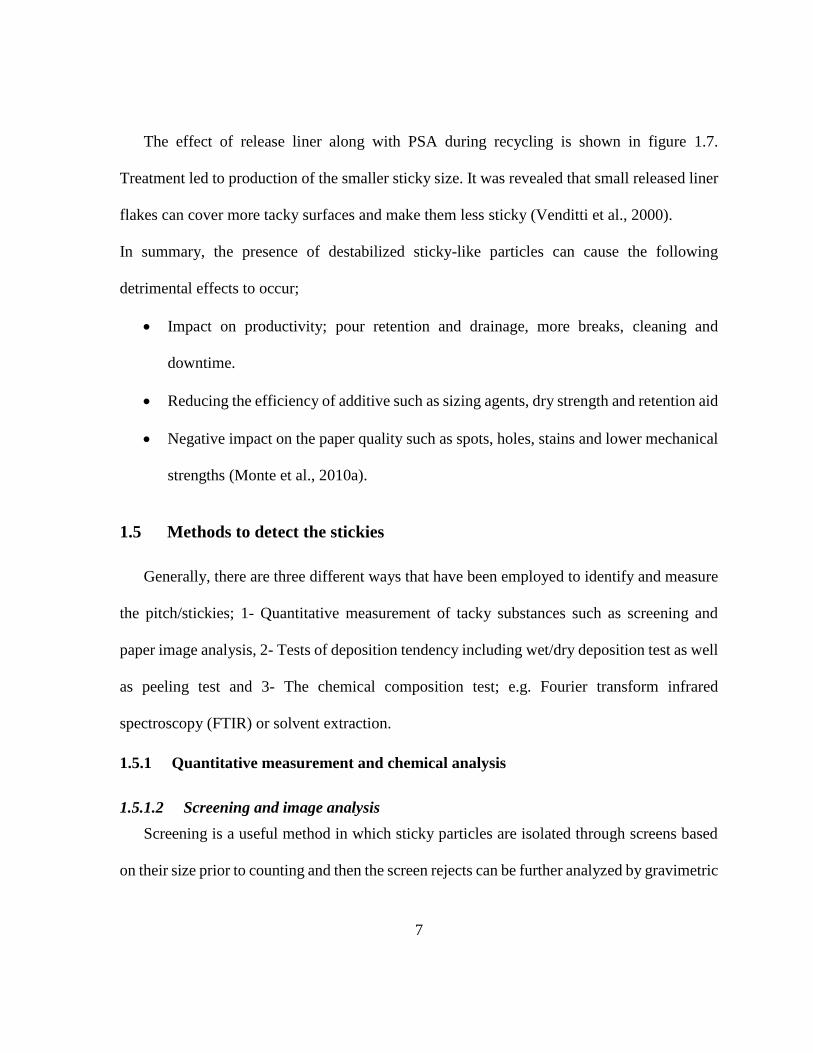
Figure 1.6. SEM picture of sticky-containing pulp in presence of release liner (right) and
without release liner (left), (Venditti et al., 2000).
7
The effect of release liner along with PSA during recycling is shown in figure 1.7.
Treatment led to production of the smaller sticky size. It was revealed that small released liner
flakes can cover more tacky surfaces and make them less sticky (Venditti et al., 2000).
In summary, the presence of destabilized sticky-like particles can cause the following
detrimental effects to occur;
Impact on productivity; pour retention and drainage, more breaks, cleaning and
downtime.
Reducing the efficiency of additive such as sizing agents, dry strength and retention aid
Negative impact on the paper quality such as spots, holes, stains and lower mechanical
strengths (Monte et al., 2010a).
1.5 Methods to detect the stickies
Generally, there are three different ways that have been employed to identify and measure
the pitch/stickies; 1- Quantitative measurement of tacky substances such as screening and
paper image analysis, 2- Tests of deposition tendency including wet/dry deposition test as well
as peeling test and 3- The chemical composition test; e.g. Fourier transform infrared
spectroscopy (FTIR) or solvent extraction.
1.5.1 Quantitative measurement and chemical analysis
1.5.1.2 Screening and image analysis
Screening is a useful method in which sticky particles are isolated through screens based
on their size prior to counting and then the screen rejects can be further analyzed by gravimetric
8
analysis or via visual inspection. Visual inspection is an image analysis in which particles are
colored via specific dye for a better observation. The dyed sheets will be visually inspected by
Apogee Specs; an image analysis program to determine the specks in the paper. This program
is based on the collecting of data through a scanner that gathers images of the samples.
1.5.1.3 Solvent extraction
Extraction of the hydrophobic components through an organic solvent, e.g. benzene-
ethanol, is a common method to separate these substances from pulp or deposit sample. The
extraction may be carried out through different techniques such as soxhlet, reflux or extraction
in the test tube with ultrasound application. The type and amount of the extracted components
is highly dependent on the solvent used in each of the mentioned methods since the solubility
of stickies varies in different solvents. Different solvents have been reported in literature such
as dichloromethane (Delagoutte et al., 2001), Dimethyl formaldehyde (Hamann, 2005),
acetone and benzene-ethanol (Lenes et al., 2001) that each can separate different fraction of
the sticky components in the pulp.
1.5.1.4 Chemical analysis
For the chemical analysis, there are multiple techniques that can be used. Gas
chromatography with mass spectroscopy is a common method to identify and even quantify
volatile components in wood extractives (Guo et al., 1995; Örsa et al., 1994). In this technique,
components depending on their physical and chemical properties separate while moving in a
long column and then a mass spectroscopy unit detects the components.
Fourier transform infrared is another useful technique that identifies different components
based on their functional groups and IR absorbance wavelengths. It has been used by many
9
authors to monitor the stickies in the paper (Allen et al., 2007; Cao et al., 2005; Ward et al.,
1994; Yordan et al., 1997). Furthermore, many synthetic stickies have different pyrolysis
temperature in nitrogen atmosphere than the natural lignocellulosic polymers such as lignin
and cellulose, and therefore, thermogravimetric analysis (TGA) can be used to identify this
group of substances. In this method simply the weight loss of the sample within certain
temperature is monitored to calculate the percentage of synthetic polymer in the sample.
1.5.1.5 Deposition Tendency Test
The aim of this test is usually to mimic a real deposition phenomenon that can occur in the
wet sections of the paper mill. When this test is performed in wet parts of a paper machine
system, lipophilic components in pulp can form deposits on different parts such as plastic or
metal surfaces, and the deposited material can be measured via surface weighing or image
analysis. This method has been used by many authors in the past (Blanco et al., 2002; Doshi et
al., 1997, 2003; Kanto et al., 2005; Putz, 2000; Sithole et al., 1999; Welkener et al., 1993).
Tackiness tendency also can be measured to determine the tackiness of the stickies. In a
study by Vähäsalo (2005) the tackiness was measured using a probe that was pressed against
the latex film. Then probe was drawn back so that the strain could be measured. Another way
of measuring the tackiness is the peeling test in which paper is attached to the adhesive coated
surface, and with the help of an Instron device, the force needed to detach the paper from sticky
surface is measured.
10
1.6 Common sticky control approaches
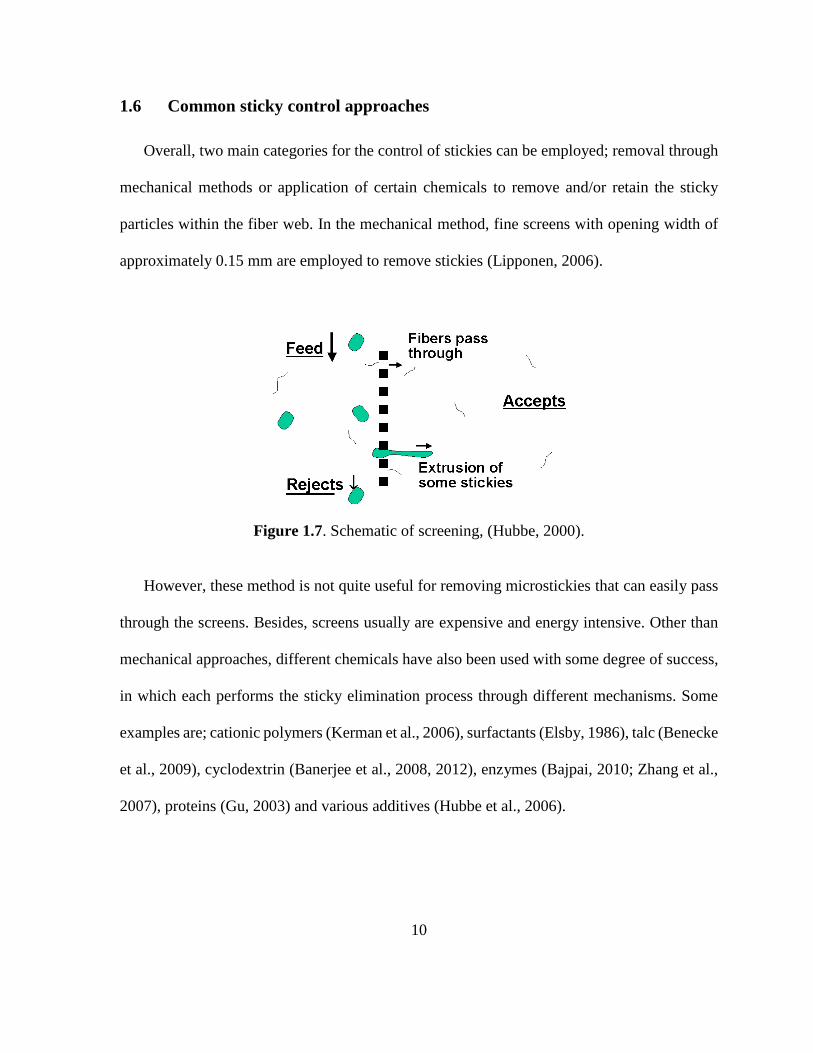
Overall, two main categories for the control of stickies can be employed; removal through
mechanical methods or application of certain chemicals to remove and/or retain the sticky
particles within the fiber web. In the mechanical method, fine screens with opening width of
approximately 0.15 mm are employed to remove stickies (Lipponen, 2006).
Figure 1.7. Schematic of screening, (Hubbe, 2000).
However, these method is not quite useful for removing microstickies that can easily pass
through the screens. Besides, screens usually are expensive and energy intensive. Other than
mechanical approaches, different chemicals have also been used with some degree of success,
in which each performs the sticky elimination process through different mechanisms. Some
examples are; cationic polymers (Kerman et al., 2006), surfactants (Elsby, 1986), talc (Benecke
et al., 2009), cyclodextrin (Banerjee et al., 2008, 2012), enzymes (Bajpai, 2010; Zhang et al.,
2007), proteins (Gu, 2003) and various additives (Hubbe et al., 2006).
Screening
11
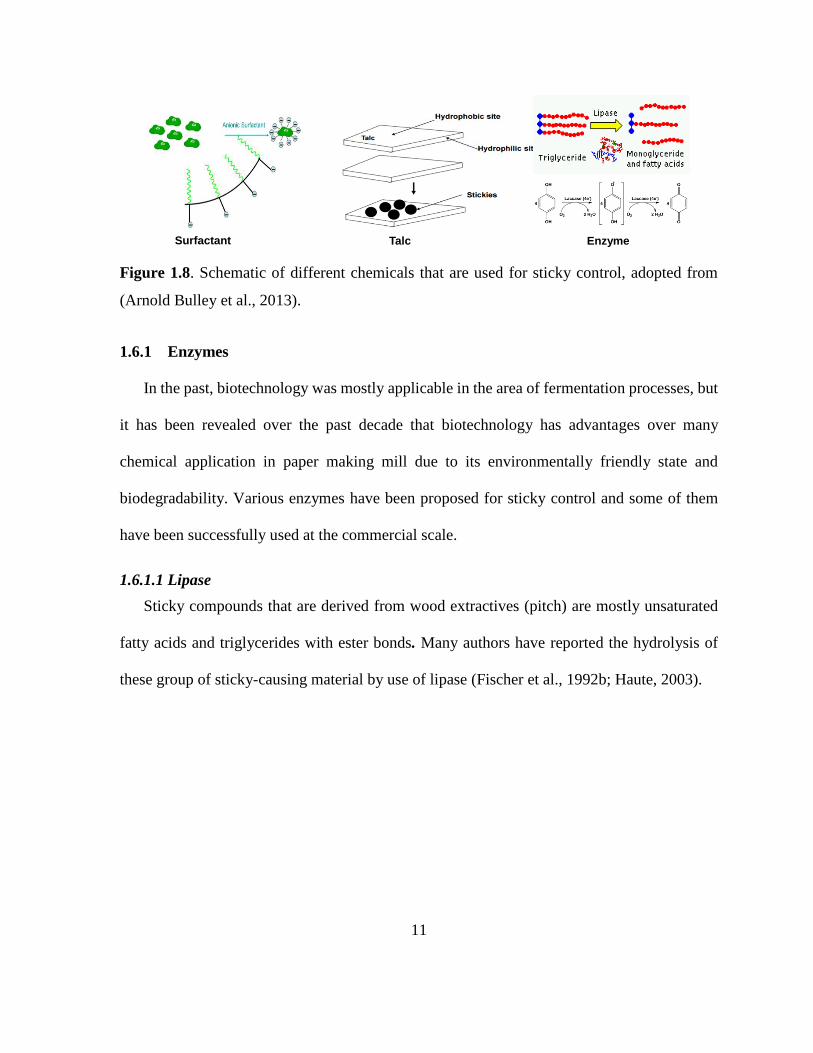
Figure 1.8. Schematic of different chemicals that are used for sticky control, adopted from
(Arnold Bulley et al., 2013).
1.6.1 Enzymes
In the past, biotechnology was mostly applicable in the area of fermentation processes, but
it has been revealed over the past decade that biotechnology has advantages over many
chemical application in paper making mill due to its environmentally friendly state and
biodegradability. Various enzymes have been proposed for sticky control and some of them
have been successfully used at the commercial scale.
1.6.1.1 Lipase
Sticky compounds that are derived from wood extractives (pitch) are mostly unsaturated
fatty acids and triglycerides with ester bonds. Many authors have reported the hydrolysis of
these group of sticky-causing material by use of lipase (Fischer et al., 1992b; Haute, 2003).
Surfactant Talc Enzyme

12
Figure 1.9. Schematic Hydrolysis of triglycerides catalyzed by lipase.
Lipase was used at the commercial scale to hydrolyze a group of troublesome triglycerides
in ground wood pulp and was demonstrated to be an effective enzyme to decrease the sticky
component and pitch deposition (Sharyo et al., 1993). The industrial scale trial was relatively
successful in lowering the depositions and even some side advantages were observed.
However, lipase could only hydrolyze the ester bonded lipids and it left the rest of the glycerin
and fatty acid chains in the process. Besides, it was revealed in a similar study that a significant
portion of the enzyme tended to absorb on the fibers and it was not able to hydrolyze the resins
(Fischer et al., 1992a).
1.6.1.2 Laccase
The application of laccase toward the delignification and pitch removal as an
environmentally-benign approach has been subject of high interest in paper mills. Laccase is a
multicopper enzyme that can oxidize phenolic and non-phenolic component through the
substrate radicalization process (Babot et al., 2011; Mayer et al., 2002). The effect of laccase
on the non-phenolic substrates through the mediator radical, suggested the application of
enzyme on degradation or modification of lipophilic extractives for the purpose of pitch control
Glycerol Fatty acid
CH2-----CH-----CH2
OH OH OH
OH
C=O
(CH2)15 CH3+
Ester-Bond
Triglycerides
CH3
CH2------------CH------------CH2
O OO

13
(Zhang et al., 2005). Recently more study has indicated a relatively high efficiency of laccase-
mediator system for controlling the deposition in various pulping process (Gutiérrez et al.,
2006; Molina et al., 2008). However there are cost, safety and environmental concerns about
some of the synthetic mediator that make its application difficult at the mill scale (Babot et al.,
2011).
1.6.1.3 Lipoxygenaase
Lipoxygenases are a class of iron-containing enzymes that are able to catalyze the
peroxygenation of methyl-interrupted poly unsaturated oils stereo-selectively to their
corresponding hydroperoxy derivatives (Kuhn et al., 1999). The catalyzed reaction contains
two steps; firstly the attack of enzyme’s iron to the proton associated to bis-allylic carbon that
creates an active radical and secondly, the reaction of radicalized carbon with oxygen molecule
(oxygen insertion) that leads to production of a hydroperoxide group (L-OOH) on the lipid
(Girotti, 1998; Kanner et al., 1987; Yin et al., 2011).

14
Figure 1.10. Oxidation mechanism through carbon-based radicalization catalyzed by
lipoxygenase (Zoia et al., 2011).
Different types of lipoxygenases (5-, 12-, and 15-lipoxygenases) have been characterized
so far (Ford et al., 1994; Prigge et al., 1997). Lipoxygenase oxidation of pitch-causing
unsaturated oils such as linoleic acid and triglycerides that are found in wood extractives has
led to a possible application of this enzyme in the pulp and paper industries for pitch control.
Figure 1.11. Structure of soybean lipoxygenase-1, Fe+2/Fe+3 in the center of the enzyme has
an essential role (Egmond, 2013).
15
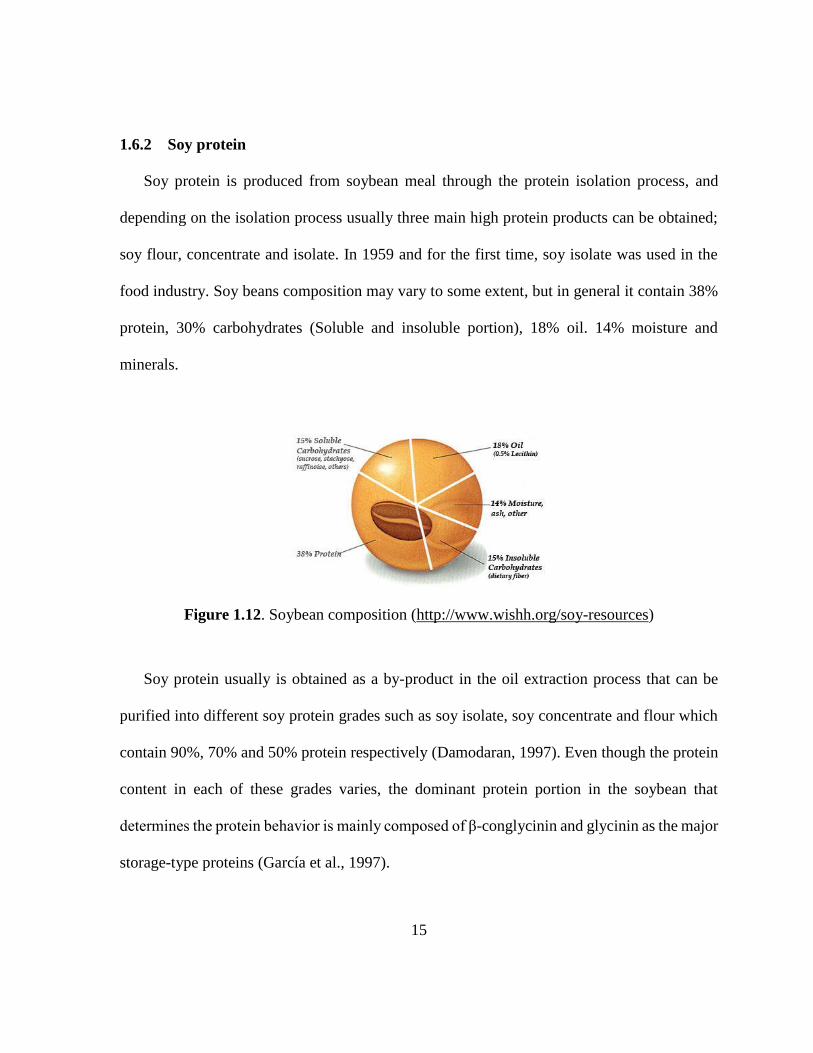
1.6.2 Soy protein
Soy protein is produced from soybean meal through the protein isolation process, and
depending on the isolation process usually three main high protein products can be obtained;
soy flour, concentrate and isolate. In 1959 and for the first time, soy isolate was used in the
food industry. Soy beans composition may vary to some extent, but in general it contain 38%
protein, 30% carbohydrates (Soluble and insoluble portion), 18% oil. 14% moisture and
minerals.
Figure 1.12. Soybean composition (http://www.wishh.org/soy-resources)
Soy protein usually is obtained as a by-product in the oil extraction process that can be
purified into different soy protein grades such as soy isolate, soy concentrate and flour which
contain 90%, 70% and 50% protein respectively (Damodaran, 1997). Even though the protein
content in each of these grades varies, the dominant protein portion in the soybean that
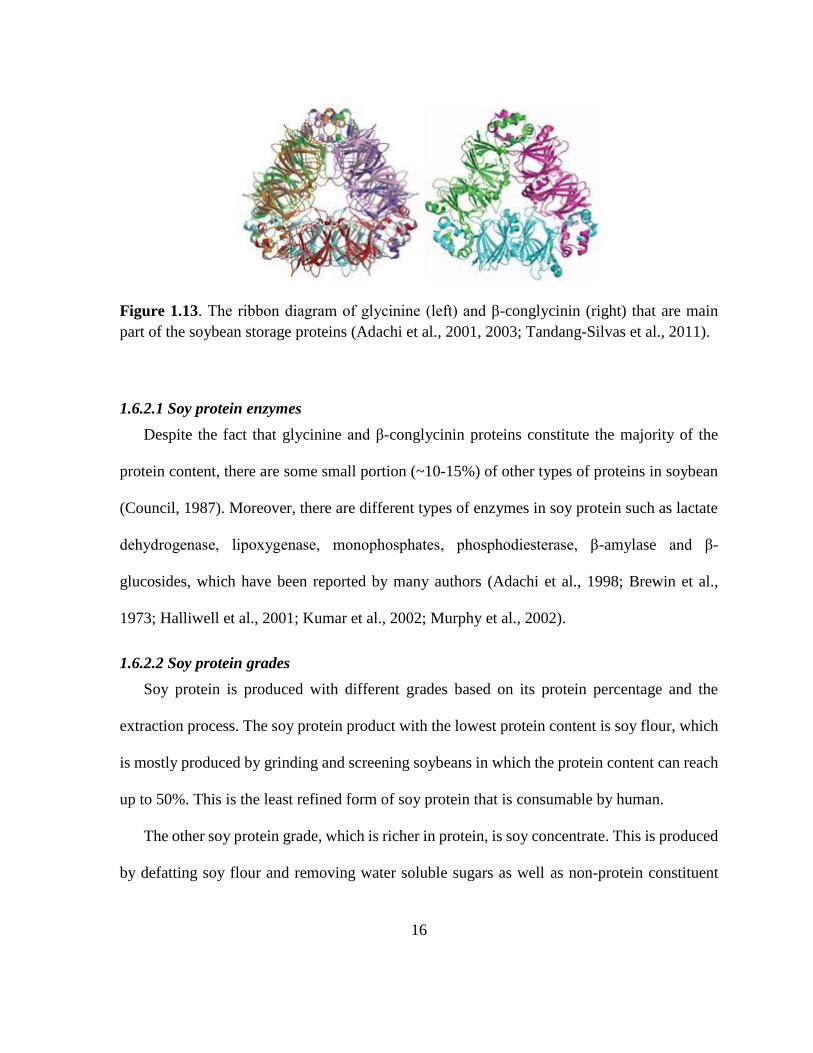
determines the protein behavior is mainly composed of β-conglycinin and glycinin as the major
storage-type proteins (García et al., 1997).
16
Figure 1.13. The ribbon diagram of glycinine (left) and β-conglycinin (right) that are main
part of the soybean storage proteins (Adachi et al., 2001, 2003; Tandang-Silvas et al., 2011).
1.6.2.1 Soy protein enzymes
Despite the fact that glycinine and β-conglycinin proteins constitute the majority of the
protein content, there are some small portion (~10-15%) of other types of proteins in soybean
(Council, 1987). Moreover, there are different types of enzymes in soy protein such as lactate
dehydrogenase, lipoxygenase, monophosphates, phosphodiesterase, β-amylase and β-
glucosides, which have been reported by many authors (Adachi et al., 1998; Brewin et al.,
1973; Halliwell et al., 2001; Kumar et al., 2002; Murphy et al., 2002).
1.6.2.2 Soy protein grades
Soy protein is produced with different grades based on its protein percentage and the
extraction process. The soy protein product with the lowest protein content is soy flour, which
is mostly produced by grinding and screening soybeans in which the protein content can reach
up to 50%. This is the least refined form of soy protein that is consumable by human.
The other soy protein grade, which is richer in protein, is soy concentrate. This is produced
by defatting soy flour and removing water soluble sugars as well as non-protein constituent

17
(Singh et al., 2008). The protein content can reach up to 70% in this grade, and production
process includes; acid leaching, protein extraction through alcohol solution, denaturing the
protein with heat and extraction with water. Soy concentrate is mostly used as a nutritional
ingredient in many food products.
Finally the protein grade with the highest protein content is soy isolate in which the protein
has gone through more purification steps and most of the sugars and non-protein components
have been removed. This is the most refined soy protein type; it has 90% protein content on a
moisture-free basis.
1.62.3 Soy protein application in industry
Other than a source of nutrient, soy protein also has properties that can be used as a
chemical for industry-type applications. Soy proteins have a tendency to lower the surface
tension of water. This ability to play the role of surfactant can be attributed to its hydrophobic
and hydrophilic parts (Wagner et al., 1995). Besides, there is a possibility of emulsion
formation due to the presence of hydrophobic and hydrophilic groups in the protein that allows
the adsorption of protein at the water-oil interface (Phoon et al., 2014). It was also reported
that soy protein has the ability to contribute to the hydrogen bonds within the fibers in the paper
and improve its overall mechanical properties (Arboleda et al., 2014). There are many more
industry applications for soy protein such as film and gel formation (Renkema et al., 2001;
Song et al., 2011), surface modification (Goli et al., 2012; Salas et al., 2013), adhesive
formulation (Hettiarachchy et al., 1995; Wang et al., 2007), foam control (Wagner et al., 1999)
and etc.

18
1.7 Molecular-level study of deposit
To characterize and measure the sticky deposits in present study different techniques
were employed.
1.7.1 Nuclear Magnetic Resonance (NMR)
NMR spectroscopy is a useful technique to obtain chemical and structural information
about molecules. In general, all the isotopes with odd number of protons have a magnetic
moment and angular momentum, which causes a non-zero spin while the rest of nuclides with
even numbers have a zero spin. When a sample is placed in an external magnetic field, the
nuclei such as 1H and 13C absorb electromagnetic radiation at the certain frequency and get
aligned (Shah et al., 2006).
Figure 1.14. Applying the external magnetic field in NMR to randomly oriented nuclear
magnetic moments aligns them against or with the field (Carey, 2000).
This frequency is proportional to the strength of applied magnetic field and can be used to
identify the molecule structure.
No field With field
19
1.7.1.1 Chemical Shift
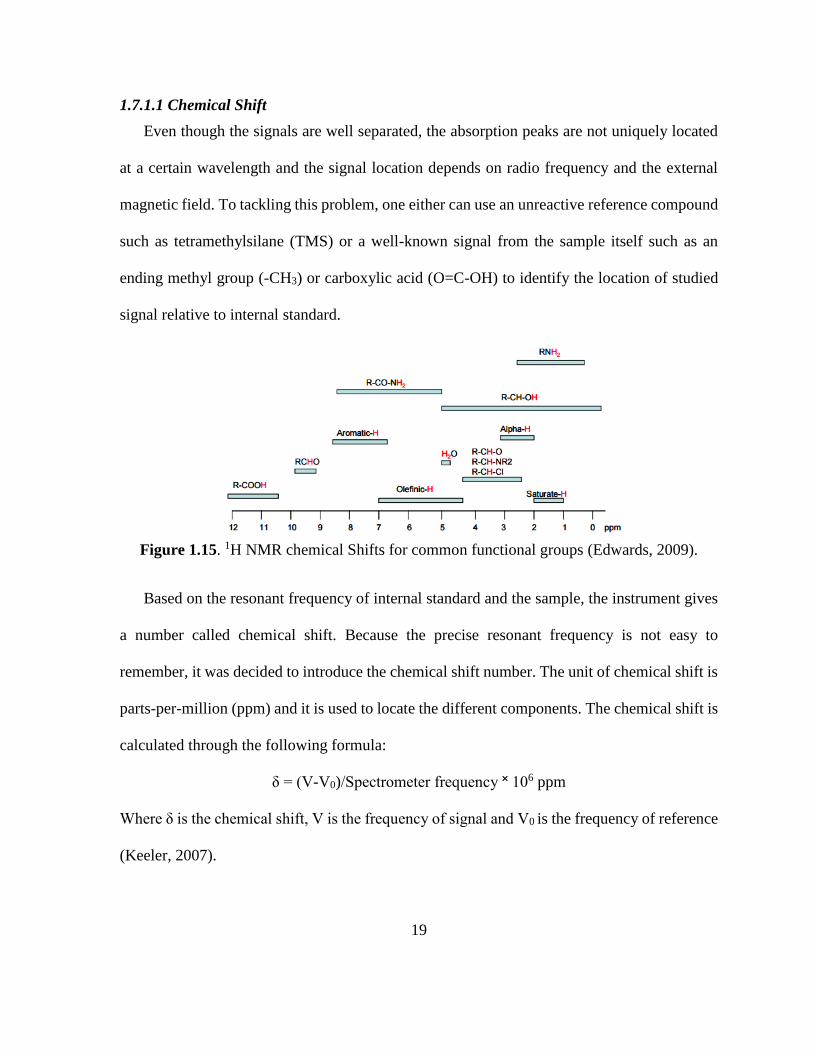
Even though the signals are well separated, the absorption peaks are not uniquely located
at a certain wavelength and the signal location depends on radio frequency and the external
magnetic field. To tackling this problem, one either can use an unreactive reference compound
such as tetramethylsilane (TMS) or a well-known signal from the sample itself such as an
ending methyl group (-CH3) or carboxylic acid (O=C-OH) to identify the location of studied
signal relative to internal standard.
Figure 1.15. 1H NMR chemical Shifts for common functional groups (Edwards, 2009).
Based on the resonant frequency of internal standard and the sample, the instrument gives
a number called chemical shift. Because the precise resonant frequency is not easy to
remember, it was decided to introduce the chemical shift number. The unit of chemical shift is
parts-per-million (ppm) and it is used to locate the different components. The chemical shift is
calculated through the following formula:
δ = (V-V0)/Spectrometer frequency ˟ 106 ppm
Where δ is the chemical shift, V is the frequency of signal and V0 is the frequency of reference
(Keeler, 2007).
20
1.7.2 Fourier Transform Infrared (FTIR)
FTIR (usually mid-infrared region; 400-4000 cm-1) is a technique that can provide certain
molecular structure information of unknown substances to identify them. Despite significant
improvement in today’s FTIR instruments, they still can employ the basic optical design that
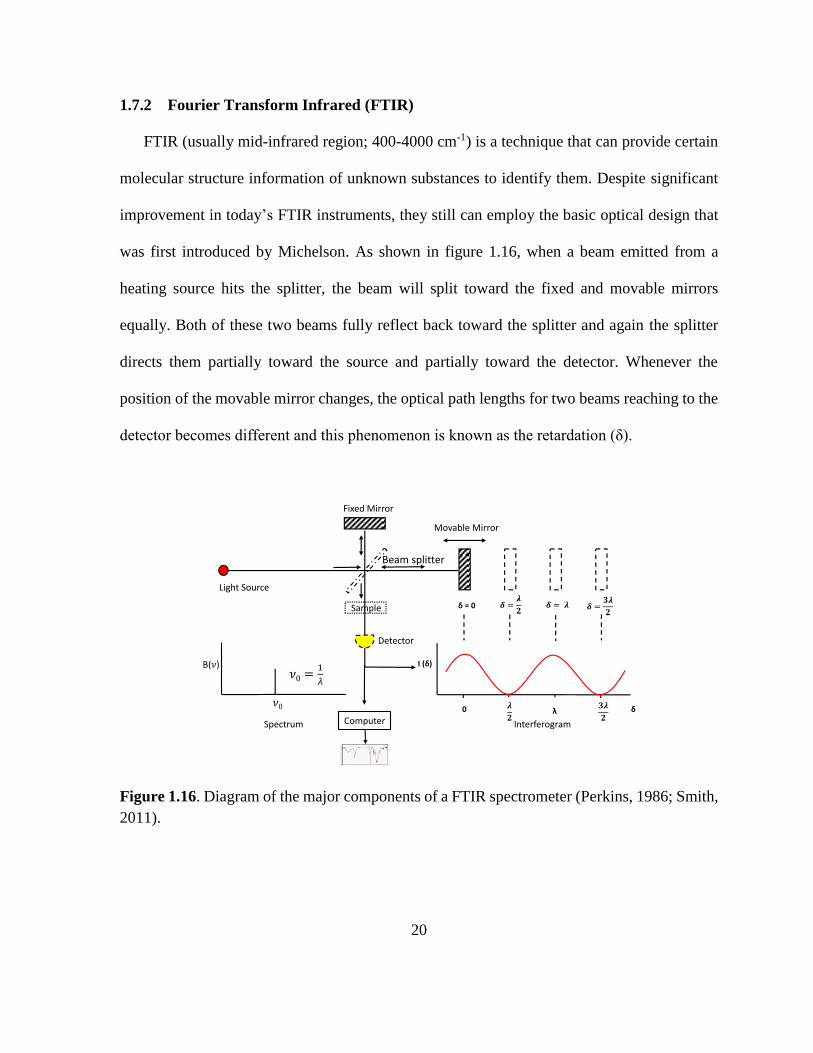
was first introduced by Michelson. As shown in figure 1.16, when a beam emitted from a
heating source hits the splitter, the beam will split toward the fixed and movable mirrors
equally. Both of these two beams fully reflect back toward the splitter and again the splitter
directs them partially toward the source and partially toward the detector. Whenever the
position of the movable mirror changes, the optical path lengths for two beams reaching to the
detector becomes different and this phenomenon is known as the retardation (δ).
Figure 1.16. Diagram of the major components of a FTIR spectrometer (Perkins, 1986; Smith,
2011).
Light Source
Fixed Mirror
Movable Mirror
Sample
Beam splitter
B( )
0 λ δ
I (δ)
δ = 0
InterferogramComputer
Detector
Spectrum
21
It is known that when the mirror moves a distance of “X” the retardation would be “2X”
due to the fact the light has to travel a farther distance to reach the mirror and another distance
to travel this distance back. This added distance in the movable mirror will increase the
retardation to λ/2 and as a result when the light reaches the detector would be 180˚ out of phase
to the reference beam and subsequently these two cancel each other. While before the mirror
movement, the retardation was zero and energy which had reached to the detector was the sum
of two beams. The reason was that, they were in phase and reinforced each other. This
interruption that is detectable as compared to the reference beam can be plotted as the light
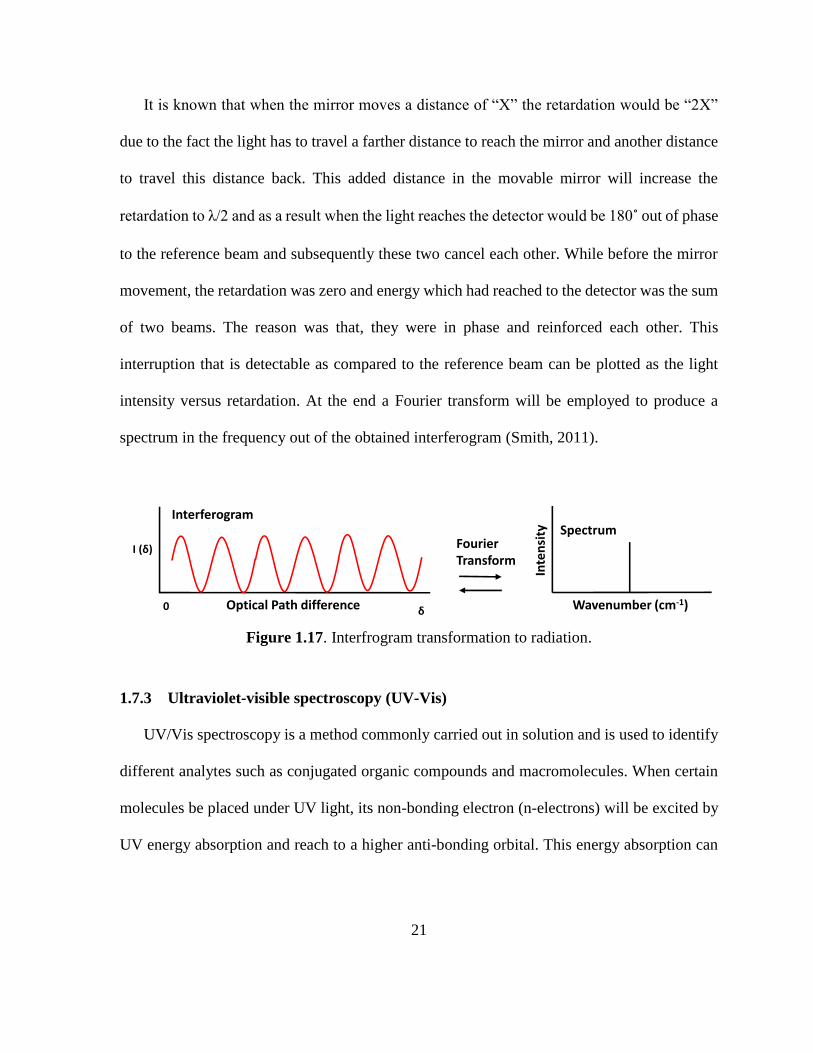
intensity versus retardation. At the end a Fourier transform will be employed to produce a
spectrum in the frequency out of the obtained interferogram (Smith, 2011).
Figure 1.17. Interfrogram transformation to radiation.
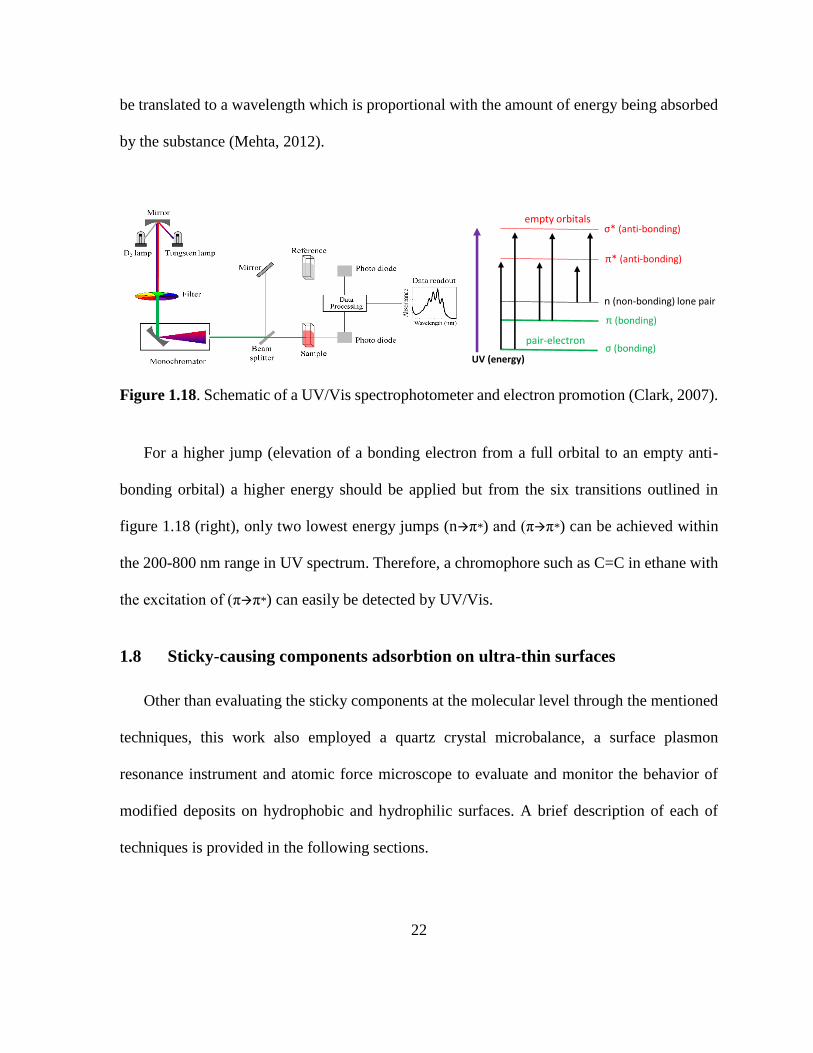
1.7.3 Ultraviolet-visible spectroscopy (UV-Vis)
UV/Vis spectroscopy is a method commonly carried out in solution and is used to identify
different analytes such as conjugated organic compounds and macromolecules. When certain
molecules be placed under UV light, its non-bonding electron (n-electrons) will be excited by
UV energy absorption and reach to a higher anti-bonding orbital. This energy absorption can
Inte
nsi
ty
0 δ
I (δ)
Optical Path difference Wavenumber (cm-1)
SpectrumInterferogram
Fourier Transform
22
be translated to a wavelength which is proportional with the amount of energy being absorbed
by the substance (Mehta, 2012).
Figure 1.18. Schematic of a UV/Vis spectrophotometer and electron promotion (Clark, 2007).
For a higher jump (elevation of a bonding electron from a full orbital to an empty anti-
bonding orbital) a higher energy should be applied but from the six transitions outlined in
figure 1.18 (right), only two lowest energy jumps (nπ*) and (ππ*) can be achieved within
the 200-800 nm range in UV spectrum. Therefore, a chromophore such as C=C in ethane with
the excitation of (ππ*) can easily be detected by UV/Vis.
1.8 Sticky-causing components adsorbtion on ultra-thin surfaces
Other than evaluating the sticky components at the molecular level through the mentioned
techniques, this work also employed a quartz crystal microbalance, a surface plasmon
resonance instrument and atomic force microscope to evaluate and monitor the behavior of
modified deposits on hydrophobic and hydrophilic surfaces. A brief description of each of
techniques is provided in the following sections.
σ (bonding)
π (bonding)
n (non-bonding) lone pair
π* (anti-bonding)
σ* (anti-bonding)
UV (energy)
empty orbitals
pair-electron
23
1.8.1 Quartz crystal microbalance with dissipation (QCM-D)
The quartz crystal microbalance (QCM) is a useful technique for measuring the rate of the
deposition and mass variation per unit area under vacuum, gas and liquid environments by
monitoring the change of the crystal resonator. The study of adsorbed protein molecules or
film deposition as a result of molecular interactions with the corresponding substrates are some
examples that can be carried out via QCM. In principle, this technique is based on the
application of an electrical potential to a thin piezoelectric quartz crystal (Marx, 2003) with
two electrodes that can mechanically oscillate with certain frequency. The range of the
produced frequency on the crystal which is called “fundamental frequency” highly depends on
the crystal nature and its chemical composition but in most of the QCM instruments it is
between 5 and 10 MHz (Casero et al., 2010).
When there is an adsorption or desorption of mass adjacent to the oscillating crystal, its
fundamental frequency changes. Sauerbrey showed that adsorbed mass on the crystal
(if evenly distributed) is proportional to the change of oscillation frequency (Sauerbrey, 1959).
∆m = −𝜌𝑞𝑡𝑞∆f
𝑓0ɲ= −
𝜌𝑞𝜈𝑞∆f
2𝑓02ɲ
=𝐶. ∆f
𝑛
Where ρq is specific density, νq; shear wave velocity, tq; thickness and f0; is the fundamental
frequency of the quartz crystal (Sauerbrey, 1959; Tomlins et al., 2005). Also ∆m is the change
in the frequency, n refers to the overtone number (it is usually used of the third overtone) and
C is a constant (17.7 ngcm-2s-1).

24
Figure 1.19. Left: QCM cell with oscillating crystal, Right: variation of oscillation frequency
as a function of time.
Even though this formula has been used for many studies in the past, in overall, this model
is only true if the following conditions happen;
The mass that is adsorbing on the crystal should be evenly distributed
The total added mass during the experiment needs to be less than the mass of crystal
Adsorbed film attaches to the surface with certain rigidity
Beside the mentioned points, in case of liquid environment, the nature of the liquid such as
density and viscosity can affect the frequency change in the crystal.
Furthermore, QCM-D can give information regarding the properties of the adsorbed layer
on the sensor by monitoring the crystal energy dissipation while oscillating. Energy dissipation
can be calculated through the following formula and is defined as the ratio of dissipated energy
to stored energy within one oscillation (Marx, 2003; Rodahl et al., 1995).
D =1
𝜋𝑓𝜏=
𝐸𝑙𝑜𝑠𝑡
2𝜋𝐸𝑠𝑡𝑜𝑟𝑒𝑑
D, in this formula, refers to any change in the viscoelastic properties of the adjacent mass
due to decay or film deposition and etc. that causes an energy dissipation. Films with high
QCM
Freq
ue
ncy
Time
Sensor primary oscillation After the mass addition
25
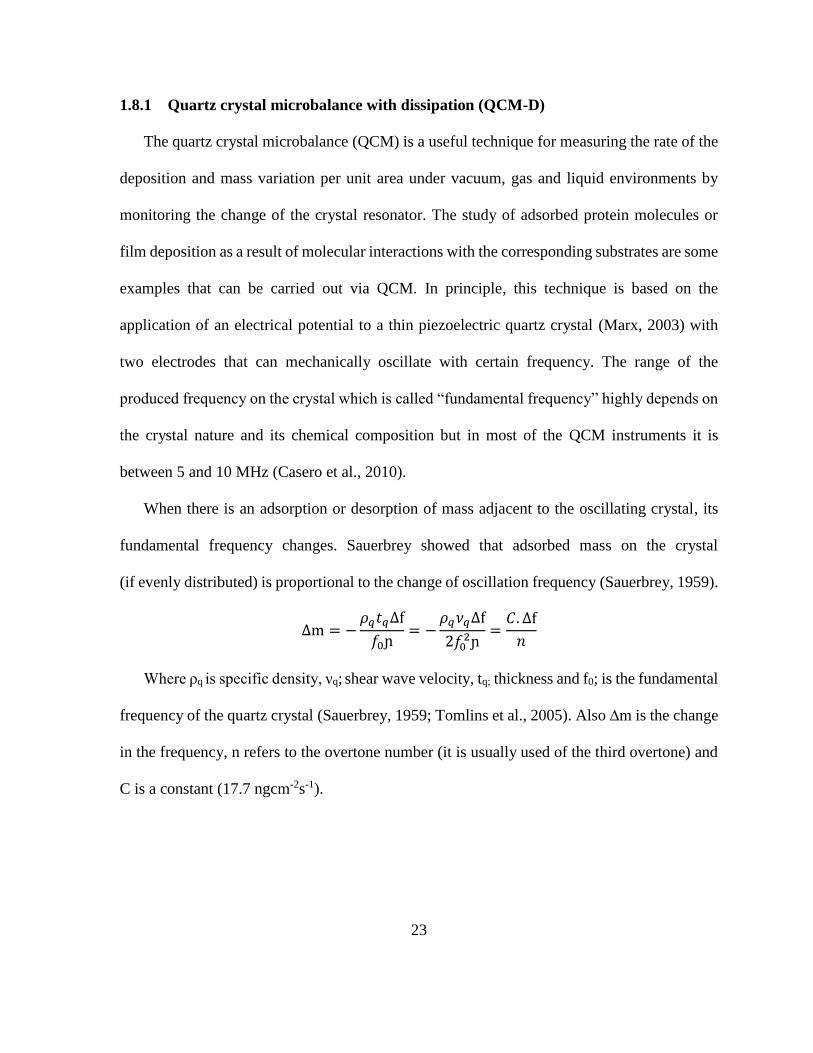
rigidity and strong attachment, show less dissipation values while loose and soft films have
higher energy dissipation (Rodahl et al., 1996).
Figure 1.20. Top left: Gold coated quartz crystal used in QCM. Bottom left: Change in
frequency when mass adsorbed, Right: The shearing stationary wave in quartz crystal and its
propagation.
1.8.2 Surface Plasmon Resonance (SPR)
Similar to QCM, SPR is also a useful technique to monitor the mass adsorbed on a metal
surface (usually gold or silver) with vast applications for biosensors (Liedberg et al., 1995). It
also can be used as complementary test to confirm the obtained results from QCM. However
the principle in SPR is quite different, and the measurement of mass is based on the refractive
index of the adsorbed material; so compared to QCM, even detection of smaller quantity of the
adsorbed film is possible (Jung et al., 1998). Plasmon resonance happens within a visible
spectra at the surface of a metal where there is no electron. When light hits the metal surface,
an excitation with certain angle occurs and forms an evanescent electric field that strongly
interacts with the metal surface which causes a dip in the reflected portion of light. When mass
Quartz Crystal
Electrode
TimeΔ
D (1
˟10
-6)Δf
(Hz)
quartz
Displacement
y
x
hf
Surface Mass
Layer f -f
Liquid
-
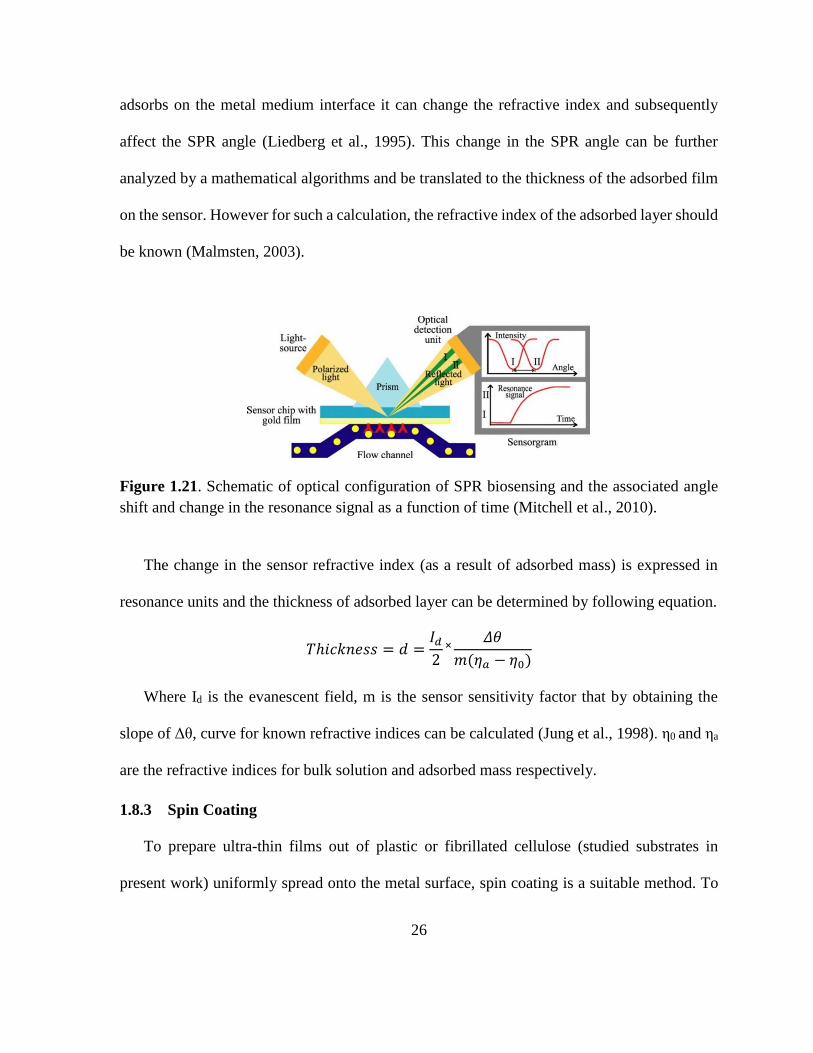
26
adsorbs on the metal medium interface it can change the refractive index and subsequently
affect the SPR angle (Liedberg et al., 1995). This change in the SPR angle can be further
analyzed by a mathematical algorithms and be translated to the thickness of the adsorbed film
on the sensor. However for such a calculation, the refractive index of the adsorbed layer should
be known (Malmsten, 2003).
Figure 1.21. Schematic of optical configuration of SPR biosensing and the associated angle
shift and change in the resonance signal as a function of time (Mitchell et al., 2010).
The change in the sensor refractive index (as a result of adsorbed mass) is expressed in
resonance units and the thickness of adsorbed layer can be determined by following equation.
𝑇ℎ𝑖𝑐𝑘𝑛𝑒𝑠𝑠 = 𝑑 =𝐼𝑑
2˟
𝛥𝜃
𝑚(𝜂𝑎 − 𝜂0)
Where Id is the evanescent field, m is the sensor sensitivity factor that by obtaining the
slope of Δθ, curve for known refractive indices can be calculated (Jung et al., 1998). η0 and ηa
are the refractive indices for bulk solution and adsorbed mass respectively.
1.8.3 Spin Coating
To prepare ultra-thin films out of plastic or fibrillated cellulose (studied substrates in
present work) uniformly spread onto the metal surface, spin coating is a suitable method. To
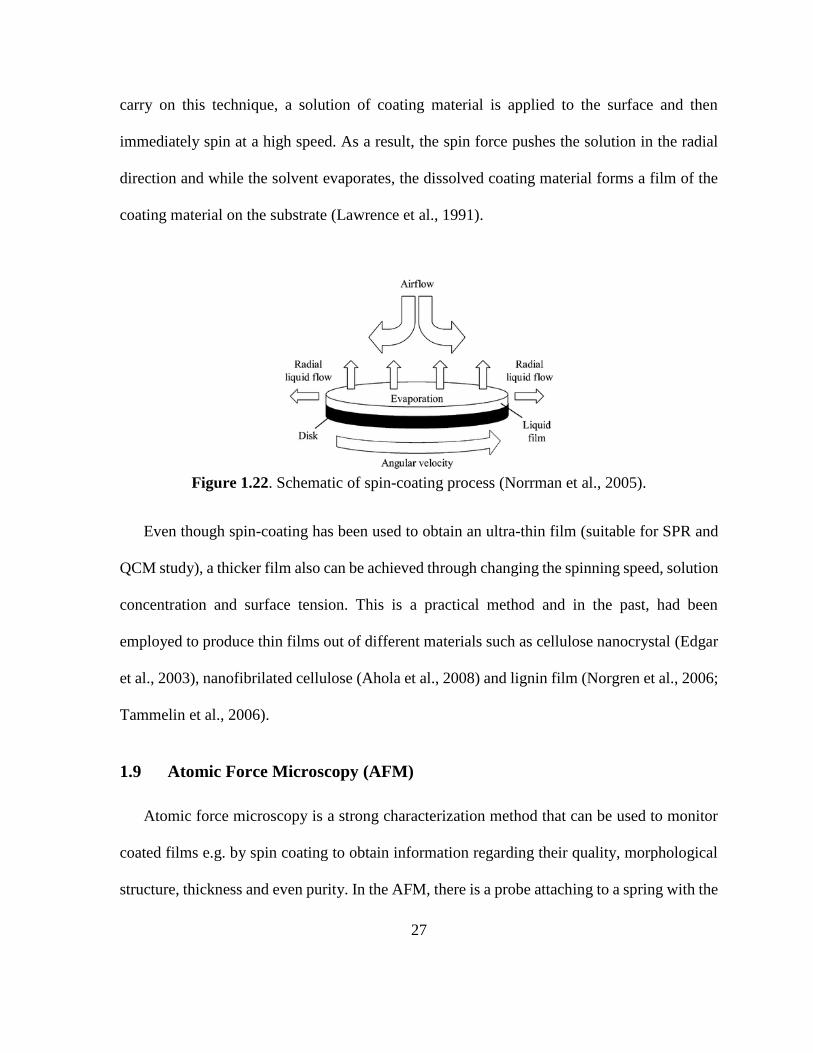
27
carry on this technique, a solution of coating material is applied to the surface and then
immediately spin at a high speed. As a result, the spin force pushes the solution in the radial
direction and while the solvent evaporates, the dissolved coating material forms a film of the
coating material on the substrate (Lawrence et al., 1991).
Figure 1.22. Schematic of spin-coating process (Norrman et al., 2005).
Even though spin-coating has been used to obtain an ultra-thin film (suitable for SPR and
QCM study), a thicker film also can be achieved through changing the spinning speed, solution
concentration and surface tension. This is a practical method and in the past, had been
employed to produce thin films out of different materials such as cellulose nanocrystal (Edgar
et al., 2003), nanofibrilated cellulose (Ahola et al., 2008) and lignin film (Norgren et al., 2006;
Tammelin et al., 2006).
1.9 Atomic Force Microscopy (AFM)
Atomic force microscopy is a strong characterization method that can be used to monitor
coated films e.g. by spin coating to obtain information regarding their quality, morphological
structure, thickness and even purity. In the AFM, there is a probe attaching to a spring with the
28
parallel position to the surface. As the tip interacts with the sample surface, the force is
measured by the deflection and a laser beam aiming on top of the tip. A laser beam is used
with a photo detector to catches the light when it is reflected from the back of spring
(Vickerman et al., 2009). A control loop in the microscopy translates the obtained signal and
controls the tip to sample distance. At the end, laser beam signals will be digitalized to produce
a topographic image as a function of lateral position (Meyer, 1992).
AFM is able to operate with two different modes; contact mode and non-contact mode. In
the first mode, the tip is constantly in contact to the surface and can measure the plastic
deformation of the sample as well as the frictional forces. However, this mode is not suitable
for soft surfaces due to the possibility of surface deformation as a result of probe contact with
surface. But in non-contact mode, the tip is kept at a distance of 10-100 nm from the surface,
and acquired signals from the sample is obtained by forces such as electrostatic, magnetic,
capillary and van der Waals (Meyer, 1992).
29
1.10 References
Adachi, M., Kanamori, J., Masuda, T., Yagasaki, K., Kitamura, K., Mikami, B., & Utsumi, S.
(2003). Crystal structure of soybean 11S globulin: Glycinin A3B4 homohexamer. Proceedings
of the National Academy of Sciences, 100(12), 7395–7400.
Adachi, M., Takenaka, Y., Gidamis, A. B., Mikami, B., & Utsumi, S. (2001). Crystal Structure
of Soybean Proglycinin A1aB1b Homotrimer. Journal of Molecular Biology, 305(2), 291–305.
Adachi, Mikami, B., Katsube, T., & Utsumi, S. (1998). Crystal Structure of Recombinant
Soybean -Amylase Complexed with -Cyclodextrin. Journal of Biological Chemistry, 273(31),
19859–19865.
Ahola, S., Salmi, J., Johansson, L.-S., Laine, J., & Österberg, M. (2008). Model Films from
Native Cellulose Nanofibrils. Preparation, Swelling, and Surface Interactions.
Biomacromolecules, 9(4), 1273–1282.
Allen, L., & Ouellet, S. (2007). Deposit control: A team effort leading to improvements in a
TMP/DIP newsprint mill. Pulp & Paper Canada, 108(3), 45–50.
Annual Report, Mercer International Inc. (2003). Retrieved from
https://www.sec.gov/Archives
Arboleda, J. C., Niemi, N., Kumpunen, J., Lucia, L. A., & Rojas, O. J. (2014). Soy Protein-
Based Polyelectrolyte Complexes as Biobased Wood Fiber Dry Strength Agents. ACS
Sustainable Chemistry & Engineering, 2(10), 2267–2274.
Arnold Bulley, & James Hsiao. (2013). Control of Sticky Material in Paper Machines Systems.
In Taiwan TAPPI Seminar.
Babot, E. D., Rico, A., Rencoret, J., Kalum, L., Lund, H., Romero, J., … Gutiérrez, A. (2011).
Towards industrially-feasible delignification and pitch removal by treating paper pulp with
Myceliophthora thermophila laccase and a phenolic mediator. Bioresource Technology,
102(12), 6717–6722.
Babot, E., Rico, A., Rencoret, J., Kalum, L., & Lund, H. (2011). Towards industrially-feasible
delignification and pitch removal by treating paper pulp with Myceliophthora thermophila
laccase and a phenolic mediator. Bioresource, 102(12), 6717–6722.
Bajpai. (2010). Solving the problems of recycled fiber processing with enzymes.
BioResources, 5(2), 1311–1325.
Bajpai, P. (2012). Effects of increased closure water-loop systems in pulp and paper industry.
30
Journal of Indian Pulp and Paper Technical Association, 24(2), 91–95.
Banerjee, S., Le, L., & Haynes, R. D. (2008). Stickies control with cyclodextrins. Tappi
Journal, 7(11), 4–7.
Banerjee, S., Le, T., Haynes, R. D., & Bradbury, J. E. (2012). Solubilizing and detackifying
stickies with ß-cyclodextrin. BioResources, 7(2), 1533–1539.
Barnett, D. ., & Michalopoulos, D. L. (1989). Process for inhibiting white pitch deposition in
papermaking felts.
Benecke, F., Gantenbein, D., Schoelkopf, J., Gane, P. A. C., & Gliese, T. (2009). Organic
contaminants in recycled paper: a model study of the adsorbent properties of talc for idealised
component suspensions. Nordic Pulp and Paper Research Journal, 24(2), 219–224.
Biermann, C. (1996). Handbook of Pulping and Papermaking (Second). San Diego: Academic
Press.
Blanco, A., Negro, C., Monte, C., Fuente, H., & Tijero, J. (2002). Overview of two major
deposit problems in recycling: slime and stickies. Part II: stickies problems in recycling.
Progress in Paper Recycling, 11(2), 26–37.
Blanco Suárez, Á., Miranda Carreño, R., Negro Álvarez, C. M., García Suárez, C., García-
Prol, M., Sánchez, Á., … Sánchez, Á. (2007). Full characterization of stickies in a newsprint
mill: the need for a complementary approach. Tappi Journal, 6(1), 19–25.
Brewin, N. J., & Northcote, D. H. (1973). Partial purification of a cyclic amp
phosphodiesterase from soybean callus Isolation of a non-dialysable inhibitor. Biochimica et
Biophysica Acta (BBA) - General Subjects, 320(1), 104–122.
Cao, B., & Heise, O. (2005). Analyzing contaminants in OCC: Wax or not wax. Pulp Pap.
Can, 106(4), 41–45.
Carey, F. (2000). Organic Chemistry (forth). MC Graw Hill.
Casero, E., Vázquez, L., Parra-Alfambra, A. M., & Lorenzo, E. (2010). AFM, SECM and
QCM as useful analytical tools in the characterization of enzyme-based bioanalytical
platforms. Royal Society of Chemistry, 135(8), 1878–1903.
Clark, J. (2007). UV-visible absorption spectra. Retrieved from
http://www.chemguide.co.uk/analysis/uvvisible/theory.html
Council, S. P. (1987). Soy Protein Council. Soy protein products. In Nutritional Aspects and
31
Utilization. Washington D.C.
Damodaran, S. (1997). Food proteins and their applications. NewYork.
Delagoutte, T. (2005). Management and control of stickies. Progress in Paper Recycling,
15(1), 31.
Delagoutte, T., & Brun, J. (2001). Drying section deposits: Origin identification and influence
of the recycling processes: Deinking and packaging line comparison. Tappi Journal, 40(149),
153–158.
Doshi, M., Blanco, A., Negro, C., Monte, C., Dorris, G., Castro, C., … Putz, H. (2003).
Comparison of microstickies measurement methods. Part II: results and discussion. Progress
in Paper, 13(1), 44–53.
Doshi, M., Dyer, J., Aziz, S., Jackson, K., Abubakr, S. M., Doshi, M., … Abubakr, S. M.
(1997). Quantification of micro stickies. Paper Recycling Challenge, 199–122.
Edgar, C. D., & Gray, D. G. (2003). Smooth model cellulose I surfaces from nanocrystal
suspensions. Cellulose, 10(4), 299–306.
Edwards, J. (2009). Principles of NMR. Process NMR Associates LLC.
Egmond, M. (2013). Membrane Biochemistry & Biophysics. Retrieved from
http://mbb.science.uu.nl/Egmond.html
Elsby, L. E. (1986). Experiences from tissue and board production using stickies additives. In
Proeeding of Pulping Conference (pp. 187–191). Tappi Press, Atlanta.
Fischer, K., & Messner, K. (1992a). Adsorption of lipase on pulp fibers during biological pitch
control in paper industry. Enzyme and Microbial Technology, 14(6), 470–473.
Fischer, & Messner, K. (1992b). Reducing troublesome pitch in pulp mills by lipolytic
enzymes. Tappi Journal, 75(2), 130–134.
Ford, A. W., Gresser, M., & Young, R. N. (1994). 5-Lipoxygenase. Annu Rev Biochem, 63,
383–417. Journal Article.
García, M. C., Torre, M., Marina, M. L., Laborda, F., & Rodriquez, A. R. (1997). Composition
and characterization of soyabean and related products. Critical Reviews in Food Science and
Nutrition, 37(4), 361–391.
Girotti, A. W. (1998). Lipid hydroperoxide generation, turnover, and effector action in
32
biological systems. J Lipid Res, 39(8), 1529–1542. Journal Article.
Goli, K. K., Rojas, O. J., & Genzer, J. (2012). Formation and Antifouling Properties of
Amphiphilic Coatings on Polypropylene Fibers. Biomacromolecules, 13(11), 3769–3779.
Gu, Q.-M. (2003). Proteins for use as pitch and stickies control agents in pulp and papermaking
processes US Patent, 6527915.
Guo, X., & Douek, M. (1995). New scheme to analyze deposits/stickies from mills using
recycled fibre. In The 3 rd Research Forum on Recycling (pp. 91–101). Vancouver, Canada.
Gutiérrez, A., Ibarra, D., Rencoret, J., Romero, J., Speranza, M., Camarero, S., & Martínez,
M. J. (2006). Enzymatic Removal of Free and Conjugated Sterols Forming Pitch Deposits in
Environmentally Sound Bleaching of Eucalypt Paper Pulp. Environmental Science &
Technology, 40(10), 3416–3422.
Halliwell, C. M., Morgan, G., Ou, C.-P., & Cass, A. E. G. (2001). Introduction of a
(Poly)histidine Tag in l-Lactate Dehydrogenase Produces a Mixture of Active and Inactive
Molecules. Analytical Biochemistry, 295(2), 257–261.
Hamann, L. (2005). Stickies analytics – experience on the measurement techniques. In Proc
PTS-Sticky-Seminarreihe (p. 5). Dresden, Germany.
Haute, E. van. (2003). Enzymes and biodispersants as highly performing alternatives to
conventional deposit control programs on paper machines. Chimica Oggi, 21(12), 48–50.
Hettiarachchy, N. S., Kalapathy, U., & Myers, D. J. (1995). Alkali-modified soy protein with
improved adhesive and hydrophobic properties. Journal of the American Oil Chemists’
Society, 72(12), 1461–1464.
Hubbe. (2000). Opportunities in Wet-End Chemistry: Feature Essay, from June 2000
"Stickies, Pitch, and Secondary Fiber - A Chemist’s View" Retrieved from
http://www4.ncsu.edu/~hubbe/new
Hubbe, M., Rojas, O., & Venditti, R. (2006). Control of tacky deposits on paper machines–A
Review. Nordic Pulp and Paper Research Journal, 21(2), 154–171.
Huhtamaki, M. (2003). Closing the water cycles: How far can we go? Paper Technology,
44(10), 27–32.
Jung, L., Charles T. Campbell, Timothy M. Chinowsky, Mimi, M., & Yee, S. S. (1998).
Quantitative Interpretation of the Response of Surface Plasmon Resonance Sensors to
Adsorbed Films. Langmuir, 14(19), 5636–5648.
33
Kanner, J., German, J. B., Kinsella, J. E., & Hultin, H. O. (1987). Initiation of lipid
peroxidation in biological systems. C R C Critical Reviews in Food Science and Nutrition,
25(4), 317–364. Journal Article.
Kanto, L., Salkinoja-Salonen, M., & Pelzer, R. (2005). Novel evaluation methods for paper
machine deposits. Wochenblatt Papierfabrikation, 1, 36–42.
Keeler, J. (2007). NMR and energy levels (pp. 05–11). Irvine: University of Cambridge.
Kerman, N., Eronen, H., Burke, T., & Vanninen, S. P. (2006). Novel approach to select and
optimize fixatives for pitch and sticky control in different fiber systems. Wochenblatt Fur
Papierfabrikation, 134(21), 1203–1207.
Kuhn, H., & Thiele, B. J. (1999). The diversity of the lipoxygenase family: Many sequence
data but little information on biological significance1. FEBS Letters, 449(1), 7–11. Journal
Article.
Kumar, R., Choudhary, V., Mishra, S., Varma, I. K., & Mattiason, B. (2002). Adhesives and
plastics based on soy protein products. Industrial Crops and Products, 16(3), 155–172.
Lawrence, C., & Zhou, W. (1991). Spin coating of non-Newtonian fluids. Journal of Non-
Newtonian Fluid Mechanics, 39(2), 137–187.
Lenes, M., Andersen, I., & Stenbacka, I. (2001). Deposition of secondary stickies in DIP and
TMP suspensions. In 11th ISWPC International Symposium on Wood and Pulping Chemistry
(pp. 111–114). Nice, France.
Liedberg, B., Nylander, C., & Lundström, I. (1995). Biosensing with surface plasmon
resonance--how it all started. Biosensors & Bioelectronics, 10(8), i–ix.
Lindholm, G. (1998). Reduction of fresh water consumption in pulp and paper production.
Paperi Ja Puu, 80(4), 260–263.
Lipponen, J. (2006). State-of-the-art Screening Systems. Paper Technology, 47(1), 39–44.
Malmsten, M. (Ed.). (2003). Biopolymers at Interfaces (Second). New York: Marcel Dekker,
Inc.
Marques, G., Molina, S., Babot, E. D., Lund, H., del Río, J. C., & Gutiérrez, A. (2011).
Exploring the potential of fungal manganese-containing lipoxygenase for pitch control and
pulp delignification. Bioresource Technology, 102(2), 1338–43.
Marx, K. A. (2003). Quartz Crystal Microbalance: A Useful Tool for Studying Thin Polymer
34
Films and Complex Biomolecular Systems at the Solution−Surface Interface.
Biomacromolecule, 4(5), 1099–1120.
Mayer, A. M., & Staples, R. C. (2002). Laccase: new functions for an old enzyme.
Phytochemistry, 60(6), 551–65.
Mehta, A. (2012). Ultraviolet-Visible (UV-Vis) Spectroscopy–Woodward-Fieser Rules to
Calculate Wavelength of Maximum Absorption (Lambda-max) of Conjugated Dienes.
Retrieved September 22, 2016, from http://pharmaxchange.info/press.
Meyer, E. (1992). Atomic force microscopy. Progress in Surface Science, 41(1), 3–49.
Miranda, R., Balea, A., Blanca, E. S. de la, Carrillo, I., & Blanco, A. (2008). Identification of
Recalcitrant Stickies and Their Sources in Newsprint Production. Industrial & Engineering
Chemistry Research, 47(16), 6239–6250.
Mitchell, J., & John. (2010). Small Molecule Immunosensing Using Surface Plasmon
Resonance. Sensors, 10(8), 7323–7346.
Molina, S., Rencoret, J., del Río, J., Lomascolo, A., Record, E., Martínez, A. T., & Gutiérrez,
A. (2008). Oxidative degradation of model lipids representative for main paper pulp lipophilic
extractives by the laccase–mediator system. Applied Microbiology and Biotechnology, 80(2),
211–222.
Monte, M. C., MacNeil, D., Negro, C., & Blanco, A. (2010a). Interaction of dissolved and
colloidal material during the mixing of different pulps. Holzforschung, 64(3), 277–283.
Monte, MacNeil, D., Negro, C., & Blanco, A. (2010b). Interaction of dissolved and colloidal
material during the mixing of different pulps. Holzforschung, 64(3), 277–283.
Murphy, P. A., Barua, K., & Hauck, C. C. (2002). Solvent extraction selection in the
determination of isoflavones in soy foods. Journal of Chromatography B, 777(1), 129–138.
Norgren, M., Shannon M. Notley, Andrea Majtnerova, & Gellerstedt, G. (2006). Smooth
Model Surfaces from Lignin Derivatives. I. Preparation and Characterization. Langmur, 22(3),
1209–1214.
Norrman, K., Ghanbari-Siahkali, A., & Larsen, N. B. (2005). 6 Studies of spin-coated polymer
films. Royal Society of Chemistry, 101, 174–201.
Olson, C., & Letscher, M. (1992). Increasing the use of secondary fibre: an overview of
deinking chemistry and stickies control. Appita Journal, 45(2), 125–130.
35
Örsa, F., & Holmbom, B. (1994). A convenient method for the determination of wood
extractives in papermaking process waters and effluents. Journal of Pulp and Paper Science,
20(12), 361–366.
Perkins, W. (1986). Fourier Transform-Infrared Spectroscopy; Part I. Instrumantation. Journal
of Chemical Education, 63(1), 5–10.
Phoon, P. Y., San Martin-Gonzalez, M. F., & Narsimhan, G. (2014). Effect of hydrolysis of
soy β-conglycinin on the oxidative stability of O/W emulsions. Food Hydrocolloids, 35, 429–
443.
Pietschker, D. A. (1996). 100% Closed Water System-What to Expect, 1996 Papermakers
Conference Proceedings. In Proceeding of Paper Makers Conference . Atlanta: Tappi Press .
Prigge, S. T., Boyington, J. C., Faig, M., Doctor, K. S., Gaffney, B. J., & Amzel, L. M. (1997).
Structure and mechanism of lipoxygenases. Biochimie, 79(11), 629–636.
Putz, H. (2000). Stickies in recycled fiber pulp. In Recycled Fiber and Deinking. Industrial &
Engineering Chemistry Research. Papermaking Science and Technology.
Renkema, J. M. S., Knabben, J. H. M., & van Vliet, T. (2001). Gel formation by β-conglycinin
and glycinin and their mixtures. Food Hydrocolloids, 15(4), 407–414.
Rodahl, M., Hook, F., Krozer, A., Brzezinski, P., & Kasemo, B. (1995). Quartz crystal
microbalance setup for frequency and Q-factor measurements in gaseous and liquid
environments. Review of Scientific Instruments, 66(7), 3924.
Rodahl, M., & Kasemo, B. (1996). On the measurement of thin liquid overlayers with the
quartz-crystal microbalance. Sensors and Actuators A: Physical, 54(1), 448–456.
Salas, C., Rojas, O. J., Lucia, L. A., Hubbe, M. A., & Genzer, J. (2013). On the Surface
Interactions of Proteins with Lignin. ACS Applied Materials & Interfaces, 5(1), 199–206.
Sauerbrey, G. (1959). Use of vibrating quartz for thin film weighing and microweighing. Z
Phys, 155(2), 206–222.
Shah, N., Sattar, A., Benanti, M., Hollander, S., & Cheuck, L. (2006). Magnetic Resonance
Spectroscopy as an Imaging Tool for Cancer: A Review of the Literature. The Journal of the
American Osteopathic Association, 106(1), 919–27.
Sharyo, M., Shimoto, H., Sakaguchi, H., Isaji, M., Fujita, Y., Awaji, H., … Hata, K. (1993).
The recent progress and general status of the lipase pitch control technology in Japan. Japan
Tappi Journal, 47(10), 1223–1233.
36
Singh, P., Kumar, R., Sabapathy, S. N., & Bawa, A. S. (2008). Functional and Edible Uses of
Soy Protein Products. Comprehensive Reviews in Food Science and Food Safety, 7(1), 14–28.
Sithole, B., Filion, D., & Allen, L. (1999). A laboratory test to measure deposition in recycled
paper making. Paper Technology, 40(1), 26–30.
Smith, B. (2011). Fundamentals of Fourier transform infrared spectroscopy (Second). CRC
press, Taylor &Francis Group.
Song, F., Tang, D.-L., Wang, X.-L., & Wang, Y.-Z. (2011). Biodegradable Soy Protein Isolate-
Based Materials: A Review. Biomacromolecules, 12(10), 3369–3380.
Tammelin, T., Osterberg, M., Johansson, L., & Laine, J. (2006). Preparation of lignin and
extractive model surfaces by using spincoating technique-Application for QCM-D studies.
Nordic Pulp & Paper Research Journal, 21(4), 444–450.
Tandang-Silvas, M. R. G., Tecson-Mendoza, E. M., Mikami, B., Utsumi, S., & Maruyama, N.
(2011). Molecular Design of Seed Storage Proteins for Enhanced Food Physicochemical
Properties. Annual Review of Food Science and Technology, 2, 59–73.
Tomlins, P., & Leach, R. (2005). Surface and Interfaces for Biomaterials. In P Vadgama (Ed.).
Cambridge.
Vähäsalo, L. (2005). White pitch deposition : mechanisms and measuring techniques. 2005.
Laboratory of Wood and Paper Chemistry, Faculty of Chemical Engineering, Åbo Akademi
University, Turku.
Venditti, R., Gilbert, R., & Zhang, A. (2000). The Effect Of Release Liner Materials On
Adhesive Contaminants, Paper Recycling And Recycled Paper Properties. In Paper Recycling
Conference. Atlanta: Tappi Press.
Vickerman, john, & Gilmore, S. (2009). Surface Analysis - The Principal Techniques. Wiley
(2nd ed.). Chichester: John Wiley & Sons.
Wagner, J. R., & Gueguen, J. (1995). Effects of Dissociation, Deamidation, and Reducing
Treatment on Structural and Surface Active Properties of Soy Glycinin. Journal of Agricultural
and Food Chemistry, 43(8), 1993–2000.
Wagner, & Guéguen, J. (1999). Surface Functional Properties of Native, Acid-Treated, and
Reduced Soy Glycinin. 1. Foaming Properties. Journal of Agriculture And Food Chemistry,
47(6), 2173–2180.

37
Wang, Y., Mo, X., Sun, X. S., & Wang, D. (2007). Soy protein adhesion enhanced by
glutaraldehyde crosslink. Journal of Applied Polymer Science, 104(1), 130–136.
Ward, J., Hensel, D., & Patterson, J. (1994). New Approach to the Control of Stickies, 1994
Recycling Symposium Proceedings. In Recycling Symposium. Tappi.
Weidenmüller, R. (1984). Papermaking, the Art and Craft of Handmade Paper. In Thorfinn
International Marketing Consultants Inc. San Diego, CA.
Welkener, U., Hassler, T., & McDermott, M. (1993). The effect of furnish components on
depositability of pitch and stickies. Nordic Pulp and Paper.
Yin, H., Xu, L., & Porter, N. A. (2011). Free radical lipid peroxidation: mechanisms and
analysis. Chem Rev, 111(10), 5944–5972. Journal Article. http://doi.org/10.1021/cr200084z
Yordan, L., & Maa, P. (1997). Application of new analytical tools to determine efficiency of
talc as a pitch/stickies control agent. In Recycling Symposium (pp. 361–366). Tappi Press.
Zhang, X., Nguyen, D., Paice, M. G., Tsang, A., & Renaud, S. (2007). Degradation of wood
extractives in thermo-mechanical pulp by soybean lipoxygenase. Enzyme and Microbial
Technology, 40(4), 866–873.
Zhang, X., Renaud, S., & Paice, M. (2005). The potential of laccase to remove extractives
present in pulp and white water from TMP newsprint mills. Journal of Pulp and Paper Science,
31(4), 175–180.
Zoia, L., Perazzini, R., Crestini, C., & Argyropoulos, D. S. (2011). Understanding the radical
mechanism of lipoxygenases using 31P NMR spin trapping. Bioorg Med Chem, 19(9), 3022–
3028.

38
2. Research objective
The main objective of the current work is to establish a biotechnological method by using
soy protein and soy bean lipoxygenases through different mechanisms to tackle the deposition
of hydrophobic substances in paper mills. The presence of sticky particles is considered as a
major issue in most of the mills, especially in paper recycling mills, due to the numerous
problems that it creates including defects in the product quality and considerably elevating the
cost. Overall, the advantages that papermaking industries can receive as result of eliminating
the stickies, include but not limited to:
a. The production of paper with notably less defects, such as presence of holes, dirt, stains,
on the paper sheet as well as having weak resistance.
b. Improvement in machine runnability due to the less clogged wires, cleaner felts and
de-watering enhancement.
c. Consuming smaller amount of the sticky-control chemicals, such as fine talc, bentonite,
cationic polymers, etc.
d. Subsequently spending not as much money on the detackifier chemicals, factory
downtime and process cleaning, which can be quite significant.
Therefore the removal of problematic stickies is the main goal in this research.
This thesis document is divided into 6 main chapters that follow a sequence which starts
with an introduction for papermaking process and its different aspects along with
corresponding literature about stickies and related issues. Then all the instruments and
techniques that have been employed in this work are explained, with the emphasis on their
39
importance on current study. Chapter 3 demonstrates the enzyme-substrate interactions at a
molecular level and shows the changes on the sticky molecular structure as a result of being
submitted to oxidative condition induced by enzyme. Then the hydrophobicity of modified
sticky components and its behavior toward cellulose and plastic surfaces is determined
(Chapter 4) by making ultra-thin films through spin-coating technique. Additional QCM
analysis revealed a notable change in viscoelastic characteristic of the attached layer to the
model surfaces in a desirable manner.
Moreover, the novel application of soy protein was introduced to control the tackiness in
recycled papers as compared to talc, and the effect of protein on fiber charge, brightness and
strengths was studied (Chapter 6).
Finally the last step was taken and, protein application as a pitch control and strength agent
was examined at the pilot-scale. The results indicate a positive synergistic interaction between
protein and fibers and a marginal improvement in paper formation uniformity was achieved
(Chapter 7). The goal of this work is to take advantage of all the possible favorable
interactions of protein in a paper making system to introduce a new additive from an affordable
renewable sources.
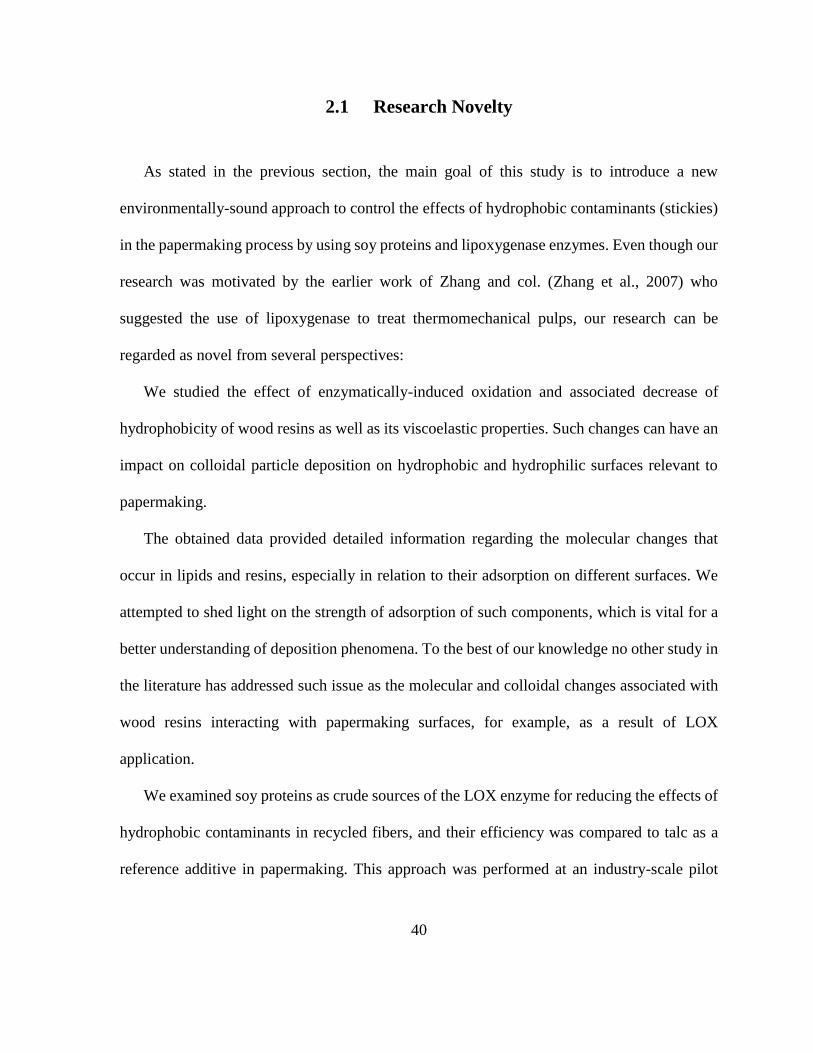
40
2.1 Research Novelty
As stated in the previous section, the main goal of this study is to introduce a new
environmentally-sound approach to control the effects of hydrophobic contaminants (stickies)
in the papermaking process by using soy proteins and lipoxygenase enzymes. Even though our
research was motivated by the earlier work of Zhang and col. (Zhang et al., 2007) who
suggested the use of lipoxygenase to treat thermomechanical pulps, our research can be
regarded as novel from several perspectives:
We studied the effect of enzymatically-induced oxidation and associated decrease of
hydrophobicity of wood resins as well as its viscoelastic properties. Such changes can have an
impact on colloidal particle deposition on hydrophobic and hydrophilic surfaces relevant to
papermaking.
The obtained data provided detailed information regarding the molecular changes that
occur in lipids and resins, especially in relation to their adsorption on different surfaces. We
attempted to shed light on the strength of adsorption of such components, which is vital for a
better understanding of deposition phenomena. To the best of our knowledge no other study in
the literature has addressed such issue as the molecular and colloidal changes associated with
wood resins interacting with papermaking surfaces, for example, as a result of LOX
application.
We examined soy proteins as crude sources of the LOX enzyme for reducing the effects of
hydrophobic contaminants in recycled fibers, and their efficiency was compared to talc as a
reference additive in papermaking. This approach was performed at an industry-scale pilot
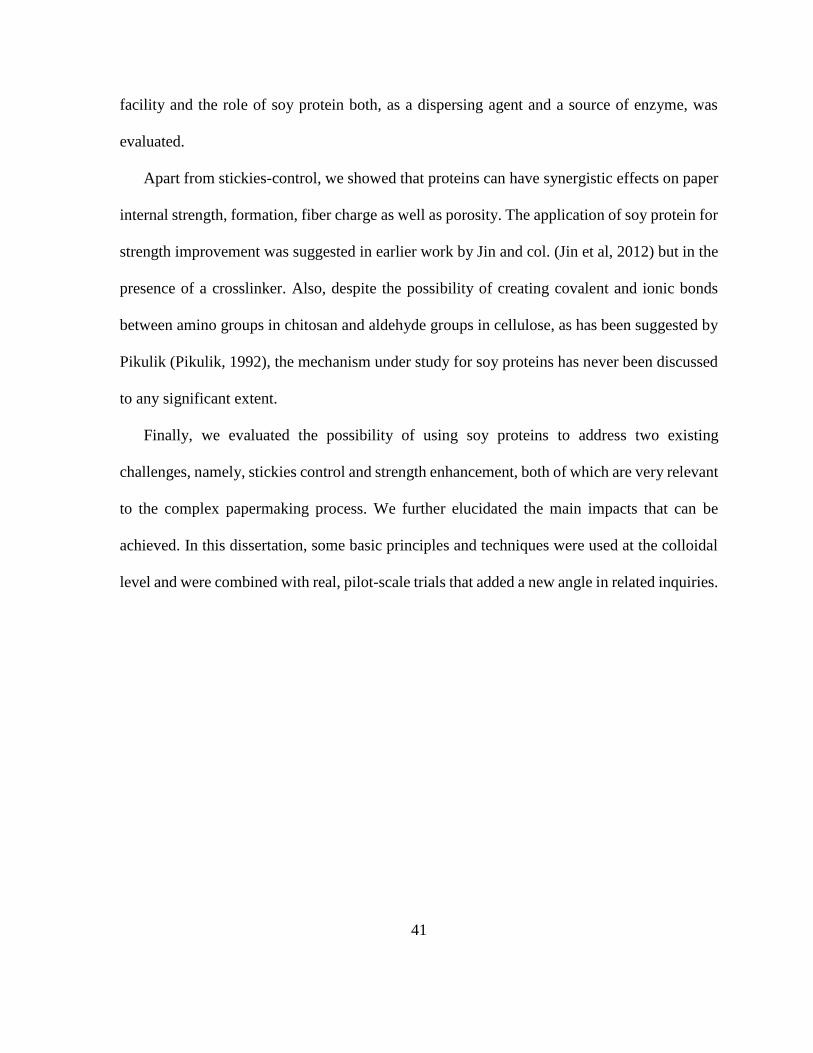
41
facility and the role of soy protein both, as a dispersing agent and a source of enzyme, was
evaluated.
Apart from stickies-control, we showed that proteins can have synergistic effects on paper
internal strength, formation, fiber charge as well as porosity. The application of soy protein for
strength improvement was suggested in earlier work by Jin and col. (Jin et al, 2012) but in the
presence of a crosslinker. Also, despite the possibility of creating covalent and ionic bonds
between amino groups in chitosan and aldehyde groups in cellulose, as has been suggested by
Pikulik (Pikulik, 1992), the mechanism under study for soy proteins has never been discussed
to any significant extent.
Finally, we evaluated the possibility of using soy proteins to address two existing
challenges, namely, stickies control and strength enhancement, both of which are very relevant
to the complex papermaking process. We further elucidated the main impacts that can be
achieved. In this dissertation, some basic principles and techniques were used at the colloidal
level and were combined with real, pilot-scale trials that added a new angle in related inquiries.
42
3 Lipoxygenase-mediated peroxidation mechanism of unsaturated
lipids studied by 13C/1H NMR, FTIR and UV spectroscopy
3.1 Abstract
In this study, unsaturated fatty acids were selected as model wood extractives to monitor
the hydroperoxygenation induced by soybean lipoxygenase 1-B (LOX), which was applied as
an oxidative catalyst at room temperature. Three fatty acids were considered, namely, 9-cis,12-
cis-linoleic acid, 1,2,3-tri-cis,cis-9,12-octadecadienoyl (glycerol trilinolein) and 1,2,3-tri-cis-
9-octadecenoyl (triolein), which were used in colloidal dispersions and monitored in relation
to their molecular changes by using 1H/13C nuclear magnetic resonance (NMR), Fourier
transform infrared (FTIR) and UV spectroscopies. As detected and quantified by 1H/13C NMR,
it was shown that enzyme was effective in the substitution of hydroperoxyl group at the allylic
positon in conjugated lipid by inducing chemical shift on the hydroperoxyl-bearing 13C and 1H
resonance, respectively. It was also revealed that the detection of hydroperoxyl group was
limited by its unstable nature; however the reduction of protons associated with diene group
and new signals observed in both 13C and 1H NMR was attributed to the oxygen absorption
and change in the molecule structure, in agreement with the FTIR and UV results. Moreover,
almost no oxygen substitution was observed in triolein, in accordance with its lower level of
saturation compared to the two other substrates and the absence of bis-allylic proton. The
results of this work are potentially useful in paper mills since unsaturated fatty acids are major
constituents of wood extractive-based sticky components in mechanical pulps and are known
to cause a range of manufacturing problems including pitch deposition and lower paper

43
machine runnability. Besides, understanding the mentioned oils degradation can be useful in
food industries given that the oils studied in this work are also edible.
3.2 Introduction
Soybean lipoxygenase (LOX) is a type of enzyme that is found widely in plants, fungi, and
animals (Siedow, 1991; Yamamoto, 1992). It is a non-heme iron-containing enzyme mostly
responsible for catalyzing the stereo-selective dioxidation of methyl-interrupted poly-
unsaturated fatty acids and their esters, such as linoleic, linolenic and arachidonic acids, that
contain a 1, 4-cis, cis-pentadiene system, to their corresponding hydroperoxy derivatives and
giving cis-trans conjugated hydroperoxide (Kuhn et al., 1999). Some of LOX roles in plants
include responses to wounding and senescence (Kadamne et al., 2011; Porta et al., 2002;
Siedow, 1991) and linoleic and arachidonic acid are common substrates for LOX in plant and
animal tissue, respectively. It was reported that the enzyme is involved in inflammatory
processes (Samuelsson et al., 1987), cell membrane maturation (Schewe et al., 1991),
atherogenesis and osteoporosis (Cathcart et al., 2000; Cyrus et al., 1999; Klein et al., 2004).
Lipid peroxidation catalyzed by LOX is a two-step process. In the first step, an oxidant
Fe+3 from active lipoxygenase attacks unsaturated fatty acids (containing carbon-carbon
double bound(s)) to abstract one allylic hydrogen from carbon and forms the carbon-centered
lipid radical (L.). In the next step, the radicalized lipid reacts with the oxygen molecule (oxygen
insertion) leading to a lipid peroxy radical (LOO.) that can abstract a hydrogen molecule from
a neighboring lipid molecule and form a new lipid radical and a hydroperoxide (LOOH)
(Girotti, 1998; Kanner et al., 1987; Yin et al., 2011).
44
Many studies indicate the ability of LOX to accept simple chain lipids, However, there is
some evidence showing that the enzyme is even able to catalyze the oxygenation of more
complex oils in living system and produce monohydroperoxy derivatives (Feussner et al.,
1998). Besides, LOX has been used to oxygenate not only fatty acids, but also ester lipids such
as phospholipids or even bio-membranes (Brash et al., 1987; Maccarrone et al., 1994). Plant
oils such as soy bean oil are important sources of unsaturated fatty acids such as oleic and
linoleic acyl groups, which make them more prone to enzymatic oxidation (Chin et al., 1992).
Even though the oils oxidation products are usually considered as toxic components in the
food industry and harmful to human health, it is also possible that the oxidized or modified oils
can be beneficial. For example, the modification of fatty acid fractions derived from wood
extractives or other sources, through oxidation and radical formation from the unsaturated fatty
acids, can be used for coupling onto cellulosic surfaces. In turn, surface hydrphobization can
be achieved. The role of aldehydes involved in pathophysiological processes has been
addressed (Esterbauer et al., 1991; Guillén et al., 2004; , 1998; Simopoulos, 2002) and the
number of studies on conjugated fatty acids has been increased over the recent years due to
their reported beneficial effects in anti-cancer and anti-obesity (Gnadig et al., 2001; Wahle et
al., 2004).
Among the analytical techniques, NMR spectroscopy is reported to be very valuable to
characterize plant oils and identify their functional groups. It has been used for different types
of studies on the oils by many authors (Belury, 2002; Cao et al., 2007; Evans et al., 2002;
Gunstone, 1993; Jie et al., 1997; Knothe et al., 2004; Lie Ken Jie, 2001; Pajunen et al., 2008;
Prema et al., 2013; Siciliano et al., 2013). NMR was used to determine the proportion of acyl
45
group in the sesame oil throughout oxidation under high temperature, and to follow the
formation of primary and secondary oxidation compounds in the oil (Guillén et al. , 2004).
Analyses of pure model lipids have adopted NMR for understanding the chemical composition
of lipids such as soybean, fish, and vegetable oils. More importantly, 1H NMR with its short
testing time and high accuracy, has been useful in providing detailed chemical information of
the lipid mixtures, both on qualitative and quantitative basis. In the past, NMR was used for
studying low-density lipoprotein (LDL) peroxidation compounds as well as thermal stressing
of fish oils (Claxson et al., 1994; Haywood et al., 1995; Lodge et al., 1995; Medina et al., 1998;
Silwood et al., 1999). Despite the existence of much data on lipid mixture oxidation, there have
been limited studies on pure lipid oxidation (Hämäläinen et al., 2001, 2002, 2005) and there is
limited 1H/13CNMR data reporting on the peroxidation of plant oils or wood extractives
catalyzed by soybean lipoxygenase. This might be due to the fact that the oxidation and
peroxidation reaction products are usually mixtures and quite difficult to separate.
Furthermore, most of the derived components, in particular lipid hydroperoxides, are very
unstable, having a short life time, and they are usually studied as hydroxy derivatives, which
are expected to be more stable (Pajunen et al. , 2008).
Because of the biological importance and the possible application of LOX in modifying
and degrading unsaturated fatty acids in wood extractives (Gutiérrez et al., 2009; Marques et
al., 2011; Zhang et al., 2007) we examined the effect of LOX on the molecular structure of
three types of unsaturated wood extractives oils. This was accomplished in the presence of
active enzyme, and the separation of the modified lipid was achieved by liquid phase separation
using polar and nonpolar solvents. The 1H and 13C NMR of the conjugated diene allylic
46
hydroperoxides were assigned to determine the influence of the hydroperoxy on the chemical
structure of the oils.
Therefore, in order to obtain direct evidence and to compare the effect of lipoxygenase on
lipid radicalization and oxidation, three substrates were characterized before and after the
enzymatic treatment upon dissolution in deuterated solvent followed by 13C/1H NMR analyses,
and the detailed chemistry of peroxidation reaction of the chosen lipids was elucidated. The
study was complemented by measurements via Fourier transform infrared spectroscopy (FTIR)
and UV. Even though the motivation of this study was to apply the enzyme as an additive to
degrade the fatty acids that cause stickies and deposits in papermaking, the discussion in this
paper centers around the effect of LOX on the lipid substrates. Such molecular level analysis
is essential to understanding the structural changes the lipids undergo after treatment with the
enzyme and to determining the effect of oxidation on lipid water solubility, hydrophobicity,
molecular weight, etc.
3.3 Materials and Methods
Soybean lipoxygenase from glycine max type I-B with 150,000 U/mg activity, pure linoleic
acid, glycerol trilinolein and triolein were purchased from Sigma Aldrich and used as received.
The enzyme has the molecular weight of 108 kDa. All the reagents and buffers were prepared
with Millipore Milli-Q deionized water. Boric acid and potassium hydroxide were obtained
from Fisher Scientific for preparation of the buffer solution.
47
3.3.1 Lipid oxidation by lipoxygenase
The three lipid substrates were subjected to oxidation with lipoxygenase separately at room
temperature following the same experimental conditions. The enzyme/substrate ratio,
temperature, and pH were kept constant throughout the experiments. Experiments were carried
out in an ambient atmosphere of air with magnetic stirring in an open reaction vial (inner
volume 20mL). 400 mg of lipid was dispersed in 20mL of 0.2M boric buffer (pH 9.0) under
agitation at 250 rpm (magnetic stirring). In order to fully disperse the substrate, 10 min
sonication was applied. Separately, 20 mg (185 nM) of soybean lipoxygenase was dissolved
in 0.2M boric buffer (pH 9.0) vial (20mL) using a magnetic stirrer and was then added to the
vial containing the dispersed lipid and stirred at 250 rpm. The reaction time for linoleic acid
was 0.5, 2, 24 hours and 1 week. However, 2 h reaction time was used for the other two lipids.
After the completion of the reaction time, the dispersion was acidified with 1.0 M HCl solution
to pH: 4 to stop the enzymatic reaction. The treated lipid was then extracted through phase
separation using three times chloroform extraction in a 100 mL separation funnel. Following,
the organic solvent was dried with NaSO4, evaporated under reduced pressure and the
separation yield was determined. For complete drying, the extracted lipid was left in the
vacuum oven for 24 h. Finally the residue was dissolved in deuterated solvent for subsequent
NMR spectroscopy.
3.3.2 LOX reaction followed by UV Spectrophotometry
LOX reaction with linoleic acid substrate was determined by UV spectroscopy using a
Single-Beam UV/Visible Spectrophotometer (Holman et al., 1969). UV absorption at 234 nm
was measured to detect enzyme activity. The production of hydroperoxide groups and
48
conjugated diene systems in the solution induces UV absorbance at 234 nm for the trans-trans
isomers and 236 nm for the cis-trans isomers (Chan et al., 1977).
3.3.3 1H analysis of the lipids
The lipids were analyzed using proton NMR; carbon NMR was also used for the linoleic acid.
The measurements were acquired on a Bruker 300 MHz spectrometer equipped with a quad
probe dedicated to 31P, 13C, 19F, and 1H acquisition at 28 °C. NMR spectra were recorded when
the NMR sample was prepared into a normal 5 mm NMR tube by dissolving 20 mg of extracted
lipid in 1 mL deuterated solvent. The tube was sealed with a Teflon cap and secured with
paraffin film. The total number of scans for all the experiments was 256 with an acquisition
time of 1.6 s.
3.3.4 13C NMR analysis of the linoleic acid
Linoleic acid samples were analyzed using a 500 MHz 13C NMR spectrometer operating
with topspin 3.2 software. For each test 100 mg of pure oil was dissolved in 0.8 mL DMSO in
a 5 mm NMR tube. All the spectra were collected with a 1.6 s delay time and 5,000 scans and
signals phase/baseline were corrected.
3.3.5 Fourier Transform Infrared Spectroscopy (FTIR)
The infrared absorption spectra of the oxidized and unmodified samples were obtained by
using a Perkin Elmer FTIR spectrometer Frontier at a wavelength resolution of 4 cm-1 and
using 64 scans per sample. Extracted lipid samples were dried overnight in a vacuum oven at
40 °C before subsequent FTIR analysis, which used the same as that NMR analysis.

49
3.4 Results and Discussion
The effect of soy bean lipoxygenase on glycerol trilinolein, triolein as well as linoleic acid
oxidation was investigated given its relevance in lipid processing. The experimental conditions
were optimized in preliminary experiments. The main variables included the substrate type and
the time used in the enzymatic reaction
Soybean lipoxygenase in plants has a single polypeptide chain with a molecular mass of
94-104 kDa, and it was used in our work because, compared to other types of enzymes, it is
easier to purify and has been characterized already (Shibata et al., 1987). The goal of this study
was to monitor the effect of LOX on different unsaturated fatty acids through multiple
techniques. In addition, we address the question whether the enzyme is able to produce
hydroperoxide groups in other substrates.
3.4.1 Characterization of pure lipids using proton NMR
After LOX treatment, modified lipids were successfully separated (yield 90%) using a
nonpolar solvent (chloroform). Figure 3.1 shows the 1H NMR spectra of the three model lipids
before enzymatic oxidative treatment. These experiments were performed to provide reference
spectra prior to modification through enzymatic reaction. Modified lipids should have similar
spectra with the main difference being the presence of few peaks associated with the protons
added to the lipid chain. The region between 0.5 and 5.5 ppm contains all the typical proton
NMR features of oils (Guillén et al. , 2004). Table 3.1 summarizes relevant chemical shift
assignments. Proton intensity in the 1H NMR spectra is directly related to protons
concentration in the sample, and the correlation coefficient is the same for all protons; therefore
it was possible to determine the proportion of different functional groups, such as OH and
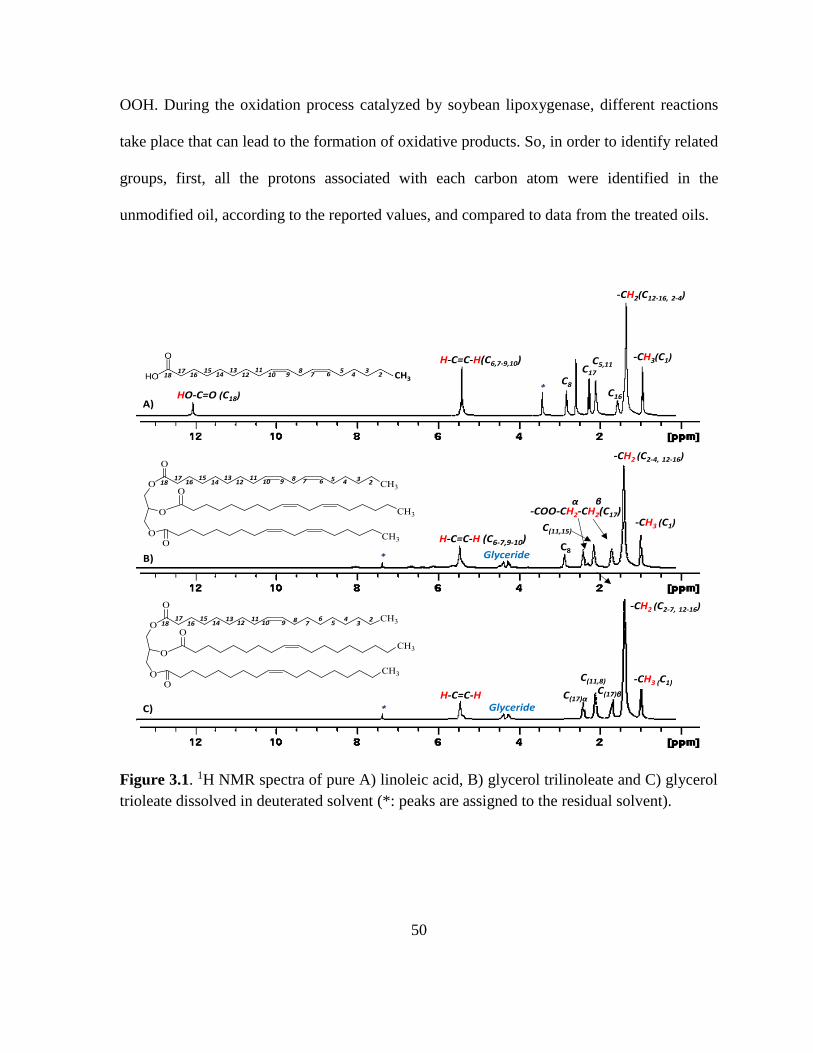
50
OOH. During the oxidation process catalyzed by soybean lipoxygenase, different reactions
take place that can lead to the formation of oxidative products. So, in order to identify related
groups, first, all the protons associated with each carbon atom were identified in the
unmodified oil, according to the reported values, and compared to data from the treated oils.
Figure 3.1. 1H NMR spectra of pure A) linoleic acid, B) glycerol trilinoleate and C) glycerol
trioleate dissolved in deuterated solvent (*: peaks are assigned to the residual solvent).
CH32
34
5710 9 6
15 814
1312
1116
1718
-CH3(C1)H-C=C-H(C6,7-9,10)
-CH2(C12-16, 2-4)
C5,11
C16
C17
C8
HO-C=O (C18)
2345710 9 615 8
1413
1211
1617
18
23
45710 9
615 81413
1211
1617
18
-CH3 (C1)
-CH2 (C2-4, 12-16)
C(11,15)
Glyceride
H-C=C-H (C6-7,9-10)
H-C=C-HGlyceride
-CH3 (C1)
-CH2 (C2-7, 12-16)
-COO-CH2-CH2(C17)βα
C8
C(11,8)
C(17)αC(17)β
A)
B)
C)
*
*
*
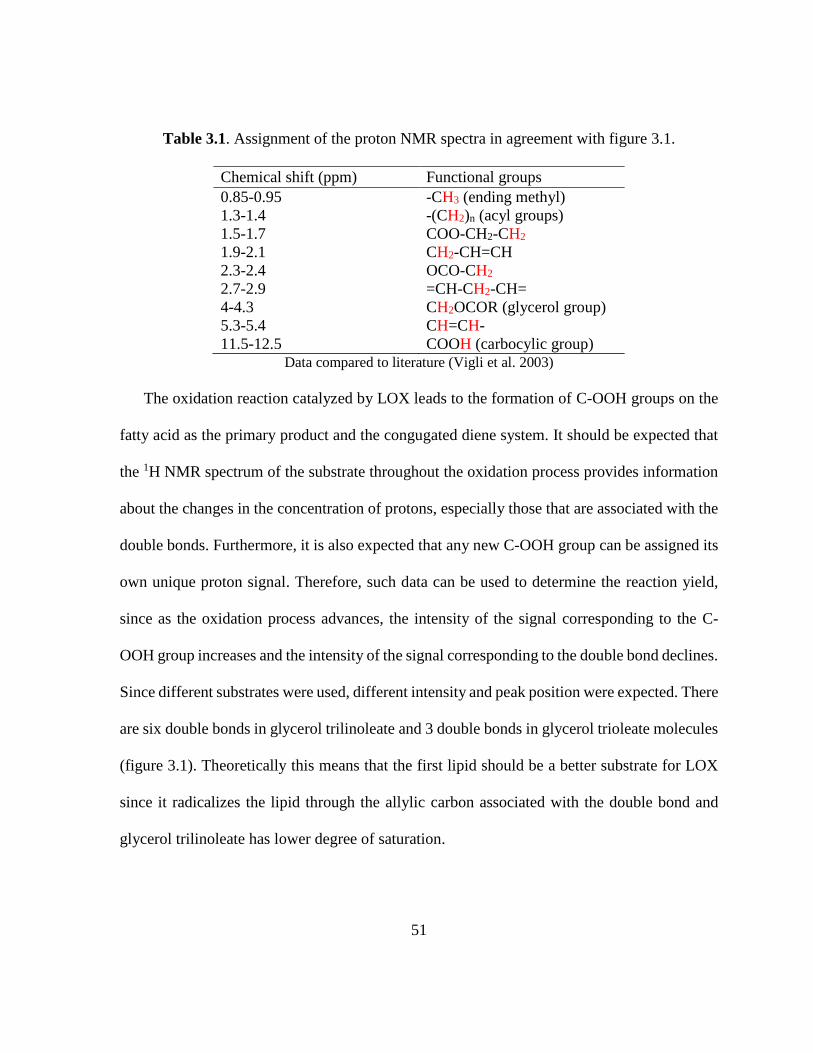
51
Table 3.1. Assignment of the proton NMR spectra in agreement with figure 3.1.
Chemical shift (ppm) Functional groups
0.85-0.95 -CH3 (ending methyl)
1.3-1.4 -(CH2)n (acyl groups)
1.5-1.7 COO-CH2-CH2
1.9-2.1 CH2-CH=CH
2.3-2.4 OCO-CH2
2.7-2.9 =CH-CH2-CH=
4-4.3 CH2OCOR (glycerol group)
5.3-5.4 CH=CH-
11.5-12.5 COOH (carbocylic group) Data compared to literature (Vigli et al. 2003)
The oxidation reaction catalyzed by LOX leads to the formation of C-OOH groups on the
fatty acid as the primary product and the congugated diene system. It should be expected that
the 1H NMR spectrum of the substrate throughout the oxidation process provides information
about the changes in the concentration of protons, especially those that are associated with the
double bonds. Furthermore, it is also expected that any new C-OOH group can be assigned its
own unique proton signal. Therefore, such data can be used to determine the reaction yield,
since as the oxidation process advances, the intensity of the signal corresponding to the C-
OOH group increases and the intensity of the signal corresponding to the double bond declines.
Since different substrates were used, different intensity and peak position were expected. There
are six double bonds in glycerol trilinoleate and 3 double bonds in glycerol trioleate molecules
(figure 3.1). Theoretically this means that the first lipid should be a better substrate for LOX
since it radicalizes the lipid through the allylic carbon associated with the double bond and
glycerol trilinoleate has lower degree of saturation.

52
Figure 3.2. Substrate oxidation mechanism through carbon-based radicalization (left). The UV
spectrum of oxidized linoleic acid (right).
As shown in figure 3.2 (right), the formation of the conjugated linoleic acid resulted from
lipoxygenase treatment, which produced, as a function of reaction time, an increased UV
absorbance at 234 nm. During the oxidation process catalyzed by the lipoxygenase, the enzyme
reacted with substrate by abstracting one proton from the bis-allylic methylene position (De
Groot et al., 1975) and formed an enzyme-carbon radical complex. The mechanism of
formation of this complex is not exactly known yet, but the role of iron for the formation of
such complex (LOX- radicalized lipid) has been confirmed. However, the produced complex
is extremely unstable and can easily react with the dioxygen to form a new proxy radical
complex (LOX-LOO.). The group that was produced by the reaction can be stabilized during
the LOX catalytic cycle via an intra-complex electron transfer process, which reduces the
radical to its anion (LOO-) (Zoia et al., 2011). As it is shown in figure 3.2, this is the
Lipoxygenase Fe 3+
Fe 2+
Fe 2+ Fe 3+(e- Transfer)
225 240 255 270 285 300
0.0
0.5
1.0
1.5
2.0
Ab
so
rban
ce (
A)
Wavelength (nm)
Hydroperoxide
234 nm 284 nm
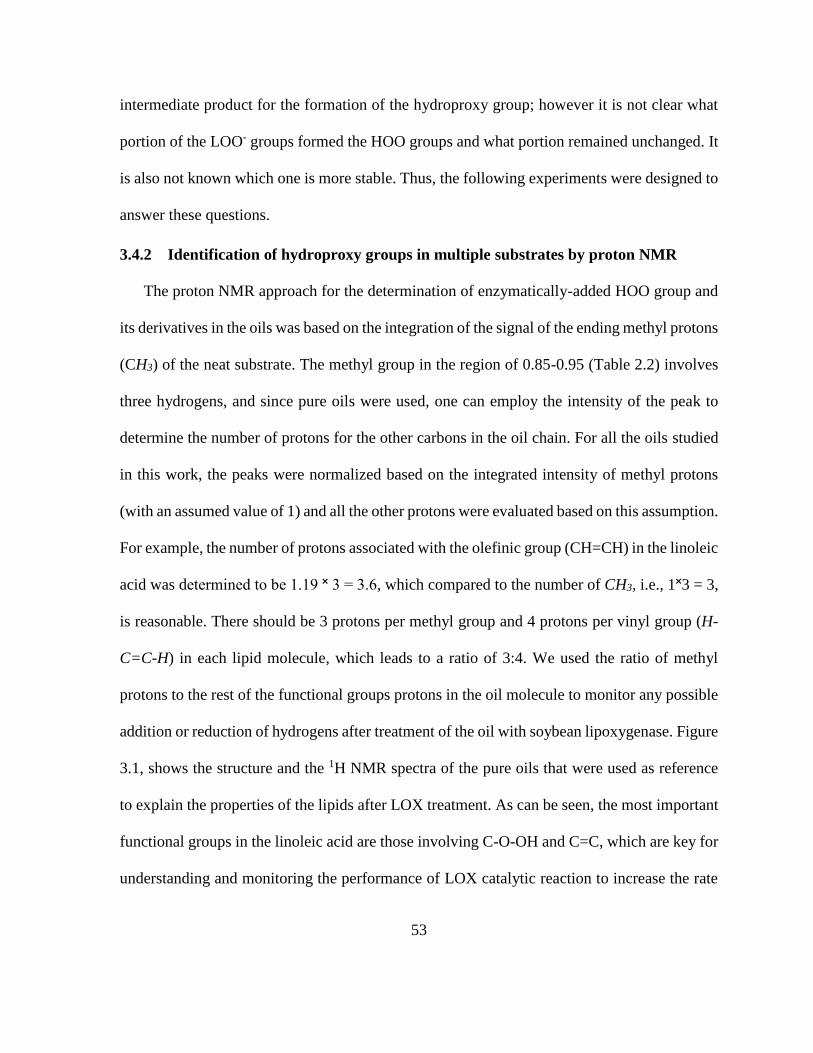
53
intermediate product for the formation of the hydroproxy group; however it is not clear what
portion of the LOO- groups formed the HOO groups and what portion remained unchanged. It
is also not known which one is more stable. Thus, the following experiments were designed to
answer these questions.
3.4.2 Identification of hydroproxy groups in multiple substrates by proton NMR
The proton NMR approach for the determination of enzymatically-added HOO group and
its derivatives in the oils was based on the integration of the signal of the ending methyl protons
(CH3) of the neat substrate. The methyl group in the region of 0.85-0.95 (Table 2.2) involves
three hydrogens, and since pure oils were used, one can employ the intensity of the peak to
determine the number of protons for the other carbons in the oil chain. For all the oils studied
in this work, the peaks were normalized based on the integrated intensity of methyl protons
(with an assumed value of 1) and all the other protons were evaluated based on this assumption.
For example, the number of protons associated with the olefinic group (CH=CH) in the linoleic
acid was determined to be 1.19 ˟ 3 = 3.6, which compared to the number of CH3, i.e., 1˟3 = 3,
is reasonable. There should be 3 protons per methyl group and 4 protons per vinyl group (H-
C=C-H) in each lipid molecule, which leads to a ratio of 3:4. We used the ratio of methyl
protons to the rest of the functional groups protons in the oil molecule to monitor any possible
addition or reduction of hydrogens after treatment of the oil with soybean lipoxygenase. Figure
3.1, shows the structure and the 1H NMR spectra of the pure oils that were used as reference
to explain the properties of the lipids after LOX treatment. As can be seen, the most important
functional groups in the linoleic acid are those involving C-O-OH and C=C, which are key for
understanding and monitoring the performance of LOX catalytic reaction to increase the rate
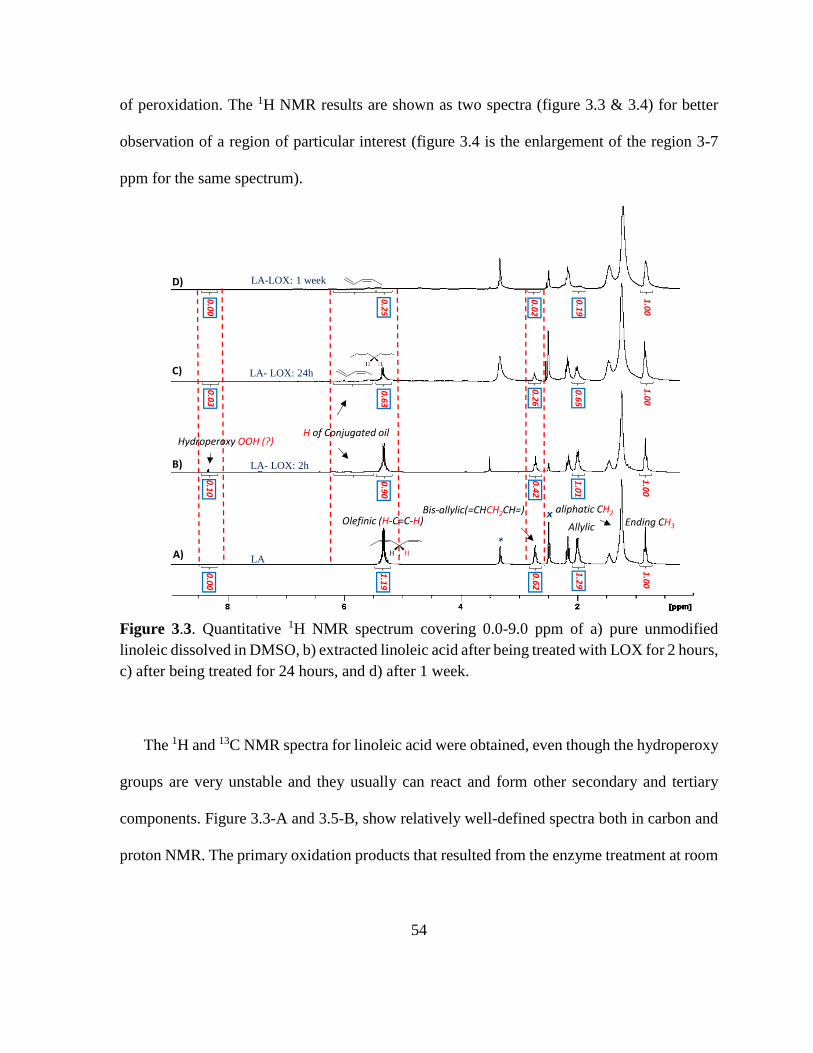
54
of peroxidation. The 1H NMR results are shown as two spectra (figure 3.3 & 3.4) for better
observation of a region of particular interest (figure 3.4 is the enlargement of the region 3-7
ppm for the same spectrum).
Figure 3.3. Quantitative 1H NMR spectrum covering 0.0-9.0 ppm of a) pure unmodified
linoleic dissolved in DMSO, b) extracted linoleic acid after being treated with LOX for 2 hours,
c) after being treated for 24 hours, and d) after 1 week.
The 1H and 13C NMR spectra for linoleic acid were obtained, even though the hydroperoxy
groups are very unstable and they usually can react and form other secondary and tertiary
components. Figure 3.3-A and 3.5-B, show relatively well-defined spectra both in carbon and
proton NMR. The primary oxidation products that resulted from the enzyme treatment at room
1.1
90
.90
0.6
30
.25
Olefinic (H-C=C-H)Bis-allylic(=CHCH2CH=)
Ending CH3
1.0
01
.00
1.0
01
.00
aliphatic CH2
0.0
00
.10
0.0
3
Hydroperoxy OOH (?)
0.6
20
.42
0.2
60
.02
*
LA
LA- LOX: 2h
LA- LOX: 24h
LA-LOX: 1 week
0.0
0
ˣ
H of Conjugated oil
A)
B)
C)
D)
1.2
91
.01
0.6
50
.19
Allylic

55
temperature, indicated conjugated diene and HOO groups (Chan et al. , 1977; Claxson et al. ,
1994).
Table 3.2. Assignment of signals of the 1H NMR spectra for the linoleic acid (integrated values
was used)
Chemical
shift (ppm) Functional groups
Proton intensity for linoleic acid
LA LA-LOX
(2h)
LA-LOX
(24h)
LA-LOX
(1 week)
0.85-0.95 -CH3 (ending methyl) 1 1 1 1
1.9 -CH2-CH2=CH (allylic) 1.29 1.01 0.65 0.19
2.7-2.9 =CH-CH2-CH= (bis allylic) 0.62 0.42 0.26 0.02
5.3-5.4 CH=CH- (olefinic) 1.19 0.90 0.63 0.25
8.3 OOH (hydroperoxy group) - 0.10 0.03 -
6.0-6.5 H (Conjugated diene) - 0.10 0.53 0.35
Table 3.2, shows that the reaction between enzyme and lipid caused a chemical shift of 8.3
ppm, as indicated by the appearance of the HOO group on the oil chain. Figure 3.4 displays
the region between 6.0 and 7.0 ppm of the 1H NMR spectra of untreated and treated linoleic
acid. This region is free of signal for the unoxidized substrate; however, after oil oxidation
with LOX, proton associated for conjugated diene signal is observed. This indicates that even
at an early stage of the oxidation process, 1H NMR spectroscopy was able to detect the reaction
product. This is in agreement with (Knothe et al. , 2004; Martínez-Yusta et al., 2014) who
reported the production of HOO groups in plant oil under thermal stress. Based on the
integration technique, it was realized that the intensity of the HOO peak was about 10% of that
of CH3 (methyl ending group). Therefore, since each methyl group contains three protons, it
can be concluded that the 10% intensity attributed to HOO (at 8.3 ppm) is equivalent to 30%
of one proton. The intensity of the other protons after the enzymatic reaction is summarized in
table 3.2.

56
Figure 3.4. Enlargement of region between 3-7 ppm of the 1H NMR spectra of the figure 3, a)
pure unmodified linoleic acid, b) extracted lipid after being treated with LOX for 2 hours, c)
24 h and d) 1 week. The peak assignment for the conjugated diene was seen at 6.0-6.5 ppm,
the peak in 5.3 is representing the CH=CH which is weaker in the modified sample.
Protons corresponding to bis-allylic (=CH-CH2-CH=) were observed in the range of 2.7-
2.9, the intensity of which declined with the advance of the reaction. There was also a
significant decline in the signal of proton associated to olefinic (H-C=C-H) groups as the
oxidation proceeded. The proton signal intensity for both groups continued to decrease with
additional reaction time and the signal associated with vinyl group almost disappeared after 1
week. This indicates that, although the majority of oxidation process was catalyzed within the
first 2 hours, the reduction of carbon double bond signal continued until complete degradation.
It is expected that the intensity of HOO grows as the oxidation process advances; however, it
actually decreased after 24 hours under oxidation by LOX. The reason for this reduction in
HOO groups can be explained by their instability, since they can react with other components.
LA-LOX: 1 Week
LA-LOX: 24h
LA-LOX: 2h
LA
Conjugated H
0.1
00
.53
0.35
A)
B)
C)
D)
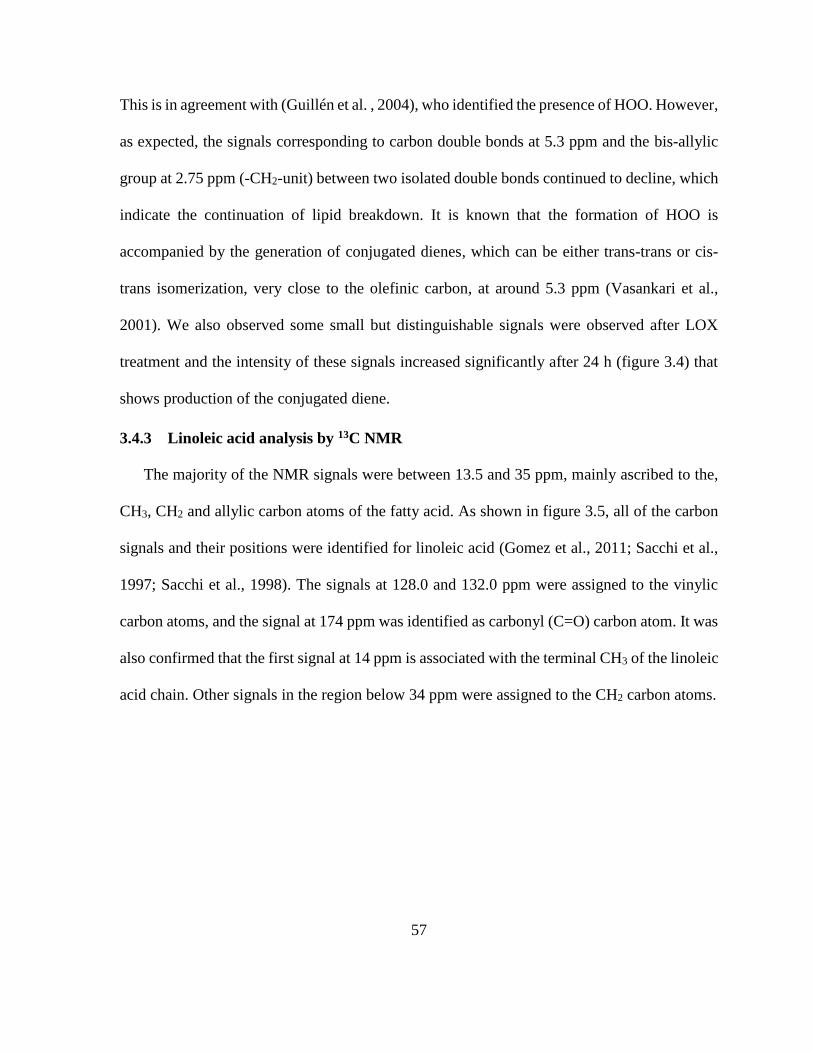
57
This is in agreement with (Guillén et al. , 2004), who identified the presence of HOO. However,
as expected, the signals corresponding to carbon double bonds at 5.3 ppm and the bis-allylic
group at 2.75 ppm (-CH2-unit) between two isolated double bonds continued to decline, which
indicate the continuation of lipid breakdown. It is known that the formation of HOO is
accompanied by the generation of conjugated dienes, which can be either trans-trans or cis-
trans isomerization, very close to the olefinic carbon, at around 5.3 ppm (Vasankari et al.,
2001). We also observed some small but distinguishable signals were observed after LOX
treatment and the intensity of these signals increased significantly after 24 h (figure 3.4) that
shows production of the conjugated diene.
3.4.3 Linoleic acid analysis by 13C NMR
The majority of the NMR signals were between 13.5 and 35 ppm, mainly ascribed to the,
CH3, CH2 and allylic carbon atoms of the fatty acid. As shown in figure 3.5, all of the carbon
signals and their positions were identified for linoleic acid (Gomez et al., 2011; Sacchi et al.,
1997; Sacchi et al., 1998). The signals at 128.0 and 132.0 ppm were assigned to the vinylic
carbon atoms, and the signal at 174 ppm was identified as carbonyl (C=O) carbon atom. It was
also confirmed that the first signal at 14 ppm is associated with the terminal CH3 of the linoleic
acid chain. Other signals in the region below 34 ppm were assigned to the CH2 carbon atoms.
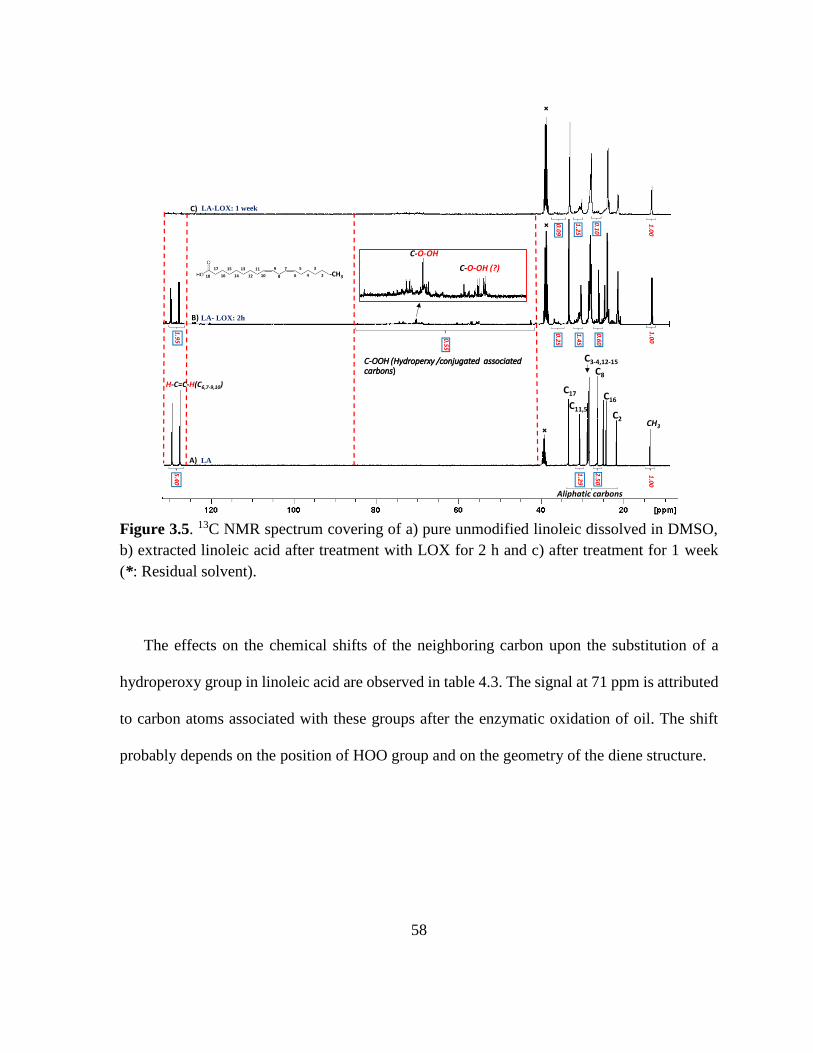
58
Figure 3.5. 13C NMR spectrum covering of a) pure unmodified linoleic dissolved in DMSO,
b) extracted linoleic acid after treatment with LOX for 2 h and c) after treatment for 1 week
(*: Residual solvent).
The effects on the chemical shifts of the neighboring carbon upon the substitution of a
hydroperoxy group in linoleic acid are observed in table 4.3. The signal at 71 ppm is attributed
to carbon atoms associated with these groups after the enzymatic oxidation of oil. The shift
probably depends on the position of HOO group and on the geometry of the diene structure.
5.4
0
H-C=C-H(C6,7-9,10)
˟
1.9
5
C11,5
C16
CH3
C17
C8
C2
C3-4,12-15
18
17
16 14 -CH32
3
4
5
6
7
8
9
10
11
12
1315
C-OOH (Hydroperxy /conjugated associated carbons)
˟
˟
1.0
01
.00
1.0
0
2.5
0
1.2
9
0.5
5
1.4
5
0.2
5
0.6
00
.10
1.2
5
0.0
9
LA
LA- LOX: 2h
LA-LOX: 1 week
Aliphatic carbons
A)
B)
C)
C-O-OH
C-O-OH (?)
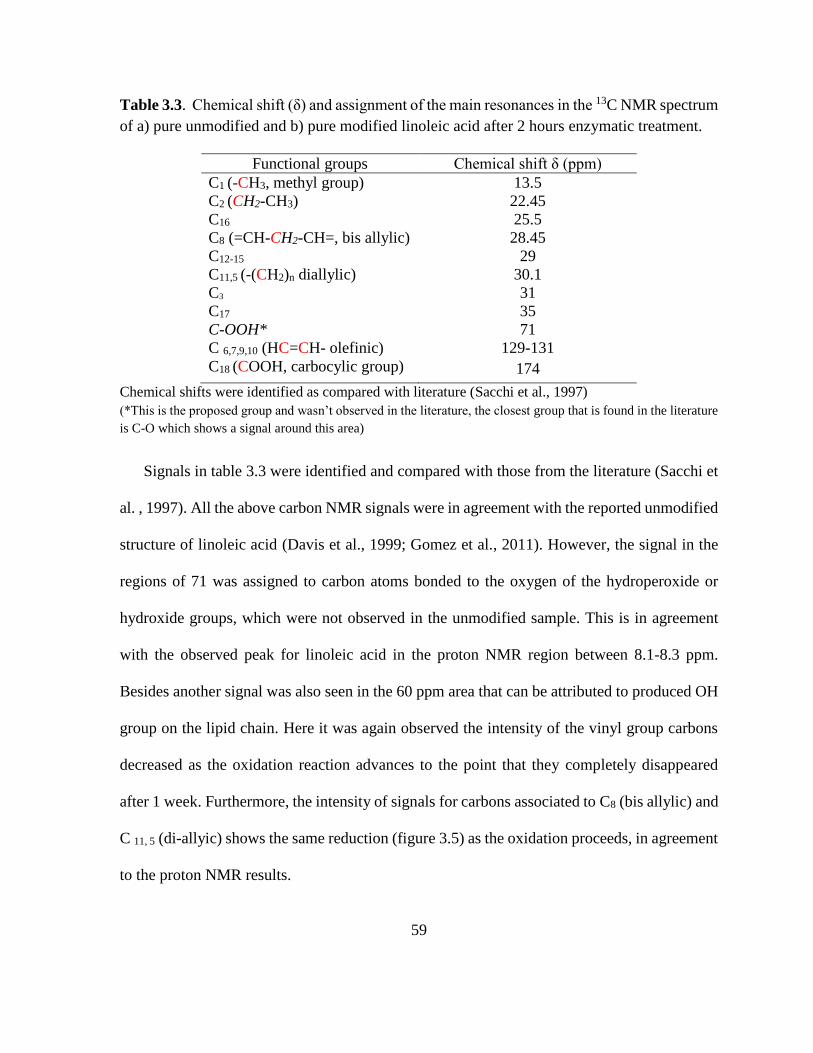
59
Table 3.3. Chemical shift (δ) and assignment of the main resonances in the 13C NMR spectrum
of a) pure unmodified and b) pure modified linoleic acid after 2 hours enzymatic treatment.
Functional groups Chemical shift δ (ppm)
C1 (-CH3, methyl group) 13.5
C2 (CH2-CH3) 22.45
C16 25.5
C8 (=CH-CH2-CH=, bis allylic) 28.45
C12-15 29
C11,5 (-(CH2)n diallylic) 30.1
C3 31
C17 35
C-OOH* 71
C 6,7,9,10 (HC=CH- olefinic) 129-131
C18 (COOH, carbocylic group) 174
Chemical shifts were identified as compared with literature (Sacchi et al., 1997)
(*This is the proposed group and wasn’t observed in the literature, the closest group that is found in the literature
is C-O which shows a signal around this area)
Signals in table 3.3 were identified and compared with those from the literature (Sacchi et
al. , 1997). All the above carbon NMR signals were in agreement with the reported unmodified
structure of linoleic acid (Davis et al., 1999; Gomez et al., 2011). However, the signal in the
regions of 71 was assigned to carbon atoms bonded to the oxygen of the hydroperoxide or
hydroxide groups, which were not observed in the unmodified sample. This is in agreement
with the observed peak for linoleic acid in the proton NMR region between 8.1-8.3 ppm.
Besides another signal was also seen in the 60 ppm area that can be attributed to produced OH
group on the lipid chain. Here it was again observed the intensity of the vinyl group carbons
decreased as the oxidation reaction advances to the point that they completely disappeared
after 1 week. Furthermore, the intensity of signals for carbons associated to C8 (bis allylic) and
C 11, 5 (di-allyic) shows the same reduction (figure 3.5) as the oxidation proceeds, in agreement
to the proton NMR results.
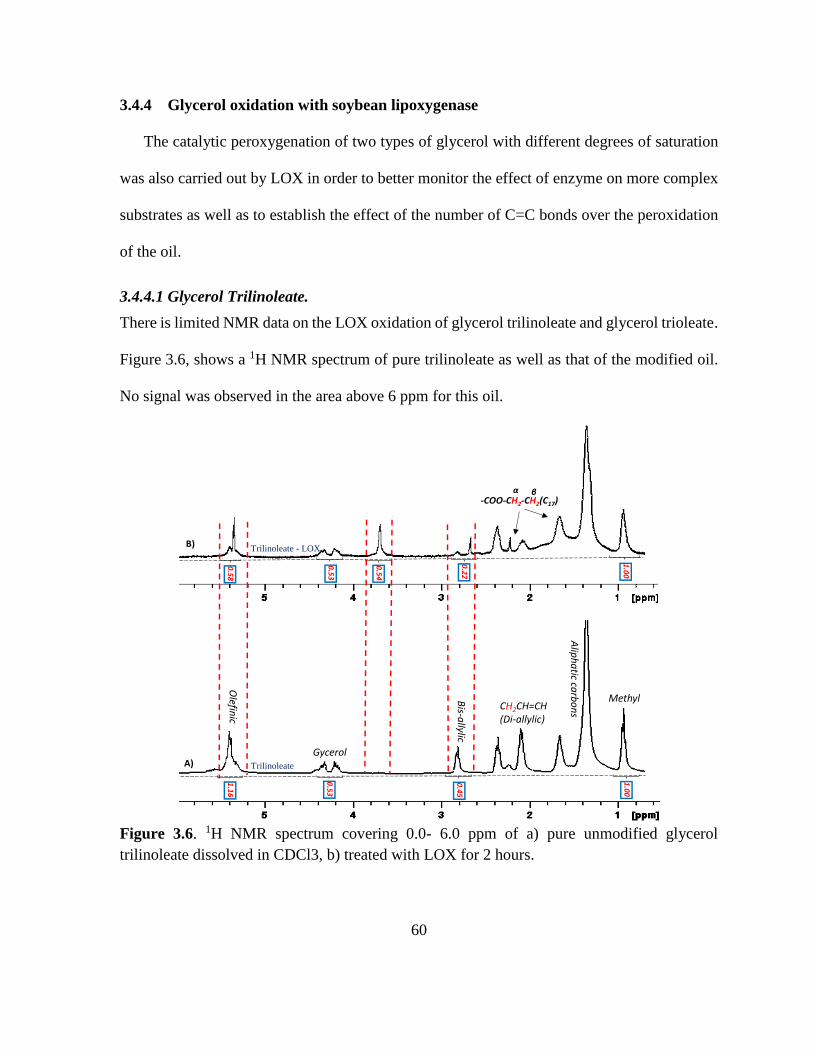
60
3.4.4 Glycerol oxidation with soybean lipoxygenase
The catalytic peroxygenation of two types of glycerol with different degrees of saturation
was also carried out by LOX in order to better monitor the effect of enzyme on more complex
substrates as well as to establish the effect of the number of C=C bonds over the peroxidation
of the oil.
3.4.4.1 Glycerol Trilinoleate.
There is limited NMR data on the LOX oxidation of glycerol trilinoleate and glycerol trioleate.
Figure 3.6, shows a 1H NMR spectrum of pure trilinoleate as well as that of the modified oil.
No signal was observed in the area above 6 ppm for this oil.
Figure 3.6. 1H NMR spectrum covering 0.0- 6.0 ppm of a) pure unmodified glycerol
trilinoleate dissolved in CDCl3, b) treated with LOX for 2 hours.
Olefin
ic0
.58
1.0
01
.00
1.1
6
0.2
20
.45
Trilinoleate
Trilinoleate - LOX
Alip
ha
tic carb
on
s
MethylBis-a
llylic
GycerolA)
B)
0.5
4
0.5
30
.53
CH2CH=CH (Di-allylic)
-COO-CH2-CH2(C17)βα
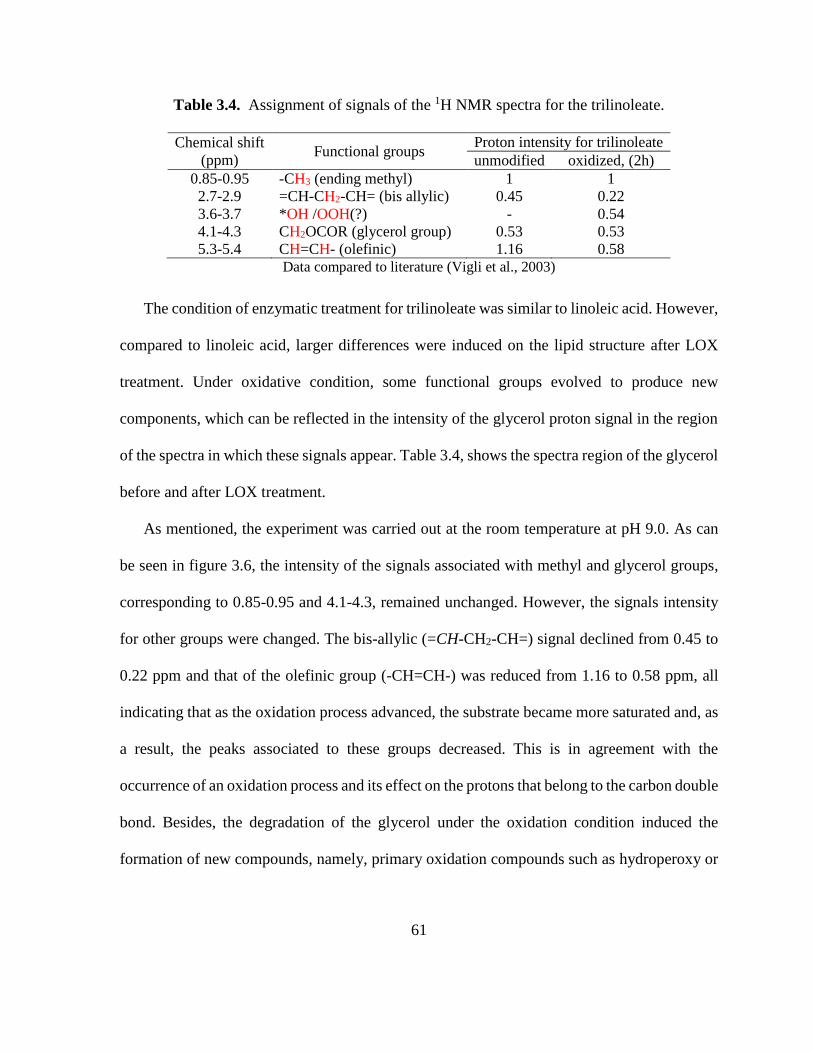
61
Table 3.4. Assignment of signals of the 1H NMR spectra for the trilinoleate.
Chemical shift
(ppm) Functional groups
Proton intensity for trilinoleate
unmodified oxidized, (2h)
0.85-0.95 -CH3 (ending methyl) 1 1
2.7-2.9 =CH-CH2-CH= (bis allylic) 0.45 0.22
3.6-3.7 *OH /OOH(?) - 0.54
4.1-4.3 CH2OCOR (glycerol group) 0.53 0.53
5.3-5.4 CH=CH- (olefinic) 1.16 0.58
Data compared to literature (Vigli et al., 2003)
The condition of enzymatic treatment for trilinoleate was similar to linoleic acid. However,
compared to linoleic acid, larger differences were induced on the lipid structure after LOX
treatment. Under oxidative condition, some functional groups evolved to produce new
components, which can be reflected in the intensity of the glycerol proton signal in the region
of the spectra in which these signals appear. Table 3.4, shows the spectra region of the glycerol
before and after LOX treatment.
As mentioned, the experiment was carried out at the room temperature at pH 9.0. As can
be seen in figure 3.6, the intensity of the signals associated with methyl and glycerol groups,
corresponding to 0.85-0.95 and 4.1-4.3, remained unchanged. However, the signals intensity
for other groups were changed. The bis-allylic (=CH-CH2-CH=) signal declined from 0.45 to
0.22 ppm and that of the olefinic group (-CH=CH-) was reduced from 1.16 to 0.58 ppm, all
indicating that as the oxidation process advanced, the substrate became more saturated and, as
a result, the peaks associated to these groups decreased. This is in agreement with the
occurrence of an oxidation process and its effect on the protons that belong to the carbon double
bond. Besides, the degradation of the glycerol under the oxidation condition induced the
formation of new compounds, namely, primary oxidation compounds such as hydroperoxy or
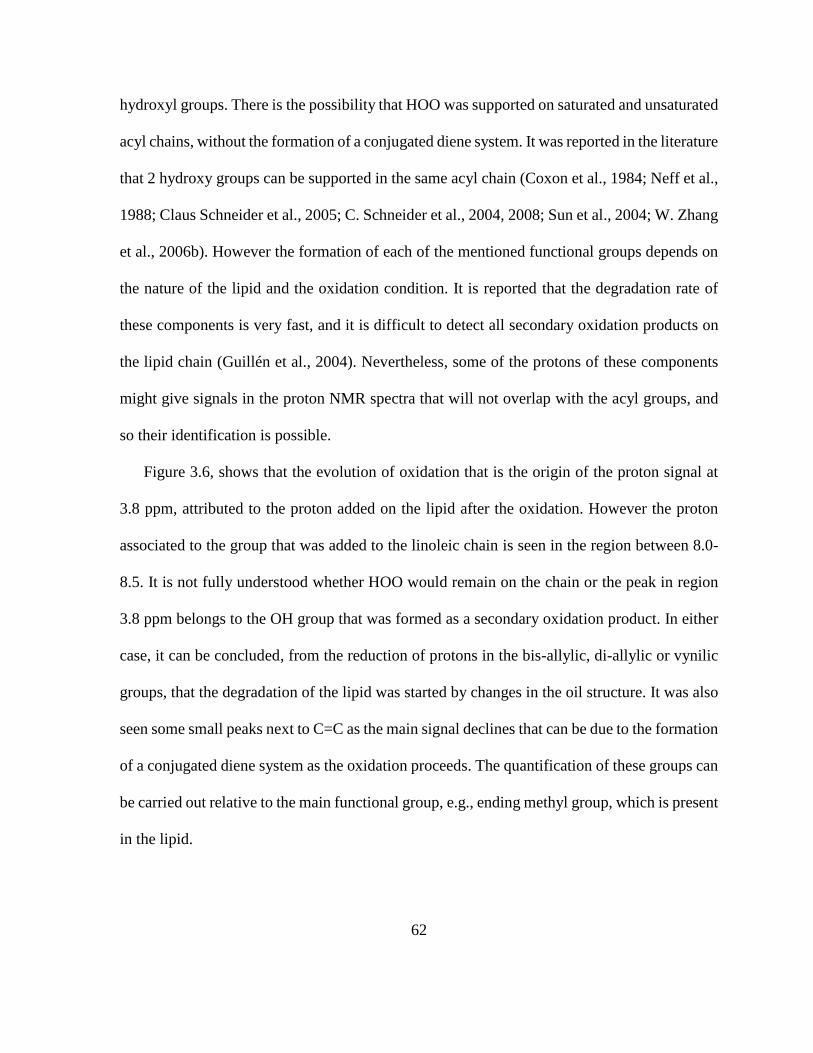
62
hydroxyl groups. There is the possibility that HOO was supported on saturated and unsaturated
acyl chains, without the formation of a conjugated diene system. It was reported in the literature
that 2 hydroxy groups can be supported in the same acyl chain (Coxon et al., 1984; Neff et al.,
1988; Claus Schneider et al., 2005; C. Schneider et al., 2004, 2008; Sun et al., 2004; W. Zhang
et al., 2006b). However the formation of each of the mentioned functional groups depends on
the nature of the lipid and the oxidation condition. It is reported that the degradation rate of
these components is very fast, and it is difficult to detect all secondary oxidation products on
the lipid chain (Guillén et al., 2004). Nevertheless, some of the protons of these components
might give signals in the proton NMR spectra that will not overlap with the acyl groups, and
so their identification is possible.
Figure 3.6, shows that the evolution of oxidation that is the origin of the proton signal at
3.8 ppm, attributed to the proton added on the lipid after the oxidation. However the proton
associated to the group that was added to the linoleic chain is seen in the region between 8.0-
8.5. It is not fully understood whether HOO would remain on the chain or the peak in region
3.8 ppm belongs to the OH group that was formed as a secondary oxidation product. In either
case, it can be concluded, from the reduction of protons in the bis-allylic, di-allylic or vynilic
groups, that the degradation of the lipid was started by changes in the oil structure. It was also
seen some small peaks next to C=C as the main signal declines that can be due to the formation
of a conjugated diene system as the oxidation proceeds. The quantification of these groups can
be carried out relative to the main functional group, e.g., ending methyl group, which is present
in the lipid.

63
3.4.4.2 Glycerol Trioleate
Trioleate has a very similar structure to trilinoleate, with the only difference that it has one
double bond in each chain. This oil was also submitted to oxidation by LOX to evaluate the
effect of the number of double bonds on the oxidation yield. As shown in figure 3.7, all the
proton signals were identical as those observed for trilinoleate, except for the (H-C=C-H)
group, which was weaker (0.72 ppm) compared to the corresponding signal in trilinoleate (1.19
ppm).
Figure 3.7. 1H NMR spectrum covering 0.0- 6.0 ppm of a) pure unmodified glycerol trioleate
dissolved in CDCl3, b) treated with LOX for 2 hours.
0.6
8
1.0
01
.00
0.7
2
Trioleate
Trioleate- LOX
Alip
ha
tic carb
on
s
Methyl
Gycerol
Olefin
ic
A)
B)0
.53
0.5
3
Di-Allylic(CH2CH=CH)
0.0
3
1.2
11
.18
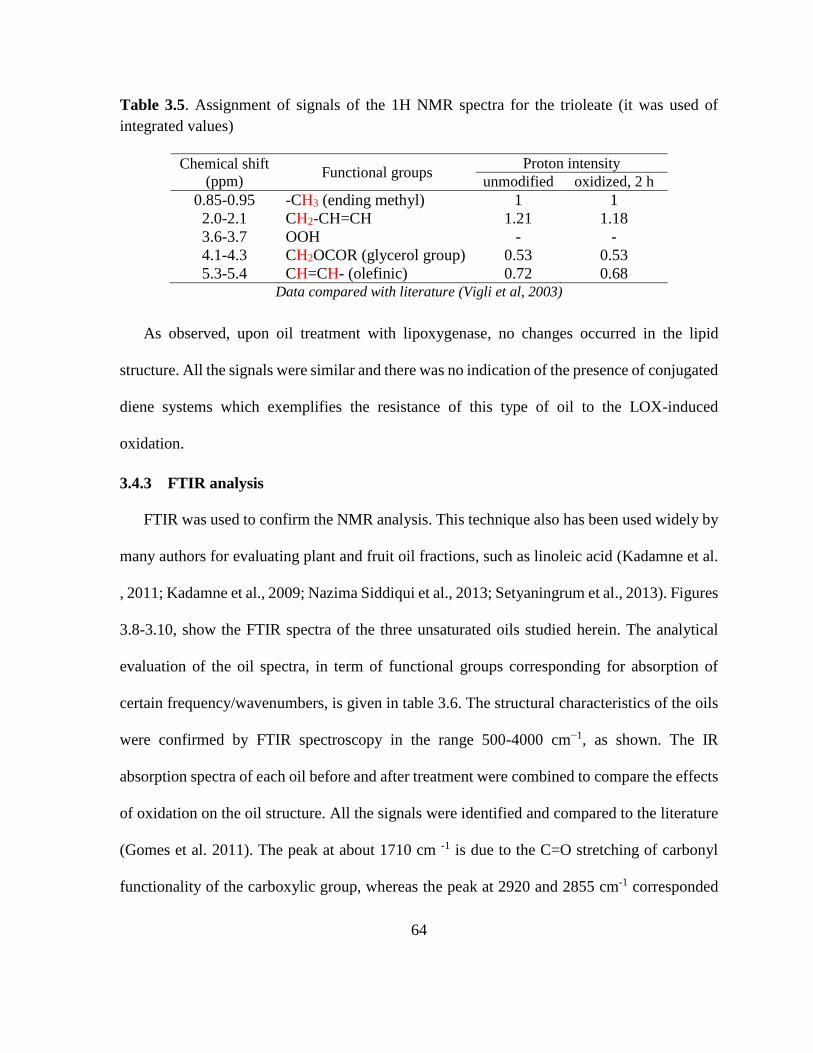
64
Table 3.5. Assignment of signals of the 1H NMR spectra for the trioleate (it was used of
integrated values)
Chemical shift
(ppm) Functional groups
Proton intensity
unmodified oxidized, 2 h
0.85-0.95 -CH3 (ending methyl) 1 1
2.0-2.1 CH2-CH=CH 1.21 1.18
3.6-3.7 OOH - -
4.1-4.3 CH2OCOR (glycerol group) 0.53 0.53
5.3-5.4 CH=CH- (olefinic) 0.72 0.68 Data compared with literature (Vigli et al, 2003)
As observed, upon oil treatment with lipoxygenase, no changes occurred in the lipid
structure. All the signals were similar and there was no indication of the presence of conjugated
diene systems which exemplifies the resistance of this type of oil to the LOX-induced
oxidation.
3.4.3 FTIR analysis
FTIR was used to confirm the NMR analysis. This technique also has been used widely by
many authors for evaluating plant and fruit oil fractions, such as linoleic acid (Kadamne et al.
, 2011; Kadamne et al., 2009; Nazima Siddiqui et al., 2013; Setyaningrum et al., 2013). Figures
3.8-3.10, show the FTIR spectra of the three unsaturated oils studied herein. The analytical
evaluation of the oil spectra, in term of functional groups corresponding for absorption of
certain frequency/wavenumbers, is given in table 3.6. The structural characteristics of the oils
were confirmed by FTIR spectroscopy in the range 500-4000 cm−1, as shown. The IR
absorption spectra of each oil before and after treatment were combined to compare the effects
of oxidation on the oil structure. All the signals were identified and compared to the literature
(Gomes et al. 2011). The peak at about 1710 cm -1 is due to the C=O stretching of carbonyl
functionality of the carboxylic group, whereas the peak at 2920 and 2855 cm-1 corresponded

65
to the CH2 and CH3 groups of the aliphatic chain. None of the intensities for these groups
changed after the LOX treatment, which is in agreement with both carbon and proton NMR
results.
Figure 3.8. FTIR spectra of linoleic acid (region between 500 and 4500 cm-1) before/after
treatment with LOX for 2h.
The peak at 3010 cm-1 was identified as the H-C=C-H (vinyl group), which almost
disappeared in linoleic acid and trilinoleate but did not change in the case of the trioleate. This
indicates partial removal of the C=C bond by addition of oxidation products on the oil chain.
In addition, two peaks in 945 and 970 were observed in linoleic acid that are contributed to the
formation of the cis and trans conjugated linoleaic acid respectively (Kadamne et al., 2009;
Poiana et al., 2015).
5001000150020002500300035004000
50
60
70
80
90
100
% T
rans
mitt
ance
Wave number cm-1
LA
LA-LOX
3009
CH3 2855 1180
1180
1085
970 trans
930
945 cis
725
CH2
C=C(double bond)
Asymmetric – CH2 2926
O-C=O 1709
OH/O-O-H 3450
1085
3009
66
Table 3.6. Functional groups from FTIR spectra of evaluated oils. Data compared to literature;
(Esterbauer et al., 1991; Guillén et al., 1998; Gutiérrez et al., 1998; Lerma-García et al., 2010)
Frequency (cm-1) Functional groups
3460 -80
3005-10
-OH
=C-H
2922-26 -C-H(CH2)
2855 -C-H(CH3)
1736-42 -C=O
1235-58
1160
-C-O, CH2
-C-O, CH2
1094
1024
970
810
-C-O
-C-O
Conjugated dine (cis)
Conjugated diene (trans)
723 -(CH2)-
Also, there was a strong band at about 1024 cm -1 on the modified trilinoleate, indicating
the presence of new groups on the lipid structure. This peak, however, was not observed in the
two other oils. As reported by (Guillén et al. , 1998), this can be associated with the C-O bond
as was also observed in 1H NMR spectrum. There was a 1H NMR signal at 3.6 ppm that arose
in an area different than that of the region expected for the HOO group. The FTIR spectrum
(figure 3.9) supports the hypothesis that an unstable, short-lived HOO group underwent a
secondary reaction, leading to formation of a C-O group on the lipid chain, rather than a HOO
group.
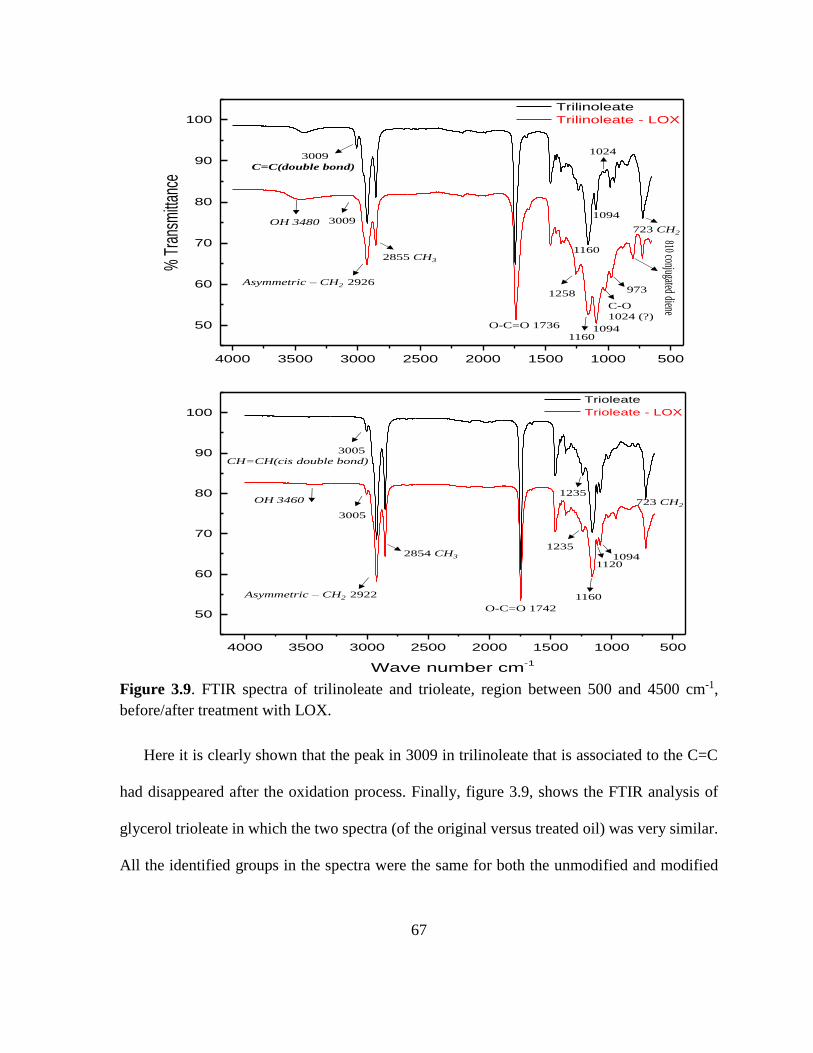
67
Figure 3.9. FTIR spectra of trilinoleate and trioleate, region between 500 and 4500 cm-1,
before/after treatment with LOX.
Here it is clearly shown that the peak in 3009 in trilinoleate that is associated to the C=C
had disappeared after the oxidation process. Finally, figure 3.9, shows the FTIR analysis of
glycerol trioleate in which the two spectra (of the original versus treated oil) was very similar.
All the identified groups in the spectra were the same for both the unmodified and modified
5001000150020002500300035004000
50
60
70
80
90
100
% T
rans
mitt
ance
Wave number cm-1
Trilinoleate
Trilinoleate - LOX
3009
2855 CH3
1258 973
723 CH2
C=C(double bond)
Asymmetric – CH2 2926
O-C=O 1736
OH 3480
1160
1160
1094
1094
C-O
1024 (?)
1024810 conjugated diene
3009
5001000150020002500300035004000
50
60
70
80
90
100
% T
rans
mitt
ance
Wave number cm-1
Trioleate
Trioleate - LOX
3005
2854 CH3
1235
723 CH2
CH=CH(cis double bond)
Asymmetric – CH2 2922
O-C=O 1742
OH 34601235
1160
11201094
3005
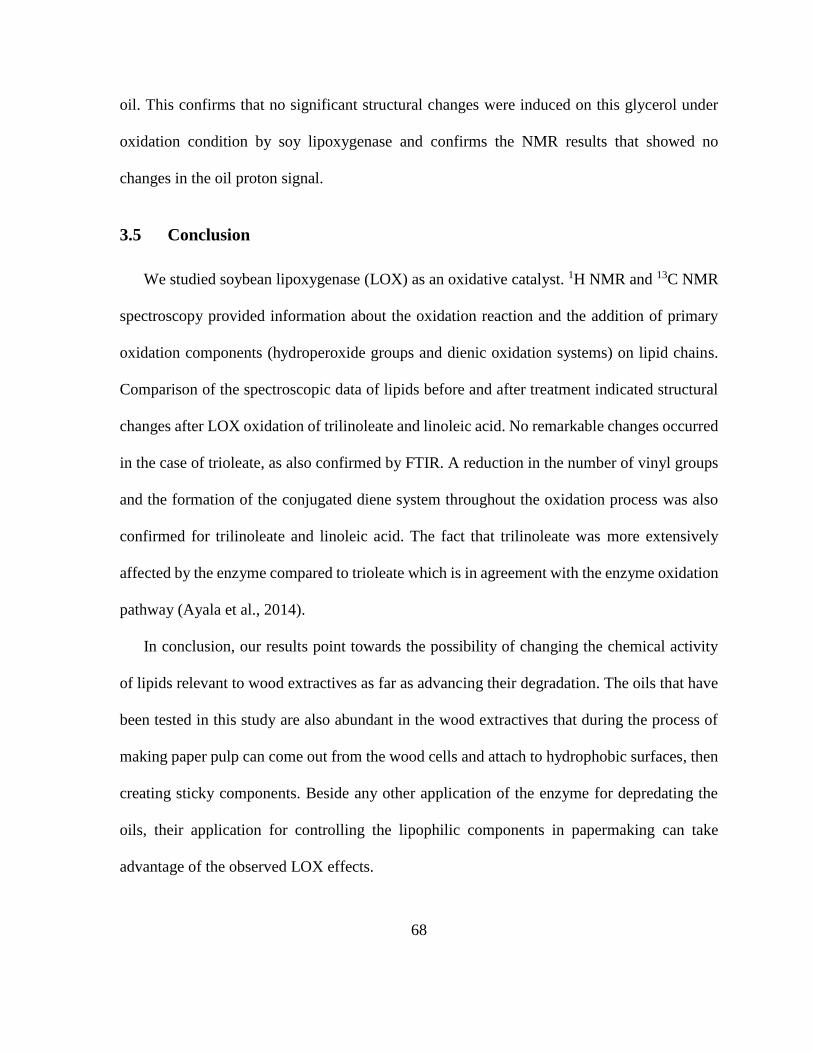
68
oil. This confirms that no significant structural changes were induced on this glycerol under
oxidation condition by soy lipoxygenase and confirms the NMR results that showed no
changes in the oil proton signal.
3.5 Conclusion
We studied soybean lipoxygenase (LOX) as an oxidative catalyst. 1H NMR and 13C NMR
spectroscopy provided information about the oxidation reaction and the addition of primary
oxidation components (hydroperoxide groups and dienic oxidation systems) on lipid chains.
Comparison of the spectroscopic data of lipids before and after treatment indicated structural
changes after LOX oxidation of trilinoleate and linoleic acid. No remarkable changes occurred
in the case of trioleate, as also confirmed by FTIR. A reduction in the number of vinyl groups
and the formation of the conjugated diene system throughout the oxidation process was also
confirmed for trilinoleate and linoleic acid. The fact that trilinoleate was more extensively
affected by the enzyme compared to trioleate which is in agreement with the enzyme oxidation
pathway (Ayala et al., 2014).
In conclusion, our results point towards the possibility of changing the chemical activity
of lipids relevant to wood extractives as far as advancing their degradation. The oils that have
been tested in this study are also abundant in the wood extractives that during the process of
making paper pulp can come out from the wood cells and attach to hydrophobic surfaces, then
creating sticky components. Beside any other application of the enzyme for depredating the
oils, their application for controlling the lipophilic components in papermaking can take
advantage of the observed LOX effects.
69
3.6 Reference
Ayala, A.F., M. M. & Argauelles, s. (2014). Lipid Peroxidation: Production, Metabolism, and
Signaling Mechanisms of Malondialdehyde and 4-Hydroxy-2-Nonenal. Oxidative Medicine
and Cellular Longevity, 2014, 31.
Belury, M. A. (2002). Inhibition of carcinogenesis by conjugated linoleic acid: potential
mechanisms of action. J Nutr, 132(10), 2995-2998.
Brash, A. R.Ingram, C. D. & Harris, T. M. (1987). Analysis of a specific oxygenation reaction
of soybean lipoxygenase-1 with fatty acids esterified in phospholipids. Biochemistry, 26(17),
5465-5471.
Cao, Y.Yang, L.Gao, H.-L.Chen, J.-N.Chen, Z.-Y. & Ren, Q.-S. (2007). Re-characterization
of three conjugated linolenic acid isomers by GC–MS and NMR. Chemistry and Physics of
Lipids, 145(2), 128-133.
Cathcart, M. K. & Folcik, V. A. (2000). Lipoxygenases and atherosclerosis: protection versus
pathogenesis. Free Radical Biology and Medicine, 28(12), 1726-1734.
Chan, H. W. & Levett, G. (1977). Autoxidation of methyl linoleate. Separation and analysis of
isomeric mixtures of methyl linoleate hydroperoxides and methyl hydroxylinoleates. Lipids,
12(1), 99-104.
Chin, S. F.Liu, W.Storkson, J. M.Ha, Y. L. & Pariza, M. W. (1992). Dietary sources of
conjugated dienoic isomers of linoleic acid, a newly recognized class of anticarcinogens.
Journal of Food Composition and Analysis, 5(3), 185-197.
Christy, A. A. (2009). Evidence in the formation of conjugated linoleic acids from thermally
induced 9t12t linoleic acid: a study by gas chromatography and infrared spectroscopy. Chem
Phys Lipids, 161(2), 86-94.
Claxson, A. W.Hawkes, G. E.Richardson, D. P.Naughton, D. P.Haywood, R. M.Chander, C.
L.Atherton, M.Lynch, E. J. & Grootveld, M. C. (1994). Generation of lipid peroxidation
products in culinary oils and fats during episodes of thermal stressing: a high field 1H NMR
study. FEBS Lett, 355(1), 81-90.
Coxon, D. T.Peers, K. E. & Rigby, N. M. (1984). Selective formation of dihydroperoxides in
the [small alpha]-tocopherol inhibited autoxidation of methyl linolenate. Journal of the
Chemical Society, Chemical Communications(1), 67-68.

70
Cyrus, T.Witztum, J. L.Rader, D. J.Tangirala, R.Fazio, S.Linton, M. F. & Funk, C. D. (1999).
Disruption of the 12/15-lipoxygenase gene diminishes atherosclerosis in apo E-deficient mice.
J Clin Invest, 103(11), 1597-1604.
Davis, A. L.Mc Neill, G. P. & Caswell, D. C. (1999). Analysis of conjugated linoleic acid
isomers by 13C NMR spectroscopy. Chemistry and Physics of Lipids, 97(2), 155-165.
De Groot, J. M. C.Veldink, G. A.Vliegenthart, J. F. G.Boldingh, J.Wever, R. & van Gelder, B.
F. (1975). Demonstration by EPR spectroscopy of the functional role of iron in soybean
lipoxygenase-1. Biochimica et Biophysica Acta (BBA) - Enzymology, 377(1), 71-79.
Esterbauer, H.Schaur, R. J. & Zollner, H. (1991). Chemistry and biochemistry of 4-
hydroxynonenal, malonaldehyde and related aldehydes. Free Radical Biology and Medicine,
11(1), 81-128.
Evans, M.Brown, J. & McIntosh, M. (2002). Isomer-specific effects of conjugated linoleic acid
(CLA) on adiposity and lipid metabolism. J Nutr Biochem, 13(9), 508.
Feussner, I.Bachmann, A.Hohne, M. & Kindl, H. (1998). All three acyl moieties of trilinolein
are efficiently oxygenated by recombinant His-tagged lipid body lipoxygenase in vitro. FEBS
Lett, 431(3), 433-436.
Girotti, A. W. (1998). Lipid hydroperoxide generation, turnover, and effector action in
biological systems. J Lipid Res, 39(8), 1529-1542.
Gnadig, S.Rickert, R.Sébédio, J. L. & Steinhart, H. (2001). Conjugated linoleic acid (CLA):
physiological effects and production. European Journal of Lipid Science and Technology,
103(1), 56-61.
Gomez, N. A.Abonia, R.Cadavid, H. & Vargas, I. H. (2011). Chemical and spectroscopic
characterization of a vegetable oil used as dielectric coolant in distribution transformers.
Journal of the Brazilian Chemical Society, 22(12), 2292-2303.
Guillén, M. D. & Cabo, N. (1998). Relationships between the Composition of Edible Oils and
Lard and the Ratio of the Absorbance of Specific Bands of Their Fourier Transform Infrared
Spectra. Role of Some Bands of the Fingerprint Region. Journal of Agricultural and Food
Chemistry, 46(5), 1788-1793.
Guillén, M. D. & Ruiz, A. (2004). Formation of hydroperoxy- and hydroxyalkenals during
thermal oxidative degradation of sesame oil monitored by proton NMR. European Journal of
Lipid Science and Technology, 106(10), 680-687.
71
Gunstone, F. (1993). High resolution 13C NMR spectroscopy of lipids. Advances in Lipid
Methodology two, 4(2), 1-68.
Gutiérrez, A.del Rıo, J. C.González-Vila, F. J. & Martın, F. (1998). Analysis of lipophilic
extractives from wood and pitch deposits by solid-phase extraction and gas chromatography.
Journal of Chromatography A, 823(1–2), 449-455.
Gutiérrez, A.José, C. & Martínez, A. T. (2009). Microbial and enzymatic control of pitch in
the pulp and paper industry. Applied microbiology and biotechnology, 82(6), 1005-1018.
Hämäläinen, T. & Kamal-Eldin, A. (2005). Analysis of lipid oxidation products by NMR
spectroscopy: AOCS Press: Champaign, IL.
Hämäläinen, T.Sundberg, S.Hase, T. & Hopia, A. (2002). Stereochemistry of the
hydroperoxides formed during autoxidation of CLA methyl ester in the presence of α-
tocopherol. Lipids, 37(6), 533-540.
Hämäläinen, T.Sundberg, S.Mäkinen, M.Kaltia, S.Hase, T. & Hopia, A. (2001).
Hydroperoxide formation during autoxidation of conjugated linoleic acid methyl ester.
European Journal of Lipid Science and Technology, 103(9), 588-593.
Haywood, R. M.Claxson, A. W.Hawkes, G. E.Richardson, D. P.Naughton, D. P.Coumbarides,
G.Hawkes, J.Lynch, E. J. & Grootveld, M. C. (1995). Detection of aldehydes and their
conjugated hydroperoxydiene precursors in thermally-stressed culinary oils and fats:
investigations using high resolution proton NMR spectroscopy. Free Radic Res, 22(5), 441-
482.
Holman, R. T.Egwim, P. O. & Christie, W. W. (1969). Substrate specificity of soybean
lipoxidase. Journal of Biological Chemistry, 244(5), 1149-1151.
Jie, M. S. & Mustafa, J. (1997). High-resolution nuclear magnetic resonance spectroscopy--
applications to fatty acids and triacylglycerols. Lipids, 32(10), 1019-1034.
Kadamne, J. V.Castrodale, C. L. & Proctor, A. (2011). Measurement of conjugated linoleic
acid (CLA) in CLA-rich potato chips by ATR-FTIR spectroscopy. J Agric Food Chem, 59(6),
2190-2196.
Kadamne, J. V.Jain, V. P.Saleh, M. & Proctor, A. (2009). Measurement of conjugated linoleic
acid (CLA) in CLA-rich soy oil by attenuated total reflectance-Fourier transform infrared
spectroscopy (ATR-FTIR). J Agric Food Chem, 57(22), 10483-10488.
Kanner, J.German, J. B. & Kinsella, J. E. (1987). Initiation of lipid peroxidation in biological
systems. Crit Rev Food Sci Nutr, 25(4), 317-364.
72
Klein, R. F.Allard, J.Avnur, Z.Nikolcheva, T.Rotstein, D.Carlos, A. S.Shea, M.Waters, R.
V.Belknap, J. K.Peltz, G. & Orwoll, E. S. (2004). Regulation of bone mass in mice by the
lipoxygenase gene Alox15. Science, 303(5655), 229-232.
Knothe, G. & Kenar, J. A. (2004). Determination of the fatty acid profile by 1H-NMR
spectroscopy. European Journal of Lipid Science and Technology, 106(2), 88-96.
Kuhn, H. & Thiele, B. J. (1999). The diversity of the lipoxygenase family. Many sequence data
but little information on biological significance. FEBS Lett, 449(1), 7-11.
Lerma-García, M. J.Ramis-Ramos, G.Herrero-Martínez, J. M. & Simó-Alfonso, E. F. (2010).
Authentication of extra virgin olive oils by Fourier-transform infrared spectroscopy. Food
Chemistry, 118(1), 78-83.
Lie Ken Jie, M. S. F. (2001). Analysis of conjugated linoleic acid esters by nuclear magnetic
resonance spectroscopy. European Journal of Lipid Science and Technology, 103(9), 628-632.
Lodge, J. K.Sadler, P. J.Kus, M. L. & Winyard, P. G. (1995). Copper-induced LDL
peroxidation investigated by 1H-NMR spectroscopy. Biochim Biophys Acta, 1256(2), 130-
140.
Maccarrone, M.van Aarle, P. G. M.Veldink, G. A. & Vliegenthart, J. F. G. (1994). In vitro
oxygenation of soybean biomembranes by lipoxygenase-2. Biochimica et Biophysica Acta
(BBA) - Biomembranes, 1190(1), 164-169.
Marques, G.Molina, S.Babot, E. D.Lund, H.José, C. & Gutiérrez, A. (2011). Exploring the
potential of fungal manganese-containing lipoxygenase for pitch control and pulp
delignification. Bioresource technology, 102(2), 1338-1343.
Martínez-Yusta, A.Goicoechea, E. & Guillén, M. D. (2014). A Review of Thermo-Oxidative
Degradation of Food Lipids Studied by 1H NMR Spectroscopy: Influence of Degradative
Conditions and Food Lipid Nature. Comprehensive Reviews in Food Science and Food Safety,
13(5), 838-859.
Medina, I.Sacchi, R.Giudicianni, I. & Aubourg, S. (1998). Oxidation in fish lipids during
thermal stress as studied by 13C nuclear magnetic resonance spectroscopy. Journal of the
American Oil Chemists' Society, 75(2), 147-154.
Nazima Siddiqui & Adeel Ahmad. (2013). Infrared Spectroscopic Studies On Edible And
Medicinal Oils. International Journal of Science and Technology, 2(6), 1297-1306.

73
Neff, W. E.Frankel, E. N. & Fujimoto, K. (1988). Autoxidative dimerization of methyl
linolenate and its monohydroperoxides, hydroperoxy epidioxides and dihydroperoxides.
Journal of the American Oil Chemists’ Society, 65(4), 616-623.
Pajunen, T. I.Koskela, H.Hase, T. & Hopia, A. (2008). NMR properties of conjugated linoleic
acid (CLA) methyl ester hydroperoxides. Chemistry and Physics of Lipids, 154(2), 105-114.
Poiana, M.-A., Alexa, E., Munteanu, M.-F., Gligor, R., Moigradean, D., & Mateescu, C.
(2015). Use of ATR-FTIR spectroscopy to detect the changes in extra virgin olive oil by
adulteration with soybean oil and high temperature heat treatment. Open Chemistry, 13, 689–
698.
Porta, H. & Rocha-Sosa, M. (2002). Plant Lipoxygenases. Physiological and Molecular
Features. Plant Physiology, 130(1), 15-21.
Prema, D.Pilfold, J. L.Krauchi, J.Church, J. S.Donkor, K. K. & Cinel, B. (2013). Rapid
Determination of Total Conjugated Linoleic Acid Content in Select Canadian Cheeses by 1H
NMR Spectroscopy. Journal of Agricultural and Food Chemistry, 61(41), 9915-9921.
Sacchi, R.Addeo, F. & Paolillo, L. (1997). 1H and 13C NMR of virgin olive oil. An overview.
Magnetic Resonance in Chemistry, 35(13), S133-S145.
Sacchi, R.Mannina, L.Fiordiponti, P.Barone, P.Paolillo, L.Patumi, M. & Segre, A. (1998).
Characterization of Italian Extra Virgin Olive Oils Using 1H-NMR Spectroscopy. Journal of
Agricultural and Food Chemistry, 46(10), 3947-3951.
Samuelsson, B.Dahlen, S. E.Lindgren, J. A.Rouzer, C. A. & Serhan, C. N. (1987).
Leukotrienes and lipoxins: structures, biosynthesis, and biological effects. Science, 237(4819),
1171-1176.
Schewe, T. & Ku¨hn, H. (1991). Do 15-lipoxygenases have a common biological role? Trends
in Biochemical Sciences, 16, 369-373.
Schneider, C.Boeglin, W. E.Yin, H.Stec, D. F.Hachey, D. L.Porter, N. A. & Brash, A. R.
(2005). Synthesis of dihydroperoxides of linoleic and linolenic acids and studies on their
transformation to 4-hydroperoxynonenal. Lipids, 40(11), 1155-1162.
Schneider, C.Porter, N. A. & Brash, A. R. (2004). Autoxidative transformation of chiral
omega6 hydroxy linoleic and arachidonic acids to chiral 4-hydroxy-2E-nonenal. Chem Res
Toxicol, 17(7), 937-941.
Schneider, C.Porter, N. A. & Brash, A. R. (2008). Routes to 4-hydroxynonenal: fundamental
issues in the mechanisms of lipid peroxidation. J Biol Chem, 283(23), 15539-15543.

74
Setyaningrum, D. L.Riyanto, S. & Rohman, A. (2013). Analysis of corn and soybean oils in
red fruit oil using FTIR spectroscopy in combination with partial least square. International
Food Research Journal, 20(4), 1977-1981.
Shibata, D.Steczko, J.Dixon, J. E.Hermodson, M.Yazdanparast, R. & Axelrod, B. (1987).
Primary structure of soybean lipoxygenase-1. J Biol Chem, 262(21), 10080-10085.
Siciliano, C.Belsito, E.De Marco, R.Di Gioia, M. L.Leggio, A. & Liguori, A. (2013).
Quantitative determination of fatty acid chain composition in pork meat products by high
resolution 1H NMR spectroscopy. Food Chemistry, 136(2), 546-554.
Siedow, J. N. (1991). Plant Lipoxygenase: Structure and Function. Annual Review of Plant
Physiology and Plant Molecular Biology, 42, 145-188.
Silwood, C. J. & Grootveld, M. (1999). Application of high-resolution, two-dimensional 1H
and 13C nuclear magnetic resonance techniques to the characterization of lipid oxidation
products in autoxidized linoleoyl/linolenoylglycerols. Lipids, 34(7), 741-756.
Simopoulos, A. P. (2002). The importance of the ratio of omega-6/omega-3 essential fatty
acids. Biomedicine & Pharmacotherapy, 56(8), 365-379.
75
4 Oxidation and removal of unsaturated fatty acids from nanofibrillated
cellulose and polyester surfaces by lipoxygenase treatment: A QCM/SPR
study
4.1 Abstract
A quartz crystal microbalance (QCM) was used to investigate the oxidation and removal of
three model fatty acids, linoleic acid, glycerol trilinoleate, and wood extractives, from a soft
surface (nanofibrillated cellulose, NFC) and a hard surface (polyethylene terephthalate, PET).
The effect of soybean enzyme (lipoxygenase) to decrease the affinity of soiling lipid layer to
two types of surfaces as well as the lipid formation on the surfaces at the molecular level was
elucidated as far as the enzyme activity. The results indicated that lipids that have been treated
with soybean lipoxygenase have less affinity to PET in particular. Also, the rate of oxidation
depends on the type of lipid substrate structure. Surface plasmon resonance (SPR) was for used
to confirm the oxidation effect of enzyme in aqueous solution, and the amounts of mass
removed with both techniques were calculated and compared. The study of dissipation of the
adsorbed layer confirmed the change in the lipid configuration on the surface of PET and NFC.
Finally the atomic forced microscopic analysis (AFM) showed the role of morphology and
surface roughness on the lipid configuration before and after enzyme addition. The obtained
results can be used for enzyme applications in papermaking, as a viable solution to deposit
problems and for fiber surface modification.

76
4.2 Introduction
Lipoxygenase is an iron-containing enzyme that is able to catalyze the dioxygenation of
poly-unsaturated fatty acids (PUFA) having at least one 1-cis-4 pentadiene system (Kuhn et
al., 1999). This is the system that has at least one double bond in the fatty acid chain.
Lipoxygenases are found in both plants and animal tissues. According to previous studies,
lipoxygenase in plants is responsible for plant development stages, signaling wounds,
induction of cell death (Porta et al., 2002; Siedow, 1991) and/or senescence processes
(Gardner, 1991). The main substrate for lipoxygenase in plants is linoleic acid (C18). The role
of animal-extracted lipoxygenase, whose main substrate is arachidonic acid (C20), is however
more studied. It is reported elsewhere that this enzyme is involved in inflammatory process,
(Samuelsson et al., 1987) cell membrane maturations (Schewe et al., 1991), atherogenesis
(Cathcart et al., 2000; Cyrus et al., 1999) and osteoporosis (Klein et al., 2004).
The non-heme iron in the lipoxygenase exists in two forms of Fe+2 and Fe+3, and the
enzyme is inactive in the Fe+2 form (De Groot et al., 1975). However when the enzyme is
treated with an equimolar amount of substrate and in presence of oxygen, Fe+2 can be oxidized
to Fe+3, which will cause enzyme activation. In case of treating the enzyme with linoleic acid,
the ferric form of the enzyme can catalyze the hydrogen abstraction from the bis-allylic
(H2C=CH-CH2R) carbon atom of the linoleic acid from the 11th position stereospecifically,
which will result in a pentadienyl radical complexed with the ferrous enzyme (Prigge et al.,
1997). In the next step, the radical reacts with biomolecular oxygen (OO), forming an oxygen-
centered radical. Subsequently peroxy radical oxidizes the iron and forms a peroxy-anion that
reactivate the iron (Fe+3). Finally, the proxy-anion is protonated through the enzyme tunnel,

77
which leads to the formation of hydro peroxide product (Haeggström et al., 2011; Hatcher et
al., 2004; Lehnert et al., 2003). This product has UV absorbance at 234 nm, and therefore UV
light can be used for enzyme activity measurement (Brash et al., 1996). Even though non-
enzymatic lipid oxidation is very similar to the mentioned mechanism in some respects, it is
unlike enzymatic lipid oxidation insofar as it can lead to a racemic mixture of hydroperoxides.
It was also reported through a 13P-NMR spin trapping method that under certain conditions,
including high substrate concentration and/or lower or no oxygen concentration, radicals may
escape, leaving the iron in the inactive form; possibly a secondary radical peroxidation reaction
also occurs, and this can lead to other intermediate reactions (Zoia et al., 2011).
There are different types of lipoxygenases including, 5-, 12-, and 15-lipoxygenases that
depending on their location in the cell, each have their specificity (Ford-Hutchinson et al.,
1994; Prigge et al. , 1997) but soy bean lipoxygenase-1 is easier to be purified compared to
other types of enzymes and it has been well characterized in the past (Shibata et al., 1987).
Lipoxygenase oxidation of linoleic acid and triglycerides that are derived from linoleic acid
will lead to a possible application of this enzyme in the pulp and paper industry. Wood chips
that are being used for paper making as the raw material contain wood extractives, a significant
portion of which are organic lipophilic components that can cause detrimental effect on the
paper making process. These extractives, which may make up 2-5% of the solid mass, have
different physiological functions in the living tree such as protecting the wood from microbial
attack, formation of color or odor and even storage of nutrients. However, the presence of these
complex materials in the pulping process can cause serious problems, especially when there is
no or less chemical used in the pulping process such as mechanical pulping. During the

78
pulping, part of extractives that are trapped in the cell lumens can be released and accumulate
on lipophilic surfaces. Among the extractives components, fatty acids, in saturated and
unsaturated form, their esters, and sterols, are of big portion and by sticking to the oil-loving
surfaces they can cause issues in the paper products including poor paper mechanical and
optical properties as well as lower runnability that eventually will increase the production cost
(Gurnagul et al., 1992). There are many publications that have addressed this issue and have
introduced chemicals such as talc, positively charged polymers and surfactants that can remove
theses hydrophobic materials or make them less problematic (Hubbe et al., 2006). However
there is yet not a complete cost-effective solution for this problem.
Other enzymes such as lipase and laccase have been used for the lipophilic components in
the pulp (Sharyo et al., 1993). However, lipase can only hydrolyze the ester-bonded extractives
and is not able to degrade the fatty acids (Paice M, 2005). Laccase also could decrease both
lipophilic and hydrophilic as well as phenolic components in the pulps (Buchert et al., 2002;
Zhang et al., 2005); but it also causes a reduction in pulp brightness, which is a drawback of
using this enzyme (Stebbing et al., 2004).
Since other studies have shown that more than 50% of extractives are fatty acids and
triglycerides that are derived from linoleic acid, (Ekman et al., 1990; Fengel et al., 1983), then
the ability of lipoxygenase to oxidize this group of lipids encouraged us to consider using this
enzyme to battle the pitch problem in the paper making process.
Besides, lipoxygenase application for pitch control in softwood TMP pulps was suggested
by earlier work by (Zhang et al., 2007). They reported the removal of 25% of lipophilic
components after 2 hour treatment with lipoxygenase. However, they found that some of the
79
extractives and lignin fragments have an inhibitory effect on enzyme activity. An earlier patent
by Novozymes also had suggested the possibility of using lipoxygenase to remove a model
wood pitch (Borch et al., 2003). And finally our NMR/FTIR study confirmed the modification
of lipids when submitted to LOX-induced oxidation condition and suggests the possible change
in lipid sorption properties after being oxidized with LOX.
4.2.1 Sorption properties
The sorption properties of dispersed lipophilic materials in pulp within the papermaking
process affect their fate both in water treatment and in the final produced paper. Lipophilic
components have different origins depending on the pulping process. In the thermomechanical
pulping they come from natural wood chips extractives; however in the recycled pulps they
can consist of stickies and additives that are being used in the chemical pulping and
papermaking processes. In both cases they are capable of attaching to lipophilic surfaces and
agglomerates and as a result causing different problems and promoting fouling (Rana et al.,
2010). However, the present study mainly focuses on extractive-originated components.
It is reported that modification of dissolved organic materials (DOM) by an oxidative agent
can alter their sorption properties, and their removal will become easier during the process
(Zeng et al., 2014). Other studies have shown that by decreasing the surface hydrophobicity
there will be less organic materials absorbed (Rana et al., 2010). To fully understand the
sorption properties of extractives lipophilic components after enzymatic treatments, the present
work employed two ultra-thin hydrophobic and hydrophilic surfaces using quartz crystal
microbalance and surface plasmon resonance technique to measure the sorption rate of these
components after being oxidized.

80
4.2.2 Quartz crystal microbalance (QCM)-D
Quartz crystal microbalance (QCM) is a sensitive technique that uses acoustic waves
generated by oscillating a piezoelectric crystal quartz plate to monitor mass adsorption or
desorption. By applying an alternating electric current to the quartz, an alternating expansion
and contraction is induced to the crystal that eventually makes it oscillate at the certain
frequency. Adsorption or desorption of any material on/ from the crystal sensors can affect the
frequency of the oscillation. Sauerbrey (1959) demonstrated that there is a linear relationship
between mass change on the crystals and the frequency, and accordingly the mass adsorbed
can be calculated.
Figure 4.1. Schematic for QCM analysis system. Solutions of the buffer were pumped into the
chamber in connection with the oscillator and counter. QCM frequency responses versus time
were collected and displayed by the computer.
Due to its high sensitivity and fast response, this technique seems to be a useful method for
studying the changes associated with extractives on crystals coated surface. Thus, QCM was
81
used to understand the fatty acid molecular adsorption on the cellulosic hydrophilic and a
hydrophobic polyester surfaces. Atomic force microscopy (AFM) was also utilized in this
study to monitor the lipid layer formation during the adsorption process, showing critical
morphological information about the lipid adsorption process.
4.2.3 Surface Plasmon Resonance (SPR)
SPR is also a useful technique to detect small changes in mass adsorption/desorption.
Adsorbed layers on the gold surface produce a shift in the SPR angle that can be modeled
mathematically to calculate the thickness of the layer. By comparing the results of acoustic
(QCM) and optical based methods; surface plasmon resonance (SPR), it is possible to precisely
monitor any changes in the thin film mass and/or its thickness (Anderson et al., 2009). The
combined information from these two techniques will be used here to identify the kinetics of
built up film such as adsorption rate, point of critical lipids coverage and their molecular
conformation during the adsorption (Cho et al., 2009; Wang et al., 2008).
Even though relative retention on reversed phase liquid chromatography has been used to
measure the lipophilicity of lipids in the past (Namjesnik-Dejanovic et al., 2004), In our case,
the long contact time in liquid chromatography between the enzyme and organic solvent within
the stationary phase could denature the enzyme and an artificial hydrophobicity could be
obtained.
The goal of this study is to quantify changes in the sorption tendency of wood extractives
as well as model lipids to mimic lipophilic and hydrophilic surfaces upon oxidation by soybean
lipoxygenase using QCM-D and SPR techniques. It is assumed the attachment of fatty acids to
the sensors results from non-covalent interactions, and QCM-D can be used to track the extent
82
and reversibility of fatty acids sorption as a function of on the model surfaces. This technique
has not been used previously to evaluate the changes in sorption properties of wood extractive
components from any oxidative treatments. Accordingly, SPR with the same model surfaces,
was used to clarify the changes in the fatty acid structure to validate results obtained from
QCM-D.
Hence, we tried to provide a more defined system to better understand the enzyme effect
on lipid hydrophilicity and their sorption properties on model surfaces so that by studying the
lipophilic components interaction with model surfaces we can develop increasingly
sophisticated assays for lipoxygenase application for battling the pitch issues. Yet another
application of growing interest for this enzyme is to modify the lignin.
4.3 Materials and Methods
Pure linoleic acid, glycerol trilinoleate and soybean lipoxygenase from glycine max type I-B
with 150,000 U/mg activity as well as boric acid and potassium hydroxide for the buffer
preparation were obtained from Sigma Aldrich and used as received. Hexafluoroisopropanol
was purchased from Fisher Scientific. All the reagents and buffers were prepared using Milli
pore MilliQ deionized water. Wood extractives were extracted from white pine wood chips
using benzene ethanol solvent according to TAPPI standard T 204 cm-97. Polyethylene
terephthalate (PET) and QCM sensors were purchased from scientific polymer and Biolin
scientific respectively.

83
4.3.1 Model films preparation
The polyethylene terephthalate (PET) films were prepared according to the procedure of
(Song et al., 2010). Briefly, clean QCM gold electrodes were put in the UV-Ozone cleaner
before the coating process. A 0.15 wt% solution of PET in hexafluoroisopropanol was prepared
using PET beads and let stir for several hours until complete dissolution of the polymer.
Approximately 50-60 µL of PET solution were put on the surface and spun at 3000 rpm for 20
s keeping it under IR light to assure that the surface was warm before and during the spinning
process.
4.3.2 NFC films
Sufficient amount of nanofibril gel was dispersed in milli-Q water up to 1.67 g/L
concentration. The suspension was dispersed by using an ultrasonic micro tip homogenizer
during ten minutes at 25% amplitude. The final dispersion was centrifuged during 30 minutes,
and the supernatant was used for spin coating. Cleaned gold sensors were put into UV lamp
treatment for 15 minutes, and afterward sensors were immersed in a 500 ppm solution of poly-
(ethyleneimine) solution during 20 minutes, rinsed with water and dried with blown nitrogen
to induce a positive charge. Films were prepared by spin coating the fibril dispersion onto the
sensor surface at 3000 rpm for 30 s.
4.3.3 Enzymatic treatment of model oils and wood extractives
Two types of pure oil substrates (trilinoleate and linoleic acid) as well as white pine
extractives were used to be treated with active lipoxygenase separately at room temperature
under equal experimental conditions. Experiments were carried out in a stationary atmosphere
of air with magnetic stirring in an open reaction vial, where 10 mg of substrate was dispersed
84
in 10 mL of 0.2M boric buffer (pH 9.0) containing with magnetic stirrer shaken at 200 rpm. In
order to fully disperse the substrate, 10 minutes of sonication was applied. Separately, an initial
lipoxygenase stock solution was prepared, in which 10 mg of soybean lipoxygenase was
dissolved in 10 mL 0.2M boric buffer (pH 9.0) using a magnetic stirrer. 1 mL of this solution
was added to the vial containing dispersed lipid and let stirring at 200 rpm. The length of the
reaction was 2 hours, and at the end the solution was filtered for the subsequent QCM/SPR
analysis. The dispersed solution was subject to another 10 minutes sonication for the purpose
of evacuating the air bubbles from the solution.
4.3.4 QCM analysis
Adsorption of lipids on different surfaces was studied using the quartz crystal microbalance
with dissipation (QCM-D, Västra Frölunda, Sweden). The technique is based on a quartz
crystal that resonates at a certain frequency. The change of the frequency can be used for the
mass change calculation on the QCM sensors. Milli-Q water was used in all the experiments.
Water was injected to the QCM modulus initially, and after 10 minutes baseline it was replaced
by lipid solutions. QCM experiments were carried out under 30 C and a laminar-flow stream
of buffer solution (100 µL/min) containing the oxidized fatty acids were passed over the
ultrasensitive quartz mass sensor crystal having a resolution of 1 ng/cm2. After reaching to a
plateau region in QCM graphs, lipid solution was replaced with the MilliQ water for rinsing
the electrodes. At the end sensors were removed and modules well cleaned with nitrogen gas
for the next tests. The mass of the lipid layer was determined by measuring the change in
frequency (in air oscillation) of the gold sensors before and after spin coating. The Sauerbery
equation was used to calculate the mass has been built up on model surfaces.
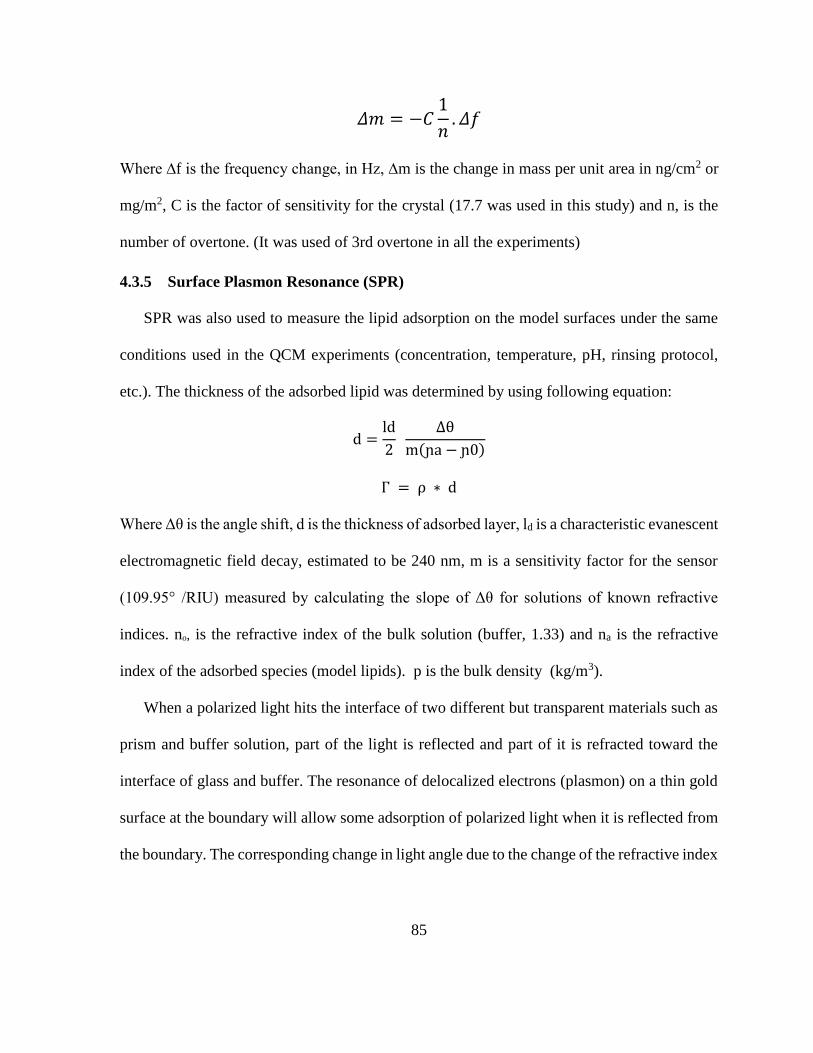
85
𝛥𝑚 = −𝐶1
𝑛. 𝛥𝑓
Where ∆f is the frequency change, in Hz, ∆m is the change in mass per unit area in ng/cm2 or
mg/m2, C is the factor of sensitivity for the crystal (17.7 was used in this study) and n, is the
number of overtone. (It was used of 3rd overtone in all the experiments)
4.3.5 Surface Plasmon Resonance (SPR)
SPR was also used to measure the lipid adsorption on the model surfaces under the same
conditions used in the QCM experiments (concentration, temperature, pH, rinsing protocol,
etc.). The thickness of the adsorbed lipid was determined by using following equation:
d =ld
2
Δθ
m(ɲa − ɲ0)
Γ = ρ ∗ d
Where Δθ is the angle shift, d is the thickness of adsorbed layer, ld is a characteristic evanescent
electromagnetic field decay, estimated to be 240 nm, m is a sensitivity factor for the sensor
(109.95° /RIU) measured by calculating the slope of Δθ for solutions of known refractive
indices. no, is the refractive index of the bulk solution (buffer, 1.33) and na is the refractive
index of the adsorbed species (model lipids). p is the bulk density (kg/m3).
When a polarized light hits the interface of two different but transparent materials such as
prism and buffer solution, part of the light is reflected and part of it is refracted toward the
interface of glass and buffer. The resonance of delocalized electrons (plasmon) on a thin gold
surface at the boundary will allow some adsorption of polarized light when it is reflected from
the boundary. The corresponding change in light angle due to the change of the refractive index
86
of the surface is proportional to the mass adsorption or desorption of the surface, as indicated
in the equation. So, as optical energy is coupled into the gold surface, the reflection is decreased
at this resonance angle. Any change in the composition of the material can alter the surface
plasmon, and their associated evanescent wave. As a consequence, SPR no longer occurs at
the previous incidence angle, and will shift. This shift in the resonance angle is directly
proportional to the change in mass at the gold surface.
4.3.6 Atomic force microscopy imaging
AFM imaging was performed in tapping mode in air using a Nano Scope III D3000
multimode scanning probe microscope from Digital Instruments Inc. Scan sizes of 10.10 μm2
were employed and three different areas on each sample were measured. We didn’t use any
image processing except flattening.
4.4 Results and discussion
4.4.1 Dynamics of lipid adsorption
The dynamics of adsorption of the model lipids as well as wood extractives are illustrated
in figure 4.2 and 4.3 for NFC (hydrophilic) and PET (hydrophobic) surfaces under the same
conditions. The downward shift in resonant frequency is associated with the adsorption of
lipids on surfaces. As can be seen, the adsorption of all the lipid models and wood extractives
decreased when being treated with enzyme. Rinsing buffer was allowed to flow through the
cell after 50 minutes and continued until 60 minutes. Irreversible mass adsorption was
observed in all cases, as indicated by the fact that the frequency after rinsing did not return to
the respective baseline. However a faster adsorption process was observed on the PET surface,
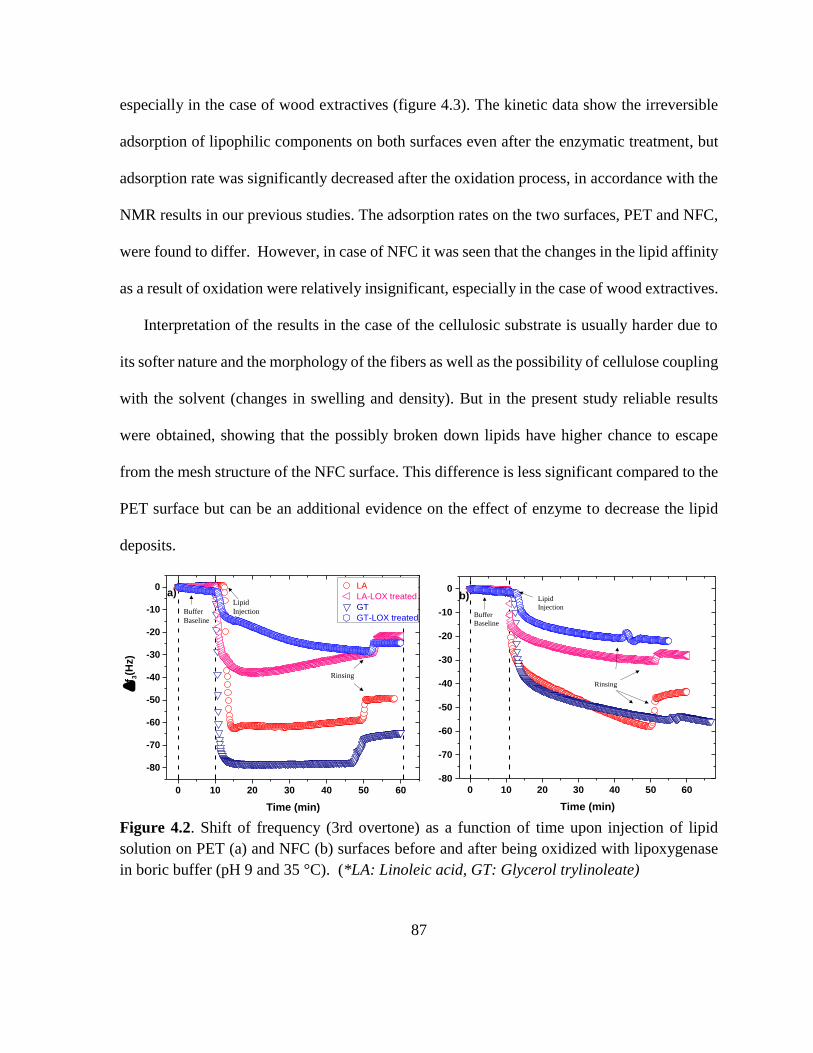
87
especially in the case of wood extractives (figure 4.3). The kinetic data show the irreversible
adsorption of lipophilic components on both surfaces even after the enzymatic treatment, but
adsorption rate was significantly decreased after the oxidation process, in accordance with the
NMR results in our previous studies. The adsorption rates on the two surfaces, PET and NFC,
were found to differ. However, in case of NFC it was seen that the changes in the lipid affinity
as a result of oxidation were relatively insignificant, especially in the case of wood extractives.
Interpretation of the results in the case of the cellulosic substrate is usually harder due to
its softer nature and the morphology of the fibers as well as the possibility of cellulose coupling
with the solvent (changes in swelling and density). But in the present study reliable results
were obtained, showing that the possibly broken down lipids have higher chance to escape
from the mesh structure of the NFC surface. This difference is less significant compared to the
PET surface but can be an additional evidence on the effect of enzyme to decrease the lipid
deposits.
Figure 4.2. Shift of frequency (3rd overtone) as a function of time upon injection of lipid
solution on PET (a) and NFC (b) surfaces before and after being oxidized with lipoxygenase
in boric buffer (pH 9 and 35 °C). (*LA: Linoleic acid, GT: Glycerol trylinoleate)
0 10 20 30 40 50 60
-80
-70
-60
-50
-40
-30
-20
-10
0 LA
LA-LOX treated
GT
GT-LOX treated
a)
f 3
(Hz)
Time (min)
Buffer
Baseline
Lipid
Injection
Rinsing
0 10 20 30 40 50 60
-80
-70
-60
-50
-40
-30
-20
-10
0b)
Time (min)
Buffer
Baseline
Lipid
Injection
Rinsing
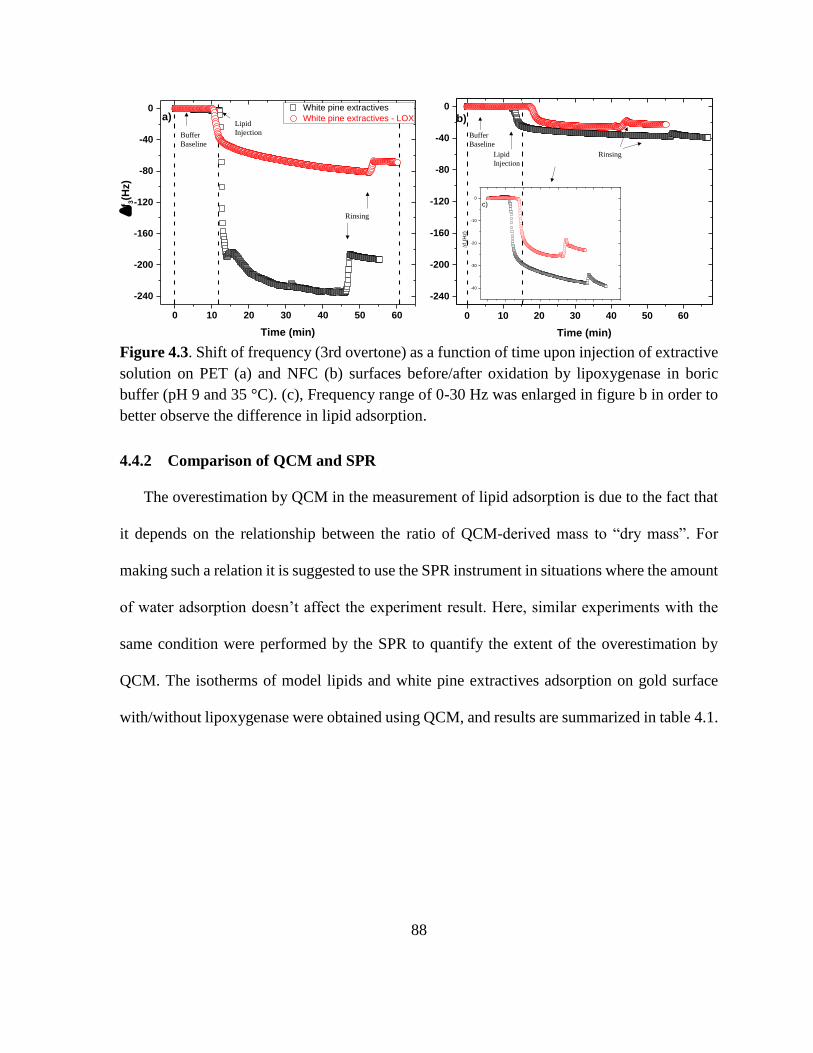
88
Figure 4.3. Shift of frequency (3rd overtone) as a function of time upon injection of extractive
solution on PET (a) and NFC (b) surfaces before/after oxidation by lipoxygenase in boric
buffer (pH 9 and 35 °C). (c), Frequency range of 0-30 Hz was enlarged in figure b in order to
better observe the difference in lipid adsorption.
4.4.2 Comparison of QCM and SPR
The overestimation by QCM in the measurement of lipid adsorption is due to the fact that
it depends on the relationship between the ratio of QCM-derived mass to “dry mass”. For
making such a relation it is suggested to use the SPR instrument in situations where the amount
of water adsorption doesn’t affect the experiment result. Here, similar experiments with the
same condition were performed by the SPR to quantify the extent of the overestimation by
QCM. The isotherms of model lipids and white pine extractives adsorption on gold surface
with/without lipoxygenase were obtained using QCM, and results are summarized in table 4.1.
0 10 20 30 40 50 60
-240
-200
-160
-120
-80
-40
0 White pine extractives
White pine extractives - LOXa)
f 3(H
z)
Time (min)
Buffer
Baseline
Lipid
Injection
Rinsing
0 10 20 30 40 50 60
-240
-200
-160
-120
-80
-40
0
b)
Time (min)
-40
-30
-20
-10
0
c)
f 3
(Hz)
Buffer
Baseline
Lipid
Injection
Rinsing

89
Figure 4.4. Adsorption for white pine extractives before and after enzyme treatment onto oil-
loving model films as determined by surface plasmon resonance.
Overall, similar trends were found for adsorption of lipophilic component onto ultrathin
films of cellulose and plastic, as shown on figures 4.2 and 4.3. However, the absolute
adsorption amounts were significantly lower than those obtained with QCM for all cases. As
shown in table 4.1, the lipid adsorption amount estimated from QCM measurement was about
4~6 times that obtained with SPR, which as mentioned is due to the fact that in SPR only
adsorbed dry mass is reported. With the data in table 4.1 and by subtracting the mass obtained
by SPR from the mass obtained by QCM, the amount of coupled water can be calculated.
0 5 10 15 20 25 30 35
-0.02
0.00
0.02
0.04
0.06
0.08
0.10
0.12
0.14
Re
so
un
an
ce
Time (min)
Wood extractives
Wood extractives - treated by LOX
Buffer
Baseline
Lipid
Injection
Rinsing
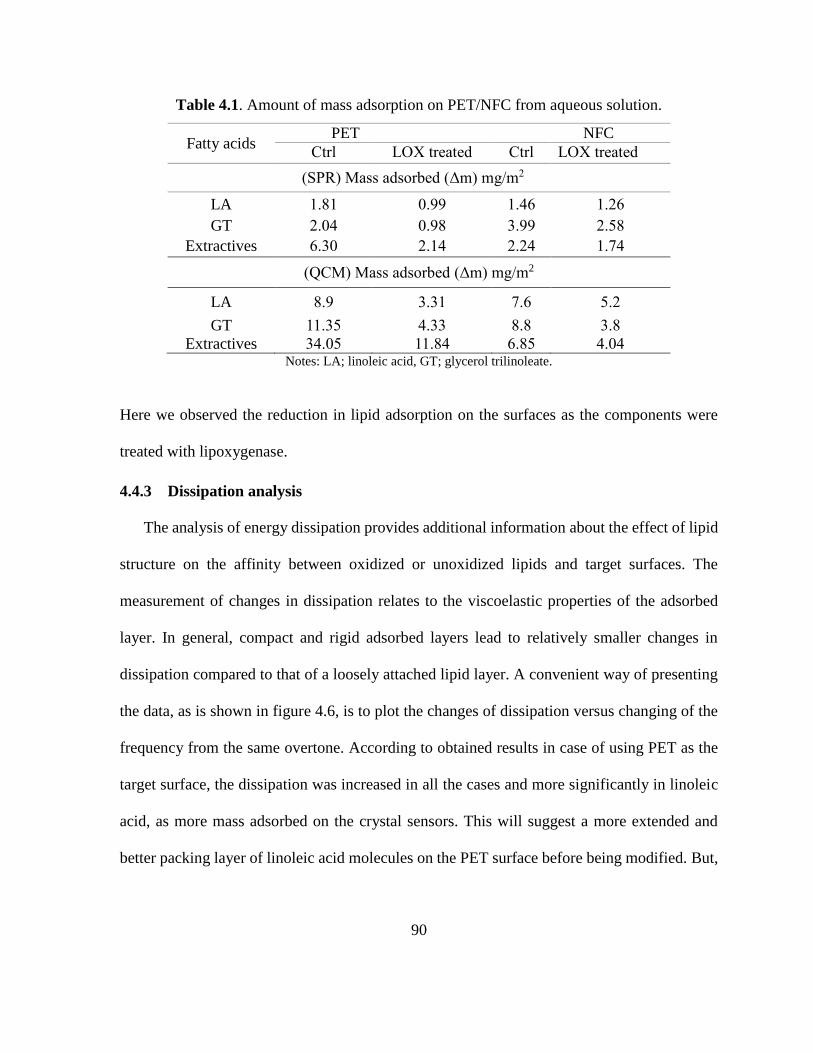
90
Table 4.1. Amount of mass adsorption on PET/NFC from aqueous solution.
Fatty acids PET NFC
Ctrl LOX treated Ctrl LOX treated
(SPR) Mass adsorbed (Δm) mg/m2
LA 1.81 0.99 1.46 1.26
GT 2.04 0.98 3.99 2.58
Extractives 6.30 2.14 2.24 1.74
(QCM) Mass adsorbed (Δm) mg/m2
LA 8.9 3.31 7.6 5.2
GT 11.35 4.33 8.8 3.8
Extractives 34.05 11.84 6.85 4.04 Notes: LA; linoleic acid, GT; glycerol trilinoleate.
Here we observed the reduction in lipid adsorption on the surfaces as the components were
treated with lipoxygenase.
4.4.3 Dissipation analysis
The analysis of energy dissipation provides additional information about the effect of lipid
structure on the affinity between oxidized or unoxidized lipids and target surfaces. The
measurement of changes in dissipation relates to the viscoelastic properties of the adsorbed
layer. In general, compact and rigid adsorbed layers lead to relatively smaller changes in
dissipation compared to that of a loosely attached lipid layer. A convenient way of presenting
the data, as is shown in figure 4.6, is to plot the changes of dissipation versus changing of the
frequency from the same overtone. According to obtained results in case of using PET as the
target surface, the dissipation was increased in all the cases and more significantly in linoleic
acid, as more mass adsorbed on the crystal sensors. This will suggest a more extended and
better packing layer of linoleic acid molecules on the PET surface before being modified. But,
91
this trend was not seen in the case of trilinoleate which is branched and bigger. In other words,
it seems that the layer formed as a result of linear fatty acid is more viscoelastic compared to
glycerol which is more rigid. However this rigidity tends to decrease when these branched
lipids are oxidized by enzyme.
This loss of energy in oxidized lipids can be due to the new lipid structure and the addition
of peroxy groups on the lipid chain that can cause a slightly more viscoelastic layer, in
agreement with NMR data in our previous chapter. From figure 4.5 we can highlight two
things: 1- the percentage of coupled water is slightly higher for oxidized lipid in case of PET
as the target surface, especially in glycerol fatty acids. This seems to favor a more extended
viscoelastic layer of adsorbed lipid substrate on the surfaces as evidenced in the dissipation-
frequency profiles, where the adsorption of glycerol trilinoleate exhibited a high dissipation
value compared to extractives. 2- The high dissipation observed implies more extended lipid
layer at the interface and the promotion of higher adsorption suggesting that the molecules
adsorb with different configuration.
Wood extractives have shown a high adsorption but at the same time little change in
dissipation. This can imply a more rigid layer that can be made as a result of wood extractive
adsorption on the PET surface. However we can see a slight increase in the dissipation after
the treatment with enzyme, which shows that the oxidized components will result in a looser
layer of lipids.
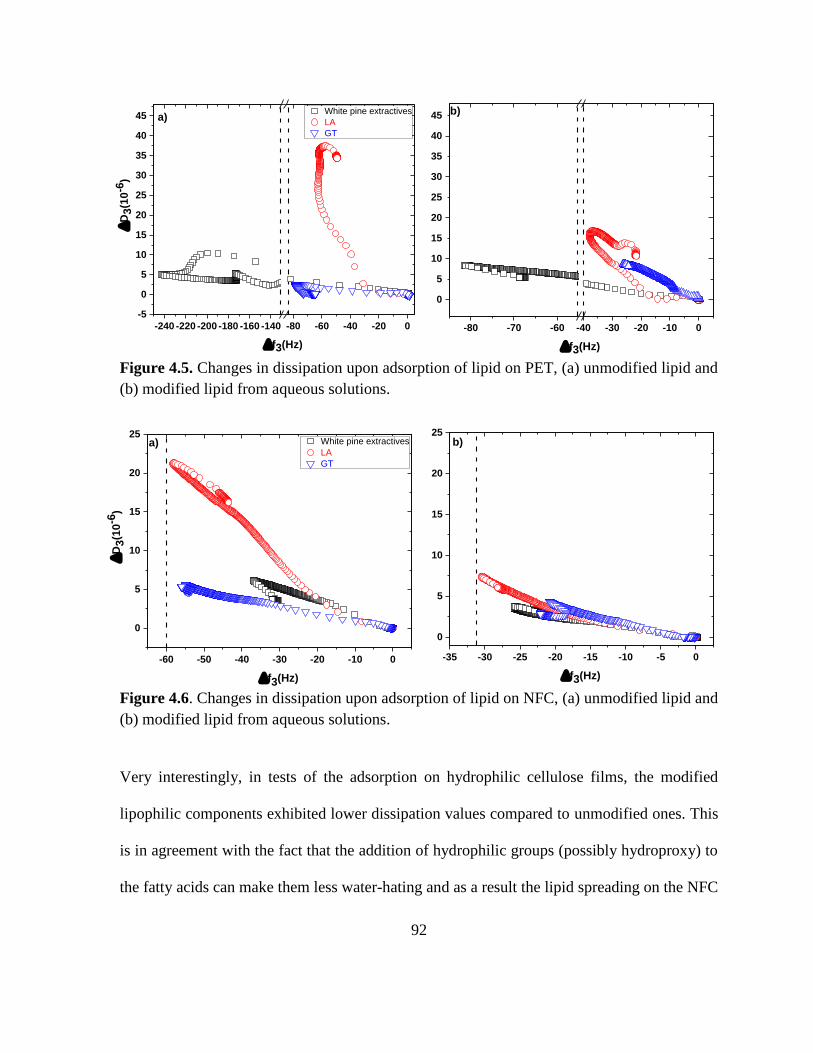
92
Figure 4.5. Changes in dissipation upon adsorption of lipid on PET, (a) unmodified lipid and
(b) modified lipid from aqueous solutions.
Figure 4.6. Changes in dissipation upon adsorption of lipid on NFC, (a) unmodified lipid and
(b) modified lipid from aqueous solutions.
Very interestingly, in tests of the adsorption on hydrophilic cellulose films, the modified
lipophilic components exhibited lower dissipation values compared to unmodified ones. This
is in agreement with the fact that the addition of hydrophilic groups (possibly hydroproxy) to
the fatty acids can make them less water-hating and as a result the lipid spreading on the NFC
-240 -220 -200 -180 -160 -140 -80 -60 -40 -20 0
-5
0
5
10
15
20
25
30
35
40
45 a)White pine extractives
LA
GT
D3(1
0-6
)
f3(Hz)
-80 -70 -60 -40 -30 -20 -10 0
5
15
25
35
45
0
10
20
30
40
b)
f3(Hz)
-60 -50 -40 -30 -20 -10 0
0
5
10
15
20
25a) White pine extractives
LA
GT
D
3(1
0-6
)
f3(Hz)
-35 -30 -25 -20 -15 -10 -5 0
0
5
10
15
20
25b)
f3(Hz)
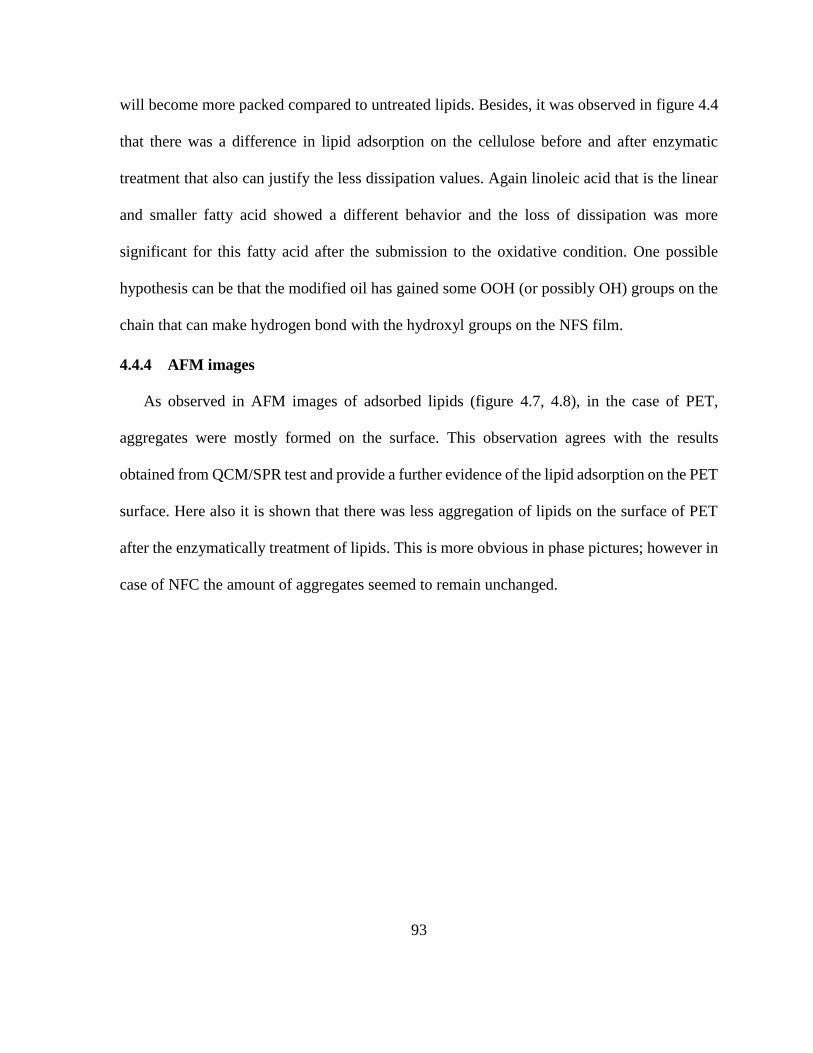
93
will become more packed compared to untreated lipids. Besides, it was observed in figure 4.4
that there was a difference in lipid adsorption on the cellulose before and after enzymatic
treatment that also can justify the less dissipation values. Again linoleic acid that is the linear
and smaller fatty acid showed a different behavior and the loss of dissipation was more
significant for this fatty acid after the submission to the oxidative condition. One possible
hypothesis can be that the modified oil has gained some OOH (or possibly OH) groups on the
chain that can make hydrogen bond with the hydroxyl groups on the NFS film.
4.4.4 AFM images
As observed in AFM images of adsorbed lipids (figure 4.7, 4.8), in the case of PET,
aggregates were mostly formed on the surface. This observation agrees with the results
obtained from QCM/SPR test and provide a further evidence of the lipid adsorption on the PET
surface. Here also it is shown that there was less aggregation of lipids on the surface of PET
after the enzymatically treatment of lipids. This is more obvious in phase pictures; however in
case of NFC the amount of aggregates seemed to remain unchanged.
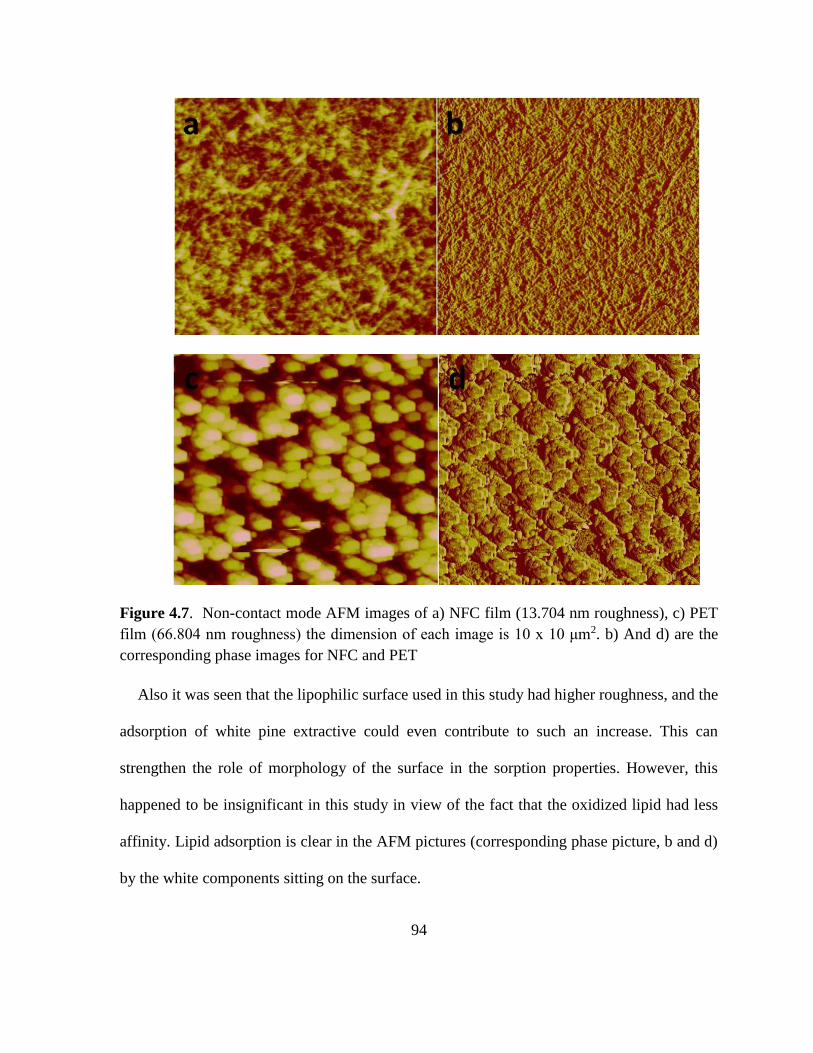
94
Figure 4.7. Non-contact mode AFM images of a) NFC film (13.704 nm roughness), c) PET
film (66.804 nm roughness) the dimension of each image is 10 x 10 μm2. b) And d) are the
corresponding phase images for NFC and PET
Also it was seen that the lipophilic surface used in this study had higher roughness, and the
adsorption of white pine extractive could even contribute to such an increase. This can
strengthen the role of morphology of the surface in the sorption properties. However, this
happened to be insignificant in this study in view of the fact that the oxidized lipid had less
affinity. Lipid adsorption is clear in the AFM pictures (corresponding phase picture, b and d)
by the white components sitting on the surface.
95
Figure 4.8. AFM images of PET substrate a) film after adsorption of extractive, c) after
adsorption of oxidized extractive (62.168 nm roughness) the dimension of each image is 10 x
10 μm2. b) And d) are the corresponding phase images for a) and c) respectively.

96
Figure 4.9. AFM images of NFC substrate a) film after adsorption of extractive (10.805 nm
roughness), c) after adsorption from solution of oxidized extractive (8.686 nm roughness) the
dimension of each image is 10 x 10 μm2. b) and d) are the corresponding phase images for a
and c.
4.5 Conclusions
The effects of enzyme treatment on adsorption of oil-loving components onto hard and soft
surfaces has been studied and compared. The present results reveal different adsorption
behaviors for each component, which highlights the complexity of lipid adsorption onto solid
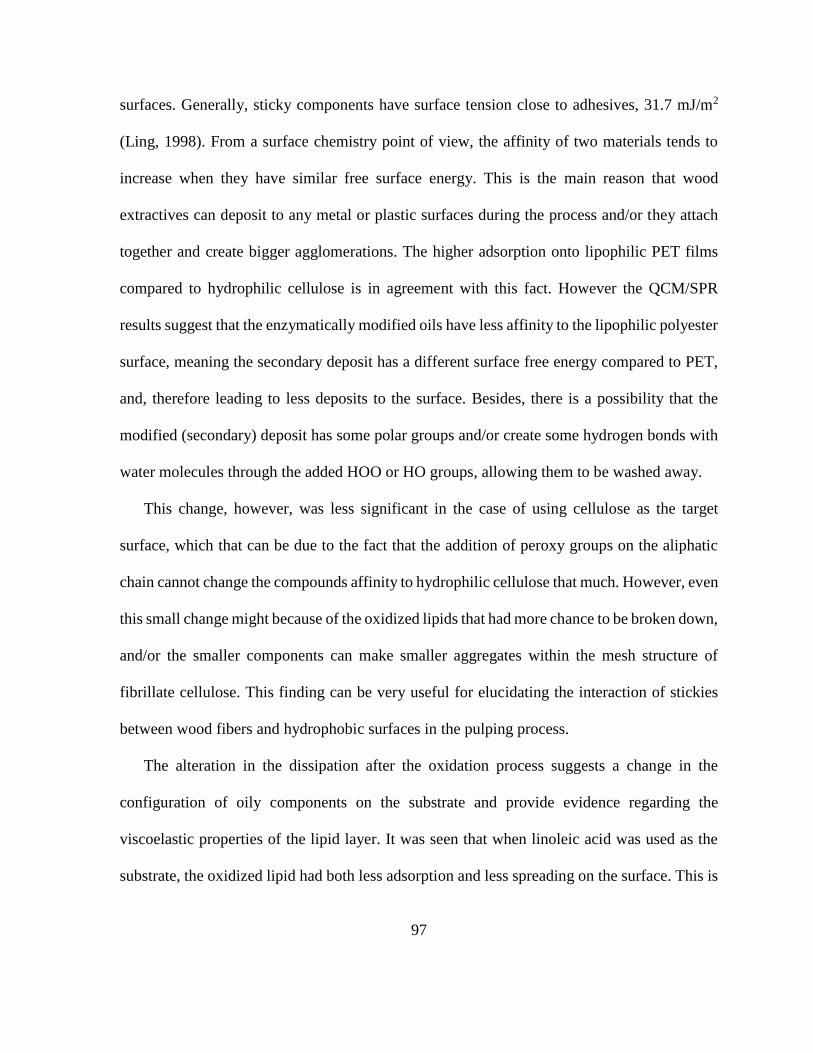
97
surfaces. Generally, sticky components have surface tension close to adhesives, 31.7 mJ/m2
(Ling, 1998). From a surface chemistry point of view, the affinity of two materials tends to
increase when they have similar free surface energy. This is the main reason that wood
extractives can deposit to any metal or plastic surfaces during the process and/or they attach
together and create bigger agglomerations. The higher adsorption onto lipophilic PET films
compared to hydrophilic cellulose is in agreement with this fact. However the QCM/SPR
results suggest that the enzymatically modified oils have less affinity to the lipophilic polyester
surface, meaning the secondary deposit has a different surface free energy compared to PET,
and, therefore leading to less deposits to the surface. Besides, there is a possibility that the
modified (secondary) deposit has some polar groups and/or create some hydrogen bonds with
water molecules through the added HOO or HO groups, allowing them to be washed away.
This change, however, was less significant in the case of using cellulose as the target
surface, which that can be due to the fact that the addition of peroxy groups on the aliphatic
chain cannot change the compounds affinity to hydrophilic cellulose that much. However, even
this small change might because of the oxidized lipids that had more chance to be broken down,
and/or the smaller components can make smaller aggregates within the mesh structure of
fibrillate cellulose. This finding can be very useful for elucidating the interaction of stickies
between wood fibers and hydrophobic surfaces in the pulping process.
The alteration in the dissipation after the oxidation process suggests a change in the
configuration of oily components on the substrate and provide evidence regarding the
viscoelastic properties of the lipid layer. It was seen that when linoleic acid was used as the
substrate, the oxidized lipid had both less adsorption and less spreading on the surface. This is
98
in agreement with the hypothesis of this study; however in case of glycerol and extractives this
behavior was reversed. The implication is that even though a lesser amount of lipophilic
components were adsorbing on the surface, the loose nature of the adsorbed matter caused a
greater energy dissipation. Apparently, the layer is looser and should be easier to remove
compared to unmodified layer of lipid to the PET surface. This also implies that once in contact
with lipophilic material, modified oil might spread on the surface less tightly and alter the
viscoelasticity of the surface. This trend wasn’t seen in case of using hydrophilic cellulose
surface, meaning that the configuration of studied material on the NFC surface is more
complex and has not been effected by the enzyme significantly. However, when linoleic acid
was in contact with NFC, the reduction in the viscoelastic property of the adsorbed layer after
the treatment was more significant.
The combination of tendencies just described would be beneficial in practice, since it is
possible to allow less contact between hard, olephilic surfaces and sticky-like components in
pulping applications. This will also facilitate the removal of the wood extractives during the
process, which will benefit the coating process as well. The results also show that interactions
of oils with the hydrophilic substrates are favorable; this could be of advantage for further uses
of these components, for example in cellulose surface modification.

99
4.5 References
Anderson, T. H.Min, Y.Weirich, K. L.Zeng, H.Fygenson, D. & Israelachvili, J. N. (2009).
Formation of Supported Bilayers on Silica Substrates. Langmuir, 25(12), 6997-7005.
Borch, K.Franks, N.Lund, H.Xu, H. & Luo, J. (2003). Oxidizing enzymes in the manufacturing
of paper materials. Patent (USA) US, 124710, A1.
Brash, A. R. & Song, W. (1996). Detection, assay, and isolation of allene oxide synthase.
Methods in enzymology, 272(B), 250-259.
Buchert, J.Mustranta, A.Tamminen, T.Spetz, P. & Holmbom, B. (2002). Modification of
spruce lignans with Trametes hirsuta laccase. Holzforschung, 56(6), 579-584.
Cathcart, M. K. & Folcik, V. A. (2000). Lipoxygenases and atherosclerosis: protection versus
pathogenesis. Free Radical Biology and Medicine, 28(12), 1726-1734.
Cho, N.-J.Wang, G.Edvardsson, M.Glenn, J. S.Hook, F. & Frank, C. W. (2009). Alpha-Helical
Peptide-Induced Vesicle Rupture Revealing New Insight into the Vesicle Fusion Process As
Monitored in Situ by Quartz Crystal Microbalance-Dissipation and Reflectometry. Analytical
Chemistry, 81(12), 4752-4761.
Cyrus, T.Witztum, J. L.Rader, D. J.Tangirala, R.Fazio, S.Linton, M. F. & Funk, C. D. (1999).
Disruption of the 12/15-lipoxygenase gene diminishes atherosclerosis in apo E–deficient mice.
The Journal of clinical investigation, 103(11), 1597-1604.
De Groot, J. J. M. C.Veldink, G. A.Vliegenthart, J. F. G.Boldingh, J.Wever, R. & van Gelder,
B. F. (1975). Demonstration by EPR spectroscopy of the functional role of iron in soybean
lipoxygenase-1. Biochimica et Biophysica Acta (BBA) - Enzymology, 377(1), 71-79.
Ekman, R.Eckerman, C. & Holmbom, B. (1990). Studies on the behavior of extractives in
mechanical pulp suspensions. Nordic Pulp and Paper Research Journal (Sweden)(5), 96-102.
Fengel, D. & Wegener, G. (1983). Wood: chemistry, ultrastructure, reactions: Walter de
Gruyter.
Ford-Hutchinson, A. W.Gresser, M. & Young, R. N. (1994). 5-Lipoxygenase. Annu Rev
Biochem, 63, 383-417.
Gardner, H. W. (1991). Recent investigations into the lipoxygenase pathway of plants.
Biochimica et Biophysica Acta (BBA)-Lipids and Lipid Metabolism, 1084(3), 221-239.

100
Gurnagul, N.Ouchi, M. D.Dunlop-Jones, N.Sparkes, D. G. & Wearing, J. T. (1992). Factors
affecting the coefficient of friction of paper. Journal of Applied Polymer Science, 46(5), 805-
814.
Haeggström, J. Z. & Funk, C. D. (2011). Lipoxygenase and Leukotriene Pathways:
Biochemistry, Biology, and Roles in Disease. Chemical Reviews, 111(10), 5866-5898.
Hatcher, E.Soudackov, A. V. & Hammes-Schiffer, S. (2004). Proton-Coupled Electron
Transfer in Soybean Lipoxygenase. Journal of the American Chemical Society, 126(18), 5763-
5775.
Hubbe, M. A.Rojas, O. J. & Venditti, R. A. (2006). Control of tacky deposits on paper
machines-A review. Nordic Pulp and Paper Research Journal, 21(2), 154.
Klein, R. F.Allard, J.Avnur, Z.Nikolcheva, T.Rotstein, D.Carlos, A. S.Shea, M.Waters, R.
V.Belknap, J. K. & Peltz, G. (2004). Regulation of bone mass in mice by the lipoxygenase
gene Alox15. Science, 303(5655), 229-232.
Kuhn, H. & Thiele, B. J. (1999). The diversity of the lipoxygenase family: Many sequence
data but little information on biological significance1. FEBS Letters, 449(1), 7-11.
Lehnert, N. & Solomon, E. I. (2003). Density-functional investigation on the mechanism of H-
atom abstraction by lipoxygenase. JBIC Journal of Biological Inorganic Chemistry, 8(3), 294-
305.
Ling, T. F. (1998). Agglomeration tendency of contaminants in recycled fibers. Tappi journal,
81(3), 161-165.
Namjesnik-Dejanovic, K. & Cabaniss, S. E. (2004). Reverse-Phase HPLC Method for
Measuring Polarity Distributions of Natural Organic Matter. Environmental Science &
Technology, 38(4), 1108-1114.
Paice M, Z. (2005). Enzyme find their niche. Pulp Pap Canada, 106(6), 17-20.
Porta, H. & Rocha-Sosa, M. (2002). Plant lipoxygenases. Physiological and molecular
features. Plant physiology, 130(1), 15-21.
Prigge, S.Boyington, J.Faig, M.Doctor, K.Gaffney, B. & Amzel, L. (1997). Structure and
mechanism of lipoxygenases. Biochimie, 79(11), 629-636.
Rana, D. & Matsuura, T. (2010). Surface modifications for antifouling membranes. Chemical
Reviews, 110(4), 2448-2471.
101
Samuelsson, B.Dahlen, S. E.Lindgren, J. A.Rouzer, C. A. & Serhan, C. N. (1987).
Leukotrienes and lipoxins: structures, biosynthesis, and biological effects. Science, 237(4819),
1171-1176.
Sauerbrey, G. (1959). Verwendung von Schwingquarzen zur Wägung dünner Schichten und
zur Mikrowägung. Zeitschrift für physik, 155(2), 206-222.
Schewe, T. & Ku, H. (1991). Do 15-lipoxygenases have a common biological role? Trends in
biochemical sciences, 16, 369-373.
Sharyo, M.Shimoto, H.Sakaguchi, H.Isaji, M.Fujita, Y.Awaji, H.Matsukura, M. & Hata, K.
(1993). The recent progress and general status of the lipase pitch control technology in Japan.
Jpn. Tappi J, 47, 41-51.
Shibata, D.Steczko, J.Dixon, J.Hermodson, M.Yazdanparast, R. & Axelrod, B. (1987).
Primary structure of soybean lipoxygenase-1. Journal of Biological Chemistry, 262(21),
10080-10085.
Siedow, J. N. (1991). Plant lipoxygenase: structure and function. Annual review of plant
biology, 42(1), 145-188.
Song, J.Yamagushi, T.Silva, D. J.Hubbe, M. A. & Rojas, O. J. (2010). Effect of Charge
Asymmetry on Adsorption and Phase Separation of Polyampholytes on Silica and Cellulose
Surfaces. The Journal of Physical Chemistry B, 114(2), 719-727.
Stebbing, D.Zhang, X.Soong, G.Mansfield, S. & Saddler, J. (2004). Fungal enzyme treatment
of newsprint mill white water: impact on white water and paper properties. Journal of pulp and
paper science, 30(1), 3-8.
Wang, G.Rodahl, M.Edvardsson, M.Svedhem, S.Ohlsson, G.Höök, F. & Kasemo, B. (2008).
A combined reflectometry and quartz crystal microbalance with dissipation setup for surface
interaction studies. Review of Scientific Instruments, 79(7), 075107.
Zeng, T.Wilson, C. J. & Mitch, W. A. (2014). Effect of chemical oxidation on the sorption
tendency of dissolved organic matter to a model hydrophobic surface. Environmental Science
& Technology, 48(9), 5118-5126.
ZhangNguyen, D.Paice, M. G.Tsang, A. & Renaud, S. (2007). Degradation of wood
extractives in thermo-mechanical pulp by soybean lipoxygenase. Enzyme and Microbial
Technology, 40(4), 866-873.
Zhang, X.Eigendorf, G.Stebbing, D. W.Mansfield, S. D. & Saddler, J. N. (2002). Degradation
of trilinolein by laccase enzymes. Archives of Biochemistry and Biophysics, 405(1), 44-54.

102
Zhang, X.Renaud, S. & Paice, M. (2005). The potential of laccase to remove extractives
present in pulp and white water from TMP newsprint mills. Journal of pulp and paper science,
31(4), 175-180.
Zoia, L.Perazzini, R.Crestini, C. & Argyropoulos, D. S. (2011). Understanding the radical
mechanism of lipoxygenases using 31P NMR spin trapping. Bioorganic & Medicinal
Chemistry, 19(9), 3022-3028.
103
5 Soy proteins and lipoxygenases to reduce deposits on polypropylene
surfaces
5.1 Abstract
Natural hydrophobic substances in lignocellulose include resinous materials that often
generate serious problems in fiber processing and paper quality. Common methods to control
hydrophobic substances include seasoning of wood raw materials, the application of cationic
polymers or mineral particles such as talc to prevent surface deposition. In this chapter we are
proposing a biotechnological approach to control the deposition of hydrophobic wood
extractives in the papermaking process by using lipoxygenase enzymes (LOX), which can
catalyze the oxidation of triglycerides and unsaturated fatty acids in resinous materials.
Initially, an ultraviolet test was employed to detect the enzyme activity on model substrates
and then optimizing the experimental condition to obtain the highest possible activity for the
enzyme. Then the active enzyme was applied in an aqueous phase at different dosage levels
and conditions to evaluate changes in resin tendency to form the deposit on polypropylene
surface. The water contact angle and deposit test both confirmed the positive affect of enzyme
to decrease the oil-loving nature of the deposits after the treatment. Moreover, the role of soy
proteins was also elucidated for their effect on physical adsorption and passivation and results
were compared to isolated enzyme. It was confirmed that soy proteins could also perform
positively to decrease the deposits on the polypropylene; however, compared to enzyme, its
affect was less pronounced. Besides, lipoxygenase was applied to thermo-mechanical pulp
104
fiber suspensions along with common bleaching chemicals and we noticed that the fibers
optical properties tends to slightly improve.
5.2 Introduction
Extractive contents in many wood species are about 2-8%, by mass and in some tropical
species they can reach up to 15% (Zhang et al., 2007). These materials in a live tree have
important functions such as wood preservation from any microbial attack, contributing to wood
color and odor as well as nutrient storage. However, the presence of these materials in pulp
and papermaking processes can cause many types of troubles, especially in thermo-mechanical
pulps (TMP). Mechanical pulping processes are based on application of mechanical energy for
pulping, and basically there is no chemical treatment. The mechanical action can release wood
resins from fiber lumens and through resin canals, and then because of the small size of the
emulsified resin particles they will accumulate in process streams. Extractive components that
in paper making are called “pitch” are mainly fatty acids and their esters, which are capable of
causing a range of problems including decreasing the paper strength, hurting optical properties
and increasing the slippage problems. Such difficulties are due to deposition of those fatty
acids on the process equipment, as well as subsequent transfer of pitch agglomerates to the
paper. Since the TMP pulping process is a common choice for producing newsprint, it is an
important issue in newsprint industries (Gurnagul et al., 1992). Lipophilic materials, which are
often referred to as wood resin, include free fatty acids, fatty alcohols, resin acids, triglycerides,
waxes, sterol esters and other oxidized ingredients (Gutiérrez et al., 1998). Previous studies
have shown that almost 60% of fatty acids and triglycerides in wood extractives are derived
105
from linoleic acids and other unsaturated acids (Ekman et al., 1990; Fengel et al., 1983;
Gutiérrez, 2001).
When resinous components are released from the wood, they can deposit alone or with
other components such as inorganic salts, de-foamers, or coating binders that are present in the
pulping process and later stick to the tile, plastic or metal parts in forming fabrics and rolls.
Also pitch can plug the felts and finally reach to the dryer section. Pitch accumulation brings
about spots in the paper and or causes web breaks, (Farrell et al., 1997). Accumulation of even
small amounts of this material can result in blockages of openings in forming fabrics and press
felt and bring about a slowing or shutdown of operations. These blockages are also responsible
for lower production levels and an increase of quality defects (Back and Allen, 2000; Hillis et
al., 1989). Other undesired effects include prolonged downtime, costs to replace forming
fabrics and drying felts, more paper breaks and the related cleaning downtime, decrease in
production quality as result of fish-eyes, pinholes, as well as reduction in operational efficiency
(Hubbe et al., 2006).
5.2.1 Pitch Problem Solutions
Allowing chips to age sufficiently while stored in piles in order to partly decompose the
extractives with microorganisms before the pulping process is one of the traditional methods
for pitch control. However biological degradation can cause a brightness reversion or pulp
yield loss by decomposing the cellulose component (Farrell et al., 1997). Adsorption and
dispersion of tacky materials with chemicals is also used to reduce the accumulation of pitch
in the paper mill. Chemicals such as talc are able to lessen the impact of pitch by attaching to
the surfaces early in the system. The hydrophobic surface of talc can attract the pitch and tacky
106
substances and keep the tackiness of the system in an acceptable range and help them to retain
well; however talc is quite sensitive to shear forces.
Other technologies include using enzymes, microbes and fungi to degrade the lipophilic
materials in wood extractives. In the early 1990s a new pitch control method was examined
and successfully used in large-scale papermaking process by using the lipase enzyme in
Japanese red pine ground wood pulp (Fujita et al., 1991; Irie Y., 1990). Although lipase and
esterase treatments have been used for reducing the pitch problems relatively successfully
(Sharyo et al., 1993), these enzymes work very selectively. They hydrolyze only the ester-
bonded extractives such as glycerides and steryl esters, and the release fatty acids that still can
cause problems in the process (Paice et al., 2005). Laccase also has been used for this purpose
because of its ability to react with a broad range of wood extractives including phenolic
compounds, unsaturated fatty acids, and their esters (Buchert et al., 2002; Zhang et al., 2002).
Other studies showed that mechanical pulp treatment with laccase can remarkably reduce both
lipophilic and hydrophilic components in the extractive contents (Zhang et al., 2005), but
reduction in pulp brightness and other optical properties was also reported (Stebbing et al.,
2004).
Gutiérrez et al. (2009) investigated the biotechnological process based on the use of a
selective white-rot fungi that had some advantages, including degradation of some lipophilic
extractives such as triglycerides and fatty acids; however they realized that the white rot fungi
acts poorly to degrade the free sterols and triterpenols as well as resin acids and reported the
use of isolated enzymes generally can be a better choice for pitch removal, compared to use of
107
fungus. They also mentioned that enzymes have advantages such as a shorter treatment time
and higher specificity in removal of those components compared to fungi.
In another study, soybean lipoxygenase was used along with a manganese-containing
fungal enzyme for pitch control (Marques et al., 2011). The cited authors reported that
lipoxygenase treatments can lead to high removal of lipophilic materials including alkanes (21-
55%) and fatty alcohols (42-61%). Earlier work by (Borch et al., 2003) also suggested the use
of lipoxygenase to reduce a model pitch mixture in pulp and paper. Despite studies on a group
of enzymes (Brash, 1999; Hamberg et al., 1998; Prigge et al., 1997; Su et al., 1998), the
possibility of using this naturally abundant enzyme in industrial processing has not been
sufficiently considered. So, among the different enzymes, lipoxygenase type 1, was selected
for this study due to its ability to oxidize the unsaturated fatty acids. Besides, this is the most
common type of enzyme and has been used as a model for understanding other kinds of
lipoxygenases.
5.2.2 Lipoxygenase
Lipoxygenase is an iron-containing enzyme that can catalyze the oxygenation of
unsaturated fatty acids and their esters. This enzyme is abundant and widely distributed in
plants, fungi and animals (Grechkin A, 1998; Hildebrand et al., 1988). Lipoxygenase has a
different cell function in plants and animals. In plants, this enzyme plays an important role in
different stages of plant development, including seeding, germinating, vegetable growth,
signaling in wounds and even induction of cell death (Porta et al., 2002; Siedow, 1991).
Furthermore, it can produce volatile compounds as a result of catalyzing the lipid peroxidation
108
in plants, which is closely associated with plant defensive mechanisms. Besides, it has been
shown before that LOX has vast potential applications in medical science (Folcik et al., 1995).
Lipoxygenase was first found in soybean, and then soybean lipoxygenase-1 for the first
time was well characterized (Shibata et al., 1987). Lipoxygenase is also easy to purify and can
be obtained in large quantities with acceptable stability and has also been used as a model for
understanding other types of enzymes from this class. Zhang et al. (2007) showed that LOX
has a significant selectivity toward lipophilic extractives that primarily consist of fatty acids
and their esters. Marques et al. (2011) used the lipoxygenase from Gaeumannomyces gramanis
for removing the extractives from eucalypt and flax pulp. They performed their treatments both
in the presence and absence of linoleic acid, then followed process with a peroxide bleaching
stage. It was reported that the main lipophilic extractives were removed in the presence of
linoleic acid and lipoxygenase, and then indicated different patterns among lipophilic
compounds in flax pulps. However, there was also a high degree of removal of extractive
classes including alkanes, fatty acids and glycosylated sterols. So, the good performance of
lipoxygenase in degradation of lipophilic material, such as fatty acids, leads to a possible
application of this enzyme for removing the detrimental effects of wood extractives from pulp
and paper operations.
5.2.3 Enzyme reaction mechanism
The reaction of lipoxygenase with the substrate involves two main steps. In the first step
the Fe+3 from lipoxygenase abstracts one electron from fatty acids and produces a free radical
and reduced Fe+2 from the enzyme. This step is called substrate activation. In the second step,
109
molecular of oxygen reacts with a radical that leads to formation of a hydroperoxide product
(Prigge et al., 1997). Several reviews and research articles have been published on the subject
of lipoxygenase, but most of them have considered this enzyme and its involvement in cell
functions. (Porta et al., 2002) and (Siedow, 1991) studied the physiological and molecular
structure of this enzyme.
Despite many studies on this group of enzymes, there is still a lack of application of a
natural and abundant material in industries such as papermaking. The lipoxygenase’s ability to
degrade linoleic acid can be very useful for pitch control in the papermaking processes. The
present study considers whether such enzymatic treatment has any effect on pulp’s stickies
content as well as its optical properties. Pitch deposition is a serious problem in a paper mills,
and by introducing a new effective solution for this problem there may be potential to produce
paper with higher quality as well as a lower cost. Therefore, this research work evaluates the
possibility of lipoxygenase application for pitch control in pulp suspensions.
5.3 Materials and method
5.3.1 Lipoxygenase Activity
Soybean lipoxygenase Type B-1 and V was obtained from Sigma-Aldrich. The enzymes
activity were around 50,000 and 500,000 units per mg of solid for type B-1 and V respectively,
where one unit will cause an absorbance increase at 234 nm of 0.001 units per minute at
temperature 25-30 °C, when linoleic acid is used as standard substrate for enzyme. The two
enzymes showed equal activity in the same condition, and we chose to use lipoxygenase type

110
B-1 for this study. Linoleic acid, was purchased from Sigma-Alderich with 99% purity. A TMP
pulp was a gift from Resolute paper making company in West Virginia.
Figure 5.1. Activity measurement of two types of lipoxygenase, performed with UV, multiple
wavelength (left) and single beam mode (right).
5.3.2 Lipoxygenase Solution Preparation
The desired level of enzyme was added to a 20 mL liquid scintillation vial under nitrogen
gas, where enzyme was dissolved to homogeneity in a 0.2 M borate and/or phosphate buffer
with constant stirring at 200 rpm. Enzyme activity was determined spectrophotometrically,
based on formation of conjugated diene hydroperoxide, over reading the linear change at 234
nm wave length. 20 mg of linoleic acid plus equal amount of Tween 20 was weighted into a
10 mL glass. Then the volume of the solution was made up to 10 mL with distilled water. Fresh
substrate was used for each test. 0.3 mL of this solution was added to 2.7 mL of buffer with
different pH, and finally 0.3 mL of LOX solution in the buffer was added to initiate the
reaction. This solution was used for the subsequent UV test.
224 240 256 272 288
0.0
0.5
1.0
1.5
2.0
UV
Ab
so
rba
nce (
A)
Wavelength (nm)
LOX I-B
234 nm
0 1 2 3 4 5 6 7 8 9 10 11
0.0
0.4
0.8
1.2
1.6
UV
Ab
so
rban
ce
Time (min)
LOX V
LOX I-B
111
5.3.3 Pulp treatment with lipoxygenase
Mechanical pulp was suspended in an aqueous phase with pH 9 at room temperature. The
pulp concentration was adjusted to 3%, and the desired amounts of, NaOH, H2O2 and DTPA
were added to the suspension. The solution of enzyme (1 to 4% enzyme based on fiber oven-
dried weight) was added and left stirring for 2 hours before the subsequent washing step. A
parallel experiment was also done with no enzyme addition. At the end, both control and
enzyme-treated pulp samples were washed with de-ionized water before the pulp brightness
analysis. Color Touch 2 Model IOS instrument was used to determine the handsheets
brightness values.
5.3.4 Extractives analysis and deposit test
Three pure unsaturated fatty acids; linoleic acid, glycerol trilinoleate and glycerol trioleate,
were purchased from sigma Aldrich. Natural extractives were obtained from white pine chips
through a Soxhlet extraction. A mixture of ethanol-benzene 1:2 was used according to TAPPI
standard (T 204 cm-97). After a complete extraction, (about 8 h) the solvent containing
extractives were evaporated to a suitable concentration for analysis. Round pieces of
polypropylene mat with diameter of 10 cm were used to mimic the lipophilic surfaces in a
paper making process. A precisely weighed piece was fixed at the bottom of the cylindrical
container. 100 mg of substrate (either resin or model oils) was dispersed in 300 mL boric buffer
for each trial and then solution of fresh enzyme with different concentrations was added to the
system. A propeller attached to a rotor was used to stir the mixture of buffer, dispersed deposits
and solubilized enzyme inside the cylindrical container for 2 hours.
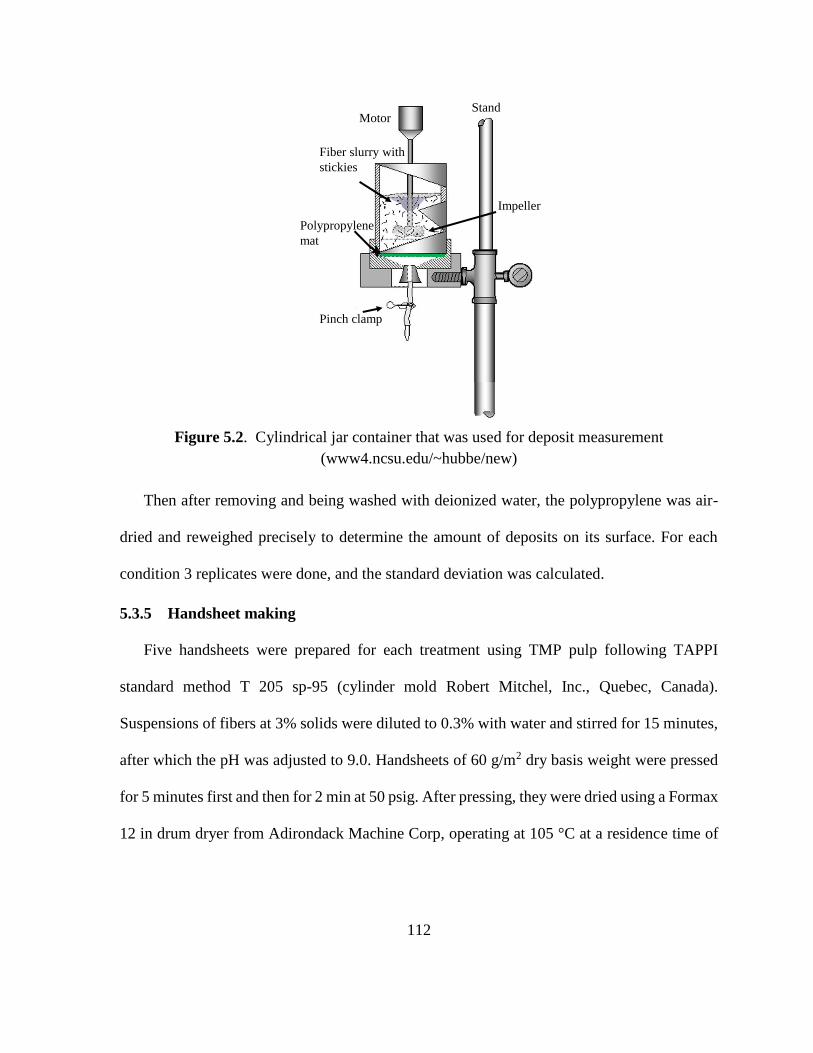
112
Figure 5.2. Cylindrical jar container that was used for deposit measurement
(www4.ncsu.edu/~hubbe/new)
Then after removing and being washed with deionized water, the polypropylene was air-
dried and reweighed precisely to determine the amount of deposits on its surface. For each
condition 3 replicates were done, and the standard deviation was calculated.
5.3.5 Handsheet making
Five handsheets were prepared for each treatment using TMP pulp following TAPPI
standard method T 205 sp-95 (cylinder mold Robert Mitchel, Inc., Quebec, Canada).
Suspensions of fibers at 3% solids were diluted to 0.3% with water and stirred for 15 minutes,
after which the pH was adjusted to 9.0. Handsheets of 60 g/m2 dry basis weight were pressed
for 5 minutes first and then for 2 min at 50 psig. After pressing, they were dried using a Formax
12 in drum dryer from Adirondack Machine Corp, operating at 105 °C at a residence time of
http://www4.ncsu.edu/~hubbe/new
Impeller
Stand
Polypropylene
mat
Pinch clamp
Fiber slurry with
stickies
Motor
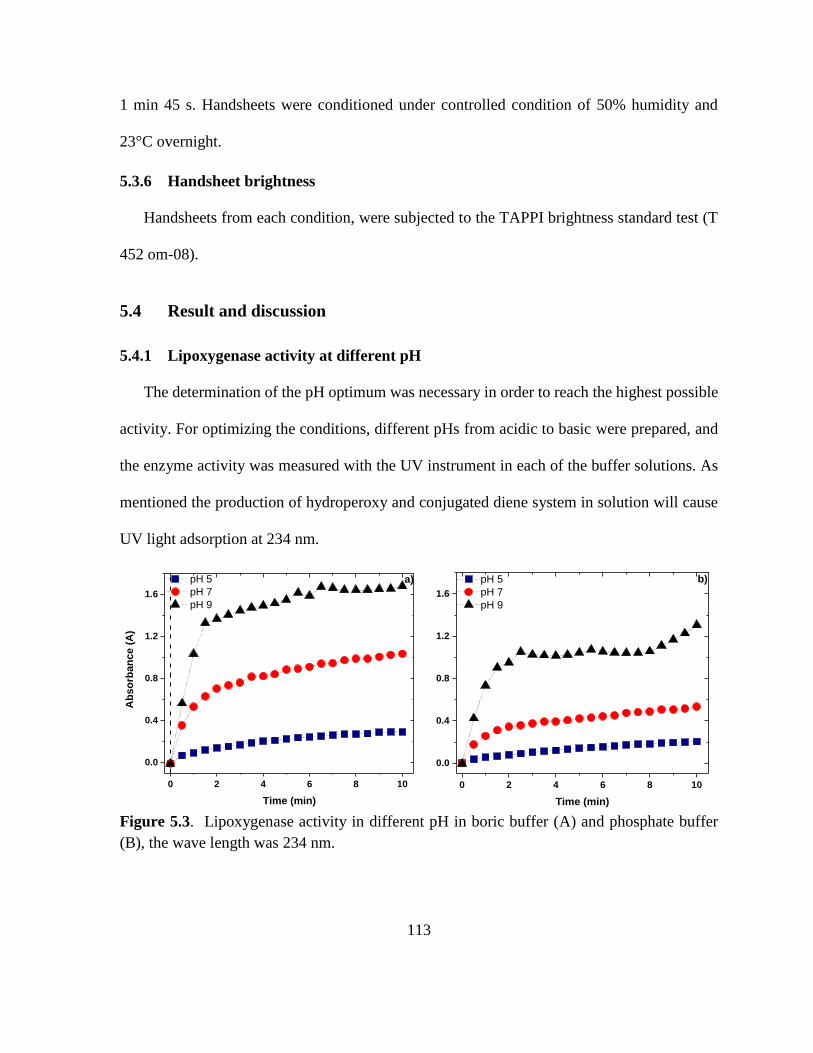
113
1 min 45 s. Handsheets were conditioned under controlled condition of 50% humidity and
23°C overnight.
5.3.6 Handsheet brightness
Handsheets from each condition, were subjected to the TAPPI brightness standard test (T
452 om-08).
5.4 Result and discussion
5.4.1 Lipoxygenase activity at different pH
The determination of the pH optimum was necessary in order to reach the highest possible
activity. For optimizing the conditions, different pHs from acidic to basic were prepared, and
the enzyme activity was measured with the UV instrument in each of the buffer solutions. As
mentioned the production of hydroperoxy and conjugated diene system in solution will cause
UV light adsorption at 234 nm.
Figure 5.3. Lipoxygenase activity in different pH in boric buffer (A) and phosphate buffer
(B), the wave length was 234 nm.
0 2 4 6 8 10
0.0
0.4
0.8
1.2
1.6
a)
Ab
so
rban
ce
(A
)
Time (min)
pH 5
pH 7
pH 9
0 2 4 6 8 10
0.0
0.4
0.8
1.2
1.6
b)
Time (min)
pH 5
pH 7
pH 9
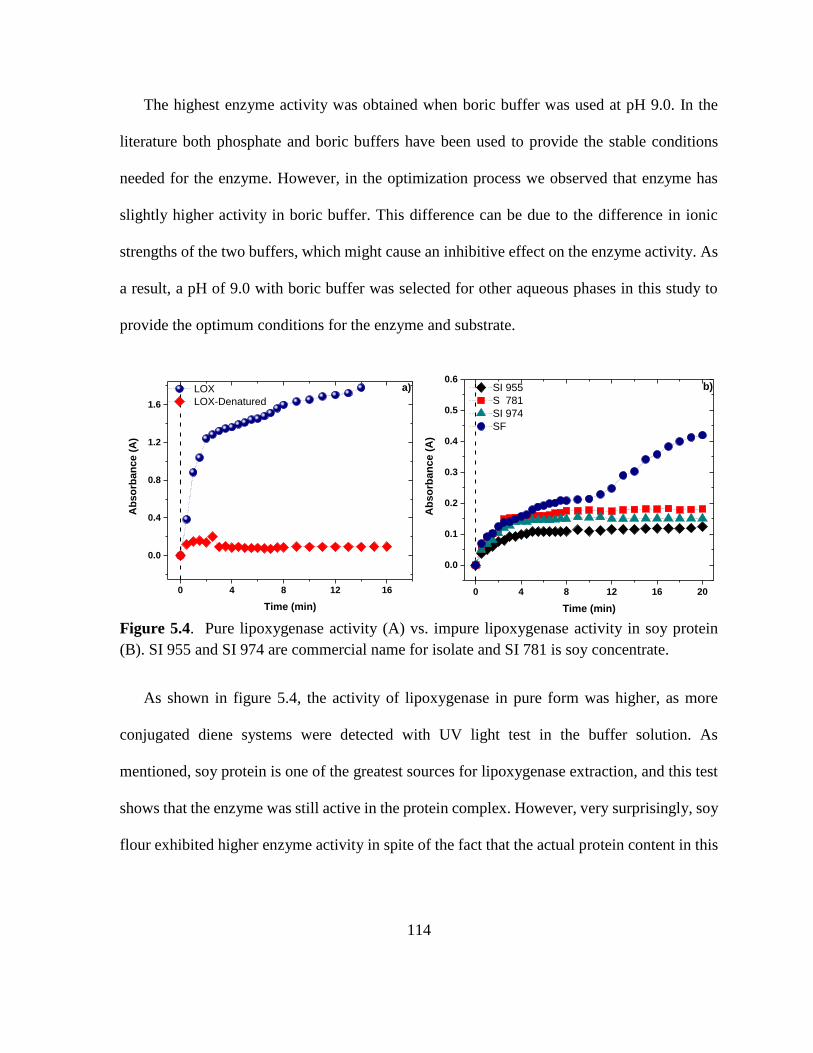
114
The highest enzyme activity was obtained when boric buffer was used at pH 9.0. In the
literature both phosphate and boric buffers have been used to provide the stable conditions
needed for the enzyme. However, in the optimization process we observed that enzyme has
slightly higher activity in boric buffer. This difference can be due to the difference in ionic
strengths of the two buffers, which might cause an inhibitive effect on the enzyme activity. As
a result, a pH of 9.0 with boric buffer was selected for other aqueous phases in this study to
provide the optimum conditions for the enzyme and substrate.
Figure 5.4. Pure lipoxygenase activity (A) vs. impure lipoxygenase activity in soy protein
(B). SI 955 and SI 974 are commercial name for isolate and SI 781 is soy concentrate.
As shown in figure 5.4, the activity of lipoxygenase in pure form was higher, as more
conjugated diene systems were detected with UV light test in the buffer solution. As
mentioned, soy protein is one of the greatest sources for lipoxygenase extraction, and this test
shows that the enzyme was still active in the protein complex. However, very surprisingly, soy
flour exhibited higher enzyme activity in spite of the fact that the actual protein content in this
0 4 8 12 16
0.0
0.4
0.8
1.2
1.6
a)
Ab
so
rban
ce
(A
)
Time (min)
LOX
LOX-Denatured
0 4 8 12 16 20
0.0
0.1
0.2
0.3
0.4
0.5
0.6b)
Ab
so
rban
ce (
A)
Time (min)
SI 955
S 781
SI 974
SF
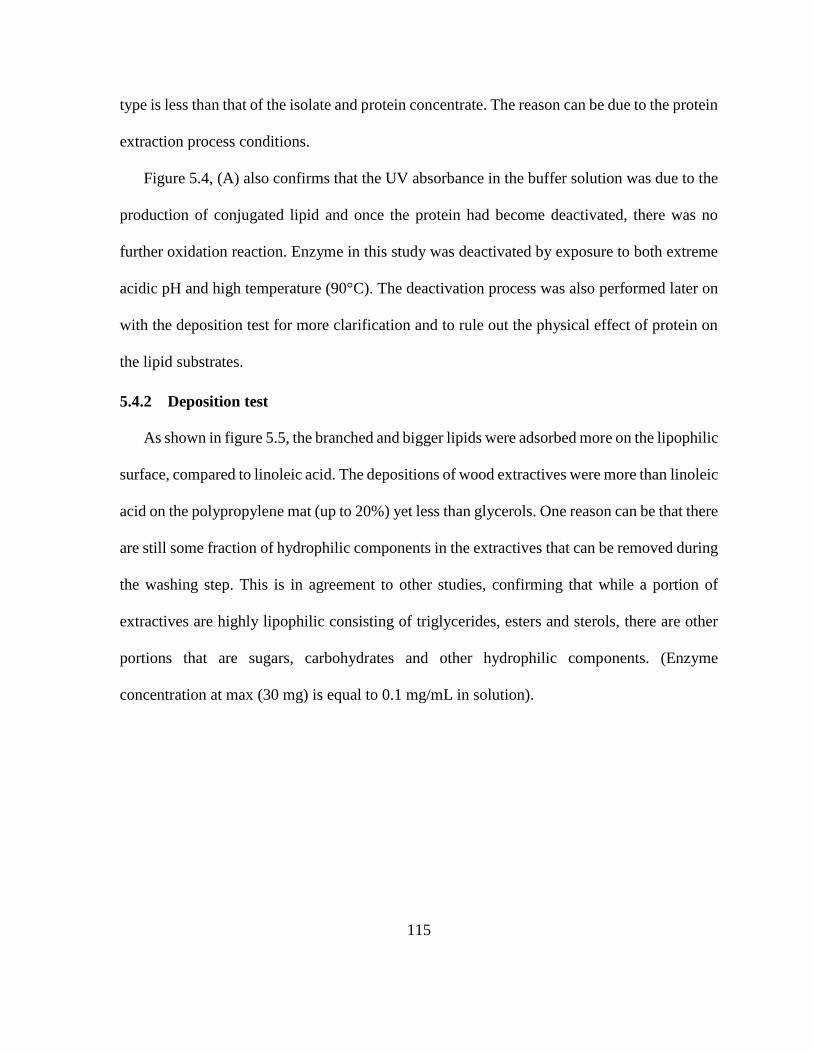
115
type is less than that of the isolate and protein concentrate. The reason can be due to the protein
extraction process conditions.
Figure 5.4, (A) also confirms that the UV absorbance in the buffer solution was due to the
production of conjugated lipid and once the protein had become deactivated, there was no
further oxidation reaction. Enzyme in this study was deactivated by exposure to both extreme
acidic pH and high temperature (90°C). The deactivation process was also performed later on
with the deposition test for more clarification and to rule out the physical effect of protein on
the lipid substrates.
5.4.2 Deposition test
As shown in figure 5.5, the branched and bigger lipids were adsorbed more on the lipophilic
surface, compared to linoleic acid. The depositions of wood extractives were more than linoleic
acid on the polypropylene mat (up to 20%) yet less than glycerols. One reason can be that there
are still some fraction of hydrophilic components in the extractives that can be removed during
the washing step. This is in agreement to other studies, confirming that while a portion of
extractives are highly lipophilic consisting of triglycerides, esters and sterols, there are other
portions that are sugars, carbohydrates and other hydrophilic components. (Enzyme
concentration at max (30 mg) is equal to 0.1 mg/mL in solution).
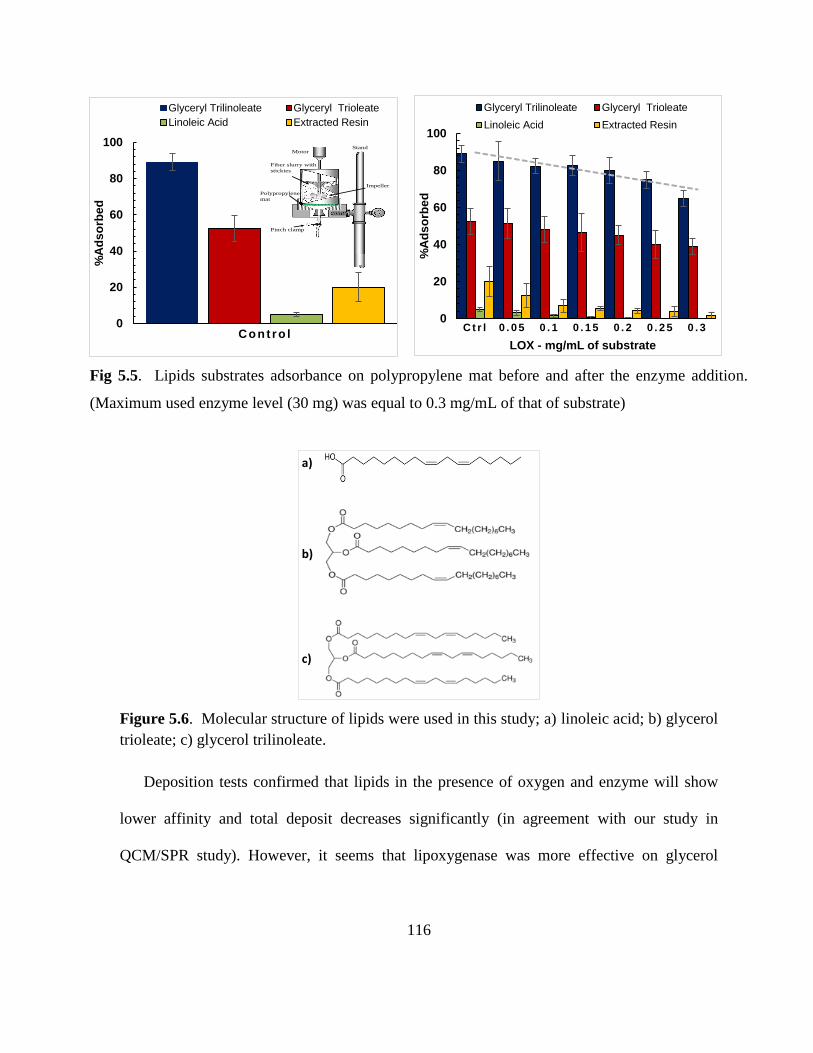
116
Fig 5.5. Lipids substrates adsorbance on polypropylene mat before and after the enzyme addition.
(Maximum used enzyme level (30 mg) was equal to 0.3 mg/mL of that of substrate)
Figure 5.6. Molecular structure of lipids were used in this study; a) linoleic acid; b) glycerol
trioleate; c) glycerol trilinoleate.
Deposition tests confirmed that lipids in the presence of oxygen and enzyme will show
lower affinity and total deposit decreases significantly (in agreement with our study in
QCM/SPR study). However, it seems that lipoxygenase was more effective on glycerol
0
20
40
60
80
100
Cont ro l
%A
ds
orb
ed
Glyceryl Trilinoleate Glyceryl Trioleate
Linoleic Acid Extracted Resin
http://www4.ncsu.edu/~hubbe/new
Impeller
Stand
Polypropylene
mat
Pinch clamp
Fiber slurry with
stickies
Motor
0
20
40
60
80
100
C t r l 0 . 0 5 0 . 1 0 . 1 5 0 . 2 0 . 2 5 0 . 3
%A
ds
orb
ed
LOX - mg/mL of substrate
Glyceryl Trilinoleate Glyceryl Trioleate
Linoleic Acid Extracted Resin
a)
b)
c)
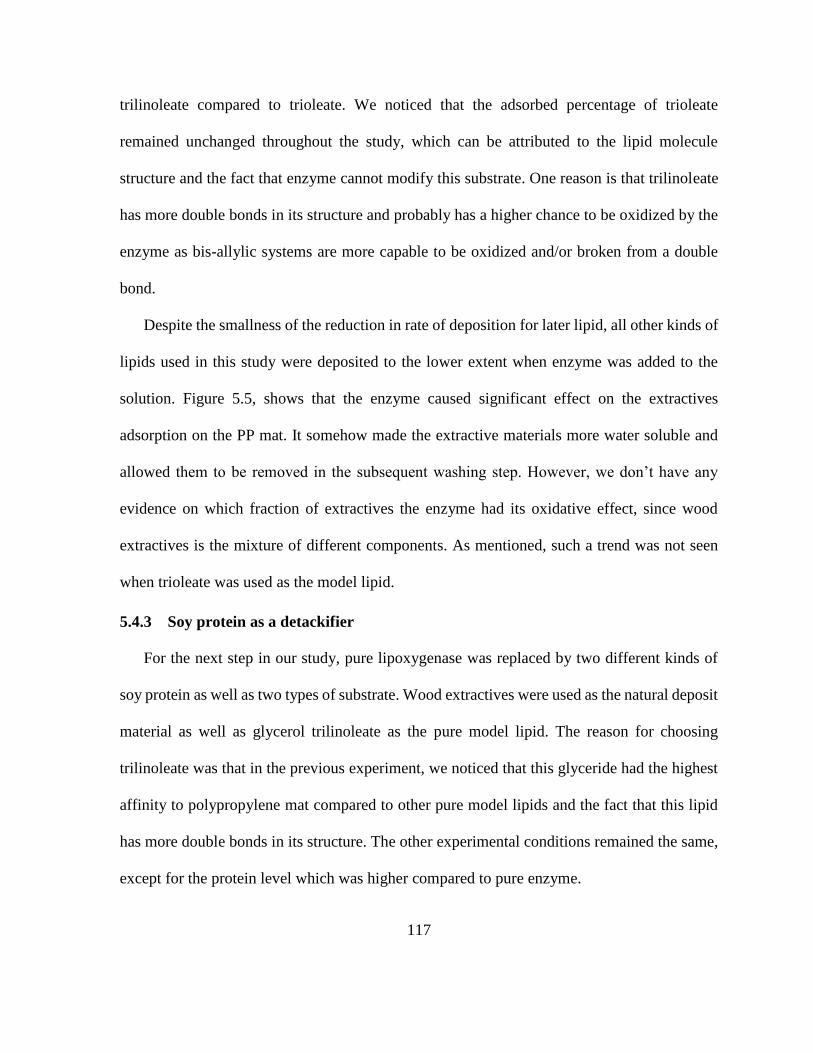
117
trilinoleate compared to trioleate. We noticed that the adsorbed percentage of trioleate
remained unchanged throughout the study, which can be attributed to the lipid molecule
structure and the fact that enzyme cannot modify this substrate. One reason is that trilinoleate
has more double bonds in its structure and probably has a higher chance to be oxidized by the
enzyme as bis-allylic systems are more capable to be oxidized and/or broken from a double
bond.
Despite the smallness of the reduction in rate of deposition for later lipid, all other kinds of
lipids used in this study were deposited to the lower extent when enzyme was added to the
solution. Figure 5.5, shows that the enzyme caused significant effect on the extractives
adsorption on the PP mat. It somehow made the extractive materials more water soluble and
allowed them to be removed in the subsequent washing step. However, we don’t have any
evidence on which fraction of extractives the enzyme had its oxidative effect, since wood
extractives is the mixture of different components. As mentioned, such a trend was not seen
when trioleate was used as the model lipid.
5.4.3 Soy protein as a detackifier
For the next step in our study, pure lipoxygenase was replaced by two different kinds of
soy protein as well as two types of substrate. Wood extractives were used as the natural deposit
material as well as glycerol trilinoleate as the pure model lipid. The reason for choosing
trilinoleate was that in the previous experiment, we noticed that this glyceride had the highest
affinity to polypropylene mat compared to other pure model lipids and the fact that this lipid
has more double bonds in its structure. The other experimental conditions remained the same,
except for the protein level which was higher compared to pure enzyme.
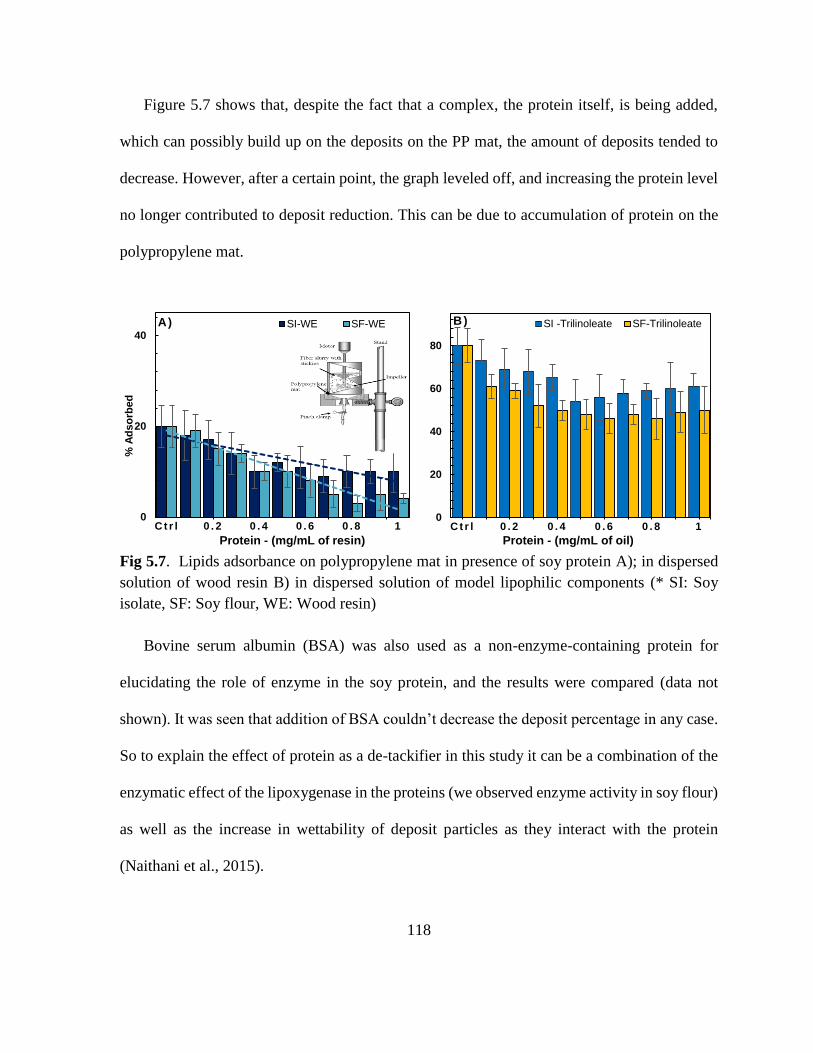
118
Figure 5.7 shows that, despite the fact that a complex, the protein itself, is being added,
which can possibly build up on the deposits on the PP mat, the amount of deposits tended to
decrease. However, after a certain point, the graph leveled off, and increasing the protein level
no longer contributed to deposit reduction. This can be due to accumulation of protein on the
polypropylene mat.
Fig 5.7. Lipids adsorbance on polypropylene mat in presence of soy protein A); in dispersed
solution of wood resin B) in dispersed solution of model lipophilic components (* SI: Soy
isolate, SF: Soy flour, WE: Wood resin)
Bovine serum albumin (BSA) was also used as a non-enzyme-containing protein for
elucidating the role of enzyme in the soy protein, and the results were compared (data not
shown). It was seen that addition of BSA couldn’t decrease the deposit percentage in any case.
So to explain the effect of protein as a de-tackifier in this study it can be a combination of the
enzymatic effect of the lipoxygenase in the proteins (we observed enzyme activity in soy flour)
as well as the increase in wettability of deposit particles as they interact with the protein
(Naithani et al., 2015).
0
20
40
C t r l 0 . 2 0 . 4 0 . 6 0 . 8 1
% A
ds
orb
ed
Protein - (mg/mL of resin)
A) SI-WE SF-WE
0
20
40
60
80
C t r l 0 . 2 0 . 4 0 . 6 0 . 8 1
Protein - (mg/mL of oil)
B ) SI -Trilinoleate SF-Trilinoleate

119
5.4.4 Deposit test after 5 adsorption cycles
In adsorption cycle tests, the lipids built up on the lipophilic surface after 5 cycles were
measured. As is obvious in figure 5.8, each time that poly-propylene mats were in contact with
the sickies, a certain portion of lipids deposited on its surface to the point that the PP surface
became completely saturated and adsorption graph reached to a plateau region. However, when
enzyme was added to the solution, the deposit level during the cycles decreased remarkably.
The aim of this test was to provide a condition closer to a papermaking process, in which a
hydrophobic metal or plastic surface is in continuous contact with sticky particles and stickies
can make a thick layer of deposits on that surface.
This experiment was carried out using pure lipid linoleic acid and natural wood resin. Here,
as was confirmed in the previous experiment, the reduction of extractive based deposits were
more significant.
Fig 5.8. Extractives/model lipid accumulation on PP surfaces after 5 adsorption cycles, with
lipoxygenase.
0
5
10
15
20
25
0 2 4 6
% A
ds
orb
ed
Number of cycles
Linoleic Acid Linoleic Acid + LOX
0
20
40
60
80
100
0 1 2 3 4 5 6
Number of cycles
Extractives Extractives + LOX

120
5.4.5 Water contact angle (WCA) measurement
The water contact angles of extractives on a glass plate were carried out after the
subsequent enzymatic oxidation. Results in table 5.1 showed that those extractive samples that
had been treated with a higher level of enzyme had more affinity to the water molecules and
showed lower contact angle values. The reason is that the oxidized fatty acids in the extractive
(the one with the added hydroperoxy group on the chain) should be more polar and therefore
will become somehow water soluble. This was in agreement with the deposition test, which
showed that enzymatically treated extractive tended to deposit less on the poly propylene
surface.
In order to avoid error in our experiment, the enzyme was separated from its substrate
through a phase separation using a polar and nonpolar solvent, and only the pure extracted lipid
was used for the water contact angle measurement. We observed the contact angle values are
decreasing up to certain point and after that, increasing in the enzyme level no longer cause
reduction in WCA values.
Table 5.1. WCA values (deg) for the enzymatically oxidized extractives on the glass surface
LOX level - mg/mL
of resin
WCA for treated
extractives (± 5°)
- 115
0.05 105
0.1 101
0.15 98
0.2 96
0.25 95
0.30 88
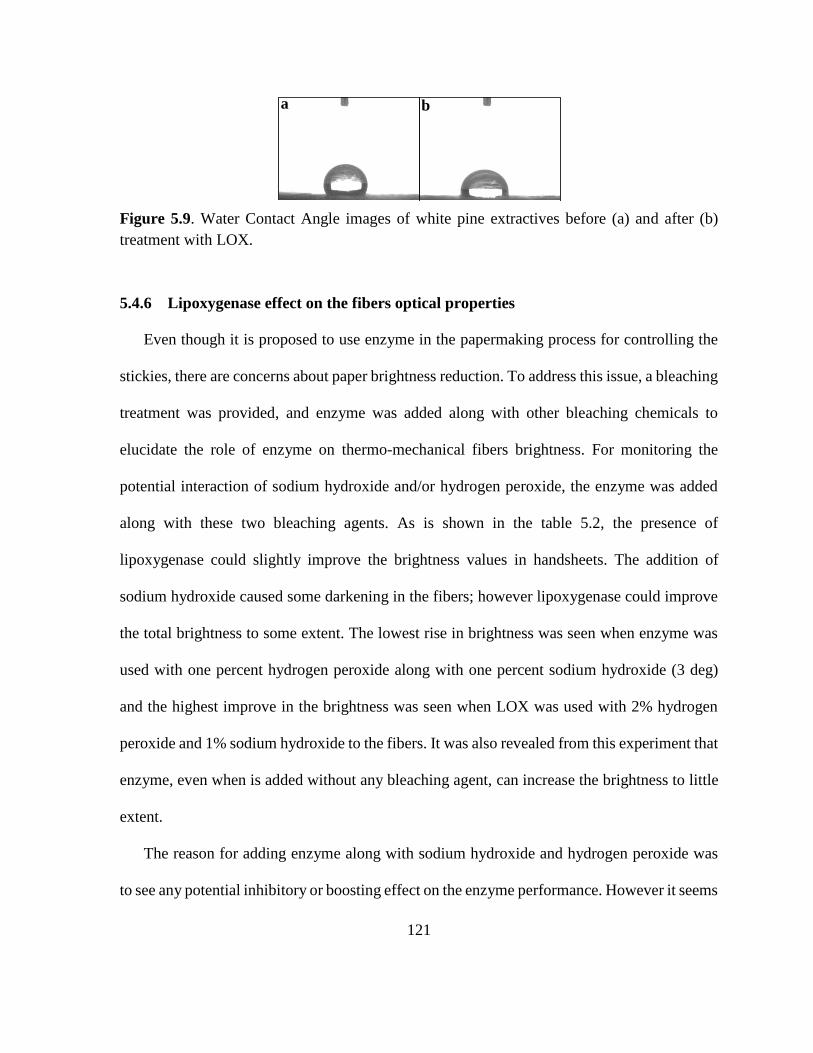
121
Figure 5.9. Water Contact Angle images of white pine extractives before (a) and after (b)
treatment with LOX.
5.4.6 Lipoxygenase effect on the fibers optical properties
Even though it is proposed to use enzyme in the papermaking process for controlling the
stickies, there are concerns about paper brightness reduction. To address this issue, a bleaching
treatment was provided, and enzyme was added along with other bleaching chemicals to
elucidate the role of enzyme on thermo-mechanical fibers brightness. For monitoring the
potential interaction of sodium hydroxide and/or hydrogen peroxide, the enzyme was added
along with these two bleaching agents. As is shown in the table 5.2, the presence of
lipoxygenase could slightly improve the brightness values in handsheets. The addition of
sodium hydroxide caused some darkening in the fibers; however lipoxygenase could improve
the total brightness to some extent. The lowest rise in brightness was seen when enzyme was
used with one percent hydrogen peroxide along with one percent sodium hydroxide (3 deg)
and the highest improve in the brightness was seen when LOX was used with 2% hydrogen
peroxide and 1% sodium hydroxide to the fibers. It was also revealed from this experiment that
enzyme, even when is added without any bleaching agent, can increase the brightness to little
extent.
The reason for adding enzyme along with sodium hydroxide and hydrogen peroxide was
to see any potential inhibitory or boosting effect on the enzyme performance. However it seems
a b
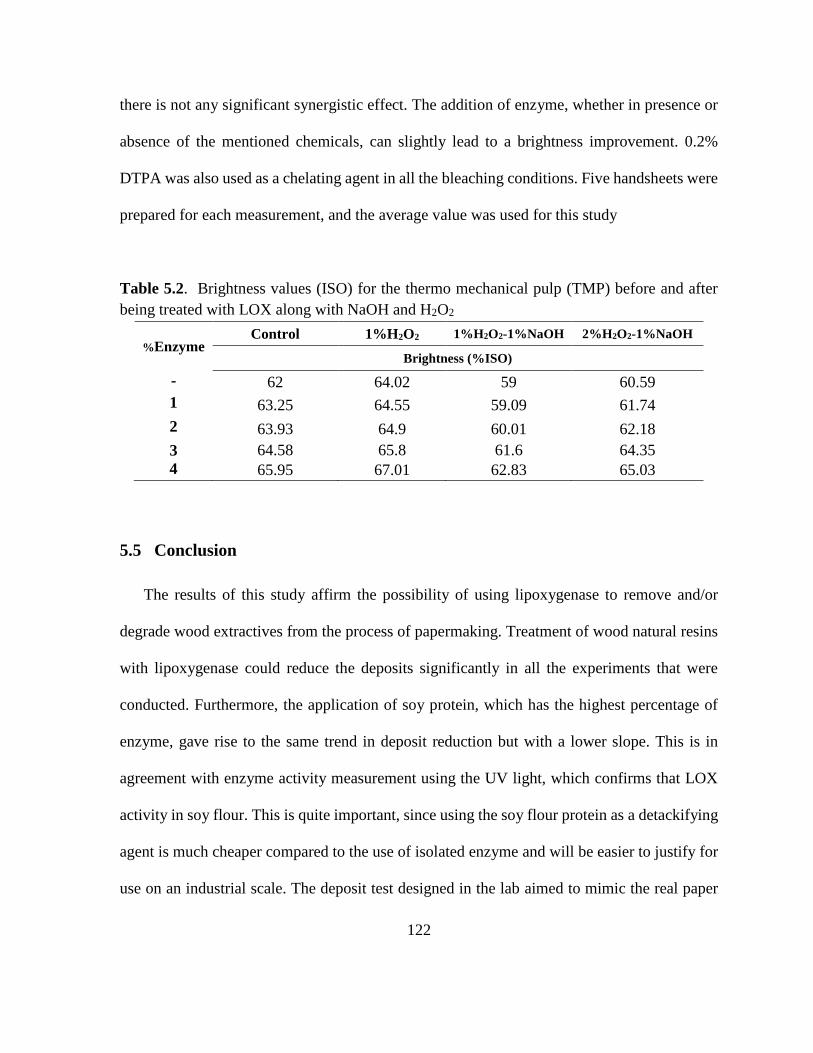
122
there is not any significant synergistic effect. The addition of enzyme, whether in presence or
absence of the mentioned chemicals, can slightly lead to a brightness improvement. 0.2%
DTPA was also used as a chelating agent in all the bleaching conditions. Five handsheets were
prepared for each measurement, and the average value was used for this study
Table 5.2. Brightness values (ISO) for the thermo mechanical pulp (TMP) before and after
being treated with LOX along with NaOH and H2O2
%Enzyme Control 1%H2O2 1%H2O2-1%NaOH 2%H2O2-1%NaOH
Brightness (%ISO)
- 62 64.02 59 60.59
1 63.25 64.55 59.09 61.74
2 63.93 64.9 60.01 62.18
3 64.58 65.8 61.6 64.35
4 65.95 67.01 62.83 65.03
5.5 Conclusion
The results of this study affirm the possibility of using lipoxygenase to remove and/or
degrade wood extractives from the process of papermaking. Treatment of wood natural resins
with lipoxygenase could reduce the deposits significantly in all the experiments that were
conducted. Furthermore, the application of soy protein, which has the highest percentage of
enzyme, gave rise to the same trend in deposit reduction but with a lower slope. This is in
agreement with enzyme activity measurement using the UV light, which confirms that LOX
activity in soy flour. This is quite important, since using the soy flour protein as a detackifying
agent is much cheaper compared to the use of isolated enzyme and will be easier to justify for
use on an industrial scale. The deposit test designed in the lab aimed to mimic the real paper
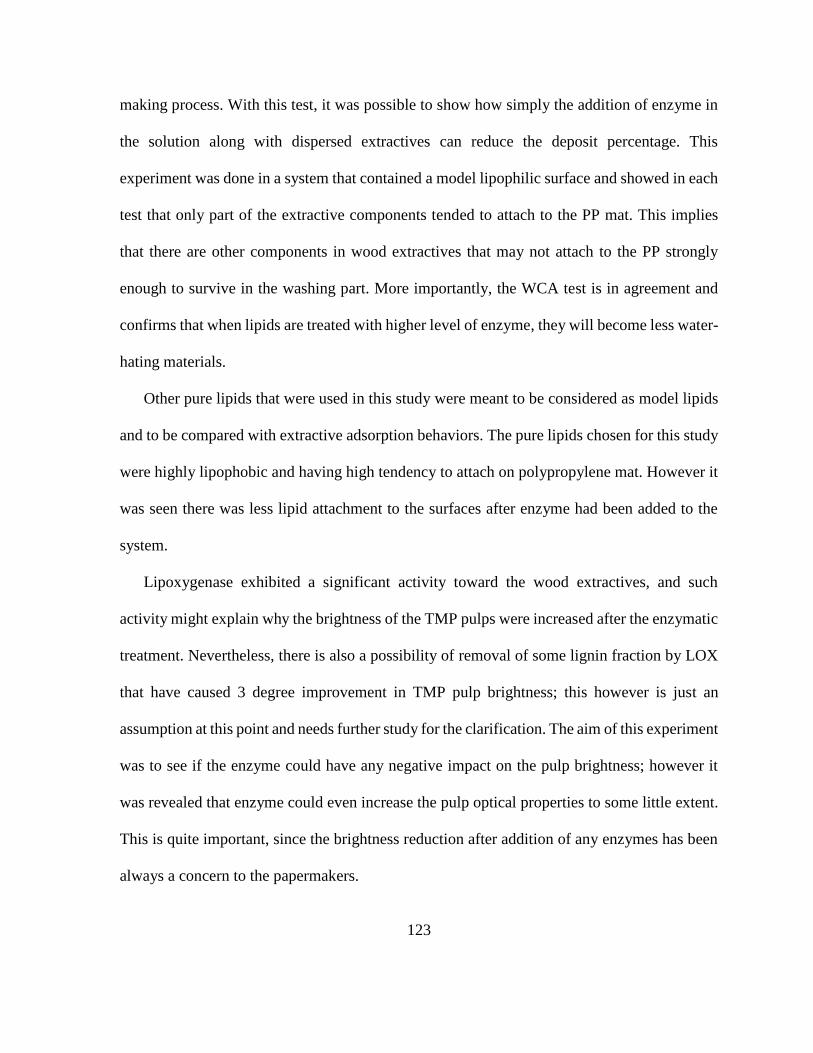
123
making process. With this test, it was possible to show how simply the addition of enzyme in
the solution along with dispersed extractives can reduce the deposit percentage. This
experiment was done in a system that contained a model lipophilic surface and showed in each
test that only part of the extractive components tended to attach to the PP mat. This implies
that there are other components in wood extractives that may not attach to the PP strongly
enough to survive in the washing part. More importantly, the WCA test is in agreement and
confirms that when lipids are treated with higher level of enzyme, they will become less water-
hating materials.
Other pure lipids that were used in this study were meant to be considered as model lipids
and to be compared with extractive adsorption behaviors. The pure lipids chosen for this study
were highly lipophobic and having high tendency to attach on polypropylene mat. However it
was seen there was less lipid attachment to the surfaces after enzyme had been added to the
system.
Lipoxygenase exhibited a significant activity toward the wood extractives, and such
activity might explain why the brightness of the TMP pulps were increased after the enzymatic
treatment. Nevertheless, there is also a possibility of removal of some lignin fraction by LOX
that have caused 3 degree improvement in TMP pulp brightness; this however is just an
assumption at this point and needs further study for the clarification. The aim of this experiment
was to see if the enzyme could have any negative impact on the pulp brightness; however it
was revealed that enzyme could even increase the pulp optical properties to some little extent.
This is quite important, since the brightness reduction after addition of any enzymes has been
always a concern to the papermakers.

124
5.6 References
Borch, K., Franks, N., Lund, H., Xu, H., & Luo, J. (2003). Oxidizing enzymes in the
manufacturing of paper materials. Patent USA, 124710.
Brash, A. (1999). Lipoxygenases: Occurrence, Functions, Catalysis, and Acquisition of
Substrate. Journal of Biological Chemistry, 274(34), 23679–23682.
Buchert, J., Mustranta, A., Tamminen, T., Spetz, P., & Holmbom, B. (2002). Modification of
spruce lignans with Trametes hirsuta laccase. Holzforschung, 56(6), 579–584.
Ekman, R., Eckerman, C., & Holmbom, B. (1990). Studies on the behavior of extractives in
mechanical pulp suspensions. Nordic Pulp and Paper Research Journal (Sweden), 5(2), 96–
103.
Ernst L. Back, L. H. A. (2000). Pitch Control, Wood Resin and Deresination. Atlanta: Tappi
Press.
Farrell, R. L., Hata, K., & Wall, M. B. (1997). Solving pitch problems in pulp and paper
processes by the use of enzymes or fungi (pp. 197–212). Springer Berlin Heidelberg.
Fengel, D., & Wegener, G. (1983). Wood: chemistry, ultrastructure, reactions. Walter de
Gruyter.
Folcik, V. A., Nivar-Aristy, R. A., Krajewski, L. P., & Cathcart, M. K. (1995). Lipoxygenase
contributes to the oxidation of lipids in human atherosclerotic plaques. The Journal of Clinical
Investigation, 96(1), 504–10.
Fujita, Y., Awaji, H., Matsukura, M., & Hata, K. (1991). Enzymatic pitch control in
papermaking process. Japan Tappi Journal, 45(8), 905–921.
Grechkin A. (1998). Recent developments in biochemistry of the plant lipoxygenase pathway.
Progress in Lipid Research, 37(5), 317–352.
Gurnagul, N., Ouchi, M. D., Dunlop-Jones, N., Sparkes, D. G., & Wearing, J. T. (1992).
Factors affecting the coefficient of friction of paper. Journal of Applied Polymer Science,
46(5), 805–814.
Gutiérrez, A. (2001). The biotechnological control of pitch in paper pulp manufacturing.
Trends in Biotechnology, 19(9), 340–348.
Gutiérrez, A., del Rıo, J. C., González-Vila, F. J., & Martın, F. (1998). Analysis of lipophilic
extractives from wood and pitch deposits by solid-phase extraction and gas chromatography.
125
Journal of Chromatography A, 823(1), 449–455.
Gutiérrez, A., José, C., & Martínez, A. T. (2009). Microbial and enzymatic control of pitch in
the pulp and paper industry. Applied Microbiology and Biotechnology, 82(6), 1005–1018.
Hamberg, M., Su, C., & Oliw, E. (1998). Manganese lipoxygenase. Discovery of a bis-allylic
hydroperoxide as product and intermediate in a lipoxygenase reaction. The Journal of
Biological Chemistry, 273(21), 13080–8.
Hildebrand, D., Hamilton-Kemp, T., & Legg, C. (1988). Plant lipoxygenases: occurrence,
properties and possible functions. In Proceedings of the Plant Biochemistry and Physiology.
Hillis, W. E., & Sumimoto, M. (1989). Effect of Extractives on Pulping (pp. 880–920).
Springer Berlin Heidelberg.
Hubbe, M. A., Rojas, O. J., & Venditti, R. A. (2006). Control of tacky deposits on paper
machines-A review. Nordic Pulp and Paper Research Journal, 21(2), 154–171.
Irie Y., H. K. (1990). Enzymatic pitch control in papermaking system. Atlanta: Proceeding of
papermaker conference.
Marques, G., Molina, S., Babot, E. D., Lund, H., José, C., & Gutiérrez, A. (2011). Exploring
the potential of fungal manganese-containing lipoxygenase for pitch control and pulp
delignification. Bioresource Technology, 102(2), 1338–1343.
Naithani, V., Lucia, L. A., & Banerjee, S. (2015). Soy flour detackification of stickies from
paper recycling, 30(3), 541–545.
Paice, M., & Zhang, X. (2005). Enzymes find their niche. Pulp and Paper Canada, 106(6),
17–20.
Porta, H., & Rocha-Sosa, M. (2002). Plant Lipoxygenases. Physiological and Molecular
Features. Plant Physiology, 130(1), 15–21.
Prigge, S. T., Boyington, J. C., Faig, M., Doctor, K. S., Gaffney, B. J., & Amzel, L. M. (1997).
Structure and mechanism of lipoxygenases. Biochimie, 79(11), 629–636.
Sharyo, M., Shimoto, H., Sakaguchi, H., Isaji, M., Fujita, Y., Awaji, H., … Hata, K. (1993).
The recent progress and general status of the lipase pitch control technology in Japan. Japan
Tappi Journal, 47(10), 1223–1233.
Shibata, D., Steczko, J., Dixon, J. E., Hermodson, M., Yazdanparast, R., & Axelrod, B. (1987).
Primary structure of soybean lipoxygenase-1. The Journal of Biological Chemistry, 262(21),
126
10080–5.
Siedow, J. N. (1991). Plant Lipoxygenase: Structure and Function. Annual Review of Plant
Physiology and Plant Molecular Biology, 42, 145–188.
Stebbing, D. W., Zhang, X., Soong, G., Mansfield, S. D., & Saddler, J. N. (2004). Fungal
enzyme treatment of newsprint mill white water: Impact on white water and paper properties,
30(1), 3–8.
Su, C., & Oliw, E. H. (1998). Manganese lipoxygenase. Purification and characterization. The
Journal of Biological Chemistry, 273(21), 13072–9.
Zhang, Nguyen, D., Paice, M. G., Tsang, A., & Renaud, S. (2007). Degradation of wood
extractives in thermo-mechanical pulp by soybean lipoxygenase. Enzyme and Microbial
Technology, 40(4), 866–873.
Zhang, Renaud, S., & Paice, M. (2005). The potential of laccase to remove extractives present
in pulp and white water from TMP newsprint mills. Journal of Pulp and Paper Science, 31(4),
175–180.
Zhang, X., Eigendorf, G., Stebbing, D. ., Mansfield, S. ., & Saddler, J. . (2002). Degradation
of trilinolein by laccase enzymes. Archives of Biochemistry and Biophysics, 405(1), 44–54.
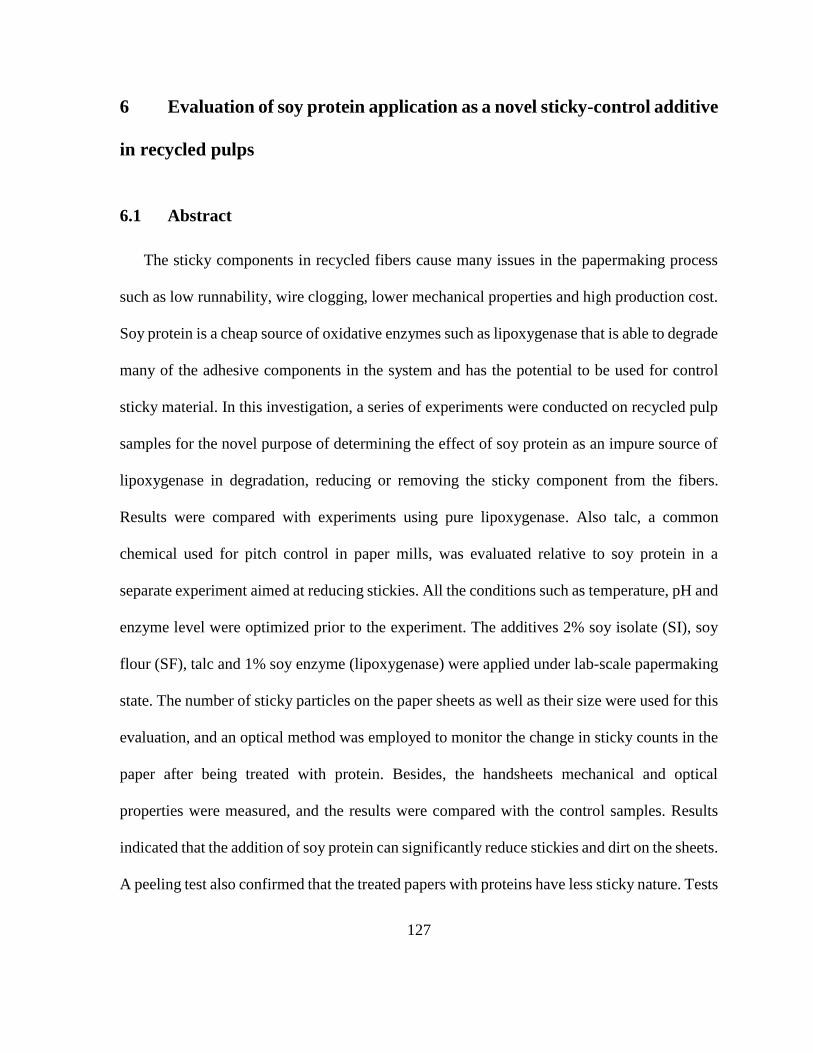
127
6 Evaluation of soy protein application as a novel sticky-control additive
in recycled pulps
6.1 Abstract
The sticky components in recycled fibers cause many issues in the papermaking process
such as low runnability, wire clogging, lower mechanical properties and high production cost.
Soy protein is a cheap source of oxidative enzymes such as lipoxygenase that is able to degrade
many of the adhesive components in the system and has the potential to be used for control
sticky material. In this investigation, a series of experiments were conducted on recycled pulp
samples for the novel purpose of determining the effect of soy protein as an impure source of
lipoxygenase in degradation, reducing or removing the sticky component from the fibers.
Results were compared with experiments using pure lipoxygenase. Also talc, a common
chemical used for pitch control in paper mills, was evaluated relative to soy protein in a
separate experiment aimed at reducing stickies. All the conditions such as temperature, pH and
enzyme level were optimized prior to the experiment. The additives 2% soy isolate (SI), soy
flour (SF), talc and 1% soy enzyme (lipoxygenase) were applied under lab-scale papermaking
state. The number of sticky particles on the paper sheets as well as their size were used for this
evaluation, and an optical method was employed to monitor the change in sticky counts in the
paper after being treated with protein. Besides, the handsheets mechanical and optical
properties were measured, and the results were compared with the control samples. Results
indicated that the addition of soy protein can significantly reduce stickies and dirt on the sheets.
A peeling test also confirmed that the treated papers with proteins have less sticky nature. Tests
128
of mechanical properties also revealed that soy flour has a synergistic effect and can cause a
remarkable increase in most of the strengths, such as tensile, tear and burst. Tensile index was
the prime criterion for the comparison based on industrial consideration.
6.2 Introduction
Recycled fibers are important sources of papermaking raw material because reusing the
paper can both reduce the volume of waste as well as decrease the use of virgin fibers. This
can make it possible to produce papers with lower cost and energy, which makes the
application of recycle fibers quite interesting for the paper companies. Recent increases in
environmental awareness also have promoted the demand for paper products because there
will be less impact on the environment when paper is recycled.
However, compared to virgin fibers, recycled fibers have some drawbacks that need to be
addressed in order to reach to the desirable quality of the resulting paper. In study by Howard
(1990, 1992), it was reported that recycling has a direct effect on paper strengths properties.
They showed that by increasing the recycle number in Kraft pulp, the density and tensile
strength were decreased significantly. Similarly, burst and tear strengths tend to decrease when
mechanical pulp is used. In another study by (Hamzeh et al., 2012) , it was revealed that most
of the mechanical indices such as tensile, burst, tear and folding endurance strength in both
bleached and unbleached Kraft pulp decline as the number of recycling steps advances. They
also showed that recycling of the mentioned pulps can increase the hornification in the pulp to
a great extent.
129
The paper strength is mostly related to the fiber-fiber bonds that form as water is removed,
giving rise to strong contact between fibers and other types of molecular interactions between
the fibers (Lindström et al., 2005). Different methods can be used to improve the paper
mechanical properties, especially its dry strength. These include beating, refining of the fibers
and using chemicals to increase the bonding strengths between the fibers. Applying the shear
force to the fibers will cause them to become more fibrillated, and more hydrated and as a
result, mechanical entanglement between the fibers increases. Beating also improves the fibers
strengths by increasing their surface area, allowing the formation of a better fibrous network
(Dasgupta, 1994; Mohlin, 1975). It was also, reported that refining the pulps can increase both
paper strengths and its deinking potential (Tayeb et al., 2012). However, there are limitations
to applying refining on the fibers, since it causes increase in the fines and reduces the fiber
length. Moreover, refining usually consumes a high amount of energy which will increase the
production cost as well as lowering the rate of dewatering in the paper making process (Marais
et al., 2012).
Other studies have suggested the use of chemicals such as high molecular mass
polyelectrolyte to increase the fiber-fiber bonding (Lindström et al., 2005; Pelton, 2004).
(Marais et al., 2012) used polymeric amines as a dry additives to enhance the mechanical
properties of fibrous network. Other chemicals that are also used as dry strength additives are
polyacrylamide (Carlsson et al., 1977), starch (Marton, 1980; Moeller, 1966; Wagberg, 1993)
guar gums, carboxymethyl cellulose and methyl cellulose, (Biermann, 1996; Pelton, 2004).
Usually the purpose of using dry strength agents is to maximize the mechanical robustness of
the paper while preserving other properties such as opacity and printability. Even though starch
130
has been used widely for dry strength improvement, increasing the level of starch might bring
about a higher biological oxygen demand (BOD) and affect the retention in a negative manner
(Hubbe, 2012). Besides, one prerequisite for the polyelectrolytes is to have them fully adsorbed
onto cellulose fibers before the paper formation, and most of the time polymers adsorption
onto cellulose is highly dependent on the pH and ionic strengths of the medium (Wagberg,
2000). Other researchers have suggested the application of other types of polyelectrolytes such
as polyallylamine hydrochloride (PAH), polyacrylamide by adsorption of a one layer (Gimåker
et al., 2007; Petlicki et al., 1994) or by adsorption of cationic and anionic polyelectrolyte
multiple layers on the surface of fibers (Eriksson et al., 2005; Wågberg et al., 2002). But the
application of the mentioned chemicals are usually expensive and will add to the final
production cost. It has been estimated that 10% of paper total cost production can be attributed
to the different classes of paper strength additives (Smook, 2002).
Another issue with the recycled fibers is the presence of lipophilic and sticky components
in the pulp that can come into the process through many different sources such as raw materials,
virgin fibers, recycled papers as well as broke (Back and Allen., 2000; Dechandt et al., 2004).
Stickies that are coming from virgin fibers are mainly the lipophilic fraction in wood
extractives. Such materials are usually seen in mechanical pulps. Other sources of stickies that
can be found in chemical and recycled pulps are adhesive materials that enter the mill with
furnish. They are typically composed of binders, or pressure sensitive adhesives (PSAs) that
are found in recycled papers (Douek et al., 2003). Other chemicals that can attribute to the
sticky components are latex (Laubach, 1994), adhesive waxes (Patel et al., 1999) and
elastomers from labels (Capozzi et al., 1994; Doshi, 1991; Douek et al., 1997). It is known

131
that the adhesive properties are influenced enormously by the pH and the temperature of the
water in which the recycling process takes place (Onusseit, 2006).
The percentage of the mentioned components are very low compared to the volume of pulp
in the process; nevertheless they can be very problematic when they deposit on the surfaces of
machines, dryer cans, press felt as well as on the forming fabrics due to their hydrophobic
nature. The deposition of components will cause negative effects on the paper making process
such as cost to replace the clogged forming fabrics, press and drying felts and brings about
more paper breaks, lower production quality, higher degree of defects and finally less
operational efficiency. These small particles can agglomerate during the process and cause
sticky deposits that will lead to production of paper with lower quality and higher cost.
Therefore stickies will continue to be an issue due to the fact 63.5% of the produced paper in
Unites States was recycled as reported recently (53rd Annual Survey of Paper, Paperboard
and Pulp Capacity, 2013).
There are different approaches such as chemical, enzymatic and mechanical methods that
can be applied to control stickies. Lipponen (2006) used fine screens with openings of 0.15
mm to remove non-colloidal stickies. However screening is usually energy-intensive and
costly as well as inefficient in removing the colloidal components such a microstickies that can
agglomerate after passing the screens. There are different types of chemicals such as
cyclodextrin (Banerjee et al., 2008, 2012), different types of polymers (Kerman et al., 2006),
talc (Benecke et al., 2009), enzymes (Bajpai, 2010; Gutiérrez et al., 2009; Zhang et al., 2002,
2005), fungi (Marques et al., 2011), proteins (Gu, 2003; Naithani et al., 2015), and various
additives (Hubbe et al., 2006) that have been used with some degree of success. Most of the

132
methods mentioned above are either costly or source-oriented solutions, meaning that they can
minimize the tacky deposits at vulnerable parts of the paper making process.
However in this study we are demonstrating that soy protein for its specifications can be a
good approach for both controlling the hydrophobic interaction and improving the mechanical
strengths in the paper making process. It is suggested macromolecules with inexpensive price
and acceptable performance such as soy protein and soy oil residual, when used alone or in
combination with other polymers, can be a good alternative additive in paper making process
(Fahmy et al., 2010; Jin et al., 2012). Paper making additives should be chosen regarding to
their effect on final paper performance and include economy feasibility, government
compliance and environmentally friendly nature. Soy protein is one of the most important
sources of vegetable protein in the world and products that are derived from soy protein are
inexpensive, compatible with environment, and sustainable, which makes these products good
alternatives in applications such as films, foams, gels, emulsions, aerogels and adhesives
(Arboleda et al., 2013; Bai et al., 2013; Hua et al., 2005; Martínez et al., 2009; Phoon et al.,
2014; Wang et al., 2007). In another study by (Liu et al., 2007), soy protein was suggested as
a good adhesives to be used as a substitution to industrial petro-based adhesives.
Soy bean is composed of 30% carbohydrates, 38% proteins, 18% oil, 10% moisture and
4% minerals, such that after the defatting process (extraction of oil) the remaining material will
be a protein-rich mixture, which is called soy flour with about 50% protein content. This also
can be further purified into soy concentrate and soy isolate with 70% and 90% protein,
respectively (Damodaran et al., 1997). However the application of soy four is more attractive
in the industry due to its low manufacturing price.
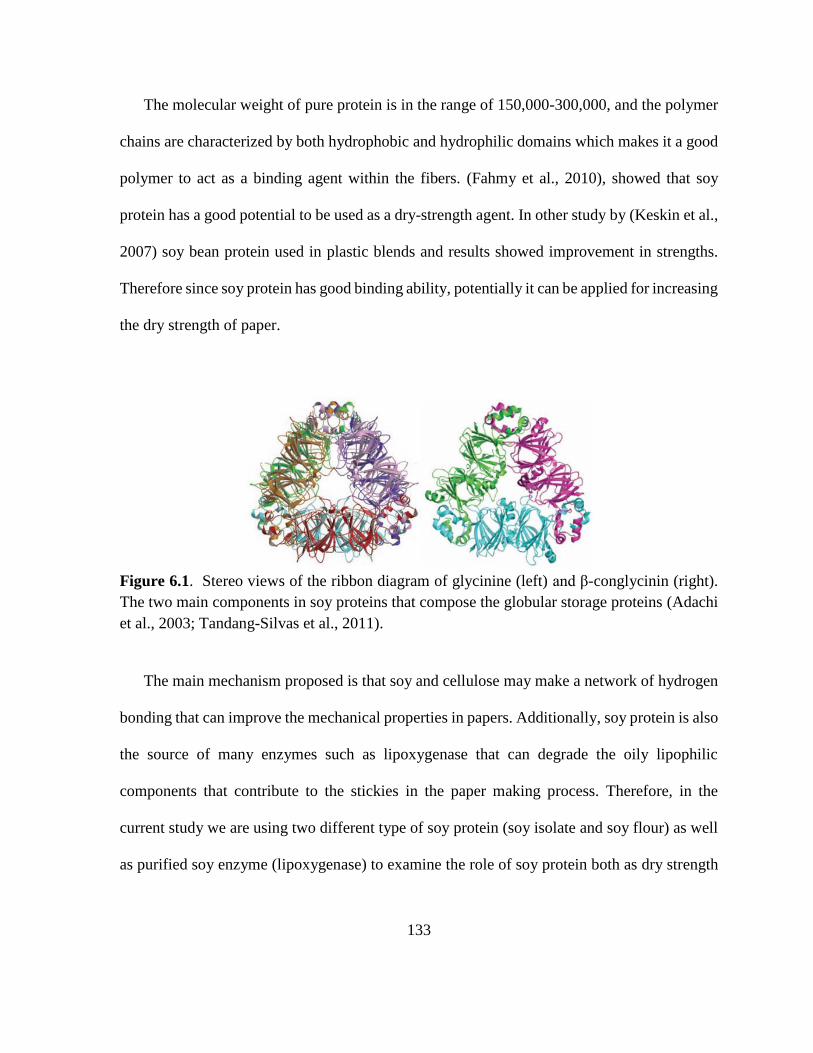
133
The molecular weight of pure protein is in the range of 150,000-300,000, and the polymer
chains are characterized by both hydrophobic and hydrophilic domains which makes it a good
polymer to act as a binding agent within the fibers. (Fahmy et al., 2010), showed that soy
protein has a good potential to be used as a dry-strength agent. In other study by (Keskin et al.,
2007) soy bean protein used in plastic blends and results showed improvement in strengths.
Therefore since soy protein has good binding ability, potentially it can be applied for increasing
the dry strength of paper.
Figure 6.1. Stereo views of the ribbon diagram of glycinine (left) and β-conglycinin (right).
The two main components in soy proteins that compose the globular storage proteins (Adachi
et al., 2003; Tandang-Silvas et al., 2011).
The main mechanism proposed is that soy and cellulose may make a network of hydrogen
bonding that can improve the mechanical properties in papers. Additionally, soy protein is also
the source of many enzymes such as lipoxygenase that can degrade the oily lipophilic
components that contribute to the stickies in the paper making process. Therefore, in the
current study we are using two different type of soy protein (soy isolate and soy flour) as well
as purified soy enzyme (lipoxygenase) to examine the role of soy protein both as dry strength
134
and detackifier agent in recycle pulps. The application of soy protein was also considered as a
source of enzyme. Furthermore, we also used talc in our study as the benchmark to compare
the efficiency of protein in reducing the stickies with talc as a common de-tackifier chemical.
To carry on this test, a series of experiments were set, and the force required to initiate
detaching the sticky containing paper from glass surface being coated by Carbotec (common
PSA adhesive) was determined. Furthermore, an optical approach was proposed to determine
the number of sticky components on the sheets after the treatment with soy protein and results
were compared. Finally for evaluating the effect of protein on other paper making aspects, we
measured the fibers total charge, and paper porosity.
6.3 Materials and Methods
6.3.1 Soy protein and enzyme preparation
Soy flour (SF) with the soy content of 53% and soy isolate (Pro-Fam 955 from ADM) with
the protein content of 90% were gift from ADM (Archer Daniels Midland) company and used
as received. The desired level of protein/enzyme was fully dissolved in boric buffer with pH
9.0 before applying to the pulp. Laboratory grade NaOH, HCl, KOH and H3BO3 (Boric Acid)
was purchased from sigma and were used for pH and conductivity adjustment.
Soybean lipoxygenase Type B-1 was obtained from Sigma-Aldrich. The enzymes activity
were around 50,000 units per mg of solid, where one unit will cause an absorbance increase at
234 nm of 0.001 units per minute at temperature 25-30 °C, when linoleic acid is used as
standard substrate for enzyme. Recycled pulp was a gift from resolute paper making company.

135
6.3.2 Lipoxygenase and protein solution preparation
The desired level of enzyme and soy protein was added to a 20 mL liquid scintillation vial
under nitrogen gas, where enzyme or protein was dissolved to homogeneity in a 0.2 M borate
with constant stirring at 200 rpm for 5 minutes. Enzyme activity in protein and lipoxygenase
was determined spectrophotometrically. The addition level was determined to be 1% for
enzyme (LOX) and 2% for soy protein based on the fiber dry weight in room temperature.
6.3.3 Pulp treatment with lipoxygenase and protein
The recycled pulp with sticky amount of (145 mm2/kg) was dispersed in water with the pH
9.0 and under room temperature to the consistency of 3% where desired amount of retention
aid (0.05% CAT PAM) was added to the pulp. The dilute solution of enzyme/protein was added
to the pulp suspension and left stirring for 2 hours before the subsequent washing step. The
final concentration was determined to be 1% pure lipoxygenase, 2% soy protein and 2 % talc
based on the fiber oven dried. A parallel experiment was done with same conditions except
that no enzyme or protein was added. At the end, both control and enzyme treated pulp samples
were washed with de-ionized water before the subsequent handsheet preparation step. Part of
the slurry was kept for fiber total charge measurement and other part was used to make
handsheets.
6.3.4 Handsheet preparation
20 handsheets were prepared for each treatment using TAPPI standard method T-205 sp-
95 (cylinder mold Robert Mitchel, Inc., Quebec, Canada). Suspension of fibers at 3% solids
were diluted to 0.3% with water and stirred for 15 minutes. Before making the handsheets, the
screen was thoroughly cleaned with a steam hose to ensure proper drainage. Handsheets of 60
136
g/m2 dry basis weight were prepared and pressed for 5 minutes first and then for 2 min at 50
psig in a testing machine Inc, handsheet press. After pressing, they were air dried and
conditioned under 50% humidity and 23 °C temperature overnight.
6.3.5 Optical properties
Handsheets from each condition were subjected to the Tappi brightness standard test (T
452 om-08). Color Touch 2 Model IOS instrument was used to determine the handsheets’
brightness.
6.3.6 Mechanical properties
6.3.6.1 Tensile strength
Handsheets tensile indices were measured according to Tappi T-220 test method.
Handsheets were weighed to determine their basis weight, and only proper handsheets were
chosen for the preparation of test specimens at a 15 mm strip width using a Lorentzen &Wettre
strip cutter. The gap between clamping jaws was set to 150 mm, and the cross head speed was
set to 10 mm/min. Samples were tested for their tensile strength in a Lorentzen &Wettre tensile
test device. Results were reported in units of Nmax (newton max force), and tensile index values
were calculated by dividing the strength value by the corresponding basis weight. It is defined
as the tensile strength (N/m) and the basis weight (g/m2) with the units of (N/m)/(g/m2) = Nm/g,
where tensile strength is the breaking force (load) per standard width of the paper. The average
value of 10 sample were used and standard deviation calculated.
6.3.6.2 Roughness and Burst strength
The roughness of recycled pulp hand sheet was tested using all L & W roughness tester
according to Tappi T 538 test method, and the burst strength was tested with a Mullen tester

137
base on Tappi T810 test method. Testing specimens for burst strength were cut into 100 x 100
mm pieces.
6.3.6.3 Tear strength
Tear index refers to the tearing strength in relation to the basis weight. Tear strength was
also tested with an L & W tester according to ASTM D 689 test method. Testing samples were
cut into 100 x 100 mm pieces.
6.3.7 Charge measurement
Total charge of the fibers were measured using a method from Fras et al. (2004). A
consistency of 0.1% of fibers in distilled water was prepared and then using the acid-base
titration the total charge was determined. Solutions of 0.01N HCl and NaOH were used. The
volume of base used to neutralize the C-OOH in the fibers was recorded to measure the fiber
charges.
6.3.8 Test of porosity
Porosity was obtained with a Gurley Porosimeter. Testing was performed according to
Tappi standard T 460 om-02. Paper samples, measuring 50 x 100 mm, were cut and marked
on both sides for easy identification and the Gurley seconds were recorded for each sample.
All results were obtained from the average of at least 10 tested samples.
6.3.9 Dye application
Handsheets were dyed with 0.067% oil-based dye Morplas Blue 1003 at room temperature
to increase the contrast in the sheets. 0.68 grams of Morplas Blue was weighed and dissolved
to 1000 mL of heptane, mixing vigorously and then filtering the solution through Whatman
filter Paper #4. Then handsheets were immersed in the dye solution for 10 seconds and put in
138
the hood for drying overnight. Next day they were rinsed in heptane bath to remove the excess
dye stained on the papers and were again left under the hood for 2 hours to dry. A 1000 mL of
dye solution and 1000 mL baths of the heptane were used for about 40 handsheets. The tacky
components retained the blue color after rinsing and increased the contrast for the subsequent
handsheets optical analysis
6.3.10 Stickies analysis
For measuring the amount and size of stickies in sheets from different treatments, the
“Apogee Image Analysis System” using a high resolution scanner (HP Scan Jet 4C scanner at
600 dots per inch) was employed to perform the image analysis on handsheets. Analysis was
performed on the 5 handsheets, front and back, 6-inch round, using 0.02 mm2 as the smallest
speck counted. Value of 80% threshold of the average gray scale was used to detect specks.
6.3.11 Peeling test & sample preparation
A polyacrylate-based pressure sensitive adhesion, Carbotac 26171 with 50% solid content
was used as standard adhesive surface for attaching the paper samples. Experiments were
carried on with 60 gram handsheets and 250,000 ppm Carbotac. Prior to the experiment an
optimization process was carried out to obtain the right concentration of the adhesive. (It was
tested with 5,000 - 10,000 - 50,000 -100,000 - 250,000 and 500,000 ppm), and the best results
were obtained from 250,000 ppm. The solution was diluted to 25% concentration (250.000
ppm) by adding distilled water and applying constant stirring. The peeling test samples were
prepared following the work of Pelton et al. (2001). The glass slides were glued with the PAS
solution and immediately paper strips of 2.5 cm x 15 cm attached to the glass slide, pre-cleaned
and dried by sonication for 10 minutes in a way that 5 cm sample tail being extended beyond
139
the tape. Before attaching the strips, excess fluid was shaken off and the strips flattened to
remove air bubble. The slides were air dried overnight and after the complete drying, the
extended tail was used to attach the strip to the clamps of the Instron machine.
For 180° peel tests, the paper substrate after being dried on the glass plate was loaded into
an Instron 4443 tensile tester in a constant temperature (23°C) and humidity (50%) room. The
strip was peeled from the glass slide at a rate of 50 mm/min, and the force needed for peeling
the paper from glass plate was recorded. The results were reported as mN/mm width of the
strip. A 50 N load cell was used in all experiments and a computer interface was used to control
the peel conditions and restore the peel data in the form of force versus displacement. An
average from 5 strip measurements was reported.
6.4 Result and Discussion
6.4.1 Internal strengths of soy-added handheets
High mechanical properties in a two dimensional paper sheet is one of the important criteria
for producing paper. The produced sheets must have sufficient strength to resist the stresses
induced in packaging, wrapping or sealing. It is reported in the literature that mechanical
strength in paper is governed by fiber strength, fiber-fiber joint strength and the number of
efficient joints per volume (Marais et al., 2012). Most of the time the weak strength in the
paper is due to the weak link in the fiber-fiber joint and not the fiber strength (Davison, 1972).
For creating a good fiber-fiber joint strength, molecular contact area and the molecular
adhesion is necessary. It is known that the resistance of the produced paper is directly related
to the molecular level structure, especially to the hydrogen-bonding between the fibers and
140
surface area of the bonding sites. Recycled fibers irreversibly damaged during the paper
making process and as a result the final paper strength declines. Table 6.1, shows the
mechanical properties of handsheets made of recycle fibers before and after the addition of soy
flour, soy isolate, soy enzyme (lipoxygenase) and talc to the furnish.
6.4.2 Tensile and Burst indices
It can be observed that the addition of both kinds of protein (isolate and flour) could
increase the tensile index remarkably. However, strength results in table 6.1 demonstrate a
more pronounced increase in tensile indices in papers that had been treated with Profam 955
(soy isolate), most likely due to the fact that this grade protein contains more protein (90%)
and can better contribute to the mechanical properties improvement.
Similarly the bursting index of these pulps showed an improvement, especially in the trial
with using 2% soy isolate as the dry strength agent. The increased strength properties can be
attributed to the higher inter-fiber bonding between the fibers and soy protein. Soy protein has
a large quantity of NH2 functional groups that can contribute in hydrogen and ionic bonding
with cellulose or lignin of the pulp that contain many hydroxyl groups. The treatment with soy
lipoxygenase showed the same trend; however, for this trial we only used 1% enzyme due to
the cost limitation.
One assumption is, when applying the lipoxygenase as a potential dry strength agent;
enzyme oxidizes the sticky substrate in the pulp and add hydroxyl or hydroperoxy groups to a
fraction of lipophilic components chains, and the addition of these groups can further broaden
the hydrogen bonding network between the fibers and retained stickies. However we didn’t
see any evidence to support this hypothesis in our results, and the same improvement of tensile

141
strength that was seen in the trial with pure enzyme, was also observed in the trial with soy
isolate. This means that, since enzyme is also a source of protein, the same mechanism can be
applied and protein can act as a bonding agent.
Our results are in agreement with research was done by (Salam et al., 2015), in which they
showed that treatment of OCC, NSSC and Kraft pulp with soy flour-DTPA-Chitosan additive
can increase the tensile and burst indices significantly. Another goal for applying the soy
protein in this study was to decrease the tackiness of the paper, which will be discussed in the
next part where talc was used as a bench-mark. As can be seen in table below, in the trial with
talc almost all the strengths were remained unchanged, and not much of the improvement was
seen.
Table 6.1. Mechanical properties of the controls and respective treated handsheets from
recycle pulp, with different additives and same basis weights.
Treatment Strength
(KN/m)
Tensile
Index
(N.m2/g)
Strain% Stiffness
(KN/m)
Tear Index
(mN.m2/g)
Burst
Index
(KN/g)
Roughness
Control 2.52 42.15 2.42 233.91 1.23 0.40 35.4
2% SF 2.73 45.53 2.45 241.35 1.24 0.41 33.0
2% SI 2.77 46.23 2.46 240.49 1.25 0.44 33.8
2% Tc 2.55 42.59 2.49 233.58 1.24 0.39 33.0
1% LOX 2.65 44.26 2.45 243.72 1.23 0.43 33.8
In our study we didn’t use the soy protein in combination of any other material (except for
retention aid) to better elucidate the role of soy protein as a dry-strength agent. The average
values in the tables below were obtained from 10 replicates for each condition.
6.4.3 Roughness and tear index
As it is seen, handsheets with soy protein additive showed slightly less roughness compared
to other samples. This can be attributed to the fact that the additives had filled the pores to

142
some extent causing a reduction in roughness values. There was, however, no visual change in
the surface roughness. The tear indices also increased when protein added to the papers,
however the change in the tear strengths was less pronounced compared to tensile indices.
6.4.4 Reduction in the overall basis weight
As mentioned dry strength additives are essential for maximizing the mechanical integrity
of the paper in its air dried state while not affecting the other properties such as brightness,
opacity or stiffness of the papers. Besides, dry strength additives allow for a reduction of paper
overall basis weight to achieve the same strength and therefore can save on the cost of raw
material. Thus, it is very important to find the proper type of dry-strength agent to make a
balance in cost and benefits. So based on the promising results we obtained (shown in table
4.1), we applied the soy flour to handsheet with lower basis weight to find out about the
potential raw material saving if soy protein is used as a dry-strength agent.
Figure 6.2. Tensile strengths of handsheets treated with soy protein versus untreated ones in
different basis weights.
33
35
37
39
41
43
45
60 57.5 55 52.5 50
Te
ns
ile
in
de
x (
N.m
/g)
Handsheets basis weight g/m2
Ctrl Protein added
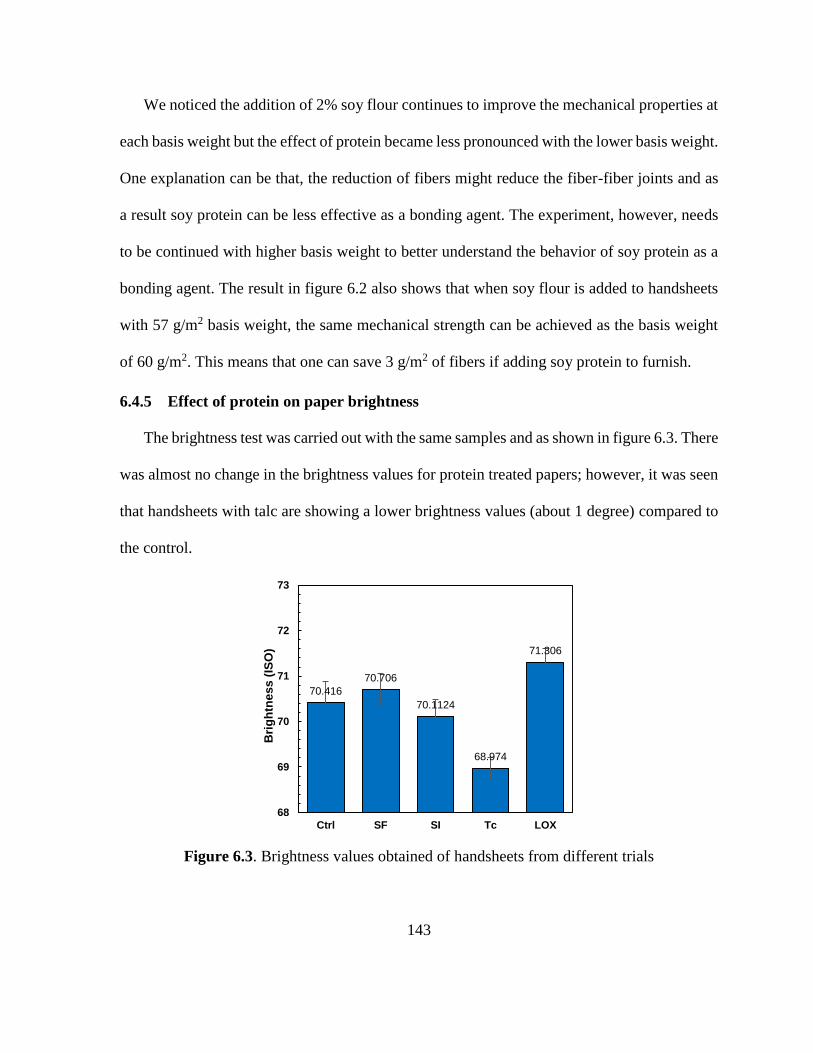
143
We noticed the addition of 2% soy flour continues to improve the mechanical properties at
each basis weight but the effect of protein became less pronounced with the lower basis weight.
One explanation can be that, the reduction of fibers might reduce the fiber-fiber joints and as
a result soy protein can be less effective as a bonding agent. The experiment, however, needs
to be continued with higher basis weight to better understand the behavior of soy protein as a
bonding agent. The result in figure 6.2 also shows that when soy flour is added to handsheets
with 57 g/m2 basis weight, the same mechanical strength can be achieved as the basis weight
of 60 g/m2. This means that one can save 3 g/m2 of fibers if adding soy protein to furnish.
6.4.5 Effect of protein on paper brightness
The brightness test was carried out with the same samples and as shown in figure 6.3. There
was almost no change in the brightness values for protein treated papers; however, it was seen
that handsheets with talc are showing a lower brightness values (about 1 degree) compared to
the control.
Figure 6.3. Brightness values obtained of handsheets from different trials
70.416
70.706
70.1124
68.974
71.306
68
69
70
71
72
73
Ctrl SF SI Tc LOX
Bri
gh
tne
ss
(IS
O)
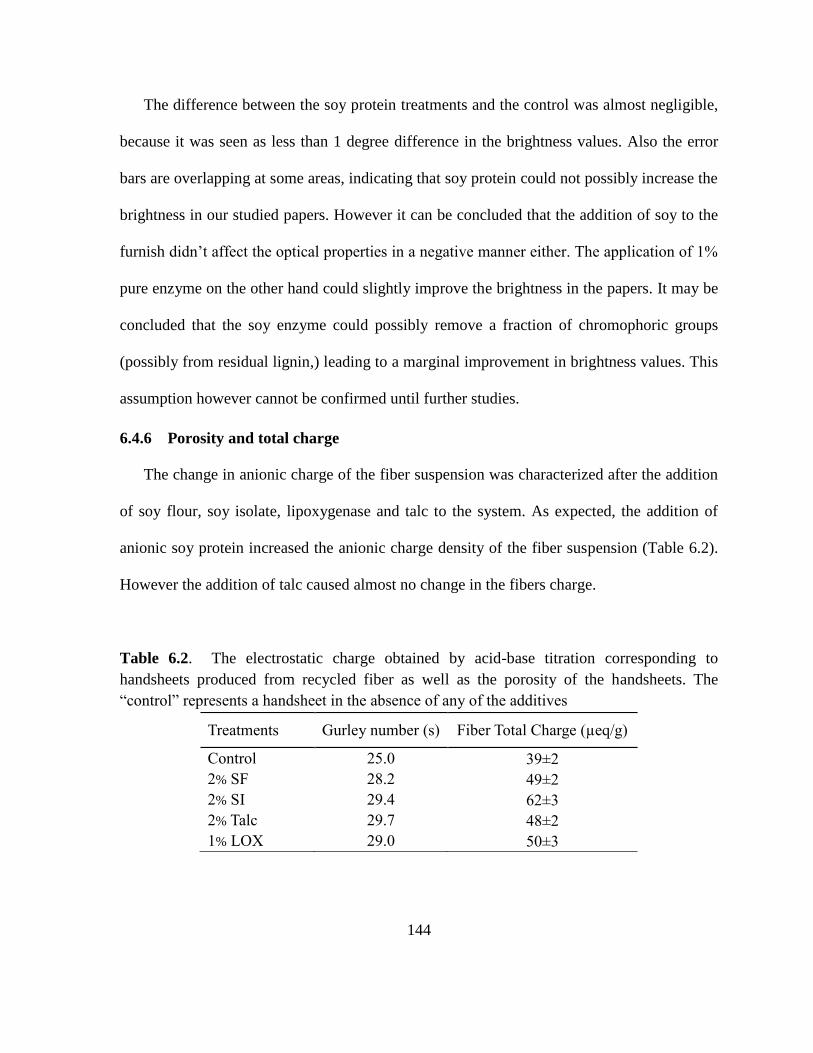
144
The difference between the soy protein treatments and the control was almost negligible,
because it was seen as less than 1 degree difference in the brightness values. Also the error
bars are overlapping at some areas, indicating that soy protein could not possibly increase the
brightness in our studied papers. However it can be concluded that the addition of soy to the
furnish didn’t affect the optical properties in a negative manner either. The application of 1%
pure enzyme on the other hand could slightly improve the brightness in the papers. It may be
concluded that the soy enzyme could possibly remove a fraction of chromophoric groups
(possibly from residual lignin,) leading to a marginal improvement in brightness values. This
assumption however cannot be confirmed until further studies.
6.4.6 Porosity and total charge
The change in anionic charge of the fiber suspension was characterized after the addition
of soy flour, soy isolate, lipoxygenase and talc to the system. As expected, the addition of
anionic soy protein increased the anionic charge density of the fiber suspension (Table 6.2).
However the addition of talc caused almost no change in the fibers charge.
Table 6.2. The electrostatic charge obtained by acid-base titration corresponding to
handsheets produced from recycled fiber as well as the porosity of the handsheets. The
“control” represents a handsheet in the absence of any of the additives
Treatments Gurley number (s) Fiber Total Charge (µeq/g)
Control 25.0 39±2
2% SF 28.2 49±2
2% SI 29.4 62±3
2% Talc 29.7 48±2
1% LOX 29.0 50±3

145
Tests of porosity (Gurley numbers) also confirmed that the addition of all the additives
used in this study will lead to a slightly less porous structure in the paper. As was mentioned
before, protein can fill the pores between the fibers to some extent and cause a barrier for air
to permeate through the paper structure.
6.4.7 Sticky and deposit analysis
All the studied papers were dyed for the performance of image analysis. The sticky
particles are white and not visible in bright recycled pulps, therefore, to enhance the contrast
between the background and the sticky components, a dyeing method using hydrophobic dye,
MorePlas blue, was used.
Figure 6.4. Apogee Image Analysis system using a high resolution scanner (HP Scan Jet 4C
scanner at 600 dots per inch)
In this analysis it was observed that lipophilic particles absorb dye particles due to their
affinity to nonpolar dye and are detected in image analysis. The presence of the soy protein as
a de-tackifier during the pulping showed a significant effect on the final numbers of the
adhesive particles. Figure 6.5-B, displays the parts per millions, average number of spots of
the adhesives and stickies in the handsheets after the analysis. By subtracting the PPM and
number of specks in control experiment with no additive from other treatments, the difference
146
can be obtained, which indicates the effect that any of the particular detackifiers had on the
adhesive and lipophilic component removal from the pulp. It is acknowledged that the highest
level of sticky particles were observed in handsheets that had not been treated with protein, but
in other treatments, the sticky total covered area in the handsheets decreased remarkably
The sticky specks value shifted from 250 ppm to 150 ppm in the soy flour trial, indicating
a reduction of about 40% in the sticky components, which is due to the interaction between
soy protein and hydrophobic components. It seems that among the additives, isolated
lipoxygenase had the highest effect and it was even more effective than talc. Even soy flour
and soy isolate reduced the stickies to the higher extend compared to talc. However the
difference was not very significant considering the error bars of the graph. Interestingly, we
saw the soy flour is working slightly better than isolate even though that there is higher protein
concentration in isolate. This experiment also provided us some detail (data not shown) that
indicates the size range of stickies in the hand sheets.
In a related study (Xin et al., 1999), it was found that sticky-control materials (such as talc)
enhance adhesive breakage in the pulper. They have hypothesized that the de-tackified
adhesive particles remain extended and susceptible to breakage in the high-shear fields during
the pulping process. Adhesive particles that are not affected, self-adhere and fold, forming a
more spherical shape that is harder to break. However justification of the soy detackificattion
mechanism is not very straightforward. One explanation, which is closer to what talc does, is
that soy flour can attach to the tacky materials and produce agglomerates of bigger components
that are yet less tacky that can either retain on the fiber or being washed during the pulping
step. Another hypothesis is that, since protein has both hydrophobic and hydrophilic groups,
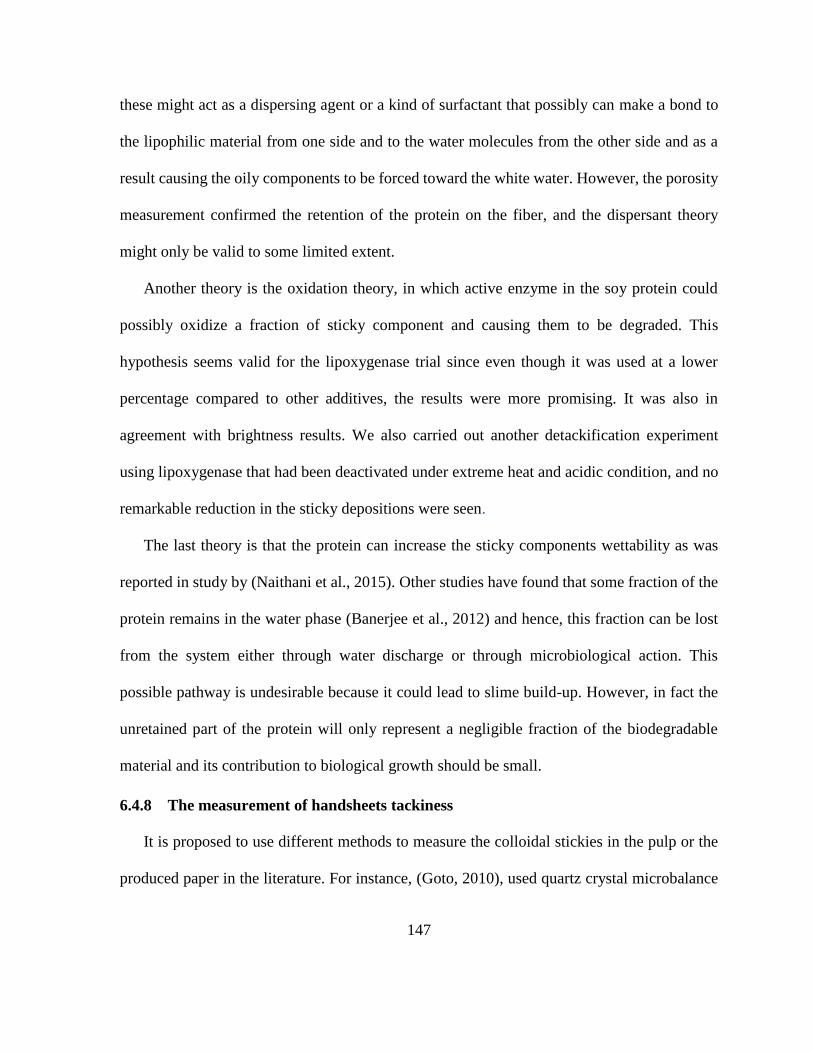
147
these might act as a dispersing agent or a kind of surfactant that possibly can make a bond to
the lipophilic material from one side and to the water molecules from the other side and as a
result causing the oily components to be forced toward the white water. However, the porosity
measurement confirmed the retention of the protein on the fiber, and the dispersant theory
might only be valid to some limited extent.
Another theory is the oxidation theory, in which active enzyme in the soy protein could
possibly oxidize a fraction of sticky component and causing them to be degraded. This
hypothesis seems valid for the lipoxygenase trial since even though it was used at a lower
percentage compared to other additives, the results were more promising. It was also in
agreement with brightness results. We also carried out another detackification experiment
using lipoxygenase that had been deactivated under extreme heat and acidic condition, and no
remarkable reduction in the sticky depositions were seen.
The last theory is that the protein can increase the sticky components wettability as was
reported in study by (Naithani et al., 2015). Other studies have found that some fraction of the
protein remains in the water phase (Banerjee et al., 2012) and hence, this fraction can be lost
from the system either through water discharge or through microbiological action. This
possible pathway is undesirable because it could lead to slime build-up. However, in fact the
unretained part of the protein will only represent a negligible fraction of the biodegradable
material and its contribution to biological growth should be small.
6.4.8 The measurement of handsheets tackiness
It is proposed to use different methods to measure the colloidal stickies in the pulp or the
produced paper in the literature. For instance, (Goto, 2010), used quartz crystal microbalance

148
technique to measure the sticky deposits and (Koskinen et al., 2002), suggested an indirect
measurement of colloidal material by using total organic carbon analyzer. In the current study
we used a method to determine how soy protein is effective to reduce the tackiness of the
produced handsheets. The effect of soy protein on tackiness of sticky component compared to
other used additives in this study was measured by performing the peeling test.
Figure 6.5. A) Number of sticky particles (ppm) per square meter, B) peeling test using Instron
with geometry of the 180° peel test; showing the effect of different additives on the handsheet
tackiness when attached on glass plate using 25% solid content carbotac.
Peel force measurements are used in the adhesive industry to characterize the performance
of adhesive tapes; however we used this technique to measure the tackiness of sticky
containing papers. The peeling strength results are summarized in table 6.3. The required force
to initiate detaching the attached strip paper from the glass surface is proposed as paper peeling
strength. We employed a 180 degree peeling geometry to bend the paper strip in order to
minimize sensitivity of the strip to the peeling direction and velocity.
0
50
100
150
200
250
300
Control SF SI Tc LOX
Pa
rts p
er
mil
lio
n
A)
Ctrl(4.42)
SF(3.82) SI(4.04) Tc(3.86)
LOX(3.6)
2.5
3
3.5
4
4.5
5
Pe
el S
tren
gth
(N
/mm
)
Multiple Treatments
Instron
crosshead
Glass platePeeling test paper
Instron clamps
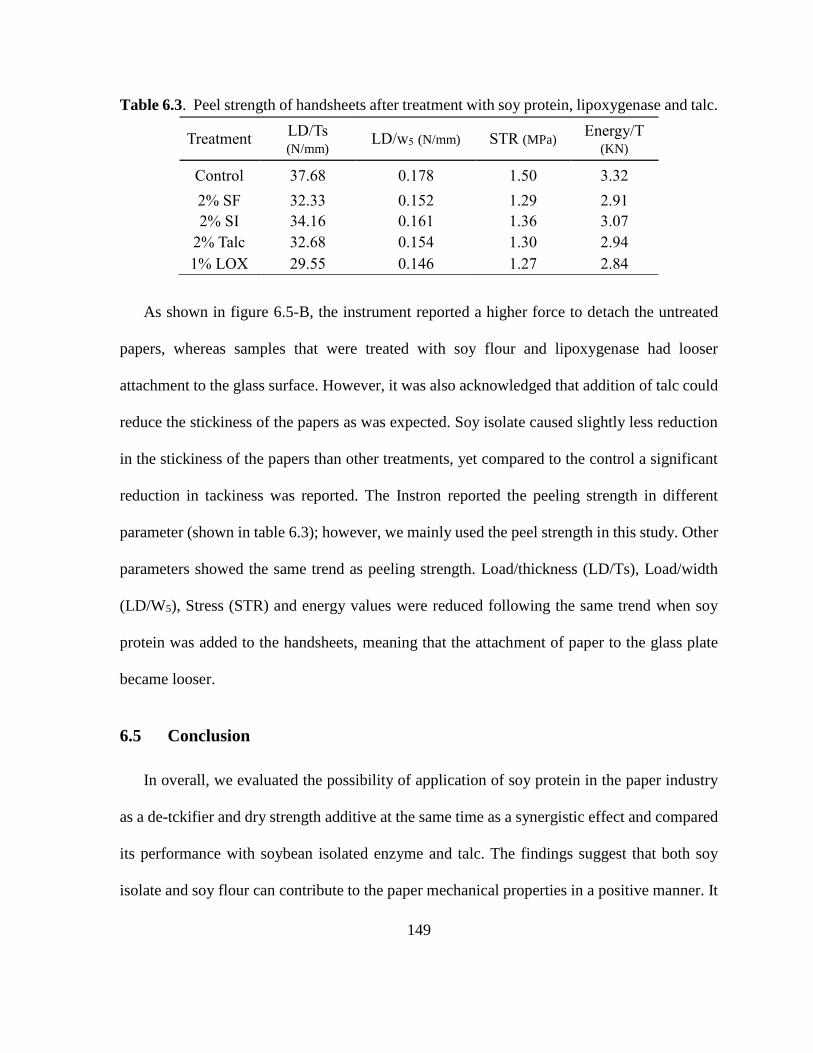
149
Table 6.3. Peel strength of handsheets after treatment with soy protein, lipoxygenase and talc.
Treatment LD/Ts (N/mm)
LD/w5 (N/mm) STR (MPa) Energy/T
(KN)
Control 37.68 0.178 1.50 3.32
2% SF 32.33 0.152 1.29 2.91
2% SI 34.16 0.161 1.36 3.07
2% Talc 32.68 0.154 1.30 2.94
1% LOX 29.55 0.146 1.27 2.84
As shown in figure 6.5-B, the instrument reported a higher force to detach the untreated
papers, whereas samples that were treated with soy flour and lipoxygenase had looser
attachment to the glass surface. However, it was also acknowledged that addition of talc could
reduce the stickiness of the papers as was expected. Soy isolate caused slightly less reduction
in the stickiness of the papers than other treatments, yet compared to the control a significant
reduction in tackiness was reported. The Instron reported the peeling strength in different
parameter (shown in table 6.3); however, we mainly used the peel strength in this study. Other
parameters showed the same trend as peeling strength. Load/thickness (LD/Ts), Load/width
(LD/W5), Stress (STR) and energy values were reduced following the same trend when soy
protein was added to the handsheets, meaning that the attachment of paper to the glass plate
became looser.
6.5 Conclusion
In overall, we evaluated the possibility of application of soy protein in the paper industry
as a de-tckifier and dry strength additive at the same time as a synergistic effect and compared
its performance with soybean isolated enzyme and talc. The findings suggest that both soy
isolate and soy flour can contribute to the paper mechanical properties in a positive manner. It
150
was revealed that application of protein could increase all the mechanical properties such as
tensile and tear indices in treated papers. This was attributed to an increase in hydrogen bonds
between the NH2 groups and OH groups in the fibrous network. Jin et al. (2012) also have
shown that soy protein formulated with cationic starch increases dry strength.
An experiment of applying soy protein to handsheets with lower bass weights showed that
the positive effect of protein as a bonding agent continued to exist even when a lower basis
weight was used. However the positive effect in paper mechanical properties were less
pronounced. Besides, the optical properties evaluation of the treated papers revealed that the
addition of protein could neither improve nor damage the paper brightness. Only a slight
increase in trial with soy lipoxygenase was seen that could be due to the effect of the enzyme
on the pulp residual lignin. The addition of talc on the other hand could decrease the overall
brightness up to 3 degree that can be due to the color of talc itself.
The porosity test signaled the presence of protein in the produced paper and it confirms the
lower air permeability within the handsheets. Soy proteins can induce negative charge to the
pulp in pH above 4.5 due to the presence of amino acid groups such as glutamic and aspartic
acid, accounting for about 30% of protein, which can confer anionic character to the protein at
alkaline pH, and since it was used of alkaline pulping condition, the application of all kinds of
soy proteins increased the anionic charge of the slurry. This is useful data, since the charge
interaction is a key factor for the cationic polymers adsorption on the fiber. However, the
presence of aminic residues in protein (arginine, lysine, and histidine) that account for about
15% of the total composition can develop cationic charges at pH below 4.5 (García et al.,
1997).
151
With respect to the detackification property of soy protein, we conclude that the application
of soy protein can lead to the production of a paper with less sticky components as well as
lower state of stickiness. We discussed and explained several possible sticky removal
mechanisms of soy protein earlier in this manuscript. The peeling test shows protein-treated
papers had lower peeling strength compared to the control. Also in the sticky analysis we
noticed there were less spots of adhesive component in all the treated handsheets, and we saw
the same trend in the trials with talc. Therefore it was understood that soy protein has the
potential to be as effective for stickies control as talc. In general the main advantage of using
soy protein over conventional chemicals is cost and the environmentally friendly state of soy
protein.
In a summary, we are suggesting that soy protein can be used as a paper making additive
for the purpose of stickies removal as well as dry-strength improvements. Soy protein is a
cheap, green and effective material, and can be applied in the paper making process to solve
the strength and sticky problem and as a result contribute to the better runnability and paper
quality.
152
6.6 References
53rd Annual Survey of Paper, Paperboard and Pulp Capacity. (2013).
Adachi, M., Kanamori, J., Masuda, T., Yagasaki, K., Kitamura, K., Mikami, B., & Utsumi, S.
(2003). Crystal structure of soybean 11S globulin: Glycinin A3B4 homohexamer. Proceedings
of the National Academy of Sciences, 100(12), 7395–7400.
Arboleda, J. C., Hughes, M., Lucia, L. A., Laine, J., Ekman, K., & Rojas, O. J. (2013). Soy
protein–nanocellulose composite aerogels. Cellulose, 20(5), 2417–2426.
Back, E., & Lawrence, A. (2000). Pitch Control, Wood Resin and Deresination. Atlanta: Tappi
Press.
Bai, H., Xu, J., Liao, P., & Liu, X. (2013). Mechanical and water barrier properties of soy
protein isolate film incorporated with gelatin. Journal of Plastic Film & Sheeting, 29(2), 174–
188.
Bajpai, P. K. (2010). Solving the problems of recycled fiber processing with enzymes.
BioResources, 5(2), 1311–1325.
Banerjee, S., Le, L., & Haynes, R. D. (2008). Stickies control with cyclodextrins. Tappi
Journal, 7(11), 4–7.
Banerjee, S., Le, T., Haynes, R. D., & Bradbury, J. E. (2012). Solubilizing and detackifying
stickies with ß-cyclodextrin. BioResources, 7(2), 1533–1539.
Benecke, F., Gantenbein, D., Schoelkopf, J., Gane, P. A. C., & Gliese, T. (2009). Organic
contaminants in recycled paper: a model study of the adsorbent properties of talc for idealised
component suspensions. Nordic Pulp and Paper Research Journal, 24(02), 219–224.
Biermann, C. J. (1996). Handbook of pulping and papermaking. Academic Press.
Capozzi, A., & Rende, D. (1994). Particle Management: An Effective Stickie Control
Approach. In Pulping conference (p. 643). Tappi Press.
Carlsson, G., Lindström, T., & Söremark, C. (1977). The effect of cationic polyacrylamides on
some dry strength properties of paper. Svensk Papperstidning , 80(6), 173–176.
Damodaran, S., & Paraf, A. (1997). Food proteins and their applications, 8247–9820.
Dasgupta, S. (1994). Mechanism of paper tensile-strength development due to pulp beating.
Tappi Journal (USA), 77(6), 158–166.
153
Davison, R. W. (1972). Weak link in paper dry strength. Tappi Journal, 55(4), 567.
Dechandt, A., Watkins, T., & Pruszynski, P. (2004). Total Approach to Deposit Control on
Newsprint Machine Using TMP and DIP Pulp Mix - from Specialized Fixation of Individual
Pulps to Retention. Appita Journal: Journal of the Technical Association of the Australian and
New Zealand Pulp and Paper Industry, 57(1), 13.
Doshi, M. R. (1991). Properties and control of stickies, Prog. Paper Recycling. Paper
Recycling, 1(1), 54–63.
Douek, M., Ing, J., & Guo, Y. (1997). An overview of the chemical nature of deposits/stickies
in mills using recycled fibre. TAPPI PRESS, 313.
Douek, M., Sithole, & Banerjee, S. (2003). Survey of deposits and contaminants in mills using
recycled fiber. Progress in Paper Recycling, 13(1), 12–22.
Eriksson, M., Notley, S. M., & Wågberg, L. (2005). The influence on paper strength properties
when building multilayers of weak polyelectrolytes onto wood fibres. Journal of Colloid and
Interface Science, 292(1), 38–45.
Fahmy, Y., El-Wakil, N. A., El-Gendy, A. A., Abou-Zeid, R. E., & Youssef, M. A. (2010).
Plant proteins as binders in cellulosic paper composites. International Journal of Biological
Macromolecules, 47(1), 82–85.
Fras, L., Laine, J., Stenius, P., Stana-Kleinschek, K., Ribitsch, V., & Dole?ek, V. (2004).
Determination of dissociable groups in natural and regenerated cellulose fibers by different
titration methods. Journal of Applied Polymer Science, 92(5), 3186–3195.
García, M. C., Torre, M., Marina, M. L., Laborda, F., & Rodriquez, A. R. (1997). Composition
and characterization of soyabean and related products. Critical Reviews in Food Science and
Nutrition, 37(4), 361–391.
Gimåker, M., Horvath, A., & Wågberg, L. (2007). Influence of polymeric additives on short-
time creep of paper. Nordic Pulp and Paper Research Journal, 22(2), 217–227.
Goto, O. (2010). Evaluation and control of microstickies deposition using QCM technique. In
9th Research Forum on Recycling (pp. 855–890). Tappi Press.
Gu, Q.-M. (2003). Proteins for use as pitch and stickies control agents in pulp and papermaking
processes US Patent, 6527915.
Gutiérrez, A., José, C., & Martínez, A. T. (2009). Microbial and enzymatic control of pitch in
the pulp and paper industry. Applied Microbiology and Biotechnology, 82(6), 1005–1018.

154
Hamzeh, Y., Mohammad, S., Najafi, H., Hubbe, M. A., Salehi, K., Reza, M., & Firouzabadi,
D. (2012). Recycling potential of unbleached and bleached chemical pulps from juvenile and
mature wood of Populus deltoides. Holzforschung, 66(2), 155–161.
Howard, R. C. (1990). The effects of recycling on paper quality. Journal of Pulp and Paper
Science, 16(5), 143–149.
Howard, R. C. (1992). The Basic Effects of Recycling on Pulp Properties. MRS Proceedings,
266, 195.
Hua, Y., Cui, S. W., Wang, Q., Mine, Y., & Poysa, V. (2005). Heat induced gelling properties
of soy protein isolates prepared from different defatted soybean flours. Food Research
International, 38(4), 377–385.
Hubbe, M. (2012). Mini-Encyclopedia of Papermaking Wet-End Chemistry.
Hubbe, M., Rojas, O., & Venditti, R. (2006). Control of tacky deposits on paper machines–A
Review. Nordic Pulp and Paper Research Journal, 21(2), 154–171.
Jin, H., Lucia, L. A., Rojas, O. J., Hubbe, M. A., & Pawlak, J. J. (2012). Survey of Soy Protein
Flour as a Novel Dry Strength Agent for Papermaking Furnishes. Agricultural and Food
Chemistry, 60(39), 9828–9833.
Kerman, N., Eronen, H., Burke, T., & Vanninen, S. P. (2006). Novel approach to select and
optimize fixatives for pitch and sticky control in different fiber systems. Wochenblatt Fur
Papierfabrikation, 134(21), 1203–1207.
Keskin, S., Kayrak-Talay, D., Akman, U., & Hortaçsu, Ö. (2007). A review of ionic liquids
towards supercritical fluid applications. The Journal of Supercritical Fluids, 43(1), 150–180.
Koskinen, J. T., Sung, D.-J., Kazi, F., Yang, J., & Banerjee, S. (2002). Sensor for microstickies.
Tappi Journal, 2(4), 1–9.
Laubach, G. D. (1994). Innovations in Coated Broke Treatment Programs. Atlanta: Tappi
Press.
Lindström, T., Wågberg, L., & Larsson, T. (2005). On the nature of joint strength in paper A
review of dry and wet strength resins used in paper manufacturing. 13th Fundamental
Research Symposium, 457–562.
Lipponen, J. (2006). State-of-the-art Screening Systems. Paper Technology, 47(1), 39–44.
Liu, Y., & Li, K. (2007). Development and characterization of adhesives from soy protein for
155
bonding wood. International Journal of Adhesion and Adhesives, 27(1), 59–67.
Marais, A., & Wågberg, L. (2012). The use of polymeric amines to enhance the mechanical
properties of lignocellulosic fibrous networks. Cellulose, 19(4), 1437–1447.
Marques, G., Molina, S., Babot, E. D., Lund, H., Río, J. C. de., & Gutiérrez, A. (2011).
Exploring the potential of fungal manganese-containing lipoxygenase for pitch control and
pulp delignification. Bioresource Technology, 102(2), 1338–1343.
Martínez, K. D., Carrera Sánchez, C., Rodríguez Patino, J. M., & Pilosof, A. M. R. (2009).
Interfacial and foaming properties of soy protein and their hydrolysates. Food Hydrocolloids,
23(8), 2149–2157.
Marton, J. (1980). The role of surface chemistry in fines-cationic starch interactions
[Papermaking]. Journal of the Technical Association of the Pulp and Paper Industry, 43(4),
87–91.
Moeller, H. W. (1966). Cationic starch as a wet-end strength additive. Tappi Journal, 49(5),
211.
Mohlin, U. B. (1975). Cellulose fibre bonding. 3. The effect of beating and drying on interfibre
bonding. Svensk Papperstidning, 78(9), 338–341.
Naithani, V., Lucia, L. A., & Banerjee, S. (2015). Soy flour detackification of stickies from
paper recycling, 30(3), 541–545.
Onusseit, H. (2006). The influence of adhesives on recycling. Resources, Conservation and
Recycling, 46(2), 168–181.
Patel, S., & Banerjee, S. (1999). Deposition of hot melt and wax on surfaces. Tappi Journal,
82(11), 99.
Pelton, R. (2004). On the Design of Polymers for Increased Paper Dry Strength - a Review.
Appita Journal: Journal of the Technical Association of the Australian and New Zealand Pulp
and Paper Industry, 57(3), 181–190.
Pelton, R., Chen, W., Li, H., & Engel, M. R. (2001). The Peeling Behavior of Pressure
Sensitive Adhesives from Uncoated Papers. The Journal of Adhesion, 77(4), 285–308.
Petlicki, J., & van de Ven, T. G. M. (1994). Adsorption of polyethylenimine onto cellulose
fibers. Colloids and Surfaces A: Physicochemical and Engineering Aspects, 83(1), 9–23.
Phoon, P. Y., San Martin-Gonzalez, M. F., & Narsimhan, G. (2014). Effect of hydrolysis of
156
soy β-conglycinin on the oxidative stability of O/W emulsions. Food Hydrocolloids, 35, 429–
443.
Salam, A., Lucia, L. A., & Jameel, H. (2015). A new class of biobased paper dry strength
agents: Synthesis and characterization of soy-based polymers. ACS Sustainable Chemistry and
Engineering, 3(3), 524–532.
Smook, G. A. (2002). Handbook for Pulp and Paper Technologists. Angus Wild Publications.
Tandang-Silvas, M. R. G., Tecson-Mendoza, E. M., Mikami, B., Utsumi, S., & Maruyama, N.
(2011). Molecular Design of Seed Storage Proteins for Enhanced Food Physicochemical
Properties. Annual Review of Food Science and Technology, 2, 59–73.
Tayeb, S. A. H. M., Latibari, A. J., Tajdini, A., & Sepidehdam, S. M. J. (2012). The influence
of pulp refining on de-inking potential and strength properties of ink jet printed paper.
BioResources, 7(3), 3837–3846.
Wagberg. (2000). Polyelectrolyte adsorption onto cellulose fibres-A review. Nordic Pulp &
Paper Research Journal, 15(5), 586–597.
Wagberg, B. M. (1993). Adsorption of cationic potato starch on cellulosic fibres. Nordic Pulp
and Paper Research Journal, 8(4), 399–404.
Wågberg, L., Forsberg, S., Johansson, A., & Juntti, P. (2002). Engineering of fibre surface
properties by application of the polyelectrolyte multilayer concept. Part I: modification of
paper strength. J Pulp Pap Sci. Journal of Pulp and Paper Science, 28(7), 222–228.
Wang, Y., Mo, X., Sun, X. S., & Wang, D. (2007). Soy protein adhesion enhanced by
glutaraldehyde crosslink. Journal of Applied Polymer Science, 104(1), 130–136.
Xin, H., Venditti, R., & Hou-min, C. (1999). Effect of Papermaking Components on Adhesive
Contaminant (Stickies) Characteristics After Pulping. Tappi Recycling Symposium, 681–692.
Zhang, X., Eigendorf, G., Stebbing, D., Mansfield, S., & Saddler, J. (2002). Degradation of
trilinolein by laccase enzymes. Archives of Biochemistry and Biophysics, 405(1), 44–54.
Zhang, X., Nguyen, D., Paice, M. G., Tsang, A., & Renaud, S. (2007). Degradation of wood
extractives in thermo-mechanical pulp by soybean lipoxygenase. Enzyme and Microbial
Technology, 40(4), 866–873.
Zhang, X., Renaud, S., & Paice, M. (2005). The potential of laccase to remove extractives
present in pulp and white water from TMP newsprint mills. Journal of Pulp and Paper Science,
31(4), 175–180.

157
7 Soy Protein as a Sticky-Control and Strength Agent for Recycle Paper
Furnish at Pilot-Scale
7.1 Abstract
In the process of paper recycling, the presence of sticky components can cause many issues
including low runnability, weak mechanical properties, more down time and higher production
cost. In the current chapter, the application of soy protein as an additive in the papermaking
process is proposed to remove and/or detackifiy the sticky components, as well as boost the
sheet’s mechanical properties. Therefore, a series of trials were performed on recycled pulps
at NC State University on a pilot-scale paper machine. The effect of soy protein, as a detackifier
and dry strength agent was evaluated. The performance of the protein to lower the tacky
contaminants was compared to talc as a benchmark chemical. They were evaluated under the
same experimental conditions such as temperature, pH, and chemical level. To elucidate the
role of the protein, sticky particles on the paper sheets were counted through an optical method
before/after the protein addition and their level of stickiness was determined by the peeling
test. Then, strengths, brightness, formation, and porosity of the corresponding papers were
examined and the data was compared to the control samples. Obtained results confirmed the
positive role of the protein in both, decreasing the sticky particles within the papers and
improving corresponding mechanical strengths, such as tensile and burst indices. Besides,
further analysis indicated that the paper’s porosity and roughness were slightly decreased. The
most promising data were obtained when using 2% soy flour under mild agitation with 30
minutes protein-slurry contact time.
158
Also it was demonstrated that addition of soy protein with or without the retention aid can
improve the formation to some limited degree.
7.2 Introduction
Pulp and paper form a sustainable industry that consumes huge quantities of lignocellulosic
material to produce paper and paper board every year. Although the use of virgin fibers as the
raw material results in a higher quality product, paper recycling presents several advantages.
These advantages include less environmental impact by reducing the harvest demand on
forests, lower volume of waste and disposal, as well as cost and energy efficiency. Therefore,
mills strive to save more money on their raw material by using a higher proportion of recycled
paper. However, the use of recycled fibers has some disadvantages as well such as lower paper
strengths (Hamzeh et al., 2012; Howard, 1990, 1992), more contaminants in the pulp (Blanco
et al., 2002) and increased complexity of sticky particles when they are mixed with each other
(Dechandt et al., 2004; Haynes, 2008). As explained, stickies are hydrophobic organic
materials that can be classified based on their size as follows:
Colloidal stickies (smaller than 1-5 µm): this group is considered less detrimental and
more as potential stickies until they are destabilized (Bajpai, 2012).
Tacky particles (between 5-100 µm): this group includes dispersed and suspended
tacky particles and can pass easily through the screen opening and for these reason are
the most problematic group in the recycled pulp (Delagoutte et al., 2003; Johansson et
al., 2003).
159
Solid stickies (bigger than 1 µm): this solid particles are called macrostickies and can
efficiently be removed by the screens.
Among these issues, the presence of sticky contaminants are the main challenge, and it is
important to find a way to have them fully removed from the process (Delagoutte, 2005; Doshi
et al., 2003). Recently, environmental regulations have forced paper mills to reduce water
usage and control their effluent discharge; however, more reuse of water has led to a rise in
colloidal substances and subsequently, more sticky issues in the paper recycling mills. Tacky
components are considered an issue in every paper mill especially, in recycle mills, since the
mixture of several pulps e.g thermomechanical, kraft, deinked, etc. (Dechandt et al., 2004;
Lenes et al., 2001) contain many different types of chemicals and additives that can contribute
to the formation of complex sticky particles during the papermaking process (Dechandt et al.,
2004; Haynes, 2008). In the United States, 63.5% of produced papers are recycled every year.
For this reason, stickies still remain a major issue in all paper machines (53rd Annual Survey
of Paper, Paperboard and Pulp Capacity, 2013).
Some examples of micro and macro-stickies are pressure sensitive adhesives (PSA),
styrene-butadiene rubber (SBR), vinyl acrylates, hot melts binders, waxes and plastics. They
can easily stick together and negatively affect the product quality by making holes and specks
in papers, which also leads to the production of more broke (pre-consumer waste). This is
usually accompanied by slower runnability due to breaks, and subsequent washing and
cleansing steps. Furthermore, the accumulation of stickies on dryer cylinders and forming
wires can cause problems with heat-transfer and de-watering respectively (Barnett et al., 1989;

160
Blanco et al., 2002; Delagoutte, 2005). These affects can worsen under high machine speeds,
dynamic stresses and/or for producing lower basis weight paper.
All the above issues can increase the production cost and time as well as lower the product
quality. While it is possible to evaluate the effect of stickies on the paper quality, it is difficult
to accurately estimate the exact increase in cost related to stickies. One study claimed that the
increase in cost related to this issue in all United States mills totaled $700 million per year
(Friberg, 1996). In another report (McHugh et al., 2001), the increase in downtime was
considered the main cost factor in decreased cost efficiency. This study claimed that linerboard
and corrugating mills spend about $218 million annually for sticky control. Similar work
estimated the cost of downtime and furnish downgrades due to stickies as €500 million per
year in USA by (Bajpai, 2006). In order to avoid the mentioned costs, paper makers use
different approaches that can each be applied to some degree of success.
In general, solution to the problem is either mechanical separation, or fixation onto fibers
through the use of various chemicals. Energy consumption is always a concern, and removal
should be balanced against the costs. In mechanical separation, fine screens are used that
simply remove the particles based on their size. This type of removal is more efficient for
certain type of stickies (macrostickies with the bigger size), and is not suitable for removing
microstickies since they can easily pass through the screen openings.
With respect to microstickies, physico-chemical methods such as detackification and
fixation onto fibers can be considered (Dechandt et al., 2004; Doshi et al., 2003; Hubbe et al.,
2006). Depending on the nature and origin of the sticky particles, different chemicals, such as
polyacrylamide and polyethylene-imine, can be employed, to force microstickies to remain on

161
the fibers; however, the negative charge of dissolved and colloidal substances (DSC) can
interfere with the cationic polymer efficiency. Enzymes such as lipase can be efficient in
breaking the ester-bonds in hydrophobic substances and reducing their size and deposition
tendency (Jones et al., 2010; Patrick, 2004); however, lipase leaves the other types of sticky-
causing particles unchanged. Application of bentonite, talc (Benecke et al., 2009), surfactants
(Elsby, 1986), polymers (Kerman et al., 2006), oxidative enzymes (Bajpai, 2010; Farrell et al.,
1997; Zhang et al., 2007), proteins (Gu, 2003), fungi (Marques et al., 2011) and cyclodextrin
(Banerjee et al., 2012) are also suggested by researchers. Even though all these methods have
been used to some extent, none have been considered as fully effective approach to completely
remove stickies. Thus, paper mills still need an alternative approach to address sticky issues
on an economically viable way.
Another problem that costs paper makers considerable amounts of money each year is dry
strength. The purpose of using dry strength additives is to allow the production of paper with
an acceptable strength, especially when recycled pulp is used as the raw material. They can
also be used to reduce the overall basis weight to achieve the same strength with less raw
materials thus saving on the production cost (Slagel et al., 1977). Some examples additives are
starch (Marton, 1980; Wagberg, 1993), carboxymethyl cellulose, and methyl cellulose
(Biermann, 1996; Pelton, 2004).
Among the above mentioned chemicals, starch has been used more than others due to its
low price and relatively good performance. However, increasing the level of starch can bring
about a higher biological oxygen demand (BOD) and reduce the retention of fillers and fines
on fibers (Hubbe, 2012).

162
However, it has been reported recently that macromolecules such as soy proteins can be
employed in different industries for economic and performance reasons. Soy protein and its
derivatives are environmentally benign, biodegradable, and inexpensive. It has already been
used in different applications such as adhesives, (Hettiarachchy et al., 1995; Wang et al., 2007),
gels (Adachi et al., 1998; Hua et al., 2005), paper coatings, paints, films (Bai et al., 2013),
foams (Martínez et al., 2009; Wagner et al., 1999) and even aerogels (Arboleda et al., 2013).
Soy protein has a high molecular weight (~200-300 kDa) and contains both hydrophobic and
hydrophilic domains on its chain that allow it to bind to cellulose fibers (Fahmy et al., 2010).
Figure 7.1, General structure of soy protein
In a study by Fahmy et al., 2010; Jin et al., 2012 it was revealed that soy protein could be
used as a dry strength additive for maximizing the mechanical integrity of papers in their air-
dried state and it seems possible to employ soy protein for increasing the overall mechanical
properties of the paper due to its binding nature. The proposed mechanism is based on the
potential interaction of cellulose with protein functionalities through a network of hydrogen
bonds.
Additionally, soy protein may act somewhat similar to surfactants due to its hydrophobic-
hydrophilic groups. It can attach to sticky particles to either remove or disperse them during
the papermaking process. It is also considered a source of enzymes such as lipoxygenases,
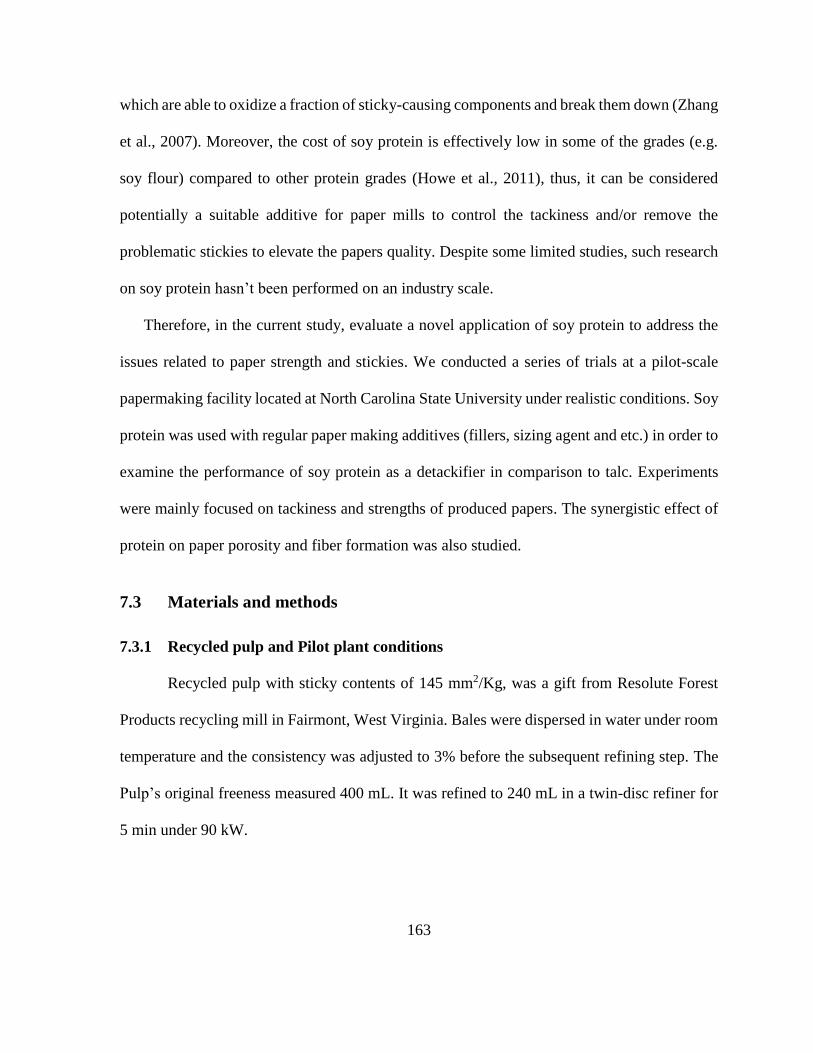
163
which are able to oxidize a fraction of sticky-causing components and break them down (Zhang
et al., 2007). Moreover, the cost of soy protein is effectively low in some of the grades (e.g.
soy flour) compared to other protein grades (Howe et al., 2011), thus, it can be considered
potentially a suitable additive for paper mills to control the tackiness and/or remove the
problematic stickies to elevate the papers quality. Despite some limited studies, such research
on soy protein hasn’t been performed on an industry scale.
Therefore, in the current study, evaluate a novel application of soy protein to address the
issues related to paper strength and stickies. We conducted a series of trials at a pilot-scale
papermaking facility located at North Carolina State University under realistic conditions. Soy
protein was used with regular paper making additives (fillers, sizing agent and etc.) in order to
examine the performance of soy protein as a detackifier in comparison to talc. Experiments
were mainly focused on tackiness and strengths of produced papers. The synergistic effect of
protein on paper porosity and fiber formation was also studied.
7.3 Materials and methods
7.3.1 Recycled pulp and Pilot plant conditions
Recycled pulp with sticky contents of 145 mm2/Kg, was a gift from Resolute Forest
Products recycling mill in Fairmont, West Virginia. Bales were dispersed in water under room
temperature and the consistency was adjusted to 3% before the subsequent refining step. The
Pulp’s original freeness measured 400 mL. It was refined to 240 mL in a twin-disc refiner for
5 min under 90 kW.
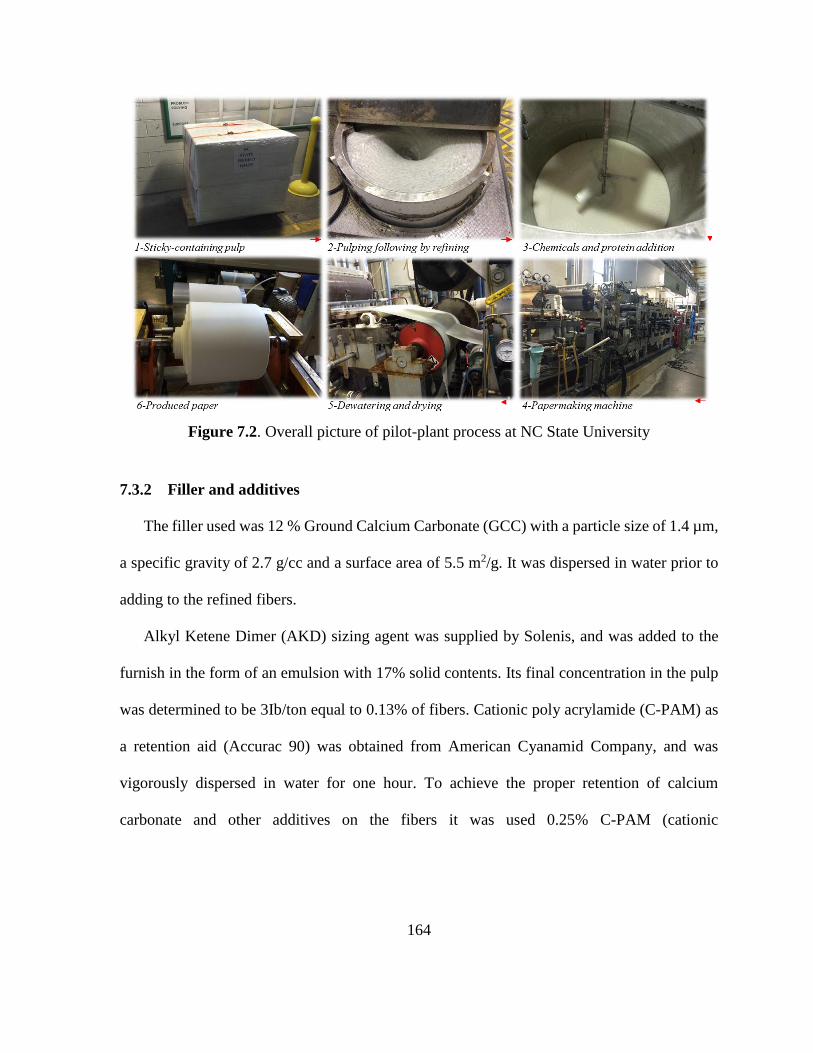
164
Figure 7.2. Overall picture of pilot-plant process at NC State University
7.3.2 Filler and additives
The filler used was 12 % Ground Calcium Carbonate (GCC) with a particle size of 1.4 µm,
a specific gravity of 2.7 g/cc and a surface area of 5.5 m2/g. It was dispersed in water prior to
adding to the refined fibers.
Alkyl Ketene Dimer (AKD) sizing agent was supplied by Solenis, and was added to the
furnish in the form of an emulsion with 17% solid contents. Its final concentration in the pulp
was determined to be 3Ib/ton equal to 0.13% of fibers. Cationic poly acrylamide (C-PAM) as
a retention aid (Accurac 90) was obtained from American Cyanamid Company, and was
vigorously dispersed in water for one hour. To achieve the proper retention of calcium
carbonate and other additives on the fibers it was used 0.25% C-PAM (cationic
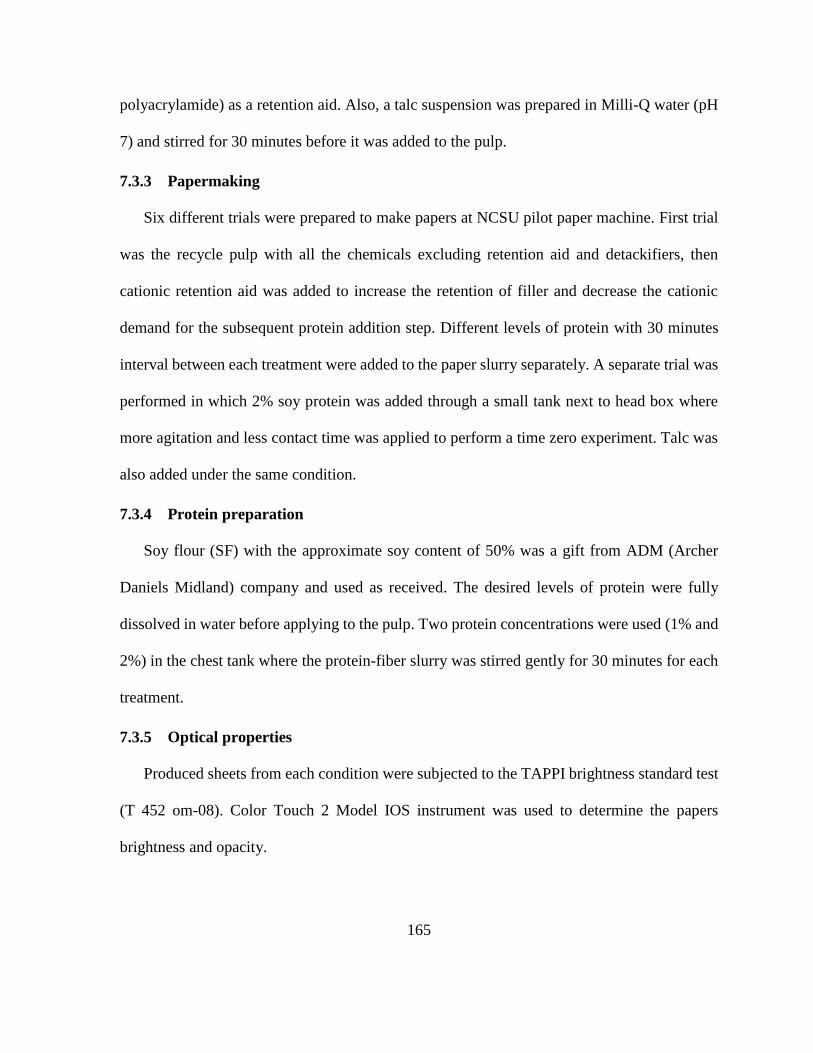
165
polyacrylamide) as a retention aid. Also, a talc suspension was prepared in Milli-Q water (pH
7) and stirred for 30 minutes before it was added to the pulp.
7.3.3 Papermaking
Six different trials were prepared to make papers at NCSU pilot paper machine. First trial
was the recycle pulp with all the chemicals excluding retention aid and detackifiers, then
cationic retention aid was added to increase the retention of filler and decrease the cationic
demand for the subsequent protein addition step. Different levels of protein with 30 minutes
interval between each treatment were added to the paper slurry separately. A separate trial was
performed in which 2% soy protein was added through a small tank next to head box where
more agitation and less contact time was applied to perform a time zero experiment. Talc was
also added under the same condition.
7.3.4 Protein preparation
Soy flour (SF) with the approximate soy content of 50% was a gift from ADM (Archer
Daniels Midland) company and used as received. The desired levels of protein were fully
dissolved in water before applying to the pulp. Two protein concentrations were used (1% and
2%) in the chest tank where the protein-fiber slurry was stirred gently for 30 minutes for each
treatment.
7.3.5 Optical properties
Produced sheets from each condition were subjected to the TAPPI brightness standard test
(T 452 om-08). Color Touch 2 Model IOS instrument was used to determine the papers
brightness and opacity.
166
7.3.6 Paper dying and sticky content measurement
Papers were dyed with an oil-base dye to obtain a better contrast for the sticky analysis.
Under the room temperature, 0.68 grams of “Morplas Blue” was weighed and dissolved in
1000 mL of heptane, mixing vigorously and then filtering the solution through Whatman filter
Paper #4. The final concentration of the obtained solution was determined to be 0.067%. After
that, papers were immersed in the dye solution for 10 seconds and put in the hood for drying
overnight. On the following day they were rinsed in heptane bath to remove the excess dye
stained on the samples and again left under the hood for 2 hours to dry. A 1000 mL of dye
solution and 1000 mL baths of the heptane were used for about 40 sheets. The stickies
components retained the blue color after rinsing and increased the contrast for the subsequent
optical analysis.
Figure 7.3. Dying the sticky particles on the sheets using “MorePlas blue” and image analysis
via high resolution scanner
For measuring the amount and size of stickies in the samples, the “Apogee Image Analysis
System” using a high resolution scanner (HP Scan Jet 4C scanner at 600 dots per inch) was
employed to perform the image analysis. Experiment was performed on 5 papers, front and
back, 6-inch round, using 0.02 mm2 as the smallest speck counted. Value of 80% threshold of
the average gray scale was used to detect specks.
167
7.3.7 Peeling Test
A polyacrylate-based pressure sensitive adhesion, “Carbotac 26171” with 50% solid
content was used as standard adhesive surface for attaching the paper samples on a glass
surface. Experiments were carried out with the diluted adhesive concentration of 25% and
peeling test were prepared based on the work of (Pelton et al., 2001). Paper strips of 2.5 ˟ 15
cm were attached to the PSA covered glass slide, pre-cleaned and dried by sonication for 10
minutes in a way that 5 cm of sample tail being extended beyond the tape. During attaching
the strips, excess fluid was shaken off and the strips flattened to remove air bubble. The slides
were air dried overnight and after the complete drying, the extended tail was used to attach the
strip to the clamps of the Instron machine.
We chose 180° peel tests in which the attached paper stripes on the glass plate were loaded
into an Instron 4443 tensile tester under constant temperature (23°C) and humidity (50%).
Studied papers were peeled at a rate of 50 mm/min, and the force needed for peeling the paper
from glass plate was recorded. The results were reported as mN/mm width of the strip. A 50
N load cell was used in all experiments and a computer interface employed to control the peel
conditions and restore the peel data in the form of force versus displacement. An average from
5 strips measurements was reported.
7.3.8 Formation Analysis
Sheet formation was analyzed with the Paper Perfect Formation Analyzer (PPF, Op-Test
Equipment Inc.). Instrument has a camera with high depth of field that takes pictures of the
paper while it is well illuminated by a diffused quartz halogen light. The equipment reports the
size distribution into 10 different ranges and the paper formation result is compared to PPF or
168
a reference sheet that reflects the uniformity of the sheet. The Relative Formation Values are
reported for each range of component, if the relative index of tested paper is greater than 1 it
means the formation of the tested paper is better than the reference sheet and vice versa.
7.3.9 Thermal Gravimetric Analysis (TGA)
The thermogravimetric analyzer used in this study was a TGA Q500. A nitrogen
atmosphere followed by oxygen was applied to determine the ash content of the sheet. The
temperature range and heating rate were 30-700°C and 5°C/min respectively, followed by
isothermal heating at 600°C.
7.3.10 Fourier Transform Infrared Spectroscopy (FTIR)
The infrared absorption spectra of the air-dried papers before and after the protein treatment
were obtained using Perkin Elmer FTIR spectrometer to identify the sticky particles within the
papers. Instrument used the wavelength between 600-4000 with the 4 cm-1 resolution and each
sample was scanned for 32 times.
7.3.11 Mechanical Properties
7.3.11.1 Tensile Strength
For the tensile test, Papers were cut into strips with a 15 mm width and it was used of
Lorentzen & Wettre tensile test device according to TAPPI standard (T220). The gap between
clamping jaws of the instrument was set to 150 mm, and the cross head speed was adjusted to
10 mm/min. Then they were tested for their tensile strength and results were reported in units
of newton max force. Tensile indices (Nm/g) were determined with dividing the strength
values (N/m) by the corresponding basis weight (g/m2) where tensile strength is defined as the

169
breaking force (load) per standard width of the paper. The average value of 10 sample were
used and standard deviation calculated.
7.3.11.2 Roughness and Burst Strength
The roughness test was done using a Lorentzen & Wettre roughness tester according to
TAPPI T 538 test method, and the burst strength was tested with a Mullen tester according to
TAPPI-T810 test method. Testing specimens for burst strength were cut into 100 x 100 mm
pieces.
7.3.11.3 Tear Strength
Tear index refers to the tearing strength in relation to the basis weight. Tear strength was
also tested with a Lorentzen & Wettre tester according to ASTM D 689 test method. Samples
were cut into 100 x 100 mm pieces and 5 plies of papers were used for each test.
7.3.11.4 Test of Porosity
A Gurley Densometer was used to determine the porosity of the papers (T 460 om-02).
Paper samples, were cut into 50 ˟ 100 mm dimensions and marked on both sides for easy
identification and the Gurley seconds were recorded for each sample.
7.4 Results and Discussion
As mentioned, in this work we used soy protein (flour grade) as an additive in recycled
pulp to elucidate potential role of protein as a sticky control chemical and the dry strength
booster. In order to do so, multiple protein levels along with common papermaking chemicals
were added to the furnish in two different points of the process and the produced paper were
examined regarding their sticky contents and internal strengths. The main adding point was the
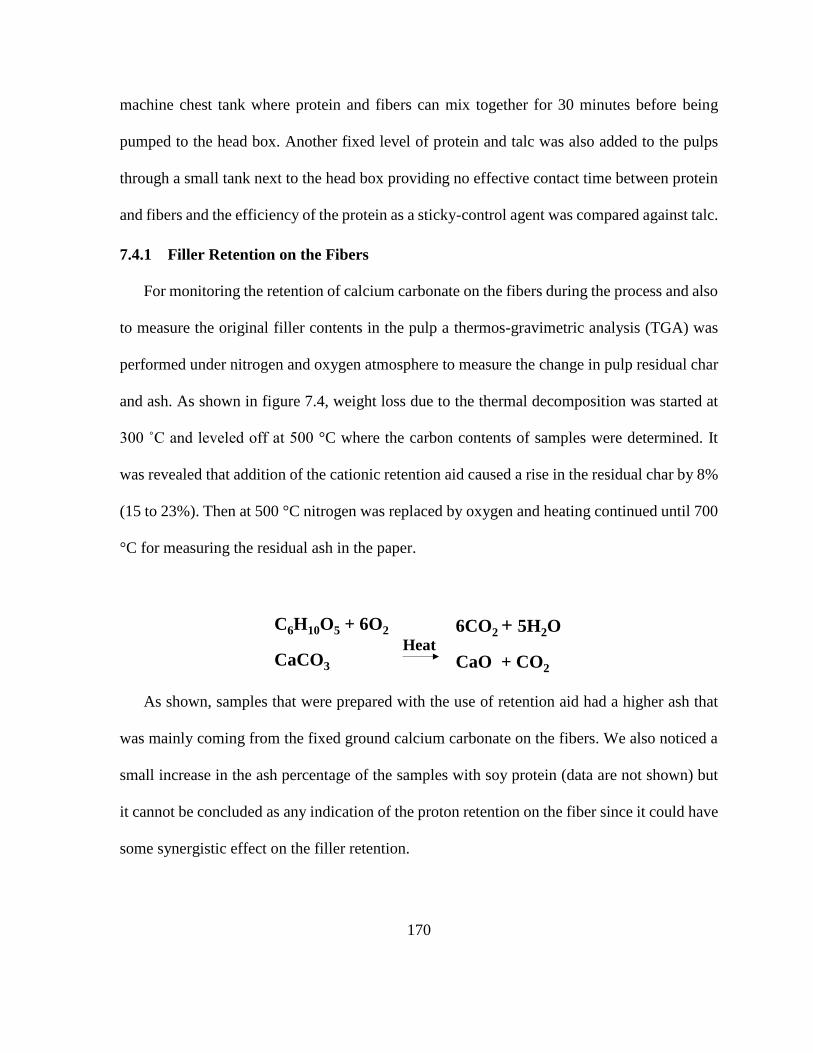
170
machine chest tank where protein and fibers can mix together for 30 minutes before being
pumped to the head box. Another fixed level of protein and talc was also added to the pulps
through a small tank next to the head box providing no effective contact time between protein
and fibers and the efficiency of the protein as a sticky-control agent was compared against talc.
7.4.1 Filler Retention on the Fibers
For monitoring the retention of calcium carbonate on the fibers during the process and also
to measure the original filler contents in the pulp a thermos-gravimetric analysis (TGA) was
performed under nitrogen and oxygen atmosphere to measure the change in pulp residual char
and ash. As shown in figure 7.4, weight loss due to the thermal decomposition was started at
300 ˚C and leveled off at 500 °C where the carbon contents of samples were determined. It
was revealed that addition of the cationic retention aid caused a rise in the residual char by 8%
(15 to 23%). Then at 500 °C nitrogen was replaced by oxygen and heating continued until 700
°C for measuring the residual ash in the paper.
As shown, samples that were prepared with the use of retention aid had a higher ash that
was mainly coming from the fixed ground calcium carbonate on the fibers. We also noticed a
small increase in the ash percentage of the samples with soy protein (data are not shown) but
it cannot be concluded as any indication of the proton retention on the fiber since it could have
some synergistic effect on the filler retention.
CaCO3
HeatCaO + CO2
C6H10O5 + 6O2 6CO2 + 5H2O
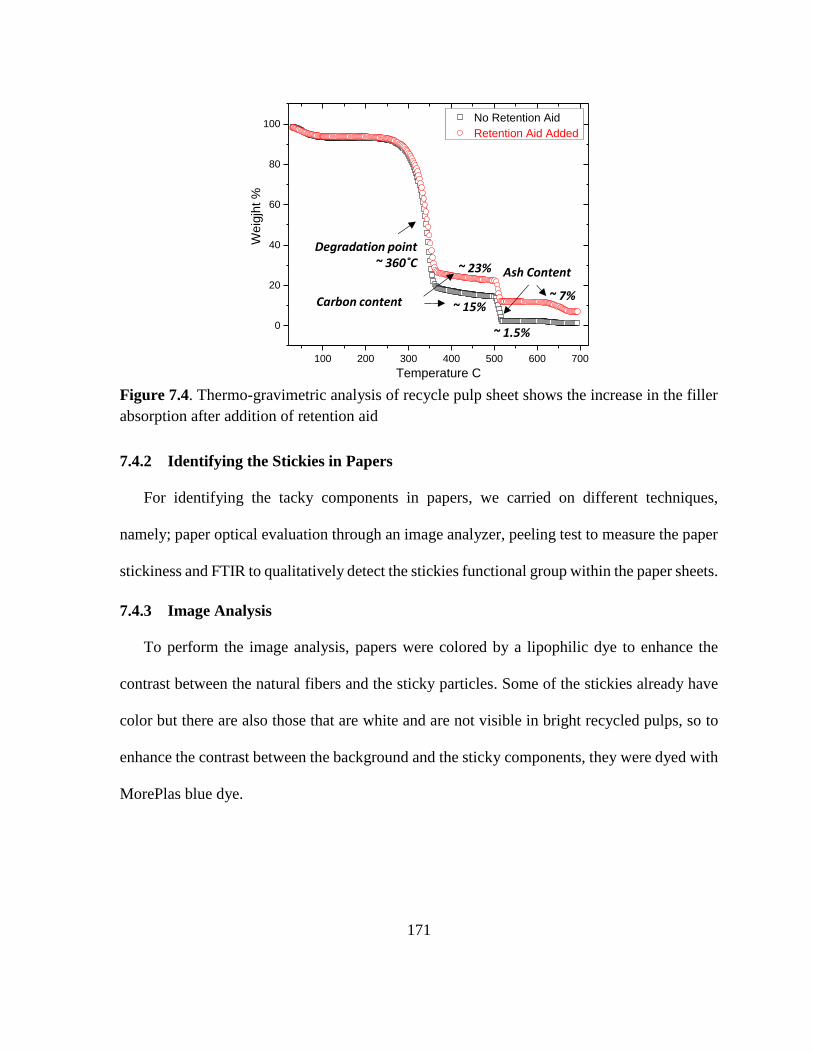
171
Figure 7.4. Thermo-gravimetric analysis of recycle pulp sheet shows the increase in the filler
absorption after addition of retention aid
7.4.2 Identifying the Stickies in Papers
For identifying the tacky components in papers, we carried on different techniques,
namely; paper optical evaluation through an image analyzer, peeling test to measure the paper
stickiness and FTIR to qualitatively detect the stickies functional group within the paper sheets.
7.4.3 Image Analysis
To perform the image analysis, papers were colored by a lipophilic dye to enhance the
contrast between the natural fibers and the sticky particles. Some of the stickies already have
color but there are also those that are white and are not visible in bright recycled pulps, so to
enhance the contrast between the background and the sticky components, they were dyed with
MorePlas blue dye.
100 200 300 400 500 600 700
0
20
40
60
80
100
Weig
jht %
Temperature C
No Retention Aid
Retention Aid Added
Degradation point ~ 360˚C ~ 23%
~ 15%~ 7%
~ 1.5%
Ash Content
Carbon content
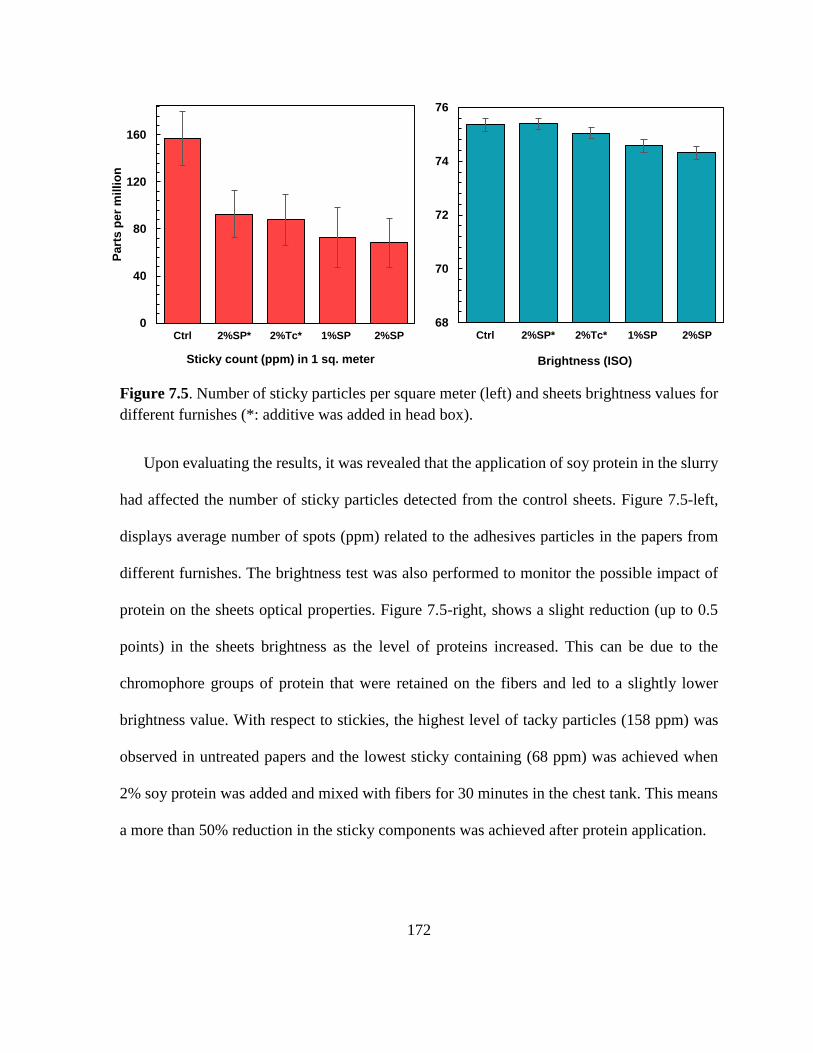
172
Figure 7.5. Number of sticky particles per square meter (left) and sheets brightness values for
different furnishes (*: additive was added in head box).
Upon evaluating the results, it was revealed that the application of soy protein in the slurry
had affected the number of sticky particles detected from the control sheets. Figure 7.5-left,
displays average number of spots (ppm) related to the adhesives particles in the papers from
different furnishes. The brightness test was also performed to monitor the possible impact of
protein on the sheets optical properties. Figure 7.5-right, shows a slight reduction (up to 0.5
points) in the sheets brightness as the level of proteins increased. This can be due to the
chromophore groups of protein that were retained on the fibers and led to a slightly lower
brightness value. With respect to stickies, the highest level of tacky particles (158 ppm) was
observed in untreated papers and the lowest sticky containing (68 ppm) was achieved when
2% soy protein was added and mixed with fibers for 30 minutes in the chest tank. This means
a more than 50% reduction in the sticky components was achieved after protein application.
0
40
80
120
160
Ctrl 2%SP* 2%Tc* 1%SP 2%SP
Pa
rts
pe
r m
illi
on
Sticky count (ppm) in 1 sq. meter
68
70
72
74
76
Ctrl 2%SP* 2%Tc* 1%SP 2%SP
Brightness (ISO)
173
Even though there was a difference in sticky removal efficiency when more protein was
used (lower value), the improvement was not remarkable between dosage of 1 and 2%
considering the standard deviation between the average values. This indicates perhaps there is
only a fraction of components that soy protein was able to affect and using more protein
couldn’t reduce the certain portion of stickies. Besides, we noticed that the addition of protein
with time zero condition (addition from head box) was also effective to decrease the sticky
particles, the ppm value decreased to 93 ppm. Similar results were also obtained in case, talc
was used and particle count reached to 88 ppm. The aim of adding protein from two places
was to elucidate the role of the agitation and the contacting time with the stickies. Results show
that apparently the addition point of the protein matters and it’s more effective when having
more contact time with the fibers and substrates.
Figure 7.6. Example of paper images taken by the apogee image analyzer; a) dyed paper from
control furnish, b) corresponding sheets after being treated with soy protein.
It was hypothesized that high surface area materials such as talc can detackify the sticky
particles by attaching to them and make bigger non-sticky particles. They also may cause the
particles to extend and being more susceptible to breakage in the high-shear fields. However

174
the application of soy protein as a sticky-control agent is a new approach and the mechanism
is not fully understood. It is conceived that protein can attach to the tacky materials and produce
agglomerations of bigger components yet less tacky that can either retain on the fiber or being
washed during the pulping step. This hypothesis is similar to what we stated in respect to talc.
A second theory is related to the protein hydrophobic-hydrophilic domains that make it
possible to act as a dispersing agent or surfactant which bonds to the lipophilic material and
water molecules, thus leading the sticky components to be removed and go to the white water.
In agreement with this theory, (Banerjee et al., 2012) reported that a portion of the protein can
remain in the water phase and hence, be removed through water discharge. This possible
pathway is undesirable because can lead to slime build-up. However, in fact the unretained
part of the protein will only represent a negligible fraction of the biodegradable material and
its contribution to biological growth wouldn’t be significant. Mentioned theory might only be
valid to some little extent since the test of brightness and internal strengths (will be discussed
in next section) indicated the retention of protein on the fibers.
Researchers have reported soy protein as a source of enzymes such as lipoxygenase (Porta
et al., 2002) that under optimum conditions can oxidize a portion of hydrophobic component
and subsequently cause them to be removed from the pulp. This hypothesis seems valid since
test with isolated enzyme (data in chapter 6) shows similar trend. Furthermore it was reported
by (Naithani et al., 2015) that protein can increase the wettability of sticky components and
affect their state of tackiness in a desired manner.
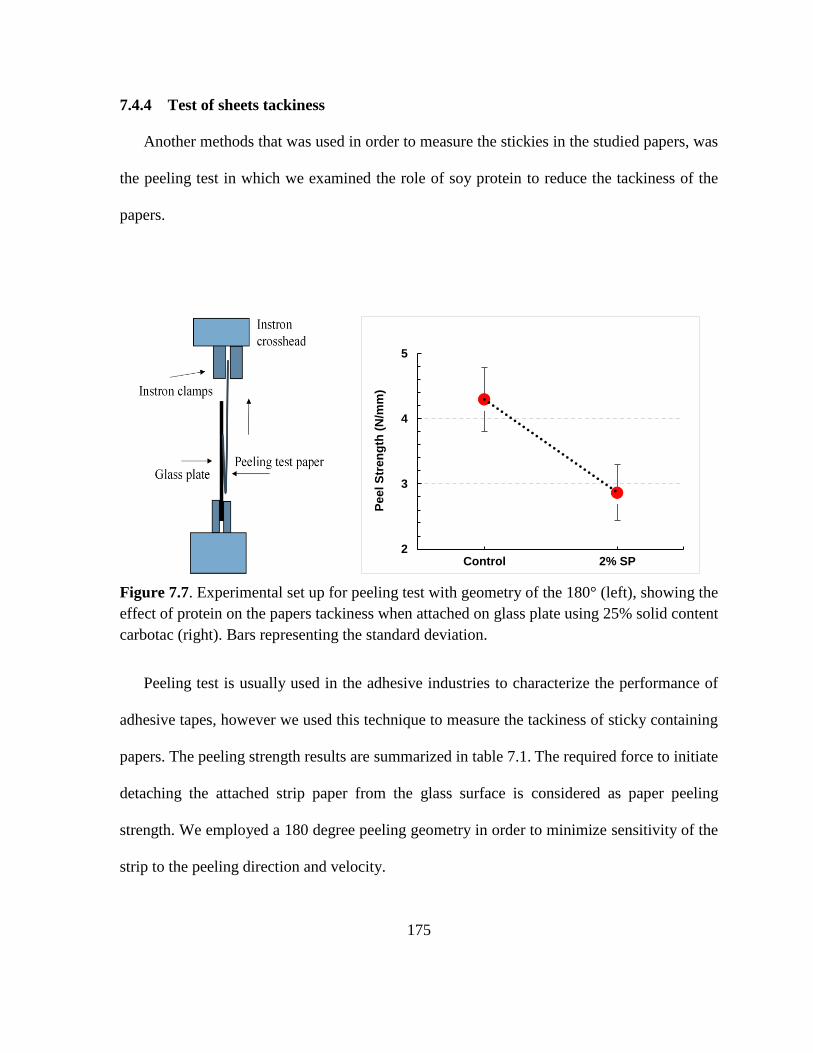
175
7.4.4 Test of sheets tackiness
Another methods that was used in order to measure the stickies in the studied papers, was
the peeling test in which we examined the role of soy protein to reduce the tackiness of the
papers.
Figure 7.7. Experimental set up for peeling test with geometry of the 180° (left), showing the
effect of protein on the papers tackiness when attached on glass plate using 25% solid content
carbotac (right). Bars representing the standard deviation.
Peeling test is usually used in the adhesive industries to characterize the performance of
adhesive tapes, however we used this technique to measure the tackiness of sticky containing
papers. The peeling strength results are summarized in table 7.1. The required force to initiate
detaching the attached strip paper from the glass surface is considered as paper peeling
strength. We employed a 180 degree peeling geometry in order to minimize sensitivity of the
strip to the peeling direction and velocity.
2
3
4
5
Control 2% SP
Pe
el S
tren
gth
(N
/mm
)
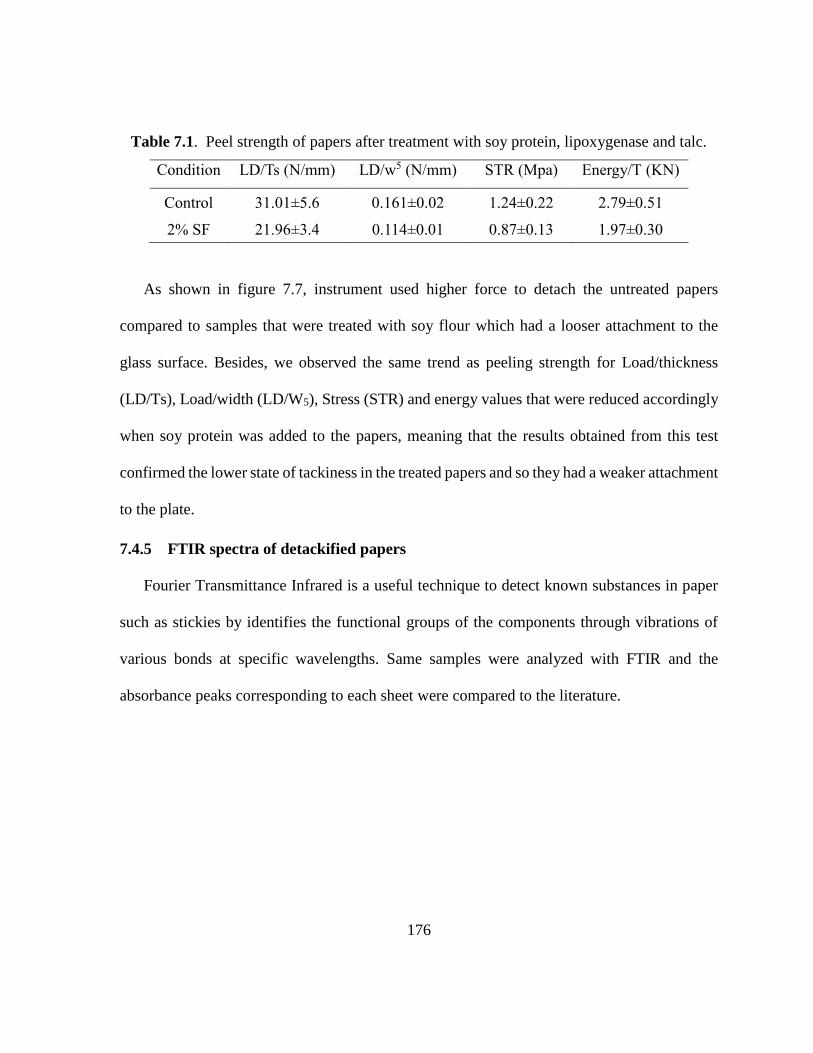
176
Table 7.1. Peel strength of papers after treatment with soy protein, lipoxygenase and talc.
Condition LD/Ts (N/mm) LD/w5 (N/mm) STR (Mpa) Energy/T (KN)
Control 31.01±5.6 0.161±0.02 1.24±0.22 2.79±0.51
2% SF 21.96±3.4 0.114±0.01 0.87±0.13 1.97±0.30
As shown in figure 7.7, instrument used higher force to detach the untreated papers
compared to samples that were treated with soy flour which had a looser attachment to the
glass surface. Besides, we observed the same trend as peeling strength for Load/thickness
(LD/Ts), Load/width (LD/W5), Stress (STR) and energy values that were reduced accordingly
when soy protein was added to the papers, meaning that the results obtained from this test
confirmed the lower state of tackiness in the treated papers and so they had a weaker attachment
to the plate.
7.4.5 FTIR spectra of detackified papers
Fourier Transmittance Infrared is a useful technique to detect known substances in paper
such as stickies by identifies the functional groups of the components through vibrations of
various bonds at specific wavelengths. Same samples were analyzed with FTIR and the
absorbance peaks corresponding to each sheet were compared to the literature.
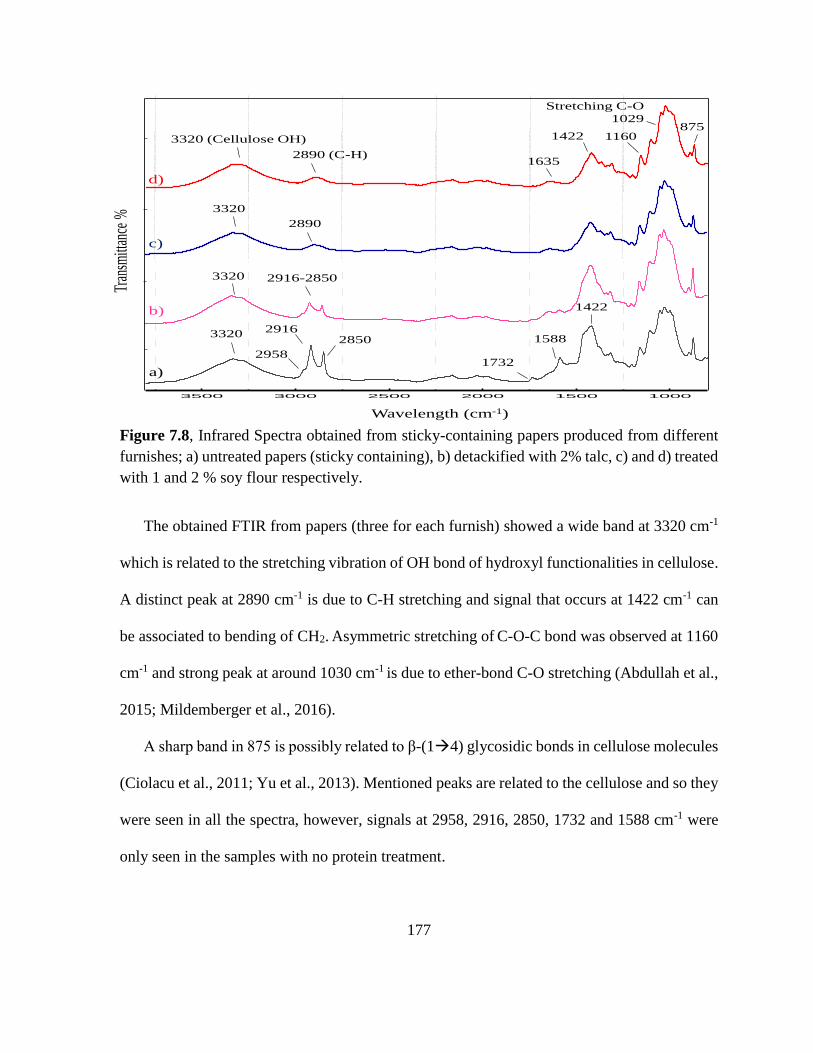
177
Figure 7.8, Infrared Spectra obtained from sticky-containing papers produced from different
furnishes; a) untreated papers (sticky containing), b) detackified with 2% talc, c) and d) treated
with 1 and 2 % soy flour respectively.
The obtained FTIR from papers (three for each furnish) showed a wide band at 3320 cm-1
which is related to the stretching vibration of OH bond of hydroxyl functionalities in cellulose.
A distinct peak at 2890 cm-1 is due to C-H stretching and signal that occurs at 1422 cm-1 can
be associated to bending of CH2. Asymmetric stretching of C-O-C bond was observed at 1160
cm-1 and strong peak at around 1030 cm-1 is due to ether-bond C-O stretching (Abdullah et al.,
2015; Mildemberger et al., 2016).
A sharp band in 875 is possibly related to β-(14) glycosidic bonds in cellulose molecules
(Ciolacu et al., 2011; Yu et al., 2013). Mentioned peaks are related to the cellulose and so they
were seen in all the spectra, however, signals at 2958, 2916, 2850, 1732 and 1588 cm-1 were
only seen in the samples with no protein treatment.
100015002000250030003500
Wavelength (cm-1)
Tran
smitt
ance
%3320 (Cellulose OH)
2890 (C-H)
a)
b)
c)
d)
2958
29162850
1732
1422
1588
1635
1422 1160
Stretching C-O
1029
3320
2890
3320 2916-2850
3320
875
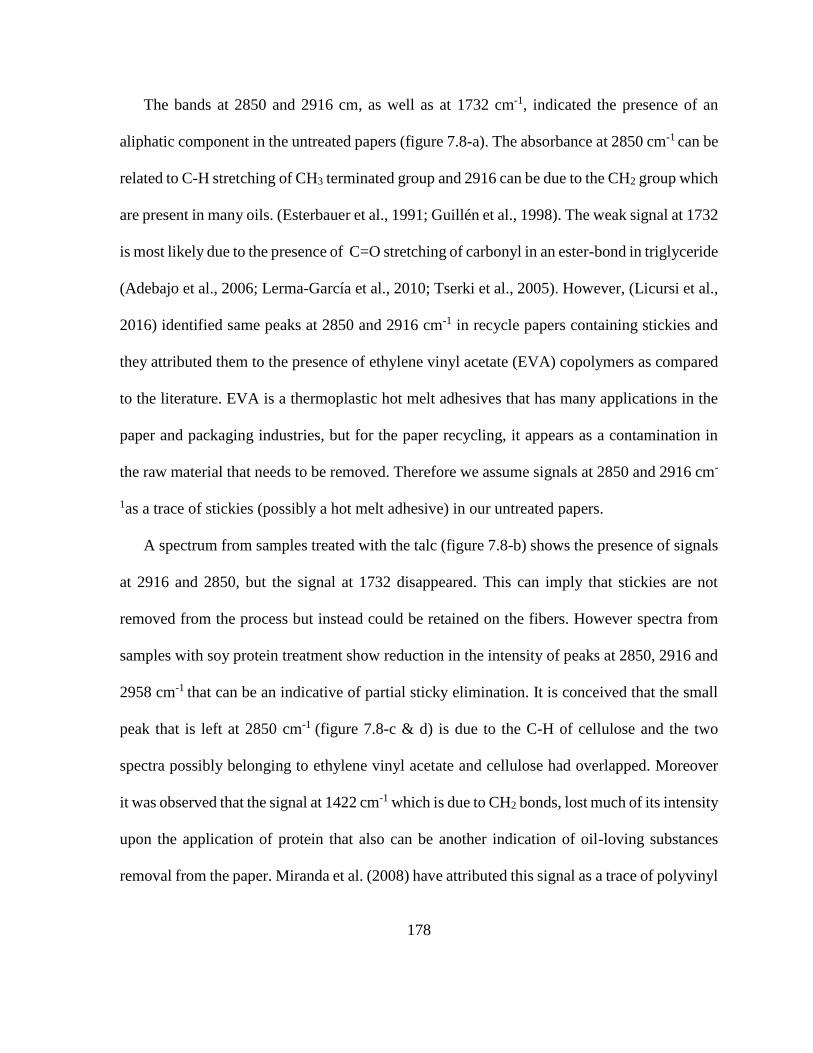
178
The bands at 2850 and 2916 cm, as well as at 1732 cm-1, indicated the presence of an
aliphatic component in the untreated papers (figure 7.8-a). The absorbance at 2850 cm-1 can be
related to C-H stretching of CH3 terminated group and 2916 can be due to the CH2 group which
are present in many oils. (Esterbauer et al., 1991; Guillén et al., 1998). The weak signal at 1732
is most likely due to the presence of C=O stretching of carbonyl in an ester-bond in triglyceride
(Adebajo et al., 2006; Lerma-García et al., 2010; Tserki et al., 2005). However, (Licursi et al.,
2016) identified same peaks at 2850 and 2916 cm-1 in recycle papers containing stickies and
they attributed them to the presence of ethylene vinyl acetate (EVA) copolymers as compared
to the literature. EVA is a thermoplastic hot melt adhesives that has many applications in the
paper and packaging industries, but for the paper recycling, it appears as a contamination in
the raw material that needs to be removed. Therefore we assume signals at 2850 and 2916 cm-
1as a trace of stickies (possibly a hot melt adhesive) in our untreated papers.
A spectrum from samples treated with the talc (figure 7.8-b) shows the presence of signals
at 2916 and 2850, but the signal at 1732 disappeared. This can imply that stickies are not
removed from the process but instead could be retained on the fibers. However spectra from
samples with soy protein treatment show reduction in the intensity of peaks at 2850, 2916 and
2958 cm-1 that can be an indicative of partial sticky elimination. It is conceived that the small
peak that is left at 2850 cm-1 (figure 7.8-c & d) is due to the C-H of cellulose and the two
spectra possibly belonging to ethylene vinyl acetate and cellulose had overlapped. Moreover
it was observed that the signal at 1422 cm-1 which is due to CH2 bonds, lost much of its intensity
upon the application of protein that also can be another indication of oil-loving substances
removal from the paper. Miranda et al. (2008) have attributed this signal as a trace of polyvinyl
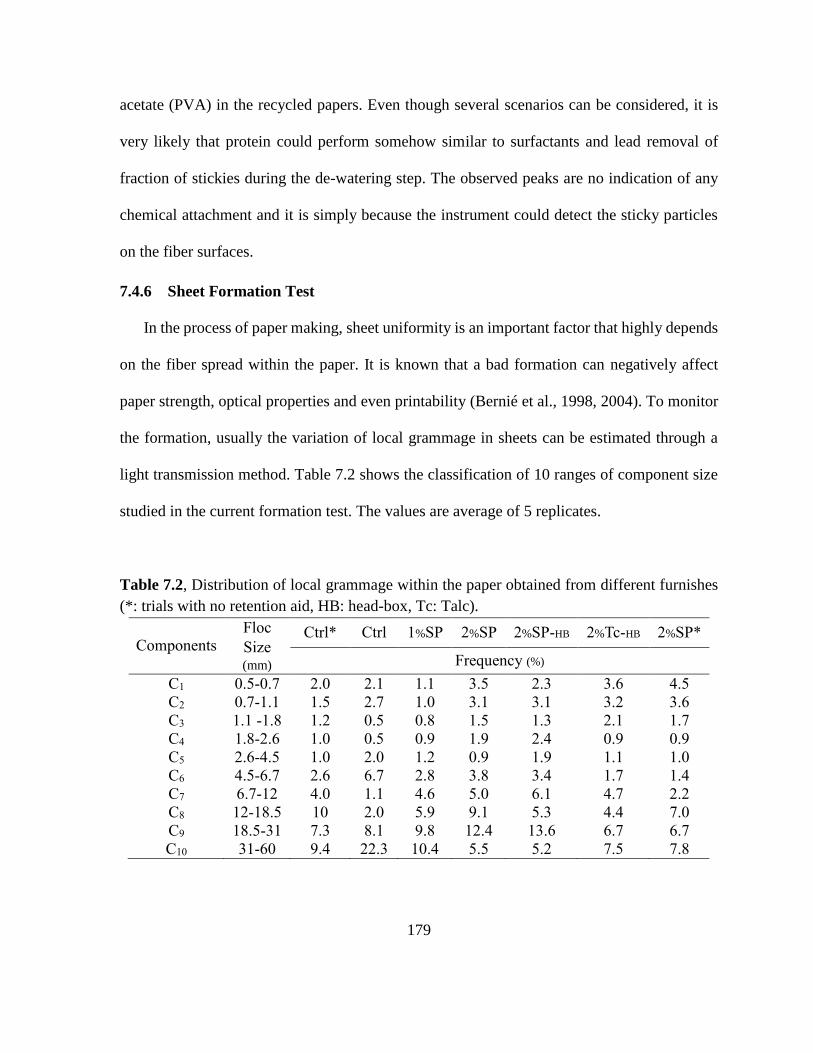
179
acetate (PVA) in the recycled papers. Even though several scenarios can be considered, it is
very likely that protein could perform somehow similar to surfactants and lead removal of
fraction of stickies during the de-watering step. The observed peaks are no indication of any
chemical attachment and it is simply because the instrument could detect the sticky particles
on the fiber surfaces.
7.4.6 Sheet Formation Test
In the process of paper making, sheet uniformity is an important factor that highly depends
on the fiber spread within the paper. It is known that a bad formation can negatively affect
paper strength, optical properties and even printability (Bernié et al., 1998, 2004). To monitor
the formation, usually the variation of local grammage in sheets can be estimated through a
light transmission method. Table 7.2 shows the classification of 10 ranges of component size
studied in the current formation test. The values are average of 5 replicates.
Table 7.2, Distribution of local grammage within the paper obtained from different furnishes
(*: trials with no retention aid, HB: head-box, Tc: Talc).
Components Floc
Size (mm)
Ctrl* Ctrl 1%SP 2%SP 2%SP-HB 2%Tc-HB 2%SP*
Frequency (%)
C1 0.5-0.7 2.0 2.1 1.1 3.5 2.3 3.6 4.5
C2 0.7-1.1 1.5 2.7 1.0 3.1 3.1 3.2 3.6
C3 1.1 -1.8 1.2 0.5 0.8 1.5 1.3 2.1 1.7
C4 1.8-2.6 1.0 0.5 0.9 1.9 2.4 0.9 0.9
C5 2.6-4.5 1.0 2.0 1.2 0.9 1.9 1.1 1.0
C6 4.5-6.7 2.6 6.7 2.8 3.8 3.4 1.7 1.4
C7 6.7-12 4.0 1.1 4.6 5.0 6.1 4.7 2.2
C8 12-18.5 10 2.0 5.9 9.1 5.3 4.4 7.0
C9 18.5-31 7.3 8.1 9.8 12.4 13.6 6.7 6.7
C10 31-60 9.4 22.3 10.4 5.5 5.2 7.5 7.8

180
The uniformity of components with the smaller size (1-10 mm) may impact the printability
and those with bigger size (10-30 mm) can affect the mechanical properties (Bernié et al.,
2000; Zhang et al., 2010). The result summarized in table 7.2 and figure 7.9 shows that the
addition of retention aid caused a significant change in sheet formation. For example the
frequency of C8,10 decreased while C1-5 remained almost unchanged. It was also noticed that
the protein-containing fibers engendered more small (C1-3) and middle size flocs (C7-9),
however the rate of C9-10 decreased. When no retention aid was used the application of protein
caused a slight increase in (C1-3) and significant raise in C6-10.
Figure 7.9. PPF values of sheet formation (relative to a perfect paper) before/after the addition
of C-PAM, soy protein and talc (9-left), relative index of fiber formation compared to reference
(copy paper) after the addition of same additives (9-right).
Relative formation test can save time by determining the difference between sheets
formation. If the obtained values is greater than those of the reference paper, then it means the
tested paper has a better formation than the reference and vice versa. According to the results
4
40
0.5 4 32
PP
F V
alu
es %
Components (mm)
Control
CPAM
2%SP
2%SP-CPAM
Talc-CPAM
Reference
0.2
0.3
0.4
0.5
0.5 5 50
Rela
tive In
de
x
Components (mm)
Control
CPAM
2%SP
2%SP-CPAM
Talc-CPAM
Reference
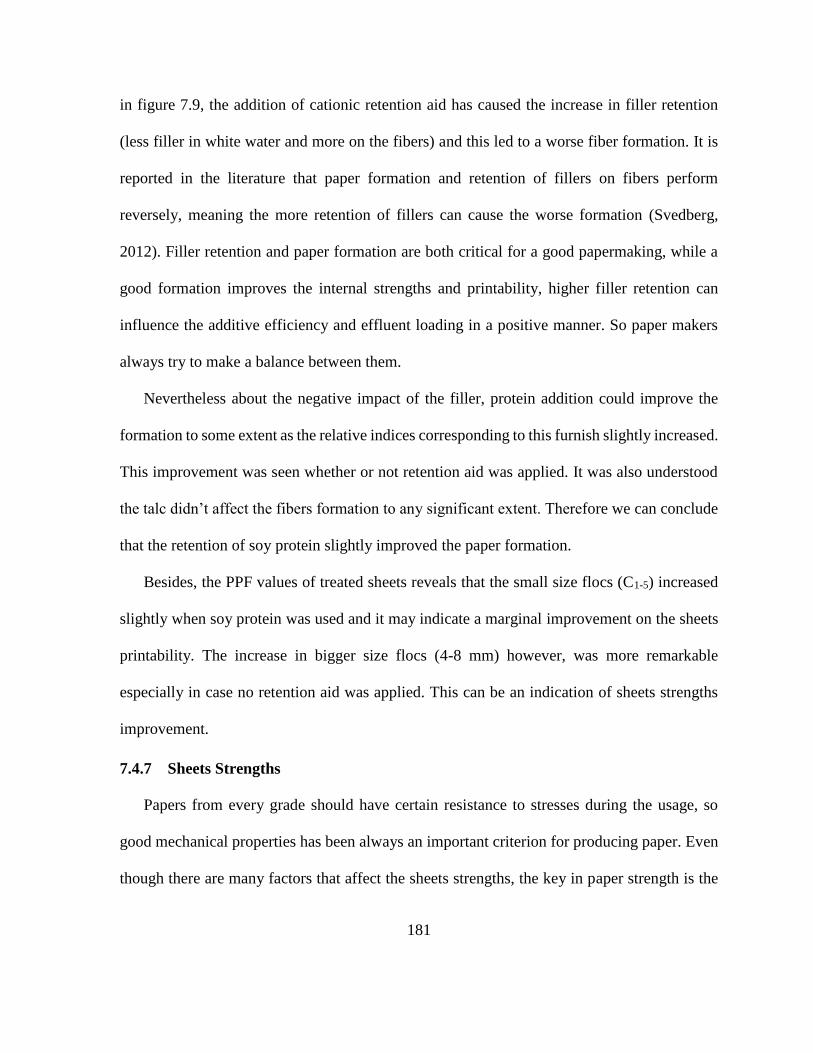
181
in figure 7.9, the addition of cationic retention aid has caused the increase in filler retention
(less filler in white water and more on the fibers) and this led to a worse fiber formation. It is
reported in the literature that paper formation and retention of fillers on fibers perform
reversely, meaning the more retention of fillers can cause the worse formation (Svedberg,
2012). Filler retention and paper formation are both critical for a good papermaking, while a
good formation improves the internal strengths and printability, higher filler retention can
influence the additive efficiency and effluent loading in a positive manner. So paper makers
always try to make a balance between them.
Nevertheless about the negative impact of the filler, protein addition could improve the
formation to some extent as the relative indices corresponding to this furnish slightly increased.
This improvement was seen whether or not retention aid was applied. It was also understood
the talc didn’t affect the fibers formation to any significant extent. Therefore we can conclude
that the retention of soy protein slightly improved the paper formation.
Besides, the PPF values of treated sheets reveals that the small size flocs (C1-5) increased
slightly when soy protein was used and it may indicate a marginal improvement on the sheets
printability. The increase in bigger size flocs (4-8 mm) however, was more remarkable
especially in case no retention aid was applied. This can be an indication of sheets strengths
improvement.
7.4.7 Sheets Strengths
Papers from every grade should have certain resistance to stresses during the usage, so
good mechanical properties has been always an important criterion for producing paper. Even
though there are many factors that affect the sheets strengths, the key in paper strength is the
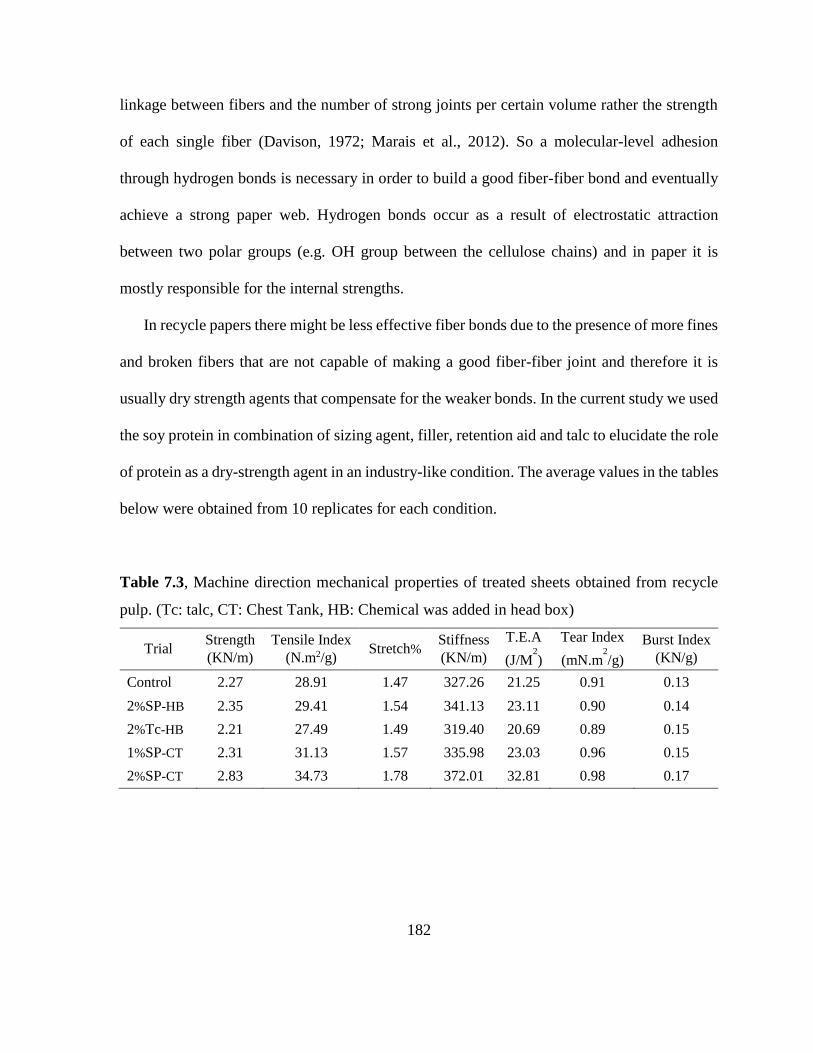
182
linkage between fibers and the number of strong joints per certain volume rather the strength
of each single fiber (Davison, 1972; Marais et al., 2012). So a molecular-level adhesion
through hydrogen bonds is necessary in order to build a good fiber-fiber bond and eventually
achieve a strong paper web. Hydrogen bonds occur as a result of electrostatic attraction
between two polar groups (e.g. OH group between the cellulose chains) and in paper it is
mostly responsible for the internal strengths.
In recycle papers there might be less effective fiber bonds due to the presence of more fines
and broken fibers that are not capable of making a good fiber-fiber joint and therefore it is
usually dry strength agents that compensate for the weaker bonds. In the current study we used
the soy protein in combination of sizing agent, filler, retention aid and talc to elucidate the role
of protein as a dry-strength agent in an industry-like condition. The average values in the tables
below were obtained from 10 replicates for each condition.
Table 7.3, Machine direction mechanical properties of treated sheets obtained from recycle
pulp. (Tc: talc, CT: Chest Tank, HB: Chemical was added in head box)
Trial Strength
(KN/m)
Tensile Index
(N.m2/g) Stretch%
Stiffness
(KN/m)
T.E.A
(J/M2
)
Tear Index
(mN.m2
/g)
Burst Index
(KN/g)
Control 2.27 28.91 1.47 327.26 21.25 0.91 0.13
2%SP-HB 2.35 29.41 1.54 341.13 23.11 0.90 0.14
2%Tc-HB 2.21 27.49 1.49 319.40 20.69 0.89 0.15
1%SP-CT 2.31 31.13 1.57 335.98 23.03 0.96 0.15
2%SP-CT 2.83 34.73 1.78 372.01 32.81 0.98 0.17

183
7.4.8 Tensile and Burst Indices
The effect of soy protein on the strengths of the resulting sheets from pilot machine is
reflected in table 7.3. Among the trials, it was seen that applying 2% of protein either in head
box or in chest tank (after 30 minutes mixing time) tends to cause a rise in the tensile and burst
indices. However, results showed a more pronounced improvement when protein was added
in the chest tank with 30 minutes mixing time. The reason might be due to the fact that there
was less agitation in the chest tank compared to the head box and protein molecules had enough
time for blend with fibers and contribute to more hydrogen bonds. Even the increase obtained
in case of using 1% soy protein in the chest tank was better compared to the case of 2% in head
box, which is in accordance to the mentioned assumption. Most likely the higher shear force
and the absence of enough protein-fiber contact time has caused the majority of the proteins
molecules go to the white water rather retaining on the fibers.
Similarly the highest improvement for burst indices was seen in the same trial, where it can
be attributed to more inter-fiber bonding between the fibers and soy protein. Soy protein has a
large quantity of NH2 groups that can bring about hydrogen and ionic bonding with hydroxyl
group of cellulose or lignin in the pulp. Besides, it is reported that the amino groups on the
chitosan can react with cellulose aldehydes (pikulik, 1992) and make subsequent covalent
bonds. Similar reaction can occur between the protein amino groups and cellulose molecules
in the recycled fibers. Other possibility is the formation of amino bonds through a reaction
between cellulose carbonyl groups and amines.
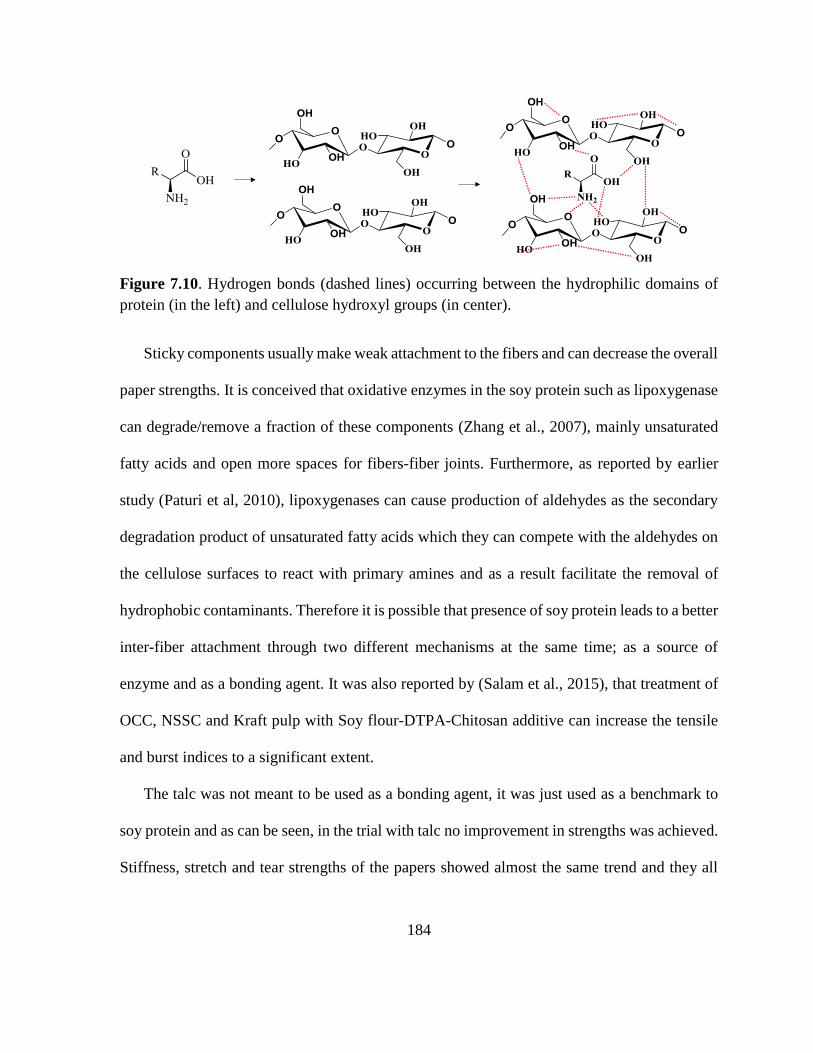
184
Figure 7.10. Hydrogen bonds (dashed lines) occurring between the hydrophilic domains of
protein (in the left) and cellulose hydroxyl groups (in center).
Sticky components usually make weak attachment to the fibers and can decrease the overall
paper strengths. It is conceived that oxidative enzymes in the soy protein such as lipoxygenase
can degrade/remove a fraction of these components (Zhang et al., 2007), mainly unsaturated
fatty acids and open more spaces for fibers-fiber joints. Furthermore, as reported by earlier
study (Paturi et al, 2010), lipoxygenases can cause production of aldehydes as the secondary
degradation product of unsaturated fatty acids which they can compete with the aldehydes on
the cellulose surfaces to react with primary amines and as a result facilitate the removal of
hydrophobic contaminants. Therefore it is possible that presence of soy protein leads to a better
inter-fiber attachment through two different mechanisms at the same time; as a source of
enzyme and as a bonding agent. It was also reported by (Salam et al., 2015), that treatment of
OCC, NSSC and Kraft pulp with Soy flour-DTPA-Chitosan additive can increase the tensile
and burst indices to a significant extent.
The talc was not meant to be used as a bonding agent, it was just used as a benchmark to
soy protein and as can be seen, in the trial with talc no improvement in strengths was achieved.
Stiffness, stretch and tear strengths of the papers showed almost the same trend and they all

185
were improved by increasing the level of protein in the chest tank. We believe the same theory
can be valid and the stronger bonds between protein and the fibers could affect these
parameters as well.
7.4.9 Roughness and Porosity
Data in table 7.4 shows, the application of protein can also slightly affect the papers
roughness and porosity, which can be due to the fact that the protein molecules could cause
more fiber-fiber attachment (as explained in the previous section) and as a result the number
of pores on the paper surface has decreased. Similarly papers with less pores are smoother and
for this reason the roughness values declined. However, no visual change was seen on the
surface roughness since the change was not very remarkable.
Table 7.4. The roughness and porosity values obtained from produced sheets from the pilot
machine. (HB: head box, CT: Chest tank, SP: Soy protein, Tc: Talc)
Trials Gurley numbers (s) Roughness
Control 19.2 25.78
2% SP-HB 23.7 22.54
2% Tc-HB 20.0 24.48
0.5%SP-CT 21.5 23.98
1%SP-CT 24.4 20.61
2%SP-CT 29.5 18.35
The porosity test (Gurley numbers) showed the protein can act as barrier for air to pass
through the paper structure which also can be an indicative of protein retention on the fiber
surfaces. The least porous papers were those that had been treated with protein under the gentle

186
agitation with more mixing time (2%SP-CT). Probably this happened due to the fact that
protein filled the pores between the fibers to some extent.
7.5 Conclusion
In this study we used various techniques to study the feasibility of using soy protein as a
potential sticky-control agent in paper mills and then evaluated positive synergistic impacts on
sheets such as dry strength, formation, and paper structure. The obtained results suggest there
is a reduction in the sheets sticky contents after the application of protein. This was confirmed
through FTIR, image analyzer and peeling test. It was revealed that talc’s effect to reduce the
tackiness is mostly through particle retention on the fibers rather an actual removal. However,
the stickies elimination theory was more valid for protein since there was less trace of stickies
in protein-treated paper as was analyzed by FTIR. So we can conclude protein was effective
to attach to part of stickies and force them toward the waste water, yet, the exact mechanism
is not clear and more studies are needed.
The mechanical property tests, reinforced the theory of “protein’s role as a bonding agent”.
Many aspects of mechanical properties were examined (tensile index was the main criterion)
and data showed an improvement in sheets strengths. The reason for such improvement is
related to the role of protein’s functional group (NH2, C-OOH) in creating more hydrogen
bonds within the fibrous networks, as well as possible aldehyde-amines reactions that can lead
to covalent bonds if there is enough active aldehydes in the fiber slurry. It may also be possible
that there is a weak ionic attractions between carboxyl anions of cellulose and soy protein. it
had been reported before by (Jin et al., 2012) that soy protein caused a stronger paper when

187
mixed with starch. Therefore it is possible to produce a lighter grade paper with less raw
material and still keep the same strengths which potentially can lead to reduce the paper
production cost. As mentioned, the main goal of current study was to establish a novel
approach to address the sticky issues in paper making and the study on other aspects in
papermaking process was merely done to elucidate the possible negative or positive impacts
on the process.
Finally, we noticed that soy protein could slightly improve the formation and decrease the
porosity of the papers. The roughness decreased with the increase of protein dosage which
shows under the applied condition in this experiment, protein could stay within or on the fibers.
Also the optical properties evaluation mostly revealed that the addition of protein could neither
improve nor damage the paper brightness.
In summary, data provided in this manuscript confirmed the positive effect of protein in
the papermaking mill under the realistic condition and imply to protein as a potential
detackifier. Soy protein is a biodegradable material and performs well in reducing the
hydrophobic component from the pulp. So such a chemical can potentially be used widely in
near future at many pulp and paper mills
188
7.6 References
53rd Annual Survey of Paper, Paperboard and Pulp Capacity. (2013).
Abdullah, R., Ishak, C., Kadir, W., & Bakar, R. (2015). Characterization and Feasibility
Assessment of Recycled Paper Mill Sludges for Land Application in Relation to the
Environment. International Journal of Environmental Research and Public Health, 12(8),
9314–9329.
Adachi, Mikami, B., Katsube, T., & Utsumi, S. (1998). Crystal Structure of Recombinant
Soybean -Amylase Complexed with -Cyclodextrin. Journal of Biological Chemistry, 273(31),
19859–19865.
Adebajo, M. O., Frost, R. L., Kloprogge, J. T., & Kokot, S. (2006). Raman spectroscopic
investigation of acetylation of raw cotton. Spectrochimica Acta Part A: Molecular and
Biomolecular Spectroscopy, 64(2), 448–453.
Arboleda, J. C., Hughes, M., Lucia, L. A., Laine, J., Ekman, K., & Rojas, O. J. (2013). Soy
protein–nanocellulose composite aerogels. Cellulose, 20(5), 2417–2426.
Bai, H., Xu, J., Liao, P., & Liu, X. (2013). Mechanical and water barrier properties of soy
protein isolate film incorporated with gelatin. Journal of Plastic Film & Sheeting, 29(2), 174–
188.
Bajpai. (2010). Solving the problems of recycled fiber processing with enzymes.
BioResources, 5(2), 1311–1325.
Bajpai, P. (2006). Advances in recycling and deinking. In Pira International.
Bajpai, P. (2012). Biotechnology for Pulp and Paper Processing. Boston, MA: Springer US.
Banerjee, S., Le, T., Haynes, R. D., & Bradbury, J. E. (2012). Solubilizing and detackifying
stickies with ß-cyclodextrin. BioResources, 7(2), 1533–1539.
Barnett, D. ., & Michalopoulos, D. L. (1989). Process for inhibiting white pitch deposition in
papermaking felts.
Benecke, F., Gantenbein, D., Schoelkopf, J., Gane, P. A. C., & Gliese, T. (2009). Organic
contaminants in recycled paper: a model study of the adsorbent properties of talc for idealised
component suspensions. Nordic Pulp and Paper Research Journal, 24(2), 219–224.
Bernié, J.-P., Romanetti, J. L., & Douglas, W. J. M. (2000). Use of components of formation
for predicting print quality and physical properties of newsprint. In Proceeding of PATTAC
86th Annual Meeting, (pp. A285–A291). Montreal, Canada.
189
Bernié, & Douglas, W. (1998). Paper strength-paper formation relations. In ANNUAL
MEETING-TECHNICAL SECTION CANADIAN PULP AND PAPER ASSOCIATION (p. Vol
84). CANADIAN PULP & PAPER ASSN-TECHNICAL SECTION.
Bernié, & Pande, H. (2004). paper formation-print quality linkage for uncoated fine - Google
Scholar. In n ANNUAL MEETING-PULP AND PAPER TECHNICAL ASSOCIATION OF
CANADA (p. Vol. 90, No. A, pp. 27–32). Pulp and Paper Technical Association of Canada.
Biermann, C. J. (1996). Handbook of pulping and papermaking. Academic Press.
Blanco, A., Negro, C., Monte, C., Fuente, H., & Tijero, J. (2002). Overview of two major
deposit problems in recycling: slime and stickies. Part II: stickies problems in recycling.
Progress in Paper Recycling, 11(2), 26–37.
Ciolacu, D., Ciolacu, F., & Popa, V. I. (2011). Amorphous Cellulose–Structure and
Characterization. Cellulose Chemistry And Technology Cellulose Chem. Technol, 45(12), 13–
21.
Davison, R. W. (1972). Weak link in paper dry strength. Tappi Journal, 55(4), 567.
Dechandt, A., Watkins, T., & Pruszynski, P. (2004). Total Approach to Deposit Control on
Newsprint Machine Using TMP and DIP Pulp Mix - from Specialized Fixation of Individual
Pulps to Retention. Appita Journal: Journal of the Technical Association of the Australian and
New Zealand Pulp and Paper Industry, 57(1), 13.
Delagoutte, T. (2005). Management and control of stickies. Progress in Paper Recycling,
15(1), 31.
Delagoutte, T., Brun, J., & Galland, G. (2003). Drying section deposits: identification of their
origin. In IPE International Symposium-New Technological Developments in paper recycling.
Valencia, Spain.
Doshi, M., Blanco, A., Negro, C., Monte, C., Dorris, G., Castro, C., … Putz, H. (2003).
Comparison of microstickies measurement methods. Part II: results and discussion. Progress
in Paper, 13(1), 44–53.
Elsby, L. E. (1986). Experiences from tissue and board production using stickies additives. In
Proeeding of Pulping Conference (pp. 187–191). Tappi Press, Atlanta.
Esterbauer, H., Schaur, R. J., & Zollner, H. (1991). Chemistry and biochemistry of 4-
hydroxynonenal, malonaldehyde and related aldehydes. Free Radical Biology and Medicine,
11(1), 81–128. Journal Article. http://doi.org/http://dx.doi.org/10.1016/0891-5849(91)90192-
6
Fahmy, Y., El-Wakil, N. A., El-Gendy, A. A., Abou-Zeid, R. E., & Youssef, M. A. (2010).
190
Plant proteins as binders in cellulosic paper composites. International Journal of Biological
Macromolecules, 47(1), 82–85.
Farrell, R. L., Hata, K., & Wall, M. B. (1997). Solving pitch problems in pulp and paper
processes by the use of enzymes or fungi (pp. 197–212). Springer Berlin Heidelberg.
Friberg, T. (1996). Cost impact of stickies. Progress in Paper Recycling, 70–72.
García, M. C., Torre, M., Marina, M. L., Laborda, F., & Rodriquez, A. R. (1997). Composition
and characterization of soyabean and related products. Critical Reviews in Food Science and
Nutrition, 37(4), 361–391.
Gu, Q.-M. (2003). Proteins for use as pitch and stickies control agents in pulp and papermaking
processes US Patent, 6527915.
Guillén, M. D., & Cabo, N. (1998). Relationships between the Composition of Edible Oils and
Lard and the Ratio of the Absorbance of Specific Bands of Their Fourier Transform Infrared
Spectra. Role of Some Bands of the Fingerprint Region. Journal of Agricultural and Food
Chemistry, 46(5), 1788–1793. Journal Article. http://doi.org/10.1021/jf9705274
Hamzeh, Y., Mohammad, S., Najafi, H., Hubbe, M. A., Salehi, K., Reza, M., & Firouzabadi,
D. (2012). Recycling potential of unbleached and bleached chemical pulps from juvenile and
mature wood of Populus deltoides. Holzforschung, 66(2), 155–161.
Haynes, R. (2008). nderstanding and Controlling Colloidal Organics when Mixing TMP and
DIP. In Engineering, Pulping and Environmental Conference (pp. 2026–2067). Tappi.
Hettiarachchy, N. S., Kalapathy, U., & Myers, D. J. (1995). Alkali-modified soy protein with
improved adhesive and hydrophobic properties. Journal of the American Oil Chemists’
Society, 72(12), 1461–1464.
Howard, R. C. (1990). The effects of recycling on paper quality. Journal of Pulp and Paper
Science, 16(5), 143–149.
Howard, R. C. (1992). The Basic Effects of Recycling on Pulp Properties. MRS Proceedings,
266, 195.
Howe, C., Hogan, R., & Wildes, S. (2011). Soy Chemicals For Paper Processing.
Hua, Y., Cui, S. W., Wang, Q., Mine, Y., & Poysa, V. (2005). Heat induced gelling properties
of soy protein isolates prepared from different defatted soybean flours. Food Research
International, 38(4), 377–385.
Hubbe, M. (2012). Mini-Encyclopedia of Papermaking Wet-End Chemistry.
191
Hubbe, M., Rojas, O., & Venditti, R. (2006). Control of tacky deposits on paper machines–A
Review. Nordic Pulp and Paper Research Journal, 21(2), 154–171.
Jin, H., Lucia, L. A., Rojas, O. J., Hubbe, M. A., & Pawlak, J. J. (2012). Survey of Soy Protein
Flour as a Novel Dry Strength Agent for Papermaking Furnishes. Agricultural and Food
Chemistry, 60(39), 9828–9833.
Johansson, H., Wikman, B., Lindstrom, E., & Osterberg, F. (2003). Detection and evaluation
of micro-stickies. Progress in Paper Recycling, 12(2), 4–12.
Jones, D., & Glover, D. (2010). Enzymatic Stickies Control-The Next Plus Generation. In
Tappi (Ed.), Conference and 9th Research Forum on Recycling. 1282-1315.
Kerman, N., Eronen, H., Burke, T., & Vanninen, S. P. (2006). Novel approach to select and
optimize fixatives for pitch and sticky control in different fiber systems. Wochenblatt Fur
Papierfabrikation, 134(21), 1203–1207.
Lenes, M., Andersen, I., & Stenbacka, I. (2001). Deposition of secondary stickies in DIP and
TMP suspensions. In 11th ISWPC International Symposium on Wood and Pulping Chemistry
(pp. 111–114). Nice, France.
Lerma-García, M. J., Ramis-Ramos, G., Herrero-Martínez, J. M., & Simó-Alfonso, E. F.
(2010). Authentication of extra virgin olive oils by Fourier-transform infrared spectroscopy.
Food Chemistry, 118(1), 78–83. Journal Article.
http://doi.org/http://dx.doi.org/10.1016/j.foodchem.2009.04.092
Licursi, D., Antonetti, C., Martinelli, M., Ribechini, E., Zanaboni, M., & Raspolli Galletti, A.
M. (2016). Monitoring/characterization of stickies contaminants coming from a papermaking
plant – Toward an innovative exploitation of the screen rejects to levulinic acid. Waste
Management, 49, 469–482.
Marais, A., & Wågberg, L. (2012). The use of polymeric amines to enhance the mechanical
properties of lignocellulosic fibrous networks. Cellulose, 19(4), 1437–1447.
Marques, G., Molina, S., Babot, E. D., Lund, H., José, C., & Gutiérrez, A. (2011). Exploring
the potential of fungal manganese-containing lipoxygenase for pitch control and pulp
delignification. Bioresource Technology, 102(2), 1338–1343. Journal Article.
Martínez, K. D., Carrera Sánchez, C., Rodríguez Patino, J. M., & Pilosof, A. M. R. (2009).
Interfacial and foaming properties of soy protein and their hydrolysates. Food Hydrocolloids,
23(8), 2149–2157.
Marton, J. (1980). The role of surface chemistry in fines-cationic starch interactions
[Papermaking]. Journal of the Technical Association of the Pulp and Paper Industry, 43(4),
87–91.

192
McHugh, J., Hodgson, K., & Heindel, T. (2001). Quantification of stickie removal from OCC
by dispersed air flotation. In TappiI 2001 Pulping Conference. Seattle, WA.
Mildemberger, L., Andreoli, M., Silva, G., & Motta, H. (2016). Correlation between stabilizer
consumption and degree of polymerization of thermally upgraded paper aged in insulating
natural ester and insulating mineral. Polímeros, 26(1), 61–65.
Miranda, R., Balea, A., Blanca, E. S. de la, Carrillo, I., & Blanco, A. (2008). Identification of
Recalcitrant Stickies and Their Sources in Newsprint Production. Industrial & Engineering
Chemistry Research, 47(16), 6239–6250.
Naithani, V., Lucia, L. A., & Banerjee, S. (2015). Soy flour detackification of stickies from
paper recycling, 30(3), 541–545.
Patrick, K. (2004). Enzyme technology improves efficiency, cost, safety of stickies removal
program. Paper Age, 120, 22–25.
Pelton, R. (2004). On the Design of Polymers for Increased Paper Dry Strength - a Review.
Appita Journal: Journal of the Technical Association of the Australian and New Zealand Pulp
and Paper Industry, 57(3), 181–190.
Porta, H., & Rocha-Sosa, M. (2002). Plant Lipoxygenases. Physiological and Molecular
Features. PLANT PHYSIOLOGY, 130(1), 15–21.
Salam, A., Lucia, L. A., & Jameel, H. (2015). A new class of biobased paper dry strength
agents: Synthesis and characterization of soy-based polymers. ACS Sustainable Chemistry and
Engineering, 3(3), 524–532.
Slagel, R., & Sinkovitz, G. (1977). Process for making paper products of improved dry
strength. US Patent 4,056,432.
Svedberg, A. (2012). Improvement of the retention-formation relationship using three-
component retention aid systems. Royal Institute of Technology.
Tserki, V., Zafeiropoulos, N. E., Simon, F., & Panayiotou, C. (2005). A study of the effect of
acetylation and propionylation surface treatments on natural fibres. Composites Part A:
Applied Science and Manufacturing, 36(8), 1110–1118.
Wagberg, B. M. (1993). Adsorption of cationic potato starch on cellulosic fibres. Nordic Pulp
and Paper Research Journal, 8(4), 399–404.
Wagner, & Guéguen, J. (1999). Surface Functional Properties of Native, Acid-Treated, and
Reduced Soy Glycinin. 1. Foaming Properties. Journal of Agriculture And Food Chemistry,
47(6), 2173–2180.
193
Wang, Y., Mo, X., Sun, X. S., & Wang, D. (2007). Soy protein adhesion enhanced by
glutaraldehyde crosslink. Journal of Applied Polymer Science, 104(1), 130–136.
Yu, X., Tong, S., Ge, M., Wu, L., Zuo, J., Cao, C., & Song, W. (2013). Synthesis and
characterization of multi-amino-functionalized cellulose for arsenic adsorption. Carbohydrate
Polymers, 92(1), 380–387.
Zhang, X., Nguyen, D., Paice, M. G., Tsang, A., & Renaud, S. (2007). Degradation of wood
extractives in thermo-mechanical pulp by soybean lipoxygenase. Enzyme and Microbial
Technology, 40(4), 866–873.
Zhang, Hu, H., Hou, Q., & Ni, Y. (2010). Effect of Fines from High-Yield Pulp on Filler
Retention and Paper Formation in Fine Paper Production. Journal of Biobased Materials and
Bioenergy, 4(4), 372–377.
194
8 Concluding remarks
In the present work, an alternative potential application of soy proteins and lipoxygenases
was investigated. Fundamental studies were carried out on the molecular interactions between
lipoxygenases and substrates relevant to industry (Chapter 3 & 4). In addition, the role of
proteins to control the deposition of sticky substances in papermaking based on recycled fibers
was addressed (Chapter 7). In both efforts, we proposed a biotechnological approach based
on soybean proteins and isolated lipoxygenases to reduce or control the negative effects of
tacky particles for the purpose of improving the machine runnability and paper quality.
Our studies were initiated at the molecular scale and then were expanded to larger systems.
In chapter 3, we considered active soybean lipoxygenases to catalyze the oxidation of lipids
used as models for stickies, in their oxidation to expedite degradation.
In the following chapter 4, it was shown that the changes on the substrate, as reported in
the previous chapter, induce different levels of hydrophobicity and viscoelastic properties. The
reduction of lipid adsorption on lipophilic polyester and polyolefin surfaces was monitored
with both QCM and SPR techniques. The results highlighted the potential of soy lipoxygenases
as pitch-control enzyme in paper mills.
In chapter 5, the deposit tendency of model hydrophobic components and natural wood
resins was studied. It was concluded that stickies that were treated with enzymes had less
tendency to adhere on polypropylene surfaces.
After confirmation of enzyme activity of soy flour through UV spectroscopy, isolated
enzymes were replaced with soy flour as a raw source of enzyme and applied to sticky-
195
containing recycled fibers. In chapter 6, we concluded that the effect of the soy proteins can
be equivalent to that of the pure enzyme as far as decreasing the sticky particles and lowering
the tackiness in the produced papers. Also, the application of soy proteins as a detackifier agent
was examined at the pilot-scale (Chapter 7) and the reduction of the stickies in the papers was
confirmed. Moreover, it was revealed that the incorporation of proteins in fiber processing can
improve the paper strengths and its formation, both taken as a synergistic effect.
Based on the results from this investigation, it can be concluded that soy proteins can be
effective in their different roles in the complex papermaking system. They contribute to the
bonding between the fibers, perform as a dispersing agent or as a source of oxidative enzymes.
The biotechnological approach utilized in this work can be considered as a novel, feasible and
cost-effective alternative that provides a number of advantages compared to methods and
chemicals that are used currently.

196
APPENDIX
Appendix A. Numerical values of mechanical strengths obtained in pilot-plant
paper making experiments
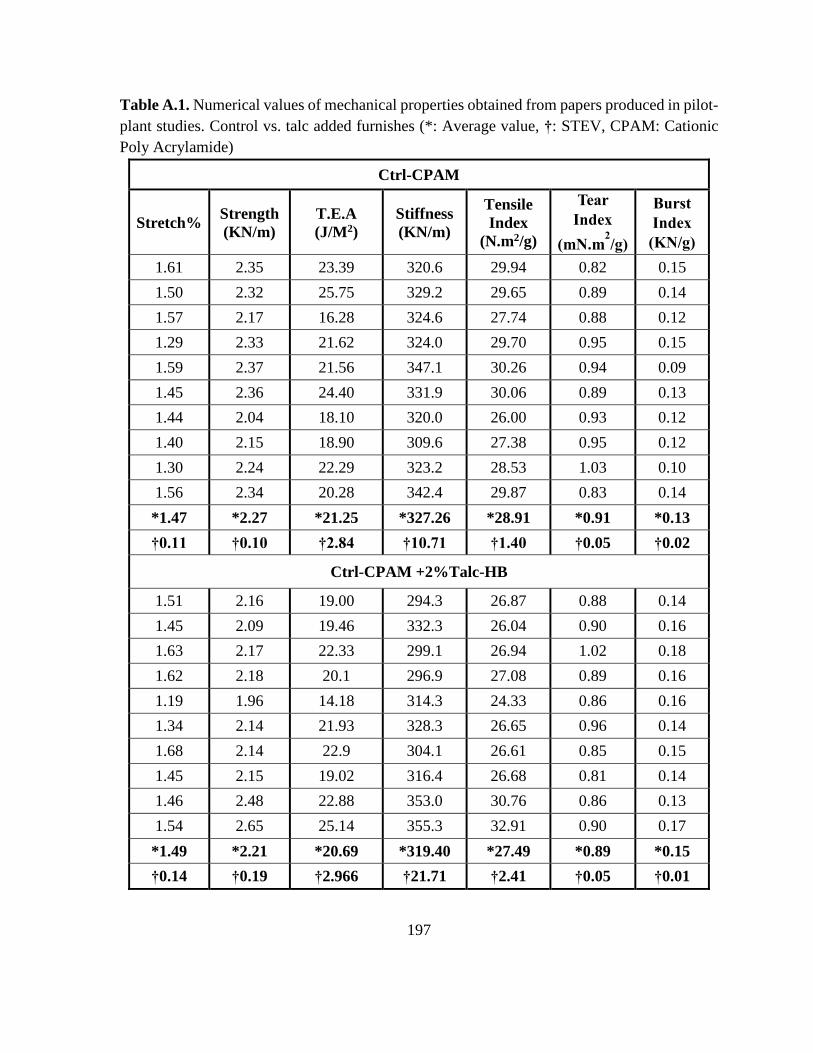
197
Table A.1. Numerical values of mechanical properties obtained from papers produced in pilot-
plant studies. Control vs. talc added furnishes (*: Average value, †: STEV, CPAM: Cationic
Poly Acrylamide)
Ctrl-CPAM
Stretch% Strength
(KN/m)
T.E.A
(J/M2)
Stiffness
(KN/m)
Tensile
Index
(N.m2/g)
Tear
Index
(mN.m2/g)
Burst
Index
(KN/g)
1.61 2.35 23.39 320.6 29.94 0.82 0.15
1.50 2.32 25.75 329.2 29.65 0.89 0.14
1.57 2.17 16.28 324.6 27.74 0.88 0.12
1.29 2.33 21.62 324.0 29.70 0.95 0.15
1.59 2.37 21.56 347.1 30.26 0.94 0.09
1.45 2.36 24.40 331.9 30.06 0.89 0.13
1.44 2.04 18.10 320.0 26.00 0.93 0.12
1.40 2.15 18.90 309.6 27.38 0.95 0.12
1.30 2.24 22.29 323.2 28.53 1.03 0.10
1.56 2.34 20.28 342.4 29.87 0.83 0.14
*1.47 *2.27 *21.25 *327.26 *28.91 *0.91 *0.13
†0.11 †0.10 †2.84 †10.71 †1.40 †0.05 †0.02
Ctrl-CPAM +2%Talc-HB
1.51 2.16 19.00 294.3 26.87 0.88 0.14
1.45 2.09 19.46 332.3 26.04 0.90 0.16
1.63 2.17 22.33 299.1 26.94 1.02 0.18
1.62 2.18 20.1 296.9 27.08 0.89 0.16
1.19 1.96 14.18 314.3 24.33 0.86 0.16
1.34 2.14 21.93 328.3 26.65 0.96 0.14
1.68 2.14 22.9 304.1 26.61 0.85 0.15
1.45 2.15 19.02 316.4 26.68 0.81 0.14
1.46 2.48 22.88 353.0 30.76 0.86 0.13
1.54 2.65 25.14 355.3 32.91 0.90 0.17
*1.49 *2.21 *20.69 *319.40 *27.49 *0.89 *0.15
†0.14 †0.19 †2.966 †21.71 †2.41 †0.05 †0.01
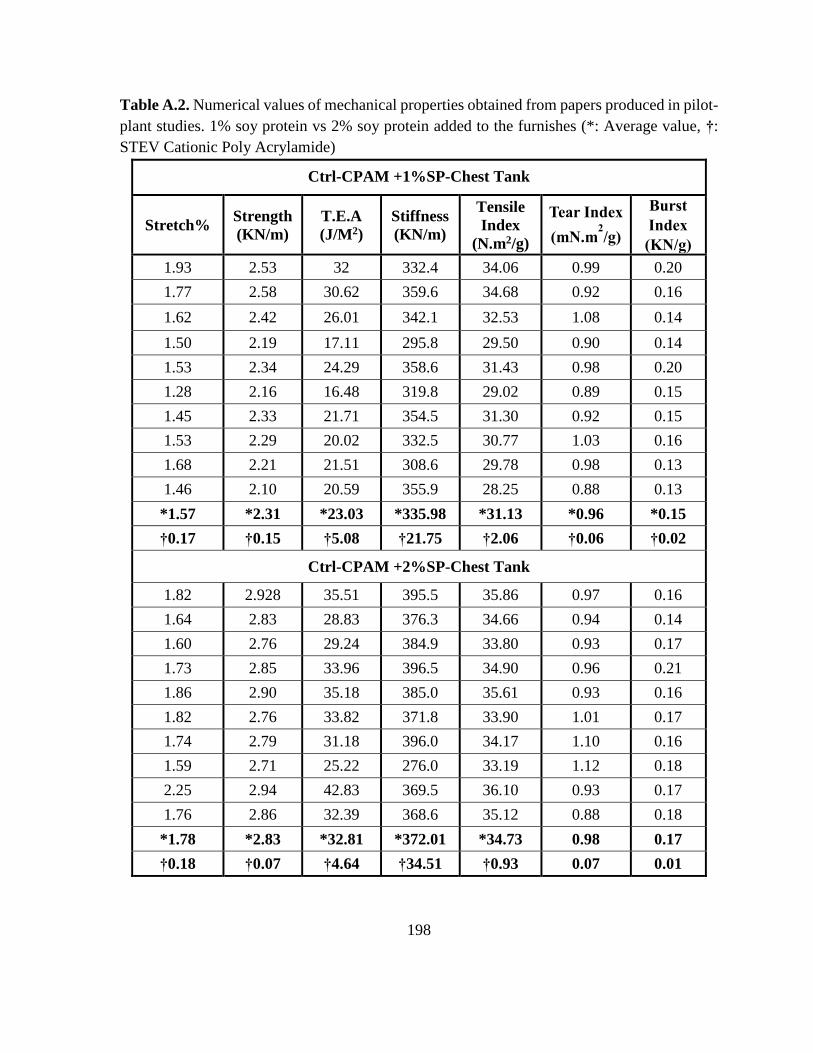
198
Table A.2. Numerical values of mechanical properties obtained from papers produced in pilot-
plant studies. 1% soy protein vs 2% soy protein added to the furnishes (*: Average value, †:
STEV Cationic Poly Acrylamide)
Ctrl-CPAM +1%SP-Chest Tank
Stretch% Strength
(KN/m)
T.E.A
(J/M2)
Stiffness
(KN/m)
Tensile
Index
(N.m2/g)
Tear Index
(mN.m2/g)
Burst
Index
(KN/g)
1.93 2.53 32 332.4 34.06 0.99 0.20
1.77 2.58 30.62 359.6 34.68 0.92 0.16
1.62 2.42 26.01 342.1 32.53 1.08 0.14
1.50 2.19 17.11 295.8 29.50 0.90 0.14
1.53 2.34 24.29 358.6 31.43 0.98 0.20
1.28 2.16 16.48 319.8 29.02 0.89 0.15
1.45 2.33 21.71 354.5 31.30 0.92 0.15
1.53 2.29 20.02 332.5 30.77 1.03 0.16
1.68 2.21 21.51 308.6 29.78 0.98 0.13
1.46 2.10 20.59 355.9 28.25 0.88 0.13
*1.57 *2.31 *23.03 *335.98 *31.13 *0.96 *0.15
†0.17 †0.15 †5.08 †21.75 †2.06 †0.06 †0.02
Ctrl-CPAM +2%SP-Chest Tank
1.82 2.928 35.51 395.5 35.86 0.97 0.16
1.64 2.83 28.83 376.3 34.66 0.94 0.14
1.60 2.76 29.24 384.9 33.80 0.93 0.17
1.73 2.85 33.96 396.5 34.90 0.96 0.21
1.86 2.90 35.18 385.0 35.61 0.93 0.16
1.82 2.76 33.82 371.8 33.90 1.01 0.17
1.74 2.79 31.18 396.0 34.17 1.10 0.16
1.59 2.71 25.22 276.0 33.19 1.12 0.18
2.25 2.94 42.83 369.5 36.10 0.93 0.17
1.76 2.86 32.39 368.6 35.12 0.88 0.18
*1.78 *2.83 *32.81 *372.01 *34.73 0.98 0.17
†0.18 †0.07 †4.64 †34.51 †0.93 0.07 0.01

199
Table A.3. Numerical values of mechanical properties obtained from papers produced in pilot-
plant studies. 2% soy protein added to the furnishes through head box (*: Average value, †:
STEV Cationic Poly Acrylamide)
Ctrl-CPAM +2%SP-HB
Stretch% Strength
(KN/m)
T.E.A
(J/M2)
Stiffness
(KN/m)
Tensile
Index
(N.m2/g)
Tear
Index
(mN.m2/g)
Burst
Index
(KN/g)
1.63 2.37 25.08 332.9 29.70 0.91 0.12
1.66 2.44 25.32 348.8 30.60 0.90 0.14
1.43 2.26 20.24 335.9 28.35 0.89 0.12
1.50 2.23 22.71 323.0 27.92 0.92 0.14
1.45 2.27 21.96 350.2 28.38 0.92 0.14
1.64 2.39 25.44 340.9 29.88 0.90 0.15
1.71 2.43 24.43 345.3 30.38 0.82 0.16
1.56 2.31 22.53 333.1 28.91 0.88 0.14
1.50 2.49 24.30 355.61 31.13 0.88 0.16
1.32 2.31 19.09 345.59 28.88 0.96 0.16
*1.54 *2.35 *23.11 *341.13 *29.41 *0.90 *0.14
†0.11 †0.08 †2.14 †9.60 †1.05 †0.03 †0.01