a topographical erp study of healthy premature 5 year old children in the auditory and visual...
TRANSCRIPT
A topographical ERP study of healthy premature 5-year-old children in theauditory and visual modalities
Marc E. Lavoiea, Philippe Robaeya,*, Johannes E.A. Stauderc,Jacqueline Glorieuxb, Francine Lefebvreb
aCognitive Psychophysiology and Neuropsychiatry Laboratory, Department of Psychiatry, Sainte-Justine Hospital and University of Montreal,Montreal, Quebec, Canada
bDepartment of Pediatrics, Service of Neonatology, Sainte-Justine Hospital and University of Montreal, Montre´al, Quebec, CanadacResearch Unit, Rivie`re-des-Prairies Hospital and Cognitive Psychophysiology Laboratory, Department of Psychology,
University of Montreal, Montre´al, Quebec, Canada
Accepted for publication: 21 October 1996
Abstract
The aim of this research is to study the impact of extreme prematurity on the cognitive development of the child as assessed at age 5 years9 months. Our samples include 15 healthy prematures born between 25 and 28 weeks of gestational age carefully matched with 15 full-termcontrols. In the first experiment, two different auditory stimuli were presented to the subjects who listened passively without instruction.The second experiment consisted of a standard visual oddball task in which the subjects were instructed to ‘catch’ two different animals, bypushing a left or right button for a moose (n = 120) or a raccoon (n = 40), respectively. In the auditory task, 3 ERP peaks were analyzed(frontal N100 and P3a, temporal P2). All premature children demonstrated normal early frontal N100 and temporal P2 responses. The groupdifferences were apparent in the late positivity (P3a) where controls showed a larger amplitude to the rare tones applied evenly to both ears.In contrast, the prematures did not show sensitivity to rare tones but showed a larger P3a upon left ear stimulation, when compared to theright. Also, the ERPs to the visual oddball task showed normal early positivities (P250–300) in the premature group. Once again, deviationsfrom the normal were evident in late waves. The ERPs recorded from prematures showed a more diffuse topography especially between500 and 600 ms post-stimulus and around the posterior area (P550). The succeeding negativity (SW) was not altered in the prematuregroup. The ERP data suggest that premature children, even without clinically apparent problems, convey specific ERP singularity whenengaged in a task that involves complex processing. 1997 Elsevier Science Ireland Ltd.
Keywords:Prematurity; Low birth-weight; Event-Related Potentials; Oddball effect; Topography
1. Introduction
Progress in medical technology has significantly loweredthe mortality rate of prematurely born infants (Whythe etal., 1993). However, in surviving prematures, there appearsto be a substantial incidence of major disabilities such ascerebral palsy, mental retardation, vision or hearing lossnoted during early childhood. These disabilities may bedue to a variety of neonatal complications such as intraven-tricular hemorrhages, hypoxic episodes and poor growth
during prolonged hospitalizations for example (Hack etal., 1994). Social disadvantage was not found to be asso-ciated with any of the latter 3 major developmental handi-caps, but constitutes often the most important predictor oflong-term minor disabilities in children (Ornstein et al.,1991).
A variety of subtle long-term morbidities have morerecently been investigated in preterm children at pre-schooland school age. They include normal but lower IQs thannormal full-term (NFT) controls, learning and academicproblems, inattentive and hyperactive behavior, languagedelay and articulation deficits. Poor motor function, espe-cially visuo-motor integration deficits, was one of the mostfrequently reported impairments, particularly among extre-mely low birth weight (ELBW; 1000 g) premature children(Vohr and Garcia-Coll, 1988; Ornstein et al., 1991). Visual
Electroencephalography and clinical Neurophysiology 104 (1997) 228–243
0168-5597/97/$17.00 1997 Elsevier Science Ireland Ltd. All rights reservedPII S0013-4694(97)00017-5 EEP 95208
* Corresponding author. Centre de recherche de l’Hoˆpital Ste-Justine,Laboratoire de Psychophysiologie Cognitive et de Neuropsychiatrie,Departement de Psychiatrie, Hoˆpital Sainte-Justine, 3100 Ellendale, Mon-treal, Quebec, Canada H3S 1W3. Tel.: +1 514 3454997; fax: +1 5143454635; e-mail: [email protected]
and auditory orienting problems were also reported byKurtzberg et al. (1979)
Recent findings suggest that minor brain EEG alterationsare present even in healthy preterm babies (Scher et al.,1994). The organic causes of these minor disabilities arelargely unknown. A number of different yet not mutuallyexclusive hypotheses may be proposed. Minor disabilitiesmay be associated with the same type of brain injuries thatcause major disabilities, such as minor hemorrhages orhypoxic episodes. Minor disabilities may also be relatedto the combined effects of the premature experience per seand detrimental environmental conditions for brain matura-tion processes. Mothers of preterm babies often come from alower socioeconomic level and consequently have a signifi-cantly reduced intake of several vitamins, minerals and fattyacids, not only during pregnancy but also before. Their pre-term babies are thus at a higher risk of developing neurode-velopmental disorders (Crawford, 1993).
For 3 decades, various changes in brain electrical activityhave been reported in healthy premature babies (Hrbekand Mares, 1964; Graziani et al., 1968; Hrbek et al., 1973;Kurtzberg, 1982; Duffy et al., 1990; Tsuneishi et al.,1995). In both the auditory and visual modality, a latencydecrease of the early deflections (N1-P2) of the evokedpotentials (EP) with maturation, as well as a normalizationof the EP pattern in the premature group around 41–43 weeks of post-conceptional age, were consistentlyreported (Weitzman and Graziani, 1968; Umezaki andMorrell, 1970; Watanabe et al., 1972; Graziani et al.,1974).
In recent studies, auditory evoked responses (AER) werealso used to assess brain processing of consonant-vowelsyllable (‘da’ and ‘ta’) and of pure tones (Kurtzberg et al.,1984). With this paradigm, clear maturational differenceswere found. At 40 weeks post-conception age, VLBWinfants had a higher proportion of immature response (asingle prolonged negative wave over both midline andtemporal regions) than the normal full-term (NFT) babies,although a considerable overlap was also evident. At 1 and2 months of age, VLBW infants exhibited a consistentmaturational delay, as compared with the NFT babies.Their midline response often turned out to be a positivewave, whereas the temporal response remained negativein polarity. All premature and control subjects exhibiteda mature waveform at 3 months of age, with positivitiesat the midline and temporal electrodes. In another experi-ment, with flash visual evoked potentials (VEP) recordedat 40 weeks post-conceptional age in VLBW infants, 45% ofthe subjects displayed abnormal brain responses. Normal orsubsequent normalized VEP at 1 or 2 months were asso-ciated with a better neurological and developmental out-come at 7 and 12 months (Kurtzberg et al., 1984). How-ever, the fact that these immature brain responses recoveredto normal in VLBW infants within 3 months does not neces-sarily imply that they are not associated with subtle long-term developmental consequences, that may present them-
selves at pre-school or school age. To date no study hasaddressed this question by using brain event-related poten-tials (ERPs) in extremely premature children at pre-schoolor school age.
In order to address this issue, we first decided to deter-mine whether a complete normalization occurs in the verypremature children whose cognitive and behavioral devel-opment is indistinguishable at pre-school age from thatof matched normal full-term children. In line with the pre-vious work conducted in infants, we hypothesized thatif brain activity is identical between the two groups (healthyvery premature and full-term children), a long-term fullrecovery of the initial developmental lag would be indi-cated. However, if cerebral activity is different betweenthese groups, the nature of the brain developmental con-sequences of prematurity may be reflected by these ERPchanges.
We thus selected within a longitudinal cohort of healthyprematurely born children, and matched them with a normalcontrol group born at term. The preterms at 5 years 9 monthswere clinically indistinguishable from the controls withrespect to physical measures, age, IQ, socio-economic sta-tus, manual laterality and neurological as well as psychiatricstatus. In this study, ERPs were recorded in both groups byusing either an auditory passive task (experiment 1) and avisual active oddball task (experiment 2). The auditory taskinvolved two conditions, one with a rare deviant and anotherwith a frequent standard stimulus. Both stimuli were usedwithout instruction. The visual oddball is a classical taskusing two stimuli presented randomly at a different fre-quency of occurrence. These paradigms are well known togenerate ERP components related to cognitive processessuch as stimulus evaluation and processing efficiency (seeDuncan-Johnson and Donchin, 1977; Duncan-Johnson,1981; Ridderinkhof and Bashore, 1995). We propose thatthe long latency processes are more affected in prematuresthan the earlier automatic brain processes, as they have alonger developmental course and are more demanding. Bylonger latency processes, we refer to the latencies of thewaveforms which are suggested to be related to controlledmechanisms. According to Newmann (1984), the following3 criteria are important to qualify controlled processes. First,controlled processes use a limited capacity of resources andcannot be combined with other attention-demanding activ-ities without interference. Secondly, controlled processesare dependent on the person’s intentions or ‘task’ demands,and finally, controlled processes are represented in con-scious awareness.
2. General method
2.1. Subjects
A total of 102 premature newborns (24–28 weeks ofgestation) survived in Ste-Justine Hospital (Montre´al)
229M.E. Lavoie et al. / Electroencephalography and clinical Neurophysiology 104 (1997) 228–243
between January, 1987 and September, 1988. A sample ofthese children (25 boys, 23 girls) now aged 5 years 9 monthsrepresent our premature subjects. The controls born at term(18 boys, 15 girls) were recorded at precisely the same age.The two groups were matched a priori as well on basis ofsex, race and family rank. The gestational ages of all chil-dren were determined by antenatal ultrasound examinations.As the ultrasound data were not available for 3 subjects (twoprematures, one control), we used the mother’s history ofamenorrhoea. In addition, a thorough review of the medicalrecords was conducted to verify the health status of the full-term infants at birth. At 5 years of age, we selected onlythose children who did not display any psychiatric or neu-rologic problems. Therefore, a psychiatric evaluation wasperformed by using a computerized diagnostic interview(DISC-2.3) with the mother. Based on the DSM-III-R(American Psychiatric Association, 1987) criteria, 6 typesof problems were screened for: hyperactivity, depression,generalized anxiety, separation anxiety, simple phobia anddelinquency. A neurological evaluation was done by twosystematic exams (Amiel-Tison and Stewart, 1989; Hut-tenlocher et al., 1990) and intelligence was evaluated bythe full version of the McCarthy (1972) at 5 years old.Premature and control groups were paired post-hoc on thestandardized General Cognitive Index (GCI range 85–125)and on each of the 5 subscales (Verbal, Perceptual, Mem-ory, Motor, Quantitative indices). Given that socioeconomicstatus was the most important predictor of poor outcome,the controls were matched during their recruitment withprematures according to their global socioeconomic indices(Hollingshead, 1969). All children were French-speaking.
In the premature group a total of 33 subjects wererejected. Within this group, 9 subjects were excluded forneurological problems (cerebral palsy, hemiplegia, etc.)and 10 for various psychiatric problems (hyperactivity,anxious disorders, etc.). In addition, 11 premature childrenwere excluded for an IQ less than 85 and 3 children wererejected for technical problems or missing data. In the con-trol group, a total of 13 subjects were rejected, two forpsychiatric problems, one for an IQ less than 85, 5 for anIQ higher than 125, and 5 others because of technical pro-blems, incomplete or missing data.
This selection resulted in a final number of 15 prema-tures of a gestational age between 25 and 28 weeks(mean= 27 ± 8) and a birth weight ranging between 720and 1320 g (mean= 987 ± 173), and 15 full-term con-trols of a gestational age between 37 and 42 weeks(mean= 39 ± 1) with a birth weight range between 2700and 4500 grams (mean = 3382± 440). In the prematuregroup, the cerebral ultrasonography was evaluated normalfor 13 subjects, grade 1 or 2 for two, and grade 3 for one(Table 1). presents the clinical data for these subjects at 5years of age. Although strikingly different from the full-terms at birth, all prematures at 5 years of age were physi-cally healthy with average height and weight. Furthermore,they all had normal or corrected to normal vision. They
were also matched on the basis of each subscale on theGeneral Cognitive Index (GCI) and global socioeconomicstatus (Hollingshead, 1969).
The preterm cohort were subjected to an audiometricassessment for pure tone and speech perception (Yantis,1985). Their mean audiometric threshold (db HL) forspeech perception was 10 (±5) and 12 (±9) and for puretone 11 (±5) and 12 (±11) for left and right ear, respectively.The hearing evaluation was normal for 13 subjects whiletwo were found to have mild conductive hearing in the leftear.
2.2. Overall procedures and instruments
For the two parts of the study, the recordings were madein a dimly-lit room where the subject was seated 90 cm infront of a 14 inch Mitsubishi Diamond Pro VGA monitor inan adjustable chair. The recording room constituted a sepa-rate corner of a larger room in which the experimenters,amplifiers and computers were placed. One experimenterstayed with the child to give instructions while anotherexperimenter was assigned to control the experiment withconstant visual contact of the subject by means of a one-waymirror. Auditory contact was maintained by means of a two-way intercom. One of the experimenters was assigned atrandom to explain the task to the subject while the otheroperated the computers.
All subjects arrived at the same time in the morning withno differences between groups (mean time= 0930 h± 24min; t = 0.61, P = 0.551). On arrival the subject was firstbriefed on the experimental procedures. Then the electro-
Table 1
Clinical data at 5 years old
Prematures(n = 15)
Fullterms(n = 15)
P value
Mean SD Mean SD
Age (months) 70.4 (1) 69.7 (1) nsWeight (kg) 18 (3) 20 (2) nsHeight (cm) 111 (3) 112 (6) nsNeurological soft signs 2 (2) 2 (2) ns
Intellectual Quotientand Subscales GeneralCognitive Index(McCarthy, 1972)
105 (8) 109 (11) ns
Verbal 52 (6) 55 (8) nsPerceptualperformance
56 (9) 54 (8) ns
Memory 53 (7) 50 (10) nsMotor 48 (7) 50 (10) nsQuantitative 48 (8) 53 (10) nsLaterality score 8 (3) 8 (2) ns
Family SESa
(Hollingshead)3 (1) 3 (1) ns
ns, non-significant.aData were missing for one.
230 M.E. Lavoie et al. / Electroencephalography and clinical Neurophysiology 104 (1997) 228–243
cap, electrooculogram and earlobe references were placed.This installation usually took no more than 30 min. Theheight of the monitor was aligned to eye level and thetask explained to the subject. The experimental sessionalways began with the passive auditory task during whichthe subject was instructed to listen passively while fixinghis/her gaze on a dark point in the middle of a blue screen.The duration of the auditory passive task and the visualoddball task was 7 min and 6 min 40 s, respectively. Thetotal duration of the testing, including pauses and practices,was approximately 30 min, without significant groupdifferences (mean time= 29 ± 9 min; t = 1.81, P =0.08).
2.3. EEG recordings
Stimulus presentation and the data-acquisition were con-trolled by an InstEP system . The EEG was recorded from14 tin electrodes mounted in a cap (Electro-cap Interna-tional, Inc. ). The electrodes were placed according to theguidelines for standard electrode position nomenclature bythe 10–20 System (Jasper, 1958) at Fz, Cz, Pz, Oz, F8, F7,C3, C4, T3, T4, P3, P4, T5 and T6. All electrodes werereferenced to linked earlobes and their impedance waskept below 5 kQ. The electro-oculogram (EOG) wasrecorded using 4 tin electrodes with a diameter of 6 mm.For the horizontal EOG the electrodes were placed at theouter canthus of each eye and for the vertical EOG infra-and supraorbital to the left eye, in line with the pupil whenlooking straight ahead. The EEG signals were amplified by aGrass Model 12c-32 system with a bandpass between 0.1and 30 Hz. The EEG was averaged time-locked to the sti-mulus and was corrected for EOG artifacts in the frequencydomain (Instep-TALO B.V. ; Woestenburg et al., 1983).Before EOG correction, all EOG epochs with a clippingduration longer than 100 ms were rejected. Digital filteringwas done offline with a bandpass of 0.25 and 27 Hz for theauditory task and 0.1 and 8 Hz for the active oddball taskafter visual inspection. The filter settings were determinedto obtain a maximum smoothing of the ERP for more reli-able peak latency without affecting the integrity of the com-ponent. For each electrode and condition, the baseline-to-peak amplitude and peak latencies from stimulus onset weredetermined separately.
2.4. Statistical analyses
An independentt test was used to compare the prematuresand the full-term controls on the McCarthy intelligencescales, as well as on the laterality and the anthropometricdata. The behavioral and ERP data were submitted to ananalysis of variance (SPSS -Windows). For experiment 1(passive auditory task), there was one between-groups fac-tor (premature/control: GROUP) and two within-subjectfactors (rare/frequent: CONDITION and left/right: SIDE).The 14 leads constituted an additional within-subject factor
(LEAD). For the behavioral data of the oddball task (experi-ment 2), the reaction time to the rare and to the frequentstimuli was used as a within-subject factor (rare/frequent:CONDITION). Basically, there was one between-group fac-tor (prematures/controls: GROUP) and one within-subjectfactor (rare/frequent: CONDITION). In the ERP data the 14electrodes constituted an additional within-subject factor(LEAD). In all analyses the significance level was set at5% (two-tailed) with Greenhouse and Geisser (1958) cor-rections for degrees of freedom. We also normalized1 thedata in order to eliminate amplitude differences betweenconditions and to focus on the analysis of the shape of theERP wave. It has been suggested that this normalizationremoved the differences between conditions in overallamplitudes while preserving differences in scalp distribu-tion. The normalized amplitudes then varied between 0 and1 and a repeated measures ANOVA was reapplied to thesevalues (McCarthy and Wood, 1985).
3. Experiment 1: the passive auditory task
The passive auditory task was used to test the hypothesisthat a functional impairment in the automatic detection ofdeviant tones shown with early evoked potentials (EP) inpremature babies by Kurtzberg (1982) is still manifest laterin development. Furthermore, auditory Event-RelatedPotentials (ERP) are also known to be affected by prema-turity as premature babies displayed a smaller amplitude ofthe first positivity to the rare tones (Tokioka et al., 1995).Thus, as these EP and ERP studies were mainly focused onpremature babies or infants, we aimed to address this issuelater in development, when children reach the preschoolage. In the long-term developmental perspective, our mainquestion can be stated accordingly: does the developmentallag recover with time for higher order brain processing oryield long-term specific brain dysfunctions? According toprevious studies, we anticipated that the premature groupwould display normal amplitude and latency in early ERPpeaks, whereas the late ones would be altered.
3.1. Method
3.1.1. Procedures and instrumentsThe passive auditory task was always presented before
the visual oddball task and consisted of a sequential presen-tation of 300 tones to each ear. The stimuli consisted of twotones (rare 20% vs. frequent 80%) of 80 db SPL. The rarestimulus (n = 60) was a 1200 Hz tone and the frequentstimulus (n = 240) was a 1000 Hz tone. Each category
1 1VN(cond) = (EV(cond) −EVmin(cond))/(EVmax(cond) −EVmin(cond)), whereVN(cond) represents the voltage normalization for each condition andEV(cond) represents the actual electrode voltage for a given electrode.EVmin(cond) represents the minimum and EVmax(cond) represents the max-imum value for a given condition. The resulting values VN(cond) are thus ascale with a possible minimum value at 0 and a maximum at 1.
231M.E. Lavoie et al. / Electroencephalography and clinical Neurophysiology 104 (1997) 228–243

was equally distributed to both ears. The interstimulus inter-val varied quasi-randomly between 550 and 950 ms with afixed presentation time of 20 ms (rise-fall time 2 ms). Inorder to avoid ocular movement artifacts, the subjects werein-structed to fix their gaze on a dark cross in the middle of ablue screen. The bandpass and sampling started at 72 msbefore the stimulus onset and continued until 440 ms afterstimulus onset.
3.1.2. Extraction of the ERP data and peak identificationThe dependent measures were obtained for two early
negativities (N100 and MMN) and two subsequent posi-tivities (P2 and P3a). For two subjects, the data were scoredvisually because the peaks were out of latency rangefor several electrodes. In order to avoid the possibilitythat different peaks would be mingled within a time win-dow, we first looked at the latency differences across elec-trodes.
3.1.3. The negativities (N100 and MMN)The criteria used for identifying the MMN and the
N100 are based on those used by Kurtzberg et al. (1995)in 8 year old children. First, the most negative deflectionbetween 0 and 300 ms was obtained across all electrodes.To be considered as a N100, this deflection has to fit within±2 SD mean latency and to show the proper negativepolarity. In 73% of the subjects (11 preterms, 11 controls),the N100 was present and stable with a mean latency of100 ms for both ear across all central and frontal electr-odes (Appendix A and B). The peak latency failed toyield any significant topographical differences. The statis-tical analyses were applied only on subjects (n = 22)who showed a N100 wave according to these latter crit-eria.
The MMN was obtained by subtracting the ERP to thefrequent from the ERP to the deviants and was identified inthe difference waveform at Fz as the most negative deflec-tion between 160 and 254 ms. To be identified as a MMN,this deflection had to be preceded by a N100 which wasconsidered as contributing to the MMN. Only 4 out of the15 premature and 3 out of the 15 full-term children dis-played a clear negative difference waveform that could beidentified as a MMN. The mean latency was 217 ms andthe mean amplitude 1.97mV. This small number of sub-jects was not adequate for a reliable ANOVA. For thisreason, we excluded the MMN from further statistical ana-lyses.
3.1.4. The positivities (P2 and P3a)The latency of the following positivities were compared
across all electrodes, by using the same procedure asdescribed for N100. The topography of these positive com-ponents seemed to be far more complex than that of theN100 wave. Consequently, the parieto-occipital electrodes(P3-Pz-P4-Oz) were removed from the analyses because ofthe difficulty of separating and selecting the different posi-
tivities recorded from these parietal regions. A first compo-nent emerged over the temporal leads (T3, T4, T5, T6) atapproximately 200 ms post-stimulus onset. This first tem-poral peak (P2) was followed by a second fronto-centralpeak (F7, Fz, F8, C3, Cz, C4) at 230 ms. Given its latencyand topographical localization, this component was calledthe P3a (see Section 2.3). The latencies of these two com-ponents were significantly different (F(7.03, 196.91)=11.85, P , 0.001). A second regional ANOVA was per-formed on the latencies of each of these electrode groupingsseparately and revealed no difference in latencies withinthese two regions. These positivities were present in allsubjects.
3.2. Results
3.2.1. The frontal N100
3.2.1.1. Latency.As reported in the previous section, thelatency of the N100 was not different between groups oracross conditions. Moreover, the latency of this componentwas not dependent on the side of stimulation.
3.2.1.2. Amplitudes.The rare stimulus elicited significantlylarger N100 than the frequent stimuli (F(1,20) = 11.94,P , 0.005). The amplitude of the N100 was also sig-nificantly larger at the frontal regions as compared to thecentral regions (F(2.37,47.38)= 7.59, P , 0.001). How-ever, none of these effects interacted with the groups.There was no effect for side of stimulation. In brief,these results indicate that premature children have aN100 activity comparable to the control group.
3.2.2. The temporal P2
3.2.2.3. Latency.The rare stimuli elicited an earliertemporal P2 (F(1,28) = 6.69, P , 0.05) than the frequentones. No difference was found for the side of stimulation,or between groups.
3.2.2.4. Amplitude. The temporal P2 had a largeramplitude to the rare than to the frequent stimuli(F(1,28) = 9.17, P , 0.01), and was larger on theanterior (T3-T4) than on the posterior (T5-T6-Oz) leads(F(2.24,62.68)= 20.21, P , 0.001). No amplitudedifference was found according to the side of stimulation.This finding was consistent across groups, conditions andleads.
In short, the amplitude of the temporal P2 was sensitive tothe stimulus frequency, but not to the side of stimulation.Moreover, the prematures were not different from the con-trols for this component.
3.2.3. The frontal P3a
3.2.3.5. Latency.As expected, the rare stimuli evoked a
232 M.E. Lavoie et al. / Electroencephalography and clinical Neurophysiology 104 (1997) 228–243
significantly earlier P3a (F(1,28) = 4.89, P , 0.05).Nevertheless, no other effect was found on latencies,especially no group effect.
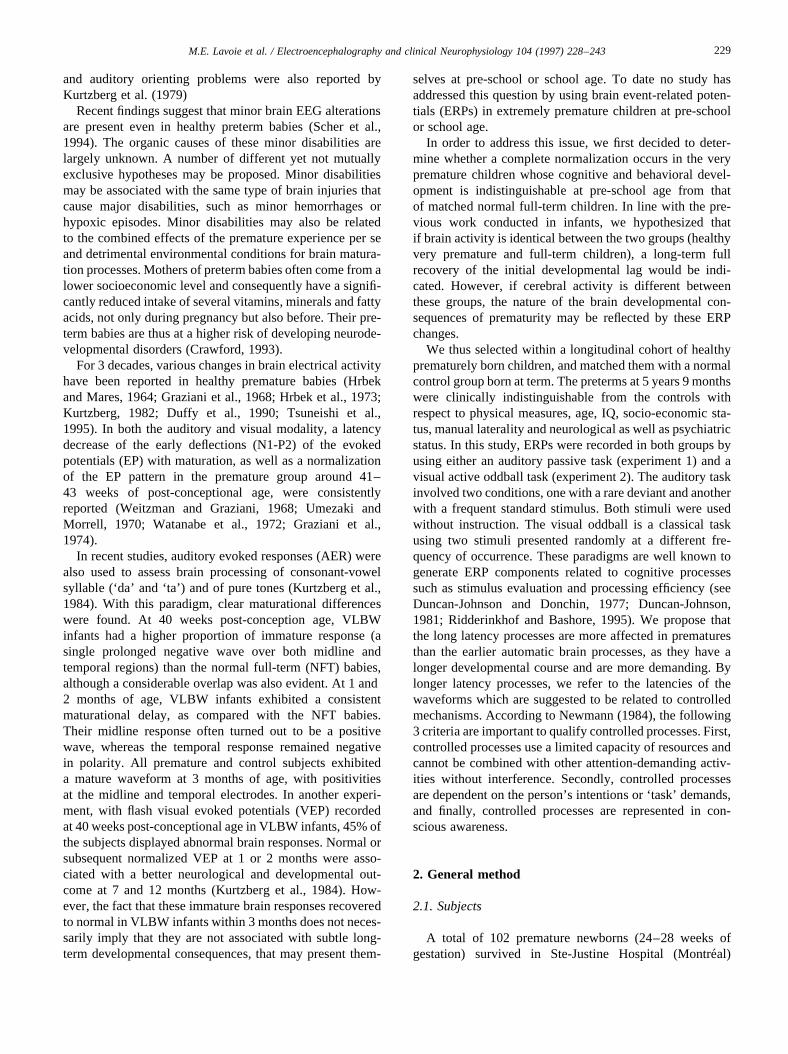
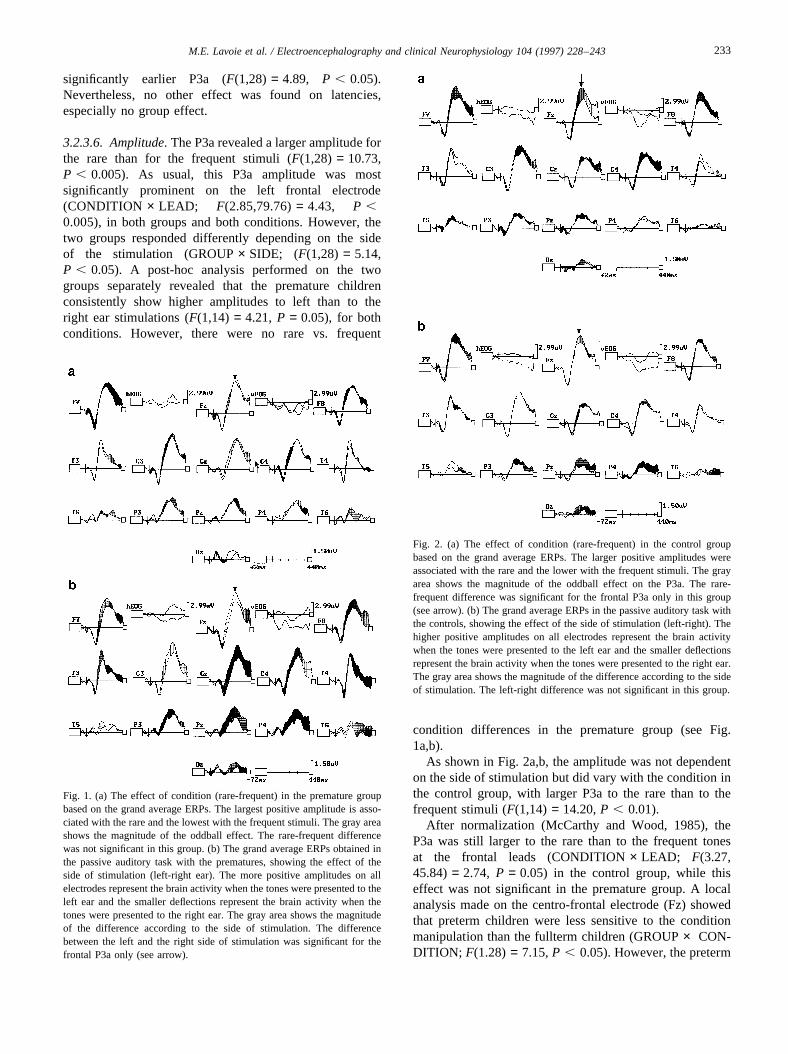
3.2.3.6. Amplitude.The P3a revealed a larger amplitude forthe rare than for the frequent stimuli (F(1,28) = 10.73,P , 0.005). As usual, this P3a amplitude was mostsignificantly prominent on the left frontal electrode(CONDITION × LEAD; F(2.85,79.76)= 4.43, P ,0.005), inboth groups and both conditions. However, thetwo groups responded differently depending on the sideof the stimulation (GROUP× SIDE; (F(1,28) = 5.14,P , 0.05). A post-hoc analysis performed on the twogroups separately revealed that the premature childrenconsistently show higher amplitudes to left than to theright ear stimulations (F(1,14) = 4.21, P = 0.05), for bothconditions. However, there were no rare vs. frequent
condition differences in the premature group (see Fig.1a,b).
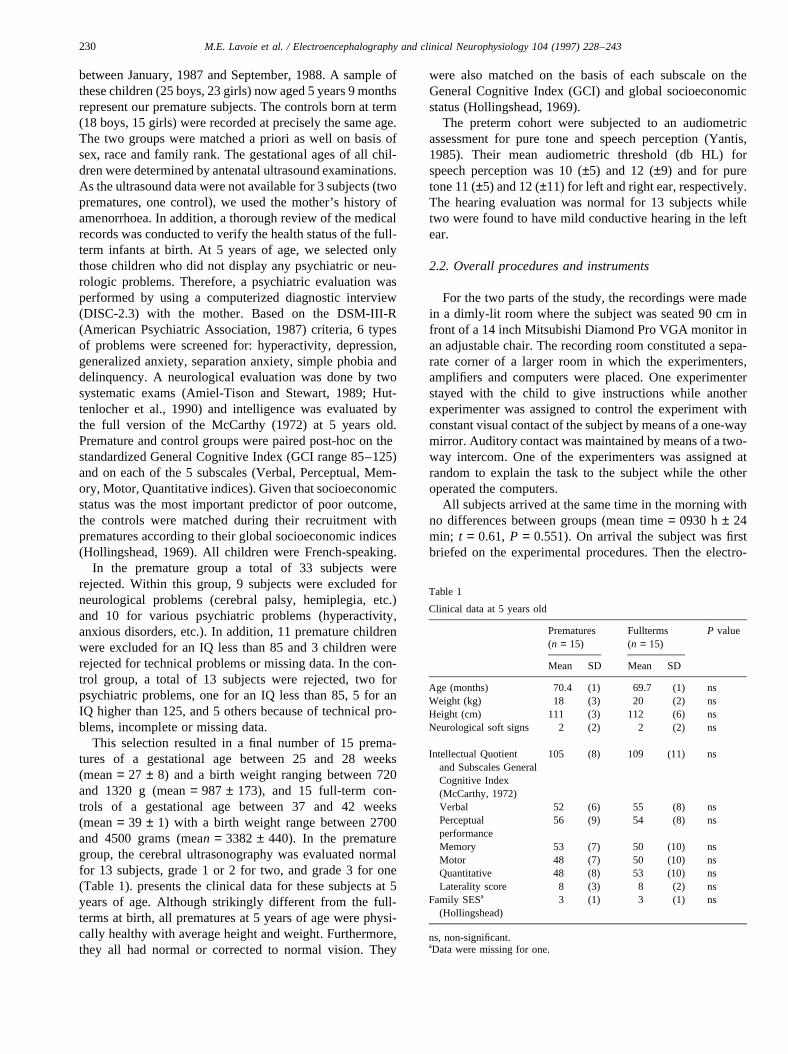
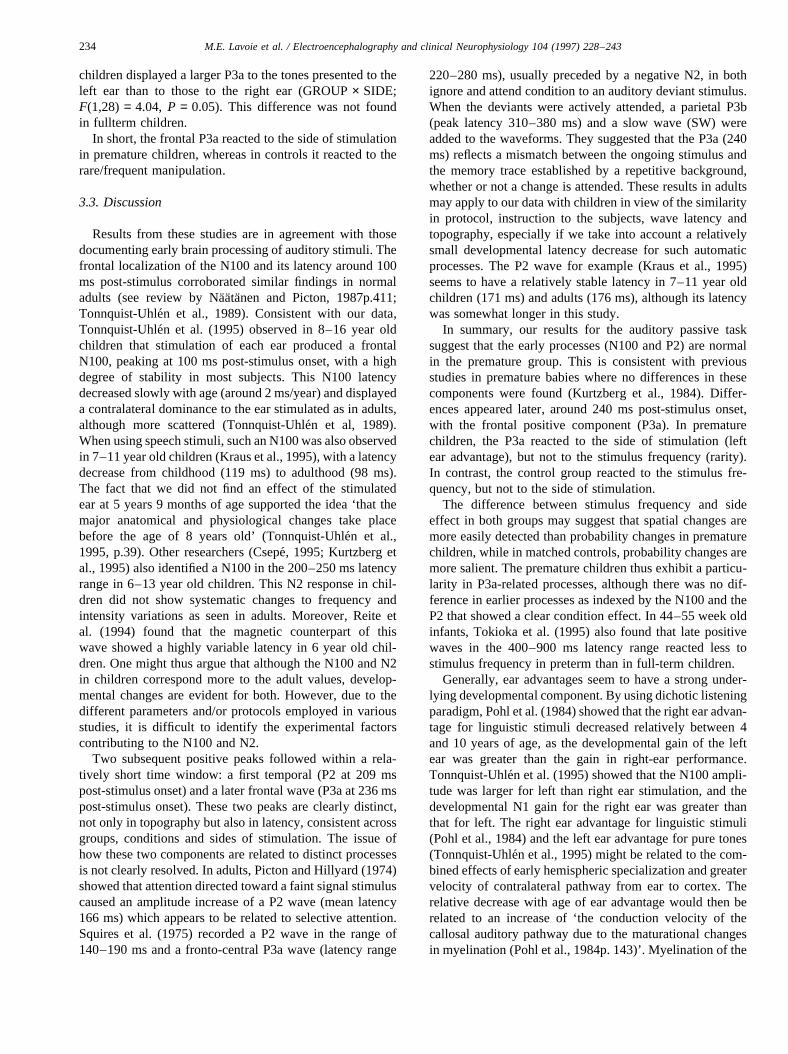
As shown in Fig. 2a,b, the amplitude was not dependenton the side of stimulation but did vary with the condition inthe control group, with larger P3a to the rare than to thefrequent stimuli (F(1,14) = 14.20,P , 0.01).
After normalization (McCarthy and Wood, 1985), theP3a was still larger to the rare than to the frequent tonesat the frontal leads (CONDITION× LEAD; F(3.27,45.84)= 2.74, P = 0.05) in the control group, while thiseffect was not significant in the premature group. A localanalysis made on the centro-frontal electrode (Fz) showedthat preterm children were less sensitive to the conditionmanipulation than the fullterm children (GROUP× CON-DITION; F(1.28) = 7.15,P , 0.05). However, the preterm
Fig. 1. (a) The effect of condition (rare-frequent) in the premature groupbased on the grand average ERPs. The largest positive amplitude is asso-ciated with the rare and the lowest with the frequent stimuli. The gray areashows the magnitude of the oddball effect. The rare-frequent differencewas not significant in this group. (b) The grand average ERPs obtained inthe passive auditory task with the prematures, showing the effect of theside of stimulation (left-right ear). The more positive amplitudes on allelectrodes represent the brain activity when the tones were presented to theleft ear and the smaller deflections represent the brain activity when thetones were presented to the right ear. The gray area shows the magnitudeof the difference according to the side of stimulation. The differencebetween the left and the right side of stimulation was significant for thefrontal P3a only (see arrow).
Fig. 2. (a) The effect of condition (rare-frequent) in the control groupbased on the grand average ERPs. The larger positive amplitudes wereassociated with the rare and the lower with the frequent stimuli. The grayarea shows the magnitude of the oddball effect on the P3a. The rare-frequent difference was significant for the frontal P3a only in this group(see arrow). (b) The grand average ERPs in the passive auditory task withthe controls, showing the effect of the side of stimulation (left-right). Thehigher positive amplitudes on all electrodes represent the brain activitywhen the tones were presented to the left ear and the smaller deflectionsrepresent the brain activity when the tones were presented to the right ear.The gray area shows the magnitude of the difference according to the sideof stimulation. The left-right difference was not significant in this group.
233M.E. Lavoie et al. / Electroencephalography and clinical Neurophysiology 104 (1997) 228–243
children displayed a larger P3a to the tones presented to theleft ear than to those to the right ear (GROUP× SIDE;F(1,28) = 4.04, P = 0.05). This difference was not foundin fullterm children.
In short, the frontal P3a reacted to the side of stimulationin premature children, whereas in controls it reacted to therare/frequent manipulation.
3.3. Discussion
Results from these studies are in agreement with thosedocumenting early brain processing of auditory stimuli. Thefrontal localization of the N100 and its latency around 100ms post-stimulus corroborated similar findings in normaladults (see review by Na¨atanen and Picton, 1987p.411;Tonnquist-Uhle´n et al., 1989). Consistent with our data,Tonnquist-Uhle´n et al. (1995) observed in 8–16 year oldchildren that stimulation of each ear produced a frontalN100, peaking at 100 ms post-stimulus onset, with a highdegree of stability in most subjects. This N100 latencydecreased slowly with age (around 2 ms/year) and displayeda contralateral dominance to the ear stimulated as in adults,although more scattered (Tonnquist-Uhle´n et al, 1989).When using speech stimuli, such an N100 was also observedin 7–11 year old children (Kraus et al., 1995), with a latencydecrease from childhood (119 ms) to adulthood (98 ms).The fact that we did not find an effect of the stimulatedear at 5 years 9 months of age supported the idea ‘that themajor anatomical and physiological changes take placebefore the age of 8 years old’ (Tonnquist-Uhle´n et al.,1995, p.39). Other researchers (Csepe´, 1995; Kurtzberg etal., 1995) also identified a N100 in the 200–250 ms latencyrange in 6–13 year old children. This N2 response in chil-dren did not show systematic changes to frequency andintensity variations as seen in adults. Moreover, Reite etal. (1994) found that the magnetic counterpart of thiswave showed a highly variable latency in 6 year old chil-dren. One might thus argue that although the N100 and N2in children correspond more to the adult values, develop-mental changes are evident for both. However, due to thedifferent parameters and/or protocols employed in variousstudies, it is difficult to identify the experimental factorscontributing to the N100 and N2.
Two subsequent positive peaks followed within a rela-tively short time window: a first temporal (P2 at 209 mspost-stimulus onset) and a later frontal wave (P3a at 236 mspost-stimulus onset). These two peaks are clearly distinct,not only in topography but also in latency, consistent acrossgroups, conditions and sides of stimulation. The issue ofhow these two components are related to distinct processesis not clearly resolved. In adults, Picton and Hillyard (1974)showed that attention directed toward a faint signal stimuluscaused an amplitude increase of a P2 wave (mean latency166 ms) which appears to be related to selective attention.Squires et al. (1975) recorded a P2 wave in the range of140–190 ms and a fronto-central P3a wave (latency range
220–280 ms), usually preceded by a negative N2, in bothignore and attend condition to an auditory deviant stimulus.When the deviants were actively attended, a parietal P3b(peak latency 310–380 ms) and a slow wave (SW) wereadded to the waveforms. They suggested that the P3a (240ms) reflects a mismatch between the ongoing stimulus andthe memory trace established by a repetitive background,whether or not a change is attended. These results in adultsmay apply to our data with children in view of the similarityin protocol, instruction to the subjects, wave latency andtopography, especially if we take into account a relativelysmall developmental latency decrease for such automaticprocesses. The P2 wave for example (Kraus et al., 1995)seems to have a relatively stable latency in 7–11 year oldchildren (171 ms) and adults (176 ms), although its latencywas somewhat longer in this study.
In summary, our results for the auditory passive tasksuggest that the early processes (N100 and P2) are normalin the premature group. This is consistent with previousstudies in premature babies where no differences in thesecomponents were found (Kurtzberg et al., 1984). Differ-ences appeared later, around 240 ms post-stimulus onset,with the frontal positive component (P3a). In prematurechildren, the P3a reacted to the side of stimulation (leftear advantage), but not to the stimulus frequency (rarity).In contrast, the control group reacted to the stimulus fre-quency, but not to the side of stimulation.
The difference between stimulus frequency and sideeffect in both groups may suggest that spatial changes aremore easily detected than probability changes in prematurechildren, while in matched controls, probability changes aremore salient. The premature children thus exhibit a particu-larity in P3a-related processes, although there was no dif-ference in earlier processes as indexed by the N100 and theP2 that showed a clear condition effect. In 44–55 week oldinfants, Tokioka et al. (1995) also found that late positivewaves in the 400–900 ms latency range reacted less tostimulus frequency in preterm than in full-term children.
Generally, ear advantages seem to have a strong under-lying developmental component. By using dichotic listeningparadigm, Pohl et al. (1984) showed that the right ear advan-tage for linguistic stimuli decreased relatively between 4and 10 years of age, as the developmental gain of the leftear was greater than the gain in right-ear performance.Tonnquist-Uhle´n et al. (1995) showed that the N100 ampli-tude was larger for left than right ear stimulation, and thedevelopmental N1 gain for the right ear was greater thanthat for left. The right ear advantage for linguistic stimuli(Pohl et al., 1984) and the left ear advantage for pure tones(Tonnquist-Uhle´n et al., 1995) might be related to the com-bined effects of early hemispheric specialization and greatervelocity of contralateral pathway from ear to cortex. Therelative decrease with age of ear advantage would then berelated to an increase of ‘the conduction velocity of thecallosal auditory pathway due to the maturational changesin myelination (Pohl et al., 1984p. 143)’. Myelination of the
234 M.E. Lavoie et al. / Electroencephalography and clinical Neurophysiology 104 (1997) 228–243
callosal fibers is complete only by about 6 years of age. Inthis perspective, the left ear advantage for the P3a responseobserved in this study may reflect a developmental delay ofthe myelination of the callosal fibers in premature children.However, we cannot exclude the role of group differences inthe arousal level during the recording.
In this auditory paradigm, although the subjects were notengaged in particularly demanding processing, our resultssuggest that an alteration of higher order information pro-cessing may exist in premature children. The next experi-ment further examined this by assessing longer latency ERPcomponents, when the subject was actively involved in atask.
4. Experiment 2: visual oddball task
Experiment 2 addressed the question of whether the pre-mature children would respond differently in a moredemanding task in which the subject paid voluntary atten-tion and gave a motor response. The findings in the firstexperiment suggested that the early processes (N100 andP2) are intact in the healthy premature group. Based onthis, we predicted that in the present active task, the earlyprocesses also would be intact in the premature groupwhereas later cognitive processes would be affected. Theoddball task is widely used as a standard paradigm in cog-nitive psychophysiology and is typically used for P300manipulation (see Bashore and Van der Molen, 1991).The so-called P300 effect is characterized by a larger ampli-tude (Duncan-Johnson and Donchin, 1977; Donchin, 1984;Johnson, 1993) and a longer latency to the rare than to thefrequent stimuli (Duncan-Johnson, 1981). A relatively smallnumber of ERP studies documented developmental changesof the P300. It is well known that the amplitude of the P300,as well as its latency, decrease with age until adolescencewhen they reach adult level (Courchesne, 1978; Johnson,1989; Friedman, 1991). It was suggested that the P300latency is related to gradual improvement in processingefficiency with age, whereas changes in ERP scalp localiza-tion reflect developmental transitions in the processingmode. Accordingly, if we assume that premature childrenhave a developmental lag in processing efficiency, we maypredict that the P300 latency as well as the reaction time aresignificantly slower in the premature group. However, ourpremature sample was carefully selected within the normalrange of several IQ subscales. Consequently, there is noreason to assume that these healthy premature childrenwill perform poorer in the oddball task and that their ERPlatencies would be slower than those of the full-terms. Thesecond question is related to the ERP scalp topography. Inrecent studies, it was suggested that changes in brain scalptopography occur during cognitive transitions, e.g. topogra-phical differences between conservers and non-conservers.(Stauder et al., 1993, 1995). Thus, if we assume that braincortical functional organization is disturbed by prematurity,
ERP topography might be altered as well. An alteration inbrain topography could be non-specific in time or be presenton particular components. In the preceding experiment, wefound that the premature children differed only for the P3a,which seems to suggest that the dysfunction is specific tolate cognitive process. Thus, in the visual oddball task, onecan also expect such a specific alteration in the prematuregroup in the late cognitive process.
4.1. Methods
4.1.1. ProceduresThe visual oddball task presented the subject with a total
of 160 stimuli consisting of two pictures with unequal prob-abilities of presentation (75 vs. 25%). The stimuli wereblack line drawings on a white background of a moose(standard) and a raccoon (rare) with a visual angle of 5°and presented in a quasi-random order for 100 ms. Theinterval between subsequent stimuli varied randomlybetween 2200 and 2800 ms. Drawings were sampled fromthe ‘Pictures Please’ manual of the Communication SkillBuilders (Tucson, AZ). The subjects were instructed topress a left key (15× 15 mm) when presented with themoose and a similar right key for the raccoon. These key-board keys were fixed, 25 mm apart in a standard 101–102enhanced US keyboard setting which was mounted on theadjustable arms of the subject’s chair. A practice series ofabout 15 stimuli was given to familiarize the subject withthe task. The actual start of the recording was indicated bymeans of the intercom by saying ‘Attention, we are startingthe task and the first stimulus to appear is a moose’.
4.1.2. Extraction of the ERP data and peak identificationEEG epochs related to responses given between 0 and 200
ms and to false responses were rejected. The child needed tohave more than 50% good responses on both rare and fre-quent stimuli to be included in the ERP analysis.
Three baseline-to-peak measures were included in theanalyses: an early P2, the P3 and a late negativity calledthe slow wave (SW). The early positivity (P2) was definedas the most positive peak between 120 and 400 ms post-stimulus (Wijker, 1991). The P3 is thought to be slower inchildren than in adults. For this reason, a 400–1070 ms post-stimulus window range was used. This P300 time windowwas also used by Wijker (1991), Stauder (1992) and Stauderet al. (1993) on the basis of a principal component analysis(PCA) on ERP data obtained in a similar task performed by5–6 year old normal children. The SW parameters weremeasured by taking the most negative peak within a windowof 800–1800 ms post-stimulus and represent the SW asdescribed by Ruchkin et al. (1988).
As for the auditory components, a MANOVA was per-formed on the latencies of the different peaks in order toseparate components that showed latency differences acrossscalp locations. The latency of the P2 was significantlyshorter (F(5.34,149.58)= 9.62, P , 0.001) at the anterior
235M.E. Lavoie et al. / Electroencephalography and clinical Neurophysiology 104 (1997) 228–243
(mean latency 240 ms; SD 30.21) than at the posterior leads(mean latency 278 ms; SD 29.02). This difference was con-sistent across groups and conditions. Accordingly, withinthe 120–400 ms post-stimulus window, we analyzed theanterior (F7, F8, Fz, C3, C4, Cz, T3, T4) and the posteriorelectrodes (P3, P4, Pz, T5, T6, Oz) separately.
Like the preceding positivity we noticed an anterior/pos-terior shift in the P300 time window. The latency wasshorter on the posterior (mean latency 545 ms; SD 64)than the anterior regions (mean latency 653 ms; SD 94),as revealed by a significant LEAD main effect (F(5.61,157.08)= 17.90P , 0.001). For these positivities, we per-formed a repeated measures ANOVA on the normalizedamplitudes, separately for the anterior and the posteriorregions. The CONDITION× LEAD interaction was signif-icant for the posterior P550 (F(4.29,60.10)= 6.07, P ,0.001), with a left central maximum, but not for the anteriorP650. Thus, the two positivities reacted differently to thecondition. Consequently, these two positivities were treatedas two different components: an anterior P650 recorded atF7, F8, Fz, T3, T4, and a posterior P550 recorded at C3, C4,Cz, P3, P4, Pz, Oz, T5, T6.
The SW latency also appeared to be significantly shorter(F(7.16,200.58)= 11.85, P , 0.001) on the posterior(mean latency 1227 ms; SD 154 ms) than on the anteriorregions (mean latency 1405 ms; SD 204 ms), as well asshorter for the frequent than for the rare stimuli (F(7.16,200.58)= 11.85,P , 0.001) However, there was no differ-ence between groups. Thus, as for the other ERP peaks, wedecided to run separate analyses for the anterior (F7, F8, Fz,T3, T4) and posterior SWs (C3, C4, Cz, P3, P4, Pz, Oz, T5,T6). Within the anterior and posterior groupings, no latencydifferences were found.
4.2. Results
4.2.1. Accuracy and reaction timeOverall, the premature children had a tendency to be
slower and less accurate. The percentage of correctresponses to the rare and frequent stimuli, respectively,were 57% and 67% for the premature children and 62%and 80% for the controls. The average reaction times tothe rare and frequent stimuli were, respectively, 706 ms(SD 176.4) and 655 ms (SD 150.6) for the premature chil-dren, and 646 ms (SD 128) and 595 ms (SD 111.7) for thecontrols. However, these group differences were not signif-icant. The reaction time to the rare stimuli was on the aver-age 51 ms slower than to the frequent stimuli in both groupsand this CONDITION effect was significant (F(1,27) =52.59, P , 0.001), indicating a successful oddball taskmanipulation in both groups.
4.2.2. The anterior P240
4.2.2.1. Latency.The latency of the P240 was not differentbetween prematures and controls. Furthermore, its latency
to the rare was not significantly longer than to the frequentstimuli.
4.2.2.2. Amplitude.The two groups showed similar P240amplitudes. The peak amplitudes were significantly largerat frontal and central sites as shown by the LEAD maineffect (F(3.51,98.40)= 8.22,P , 0.001). This localizationwas not different between the premature and the controlchildren. In addition, the P240 amplitude was sig-nificantly larger to the rare than to the frequent in thetwo groups (F(1,28) = 20.36, P , 0.001). Thus, the re-sults showed that the anterior P240 was localized oncentral leads and sensitive to the task manipulation.
4.2.3. The posterior P280
4.2.3.3. Latency.Again, the latency data did not yield anydifferences between groups, leads or condition.
4.2.3.4. Amplitude.The posterior P280 amplitudes werenot different between the groups. In contrast to theanterior P240, this component did not show a LEADeffect. The rare stimuli consistently elicited significantly(F(1,28) = 8,18, P , 0.01) larger P280 amplitudes (meanamplitude 5.0mV, SD 3.6) than the frequent stimuli (meanamplitude 2.6mV, SD 2.2). This condition effect was notlocalized nor different between groups.
4.2.4. The anterior P650
4.2.4.5. Latency.Across all electrodes, the latencies of theanterior P650 were not significantly different according tothe condition. However, this component displayedsignificantly longer latencies for the rare than for thefrequent stimuli around the frontal leads, as indicated bya significant CONDITION× LEAD interaction (F(6.14,171.88)= 2.56,P , 0.05). Only for the frontal electrodeswas the condition effect significant (F(1,28) = 27.34,P ,0.001).
4.2.4.6. Amplitude.The anterior P650 amplitude wassignificantly larger for the rare than for the frequentstimuli (F(1,28) = 43.39, P , 0.001). No othersignificant effect was found. In summary, these resultsconfirmed the successful task manipulation of the peaklatency and amplitude, but did not reveal any differencesbetween groups.
4.2.5. The posterior P550
4.2.5.7. Latency.The latencies of the posterior P550 didnot differ between group or conditions and did not showsignificant interactions between these variables. Thelatency was correlated significantly with the reactiontimes for both frequent (r = 0.61, P , 0.001) and rarestimuli (r = 0.45,P , 0.05) over the centro-parietal area.
236 M.E. Lavoie et al. / Electroencephalography and clinical Neurophysiology 104 (1997) 228–243
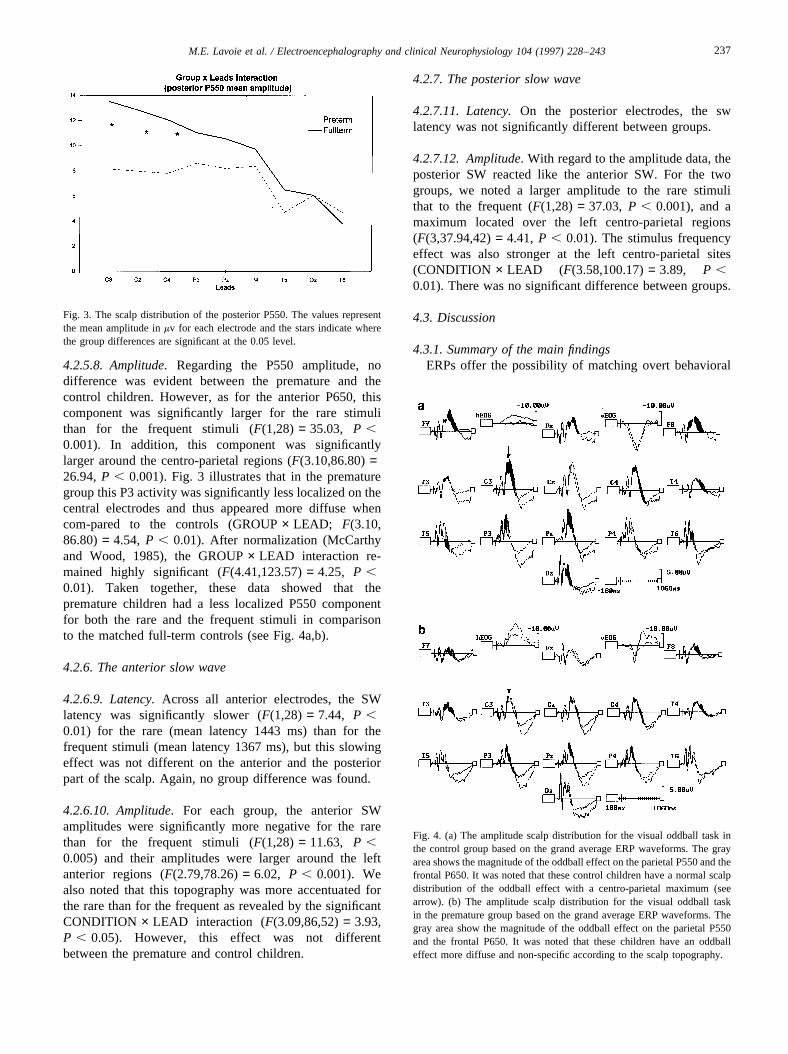
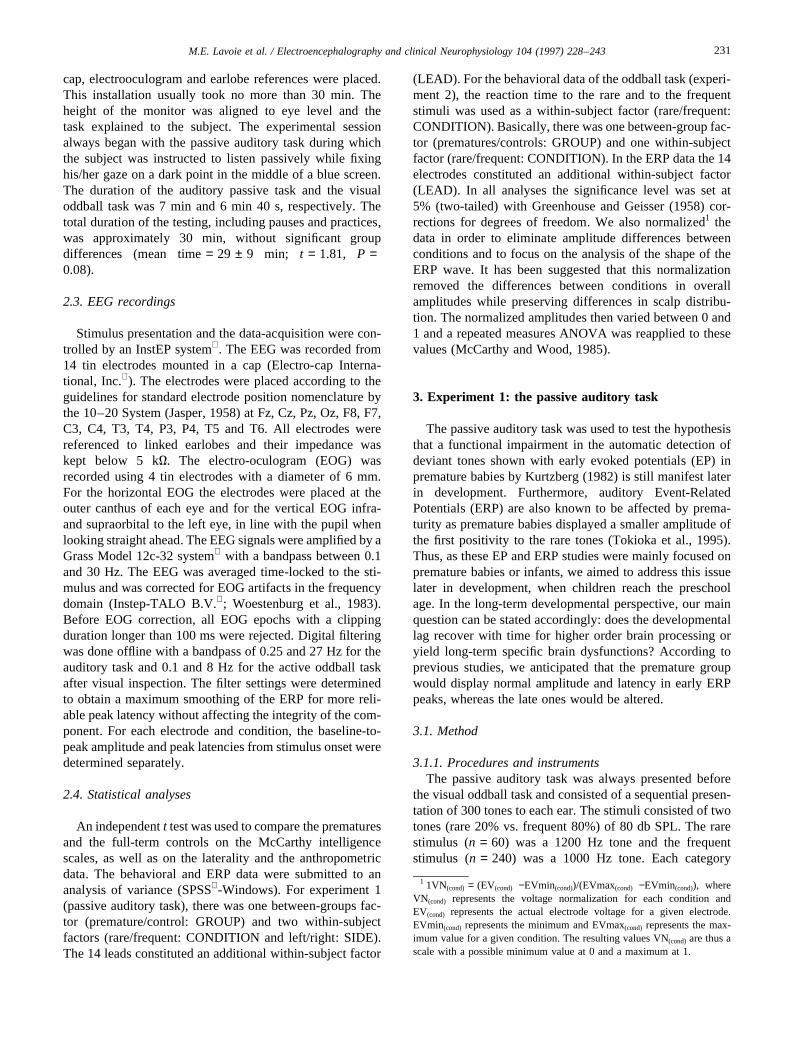
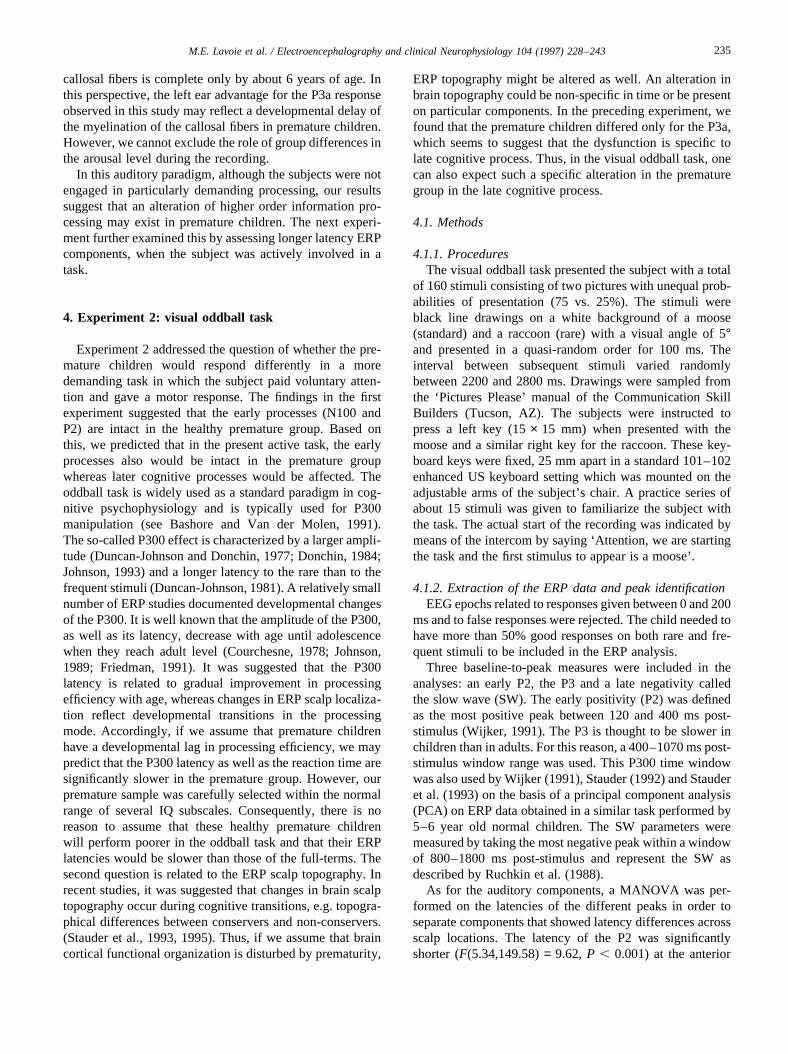
4.2.5.8. Amplitude.Regarding the P550 amplitude, nodifference was evident between the premature and thecontrol children. However, as for the anterior P650, thiscomponent was significantly larger for the rare stimulithan for the frequent stimuli (F(1,28) = 35.03, P ,0.001). In addition, this component was significantlylarger around the centro-parietal regions (F(3.10,86.80)=26.94,P , 0.001). Fig. 3 illustrates that in the prematuregroup this P3 activity was significantly less localized on thecentral electrodes and thus appeared more diffuse whencom-pared to the controls (GROUP× LEAD; F(3.10,86.80)= 4.54, P , 0.01). After normalization (McCarthyand Wood, 1985), the GROUP× LEAD interaction re-mained highly significant (F(4.41,123.57)= 4.25, P ,0.01). Taken together, these data showed that thepremature children had a less localized P550 componentfor both the rare and the frequent stimuli in comparisonto the matched full-term controls (see Fig. 4a,b).
4.2.6. The anterior slow wave
4.2.6.9. Latency.Across all anterior electrodes, the SWlatency was significantly slower (F(1,28) = 7.44, P ,0.01) for the rare (mean latency 1443 ms) than for thefrequent stimuli (mean latency 1367 ms), but this slowingeffect was not different on the anterior and the posteriorpart of the scalp. Again, no group difference was found.
4.2.6.10. Amplitude.For each group, the anterior SWamplitudes were significantly more negative for the rarethan for the frequent stimuli (F(1,28) = 11.63, P ,0.005) and their amplitudes were larger around the leftanterior regions (F(2.79,78.26)= 6.02, P , 0.001). Wealso noted that this topography was more accentuated forthe rare than for the frequent as revealed by the significantCONDITION × LEAD interaction (F(3.09,86,52)= 3.93,P , 0.05). However, this effect was not differentbetween the premature and control children.
4.2.7. The posterior slow wave
4.2.7.11. Latency.On the posterior electrodes, the swlatency was not significantly different between groups.
4.2.7.12. Amplitude.With regard to the amplitude data, theposterior SW reacted like the anterior SW. For the twogroups, we noted a larger amplitude to the rare stimulithat to the frequent (F(1,28) = 37.03, P , 0.001), and amaximum located over the left centro-parietal regions(F(3,37.94,42)= 4.41, P , 0.01). The stimulus frequencyeffect was also stronger at the left centro-parietal sites(CONDITION × LEAD (F(3.58,100.17)= 3.89, P ,0.01). There was no significant difference between groups.
4.3. Discussion
4.3.1. Summary of the main findingsERPs offer the possibility of matching overt behavioral
Fig. 3. The scalp distribution of the posterior P550. The values representthe mean amplitude inmv for each electrode and the stars indicate wherethe group differences are significant at the 0.05 level.
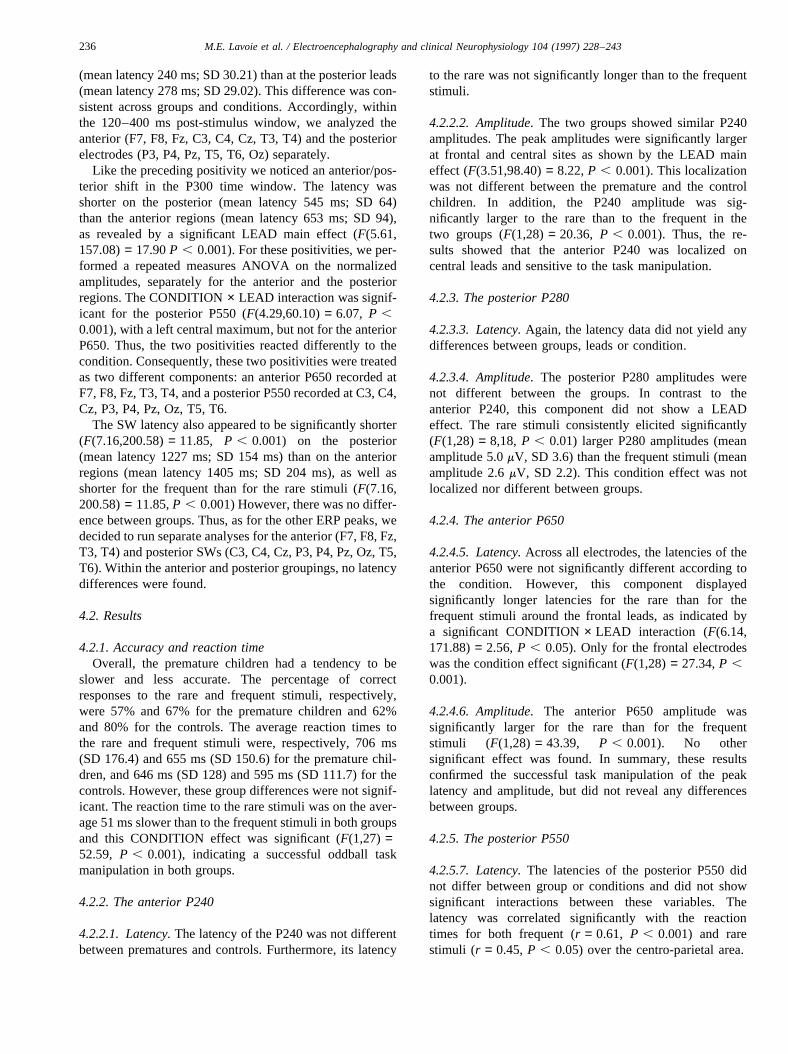
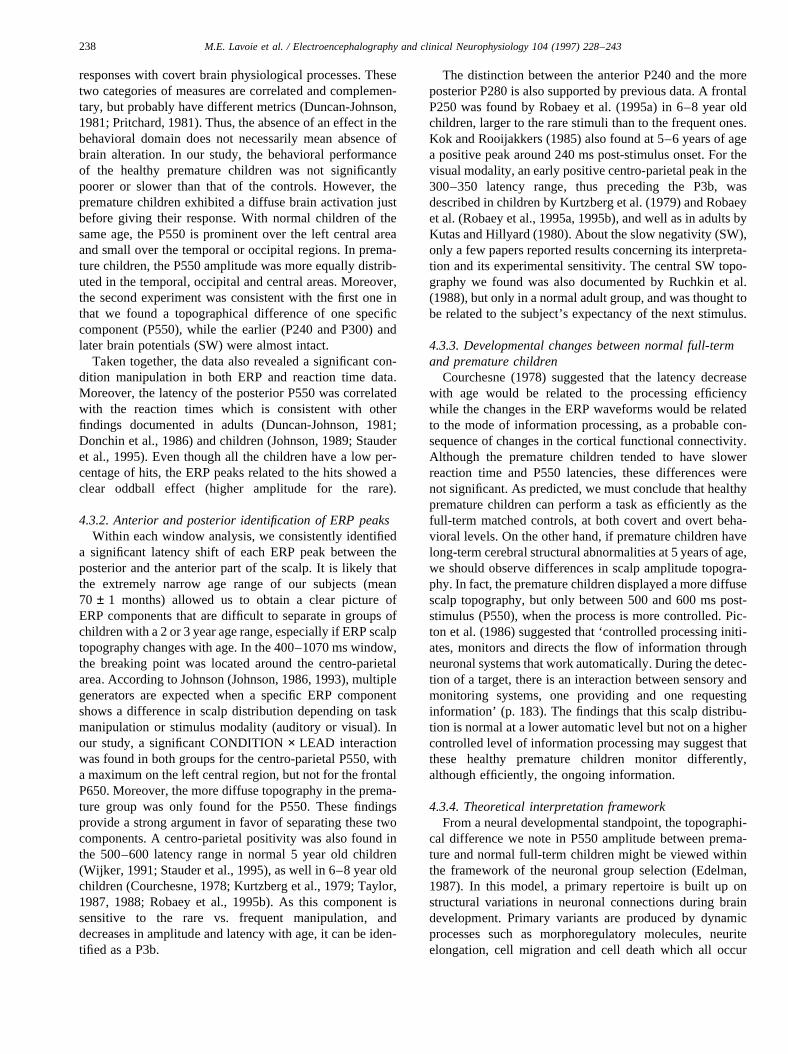
Fig. 4. (a) The amplitude scalp distribution for the visual oddball task inthe control group based on the grand average ERP waveforms. The grayarea shows the magnitude of the oddball effect on the parietal P550 and thefrontal P650. It was noted that these control children have a normal scalpdistribution of the oddball effect with a centro-parietal maximum (seearrow). (b) The amplitude scalp distribution for the visual oddball taskin the premature group based on the grand average ERP waveforms. Thegray area show the magnitude of the oddball effect on the parietal P550and the frontal P650. It was noted that these children have an oddballeffect more diffuse and non-specific according to the scalp topography.
237M.E. Lavoie et al. / Electroencephalography and clinical Neurophysiology 104 (1997) 228–243
responses with covert brain physiological processes. Thesetwo categories of measures are correlated and complemen-tary, but probably have different metrics (Duncan-Johnson,1981; Pritchard, 1981). Thus, the absence of an effect in thebehavioral domain does not necessarily mean absence ofbrain alteration. In our study, the behavioral performanceof the healthy premature children was not significantlypoorer or slower than that of the controls. However, thepremature children exhibited a diffuse brain activation justbefore giving their response. With normal children of thesame age, the P550 is prominent over the left central areaand small over the temporal or occipital regions. In prema-ture children, the P550 amplitude was more equally distrib-uted in the temporal, occipital and central areas. Moreover,the second experiment was consistent with the first one inthat we found a topographical difference of one specificcomponent (P550), while the earlier (P240 and P300) andlater brain potentials (SW) were almost intact.
Taken together, the data also revealed a significant con-dition manipulation in both ERP and reaction time data.Moreover, the latency of the posterior P550 was correlatedwith the reaction times which is consistent with otherfindings documented in adults (Duncan-Johnson, 1981;Donchin et al., 1986) and children (Johnson, 1989; Stauderet al., 1995). Even though all the children have a low per-centage of hits, the ERP peaks related to the hits showed aclear oddball effect (higher amplitude for the rare).
4.3.2. Anterior and posterior identification of ERP peaksWithin each window analysis, we consistently identified
a significant latency shift of each ERP peak between theposterior and the anterior part of the scalp. It is likely thatthe extremely narrow age range of our subjects (mean70 ± 1 months) allowed us to obtain a clear picture ofERP components that are difficult to separate in groups ofchildren with a 2 or 3 year age range, especially if ERP scalptopography changes with age. In the 400–1070 ms window,the breaking point was located around the centro-parietalarea. According to Johnson (Johnson, 1986, 1993), multiplegenerators are expected when a specific ERP componentshows a difference in scalp distribution depending on taskmanipulation or stimulus modality (auditory or visual). Inour study, a significant CONDITION× LEAD interactionwas found in both groups for the centro-parietal P550, witha maximum on the left central region, but not for the frontalP650. Moreover, the more diffuse topography in the prema-ture group was only found for the P550. These findingsprovide a strong argument in favor of separating these twocomponents. A centro-parietal positivity was also found inthe 500–600 latency range in normal 5 year old children(Wijker, 1991; Stauder et al., 1995), as well in 6–8 year oldchildren (Courchesne, 1978; Kurtzberg et al., 1979; Taylor,1987, 1988; Robaey et al., 1995b). As this component issensitive to the rare vs. frequent manipulation, anddecreases in amplitude and latency with age, it can be iden-tified as a P3b.
The distinction between the anterior P240 and the moreposterior P280 is also supported by previous data. A frontalP250 was found by Robaey et al. (1995a) in 6–8 year oldchildren, larger to the rare stimuli than to the frequent ones.Kok and Rooijakkers (1985) also found at 5–6 years of agea positive peak around 240 ms post-stimulus onset. For thevisual modality, an early positive centro-parietal peak in the300–350 latency range, thus preceding the P3b, wasdescribed in children by Kurtzberg et al. (1979) and Robaeyet al. (Robaey et al., 1995a, 1995b), and well as in adults byKutas and Hillyard (1980). About the slow negativity (SW),only a few papers reported results concerning its interpreta-tion and its experimental sensitivity. The central SW topo-graphy we found was also documented by Ruchkin et al.(1988), but only in a normal adult group, and was thought tobe related to the subject’s expectancy of the next stimulus.
4.3.3. Developmental changes between normal full-termand premature children
Courchesne (1978) suggested that the latency decreasewith age would be related to the processing efficiencywhile the changes in the ERP waveforms would be relatedto the mode of information processing, as a probable con-sequence of changes in the cortical functional connectivity.Although the premature children tended to have slowerreaction time and P550 latencies, these differences werenot significant. As predicted, we must conclude that healthypremature children can perform a task as efficiently as thefull-term matched controls, at both covert and overt beha-vioral levels. On the other hand, if premature children havelong-term cerebral structural abnormalities at 5 years of age,we should observe differences in scalp amplitude topogra-phy. In fact, the premature children displayed a more diffusescalp topography, but only between 500 and 600 ms post-stimulus (P550), when the process is more controlled. Pic-ton et al. (1986) suggested that ‘controlled processing initi-ates, monitors and directs the flow of information throughneuronal systems that work automatically. During the detec-tion of a target, there is an interaction between sensory andmonitoring systems, one providing and one requestinginformation’ (p. 183). The findings that this scalp distribu-tion is normal at a lower automatic level but not on a highercontrolled level of information processing may suggest thatthese healthy premature children monitor differently,although efficiently, the ongoing information.
4.3.4. Theoretical interpretation frameworkFrom a neural developmental standpoint, the topographi-
cal difference we note in P550 amplitude between prema-ture and normal full-term children might be viewed withinthe framework of the neuronal group selection (Edelman,1987). In this model, a primary repertoire is built up onstructural variations in neuronal connections during braindevelopment. Primary variants are produced by dynamicprocesses such as morphoregulatory molecules, neuriteelongation, cell migration and cell death which all occur
238 M.E. Lavoie et al. / Electroencephalography and clinical Neurophysiology 104 (1997) 228–243
during fetal life. Once such a primary variant repertoire isestablished, a second process of selection occurs, one that isinfluenced by environmental experiences. The neuronalgroups that respond best to a given input, and are behavio-rally relevant, are selected by increasing the efficacy of theirsynaptic connections. The differential amplification of cer-tain connections results in a secondary repertoire.
This concept of synapse elimination was introduced byRakic et al. (1986) from results obtained in animal studies.They reported that the synaptic density doubles duringinfancy, concurrently in all cortical and limbic layers,whereas after infancy, the number of synapses graduallydeclines until puberty. This pattern of discontinuous devel-opment of synaptic density or selective elimination was alsoshown in humans (Huttenlocher, 1979, 1990, 1994). Synap-tic density increases during late fetal life (especially after 28weeks of gestation) and during early infancy. It is followedby a continuous decrease after age 1 year to reach adultvalues at different pace according to the cortical areas(e.g. slower for the frontal than for the occipital areas). Ithas been proposed that this decrease results from a processof synaptic elimination which is necessary for the elabora-tion of complex neural systems. Interestingly, a proposalwas put forth by Courchesne (1990) to suggest ERP onto-genesis parallels synaptogenesis. In this regard, the devel-opmental course of an ERP wave as the Nc (typicallyelicited in a oddball-novelty paradigm) parallels the synap-tic density change during childhood.
Our finding of topographical changes in P550 amplitudemay suggest that the premature experience can lead to analteration of these processes. By 24–28 weeks of gestation,the primary repertoire is smaller than that established by37–42 weeks, due to the early disruption of the develop-ment process, to the detrimental nutritional conditions dur-ing pregnancy (Crawford, 1993), etc. The content of thesecondary repertoire depends on the size of the primaryvariations and the subsequent selection process. After theimmediate neonatal period, the selection process thus actsupon a reduced number of connections in extremely prema-ture infants, as compared to fullterms. As the subgroup ofpremature children included in this study did not display anyovert developmental deficits, as assessed by their choice
reaction times and clinical evaluation, efficient compensa-tion mechanisms formed the secondary repertoire. It maythus be proposed that the operation of a selection processcompensates for the reduced number of available connec-tions by increasing the spatial distribution of synaptic con-nections. This might result in a more flattened and diffusebrain ERP topography in such healthy extremely prematurechildren. The fact that these topographical effects arise onlyafter 250 ms post-stimulus for the largest P3-like componentsuggests that this compensatory mechanism occurs mainlyfor more controlled and demanding processes. Further stu-dies may further explore this concept in testing the hypoth-esis of a failure of this compensation mechanism inpremature children without major brain damage whodo not regain a normal developmental level, or a disruptionof this mechanism in the case of brain injuries such asmajor hemorrhages. In a clinical perspective, inclusion ofother pre-school groups and follow-up studies after the entryto school with healthy and disabled children are thusneeded.
Acknowledgements
We gratefully acknowledge the support of the Fonds de laRecherche en Sante´ du Quebec (FRSQ) and the ConseilQuebecois de la Recherche sociale (CQRS). This workwas supported by a Ph.D. fellowship (FRSQ) to the firstauthor, a clinician-scientist award (FRSQ) to the secondauthor and a fellowship from the Research Centre of theSte-Justine Hospital (Telethon of Stars) to the third author.This article was written in partial fulfillment of the require-ments for a doctoral degree at the University of Montreal.Special thanks go to Anne Bolduc for evaluation and psy-chometric testing, Jocelyne Valle´e for the recruitment of thesubjects, to Phetsamone Vannasing, Isabelle Lamothe andCecile Ladouceur for their highly competent technical assis-tance during recordings, and to Rhoda Kenigsberg for revis-ing the English. Last, but not least, we would like to expressour gratitude to the children and families who participated inthe study.
239M.E. Lavoie et al. / Electroencephalography and clinical Neurophysiology 104 (1997) 228–243
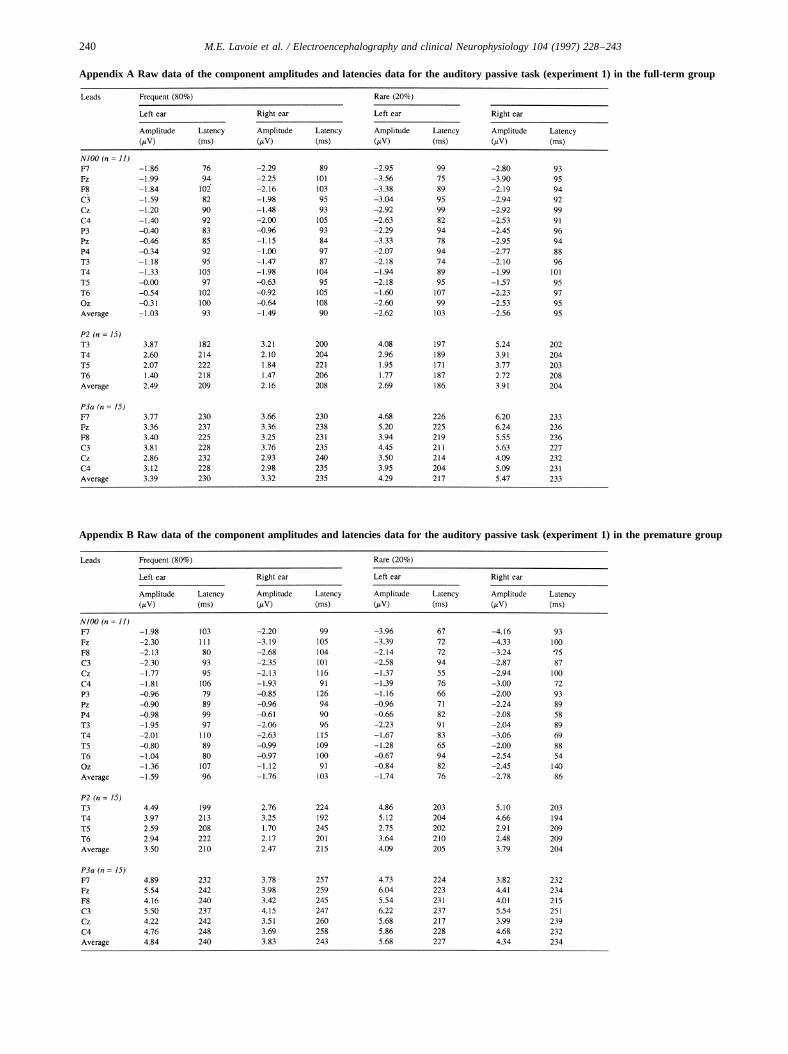
Appendix A Raw data of the component amplitudes and latencies data for the auditory passive task (experiment 1) in the full-term group
Appendix B Raw data of the component amplitudes and latencies data for the auditory passive task (experiment 1) in the premature group
240 M.E. Lavoie et al. / Electroencephalography and clinical Neurophysiology 104 (1997) 228–243
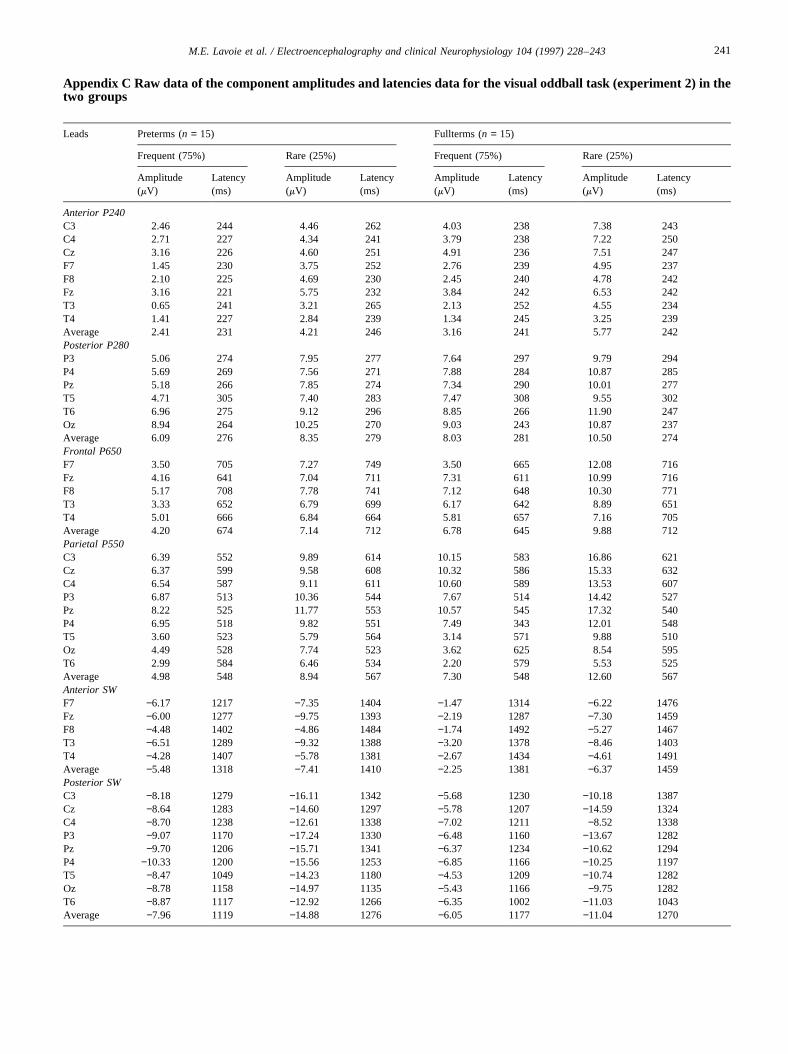
Appendix C Raw data of the component amplitudes and latencies data for the visual oddball task (experiment 2) in thetwo groups
Leads Preterms (n = 15) Fullterms (n = 15)
Frequent (75%) Rare (25%) Frequent (75%) Rare (25%)
Amplitude(mV)
Latency(ms)
Amplitude(mV)
Latency(ms)
Amplitude(mV)
Latency(ms)
Amplitude(mV)
Latency(ms)
Anterior P240C3 2.46 244 4.46 262 4.03 238 7.38 243C4 2.71 227 4.34 241 3.79 238 7.22 250Cz 3.16 226 4.60 251 4.91 236 7.51 247F7 1.45 230 3.75 252 2.76 239 4.95 237F8 2.10 225 4.69 230 2.45 240 4.78 242Fz 3.16 221 5.75 232 3.84 242 6.53 242T3 0.65 241 3.21 265 2.13 252 4.55 234T4 1.41 227 2.84 239 1.34 245 3.25 239Average 2.41 231 4.21 246 3.16 241 5.77 242Posterior P280P3 5.06 274 7.95 277 7.64 297 9.79 294P4 5.69 269 7.56 271 7.88 284 10.87 285Pz 5.18 266 7.85 274 7.34 290 10.01 277T5 4.71 305 7.40 283 7.47 308 9.55 302T6 6.96 275 9.12 296 8.85 266 11.90 247Oz 8.94 264 10.25 270 9.03 243 10.87 237Average 6.09 276 8.35 279 8.03 281 10.50 274Frontal P650F7 3.50 705 7.27 749 3.50 665 12.08 716Fz 4.16 641 7.04 711 7.31 611 10.99 716F8 5.17 708 7.78 741 7.12 648 10.30 771T3 3.33 652 6.79 699 6.17 642 8.89 651T4 5.01 666 6.84 664 5.81 657 7.16 705Average 4.20 674 7.14 712 6.78 645 9.88 712Parietal P550C3 6.39 552 9.89 614 10.15 583 16.86 621Cz 6.37 599 9.58 608 10.32 586 15.33 632C4 6.54 587 9.11 611 10.60 589 13.53 607P3 6.87 513 10.36 544 7.67 514 14.42 527Pz 8.22 525 11.77 553 10.57 545 17.32 540P4 6.95 518 9.82 551 7.49 343 12.01 548T5 3.60 523 5.79 564 3.14 571 9.88 510Oz 4.49 528 7.74 523 3.62 625 8.54 595T6 2.99 584 6.46 534 2.20 579 5.53 525Average 4.98 548 8.94 567 7.30 548 12.60 567Anterior SWF7 −6.17 1217 −7.35 1404 −1.47 1314 −6.22 1476Fz −6.00 1277 −9.75 1393 −2.19 1287 −7.30 1459F8 −4.48 1402 −4.86 1484 −1.74 1492 −5.27 1467T3 −6.51 1289 −9.32 1388 −3.20 1378 −8.46 1403T4 −4.28 1407 −5.78 1381 −2.67 1434 −4.61 1491Average −5.48 1318 −7.41 1410 −2.25 1381 −6.37 1459Posterior SWC3 −8.18 1279 −16.11 1342 −5.68 1230 −10.18 1387Cz −8.64 1283 −14.60 1297 −5.78 1207 −14.59 1324C4 −8.70 1238 −12.61 1338 −7.02 1211 −8.52 1338P3 −9.07 1170 −17.24 1330 −6.48 1160 −13.67 1282Pz −9.70 1206 −15.71 1341 −6.37 1234 −10.62 1294P4 −10.33 1200 −15.56 1253 −6.85 1166 −10.25 1197T5 −8.47 1049 −14.23 1180 −4.53 1209 −10.74 1282Oz −8.78 1158 −14.97 1135 −5.43 1166 −9.75 1282T6 −8.87 1117 −12.92 1266 −6.35 1002 −11.03 1043Average −7.96 1119 −14.88 1276 −6.05 1177 −11.04 1270
241M.E. Lavoie et al. / Electroencephalography and clinical Neurophysiology 104 (1997) 228–243
References
American Psychiatric Association. Diagnostic and Statistical Manual ofMental Disorders (3rd edn., revised). American Psychiatric Association,Washington, DC, 1987.
Amiel-Tison, C. and Stewart, A. Follow-up studies during the first fiveyears of life: a prevasive assessment of neurological function. Arch. Dis.Child., 1989, 64: 496–502.
Bashore, T.R. and Van der Molen, M. The discovery of the P300: a tribute.Biol. Psychol., 1991, 32: 155–171.
Courchesne, E. Neurophysiological correlates of cognitive development:changes in long-latency event-related potentials from childhood toadulthood. Electroenceph. clin. Neurophysiol., 1978, 45: 468–482.
Courchesne, E. Chronology of postnatal human brain development: event-related potential, positron emission tomography, myelogenesis, andsynaptogenesis. In: J.W. Rorhbaugh, R. Parasuraman and R. JohnsonJr. (Eds.), Event-Related Brain Potentials: Basic Issues and Applica-tions. Oxford University Press, New York, 1990, pp. 210–241.
Crawford, M.A. The role of essential fatty acids in neural development:implications for perinatal nutrition. Am. J. Clin. Nutr., 1993, 57 (suppl.):703S–710S.
Csepe´, V. On the origin and development of the mismatch negativity. EarHearing, 1995, 16: 91–104.
Donchin, E. Cognitive Psychophysiology. Erlbaum, Hillsdale, NJ, 1984.Donchin, E., Karis, D., Bashore, T.R., Coles, M.G.H. and Gratton, G.
Cognitive psychophysiology and human information processing. In:M.G.H. Coles, E. Donchin, and S.W. Porges (Eds.), Psychophysiology:Systems, Processes and Applications. The Guiford Press, New York,1986, pp. 244–267.
Duffy, F.H., Als, A. and McAnulty, G.B. Behavioral and electrophysiolo-gical evidence for gestational age effects in healthy preterm and full-term infants studied two weeks after expected due date. Child Dev.,1990, 61: 1271–1286.
Duncan-Johnson, C.C. P300 latency: a new metric of information proces-sing. Psychophysiology, 1981, 18: 207–215.
Duncan-Johnson, C.C. and Donchin, E. On quantifying surprise: the var-iation of event-related potentials to subjective probability. Psychophy-siology, 1977, 14: 456–467.
Edelman, G.M. Neural Darwinism: The Theory of Neuronal Group Selec-tion. Basic Books, New York, 1987, p. 371.
Friedman, D. The endogenous scalp-recorded brain potentials and theirrelationship to cognitive development. In: J.R. Jennings and M.G.H.Coles (Eds.), Psychophysiology of Human Information Processing: AnIntegration of Central Autonomic Nervous System Approaches. Wiley,New York, 1991, pp. 621–656.
Graziani, L.J., Weitzman, E.D., Mutya, S.A. and Velasco, M.D. Neurolo-gic maturation and auditory evoked responses in low birth weightinfants. Pediatrics, 1968, 41: 483–494.
Graziani, L.J., Katz, L., Cracco, R.Q., Cracco, J.B. and Weitzman, E.D.The maturation and interrelationship of EEG patterns and auditoryevoked responses in premature infants. Electroenceph. clin. Neurophy-siol., 1974, 36: 367–375.
Greenhouse, S.W. and Geisser, S. An extension of Box’s results on the useof the F distribution in multivariate analysis. Ann. Math. Stat., 1958, 29:885–891.
Hack, M., Taylor, H.G., Klein, N., Eiben, R., Schatschneider, C. andMercuri-Minich, N. School-age outcome in children with birth weightsunder 750 g. N. Engl. J. Med., 1994, 331: 753–759.
Hollingshead, A.B. Two-Factor Index of Social Position. Yale UniversityPress, New Haven, CT, 1969.
Hrbek, A. and Mares, P. Cortical evoked responses to visual stimulation infull-term and premature newborns. Electroenceph. clin. Neurophysiol.,1964, 16: 525–581.
Hrbek, A., Karlberg, P. and Olsson, T. Development of visual and soma-tosensory evoked responses in pre-term newborn infants. Electroenceph.clin. Neurophysiol., 1973, 34: 225–232.
Huttenlocher, P.R. Synaptic density in human frontal cortex: develop-mental changes and effects of aging. Brain Res., 1979, 163: 195–205.
Huttenlocher, P.R. Morphometric study of human cerebral cortex devel-opment. Neuropsychologia, 1990, 28: 517–527.
Huttenlocher, P.R. Synaptogenesis in human cerebral cortex. In: G. Daw-son and K.W. Fisher (Eds.), Human Behavior and the Developing Brain.Guilford Press, New York, 1994, pp. 137–152.
Huttenlocher, P.R., Levine, S.C., Huttenlocher, J. and Gates, J. Discrimi-nation of normal and at-risk preschool children on the basis of neuro-logical tests. Dev. Med. Child Neurol., 1990, 32: 394–402.
Jasper, H.H. Report of the committee on methods of clinical examinationin electroencephalography. Electroenceph. clin Neurophysiol., 1958, 10:370–375.
Johnson, Jr., R. A triarchic model of P300 amplitude. Psychophysiology,1986, 23: 367–383.
Johnson, Jr., R. Developmental evidence for modality-dependent P300generators: a normative study. Psychophysiology, 1989, 26: 651–667.
Johnson, Jr., R. On the neural generators of the P300 component of theevent-related potential. Psychophysiology, 1993, 30: 90–97.
Kok, A. and Rooijakkers, J.A.J. Comparison of event-related potentials inyoung children and adults in visual recognition and word reading tasks.Psychophysiology, 1985, 22: 11–23.
Kraus, N., McGee, T., Carrell, T., Sharma, A. and Nicol, T. Mismatchnegativity to speech stimuli in school-age children. In: G. Karmos, M.Molnar, V. Csepe, I. Czigler and J.E. Desmedt (Eds.), Perspectives ofEvent-Related Brain Potentials Research, EEG Suppl. 44. Elsevier,Amsterdam, 1995, pp. 211–217.
Kurtzberg, D., Event-related potentials in the evaluation of high-riskinfants. Ann. N. Y. Acad. Sci., 1982, 388: 557–571.
Kurtzberg, D., Vaughan, Jr., H.G., Daum, C., Grellong, B.A., Albin, S. andRotkin, L. Neurobehavioral performance of low-birthweight infants at40 weeks conceptional age: comparison with normal full-term infants.Dev. Med. Child Neurol., 1979, 21: 590–607.
Kurtzberg, D., Hilpert, P.M., Kreuzer, J.A. and Vaughan, Jr., H.G. Differ-ential maturation of cortical auditory evoked potentials to speech soundsin normal full-term and very low-birth weight infants. Dev. Med. ChildNeurol., 1984, 26: 466–475.
Kurtzberg, D., Vaughan, Jr., H.G., Kreuzer, J.A. and Fliegler, K.Z. Devel-opmental studies and clinical application of mismatch negativity: pro-blems and prospects. Ear Hearing, 1995, 16: 105–117.
Kutas, M. and Hillyard, S.A. Event-related brain potentials to semanticallyinappropriate and surprisingly large words. Biol. Psychol., 1980, 11:99–116.
McCarthy, D. Manual for the McCarthy Scales of Children’s Abilities.Psychological Corporation, Harcourt Brace Jovanovich, 1972.
McCarthy, G. and Wood, C.C. Scalp distributions of event-related poten-tials: an ambiguity associated with analysis of variance models. Elec-troenceph. clin. Neurophysiol., 1985, 62: 203–208.
Naatanen, R. and Picton, T.W. The N1 wave of the human electric andmagnetic response to sound: a review and an analysis of the componentstructure. Psychophysiology, 1987, 24: 375–425.
Newmann, O. Automatic processing: a review of recent findings and a pleafor an old theory. In: W. Prinz and A.F. Sanders (Eds.), Cognition andMotor Processes. Springer-Verlag, Berlin, 1984, pp. 225–293.
Ornstein, M., Ohlsson, A., Edmonds, J. and Asztalos, E. Neonatal follow-up of very low birth weight/extremely low birthweight infants to schoolage: a critical overview. Acta Paediatr. Scand., 1991, 80: 741–748.
Picton, T.W. and Hillyard, S.A. Human auditory evoked potentials. II.Effects of attention. Electroenceph. clin. Neurophysiol., 1974, 36:191–199.
Picton, T.W., Stuss, D.T., Fitzgerald, P.G. and Perrault, N. Overlappingcerebral processes during the N2 peak of the event-related brain poten-tial. Electroenceph. clin. Neurophysiol., 1986 (suppl. 38): 178–186.
Pohl, P., Grubmu¨ller, H.G. and Grubmu¨ller, R. Developmental changes indichotic right ear advantage (REA). Neuropediatrics, 1984, 15: 139–144.
242 M.E. Lavoie et al. / Electroencephalography and clinical Neurophysiology 104 (1997) 228–243
Pritchard, W. The psychophysiology of the P300. Psychol. Bull., 1981, 89:506–540.
Rakic, P., Bourgeois, J.-P., Eckhenhoff, M.F., Zecevic, N. and Goldman-Rakic, P.S. Concurrent overproduction of synapses in diverse regions ofprimate cerebral cortex. Science, 1986, 232: 232–234.
Reite, M., Neumann, R., Richardson, D., Teale, P. and Sheeder, J. Audi-tory evoked field source location in children. In: Abstract Book of theFifth International Evoked Potential Symposium, 1994.
Ridderinkhof, K. R. and Bashore, T.R. Using event-related brain potentialsto draw inferences about human information processing. In: P. Allen andT.R. Bashore (Eds.), Age Differences in Word and Language Proces-sing. Elsevier, Amsterdam, 1995, pp. 294–313.
Robaey, P, Cansino, S., Dugas, M. and Renault, B. A comparative study ofERP correlates of psychometric and Piagetian intelligence measures innormal and hyperactive children. Electroenceph. clin. Neurophysiol.,1995a, 96: 56–75.
Robaey, P, Cansino, S. and Renault, B. ERP changes with intelligence anddevelopment in children. In: G. Karmos, M. Molnar, V. Cse´pe, I. Czig-ler and J.E. Desmedt (Eds.), Perspectives of Event-Related Brain Poten-tials Research. EEG suppl. 44. Elsevier, Amsterdam, 1995b, pp. 334–338.
Ruchkin, D.S., Johnson, Jr., R., Mahaffey, D. and Sutton, S. Toward afunctional categorization of slow waves. Psychophysiology, 1988, 25:339–353.
Scher, M.S., Sun, M., Steppe, D.A., Guthrie, R.D. and Sclabassi, R.J.Comparison of EEG spectral and correlation measures between healthyterm and preterm infants. Pediatr. Neurol., 1994, 10: 104–108.
Squires, N.K., Squires, K.C. and Hillyard, S.A. Two varieties of long-latency positive waves evoked by unpredictable auditory stimuli inman. Electroenceph. clin Neurophysiol., 1975, 38: 387–401.
Stauder, J.E.A. A longitudinal study of developmental changes in event-related brain potentials and cognition during childhood. In: Event-Related Brain Potentials and Cognitive Development During Childhood.Doctoral dissertation, University of Amsterdam, Amsterdam, 1992, pp.47–74.
Stauder, J.E.A., Molenaar, P.C.M. and van der Molen, M. Scalp topogra-phy of event-related brain potentials and cognitive and cognitive transi-tion during childhood. Child Dev., 1993, 64: 769–788.
Stauder, J.E.A., van der Molen, M. and Molenaar, P.C.M. Event-relatedbrain potentials and transitions in the level of cognitive developmentduring childhood. In: G. Karmos, M. Molnar, V. Cse´pe, I. Czigler andJ.E. Desmedt (Eds.), Perspectives of Event-Related Brain PotentialsResearch, EEG suppl. 44.. Elsevier, Amsterdam, 1995, pp. 339–346.
Taylor, M.J. Developmental changes in cognitive ERPs to linguistic and
non-linguistic stimuli. In: C. Barber and T. Blum (Eds.), Evoked Poten-tials III. Butterworth, London, 1987, pp. 337–341.
Taylor, M.J. Developmental changes in ERPs to visual language stimuli.Biol. Psychol., 1988, 26: 321–338.
Tokioka, A.B., Pearce, J.W. and Crowell, D.H. Endogenous event-relatedpotentials in term and preterm infants. J. Clin. Neurophysiol., 1995, 12:468–475.
Tonnquist-Uhle´n, I., Borg, E. and Spens, K.E. Auditory stimulation brain-map. Scand. Audiol., 1989, 18: 3–12.
Tonnquist-Uhle´n, I., Borg, E. and Spens, K.E. Topography of auditoryevoked long-latency potentials in normal children, with particular refer-ence to the N1 component. Electroenceph. clin. Neurophysiol., 1995,95: 34–41.
Tsuneishi, S., Casaer, P., Fock, J.M. and Hirano, S. Establishment ofnormal values for flash visual evoked potentials (VEPs) in preterminfants: a longitudinal study with special reference to two componentsof the N1 wave. Electroenceph. clin. Neurophysiol., 1995, 96: 291–299.
Umezaki, H. and Morrell, F. Developmental study of photic evokedresponses in premature infants. Electroenceph. clin. Neurophysiol.,1970, 28: 55–63.
Vohr, B.R. and Garcia-Coll, C.T. Follow-up studies of high-risk low birthweight in infants. In: H.E. Fitzgerald, B.H. Lester and M.W. Yogman,(Eds.), Theory and Research in Behavioral Pediatrics, 4. Plenum Press,New York, 1988, pp. 1–65.
Watanabe, K., Katsuhiko, I. and Kimiko, H. Maturation of visual evokedresponses in low-birthweight infants. Dev. Med. Child Neurol., 1972,14: 425–435.
Weitzman, E.D. and Graziani, L.J. Maturation and topography of theauditory evoked response of the prematurely born infant. Dev. Psycho-biol., 1968, 1: 79–89.
Whythe, H.E., Fitzhardinge, P.M., Shennan, A.T., Lennox, K., Smith, L.and Lacy, J. Extreme immaturity: outcome of 568 pregnancies of 23–26weeks gestation. Obstet. Gynecol., 1993, 82: 1–7.
Wijker, W. (1991). Age-changes in scalp distribution of cognitive event-related potentials elicited in an oddball task. In: ERP Ontogenesis inChildhood, p. 26 Doctoral Dissertation, University of Amsterdam,Amsterdam.
Woestenburg, J.C., Verbaten, M.N. and Slangen, J.L. The regression of theeye-movement artifact from EEG by regression analysis in the fre-quency domain. Biol. Psychol., 1983, 16: 127–147.
Yantis, P.A. Pure tone air-conduction testing. In: J. Katz (Ed.), Handbookof Clinical Audiology (3rd edn.). William and Wilkins, Los Angeles,CA, 1985, pp. 153–169.
243M.E. Lavoie et al. / Electroencephalography and clinical Neurophysiology 104 (1997) 228–243