a systematic study of ammonia recovery from anaerobic
TRANSCRIPT
�����������������
Citation: Rivera, F.; Muñoz, R.;
Prádanos, P.; Hernández, A.; Palacio,
L. A Systematic Study of Ammonia
Recovery from Anaerobic Digestate
Using Membrane-Based Separation.
Membranes 2022, 12, 19.
https://doi.org/10.3390/
membranes12010019
Academic Editors: Heitor Bento and
Cristiano E. Rodrigues Reis
Received: 9 December 2021
Accepted: 23 December 2021
Published: 24 December 2021
Publisher’s Note: MDPI stays neutral
with regard to jurisdictional claims in
published maps and institutional affil-
iations.
Copyright: © 2021 by the authors.
Licensee MDPI, Basel, Switzerland.
This article is an open access article
distributed under the terms and
conditions of the Creative Commons
Attribution (CC BY) license (https://
creativecommons.org/licenses/by/
4.0/).
membranes
Article
A Systematic Study of Ammonia Recovery from AnaerobicDigestate Using Membrane-Based Separation
Fanny Rivera 1,2, Raúl Muñoz 1,3 , Pedro Prádanos 1,2 , Antonio Hernández 1,2 and Laura Palacio 1,2,*1 Institute of Sustainable Processes, University of Valladolid, 47011 Valladolid, Spain;
[email protected] (F.R.); [email protected] (R.M.); [email protected] (P.P.);[email protected] (A.H.)
2 Department of Applied Physics, Science Faculty, University of Valladolid, 47011 Valladolid, Spain3 Department of Chemical Engineering and Environmental Technology, University of Valladolid,
47011 Valladolid, Spain* Correspondence: [email protected]
Abstract: Ammonia recovery from synthetic and real anaerobic digestates was accomplished us-ing hydrophobic flat sheet membranes operated with H2SO4 solutions to convert ammonia intoammonium sulphate. The influence of the membrane material, flow rate (0.007, 0.015, 0.030 and0.045 m3 h−1) and pH (7.6, 8.9, 10 and 11) of the digestate on ammonia recovery was investigated.The process was carried out with a flat sheet configuration at a temperature of 35 ◦C and with a 1 M, or0.005 M, H2SO4 solution on the other side of the membrane. Polytetrafluoroethylene membranes witha nominal pore radius of 0.22 µm provided ammonia recoveries from synthetic and real digestates of84.6% ± 1.0% and 71.6% ± 0.3%, respectively, for a membrane area of 8.6 × 10⁻⁴ m2 and a reservoirvolume of 0.5 L, in 3.5 h with a 1 M H2SO4 solution and a recirculation flow on the feed side of themembrane of 0.030 m3 h−1. NH3 recovery followed first order kinetics and was faster at higher pHsof the H2SO4 solution and recirculation flow rate on the membrane feed side. Fouling resulted inchanges in membrane surface morphology and pore size, which were confirmed by Atomic ForceMicroscopy and Air Displacement Porometry.
Keywords: ammonia recovery; anaerobic digestate; flat sheet membranes; mass transfer;membrane fouling
1. Introduction
A change in the perception of the uses of anaerobic digestion has occurred over pastdecades. Thus, anaerobic digestion was initially considered as a cost-competitive technol-ogy for organic matter stabilization in wastewaters and solid waste, then a sustainableplatform for renewable electricity and heat generation via biogas production, and morerecently, it has been regarded as the potential core of a multiproduct biorefinery. Energyand carbon in the form of biogas, along with nutrients dissolved in anaerobic effluents (typ-ically called digestates), represent nowadays the main by-products from anaerobic wastetreatment. NH3 recovery from digestates will prevent the pollution of natural water bodies,which is desirable as this nitrogenous compound is toxic to fish, increases oxygen demandand induces eutrophication [1]. NH3 is also harmful to humans as it causes respiratoryproblems and is considered a precursor of N2O, a potent greenhouse gas [2–4]. Therefore,NH3 recovery from digestates is crucial to improve the environmental sustainability ofanaerobic digestion processes and could bring additional economic benefits. Unfortunately,only 10% of the nitrogen present in wastewater is recovered by conventional wastewatertreatment plants (WWTPs) [5–7]. Today, there is a wide range of commercial technologiesto remove ammonia from wastewater, but most of them entail high operating costs [8] andenvironmental impacts resulting from nitrogen conversion and release to the atmosphere.Thus, conventional physical/chemical technologies are based on selective ion exchange, airstripping, chemical precipitation, adsorption, advanced oxidation processes, breakpoint
Membranes 2022, 12, 19. https://doi.org/10.3390/membranes12010019 https://www.mdpi.com/journal/membranes
Membranes 2022, 12, 19 2 of 14
chlorination, etc. [9–12]. For instance, NH3 stripping ranks among the most popular, butenergy demanding, technologies available to remove nitrogen from high-strength wastewa-ter, with an average energy consumption of 4 kwh per kg of nitrogen [13]. On the otherhand, conventional nitrogen removal in domestic WWTPs relies on nitrification, which isthe conversion of ammoniacal nitrogen (NH3-N) to NO−3 , and denitrification, which is theconversion of NO−3 to N2 gas [14–16]. In this context, 1.5 kWh of electricity are typicallyrequired to remove 1 kg of N in denitrification/nitrification or anammox processes [17]. Inaddition, conventional biological nitrogen removal in WWTPs entails 0.9 kg CO2 eq per m3
of treated water [18,19]. Therefore, there is an urgent need to develop and implementcost-competitive and sustainable NH3 recovery technologies in high strength wastewatersuch as digestates [20–22].
Recently, the use of membranes for NH3 recovery from high strength wastewater hasbeen proposed as a cost-competitive and environmentally friendly approach to upgraderesidual nitrogen. For example, Brennan et al. [23] made an extensive analysis of costsdemonstrating the feasibility of NH3 recovery by membranes over conventional methods ata pilot plant scale. Membrane contactors require less energy because of their high specificsurface area, which provides a faster NH3 separation. In this context, membrane contactorshave been successfully implemented for NH3 recovery from gaseous emissions [24–26].Membrane contactors have also been implemented to support a direct NH3 recovery fromwastewater [27–29]. This approach is based on hydrophobic membranes made of polymershighly permeable to NH3, which is transported through the membrane pores into thereceiving liquid phase recirculating through the permeate side [20,21,30]. This permeatingNH3 reacts with an acid contained in the permeate side of the membrane. For the processto be efficient, ammoniacal nitrogen has to be present in its volatile form (NH3), which canbe ensured by increasing pH and temperature [22]. Ammonium sulphate, a commercialchemical fertilizer, can be generated during membrane-based NH3 recovery when usingH2SO4 to boost NH3 diffusion (Equation (1)) [31]. The use of H3PO4 and HNO3 on thepermeate side also results in the generation of chemical fertilizers such as ammoniumphosphate and ammonium nitrate, respectively [27–29]. In this regard, Damtie and co-workers concluded that H2SO4 mediates a more effective ammonia capture than H3PO4and HNO3 [32].
2NH3 + H2SO4 → (NH4)2SO4 (1)
In this work, the performance of commercial flat sheet membranes for NH3 recoveryfrom synthetic and real digestates was systematically evaluated. To optimize the operationconditions, the influence of digestate pH, within the range of coexisting NH4
+, NH3 [33],and recirculation flow rate, was investigated using different concentrations of sulfuricacid on the other side of the membrane. To make this new ammonia process accessible,our proposal involves the use of commercial membranes that were previously employedfor other applications. By scanning the variables that can be controlled at the place ofinstallation, we reached the optimal conditions, without using the latest generation andnon-commercial materials. Ultimately, our objective was to propose a solution within thereach of the farmer who intends to implement it in their facilities. Finally, membrane foulingwas studied using Atomic Force Microscopy (AFM) to examine the surface morphology ofthe membranes and Air Displacement Porometry (ADP) to determine the correspondingchanges of the pore sizes of the membranes.
2. Materials and Methods2.1. Real and Synthetic Digestate Characterization
The synthetic digestate (SD) composition mimicked a real digestate and consistedof 5.0 g NaHCO3, 0.85 g C8H5KO4, 0.73 g peptone from casein, 1.70 g NH4Cl, 0.90 gCO(NH2)2, 0.224 g K2HPO4, 0.0175 g NaCl, 0.01 Ca2Cl and 0.005 g MgSO4 (per litre ofdistilled water) [34]. All reagents were purchased from PANREAC (Panreac, Química SAU,Barcelona, Spain). The real digestate (RD) used in this study was supplied by ValladolidWWTP (Spain). This digestate was obtained from the anaerobic digestion of mixed sludge
Membranes 2022, 12, 19 3 of 14
and on-site centrifuged prior to use to eliminate suspended solids. The concentration ofNH3 in SD and RD averaged 605.8 ± 0.1 and 678.9 ± 0.6 ppm, respectively, while pHsaveraged 7.57 ± 0.05 and 8.99 ± 0.08, respectively.
2.2. Experimental Setup
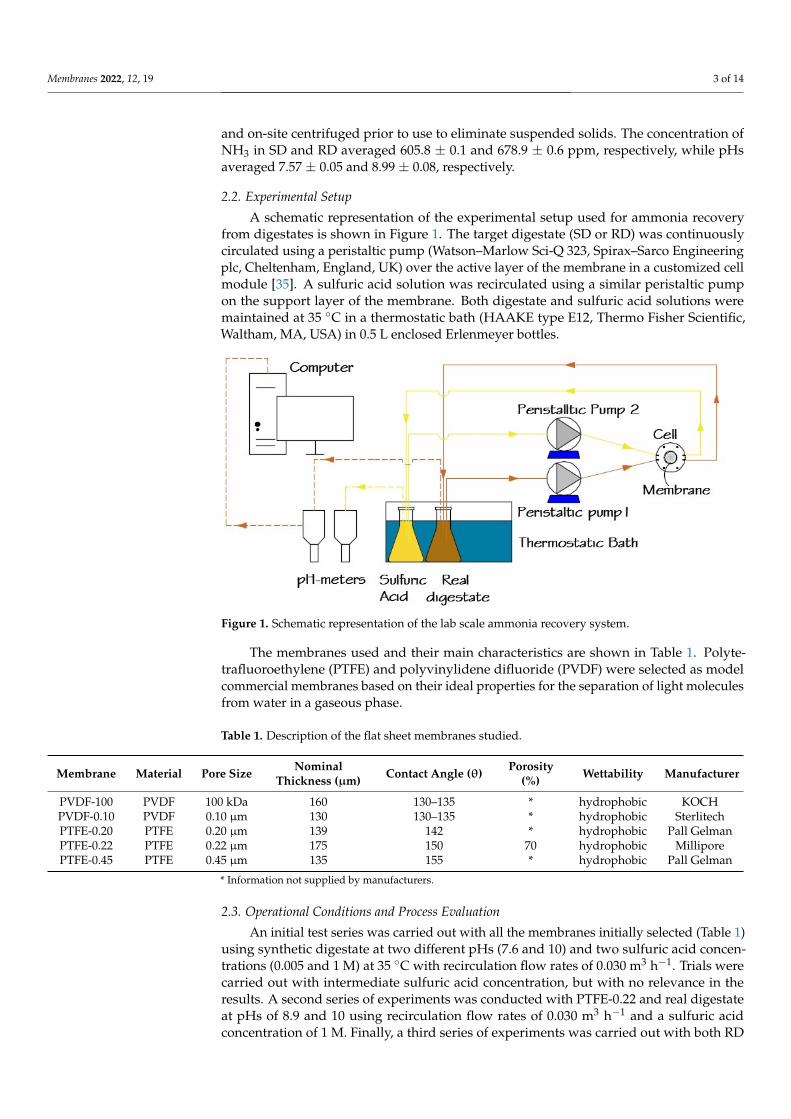
A schematic representation of the experimental setup used for ammonia recoveryfrom digestates is shown in Figure 1. The target digestate (SD or RD) was continuouslycirculated using a peristaltic pump (Watson–Marlow Sci-Q 323, Spirax–Sarco Engineeringplc, Cheltenham, England, UK) over the active layer of the membrane in a customized cellmodule [35]. A sulfuric acid solution was recirculated using a similar peristaltic pumpon the support layer of the membrane. Both digestate and sulfuric acid solutions weremaintained at 35 ◦C in a thermostatic bath (HAAKE type E12, Thermo Fisher Scientific,Waltham, MA, USA) in 0.5 L enclosed Erlenmeyer bottles.
Membranes 2022, 11, x FOR PEER REVIEW 3 of 14
0.224 g K2HPO4, 0.0175 g NaCl, 0.01 Ca2Cl and 0.005 g MgSO4 (per litre of distilled water) [34]. All reagents were purchased from PANREAC (Panreac, Química SAU, Barcelona, Spain). The real digestate (RD) used in this study was supplied by Valladolid WWTP (Spain). This digestate was obtained from the anaerobic digestion of mixed sludge and on-site centrifuged prior to use to eliminate suspended solids. The concentration of NH3 in SD and RD averaged 605.8 ± 0.1 and 678.9 ± 0.6 ppm, respectively, while pHs averaged 7.57 ± 0.05 and 8.99 ± 0.08, respectively.
2.2. Experimental Setup A schematic representation of the experimental setup used for ammonia recovery
from digestates is shown in Figure 1. The target digestate (SD or RD) was continuously circulated using a peristaltic pump (Watson–Marlow Sci-Q 323, Spirax–Sarco Engineering plc, Cheltenham, England, UK) over the active layer of the membrane in a customized cell module [35]. A sulfuric acid solution was recirculated using a similar peristaltic pump on the support layer of the membrane. Both digestate and sulfuric acid solutions were main-tained at 35 °C in a thermostatic bath (HAAKE type E12, Thermo Fisher Scientific, Wal-tham, MA, USA) in 0.5 L enclosed Erlenmeyer bottles.
Figure 1. Schematic representation of the lab scale ammonia recovery system.
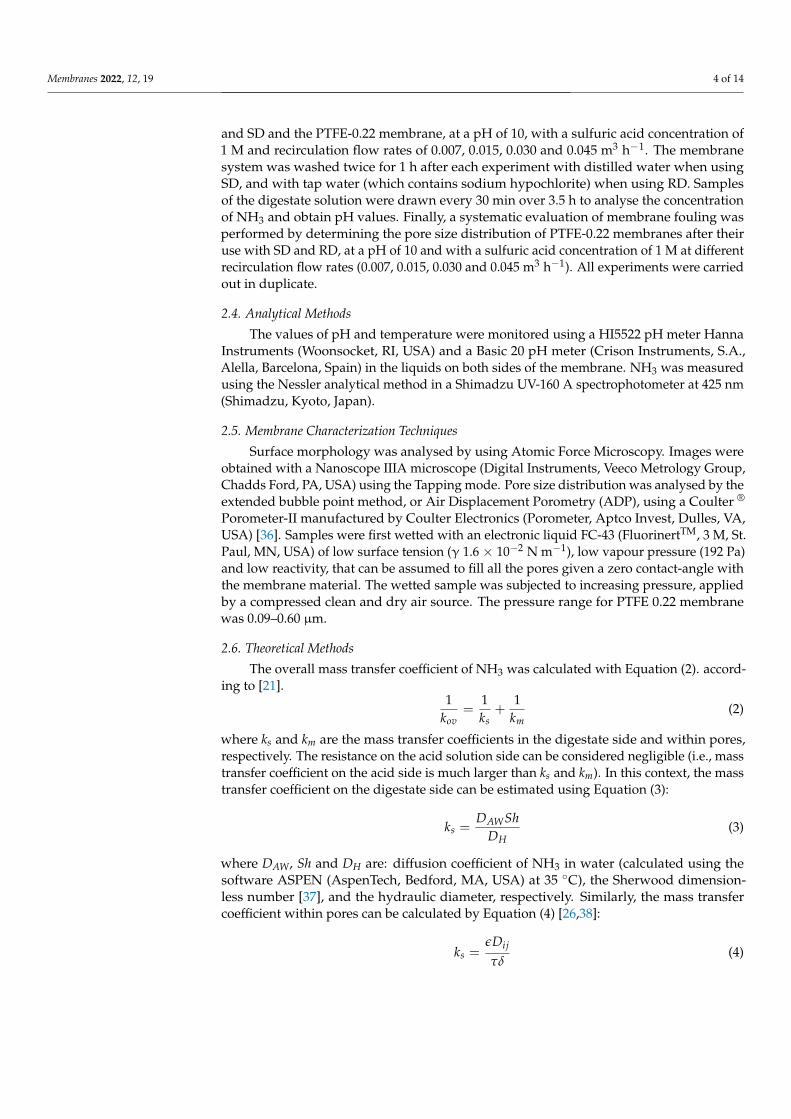
The membranes used and their main characteristics are shown in Table 1. Polytetra-fluoroethylene (PTFE) and polyvinylidene difluoride (PVDF) were selected as model com-mercial membranes based on their ideal properties for the separation of light molecules from water in a gaseous phase.
Table 1. Description of the flat sheet membranes studied.
Membrane Material Pore Size
Nominal Thickness
(µm)
Contact Angle
(θ)
Poros-ity (%)
Wettability Manufacturer
PVDF-100 PVDF 100 kDa 160 130–135 * hydrophobic KOCH PVDF-0.10 PVDF 0.10 µm 130 130–135 * hydrophobic Sterlitech PTFE-0.20 PTFE 0.20 µm 139 142 * hydrophobic Pall Gelman PTFE-0.22 PTFE 0.22 µm 175 150 70 hydrophobic Millipore PTFE-0.45 PTFE 0.45 µm 135 155 * hydrophobic Pall Gelman
* Information not supplied by manufacturers.
Figure 1. Schematic representation of the lab scale ammonia recovery system.
The membranes used and their main characteristics are shown in Table 1. Polyte-trafluoroethylene (PTFE) and polyvinylidene difluoride (PVDF) were selected as modelcommercial membranes based on their ideal properties for the separation of light moleculesfrom water in a gaseous phase.
Table 1. Description of the flat sheet membranes studied.
Membrane Material Pore Size NominalThickness (µm) Contact Angle (θ) Porosity
(%) Wettability Manufacturer
PVDF-100 PVDF 100 kDa 160 130–135 * hydrophobic KOCHPVDF-0.10 PVDF 0.10 µm 130 130–135 * hydrophobic SterlitechPTFE-0.20 PTFE 0.20 µm 139 142 * hydrophobic Pall GelmanPTFE-0.22 PTFE 0.22 µm 175 150 70 hydrophobic MilliporePTFE-0.45 PTFE 0.45 µm 135 155 * hydrophobic Pall Gelman
* Information not supplied by manufacturers.
2.3. Operational Conditions and Process Evaluation
An initial test series was carried out with all the membranes initially selected (Table 1)using synthetic digestate at two different pHs (7.6 and 10) and two sulfuric acid concen-trations (0.005 and 1 M) at 35 ◦C with recirculation flow rates of 0.030 m3 h−1. Trials werecarried out with intermediate sulfuric acid concentration, but with no relevance in theresults. A second series of experiments was conducted with PTFE-0.22 and real digestateat pHs of 8.9 and 10 using recirculation flow rates of 0.030 m3 h−1 and a sulfuric acidconcentration of 1 M. Finally, a third series of experiments was carried out with both RD
Membranes 2022, 12, 19 4 of 14
and SD and the PTFE-0.22 membrane, at a pH of 10, with a sulfuric acid concentration of1 M and recirculation flow rates of 0.007, 0.015, 0.030 and 0.045 m3 h−1. The membranesystem was washed twice for 1 h after each experiment with distilled water when usingSD, and with tap water (which contains sodium hypochlorite) when using RD. Samplesof the digestate solution were drawn every 30 min over 3.5 h to analyse the concentrationof NH3 and obtain pH values. Finally, a systematic evaluation of membrane fouling wasperformed by determining the pore size distribution of PTFE-0.22 membranes after theiruse with SD and RD, at a pH of 10 and with a sulfuric acid concentration of 1 M at differentrecirculation flow rates (0.007, 0.015, 0.030 and 0.045 m3 h−1). All experiments were carriedout in duplicate.
2.4. Analytical Methods
The values of pH and temperature were monitored using a HI5522 pH meter HannaInstruments (Woonsocket, RI, USA) and a Basic 20 pH meter (Crison Instruments, S.A.,Alella, Barcelona, Spain) in the liquids on both sides of the membrane. NH3 was measuredusing the Nessler analytical method in a Shimadzu UV-160 A spectrophotometer at 425 nm(Shimadzu, Kyoto, Japan).
2.5. Membrane Characterization Techniques
Surface morphology was analysed by using Atomic Force Microscopy. Images wereobtained with a Nanoscope IIIA microscope (Digital Instruments, Veeco Metrology Group,Chadds Ford, PA, USA) using the Tapping mode. Pore size distribution was analysed by theextended bubble point method, or Air Displacement Porometry (ADP), using a Coulter ®
Porometer-II manufactured by Coulter Electronics (Porometer, Aptco Invest, Dulles, VA,USA) [36]. Samples were first wetted with an electronic liquid FC-43 (FluorinertTM, 3 M, St.Paul, MN, USA) of low surface tension (γ 1.6 × 10⁻² N m−1), low vapour pressure (192 Pa)and low reactivity, that can be assumed to fill all the pores given a zero contact-angle withthe membrane material. The wetted sample was subjected to increasing pressure, appliedby a compressed clean and dry air source. The pressure range for PTFE 0.22 membranewas 0.09–0.60 µm.
2.6. Theoretical Methods
The overall mass transfer coefficient of NH3 was calculated with Equation (2). accord-ing to [21].
1kov
=1ks
+1
km(2)
where ks and km are the mass transfer coefficients in the digestate side and within pores,respectively. The resistance on the acid solution side can be considered negligible (i.e., masstransfer coefficient on the acid side is much larger than ks and km). In this context, the masstransfer coefficient on the digestate side can be estimated using Equation (3):
ks =DAWSh
DH(3)
where DAW, Sh and DH are: diffusion coefficient of NH3 in water (calculated using thesoftware ASPEN (AspenTech, Bedford, MA, USA) at 35 ◦C), the Sherwood dimension-less number [37], and the hydraulic diameter, respectively. Similarly, the mass transfercoefficient within pores can be calculated by Equation (4) [26,38]:
ks =εDij
τδ(4)
Membranes 2022, 12, 19 5 of 14
where τ, δ, Dij and ε are: the tortuosity, the wall thickness of the membrane, the diffu-sion coefficient of NH3 in the air gap within pores, and the porosity of the membrane,respectively. Accepting Knudsen regime [21]:
Dij =dp
3
√8RTπm
(5)
in terms of the pore diameter and NH3 molar mass m.The molar theoretical flux of NH3 across the membrane can be estimated using
Equation (6) [39]:JT = kov∆C (6)
here, ∆C is the difference in NH3 concentrations between the feed and permeate sides.Finally, NH3 recovery seems to follow first-order kinetics, which can be estimated usingEquation (7) [40,41]:
lnC0
Ct= kov
Am
Vtt (7)
where kov, Am/Vt and t are the overall mass transfer coefficient, the effective ratio ofmembrane area to feed volume of the digestate, and the elapsed time, respectively. C0 andCt are the concentration of ammonia at time zero and time t in the digestate, respectively.NH3 recovery (R) ranges between 0 and 1 (Equation (8)):
R = 1− Ct
C0= 1− e−kov
AmVt
t ≡ 1− e−αt (8)
here α = kovAmVt
is the rate of concentration decrease and recovery increase. Therefore, thetime needed to reach a given R can be estimated using Equation (9):
t(R) = − ln(1− R)kov
AmVt
= − ln(1− R)α
(9)
3. Results and Discussion3.1. Influence of Membrane Material, pH and H2SO4 Concentration
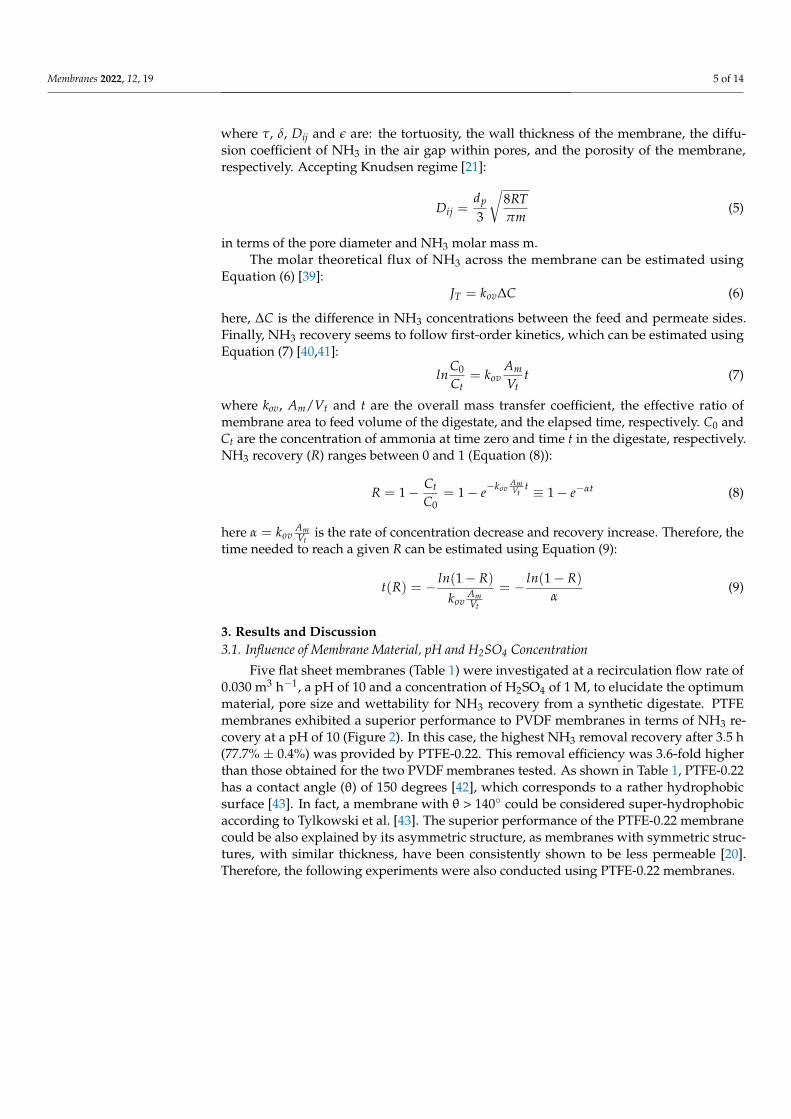
Five flat sheet membranes (Table 1) were investigated at a recirculation flow rate of0.030 m3 h−1, a pH of 10 and a concentration of H2SO4 of 1 M, to elucidate the optimummaterial, pore size and wettability for NH3 recovery from a synthetic digestate. PTFEmembranes exhibited a superior performance to PVDF membranes in terms of NH3 re-covery at a pH of 10 (Figure 2). In this case, the highest NH3 removal recovery after 3.5 h(77.7% ± 0.4%) was provided by PTFE-0.22. This removal efficiency was 3.6-fold higherthan those obtained for the two PVDF membranes tested. As shown in Table 1, PTFE-0.22has a contact angle (θ) of 150 degrees [42], which corresponds to a rather hydrophobicsurface [43]. In fact, a membrane with θ > 140◦ could be considered super-hydrophobicaccording to Tylkowski et al. [43]. The superior performance of the PTFE-0.22 membranecould be also explained by its asymmetric structure, as membranes with symmetric struc-tures, with similar thickness, have been consistently shown to be less permeable [20].Therefore, the following experiments were also conducted using PTFE-0.22 membranes.
Membranes 2022, 12, 19 6 of 14Membranes 2022, 11, x FOR PEER REVIEW 6 of 14
Figure 2. Influence of the type of membrane on ammonia recovery, after 3.5 h, in SD with a recircu-lation flow rate of 0.030 m3 h−1, a pH of 10 and a concentration of H2SO4 of 1 M. Vertical bars repre-sent the standard deviation obtained from duplicate measurements.
The influence of the digestate pH was also studied. This parameter determines NH3 mass transfer as it shifts the equilibrium NH ↔ NH + H . In our study, higher ammo-nia recoveries were achieved by increasing the pH of the synthetic digestate because of the increase in the NH3 concentration gradient (Figure S1 in the Supplementary material). Nevertheless, an increase in the pH of the digestate above 10 does not entail large im-provement in the ammonia removal [20]. Operating the process at a pH of 11 with a PTFE-0.22 membrane, a recirculation flow rate of 0.030 m3 h−1 and a concentration of H2SO4 of 1 M, resulted in a NH3 recovery of 82.8% ± 0.4%, only 10% higher than the recoveries rec-orded at a pH of 10. NH3 recovery was lower in real digestate than in synthetic digestate using a PTFE-0.22 membrane at pHs of 10 and 7.6, the latter pH supporting lower NH3 recoveries (Figure S1 in the Supplementary material). Thus, the times needed to reach 95% NH3 recovery significantly increased by a factor of 6.5 and 2.3 in SD and RD, respectively, when digestate pH was increased from 7.6 to 10 (Table 2).
Table 2. Time needed to reach 95% NH3 recovery for the PTFE-0.22 membrane operated with a concentration of H2SO4 of 1 M and a flow rate of 0.030 m3 h−1.
Digestate
SD RD pH t (95%)/h 7.6 36.03 16.88 10 5.49 7.31
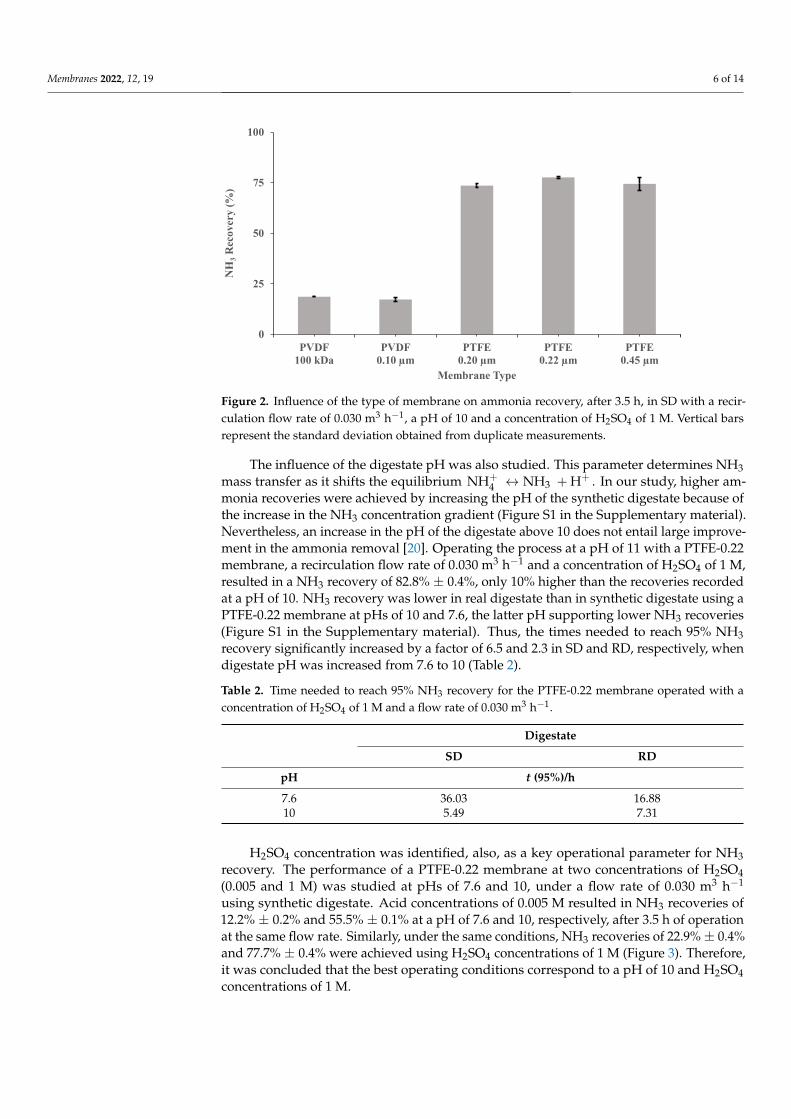
H2SO4 concentration was identified, also, as a key operational parameter for NH3 re-covery. The performance of a PTFE-0.22 membrane at two concentrations of H2SO4 (0.005 and 1 M) was studied at pHs of 7.6 and 10, under a flow rate of 0.030 m3 h−1 using synthetic digestate. Acid concentrations of 0.005 M resulted in NH3 recoveries of 12.2% ± 0.2% and 55.5% ± 0.1% at a pH of 7.6 and 10, respectively, after 3.5 h of operation at the same flow rate. Similarly, under the same conditions, NH3 recoveries of 22.9% ± 0.4% and 77.7% ± 0.4% were achieved using H2SO4 concentrations of 1 M (Figure 3). Therefore, it was con-cluded that the best operating conditions correspond to a pH of 10 and H2SO4 concentra-tions of 1 M.
0
25
50
75
100
PVDF100 kDa
PVDF0.10 µm
PTFE0.20 µm
PTFE0.22 µm
PTFE0.45 µm
NH
3R
ecov
ery
(%)
Membrane Type
Figure 2. Influence of the type of membrane on ammonia recovery, after 3.5 h, in SD with a recir-culation flow rate of 0.030 m3 h−1, a pH of 10 and a concentration of H2SO4 of 1 M. Vertical barsrepresent the standard deviation obtained from duplicate measurements.
The influence of the digestate pH was also studied. This parameter determines NH3mass transfer as it shifts the equilibrium NH+
4 ↔ NH3 + H+ . In our study, higher am-monia recoveries were achieved by increasing the pH of the synthetic digestate because ofthe increase in the NH3 concentration gradient (Figure S1 in the Supplementary material).Nevertheless, an increase in the pH of the digestate above 10 does not entail large improve-ment in the ammonia removal [20]. Operating the process at a pH of 11 with a PTFE-0.22membrane, a recirculation flow rate of 0.030 m3 h−1 and a concentration of H2SO4 of 1 M,resulted in a NH3 recovery of 82.8% ± 0.4%, only 10% higher than the recoveries recordedat a pH of 10. NH3 recovery was lower in real digestate than in synthetic digestate using aPTFE-0.22 membrane at pHs of 10 and 7.6, the latter pH supporting lower NH3 recoveries(Figure S1 in the Supplementary material). Thus, the times needed to reach 95% NH3recovery significantly increased by a factor of 6.5 and 2.3 in SD and RD, respectively, whendigestate pH was increased from 7.6 to 10 (Table 2).
Table 2. Time needed to reach 95% NH3 recovery for the PTFE-0.22 membrane operated with aconcentration of H2SO4 of 1 M and a flow rate of 0.030 m3 h−1.
Digestate
SD RD
pH t (95%)/h
7.6 36.03 16.8810 5.49 7.31
H2SO4 concentration was identified, also, as a key operational parameter for NH3recovery. The performance of a PTFE-0.22 membrane at two concentrations of H2SO4(0.005 and 1 M) was studied at pHs of 7.6 and 10, under a flow rate of 0.030 m3 h−1
using synthetic digestate. Acid concentrations of 0.005 M resulted in NH3 recoveries of12.2% ± 0.2% and 55.5% ± 0.1% at a pH of 7.6 and 10, respectively, after 3.5 h of operationat the same flow rate. Similarly, under the same conditions, NH3 recoveries of 22.9%± 0.4%and 77.7% ± 0.4% were achieved using H2SO4 concentrations of 1 M (Figure 3). Therefore,it was concluded that the best operating conditions correspond to a pH of 10 and H2SO4concentrations of 1 M.
Membranes 2022, 12, 19 7 of 14Membranes 2022, 11, x FOR PEER REVIEW 7 of 14
Figure 3. Influence of the sulfuric acid concentration on NH3 recovery from SD at pHs of 7.6 and 10 and a flow rate of 0.030 m3 h−1 using the PTFE-0.22 membrane. Vertical bars (very short here) repre-sent the standard deviation from replicate measurements.
3.2. Influence of the Digestate Recirculation Flow Rate Ammonia removal efficiencies of 84.6% ± 1.0% were achieved using the PTFE-0.22
membrane after 3.5 h of experiment in synthetic digestate, which were higher than the removal efficiencies in real digestate (71.6% ± 0.3%), at 0.045 m3 h−1 and a pH of 10. The lower NH3 recoveries in real digestate were likely due to membrane fouling. This fouling affected the NH3 permeate flux mainly due to adsorption of colloids, or solutes including ammonia, within the membrane pores, with a subsequent reduction in mean pore sizes. According to Meng et al. [44], membrane fouling typically causes cake layer formation, deposition of sludge flocs and their deposition on the membrane. The influence of the velocity of the acid solution was not herein assessed as previous literature has consistently shown that the velocity of the acid solutions does not impact significantly on NH3 mass transfer [20,31].
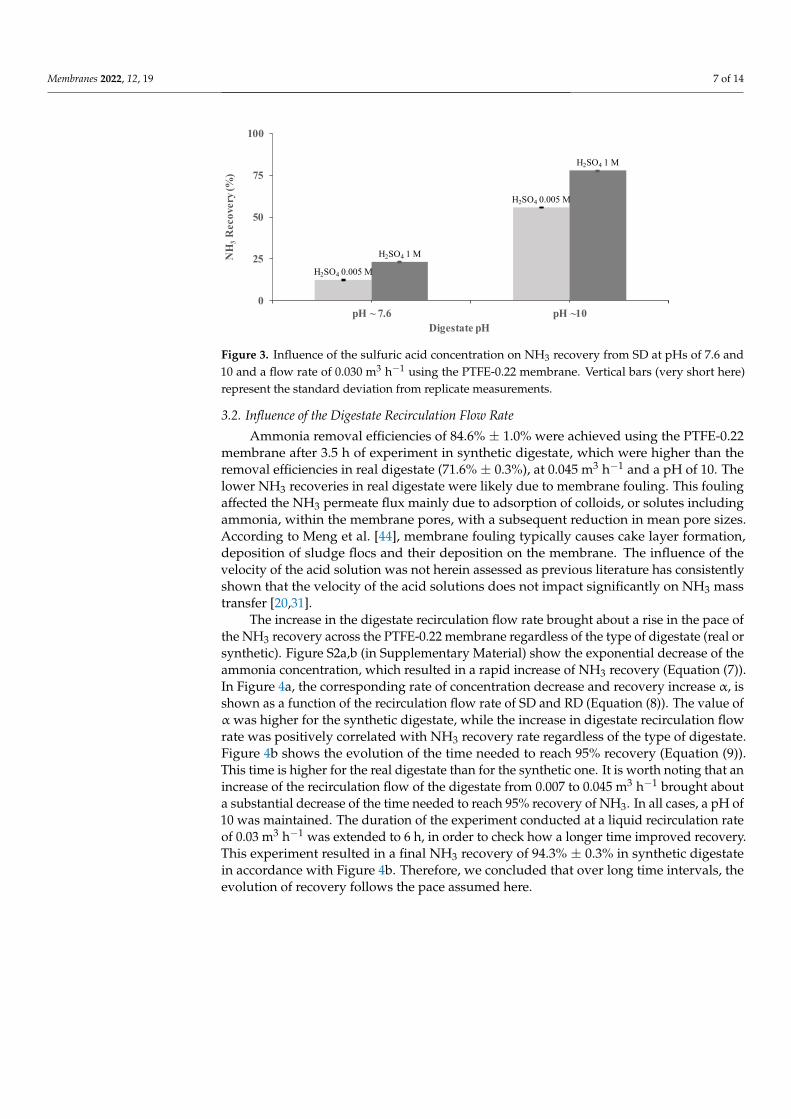
The increase in the digestate recirculation flow rate brought about a rise in the pace of the NH3 recovery across the PTFE-0.22 membrane regardless of the type of digestate (real or synthetic). Figure S2a,b (in Supplementary Material) show the exponential de-crease of the ammonia concentration, which resulted in a rapid increase of NH3 recovery (Equation (7)). In Figure 4a, the corresponding rate of concentration decrease and recovery increase α, is shown as a function of the recirculation flow rate of SD and RD (Equation (8)). The value of α was higher for the synthetic digestate, while the increase in digestate recirculation flow rate was positively correlated with NH3 recovery rate regardless of the type of digestate. Figure 4b shows the evolution of the time needed to reach 95% recovery (Equation (9)). This time is higher for the real digestate than for the synthetic one. It is worth noting that an increase of the recirculation flow of the digestate from 0.007 to 0.045 m3 h−1 brought about a substantial decrease of the time needed to reach 95% recovery of NH3. In all cases, a pH of 10 was maintained. The duration of the experiment conducted at a liquid recirculation rate of 0.03 m3 h−1 was extended to 6 h, in order to check how a longer time improved recovery. This experiment resulted in a final NH3 recovery of 94.3% ± 0.3% in synthetic digestate in accordance with Figure 4b. Therefore, we concluded that over long time intervals, the evolution of recovery follows the pace assumed here.
H2SO4 0.005 M
H2SO4 0.005 M
H2SO4 1 M
H2SO4 1 M
0
25
50
75
100
pH ~ 7.6 pH ~10
NH
3R
ecov
ery (
%)
Digestate pH
Figure 3. Influence of the sulfuric acid concentration on NH3 recovery from SD at pHs of 7.6 and10 and a flow rate of 0.030 m3 h−1 using the PTFE-0.22 membrane. Vertical bars (very short here)represent the standard deviation from replicate measurements.
3.2. Influence of the Digestate Recirculation Flow Rate
Ammonia removal efficiencies of 84.6% ± 1.0% were achieved using the PTFE-0.22membrane after 3.5 h of experiment in synthetic digestate, which were higher than theremoval efficiencies in real digestate (71.6% ± 0.3%), at 0.045 m3 h−1 and a pH of 10. Thelower NH3 recoveries in real digestate were likely due to membrane fouling. This foulingaffected the NH3 permeate flux mainly due to adsorption of colloids, or solutes includingammonia, within the membrane pores, with a subsequent reduction in mean pore sizes.According to Meng et al. [44], membrane fouling typically causes cake layer formation,deposition of sludge flocs and their deposition on the membrane. The influence of thevelocity of the acid solution was not herein assessed as previous literature has consistentlyshown that the velocity of the acid solutions does not impact significantly on NH3 masstransfer [20,31].
The increase in the digestate recirculation flow rate brought about a rise in the pace ofthe NH3 recovery across the PTFE-0.22 membrane regardless of the type of digestate (real orsynthetic). Figure S2a,b (in Supplementary Material) show the exponential decrease of theammonia concentration, which resulted in a rapid increase of NH3 recovery (Equation (7)).In Figure 4a, the corresponding rate of concentration decrease and recovery increase α, isshown as a function of the recirculation flow rate of SD and RD (Equation (8)). The value ofα was higher for the synthetic digestate, while the increase in digestate recirculation flowrate was positively correlated with NH3 recovery rate regardless of the type of digestate.Figure 4b shows the evolution of the time needed to reach 95% recovery (Equation (9)).This time is higher for the real digestate than for the synthetic one. It is worth noting that anincrease of the recirculation flow of the digestate from 0.007 to 0.045 m3 h−1 brought abouta substantial decrease of the time needed to reach 95% recovery of NH3. In all cases, a pH of10 was maintained. The duration of the experiment conducted at a liquid recirculation rateof 0.03 m3 h−1 was extended to 6 h, in order to check how a longer time improved recovery.This experiment resulted in a final NH3 recovery of 94.3% ± 0.3% in synthetic digestatein accordance with Figure 4b. Therefore, we concluded that over long time intervals, theevolution of recovery follows the pace assumed here.
Membranes 2022, 12, 19 8 of 14
Membranes 2022, 11, x FOR PEER REVIEW 8 of 14
Figure 4. Influence of the recirculation flow rate on (a) α, and (b) the time to reach 95% NH3 recovery using a PTFE-0.22 membrane at different recirculation flow rates at a pH of 10 and a concentration of H2SO4 of 1M for both digestates.
The NH3 fluxes across the PTFE-0.22 membrane in both SD and RD are shown in Figure 5. They decreased as the recirculation flow rate increased because of fouling, prob-ably induced by shear. In addition, NH3 fluxes were slightly higher in SD than in RD ac-cording to its lower induction of membrane fouling. By fitting theoretical to experimental fluxes and using Equations (2)–(6), the corresponding effective pore diameters were eval-uated at the end of each experiment, as a function of the recirculation flow Q, which was 0.25 µm.
Figure 4. Influence of the recirculation flow rate on (a) α, and (b) the time to reach 95% NH3 recoveryusing a PTFE-0.22 membrane at different recirculation flow rates at a pH of 10 and a concentration ofH2SO4 of 1M for both digestates.
The NH3 fluxes across the PTFE-0.22 membrane in both SD and RD are shown inFigure 5. They decreased as the recirculation flow rate increased because of fouling,probably induced by shear. In addition, NH3 fluxes were slightly higher in SD thanin RD according to its lower induction of membrane fouling. By fitting theoretical toexperimental fluxes and using Equations (2)–(6), the corresponding effective pore diameters
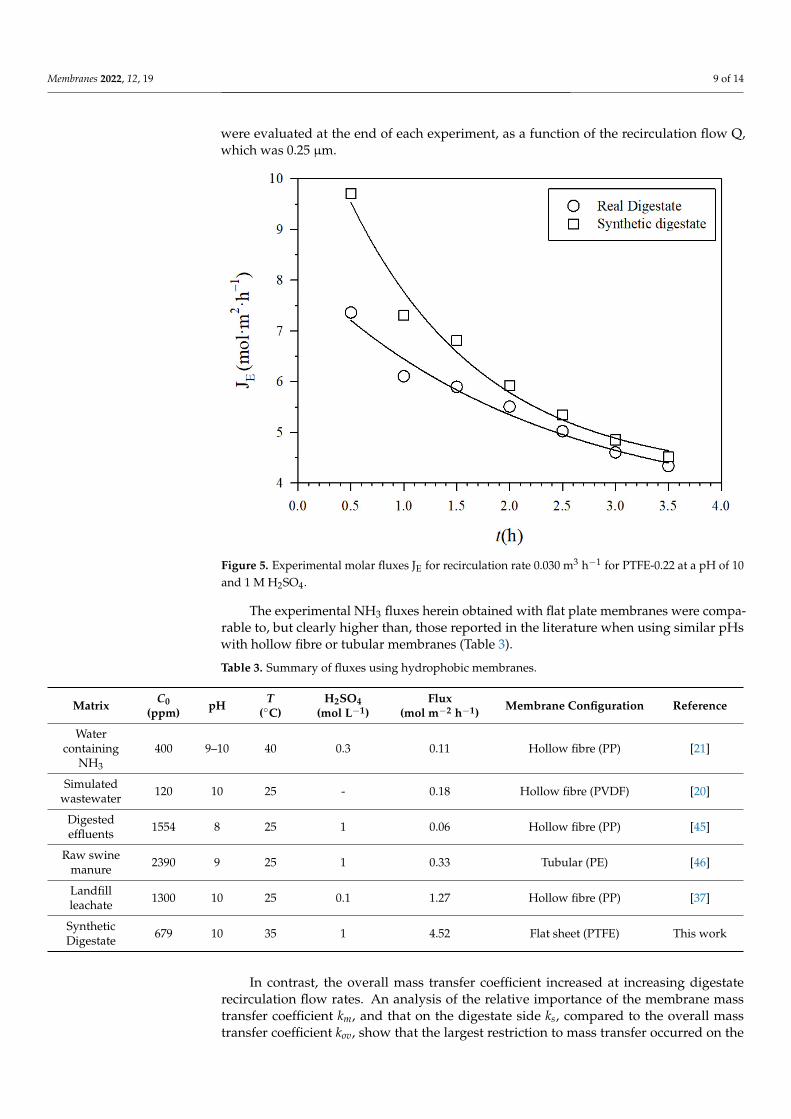
Membranes 2022, 12, 19 9 of 14
were evaluated at the end of each experiment, as a function of the recirculation flow Q,which was 0.25 µm.
Membranes 2022, 11, x FOR PEER REVIEW 9 of 14
Figure 5. Experimental molar fluxes JE for recirculation rate 0.030 m3 h−1 for PTFE-0.22 at a pH of 10 and 1 M H2SO4.
The experimental NH3 fluxes herein obtained with flat plate membranes were com-parable to, but clearly higher than, those reported in the literature when using similar pHs with hollow fibre or tubular membranes (Table 3).
Table 3. Summary of fluxes using hydrophobic membranes.
Matrix Co (ppm) pH T
(°C) H2SO4
(mol L−1) Flux
(mol m−2 h−1) Membrane
Configuration Reference
Water con-taining NH3 400 9–10 40 0.3 0.11
Hollow fibre (PP) [21]
Simulated wastewater 120 10 25 - 0.18
Hollow fibre (PVDF) [20]
Digested ef-fluents 1554 8 25 1 0.06
Hollow fibre (PP) [45]
Raw swine manure 2390 9 25 1 0.33 Tubular (PE) [46]
Landfill leachate 1300 10 25 0.1 1.27
Hollow fibre (PP) [37]
Synthetic Digestate 679 10 35 1 4.52
Flat sheet (PTFE) This work
In contrast, the overall mass transfer coefficient increased at increasing digestate re-circulation flow rates. An analysis of the relative importance of the membrane mass trans-fer coefficient km, and that on the digestate side ks, compared to the overall mass transfer coefficient kov, show that the largest restriction to mass transfer occurred on the digestate side of the membrane, while through the pores, there was a very high NH3 mass transfer. NH3 mass transfer through the pores decreased steeply when the recirculation flow rate was increased, but with a concomitant increase of the mass transfer on the digestate side of the membrane. Values of Table 4 correspond to synthetic digestate.
Figure 5. Experimental molar fluxes JE for recirculation rate 0.030 m3 h−1 for PTFE-0.22 at a pH of 10and 1 M H2SO4.
The experimental NH3 fluxes herein obtained with flat plate membranes were compa-rable to, but clearly higher than, those reported in the literature when using similar pHswith hollow fibre or tubular membranes (Table 3).
Table 3. Summary of fluxes using hydrophobic membranes.
Matrix C0(ppm) pH T
(◦C)H2SO4
(mol L−1)Flux
(mol m−2 h−1) Membrane Configuration Reference
Watercontaining
NH3
400 9–10 40 0.3 0.11 Hollow fibre (PP) [21]
Simulatedwastewater 120 10 25 - 0.18 Hollow fibre (PVDF) [20]
Digestedeffluents 1554 8 25 1 0.06 Hollow fibre (PP) [45]
Raw swinemanure 2390 9 25 1 0.33 Tubular (PE) [46]
Landfillleachate 1300 10 25 0.1 1.27 Hollow fibre (PP) [37]
SyntheticDigestate 679 10 35 1 4.52 Flat sheet (PTFE) This work
In contrast, the overall mass transfer coefficient increased at increasing digestaterecirculation flow rates. An analysis of the relative importance of the membrane masstransfer coefficient km, and that on the digestate side ks, compared to the overall masstransfer coefficient kov, show that the largest restriction to mass transfer occurred on the
Membranes 2022, 12, 19 10 of 14
digestate side of the membrane, while through the pores, there was a very high NH3 masstransfer. NH3 mass transfer through the pores decreased steeply when the recirculation flowrate was increased, but with a concomitant increase of the mass transfer on the digestateside of the membrane. Values of Table 4 correspond to synthetic digestate.
Table 4. Calculated mass transfer coefficients for synthetic digestate.
Recirculation Rate (m3 h−1)kov
a
(m h−1)ks
b/kov(m h−1)
kmc/kov
(m h−1)
0.007 0.13 3.48 1.400.015 0.15 5.91 1.200.030 0.16 9.73 1.110.045 0.17 13.23 1.08
a Calculated from Equation (2). b Calculated from Equation (3) Daw = 1.26 × 10 −5 m2 h−1. c Calculated fromEquation (4) Dij = 0.26 m2 h−1.
3.3. Pore Size
The characteristics of the PTFE-0.22 membrane were studied by air displacementporometry after the operation of the process under different experimental conditions(pH of 10, concentration of H2SO4 1 M, recirculation flow rates 0.007, 0.015, 0.030 and0.045 m3 h−1) using both synthetic digestate and real digestate. The increase in membranefouling reduced the pore diameter, as a result of deposits that partially or totally blocked themembrane pores (Table 5) [47]. A higher reduction in pore diameter was observed when thePTFE-0.22 membrane was exposed to longer periods of filtration, lower recirculation ratesand real digestate from Valladolid WWTP. Interestingly, the mean pore size was similarin the new membrane and in the membranes used twice with recirculation flow rates of0.045 m3 h−1 (0.3548 µm ± 0.0004 and 0.3521 µm ± 0.0004, respectively). This behaviour isin accordance with more specific fouling studies for PTFE in literature [48,49].
Table 5. Mean pore sizes of the PTFE-0.22 membrane under different operational conditions.
Type of Digestate Recirculation Rate(m3 h−1) Type of Membrane Mean Pore Size
(µm)
None None New membrane 0.3548 ± 0.0004SD 0.045 Used twice 0.3521 ± 0.0004SD 0.007, 0.015, 0.030 Used multiple times 0.3443 ± 0.0004RD 0.045 Used twice 0.3347 ± 0.0003RD 0.007, 0.015, 0.030 Used multiple times 0.3228 ± 0.0002
3.4. Membrane Morphology Analysis
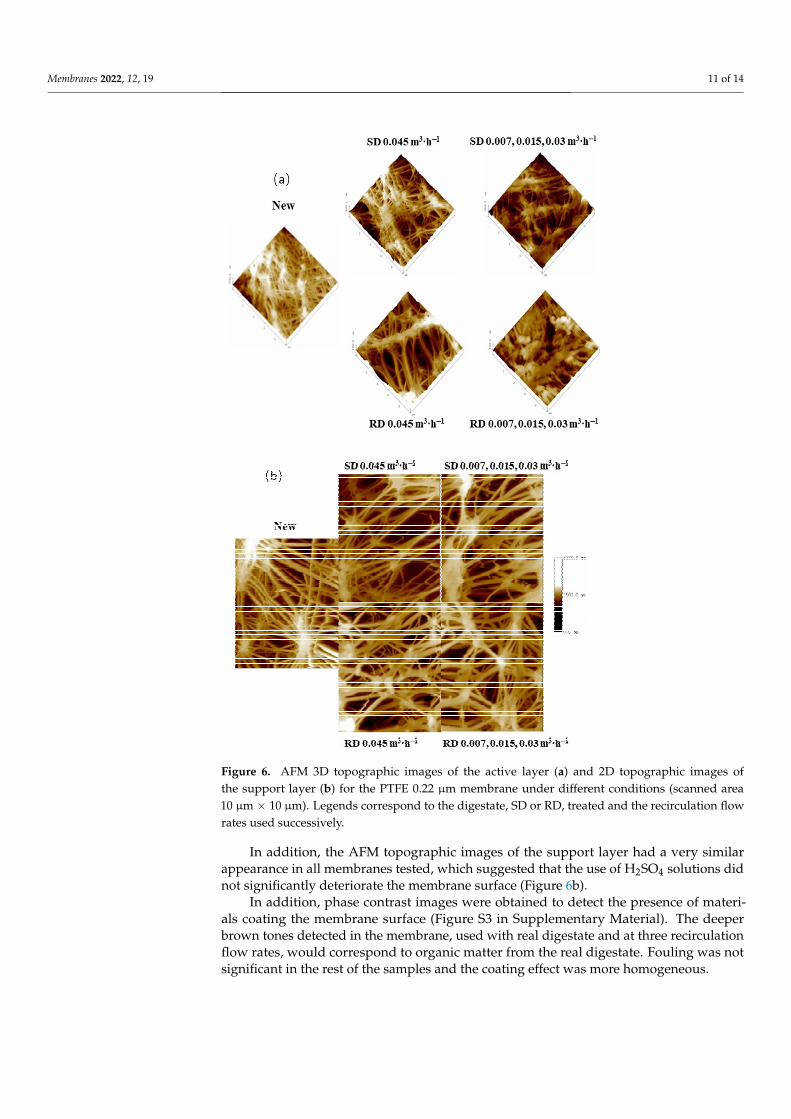
Figure 6a shows three-dimensional AFM pictures of PTFE-0.22 membranes that wereunused or used under multiple operational conditions. More fouling was detected on thesurfaces of the membrane operated with real digestate at three recirculation flow rates.The membranes operated with real digestate at the highest circulation flow rate presenteda surface fouling level in agreement with the pore size results (Table 4). The unusedmembrane has a topography with higher roughness than for the used membranes, inaccordance with Zhang et al. [50].
Membranes 2022, 12, 19 11 of 14Membranes 2022, 11, x FOR PEER REVIEW 11 of 14
Figure 6. AFM 3D topographic images of the active layer (a) and 2D topographic images of the support layer (b) for the PTFE 0.22 µm membrane under different conditions (scanned area 10 µm × 10 µm). Legends correspond to the digestate, SD or RD, treated and the recirculation flow rates used successively.
In addition, the AFM topographic images of the support layer had a very similar appearance in all membranes tested, which suggested that the use of H2SO4 solutions did not significantly deteriorate the membrane surface (Figure 6b).
In addition, phase contrast images were obtained to detect the presence of materials coating the membrane surface (Figure S3 in Supplementary Material). The deeper brown tones detected in the membrane, used with real digestate and at three recirculation flow rates, would correspond to organic matter from the real digestate. Fouling was not signif-icant in the rest of the samples and the coating effect was more homogeneous.
Figure 6. AFM 3D topographic images of the active layer (a) and 2D topographic images ofthe support layer (b) for the PTFE 0.22 µm membrane under different conditions (scanned area10 µm × 10 µm). Legends correspond to the digestate, SD or RD, treated and the recirculation flowrates used successively.
In addition, the AFM topographic images of the support layer had a very similarappearance in all membranes tested, which suggested that the use of H2SO4 solutions didnot significantly deteriorate the membrane surface (Figure 6b).
In addition, phase contrast images were obtained to detect the presence of materi-als coating the membrane surface (Figure S3 in Supplementary Material). The deeperbrown tones detected in the membrane, used with real digestate and at three recirculationflow rates, would correspond to organic matter from the real digestate. Fouling was notsignificant in the rest of the samples and the coating effect was more homogeneous.
Membranes 2022, 12, 19 12 of 14
4. Conclusions
The feasibility of several commercial flat sheet membranes for ammonia recoveryand their fouling were studied using synthetic and real digestate. PTFE was identifiedas the most efficient material for NH3 recovery regardless of the type of digestate. Thehighest NH3 recovery was obtained when the pH of the digestate was increased to 10 and1 M sulfuric acid was used. NH3 recovery also increased at higher digestate circulationflow rates because of the inherent reduction in mass transfer resistance. NH3 recoverywas shown to follow first order kinetics and to be faster under alkaline pH, high H2SO4concentration and high recirculation flow rate on the digestate side of the membrane.A PTFE-0.22 membrane operated under optimal conditions supported NH3 recoveriesof 71.6% ± 0.3% and 84.6% ± 1.0% after only 3.5 h using real and synthetic digestates,respectively. After 6 h of operation, 94.3%± 0.3% NH3 recoveries were reached in syntheticdigestate under similar operational conditions in accordance with the kinetics assumedhere. Membrane fouling was relevant when using real digestate and resulted in a decreasein membrane pore diameter and growing surface deposition.
Supplementary Materials: The following are available online at https://www.mdpi.com/article/10.3390/membranes12010019/s1, Figure S1: Influence of the pH in (a) SD and (b) RD on the time courseof NH3 concentration in the feed side of the PTFE-0.22 membrane operated with a concentrationof H2SO4 of 1 M and a recirculation flow rate of 0.030 m3 h−1. Figure S2: Time course of ammoniarecovery using a PTFE-0.22 membrane at different recirculation flow rates, a pH of 10, a concentrationof H2SO4 of 1 M in (a) synthetic digestate and (b) real digestate. Figure S3: AFM Phase Imaging ofthe active layer for a PTFE 0.22 membrane under different conditions (scanned area 10 µm × 10 µm).
Author Contributions: Conceptualization, L.P., P.P., A.H., R.M.; methodology, P.P. and R.M.; valida-tion, L.P., P.P., A.H., R.M.; formal analysis, L.P., P.P., A.H., R.M.; investigation, F.R.; resources, L.P. andR.M.; data curation, L.P., P.P., A.H., R.M.; writing—original draft preparation, F.R.; writing—reviewand editing, L.P., P.P., A.H., R.M.; visualization, L.P., P.P., A.H., R.M.; supervision, L.P., P.P., A.H.,R.M.; project administration, L.P. and R.M.; funding acquisition, L.P. and R.M. All authors have readand agreed to the published version of the manuscript.
Funding: This research was funded by the Regional Government of Castilla y León and the EuropeanFEDER Program (VA088G19, CLU 2017-09 and UIC 071) and the Spanish Ministry of Science andInnovation (project: PID2019-109403RB-C21/AEI/10.13039/501100011033).
Institutional Review Board Statement: Not applicable.
Informed Consent Statement: Not applicable.
Data Availability Statement: Not applicable.
Acknowledgments: This work was supported by the Regional Government of Castilla y León andthe European FEDER Program (VA088G19, CLU 2017-09 and UIC 071) and the Spanish Ministry ofScience and Innovation (project: PID2019-109403RB-C21/AEI/10.13039/501100011033). F. Riverathanks University of Valladolid for the PhD Contract.
Conflicts of Interest: The authors declare no conflict of interest.
References1. Forster, C.F. Biotechnology and Wastewater Treatment; University of Cambridge: Cambridge, UK, 1985.2. Tonelli, A.R.; Pham, A. Bronchiectasis, a long-term sequela of ammonia inhalation: A case report and review of the literature.
Burns 2009, 35, 451–453. [CrossRef] [PubMed]3. De La Hoz, R.E.; Schlueter, D.P.; Rom, W.N. Chronic lung disease secondary to ammonia inhalation injury: A report on three
cases. Am. J. Ind. Med. 1996, 29, 209–214. [CrossRef]4. Brautbar, N.; Wu, M.P.; Richter, E.D. Chronic ammonia inhalation and interstitial pulmonary fibrosis: A Case report and review
of the literature. Arch. Environ. Health 2003, 58, 592–596. [CrossRef] [PubMed]5. Ni, H.; Fan, X.M.; Guo, H.N.; Liang, J.H.; Li, Q.R.; Yang, L.; Li, H.; Li, H.H. Comprehensive utilization of activated sludge for the
preparation of hydrolytic enzymes, polyhydroxyalkanoates, and water-retaining organic fertilizer. Prep. Biochem. Biotechnol. 2017,47, 611–618. [CrossRef]
Membranes 2022, 12, 19 13 of 14
6. Hermassi, M.; Valderrama, C.; Dosta, J.; Cortina, J.L.; Batis, N.H. Evaluation of hydroxyapatite crystallization in a batch reactorfor the valorization of alkaline phosphate concentrates from wastewater treatment plants using calcium chloride. Chem. Eng. J.2015, 267, 142–152. [CrossRef]
7. Sutton, P.M.; Rittmann, B.E.; Schraa, O.J.; Banaszak, J.E.; Togna, A.P. Wastewater as a resource: A unique approach to achievingenergy sustainability. Water Sci. Technol. 2011, 63, 2004–2009. [CrossRef] [PubMed]
8. Licon Bernal, E.E.; Maya, C.; Valderrama, C.; Cortina, J.L. Valorization of ammonia concentrates from treated urban wastewaterusing liquid-liquid membrane contactors. Chem. Eng. J. 2016, 302, 641–649. [CrossRef]
9. Zheng, Y.; Wang, A. Evaluation of ammonium removal using a chitosan-g-poly (acrylic acid)/rectorite hydrogel composite.J. Hazard. Mater. 2009, 171, 671–677. [CrossRef]
10. Ozturk, I.; Altinbas, M.; Koyuncu, I.; Arikan, O.; Gomec-Yangin, C. Advanced physico-chemical treatment experiences on youngmunicipal landfill leachates. Waste Manag. 2003, 23, 441–446. [CrossRef]
11. Hung, C.M.; Lou, J.C.; Lin, C.H. Removal of ammonia solutions used in catalytic wet oxidation processes. Chemosphere 2003,52, 989–995. [CrossRef]
12. Jorgensen, T.C.; Weatherley, L.R. Ammonia removal from wastewater by ion exchange in the presence of organic contaminants.Water Res. 2003, 37, 1723–1728. [CrossRef]
13. Provolo, G.; Perazzolo, F.; Mattachini, G.; Finzi, A.; Naldi, E.; Riva, E. Nitrogen removal from digested slurries using a simplifiedammonia stripping technique. Waste Manag. 2017, 69, 154–161. [CrossRef]
14. Wang, G.; Xu, X.; Zhou, L.; Wang, C.; Yang, F. A pilot-scale study on the start-up of partial nitrification-anammox process foranaerobic sludge digester liquor treatment. Bioresour. Technol. 2017, 241, 181–189. [CrossRef]
15. Gonzalez-Martinez, A.; Poyatos, J.M.; Hontoria, E.; Gonzalez-Lopez, J.; Osorio, F. Treatment of Effluents Polluted by Nitrogenwith New Biological Technologies Based on Autotrophic Nitrification-Denitrification Processes. Recent Pat. Biotechnol. 2011,5, 74–84. [CrossRef] [PubMed]
16. Tchobanoglous, G.; Burton, F.L. Wastewater Engineering Treatment, Disposal and Reuse; McGraw-Hill Inc.: New York, NY, USA, 1991.17. Vineyard, D.; Hicks, A.; Karthikeyan, K.G.; Barak, P. Economic analysis of electrodialysis, denitrification, and anammox for
nitrogen removal in municipal wastewater treatment. J. Clean. Prod. 2020, 262, 121145. [CrossRef]18. Rothausen, S.G.S.A.; Conway, D. Greenhouse-gas emissions from energy use in the water sector. Nat. Clim. Chang. 2011,
1, 210–219. [CrossRef]19. Hall, M.R.; West, J.; Sherman, B.; Lane, J.; De Haas, D. Long-term trends and opportunities for managing regional water supply
and wastewater greenhouse gas emissions. Environ. Sci. Technol. 2011, 45, 5434–5440. [CrossRef]20. Tan, X.; Tan, S.P.; Teo, W.K.; Li, K. Polyvinylidene fluoride (PVDF) hollow fibre membranes for ammonia removal from water.
J. Membr. Sci. 2006, 271, 59–68. [CrossRef]21. Hasanoglu, A.; Romero, J.; Pérez, B.; Plaza, A. Ammonia removal from wastewater streams through membrane contactors:
Experimental and theoretical analysis of operation parameters and configuration. Chem. Eng. J. 2010, 160, 530–537. [CrossRef]22. Norddahl, B.; Horn, V.G.; Larsson, M.; du Preez, J.H.; Christensen, K. A membrane contactor for ammonia stripping, pilot scale
experience and modeling. Desalination 2006, 199, 172–174. [CrossRef]23. Brennan, B.; Briciu-Burghina, C.; Hickey, S.; Abadie, T.; Al Ma Awali, S.M.; Delaure, Y.; Durkan, J.; Holland, L.; Quilty, B.;
Tajparast, M.; et al. Pilot scale study: First demonstration of hydrophobic membranes for the removal of ammonia moleculesfrom rendering condensate wastewater. Int. J. Mol. Sci. 2020, 21, 3914. [CrossRef]
24. Yeon, S.H.; Sea, B.; Park, Y.I.; Lee, K.H. Determination of mass transfer rates in PVDF and PTFE hollow fiber membranes for CO2absorption. Sep. Sci. Technol. 2003, 38, 271–293. [CrossRef]
25. Malek, A.; Li, K.; Teo, W.K. Modeling of Microporous Hollow Fiber Membrane Modules Operated under Partially WettedConditions. Ind. Eng. Chem. Res. 1997, 36, 784–793. [CrossRef]
26. Mahmud, H.; Kumar, A.; Narbaitz, R.M.; Matsuura, T. A study of mass transfer in the membrane air-stripping process usingmicroporous polypropylene hollow fibers. J. Membr. Sci. 2000, 179, 29–41. [CrossRef]
27. Vecino, X.; Reig, M.; Bhushan, B.; Gibert, O.; Valderrama, C.; Cortina, J.L. Liquid fertilizer production by ammonia recovery fromtreated ammonia-rich regenerated streams using liquid-liquid membrane contactors. Chem. Eng. J. 2019, 360, 890–899. [CrossRef]
28. Sheikh, M.; Reig, M.; Vecino, X.; Lopez, J.; Rezakazemi, M.; Valderrama, C.A.; Cortina, J.L. Liquid–Liquid membrane contactorsincorporating surface skin asymmetric hollow fibres of poly(4-methyl-1-pentene) for ammonium recovery as liquid fertilisers.Sep. Purif. Technol. 2022, 283, 120212. [CrossRef]
29. Vecino, X.; Reig, M.; Gibert, O.; Valderrama, C.; Cortina, J.L. Integration of liquid-liquid membrane contactors and electrodialysisfor ammonium recovery and concentration as a liquid fertilizer. Chemosphere 2020, 245, 125606. [CrossRef]
30. Carter, D.; Rose, L.; Awobusuyi, T.; Gauthier, M.; Tezel, F.H.; Kruczek, B. Characterization of commercial RO membranes for theconcentration of ammonia converted to ammonium sulfate from anaerobic digesters. Desalination 2015, 368, 127–134. [CrossRef]
31. Darestani, M.; Haigh, V.; Couperthwaite, S.J.; Millar, G.J.; Nghiem, L.D. Hollow fibre membrane contactors for ammonia recovery:Current status and future developments. J. Environ. Chem. Eng. 2017, 5, 1349–1359. [CrossRef]
32. Damtie, M.M.; Volpin, F.; Yao, M.; Tijing, L.D.; Hailemariam, R.H.; Bao, T.; Park, K.; Shon, H.K.; Choi, J. Ammonia recovery fromhuman urine as liquid fertilizers in hollow fiber membrane contactor: Effects of permeate chemistry. Environ. Eng. Res. 2021,26, 190523. [CrossRef]
Membranes 2022, 12, 19 14 of 14
33. Li, L.; Lollar, B.S.; Li, H.; Wortmann, U.G.; Lacrampe-Couloume, G. Ammonium stability and nitrogen isotope fractionationsfor NH4+-NH 3(aq)-NH 3(gas) systems at 20–70 ◦C and pH of 2-13: Applications to habitability and nitrogen cycling inlow-temperature hydrothermal systems. Geochim. Cosmochim. Acta 2012, 84, 280–296. [CrossRef]
34. Torres-Franco, A.F.; Zuluaga, M.; Hernández-Roldán, D.; Leroy-Freitas, D.; Sepúlveda-Muñoz, C.A.; Blanco, S.; Mota, C.R.;Muñoz, R. Assessment of the Performance of an Anoxic aerobic Microalgal-bacterial System Treating High-strength wastewater.Chemosphere 2021, 270, 129437. [CrossRef]
35. Montalvillo, M.; Silva, V.; Palacio, L.; Calvo, J.I.; Carmona, F.J.; Hernández, A.; Prádanos, P. Charge and dielectric characterizationof nanofiltration membranes by impedance spectroscopy. J. Membr. Sci. 2014, 454, 163–173. [CrossRef]
36. Hernández, A.; Calvo, J.I.; Prádanos, P.; Tejerina, F. Pore size distributions in microporous membranes. A critical analysis of thebubble point extended method. J. Membr. Sci. 1996, 112, 1–12. [CrossRef]
37. Amaral, M.C.; Magalhães, N.C.; Moravia, W.G.; Ferreira, C.D. Ammonia recovery from landfill leachate using hydrophobicmembrane contactors. Water Sci. Technol. 2016, 74, 2177–2184. [CrossRef] [PubMed]
38. Gabelman, A.; Hwang, S.T. Hollow fiber membrane contactors. J. Membr. Sci. 1999, 159, 61–106. [CrossRef]39. Guo, J.; Lee, J.G.; Tan, T.; Yeo, J.; Wong, P.W.; Ghaffour, N.; An, A.K. Enhanced ammonia recovery from wastewater by Nafion
membrane with highly porous honeycomb nanostructure and its mechanism in membrane distillation. J. Membr. Sci. 2019,590, 117265. [CrossRef]
40. Zhu, Z.; Hao, Z.; Shen, Z.; Chen, J. Modified modeling of the effect of pH and viscosity on the mass transfer in hydrophobichollow fiber membrane contactors. J. Membr. Sci. 2005, 250, 269–276. [CrossRef]
41. Tun, L.L.; Jeong, D.; Jeong, S.; Cho, K.; Lee, S.; Bae, H. Dewatering of source-separated human urine for nitrogen recovery bymembrane distillation. J. Membr. Sci. 2016, 512, 13–20. [CrossRef]
42. Cabrerizo, M.A. Bubble and Drop Interfaces: Selected Papers from International Workshop on Bubble and Drop Interfaces; Elsevier:Amsterdam, The Netherlands, 2008.
43. Tylkowski, B.; Tsibranska, I. Overview of main techniques used for membrane characterization. J. Chem. Technol. Metall. 2015,50, 3–12.
44. Meng, F.; Chae, S.R.; Drews, A.; Kraume, M.; Shin, H.S.; Yang, F. Recent advances in membrane bioreactors (MBRs): Membranefouling and membrane material. Water Res. 2009, 43, 1489–1512. [CrossRef] [PubMed]
45. Dube, P.J.; Vanotti, M.B.; Szogi, A.A.; García-González, M.C. Enhancing recovery of ammonia from swine manure anaerobicdigester effluent using gas-permeable membrane technology. Waste Manag. 2016, 49, 372–377. [CrossRef] [PubMed]
46. García-González, M.C.; Vanotti, M.B.; Szogi, A.A. Recovery of ammonia from swine manure using gas-permeable membranes:Effect of aeration. J. Environ. Manag. 2015, 152, 19–26. [CrossRef] [PubMed]
47. Wu, H.; Kanora, A.; Schwartz, D.K. Fouling of microfiltration membranes by bidisperse particle solutions. J. Membr. Sci. 2022,641, 119878. [CrossRef]
48. Liu, C.; Chen, L.; Zhu, L. Fouling mechanism of hydrophobic polytetrafluoroethylene (PTFE) membrane by differently chargedorganics during direct contact membrane distillation (DCMD) process: An especial interest in the feed properties. J. Membr. Sci.2018, 548, 125–135. [CrossRef]
49. Zhang, B.; Huang, D.; Shen, Y.; Yin, W.; Gao, X.; Zhang, B.; Shi, W. Treatment of alkali/surfactant/polymer flooding oilfieldwastewater with polytetrafluoroethylene microfiltration membrane: Performance and membrane fouling. J. Environ. Chem. Eng.2020, 8, 104462. [CrossRef]
50. Zhang, B.; Shi, W.; Yu, S.; Zhu, Y.; Zhang, R.; Li, L. Optimization of cleaning conditions on a polytetrafluoroethylene (PTFE)microfiltration membrane used in treatment of oil-field wastewater. RSC Adv. 2015, 5, 104960–104971. [CrossRef]