a systematic review of cardiac time intervals utilising non
TRANSCRIPT
RESEARCH ARTICLE Open Access
A systematic review of cardiac timeintervals utilising non-invasive fetalelectrocardiogram in normal fetusesVinayak Smith1,3* , Senthuran Arunthavanathan2, Amrish Nair3, Diane Ansermet3, Fabricio da Silva Costa1
and Euan Morrison Wallace1
Abstract
Background: Non-invasive fetal electrocardiogram (NIFECG) is an evolving technology in fetal surveillance which isattracting increasing research interest. There is however, only limited data outlining the reference ranges for normalcardiac time intervals (CTIs). The objective of our group was to carry out a systematic review to outline normal fetalCTIs using NIFECG.
Methods: A systematic review of peer reviewed literature was performed, searching PUBMED,Ovid MEDLINE andEMBASE. The outcomes of interest included fetal CTIs (P wave duration, PR interval, QRS duration and QT interval)and a descriptive summary of relevant studies as well. The outcomes were grouped as early pre-term (≤ 32 weeks),moderate to late pre-term (32–37 weeks) and term (37–41 weeks).
Results: 8 studies were identified as suitable for inclusion. Reference ranges of CTIs were generated. Both PRinterval and QRS duration demonstrated a linear correlation with advancing gestation. Several studies alsodemonstrated a reduction in signal acquisition between 27 and 32 weeks due to the attenuation by vernix caseosa.In this group, both the P wave and T waves were difficult to detect due to signal strength and interference.
Conclusion: NIFECG demonstrates utility to quantify CTIs in the fetus, particularly at advanced gestations. Largerprospective studies should be directed towards establishing reliable CTIs across various gestations.
Keywords: Fetal electrocardiogram, Cardiac time intervals, Non-invasive fetal monitoring
BackgroundEvaluation of the fetal cardiac activity remains a corner-stone of obstetric practice. These are broadly classifiedinto invasive and non-invasive forms of monitoring. Atpresent, the main modalities being utilised include:
CardiotocographyCardiotocography (CTG) is a non-invasive form of mon-itoring which has been utilised widely to measure thefetal heart rate (FHR) by means of Doppler ultrasoundsince the 1970s. Through this, an ultrasound wave of1.5 MHz is utilised to resonate with the fetal cardiac
structures. Subsequently, the dispersed waveforms aremeasured through a transducer via the ensuing Dopplereffect. This produces an approximation of the fetal heartrate using autocorrelation techniques which compareand average it against the previous doppler waveforms.The methodology however, is not without its shortcom-ings [1]. Several issues with respect to the data acquiredhave been outlined which include the lack of beat tobeat data (i.e. true fetal heart rate variability), signal lossduring monitoring (15–40%), signal artifacts (i.e. result-ing in double and half counting), the inability to detectfetal arrythmias and confusion between maternal heartrate (MHR) and FHR [2–4]. These limitations are gener-ally well appreciated by the workforce, obstetricians andmidwives, but significant mis-interpretation and harmcontinues to arise from them. From the perspective ofthe pregnant woman herself, CTG technology appears
* Correspondence: [email protected] of Obstetrics and Gynaecology, Monash University, 252 ClaytonRoad, Melbourne, VIC 3168, Australia3Biorithm Pte Ltd, 81 Ayer Rajah Crescent 03-53, Singapore 139967,SingaporeFull list of author information is available at the end of the article
© The Author(s). 2018 Open Access This article is distributed under the terms of the Creative Commons Attribution 4.0International License (http://creativecommons.org/licenses/by/4.0/), which permits unrestricted use, distribution, andreproduction in any medium, provided you give appropriate credit to the original author(s) and the source, provide a link tothe Creative Commons license, and indicate if changes were made. The Creative Commons Public Domain Dedication waiver(http://creativecommons.org/publicdomain/zero/1.0/) applies to the data made available in this article, unless otherwise stated.
Smith et al. BMC Pregnancy and Childbirth (2018) 18:370 https://doi.org/10.1186/s12884-018-2006-8
cumbersome, limiting mobility even where wirelesstransducers are employed [5].
Direct fetal electrocardiogram (FECG)One approach to improving signal detection is the useof the fetal scalp electrode (FSE). This involves the directapplication of an electrode to the fetal scalp and re-quires adequate cervical dilation as well as rupture ofthe amniotic membranes. This method provides amore reliable measurement of the FHR than indirectCTG. It generates a FHR by identifying the R-R inter-val (separation between an R peak and the followingR peak) on the FECG signal. Given its invasive na-ture, it can only be used in labour and cannot be ap-plied antenatally. Further, there is a small risk ofinjury to the fetal scalp and use of the FSE is rela-tively contraindicated in preterm infants and contrain-dicated in fetuses with bleedings disorders, instancesof maternal viremia (such as Hepatitis B/C/D/ E aswell as Human Immunodeficiency Virus) and chor-ioamnionitis [2, 6].Both CTG and FSE are predominantly focused on
screening for FHR changes secondary to fetal hypoxia toguide obstetric decision regarding timing of delivery andthereby preventing fetal injury, particularly brain injury.Unfortunately, the results from randomised controlledclinical trials do not demonstrate that the use of CTGs,at least in low risk births, has improved perinatal mor-tality or longer term outcomes associated with injury,such as cerebral palsy. On the contrary, increasing up-take of CTGs has been associated with an increase inobstetric intervention [7].
Non-invasive fetal electrocardiogram (NIFECG)An alternative form of monitoring which has beenrecently gaining increasing attention involves utilisingNIFECG. This is carried out by using surface electrodeson the abdomen of the pregnant woman and obtaining aFECG signal.The NIFECG promises to offer assessment of both the
FHR rhythm as well as its morphology. Additional infor-mation such as fetal orientation and movements assess-ment can be garnered from the signal too [5]. Withthese advances, NIFECG potentially offers a superiorquality of FHR information in comparison to existingmonitoring modalities such as CTG or FSE [8, 9].NIFECG has also the ability to reduce MHR and FHRconfusion and to monitor women with a high body massindex (BMI) more effectively [10–12].Cardiac time interval (CTI) analysis is a core in the
evolving field of morphology analysis that is attractingan increasing amount of research. CTIs specifically referto the duration of the P wave, PR interval, QRS complexand QT interval. Amongst its utilisation in detecting
hypoxia, novel indications linked to its utility includescreening for congenital heart defects, determining trueheart rate and short term variability, fetal arrhythmiasand fetal growth restriction as well [6, 13, 14].As with other forms of monitoring however, there
have been some technological challenges related to de-tection of the NIFECG. Primarily, this has been relatedto the low signal-to-noise ratio (SNR) of the FECG sig-nal, due to its low electrical amplitude (1/50 that of thematernal ECG signal) and the large maternal ECG(MECG) and background noise [5, 15]. In addition, thereare some limitations to signal acquisition as well. Forinstance, between the 27th to 32nd week of gestation,signal acquisition becomes more onerous due to the at-tenuation caused by the vernix caseosa surrounding thefetus [16] . Another important limitation is the lack ofavailable references and databases for comparison ofNIFECG signal [5, 6]. Nevertheless, recent signal pro-cessing techniques and advances in data processors haveafforded improved consistency in signal acquisition andanalysis [5].
ObjectiveConsidering these observations, the following reviewaims to provide a reference for researchers in the field toidentify the normal range of CTIs for fetuses across arange of gestational ages when utilising NIFECG. CTIsvary through gestation and available information is lim-ited by the finite number of observational studies ad-dressing this topic. In addition, correlation between theCTIs and end-points in both animal models and humansare presented in the discussion to provide a guide onend-points which ongoing research can be directedtowards as well.
Data sourcesThe inclusion criteria for the following study are studiesexamining the CTIs in fetuses with normal cardiac anat-omy with the utilisation of NIFECG technology specific-ally across all gestational ages. CTIs of interest wouldinclude the P wave, PR interval, QRS complex and QTinterval. The ST segment will not be included in this re-view as it is not a routine part of CTI analysis, has onlypreliminary data proving its feasibility and is more in rela-tion to morphological analysis of the waveform [17–19].No limitation was placed on the year of publications or onlanguage. For the following systematic review,PubMed, Ovid MEDLINE and EMBASE were searched
to identify studies till 30th of May 2018. by DA and VS.The following keywords were utilised for the search, uti-lising both British and American spellings: “fetal electro-cardiogram”, “fetal ECG”, “fetal electrocardiography” and“fetal cardiac time intervals”. The database was searchedindependently by VS and DA. The reference lists of
Smith et al. BMC Pregnancy and Childbirth (2018) 18:370 Page 2 of 15
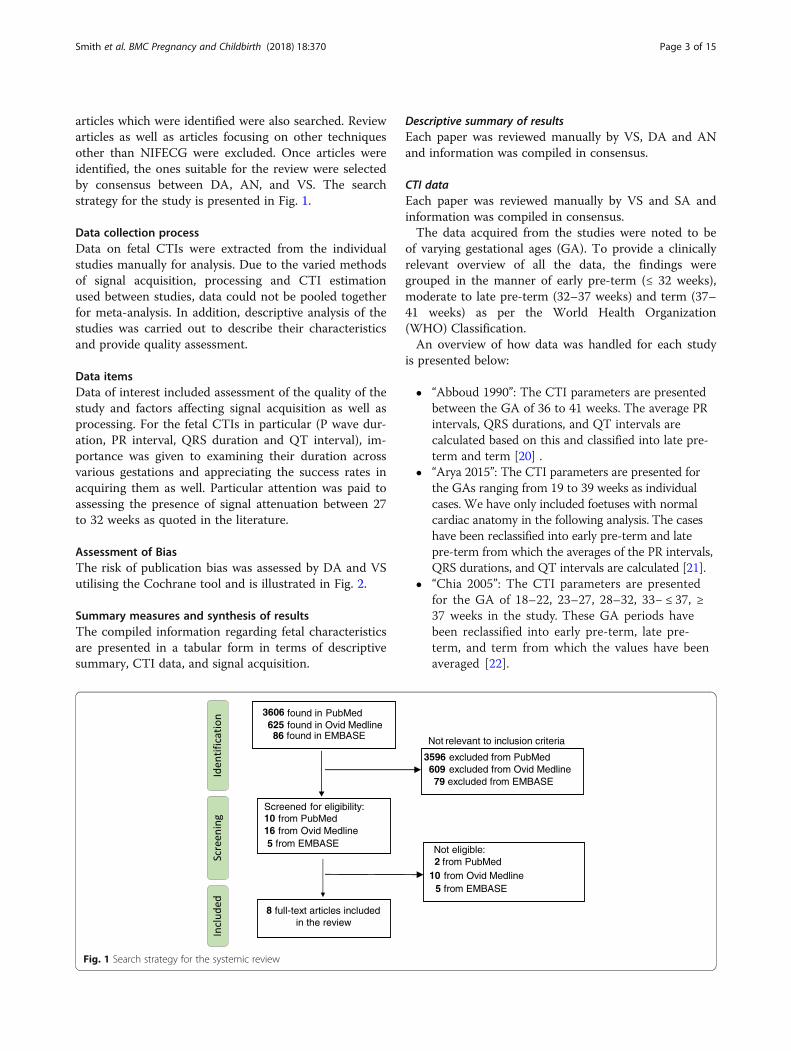
articles which were identified were also searched. Reviewarticles as well as articles focusing on other techniquesother than NIFECG were excluded. Once articles wereidentified, the ones suitable for the review were selectedby consensus between DA, AN, and VS. The searchstrategy for the study is presented in Fig. 1.
Data collection processData on fetal CTIs were extracted from the individualstudies manually for analysis. Due to the varied methodsof signal acquisition, processing and CTI estimationused between studies, data could not be pooled togetherfor meta-analysis. In addition, descriptive analysis of thestudies was carried out to describe their characteristicsand provide quality assessment.
Data itemsData of interest included assessment of the quality of thestudy and factors affecting signal acquisition as well asprocessing. For the fetal CTIs in particular (P wave dur-ation, PR interval, QRS duration and QT interval), im-portance was given to examining their duration acrossvarious gestations and appreciating the success rates inacquiring them as well. Particular attention was paid toassessing the presence of signal attenuation between 27to 32 weeks as quoted in the literature.
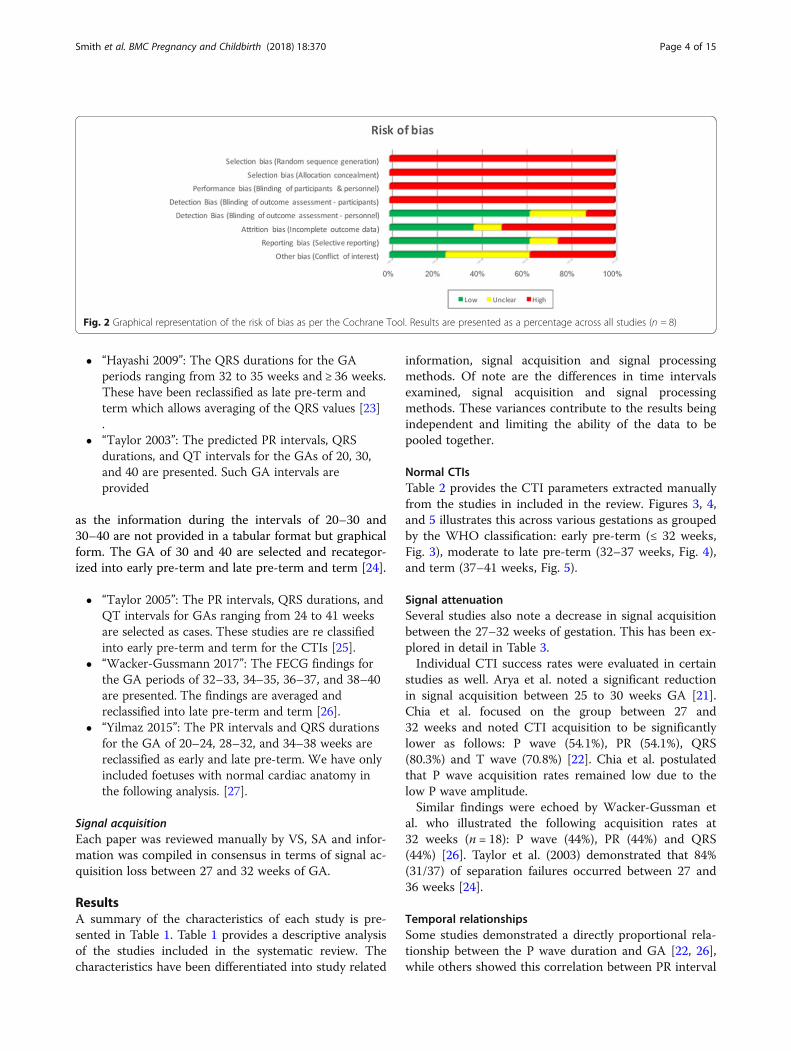
Assessment of BiasThe risk of publication bias was assessed by DA and VSutilising the Cochrane tool and is illustrated in Fig. 2.
Summary measures and synthesis of resultsThe compiled information regarding fetal characteristicsare presented in a tabular form in terms of descriptivesummary, CTI data, and signal acquisition.
Descriptive summary of resultsEach paper was reviewed manually by VS, DA and ANand information was compiled in consensus.
CTI dataEach paper was reviewed manually by VS and SA andinformation was compiled in consensus.The data acquired from the studies were noted to be
of varying gestational ages (GA). To provide a clinicallyrelevant overview of all the data, the findings weregrouped in the manner of early pre-term (≤ 32 weeks),moderate to late pre-term (32–37 weeks) and term (37–41 weeks) as per the World Health Organization(WHO) Classification.An overview of how data was handled for each study
is presented below:
� “Abboud 1990”: The CTI parameters are presentedbetween the GA of 36 to 41 weeks. The average PRintervals, QRS durations, and QT intervals arecalculated based on this and classified into late pre-term and term [20] .
� “Arya 2015”: The CTI parameters are presented forthe GAs ranging from 19 to 39 weeks as individualcases. We have only included foetuses with normalcardiac anatomy in the following analysis. The caseshave been reclassified into early pre-term and latepre-term from which the averages of the PR intervals,QRS durations, and QT intervals are calculated [21].
� “Chia 2005”: The CTI parameters are presentedfor the GA of 18–22, 23–27, 28–32, 33− ≤ 37, ≥37 weeks in the study. These GA periods havebeen reclassified into early pre-term, late pre-term, and term from which the values have beenaveraged [22].
Not relevant to inclusion criteria
3596 excluded from PubMed609 excluded from Ovid Medline
3606 found in PubMed625 found in Ovid Medline
Screened for eligibility:10 from PubMed16 from Ovid Medline
Not eligible:2 from PubMed
10 from Ovid Medline
8 full-text articles included in the review
86 found in EMBASE
79 excluded from EMBASE
5 from EMBASE
5 from EMBASE
Fig. 1 Search strategy for the systemic review
Smith et al. BMC Pregnancy and Childbirth (2018) 18:370 Page 3 of 15
� “Hayashi 2009”: The QRS durations for the GAperiods ranging from 32 to 35 weeks and ≥ 36 weeks.These have been reclassified as late pre-term andterm which allows averaging of the QRS values [23].
� “Taylor 2003”: The predicted PR intervals, QRSdurations, and QT intervals for the GAs of 20, 30,and 40 are presented. Such GA intervals areprovided
as the information during the intervals of 20–30 and30–40 are not provided in a tabular format but graphicalform. The GA of 30 and 40 are selected and recategor-ized into early pre-term and late pre-term and term [24].
� “Taylor 2005”: The PR intervals, QRS durations, andQT intervals for GAs ranging from 24 to 41 weeksare selected as cases. These studies are re classifiedinto early pre-term and term for the CTIs [25].
� “Wacker-Gussmann 2017”: The FECG findings forthe GA periods of 32–33, 34–35, 36–37, and 38–40are presented. The findings are averaged andreclassified into late pre-term and term [26].
� “Yilmaz 2015”: The PR intervals and QRS durationsfor the GA of 20–24, 28–32, and 34–38 weeks arereclassified as early and late pre-term. We have onlyincluded foetuses with normal cardiac anatomy inthe following analysis. [27].
Signal acquisitionEach paper was reviewed manually by VS, SA and infor-mation was compiled in consensus in terms of signal ac-quisition loss between 27 and 32 weeks of GA.
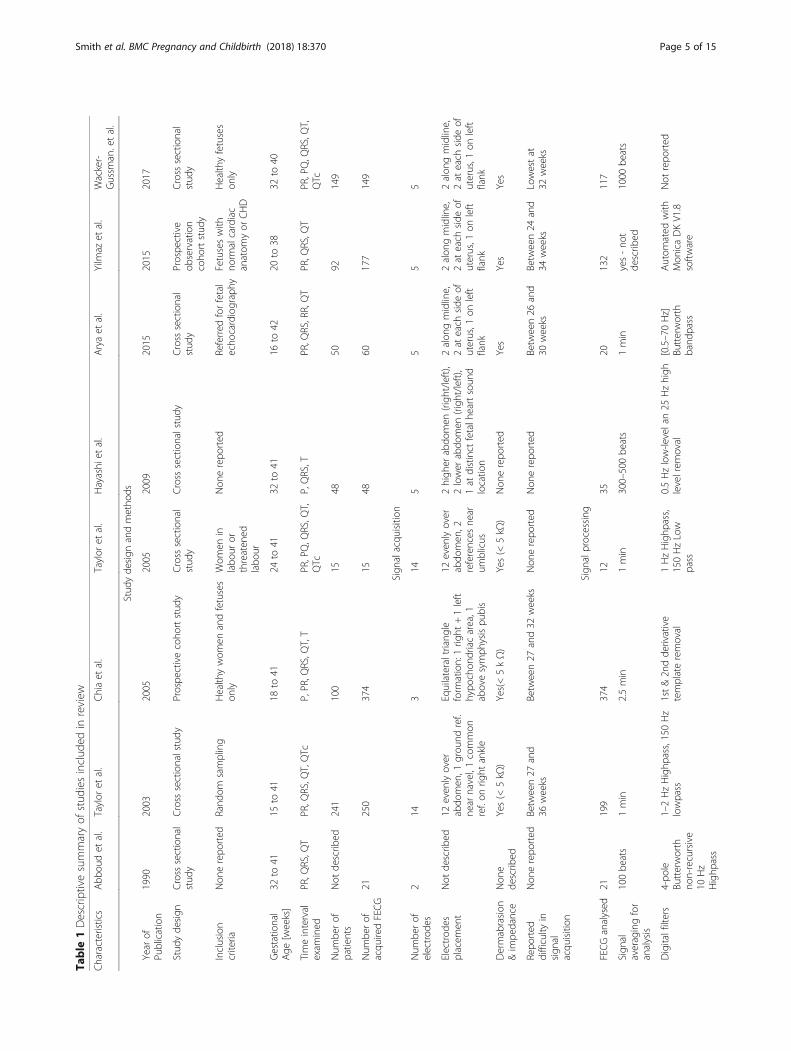
ResultsA summary of the characteristics of each study is pre-sented in Table 1. Table 1 provides a descriptive analysisof the studies included in the systematic review. Thecharacteristics have been differentiated into study related
information, signal acquisition and signal processingmethods. Of note are the differences in time intervalsexamined, signal acquisition and signal processingmethods. These variances contribute to the results beingindependent and limiting the ability of the data to bepooled together.
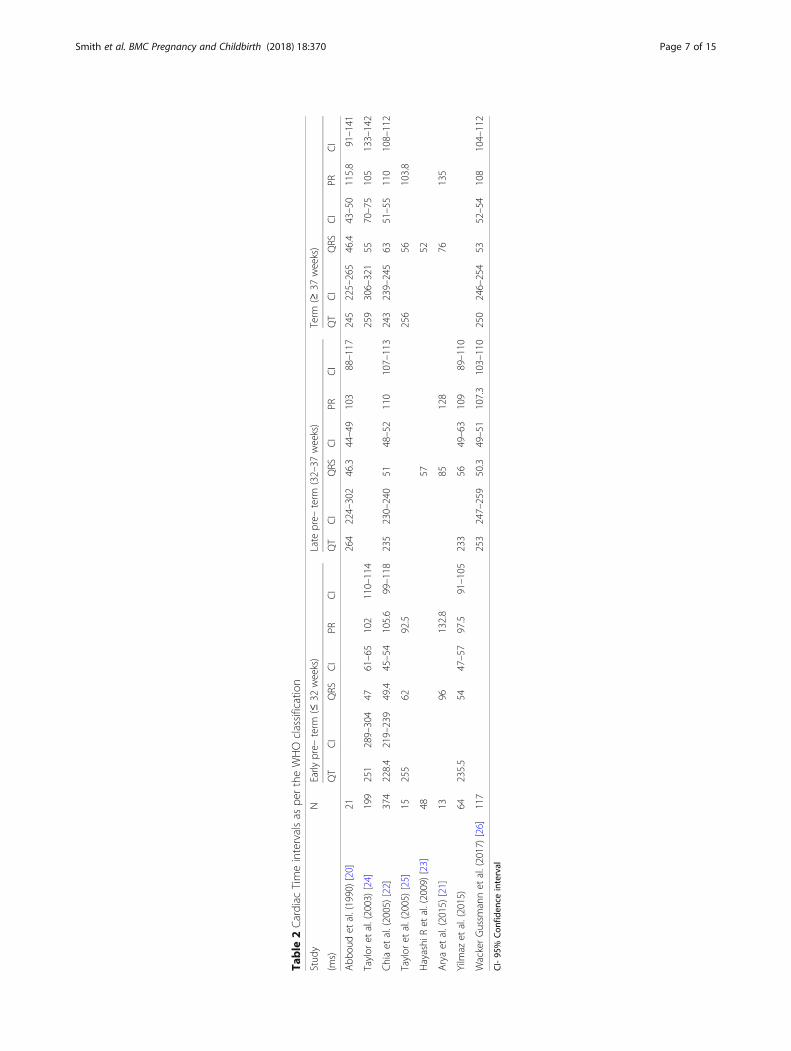
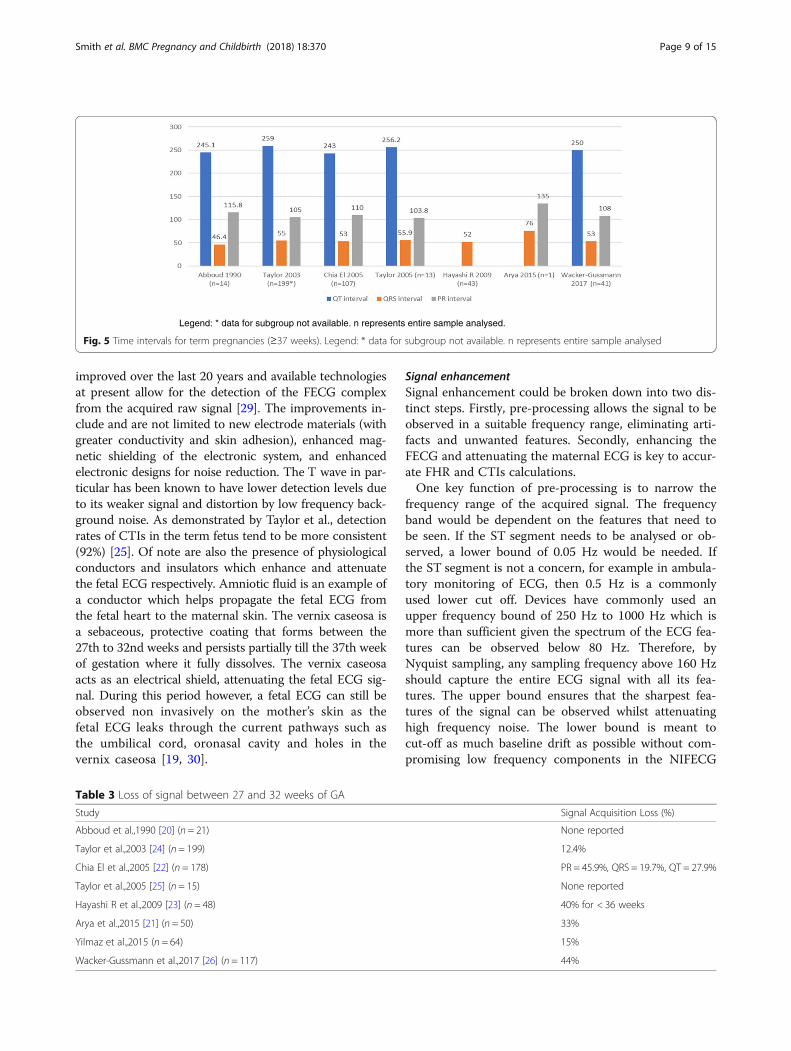
Normal CTIsTable 2 provides the CTI parameters extracted manuallyfrom the studies in included in the review. Figures 3, 4,and 5 illustrates this across various gestations as groupedby the WHO classification: early pre-term (≤ 32 weeks,Fig. 3), moderate to late pre-term (32–37 weeks, Fig. 4),and term (37–41 weeks, Fig. 5).
Signal attenuationSeveral studies also note a decrease in signal acquisitionbetween the 27–32 weeks of gestation. This has been ex-plored in detail in Table 3.Individual CTI success rates were evaluated in certain
studies as well. Arya et al. noted a significant reductionin signal acquisition between 25 to 30 weeks GA [21].Chia et al. focused on the group between 27 and32 weeks and noted CTI acquisition to be significantlylower as follows: P wave (54.1%), PR (54.1%), QRS(80.3%) and T wave (70.8%) [22]. Chia et al. postulatedthat P wave acquisition rates remained low due to thelow P wave amplitude.Similar findings were echoed by Wacker-Gussman et
al. who illustrated the following acquisition rates at32 weeks (n = 18): P wave (44%), PR (44%) and QRS(44%) [26]. Taylor et al. (2003) demonstrated that 84%(31/37) of separation failures occurred between 27 and36 weeks [24].
Temporal relationshipsSome studies demonstrated a directly proportional rela-tionship between the P wave duration and GA [22, 26],while others showed this correlation between PR interval
Fig. 2 Graphical representation of the risk of bias as per the Cochrane Tool. Results are presented as a percentage across all studies (n = 8)
Smith et al. BMC Pregnancy and Childbirth (2018) 18:370 Page 4 of 15
Table
1Descriptivesummaryof
stud
iesinclud
edin
review
Characteristics
Abb
oudet
al.
Taylor
etal.
Chiaet
al.
Taylor
etal.
Hayashi
etal.
Aryaet
al.
Yilm
azet
al.
Wacker-
Gussm
an.etal.
Stud
yde
sign
andmetho
ds
Year
ofPu
blication
1990
2003
2005
2005
2009
2015
2015
2017
Stud
yde
sign
Cross
sectional
stud
yCross
sectionalstudy
Prospe
ctivecoho
rtstud
yCross
sectional
stud
yCross
sectionalstudy
Cross
sectional
stud
yProspe
ctive
observation
coho
rtstud
y
Cross
sectional
stud
y
Inclusion
criteria
Non
erepo
rted
Rand
omsampling
Health
ywom
enandfetuses
only
Wom
enin
labo
uror
threaten
edlabo
ur
Non
erepo
rted
Referred
forfetal
echo
cardiography
Fetuseswith
norm
alcardiac
anatom
yor
CHD
Health
yfetuses
only
Gestatio
nal
Age
[weeks]
32to
4115
to41
18to
4124
to41
32to
4116
to42
20to
3832
to40
Timeinterval
exam
ined
PR,Q
RS,Q
TPR,Q
RS,Q
T,QTc
P,PR,Q
RS,Q
T,T
PR,PQ,Q
RS,Q
T,QTc
P,QRS,T
PR,Q
RS,RR,QT
PR,Q
RS,Q
TPR,PQ,Q
RS,Q
T,QTc
Num
berof
patients
Not
describ
ed241
100
1548
5092
149
Num
berof
acqu
iredFECG
21250
374
1548
60177
149
Sign
alacqu
isition
Num
berof
electrod
es2
143
145
55
5
Electrod
esplacem
ent
Not
describ
ed12
even
lyover
abdo
men
,1grou
ndref.
near
navel,1common
ref.on
right
ankle
Equilateraltriang
leform
ation:1rig
ht+1left
hypo
chon
driacarea,1
abovesymph
ysispu
bis
12even
lyover
abdo
men
,2references
near
umblicus
2high
erabdo
men
(righ
t/left),
2lower
abdo
men
(righ
t/left),
1at
distinct
fetalh
eartsoun
dlocatio
n
2alon
gmidline,
2at
each
side
ofuterus,1
onleft
flank
2alon
gmidline,
2at
each
side
ofuterus,1
onleft
flank
2alon
gmidline,
2at
each
side
ofuterus,1
onleft
flank
Dermabrasion
&im
pedance
Non
ede
scrib
edYes(<
5kΩ
)Yes(<5kΩ)
Yes(<
5kΩ
)Non
erepo
rted
Yes
Yes
Yes
Repo
rted
difficulty
insign
alacqu
isition
Non
erepo
rted
Betw
een27
and
36weeks
Betw
een27
and32
weeks
Non
erepo
rted
Non
erepo
rted
Betw
een26
and
30weeks
Betw
een24
and
34weeks
Lowestat
32weeks
Sign
alprocessing
FECGanalysed
21199
374
1235
20132
117
Sign
alaveragingfor
analysis
100be
ats
1min
2.5min
1min
300–500be
ats
1min
yes-no
tde
scrib
ed1000
beats
Digitalfilters
4-po
leBu
tterworth
non-recursive
10Hz
Highp
ass
1–2HzHighp
ass,150Hz
lowpass
1st&2n
dde
rivative
templateremoval
1HzHighp
ass,
150HzLow
pass
0.5Hzlow-levelan25
Hzhigh
levelrem
oval
[0.5–70Hz]
Butterworth
band
pass
Autom
ated
with
Mon
icaDKV1.8
software
Not
repo
rted
Smith et al. BMC Pregnancy and Childbirth (2018) 18:370 Page 5 of 15

Table
1Descriptivesummaryof
stud
iesinclud
edin
review
(Con
tinued)
Characteristics
Abb
oudet
al.
Taylor
etal.
Chiaet
al.
Taylor
etal.
Hayashi
etal.
Aryaet
al.
Yilm
azet
al.
Wacker-
Gussm
an.etal.
MEC
Gremoval
Digital
subtractionof
averaged
sign
al
SeePatent
appl.
GB2002/004410
Templatesubtraction
SeePatent
appl.
GB2002/004410
Templatesubtraction
Template
matchingand
digital
subtraction
Autom
ated
with
Mon
icaDKV1.8
software
Template
subtraction
Successrates
inCTI
detection
QT-80%
P,Q,R,S-100%;T-78%
P-74.6%,Q
RS-91.0%
,T-
79.3%
P,QRS-100%,T-
92%
72.9%
100%
dueto
strictFECGexcl.
Criteria
PR-77%
,QRS-
98%,Q
T-30%
P,PQ
,PR-97%,
QRS-100%,T-
41%
CTIC
ardiac
timeintervals,FECG
fetale
lectrocardiogram
,MEC
GMaterna
lelectrocardiogram
Smith et al. BMC Pregnancy and Childbirth (2018) 18:370 Page 6 of 15
Table
2Cardiac
Timeintervalsas
pertheWHOclassification
Stud
yN
Early
pre–
term
(≤32
weeks)
Late
pre–
term
(32–37
weeks)
Term
(≥37
weeks)
(ms)
QT
CI
QRS
CI
PRCI
QT
CI
QRS
CI
PRCI
QT
CI
QRS
CI
PRCI
Abb
oudet
al.(1990)[20]
21264
224–302
46.3
44–49
103
88–117
245
225–265
46.4
43–50
115.8
91–141
Taylor
etal.(2003)[24]
199
251
289–304
4761–65
102
110–114
259
306–321
5570–75
105
133–142
Chiaet
al.(2005)[22]
374
228.4
219–239
49.4
45–54
105.6
99–118
235
230–240
5148–52
110
107–113
243
239–245
6351–55
110
108–112
Taylor
etal.(2005)[25]
15255
6292.5
256
56103.8
Hayashi
Ret
al.(2009)[23]
4857
52
Aryaet
al.(2015)[21]
1396
132.8
85128
76135
Yilm
azet
al.(2015)
64235.5
5447–57
97.5
91–105
233
5649–63
109
89–110
WackerGussm
annet
al.(2017)[26]
117
253
247–259
50.3
49–51
107.3
103–110
250
246–254
5352–54
108
104–112
CI-95
%Con
fiden
ceinterval
Smith et al. BMC Pregnancy and Childbirth (2018) 18:370 Page 7 of 15
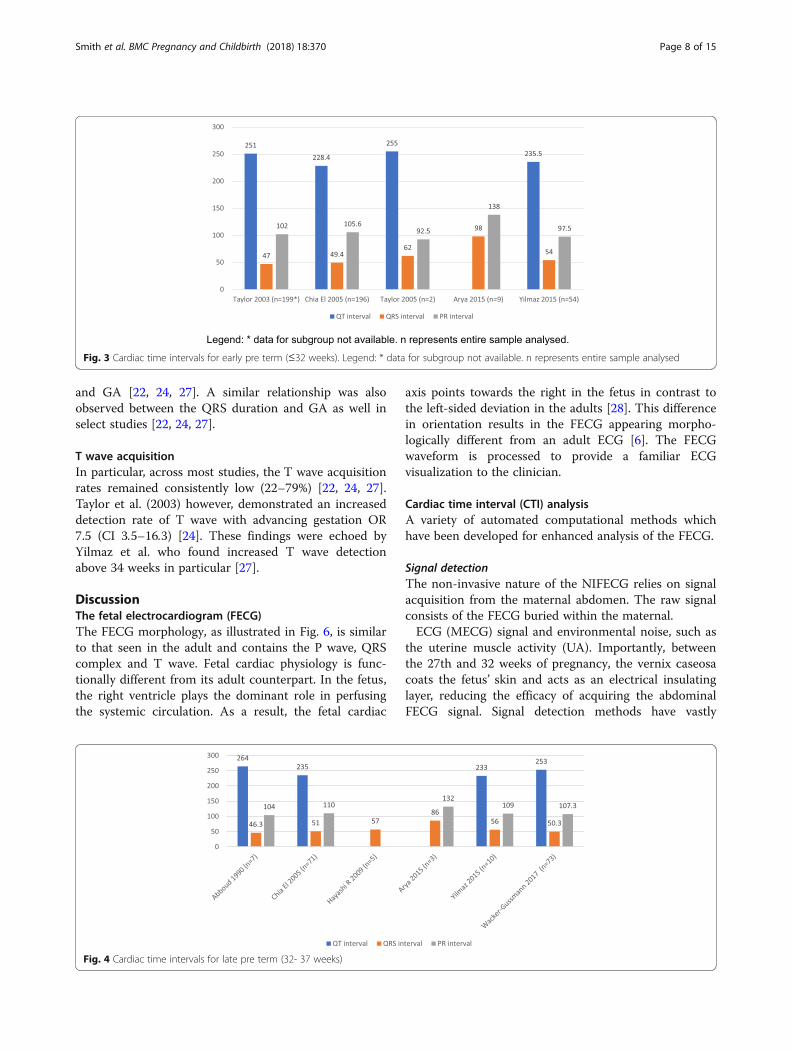
and GA [22, 24, 27]. A similar relationship was alsoobserved between the QRS duration and GA as well inselect studies [22, 24, 27].
T wave acquisitionIn particular, across most studies, the T wave acquisitionrates remained consistently low (22–79%) [22, 24, 27].Taylor et al. (2003) however, demonstrated an increaseddetection rate of T wave with advancing gestation OR7.5 (CI 3.5–16.3) [24]. These findings were echoed byYilmaz et al. who found increased T wave detectionabove 34 weeks in particular [27].
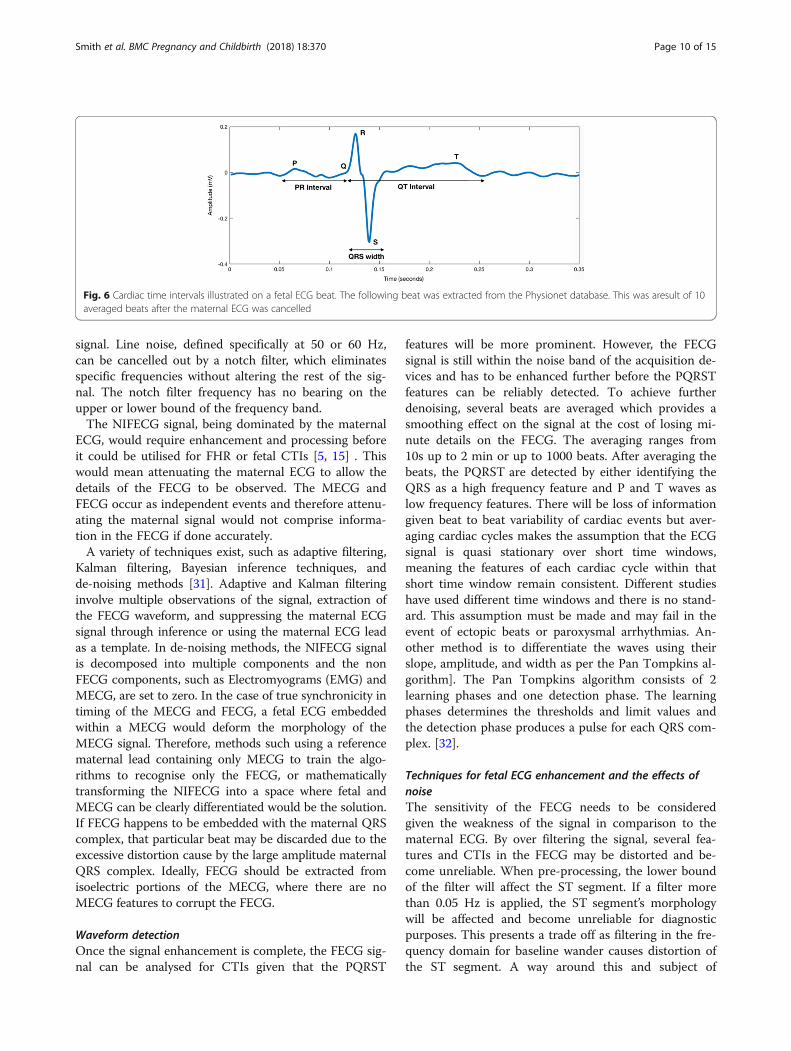
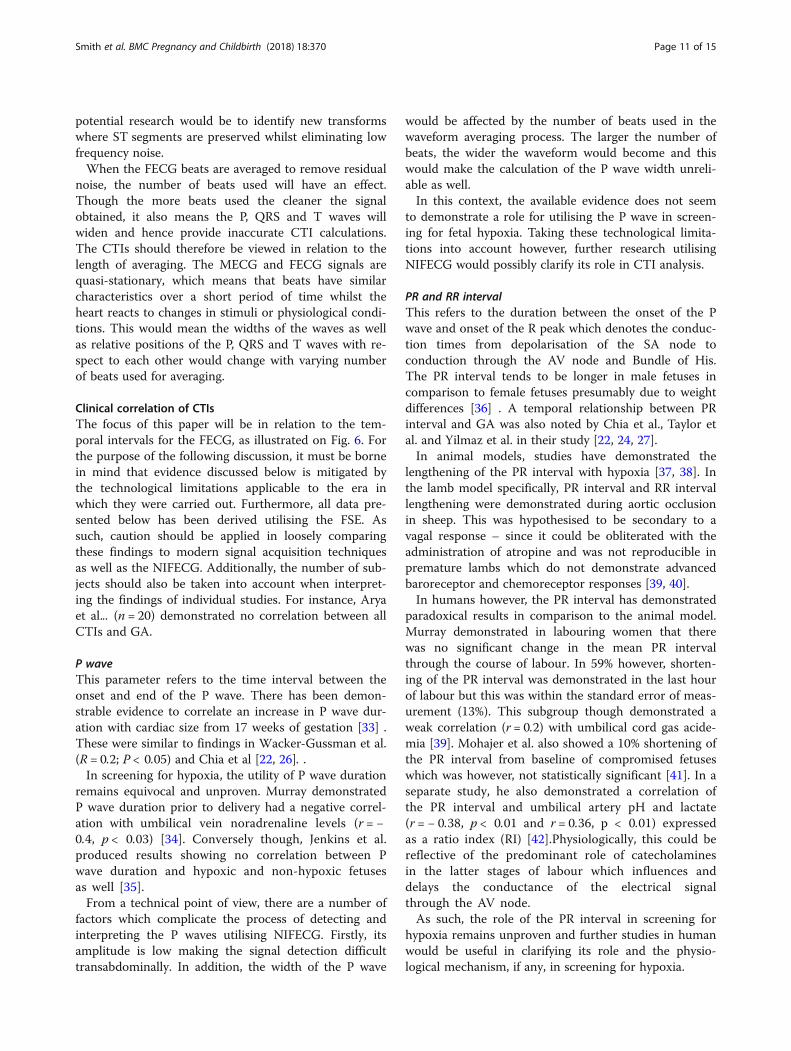
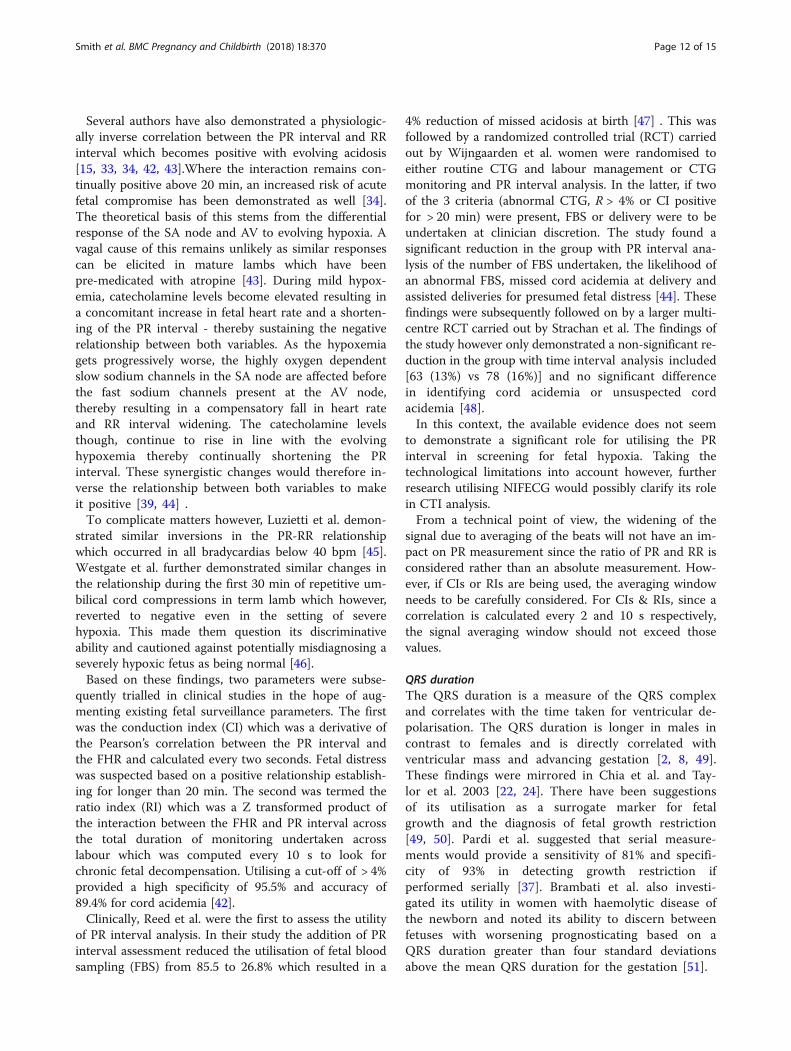
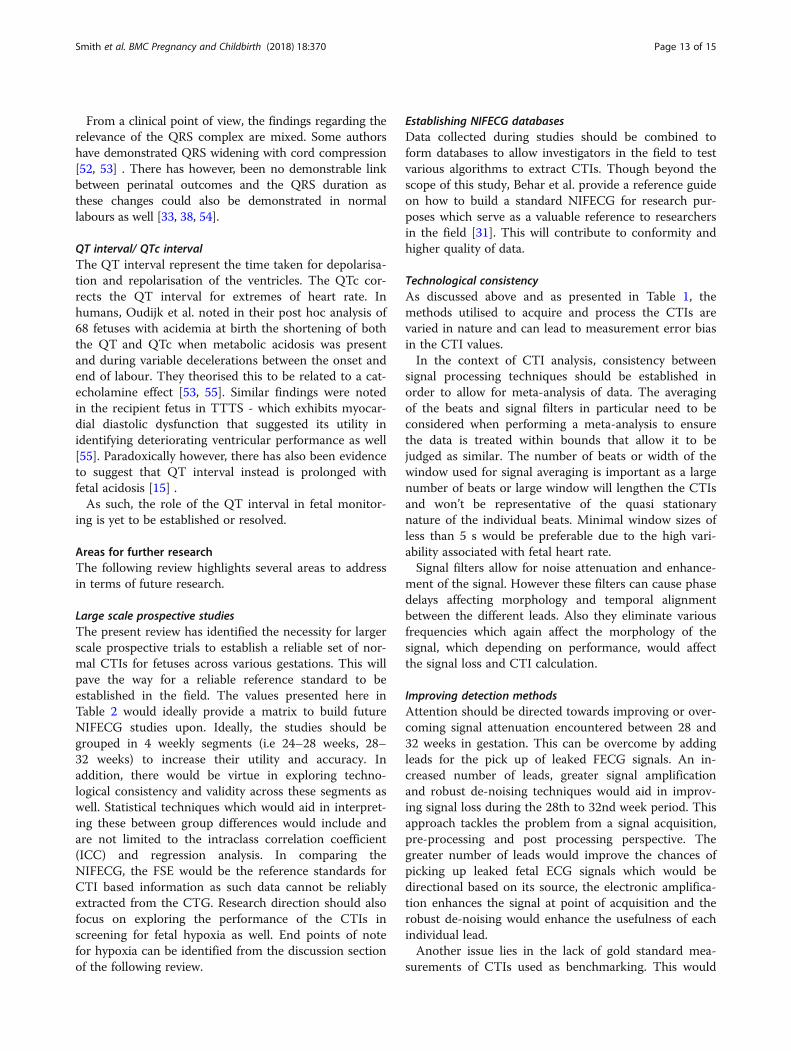
DiscussionThe fetal electrocardiogram (FECG)The FECG morphology, as illustrated in Fig. 6, is similarto that seen in the adult and contains the P wave, QRScomplex and T wave. Fetal cardiac physiology is func-tionally different from its adult counterpart. In the fetus,the right ventricle plays the dominant role in perfusingthe systemic circulation. As a result, the fetal cardiac
axis points towards the right in the fetus in contrast tothe left-sided deviation in the adults [28]. This differencein orientation results in the FECG appearing morpho-logically different from an adult ECG [6]. The FECGwaveform is processed to provide a familiar ECGvisualization to the clinician.
Cardiac time interval (CTI) analysisA variety of automated computational methods whichhave been developed for enhanced analysis of the FECG.
Signal detectionThe non-invasive nature of the NIFECG relies on signalacquisition from the maternal abdomen. The raw signalconsists of the FECG buried within the maternal.ECG (MECG) signal and environmental noise, such as
the uterine muscle activity (UA). Importantly, betweenthe 27th and 32 weeks of pregnancy, the vernix caseosacoats the fetus’ skin and acts as an electrical insulatinglayer, reducing the efficacy of acquiring the abdominalFECG signal. Signal detection methods have vastly
Fig. 3 Cardiac time intervals for early pre term (≤32 weeks). Legend: * data for subgroup not available. n represents entire sample analysed
Fig. 4 Cardiac time intervals for late pre term (32- 37 weeks)
Smith et al. BMC Pregnancy and Childbirth (2018) 18:370 Page 8 of 15
improved over the last 20 years and available technologiesat present allow for the detection of the FECG complexfrom the acquired raw signal [29]. The improvements in-clude and are not limited to new electrode materials (withgreater conductivity and skin adhesion), enhanced mag-netic shielding of the electronic system, and enhancedelectronic designs for noise reduction. The T wave in par-ticular has been known to have lower detection levels dueto its weaker signal and distortion by low frequency back-ground noise. As demonstrated by Taylor et al., detectionrates of CTIs in the term fetus tend to be more consistent(92%) [25]. Of note are also the presence of physiologicalconductors and insulators which enhance and attenuatethe fetal ECG respectively. Amniotic fluid is an example ofa conductor which helps propagate the fetal ECG fromthe fetal heart to the maternal skin. The vernix caseosa isa sebaceous, protective coating that forms between the27th to 32nd weeks and persists partially till the 37th weekof gestation where it fully dissolves. The vernix caseosaacts as an electrical shield, attenuating the fetal ECG sig-nal. During this period however, a fetal ECG can still beobserved non invasively on the mother’s skin as thefetal ECG leaks through the current pathways such asthe umbilical cord, oronasal cavity and holes in thevernix caseosa [19, 30].
Signal enhancementSignal enhancement could be broken down into two dis-tinct steps. Firstly, pre-processing allows the signal to beobserved in a suitable frequency range, eliminating arti-facts and unwanted features. Secondly, enhancing theFECG and attenuating the maternal ECG is key to accur-ate FHR and CTIs calculations.One key function of pre-processing is to narrow the
frequency range of the acquired signal. The frequencyband would be dependent on the features that need tobe seen. If the ST segment needs to be analysed or ob-served, a lower bound of 0.05 Hz would be needed. Ifthe ST segment is not a concern, for example in ambula-tory monitoring of ECG, then 0.5 Hz is a commonlyused lower cut off. Devices have commonly used anupper frequency bound of 250 Hz to 1000 Hz which ismore than sufficient given the spectrum of the ECG fea-tures can be observed below 80 Hz. Therefore, byNyquist sampling, any sampling frequency above 160 Hzshould capture the entire ECG signal with all its fea-tures. The upper bound ensures that the sharpest fea-tures of the signal can be observed whilst attenuatinghigh frequency noise. The lower bound is meant tocut-off as much baseline drift as possible without com-promising low frequency components in the NIFECG
Legend: * data for subgroup not available. n represents entire sample analysed.
Fig. 5 Time intervals for term pregnancies (≥37 weeks). Legend: * data for subgroup not available. n represents entire sample analysed
Table 3 Loss of signal between 27 and 32 weeks of GA
Study Signal Acquisition Loss (%)
Abboud et al.,1990 [20] (n = 21) None reported
Taylor et al.,2003 [24] (n = 199) 12.4%
Chia El et al.,2005 [22] (n = 178) PR = 45.9%, QRS = 19.7%, QT = 27.9%
Taylor et al.,2005 [25] (n = 15) None reported
Hayashi R et al.,2009 [23] (n = 48) 40% for < 36 weeks
Arya et al.,2015 [21] (n = 50) 33%
Yilmaz et al.,2015 (n = 64) 15%
Wacker-Gussmann et al.,2017 [26] (n = 117) 44%
Smith et al. BMC Pregnancy and Childbirth (2018) 18:370 Page 9 of 15
signal. Line noise, defined specifically at 50 or 60 Hz,can be cancelled out by a notch filter, which eliminatesspecific frequencies without altering the rest of the sig-nal. The notch filter frequency has no bearing on theupper or lower bound of the frequency band.The NIFECG signal, being dominated by the maternal
ECG, would require enhancement and processing beforeit could be utilised for FHR or fetal CTIs [5, 15] . Thiswould mean attenuating the maternal ECG to allow thedetails of the FECG to be observed. The MECG andFECG occur as independent events and therefore attenu-ating the maternal signal would not comprise informa-tion in the FECG if done accurately.A variety of techniques exist, such as adaptive filtering,
Kalman filtering, Bayesian inference techniques, andde-noising methods [31]. Adaptive and Kalman filteringinvolve multiple observations of the signal, extraction ofthe FECG waveform, and suppressing the maternal ECGsignal through inference or using the maternal ECG leadas a template. In de-noising methods, the NIFECG signalis decomposed into multiple components and the nonFECG components, such as Electromyograms (EMG) andMECG, are set to zero. In the case of true synchronicity intiming of the MECG and FECG, a fetal ECG embeddedwithin a MECG would deform the morphology of theMECG signal. Therefore, methods such using a referencematernal lead containing only MECG to train the algo-rithms to recognise only the FECG, or mathematicallytransforming the NIFECG into a space where fetal andMECG can be clearly differentiated would be the solution.If FECG happens to be embedded with the maternal QRScomplex, that particular beat may be discarded due to theexcessive distortion cause by the large amplitude maternalQRS complex. Ideally, FECG should be extracted fromisoelectric portions of the MECG, where there are noMECG features to corrupt the FECG.
Waveform detectionOnce the signal enhancement is complete, the FECG sig-nal can be analysed for CTIs given that the PQRST
features will be more prominent. However, the FECGsignal is still within the noise band of the acquisition de-vices and has to be enhanced further before the PQRSTfeatures can be reliably detected. To achieve furtherdenoising, several beats are averaged which provides asmoothing effect on the signal at the cost of losing mi-nute details on the FECG. The averaging ranges from10s up to 2 min or up to 1000 beats. After averaging thebeats, the PQRST are detected by either identifying theQRS as a high frequency feature and P and T waves aslow frequency features. There will be loss of informationgiven beat to beat variability of cardiac events but aver-aging cardiac cycles makes the assumption that the ECGsignal is quasi stationary over short time windows,meaning the features of each cardiac cycle within thatshort time window remain consistent. Different studieshave used different time windows and there is no stand-ard. This assumption must be made and may fail in theevent of ectopic beats or paroxysmal arrhythmias. An-other method is to differentiate the waves using theirslope, amplitude, and width as per the Pan Tompkins al-gorithm]. The Pan Tompkins algorithm consists of 2learning phases and one detection phase. The learningphases determines the thresholds and limit values andthe detection phase produces a pulse for each QRS com-plex. [32].
Techniques for fetal ECG enhancement and the effects ofnoiseThe sensitivity of the FECG needs to be consideredgiven the weakness of the signal in comparison to thematernal ECG. By over filtering the signal, several fea-tures and CTIs in the FECG may be distorted and be-come unreliable. When pre-processing, the lower boundof the filter will affect the ST segment. If a filter morethan 0.05 Hz is applied, the ST segment’s morphologywill be affected and become unreliable for diagnosticpurposes. This presents a trade off as filtering in the fre-quency domain for baseline wander causes distortion ofthe ST segment. A way around this and subject of
Fig. 6 Cardiac time intervals illustrated on a fetal ECG beat. The following beat was extracted from the Physionet database. This was aresult of 10averaged beats after the maternal ECG was cancelled
Smith et al. BMC Pregnancy and Childbirth (2018) 18:370 Page 10 of 15
potential research would be to identify new transformswhere ST segments are preserved whilst eliminating lowfrequency noise.When the FECG beats are averaged to remove residual
noise, the number of beats used will have an effect.Though the more beats used the cleaner the signalobtained, it also means the P, QRS and T waves willwiden and hence provide inaccurate CTI calculations.The CTIs should therefore be viewed in relation to thelength of averaging. The MECG and FECG signals arequasi-stationary, which means that beats have similarcharacteristics over a short period of time whilst theheart reacts to changes in stimuli or physiological condi-tions. This would mean the widths of the waves as wellas relative positions of the P, QRS and T waves with re-spect to each other would change with varying numberof beats used for averaging.
Clinical correlation of CTIsThe focus of this paper will be in relation to the tem-poral intervals for the FECG, as illustrated on Fig. 6. Forthe purpose of the following discussion, it must be bornein mind that evidence discussed below is mitigated bythe technological limitations applicable to the era inwhich they were carried out. Furthermore, all data pre-sented below has been derived utilising the FSE. Assuch, caution should be applied in loosely comparingthese findings to modern signal acquisition techniquesas well as the NIFECG. Additionally, the number of sub-jects should also be taken into account when interpret-ing the findings of individual studies. For instance, Aryaet al... (n = 20) demonstrated no correlation between allCTIs and GA.
P waveThis parameter refers to the time interval between theonset and end of the P wave. There has been demon-strable evidence to correlate an increase in P wave dur-ation with cardiac size from 17 weeks of gestation [33] .These were similar to findings in Wacker-Gussman et al.(R = 0.2; P < 0.05) and Chia et al [22, 26]. .In screening for hypoxia, the utility of P wave duration
remains equivocal and unproven. Murray demonstratedP wave duration prior to delivery had a negative correl-ation with umbilical vein noradrenaline levels (r = −0.4, p < 0.03) [34]. Conversely though, Jenkins et al.produced results showing no correlation between Pwave duration and hypoxic and non-hypoxic fetusesas well [35].From a technical point of view, there are a number of
factors which complicate the process of detecting andinterpreting the P waves utilising NIFECG. Firstly, itsamplitude is low making the signal detection difficulttransabdominally. In addition, the width of the P wave
would be affected by the number of beats used in thewaveform averaging process. The larger the number ofbeats, the wider the waveform would become and thiswould make the calculation of the P wave width unreli-able as well.In this context, the available evidence does not seem
to demonstrate a role for utilising the P wave in screen-ing for fetal hypoxia. Taking these technological limita-tions into account however, further research utilisingNIFECG would possibly clarify its role in CTI analysis.
PR and RR intervalThis refers to the duration between the onset of the Pwave and onset of the R peak which denotes the conduc-tion times from depolarisation of the SA node toconduction through the AV node and Bundle of His.The PR interval tends to be longer in male fetuses incomparison to female fetuses presumably due to weightdifferences [36] . A temporal relationship between PRinterval and GA was also noted by Chia et al., Taylor etal. and Yilmaz et al. in their study [22, 24, 27].In animal models, studies have demonstrated the
lengthening of the PR interval with hypoxia [37, 38]. Inthe lamb model specifically, PR interval and RR intervallengthening were demonstrated during aortic occlusionin sheep. This was hypothesised to be secondary to avagal response – since it could be obliterated with theadministration of atropine and was not reproducible inpremature lambs which do not demonstrate advancedbaroreceptor and chemoreceptor responses [39, 40].In humans however, the PR interval has demonstrated
paradoxical results in comparison to the animal model.Murray demonstrated in labouring women that therewas no significant change in the mean PR intervalthrough the course of labour. In 59% however, shorten-ing of the PR interval was demonstrated in the last hourof labour but this was within the standard error of meas-urement (13%). This subgroup though demonstrated aweak correlation (r = 0.2) with umbilical cord gas acide-mia [39]. Mohajer et al. also showed a 10% shortening ofthe PR interval from baseline of compromised fetuseswhich was however, not statistically significant [41]. In aseparate study, he also demonstrated a correlation ofthe PR interval and umbilical artery pH and lactate(r = − 0.38, p < 0.01 and r = 0.36, p < 0.01) expressedas a ratio index (RI) [42].Physiologically, this could bereflective of the predominant role of catecholaminesin the latter stages of labour which influences anddelays the conductance of the electrical signalthrough the AV node.As such, the role of the PR interval in screening for
hypoxia remains unproven and further studies in humanwould be useful in clarifying its role and the physio-logical mechanism, if any, in screening for hypoxia.
Smith et al. BMC Pregnancy and Childbirth (2018) 18:370 Page 11 of 15
Several authors have also demonstrated a physiologic-ally inverse correlation between the PR interval and RRinterval which becomes positive with evolving acidosis[15, 33, 34, 42, 43].Where the interaction remains con-tinually positive above 20 min, an increased risk of acutefetal compromise has been demonstrated as well [34].The theoretical basis of this stems from the differentialresponse of the SA node and AV to evolving hypoxia. Avagal cause of this remains unlikely as similar responsescan be elicited in mature lambs which have beenpre-medicated with atropine [43]. During mild hypox-emia, catecholamine levels become elevated resulting ina concomitant increase in fetal heart rate and a shorten-ing of the PR interval - thereby sustaining the negativerelationship between both variables. As the hypoxemiagets progressively worse, the highly oxygen dependentslow sodium channels in the SA node are affected beforethe fast sodium channels present at the AV node,thereby resulting in a compensatory fall in heart rateand RR interval widening. The catecholamine levelsthough, continue to rise in line with the evolvinghypoxemia thereby continually shortening the PRinterval. These synergistic changes would therefore in-verse the relationship between both variables to makeit positive [39, 44] .To complicate matters however, Luzietti et al. demon-
strated similar inversions in the PR-RR relationshipwhich occurred in all bradycardias below 40 bpm [45].Westgate et al. further demonstrated similar changes inthe relationship during the first 30 min of repetitive um-bilical cord compressions in term lamb which however,reverted to negative even in the setting of severehypoxia. This made them question its discriminativeability and cautioned against potentially misdiagnosing aseverely hypoxic fetus as being normal [46].Based on these findings, two parameters were subse-
quently trialled in clinical studies in the hope of aug-menting existing fetal surveillance parameters. The firstwas the conduction index (CI) which was a derivative ofthe Pearson’s correlation between the PR interval andthe FHR and calculated every two seconds. Fetal distresswas suspected based on a positive relationship establish-ing for longer than 20 min. The second was termed theratio index (RI) which was a Z transformed product ofthe interaction between the FHR and PR interval acrossthe total duration of monitoring undertaken acrosslabour which was computed every 10 s to look forchronic fetal decompensation. Utilising a cut-off of > 4%provided a high specificity of 95.5% and accuracy of89.4% for cord acidemia [42].Clinically, Reed et al. were the first to assess the utility
of PR interval analysis. In their study the addition of PRinterval assessment reduced the utilisation of fetal bloodsampling (FBS) from 85.5 to 26.8% which resulted in a
4% reduction of missed acidosis at birth [47] . This wasfollowed by a randomized controlled trial (RCT) carriedout by Wijngaarden et al. women were randomised toeither routine CTG and labour management or CTGmonitoring and PR interval analysis. In the latter, if twoof the 3 criteria (abnormal CTG, R > 4% or CI positivefor > 20 min) were present, FBS or delivery were to beundertaken at clinician discretion. The study found asignificant reduction in the group with PR interval ana-lysis of the number of FBS undertaken, the likelihood ofan abnormal FBS, missed cord acidemia at delivery andassisted deliveries for presumed fetal distress [44]. Thesefindings were subsequently followed on by a larger multi-centre RCT carried out by Strachan et al. The findings ofthe study however only demonstrated a non-significant re-duction in the group with time interval analysis included[63 (13%) vs 78 (16%)] and no significant differencein identifying cord acidemia or unsuspected cordacidemia [48].In this context, the available evidence does not seem
to demonstrate a significant role for utilising the PRinterval in screening for fetal hypoxia. Taking thetechnological limitations into account however, furtherresearch utilising NIFECG would possibly clarify its rolein CTI analysis.From a technical point of view, the widening of the
signal due to averaging of the beats will not have an im-pact on PR measurement since the ratio of PR and RR isconsidered rather than an absolute measurement. How-ever, if CIs or RIs are being used, the averaging windowneeds to be carefully considered. For CIs & RIs, since acorrelation is calculated every 2 and 10 s respectively,the signal averaging window should not exceed thosevalues.
QRS durationThe QRS duration is a measure of the QRS complexand correlates with the time taken for ventricular de-polarisation. The QRS duration is longer in males incontrast to females and is directly correlated withventricular mass and advancing gestation [2, 8, 49].These findings were mirrored in Chia et al. and Tay-lor et al. 2003 [22, 24]. There have been suggestionsof its utilisation as a surrogate marker for fetalgrowth and the diagnosis of fetal growth restriction[49, 50]. Pardi et al. suggested that serial measure-ments would provide a sensitivity of 81% and specifi-city of 93% in detecting growth restriction ifperformed serially [37]. Brambati et al. also investi-gated its utility in women with haemolytic disease ofthe newborn and noted its ability to discern betweenfetuses with worsening prognosticating based on aQRS duration greater than four standard deviationsabove the mean QRS duration for the gestation [51].
Smith et al. BMC Pregnancy and Childbirth (2018) 18:370 Page 12 of 15
From a clinical point of view, the findings regarding therelevance of the QRS complex are mixed. Some authorshave demonstrated QRS widening with cord compression[52, 53] . There has however, been no demonstrable linkbetween perinatal outcomes and the QRS duration asthese changes could also be demonstrated in normallabours as well [33, 38, 54].
QT interval/ QTc intervalThe QT interval represent the time taken for depolarisa-tion and repolarisation of the ventricles. The QTc cor-rects the QT interval for extremes of heart rate. Inhumans, Oudijk et al. noted in their post hoc analysis of68 fetuses with acidemia at birth the shortening of boththe QT and QTc when metabolic acidosis was presentand during variable decelerations between the onset andend of labour. They theorised this to be related to a cat-echolamine effect [53, 55]. Similar findings were notedin the recipient fetus in TTTS - which exhibits myocar-dial diastolic dysfunction that suggested its utility inidentifying deteriorating ventricular performance as well[55]. Paradoxically however, there has also been evidenceto suggest that QT interval instead is prolonged withfetal acidosis [15] .As such, the role of the QT interval in fetal monitor-
ing is yet to be established or resolved.
Areas for further researchThe following review highlights several areas to addressin terms of future research.
Large scale prospective studiesThe present review has identified the necessity for largerscale prospective trials to establish a reliable set of nor-mal CTIs for fetuses across various gestations. This willpave the way for a reliable reference standard to beestablished in the field. The values presented here inTable 2 would ideally provide a matrix to build futureNIFECG studies upon. Ideally, the studies should begrouped in 4 weekly segments (i.e 24–28 weeks, 28–32 weeks) to increase their utility and accuracy. Inaddition, there would be virtue in exploring techno-logical consistency and validity across these segments aswell. Statistical techniques which would aid in interpret-ing these between group differences would include andare not limited to the intraclass correlation coefficient(ICC) and regression analysis. In comparing theNIFECG, the FSE would be the reference standards forCTI based information as such data cannot be reliablyextracted from the CTG. Research direction should alsofocus on exploring the performance of the CTIs inscreening for fetal hypoxia as well. End points of notefor hypoxia can be identified from the discussion sectionof the following review.
Establishing NIFECG databasesData collected during studies should be combined toform databases to allow investigators in the field to testvarious algorithms to extract CTIs. Though beyond thescope of this study, Behar et al. provide a reference guideon how to build a standard NIFECG for research pur-poses which serve as a valuable reference to researchersin the field [31]. This will contribute to conformity andhigher quality of data.
Technological consistencyAs discussed above and as presented in Table 1, themethods utilised to acquire and process the CTIs arevaried in nature and can lead to measurement error biasin the CTI values.In the context of CTI analysis, consistency between
signal processing techniques should be established inorder to allow for meta-analysis of data. The averagingof the beats and signal filters in particular need to beconsidered when performing a meta-analysis to ensurethe data is treated within bounds that allow it to bejudged as similar. The number of beats or width of thewindow used for signal averaging is important as a largenumber of beats or large window will lengthen the CTIsand won’t be representative of the quasi stationarynature of the individual beats. Minimal window sizes ofless than 5 s would be preferable due to the high vari-ability associated with fetal heart rate.Signal filters allow for noise attenuation and enhance-
ment of the signal. However these filters can cause phasedelays affecting morphology and temporal alignmentbetween the different leads. Also they eliminate variousfrequencies which again affect the morphology of thesignal, which depending on performance, would affectthe signal loss and CTI calculation.
Improving detection methodsAttention should be directed towards improving or over-coming signal attenuation encountered between 28 and32 weeks in gestation. This can be overcome by addingleads for the pick up of leaked FECG signals. An in-creased number of leads, greater signal amplificationand robust de-noising techniques would aid in improv-ing signal loss during the 28th to 32nd week period. Thisapproach tackles the problem from a signal acquisition,pre-processing and post processing perspective. Thegreater number of leads would improve the chances ofpicking up leaked fetal ECG signals which would bedirectional based on its source, the electronic amplifica-tion enhances the signal at point of acquisition and therobust de-noising would enhance the usefulness of eachindividual lead.Another issue lies in the lack of gold standard mea-
surements of CTIs used as benchmarking. This would
Smith et al. BMC Pregnancy and Childbirth (2018) 18:370 Page 13 of 15
be necessary to establish how accurate are the CTIs, es-pecially in the case of NI-FECG.
LimitationsThere were several limitations for the following study.Firstly, given the small amount of data published, therewas as limited amount of data for analysis. In particular,the study by Taylor et al. was utilised in patients inlabour. Although all foetuses included in the study werenormal and no instances of fetal distress/ hypoxia wasmentioned in their study, the effect of labour on theCTIs needs to be taken into consideration as it may haveaffected our results [25]. Also, the wide variation in CTIacquisition techniques and signal processing did notallow for meta-analysis. This would have been useful forexamining temporal relationships between the CTIs. Inaddition, the studies included in the review were at highrisk of bias due to study design as well. Nevertheless, thefollowing studies do still demonstrate the benefit andpotential in utilising CTIs in fetal diagnostics.
ConclusionIn conclusion, NIFECG shows promise as an adjunctdiagnostic tool in fetal diagnostics. Larger prospectivestudies should be directed towards establishing reliableCTIs across various gestations and investigating correla-tions between the parameters to establish it as an effect-ive screening tool. There is also potential benefit inestablishing consistencies in signal processing techniquesduring a period where much attention is being directedtoward this monitoring modality. Furthermore, tech-nologies being developed in the area should aim to ad-dress current shortcomings in signal detection toimprove reliability and functionality of the methodology.
AcknowledgementsNo acknowledgements were applicable to the following systematic review.
FundingNo funding was provided for the following study.
Availability of data and materialsAll data generated or analysed during the study is included in this publishedarticle.
Authors’ contributionsAll authors (VS, SA, AN, DA, FdSC, EMW) were equally involved in theconception, editing, and review process of the present article. All authorsread and approved the final manuscript.
Ethics approval and consent to participateNot applicable.
Consent for publicationNot applicable.
Competing interestsVS owns shares and works as a consultant for Biorithm Pte Ltd. AN and DAare employees of Biorithm Pte Ltd. SA, EMW, and FDC have no competinginterests.
Publisher’s NoteSpringer Nature remains neutral with regard to jurisdictional claims inpublished maps and institutional affiliations.
Author details1Department of Obstetrics and Gynaecology, Monash University, 252 ClaytonRoad, Melbourne, VIC 3168, Australia. 2Department of Electrical andElectronic Engineering, University of Melbourne, Parkville Campus,Melbourne, VIC 3010, Australia. 3Biorithm Pte Ltd, 81 Ayer Rajah Crescent03-53, Singapore 139967, Singapore.
Received: 9 May 2018 Accepted: 2 September 2018
References1. Peters CH, ten Broeke ED, Andriessen P, Vermeulen B, Berendsen RC, Wijn
PF, Oei SG. Beat-to-beat detection of fetal heart rate: Doppler ultrasoundcardiotocography compared to direct ECG cardiotocography in time andfrequency domain. Physiol Meas. 2004;25(2):585–93.
2. Ayres-de-Campos D, Spong CY, Chandraharan E. FIGO consensus guidelineson intrapartum fetal monitoring: Cardiotocography. Int J Gynecol Obstet.2015;131(1):13–24.
3. Bakker PC, Colenbrander GJ, Verstraeten AA, Van Geijn HP. The quality ofintrapartum fetal heart rate monitoring. Eur J Obstet Gynecol Reprod Biol.2004;116(1):22–7.
4. Peters M, Crowe J, Pieri JF, Quartero H, Hayes-Gill B, James D, Stinstra J,Shakespeare S. Monitoring the fetal heart non-invasively: a review ofmethods. J Perinat Med. 2001;29(5):408–16.
5. Clifford GD, Silva I, Behar J, Moody GB. Non-invasive fetal ECG analysis.Physiol Meas. 2014;35(8):1521–36.
6. Agostinelli A, Grillo M, Biagini A, Giuliani C, Burattini L, Fioretti S, Di Nardo F,Giannubilo SR, Ciavattini A, Burattini L. Noninvasive fetalelectrocardiography: an overview of the signal electrophysiologicalmeaning, recording procedures, and processing techniques. AnnNoninvasive Electrocardiol. 2015;20(4):303–13.
7. Alfirevic Z, Devane D, Gyte GM. Continuous cardiotocography (CTG) as aform of electronic fetal monitoring (EFM) for fetal assessment during labour.Cochrane Database Syst Rev. 2013;5:Cd006066.
8. Reinhard J, Hayes-Gill BR, Schiermeier S, Hatzmann W, Herrmann E,Heinrich TM, Louwen F. Intrapartum signal quality with external fetalheart rate monitoring: a two way trial of external Doppler CTGultrasound and the abdominal fetal electrocardiogram. Arch GynecolObstet. 2012;286(5):1103–7.
9. Reinhard J, Hayes-Gill BR, Yi Q, Hatzmann H, Schiermeier S. Comparison ofnon-invasive fetal electrocardiogram to Doppler cardiotocogram during the1st stage of labor. J Perinat Med. 2010;38(2):179–85.
10. Cohen WR, Hayes-Gill B. Influence of maternal body mass index on accuracyand reliability of external fetal monitoring techniques. Acta Obstet GynecolScand. 2014;93(6):590–5.
11. Reinhard J, Hayes-Gill BR, Schiermeier S, Hatzmann H, Heinrich TM, LouwenF. Intrapartum heart rate ambiguity: a comparison of Cardiotocogram andabdominal fetal electrocardiogram with maternal electrocardiogram.Gynecol Obstet Investig. 2013;75(2):101–8.
12. Euliano TY, Darmanjian S, Nguyen MT, Busowski JD, Euliano N, Gregg AR.Monitoring fetal heart rate during labor: a comparison of three methods. JPregnancy. 2017;2017:8529816.
13. Zador I, Wolfson R, Pillay S, Timor-tritsch I. Fetal cardiac time intervals andtheir potential clinical applications. Clin Obstet Gynecol. 1979;22(3):651–33.
14. Verdurmen KMJ, Warmerdam GJJ, Lempersz C, Hulsenboom ADJ, RenckensJ, Dieleman JP, Vullings R, van Laar J, Oei SG. The influence ofbetamethasone on fetal heart rate variability, obtained by non-invasive fetalelectrocardiogram recordings. Early Hum Dev. 2018;119:8–14.
15. Symonds EM, Sahota D, Chang A. The intervals and morphology of the fetalECG. In: Fetal Electrocardiography: Published By Imperial College Press andDistributed By World Scientific Publishing Co; 2001. p. 89–107.
16. Wakai RT, Lengle JM, Leuthold AC. Transmission of electric and magneticfoetal cardiac signals in a case of ectopia cordis: the dominant role of thevernix caseosa. Phys Med Biol. 2000;45(7):1989.
17. Clifford G, Sameni R, Ward J, Robinson J, Wolfberg AJ: Clinically accuratefetal ECG parameters acquired from maternal abdominal sensors. Am JObstet Gynecol 2011, 205(1):47.e41–45.
Smith et al. BMC Pregnancy and Childbirth (2018) 18:370 Page 14 of 15
18. Reinhard J, Hayes-Gill B, Yuan J, Schiermeier S, Louwen F. Intrapartum STsegment analyses (STAN) using simultaneous invasive and non-invasive fetalelectrocardiography: a report of 6 cases. Zeitschrift fur Geburtshilfe undNeonatologie. 2014;218(3):122–7.
19. Sameni R, Clifford GD. A review of fetal ECG signal processing; issues andpromising directions. Open Pacing Electrophysiol Ther J. 2010;3:4–20.
20. Abboud S, Barkai G, Mashiach S, Sadeh D. Quantification of the fetalelectrocardiogram using averaging technique. Comput Biol Med. 1990;20(3):147–55.
21. Arya B, Govindan R, Krishnan A, Duplessis A, Donofrio MT. Feasibility ofnoninvasive fetal electrocardiographic monitoring in a clinical setting.Pediatr Cardiol. 2015;36(5):1042–9.
22. Chia EL, Ho TF, Rauff M, Yip WC. Cardiac time intervals of normal fetusesusing noninvasive fetal electrocardiography. Prenat Diagn. 2005;25(7):546–52.
23. Hayashi R, Nakai K, Fukushima A, Itoh M, Sugiyama T. Development andsignificance of a fetal electrocardiogram recorded by signal-averaged high-amplification electrocardiography. Int Heart J. 2009;50(2):161–71.
24. Taylor MJ, Smith MJ, Thomas M, Green AR, Cheng F, Oseku-Afful S, Wee LY,Fisk NM, Gardiner HM. Non-invasive fetal electrocardiography in singletonand multiple pregnancies. BJOG. 2003;110(7):668–78.
25. Taylor MJO, Thomas MJ, Smith MJ, Oseku-Afful S, Fisk NM, Green AR,Paterson-Brown S, Gardiner HM. Non-invasive intrapartum fetal ECG:preliminary report. BJOG Int J Obstet Gynaecol. 2005;112(8):1016–21.
26. Wacker-Gussmann A, Plankl C, Sewald M, Schneider KM, Oberhoffer R,Lobmaier SM. Fetal cardiac time intervals in healthy pregnancies - anobservational study by fetal ECG (Monica healthcare system). J Perinat Med.2018;46(6):587–92. https://doi.org/10.1515/jpm-2017-0003
27. Yilmaz B, Narayan HK, Wilpers A, Wiess C, Fifer WP, Williams IA.Electrocardiographic intervals in fetuses with congenital heart disease.Cardiol Young. 2016;26(1):84–9.
28. Verdurmen KMJ, Hulsenboom ADJ, van Laar JOEH, Wijn PFF, Vullings R, OeiSG. Orientation of the electrical heart axis in mid-term pregnancy. Eur JObstet Gynecol Reprod Biol. 2016;207:243–6.
29. Sun Y, Yu XB. Capacitive biopotential measurement for electrophysiologicalsignal acquisition: a review. IEEE Sensors J. 2016;16(9):2832–53.
30. Rooijakkers MJ, Song S, Rabotti C, Oei SG, Bergmans JWM, Cantatore E,Mischi M. Influence of electrode placement on signal quality for ambulatorypregnancy monitoring. Comput Math Methods Med. 2014;2014:12.
31. Behar J, Andreotti F, Zaunseder S, Oster J, Clifford GD. A practical guide tonon-invasive foetal electrocardiogram extraction and analysis. Physiol Meas.2016;37(5):R1–r35.
32. Pan J, Tompkins WJ. A real-time QRS detection algorithm. IEEE TransBiomed Eng. 1985;BME-32(3):230–6.
33. Kurjak A, Chervenak FA. The fetal electrocardiogram. In: Textbook ofperinatal medicine. 2nd ed. Abingdon: Informa; 2006.
34. Murray HG. The fetal electrocardiogram: current clinical developments inNottingham. In: Kooperation de Gruyter. 1986;
35. Jenkins H. A study of intrapartum electrocardiogram using a real timecomputer: Univeristy of Nottingham; 1984.
36. Morgan M, Symonds EM. Natural history determinants of the timeconstants of the fetal electrocardiogram. Eur J Obstet Gynecol ReprodBiol. 1991;42:S9–S13.
37. Pardi G, Ferrazzi E, Cetin I, Rampello S, Baselli G, Cerutti S, Civardi S. Theclinical relevance of the abdominal fetal electrocardiogram. J Perinat Med.1986;14(6):371–7.
38. Yeh M-N, Morishima HO, Niemann WH, James LS. Myocardial conductiondefects in association with compression of the umbilical cord. Am J ObstetGynecol. 1975;121(7):951–7.
39. Murray HG. Evaluation of the fetal electrocardiogram ECG: University ofNottingham; 1992.
40. Widmark C, Lindecrantz K, Murray H, Rosen KG. Changes in the PR, RRintervals and ST waveform of the fetal lamb electrocardiogram with acutehypoxemia. J Dev Physiol. 1992;18(3):99–103.
41. Mohajer MP. The fetal electrocardiogram and intrapartum asphixia:University of Nottingham; 1994.
42. Mohajer MP, Sahota DS, Reed NN, Chang A, Symonds EM, James DK.Cumulative changes in the fetal electrocardiogram and biochemical indicesof fetal hypoxia. Eur J Obstet Gynecol Reprod Biol. 1994;55(1):63–70.
43. van Wijngaarden WJ, de Haan HH, Sahota J, Symonds H. Changes in the PRinterval - fetal heart rate relationship of the electrocardiogram during fetal
compromise in chronically instrumented sheep. Am J Obstet Gynecol. 1996;175(3, Part 1):548–54.
44. van Wijngaarden WJ, Sahota DS, James DK, Farrell T, Mires GJ, Wilcox M,Chang A. Improved intrapartum surveillance with PR interval analysis of thefetal electrocardiogram: a randomized trial showing a reduction in fetalblood sampling. Am J Obstet Gynecol. 1996;174(4):1295–9.
45. Luzietti R, Erkkola R, Hasbargen U, Mattson LA, Thoulon JM, Rosen KG.European Community multicentre trial “fetal ECG analysis during labour”:the P-R interval. J Perinat Med. 1997;25(1):27–34.
46. Westgate JA, Gunn AJ, Bennet L, Gunning MI, De Haan HH, GluckmanPD. Do fetal electrocardiogram PR-RR changes reflect progressiveasphyxia after repeated umbilical cord occlusion in fetal sheep? PediatrRes. 1998;44(3):297–303.
47. Reed NN, Mohajer MP, Sahota DS, James DK, Symonds EM. Thepotential impact of PR interval analysis of the fetal electrocardiogram(FECG) on intrapartum fetal monitoring. Eur J Obstet Gynecol ReprodBiol. 1996;68:87–92.
48. Strachan BK, van Wijngaarden WJ, Sahota D, Chang A, James DK.Cardiotocography only versus cardiotocography plus PR-interval analysis inintrapartum surveillance: a randomised, multicentre trial. FECG Study Group.Lancet (London, England). 2000;355(9202):456–9.
49. Brambati B, Pardi G. The intraventricular conduction time of fetal heart inuncomplicated pregnancies. BJOG Int J Obstet Gynaecol. 1980;87(11):941–8.
50. Brambati B, Bonsignore L. Intraventricular conduction time in fetuses bornwith growth retardation. Br J Obstet Gynaecol. 1982;89(11):900–3.
51. Brambati B, Pardi G. The intraventricular conduction time of fetal heart inpregnancies complicated by rhesus haemolytic disease. Br J ObstetGynaecol. 1981;88(12):1233–40.
52. Larks SD, Longo LD. Electrocardiographic studies of the fetal heart duringdelivery. Obstet Gynecol. 1962;19:740–7.
53. Lee KH, Blackwell R. Observations on the configuration of the fetalelectrocardiogram before and during labour. J Obstet Gynaecol BrCommonw. 1974;81(1):61–9.
54. Sletten J, Kessler J. QRS abnormalities of the fetal electrocardiogram, andtheir implications for ST-interval analysis during labor. Acta Obstet GynecolScand. 2015;94(10):1128–35.
55. Oudijk MA, Kwee A, Visser GH, Blad S, Meijboom EJ, Rosen KG. The effects ofintrapartum hypoxia on the fetal QT interval. BJOG. 2004;111(7):656–60.
Smith et al. BMC Pregnancy and Childbirth (2018) 18:370 Page 15 of 15