a study of the relationship between - mahatma gandhi university
TRANSCRIPT
A STUDY OF THE RELATIONSHIP BETWEEN INTELLIGENCE, SCIENTIFIC CREATIVITY,
ACHIEVEMENT MOTIVATION, HOME ENVIRONMENT AND ACHIEVEMENT
IN SCIENCE OF HIGHER SECONDARY SCHOOL PUPILS OF KERALA
ROSAMMA PHILIP M.Sc., M.Ed. Senior Lecturer in Physical Science
Mount Tabor Training College Pathanapuram
SUBMITTED THESIS
FOR THE DOCTOR OF PHILOSOPHY
IN EDUCATION
SCHOOL OF PEDAGOGICAL SCIENCES MAHATMA GANDHI UNIVERSITY
KOTTAYAM, KERALA c 2007

DECLARATION
I , ROSAMMA PHILIP. do hereby declare that this thesis
"A STUDY OF THE RELATIONSHIP BETWEEN INTELLIGENCE, SCIENTIFIC
CREATIVITY, ACHIEVEMENT MOTIVATION, HOME ENVIRONMENT AND
ACHIEVEMENT IN SCIENCE OF HIGHER SECONDARY SCHOOL PUPILS OF
KERALA" Is an original work done by me for the award of the degree of
Doctor of Philosophy in the faculty of Education. I also declare that this
thesis or any part of it has not been submitted by me for the award of a
degree, diploma. title or recognition before,
Kottayam 6 b - ja. 2007
Dr. P.M. JALEEL Former Professor & Director,
School of Pedagogical Sciences, Mahatma Gandhi University, Kottayam.
J.P. No. 30, Thycaud P.O..
Thiruvanant hap uram.
This is to certify that this thesis "A STUDY OF THE RELATIONSHIP
BETWEEN INTELLIGENCE, SCIENTIFIC CREATIVITY, ACHIEVEMENT
MOTIVATION, HOME ENVIRONMENT AND ACHIEVEMENT IN SCIENCE OF
HIGHER SECONDARY SCHOOL PUPILS OF KERALA" is a genuine and
bonafide research work carried out by Ms. Rosamma Philip under my
supervision and guidance 4 0 be submitted for the award of the degree of
Doctor of Philosophy in the Faculty of Education, Mahatma Gandhi
University, Kottayarn, Kerala.
Kottayam 03.~0- 2007
Dr. P.M. JALEEL (Supervising Teacher)
ACKNOWLEDGEMENT The investigator wishes to place on record her deep indebtedness to a large number of institutions and individuals for the contributions they extended to her in the execution of the present study. Though it is impossible to acknowledge all of them by names, special mention is made here to the key scaffolders who supported a lot for the successful completion of the study.
The investigator expresses immense thankfulness to Dr. P .M Jaleel, Former Director of School of Pedagogical Sciences, Mahatma Gandhi University for the inspiring guidance and sustaining encouragement during the period of the study.
The investigator is deeply indebted to Dr.P.Viswanadhan Nair, Professor and Head of the Department of Education, University of Kerala, who laid the indelible base for the present study. A great deal of gratitude is owed to the distinguished thinkers Dr. Vedamoni Manuel and Dr. A. Sukumaran Nair who contributed for the preliminary phase of the study.
The investigator expresses her sincere gratitude to Dr. P. J. Jacob, Director, School of Pedagogical Sciences for the timely assistance in refreshing and refining the work. The cordial support provided by each and every member of the staff of School of Pedagogical Sciences is to be acknowledged. Her thanks are due to the Librarian Mr. A. T. Anilkumar for the services rendered at all stages of the study.
The investigator is highly obliged to Dr. Teresa Susan, Department of Education, University of Kerala for inspiriting and energising the investigator with ineffable affection.
The investigator extends her profound gratitude to Fr. K. A. Abraham, Manager and members of the Mount Tabor Family for their encouragement. The investigator is indebted to principals and teachers of various schools for giving necessary arrangements for the conduct of the study.
The investigator appreciates Capital Computer Centre for their professional competency in data analysis, typing and binding of the thesis.
The investigator expresses her affection to her husband Josy Sebastian and kids Russel, Russo and Bappu who are the real motivators of her accomplishments.
The investigator remembers three beloved Souls in Heaven who departed from her home during the course of this study.
Above all the investigator bows her head before the Holy Spirit that empowers her miraculously.
Rosamma Philip
List of Tables
List of Figures
List of Appendices
No. Chapter Page
I , INTRODUCTION 1-20
12. REVlEW OF RELATED STUDIES 21 -43
Ill. METHODOLOGY 44-91
IV. A NA LYSZS AND DISCUSSZONS 92-294
V. SUMMARY, FINDINGS AND CONCLUSlONS 295-323
- -
BIBLIOGRAPHY
APPENDICES
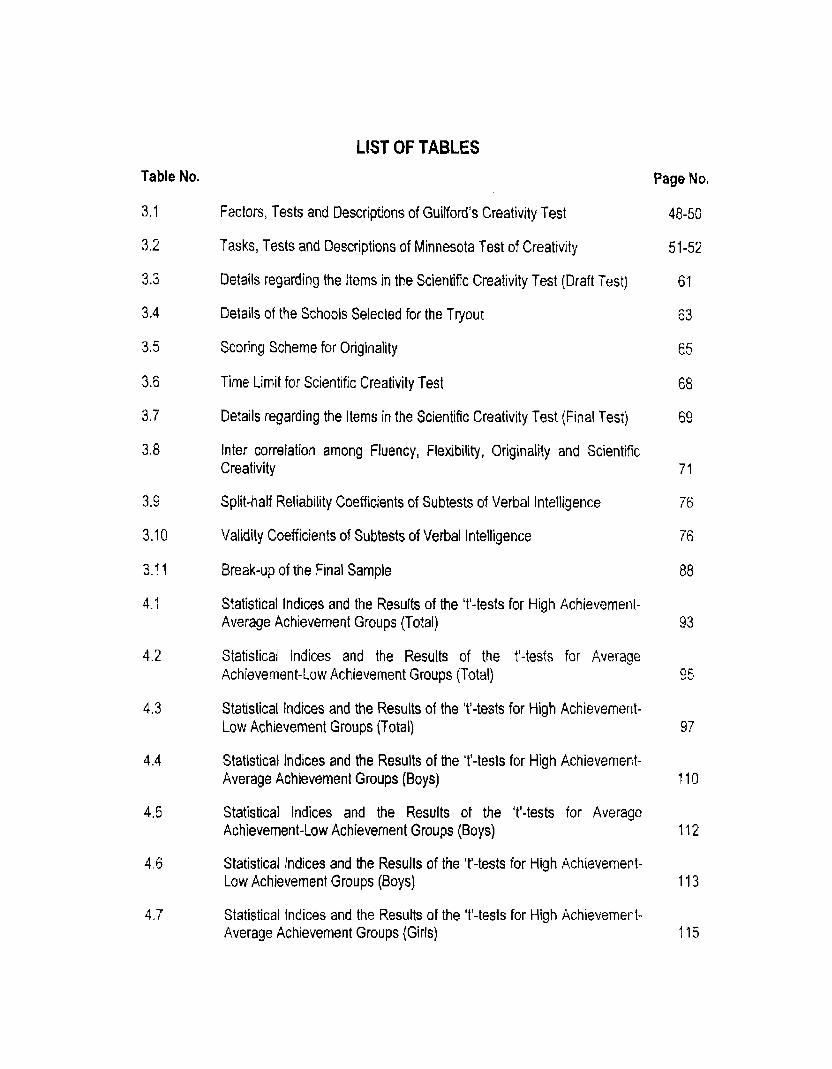
LIST OF TABLES
Table No.
3.1
3.2
3.3
3.4
3#5
3.6
3.7
3.8
Factors, Tests and Descriptions of Guilford's Creativity Test
Tasks, Tests and Descriptions of Minnesota Test of Creativity
Details regarding the ltems in the Scientific Creativity Test (Draft Test)
Details of the Schools Selected for the Tryout
Scoring Scheme for Originality
Time Limit for Scientific Creativity Test
Details regarding the Items in the Scientific Creativity Test (Final Test)
Inter correlation among Fluency, Flexibility, Originality and Scientific Creativity
Split-half Reliability Coefficients of Subtests of Verbal Intelligence
Validity Coefficients of Subtests of Verbal Intelligence
Break-up of the Final Sample
Statistical lndices and the Results of the 7'-tests for High Achievement- Average Achievement Groups (Total)
Statistical lndices and the Results af the '1'-tests for Average Achievement- tow Achievement Groups (Total)
Statistical Indices and the Results of the ?'-tests for High Achievement- Low Achievement Groups (Total)
Statistical lndices and the Results of the 't'-tests for High Achievement- Average Achievement Groups (Boys)
Statistical lndices and the Results of the 'tl-tests for Average Achievement-Low Achievement Groups (Boys)
Statistical lndices and the Results of the 't'-tests for High Achievement- Low Achievement Groups (Boys)
Statistical Indices and the Results of the 7'-tests for High Achievement- Average Achievement Groups (Girls)
Page No,
48-50
5 1-52
61
63
6 5
68
69
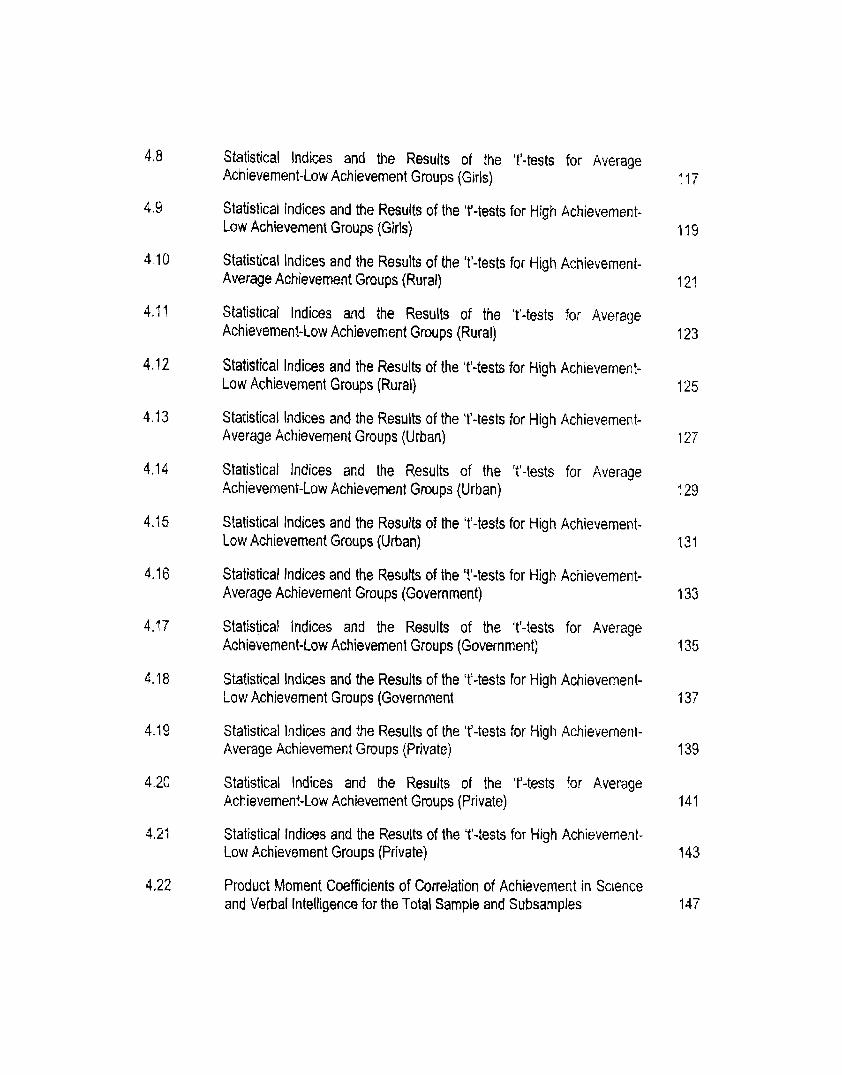
Statistical lndices and the Results of Ihe 'I1-tests for Average Achievement-Low Achievement Groups (Girls)
Statistical lndices and the Results of the 't'-tests for High Achievement- Law Achievement Groups (Girls)
Statistical lndices and the Results of the It'-tests for High Achievement- Average Achievement Groups (Rural)
Slatistical lndices and the Results of the 't'-tests for Average Achievement-Low Achievement Groups (Rural)
Statistical lndices and the Results of the 'tl-tests for High Achievement- Low Achievement Groups (Rural)
Statistical lndices and the Results of the 't'-tests for High Achievement- Average Achievement Groups (Urban)
Statistical Indices and the Results of the 'tl-tests for Average Achievement-Low Achievement Groups (Urban)
Statistical lndices and the Results of the It'-tests for High Achievement- Low Achievement Groups (Urban)
Statistical lndices and the Results of the It'-tests for High Achievement- Average Achievement Groups (Government)
Statistical lndices and the Results of the 'tf-tests for Average Achievement-Low Achievement Groups (Government)
Statistical lndices and the Results of the 'ti-tests for High Achievement- Low Achievement Groups (Government
Statistical lndices and the Results of the 't'-tests for High Achievement- Average Achievement Groups (Private)
Statistical lndices and the Results of the It'-tests for Average Achievement-Low Achievement Groups (Private)
Statistical lndices and the Results of the 't'-tests for High Achievement- Low Achievement Groups (Private)
Product Moment Coefficients of Correlation of Achievement in Science and Verbal Intelligence for the Total Sample and Subsamples
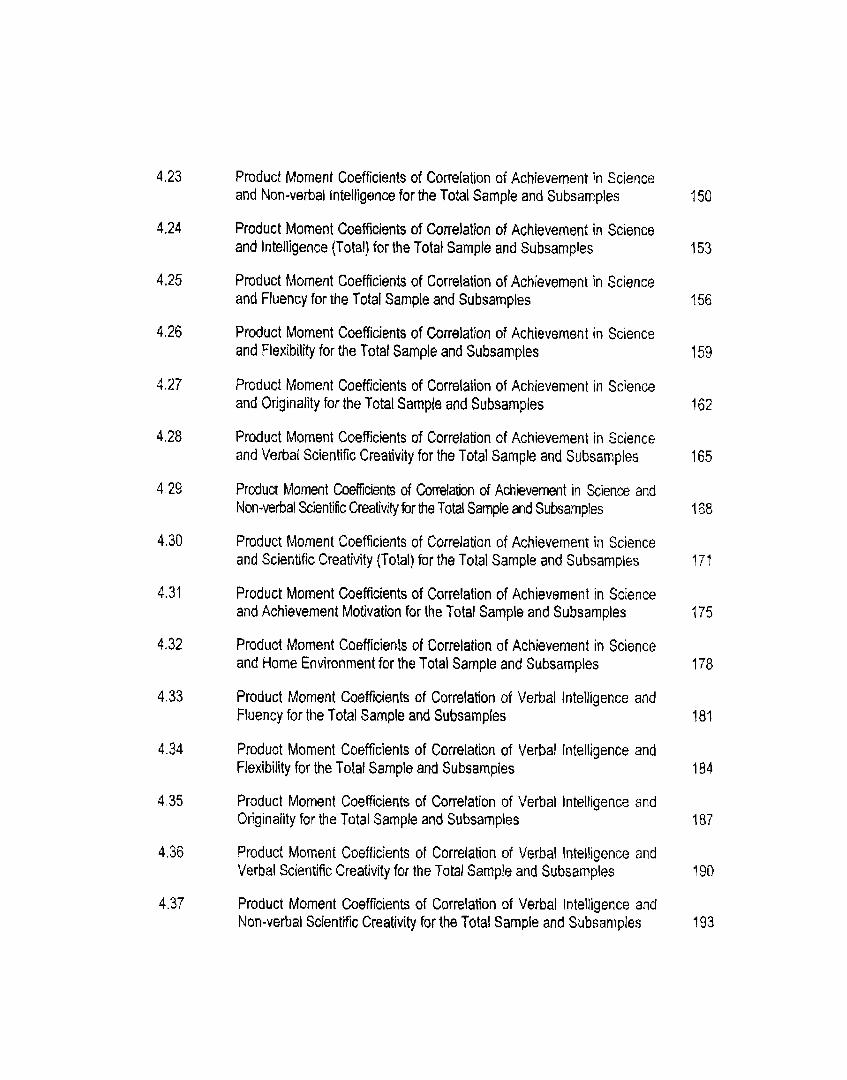
Product Moment Coefficients of Correlation of Achievement in Science and Non-verbal Intelligence for the Total Sample and Subsamples
Product Moment Coefficients of Correlation of Achievement in Science and lntelligence (Total) for the Total Sample and Subsamples
Product Moment Coefficients of Correlation of Achievement in Science and Fluency for the Total Sample and Subsamples
Product Moment Coefficients of Correlation of Achievement in Science and Flexibility for the Total Sample and Subsamples
Product Moment Coefficients of Correlation of Achievement in Science and Originality for the Total Sample and Subsamples
Product Moment Coefficients of Correlation of Achievement in Science and Verbal Scientific Creativity for the Total Sample and Subsamples
Prduct Moment Coefficients of Comiabn of Achievement in Science and Non-verbal Scientific Creativity for the Total Sample and Subsamples
Product Moment Coefficients of Correlation of Achievement in Science and Scientific Creativity (Total) for the Total Sample and Subsamples
Product Moment Coefficients of Correlation of Achievement in Science and Achievement Motivation for the Total Sample and Subsamples
Product Moment Coefficients of Correlation of Achievement in Science and Home Environment for the Total Sample and Subsamples
Product Moment Coefficients of Correlation of Verbal lntelligence and Fluency for the Total Sample and Subsamples
Product Moment Coefficients of Correlation of Verbal Intelligence and Flexibility for the Totaf Sample and Subsamples
Product Moment Coefficients of Correlation of Verbal lntelligence and Originality for the Total Sample and Subsamples
Product Moment Coefficients of Correlation of Verbal lntelligence and Verbal Scientific Creativity for the Total Sample and Subsamples
Product Moment Coefficients of Correlation of Verbal lntelligence and Non-verbal Scientific Creativity for the Tota! Sample and Subsamples
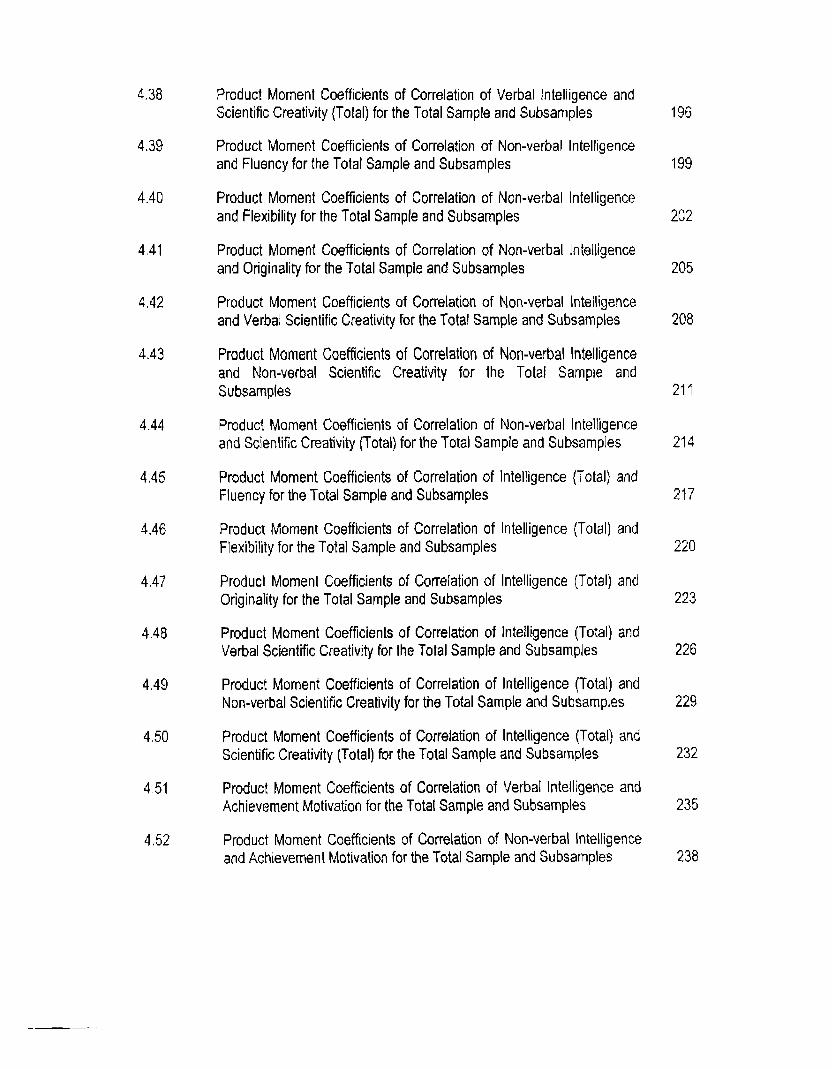
Product Moment Coefficients of Correlation of Verbal Intelligence and Scientific Creativity (Total) for the Total Sample and Subsamples
Product Moment Coefficients of Correlation of Non-verbal Intelligence and Fluency for the Total Sample and Subsamples
Product Moment Coefficients of Correlation of Non-verbal lntelligence and Flexibility for the Total Sample and Subsamples
Product Moment Coefficients of Correlation of Non-verbal Intelligence and Originality for the Total Sample and Subsamples
Product Moment Coefficients of Correlation of Non-verbal Intelligence and Verbal Scientific Creativity for the Total Sample and Subsamples
Product Moment Coefficients of Correlation of Non-verbal Intelligence and Non-verbal Scientific Creativity for the Total Sample and Subsampies
Product Moment Coefficients of Correlation of Non-verbal lntelligence and Scientific Creativity (Total) for the Total Sample and Subsamples
Product Moment Coefficients of Correlation of lntelligence (Total) and Fluency for the Total Sample and Subsamples
Product Moment Coefficients of Correlation of lntelligence (Total) and Flexibility for the Total Sample and Subsamples
Product Moment Coefficients of Correlation of lntelligence (Total) and Originality for the Total Sample and Subsamples
Product Moment Coefficients of Correlation of Intelligence (Total) and Verbal Scientific Creativity for the Total Sample and Subsamples
Product Moment Coefficients of Correlation of lntelligence (Total) and Non-verbal Scientific Creativity for the Total Sample and Subsamples
Product Moment Coefficients of Correlation of lntelligence (Total) and Scientific Creativity (Total) for the Total Sample and Subsamples
Product Moment Coefficients of Correlation of Verbal Intelligence and Achievement Motivation for the Total Sample and Subsamples
Product Moment Coefficients of Correlation of Non-verbal Intelligence and Achievement Motivation for the Total Sample and Subsamples
Product Moment Coefficients of Correlation of Intelligence (Total) and Achievement Motivation for the Total Sample and Subsamples
Product Moment Coefficients of Correlation of Verbal Intelligence and Home Environment for the Total Sample and Subsamples
Product Moment Coefficients of Correlation of Non-verbal Intelligence and Home Environment for the Total Sample and Subsamples
Product Moment Coefficients of Correlation of Intelligence (Total) and Home Environment for the Total Sample and Subsamples
Product Moment Coefficients of Correlation of Fluency and Achievement Motivation for the Total Sample and Subsamples
Product Moment Coefficients of Correlation of Flexibility and Achievement Motivation for the Total Sample and Subsampies
Product Moment Coefficients of Correlation of Originality and Achievement Motivation for the Total Sample and Subsamples
Product Moment Coefficients of Correlation of Verbal Scientific Creativity Achievement Motivation for the Total Sample and Subsamples
Product Moment Coefficients of Correlation of Non-verbal Scientific Creativity and Achievement Motivation for the Total Sample and Subsamples
Product Moment Coefficients of Correlation of Scientific Creativity and Achievement Motivation for the Total Sample and Subsamples
Product Moment Coefficients of Correlation of Fhency and Home Environment for the Total Sample and Subsamples
Product Moment Coefficients of Correlation of Flexibility and Home Environment for the Total Sample and Subsamples
Product Moment Coefficients of Correlation of Originality and Home Environment for the Total Sample and Subsamples
Product Moment Coefficients of Correlation of Verbal Scientific Creativity and Home Environment for the Total Sample and Su bsamples
4.67 Product Moment Coefficients of Correlation of Non-verbal Scientific Creativity and Home Environment for the Total Sample and Subsamples 281
4.68 Product Moment Coefficients of Correlation of Scientific Creativity and Home Environment for the Total Sample and Subsampies 284
4.69 Product Moment Coefficients of Correlation of Achievement Motivation and Home Environment for the Total Sample and Subsamples 287
4.70 Mean and Standard Deviation 290
4,71 inter correlations of the Variables 290
LIST OF FIGURES Figure No. Page No.
4.1 Mean Verbal Intelligence Scores of High, Average and Low 99 Achievement Groups (Total Sample)
4.2 Mean Non-verbal intelligence Scores of High, Average and Low 100 Achievement Groups (Total Sample)
4.3 Mean Intelligence (Total) Scores of High, Average and Low 101 Achievement Groups (Total Sample)
4.4 Mean Fluency Scores of High, Average and Low Achievement Groups 102 (Total Sample)
4.5 Mean Flexibility Scores of High, Average and Low Achievement Groups 103 (Total Sample)
4.6 Mean Originality Scores of High, Average and Low Achievement 104 Groups (Total Sample)
4.7 Mean Verbal Scientific Creativity Scores of High, Average and Low 105 Achievement Groups (Total Sample)
4.8 Mean Non-verbal Scientific Creativity Scores of High, Average and Low 106 Achievement Groups (Total Sample)
4.9 Mean Scientific Creativity (Total) Scores of High, Average and Low 107 Achievement Groups (Total Sample)
4.10 Mean Achievement Motivation Scores of High, Average and Low 108 Achievement Groups (Total Sample)
4.1 1, Mean Home Environment Scores of High, Average and Low 109 Achievement Groups (Total Sample)
LIST OF APPENDICES
Appendix A: Test of Scientific Creativity for Higher Secondary School
Students (Draft)
Appendix 8: Dl and DP for Test of Scientific Creativity for Higher Secondary
School Students
Appendix C:Test of Scientific Creativity for Higher Secondary School
Students (Final)
Appendix D: Kerala University Group Test of Intelligence
Appendix E: Kerala Scale of Achievement Motivation
Appendix F: Home Environment Inventory (Draft)
Appendix G: Dl and DP of Home Environment Inventory
Appendix H: Home Environment Inventory (Final)
Appendix 1: List of Schools
Appendix J: List of Experts
CHAPTER I
INTRODUCTION
Introduction
Science Education
Importance of Science Education at Higher Secondar~ Level
Certain Correlates of Science Achievement
Need and Significance of the Study
Statement of the Problem and Definition of Key Terms
Variables of the Study
Objectives of the Study
Hypotheses
Methodology in Brief
Scope and Limitations of the Study
Organisation of the Report

CHAPTER l
INTRODUCTION
I ..1 INTRODUCTION
"Youth must be made to understand the beauty of doing
Science, the pleasure of doing Science and the ultimate bliss
of Science that improve the qualify of life of humankind."
(Dr. A.P.J. Abdul Kalamj
Today, India has become one of the strongest countries in the world in
terms of scientific manpower in capability and maturity. We are in a position
not only to understand technologies that we may borrow but also to create our
own technologies with extensive scientific inputs of indigenous origin. Now
Science and Technology acts as an important contribution to National
development and societal transformation.
In a world where power is determined by nation's share of the world
knowledge, it is impartant for India to become a continuous innovator and
creator of scientific knowledge. The science that we do today must have
creativity, foresight and vision for it to be the centre of technology that we
develop tomorrow for the competitive world. So, we must take the message
and mission of successful scientists to youth so that they can understand the
ways of contributing to the growth of the nation through careers in science.
2 Introduction
1.2 SCIENCE EDUCATION
The rapid expansion of knowledge in different branches of science and
its consequent impact on the daily life of people have set educationists of all
the advanced countries to think about the position of Science Education in
schools. Brownski (1 9761, a distinguished scientist and humanist, defines
Science as the organisation of our knowledge in such a way that it commands
or makes possible the explanation of more of the hidden potential found in the
individual and in the environment. So, the unique potentialities of the child
should be preserved and enriched by science education.
In every school, there are certain students who may become creative
scientists. An important objective of science education is to locate and
nurture these talented learners so that they may be directed to intellectually
stimulating researchers and thus provide the nation with future scientists. The
reflective thinking capabilities of children must be sharpened through the
learning strategies of science. Thus, science education become one of the
best vehicles to foster intellectual potentialities and independent thinking of
individuals.
1.3 IMPORTANCE OF SCIENCE EDUCATION AT HIGHER SECONDARY LEVEL
In India, approximately seven million students appear for the plus two
examination every year, and more than three million of them are from the
science stream. In Kerala State, the annual intake of students in Higher
Secondary Schools is more than 1,50,000 from the year 2000 onwards. The
strength of Higher Secondary School students goes on increasing each year.
3 Introduction
The admission records af Directorate of Higher Secondary Education, Kerala
shows that number of students who join the Science group is three times
more than that of Humanities and Commerce. Enrolment in Science group
has raised steadily over the years.
It is an emerging trend that young students select Physics and
Chemistry courses because of these subjects' potentialities for job
opportunities. As a prerequisite for attending entrance examinations of many
professions, they choose science group willy-nilly. As a result,
commercialisation of learning takes place and vested interest groups try to
disfigure science curriculum for entrance-oriented coaching. So, after higher
secondary stage, students assume and feel that science is a mere collection
of information. Rote rnemorisation of scientific facts devoid of meaningful
understanding of it influences negatively on the thinking capacities of the
learners. So, the science teaching especially Physical Science teaching in
Higher Secondary classes has to be redefined with broader perspectives.
In this context, science instruction at Higher Secondary level should
aim at the following behavioural changes.
> To prepare young learners to enter scientific professions and
occupations.
i To prepare future scientists and technologists.
i To develop scientific research skills that are appropriate to meet the
needs of professional training in science.
4 Introduction
> To develop the ability to identify and use scientific knowledge
appropriately to make wise choices.
b To make judicious critical judgements about the reliability and
accuracy of information that is passed off as scientifically based.
i To use required scientific knowledge constructively.
To generate knowledge and enhance intellectual capability.
i. To solve problems encountered in their professional and personal
lives effectively.
I .4 CERTAIN CORRELATES OF ACHIEVEMENT IN SClENCE
The academic achievement of an individual depends on variables of
cognitive, affective and social-familial fields. Some of these variables are
described below.
1.4.1 Intelligence
Traditionally, intelligence was defined in terms of ability to do abstract
reasoning, ability to learn and ability to adapt in novel situations. The recent
views of intelligence recognise active role of an intelligent person in terms of
shaping and selecting an environment according to his or her choice.
Gardner (1983) proposed the theory of Multiple Intelligence consisting
of eight intelligences; Linguistic, Logical-mathematical, Spatial, Musical,
Bodily-kinesthetic, Interpersonal, lntrapersonal and Naturalistic Intelligences.
All the individuals do not possess them in equal proportion. The particular
situation or the context decides the prominence of one type of intelligence
over the others.
Sternberg (1985) proposed componential, experiential and contextual
sub theories of intelligence. Componential intelligence is concerned with
components of mental functioning involved in cognitive tasks that underlie
vocabulary, knowledge, insight and analogies. Experiential and contextual
intelligence add creativity and practicality, respectively to the understanding of
intelligence.
Das, Naglieri and Kirby (1994) proposed the information processing
approach of intelligence, Intelligence includes Planning, Attention,
Simultaneous and Successive processes (PASS Model).
According to the Indian view, an intelligent person shows the following
four competencies:
J Cognitive competence such as sensitivity to context, comprehension,
discrimination, problem solving and effective communication.
J Social competence such as following social norms, service to elders,
obedience, helping the needy, showing concern for the environment.
J Entrepreneurial competence such as hard work, commitment,
vigilance, goal-directed behaviour.
J Emotional competence such as control of emotions, honesty,
politeness, realistic self-appraisal, good conduct.
This type of intelligence is termed as Integral Intelligence.
Even though the expression of Intelligence is not limited to any
particular activity and domain or context, it is a manifestation of cognitive
ability with reference to one's academic achievement. The scientific
6 introduction
vocabulary and scientific knowledge acquired by a person has direct link with
one's intelligence. To get good achievement in science subjects, one has to
think creatively, reason abstractly, make inference form data and understand
relationship. These factors of Achievement in Science have close association
with intelligence. Thus, Achievement in Science is an indicator of cognitive
ability.
1.4.2 Scientific Creativity
Sternberg (1985) proposes that creativity is one type of intelligence.
The creative intelligence is the ability to go beyond the given data to generate
novel and interesting ideas. Thus, creativity is the higher order intelligence
that helps a person to translate ideas into practical accomplishments.
Guilford (1967) presented the intellectual factors of creativity on his
investigations. These are:
(i) Fluency (word fluency, ideational fluency, associational fluency and
expressional fluency)
(ii) Flexibility (spontaneous flexibility and adaptive flexibility)
(iii) Originality
(iv) Elaboration
(v) Redefinition
(vi) Sensitivity to problems
Thus, many factors of intelligence and creativity overlap each other and
these are interdependent also. Hence, a test of creativity measures creativity
as well as intelligence since creative abilities are intellectual components.
7 Introduction
When creativity is specifically directed to science, it reflects the scientific
temper.
It is found that arts students show a bias towards convergent thinking
ability (Hudson, 1966; Mackay and Camerson, 1968; Filed and Polle, 1970).
Webster and Walker (1981) showed that science students have not performed
as well as non-science students on tests of divergent thinking simply because
the questions asked were related to non-scientific topics. It has not been an
established fact that creativity generates regardless of content matter area
and with reference to achievement in science, scientific creativity has its
significance.
If science is to be developed as a creative subject, the creative spirit of
children should be identified and stimulated. Creative people in science are
problem seekers and problem solvers. So Scientific Creativity enhances the
problem solving capacity and critical thinking of learners.
Scientific creativity includes processes that promote planning,
producing and generating original scientific contributions. According to Cole
(1970), this process engages the learner to acquire, organise, generalise,
utilise and construct information creatively. In effect, Scientific Processes are
equal to Scientific Creativity. Both scientific process and scientific creativity
facilitate better meta cognitive skills and problem solving abilities. So, when
we analyse the Achievement in Science of a learner, it is imperative that his
scientifically creative talents are to be assessed.
8 introduction
1.4.3 Achievement Motivation
Achievement Motivation refers to the striving to perform difficult task as
well as possible. Murray (1938) identified Achievement motivation along with
the physiological and psychological needs contributing to personality
development and achievement. According to Expectancy-value Theory of
Achievement Motivation of Atkinson (1978), behaviour of a learner depends
on how much individuals value a particular outcome and their expectation of
attaining that outcome as a result of performing that behaviour.
The contemporary theory of Achievement Motivation proposed by
Eccles (1 983) and Wigfield (1 994) shows how t he students' cognitive process
and perceptions of their environment works in an achievement situation
Students' initial motivation beliefs centre on Task specific self-concepts
which are the students' perceptions of their ability. Perceptions of task
difficulty is another important factor. The overall value of any task depends on
its attainment value, interest value and utility value. The individual's
perceptions concerning the likelihood of success at the task is known as
expectancy. Research shows that higher expectancies for success are
positively related to various forms of achievement behaviour (Bandura, 1986;
Eccles, 1983; Wigfield, 1994).
DeCharms (1976) put forward the idea of Achievement Motivation
training that aims to help students to develop thoughts and behaviour typical
of learners high in Achievement motivation. Following activities are included
in Achievement Motivation training to make better academic performance.
*:+ Development of self-concept
*:* Realistic goal setting
43 Achievement motivation thinking
*:+ Personal responsibility training
*3 Development of concrete plans to accomplish goals
Q Evaluation of goal progress.
Thus, Achievement Motivation training is to be integrated with regular
classroom content, rather than include it as an activity with special content.
Creative students usually generate their own goals; they are self-
regulating and self-monitoring. Understanding the true self is important for
achievement of a learner and creativity will be possible only when the
individual is with one's self. Haywood et al. (1992) suggested that each
individual has scope for intellectual development if he possess achievement
motive. So, studying the achievement of an individual in relation to
Intelligence and Creativity would be more meaningful if it peruse the
achievement motive also.
1.4.4 Home Environment
Home is the first institution which is responsible for the education of the
child and parents are the first educators. Home environment includes the
conditions, forces, and external stimuli at home which impinge upon the
individual. The physical, social as well as intellectual environment of the
home is a reinforcing force which shapes the individuals.
10 Introduction
Educational and cultural level of parents, parental attitude towards
education, value orientation of the family members, and socio-economic
status of the family normally affect the achievement of every child. All the
above mentioned factors have significant impact on the intellectual
development, creative potentialities and achievement motive of children.
Parental characteristics associated with higher rates of divergent
production in children are
+:+ low degree of punishment in the home
4:. low pressure for conformity
*:+ absence of intrusiveness
*:+ emotional support for the child
*:* self-acceptance
(McCandless, 1973)
Bloom (1964) in detailed analysis of Wolf's (1963) work, gives a list of
thirteen process variables that can be used to describe the interactions
between parents and children in so far as intellectual development is
concerned.
A. Press for achievement motivation
1 . Nature of intellectual expectations of child
2. Nature of intellectual aspirations for child
3, Amount of information about child's intellectual development
4. Nature of rewards for intellectual development
9 1 Introduction
6. Press for language development
5. Emphasis on use of language in a variety of situations.
6. Opportunities provided for enlarging vocabulary
7. Emphasis on correctness of usage
8. Quality of language models available
C. Provision for general learning
9. Opportunities provided for learning in the home
10. Opportunities provided for learning outside the home
11. Availability of learning supplies
12. Availability of books
73. Nature and amount of assistance provided to facilitate learning in a
variety of situations.
Thus, Home Environment is a crucial component that influences the
academic achievement, intellectual development, creative capacities and
achievement motivation of an individual. So, parents might well help their
children to achieve higher achievements through monitoring their children's
learning tasks.
1.5 NEED AND SIGNIFICANCE OF THE STUDY
Academic achievement is the prime concern of psychologists,
educators, learners as well as parents. Achievement in Science is of key
importance at the Higher Secondary level since it provides a base for higher
studies which is inevitable for admissions of various medical and engineering
professions. So, achievement in science at this stage has to be scrutinised.
Almost all recently generated science teaching strategies insist the
importance of developing the creative talents of the learners concerned.
Review of related literature shows that achievement in science
depends mainly on three learner characteristics.
1. Cognitive variables like Intelligence, Aptitude, Creativity, Problem
Solving skills and so on.
2. Motivational variables like achievement motivation, self-concept, self-
efficacy, self-monitoring, self-monitoring and self-regulation.
3. Environmental variables like Home Environment, class atmosphere,
peer group, socio-cultural and similar variables.
Research suggest that the right cerebral hemisphere is involved in
visual, non-verbal, spatial, divergent and intuitive thinking. Left cerebral
hemisphere is involved in verbal, logical and convergent thinking. The right
brain works more with creativity whereas the left brain works more with
intelligence. Vast majority of school activities focus an the convergent
functions dominated by the left side of the brain (Caine and Caine, 1997;
Jansen, 1998). To teach most effectively to either side of the brain, we must
balance outcomes and learning experiences to involve both sides whenever
possible (Baker and Martin, 1998). Intelligence and creativity are two
correlating variables that influence the scholastic performance. In relation to
achievement in science, creativity in science is more consequential than
general creativity.
73 Introducbon
The great scientists Edisan and Einstein had no remarkable school
records even though they were intelligent and creative human beings. The
accomplishments of such renowned scientists were generated from their self-
motivation. Thus, achievement motivation provide an explanation for the
resourceful nature of an individual and the way he uses these resources to
achieve higher level of excellence. But it rarely manifests itself uniformly
across different achievement domains. Students typically show greater
motivation to perform well in some subjects than others (Schunk, 1996).
Since the achievement motive varies with the domain, how well such a global
trait predicts achievement in science is questionable. Learners' cognitive and
behavioural aspects cannot be treated individually because they are
overlapping components (Sappand Farrell, 1994). These factors have strong
causative roots of environmental nature. Parents have both a right and
responsibility to be directly involved in their children's education. Family play
a complementary role to the cognitive approaches of the classroom, by
providing the bridge between cognitive skills and everyday life activities
(Heywood, 1993). Parental pressure to perform well is more crucial a t the
higher secondary level. Determining which parental behaviours are most
influential that encourage achievement strivings are complicated and research
has yielded conflicting findings (Weiner, 1992).
Thus, on the strength of the theories and related literature on the topic,
it has been assumed that studying the Achievement in Science at Higher
Secondary level is significant with reference to Intelligence, Scientific
14 Introduction
Creativity, Achievement Motivation and Home Environment. The analysis of
the above mentioned cognitive, motivational and familial variables may open
many new horizons to make educators and learners to think and act in terms
of optimism and achievement and to pave the way towards progress and
prosperity.
1.6 STATEMENT OF THE PROBLEM AND DEFINITION OF KEY TERMS
The problem taken up for the present study is entitled as "A STUDY
OF THE RELATIONSHIP BETWEEN INTELLIGENCE, SCIENTlFjC
CREATIVITY, ACHIEVEMENT MOTIVATION, HOME ENVIRONMENT AND
ACHIEVEMENT IN SCIENCE OF HIGHER SECONDARY SCHOOL PUPILS
OF KERALA. "
The key terms used in the study are defined below.
( i ) Relationship
In a simple relationship study, researchers obtain two scores for each
subject and then use the pairs of scores to calculate a correlation coefficient.
Coefficient of Correlation is a single number that tells us to what extent
two things are related; to what extent variations in one variable are
accompanied by changes in the other.
(ii) Intelligence
Intelligence comprises the mental abilities necessary for adaptation to,
as well as shaping and selection of any environmental context (Sternberg,
1 997).
15 introduction
( i i i ) Scientific Creativity
The term stands for various aspects of divergent thinking ability in
science (as defined by Guilford and his associates), estimated through its
accepted characteristics, viz., measures of fluency, flexibility and originality
and obtained using standardised test of Scientific Creativity.
(iv) Achievement Motivation
it is the need for achievement. It refers to the striving to perform
difficult tasks as well as possible (Schunk, 1996).
It is the restless driving energy aimed at achieving excellence, getting
ahead, improving past records, doing things faster, better, more efficiently and
finding unique situations to difficult problems.
(v) Home Environment
It includes things, events and people in the real world in and around the
family of t he child that he might perceive or that might have some effect on
him. In the present study, Home Environment means physical, cultural and
emotional environment of the home.
(vi ) Achievement in Science
The term refers standard performance in science of the students in the
group under consideration for the annual examination. The variable
Achievement in Science as used in the study measure t h e important curricular
outcomes of Physics and Chemistry. The achievement levels of students are
expressed in terms of total scores obtained for Physics and Chemistry in the
Standard XI annual examination.
(vi i) Higher Secondary School
The term higher secondary refers to the fourth stage of school
education in Kerala. It consists of pupils in standard XI and XII.
1.7 VARIABLES OF THE STUDY
The study has been designed with Achievement in Science as the
dependent variable and the following independent variables:
(1 ) Intelligence
(2) Scientific Creativity
(3) Achievement Motivation
(4) Home Environment
1.8 OBJECTIVES OF THE STUDY
The major objectives of the study are stated as follows:
'I. To compare the three achievement groups in pairs (High-Average,
Average-Low and High-Low) in respect of each of the independent
variables (Intelligence, Scientific Creativity, Achievement Motivation and
Home Environment) for the total sample and sub samples based on
gender, place of residence and nature of the institution.
2. To find out the relationship between the independent variables
(Intelligence, Scientific Creativity, Achievement Motivation and Home
Environment) for the Total sample and sub samples based on gender,
place of residence, nature of the institution and achievement levels.
3. To find out the relationship between each of the independent variables
(Intelligence, Scientific Creativity, Achievement Motivation and Home
Environment) and Achievement in Science for the total sample and sub
samples based on gender, place of residence, nature of the institution and
achievement levels.
4. To develop a multiple regression equation to predict the Achievement in
Science using best predictors selected from the independent variables.
5. To find out the combined effect of the predictor variables on Achievement
in Science,
1.9 HYPOTHESES
The study has been designed to test the following hypotheses:
1. Each of the independent variables selected will discriminate between
students of various achievement levels for the total sample and sub
samples.
2. There will be significant relationship between the selected independent
variables when each variable is correlated with the other for the total
sampk and subsamples.
3. There will be significant relationship between each of the selected
independent variables and Achievement in Science for the total sample
and sub samples.
4 . Achievement in Science can be predicted in.terms of the highly correlating
independent variables which are chosen as best predictors.
5. The combined effect of the predictor variables on Achievement in Science
will be significant.
1.10 METHODOLOGY IN BRIEF
1.1 0.1 Sample
The study was conducted on a sample of 1120 Standard XI1 students
from four districts of Kerala.
1.10.2 Tool
The investigator developed the following tools:
I. Test of Scientific Creativity for Higher Secondary school students
2. Home Environment Inventory
Other tools used for the study are:
1. Verbal Group Test of Intelligence
2. Raven's progressive Matrices Test
3. Achievement Motivation Scale
1.1 0.3 Statistical Techniques Used
(i) Two-tailed test of significance of the difference between means;
(ii) Pearson's Product Moment Coefficient of Correlation;
(iii) Multiple Regression Equation;
(iv) Multiple Coefficient of Correlation
1 .I 1 SCOPE AND LlMlTATlONS OF THE STUDY
The theoretical base for selection of variables has stated in earlier
contexts. The present study attempts to identify the effect of Intelligence,
Scientific Creativity, Achievement Motivation and Home Environment on
Achievement in Science. The findings of the study may stimulate the
teachers, parents and students to redefine their approaches towards science
19 intraduction
teaching, science learning and Achievement in Science. When scientific
concepts are transacted through creative strategies, learning becomes a
pleasant experience for learners and it enhances academic achievement.
The study emphasises the role of teachers as well as parents in channelising
the achievement motive of young learners for better performance
Major limitations of the study are the following:
i The operational definition of Achievement in Science is confined to
the scares of theory examination; skills for performing science
experiments are not taken into consideration. The Achievement in
Science is limited to achievement in Physics and Chemistry since
these two subjects are of prime importance for various science
groups.
(ii) The concept of Scientific Creativity has been confined to three
components only. The other factors like elaboration, redefinition and
sensitivity to problems were excluded considering practical limitations.
(iii) Due to paucity of time and other inconveniences, selection of
independent variables was limited.
(iv) The sample for t he study is selected only from four districts of Kerala,
assuming that this represents the total population of Kerala
1.12 ORGANISATION OF THE REPORT
The report has been organised into five chapters.
Chapter 1 contains the rationale for selecting the present problem, the
significance of the variables selected, .statement of objectives and
20 Introduction
hypotheses, brief outline of the methodology and discussion on scope and
limitations of the study.
Chapter 1 1 provides a review of related literature.
Chapter Ill provides a description of the design of the study which gives
an account of the methodology in detail.
Chapter IV gives the analysis of the data collected and interpretation of
the findings.
Chapter V offers a brief summary of the study, conclusions,
educational implications of the findings and suggestions for further research.
CHAPTER II
REVIEW OF RELATED STUDIES
Studies related to Intelligence. Creativity and Academic Achievement
Studies related to Achievement Motivation and Academic Achievement
Studies related to Home Environment and Academic Achievement
Studies related to Intelligence, Creativity and Achievement Motivation
Studies related to Intelligence. Creativity and Home Environment
Studies related to Scientific Creativity
Major Trends Indicated by the Review
CHAPTER ll
REVIEW OF RELATED STUDIES
A systematic canvass of t h e related studies is the means of
determining whether the proposed study unnecessarily duplicates some
earlier investigation. The knowledge secured from such reading in terms of
sources, procedures and results represents essential orientation for definition
of the problem, selection of method and interpretation of findings.
The review of related studies has been conducted including the four
experimental variables, viz., Intelligence, Scientific Creativity, Achievement
Motivation and Home Environment as related to Academic Achievement and
their interrelations.
The review of related studies are organised under the following heads:
2.1. Studies related to Intelligence, Creativity and Academic Achievement
2.2. Studies related to Achievement Motivation and Academic Achievement
2.3. Studies related to Home Environment and Academic Achievement
2.4. Studies related to Inteiligence, Creativity and Achievement Motivation
2.5. Studies related to Intelligence, Creativity and Home Environment
2.6. Studies related to Scientific Creativity
22 Review of Related Studies
2.1 STUDIES RELATED TO INTELLIGENCE, CREATIVITY AND ACADEMIC
ACHIEVEMENT
Achievement of an individual depends to a great extent an his
intellectual characteristics and the creative abilities. The following studies
revealed the relationship between Intelligence, Creativity and Achievement.
Wright (1985) conducted a factor analytic study of intelligence and
achievement. Scores in the Wechsler Intelligence Scale for Children
(Revised) and the Wide Range Achievement Test were collected from 160
children (9-12 years). The four factors identified were verbal comprehension,
numerical, written language and pedormance. The results indicated a
functional overlap of the variables studied.
Brar (1986) found the influence of intelligence was significant on t he
performance of students. It was also found that high creative girls and low
creative girls scored higher than high creative boys and low creative boys
respectively.
Olesky-Ojikutu (1986) found that intelligence had a significant positive
correlation with all the five creativity sub-scores.
Sumangala (1986) found that there was significant relationship
between creativity and verbal intelligence, and between creativity and non-
verbal intelligence.
Nair (1987) found that certain cognitive variables, namely verbal
classification, proverbs, verbal intelligence, non-verbal intelligence and
23 Review of Related Studies
number series differed between high creative underachievers and low creative
underachievers.
Trimurthy (1987) found that students with high I.Q. were more creative
than students with low I.Q. in verbal Creative Thinking Ability (CTA),
Gakhar, Paramjit and Pushpa (1989) found that there was significant
difference in fluency, flexibility and total creativity among s t u d e n t s of high,
average and low intelligence groups and there was no significant difference in
originality among s tudents of high, average a n d law intelligence groups.
Patel (7990) found that there was significant, positive but low
correlation between creativity and two groups of intellectuals.
Gill (1991) found that high intelligent subjects scores higher on
originality than low intelligent subjects irrespective of training strategies,
whereas fluency, flexibility and creative problem solving skill totals were not
affected by levels of intelligence.
Jaswal and Jerath (1991) found that for pupils in the high intelligence
group, there was no significant correlation between intelligence and creativity.
For pupils in the low intelligence group, intelligence was related to verbal and
total creativity but not to figural creativity.
Sreekala ( I 99.l) found that the relation between intelligence, creativity
and achievement was significant.
Srivastava and Thomas (1991) found that there was positive
relationship between intelligence and creativity.
24 Review of Related Studies
Narramore (1992) found that low correlation existed between creativity
and intelligence.
Ajitha (q992) explored the association between creativity, intelligence
and achievement in English. The study showed that (i) the relationship
between creativity and achievement was significant (r = 0.2216) for whole
sample.
Raj (1994) concluded that there was positive correlation among the
variables, viz., fluency, flexibility, originality and verbal and non-verbal
intelligence. The fange of correlation between variables of creativity, on the
one hand, and the variables of intelligence, on the other, was between +0.219
and +0.287.
George (1994) made a study of the mathematical creativity of
secondary school pupils in relation to their intelligence and mathematics
achievement. The study showed that mathematical creativity was significantly
correlated with intelligence and mathematics achievement.
Pillai and Kumar (1996) designed a study to find out the magnitude of
direct, indirect and casual relationship of intelligence, cognitive style and
approaches to studying on achievement in Biology of Standard IX pupils.
They found that among the three variables, intelligence shows the maximum
total effect on achievement in secondary school Biology.
Jayalekshmi (2000) found a significant correlation between
achievement in problem solving in science and intelligence {r = 0.627).
25 Review of Related Studies
Sabeena (2000) reported that there was positive and significant
relation between verbal comprehension, numerical reasoning, spatial ability
and achievement in Chemistry.
George (2000) conducted a study on correlates of mathematical
creativity. The study showed that (i) there was positive and significant
relationship between verbal mathematical creativity and verbal intelligence
(r = 0.4797); (ii) there was positive and significant relationship between non-
verbal mathematical creativity and nan-verbal intelligence ( r = 0.5953).
Kumari (2002) conducted a study on the effect of verbal and non-verbal
intelligence on process outcomes in science of secondary school children.
The study found that verbal intelligence, non-verbal intelligence and total
intelligence were closely related with process outcomes in science.
2.2 STUDIES RELATED TO ACHIEVEMENT MOTIVATION AND ACADEMIC
ACHlEVEMENT
Ahluwalia (1985) found a significant and positive relationship between
achievement motivation and scholastic performance.
Raghava (1985) conducted a study of achievement motivation
development in the pupils of ninth standard with various socio-economic
levels and arrived at the following conclusions:
(i) The achievement motivation development course resulted in a positive
gain in the immediate performance of pupils;
(ii) The training course resulted in improved achievement at the S.S.L.C.
examination;
26 Re view of Related Studies
Ghoash (1985) studied the achievement of the students in Chemistry
and investigated the determinants of achievement in Chemistry. He found
that there was a positive correlation between the scores in Achievement Test
in Chemistry and Achievement Motivation Test.
Geetha (1985) found a significant relationship between Achievement
Motivation and Biology Achievement.
Natesan and Seeta (1986) conducted a study to find the relationship
between achievement motivation and achievement. A sample of 60 students,
30 high achievers and 30 low achievers from Standard XI1 was selected. The
results showed that (i) the high achievers have high achievement motivation
scores when compared to the low achievers; (ii) the critical ratio revealed that
there was significant difference between high achievers and low achievers
with regard to need for achievement scores; (iii) there was significant positive
correlation between achievement motivation and academic achievement.
Oliver and Simpson (1988) found that effective behaviour in classroom
are strongly related to achievement and the effective constructs like
motivation, interests, etc., could be successfully used to predict achievement.
Snadgrass (7989) found significant positive correlation between
achievement motivation and grade point average.
Biggs (1989) studied the relationship of achievement motivation and
achievement of emotionally and behaviourally handicapped children. The
study found that controlling intelligence, there was no significant relationship
between achievement motivation and achievement.
27 Review of Rela fed Sfudies
Lee's (1989) study showed that there existed positive correlation
between achievement motivation a n d achievement in science.
Suciati (1990) studied the effect of motivation on academic
achievement in a distance education setting. The concept of motivation was
measured by three factors: academic self-concept expectancy and value of
success. The study showed a positive and significant relationship between
motivation and achievement.
John (1991) investigated the effects of a specific goal setting procedure
on three dependent variables, achievement, perception of self-efficacy and
goal setting accuracy. There were three experimental groups. Students in
the goal setting conference group were hypothesised to show higher
academic achievement. The students of this group showed statistically
significant higher achievement.
Wang (1991) studied the relationship between achievement motivation,
goal acceptance and goal difficulty on task performance. The study used
Locke's goal setting theory and Atkinson's achievement motivation theory to
examine the effects of achievement motivation. Effect of achievement
motivation on task performance was significant.
Yeh (1991) conducted a study to find out the relationship of academic
achievement to the variables of achievement motivation, study habits and
intellectual development. The important finding of the study was that a weak
but positive correlation was found between achievement motivation and
academic achievement.
28 Review of Related Studies
Lewis (1991) found that achievement motivation influenced academic
achievement positively.
Sundararajan and Gnana Guru (1992) found that there was no
significant relationship between achievement motivation and achievement.
Wolf (1993) examined the effects of anxiety and motivation on test
performance. The study showed that motivation to perform on a test is
directly influenced by the consequence of the level of performance
Gardner (-1993) studied t h e relationship between self-esteem and
academic motivation for higher education and he analysed the perception and
expectations of students relating to significant others in their roles as
motivators of students for academic achievement. The results showed
significant relationship between motivation and academic achievement.
Neibur (1994) found tha t there is significant relationship between
school-student academic orientation, intrinsic motivation and grade point
average.
Manijeh's (1994) study showed that there was significant relationship
between children's Academic Intrinsic Motivation Inventory scores and
children's school grades.
Abouserle (1 995) showed that students' personality trait in general and
their self-esteem and achievement motivation in particular have substantial
influence on their approaches to study and levels of knowledge processing.
Eppfer and Harju (1997) compared traditional and non-traditional
college students with respect to their learning goats and achievement goal
29 Review of Related Studies
and found that the group differed inversely on variables related to
achievement.
Jayalekshmi (2000) conducted a study of achievement facilitating
variables affecting the problem solving ability of girls in higher secondary
schools of Kerala. The coefficient of correlation between achievement
motivation a n d achievement was found to be significant for the total sample
( r = 0.577), rural ( r = 0.432), urban (r = 0.579). government (r = 0 5 2 7 ) and
private (0.72). All these relationships were significant at 0.01 level.
Lan (2002) found that motivational forces enhanced achievement and
they were the strongest predictors of student's commitment to science.
Riley (2002) conducted a study on elementary school students'
academic motivation. The study found that teacher's perception of students '
motivation was mediated by student performance.
Nancy (2003) conducted a study on the degree of association between
achievement motivation and cognitive ability in chemistry of high school
students. The s tudy revealed that for t h e whole sample, t h e relationship
between n-ach and cognitive ability was significant at 0.01 level. In the case
of subsamples for girls, the relationship was significant at 0.05 level.
2.3 STUDIES RELATED TO HOME ENVIRONMENT AND ACADEMIC
ACHIEVEMENT
The parent is the first teacher and the teacher is the second parent.
The role of parents and family in the development of cognitive abilities and
social competence in children has been well proved. The researches
3 0 Review of Related Studies
reported here seek to identify those aspects of family environment which
deeply influence student's achievement.
Jagannadhan (1986) has studied on home environment and academic
achievement. The result showed that home environment has got strong
association with academic achievement. In the prediction of academic
achievement, home environment of children played a significant role.
Soto (1986) examined the difference in the home environment between
high achieving and low achieving children. Statistical analyses revealed
significant differences in home environment between high and low achieving
students.
Ekeoha (I 986) found that home environment is an important correlate
of achievement in science. Analysis of the home background component
variables indicated that possession of books in the home had a significant
effect on achievement in science.
Pillai (1987) found that greater number of underachievers were
associated with large family.
Lethakumari (1987) conducted a study on the environmental factors
and achievement in social science. It was found that the group under study
differ significantly with respect to family climate. A significant proportion
(76%) of the high achievers had happy parental relationship. The high and
low achievers under study differ significantly with respect to adequacy of
facilities for learning. Here also, 80% of the high achievers had adequate
facilities for learning.
3 1 Review of Related Studies
Topper (1989) examined the relationship between the levels of parental
environment in a pilot program entitled parents and children together. The
study suggested that there was a relationship between parental involvement
and child's academic achievement.
Chaman (1990) studied the impact of parent child relation on
achievement of pre-degree students. She found that there was no significant
relationship between parent child relations and achievement. The high and
low achievers were identical with respect to their relationship to parents.
Harris (7991) in his study showed that parent involvement in academic
home work and academic achievement were not significantly correlated.
Sanchez (1991) has studied parental support and academic
achievement. The study showed that academic achievement was a
combination of student ability, parent beliefs, and parent support for
education.
Blanchard (1991) in his study showed that within the home setting of
low socio-economic African American families, boys and girls were not
provided with good support by their parents for academic achievement.
Lee's (19991) study showed that home environment and educational
achievement had low correlation.
Srivastava (1991) found that families of high achievers were more
structured and organised and they exercised more controls and had a set of
rules and procedures to be followed by its members.
32 Review of Related Studies
Marope (1992) has studied the determinants of academic achievement
and found that home support was an important factor that determines
achievement.
Ajitha (1992) showed that the relationship between home environment
and achievement was negligible. For the whole sample, the relation between
home environment and achievement was negative but for three subsamples.
rural government and private the relation was significant.
Keating (1992) found that there was a positive relationship between
family income level and student's science grades.
Youn's (1993) study investigated the relationship between home
environment, self-efficacy and academic achievement of 89 Asian American
students. The study showed that family income and self efficacy were
positively related with academic achievement.
Robinson (1994) has studied the effect of certain selected variables on
achievement. Analysis of the data indicated significant relationships between
achievement scores and the predictor variables of family type and date of
birth,
Barker (1994) conducted a study on selected factors related to
academic achievement of developmental introductory algebra students at the
two year college level. The study revealed that there was a significant
relationship between the annual income and academic achievement and also
the percent of college expenses paid by the employer on academic
achievement.
33 Review of Related Studies
Rekha (1994) conducted a study to examine the relationship between
home environment and achievement in science of lower primary school. The
results showed that
(i) Parental involvement and parental help to solve doubts were factors
that determine the achievement in science;
(ii) Home learning facility, availability of books, parental discussion on
educational problems of children and parental attention to educational
problems of children were not factors that determine the achievement
in science.
Sayfried (1994) studied the factors associated with academic success
of students and the data showed that the family environment had no direct or
indirect effect on grade point average.
Al Shahany (1995) explored the relationship of selected variables to
biology achievement of secondary school students. The results of the study
revealed that student antecedent variables namely home environment and
prior knowledge seemed to correlate highly with biology achievement.
Reju (1997) conducted a study on achievement in science as related to
sc ience attitude, science interest and home learning facility of upper primary
school pupils. The major finding of t he study showed that achievement in
science and home learning facility was not significantly related.
Jacob (1998) conducted a study on selected variables associated with
achievement in chemistry of vocational higher secondary school students.
The findings of the study were as follows:
34 Review of Related Studies
The coefficient of correlation between home environment and
achievement in chemistry for the total sample (r = 0.509), boys (0.4651, girls
(r = 0.468), rural (r = 0.487), urban (r = 0.531), government (r = 0.716) and
private ( r 0.364). All the obtained relationships were positive and significant
which proved that home environment and achievement in science was closely
associated.
Smith and Hausafus (I 998) found the relationship of family support and
ethnic minority students' achievement in science and mathematics. The study
found that family support was strongly associated with science and
mathematics achievement.
Mashile (1999) has studied the psychological and social factors related
to physical achievement in science and attitude of secondary school students.
The results of the study indicated that home environment and motivation had
the greatest total contributions to physical achievement in science.
Heastie (2001) conducted a study of the relationships and difference
on self-regulated learning, parental involvement in home work and academic
achievement among high school students in Rural West Virginia. The study
found that there was no statistically significant positive relationship between
parental involvement and academic achievement.
Antony (2003) found that Family Climate and Academic Achievement
were significantly correlated. For the total sample, the coefficient of
correlation obtained was 0.674-
35 Rewe w of Related Studies
Netto (2004) in his study on influence of Home Environment and
Achievement Motivation on Academic Achievement of Fishermen Students at
Higher Secondary Level found that Home Environment and Achievement
Motivation were highly influencing variables of Academic achievement.
2.4 STUDIES RELATED TO INTELLIGENCE, CREATIVITY AND
ACHIEVEMENT MOTIVATION
Sujatha and Yasodhara (1986) in a comparative study of some
educational variables of STISC students, found that SCIST students were low
in their academic achievement and achievement motivation. Achievement
motivation and socio-economic status were found to be independent of each
other. Significant relationship was found between achievement motivation
and type of school.
Tripati's (1 986) study on achievement motivation found that
achievement motivation of boys and girls was highly correlated with
intelligence.
Fatmi (1986) found that social background, sex, religious background
and caste status influenced achievement motivation. The area of residence
and socio-economic status were important determinants of achievement
motivation. Family type had little to do and ordinal position had almost
nothing to do with achievement motivation.
Rajagopalan's (I 988) study on creativity and achievement motivation
showed that there was a significant positive correlation between achievement
36 Review of Related Sfudies
motivation and creativity. It was concluded that classroom climate and
intelligence had significant effect on creativity scores.
Archer's (1990) study showed that there was significant relationship
between achievement motivation and creativity.
Johnkutty (1 990) found that one among the personality variables which
discriminate between high creative and low creative pair was achievement
motivation. The other variables were social adjustment, personal adjustment,
general anxiety, examination anxiety, school relations, social standards,
community relations, family relations, social skills, self-reliance and sense of
personal freedom.
Petrick (2002) in the study on early adolescents motivation during
science investigation examined evidences of students motivational beliefs and
goal orientation. Achievement Motivation appeared most strongiy related to
increased understanding of Science.
Hancock (2003) in the study on Co operative learning and Peer
Orientation Effects on Motivation and Achievement found that the students
with high peer orientation were significantly more motivated to learn than
students with low peer orientation.
Joseph (2004) in his study on Relationship of Achievement Motivation
and Level of Aspiration with Achievement in Social Science found that both
the variables, Achievement Motivation and Level of Aspiration have significant
effect on Academic Achievement.
37 Review of Related Studies
Ambily (2005) in the study on relationship of Creativity and Intelligence
with reading Comprehension in English found that Creativity and Intelligence
were significantly related to reading comprehension in English.
Sindhu (2005) in the study of relationship among creativity. Classroom
Adjustment and Academic Achievement of Students at Higher Secondary
Level found that Creativity and Achievement were closely related variables.
2-5 STUDIES RELATED TO INTELLIGENCE, CREATIVITY AND HOME
ENVIRONMENT
Bharadwaj (1985) reported that age, sex and intelligence affected the
creativity components and that the discerned facts would provide a better
future in the domain of creativity along with better guidelines to the
adolescent's future perspectives.
Brar (1986) found that high-creative girls and low-creative girls scored
higher than high creative boys and low creative boys respectively. It was also
found that the influence of intelligence a n d socio-economic s ta tus on the
performance of students was significant.
Nair (1987) in a comparative study of certain cognitive, affective and
social variables which discriminate between high and low creative
underachievers in secondary school science, found that the following familial
variables are capable af discriminating the different groups of creative
subjects.
(i) Father's educational a n d family cultural level
(ii) Family environment
38 Review of Related Stud~es
(iii) SES, father's income level, father's occupational level and family
acceptance of education.
Moni (1990) found that variables like family ~ncome level, family
occupation level and socio-economic status were capable enough to
discriminate between high creative and low creative pupils.
Kamaini (1991) found that those children who lived with their families
scored more in creative assessment. The unfavourable, depressed and non-
stimulating conditions of the home for the destitute children inhibited their
creative potentiality.
Srivastava and Thomas (1991) conducted a study of the effect of sex,
age, birth order and intelligence on creativity of pre-school children. There
was a positive relationship among intelligence and creativity and also the birth
order was found to be positively correlated with creative ability. As the
children grew older, it was observed, their creative ability also increased,
based on the opportunities and facilities available.
Biller (1993) conducted a study on the impact of parental involvement
in child development, intelligence and creativity. The study supparted the
view that the fathers have a significant role in the proper development of
intelligence and creativity of children.
Renrulli (1995) found that the parents have a crucial role in stimulating
children's creativity and intelligence.
39 Review of Related Studies
Jyothimol (2003) in the study on the relationship among home learning
environment, classroom learning environment and creativity found that home
learning environment and creativity were closely associated variables.
2.6 STUDIES RELATED TO SCIENTIFIC CREATIVITY
Yawalkar (1985) investigated a study on development of some
personality correlates of scientific creativity. The study was aimed at
investigating the efficiency of two creative teaching techniques, viz., bionics
and morphological correlates analysis conducive to develop some personality
correlates of scientific creativity. The personality variables under study were
(i) self-reliance, (ii) dominance, (iii) emotional stability, (iv) venturesome, (v)
super ego strength.
Misra (1986) conducted a study on effect of home and school
environments on scientific creativity. The major findings showed that boys do
not differ significantly from girls with respect to inquisitiveness which is an
aspect of scientific creativity. However, girls excel boys in three aspects, viz.,
fluency, flexibility and originality. All the significant relations among the
variables seemed to be tied with verbal intelligence, non-verbal intelligence
and socio-economic status.
Sukla and Sharma (1987) administered a Scientific Creativity Scale in
330 urban, rural and refugee students in the middle school to test for fluency,
flexibility and originality. The results indicated that the lowest scores came
from tribal pupils and rural pupils scored higher in fluency than the refugees.
40 Review of Related Studies
Baby (1989) found that relation between science learning environment
and divergent thinking in science was positive. There was no significant
difference based on sex in the relation between science learning environment
and divergent thinking in science.
There was significant difference for the rural urban subsample when
the science learning environment and divergent thinking in science were
correlated.
Gregor (1991) conducted a study to understand creativity, creative
personality and the productively creative scientist. Attempt was to understand
and utilise personality measures which are valid and effective, for identifying,
significantly predicting and selecting creative talent.
Anilkumar (1 992) studied the relationship between creativity in science
and certain demographic variables of secondary school pupils. The study
showed that there exists a significant relationship between each of the
component of creativity in science and total creativity in science with each of
the demographic variables, viz., sex, locale and socio-economic status.
Asmali ('l994) conducted a study to find out the relationship between
achievement in science, science interest, scientific attitude, process outcomes
in science and scientific creativity of secondary school pupils. The correlation
coefficient of achievement in science and scientific creativity was found to be
0.3012 (total), 0.2781 (boys), 0.3227 (girls), 0.3740 (rural) and 0.2195 (urban).
For all samples, the coefficients were significant at 0.01 level.
Sansanwal and Deepika (1 997) found that
41 Review of Related Studies
i male and female students did not differ significantly in scientific
creativity;
(ii) Interaction between standard and sex did not have any significant
influence on scientific creativity; and
(iii) Scientific creativity scores of students belonging to high and low
levels of intelligence did not differ significantly.
Sreejaya (1 998) conducted a study on scientific creativity in relation to
intelligence of degree students. The major objectives were (i) to estimate the
degree of association between scientific creativity and intelligence; (ii) to
zstimate the degree of association between each of the components of
s1:ientific creativity and the four components of intelligence; (iii) to compare
thl? three intelligence pairs (H-A, A-L, H-I).
The coefficient of correlation between scientific creativity and
intellillence was found to be 0.7035 (total), 0.2987 (boys), 0.2832 (girls),
0.5984 (rura!), 0.6219 (urban), 0.6668 (physics optional group), 0.3630
(chemistr r optional group), 0.3901 (zoology optional group) and 0.4330
(botany 01 ltional group). For all samples, the coefficients were significant at
0.01 level.
Haneeshia (2001) conducted a comparative study of scientific creativity
of pupils in DPEP and non-DPEP schools in the State of Kerala. The study
found that the two groups differ significantly with respect to fluency (CR =
4.27), flexibility (CR = 2.02), originality (CR = 2.07) and total creativity (CR = 4.56).
42 Review of Related Studies
2.7 MAJOR TRENDS INDICATED BY THE REVIEW
The review of studies mentioned so far, gives a perspective of the
empirical works done in the area. The major implications derived from the
related studies are presented below.
(i) Most of the studies in achievement in science have been conducted
in relation to cognitive variables. Studies showing the combined
effect of cognitive, affective and familial variables are very few:
( i i ) Studies on achievement in science in relation to scientific creativity
and intelligence are very rare;
(iii) A vast majority of the reported studies on achievement have been
done in relation to intelligence and general creativity. Achievement in
science and scientific creativity has not correlated by considering the
effects of other affective and social variables;
(iv) Many studies explored the relationship between achievement and
home environment. The family variables like dependence-
independence, birth order, family size, etc, have been studied by
western researchers. Home environment has been studied by
analysing the physical environment of the home. Many emotional
factors of the home which are significant for t he achievement of an
adolescent student has not been considered in earlier studies;
(v) Scientific creativity with its components, viz., fluency, flexibility and
originality and verbal and non-verbal forms of intelligence and
43 Review of Related Sfudies
scientific creativity correlating with achievement in science have not
been studied earlier;
(vi) The review of above-mentioned studies does not enable to draw a
generalised conclusion regarding the effect of achievement in science
related variables. Some of the studies show a significant relationship
between the selected variables whereas some studies clearly indicate
that the relationship is not significant.
The review of related studies provides supporting evidences for the
present study by revealing t he results of those works. Simultaneously, the
drawbacks observed stimulate the investigator for a more systematic and
adequate study in the above field.
CHAPTER I11
METHODOLOGY
Method Adopted for the Study
Variables of the Study
Tools Used for Measurement
Sample Used for the Study
Collection of Data
Statistical Techniques Employed
CHAPTER ill
METHODOLOGY
The hypotheses set for the study suggested the procedure to be
adopted for conducting the study. The details of the procedure adopted are
briefly described below under the following heads:
3.1 Method adopted for the study
3.2 Variables of the study
3.3 Tools used for measurement
3.4 Sample used for the study
3.5 Collection of data
3.6 Statistical techniques employed
3.1 METHOD ADOPTED FOR THE STUDY
The present study aims at studying the association between
Achievement in Science and certain other variables. So the Normative
Survey method was found suitable for the collection of data as it has the
following characteristics:
(i) It gathers data from a relatively large number of cases;
(ii) It is cross sectional, mostly for what exists type;
(iii) It is concerned with generalised statistics of the whole population or a
sample;
(iv) It involves clearly defined problems and definite objectives
45 Methodology
jv) It provides information useful to the solution of current practical
problems.
(vi) It suggests the cause af future development.
3.2 VARIABLES OF THE STUDY
In research works, independent variables are manipulated by
researcher and measures changes in dependent variables (8urns, 2000).
In the present study, the dependent variable is Achievement in
Science, Independent variables are:
1. Intelligence
2. Scientific Creativity
3. Achievement Motivation
4. Home Environment
3.3 TOOLS USED FOR MEASUREMENT
A number of standardised psychological and educational tests were
coltected for measuring the different variables. Certain criteria were set up for
selecting the tools. They are:
(i) The tool should be standardised for the population in question;
(ii) The tools should yield valid and reliable measures of the variables in
question;
(iii) The tool should be in the regional language, which is the medium of
instruction in mast of the schools in the State;
(iv) The tool should be a group test so that a reasonably large number of ' -+
pupils can be tested at a time and
46 Methodology
(v) The tool should be provided with standardised instruction for
administration and scoring.
Thus, the following tools were selected for the present study.
1. Test of Scientific Creativity for Higher Secondary School students
2. Kerala University Group Test of Intelligence for Adults
3. Raven's Progressive Matrices Test
4. Kerala scale of Achievement Motivation, and
5. Home Environment Inventory
The psychometric descriptions and other relevant details of the above
tools are presented below.
3.3.1 Measurement of Scientific Creativity
Scientific: Creativity test
An apt tool for measuring the Scientific Creativity of Higher Secondary
School pupils with due weightage to verbal and figural Scientific Creativity
was not available. So, the investigator decided to prepare a Test of Scientific
Creativity.
A standardised test has high validity and reliability and it provides
norms for various groups. Standardisation is defined by Waren (I 934, p.261)
as the establishment of fixed or standardised procedure in giving and scoring
of tests, as well as the establishment of adequate age, grade, race or other
norms.
Therefore, it was decided to construct a standardised test on Scientific
Creativity for Higher Secondary School Science students.
47 Methodology
The important steps in the construction and standardisation of the test
are:
(1) Planning the test
(2) Preparing the test
(3) Trying out the test and
(4) Evaluating the test
Planning the Test
"Good test do not just happen nor are they the result of a few moments
of high inspiration and exaltation. On the contrary, the process is calm,
deliberate and time consuming." (Ross and Stanley, 1 954, p. 140).
The investigator went through several books and journals in Science,
Psychology, Education, Evaluation and Research Methodology and other
such materials to find out details regarding test construction. The investigator
also met many experts in the field. The Creativity Test of Guilford and the
Minnesota Test of Creativity were referred and selected as the base for the
preparation of the present test. Details of the above tests are given below.
Guilford's Test of Creativity
The following factors and tasks summarise Guilford's theory
concerning the measurement of creative thinking abilities (Torrance, 1962, pp.
30-31).

48 Methodology
Table 3.1
Factors, Tests and Descriptions of Guilford's Creativity Test
Windmill Alternations - lndicate the number of alternations form the illusion to another while observing shadow of rotating rectangular blade (Thurstone)
-
Sensitivity to problems (seeing defects, needs, deficiencies, seeing the Odd, the unusual, seeing what must be done)
Figural Spontaneous Flexibility
I
Retinal-Rivalry Reversals - Indicate the number of reversals when a blue field is presented, stereoscopically to one eye and a yellow field to the other eye (Thurstone)
Tests and Descriptions .-."-
Apparatus Test - Suggest two improvements a appliance.
Seeing Problems - List problems that might arise in connection with common objects.
Seeing Deficiencies - Point out the way in which a described plan or activity is faulty.
,--.A-
Cube Fluctuations - lndicate the number of changes in perspective of ambiguous cube (Thurstone)
1- -. .&.,-
Factor --
I [kt----
1 1
4 ; Word Fluency
1 3. I
Match Problems II - lndicate three or four different patterns of a specific number of matches that can be removed to leave a specified number of triangles and squares.
Figural Adaptive Flexibility
a Match Problems 111 - lndicate several different patterns of matches that can be removed to leave a specific number of squares.
Planning Air Manoeuvres - Select the most direct in 'Sky Writing' letter combinations (USAF)
-- -- -. - Tests and Descriptions
Suffixes W-l - Write words ending with a specific suffix (ETS)
Prefixes W-2 - Write wards beginning with a specified prefix (ETS)
First and last letters W-3 - Write words beginning and ending with a specified letter (ETS)
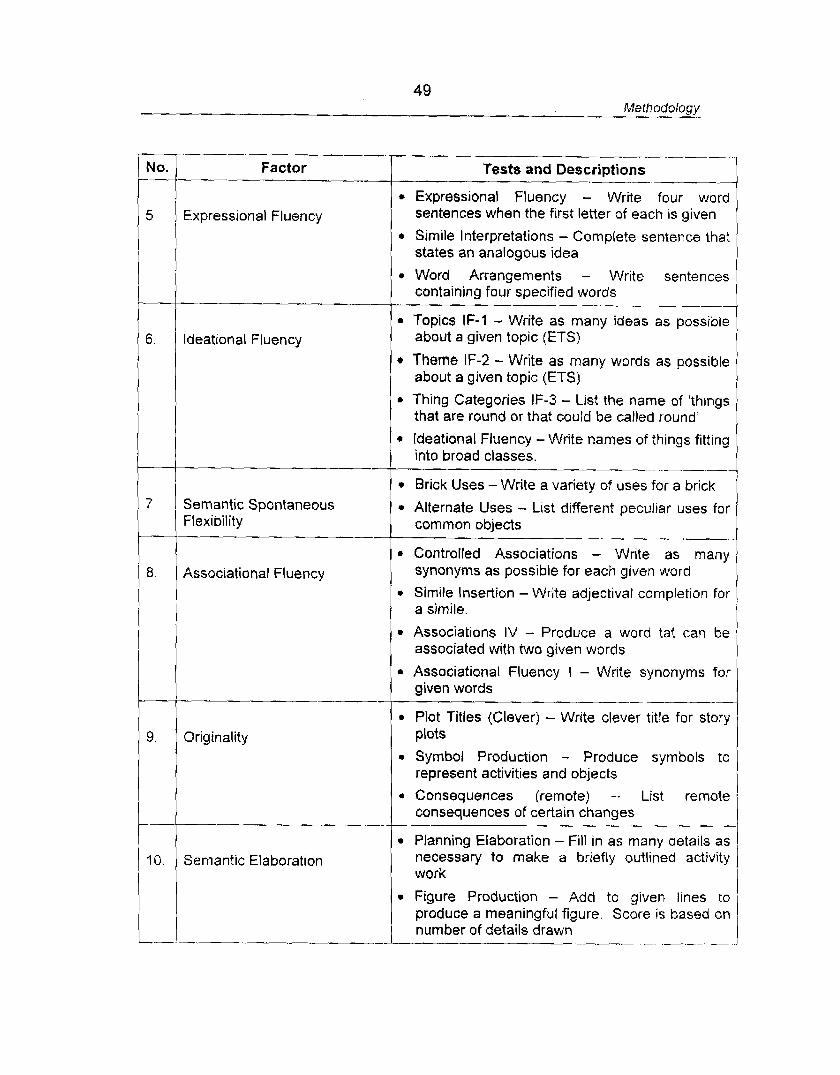
49 Methodology
- Factor -
5 1 Expressional Fluency I
1 6. 1 Ideational Fluency
Tests and Descriptions A
Expressional Fluency - Write four word sentences when the first letter of each is given
Simile Interpretations - Complete sentence that states an analogous idea
Word Arrangements - Write sentences I containing four specified words
----- -- Topics IF-1 - Write as many ideas as possible about a given topic (ETS)
Theme IF-2 - Write as many words as possible about a given topic (ETs) i
I
Thing Categories IF-3 - List the name of 'things that are round or that could be called round' 1 Ideational Fluency -Write names of things fitting / 1 k o a d classes. - .-- i Brick Uses -Write a variety of uses for a brick i
Associations IV - Produce a word tat can be associated with two given words
Semantic Spontaneous Flexibility
Associational Fluency
l
Associational Fluency I - Write synonyms for given words
a Plot Titles (Clever) - Write clever title for story plots
Symbol Production - Produce symbols to represent activities and objects I
Alternate Uses - List different peculiar uses for common objects
Controlled Associations - Write as many synonyms as possible for each given word
Simile Insertion -Write adjectival completion for a simile.
Figure Production Add to given lines to ' produce a meaningful figure. Score is based on number of details drawn
.- - L -- - .- ..
10. Semantic Elaboration ---k a Consequences (remote) - List remote
consequences of certain changes
Planning Elaboration - Fill in as many details as necessary to make a briefly outlined activity work
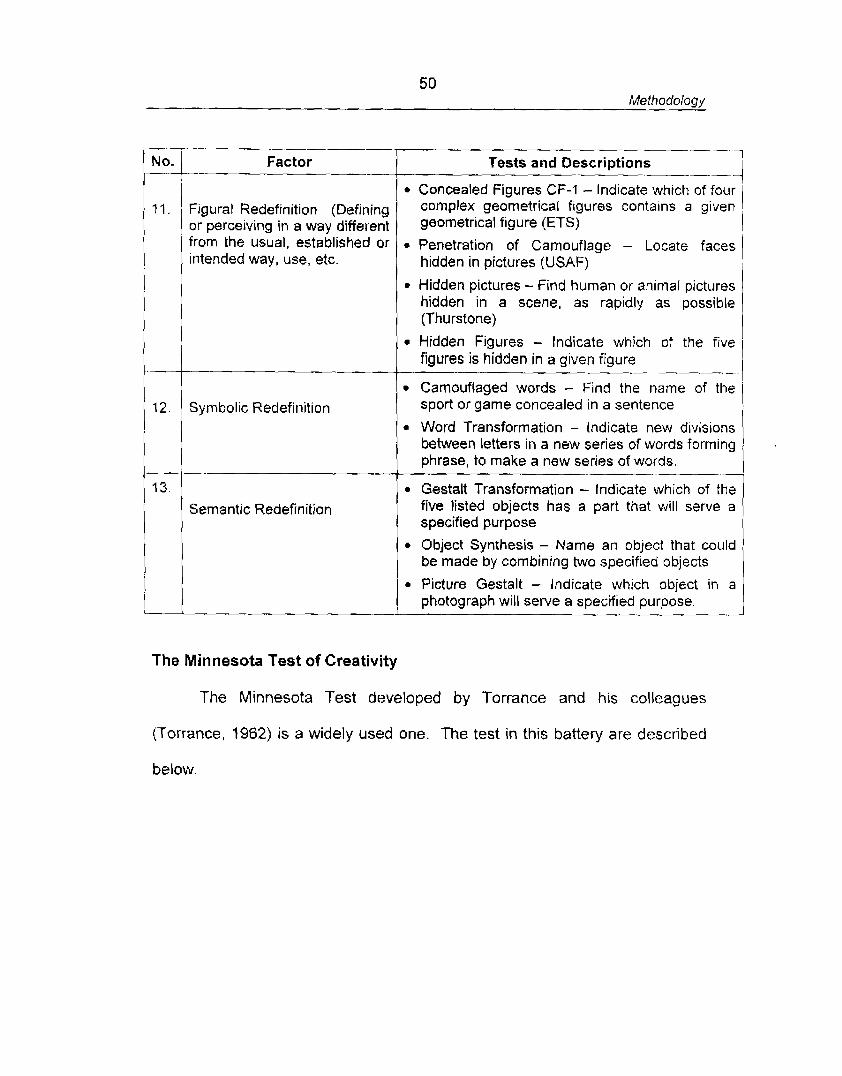
50 Methodology
- No.
! 'I,
Factor T----- Figural Redefinition (Defining or perceiving in a way different from the usual, established or intended way, use, etc.
--
Tests and Descriptions i Concealed Figures CF-1 - lndicate which of four complex geometrical figures contains a given geometrical figure (ETS)
I I
s Penetration of Camouflage - Locate faces ( hidden in pictures (USAF) i Hidden pictures - Find human or animal pictures hidden in a scene, as rapidly as possible (Thurstone)
which of the five figures is hidden in a given figure
-* I Symbolic Redefinition
Camouflaged words - Find the name of the sport or game concealed in a sentence 1
I
Object Synthesis - Name an object that could I be made by combining two specified objects
Semantic Redefinition
Picture Gestalt - lndicate which object in a photograph will serve a specified purpose. J
Word Transformation - lndicate new divisions between letters in a new series of words forming 1 phrase, to make a new series of words. i Gestalt Transformation - lndicate which of t;J five listed objects has a part that will serve a 1 specified purpose I
The Minnesota Test of Creativity
The Minnesota Test developed by Torrance and his colleagues
(Torrance, 1962) is a widely used one. The test in this battery are described
below.
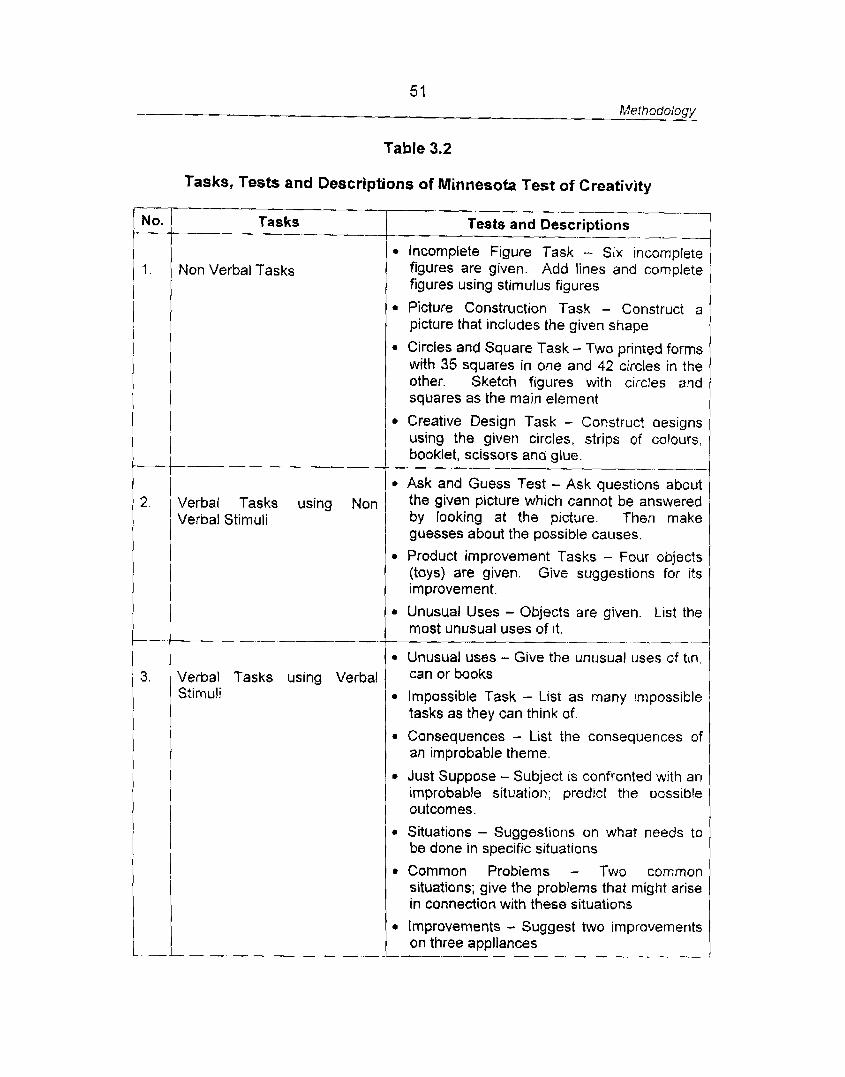
Table 3.2
Tasks, Tests and Descriptions of Minnesota Test of Creativity
A- -- - "-I --- Tasks rts and ~ e s c r i ~ t i o n s -- -- -- -
incomplete Figure Task - Six incomplete / i Non Verbal Tasks figures are given. Add lines and complete I I figures using stimulus figures I
Picture Construction Task - Construct a [ picture that includes the given shape I Circles and Square Task - Two printed forms with 35 squares in one and 42 circles in the other. Sketch figures with circles and squares as the main element 1
I Creative Design Task - Construct designs using the given circles, strips of colours,
-- - -- questions about
Verbal Tasks be answered Verbal Stimuli by looking at the picture. Then make
guesses about the possible causes.
Product improvement Tasks - Four objects (toys) are given. Give suggestions for its improvement.
Consequences - List the consequences of an improbable theme.
Verbal Tasks using Verbal Stimuli
Just Suppose - Subject is confronted with an 1 improbable situation; predict the possible outcomes. !
Unusual Uses - Objects are given. List the most unusual uses of it.
-
Unusual uses - Give the unusual uses of tin, =an or books
Impossible Task - List as many impossible tasks as they can think of.
Situations - Suggestions on what needs to be done in specific situations
Common Problems - Two common situations; give the problems that might arise in connection with these situations
a Improvements - Suggest two improvements on three appliances -- I -- --- -- - - - - ,
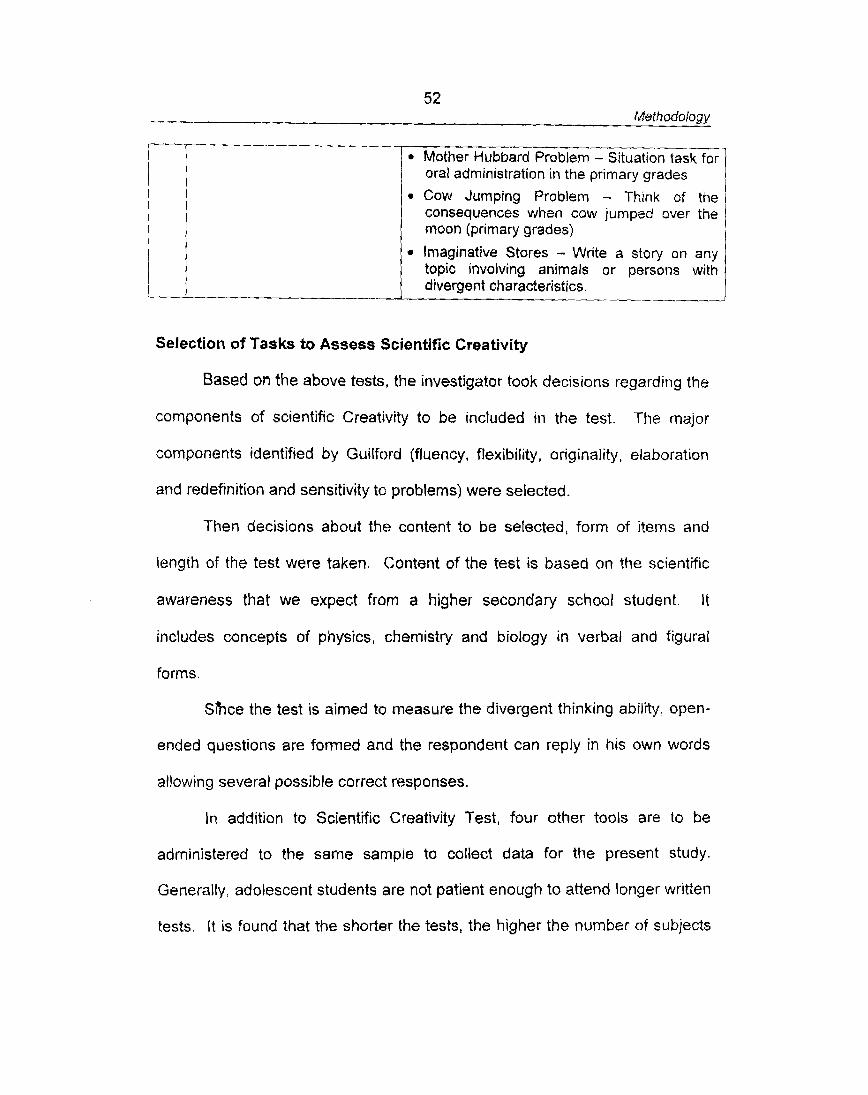
Methodology
I- ---- - Situation task for
oral administration in the primary grades
Cow Jumping Problem - Think of the consequences when cow jumped over the moon (primary grades)
Imaginative Stores - Write a story on any topic involving animals or persons with
--- - "--
Selection of Tasks to Assess Scientific Creativity
Based on the above tests, the investigator took decisions regarding the
components of scientific Creativity to be included in the test. The major
components identified by Guilford (fluency, flexibility, originality, elaboration
and redefinition and sensitivity to problems) were selected.
Then decisions about the content to be selected, form of items and
length of the test were taken. Content of the test is based on the scientific
awareness that we expect frorn a higher secondary school student. It
includes concepts of physics, chemistry and biology in verbal and figural
forms.
Shce the test is aimed to measure t h e divergent thinking ability, open-
ended questions are formed and the respondent can reply in his own words
allowing several possible correct responses.
In addition to Scientific Creativity Test, four other tools are to be
administered to the same sample to collect data far the present study.
Generally, adolescent students are not patient enough to attend longer written
tests. It is found that the shorter the tests, the higher the number of subjects
Methodology
completing the test. Taking these assumptions into consideration, it was
decided to construct a test for 90 minutes (including the time for giving
instructions) which would serve the purpose of measuring Scientific Creativity
of Higher Secondary School pupils.
For higher secondary classes, the medium of instruction is English. So
the test was prepared in English. However, the respondents are allowed to
answer in the mother tongue (Malayalam) whenever they feel difficulty in
answering in English.
Preparing the Test
The test items were prepared based on the following principles:
The items selected should be
suitable for the cognitive level of the Higher Secondary School
Students
related to the physical and social environment of the learners
r motivating for imaginative insights
helpful for promoting critical thinking skills
easily scorable
presented in unambiguous terms
accessible to learners with minimum instruction
simple and of proper length to avoid fatigue and boredom.
Thus, a careful scrutiny of the items with regard to language, length,
clarity and accuracy was done with the help of the Supervising Teacher.
The items selected were grouped into five major parts. They are:
Part A - Fluency
B - Flexibility
C - Originality
D Elaboration and Redefinition
E - Sensitivity to Problem
Description of the Tasks and Test ifems
A brief description of the tasks and test items is given below.
Part A - Fluency
Word Fluency: Prefixes
This is a direct adaptation of Guilford's Word Fluency: Prefixes W-2.
Here, the examinee has to write down as many scientific words as he can
which begin with a specified prefix.
An example for the item IS given below.
Write as many scientific words as possible beginning with In.. .
Ans; Induction, Inertia, Incubation, Insulator
Word Fluency - Suffixes
This is a direct adaptation of Guilford's Word Fluency Suffixes W-I.
The subject has to write as marly scientific words as he can which end with
the specified suffix. The emphasis here is on fluency (i.e., the seer number of
responses) while the subject who can write unusual words will probably be
given score for originality.
An illustration of an item is given below. Write as many words as possible associated with science ending in . . .ance
Ans: Resistance, Inductance, Reactance, Valance
55 Methodology
Ideational Fluency: Topics IF-I and Topics IF-2
This is mostly on the lines of Guilford's Ideational Fluency: Topics IF-I
and IF-2. The tasks in this test are designed to measure fluency in terms of
rate of generation of ideas. Instructions emphasise sheer number of
responses produced rather than their quality. Unusual responses will tend to
increase with the total number of responses produced.
Example of an item is as follows;
Give maximum number of examples for household chemicals.
Associational Fluency: Associations
This is an adaptation of Guilford's Associational Fluency: Associations
IV, in which the subject has to produce a word that could be associated with
two given words. Associational fluency as measured by the test pertains to
the completion of relationship in distinction with ideational fluency which
involves generation of ideas. Associational fluency measures the ability of an
individual to associate terms fluently.
An illustration of the items would be:
Write as many compounds as possible by combining the elements Sulphur
and Oxygen.
Part B - Flexibility
Semantic S p on faneous Flexibility: Alternate Uses
This is a modification of Guilford's Alternate Uses Test intended to
measure semantic spontaneous flexibility. The subject is required to write as
many usual and unusual applications of the given concept.
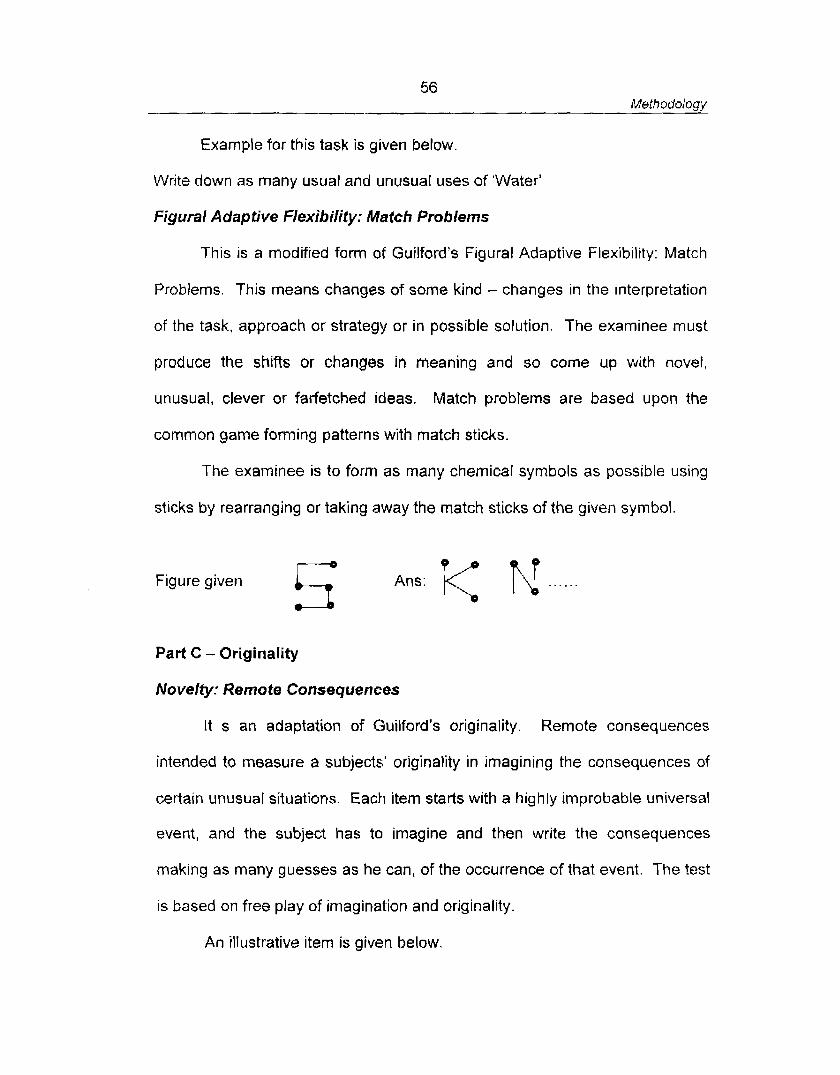
56 Methodology
Example for this task is given below.
Write down as many usual and unusual uses of 'Water'
Figural Adaptive Flexibility: Match Problems
This is a modified form of Guilford's Figural Adaptive Flexibility: Match
Problems. This means changes of some kind - changes in the interpretation
of the task, approach or strategy or in possible solution. The examinee must
produce the shifts or changes in meaning and so come up with novel,
unusual, clever or farfetched ideas. Match problems are based upon the
common game forming patterns with match sticks.
The examinee is to form as many chemical symbols as possible using
sticks by rearranging or taking away the match sticks of the given symbol.
Figure given A : T( N . . . . Part C - Originality
Novelty: Remote Consequences
It s an adaptation of Guilford's originality. Remote consequences
intended to measure a subjects' originality in imagining the consequences of
certain unusual situations. Each item starts with a highly improbable universal
event, and the subject has to imagine and then write the consequences
making as many guesses as he can, of the occurrence of that event. The test
is based on free play of imagination and originality.
An illustrative item is given below.
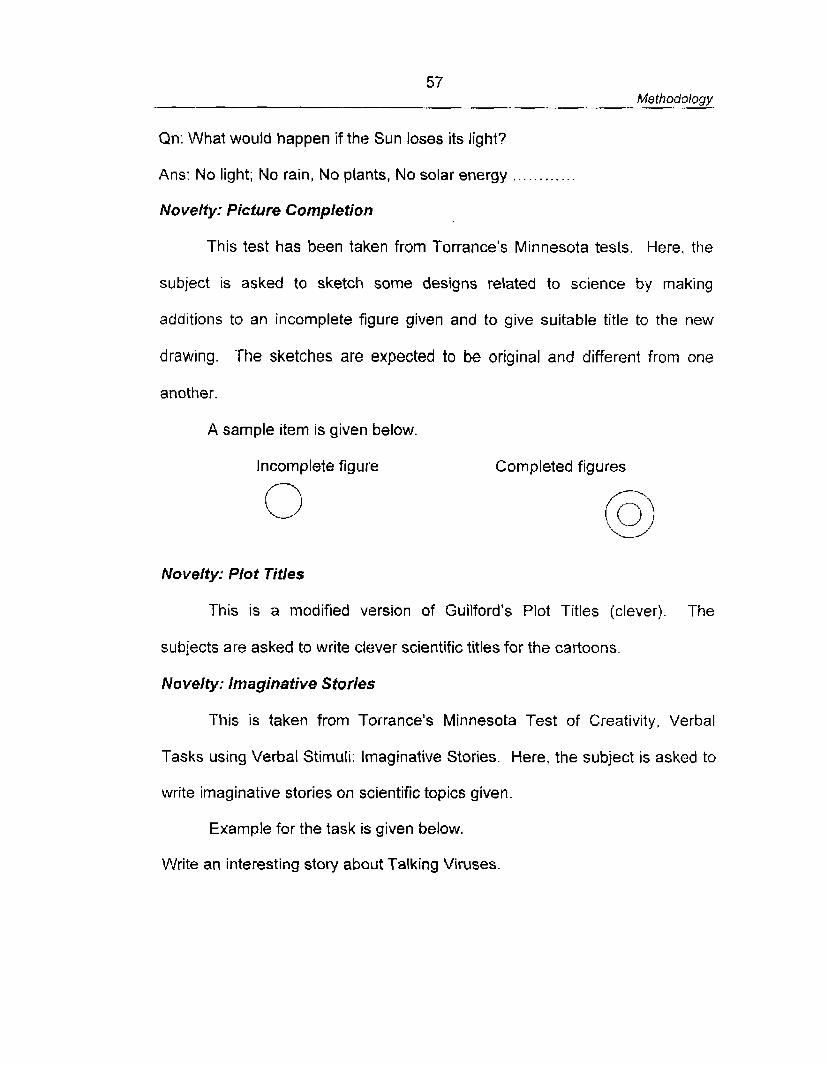
57 Methodology
Qn: What would happen if the Sun loses its light?
Ans: No light; No rain, No plants, No solar energy . . . ......
Novelty: Picture Completion
This test has been taken from Torrance's Minnesota tests. Here, the
subject is asked to sketch some designs related to science by making
additions to an incomplete figure given and to give suitable title to the new
drawing. The sketches are expected to be original and different from one
another.
A sample item is given below.
Incomplete figure Completed figures
Novelty: Plot Titles
This is a modified version of Guilford's Plot Titles (clever). The
subjects are asked to write clever scientific titles for the cartoons.
Novelty: Imaginative Stories
This is taken from Torrance's Minnesota Test of Creativity, Verbal
Tasks using Verbal Stimuli: Imaginative Stories. Here, the subject is asked to
write imaginative stories on scientific topics given.
Example for the task is given below.
Write an interesting story about Talking Viruses.
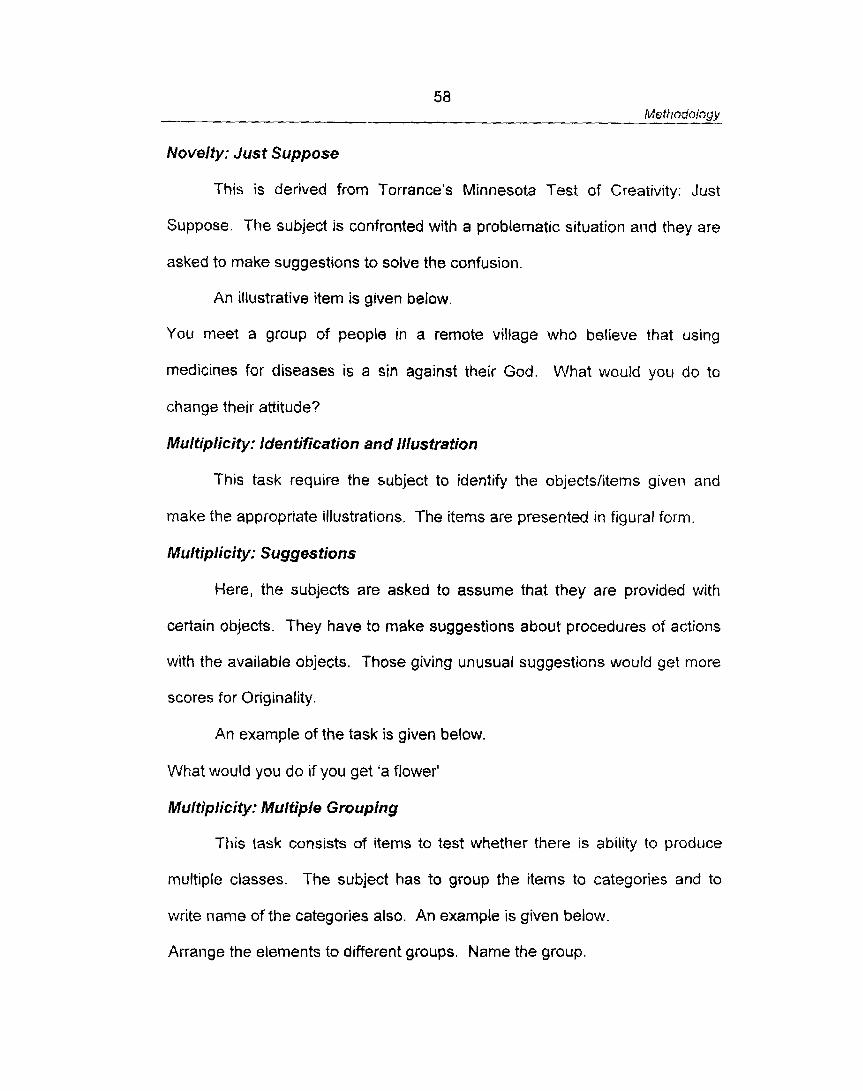
58 Methodology
Novelty: Just Suppose
This is derived from Torrance's Minnesota Test of Creativity: Just
Suppose. The subject is confronted with a problematic situation and they are
asked to make suggestions to solve the confusion.
An illustrative item is given below.
You meet a group of people in a remote village who believe that using
medicines for diseases is a sin against their God. What would you do to
change their attitude?
Multiplicity: Identification and illustration
This task require the subject to identify the objectslitems given and
make the appropriate illustrations. The items are presented in figural form.
Multiplicity: Suggestions
Here, the subjects are asked to assume that they are provided with
certain objects. They have to make suggestions about procedures of actions
with the available objects. Those giving unusual suggestions would get more
scores for Originality.
An example of the task is given below.
What would you do if you get 'a flower'
Multiplicity: Multipie Grouping
This task consists of iterr~s to test whether there is ability to produce
multiple classes. The subject has to group the items to categories and to
write name of the categories also. An example is given below.
Arrange the elements to different groups. Name the group.
59 Methodology
Aluminium Calcium Carbon Chlorine Copper Helium
Answer: Gases-, Chlorine, Helium
Metals+ Aluminium, Copper
Part D - Elaboration and Redefinition
figural Redefinition: Concealed Phenomena
This is a modified form of Guilford's' Figural Redefinition: Concealed
Figures CF-1. Redefinition involves the changing of functions or uses of parts
of one unit and giving them new functions or uses in some new unit. The
subject has to recognise the scientific concept concealed in the given pictures
which helps him to redefine the figure scientifically.
Symbolic Redefinition: Camouflaged Words
This is a modified version of Guilford's Symbolic Redefinition:
Camouflaged Words. This is a word search puzzle in science. The subject is
required to find the scientist in the given puzzle. Thus, his ability to redefine
meaningless symbols to meaningful terms is to be counted as creative talent.
Semantic Redefinition: Object Synthesis
This is a modified form of Guilford's Semantic Redefinition: Object
Synthesis. Redefinition means the ability to perceive in a way different from
the established way., A semantic test require the examinee do find new
meanings to the details given. The subject has to make proper alterations for
the given figure to redefine it to a meaningful pattern.
Methodology
Semantic Elaboration: Figure Production
This task is directly taken from Guilford's Semantic Elaboration: Figure
Production. Elaboration means giving more details about a simple concept.
Score is based on number of details drawn.
An example is mentioned below.
Make a drawing an 'Science a bliss or a curse.'
Part E- Sensitivity to Problems
Sensitivity to Problems: Seeing Deficiencies
This is an adaptation of Guilford's Sensitivity to Problem: seeing
Deficiencies, This task is to point out the way in which a described activity is
faulty.
An illustrative item is given below.
Point out the problems due to the following activity
Paddy fields are levelled for constructing buildings.
Sensitivity to Problems; Seeing Problems
This is directly adapted from Guilford's Sensitivity to Problems: Seeing
Problems. Here, the subject is to list problems that might arise in connection
with common objects.
Example for this task is given below.
What problems may arise due to the use of 'soft drinks'?
Sensitivity to Pro biems: Apparatus Test
This is directly adapted from Guilford's Sensitivity to Problems:
Apparatus Test. The subject is required to suggest improvements to the
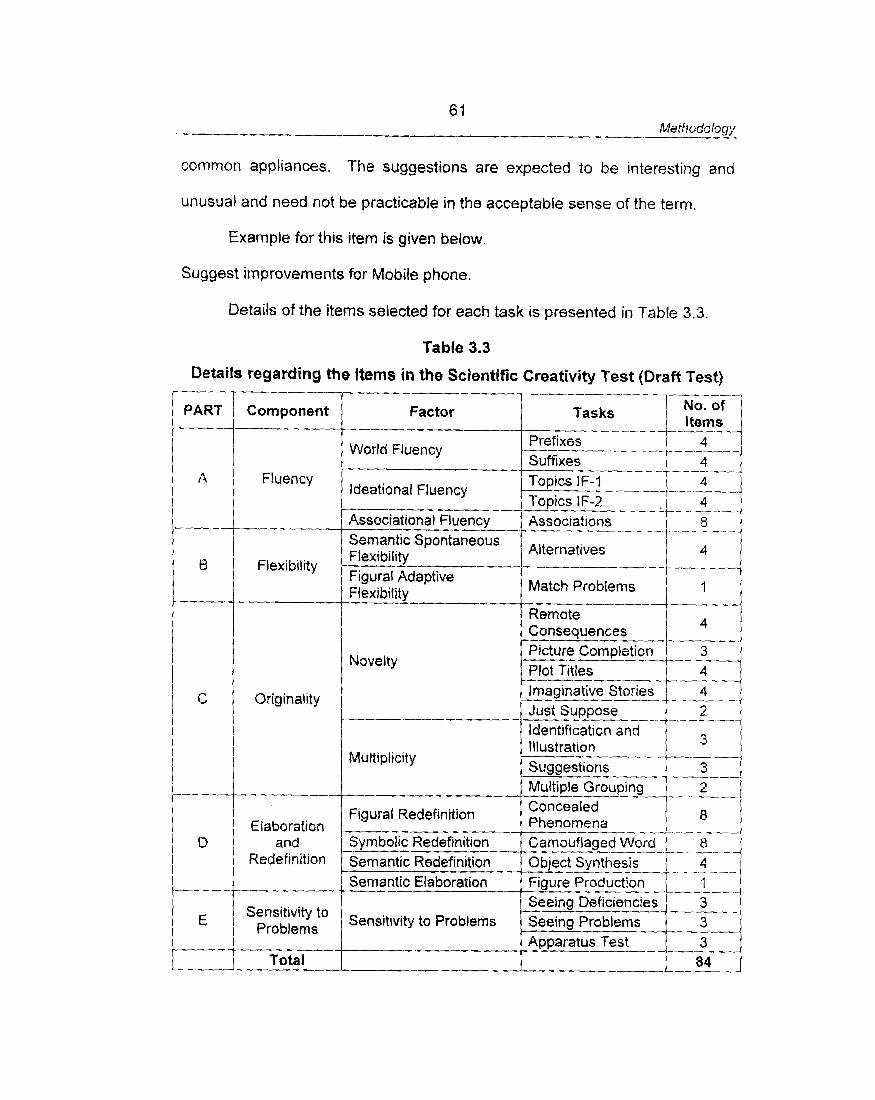
- Methodology
common appliances. The suggestions are expected to be interesting and
unusual and need not be practicable in t he acceptable sense of t he term.
Example for this item is given below.
Suggest improvements for Mobile phone.
Details of the items selected for each task is presented in Table 3.3.
Table 3.3
Details regarding the Items in the Scientific Creativity Test (Draft Test)
1 r-- PART - - la----- Component I--- -+ .---
---- --- -
Factor Tasks
World Fluency Prefixes -- -- Suffixes l i t I Fluency -
Ideational Fluency Topics IF-) Topics IF-2 I
I Associational Fluency Associations -- -- Semantic Spontaneous
-- I -- -
Flexibility 1 Figural Adaptive - -- Flexibility Match Problems
Remote Consequences Picture Completion
Novelty Plot Titles
I
I C Originality
----- --- Imaginative Stories ------I 4 Just Suppose
Multiplicity
Figural Redefinition
Symbolic Redefinition Semantic Redefinition Semantic Elaboration
Sensitivity ta Problems
I I I
I I I I
I ( Elaboration I D 1
and 1 ~edefinitlon I I
2 1
1- - --
!
------
Sensitivity to Problems
Total
Identification and Illustration - - --
-- -
--
1 Suggestions ---
---A 3 --
Multiple Grouping Concealed Phenomena a
---- Camouflaged - Word -- r I
Object Synthesis r 7- -I ---- I
Figure Production 7- -7 - - - I Seeing Deficiencies Seeing Problems Apparatus Test
--I-:-- -- 1 3 3
84 --
All the general instructions about the test, explaining clearly the nature
of the test and what is expected of the subjects, were given on the facing
sheet. Then specific instructions along with illustrative examples were given
clearly at the beginning of each type of item. The test material was printed as
a booklet. Separate answer sheets were prepared. Copy of the draft test is
given as Appendix A.
Tryout
Tryout of the test is ta select good items for the final form of the test
and to know exactly how the test will function in actual use. The tryout is to
serve the following purposes:
(i) To fix a suitable time limit for each part.
(ii) To examine the adequacy and clarity of the instructions and the
effectiveness of the items given.
(iii) To decide the improvements in the test administration procedure.
(iv) To eliminate items, if any, for which the average frequency count of
responses is very low, because it is essential that the items should be
capable of arousing large number of responses easily.
(v) To decide the extent of space for answering.
Sample for Tryout
A representative sample of 620 pupils of Higher Secondary Schools of
Kollam, Kottayam and Pathanamthitta districts were chosen for trying out the
test. In selecting the sample, care was taken to give representation to
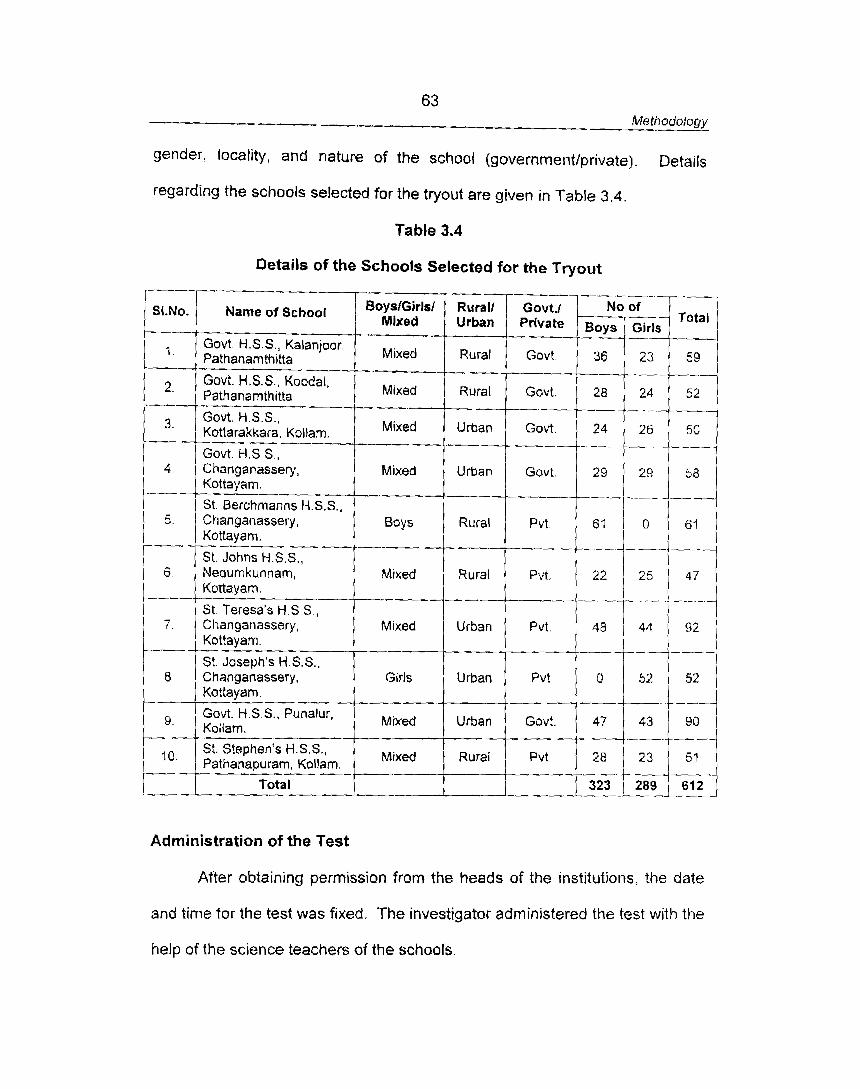
63 Me thodology
gender, locality, and nature of the school (government/private). Details
regarding the schools selected for the tryout are given in Table 3 .4 .
Table 3.4
Details of the Schools Selected for the Tryout
Administration of the Test
After obtaining permission from t h e heads of the institutions, the date
Name of School r--
Govt. H.S.S., Kalanjoor, Pathanamthitta
Govt. H.S.S., Koodal, Pathanamthitta
Govt. H.S.S., Kottarakkara, Kollam.
and time for the test was fixed. The investigator administered the test with t he
BoysfGirlsl Mixed
Mixed
Mixed
Mixed
Mixed
Boys
-.-
Mixed
Mixed
Girls
Mixed
1 4 I 1
1 5.
I I ( 6. I
P----
i 7
8.
9.
help of the science teachers of the schools.
1 lo' 1 Pathanap;=; Kol!am. 1 Mixed
---
Govt. H.S.S., Changanassery, Kottayam. St. Berchmanns H.S.S., Changanassery, KO ttayam.
St. Johns H.S,S., Nedumkunnam, Kottayam.
St. Teresa's H.S.S., Changanassery, Kottayam.
St. Joseph's H.S.S., Changanassery, Kattayam. Govt. H.S.S., Punalur, Koliam. St. Stephen's H.S.S.,
Rural/ Urban
Rural
Rural
Urban
Urban
--
Rural
Rural
.-
Urban
Urban
Urban
- Govt.1 No of Private B~~~
i Govt.
Govt. 52
24
Govt.
Pvt.
-
Pvt. 22 47
- - -
Pvt 0
Govt.
Rural Pvt. 28 23 --
64 Methodology
Emotional climate of the class is of much significance when a creativity
tool is administered. Students would express their imaginative ideas freely if
there exists a friendly atmosphere in the classroom. Hence, a non-
threatening, relaxed and game like environment was organised by means of a
free and humorous approach. Thus, a good rapport was established before
the commencement of the test
The following steps were followed for administering the test:
(i) Distribution of the test booklets to the subjects.
(ii) Explaining the general instructions in the booklet.
(iii) Distribution of the answer sheets with necessary instructions.
(iv) Making the students familiar with the examples given and directing
them to answer all the items accordingly.
(v) Provide enough time to complete the test.
(vi) Clearing the doubts of subjects.
{vii) Collecting back the booklets and response sheets.
Scoring
A scoring scheme was prepared by scoring the items for Fluency,
Flexibility and Originality.
Scoring Scheme for Fluency
An individual score for fluency was determined by counting the total
number of right relevant and unrepeated responses. One point credit was
given to each response. Thus, the total score for fluency for each item was
found out.
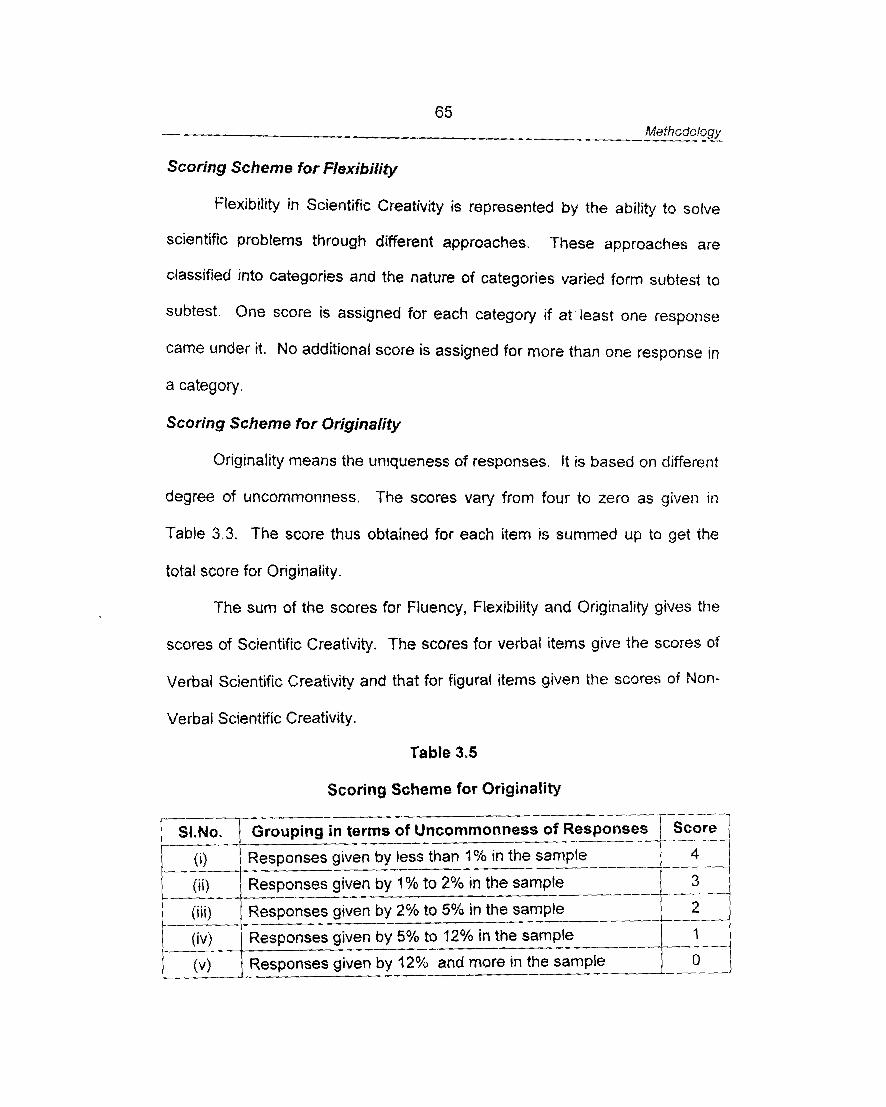
Scoring Scheme for Flexibility
Flexibility in Scientific Creativity is represented by the ability to solve
scientific problems through different approaches. These approaches are
classified into categories and the nature of categories varied form subtest to
subtest. One score is assigned for each category if at least one response
came under it. No additional score is assigned for more than one response in
a category.
Scoring Scheme for Originalify
Originality means the uniqueness of responses. It is based on different
degree of uncommonness. The scores vary from four to zero as given in
Table 3.3. The score thus obtained for each item is summed up to get the
total score for Originality.
The sum of the scores for Fluency, Flexibility and Originality gives the
scores of Scientific Creativity. The scores for verbal items give the scores of
Verbal Scientific Creativity and that for figural items given the scores of Non-
Verbal scientific Creativity.
Table 3.5
Scoring Scheme for Originality ----
Grouping in terms of Uncommonness of -- - Responses given by less than 1% in the sample
Responses given by 1 % to 2% in the sample
Responses given by 2% to 5% in the sample - --L---J 2 Responses given by 5% to 12% in the sample ---- J ' l
I (v) / Responses given by 12Y0 and more in the sample 1 0 ,

66 Methodology
Scoring Process
The scoring process was time consuming since each item had to be
scored three times as mentioned below.
(i) Number of responses were counted and fluency score was assigned.
( i i ) Categorisation of the responses examined and flexibility score was
assigned.
(iii) Uncommon nature of the responses was examined and originality
score was assigned.
A score sheet was prepared for entering the scores of Fluency,
Flexibility, Originality, Verbal Scientific Creativity, Non-verbal Scientific
Creativity and Total Scientific Creativity.
ltem Analysis
Item analysis refers to the application of statistical techniques to
assess two characteristics of items, their difficulty and the extent to which they
are correlated with other measures (Wood, 1960, p.81).
ltem analysis helps the investigator to make a test valid and reliable.
Validity and reliability can both be improved through the selection and revision
of items. Other things being equal, a longer test would be more valid and
reliable than a shorter test. However, when a test is shortened by eliminating
the least satisfactory items, the shorter version will be more valid and reliable.
Gulliksen (1 9501, Guilford (1 9541, Garrett (1 959) and Edward (1 969)
have favoured employing item analysis for improving the reliability and validity
of tests. Item analysis primarily concerns with item difficulty and item
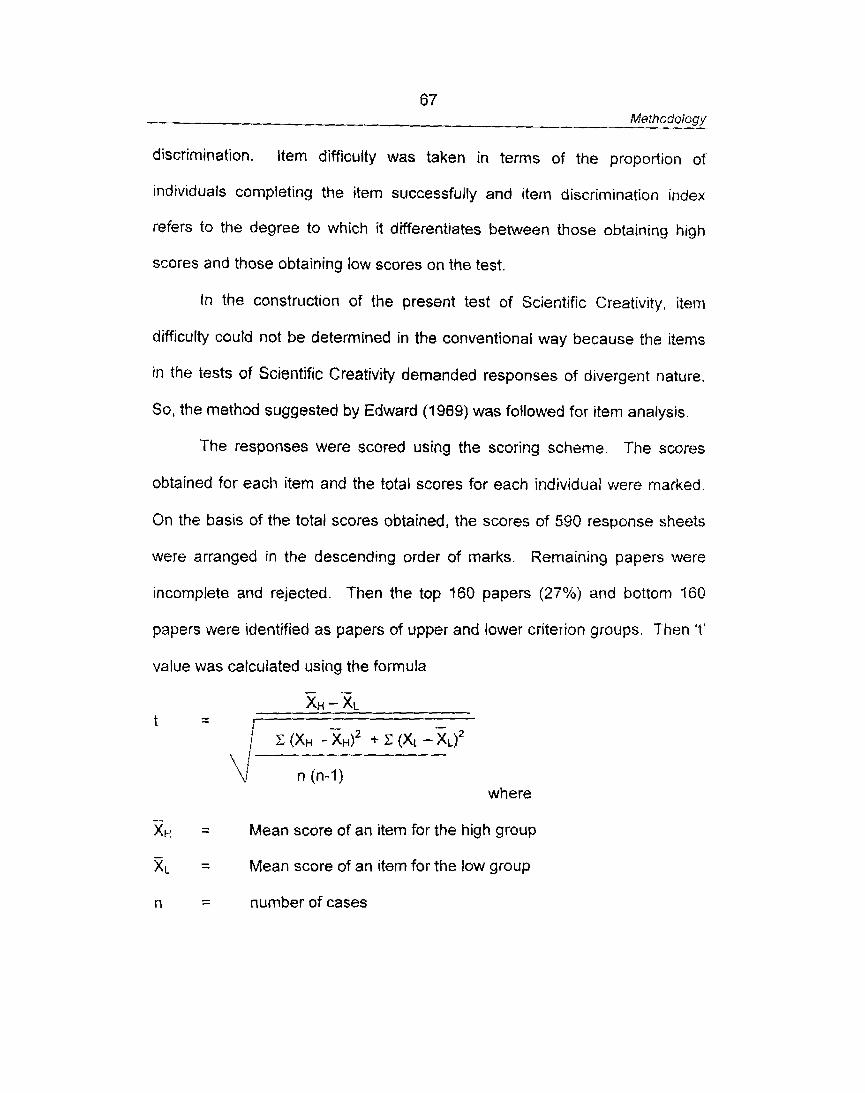
67 Methodology
discrimination. Item difficulty was taken in terms of the proportion of
individuals completing the item successfully and item discrimination index
refers to the degree to which it differentiates between those obtaining high
scores and those obtaining low scores on the test.
In the construction of the present test of Scientific Creativity, item
difficulty could not be determined in the conventional way because the items
in the tests of Scientific Creativity demanded responses of divergent nature.
So, the method suggested by Edward (1969) was followed for item analysis.
The responses were scored using the scoring scheme. The scores
obtained for each item and the total scores for each individual were marked.
On the basis of the total scores obtained, the scores of 590 response sheets
were arranged in the descending order of marks. Remaining papers were
incomplete and rejected. Then the top 160 papers (27%) and bottom 160
papers were identified as papers of upper and lower criterion groups. Then 't'
value was calculated using the formula
V n (n-I) where
- - XH - Mean score of an item for the high group
- x L - - Mean score of an item for t h e low group
n - - number of cases
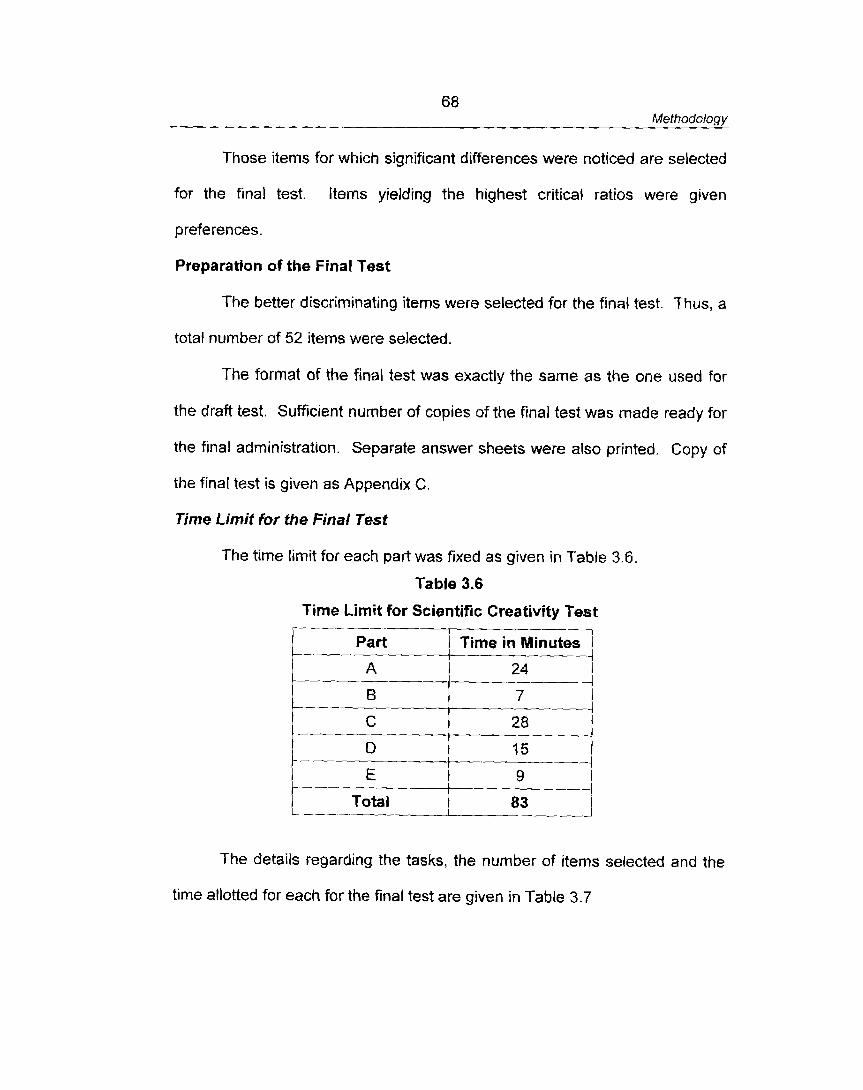
Those items for which significant differences were noticed are selected
for the final test. Items yielding the highest critical ratios were given
preferences.
Preparation of the Final Test
The better discriminating items were selected for the final test. Thus, a
total number of 52 items were selected.
The format of the final test was exactly the same as the one used for
the draft test. Sufficient number of copies of the final test was made ready for
the final administration. Separate answer sheets were also printed. Copy of
the final test is given as Appendix C.
Time Limit far the Final Test
The time limit for each part was fixed as given in Table 3.6.
Table 3.6
Time Limit for Scientific Creativity Test
Part
I Total 1 83
The details regarding the tasks, the number of items selected and the
time allotted for each for the final test are given in Table 3.7
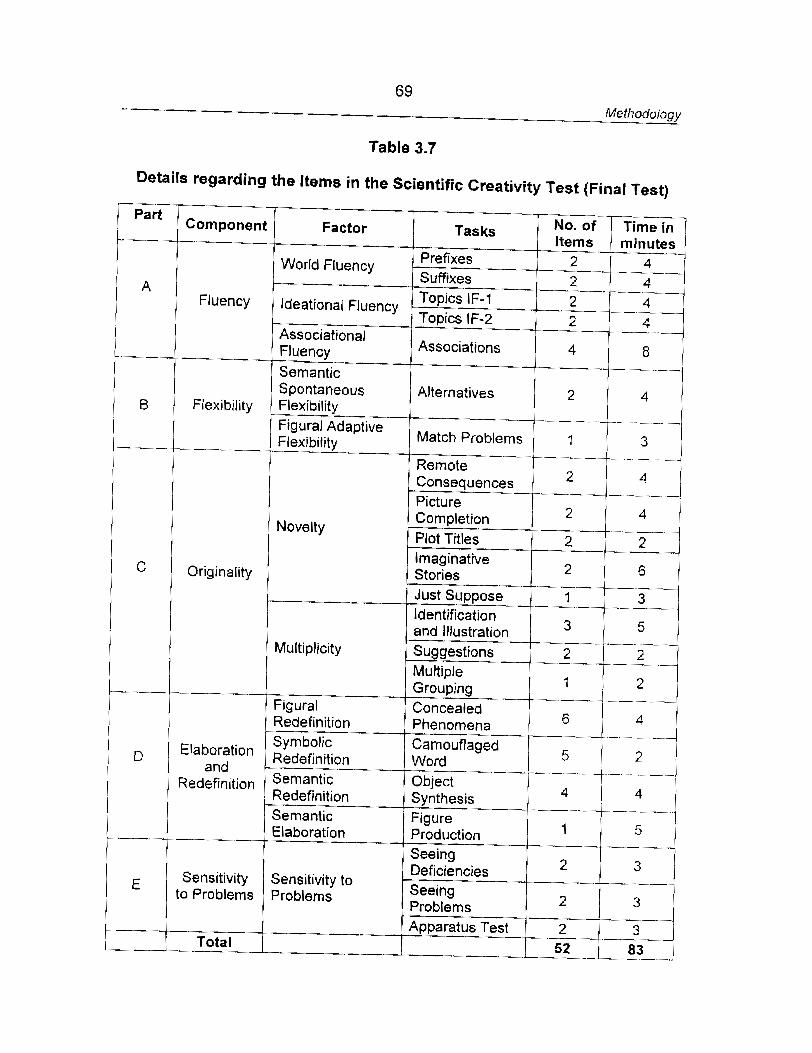
Methodology
Table 3.7
Details regarding the Items in me Scientific Creativity ~ e s t (Final teat) I-.
Part
1 A
component
Fluency
Factor
World Fluency
Ideational Fluency
I I I
I Flexlbil~ty
Associational Fluency Semantic Spontaneous Flex~bility Figural Adaptive Flexibility
Novelty
Multiplicity
F~gural Redefinition Symbolic Redefinition Semantic Redefinition Semantic Elaboration
Sensitivity to Problems
I I
I C
t I
Tasks
Prefixes S Mixes
Topics IF-l
Originality
-.---
Items minutes 2 ---- -
2 ---- Topics IF-2
Associations
Alternatives
I 1 D 1 and ) Redefinition
C E Sensitivity
to Problems
I-- - Total - - -
2 4 - 4 8 - -
2 4
---- - - I Match Problems i 1 - i 1
.---.-L
Remote Consequences Picture Completion Plot Titles Imaginative Stories
- -- -
2 - -
2 -
2
2
Just Suppose Identification and illustration Suggestions 2 -- -- Multiple Grouping 7
Concealed Phenomena Camouflaged Word 5
Object
-.
4 - -
2
6
Synthesis Figure Production
4 1 4 - - 1 1
1 1
5 1 Seeing Deficiencies 2
--- Seeing Problems 2 - Apparatus Test
-- - 52
70 Methodology
Evaluating the Test
Evaluating the test means checking the most important requirements of
a test in terms of Validity and Reliability.
Validity
The validity of a test concerns what the test measures and how will it
does so. The trait measured by a given test can be defined only through an
examination of the objective sources of information and empirical operations
utilised in establishing the validity (Anastasi, 1997, p. 11 3).
The test possess construct validity to a reasonably high degree due to
the theory used in the development of the test, tasks included, selection of
discriminating items, etc.
Evidence in terms of the internal consistency of the components of
Scientific Creativity has been examined for the sample for tryout. The
components have been found to be correlated positively and significantly with
one another. Each of the components correlates considerably with the Total
Scientific Creativity Test scores, the coefficients vary from 0.6543 to 0.8123,
the average correlation being 0.76391. The details are presented below in
Table 3.8
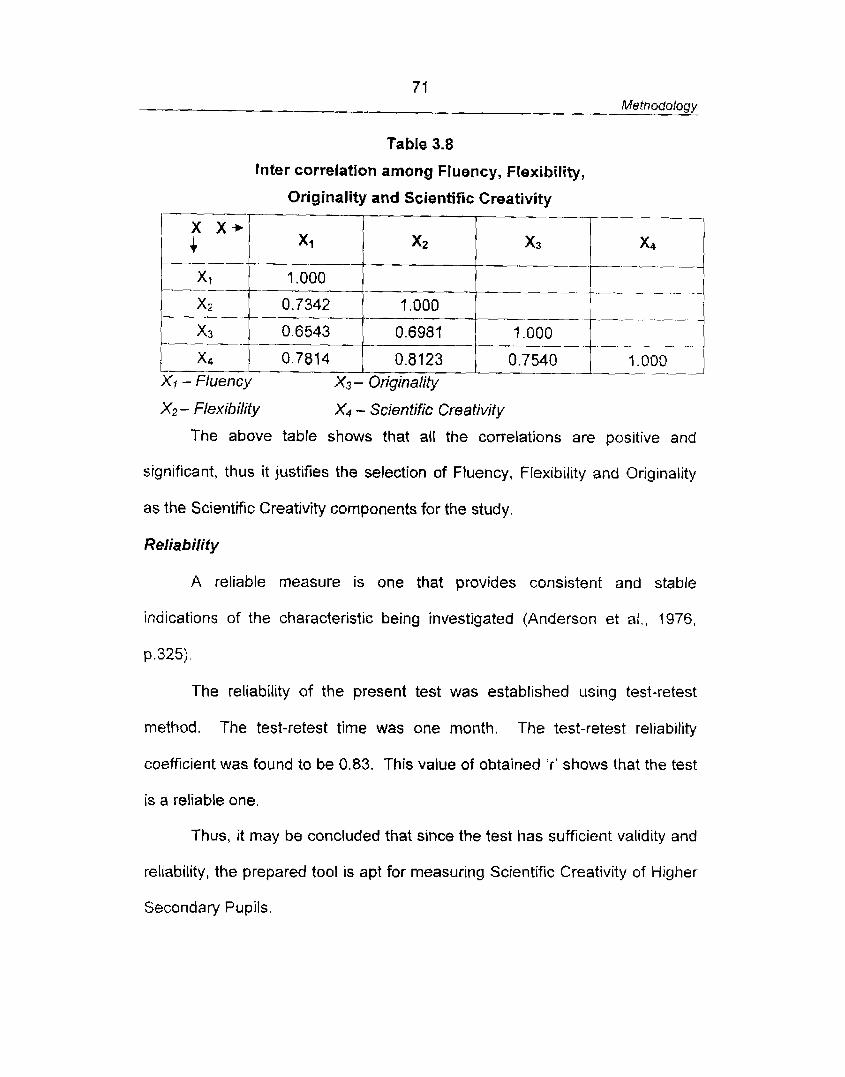
7 1 Methodology
Table 3.8
Inter correlation among Fluency, Flexibility,
Originality and Scientific Creativity
X2 - Flexibiiity X4 - Scientific Creativity
The above table shows that all the correlations are positive and
1.000
0.7342
0.6543
I---- X 4 0.7814
significant, thus it justifies the selection of Fluency, Flexibility and Originality
as the Scientific Creativity components for the study.
Xi - Fluency X3 - Originality
x2
1.000
0.6981
0.8123
Reliability
.---.
-- - + . - - .- -1 +
1 .OOO A
0.7540
A reliable measure is one that provides consistent and stable
indications of the characteristic being investigated (Anderson et al., 1976,
p.325).
The reliability of the present test was established using test-retest
method. The test-retest time was one month. The test-retest reliability
coefficient was found to be 0.83. This value of obtained 'r' shows that the test
is a reliable one.
Thus, it may be concluded that since the test has sufficient validity and
reliability, the prepared tool is apt for measuring Scientific Creativity of Higher
Secondary Pupils.
72 Methodology
3.3.2 Measurement of Intelligence
Intelligence Test
To measure the lntelligence of Higher Secondary school pupils, two
procedures were adopted using two tools.
3.3.2.1 Verbal Test of lntelligence
3.3.2.2 Nan-verbal Test of lntelligence
3.3.2. f Verbal Test of Intelligence
To measure the verbal intelligence of the subjects, the investigator
selected an available tool, Kerala University Group Test of lntelligence for
Adults.
Kerala University Group Test of lntelligence for Adults (Revised Version)
This test was designed by Anandavalliamma for measuring the
General lntelligence of Adults. The test contains five subtests as Verbal
Analogy, Verbal Classification, Numerical Reasoning, Letter Matrices and
Spatial Reasoning. The total time for the test is 40 minutes.
Of t h e five subtests, four are in the verbal form and last subtest is in
figural form. Since the present study envisages t he use of a separate Non-
verbal lntelligence test, the fifth subtest was not used for measuring the
Verbal Intelligence, since it was in non-verbal form.
The illustrative items of the subtests are given below.
Subtest I - Verbal Analogy
This items presents three words in a particular order. The examinee is
required to infer a missing fourth word in the sequence from the three words
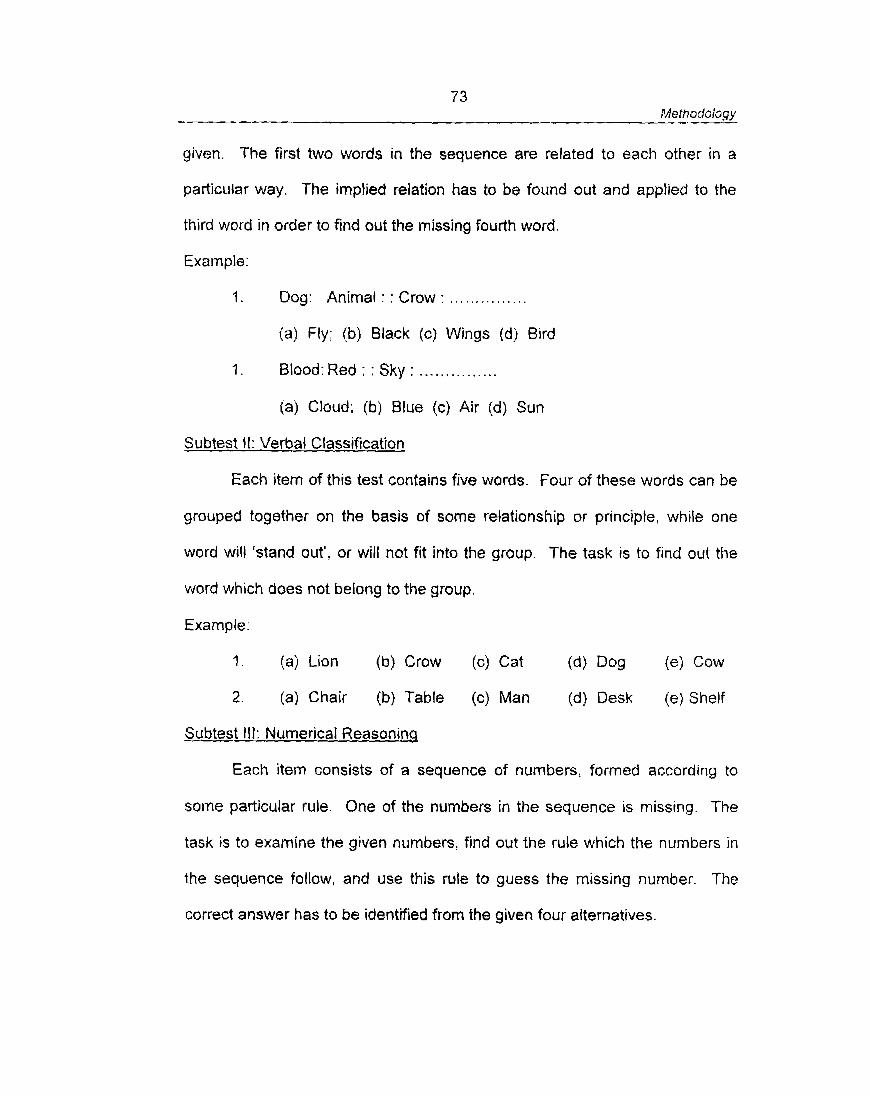
73 Methodology
given. The first two words in the sequence are related to each other in a
particular way. The implied relation has to be found out and applied to the
third word in order to find out the missing fourth ward.
Example:
1. Dog: Animal : : Crow : ... . . . . . . . . . . . .
(a) Fly; (b) Black (c) Wings (d) Bird
1. Blood: Red ; : Sky : ...............
(a) Cloud; (b) Blue (c) Air (d) Sun
Subtest II: Verbal Classification
Each item of this test contains five wards. Four of these words can be
grouped together on the basis of some relationship or principle, while one
word will 'stand out', or will not fit into the group. The task is to find out the
word which does not belong to the group.
Example:
? . (a) Lion (b) Crow (c) Cat (4 Dog (e) Cow
2 . (a) Chair fb) Table (c) Man (d) Desk (e) Shelf
Subtest I l l : Numerical Reasoninq
Each item consists of a sequence of numbers, formed according to
some particular rule. One of the numbers in t he sequence is missing. The
task is to examine the given numbers, find out the rule which the numbers in
the sequence follow, and use this rule to guess the missing number. The
correct answer has to be identified from the given four alternatives.
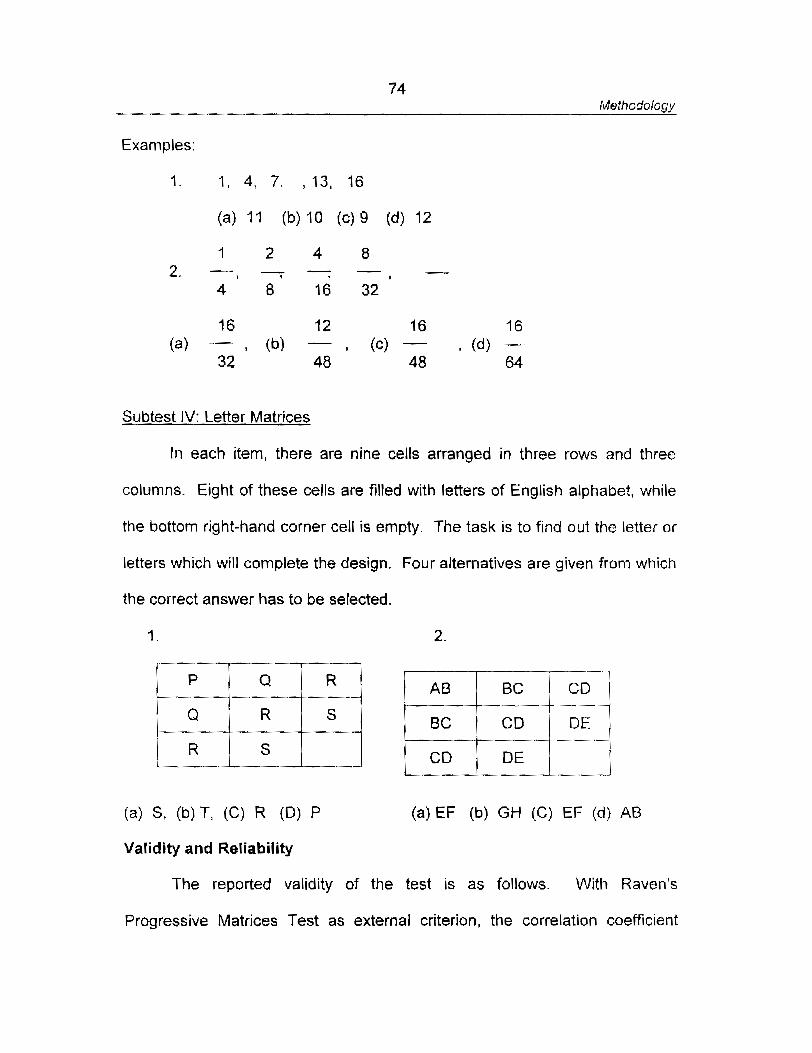
74 Methodology
Examples:
(a) 11 (b)10 ( ~ 1 9 (dl 12
Subtest IV: Letter Matrices
In each item, there are nine cells arranged in three rows and three
columns. Eight of these cells are filled with letters of English alphabet. while
the bottom right-hand corner cell is empty. The task is to find out the letter or
letters which will complete the design. Four alternatives are given from which
the correct answer has to be selected.
(a) s. (b) T. (C) R (Dl f' (a) EF (b) GH (C) EF (d) A6
Validity and Reliability
The reported validity of the test is as follows. With Raven's
Progressive Matrices Test as external criterion, the correlation coefficient
75 Me thodoiogy
obtained was 0.760 which shows that the test is a reasonably good test for
measuring the Intelligence.
The reported reliability of the test estimated by split-half method is as
follows. The split-half coefficient for the whole test is 0.890, Verbal Analogy =
0.775, Verbal Classification = 0.650, Numerical Reasoning = 0.650, Letter
Matrices = 0.820 and Spatial Reasoning = 0.717. These reliability coefficients
are significant which shows that the test is reliable.
The investigator established the validity and reliability of the test to
select this tool for the present study.
Split half method was employed to find out the reliability of the test. A
sample of 350 Higher Secondary School students (selected from the sample
for tryout of Scientific Creativity test) were subjected to the Intelligence Test.
The test scores were divided to two halves. The first set of scores represent
scores for the odd number of items 7 , 3, 5, etc and the second set of scores
present scores on the even number of items 2, 4, 6, etc. Self correlation of
the half tests was found out and then the reliability coefficient of the whole test
was estimated by Spearman-Brown Prophecy formula (Garrett, 2004, p.339).
The value of reliability coefficient thus obtained for the subtests are
given in Table 3.9.
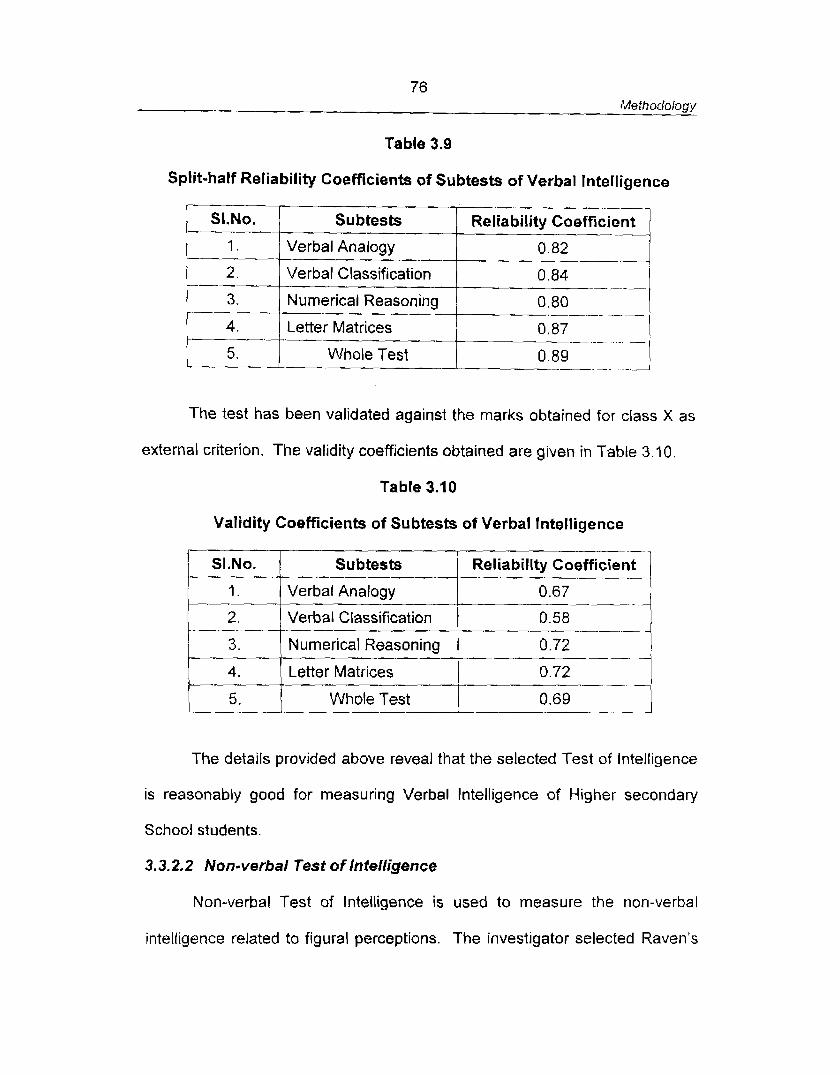
76 Methodology
Table 3.9
Split-half Reliability Coefficients of Subtests of Verbal lntelligence
The test has been validated against the marks obtained for class X as
external criterion. The validity coefficients obtained are given in Table 3.10.
--, -.-
Reliability Coefficient
0.82
0.84 - - . -. - -.
0.80 , .-
0.87 - - .- -- . . .
I I
0.89 - -I - . . -..-
SI.No. Subtests
Verbal Classification
Numerical Reasoning
Table 3.10
4. I.--- 1-,. 5.
Validity Coefficients of Subtests of Verbal lntelligence
Letter Matrices ----- -.
Whole Test - p-
SI.No. 1 Subtests
I 1 3. / Numerical Reasoning 1 0.72 1
- I. C.-- 2. I--.
1 4, [Letter Matrices 0.72 1 --- -
Reliability Coefficient
1 5. 1 Whole Test 1 0.69 1
I- -- .-
Verbal Analogy
Verbal Classification
The details provided above reveal that the selected Test of lntelligence
0.67 I
0.58 - -1 - -. . - - , . - 4
is reasonably good for measuring Verbal lntelligence of Higher secondary
School students.
3.3.2.2 Non-verbal Test of lntelligence
Non-verbal Test of lntelligence is used to measure the non-verbal
intelligence related to figural perceptions. The investigator selected Raven's
77 Me thodology
progressive Matrices Test for measuring the non-verbal intelligence of higher
secondary students.
Raven's Progressive Matrices Sets A, B, C, D and E
This is a non-verbal group test for measuring a person's capacity at the
time of the test to apprehend meaningless figures presented for his
observation, see the relations between them, conceive the nature of the
figures completing each system of relation presented, and thus develop a
systematic method of reasoning (Raven, 1960, p.1).
This scale consists of 60 problems divided into five sets of 12 each. In
each set, the first problem is as nearly as possible self-evident. The problems
which follow become progressively more difficult. The order of the tests
provides the standard training in the method working. The five sets provide
five opportunities for grasping the method and give progressive assessments
of a person's capacity for intellectual activity. Part of a figure is removed in
each item and a number of alternatives (six for the first two sets A and B and
eight for the last three sets C, D and E) are given from which the correct
answer has to be chosen.
These tests are intended to evaluate the person's ability to discern and
utilise a logical relationship presented by non-verbal materials. The problem
requires, in varying degrees, analytical and integrating operations of the kind
called 'insight through visual survey1. Each problem in the scale is the source
of a system of thought and hence the name 'progressive matrices'. The scale
is intended to cover the whole range of intellectual development from the time
78 Methodology
a child is able to grasp the idea of finding a missing piece to complete a
pattern and to be sufficiently long to assess a person's maximum capacity to
form comparison and reason by analogy without being unduly exhausting or
unwieldy.
As reported by Raven, the test has a retest reliability varying from 0.83
to 0.93. It correlates 0.86 with the Terman-Merrill Scale and has been found
to have a 'g ' saturation of 0.82.
This test is a popular measure used in Indian schools. This tool is of
good standard items and it may be used for Higher Secondary School
students to measure their Intelligence.
The investigator employed test-retest method to find out the reliability
of the test. The test was administered to 350 students of Standard XI and
retest was conducted after one month. The test-retest reliability coefficient
was found to be 0.89. So, t he test is a reliable one.
The test has been validated against the marks obtained for class X as
external criterion. The validity coefficient obtained is 0.71.
The test is reasonably reliable and valid to measure the Non-verbal
Intelligence of Higher Secondary School students.
3.3.3 Measurement of Achievement Motivation
3.3.3.1 Achievement Motivation Scale
To assess the Achievement Motivation of the sample, a tool was
selected namely Kerala Scale of Achievement Motivation. Though the tool
was prepared in 1976, the items of the scale have still relevance with regard
79 Methodology
to the motivational implications of Higher Secondary School students. The
investigator felt that the statements included in the scale would b e more
meaningful for adolescent students than secondary school students. Each
statement has a direct link with the achievement-oriented thoughts of an
adolescent. So, the Kerala Scale of Achievement Motivation was chosen to
assess the Achievement Motivation of Higher Secondary School students.
3.3.3.2 Kerafa Scale of Achievement Motivation
The scale developed by Nair (1976) has 60 items in the form of
statements intended to measure the Achievement Motivation of subjects.
The subjects are to respond to the items by marking either Y (Yes), U
(Undecided) or N (No) on the response sheet supplied. Each Y responses
carries one credit. There is no time limit for the test.
Example of a statement is given below.
I What others think of me won't be an obstacle to my success in life.
2. 1 feel tired when 1 have to perform very important things.
Validity and Reliability
The reported validity coefficients with school marks as external criterion
were found to be 0.38 (N = 47, standard VIII), 0.44 (N = 38, standard IX and
0.39 (N = 42, standard X). The established reliability of the scale was 0.73
(N = 56).
To apply the scale with Higher Secondary School students, the
investigator examined its validity and reliability. The test-retest reliability
80 Me thodology
coefficient obtained is 0.79 (N = 350). When the scale was validated against
the final examination marks of class X, the validity coefficient obtained is 0.40.
The details provided above indicate that the Kerala Scale of
Achievement Motivation is a reasonably good tool to assess the Achievement
Motivation of Higher Secondary School students.
3.3.4 Measurement of Home Environment
3.3.4.7 Home Environment hventory
Higher Secondary school period being the most crucial stage that
forces a students to interact positively and negatively with his home, t he
physical and emotional set up of the home is to be analysed. The investigator
went through the available tools for measuring Home Environment of
students. It was found that the major aspects of a home that influences
higher secondary school students were not considered in those tests. So, the
investigator constructed a tool by incorporating the theoretical rnodel adopted
in the existing tools.
Development of Tool
Following tools helped the investigator for the preparation of the
present tool. (a) Minnesota Counselling Inventory, (b) Family Climate
Inventory, (c) Family Integration Inventory (d) Family Environment Index
Inventory. The investigator got many opportunities to interact with Higher
Secondary School students and their parents during counselling sessions
specially arranged by the Parent Teacher Associations (PTA) of various
schools. Major components of the home that directly influence the
8 1 Methodology
achievement of Higher Secondary School students were identified and these
were grouped to six categories as given below.
1. Physical Facilities for Learning
1 1 . Guidance for Learning
111. Socio-cultural Environment of the Home
IV. Family Cohesion
V. Value Orientation of the Home Members
VI. Emotional Support
I . Physical facilities for Learning
As far as Higher secondary School science students are concerned,
certain basic facilities are essential for effective learning. Facilities like
scientific calculator, computer, internet, etc. are helpful for promoting learning.
This section deals with physical facilities available at home. Two
representative items are given below.
Following facilities that promotes learning are available in my home.
Always Sometimes Never
1. Computer
2. internet
II. Guidance for Learning
Proper encouragement for learning is essential during the adolescent
stage. Even though enough physical facilities are present, it is true that
children try to misuse television, computer, internet, etc. So, proper guidance
and support from the family members is necessary for Academic
82 Methodology
Achievement. Whenever the students feel confused in academic and
personal problems they need timely help. Example for this item is given
below.
My family members provide the following helps.
Always Sometimes Never
(1) Clear doubts in various subjects
(2) Tuition for difficult subjects
I l l . Socio-cultural Environment of the Home
The cultural and social conditions of the family has definite influence on
the academic achievement of a student. The quarrelling parents, noisy
neighbourhood, disorganised home relations, poverty, etc. affects the
intellectual progress of an individual adversely. An adolescent living in
deprived and impoverished conditions of life lacks the basic stimulation and
motivation to learn. If the cultural demands and social expectations of the
family is conducive for learning, it paves the way for good scholastic
achievement of children.
Illustrative items are as follows:
Fallowing situations of my home make problems that negatively affecting my
studies.
Always Sometimes Never
1. Economic backwardness .
2 . Noisy surrounding
83 Methodology
IV. Family Cohesion
A good family where exist cordial relationship can provide the child a
congenial atmosphere for learning. The adolescent members of such family
find themselves to cope up with difficult situations. Thus, a healthy
relationship between the family members is preferable for acquiring academic
excellence. The degree of family cohesion experienced by the student as a
member of the family is measured here.
Examples of items are:
Following occasions are present in my home:
Always Sometimes Never
I. Praying together
2. Conducting picnics
V. Value Orientation
The value system prevailing in the home is an essential component in
modelling the personality of adolescents and in monitoring achievements.
The negative values shown by parents are a major cause of crime and
delinquency among adolescents. If children are exposed to good values at
home, they are motivated to follow up what they observe at home.
During Higher Secondary stage, the students have a tendency to
experiment with many social evils and so special care is to be taken for
directing them in the proper channel. This pafl of the test measures the
extent of value orientation they absorb from home.
Examples for test items are given below.
84 Methodology
My parents provide encouragement for me t o do the following activities:
Always Sometimes Never
1. Helping the poor
2. Reading good books
VI. Emotional Support
It is obvious that the adolescent students have many emotional
problems and difficulties. The emotional inability and maladjustment causes
too many failures during this developmental stage. The nature of discipline at
home, expression of love by family members, approval for success, etc. have
great influence upon the emotional intelligence of the child. Presence of a
relaxed atmosphere is necessary for proper emotional development.
Excessive pressure for study, sarcasm or ridicule by parents, inhumane
punishments a n d rejection should be avoided in the home since these may
hurt the feelings of an adolescent student. This part of the test is to measure
the extent of emotional protection and support provided by the home.
Example for test items is given below.
Following situations are present in my home:
Always Sometimes Never
1 . Expression of love and happiness
2. Console in a grief or depression
Scoring
The items in the inventory are arranged in the form of a rating scale.
The response to each item is made by putting a tick mark against the relevant
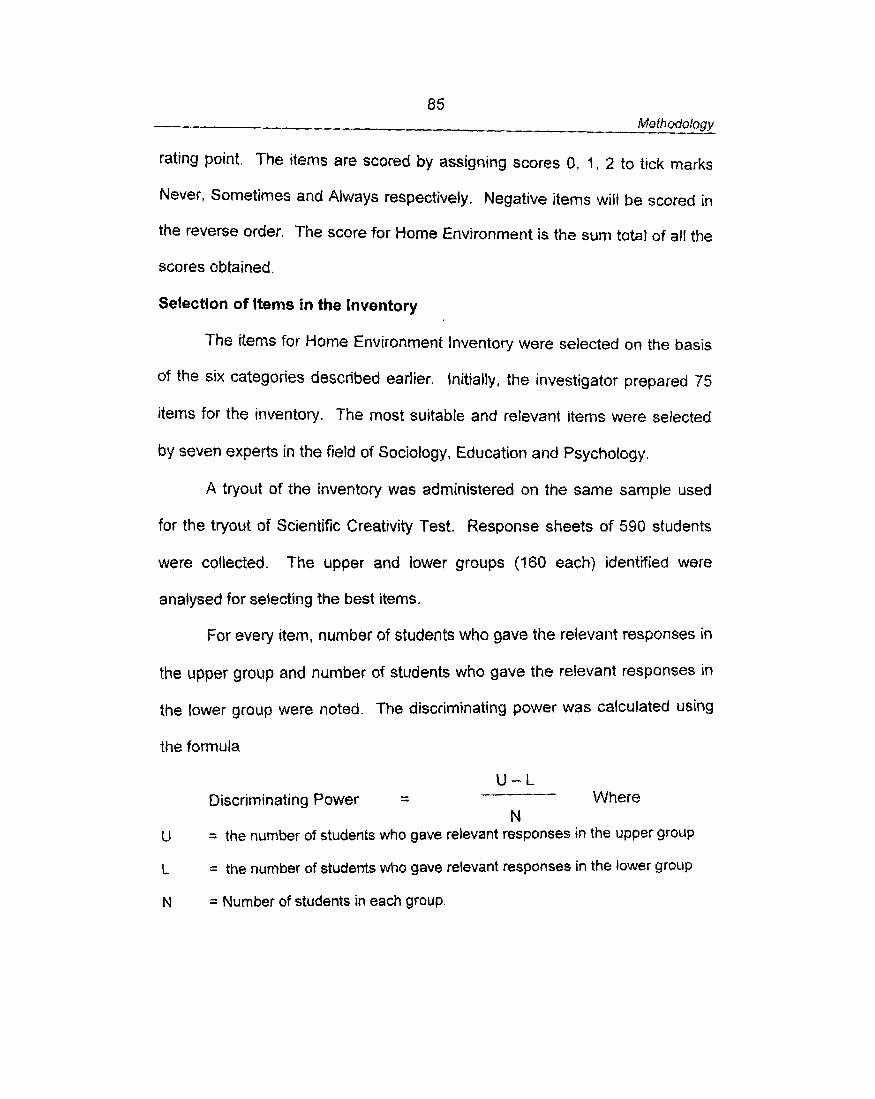
8 5 Methodology
rating point. The items are scored by assigning scores 0, 1, 2 to tick marks
Never. Sometimes and Always respectively. Negative items will be scored in
the reverse order. The score for Home Environment is the sum total of all the
scores obtained.
Selection of Items in the Inventory
The items for Home Environment Inventory were selected on the basis
of the six categories described earlier. Initially. the investigator prepared 75
items for the inventory. The most suitable and relevant items were selected
by seven experts in the field of Sociology, Education and Psychology.
A tryout of the inventory was administered on the same sample used
for the tryout of Scientific Creativity Test. Response sheets of 590 students
were collected. The upper and lower groups (160 each) identified were
analysed for selecting the best items.
For every item, number of students who gave the relevant responses in
the upper group and number of students who gave the relevant responses in
the lower group were noted. The discriminating power was calculated using
the formula
U - L Discriminating Power - - Where
N U = the number of students who gave relevant responses in the upper group
L = the number of students who gave relevant responses in the lower group
N = Number of students in each group.
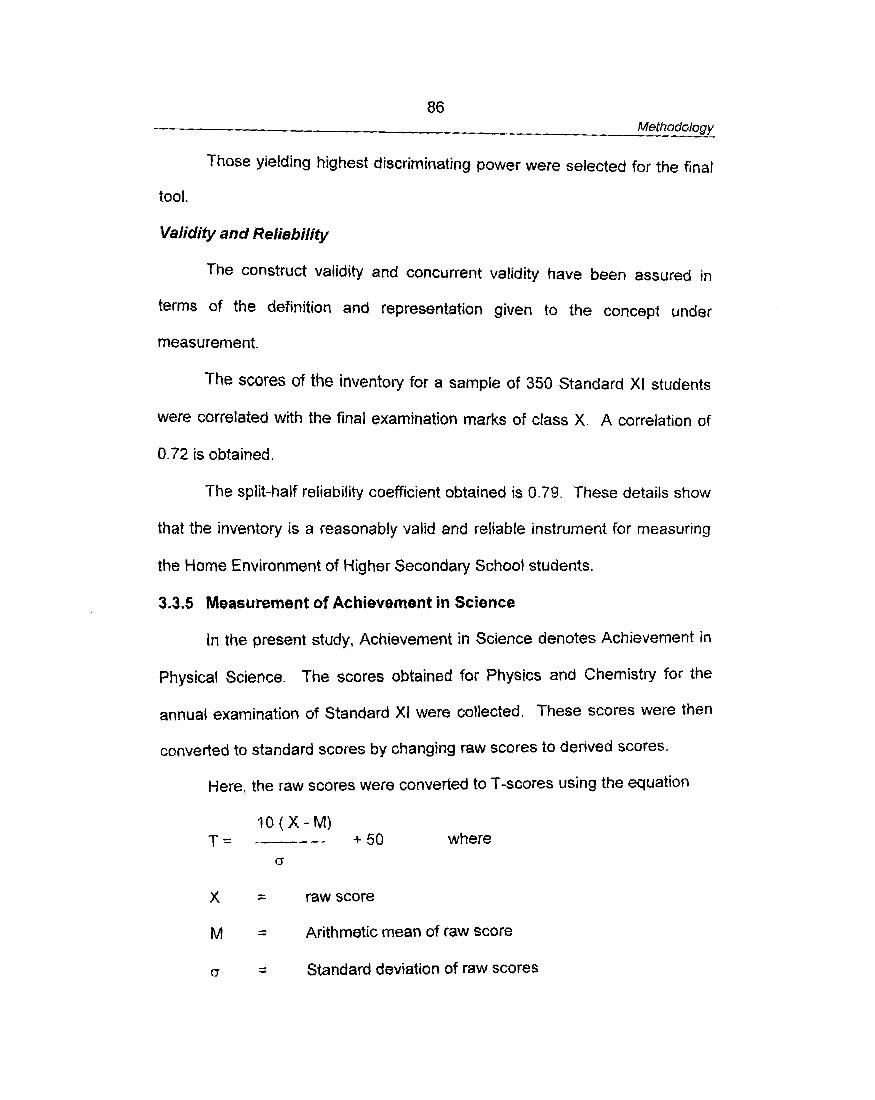
86 Methodology
Those yielding highest discriminating power were selected for the final
tool.
Validity and Reliability
The construct validity and concurrent validity have been assured in
terms of the definition and representation given to the concept under
measurement.
The scores of the inventoly for a sample of 350 Standard XI students
were correlated with the final examination marks of class X. A correlation of
0.72 is obtained.
The split-half reliability coefficient obtained is 0.79. These details show
that the inventory is a reasonably valid and reliable instrument for measuring
the Home Environment of Higher Secondary School students.
3.3.5 Measurement of Achievement in Science
In the present study, Achievement in Science denotes Achievement in
Physical Science. The scores obtained for Physics and Chemistry for the
annual examination of Standard XI were collected. These scores were then
converted to standard scores by changing raw scores to derived scores.
Here, the raw scares were converted to T-scores using the equation
l O ( X - M ) T = + 50 where
X - - raw score
- M - Arithmetic mean of raw score
D - - Standard deviation of raw scores
87 Methodology
3.4 SAMPLE USED FOR THE STUDY
The population for the present study is pupils attending Standard XI1 in
the Higher Secondary Schools of Kerala. Treating this as the reference
population, the sample was fixed by taking into consideration, the following
factors:
3.4.1 Size of the Sample
3.4.2 Techniques of Sampling
3.4.3 Factors to be represented in the Sample
3.4.1 Size of the Sample
An optimum sample is one which fulfils the requirements of efficiency,
representativeness, reliability and flexibility. The sample should be small
enough to avoid unnecessary expenses and large enough to avoid intolerable
sampling error.
According to Krech and Crutchfield (1948, p.298), a sample of 500 will
give just about as precise results a study as it will be for the whole population.
In this study, a sample of 1200 Higher Secondary School students
were selected.
3.4.2 Techniques of Sampling
if a population from which a sample is to be drawn does not constitute
a homogenous group, stratified sampling technique is generally applied in
order to obtain a representative sample (Kothari, 1998, p.62). So, stratified
sampling was used to get representative sample of Higher Secondary School
students.
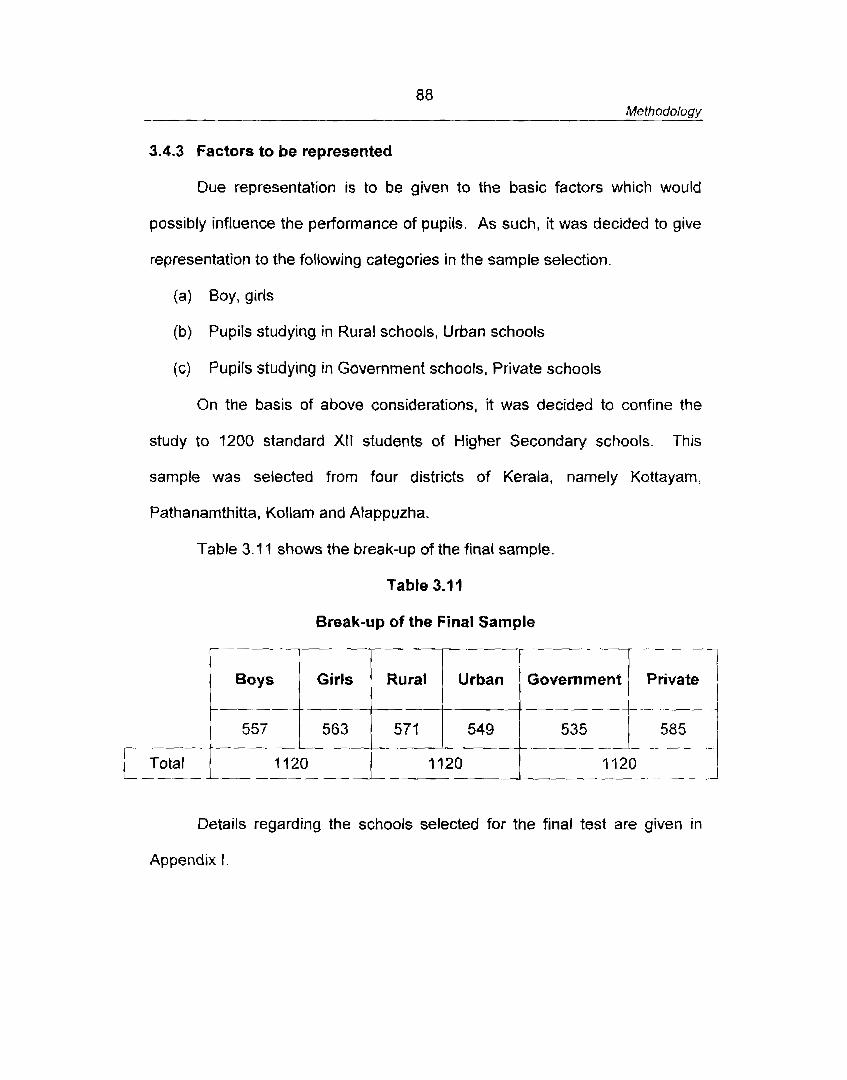
88 Methodology
3.4.3 Factors to be represented
Due representation is to be given to the basic factors which would
possibly influence the performance of pupils. As such, it was decided to give
representation to the following categories in the sample selection.
(a) Boy, girls
(b) Pupils studying in Rural schools, Urban schools
(c) Pupils studying in Government schools, Private schools
On the basis of above considerations, it was decided to confine the
study to 1200 standard XI1 students of Higher Secondary schools. This
sample was selected from four districts of Kerala, namely Kattayam,
Pathanamthitta, Kollam and Alappuzha.
Table 3.7 1 shows the break-up of the final sample.
Table 3.1 1
Break-up of the Final Sample ---- -- -- - -- A A -. - - r BOYS 1 Girls [ T h a n Lovernmentj Private]
Details regarding the schools selected for t h e final test are given in
Appendix 1 .
89 Methodology
3.5 COLLECTION OF DATA
After finalising the sample and tools to be used, the investigator met
the Heads of the schools and the teachers and had discussions with them.
Dates and time was fixed and most of the teachers allotted the whole
afternoon periods for the administration of the tools.
Uniform procedures were followed in al the schools selected. This
include the following aspects:
(i) Distribution of the answer sheets to the subjects with instructions for
filling them up.
(ii) Distribution of the test booklets together with printed instructions
regarding the test.
(iii) Explaining the general instructions in the booklet.
(iv) f amiliarising the subjects with the answer sheets, method of entering
responses, etc.
(v) Clearing the doubts of subjects, giving instructions regarding time-
limit, methods of dealing with eventualities, etc.
(vi) Strict adherence to the time limit prescribed in the test booklet.
(vii) Giving directions not to disfigure the test booklets
(viii) Giving intervals between tests.
(ix) Collecting back the test booklets and answer sheets
90 Methodology
3.5.1 Scoring
The response sheets of all the tests were scored as per the scoring
scheme of the test described earlier along with each test. Scoring was a
lengthy process for the Scientific Creativity Test compared to other tests
3-52 Consolidation of Data
All the relevant data relating to each pupil (Sex, Management of t h e
Institution. Locality, test scores in each test, etc.) were entered separately in
corresponding rows and columns of specially designed papers. The data was
entered in such a way that they could be used for computer data processing.
A total of 4224 answer sheets were obtained. From this, 64 answer
sheets were incomplete and a few failed to attend all the tests, Eliminating
these, data pertaining to 1120 sample were used for analysis.
3.5.3 Selection of High Achievement Group (HA), Average Achievement
Group (AA) and Low Achievement Group (LA)
Based on the scores in the Achievement in Science, the subjects were
grouped into three, viz., High, Average and Low. The Mean M and Standard
Deviation o of the distribution of scores on Achievement in Science for the
whole sample was determined. The subjects whose scores were at or above
M + ~ / 2 were grouped as High group and those scores were at or below
M-a12 were grouped as Low. Those subjects whose scores were in between
M - of2 and M + 012 were grouped as Average.
9 1 Methodology
3.6 STATISTICAL TECHNIQUES USED
The objectives of the study and specific hypotheses to be tested
suggest the use of the following techniques for analysis.
I. Two-tailed test of significance of the difference between means for
large independent groups (Critical Ratio) to compare the three
Achievement groups HA, AA and LA taken in pairs (HA-AA, AA-LA
and HA-LA) with respect to each independent variables.
2. Pearson's Product Moment Coefficient of Correlation to find the
relationship among the variables.
3. Multiple Regression Equation to predict Achievement in Science
using the best predictors of Achievement.
4. Multiple Coefficient of Correlation to find out t he combined effect of
predictor variables on Achievement in Science.
CHAPTER IV
ANALYSIS OF DATA
Comparative Analysis
Correlation Analysis
Prediction of Achievement in Science from the Multiple Regression Equation
CHAPTER IV
ANALYSIS OF DATA
Analysis of the data have been done as per the objectives of the study.
The details of the analysis are given below.
4.1 COMPARATIVE ANALYSIS
Comparison of the mean scores of the three achievement groups, viz.,
High achievement group, Average achievement group and Low achievement
groups with respect to each of the independent variables has been done by
means of 't' test.
4.1.1 Comparison of Selected Independent Variables with respect to
Different Achievement level for the Total Sample and Relevant
Subsamples
Here, the total sample was categorised separately on the basis of their
achievement in science. The comparable groups were put to test of
significance of difference between means for large independent groups.
Two-tailed test of significance of difference between means was
applied separately for each of the independent variables, to decide whether
an independent variable will discriminate between the compared groups or
not. The obtained 't' value is then treated as belonging to a normal
distribution. If the obtained 't' value falls outside the interval f 1.96, then the
difference is treated as significant at 0.05 level. If the obtained 't' value falls
outside the interval +2.58, the difference is said to be significant at 0.01 level.
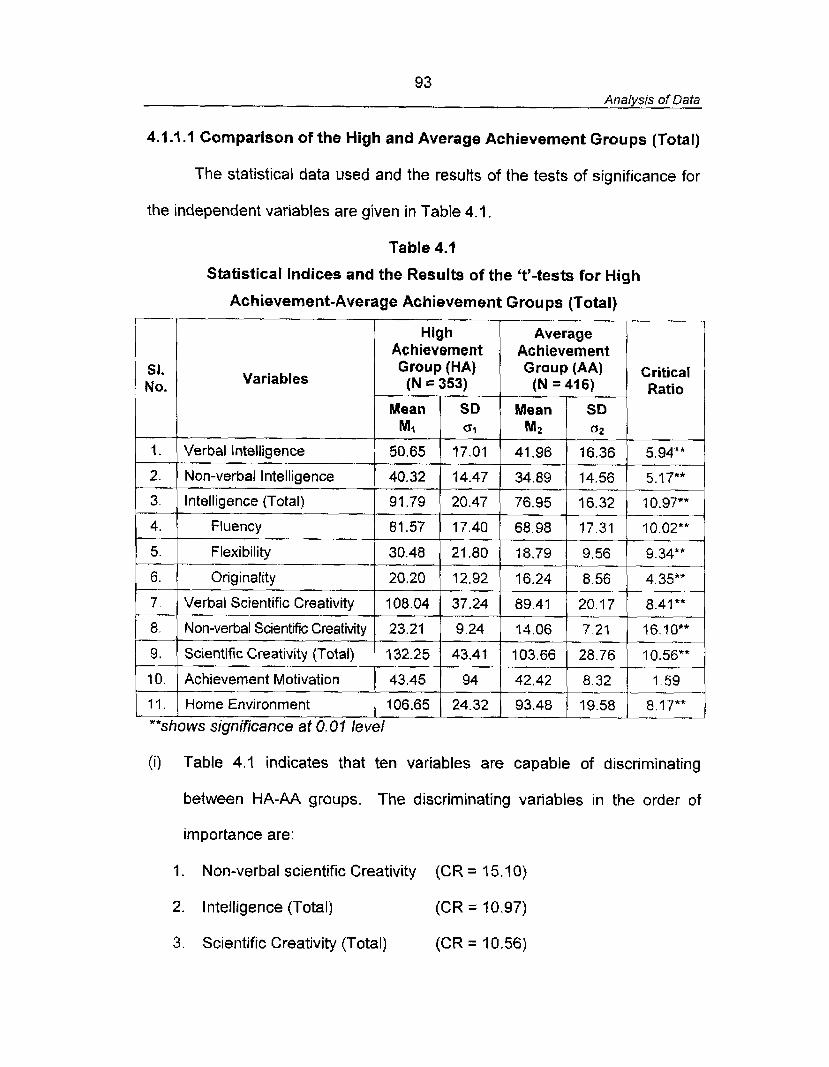
93 Analysis of Data
4.1 .I .I Comparison of the High and Average Achievement Groups (Total)
The statistical data used and the results of the tests of significance for
the independent variables are given in Table 4. I.
Table 4.7
Statistical Indices and the Results of the %'-tests for High
Achievement-Average Achievement Groups (Total) -
High A 7 -'--I
(i) Table 4.1 indicates that ten variables are capable of discriminating
Achievement SI. No.
1.
2.
3.
4.
5.
6.
7
8.
9.
10.
1 1 -
between HA-AA groups. The discriminating variables in the order of
Achievement
importance are:
"*shows significance af 0.01 level
Variables
Verbal Intelligence
Non-verbal l ntelligence
Intelligence (Total)
Fluency
Flexibility
Originality
Verbal Scientific Creativity
Non-verbal Scientific Creativity
Scientific Creativity (Total)
Achievement Motivation
Home Environment
I Non-verbal scientific Creativity (CR = 15.1 0)
2. Intelligence (Total) (CR = 10.97)
3. Scientific Creativity (Total) (CR = j0.56)
Group (HA) (N = 353)
Mean MI
50.65
40.32
91.79
81.57
30.48
20.20
108.04
23.21
132.25
43.45
106.65
Critical Ratio
5.94**
5.17**
10.97**
10.02""
9.34**
4.35**
8.41 **
7 6.10**
10.56**
1 59
SD GI
17.01
14.47
20.47
17.40
27 -80
12.92
37.24
9.24
43.41
94
24.32
Group (AA) (N = 41 6)
Mean M2
41.96
34.89
76.95
68.98
18.79
16.24
89.41
14.06
103.66
42.42
SD n2
16.36
14.56
16.32
17.31
9.56
8.56
20.1 7
7.21
28.76
8.32 - 93.48 19.58L8.17"
94 Analysis of Data
4. Fluency (CR = 10.02)
5. Flexibility (CR = 9.34)
6. Verbal Scientific Creativity (CR = 8.41)
7. Home Environment (CR = 8.17)
8. Verbal Intelligence (CR = 5.94)
9. Non-verbal Intelligence (CR = 5.17)
10, Originality (CR = 4.35)
(ii) All these differences are significant well beyond 0.01 level. It means that
the mean scores of the High Achievement Group and Average
Achievement Groups differ significantly. The difference in mean scores
is not significant for Achievement Motivation (CR = 1.59; p > 0.05). It
means that the High Achievement Group and Average Achievement
Group do not differ significantly in their Achievement Motivation
4.1.1.2 Comparison of the Average and Low Achievement Groups (Total)
The statistical data used and the results of the tests of significance for
the independent variables are given in Table 4.2.
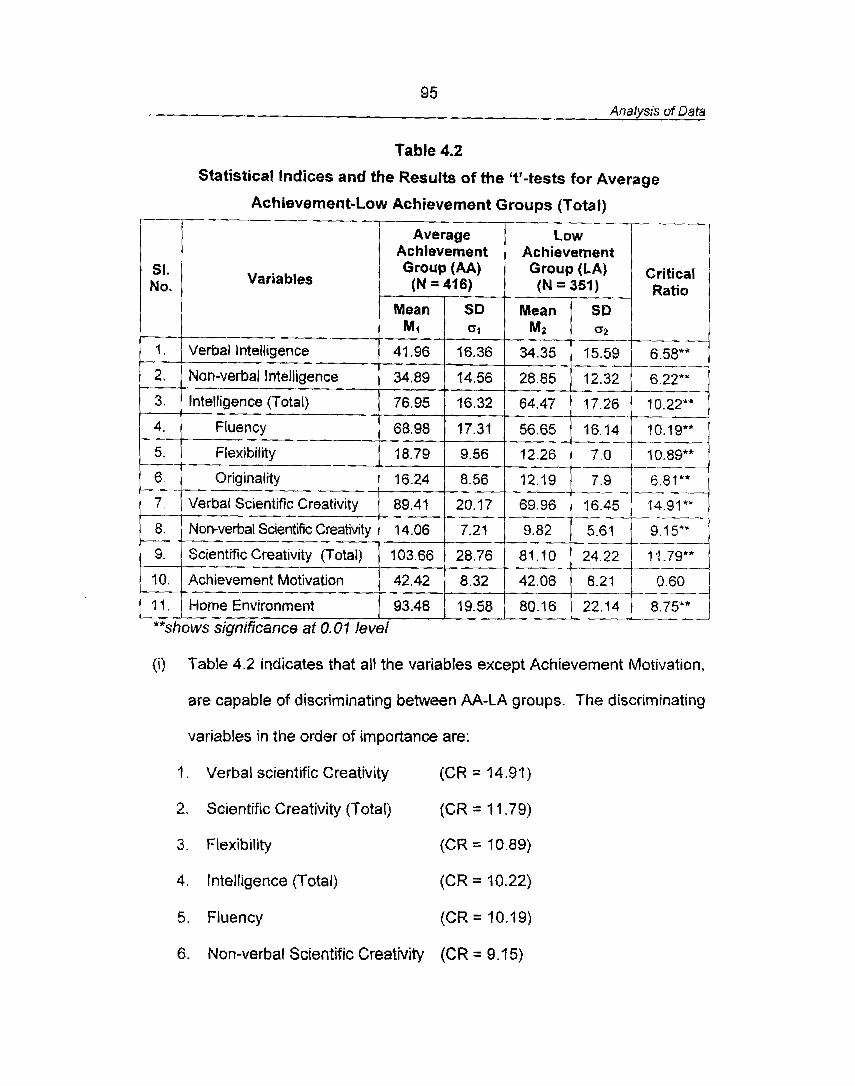
95 Analysis of Data
Table 4.2
Statistical Indices and the Results of the ?'-tests for Avenge
(i) Table 4.2 indicates that all the variables except Achievement Motivation,
Achievemen t-Low Achievement Groups (Total)
are capable of discriminating between AA-LA groups. The discriminating
SI. No.
I .
2 ,
3.
4.
5.
6.
7 .
8.
9.
10.
1 I
**shows
variables in the order of importance are:
9 . Verbal scientific Creativity (CR = 14.91)
Variables
Verbal Intelligence
Non-verbal Intelligence
Intelligence (Total)
Fluency
Flexibility
Originality
Verbal Scientific Creativity
Non-verbal Scientific Creativity
Scientific
Achievement Motivation
Home Environment significance at 0.01 level
2. Scientific Creativity (Total) (CR = 11 -79)
3. Flexibility (CR = 10.89)
4. Intelligence (Total) (CR = 10.22)
Average Achievement Group (AA) (N = 416)
5. Fluency
Mean M r
41.96
34.89
76.95
68.98
18.79
16.24
89.41
14.06
42.42
93.48
(CR = 10.19)
critical Ratio
---
6.58**
6.22**
10.22"*
10.19**
10.89*" ,--
6.81** .--,-
q4.91*" -- ---
9.15**
SD 0 9
16.36
14.56
16.32
17.31
9.56
8.56
20.17
7.2 1
cr....r.,.~~~8110~T 8.32
19.58
-- Low
Achievement Group (LA) (N = 351)
6. Non-verbal Scientific Creativity (CR = 9.7 5)
Mean M2
34.35
28.85
64.47
56.65
-12.26
12.19
69.96
9.82
SO a 2
15.59
12.32
17.26
j6.14
7.0
7.9
16.45 --
5.61
42.06
80.16
:,* 8.21 -- 22.14 8.75**
--,
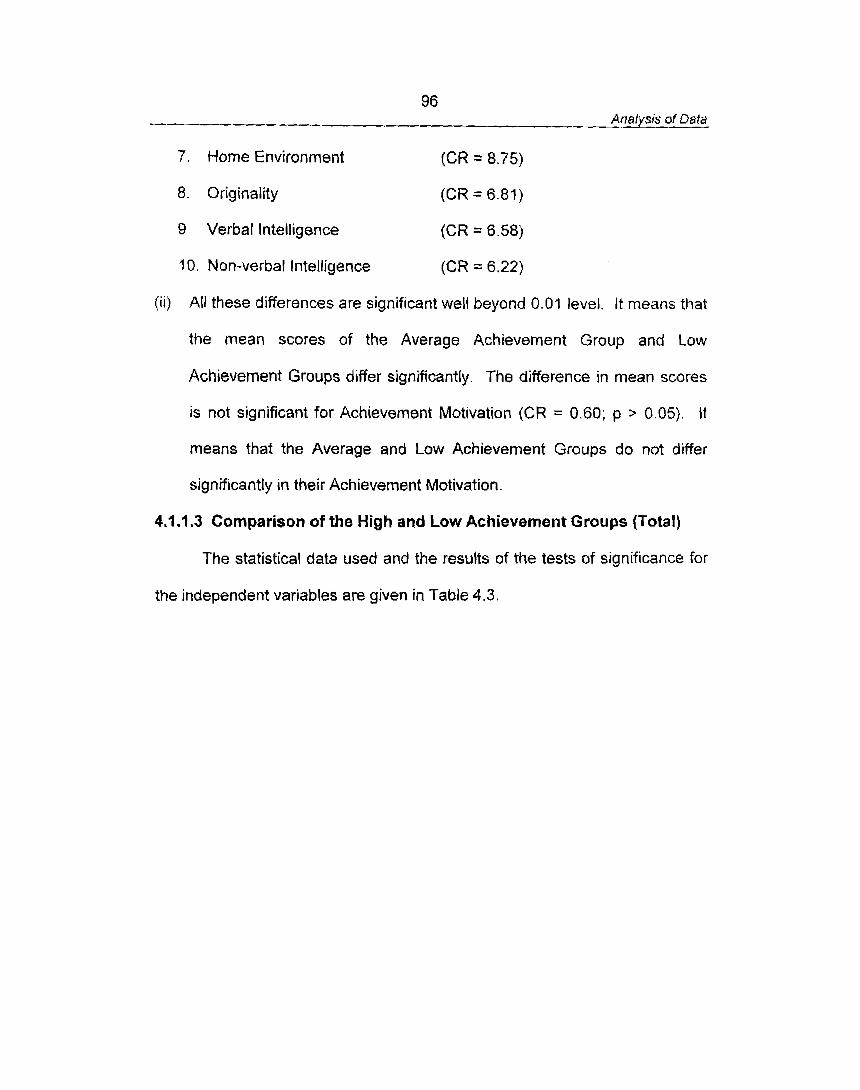
96 Analysis of Data
7. Home Environment {CR = 8.75)
8. Originality (CR = 6.81)
9 Verbal Intelligence (CR = 6.58)
10. Non-verbal Intelligence (CR = 6.22)
(ii) All these differences are significant well beyond 0.01 level. It means that
the mean scores of the Average Achievement Group and Low
Achievement Groups differ significantly. The difference in mean scores
is not significant for Achievement Motivation (CR = 0.60; p 3 0.05). It
means that the Average and Low Achievement Groups do not differ
significantly in their Achievement Motivation.
4.1.1.3 Comparison of the High and Low Achievement Groups (Total)
The statistical data used and the results of the tests of significance for
the independent variables are given in Table 4.3.
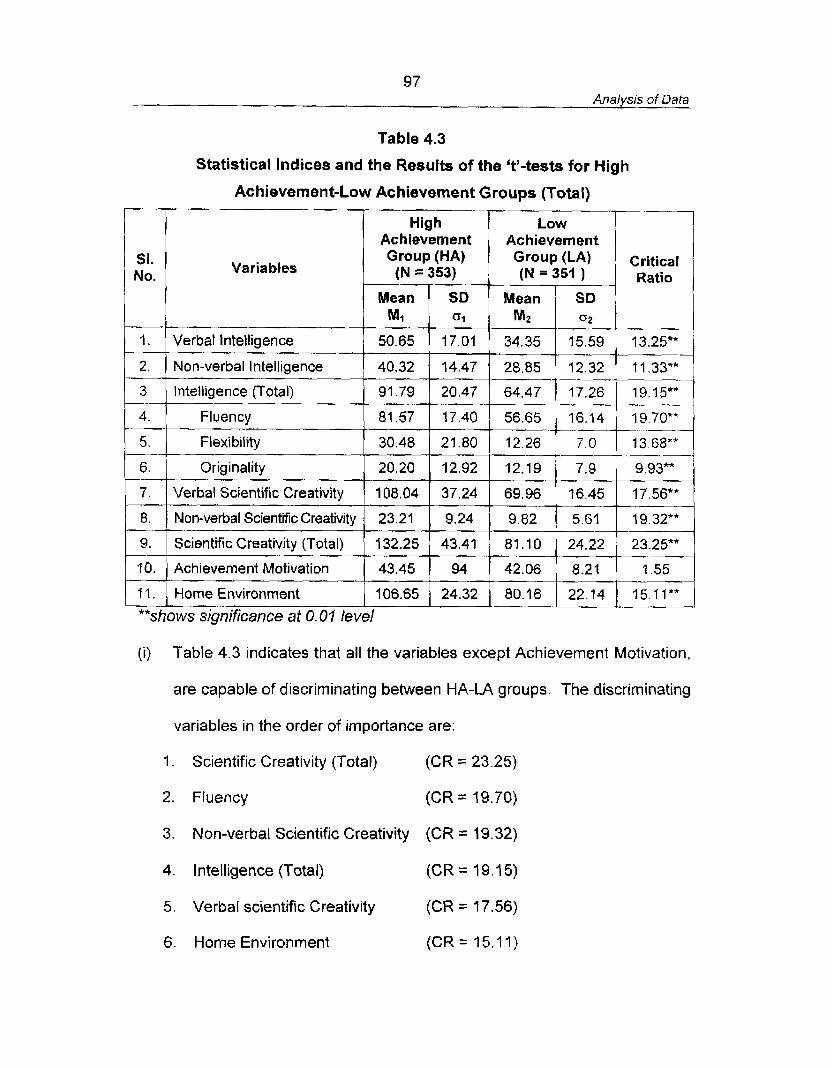
97 Analysis of Data
Table 4.3
Statistical Indices and the Results of the 't'-tests for High
Achievement-Low Achievement Groups (Total)
High -1 Achievement Achievement
No. s'* 1 Variables
1 1 Mean 1 SD 1 Mean 1 SD 1 I
Group (HA) (N = 353)
-. 1 / Verbal Intelligence 1 50.65 1 17.01 1 34.35 1 15.59 1 13.25**
-.
t
Group (LA) (N = 351 )
Critical Ratio
2.
3,
4.
5.
6.
7.
8.
9.
10.
(i) Table 4.3 indicates that all the variables except Achievement Motivation,
are capable of discriminating between HA-LA groups. The discriminating
variables in the order of importance are:
1. Scientific Creativity (Total) (CR = 23.25)
2. Fluency (CR = 19.70)
3. Non-verbal Scientific Creativity (CR = 19.32)
4. Intelligence (Total) (CR = 19.15)
5. Verbal scientific Creativity (CR = 77.56)
6. Home Environment (CR = 15.11)
Non-verbal Intelligence
Intelligence (Total)
Fluency
Flexibility
Originality
Verbal Scientific Creativity
Non-verbal Scientific Creativity
1 I
Scientific Creativity (Total)
Achievement Motivation
Home Environment 1 106.65 / 24.32 /
40.32
91.79
81.57
30.48
20.20
1 08.04
23.2 1
**shows significance at 0.07 level
132.25
43.45
14.47
20.47
17.40
21.80
12.92
37.24
9.24
43.41
94
28.85
64.47
56.65
12.26
12.19
69.96
9.82
81.10
42.06
12.32 -
17.26 -- 16.14
7.0
7.9
16.45
5.61
?1.33** ..
19.15"" - -
19.70** ..
13.68""
9.93**
1 7.56** - 19.32**
-
24.22
8.2f
-
23.25**
1 55
98 Analysis of Data
7. Flexibility (CR = 13.68)
8. Verbal intelligence (CR = 13.25)
9. Non-verbal Intelligence (CR = 11.33)
10. Originality (CR = 9.93)
( i i ) All these differences are significant well beyond 0.07 level. It means that
the mean scores of the High Achievement Group and Low Achievement
Groups differ significantly with respect to the above-mentioned variables.
The difference in mean scores is not significant for Achievement:
Motivation (CR = 1.55; p > 0.05). It means that the High and Low
Achievement Groups do not differ significantly in their Achievement
Motivation.
The graphical representation of the components of Intelligence and
Intelligence (Total), components of Scientific Creativity and Scientific
Creativity (Total), Achievement Motivation and Home Environment scores of
the High, Average and Low Achievement groups of the total sample are given
in Fig. 4.1 to 4.1 I respectively.
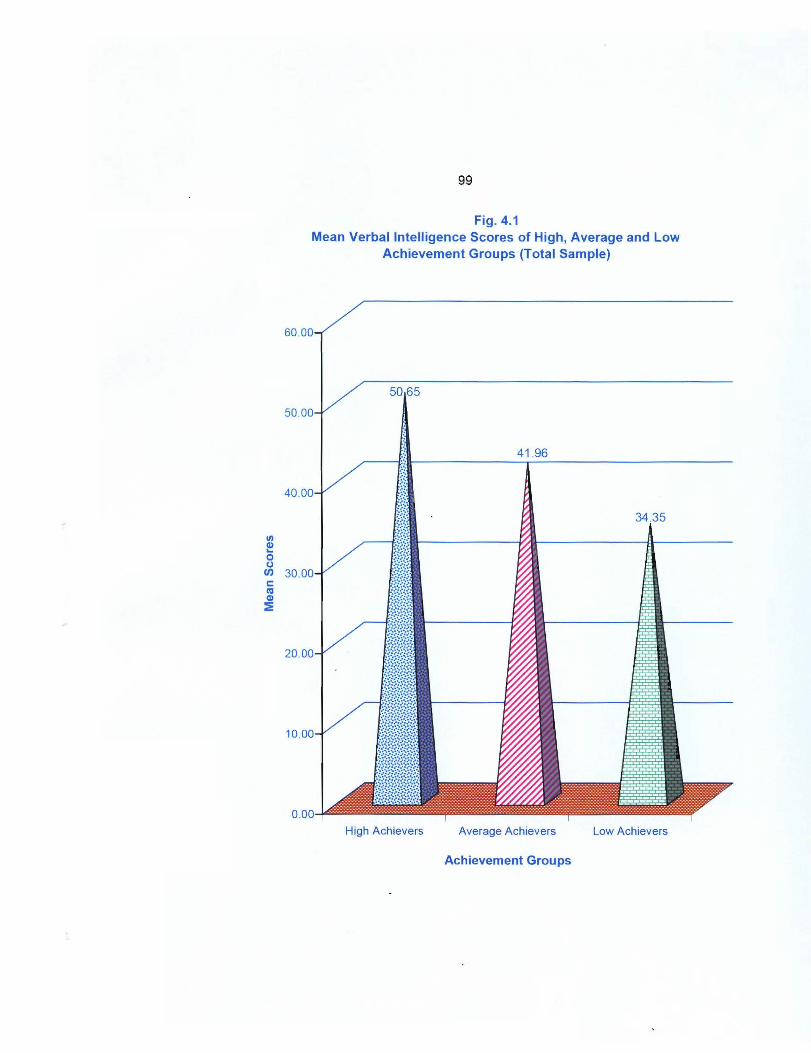
Fig. 4-1 yaMvwmi--HHliglft,awandLw
-OfiD;UPBIr9hl-IPk?
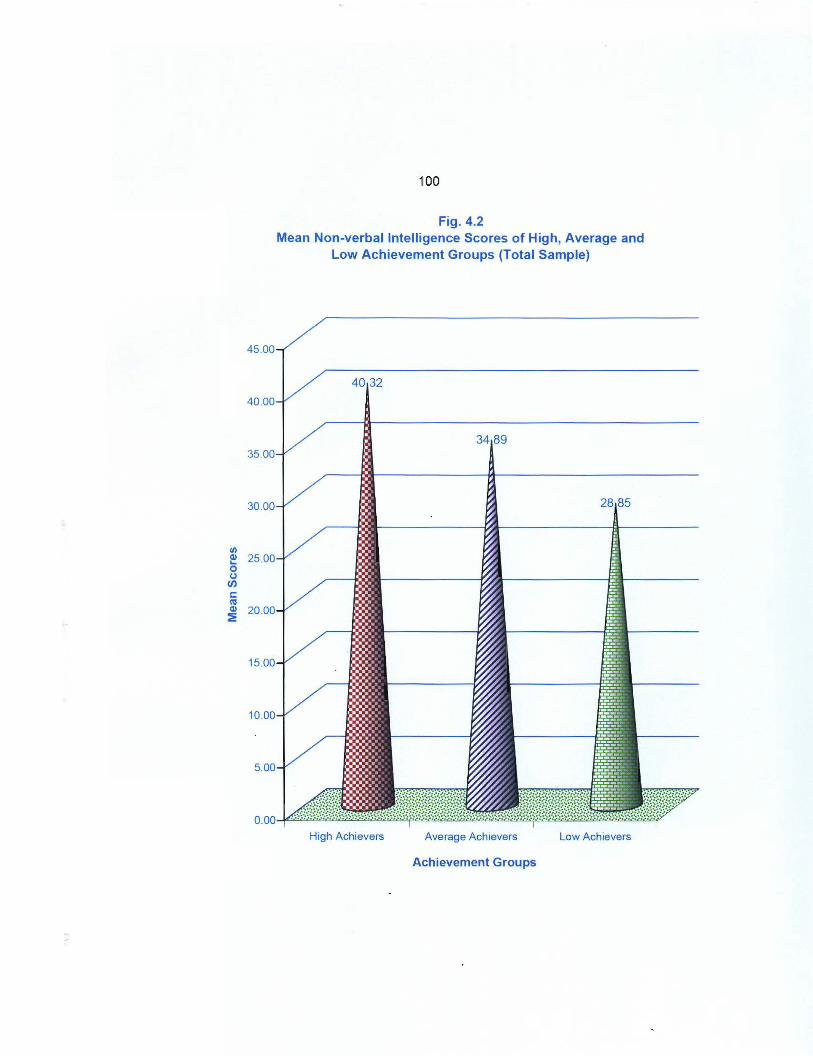
Fig. 4.2 Mean Non-verbal Intelligence Scores of High, Average and
Low Achievement Groups (Total Sample)
A m - Low AGhirmrrr
Achievement Groups
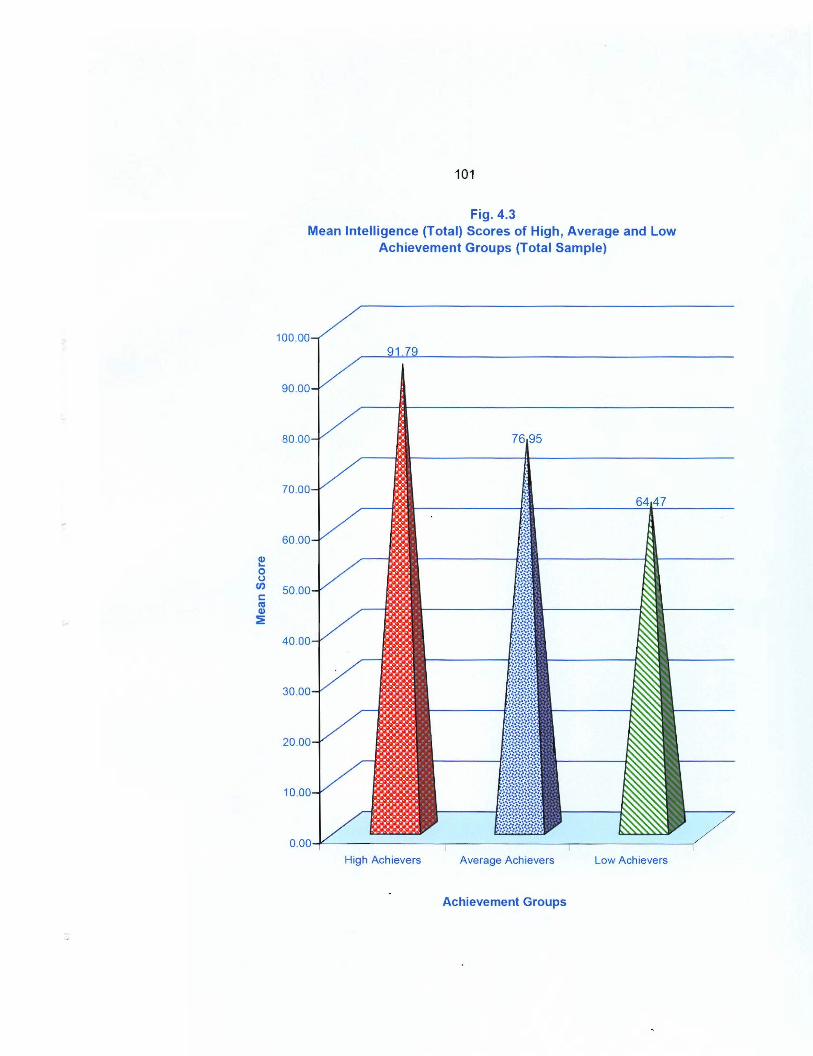
FEg, 4 3 b a n I n b l l m POW) Smmm d High, Awagp and L w
--Ir--1
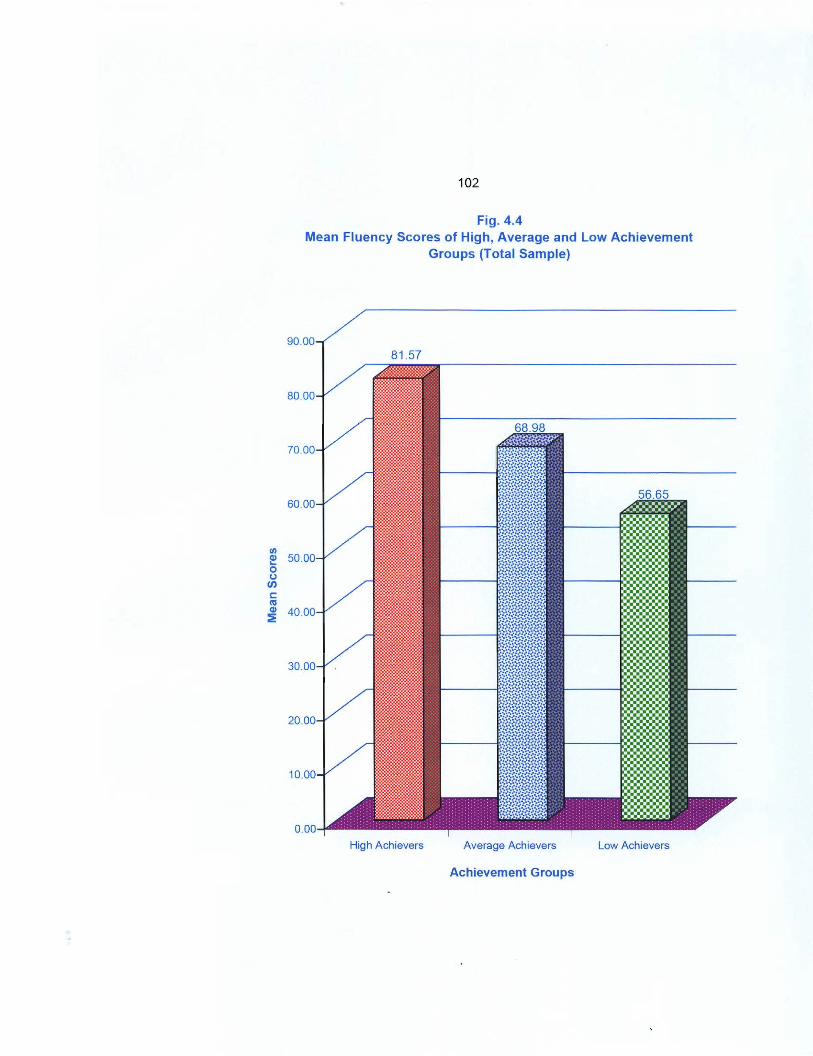
Low Achievers
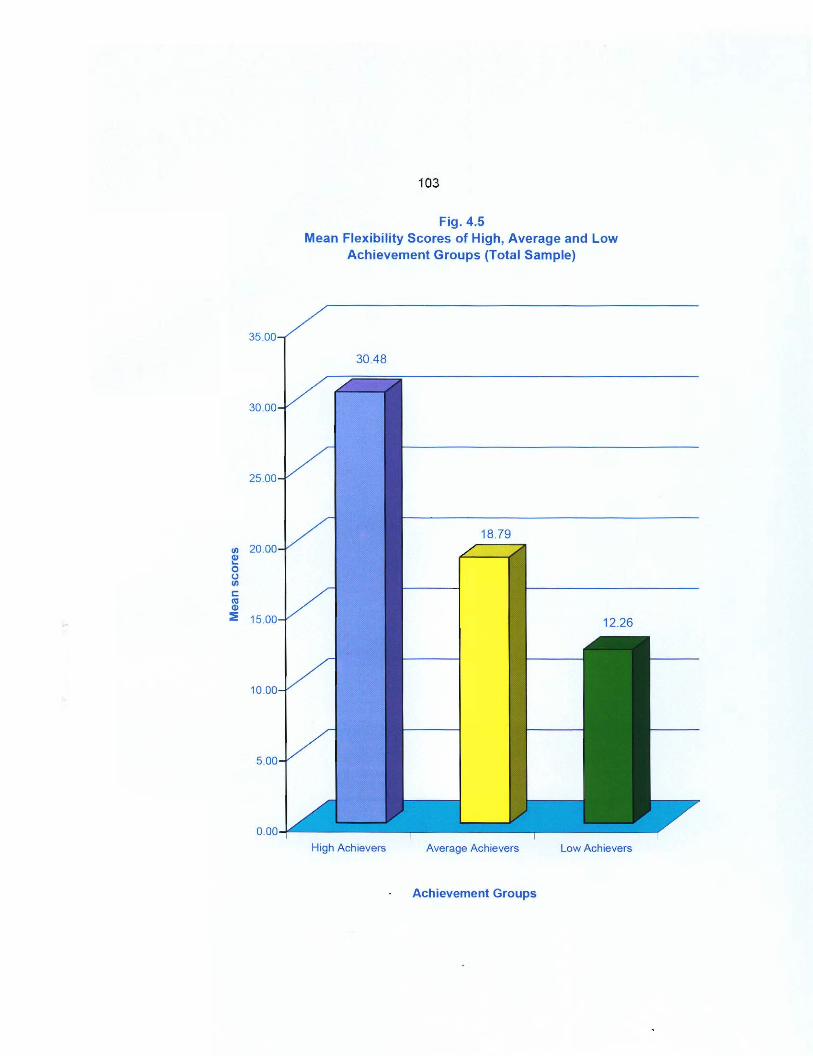
Fig. 4.5 Mean Flexibility Sums of High, Average and LMW
Achlevmmnt Oroups (Total Sample)
4verage Achievers Low Achievers
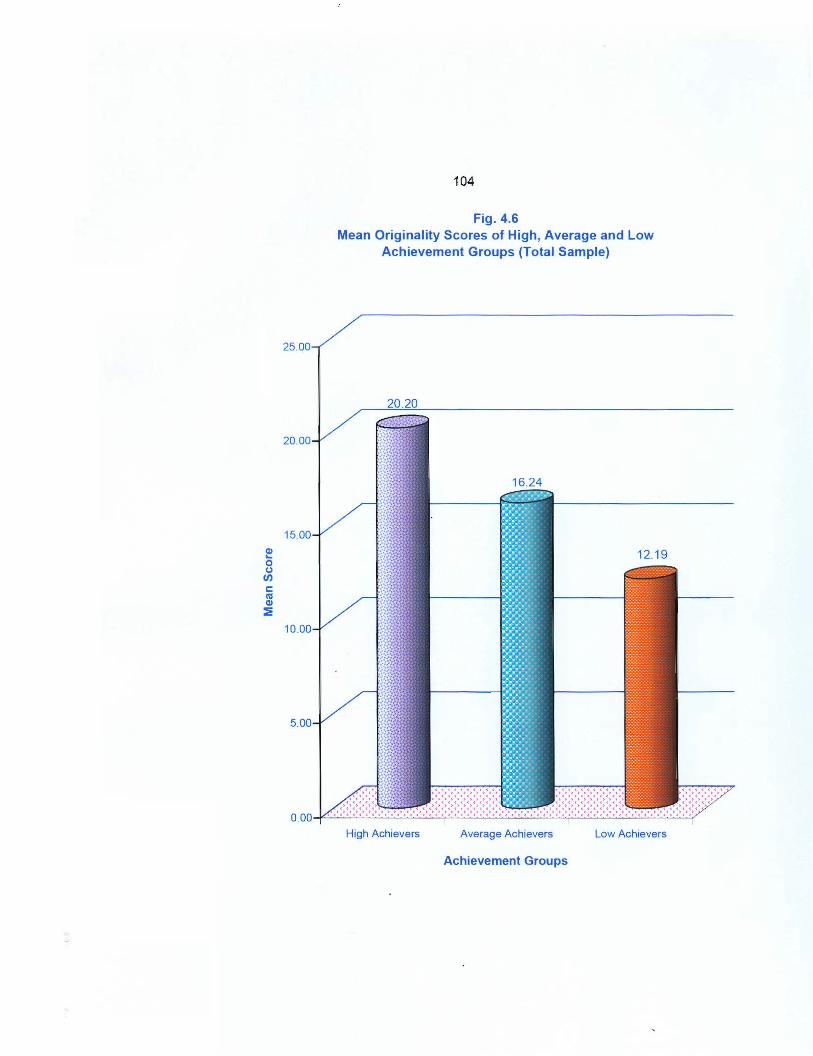
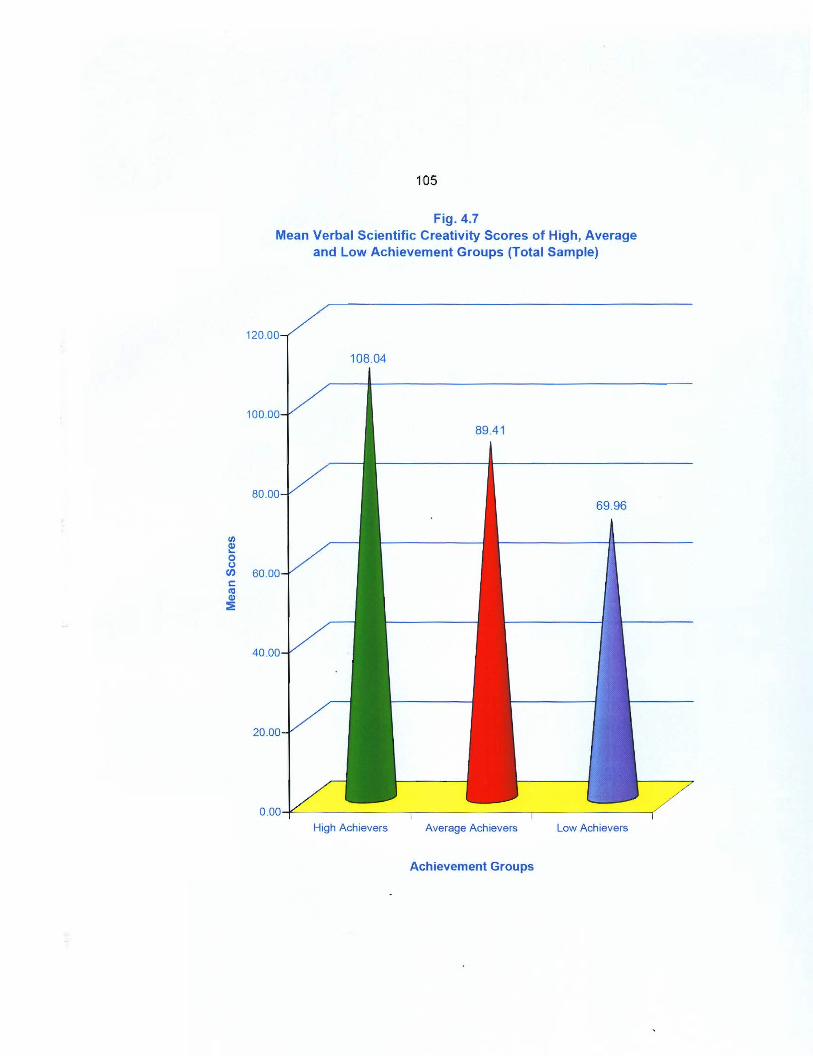
Fig. 4.7 Mean Verbal Scientific Creativity Scores of High, Average
and Low Achievement Groups (Total Sample)
0.00- , I
High Achievers Average Achievers Low Achievers
Achievement Groups
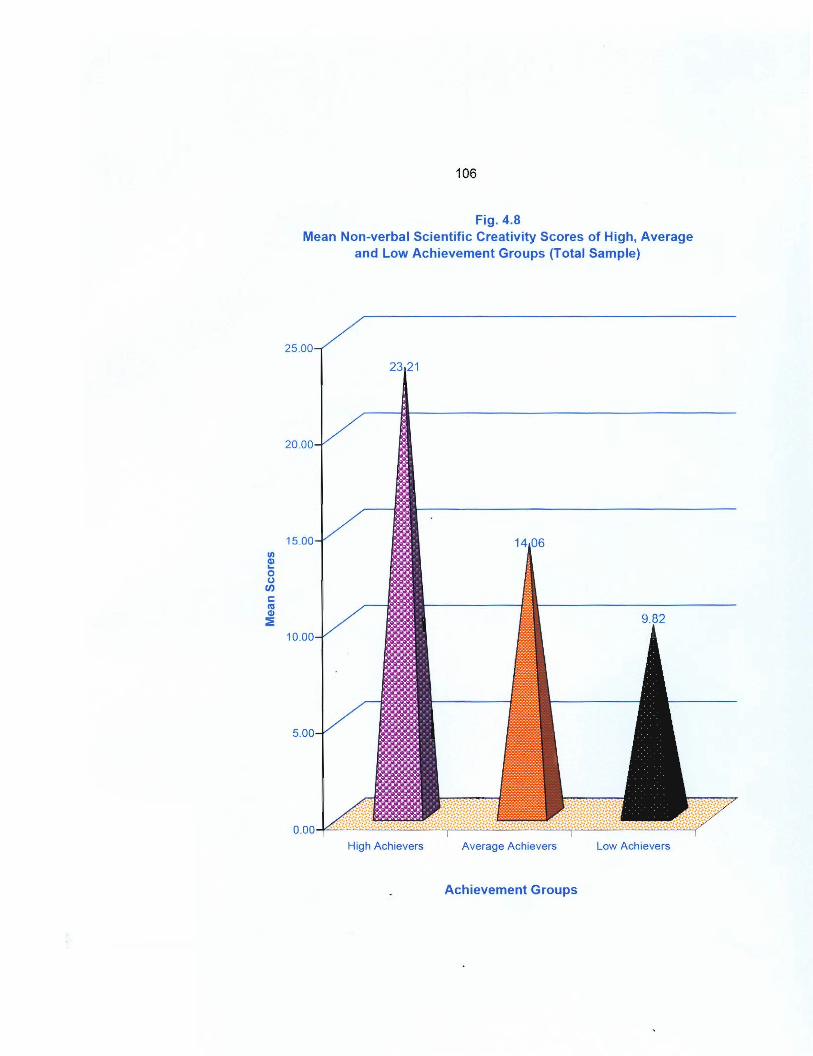
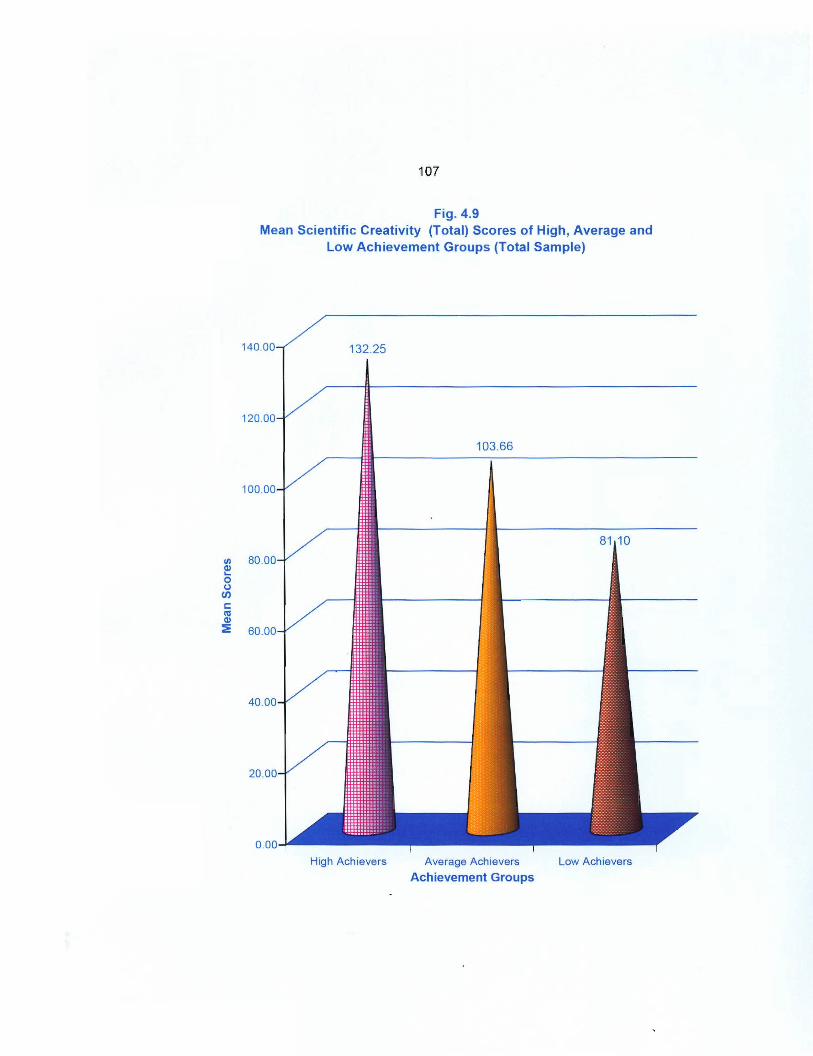
High Achievers Average Achievers L w Achievers Achievement Groups
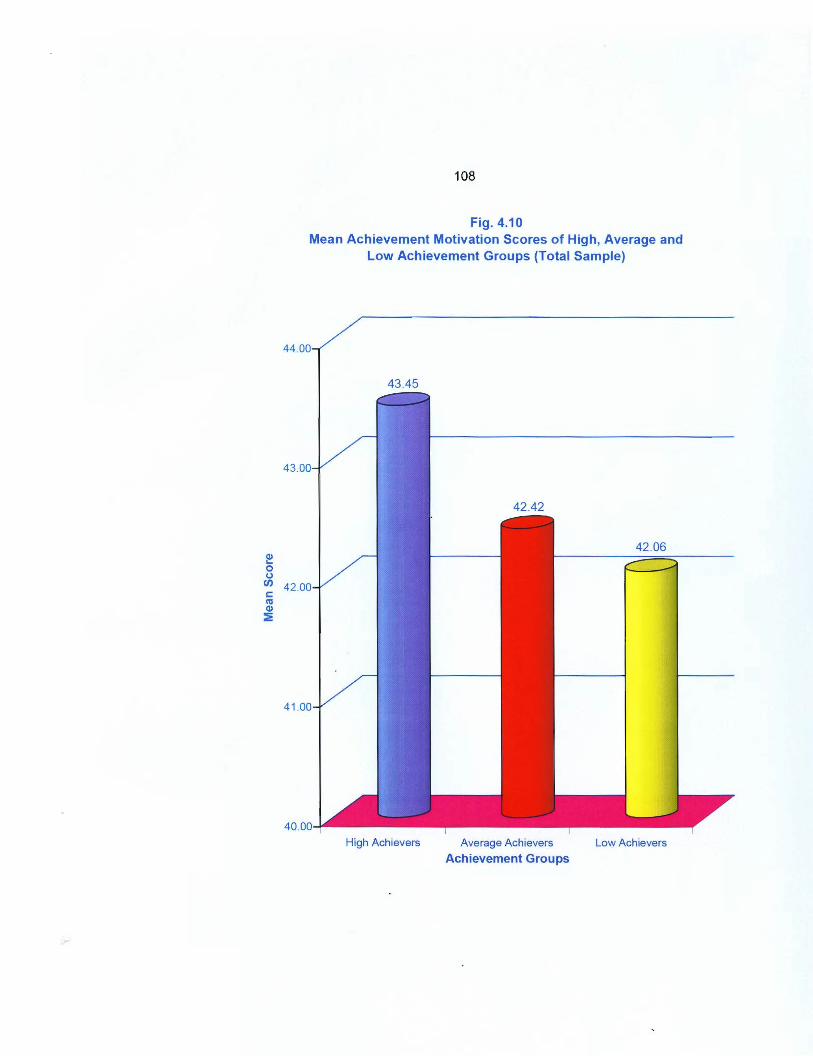
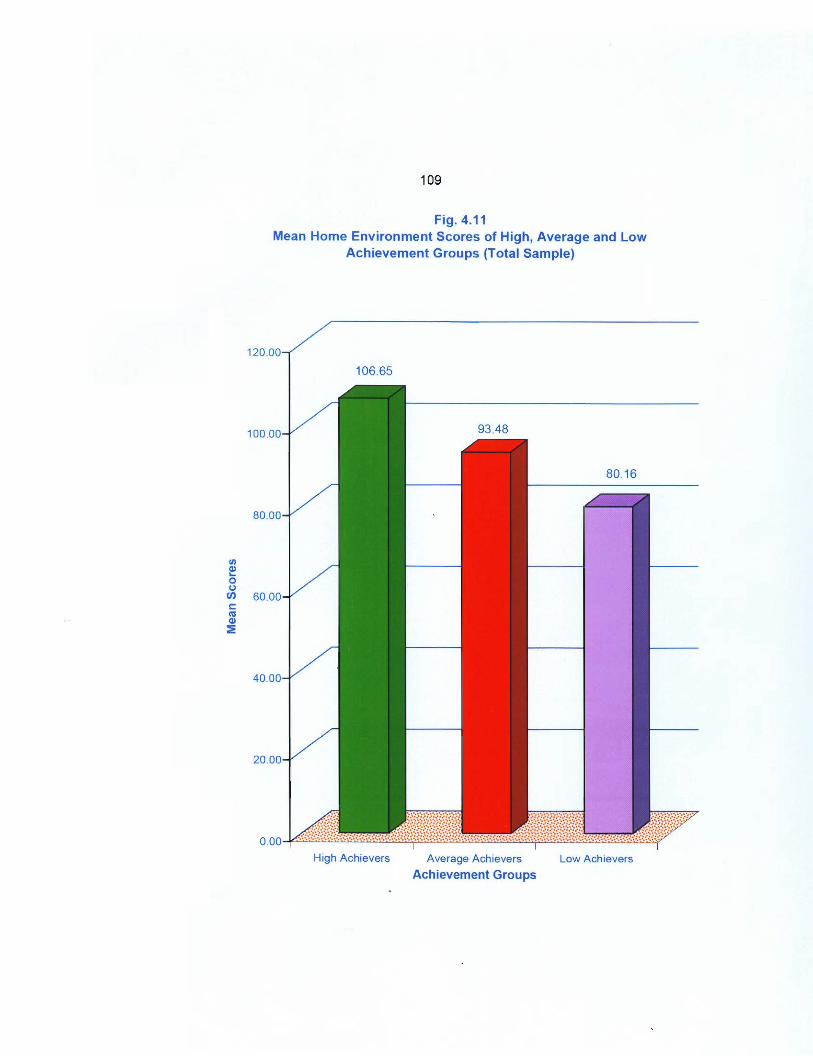
m- -- LowkphSvmr m e -
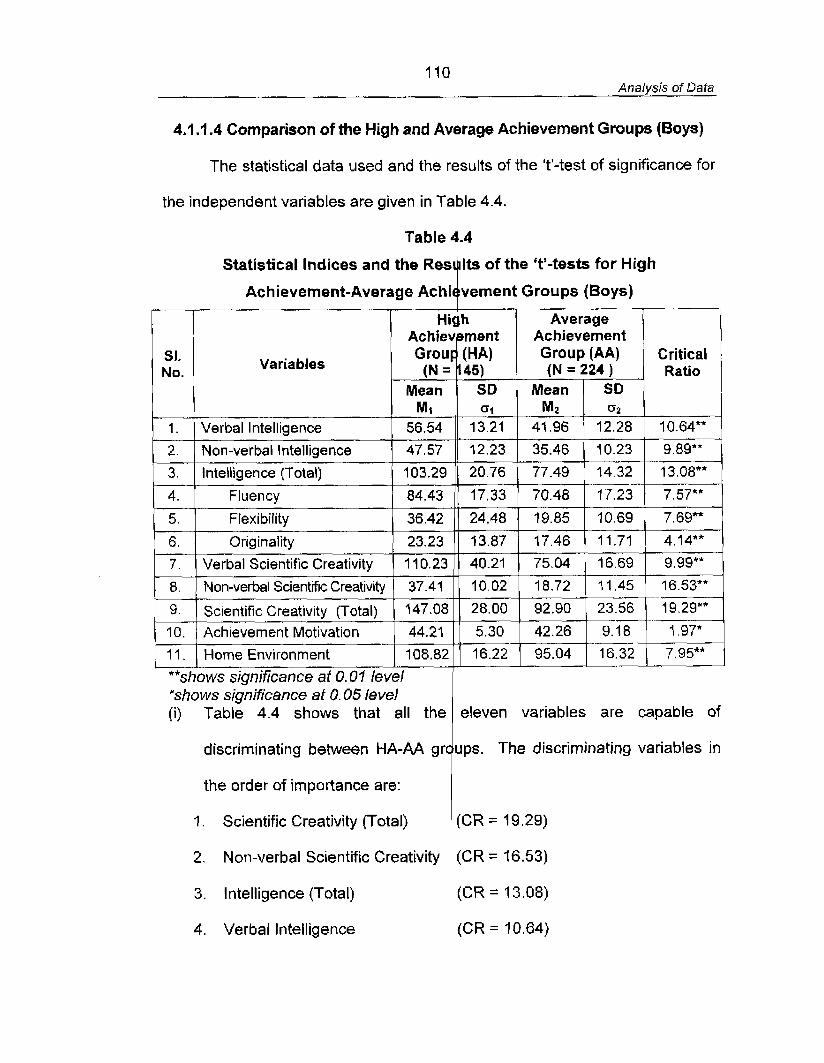
110 Analysis of Data
4.1 .I .4 Comparison of the High and Average Achievement Groups (Boys)
The statistical data used and the results of the 'tl-test of significance for
the independent variables are given in Table 4.4.
Table 4.4
Statistical Indices and the Res Its of the 't'-tests for High Ip Ach ievement-Average ~chievernent Groups (Boys)
7 A v e r s g e ) l ent Achievement
SI. No. Variables
Grou (HA) Group (AA)
I 1 (N =I4S1 I (N = 224 ) 1 '::,I Mean SD Mean So
MI Ql M2 1. Verbal Intelligence 56.54 13.21 41 -96 12.28
discriminating between HA-AA gr ups. The discriminating variables in t
8.
9.
10.
11.
the order of importance are:
1. Scientific Creativity (Total) ' (CR = 19.29)
Non-verbal scient. ~reat i i i t~
Scientific Creativity (Total) Achievement Motivation
Home Environment
2 . Non-verbal Scientific Creativity (CR = 16.53)
"*shows significance at 0.01 level *shows significance at 0.05 level (i) Table 4.4 shows that all the
3. Intelligence (Total) (CR = 13.08)
eleven variables are capable of
37.4A
147.08
44.21 108.82
4. Verbal Intelligence (CR = 10.64)
10.02
28.00
5.30
16.22
1 8.72
92.90
42.26 -
95.04 '!I ,Ti 23.56 19.29**
9.18 -- 1.97*
16.32 7.95**
Analysis of Data
5. Verbal Scientific Creativity (CR = 9.99)
6. Non-verbal Intelligence (CR = 9.89)
7. Home Environment (CR = 7.95)
8. Flexibility (CR = 7.69)
9. Fluency (CR = 7.57)
10. Originality (CR = 4.14)
11. Achievement Motivation (CR = 1.97)
(ii) All these differences except that of Achievement Motivation are
significant well beyond 0.01 level. The difference is significant at 0.05
level for Achievement Motivation (CR = 1.97; p < 0.05). This indicates
that the mean scores of the High and Average Achievement groups of
boys differ significantly with respect of each of the eleven variables.
4.1.1.5 Comparison of the Average and Low Achievement Groups (Boys)
The statistical data used and the results of the 't'-test of significance for
the independent variables is given in Table 4.5.
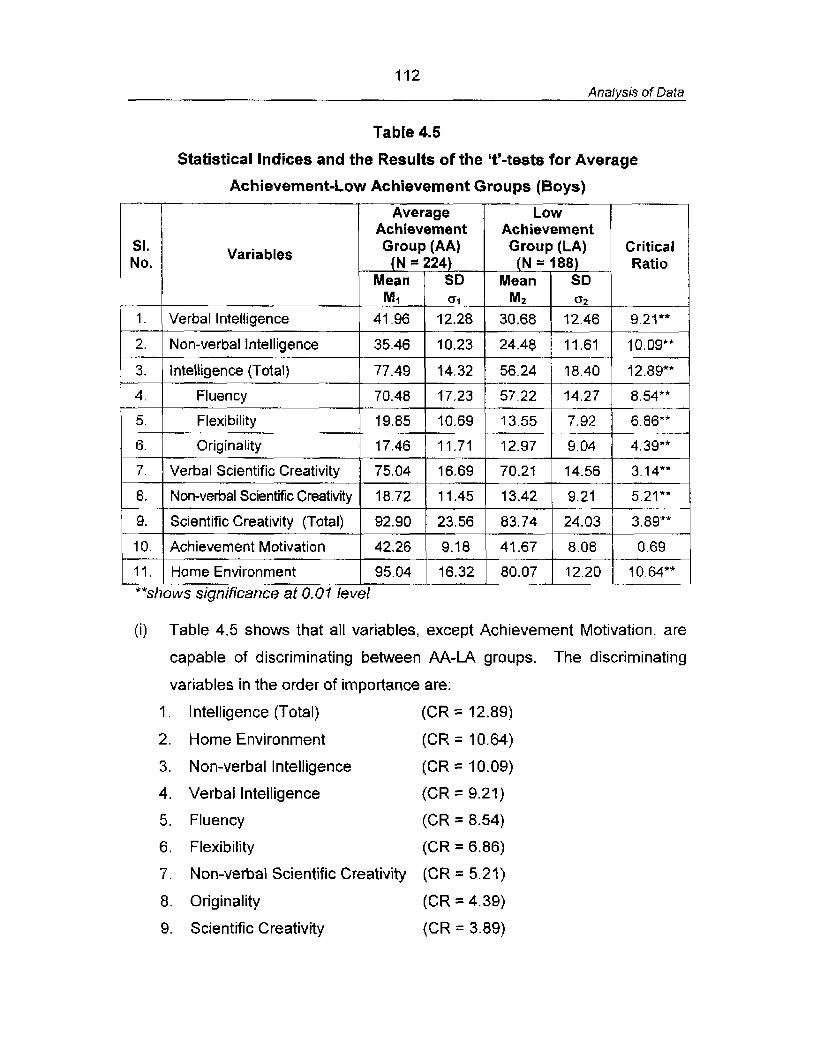
112 Analysis of Data
Table 4.5
Statistical Indices and the Results of the 't'-tests for Average
Achievement-Low Achievement Groups (Boys)
1 1 Average 1 Low 1 I 1 ( Achievement 1 Achievement 1 1
MI 6 1 M2 0 2
Verbal Intelligence 41.96 12.28 30.68 12.46 9.21**
SI. No. Variables Group (AA) Group (LA) Critical
N = 224 N = 188 Ratio
4 1 Fluency
2. - ". 3.
Non-verba! Intelligence 35.46 10.23 24.48
Intelligence (Total) 77.49 14.32 56.24
**shows significance at 0.01 (eve1
5.
6.
7.
8.
9.
10.
1 1.
(i) Table 4.5 shows that all variables, except Achievement Motivation, are
capable of discriminating between AA-LA groups. The discriminating
variables in the order of importance are:
I. Intelligence (Total) (CR = 12.89)
2. Home Environment (CR = 10.64)
3. Non-verbal Intelligence (CR = 10.09)
4. Verbal Intelligence (CR = 9.21)
5. Fluency (CR = 8.54)
6. Flexibility (CR = 6.86)
7. Non-verbal Scientific Creativity (CR = 5.21)
8. Originality (CR = 4.39)
9. Scientific Creativity (CR = 3.89)
Flexibility - Originality
Verbal Scientific Creativity
Non-verbal Scientific Creativity
Scientific Creativity (Total)
Achievement Motivation
Home Environment
19.85
17.46
75.04
18.72
92.90
42.26
95.04
10.69
11.71
16.69
1 1.45
23.56
9.18
16.32
13.55
12.97
70.21
1 3.42
83.74
41.67
80.07
7.92
9.04
14.56
9.21
24.03
8.08
12.20
6.86** -, -
4.39**
3.14**
5.21** - 3.89**
0.69
-1
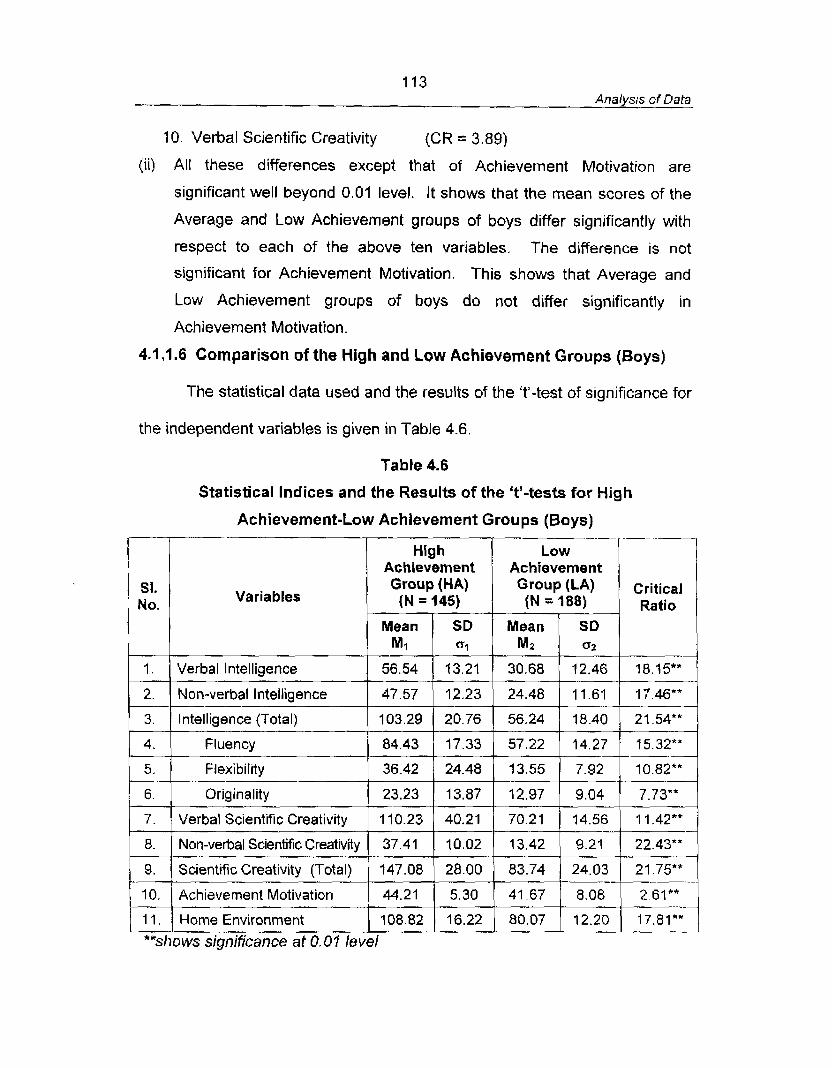
113 Analysis of Data
10. Verbal Scientific Creativity (CR = 3.89)
(ii) All these differences except that of Achievement Motivation are
significant well beyond 0.01 level. It shows that the mean scores of the
Average and tow Achievement groups of boys differ significantly with
respect to each of the above ten variables. The difference is not
significant for Achievement Motivation. This shows that Average and
Low Achievement groups of boys do not differ significantly in
Achievement Motivation.
4.1,1.6 Comparison of the High and Low Achievement Groups (Boys)
The statistical data used and the results of the 7'-test of significance for
the independent variables is given in Table 4.6.
Table 4.6
Statistical Indices and the Results of the 'tY-tests for High
Achievement-tow Achievement Groups (Boys)
S1. No. Variables
1 7 . ( Verbal Scientific Creativity 1 1 10.23 1 40.21 ) 70.21 ) 14.56 1 1 1.42** 1
Group (HA) (N = 145)
1.
2.
3.
4.
5.
6.
Mean MI
critical Ratio
SD Dl
Group (LA) (N = 7 88)
Verbal Intelligence
Non-verbal Intelligence
Intelligence (Total)
Fluency
Flexibility
Originality
8.
9.
10.
Mean M2
SD Qz
56.54
47.57
103.29
84.43
36.42
23.23
Non-verbal Scientific Creativity
Scientific Creativity (Total)
Achievement Motivation
13.21
12.23
20.76
17.33
24.48
13.87
37.4 1
147.08
44.21
11.
30.68 12.46 18 75""
24.48 11.61 17.46**
56.24 18.40 21.54**
57.22 14.27 15.32**
d3.55
12.97 9.04 7.73**
**shows significance at 0.01 level 108.82 Home Environment
10.02
16.22
13.42
28.00
5.30
80.07
9.21
83.74
41.67
22.43**
12.20 17.81** - .
24.03 -- 8.08
21.75** --
2.61** -- ..
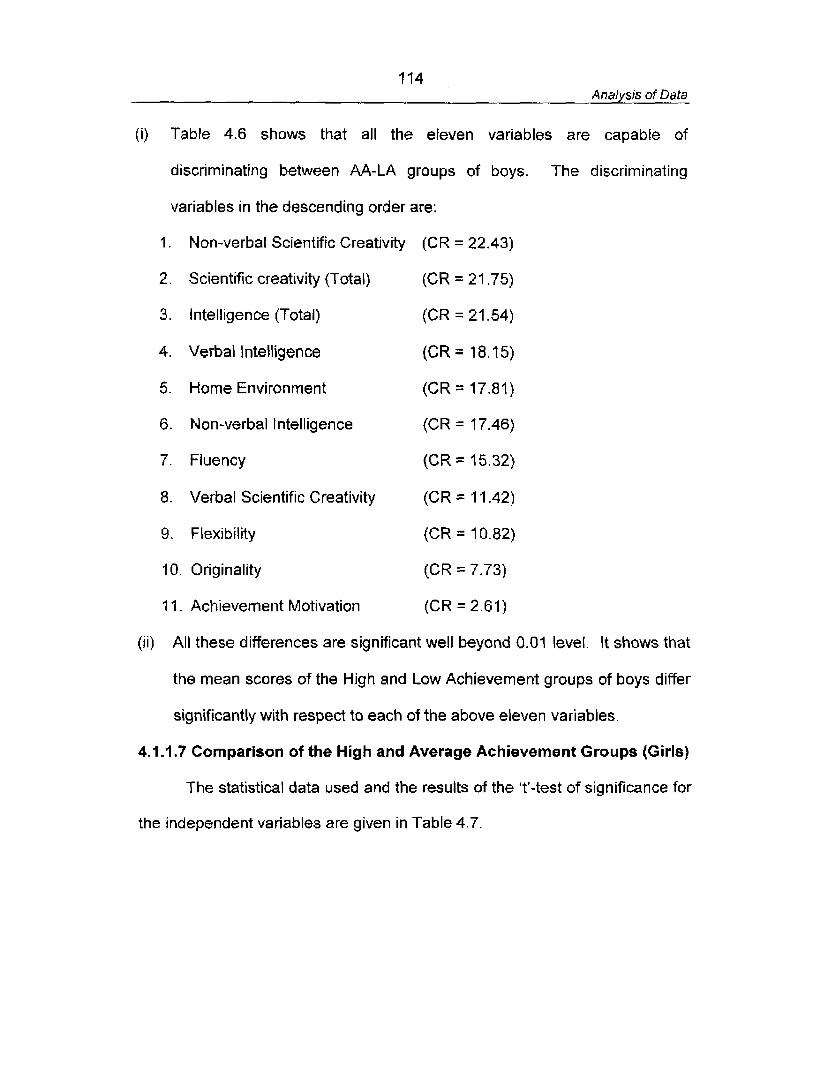
7 14 Analysis of Data
(i) Table 4.6 shows that all the eleven variables are capable of
discriminating between AA-LA groups of boys. The discriminating
variables in the descending order are:
7 . Non-verbal Scientific Creativity (CR = 22.43)
2. Scientific creativity (Total) {CR = 21 -75)
3, Intelligence (Total) (CR = 21 -54)
4. Verbal Intelligence (CR = 18.75)
5. Home Environment (CR = 17.81)
6. Non-verbal Intelligence (CR = 17.46)
7. Fluency (CR = 15.32)
8. Verbal Scientific Creativity (CR = I 1.42)
9. Flexibility (CR = 10.82)
10. Originality (CR = 7.73)
+I 1. Achievement Motivation (CR = 2.61)
(ii) All these differences are significant well beyond 0.01 level. It shows that
the mean scores of the High and Low Achievement groups of boys differ
significantly with respect to each of the above eleven variables.
4.1 -1.7 Comparison of the High and Average Achievement Groups (Girls)
The statistical data used and the results of the 't'-test of significance for
the independent variables are given in Table 4.7.
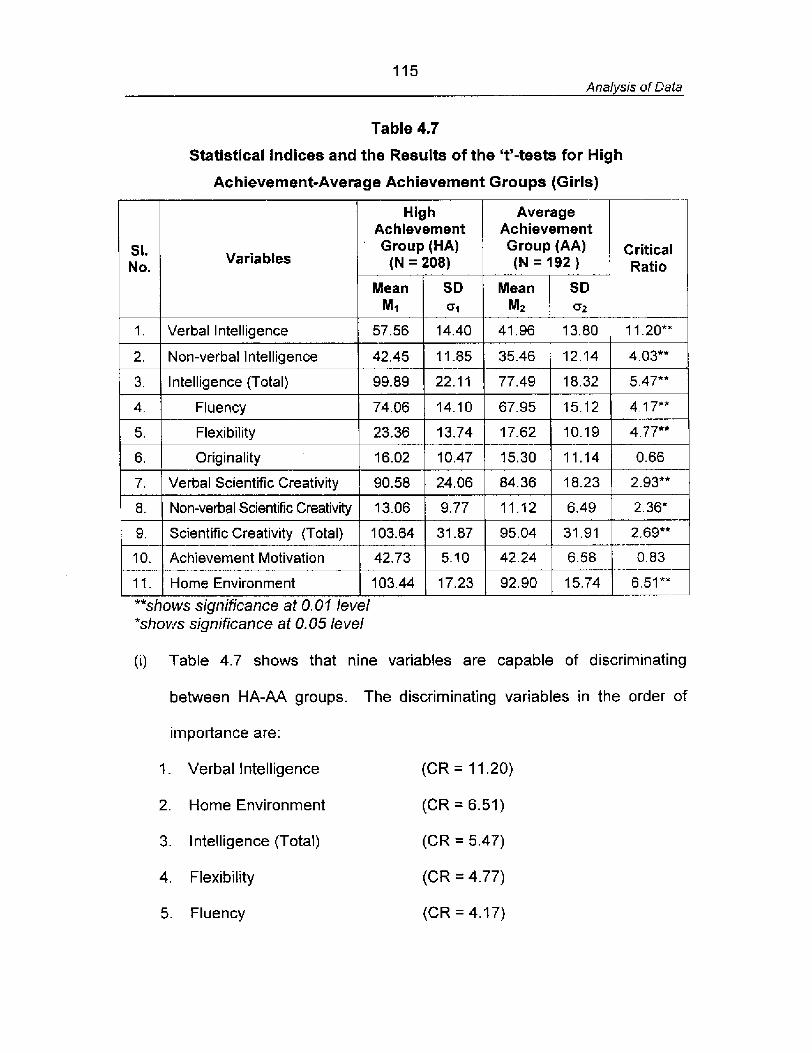
11 5 Analysis of Data
Table 4.7
Statistical Indices and the Results of the 't'-tests for High
Ac hievement-Average Achievement Groups (Girls)
Varia btes
**shows significance at 0.01 level "shows significance at 0.05 level
(I) Table 4.7 shows that nine variables are capable of discriminating
SI. No.
1
2.
3,
4.
5. -
between HA-AA groups. The discriminating variables in the order of
importance are:
I. Verbal Intelligence (CR = I 1.20)
2. Home Environment (CR = 6.51)
3. Intelligence (Total) (CR = 5.47)
4. Flexibility (CR = 4.77)
5. Fluency (CR = 4.17)
".
Critical Ratio
1120""
4 03**
547**
4 17**
4.77**
Verbal Intelligence
Non-verbal Intelligence
Intelligence (Total)
Fluency
Flexibility
Average Achievement Group IAA) (N = 192)
6. Originality 16.02 10.47 15.30 11.14 0.66
7. Verbal Scientific Creativity 90.58
Mean M2
41.96
35.46
77.49
67.95
17.62
8.
9 - -
10.
11.
High Achievement
' Group (HA) (N = 208)
SD 0 2
13.80
12.14
18.32
15.1 2
10.19
Mean MI
57.56
42.45
99.89
74.06
23.38
Non-verbal Scientific Creativity
Scientific Creativity (Total) - - - - - - - - - - - . - -. .
Achievement Motivation
Home Environment
SD a1
14.40
11.85
22.11
14.10
13.74 ----
1 3.06
103.64
42.73
103.44
9.77
31 -87
5.10
17.23
1 1 . I 2
95.04
42.24
92.90
6.49
31.91 -- . 6.58
"-
15.74
2.36*
2 69** - - - - 0.83
. - 6 51"* --
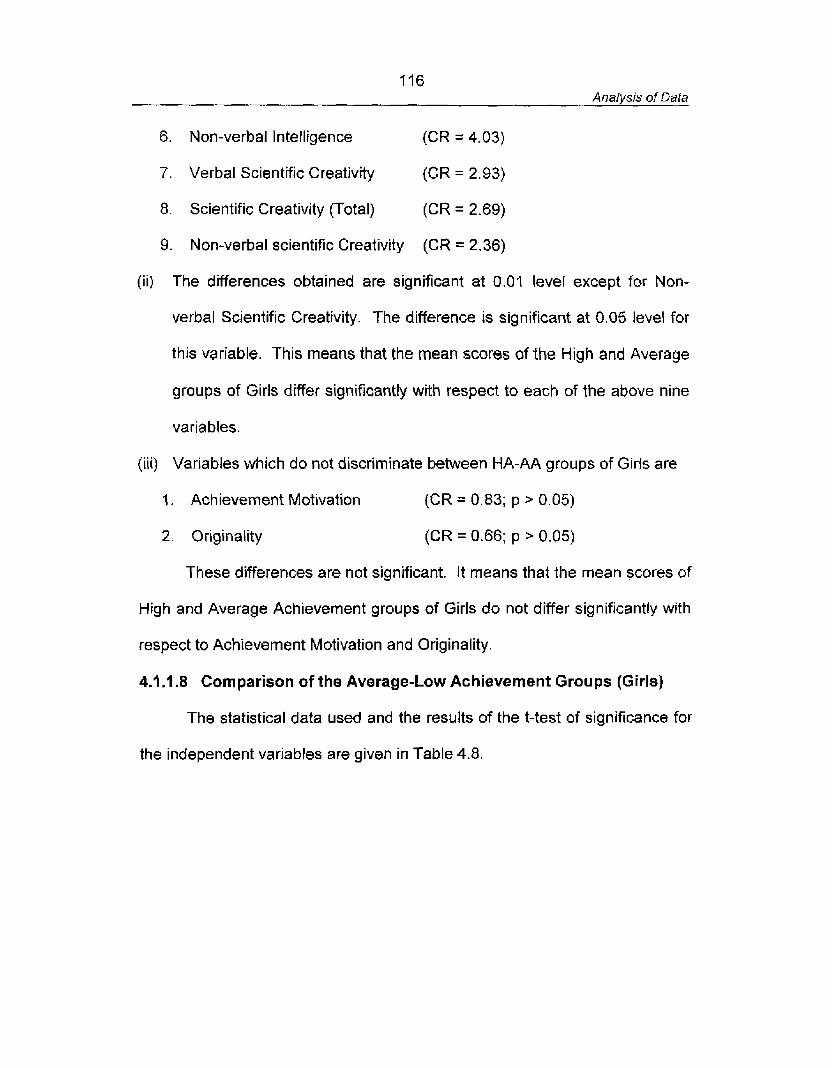
116 Analysis of Data
6. Non-verbal Intelligence (CR = 4.03)
7. Verbal Scientific Creativity (CR = 2.93)
8. Scientific Creativity (Total) (CR = 2.69)
9. Non-verbal scientific Creativity (CR = 2.36)
(ii) The differences obtained are significant at 0.01 level except for Non-
verbal Scientific Creativity. The difference is significant at 0.05 level for
this variable, This means that the mean scores of the High and Average
groups of Girls differ significantly with respect to each of the above nine
variables.
(iii) Variables which do not discriminate between HA-AA groups of Girls are
I Achievement Motivation (CR = 0.83; p > 0.05)
2. Originality (CR = 0.66; p > 0.05)
These differences are not significant. It means that the mean scores of
High and Average Achievement groups of Girls do not differ significantly with
respect to Achievement Motivation and Originality.
4.1 .I .8 Comparison of the Average-Low Achievement Groups (Girls)
The statistical data used and the results of the t-test of significance for
the independent variables are given in Table 4.8.
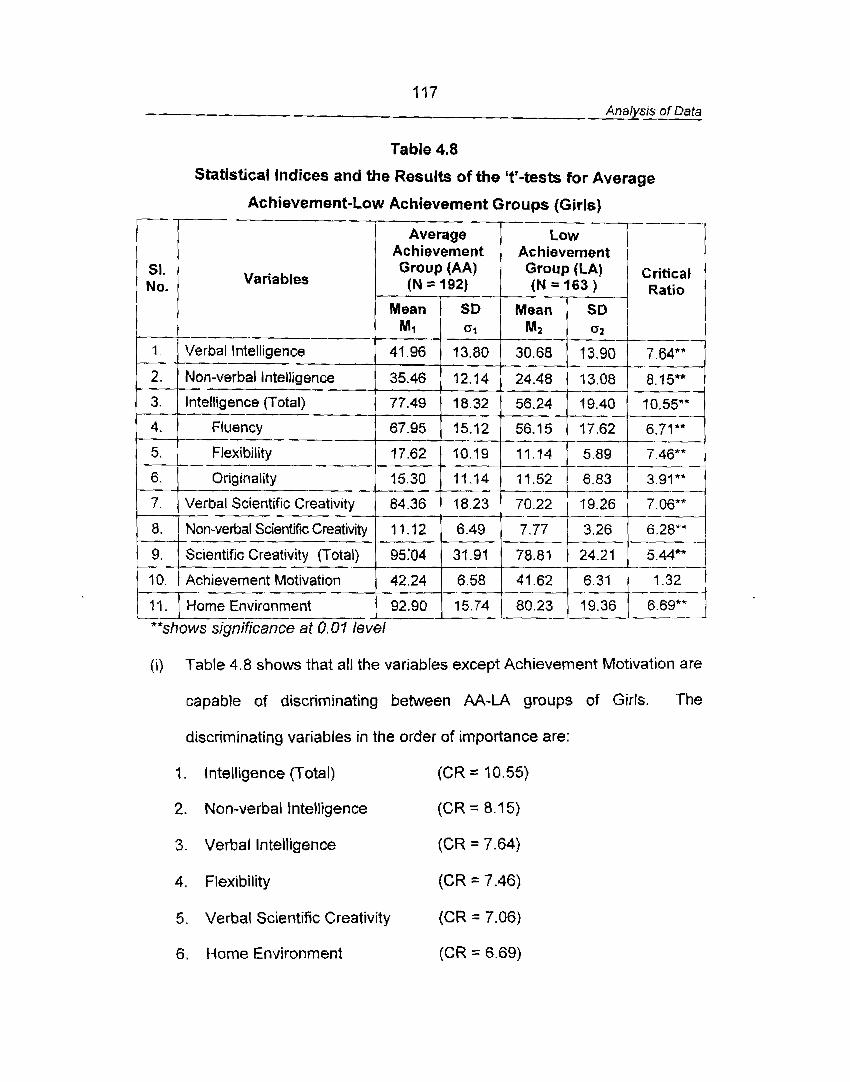
117 Analysis of Data
Table 4.8
Statistical indices and the Results of the 'tY-tests for Average
(i) Table 4.8 shows that all the variables except Achievement Motivation are
Achievement-Low Achievement Groups (Girls)
capable of discriminating between AA-LA groups of Girls. The
SI. No.
1
2.
3.
4.
5.
6.
7.
8.
9.
10.
11.
**shows
discriminating variables in the order of importance are:
7 . Intelligence (Total) (CR = 10.55)
Variables
- Verbal Intelligence
Non-verbal Intelligence
Intelligence (Total)
Fluency
Flexibility
Originality
Verbal Scientific Creativity
Non-verbal Scientific Creativity
Scientific Creativity (Total)
Achievement Motivation
Home Environment
significance at 0.01 level
2. Non-verbal Intelligence (CR = 8.15)
3. Verbal Intelligence (CR = 7.64)
4. Flexibility (CR = 7.46)
Average Achievement Group (AA) (N = 192)
5. Verbal Scientific Creativity (CR = 7.06)
Mean MI
4j.96
35.46
77.49
67.95
17.62
15.30
84.36
1 1.12
95.'04
42.24
92.90
6 . Home Environment (CR = 6.69)
Critical Ratio
7.64"*
8.75**
10.55**
6.71**
7 46** --.-
3 91**
7.06**
SD (51
13.80
12.14
18.32
15.12
40.19
11.14
18.23
6.49
31.91
6.58
15.74
- Low
Achievement Group (LA) (N = 163)
Mean M2
30.68
24.48
58.24
56.15
11.14
11.52
70.22
SD (32
13.90
13.08
19.40
17.62
5.89
6.83
19.26
7.77
78.81
41.62
80.23
24.21 5.44**
6.31
- --
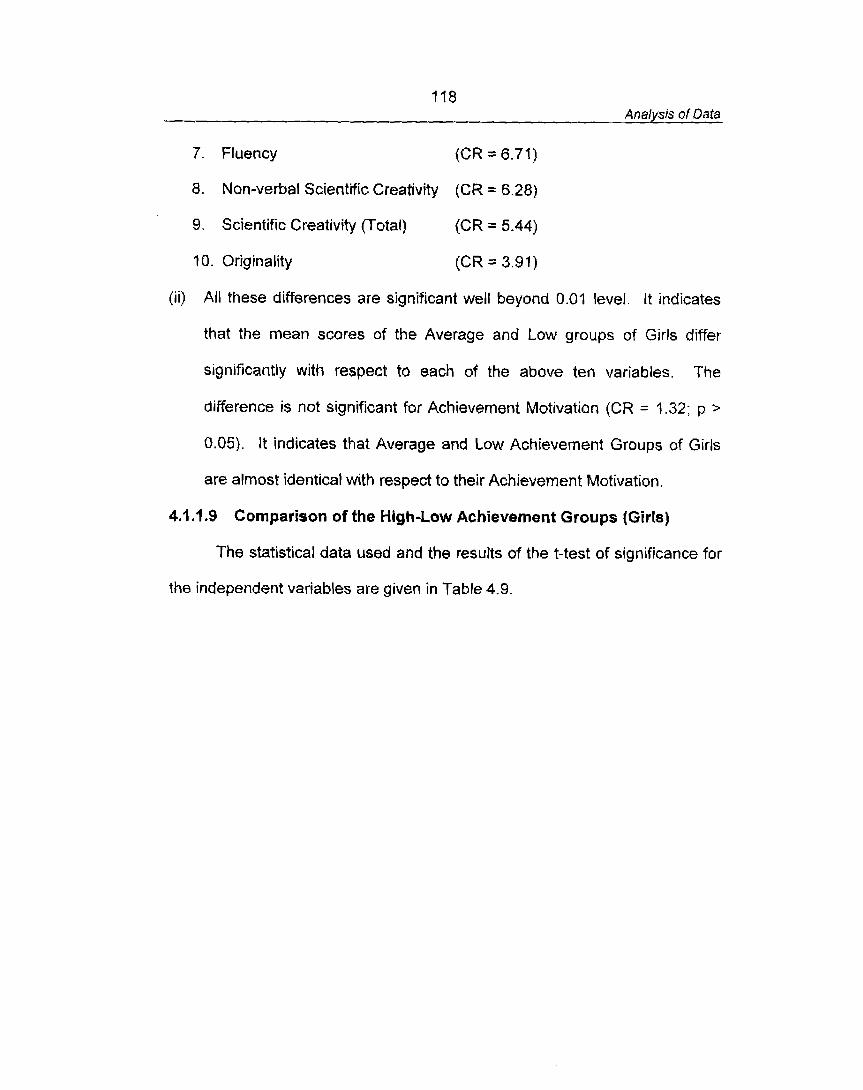
118 Analysis of Data
7. Fluency (CR = 6.71)
8. Non-verbal Scientific Creativity (CR = 6.28)
9. Scientific Creativity {Total) (CR = 5.44)
10. Originality (CR = 3.91)
(ii) All t h e s e differences are significant well beyond 0.01 level. It indicates
that t h e mean scores of the Average and Low groups of Girls differ
significantly with respect to each of the above ten variables. The
difference is not significant for Achievement Motivation (CR = 1.32; p >
0.05). It indicates that Average and Low Achievement Groups of Girls
are almost identical with respect to their Achievement Motivation.
4.1.1.9 Comparison of the High-Low Achievement Groups [Girls)
The statistical data used and the results of the t-test of significance for
the independent variables are given in Table 4.9.
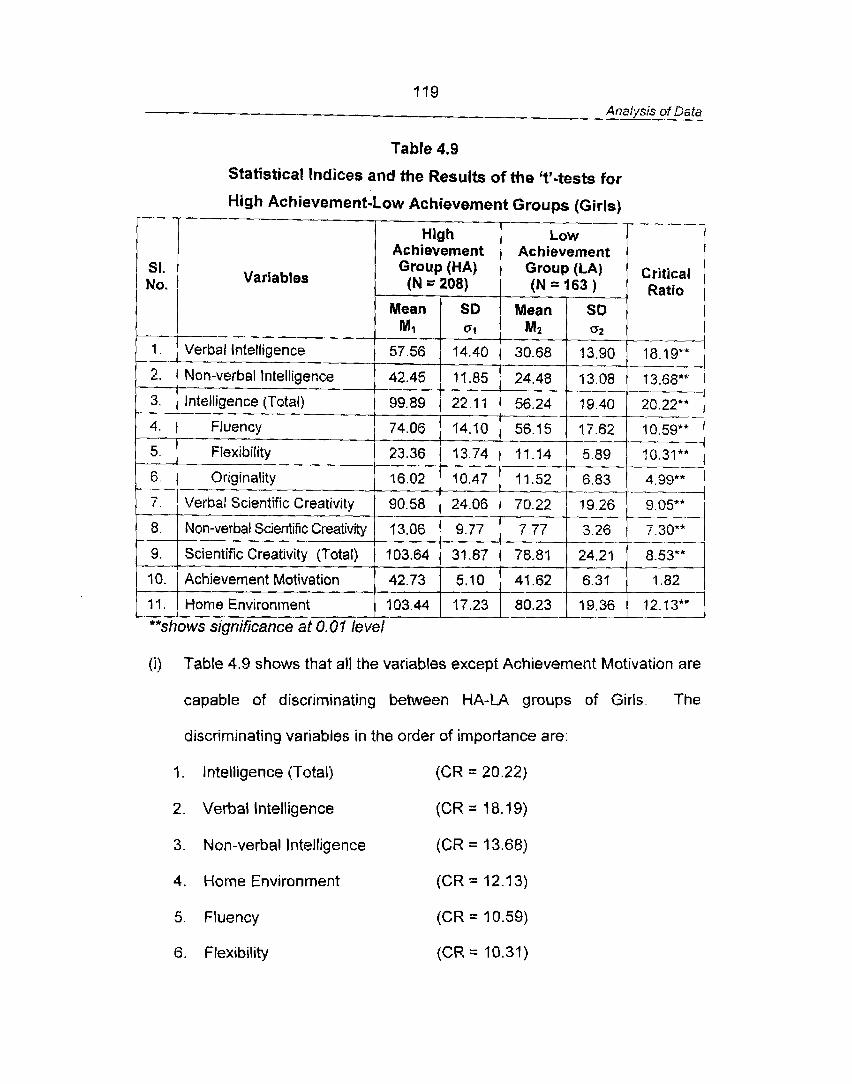
119 Analysis of Data
Table 4.9
Statistical Indices and the Results of the 'tY-tests for
(i) Table 4.9 shows that all the variables except Achievement Motivation are
High Achievement-Low Achievement Groups (Girls)
capable of discriminating between HA-LA groups of Girls. The
Sf. No.
1.
2.
3.
4.
5.
6.
7 .
8.
9.
10.
I I
**shows
discriminating variables in the order of importance are:
1. Intelligence (Total) (CR = 20.22)
Variables
Verbal Intelligence
Non-verbal Intelligence
Intelligence (Total)
Fluency
F Iexibiiity
Originality
Verbal Scientific Creativity
Non-verbal Scientific Creativity
Scientific Creativity (Total)
Achievement Motivation
Home Environment
significance at 0.07 level
2. Verbal Intelligence (CR = 18.19)
3. Non-verbal Intelligence (CR = 13.68)
4. Home Environment (CR = 12.13)
High Achievement Group (HA) (N = 208)
5 . Fluency (CR = 10.59)
Mean MI
57.56
42.45
99.89
74.06
23.36
16.02
90.58
1 3.06
103.64
42.73
103.44
6. Flexibility (CR = 10.31)
------
Critical Ratio
- 18.19**
13.68""
20.22"* ---
10.59** .-- 10.31**
4.99*' -
9.05*" --- --
7.30** ,- -
8.53"'
1.82
12.13"" -.
SD 0 1
14.40
11.85
22.1 1
'l4.10
13.74
10.47
24.06
9.77
31.87
5.10
17.23
--- Low
Achievement Group (LA) (N = 163 )
Mean M2
30.68
24.48
56.24
56.15
1 .14
11.52
70.22
7.77
78.81
41.62
80.23
Sf3 G2
13.90
13.08
19.40
17.62
5.89
6.83
19.26 -- 3.26
24.21
6.31
19.36
120 Analysis of Data
7. Verbal Scientific Creativity (CR = 9.05)
8. Scientific Creativity (Total) (CR = 8.53)
9. Non-verbal Scientific Creativity (CR 7.30)
10. Originality (CR = 4.99)
(ii) All these differences are significant well beyond 0.07 level. It means that
the mean scores of the High and Low groups of Girls differ significantly
with respect to each of the above-mentioned variables. The difference is
not significant for Achievement Motivation (CR = 9 -62; p > 0.05). It
indicates that the mean scores of High and Low Achievement Groups of
Girls do not differ with respect to their Achievement Motivation.
4.1.1.10 Comparison of the High and Average Achievement Groups (Rural)
The statistical data used and the results of the 7'-test of significance for
the independent variables are given in Table 4.10.
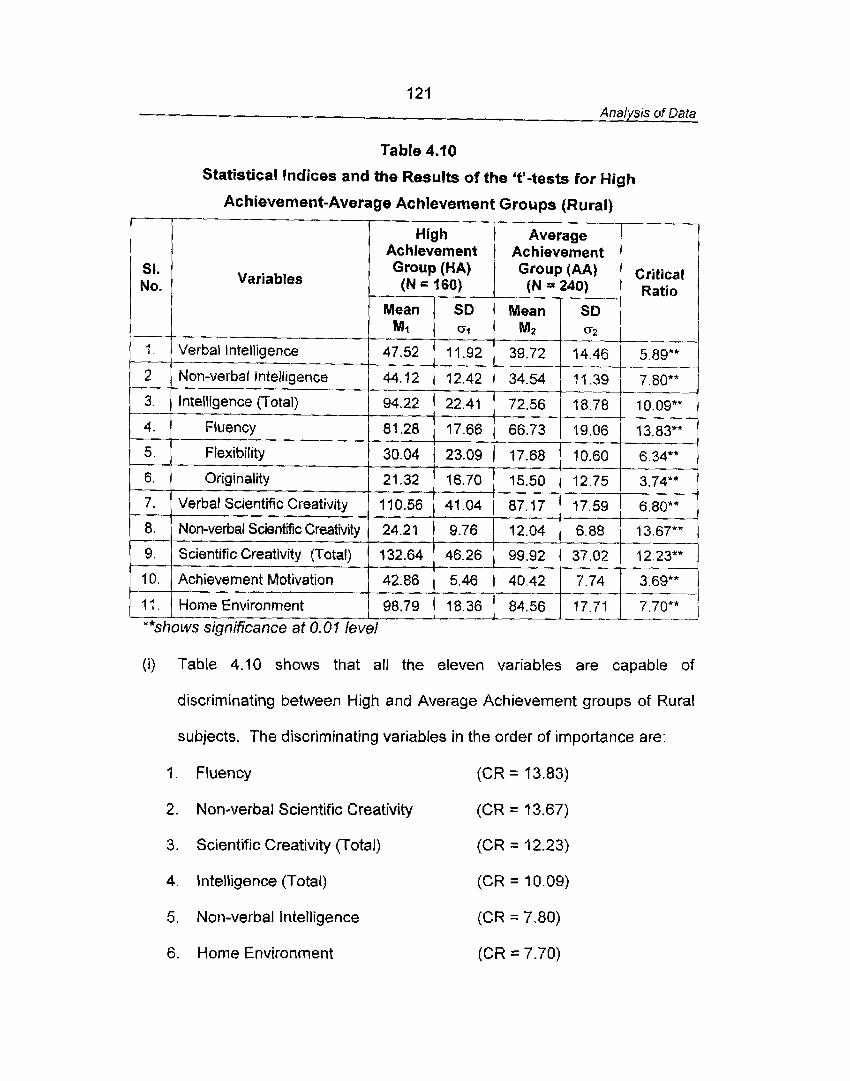
121 Analysis of Data
Table 4.10
Statistical Indices and the Results of the 'Y-tests for High
Achievement-Average Achievement Groups (Rural)
Variables (N = 'l60) (N = 240) Ratio
(i) Table 4.10 shows that all the eleven variables are capable of
7
2.
3.
4 .
5.
6.
7.
8.
9.
10.
11.
discriminating between High and Average Achievement groups of Rural
subjects. The discriminating variables in the order of importance are:
**shows significance af 0.01 level
- Verbal Intelligence
Non-verbal intelligence
Intelligence (Total)
Fluency
Flexibility
Originality
Verbal Scientific Creativity
Non-verbal Scientific Creativity
Scientific Creativity (Total)
Achievement Motivation
Home Environment
1. Fluency
2. Non-verbal Scientific Creativity
Mean MI
47.52 -
44.12
94.22
81.28
30.04
21.32
I 10.56
24.21
132.64
42.86
98.79
3. Scientific Creativity (Total)
4. Intelligence (Total)
SD at
11.92
12.42
22.41
17.66
23.09
16.70
41.04
9.76
46.26
5.46
18.36
5. Non-verbal Intelligence
(CR = 13.83)
Mean MZ
39.72
34.54
72.56
66.73
77.68
15.50
87.7 7
12.04
99.92
40.42
84.56
(CR = 13.67)
(CR = 12.23)
SD uz -
14.46
1.1.39 - f 8.78
19.06
10.60
12.75
17.59
6.88
37.02
7.74
(CR = 10.09)
5 89** --- .
7.80** -4 .----
10.09**
13.83"*
6.34**
3.74**
6.80""
13.67""
12.23*"
3.69**
(CR = 7.80)
1 7 . 7 1 1 7.70'* J --
6 Home Environment (CR = 7.70)
122 Analysis of Data
7. Verbal Scientific Creativity (CR = 6.80)
8. Flexibility (CR = 6.34)
9. Verbal Intelligence (CR = 5.89)
10. Originality (CR = 3.74)
1 1. Achievement Motivation (CR = 3.69)
(ii) All these differences are significant well beyond 0.01 level. It means that
the mean scores of the High and Average groups of Rural subjects differ
significantly with respect to each of the above eleven variables.
4.1. .?I Comparison of the Average and Low Achievement Groups (Rural)
The statistical data used and the results of t h e ?'-test of significance for
the independent variables are given in Table 4.1 I.

123 Analysis of Data
Table 4.1 1
Statistical Indices and the Results of the 't'-tests for Average
Ac hievement-Low Achievement Groups (Rural)
Variables
Average Ac hievernent
1 1 1 Mean 1 SD 1 Mean 1 SD 1 I
Low I---/ Achievement
1.
2.
3.
4.
5.
6.
7.
8.
1. 1 Home Environment 1 84.56 ( 17.71 ( 75.27 I 17.39 1 5.09** _] ,- -
**shows significance at 0.0 I level
Verbal Intelligence
Creativity (Total)
(i) Table 4.1 1 shows that all the variables except Achievement Motivation
Non-verbal Intelligence
Intelligence (Total)
Fluency
Flexibility
Originality
Verbal Scientific Creativity
Non-verbal Scientific Creativity
are capable of discriminating between AA-LA groups of Rural subjects.
MI
39.72
99.92
40.42
The discriminating variables in the order of importance are:
34.54
72.56
66.73
17.68
15.50
87.17
12.04
1, Intelligence (Total) (CR = 11 -29)
0 1
14.46
37.02
7.74
2, Verbal Scientific Creativity (CR = 10.14)
M2
28.94
I 1.39
'l8.78
19.06
d0.60
12.75
17.59
6.88 I
7923 1 ry 6,5:;* { 39.12
3. Verbal Intelligence (CR = 10.07)
23.40 12.21 8.87** - -
49.78 19.68 11.29**
55.54 16.95 6.03*"
12.29 7.30
11.41 7.82 -- 69.43 16.24 10.14""
9.2 1
4. Non-verbal intelligence (CR = 8.87)
5. Scientific Creativity (Total) (CR = 6.56)
6. Fluency (CR = 6.03)
7 . Flexibility (CR = 5.93)
8. Home Environment (CR = 5.09)
9. Non-verbal Scientific Creativity (CR = 3.98)
10. Originality (CR = 3.92)
(ii) All the above differences are significant well beyond 0.01 level. It shows
that the mean scores of Average and Low Achievement groups of Rural
subjects differ significantly with respect to each of the above-mentioned
variables. The difference is not significant for Achievement Motivation
(CR = 1.73; p > 0.05). It shows that the mean scores of Average and
Low Achievement groups of Rural subjects do not differ significantly with
respect to Achievement Motivation.
4.1.1.12 Comparison of the High and Low Achievement Groups (Rural)
The statistical data used and the results of the 't'-test of significance for
the independent variables are given in Table 4.72.

125 Analysis of Data
Table 4.1 2
Statistical Indices and the Results of the 't'-tests for High
Achievement-Low Achievement Groups (Rural)
No. I 7--
Variables
High Achievement
-
Achievement Group (HA)
(N = 160)
2. 1 Non-verbal Intelligence 1 44.12 1 12.42 1 23.40 1 12.21 [ 14.78**
Mean MI
47.52
Group (LA) (N = 149)
(i) Table 4.12 shows that all the eleven variables are capable of
Critical Ratio
SD GI
11.92
3.
4.
5.
6.
7 .
8.
9.
10.
11.
discriminating between AA-LA groups of Rural subjects. The
Mean SD M2
28.94 10.50
discriminating variables in the order of importance are:
**shows significance at 0.0 I level
Intelligence (Total)
Fluency
Flexibility
Originality
Verbal Scientific Creativity
Non-vetbat Scientific Creativity
Scientific Creativity (Total)
Achievement Motivation
Home Environment
1. Intelligence (Total) (CR = 18.55)
2. Non-verbal Scientific Creativity (CR = 15.78)
94.22
81.28
30.04
21.32
1 10.56
24.2 1
132.64
42.86
98.79
3. Non-verbal Intelligence (CR = 14.78)
4. Verbal Intelligence (CR = 14.56)
22.41
'l7.66
23.09
16.70
41.04
9.76
46.26
5.46
18.36
5. Fluency (CR = 13.07)
6. Scientific Creativity
49.78
55.54
12.29
11.41
69.43
9.21
79.23
39.12
75.27
(CR 12.73)
19.68
'l6.95
7.30
7.82
16.24
6.78
25.1 1
6.85
17.39 --
18.55**
13.07** -
9.24**
6.75**
1 1.73**
15.78**
12.73** ,. -
5.28** -- 11.56"" -
I26 Analysis of Data
7. Verbal Scientific Creativity (CR = 11.73)
8. Home Environment (CR = 11 56)
9. Flexibility (CR = 9.24)
7 0. Originality (CR = 6.75)
11. Achievement Motivation {CR = 5.28)
( i i ) All the differences are significant well beyond 0.01 level. It indicates that
the mean scores of High and Average Achievement groups of Rural
subjects differ significantly with respect to the above eleven variables.
4.1 .I -13 Comparison of the High and Average Achievement Groups (Urban)
The statistical data used and the results of the 'tl-test of significance for
the independent variables are given in Table 4.13.
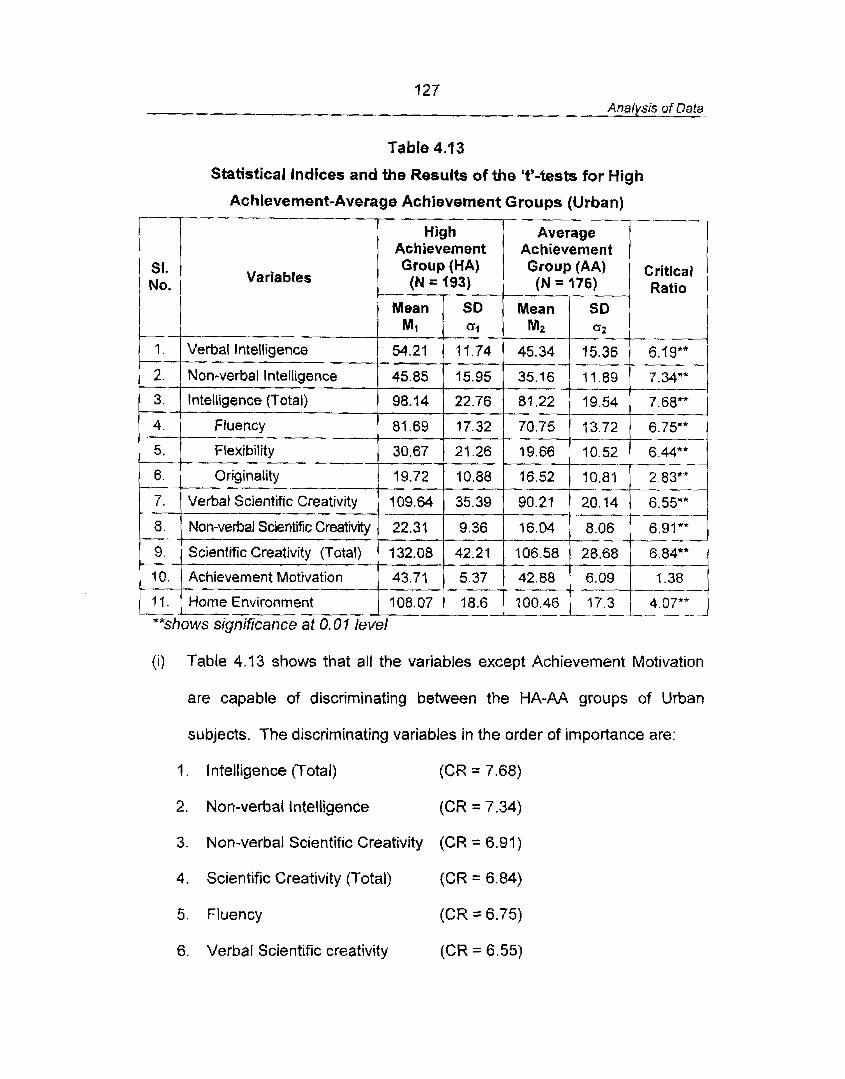
Analysis of Data
Table 4.13
Statistical indices and the Results of the ?'-tests for High
i Table 4.13 shows that all the variables except Achievement Motivation
Achievement-Average Achievement Groups (Urban)
are capable of discriminating between the HA-AA groups of Urban
SI. No.
1.
2.
3.
4.
5.
6.
7.
8.
9.
10.
7 1.
subjects. The discriminating variables in the order of importance are:
1. Intelligence (Total) (CR = 7.68)
**shows significance at 0. O f level
Variables
Verbal Intelligence
Non-verbal Intelligence
Intelligence (Total)
Fluency - -
Flexibility
Originality
Verbal Scientific Creativity -- Non-verbal Scientific Creat'iity
Scientific Creativity (Total)
Achievement Motivation
Home Env~ronment
2. Non-verbal intelligence (CR = 7.34)
3. Non-verbal Scientific Creativity (CR = 6.91)
4. Scientific Creativity (Total)
High Achievement Group (HA) (N = 193)
5. Fluency
Mean MI
54.21
45.85
98.14
81.69
30.67
19.72
109.64
22.31
132.08
43.71
108.07
(CR = 6.84)
-1 Critical Ratio
6.19""
7 34**
7 68**
6.75**
644*' -- -
2 83**
6.55""
6.91"*
6.84*"
1.38
SO
11.74
15.95
22.76
17.32
21.26
10.88
35.39
9.36
42.21
5.37
18.6
--- Average
Achievement Group IAA) (N = 176)
(CR = 6.75)
1 0 0 . 4 6 k ~ t 4 ~ ] -- - --
Mean M2
45.34
35.16
81.22
70.75
19.66
16.52
90.21
16.04
106.58
42.88
6 . Verbal Scientific creativity (CR = 6.55)
--.
SO 6 2
15.36
11.89
19.54
7372
10.52
10 81
20.14
8.06
28.68
6.09
128 Analysis of Data
7. Flexibility (CR = 6.44)
8. Verbal Intelligence (CR = 6.19)
9. Home Environment (CR = 4.07)
1 0. Originality (CR = 2.83)
(ii) All these differences are significant well beyond 0.01 level. It means that
the mean scores of High and Average Achievement groups of Urban
subjects differ significantly with respect to the above-mentioned
variables. The difference is not significant for the variable Achievement
Motivation
(CR = 1.38; p 0.05). This indicates that the High and Average
Achievement groups of Urban subjects do not differ significantly with
respect to their Achievement Motivation.
4. I. 1 .I 4 Comparison of the Average and Low Achievement Groups (Urban)
The statistical data used and the results of the 'tl-test of significance for
the independent variables are given in Table 4.14.
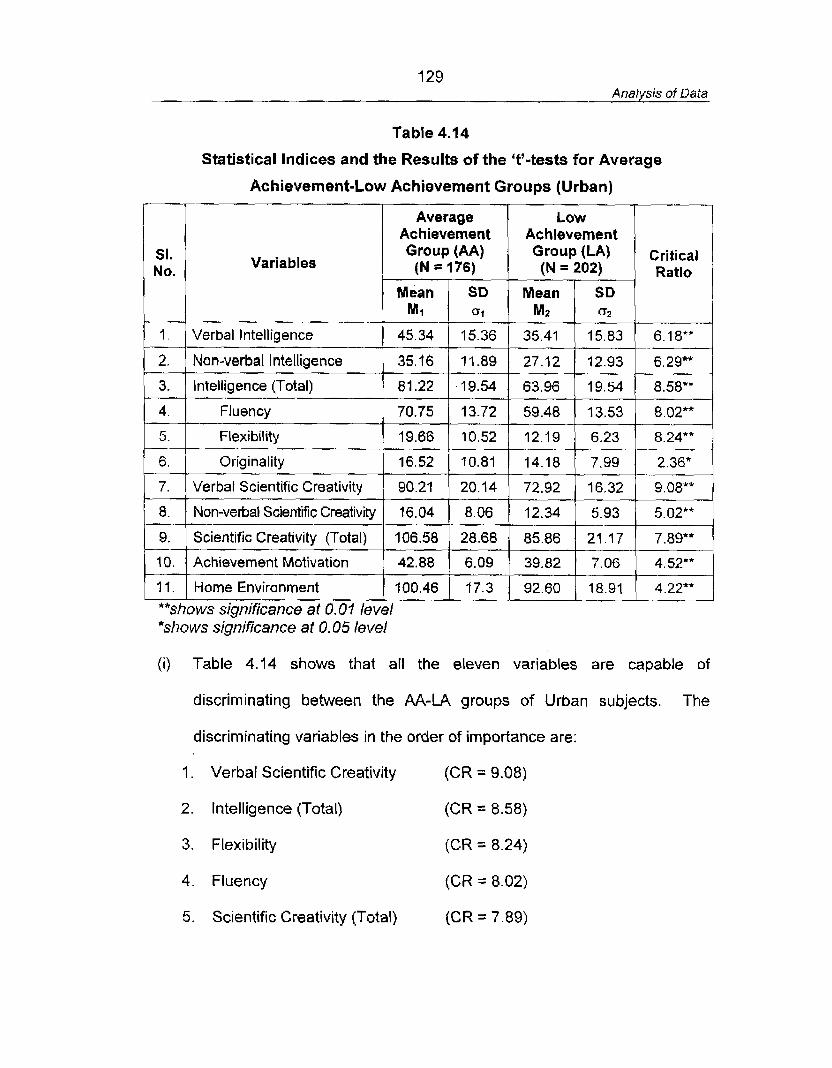
129 Analysis of Data
Table 4.14
Statistical Indices and the Results of the 't'-tests for Average
Achievement-Low Achievement Groups (Urban)
No. 1 Variables
I A ~ ~ . " ~ ~ ~ n t 1 Achievement 1 1 ( Mean 1 SD ) Mean ] SD [ 1
Group (AA) (N = 176)
1. 1 Verbal Intelligence 1 45.34 1 15.36 1 35.41 1 15.83 1 6.18*' 1 TINOR-verbal Intelligence i 35.16 i 11.89 j 27.12 / ~ i 1 - 6 . 2 9 . ~ 1
Group (LA) (N = 202)
Flexibility 19.66 10.52 12.19 6.23 -- -- Originality 16.52 10.87 14.d8 7.99
Critical Ratio
7. Verbal Scientific Creativity 90.21 20.14 72.92
8. Non-verbal Scientific Creativity 16.04 8.06 1 2.34 5.93
9. Scientific Creativity (Total) 106.58 28.68 85.86
10. Achievement Motivation 42.88 6.09 39.82
1 I. Home Environment 900.46 17.3 92.60
**shows significance at 0. O? level *shows significance at 0.05 level
(i) Table 4.14 shows that all the eleven variables are capable of
discriminating between the AA-LA groups of Urban subjects. The
discriminating variables in the order of importance are:
1. Verbal Scientific Creativity (CR = 9.08)
2. Intelligence (Total) (CR = 8.58)
3. Flexibility (CR = 8.24)
4. Fluency (CR = 8.02)
5. Scientific Creativity (Total) (CR = 7.89)
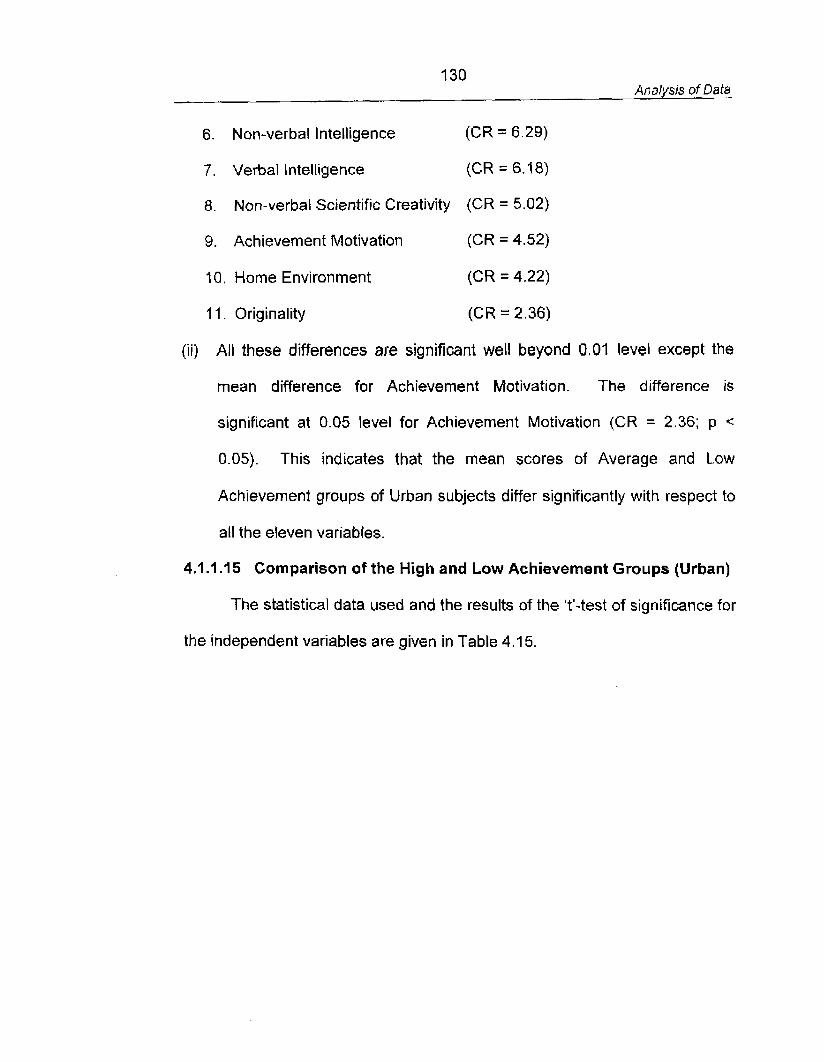
130 Analysis of Data
6 . Non-verbal Intelligence (CR = 6.29)
7 . Verbal Intelligence (CR = 6.18)
8. Non-verbal Scientific Creativity {CR = 5.02)
9. Achievement Motivation (CR = 4.52)
10, Home Environment (CR = 4.22)
11. Originality (CR = 2.36)
{ i i ) All these differences are significant well beyond 0,01 level except the
mean difference for Achievement Motivation. The difference is
significant at 0.05 level for Achievement Motivation (CR = 2.36; p <
0.05). This indicates that the mean scores of Average and Low
Achievement groups of Urban subjects differ significantly with respect to
all the eleven variables.
4.1.1 . I 5 Comparison of the High and Low Achievement Groups (Urban)
The statistical data used and the results of the ?'-test of significance for
the independent variables are given in Table 4.1 5.
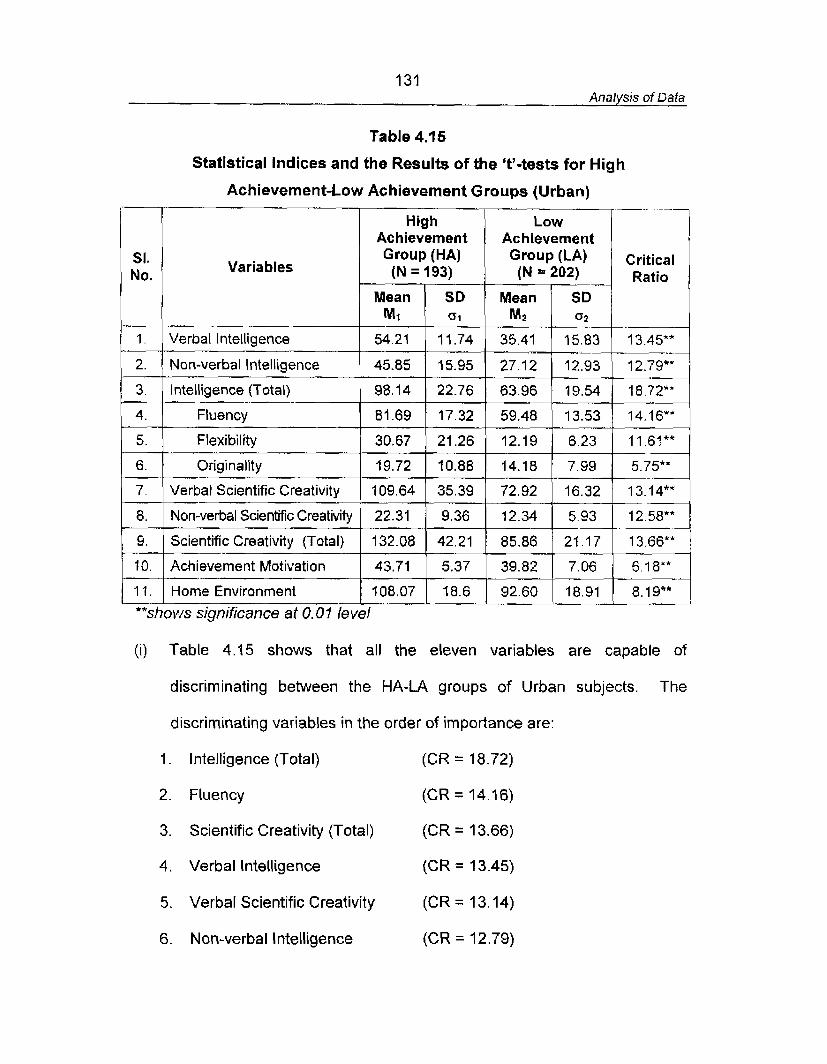
131 Analysis of Dafa
Table 4.15
Statistical Indices and the Results of the 't'-tests for High
Achievement-low Achievement Groups (Urban)
Variables
High Achievement
Low Achievement
I Group (HA) (N = 193)
I
- - -1 1
Group (LA) Critical IN = fO2I 1 Ratio 1 -
Mean
I I I 1 I
**shows significance at 0.01 level
SD
1. - 2.
3.
4.
5.
(i) Table 4.15 shows that all the eleven variables are capable of
discriminating between the HA-LA groups of Urban subjects. The
discriminating variables in the order of importance are:
7 . Intelligence (Total) (CR = 18.72)
2. Fluency (CR = 14.16)
3. Scientific Creativity (Total) (CR = 13.66)
4. Verbal Intelligence (CR = 13.45)
5. Verbal Scientific Creativity (CR = 13.14)
6. Non-verbal Intelligence (CR = 12.79)
MI GI , 1 Verbal Intelligence
Non-verbal Intelligence
Intelligence (Total)
Fluency
Flexibility
Originality
Verbal Scientific Creativity
8. Non-verbal Scientific Creativity
Scientific Creativity (Total)
70. Achievement Motivation
1 1. Home Environment
54.21
45.85
98.14
81.69
30.67
19.72
109.64
22.31
132.08
43.71
108.07
11.74
15.95
22.76
17.32
21.26
10.88
35.39
9.36
42.21
5.37
18.6
35.41
27.12
63.96
59.48
12.19
14.18
72.92
12.34
85.86
39.82
92.60
15.83 - 12.93
19.54
13.53
6.23
13.45**
12.79** --
18.72**
14.16**
11.61**
7.99 5 . 7 s "
16.32 1 3-14""
5.93
21.17
7.06
18.91 8.19""
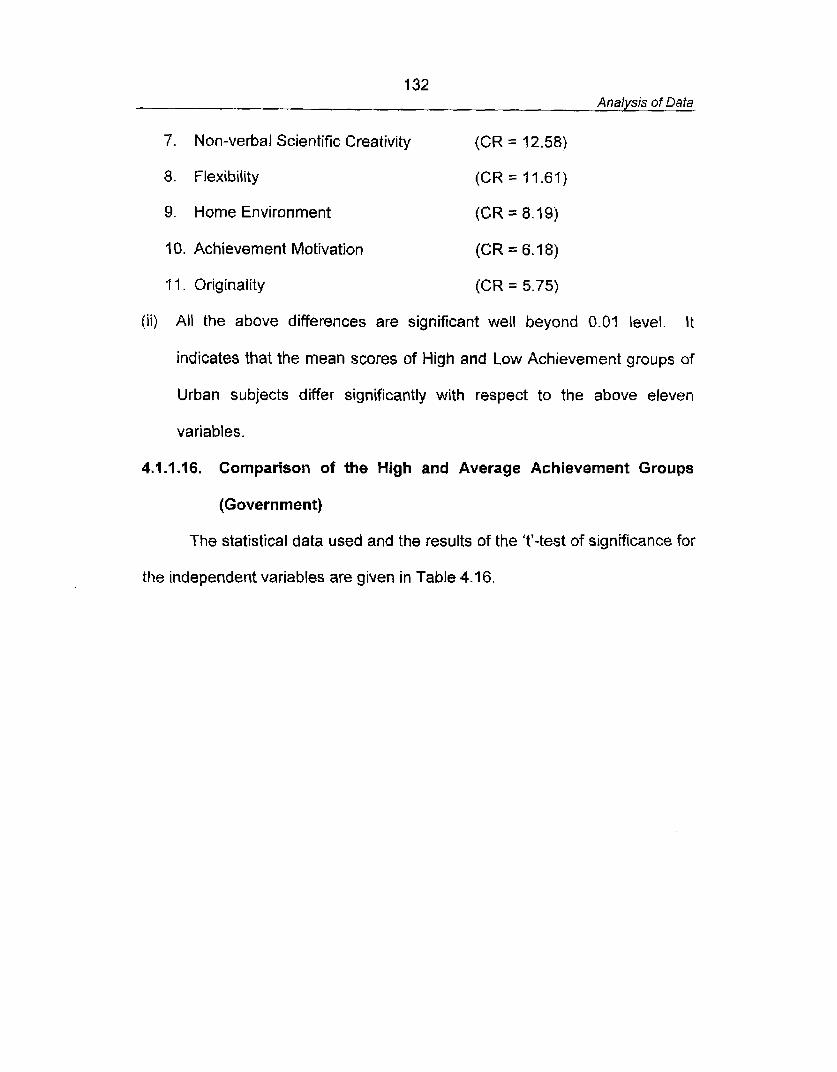
132 Analysis of Data
7. Non-verbal Scientific Creativity (CR = 12.58)
8. Flexibility (CR = 11.61)
9. Home Environment (CR = 8.19)
10. Achievement Motivation (CR = 6.18)
11. Originality (CR = 5.75)
( i i ) All the above differences are significant well beyond 0.01 level. It
indicates that the mean scores of High and Low Achievement groups of
Urban subjects differ significantly with respect to the above eleven
variables.
4.1.1.16. Comparison of the High and Average Achievement Groups
(Government)
The statistical data used and the results of the 't'-test of significance for
the independent variables are given in Table 4.16.
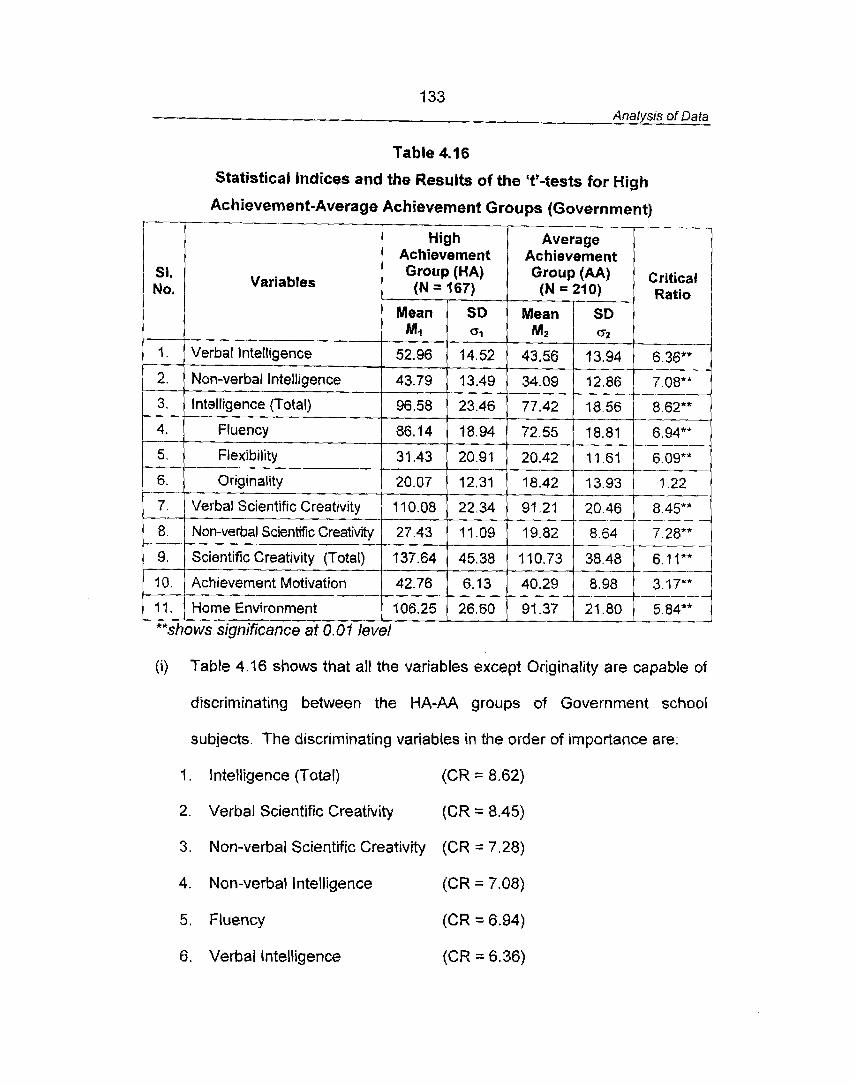
133 Analysis of Data
Table 4.16
Statistical Indices and the Results of the "'--tests for High
Achievement-Average Achievement Groups (Government)
-1--- No. =I. 1 Varia hles
Mean SD Mean SD
3. Intelligence (Total) 96.58 23.46 77.42 18.56 8.62**
4. Fluency 86.14 18.94 72.55 18.81 6.94**
5. Flexibility
Group (HA) (N = 167)
6. Originality 20.07 12.31 18.42 13.93
7. Verbal Scientific Creatrvity 110.08 22.34 91.21 20.48 8.45** - -- 8. Non-verbal Scientific Creativity 27.43 I 1.09 19.82 8.64
. - . - - - - - 9. Scientific Creativity (Total) 137.64 45.38 I 10.73 38.48 6.1 I**
10. Achievement Motivation 42.76 6.13 40.29 8.98 3. 7 7**
11. Home Environment 106.25 26.60 91.37 21.80 5.84"'
**shows significance af 0. O f level
(i) Table 4.16 shows that all the variables except Originality are capable of
Group (AA) (N = 21 0)
discriminating between the HA-AA groups of Government school
Critical Ratio
subjects. The discriminating variables in the order of importance are:
I . InteHigence (Total) (CR = 8.62)
2. Verbal Scientific Creativity (CR = 8.45)
3. Non-verbal Scientific Creativity (CR = 7.28)
4. Non-verbal Intelligence (CR = 7.08)
5 . Fluency (CR = 6.94)
6. Verbal Intelligence (CR = 6.36)
1 34 Analysis of Data
7. Scientific Creativity (Total) (CR = 6.1 1)
8. Flexibility (CR = 6.09)
9. Home Environment (CR = 5.84)
10. Achievement Motivation (CR = 3.17)
(ii) All these differences are significant well beyond 0.07 level. It indicates
that the mean scores of High and Average Achievement groups of
Government subjects differ significantly with respect to the above the
variables. The difference is not significant for Originality (CR = 1.22;
p > 0.05). It shows that the mean scores of High and Average
Achievement groups are almost identical with respect to their Originality.
4.1.1.17 Comparison of the Average and Low Achievement Groups
(Government)
The statistical data used and the results of the 't'-test of significance for
the independent variables are given in Table 4.1 7.
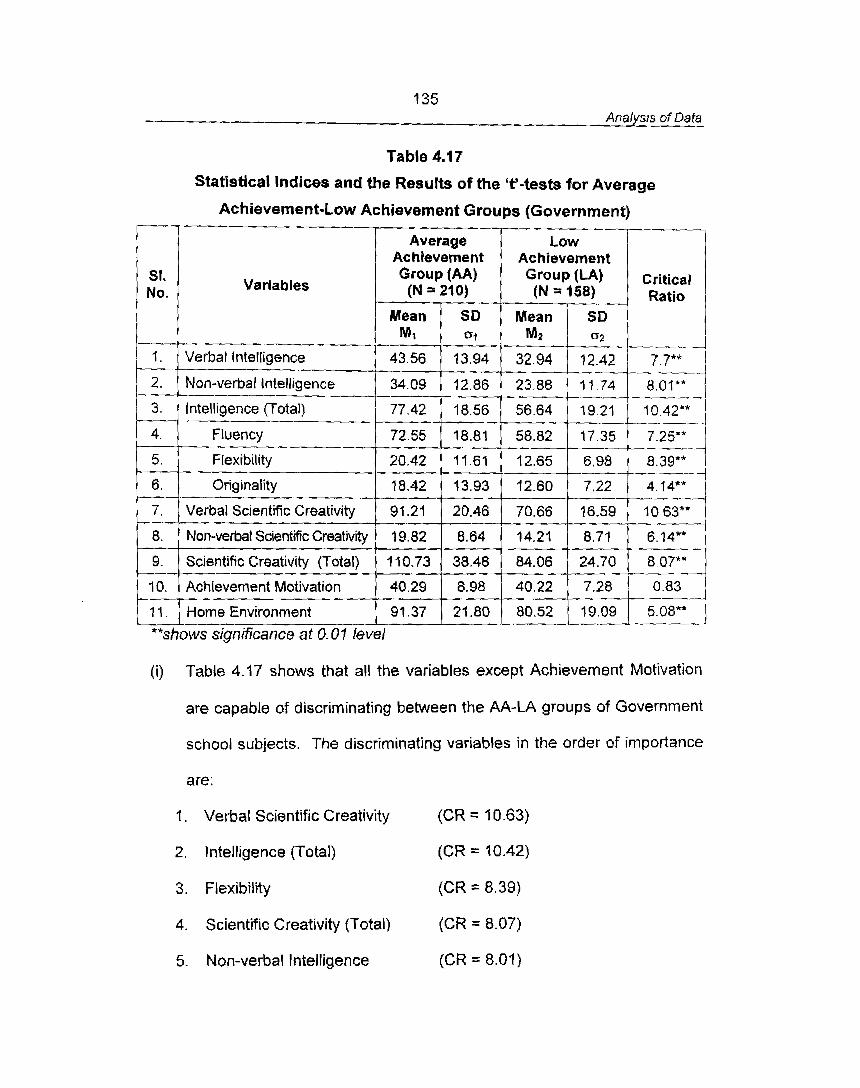
135 Analysts of Data
Table 4.1 7
Statistical Indices and the Results of the 't'-tests for Average
(i) Table 4.17 shows that all the variables except Achievement Motivation
Achievement-Low Achievement Groups (Government)
are capable of discriminating between t he AA-LA groups of Government
St. No.
I .
2.
3.
4.
5.
6 .
7.
8.
9.
10.
11.
**shows
school subjects. The discriminating variables in the order of importance
are:
Variables
Verbal Intelligence - Non-verbal intelligence
Intelligence (Total)
Fluency
Flexibility
Originality
Verbal Scientific Creativity
Non-verbal Scientfic Creativity
Scientific Creativity (Total)
Achievement Motivation
Home Environment
significance at 0.07 level
I. Verbal Scientific Creativity (CR = 10.63)
2, Intelligence (Total)
3. Flexibility
Average Achievement Group (AA) (N = 210)
4. Scientific Creativity (Total)
Mean M I 43.56
34.09
77.42
72.55
20.42
18.42
94.21
19.82
110.73
40.29
91.37
(CR = 10.42)
Critical Ratio
- -'I -.
7.7"*
8.0IW* ---- 10.42**
-------- .
7.25** -- -
8.39** -- -
4.14** - -,-
10.63**
6,14**
8.07"*
0.83 --- 5.08*" - - - , - -
SD at
13.94
12.86
18.56
18.81
11.61
13.93
20.46
8.64
38.48
8.98
21.80
Low Achievement Group (LA) (N = 158)
(CR = 8.39)
Mean Mz
32.94
23.88
56.64
58.82
12.65
12.60
70.66
d4.21
84.06
40.22
80.52
(CR = 8.07)
SD 132
12.42
11.74
19.21
17.35 - 6.98
7.22
16.59
8.71
24.70
7.28
19.09 -
5. Non-verbal Intelligence (CR = 8.01)
136 Analysis of Data
6 . Verbal Intelligence (CR = 7.70)
7. Fluency (CR = 7.25)
8. Non-verbal Scientific Creativity (CR = 6.14)
9. Hame Environment (CR = 5.08)
10. Originality (CR = 4.14)
(ii) All these differences are significant well beyond 0.07 level. It indicates
that the mean scores of Average and Low Achievement groups of
Government subjects differ significantly with respect to the above the
variables. The mean difference is not significant for the variable
Achievement Motivation. It shows that the mean scores of Average and
Low Achievement group of Government subjects do not differ
significantly with respect to their Achievement Motivation.
4.1.1.18 Comparison of the High and Low Achievement Groups
(Government)
The statistical data used and the results of the ?'-test of significance far
the independent variables are given in Table 4.18.
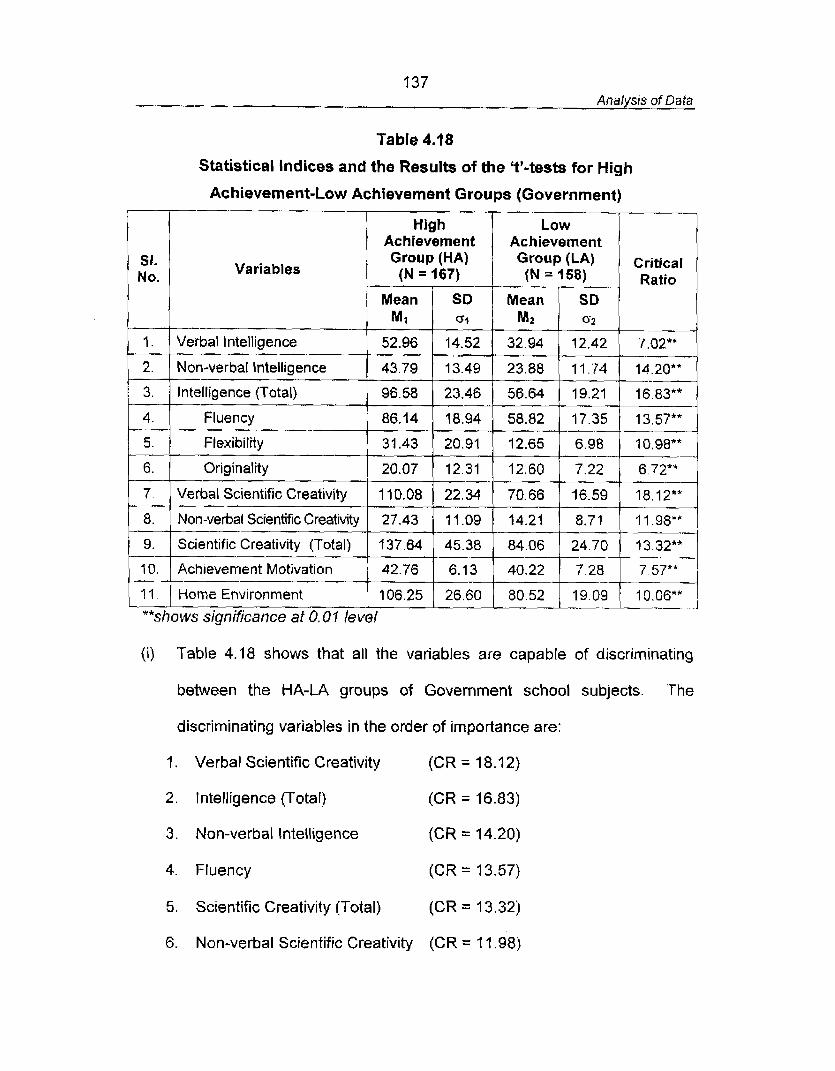
137 Analysis of Dafa
Table 4.18
Statistical Indices and the Results of the 't'-tests for High
Achievement-Low Achievement Groups (Government)
i High Achievement Achievement
No. S I - 1 Variables Group (HA)
- -
(i) Table 4.18 shows that all the variables are capable of discriminating
1.
2.
3.
4.
5.
between the HA-LA groups of Government school subjects. The
discriminating variables in the order of importance are:
1 . Verbal Scientific Creativity (CR = 18.12)
1 Mean
2. Intelligence (Total) (CR = 16.83)
SO a1
14.52
13.49
23.46
18.94
20.91
Verbal Intelligence
Non-verbal Intelligence
Intelligence (Total)
Fluency
Flexibility
originality
7. Verbal Scientific Creativity
8. Non-verbal Scientific Creativity
Scientific Creativity (Total)
10. Achievement Motivation
11 Home Environment
3. Non-verbal Intelligence (CR = 14.20)
"*shows significance at 0.04 level
72.3,
22.34
1 1.09
45.38
6.13
26.60
M 1
52.96
43.79
96.58
86.14
31.43
20.07
1 10.08
27.43
f 37.64
42.76
106.25
4. Fluency (CR = 13.57)
Mean Mz
32.94
23.88
56.64
58.82
12.65
5. Scientific Creativity (Total) (CR = 13.32)
12.60
70.66
14.21
84.06
40.22
80.52
6 . Non-verbal Scientific Creativity (CR = 11.98)
SD (52
12.42
11.74
19.21
17.35
6.98
7.02**
14.20**
16.83**
13.57**
10.98**
7.22
16.59
8.7 1
24.70
7.28
19.09 -- 6.7*:1
18.12**
I 1.98**
73.32""
- 7 57**
10.06**
138 Analysis of Data
7. Flexibility (CR = 10.98)
8. Home Environment (CR = 10.06)
9. Achievement Motivation (CR = 7.57)
10. Verbal Intelligence (CR = 7.02)
1 I. Originality (CR = 6.72)
(ii) All these differences are significant well beyond 0.09 level. It indicates
that the mean scores of High and Low Achievement groups of
Government school subjects differ significantly with respect to all the
eleven variables.
4 1 .I 9 Comparison of the High and Average Achievement Groups
(Private)
The statistical data used and the results of the 't'-test of significance for
the independent variables are given in Table 4.19.
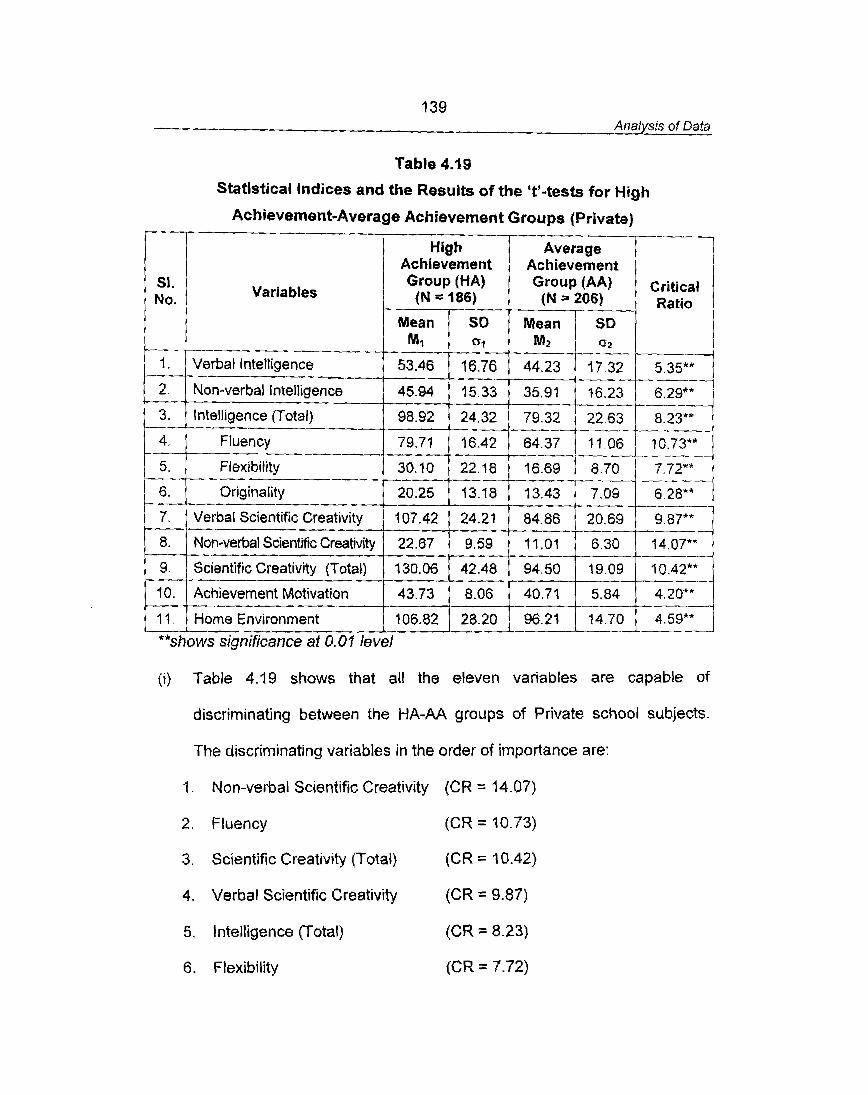
139 - Analysis of Data
Table 4.19
Statistical Indices and the Results ofthe 'P-tests for High
( i ) Table 4.19 shows that all the eleven variables are capable of
Achievement-Average Achievement Groups (Private)
discriminating between the HA-AA groups of Private school subjects.
Sl. No.
---.
1.
2.
3.
4.
5.
6.
7.
8.
9.
10.
1 1.
**shows
The discriminating variables in the order of importance are:
1 . Non-verbal Scientific Creativity (CR = 14.07)
Variables
Verbal Intelligence
Nan-verbal Intelligence
Intelligence (Total)
Fluency
Flexibility
Originality
Verbal Scientific Creativity
Non-verbal Scientific Creativity
Scientific Creativity (Total)
Achievement Motivation
Home Environment significance at 0.01 level
2. Fluency (CR = 10.73)
3. Scientific Creativity (Total) (CR = 10.42)
High Achievement Group (HA) (N = 186)
4. Verbal Scientific Creativity (CR = 9.87)
Mean MI
53.46
45.94
98.92
79.71
30.10
20.25
107.42
22.67
130.06
43.73
106.82
5. Intelligence (Total)
Critical . Ratio
--- 5.35**
6.29**
8.23** -----
10.73** -- -
7.72%"
6.28*" -- 9.87** ---
7 4.07*"
10.42**
4.20**
4.59** .----
SO 0 1
16.76
15.33
24.32
16.42
22.18
j3.18
24.21
9.59
42.48
8.06
28.20
Average Achievement Group (AA) {N = 206)
(CR = 8.23)
Mean M2
44.23
35.91
79.32
64.37
16.69
13.43
84.86
1 1 -0.1
94.50
40.71
96.27
6 . Flexibility
SD a2
17.32
16.23
22.63
11.06 ..-.
8.70
7.09
20.69
6.30
19.09
5.84
14.70
(CR = 7.72)
140 - Analysis of Data
7 . Non-verbal Intelligence (CR = 6.29)
8. Originality (CR = 6.28)
9. Verbal Intelligence (CR = 5.35)
10. Home Environment (CR = 4.59)
11, Achievement Motivation (CR = 4.20)
(ii) All these differences are significant well beyond 0.01 level. It shows that
the mean scores of High and Average Achievement groups of Private
school subjects differ significantly with respect to the above eleven
variables.
4.1.1.20 Comparison of the Average and Low Achievement Groups
(Private)
The statistical data used and the results of the 't'-test of significance for
the independent variables are given in Table 4.20.
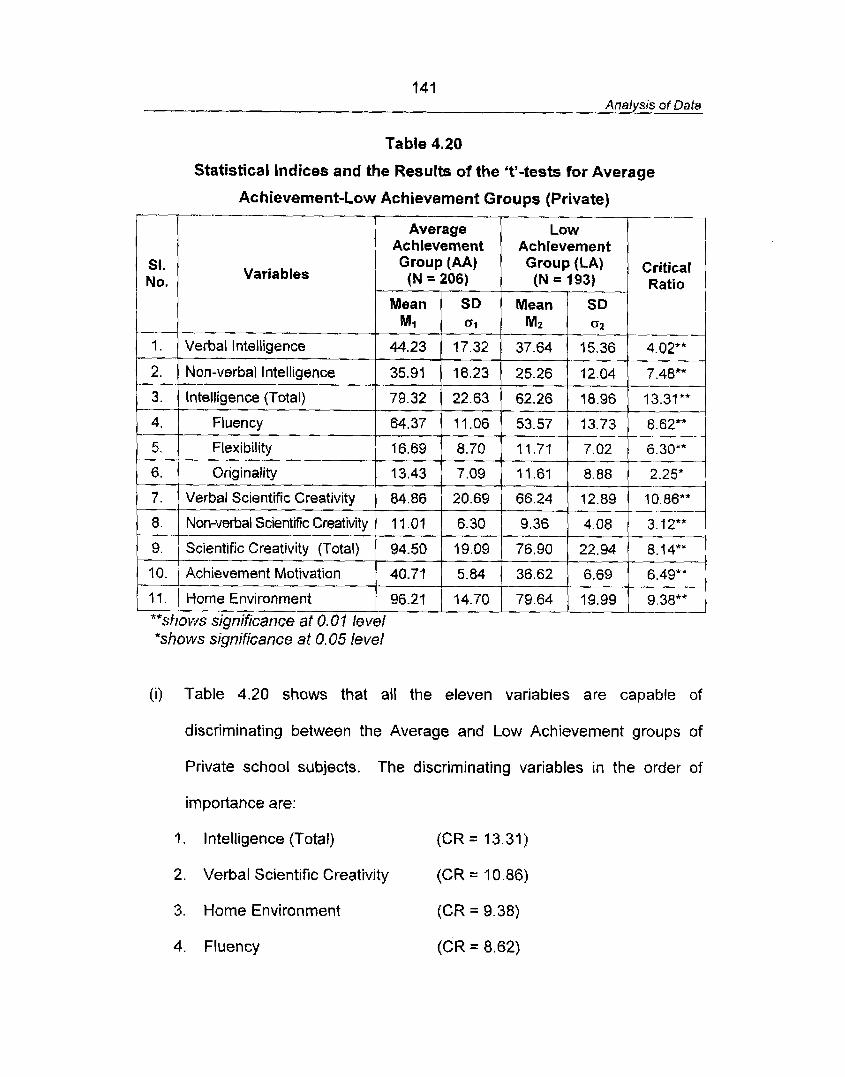
14 1 Analysis of Data
Table 4.20
Statistical Indices and the Results of the 9'-tests for Average
Achievement-Low Achievement Groups (Private)
r 1---
(i) Table 4.20 shows that all the eleven variables are capable of
SI. No.
- 1.
2.
3,
discriminating between the Average and Low Achievement groups of
Private school subjects. The discriminating variables in the order of
Variables
Verbal Intelligence
Non-verbal Intelligence
lntelligence(Total)
importance are:
Fluency
Flexibility
Originality
Scientific Creativity
Scientific Creativity
(Total)
1, lntelligence (Total) (CR = 13.31)
2. Verbal Scientific Creativity (CR = 10.86)
**shows significance at 0.01 level *shows significance at 0.05 level
Group (AA) (N = 206)
3. Home Environment (CR = 9.38)
Mean M1
44.23
35.91
79.32
64.37
16.69
13.43
84.86
1 1.01
94.50
40.71
96.21
4. Fluency
Critical Ratio
4.02**
7.48'"
13.31**
SD fl1
17.32
16.23
22.63
11.06
8.70
7.09
20.69
6.30
19.09
5.84
14.70
Group(LA) (N = 193)
(CR = 8.62)
8.62**
6.30**
2.25' ': 10.86**
3.12**
8.14**
6.49"' -,
9.38**
Mean Mz -
37.64
25.26
62.26
53.57
SO n2
'l5.36
12.04
18.96
13.73
11.71
11.61
66.24
9.36
76.90
36.62
79.64
7.02
8.88
12.89
4.08
22.94
6.69
19.99
142 Analysis of Data
5. Scientific Creativity (Total) (CR = 8.14)
6. Non-verbal Intelligence (CR = 7.48)
7. Achievement Motivation (CR = 6.49)
8. Flexibility (CR = 6.30)
9. Verbal Intelligence (CR = 4.02)
10. Non-verbal Scientific Creativity (CR = 3.12)
11. Originality (CR = 2.25)
(ii) All the differences are significant well beyond 0.01 level except for
originality. The mean difference for originality is significant only at 0.05
level (CR = 2.25; p 4 0.05). This shows that the mean scores of Average
and Low Achievement groups of Private school subjects differ
significantly with respect to the above eleven variables.
4.1.'l.21 Comparison of the High and Low Achievement Groups
(Private)
The statistical data used and the results of the 'ti-test of significance for
the independent variables are given in Table 4.21
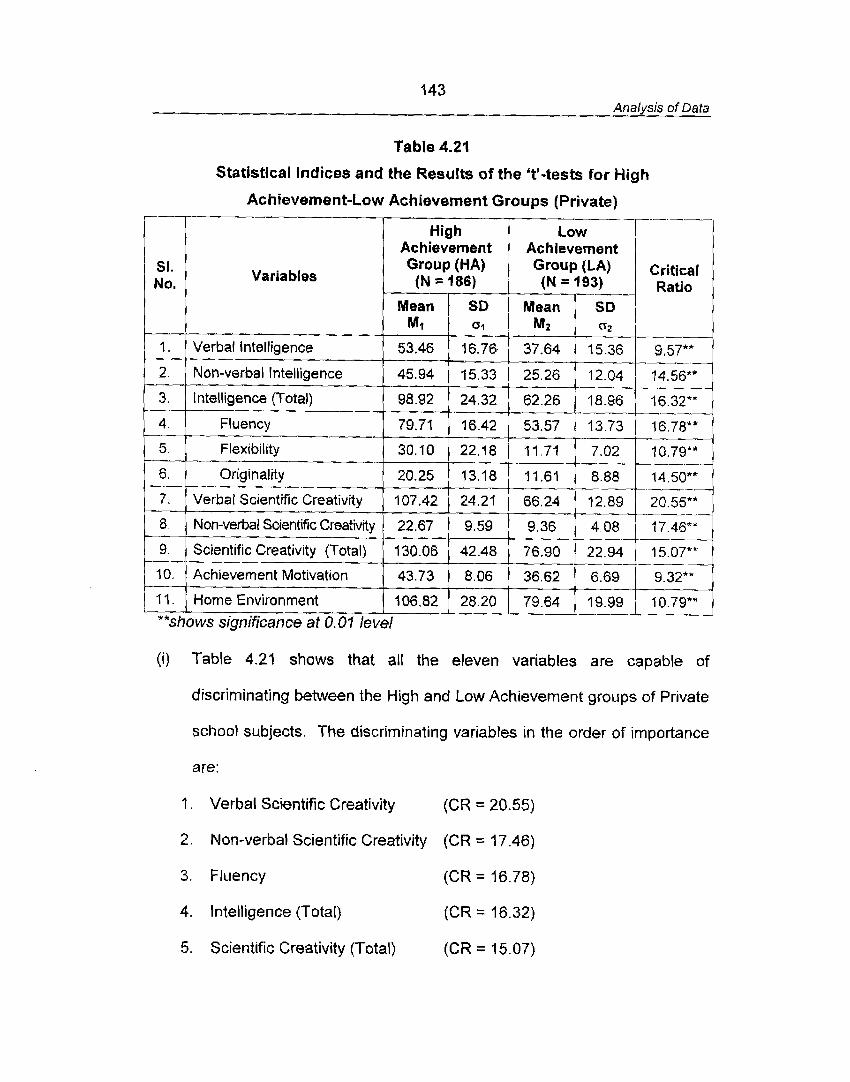
143 Analysis of Data
Table 4.21
Statistical indices and the Results of the 't'-tesl for High
Ac hievement-Low Achievement Groups (Private)
1 Achievement High I Achievement
Variables
( i ) Table 4.21 shows that all the eleven variables are capable of
discriminating between the High and Low Achievement groups of Private
school subjects. The discriminating variables in the order of importance
are:
1. Verbal Scientific Creativity (CR = 20.55)
2. Nun-verbal Scientific Creativity (CR = j7.46)
3. Fluency (CR = 16.78)
4, Intelligence (Total) (CR = 76.32)
5. Scientific Creativity (Total) (CR = 15.07)
144 Analysis of Data
6. Non-verbal Intelligence (CR = 14.56)
7. Originality (CR = 14.50)
8. Home Environment (CR = 10.79)
9. Flexibility (CR = 10.79)
t 0. Verbal Intelligence (CR = 9.57)
11. Achievement Motivation (CR = 9.32)
(ii) All these differences are significant well beyond 0.01 level. This
indicates that the mean scores of High and Low Achievement groups of
Private school subjects differ significantly with respect to the above
eleven variables.
4.2 CORRELATION ANALYSIS
The 't'-tests discussed above are evidences of the direct or indirect
relationship between the variables. Confirmatory evidences of these
associations are desirable to interpret the obtained findings of 'tZ-tests with
greater confidence. Accordingly, the extent and nature of the association
between the select experimental variables has been worked out using the Karl
Pearson's Product Moment Correlation Method.
The correlations were scrutinised for significance against the null
hypothesis (r = 0). It was examined to see whether the obtained 'r's could be
treated as significant. The absolute value of ' r ' should exceed I/& x 2.58 for
significance at 0.01 level and I / dN x 1.96 for significance at 0.05 level.
Hence, the limits obtained are as follows:
745 Analysis of Data
(i) For the Total sample (N = ? 720), limit for significance at 0.01 level is
0.0770 and at 0.05 level is 0.0585.
( i i ) For Boys (N = 557), limit for significance at 0.01 level is 0.q094 and at
0.05 level is 0.0830.
(iii) For Girls (N = 563), limit for significance at 0.01 level is 0.1087 and at
0.05 level is 0.0826.
(iv) For Rural sample (N = 571), limit for significance at 0.01 level is
0.1 101 and at 0.05 level is 0.0820.
(v) For Urban sample (N = 549), limit for significance at 0.01 level is
0.1079 and at 0.05 level is 0.0836.
(vi) For Government school sample (N = 535), limit for significance at
0.01 level is 0.1115 and at 0.05 level is 0.0847.
(vii) For Private school sample (N = 585), limit for significance at 0.01
level is 0.1067 at 0.0j level and at 0.05 level is 0.081.
(viii) For High Achievement group (N = 353), limit for significance at 0.01
level is 0.1373 and at 0.05 level is 0.1043.
(ix) For Average Achievement group (N = 416), limit for significance at
0.01 level is 0.1265 and at 0.05 level is 0.0960.
(x) For Low Achievement group (N = 351), limit for significance at 0.01
level is 0.1377 and at 0.05 level is 0.1046.
The Q.O1 confidence intervat denotes the interval outside which the
population 'r' would lie at the specified level of probability, viz., 0.01 level. The
0.01 confidence interval of 'r' is r& 2.58 SEr, which means that the probability
146 Analysis of Data
of 0.02 that the population 'r' falls outside the interval r + 2.58 SEr and the
probability is 0.99 that it lies within this interval.
The percentage variance (showing the overlap of the two variables) is
a n index that is helpful in understanding the extent of association between the
variables. It gives an indication of the amount of overlap of a variablg with the
other variable in respect of its total variance. The percentage variance
common to the two variables is given by ? x 100.
Correlation analysis is done under the following heads:
4.2.1 Coefficients of Correlation between Achievement in Science and
lndependent Variables
4.2.2 Coefficients of Correlation between tndependent Variables
4.2.1 Coefficients of Correlation between Achievement in Science and
Independent Variables
The relationship between Achievement in Science and Independent
variables namely, Intelligence, Scientific Creativity, Achievement Motivation
and Home Environment are discussed here.
4.2.1.4 Relationship between Achievement in Science and Intelligence
The relationship between Achievement in Science and Verbal
Intelligence, Non-verbal intelligence and intelligence are given in the following
tables:
I. Relationship between Achievement in Science and Verbal Intelligence
Table 4.22 shows the correlations between Achievement in Science
a n d Verbal Intelligence for the Total sample and relevant subsamples.
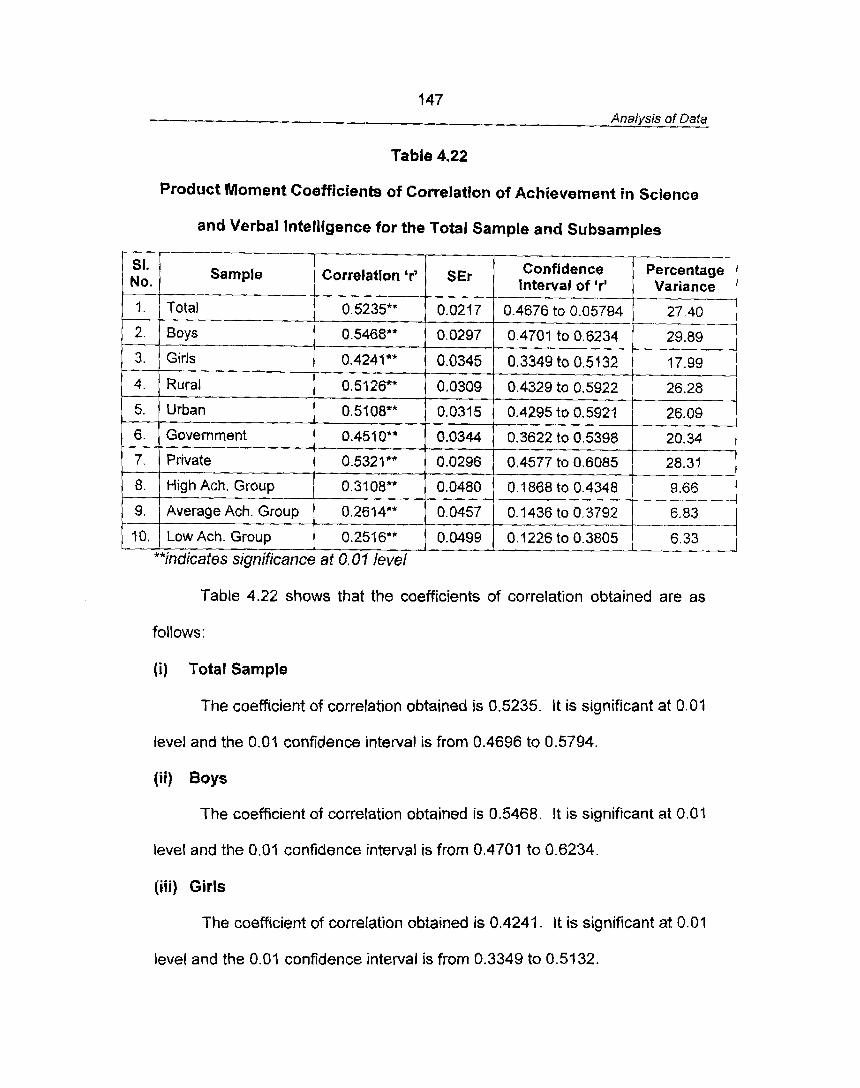
147 Analysis of Data
Table 4.22
Product Moment Coefficients of Correlation of Achievement in Science
and Verbal Intelligence for the Total Sample and Subsamples
-.
Confidence 1 . 1 Sample / Correlation / SEI I of ,r, Variance I Percentage I
Table 4.22 shows that the coefficients of correlation obtained are as
follows:
( i ) Total Sample
The coefficient of correlation obtained is 0.5235. It is significant at 0.0A
level and the 0.01 confidence interval is from 0.4696 to 0.5794.
( i i ) Boys
The coefficient of correlation obtained is 0.5468. It is significant at 0.01
level and t h e 0.01 confidence interval is from 0.4701 to 0.6234.
(iii) Girls
The coefficient of correlation obtained is 0.4241. It is significant at 0.07
level and the 0.0q confidence interval is from 0.3349 to 0.51 32.
I .
2.
3.
4.
5.
6.
7.
8.
9.
10.
**indicates significance at 0.07 level
- Total - Boys
Girls
Rural
Urban
Government
Private
High Ach. Group
Average Ach. Group
Low Ach. Group
0.5235**
0.5468**
0.4241 *"
0.5126**
0.5108**
0.451 0**
0.5321 **
0.3108**
0.2614**
0.2516**
0.02j 7
0.0297
0,0345
0.0309
0.0315
0.0344
0.0296
0.0480
0.0457
0.0498
. -
0.4676 to 0.05794 ,
0.4701 to 0.6234
0.3349 to 0.5132
0.4329 to 0.5922
0.4295 to 0.5921
0.3622 to 0.5398
0.4577 to 0.6085
0.1868to0.4348
0.1436 to 0.3792
.----
27.40 -----
29.89 - 17.99
- 26.28
26.09
20.34
28.31 --- 9.66
6.83
0.1226 to 0.3804- 6 3 3 -
'148 Analysis of Data
(iv) Rural Subjects
The coefficient of correlation obtained is 0.5126. It is significant at 0.01
level and the 0.01 confidence intewal is from 0.4329 to 0.5922.
(v) Urban Subjects
The coefficient of correlation obtained is 0.5108. It is significant at 0.01
level and the 0.01 confidence interval is from 0.4295 to 0.5921.
(vi) Government School Subjects
The coefficient of correlation obtained is 0.451 0. It is significant at 0.01
level and the 0.01 confidence interval is from 0.3622 to 0.5398.
(vii) Private School Subjects
The coefficient of correlation obtained is 0.5321. It is significant at 0.01
level and the 0.01 confidence interval is from 0.4577 to 0.6085.
(viii) High Achievement Group
The coefficient of correlation obtained is 0.3108. It is significant at 0.01
level and the 0.01 confidence interval is from 0.1868 to 0.4348.
(ix) Average Achievement Group
The coefficient of correlation obtained is 0.2614. It is significant at 0.01
level and the 0.07 confidence interval is from 0.1436 to 0.3792.
(x) Low Achievement Group
The coefficient of correlation obtained is 0.2516. It is significant at 0.01
level and the 0.0q confidence interval is from 0.1226 to 0.3805.
The following results show that Verbal Intelligence has a determining
influence on one's Achievement in Science:
149 Analysis of Data
Interpretations
(a) For all samples, the coefficients of correlation obtained are significant
at 0.04 level.
fb) The coefficients of correlation obtained are in the range of 0.2516 to
0.5468. The correlation is substantial or marked for the Total sample
and subsamples of Boys, Girls, Rural, Urban, Government and
Private school subjects. The correlation is low for the three
achievement groups.
(G) All the obtained 'r' values are positive showing that any increase or
decrease in verbal intelligence will be followed by a corresponding
increase or decrease in Achievement in Science.
(d) The 0.02 confidence interval show the probable range of the
corresponding population values.
(e) Considering the correlations are caused by common elements in both
the variables as indicated by common shared variances, it may be
said that nearly 27 percent of the variance of Achievement in Science
is attributable to the variance in Verbal Intelligence of the subjects. In
terms of common shared variance, the maximum overlap of
Achievement in Science with Verbal Intelligence is about 30 percent
while t he minimum overlap is nearly 6 percent.
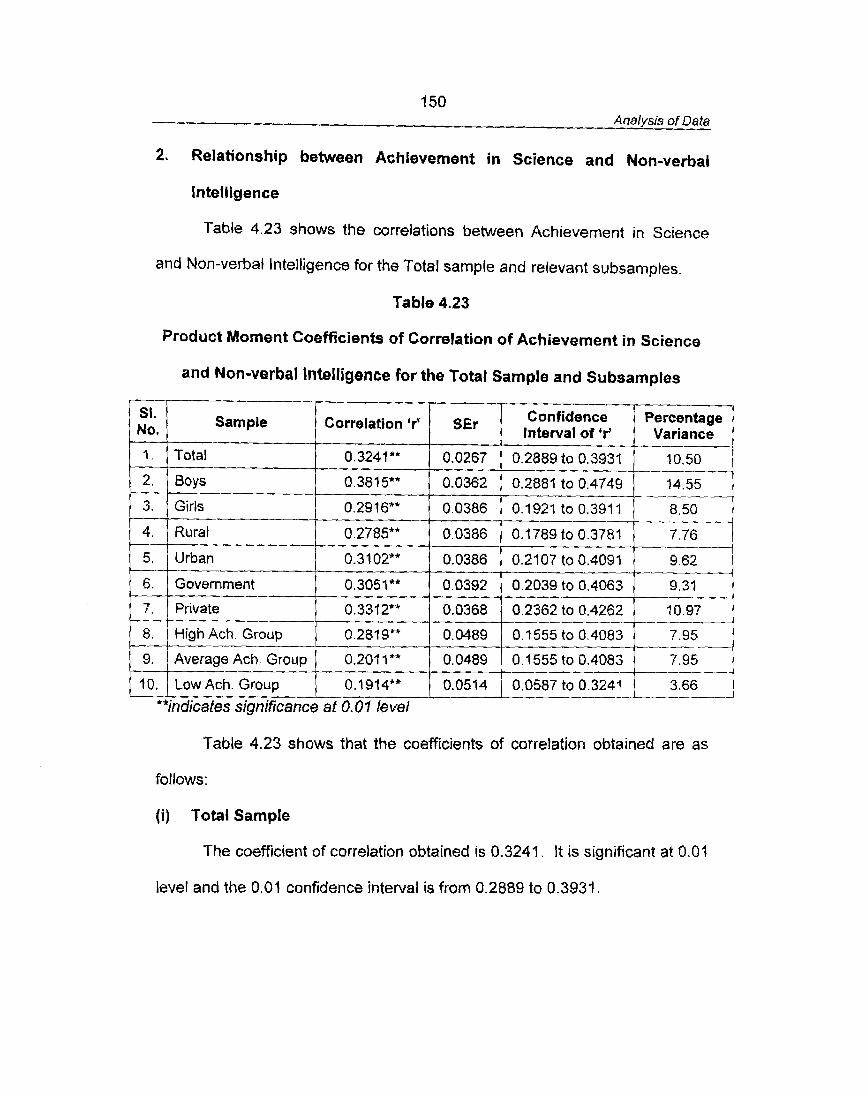
150 Analysis of Data
2. Relationship between Achievement in Science and Non-verbal
Intelligence
Table 4.23 shows t h e correlations between Achievement in Science
and Non-verbal Intelligence for the Total sample and relevant subsamples.
Table 4.23
Product Moment Coefficients of Correlation of Achievement in Science
and Non-verbal Intelligence for the Total Sample and Subsamples
Correlation 'r'
Table 4.23 shows that the coefficients of correlation obtained are as
follows:
(i) Total Sample
The coefficient of correlation obtained is 0.3241. It is significant: at 0.0?
level and the 0.07 confidence interval is from 0.2889 to 0.3931.
1.
2.
3.
4.
5.
6.
7. - 8. - 9.
10.
SET Interval of 'r' Variance
**indicates significance at 0.01 le vet
Total
Boys
Girls
Ruraf
Urban
Government
Private
High Ach. Group - Average Ach, Group - Low Ach. Group
0.324 1 **
0.381 5**
0.2916** -
0.0267
0.0362
0.0386
0.2785** 7.76
0.2889 to 0.3931:
0.2884 to 0.4749
0.1921 to 0.391 1
0.32 02**
0.3051**
0.3312** -- 0.281 9** - 0.201 1**
0.1914**
10.50
14.55 --
8.50 ---
0.0386
0.0392
0.0368
0.0489
0.0489
0.0514
0.21:07 to 0.4091 .
0.2039 to 0.4063
0.2362 to 0.4262
0.1555 to 0.4083
0.1555 to 0.4083
- 9.62
9.31 - 10.97
---
7.95 --- --
7.95 -----
0.0587 to 0 . 3 2 4 1 1 3.66 1
151 Analysis of Data
( i i ) Boys
The coefficient of correlation obtained is 0.3815. It is significant at 0.01
level and the 0.01 confidence interval is from 0.2881 to 0.4749.
(iii) Girls
The coefficient of correlation obtained is 0.2916. It is significant at 0.01
level and the 0.01 confidence interval is from 0.1921 to 0.391 I.
(iv) Rural Subjects
The coefficient of correlation obtained is 0.2785. It is significant at 0.01
level and the 0.01 confidence interval is from 6.1789 to 0.3781
(v) Urban Subjects
The coefficient of correlation obtained is 0.3 102. It is significant at 0.01
level and the 0.01 confidence interval is from 0.2107 to 0.4091.
(vi) Government School Subjects
The coefficient of correlation obtained is 0.3051. It is significant at 0.01
level and the 0.01 confidence interval is from 0.2039 to 0.4063.
(vii) Private School Subjects
The coefficient of correlation obtained is 0.3312. It is significant at 0.01
level and the 0.01 confidence interval is from 0.2362 to 0.4262.
(viii) High Achievement Group
The coefficient of correlation obtained is 0.2819. It is significant at 0.01
level and the 0.01 confidence interval is from 0.1555 to 0.4083.
152 Analvsis of Data
(ix) Average Achievement Group
The coefficient of correlation obtained is 0.201 1. It is significant at 0.01
level and the 0.01 confidence interval is from 0.0797 to 0.3225.
(x) Low Achievement Group
The coefficient of correlation obtained is 0.1914. It is significant at 0.01
level and the 0.01 confidence interval is from 0.0587 to 0.3241.
Interpretations
The following results show that there is considerable relationship
between Non-verbal Intelligence and Achievement in Science:
(a) For all samples, the coefficients of correlation obtained are significant
at 0.01 level.
(b) The coefficients of correlation obtained are in the range of 0.1914 to
0.381 5. The correlation may be described as low for all samples.
(c) All the obtained 'r' values are positive showing that any increase or
decrease in Non-verbal intelligence will be followed by a
corresponding increase or decrease in Achievement in Science.
(d) The 0.01 confidence interval show the probable range of the
corresponding population values.
(e) The percentage variance shared between the variables is 10.5%.
That is nearly 11 percent of the variance of Achievement in Science
is attributable to the variance in Non-verbal Intelligence of the
subjects. In terms of common shared variance, the maximum overlap
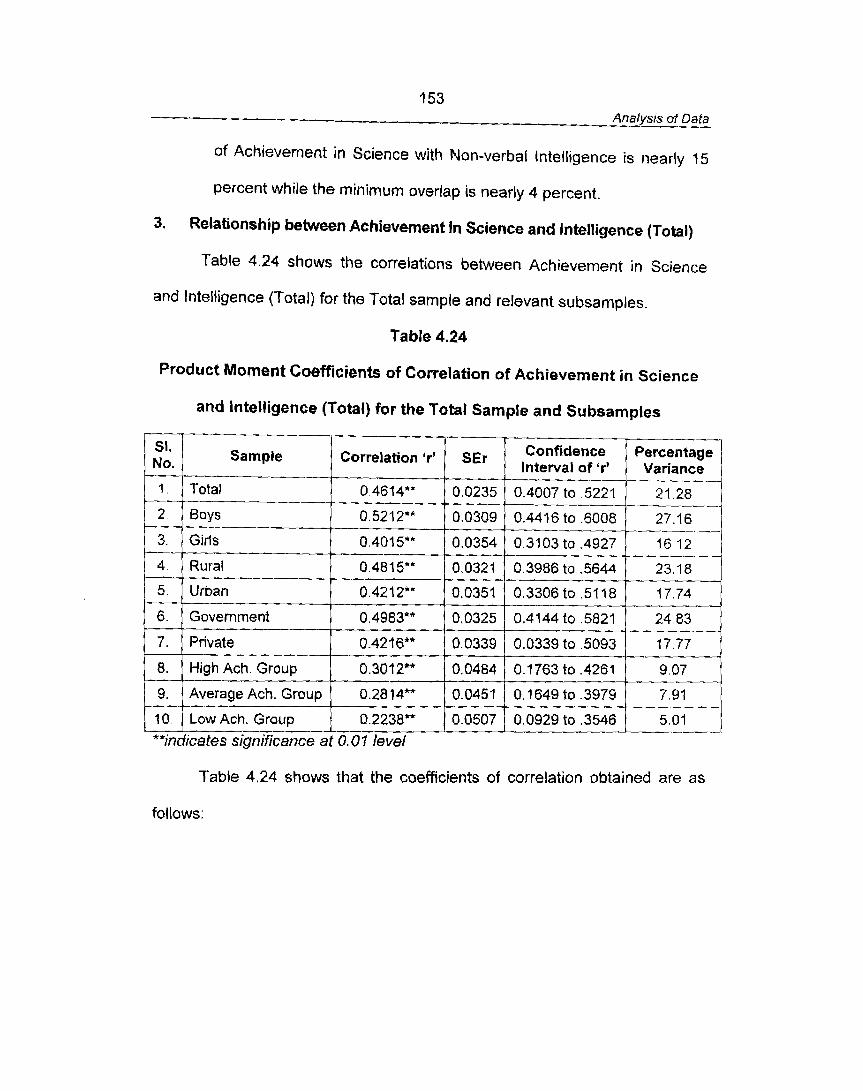
153 Analysis of Data
of Achievement in Science with Non-verbal Intelligence is nearly 15
percent while the minimum overlap is nearly 4 percent.
3. Relationship between Achievement in Science and Intelligence (Total)
Table 4.24 shows the correlations between Achievement in Science
and Intelligence (Total) for We 'total sample and relevant subsamples.
Table 4.24
Product Moment Coefficients of Correlation of Achievement in Science
and lntelligence (Total) for the Total Sample and Subsamples
1 , 1 sample 1 orr relation 'r' Confidence / Percentage / I / interval of 'rY Variance
Table 4.24 shows that the coefficients of correlation obtained are as
1
2
3.
4.
5.
6.
7.
8.
9.
10.
follows:
**indicates significance at 0.07 level
Total
Boys
Girls
Rural
Urban
Government
Private
High Ach. Group
Average Ach. Group
Low Ach. Group
- 0 4614**
0.521 2**
0.401 5**
0.481 5*'
0.421 2"*
0.4983**
0.42 16**
0.307 2**
0.2814**
0.2238**
0.0235
0.0309
0.0354
0.0321
0.0351
0.0325
0.0339
0.0484
0.0451
0.0507
0.4007 to ,5221 -- 0.4416 to ,6008
0.3103 to .4927
0.3986 to .5644
0.3306 to .5118
0.4144 to ,5821
0.0339 to ,5093
0.1763 to ,4261
0.1 649 to ,3979
0.0929 to .3546 A
------ 21.28
27.16 - ---
16 12
23.18
17.74
24.83
17.77
9.07
7.91
5.01 6- --
1 54 Analvsis of Data
(i) Total Sample
The coefficient of correlation obtained is 0.4614. It is significant at 0.0A
level and the 0.01 confidence intervat is from 0.4007 to 0.5221.
(ii) Boys
The coefficient of correlation obtained is 0.521 2. It is significant at 0.01
level and the 0.01 confidence interval is from 0.441 6 to 0.6008.
(iii) Girls
The coefficient of correlation obtained is 0.401 5. It is significant at 0.01
level and the 0.01 confidence interval is from 0.31 03 to 0.4927.
(iv) Rural Subjects
The coefficient of correlation obtained is 0.4815. It is significant at 0.01
level and the 0.01 confidence interval is from 0.3986 to 0.5644.
(v) Urban Subjects
The coefficient of correlation obtained is 0.4212. It is significant at 0.01
level and the 0.01 confidence interval is from 0.3306 to 0.51 18.
(vi) Government School Subjects
The coefficient of correlation obtained is 0.4983. It is significant at 0.01
level and the 0.01 confidence interval is from 0.4144 to 0.5821.
(vi i) Private School Subjects
The coefficient of correlation obtained is 0.4216. It is significant at 0.01
level and the 0.01 confidence interval is from 0.3339 to 0.5093.
155 Analysis of Data
(viii) High Achievement Group
The coefficient of correlation obtained is 0.3012. It is significant at 0.01
level and the 0.01 confidence interval is from 0. i 763 to 0.4261.
(ix) Average Achievement Group
The coefficient of correlation obtained is 0.2814. It is significant at 0.01
level and the 0.01 confidence interval is from 0.1649 to 0.3979.
(x) LowAchievementGroup
The coefficient of correlation obtained is 0.2238. It is significant at 0.01
level and the 0.01 confidence interval is from 0.0929 to 0.3546.
Interpretations
The following results show that Intelligence has a determining influence
on one's Achievement in Science:
{a) For all samples, the coefficients of correlation obtained are significant
at 0.01 level.
(b) The coefficients of correlation obtained are in the range of 0.2238 to
0.521 2. The correlation is substantial or marked for the Total sample
and subsamples of Boys, Girls, Rural, Urban, Government and
Private school subjects. The correlation is low for the three
achievement groups.
(c) All the obtained 'r' values are positive showing that any increase or
decrease in Intelligence will be followed by a corresponding increase
or decrease in Achievement in Science.
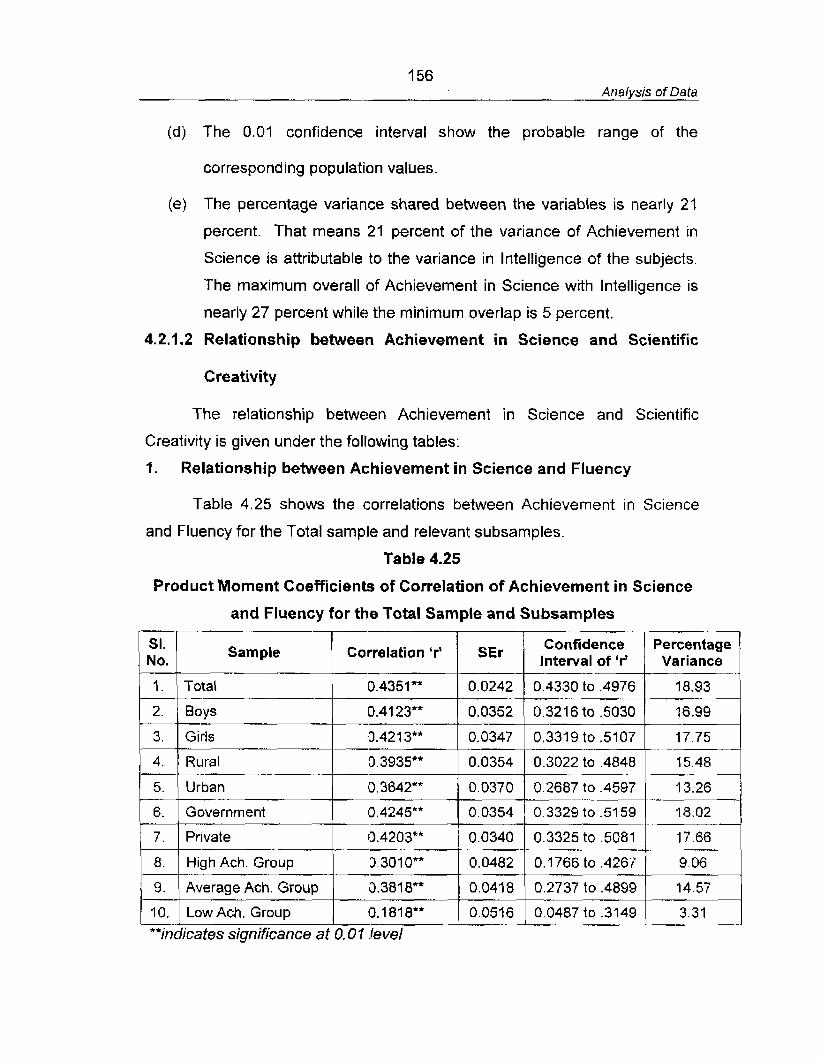
156 Analysis of Data
(d) The 0.01 confidence interval show the probable range of the
corresponding population values.
(e) The percentage variance shared between the variables is nearly 21
percent. That means 21 percent of the variance of Achievement in
Science is attributable to the variance in Intelligence of the subjects.
The maximum overall of Achievement in Science with Intelligence is
nearly 27 percent while the minimum overlap is 5 percent.
4.2.1.2 Relationship between Achievement in Science and Scientific
Creativity
The relationship between Achievement in Science and Scientific
Creativity is given under the following tables:
1 . Relationship between Achievement in Science and Fluency
Table 4.25 shows the correlations between Achievement in Science
and Fluency for the Total sample and relevant subsamples.
Table 4.25
Product Moment Coefficients of Correlation of Achievement in Science
and Fluency for the Total Sample and Subsamples
No. 1 Sample Correlation 'r'
2.
3.
4.
5.
1 + 3 8 1 8 * * i 1 1°F 1 9. Average Ach. Group 0.0418 0.2737 to ,4899
10. Low Ach. Group 13.18 1 8** 0.0516 0.0487 to ,3149 3.31
sEr
0.0242
0.0352
0.0347
0.0354
0.0370
**indicates significance at 0.0 1 level
Boys
Girls
Rural -- Urban
Confidence interval of
0.4330 to ,4976
0.3216 to ,5030
0.331 9 to -51 07
0.3022 to ,4848
0.2687 to .4597
--
0.41 23**
0.421 3**
13.3935**
0.3642**
Percentage Variance
18.93
16.99
. - 17.75
15.48
13.26

157 Analysis of Data
Table 4.25 shows that the coefficients of correlation obtained are as
follows:
(i) Total Sample
The coefficient of correlation obtained is 0.4351. It is significant at 0.01
level and the 0.01 confidence interval is from 0.4330 to 0.4796.
(ii) Boys
The c~efficient of correlation obtained is 0.4123. It is significant at 0.01
level and the 0.01 confidence interval is from 0.3216 to 0.5030.
(iii) Girls
The coefficient of correlation obtained is 0.421 3. It is significant at 0.01
level and the 0.01 confidence interval is from 0.3319 to 0.5107.
(iv) Rural Subjects
The coefficient of correlation obtained is 0.3935. It is significant at 0 .0 j
level and the 0.01 confidence interval is from 0.3022 to 0.4848.
(v) Urban Subjects
The coefficient of correlation obtained is 0.3642. It is significant at 0.01
level and the 0.01 confidence interval is from 0.2687 to 0.4597.
(vi) Government School Subjects
The coefficient of correlation obtained is 0.4245, It is significant at 0.01
level and the 0.01 confidence interval is from 0.3329 to 0.5159.
(vii) Private School Subjects
The coefficient of correlation obtained is 0.4203. It is significant at 0.01
level and the 0.01 confidence interval is-from 0.3325 to 0.5081.
158 Analysis of Data
(viii) High Achievement Group
The coefficient of correlation obtained is 0.3010. It is significant at 0.01
level and the 0.01 confidence interval is from 0.1766 to 0.4267.
(ix) Average Achievement Group
The coefficient of correlation obtained is 0.3818. It is significant at 0.01
level and the 0.01 confidence interval is from 0.2737 to 0.4899.
(x) Low Achievement Group
The coefficient of correlation obtained is 0.1 81 8. It is significant at 0.01
level and the 0.01 confidence interval is from 0.0487 to Q.3149.
Interpretations
The following results show that Achievement in Science and Fluency
are closely associated variables:
(a) For all samples, the coefficients of correlation obtained are significant
at 0.01 level.
(b) The coefficients of correlation obtained are in the range of 0.1818 to
0.4351. The correlation is substantial or marked for the Total sample
and subsamples of Boys, Girls, Government and Private school
subjects. The correlation may be described as low or slight for
subsamples of Rural, Urban, High and Average Achievement groups.
For Low Achievement group, the correlation is negligible,
(c) All the obtained ' r ' values are positive showing that any increase or
decrease in fluency will be followed by a corresponding increase or
decrease in Achievement in Science.
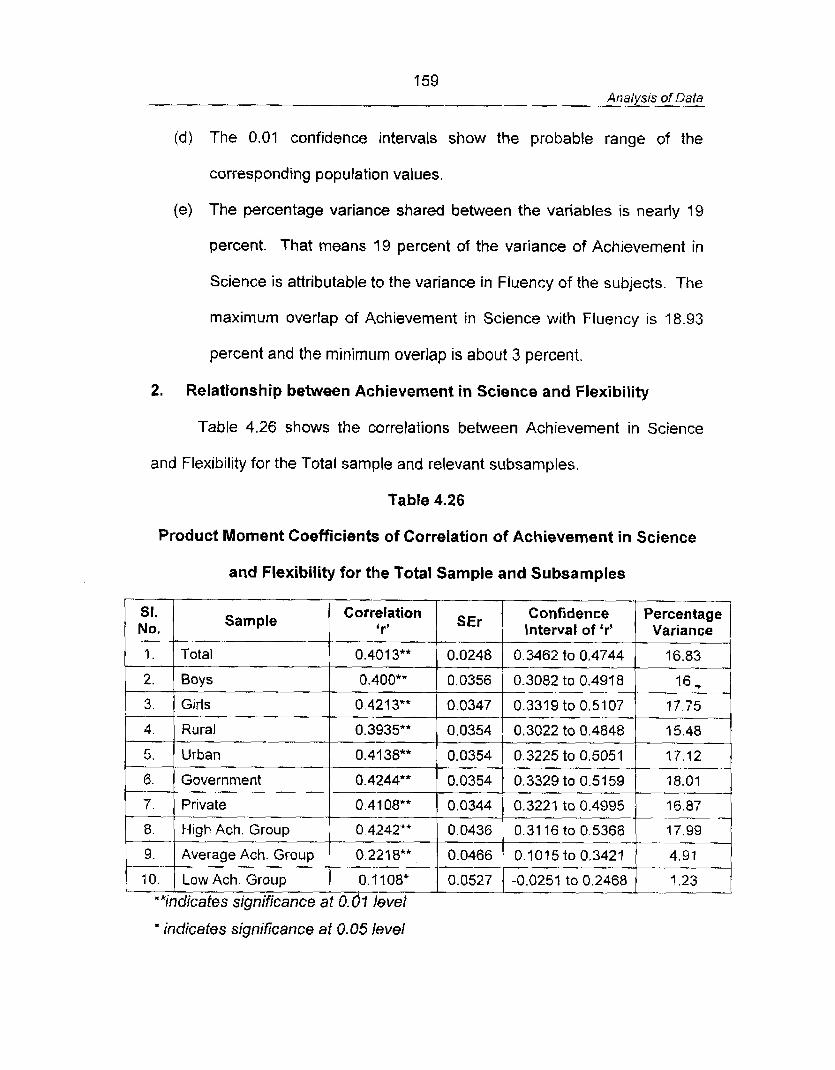
759 Analysis of Data
(d) The 0.01 confidence intervals show the probable range of the
corresponding population values.
(e) The percentage variance shared between the variables is nearly 19
percent. That means 19 percent of the variance of Achievement in
Science is attributable to the variance in Fluency of the subjects. The
maximum overlap of Achievement in Science with Fluency is 18.93
percent and the minimum overlap is about 3 percent
2. Relationship between Achievement in Science and Flexibility
Table 4.26 shows the correlations between Achievement in Science
and Flexibility for the Total sample and relevant subsamples.
Table 4.26
Product Moment Coefficients of Correlation of Achievement in Science
and Flexibility for the Total Sample and Subsamples
Sample Correlation ( SEr 1 Confidence Interval of 'r'
" indicates significance at 0.05 level
3.
4.
5.
6.
7.
8.
9.
10.
**indicates significance at 0. b 1 level
Girls
Rural
Urban
Government
Private
High Ach. Group
Average Ach. Group
Low Ach. Group
0.421 3"*
0.3935**
0.41 38"*
0.4244**
0.41 08"*
0.4242**
0.2218**
0.1108*
0.0347
0.0354
0.0354
0.0354
0.0344
0.0436
0.0466
0.0527
0.3319 to 0.5107
0.3022 to 0.4848
0.3225 to 0.5051
0.3329 to 0.51 59
0.3221 to 0.4995
0.31 16 to 0.5368 --.
0.1015to0.3421
-0.0251 to 0.2468
17.75
15.48
17.12
18.01
16.87 --
17.99
4.97
1.23
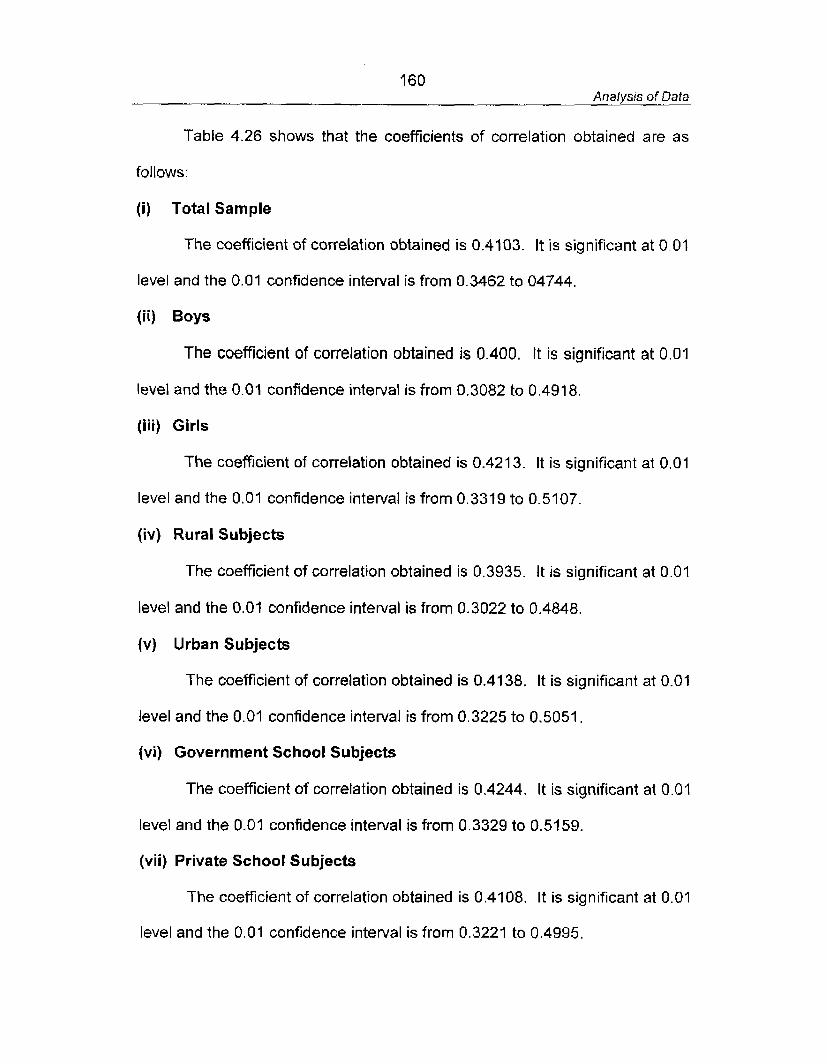
160 Analysis of Data
Table 4.26 shows that the coefficients of correlation obtained are as
follows:
(i) Total Sample
The coefficient of correlation obtained is 0.4103. It is significant at 0.01
level and the 0.01 confidence interval is from 0.3462 to 04744.
(ii) Boys
The coefficient of correlation obtained is 0.400. It is significant at 0.01
level and the 0.01 confidence interval is from 0.3082 to 0.491 8.
(iii) Girls
The coefficient of correlation obtained is 0.421 3. It is significant at 0.01
level and the 0.01 confidence interval is from 0.3319 to 0.5107.
(iv) Rural Subjects
The coefficient of correlation obtained is 0.3935. It is significant at 0.01
level and the 0.01 confidence interval is from 0.3022 to 0.4848.
(v) Urban Subjects
The coefficient of correlation obtained is 0.4138. It is significant at 0.01
level and the 0.01 confidence interval is from 0.3225 to 0.5051.
(vi) Government School Subjects
The coefficient of correlation obtained is 0.4244. It is significant at 0.01
level and the 0.01 confidence interval is from 0.3329 to 0.51 59.
(vii) Private School Subjects
The coefficient of correlation obtained is 0.4108. It is significant at 0.01
level and the 0.01 confidence interval is from 0.3221 to 0.4995.
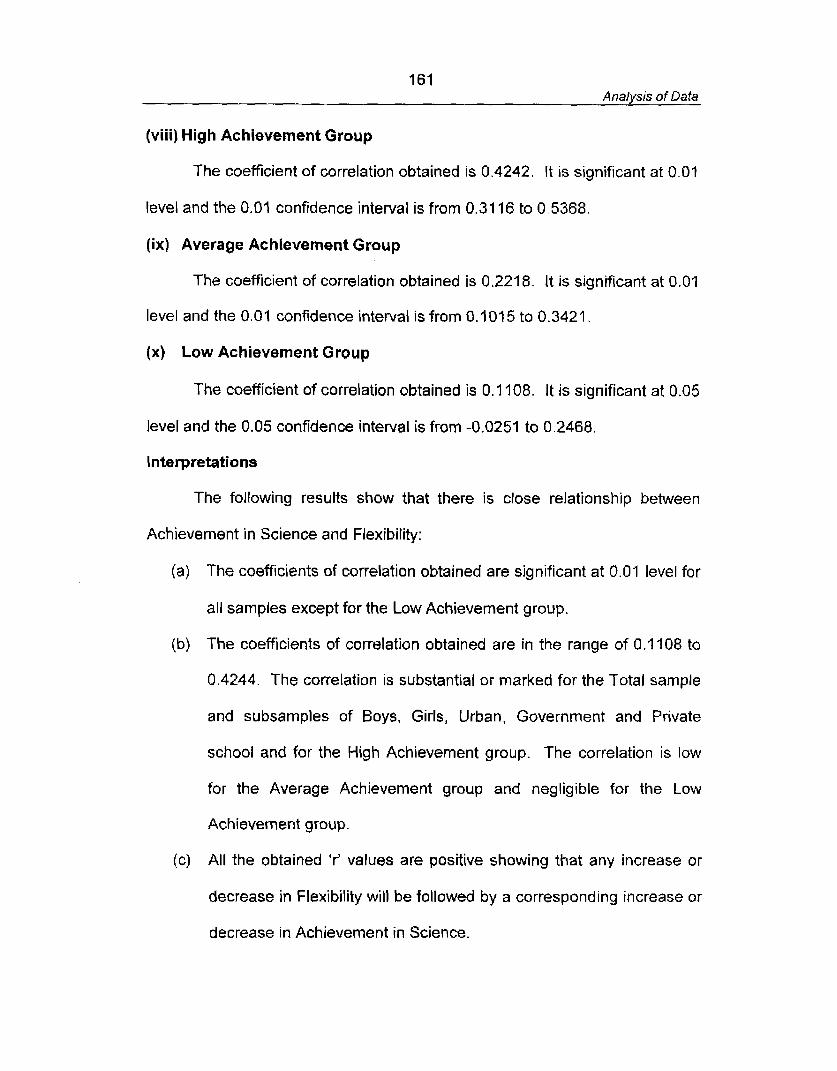
161 Analysis of Data
(viii) High Achievement Group
The coefficient of correlation obtained is 0.4242. It is significant at 0.01
level and the 0.01 confidence interval is from 0.31 16 to 0.5368.
(ix) Average Achievement Group
The coefficient of correlation obtained is 0.2218. It is significant at 0.01
level and the 0.01 confidence interval is from 0.1015 to 0.3421.
(x) Low AchievementGroup
The coefficient of correlation obtained is 0.1 108. It is significant at 0,05
level and the 0.05 confidence interval is from -0.0251 to 0.2468.
Interpretations
The following results show that there is close relationship between
Achievement in Science and Flexibility:
(a) The coefficients of correlation obtained are significant at 0.01 level for
all samples except for the Low Achievement group.
(b) The coefficients of correlation obtained are in the range of 0,1108 to
0.4244. The correlation is substantial or marked for the Total sample
and subsamples of Boys, Girls, Urban, Government and Private
school and for the High Achievement group. The correlation is low
for the Average Achievement group and negligible for the Low
Achievement group.
(c) All the obtained 'r' values are positive showing that any increase or
decrease in Flexibility will be followed by a corresponding increase or
decrease in Achievement in Science.
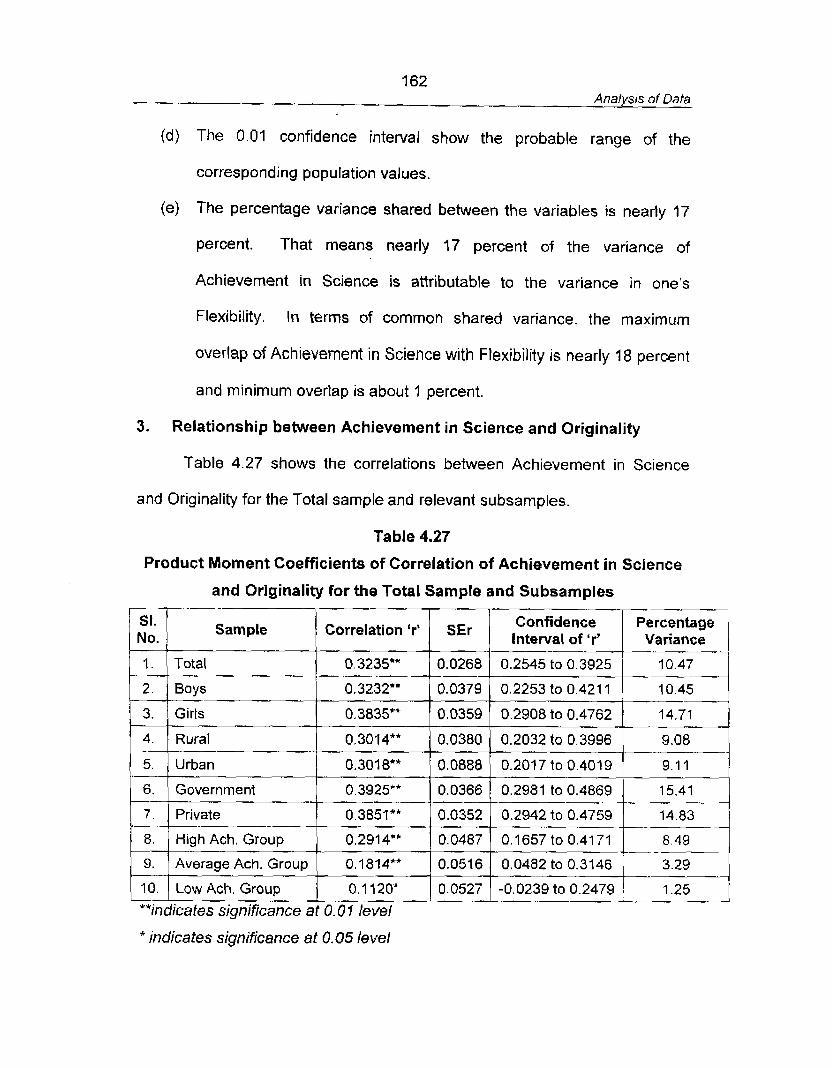
162 Analysis of Data
(d) The 0.01 confidence interval show the probable range of the
corresponding population values.
(e) The percentage variance shared between the variables is nearly 17
percent. That means nearly 17 percent of the variance of
Achievement in Science is attributable to the variance in one's
Flexibility. In terms of common shared variance, the maximum
overlap of Achievement in Science with Flexibility is nearly 18 percent
and minimum overlap is about percent.
3. Relationship between Achievement in Science and Originality
Table 4.27 shows the correlations between Achievement in Science
and Originality for the Total sample and relevant subsamples.
Table 4.27
Product Moment Coefficients of Correlation of Achievement in Science
and Originality for the Total Sample and Subsamples
Confidence 1 . Sample / Correlation Y I SEI I "tenra of 'r, 1 I
1. I Total 0.3235** I 0.2545 to 0.3925 / 10.47
* indicates significance at 0.05 level
2.
3.
4.
5.
6.
7 .
0.1 120* 1.25
**indicates significance at 0.0 I level
Boys
Girls
Rural
Urban
Government
Private
0.3232**
0.3835**
0.3074**
0.301 8**
0.3925**
0.3851**
0.0379
0.0359
0.0380
0.0888
0.0366
0.0352
0.2253 to 0.421 1
0.2908 to 0.4762
0.2032 to 0.3996
0.2017 to 0.4019
0.2981 to 0.4869
0.2942 to 0.4759
-- 10.45
14.71
9.08
9.1 1
15.41 p- -
14.83

163 Analysis of Data
Table 4.27 shows that the coefficients of correlation obtained are as
foliows:
(i) Total Sample
The coefficient of correlation obtained is 0.3235. It is significant at 0.01
level and the 0.01 confidence interval is from 0.2545 to 0.3925.
(ii) Boys
The coefficient of correlation obtained is 0.3232. It is significant at 0.01
level and the 0.01 confidence interval is from 0.2253 to 0.421 1.
(iii) Girls
The coefficient of correlation obtained is 0.3835. It is significant at 0.0-l
level and the 0.01 confidence interval is from 0.2908 to 0.4762.
(iv) Rural Subjects
The coefficient of correlation obtained is 0.3014. It is significant at 0.01
level and the 0.01 confidence interval is from 0.2032 to 0.3996.
(v) Urban Subjects
The coefficient of correlation obtained is 0.3018. It is significant at 0.01
level and the 0.07 confidence interval is from 0.2017 to 0.401 9.
(vi) Government School Subjects
The coefficient of correlation obtained is 0.3925. It is significant at 0.01
level and the 0.01 confidence interval is from 0.2981 to 0.4869.
(vii) Private School Subjects
The coefficient of correlation obtained is 0.3851. It is significant at 0.01
level and the 0.01 confidence interval is from 0.2942 to 0.4759.
164 Analysis of Data
(viii) High Achievement Group
The coefficient of correlation obtained is 0.2914. It is significant at 0.04
level and the 0.01 confidence interval is from 0.1657 to 0.4171.
(ix) Average Achievement Group
The coefficient of correlation obtained is 0.1814. It is significant at 0.01
level and t h e 0.01 confidence interval is from 0.0482 to 0.3146.
(x) Low Achievement Group
The coefficient of correlation obtained is 0.1 120. It is significant at 0.05
level and the 0.05 confidence interval is from 0.0087 to 0.2153.
Interpretations
The following results show that there is considerable relationship
between Achievement in Science and Originality:
(a) The coefficients of correlation obtained are significant at 0.01 level for
all sample except for the Low Achievement group.
(b) The coefficients of correlation obtained are in the range of 0.1 120 to
0.3925. The correlation may be described as low or slight for all
samples.
(c) All the obtained 'r' values are positive showing that any increase or
decrease in Originality will be followed by a corresponding increase
or decrease in Achievement in Science.
(d) The 0.01 confidence intervals show the probable range of the
corresponding population values.
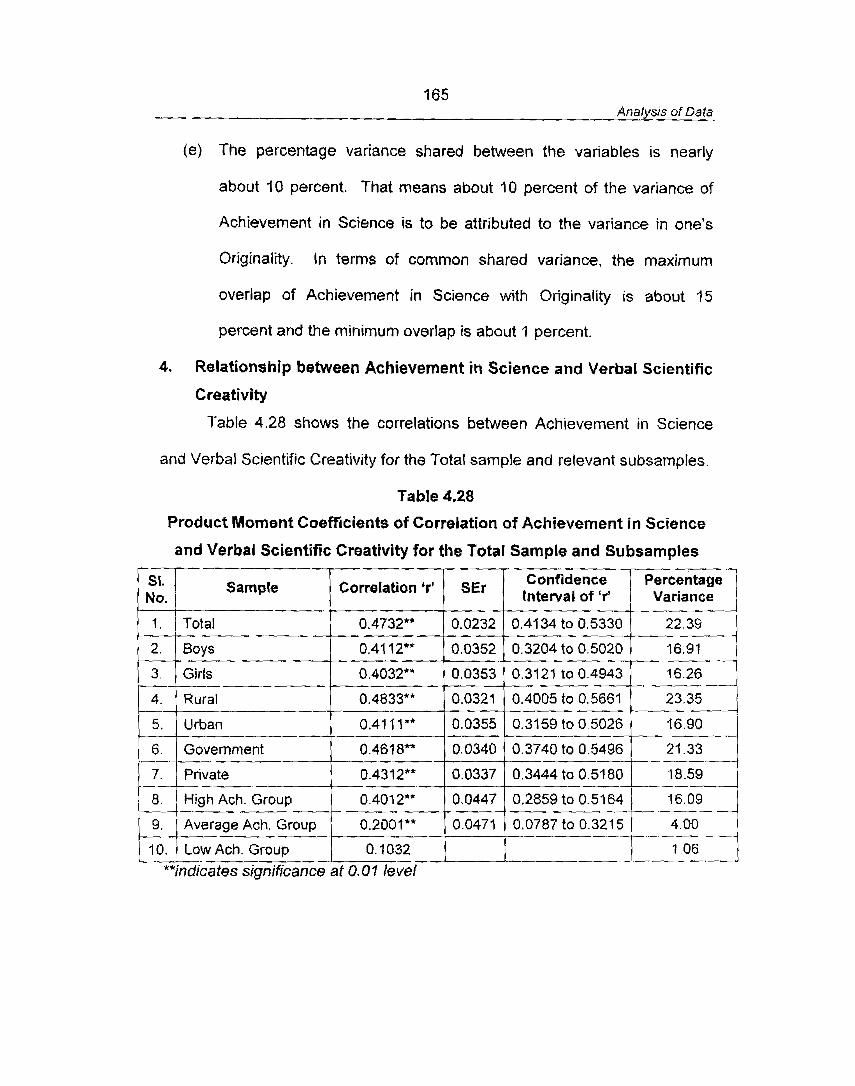
165 Analysjs of Data
(e ) The percentage variance shared between the variables is nearly
about 10 percent. That means about '10 percent of the variance of
Achievement in Science is to be attributed to the variance in one's
Originality. In terms of common shared variance, the maximum
overlap of Achievement in Science with Originality is about 15
percent and the minimum overlap is about percent.
4. Relationship between Achievement in Science and Verbal Scientific
Creativity
Table 4.28 shows the correlations between Achievement in Science
and Verbal Scientific Creativity for the Total sample and relevant subsarnples.
Table 4.28
Product Moment Coefficients of Correlation of Achievement in Science
and Verbal Scientific Creativity for the Total Sample and Subsamples
Sample No.
1.
- 2.
3.
4.
5.
6.
Correlation 'r'
7. Private 0.4312** 0.0337 0.3444 to 0.5180 18.59
- -----
-- -
Total
Boys
Girls
Rural ----
Urban
Government
SEr
0.4732**
0.41 12**
0.4032**
0.4833**
0.41 1 1 **
0.4618**
Confidence of ir, Variance
16.91
16.26 -----
23.35
J
0.0232
0.0352
0.0353
0.0321
0.4134 to 0.5330 - 0.3204 to 0.5020
0.3121 to 0.4943
0.4005 to 0.5661
0.0355
0.0340
0.3159 to 0.5026
0.3740 to 0.5496
16.90
21.33
1 66 Analysis of Data
Table 4.28 shows that the coefficients of correlation obtained are as
follows:
(i) Total Sample
The coefficient of correlation obtained is 0.4732. It is significant at 0.01
level and the 0.01 confidence interval is from 0.4134 to 0.5330.
(ii) Boys
The coefficient of correlation obtained is 0.41 12. It is significant at 0.01
level and the 0.01 confidence interval is from 0.3204 to 0.5020.
(iii) Girls
The coefficient of correlation obtained is 0.4032. It is significant at 0.01
level and the 0.01 confidence interval is from 0.3121 to 0.4943.
(iv) Rural Subjects
The coefficient of correlation obtained is 0.4883. It is significant at 0.01
level and the 0.01 confidence interval is from 0.4005 to 0.5661.
(v) Urban Subjects
The coefficient of correlation obtained is 0.41 11. It is significant at 0.07
level and the 0.01 confidence interval is from 0.31 59 to 0.5026.
(vi) Government School Subjects
The coefficient of correlation obtained is 0.461 8. It is significant at 0.01
level and the 0.07 confidence interval is from 0.3740 to 0.5496.
(vii) Private School Subjects
The coefficient of correlation obtained is 0.4312. It is significant at 0.01
level and the 0.01 confidence interval is from 0.3444 to 0.5180.
167 Analysis of Data
(viii) High Achievement Group
The coefficient of correlation obtained is 0.401 2. It is significant at 0.07
level and the 0.01 confidence interval is from 0.2859 to 0.5164.
(ix) Average Achievement Group
The coefficient of correlation obtained is 0.2007. It is significant at 0.01
level and the 0.01 confidence interval is from 0.0787 to 0.32 15.
(x) Low Achievement Group
The coefficient of correlation obtained is 0.1032. It is not significant at
any level.
Interpretations
The following results show that there is close association between
Achievement in Science and Verbal Scientific Creativity:
(a) The coefficients of correlation obtained are significant at 0.01 level for
all sample except far the Low Achievement group. The obtained 'r'
value is not significant for the Low Achievement group.
(b) The coefficients of correlation obtained are in the range of 0.1032 to
0.4833. The relationship may be described as substantial or marked
for all samples except for the Average and Low Achievement groups.
The correlation is negligible for the Average and Low Achievement
groups.
(c) All the obtained 'r' values are positive showing that any increase or
decrease in Verbal Creativity will be followed by a corresponding
increase or decrease in Achievement in Science.
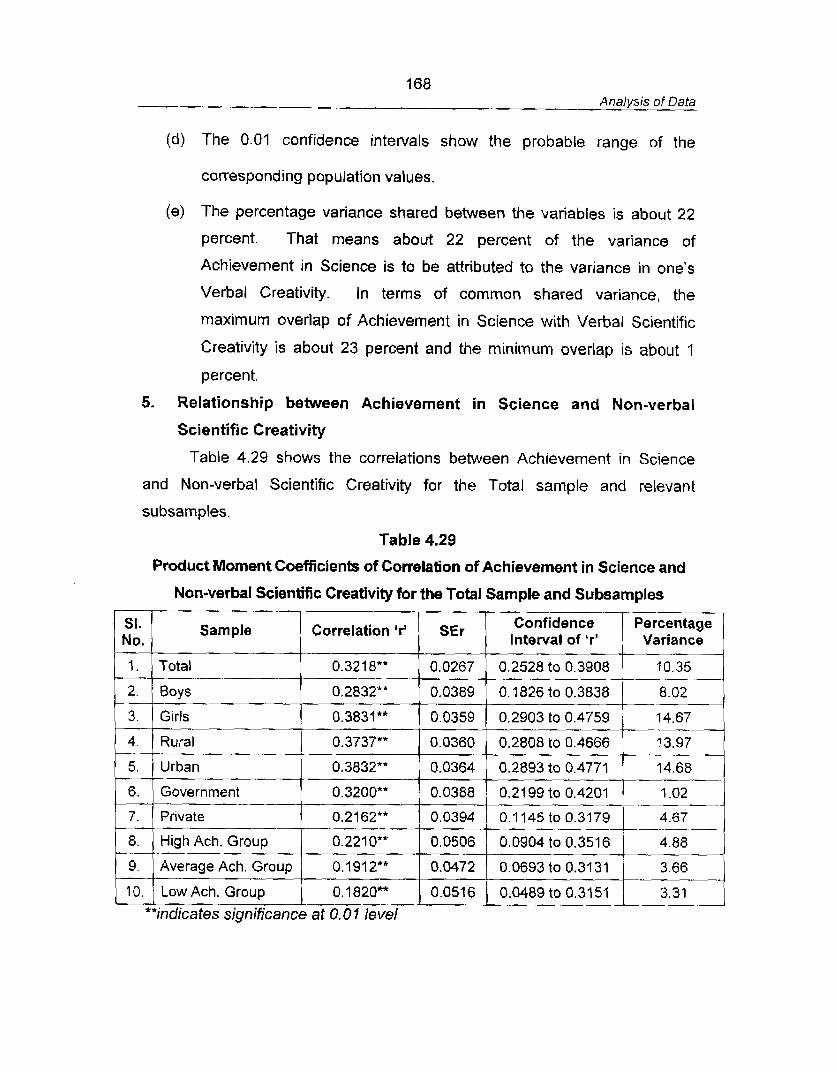
168 Analysis of Data
(d) The 0.01 confidence intervals show the probable range of the
corresponding population values.
(e) The percentage variance shared between the variables is about 22
percent. That means about 22 percent of the variance of
Achievement in Science is to be attributed to the variance in one's
Verbal Creativity. In terms of common shared variance, the
maximum overlap of Achievement in Science with Verbal Scientific
Creativity is about 23 percent and the minimum overlap is about I
percent.
5. Relationship between Achievement in Science and Non-verbal
Scientific Creativity
Table 4.29 shows the correlations between Achievement in Science
and Non-verbal Scientific Creativity for the Total sample and relevant
subsarnples.
Table 4.29
Product Moment Coefficients of Correlation of Achievement in Science and
Non-verbal Scientific Creativity for the Total Sample and Subsamples
SI. No.
1.
2
3.
4.
5.
6. -- 7.
8.
9.
10.
Sample
**indicates significance at 0.07 level
Total
Boys
Giris
Rural
Urban
Government
Pr~vate
High Ach. Group
Average Ach. Group
Low Ach. Group
Correlation 'r'
0.32 18**
0.2832"*
0.3831**
0.3737""
0.3832**
0.3200**
0.21 62**
0.221 O**
0.1912**
0.1820**
SE r Confidence j---[ Percentage Interval of 'r' Variance
0.0267
0.0389
0.0359
0.0360
0.0364
0.0388
0.0394
0.0506
0.0472
0.0516
0.2528 to 0.3908
0.1826 to 0.3838
0.2903 to 0.4759
0.2808to0.4666
0.2893 to 0.4771
0.2199 to 0.4201
0.1 145 to 0.31 79
0.0904 to 0.3516
0.0693 to 0.3131
0.0489 to 0.3151
10.35 - -. 8.02
14.67 --
- . 73.97
14.68
1.02
4.67
- 4.88
3.66 -- 3.31
A
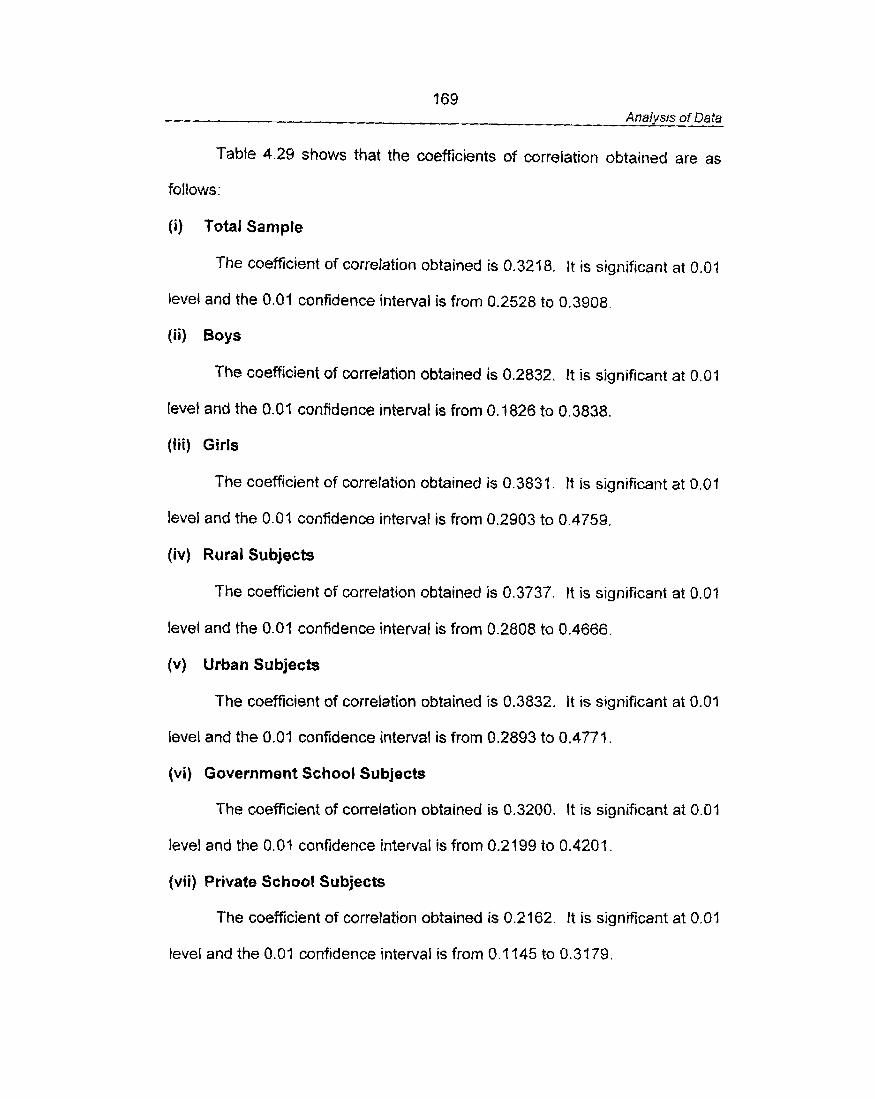
169 Analysis of Data
Table 4.29 shows that the coefficients of correlation obtained are as
follows:
i ) Total Sample
The coefficient of correlation obtained is 0.3218. It is significant at 0.01
level and the 0.01 confidence interval is from 0.2528 to 0.3908.
(ii) Boys
The coefficient of correlation obtained is 0.2832. It is significant at 0.01
level and the 0.01 confidence interval is from 0.4826 to 0.3838.
{ i i i ) Girls
The coefficient of correlation obtained is 0.3831. If is significant at 0.01
level and t he 0.0? confidence interval is from 0.2903 to 0.4759.
(iv) Rural Subjects
The coefficient of correlation obtained is 0.3737. It is significant at 0.01
level and the 0.01 confidence interval is from 0.2808 to 0.4666.
(v) Urban Subjects
The coefficient of correlation obtained is 0.3832. It is signifi~ant at 0.01
level and the 0.01 confidence interval is from 0.2893 to 0.4771.
(vi) Government School Subjects
The coefficient of correlation obtained is 0.3200. It is significant at 0.01
level and the 0.07 confidence interval is from 0.2199 to 0.4201.
(vii) Private School Subjects
The coefficient of correlation obtained is 0.2162. It is significant at 0.01
level and the 0.01 confidence interval is from 0. I 145 to 0.3 179,
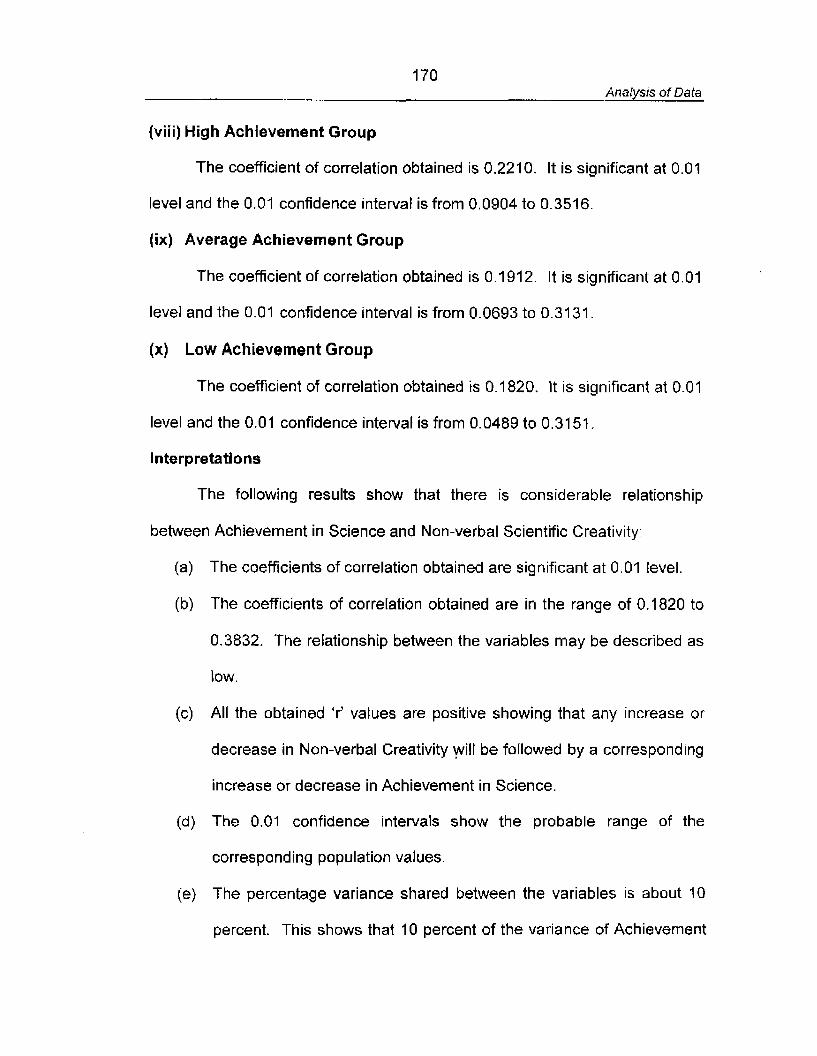
170 Analysis of Data
(viii) High Achievement Group
The coefficient of correlation obtained is 0.2210. It is significant at 0.01
level and the 0.01 confidence interval is from 0.0904 to 0.351 6.
(ix) Average Achievement Group
The coefficient of correlation obtained is 0.1 912. It is significant at 0.01
level and the 0.01 confidence interval is from 0.0693 to 0.31 3 1.
(x) Low Achievement Group
The coefficient of correlation obtained is 0.1820. It is significant at 0.01
level and the 0.01 confidence interval is from 0.0489 to 0.31 51.
Interpretations
The following results show that there is considerable relationship
between Achievement in Science and Non-verbal Scientific Creativity:
(a) The coefficients of correlation obtained are significant at 0.01 level.
(b) The coefficients of correlation obtained are in the range of 0.1820 to
0.3832. The relationship between the variables may be described as
low.
(c) All the obtained 'r' values are positive showing that any increase or
decrease in Non-verbal Creativity will be followed by a corresponding
increase or decrease in Achievement in Science.
(d) The 0.01 confidence intervals show the probable range of the
corresponding population values.
(e) The percentage variance shared between the variables is about A0
percent. This shows that 10 percent of the variance of Achievement
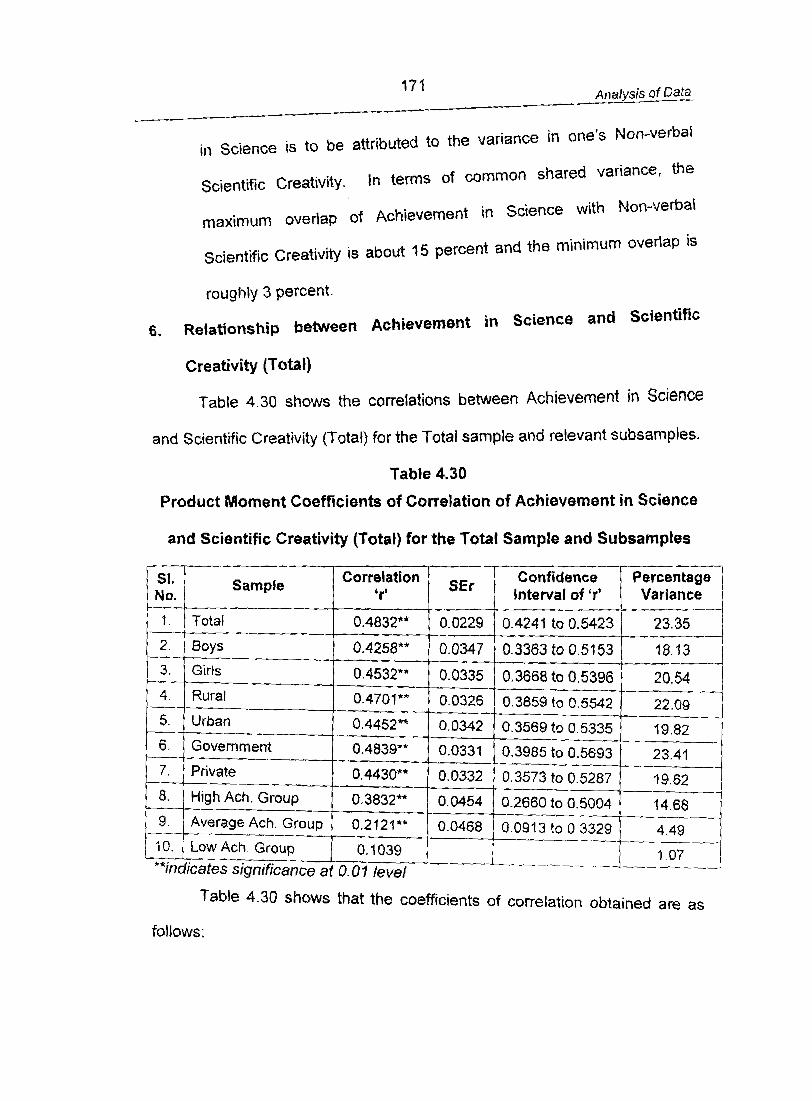
j7? Analysis of Data
in Science is to be attributed to the variance in one's Non-verbal
Scientific Creativity. In terms of common shared variance, the
maximum overlap of Achievement in Science with Non-verbal
Scientific Creativity is about 15 percent and the minimum overlap is
roughly 3 percent
6. Relationship between Achievement in Science and Scientific
Creativity (Total)
Table 4.30 shows the correlations between Achievement in Science
and Scientific Creativity (Total) for the Total sample and relevant subsamples.
Table 4.30
Product Moment Coefficients of Correlation of Achievement in Science
and Scientific Creativity (Total) for the Total Sample and Subsamples
Table 4.30 shows that the coefficients of correlation obtained are as
follows:
- -
St. No.
1.
2.
3.
4.
5.
6.
---.
-
Sample
Total
Boys - Girls
Rural -
Urban
Government
Correlation r'
0,4832""
0.4258**
0.4532**
0.4701""
0.4452**
0.4839**
SEr
0.0229
0.0347
0.0335
0.0326
0.0342
0.0331
Confidence Interval of 'r'
0.4241 to 0.5423
Percentage I Variance
- 23.35
0.3363 to 0.5153
0.3668 to 0.5396
0.3859 to 0.5542
0.3569 to 0.5335
0.3985 to 0.5693
18.13
20.54
22.09 - . .- 19.82
--- 23.41

172 Analysis of Data
(i) Total Sample
The coefficient of correlation obtained is 0.4832. It is significant at 0.01
level and the 0.01 confidence interval is from 0.4241 to 0.5423.
( i i ) Boys
The coefficient of correlation obtained is 0.4258. It is significant at 0.01
level and the 0.01 confidence interval is from 0.3363 to 0.5153.
(iii) Girls
The coefficient of correlation obtained is 0,4532. It is significant at 0.01
level and the 0.01 confidence interval is from 0.3668 to 0.5396.
(iv) Rural Subjects
The coefficient of correlation obtained is 0.4701. It is significant at 0.01
level and the 0.01 confidence intewal is from 0.3859 to 0.5542.
(v) Urban Subjects
The coefficient of correlation obtained is 0.4452. It is significant at 0.01
level and the 0.01 confidence interval is from 0.3569 to 0.5335.
(vi) Government School Subjects
The coefficient of correlation obtained is 0.4839. It is significant at 0.01
level and the 0.01 confidence interval is from 0.3985 to 0.5693.
(vii) Private School Subjects
The coefficient of correlation obtained is 0.4430. It is significant at 0.01
leve! and the 0.03 confidence interval is from 0.3573 to 0.5287.
173 Analysis of Data
(viii) High Achievement Group
The coeftcient of correlation obtained is 0.3832. It is significant at 0.01
level and the 0.04 confidence interval is from 0.2660 to 0.5004.
(ix) Average Achievement Group
The coefficient of correlation obtained is 0.21 21. It is significant at 0.01
level and the 0.01 confidence interval is from 0.0913 to 0.3329.
(x) Low Achievement Group
The coefficient of correlation obtained is 0.d039. It is not significant at
any level.
Interpretations
The following results show that Achievement in Science is closely
associated Scientific Creativity (Total):
(a) The coefficients of correlation obtained are significant at 0.01 level for
all samples except for the Low Achievement group. The obtained 'r'
value is not significant for the Low Achievement group.
(b) The coefficients of correlation obtained are in the range of 0.1039 to
0.4839. The relationship may be described as substantial or marked
for the Total sample, Boys, Girls, Rural, Urban, Government and
Private school subjects. The relationship is low or slight for the High
and Average Achievement groups. The 'r' is negligible for the Low
Achievement group.
174 Analysis of Data
(c) All the obtained ' r ' values are positive showing that any increase or
decrease in Scientific Creativity will be followed by a corresponding
increase or decrease in Achievement in Science.
(d) The 0.01 confidence intervals show the probable range of the
corresponding population values.
(e) The percentage variance shared between the variables is about
23,35 percent. That means, about 23 percent of the variance of
Achievement in Science is to be attributed to the variance in one's
Scientific Creativity. In terms of common shared variance, the
maximum overlap of Achievement in Science with Scientific Creativity
(Total) is 23.41 percent and the minimum overlap is about 1 percent.
4.2.1.3 Relationship between Achievement in Science and
Achievement Motivation
Table 4.31 shows the correlations between Achievement in Science
and Achievement Motivation for the Total sample and relevant subsamples.
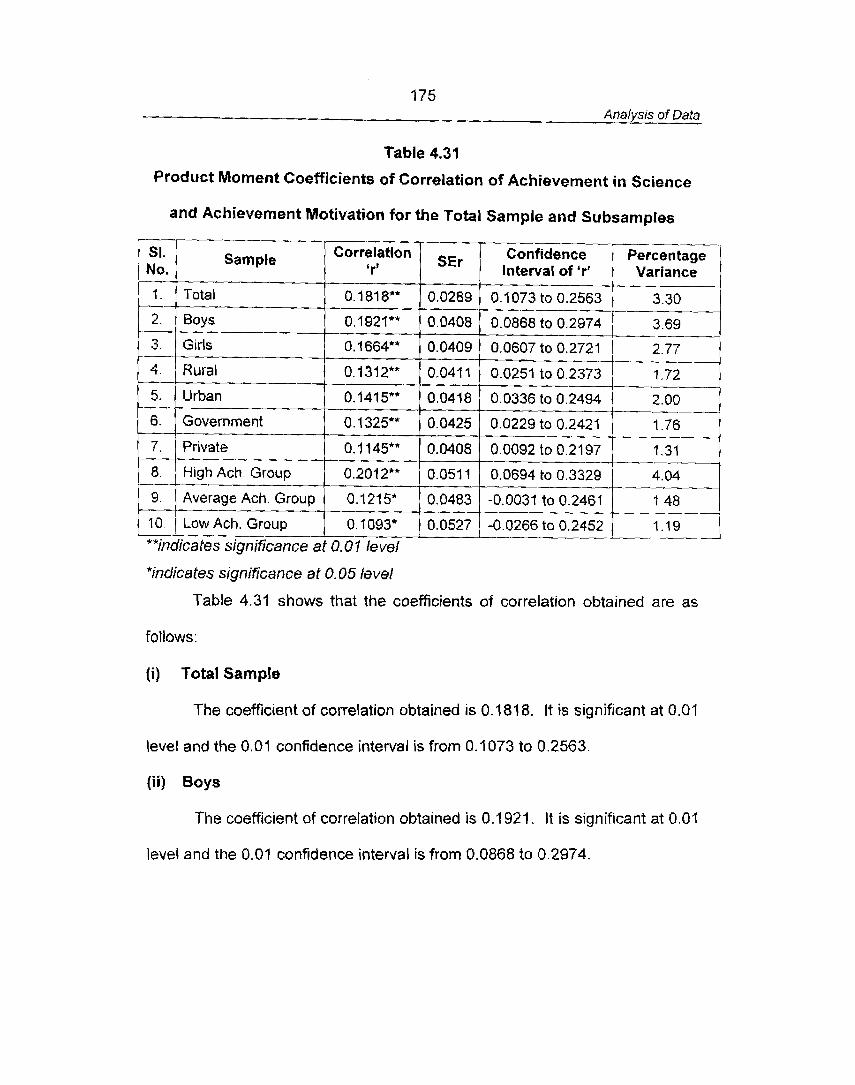
175 Analys~s of Data
Table 4.31
Product Moment Coefficients of Correlation of Achievement in Science
and Achievement Motivation for the Total Sample and Subsamples
*indicates significance at 0.05 level
SI. No. 1. -- 2. - 3.
4 .
5.
6.
7 .
8.
9.
10.
Table 4.31 shows that the coefficients of correlation obtained are as
follows:
**indicates significance at 0.0 1 level
-----
Sample
Total
Boys
Girls
Rural
Urban
Government
Private
High Ach. Group
Average Ach. Group
LOW Ach. Group
(i) Total Sample
The coefficient of correlation obtained is 0.1818. It is significant at 0.01
Correlation 'rr
0.181 8""
0.1921**
0.1664**
0.1312**
0.1415"*
O.q325**
0.1 145**
0.2012**
0.1215*
0.1093*
level and the 0.01 confidence interval is from 0.1073 to 0.2563.
(ii) Boys
SEr
0.0289
0.0408
0.0409
0.041 I
0.0418
0.0425
0.0408
0.051 1
0.0483
0.0527
The coefficient of correlation obtained is 0.2921. It is significant at 0.0j
level and the 0.01 confidence interval is from 0.0868 to 0.2974.
--- Confidence Interval of 'r'
0.1073 to 0.2563
0.0868 to 0.2974
0.0607 to 0.2721
0.0251 to 0.2373
0.0336 to 0.2494
0.0229 to 0.2421
0.0092 to 0.2197
0.0694 to 0.3329 -.
-0.0031 to 0.2461 - -0.0266t00.2452
--
--.
Percentage Variance
3.30
3.69
2.77
1.72
2.00 --
---
1.48
- 1.19 -- -
1 76 Analysis of Dafa
(iii) Girls
The coefficient of correlation obtained is 0.1664. It is significant at 0.01
level and the 0.01 confidence interval is from 0.0607 to 0.2721.
(iv) Rural Subjects
The coefficient of correlation obtained is 0.1312. It is significant at 0.01
level and the 0.01 confidence interval is from 0.0251 to 0.2373.
(v) Urban Subjects
The coefficient of correlation obtained is 0.1415. It is significant at 0.01
level and the 0.01 confidence interval is from 0.0336 to 0.2494.
(vi) Government School Subjects
The coefficient of correlation obtained is 0.1325. It is significant at 0.01
level and the 0.01 confidence interval is from 0.0229 to 0.2427.
(vii) Private School Subjects
The coefficient of correlation obtained is 0.7 145. It is significant at 0.01
level and the 0.01 confidence interval is from 0.0092 to 0.2195.
(viii) High Achievement Group
The coefficient of correlation obtained is 0.2012. It is significant at 0.01
level and the 0.01 confidence interval is from 0.0694 to 0.3329.
(ix) Average Achievement Group
The coefficient of correlation obtained is 0.1215. It is significant at 0.05 I
level and the 0.05 confidence interval is from -0.0031 to 0.2461.
777 Analysis of Data
(x) LowAchievementGroup
The coefficient of correlation obtained is 0.1 093. It is significant at 0.05
level and the 0.05 confidence interval is from -0.0266 to 0.2452.
Interpretations
The following results show that there is low relationship between
Achievement in Science and Achievement Motivation:
(a) The coefficients of correlation obtained are significant at 0.01 level for
all samples except for the Average and Low Achievement group. The
'r' values of Average and Low Achievement groups are significant at
0.05 level.
(b) The coefficients of correlation obtained are in the range of 0.1093 to
0.201 2. The relationship may be described as very low.
(c) All the obtained 'r' values are positive showing that any increase or
decrease in Achievement Motivation will be followed by a
corresponding increase or decrease in Achievement in Science.
(d) The 0.01 confidence intervals show the probable range of the
corresponding population values.
(e) The percentage variance shared between the variables is about 4
percent. That means, nearly 4 percent of the variance of
Achievement in Science is to be attributed to the variance in one's
Achievement Motivation. In terms of common shared variance, the
maximum overlap of Achievement in Science with Achievement
Motivation is 3.69 percent and the minimum overlap is about 1 percent.
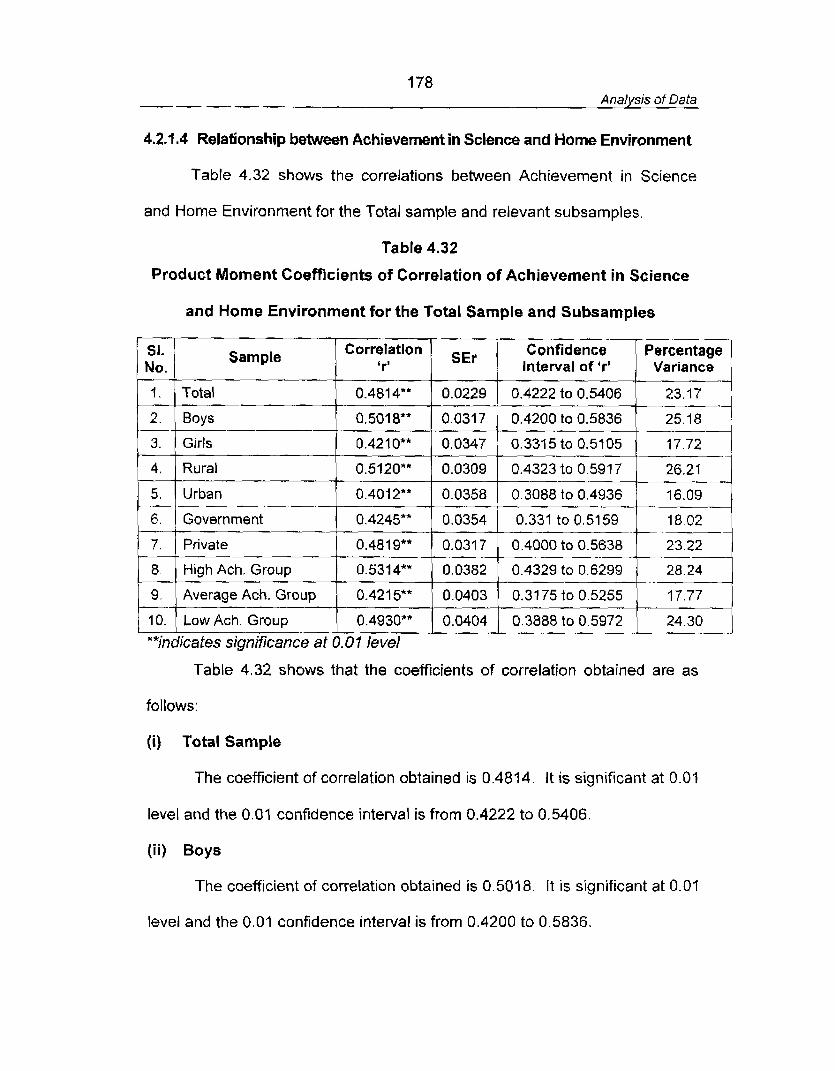
178 Analysis of Data
4.2.1.4 Relationship between Achievement in Science and Home Environment
Table 4.32 shows the correlations between Achievement in Science
and Home Environment for the Total sample and relevant subsamples.
Table 4.32
Product Moment Coefficients of Correlation of Achievement in Science
and Home Environment for the Total Sample and Subsamples
( 1. 1 Total 1 0.4814"* 1 0.0229 1 0.4222 to 0.5406 1 23.17 1 Sample
Table 4.32 shows that the coefficients of correlation obtained are as
Correlation 'r'
2.
3.
4.
5.
6.
7.
8.
9.
10.
follows:
(i) Total Sample
SEr
**indicafes significance at 0.01 level
Boys
Girls
Rural
Urban
Government
Private
High Ach. Group
Average Ach. Group
Low Ach. Group
The coefficient of correlation obtained is 0.4814. It is significant at 0.01
Interval of 'r' Variance
level and the 0.01 confidence interval is from 0.4222 to 0.5406.
0.5018**
0.4210**
0.5120"*
0.4012""
0.4245""
0.4819**
0.5314**
0.4215**
0.4930""
(ii) Boys
The coefficient of correlation obtained is 0.501 8. It is significant at 0.01
0.0317
0.0347
0.0309
0.0358
0.0354
0.0317
0.0382
0.0403
0.0404
level and the 0.01 confidence interval is from 0.4200 to 0.5836.
0.4200 to 0.5836
0.331 5 to 0.5105
0.4323 to 0.591 7
0.3088 to 0.4936 .--
0.331 to 0.5159
0.4000 to 0.5638
0.4329 to 0.6299
0.3175to0.5255
0.3888 to 0.5972 .-*
25.18 - .-
17.72
26.21
16.09
18.02
23.22
28.24
17.77
24.30 J
179 Analysis of Data
(iii) Girls
The coefficient of correlation obtained is 0.4210. It is significant at 0.01
level and the 0.01 confidence interval is from 0.331 5 to 0.51 05.
(iv) Rural Subjects
The coefficient of correlation obtained is 0.5120. It is significant at 0.01
level and the 0.01 confidence interval is from 0.4323 to 0.591 7 .
(v) Urban Subjects
The coefficient of correlation obtained is 0.4012. It is significant at 0.01
level and the 0.01 confidence interval is from 0.3088 to 0.4936.
(vi) Government School Subjects
The coefficient of correlation obtained is 0.4245. It is significant at 0.01
level and t he 0.01 confidence interval is from 0.3331 to 0.5159.
(vii) Private School Subjects
The coefficient of correlation obtained is 0.4819. It is significant at 0.01
level and the 0.01 confidence interval is from 0.4000 to 0.5638.
(viii) High Achievement Group
The coefficient of correlation obtained is 0.5314. It is significant at 0.0A
level and t he 0.01 confidence interval is from 0.4329 to 0.6299.
(ix) Average Achievement Group
The coefficient of correlation obtained is 0.4215. It is significant at 0.01
level and the 0.01 confidence interval is from 0.3175 to 0.5255,
180 Analysis of Data
(x) Low Achievement Group
The coefficient of correlation obtained is 0.4930. It is significant at 0.01
level and the 0.01 confidence interval is from 0.3888 to 0.5972.
Interpretations
The following results show that Home Environment has a determining
influence on one's Achievement in Science:
(a) The coefficients of correlation obtained are significant at 0.01 level for
all samples.
(b) The coefficients of correlation obtained are in the range of 0.4210 to
0.5314. The relationship between the variables may be described as
substantial or marked.
(c) All the obtained 'r' values are positive showing that any increase or
decrease in Home Environment will be followed by a corresponding
increase OF decrease in Achievement in Science.
(d) The 0.01 confidence intervals show the probable range of the
corresponding population values.
(e ) The percentage variance shared between the variables is about
23.17 percent. That means, nearly 23 percent of the variance of
Achievement in Science is to be attributed to the variance in one's
Home Environment. In terms of common shared variance, the
maximum overlap of Achievement in Science with Home Environment
is about 28 percent and the minimum overlap is about 16 percent.
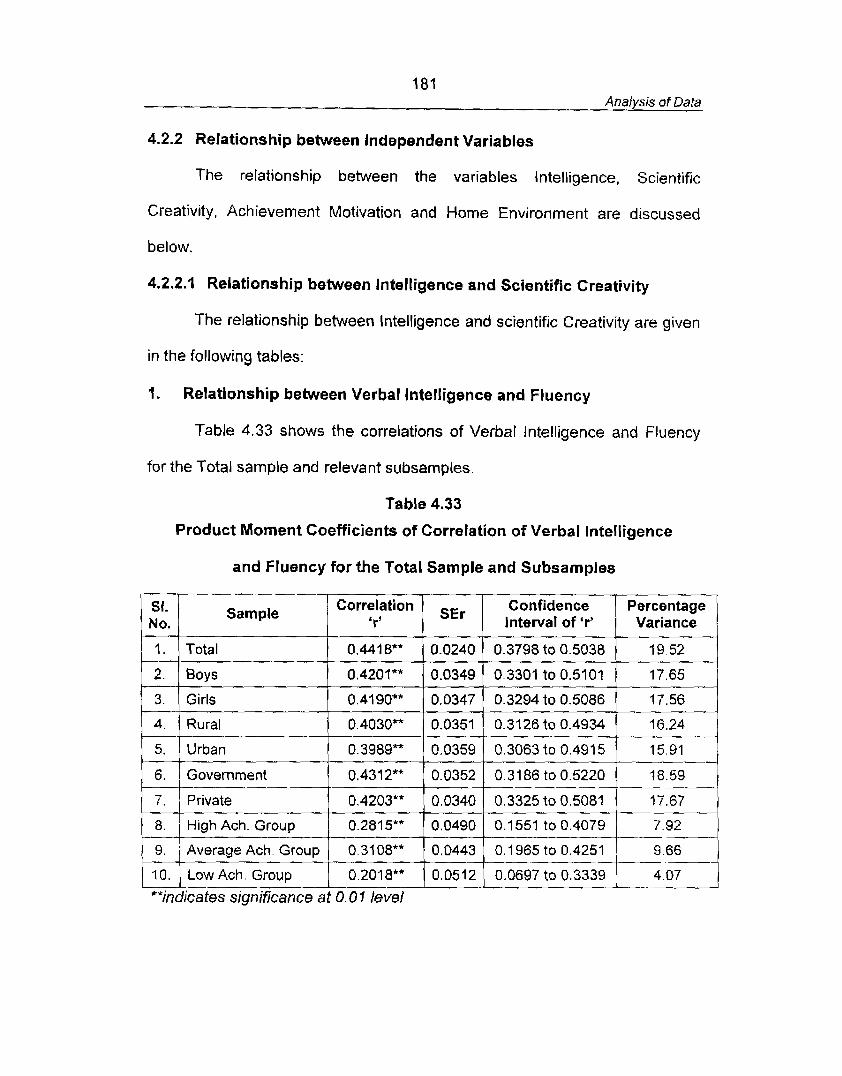
181 AnaIysis of Data
4.2.2 Relationship between independent Variables
The relationship between the variables Intelligence, Scientific
Creativity, Achievement Motivation and Home Environment are discussed
below.
4.2.2.1 Relationship between Intelligence and Scientific Creativity
The relationship between lntelligence and scientific Creativity are given
in the following tables:
1. Relationship between Verbal lntelligence and Fluency
Table 4.33 shows the correlations of Verbal lntelligence and Fluency
for the Total sample and relevant subsamples.
Table 4.33
Product Moment Coefficients of Correlation of Verbal lntelligence
and Fluency for the Total Sample and Subsamples
Sf. No.
4. 1 Rural 1 0.4030'* 1 0.0351 1 0.3126 to 0.4934 ( 16.24 (
1.
2.
3.
5. 1 Urban 1 0.3989** 10.03591 0.3063to0.4915 ( 15.91 1
Sample
Total
Boys
Girls
9. / Average Ach Group ( 0.3108" 1 0.0443 1 0.1 965 to 0.4251 1 9.66 1
6.
7 .
8.
10. 1 Cow Ach Group I 0.2018** 1 0.0512 1 0.0697 to 0.3339 1 4.07 1 -- .-
**indicates significance at 0.01 level
Correlation 'r'
0.441 8**
0.4201**
0.4190**
SEr Confidence Interval of 'r'
Government
Private
High Ach. Group
Variance
0.0240
0.0349
0.0347
0.4312**
0.4203**
0.2815**
0.3798 to 0.5038
0.3301 to 0.5101
0.3294 to 0.5086
19.52
17.65
17.56
0.0352
0.0340
0.0490
0.3186to0.5220 18.59
0.3325 to 0.5081 17.67 --
0.1551 to 0.4079 7.92
7 82 Analysis of Data
Table 4.33 shows that the coefficients of correlation obtained are as
fallows:
(i) Total Sample
The coefficient of correlation obtained is 0.4418. It is significant at 0.01
level and the 0.01 confidence interval is from 0.3798 to 0.5038.
(ii) Boys
The coefficient of correlation obtained is 0.4201. It is significant at 0.01
level and the 0.01 confidence interval is from 0.3301 to 0.5101.
(iii) Girls
The coefftcient of correlation obtained is 0.4190. It is significant at 0.0d
level and the 0.01 confidence interval is from 0.3294 to 0.5086.
(iv) Rural Subjects
The coefficient of correlation obtained is 0.4030. It is significant at 0.01
jevel and the 0.01 confidence interval is from 0.3126 to 0.4934.
(v) Urban Subjects
The coefficient of correlation obtained is 0.3989. It is significant at 0.01
level and the 0.01 confidence interval is from 0.3063 to 0.4915.
(vi) Government School Subjects
The coefficient of correlation obtained is 0.4312. It is significant at 0.01
level and the 0.01 confidence interval is from 0.3186 to 0.5220.
(vii) Private School Subjects
The coefficient of correlation obtained is 0.4203. It is significant at 0.01
level and the 0.01 confidence interval is from 0.3325 to 0.5081.
183 Analysis of Data
(viii) High Achievement Group
The coefficient of correlation obtained is 0.281 5. It is significant at 0.01
level and the 0.01 confidence interval is from 0.1 551 to 0.4079.
(ix) Average Achievement Group
The coeficient of correlation obtained is 0.3108. It is significant at 0.01
level and the 0.01 confidence interval is from 0.1965 to 0.4257.
(x) Low Achievement Group
The coefficient of correlation obtained is 0.201 8. It is significant at 0.01
level and the 0.01 confidence interval is from 0.0697 to 0.3339.
interpretations
The following results show that Verbal Intelligence has close
relationship with Fluency:
{a) The coefficients of correlation obtained are significant at 0.07 level for
all samples.
(b) The coefficients of correlation obtained are in the range of 0.2018 to
0.441 8. The relationship between the variables may be described as
substantial or marked for the Total sample and subsamples of Boys,
Girls, Rural, Government and Private schools.
(c) All the obtained 'r' values are positive showing that any increase or
decrease in Fluency will be attended by a corresponding increase or
decrease in Verbal Intelligence.
(d) The 0.01 confidence intervals show the probable range of the
corresponding population values.
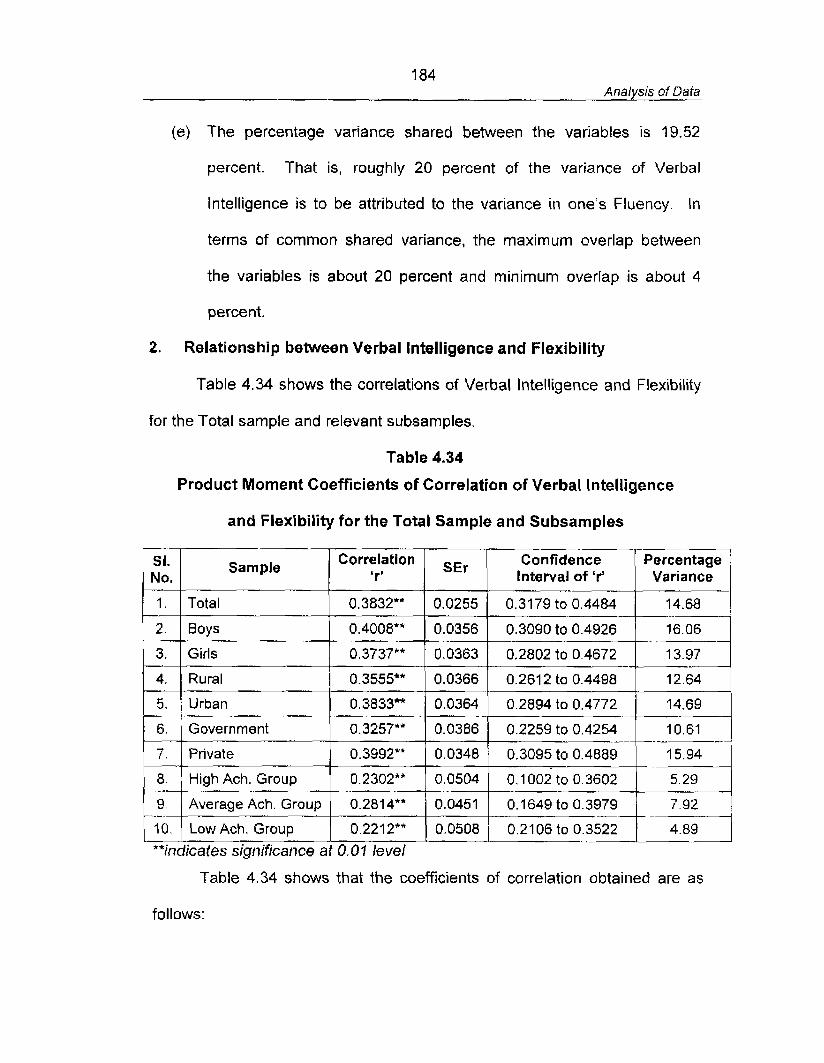
I 84 Analysis of Data
(e) The percentage variance shared between the variables is 19.52
percent. That is, roughly 20 percent of t h e variance of Verbal
lntelligence is to be attributed to the variance in one's Fluency. In
terms of common shared variance, the maximum overlap between
the variables is about 20 percent and minimum overlap is about 4
percent.
2. Relationship between Verbal lntelligence and Flexibility
Table 4.34 shows the correlations of Verbal lntelligence and Flexibility
for the Total sample and relevant subsamples.
Table 4.34
Product Moment Coefficients of Correlation of Verbal Intelligence
and Flexibility for the Total Sample and Subsamples
Sample No.
1 5. 1 Urban 1 0.3833** 1 0.0364 1 0.2894 to 0.4772 1 14.69 1
- 1. - 2.
3.
4.
Correlation &rr
Table 4.34 shows that the coefficients of correlation obtained are as
Total
Boys
Girls
Rural
6.
7 .
8.
9.
10.
follows:
SEr I Confidence [ G & n t a g e
Interval of 'r' Variance 1 0.3832"*
0.4008**
0.3737**
0.3555**
**indicates significance af 0.01 level
Government
Private
High Ach. Group
Average Ach. Group
Low Ach. Group
0.0255
0.0356
0.0363
0.0366
0.3257**
0.3992"*
0.2302**
0.2814"*
0.221 2"*
0.31 79 to 0.4484
0.3090 to 0.4926
0.2802 to 0.4672 -- 0.261 2 to 0.4498
0.0386
0.0348
0.0504
0.0451
0.0508
'-1
0.2259 to 0.4254
0.3095 to 0.4889
0.1 002 to 0.3602
0.1649 to 0.3979
0.21 06 to 0.35%-- --
10.61
15.94
5.29
7.92
-4891
185 Analysis of Data
(i) Total Sample
The coefficient of correlation obtained is 0.3832. It is significant at 0.01
level and the 0.01 confidence interval is from 0.3179 to 0.4484.
(ii) Boys
The coefficient of correlation obtained is 0.4008. It is significant at 0.01
level and the 0.01 confidence interval is from 0.3090 to 0.4926.
( i i i ) Girls
The coefficient of correlation obtained is 0.3737. tt is significant at 0.01
level and the 0.01 confidence interval is from 0.2802 to 0.4672.
(iv) Rural Subjects
The coefficient of correlation obtained is 0.3555. It is significant at 0.01
level and the 0.01 confidence interval is from 0.2612 to 0.4498.
(v) Urban Subjects
The coefficient of correlation obtained is 0.3833. It is significant at 0.01
level and the 0.01 confidence interval is from 0.2894 to 0.4772.
(vi) Government School Sub~ects
The coefficient of correlation obtained is 0.3257. It is significant at 0.01
level and the 0.01 confidence interval is from 0.2259 to 0.4254.
(vii) Private School Subjects
The coeficient of correlation obtained is 0.3992. It is significant at 0.01
level and the 0.01 confidence interval is from 0.3095 to 0.4889.
1 86 Analysis of Data
(viii) High Achievement Group
The coefficient of correlation obtained is 0.2302. It is significant at 0.01
level and the O.O? confidence interval is from 0.1002 to 0.3602.
(ix) Average Achievement Group
The coefficient of correlation obtained is 0.2814. It is significant at 0.0q
level and the 0.01 confidence interval is from 0.1649 to 0.3979.
(x) Low Achievement Group
The coefficient of correlation obtained is 0.2212. It is significant at 0.01
level and the 0.01 confidence interval is from 0.2106 to 0.3522.
Interpretations
The following results show that Verbal Intelligence and Flexibility are
related to some extent:
(a) For all samples, the coefficients of correlation obtained are significant
at 0.01 level.
(b) The coefficients of correlation obtained are in the range of 0.2212 to
0.4008. The relationship between the variables may be explained as
low or slight.
(c) All the obtained 'r' values are positive showing that any increase or
decrease in Flexibility will be attended by a corresponding increase or
decrease in Verbal Intelligence.
(d) The 0.01 confidence intervals show the probable range of the
corresponding population values.
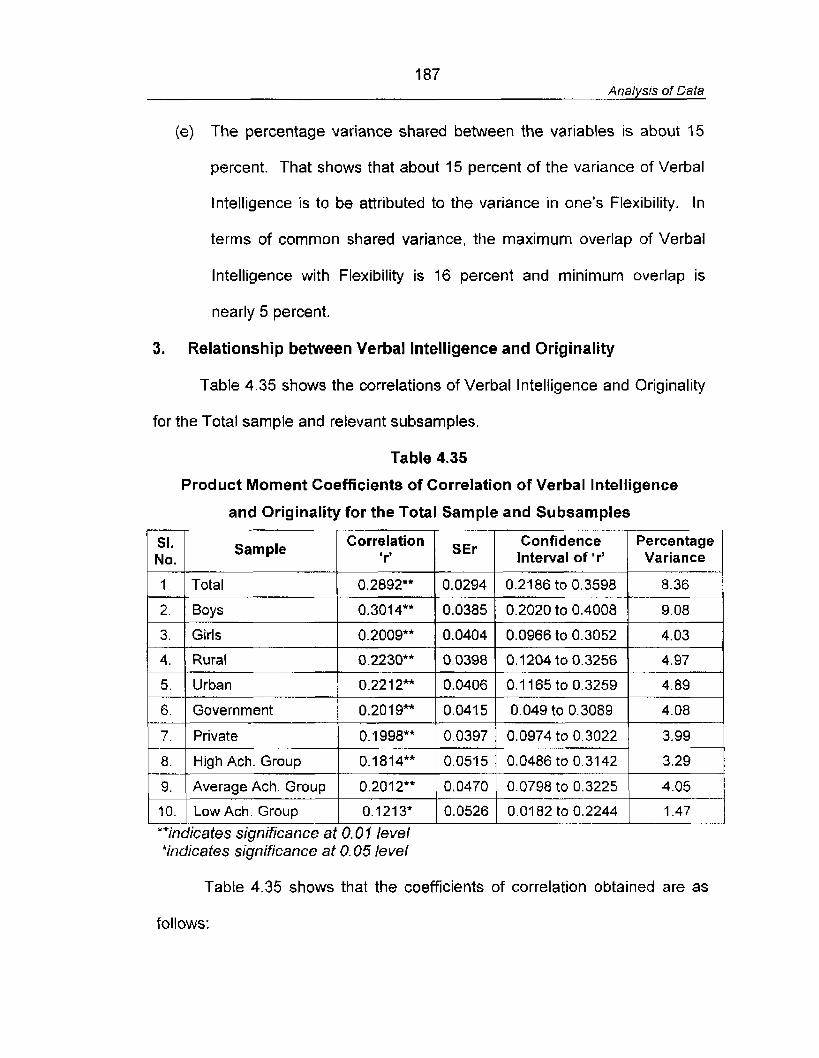
187 Analysis of Data
(e) The percentage variance shared between the variables is about I 5
percent. That shows that about 15 percent of the variance of Verbal
Intelligence is to be attributed to the variance in one's Flexibility. In
terms of common shared variance, the maximum overlap of Verbal
Intelligence with Flexibility is 16 percent and minimum overlap is
nearly 5 percent.
3. Relationship between Verbal Intelligence and Originality
Table 4.35 shows the correlations of Verbal Intelligence and Originality
for the Total sample and relevant subsarnples.
Table 4.35
Product Moment Coefficients of Correlation of Verbal Intelligence
and Originality for the Total Sample and Subsamples
'Id 1 Sample Correlation 1 SEr 1 Confidence Percentage
No. Interval of 'r' Variance
1 1 Total 1 0.2892** 1 0.0294 1 0.2186 to 0.3598 1 8.36 1 2. 1 Boys 1 0.3014** ] 0.0385 I 0.2020 to 0.4008 1 9.08 1
5 1 Urban 1 0.2212** 0.04061 0.1165to0.3259 1 4.89 1
3.
4.
6. 1 Government / 0.2019** 1 0.0415 1 0.049 to 0.3089 1 4.08 1 1 7. 1 Private 1 0.1998" 1 0.0397 1 0.0974 to 0.3022 1 3.99 1
Girls
Rural
1 8. 1 High Ach. Group 1 0.1814'* 1 0.0515 / 0.0486 to 0.3142 1 3.29 1
0.2009**
0.2230""
Table 4.35 shows that the coefficients of correlation obtained are as
9.
follows:
0.0404
0.0398
**indicates significance at 0.0 1 level * M i c a tes significance at 0.05 level
Average Ach. Group
Low Ach. Group
0.0966 to 0.3052
0.1204to0.3256
4.03
4.97
0.2012**
0.1213*
0.0470
0.0526
0.0798 to 0.3225
0.0182to0.2244 . , . . - .- -

188 Analysis of Data
(i) Total Sample
The coefficient of correlation obtained is 0.2892. It is significant at 0.01
level and the 0.01 confidence interval is from 0.2186 to 0.3598.
( i i ) Boys
The coefficient of correlation obtained is 0.3014. It is significant at 0.01
level and the 0.01 confidence interval is from 0.2020 to 0.4008.
(iii) Girls
The coefficient of correlation obtained is 0.2009. It is significant at 0.01
level and the 0.07 confidence interval is from 0.0966 to 0.3052.
(iv) Rural Subjects
The coefficient of correlation obtained is 0.2230. It is significant at 0.01
level and the 0.01 confidence interval is from 0.1204 to 0.3256.
{v) Urban Subjects
The coefficient of correlation obtained is 0.2212. It is significant at 0.01
level and the 0.01 confidence interval is from 0.4 165 to 0.3259.
(vi) Government School Subjects
The coefficient of correlation obtained is 0.2019. It is significant at 0.01
level and the 0.01 confidence intetval is from 0.0949 to 0.3089.
(vii) Private School Subjects
The coefficient of correlation obtained is 0.1998. It is significant at 0.01
level and the 0.01 confidence interval is from 0.0974 to 0.3022. -
189 Analysis of Data
(viii) High Achievement Group
The coefficient of correlation obtained is 0.1814. It is significant at 0.01
level and the 0.01 confidence interval is from 0.0486 to 0.3142.
(ix) Average Achievement Group
The coefficient of correlation obtained is 0.2012. It is significant at 0.01
level and the 0.07 confidence interval is from 0.0798 to 0.3225.
(x) Low Achievement Group
The coefficient of correlation obtained is 0.1213. It is significant at 0.05
level and the 0.05 confidence interval is from 0.0782 to 0.2244.
Interpretations
The following results show that there exists slight relationship between
Verbal Intelligence and Originality:
(a) The coefficients of correlation obtained for all samples are significant
at 0.01 level except for the Low Achievement group, whose 'r' is
significant at: 0.05 level.
{b) The coefficients of correlation obtained are in the range of 0.A213 to
0.3014. The relationship between the variables may be explained as
low or slight.
(c) All the obtained 'r' values are positive showing that any increase or
decrease in originality will be followed by a corresponding increase or
decrease in Verbal Intelligence.
(d) The 0.01 confidence intervals show the probable range of the
corresponding population values.
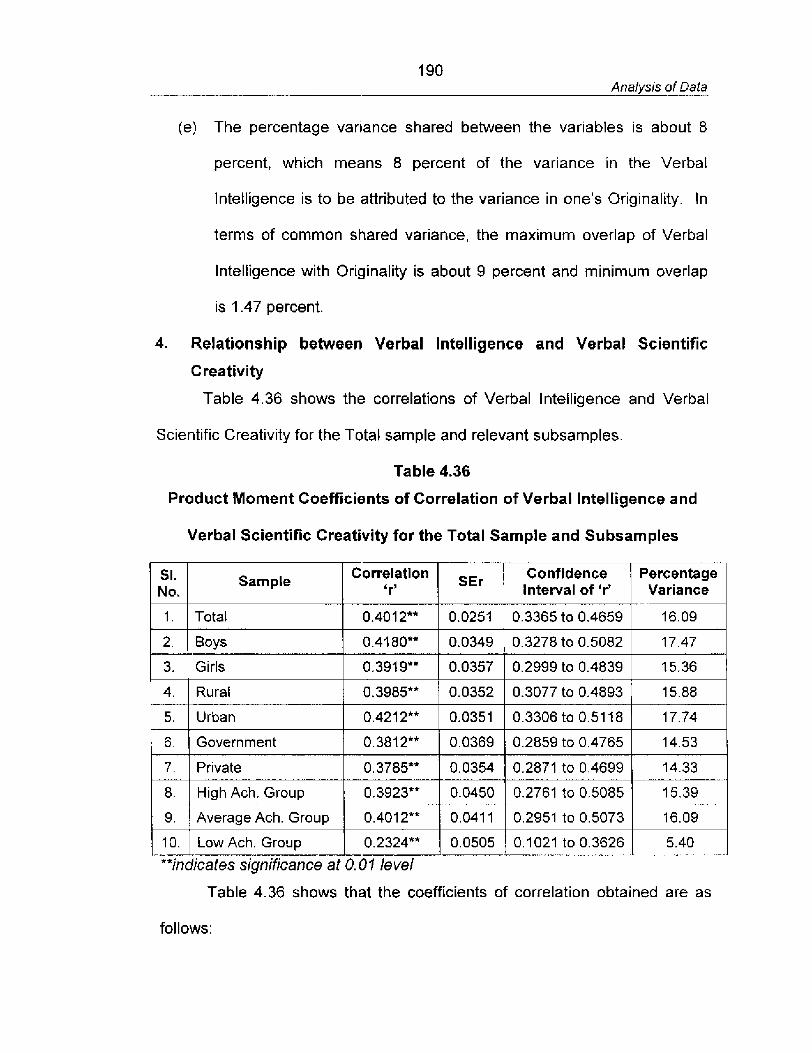
190 Analysis of Data
(e) The percentage variance shared between the variables is about 8
percent, which means 8 percent of the variance in the Verbat
Intelligence is to be attributed to the variance in one's Originality. In
terms of common shared variance, the maximum overlap of Verbal
Intelligence with Originality is about 9 percent and minimum overlap
is 1.47 percent.
4. Relationship between Verbal Intelligence and Verbal Scientific
Creativity
Table 4.36 shows the correlations of Verbal Intelligence and Verbal
Scientific Creativity for the Total sample and relevant subsamples.
Table 4.36
Product Moment Coefficients of Correlation of Verbal Intelligence and
Verbal Scientific Creativity for the Total Sample and Subsamples
Sample Correlation I SEr 1 Confidence Interval of 'rY I Percentage Variance I
I 1. 1 Total 1 0.401 2** 1 0.0251 1 0.3365 to 0.4659 1 16.09 1 1 2. I Boys / 0.41 80" 1 0.0349 1 0.3278 to 0.5082 1 17.47 1
1 5 , 1 Urban 1 0.421 2** 1 0.0351 1 0.3306 to 0.51 18 1 17.74 1
3.
4.
1 9. / Average Ach. Group 1 0.401 2'* / 0.041 1 1 0.2951 to 0.5073 1 16.09 1
Girls
Rural
6.
7.
8.
( 1 q Loow Ach. Group 1 0.2324"' / 0.0505 10.1021 to 0.3626 1 5.40 1 , - - . . . . . . , -.
**indicates significance at 0.0 7 level
Table 4.36 shows that the coefficients of correlation obtained are as
0.3919**
0.3985**
Government
Private
High Ach. Group
follows:
0.0357
0.0352
0.3812**
0.3785**
0.3923**
0.2999 to
0.3077 to 0.4893 15.88
0.0369
0.0354
0.0450
0.2859 to 0.4765
0.2871 to 0.4699
0.2761 to 0.5085
14.53
14.33
15.39
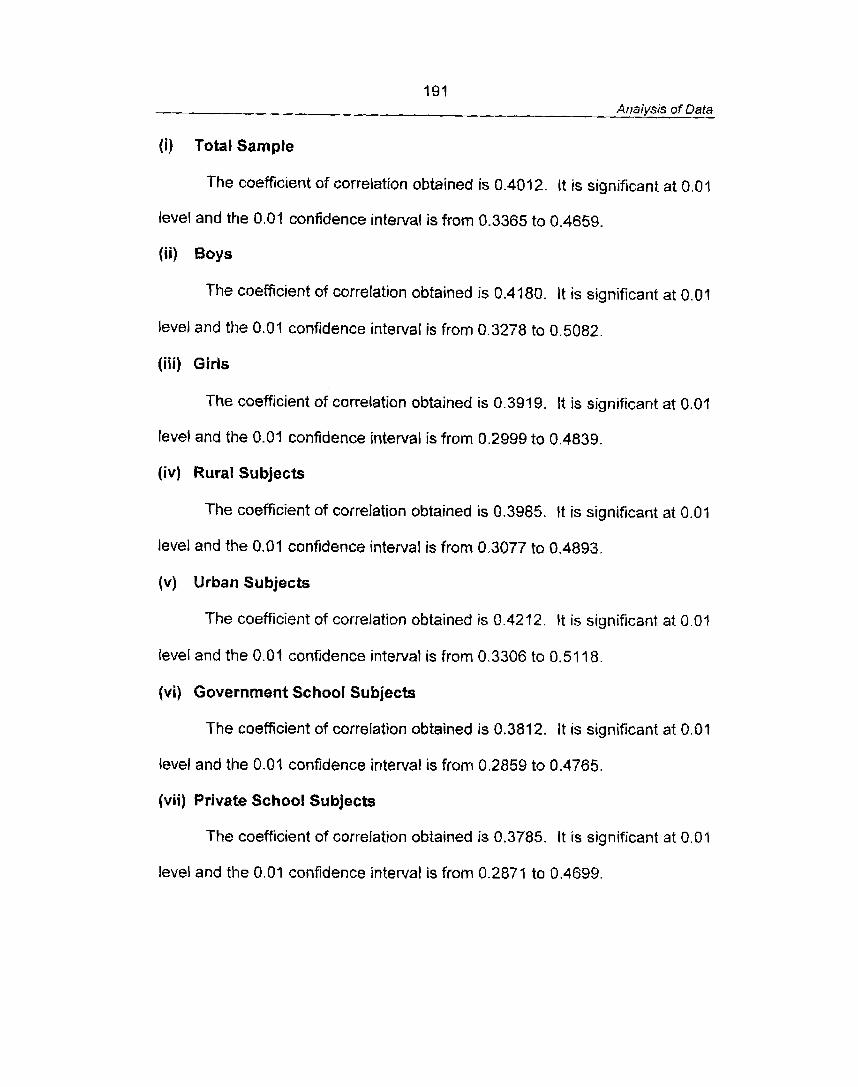
191 Analysis of Data
(i) Total Sample
The coefficient of correlation obtained is 0.4012. It is significant at 0.01
level and the 0.01 confidence internal is from 0.3365 to 0.4659.
(ii) Boys
The coefficient of correlation obtained is 0.4180. It is significant at 0.01
level and the 0.01 confidence interval is from 0.3278 to 0.5082.
(iii) Girls
The coefficient of correlation obtained is 0.3919. It is significant at 0.01
level and the 0.01 confidence interval is from 0.2999 to 0.4839.
(iv) Rural Subjects
The coefficient of correlation obtained is 0.3985. It is significant at 0.01
level and t h e 0.01 confidence interval is from 0.3077 to 0.4893.
(v) Urban Subjects
The coefficient of correlation obtained is 0.4212. It is significant at 0.01
level and the 0.01 confidence interval is from 0.3306 to 0.51 18.
(vi) Government School Subjects
The coefficient of correlation obtained is 0.3812. It is significant at 0.01
level and the 0.01 confidence interval is from 0.2859 to 0.4765.
(vii) Private School Subjects
The coefficient of correlation obtained is 0.3785. It is significant at 0.01
level and the 0.01 confidence interval is from 0.2871 to 0.4699.
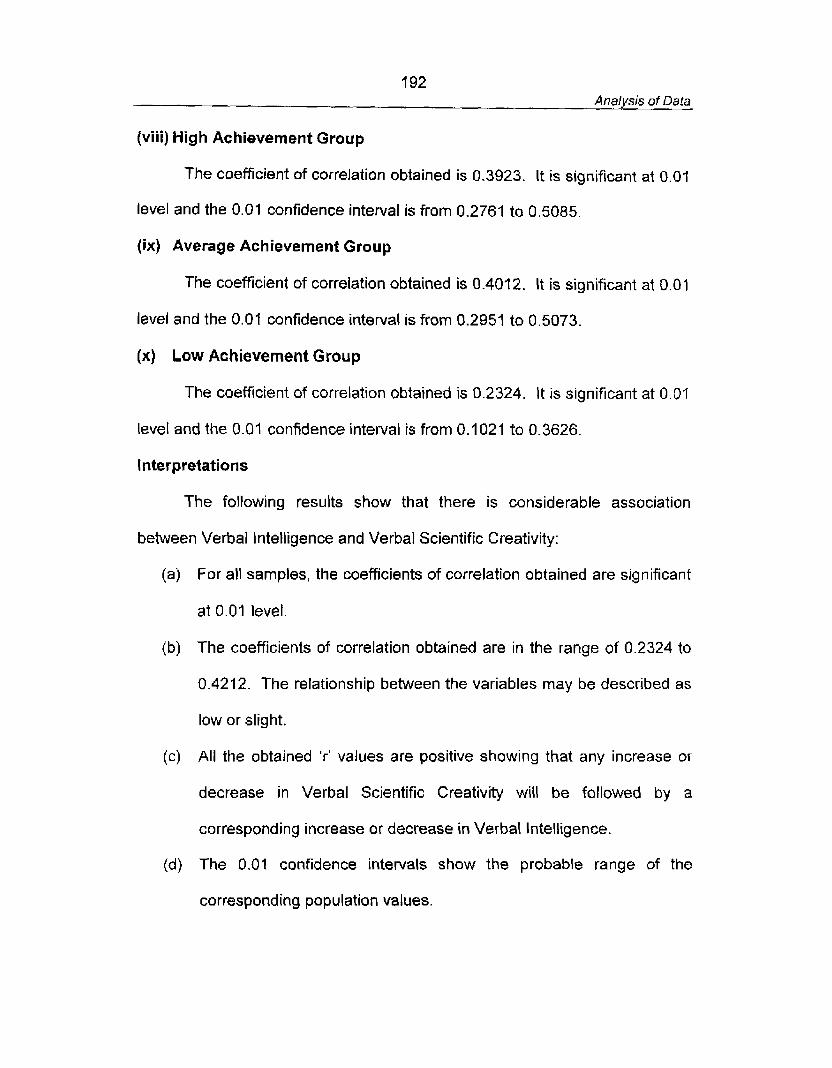
192 Analysis of Data
(viii) High Achievement Group
The coefficient of correlation obtained is 0.3923. It is significant at 0.01
level and the 0.01 confidence interval is from 0.2761 to 0.5085.
(ix) Average Achievement Group
The coefficient of correlation obtained is 0.4012. It is significant at 0.01
level and the 0.01 confidence interval is from 0.2951 to 0.5073.
(x) Low Achievement Group
The coefficient of correlation obtained is 0.2324. It is significant at 0.01
level and the 0.01 confidence interval is from 0.1021 to 0.3626.
Interpretations
The following results show that there is considerable association
between Verbal Intelligence and Verbal Scientific Creativity:
(a) For all samples, the coefficients of correlation obtained are significant
at 0.01 level.
(b) The coefficients of correlation obtained are in the range of 0.2324 to
0.4212. The relationship between the variables may be described as
low or slight.
(c) All the obtained 'r' values are positive showing that any increase or
decrease in Verbal Scientific Creativity will be followed by a
corresponding increase or decrease in Verbal Intelligence.
(d) The 0.01 confidence intervals show the probable range of the
corresponding population values.
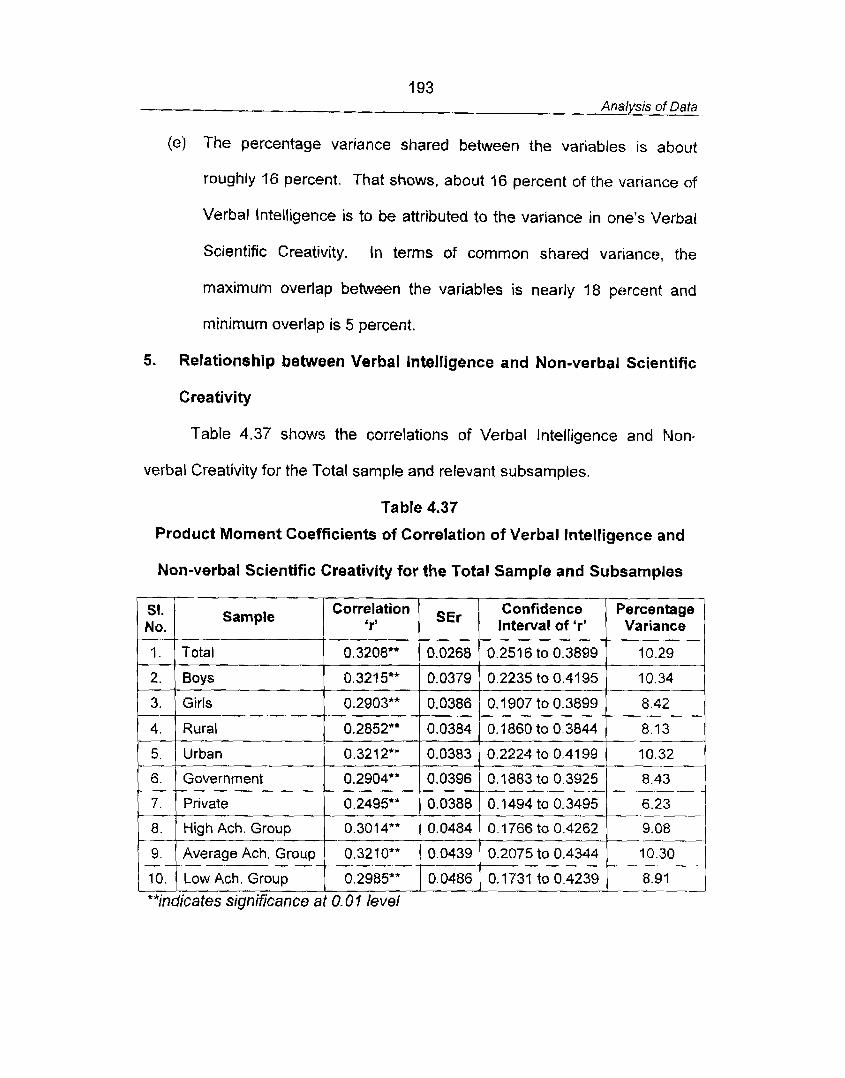
193 Analysis of Data
(e) The percentage variance shared between the variables is about
roughly 16 percent. That shows, about 16 percent of the variance of
Verbal Intelligence is to be attributed to the variance in one's Verbal
Scientific Creativity. In terms of common shared variance, the
maximum overlap between the variables is nearly 18 percent and
minimum overlap is 5 percent.
5. Relationship between Verbal IntelJigence and Non-verbal Scientific
Creativity
Table 4.37 shows the correlations of Verbal Intelligence and Non-
verbal Creativity for the Total sample and relevant subsamples.
Table 4.37
Product Moment Coefficients of Correlation of Verbal Intelligence and
Nowverbal Scientific Creativity for the Total Sample and Subsamples
**indicates significance at 0.0 7 level
SI. No.
1.
2.
3.
4.
5.
Sample
Total
Boys
Girls
Rural
Urban
0.2904**
0.2495**
0.301 4""
0.321 0**
0.2985**
Correlation 'r'
0.3208**
0.3215**
Q.2903**
0.2852**
0.321 2'"
8.43 -
6.23 --- 9.08 --- 10.30
-- - -- 8.91
0.0396
0.0388
0.0484
0.0439
0.0486
- Percentage
Variance
10.29
10.34
8.42
8.13
10.32 -.
0.1883 to 0.3925
0.1494 to 0.3495
0.1766 to 0.4262 - 0.2075 to 0.4344
0.1731 to 0.4239
SEr
0.0268
0.0379
0.0386
0.0384
0.0383
Confidence Interval of 'r'
0.2516 to 0.3899
0.2235 to 0.4195
0.1907 to 0.3899
0.1860to0.3844
0.2224 to 0.41 99
1 94 Analys~s of Data
Table 4.37 shows that the coefficients of correlation obtained are as
follows:
(i) Total Sample
The coefficient of correlation obtained is 0.3208. It is significant at 001
level and the 0.01 confidence interval is from 0.2516 to 0.3899.
(ii) Boys
The coefficient of correlation obtained is 0.3215. It is significant at 0.01
level and the 0.01 confidence interval is from 0.2235 to 0.4195.
(iii) Girls
The coefficient of correlation obtained is 0.2903. It is significant at 0.01
level and the 0.01 confidence interval is from 0.1907 to 0.3899.
(iv) Rural Subjects
The coefficient of correfation.obtained is 0.2852. It is significant at 0.01
level and the 0.01 confidence interval is from 0.1860 to 0.3844.
(v) Urban Subjects
The coefficient of correlation obtained is 0.3212. It is significant at 0.01
level and the 0.01 confidence interval is from 0.2224 to 0.4199.
(vi) Government School Subjects
The coefficient of correlation obtained is 0.2904. It is significant at 0.01
level and the 0.01 confidence interval is from 0.1883 to 0.3925.
(vii) Private School Subjects
The coefficient of correlation obtained is 0.2495. It is significant at 0.01
level and the 0.01 confidence interval is from 0.1494 to 0.3495.
195 AnaIysis of Data
(viii) High Achievement Group
The coefficient of correlation obtained is 0.3014. It is significant at 0.01
level and the 0.01 confidence interval is from 0.1 766 to 0.4262.
(ix) Average Achievement Group
The coefficient of correlation obtained is 0.3210. It is significant at 0.01
level and the 0.01 confidence interval is from 0.2075 to 0.4344.
(x) Low Achievement Group
The coefficient of correlation obtained is 0.2985. It is significant at 0.01
level and the 0.01 confidence interval is from 0.1731 to 0.4239.
Interpretations
The following results show that relationship between Verbal
Intelligence and Non-verbal Scientific Creativity is considerable:
(a) The coefficients of correlation obtained are significant at 0.01 level for
all samples.
(b) The coefficients of correlation obtained are in the range of 0.2495 to
0.3215. The relationship between the variables may be described as
low or slight.
(c) All the obtained 'r' values are positive showing that any increase or
decrease in Non-verbal Creativity will be followed by a corresponding
increase or decrease in Verbal Intelligence.
(d) The 0.01 confidence intervals show the probable range of the
corresponding population values.
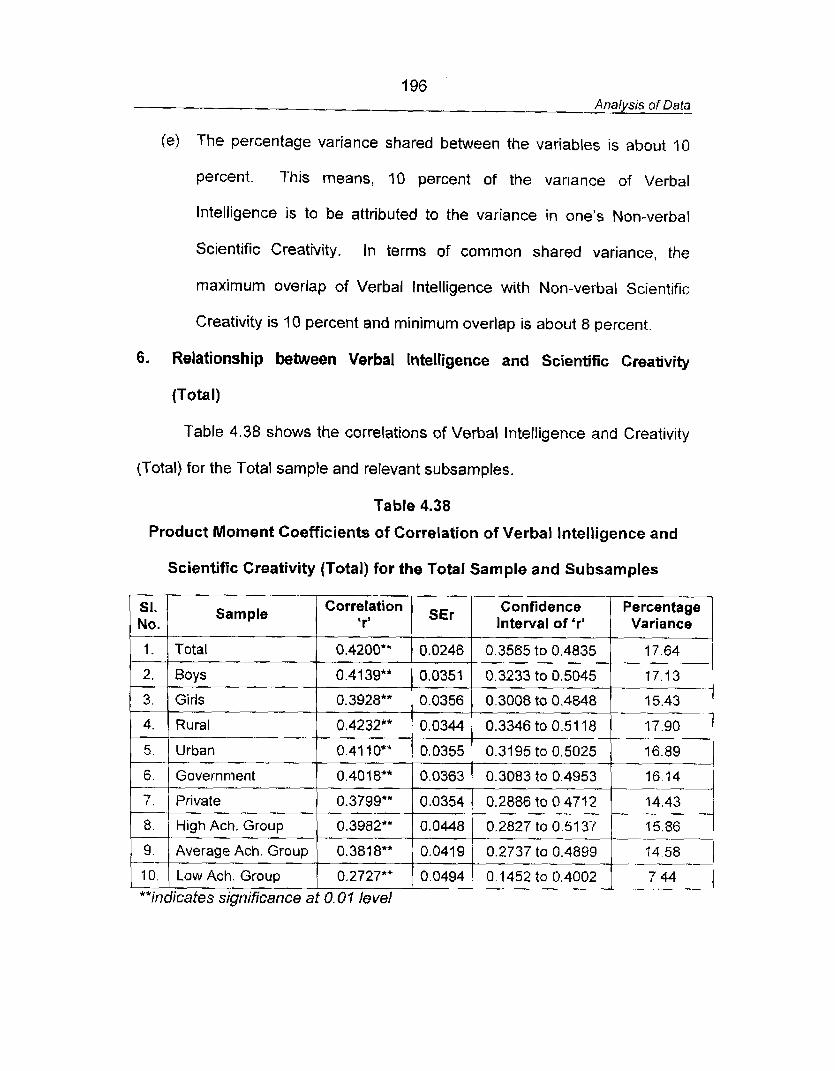
196 Analysis of Data
(e) The percentage variance shared between the variables is about 10
percent. This means, 10 percent of the variance of Verbal
lntelligence is to be attributed to the variance in one's Non-verbal
Scientific Creativity. In terms of common shared variance, the
maximum overlap of Verbal lntelligence with Non-verbal Scientific
Creativity is 10 percent and minimum overlap is about 8 percent.
6. Relationship between Verbal Intelligence and Scientific Creativity
(Total)
Table 4.38 shows the correlations of Verbal lntelligence and Creativity
(Total) for the Total sample and relevant subsamples.
Table 4.38
Product Moment Coefficients of Correlation of Verbal Intelligence and
Scientific Creativity (Total) for the Total Sample and Subsamples
SI. No.
1.
2.
3.
4.
5
6
7 .
8
9.
1 0.
**indicates significance at 0.0 7 level
Sample
Total
Boys
Girls
Rural
Urban
Government
Private .-
High Ach. Group
Average Ach. Group
Low Ach. Group
Correlation 'rr
0.4200*"
0.41 39**
0.3928**
0.4232**
0.41 lo** 0.4018**
0.3799'*
0.3982**
0.3818""
0.2727**
0.0246 ---- 0.0351
0.0356
0.0344
0.0355
0.0363
0.0354
0.0448
0.0419
0.0494
Confidence Interval of 'r'
0.3565 to 0.4835
0.3233 to 0.5045
0.3008 to 0.4848
0.3346 to 0.51 18
0.31 95 to 0.5025
0.3083 to 0.4953
~arcenta- is Variance
17.64
17.13
15.43
17.90
16.89 -- 16 74
0.2886 to 0.471 2
-. 0.1452 to 0.4002 7 44 -. --
197 Analysis of Data
Table 4.38 shows that the coeficients of correlation obtained are as
follows:
(i) TotalSample
The coefficient of correlation obtained is 0.4200. It is significant at 0.01
level and the 0.01 confidence interval is from 0.3565 to 0.4835.
(ii) Boys
The coefficient of correlation obtained is 0.4139. It is significant at 0.01
level and the 0.01 confidence interval is from 0.3233 to 0.5045.
(iii) Girls
The coefficient of correlation obtained is 0.3928. It is significant at 0.01
level and the 0.07 confidence interval is from 0.3008 to 0.4848.
(iv) Rural Subjects
The coefficient of correlation obtained is 0.4232. It is significant at 0.01
level and the 0.0 1 confidence interval is from 0.3346 to 0.5 1 18.
(v) Urban Subjects
The coefficient of correlation obtained is 0.41 10. It is significant at 0.01
level and the 0.0t confidence interval is from 0.3195 to 0.5025.
(vi) Government School Subjects
The coefficient of correlation obtained is 0.4018. It is significant at 0.01
level and the 0.07 confidence interval is from 0.3083 to 0.4953.
(vii) Private School Subjects
The coefficient of correlation obtained is 0.3799. It is significant at 0.01
level and the 0.01 confidence interval is from 0.2886 to 0.4712.
198 Analysis of Data
(viii) High Achievement Group
The coefficient of correlation obtained is 0.3982. It is significant at 0.01
level and the 0.01 confidence interval is from 0.2827 to 0.5137.
(ix) Average Achievement Group
The coefficient of correlation obtained is 0.3818. It is significant at 0.01
level and the 0.01 confidence interval is from 0.2737 to 0.4899.
(x) Low Achievement Group
The coefficient of correlation obtained is 0.2727. It is significant at 0.01
level and the 0.01 confidence interval is from 0.1452 to 0.4002.
l nterpretations
The above results show that Verbal Intelligence and Scientific
Creativity are closely related variables.
(a) The coefficients of correlation obtained are significant at 0.01 level for
all samples.
(b) The coefficients of correlation obtained are in the range of 0.3727 to
0.4232. The relationship between the variables may be described as
substantial or marked for the Total sample and subsamples of Boys,
Rural, Urban and Government schools. The relationship is low for
subsamples of Girls, Private schools and High, Average and Low
Achievement groups.
(c) All the obtained 'r' values are positive showing that any increase or
decrease in Creativity (Total) will be followed by a corresponding
increase or decrease in Verbal Intelligence.
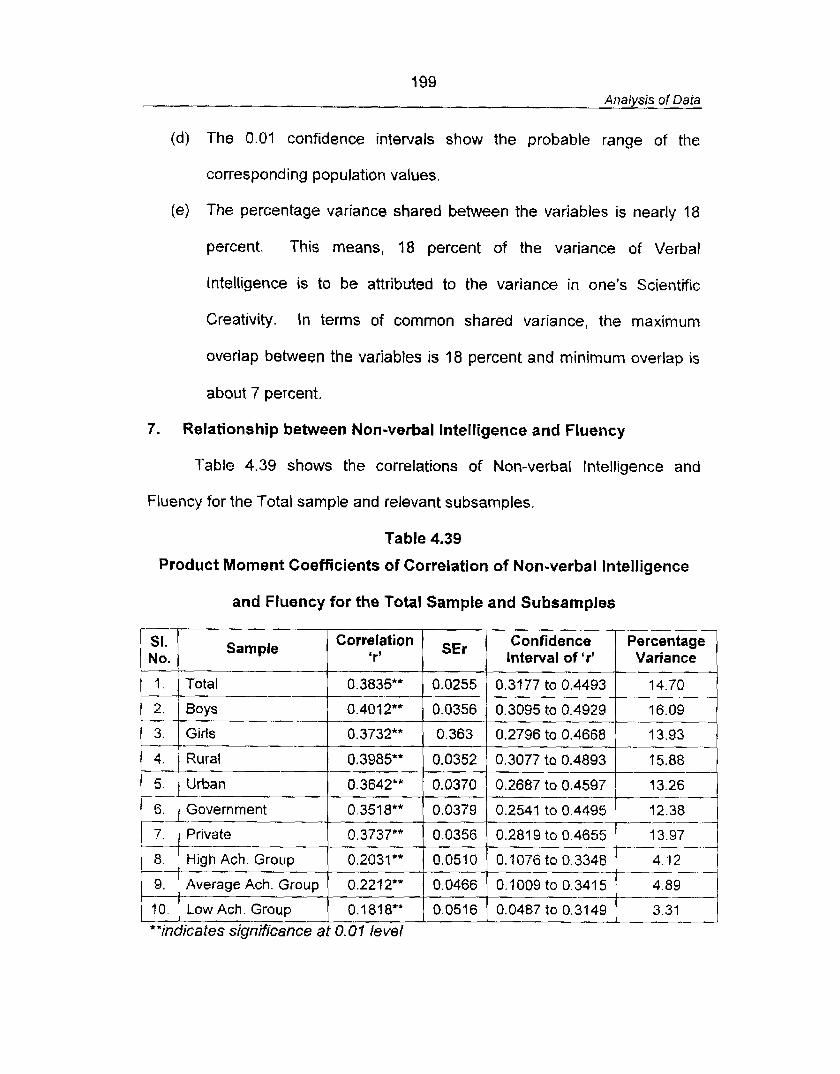
199 Analysis of Data
(d) The 0.01 confidence intervals show the probable range of the
corresponding population values.
(e) The percentage variance shared between t he variables is nearly 18
percent. This means, 18 percent of the variance of Verbal
lntelligence is to be attributed to the variance in one's Scientific
Creativity. In terms of common shared variance, the maximum
overlap between the variables is 18 percent and minimum overlap is
about 7 percent.
7. Relationship between Non-verbal Intelligence and Fluency
Table 4.39 shows the correlations of Non-verbal lntelligence and
Fluency for the Total sample and relevant subsamples.
Table 4.39
Product Moment Coefficients of Correlation of Non-verbal Intelligence
and Fluency for the Total Sample and Subsamples
SI. NO.
1.
2.
3.
4 .
5.
6.
Sample
0.3737""
0.2031**
0.2212**
0.1878""
Total
Boys
Girls ----A
Rural
Urban
Government
Correlation 'rr
**indicates significance at 0.0 1 Ie vel
0.0356
0.0510
0.0466
0.0516
0.3835**
0.401Zn*
0.3732**
0.3985"'
0.3642**
0.351 8**
0.2819 to 0.4655 13.97 --- --
0.1076to0.3348
0.1009 to 0.341 5 - 0.0487to0.3149 3.31
----
SEr
0.0255
0.0356
0.363
0.0352
0.0370
0.0379
Confidence Interval of 'r'
Percentage -7 Variance
0.3177 to 0.4493
0.3095to0.4929
0.2796 to 0.4668
0.3077 to 0.4893
0.2687 to 0.4597
0.2541 to 0.4495
14.70 -
16.09 - -
13.93 - 5.88
13.26 --- 12.38
200 Analysis of Data
Table 4.39 shows that the coefficients of correlation obtained are as
follows:
(i) Total Sample
The coefficient of correlation obtained is 0.3835. It is significant at 0.01
level and the 0.01 confidence interval is from 0.3177 to 0.4493.
( i i ) Boys
The coefkient of correlation obtained is 0.4012. It is significant at 0.01
level and the 0.01 confidence interval is from 0.3095 to 0.4929.
(iii) Girls
The coefficient of correlation obtained is 0.3732. It is significant at 0.01
level and the 0.01 confidence interval is from 0.2796 to 0.4668.
(iv) Rural Subjects
The coefficient of correlation obtained is 0.3985. It is significant at 0.01
level and the 0.01 confidence interval is from 0.3077 to 0.4893.
(v) Urban Subjects
The coefficient of correlation obtained is 0.3642. It is significant at 0.01
level and the 0.01 confidence interval is from 0.2687 to 0.4597.
(vi) Government School Subjects
The coefficient of correlation obtained is 0.351 8. It is significant at 0.01
level and the 0.01 confidence interval is from 0.2541 to 0.4495.
(vii) Private School Subjects
The coefficient of correlation obtained is 0.3737. It is significant at 0.01
level and the 0.01 confidence interval is from 0.2819 to 0.4655.
201 Analysis of Data
(viii) High Achievement Group
The coefficient of correlation obtained is 0.2031 . It is significant at 0.01
level and the 0.07 confidence interval is from 0.1076 to 0.3348.
(ix) Average Achievement Group
The coefficient of correlation obtained is 0.2212. It is significant at 0.01
level and the 0.01 confidence interval is from 0.1 009 to 0.341 5.
(x) Low Achievement Group
The coefficient of correlation obtained is 0.A 818. It is significant at 0.01
level and the 0.01 confidence interval is from 0.0487 to 0.31 49.
Interpretations
The following results show that there exists considerable relationship
between Non-verbal Intelligence and Fluency:
(a) The coefficients of correlation obtained are significant at 0.01 level for
all samples.
(b) The coefficients of correlation obtained are in the range of 0.1818 to
0.401 2. The relationship between the variables may be considered
as low or slight.
(c) All the obtained coefficients of correlation are positive showing that
any increase or decrease in Fluency will be followed by a
corresponding increase or decrease in Non-verbal Intelligence.
(d) The 0.01 confidence intervals show the probable range of the
corresponding population values.
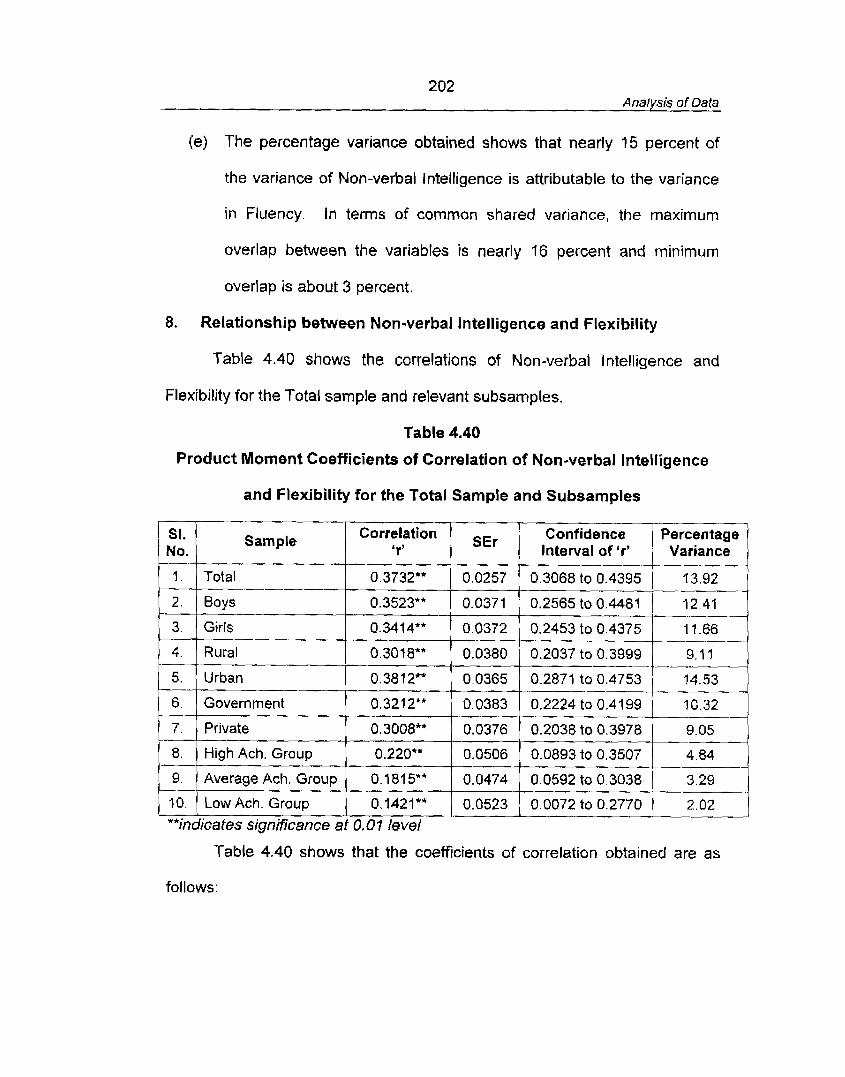
202 Analysis of Data
(e) The percentage variance obtained shows that nearly 15 percent of
the variance of Non-verbal lntelligence is attributable to t he variance
in Fluency. In terms of common shared variance, the maximum
overlap between the variables is nearly 16 percent and minimum
overlap is about 3 percent.
8. Relationship between Non-verbal lntelligence and Flexibility
Table 4.40 shows the correlations of Non-verbal Intelligence and
Flexibility for the Total sample and relevant subsamples.
Table 4.40
Product Moment Coefficients of Correlation of Non-verbal Intelligence
and Flexibility for the Total Sample and Subsamples
Table 4.40 shows that the coefficients of correlation obtained are as
follows:
SI. No.
1.
2.
3.
4.
5.
6.
7.
8.
9.
10.
**indicates significance at 0.0 1 level
Sample
Total
Boys
Girls
Rural
Urban
Government
Private
High Ach. Group
Average Ach. Group
Low Ach. Group
Correlation 'r'
0.3732**
0.3523**
0.3414**
0.3018*"
0.3812**
0.3212**
0.3008**
0.220**
0.1815**
0.1421**
SEr
0.0257
0.0371
0.0372
0.0380
0.0365
0.0383
0.0376
0.0506
0.0474
0.0523
Confidence Interval of 'r'
0.3068 to 0.4395
0.2565 to 0.4481
0.2453 to 0.4375
0.2037 to 0.3999 - .
0.2871 to 0.4753 -- 0.2224 to 0.4199
0.2038 to 0.3978
0.0893 to 0.3507 - 0.0592 to 0.3038
0.0072 to 0.2770
Percentage Variance
- 13.92
12.41
11.66
9.1 1 ---
--- 14.53
10.32
-
2.02
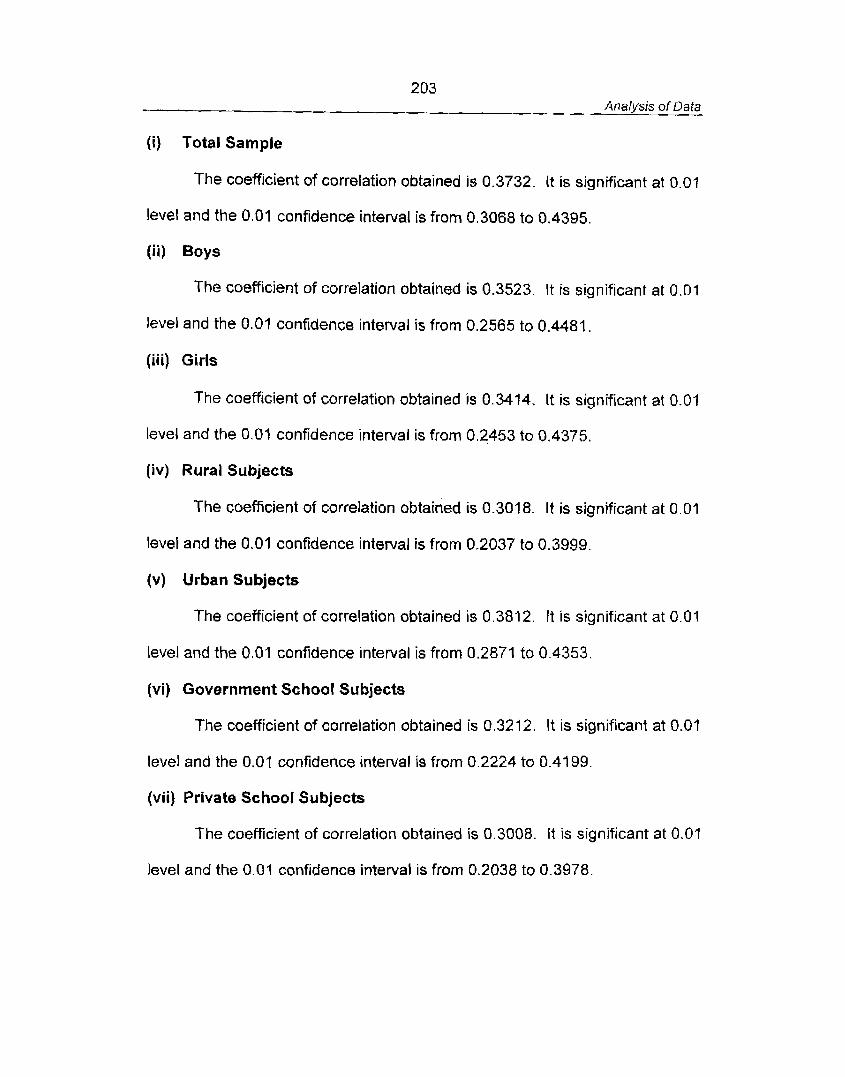
203 Analysis of Data
( i ) Total Sample
The coefficient of correlation obtained is 0.3732. It is significant at 0.01
level and the 0.01 confidence interval is from 0.3068 to 0.4395.
(ii) Boys
The coefficient of correlation obtained is 0.3523. It is significant at 0.01
level and the 0.01 confidence interval is from 0.2565 to 0.4481.
(iii) Girls
The coefficient of correlation obtained is 0.3414. It is significant at 0.01
level and the 0.01 confidence interval is from 0.2453 to 0.4375.
(iv) Rural Subjects
The coefficient of correlation obtained is 0.3018. It is significant at 0.01
level and the 0.01 confidence interval is from 0.2037 to 0.3999.
(v) Urban Subjects
The coefficient af correlation obtained is 0.3812. It is significant at 0.01
level and the 0.01 confidence interval is from 0.2871 to 0.4353.
(vi) Government School Subjects
The coefficient of correlation obtained is 0.3212. It is significant at 0.01
level and the 0.01 confidence interval is from 0.2224 to 0.41 99.
(vii) Private School Subjects
The coefficient of correlation obtained is 0.3008. It is significant at 0.01
level and the 0.01 confidence interval is from 0.2038 to 0.3978
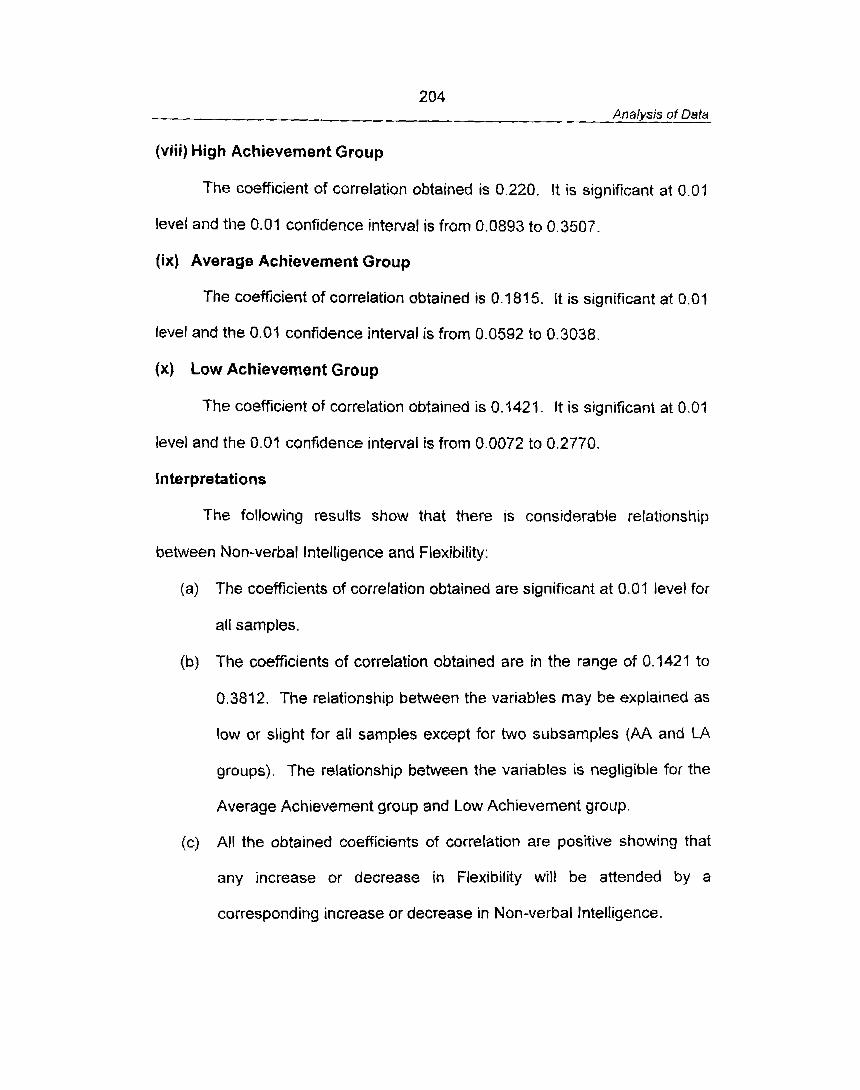
204 Analysis of Data
(viii) High Achievement Group
The coefficient of correlation obtained is 0.220. It is signifi~ant at 0.01
level and the 0.01 confidence interval is from 0.0893 to 0.3507.
(ix) Average Achievement Group
The coefficient of correlation obtained is 0.1815. It is significant at 0.01
level and the 0.0-l confidence interval is from 0.0592 to 0.3038.
(x) Low Achievement Group
The coefficient of correlation obtained is 0.q421. It is significant at 0.01
level and t he 0.0t confidence interval is from 0.0072 to 0.2770.
Interpretations
The following results show that there is considerable relationship
between Non-verbal Intelligence and Flexibility:
(a) The coefficients of correlation obtained are significant at 0.01 level for
all samples.
(b) The coefficients of correlation obtained are in the range of 0.1421 to
0.3812. The relationship between the variables may be explained as
low or slight for all samples except for two subsamples (AA and LA
groups). The relationship between the variables is negligible for the
Average Achievement group and Low Achievement group.
(c) All the obtained coefficients of correlation are positive showing that
any increase or decrease in Flexibility will be attended by a
corresponding increase or decrease in Non-verbal Intelligence.
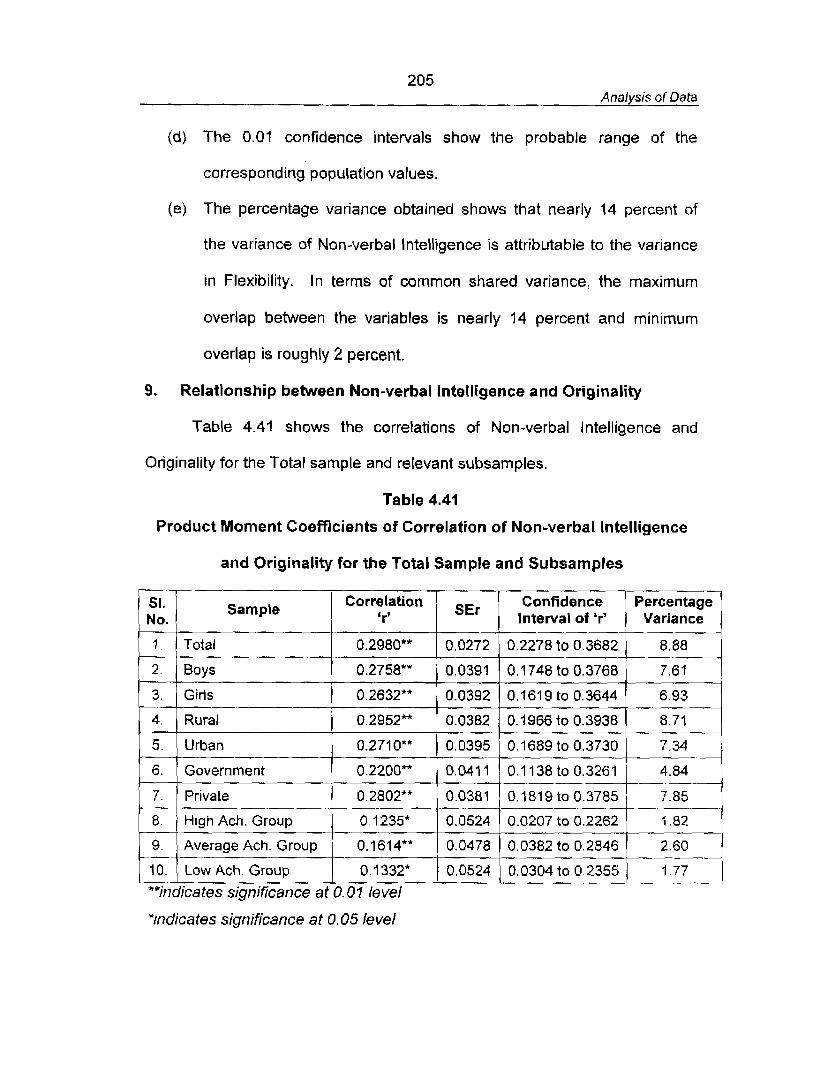
205 Analysis of Data
(d) The 0.01 confidence intervals show the probable range of the
corresponding population values.
(e) The percentage variance obtained shows that nearly 14 percent of
the variance of Non-verbal Intelligence is attributable to the variance
in Flexibility. In terms of common shared variance, the maximum
overlap between the variables is nearly 14 percent and minimum
overlap is roughly 2 percent.
9. Relationship between Non-verbal Intelligence and Originality
Table 4.41 shows the correlations of Non-verbal Intelligence and
Originality for the Total sample and relevant subsamples.
Table 4.41
Product Moment Coefficients of Correlation of Non-verbal Intelligence
and Originality for the Total Sample and Subsamples
3. 1 Girls
SI. No.
7 .
2.
1 4. 1 Rural 1 0.2952** 1 0.0382 1 0. I966 to 0.3938 1 8.71 1
Sample
Total
Boys
1 9. 1 Average Ach. Group 1 0.1614** 1 0.0478 1 0.0382 to 0.2846 1 2.60 (
5.
6.
7. - 8.
10. Low Ach. Group 0.1332' / 0.0524 / 0.0304 to 0 . 2 3 5 c 1.77 -, - .
**indicates significance at 0.0 1 Ie vel
*indicates significance at 0.05 level
Percentage Variance
8.88
7.61
Urban
Government
Private
High Ach. Group
Confidence Interval of 'r'
0.2278 to 0.3682
0.1748 to 0.3768
Correlation 'r'
0.2980**
0.2758**
SEr
0.0272
0.0391
0.271 0""
0.2200**
0.1235*
0.2802**
0.0395
0.041 1
0.0381
0.0524
0.1689 to 0.3730
0.1 138 to 0.3261
0.1819 to 0.3785
0.0207 to 0.2262
206 Analysis of Data
Table 4.41 shows that the coefficients of correlation obtained are as
follows:
(i) Total Sample
The coefficient of correlation obtained is 0.2980. It is significant at 0.01
level and the 0.07 confidence interval is from 0.2278 to 0.3682.
( i i ) Boys
The coefficient of correlation obtained is 0.2758. It is significant at 0.01
level and the 0.01 confidence interval is from 0.1748 to 0.3768.
( i i i ) Girls
The coefficient of correlation obtained is 0.2632. It is significant at 0.01
level and the 0.01 confidence interval is from 0.161 9 to 0.3644.
(iv) Rural Subjects
The coefficient of correlation obtained is 0.2952. It is significant at 0.01
level and the 0.01 confidence interval is from 0.1966 to 0.3928.
(v) Urban Subjects
The coefficient of correlation obtained is 0.271 0. It is significant at 0.01
level and the 0.01 confidence interval is from 0.1689 to 0.3720.
(vi) Government School Subjects
The coefficient of correlation obtained is 0.2200. It is significant at 0.01
level and the 0.01 confidence interval is from 0.1 138 to 0.3261.
(vii) Private School Subjects
The coefficient of correlation obtained is 0.2802. It is significant at 0.01
level and the 0.01 confidence interval is from 0.181 9 to 0.3785.
Analysis of Data
(viii) High Achievement Group
The coefficient of correlation obtained is 0.1235. It is significant at 0.05
level and the 0.05 confidence interval is from 0.01 16 to 0.2587.
(ix) Average Achievement Group
The coefficient of correlation obtained is 0.1614. It is significant at 0.01
level and the 0.01 confidence interval is from 0.0382 to 0.2846.
(x) Low Achievement Group
The coefficient of correlation obtained is 0.1332. It is significant at 0.05
level and the 0.05 confidence interval is from 0.0304 to 0.2355.
lnterpretatians
The following results show that Non-verbal Intelligence and Originality
are related to some extent:
(a) The coefficients of correlation obtained are significant at 0.01 level for
all samples except for the subsamples of High Achievement and Low
Achievement groups.
{b) The coefficients of correlation obtained are in the range of 0.1235 to
0.2980. For the Total sample and subsamples of Boys, Girls, Rural,
urban, Government and Private schools, the coefficients of
correlation are low or slight. For the three Achievement groups (HA,
AA and LA groups), t he 'r' values obtained are negligible or
indifferent.
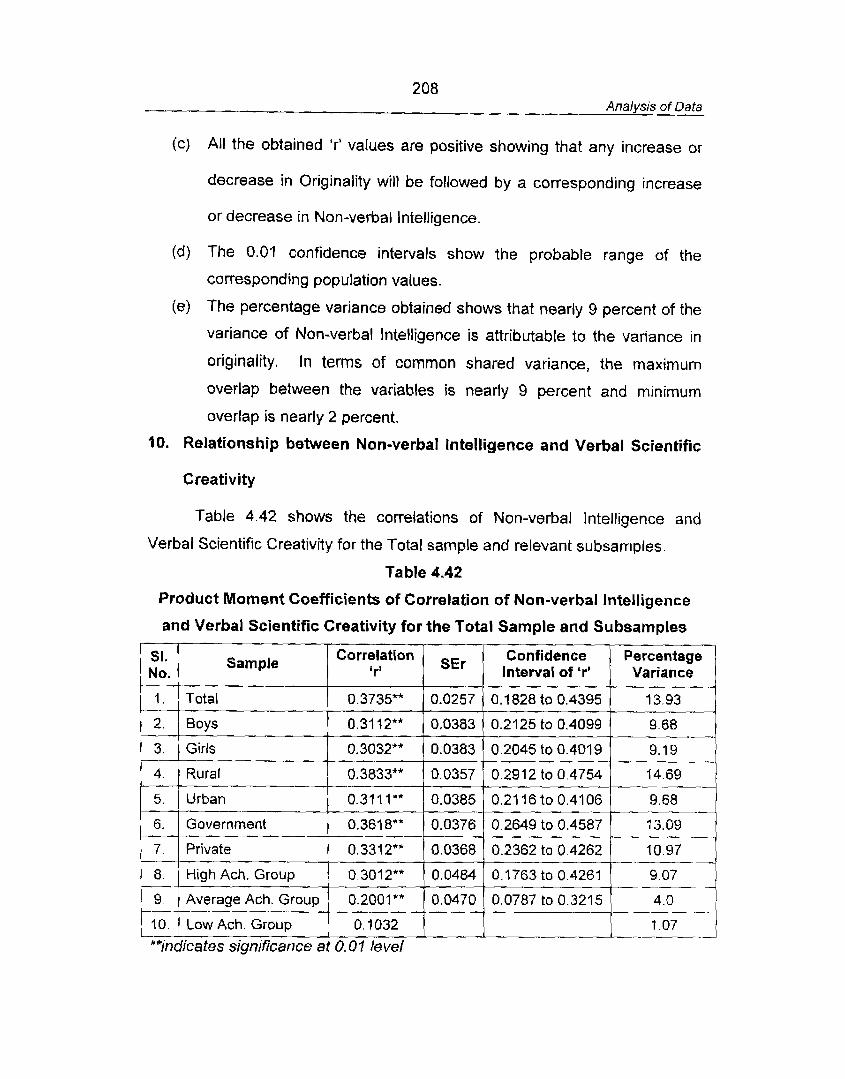
208 Analysis of Data
(c) All the obtained 'r ' values are positive showing that a n y increase or
decrease in Originality will be followed by a corresponding increase
or decrease in Non-verbal Intelligence.
(d) The 0.01 confidence intervals show the probable range of the
corresponding population values.
je) The percentage variance obtained shows that nearly 9 percent of the
variance af Non-verbal Intelligence is attributable to the variance in
originality. In terms of common shared variance, the maximum
overlap between the variables is nearly 9 percent and minimum
overlap is nearly 2 percent.
10. Relationship between Non-verbal Intelligence and Verbal Scientific
Creativity
Table 4.42 shows the correlations of Non-verbal Intelligence and
Verbal Scientific Creativity for the Total sample and relevant subsamples.
Table 4.42
Product Moment Coefficients of Correlation of Non-verbal Intelligence
and Verbal Scientific Creativity for the Total Sample and Subsamples
SI. No.
1
2.
3.
4.
5.
Sample
6.
7
8.
9.
10.
Total
Boys
Girls
Rural
Urban
**indicates significance at 0.01 level
Government
Private
High Ach. Group
Average Ach. Group
Low Ach. Group
Correlation r'
0.3735**
0.31 12**
0.3032**
0.3833**
0.31 1 I**
SEr Confidence Interval d 'r'
0.361 8**
0.3312**
0.3012**
0.2001 "*
0.1032
Percentage Variance
0.0257
0.0383
0.0383
0.0357
0.0385
0.0376
0.0368
0.0484
0.0470
0.1828 to 0.4395
0.21 25 to 0.4099
0.2045 to 0.4019
0.291 2 to 0.4754 . 0.21 16 to 0.4106
13.93
9.68 -- 9.19
14.69 ---- 9.68
0.2649 to 0.4587
0.2362to0.4262
0.1763 to 0.4261
0,0787 to 0.3215
.- 7 3.09
10.97
9 07 1
--- 4.0
--- 1.07 - i - A
209 Analvsis of Data
Table 4.42 shows that the coefficients of correlation obtained are as
follows:
(i) Total Sample
The coefficient of correlation obtained is 0.3735. It is significant at 0.01
level and the 0.01 confidence interval is from 0.1 828 to 0.4395.
(ii) Boys
The coefficient of correlation obtained is 0.31 12. It is significant at 0.01
level and the 0.01 confidence interval is from 0.2125 to 0.4099.
(iii) Girls
The coefficient of correlation obtained is 0.3032. It is significant at 0.01
level and the 0.01 confidence interval is from 0.2045 to 0.401 9.
(iv) Rural Subjects
The coefficient of correlation obtained is 0.3833. It is significant at 0.01
level and the 0.01 confidence interval is from 0.2912 to 0.4754.
(v) Urban Subjects
The coefficient of correlation obtained is 0.31 1 1. It is significant at 0.01
level and the 0.01 confidence interval is from 0.21 16 to 0.41 06.
(vi) Government School Subjects
The coefficient of correlation obtained is 0.361 8. It is significant at 0.01
level and the 0.01 confidence interval is from 0.2649 to 0.4587.
(vii) Private School Subjects
The coefficient of correlation obtained is 0.331 2. It is significant at 0.01
level and the 0.01 confidence interval is from 0.2362 to 0.4262.
21 0 Analysis of Data
(viii) High Achievement Group
The coefficient of correlation obtained is 0.3012. It is significant at 0.01
level and the 0.01 confidence interval is from 0.1763 to 0.4261.
(ix) Average Achievement Group
The coefficient of correlation obtained is 0.2001. It is significant at 0.01
level and the 0.01 confidence interval is from 0.0787 to 0.321 5.
(x) Low Achievement Group
The coefficient of correlation obtained is 0.1032. It is not significant at
any level.
Interpretations
The following results show that there exists low relationship between
Non-verbal Intelligence and Verbal Scientific Creativity:
(a) The coefficient of correlation obtained is not significant for Low
Achievement group. For all other samples, the obtained 'r' values are
significant at 0.01 level.
{b) The significant coefficients of correlation obtained are in the range of
0.2001 to 0.3883. The relationship between the variables may be
described as low or slight.
(c) All the obtained coefficients of correlation are positive showing that
any increase or decrease in Non-verbal Intelligence will be followed
by a corresponding change in Verbal Scientific Creativity.
(d) The 0.01 confidence intervals show the probable range of the
corresponding population values.
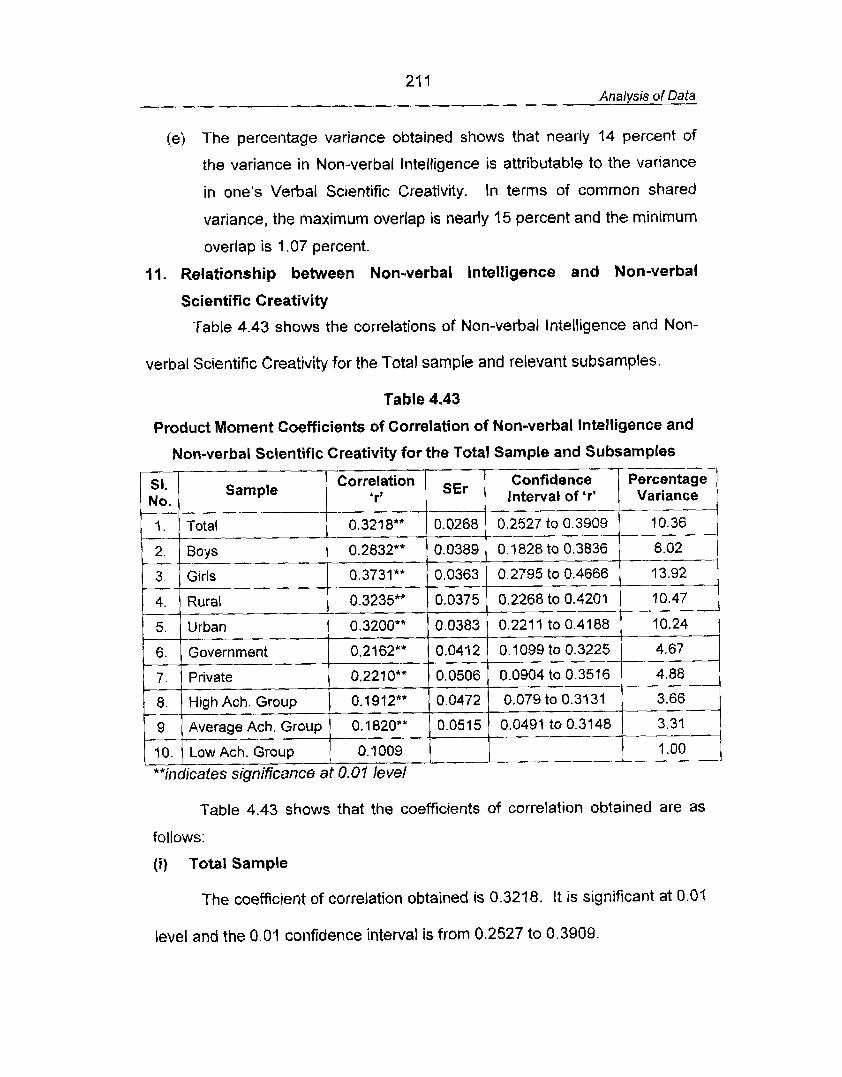
21 1 Analysis of Data
(e) The percentage variance obtained shows that nearly 14 percent of
the variance in Non-verbal Intelligence is attributable to the variance
in one's Verbal Scientific Creativity. In terms of common shared
variance, the maximum overlap is nearly 15 percent and the minimum
overlap is 1.07 percent.
1 1 Relationship between Non-verbal lntelligence and Non-verbal
Scientific Creativity
Table 4.43 shows the correlations of Non-verbal Intelligence and Non-
verbal scientific Creativity for the Total sample and relevant subsamples.
Table 4.43
Product Moment Coefficients of Correlation of Non-verbal Intelligence and
Table 4.43 shows that the coefficients of correlation obtained are as
Non-verbal Scientific Creativity for the Total Sample and Subsamples
follows:
( i ) Total Sample
Percentage ) Variance
10.36
8.02
13.92
10.47
10.24
4.67
4.88
3.66
3.31
- 1 .OO
The coefficient of correlation obtained is 0.3218. It is significant at 0.01
*"indicates significance at 0.0 1 level
level and the 0.01 confidence interval is from 0.2527 to 0.3909.
SEr
0.0268
0.0389
0.0363
0.0375
0.0383
0.041 2
0.0506
0.0472
0.0515
Correlation 'r' -
0.3218**
0.2832**
0.3731**
0.3235**
0.3200**
0,2162**
0.2210**
0.1912""
0.1 820"" ------ , 0.1009
Sl. No.
7 .
2.
3.
4.
5.
6.
7 .
8.
9
90.
Confidence Interval of 'r'
0.2527 to 0.3909
0.1828 to 0.3836
0.2795 to 0.4666
0.2268 to 0.420 1
0.221 1 to 0.4188
0.1099 to 0.3225
0.0904 to 0.3516
0.079 to 0.3131
0.0491 to 0.3148
-
Sample
Total
Boys
Girls
Rural
Urban
Government
Private
High Ach. Group
Average Ach. Group
Low Ach. Group
2 12 Analysis of Data
( i i ) Boys
The coefficient of correlation obtained is 0.2832. It is significant at 0.01
level and the 0.01 confidence interval is from 0.1828 to 0.3836.
(iii) Girls
The coefficient of correlation obtained is 0.3731. It is significant at 0.01
level and the 0.0? confidence interval is from 0.2795 to 0.4666.
(iv) Rural Subjects
The coefficient of correlation obtained is 0.3235. It is significant at 0.01
level and the 0.01 confidence interval is from 0.2268 to 0.4201.
(v) Urban Subjects
The coefficient of correlation obtained is 0.3200. It is significant at 0.01
level and the 0.01 confidence interval is from 0.227 1 to 0.4188.
(vi) Government School Subjects
The coefficient of correlation obtained is 0.2162. It is significant at 0.01
level and the 0.01 confidence interval is from 0.1099 to 0.3225.
(vii) Private School Subjects
The coefficient of correlation obtained is 0.221 0. It is significant at 0.01
level and the 0.01 confidence interval is from 0.0904 to 0.3516.
(viii) High Achievement Group
The coefficient of correlation obtained is 0.1912. It is significant at 0.01
level and the 0.01 confidence interval is from 0.079 ta 0.3131.
21 3 Analysis of Data
(ix) Average Achievement Group
The coefficient of correlation obtained is 0.1820. It is significant at 0.01
level and the 0.07 confidence interval is from 0.0491 to 0.3148.
(x) Low Achievement Group
The coefficient of correlation obtained is 0.1009. It is not significant at
any level.
Interpretations
The following results show that there exists a low relationship between
Non-verbal Intelligence and Non-verbal Scientific Creativity:
(a) The coefficient of correlation obtained is not significant for Low
Achievement group. For all other samples, the obtained 'r' values are
significant at 0.0A level.
(b) The significant coefficients of correlation obtained are in the range of
0.1820 to 0.3731. The relationship between the variables may be
described as low or slight.
(c) All the obtained coefficients of correlation are positive showing that
any increase or decrease in Non-verbal Scientific Creativity will be
followed by a corresponding change in Non-verbal Intelligence.
(d) The 0.01 confidence intervals show the probable range of the
corresponding population values.
(e) The percentage variance obtained shows that nearly 10 percent of
the variance of Non-verbal Intelligence is attributable to the variance
in one's Non-verbal Scientific Creativity. In terms of common shared
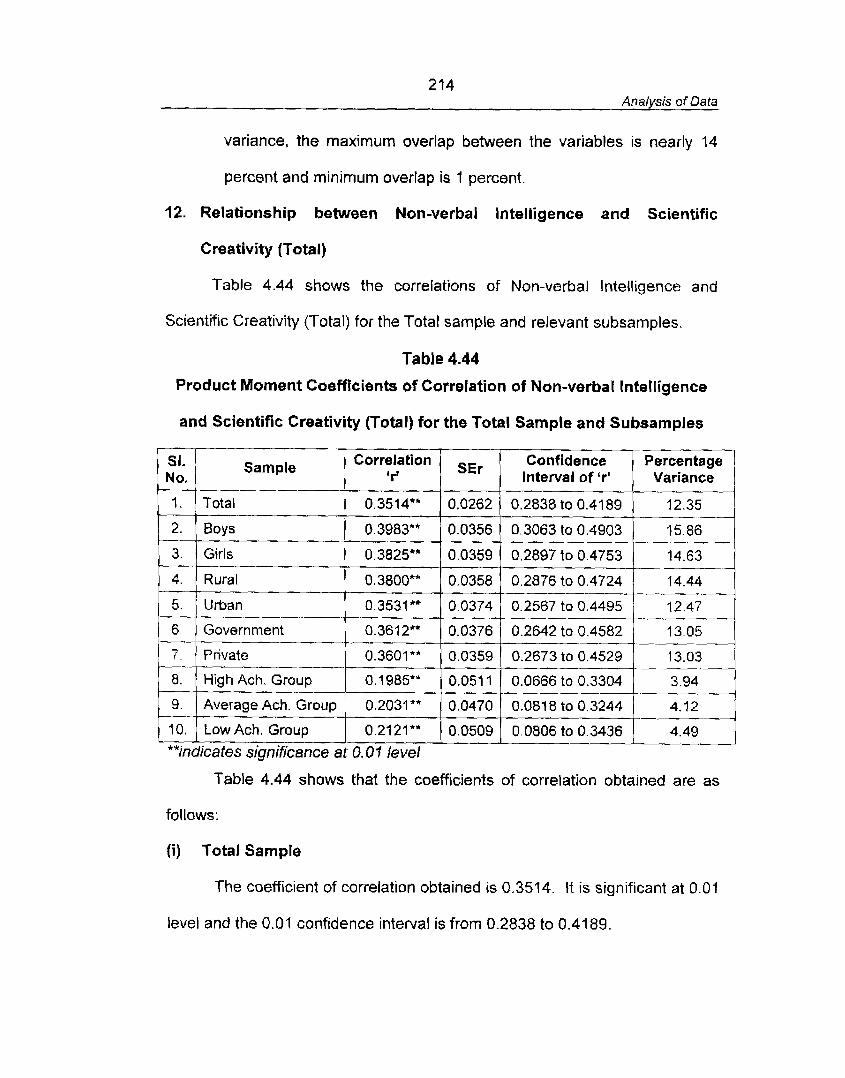
214 Analysis of Data
variance, the maximum overlap between the variables is nearly 14
percent and minimum overlap is 1 percent.
12. Relationship between Non-verbal Intelligence and Scientific
Creativity (Total)
Table 4.44 shows the correlations of Non-verbal Intelligence and
Scientific Creativity (Total) for the Total sample and relevant subsamples.
Table 4.44
Product Moment Coefficients of Correlation of Non-verbal Intelligence
and Scientific Creativity (Total) for the Total Sample and Subsamples
**indicates significance at 0.0 7 level
Table 4.44 shows that t h e coefficients of correlation obtained are as
follows:
(i) Total Sample
The coefficient of correlation obtained is 0.3574. It is significant at 0.01
level and the 0.01 confidence interval is from 0.2838 to 0.4189
21 5 Analysis of Data
( i i ) Boys
The coefticient of correlation obtained is 0.3983. It is significant at 0.01
level and the 0.01 confidence interval is from 0.3063 to 0.4903
(iii) Girls
The coefficient of correlation obtained is 0.3825. It is significant at 0.01
level and the 0.01 confidence interval is from 0.2897 to 0.4753.
(iv) Rural Subjects
The coefficient of correlation obtained is 0.3800. It is significant at 0.01
level and the 0.01 confidence interval is from 0.2876 to 0.4724.
(v) Urban Subjects
The coefficient of correlation obtained is 0.3531. It is significant at 0.01
level and the 0.01 confidence interval is from 0.2567 to 0.4495.
(vi) Government School Subjects
The coefficient of correlation obtained is 0.3612. It is significant at 0.01
level and the 0.01 confidence interval is from 0.2642 to 0.4582.
(vii) Private School Subjects
The coefficient of correlation obtained is 0.3601. It is significant at 0.01
level and the 0.01 confidence interval is from 0.2673 to 0.4529.
(viii) High Achievement Group
The coefficient of correlation obtained is 0.1985. It is significant at 0.01
level and the 0.01 confidence interval is from 0.0666 to 0.3304.

216 Analysis of Data
(ix) Average Achievement Group
The coefficient of correlation obtained is 0.2031. It is significant at 0.01
level and the 0.01 confidence interval is from 0.0818 to 0.3244.
(x) Low Achievement Group
The coefficient of correlation obtained is 0.2121. It is significant at 0.01
level and the 0.01 confidence interval is from 0.0806 to 0.3436.
Interpretations
The following results show that there is considerable relationship
between Non-verbal Intelligence and Scientific Creativity:
(a) The coefficients of correlation obtained are significant at 0.01 level for
all samples.
(b) The coefficients of correlation obtained are in the range of 0.1985 to
0.3983. The relationship can be explained as low or slight.
(c) All the obtained 'r' values are positive showing that any increase or
decrease in Scientific Creativity will be followed by a corresponding
increase or decrease in Non-verbal Intelligence.
(d) The 0.01 confidence intervals show the probable range of the
corresponding population values.
(e) The percentage variance obtained shows that about 12 percent of the
variance of Non-verbal Intelligence is attributable to the variance in
Scientific Creativity. In terms of common shared variance, the
maximum overlap between the variables is nearly 16 percent and the
minimum overlap is about 4 percent.
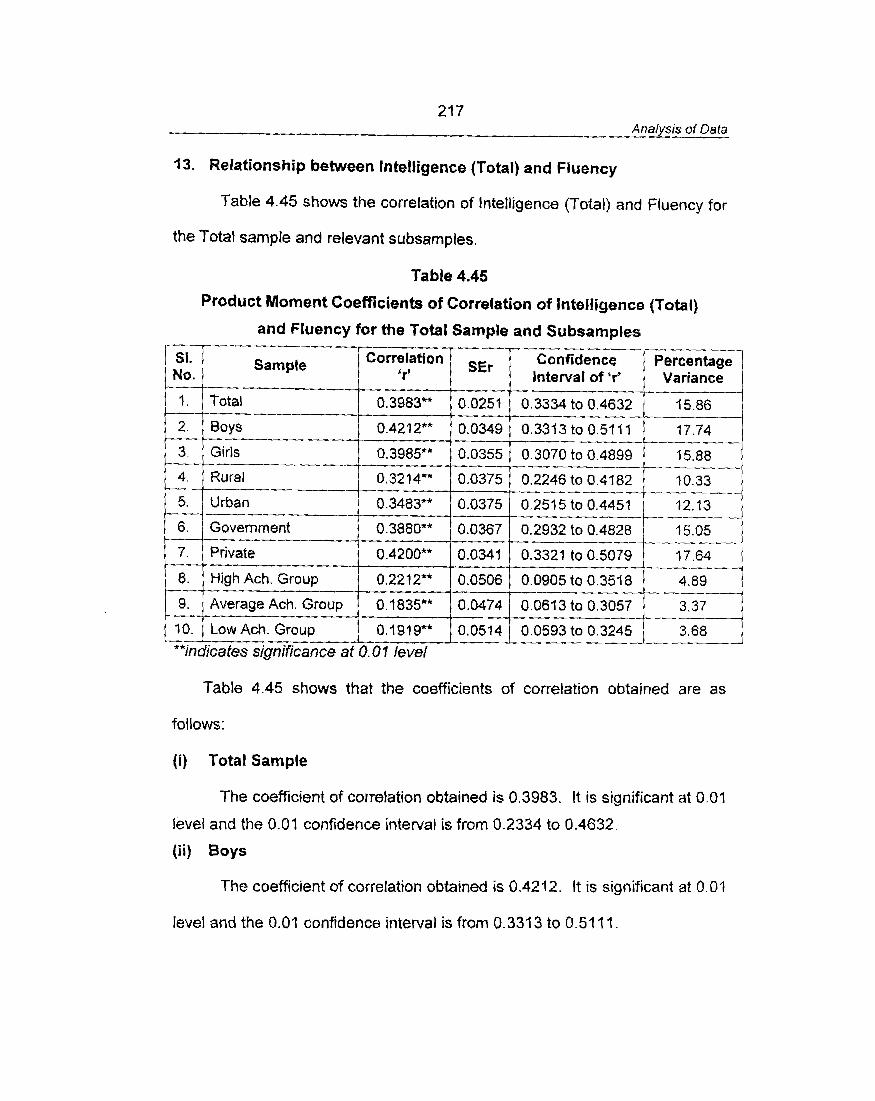
21 7 Analysis of Data
13. Relationship between Intelligence (Total) and Fluency
Table 4.45 shows the correlation of Intelligence (Total) and Fluency for
the Total sample and relevant subsamples.
Table 4.45
Product Moment CoeMciente of Correlation of Intelligence (Total)
and Fluency for the Total Sample and Subsamples - 1 - Sample Correlation Confidence
Table 4.45 shows that the coefficients of correlation obtained are as
'rr
I .
2.
3.
4.
5.
6.
7.
8.
9.
10.
follows:
fi) Total Sample
The coefficient of correlation obtained is 0.3983. It is significant at 0.01
level and t h e 0.01 confidence interval is from 0.2334 to 0.4632.
( i i ) Boys
The coefficient of correlation obtained is 0.4212. It is significant at 0.01
SEr
**indicates significance at 0.0 f level
Total
Boys
Girls - Rural
Urban
Government - Private
High Ach. Group
Average Ach Group
Low Ach. Group
level and the 0.01 confidence interval is from 0.3343 to 0.51 11
lnterval of 'r7
0.3983**
0.4212**
0.3985**
0.3214**
0.3483**
0.3880**
0.4200**
0.2212'"
01835"
O.1919*"
0.0251
0.0349
0.0355
0.0375
0.0375
0.0367
0.0341
0.0506
0.0474
0.0514
0.3334 to 0.4632
0.3313ta0.5111
0.3070 to 0.4899 ----
45.86
17.74
15.88
0.2246 to 0.4182 10.33
0.251 5 to 0.4451 12.13
0.2932 to 0.4828 95.05
0.3321 to 0.5079 17.64
0.0905 to 0.3518
0.0613 to 0.3057
0.0593 to 0.3245 3.68 - ---
218 Analysis d Data
(iii) Girls
The coefficient of correlation obtained is 0.3985. It is significant at 0.01
level and the 0.01 confidence interval is from 0.3070 to 0.4899.
(iv) Rural Subjects
The coefficient of correlation obtained is 0.3214. It is significant at 0.01
level and the 0.01 confidence interval is from 0.2246 to 0.4182.
(v) Urban Subjects
The coefficient of correlation obtained is 0.3483. It is significant at 0.01
level and the 0.01 confrdence interval is from 0.2515 to 0.4451.
(vi) Government School Subjects
The coefficient of correlation obtained is 0.3880. It is significant at 0.01
level and the 0.01 confidence interval is from 0.2932 to 0.4828.
(vii) Private School Subj'ects
The coefficient of correlation obtained is 0.4200. It is significant at 0.01
level and the 0.01 confidence interval is from 0.3321 to 0.5079.
(viii) High Achievement Group
The coefficient of correlation obtained is 0.2212. It is significant at 0.01
level and the 0.01 confidence interval is from 0.0905 to 0.3518.
( i x ) Average Achievement Group
The coefficient of correlation obtained is 0.1835. It is significant at 0.01
level and the 0.01 confidence interval is from 0.0613 to 0.3057.
21 9 Anafysis of Data
(x) LOW Achievement Group
The coefficient of correlation obtained is 0.1919. It is significant at 0.01
level and the 0.01 confidence interval is from 0.0593 to 0.3245.
Interpretations
The following results show that Intelligence (Total) and Fluency are
closely related variables:
(a) The coefficients of correlations obtained are significant at 0.01 level
for all samples.
(b) The coefficients of correlation obtained are in the range of 0.1835 to
0.4212. The relationship between the variables may be described as
substantial or marked for the subsamples Boys and private school
subjects. For all other samples, the relationship may be considered
as low or slight.
(c) All the coefficients of correlation obtained are positive showing that
any increase or decrease in Fluency will be followed by a
corresponding increase or decrease in Intelligence (total) and vice
versa.
(d) The 0.01 confidence intervals show the probable range of the
corresponding population values.
(e) The percentage variance obtained shows that nearly 16 percent of
the variance of Intelligence (Total) is attributable to the variance in
one's Fluency. In terms of common shared variance, the maximum
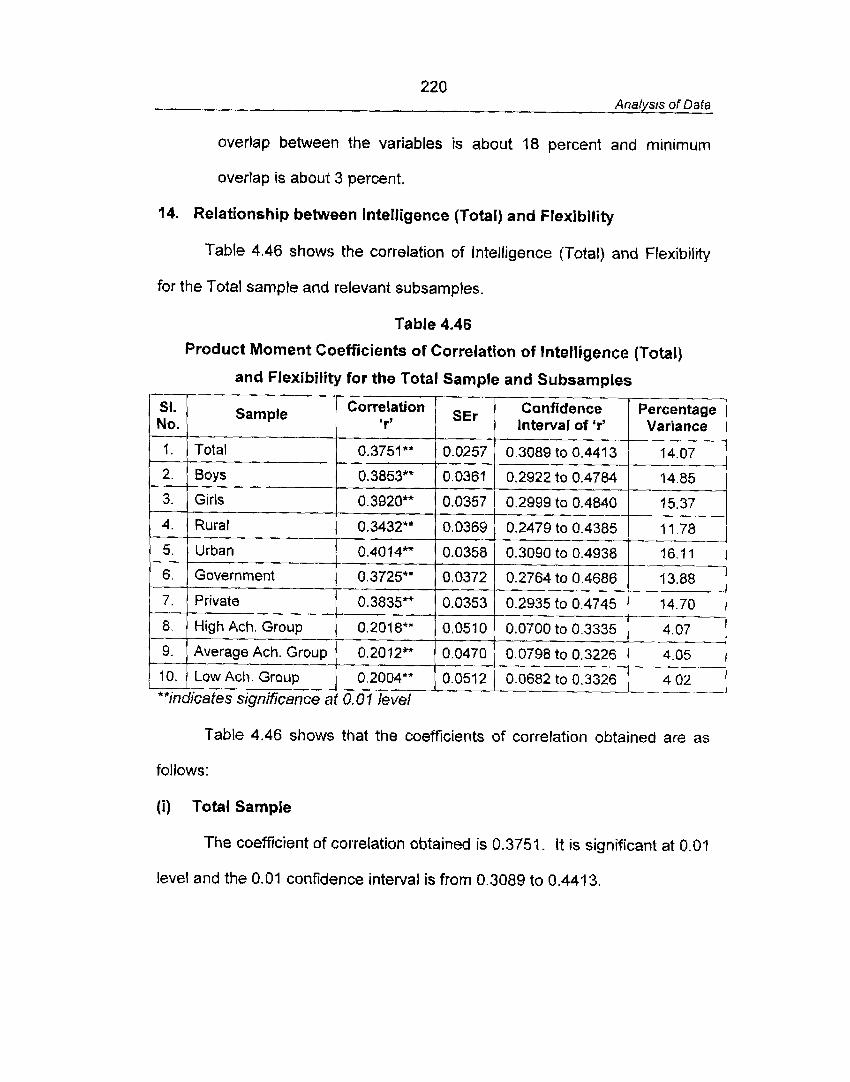
220 Analysls of Dafa
overlap between the variables is about 18 percent and minimum
overlap is about 3 percent.
14. Relationship between Intelligence (Total) and Flexibility
Table 4.46 shows the correlation of Intelligence (Total) and Flexibility
for the Total sample and relevant subsamples.
Table 4.46
Product Moment Coefficients of Correlation of Intelligence (Total)
and Flexibility for the Total Sample and Subsamples
7 1 Sample cornlation SEr
Table 4.46 shows that the coefficients of correlation obtained are as
No. I 'rr I. - 2.
3.
4.
5.
6.
7 .
8.
9.
10.
follows:
Interval of 'r' Variance
(i) Total Sample
**indicates significance at 0.07 level
Total
Boys
Girls
Rural
Urban
Government
Private
High Ach. Group
Average Ach. Group
Low Ach. Group
The coefficient of correlation obtained is 0.3751. It is significant at 0.01
level and the 0.01 confidence interval is from 0.3089 to 0.4413.
0.3751 **
0.3853**
0.3920k*
0.3432**
0.4014**
0.3725**
0.3835**
0.201 8"'
0.2012**
0.2004**
0.0257
0.0361
0.0357
0.0369
0.0358
0.0372
0.0353
0.051 0
0.0470
0.0512
0.3089 to 0.441 3
0.2922 to 0.4784
0.2999 to 0.4840
0.2479 to 0.4385
0.3090 to 0.4938
0.2764 to 0.4686
0.2935 to 0.4745
0.0700 to 0.3335
0.0798 to 0.3226
0.0682 to 0.3326 --
14.07
14.85
15.37
11 78 ----
16.11
13.88
74.70
4.07
Ti 402 j
--
22 1 Analysis of Data
( i i ) Boys
The coefficient of correlation obtained is 0.3853. It is significant at 0.01
level and the 0.01 confidence internal is from 0.2922 to 0.4784.
(iii) Girls
The coefficient of correlation obtained is 0.3920. It is significant at 0.01
level and t h e 0.01 confidence interval is from 0.2999 to 0.4840.
(iv) Rural Subjects
The coefficient of correlation obtained is 0.3432. It is significant at 0.01
level and the 0.01 confidence interval is from 0.2479 to 0.4385
(v) Urban Subjects
The coefficient of correlation obtained is 0.4014. It is significant at 0.01
level and the 0.01 confidence interval is from 0.3090 to 0.4938.
(vi) Government School Subjects
The coefficient of correlation obtained is 0.3725. It is significant at 0.01
level and the 0.01 confidence interval is from 0.2764 to 0.4686.
(vii) Private School Subjects
The coefficient of correlation obtained is 0.3835. It is significant at 0.01
level and the 0.01 confidence interval is from 0.2925 to 0.4745.
(viii) High Achievement Group
The coefficient of correlation obtained is 0.201 8. It is significant at 0.01
level and the 0.07 confidence interval is from 0.0700 to 0.3335.
222 Analysis of Data
( i x ) Average Achievement Group
The coefficient of correlation obtained is 0.2012. It is significant at 0.01
level and the 0.0A confidence intenral is from 0.0798 to 0.3226.
( x ) Low Achievement Group
The coefficient of t:orrelation obtained is 0.2004. It is significant at 0.01
level and the 0.01 confidence interval is from 0.0682 to 0.3326.
Interpretations
The following results show that the relationship between Intelligence
(Total) and Flexibility can be considered as low:
(a) The coefficients of correlations obtained are significant at 0.01 level
for all samples.
(b) The coefficients of correlation obtained are in the range of 0.2012 to
0.4014. The relationship between the variables may be described as
low or slight.
(c) All the coefficients of correlation obtained are positive showing that
any increase or decrease in Flexibility will be followed by a
corresponding increase or decrease in Intelligence (total).
(d) The 0.01 confidence intervals show the probable range of the
corresponding population values.
(e) The percentage variance obtained shows that 14 percent of the
variance of Intelligence (Total) is attributable to the variance in
Flexibility. In terms of common shared variance, the maximum
overlap between the variables is about 15 percent and minimum
overlap is 4 percent.
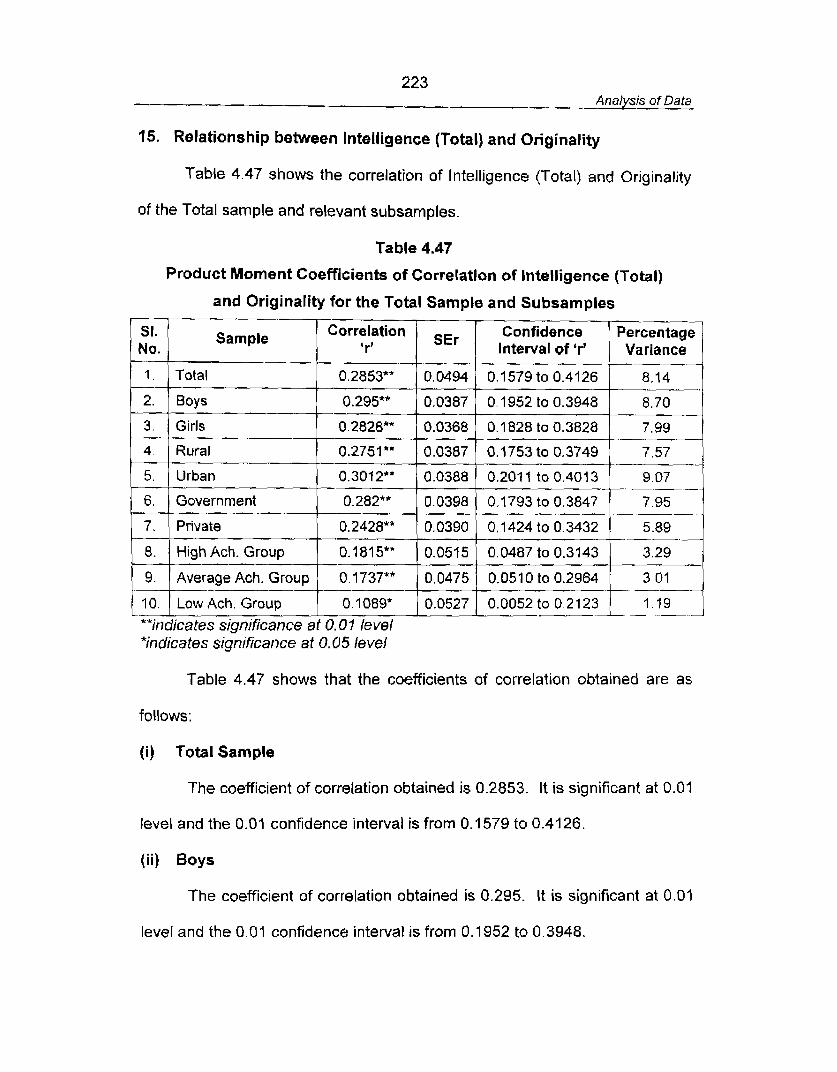
223 Analysis of Data
15. Relationship between Intelligence (Total) and Originality
Table 4.47 shows the correlation of Intelligence (Total) and Originality
of the Total sample and relevant subsamples.
Table 4.47
Product Moment Coefficients of Correlation of Intelligence (Total)
and Originality for the Tobl Sample and Subsamples
'I. I Sample Correlation I SEr I Confidence No. Interval of 'r'
1.
2.
3.
Table 4.47 shows that the coefficients of correlation obtained are as
Total
Boys
Girls 7.99
4.
5.
6.
7 .
8.
9.
10.
follows:
(i) Total Sample
**indicates significance at 0.0 1 level *indicates significance at 0.05 level
Rural
Urban
Government
Private
High Ach. Group
Average Ach. Group
Low Ach. Group
The coefficient of correlation obtained is 0.2853. It is significant at 0.01
level and the 0.01 confidence interval is from 0.1579 to 0.4126.
0.2751 **
0.3012**
0.282**
0.2428**
0.1815""
0.1737**
0.1089'
(ii) Boys
The coefficient of correlation obtained is 0.295. It is significant at 0.01
0.0387
0.0388
0.0398
0.0390
0.0575
0.0475
0.0527
level and the 0.01 confidence interval is from 0.1952 to 0.3948.
0.1753 to 0.3749
0.201 1 to 0.4013
0.1793 to 0.3847
0.1424 to 0.3432
0.0487 to 0.3143
0.0510 to 0.2964
0.0052 to 0.2123
7.57
9.07 - - . -. - - -
7.95
5.89 --- 3.29
3.01
1.19 .- . . - , -
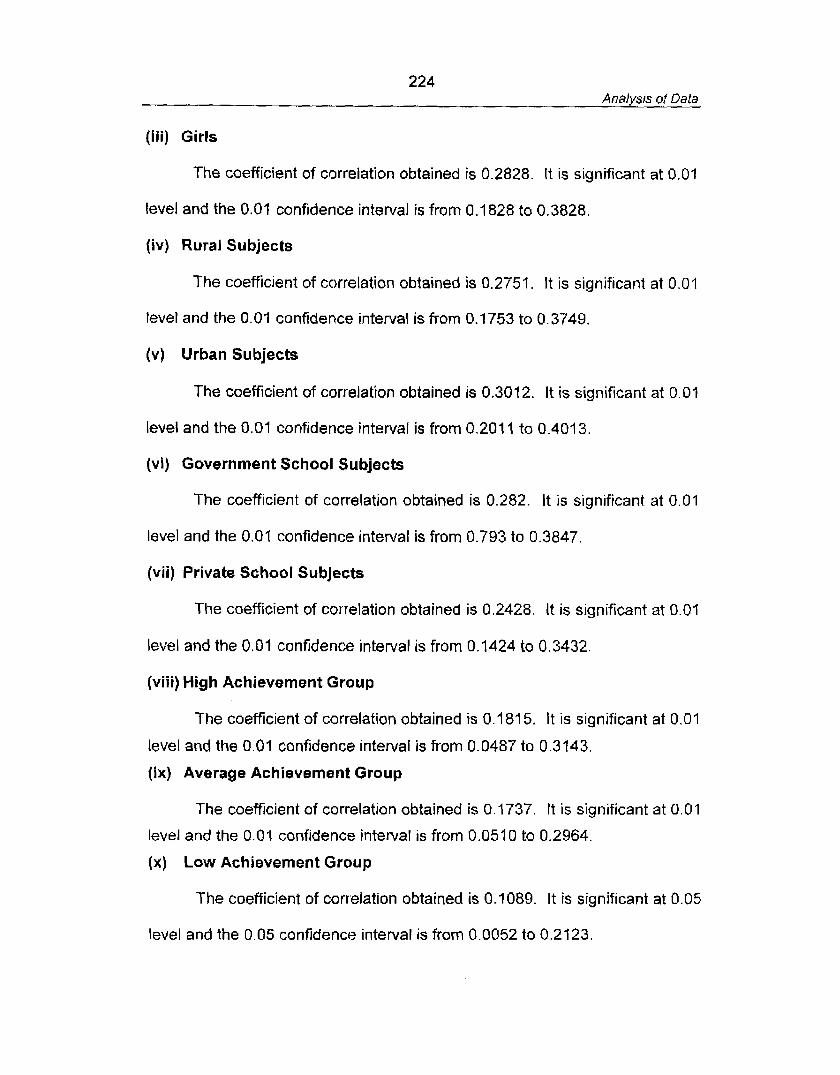
224 Analysis of Data
[iii) Girls
The coefficient of correlation obtained is 0.2828. It is significant at 0.01
level and the 0.01 confidence interval is from 0.1828 to 0.3828.
(iv) Rural Subjects
The coefficient of correlation obtained is 0.2751, It is significant at 0.01
level and the 0.01 confidence interval is from 0.1753 to 0.3749.
(v) Urban Subjects
The coefficient of correlation obtained is 0.3012. It is significant at 0.01
level and the 0.01 confidence interval is from 0.202 I to 0.4013.
(vi) Government School Subjects
The coefficient of correlation obtained is 0.282. It is significant at 0.01
level and the 0.01 confidence interval is from 0.793 to 0.3847
(vii) Private School Subjects
The coefficient of correlation obtained is 0.2428. It is significant at 0.0?
level and the 0.01 confidencie interval is from 0.1424 to 0.3432
(viii) High Achievement Group
The coefficient of correlation obtained is 0.1 81 5, it is significant at 0.01
level and the 0.01 confidence interval is from 0.0487 to 0.3143.
(ix) Average Achievement Group
The coefficient of correlation obtained is 0.1737. It is significant at 0.01
level and the 0.01 confidence interval is from 0.051 0 to 0.2964.
( x ) Low AchievementGroup
The coefficient of correlation obtained is 0.1089. It is significant at 0.05
level and the 0.05 confidence interval is from 0.0052 to 0.2123.
225 Analysis of Data
Interpretations
The following results show that lntelligence (Total) is influenced by
Originality to a little extent:
(a) The coefficients of correlations obtained are significant at 0.01 level
except for one subsample. The coefficient of correlation obtained for
Low Achievement group is significant at 0.05 level.
(b) The obtained coefficients of correlation are in the range of 0.7089 to
0.3012. The relationship between the variables may be explained as
low or slight.
(c) All the coefficients of correlation obtained are positive showing that
any increase or decrease in Originality will be followed by a
corresponding illcrease or decrease in Intelligence (total).
(d) The 0.07 confidence intervals show the probable range of the
corresponding population values.
(e) The percentage variance obtained shows that about 8 percent of the
variance of Intelligence (Total) is attributable to the variance of
Originality. In terms of common shared variance, the maximum
overlap between the variables is about 9 percent and minimum
overlap is about '1 percent.
76. Relationship between Intelligence (Total) and Verbal Scientific
Creativity
Table 4.48 shows the correlation of Intelligence (Total) and Verbal
Scientific Creativity for the Total sample and relevant subsamples.
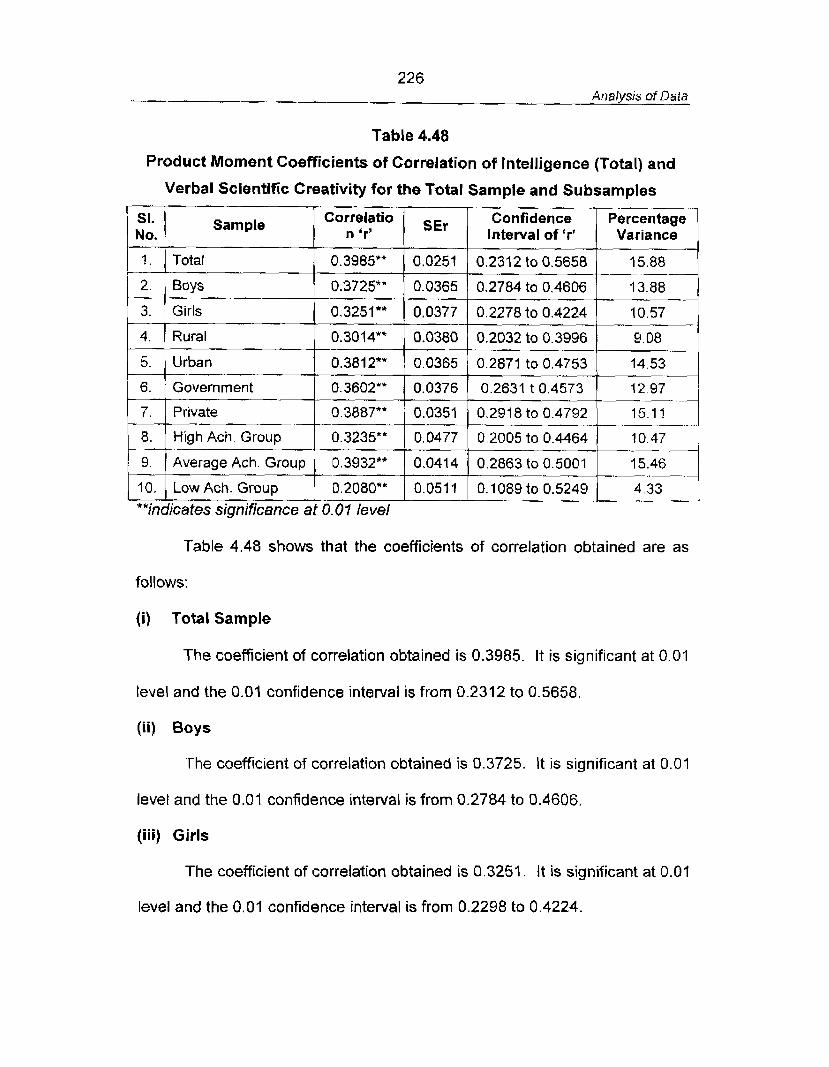
226 Analysis of Data
Table 4.48
Product Moment Coefficients of Correlation of Intelligence (Total) and
Verbal Scientific Creativity for the Total Sample and Subsamples
.-
**indicates significance at 0.0 1 level
Table 4.48 shows that the coefficients of correlation obtained are as
follows:
( i ) Total Sample
The coefficient of correlation obtained is 0.3985. It is significant at 0.01
level and the 0.01 confidence interval is from 0.2312 to 0.5658.
(ii) Boys
The coefficient of conhelation obtained is 0.3725. It is significant at 0.01
level and the 0.01 confidence interval is from 0.2784 to 0.4606.
(iii) Girls
The coefficient of correlation obtained is 0.3251. !t is significant at 0.07
level and the 0.0? confidence interval is from 0.2298 to 0.4224.
227 Analysis of Data
(iv) Rural Subjects
The coefficient of correlation obtained is 0.3014. It is significant at 0.01
level and the 0.01 confidence interval is from 0.2032 to 0.3996.
(v) Urban Subjects
The coefficient of correlation obtained is 0.3812. It is significant at 0.01
level and the 0.01 confidence interval is from 0.2871 to 0.4753.
(vi) Government School Subjects
The coefficient of correlation obtained is 0.3602. It is significant at 0.01
level and the 0.01 confidence interval is from 0.2631 to 0.4573.
[vii) Private School Subjects
The coefficient of correlation obtained is 0.3887. It is significant at 0.01
level and the 0.01 confidence interval is from 0.2981 to 0.4792.
(viii) High Achievement Group
The coefficient of correlation obtained is 0.3235. It is significant at 0.01
level and the 0.01 confidence interval is from 0.2005 to 0.4464.
(ix) Average Achievement Group
The coefficient of correlation obtained is 0.3932. It is significant at 0.01
level and the 0.01 confidence interval is from 0.2863 to 0.5001.
( x ) Low Achievement Group
The coefficient of correlation obtained is 0.2080. It is significant at 0.01
level and the 0.01 confidence interval is from 0.1089 to 0.5249.
228 Analysis of Data
Interpretations
The following results show that there exists a low relationship between
Intelligence (Total) and Verbal Scientific Creativity:
(a) All the obtained coefficients of correlation are significant at 0.01 level.
(b) The coefficients of correlation obtained are in the range of 0.2080 to
0.3985. The relationship between the variables may be described as
low or slight.
(c) All the obtained coefficients of correlation are positive showing that
any increase or decrease in Verbal Scientific Creativity will be
attended by a corresponding increase or decrease in lntelligence
(total).
(d) The 0.01 confider~ce intervals show the probable range of the
corresponding population values.
(e) The percentage variance obtained shows that nearly 16 percent of
the variance of Intelligence (Total) is attributable to the variance in
one's Verbal Scientific Creativity. In terms of common shared
variance, the maxirnum overlap between the variables is nearly 16
percent and minimum overlap is about 4 percent.
17. Relationship between lntelligence (Total) and Non-verbal Scientific
Creativity
Table 4.49 shows the correlation of lntelligence (Total) and Non-verbal
Scientific Creativity for the Total sample and relevant subsarnples.
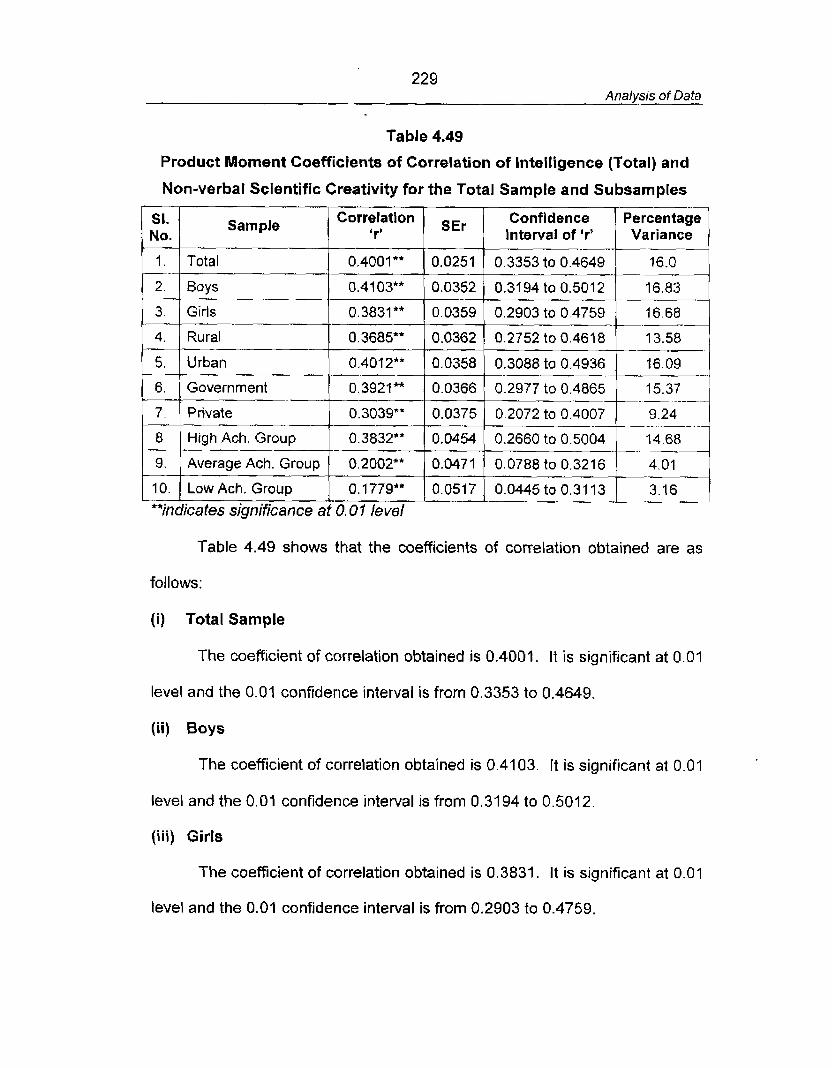
229 Analysis of Data
Table 4.49
Product Moment Coefficients of Correlation of Intelligence (Total) and
Non-verbal Scientific Creativity for the Total Sample and Subsamples
Table 4.49 shows that the coefficients of correlation obtained are as
Percentage Variance
Sample
1.
2.
3.
4.
-, 5.
6.
7.
8.
9.
10.
follows:
Confidence Interval of 'r'
(i) Total Sample
**indicates significance at 0.0 1 level
Total
Boys
Girls
Rural
Urban
Government
Private
High Ach. Group
Average Ach. Group
Low Ach. Group
The coefficient of correlation obtained is 0.4001. It is significant at 0.01
level and the 0.01 confiderlee interval is from 0.3353 to 0.4649.
0.4001 **
0.4103**
0.3831 **
0.3685**
0.4012**
0.3921**
0.3039**
0.3832**
0.2002**
0.1779**
(ii) Boys
The coefficient of correlation obtained is 0.41 03. It is significant at 0.01
- 0.0251
0.0352
0.0359
0.0362
0.0358
0.0366
0.0375
0.0454
0.0471
0.0517
level and the 0.01 confidence interval is from 0.31 94 to 0.501 2.
(iii) Girts
.-
0.3353 to 0.4649
0.3494 to 0.5012
0.2903 to 0.4759
0.2752 to 0.4618
0.3088 to 0.4936
0.2977 to 0.4865 .-
0.2072 to 0.4007
0.2660 to 0.5004
0.0788 to 0.321 6
0.0445to0.3113
The coefficient of correlation obtained is 0.3831. It is significant at 0.01
--
16.0 .q 76.68
13.58
16.09
. ' 5 3 7 . ~ 9.24 . - - - A .
14.68
3.16
level and the 0.01 confidence interval is from 0.2903 to 0.4759.
230 Analysis of Data
(iv) Rural Subjects
The coefficient of correlation obtained is 0.3685. It is significant at 0.01
level and the 0.01 confidence interval is from 0.2752 to 0.461 8.
(v) Urban Subjects
The coefficient of correlation obtained is 0.4012. It is significant at 0.01
level and the 0.01 confidence interval is from 0.3088 to 0.4936.
(vi) Government School Subjects
The coefficient of correlation obtained is 0.3921. It is significant at 0.01
level and the 0.01 confidence interval is from 0.2977 to 0.4865.
(vii) Private Schoof Subjects
The coefficient of correlation obtained is 0.3039. It is significant at 0.01
level and the 0.01 confidence interval is from 0.2072 to 0.4007.
(viii) High Achievement Group
The coefficient of correlation obtained is 0.3832. It is significant at 0.01
level and the 0.01 confidence interval is from 0.2660 to 0.5004.
(ix) Average Achievement Group
The coefficient of correlation obtained is 0.2002. It is significant at 0.01
level and the 0.01 confidence interval is from 0.0788 to 0.3216.
(x) Low Achievement Group
The coefficient of correlation obtained is 0.1779. It is significant at 0.05
level and the 0.01 confidence interval is from 0.0445 to 0.31 13.
23 1 Analysis of Data
Interpretations
The following results show that there is considerable relationship
between Intelligence (Total) and Non-verbal Scientific Creativity:
(a) All coefficients of correlation obtained are significant at 0.01 level for
all samples.
{b) The coefficients of correlation obtained are in the range of 0.1789 to
0.4103. The relationship between the variables may be described as
low or slight for all samples except for Boys. The relationship is
substantial or marked for Boys.
(c) All the obtained coefficients of correlation are positive showing that
any increase or decrease in Non-verbal Scientific Creativity will be
attended by a corresponding change in Intelligence (total).
(d) The 0.01 confidence intervals show the probable range of the
corresponding population values.
(e) The percentage variance obtained shows that 16 percent of the
variance of Intelligence (Total) is attributable to the variance in one's
Non-verbal Scientific Creativity. In terms of common shared
variance, the maximum overlap between the variables is nearly 17
percent and minimum overlap is about 3 percent.
18. Relationship between Intelligence (Total) and Scientific Creativity
(Total)
Table 4.50 shows the correlation of Intelligence (Total) and Scientific
Creativity (Total) for the Total sample and relevant subsamples.
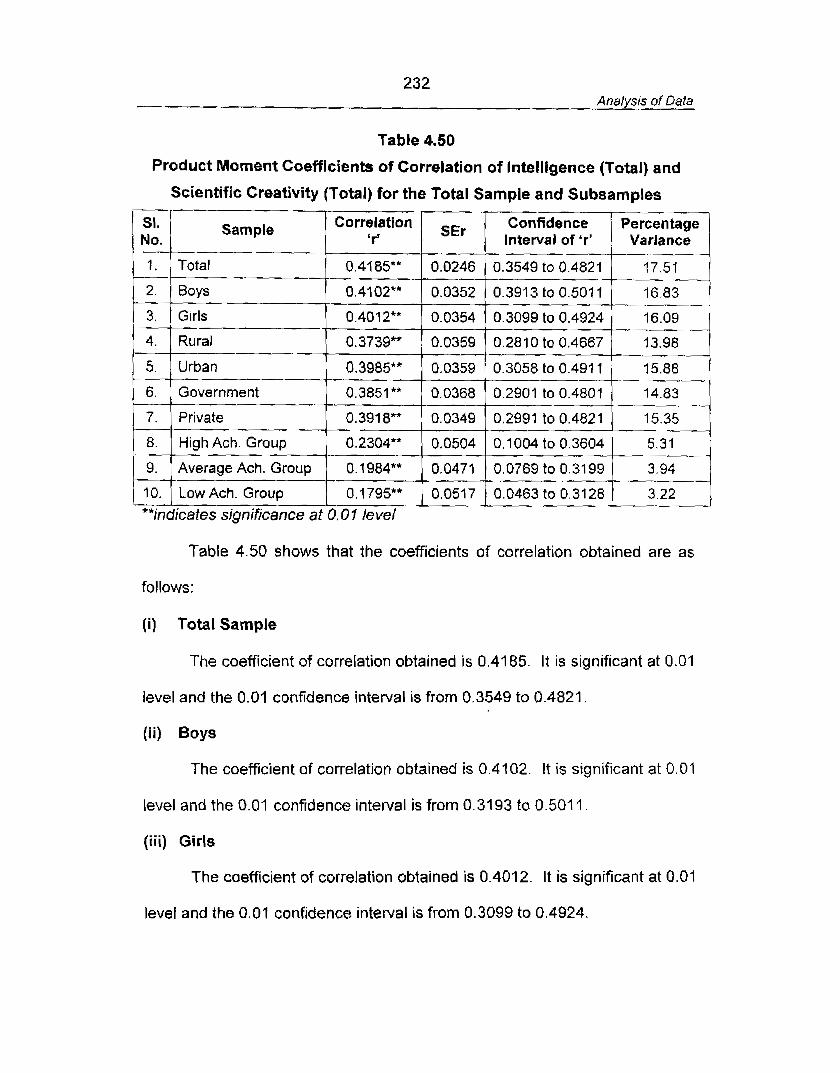
232 Analysis of Data
Table 4.50
Table 4.50 shows that the coefficients of correlation obtained are as
Product Moment Coefficients of Correlation of Intelligence (Total) and
Scientific Creativity (Total) for the Total Sample and Subsamples
follows:
Correlation 'rr
0.4'l85**
0.410ZW*
0.4012**
0.3739**
0.3985**
0.3851""
0.3918"*
0.2304**
0.1984**
0.1795**
(i) Total Sample
The coefficient of correlation obtained is 0.41 85. It is significant at 0.01
*"indicates significance at 0.0 1 level
SEr
0.0246
0.0352
0.0354
0.0359
0.0359
0.0368
0.0349
0.0504
0.0471
0.0517
level and the 0.01 confidence interval is from 0.3549 to 0.4821
(ii) Boys
The coeficient of correlation obtained is 0.4102. It is significant at 0.01
level and the 0.01 confidence interval is from 0.3193 to 0.501 1.
(iii) Girls
The coefficient of correlation obtained is 0.4012. It is significant at 0.01
level and the 0.01 confidence interval is from 0.3099 to 0.4924.
Confidence Interval of 'r'
0.3549 to 0.4821
0.3913 to 0.507 1
0.3099 to 0.4924
0.281 0 to 0.4667
0.3058 to 0.491 1
0.2901 to 0.4801
0.2991to0.4821
0.1004to0.3604
0.0769 to 0.3199
0.0463to0.3128
percentage Variance
17.51 7 16.83
16.09 ,--
13.98 -.---
15.88
14.83
15.35
5.31 --- 3.94
3.22
233 Analysis of Data
(iv) Rural Subjects
The coefficient of correlation obtained is 0.3739. It is significant at 0.01
level and the 0.01 confidence interval is from 0.2810 to 0.4667.
(v) Urban Subjects
The coefficient of correlation obtained is 0.3985. It is significant at 0.01
level and the 0.0? confidence interval is from 0.3058 to 0.491 1.
(vi) Government School Subjects
The coefficient of correlation obtained is 0.3851. It is significant at 0.01
level and t h e 0.01 confiderice interval is from 0.2901 to 0.4801
(vii) Private School Subjects
The coefficient of correlation obtained is 0.3918. Jt is significant at 0.01
level and the 0.01 confidence interval is from 0.2991 to 0.4821.
(viii) High Achievement Group
The coefficient of correlation obtained is 0.2304. It is significant at 0.01
level and the 0.01 confidence interval is from 0.1004 to 0.3604.
( i x ) Average Achievement Group
The coefficient of correlation obtained is 0.1 984. It is significant at 0.01
level and the 0.01 confidence interval is from 0.0769 to 0.31 99:
(x) Low Achievement Group
The coefficient of correlation obtained is 0.1795. It is significant at 0.05
level and the 0.01 confidence interval is from 0.0463 to 0.3128.
234 Analysis of Data
Interpretations
The following results show that Intelligence (Total) and Scientific
Creativity are closely associated variables:
(a) All coefficients of correlation obtained are significant a t 0.01 level for
all samples.
(b) The coefficients of correlation are in the range of 0.1795 to 0.4185.
The relationship between the variables may be described as
substantial or marked for Total sample and Boys. For all other
subsamples, the relationship may be described as low ar slight.
(c) All the obtained coefficients of correlation are positive showing that
any increase or decrease in Scientific Creativity will be followed by a
corresponding increase or decrease in Intelligence (total).
(d) The 0.01 confidence intervals show the probable range of the
corresponding population values.
(e) The percentage variance obtained shows that nearly 18 percent of
the variance of Intelligence (Total) is attributable to the variance in
one's Scientific Creativity. In terms of common shared variance, the
maximum overlap between the variables is nearly 17 percent and
minimum overlap is about 3 percent.
4.2.2.2 Relationship between Intelligence and Achievement Motivation
The relationship between Intelligence and Achievement Motivation is
discussed under the following the tables:
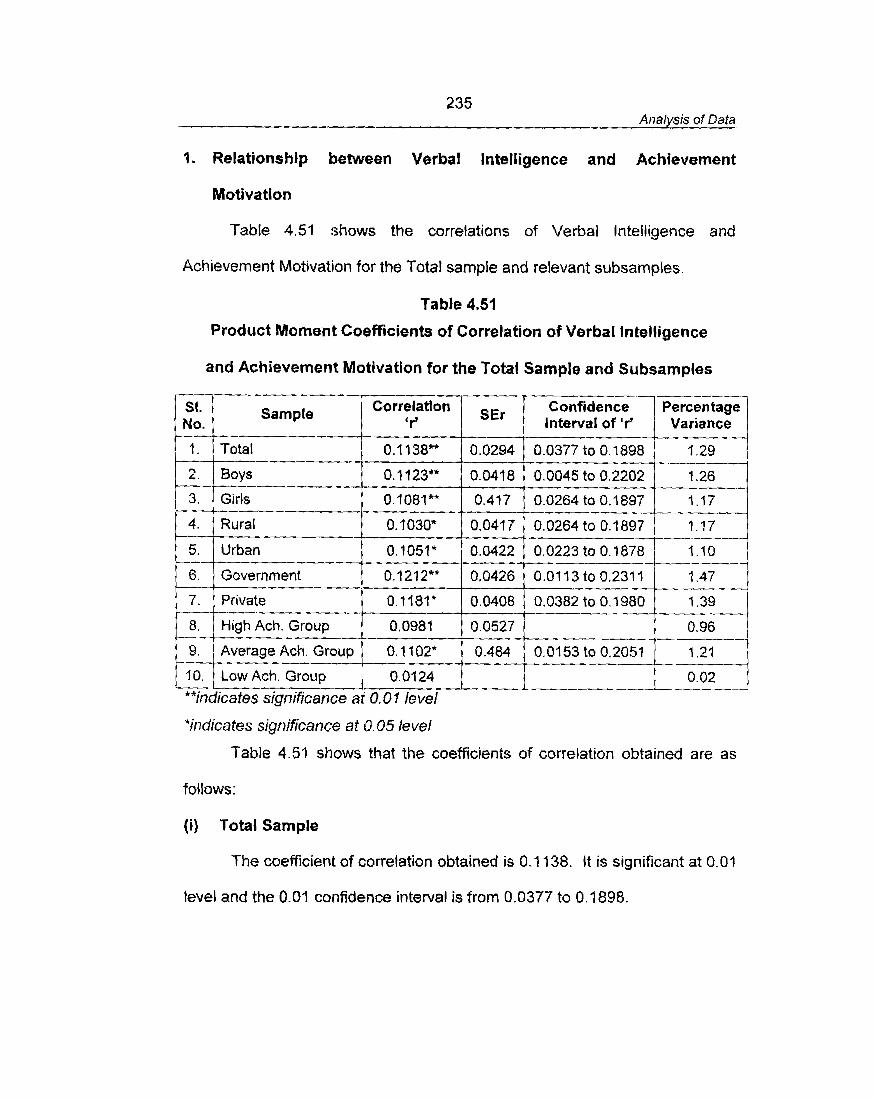
235 Analysis of Data
9. Relationship between Verbal intelligence and Achievement
Motivation
Table 4.51 shows the correlations of Verbal Intelligence and
Achievement Motivation for the Total sample and relevant subsamples.
Table 4.51
Product Moment Coefficients of Correlation of Verbal intelligence
and Achievement Motivation for the Total Sample and Subsamples
*indicates significance at 43.05 level
Sf. No.
1 .
2.
3.
4.
5.
6.
7 .
8.
9.
10.
Table 4.51 shows that t h e coefficients of correlation obtained are as
follows:
**indicates significance at 0.01 level
Sample
Total
Boys
Girls
Rural
Urban
Government
Private A-.
High Ach. Group
Average Ach. Group
{i) Total Sample
The coefficient of correlation obtained is 0.1 j38. It is significant at 0.0?
level and the 0.01 confidence interval is from 0.0377 to 0.1898.
Low Ach. Group I 0.0124
Correlation 'rr
0.1 138**
0.1123**
0.1081**
0.1030"
0.1051"
0.1212**
0.1 181*
0.0981
0.11 02*
0.02
SEr
0.0294
0.0418
0.41 7
0.041 7
0.0422
0.0426
0.0408
0.0527
0.484
Confidence Interval of 'r'
0.0377 to 0.1898
0.0045 to 0.2202
0.0264 to 0.1 897
0.0264 to 0.1897
0.0223 to 0.1878
0.01 13 to 0.231 7
----- Percentage
Variance
4.29
1.26
1.17
1.17 -.--
-- 1.10
1.47
0.0382 to 0.1980
0.0153 to 0.2051
236 Analysis of Data
(ii) Boys
The coefficient of correlation obtained is 0.1 123. It is significant at 0.0-l
level and the 0.01 confidence interval is from 0.0045 to 0.2202.
(iii) Girls
The coefficient of correlation obtained is 0.1081. It is significant at 0.05
level and the 0.05 confidence interval is from 0.0264 to 0.1897.
(iv) Rural Subjects
The coefficient of correlation obtained is 0.1030. It is significant at 0.05
level and the 0.05 confidenc:e interval is from 0.021 8 to 0.1842.
(v) Urban Subjects
The coefficient of correlation obtained is 0.1051. It is significant at 0.05
level and the 0.05 confidence interval is from 0.0223 to 0.?878.
(vi) Government School Subjects
The coefficient of correlation obtained is 0.1212. It is significant at 0.01
level and the 0.01 confidence interval is from 0.01 13 to 0.231 1.
(vii) Private School Subjects
The coefficient of correlation obtained is 0.1 181. It is significant at 0.05
level and the 0.05 confidence interval is from 0.0382 to 0.1980.
(viii) High Achievement Group
The coefficient of correlation obtained is 0.0981. It is not significant at
any level.
237 Analysis of Data
( i x ) Average Achievement Group
The coefficient of correlation obtained is 0.1 102. It is significant at 0.05
level and the 0.05 confidence interval is from 0.0153 to 0.2051.
(x) Low Achievement Group
The coefficient of correlation obtained is 0.0124. It is not significant at
any level.
Interpretations
The following results indicate a very slight association between Verbal
Intelligence and Achievement Motivation:
(a) The cueficients of correlation obtained are significant at 0.01 level for
the Total sample and subsamples of Boys and Government schools.
The 'r's are significant at 0.05 level for subsamples of Girls, Rural,
Urban, Private schools and Average Achievement groups. The
obtained 'r's are not significant for High and Low Achievement
groups.
(b) The coefficients of correlation obtained are in the range of 0.0d24 to
0.1 181. The relationship between the variables may be considered
as very low.
(c) All the obtained 'r' values are positive showing that any increase or
decrease in Achievement Motivation will be followed by a
corresponding increase or decrease in Verbal Intelligence.
Id) The 0.01 confidence intervals show the probable range of the
corresponding population values.
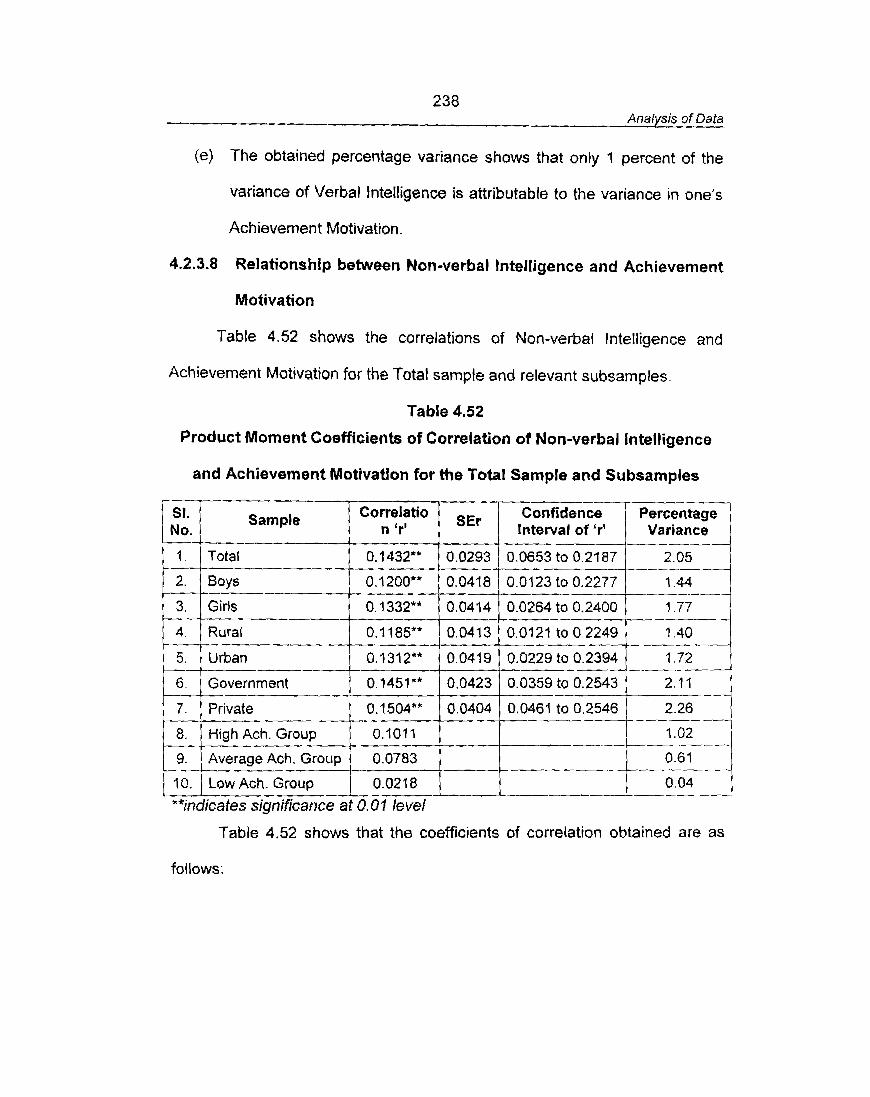
238 Analysis of Data
(e) The obtained percentage variance shows that only 'I percent of the
variance of Verbal Intelligence is attributable to the variance in one's
Achievement Motivation.
4.2.3.8 Relationship between Non-verbal Intelligence and Achievement
Motivation
Table 4.52 shows the correlations of Non-verbal Intelligence and
Achievement Motivation for the Total sample and relevant subsamples.
Table 4.52
Product Moment Coefficients of Correlation of Non-verbal Intelligence
and Achievement Motivation for the Total Sample and Subsamples
[ T I curmIatiO n 'r' SEr Interval confidencq-1 of 'r' Variance
k+!!*---+--;;+--j ----/-
**indicates significance at 0. O? level
1 .
2.
3.
4.
5.
6 .
7 .
8.
Table 4.52 shows that the coefficients of correlation obtained are as
fallows:
Total
Boys
Girls
Rural
Urban
Government
Private
High Ach. Group
0.1432*"
0.1200°*
0.1332**
0.1185**
0.1312**
0.1451**
0.1504"*
0.101 I
0.0293
0.0418
0.0414
0.0413
0.0419
0.0423
0.0404
0.0653 to 0.2187
0.01 23 to 0.2277
0.0264 to 0.2400
0.0121to0.2249
0.0229to0.2394
0.0359 to 0.2543
0.0461 to 0.2546 ----
--- .--tq --
.--.-- 2.11
2.26
--,=-] - -- - -- - /
239 Analysis of Data
(i) Total Sample
The coefficient of correlation obtained is 0.1432. It is significant at 0.0A
level and the 0.01 confidence interval is from 0.0653 to 0.2187.
(ii) Boys
The coefficient of correlation obtained is 0.1200. It is significant at 0.01
level and the 0.01 confidence interval is from 0.01 23 to 0.2227.
(iii) Girls
The coefficient of correlation obtained is 0.1332. It is significant at 0.01
level and the 0.01 confidence interval is from 0.0264 to 0.2400.
(iv) Rural Subjects
The coefficient of correlation obtained is 0.1 185. It is significant at 0.01
level and the 0.01 confidence interval is from 0.0121 to 0.2249.
(v) Urban Subjects
The coefficient of correlation obtained is 0.1 312. It is significant at 0.01
level and the 0.01 confidence interval is from 0.0229 to 0.2394.
(vi) Government School Subjects
The coefficient of correlation obtained is 0.1451. It is significant at 0.01
level and the 0.01 confidence interval is from 0.0359 to 0.2543.
(vii) Private School Subjects
The coefficient of correlation obtained is 0.1 504. It is significant at 0.01
level and the 0.01 confidence interval is from 0.0461 to 0.2546.
240 Analysis of Data
(viii) High Achievement Group
The coefficient of correlation obtained is 0.101 1. It is not significant at
any level.
(ix) Average Achievement Group
The coefficient of correlation obtained is 0.0783. It is not significant at
any level.
(x) Low Achievement Group
The coefficient of correlation obtained is 0.021 8. It is not significant at
any level.
Interpretations
The following results show that there is negligible relationship between
Non-verbal Intelligence and Achievement Motivation.
(a) The coefficients of correlation obtained are not significant for the
three Achievement groups (HA, AA and 14 groups). The obtained 'r'
values are significant at 0.01 level for all other samples.
{b) The significant coefficients of correlation are in the range of 0.1 I85 to
0.1504. The relationship between the variables is to be considered
as very low.
(c) All the obtained 'r' values are positive showing that any increase or
decrease in Achievement Motivation will be followed by a
corresponding increase or decrease in Non-verbal Intelligence.
(d) The 0.0q confidence intervals show the probable range of the
corresponding population values.
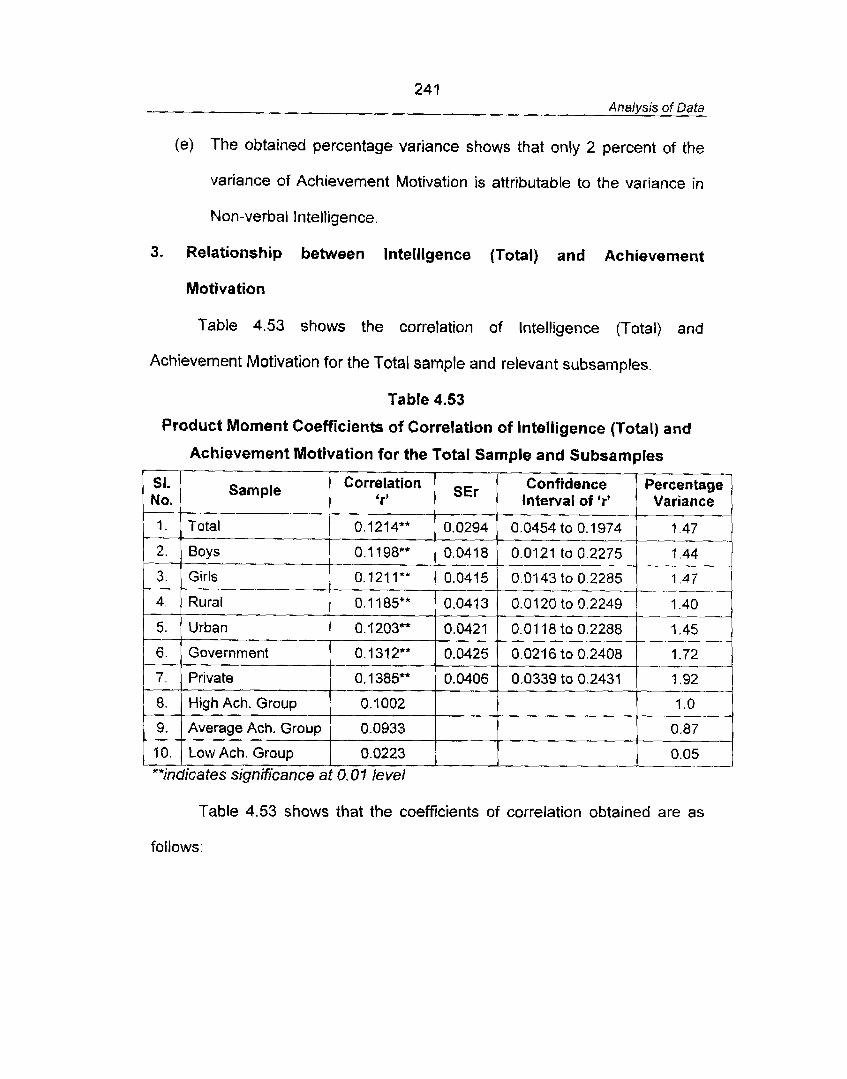
241 AnaIysis of Data
(e) The obtained percentage variance shows that only 2 percent of the
variance of Achievement Motivation is attributable to the variance in
Non-verbal Intelligence
3. Relationship between Intelligence (Total) and Achievement
Motivation
Table 4.53 shows the correlation of Intelligence (Total) and
Achievement Motivation for the Total sample and relevant subsamples.
Tabfe 4.53
Product Moment Coefficients of Correlation of Intelligence (Total) and
Achievement Motivation for the Total Sample and Subsamples
SI.
Table 4.53 shows that the coefficients of correlation obtained are as
1. - -
2.
3.
4.
5.
- 6.
7.
8.
9.
70.
follows:
Sample
**indicates significance at 0.W level
Total
Boys
Girls -- Rural
Urban
Government
Private
High Ach. Group
Average Ach. Group
Low Ach. Group
Correlation Variance I No.
0.1214""
0.1 198"* - 0.121 1""
0.1 185**
0.1203**
0.1312""
0. I 385**
0.1002
0.0933
0.0223
SEr *rl Interval of 'r'
0.0294
0.0418
0.0415
0.041 3
0.0421
0.0425
0.0406
Confidence Percentage 1
0.0454 to 0.1974
0.0121 to 0.2275
1.47
1.44 -- .
0.0143 to 0.2285
0.0120 to 0.2249
0.0118to0.2288
0.021 6 to 0.2408
0.0339 to 0.2431
1.47 ---- . .- ---
I .40
I .45
1.72 --.-
I .92
1 .O
0.87
0.05

242 Analysis of Data
(i) Total Sample
The coefficient of correlation obtained is 0.1214. It is significant at 0.01
level and the 0.01 confidence interval is from 0.0484 to 0.1 974.
(ii) Boys
The coefficient of correlation obtained is 0.1 198. It is significant at 0.01
level and the 0.01 confidence interval is from 0.0121 to 0.2275.
(iii) Girls
The coefficient of correlation obtained is 0.121 1. It is significant at 0.01
level and the 0.01 confidence interval is from 0.0143 to 0.2285.
(iv) Rural Subjects
The coefficient of correlation obtained is 0.7 185. It is significant at 0.01
level and the 0.01 confidence interval is from 0.0120 to 0.2240.
(v) Urban Subjects
The coefficient of correlation obtained is 0.1203. It is significant at 0.01
level and the 0.01 confidence interval is from 0.07 18 to 0.2288.
(vi) Government School Subjects
The coefficient of correlation obtained is 0.1312. It is significant at 0.01
level and the 0.01 confidence interval is from 0.0216 to 0.2408.
(vii) Private School Subjects
The coefficient of correlation obtained is 0.1385- It is significant at 0.09
level and the 0.01 confidence interval is from 0.0339 to 0.2431.
243 Analysrs of Data
(viii) High Achievement Group
The coefficient of correlation obtained is 0.1002. It is not significant at
any level.
(ix) Average Achievement Group
The coefficient of correlation obtained is 0.0933. It is not significant at
any level.
(x) Low Achievement Group
The coefficient of correlation obtained is 0.0223. It is not significant at
any level.
Interpretations
The following results show that the relationship between Intelligence
(total) and Achievement Motivation is low:
(a) The coefficients of correlation obtained are significant at 0.01 level for
the Total sample and subsamples of Boys, Girls, Rural, Urban,
Government and Private schools. The obtained 'r's are not significant
for the three Achievement groups (HA, AA and LA groups).
(b) The significant coefficients of correlation obtained are in the range of
0.7 185 to 0.q385. Though these ' r ' values are negligible, their
significance shows that there exists a true relationship between the
two variables.
(c) All the 'r's are positive showing that any increase or decrease in
Achievement Motivation will be attended by a corresponding increase
or decrease in Intelligence (total).
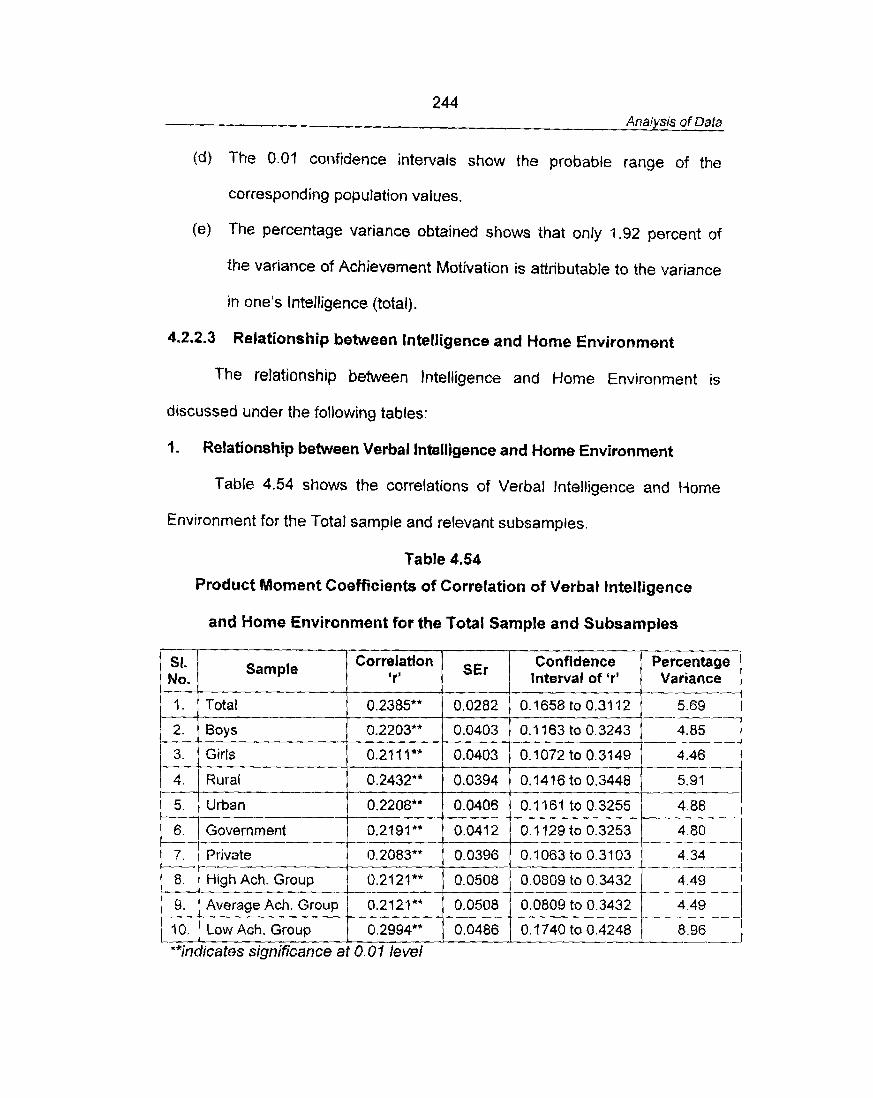
244 Analysis of Data
(d) The 0.01 confidence intervals show the probable range of the
corresponding population values.
(e) The percentage variance obtained shows that only 1.92 percent of
the variance of Achievement Motivation is attributable to the variance
in one's lntelligence (total).
4.2.2.3 Relationship between lntelligence and Home Environment
The relationship between Intelligence and Home Environment is
discussed under the following tables:
1. Relationship between Verbal Intelligence and Home Environment
Table 4.54 shows the correlations of Verbal Intelligence and Home
Environment for the Total sample and relevant subsamples.
Table 4.54
Product Moment Coefficients of Correlation of Verbal Intelligence
and Home Environment for the Total Sample and Subsamples
SI. No.
-. I.
2.
3
- 4.
5.
6.
7 .
8.
9.
- 10.
**indicates significance at 0. Of level
Sample
Total
Boys
Girls
Rural
Urban
Government
Private ----- High Ach. Group
--
Average Ach. Group - - --
Low Ach. Group
Correlation 'rr
0.2385**
0.2203**
0.211 A * "
0.2432**
0.2208**
0.2191""
0.2083*"
U.2?21**
0.21 21**
0.2994"
sEr Confidence percentage Interval of 'r' Variance
---- 0.0282 0.1658 to 0.31 12
0.0403 0.1 163 to 0.3243 - 0.0403 0.1072 to 0.3749
0.0394 0.1416 to 0.3448 5.91 --- 0.0406 0.1 161 to 0.3255 4.88
0.04j2 0.1129 to 0.3253 4.80 ---/---
0.0396 0.1063 to 0.31 03 - 4 34 - - -- -- - - - 0.0508 0.0809 to 0.3432
.-- - 0.0508 0.0809 to 0.3432
0.0486 0.1 740 to 0.4248 8.96
245 Analysis of Data
Table 4.54 shows that the coefficients of correlation obtained are as
follows:
( i ) Total Sample
The coefficient of correlation obtained is 0.2385. It is significant at 0.01
level and the 0.01 confidence interval is from 0.1658 to 0.31 12.
(ii) Boys
The coefficient of correlation obtained is 0.2203. It is significant at 0.01
level and the 0.01 confidence interval is from 0.1 163 to 0.3243.
(iii) Girls
The coefficient of correlation obtained is 0.2 1 I I . It is significant at 0.01
level and the 0.01 confidence interval is from 0.1072 to 0.31 49.
(iv) Rural Subjects
The coefficient of correlation obtained is 0.2432. It is significant at 0.01
level and the 0.01 confidence interval is from 0.141 6 to 0.3448.
(v) Urban Subjects
The coefficient of correlation obtained is 0.2208. It is significant at 0.01
level and the 0.01 confidence interval is from 0.1 161 to 0.3255.
(vi) Government School Subjects
The coefficient of correlation obtained is 0.21 91. It is significant at 0.01
level and the 0.01 confidence interval is from 0.1 129 to 0.3253.
(vii) Private School Subjects
The coefficient of correlation obtained is 0.2083. It is significant at 0.01
level and the 0.01 confidence interval is from 0.1063 to 0.31 03.
246 Analysis of Data
(viii) High Achievement Group
The coefficient of correlation obtained is 0.2121. It is significant at 0.01
level and the 0.01 confidence interval is from 0.0809 to 0.3432.
(ix) Average Achievement Group
The coefficient of correlation obtained is 0.7882. It is significant at 0.01
level and the 0.01 confidence interval is from 0.0662 to 0.3102.
(x) Low Achievement Group
The coefficient of correlation obtained is 0.2994. It is significant at 0.01
level and the 0.01 confidence interval is from 0.1 740 to 0.4248.
Interpretations
The following results show that Verbal Intelligence and Home
Environment are related to some extent;
(a) For all samples, the coefficients of correlation obtained are significant
at 0.01 level.
(b) The coefficients of correlation obtained are in the range of 0.1882 to
0.2994. The relationship between the variables can be considered as
low or slight.
(c) All the obtained ' r ' values are positive showing that any increase or
decrease in Home Environment will be followed by a corresponding
increase or decrease in Verbal Intelligence.
(d) The 0.0? confidence intervals show the probable range of the
corresponding population values.
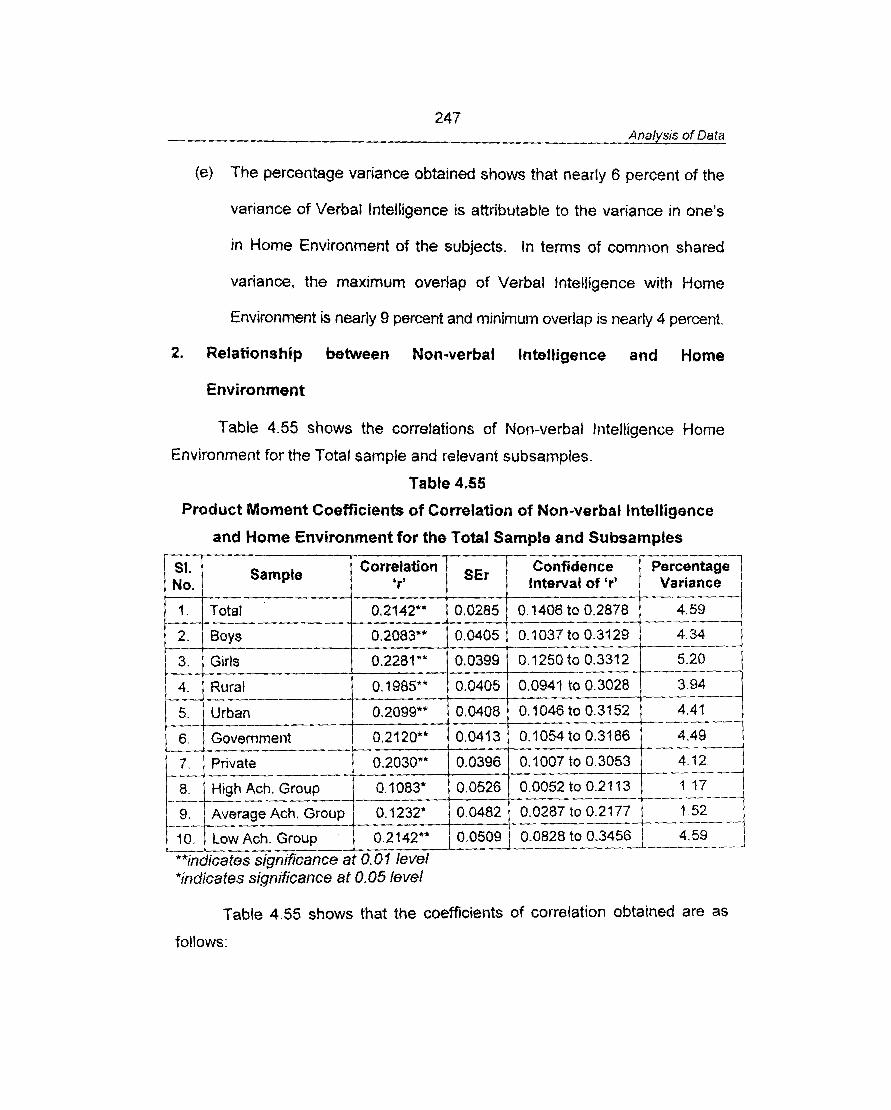
(e) The percentage variance obtained shows Mat nearly 6 percent of the
var~ance of Verbal lntelligence is attributable to the variance in one's
in Home Environment of the subjects. In terms of common shared
variance, the maximum overlap of Verbal lntelligence with Home
Environment is nearly 9 percent and minimum overlap is nearly 4 percent.
2. Relationship between Non-verbal lntelligence and Home
Environment
Table 4.55 shows the correlations of Non-verbal Intelligence Home
Environment for the Total sample and relevant subsamples.
Table 4.55
Product Moment Coefficients of Correlation of Non-verbal Intelligence
and Home Environment for the Total Sample and Subsamples
Sample Confidence No. Interval of 'r' Variance
*indicates significance at 0.05 level
Table 4.55 shows that the coefficients of correlation obtained are as
follows:
248 Analysis of Data
fi) Total Sample
The coefficient of correlation obtained is 0.2142. It is significant at 0.01
level and the 0.01 confidence interval is from 0.1406 to 0.2878.
(ii) Boys
The coefficient of correlation obtained is 0.2083. It is significant at 0.01
level and the 0.01 confidence interval is from 0.1037 to 0.3 129.
(iii) Girls
The coefficient of correlation obtained is 0.2281. It is significant at 0.01
level and the 0.07 confidence interval is from 0.1250 to 0.331 2.
(iv) Rural Subjects
The coefficient of correlation obtained is 0.1985. It is significant at 0.01
level and the 0.01 confidence interval is from 0.0941 to 0.3029.
(v) Urban Subjects
The coefficient of correlation obtained is 0.2099. It is significant at 0.01
level and the 0.01 confidence interval is from 0.1046 to 0.3 152.
(vi) Government School Subjects
The coefficient of correlation obtained is 0.2120. It is significant at 0.01
level and the 0.01 confidence intewal is from 0.1054 to 0.3186.
(vii) Private School Subjects
The coefficient of correlation obtained is 0.2030. It is significant at 0.07
level and the 0.01 confidence interval is from 0.1007 to 0.3053.
249 Analvsis of Data
(viii) High Achievement Group
The coefficient of correlation obtained is 0.1083. It is significant at 0.05
level and the 0.05 confidence interval is from 0.0052 to 0.21 13.
(ix) Average Achievement Group
The coefficient of correlation obtained is 0.1232. It is significant at 0.05
level and the 0.05 confidence interval is from 0.0287 to 0.2177.
(x) Low Achievement Group
The coefficient of correlation obtained is 0.2142. It is significant at 0.01
level and the 0.01 confidence interval is from 0.0828 to 0.3456.
I nterpretatians
The following results show that Non-verbal Intelligence is slightly
influenced by Home Environment:
(a) The coefficients of correlation obtained for the High Achievement and
Average Achievement groups are significant at 0.05 level. All other
'r's are significant at 0.01 level.
(b) The coefficients of correlation obtained are in the range of 0.1083 to
0.2281. The relationship between the variables is low or slight.
(c) All the obtained 'r' values are positive showing that any increase or
decrease in Home Environment will be followed by a corresponding
increase or decrease in Non-verbal Intelligence.
(d) The 0.01 confidence intervals show the probable range of the
corresponding population values.
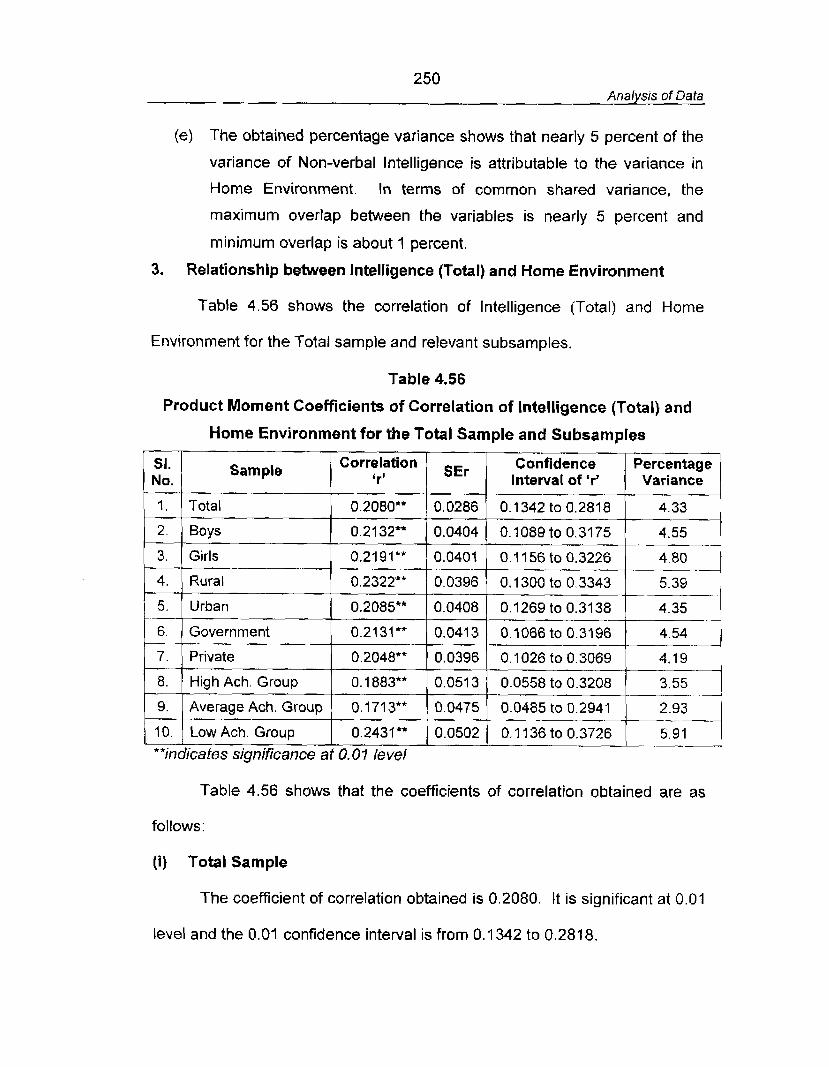
250 Analysis of Data
(e) The obtained percentage variance shows that nearly 5 percent of the
variance of Non-verbal lntelligence is attributable to the variance in
Home Environment. In terms of common shared variance, the
maximum overlap between the variables is nearly 5 percent and
minimum overlap is about I percent.
3. Relationship between Intelligence (Total) and Home Environment
Table 4.56 shows the correlation of Intelligence (Total) and Home
Environment for the Total sample and relevant subsamples.
Table 4.56
Product Moment Coefficients of Correlation of lntelligence (Total) and
Table 4.56 shows that the coefficients of correlation obtained are as
follows:
(i) Total Sample
The coefficient of correlation obtained is 0.2080. It is significant at 0.01
level and the 0.01 confidence interval is from 0.1 342 to 0.281 8.
Home Environment for the Total Sample and Subsamples
SI. No.
1
2.
3. -.
4.
. . 5.
6.
7 .
8.
9.
10.
**indicates significance a f 0.0 1 level
Sample
Total
Boys
Girls
Rural
Urban
Government
Private
High Ach. Group
Average Ach. Group
Low Ach. Group
Correlation 'r'
0.208OW*
0.21 32**
0.2191*"
0.2322**
0.2085**
0.2131**
0.2048**
0.1883**
0.1713**
0.2431**
SEr
0.0286
0.0404
0.0404
0.0396
0.0408
0.0413
0.0396
0.051 3
0.0475
0.0502
Confidence interval of 'ry
0.1342 to 0.281 8
0.1089 to 0.31 75
0.1 156 to 0.3226
Percentage Variance
4.33
4.55 -.
4.80
0.1300 to 0.3343
0.1269 to 0.31 38
0.1066 to 0.3196
0.1026 to 0.3069
0.0558 to 0.3208
5.39
4.35
4.54
4.19
3.55 .-
0.0485 to 0.2941
0.1 136 to 0.3726
2.93 - - - -.
5.91
25 1 Analysis of Data
( i i ) Boys
The coefficient of correlation obtained is 0.2132. It is significant at 0.01
level and the 0.01 confidence interval is from 0.1089 to 0.3175.
(iii) Girls
The coefficient of correlation obtained is 0.21 91. It is significant at 0.01
level and the 0.01 confidence interval is from 0.1 156 to 0.3226.
(iv) Rural Subjects
The coefficient of correlation obtained is 0.2322. It is significant at 0.01
level and the 0.01 confidence interval is from 0.1300 to 0.3343.
(v) Urban Subjects
The coefficient of correlation obtained is 0.2085. It is significant at 0.01
level and the 0.01 confidence interval is from 0.1269 to 0.3138.
(vi) Government School Subjects
The coefficient of correlation obtained is 0.2131. It is significant at 0.01
level and the 0.01 confidence interval is from 0.1066 to 0.3196.
(vii) Private School Subjects
The coefficient of correlation obtained is 0.2048. It is significant at 0.01
level and the 0.01 confidence interval is from 0.1 026 to 0.3069.
(viii) High Achievement Group
The coefficient of correlation obtained is 0.1883. It is significant at 0 .0 j
level and the 0.01 confidence interval is from 0.0558 to 0.3208.
252 Analysis of Data
(ix) Average Achievement Group
The coefficient of correlation obtained is 0.1713. It is significant at 0.01
level and the 0.01 confidence interval is from 0.0485 to 0.2941.
(x) Low Achievement Group
The coefficient of correlation obtained is 0.2431. It is significant at 0.05
level and the 0.01 confidence interval is from 0.1 1 36 to 0.3726.
Interpretations
The following results show that Intelligence (Total) and Home
Environment are associated variables:
(a) The coefficients of correlation obtained are significant at 0.01 level for
all samples.
(b) The coefficients of correlation are in the range of 0.1713 to 0.2322.
The relationship between the variables may be described as low or
slight.
( c ) All the obtained coefficients of correlation are positive showing that
any increase or decrease in Home Environment will be followed by a
corresponding increase or decrease in Intelligence (total).
(d) The 0.01 confidence intervals show the probable range of the
corresponding population values.
(e) The percentage variance obtained shows that about 4 percent of the
variance of Intelligence (Total) is attributable to the variance in one's
Home Environment. In terms of common shared variance, the
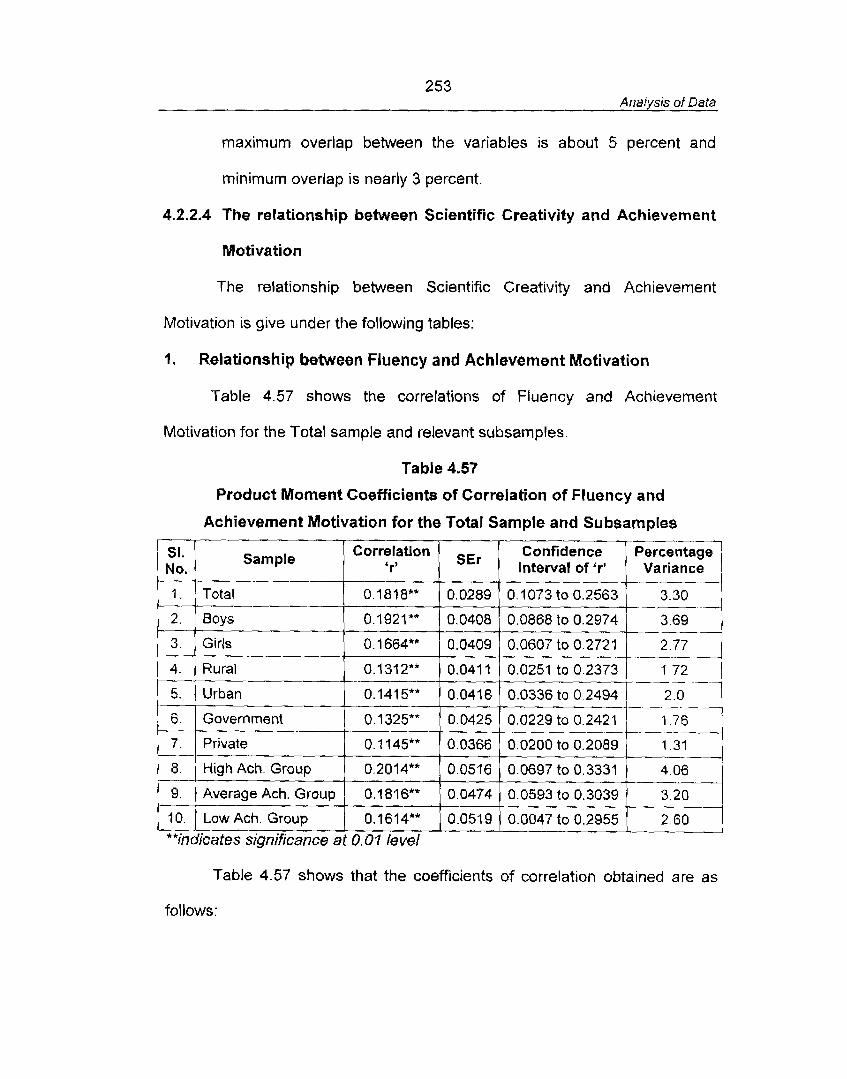
253 Analysis of Data
maximum overlap between the variables is about 5 percent and
minimum overlap is nearly 3 percent.
4.2.2.4 The relationship between Scientific Creativity and Achievement
Motivation
The relationship between Scientific Creativity and Achievement
Motivation is give under the following tables:
i . Relationship between Fluency and Achievement Motivation
Table 4.57 shows the correlations of Fluency and Achievement
Motivation for t h e Total sample and relevant subsamples.
Table 4.57
Product Moment Coefficients of Correlation of Fluency and
Achievement Motivation far the Total Sample and Subsamples
Sample Correlation / 9Er 1 Confidence Interval of 'r'
10. 1 Low Ach. Group / 0.7614" / 0.0519 ( 0.0047 to 0.2955 1 2.60
**indicates significance at 0.0 1 level
- 1. - 2.
3.
1 4.
5.
6
7 .
8.
9.
Table 4.57 shows that the coefficients of correlation obtained are as
follows:
- Total
Boys
Girls
Rural
Urban
Government
Private
High Ach. Group
Average Ach. Group
0.1818""
0.1921**
0.1664**
0.1312""
0.141 5**
0.1 325**
0.1145**
0.2014**
0.1818**
0.0289
0.0408
0.0409
0.041 1
0.0418
0.0425
0.0366
0.0516
0.0474
0.1073 to 0.2563
0.0868to0.2974
0.0607 to 0.2721
0.0251 ta 0.2373
0.0336 to 0 2494
-- 3.30 -1
~@q 1 72 - - -
2.0 ---- --
0.0229 to 0.2421 I 76 - --
0.0200 to 0.2089
0.0697 to 0.3331 4.06
0.0593 to 0.3039 3.20

254 Analysis of Data
(i) Total Sample
The coefficient of correlation obtained is 0.1 818. It is significant at 0.01
level and the 0.01 confidence interval is from 0.1073 to 0.2563.
(ii) Boys
The coefficient of correlation obtained is 0.1921 . It is significant at 0.01
level and the 0.01 confidence interval is from 0.0868 to 0.2974.
(iii) Girls
The coefficient of correlation obtained is 0.1664. It is significant at 0.07
level and the 0.01 confidence interval is from 0.0607 to 0.2721.
(iv) Rural Subjects
The coefficient of correlation obtained is 0.1312. It is significant at 0.01
level and the 0.01 confidence interval is from 0.0251 to 0.2373.
(v) Urban Subjects
The coefficient of correlation obtained is 0.141 5. It is significant at 0.01
level and the 0.01 confidence interval is from 0.0336 to 0.2494.
(vi) Government School Subjects
The coefficient of correlation obtained is 0.1 325. It is significant at 0.01
level and the 0.01 confidence interval is from 0.0229 to 0.242 1.
(vii) Private School Subjects
The coefficient of correlation obtained is 0.1 145. It is significant at 0.01
level and the 0.01 confidence interval is from 0.0200 to 0.2089.
255 Analysis of Data
(viii) High Achievement Group
The coefficient of correlation obtained is 0.2014. It is significant at 0.01
level and the 0.01 confidence interval is from 0.0697 to 0.3331.
(ix) Average Achievement Group
The coefficient of correlation obtained is 0.1816. It is significant at 0.01
level. The 0.01 confidence interval is from 0.0593 to 0.3093.
(x) Low Achievement Group
The coefficient of correlation obtained is 0.1 61 4. It is significant at 0.01
level and the 0.01 confidence interval is from 0.0047 to 0.2995.
Interpretations
The following results show that there exists a very low relationship
between Fluency and Achievement Motivation:
(a) The coefficients of correlation obtained are significant at 0.01 level for
all samples.
(b) The coefficients of correlation obtained are in the range of 0.1 145 to
0.2014. Though the values of 'r' are negligible, their significance
indicate that there exists a true relationship between the two
variables.
(c) All the coefficients of correlation obtained are positive showing that
any increase or decrease in Achievement Motivation will be followed
by a corresponding slight change in one's Fluency.
(d) The 0.01 confidence intervals show the probability of the
corresponding population values.
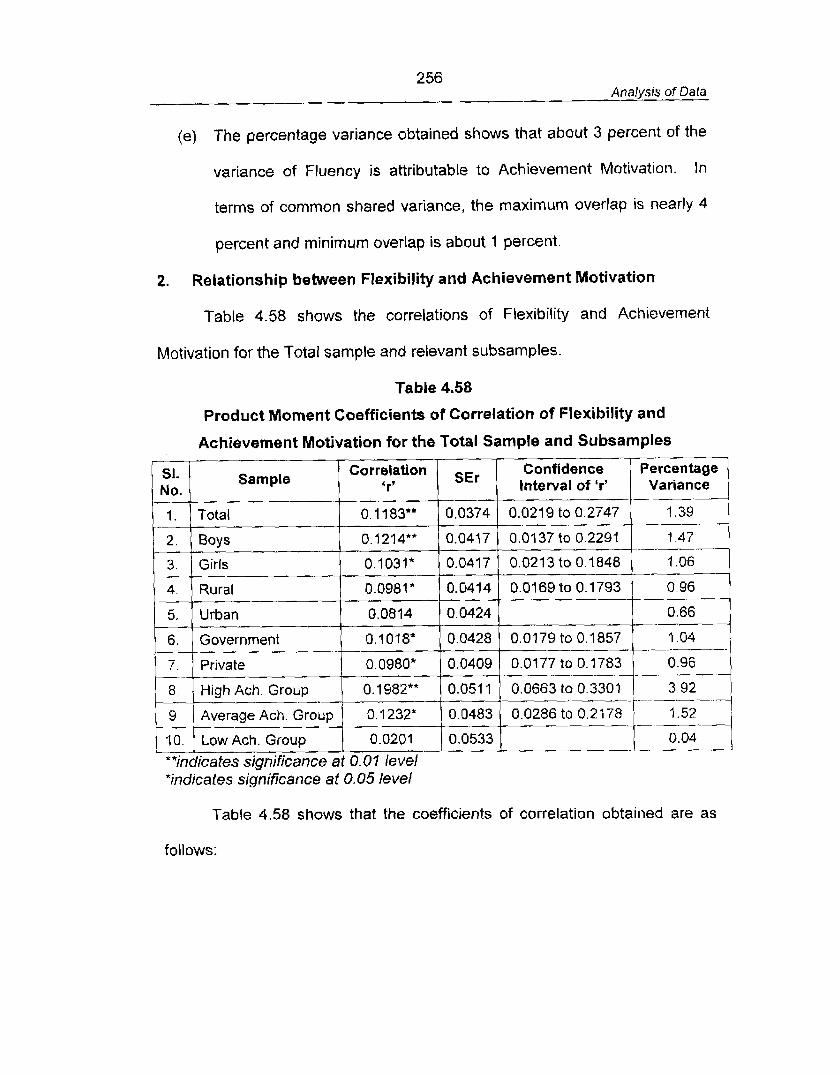
256 Analysis of Data
(e) The percentage variance obtained shows that about 3 percent of the
variance of Fluency is attributable to Achievement Motivation. In
terms of common shared variance, the maximum overlap is nearly 4
percent and minimum overlap is about 1 percent.
2. Relationship between Flexibility and Achievement Motivation
Table 4.58 shows the correlations of Flexibility and Achievement
Motivation for the Total sample and relevant subsamples.
Table 4.58
Product Moment Coefficients of Correlation of Flexibility and
Table 4.58 shows that the coefficients of correlation obtained are as
Achievement Motivation for the Total Sample and Subsamples
follows:
Variance
7.39
1.47 ---
-- I .06
0.96
0.66
Confidence Interval of 'r'
0.021 9 to 0.2747
0.0137 to 0.2291
0.0213to0.1848
0.0169 to 0.1793
SEr
0.0374
0.0417
0.0417
0.0414
0.0424
0.0179 to 0.1857 1.04 - 0.0177 to 0.1783
0.0663 to --.
0.0286 to 0.21 78 -. -- - -
-
Correlation 'r'
0.11 83**
0.1214**
0.1031*
0.0981*
0.0814
SI. No.
1.
2.
3.
4.
5.
**indicates significance at 0.01 level *indicates significance at 0.05 level
0.0428
0.0409
0.051 1
0.0483
0.0533
Sample
Total
Boys
Girls
Rural
Urban
0.-7018*
0.0980"
0.1982**
0.1232'
0.0201
6 , Government
7 . Private
8. High Ach. Group
9.
10.
--- Average Ach. Group
Low Ach. Group
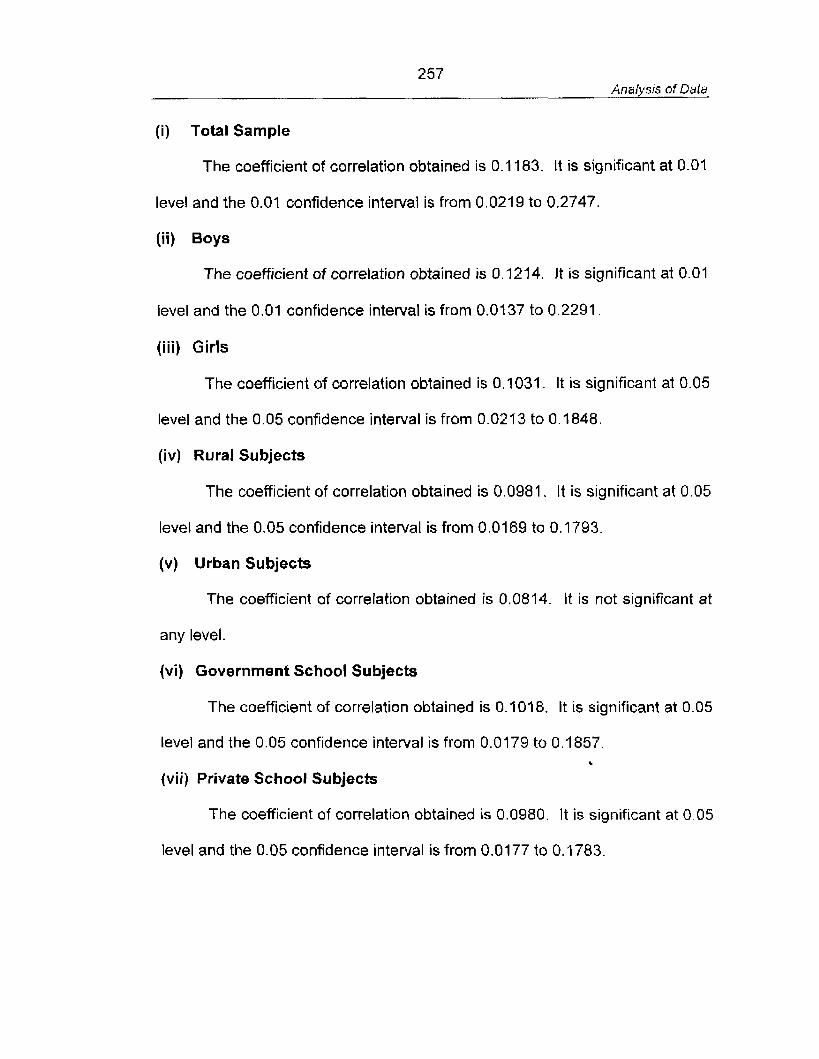
257 Analysfs of Data
(i) Total Sample
The coefficient of correlation obtained is 0.1 183. It is significant at 0.01
level and the 0.01 confidence interval is from 0.021 9 to 0.2747.
(ii) Boys
The coefficient of correlation obtained is 0.1214. It is significant at 0.01
level and the 0.01 confidence interval is from 0.01 37 to 0.2291.
(iii) Girls
The coefficient of correlation obtained is 0.1031. It is significant at 0.05
level and the 0.05 confidence interval is from 0.021 3 to 0.1848.
(iv) Rural Subjects
The coefficient of correlation obtained is 0.0981 . It is significant at 0.05
level and the 0.05 confidence interval is from 0.01 69 to 0.1793.
(v) Urban Subjects
The coefficient of correlation obtained is 0.0814. It is not significant at
any level.
(vi) Government School Subjects
The coefficient of correlation obtained is 0.1018. It is significant at 0.05
level and the 0.05 confidence interval is from 0.0179 to 0.1 857 b
(vii) Private School Subjects
The coefficient of correlation obtained is 0.0980. It is significant at 0.05
level and the 0.05 confidence interval is from 0.0177 to 0.1783.
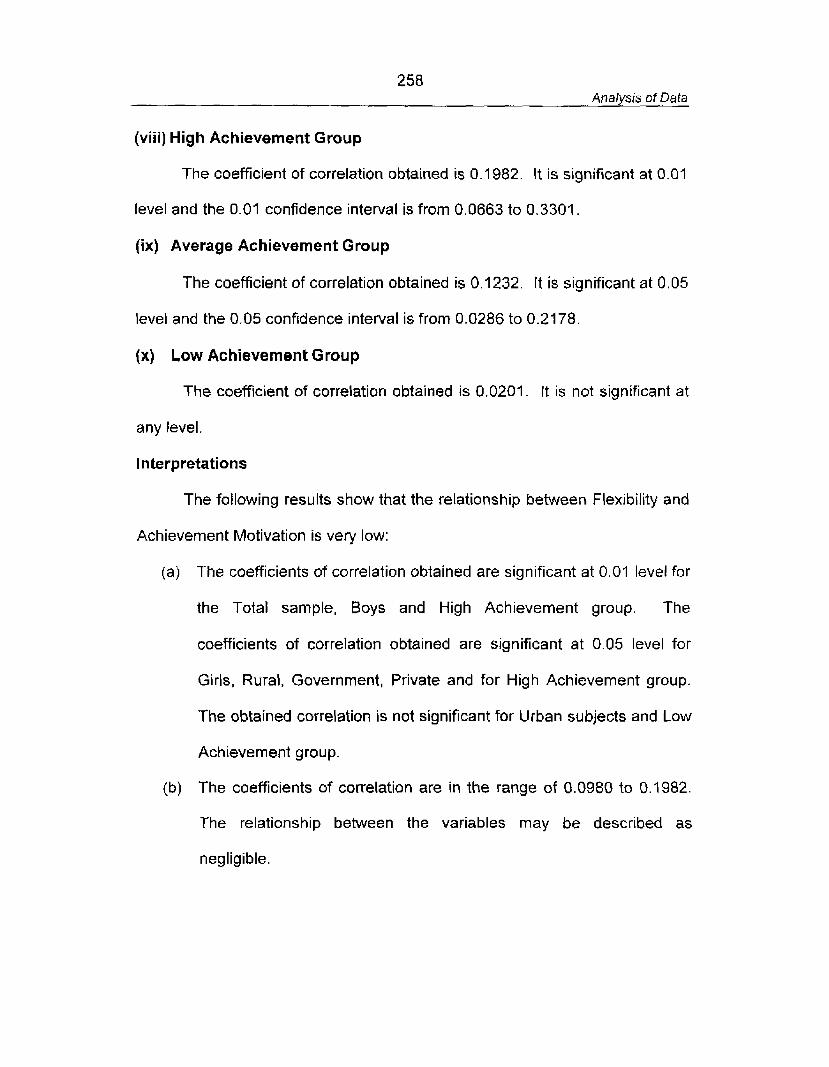
258 Analysis of Data
(viii) High Achievement Group
The coefficient of correlation obtained is 0.1982. It is significant at 0.01
level and the 0.01 confidence interval is from 0.0663 to 0.3301.
(ix) Average Achievement Group
The coefficient of correlation obtained is 0.1232. It is significant at 0.05
level and the 0.05 confidence interval is from 0.0286 to 0.21 78.
(x) Low Achievement Group
The coefficient of correlation obtained is 0.0201. It is not significant at
any level.
Interpretations
The following results show that the relationship between Flexibility and
Achievement Motivation is very low:
(a) The coefficients of correlation obtained are significant at 0.01 level for
the Total sample, Boys and High Achievement group. The
coefficients of correlation obtained are significant at 0.05 level for
Girls, Rural, Government, Private and for High Achievement group.
The obtained correlation is not significant for Urban subjects and Low
Achievement group.
(b) The coefficients of correlation are in the range of 0.0980 to 0.1982.
The relationship between the variables may be described as
negligible
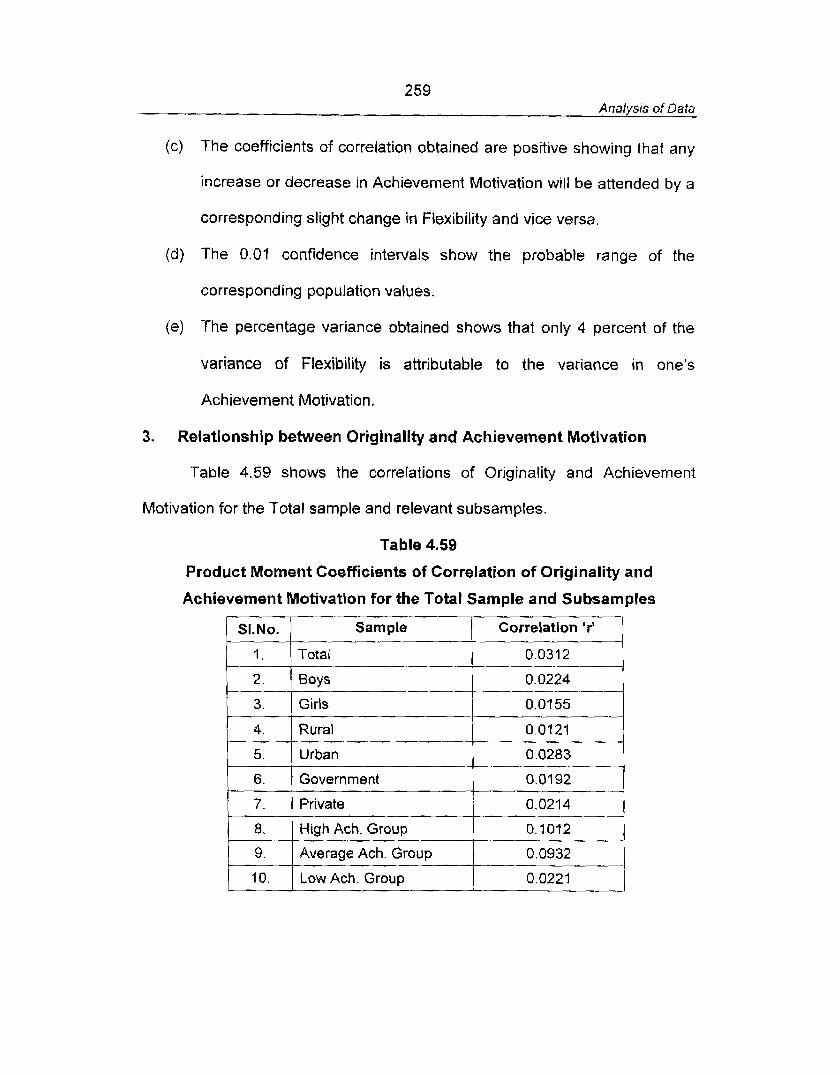
259 Analysis of Data
(c) The coefficients of correlation obtained are positive showing that any
increase or decrease in Achievement Motivation will be attended by a
corresponding slight change in Flexibility and vice versa.
(d) The 0.01 confidence intervals show the probable range of the
corresponding population values.
(e) The percentage variance obtained shows that only 4 percent of the
variance of Flexibility is attributable to the variance in one's
Achievement Motivation.
3. Relationship between Originality and Achievement Motivation
Table 4.59 shows the correlations of Originality and Achievement
Motivation for the Total sample and relevant subsamples
Table 4.59
Product Moment Coefficients of Correlation of Originality and
Achievement Motivation for the Total Sample and Subsamples
SI-No. -- 1
2.
3. - 4.
5.
6.
7.
8.
9.
10.
Sample .-
Total
Boys
Girls
Rural
Urban
Government
Private
High Ach. Group
Average Ach. Group
Low Ach. Group
Correlation 'r'
0.0312
0.0224
0.01 55
0.0121
0.0283
0.0192
0.0214
0.1012
0.0932
0.0221 J
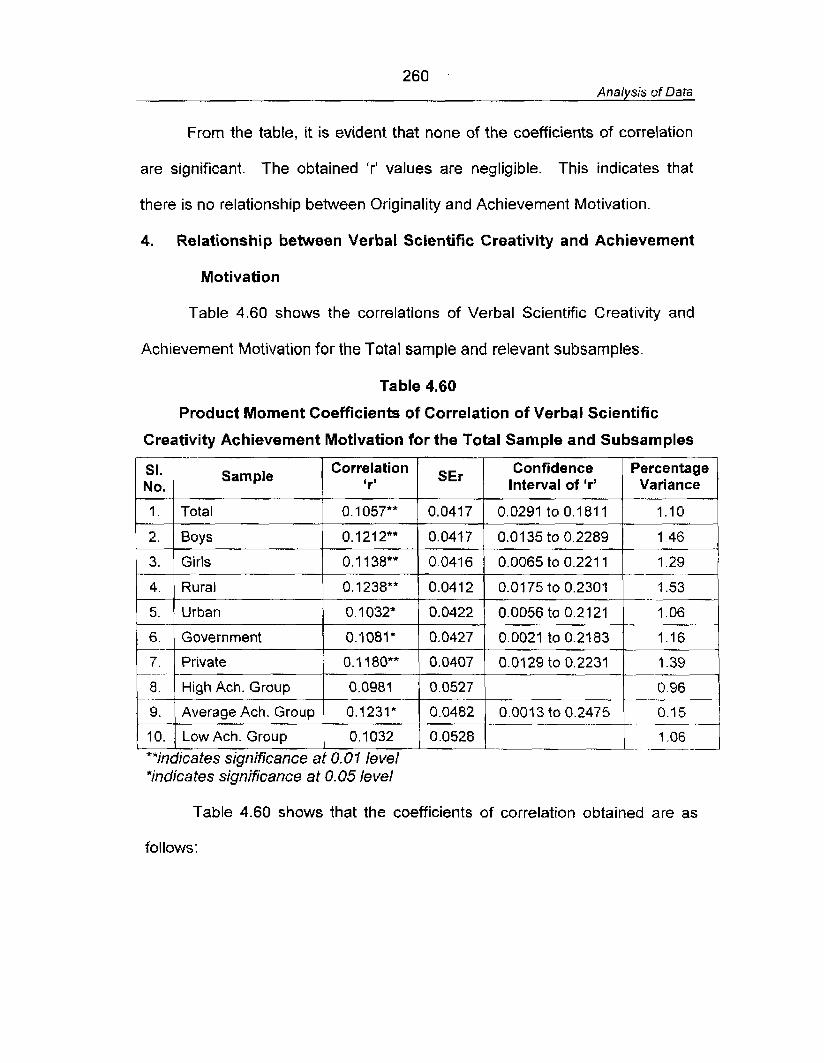
260 Analysis of Data
From the table, it is evident that none of the coefficients of correlation
are significant. The obtained 'r' values are negligible. This indicates that
there is no relationship between Originality and Achievement Motivation.
4. Relationship between Verbat Scientific Creativity and Achievement
Motivation
Table 4.60 shows the correlations of Verbal Scientific Creativity and
Achievement Motivation for the Total sample and relevant subsamples
Table 4.60
Product Moment Coefficients of Correlation of Verbal Scientific
Creativity Achievement Motivation for the Total Sample and Subsamples
I I I I I
1. 1 Total 1 0.1057*' 10.0417 1 0.0291 to0.1811 / 1.10
Sample NO.
3. 1 Girls / 0.1 138" 1 0.0416 1 0.0065 to 0.221 1 L 1.29
4. 1 Rural / 0.1238** 1 0.0412 1 0.0175 to 0.2301 1 ? .53
5. ( Urban 1 0.1032* [0.0422[ 0.0056to0.2121 1 1.06
Percentage Variance -1 Correlation
'rl
Table 4.60 shows that the coefficients of correlation obtained are as
SEr
6.
7 .
8 - .
9.
10.
follows:
Confidence Interval of 'rl
**indicates significance at 0.01 level *indicates significance at 0.05 level
Government
Private
High Ach. Group
Average Ach. Group
Low Ach. Group
0.1081*
0.1 180"*
0.0981
0.1231"
0.1032
0.0427
0.0407
0.0527
0.0482
0.0528
0.0021to0.2183
0.0129 to 0.2231 -,--
- ,. .
0.0013 to 0.2475
--
1.16
1.39
- 0 96
0.15 . - -
1.06 .

26 1 Analysis of Data
(i) Total Sample
The coefficient of correlation obtained is 0.1051. It is significant at 0.01
level and t h e 0.01 confidence interval is from 0.0291 to 0.181 1 .
(ii) Boys
The coefficient of correlation obtained is 0.1212. It is significant at 0.01
level and the 0.01 confidence interval is from 0.0135 to 0.2289.
( i i i ) Girls
The coefficient of correlation obtained is 0.1 138. It is significant at 0.01
level and the 0.01 confidence interval is from 0.0065 to 0.221 1.
(iv) Rural Subjects
The coefficient of correlation obtained is 0.1238. It is significant at 0.01
level and the 0.01 confidence interval is from 0.0175 to 0.2301.
(v) Urban Subjects
The coefficient of correlation obtained is 0.1032. It is significant at 0.05
level and the 0.05 confidence. interval is from 0.0056 to 0.2 12 I.
(vi) Government School Subjects
The coefficient of correlation obtained is 0.1081. it is significant at 0.05
level and the 0.05 confidence interval is from 0.0027 to 0.2183.
(vii) Private School Subjects
The coefficient of correlation obtained is 0.1 180. It is significant at 0.01
level and t h e 0.01 confidence interval is from 0.01 29 to 0.223 1.
262 Analysis of Data
(viii) High Achievement Group
The coefficient of correlation obtained is 0.0981. It is not significant at
any level.
(ix) Average Achievement Group
The coefficient of correlation obtained is 0.1 231 . It is significant at 0.05
level. The 0.05 confidence interval is from 0.001 3 to 0.2475.
(x) Low Achievement Group
The coefficient of correlation obtained is 0.1032, It is not significant at
any level.
Interpretations
The following results show that there exists a very low relationship
between Verbal Scientific Creativity and Achievement Motivation:
(a) The coefficients of correlation obtained are significant at 0.01 level for
the Total sample and subsamples of Boys, Girls, Rural and Private
schools. The obtained 'r's are significant at 0.05 level for subsamples
of Urban, Government schools and Average Achievement group.
The obtained 'r's are not significant for High and Low Achievement
groups.
(b) The significant coefficients of correlation obtained are in the range of
0.1 032 to 0.1238. Even though the 'r' values are negligible, its
significance indicate a very low association between the variables.
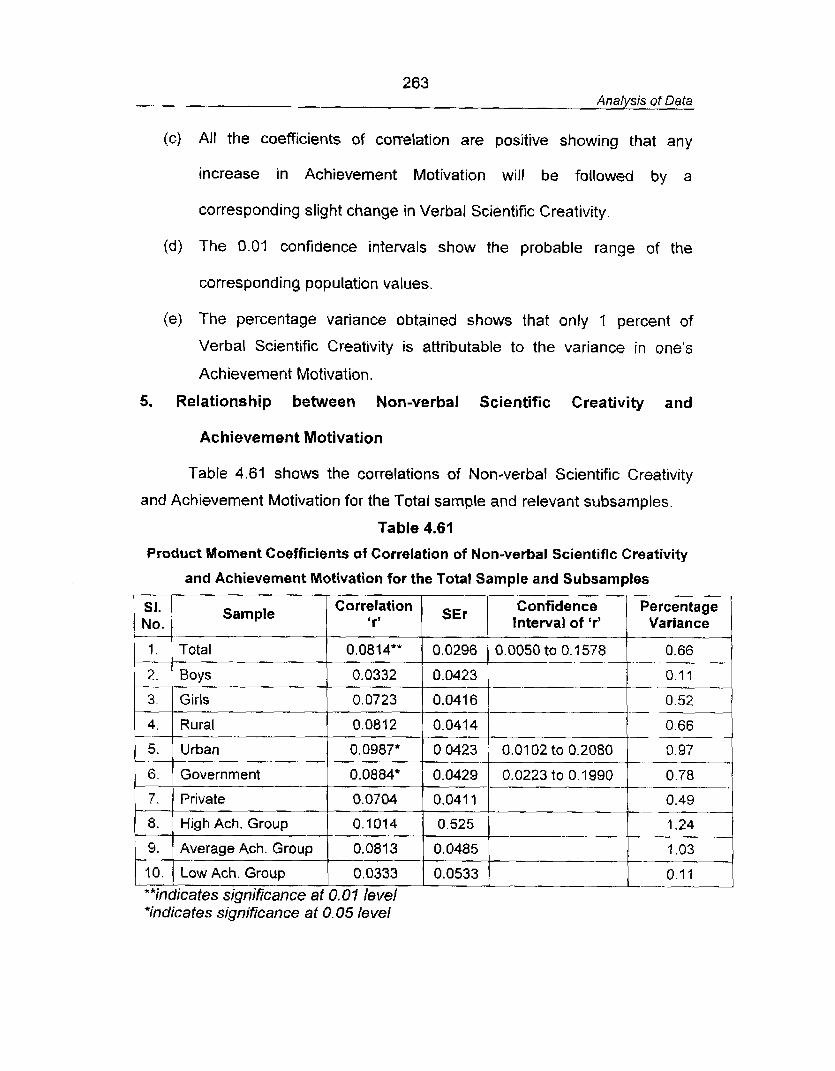
263 Analysis of Data
(c) All the coefficients of correlation are positive showing that any
increase in Achievement Motivation will be followed by a
corresponding slight change in Verbal Scientific Creativity
(d) The 0.01 confidence intervals show the probable range of the
corresponding population values.
(e) The percentage variance obtained shows that only I percent of
Verbal Scientific Creativity is attributable to the variance in one's
Achievement Motivation.
5. Relationship between Non-verbal Scientific Creativity and
Achievement Motivation
Table 4.61 shows the correlations of Non-verbal Scientific Creativity
and Achievement Motivation for the Total sample and relevant subsamples.
Table 4.61
Product Moment Coefficients of Correlation of Non-verbal Scientific Creativity
and Achievement Motivation for the Total Sample and Subsamples
No.
1. "-
2.
3.
4.
5.
6.
7.
8.
9.
*indicates significance at 0.05 le vei
Sample
1 10. / Low Ach. Group
Total
Boys -.
Girls
Rural --
Urban
Government
Private
High Ach. Group
Average Ach. Group
0.0333 1 0.0533 1 1 0.11
Correlation 'rr
**indicates significance a f 0.0 7 level
Interval of 'r' Variance
0.0814**
0.0332
0.0723
0.0812
0.0987*
0.0884*
0.0704
0.1014
0.081 3
0.0296
0.0423
0.041 6
0.0414
0.0423
0.0429
0.041 1
0.525
0.0485
0.0050 to 0.1578
-
-
0.01 02 to 0.2080
0.0223 to 0.1990
.
-- 0.66 ---
-. .. 0.1 1
.-
.- 0.52
.-
0.66
0.97
-. .. 0.78
- 0.49
1.24
7.03
264 Analysis of Data
Table 4.61 shows that the coefficients of correlation obtained are as
follows:
(i) Total Sample
The coefficient of correlation obtained is 0.0814. It is significant at 0.01
level and the 0.01 confidence interval is from 0.0050 to 0.1 378.
(ii) Boys
The coefficient of correlation obtained is 0.0332. It is not significant at
any level.
(iii) Girls
The coefficient of correlation obtained is 0.0723. It is not significant at
any level.
(iv) Rural Subjects
The coefficient of correlation obtained is 0.0812. It is not significant at
any level..
(v) Urban Subjects
The coefficient of correlation obtained is 0.0987. It is significant at 0.05
level. The 0.05 confidence interval is from 0.0102 to 0.2080.
(vi) Government School Subjects
The coefficient of correlation obtained is 0.0884. It is significant at 0.05
level. The 0.05 confidence interval is from 0.0223 to 0.1990.
(vii) Private School Subjects
The coefficient of correlation obtained is 0.0704. It is not significant at
any level.
265 Analysis of Data
(viii) High Achievement Group
The coefficient of correlation obtained is 0.1014. It is not significant at
any level.
(ix) Average Achievement Group
The coefficient of correlation obtained is 0.0813. It is not significant at
any level.
(x) Low Achievement Group
The coefficient of correlation obtained is 0.0333. It is not significant at
any level.
Interpretations
The following results show that the relationship between Non-verbal
Scientific Creativity and Achievement Motivation is very low:
(a) The coefficients of correlation obtained are significant at 0.01 level for
the Total sample. The obtained 'r's are significant at 0.05 level for
subsamples of Urban and Government schools. The obtained 'r's are
not significant for Boys, Girls, Rural and Private school subjects and
for the three Achievement groups (HA, AA and LA groups).
(b) The significant coefficients of correlation are in the range of 0.0814 to
0.j014. The obtained 'r' values are too small to be considered.
6. Relationship between Scientific Creativity (Total) and Achievement
Motivation
Table 4.62 shows the correlations of Scientific Creativity and
Achievement Motivation for the Total sample and relevant subsamples.
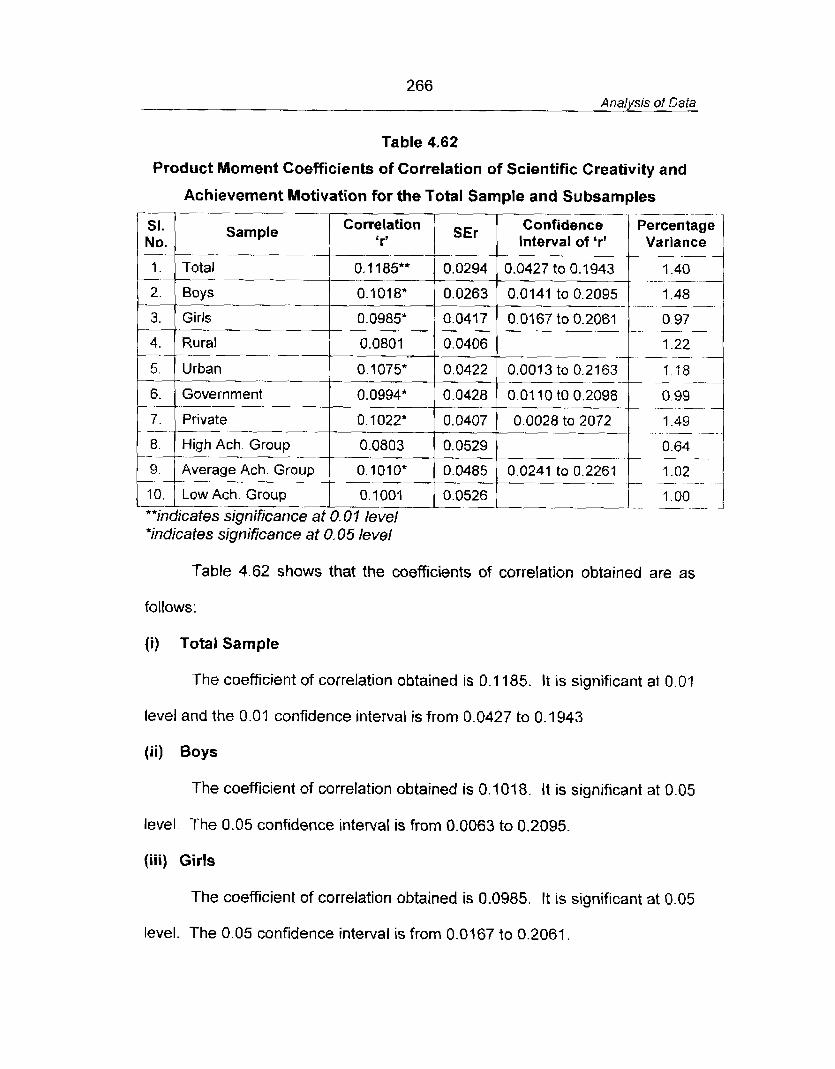
266 Analysis of Data
Table 4.62
Product Moment Coefficients of Correlation of Scientific Creativity and
Achievement Motivation for the Total Sample and Subsamples .- - - - - -. - - - - - -- .-
SI. Sample Correlation Confidence Percentage 'r' interval of 'r' Variance
-- 0.1 185"" 0.0294 0.0427 to 0.1943
0.1018" 0.0263 0.0141 to 0.2095 - - -
3. Girls 0.0985* 0.0417 0.0167 to 0.2061 0.97 ---- -- - - -- .- .-
0.0801 0.0406 1.22 - - -. . . - - - - - .
-- 0.1075* 0.0422 0.001 3 to 0.21 63
- - -- 6. Government 0.0428 0.01 10 to 0.2098 ---- -- - -- 0.0994" -- -- . - - -- 0.99
.- - 7 . Private -- --
0.1022* -
0.0407 0.0028 to 2072 - --- 1 49 .- --
8. High Ach. Group 0.0803 0.0529 - - 0.64
.
Average Ach. Group -- - -
0. 1010* 0.0485 0.0241 to 0.2261 1.02 - -- - - -- - -
0.1001 0.0526 1 .OO 2 .- - .
**indicaf es significance3-0. 0 1 level 'indicates significance at 0.05 level
Table 4.62 shows that the coefficients of correlation obtained are as
follows:
( i ) Total Sample
The coefficient of correlation obtained is 0.1 185. It is significant at 0.01
level and the 0.01 confidence interval is from 0.0427 to 0.1 943
(ii) Boys
The coefficient of correlation obtained is 0.1018. It is significant at 0.05
level. The 0.05 confidence interval is from 0.0063 to 0.2095.
(iii) Girls
The coefficient of correlation obtained is 0.0985. It is significant at 0.05
level. The 0.05 confidence interval is from 0.0167 to 0.2061.
267 Analysis of Data
(iv) Rural Subjects
The coefficient of correlation obtained is 0.0801. It is not significant at
any level.
(v) Urban Subjects
The coefficient of correlation obtained is 0.1075. It is significant at 0.05
level. The 0.05 confidence interval is from 0.0013 to 0.2163.
(vi) Government School Subjects
The coefficient of correlation obtained is 0.0994. It is significant at 0.05
level. The 0.05 confidence interval is from 0.01 10 to 0.2098.
(vii) Private School Subjects
The coefficient of correlation obtained is 0.1022. It is significant at 0.05
level. The 0.05 confidence interval is from 0.0028 to 0.2072.
(viii) High Achievement Group
The coefficient of correlation obtained is 0.0803. It is not significant at
any level.
(ix) Average Achievement Group
The coefficient of correlation obtained is 0.4010. It is significant at 00.5
level and the 0.05 confidence interval is from 0.0241 to 0.226 j.
{x) Low Achievement Group
The coefficient of correlation obtained is 0.1001. It is not significant at
any level.
268 Analysis of Data
Interpretations
The following results show that there is very low relationship between
Scientific Creativity (Total) and Achievement Motivation:
(a) The coefficients of correlation obtained are significant at 0.01 level for
the Total sample only. The obtained 'r's are significant at 0.05 level
for Boys, Girls, Urban, Government and Private school subjects and
for average achievement group, The obtained 'r's are not significant
for Rural subjects and two Achievement groups (HA, and LA groups).
(b) The significant coefficients of correlation obtained are in the range of
0.0985 to 0.1 185. The 'r' values are too smalt to be considered.
4.2.2.5 Relationship between Scientific Creativity and Home Environment
The relationship between Scientific Creativity and Home Environment
is given under the following tables:
1. Relationship between Fluency and Home Environment
Table 4.63 shows the correlations of Fluency and Home Environment
for the Total sample and relevant subsamptes.
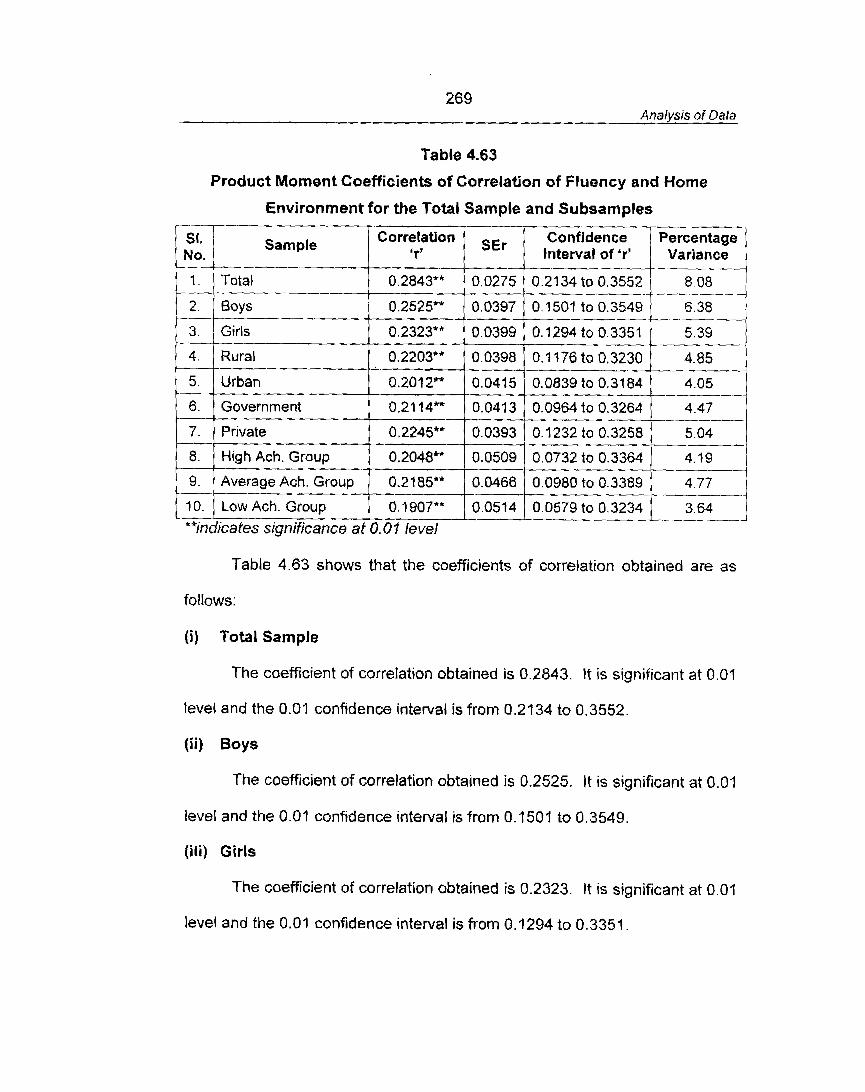
269 Anafysis of Data
Table 4.63
Product Moment Coefficients of Correlation of Fluency and Home
Table 4.63 shows that the coefficients of correlation obtained are as
Environment for the Tobl Sample and Subsamples
follows:
( i ) Total Sample
Sample
The coefficient of correlation obtained is 0.2843. It is significant at 0.01
Correlation 'ry
0.2843**
0.2525**
0.2323**
0.2203**
0.2012**
0.21 14*"
0.2245**
0.2048"*
0.2185**
2 .
-/
3.
4 .
5.
6.
7.
8.
9.
level and the 0.01 confidence interval is from 0.2134 to 0.3552
Boys ,-
Girls
Rural
Urban
Government
Private
High Ach. Group
Average Ach. Group
(ii) Boys
SEr
0.0275
0.0397
0.0399
0.0398
0.0415
0.041 3
0.0393
0.0509
0.0466 - 1 0.
The coefficient of correlation obtained is 0.2525. It is significant at 0.01
**indicates significance at 0.01 level 0.0579 to 0.3234
level and the 0.01 confidence interval is from O.150q to 0.3549.
Confidence Interval of 'r'
0.21 34 to 0.3552
3.64 - --
Low Ach. Group
(iii) Girls
Percentage Variance
8.08 I
The coefficient of correlation obtained is 0.2323. It is significant at 0.01
0.1907**
level and the 0.01 confidence interval is from 0.1294 to 0.3351.
0.1 501 to 0.3549
0.1294 to 0.3351
0.1 176 to 0.3230
0.0839 to 0.3184
0.0964 to 0.3264
0.1232 to 0.3258
0.0732 to 0.3364
0.0980 to 0.3389
0.0514
, 6.38 1 -- -
-. 5.39
4.85
4.05
4.47
5.04
4.19
4.77 ---
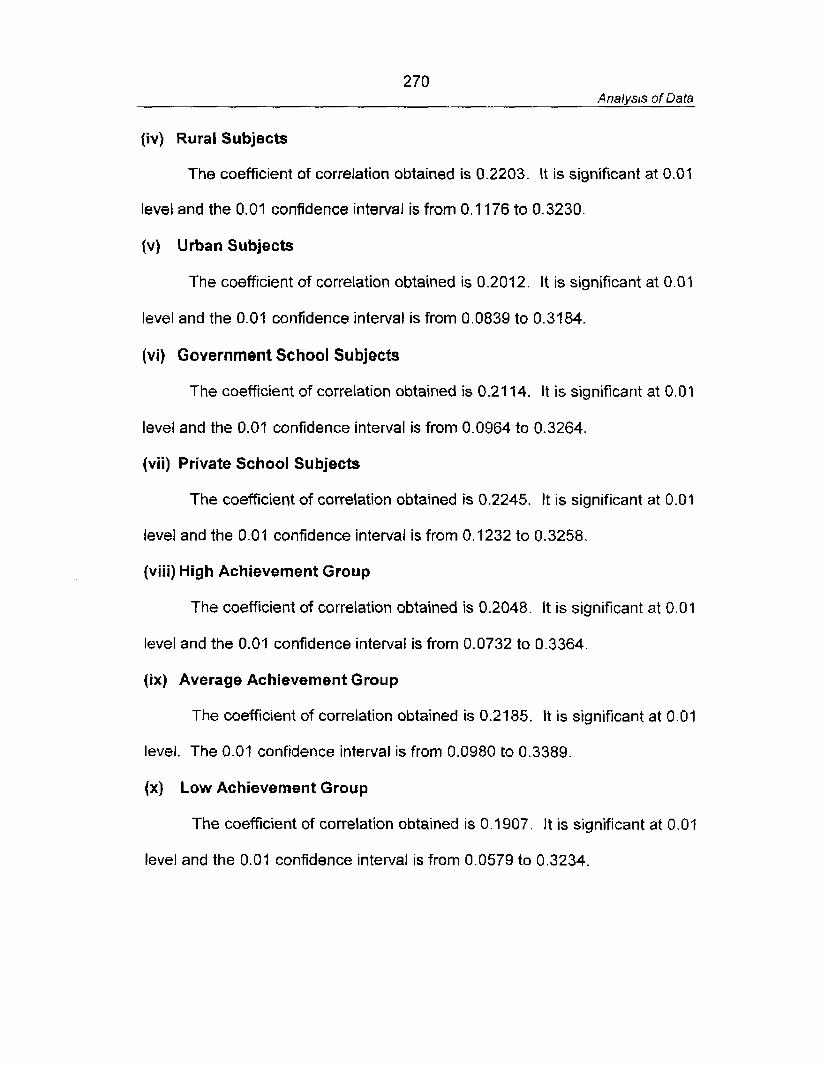
270 Analysrs of Data
(iv) Rural Subjects
The coefficient of correlation obtained is 0.2203. It is significant at 0.01
level and the 0.01 confidence interval is from 0.7 176 to 0.3230.
(v) Urban Subjects
The coefficient af correlation obtained is 0.2012. It is significant at 0.01
level and the 0.01 confidence interval is from 0.0839 to 0.3184.
(vi) Government School Subjects
The coefficient of correlation obtained is 0.21 14. It is significant at 0.01
level and the 0.07 confidence interval is from 0.0964 to 0.3264.
(vii) Private School Subjects
The coefficient of correlation obtained is 0.2245. It is significant at 0.01
level and the 0.01 confidence interval is from 0.1232 to 0.3258.
(viii) High Achievement Group
The coefficient of correlation obtained is 0.2048. It is significant at 0.01
level and the 0.01 confidence interval is from 0.0732 to 0.3364.
(ix) Average Achievement Group
The coefficient of correlation obtained is 0.2185. It is significant at 0.01
level. The 0.07 confidence interval is from 0.0980 to 0.3389.
(x) Low AchievernentGroup
The coefficient of correlation obtained is 0.1907. It is significant at 0.07
level and the 0.01 confidence interval is from 0.0579 to 0.3234.
27 1 Analysis of Data
Interpretations
The following results show that there exists a considerable relationship
between Fluency and Home Environment:
(a) The coefficients of correlation obtained are significant at 0.01 level for
all samples.
(b) The coefficients of correlation obtained are in the range of 0.1907 to
0,2843, The relationship between the variables may be described as
low or slight.
(c) All the coefficients of correlation obtained are positive showing that
an increase or decrease in one variable will be followed by a
corresponding change in the other variable.
(d) The 0.01 confidence intervals show the probable range of the
corresponding population values.
(e) The percentage variance obtained shows that about 8 percent of the
variance of Fluency is attributable to the variance in one's Home
Environment. In terms of common shared variance, the maximum
overlap between the variables is about 8 percent and minimum
overlap is nearly 4 percent.
2. Relationship between Flexibility and Home Environment
Table 4.64 shows the correlations of Flexibility and Home Environment
for the Total sample and relevant subsamples.
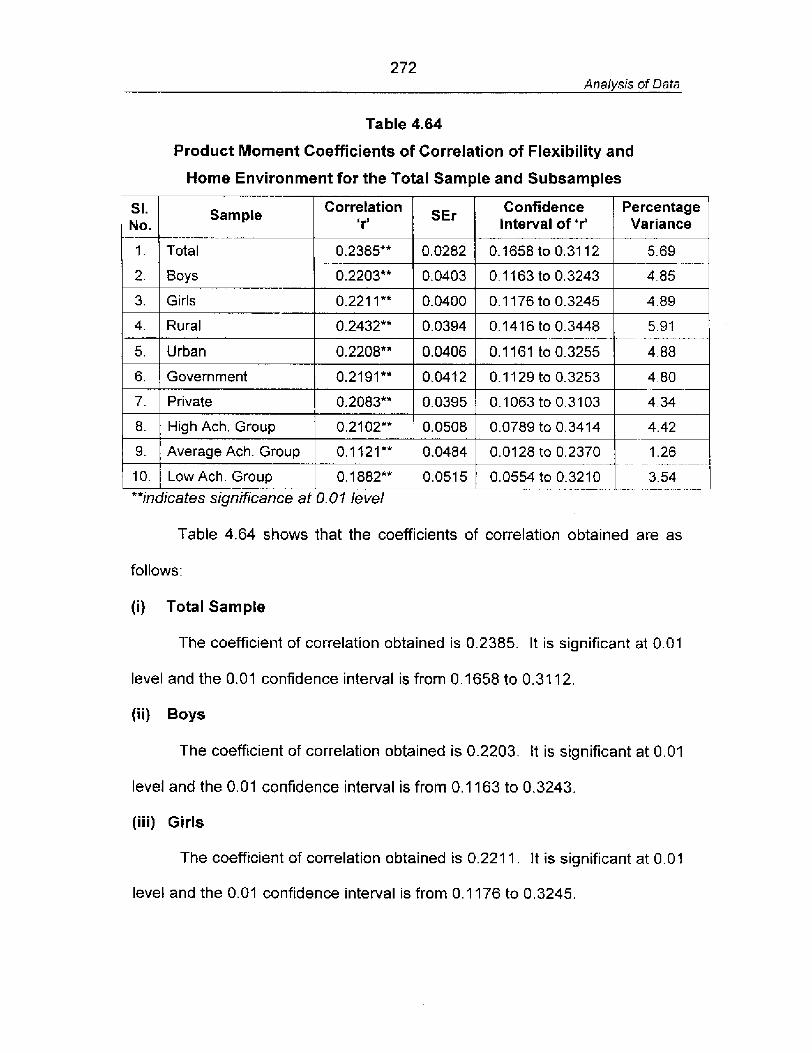
272 Analysis of Data
Table 4.64
Product Moment Coefficients of Correlation of Flexibility and
Home Environment for the Total Sample and Subsamples
Sample Correlation / SEr 1 Confidence interval of 'rY / P;z,"AE:e I
1. Total
2. Boys
1 7 . 1 Private 1 0.2083** 10.03951 0.1063to0.3103 1 4.34 1
3.
4.
5.
6.
1 8. 1 High Ach. Group / 0.2102" / 0.0508 1 0.0789 to 0.3414 1 4.42 1
0.2385**
0.2203**
Girls
Rural
Urban
Government
Table 4.64 shows that the coefficients of correlation obtained are as
follows:
(i) Total Sample
The coefficient of correlation obtained is 0.2385. It is significant at 0.01
level and the 0.01 confidence interval is from 0.1658 to 0.31 12.
(ii) Boys
The coefficient of correlation obtained is 0.2203. It is significant at 0.01
level and the 0.01 confidence interval is from 0.1 163 to 0.3243.
(iii) Girls
The coefficient of correlation obtained is 0.221 1. It is significant at 0.01
level and the 0.01 confidence interval is from 0.1 176 to 0.3245.
0.0282
0.0403
9.
10.
0.221 1 "*
0.2432**
0.2208""
0.2191**
0.1658 to 0.31 12
0.1 163 to 0.3243
**indicates significance at 0.0 1 level
Average Ach. Group
Low Ach. Group
- - . , . - -. 4.85
0.0400
0.0394
0.0406
0.0412
0.11 21**
0.1882""
0.1 176 to 0.3245
0.141 6 to 0.3448
0.1 161 to 0.3255
0.1129to0.3253
4.89
5.91 - - -- ,- .- 4.88
4.80
0.0484
0.051 5
0.01 28 to 0.2370 1.26 [ -. . - -..l
0.0554 to 0.3210 3.54 1 - -. -
273 Analysrs of Data
(iv) Rural Subjects
The coefficient of correlation obtained is 0.2432. It is significant at 0.01
level and the 0.01 confidence interval is from 0.1416 to 0.3448.
(v) Urban Subjects
The coefficient of correlation obtained is 0.2208. It is significant at 0.01
level and the 0.01 confidence interval is from 0.1 161 to 0.3255.
(vi) Government School Subjects
The coefficient of correlation obtained is 0.21 91 . It is significant at 0.01
level and the 0.01 confidence interval is from 0.1 129 to 0.3253.
(vii) Private School Subjects
The coefficient of correlation obtained is 0.2083. It is significant at 0.01
tevel and the 0.01 confidence interval is from 0.1 063 to 0.3103.
(viii) High Achievement Group
The coefficient of correlation obtained is 0.2102. It is significant at 0.01
level and the 0.0q confidence interval is from 0.0789 to 0.3414.
(ix) Average Achievement Group
The coefficient of correlation obtained is 0.1 121. It is significant at 0.01
level and the 0.01 confidence interval is from 0.0128 to 0.2370.
(x) Low Achievement Group
The coefficient of correlation obtained is 0.1882. It is significant at 0.01
tevel and the 0.01 confidence interval is from 0.0554 to 0.321 0.
274 Analysis of Data
Interpretations
The following results show the existence of a true relationship between
Flexibility and Home Environment:
(a) The coefficients of correlation obtained are significant at 0.01 level for
all samples.
(b) The coefficients of correlation obtained are in the range of 0.1121 to
0,2432. The relationship between the variables is described as low
or slight.
(c) The coefficients of correlation obtained are positive for all samples
showing that any increase or decrease in Home Environment will be
attended by a corresponding increase or decrease in Scientific
Creativity.
{d) The 0.01 confidence intervals show the probable range of the
corresponding population values.
(e) The percentage variance obtained shows that nearly 6 percent of the
variance of Flexibility is attributable to the variance in one's Home
Environment. In terms of common shared variance, the maximum
overlap between the variables is nearly 6 percent and minimum
overlap is about I percent.
3. Relationship between Originality and Home Environment
Table 4.65 shows the correlations of Originality and Home Environment
for the Total sample and relevant subsamples.
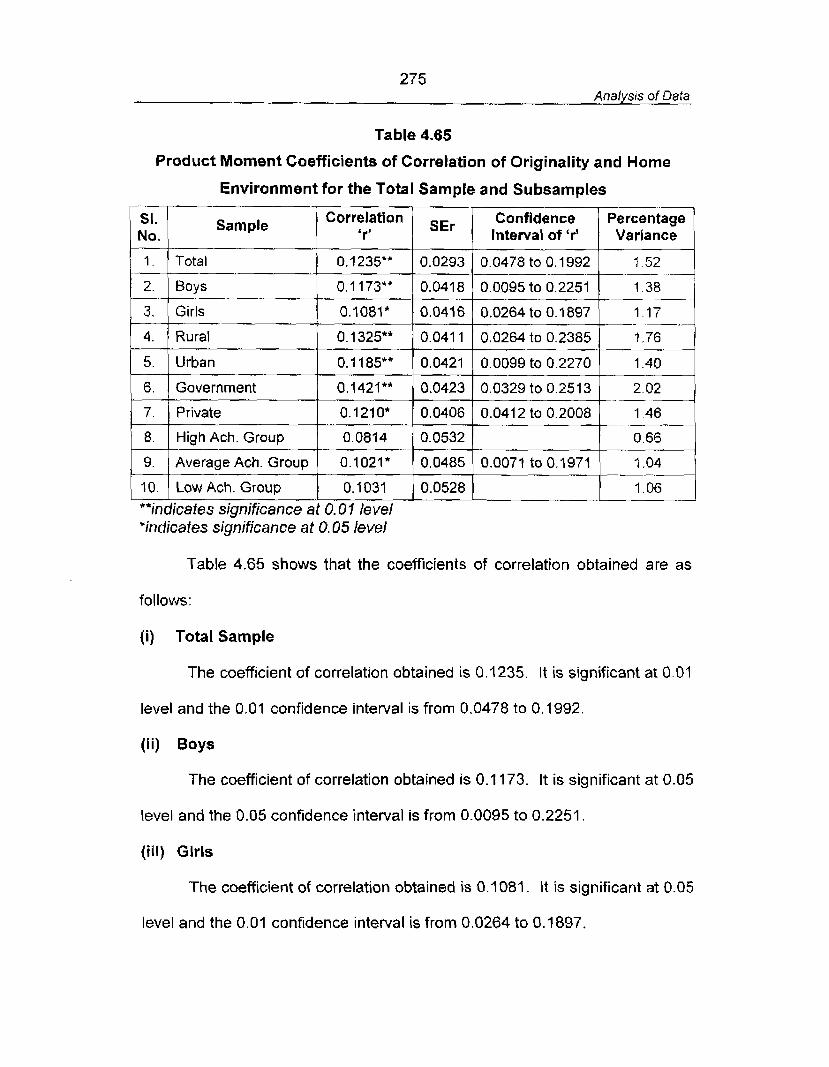
275 Analys~s of Data
Table 4.65
Product Moment Coefficients of Correla-tion of Originality and Home
Environment for the Total Sample and Subsamples
5. 1 Urban 1 0.1 185"" 1 0.0421 1 0.0099 to 0.2270 1 1.40 1
Sample "...-- 2. Boys
3. Girls
4. Rural
'indicates significance at 0.0 5 level
Correlation 'r'
0.1 235*"
0.1 173**
0.1081*
0.1325""
6.
7.
8
9.
10.
Table 4.65 shows that the coefficients of correlation obtained are as
follows:
SEr
0.0293
0.041 8
0.0416
0.041 1
**indicates significance at 0.0 1 /e vel
Government
Private
High Ach. Group
Average Ach. Group
Low Ach. Group
(i) Total Sample
The coefficient of correlation obtained is 0.1235. It is significant at 0.01
Confidence Interval of 'r'
0.0478 to 0.1992
0.0095 to 0.2251
0.0264 to 0.1897
0.0264 to 0.2385
0.1421**
0.1210*
0.0814
0.1021*
0.1031
level and the 0.01 confidence interval is from 0.0478 to 0.1992.
Variance
1 52
1.76 -
(ii) Boys
0.0423
0.0406
0.0532
0.0485
0.0528
The coefficient of correlation obtained is 0.1 173. It is significant at 0.05
0.0329 to 0.2513
0.0412 to 0.2008
0.0071 to 0.1971
level and the 0.05 confidence interval is from 0.0095 to 0.2251
(iii) Girls
The coefficient of correlation obtained is 0.1 081. It is significant at 0.05
level and the 0.01 confidence interval is from 0.0264 to 0.1897.
276 Analys~s of Data
(iv) Rural Subjects
The coefficient of correlation obtained is 0.1325. It is significant at 0.01
level and the 0.01 confidence interval is from 0.0264 to 0.1897.
(v) Urban Subjects
The coefficient of correlation obtained is 0.1 185. It is significant at 0.01
level and the 0.01 confidence interval is from 0.0099 to 0.2270.
(vi) Government School Subjects
The coefficient of correlation obtained is 0.1421. It is significant at 0.07
level and the 0.0j confidence interval is from 0.0329 to 0.2513.
(vii) Private School Subjects
The coefficient of correlation obtained is 0.1210. It is significant at 0.05
level and the 0.05 confidence interval is from 0.0412 to 0.2008.
(viii) High Achievement Group
The coefficient of correlation obtained is 0.0814. It is not significant at
any level.
(ix) Average Achievement Group
The coefficient of correlation obtained is 0.1021. It is significant at 0.05
level. The 0.05 confidence interval is from 0.0071 to 0.1971.
( x ) Low Achievement Group
The coefficient of correlation obtained is 0.1031, It is not significant at
any level.
277 Analysis of Data
Interpretations
The following results show that there is very low relationship between
Originality and Home Environment:
(a) The coefficients of correlation obtained are significant at 0.01 level for
the Total sample and subsamples of Bays, Rural, Urban and
Government schools. The obtained 'r's are significant at 0.05 level
for Girls, Private school subjects and Average Achievement group.
The obtained 'r's are not significant for High and Low Achievement
groups.
(b) Thesignificant coefficientsofcorrelation are in the rangeof 0.1021 to
0.1325. Though the 'r' values are negligible, its significance indicate
a very low association between the variables.
(c) The coefficients of correlation are positive showing that any increase
or decrease in Home Environment will be followed by a
corresponding slight change in Originality.
(d) The 0.01 confidence intervals show the probable range of the
corresponding population values.
(e) The percentage variance obtained shows that only 2 percent of the
variance of Originality is to be attributed to the variance in one's
Home Environment.
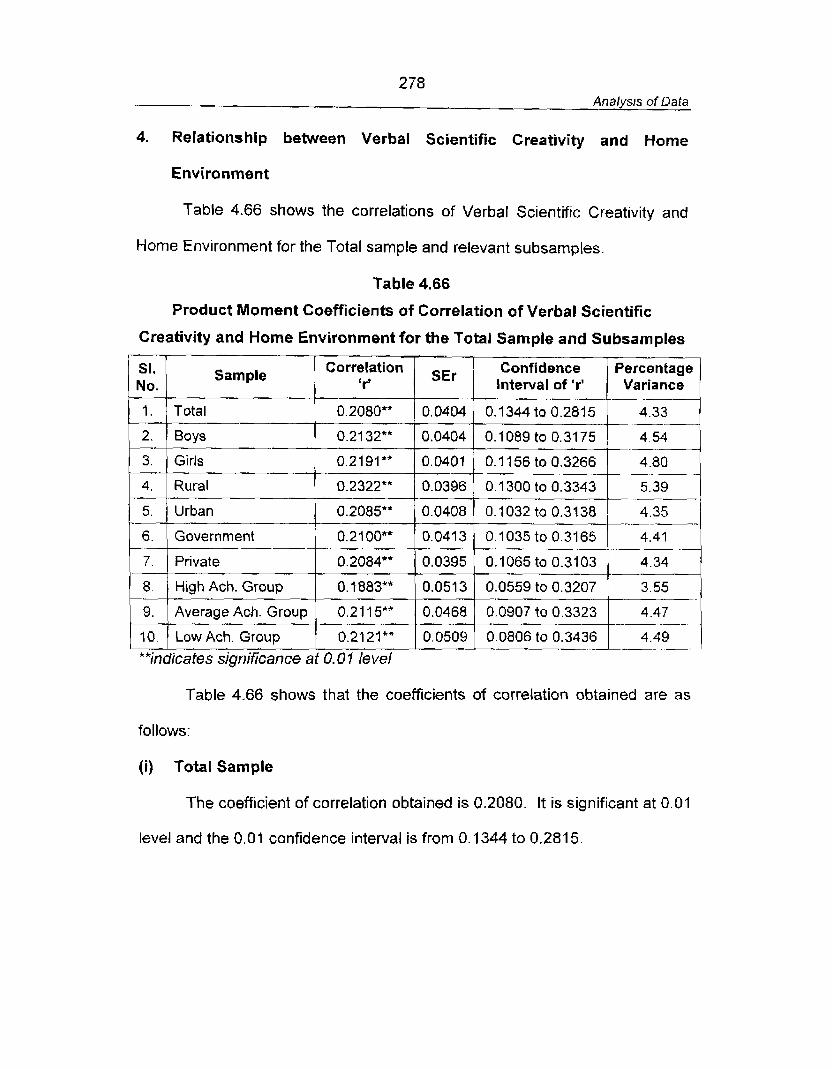
278 Analysis of Data
4. Relationship between Verbal Scientific Creativity and Home
Environment
Table 4.66 shows the correlations of Verbal Scientific Creativity and
Home Environment for the Total sample and relevant subsamples.
Table 4.66
Product Moment Coefficients of Correlation of Verbal Scientific
Creativity and Home Environment for the Total Sample and Subsamples
5. Urban 0.2085** 0.0408 0.1032 to 0.3138 4.35 .
6 Government 0.2100** 0.0413 0.1035 to 0.3165
7. Private 0.2084** 0.0395 0.2065 to 0.3103
8. High Ach. Group 0.1883** 0.0513 0.0559 to 0.3207
9. Average Ach. Group 0.21 15"" 0.0468 0.0907 to 0.3323 4.47 -- --
10. Low Ach. Group 0.2121"" 0.0509 0.0806 to 0.3436 .-
4.49 .-
""indicates significance at 0.0 1 level
SI. No.
1.
2. - 3.
4.
Table 4.66 shows that the coefficients of correlation obtained are as
follows:
(i) Total Sample
The coefficient of correlation obtained is 0.2080. It is significant at 0.01
level and the 0.01 confidence interval is from 0.1344 to 0.281 5.
Sample
Total
Boys
Girls
Rural
Correlation ' rt
0.2080**
0.21 32**
0.21 91 **
0.2322**
0.0404
0.0404
0.0401
0.0396
Confidence interval of 'rl
0.1344 to 0.2815
0.1089 to 0.3175
0.1 156 to 0.3266 -
0.1 300 to 0.3343
Percentage Variance
-.
4.33
4.54
4.80 --
5.39
279 Analysis of Data
( i i ) Boys
The coefficient of correlation obtained is 0.21 32. It is significant at 0.01
level and the 0.07 confidence interval is from 0.1089 to 0.3175.
(iii) Girls
The coefficient of correlation obtained is 0.2191. It is significant at 0.01
level and the 0.01 confidence interval is from 0.1 156 to 0.3226.
(iv) Rural Subjects
The coefficient of correlation obtained is 0.2322. It is significant at 0.01
level and the 0.01 confidence interval is from 0.1300 to 0.3343.
(v) Urban Subjects
The coefficient of correlation obtained is 0.2085. It is significant at 0.09
level and the 0.01 confidence interval is from 0.1 032 to 0.3138.
(vi) Government School Subjects
The coefficient of correlation obtained is 0.2100. It is significant at 0.01
level and the 0.01 confidence interval is from 0.1035 to 0.3165.
(vii) Private School Subjects
The coefficient of correlation obtained is 0.2084. It is significant at 0.01
level and the 0.01 confidence interval is from 0.1065 to 0.31 03.
(viii) High Achievement Group
The coefficient of correlation obtained is 0.1883. It is significant at 0.07
level and the 0.01 confidence interval is from 0.0559 to 0.3207.
280 Analys~s of Data
(ix) Average Achievement Group
The coeficient of correlation obtained is 0.21 15. It is significant at 0.01
level. The 0.01 confidence interval is from 0.0907 to 0.3323.
(x) Low Achievement Group
The coefficient of correlation obtained is 0.2121. It is significant at 0.01
level and the 0.01 confidence interval is from 0.0806 to 0.3436.
I nterpretationa
The following results indicate that there is considerable relationship
between Verbal Scientific Creativity and Home Environment:
(a) The coeficients of correlation obtained are significant at 0.01 level for
all samples.
(b) The coefficients of correlation obtained are in the range of 0.1883 to
2322. The relationship between the variables can be explained as
low or slight.
(G) All the coefficients of correlation are positive showing that any
increase in Home Environment will cause a corresponding change in
one's Verbal Scientific Creativity.
(d) The 0.01 confidence intervals show the probable range of the
corresponding population values.
(e) The percentage variance obtained shows that about 4 percent of the
variance of Verbal Scientific Creativity is attributable to the variance
in one's Home Environment. In terms of common shared variance,
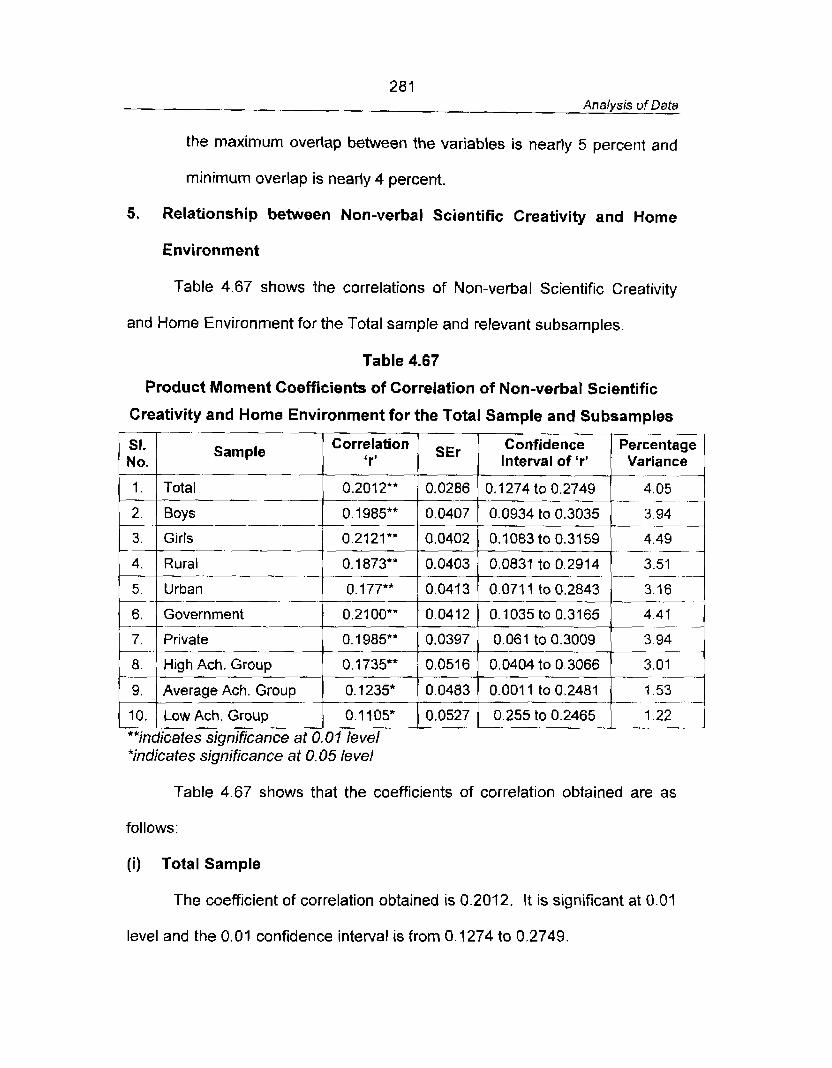
281 Analysis of Data
the maximum overlap between the variables is nearly 5 percent and
minimum overlap is nearly 4 percent.
5. Relationship between Non-verbal Scientific Creativity and Home
Environment
Table 4.67 shows the correlations of Non-verbal Scientific Creativity
and Home Environment for the Total sample and relevant subsamples.
Table 4.67
Product Moment Coefficients of Correlation of Non-verbal Scientific
Creativity and Home Environment for the Total Sample and Subsamples
Sample Correlation I SEr I Confidence Percentage Interval of 'r' Variance
I
1. Total 0.2012"* 0.0286 0.1274 to 0.2749 4 05 .- -
2. Boys 0.1985** 0.0407 0.0934 to 0.3035
3. Girls 0.2121** 0.0402 0.1083 to 0.3159 - -- -- - 4. Rural 0.1873** 0.0403 0.0831 to 0.291 4
-- -- - - - - - - . - 5. Urban 0.177** 0.0413 0.071 1 to 0.2843 --
6. Government 0.2100"* 0.0412 0.1035to0.3165 4 41 - -- --
7. Private 0.1985** 0.0397 0.061 to 0.3009 - 3 94
8. High Ach. Group 0.1735** 0.0516 0.0404 to 0.3066 3.01 - - 9. Average Ach. Group 0.1235* 0.0483 0.001 1 to 0.2481 7 53
.- -- -
10. Low Ach. Group 0.1 105* 0.0527 0.255 to 0.2465 1.22 .- -
**indicates significance af 0.0? level ' *indicates significance at 0.05 le vet
Table 4.67 shows that the coefficients of correlation obtained are as
follows:
( i ) Total Sample
The coefficient of correlation obtained is 0.2012. It is significant at 0.01
level and the 0.01 confidence interval is from 0.1274 to 0.2749.
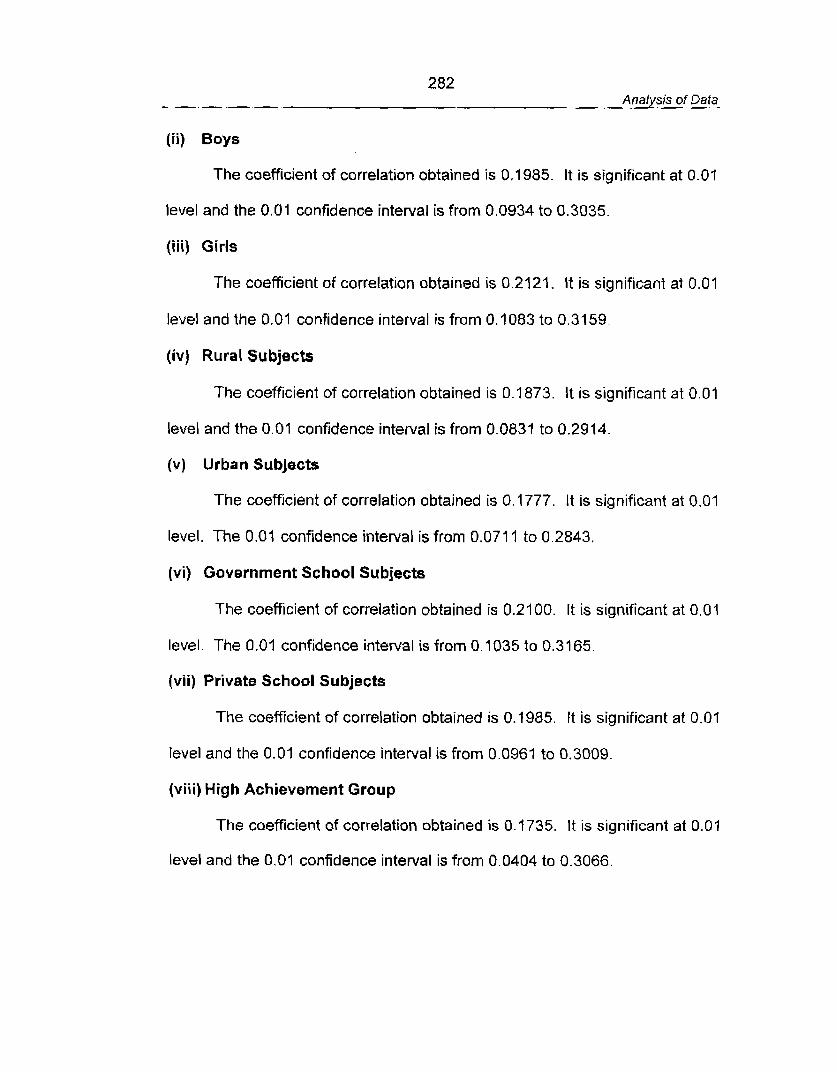
282 Analysis of Data
( i i ) Boys
The coefficient of correlation obtained is 0.1985. It is significant at 0.01
level and the 0.01 confidence interval is from 0.0934 to 0.3035.
( i i i ) Girls
The coefficient of correlation obtained is 0.2121. It is significant at 0.01
level and the 0.01 confidence intetval is from 0.1083 to 0.3159.
(iv) Rural Subjects
The coefficient of correlation obtained is 0.1 873. It is significant at 0.01
level and the 0.01 confidence interval is from 0.0831 to 0.2914.
(v) Urban Subjects
The coefficient of correlation obtained is 0.1777. It is significant at 0.01
level. The 0.0j confidence interval is from 0.071 1 to 0.2843.
(vi) Government School Subjects
The coefficient of correlation obtained is 0.21 00. It is significant at 0.01
level. The 0.01 confidence interval is from 0.1 035 to 0.31 65.
(vii) Private School Subjects
The coefficient of correlation obtained is 0.1985. It is significant at 0.01
level and the 0.01 confidence interval is from 0.0961 to 0.3009.
(viii) High Achievement Group
The coefficient of correlation obtained is 0.1735. It is significant at 0.07
level and the 0.01 confidence interval is from 0.0404 to 0.3066.
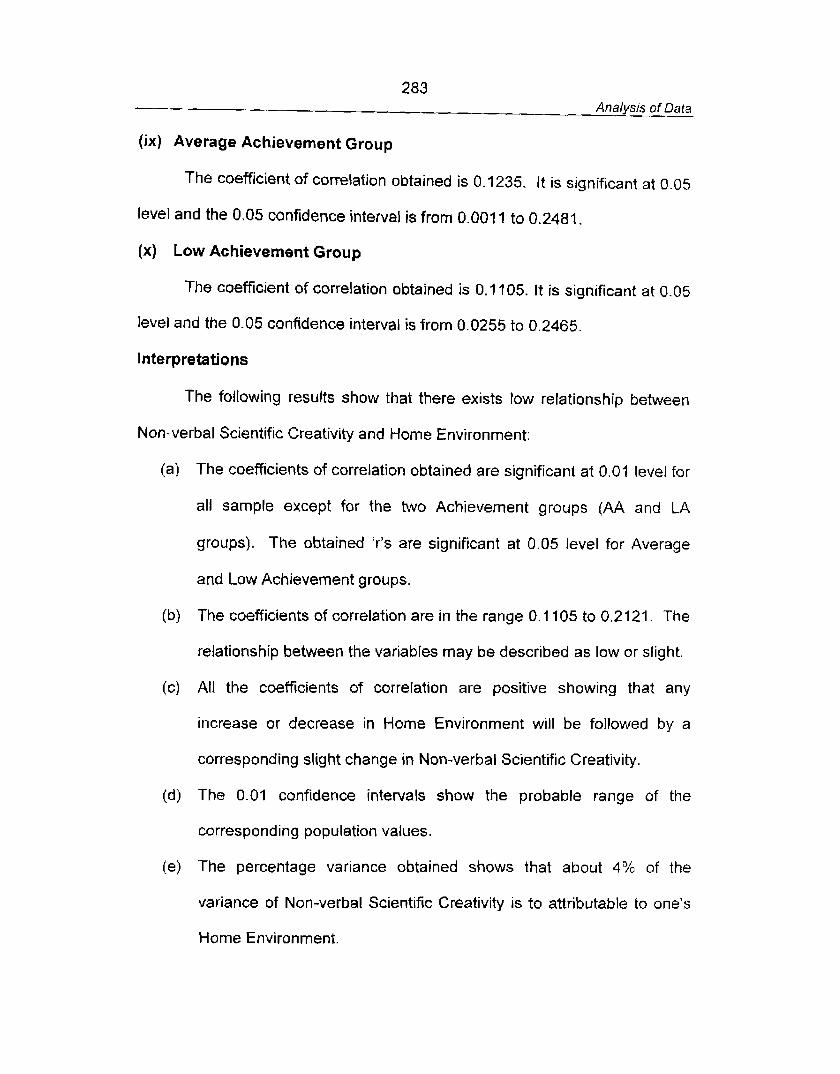
283 Analysis of Data
(ix) Average Achievement Group
The coefficient of correlation obtained is 0.1235. It is significant at 0.05
level and the 0.05 confidence interval is from 0.001 1 to 0.2481.
(x) Low Achievement Group
The coefficient of correlation obtained is 0.7 705. It is significant at 0.05
level and the 0.05 confidence interval is from 0.0255 to 0.2465.
Interpretations
The following results show that there exists low relationship between
Non-verbal Scientific Creativity and Home Environment:
(a) The coefficients of correlation obtained are significant at 0.01 level for
all sample except for the two Achievement groups {AA and LA
groups). The obtained 'r's are significant at 0.05 level for Average
and Low Achievement groups.
(b) The coefficients of correlation are in the range 0.7 105 to 0.2 121. The
relationship between the variables may be described as low or slight.
(c) All the coefficients of correlation are positive showing that any
increase or decrease in Home Environment will be followed by a
corresponding slight change in Non-verbal Scientific Creativity.
(d) The 0.01 confidence intervals show the probable range of the
corresponding population values.
(e) The percentage variance obtained shows that about 4% of the
variance of Non-verbal Scientific Creativity is to attributable to one's
Home Environment.
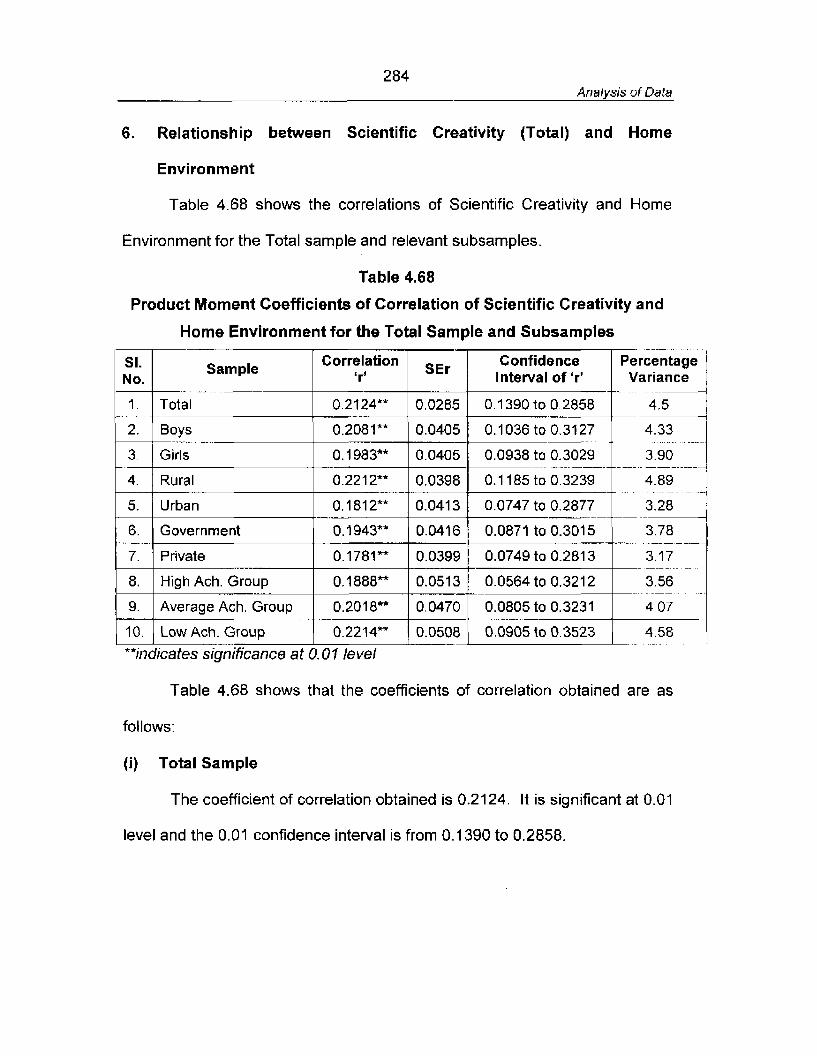
284 Analysis of Data
6. Relationship between Scientific Creativity (Total) and Home
Environment
Table 4.68 shows the correlations of Scientific Creativity and Home
Environment for the Total sample and relevant subsarnples.
Table 4.68
Product Moment Coefficients of Correlation of Scientific Creativity and
Table 4.68 shows that the coefficients of correlation obtained are as
Home Environment for the Total Sample and Subsamples
follows:
SI. No.
1.
2
3
4.
5.
6. - -
7.
8,
9.
10.
( i ) Total Sample
The coefficient of correlation obtained is 0.21 24. It is significant at 0.01
**indicates significance at 0.0 7 level
-
Sample -- --
Total
Boys ---- ..
Girls
Rural
Urban
Government
Private -- High Ach. Group
Average Ach. Group
Low Ach. Group
level and the 0.01 confidence interval is from 0.1 390 to 0.2858.
periEitage Variance
4 5
4.33 . -.
3 90 - - - - . - - -. . - - - -
4.89
3 28 -
3.78 . . -- - - - -
3.17 --.- -
3.56 .
4 07
4 58
Confidence Interval of 'r'
0.1 390 to 0.2858
0.1036 to 0.31 27 --
0.0938 to 0.3029 - - . - - - - - - -. -.
0.1 185 to 0.3239
0.0747 to 0.2877
0.0871 to 0.3015 -.
0.0749 to 0.281 3
0.0564 to 0.321 2 -
0.0805 to 0.3231
0.0905 to 0.3523
Correlation lrr
0.2124**
0.2081""
0.1983**
0.221 2**
0.181 2**
0.1943""
0.1781**
0.1888**
-- 0.201 8**
0.2214**
SEr
0.0285
0.0405
0.0405
0.0398
0.041 3
0.0416
0.0399
0.051 3
0.0470
0.0508

285 Analysis of Data
( i i ) Boys
The coefftcient of correlation obtained is 0.2081. It is significant at 0.01
level and the 0.0? confidence interval is from 0.1036 to 0.3 127.
(iii) Girls
The coefficient of correlation obtained is 0.1983. It is significant at 0.01
level and the 0.01 confidence interval is from 0.0938 ta 0.3027.
(iv) Rural Subjects
The coefficient of correlation obtained is 0.2212. It is significant at 0.01
level and the 0.01 confidence interval is from 0.1185 to 0.3239.
(v) Urban Subjects
The coefficient of correlation obtained is 0.1812. It is significant at 0.0-l
level. The 0.01 confidence interval is from 0.0747 to 0.2877.
(vi) Government School Subjects
The coefficient of correlation obtained is 0.1943. It is significant at 0.01
level. The 0.01 confidence interval is from 0.0871 to 0.301 5.
(vii) Private School Subjects
The coefficient of correlation obtained is 0.q781. It is significant at 0.01
level and the 0.01 confidence interval is from 0.0749 to 0.281 3.
(viii) High Achievement Group
The coefficient of correlation obtained is 0.1880. It is significant at 0.01
level and the 0.01 confidence interval is from 0.0564 to 0.3212.
286 Analysis of Data
(ix) Average Achievement Group
The coefficient of correlation obtained is 0.201 8, It is significant at 0.01
level and the 0.01 confidence interval is from 0.0805 to 0.3231.
(x) Low Achievement Group
The coefficient of correlation obtained is 0.2214. It is significant at 0.01
level and the 0.01 confidence interval is from 0.0905 to 0.3523.
Interpretations
The following results show the existence of a considerable relationship
between Scientific Creativity and Home Environment:
(a) The coefficients of correlation obtained are significant at 0.01 level for
all samples.
{b) The obtained 'r' values are in the range 0.1812 to 0.2214. The
relationship between the variables is low or slight.
(c) The coefficients of correlation obtained are positive showing that any
increase or decrease in Home Environment will be followed by a
corresponding increase in Scientific Creativity and vice versa.
(d) The 0.01 confidence intervals show the probable range of the
corresponding population values.
(e) The percentage variance obtained shows that about 5 percent of the
variance of Scientific Creativity is to attributable to one's Home
Environment. In terms of common shared variance, the maximum
overlap between the variables is nearly 5 percent and minimum
overlap is about 3 percent.
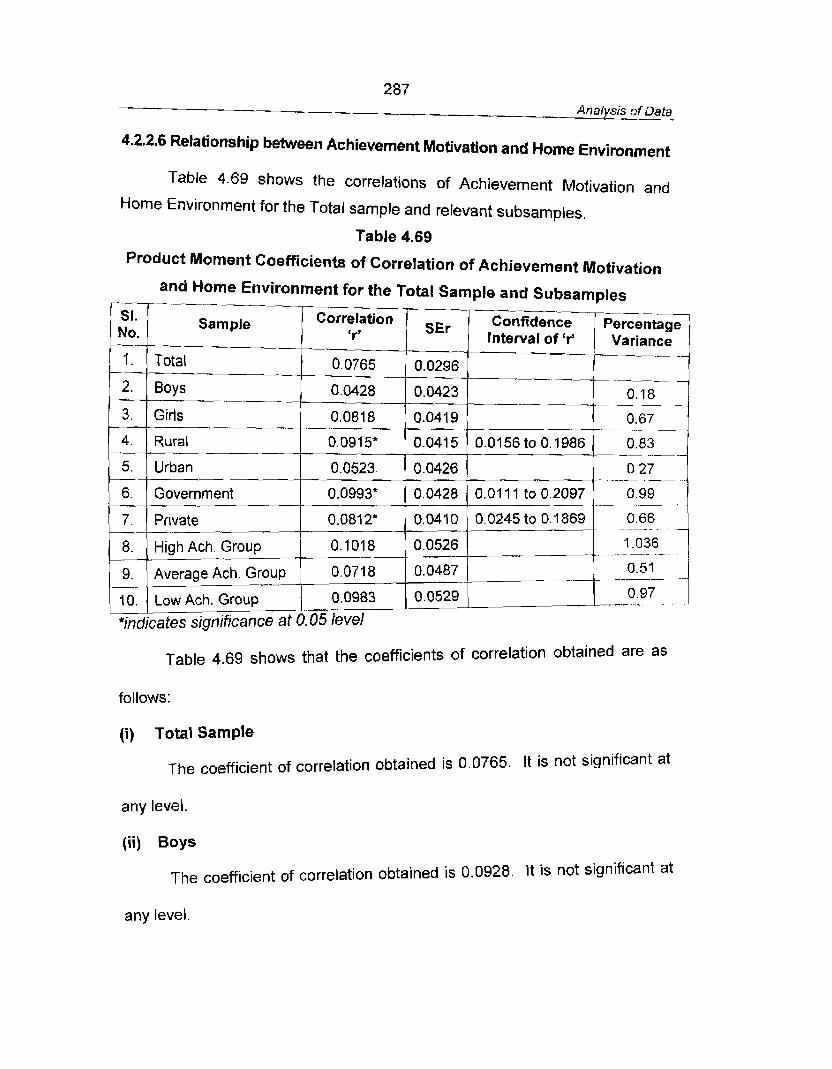
287 Analysis of Data
4.2.2.6 Relationship between Achievement Motivation and Home Environment
Table 4.69 shows the correlations of Achievement Motivation and
Home Environment for the Total sample and relevant subsamples.
Table 4.69 Product Moment Coefficients of Correlation of Achievement Motivation
Table 4.69 shows that the coefficients of correlation obtained are as
and Home Environment for the Total Sample and Subsamples
follows:
- --- SI. No.
1.
2.
3.
4.
5.
6.
7.
8.
9. . .- I 0.
(i) Total Sample
The coefficient of correlation obtained is 0.0765. It is not significant at
any level.
*jndjcates significance at 0.05 level
---
Sample
Total -- -
Boys --
Girls
Rural - Urban
Government
Pr~vate
High Ach Group
Average Ach Group -"-- tow Ach. Group
(ii) Boys
The coefficient of correlation obtained is 0.0928. It is not significant at
any level.
Correlation 'r'
0.0765
0.0428
0.081 8
0.0915*
0.0523
0.0993*
0.081 2*
0. I01 8 -- 0.0718
0.0983
SEr
0.0296
0.0423
0.041 9
0.041 5
0.0426
0.0428
0.041 0
0.0526
0.0487
0.0529
Confidence Interval of 'r'
--
"-
-- Percentage Variance --- -
--- - 0 18 - - -
- -- 0.01 56 to 0.1986
0.01 1 1 to 0.2097
0.0245 to 0.1869
--- .
0.67 -
0.83 -- - -
. . 0 27 -
0 99 -.
0.66 -- -
1.036 - - -
0.97
288 Analysis of Data
(iii) Girls
The coefficient of correlation obtained is 0.081 8. It is not significant at
any level.
(iv) Rural Subjects
The coefficient of correlation obtained is 0.0915. It is significant at 0.05
level. The 0.05 level confidence interval is from 0.0156 to 0.1986.
(v) Urban Subjects
The coefficient of correlation obtained is 0.0523. It is not significant at
any level.
(vi) Government School Subjects
The coefficient of correlation obtained is 0.0993. It is significant at 0.05
level. The 0.05 confidence interval is from 0.01 1 I to 0.2097.
(vii) Private School Subjects
The coefficient of correlation obtained is 0.081 2. It is significant at 0.05
level. The 0.05 confidence interval is from 0.0245 to 0.1869.
(viii) High Achievement Group
The coefficient of correlation obtained is 0.1018. It is not significant at
a n y level.
(ix) Average Achievement Group
The coefficient of correlation obtained is 0.0718. It is not significant at
any level.
289 Analysis of Data
(x) Low Achievement Group
The coefficient of correlation obtained is 0.0983. It is not significant at
any level.
Interpretations
The following results indicate that the relationship between
Achievement Motivation and Home Environment is negligible:
(a) The coefficients of correlation obtained are significant at 0.05 level for
Rural, Government and Private school subsamples. The obtained 'r's
are not significant for the Total sample, Boys, Girls, Urban subjects
and for the three Achievement groups (HA, AA and LA groups).
(b) The significant coefficients of correlation obtained are in the range of
0.0812 to 0.0993. The 'r' values are negligible or indifferent.
4.3 PREDICTION OF ACHIEVEMENT IN SCIENCE FROM THE MULTIPLE
REGRESSION EQUATION
To develop a Multiple Regression Equation for predicting the criterion
variable, viz., Achievement in Science, the best predictor variables are to be
isolated. The Correlation analysis clearly indicates that Achievement in
Science is closely associated with Intelligence, Scientific Creativity and Home
Environment whereas the influence of Achievement Motivation is less. So the
variables Intelligence, Scientific Creativity and Home Environment are
selected as the best predictor variables.
The Regression Equation has been developed by the following
procedures:
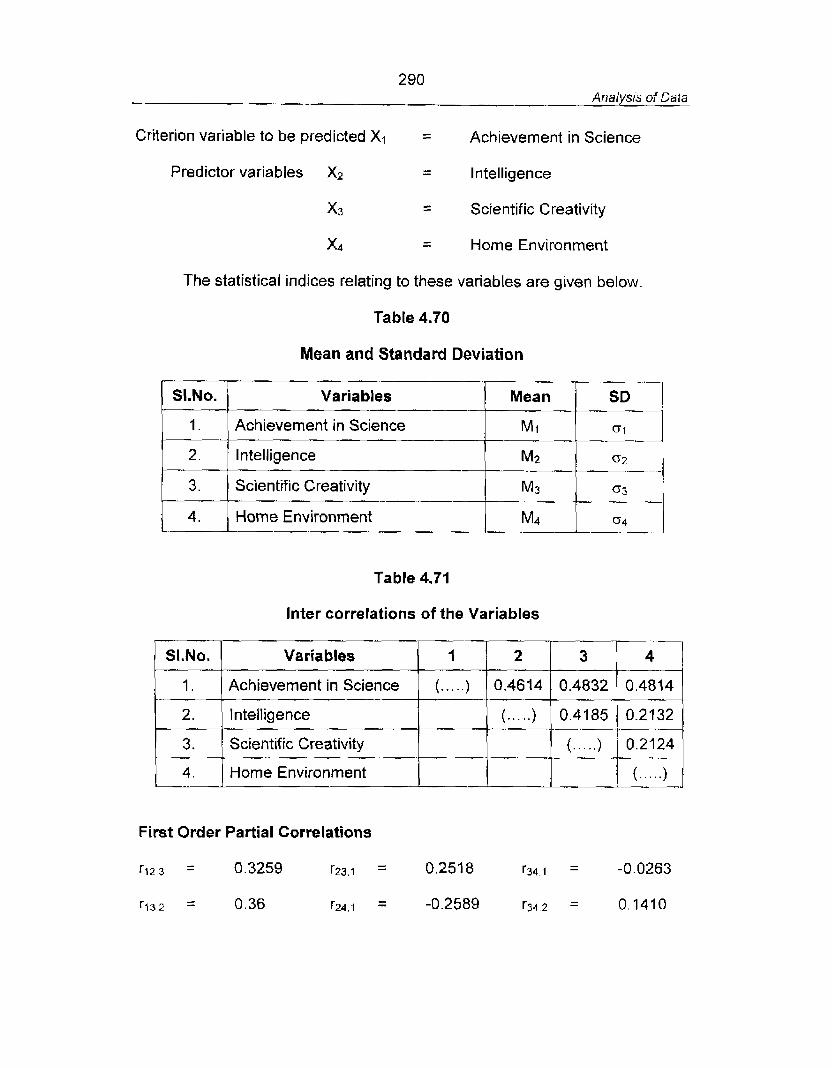
290 Analysts of Data
Criterion variable to be predicted XI - - Achievement in Science
Predictor variables X2 - - Intelligence
x3 - - Scientific Creativity
x4 - - Home Environment
The statistical indices relating to these variables are given below
Table 4.70
Mean and Standard Deviation
Table 4.71
Inter correlations of the Variables
SI.No.
1.
2 .
3.
4.
First Order Partial Correlations
- 0.3259 - r123 - r23.1 - 0.251 8
r132 = 0.36 rz4.1 = -0.2589
Variables
Achievement in Science
Intelligence
Scientific Creativity
Home Environment
SI.No.
1.
2,
3.
4.
Mean
Mi - Mz
M3
M4
Variables
Achievement in Science
Intelligence
Scientific Creativity
Home Environment
SD
61
0 2
~3
[34 ..-d
I
(. . . ..)
2
0.4614
(. . . . .I
3
0.4832
0.4185
(.....>
4
0.4814
0.2132
0.2124 -, .-
(.....)
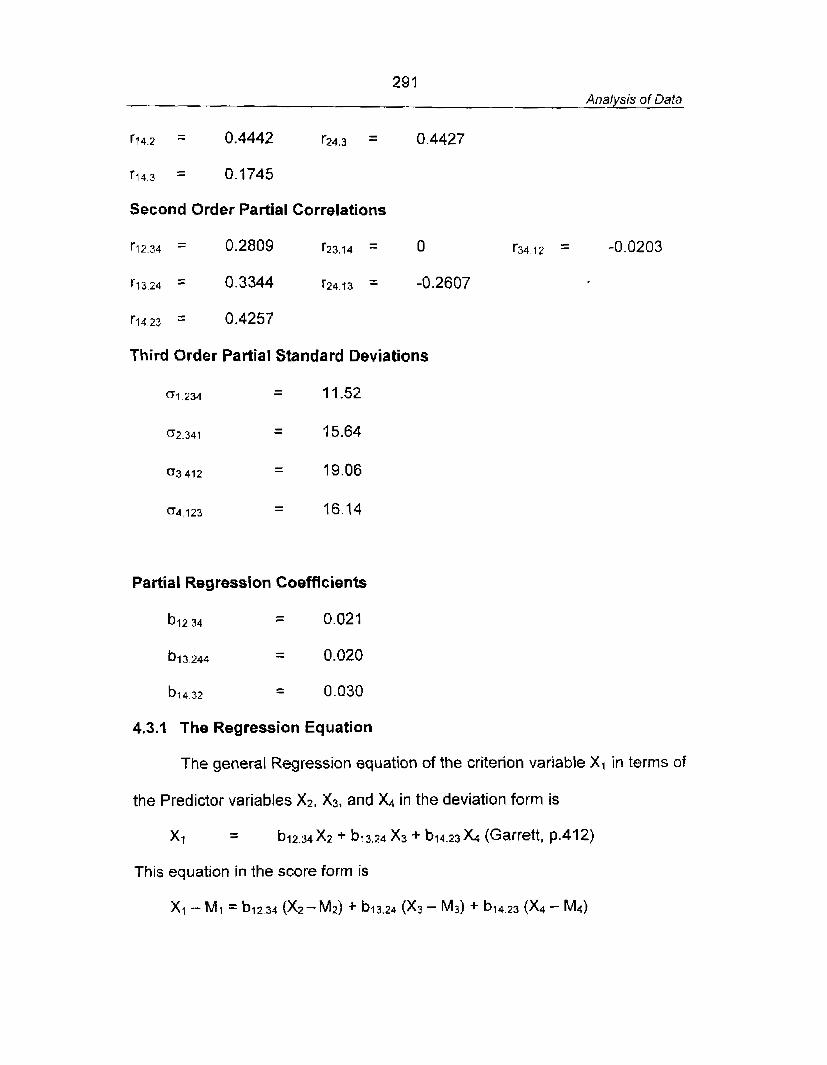
291 Analysis of Data
Second Order Partial Correlations
Third Order Partial Standard Deviations
Partial Regression Coefficients
b12.34 - - 0.021
b13 244 - - 0.020
b14.32 - - 0.030
4.3.1 The Regression Equation
The general Regression equation of the criterion variable X1 in terms of
the Predictor variables X2, X3, and X4 in the deviation form is
x1 - - 612.34 X2 + b13.24 X3 + b14.23 X4 (Garrett, p.412)
This equation in the score form is
XI - M1 = b12.34 (X2-Mz) + b13.24 (X3 - M3) + b14.23 (X4 - M4)
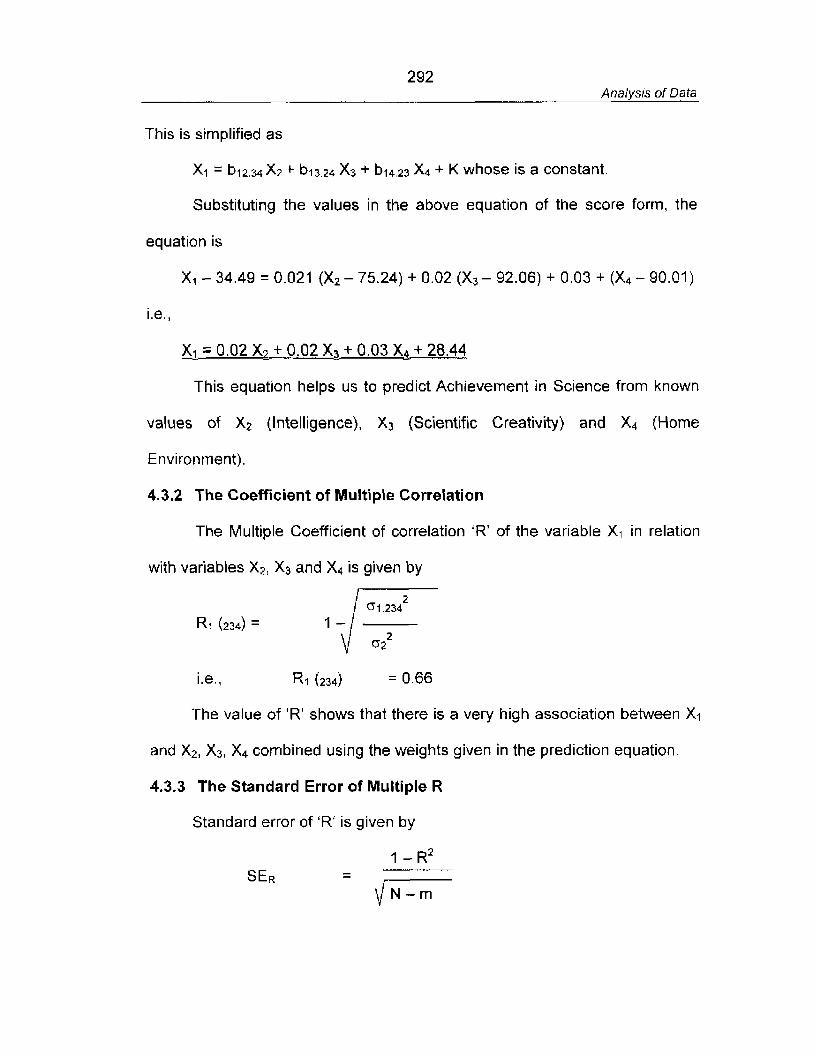
292 Analysis of Data
This is simplified as
XI = b12.34 X2 + b13,24 X3 + b14,23 X4 + K whose is a constant
Substituting the values in the above equation of the score form, the
equation is
This equation helps us to predict Achievement in Science from known
values of X2 (Intelligence), X3 (Scientific Creativity) and X4 (Home
Environment).
4.3.2 The Coefficient of Multiple Correlation
The Multiple Coefficient of correlation 'R' of the variable XI in relation
with variables X2, X3 and Xa is given by
The value of 'R' shows that there is a very high association between XI
and X2, X3' X4 combined using the weights given in the prediction equation
4.3.3 The Standard Error of Multiple R
Standard error of 'R' is given by
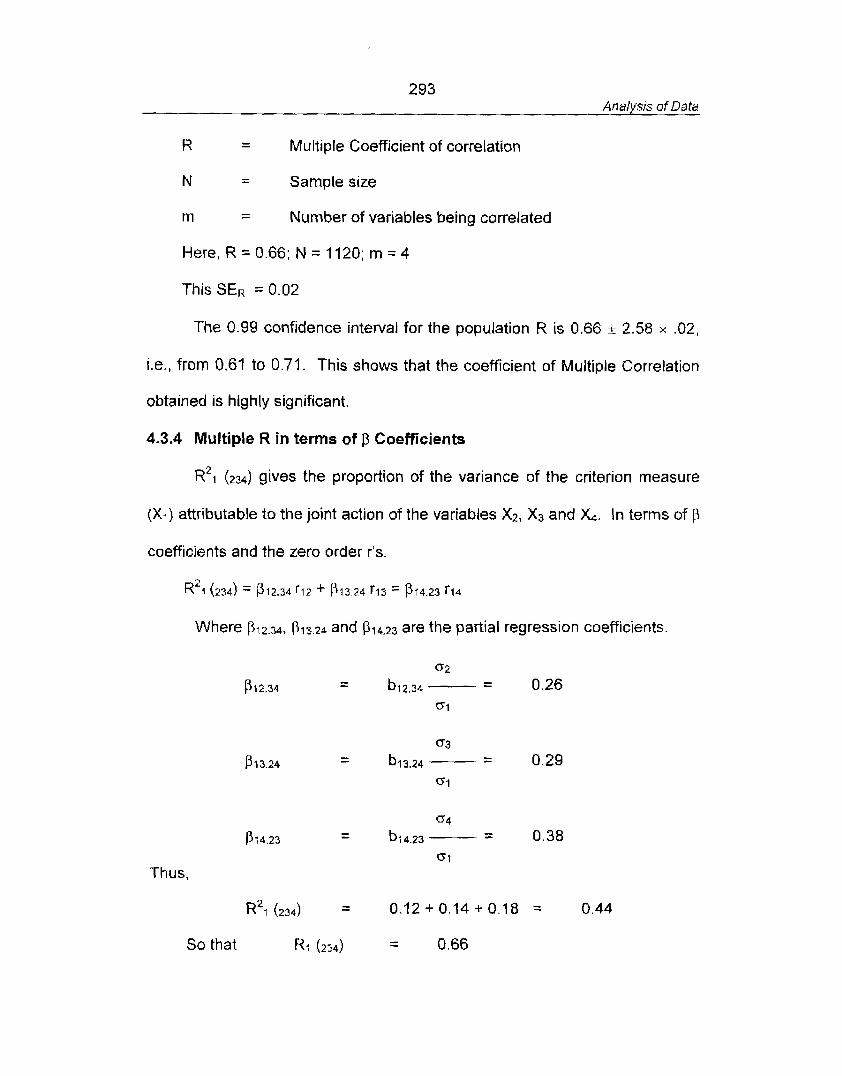
293 Analysis of Data
R - - Multiple Coefficient of correlation
N - - Sample size
m - - Number of variables being correlated
Here, R = 0.66; N = 1120; m = 4
This SER = 0.02
The 0.99 confidence interval for the population R is 0.66 t 2.58 x .02,
i.e., from 0.61 to 0.71. This shows that the coefficient of Multiple Correlation
obtained is highly significant.
4.3.4 Multiple R in terms of P Coefficients
~~1 (234) gives the proportion of the variance of the criterion measure
(XI) attributable to the joint action of the variables X2, X3 and &. In terms of p
coefficients and the zero order r's.
Where P12.34, P13.24 and P14.23 are the partial regression coefficients.
G4 - - - P ~ 4 . 2 3 b14.23- - 0.38
0 1
Thus,
So that RI (234) - 0.66 -
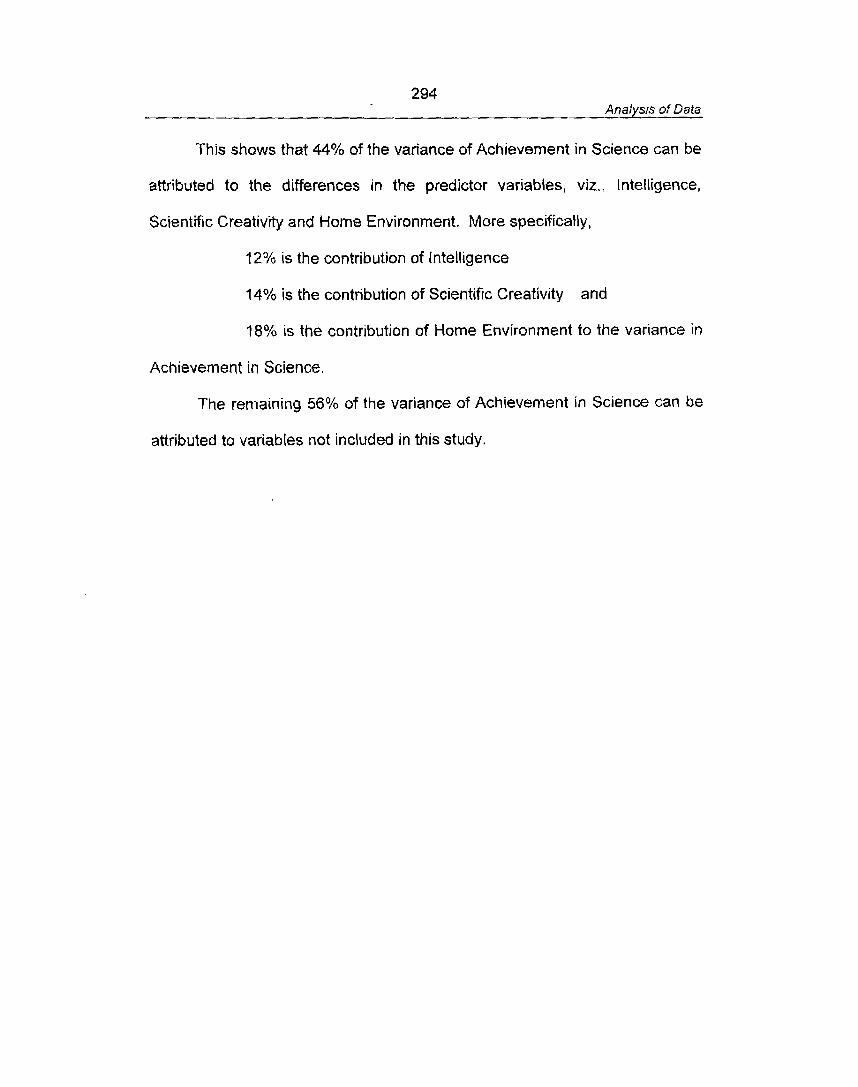
294 Analysis of Data
This shows that 44% of t h e variance of Achievement in Science can be
attributed to the differences in the predictor variables, viz., Intelligence,
Scientific Creativity and Home Environment. More specifically,
t2% is t he contribution of Intelligence
t4% is the contribution of Scientific Creativity and
18% is the contribution of Home Environment to the variance in
Achievement in Science.
The remaining 56% of the variance of Achievement in Science can be
attributed to variables not included in this study.
CHAPTER V
CONCLUSIONS AND SUGGESTIONS
Study in Retrospect
Summary of Findings
Tenability of Hypotheses
Implications
Suggestions for Further Research
CHAPTER V
CONCLUSlONS AND SUGGESTIONS
The present study was undertaken to study the relationship between
Intelligence, Scientific Creativity, Achievement Motivation, Home Environment
and Achievement in science of Higher Secondary School Pupils of Kerala.
The summary of the procedure adopted for the study, findings, implications
and suggestions are briefly discussed below.
5.1 STUDY fN RETROSPECT
5.1 .I Objectives of the Study
The major objectives of the study were stated as follows:
1. To compare the three achievement groups in pairs (High-Average,
Average-Low and High-Law) in respect of each of the independent
variables (Intelligence, Scientific Creativity, Achievement Motivation and
Home Environment) for the total sample and sub samples based on
gender, place of residence and nature of the institution.
2. To find out the relationship between the independent variables
(Intelligence, Scientific Creativity, Achievement Motivation and Home
Environment) for the Total sample and sub samples based on gender,
place of residence, nature of the institution and achievement levels.
3. To find out the relationship between each of the independent variables
(Intelligence, Scientific Creativity, Achievement Motivation and Home
Environment) and Achievement in Science for the total sample and sub
296 Conclusions and Suggestions
samples based on gender, place of residence, nature of the institution and
achievement levels.
4. To develop a multiple regression equation to predict the Achievement in
Science using best predictors selected from the independent variables.
5. To find out the combined effect of the predictor variables on Achievement
in Science.
5.1.2 Hypotheses
1. Each of the independent variables selected will discriminate between
students of various achievement levels for the total sample and sub
samples.
2. There will be significant relationship between the selected independent
variables when each variable is correlated with the other for the total
sample and subsamples.
3. There will be significant relationship between each of the selected
independent variables and Achievement in Science for the total sample
and sub samples.
4. Achievement in Science can be predicted in terms of the highly correlating
independent variables which are chosen as best predictors.
5- The combined effect of the predictor variables on Achievement in Science
will be significant.
5.1.3 Method Adopted
The investigator adopted Survey Method for the present study.
297 Conclusions and Suggesttons
5.1.4 Sample
The study was conducted on a sample of 1120 Higher Secondary
School students.
5.1.5 Tools
The investigator developed the following Tools:
( i ) Test of Scientific Creativity for Higher Secondary School Students.
(ii) Home Environment Inventory
Other tools used for the study were
(i) Verbal Group test of Intelligence
(ii) Raven's Progressive Matrices test
(iii) Achievement Motivation Scale
5.1.6 Statistical Techniques Used
(i) Two tailed test of significance of the difference between means
(ii) Pearson's product moment Coefficient of Correlation
(iii) Multiple regression equation
(iv) Multiple correlation coefficient
5.2 SUMMARY OF FINDINGS
The important findings of the study have been presented as follows:
5.2.1 Findings based on Comparative studies
5.2.2 Findings based on Correlational studies
298 Conclusions and Suggestions
5.2.1. Findings based on Comparative Studies
5.2.2 -1 . Comparison of HA- AA Pair
Total sample
1. The variables Intelligence, Scientific Creativity, and Home Environment
clearly discriminated the HA -AA pair well beyond 0.01 level.
Achievement Motivation could not discriminate the pair (CR=1.59,
p=-0.05).
2. The components of Intelligence namely, Verbal Intelligence and Non
verbal Intelligence, and the components of Scientific Creativity namely,
Fluency, Flexibility, Originality, Verbal Scientific Creativity and Non
verbal Scientific Creativity discriminated the HA -AA pair.
Sub samples
1. The variables Intelligence, Scientific Creativity, Achievement Motivation
and Home Environment clearly discriminated the HA -AA pair of Boys,
Rural, Government and Private school sub samples. Achievement
Motivation could not discriminate the HA -AA pair of Girls, (CR=0.83,
pB0.05) and Urban school (CR=t -38, p0.05) sub samples
2. The components of Intelligence namely, Verbal Intelligence and Non
verbal Intelligence, and the components of Scientific Creativity namely,
Fluency, Flexibility, Originality, Verbal Scientific Creativity and Non
verbal Scientific Creativity discriminated the HA -AA pair of Boys, Girls,
Rural Urban, and Private school sub samples. Originality could not
299 Conclusions and Suggestions
discriminate the HA -AA pair of Government school sub sample
(CR=t .22, pz0.05)
5.2.1.2. Comparison of AA- LA pair
Total sample
1. The variables Intelligence, Scientific Creativity, and Home Environment
clearly discriminated the AA- LA pair well beyond 0.01 level.
Achievement Motivation could not discriminate the pair (CR=0.60,
p>0.05)
2. The components of lntelligence namely, Verbal Intelligence and Non
verbal Intelligence, and the components of Scientific Creativity namely,
Fluency, Flexibility, Originality, Verbal Scientific Creativity and Non
verbal Scientific Creativity discriminated the AA- LA pair
Sub samples
1 . The variables Intelligence, Scientific Creativity, Achievement Motivation
and Home Environment clearly discriminated the AA- LA pair of Rural,
Urban and Private school sub samples. Achievement Motivation could
not discriminate the AA- LA pair of Boys (CR=0.69, p>0.05), Girls
(CR=1.32, p>0.05) and Government school (CR=0.83, p>0.05) sub
samples.
2. The components of lntelligence namely, Verbal Intelligence and Non
verbal Intelligence, and the components of Scientific Creativity namely,
Fluency, Flexibility, Originality, Verbal Scientific Creativity and Non
300 Conclusions and Suggestions
verbal Scientific Creativity discriminated the HA -AA pair of Boys, Girls,
Rural, Urban, Government and Private school sub samples
5.2.1.3. Comparison of HA- LA pair
Total sample
1. The variables Intelligence, Scientific Creativity, and Home Environment
clearly discriminated the HA- LA pair well beyond 0.01 level.
Achievement Motivation could not discriminate t he pair (CR= I .55,
p>0.05)
2. The components of Intelligence namely, Verbal Intelligence and Non
verbal Intelligence, and the components of Scientific Creativity namely,
Fluency, Flexibility, Originality, Verbal Scientific Creativity and Non
verbal Scientific Creativity discriminated the HA- LA pair
Sub samples
I . The variables Intelligence, Scientific Creativity, Achievement Motivation
and Home Environment clearly discriminated the HA- LA pair of Boys,
Rural, Urban, Government and Private school sub samples.
Achievement Motivation could not discriminate the HA-LA pair of Girls
(CR=1.82, pN.05).
2. The components of lntelligence namely, Verbal Intelligence and Non
verbal Intelligence, and the components of Scientific Creativity namely,
Fluency, Flexibility, Originality, Verbal Scientific Creativity and Non
verbal Scientific Creativity discriminated the HA -AA pair of Boys, Girls,
Rural, Urban, Government and Private school sub samples.
301 Conclusions and Suggestions
5.2.2 Findings based on Correlational Studies.
5.2.2.1 Findings Based on Simple Correlations
A. RELATIONSHIP BETWEEN ACHIEVEMENT IN SCIENCE AND
INDEPENDENT VARIABLES
I. Relationship between Achievement in Science and Intelligence
1 The relationship between Achievement in Science and Intelligence is
positive and significant at 0.01 level for the Total sample (r=0.4614),
Boys (r=0.5212), Girls {r=0.4015) Rural (r=0.4815), Urban (r=0.4212),
Government (r=0.4983), Private (r=0.42 16), High Achievement
(r=0.3012), Average Achievement (r=0.2814), and Low Achievement
(.r=0.2238) sub samples.
2. The relationship between Achievement in Science and Verbal
Intelligence is positive and significant for the Total sample (r=0.5235),
Boys (r=0.5468), Girls (r=0.4241) Rural (r=0.5126), Urban (r=0.5108),
Government (r=0.451 Q), Private (r=0.5321), High Achievement
(r=0.3108), Average Achievement (r=0.2614), and Low Achievement
(r=0.2516) sub samples
3. The relationship between Achievement in Science and Non Verbal
Intelligence is positive and significant for the Total sample (r=0.3241),
Boys (r=0.3815), Girls (r=0.2916) Rural (r=0.2785), Urban (r=O. 3102),
Government (r=0.3051), Private (r=0.3312), High Achievement
(r=0.2819), Average Achievement (r=0.201 I ) , and Low Achievement
(r=0.1914) sub samples
302 Conclusions and Suggestions
11. Relationship between Achievement in Science and Scientific
Creativity
I. The relationship between Achievement in Science and Scientific
Creativity is positive and significant at 0.01 level for the Total sample
(r=0.4832), Boys (r=0.4258), Girls (r=0.4532) Rural (r=0.4701), Urban
(r=0.4451), Government (r=0.4839), Private (r=0.4430), High
Achievement (r=0.3832) and Average Achievement (r=0.2121) sub
samples
The relationship is positive but not significant for the Low Achievement
(r=0.1039) sub sample.
2. The relationship between Achievement in Science and Fluency is
positive and significant at 0.01 level for the Total sample (r=0.4351),
Boys (r=0.4123), Girls (r=0.4213) Rural (r=0.3935), Urban (r=0.3642),
Government (r=0.4245), Private (r=O.4203), High Achievement
(r=0.301 O), Average Achievement (r=0.3818) and Low Achievement
(r=0.1818) sub samples.
3. The relationship between Achievement in Science and Flexibility is
positive and significant at 0.01 level for the Total sample (r=0.4013),
Boys (r=0.4000), Girls (r=0.42 13) Rural (r=0.3935), Urban (r=0.4138),
Government (r=O .4244), Private (r=0.4 108), High Achievement
(r=0.4242) and Average Achievement (r=0.22 18) sub samples
The relationship is positive and significant at 0.05 level for the Low
Achievement (r=O. 1 108) sub sample.
303 Conclusions and Suggestions
4. The relationship between Achievement in Science and Originality is
positive and significant at 0.01 level for the Total sample (r=0.3235),
Boys (r=0.3232), Girls (r=0.3835) Rural (r=0.3014), Urban (r=0.3018),
Government (r=0.3925), Private (r=0.3851), High Achievement (r=0.2914)
and Average Achievement (~0.1814) sub samples.
The relationship is positive and significant at 0.05 level for the Low
Achievement (r=0.1120) sub sample.
5. The relationship between Achievement in Science and Verbal Scientific
Creativity is positive and significant at 0.01 level for the Total sample
(r=0.4732), Boys (r=0.4112), Girls (r=0.4032) Rural (r=0.4833), Urban
r = 4 I I, Government (r=0.4618), Private (r=0.4312), High
Achievement (r=0.4012) and Average Achievement (r=0.2001) sub
samples.
The relationship is positive but not significant for the Low Achievement
(r-0.1032) sub sample.
6. The relationship between Achievement in Science and Non Verbal
Scientific Creativity is positive and significant at 0.01 level for the Total
sample (r=0.3218), Boys (r=0.2832), Girls (r=0.3831), Rural (r=0.3737),
Urban (r=0.3832), Government (r=0.3200), Private (r=0.2162), High
Achievement (r=0.2210), Average Achievement (r=O. 191 2) and Low
Achievement (r=O.1820) sub samples.
304 Conclusions and Suggestions
I l l . Relationship between Achievement in Science and Achievement
Motivation
The relationship between Achievement in Science and Achievement
Motivation is positive and significant at 0.01 level for the Total sample
(r=0.1818), Boys (r=0.?921), Girls (~0.1664) Rural (r=0.1312), Urban (1=0.1415),
Government (r=0.1325), Private (r=O.t 145) and High Achievement (r=0.207 2)
sub samples.
The relationship is positive and significant at 0.05 level for the Average
Achievement(r=O.t215) and Low Achievement (r=O.l093) sub samples.
IV. Relationship between Achievement in Science and Home
Environment
The relationship between Achievement in Science and Home
Environment is positive and significant at 0.07 level for the Total sample
(r=0.4814), Boys (r=0.5018), Girls (r=0.42 10) Rural (r=0.5120), Urban
(r=0.4012), Government (r=0.4245), Private (r=0.4819), High Achievement
(r=0.5314), Average Achievement (r=0.4215) and Low Achievement
(r=0.4930) sub samples.
8. RELATIONSHIP BETWEEN INDEPENDENT VARIABLES
. Relationship between Intelligence and Scientific Creativity
1. The relationship between Intelligence and Scientific Creativity is positive
and significant at 0.01 level for the Total sample (r=0.4185), Boys
(r=0.4102), Girls (~0.4012) Rural (~0.37391, Urban (r=0.3985), Government
305 Conclusions and Suggestions
(r=0.3851), Private (r=0.3918), High Achievement (r=0.2304), Average
Achievement (r=O. 1984) and Low Achievement (r=O. 1795) sub samples.
2. The relationship between Intelligence and Fluency is positive and
significant at 0.01 level for the Total sample (r=0.3983), Boys (r=0.4212),
Girls (r=0.3985) Rural (r=0.3214), Urban (r=0.3483), Government
(r=0.3880), Private (r=0.4200), High Achievement (r=Q.22 12), Average
Achievement (r=O. 1835) and Low Achievement (r=O. I 91 9) sub samples.
3. The relationship between Intelligence and Flexibility is positive and
significant at 0.01 level for the Total sample (r=0.3751), Boys (r=0.3853),
Girls (r=0.3920) Rural (r=0.3432), Urban (r=0.4014), Government
(r=0.3725), Private (r=0.3835), High Achievement (r=0.2018), Average
Achievement (r=0.201 I) and Low Achievement (r=0.2004) sub samples.
4. The relationship between Intelligence and Originality is positive and
significant at 0.01 level for the Total sample (r=0.2853), Boys (r=0.295),
Girls (~0 .2828 ) Rural (r=0.2751), Urban (r=0.3012), Government
(r=0.282), Private (r=0.2428), High Achievement (r=0.1815) and Average
Achievement (r=0.1737) sub samples.
The relationship is positive and significant at 0.05 level for the Low
Achievement {r=O. 1089) sub sample.
5. The relationship between Intelligence and Verbal Scientific Creativity is
positive and significant at 0.01 level for the Total sample (r=0.3985),
Boys (r=0.3725), Girls (r=0.3251), Rural (r=0.3014), Urban (r=0.3812),
Government (r=0.3602), Private (r=0.3887), High Achievement
306 Conclusions and Suggestions
(r=0.3235), Average Achievement (r=0.2932) and Low Achievement
(r=0.2080) sub samples.
6. The relationship between lntelligence and Non Verbal Scientific
Creativity is positive and significant at 0.01 level for the Total sample
(r=0.4001), Boys (r=0.4103), Girls (r=0.3831) Rural (r=0.3685), Urban
(r=0.4012), Government (r=0.3921), Private (r=0.3029), High
Achievement (r=0.3832), Average Achievement (r=0.2002) and Low
Achievement (r=0.1779) sub samples.
7 The relationship between Verbal Intelligence and Scientific Creativity is
positive and significant at 0.01 level for the Total sample (r=0.4200),
Boys (r=0.4139), Girls (r=0.3928) Rural (r=0.4232), Urban (r=0.4110),
Government (r=0.4018), Private (r=O. 3799), High Achievement
(r=0.3982), Average Achievement (r=0.3818) and Low Achievement
(r=0.2727) sub samples.
8. The relationship between Verbal intelligence and Fluency is positive and
significant at 0.01 level for the Total sample (r=0.44j8), Boys (r=0.4201),
Girls (r=0.4190) Rural (r=0.4030), Urban (r=0.3989), Government
(r=0.4312), Private (r=0.4203), High Achievement (r=0.2815), Average
Achievement (r=0.3108) and Low Achievement (r=0.2018) sub samples
9. The relationship between Verbal Intelligence and Flexibility is positive
and significant at 0.01 level for the Total sample (r=0.3832), Boys
(~0.4008), Girls (r=0.3737) Rural (r=0.3555), Urban (~0.3833), Government
307 Conclusions and Suggestions
(r=O. 3257), Private (r=0.3992), High Achievement (r=0.2302), Average
Achievement (r=0.2814) and Low Achievement (r=0.2212) sub samples.
70. The relationship between Verbal Intelligence and Originality is positive
and significant at 0.01 level for the Total sample (r=0.2892), Boys
(r=0.3014), Girls (r=0.2009) Rural (r=0.2230), Urban (r=0.2212),
Government (r=0.2019), Private (r=O. 7 998), High Achievement
(r=O. 1814) and Average Achievement (r=0.2012) sub samples.
The relationship is positive and significant at 0.05 level for the Low
Achievement (r=O. 121 3) sub sample.
11. The relationship between Verbal Intelligence and Verbal Scientific
Creativity is positive and significant at 0.01 level for the Total sample
(r=0.4012), Boys (r=0.4180), Girls (r=0.3919), Rural (r=0.3985), Urban
(r=0.3985), Government (r=0.3812), Private (r=0.3785), High
Achievement (r=0.3923), Average Achievement (r=0.4012) and Low
Achievement (r=0.2324) sub samples.
12. The relationship between Verbal Intelligence and Non Verbal Scientific
Creativity is positive and significant at 0.01 level for the Total sample
(r=0.3208), Boys (r=0.3215), Girls (r=0.2903), Rural (r=0.2852), Urban
(r-0.3212), Government (r=0.2904), Private (r=0.2495), High Achievement
(t=O. 301 41, Average Achievement (r=0.3210) and Low Achievement
(~0.2985) sub samples.
13. The relationship between Non Verbal Intelligence and Scientific
Creativity is positive and significant at 0.01 level for the Total sample
308 Condusions and Suggestions
(r=0.3514), Boys (r=0.3983), Girls (r=0.3825) Rural (r=0.3800), Urban
(r-0.3531), Government (r=0.3612), Private (~0.3601), High Achievement
(r=0.1985), Average Achievement (r=0.2031) and Low Achievement
(r=0.2121) sub samples
14. The relationship between Non Verbal Intelligence and Fluency is positive
and significant at 0.01 level for the Total sample (r=0.3835), Boys
(r=0,4012), Girls (r=0.3732) Rural (r=0.3985), Urban (r=0.3642),
Government (r=0.3518), Private (r=0.3737), High Achievement
(r=0.2031), Average Achievement (r=0.2212) and Low Achievement
(r=O. 181 8) sub samples.
15. The relationship between Non Verbal Intelligence and Flexibility is
positive and significant at 0.01 level for the Total sample (r=0.3732),
Boys (r=0.3523), Girls (r=0.3414) Rural (r=0.3018), Urban (r=0.387 2),
Government (r=0.3212), Private (r=0.3008), High Achievement (r=0.220),
Average Achievement (~0 .1815 ) and Low Achievement (r=O. 1421) sub
samples.
16. The relationship between Non Verbal Intelligence and Originality is
positive and significant at 0.0? level for the Total sample (r=0.2980),
Boys (r=0.2758), Girls (~0.2632) Rural (r=0.2952), Urban (r=0.2710),
Government (r=0.2200), Private (r=0.2802), and Average Achievement
{r=0. -1614) sub samples.
The relationship is positive and significant at 0.05 level for High
Achievement (r=O. 1235) and Low Achievement (r=O. 1332) sub samples.
309 Conclusions and Suggestions
17. The relationship between Non Verbal Intelligence and Verbal Scientific
Creativity is positive and significant at 0.01 level for the Total sample
(r=0.3735), Boys (r=0.3112), Girls (r=0.3032), Rural (r=0.3833), urban
(r=O.311 I), Government (r=0.3618), Private (r=0.33 121, High Achievement
(r=0.3012) and Average Achievement (r=0.4012) sub samples
The relationship is positive but not significant for the Low Achievement
(r=Q. 1032) sub sample.
18. The relationship between Non Verbal intelligence and Non Verbal
Scientific Creativity is positive and significant at 0.01 level for the Total
sample (r=0.3218), Boys (r=0.2832), Girls (r=0.373t) Rural (r=0.3235),
Urban (r=0.3200), Government (1=0.2162), Private (r=0.221 O), High Achievement
(r=0.1912) and Average Achievement (r=0.1820). The relationship is
positive but not significant for the Low Achievement (r=0.1009) sub
sample.
I I Relationship between Intelligence and Achievement Motivation
1. The relationship between Intelligence and Achievement Motivation is
positive and significant at 0.01 level for the Total sample (r=0.12q4),
Boys (r=0.1198), Girls (r=0.1211) Rural (r=0.1185), Urban (r=0.1203),
Government (r=O. 131 2) and Private (r=O.1385) sub samples.
The relationship is positive but not significant for the High Achievement
(r=O. 1002), Average Achievement (r=0.0933) and Low Achievement
(r=0.0223) sub samples.
310 Conclusions and Suggestions
2. The relationship between Verbal Intelligence and Achievement
Motivation is positive and significant at 0.01 level for the Total sample
(r=0.1138), Boys (r=O. t 123), Girls (r=0.1081) and Government(r=O.l212)
sub samples.
The relationship is positive and significant at 0.05 level for Rural
(r=0.1030), Urban (r=0.1051), Private (r=0.1181) and Average Achievement
(r=0.1102) sub samples,
The relationship is positive but not significant for the High Achievement
(r=0.098 I ) , and Low Achievement (r=0.0124) sub samples.
3. The relationship between Non Verbal Intelligence and Achievement
Motivation is positive and significant at 0.01 level for the Total sample
(r=0.1432), Boys (r=0.1200), Girls (r=0.1332) Rural (r=O. 1 185), Urban
(r=0.1312), Government (r=0.1451) and Private (r=0.1504) sub samples.
The relationship is positive but nut significant for the High Achievement
r = O . O ) Average Achievement (r=0.0783) and Low Achievement
(r=0.02 18) sub samples.
Ill. Relationship between Intelligence and Home Environment
1. The relationship between lntelligence and Home Environment is positive
and significant at 0.01 level for the Total sample jr=0.2080), Boys
(r=0.2132), Girls (r=0.2191), Rural (r=0.2322), Urban (r=0.2085),
Government (r=0.2131), Private (r=0.2048), High Achievement
(r=O. 1883), Average Achievement (r=0.1713) and Low Achievement
(r=0.2431) sub samples.
31 1 Conclusions and Suggestions
2. The relationship between Verbal Intelligence and Home Environment is
positive and significant at 0.01 level for the Total sample (r=0.2385),
Boys (r=0.2203), Girls (r=0.2111) Rural (r=0.2432), Urban (r=0.2208),
Government (r=0.2191), Private (r=0.2083), High Achievement
(r=0.2 12 'I), Average Achievement (r=O. 1 882) and Low Achievement
(r=0.2994) sub samples.
3. The relationship between Non Verbal Intelligence and Home
Environment is positive and significant at 0.01 level for the Total sample
(r=0.2142), Boys (r=0.2083), Girls (r=0.228d) Rural (r=0.1985), Urban
(r=0.2099), Government (r=0.2120), Private (r=0.2030), and Average
Achievement (r=0.2142) sub samples.
The relationship is positive and significant at 0.05 level for High
Achievement (r=O. 1083), and Low Achievement (r=O. 1 232) sub samples.
IV. Relationship between Scientific Creativity and Achievement
Motivation
1 The relationship between Scientific Creativity and Achievement
Motivation is positive and significant at 0.01 level for the Total
sample(r=O. I 1 85).
The relationship is positive and significant at 0.05 level for Boys
(r=0.10-l8), Girls (r=0.0985), Urban (r=0.1075), Government (r=0.0994),
Private (r=0.1022) and Average Achievement (r=0.1010) sub samples.
The relationship is positive but not significant for Rural (r=0.0801), High
Achievement (r=0.0803) and Low Achievement (r=0.1001) sub samples.
312 Conclusions and Suggestions
2. The relationship between Fluency and Achievement Motivation is
positive and significant at 0.01 level for the Total sample (r=0.1818),
Boys (r=0.1921), Girls (r=0.1664), Rural (r=0.1312), Urban (r=0.1415),
Government (r=O. I 325). Private (r=0. I 145), High Achievement
(r=0.2014), Average Achievement (~0.1816) and Low Achievement
(r=O. 1614) sub samples.
3. The relationship between Flexibility and Achievement Motivation is
positive and significant at 0.01 level for the Total sample (r=0.-?183),
Boys (r=O. 7214) and High Achievement (r=O.I 982) sub samples.
The relationship is positive and significant at 0.05 level for Girls
(r=0.1031), Rural (r=0.0981), Government (~0.7018) and Private (r=O.0980)
and Average Achievement(r=O. 1232) sub samples.
The relationship is positive but not significant for Urban(r=0.0814) and
Low Achievement (r=0.0201) sub samples.
4. The relationship between Originality and Achievement Motivation is
positive but not significant for the Total sample and sub samples.
5. The relationship between Verbal Scientific Creativity and Achievement
Motivation is positive and significant at 0.01 level for the Total sample
(r=O. 1057), Boys (r=0.1212), Girls (r=O. 11 38), and Rural (r=0.1238) sub
samples.
The relationship is positive and significant at 0.05 level for Urban
(r=0. '10321, Government (r=0.1081) and Average Achievement (r=0.1231) sub
samples.
31 3 Conclusions and Suggestions
The relationship is positive but not significant for High Achievement
(r=0.0981) and Low Achievement (r=O.1032) sub samples.
6. The relationship between Non Verbal Scientific Creativity and
Achievement Motivation is positive and significant at 0.01 level for the
Total sample(r=0.0814).
The relationship is positive and significant at 0.05 level for Urban
(r=0.0987) and Government (r=0.0884) sub samples.
The relationship is positive but not significant for Boys, Girls, Rural, and
Private and for the three Achievement Groups sub samples.
V. Refationship between Scientific Creativity and Home Environment
1. The relationship between Scientific Creativity and Home Environment is
positive and significant at 0.01 level for the Total sample (r=0.2124),
Boys (r=0.2081), Girls (r=0.1983), Rural (~0 .2212 )~ Urban (r=0.1812),
Government (r=0.1943), Private (r=0.1781), High Achievement
{r=0.1888), Average Achievement (r=0.2018) and Low Achievement
(r=0.2224) sub samples.
2. The relationship between Fluency and Home Environment is positive and
significant at 0.01 level for the Total sample {r=0.2843), Boys (r=0.2525),
Girls (r=0.2323) Rural (r=0.2203), Urban (r=0.2012), Government
(r=O. 2 1 141, Private (r=0.2245), High Achievement (r=0.2048), Average
Achievement (r=0.2185) and Low Achievement (r=O. 1907) sub samples.
3. The relationship between Flexibility and Home Environment is positive
and significant at 0.0? level for the Total sample (r=0.2385), Boys
3 14 Conc/usions and Suggestions
(r=0.2203), Girls (r=0.2211), Rural (r=0.2432), Urban (r=0.2208),
Government (r=0 -21 91), Private (r=0.2083), High Achievement
(r=0.2102), Average Achievement (~0.1121) and Low Achievement
(r=O.I 882) sub samples.
4. The relationship between Originality and Home Environment is positive
and significant at 0.01 level for the Total sample (r=0.1235), Boys
(r=O. 1 173), Girls (r=0.1081), Rural (r=0.1325), Urban (r=O. 1 185), and
Government (r=0.1421) sub samples.
The relationship is positive and significant at 0.05 level for Girls
(r=O. 1081), Private (r=0.12 10) and Average Achievement(r=O. 1021) sub
samples.
The relationship is not significant for High Achievement (r=0.0814) and
Low Achievement (r=0.1031) sub samples.
5. The relationship between Verbal Scientific Creativity and Home
Environment is positive and significant at 0.01 level for Total sample
(r=0.2080), Boys (r=0.2132), Girls (r=0.2191), and Rural (r=0.2322),
Urban (r=0.2085), Government (r=0.21 QO), Private(r=0.2084), High
Achievement ( ~ 0 . 7 883), Average Achievement (r=0.21 f 5) and Low
Achievement (r=0.2121) sub samples.
6. The relationship between Non Verbal Scientific Creativity and Home
Environment is positive and significant at 0.01 level for Total sample
(r=0.2012), Boys (r=0.1985), Girls (r=0.2121), Rural (r=0.1873), Urban
315 Conclusions and Suggestions
(r=0.177), Government (r=0.2100), Private (~0.1985) and High Achievement
(r=0.1735) sub samples.
The relationship is positive and significant at 0.05 level for Average
Achievement (r=O. 1235) and Law Achievement (r=0.1105) sub samples.
VI. Relationship between Achievement Motivation and Home
Environment
The relationship between Achievement Motivation and Home
Environment is positive but not significant for Total sample (r=0.0765), Boys
(r=0.0428), Girls (r=0.0819), Urban (r=0.0523), High Achievement (r=0.1018),
Average Achievement fr=0.0718) and Low Achievement (r=0.0983) sub
samples.
The relationship is positive and significant at 0.05 level for Rural
(r=0.0915), Government (r=0.0993) and Private (r=0.0812) sub samples.
5.2.2.2. Findings based on Multiple Correlations
1. The Multiple correlation coefficients obtained is positive and significant
(R=0.66) for the Total sample.
2. Nearly 44% of variance of Achievement in Science can be attributed to
differences in the predictor variables namely ., Intelligence, Scientific
Creativity and Home Environment.
The relative influence of each independent variable to the variance of
criterion variable. Achievement in Science is as follows.
12% is the contribution of Intelligence.
14% is the contribution of Scientific Creativity.
3 16 Conclusions and Suggestions
18% is the contribution of Home Environment.
This shows that Home Environment is the most influencing factor of
Achievement in Science.
The remaining 56% of t h e variance of Achievement in Science can be
attributed to variables not included in this study.
5.2.2.3. The Regression Equation
Considering Achievement in Science as the criterion variable(X1) and
Intelligence((Xz), Scientific Creativity(X3) and Home Environment(X4) as the
predictor variables Multiple Regression Equation was found out as
XI = 0.02 Xz + 0.02 X3 + 0.03 X4 + 28.44 - This equation helps us to predict Achievement in Science from known
values of X p (Intelligence, X3 (Scientific Creativity) and X4 (Home
Environment).
5.3 CONCLUSIONS
The major conclusions of the study drawn from the findings are given
1. The variables Intelligence, Scientific Creativity, and Home Environment
clearly discriminated the High, Average and Low achievement groups.
So these variables have significant association with Achievement in
Science.
The correaltional studies indicate that Intelligence, Scientific Creativity,
and Home Environment have close relationship with Achievement in Science.
31 7 Conclusions and Suggestions
2. Achievement Motivation do not discriminate the three achievement
groups. Thus the High, Average and Low achievement groups do not
differ significantly in their mean scores of Achievement Motivation.
The correlational studies show that there exist very low relationship
between Achievement Motivation and Achievement in Science of Higher
Secondary School Students.
3. The components of Intelligence namely, Verbal lntelligence and Non
verbal Intelligence are equally important variables in discriminating the
High, Average and Low achievement groups when taken in pairs. So
Verbal lntelligence and Non verbal Intelligence are associated with
Achievement in Science. The correlational studies confirm the high
relationship of Achievement in Science with Verbal lntelligence and Non
verbal Intelligence.
4. The components of Scientific Creativity namely, Verbal Scientific
Creativity and Non verbal Scientific Creativity have similar effect in
discriminating the High, Average and Low achievement groups. So
Verbal Scientific Creativity and Non Verbal Scientific Creativity are
associated with Achievement in Science
The correlational studies imply that the relationship of Achievement in
Science with Verbal Scientific Creativity and Non verbal Scientific Creativity is
very high.
5. The components of Scientific Creativity namely, Fluency, Flexibility and
Originality discriminated the High, Average and Low achievement groups
318 Conclusions and Suggestions
when taken in pairs. Among these variables Fluency discriminated the
three groups more and Originality less. This shows that Fluency is the
prime component of Scientific Creativity that influences the Achievement
in Science.
The correlational studies show that Fluency, Flexibility and Originality
have high relationship with Achievement in Science.
6 . Intelligence and Scientific Creativity are closely related variables. The
components of lntelligence namely, Verbal lntelligence and Non verbal
Intelligence, and the components of Scientific Creativity namely, Fluency,
Flexibility, Originality, Verbal Scientific Creativity and Non verbal
Scientific Creativity are mutually related variables.
7. Achievement Motivation has a very low association with Intelligence
whereas its influence on Scientific Creativity and Home Environment is
negligible.
8. Home Environment has significant influence on lntelligence and
Scientific Creativity. Conducive Home Environment will foster the
Intelligence and Scientific Creativity of a learner.
9. From the known values of Intelligence, Scientific Creativity and Home
Environment Achievement in Science can be predicted using the
developed Regression Equation.
10. The combined effect of Intelligence, Scientific Creativity and Home
Environment on Achievement in Science is very high and Home
31 9 Conclusions and Suggestions
Environment is the most influencing factor of Achievement in Science of
Higher Secondary School Students.
5.4 TENABILITY OF HYPOTHESES
The study provides sufficient evidence to decide the validity of the
hypotheses set for. An attempt has been made to examine the validity of the
hypotheses.
1. Tenability of Hypothesis I
The three achievement groups (HA, AA and HL) differ significantly with
respect to the selected independent variables for the total sample. The
variable Achievement Motivation does not discriminate the three groups of a
few sub samples. So Hypothesis 1 is mostly substantiated.
2. Tenability of Hypothesis ll
When independent variables were correlated with each other,
Achievement Motivation has negligible relationship with Scientific Creativity
and Home Environment. All other independent variables have significant
positive relationship with each other. So Hypothesis I l is mostly substantiated.
3. Tenability of Hypothesis III
There is significant relationship between each of the independent
variables and Achievement in Science for the total sample and sub samples.
except for two cases. So Hypothesis Ill is mostly substantiated.
4. Tenability of Hypothesis IV
Achievement in science can be predicted with the help of t h e Multiple
Regression Equation developed. So Hypothesis IV is wholly substantiated.
320 Conclusions and Suggesfions
5. Tenability of Hypothesis V
The multiple correlation coefficient obtained is significant. So
Hypothesis V is wholly substantiated.
5.4 IMPLICATIONS
The study revealed the interactive effect among the variables
Intelligence, Scientific Creativity, Achievement Motivation, Home Environment
and Achievement in Science. Since all these variables are important, the
present study indicates certain factors to be borne in mind while we train and
nurture our children. The implications revealed by the study are given below.
5.4.1 Implications for Teachers
- Verbal Intelligence and Nonverbal Intelligence develop through
reasoning, critical thinking and problem solving. So Science teaching
must be aimed at the development of higher order thinking skills
- Provide opportunities for children to express their ideas through verbal
as well as nonverbal media.
- 'create' should be taken as a major objective of Science Teaching
- Promote divergent thinking and originality of ideas.
- Understanding the home environment of the learner is a pre requisite
for effective teaching.
- Emotional stress is a major cause for cognitive decline and low
achievement. So teachers must render comfortable emotional
atmosphere for students.
Conclusions and Suggestions
- Establishing a cordial relationship with parents of students' and timely
interactions with them may help students to cope with many difficulties.
Help learners to set realistic goals and motivate them to achieve their
goals.
- Use positive reinforcers for developing proper achievement behaviour.
- Promate Achievement Motivation by combining strong hope for
success with low fear of failure.
- Proper guidance and counselling facilities can be provided to solve the
problems and render help for the needy students.
5.4.2 Implications for Parents
Encourage children's critical questioning and divergent thinking habits.
Discuss daily life situations with children to help them to draw right
conclusions and decisions.
Develop awareness that examination result is not the only criteria for
assessing children.
Their creative potentialities are to be reinforced.
Emotional support is the most important factor to be provided at home.
Provide tension free and emotionally relaxed home atmosphere for
children.
Inculcate good values in children through proper interactions.
Help children to face failures successfully.
Develop positive attitude among children to boost their self concept.
322 Conclusions and Suggestions
- Harsh punishments, sarcastic comments and negative attitudes are to
be avoided to develop good self-concept and achievement motivation.
5.4.3 Implications for Students
- Good reading skill, writing skill and vocabulary skills are to be
developed for verbal intelligence and creative expression of ideas.
- Present imaginative ideas through verbal as well as nonverbal paths
- Think for novelty and originality.
- Elaborate and extend the thought process.
- Accept the home environment with all its limitations and try to
overcome the deficiencies of the home environment.
- Set realistic goals and plan to achieve the goal.
- Motivation added with hard work is the key component of success in
life.
5.5 SUGGESTIONS FOR FURTHER RESEARCH
On the basis of the findings of t h e present study, the investigator would
like to suggest the following areas for further research.
( i ) The present study was confined to the Verbal and Non verbal
components of Intelligence. More comprehensive studies on the
interaction of components of Multiple Intelligence with cognitive and
affective variables may be conducted.
(ii) Scientific Creativity with a wider variety of creative measures like
elaboration spontaneity etc., and its effect on Achievement may be
studied
323 Conclusions and Suggestions
(iii) The Achievement in Science for Higher Secondary school students
can be measured in terns of written tests as well as practical tests.
(iv) The effect of more number of cognitive, affective and social variables
on performance of the students may be conducted.
(v) Replication of the study may be conducted -in other subject areas
also.
(vi) More studies related to the impact of Home Environment on
Personality development and Achievement is to be conducted.

BIBLIOGRAPHY
BIBLIOGRAPHY
Abrol, D. N. (1977). A study of achievement motivation in relation to
intelligence, vocational interests, achievement, sex and socio economic
status. Ph.D., Delhi University. In M. B. Butch (Ed.). Third survey of
research in education. New Delhi: NCERT.
Acharyulu, G. (1 978). A study of the relationship among creativity thinking,
intelligence and school achievement. Ph. D., Psychology, Utkal
University. In M. B. Butch(Ed.). Thirdsurvey of research In education.
New Delhi: NCERT, P. 657.
Adder, Binnagold Barton (I 988). The relationship between family cohesion
and children's academic performance. Dissertation Abstracts
International, 49 (8), 2 1 50.
Ajitha, D. (1992). A study of the association between creativify,
intelligence, socio-economic status, family environment and
achievement in English of higher secondary students of Kerala.
Unpublished M. Ed. Thesis, University of Kerala, Thiruvananthapuram.
Alrwais (2000). The relationship among €Ith grade students' creativity,
attitudes, school grade and achievement in mathematics in Saudi Arabia.
Disserfation Abstracts International, 6 1 (9).
Alsop, Steve and Hicks, Keith (2003). Teaching science. New Delhi: Kogan
Page India Pvt Ltd.
Am bily , Y. (2005). Relationship of creativity and intelligence with reading
comprehension In English of higher secondary school students.
Unpublished M. Ed Thesis, School of Pedagogical Sciences, Mahatma
Gandhi University, Kottayam.
Anastasi, Anne and Urbina, Susana (2003). Psychological testing. New
Delhi: Pearson Education Pvt Ltd.
Antony , Pearly 0. (2003). Relationship among family climate, classroom
adjustment and academic achievement of students at higher
secondary level. Unpublished M. Ed Thesis, School of Pedagogical
Sciences, Mahatma Gandhi University, Kottayam.
Archer, Jenifer (1 989). Motivation and creativity. Dissertation Abstrach
International, 50 (1 1 ), 351 8.
Asmali, K. (1994). A study of the relationship between science
achievement, science interest, scientific attitude, process outcomes
in science and scientific creativity of secondary school pupils.
Unpublished M. Phil. Thesis, University of Kerala, Thiruvananthapuram.
Atkinson, John W. (1964). An introduction to motivation. New Delhi: East
West Press Pvt. Ltd.
Ausubel, David P . (1 963). The psychology of meaningful verbal learning:
An introduction to skill learning. New York: Grune and Stratton, Inc.
Balasubramaniam, G. (2002). Mindscaping education. New Delhi: Frank
Bros & Co Ltd.
Beevi, Mansila, E. (1992). A study of certain convergent divergent
thinking variables which discriminate between the high and low
science achievers in higher secondary schools. Unpublished M. Ed.
Thesis, University of Kerala, Thiruvananthapuram.
Best, John, W. and Kahn, James, V. (I 992). Research in education. New
Delhi: Prentice Hall India Pvt Ltd.
Biggs, Francis (1989). The relationship of achievement motivation and
academic achievement with externalising and internalising emotionally
and behaviourally handicapped children. Dissertation Abstracts
international, 50(1 I), 3519.
Blanchard, Loren James (1991). Parental difference in the support of school
achievement of African American boys and girls. Dissertation Abstracts
International, 52(1 ), 3859.
Bloom, Benjamin (1 968). Stability and change in human characteristics.
New York: John Wiley and Sons.
Brabeher, Walter E. (1982). The influence of the family on carrier selection:
A family systems perspective. The Personal and Guidance Journal,
61, 87-92.
Chaman, Mini, J. (1990). A study of parent child relation and peer group
influence of factors of achievement in mathematics among P. D. C.
students of Kerala. Unpublished M. Ed. Thesis, University of Kerala,
Thiruvananthapuram.
Chouhan, S.S. (1984). A comparative study of the achievement motivation of
SC ST students of Himachel Pradesh in relation to their intelligences and
socio economic status. Department of Education, Himachel Pradesh
University. In M. 0. Butch (Ed.). Fourth survey of research In
education. New Delhi: NCERT.
Cole, Henry P. and Sanoff, David (1980). Creativity and counselling. The
Personal and Guidance Journal, 59,140-147.
Costa, Arthur, L. Liebmann, Rosemarie, M. (1997). Supporting the spirit of
learning. California: Corwin Press, Inc.
Craig, Schniedr, Steven (1 990). The relation of parenting styles and family
environmental components to school performance. Dissertation
Abstracts /nternational, 52 (2), 482.
Cronbach, Lee, J. (1968). Educational psychology (2" ed.). New York:
Harcourt, Brace and World, Inc.
Dandapani, S. (2005). Advanced educational psychology. New Delhi:
Anmol Publications Pvt. Ltd.
De Decco, John, P. and Crawford, William.(l977). The psychology of
learning and instruction (2nd ed.). New Delhi: Prentice Hall of India,
Pvt. Ltd.
Deighton, Lee C. (Ed.). (1 972). The Encyclopaedia of Education (Vo1.2).
The Macmillan and The Free Press.
Dey, B. (1984). The relationship of creativity to intelligence and academic
achievement of national rural talent scholarship Awardees. Doctoral
Dissertation, Utkal University. In M. 6. Butch(Ed.). Fourth survey of
research in education. New Delhi: NCERT.
Ediger, Marlow & Rao, Bhaskara, Digumarti (2004). Science curriculum.
New Delhi :Discovery Publishing House.
Edwards, A. L. (1960). Experimental design in psychological research.
New York: Rinehart.
Edwards, A. L.(1970). The rneasuremenf of personality traits by scajes
and inventories. New York: Holt Rinehart and Winston, Inc.
Eson, Moris E.(1964). The psychological foundation of education. New
York: Holt, Rinehart, and Winston, Inc.
Eysenck, H. J., et al. (Eds.). (1 972). Encyclopaedia of psychology (V01.2).
London; Search Press.
Fahrmann, Paul G., Temothy, Keiz 2. and Reimers, Thomas M. (1987).
Home influence on learning. The Journal of Educational Research,
80, 331-333.
Fatrni, M. B. (1986). A study of achievement related motivations among tribal
and non tribal high school students. Doctoral Dissertation, Kanpur
University. In M. 6. Butch(Ed.). Fourth sunfey of research in
education. New Delhi: NCERT.
Faveretto, Francine Grace (1990). The impact of family environment on the
well being of college students. Dissertation Abstracts International,
52 (51, 1687.
Gaol Hang (2003). Contributions of parent involvement in home, school and
community to student outcomes. Dissertation Abstracts International,
64 (5).
Garrett, Henry E. (2004). Statistics in psychology and education. New
Delhi: Parogon International Publishers.
George, Tharamma T. (2000). Some correlates of mathematical creativity.
Unpublished Dactaral Dissertation, Universrty of Kerala, Thiruvananthapuram.
George, Tharamma, T. (1994). A study of the mathematical creativity of
secondary school students in relation to their intelligence and
mathematics achievement M. P hi1 Thesis, University of Kerala.
Goldenberg and Goldenberg (1980). Family therapy: An overview.
Montercy, Calif: BrookslCoIe.
Good, Carter V. (I 973). Dictionary of education (3Cd ed.). New York:
McGraw Hill.
Guilford, J. P. (1954). Psychometric method. New York: McGraw Hill
Company, Inc.
Guilford, J. P., et al. (1952). A factor analysis study of creative thinking:
Administration of tests and analysis of resulfs. Report from the
Psychological Lab No. 8, Los Angels: University of South California.
Hancock, Dawnson (2003). Learning and peer orientation effects on
motivation and achievement. The Journal of Educational Research, 37
(5), 12-14.
Haneeshia, D. (2001). A study on the scientific creativity of pupils in
DPEP and non-DPEP schools in Kerala. Unpublished M. Ed Thesis,
University of Kerala, Thiruvananthapuram.
Harvighuest, Robert J. et at. (1962). Society and education (znd ed.). Boston
Massachusetts: Allen and Bacon. Inc
Heastie, Samuel, R. (2001). Relationship and difference on self regulated
learning, parental involvement, home work and academic achievement
among high school students in rural West Virginia. Disserfation
Abstracts International, 62(5), 43 12.
Hickey, Grace (7992). The rate of achievement motivation in the relationship
between athletic and academic achievement. Dissertation Abstracts
Internefional, 53 (2): 3020.
Hurlock, Elizabeth, B. (2005). Developmental psychology: A life span
approach. New Delhi: Tata McGraw Hill Publishing Company Ltd.
Jacob, Beenamma (1 998). Selected variables associated with
achievement in chemistry of higher secondary school students.
Unpublished D0d~ral Dissertation, University of Kerala, Thiruvananthapuram.
Jagannadhan, K. (1984). Home environment and academic achievement.
Journal of Educational Research and Extension, 23, I 9-2 I .
John, Mac Kebzie Robert (4990). The effects of goal setting on achievement
and perception of self efficiency of 8th grade students. Dissertation
Abstracts International, 51 ( 1 I), 131 2.
Joseph, Mathew (2004). A study of the relationship of achievement
motivation and level of aspiration with achievement in social
science in secondary school students of Kerala. Unpublished M . Ed
Thesis, School of Pedagogical Sciences, Mahatma Gandhi University,
Kottayam.
Jyothimol, K. A. (2003). A study of the relationship between home
learning environment, class room learning environment and
creativity of higher secondary school students. Unpublished M. Ed
Thesis, School of Pedagogical Sciences, Mahatma Gandhi University,
Kottayam.
Kalam, Abdul A.P.J. (1999). Wings of fire. Hyderabad: Universities Press
(India) Ltd.
Kalam, Abdul A.P. J. (2003). Restructuring higher education. Keraia Calling,
24(j); 3-6, Thiruvananthapuram: Directorate of Information and Public
Relations.
Kalia, Ashok (A984). A study of the relationship between creativity,
intelligence, academic achievement and extraversion neuroticism.
Journal of Educational Research and Extension, 20 (3), I 20-1 26.
Karrner, C. (1980). Becoming a family therapist. New York: Human
Science Press.
Koushik, Vijayakurnari and Sharma, S. R. (1 997). Teaching science in
elementary school. New Delhi: Anrnol Publications Pvt. Ltd.
Kumar, Satheesh J. (I 992). A study of the relationship between scientific
reasoning scientific attitude, science interest and creativity of
higher secondary school students of Kerala. Unpublished M. Ed.
Thesis, University of Kerala, Thiruvananthapuram.
Kurnari, K. (1978). A study of the relationship among creativity, intelligence,
adjustment and value patterns in adolescence. Doctoral Dissertation,
Agra University. In M. B. Butch(Ed.). Fourth survey of research in
education. New Delhi: NCERT.
Kuppuswamy (1974)- A text book of child behaviour and development
(3rd ed.). Delhi: Kanak Publishers Pvt. Ltd.
Lan, Shaun (2003). Cognitive abilities and motivational process in high School
students' science achievement and engagement. Dissertation
Abstracts International, 64 (3).
Lee, Brenda Joyce (1991). A correlation of then educational achievement and
environment of the home of 6th grade welfare supported students. .
Dissertation Abstracts International, 52 (7), 2 5 1 4.
Manju, K. (1 973). A study of the relation between intelligence and
achievement in curricular and co-curricular areas of scheduled
caste pupils of secondary schools of Thiruvananthapuram district.
Unpublished M. Ed. Thesis, University of Kerala, Thiruvananthapuram.
Marope, Miansetsa Toka.(l992). Determinants of academic achievement in
Botswana junior secondary schools. Dissertation A bstrac fs
International, 53(1), 57-58.
Martz, Allyson Holler (2003). Family and school achievement: an exploration
of psychometric properties, Indiana University of Pennsylvania.
Dissertation Abstracts International, 64 ( 8 ) .
May, R. (1975). The courage to create. New York: Bantom Mc.Candless.
Mayor, Roy G. (I 975). Creativity: Made, not born. Personal and Guidance
Journal, 54,162-165.
Mehna, V. H. (1986). An investigation into some factors affecting academic
achievement in science of std ix students of Greater Bombay. Doctoral
Dissertation, Bombay University. In M. 0 . Butch(Ed.1. Fourth sunfey of
research in education. New Delhi: NCERT.
Milter, G. W. (1 97 1). Educational opporfunity and the home. London:
Longmans.
Misra, K. S. (1 986). Effect of school and home environment on scientific
creativity. Kanpur: Sangyanalaya.
Mouly, George, J. (1 964). The science of educational research. New Delhi:
Eurasia Publishing House.
Nair, Sukumaran (1 976). Kerala scale of achievement motivation. Calicut:
Calicut University Press.
Nancy, Ida (2003). Achievement motivation as a predictor of academic
excellence. international Educator, 15 ( l ) , 30-33.
Natesan, Hemaletha & Seetha, R. (1986). Achievement motivation and
academic achievement. Journaf of Educational Research and
Extension. 23(2), 4449,
Netto, Thadevoose Y. (2004). Influence of home environment and
achievement of fishermen students at higher secondary level.
.Unpublished M . Ed Thesis, School of Pedagogical Sciences, Mahatma
Gand h i University, Kottayam.
Oberoi (2000). Essentials of teaching learning. New Delhi: Arya Book
Depot.
Orlich, et al. (2001). Teaching strategies. Boston: Houghton Mifflin
Company.
Osborn, Michel, E. (1971). The impact of differing parental educational level
on the educational achievement , attitude, aspiration and expectation of
the child. TheJournalof Educational Research, 65 (4),163-165.
Panda, M. (1983). The relationship of parental life style and intellectual
achievement, responsibility, adjustment and cognitive performance
among under privileged children. Doctoral Dissertation, Patna
University. In M. 0. Butch(Ed.). Fourth survey of research in
education. New Delhi: NCERT.
Patel, and Shah, G.B. (Eds. ). Education of the backward and the giffed
children. Baroda: CASE.
Petrick, Helen (2002). Early adolescents' motivation during science
investigation. The Journal of Educational Research, 90 (4), 27-29.
Philips, La kin, E. (1 960) Discipline, achievement and mental health.
Englewood Cliffs New Jersey: Prentice Hall, Inc.
Pillai, N. P. (1965) . Studies in education. Department of Education ,
University of Kerala, Thiruvananthapurarn.
Prahllada, N. N. (2002). Role of teacher, student and parent in the New
Millennium. Edutracks, 2 ( I ) , 21 -25.
Raina, K. (1 986). Psycho social correlates of scientific creativity among high
school students. Doctoral Dissertation, Kurukshetra University. In M. €3.
Butch (Ed.). Fourth survey of research in education. New Delhi:
NCERT.
Rajagopalan,S. (1988). A study of creativity of secondary school students in
relation to classroom climate, achievement motivation and mental ability.
Doctoral Dissertation, S. P University. In M. B. Butch(Ed.). Fourth
suwey of research in education. New Delhi: NCERT.
Rawon, Elaine. (1982). The relationship between parent involvement and the
success of the learning handicapped students. Dissertation Abstracts
international, 43 (21, 32 1 2.
Reddy, D. R. (1983). A study of the achievement and intellectual capacity of
high school students. Doctoral Dissertation, Andra University. In M. B.
Butch(Ed.). Fourth survey of research in education. New Delhi:
NCERT
Reju, R. S. (1 997). Science achievement at: related to scientific attitude,
science interest, and home learning facility of upper primary school
pupils. Unpublished M. Ed. Thesis, University of Kerala,
Thiruvananthapuram.
Renzulli (1995). Parents role in stimulating their children's creativity and
intelligence. Gifted Child Today Magazine, 17, 20.
Renzulli, Joseph S. (2004). Identification of students for gifted and
talented programs. California: Cowin Press, Inc
Retidevi, K. ('1984). A study of certain social familial and personality
correlates of creativity among secondary school children. Doctoral
Dissertation, Kerala University. In M. 8. Butch (Ed.). Fourth survey of
research in education. New Delhi: NCERT.
Riley, Ayers and Shannon, Eileen (2003). Elementary school students'
motivation. Dissertation Abstracts International, 63 (9).
Sanchez, David Philip.(I 991). Parental support and academic achievement:
a case study of five female Mexican American high school students.
Dissertation Abstracts International, 53(2), 23 1 8.
Sansanwal, D, N. (1984). Effect of training programme on the development of
verbal and non verbal creative thinking abilities of students. Indian
Educational Review, 19,l-.12.
Schunk, Dale H. ( 1996. ). Learning theories: An educational perspective.
Englewood Cliffs New Jersey: Prentice Hall, lnc.
S h yja, K. G. (200 1 ) . Certain science related variables associated with
intelligence and chemistry achievement of higher secondary school
pupils. Unpublished M. Ed. Thesis, University of Kerala,
Thiruvananthapuram.
Sindhu, G. (2005). Relationship among creativity, classroom adjustment
and academic achievement of students at higher secondary level.
Unpublished M. Phil. Thesis, School of Pedagogical Sciences, Mahatma
Gandhi University, Kottayam.
Sing, Kulwinder (1987). A study on academic achievement as a function of
creative thinking and intelligence among high school students of H.P.
Journal of Educational Research, 1 0,4.
Singh, Rajendra (1 985). Relation between achievement motivation,
intelligence, introversion-extraversion, SES and achievement in
mathematics. Indian Education Review, 23 (21, 99-1 01 .
Smith, Edward W. (ed. ). (1 961 ). The educators encyclopaedia. Englewood
Cliffs New Jersey: Prentice Hall, Inc.
Sreejaya, S. R. (1998). A study of scientific creativity in relation to
intelligence of degree students. Unpublished M. Ed. Thesis,
University of Kerala, Thiruvananthapuram.
Sreekala, C. (1 99 1 ). Effect of certain attitude variables on intelligence
and creativity of secondary school pupils of Kerala. Unpublished M .
Ed. Thesis, University of Calicut.
Srivastava, S. S. (1 977). A study of creativity in relation to neuroticism
and extraversion in high school studen&. Doctoral Dissertation,
Patna University.
Sternbrg, Robert J. (1985). Cognitiveprocesses in problem solving. New
York: Longman.
Stewart, Co hen (1 976). Social and personality development in childhood.
New York: Macrnillan Publishing Co., Inc.
Sujatha, B. N. and Yesodhara, K. (1986). A comparative study of some
educational variables of SClST students. Doctoral Dissertation, Utkal
University. In M. B. Butch (Ed.). Fourth survey of research in
education. New Delhi: NCERT.
Sumangala, V. (1986). Some psychological and social familial correlates
of creative behaviour among secondary school children. Ph. D .
Thesis, Kerala University, Thiruvananthapuram.
Tamis, P. (1985). Home work and science learning in secondary schoals.
Science Education, 69 (5), 60-65.
Taylor, Calurin W. (1 964). Creativity: progress and potential. New York:
McGraw Hill Book Company.
Taylor, Dallas (2001). Factors that Influence Student Motivation.
Dissertation Abstracts International, 62 (4).
Thripthi, R. C. (1986). Achievement motivation and its correlates of high
school students of East U.P. Doctoral Dissertation, Gorakhpur
University. In M. B. Butch(Ed.). Fourth survey of research in
education. New Delhi: NCERT.
Torrence et. at. (1 978). Revised norms- Technical manual for your style
of learning. Department of Psychology, University of Georgia, Athens.
Torrence, Paul, E. (1967). Scientific views of creativity and factors affecting
its growth. In Jerome Kagan {ed.). Creativity and learning. Boston:
Haughton Mifflin Company.
Treffinger, Donald (2004). Creativity and giftedness. California: Cotwin
Press, Inc.
Vaidya, Narendra (1 971). The impact science teaching. New Delhi: Oxford
and IBH Publishing Go.
Venville, Grady Jane (2006). The art of feaching science. National Library of
Australia: Cataloguing-in-Publication Entry.
Verma, B. P., and Gupts, C. K. (1989). Influence of home environment on
children's scholastic achievement. Journal of Education and
Psychology, 47 (41, 159-1 62.
Wang, Ming John (1991). The effect of achievement motivation, goal
acceptance and goal difficulty on task performance. Disserfafion
Abstracts International, 52 (1 2), 4275.
Watson, Janet (1 982). The relationship between family environment and ego
development in the creative thinking of college-age females.
Dissertation Abstracts international, 43 (2), 431 2.
Yeh, Hsiang-yeng (1991). The relationship of academic achievement to the
variables of achievement motivation, study habits, intellectual
development and junior college joint entrance examination scores among
junior college students in the Republic of China. Dissertation Abstracts
International, 52 (31, 859.
Web Resources
www.eric.ed.gov
www. experimentsineducation. 750m. corn.
www. fin da rticies. com/p/articies/tnre f
www.outreach world.org/articie.asp?articleid
www.sfudygs. netrindex. htm.

APPENDICES
Appendix A
TEST OF SCIENTIFIC CREATIVITY
FOR
Dr. P.M. Jaleel
and
Rosamma Philip
HIGHER SECONDARY SCHOOL STUDENTS (DRAFT TEST)
School of Pedagogical Sciences
Mahatma Gandhi Universiq
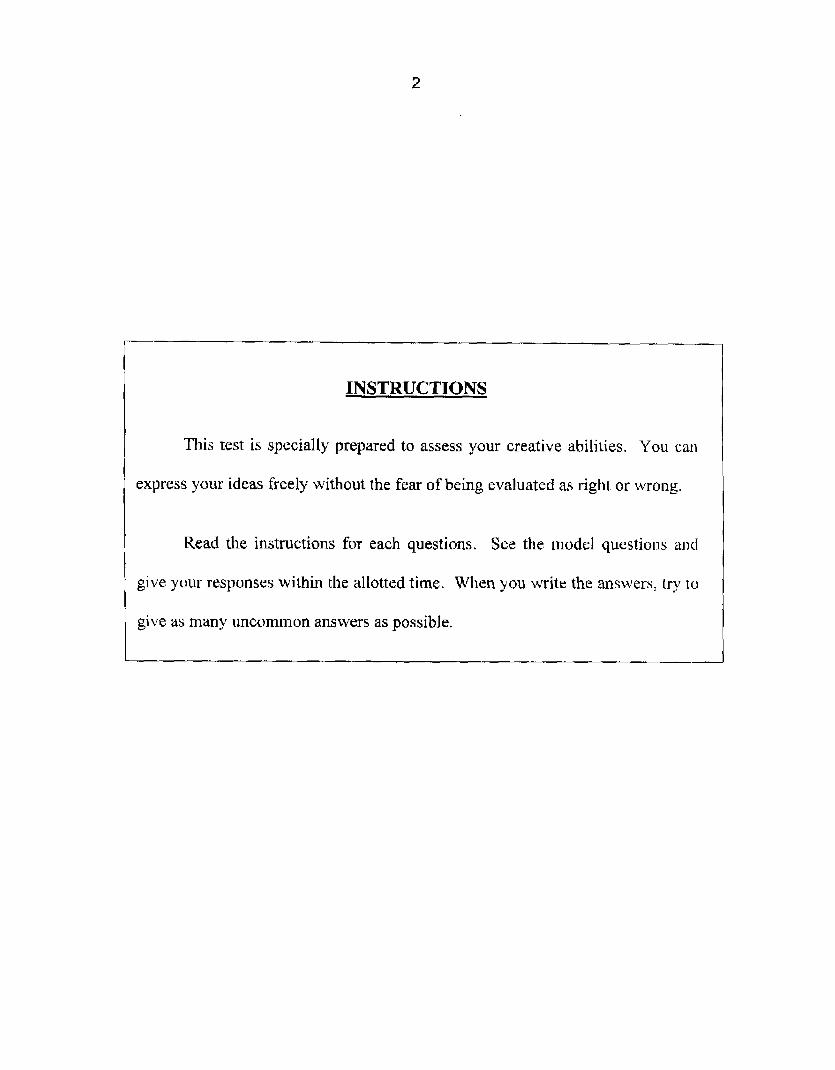
INSTRUCTIONS
I This test is specially prepared to assess your creative abilities. You can
1 express your ideas freely without the fear of being evaluated as right or wrong.
Read the instructions for each questions. See the model questions and
give your responses within the allotted time. When you write the answers, try to
/ give as many uncommon answers as possible.
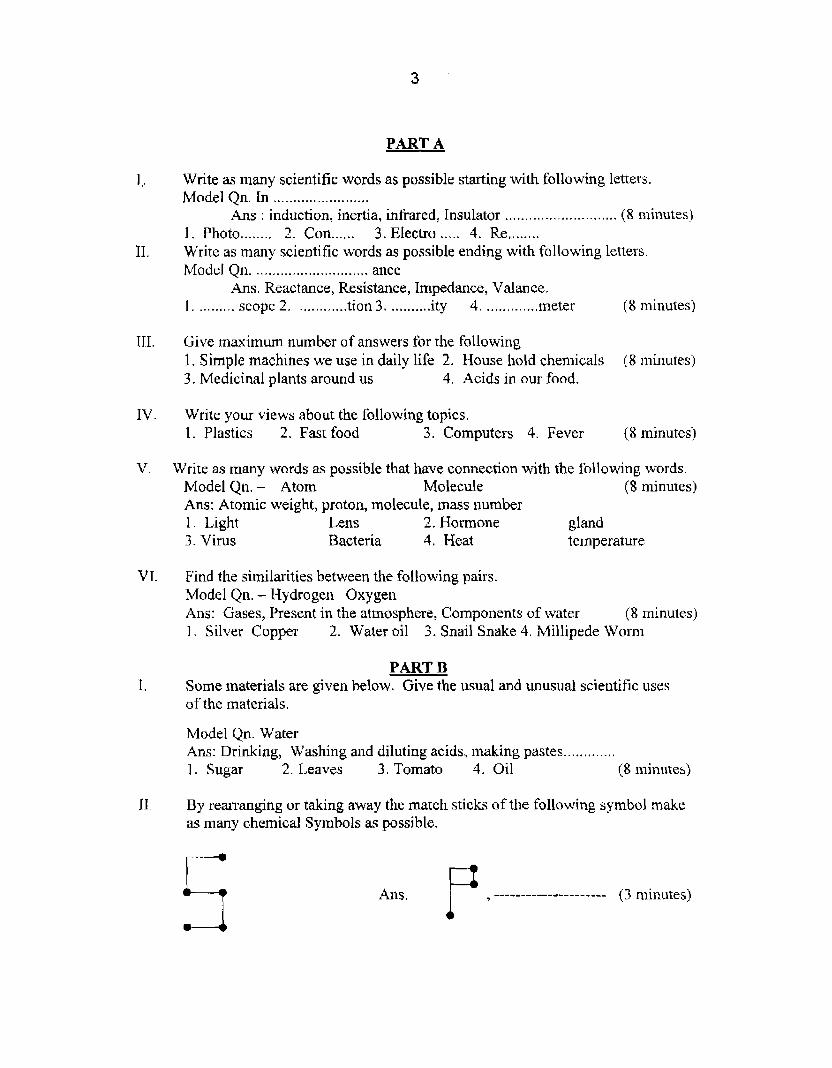
PART A
IJI.
IV.
v.
VT.
Write as many scientific words as possible starting with following letters. ........................ Model Qn. En
............................ Ans : induction, inertia, infrared, Insulator (8 minutes) ..... ........ 1. Photo ........ 2. Con ...... 3.Efectro 4. Re
Write as many scientific words as possible ending with following letters. Mode1 Qn. ............................ ance
Ans. Reactance, Resistance, Impedance, Valance. ............. ............ .......... 1. ......... scope 2. tion 3. ity 4. meter (8 minutes)
Give maximum number of answers for the following 1. Simple machines we use in daily life 2. House hold chernicaIs (8 minutes) 3. Medicinal plants around us 4. Acids in our food.
Write your views about the following topics. 1 . Plastics 2. Fast food 3. Computers 4. Fever (8 minutes)
Write as many words as possible that have connection with the following words. Model Qn. - Atom Molecule (8 minutes) Ans: Atomic weight, proton, molecule, mass number 1. Light Lens 2. Hormone gland 3. Virus Bacteria 4. Heat temperature
Find the similarities between the following pairs. Model Qn. - Hydrogen Oxygen Ans: Gases, Present in the atmosphere, Components of water (8 minutes) 1. Silver Copper 2. Water oil 3. Snail Snake 4. Millipede Worm
PART B Some materials are given below. Give the usual and unusual scientific uses of the materials.
Model Qn. Water Ans: Drinking, Washing and diluting acids, making pastes ............. I . Sugar 2. Leaves 3. Tomato 4. Oil (8 minutes)
By rearranging or taking away the match sticks of the following symbol make as many chemical Symbols as possible.
Ans. --------------------- (3 minutes)
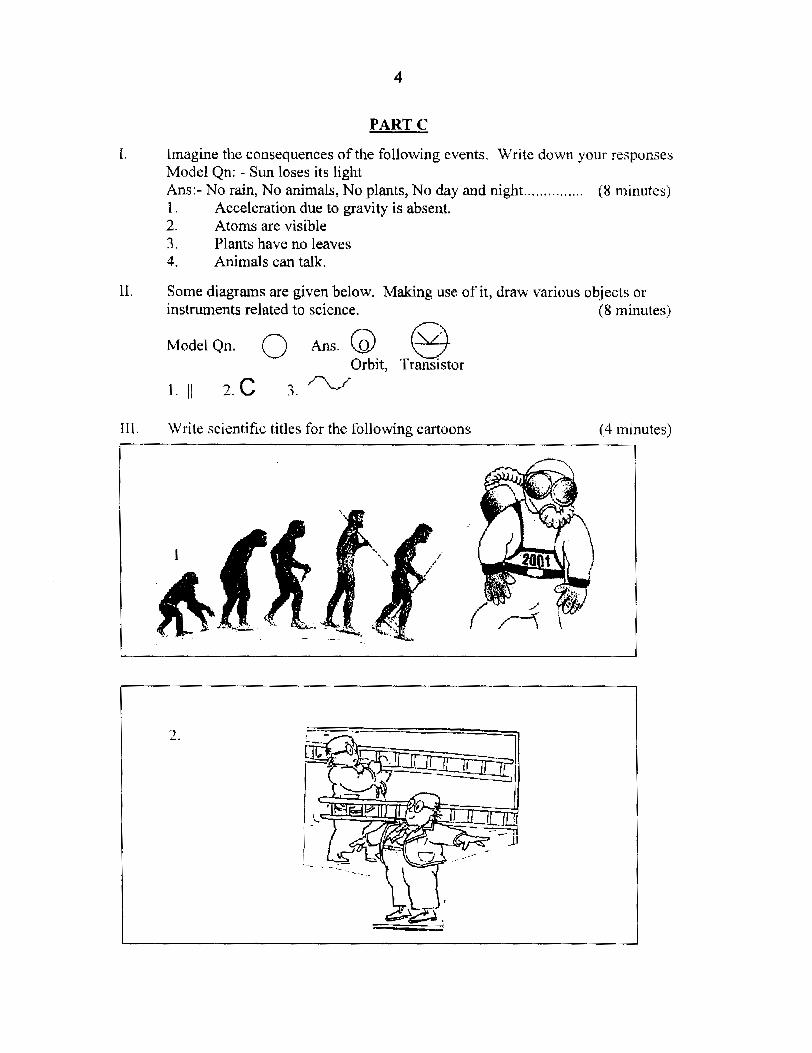
PART C
I. imagine the consequences of the following events. Write down your rcspunses Model Qn: - Sun loses its light Am:- No rain, No animals, No plants, NO day and night. .. . . . . . . . . . . . . (8 minutes) 1 . Acceleration due to gravity is absent. 2. Atoms are visible 3. Plants have no leaves 4. Animals can talk.
I 1 Some diagrams are given below. Making use of it, draw various objects or instruments related to science. (8 minutes)
ModelQn. 0 Ani. @ @ Orbit, Transistor
1 . 1 2.C 3. "d
I I 1 Write scientific titles for the following cartoons (4 minutes) I
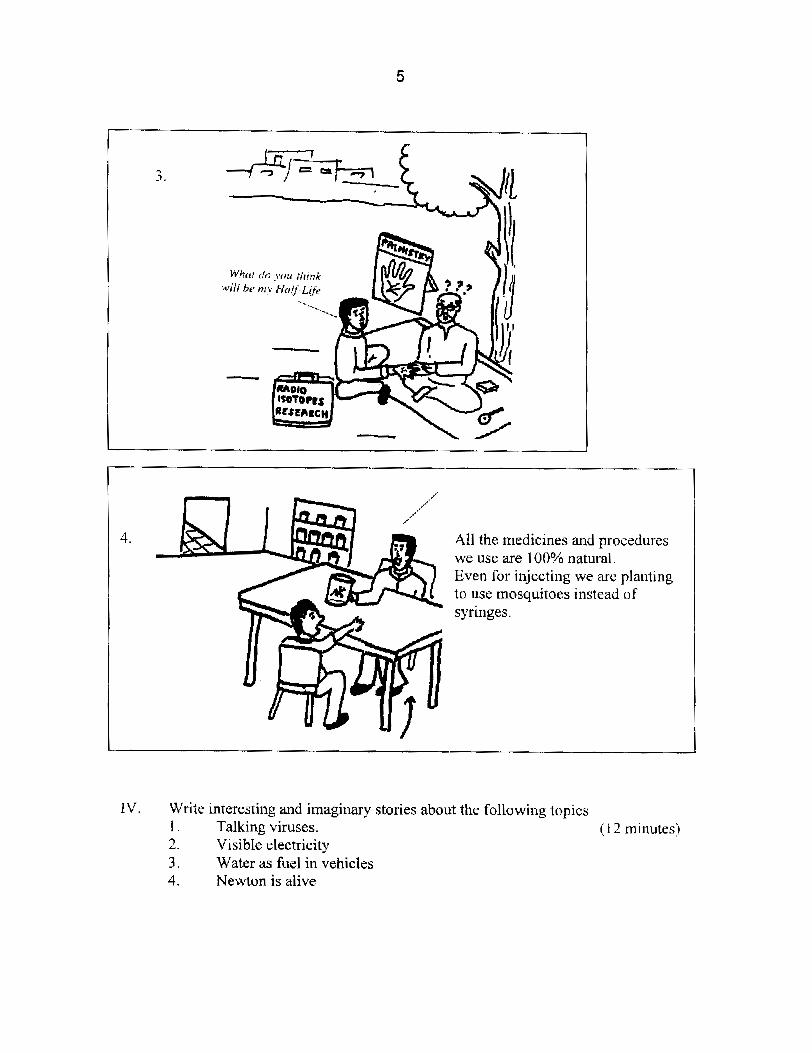
All the medicines and procedures we use are 100% natural. Even for injecting we arc planting to use mosquitoes instead of syringes.
1V. Write interesting and imaginary stories about the following topics 1 . Talking viruses. ( I 2 minutes) 2. VisibIe electricity 3. Water as fuel in vehicles 4. Newton is alive
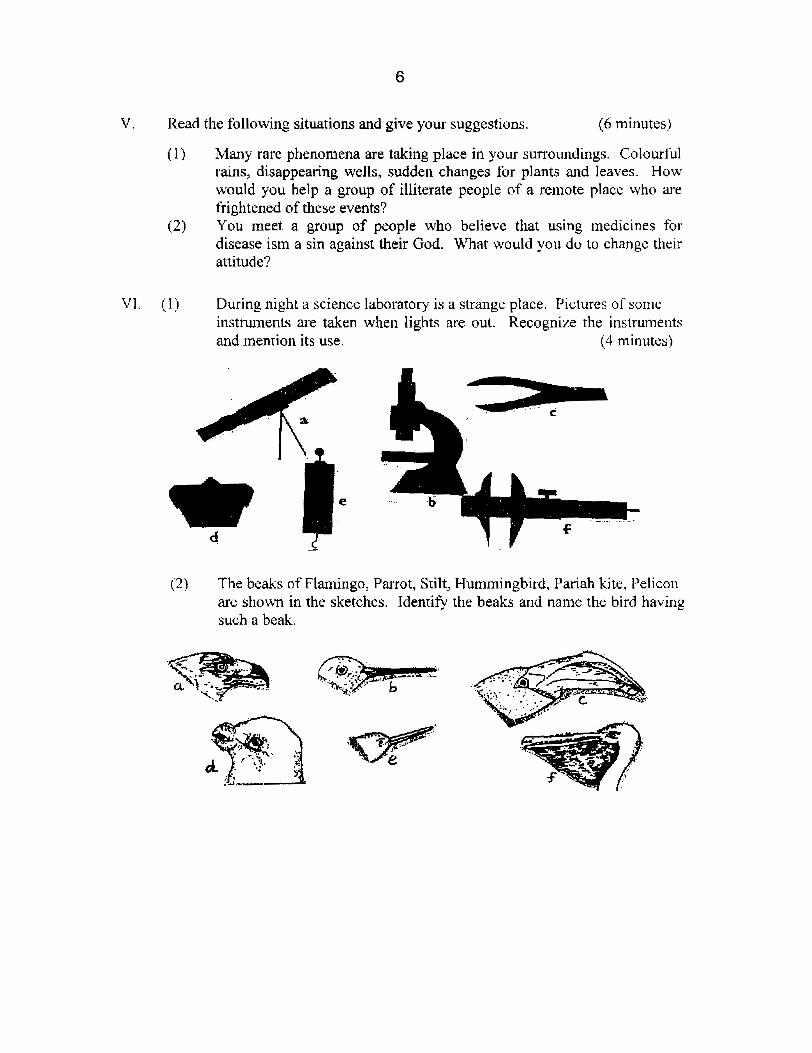
V. Read the following situations and give your suggestions. (6 minutes)
(1) Many rare phenomena are taking place in your surroundings. Colourful rains, disappearing wells, sudden changes for plants and leaves. How would you help a group of iIliterate people of a remote place who are frightened of these events?
(2) You meet a group of people who believe that using medicines for disease ism a sin against their God. What would you do to change their attitude?
Vl. (1) During night a science laboratory is a strange place. Pictures oSsome instruments are taken when lights are out. Recognize the instruments and mention its use. (4 minutes)
(2) The beaks of Flamingo, Parrot, Stilt, Hummingbird, Pariah kite, Pelicoi~ are shown in the sketches. Identify the beaks and name the bird having such a beak.
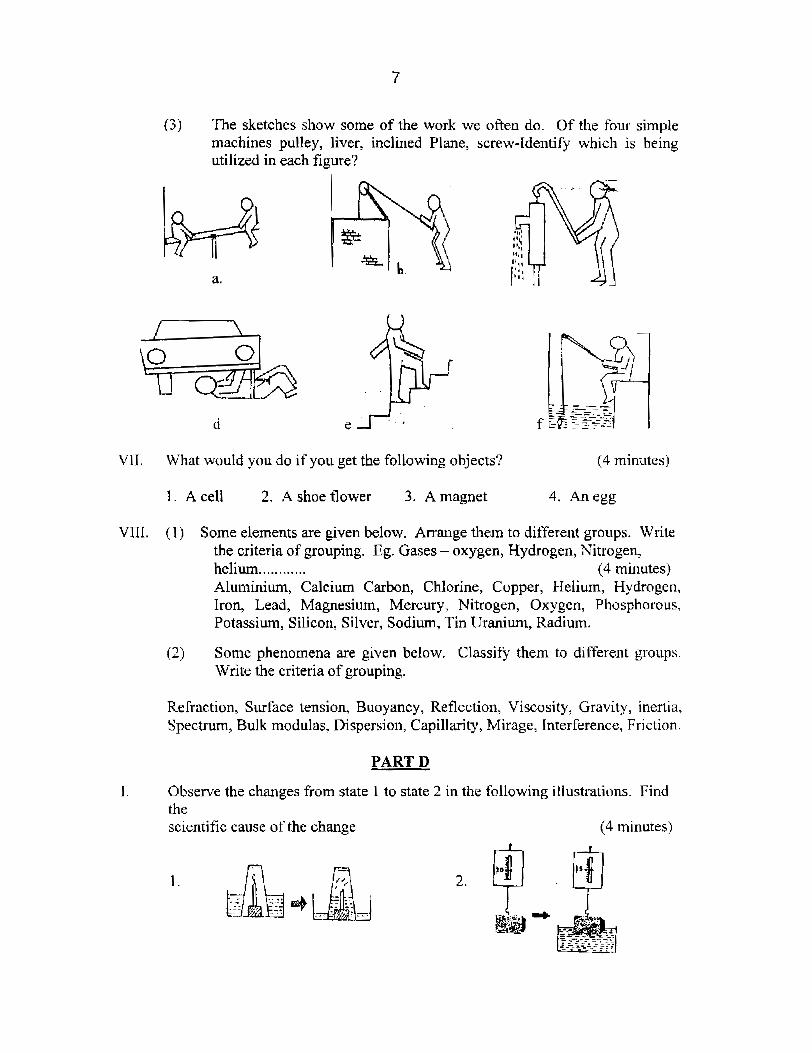
(3) The sketches show some of the work we often do. Of the four simple machines pulley, liver, inclined Plane, screw-Identify which is being utilized in each figure?
VII. What would you do if you get the following objects? (4 minutes)
I . A cell 2. A shoe flower 3. A magnet 4. An egg
VIII. ( 1 ) Some elements are given below. Arrange them to different groups. Write the criteria of grouping. Eg. Gases - oxygen, Hydrogen, Nitrogen, helium.. . .. . . . . . . . (4 minutes) Aluminium, Calcium Carbon, Chlorine, Copper, Helium, Hydrogen, Iron, Lead, Magnesium, Mercury. Nitrogen, Oxygen, Phosphorous, Potassium, Silicon, Silver, Sodium, 'Tin Uranium, Radium.
(2) Some phenomena are given below. Classify them to different groups. Write the criteria of grouping.
Refraction, Surface tension, Buoyancy, Reflection, Viscosity, Gravity, inertia. Spectrum, Bulk modulas, Dispersion, Capillarity, Mirage, Interference. Friction.
PART D
I . Observe the changes from state 1 to state 2 in the following illustrations. Find the scientific cause of the change (4 minutes)
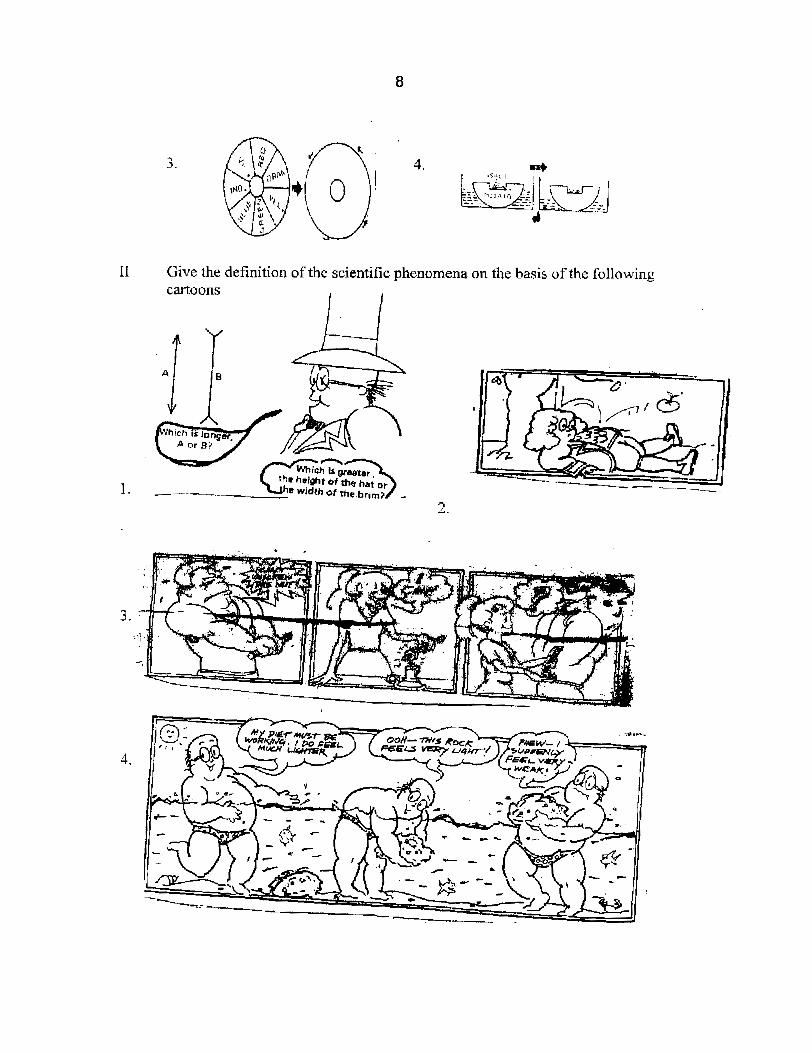
Give the definition of the scientific phenomena cartoons
1 I on the basis of the following
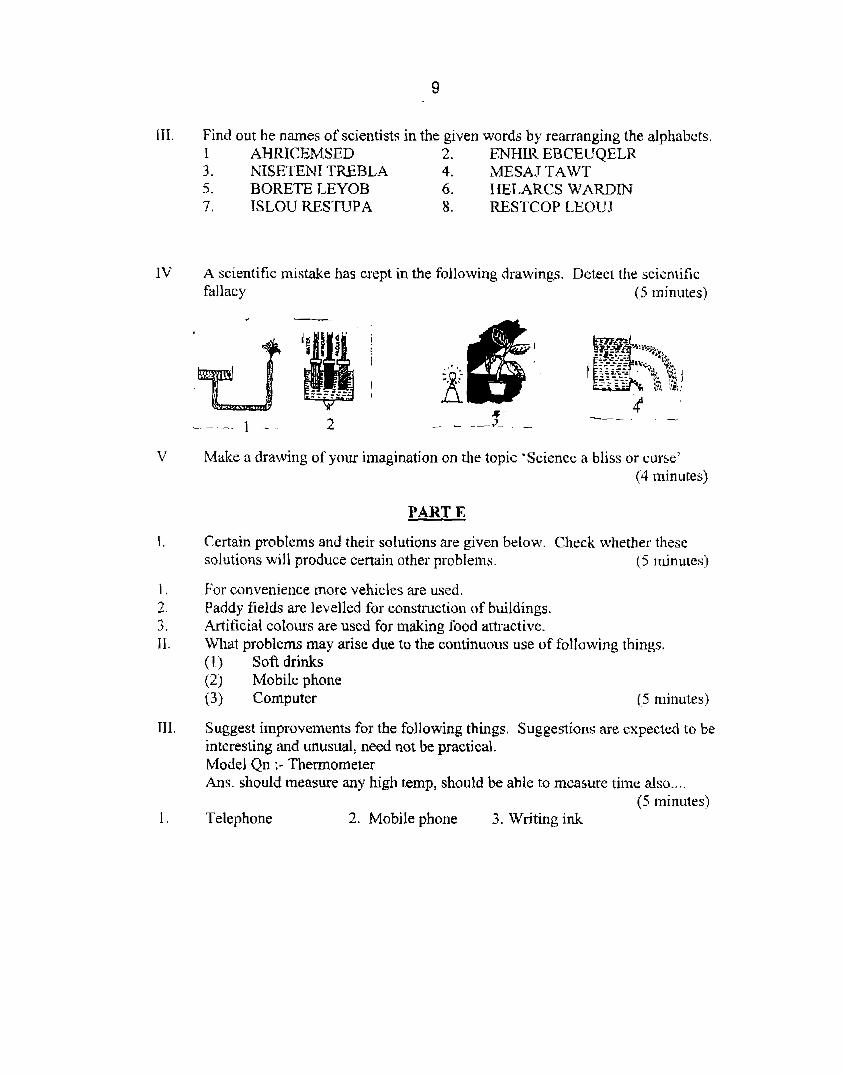
Find out he names of scientists in the given words by rearranging the alphabets. I AHRICEMSED 2. ENHIR EBCEUQELR 3. NISETENI TREBLA 4. MESAJ TAWT 5. BORETE LEYOB 6. HE,LARCS WARDIN 7. ISLOU RESTUPA 8. RESTCOP LEOUJ
A scientific mistake has crept in the following drawings. Detect the scientific fallacy ( 5 minutes)
Make a drawing of your imagination on the topic 'Science a bliss or curse' (4 minutes)
PART E
Certain problems and their solutions are given betow. Check whether these solutions will produce certain other probfems. (5 minutes)
For convenience mare vehicles are used. Paddy fields are levelled for construction of buildings. Artificial colours arc used for making food attractive. What problems may arise due to the continuous use of following things. (1) Soft drinks (2) Mobile phone (3) Computer (5 minutes)
Suggest improvements for the following things. Suggestions are expected to be interesting and unusual, need not be practical. Model Qn :- Thermometer A n s . should measure, any high temp, should be able to measure time also.. . .
( 5 minutes) Telephone 2. Mobile phone 3. Writing ink
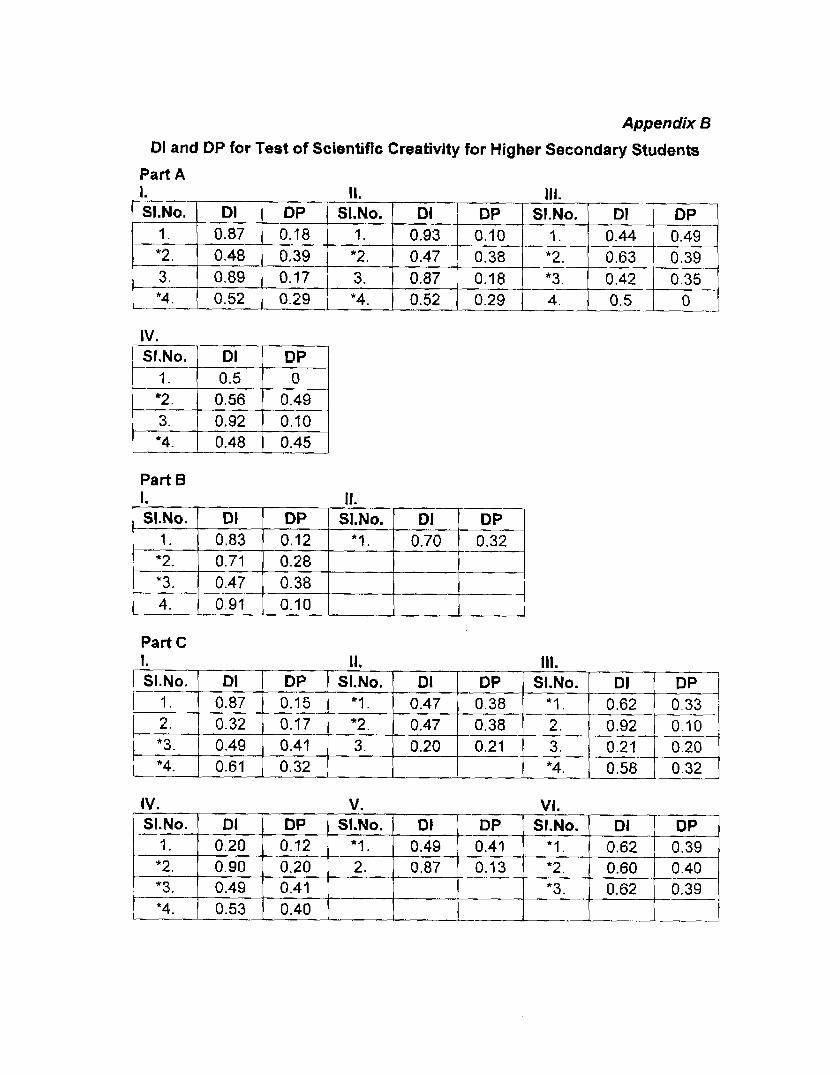
Appendix B
Dl and DP for Test of Scientific Creativity for Higher Secondary Students
Part 6 1.
Part A 1. I I . 111.
If.
SI.No. - 1. *2.
- 3.
-- .. "4.
Part C
Dl 0.87 0.48 0.89 0.52
DP 0.18 0.39 0.17 0.29
SI.No. 1 . *2. 3. *4.
Dl 0.93 0.47
DP 0.10 0.38
SI.No. 1. *2.
0.87 0.18
D I DP 0.44 0.49
*3. 4. 0.52
0.42 0.35 0.5 0.29
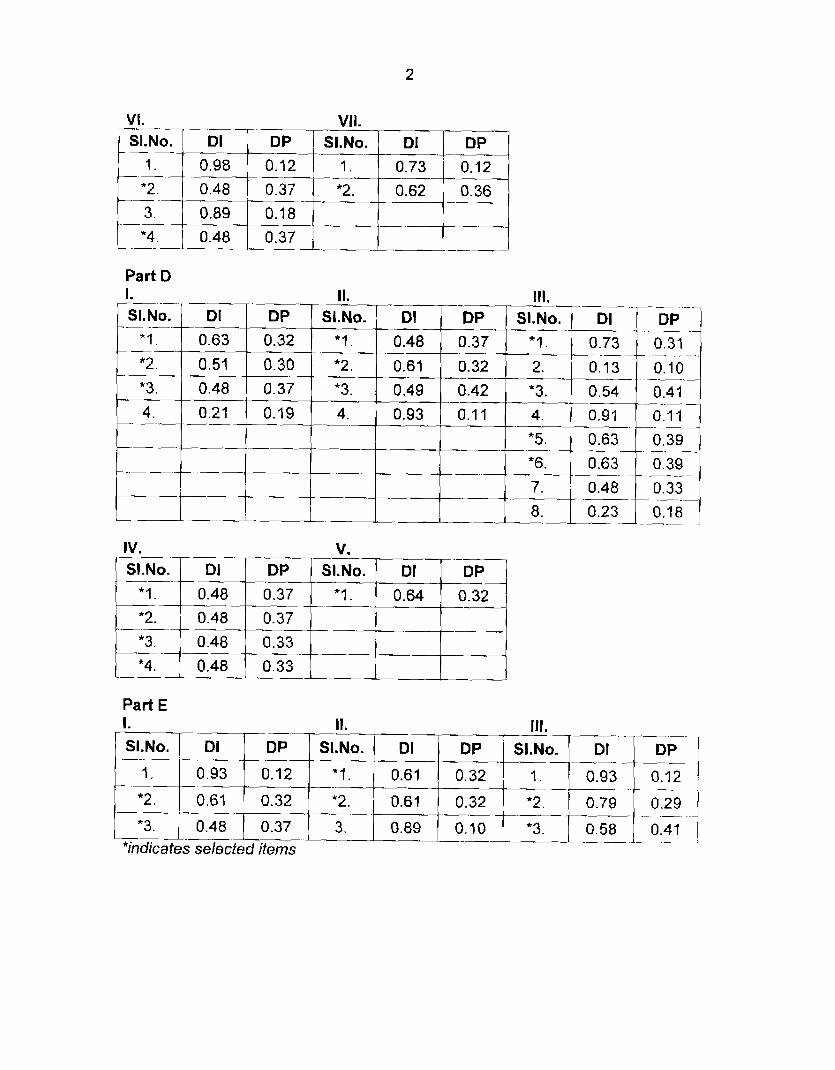
Part E 1. 11. Ill.
JSI.N~.~ -DI~DP~x,.N~. I 1 D ~ O J D ~ -TDP I
Part D 1.
L~I-oTT~TTF~R TG /-;c2;- 1 - - - - - .
0.48 0.37 .- 0.89 0.10 0.58 0.41
-- - --
*indicates selected items
-- - - _ ___ If. - 111. -- DP
0.32
0.30 0.37
0.19
SI.No. * 1 .
"2.
*3.
4. .-
SI.No. Dl -- *I.
"2. -- "3.
4. - -----
-- -
Dl 0.48
0.61
0.49 0.93
0.63
0.51 0.48
0.21
-
-
-
--
- *6. 0.63 0.39 - -- - -- 7. 0.48 0.33
8. 0.23 0.18 ---
DP 0.37
0.32
0.42
0.1?
SI.No. Dl DP -- *I. 0.73 0.31
-
2. 0.13 0.10
*3. 0.54 0.41 -- -
4. 0.91
*5. 0.63 0.39 - --
Appendix C
TEST OF SCIENTIFIC CREATIVITY
FOR
I HIGHER SECONDARY SCHOOL STUDENTS
(FINAL TEST)
Dr. P.M. Jaleel
and
Rosamma Philip
School of Pedagogical Sciences
Mahatma Gandhi University
Kottayam
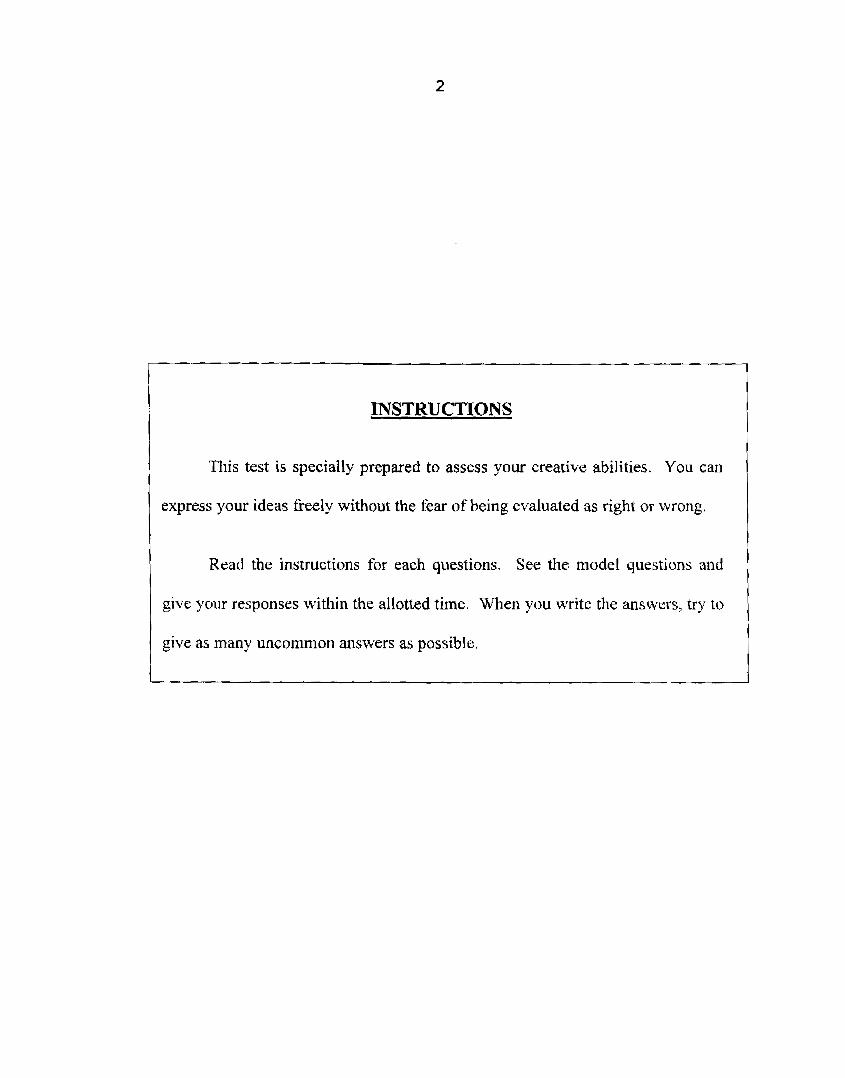
INSTRUCTIONS
This test is specially prepared to assess your creative abilities. You can
express your ideas freely without the fear of being evaluated as right or wrong.
Read the instructions for each questions. See the model questions and
give your responses within the allotted time. When you write the answers, try to
give as many uncommon answers as possible.
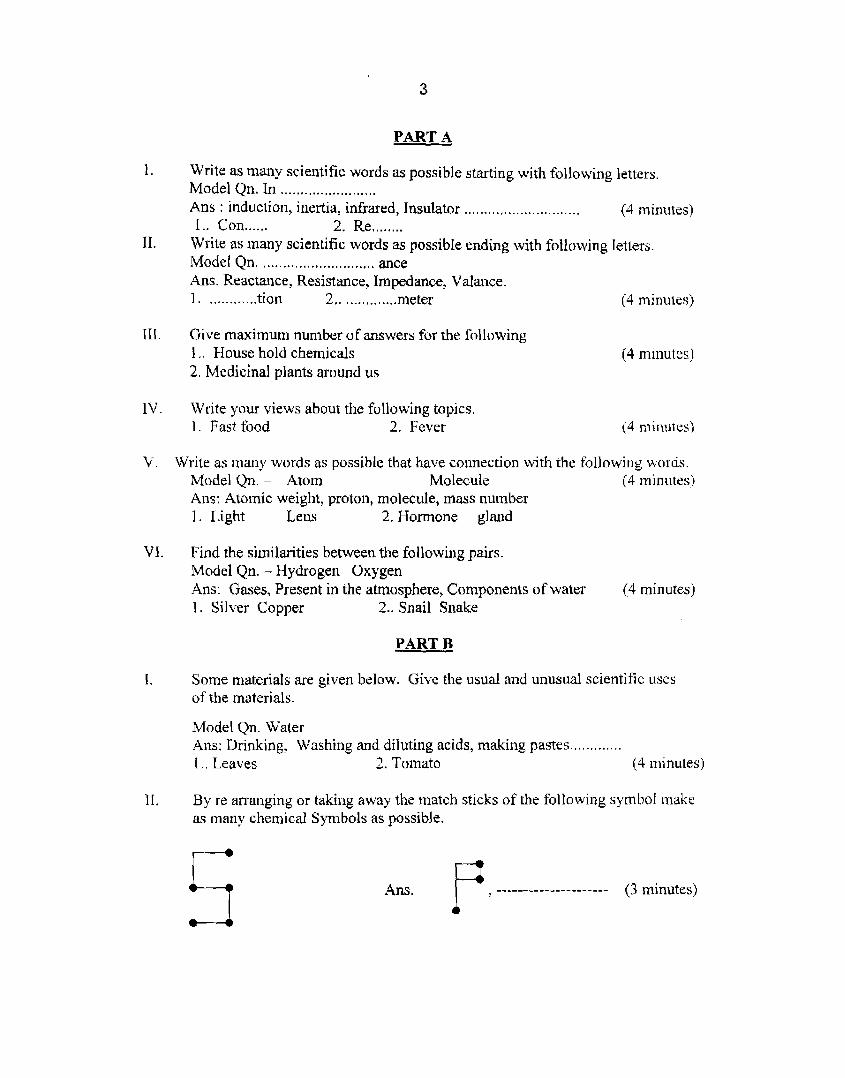
PART A
1. Write as many scientific words as possible starting with following letters. .................... Model Qn. In .,,.
Ans : induction, inertia, infrared, Insulator ............................. (4 minutes) I.. Con ...... 2. Re ........
11. Write as many scientific words as possible ending with following Ietlers. Model Qn. ............................ ance Ans. Reactance, Resistance, Impedance, Valance. 1 ........... ..tion 2.. ............. meter (4 minules)
111. Give maximum number of answers for the following 1.. House hold chemicals (4 minutes) 2. Medicinal plants around us
IV. Writc your views about the following topics. 1. Fast food 2. Fever (4 minutes)
V. Write as many words as possible that have connection with the following words. Model Qn. - Atom Molecule (4 minutes) Ans: Atomic weight, proton, molecule, mass number 1. Light Lens 2. Hormone gland
VI. Find the similarities between the following pairs. Model Qn. - Hydrogen Oxygen Ans: Gases, Present in the atmosphere, Components of water (4 minutes) 1 . Silver Copper 2.. Snail Snake
PART B
I . Some materials are given below. Give the usual and unusual scientific uses of the materials.
Model Qn. Water ............. Arts: Drinking, Washing and diluting acids, making pastes
I.. Leaves 2. Tomato (4 minutes)
11. By re arranging or taking away the match sticks of he following symbol make as many chemical Symbols as possible.
Ans . --------------------- (3 minutes)
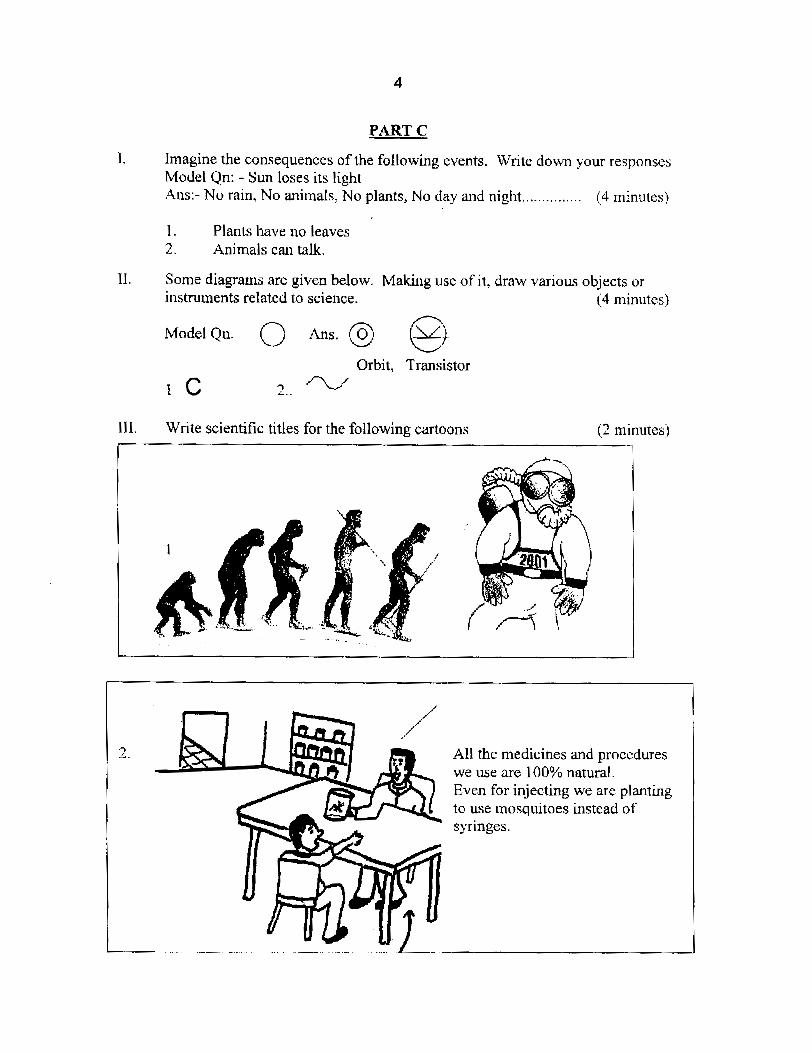
PART C
I. Imagine the consequences of the following events. Write down your responses Model Qn: - Sun loses its light
V
Ans:- No rain, No animals, No plants, No day and night ............. . (4 minutes)
1 . Plants have no leaves 2. Animals can talk,
11. Some diagrams are given below. Making use of it, draw various objects or instruments related to science. (4 minutes)
Model Qn. 0 hi. @ @) Orbit, Transistor
I C 2.. '-'.-,' 111. Write scientific titles for the following cartoons (2 minutes)
C I
All the medicines and proccdures we use are 100% naturai. Even for injecting we are planting to use mosquitoes instead oi' syringes.
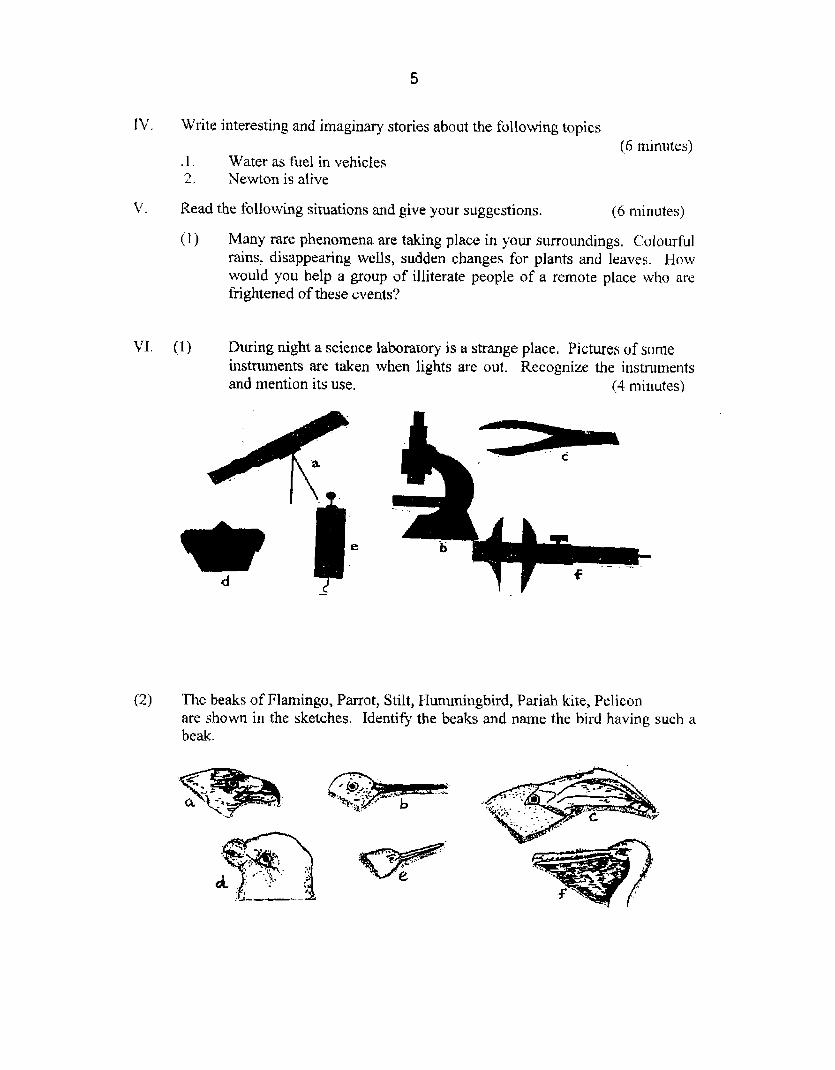
IV. Write interesting and imaginary stories about the following topics (6 minutes)
- 1 . Water as fuel in vehicles 2. Newton is alive
V . Read the following situations and give your suggestions. (6 minutes)
( 1) Many rare phenomena are taking place in your surroundings. Colourful rains, disappearing wells, sudden changes for plants and leaves. How would you help a group of illiterate people of a remote place who are frightened of these events?
VI. ( I ) During night a science laboratory is a strange place, Pictures of some instruments are taken when lights are out. Recognize the instruments and mention its use. (4 minutes)
(2) The beaks of Flamingo, Parrot, Stilt, Hummingbird, Pariah kite, Pelicon are shown in the sketches. Identify the beaks and name the bird having such a beak.
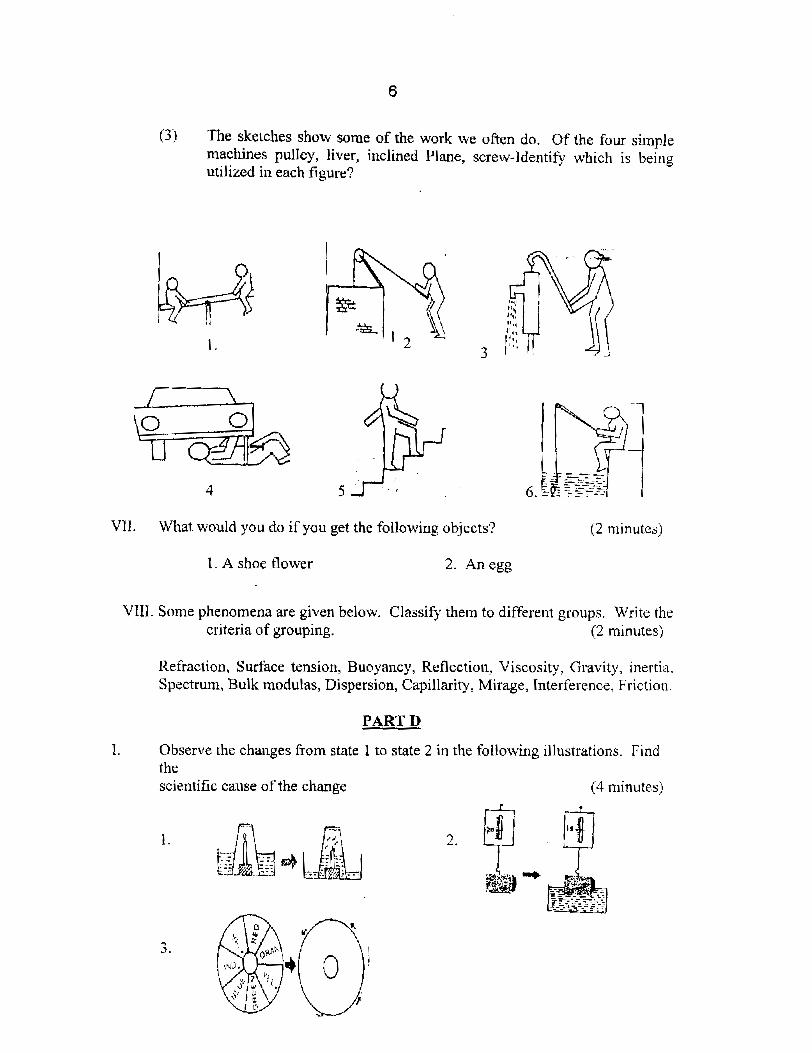
(3) The sketches show some of the work we often do. Of the four simple machines pulley, liver, inclined Plane, screw-identify which is being utilized in each figure?
VI I . What would you do if you get the following objects? (2 minutes)
I . A shoe flower 2. An egg
VII1. Some phenomena are given below. Classify them to different groups. Write the criteria of grouping. (2 minutes)
Kefraction, Surface tension, Buoyancy, Re,flection, Viscosity, Gravity, inertia. Spectrum, Bulk modulas, Dispersion, Capillarity, Mirage, Interference, Friction.
PART D
I . Observe the changes horn state 1 to state 2 in the following illustrations. Find the scientific cause of the change (4 minutes)
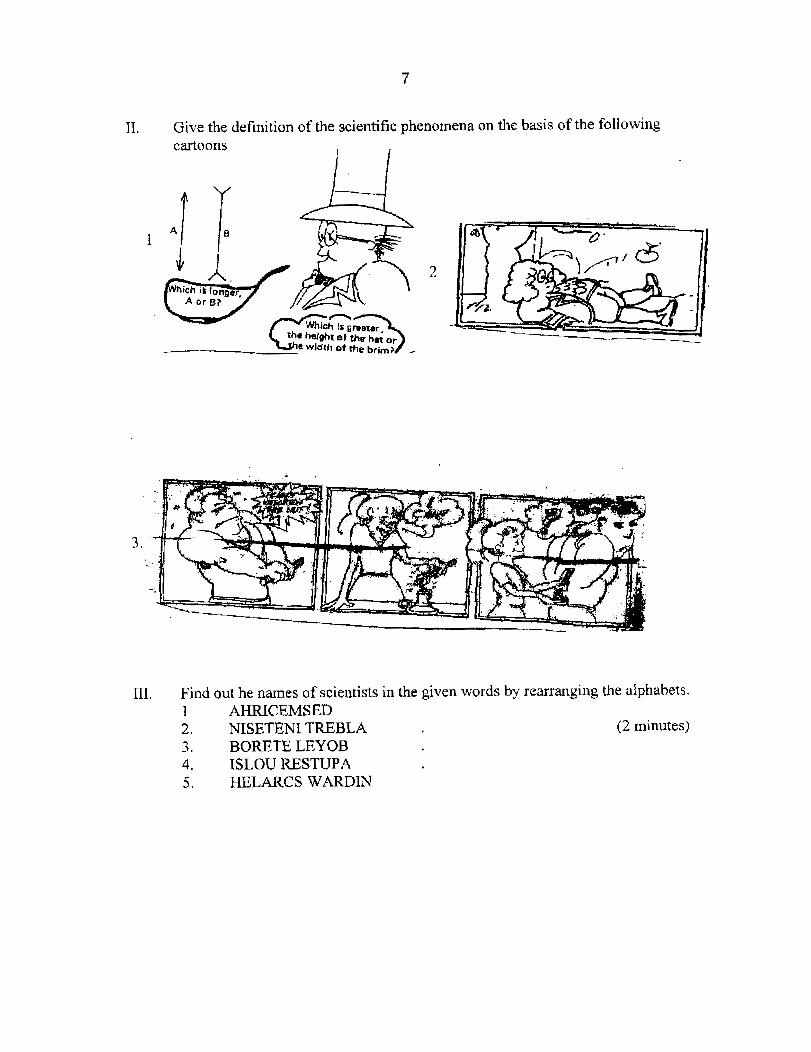
11. Give the definition of the scientific phenomena on the basis of the following cartoons
2
111. Find out he names of scientists in the given words by rearranging the alphabets. 1 AHRICEMSED 2. NISETENI TREBLA (2 minutes) 3. BORETE LEYOB 4. ISLOU RESTUPA 5 . HELARCS WARDJN
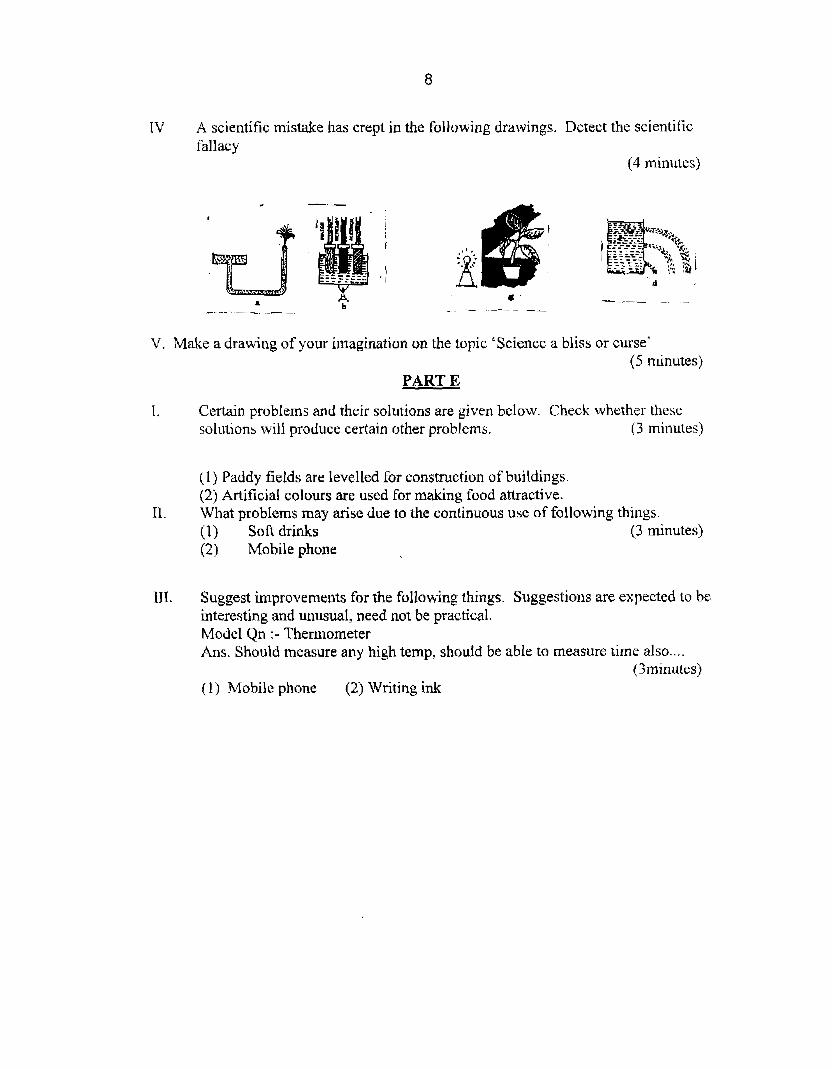
IV A scientific mistake has crept in the following drawings. Detect the scientific fallacy
(4 minutes)
V. Make a drawing of your imagination on the topic 'Science a bliss or curse' (5 minutes)
PART E
I. Certain problems and their solutions are given below. Check whether these solutions will produce certain other problems. (3 minutes)
(1) Paddy fields are levelled for construc,tion of buildings. (2) Artificial colours are used for making food attractive.
II. What problems may arise due to the continuous use of following things. (I) Soft drinks (3 minutes) (2) Mobile phone
111. Suggest improvements for the following things. Suggestions are expected io be interesting and unusual, need not be practical. Model Qn :- Thennometer Ans. Should measure any high temp, should be able to measure time also.. . .
(3rninutes) (1) Mobile phone (2) Writing ink
Appendix D
KERALA UNIVERSITY GROUP TEST OF INTELLIGENCE
GENERAL INSTRUCTIONS
This test is designed to measure your general mental ability. There are
four types of problems in this test. You have twenty problems under each type.
Mark your answers only in the answer sheet given and not on the test booklet.
(Turn the page only when you are asked to)
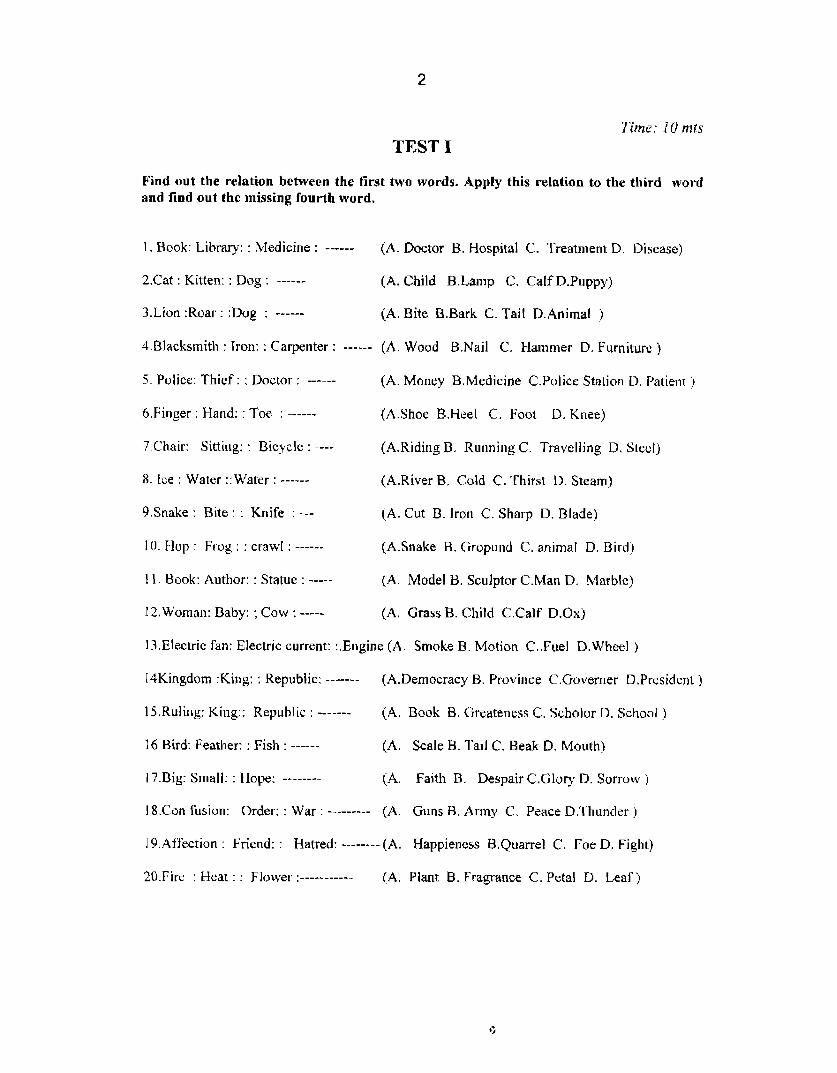
Time: 10 mls TEST I
Find out the relation between the first two words. Apply this relation to the third word and find out the missing fourth word.
I . Book: Library: : Medicine : ------ (A. Doctor B. Hospital C. Treatment D. Disease)
2.Cat : Kitten: : Dog : ------ (A. Child B.Lamp C. Calf D.Puppy)
3 .Lion :Roar : :Dog : ------ (A. Bite &Bark C. Tail D.Animal )
4,Blacksmith : Iron: : Carpenter : ------ (A. Wood B.Najl C. Hammer D. F~lrniturc )
5. Police: Thief : : Doctor : ------ (A. Money B.Medicine C.Police Station D. Patient )
6.Finger : Hand: : Toe : ------ (A.Shoe B.Heel C. Foot D. Knee)
7.C'hair: Sitting: : Bicycle : ---- (A.Riding 0. Running C. Travelling D. Stec I )
8 . ice : Water ::Water : ------ (A-River B. Cold C. Thirst D. Steam)
9.Snake : Bite : : Knife : --- (A. Cut B. Iron C. Sharp D. Blade)
10. I-Iop : Frog : : craw[ : ------ (A.Snake B. (iropund C. animal D. Bird)
1 1 . Book: Author: : Statue : ----- (A. Model B. Sculptor C.Man D. Marble)
12. Woman: Bahy: ; Cow : ----- (A. Grass B. C:hild C.Calf D.Ox)
13 .Electric fan: Electric current: :.Engine (A. Smoke B. Motion C. .Fuel D.Whee1 )
I4Kingdom :King: : Republic: ------- (AnDemocracy B. Province C.Governer D.President )
15,RuIing: King: : Republic : ------- (A. Book B. Cheateness C. Scholor D. School )
16 Bird: Feather: : Fish : ------ (A. Scale 13. Tail C. Beak D. Mouth)
17.Big: Small: : Hope: -------- (A. Faith B. Despair C.Glory D. Sorrow )
I8.Con fusion: Order: : War : --------- (A. Guns B. Army C. Peace D.'Thunder )
I9.Affection : Friend: : Hatred: -------- (A. Happieness B.Quarrel C. Foe D. Fight)
20.Fi1-e : Heat : : Flower :----------- (A. Plant B. Fragrance C. Petal D, Leaf )
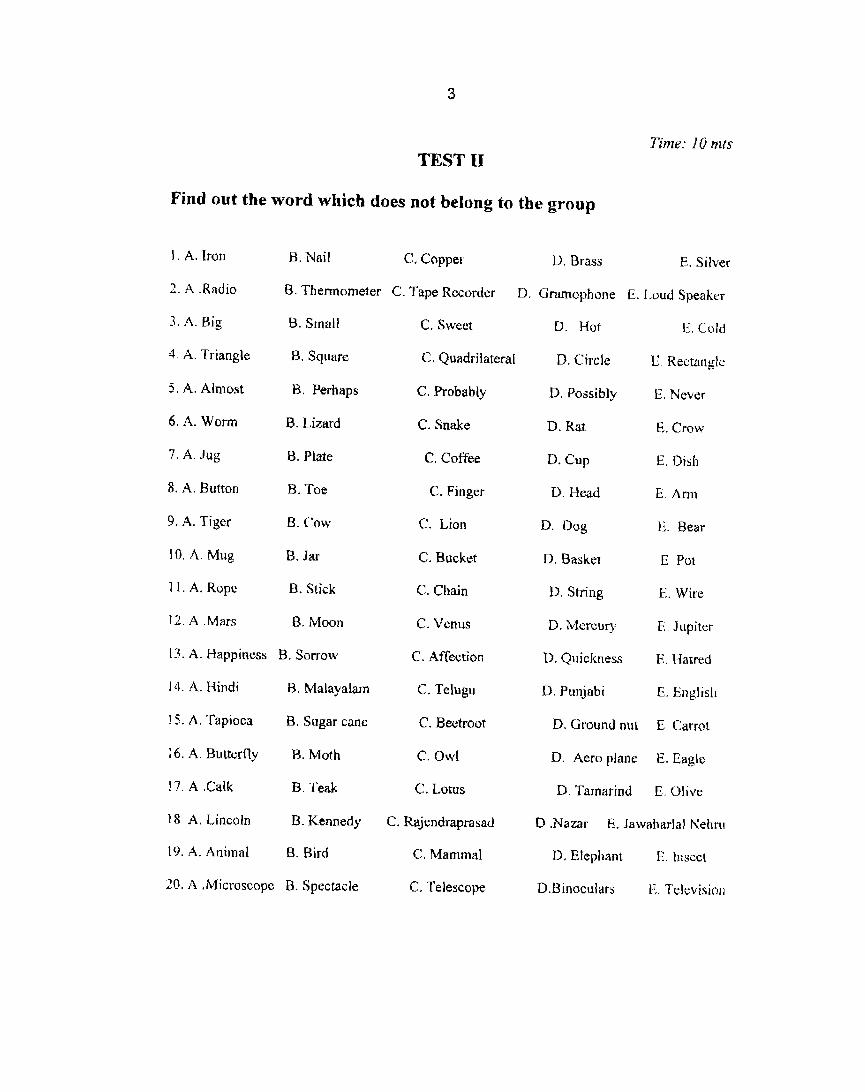
Time: 10 mls TEST I1
Find out the word which does not belong to the group
1 . A. Iran B. Nail C. Copper D. Brass E. Silver
2. A .Rnd io B. Thermometer C. Tape Recorder D. Gramophone E. I'oud Speaker
3 . A. Big B. Small C. Sweet D. Iiot I<. Cold
4 A. Triangle 0. Square C. Quadrilateral D. Circle E. Rectangle
5 . A. Almost €3. Perhaps C. Probably D. Possibly E. Never
6 . A. Worm B. Lizard C. Snake D. Rat E. Crow
7 . A. Jug B. Plate C. Coffee 0. Cup E. Dish
8. A. Button B. Toe C. Finger D. Head E. Arn~
9. A. Tiger B. Cow C. Lion D. Dog F,. Bear
10. A. Mug B. Jar C. Bucket D. Basket E Pot
I I . A. Rope B. Stick C. Chain D. String E. Wire
12. A .Mars B. Moon C. Venus D. Mercury F.. Jupiter
13. A. Happiness B. Sorrow C . Affection D. Quickness E. Hatred
14. A. Hindi B. Malayalam C. Telugu D. Punjabi E. English
1 5. A. Tapioca B. Sugar cane C. Beetroot D. Ground nut E. Carrot
16. A. Butterfly B. Moth C. Owl D. Aero plane E . Eagle
17. A .Calk B. Teak C. Lotus D. Tamarind E. Olive
18 A. Lincoln B. Kennedy C. Rajendraprasad D .Nazar E. Jawaharlal Nehru
19. A. Animal B. Bird C . Mammal D. Elephant E. btsect
20. A .Microscope B. Spectacle C. Telescope D.Binoculars I! . Television
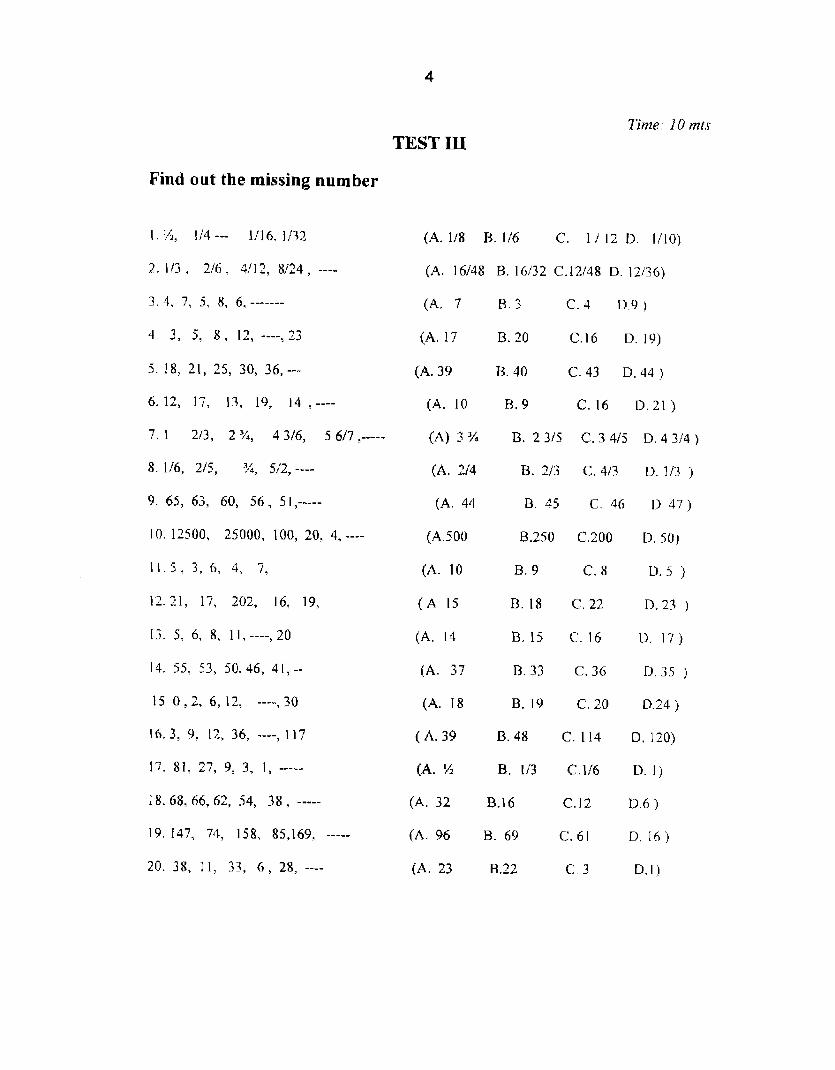
Tinze: I0 rnis
TEST XI1
Find out the missing number
(A.1/8 B . t / 6 C. 1 / 1 2 D . 1/10)
(A. 16/48 B. 16/32 C.12/48 D. 12/36)
3 (A. / B. 3 C. 4 D.4 }
(A. 17 B. 20 C.16 D. 19)
(A. 39 B. 40 C. 43 D. 44 )
(A. 10 R. 9 (2.16 D . 2 1 )
(A) 3 % 8. 2 3/5 C. 3 4/5 D. 4 3/4 )
(A. 2/4 B.2 /3 C.4/3 U . 1 ! 3 )
(A. 34 B. 45 C. 46 I?. 4 7 )
(A.500 B.250 C.200 D. 50)
(A. 10 B. 9 C. 8 D . 5 )
( A 15 B . I ~ c . 22 n. 23 )
(A. 14 B.15 C.16 TI. 17)
(A. 37 R . 33 C. 36 n. 3s )
(A. 18 B. 19 C . 20 D.24 )
( A. 39 B. 48 C. 114 D. 120)
(A. L/z B. I/3 C.1/6 D. I )
(A. 32 B. 16 C . 12 U.6 )
( A . 9 6 B . 6 9 C:. 6 1 D. 16)
(A. 23 B.22 C. 3 D.1)
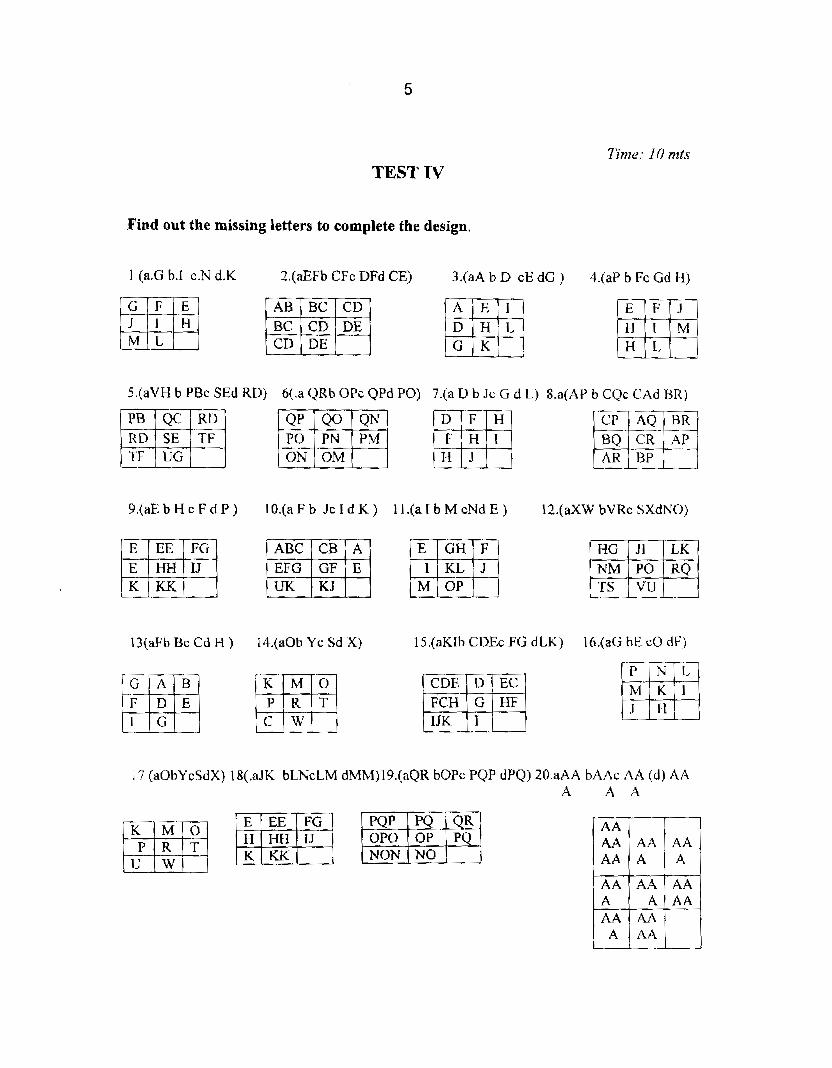
TEST IV
Find out the missing letten to complete the design.
I (a.G 6.1 c.N d.K Z.(aEFb CFc DFd CE) 3.(aA b D cE dG ) 4.(aP b Fc Gd N)
5.(aVH b PRc SEd RD) 6(.a QRb OPc QPd PO) 7.(a D b Jc G d L) 8.a(AP b CQc CAd BR)
pJ%j - R- zj" 9 . (aEbHc F d P ) lO.(aF b Jc I d K ) l l .(aI b M c N d E ) 12.(aXW bVRc SXdNO)
EFG GF E Eiz 15.(aKlb CDEc FG dLK) 16.(aG bE cO dF)
1 7 (aObYcSdX) 18(.aJK bLNcLM dMM)19.(aQR bOPc POP dPQ) 2O.aM M A C AA (d) AA A A A
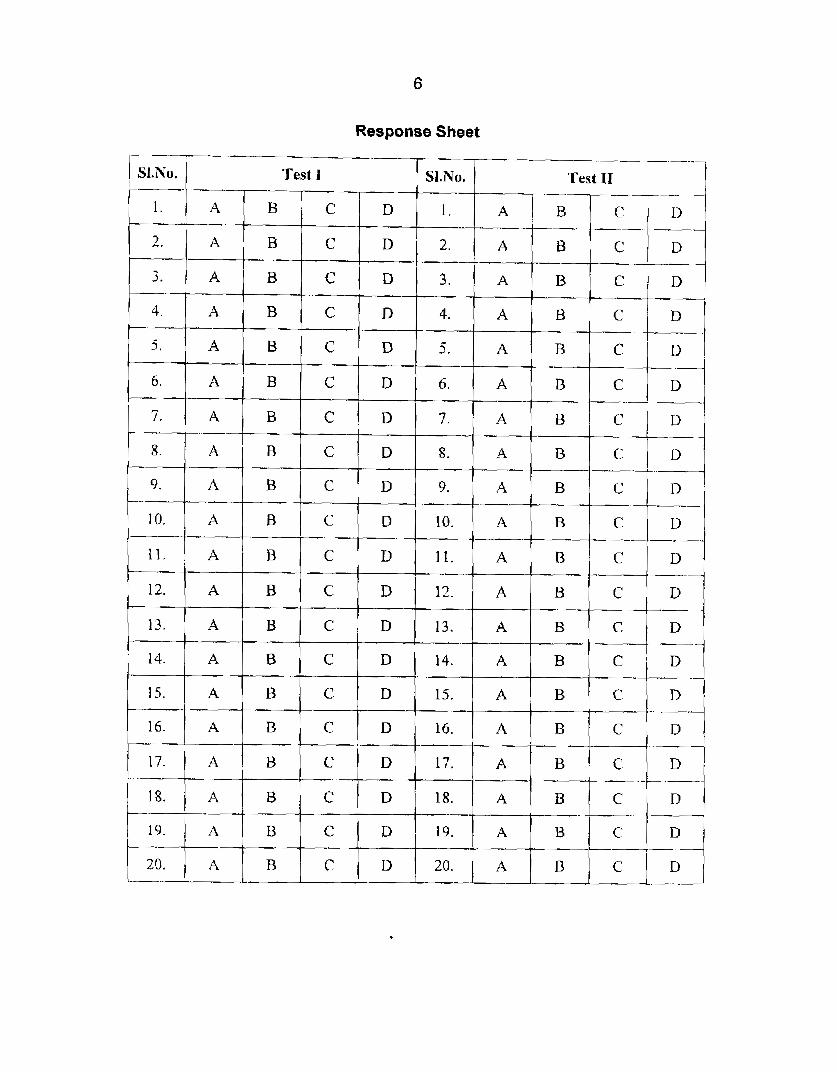
Response Sheet
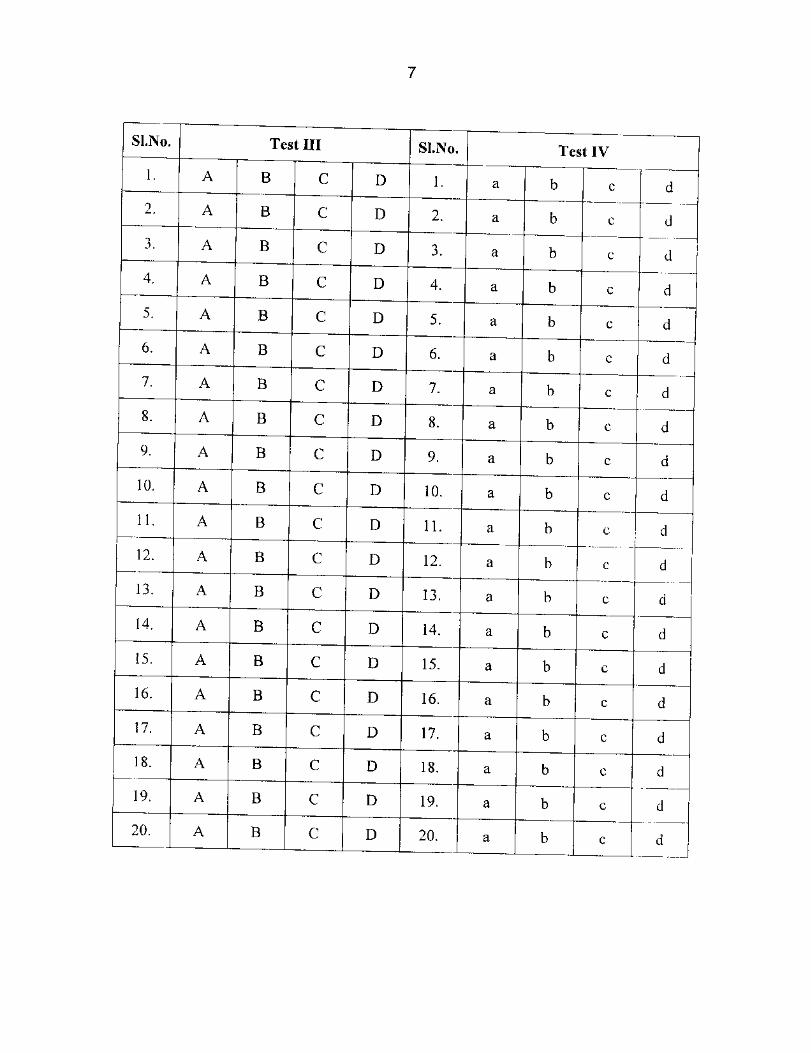
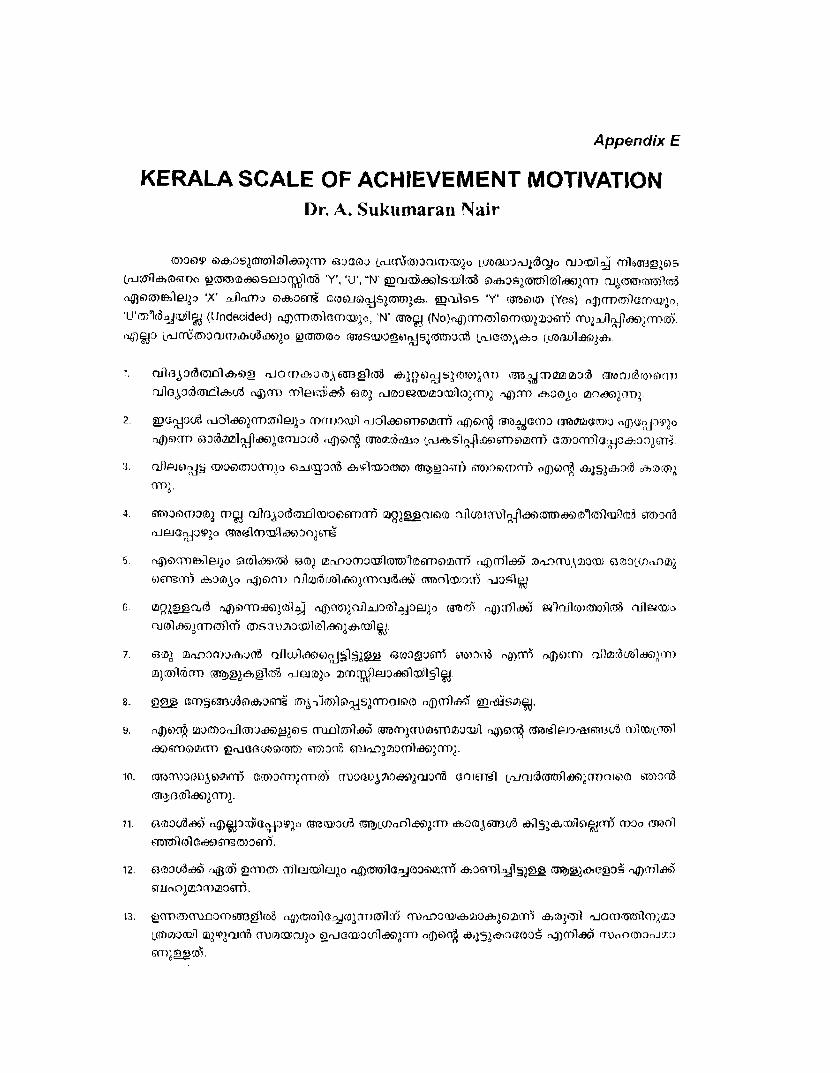
Appendix E
KERALA SCALE OF ACHIEVEMENT MOTIVATION Dr. A. Sukumaran Nair
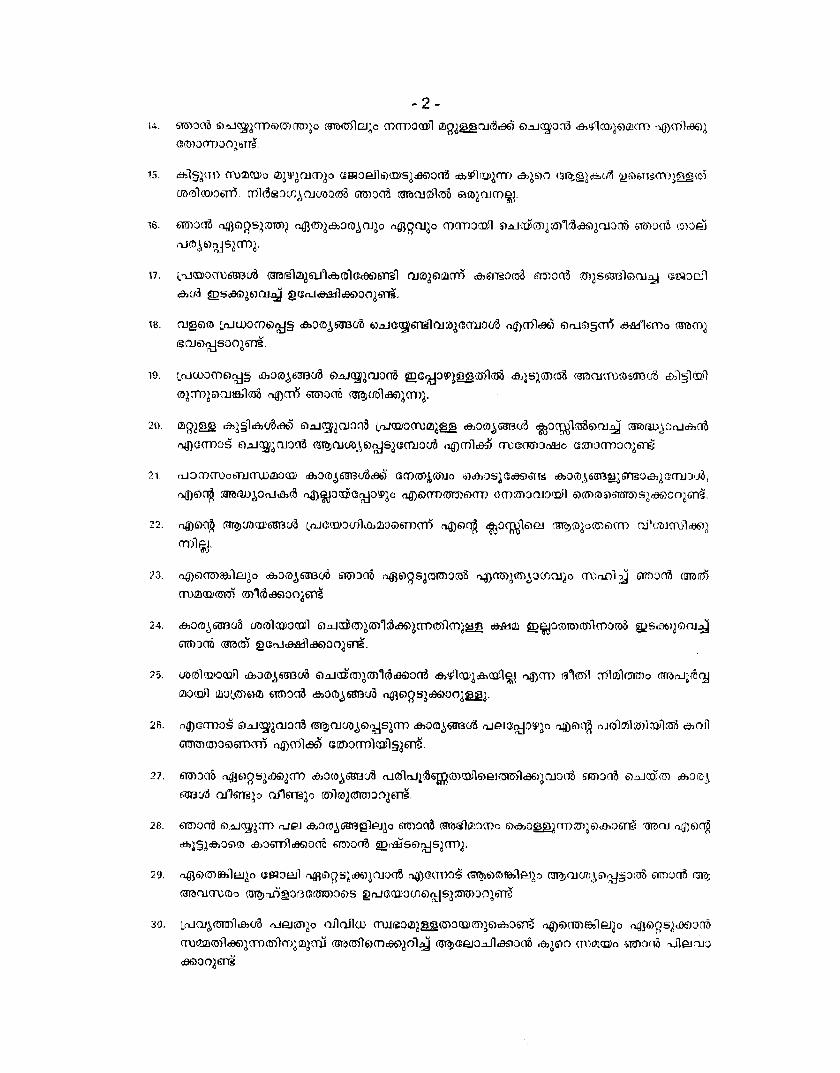
'OF.
'6Z
'82
'LZ
'9 2
32
'VZ
'EZ
'ZZ
'12
'02
'61
'81
' LL
'91
'SL
-1'1
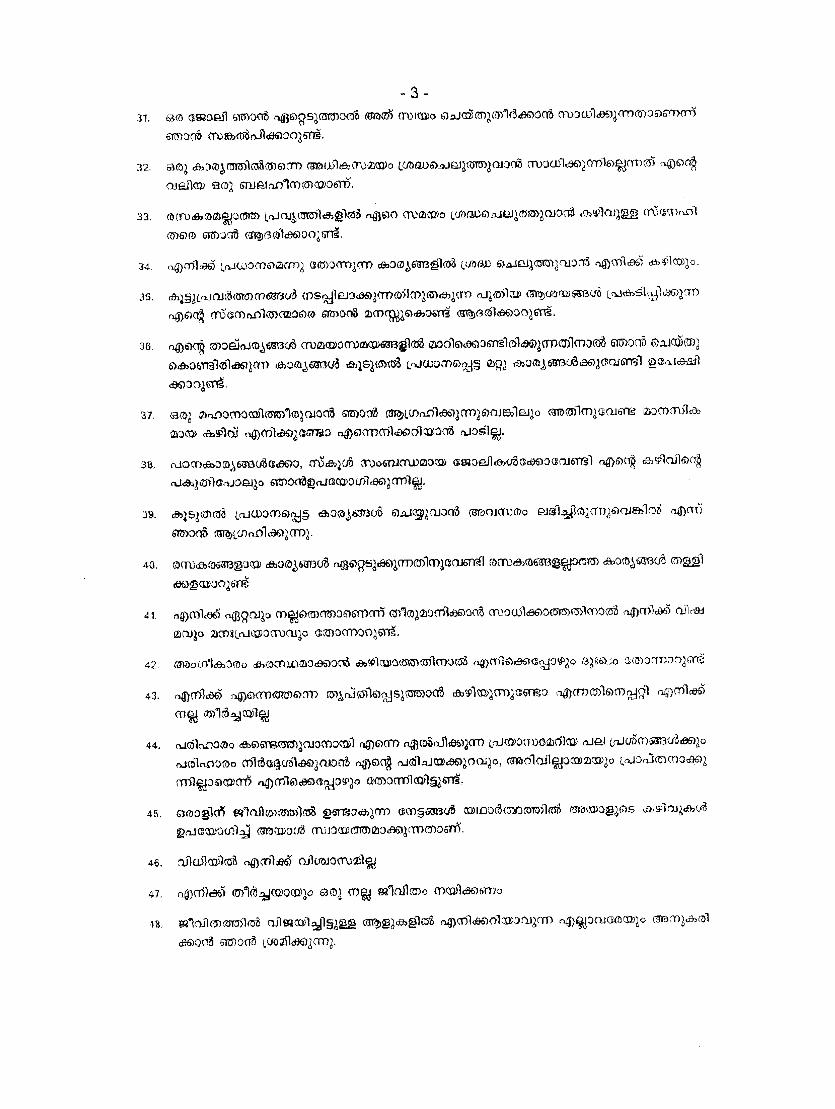
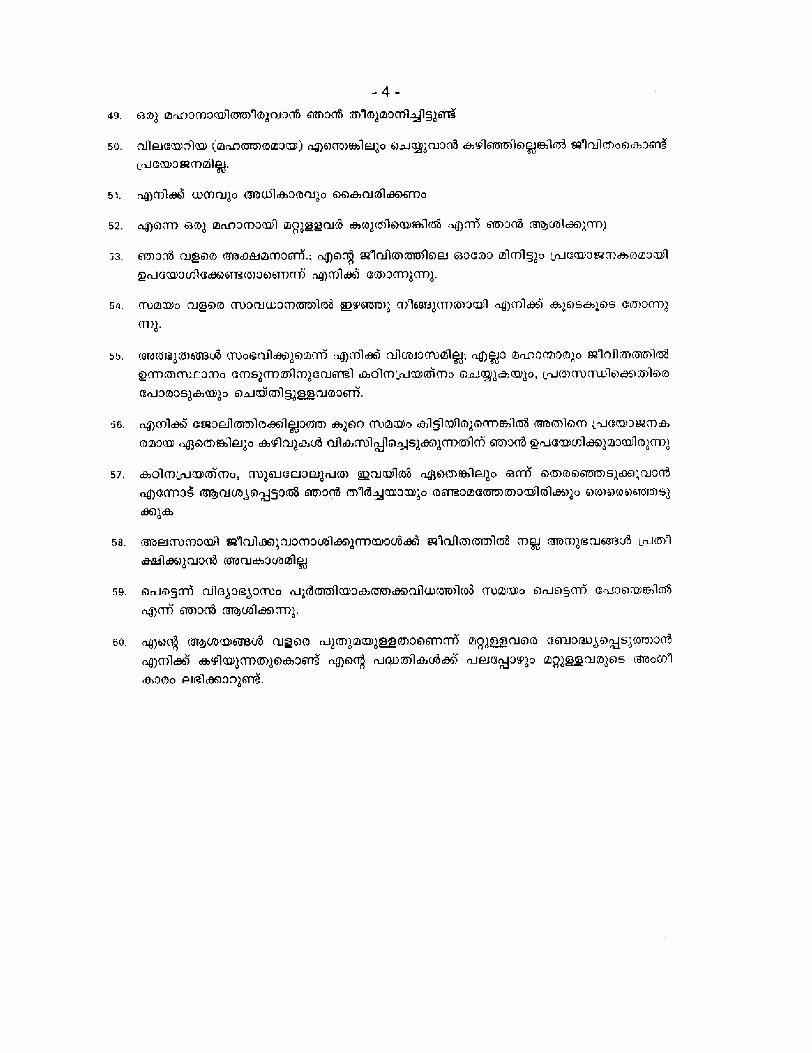
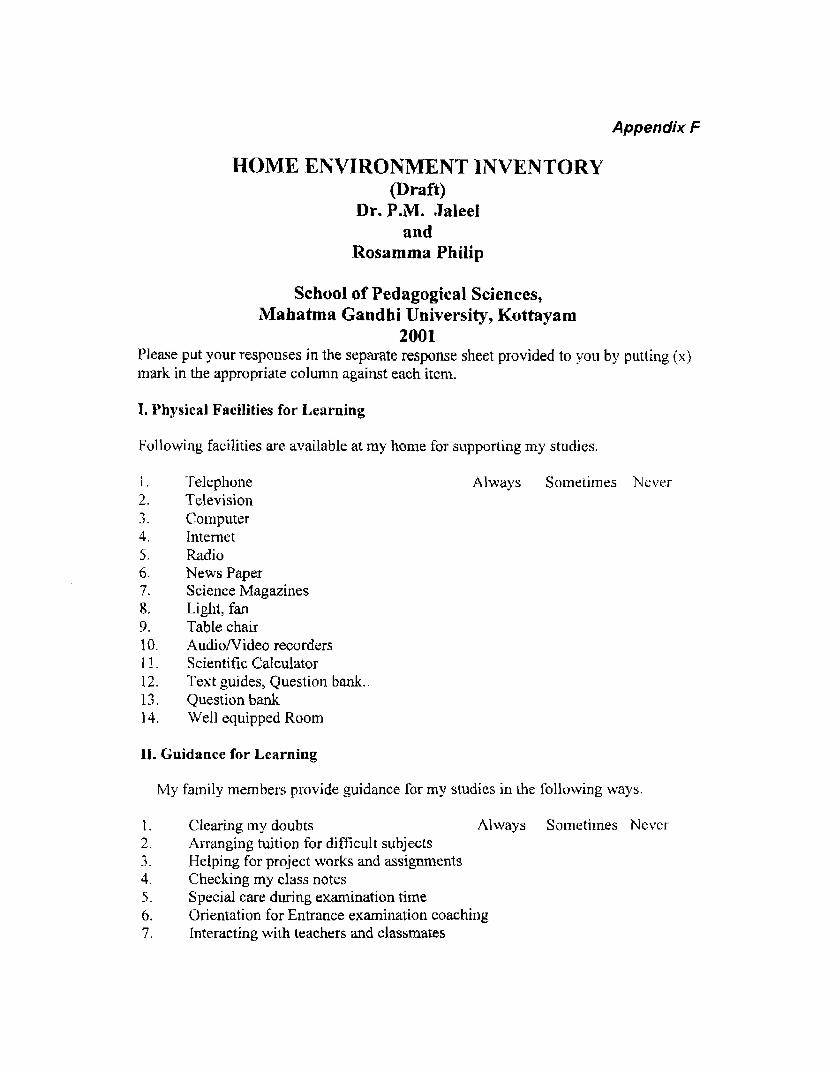
Appendix F
HOME ENVIRONMENT 1NVENTORY (Draft)
Dr. P.M. JaleeI and
Rosamma Philip
School of Pedagogical Sciences, Mahatma Gandhi University, Kottayam
2001 Please put your responses in the separate response sheet provided to you by putting (x) mark in the appropriate column against each item.
I. Physical Facilities for Learning
Following facilities are available at my home for supporting my studies.
Telephone Television Computer Internet Radio News Paper Science Magazines Light, fan Table chair Audio/Video recorders Scientific Calculator Text guides, Question bank.. Question bank Well equipped Room
Always Sometimes Ncver
11. Guidance for Learning
My family members provide guidance for my studies in the following ways.
I . Clearing my doubts Always Sometimes Nevcr 2. Arranging tuition for difficult subjects 3. Helping for project works and assignments 4. Checking my class notes 5 . Special care during examination time 6. Orientation for Entrance examination coaching 7 . Interacting with teachers and classmates
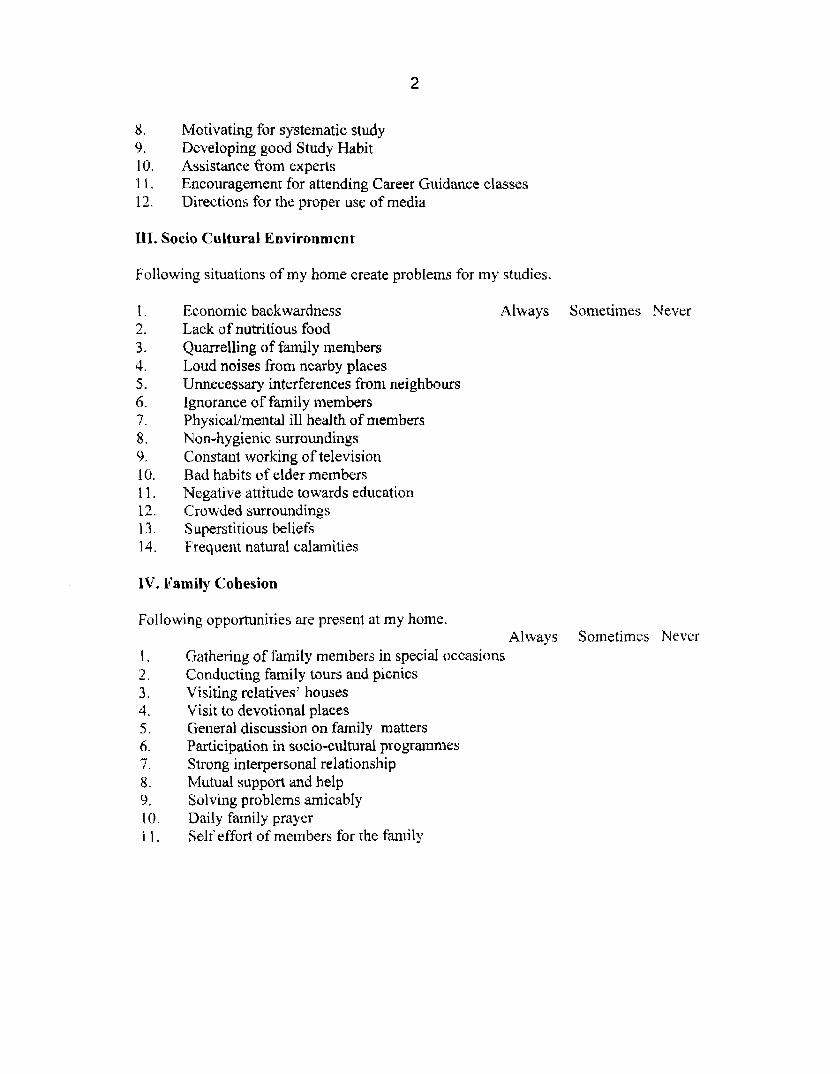
8. Motivating for systematic study 9. Developing good Study Habit 10. Assistance from experts 1 I . Encouragement for attending Career Guidance classes 12. Directions for the proper use of media
111. Socio Cultural Environment
Following situations of my home create problems for my studies.
Economic backwardness Always Sometimes Never Lack of nutritious food Quarrelling of family members Loud noises from nearby places Unnecessary interferences from neighbours Ignorance of family members Physical/mental ill health of members Non-hygienic surroundings Constant working of television Bad habits of elder members Negative attitude towards education Crowded surroundings Superstitious beliefs Frequent natural calamities
IV. Family Cohesion
Following opportunities are present at my home. Always Sometimes Never
Gathering of family members in special. occasions Conducting family tours and picnics Visiting relatives' houses Visit to devotional places General discussion on family matters Participation in socio-cultural programmes Strong interpersonal relationship Mutual support and help Solving problems arnicabIy Daily family prayer Self effort of members for the family
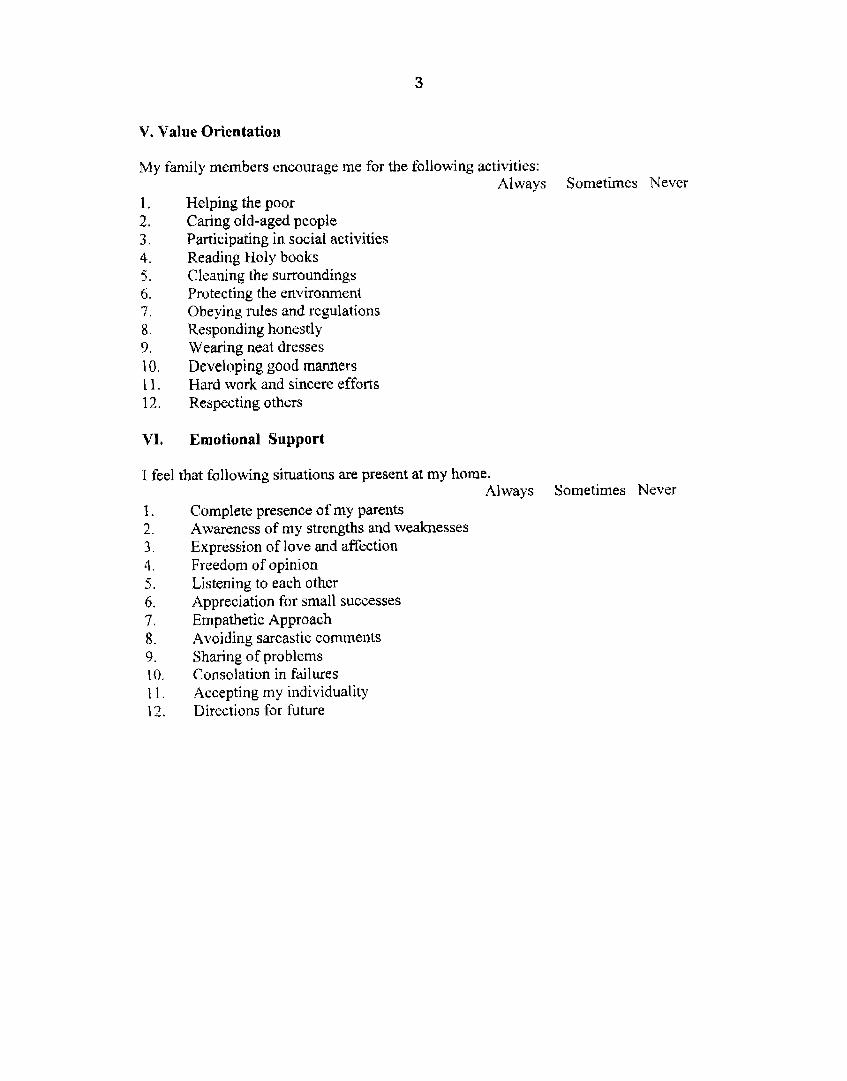
V. Value Orientation
My family members encourage me for the following activities: Always Sometimes Never
1. Helping the poor 2. Caring old-aged people 3. Participating in social activities 4. Reading Holy books 5. Cleaning the surroundings 6. Protecting the environment 7 . Obeying rules and regulations 8 . Responding honestly 9. Wearing neat dresses 10. Developing good manners 1 1. Hard work and sincere efforts 12. Respecting others
VI, Emotional Support
1 feel that following situations are present at my home. Always Sometimes Never
I . Complete presence of my parents 2. Awareness of my strengths and weaknesses 3. Expression of love and affection 4. Freedom of opinion 5 . Listening to each other 6. Appreciation for small successes 7. Empathetic Approach 8. Avoiding sarcastic comments 9. Sharing of problems 10. Consolation in failures I 1. Accepting my individuality 12. Directions for future
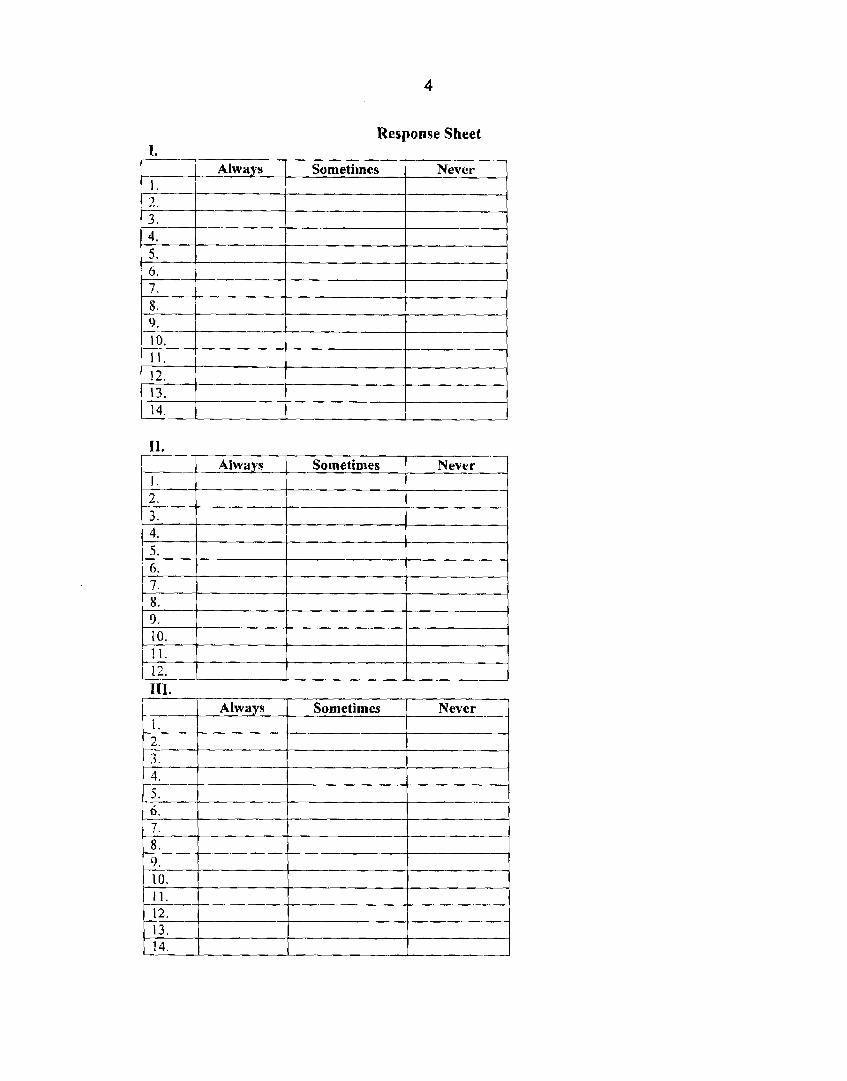
Response Sheet
Always Sometimes Never 1. 2. -- 3 .
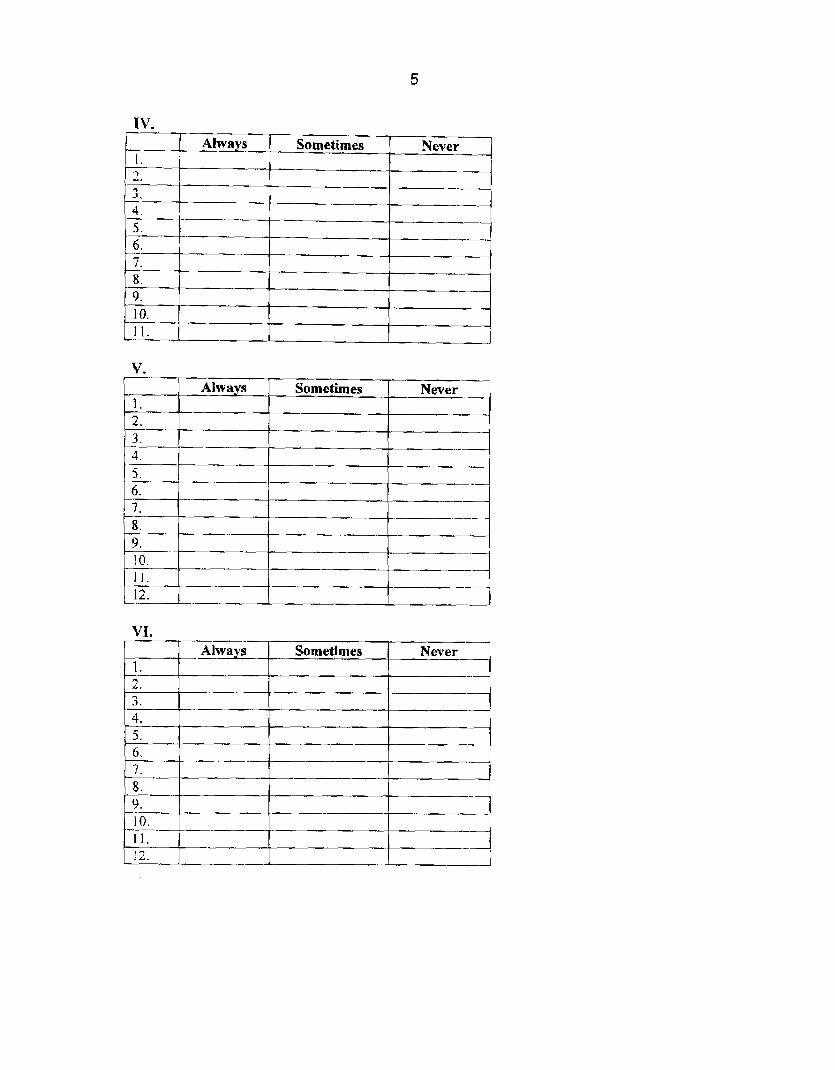
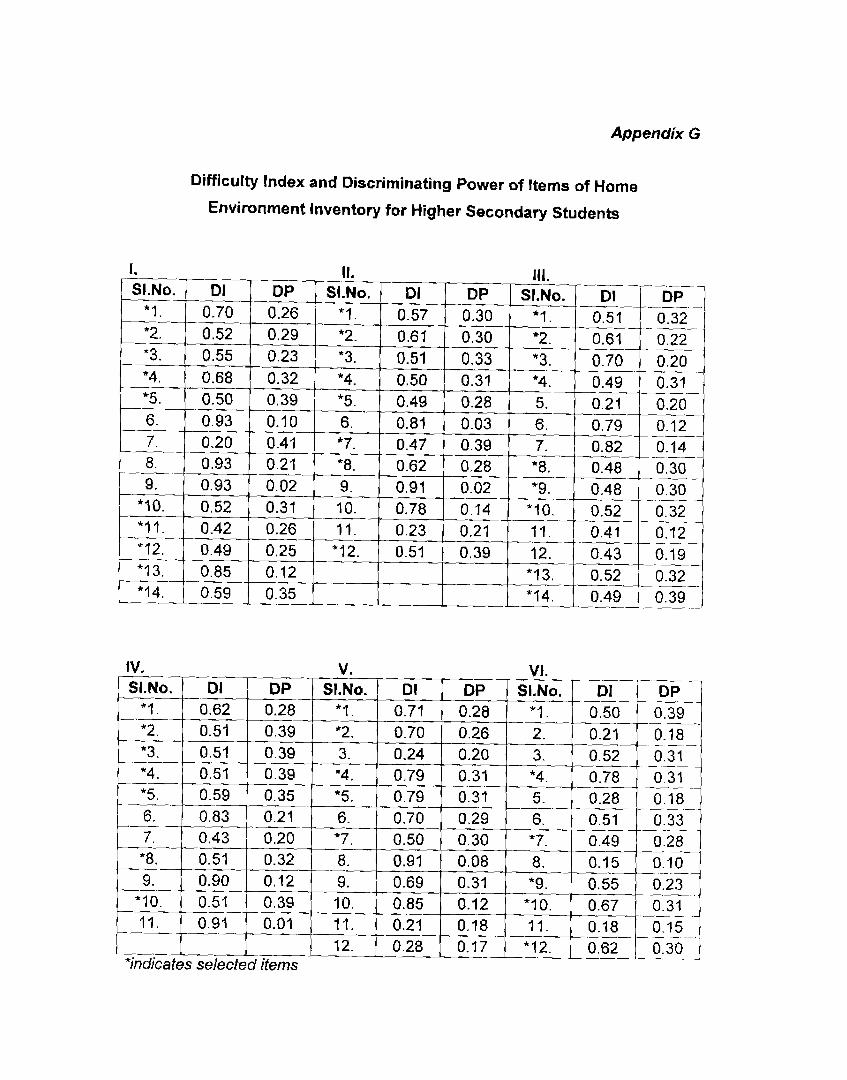
Appendix G
Difficulty Index and Discriminating Power of Items of Home
Environment Inventory for Higher Secondary Students
I. SI.No.
*I . - *2. --
"3. "4. *5. 6. 7.
- 8.
- -- 9.
*lo. *-It. *12.
IV. -
--- Dl
0.70 0.52 0.55 0.68 0.50 0.93 0.20 0.93 0.93 0.52 0.42 0.49
--_-____
- If. Ill. --- - - - - - -- - DP SI.No. Dl DP Sl.No. D I DP - - - - - - - - 0.26 *I . 0.57 0.30 *l. 0.51 0.32 - - - - - - -, - - - . 0.29 *2. 0.61 0.30 *2. 0.61 0.22 0.23 "3. 0.51 0.33 *3.
-- 0.70 0.20 -- -
0.32 *4. 0.50 0.31 *4. 0.49 0.31 0.39 *5. 0.49 0.28 5. -. 0.21 0.20 -- 0.10 6. 0.81 0.03 6 . 0.79 0.12 0.41 "7. 0.47 0.39 7. 0.82--- 0.14 -- P - L- .- -- - 0.21 "8. 0.62 0.28 *8. 0.48 0.30 -- --A - 0.02 9. 0.91 0.02 *9. 0.48 0.30 --- - -- - 0.31 10. 0.78 0.14 * lo. 0.52 0.32 - - - - - 0.26 11. 0.23 0.21 11. 0.41 0 1 2 --- - - - - 0.25 *12. 0.51 0.39 '1 2. 0.43 0.19 ---
0.32 ~ - - 0 3 9 - - -
---- - -- .-
v. - VI. --- - DP Sl-No.
* l . -- - *2.
"3. - -- *4.
Dl 0.62 0.51 0.51 0.51
DP 0.28 0.39 0.39 0.39
*5. -- 6.
0.35 - 0.21
SI.No.
0.59 0.83
Dl DP
0.43 0.20
0.51 0.39 11. - -- 0.91 0.01 11.
12.
*l. *2. 3. "4.
0.50 0.91 0.69 0.85 0.21 0.28
0.71 0.70 0.24 0.79
*5. 6.
0.28 0.26 0.20 0.31
SI.No.
*indicates selected items
0.79 0.70
-- Dl -
0.30 0.08 0.31 0.12 0.18 0 . 1 7 -
* I . - 2. 3. *4.
0.49 "7. 8. *9. *I 0. 11. *12.
0.31 0.29
0.28 --
--- 0.28 -- 0.51
- -- --
5. 6. - -
0.50 ----
0.21 ---- 0.52
-/ - .- 0.18 0.33 - --- -- -
-.
0.39 -- -.
0.18 -- - - 0.31 - -- -
0.15 0.55 0.67 0.18
0.10 0.23 0.31 -- - - 0.15
0.78 0 3 1
0.62 --- 0.30 - - -
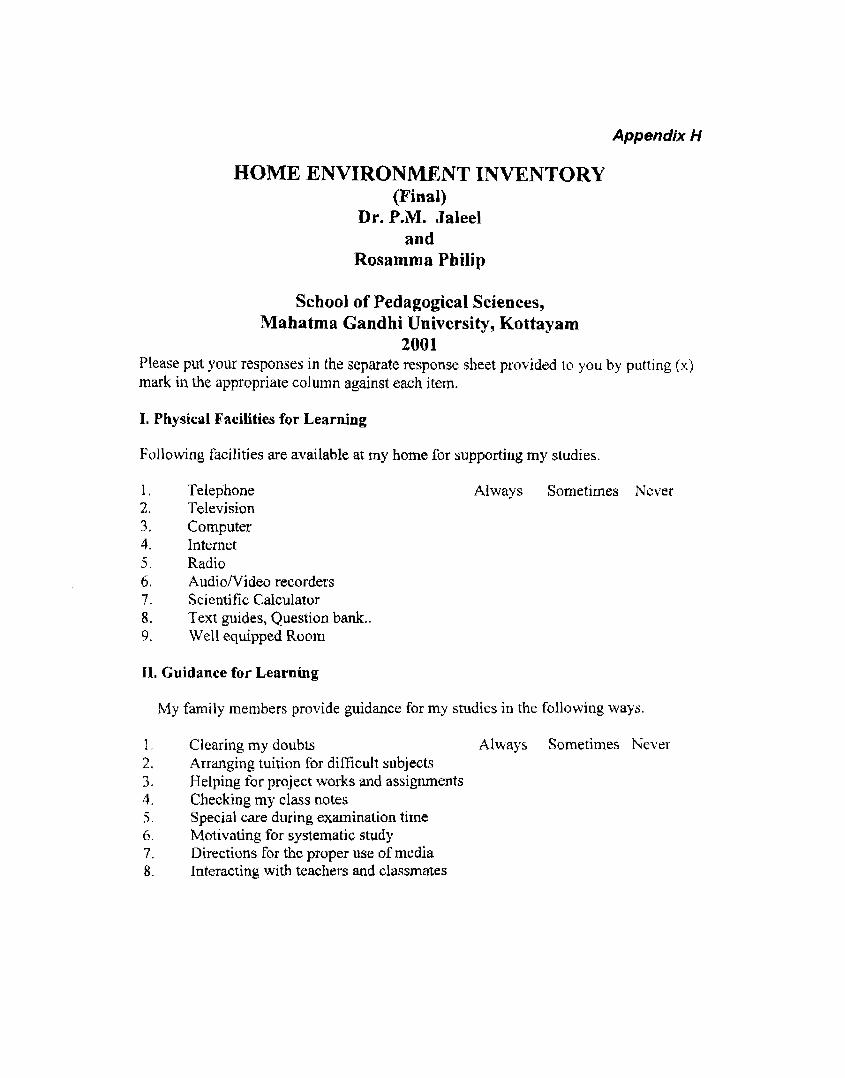
Appendix H
HOME ENVIRONMENT INVENTORY (Final)
Dr. P.M. Jaleel and
Rosamma Philip
School of Pedagogical Sciences, Mahatma Gandhi University, Kottayam
2001 Please put your responses in the separate response sheet provided to you by putting (x) mark in the appropriate column against each item.
I. Physical Facilities for Learning
Following facilities are available at my home for supporting my studies.
Telephone Always Sometimes Never Television Computer Internet Radio Audio/Video recorders Scientific Calculator Text guides, Question bank.. Well equipped Room
11. Guidance for Learning
My family members provide guidance for my studies in the following ways.
Clearing my doubts Always Sometimes Never Arranging tuition for difficult subjects Helping for project works and assignments Checking my class notes Special care during examination time Motivating for systematic study Directions for the proper use of media Interacting with teachers and classmates
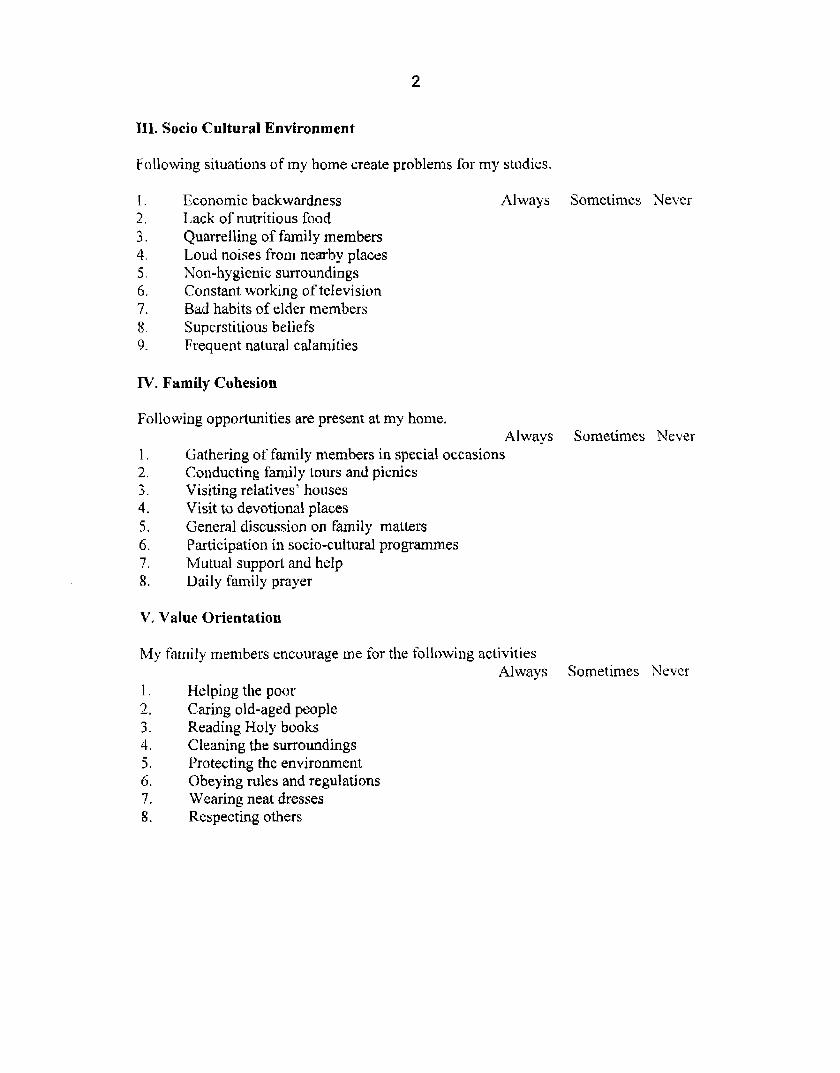
111. Socio Cultural Environment
Following situations of my home create problems for my studies.
Economic backwardness Lack of nutritious food Quarrelling of family members Loud noises from nearby places Nan-hygienic surroundings Constant working of television Bad habits of elder members Superstitious beliefs Frequent natural calamities
Always Sometimes Never
IV. Family Cohesion
Following opportunities are present at my home. Always Sometimes Never
1. Gathering of family members in special occasions 2. Conducting family tours and picnics 3. Visiting relatives' houses 4. Visit to devotional places 5 . General discussion on family matters 6 . Participation in socio-cultural programmes 7. Mutual support and help 8. Daily family prayer
V. Value Orientation
My farnily members encourage me for the following activities Always Sometimes Nevcr
1. Helping the poor 2. Caring old-aged people 3. Reading Holy books 4. Cleaning the surroundings 5 . Protecting the environment 6. Obeying rules and regulations 7. Wearing neat dresses 8. Respecting others
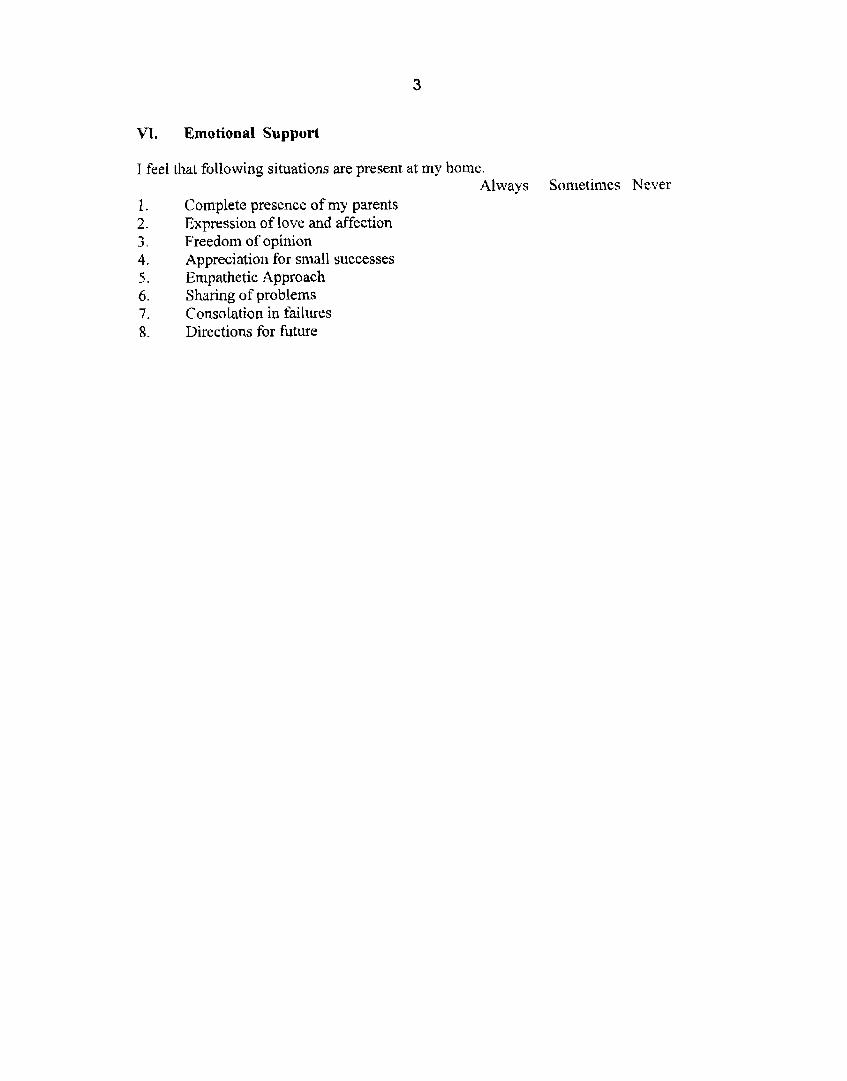
VI. Emotional Support
I feel that following situations are present at my home. Always Sometimes Never
1 . Complete presence of my parents 2. Expression of love and affection 3. Freedom of opinion 4. Appreciation far small successes 5 . Empathetic Approach 6 . Sharing of problems 7. Consolation in failures 8. Directions for future
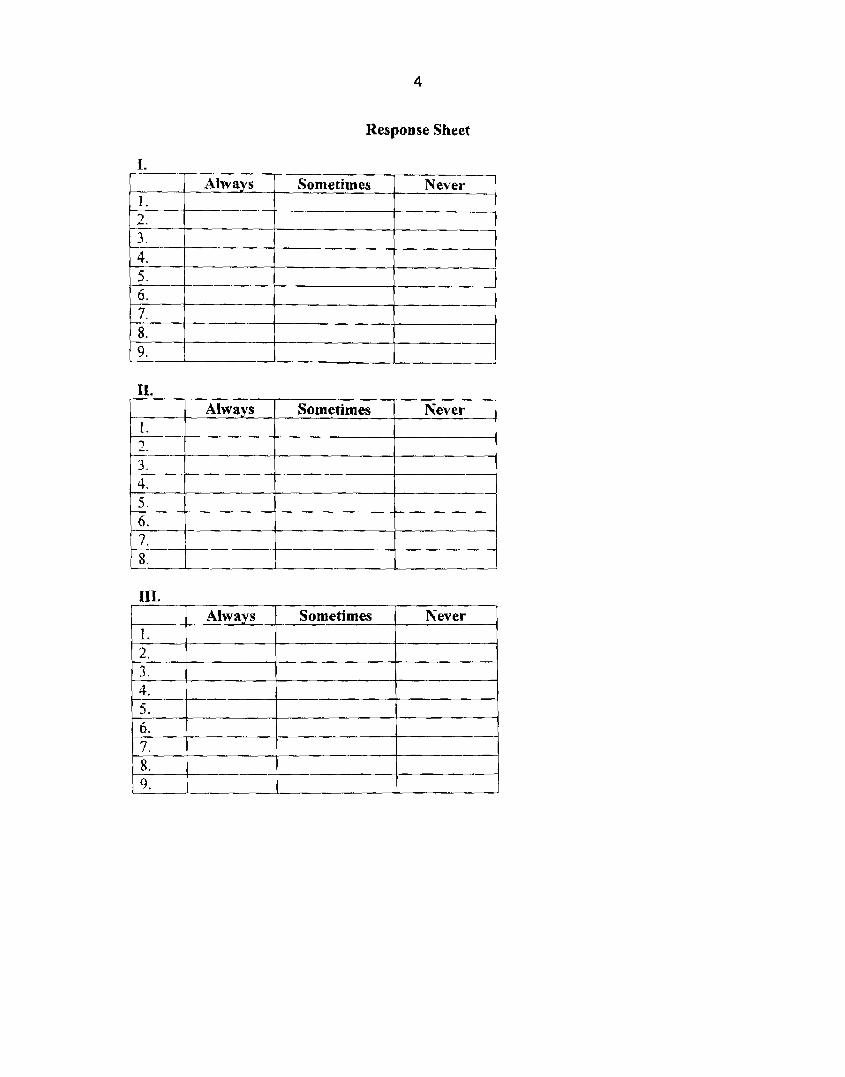
Response Sheet
I.
- .. .
1. 2. -- 3. 4. 5 . 6 .
I 7.
Always Sometimes Never
-,-
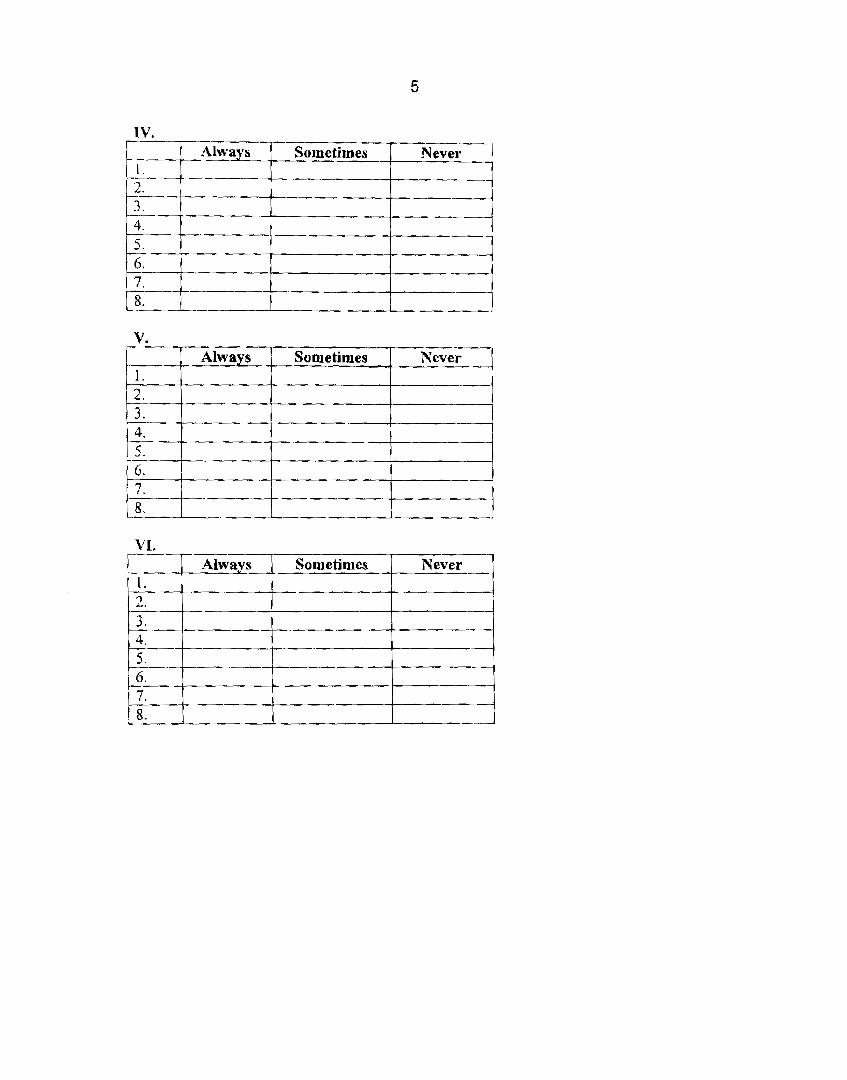
I . .----
2. 3. 4. 5 . 6. 7 . 8.
Always Sometimes Never ---
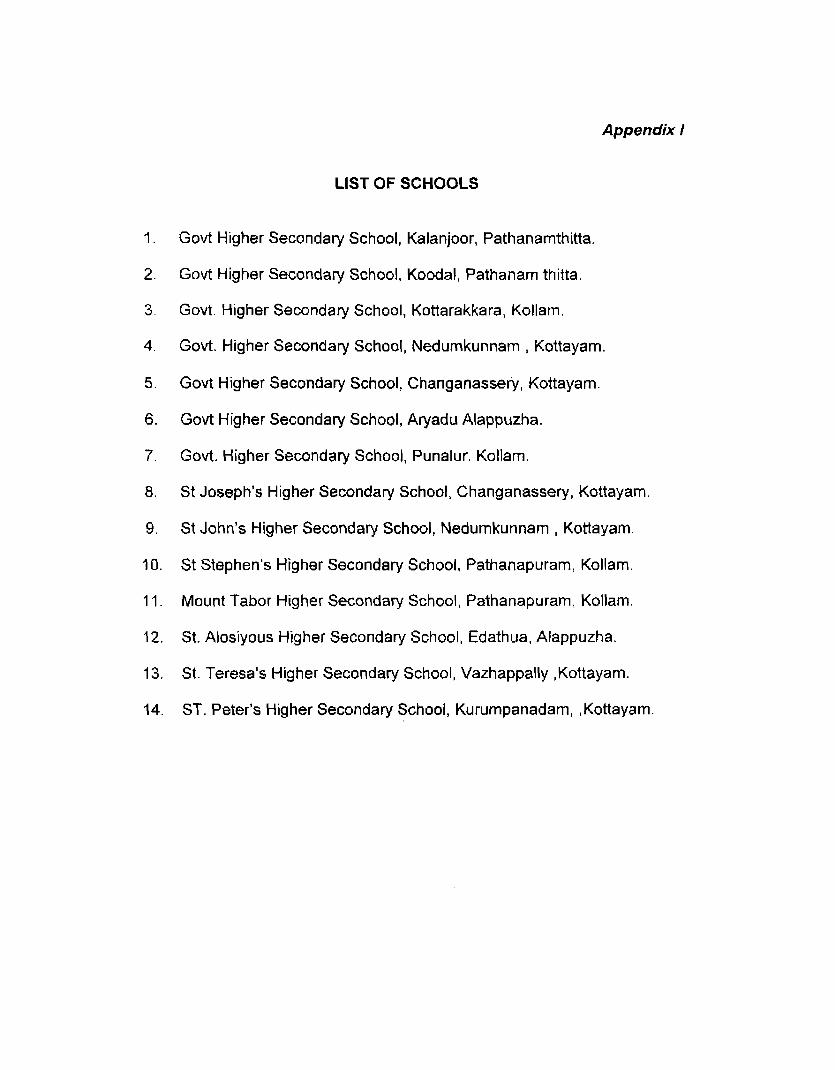
Appendix l
LIST QF SCHOOLS
Govt Higher Secondary School, Kalanjoor, Pathanamthitta.
Govt Higher Secondary School, Koodal, Pathanam thitta.
Govt. Higher Secondary School, Kottarakkara, Kollam.
Govt. Higher Secondary School, Nedumkunnam , Kottayam.
Govt Higher Secondary School, Changanassery, Kottayam.
Govt Higher Secondary School, Aryadu Alappuzha.
Govt. Higher Secondary School, Punalur. Kollam.
St Joseph's Higher Secondary School, Changanassery, Kottayam.
St John's Higher Secondary School, Nedumkunnam , Kottayam.
St Stephen's Higher Secondary School, Pathanapuram, Kollam.
Mount Tabor Higher Secondary School, Pathanapuram, Kollarn.
St. Alosiyous Higher Secondary School, Edathua, Aiappuzha.
St. Teresa's Higher Secondary School, Vazhappally ,Kottayam.
ST. Peter's Higher Secondary School, Kurumpanadam, ,Kottayam.
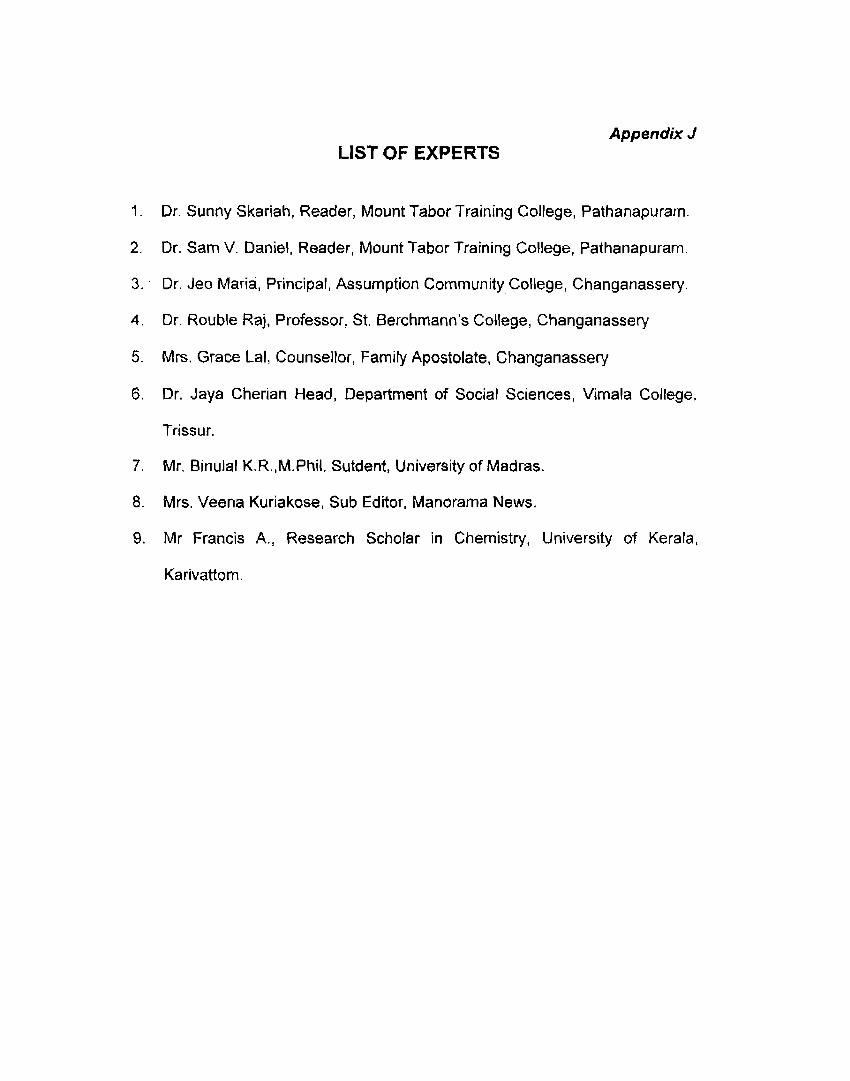
Appendix J LIST OF EXPERTS
Dr. Sunny Skariah, Reader, Mount Tabor Training College, Pathanapuram.
Dr. Sam V. Daniel, Reader, Mount Tabor Training College, Pathanapuram.
Dr. Jeo Maria, Principal, Assumption Community College, Changanassery.
Dr. Rouble Raj, Professor, St. Berchrnannls College, Changanassery
Mrs. Grace Lal, Counsellor, Family Apostolate, Changanassery
Dr. Jaya Cherian Head, Department of Social Sciences, Virnala College,
Trissur.
Mr. Binulal K.R.,M.Phil. Sutdent, University of Madras.
Mrs. Veena Kuriakose, Sub Editor, Manorama News.
Mr Francis A., Research Scholar in Chemistry, University of Kerala,
Karivattorn.