a study of tech mahindra pvt. ltd. - garud college
TRANSCRIPT
DESIGNATION WISE ANALYSIS OF EMPLOYEE
PERFORMANCE A STUDY OF TECH MAHINDRA PVT LTD
Dr Anuradha Pathak
Dr Shyam Jivan Salunkhe
Associate Professor BVPIM Maliba Campus Uka Tarsadia University Bardoli
Associate Professor A R B Garud College Shendurni Dist Jalgaon Maharashtra
ABSTRACT
This research paper highlights the topic of employee performance by taking in to consideration the
designations of employees working in the Tech Mahindra Pvt Ltd ( Pune division) Four variables of
employee performance worked out by scholars in the past are taken in the present study How different
designations have impact on the performance of the employees and how effectively to work out the needs of
different designations is the ultimate aim of this study
_________________________________________________________________________________
I MEANING OF EMPLOYEE PERFORMANCE
lsquoPerformancersquo is defined to include ldquothe action or process of performing a task or function seen in terms of
how successfully it is performedrdquo Employee performance is defines as whether a person executes their job
duties and responsibilities well Performance is a critical factor in organizational success A manager who
defines performance ensures that individual or teams know what is expected of them and that they stay
focused on effective performance A manager does it by paying careful attention to three key elements
goals measures and assessment Goal Setting has a proven track record of success in improving
performance in a variety of settings and cultures How does it improve performance Studies show that
goals direct attention to the specific performance in question they mobilize effort to accomplish higher
levels of performance and they foster persistence for higher level of performance The mere presence of
goals however is not sufficient Managers must be able to measure the extent to which goals have been
accomplished The third requirement for defining performance is assessment Regular assessment of
progress toward goals focuses the attention and efforts of an employee or a team The important functions of
managers with reference to employeersquos performance are to facilitate performance To encourage
performance especially repeated good performance managers must provide a sufficient number of rewards
that employees really value and so in a timely and fair manner The list of attributes to measure employeersquos
performance is endless However major ones that have been included in the present study are Morale
Commitment Rewards and recognition and Stress
Journal of Information and Computational Science
Volume 10 Issue 2 - 2020
ISSN 1548-7741
wwwjoicsorg592
1 Employeersquos commitment can be measured mainly with the help of the variables such as lsquolabor turnoverrsquo
and lsquosense of belongingnessrsquo towards the organization
There are almost many ways to build organizational loyalty but the following list is most prominent in the
literature
Organizational commitment is higher in organizations that fulfill their obligations to employees and abide
by humanitarian values such as fairness courtesy forgiveness and moral integrity
Employee experience more comfort and predictability when they agree with the values underlying corporate
decisions This comfort increases their motivation to stay with the organization
Employees identify with and feel obliged to work for an organization only when they trust its leads
2 Morale is defines as confidence enthusiasm and discipline of a person or group at a particular time
Morale flows from the peoplersquos conviction about the righteousness and worth of the actions and the hopes
of high rewards (material or otherwise) in the future Employees that are happy and positive at work are said
to have positive or high morale Companies that maintained employees who are dissatisfied and negative
about their work environment are said to have negative or low employee morale
It is therefore important that signs of poor employee moral be watched for very carefully among all
employees Such symptoms can include frequent absences increase in the number of errors decreased
productivity decreased quality of work frequent tardiness apathy sulking and mopping backstabbing and
increase in accidents or injuries Therefore if the problem is to be solved the reason for the poor employee
morale must be identified
3 Stress
Stress is your bodyrsquos way of responding to any kind of demand or threat Some common reasons of
employeersquos stress which affect their job performance are
1 Financial Stress
2 Job Security
3 Marriage and Relationships
4 Illness
5 Motivation
Workplace stress derives from many sources It can be a demanding boss annoying co-workers
rebellious students angry customers hazardous conditions long commutes and a never-ending workload
Your work performance is also affected by stressors such as family relationships finances and a lack of
sleep stemming from fears and anxieties about the future How you handle the effects of stress depends on
whether it is easier to change the situation or change your attitude toward it
Time Management
The positive side of stress is that it can jump-start your adrenalin and motivate you to perform your tasks
more quickly in response to impending deadlines An overwhelming workload lack of peer support and too
many demands at once however contribute to a sense of frustration and panic that there isnt enough time
to complete the work According to the authors of Performance Under Pressure Managing Stress in the
Journal of Information and Computational Science
Volume 10 Issue 2 - 2020
ISSN 1548-7741
wwwjoicsorg593
Workplace if these conditions routinely result in overtime or having to take work home the stress of being
unable to manage time efficiently can fuel employees resentment toward the company as well as negatively
influence their commitment and loyalty
Relationships
Stress is a major contributor to job burn-out and strained interactions with peers and supervisors says Bob
Losvyk author of Get a Grip Overcoming Stress and Thriving in the Workplace The combined feelings
of helplessness and hopelessness generate heightened sensitivities to any and all forms of criticism
defensiveness depression paranoia about job security jealousy and resentment toward co-workers who
seem to have everything under control short-fuse tempers diminished self-esteem and withdrawal
Focus
Stress affects your ability to remember things you already know to process new information you are
learning and to apply both to analytical situations and physical tasks that require concentration When you
are mentally exhausted from all of the worries anxieties and tension brought on by a stressful environment
or lifestyle you are more easily distracted and prone to make costly harmful or even fatal mistakes on the
job
Health
In addition to headaches sleep disorders vision problems weight lossgain and blood pressure stress
affects cardiovascular gastrointestinal and musculoskeletal systems says Richard Weinstein author of The
Stress Effect If youre not feeling well youre not going to do your best work Further the amount of sick
leave taken to rest and recuperate from stress-related illnesses often means that the work only accumulates
during your absence and thus generates even more stress about how to catch up once you return
4 Rewards and Recognition
A reward system is a defined process in organization which spells out an appetitive stimulus to be given to
an employee to alter hisher behavior Rewards typically serve as rein forcers in that when presented after a
behavior causes the probability of that behaviors occurrence to increase
Oxford dictionary defines lsquoorganizationrsquo as ldquoan organized group of people with a particular purposerdquo When
these definitions are put together we can say organizational performance relates to how successfully an
organized group of people with a particular purpose perform a function Essentially this is what we are
speaking about when we refer to organisational performance and achievement of successful outcomes3
(1)Organizational performance comprises the actual output or results of an organization as measured against
its intended outputs (or goals and objectives) (According to Richard et al (2009) (2) Organizational
performance involves the recurring activities to establish organizational goals monitor progress toward the
goals and make adjustments to achieve those goals more effectively and efficiently
Journal of Information and Computational Science
Volume 10 Issue 2 - 2020
ISSN 1548-7741
wwwjoicsorg594
II BRIEF HISTORY OF TECH MAHINDRA LIMITED
Tech Mahindra Limited is an Indian multinational provider of information technology (IT) networking
technology solutions and business support services (BPO) to the telecommunications industry Tech
Mahindra is a part of the Mahindra Group conglomerate It is headquartered at Pune Maharashtra India
Tech Mahindra was ranked 5th in Indias software services (IT) firms and overall 111 in Fortune India
500 list for 2012 Tech Mahindra on 25 June 2013 announced the completion of a merger with Mahindra
Satyam The combined entity has 98009 employees as of 2014 across 51 countries servicing 632
customers globally It has 15 overseas offices for BPO (business process outsourcing) operations and
software development Its revenue for 2012-13 was put at $27 billion (Rs 162 billion) Tech Mahindra has
operations in more than 51 countries with 40 sales offices and 72 delivery centres Assessed at SEI CMMi
Level 5 its software professional headcount stood at 67592 and BPO at 23566 at the end of 2014 Tech
Mahindras activities spread across a broad spectrum including Business Support Systems (BSS)
Operations Support Systems (OSS) Network Design amp Engineering Next Generation Networks Mobility
Solutions Security consulting and Testing The solutions portfolio includes Consulting Application
Development amp Management Network Services Solution Integration Product Engineering Infrastructure
Managed Services Remote Infrastructure Management and BSG (comprises BPO Services and
Consulting) Tech Mahindra has implemented more than 15 Greenfield Operations globally and has over
128 active customer engagements mostly in the Telecom sector The company has been involved in about 8
transformation programs of incumbent telecom operators and an array of service offerings for TSPs TEMs
and ISVs When the scope of the company is so vast and when it provides employment to masses it is felt
necessary to study its HR practices
III STATEMENT OF RESEARCH PROBLEM
In light of the literature reviewed and analyzed the following statement of research problem has been
framed Designation wise analysis of Employee Performance A study of Tech Mahindra Pvt Ltd
IV OBJECTIVES OF THE STUDY
Keeping in mind the rationale behind this study the following objectives have been framed
1 To analyze overall response of all respondents for variables of Employee performance of Tech
Mahindra Pvt Ltd Pune
2 To make a comparative study of Employeesrsquo performance on the basis of designation of employees
in Tech Mahindra Pvt Ltd Pune
V HYPOTHESES
Hypothesis is simply a statement about the universe It is a statement of the tentative solution of the
problem This statement may or may not be true the research is designed to ascertain the truth In view of
the above objectives of the study a number of research questions arise On the basis of these research
questions and review of related literature the following hypotheses have been formulated
Journal of Information and Computational Science
Volume 10 Issue 2 - 2020
ISSN 1548-7741
wwwjoicsorg595
H1 Respondents belonging to different designation have similar opinion for employeesrsquo performance in the
organization
VI RESEARCH METHODOLOGY
A quantitative approach with an exploratory and descriptive design encompassing the survey method has
been used
Research Design
Research design refers to blue print for the research It is a plan through which observations are made and
data is assembled It provides an empirical and logical basis for drawing conclusions and gaining perfect
knowledge To accomplish the above objectives of the study both primary and secondary data have been
applied
Collection of Data
The research plan calls for gathering secondary data as well as primary data
Secondary Data Secondary data are data that were collected for another purpose and already exist
somewhere It provides a starting point for research and facilitates the comparison of the research with the
existing data Secondary studies have been done by exploring and referring national and international
literatures Journals Magazines Annual Reports published papers (NationalInternational) etc
The analysis of present study is based on primary as well as on secondary data However more emphasis
has been laid on primary data
Primary Data As stated above primary data are original in character and are collected a fresh for some
specific purpose The primary data has been collected through under mentioned methods
Questionnaire A well structural schedule of questions containing different aspects of the study has been
developed and circulated to the persons concerned Demographic as well as socio-economic background of
the respondents has also been sought initially Then a well structured questionnaire has been used to collect
data from the organization The questionnaire has been divided into 7 parts for measuring various HR
practices adopted in the organization A Five point Likertrsquos rating scale has been used for the instrument
drafting The scoring scale of the questionnaire is 5=Strongly Agree 4=Agree 3=Neutral 2= Disagree and
1=Strongly Disagree Cronbachrsquos alpha test Hair et al 2009) has been applied to check the reliability or
otherwise of the questionnaire prepared The Cronbachrsquos alpha less than 07 is subject to revision which was
not the case in the present study
Interview The permission of departmental head of the company was sought for the purpose of conducting
personal interview Also informal talks out of campus were conducted to extract true and genuine
information
Sampling This study is a case study of Tech Mahindra Ltd Pune A questionnaire has been applied as the
data collection instrument and was distributed to 150 respondents Efforts were made to draw the results and
find the co-relation between various attributes forming HR practices and their corresponding effect on
various attributes forming organizational performance While selecting the sample a special care was taken
to ensure that the respondent of different caste age gender income and departments are covered
Tools of Analysis
The data has been presented through tables diagrams and figures Mathematical techniques of analysis like
simple average and percentage method will be used
Journal of Information and Computational Science
Volume 10 Issue 2 - 2020
ISSN 1548-7741
wwwjoicsorg596
Statistical techniques provide an indispensable tool for collecting organizing analyzing and interpreting
data expressed in numerical terms Simple average percentage method has been used to make interpretation
Tests like Kruskal Wallis Mann Witney and Chi square have been used to make interpretations The SPSS
170 software has been applied in initial data analysis Efforts were made to draw the results and find the co-
relation between various attributes forming HR practices and their corresponding effect on various attributes
forming organizational performance
VII EMPIRICAL ANALYSIS OF VARIABLES TO MEASURE EMPLOYEES PERFORMANCE
A cluster of variables can be used to measure performance but keeping in mind the constraints of
time resources and length of the study the present study has critically been analyzed and restricted to
variables such as morale commitment Rewards amp Recognition and Stress in order to measure the
performance of employees
i) Morale
Morale is actually a psychological term which is achieving a considerable importance on the part of the
management Morale is a group phenomenon it is an idea of the extent to which an individual perceives a
probability of satisfying his own motives through co-operation of the group
Table 1 Responses for Morale in Organization
Sr
No
Variables Strongly
Agree
Agree Uncertain Disagree Strongly
Disagree
1 Managers are Easily
Accessible
7
(50)
120
(851)
7
(50)
4
(28)
3
(21)
2 Get Sufficient
Responsibility
17
(121)
110
(78)
8
(57)
3
(21)
3
(21)
3 Duties are Clearly
Defined
17
(121)
103
(73)
15
(106)
3
(21)
3
(21)
4 Fair amp Equal Opp to
Solve Grievances
3
(21)
42
(298)
90
(638)
3
(21)
3
(21)
5 Immediate Steps
Taken to Solve
Grievances
- 45
(319)
73
(518)
23
(163)
-
Note Figures in parenthesis indicate the percentages of the row total
Source Various Questionnaires from Respondents
The table no1 clearly reveals the fact that majority of the responses are inclined towards positive side of the
table The negative responses are very few So far as lsquoFair and equal opportunities are provided to solve
grievancesrsquo and lsquoImmediate steps are taken to solve grievancesrsquo are concerned the respondent are not much
Journal of Information and Computational Science
Volume 10 Issue 2 - 2020
ISSN 1548-7741
wwwjoicsorg597
sure of their opinion However the overall response of the voters for other variables to measure lsquoMoralersquo of
employees is quite satisfactory
Table 2 Descriptive Statistics for Morale in Organization
N
Mean
Std
Deviation Skewness Kurtosis
Mean
Ranks
2
Asymp
Sig
Valid Missing
Easy Access to
Managers 141 0 212 627 2737 10068 3rd 000
Get Sufficient
Responsibility 141 0 204 675 2072 7736 1st 000
Duties are Clearly
Defined 141 0 209 706 1720 5591 2nd 000
Fair amp Equal Opp to
solve Grievances 141 0 272 645 332 2413 4th 000
Immediate Steps to
Solve Grievances 141 0 284 679 203 -824 5th 000
The employees in the organization believe that they get sufficient responsibility in the organization their
duties are clearly defined and their managers are easily accessible to them The company however needs
to pay more attention to provide fair and equal opportunities to all employees to solve grievances Also the
company should take prompt actions to solve grievances The figures of skewness and kurtosis support the
findings of mean statistics
The study of Fretwell (1998) indicating that employee morale within an organization has a direct
impact on the satisfaction level of its customers and the companys ultimate success have conformity with
the employeesrsquo morale in present study
Ho There is no significant difference between designation of employees and their morale in the
Organization
H1 There is significant difference between designation of employees and their morale in the
Organization
Journal of Information and Computational Science
Volume 10 Issue 2 - 2020
ISSN 1548-7741
wwwjoicsorg598
Table 3 Kruskal Wallis Ranks Test for Designation-wise Comparative Study
of Respondents
Designation N Mean Rank
Easy Access to
Managers
Office boys Clerks etc 18 6750
Database Adm
Officers 41 7418
ITAnalyst and Sys
Eng 49 7964
Project ManagersTech
Leaders 17 4135
Top Level Managers 16 7181
Get Sufficient
Responsibility
Office boys Clerks etc 18 7250
Database Adm
Officers 41 7174
ITAnalyst and Sys
Eng 49 7789
Project ManagersTech
Leaders 17 4635
Duties are Clearly
Defined
Office boys Clerks etc 18 6900
Database Adm
Officers 41 8100
ITAnalyst and Sys
Eng 49 7190
Project ManagersTech
Leaders 17 4429
Top Level Managers 16 7325
Fair amp Equal Opp to
solve Grievances
Office boys Clerks etc 18 9842
Database Adm
Officers 41 7674
ITAnalyst and Sys
Eng 49 7173
Project ManagersTech
Leaders 17 5035
Journal of Information and Computational Science
Volume 10 Issue 2 - 2020
ISSN 1548-7741
wwwjoicsorg599
The associated p-value (sig) is 0000 for all variables applied for measuring lsquoMoralersquo in the
organization which is less than 005 Thus null hypothesis is rejected and we can say that respondents
belonging to different designation have different opinion regarding Morale in the organization The
difference in their mean ranks is statistically significant
ii) Commitment
Early researchers of organizational commitment identified that commitment is primarily a function of
individual behavior and willingness of individuals to give their energy to the organizations through actions
Top Level Managers 16 4512
Immediate Steps to
Solve Grievances
Office boys Clerks etc 18 8200
Database Adm
Officers 41 9454
ITAnalyst and Sys
Eng 49 6514
Project ManagersTech
Leaders 17 4729
Top Level Managers 16 4144
Mean rank of I T Analysts is higher for lsquoManagers are easily accessiblersquo and lsquoThey
get sufficient responsibility in the organizationrsquo The mean ranks of project managers
and technical leaders are least for the variables lsquoDuties are clearly definedrsquo
lsquoCompany provides fair and equal opportunity to solve grievancesrsquo and lsquoCompany
takes immediate steps to solve grievancesrsquo
Table 4 Kruskal Wallis Test Statistics Grouping Variable ndash Designation for Morale
Easy Access
to Managers
Get Sufficient
Responsibility
Duties are
Clearly
Defined
Fair amp Equal
Opp to solve
Grievances
Immediate
Steps to
Solve
Grievances
Chi-Square 30097 14605 16203 27609 36428
df 4 4 4 4 4
Asymp Sig 000 006 003 000 000
Journal of Information and Computational Science
Volume 10 Issue 2 - 2020
ISSN 1548-7741
wwwjoicsorg600
and choices over time A sincere effort has been made here to find out the opinion of respondents for
commitment
Table 5 Responses for Preference to Continue to Work in Organization
Sr
No
Variables Strongly
Agree
Agree Uncertain Disagree Strongly
Disagree
1 Would Prefer Working
in the Same
Organization
- 27
(191)
89
(631)
21
(149)
4
(28)
Note Figures in parenthesis indicate the percentages of the row total
Source Various Questionnaires from Respondents
The responses for lsquoCommitmentrsquo ie would prefer to continue to work in the same organization for rest of
the working life is not much satisfactory However a large chunk of respondents are undecided to this
question Almost 18 of the employees do not continue to work in the same organization Not a single
respondent responded firmly for his desire to continue to work in the same organization all throughout
Table 6 Descriptive Statistics for Commitment of Employees
N
Mean
Std
Deviation Skewness Kurtosis
2
Asymp
Sig Valid Missing
141 0 301 676 546 884 000
Not a single respondent missed to vote for the variable used to measure lsquoCommitmentrsquo of employees
towards organization The mean statistics as well as the figures of skewness and kurtosis does not give much
satisfactory results for lsquocommitmentrsquo of employees towards organization The company does not confirm
with Wright (2006) who observed that the motivation and opportunity focused bundles of HR practices are
positively related to affective commitment and negatively related to turnover
For further analysis Kruskal Wallis test has been applied with the help of following hypotheses
Ho There is no significant difference between designation of employees and their commitment in the
Organization
H1 There is significant difference between designation of employees and their commitment in the
Organization
Journal of Information and Computational Science
Volume 10 Issue 2 - 2020
ISSN 1548-7741
wwwjoicsorg601
Table 7 Kruskal Wallis Ranks Test for Designation-wise
Comparative Study of
RRespondents
Designation N Mean Rank
Continue with
the Same
Organization
Office boys Clerks etc 18 7200
Database Adm
Officers 41 10511
ITAnalyst and Sys
Eng 49 7338
Project ManagersTech
Leaders 17 3447
Top Level Managers 16 1400
Total 141
The mean rank of Database administrators Officers is highest so far as lsquoContinue with the same
organizationrsquo is concerned The mean rank of Project managers Technical leaders is least
The associated p-value (sig) is 0000 for the variable Commitment It is less than 005 Thus null hypothesis
is rejected and we can say that respondents belonging to different designation have different opinion
regarding commitment towards the organization The difference in their mean ranks is not purely by chance
iii) RewardsRecognition
Apart from financial incentives employees have a strong urge for rewards and recognition A human being
cannot be motivated simply by paying him for his job He desires rewards and recognition in the
organization where he serves How far is the company successful in satisfying this need of its employees has
been studied here
Table 8 Kruskal Wallis Test Statistics
Grouping Variable ndash Designation for
Commitme
nt
Continue with the Same
Organization
Chi-Square 99592
df 4
Asymp
Sig 000
Journal of Information and Computational Science
Volume 10 Issue 2 - 2020
ISSN 1548-7741
wwwjoicsorg602
Table 9 Responses for RewardsRecognition in Organization
Sr
No
Variables Strongly
Agree
Agree Uncertain Disagree Strongly
Disagree
1 Rewards are Based on
Performance
4
(28)
56
(397)
32
(227)
46
(326)
3
(21)
2 Recognition for Better
Performance
- 50
(355)
63
(447)
24
(17)
4
(28)
3 Incentives linked with
Standards
14
(99)
39
(277)
38
(27)
47
(333)
3
(21)
4 Incentives linked with
Goals
3
(21)
50
(355)
38
(27)
48
(34)
2
(14)
5 Ample Career
Opportunities
19
(135)
3
(21)
70
(496)
45
(315)
4
(28)
Note Figures in parenthesis indicate the percentages of the row total
Source Various Questionnaires from Respondents
The responses are mixed for the variables used to measure lsquoRewardsRecognitionrsquo in the
organization But the table no617 makes it very clear that very few respondents have given absolute
positive response to this variable Many employees believe that they do not have ample career opportunities
in their organization Majority of them are unsure about this variable The overall responses are not much
positive
Table 10 Descriptive Statistics for Rewards Recognition
N
Mean
Std
Deviation Skewness Kurtosis
Mean
Ranks
2
Asymp
Sig
Valid Missing
Rewards are Based
on Performance 141 0 291 960 123 -1190 3rd 000
Recognition for
Better Performance 141 0 287 791 583 -220 1st 000
Incentives linked
with Standards 141 0 290 1044 -219 -962 2nd 000
Incentives linked
with Goals 141 0 297 918 000 -1200 4th 000
Ample Career
Opportunities 141 0 309 996 -832 329 5th 000
Journal of Information and Computational Science
Volume 10 Issue 2 - 2020
ISSN 1548-7741
wwwjoicsorg603
There are no missing values for the variables used to measure lsquoRewards amp Recognitionrsquo However
these figures are not absolutely positive The incentive system of the company needs to be linked with
standards of performance Again the company needs to provide ample career opportunities for employees
This analysis goes with the study of Lawler (1987) who espoused the idea of having a package of
rewards and benefits from which individuals could choose the combination most suitable for them
Employees are rarely happy with what is offered to them Hence a so-called ldquocafeteriardquo plans have to be
found to be workable and useful in industry
In order to study designation of employees and RewardsRecognition provided to them in
organization Kruskal Wallis test was conducted The following hypotheses were developed
H0 There is no statistical significant difference in the opinion of respondents belonging to different
designation regarding RewardsRecognition
H1 There is statistical significant difference in the opinion of respondents belonging to different
designation regarding RewardsRecognition
Table 11 Kruskal Wallis Ranks Test for Designation-wise Comparative Study of
Respondents
Designation N Mean Rank
Rewards are Based on
Performance
Office boys Clerks etc 18 11550
Database Adm Officers 41 10778
ITAnalyst and Sys Eng 49 5074
Project ManagersTech
Leaders 17 3332
Top Level Managers 16 2875
Recognition for Better
Performance
Office boys Clerks etc 18 9003
Database Adm Officers 41 10955
ITAnalyst and Sys Eng 49 5663
Project ManagersTech
Leaders 17 4212
Top Level Managers 16 2550
Incentives linked with
Standards
Office boys Clerks etc 18 11639
Database Adm Officers 41 10689
ITAnalyst and Sys Eng 49 5129
Project ManagersTech
Leaders 17 3385
Journal of Information and Computational Science
Volume 10 Issue 2 - 2020
ISSN 1548-7741
wwwjoicsorg604
Top Level Managers 16 2781
Incentives linked with
Goals
Office boys Clerks etc 18 11550
Database Adm Officers 41 10728
ITAnalyst and Sys Eng 49 4717
Project ManagersTech
Leaders 17 3212
Top Level Managers 16 4225
Ample Career
Opportunities
Office boys Clerks etc 18 11908
Database Adm Officers 41 10157
ITAnalyst and Sys Eng 49 5750
Project ManagersTech
Leaders 17 3085
Top Level Managers 16 2256
Table 12 Kruskal Wallis Test Statistics Grouping Variable ndash Designation for
Rewards Recognition
Rewards are
Based on
Performanc
e
Recognition
for Better
Performance
Incentives linked
with Standards
Incentives
linked with
Goals
Ample Career
Opportunities
Chi-Square 110259 86887 105545 104539 109392
df 4 4 4 4 4
Asymp Sig 000 000 000 000 000
Thus it can be inferred that RewardsRecognition change according to designation
iv) Stress
Stress is normal pressure that a person feels in his routine life While some level of stress is natural
inevitable and even essential more stress may have adverse repercussion of employeesrsquo performance thus
affecting organizational performance Here an effort has been made to study various stressors that
employees generally face while performing their tasks
Journal of Information and Computational Science
Volume 10 Issue 2 - 2020
ISSN 1548-7741
wwwjoicsorg605
Table 13 Responses for Variables Causing Stress in Organization
Sr
No
Variables Strongly
Agree
Agree Uncertain Disagree Strongly
Disagree
1 Employees have Clarity
of Job Expectations
65
(461)
65
(461)
3
(21)
4
(28)
3
(21)
2 Employees are Clear of
their Roles
65
(461)
65
(461)
2
(14)
4
(28)
4
(28)
3 Employees Can Change
Work styles
14
(99)
77
(546)
29
(206)
17
(121)
2
(28)
4 Employees have No
Fear of Losing Job
14
(99)
68
(482)
41
(291)
18
(128)
-
5 Employees have
Flexible Work
Schedules
39
(277)
43
(305)
8
(57)
46
(326)
5
(35)
6 Employees can
Maintain Worklife
Balance
14
(99)
93
(305)
28
(199)
50
(355)
6
(43)
Note Figures in parenthesis indicate the percentages of the row total
Source Various Questionnaires from Respondents
The general response of the voters indicates that the organization climate is not much stressful The
responses are more positive The respondents declared that there is clarity of job expectations and roles
they can change their work-styles Many respondents complained that they do not have flexible work
schedules and that their work is time bound Almost 40 respondents complained that they are not able to
maintain work life balance
Table 14 Descriptive Statistics for Stress in Organization
N
Mean
Std
Deviation Skewness Kurtosis
Mean
Ranks
2
Asymp
Sig
Valid Missing
Clarity of Job
Expectations 140 1 168 833 1876 4797 1st 000
Clarity of Roles 140 1 169 872 1962 4886 2nd 000
Can Change Workstyles 141 0 243 928 825 361 3rd 000
No Fear of Losing Job 141 0 245 840 317 -483 4th 000
Flexible Work Schedules 141 0 254 1296 233 -1436 4th 000
Worklife Balance 141 0 294 1110 -127 -1086 6th 000
Journal of Information and Computational Science
Volume 10 Issue 2 - 2020
ISSN 1548-7741
wwwjoicsorg606
One response is missing for the variable lsquoclarity of job expectationsrsquo and lsquocan change work stylesrsquo
The figures in the above table highly positively skewed for lsquoclarity of job expectationsrsquo and lsquoclarity of
rolesrsquo whereas they are negatively skewed for lsquowork-life balance of employeesrsquo The figures of kurtosis
also support our findings
For the sake of studying designation of employees and job stressors in organization Kruskal Wallis test was
conducted The following hypotheses were developed
H0 There is no statistical significant difference in the opinion of respondents belonging to different
designation regarding job stressors
H1 There is statistical significant difference in the opinion of respondents belonging to different
designation regarding job stressors
Table 15 Kruskal Wallis Ranks Test for Designation-wise
Comparative Study of Respondents
Designation N Mean Rank
Clarity of Job
Expectations
Office boys Clerks etc 18 10197
Database Adm
Officers 41 8880
ITAnalyst and Sys
Eng 49 6469
Project ManagersTech
Leaders 16 3706
Top Level Managers 16 3941
Total 140
Clarity of Roles Office boys Clerks etc 18 10408
Database Adm
Officers 40 8878
ITAnalyst and Sys
Eng 49 6301
Project ManagersTech
Leaders 17 4882
Top Level Managers 16 3300
Total 140
Can Change Workstyles Office boys Clerks etc 18 12958
Journal of Information and Computational Science
Volume 10 Issue 2 - 2020
ISSN 1548-7741
wwwjoicsorg607
Database Adm
Officers 41 9471
ITAnalyst and Sys
Eng 49 5477
Project ManagersTech
Leaders 17 4497
Top Level Managers 16 2172
Total 141
No Fear of Losing Job Office boys Clerks etc 18 13250
Database Adm
Officers 41 10300
ITAnalyst and Sys
Eng 49 4850
Project ManagersTech
Leaders 17 4126
Top Level Managers 16 2031
Total 141
Flexible Work
Schedules
Office boys Clerks etc 18 11633
Database Adm
Officers 41 11010
ITAnalyst and Sys
Eng 49 5012
Project ManagersTech
Leaders 17 2482
Top Level Managers 16 3281
Total 141
The Kruskal Wallis table shown above makes it clear that job stressors differ significantly according
to designation And hence we fail to accept null hypothesis as the associated p-value (sig) is 0000 for all
variables taken to measure job stressors which are less than 005
SUGGESTIONS FOR DESIGNATION WISE COMPARATIVE STUDY OF VARIABLES IN
EMPLOYEE PERFORMANCE
1 Morale Database administrators IT analyst and system Engineers rank high in terms of Morale level of
employees in organization
Journal of Information and Computational Science
Volume 10 Issue 2 - 2020
ISSN 1548-7741
wwwjoicsorg608
As it is IT Company people with technical skills directly involved in process find it easy to survive
Whereas Project Managers Team leaders top level managers junior level officers and office assistant staff
have complained that there are many levels to be followed and lengthy procedures by which work processes
gets delayed which affects morale level of employees Lack of communication in changes of rules and
regulations have also been seen as a trouble factor
Some challenges such as limited time long hours to work limited resources and lengthy processes
need to be looked urgently Highly stressful jobs despite high packages make these jobs less attractive
Speedy direct and simple communication system should be adopted in the organization Low morale may
lead to lower performance in long run
2 Rewards Recognition Except for Database administrator Officers and junior level and supportive staff
(office assistants) respondents of other designations have scored low mean ranks for variables in
RewardRecognition system Overall responsesrsquo are not so positive in this category Responses suggest that
it is a good company for entry level employees but not so encouraging for other designations Reasons as
discussed earlier are lack of proper promotion policy poor increment policy and lack of proper
implementation of certain HR policies
3 Commitment The mean rank of Database administrators Officers is highest so far as lsquoContinue with the
same organizationrsquo is concerned The mean rank of Project managers Technical leaders is least Project
managers have expressed that they are under immense pressure and their appraisal depends on clients Also
they have expressed dissatisfaction towards resource allocation policy of the company
4 Stress Mean ranks of Office boysJunior clerks Database administrators and Officers are highest for the
variables used to measure stress whereas Project Managers Technical leads and Top reporting managers
have scored least mean ranks The Kruskal Wallis table shown in analysis makes it clear that job stressors
differ significantly according to designation Employees like office assistants database administrators
doing routine jobs have less stress compared to those handling complex issues in Projects (Project
Managers Technical leads) Also Top reporting managers handling complex managerial issues have more
stress level
BIBLIOGRAPHY
1 Allen N J amp Meyer J P (2000) ldquoConstruct Validation in Organizational Behavior Research The
Case of Organizational Commitmentrdquo in R D Goffin amp E Helmes (Eds) Problems and solutions
in human assessment Honoring Douglas N Jackson at seventy Norwell MA Kluwer pp 285-314
2 Allen NJ amp Meyer J P (1996) ldquoAffective Continuance and Normative Commitment to the
Organization An examination of Construct Validityrdquo Journal of Vocational Behavior 49pp252-
276
3 Chakravarthy B S (1986) ldquoMeasuring Strategic Performancerdquo Strategic Management Journal 7
437ndash458
4 Diversity Beyond the numbers game (1995 Aug14) Business Week pp 60 61
5 Ducharme amp Martin (2000) ldquoGeneral practitionersrdquo British Medical Journal 298 pp366ndash370
Journal of Information and Computational Science
Volume 10 Issue 2 - 2020
ISSN 1548-7741
wwwjoicsorg609
6 Fama Eugene (1980) ldquoAgency Problems and the Theory of the Firmrdquo Journal of Political
Economy- 88 pp288-307
7 Johnson RW (2004) ldquoTrends in job demands among older workersrdquo Monthly Labor Review
127(7)48-56
8 Kahneman D amp Tversky A (2000) ldquoChoices Values and Framesrdquo New York Cambridge
University Press
9 Venkatraman N amp Ramanujam V (1986) ldquoMeasurement of Business Performance in Strategy
Research A Comparison of Approachesrdquo Academy of Management Review 11 801ndash814
10 Wayne F Cascio (1998) ldquoManaging Human Resources- Productivity Quality of Work Life
Profitsrdquo McGraw-Hill pp 458
Journal of Information and Computational Science
Volume 10 Issue 2 - 2020
ISSN 1548-7741
wwwjoicsorg610
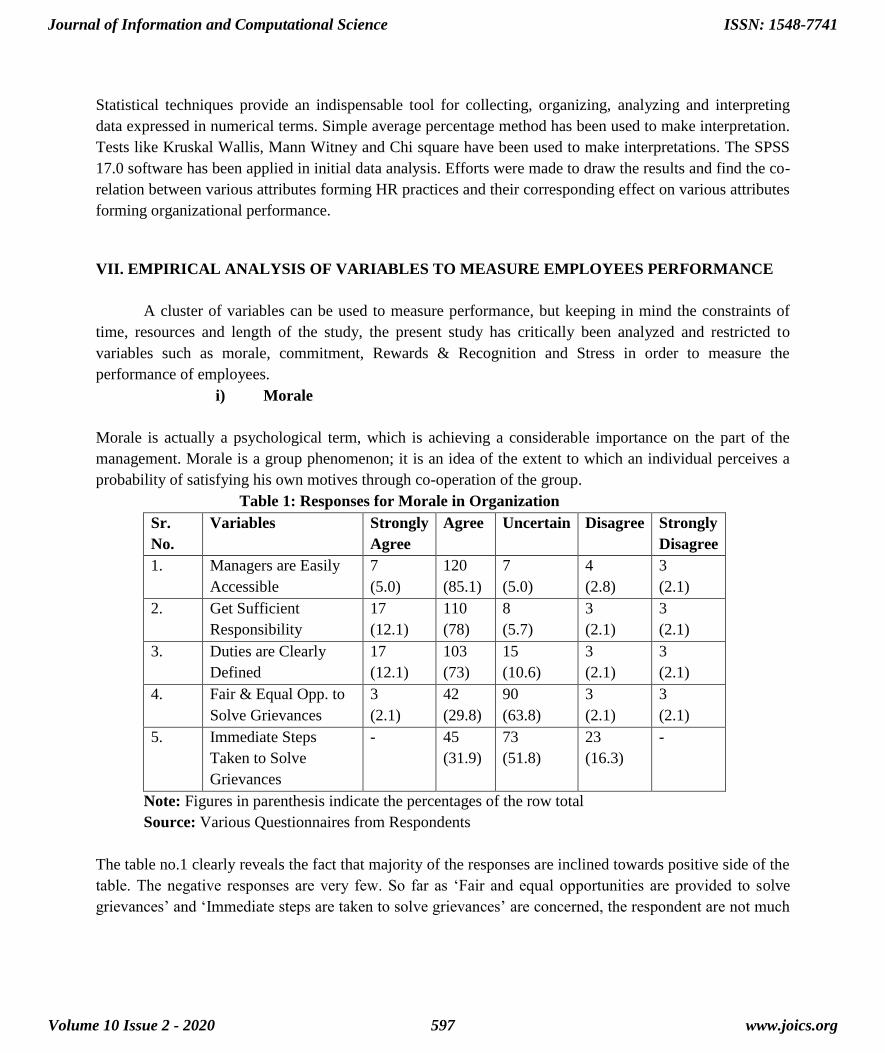
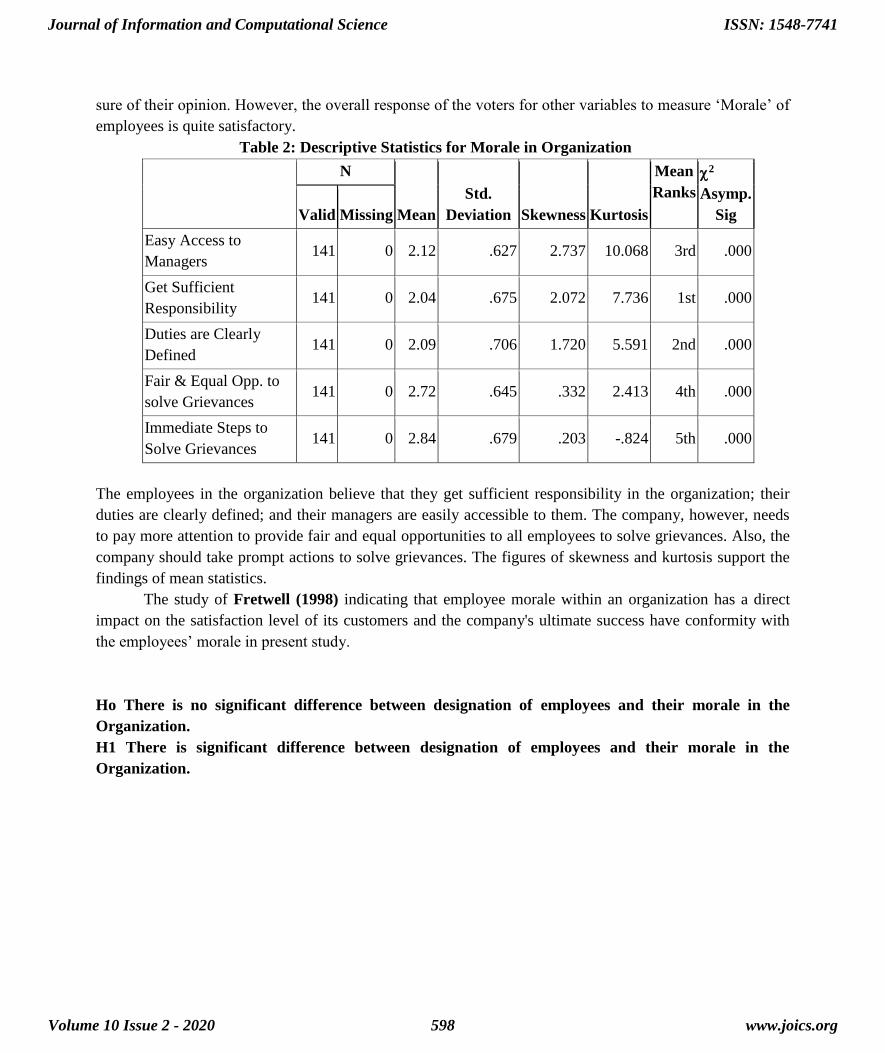
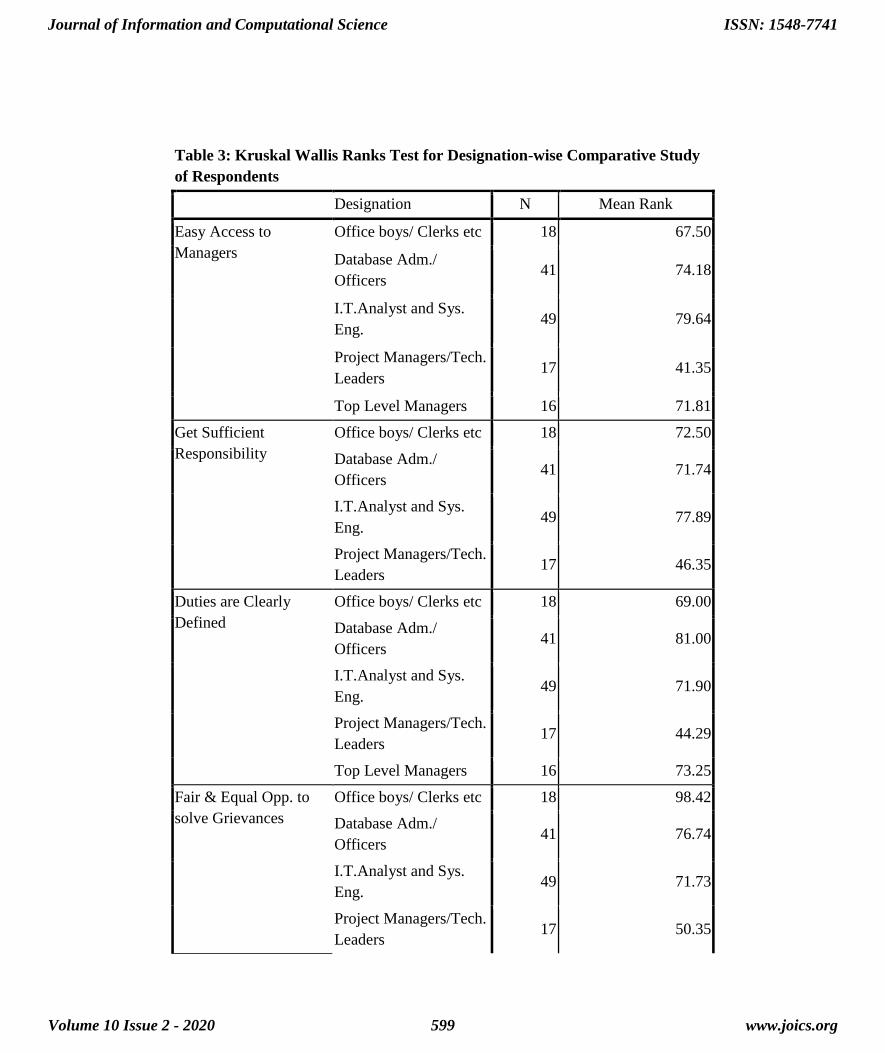
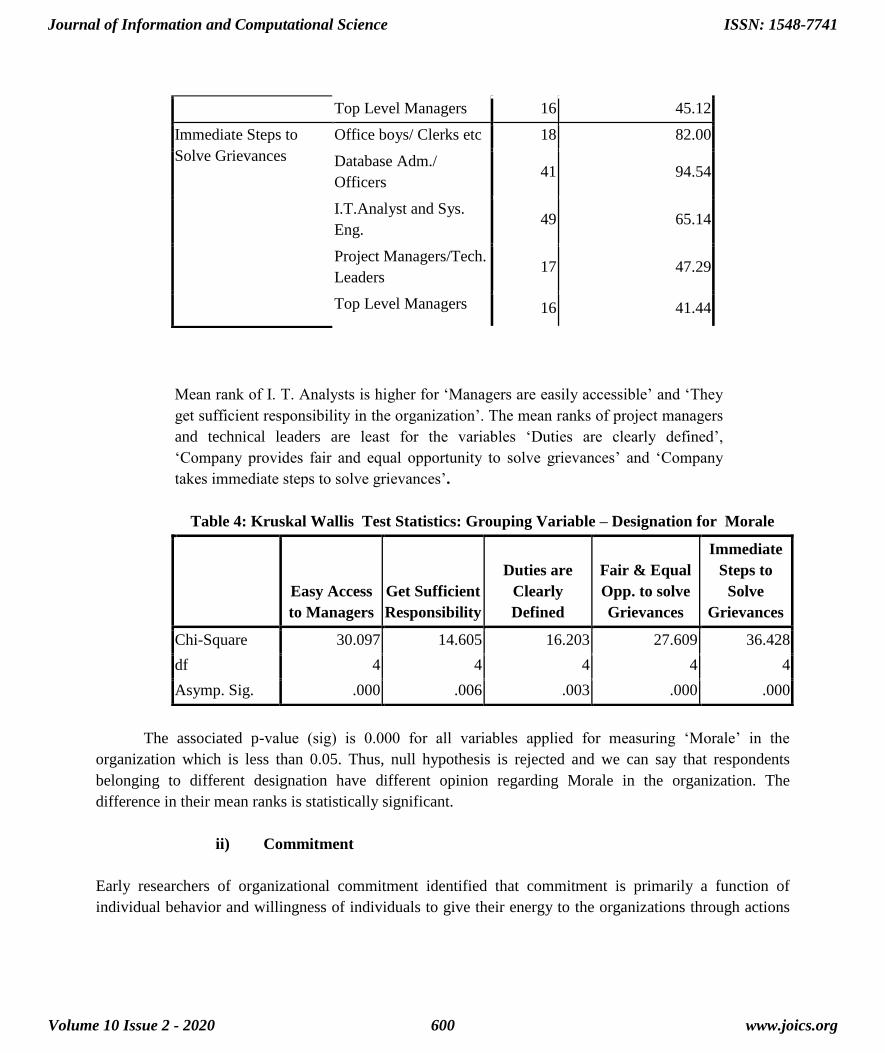
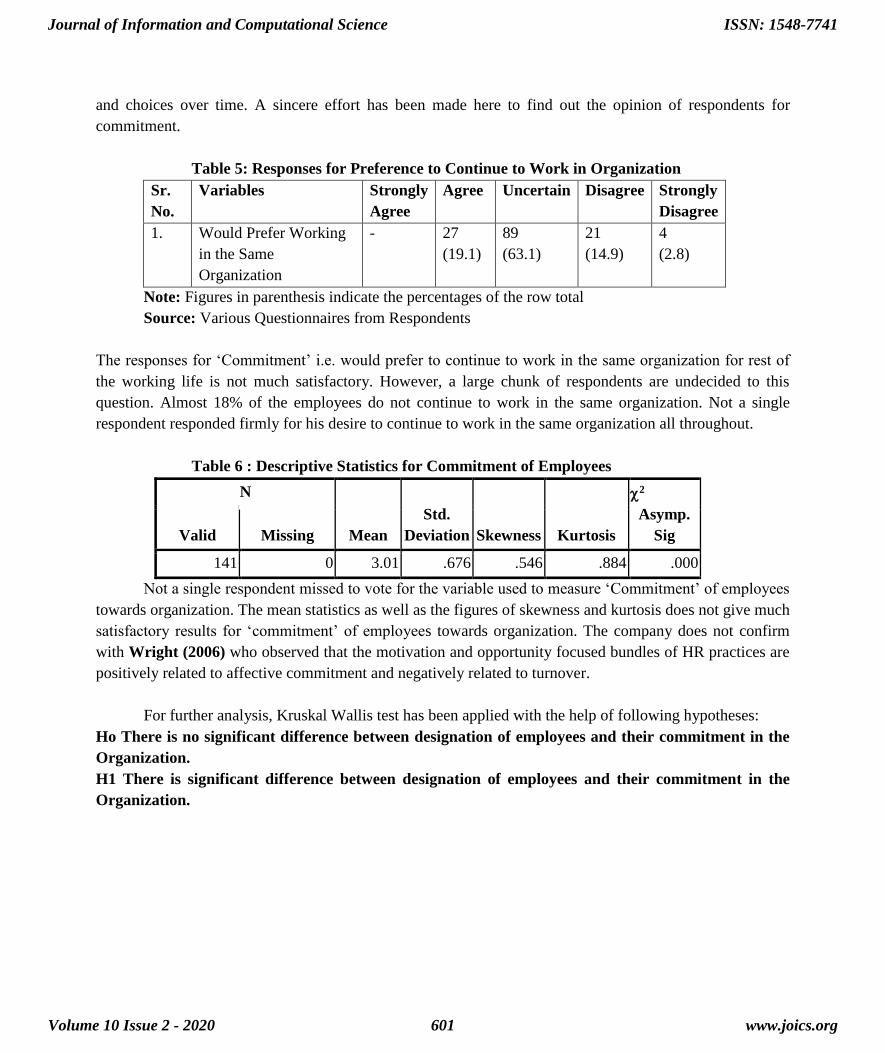
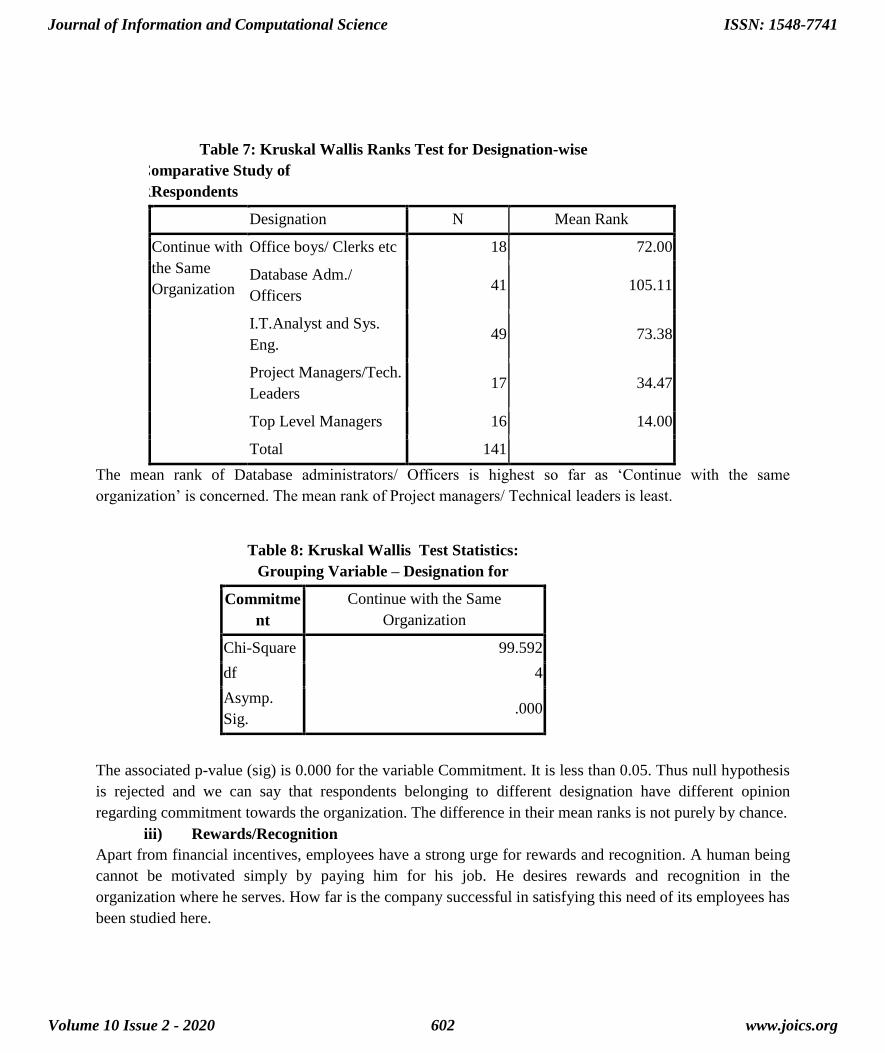
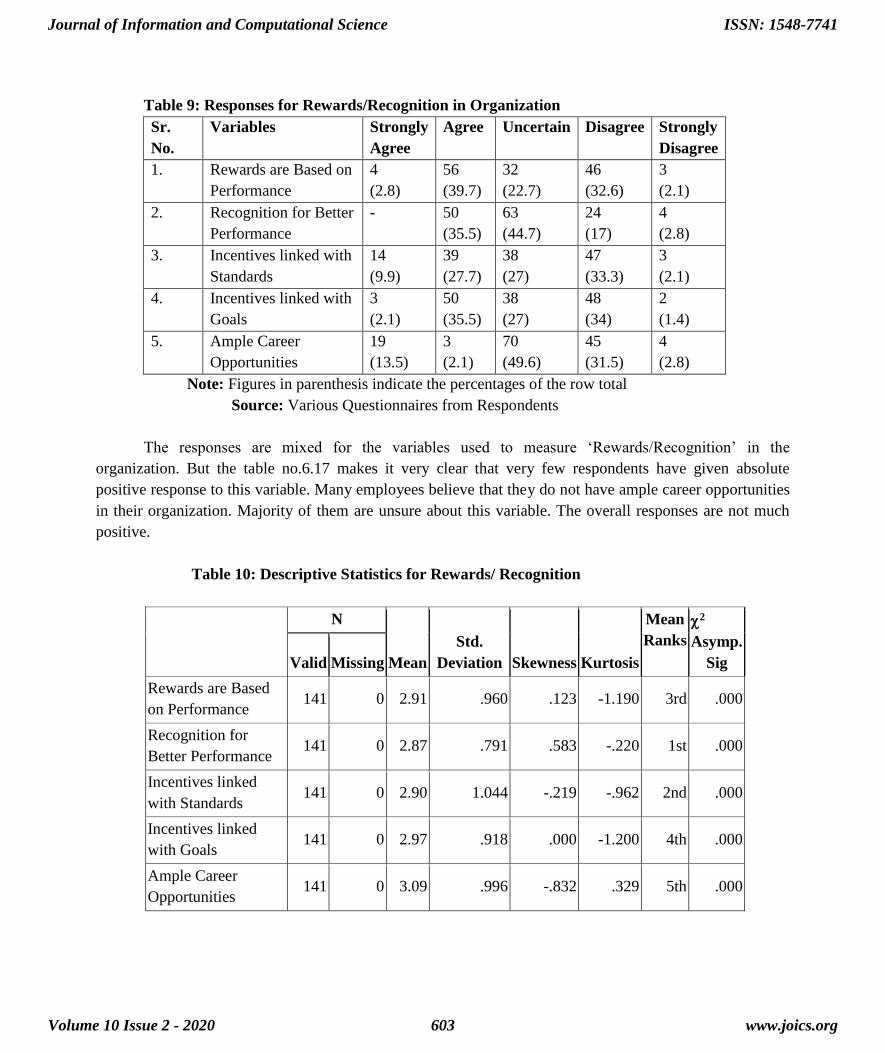
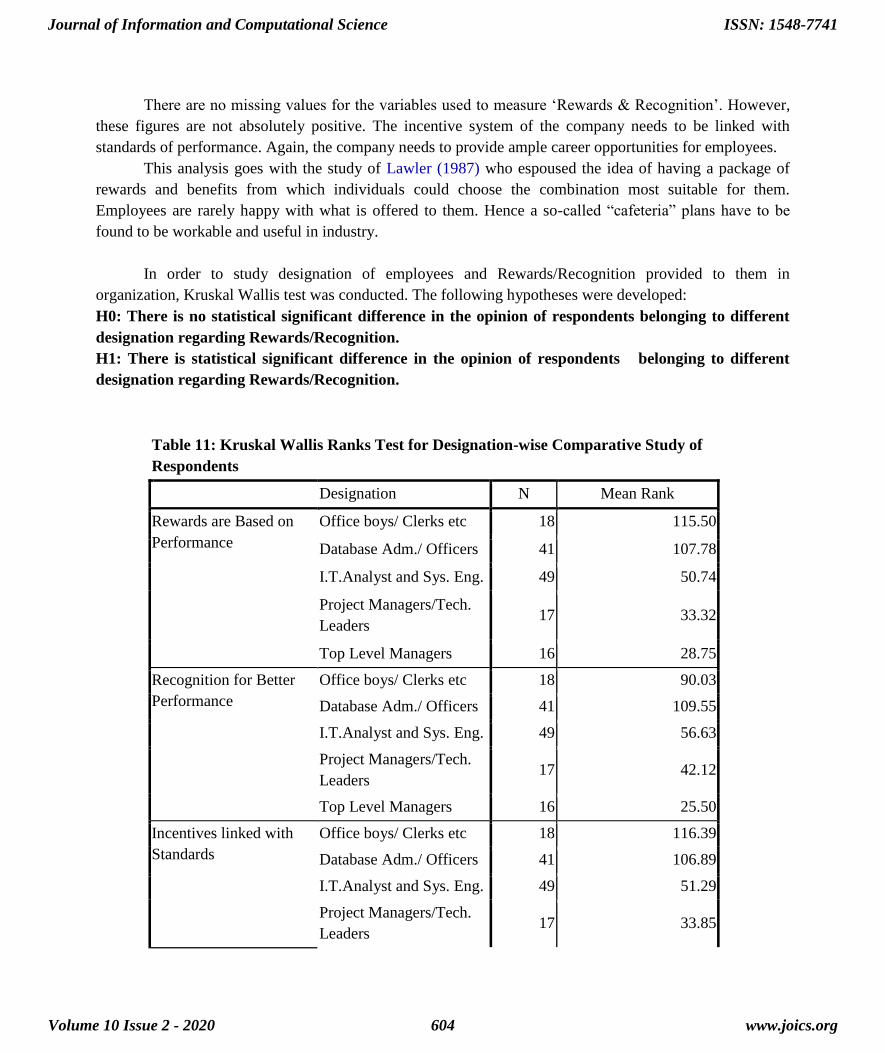
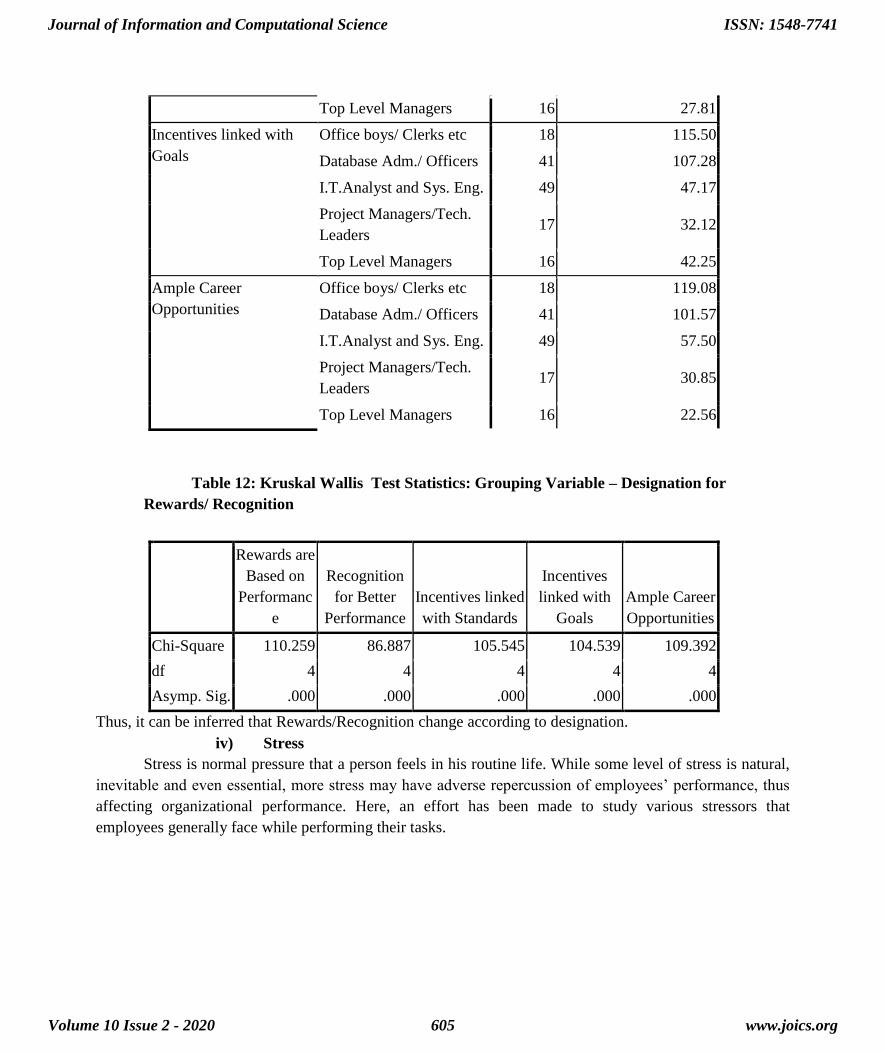
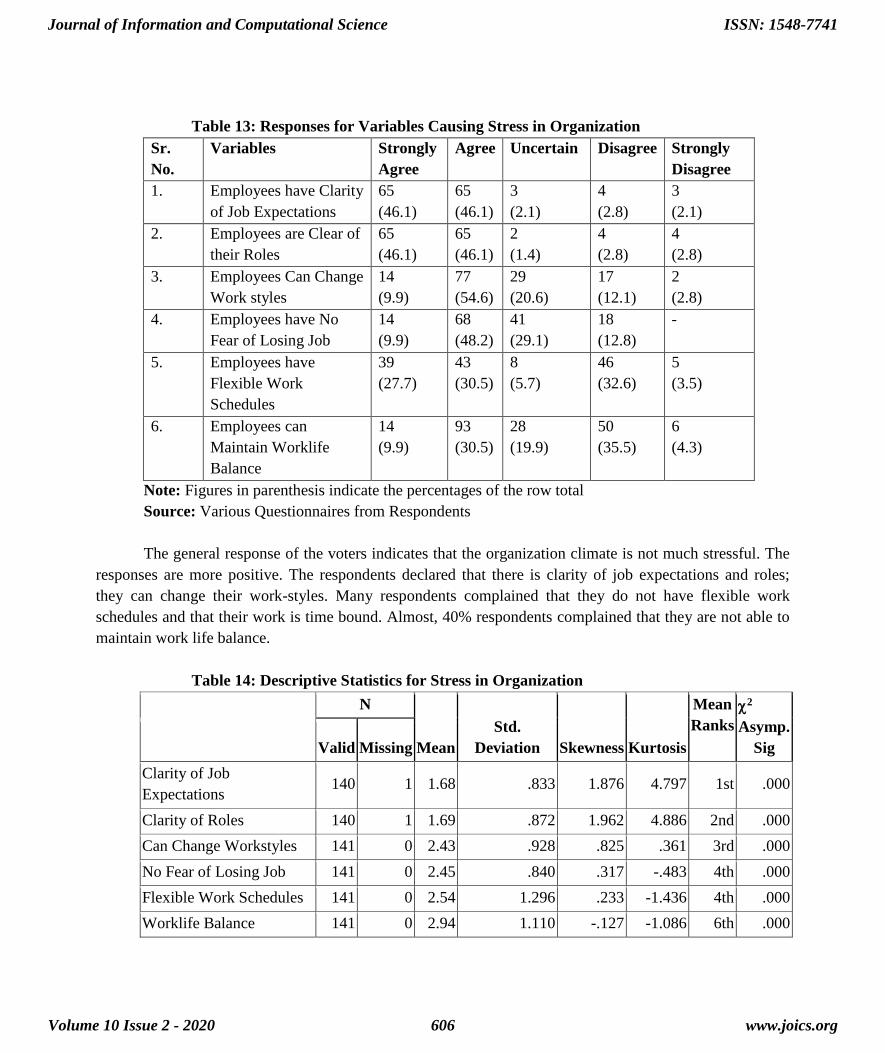
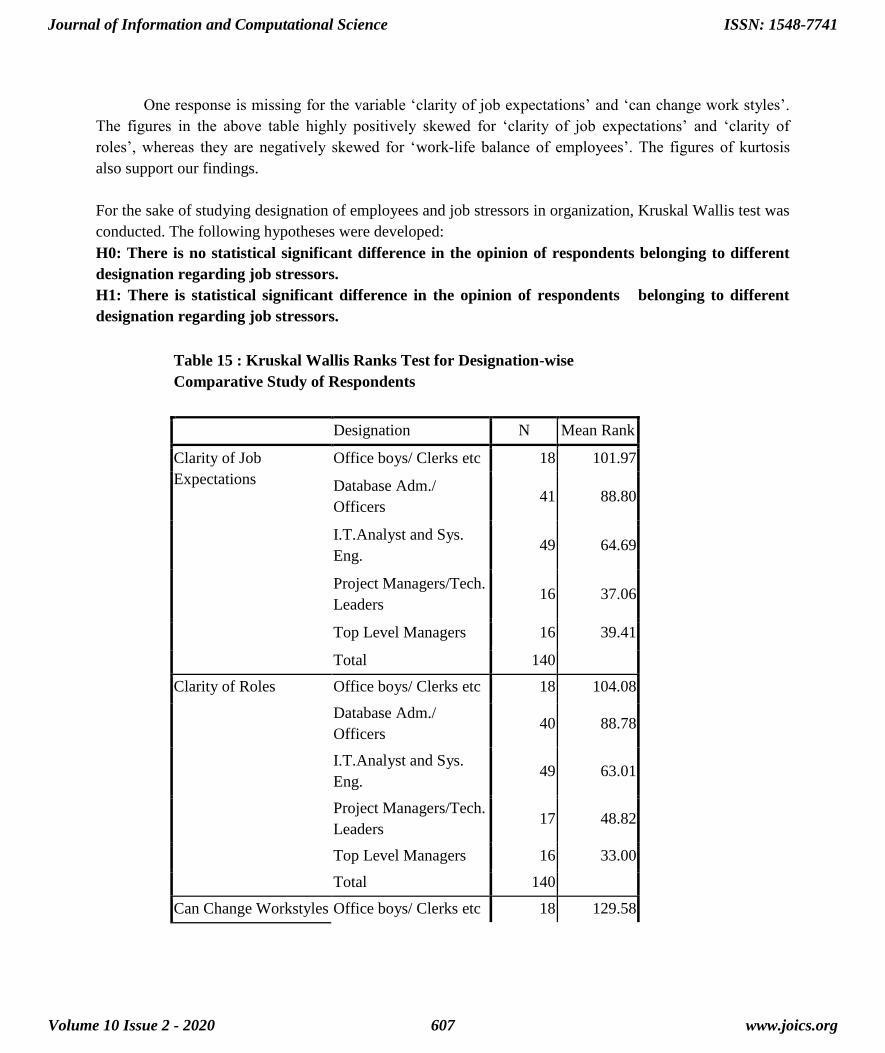
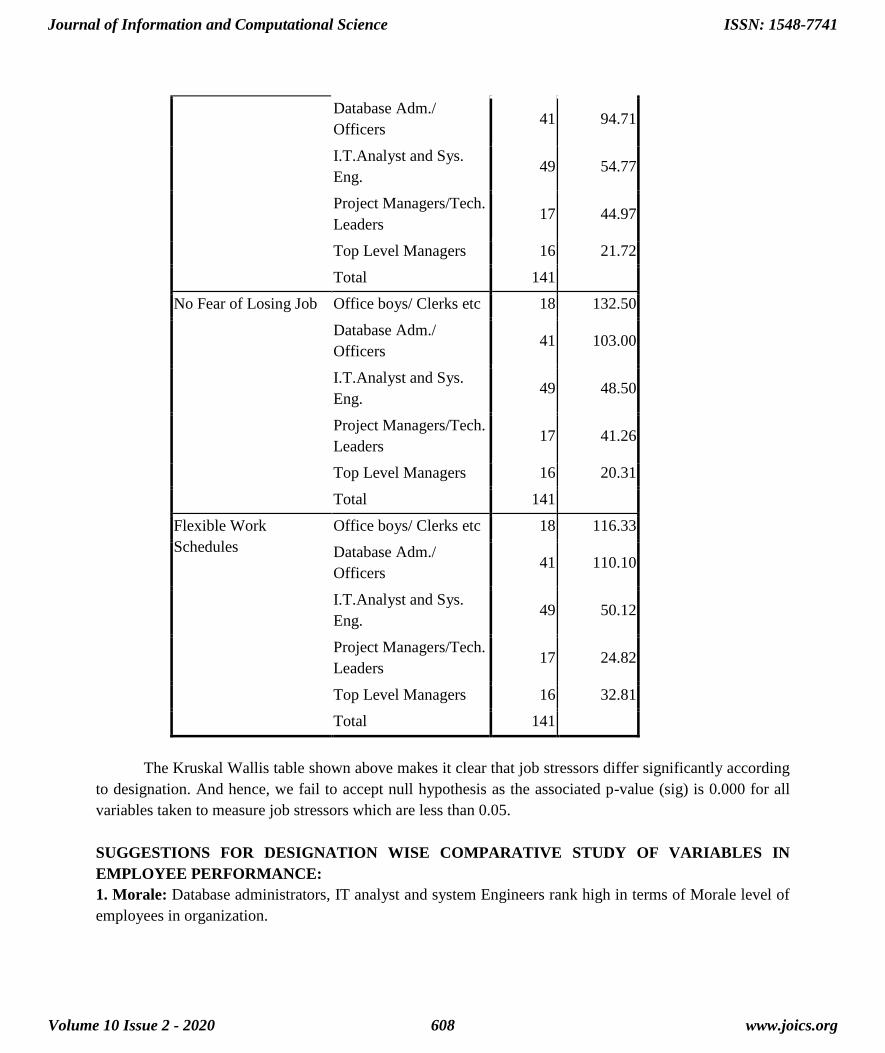
Database Adm
Officers 41 9471
ITAnalyst and Sys
Eng 49 5477
Project ManagersTech
Leaders 17 4497
Top Level Managers 16 2172
Total 141
No Fear of Losing Job Office boys Clerks etc 18 13250
Database Adm
Officers 41 10300
ITAnalyst and Sys
Eng 49 4850
Project ManagersTech
Leaders 17 4126
Top Level Managers 16 2031
Total 141
Flexible Work
Schedules
Office boys Clerks etc 18 11633
Database Adm
Officers 41 11010
ITAnalyst and Sys
Eng 49 5012
Project ManagersTech
Leaders 17 2482
Top Level Managers 16 3281
Total 141
The Kruskal Wallis table shown above makes it clear that job stressors differ significantly according
to designation And hence we fail to accept null hypothesis as the associated p-value (sig) is 0000 for all
variables taken to measure job stressors which are less than 005
SUGGESTIONS FOR DESIGNATION WISE COMPARATIVE STUDY OF VARIABLES IN
EMPLOYEE PERFORMANCE
1 Morale Database administrators IT analyst and system Engineers rank high in terms of Morale level of
employees in organization
Journal of Information and Computational Science
Volume 10 Issue 2 - 2020
ISSN 1548-7741
wwwjoicsorg608
As it is IT Company people with technical skills directly involved in process find it easy to survive
Whereas Project Managers Team leaders top level managers junior level officers and office assistant staff
have complained that there are many levels to be followed and lengthy procedures by which work processes
gets delayed which affects morale level of employees Lack of communication in changes of rules and
regulations have also been seen as a trouble factor
Some challenges such as limited time long hours to work limited resources and lengthy processes
need to be looked urgently Highly stressful jobs despite high packages make these jobs less attractive
Speedy direct and simple communication system should be adopted in the organization Low morale may
lead to lower performance in long run
2 Rewards Recognition Except for Database administrator Officers and junior level and supportive staff
(office assistants) respondents of other designations have scored low mean ranks for variables in
RewardRecognition system Overall responsesrsquo are not so positive in this category Responses suggest that
it is a good company for entry level employees but not so encouraging for other designations Reasons as
discussed earlier are lack of proper promotion policy poor increment policy and lack of proper
implementation of certain HR policies
3 Commitment The mean rank of Database administrators Officers is highest so far as lsquoContinue with the
same organizationrsquo is concerned The mean rank of Project managers Technical leaders is least Project
managers have expressed that they are under immense pressure and their appraisal depends on clients Also
they have expressed dissatisfaction towards resource allocation policy of the company
4 Stress Mean ranks of Office boysJunior clerks Database administrators and Officers are highest for the
variables used to measure stress whereas Project Managers Technical leads and Top reporting managers
have scored least mean ranks The Kruskal Wallis table shown in analysis makes it clear that job stressors
differ significantly according to designation Employees like office assistants database administrators
doing routine jobs have less stress compared to those handling complex issues in Projects (Project
Managers Technical leads) Also Top reporting managers handling complex managerial issues have more
stress level
BIBLIOGRAPHY
1 Allen N J amp Meyer J P (2000) ldquoConstruct Validation in Organizational Behavior Research The
Case of Organizational Commitmentrdquo in R D Goffin amp E Helmes (Eds) Problems and solutions
in human assessment Honoring Douglas N Jackson at seventy Norwell MA Kluwer pp 285-314
2 Allen NJ amp Meyer J P (1996) ldquoAffective Continuance and Normative Commitment to the
Organization An examination of Construct Validityrdquo Journal of Vocational Behavior 49pp252-
276
3 Chakravarthy B S (1986) ldquoMeasuring Strategic Performancerdquo Strategic Management Journal 7
437ndash458
4 Diversity Beyond the numbers game (1995 Aug14) Business Week pp 60 61
5 Ducharme amp Martin (2000) ldquoGeneral practitionersrdquo British Medical Journal 298 pp366ndash370
Journal of Information and Computational Science
Volume 10 Issue 2 - 2020
ISSN 1548-7741
wwwjoicsorg609
6 Fama Eugene (1980) ldquoAgency Problems and the Theory of the Firmrdquo Journal of Political
Economy- 88 pp288-307
7 Johnson RW (2004) ldquoTrends in job demands among older workersrdquo Monthly Labor Review
127(7)48-56
8 Kahneman D amp Tversky A (2000) ldquoChoices Values and Framesrdquo New York Cambridge
University Press
9 Venkatraman N amp Ramanujam V (1986) ldquoMeasurement of Business Performance in Strategy
Research A Comparison of Approachesrdquo Academy of Management Review 11 801ndash814
10 Wayne F Cascio (1998) ldquoManaging Human Resources- Productivity Quality of Work Life
Profitsrdquo McGraw-Hill pp 458
Journal of Information and Computational Science
Volume 10 Issue 2 - 2020
ISSN 1548-7741
wwwjoicsorg610