a study of human resource management
TRANSCRIPT
A STUDY OF HUMAN RESOURCE MANAGEMENT
PRACTICES IN CHEMICAL INDUSTRIES WITH SPECIAL
REFERENCE TO NAVI MUMBAI (2002-2012)
Submitted to the
Tilak Maharashtra Vidyapeeth, Pune, Maharashtra
For the Degree of Doctor of Philosophy (PhD)
in Management
Under the Board of Management studies
Submitted By
Mr. Prakash Digambar Sawant.
(P R N. –15811001167)
Under the Guidance of
Dr. Prin. Vishnu N. Yadav
July- 2018
Declaration
I hereby declare that the thesis entitled “A STUDY OF HUMAN RESOURCE MANAGEMENT
PRACTICES IN CHEMICAL INDUSTRIES WITH SPECIAL REFERENCE TO NAVI
MUMBAI (2002-2012).”completed and written by me has not previously formed the basis for the
award of any degree or other similar title upon me of this or any other Vidyapeeth or examining
body.
(Mr. Prakash D. Sawant.)
Place :
Date :
C E R T I F I C A T E
This is to certify that the thesis entitled “A STUDY OF HUMAN RESOURCE MANAGEMENT
PRACTICES IN CHEMICAL INDUSTRIES WITH SPECIAL REFERENCES TO NAVI
MUMBAI (2002-2012).”which is being submitted herewith for the award of the Degree of
Vidyavachaspati (PhD) in faculty of Management of Tilak Maharashtra Vidyapeeth, Pune is the
result of original research work completed by Shri. Prakash Digambar Sawant (PRN
15811001167) under my supervision and guidance. To the best of my knowledge and belief the
work incorporated in this thesis has not formed the basis for the award of any Degree or similar
title of this or any other University or examining body upon him.
Dr. Vishnu N. Yadav
(Research guide)
Place :
Date :
ACKNOWLEDGEMENT
I would like to express my sincere gratitude to my Research Guide, Principal Dr. Vishnu N.
Yadav for his never – ending encouragement and support, his Knowledge and guidance made
my journey of doctoral study complete.
I would like to extend my sincere thanks to my Principal V.B. Rokade (T.K. Tope Night
College, Parel, Mumbai.) for his support and guidance, positive, pragmatic and proactive
instructions. My deep sense of gratitude and heartful thanks my all colleagues for sharing their
wisdom and experience during research work.
My special thanks to Dr. Vinit Joshi and Prof. Krishnan Nandela (HOD) Economics Dept,
TKT College, Parel, Mumbai.) for their help and co-operation
I express my sincere gratitude to Tilak Maharashtra Vidyapeeth and vice Chancellor Ho’ble Dr.
Deepak J. Tilak for giving me an opportunity to do research and providing necessary resources and
environment. I owe my thanks to Dr. Abhyankar Sir (Dean), Management Department, of Tilak
Maharashtra Vidyapeeth for their most valuable guidance and constructive suggestions during this
study. I also thank to Dr. Yadav Madam, Head of the PhD. Department and her staff for providing
necessary guidance to me. I also thanks to Mrs. Bhakare Madam and her staff (Management
Department) for her whole-hearted help and cooperation.
My sincere thanks to Hon. President Mr. Bipin N. Shah, Sr. Secretary J. Menon and his whole
staff, Thane Belapur Industries Association (TBIA) and all 20 Chemical Industries HR
Managers/ Managers/ Superiors and employees for his whole hearted help and co-operation.
I am highly grateful to my wife Mrs. Vidya and my daughters Miss Prajakta, Miss. Pranaya
and my lovely Son Prajyot. Without their patient unfailing support and trust, I might not have
been able to complete my study. I would also like to express my gratitude to my father Dada and
mother Akka for their encouragement and motivation.
I take this opportunity to thank all those who directly and indirectly helped me in the completion of my
research work.
Mr. Prakash Digambar Sawant.
(Signature of Candidate)
Date:-
Place:-
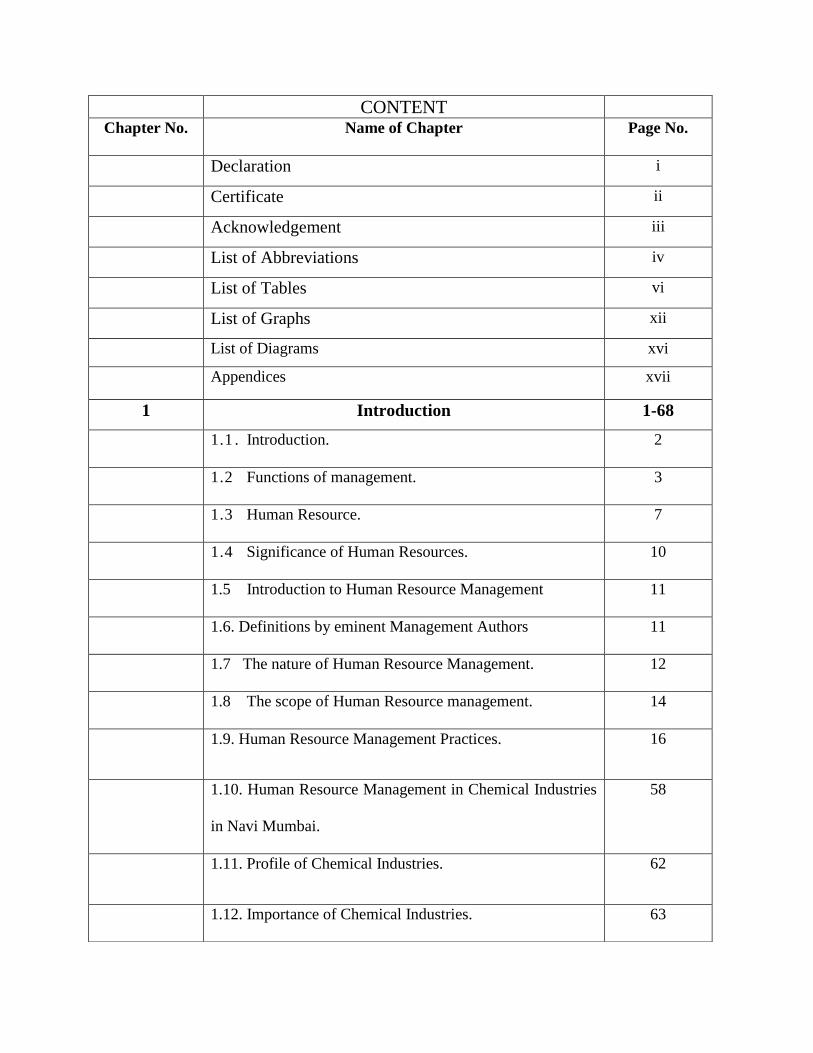
CONTENT
Chapter No. Name of Chapter Page No.
Declaration i
Certificate ii
Acknowledgement iii
List of Abbreviations iv
List of Tables vi
List of Graphs xii
List of Diagrams xvi
Appendices xvii
1 Introduction 1-68
1.1 . Introduction. 2
1.2 Functions of management. 3
1.3 Human Resource. 7
1.4 Significance of Human Resources. 10
1.5 Introduction to Human Resource Management 11
1.6. Definitions by eminent Management Authors 11
1.7 The nature of Human Resource Management. 12
1.8 The scope of Human Resource management. 14
1.9. Human Resource Management Practices. 16
1.10. Human Resource Management in Chemical Industries
in Navi Mumbai.
58
1.11. Profile of Chemical Industries. 62
1.12. Importance of Chemical Industries. 63
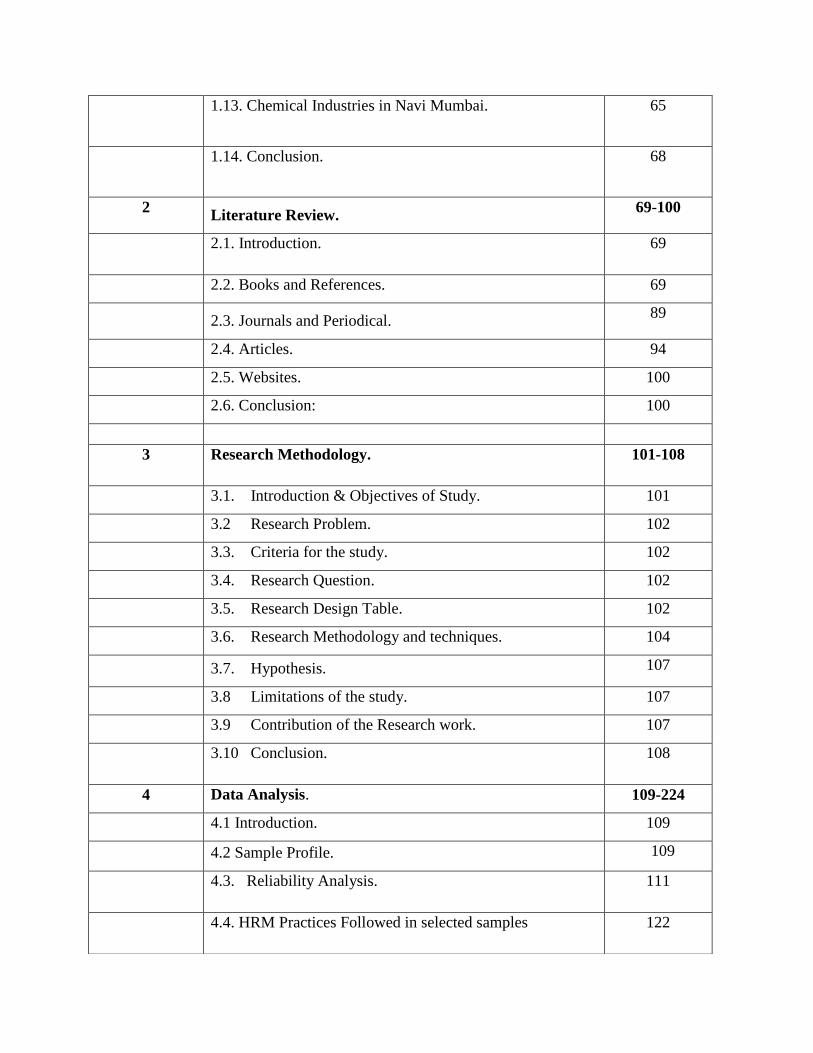
1.13. Chemical Industries in Navi Mumbai. 65
1.14. Conclusion. 68
2 Literature Review.
69-100
2.1. Introduction. 69
2.2. Books and References. 69
2.3. Journals and Periodical.
89
2.4. Articles. 94
2.5. Websites. 100
2.6. Conclusion: 100
3 Research Methodology. 101-108
3.1. Introduction & Objectives of Study. 101
3.2 Research Problem. 102
3.3. Criteria for the study. 102
3.4. Research Question. 102
3.5. Research Design Table. 102
3.6. Research Methodology and techniques. 104
3.7. Hypothesis. 107
3.8 Limitations of the study. 107
3.9 Contribution of the Research work. 107
3.10 Conclusion. 108
4 Data Analysis. 109-224
4.1 Introduction. 109
4.2 Sample Profile. 109
4.3. Reliability Analysis. 111
4.4. HRM Practices Followed in selected samples 122
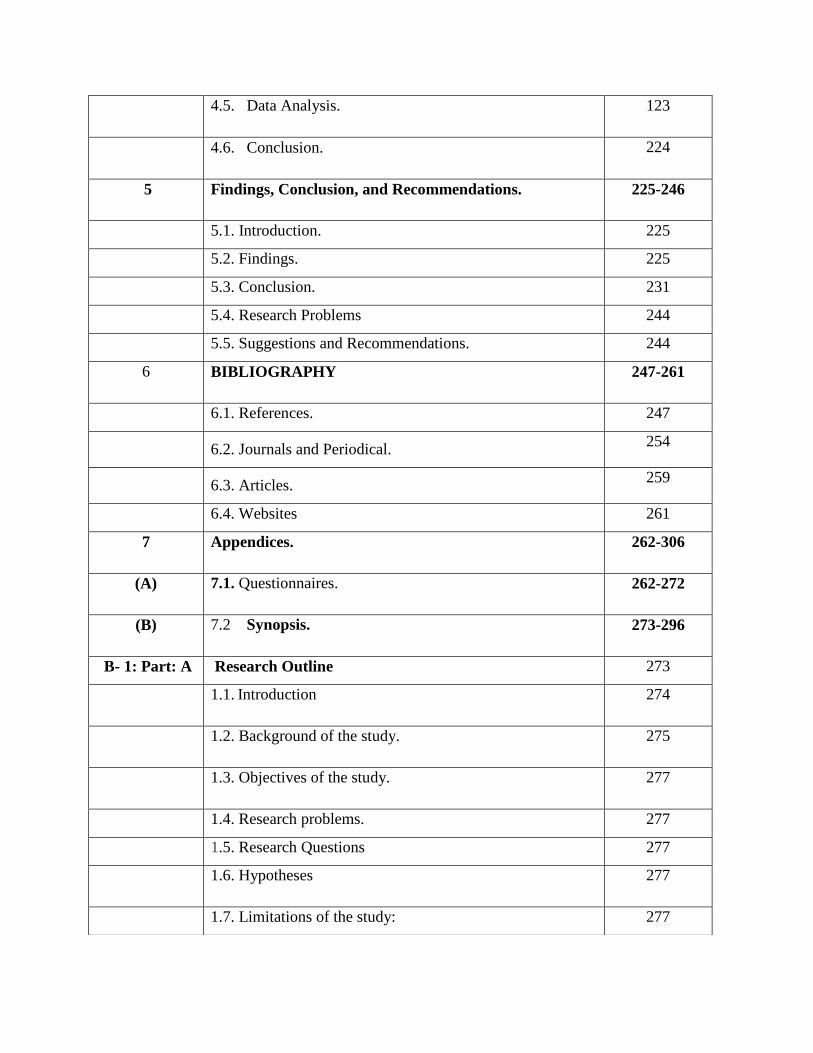
4.5. Data Analysis. 123
4.6. Conclusion. 224
5 Findings, Conclusion, and Recommendations. 225-246
5.1. Introduction. 225
5.2. Findings. 225
5.3. Conclusion. 231
5.4. Research Problems 244
5.5. Suggestions and Recommendations. 244
6 BIBLIOGRAPHY 247-261
6.1. References. 247
6.2. Journals and Periodical.
254
6.3. Articles.
259
6.4. Websites 261
7 Appendices. 262-306
(A) 7.1. Questionnaires. 262-272
(B) 7.2 Synopsis. 273-296
B- 1: Part: A Research Outline 273
1.1. Introduction 274
1.2. Background of the study. 275
1.3. Objectives of the study. 277
1.4. Research problems. 277
1.5. Research Questions 277
1.6. Hypotheses 277
1.7. Limitations of the study: 277
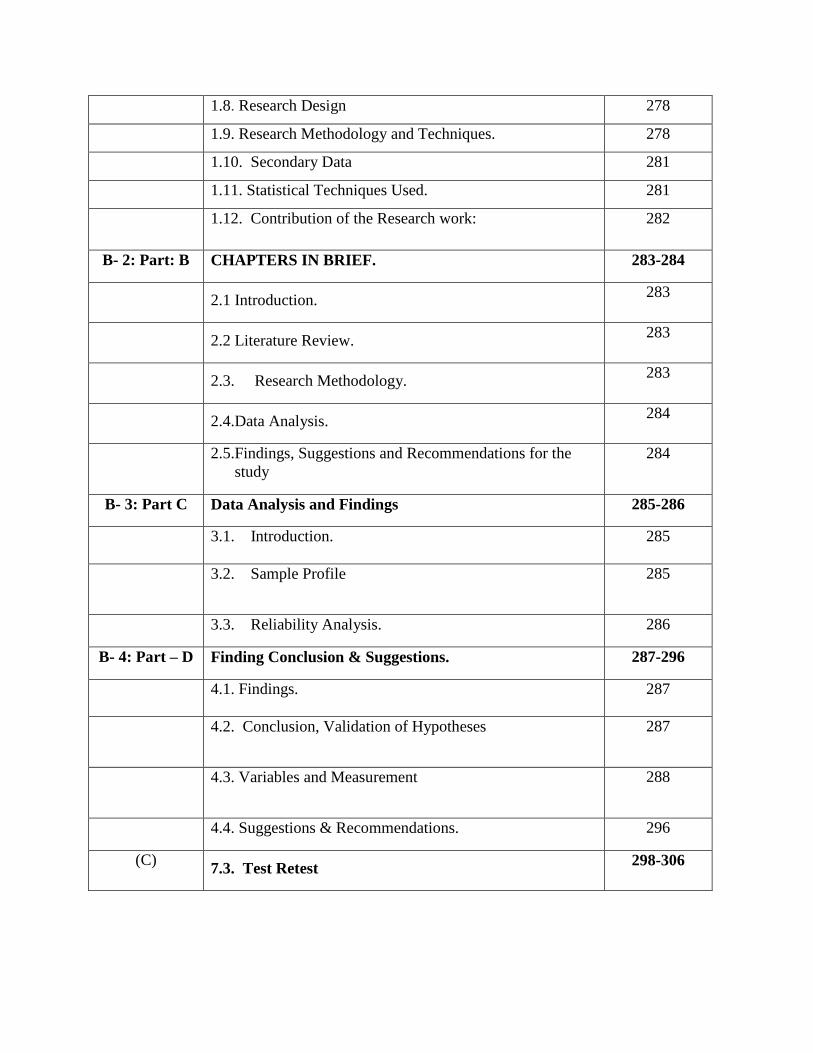
1.8. Research Design 278
1.9. Research Methodology and Techniques. 278
1.10. Secondary Data 281
1.11. Statistical Techniques Used. 281
1.12. Contribution of the Research work: 282
B- 2: Part: B CHAPTERS IN BRIEF. 283-284
2.1 Introduction.
283
2.2 Literature Review.
283
2.3. Research Methodology.
283
2.4.Data Analysis.
284
2.5.Findings, Suggestions and Recommendations for the
study
284
B- 3: Part C Data Analysis and Findings 285-286
3.1. Introduction.
285
3.2. Sample Profile
285
3.3. Reliability Analysis. 286
B- 4: Part – D Finding Conclusion & Suggestions. 287-296
4.1. Findings.
287
4.2. Conclusion, Validation of Hypotheses
287
4.3. Variables and Measurement
288
4.4. Suggestions & Recommendations. 296
(C) 7.3. Test Retest
298-306
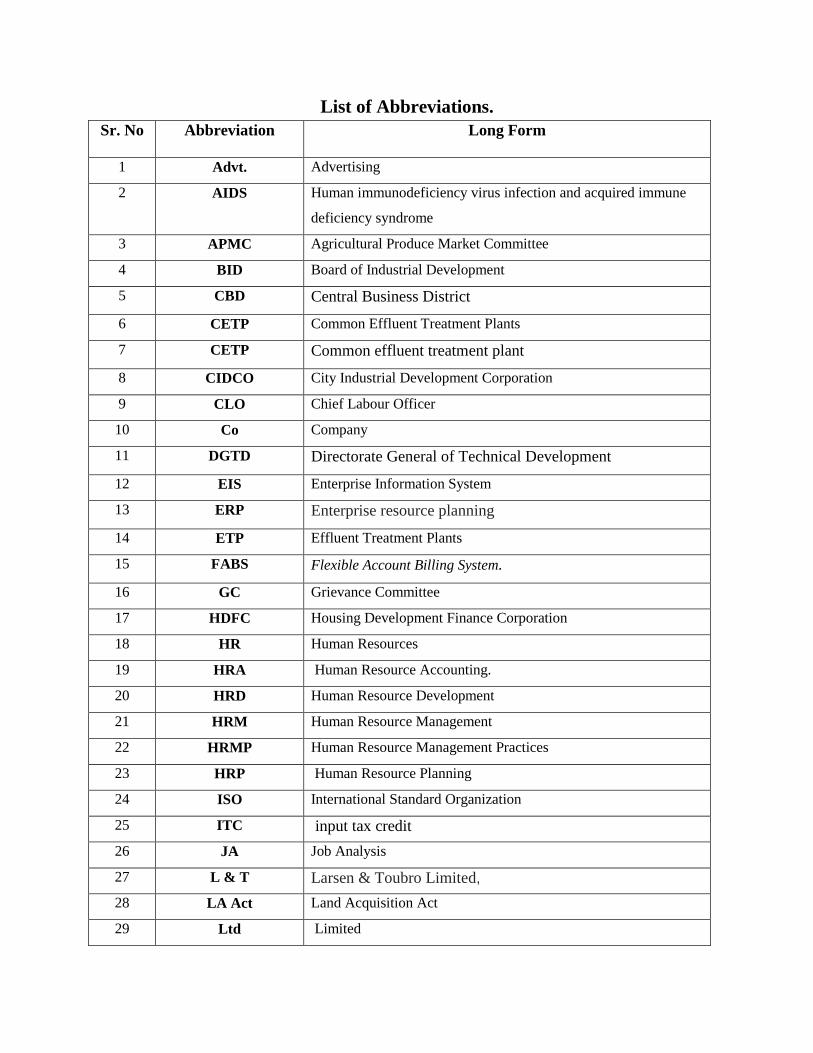
List of Abbreviations.
Sr. No Abbreviation
Long Form
1 Advt. Advertising
2 AIDS Human immunodeficiency virus infection and acquired immune
deficiency syndrome
3 APMC Agricultural Produce Market Committee
4 BID Board of Industrial Development
5 CBD Central Business District
6 CETP Common Effluent Treatment Plants
7 CETP Common effluent treatment plant
8 CIDCO City Industrial Development Corporation
9 CLO Chief Labour Officer
10 Co Company
11 DGTD Directorate General of Technical Development
12 EIS Enterprise Information System
13 ERP Enterprise resource planning
14 ETP Effluent Treatment Plants
15 FABS Flexible Account Billing System.
16 GC Grievance Committee
17 HDFC Housing Development Finance Corporation
18 HR Human Resources
19 HRA Human Resource Accounting.
20 HRD Human Resource Development
21 HRM Human Resource Management
22 HRMP Human Resource Management Practices
23 HRP Human Resource Planning
24 ISO International Standard Organization
25 ITC input tax credit
26 JA Job Analysis
27 L & T Larsen & Toubro Limited,
28 LA Act Land Acquisition Act
29 Ltd Limited
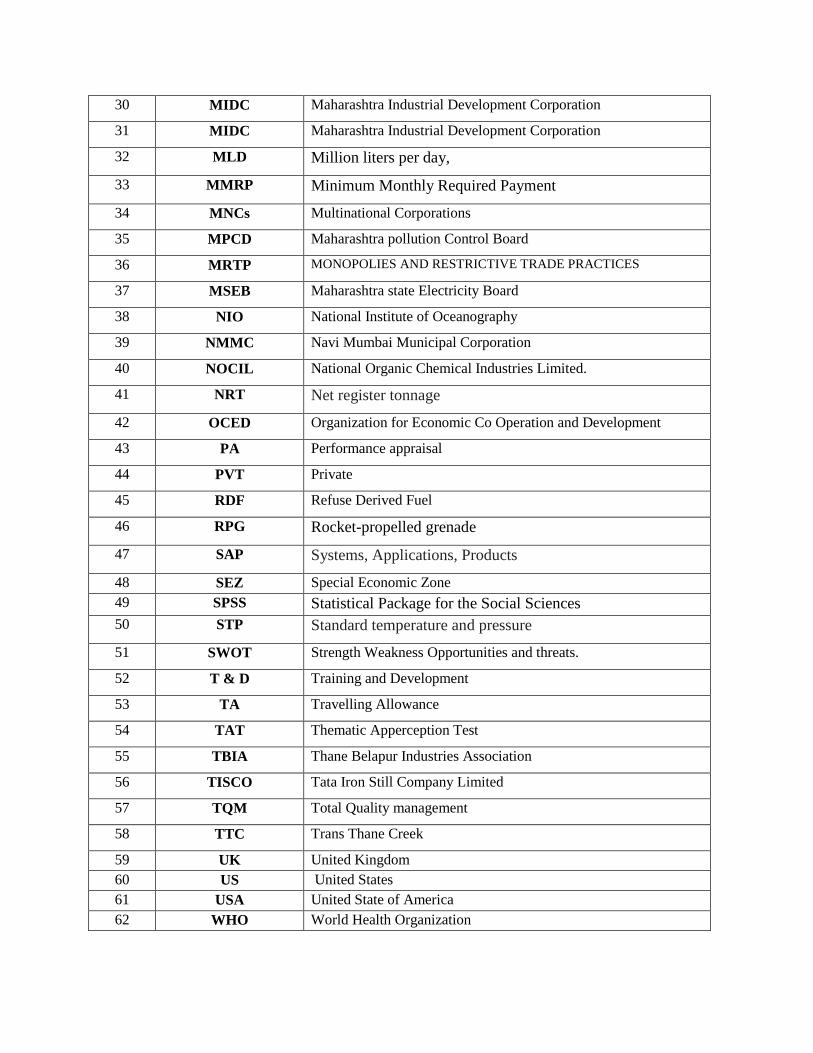
30 MIDC Maharashtra Industrial Development Corporation
31 MIDC Maharashtra Industrial Development Corporation
32 MLD Million liters per day,
33 MMRP Minimum Monthly Required Payment
34 MNCs Multinational Corporations
35 MPCD Maharashtra pollution Control Board
36 MRTP MONOPOLIES AND RESTRICTIVE TRADE PRACTICES
37 MSEB Maharashtra state Electricity Board
38 NIO National Institute of Oceanography
39 NMMC Navi Mumbai Municipal Corporation
40 NOCIL National Organic Chemical Industries Limited.
41 NRT Net register tonnage
42 OCED Organization for Economic Co Operation and Development
43 PA Performance appraisal
44 PVT Private
45 RDF Refuse Derived Fuel
46 RPG Rocket-propelled grenade
47 SAP Systems, Applications, Products
48 SEZ Special Economic Zone
49 SPSS Statistical Package for the Social Sciences
50 STP Standard temperature and pressure
51 SWOT Strength Weakness Opportunities and threats.
52 T & D Training and Development
53 TA Travelling Allowance
54 TAT Thematic Apperception Test
55 TBIA Thane Belapur Industries Association
56 TISCO Tata Iron Still Company Limited
57 TQM Total Quality management
58 TTC Trans Thane Creek
59 UK United Kingdom
60 US United States
61 USA United State of America
62 WHO World Health Organization
i
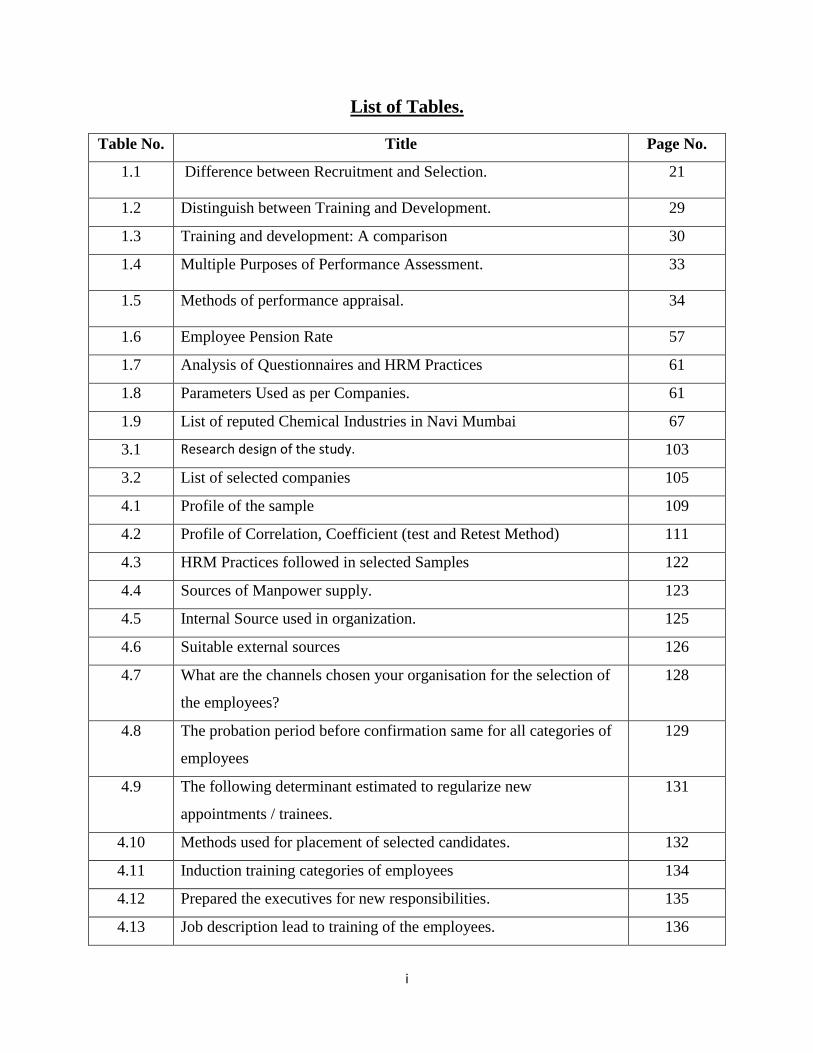
List of Tables.
Table No. Title Page No.
1.1 Difference between Recruitment and Selection. 21
1.2 Distinguish between Training and Development. 29
1.3 Training and development: A comparison 30
1.4 Multiple Purposes of Performance Assessment. 33
1.5 Methods of performance appraisal. 34
1.6 Employee Pension Rate 57
1.7 Analysis of Questionnaires and HRM Practices 61
1.8 Parameters Used as per Companies. 61
1.9 List of reputed Chemical Industries in Navi Mumbai 67
3.1 Research design of the study. 103
3.2 List of selected companies 105
4.1 Profile of the sample 109
4.2 Profile of Correlation, Coefficient (test and Retest Method) 111
4.3 HRM Practices followed in selected Samples 122
4.4 Sources of Manpower supply. 123
4.5 Internal Source used in organization. 125
4.6 Suitable external sources 126
4.7 What are the channels chosen your organisation for the selection of
the employees?
128
4.8 The probation period before confirmation same for all categories of
employees
129
4.9 The following determinant estimated to regularize new
appointments / trainees.
131
4.10 Methods used for placement of selected candidates. 132
4.11 Induction training categories of employees 134
4.12 Prepared the executives for new responsibilities. 135
4.13 Job description lead to training of the employees. 136
ii
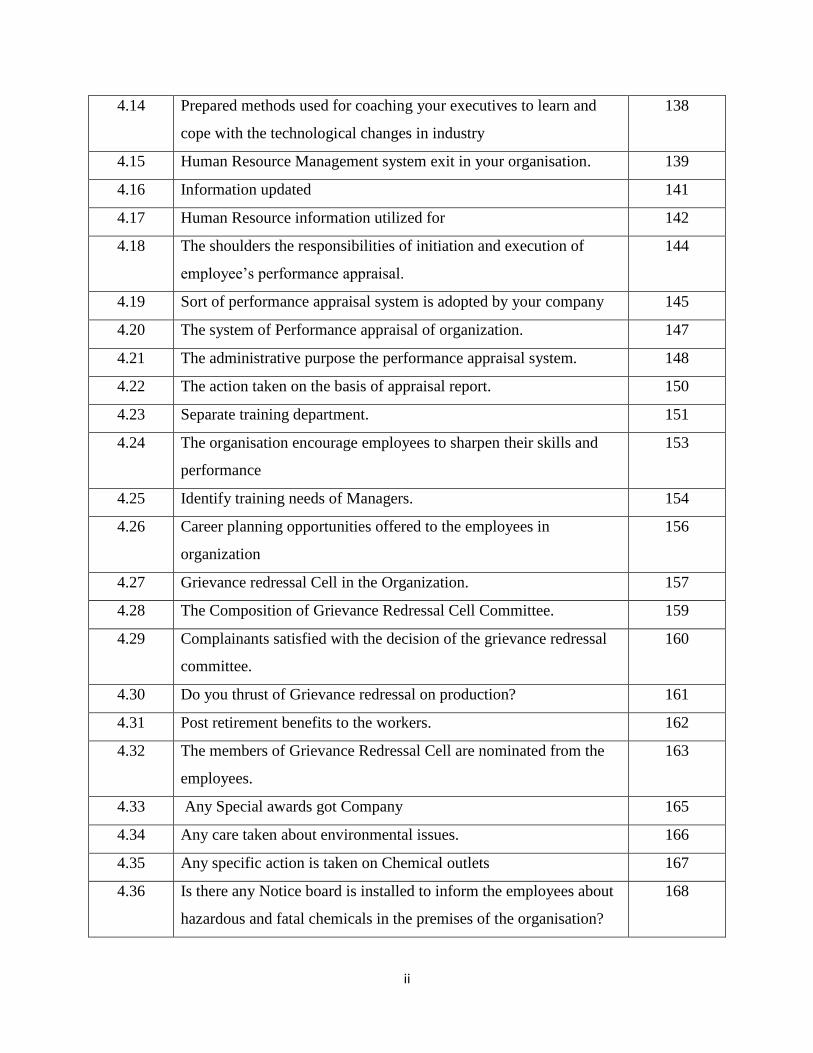
4.14 Prepared methods used for coaching your executives to learn and
cope with the technological changes in industry
138
4.15 Human Resource Management system exit in your organisation. 139
4.16 Information updated 141
4.17 Human Resource information utilized for 142
4.18 The shoulders the responsibilities of initiation and execution of
employee’s performance appraisal.
144
4.19 Sort of performance appraisal system is adopted by your company 145
4.20 The system of Performance appraisal of organization. 147
4.21 The administrative purpose the performance appraisal system. 148
4.22 The action taken on the basis of appraisal report. 150
4.23 Separate training department. 151
4.24 The organisation encourage employees to sharpen their skills and
performance
153
4.25 Identify training needs of Managers. 154
4.26 Career planning opportunities offered to the employees in
organization
156
4.27 Grievance redressal Cell in the Organization. 157
4.28 The Composition of Grievance Redressal Cell Committee. 159
4.29 Complainants satisfied with the decision of the grievance redressal
committee.
160
4.30 Do you thrust of Grievance redressal on production? 161
4.31 Post retirement benefits to the workers. 162
4.32 The members of Grievance Redressal Cell are nominated from the
employees.
163
4.33 Any Special awards got Company 165
4.34 Any care taken about environmental issues. 166
4.35 Any specific action is taken on Chemical outlets 167
4.36 Is there any Notice board is installed to inform the employees about
hazardous and fatal chemicals in the premises of the organisation?
168
iii
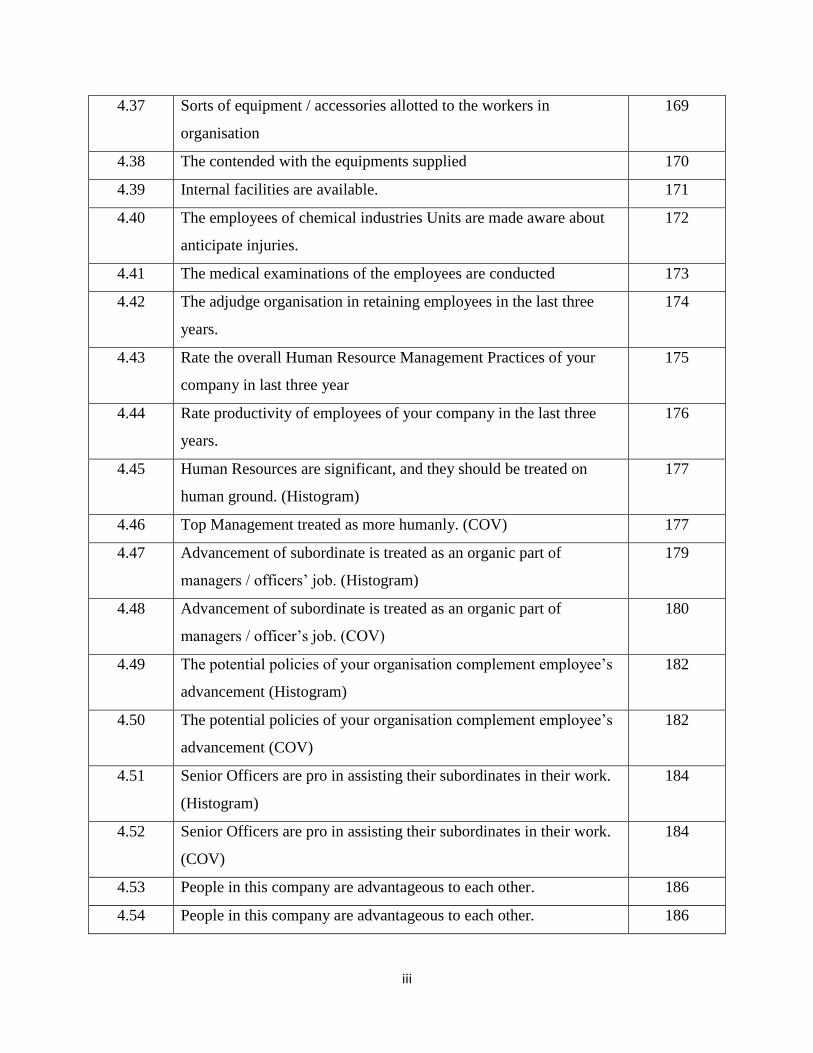
4.37 Sorts of equipment / accessories allotted to the workers in
organisation
169
4.38 The contended with the equipments supplied 170
4.39 Internal facilities are available. 171
4.40 The employees of chemical industries Units are made aware about
anticipate injuries.
172
4.41 The medical examinations of the employees are conducted 173
4.42 The adjudge organisation in retaining employees in the last three
years.
174
4.43 Rate the overall Human Resource Management Practices of your
company in last three year
175
4.44 Rate productivity of employees of your company in the last three
years.
176
4.45 Human Resources are significant, and they should be treated on
human ground. (Histogram)
177
4.46 Top Management treated as more humanly. (COV) 177
4.47 Advancement of subordinate is treated as an organic part of
managers / officers’ job. (Histogram)
179
4.48 Advancement of subordinate is treated as an organic part of
managers / officer’s job. (COV)
180
4.49 The potential policies of your organisation complement employee’s
advancement (Histogram)
182
4.50 The potential policies of your organisation complement employee’s
advancement (COV)
182
4.51 Senior Officers are pro in assisting their subordinates in their work.
(Histogram)
184
4.52 Senior Officers are pro in assisting their subordinates in their work.
(COV)
184
4.53 People in this company are advantageous to each other. 186
4.54 People in this company are advantageous to each other. 186
iv
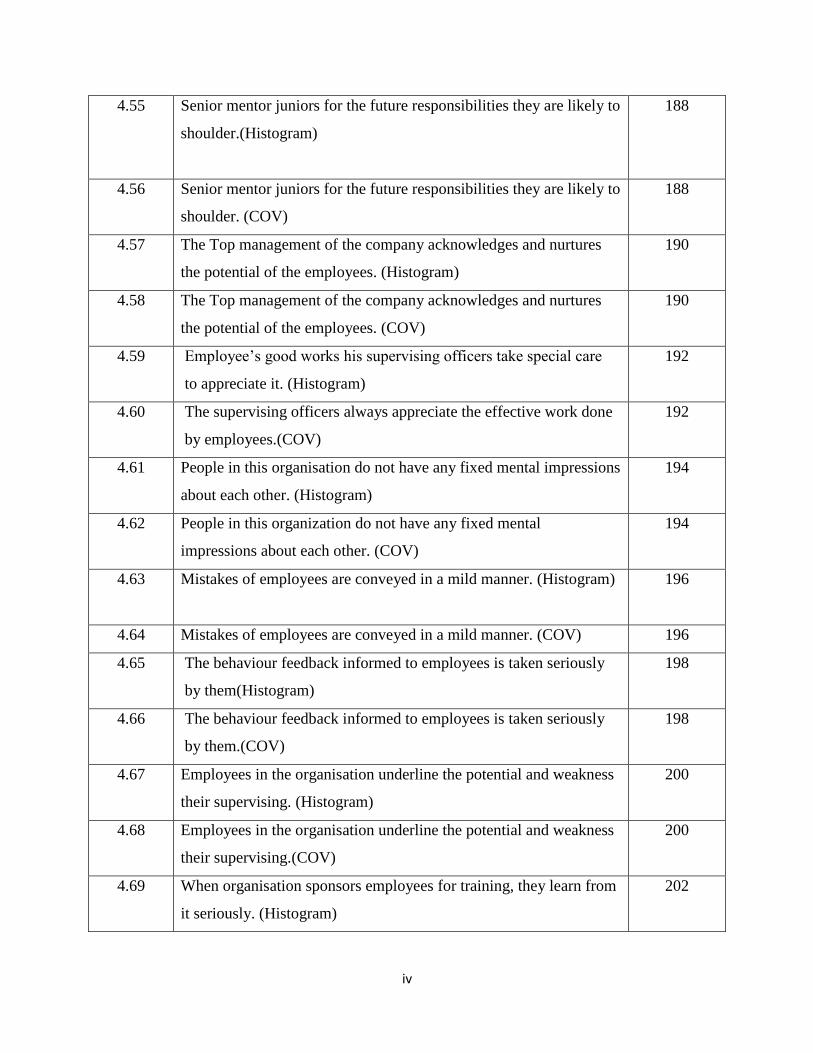
4.55 Senior mentor juniors for the future responsibilities they are likely to
shoulder.(Histogram)
188
4.56 Senior mentor juniors for the future responsibilities they are likely to
shoulder. (COV)
188
4.57 The Top management of the company acknowledges and nurtures
the potential of the employees. (Histogram)
190
4.58 The Top management of the company acknowledges and nurtures
the potential of the employees. (COV)
190
4.59 Employee’s good works his supervising officers take special care
to appreciate it. (Histogram)
192
4.60 The supervising officers always appreciate the effective work done
by employees.(COV)
192
4.61 People in this organisation do not have any fixed mental impressions
about each other. (Histogram)
194
4.62 People in this organization do not have any fixed mental
impressions about each other. (COV)
194
4.63 Mistakes of employees are conveyed in a mild manner. (Histogram)
196
4.64 Mistakes of employees are conveyed in a mild manner. (COV) 196
4.65 The behaviour feedback informed to employees is taken seriously
by them(Histogram)
198
4.66 The behaviour feedback informed to employees is taken seriously
by them.(COV)
198
4.67 Employees in the organisation underline the potential and weakness
their supervising. (Histogram)
200
4.68 Employees in the organisation underline the potential and weakness
their supervising.(COV)
200
4.69 When organisation sponsors employees for training, they learn from
it seriously. (Histogram)
202
v
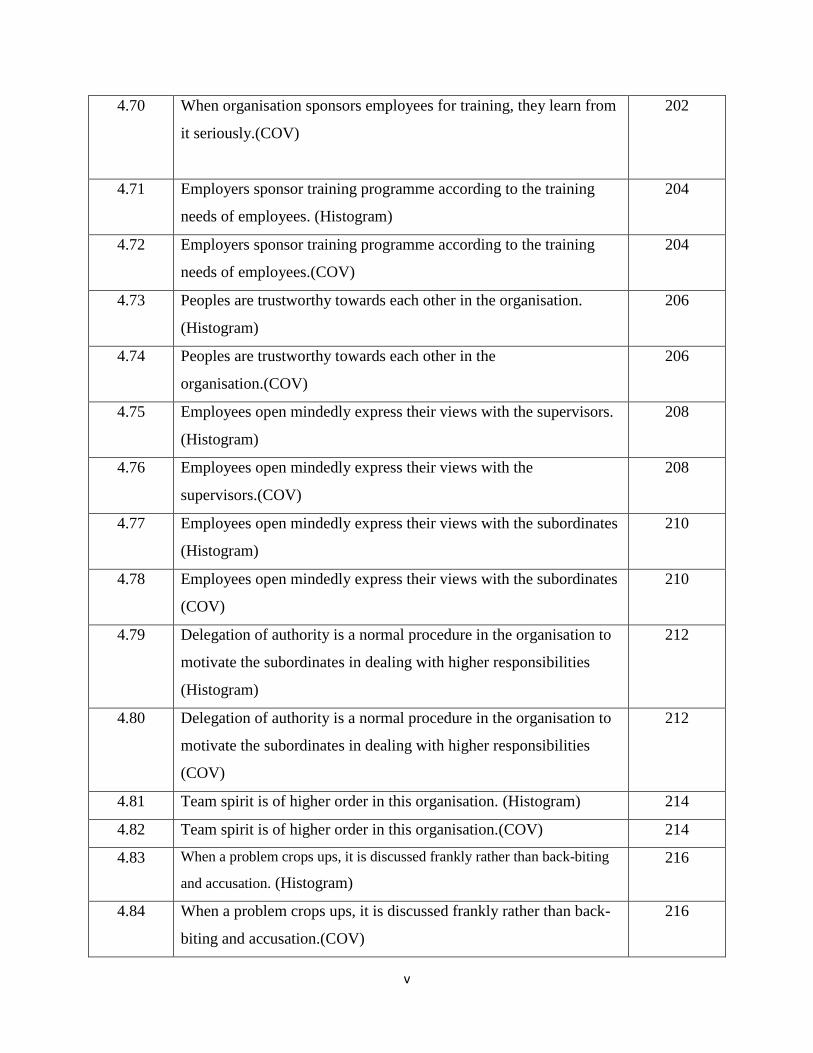
4.70 When organisation sponsors employees for training, they learn from
it seriously.(COV)
202
4.71 Employers sponsor training programme according to the training
needs of employees. (Histogram)
204
4.72 Employers sponsor training programme according to the training
needs of employees.(COV)
204
4.73 Peoples are trustworthy towards each other in the organisation.
(Histogram)
206
4.74 Peoples are trustworthy towards each other in the
organisation.(COV)
206
4.75 Employees open mindedly express their views with the supervisors.
(Histogram)
208
4.76 Employees open mindedly express their views with the
supervisors.(COV)
208
4.77 Employees open mindedly express their views with the subordinates
(Histogram)
210
4.78 Employees open mindedly express their views with the subordinates
(COV)
210
4.79 Delegation of authority is a normal procedure in the organisation to
motivate the subordinates in dealing with higher responsibilities
(Histogram)
212
4.80 Delegation of authority is a normal procedure in the organisation to
motivate the subordinates in dealing with higher responsibilities
(COV)
212
4.81 Team spirit is of higher order in this organisation. (Histogram) 214
4.82 Team spirit is of higher order in this organisation.(COV) 214
4.83 When a problem crops ups, it is discussed frankly rather than back-biting
and accusation. (Histogram)
216
4.84 When a problem crops ups, it is discussed frankly rather than back-
biting and accusation.(COV)
216
vi
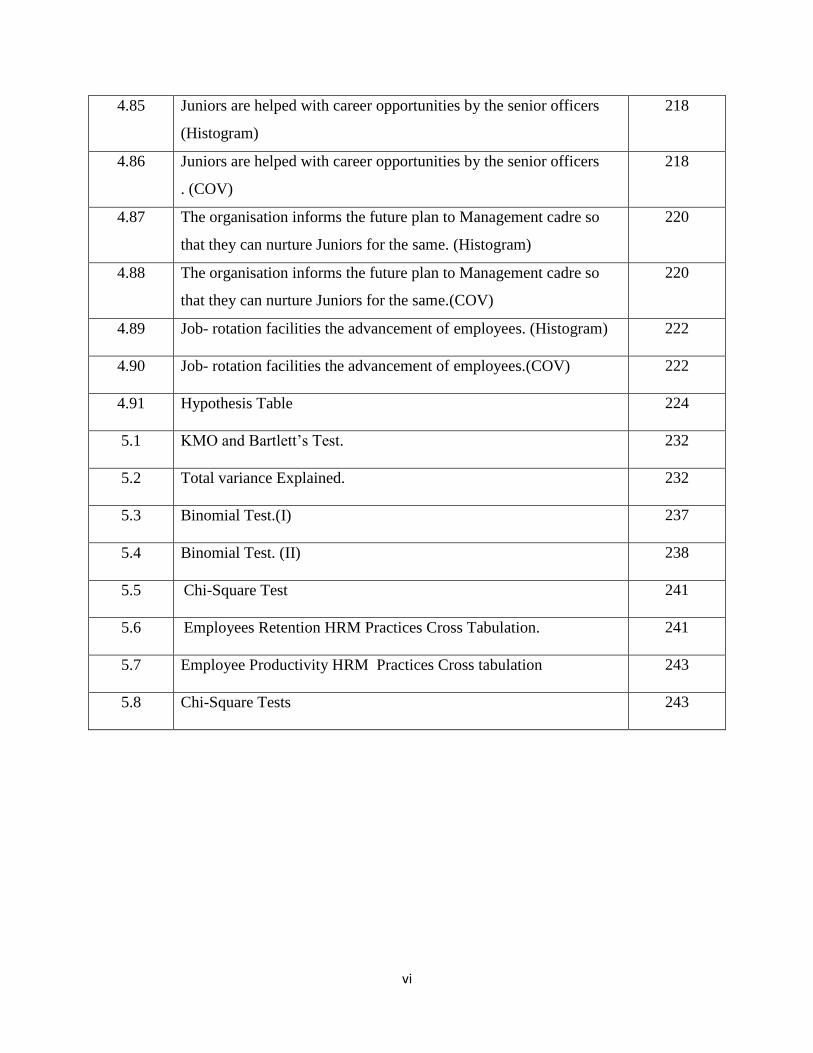
4.85 Juniors are helped with career opportunities by the senior officers
(Histogram)
218
4.86 Juniors are helped with career opportunities by the senior officers
. (COV)
218
4.87 The organisation informs the future plan to Management cadre so
that they can nurture Juniors for the same. (Histogram)
220
4.88 The organisation informs the future plan to Management cadre so
that they can nurture Juniors for the same.(COV)
220
4.89 Job- rotation facilities the advancement of employees. (Histogram) 222
4.90 Job- rotation facilities the advancement of employees.(COV) 222
4.91 Hypothesis Table 224
5.1 KMO and Bartlett’s Test. 232
5.2 Total variance Explained. 232
5.3 Binomial Test.(I) 237
5.4 Binomial Test. (II) 238
5.5 Chi-Square Test 241
5.6 Employees Retention HRM Practices Cross Tabulation. 241
5.7 Employee Productivity HRM Practices Cross tabulation 243
5.8 Chi-Square Tests 243
vii
List of Graphs
Graph No. Title Page No.
4.1 Sources of manpower supply 124
4.2 Internal Source used in organization 125
4.3 Suitable External Sources. 127
4.4 What are the channels chosen your organisation for the selection of
the employees?
128
4.5 Whether all categorical / cadres of employees are confirmed in the
probation period itself and also at the same time?
130
4.6 The determinant estimated to regularize new appointments /
trainees.
131
4.7 Methods used for placement of selected candidates 133
4.8 Induction training categories of employees 134
4.9 Prepared the executives for new responsibilities. 135
4.10 Job description lead to training of the employees 137
4.11 Prepared methods used for coaching your executives to learn and
cope with the technological changes in industry
138
4.12 Human Resource Information system exit in your organisation 140
4.13 Information updated 141
4.14 Human Resource information utilized for 143
4.15 The shoulders the responsibilities of initiation and execution of
employee’s performance appraisal.
144
4.16 Sort of performance appraisal system is adopted by your company 146
4.17 The system of Performance appraisal of organization. 147
4.18 The administrative purpose the performance appraisal system. 149
4.19 The action taken on the basis of appraisal report. 150
4.20 Separate training department. 152
4.21 The organisation encourages employees to sharpen their skills and
performance.
153
4.22 Identify training needs of Managers. 155
viii
4.23 Career planning opportunities offered to the employees in
organization.
156
4.24 Grievance redressal Cell in the Organization 158
4.25 The Composition of Grievance Redressal Cell 159
4.26 Complainants satisfied with the decision of the grievance redressal
committee.
160
4.27 The impact of Grievance Redressal on production 162
4.28 Post-retirement benefits to the workers 163
4.29 The members of Grievance Redressal Cell are nominated from the
employees
164
4.30 Special awards got Company 165
4.31 Any care taken about environmental issues. 166
4.32 Any specific action is taken on Chemical outlets 167
4.33 Is there any Notice board is installed to inform the employees about
hazardous and fatal chemicals in the premises of the organisation?
168
4.34 Sorts of equipment / accessories allotted to the workers in
organisation
169
4.35 The contended with the equipment’s supplied. 170
4.36 Internal facilities are available. 171
4.37 The employees of chemical industries Units are made aware about
anticipate injuries.
172
4.38 The employee’s medical examinations of the employees are
conducted
173
4.39 The adjudge organisation in retaining employees in the last three
years.
174
4.40 Rate the overall Human Resource Management Practices of your
company in last three years
175
4.41 Rate productivity of employees of your company in the last three
years.
176
ix
4.42 Human Resources are significant, and they should be treated on
human ground.
178
4.43 Advancement of subordinate is treated as an organic part of
managers / officer’s job. (COV)
180
4.44 The potential policies of your organisation complement employee’s
advancement
183
4.45 Senior Officers are pro in assisting their subordinates in their work. 185
4.46 People in this company are advantageous to each other. 187
4.47 Senior mentor juniors for the future responsibilities they are likely to
shoulder.
189
4.48 The Top management of the company acknowledges and nurtures
the potential of the employees.
191
4.49 The supervising officers always appreciate the effective work done
by employees.
193
4.50 People in this organization do not have any fixed mental
impressions about each other.
195
4.51 Mistakes of employees are conveyed in a mild manner. 197
4.52 The behaviour feedback informed to employees is taken seriously by
them
199
4.53 Employees in the organisation underline the potential and weakness
their supervising.
201
4.54 When organisation sponsors employees for training, they learn from
it seriously.
203
4.55 Employers sponsor training programme according to the training
needs of employees.
205
4.56 Peoples are trustworthy towards each other in the organisation 207
x
4.57 Employees open mindedly express their views with the supervisors. 209
4.58 Employees open mindedly express their views with the subordinates 211
4.59 Delegation of authority is a normal procedure in the organisation to
motivate the subordinates in dealing with higher responsibilities
213
4.60 Team spirit is of higher order in this organisation 215
4.61 When a problem crops ups, it is discussed frankly rather than back-
biting and accusation.
217
4.62 Juniors are helped with career opportunities by the senior officers 219
4.63 The organisation informs the future plan to Management cadre so
that they can nurture Juniors for the same.
221
4.64 Job- rotation facilities the advancement of employees.
223
xi
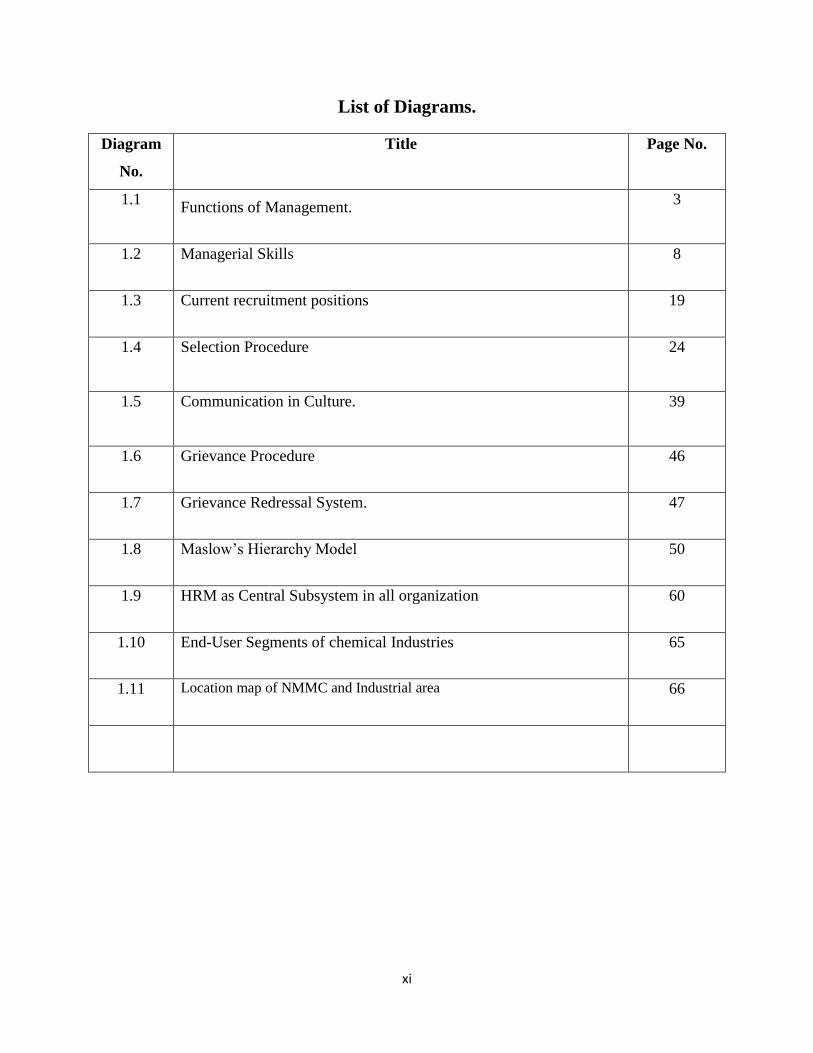
List of Diagrams.
Diagram
No.
Title Page No.
1.1 Functions of Management.
3
1.2 Managerial Skills 8
1.3 Current recruitment positions 19
1.4 Selection Procedure 24
1.5 Communication in Culture. 39
1.6 Grievance Procedure 46
1.7 Grievance Redressal System. 47
1.8 Maslow’s Hierarchy Model 50
1.9 HRM as Central Subsystem in all organization 60
1.10 End-User Segments of chemical Industries 65
1.11 Location map of NMMC and Industrial area 66
xii
7 7. Appendices.
261-306
7.1 (A) Questionnaires.
261-272
7.2 (B) Synopsis.
273-296
7.3 (C ) Test Retest
298-306
1
CHAPTER: - 1
INTRODUCTION & HUMAN RESOURCE MANAGEMENT PRACTICES
1“You Take care of your employees!
They take care of customers!
Customers take care of Business!
Business takes care of your Profit/ Mission.”
--Earnest Dale
1.1 Introduction
1.2 . Functions of management
1.3 Human Resource.
1.4 Significance of Human Resources.
1.5 Introduction to Human Resource Management.
1.6. Definitions by eminent Management Authors.
1.7 The nature and features of Human Resource Management.
1.8 The Scope of the Human Resource management
1.9. Human Resource Management Practices.
1.9.1 Recruitment and Selection
1.9.2. Training and Development
1.9.3 Performance Appraisal.
1.9.4 Communication.
1.9.5 Grievance Redressal
1.9.6 Working Conditions.
1.9.7 Retirement Benefits.
1.10 Importance of HRM
1.11. Profile of Chemical Industries.
1.12. Importance of Chemical Industries.
1.13. Chemical Industries in Navi Mumbai
1.14. Conclusion.
1Rao, Subba, P, Essentials of HRM and Industrial Relations, (p-10), Himalaya Publishing House, Pune.
2
1.1 Introduction
While discussing Human Resource Management, it is necessary to recall what is management?
2Management has been defined by Mary Parker Follett as, “the art of getting things done through
people,”
According to Henry Fayol, “To manage is to forecast and to plan, to organize, to command, to
coordinate and to control.”
3According to Harold Koontz, “Management is the art of getting things done through and with
people in formally organized groups.”
According to George Terry, “Management is a distinct process consisting of planning,
organizing, actuating and controlling, performed to determine and accomplish stated objectives
with the use of human being and other resources.”
In 1916, Henry Fayol provided a list of 14 principles in his book titled ‘Industrial and General
Administration.’ Fayol was of the opinion that all managers in all organizations, whether large or
small, need to follow the principles or guidelines in managing business affairs.
The 14 principles are as follows:
1. Division of work.
2. Authority and Responsibility.
3. Discipline.
4. Unity of Command.
5. Unity of Direction.
6. Subordination of Interest.
7. Remuneration.
8. Centralization.
9. Scalar chain.
10. Order
11. Equity.
12. Stability of Tenure.
13. Initiative.
14. Esprit de Corps
2 Burton Gene, Thakur Manab, Management Today Introduction to Management
3Sherlekar S.A. Management (Value Oriented Holistic Approach), Himalaya Publishing House.
3
Human resource is the working force of the organization which actively participate in production
process and its input effectively convert raw material into Finish Product. Industries are growth
engines for any country. Industries produce different goods and services to cater different
demands of the society as well as it also provide employment opportunities to the individuals.
Chemical industries produces polymers, bulk petrochemicals and intermediates, other derivatives
and basic industrials, inorganic chemicals, and fertilizers other chemicals for consumption.
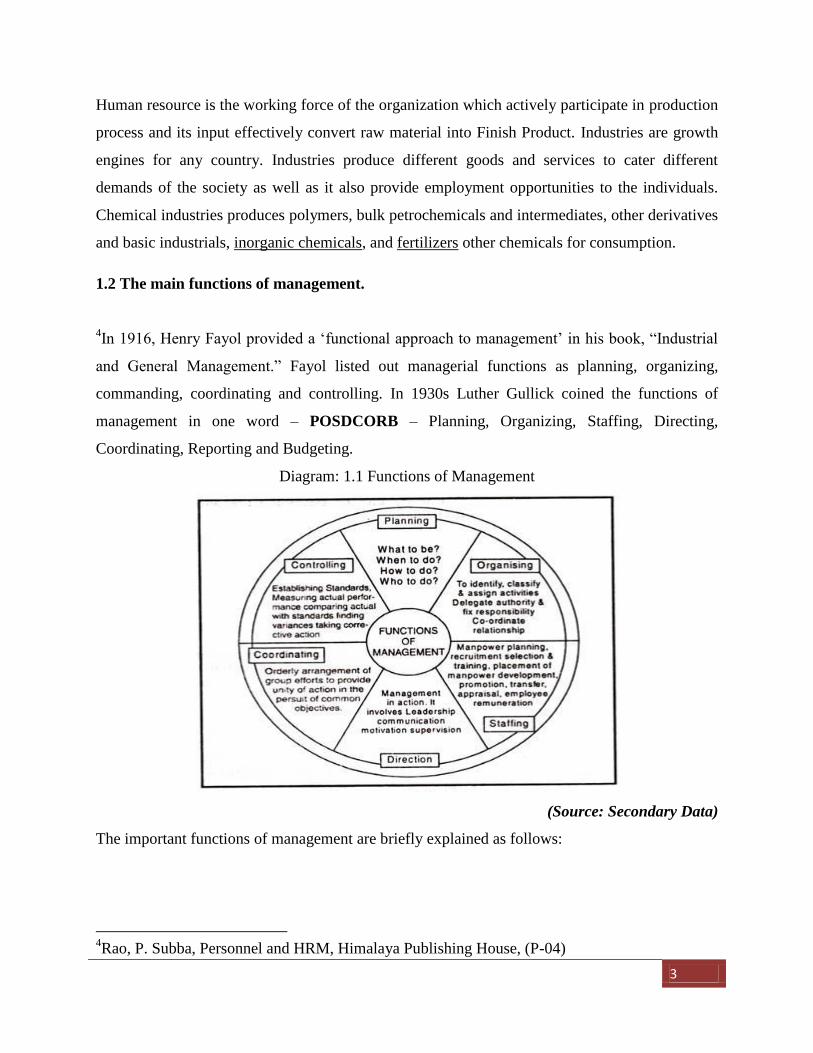
1.2 The main functions of management.
4In 1916, Henry Fayol provided a ‘functional approach to management’ in his book, “Industrial
and General Management.” Fayol listed out managerial functions as planning, organizing,
commanding, coordinating and controlling. In 1930s Luther Gullick coined the functions of
management in one word – POSDCORB – Planning, Organizing, Staffing, Directing,
Coordinating, Reporting and Budgeting.
Diagram: 1.1 Functions of Management
(Source: Secondary Data)
The important functions of management are briefly explained as follows:
4Rao, P. Subba, Personnel and HRM, Himalaya Publishing House, (P-04)
4
1. PLANNING: - James Stoner states, “Planning is a process of establishing goals and a
suitable course of action for achieving those goals.”The main steps in planning are stated
as follows.
Analyzing the internal environment to identify strength and weakness of the organization.
Analyzing the external environment to identify opportunities and threats.
Setting of clear and realistic goals.
Framing alternative plans.
Studying / evaluating the alternatives plans.
Selection of the best suitable plan(s).
Implementation of the plan(s)
Review of the plan(s)
2. ORGANISING: - Louis Allen states – “Organizing is a process of identifying and
grouping of the work to be performed, defining and delegating authority and
responsibility, and establishing relationship to accomplish objectives.”
The main steps in organizing are stated as follows.
Determining goals of the organization.
Identifying the activities to be performed to achieve goals.
Grouping of the related activities into departments.
Making arrangement of resources.
Defining authority and responsibility.
Delegating authority to managers.
Establishing superior-subordinate relationships.
3. STAFFING: - It is an important element of organizing. Since staffing is very vital, it
needs to be given proper focus. A major aspect of staffing is to find out the right person
for the right job. It also involves :
Placing the right person at right job.
Performance appraisal.
Promotion and transfer.
Training and development.
Motivating and rewarding the employees.
5
4. DECISION MAKING: - It is the essence of management. Every function of
management involves decision making. James Stoner defines decision making as, “the
process of identifying and selecting a course of action to solve a specific problem.”
The main steps in decision making are stated as follows.
Defining the problem or situation.
Framing alternative solutions.
Evaluating alternative solutions.
Selection of the best alternative.
Implementation of alternative.
Review of performance.
5. DIRECTING: - The plans may be the best ones, the activities may be systematically
organized, the staff may be highly efficient, but the organization will not succeed if there
is no proper direction.
Directing involves not only instructing people what to do, but also ensuring that they
know what is expected of them. The manager should help, motivate and guide his
subordinates. Most of all, directing involves development of high morale of the
subordinates.
Directing involves three sub-functions:
Communicating: It involves transfer of messages from one person to another. Effective
communication takes place only when the message is clearly understood and a proper
feedback is received or proper action is taken.
Leading: Leading is an act of influencing subordinates to work willingly towards the
attainment of desired objectives.
Motivating: The manager should motivate his subordinates by providing incentives so
that they work with dedication and commitment to achieve goals of the organization.
6. CONTROLLING:- In the words James Stoner, “ Controlling is the process of ensuring
that actual activities conform to the planned activities.” In controlling, the manager
monitors actual performance, and takes corrective measures, if required.
6
Controlling involves the following steps:
Setting of standards or targets.
Implementation of tasks.
Measuring actual performance.
Comparing actual performance with plans or targets.
Finding out causes of deviations if any.
Listing out various corrective measures.
Selecting the appropriate corrective measures.
Implementation and review of corrective measures.
7. COORDINATION: It refers to integration of activities or actions of the subordinates by
the superiors. There is a need for coordination at all levels.
Top level coordinates the activities of the middle level.
Example: Top level coordinates the planning and controlling activities of middle
managers.
The middle level coordinates the activities of the lower level.
Example: Production manager coordinates activities of factory supervisors at different
shifts or units.
The lower level managers coordinate the activities of the subordinates. Example: Factory
supervisor coordinates activities of machine operators.
8. OTHER FUNCTIONS: Management experts like Luther Gullick state other functions
such as reporting and budgeting. Reporting and budging are in fact, important elements
of planning and controlling.
For instance, report need to be prepared for the purpose of planning and for controlling. Also,
budgeting is an important tool of planning. Budgeting also helps to control activities, because a
manager can compare actual performance against budget estimates and accordingly take
corrective measures.
7
1.3 Human Resources.
Human Resource is the active factor of production. Management has been defined by Mary
Parker Follett as, “the art of getting things done through people,” But it is felt that management
is much more than what is said in this definition. Management is further defined as “… that field
of human behavior in which managers plan, organize staff, direct and control human physical
and financial resources in an organized effort, to achieve desire individual and group objectives
with optimum efficiency and effectiveness.” It is clear from this definition that management is
concerned with the accomplishment of objectives by utilizing physical and financial resources
through the efforts of human resources. Thus human resources are a crucial sub-system in the
process of management.
Management skills mean the ability to make business decisions and lead subordinate within a
company. In modern business the job management has become very difficult. Several skills are
requires to manage successfully a large organization in a dynamic environment. These skills of
managers have been classified into four categories, namely technical, human, diagnostic and
conceptual skills.
A) Technical Skills: -
Technical skills refer to the ability and knowledge in using the equipment, technique and
procedures involved in performing specific tasks. These skills require specialized knowledge
and proficiency in the machines of particular job. Ability in programming and operating
computer is, for instance, a technical skill. There are two things a manager should understand
about technical skills. In the first place, he must know which skills should be employed in his
particular enterprise and be familiar enough with their potentiality to ask discerning questions
of his technical advisors. Secondly a manager must understand both the role of each skill
employed and interrelations between the skills.
B) Human Skills:-
Human skills consist of the ability to work effectively with other people both as individual and as
members of a group. These are required to win cooperation of others and to build effective work
teams. Such skills require a sense of feeling for others and capacity to look at things from others
point of view. Human skills are reflected in the way a manager perceives his superiors,
subordinates and peers. An awareness of the importance of human skills should be part of a
8
manager’s orientation and such skills should be developed throughout the career. While technical
skills involve mastery of “things” human skills are concerned with understanding of “people”.
C) Conceptual skills:-
Conceptual skills comprise the ability to see the whole organization and the
interrelationships between its parts. These skills refer to the ability to visualize the entire picture
or to consider a situation in its totality. Such skills help the manager to conceptualize the
environment, to analyze the forces working in a situation and take a broad and farsighted view of
the organization. Conceptual skills also include the competence to understand a problem in all its
aspects and to use original thinking in solving the problem. Such competence is necessary for
rational decision – making.
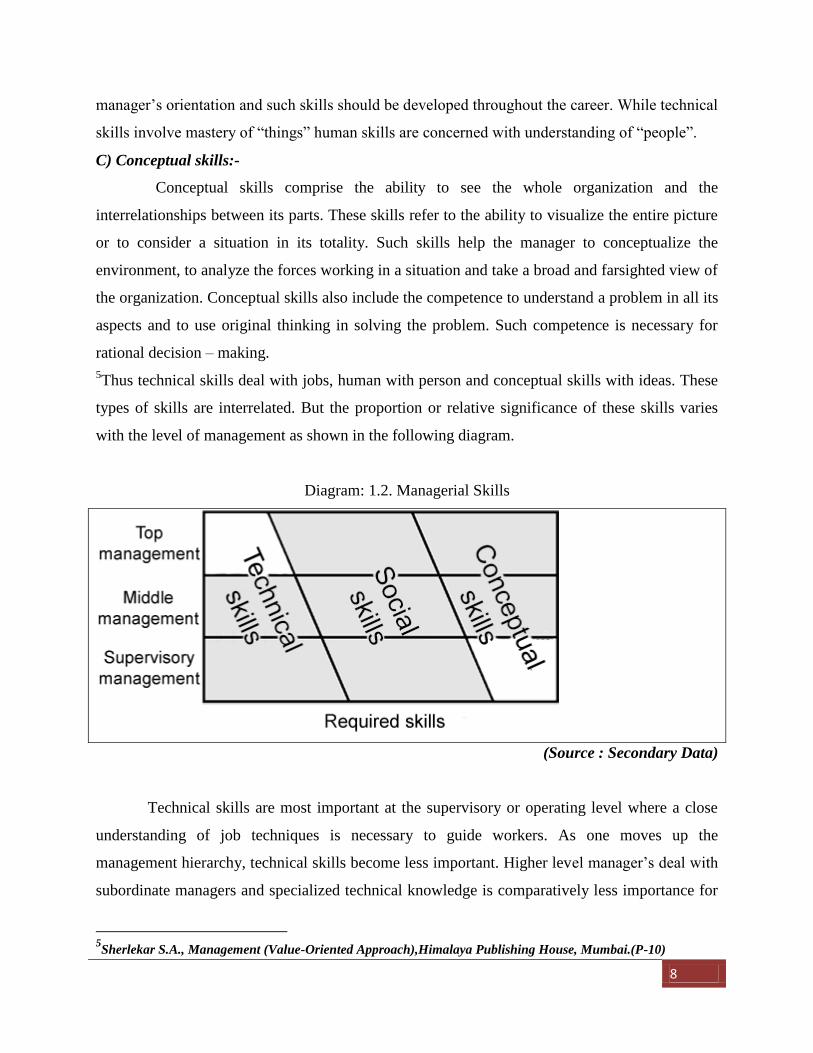
5Thus technical skills deal with jobs, human with person and conceptual skills with ideas. These
types of skills are interrelated. But the proportion or relative significance of these skills varies
with the level of management as shown in the following diagram.
Diagram: 1.2. Managerial Skills
(Source : Secondary Data)
Technical skills are most important at the supervisory or operating level where a close
understanding of job techniques is necessary to guide workers. As one moves up the
management hierarchy, technical skills become less important. Higher level manager’s deal with
subordinate managers and specialized technical knowledge is comparatively less importance for
5Sherlekar S.A., Management (Value-Oriented Approach),Himalaya Publishing House, Mumbai.(P-10)
9
them. Conceptual skills are very important for top management in formulating long-range plans,
making broad policy decisions, and relating the business enterprise to its industry and the
economy. Thus the relative importance of conceptual skills increases as we move to higher levels
of management. This would be self evident as management is the process of getting things done
through people. Human skills are equally important at all levels of management because every
manager has to deal with people.
D) Diagnostic skills:-
Diagnostic skills include the ability to determine by analysis and examination the nature
and circumstances of particular conditions. It is not only the ability to specify why something
happened but also the ability to develop certain possible outcomes. It is the ability to cut through
unimportant aspect and quickly get the heart of the problem. Diagnostic skills are probably the
most difficult ones to develop because they require the proper blend of analytic ability with
common sense and intelligence to be effective.
In a general way, Human resources are the people and their characteristics at work either at
national level or organizational level. From the national point of view , human resources are
knowledge, skills, creative abilities, attitude and other attributes obtained in the population
whereas form the viewpoint of an organization , they represent the total of the inherent abilities,
acquired knowledge, and skills as exemplified in the talent and aptitude of its employees.
Human resource is also termed as human capital though sometimes a difference, though thin, is
made between the two. From this point of view, human resource is simply human potential with
infinite capabilities and capacities with the possibilities of beneficial engagement. It may be
noted that potentials are not always in use. Human capital consist of well employed human
resources that is actively engaged in meaningful, worthwhile wok and delivering some level of
desire productivity. However, in practice, such a distribution is not made and human capital is
defined as “stock of skills and knowledge embodied in the ability to perform work so as to
produce economic value. It is the skills and knowledge gained by a worker through education
and training.”
Since an organization performs a number of functions to achieve its objectives, It requires human
resources of different types which may be categorized on the basis of functional areas like
10
production , marketing, finance, etc. or organizational hierarchy or the levels at which these
resources are put. Thus human resources across the functional areas may be arranged into op
management, middle management, Supervisory management and operatives.
1.4. Significance of Human Resources.
Human Resources are one of the most vital assets of the organization. It is the people who make
other resources moving, they perform various activities in different functional areas like
production, Marketing, finance, etc. The significance of human resources in as modern
organization can be seen in the context of activation of non-human resources, means for
developing competitive advantage, and source creative energy.
1. Activation of Non-human Resources: - Human resources handle all physical and financial
resources in an organization. Without their efforts, these non- human resources idle. In fact, all
the activities of an organization are initiated and determined by the person who makes up that
organization. All the financial and physical resources that an organization uses are unproductive
except the human efforts. The failure of any organization depends on how effectively these are
used.
2. Means for Developing Competitive Advantage: - Competitive advantage exists when there
is match between the distinctive competencies of an organization and the factors critical for
success within its industry that permits the organization o outperforms competitors. Human
resources can be used as a means for developing competitive which may be in the form of lower
cost of production , development of product for special needs, special means for making the
products, developing means for special sources for funds, etc. Since all these are done by human
resources, they can be geared to achieve all these. In his context, Ghoshal has observed as
follows: “A growing number of managers in India and abroad have begun to recognize that the
fundamental basis of competition has to change. The scarce resource, and the primary source of
competitive advantage, is no longer physical or financial capital, but human capital. As large
asset-based companies like TISCO see the market value of pygmies like Infosys soar past theirs,
the notion of competing through people has been transformed from a fashionable and politically
correct statement to a serious cause for concern.
11
3. Source of Creative Energy: - In today’s dynamic world, creativity is vital to every
organization. Creative thinking is the process of bringing a problem before one’s mind clearly by
imagining, visualizing, supposing, musing, contemplating, or the like, and then originating an
idea, concept, realization, or picture along new unconventional lines, people in the organization
are the only source of such creativity. They can produce unlimited ideas. There is no apparent
limit to what people can accomplish when they are motivated to use their potential to create new
and better ideas. No other source in the organization can do that
In other to make effective utilization of human resources, they have to be managed
appropriately. Human Resource management, as a field of study, makes an attempt o provide
knowledge, skills, and attitude for managing human resources more effectively.
1.5. Introduction to Human Resource Management
Human Resource Management is a process of managing human resources to improve individual,
group and organizational effectiveness. HRM consists of various elements such as human
resource planning, recruitment and selection, training, motivation, performance appraisal,
promotions / transfer and career development of human resources.
Human Resource Management (HRM) may be defined as a set of policies, Practices and
Programs designed to maximize both personal and organizational goals. It is the process binding
and organization together so that the objectives of each are achieved.
1.6. Definitions by eminent Management Authors
In the words of David De Cenzo and Stephen Robbins, “Human resource Management is
concerned with the people dimension in management. Since every organization is made up of
people , acquiring their services, developing their skills, motivating them to higher level of
performance and ensuring that they continue to maintain their commitment to the organization
are essential to achieving organizational objectives.”
According to Flippo human resource management is “the planning organizing , directing,
and controlling, of the procurement, development , compensation , integration, maintenance and
reproduction of human resources of the end that individual, organizational and societal
objectives are accomplished.”
12
According to Invancevich and Glueck, " HRM is concerned most effective use of people to
achieve organizational and individual goals. It is a way of managing people at work, so that they
give their best to the organizations''.
According to fisher: “Human Resource Management involves all management decisions and
practices that directly affect or influence the people, or human resources, who work for the
organization”. Human resource management is a strategic and coherent approach to the
management of an organization's most valued assets- the people working there who individually
and collectively contribute to the achievement of its goals.
As defined by story (1995): Human Resource Management which seeks to obtain competitive
advantage through the strategic deployment of highly committed and skilled work force, using an
array of cultural, structural& personnel techniques. There is a specific set of HRM Policies
which are best practice and which lead to high levels of employee performance. This
encompasses items such as team work, flexibility, quality and organizational commitment.
According to National Institute of Personnel Management of India, “Human resources
management is that part of management concerned with people at work and with their
relationship within the organization. It seeks to bring together men and women who make up an
enterprise, enabling each to make his own best contribution to its success both as an individual
and as a member of a working group”
1.7. The Nature and features of HRM can be briefly described as follows.
1. HRM is a process: HRM is a process of four main functions :
The acquisition function includes human resource planning, recruitment and selection of
employees.
The development function is concerned with training and development of employees.
The motivation function includes providing recognition and rewards to the employees.
13
The maintenance function is concerned with providing good working conditions, welfare
facilities, etc.
2. Focus on objectives: HRM places emphasis on the accomplishment of objectives. The
objectives can be broadly listed under four categories:
(a) Individual or personal objectives of the employees.
(b) Group or departmental objectives.
(c) Organizational objectives.
(d) Societal objectives.
3. Universal Application: - HRM is applicable not only to business organization, but also
to any other type of organization. Acquiring and maintaining good people is critical to the
success of every organization, where profit or non-profit, public or private.
4. Continuous in Nature: - HRM is a continuous activity. Organizations need to manage
human resources on a continuous basis. This is because of growing expectations of the
employees. Also there are constant changes in the environment. Therefore, there is a need
for the organizations to adapt to environment changes.
5. Integrated Use of Subsystems: HRM involves the integrated use of subsystems such as
training and development, career development, organizational development, performance
appraisal, potential appraisal, etc. Emphasis needs to be placed in all possible areas so
that individual, group, and organizational effectiveness is enhanced.
6. Multidisciplinary Approach: - HRM is dynamic and multidisciplinary approach. It
draws upon education, management science, psychology, communication, economics,
organizational behavior, philosophy and sociology. Since HRM aims at improving
individual, group and organizational effectiveness, it involves the use of various
disciplines of social sciences.
7. Key Element in Coping with problems: - Economic, technological and social trends
have created acute problems for business and industry. As a result, management has
focused attention on HRM as a key element in coping with these problems. This is
because; such problems can be solved with the help of committed effects and
competencies of human resources.
14
8. Development of Team Spirit: HRM aims at developing and maintaining team spirit in
every organization unit .i.e. groups and department. Such team spirit is required so that
the people work effectively together and contribute to the success of organization.
9. Development of Employees Potentialities: - HRM aims at development of employees
potentialities to the maximum possible extent, so that they gain maximum satisfaction
from their job. Employee’s potentialities can be developed through effective training and
development programs.
10. Long–term Benefits: - HRM brings long-term benefits to the individuals, organizational,
and the society as well. Employees gain long-term benefits by way of better monetary
and non- monetary incentives. The organization can gain by way of higher returns on
investment, and better corporate image. The society can be benefited be way of better
quality of goods and services.
1.8. The Scope of Human resource Management.
Human Resource Management is concerned with the human beings in an organisation. Human
Resource approach of management to its own people would go a long way in effectively
actuating. It facilitates in identifying the right kind of people, socializing them in properly,
training and development them rightly, assigning the tasks which are best suited for every
individual so as to bring out their best, motivating them to make their best contribution and
creating conditions for the people to enjoy their work. It establishes and maintains an
organizational philosophy, culture and climate conductive for the organization own people to
have job satisfaction and a sense of fulfillment. As human resource development has a pivotal
role in Human Resource Management, the organization gets the people it requires, while every
individual gets the task which he can perform efficiently.
According to Michael V.P introduction to high–tech machineries and equipments,
modernization of technology and techniques, computerization of data processing, introduction
of micro – process controlled CNC machines in many manufacturing operation, introduction of
quick communication systems, introduction of robots in repetitive manufacturing operations,
sophistication in technical operations and such other developments have brought with it the need
for well-trained technically qualified and highly skilled manpower. Human research
15
Management approaches not only helps procure such manpower but to retain their. All such
development may result in redundant workforce which must either be retrained and redeployed
or separated through golden handshake schemes. Human Resource management approach
facilitates action in such situations.
Human Resource approach helps to improve the organizational efficiency work culture, job
satisfaction of people, better understanding of human relationship resulting in cordial industrial
relation and better productivity. The scope of Human resource Management is therefore,
extensive to the extent that there cannot be a study of management without proper attention on
human resource management.
Human Resources Management (HRM) approach helps to improve the organizational
efficiency, work culture, Job satisfaction of people, better understanding and Human relationship
resulting in cordial industrial relations and better productivity. While the management
incorporates human resource policy supported by great human values, understanding, concern
for the welfare of their people, and constant efforts for human development , there is possibility
for the organization’s people to reciprocate with better behaviour, self-co-ordination , sincerity,
achievement motivation and greater co-operation. HRM has great scope to improve
organizational climate and efficiency and efficiency.
The vast scope of HRM in the context of an industrial organisation can be briefly stated
under.
1. Management would be able to understand their people better.
2. A Cordial worker- management relationship would be possible.
3. Management would be able to get great sense of accomplishment through their work.
4. A situation would be created in the organisation for the employees to enjoy their work
and gain substantial job satisfaction.
5. Organizational efficiency and workers productivity would increase.
6. The employee would be able to get great sense of accomplishment through their work.
7. There would be good sense of fulfillment and accomplishment.
8. It would be employees to gain a sense of belonging to their work place.
9. A good HRM develops better organizational climate and culture.
16
10. The employee may be able to gain a self-confidence that their competence and
performance can be improved and they would have prospects for better career growth,
and to use their competence and talents.
11. As the people are respects s individual, and their contributions are valued and rewarded,
there would be more self-confidence and self-respect, and people will learn to respect
their superiors and managers.
12. There can be reduction in adverse influence of trade unions, particularly self- seeking
militant trade union leaders.
13. Management gets enlightened workforce.
14. There would be increased in the influence level of management and managers.
15. Due to mutual Understanding and better co-ordination, a good communication channel
would become possible.
16. It would become easier for the management to identify and train appropriate talents for
every job.
17. Gap between the management and the workers can be reduced.
18. A good HRM policy would improve industrial peace, which is badly required in Indian
now-a- days.
In fact, a well planned human resource management process is essential. It
is helpful for the efficient management of business. Hence, the scope of HRM is extensive to the
extent that there cannot be a study of management without proper attention on human resource
management.
1.9. Human Resource Management Practices
Human Resource Management (HRM) is a planned approach to managing people effectively
for performance. ... Good HRM practices are instrumental in helping achieve departmental
objectives and enhance productivity.
HR practices are the means through which your human resources personnel can develop the
leadership of your staff. This occurs through the practice of developing extensive training
courses and motivational programs, such as devising systems to direct and assist management in
performing ongoing performance appraisals.
17
Human Resource is the most important asset for any organization and it is the source of
achieving competitive advantage. Managing human resources is very challenging as compared to
managing technology or capital and for its effective management, organization requires effective
HRM system. HRM system should be backed up by sound HRM practices. HRM practices refer
to organizational activities directed at managing the pool of human resources and ensuring that
the resources are employed towards the fulfillment of organizational goals
On the basis of literature review following criteria were selected for the purpose of study
1.9.1 Recruitment and Selection
6Recruitment is the discovering of potential applicants for actual or anticipated organizational
vacancies. It is a ‘linking activity’ bringing together those with jobs seeking jobs. The objectives
of recruitment include:
Generate lot of interest in job-seekers possessing relevant qualifications.
Project a highly favorable image of the company.
Encourage large number of potential candidates to apply for possible vacancies.
Create a wide choice – at an economical cost- for company so that it can pick up right
candidates.
Determine present and future needs of the organization in sync with its overall strategy and
personnel planning.
Give ample information to candidate so that they themselves can decide whether to apply or
not (say for example, some advertisement might say, only candidate with first –class degree
need apply). As rightly pointed out by Fisher , “recruitment follows HR planning and goes in
hand with the selection process by which organization evaluate the suitability of the
candidate for various jobs. Without successfully recruiting a sizable pool of candidates, even
the most accurate selection system is of little use. The nature of firm’s recruiting activities
should be matched to its strategy and corporate values as well as to other important features
such as the external labor market and the firm’s ability to attract qualified candidates at a
reasonable cost.
6Rao.P, Subba, Essentials of HRM and Industrial Relations (P-128,132), Himalaya Publishing, Pune.
18
According to Yoder, “Recruitment is a process to discover the sources of manpower to meet the
requirements of the staffing schedule and to employ effective measures for attracting that
manpower in adequate numbers to facilitate effective selection of an efficient force.”
According to Filippo, “It is a process of searching for prospective employees and stimulating
and encouraging them to apply for jobs in an organization. It is often positive in that stimulates
people to apply for jobs to increase the ‘hiring ratio, ’i.e. the number of applicants for a job.”
According to Dessler, “Employees recruitment means finding and / or attracting applicants for
the employee’s open positions.”
According to Fisher,” Recruitment is the process by which organization locates and attract
individual to fill job vacancies.”
According to Mathis and Jackson, “Recruiting is the process of generating a pool of qualified
applicants for organizational jobs.”
1.9.1.1. Factors affecting Recruitment.
Both internal and external factors affecting recruitment. The external factors include supply of
and demand for human resources, unemployment opportunities and / or unemployment rate,
labour market conditions, political, legal requirement and government policies, social factors,
Information systems, etc.
The internal factors includes the companies brand which is determined by the pay package
including salary, fringe benefits and incentives, quality of work life, organizational culture,
career planning and growth opportunities, size of the company, company’s product / services,
geographical spread of the company’s operations viz., local, national or global, company’s
growth rate, role, of trade unions and cost of recruitment.
The following diagram clears the situation of the current recruitment positions.
19
Diagram: 1.3.Current recruitment positions
(Source : Secondary Data)
FACTORS AFFECTING RECRUITMENT.
1.9..1.2. A) Internal Factors.
1.9..1.3 .B) External Factors
1.9..1.2. A) Internal Factors:-
1. Employees Brand.
2. Company’s Pay package.
3. Quality of Work life.
4. Organizational Culture.
5. Career Planning and Growth.
6. Company’s size.
7. Companies product / services.
8. Geographical spread of the Company’s operations.
9. Company’s Growth Rate.
20
10. Role of Trade Union.
11. Cost of Recruitment.
12. Company’s name and fame.
1.9.1.3. B) External Factors.
1. Socio Economic Factor.
2. Supply and demand Factor.
3. Labor Market Condition.
4. Employment Rate.
5. Political, Legal, Governmental, factors like Reservation and son-of –soil.
6. Information system like Employment Exchange / Tele Recruit like Internet.
1.9.1.(A). SELECTION:
7Human Resource planning identifies employment need. Job analysis determines the
qualifications required and recruiting provides a pool of applicants for selection. Selection is the
process of picking individuals possessing relevant qualifications, requisite knowledge and
required experience. The most suitable candidate is being chosen from out of those who apply
for the position based on certain criteria. Selection is much more than just choosing the best
candidate. It is an attempt to strike a happy balance between what the applicant can and wants to
do and what the organization actually requires. The whole process needs to be looked at
seriously and the personnel manager is not supposed to leave anything to chance here. To this
end, he must carefully follow the steps outlined hereunder.
Find the need of the job.
Match applicants profile with job need.
Do not leave anything to chance.
Poor selection could prove to be costly affair.
It is Easy to shut the Door on poor performers.
7Weihrich Heinz ,Koontz Harold, Management ( A Global Perspective), Tata McGraw-Hill,
Publishing Company New Delhi.( P-289)
21
Keep the expectations of Employees in Mind.
Legal intervention may spoil the show.
So, get the right Candidate – Burning your candle Energies – at any cost.
Selection could prove to be a source of competitive advantage.
1.9.1.(B) . DIFFERENCE BETWEEN RECRUITMENT AND SELECTION.
At this stage, it is worthwhile to understand difference between recruitment and selection as both
these terms are often used together or sometimes interchangeably. For example, when we talk
about recruitment policy of a company, sometimes, it includes selection too. Though in practice,
such usage may not affect the human resource acquisition process; such a distinction should be
made in order to have better focus on these two processes. Difference between recruitment and
selection has been described by Filippo as follows:
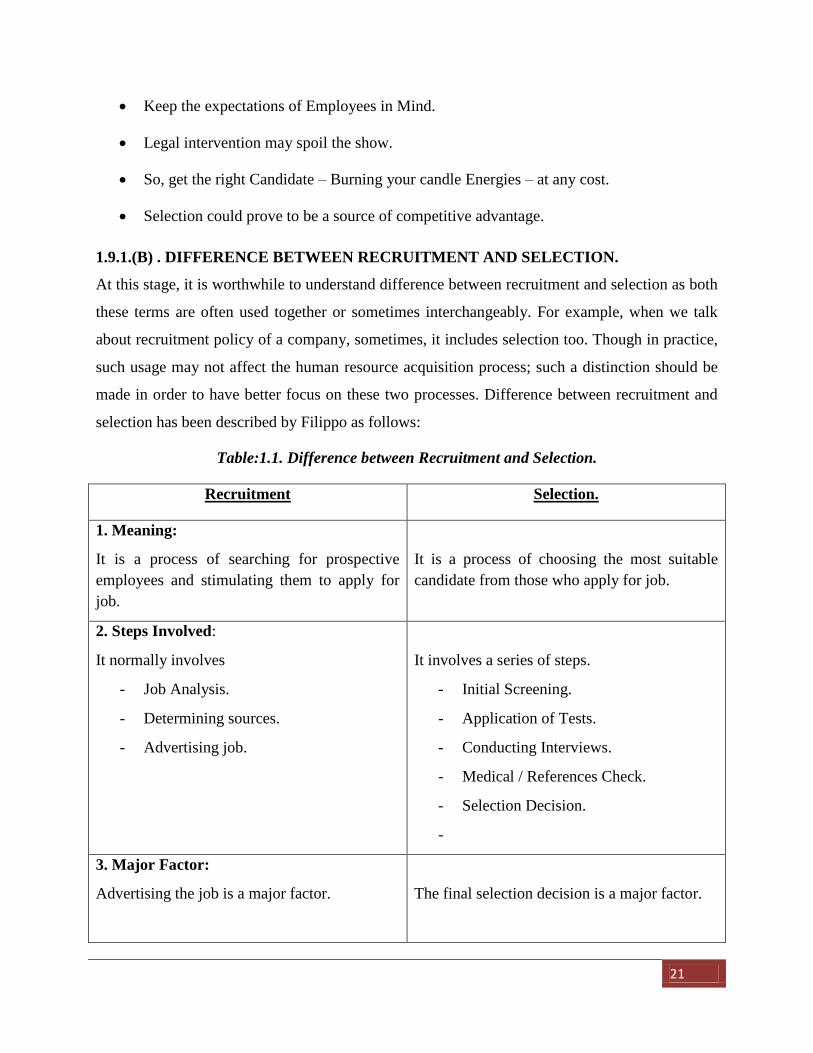
Table:1.1. Difference between Recruitment and Selection.
Recruitment Selection.
1. Meaning:
It is a process of searching for prospective
employees and stimulating them to apply for
job.
It is a process of choosing the most suitable
candidate from those who apply for job.
2. Steps Involved:
It normally involves
- Job Analysis.
- Determining sources.
- Advertising job.
It involves a series of steps.
- Initial Screening.
- Application of Tests.
- Conducting Interviews.
- Medical / References Check.
- Selection Decision.
-
3. Major Factor:
Advertising the job is a major factor.
The final selection decision is a major factor.
22
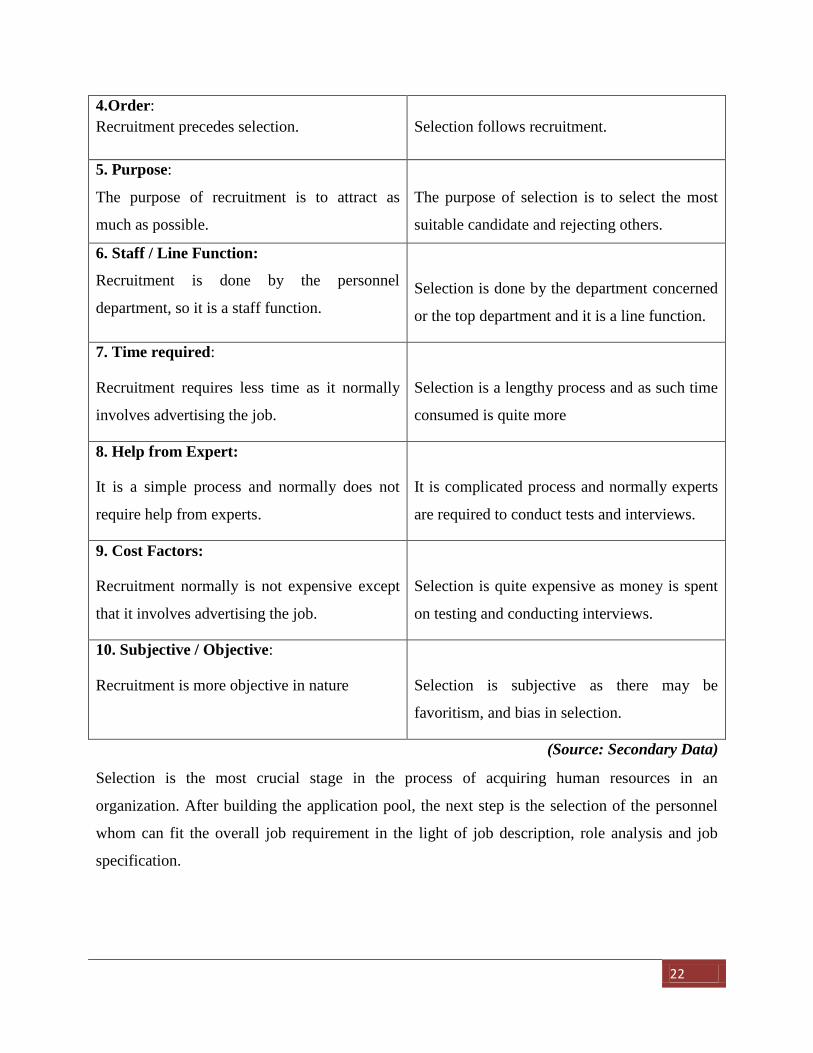
4.Order:
Recruitment precedes selection.
Selection follows recruitment.
5. Purpose:
The purpose of recruitment is to attract as
much as possible.
The purpose of selection is to select the most
suitable candidate and rejecting others.
6. Staff / Line Function:
Recruitment is done by the personnel
department, so it is a staff function.
Selection is done by the department concerned
or the top department and it is a line function.
7. Time required:
Recruitment requires less time as it normally
involves advertising the job.
Selection is a lengthy process and as such time
consumed is quite more
8. Help from Expert:
It is a simple process and normally does not
require help from experts.
It is complicated process and normally experts
are required to conduct tests and interviews.
9. Cost Factors:
Recruitment normally is not expensive except
that it involves advertising the job.
Selection is quite expensive as money is spent
on testing and conducting interviews.
10. Subjective / Objective:
Recruitment is more objective in nature
Selection is subjective as there may be
favoritism, and bias in selection.
(Source: Secondary Data)
Selection is the most crucial stage in the process of acquiring human resources in an
organization. After building the application pool, the next step is the selection of the personnel
whom can fit the overall job requirement in the light of job description, role analysis and job
specification.
23
1.9.1.(C) CONCEPT OF SELECTION
Selection can be conceptualized in terms of either choosing the fit candidate, or reject the unfit
candidate, or a combination of both. Selection involves both because it picks up the fit and
rejects the unfit. In fact, in Indian context, there are more candidates who are rejected than those
who are selected in most of the selection process. Therefore, sometimes it is called a negative
process in contrast a positive programme of recruitment. For example, Yoder has viewed that
hiring (selection) process is of one or many go or no-go gauges. Candidates are screened by the
application of these gauges. Qualified applicants go on to the next hurdle, while unqualified are
eliminated. A more formal definition of selection is as follows:
“Selection is the process of differentiating between applicants in order to identify (and hire)
those with a greater likelihood of success in job.”
Selection process assumes and rightly so, that there are more number of candidates available
than the number of candidates actually selected. These candidates are made available through
recruitment process.
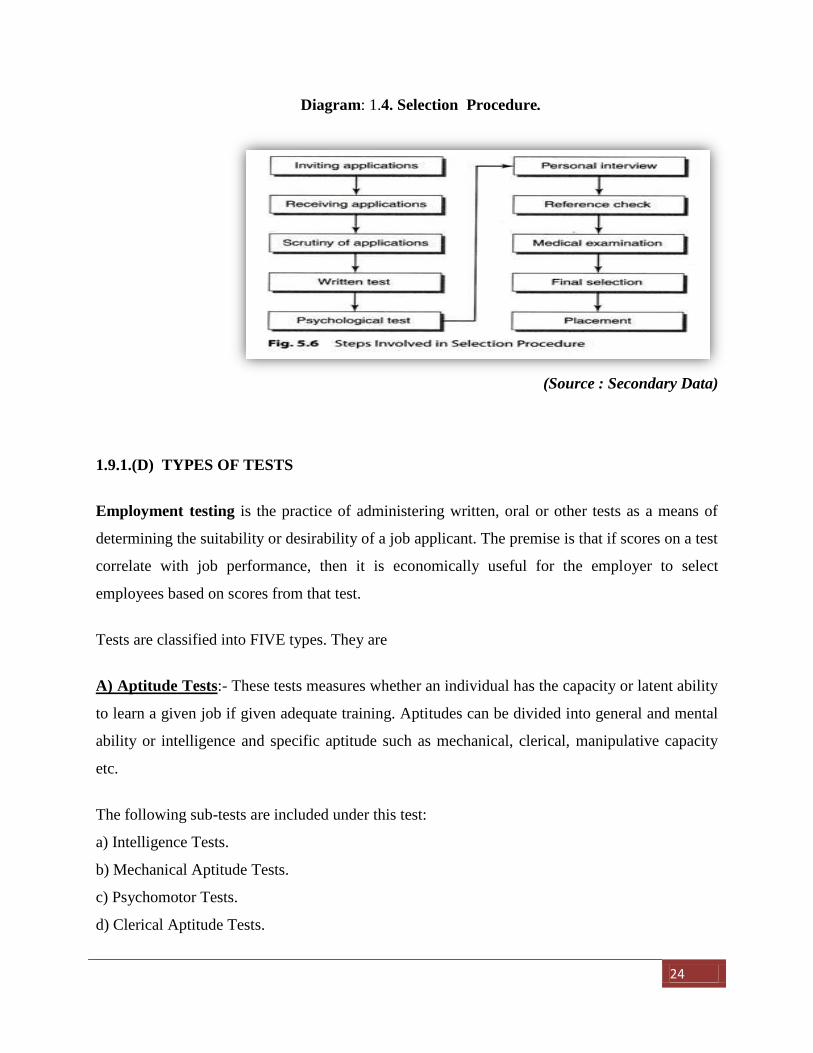
Selection is a process of choosing right person for the right job. The selection process consists of
a series of steps or techniques as follows.
1. Job analysis
2. advertising the job
3. initial screening
4. application bank
5. Tests
6. Interviews
7. Reference Check
8. Medical Check
9. Final interview
10. Job offer.
24
Diagram: 1.4. Selection Procedure.
(Source : Secondary Data)
1.9.1.(D) TYPES OF TESTS
Employment testing is the practice of administering written, oral or other tests as a means of
determining the suitability or desirability of a job applicant. The premise is that if scores on a test
correlate with job performance, then it is economically useful for the employer to select
employees based on scores from that test.
Tests are classified into FIVE types. They are
A) Aptitude Tests:- These tests measures whether an individual has the capacity or latent ability
to learn a given job if given adequate training. Aptitudes can be divided into general and mental
ability or intelligence and specific aptitude such as mechanical, clerical, manipulative capacity
etc.
The following sub-tests are included under this test:
a) Intelligence Tests.
b) Mechanical Aptitude Tests.
c) Psychomotor Tests.
d) Clerical Aptitude Tests.
25
B) Achievement Tests: - These tests are conducted when applicants claim to know something as
these tests are concerned with what one has accomplished. These tests are more useful to
measure the value of specific achievement when an organization wishes to employ experienced
candidate. These tests are classified into two categories:
a) Job Knowledge Test.
b) Work Knowledge Test.
C) Situational Test:-This test evaluates a candidate in a similar real life situation. In this test the
candidate is asked either to cope with the situation or solve critical situation of the job.
These tests are classified into two categories:
a) Group Discussion.
b) In Basket.
D) Interest Test: - These tests are inventories of the likes and dislikes of candidates in relation
to work, job, occupations, hobbies, and recreational activities. The purpose of this test is to find
out whether a candidate is interested or disinterested in the job for which he is a candidate and
find out in which area of the job range / occupation the candidate is interested. The assumption
of this test is that there is a high correlation between the interest of a candidate in a job and job
success. Interest inventories are less faked and they may not fluctuate after the age of 30.
E) Personality Tests: - These tests provide clues to an individual value system, his emotional
reactions and maturity and characteristics mood. They are expressed in such traits like self-
confidence, tact, emotional control, optimism, decisiveness, sociability, impulsiveness,
sympathy, and stability and self-confidence.
These tests are classified into two categories:
a) Thematic Apperception Test (TAT)
b) Ink-Bold Test.
26
F) OTHER TESTS;
a) Cognitive Ability Tests.
b) Wechsler Adult Intelligence Scale.
c) Wonder Personnel Test.
d) Polygraph Tests.
e) Honesty Tests.
1.9.2. TRAINING AND DEVELOPMENT
“Training his successor is the most important single job any manager or executive has. It is
also the most satisfying.” -- George H. Coppers.
1.9.2.1. Concept of Training and Development.
8Training and development play an important role in the effectiveness of organizations and to the
experiences of people in work. Training has implications for productivity, health and safety at
work and personal development. All organizations employing people need to train and develop
their staff. Most organizations are cognizant of this requirement and invest effort and other
resources in training and development. Such investment can take the form of employing
specialist training and development staff and paying salaries to staff undergoing training and
development. Investment in training and development entails obtaining and maintaining space
and equipment. It also means that operational personnel, employed in the organization’s main
business functions, such as production, maintenance, sales, marketing and management support,
must also direct their attention and effort from time to time towards supporting training
development and delivery. This means they are required to give less attention to activities that
are obviously more productive in terms of the organization’s main business. However,
investment in training and development is generally regarded as good management practice to
maintain appropriate expertise now and in the future.
8 Singh Nirmal, Human Resource Management, Galgotia Publications Pvt. Ltd. Navi Delhi. (P-
404)
27
1.9.2.2. TRAINING
Training is normally viewed as a shot term educational process by which non-managerial
personnel acquire the technical knowledge and skills necessary for increased effectiveness in
achieving organizational goals.
Training is an original procedure for increasing the knowledge and skill of people for a definite
purpose. The purpose of training is to achieve a change in the behaviour of those being trained.
In the industrial situation this means that the trainees will acquire new skills, technical
knowledge, problems solving ability and attitude. Any good training programme lays down the
procedure by which people gain knowledge and skill to perform their job effectively and
efficiently.
Distinguishing between education and training is not easy, the two overlap each other.
Training is concerned with increasing knowledge and skill in doing a particular job and the
major burden of training falls upon the employer. But education is at time narrowly used to
means the formal process of studying a syllabus of work which usually involves attendance of an
education institution.
Training usually has a more immediate purpose than education. Actually, the distinction between
training and education is not precise because in many cases both training and education occur at
the same time. Some employee development programmes in industry which is quite wider in
scope may be viewed as education. Particularly, where the emphasis is given on off-the-job
training the objectives of the training is to increase the knowledge and understanding of the
employees regarding business and general environmental.
Definitions of Terms.
Very often, we come across the following terms: training, development and education. These
terms are defined by authors in different manners. Some of these are given below.
A) Education:-
“Education is the understanding and interpretation of knowledge.”-- Memoria.
“Education is concerned with increasing the general knowledge and understanding of the
employees, total environment.” -- Tripathy.
28
B) Training
” Training consists of planned programs undertaken to improve employees’ knowledge, skills,
attitude, and social behaviour so that the performance of the organization improves
considerably” -- Wayne Casco
“Training is a short term process utilizing a systematic and organized procedure by which non-
managerial personnel learn technical knowledge and skill.” -- Steinmez.
“Training refers only to instruction in technical and mechanical operations. Training courses are
typically for short term stated purpose” -- Campbell.
“Training is the art of increasing the knowledge and skill of an employee for doing a particular
job.”-- Tripathi.
“Training is a learning process which seeks a relatively permanent change in behaviour that
occurs as a result of experience.”-- S.P. Robbins.
“Training involves changes of skills, knowledge, attitude, or social behaviour.”
-- David de Cenzo and S.P. Robbins.
1.9.2.3. Development.
9“Development covers not only those activities which improve job performance, but also those
which bring about growth of personality, help individuals in the progress towards maturity and
actualization of their potential capabilities, so that they become not only good employees but
also better men and women.”- Memoria.
9 Singh Nirmal, Human Resource Management, Galgotia Publications Pvt. Ltd. Navi Delhi. (P-
405)

29
“Development is an inclusive process where both managers and individual employees are
involved. It offers opportunities to learn skills, but also an environment designed to discovering
and cultivating basic attitude and capabilities and facilitates personal growth.” -- Yoder.
“Development is viewed as a long term learning process by which managerial personnel acquire
conceptual and theoretical knowledge and skills for enhancing general administration abilities.”
Table :1.2. Distinguish between Training and Development.
Training Development.
1. Meaning:
It refers to learning process of the employees.
It refers to learning process of managers.
2. Management / Operative Personnel:
Training is normally directed at operative
employees and related to technical aspects.
It is directed at managerial personnel to acquire
conceptual knowledge.
3. Specific / General:
Training is more specific job related
information.
It is general in nature, especially at top
management level.
4. Methods:
More emphasis on the on-the-job methods.
More emphasis in nature, on the off-the-job
method.
5. Cost involved:
Imparting training is less expensive.
Development is more expensive.
6. Frequency:
Less frequent. Mostly at induction and at every
change in job.
More frequent and continuous in nature.
7. Who Imparts:
Training is imparted mostly by the supervisors.
Development is undertaken by superiors,
outside experts.
8. Theoretical / Practical Aspects:
Emphasis is placed on practical or technical
aspects of work.
Emphasis is placed on conceptual and
theoretical aspects.
(Source: Primary Data)
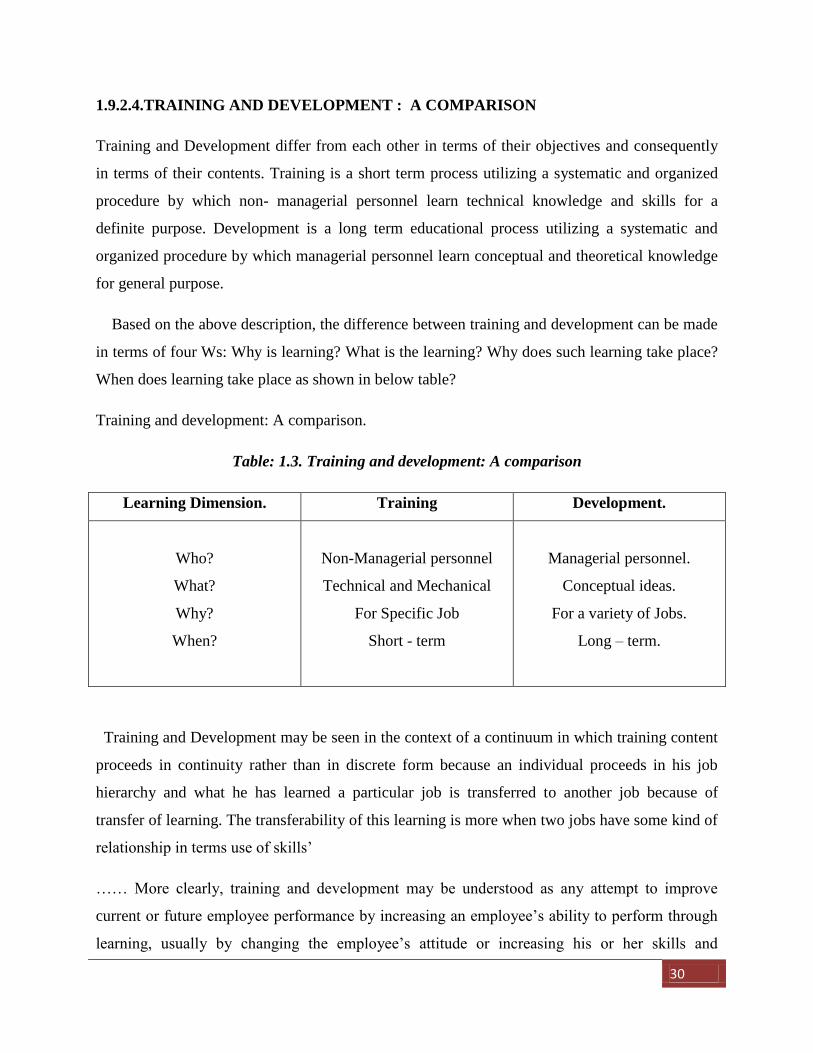
30
1.9.2.4.TRAINING AND DEVELOPMENT : A COMPARISON
Training and Development differ from each other in terms of their objectives and consequently
in terms of their contents. Training is a short term process utilizing a systematic and organized
procedure by which non- managerial personnel learn technical knowledge and skills for a
definite purpose. Development is a long term educational process utilizing a systematic and
organized procedure by which managerial personnel learn conceptual and theoretical knowledge
for general purpose.
Based on the above description, the difference between training and development can be made
in terms of four Ws: Why is learning? What is the learning? Why does such learning take place?
When does learning take place as shown in below table?
Training and development: A comparison.
Table: 1.3. Training and development: A comparison
Learning Dimension. Training Development.
Who?
What?
Why?
When?
Non-Managerial personnel
Technical and Mechanical
For Specific Job
Short - term
Managerial personnel.
Conceptual ideas.
For a variety of Jobs.
Long – term.
Training and Development may be seen in the context of a continuum in which training content
proceeds in continuity rather than in discrete form because an individual proceeds in his job
hierarchy and what he has learned a particular job is transferred to another job because of
transfer of learning. The transferability of this learning is more when two jobs have some kind of
relationship in terms use of skills’
…… More clearly, training and development may be understood as any attempt to improve
current or future employee performance by increasing an employee’s ability to perform through
learning, usually by changing the employee’s attitude or increasing his or her skills and
31
knowledge. The need for training and development is determined by the employee’s
performance deficiency, computed as follows:
Training and Development need = Standard performance - Actual Performance.
1.9.3. Performance Evaluation / Appraisal
“Most people want feedback as long, of course, as it mirrors their self-perception. When it does,
they tend to like it. When it doesn’t, they don’t.”
-- Larry Cipolla, Management Professor.
Performance Appraisal is a process of evaluating work performance of the personnel so as
facilitate individual and organizational effectiveness. Performance appraisal is also referred as
merit, rating, employee rating, and service rating.
Definitions:-
“Performance appraisal is the systematic description of an employee’s job relevant strength
and weaknesses.”-- Wayne Cascio.
“Performance appraisal is the process of assessing Qualitative and quantity aspect of an
employee’s job performance.” -MichealCrino
10In simple terms performance appraisal / Evaluation may be understood as the assessment of an
individual’s performance in a systematic way , the performance being measured against such
factors as job knowledge , quality of output initiative , leadership abilities , supervision ,
dependability, co-operation, judgment, versatility, health and the like . Assessment should not be
conformed to past performance alone. Potential of the employees for future performance must
also be assessed.
10
Towers, Brian, Handbook of HRM, Beacon Books, (p-212)
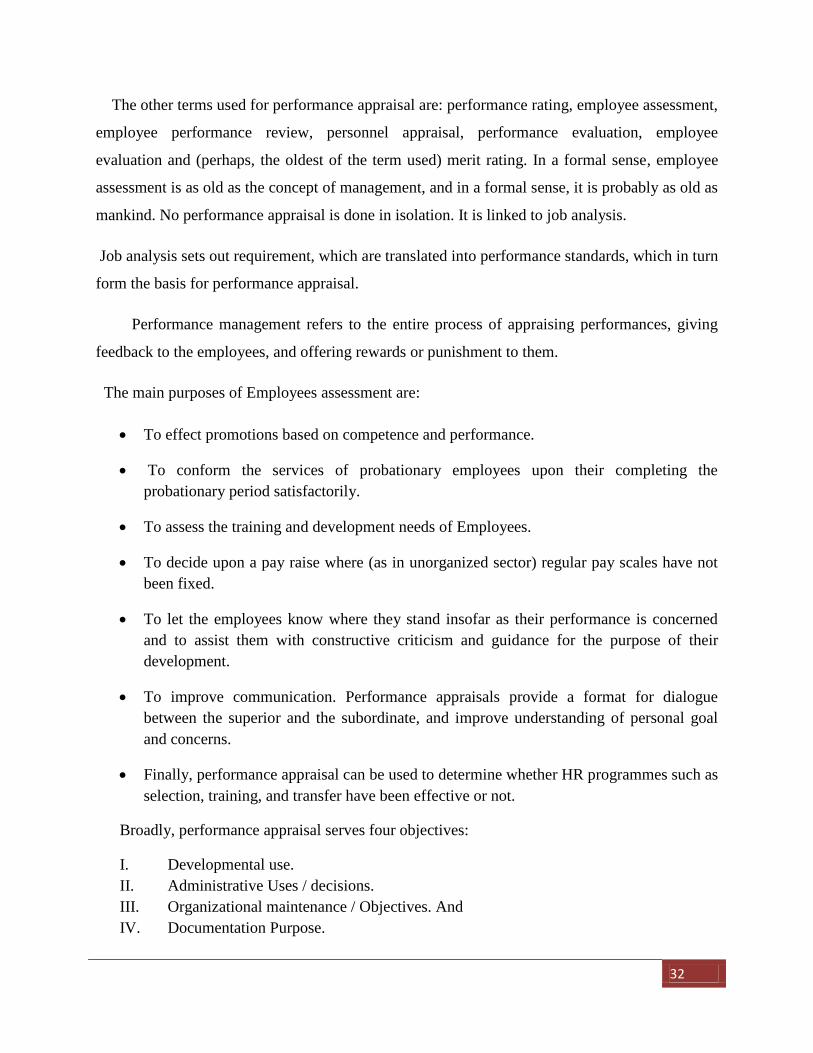
32
The other terms used for performance appraisal are: performance rating, employee assessment,
employee performance review, personnel appraisal, performance evaluation, employee
evaluation and (perhaps, the oldest of the term used) merit rating. In a formal sense, employee
assessment is as old as the concept of management, and in a formal sense, it is probably as old as
mankind. No performance appraisal is done in isolation. It is linked to job analysis.
Job analysis sets out requirement, which are translated into performance standards, which in turn
form the basis for performance appraisal.
Performance management refers to the entire process of appraising performances, giving
feedback to the employees, and offering rewards or punishment to them.
The main purposes of Employees assessment are:
To effect promotions based on competence and performance.
To conform the services of probationary employees upon their completing the
probationary period satisfactorily.
To assess the training and development needs of Employees.
To decide upon a pay raise where (as in unorganized sector) regular pay scales have not
been fixed.
To let the employees know where they stand insofar as their performance is concerned
and to assist them with constructive criticism and guidance for the purpose of their
development.
To improve communication. Performance appraisals provide a format for dialogue
between the superior and the subordinate, and improve understanding of personal goal
and concerns.
Finally, performance appraisal can be used to determine whether HR programmes such as
selection, training, and transfer have been effective or not.
Broadly, performance appraisal serves four objectives:
I. Developmental use.
II. Administrative Uses / decisions.
III. Organizational maintenance / Objectives. And
IV. Documentation Purpose.
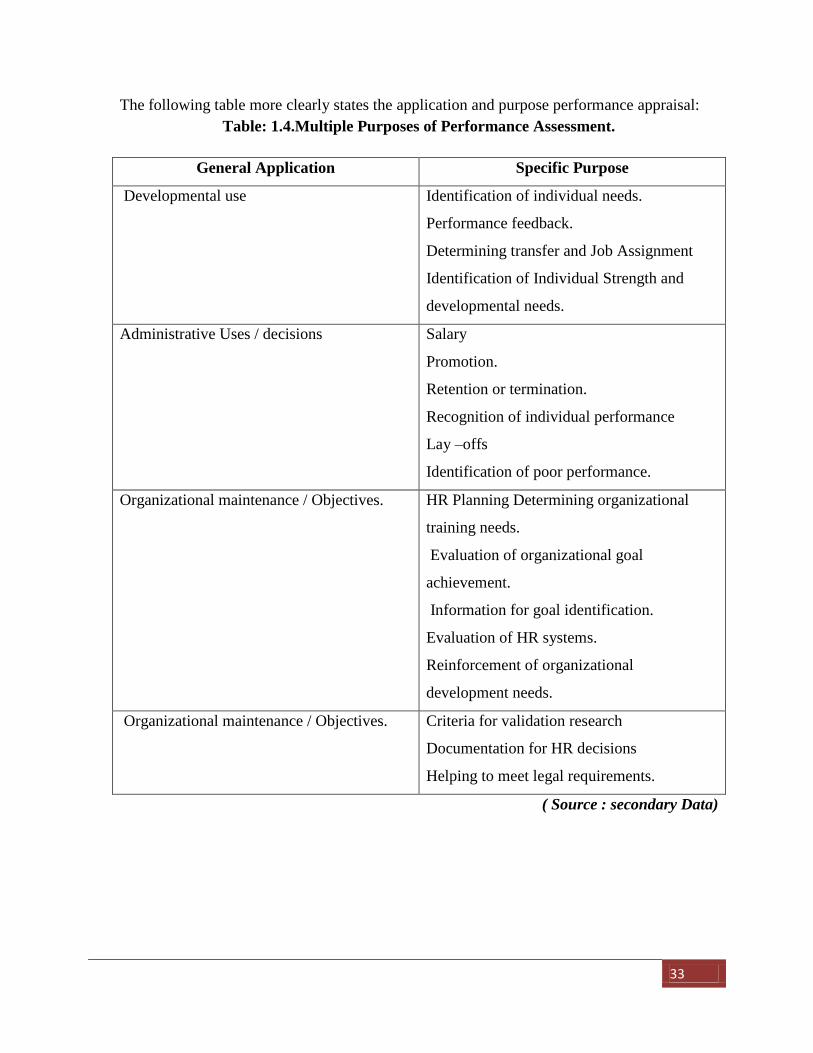
33
The following table more clearly states the application and purpose performance appraisal:
Table: 1.4.Multiple Purposes of Performance Assessment.
General Application Specific Purpose
Developmental use Identification of individual needs.
Performance feedback.
Determining transfer and Job Assignment
Identification of Individual Strength and
developmental needs.
Administrative Uses / decisions Salary
Promotion.
Retention or termination.
Recognition of individual performance
Lay –offs
Identification of poor performance.
Organizational maintenance / Objectives. HR Planning Determining organizational
training needs.
Evaluation of organizational goal
achievement.
Information for goal identification.
Evaluation of HR systems.
Reinforcement of organizational
development needs.
Organizational maintenance / Objectives. Criteria for validation research
Documentation for HR decisions
Helping to meet legal requirements.
( Source : secondary Data)
34
Some Industries use the traditional or modern methods. The following is the difference
between both methods of performance appraisal.
Table: 1.5.11
Methods of performance appraisal.
Traditional Method Modern Method.
1. Ranking method
2. Paired method.
3. Grading.
4. Force distribution method.
5. Force Choice method.
6. Checklist method.
7. Critical incidents method.
8. Graphic Scale Method.
9. Essay method.
10. Field review method.
11. Self-Appraisal.
1. Appraisal by results or objectives.
2. Behavioral anchored rating scales.
3. Assessment centers
4. 360- Degree appraisal.
5. Cost accounting Method.
(Source: secondary Data)
1.9.3.1.Performance Appraisal Process.
Performance appraisal process can be undertaken either on informal basis or on formal and
systematic basis. In Comparatively smaller organization, appraisal, either based on traits or
performance or a combination of both, is done informally through the observation of
concerned employees. In larger organization, appraisal has to be more systematic and formal
as it reveals various types of information which can have a variety of purposes as discussed
earlier. A systematic performance appraisal goes through different steps as shown below.
1. Defining Objectives of Appraisal
2. Defining appraisal norms.
3. Designing appraisal programmes.
4. Implementing appraisal Programme.
11
Khanka. S.S., Human Resource Management (Text and Cases) S .Chanda Publishing,(349)
35
5. Appraisal Feedback.
6. Post-appraisal actions.
1.9.3.2. Summary.
1. Performance appraisal is a systematic review and evaluation of an individual or teams’ job
performance.
2. Appraisal data is very helpful in numerous HR functional areas including HR planning,
recruitment, selection, training, and employee development and compensation programmes.
3. The performance appraisal process involves establishment of performance standards,
communicating the same to employees, measuring the actual performance against standards,
and take corrective action of required.
4. The methods of appraising employee performance may be broadly classified into two
categories: traditional and Modern.
5. Most organizations nowadays feel that the 360 degree appraisal method is only appropriate
for developmental purposes.
6. To be useful, appraisal has to be carried out in an objective manner, following an
acceptable criteria established for this purpose. It is important to offer training to raters, so
that they carry out the appraisal unemotionally. Both employee traits and behaviours need to
be looked into seriously in order to carry out performance appraisal process in a systematic
manner. The appraisal could be carried out at selected intervals.
7. The most important problems that could stand in the way of putting the appraisal process
in place would include: lack of objectivity, bias, leniency, central tendency, recent behaviour
bias, stereotyping, etc.
8. A good appraisal system should measure important job characteristics (relevancy), be free
from contaminating influences, and cover all key aspects of job. It should be reliable and
avoid rating errors of all kinds. More important, appraisal system must be fair to women,
minorities and other protected groups. Of course, appraisal must also be practical.
36
1.9.4. Communication.
Meaning:
12Communication is a process by which all forms of information is transferred from one person
to the other. So, for the communication to take place there must be some information to be
conveyed and there must be two or more persons – one to deliver the message and other to
receive it. Communication is said to be perfect only when the receiver understand it in the sense
the sender expect him to understand.
Some definitions about Communication:
“Communication as the transfer of information and understanding from person to person”
-- Dale S. Beach
“Communication is a process of meaningful interaction among human beings. More specifically
it is the process by which meanings perceived and understanding are reached among human
beings”-- McFarland
“Communication as a process involving the transmission and accurate replication of ideas
reinforced by feedback purporting to stimulate actions to accomplish organizational goals.”
-- Scott and others.
“Communication is interactive by words, letter symbols or message and is a way that one
organization member shares meaning and understanding with another.”
-- Herald Koontz and Cyril O’Donnell.
“Communication is the sum of all the things one person does when he wants to create
understanding in the mind of another. It involves a systematic and continuous process of telling,
listing and understating.” -- Louis A. Allen.
“Communication is the broad field of human interchange of facts and opinion and not to
technologies of telephone, telegraph, radio and the like.”
12
Michael, V.P., HRM and Human Relations, Himalaya Publishing,(P-321)
37
1.9.4.1. Purpose of Communication in HRM.
The purpose of communication in human resource management include:
Communication is needed to exchange ideas, opinion, information etc. with the
colleagues, superiors, subordinates, customers, public etc.
Communication is needed for designing jobs and human resource planning.
Employee orientation and socialization programmes became possible mostly through
communication.
Recruitment and selection functions are performed through communication by
persuading the prospective employees to apply for a job, knowing the skills and
knowledge of the prospective employees.
Employee’s performance is evaluated by getting information, opinions and rating from
the superiors, subordinates, and employers’.
Almost all the process of training and executive development is carried out through the
communication process. In fact most of the training and development are done through
teaching and learning processes.
Employees ventilate their grievances to their superior through communication. Superiors
also redress the employee grievances and deal with the disciplinary cases through
communication.
Collective bargaining process is mostly carried out through communication process of
exchanging the demand, offering proposals and counter offering etc.
Participative management is successful through effective communication process.
38
1.9.4.2. 13
TYPES OF COMMUNICATION
The following are the types of communication:
A) On the basis of Expression
B) On the basis of Organizational structure.
C) On the basis of Direction.
A) On the basis of Expression
1. Verbal or oral communication
2. Written communication
3. Formal communication.
4. Informal communication.
C) On the basis of Direction.
1. Upward Communication.
2. Downward Communication.
3. Horizontal Communication.
13
Aswathappa, K., Human Resource Management (Text and Cases) , Tata McGraw Hill
Education Pvt. Ltd., Navi Delhi.(P-490)
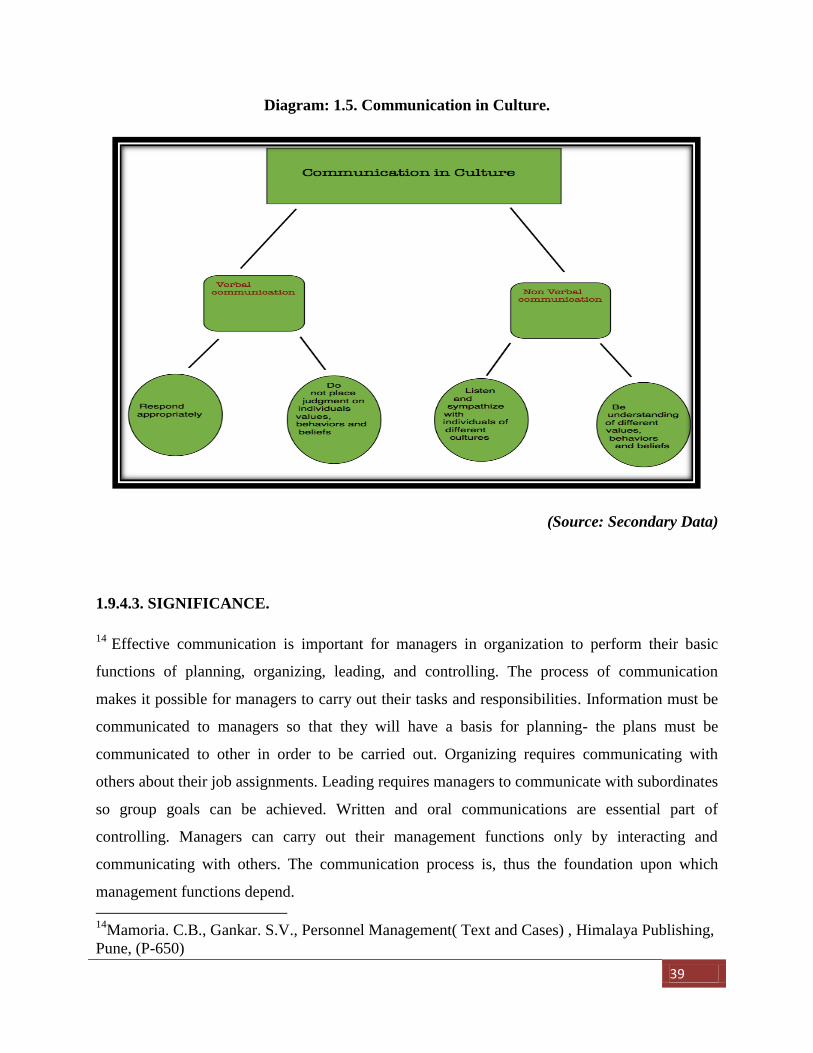
39
Diagram: 1.5. Communication in Culture.
(Source: Secondary Data)
1.9.4.3. SIGNIFICANCE.
14 Effective communication is important for managers in organization to perform their basic
functions of planning, organizing, leading, and controlling. The process of communication
makes it possible for managers to carry out their tasks and responsibilities. Information must be
communicated to managers so that they will have a basis for planning- the plans must be
communicated to other in order to be carried out. Organizing requires communicating with
others about their job assignments. Leading requires managers to communicate with subordinates
so group goals can be achieved. Written and oral communications are essential part of
controlling. Managers can carry out their management functions only by interacting and
communicating with others. The communication process is, thus the foundation upon which
management functions depend.
14
Mamoria. C.B., Gankar. S.V., Personnel Management( Text and Cases) , Himalaya Publishing,
Pune, (P-650)
40
Managers, in general spend as much as 37.5. Hours communicating per week. Thus a large
share of managerial time is devoted to the activity of communication. Rarely are managers alone
at their desks thinking, planning or contemplating alternatives. In fact managerial time is spend
largely in face to face or telephonic communication with subordinates, peers ,supervisors,
subordinates, suppliers, or customers. When not conferring with others in person or on the
telephones, manager may be writing or dictating memos, letters or reports sent to them. Even in
few periods when managers are alone, they are frequently interrupted by communication. The
time spent by managers on communication, and the attention it receives from them, speak about
the importance of communication.
For organization to function successfully, effective communication is basic requisite.
Interpersonal, intergroup and intergroup communications are essential for information to flow,
ideas to generate, and feelings to be exchanged
What communication does for an organization resemble what the bloodstream does for an
organism? The communication system supplies the entire units-department, people of the
organization – with information. Deprived of oxygen, the cells malfunction and die. Deprived of
the necessary information, individuals and departments within the organization malfunction,
which can certainly lead to a sort of terminal ineffectiveness for them and for the organization as
a whole.
Communication is significant as it serves four major functions within a group or organization –
control, motivation, emotional expression and information.
Communication helps control member behaviour in more than one way. Organizations have
authority, hierarchies and formal guidelines that employees are required to follow. When
employee, for instance, are required first to communicate any job-related grievances to their
boss, to follow their job description, or to comply with company policies, communication
performs a control function.
Communication foster motivation by clarifying to employees what is to be done, how well are
they doing? What can be done to improve performance if it is below standard?
41
For many employees, their work group is primary source for social interaction. The
communication that takes place within the group is a fundamental mechanism by which member
shows their frustration and feelings of satisfaction. Communication therefore, provides a lease
for the emotional expression of feelings and for fulfillment of social needs.
Communication provides information to individuals and members for making a decision and
for identifying and evaluating alternative choices.
Communication can play a major role in changing people’s attitude. It is said that a common
approach in molding or changing an employee’s attitude is to supply information on the object or
issues towards which attitude are directed. Company magazines, bulletin boards, pamphlets,
meetings, educational programmes, newspapers advertising, and many other forms of written and
verbal communication, formal and informal in character, are useful for this purpose. Underlying
their use is the belief that communication is a powerful factor in molding attitudes- that well-
informed individuals will have sounder attitude than those who are ill-informed.
Communication is the essence of social behaviour. In every-day living, the mere presence of
another person encourages communication. It is a universal human propensity that you cannot
disagree with it.
Most important, communication plays an important role in knowledge management,
particularly, in minimizing the” silos of knowledge” problem that undermines an organizations
potential. This relates to the increased importance of communication in decision – making. As
organizational environments become more complex, decision- making need information from
many people to perceive problem, recognize new product ideas and identify merging customers
need. Cannon, the Japanese optics and electronics firm, recognized this through its emphasis on
“heart–to-heart and mind-to-mind communication,” This corporate philosophy encourages
employees worldwide to share information on customer and product so that they can make more
informed choices about corporate actions. British Telecom does the same thing. By encouraging
ongoing communication, employees create “knowledge moments” – instances where shared
knowledge results in better decisions.
As a part of knowledge management, APTECH, the Indian Computer Education firm, has been
developing and implementing a company–wide Enterprise Information System (EIS). EIS
42
extends across the entire network of over 1200 centers in 30 countries and covers every element
of its training operations, from centers automation to academics to quality administration to
online delivery of education to complete integration into the SAP-ERP system that are used for
accounting , logistics and distribution . This is an arduous but an exciting system journey which
has demanded a revisiting of many processes, budgetary controls and the entire materials
managements process of requisitioning , ordering ,printing and supply from central stores to
regional and country offices to each education center and finally into the hands of the quarter
million students in APTECH.
What specific implications communication has to HR managers? Senior HR executives need to
communicate with several stakeholders such as investor, customers, line mangers, employees
and HR professionals.
With investors, Communication focuses on how intangible becomes a determining factor
in the creation of sustained market value.
With customers communication focus on their needs and HR practices can be aligned
with customer expectations, with a view to increasing market share. In addition to
responding to customer feedback action may involve to engage customers in designing
and delivering HR practices.
With line managers, communication centers on delivering business strategies through
prioritizing and creating organization capabilities. Actions follow ideas as the concept of
capabilities translates into investment of budget, time, focus and energy.
With employer’s communication provides insight into an employee value creation.
Actions may then be identified to ensure that employees have both the ability and the
attitude to do what is expected of them.
With HR professionals, communication helps HR leaders fulfill their roles and
demonstrate the competencies that are required to deliver value.
The role of communication in knowledge management, explained above, also revolves
around HR professionals, for it is these people who are actively involved in knowledge
management.
43
1.9.5. GRIEVANC HANDLING/ REDRESSAL
“Positive discipline does not replace reason but applies to the achievement of a common
objective” -- William R. Spiegel, Management Professor.
15A grievance is a sign of employee’s discontent with job and its nature. The employee has got
certain aspirations and expectations which he thinks must be fulfilled by the organization where
he is working, when the organization fails to satisfy the employee needs, he develops a feeling of
discontent or dissatisfaction. For instance, the employee expects proper implementation of the
Central and State Government law, Collective agreements, company policies and management
responsibilities. Any violation of these laws, agreements and policies cause dissatisfaction on his
part. Thus, grievance is caused due to the difference between the employee expectation and
management practice.
The concept ‘Grievance’ has been defined in several ways by different authorities. Some of
the definitions are as follows:
“Grievance is any discontent or dissatisfaction, whether expressed or not, whether valid or not,
arising out of anything connected with the company thinks, believes or even feels to be unfair,
unjust and inequitable.”
-- Michael Jucious
“Grievance is a written complaint filed by an employee and claiming unfair treatment.”
-- Dale Yoder.
15
Pardeshi P.C., Human Resources Management, Nirali Prakashan, Pune., (P-333)
44
1.9.5.1. Causes of Grievances:
Grievances may arise out of anything connected with the company and work-related activities.
1. Wage Related Grievances:
a) The workers may feel less equity in wages i.e., he is underpaid as compared to other.
b) Low rate of incentives.
c) Mistakes in calculation of wages.
d) Delay in payment of wages and incentives.
e) Unfair deduction in wages and incentives.
f) Denial of rightful increment.
2. Working Conditions Related Grievances:
a) Defective lighting.
b) Poor ventilation.
c) Unhygienic sanitation facilities.
d) Noise, fumes, and other unpleasant or unsafe conditions.
3. Superior Related Grievances:
a) Autocratic nature of superior.
b) Poor instruction on the part of superior.
c) Favoritism on the part of superior.
d) Divide and rule policy of superior.
e) Poor canteen facilities,
f) Lack of freedom and lack of delegation of authority.
g) Rude or unethical behaviour of the superior.
45
4. Individual Advancement Related Grievances:
a) Errors in seniority list.
b) Vindictive transfers.
c) Denials of promotion.
d) Unjustified suspension or demotion.
e) Unfair lay-off.
f) Penalty for offences not committed.
5. Health and Safety Related Grievances:
a) Lack of safety facilities like helmet, gloves, and safety sign.
b) Poor maintenance of plant and machinery.
c) Use of defective or poor quality of electrical tools and equipment.
d) Lack of emphasis on safety training.
e) Non-availability of first – aid and other materials.
f) Lack of fencing of high voltage areas.
6. Collective Bargaining.
a) Non-recognition of legitimate trade union.
b) Non-implementation of agreements such as wage agreement, which were agreed by the
management.
c) Non-compliance with the grievance procedure.
d) Victimization of employees belonging to a particular trade union.
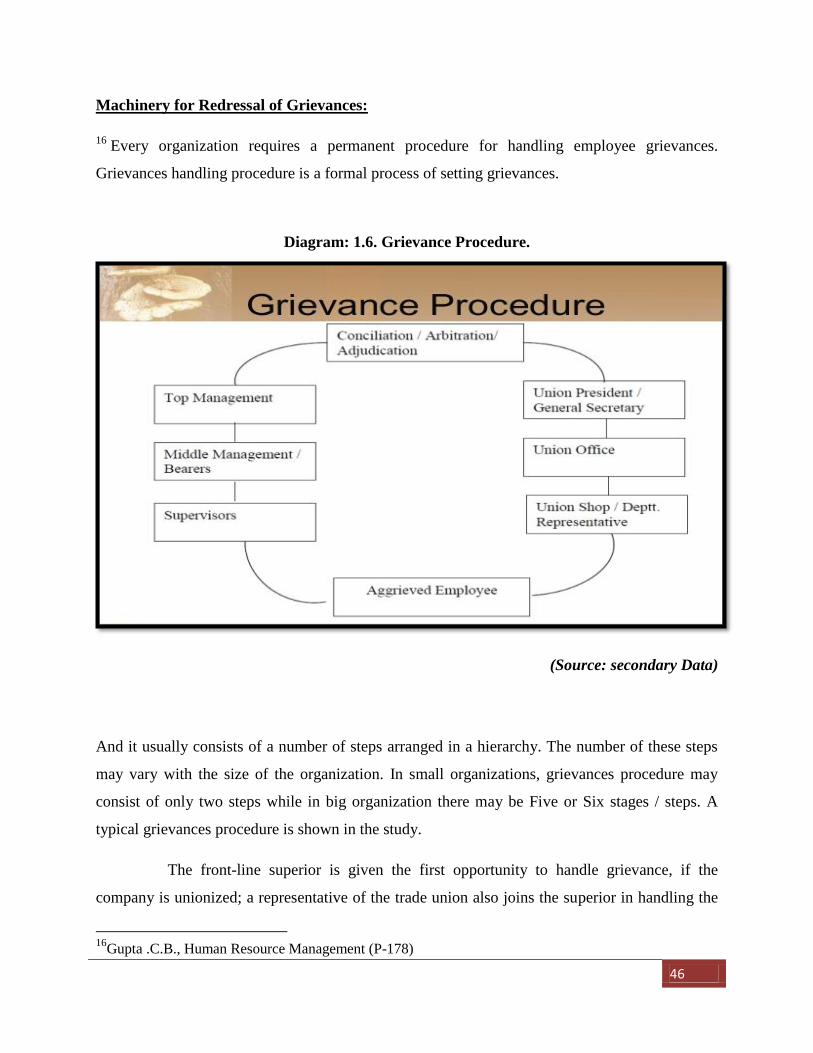
46
Machinery for Redressal of Grievances:
16Every organization requires a permanent procedure for handling employee grievances.
Grievances handling procedure is a formal process of setting grievances.
Diagram: 1.6. Grievance Procedure.
(Source: secondary Data)
And it usually consists of a number of steps arranged in a hierarchy. The number of these steps
may vary with the size of the organization. In small organizations, grievances procedure may
consist of only two steps while in big organization there may be Five or Six stages / steps. A
typical grievances procedure is shown in the study.
The front-line superior is given the first opportunity to handle grievance, if the
company is unionized; a representative of the trade union also joins the superior in handling the
16
Gupta .C.B., Human Resource Management (P-178)
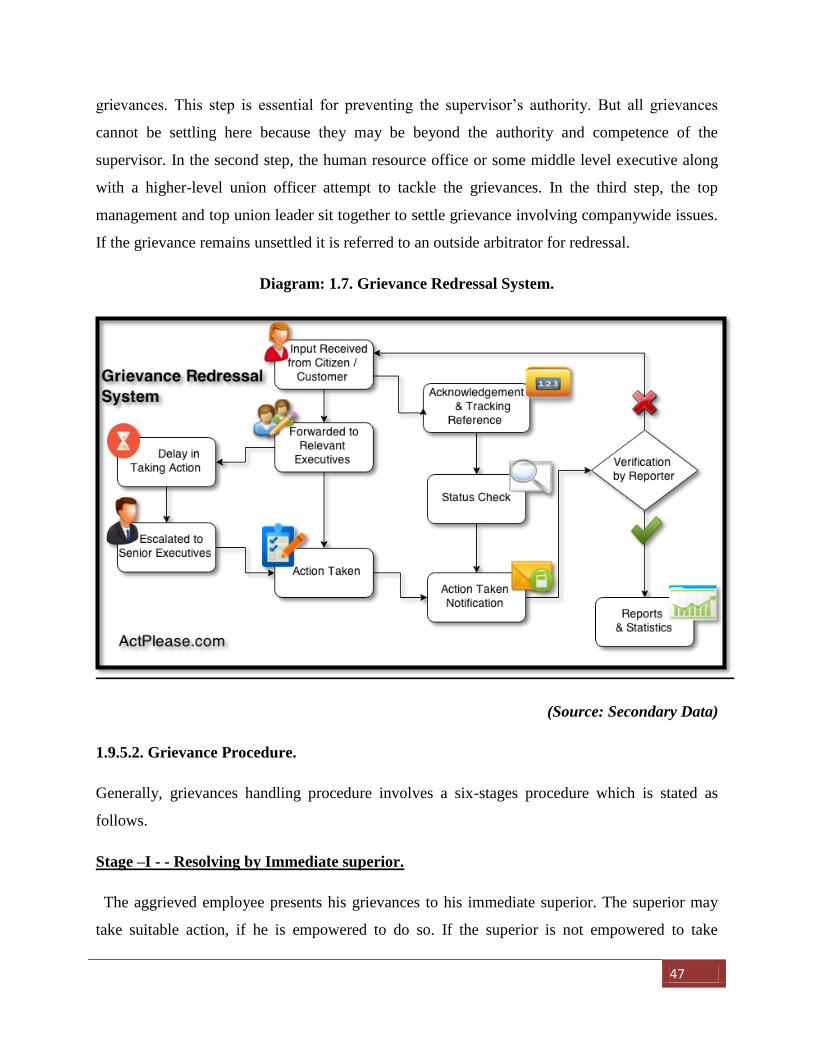
47
grievances. This step is essential for preventing the supervisor’s authority. But all grievances
cannot be settling here because they may be beyond the authority and competence of the
supervisor. In the second step, the human resource office or some middle level executive along
with a higher-level union officer attempt to tackle the grievances. In the third step, the top
management and top union leader sit together to settle grievance involving companywide issues.
If the grievance remains unsettled it is referred to an outside arbitrator for redressal.
Diagram: 1.7. Grievance Redressal System.
(Source: Secondary Data)
1.9.5.2. Grievance Procedure.
Generally, grievances handling procedure involves a six-stages procedure which is stated as
follows.
Stage –I - - Resolving by Immediate superior.
The aggrieved employee presents his grievances to his immediate superior. The superior may
take suitable action, if he is empowered to do so. If the superior is not empowered to take
48
appropriate action, he may take permission from higher authorities to take suitable action to
redress, the grievance.
Normally, the grievances are to be redressed within 48 hours (2 days) of the presentation of the
grievance. If the employee is satisfied with the action taken be the superior, the grievance is
over. If he is not satisfied, he may resort to the second stage.
Stage -- II -- Resolving by Senior Manager.
If the immediate superior fails to take appropriate decision to redress the grievance, the matter
will be handed over to senior manager, who may be the departmental head or Chief Labor
Officer. The senior manager / CLO looks into the grievances. After considering all the relevant
details of the grievances, the senior manager / CLO may take suitable action to redress the
grievance within 3 days of the presentation of the grievance. The employees may or may not be
satisfied with the action taken.
Stage – III – Resolving by Grievance Committee.
If the senior manager /CLO fail to take suitable action to redress the grievance, the managers will
then report to Grievances Committee (GC). The GC consists of representative of the workers
union and the management. The GC member discusses the problem and also reviews the
decisions taken at the earlier stages.
The GC members make recommendations to the management to overcome the grievance,
within a period of 7 days of the employee request. The final decision of the management is
communicated to the employee within 3 days of the receipt of GCs recommendations.
Stage IV -- Appeal for Revision.
If the decision of the management is not communicated to the aggrieved employee within the
stipulated period of 3 days, or if the management decision is unsatisfactory, the employee has the
right to appeal to the management for revision. The management may review its decision and
communicates its decision to the employee within the 7 days of the presentation of employees
appeal for revision.
49
Stage - V -- Voluntary Arbitration.
If the employee is not satisfied with the revised decision of the management, the workers union
and the management may refer the grievance to arbitrator for final decision. The arbitrator is
appointed with mutual consultation between the management and workers union. Both the
parties may agree that the decision of the arbitrator will be binding on both the parties – the
management and the employee.
Stage VI – Final Decision.
The arbitrator goes through the grievance, and the decisions taken at the earlier stages. He will
hold deliberation with the management and the workers union (or employee). Finally, the
arbitrator gives his ruling, which is normally final and binding on both the parties.
1.9.6. WORKING CONDITIONS:
Working conditions includes the following THREE main sub parts:
A) Employees Safety and Security.
B) Employees Health.
C) Employee’s welfare.
Accidents of various kinds occur in factories all over the globe with frustrating regularity.
Workers die almost every second because of unsafe working conditions within the factory
premises. The average cost of injury as per 2010 statistics amounts to $10.000 in dollar terms. Of
course, a worker’s life is not so precious in India. The figures are going to be miniscule in rupee
terms. After 25 years waiting the Bhopal gas victims got only $800 per person while the Chief
Executive of Union Carbide, Warren Anderson is having a joy ride in USA, enjoying all pension
benefits at a leisurely pace (www.stwr.org 2010). According to Dr. Subhodh Medgekar, a road
industrial accident investigator, “In the US, if one’s life is lost, or five people are injured in an
industrial accident – then it is very big deal. Companies pay huge insurance claims and damage.
In India, life is cheap” (Rahul Wadke, Industrial Safety Aspect Not Getting High Priority,
Business Line, June 12, 2008.)
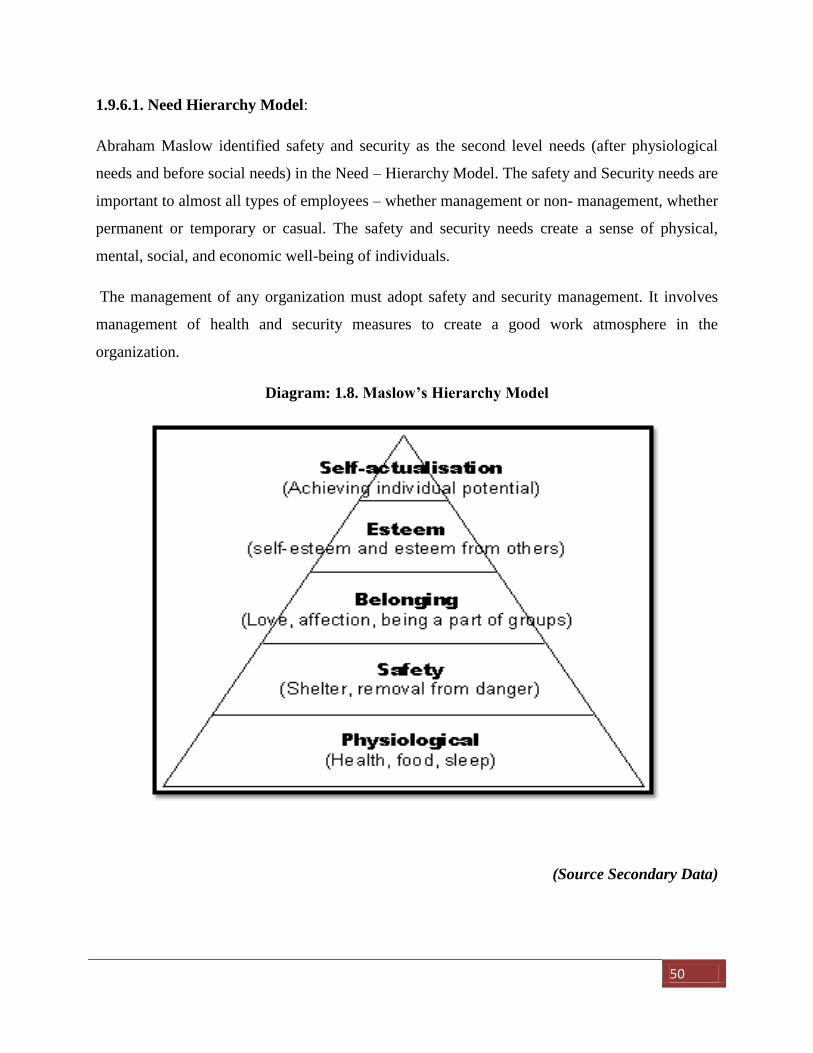
50
1.9.6.1. Need Hierarchy Model:
Abraham Maslow identified safety and security as the second level needs (after physiological
needs and before social needs) in the Need – Hierarchy Model. The safety and Security needs are
important to almost all types of employees – whether management or non- management, whether
permanent or temporary or casual. The safety and security needs create a sense of physical,
mental, social, and economic well-being of individuals.
The management of any organization must adopt safety and security management. It involves
management of health and security measures to create a good work atmosphere in the
organization.
Diagram: 1.8. Maslow’s Hierarchy Model
(Source Secondary Data)
51
1.9.6.2. SAFETY:
17Safety is primarily the responsibility of the management. This responsibility should rest on the
shoulders of all cadres of management, such as plant Manager, Production manager, Chief
Manager, Chief Engineer, Personnel, manager, Maintenance Engineer, Individual Foreman,
Safety Officer or Director.
Every organization should formulate and implement a safety policy. The procedure to be adopted
naturally depends upon the size of a company, the number of plants it operates, the nature of the
industry in which bit is engaged, the production technology it uses, and the attitude of the top
management. After it has spelt out safety policy, a company should establish a safety
programme, the primary goals of which should be to reduce the number of hazardous factors
which are likely to cause accidents, and to develop safe working habits among its employees.
1.9.6.3. HEALTH
The well-being of the employee in an industrial establishment is affected by accidents and by ill
health-physical as well as mental. In this section, we shall discuss the need for health work and
health services to be provided by the management to ensure the continuing good health of their
employees.
We proposed to examine employees’ health from the following angles-physical health, mental
health, and noise control stress management, AIDS, alcoholism, drug abuse and violence in work
place.
CII awards companies on the basis of their wellness programmes. L&T .ITC, Bhadrachalam.
Tata Steel. HDFC Bank, Birla Cement, Apollo Hospitals are some of the recipients of the
awards.
1.9.6.4. HEALTH MANAGEMENT.
Though good health is necessary for any individual and there are various methods for
maintaining good health. It has received added attention in the case of industrial workers because
17
Sarma A.M., Aspects of Labor Welfare and Social Security, Himalaya Publishing House,
Mumbai, (P-83)
52
they are prone to certain occupational diseases caused by inherent working conditions in some
specific occupations. Therefore, management of health (also known as industrial health) is a pre-
requisite for workers efficiency. According to the Joint ILO-WHO committee, organizational
health is:
1. The prevention and maintenance of physical, mental and social well-being in all occupations.
2. Prevention among workers of all ill health caused by the working conditions.
3. Protection of workers in their employment from risks resulting from factors adverse to health
and
4. Placing and maintenance of the worker in an occupational environment adapted to his physical
and psychological equipment. Thus, industrial health is concerned with preventing the disease
rather curing the disease. Industrial Health is required:
1. To maintain and improve productivity and quality of work.
2. To improve employee motivation and morale.
3. To reduce spoilage and cost of operations.
4. To reduce industrial unrest, indiscipline, and accidents, and
5. To control absenteeism and turnover.
1.9.6.5. Measuring Health and Safety performance.
The saying that ‘if you can’t measure it you can’t manage it’ is totally applicable to health and
safety. It is essential to know what is happening and it is even more essential to measure trends
as a means of identifying in good time where actions are necessary.
The most common measures are:
The frequency rate:
Number of injuries * 100 000
Number of hours worked.
53
The incidence rate
Number of injuries *1000
Average number employed during the period.
The Severity rate:-
The days lost through accidents or occupational health problems per
1000,000 hours worked.
Some organizations adopt a total loss control approach which covers the cost of accident to
the business under such headings as per pay to people off work, damage to plant or equipment
and loss of production. A cost severity rate can be calculated which is the total cost of accident
per 1000,000 hours worked.
1.9.6.6. Safety Programme:
Safety program deals with the prevention of accidents and with minimizing the resulting loss
and damage to persons and property. Five basic principles must govern the safety programme of
an organization. These are:
1. Industrial accidents result from a multiplicity of factors, but these have to be traced to their
root cause, which are usually faults in the management system arising from poor leadership from
the top, inadequate supervision, insufficient attention to the safety design into the system, an
unsystematic approach to the identification, analysis and elimination of hazards and poor training
facilities.
2. The most important functions of safety programmes is to identify potential hazards, provide
effective safety facilities and equipment and to take prompt remedial action.
3. The safety policies of the organization should be determined by the top management who must
be continuously involved in monitoring safety performance and in ensuring that corrective action
is taken when necessary.
4. Management and supervision must be made fully accountable for safety performance in the
work place they control.
54
5. All employees should be given thorough training in safe method of work and should receive
continuity education and guidance on eliminating accidents.
1.9.6.7. EMPLOYEE WELFARE (Welfare and Recreational Facilities)
18According to the Oxford dictionary employee welfare or labor welfare mans “the efforts to
make life worth living for workmen.” In the word of Arthur James Todd, “Labour welfare means
anything done for the comfort and improvement, intellectual or social, of the employee over and
above the wage paid which is not a necessity of the industry.”
According to a I.L.O. report, “worker” welfare may be understood as include such service
facilities and amenities which may be established, or in the vicinity of undertakings to perform
their work in healthy and congenial surroundings and to avail of facilities which improve their
health and bring high morale. The committee on Labor Welfare (1969) defined it as such
services, facilities and amenities as adequate canteen, rest and recreation facilities, sanitary and
medical facilities, including social security measures as contribute to improve the condition
under which workers are employed.” According to The Labor Investigation Committee (1946),
Employee welfare means “anything done for intellectual; physical moral and economic
betterment of the workers, by employers, by Government or by other agencies, over and above
what is laid down by law or what is normally expected on the part of the contributed benefits for
which workers may have bargained”.
On the basis of these definitions, the following features of employees’ welfare can be
identified:
1. Employee welfare is a comprehensive term including various services, facilities and amenities
provided to employees for their betterment.
2. Employee welfare is a dynamic concept varying from country to county and from region to
region within same county. It is a flexible and ever-changing concept as new welfare measures
are added to the existing measures from time to time.
18
Tripathi, Personnel Management and Industrial relations, Sultan Chan & Sons Educational
Publisher, New Delhi.(P-327)

55
3. Welfare measures are in addition to regular wages and other economic benefits available to
employees under legal provisions and collective bargaining.
4. Welfare measures may be provided not only by employers but by the government, trade
unions and other agencies too.
5. The basic purpose of employee welfare is to improve the lot of the working class and hereby
make a worker a good employee and happy citizen.
6. Employees welfare is an essential part of social welfare. It involves adjustment of an
employee’s work life and family life to the community or social life.
7. Welfare measures may be both voluntary and statutory. Voluntary measures are the result of
paternalist and philanthropic feelings of employer. There may also be provided due to customs or
traditions in the particular industry or region. Statutory measures are prescribed under labor laws.
8. Employee welfare measures are also known as benefits and services.
The following are the Welfare and Recreational Facilities / benefits:
Dating allowance.
Canteens.
Consumer societies.
Credit society
Housing.
Legal aid.
Employee counseling.
Welfare Organization.
Holiday homes.
Educational Facilities.
Transportation / Conveyance.
Parties and Picnics.
Child care and.
56
Miscellaneous. (Organizing games, sports, community service activities, Christmas gifts,
Deewali, Pongal, Baudh Pournima and Pooja gifts, birthday gifts, leave allowance
concession and productivity / performance awards, etc.)
1.9.7. RETIREMENT BENEFITS
19Industrial life generally breaks family system. The saving capacity of the employees is very
low due to lower wages, high living cost and increasing aspirations of the employers and his
family members. As such employers provide some benefits to the employees, after retirement
and during old age, with a view to create feelings of security about the old age. These benefits
are called old age and retirement benefits. These include:
1. Provided fund
2. Pension
3. Deposit liked insurance
4. Gratuity and
5. Medical / Health benefit.
1.9.7.20
A) Provided fund: - This benefit is meant for economic welfare of the employees. The
Employees Provided Fund, Family Pension Fund and Deposits Linked Insurance Act, 1952
provides for the institution of Provident Fund for employees in factories and establishment.
Provident fund Scheme of the Act provides for monetary assistance to the employees and / or
their dependents during post-retirement life. Thus, this facility is a security against social risk
and this benefit enables the industrial workers to have better retired life. Employs in all factories
under the Factories Act 1948 are covered by the Act. Both the employer contribute to the fund.
The employee on attaining 15 years of membership is eligible for 100% of the contributions with
interest to the employee on retirement or to the dependents of the employee, in case of death.
19
Dr. Pardeshi. P.C. , Human Resources Management., NiraliPrakashan, Pune., (303) 20
Sarma, S.A., Aspect of Labor Welfare and Social Security, Himalaya Publishing, Pune, (P-324)
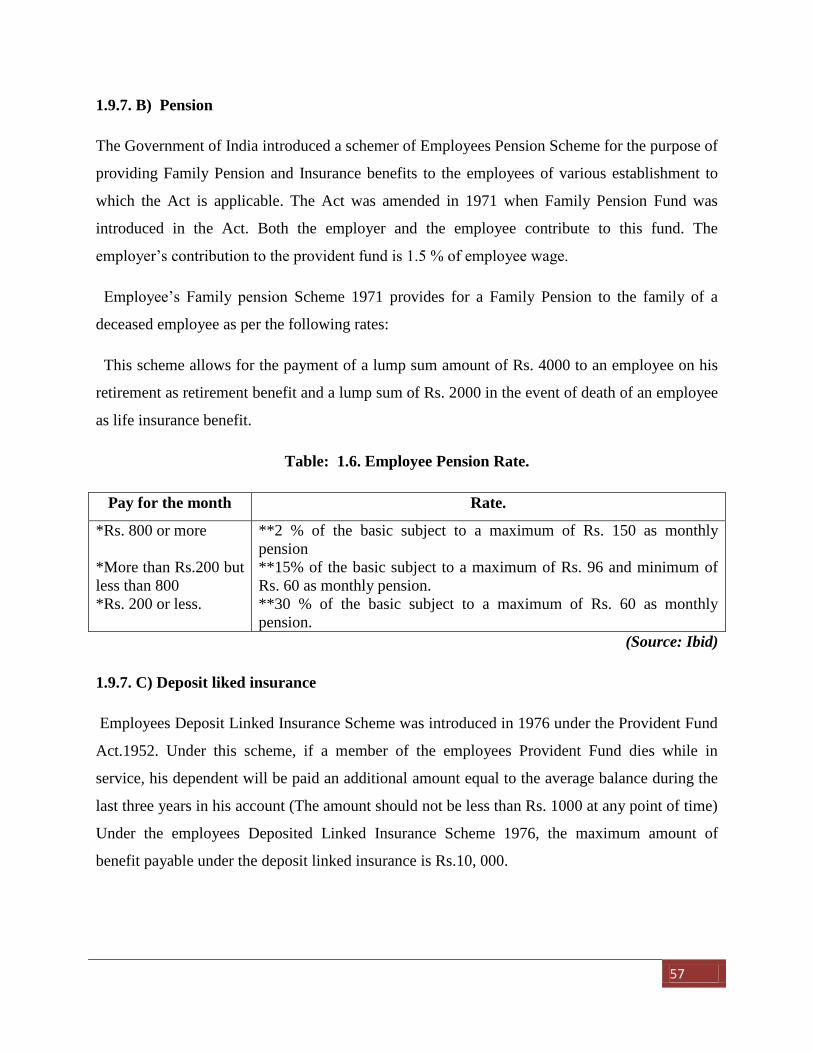
57
1.9.7. B) Pension
The Government of India introduced a schemer of Employees Pension Scheme for the purpose of
providing Family Pension and Insurance benefits to the employees of various establishment to
which the Act is applicable. The Act was amended in 1971 when Family Pension Fund was
introduced in the Act. Both the employer and the employee contribute to this fund. The
employer’s contribution to the provident fund is 1.5 % of employee wage.
Employee’s Family pension Scheme 1971 provides for a Family Pension to the family of a
deceased employee as per the following rates:
This scheme allows for the payment of a lump sum amount of Rs. 4000 to an employee on his
retirement as retirement benefit and a lump sum of Rs. 2000 in the event of death of an employee
as life insurance benefit.
Table: 1.6. Employee Pension Rate.
Pay for the month Rate.
*Rs. 800 or more
*More than Rs.200 but
less than 800
*Rs. 200 or less.
**2 % of the basic subject to a maximum of Rs. 150 as monthly
pension
**15% of the basic subject to a maximum of Rs. 96 and minimum of
Rs. 60 as monthly pension.
**30 % of the basic subject to a maximum of Rs. 60 as monthly
pension.
(Source: Ibid)
1.9.7. C) Deposit liked insurance
Employees Deposit Linked Insurance Scheme was introduced in 1976 under the Provident Fund
Act.1952. Under this scheme, if a member of the employees Provident Fund dies while in
service, his dependent will be paid an additional amount equal to the average balance during the
last three years in his account (The amount should not be less than Rs. 1000 at any point of time)
Under the employees Deposited Linked Insurance Scheme 1976, the maximum amount of
benefit payable under the deposit linked insurance is Rs.10, 000.
58
1.9.7. D) Gratuity: -This is another type of retirement benefit to be provided to an employee
either on retirement or at the time of physical disability and to the dependent of the deceased
employee Gratuity is a reward to an employee for his long service with his present employer.
1.9.7. E) Medical / Health benefit.
21This is the one of the most common and usually most expensive employee’s benefits that an
employer can provide to its employees. These range from the usual group medical health
insurance coverage to reimbursement of pharmacy and outpatient bills. These is the gradual shift
from the traditional all- expensive – paid patient indemnity health care to alternate method of
risk or cost sharing like co-pay health insurance plans or high- deductible plans.
1.10. Human Resource Management in Chemical Industries in Navi Mumbai.
The importance of Human Resource Management is discussed as follows
A) Corporate / an Enterprise
B) Professional
C) Social and
D) National
A) Corporate / an Enterprise: -
Human Resource management can help an enterprise in achieving its goal more efficiently
and effectively in following ways:
1. Attracting and retaining the required talent through effective human resource planning,
recruitment, selection, placement, orientation, compensation and promotion policies.
2. Developing the necessary skills and right attitudes among the employees through training
development, performance appraisal etc.
3. Securing willing cooperation of employees through motivation, participation. Grievance
handling etc.
4. Utilizing effective the available human resources.
5. Ensuring that the enterprise will have in future a team of competent and dedicated
employees.
21
Punekar.S.D.,Deodhar.S.B.,Sankaran,Saraswathi,Labour Welfare, Trade Unionism and
Industrial Relations, Himalaya Publishing House, Mumbai (P- 61)
59
B) Professional Significance:
Effective management of Human Resource helps to improve the quality of work life.
It permits team work among employees by providing a healthy working environment. It
contributes to professional growth in the following ways.
1. Providing maximum opportunities for personal development of each employee.
2. Maintaining healthy relationship among individuals, and different work groups.
3. Allocating work properly.
C) Social Significance:
Sound Human resource Management has a great significance for the society. It helps
to enhance the dignity of labor in the following ways.
1. Providing suitable employment that provides social and psychological satisfaction to
people.
2. Maintaining a balance between the jobs available and the jobseekers in terms of numbers,
qualifications, needs and aptitudes.
3. Elimination waste of human resource through conservation of physical and mental health.
D) National Significance:
Human Resource management plays a vital role in the development of a nation. The effective
exploitation and utilization of nation natural, physical and financial resources require an efficient
and committed manpower. The level of development of a country depends primarily on the
skills, attitudes and values of its human resources. Nations are underdeveloped because their
people are underdeveloped. Effective management of human resource helps to spend up the
process of economic growth which, In turn leads to higher standards of living and fuller
employment.
Human resource management is the central subsystem of an organization as can be seen
as below
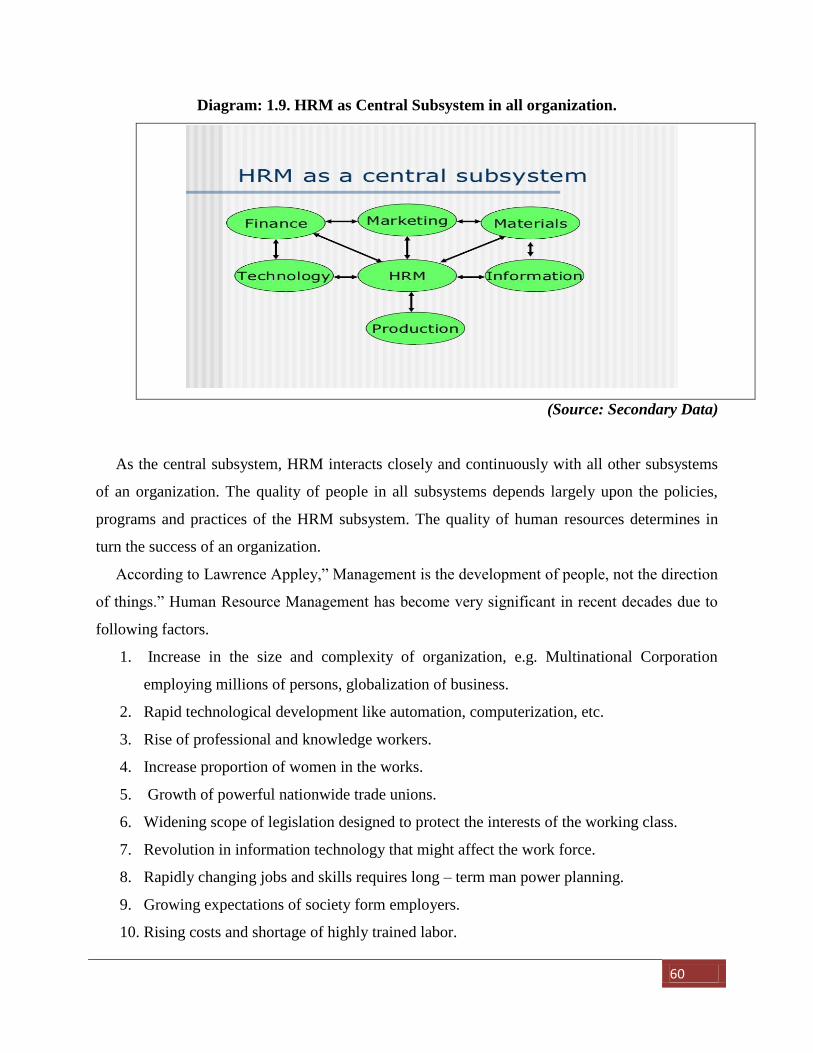
60
Diagram: 1.9. HRM as Central Subsystem in all organization.
(Source: Secondary Data)
As the central subsystem, HRM interacts closely and continuously with all other subsystems
of an organization. The quality of people in all subsystems depends largely upon the policies,
programs and practices of the HRM subsystem. The quality of human resources determines in
turn the success of an organization.
According to Lawrence Appley,” Management is the development of people, not the direction
of things.” Human Resource Management has become very significant in recent decades due to
following factors.
1. Increase in the size and complexity of organization, e.g. Multinational Corporation
employing millions of persons, globalization of business.
2. Rapid technological development like automation, computerization, etc.
3. Rise of professional and knowledge workers.
4. Increase proportion of women in the works.
5. Growth of powerful nationwide trade unions.
6. Widening scope of legislation designed to protect the interests of the working class.
7. Revolution in information technology that might affect the work force.
8. Rapidly changing jobs and skills requires long – term man power planning.
9. Growing expectations of society form employers.
10. Rising costs and shortage of highly trained labor.
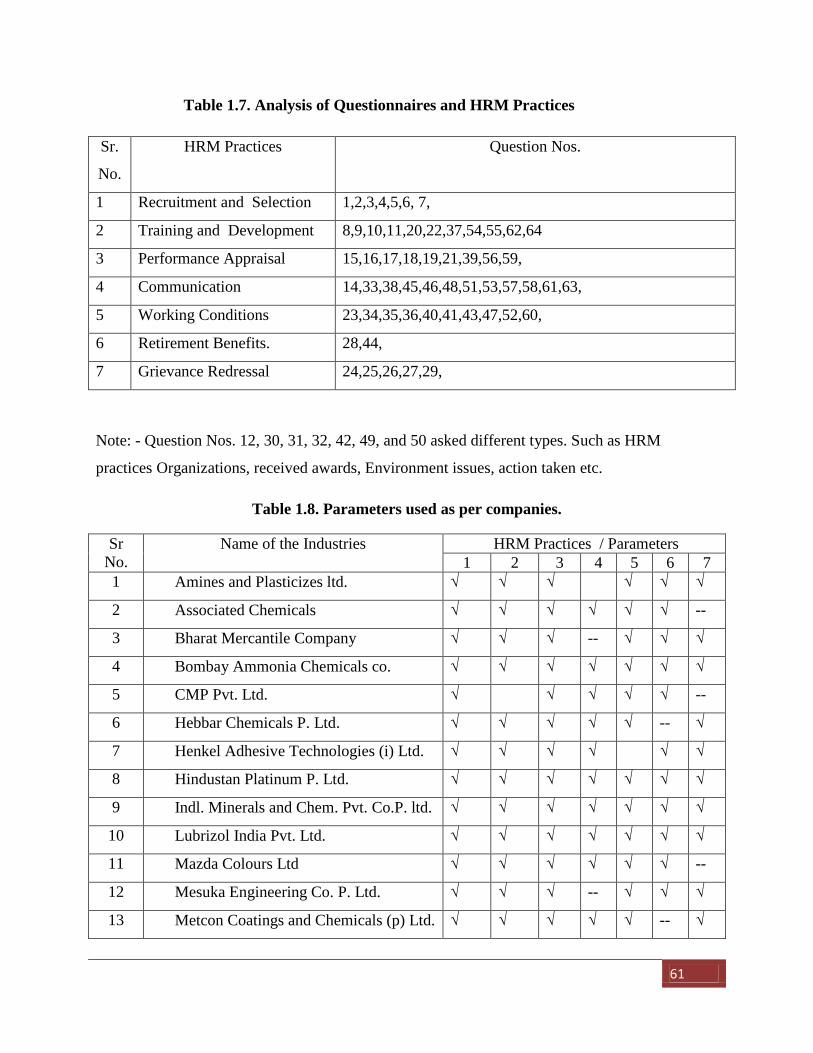
61
Table 1.7. Analysis of Questionnaires and HRM Practices
Sr.
No.
HRM Practices Question Nos.
1 Recruitment and Selection 1,2,3,4,5,6, 7,
2 Training and Development 8,9,10,11,20,22,37,54,55,62,64
3 Performance Appraisal 15,16,17,18,19,21,39,56,59,
4 Communication 14,33,38,45,46,48,51,53,57,58,61,63,
5 Working Conditions 23,34,35,36,40,41,43,47,52,60,
6 Retirement Benefits. 28,44,
7 Grievance Redressal 24,25,26,27,29,
Note: - Question Nos. 12, 30, 31, 32, 42, 49, and 50 asked different types. Such as HRM
practices Organizations, received awards, Environment issues, action taken etc.
Table 1.8. Parameters used as per companies.
Sr
No.
Name of the Industries HRM Practices / Parameters
1 2 3 4 5 6 7
1 Amines and Plasticizes ltd. √ √ √ √ √ √
2 Associated Chemicals √ √ √ √ √ √ --
3 Bharat Mercantile Company √ √ √ -- √ √ √
4 Bombay Ammonia Chemicals co. √ √ √ √ √ √ √
5 CMP Pvt. Ltd. √ √ √ √ √ --
6 Hebbar Chemicals P. Ltd. √ √ √ √ √ -- √
7 Henkel Adhesive Technologies (i) Ltd. √ √ √ √ √ √
8 Hindustan Platinum P. Ltd. √ √ √ √ √ √ √
9 Indl. Minerals and Chem. Pvt. Co.P. ltd. √ √ √ √ √ √ √
10 Lubrizol India Pvt. Ltd. √ √ √ √ √ √ √
11 Mazda Colours Ltd √ √ √ √ √ √ --
12 Mesuka Engineering Co. P. Ltd. √ √ √ -- √ √ √
13 Metcon Coatings and Chemicals (p) Ltd. √ √ √ √ √ -- √
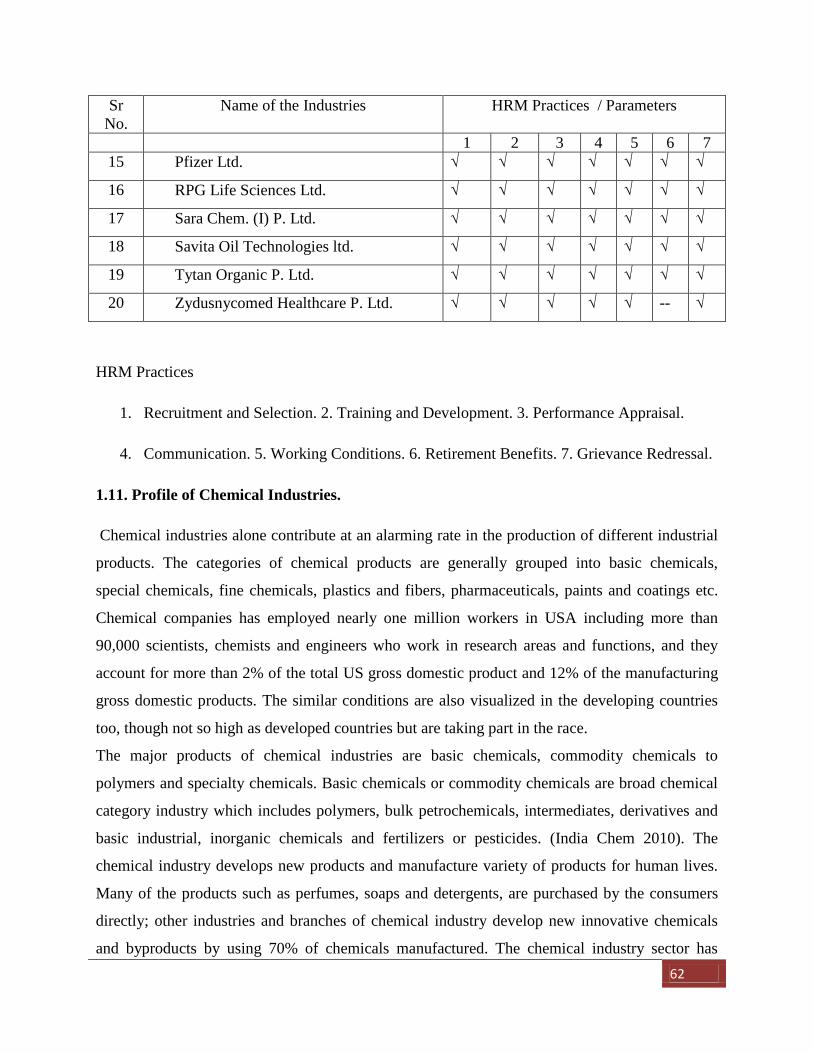
62
Sr
No.
Name of the Industries HRM Practices / Parameters
1 2 3 4 5 6 7
15 Pfizer Ltd. √ √ √ √ √ √ √
16 RPG Life Sciences Ltd. √ √ √ √ √ √ √
17 Sara Chem. (I) P. Ltd. √ √ √ √ √ √ √
18 Savita Oil Technologies ltd. √ √ √ √ √ √ √
19 Tytan Organic P. Ltd. √ √ √ √ √ √ √
20 Zydusnycomed Healthcare P. Ltd. √ √ √ √ √ -- √
HRM Practices
1. Recruitment and Selection. 2. Training and Development. 3. Performance Appraisal.
4. Communication. 5. Working Conditions. 6. Retirement Benefits. 7. Grievance Redressal.
1.11. Profile of Chemical Industries.
Chemical industries alone contribute at an alarming rate in the production of different industrial
products. The categories of chemical products are generally grouped into basic chemicals,
special chemicals, fine chemicals, plastics and fibers, pharmaceuticals, paints and coatings etc.
Chemical companies has employed nearly one million workers in USA including more than
90,000 scientists, chemists and engineers who work in research areas and functions, and they
account for more than 2% of the total US gross domestic product and 12% of the manufacturing
gross domestic products. The similar conditions are also visualized in the developing countries
too, though not so high as developed countries but are taking part in the race.
The major products of chemical industries are basic chemicals, commodity chemicals to
polymers and specialty chemicals. Basic chemicals or commodity chemicals are broad chemical
category industry which includes polymers, bulk petrochemicals, intermediates, derivatives and
basic industrial, inorganic chemicals and fertilizers or pesticides. (India Chem 2010). The
chemical industry develops new products and manufacture variety of products for human lives.
Many of the products such as perfumes, soaps and detergents, are purchased by the consumers
directly; other industries and branches of chemical industry develop new innovative chemicals
and byproducts by using 70% of chemicals manufactured. The chemical industry sector has
63
witnessed growth nearly about 13-14% in the last five years. In India chemical industries are also
growing fast and are competitive in the global market. The major causes in growth of chemical
industry in India are identified as under: (http://www.ficci.com/sector/7/Project_docs/Chemical-
Petrochemical-sector.pdf)
• Increasing urbanization and demand for the products like paints, textiles, cosmetics,
constructions etc. which supports the growth and also predicted 10-13% rise in future.
• Internal consumption of products is 33% average of output and likely to increase in future
• Diversified manufacturing base which supports to produce world class products
Export of chemical products 5.4% in dyes pigments, pharmaceutical products, agro-chemicals
etc.
• Global competition is increasing, and import / export policies are simpler. Chemical Industries
has been recognized as India’s key growth area by the Government. Indian Government has
permitted 100% FDI in chemical sector. Number of incentives and initiatives has been added in
the 12th five-year plan (1912-1917), which boosts growth of chemical industries.
• Govt. wants to support chemical industries to develop bio-based products to reduce dependency
on other countries and enhance export promotion.
Due to these facilities more, chemical industries are collaborating with multinational
companies and developing new competitive products for use.
1.12. Importance of Chemical Industries:
22Almost everything used in human life for the human survival is made up of chemical products.
In the modern world Chemical industries play an important role. In every industrial process
chemical products are involved which play an essential vital role. The Chemical industry is the
one responsible industry for converting raw materials like natural gas, oil, water, air, minerals
and metals in to more valuable products. The different chemicals used like basic chemicals
which include fertilizers, petrochemicals, inorganic chemicals, reaction intermediates and
22
www.en.wikipedia.org/wiki/chemical_industry_chemical industries, and
https://www.dnb.co.in/IndianTelecomIndustry/Chemical%20overview.asp)
64
polymers. For construction pipes, tools, appliances, electronic devices, toys, games,
transportation, clothing and textiles, packing, and manufacturing many other products polymers
and plastic are used. Crude oil or petroleum, Liquefied Petroleum Gas (LPG), natural gas raw
materials are used to produce polymers, other organic chemicals and specialty Chemicals.
(http://www.inquimica.com/chemical-industry-modern-life.html) More than 70,000 different
products are manufactured through these industries.
Basic Industrial chemicals include explosives, resins, pigments, synthetic rubber, and rubber
products. The oldest chemical categories belongs to Inorganic chemicals which include daily
23products like soda ash, caustic soda, salt, acids like nitric, chlorine, sulfuric and phosphoric
acids, and hydrogen peroxide, which are important for branches of chemical and other industries.
Chemicals like phosphates, potash and ammonia are basic fertilizers which belong to a smaller
category of chemicals used to make the soil more fertile for more production of agricultural
products and growth of various plants. Biological substances and chemicals are used by life
sciences for manufacturing animal health products, vitamins, pharmaceuticals and pesticides. As
compared to other chemical sectors this industry produces the most expensive products which
contribute a very small volume. Life science products are produced with detailed specifications
and to have best quality. Before introducing a product in market a lot of investments are made in
research and investigation. Government agencies keep a close eye and strictly scrutinize the
chemical industry for any malfunctioning. 24
Specialty chemicals are of specific categories and
covers very high valued chemical products which are rapidly growing today, innovative products
which makes today’s living better and safer includes adhesives, industrial gases, electronic
chemicals and others. Finally, the consumer products like detergents, soap, and cosmetics are
directly marketed to the customers. (http://www.inquimica.com/chemical-industry-modern-
life.html)
23
http://www.inquimica.com/chemical-industry-modern-life.html. 24
http://www.inquimica.com/chemical-industry-modern-life.html.,,
http://en.wikipedia.org/wiki/Chemical_industry,http://www.inquimica.com/chemical-
industry.html
and http://www.rsc.org/get-involved/importance-of-chemical-sciences/
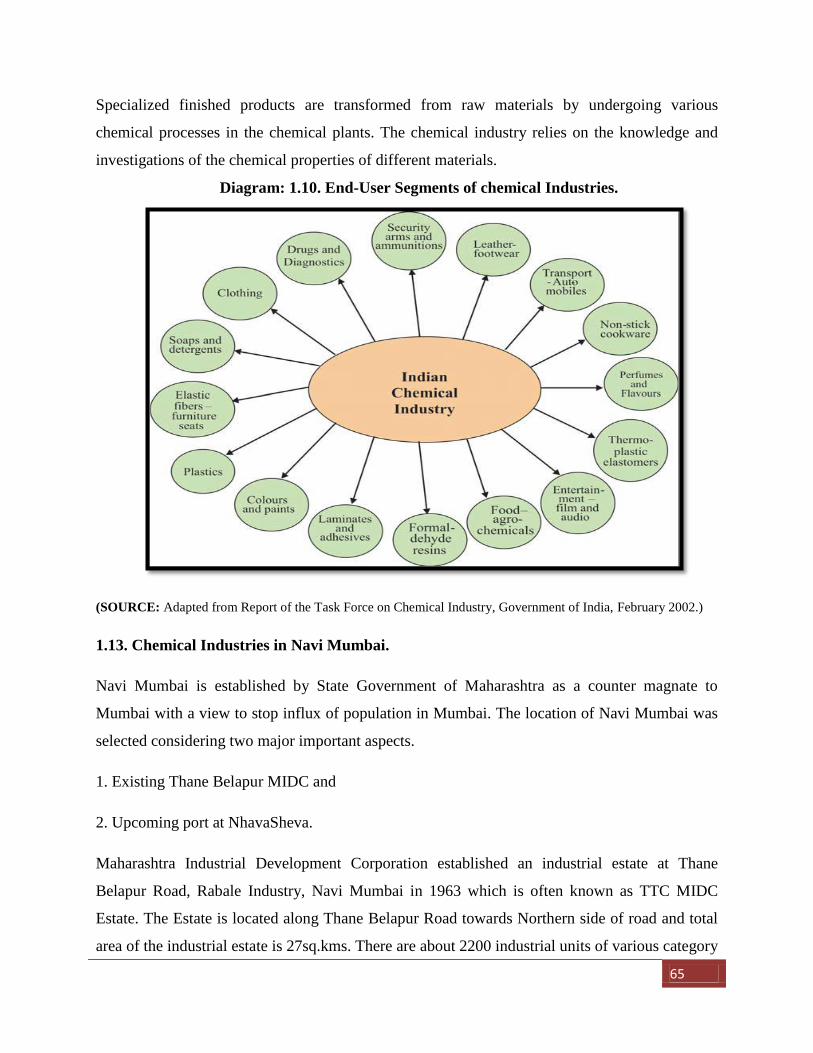
65
Specialized finished products are transformed from raw materials by undergoing various
chemical processes in the chemical plants. The chemical industry relies on the knowledge and
investigations of the chemical properties of different materials.
Diagram: 1.10. End-User Segments of chemical Industries.
(SOURCE: Adapted from Report of the Task Force on Chemical Industry, Government of India, February 2002.)
1.13. Chemical Industries in Navi Mumbai.
Navi Mumbai is established by State Government of Maharashtra as a counter magnate to
Mumbai with a view to stop influx of population in Mumbai. The location of Navi Mumbai was
selected considering two major important aspects.
1. Existing Thane Belapur MIDC and
2. Upcoming port at NhavaSheva.
Maharashtra Industrial Development Corporation established an industrial estate at Thane
Belapur Road, Rabale Industry, Navi Mumbai in 1963 which is often known as TTC MIDC
Estate. The Estate is located along Thane Belapur Road towards Northern side of road and total
area of the industrial estate is 27sq.kms. There are about 2200 industrial units of various category
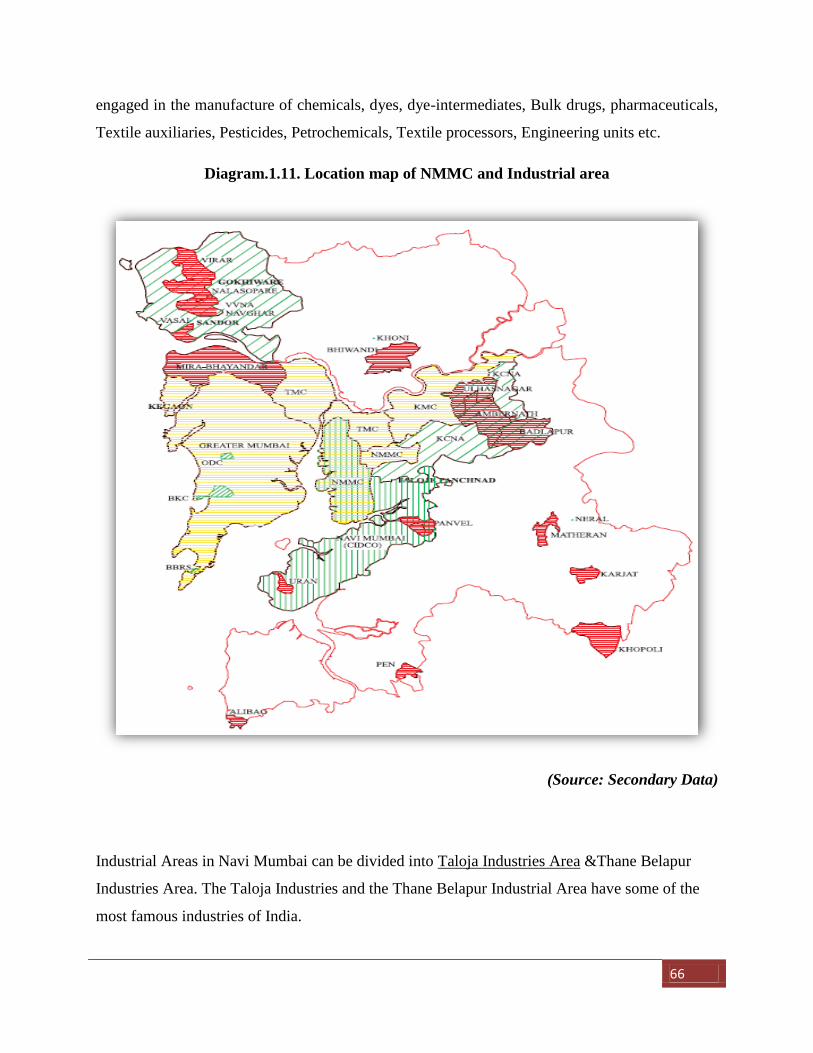
66
engaged in the manufacture of chemicals, dyes, dye-intermediates, Bulk drugs, pharmaceuticals,
Textile auxiliaries, Pesticides, Petrochemicals, Textile processors, Engineering units etc.
Diagram.1.11. Location map of NMMC and Industrial area
(Source: Secondary Data)
Industrial Areas in Navi Mumbai can be divided into Taloja Industries Area &Thane Belapur
Industries Area. The Taloja Industries and the Thane Belapur Industrial Area have some of the
most famous industries of India.
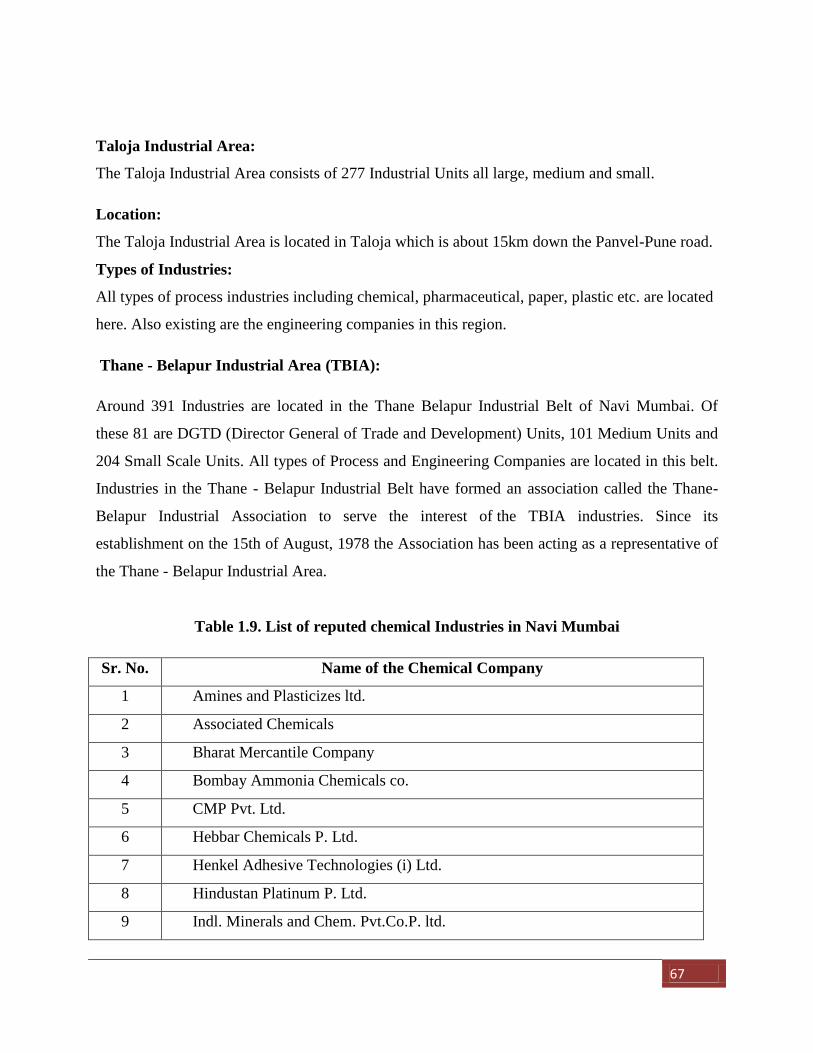
67
Taloja Industrial Area:
The Taloja Industrial Area consists of 277 Industrial Units all large, medium and small.
Location:
The Taloja Industrial Area is located in Taloja which is about 15km down the Panvel-Pune road.
Types of Industries:
All types of process industries including chemical, pharmaceutical, paper, plastic etc. are located
here. Also existing are the engineering companies in this region.
Thane - Belapur Industrial Area (TBIA):
Around 391 Industries are located in the Thane Belapur Industrial Belt of Navi Mumbai. Of
these 81 are DGTD (Director General of Trade and Development) Units, 101 Medium Units and
204 Small Scale Units. All types of Process and Engineering Companies are located in this belt.
Industries in the Thane - Belapur Industrial Belt have formed an association called the Thane-
Belapur Industrial Association to serve the interest of the TBIA industries. Since its
establishment on the 15th of August, 1978 the Association has been acting as a representative of
the Thane - Belapur Industrial Area.
Table 1.9. List of reputed chemical Industries in Navi Mumbai
Sr. No. Name of the Chemical Company
1 Amines and Plasticizes ltd.
2 Associated Chemicals
3 Bharat Mercantile Company
4 Bombay Ammonia Chemicals co.
5 CMP Pvt. Ltd.
6 Hebbar Chemicals P. Ltd.
7 Henkel Adhesive Technologies (i) Ltd.
8 Hindustan Platinum P. Ltd.
9 Indl. Minerals and Chem. Pvt.Co.P. ltd.
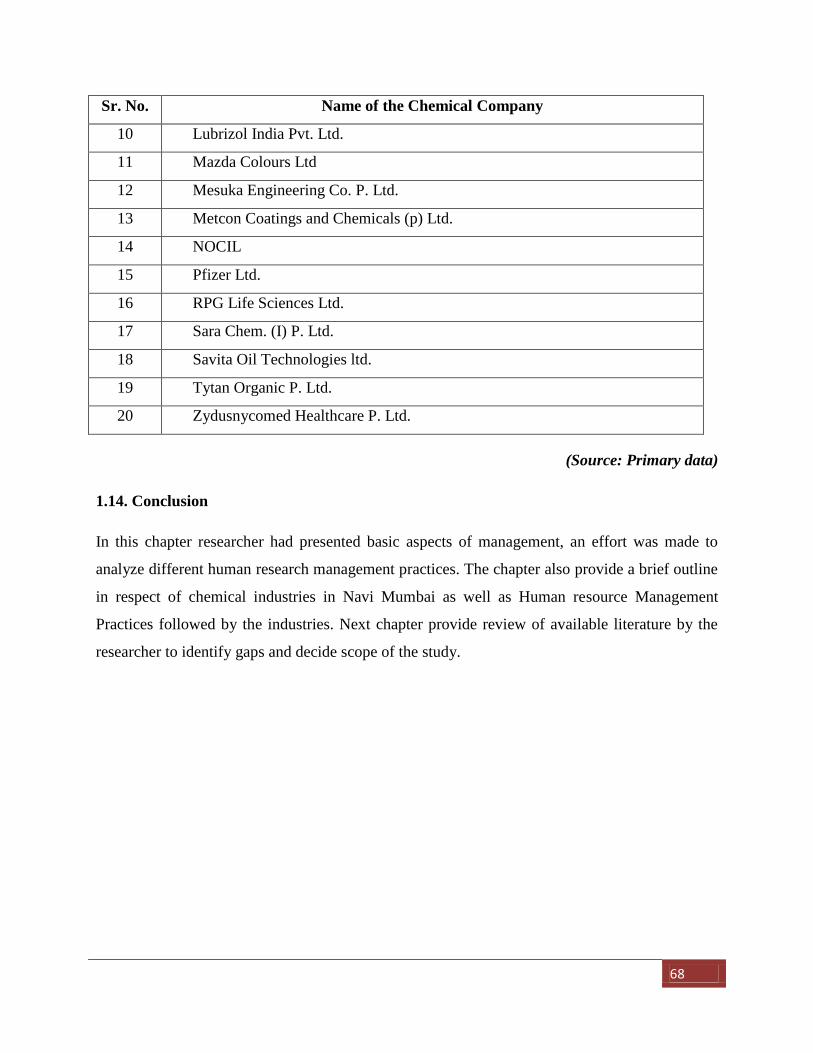
68
Sr. No. Name of the Chemical Company
10 Lubrizol India Pvt. Ltd.
11 Mazda Colours Ltd
12 Mesuka Engineering Co. P. Ltd.
13 Metcon Coatings and Chemicals (p) Ltd.
14 NOCIL
15 Pfizer Ltd.
16 RPG Life Sciences Ltd.
17 Sara Chem. (I) P. Ltd.
18 Savita Oil Technologies ltd.
19 Tytan Organic P. Ltd.
20 Zydusnycomed Healthcare P. Ltd.
(Source: Primary data)
1.14. Conclusion
In this chapter researcher had presented basic aspects of management, an effort was made to
analyze different human research management practices. The chapter also provide a brief outline
in respect of chemical industries in Navi Mumbai as well as Human resource Management
Practices followed by the industries. Next chapter provide review of available literature by the
researcher to identify gaps and decide scope of the study.
69
Chapter -2
Literature Review.
2.1. Introduction
2.2. Books and References.
2.3. Journals and Periodical
2.4. Articles.
2.5. Websites.
2.6. Conclusion.
2.1 Introduction:
Review of the related literature is one of the first but most important steps in the research
process. It consists of summary of problems to be investigated, objectives, hypotheses, data
collection method, source of data and findings of research carried out in the past on chosen topic.
This review provides insight to the research on what is already known and what remain to be
investigated regarding the topic that is under consideration. It guides the researcher to avoid
duplication and provides useful suggestion for further research of a given topic. It gives proper
direction and research design. The review of literature is necessary due to the following reasons:
1. It helps to highlight the gap in the existing knowledge.
2. It helps in deciding the methodology, design, tools and techniques for the study.
3. It helps in limiting the problems and proper enquiry and defining if in an appropriate manner
4. It helps to know type of researcher like basic or applied research.
5. It gives recommendation for further researcher and topic of research.
2.2. BOOKS/ REFERENCES: -
1. Armstrong, Michael, A Hand book Of Human Resource Management, (8th
Edition),
(2001), Printed and Bounded in Great Britain by The Bath Press, Bath, Great Briton. In
this book author focused on the Human Resource management clear explanation related
to modern environment. Author also included the motivational factors and the theories of
70
motivation, Commitment skills and the impact of the communication skills in
management and the impact on personnel at superior level. Also includes the Job and
Role design-, HRM Policies, Knowledge management , Recruitment and selection
procedure, Selection tests, Training types, and, Job Evaluation are effectively noted.
Health and safety also focused in his book. Welfare services and HRM Procedures are
also pointed out.
2. Aswathappa K., Reddy Sudarsana. G., Business Environment for Strategic
Management, Second Revised and Enlarged Edition, 2011, ISBN- 978-93-5051-104-6,
Himalaya Publishing House. In this book author focused on four parts specially business
environment, External sector, Business ethics, and Corporate Governance. Author
pointed out Industrial Labour and the present situation in India, Industrial sickness, New
Company Acts and new amendments, are focused.
3. Aswathappa, K. Human Resource management, (Text and Cases) (2011), Tata
McGraw- Hill Publishing Company Limited, New Delhi. In this book author focused on
the main factors of Human Resource management, the origin and the traditional and the
modern management are focused. Also author includes Recruiting Human Resources,
selecting Human Resources, Training development and Career Management-237,
Appraisal and Managing Performance, Management Basic Remuneration, Managing
Employee Benefits and Services, Motivation Perspectives, Empowering Employees,
Communicating with employees, Industrial Relationship, Trade Union, Resolving
Dispute, Managing ethical issues in Human resource Management, Evaluating Human
resource, Management Effectiveness, Contemporary Issues in HRM, International
Human Resource Management, The e-HR are added..
4. Aswathappa, K., Essentials of Production Management, Himalaya Publishing House,
Mumbai. 1998, ISBN- 81-7493-587-8, Manufacturing establishments seek competitive
advantages through production functions. They believe that, being strong in competitive
advantage, they are well poised to succeed whatever may be the constraints or restraints.
Production functions can offer competitive edge to a firm in various ways; prominent
among them being- shorter new product lead time, more inventory turns, higher quality,
greater flexibility, reduced wastage and shorter manufacturing lead time. Because of its
71
vast potential, production function is gaining more prominence among all functional
areas of management. Production management is obviously becoming a popular course of
study at the manufacturing level and not only useful to superior but subordinates also.
5. Burnett, Promotion Management, (1999) AITBS, Publisher and Distributor (Regd.)
Delhi-51. In this book author added the promotional activities related to management and
specially focused on promotional activities.
6. Burton Gene, Thakur Manab, (1998) Management Today, Introduction to
management(Tata McGraw- Hill Publishing Company Limited, New Delhi.) ISBN No-
0-07-463110-1. The author studied the impact on centralised authority and Japanese
method used in the management process. It is essential for an organisation to assess the
effectiveness of management training from time to time to ensure that it is giving the
optimum result while making perfect management arrangement.
7. C.B.Mamoria and S.V.Gankar, Personnel management (text and Cases) (2008)
Himalaya Publishing House, Pune,1. During the last ten years vast changes have taken
place in the economic conditions of India. It has also done away with the bureaucratic
restrictive practices, controls on industry and business. The review of literature on the
subject matter provided in the books shows that Human Resource management is
increasingly getting integrated with the strategic management at corporate level. Human
resource management in the corporate sector has assumed great importance. Human
resource management has become a driving force in the success of an enterprise.
8. Dale, Earnest, Management: Theory and Practices, 1978, International Student
Edition, ,McGraw_ Hill International Book Company. In this book author pointed out
the growing impact of public opinion on business decisions and these trends has since
that edition appeared given rise to new government regulations. The most important of
which are explained in the text. Other trend noted earlier was the increasing use of
computers and this trend not only continues but has taken new directions. A number of
other developments are reported in this edition, and many new case stories and review
questions are included.
72
9. Davar, R.S., Personnel Management and Industrial Relations, 1988, Vikas Publishing
House Pvt. Ltd, New Delhi.In this reference / book includes modern concepts such as the
managerial grid, T.A. and the more recent emphasis on the role of positive reinforcement,
intrinsic motivation, security and self-determination, etc. in the field of motivation and
leadership styles. Besides there has been a considerable change in the environment. Take
the example of selection in case of managers; it is now necessary, in the new encouraging
economic environment, for companies to remember that they have to be able to cope with
rapid change. This has brought into prominence the need for adaptive corporation even in
India. Throughout the Industrial age, technology exerted a strong pressure towards
standardisation, in case of both output as well as the people who performed work.
However, in the near future the company which knows how to de-standardize effectively
will alone be able to beat its competitors. The adaptive Cooperation needs: Managers of
adaption equipped with new, non –linear skills” who are experts not in bureaucracy but in
the coordination of ad-hocracy.’ They must adjust swiftly to immediate pressures and at
the same time think in terms of long –range goals. Therefore, whilst selecting managers
and other personnel, it has now become necessary for expanding and innovative and other
companies in India to shift the emphasis to creative persons ready to change particularly
at the higher levels in management. Such modern needs also find a place in the current
edition.
10. Davar, Rustom,S., Personnel Management and Industrial Relations, (10th edition)
1976, Vikas Publishing House Pvt. Ltd, New Delhi. In this book author has pointed out
the Personnel functions of HRM, Manpower Planning and proper provision of personnel.
Author also focused on Job Changes, Promotions, Transfers, and Dislocations. Other
thing is that author focused on modern Personnel management Thoughts. In this book
Industrial relations and Industrial Disputes are added. The author includes in his book the
Employee Communications and Performance Appraisals.
11. Deshpande A.S., Principles of Management and Personnel Management, Third
Edition, 1987, Vora and Sons Publishers Private Limited Bombay-02, In this reference,
author has focused on Management thought and Functions of different persons. Also
includes modern and traditional thought. In modern Scientific Management the names of
F.W. Taylors, Mary Parkers, Henri Fayol, Henry Gantt, Frank Bunker, Prof. Elton and
73
Douglas McGregor are included. In personnel management Industrial relations are
added. In this part Recruitment and Selection procedures are added. Especially Industry
level safety and hazards are focused in this chapter.
12. Dr.Aswathappa, K, Production management, (1998), Himalaya Publishing House,
Pune. The author discussed in his book management thoughts and the modern
management theories. Also added in the book is the impact of international management
main impact.
13. Dr.Murugan, M. Sakthivel, Management Principles and Practices, (2016), New age
International Publications, New Delhi,- In this book author focused on Scope of
management, functions and principles, Management thought, Training and development
,Leadership and leadership styles, Communication and communication skills. This part is
related to super and subordinates, Coordination and Recent trends in Management are
added.
14. Dr.Shajahan, S. Research Methodology, (text and cases) (2006), Jaico Publishing
House Mumbai. In this reference, the author points out specially Overviews, Preparation
and Laugh cycle of Research Programmes, Research process, Research Design, Primary
sources of data., Sampling theory, Data Analysis, Report Writing, first to last part related
to research scholar
15. Dr.Vaisishth, Neeru, Taxmann, Students Guide to Management, Second Edition,
July 2003,Management: In this chapter author focused on Concepts and Nature, ,
Evolution of Management, Management by Objectives all important objective are added,
Decision Making and Authority and Responsibility with relationships, Departmentation
and subordinate part also focused, Coordination, Staffing function, Direction functions,
Motivation and all types of the theories of motivations also included, , Leadership and
leadership qualities with types , Communication with communication skills,
Management of Change and finally focused on social responsibility of Business.
16. DubrinDubrinAndrew,JLeadership, ( Research Findings , Practice, and Skills) 5th
Edition (2008), Biztantra, Management for the flat world, Delhi-02,Importance of
leadership, Trans formalisation of Leadership, Situational Leadership,, Developing team
Work, Motivation and coaching and Skills and Knowledge management are focused.
74
17. Dwivedi .R.S, Manpower management, 1984, Prentice-Hall of India, Pvt., Ltd., New
Delhi., ISBN 0-87692-047-4. This book deals with a highly complex, constantly
changing and expanding field of study. In fact, human resources management involves
several complexities in the form of multidimensional reactions and individual and group
relationships. The concepts of manpower management have changed drastically from the
‘scientific management ‘to the human relations approaches and recently, there is a trend
to the behavioural science approaches. Notwithstanding these complexities, behavioural
science knowledge has reached the point where we have adequate insight into the process
of management of people. However, a great deal of knowledge available in this regard is
founded on research result abroad. Therefore, although the market is flooded with
numerous books on this topic, their applicability and relevance in the Indian context is
not certain. Indeed, there is an urgent need of books based on research findings,
empirically verified in India. This book attempts a modest and an integrated approach in
this regard. Further, in view of constantly changing and expanding characteristics of the
field, no single work can be expected to include adequately every subject in depth. This
book has been selective in stressing those developments which appear of almost
significance. It draws heavily upon the point of view, theory and empirical evidence
provided by practitioners and scholars in behavioural science without burdening the
reader with details of controversies prevailing in professional literature.
18. Goel, S.L.,Modern Management Techniques, (1995), deep and Deep publication, New
Delhi-27, Management techniques, management planning and procedures,
Administration of personnel training, Motivation and the motivational theories, Conflict
Management, Work management, Record management, Time management and time
motion also included.
19. Gupta, C.B. Human Resource management, (2010), Sultan Chand & Sons,
Educational Publishers, New Delhi, ISBN No- 978-81-8054-857-4. The author has
focused on a total of eight parts in this book and each and every part is important. He has
added new information and included the national and international situations. The eight
parts are: Introduction to management , HRM , Development of Human Resource
management, Performance appraisal, Job Evaluation, Promotions, Human Relations, Job
satisfaction, HRA, Recruitment and selection, Induction, Employee training, Executive
75
Development, Employee Empowerment, Performance appraisal, Job Evaluation,
Employee Health and safety, Employee welfare, Social security, Discipline and
Grievances, Industrial Dispute, Collective Bargaining, Workers participation in
Management, Human relation, Management of stress and Burnout, International Human
Resource management, HRM and Changing Environment. The present book under
review is an excellent work pertaining to HRM. All the topics are systematically arranged
and analytically presented. It adopts contemporary approaches. The major strength of this
book is that it gives lot of insights about the practicality of the concepts from the Indian
perspective.
20. Hannagan Tim, Management-Concepts & Practices, (1995), Macmillan India Ltd,
SBN No 0333 93081 9. In this book the author has focused on as to how the managers
are facing increasingly rapid change in the technology, culture and environment in which
they work. Rapid developments in the application of information technology are matched
by equally rapid changes in the structure of organisations, in the role of managers and in
the economy and society in which they operate. This puts pressure on management which
helps to emphasise the importance of understanding both the concepts and practices
involved.
The objective of this book is to analyse these concepts and practice in all areas of
management in order to provide an understanding of the way organisations are managed
and an appreciation of the most recent development in management theory and practice.
This analysis is based on a consideration of past developments as well as looking those
likely to take place in the future. The author also focused on other parts such as
Challenges of Management, Leadership, Organisational Culture, HRM, Motivation,
Business ethics and corporate Responsibility, Environmental issues and Environmental
management, Multinational Management, Management in Perspective.
21. Heinz Weihrich, Harold Koontz, (2006) Management – A global Perspective, (11th
Edition) (Tata McGraw- Hill Publishing Company Limited, New Delhi.). This title takes
an international view of managing. The basics of global management theory and practice
are included. Managerial functions, goals, the major trends in 21st century, productivity
and ‘Management an art or a science’ are included in this edition. Human Resources take
76
active part in the modern economic development of any country. The abundant physical
resources alone cannot benefit the growth of the country without human resource
component, which transforms physical resources into productive resources. In fact, the
differences in the level of economic development of the countries are largely reflection of
the differences in quality of people of a country that determines its economic
development. Out of the fundamental areas of management, HRM is considered as the
most important area in the management of four Ms: Money, materials, machine and Men.
It is needless to state the obvious point that considering the nature of man, the
management of men is not only fundamental but also dynamic and challenging.
Management of human resources includes guiding human resources into a dynamic
organisation that attains its objectives with a high degree of morale and to the satisfaction
of those concerned with it.
22. Kerzner, Harold, Project Management, (A system approach to planning, Scheduling
and controlling)(2002) CBS, Publisher and Distributor New Delhi-02, International
Publishers New Delhi, ISBN:81-224-1506-7, In this book author point out the modern
staffing environment, Management functions and features are point very effectively,
Time management and Conflicts part added in his book.
23. Khanka S.S.,Human Resource management,(2011), S Chand & Company Ltd, New
Delhi- 55,ISBN No- 81-219-2300-X. In this book, the author has made an attempt to
blend all aspects of HRM by logically dividing them into seven sections to enable the
readers to comprehend the key and vital issues of HRM in a dynamic environment. The
seven sections included in this book by the author focuses on HRM, specially
environment and related issues, Acquisition and Absorption, Development, Maintenance
and Retention, Control, etc, This book gives a well knitted and balanced coverage of
theory, contemporary issues and practical examples and stories drawn from the Indian
business world. Employee empowerment, potential appraisal, succession planning,
strategic human resource management, HRM in a changing environment, HR in virtual
organisation, international human resource management and leadership in the new
millennium are some of the emerging and contemporary issues discussed in the book.
These topics have not been dealt with in most of the books on HRM available in the
77
market. The book covers the whole syllabus related to HRM and latest issues in National
and international HRM.
24. Koontz O Dennell, Weihrich, Essential Of Management, Fourth Edition, Mc Grew
Hill, International Editors, New Delhi. Author focused on Management Theory,
management approaches, the elements of environment in this part author also concentrate
the environmental factor in his book, Social responsibility, Purpose of planning goals,
objectives, Strategic policies, Departmentation and types of departmentation also include,
Line and staff authority, Delegation of authority, selection procedure with scientific
method also added, Performance appraisal and the importance of the performance
appraisal, Organisational Development, Leading and Leadership, Motivation and
motivation theories, Communication are point out the author very effectively.
25. Kumar Ranjit,Research Methodology, 3rd
edition, Sage Publication India Pvt. Ltd,
New Delhi-44, (2012), ISBN- 978-81-321-0648-7(PB). In this book author focused on
Research Methodology techniques, research process. In the first step, the author discusses
about the research problem, reviewing the literature, formulating a research problem,
identifying variables, and constructing hypothesis. In the second part, author has added
topics such as: conceptualising a research design, the research design, selecting a study
design, the third part – Constructing an instrument for data collection. The fourth part-
selecting a sample. In the fifth part, the author focused on writing a research proposal.
The fifth step include collecting data, the next step relates to processing and displaying
data and the last step is about writing a research report.
26. Luis R.Gomez-Mejia, David B. Balkin, Robert L. Cardy. (2004) - stated that
organizations need to be more flexible than ever before to deal with a rapidly changing
competitive landscape where global forces play a key role. Many transitional HR
programmes designed for a stable, predictable context (for instance carefully defined
jobs, which were often used as the basis for setting pay and selecting workers) may
actually become a hindrance in the contemporary changing business environment.
27. Mamoria C.B, Rao, V.S.P. Personnel management, (text and Cases) Himalaya
Publishing House Pune, (2012), ISBN N0- 978-93-5051-468-9. During the past decades,
the personnel function has witnessed dramatic changes. The personnel manager, in the
78
past, was bombarded with record keeping activities of various kinds. It was more or less a
policing activity trying to find out where things have gone wrong and putting everything
back on track. Personnel positions were pushed to a corner and they were not part of the
core term of an organisation deciding crucial issues. The author has focused on very
important aspects on HRM and related parts and issues such as personnel management,
Functions, Role and Challenges, Personnel management in India, Job Analysis-, Human
Resource Planning, Recruitment, Selection, Employee Testing and Interviews,
Placement-Induction, Promotions and transfer, Managing employee separation,
Absenteeism, and turnover, Employee training, Performance appraisal, Job evaluation,
Human relation and Group dynamic, Motivation and Moral, Grievances and Discipline,
Workers participation in management, Industrial Relation, Industrial Conflicts,
International Human Resource management, Contemporary Issues in India.
28. Memoria, Memoria, Gankar., Dynamic Industrial Relations, (2011), Himalaya
Publishing House, Mumbai, ISBN No- 978-81-8318-140-6. In this book, the author has
focused on the industrial labour force since the first development of a few large –scale
industries- including factories, mines, plantation and other enterprises- with an analysis
of the factors leading to the growth of the industrial workers and the peculiar features that
have shaped the destiny of the millions of workers.
The conflicts are feared by all concerned as a harmful problem which leads to
tremendous losses to the economy of the country and the community in more than one
way. Hence, it has been increasingly realised that there should be a suitable, sound honest
and effective bargaining agent who would represent labour interests, sort out the
differences between the management and the workers and try to improve the relationship
ship between them. Such an agent can and must be none other than the labourers’ union.
Part two, discusses in detail the various facets of these unions- viz, their organisation,
structure, origin, function’s, working, growth and problems and the role of workers
education in fostering the interests of the trade unions in the country.
The industrial conflict is, in fact a “child of modern industrial development” and
has its origin in certain economic, political, social and psychological factors which affects
the entire community.
79
In part three, an analysis of the concept, approaches, organisation of industrial Relations,
their evaluation, their anatomy- with special reference to India-has been given. And since
Industrial Relations have been shaped and influenced by government policies, a detailed
discussion follows on the Industrial relations policies of the Government and Relations as
they exit in the public sector.
When conflict arise, they result in undesirable consequences- total stoppage of work
and loss of production, losses of wages to labourers, loss to the community resulting from
shortage of consumer and other essential goods and services, a fall in the national income
and a widespread trouble in the form of uncontrollable law and order situation.
The last part of this book deals with important legislative enactments concerning
industrial disputes, trade unions, industrial employment (standing order), wages,
factories, mines and plantations, etc., finally a critical study of the proposed industrial
relations Bill has also been made.
29. Menon P.S.K. A Comprehensive manual of Human Resource Management, (2012),
Himalaya Publishing House Pvt. Ltd., Mumbai-04., ISBN No- 978-93-5051-333-0. The
Challenges before HRM today is to evaluate the international scene under the business
perspectives and acquire the competitive skills among personnel to match with the
changing structure. This book provides a comprehensive coverage of contemporary
issues and growing concepts of HRM techniques and applications in multiple choice
questions, in simple and easily understandable style for the aspirants, who appear in
competitive examinations. It is also in place to mention that it is must manual for
management professionals in various fields. The author also focused on T & D very
effectively specially focused on labour market and impact on today’s situation. The
author points out the main factors: leadership, communication, stress management and
most important international Human resource management.
30. Michael Armstrong, Human Resource Management Practices, 8th
Edition, (2001)
British Library cataloguing in publishing data, Great Britain be the Bath press , Bath
USA.,ISBN- 07494 3393 0. The author has focused on the new concept of HRM in
Industry and the strategic HRM concept, intellectual capital and its practical implications,
and the contribution made by HR to organizational performance, knowledge management
80
practices, and the organizational learning and the learning organization, new development
in reward management, especially the play structure is explained very clearly with
changing industrial relation scene.
31. Michael, V.P., Human Resource Management and Human Relations, 2011,
Himalaya Publishing House Pvt. Ltd, ISBN-978-93-5024-998-7. Since the appearance of
this book, the HRM concepts have attained wider dimensions. Managers across the globe
now visualise HRM as their centre of attraction. Globalisation of business has given
further impetus. HRM & HR has been widely acclaimed as an authentic treatise on the
subject. The overwhelming response from the readers and managers has been evidenced
by tremendous demand for the work in the market on the one hand and widespread
appreciation of readers and HRM professionals on the other. The author points out in his
book especially some approaches of HR Communication in HR Job analysis, Leadership
and Human relations. The author has also focused on Motivation and types of motivation
which is most important in today’s Industries. Which Leadership styles are useful in
which situation is clearly classified in this book?
32. Morajkar,V.V,Kakade,M.D, Geet,S.D, Geet, A.S, Human resource Management,
NiraliPrakashan, Pune, (1999). The author has focused in this book on HRM and
Industrial Relation. In fact, the book comprises topics basically related to management of
human resources only. Keeping this in mind, various aspects of Human Resource
Management and cases in HRM are discussed in this book. The author also added in this
book other parts such as all aspects and related to management and new and traditional
aspects are added., HRM Evolution, manpower planning , Recruitment and selection,
Training and development, Management Performance Appraisal, Moral and counselling
Techniques, HRD Practices in India, Effective communication management, Professional
management Skills Development.
33. Murugan M, Sakthivel, Management Principles and Practices, 2004, New Age. The
author has focused in this reference book on management as a growing and developing
discipline. Its principles have wide applications. The book deals with principles as well
practices of management. All efforts have been made to include the latest research
contribution by management and organisation thinkers. Especially in the field of

81
motivation, leadership communication and management control. Reference has also been
made to organisation theory so as to make the readers and researchers conscious of the
development in that field.
34. P. Jyothi. andD.N.Venkatesh. (2006) stated that the human resource of an organization,
constitute its entire workforce. Human resource management is responsible for selection
and including competent people, training, facilitating and motivating them to perform at
high levels of efficiency, and provide mechanisms to ensure that they maintain good
relations with the organization. Human resource management is also an art of developing
people and their potentialities, and for the growth of the organization.
35. PardeshiP.C.,Human Resource Management, (1999), NiraliPrakashan, Pune. The
author says that HRM has achieved a pivotal position in management due to enormous
and rapid change in the business environment in India backed by liberalisation of
economy. In the context of Globalisation of business, Modernisation of technology and
large scale employment, a need exists for a fresh look at the human resources.
Multinationals, foreign investors and NRTs entering the Indian business in a big way.
Communist countries adopting capitalism and large scale transfer of technology has
necessitated a wider perspective of human resources. The workers today are being
recognised as a human being and they are more united, enlightened and right-conscious.
The advent of globalisation of business, psychology, sociology and other behavioural
sciences have contributed a lot to the development of management philosophy. In order
to ensure proper management of human resources people should be managed effectively
and efficiently, cordial industrial relation should be maintained. The author has also
focused on HRM and Personnel management, Training and Development Process,
Career Planning and development, Wage and Salary Administration, retirement and
Separations, Human Relations in Industry, Industrial relations, Grievances and
Discipline, Workers Participation in Management.
36. Peter J. Dowling and Denice E. Welch (2004). The author has rightly focused on
International Human Resource Management and how the international changes are taking
place since 2003. The author deals with the multinational context and the consequence of
international growth on human resources management. The author on focused on
activities related to expatriate management and global HRM issue.
82
37. Prasad Lallan, Gulshan.S.S., Management Principles and Practice, 1998, S. Chand &
Company Ltd., Ram Nagar, Delhi-55, ISBN-81-219-0317-3, management is a growing
and developing discipline. Its principles have wide application. The book deals with
principles as well as practices of management. All efforts have been made to include the
latest research contributions by management and organisation thinkers, especially in the
field of motivation, leadership, communication and management control. Reference has
also been made to organisation theory so as to make the researcher or studied persons
conscious of the development in that field. The author has focused on staffing,
communication, motivation leadership, and public responsibilities of business very
effectively.
38. Prasad, L. M., Human Resource Management, Sultan Chand & Sons, Educational
Publishers, New Delhi. (2006). ISBN N0 978-81-8054-769-0. The Author has added
new and latest concepts. Some relevant issues are: strategic human resource
management, implications of systems and contingency approach in managing human
resources, different models of managing human resource and their implications ,
environment influences on human resource management , relevance of human resource
department computerized human resource information system role analysis , selection
tests, training and development culture ,knowledge management , time management, self-
management, career planning and development, people capability maturity model,
performance appraisal ,planning creating motivational environmental, human resource
counselling etc.
39. Punekar, S.D, Deodhar, S.B, Sankaran, Sarswathi, Labour Welfare, Trade
Unionism and Industrial Relations, (2012), Himalaya Publishing House, Nagpur, ISBN
978-93-5051-512-9. This book has retained its three main constituents – labour welfare,
trade unionism, and industrial relations, but in a relevant and recognised form, keeping in
view, the significant impact of the changes taking place in the country under economic
reforms commonly known as LPG model i.e., Liberalisation, Globalisation and
Privatisation. The book presents the current scene in this field with a new and updated
perspective. Beside this the book contains a new part which has a focus on diverse
aspects like: Issues of segment of labour like- Child labour, women workers, HRM- as a
present approach to handling of labour relations, Labour market problems pertaining to
83
employment, i.e., displacement and utilisation of labour, 2nd
National commission on
Labour and a gist of its recommendations.
40. Rao, Subba P. Personnel and Human Resource Management (text & Cases), (2000)
Himalaya Publishing House, Pune, Mumbai, ISBN- 81-7493-777-3. In this book out of
the fundamental areas of management, HRM is considered as the most important and
critical area. In the management of five Ms: Money, Materials, Machine, Methods and
Men. It is needless to state that considering the nature of man, the management of men is
not only fundamental but dynamic and challenging. Management of human resources
includes guiding human resources into a dynamic organisation that attains its objectives
with a high degree of morale and to the satisfaction of those concerned with it.
The concept of HRD assumes immense significance due to the creation of HRD ministry
in the Union Cabinet and also as HRD plays vital role in meeting the challenging
requirement of highly skilled and competent human resource due to privatization and
globalisation.
Further, maintenance of industrial peace plays vital role as Indian economy
cannot afford industrial unrest in the context of global competition. The author also
focused on the other related issues such as HRM Scope and nature, Strategic HRM ,Job
Analysis, Recruitment, Selection, Performance Appraisal, Employment Training,
Promotion and transfer, Motivation and Job satisfaction, Communication, Leadership,
Indian labour market, Trade Union, Grievance and Discipline, Industrial Conflict,
Workers Participation in Management, Recent Techniques in management.
41. Rao, Subba. P., Essentials of Human Resource Management and Industrial
Relations, Fifth Edition, 2012, Himalaya Publishing House, Mumbai, ISBN-978-93-
5051-630-0. In this book, author has focused on the functions and principles of
management that have been undergoing sea changes since the announcement of
economic liberalisation in the country in 1991. In fact, the practice of management has
been increasingly humanised in the process of globalisation of Indian Economy. Unlike
in personnel management, the concept of human Resource Management is increasingly
becoming a most vital function of a modern manager.
84
42. Rao, V.S.P.Human Resource Management, ( Text and Cases)(2005), Excel Books ,
New Delhi, ISBN No- 81-7446-448-4. The author has focused in this book on managing
human resources. It describes how the human assets are being put to use in the service of
organisational objectives. It provides a comprehensive coverage of a vast, growing
subject- well supported by a wealth of data collected from several sources. It has a
number of informative tables, interesting summary boxes and illustrative figures. The
subject matter has been presented in a simple and clear manner, keeping the unique
requirements of all studied persons in mind. Critical and balanced coverage has been
given to the entire important topic in HRM, HRD, and Industrial Relations. The book has
many meritorious features, which sets it apart from other books in the field currently
available in the market. The author has also focused on another topic i.e. Job analysis,
HRP, Recruitment, selection, Placement, Training, Succession Planning, Job Evaluation,
Performance appraisal, Social security, team Work, Employee Grievances, Industrial
Relation and Industrial dispute, Counselling-and mentoring, International Human
resource management.
43. Robert A. Fazzal, Management Plans, 1994, IRWIN, Professional Publishing, Burr
Ridge, Illinois, New York. -- The need for a new supervisory management model, One
that works-1, Supervisory management: What is it?, Developing the functional
management model also added.
44. Sadri, Sadri Jayashree., Human Resources Management in Modern India (Concepts
and Cases), 2013, Himalaya Publishing House Pvt, Ltd, ISBN-978-93-5097-099-7.,Since
this book has been written by a political economist turned management scientist and a
classics scholar turned behavioural scientist, the reader will find an interdisciplinary
flavour throughout the discourse. Simplifying and elaborating on the earlier published
work, the author has taken twenty –two subthemes and briefly treated each of them. Each
subtheme is woven into an argument that treats people management in Indian
organisation at the beginning of the present century. The idea is to give introduction to
human resources management which is currently being taught in a manner that could do
with some improvements.
85
45. SarmaA.M., Aspect of Labour Welfare and Social Security, (2012), Himalaya
Publishing House, Pune. The author has focused on labour welfare and which types of
facility are provided by the organisation and Government, especially State and Central
Government. Industrial Health and social security chapters are latest and give us most of
latest amendment which is passed by the Central government law body. All Acts
especially the employees Compensation Act 1923 is gives valuable guidance in this book.
The book also includes ESI Act-1948, Provident Fund Legislation for coal Mines, Tea
Plantations and Seamen, The Employees provident funds and Miscellaneous Provisions
Act-1952, The Maternity Benefit Act-1961, The payment of Gratuity Act 1972 are
included.
46. Sarma, A.M.,Aspects of Labour Welfare and Social Security, 2000, Himalaya
Publishing House. In this book the author has focused on two parts: first part deals with
the concepts, principles, and practices of labour welfare and personnel services and the
second part is focused on the social security’s scheme and cover in detail different social
security legislations in our country. In this book, the author also offers few practical ideas
and suggestions for labour welfare practitioners. Many topics have been elaborated and
the latest amendments in different social security enactments and recent case law on the
same have been incorporated to make the book up-to-date.
47. Sarma, A.M.,IndustrialRelation, (2012), Himalaya Publishing House, Mumbai, ISBN:
978-93-5024-674-0. Industrial relations are a major topic which influences the social,
political and economic development of a country. Managing industrial relations is a
challenging task because it deals with a highly complex, fast developing ever changing
and expanding field. There are certain factors such as composition of working class, work
environment, socio-economic status of the workers and their attitude to work,
managements ideology, role of the State, thinking of the community, etc. which have a
considerable bearing on the state of relationship between labour and management.
Different labour enactment and judicial decisions play a major role in regulating the
employer-employee relationship. Keeping in view the different aspects of industrial
relation, an attempt has been made in this book to provide multi-dimensional approaches
to the subject. The author also focuses on the different Acts related to Industries such as,
The Industrial Employment (Standing Orders) Act 1946, The Industrial Disputes Act-
86
1947, The Trade Unions Act-1926, The Bombay Industrial Relations Act-1946, The
Maharashtra reorganisation of Trade Unions and Prevention of Unfair Labour Practices
Act-1971.
48. Sarma, A.M.,Personnel and Human Resource Management., third revised edition,
2000, Himalaya Publishing House, ISBN- 81-7866-017-2. In this book the author has
focused on the important issues on industrial relations such as job analysis, selection
procedure in internal and external, performance appraisal, training and development, The
author also points out things which are most important to employees health and safety
issues. Finally, employee’s welfare and relations are added in this book.
49. SenRatan, Industrial Relations in India, (Shifting Paradigms) (2003), Macmillan India
Ltd, ISBN 1403 910294. The author has focussed on the state of Industrial relationship
and today’s situation in industries in India, Employment and Indian labour and
participation in management, Trade Union and the role of trade union and Government,
Trade Union in India, Industrial Relationship system in India: Settlement of Disputes.
Evaluation of Industrial Relationship in India is a good contribution made by the author.
Recent Trends in Industrial Relationships, Workers Participation in Management and
correct solutions to the problems are stated in this book. Human Resources Management
and Industrial Relationship also focused and how to handle the grievances raised by the
workers and main role of superiors are given in this book.
50. Sherlekar S.A. in his book Management (Value- Oriented Holistic Approach) 1977,
Himalaya publishing, Pune. In his book, the author has focused on Management and
levels of management especially administration and Management. The author has also
discussed in his chapter Indian ethos and management and management today and
tomorrow clearly explained with different tools.
51. Singh Nisha, Human Resource Management, (2012), Himalaya Publishing House,
Mumbai. ISBN No- 978-93-5051-748-2. The author has focused on the special emphasis
on HR planning recruitment and selection, promotion, demotion and compensation;
system. This book will help clear all concepts related to HR, HRM and HRP. The author
has also focused on job analysis, design, recruitment, training and development,
performance appraisal, Industrial relations, and collective bargaining.
87
52. Singh, Nirmal, Human Resource Management, (2012), Galgotia Publications Pvt. Ltd.,
New Delhi. ISBN- 81-7515-471-3. The author has focused especially on HR that takes
active role in the modern economic development of any country. The abundant physical
resource alone cannot benefit the growth of the country without Human Resource
component which transforms physical resource into productive resource. In fact, the
differences in the level of economic development of the countries are largely a reflection
of the differences in quality of their human resources. The key element in this proposition
is that the values, attitudes, general orientation and quality of people of a country
determine its economic development. The author also focused on the HRM, Evolution
of stages of Human Resource Management, Challenges in Human Resource
Management, Innovations in HRM, Trends in HRM, Job Evaluation, Staffing and
Layout, Recruitment, Selection, Placement and Indication, Job satisfaction, Trading and
Development, Training methods and techniques, Motivation, Labour welfare and Social
security, Grievances handling Machinery, Role and Functions of Trade Unions, Industrial
Relations.
53. Stoner James, Freeman R. Edward, Daniel Gilbert Jr. Management (6th
Edition)Prentice Hall of India Private Limited New Delhi-01 (2000), ISBN No- 81-
203-0981-2. Management in 21st century is framed in detail in the chapter on
organisational and natural environment.
54. Stoner, James. A, Faeeman, R. Edward, Daniel A. Gilbert, Management, (2000),
Prentice Hall of India Private Limited, New Delhi-01,Introduction to management, 4,
Management inn Twenty- First Century-60, Managing to manageemrs,-6, Types of
Managers-16,Managemetn Theory-32,Management in 21st Century-60, Social
Responsibilities and ethics-95,Globalisation and Management-125,Culture and
Multiculturalism Strategic Implementations-84, Power and Distribution of Authority-
342,HRM-374,Leading-440,Leadership-468,Communications-522, Information System-
610.
The author point has focussed on issues such as an overview of the foundation of
HRM, concepts of HRM, strategic HRM and intellectual capital theory, an examination
of the practices of HR management with particular reference to the role of HR
88
practitioners and the HR functions, the contribution made by the functions in
organisational success, methods of evaluating that contribution and a survey of
international HRM. A description of the processes used in organisation design and
development and job and role design. A description of the major HR processes that affect
most people management practices, namely, HR policies, competentence-relate4d HR
management, knowledge management and job and role analysis. A review of the main
features of performance management process, including 360 – degree feedback. A review
of the employee relation scene covering the framework processes, negotiating skills,
involvement and participation and communication. A description of health and safety
and welfare management processes is also included. A final scene covering employment
practices, HR procedures and HR information system is also provided.
55. Towers Brain, (Handbook of Human Resource Management) (1998) , Bean Books, New
Delhi-63,ISBN- 81-86104-55-X. The most important book is written by this author. In
this book the author brings out the focus of all countries on HRM. The author points out
the central ideas and each and every country’s HRM study is discussed in this book. The
author also discussed the other related issues such as the HRM Study of UK, HRM in
USA, Trade Unions and HRM, HRM a sceptical look, Performance appraisal, Training
and Development, HRM and Women in the vision of Gender—blind?. HRM in the
information age.
56. Towers, B.,Human Resource Management, (2000), Infinity Books, New Delhi-63, In
this book author has focused on different countries study summarised in HRM, specially
US UK Australia, Workforce Flexibility Performance Appraisal-, Training and
Development of the employees, HRM Changes in the Information age, HRM Changes at
Bayer Diagnostics Manufacturing Ltd. Commitment and Conflict: Workers resistance to
HRM in Microelectronics Industries, Managers work Values in Different Cultures : the
Case of the Korea Electric Power Corporation.
57. Varma, M.M., Aggarawal, Personnel management and Industrial Relations. 1987,
Forward Book Depot, Educational Publisher Post Box-No- 1489. The author has focused
on personnel policies and manpower planning, Recruitment and selection procedure,
Interviews and tests, Job changes and impact of job changes. The author has also
89
focussed on Training and development and job analysis, motivational factors, vertical and
horizontal communication, Leadership styles, Industrial discipline, grievances and labour
problems. Today’s trade unions situation in India and Global level, Social security and
workers participation in management are also included.
58. Weihrich, Heinz, Koontz, Harold,Management –A Global Perspective, (2006) Tata
McGraw-Hills Publications limited New Delhi. ISBN No- 0-07-059856-8. In this book
the author has focused on Global management Theory and practice, Management and
Society-The External Environment, Social; Responsibility, and Ethics, Global,
Comparative and Quality management, Staffing, Performance appraisal and Career
Strategy, Managing change through manager and organisational Development, Human
Factor and motivation, Leadership, Communication, Productivity, Operations
Management, and Total Quality Management.
59. Tripathi., Personnel Management & Industrial Relations, (1997), Sultan Chand &
Sons Educational Publisher , New Delhi-2, ISBN No- 81-7014-181-8. In this book the
author has focused on the important areas of HRM such as leadership and leadership
styles, Motivation and other related theories of motivations, Employees communication
and types of communication, Performance appraisal, training and development, Job
Change, Labour welfare and social security with latest laws and amendments, role of
trade unions and industrial relations, workers participation in management.
2.3. Journals and Periodical
1. "The Hindu Speaks on Management" - 'Learning and Organization', 29'h April 1995.
In this periodical, the relationship between learning and the organization is discussed.
Both activities are interdependent and without any one we are not complete.
2. A Report on Global chemical industry merger and Acquisition Outlook Feb-2014.
In this article, the major issues are focused. What is the need and importance of merger
and acquisition is discussed in detail in this article. At the global level we have the need
to cooperate with each other. The author states that the chemical industry is developing
because of cooperation between the firms.
90
3. Abdul Aziz, Management, Personnel Management, Bibliography of Doctoral
Dissertation. (1972-78). In this journal, the author has focused on the worker related
issues especially recruitment and selection and motivational factors.
4. AICEP Portugal Global Petrochemical Industry – 2013 by “Portugal is a Business
Opportunity.”
5. BASF Report: 2012. Economic, Environment and Social Performance – BASF the
Chemical Company. In this report the most important thing is that economic development
is discussed. The author also points out that we if we do not become conscious of
environmental issues, our future is not going to be good. Other issues discussed in this
periodical are pertaining to social performance of chemical industry. In this issue, the
names of some of the chemical companies’ who are conscious of social issues are
mentioned.
6. Business Today- Dec-2012, Motoring, Amaze Driven. In this journal article titled
‘Amaze Driven’ the ideas of motoring the personnel and how to guide the personnel
properly are discussed detail.
7. Business Today,Nov. 2012, Are Indian CEO Over-paid. In this journal, the publisher has
focused on Indian chief Executives officers, their duties and responsibilities and current
situation of CEO and the future is also discussed.
8. Chains Chemical Industry: The new Forces driving Changes: Chemicals and
performance Technologies – A New paradigm ahead? (2011)
9. Chemagility: A Global perspective on the world chemical Distribution Market - First
panel session: Chemical Distribution Industry Landscape Lisbon, May-22nd
2012.
10. Chemical Industry from an economic perspective: Development trends in the world
the EU and Sweden in 2010. Published by Swedish chemical Agency
11. Chemical Industry Profile: World Chemical Sale: Geographic Breakdown – 2007. In
this issue, chemical industries geographical part is discussed. The world chemical sale
and the economic development are focused in this article. So we know which country
needs chemical raw materials and which countries export the chemical raw materials.
And other part is economic development of the country through chemical industries.
91
12. Chemical Industry Profile: World Chemical Sales: Geographic breakdown - Facts and
figures – 2011.
13. Chemical Industry Vision 2010: A European Perspective by At Kearney (2012). In this
article A European perspective are discussed. The author Kearney is focused on the
Chemical Industry Vision and the future of European countries. Need and the importance
also discussed in this article.
14. Chemical Industry: (World) Deloitte – 2011.
15. Christopher Daniel, J., 'Realizing People Philosophy of Organizations’, The Hindu
speaks of Management, 12' July 1995, page - 199. In this journal, the author has focused
on total organizational philosophy Indian management and Hindu philosophy. The
relation of management and Hindu religion and the impact of Hindu religion on
management are discussed.
16. Deenadayalan. K., "HRM past, present and future", The Hindu speaks on
Management, 4' Oct. 1995, page .230. In this article the author has focused on the Human
Resource Management. Author point outs the past, present and future situation of HR
managers and organizational factors.
17. Facts Driving Change Industry: The New Forces Diving Change: Chemical and
Performance Technology – A new paradigm ahead? (2011)
18. Global Chemical Outlook: Towards Sound Management of Chemical – Tends and
Changes- 2013.
19. Global outlook: The Chemical Industry of South Korea: Progress and Challenges
American Institute of Chemical Engneers-2011.
20. Human Resource Management review, The ICFAI University Volume – IX, Issue –III,
Press, March 2009. In this article the author has focused on the Changing trends in
Human Resource Management. At the same time author has discussed the main issue of
corporate leadership and styles of leadership. If you use the effective style of leadership
in your organization the overall impact on the organization will be fruitful.
92
21. Human Resource Management review, The ICFAI University Press, January 2009. In
this periodical, the most important issues discussed are the art of delegating, the
delegation of authority and responsibility. The delegation of authority and responsibility
are the most important factors in the organization because superiors are working with free
minds and subordinates are controlled.
22. Human Resource Management review, The ICFAI University Press, January 2009. In
this periodical, issues pertaining to Training and Development are discussed. Different
types of training are discussed and how to develop the individual, group and
organizational level are focused in this article.
23. Human Resource Management review, The ICFAI University Press, Volume IX, Issue
V, May-2009. In this periodical the author has discussed issues pertaining to managing
workplace stress and coaching the Leader and Leadership and leadership styles.
24. Human Resource Management review, The ICFAI University Press, Volume IX, Issue
VI, June -2009. In this issue Leadership failure is discussed along with work
Environment.
25. Human Resource Management reviews, The ICFAI University Press, Volume IX,
Issue – IV, April-2009. In this article the author points out the most important aspect that
is the Changing Role of HR and Qualitative Recruitment for Employability.
26. ICEP Portugal Global Petrochemical Industry – 2013 by “Portugal is a Business
Opportunity.”
27. Increased value? IBM Business Consulting Services –On Demand Business (2011)
28. International federation report - of Pharmaceutical manufacturers association – The
Pharmaceutical and global health – Facts and figures 2014. (IFPMA)
29. Mathrubootham. A, "Residual to Human Resource Management", The Hindu speaks
on Management, 22" April 1995, pp. 177, 18 1. In this issue, the relation between the
Hindu traditional and Modern Management co-relation is discussed.
30. New Biocatalysts: Essential tools for a sustainable 21st Century: Chemical Industry: -
November – 1999.
93
31. OECD- Environmental Outlook for Chemical Industry – (2001) Organization for
Economic Co-operation and Development (OECD)
32. Reaction: Strategy realignment in the global Chemical Industry – Chemical
Magazine – 11th
Edition by KPMG –Cutting through Complexity.
33. Responsible Care: Global Character – Global Chemical Report: 2002-2012.
34. S. V. Kumar, A.B., "Developing Proactive Organizational Culture", The Hindu
Speaks on Management, 1" July 1995, p.67. The author has focused on the changing
organizational structure. The proactive development and the culture of organization is
also discussed in this article.
35. Safety and Health in the Use Chemical at work – World day for Safety and health and
at work – 28th
April 2014.
36. Shankar Ravi, Employee benefits in India, an Introduction, Millennium White paper,
New Delhi, April 2013. In this article the author has focused on the employee benefits in
India and how to get better benefits in India as India is entering the global market and
accepting the new challenges.
37. Sivakumar, A.B., "HRD for Results: the new agenda", The Hindu speaks on
Management, 26' April 1995. In this article, HRD, organizational activities and result
oriented activities are discussed. The author has focused on Managerial skill
development.
38. The Chemical Industry in a Demand world: Does your future hold volatility or
increased value? IBM Business Consulting Services – On Demand Business (2012)
39. The Economic benefit of Green Chemical Industry in the United States –By Blue
green Alliance May 2011.
40. The Economic benefits of a Green chemical Industry in the United States – By Blue
green alliance. May-2011
41. The Global Chemical Industry: Profile and Trends – Global Outlook for Chemical
and Waste Geneva, June 6, 2009.

94
42. University News,Leadership to Guide the Density of India. More Ankush. L. Feb-
2012. In this periodical, the focus is on the leadership of the organization and if the
leadership is practical and effective in delivering fruitful organizational result.
43. University News: Monthly Commentary on Indian Economics –Nov.2012. The
Indian Institute of Public Opinion, - Government Goes for Major Policies Changes. In
this article the author has focused on the changes in the government policies that impact
the internal and the external environment of the organization and competitiveness of the
organization.
44. University News: Recent Trends Challenges, and Opportunity.Nov-2012 Vol-6. In
this periodical, the SWOT is discussed. The SWOT analysis and the recent changes in the
organization are pointed out. At the level of the manager, this process is challenging. If
the organization uses SWOT effectively and efficiently the organization will reach up to
the target.
45. Varadhan, S.S., 'Achieving Performance advantage through people', The Hindu
speaks on Management, 14' June 1995. p. 195. Varadhan, S.S. The article discusses
about the performance across the levels in the organization and people must get the
advantages of performance.
46. Waste Water Treatment in Chemical Industry – The Concepts and Current
Technology – Hydrology – Current Research 2014.
2.4. Articles.
1. Patrick M. Wright, Cornell University, Timothy M. Gardner, Brigham Young
University, Lisa M. Moynihan, London Business School, Human Resource Management
Journal, Vol. 13 No 3, 2003, pages 21-36. The impact of HR practices on the
performance of business units. This article examines the impact of HR practices and
organizational commitment on the operating performance and profitability of business
units. Using a predictive sign with a sample of 50 autonomous business units within the
same corporation, the article reveals that both organizational commitment and HR
practices are significantly related to operational measures of performance, as well as
operating expenses and pre-tax profits.
95
2. Pankaj Tiwari Shri Chimanbhai Patel Institute of Management & Research
Ahmedabad-380051 (India) Karunesh Saxena Faculty of Management Studies,
Mohanlal Sukhadia University, Udaipur-313001, India, Human Resource Management
Practices : A Comprehensive Review. Human Resource is the most important asset for
any organization and it is the source of achieving competitive advantage. Managing
human resources is very challenging as compared to managing technology or capital and
for its effective management, organization requires effective HRM system. HRM system
should be backed up by sound HRM practices. HRM practices refer to organizational
activities directed at managing the pool of human resources and ensuring that the
resources are employed towards the fulfillment of organizational goals. This paper has
been designed to review the existing literature available on HRM Practices. The purpose
of this paper is to develop an understanding of HRM Practices and to examine the unique
HRM practices implemented by different companies.
3. Syed Akhta R, Daniel Z. Ding, and Gloria L. GE, “Strategic Human Resource
Management Practices and their Impact on Company Performance in Chinese
Enterprises.”, Human Resource Management, spring 2008, Vol. 47, No. 1, Pp. 15–32,
2008 Wiley Periodicals, Inc. published online in Wiley Inter Science This study
examined the factorial validity of strategic human resource management practices and
their effects on company performance in a sample of 465 Chinese enterprises. Data were
collected through two questionnaire surveys among general managers and HRM directors
on product/service performance of their companies and a range of strategic HRM
practices. Our findings indicate that a valid set of strategic HRM practices (training,
participation, results-oriented appraisals, and internal career opportunities) affect both
product/service performance and financial performance. Employment security and job
descriptions contribute uniquely to product/service performance, whereas profit sharing
contributes uniquely to financial performance.
4. Mahmoud Ezzamel Cardiff Business School Cardiff University, UK Simon Lilley
School of Management University of Keele, UK Adrian Wilkinson Loughborough
University Business School Loughborough University, UK, Hugh Willmott Judge
Institute of Management University of Cambridge, UK, Practices and Practicalities:
Changing Human Resource Management, A later version of this article appears in
96
Human Resource Management Journal, 6, 1: 63-80 (1996) For more information on
published articles by Hugh Willmott.
5. Patrick M. Wright, Cornell University Timothy M. Gardner, Brigham Young
University Lisa M. Moynihan, London Business School Human Resource Management
Journal, Vol. 13 No 3, 2003, pages 21-36, The impact of HR practices on the
performance of business units, Human Resource Management Journal Vol: 13 No.3,
2003, This article examines the impact of HR practices and organizational commitment
on the operating performance and profitability of business units. Using a predictive
design with a sample of 50 autonomous business units within the same corporation, the
article reveals that both organizational commitment and HR practices are significantly
related to operational measures of performance, as well as operating expenses and pre-tax
profits.
6. Philip M. Rosenzweig and Nitin Nohria Harvard Business School , Influences on
Human Resource Management Practices in Multinational Corporations, Palgrave
Macmillan Journals is collaborating with JSTOR to Digitize, preserve, and extend access
to Journal of International Business Studies, pageNo.229, A study of human resource
management practices in 249 U.S. affiliates of Foreign-based multinational corporations
(MNCs) shows that in general affiliate Human Resource Management Practices closely
follow local practices, with differences among specific practices. The degree of similarity
to local practices is significantly influenced by the method of Founding, dependence on
local inputs, the presence of expatriates, and the extent of Communication with the
parent. In addition, sharp differences are revealed among affiliates of Canadian, Japanese
and European MNCs, suggesting strong country effects. Together, these findings support
the view of MNCs as composed of differentiated practices, which in turn are shaped by
forces for local isomorphism and for internal Consistency.
7. Francis C. Anyim PhD , Cyril OselokaIkemefuna and Samuel E. Mbah, FCIPM,
FNIM, FABS, FCAI; Department of Industrial Relations and Personnel Management,
Faculty of Business Administration, University of Lago. , Department of Industrial
Relations and Personnel Management, Faculty of Business Administration, University of
97
Lago. , Department of Industrial Relations and Personnel Management, Faculty of
Business Administration, University of Lagos. Human Resource Management
Challenges in Nigeria Under a Globalised Economy, International Journals of Economics
and management science Volume -1 No-4,-2011 PP 01-11, The pace of globalization is
increasing continuously in terms of markets for goods and services, investment
opportunities across borders amongst others. Enterprises face competition from all fronts.
Human resource management is not left out in this transformation crusade as it has
obligation to move along with the changing demands of the globalization process. One of
the objectives of this paper is to show that effective managers should constantly be aware
of the changes taking place in domestic (home country) environment, as well as around
the globe international and foreign environments) on HR issues and developments. By so
doing, they can scan their environment on an ongoing basis, and when they detect
opportunities and/or threats, they can transform their organization to seize the
opportunities and/or combat or neutralize the threats as the case may be. In this
presentation, problems, issues and trends in HRM practice in Nigeria in the current
Periods were reviewed. The factors affecting HRM and its practice in a global context
and what should be the direction of the profession and its practice in Nigeria Constitute
the main focus of this paper.
8. Mrs. EktaSrivastava, Dr. NishaAgarwal, The Emerging Challenges in HRM,
Internal Journal of Scientific & Technology Research Volume -1, Issue- 6, July 2012,
ISSN 2277-8616, This paper analysis the various challenges which are emerging in the
field of HRM. The managers today face a whole new array of changes like globalization,
technological advances and changes in political and legal environment. Changes in
Information technology. This has lead to a paradigm shift in the of roles professional
personnel. The great challenge of HRM is to attract, retain and nurture talented
employees. This paper also analysis how to overcome with these challenges. These
challenges can overcome through cross cultural training, technological and informational
training of HR people and motivation of employees through various techniques.
9. Shamas -UR - rehman Toor. (Corresponding Author) , PhD Candidate and Research
Scholar Department of Building, Faculty of Design and Environment, National
98
University of Singapore, Singapore, Problems and Challenges in Human Resource
Management: Pakistan Journal of Commerce and Social Sciences Vol.1 2008, This
paper critically analyzes the work culture for a mainstream financial organization
operating within Pakistan, while drawing a specific example to elucidate certain
dilemmas that impede the potential growth for the financial sector and its constituent
workforce, besides hampering the performance of the organizations. The case study is
related to an organization in financial sector which conducts a Management Trainee
Program with the purpose to select, train and develop a high- potential pool of talent into
future leaders and fore-runners of the organization. This paper critically analyzes several
inherent problems that face the successful implementation of the trainee program under
the frameworks of various theories of organizational management. To solve these
problems, this article presents a detailed diagnosis of the management shortcomings to
improve the firm’s corporate culture, work ethics and employee handling strategy and
mechanism. Recommendations are also made to minimize the problems and maximize
the success of the Management Trainee Program in the case study organization.
10. Balwinder Singh, 2. Dr. Seema Dhawan, CMJ University, Shillong, Meghalaya, India,
Challenges Faced by H R Managers in the Contemporary Business Atmosphere, IJMBS
Vol. 3, Issue 2, April - June 2013, ISSN: 2230-9519 (Online) | ISSN : 2231-2463 (Print),
The rapidly transforming business landscape means that there are currently many human
resource management challenges which will continue to evolve for years to come. Issues
facing HR are expected to change dramatically in the next decades. In this paper, we have
discussed about the various challenges faced by HR Managers in Contemporary Business
Environment.
11. Dr. Khaliq Ahmad, Director, Management Centre, International Islamic University
Malaysia, Challenges and Practices in Human Resource Management of the Muslim
World, The Journal of Human Resource and Adult Learning Vol. 4, Num. 2, December
2008, In a highly competitive environment of the 21st century, ignoring cultural and
religious issues in management is committing corporative suicidal. Failure to optimize
the benefits of culture-based management practices has led to flaws in many
organizations‟ implementation approaches. Realization of maximum benefits of a
99
culture-based management practice essentially requires knowledge of spiritual and
mental factors, which include “soft” (management) factors, as well as “hard” (physical)
factors such as systems, tools and techniques. These critical factors are requisites of a
successful career in management in South East Asia in general, and in Malaysia
particular. They apply in all key management processes; leadership; planning; customer
service; supplier and community relations, ‟ production and distribution of products and
services; and bench marking.
12. Pankaj Tiwari Shri Chimanbhai Patel Institute of Management & Research
Ahmedabad-380051 (India) Karunesh Saxena Faculty of Management Studies,
Mohanlal Sukhadia University, Udaipur-313001, India, HUMAN RESOURCE
MANAGEMENT PRACTICES: A COMPREHENSIVE REVIEW, Pakistan Business
Review, January-2012, Human Resource is the most important asset for any organization
and it is the source of achieving competitive advantage. Managing human resources is
very challenging as compared to managing technology or capital and for its effective
management, organization requires effective HRM system. HRM system should be
backed up by sound HRM practices. HRM practices refer to organizational activities
directed at managing the pool of human resources and ensuring that the resources are
employed towards the fulfillment of organizational goals. This paper has been designed
to review the existing literature available on HRM Practices. The purpose of this paper is
to develop an understanding of HRM Practices and to examine the unique HRM practices
implemented by different companies
100
2.5. Websites:
1. www.vidyanidhi.org (for duplication check)
2. www.isidev.org (to check articles appeared in around 125 Indian journals & newspapers)
3. www.igidr.ac.in (for e-journals and books in economics, banking and finance)
4. www.britishcouncil.org.in (books, e-journals of UK-paid service)
5. www.tiss.edu (research projects, research report, & research abstracts in social science
literature)
6. www.icssr.org (for fellowships, awards, sources, surveys in SS)
7. www.sosig.uk.in (a web portal on social science literature)
8. www.infolibrarian.com/ejls.htm (for free e-journals)
2.6. Conclusion:
In depth Literature Review provide insight to the researcher in respect of Human Resource
Management Practices. The researcher had identified the research gap which is explained below.
It was found that workers in Chemical Industries have to deal with some specific issues such as
health hazards, Navi Mumbai area has one of the biggest chemical industries zone. However a
study of Human Resource Management Practices with specific focus on Chemical Industries in
Navi Mumbai which deals with different problems faced by workers was yet to be made. Based
on this concept the researcher conducted pilot study and frame its research design and
methodology which is explained in next chapter.
101
Chapter – 3
Research Methodology
3.1. Introduction & Objectives of Study
3.2 Research Problem
3.3. Criteria for the study
3.4. Research Question
3.5. Research Design Table
3.6. Research Methodology and techniques.
3.6.1. Primary Data.
3.6.2. Secondary Data
3.6.3. Statistical Techniques used.
3.7. Hypothesis.
3.8 Limitations of the study.
3.9 Contribution of the Research work.
3.10 Conclusion
3.1. Introduction & Objectives of Study:
In the earlier chapter, the literature on Human Resource Practices followed in India
and elsewhere was reviewed. After in-depth literature review, the researcher was able to identify
several gaps in earlier study and hence there is a further scope to study the subject.
Following are objectives of study.
To study human resources Management practices prevailing in chemical industries.
To survey the awareness in the chemical industries about HRM practices
To identify the constraints of HRM practices in chemical industries.
102
3.2. Research Problem:
Literature review enable to identify gaps and also to frame research problem for the study, the
research problem of the study is whether Human Resource Practices adopted in chemical
industries in Navi Mumbai are adequate?
3.3. Criteria for the study:
On the basis of literature review following criteria were selected for the purpose of study
2. Recruitment and Selection
3. Training and Development
4. Performance Appraisal.
5. Communication.
6. Working Conditions.
7. Retirement Benefits.
8. Grievance Redressal.
3.4. Research Question:
Human Resource Management practices are an evolving concept different practices are invented
by the organization. Whether the employees are working in chemical industries of Navi Mumbai
are satisfied with the different Human Resource Management Practices followed by the
organization.
3.5. Research Design Table.
Research Design.
The study is focused on Human Resource Management Practices followed in Chemical
Industries in Navi Mumbai. The study depends on collection of primary as well as secondary
data. Following tables presents research design applied for the study.
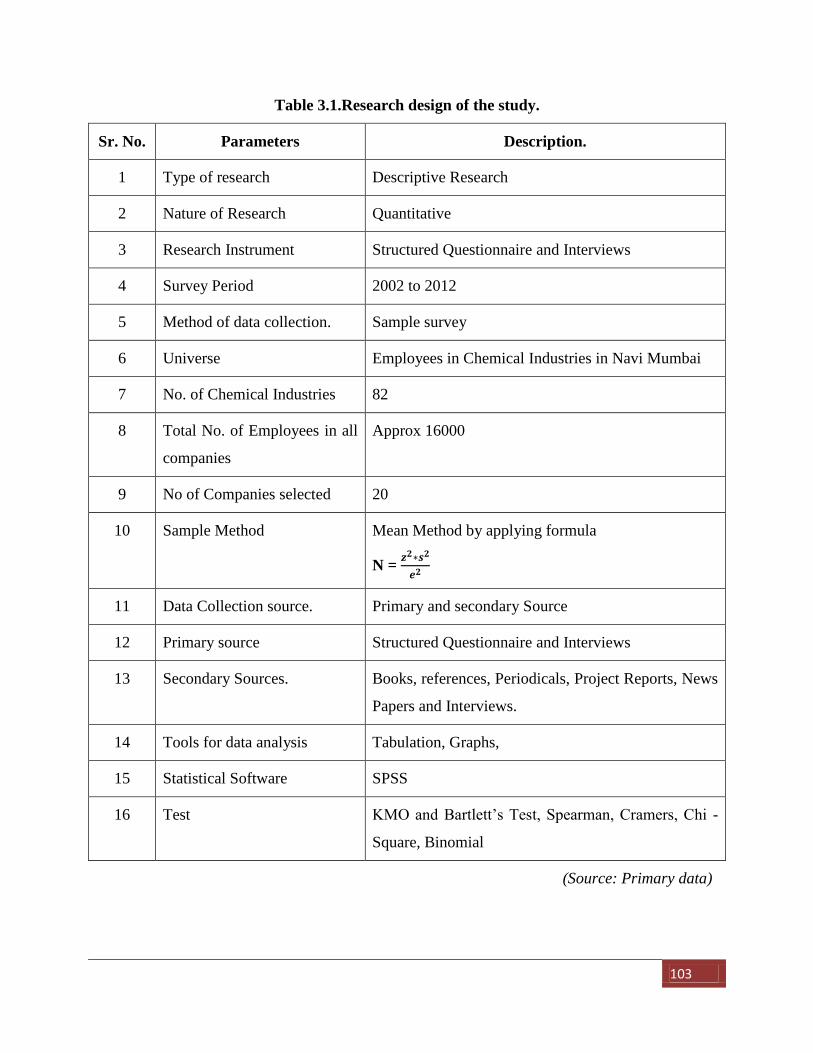
103
Table 3.1.Research design of the study.
Sr. No. Parameters Description.
1 Type of research Descriptive Research
2 Nature of Research Quantitative
3 Research Instrument Structured Questionnaire and Interviews
4 Survey Period 2002 to 2012
5 Method of data collection. Sample survey
6 Universe Employees in Chemical Industries in Navi Mumbai
7 No. of Chemical Industries 82
8 Total No. of Employees in all
companies
Approx 16000
9 No of Companies selected 20
10 Sample Method Mean Method by applying formula
N =
11 Data Collection source. Primary and secondary Source
12 Primary source Structured Questionnaire and Interviews
13 Secondary Sources. Books, references, Periodicals, Project Reports, News
Papers and Interviews.
14 Tools for data analysis Tabulation, Graphs,
15 Statistical Software SPSS
16 Test KMO and Bartlett’s Test, Spearman, Cramers, Chi -
Square, Binomial
(Source: Primary data)
104
3.6. Research Methodology and Techniques.
The research is based on Primary as well as secondary data. Primary data is collected through
sample survey through questionnaire and secondary data is collected through Books, Journals,
Research Papers, Websites etc.
3.6.1 Primary Data
The research is based on sample survey method. It is focused on responses collected from sample
i.e. employees of chemical industries in Navi Mumbai. Total 82 companies are operating in the
area of which 20 companies are selected to collect sample for the study.
The companies who are member of Thane Belapur Industrial Association and satisfying
Following conditions are selected to collect sample
A. Companies with ISO Certification
B. Recipient of Awards
C. Environmental conscious
D. Adoption of Corporate Social Responsibility
E. Turnover
F. Shares
G. More than 100 employees
H. Involved in Import and Export
Following twenty Large Scale Chemicals Industries are selected for study on the basis of above
conditions
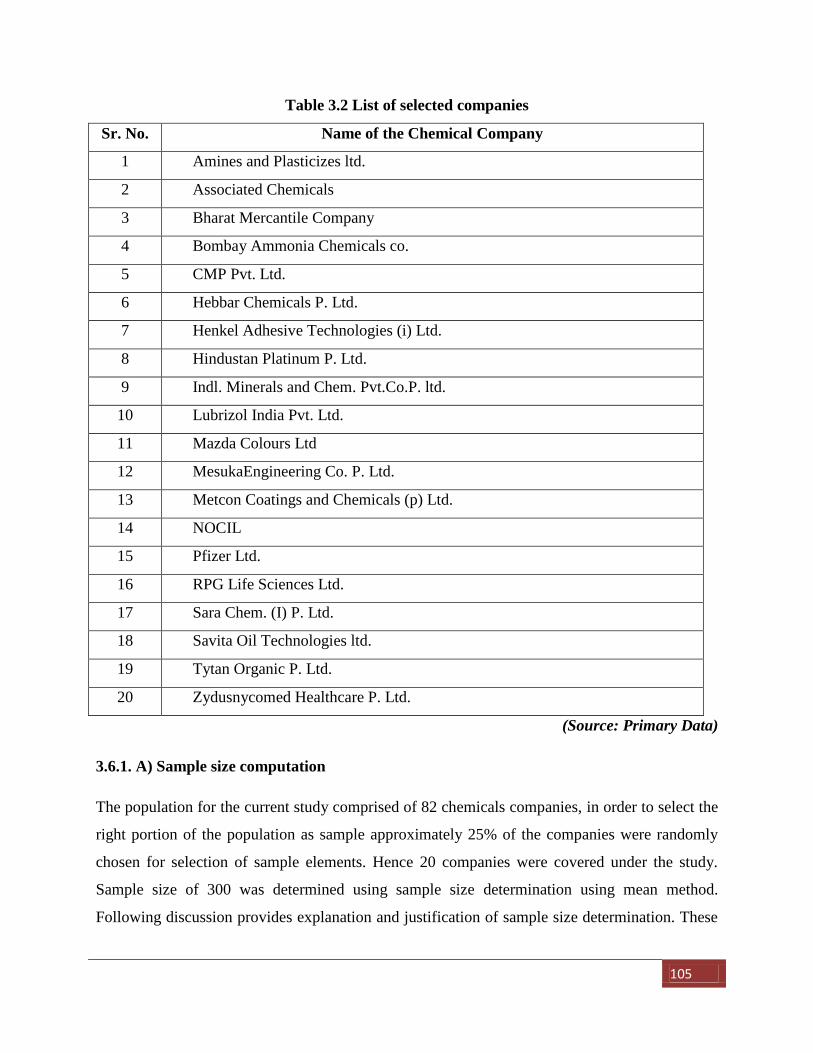
105
Table 3.2 List of selected companies
Sr. No. Name of the Chemical Company
1 Amines and Plasticizes ltd.
2 Associated Chemicals
3 Bharat Mercantile Company
4 Bombay Ammonia Chemicals co.
5 CMP Pvt. Ltd.
6 Hebbar Chemicals P. Ltd.
7 Henkel Adhesive Technologies (i) Ltd.
8 Hindustan Platinum P. Ltd.
9 Indl. Minerals and Chem. Pvt.Co.P. ltd.
10 Lubrizol India Pvt. Ltd.
11 Mazda Colours Ltd
12 MesukaEngineering Co. P. Ltd.
13 Metcon Coatings and Chemicals (p) Ltd.
14 NOCIL
15 Pfizer Ltd.
16 RPG Life Sciences Ltd.
17 Sara Chem. (I) P. Ltd.
18 Savita Oil Technologies ltd.
19 Tytan Organic P. Ltd.
20 Zydusnycomed Healthcare P. Ltd.
(Source: Primary Data)
3.6.1. A) Sample size computation
The population for the current study comprised of 82 chemicals companies, in order to select the
right portion of the population as sample approximately 25% of the companies were randomly
chosen for selection of sample elements. Hence 20 companies were covered under the study.
Sample size of 300 was determined using sample size determination using mean method.
Following discussion provides explanation and justification of sample size determination. These
106
300 respondents were picked equal proportion from each of the 20 companies, i.e. 15
respondents each from 20 companies.
Sample size = 300 employees of 20 chemical companies from Navi Mumbai.
3.6.1. B) Sample size determination using mean method
Sample size was determined using sample size determination by mean method.
Variables in study were measured using a 5-point measurement scale, hence the mean method
was adopted.
Formula
N =
Where, ‘z’ is the standard score associated with confidence level (95% in the current case).
Hence standard scores equal to 1.96 (borrowed from normal table)
‘S’ is the variability in the data set, computed as a ratio of range / 6. Range is equal to 5-1 = 4
(the difference between minimum and maximum value in the 5point scale). 6 refers to ±3
standard deviation values on the X axis of the standard normal curve, which takes in all the data
set in study.
Hence S = 4/6 = 0.66
E is the tolerable error = 8% (in the current study).
Sample size n =
= 261
In order to deal with non -response approximately 15 % of the sample size was taken as a buffer.
261*15%= 39
Therefore 261+39=, 300
Therefore 300 is the sample size that was taken into consideration
107
3.6.2 Secondary Data
Secondary Data was collected through various books, references, journals, magazines,
newspaper articles, periodicals and websites.
3.6.3. Statistical Techniques Used.
Different statistical techniques are used for analysis of data and validation of hypotheses it
includes tabulation, graphs, KMO and Bartlett’s Test, Spearman, Cramers, Chi - Square,
Binomial Test
3.7. Hypothesis:
H1:“Existing Human Resource Management Practices of Chemical Industries in Navi Mumbai
are healthy (adequate)”
H2: “Employees retention is a result of Healthy Human Resource Management Practices in
Chemical Industries in Navi Mumbai.”
H3: “Employee productivity is a result of healthy Human Resources Management Practices in
Chemical Industries in Navi Mumbai.”
3.8. Limitations of the study
1. Study period is only 2002 to 2012.
2. Geographical Limitations: The study is restricted to chemical Industries situated in Thane
Belapur MIDC Area in Navi Mumbai.
3.9. Contribution of Research Work.
The study will be beneficial in following ways
1. It will be beneficiary for all industries in general and Industries in Navi Mumbai will be
specifically benefitted as the study reveal gaps and strong aspects of Human Resource
Practices followed by Large Chemical Industries in Navi Mumbai.
2. It will help the government to identify if any corrective action is required
108
3. It will help the students of MMS, BMS and students of other faculties as it provide a real
life picture of employee situation
4. It will academicians as it could be a good case study on Human Resource Practices
followed in Navi Mumbai specifically in chemical industries.
5. It will help management of the companies to identify causes of attrition among the
employees and to take suitable action for the same.
3.10. Conclusion:
The above research design and methodology is suitable and appropriate for the title of
research topic selected which will also useful to the researcher to conduct research in a
structured way which is presented in the study and data analysis to draw appropriate
conclusions and suggestions.
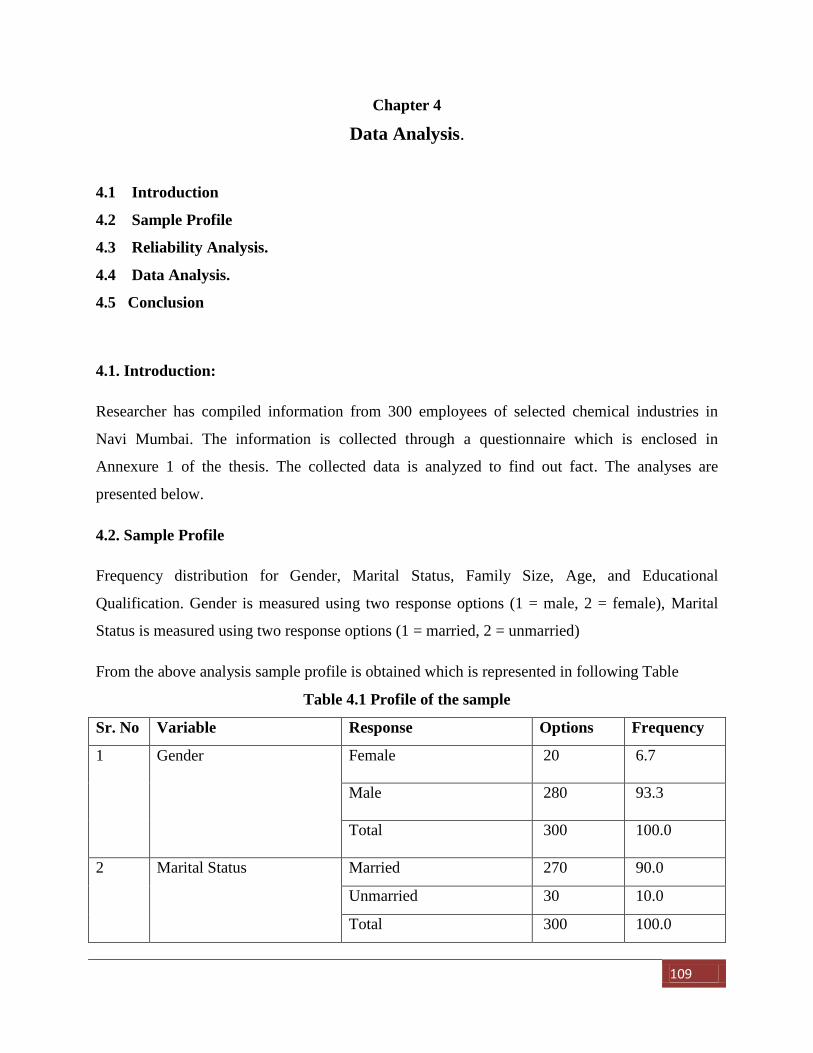
109
Chapter 4
Data Analysis.
4.1 Introduction
4.2 Sample Profile
4.3 Reliability Analysis.
4.4 Data Analysis.
4.5 Conclusion
4.1. Introduction:
Researcher has compiled information from 300 employees of selected chemical industries in
Navi Mumbai. The information is collected through a questionnaire which is enclosed in
Annexure 1 of the thesis. The collected data is analyzed to find out fact. The analyses are
presented below.
4.2. Sample Profile
Frequency distribution for Gender, Marital Status, Family Size, Age, and Educational
Qualification. Gender is measured using two response options (1 = male, 2 = female), Marital
Status is measured using two response options (1 = married, 2 = unmarried)
From the above analysis sample profile is obtained which is represented in following Table
Table 4.1 Profile of the sample
Sr. No Variable Response Options Frequency
1 Gender Female 20 6.7
Male 280 93.3
Total 300 100.0
2 Marital Status Married 270 90.0
Unmarried 30 10.0
Total 300 100.0
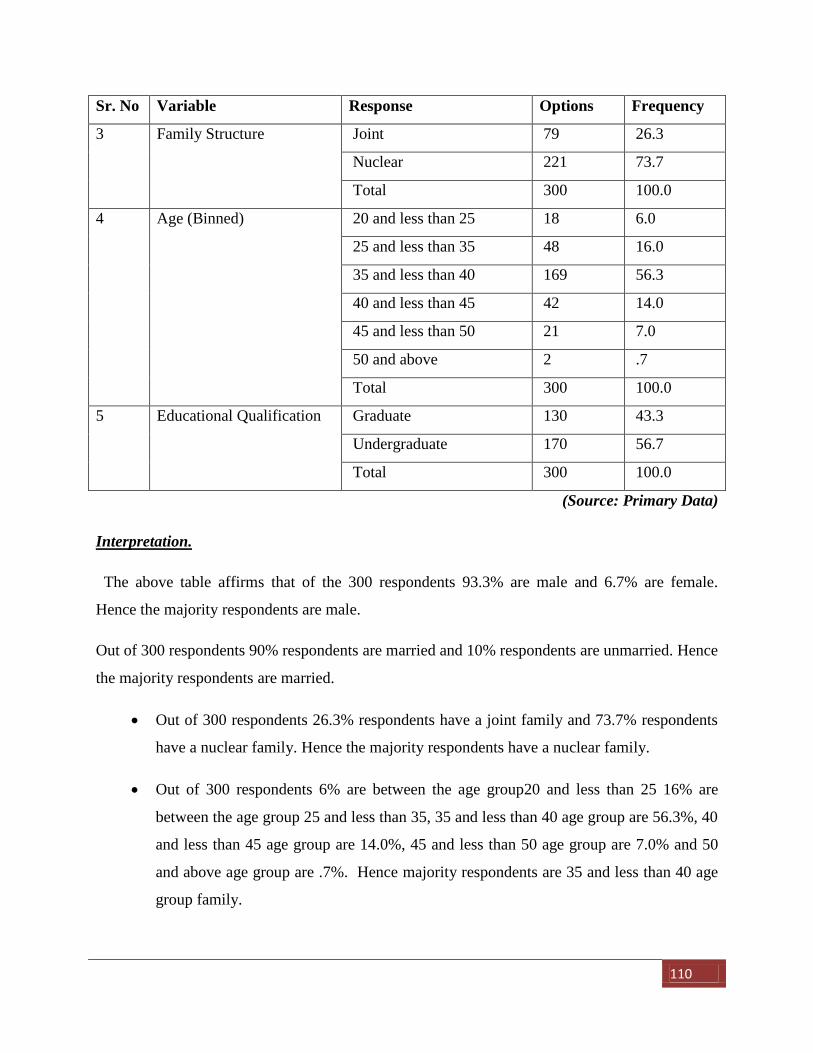
110
Sr. No Variable Response Options Frequency
3 Family Structure Joint 79 26.3
Nuclear 221 73.7
Total 300 100.0
4 Age (Binned) 20 and less than 25 18 6.0
25 and less than 35 48 16.0
35 and less than 40 169 56.3
40 and less than 45 42 14.0
45 and less than 50 21 7.0
50 and above 2 .7
Total 300 100.0
5 Educational Qualification Graduate 130 43.3
Undergraduate 170 56.7
Total 300 100.0
(Source: Primary Data)
Interpretation.
The above table affirms that of the 300 respondents 93.3% are male and 6.7% are female.
Hence the majority respondents are male.
Out of 300 respondents 90% respondents are married and 10% respondents are unmarried. Hence
the majority respondents are married.
Out of 300 respondents 26.3% respondents have a joint family and 73.7% respondents
have a nuclear family. Hence the majority respondents have a nuclear family.
Out of 300 respondents 6% are between the age group20 and less than 25 16% are
between the age group 25 and less than 35, 35 and less than 40 age group are 56.3%, 40
and less than 45 age group are 14.0%, 45 and less than 50 age group are 7.0% and 50
and above age group are .7%. Hence majority respondents are 35 and less than 40 age
group family.
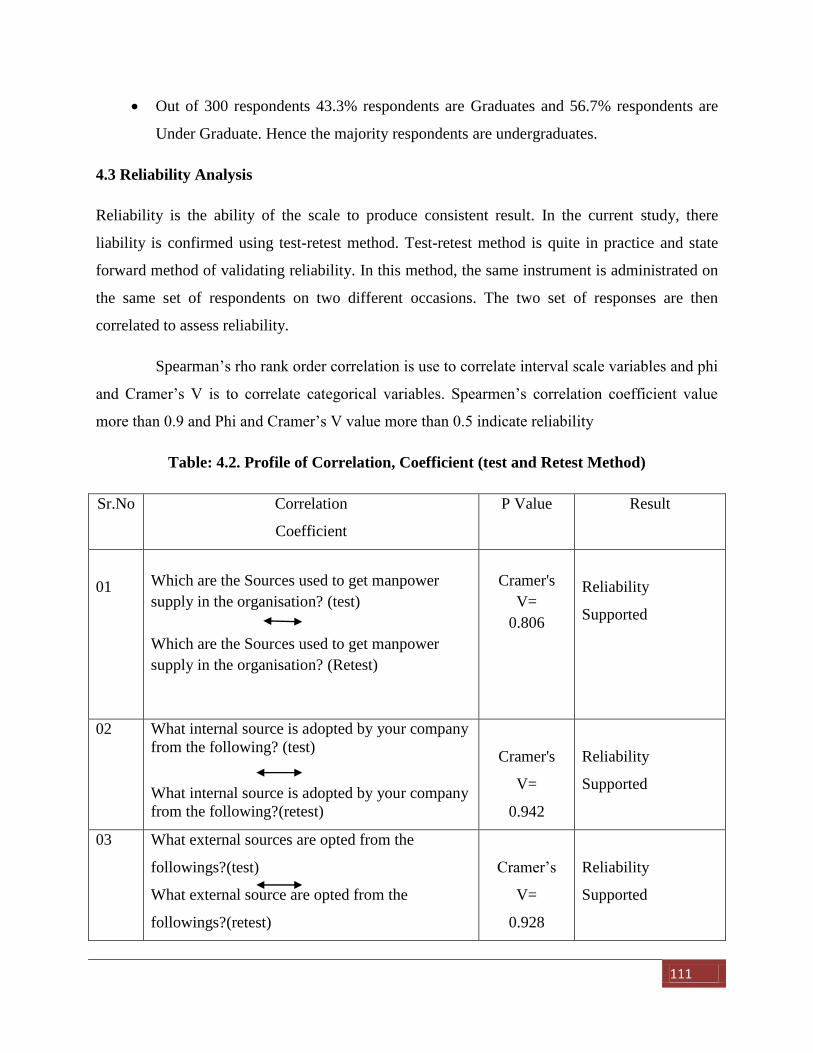
111
Out of 300 respondents 43.3% respondents are Graduates and 56.7% respondents are
Under Graduate. Hence the majority respondents are undergraduates.
4.3 Reliability Analysis
Reliability is the ability of the scale to produce consistent result. In the current study, there
liability is confirmed using test-retest method. Test-retest method is quite in practice and state
forward method of validating reliability. In this method, the same instrument is administrated on
the same set of respondents on two different occasions. The two set of responses are then
correlated to assess reliability.
Spearman’s rho rank order correlation is use to correlate interval scale variables and phi
and Cramer’s V is to correlate categorical variables. Spearmen’s correlation coefficient value
more than 0.9 and Phi and Cramer’s V value more than 0.5 indicate reliability
Table: 4.2. Profile of Correlation, Coefficient (test and Retest Method)
Sr.No Correlation
Coefficient
P Value Result
01
Which are the Sources used to get manpower
supply in the organisation? (test)
Which are the Sources used to get manpower
supply in the organisation? (Retest)
Cramer's
V=
0.806
Reliability
Supported
02 What internal source is adopted by your company
from the following? (test)
What internal source is adopted by your company
from the following?(retest)
Cramer's
V=
0.942
Reliability
Supported
03 What external sources are opted from the
followings?(test)
What external source are opted from the
followings?(retest)
Cramer’s
V=
0.928
Reliability
Supported
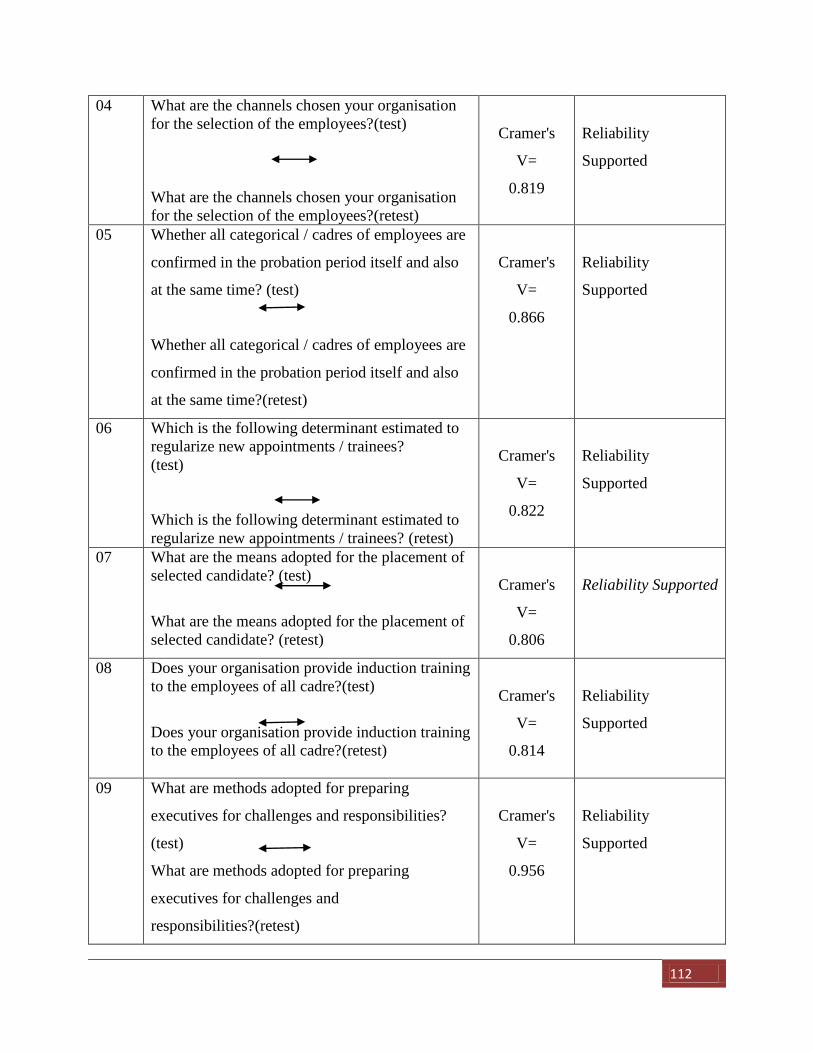
112
04 What are the channels chosen your organisation
for the selection of the employees?(test)
What are the channels chosen your organisation
for the selection of the employees?(retest)
Cramer's
V=
0.819
Reliability
Supported
05 Whether all categorical / cadres of employees are
confirmed in the probation period itself and also
at the same time? (test)
Whether all categorical / cadres of employees are
confirmed in the probation period itself and also
at the same time?(retest)
Cramer's
V=
0.866
Reliability
Supported
06 Which is the following determinant estimated to
regularize new appointments / trainees?
(test)
Which is the following determinant estimated to
regularize new appointments / trainees? (retest)
Cramer's
V=
0.822
Reliability
Supported
07 What are the means adopted for the placement of
selected candidate? (test)
What are the means adopted for the placement of
selected candidate? (retest)
Cramer's
V=
0.806
Reliability Supported
08 Does your organisation provide induction training
to the employees of all cadre?(test)
Does your organisation provide induction training
to the employees of all cadre?(retest)
Cramer's
V=
0.814
Reliability
Supported
09 What are methods adopted for preparing
executives for challenges and responsibilities?
(test)
What are methods adopted for preparing
executives for challenges and
responsibilities?(retest)
Cramer's
V=
0.956
Reliability
Supported
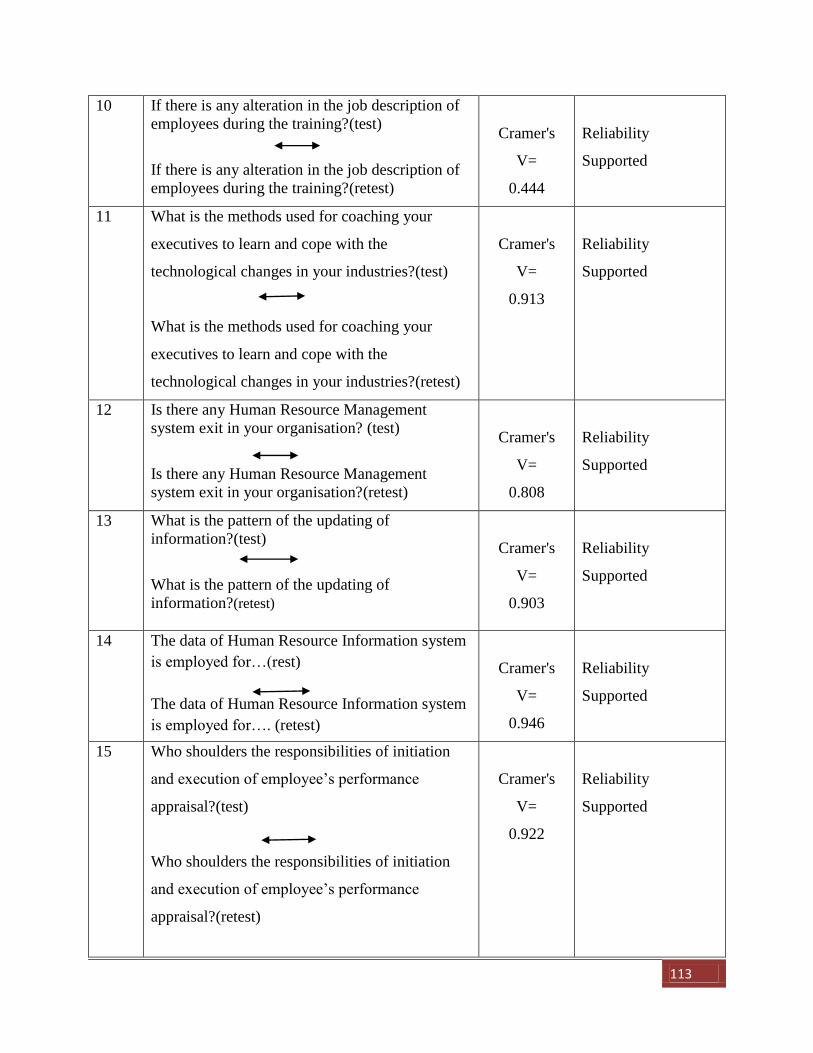
113
10 If there is any alteration in the job description of
employees during the training?(test)
If there is any alteration in the job description of
employees during the training?(retest)
Cramer's
V=
0.444
Reliability
Supported
11 What is the methods used for coaching your
executives to learn and cope with the
technological changes in your industries?(test)
What is the methods used for coaching your
executives to learn and cope with the
technological changes in your industries?(retest)
Cramer's
V=
0.913
Reliability
Supported
12 Is there any Human Resource Management
system exit in your organisation? (test)
Is there any Human Resource Management
system exit in your organisation?(retest)
Cramer's
V=
0.808
Reliability
Supported
13 What is the pattern of the updating of
information?(test)
What is the pattern of the updating of
information?(retest)
Cramer's
V=
0.903
Reliability
Supported
14 The data of Human Resource Information system
is employed for…(rest)
The data of Human Resource Information system
is employed for…. (retest)
Cramer's
V=
0.946
Reliability
Supported
15 Who shoulders the responsibilities of initiation
and execution of employee’s performance
appraisal?(test)
Who shoulders the responsibilities of initiation
and execution of employee’s performance
appraisal?(retest)
Cramer's
V=
0.922
Reliability
Supported

114
16 Whether performance appraisal system is similar
for all categories of officers?(test)
Whether performance appraisal system is similar
for all categories of officers?
(retest)
Cramer's
V=
0.852
Reliability
Supported
17 How is the performance appraisal system in your
organisation? (test)
How is the performance appraisal system in your
organisation?(retest)
Cramer's
V=
0.876
Reliability
Supported
18 For which administrative purpose the
performance appraisal system is utilized? (test)
For which administrative purpose the
performance appraisal system is utilized? (retest)
Cramer's
V=
0.873
Reliability
Supported
19 When doses the organisation take action on the
appraisal report?(test)
When doses the organisation take action on the
appraisal report?(retest)
Cramer's
V=
0.879
Reliability
Supported
20 Does any separate training department exist in
your organisation? ( test)
Does any separate training department exist in
your organisation? (retest)
Cramer's
V=
0.729
Reliability
Supported
21 How does the organisation encourage employees
to sharpen their skills and performance? (test)
How does the organisation encourage employees
to sharpen their skills and performance? (retest)
Cramer's
V=
0.956
Reliability
Supported
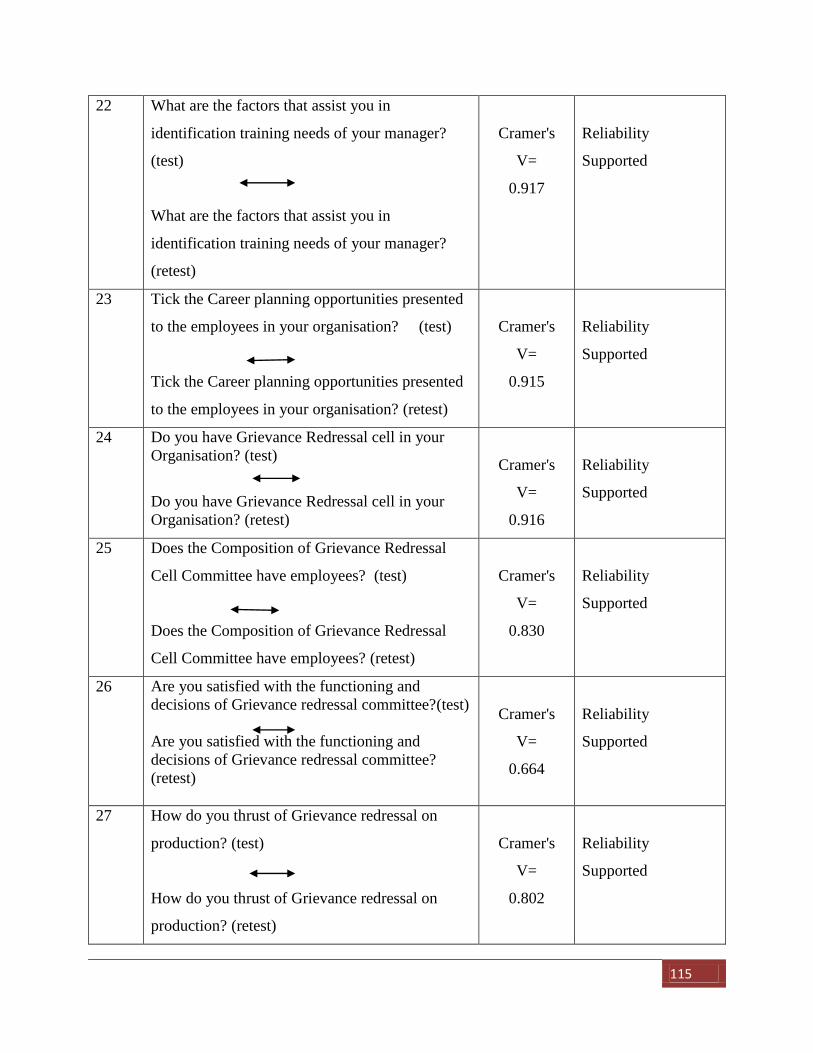
115
22 What are the factors that assist you in
identification training needs of your manager?
(test)
What are the factors that assist you in
identification training needs of your manager?
(retest)
Cramer's
V=
0.917
Reliability
Supported
23 Tick the Career planning opportunities presented
to the employees in your organisation? (test)
Tick the Career planning opportunities presented
to the employees in your organisation? (retest)
Cramer's
V=
0.915
Reliability
Supported
24 Do you have Grievance Redressal cell in your
Organisation? (test)
Do you have Grievance Redressal cell in your
Organisation? (retest)
Cramer's
V=
0.916
Reliability
Supported
25 Does the Composition of Grievance Redressal
Cell Committee have employees? (test)
Does the Composition of Grievance Redressal
Cell Committee have employees? (retest)
Cramer's
V=
0.830
Reliability
Supported
26 Are you satisfied with the functioning and
decisions of Grievance redressal committee?(test)
Are you satisfied with the functioning and
decisions of Grievance redressal committee?
(retest)
Cramer's
V=
0.664
Reliability
Supported
27 How do you thrust of Grievance redressal on
production? (test)
How do you thrust of Grievance redressal on
production? (retest)
Cramer's
V=
0.802
Reliability
Supported
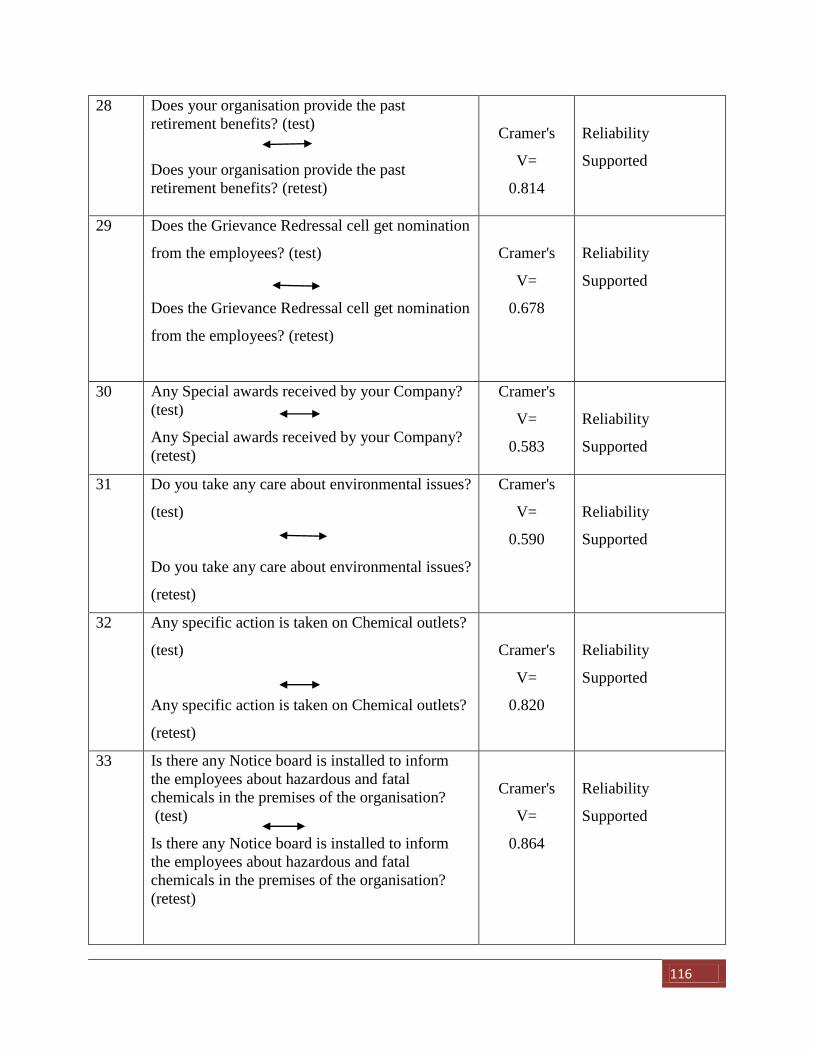
116
28 Does your organisation provide the past
retirement benefits? (test)
Does your organisation provide the past
retirement benefits? (retest)
Cramer's
V=
0.814
Reliability
Supported
29 Does the Grievance Redressal cell get nomination
from the employees? (test)
Does the Grievance Redressal cell get nomination
from the employees? (retest)
Cramer's
V=
0.678
Reliability
Supported
30 Any Special awards received by your Company?
(test)
Any Special awards received by your Company?
(retest)
Cramer's
V=
0.583
Reliability
Supported
31 Do you take any care about environmental issues?
(test)
Do you take any care about environmental issues?
(retest)
Cramer's
V=
0.590
Reliability
Supported
32 Any specific action is taken on Chemical outlets?
(test)
Any specific action is taken on Chemical outlets?
(retest)
Cramer's
V=
0.820
Reliability
Supported
33 Is there any Notice board is installed to inform
the employees about hazardous and fatal
chemicals in the premises of the organisation?
(test)
Is there any Notice board is installed to inform
the employees about hazardous and fatal
chemicals in the premises of the organisation?
(retest)
Cramer's
V=
0.864
Reliability
Supported
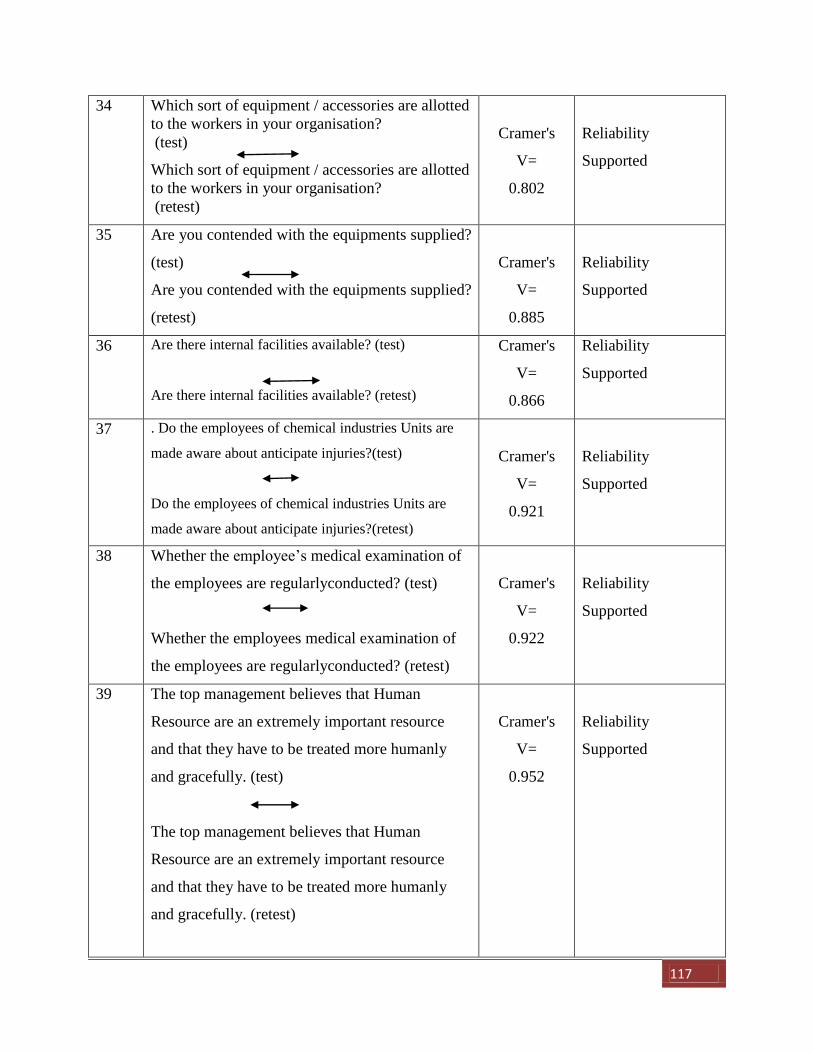
117
34 Which sort of equipment / accessories are allotted
to the workers in your organisation?
(test)
Which sort of equipment / accessories are allotted
to the workers in your organisation?
(retest)
Cramer's
V=
0.802
Reliability
Supported
35 Are you contended with the equipments supplied?
(test)
Are you contended with the equipments supplied?
(retest)
Cramer's
V=
0.885
Reliability
Supported
36 Are there internal facilities available? (test)
Are there internal facilities available? (retest)
Cramer's
V=
0.866
Reliability
Supported
37 . Do the employees of chemical industries Units are
made aware about anticipate injuries?(test)
Do the employees of chemical industries Units are
made aware about anticipate injuries?(retest)
Cramer's
V=
0.921
Reliability
Supported
38 Whether the employee’s medical examination of
the employees are regularlyconducted? (test)
Whether the employees medical examination of
the employees are regularlyconducted? (retest)
Cramer's
V=
0.922
Reliability
Supported
39 The top management believes that Human
Resource are an extremely important resource
and that they have to be treated more humanly
and gracefully. (test)
The top management believes that Human
Resource are an extremely important resource
and that they have to be treated more humanly
and gracefully. (retest)
Cramer's
V=
0.952
Reliability
Supported
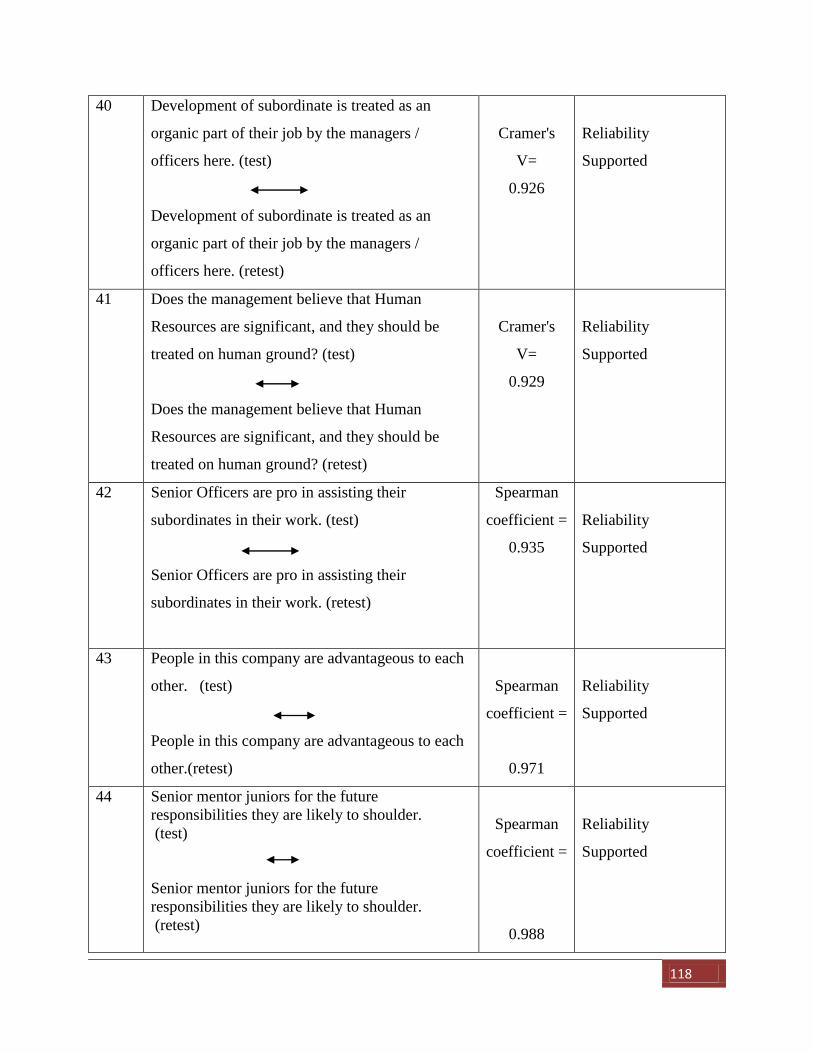
118
40 Development of subordinate is treated as an
organic part of their job by the managers /
officers here. (test)
Development of subordinate is treated as an
organic part of their job by the managers /
officers here. (retest)
Cramer's
V=
0.926
Reliability
Supported
41 Does the management believe that Human
Resources are significant, and they should be
treated on human ground? (test)
Does the management believe that Human
Resources are significant, and they should be
treated on human ground? (retest)
Cramer's
V=
0.929
Reliability
Supported
42 Senior Officers are pro in assisting their
subordinates in their work. (test)
Senior Officers are pro in assisting their
subordinates in their work. (retest)
Spearman
coefficient =
0.935
Reliability
Supported
43 People in this company are advantageous to each
other. (test)
People in this company are advantageous to each
other.(retest)
Spearman
coefficient =
0.971
Reliability
Supported
44 Senior mentor juniors for the future
responsibilities they are likely to shoulder.
(test)
Senior mentor juniors for the future
responsibilities they are likely to shoulder.
(retest)
Spearman
coefficient =
0.988
Reliability
Supported
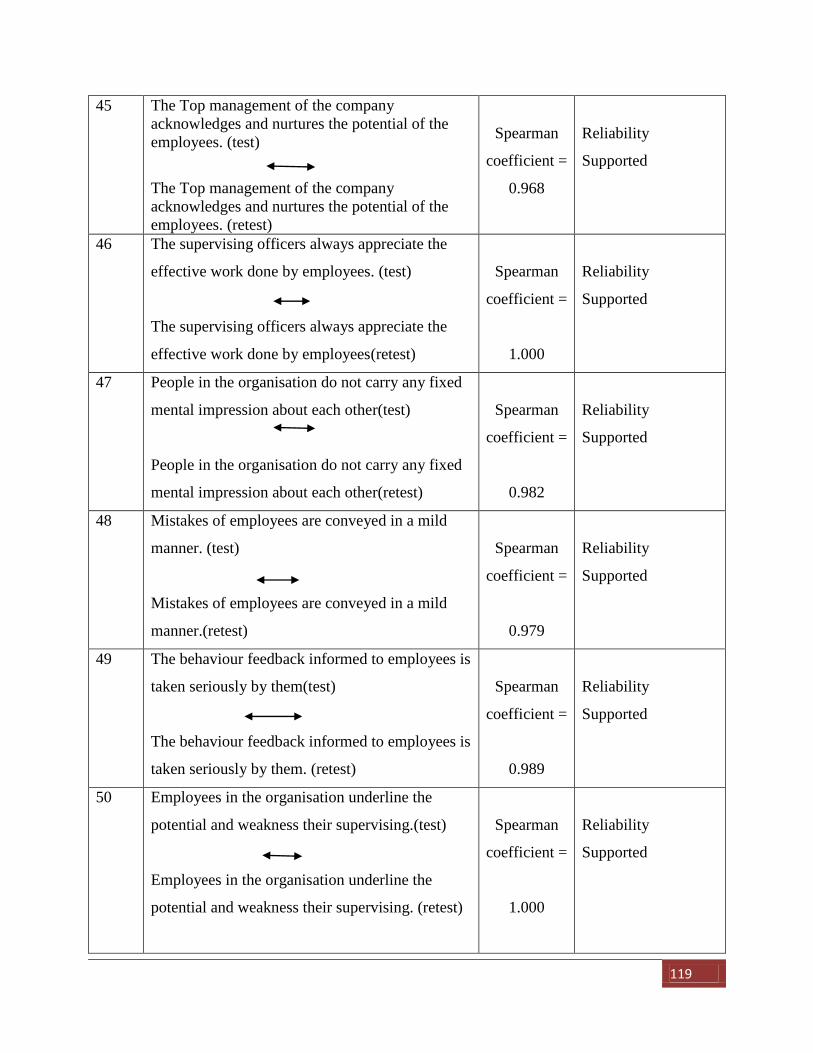
119
45 The Top management of the company
acknowledges and nurtures the potential of the
employees. (test)
The Top management of the company
acknowledges and nurtures the potential of the
employees. (retest)
Spearman
coefficient =
0.968
Reliability
Supported
46 The supervising officers always appreciate the
effective work done by employees. (test)
The supervising officers always appreciate the
effective work done by employees(retest)
Spearman
coefficient =
1.000
Reliability
Supported
47 People in the organisation do not carry any fixed
mental impression about each other(test)
People in the organisation do not carry any fixed
mental impression about each other(retest)
Spearman
coefficient =
0.982
Reliability
Supported
48 Mistakes of employees are conveyed in a mild
manner. (test)
Mistakes of employees are conveyed in a mild
manner.(retest)
Spearman
coefficient =
0.979
Reliability
Supported
49 The behaviour feedback informed to employees is
taken seriously by them(test)
The behaviour feedback informed to employees is
taken seriously by them. (retest)
Spearman
coefficient =
0.989
Reliability
Supported
50 Employees in the organisation underline the
potential and weakness their supervising.(test)
Employees in the organisation underline the
potential and weakness their supervising. (retest)
Spearman
coefficient =
1.000
Reliability
Supported
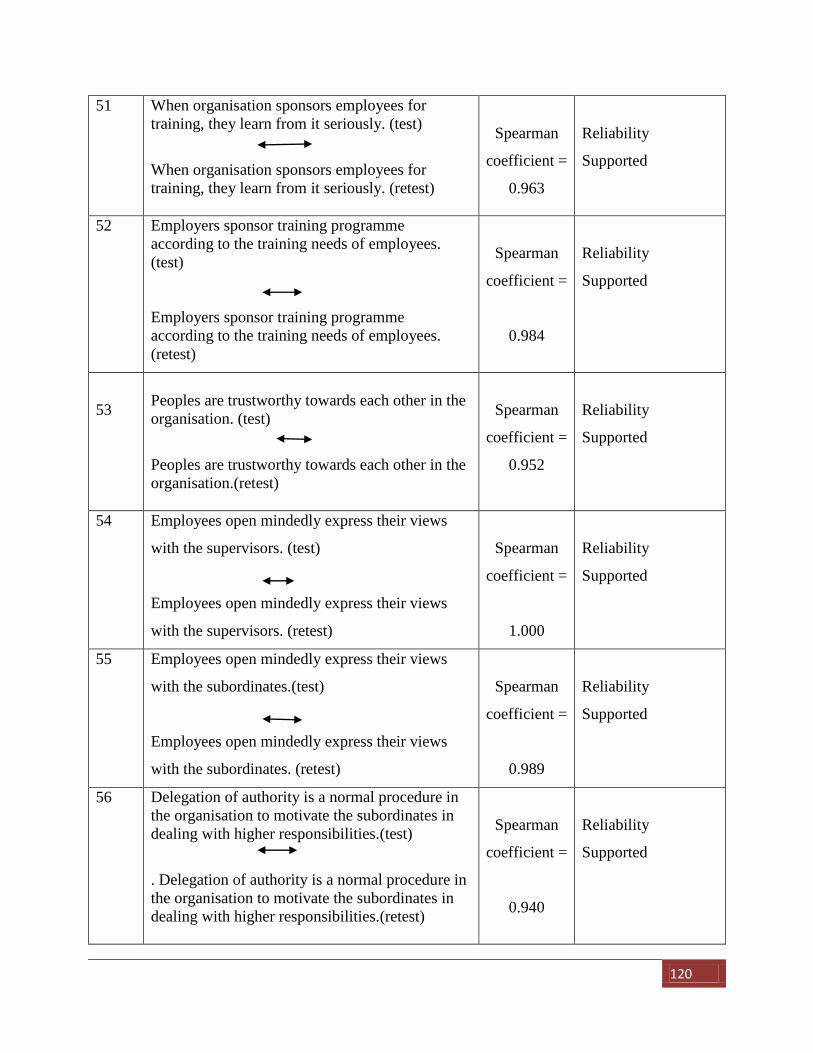
120
51 When organisation sponsors employees for
training, they learn from it seriously. (test)
When organisation sponsors employees for
training, they learn from it seriously. (retest)
Spearman
coefficient =
0.963
Reliability
Supported
52 Employers sponsor training programme
according to the training needs of employees.
(test)
Employers sponsor training programme
according to the training needs of employees.
(retest)
Spearman
coefficient =
0.984
Reliability
Supported
53
Peoples are trustworthy towards each other in the
organisation. (test)
Peoples are trustworthy towards each other in the
organisation.(retest)
Spearman
coefficient =
0.952
Reliability
Supported
54 Employees open mindedly express their views
with the supervisors. (test)
Employees open mindedly express their views
with the supervisors. (retest)
Spearman
coefficient =
1.000
Reliability
Supported
55 Employees open mindedly express their views
with the subordinates.(test)
Employees open mindedly express their views
with the subordinates. (retest)
Spearman
coefficient =
0.989
Reliability
Supported
56 Delegation of authority is a normal procedure in
the organisation to motivate the subordinates in
dealing with higher responsibilities.(test)
. Delegation of authority is a normal procedure in
the organisation to motivate the subordinates in
dealing with higher responsibilities.(retest)
Spearman
coefficient =
0.940
Reliability
Supported
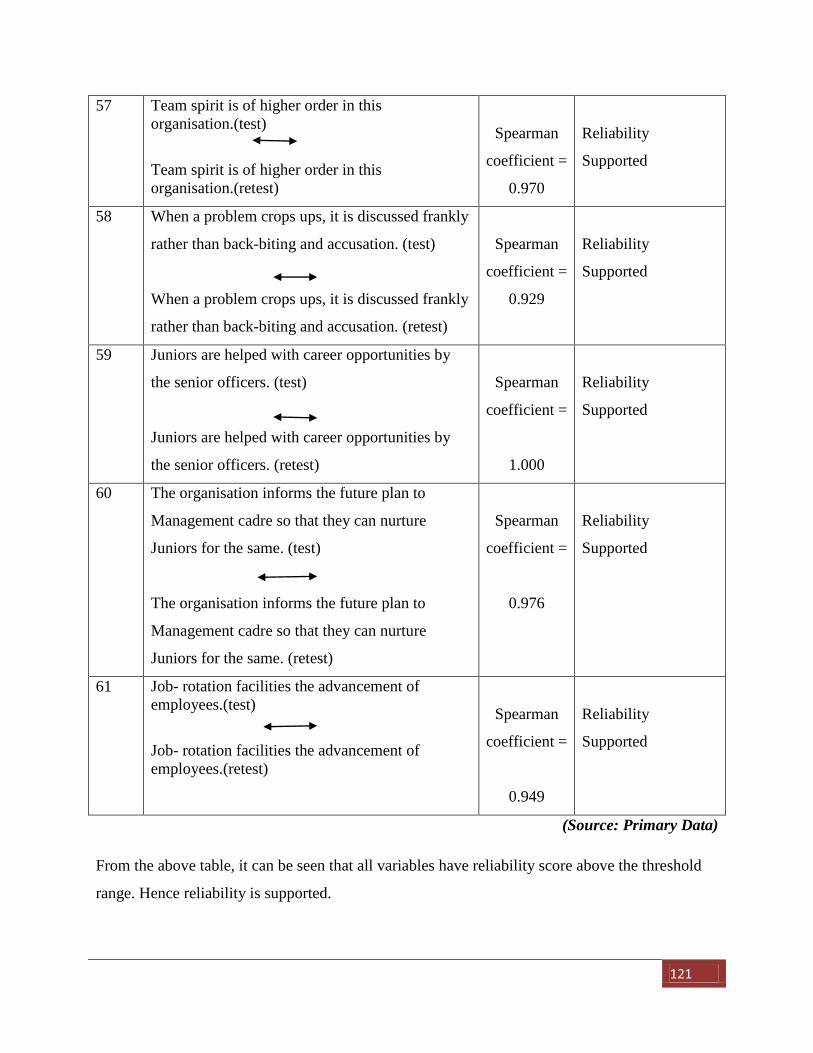
121
57 Team spirit is of higher order in this
organisation.(test)
Team spirit is of higher order in this
organisation.(retest)
Spearman
coefficient =
0.970
Reliability
Supported
58 When a problem crops ups, it is discussed frankly
rather than back-biting and accusation. (test)
When a problem crops ups, it is discussed frankly
rather than back-biting and accusation. (retest)
Spearman
coefficient =
0.929
Reliability
Supported
59 Juniors are helped with career opportunities by
the senior officers. (test)
Juniors are helped with career opportunities by
the senior officers. (retest)
Spearman
coefficient =
1.000
Reliability
Supported
60 The organisation informs the future plan to
Management cadre so that they can nurture
Juniors for the same. (test)
The organisation informs the future plan to
Management cadre so that they can nurture
Juniors for the same. (retest)
Spearman
coefficient =
0.976
Reliability
Supported
61 Job- rotation facilities the advancement of
employees.(test)
Job- rotation facilities the advancement of
employees.(retest)
Spearman
coefficient =
0.949
Reliability
Supported
(Source: Primary Data)
From the above table, it can be seen that all variables have reliability score above the threshold
range. Hence reliability is supported.
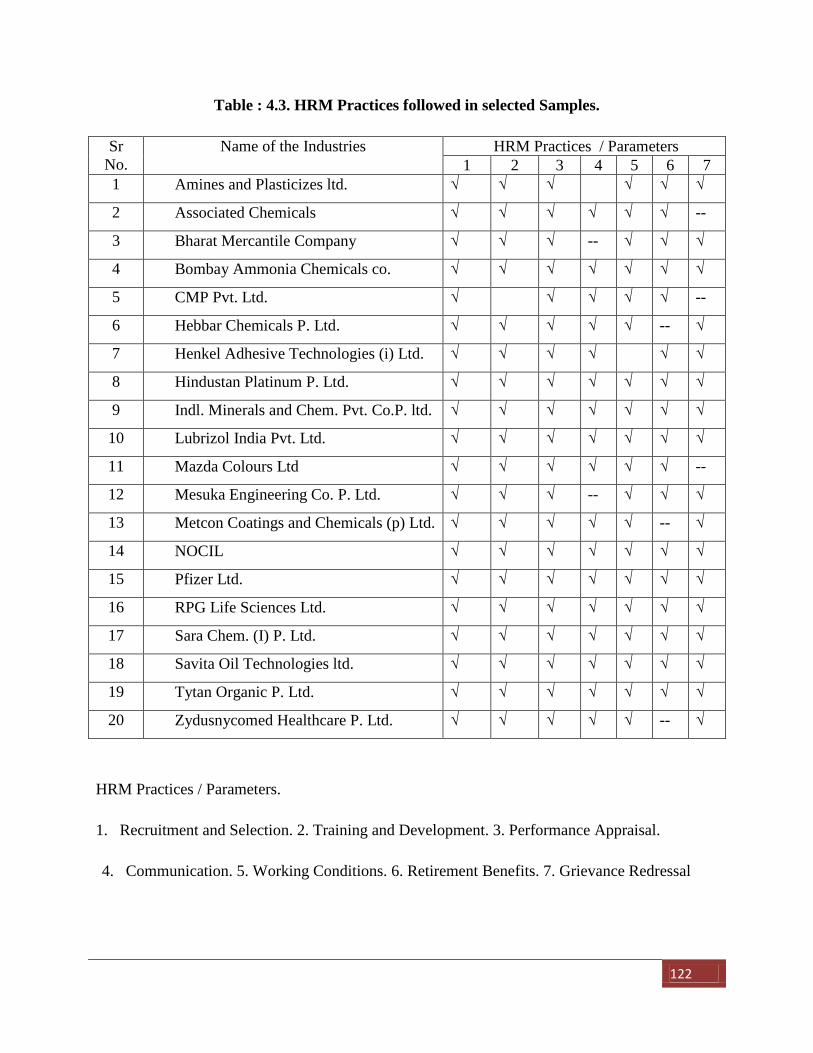
122
Table : 4.3. HRM Practices followed in selected Samples.
Sr
No.
Name of the Industries HRM Practices / Parameters
1 2 3 4 5 6 7
1 Amines and Plasticizes ltd. √ √ √ √ √ √
2 Associated Chemicals √ √ √ √ √ √ --
3 Bharat Mercantile Company √ √ √ -- √ √ √
4 Bombay Ammonia Chemicals co. √ √ √ √ √ √ √
5 CMP Pvt. Ltd. √ √ √ √ √ --
6 Hebbar Chemicals P. Ltd. √ √ √ √ √ -- √
7 Henkel Adhesive Technologies (i) Ltd. √ √ √ √ √ √
8 Hindustan Platinum P. Ltd. √ √ √ √ √ √ √
9 Indl. Minerals and Chem. Pvt. Co.P. ltd. √ √ √ √ √ √ √
10 Lubrizol India Pvt. Ltd. √ √ √ √ √ √ √
11 Mazda Colours Ltd √ √ √ √ √ √ --
12 Mesuka Engineering Co. P. Ltd. √ √ √ -- √ √ √
13 Metcon Coatings and Chemicals (p) Ltd. √ √ √ √ √ -- √
14 NOCIL √ √ √ √ √ √ √
15 Pfizer Ltd. √ √ √ √ √ √ √
16 RPG Life Sciences Ltd. √ √ √ √ √ √ √
17 Sara Chem. (I) P. Ltd. √ √ √ √ √ √ √
18 Savita Oil Technologies ltd. √ √ √ √ √ √ √
19 Tytan Organic P. Ltd. √ √ √ √ √ √ √
20 Zydusnycomed Healthcare P. Ltd. √ √ √ √ √ -- √
HRM Practices / Parameters.
1. Recruitment and Selection. 2. Training and Development. 3. Performance Appraisal.
4. Communication. 5. Working Conditions. 6. Retirement Benefits. 7. Grievance Redressal
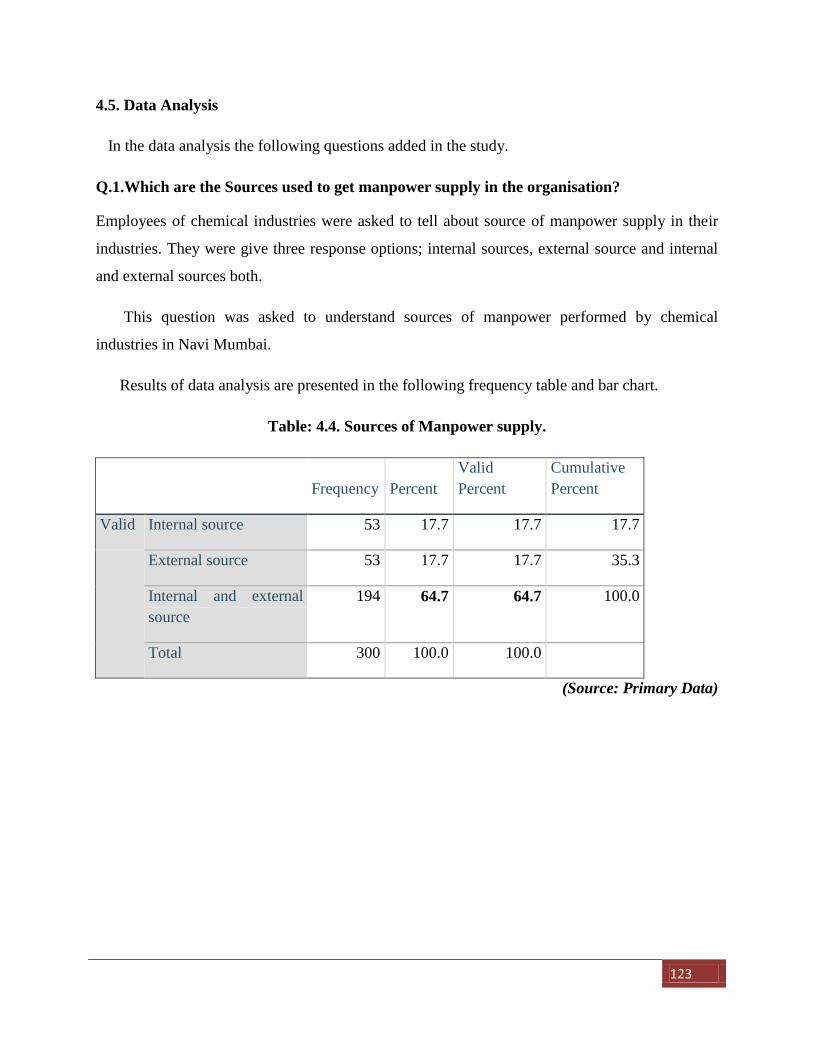
123
4.5. Data Analysis
In the data analysis the following questions added in the study.
Q.1.Which are the Sources used to get manpower supply in the organisation?
Employees of chemical industries were asked to tell about source of manpower supply in their
industries. They were give three response options; internal sources, external source and internal
and external sources both.
This question was asked to understand sources of manpower performed by chemical
industries in Navi Mumbai.
Results of data analysis are presented in the following frequency table and bar chart.
Table: 4.4. Sources of Manpower supply.
Frequency Percent
Valid
Percent
Cumulative
Percent
Valid Internal source 53 17.7 17.7 17.7
External source 53 17.7 17.7 35.3
Internal and external
source
194 64.7 64.7 100.0
Total 300 100.0 100.0
(Source: Primary Data)
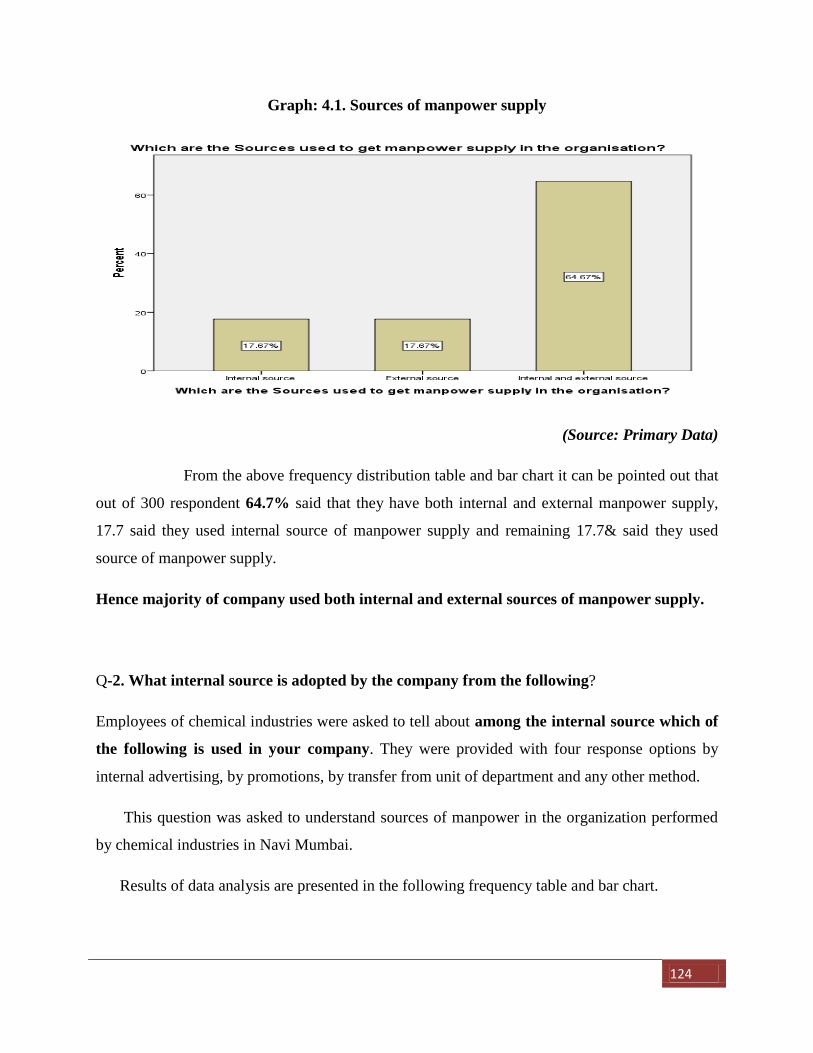
124
Graph: 4.1. Sources of manpower supply
(Source: Primary Data)
From the above frequency distribution table and bar chart it can be pointed out that
out of 300 respondent 64.7% said that they have both internal and external manpower supply,
17.7 said they used internal source of manpower supply and remaining 17.7& said they used
source of manpower supply.
Hence majority of company used both internal and external sources of manpower supply.
Q-2. What internal source is adopted by the company from the following?
Employees of chemical industries were asked to tell about among the internal source which of
the following is used in your company. They were provided with four response options by
internal advertising, by promotions, by transfer from unit of department and any other method.
This question was asked to understand sources of manpower in the organization performed
by chemical industries in Navi Mumbai.
Results of data analysis are presented in the following frequency table and bar chart.
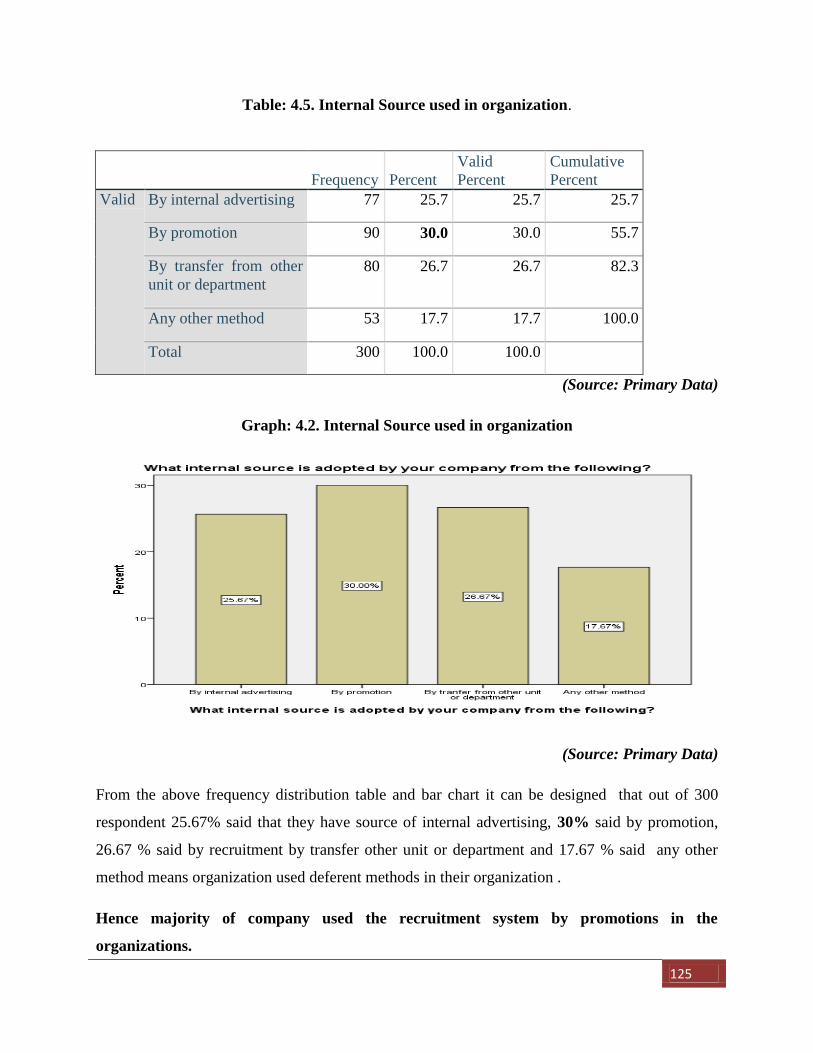
125
Table: 4.5. Internal Source used in organization.
Frequency Percent
Valid
Percent
Cumulative
Percent
Valid By internal advertising 77 25.7 25.7 25.7
By promotion 90 30.0 30.0 55.7
By transfer from other
unit or department
80 26.7 26.7 82.3
Any other method 53 17.7 17.7 100.0
Total 300 100.0 100.0
(Source: Primary Data)
Graph: 4.2. Internal Source used in organization
(Source: Primary Data)
From the above frequency distribution table and bar chart it can be designed that out of 300
respondent 25.67% said that they have source of internal advertising, 30% said by promotion,
26.67 % said by recruitment by transfer other unit or department and 17.67 % said any other
method means organization used deferent methods in their organization .
Hence majority of company used the recruitment system by promotions in the
organizations.
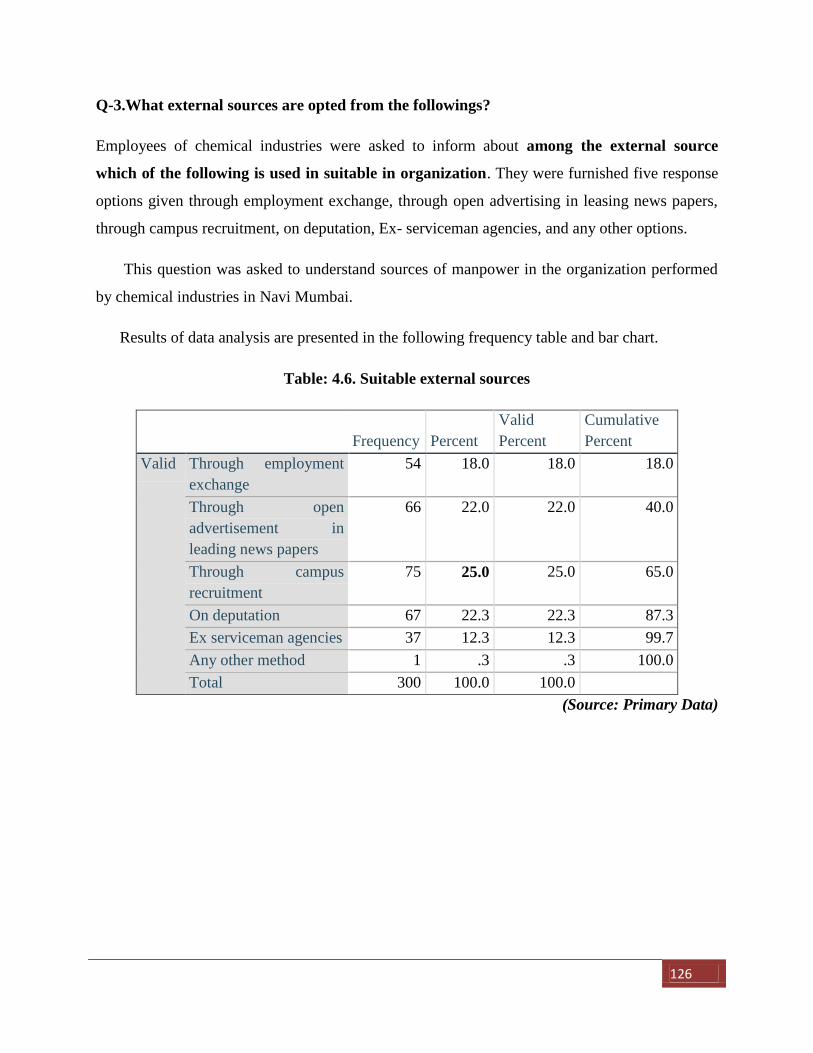
126
Q-3.What external sources are opted from the followings?
Employees of chemical industries were asked to inform about among the external source
which of the following is used in suitable in organization. They were furnished five response
options given through employment exchange, through open advertising in leasing news papers,
through campus recruitment, on deputation, Ex- serviceman agencies, and any other options.
This question was asked to understand sources of manpower in the organization performed
by chemical industries in Navi Mumbai.
Results of data analysis are presented in the following frequency table and bar chart.
Table: 4.6. Suitable external sources
Frequency Percent
Valid
Percent
Cumulative
Percent
Valid Through employment
exchange
54 18.0 18.0 18.0
Through open
advertisement in
leading news papers
66 22.0 22.0 40.0
Through campus
recruitment
75 25.0 25.0 65.0
On deputation 67 22.3 22.3 87.3
Ex serviceman agencies 37 12.3 12.3 99.7
Any other method 1 .3 .3 100.0
Total 300 100.0 100.0
(Source: Primary Data)
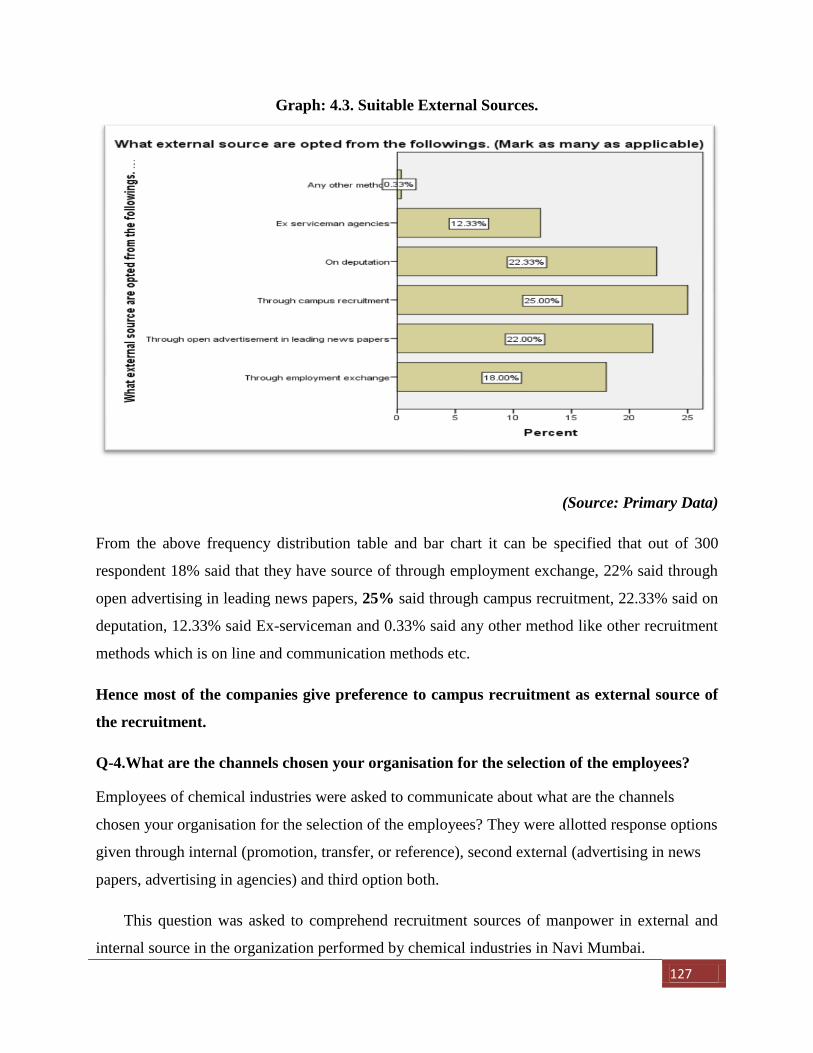
127
Graph: 4.3. Suitable External Sources.
(Source: Primary Data)
From the above frequency distribution table and bar chart it can be specified that out of 300
respondent 18% said that they have source of through employment exchange, 22% said through
open advertising in leading news papers, 25% said through campus recruitment, 22.33% said on
deputation, 12.33% said Ex-serviceman and 0.33% said any other method like other recruitment
methods which is on line and communication methods etc.
Hence most of the companies give preference to campus recruitment as external source of
the recruitment.
Q-4.What are the channels chosen your organisation for the selection of the employees?
Employees of chemical industries were asked to communicate about what are the channels
chosen your organisation for the selection of the employees? They were allotted response options
given through internal (promotion, transfer, or reference), second external (advertising in news
papers, advertising in agencies) and third option both.
This question was asked to comprehend recruitment sources of manpower in external and
internal source in the organization performed by chemical industries in Navi Mumbai.
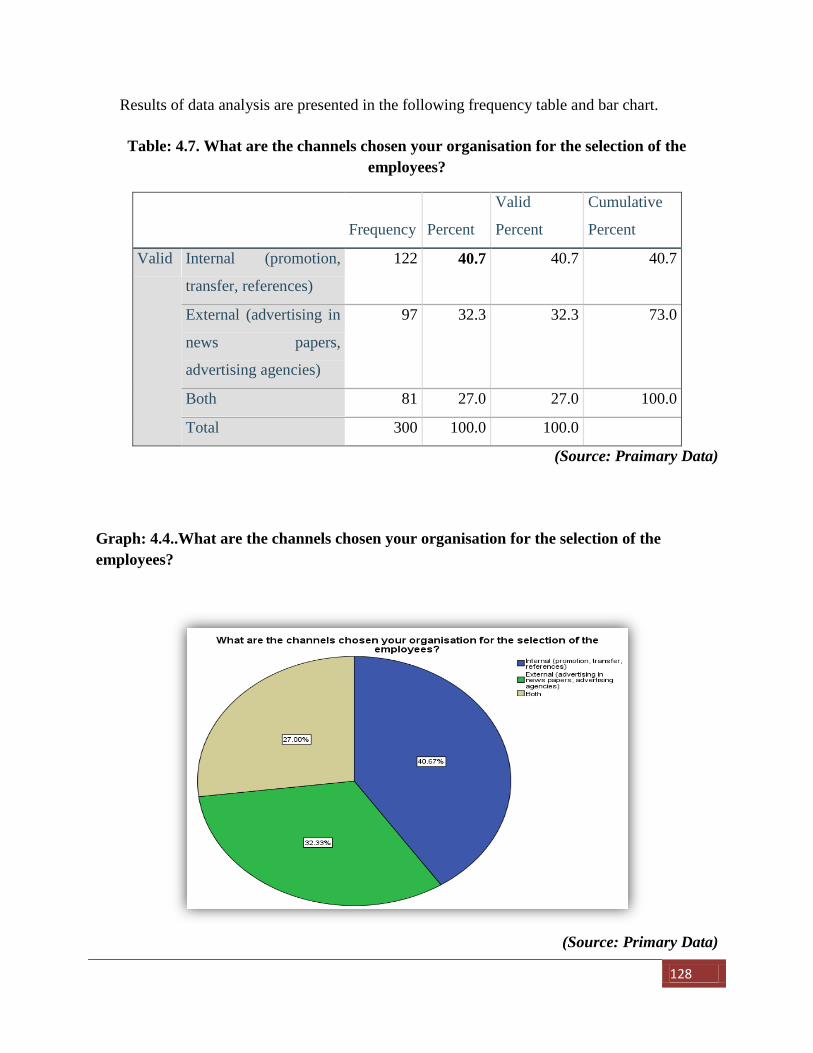
128
Results of data analysis are presented in the following frequency table and bar chart.
Table: 4.7. What are the channels chosen your organisation for the selection of the
employees?
Frequency Percent
Valid
Percent
Cumulative
Percent
Valid Internal (promotion,
transfer, references)
122 40.7 40.7 40.7
External (advertising in
news papers,
advertising agencies)
97 32.3 32.3 73.0
Both 81 27.0 27.0 100.0
Total 300 100.0 100.0
(Source: Praimary Data)
Graph: 4.4..What are the channels chosen your organisation for the selection of the
employees?
(Source: Primary Data)
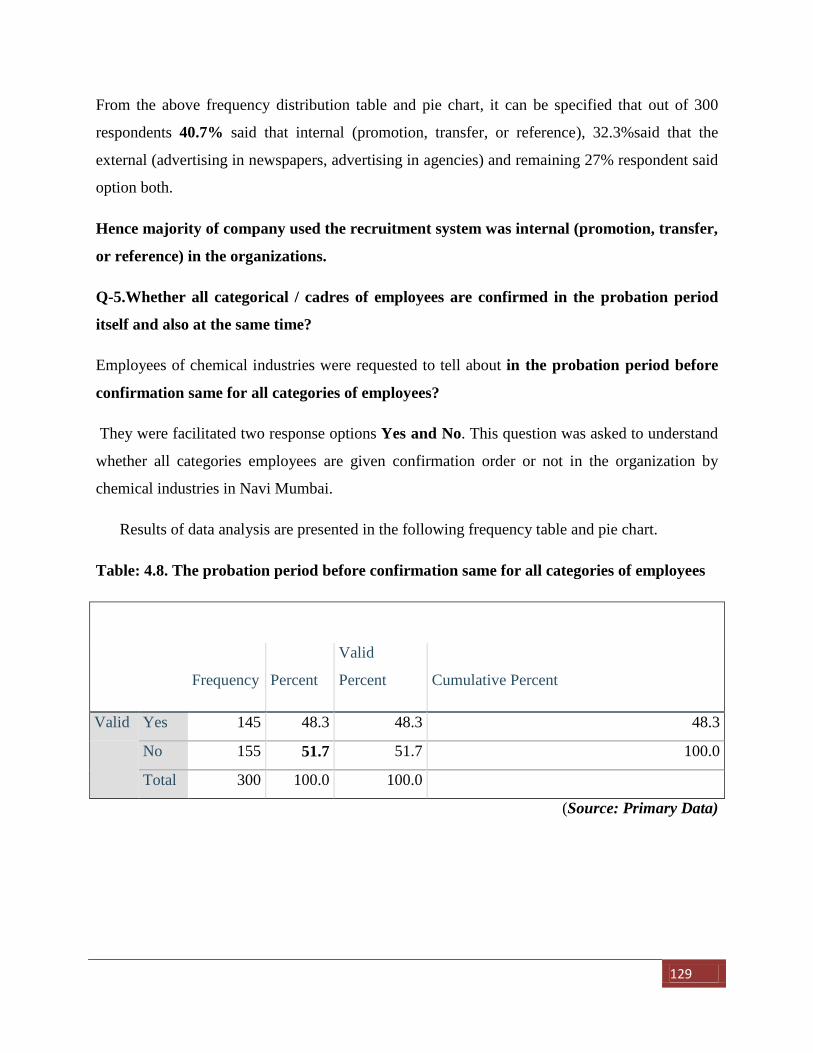
129
From the above frequency distribution table and pie chart, it can be specified that out of 300
respondents 40.7% said that internal (promotion, transfer, or reference), 32.3%said that the
external (advertising in newspapers, advertising in agencies) and remaining 27% respondent said
option both.
Hence majority of company used the recruitment system was internal (promotion, transfer,
or reference) in the organizations.
Q-5.Whether all categorical / cadres of employees are confirmed in the probation period
itself and also at the same time?
Employees of chemical industries were requested to tell about in the probation period before
confirmation same for all categories of employees?
They were facilitated two response options Yes and No. This question was asked to understand
whether all categories employees are given confirmation order or not in the organization by
chemical industries in Navi Mumbai.
Results of data analysis are presented in the following frequency table and pie chart.
Table: 4.8. The probation period before confirmation same for all categories of employees
Frequency Percent
Valid
Percent Cumulative Percent
Valid Yes 145 48.3 48.3 48.3
No 155 51.7 51.7 100.0
Total 300 100.0 100.0
(Source: Primary Data)
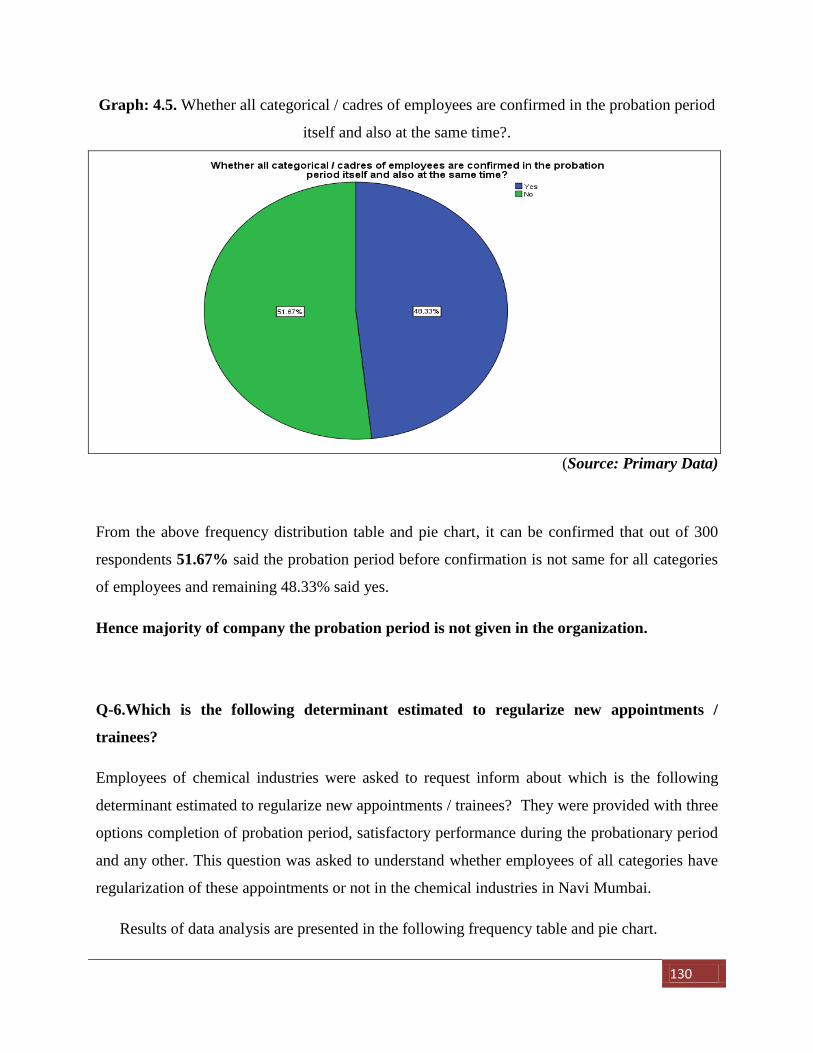
130
Graph: 4.5. Whether all categorical / cadres of employees are confirmed in the probation period
itself and also at the same time?.
(Source: Primary Data)
From the above frequency distribution table and pie chart, it can be confirmed that out of 300
respondents 51.67% said the probation period before confirmation is not same for all categories
of employees and remaining 48.33% said yes.
Hence majority of company the probation period is not given in the organization.
Q-6.Which is the following determinant estimated to regularize new appointments /
trainees?
Employees of chemical industries were asked to request inform about which is the following
determinant estimated to regularize new appointments / trainees? They were provided with three
options completion of probation period, satisfactory performance during the probationary period
and any other. This question was asked to understand whether employees of all categories have
regularization of these appointments or not in the chemical industries in Navi Mumbai.
Results of data analysis are presented in the following frequency table and pie chart.
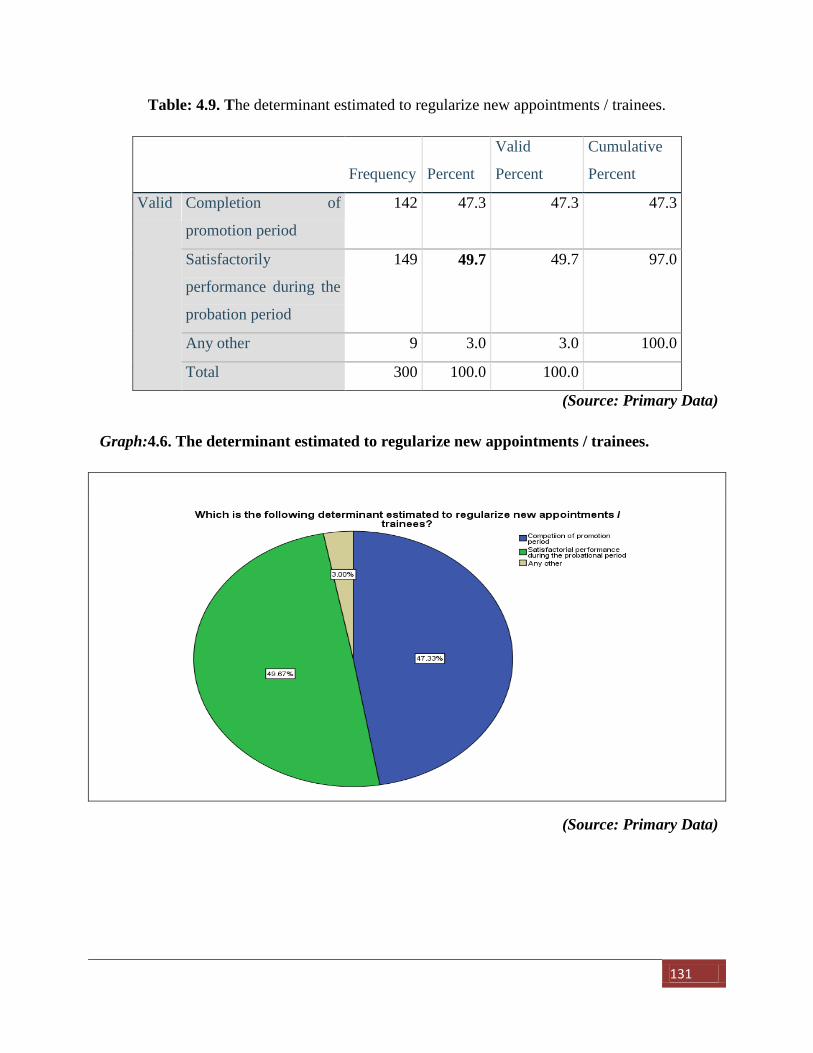
131
Table: 4.9. The determinant estimated to regularize new appointments / trainees.
Frequency Percent
Valid
Percent
Cumulative
Percent
Valid Completion of
promotion period
142 47.3 47.3 47.3
Satisfactorily
performance during the
probation period
149 49.7 49.7 97.0
Any other 9 3.0 3.0 100.0
Total 300 100.0 100.0
(Source: Primary Data)
Graph:4.6. The determinant estimated to regularize new appointments / trainees.
(Source: Primary Data)
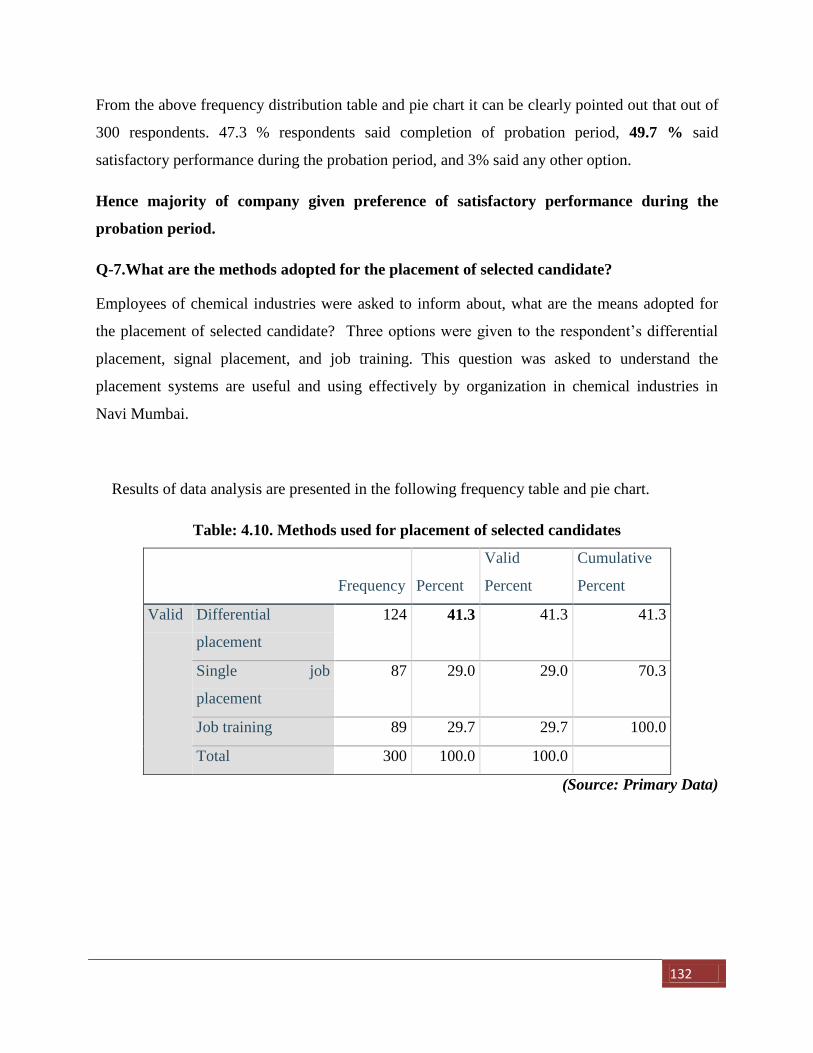
132
From the above frequency distribution table and pie chart it can be clearly pointed out that out of
300 respondents. 47.3 % respondents said completion of probation period, 49.7 % said
satisfactory performance during the probation period, and 3% said any other option.
Hence majority of company given preference of satisfactory performance during the
probation period.
Q-7.What are the methods adopted for the placement of selected candidate?
Employees of chemical industries were asked to inform about, what are the means adopted for
the placement of selected candidate? Three options were given to the respondent’s differential
placement, signal placement, and job training. This question was asked to understand the
placement systems are useful and using effectively by organization in chemical industries in
Navi Mumbai.
Results of data analysis are presented in the following frequency table and pie chart.
Table: 4.10. Methods used for placement of selected candidates
Frequency Percent
Valid
Percent
Cumulative
Percent
Valid Differential
placement
124 41.3 41.3 41.3
Single job
placement
87 29.0 29.0 70.3
Job training 89 29.7 29.7 100.0
Total 300 100.0 100.0
(Source: Primary Data)
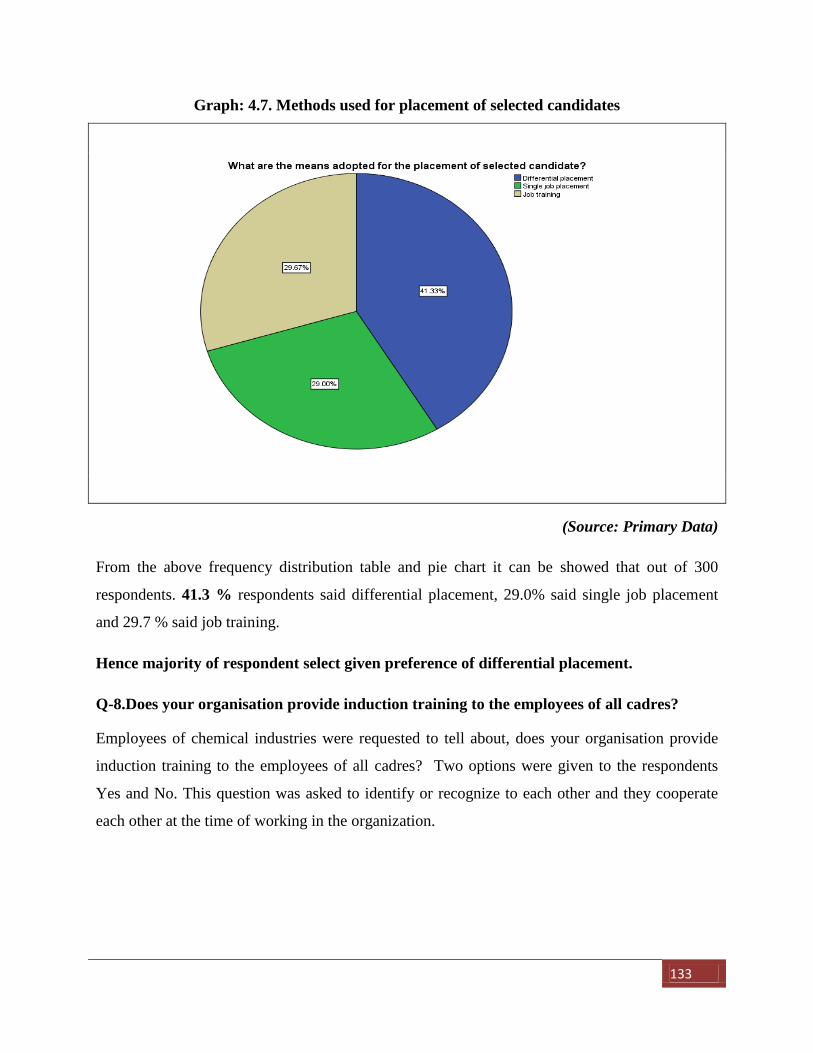
133
Graph: 4.7. Methods used for placement of selected candidates
(Source: Primary Data)
From the above frequency distribution table and pie chart it can be showed that out of 300
respondents. 41.3 % respondents said differential placement, 29.0% said single job placement
and 29.7 % said job training.
Hence majority of respondent select given preference of differential placement.
Q-8.Does your organisation provide induction training to the employees of all cadres?
Employees of chemical industries were requested to tell about, does your organisation provide
induction training to the employees of all cadres? Two options were given to the respondents
Yes and No. This question was asked to identify or recognize to each other and they cooperate
each other at the time of working in the organization.
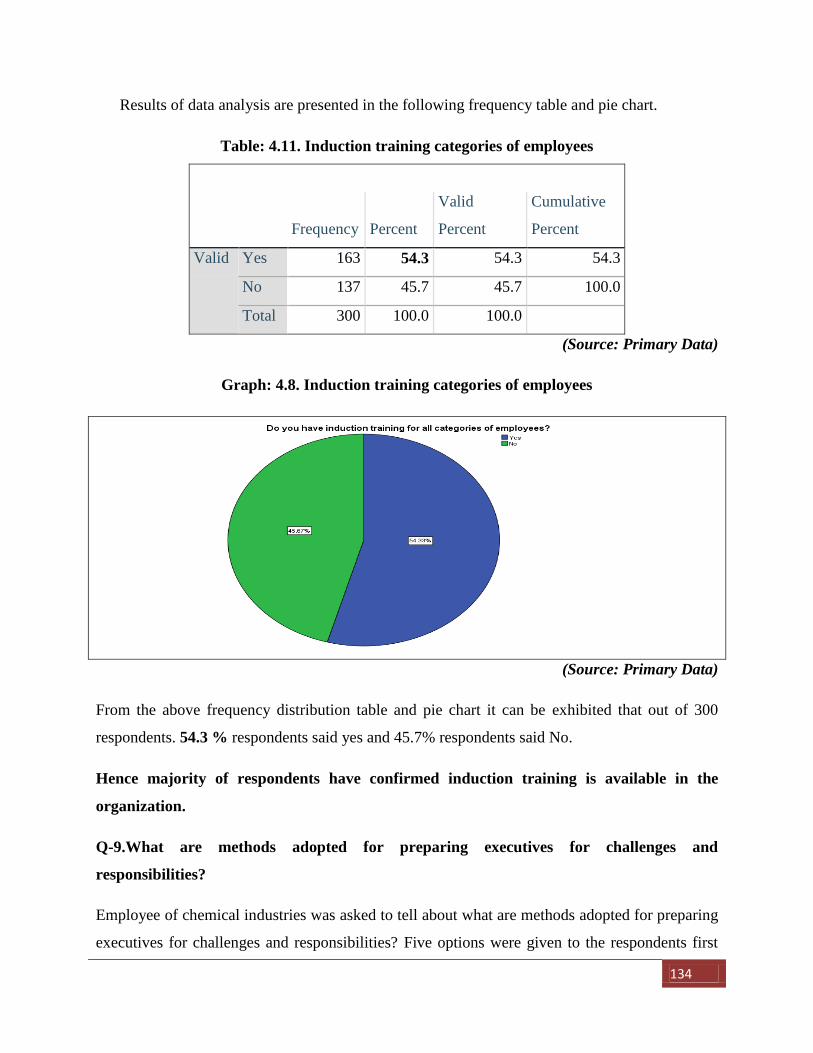
134
Results of data analysis are presented in the following frequency table and pie chart.
Table: 4.11. Induction training categories of employees
Frequency Percent
Valid
Percent
Cumulative
Percent
Valid Yes 163 54.3 54.3 54.3
No 137 45.7 45.7 100.0
Total 300 100.0 100.0
(Source: Primary Data)
Graph: 4.8. Induction training categories of employees
(Source: Primary Data)
From the above frequency distribution table and pie chart it can be exhibited that out of 300
respondents. 54.3 % respondents said yes and 45.7% respondents said No.
Hence majority of respondents have confirmed induction training is available in the
organization.
Q-9.What are methods adopted for preparing executives for challenges and
responsibilities?
Employee of chemical industries was asked to tell about what are methods adopted for preparing
executives for challenges and responsibilities? Five options were given to the respondents first
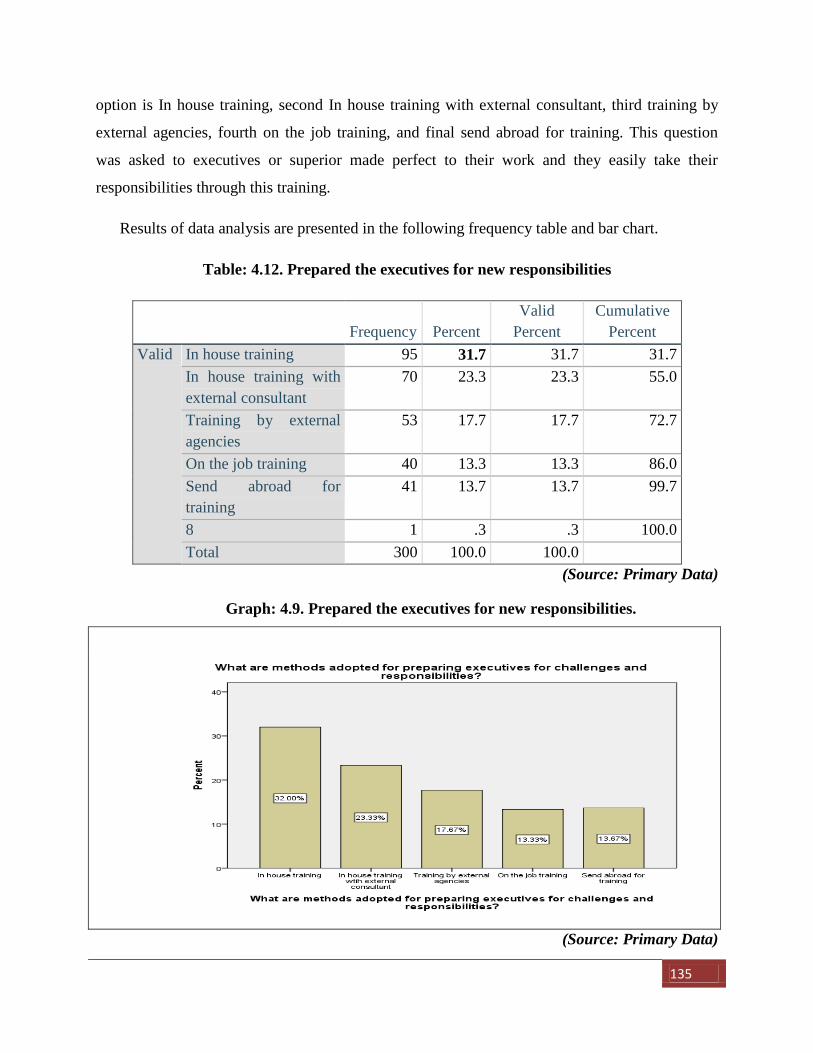
135
option is In house training, second In house training with external consultant, third training by
external agencies, fourth on the job training, and final send abroad for training. This question
was asked to executives or superior made perfect to their work and they easily take their
responsibilities through this training.
Results of data analysis are presented in the following frequency table and bar chart.
Table: 4.12. Prepared the executives for new responsibilities
Frequency Percent
Valid
Percent
Cumulative
Percent
Valid In house training 95 31.7 31.7 31.7
In house training with
external consultant
70 23.3 23.3 55.0
Training by external
agencies
53 17.7 17.7 72.7
On the job training 40 13.3 13.3 86.0
Send abroad for
training
41 13.7 13.7 99.7
8 1 .3 .3 100.0
Total 300 100.0 100.0
(Source: Primary Data)
Graph: 4.9. Prepared the executives for new responsibilities.
(Source: Primary Data)
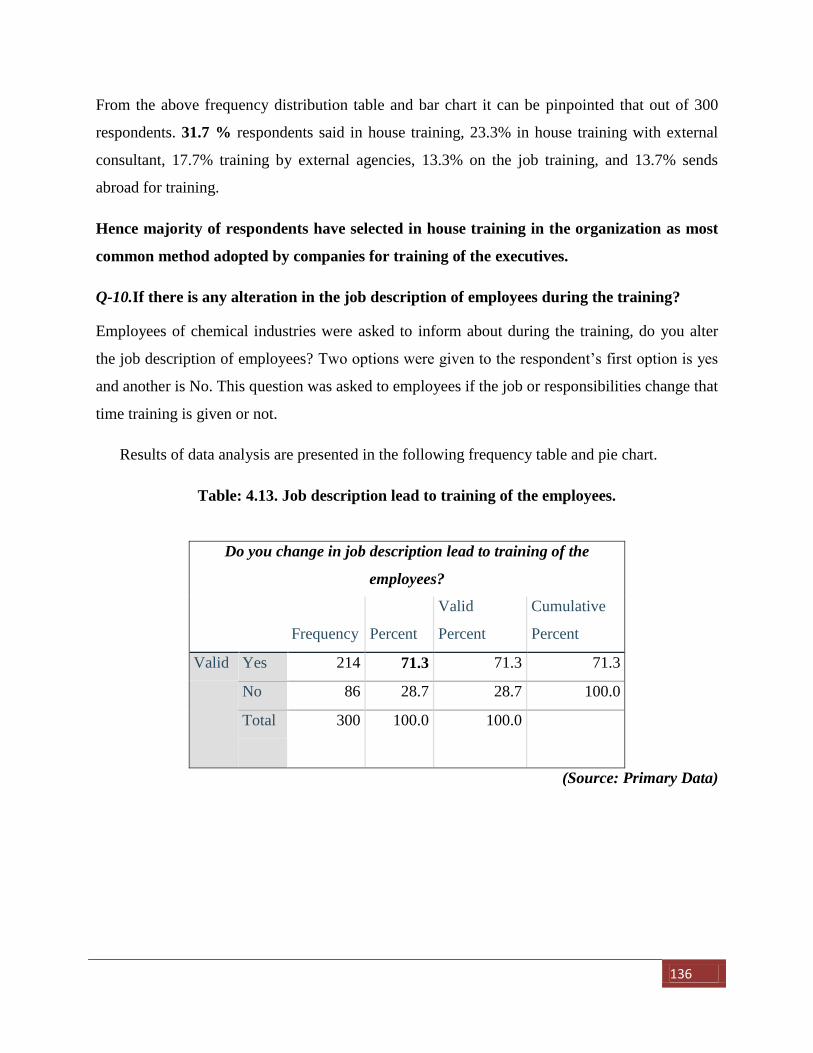
136
From the above frequency distribution table and bar chart it can be pinpointed that out of 300
respondents. 31.7 % respondents said in house training, 23.3% in house training with external
consultant, 17.7% training by external agencies, 13.3% on the job training, and 13.7% sends
abroad for training.
Hence majority of respondents have selected in house training in the organization as most
common method adopted by companies for training of the executives.
Q-10.If there is any alteration in the job description of employees during the training?
Employees of chemical industries were asked to inform about during the training, do you alter
the job description of employees? Two options were given to the respondent’s first option is yes
and another is No. This question was asked to employees if the job or responsibilities change that
time training is given or not.
Results of data analysis are presented in the following frequency table and pie chart.
Table: 4.13. Job description lead to training of the employees.
Do you change in job description lead to training of the
employees?
Frequency Percent
Valid
Percent
Cumulative
Percent
Valid Yes 214 71.3 71.3 71.3
No 86 28.7 28.7 100.0
Total 300 100.0 100.0
(Source: Primary Data)
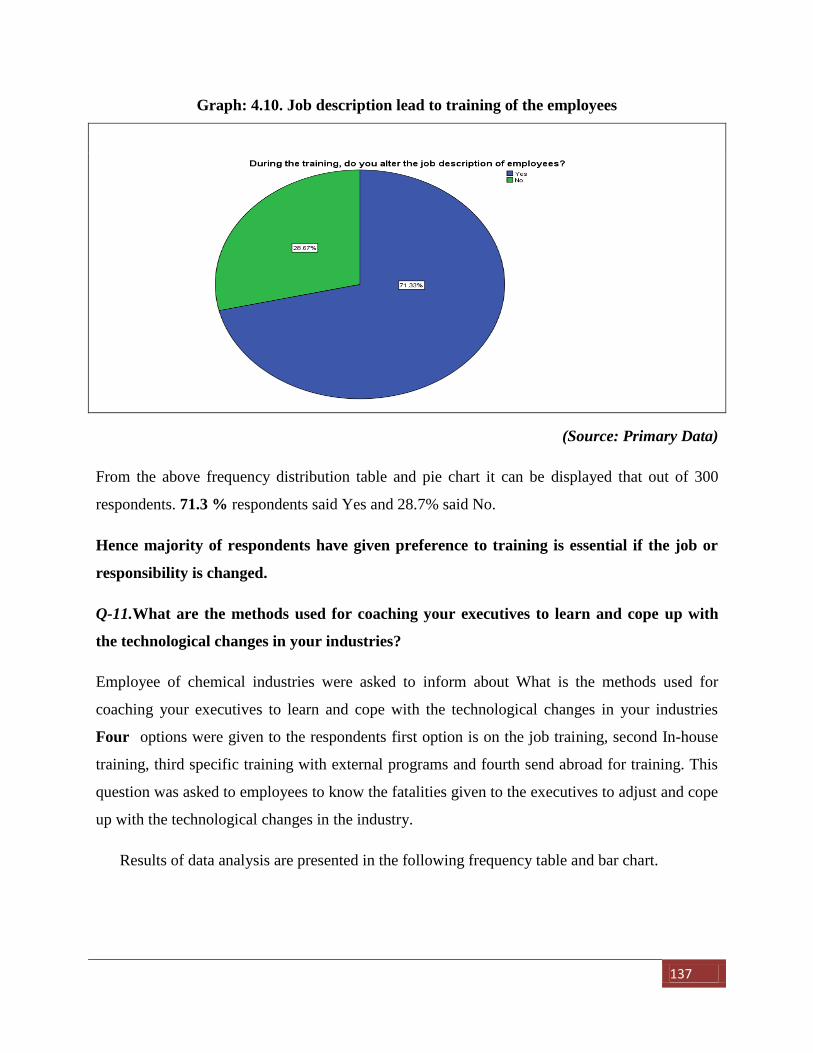
137
Graph: 4.10. Job description lead to training of the employees
(Source: Primary Data)
From the above frequency distribution table and pie chart it can be displayed that out of 300
respondents. 71.3 % respondents said Yes and 28.7% said No.
Hence majority of respondents have given preference to training is essential if the job or
responsibility is changed.
Q-11.What are the methods used for coaching your executives to learn and cope up with
the technological changes in your industries?
Employee of chemical industries were asked to inform about What is the methods used for
coaching your executives to learn and cope with the technological changes in your industries
Four options were given to the respondents first option is on the job training, second In-house
training, third specific training with external programs and fourth send abroad for training. This
question was asked to employees to know the fatalities given to the executives to adjust and cope
up with the technological changes in the industry.
Results of data analysis are presented in the following frequency table and bar chart.
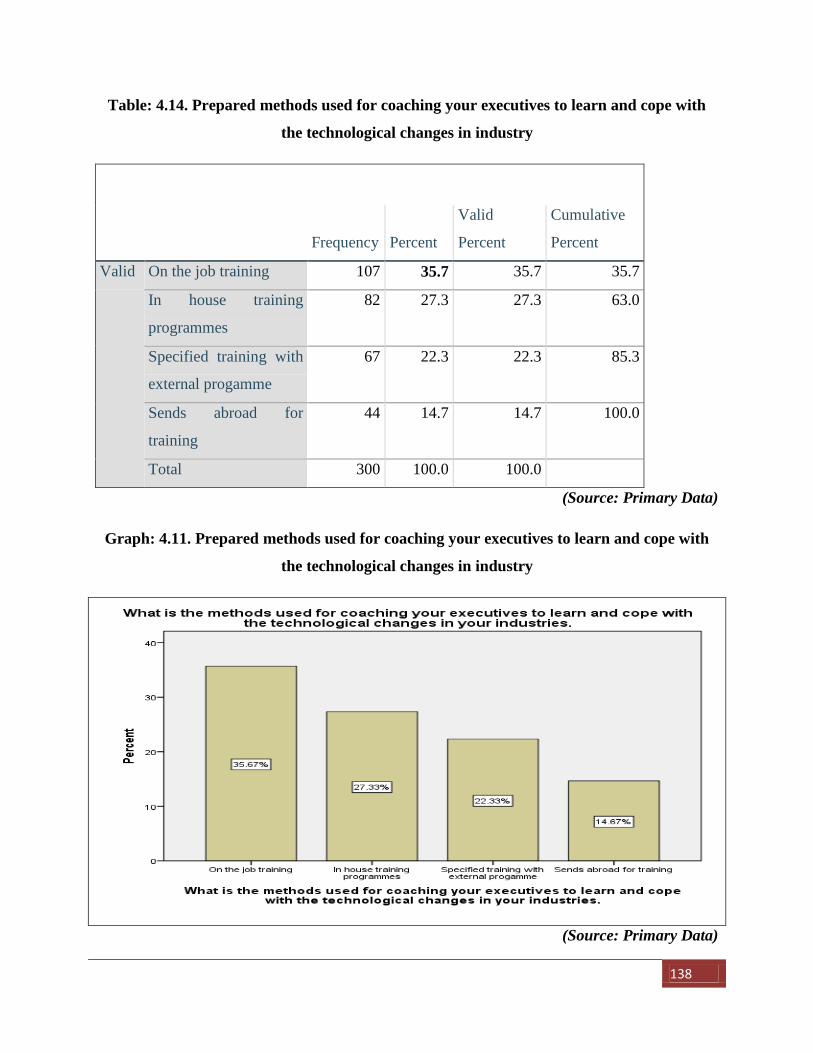
138
Table: 4.14. Prepared methods used for coaching your executives to learn and cope with
the technological changes in industry
Frequency Percent
Valid
Percent
Cumulative
Percent
Valid On the job training 107 35.7 35.7 35.7
In house training
programmes
82 27.3 27.3 63.0
Specified training with
external progamme
67 22.3 22.3 85.3
Sends abroad for
training
44 14.7 14.7 100.0
Total 300 100.0 100.0
(Source: Primary Data)
Graph: 4.11. Prepared methods used for coaching your executives to learn and cope with
the technological changes in industry
(Source: Primary Data)
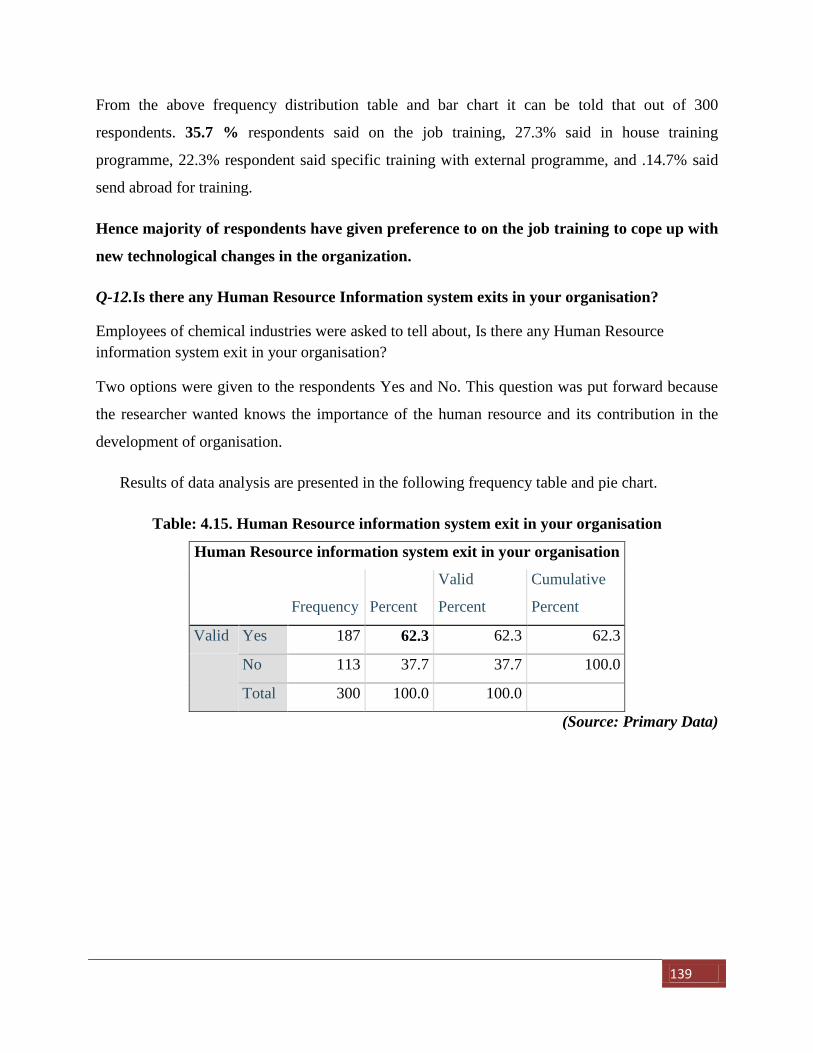
139
From the above frequency distribution table and bar chart it can be told that out of 300
respondents. 35.7 % respondents said on the job training, 27.3% said in house training
programme, 22.3% respondent said specific training with external programme, and .14.7% said
send abroad for training.
Hence majority of respondents have given preference to on the job training to cope up with
new technological changes in the organization.
Q-12.Is there any Human Resource Information system exits in your organisation?
Employees of chemical industries were asked to tell about, Is there any Human Resource
information system exit in your organisation?
Two options were given to the respondents Yes and No. This question was put forward because
the researcher wanted knows the importance of the human resource and its contribution in the
development of organisation.
Results of data analysis are presented in the following frequency table and pie chart.
Table: 4.15. Human Resource information system exit in your organisation
Human Resource information system exit in your organisation
Frequency Percent
Valid
Percent
Cumulative
Percent
Valid Yes 187 62.3 62.3 62.3
No 113 37.7 37.7 100.0
Total 300 100.0 100.0
(Source: Primary Data)
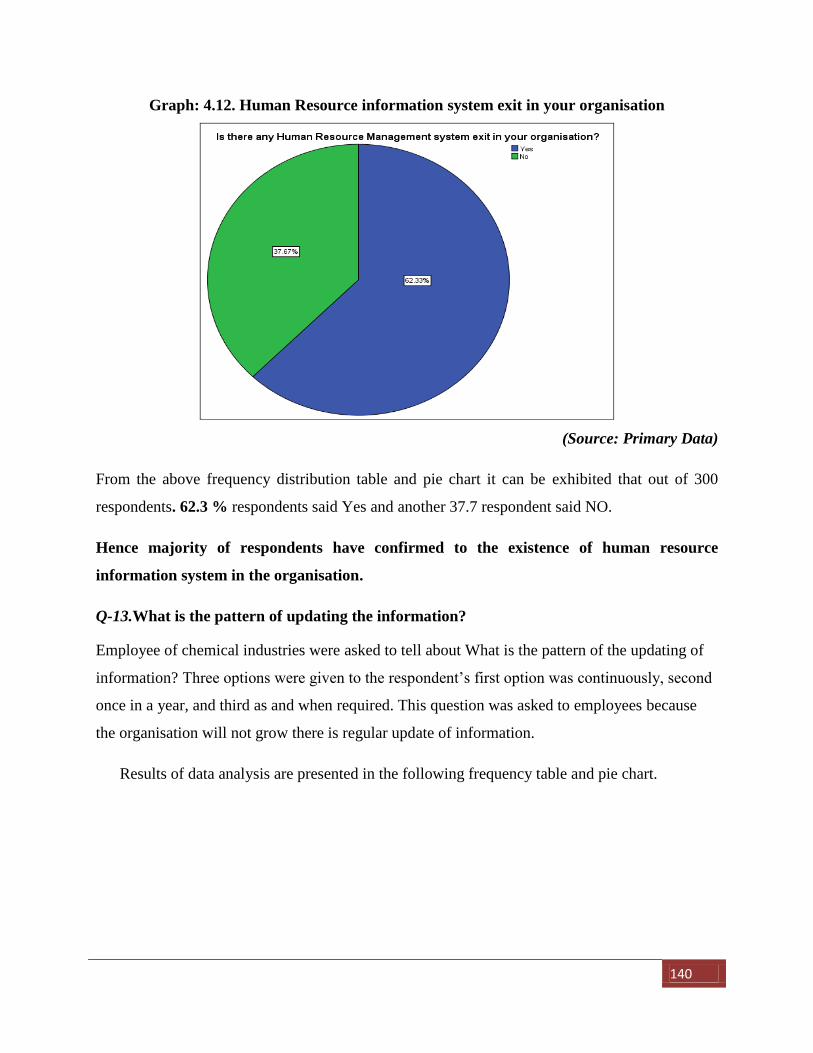
140
Graph: 4.12. Human Resource information system exit in your organisation
(Source: Primary Data)
From the above frequency distribution table and pie chart it can be exhibited that out of 300
respondents. 62.3 % respondents said Yes and another 37.7 respondent said NO.
Hence majority of respondents have confirmed to the existence of human resource
information system in the organisation.
Q-13.What is the pattern of updating the information?
Employee of chemical industries were asked to tell about What is the pattern of the updating of
information? Three options were given to the respondent’s first option was continuously, second
once in a year, and third as and when required. This question was asked to employees because
the organisation will not grow there is regular update of information.
Results of data analysis are presented in the following frequency table and pie chart.
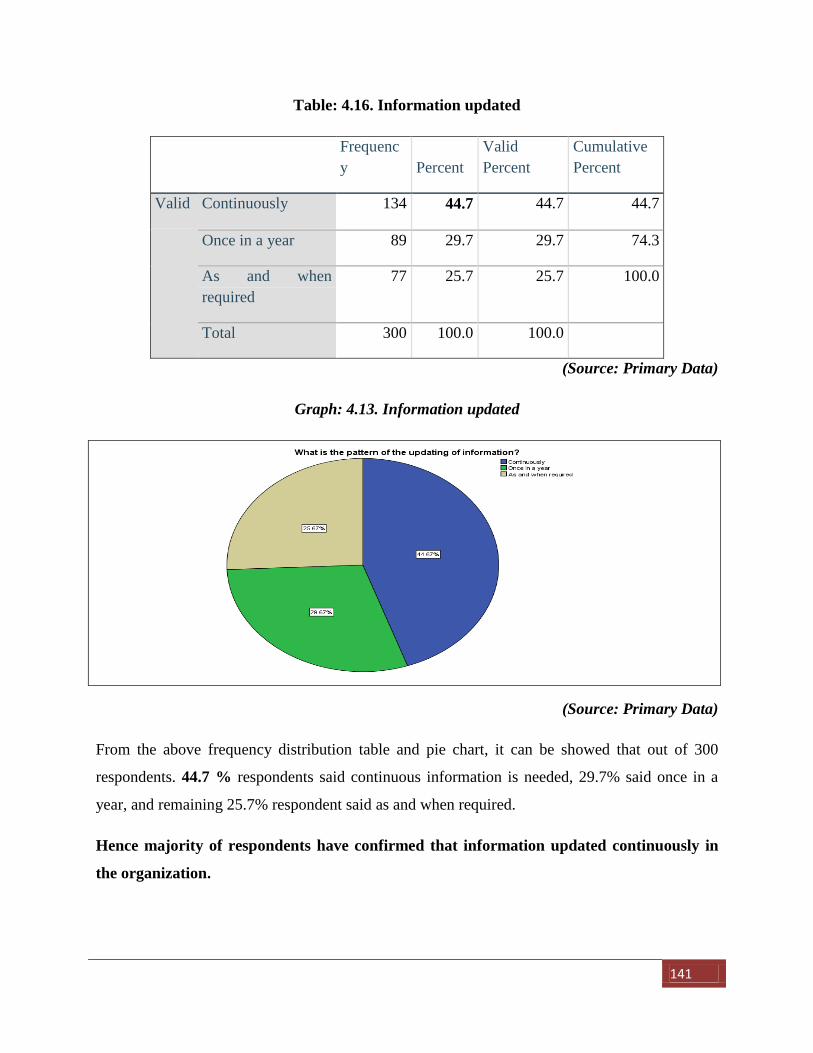
141
Table: 4.16. Information updated
Frequenc
y Percent
Valid
Percent
Cumulative
Percent
Valid Continuously 134 44.7 44.7 44.7
Once in a year 89 29.7 29.7 74.3
As and when
required
77 25.7 25.7 100.0
Total 300 100.0 100.0
(Source: Primary Data)
Graph: 4.13. Information updated
(Source: Primary Data)
From the above frequency distribution table and pie chart, it can be showed that out of 300
respondents. 44.7 % respondents said continuous information is needed, 29.7% said once in a
year, and remaining 25.7% respondent said as and when required.
Hence majority of respondents have confirmed that information updated continuously in
the organization.
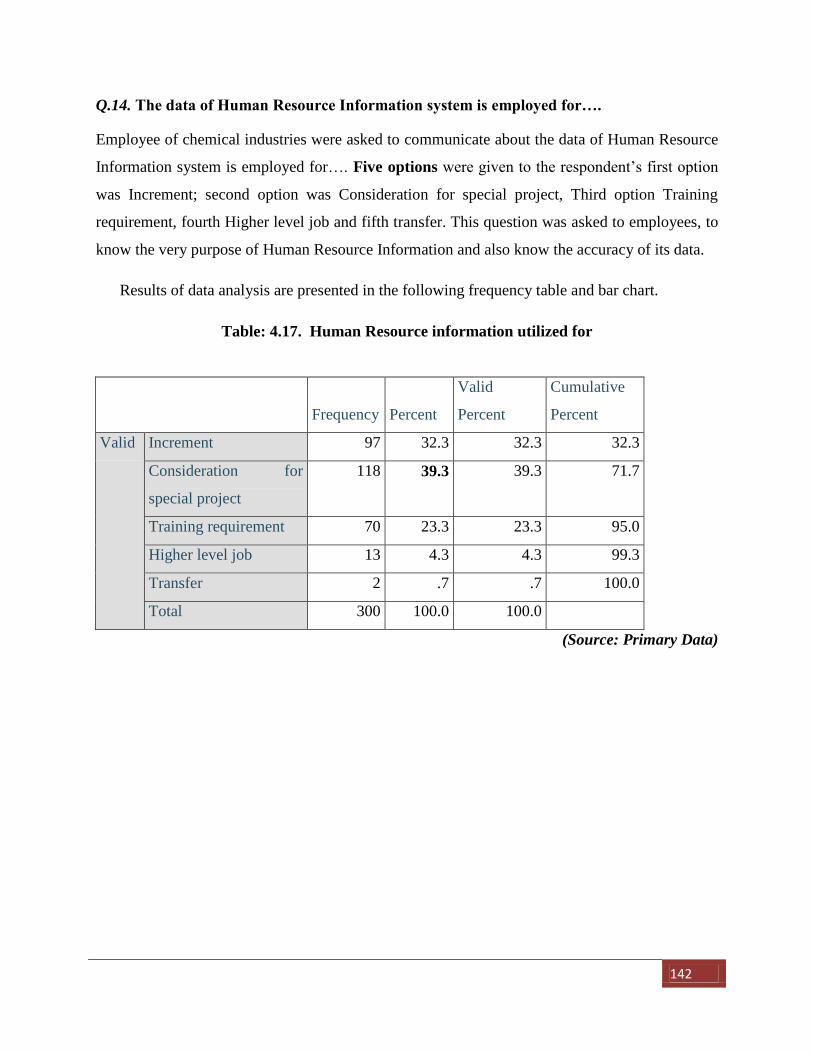
142
Q.14. The data of Human Resource Information system is employed for….
Employee of chemical industries were asked to communicate about the data of Human Resource
Information system is employed for…. Five options were given to the respondent’s first option
was Increment; second option was Consideration for special project, Third option Training
requirement, fourth Higher level job and fifth transfer. This question was asked to employees, to
know the very purpose of Human Resource Information and also know the accuracy of its data.
Results of data analysis are presented in the following frequency table and bar chart.
Table: 4.17. Human Resource information utilized for
Frequency Percent
Valid
Percent
Cumulative
Percent
Valid Increment 97 32.3 32.3 32.3
Consideration for
special project
118 39.3 39.3 71.7
Training requirement 70 23.3 23.3 95.0
Higher level job 13 4.3 4.3 99.3
Transfer 2 .7 .7 100.0
Total 300 100.0 100.0
(Source: Primary Data)
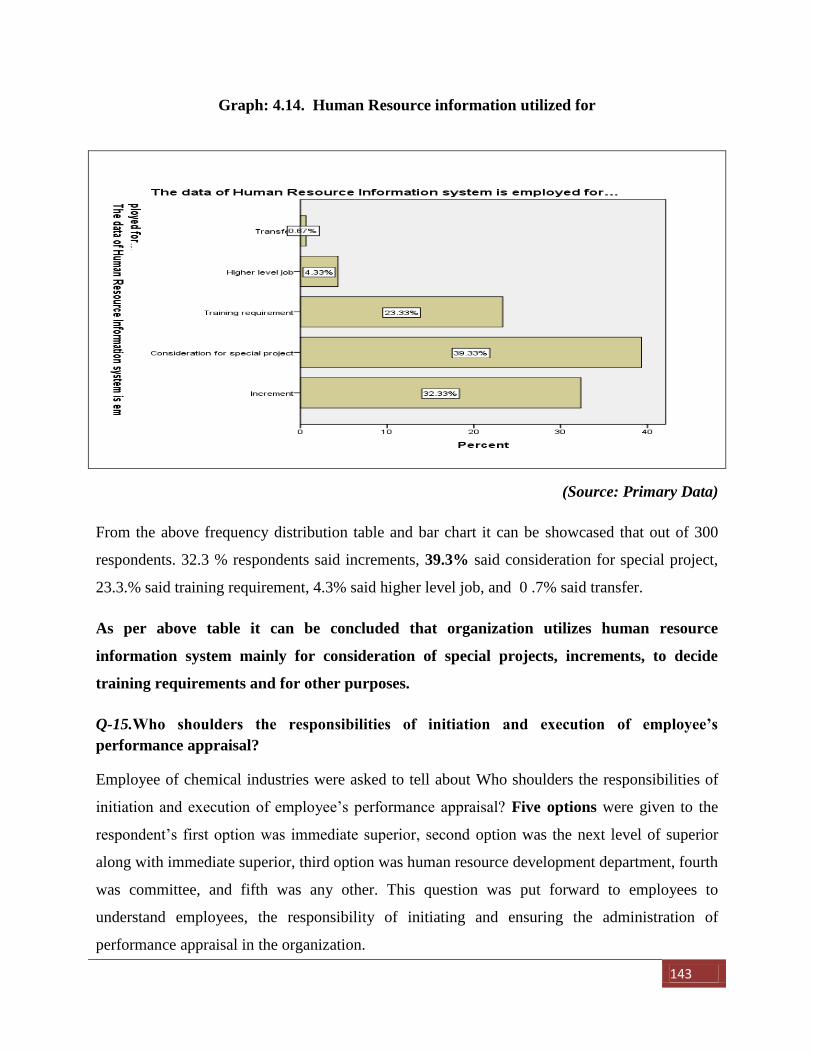
143
Graph: 4.14. Human Resource information utilized for
(Source: Primary Data)
From the above frequency distribution table and bar chart it can be showcased that out of 300
respondents. 32.3 % respondents said increments, 39.3% said consideration for special project,
23.3.% said training requirement, 4.3% said higher level job, and 0 .7% said transfer.
As per above table it can be concluded that organization utilizes human resource
information system mainly for consideration of special projects, increments, to decide
training requirements and for other purposes.
Q-15.Who shoulders the responsibilities of initiation and execution of employee’s
performance appraisal?
Employee of chemical industries were asked to tell about Who shoulders the responsibilities of
initiation and execution of employee’s performance appraisal? Five options were given to the
respondent’s first option was immediate superior, second option was the next level of superior
along with immediate superior, third option was human resource development department, fourth
was committee, and fifth was any other. This question was put forward to employees to
understand employees, the responsibility of initiating and ensuring the administration of
performance appraisal in the organization.
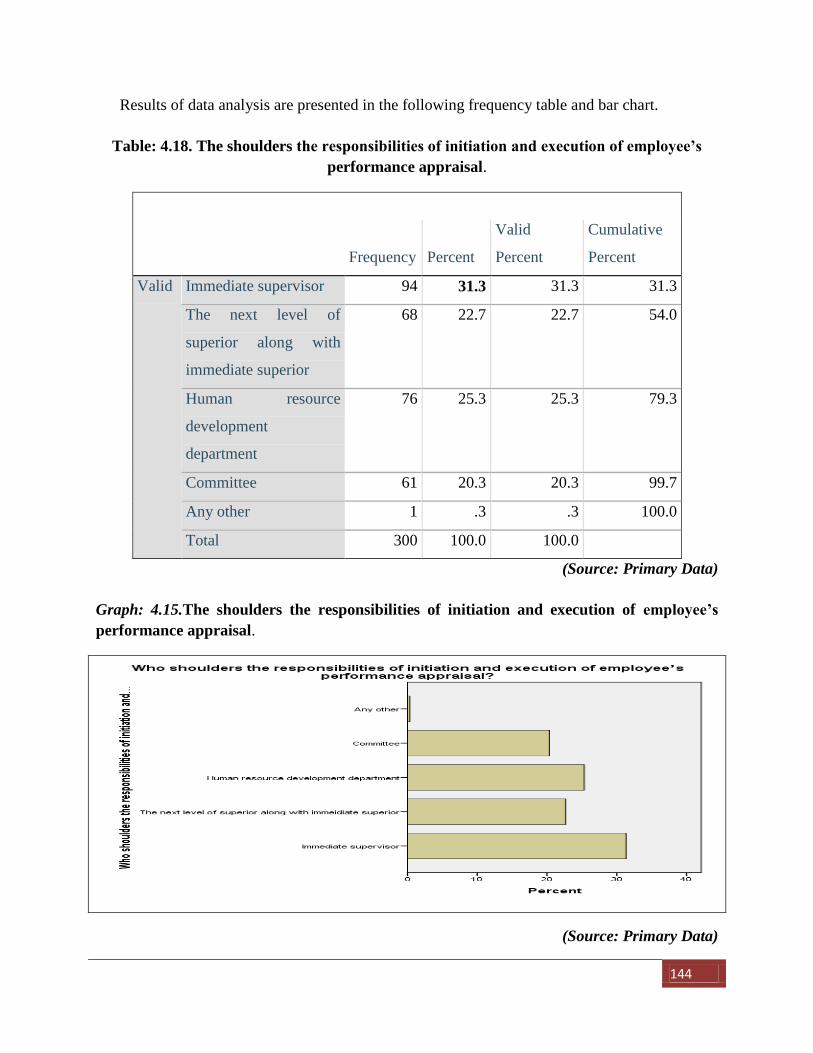
144
Results of data analysis are presented in the following frequency table and bar chart.
Table: 4.18. The shoulders the responsibilities of initiation and execution of employee’s
performance appraisal.
Frequency Percent
Valid
Percent
Cumulative
Percent
Valid Immediate supervisor 94 31.3 31.3 31.3
The next level of
superior along with
immediate superior
68 22.7 22.7 54.0
Human resource
development
department
76 25.3 25.3 79.3
Committee 61 20.3 20.3 99.7
Any other 1 .3 .3 100.0
Total 300 100.0 100.0
(Source: Primary Data)
Graph: 4.15.The shoulders the responsibilities of initiation and execution of employee’s
performance appraisal.
(Source: Primary Data)
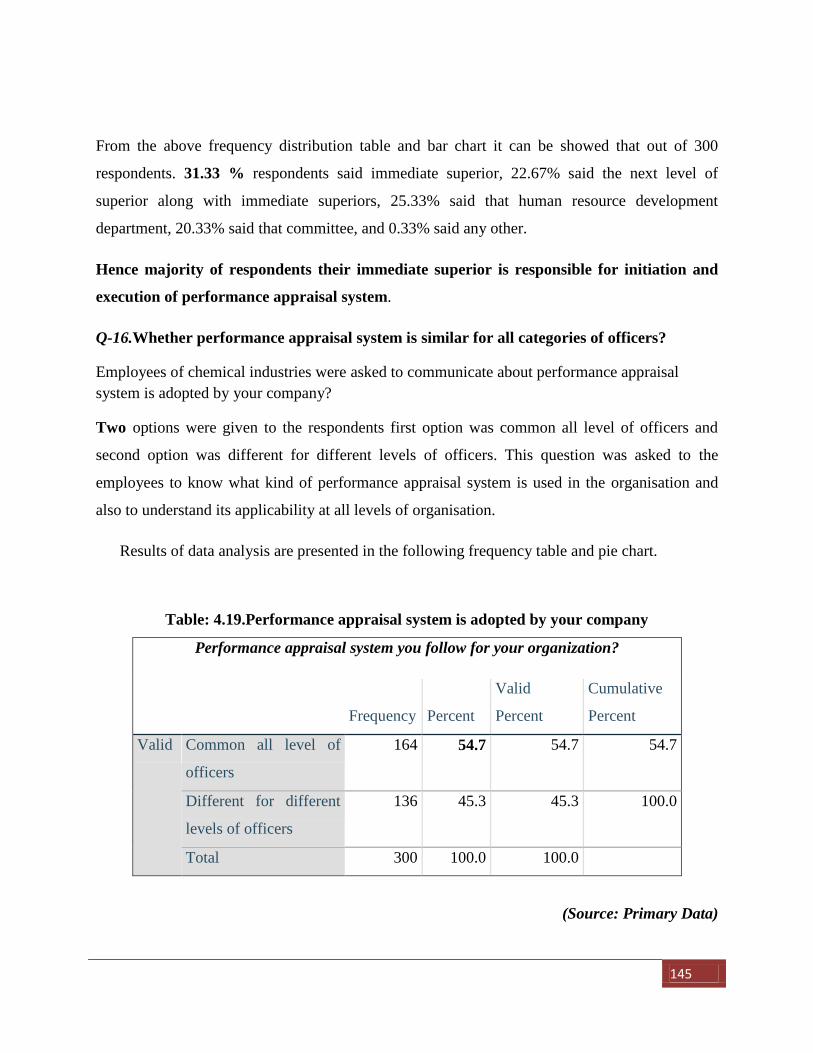
145
From the above frequency distribution table and bar chart it can be showed that out of 300
respondents. 31.33 % respondents said immediate superior, 22.67% said the next level of
superior along with immediate superiors, 25.33% said that human resource development
department, 20.33% said that committee, and 0.33% said any other.
Hence majority of respondents their immediate superior is responsible for initiation and
execution of performance appraisal system.
Q-16.Whether performance appraisal system is similar for all categories of officers?
Employees of chemical industries were asked to communicate about performance appraisal
system is adopted by your company?
Two options were given to the respondents first option was common all level of officers and
second option was different for different levels of officers. This question was asked to the
employees to know what kind of performance appraisal system is used in the organisation and
also to understand its applicability at all levels of organisation.
Results of data analysis are presented in the following frequency table and pie chart.
Table: 4.19.Performance appraisal system is adopted by your company
Performance appraisal system you follow for your organization?
Frequency Percent
Valid
Percent
Cumulative
Percent
Valid Common all level of
officers
164 54.7 54.7 54.7
Different for different
levels of officers
136 45.3 45.3 100.0
Total 300 100.0 100.0
(Source: Primary Data)
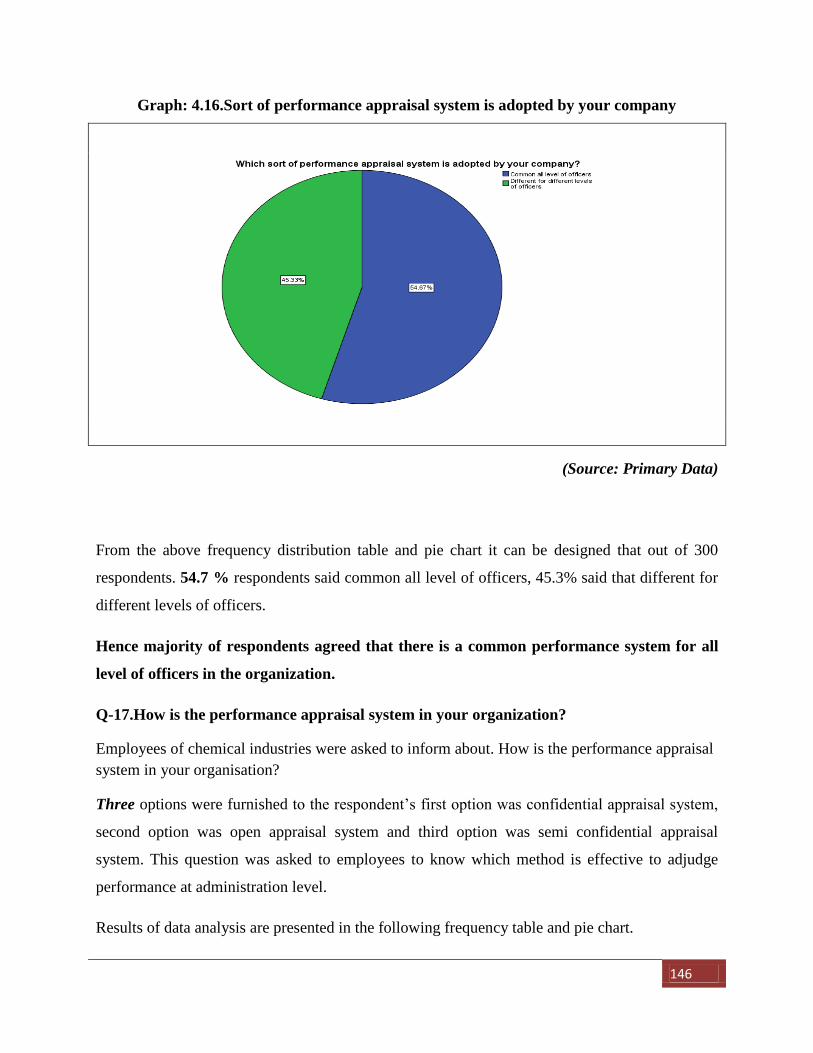
146
Graph: 4.16.Sort of performance appraisal system is adopted by your company
(Source: Primary Data)
From the above frequency distribution table and pie chart it can be designed that out of 300
respondents. 54.7 % respondents said common all level of officers, 45.3% said that different for
different levels of officers.
Hence majority of respondents agreed that there is a common performance system for all
level of officers in the organization.
Q-17.How is the performance appraisal system in your organization?
Employees of chemical industries were asked to inform about. How is the performance appraisal
system in your organisation?
Three options were furnished to the respondent’s first option was confidential appraisal system,
second option was open appraisal system and third option was semi confidential appraisal
system. This question was asked to employees to know which method is effective to adjudge
performance at administration level.
Results of data analysis are presented in the following frequency table and pie chart.
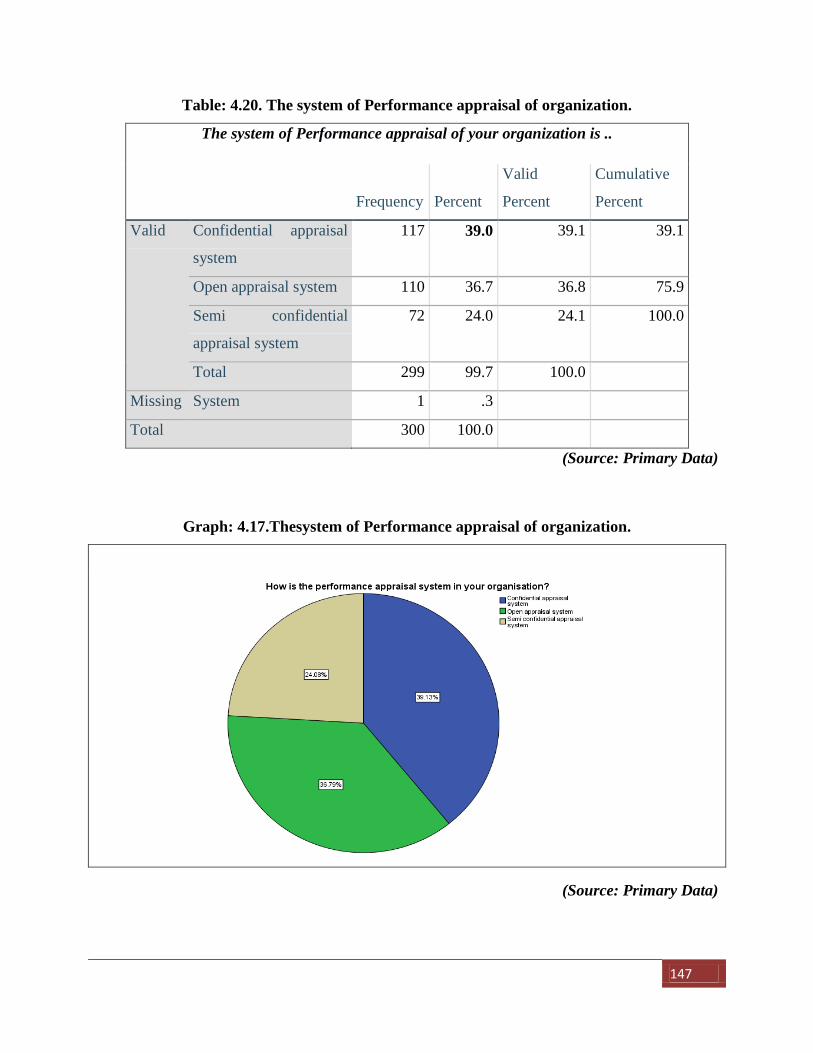
147
Table: 4.20. The system of Performance appraisal of organization.
The system of Performance appraisal of your organization is ..
Frequency Percent
Valid
Percent
Cumulative
Percent
Valid Confidential appraisal
system
117 39.0 39.1 39.1
Open appraisal system 110 36.7 36.8 75.9
Semi confidential
appraisal system
72 24.0 24.1 100.0
Total 299 99.7 100.0
Missing System 1 .3
Total 300 100.0
(Source: Primary Data)
Graph: 4.17.Thesystem of Performance appraisal of organization.
(Source: Primary Data)
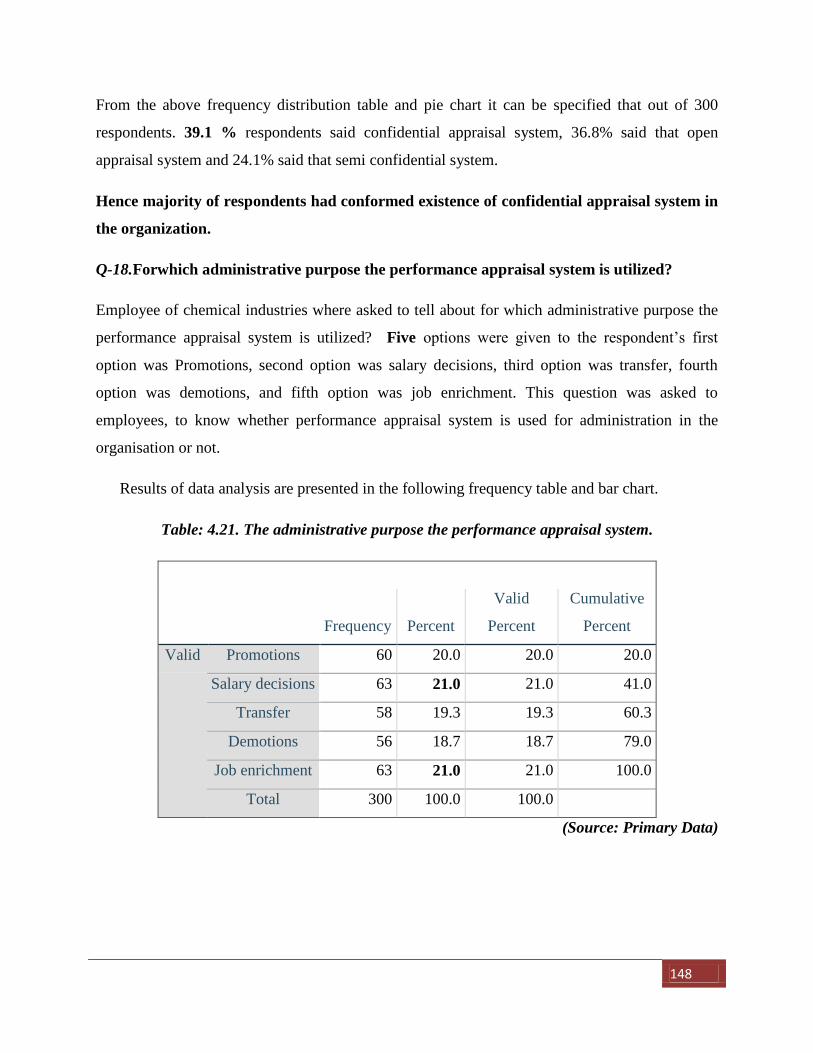
148
From the above frequency distribution table and pie chart it can be specified that out of 300
respondents. 39.1 % respondents said confidential appraisal system, 36.8% said that open
appraisal system and 24.1% said that semi confidential system.
Hence majority of respondents had conformed existence of confidential appraisal system in
the organization.
Q-18.Forwhich administrative purpose the performance appraisal system is utilized?
Employee of chemical industries where asked to tell about for which administrative purpose the
performance appraisal system is utilized? Five options were given to the respondent’s first
option was Promotions, second option was salary decisions, third option was transfer, fourth
option was demotions, and fifth option was job enrichment. This question was asked to
employees, to know whether performance appraisal system is used for administration in the
organisation or not.
Results of data analysis are presented in the following frequency table and bar chart.
Table: 4.21. The administrative purpose the performance appraisal system.
Frequency Percent
Valid
Percent
Cumulative
Percent
Valid Promotions 60 20.0 20.0 20.0
Salary decisions 63 21.0 21.0 41.0
Transfer 58 19.3 19.3 60.3
Demotions 56 18.7 18.7 79.0
Job enrichment 63 21.0 21.0 100.0
Total 300 100.0 100.0
(Source: Primary Data)
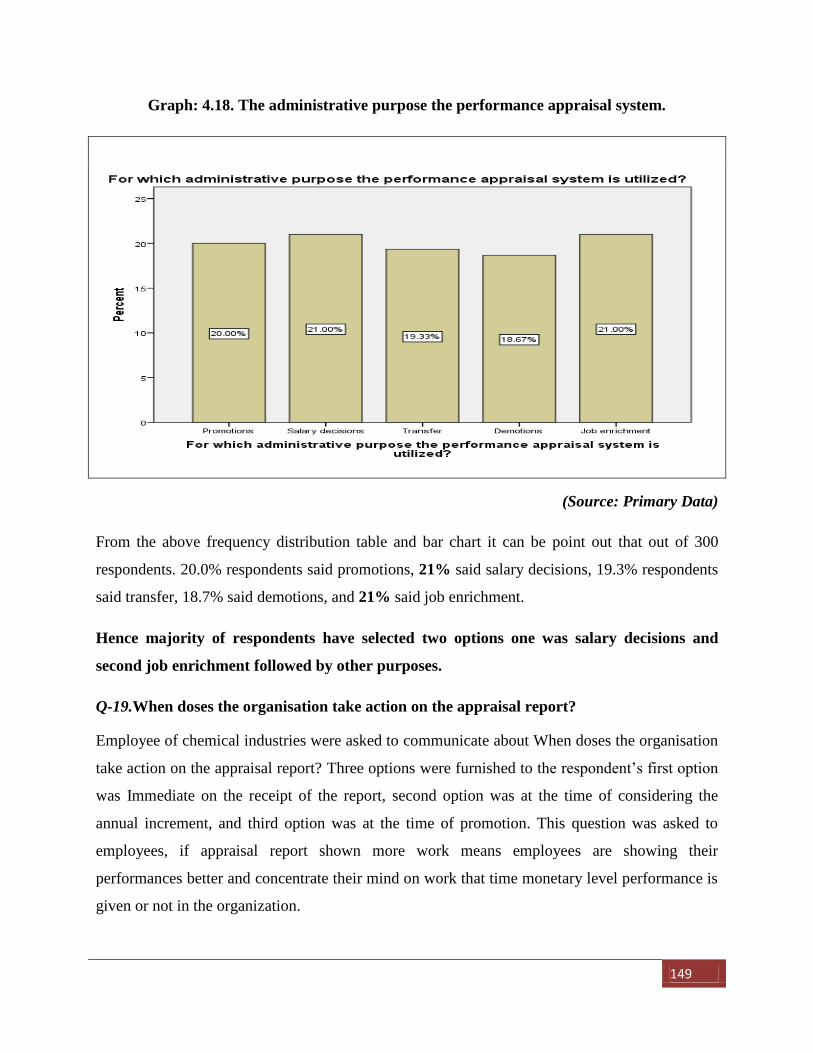
149
Graph: 4.18. The administrative purpose the performance appraisal system.
(Source: Primary Data)
From the above frequency distribution table and bar chart it can be point out that out of 300
respondents. 20.0% respondents said promotions, 21% said salary decisions, 19.3% respondents
said transfer, 18.7% said demotions, and 21% said job enrichment.
Hence majority of respondents have selected two options one was salary decisions and
second job enrichment followed by other purposes.
Q-19.When doses the organisation take action on the appraisal report?
Employee of chemical industries were asked to communicate about When doses the organisation
take action on the appraisal report? Three options were furnished to the respondent’s first option
was Immediate on the receipt of the report, second option was at the time of considering the
annual increment, and third option was at the time of promotion. This question was asked to
employees, if appraisal report shown more work means employees are showing their
performances better and concentrate their mind on work that time monetary level performance is
given or not in the organization.
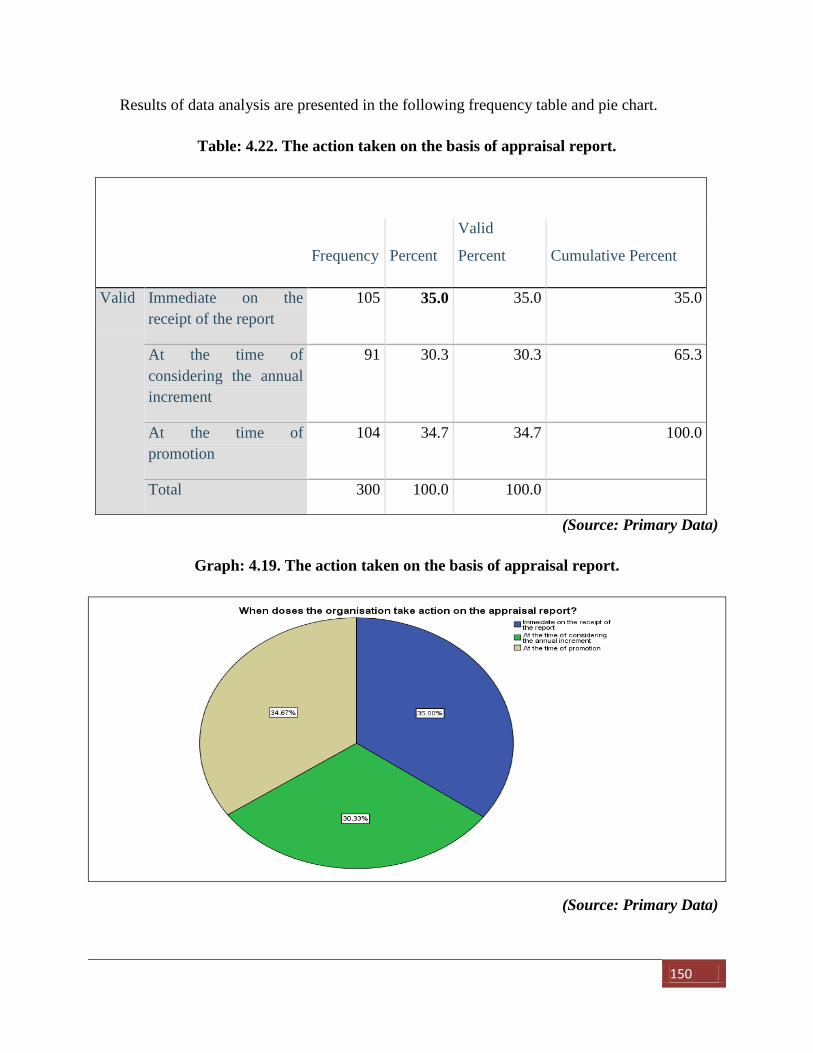
150
Results of data analysis are presented in the following frequency table and pie chart.
Table: 4.22. The action taken on the basis of appraisal report.
Frequency Percent
Valid
Percent Cumulative Percent
Valid Immediate on the
receipt of the report
105 35.0 35.0 35.0
At the time of
considering the annual
increment
91 30.3 30.3 65.3
At the time of
promotion
104 34.7 34.7 100.0
Total 300 100.0 100.0
(Source: Primary Data)
Graph: 4.19. The action taken on the basis of appraisal report.
(Source: Primary Data)
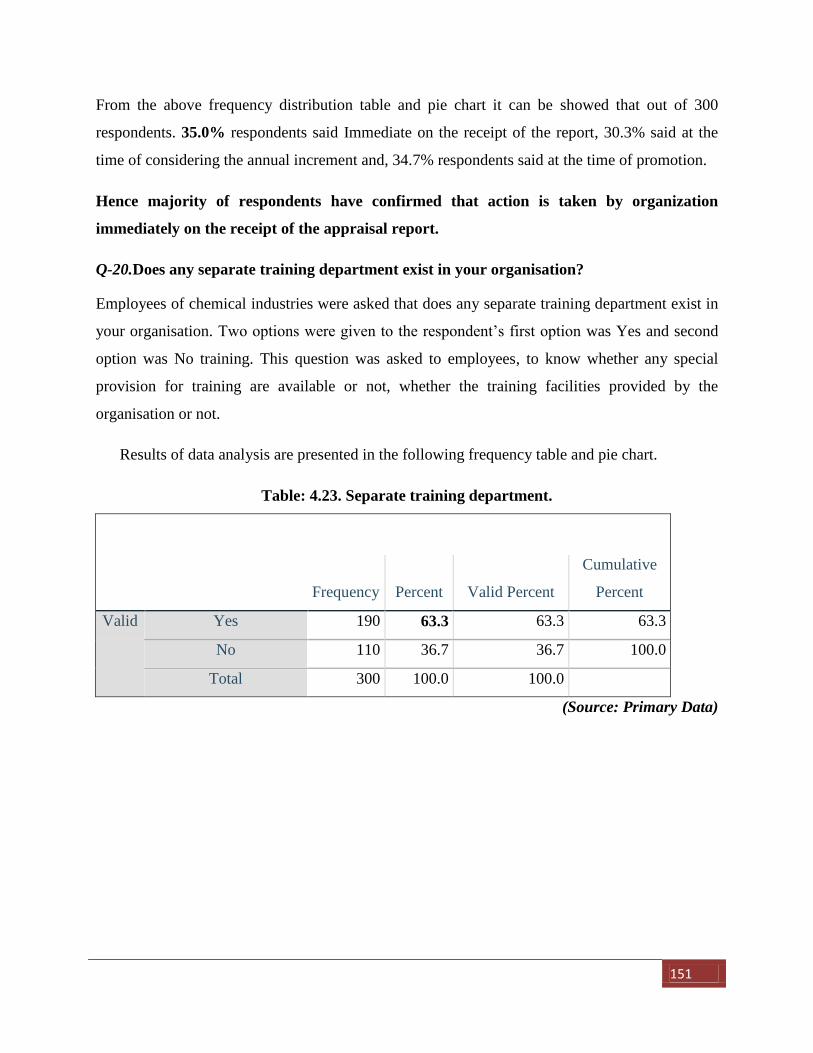
151
From the above frequency distribution table and pie chart it can be showed that out of 300
respondents. 35.0% respondents said Immediate on the receipt of the report, 30.3% said at the
time of considering the annual increment and, 34.7% respondents said at the time of promotion.
Hence majority of respondents have confirmed that action is taken by organization
immediately on the receipt of the appraisal report.
Q-20.Does any separate training department exist in your organisation?
Employees of chemical industries were asked that does any separate training department exist in
your organisation. Two options were given to the respondent’s first option was Yes and second
option was No training. This question was asked to employees, to know whether any special
provision for training are available or not, whether the training facilities provided by the
organisation or not.
Results of data analysis are presented in the following frequency table and pie chart.
Table: 4.23. Separate training department.
Frequency Percent Valid Percent
Cumulative
Percent
Valid Yes 190 63.3 63.3 63.3
No 110 36.7 36.7 100.0
Total 300 100.0 100.0
(Source: Primary Data)
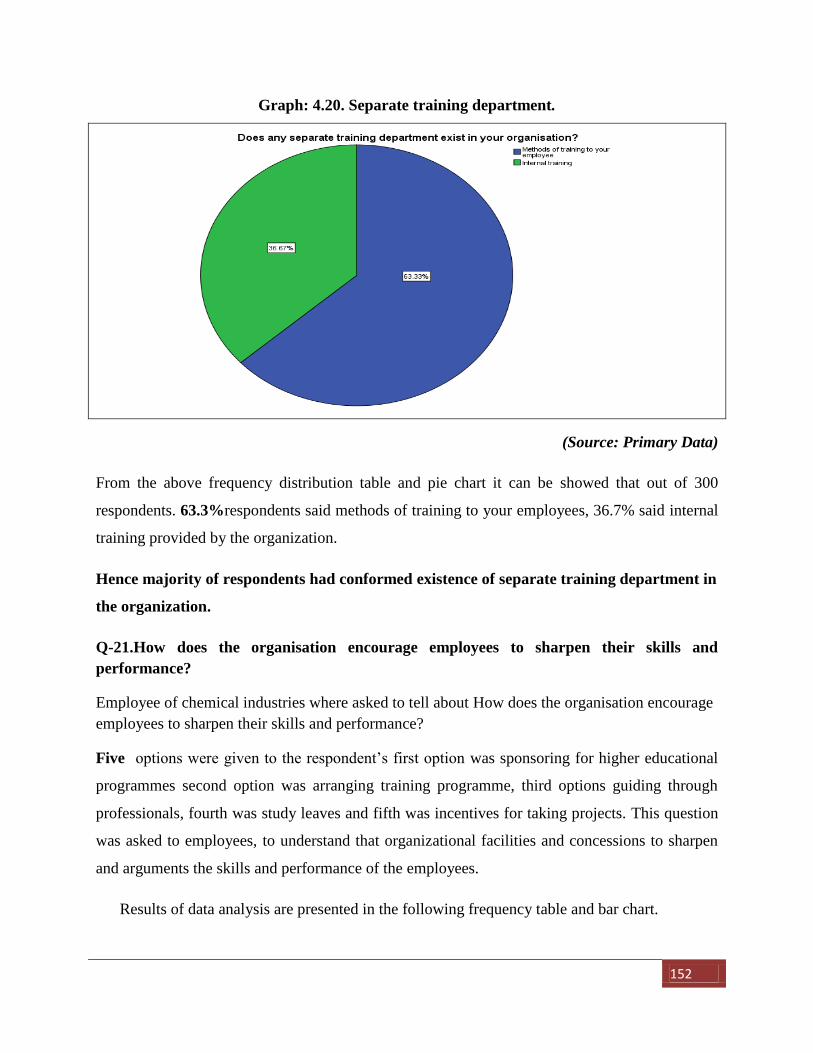
152
Graph: 4.20. Separate training department.
(Source: Primary Data)
From the above frequency distribution table and pie chart it can be showed that out of 300
respondents. 63.3%respondents said methods of training to your employees, 36.7% said internal
training provided by the organization.
Hence majority of respondents had conformed existence of separate training department in
the organization.
Q-21.How does the organisation encourage employees to sharpen their skills and
performance?
Employee of chemical industries where asked to tell about How does the organisation encourage
employees to sharpen their skills and performance?
Five options were given to the respondent’s first option was sponsoring for higher educational
programmes second option was arranging training programme, third options guiding through
professionals, fourth was study leaves and fifth was incentives for taking projects. This question
was asked to employees, to understand that organizational facilities and concessions to sharpen
and arguments the skills and performance of the employees.
Results of data analysis are presented in the following frequency table and bar chart.
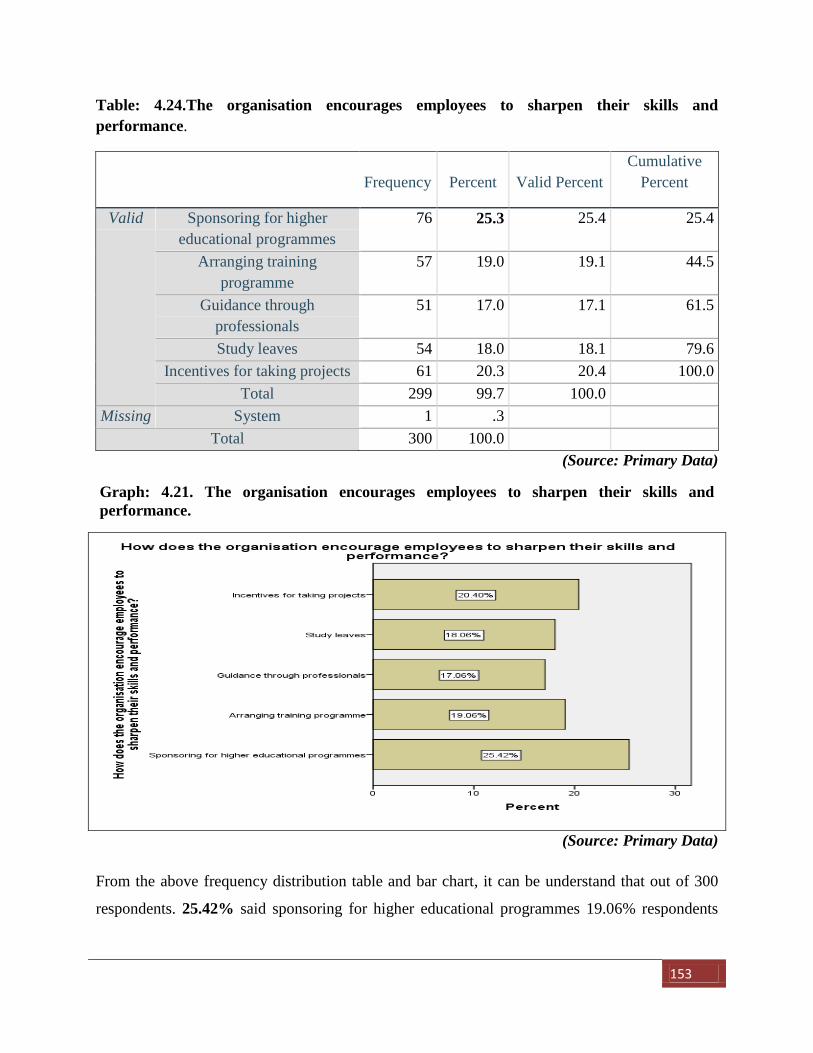
153
Table: 4.24.The organisation encourages employees to sharpen their skills and
performance.
Frequency Percent Valid Percent
Cumulative
Percent
Valid Sponsoring for higher
educational programmes
76 25.3 25.4 25.4
Arranging training
programme
57 19.0 19.1 44.5
Guidance through
professionals
51 17.0 17.1 61.5
Study leaves 54 18.0 18.1 79.6
Incentives for taking projects 61 20.3 20.4 100.0
Total 299 99.7 100.0
Missing System 1 .3
Total 300 100.0
(Source: Primary Data)
Graph: 4.21. The organisation encourages employees to sharpen their skills and
performance.
(Source: Primary Data)
From the above frequency distribution table and bar chart, it can be understand that out of 300
respondents. 25.42% said sponsoring for higher educational programmes 19.06% respondents
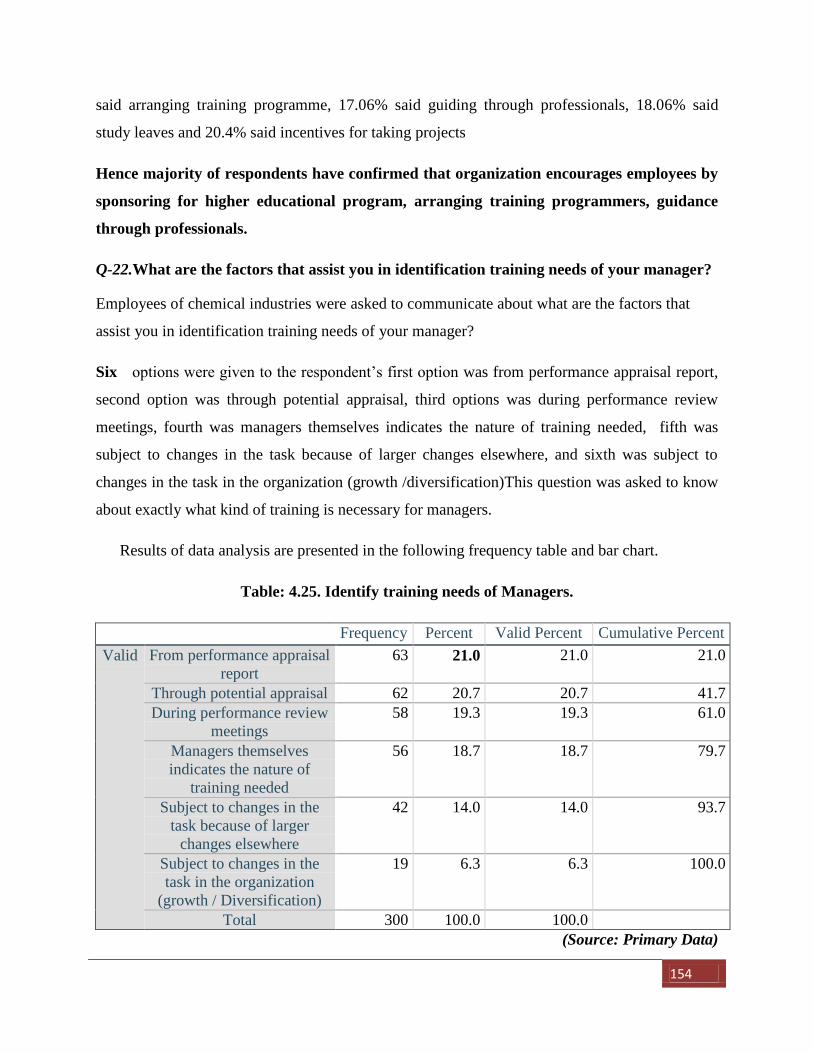
154
said arranging training programme, 17.06% said guiding through professionals, 18.06% said
study leaves and 20.4% said incentives for taking projects
Hence majority of respondents have confirmed that organization encourages employees by
sponsoring for higher educational program, arranging training programmers, guidance
through professionals.
Q-22.What are the factors that assist you in identification training needs of your manager?
Employees of chemical industries were asked to communicate about what are the factors that
assist you in identification training needs of your manager?
Six options were given to the respondent’s first option was from performance appraisal report,
second option was through potential appraisal, third options was during performance review
meetings, fourth was managers themselves indicates the nature of training needed, fifth was
subject to changes in the task because of larger changes elsewhere, and sixth was subject to
changes in the task in the organization (growth /diversification)This question was asked to know
about exactly what kind of training is necessary for managers.
Results of data analysis are presented in the following frequency table and bar chart.
Table: 4.25. Identify training needs of Managers.
Frequency Percent Valid Percent Cumulative Percent
Valid From performance appraisal
report
63 21.0 21.0 21.0
Through potential appraisal 62 20.7 20.7 41.7
During performance review
meetings
58 19.3 19.3 61.0
Managers themselves
indicates the nature of
training needed
56 18.7 18.7 79.7
Subject to changes in the
task because of larger
changes elsewhere
42 14.0 14.0 93.7
Subject to changes in the
task in the organization
(growth / Diversification)
19 6.3 6.3 100.0
Total 300 100.0 100.0
(Source: Primary Data)
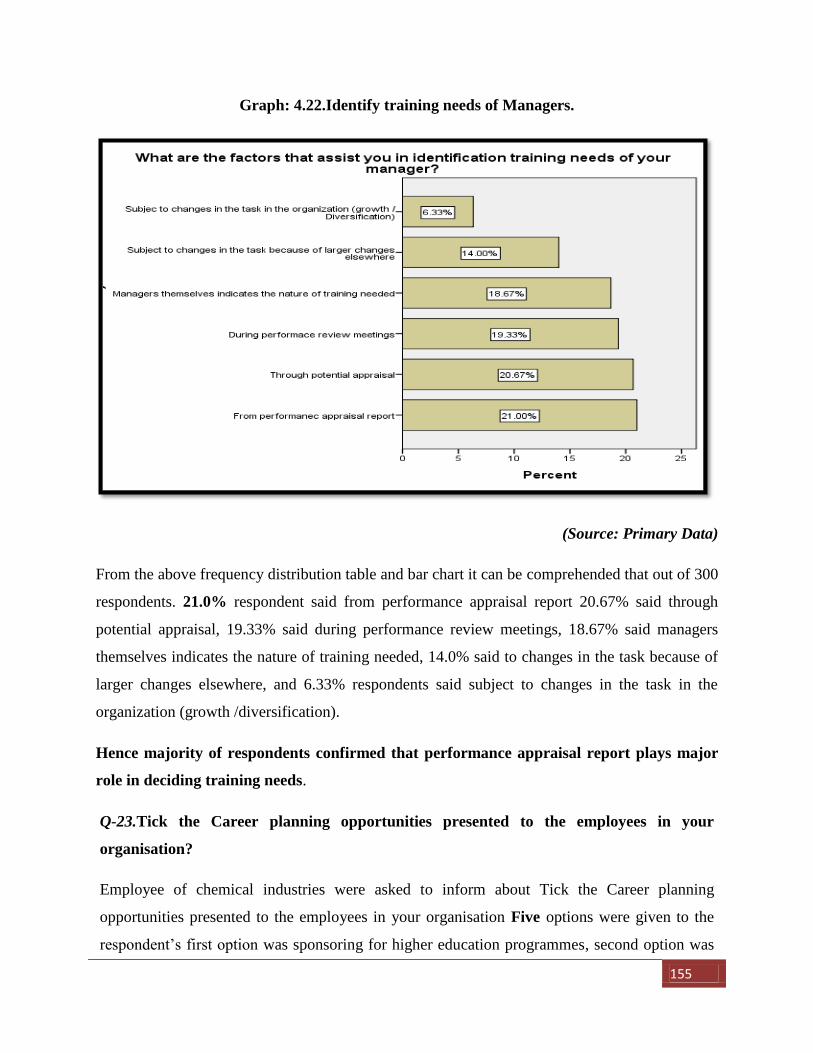
155
Graph: 4.22.Identify training needs of Managers.
(Source: Primary Data)
From the above frequency distribution table and bar chart it can be comprehended that out of 300
respondents. 21.0% respondent said from performance appraisal report 20.67% said through
potential appraisal, 19.33% said during performance review meetings, 18.67% said managers
themselves indicates the nature of training needed, 14.0% said to changes in the task because of
larger changes elsewhere, and 6.33% respondents said subject to changes in the task in the
organization (growth /diversification).
Hence majority of respondents confirmed that performance appraisal report plays major
role in deciding training needs.
Q-23.Tick the Career planning opportunities presented to the employees in your
organisation?
Employee of chemical industries were asked to inform about Tick the Career planning
opportunities presented to the employees in your organisation Five options were given to the
respondent’s first option was sponsoring for higher education programmes, second option was
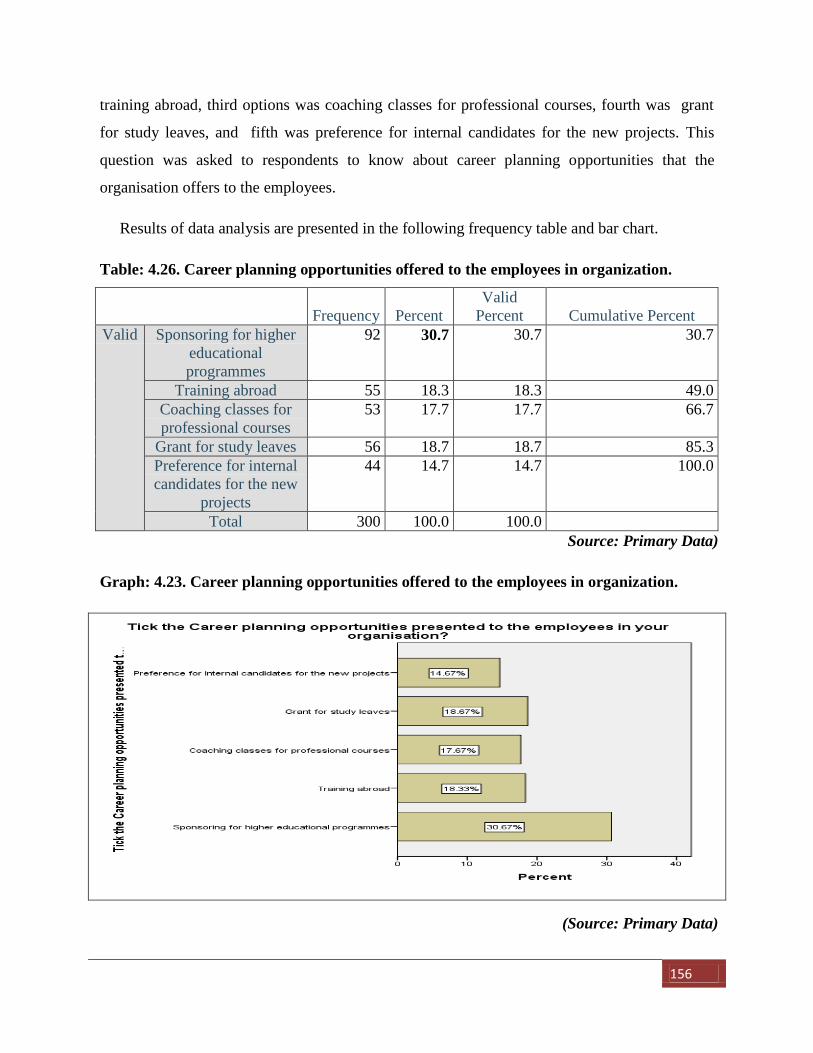
156
training abroad, third options was coaching classes for professional courses, fourth was grant
for study leaves, and fifth was preference for internal candidates for the new projects. This
question was asked to respondents to know about career planning opportunities that the
organisation offers to the employees.
Results of data analysis are presented in the following frequency table and bar chart.
Table: 4.26. Career planning opportunities offered to the employees in organization.
Frequency Percent
Valid
Percent Cumulative Percent
Valid Sponsoring for higher
educational
programmes
92 30.7 30.7 30.7
Training abroad 55 18.3 18.3 49.0
Coaching classes for
professional courses
53 17.7 17.7 66.7
Grant for study leaves 56 18.7 18.7 85.3
Preference for internal
candidates for the new
projects
44 14.7 14.7 100.0
Total 300 100.0 100.0
Source: Primary Data)
Graph: 4.23. Career planning opportunities offered to the employees in organization.
(Source: Primary Data)
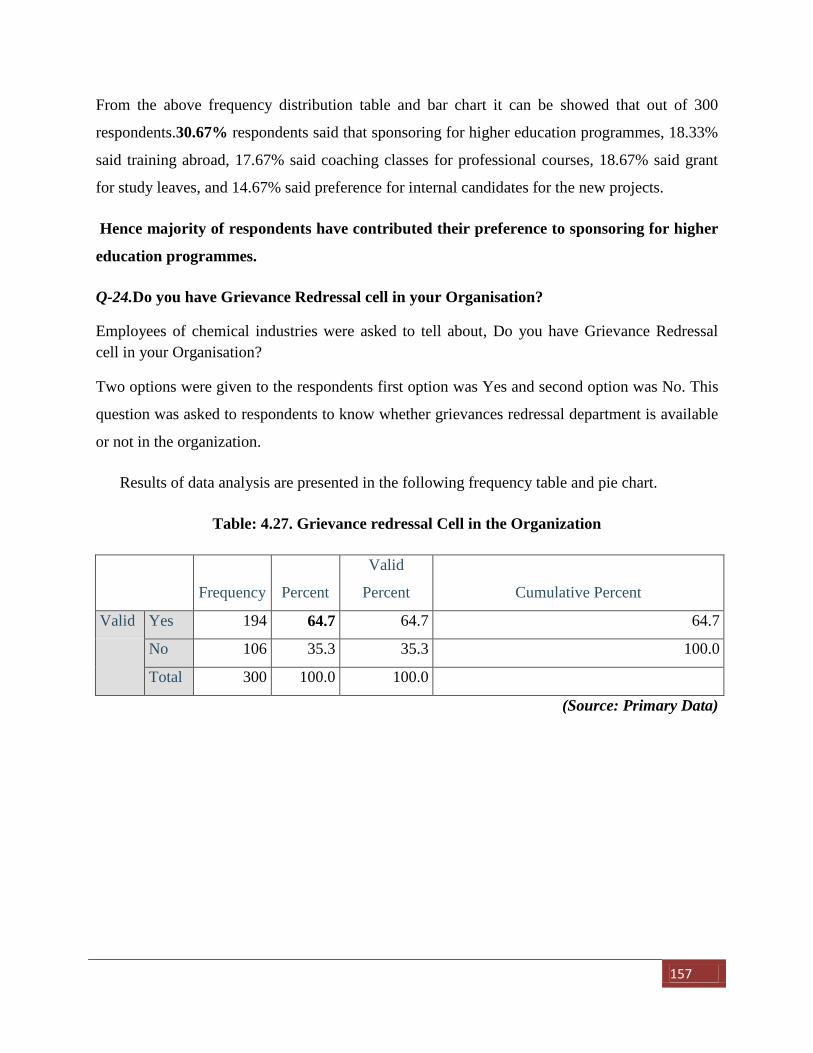
157
From the above frequency distribution table and bar chart it can be showed that out of 300
respondents.30.67% respondents said that sponsoring for higher education programmes, 18.33%
said training abroad, 17.67% said coaching classes for professional courses, 18.67% said grant
for study leaves, and 14.67% said preference for internal candidates for the new projects.
Hence majority of respondents have contributed their preference to sponsoring for higher
education programmes.
Q-24.Do you have Grievance Redressal cell in your Organisation?
Employees of chemical industries were asked to tell about, Do you have Grievance Redressal
cell in your Organisation?
Two options were given to the respondents first option was Yes and second option was No. This
question was asked to respondents to know whether grievances redressal department is available
or not in the organization.
Results of data analysis are presented in the following frequency table and pie chart.
Table: 4.27. Grievance redressal Cell in the Organization
Frequency Percent
Valid
Percent Cumulative Percent
Valid Yes 194 64.7 64.7 64.7
No 106 35.3 35.3 100.0
Total 300 100.0 100.0
(Source: Primary Data)
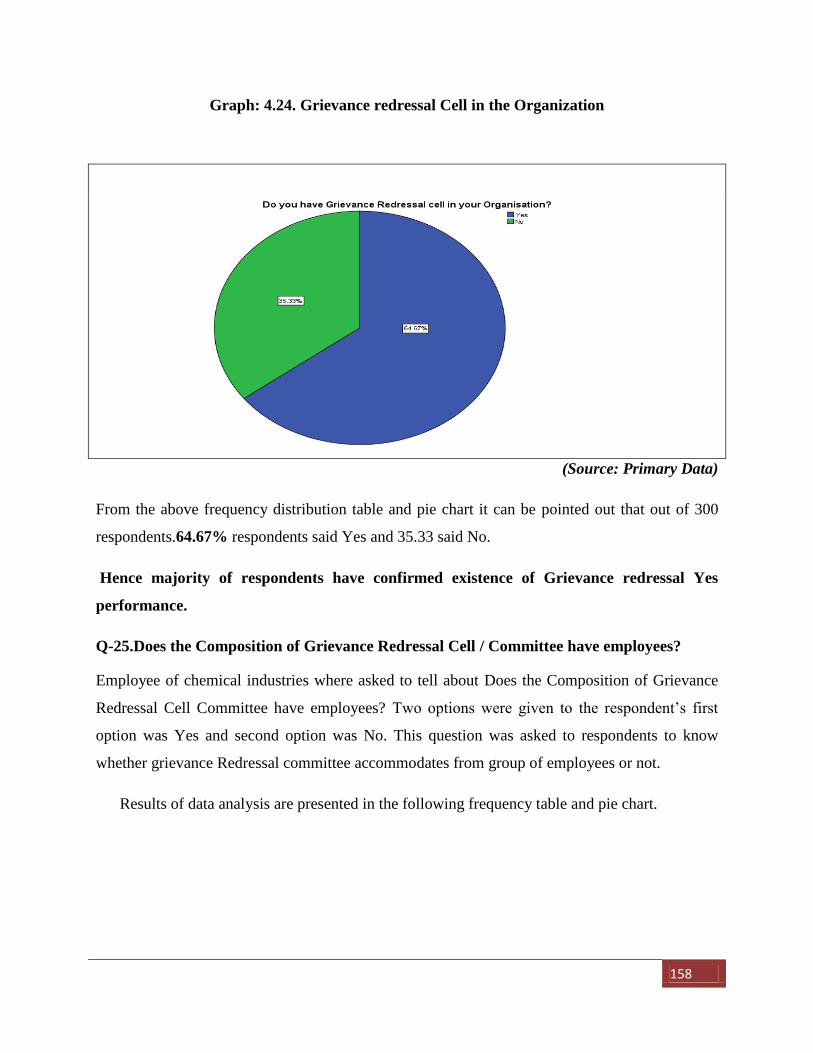
158
Graph: 4.24. Grievance redressal Cell in the Organization
(Source: Primary Data)
From the above frequency distribution table and pie chart it can be pointed out that out of 300
respondents.64.67% respondents said Yes and 35.33 said No.
Hence majority of respondents have confirmed existence of Grievance redressal Yes
performance.
Q-25.Does the Composition of Grievance Redressal Cell / Committee have employees?
Employee of chemical industries where asked to tell about Does the Composition of Grievance
Redressal Cell Committee have employees? Two options were given to the respondent’s first
option was Yes and second option was No. This question was asked to respondents to know
whether grievance Redressal committee accommodates from group of employees or not.
Results of data analysis are presented in the following frequency table and pie chart.

159
Table: 4.28. The Composition of Grievance Redressal Cell Committee.
Frequency Percent
Valid
Percent Cumulative Percent
Valid Yes 239 79.7 79.7 79.7
No 61 20.3 20.3 100.0
Total 300 100.0 100.0
(Source: Primary Data)
Graph: 4.25. The Composition of Grievance Redressal Cell
(Source: Primary Data)
From the above frequency distribution table and pie chart it can be highlighted that out of 300
respondents.79.7% respondents said Yes and 20.3% respondents said No.
Hence majority of respondents have confirmed inclusion of employees in composition of
grievance redressal cell.
Q-26. Are you satisfied with the functioning and decisions of Grievance redressal
committee?
Employee of chemical industries where asked to tell about Are you satisfied with the
functioning and decisions of Grievance redressal committee? Two options were given to the
160
respondent’s first option was Yes and second option was No. This question was asked to
respondents to know whether the employees are satisfied with the decision of the grievance
redressal committee.
Results of data analysis are presented in the following frequency table and pie chart.
Table: 4.29. Complainants satisfied with the decision of the grievance redressal committee.
Frequency Percent
Valid
Percent Cumulative Percent
Valid Yes 203 67.7 67.7 67.7
No 97 32.3 32.3 100.0
Total 300 100.0 100.0
(Source: Primary Data)
Graph: 4.26. Complainants satisfied with the decision of the grievance redressal
committee.
(Source: Primary Data)
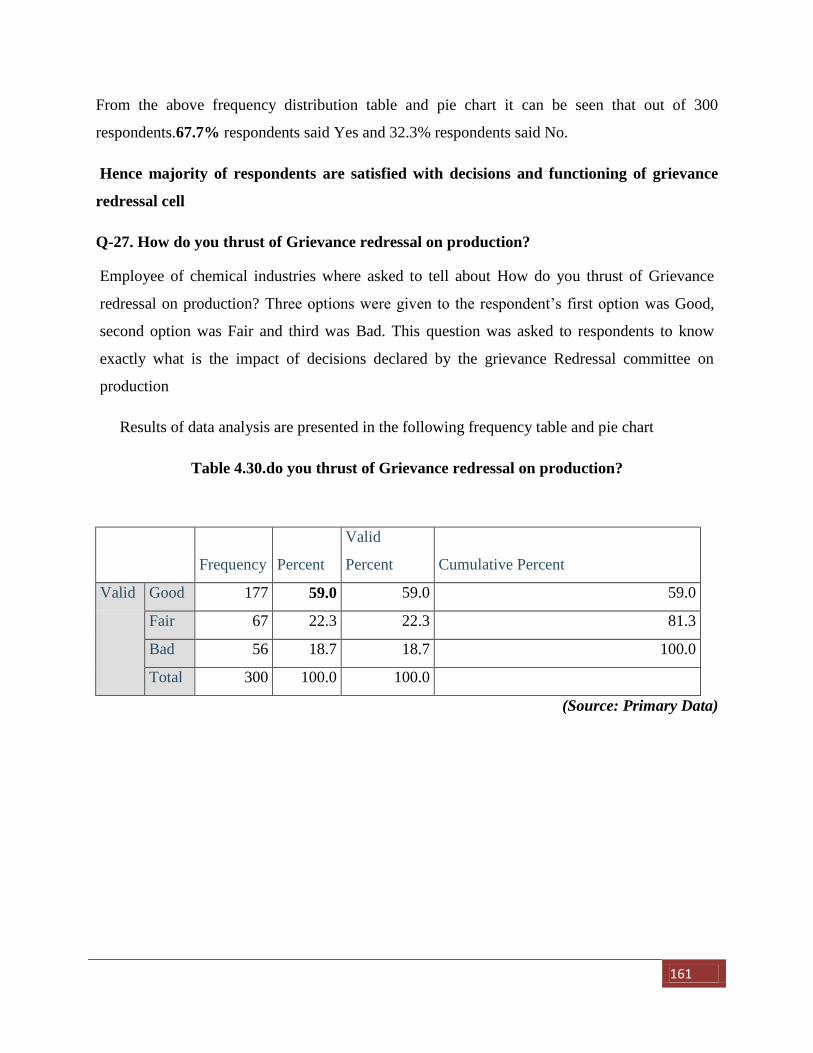
161
From the above frequency distribution table and pie chart it can be seen that out of 300
respondents.67.7% respondents said Yes and 32.3% respondents said No.
Hence majority of respondents are satisfied with decisions and functioning of grievance
redressal cell
Q-27. How do you thrust of Grievance redressal on production?
Employee of chemical industries where asked to tell about How do you thrust of Grievance
redressal on production? Three options were given to the respondent’s first option was Good,
second option was Fair and third was Bad. This question was asked to respondents to know
exactly what is the impact of decisions declared by the grievance Redressal committee on
production
Results of data analysis are presented in the following frequency table and pie chart
Table 4.30.do you thrust of Grievance redressal on production?
Frequency Percent
Valid
Percent Cumulative Percent
Valid Good 177 59.0 59.0 59.0
Fair 67 22.3 22.3 81.3
Bad 56 18.7 18.7 100.0
Total 300 100.0 100.0
(Source: Primary Data)
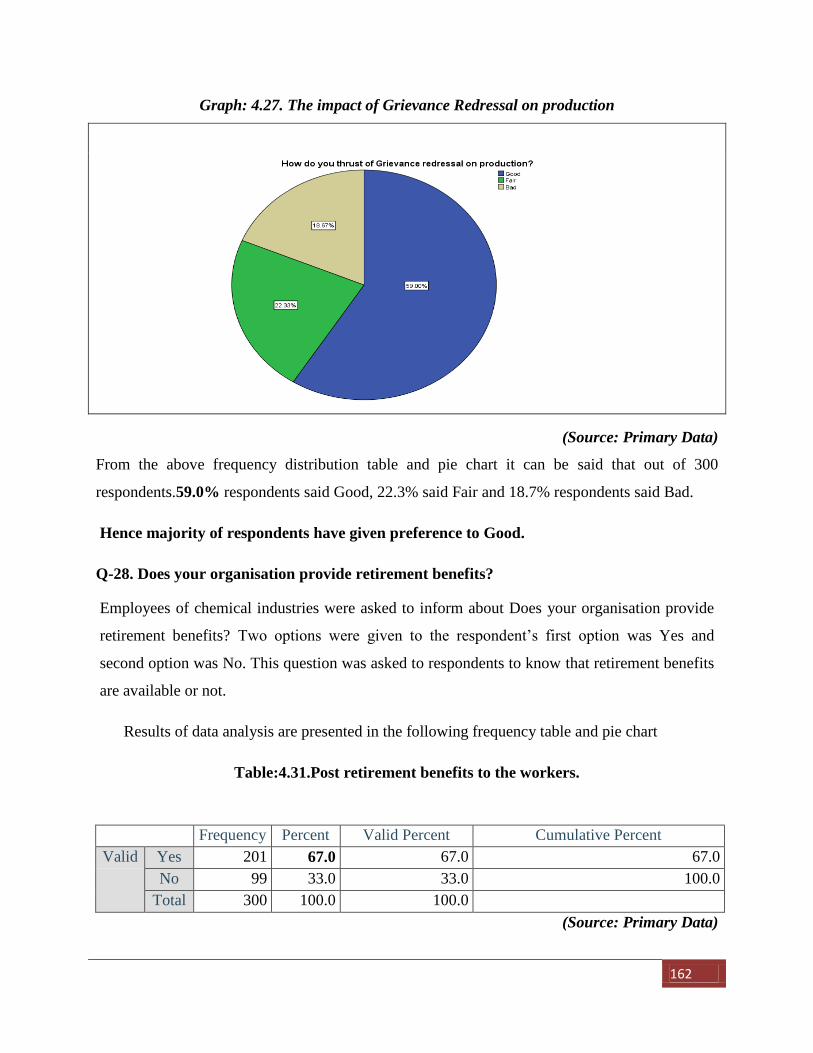
162
Graph: 4.27. The impact of Grievance Redressal on production
(Source: Primary Data)
From the above frequency distribution table and pie chart it can be said that out of 300
respondents.59.0% respondents said Good, 22.3% said Fair and 18.7% respondents said Bad.
Hence majority of respondents have given preference to Good.
Q-28. Does your organisation provide retirement benefits?
Employees of chemical industries were asked to inform about Does your organisation provide
retirement benefits? Two options were given to the respondent’s first option was Yes and
second option was No. This question was asked to respondents to know that retirement benefits
are available or not.
Results of data analysis are presented in the following frequency table and pie chart
Table:4.31.Post retirement benefits to the workers.
Frequency Percent Valid Percent Cumulative Percent
Valid Yes 201 67.0 67.0 67.0
No 99 33.0 33.0 100.0
Total 300 100.0 100.0
(Source: Primary Data)
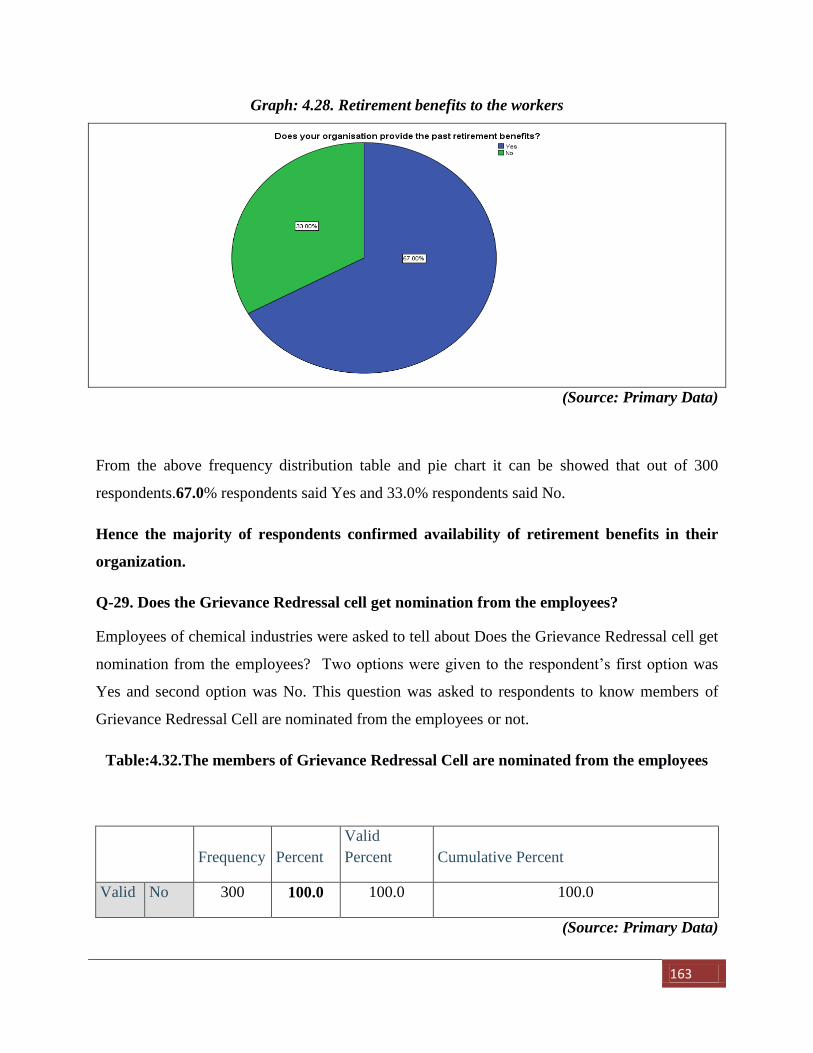
163
Graph: 4.28. Retirement benefits to the workers
(Source: Primary Data)
From the above frequency distribution table and pie chart it can be showed that out of 300
respondents.67.0% respondents said Yes and 33.0% respondents said No.
Hence the majority of respondents confirmed availability of retirement benefits in their
organization.
Q-29. Does the Grievance Redressal cell get nomination from the employees?
Employees of chemical industries were asked to tell about Does the Grievance Redressal cell get
nomination from the employees? Two options were given to the respondent’s first option was
Yes and second option was No. This question was asked to respondents to know members of
Grievance Redressal Cell are nominated from the employees or not.
Table:4.32.The members of Grievance Redressal Cell are nominated from the employees
Frequency Percent
Valid
Percent Cumulative Percent
Valid No 300 100.0 100.0 100.0
(Source: Primary Data)
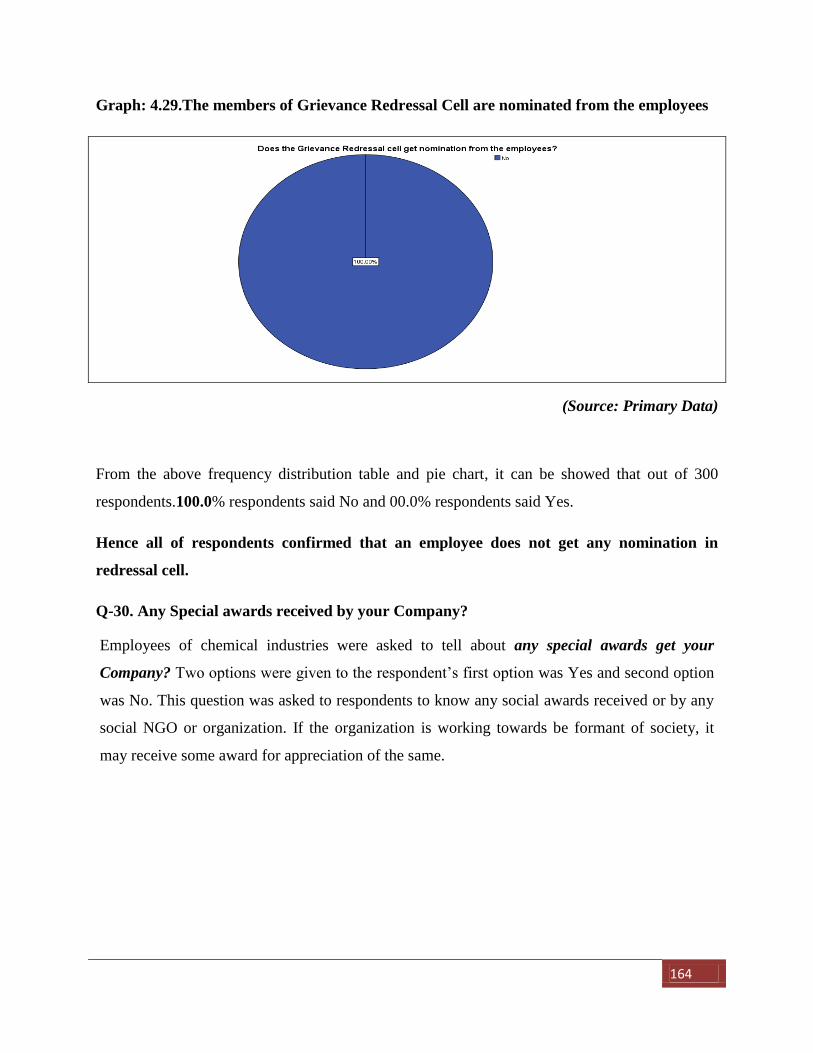
164
Graph: 4.29.The members of Grievance Redressal Cell are nominated from the employees
(Source: Primary Data)
From the above frequency distribution table and pie chart, it can be showed that out of 300
respondents.100.0% respondents said No and 00.0% respondents said Yes.
Hence all of respondents confirmed that an employee does not get any nomination in
redressal cell.
Q-30. Any Special awards received by your Company?
Employees of chemical industries were asked to tell about any special awards get your
Company? Two options were given to the respondent’s first option was Yes and second option
was No. This question was asked to respondents to know any social awards received or by any
social NGO or organization. If the organization is working towards be formant of society, it
may receive some award for appreciation of the same.
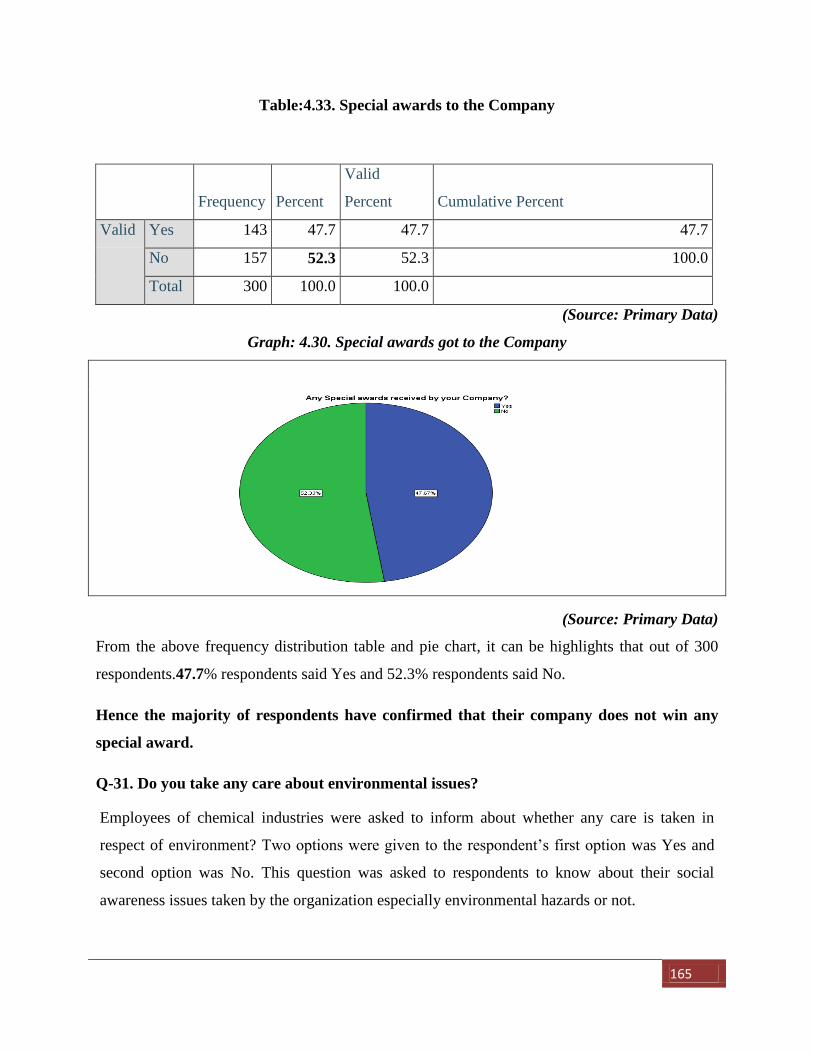
165
Table:4.33. Special awards to the Company
Frequency Percent
Valid
Percent Cumulative Percent
Valid Yes 143 47.7 47.7 47.7
No 157 52.3 52.3 100.0
Total 300 100.0 100.0
(Source: Primary Data)
Graph: 4.30. Special awards got to the Company
(Source: Primary Data)
From the above frequency distribution table and pie chart, it can be highlights that out of 300
respondents.47.7% respondents said Yes and 52.3% respondents said No.
Hence the majority of respondents have confirmed that their company does not win any
special award.
Q-31. Do you take any care about environmental issues?
Employees of chemical industries were asked to inform about whether any care is taken in
respect of environment? Two options were given to the respondent’s first option was Yes and
second option was No. This question was asked to respondents to know about their social
awareness issues taken by the organization especially environmental hazards or not.
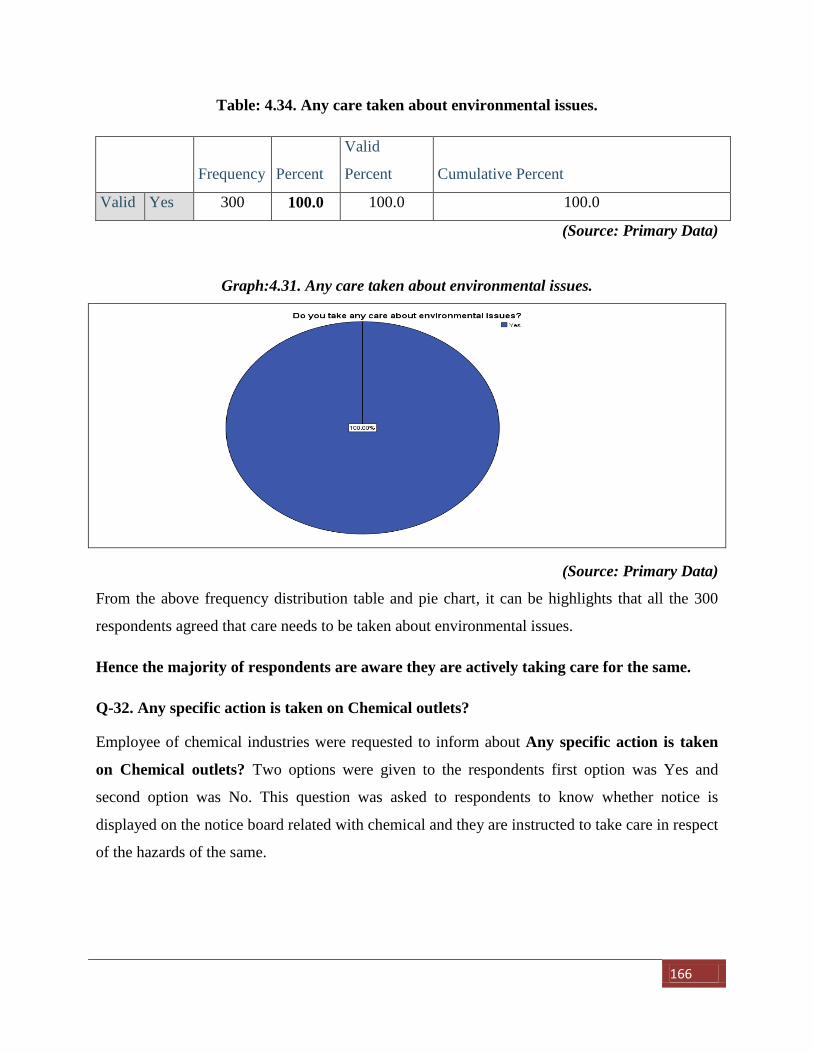
166
Table: 4.34. Any care taken about environmental issues.
Frequency Percent
Valid
Percent Cumulative Percent
Valid Yes 300 100.0 100.0 100.0
(Source: Primary Data)
Graph:4.31. Any care taken about environmental issues.
(Source: Primary Data)
From the above frequency distribution table and pie chart, it can be highlights that all the 300
respondents agreed that care needs to be taken about environmental issues.
Hence the majority of respondents are aware they are actively taking care for the same.
Q-32. Any specific action is taken on Chemical outlets?
Employee of chemical industries were requested to inform about Any specific action is taken
on Chemical outlets? Two options were given to the respondents first option was Yes and
second option was No. This question was asked to respondents to know whether notice is
displayed on the notice board related with chemical and they are instructed to take care in respect
of the hazards of the same.
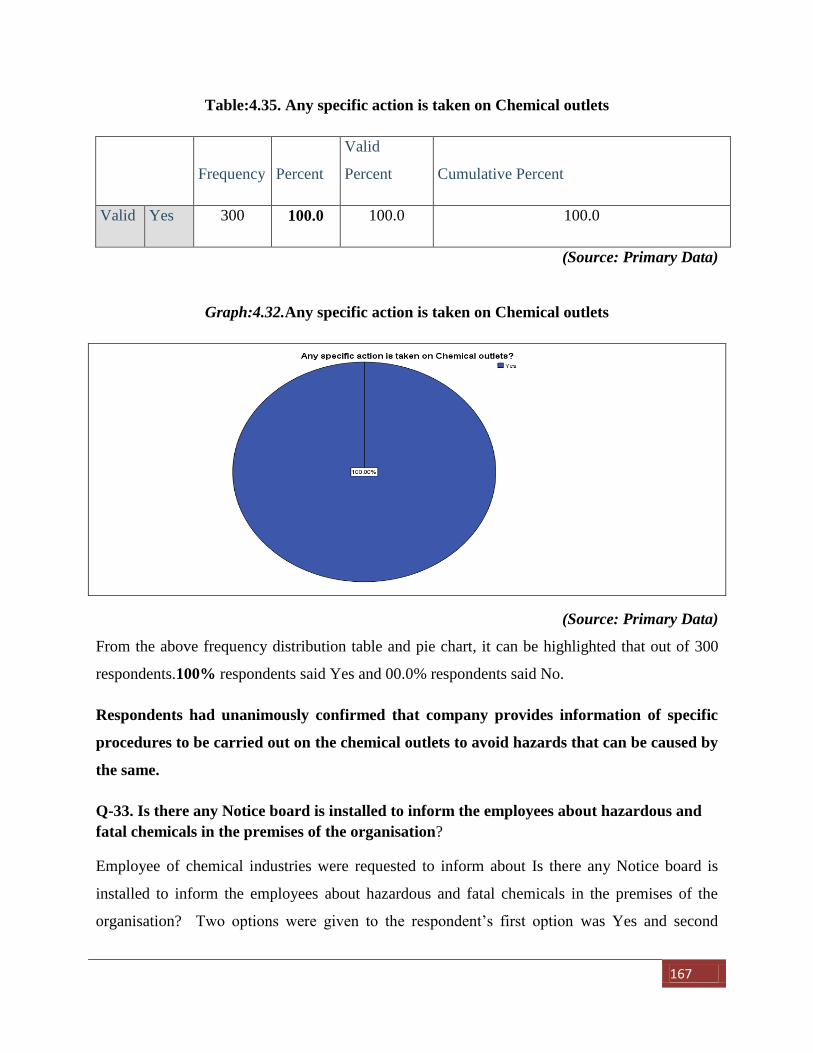
167
Table:4.35. Any specific action is taken on Chemical outlets
Frequency Percent
Valid
Percent Cumulative Percent
Valid Yes 300 100.0 100.0 100.0
(Source: Primary Data)
Graph:4.32.Any specific action is taken on Chemical outlets
(Source: Primary Data)
From the above frequency distribution table and pie chart, it can be highlighted that out of 300
respondents.100% respondents said Yes and 00.0% respondents said No.
Respondents had unanimously confirmed that company provides information of specific
procedures to be carried out on the chemical outlets to avoid hazards that can be caused by
the same.
Q-33. Is there any Notice board is installed to inform the employees about hazardous and
fatal chemicals in the premises of the organisation?
Employee of chemical industries were requested to inform about Is there any Notice board is
installed to inform the employees about hazardous and fatal chemicals in the premises of the
organisation? Two options were given to the respondent’s first option was Yes and second
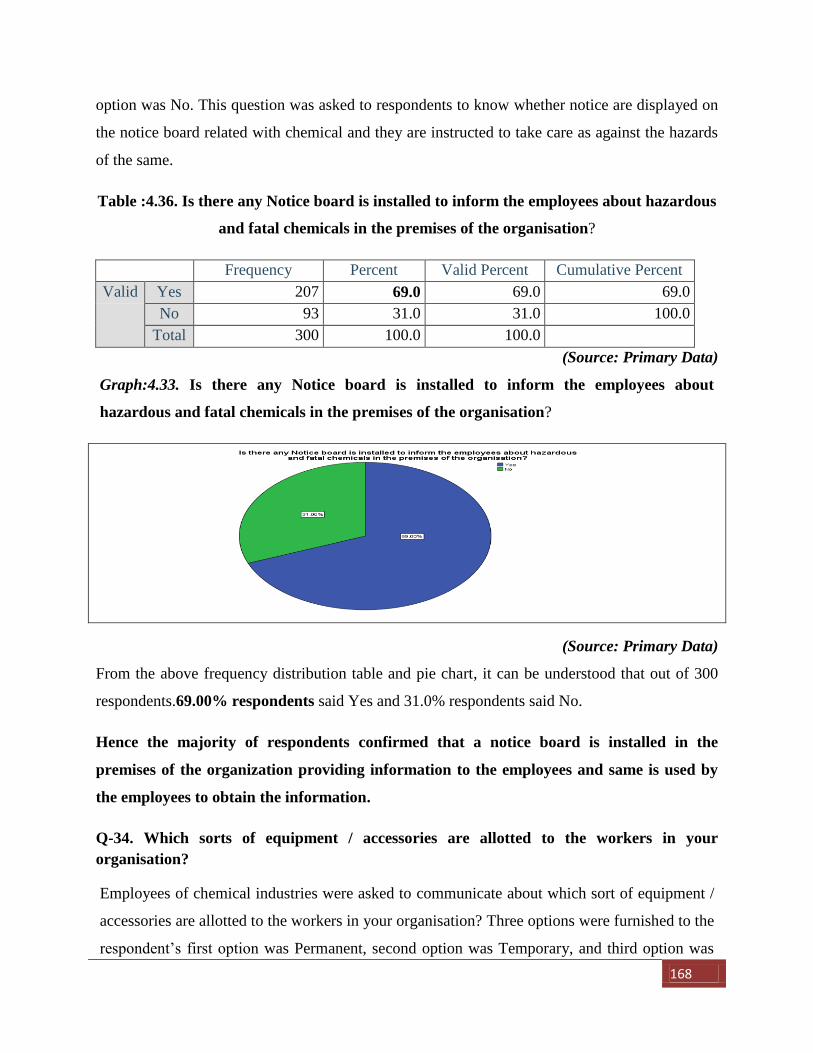
168
option was No. This question was asked to respondents to know whether notice are displayed on
the notice board related with chemical and they are instructed to take care as against the hazards
of the same.
Table :4.36. Is there any Notice board is installed to inform the employees about hazardous
and fatal chemicals in the premises of the organisation?
Frequency Percent Valid Percent Cumulative Percent
Valid Yes 207 69.0 69.0 69.0
No 93 31.0 31.0 100.0
Total 300 100.0 100.0
(Source: Primary Data)
Graph:4.33. Is there any Notice board is installed to inform the employees about
hazardous and fatal chemicals in the premises of the organisation?
(Source: Primary Data)
From the above frequency distribution table and pie chart, it can be understood that out of 300
respondents.69.00% respondents said Yes and 31.0% respondents said No.
Hence the majority of respondents confirmed that a notice board is installed in the
premises of the organization providing information to the employees and same is used by
the employees to obtain the information.
Q-34. Which sorts of equipment / accessories are allotted to the workers in your
organisation?
Employees of chemical industries were asked to communicate about which sort of equipment /
accessories are allotted to the workers in your organisation? Three options were furnished to the
respondent’s first option was Permanent, second option was Temporary, and third option was
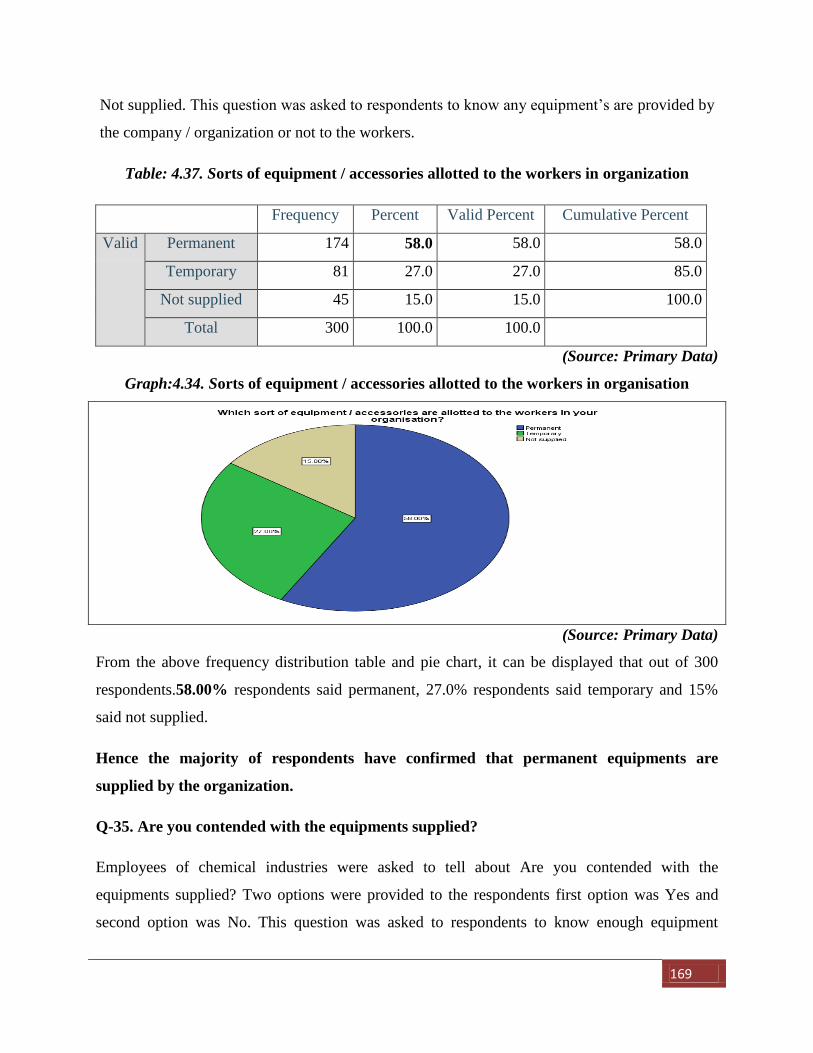
169
Not supplied. This question was asked to respondents to know any equipment’s are provided by
the company / organization or not to the workers.
Table: 4.37. Sorts of equipment / accessories allotted to the workers in organization
Frequency Percent Valid Percent Cumulative Percent
Valid Permanent 174 58.0 58.0 58.0
Temporary 81 27.0 27.0 85.0
Not supplied 45 15.0 15.0 100.0
Total 300 100.0 100.0
(Source: Primary Data)
Graph:4.34. Sorts of equipment / accessories allotted to the workers in organisation
(Source: Primary Data)
From the above frequency distribution table and pie chart, it can be displayed that out of 300
respondents.58.00% respondents said permanent, 27.0% respondents said temporary and 15%
said not supplied.
Hence the majority of respondents have confirmed that permanent equipments are
supplied by the organization.
Q-35. Are you contended with the equipments supplied?
Employees of chemical industries were asked to tell about Are you contended with the
equipments supplied? Two options were provided to the respondents first option was Yes and
second option was No. This question was asked to respondents to know enough equipment
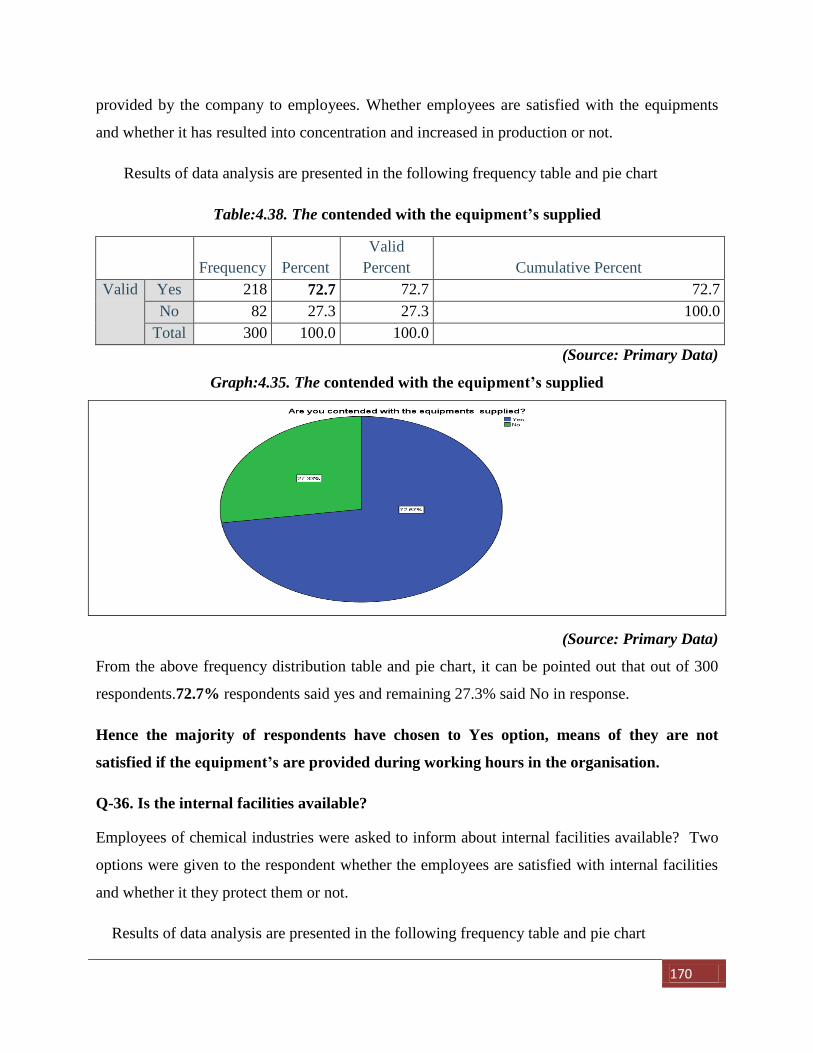
170
provided by the company to employees. Whether employees are satisfied with the equipments
and whether it has resulted into concentration and increased in production or not.
Results of data analysis are presented in the following frequency table and pie chart
Table:4.38. The contended with the equipment’s supplied
Frequency Percent
Valid
Percent Cumulative Percent
Valid Yes 218 72.7 72.7 72.7
No 82 27.3 27.3 100.0
Total 300 100.0 100.0
(Source: Primary Data)
Graph:4.35. The contended with the equipment’s supplied
(Source: Primary Data)
From the above frequency distribution table and pie chart, it can be pointed out that out of 300
respondents.72.7% respondents said yes and remaining 27.3% said No in response.
Hence the majority of respondents have chosen to Yes option, means of they are not
satisfied if the equipment’s are provided during working hours in the organisation.
Q-36. Is the internal facilities available?
Employees of chemical industries were asked to inform about internal facilities available? Two
options were given to the respondent whether the employees are satisfied with internal facilities
and whether it they protect them or not.
Results of data analysis are presented in the following frequency table and pie chart
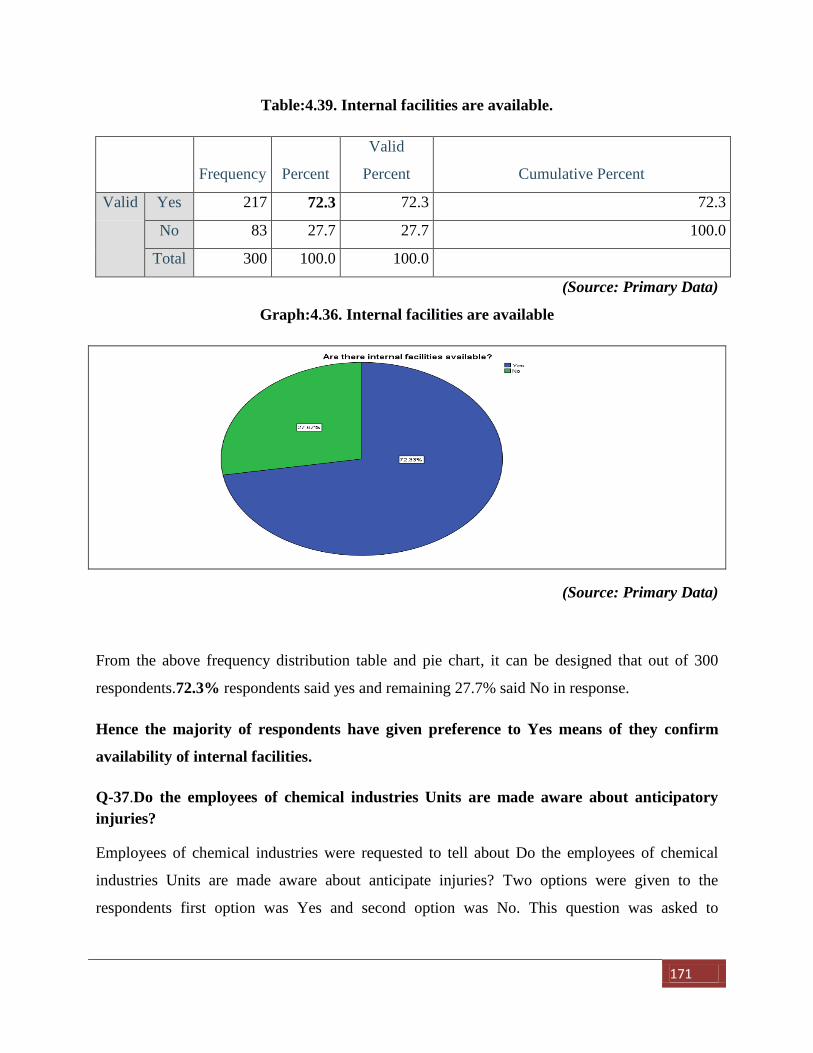
171
Table:4.39. Internal facilities are available.
Frequency Percent
Valid
Percent Cumulative Percent
Valid Yes 217 72.3 72.3 72.3
No 83 27.7 27.7 100.0
Total 300 100.0 100.0
(Source: Primary Data)
Graph:4.36. Internal facilities are available
(Source: Primary Data)
From the above frequency distribution table and pie chart, it can be designed that out of 300
respondents.72.3% respondents said yes and remaining 27.7% said No in response.
Hence the majority of respondents have given preference to Yes means of they confirm
availability of internal facilities.
Q-37.Do the employees of chemical industries Units are made aware about anticipatory
injuries?
Employees of chemical industries were requested to tell about Do the employees of chemical
industries Units are made aware about anticipate injuries? Two options were given to the
respondents first option was Yes and second option was No. This question was asked to
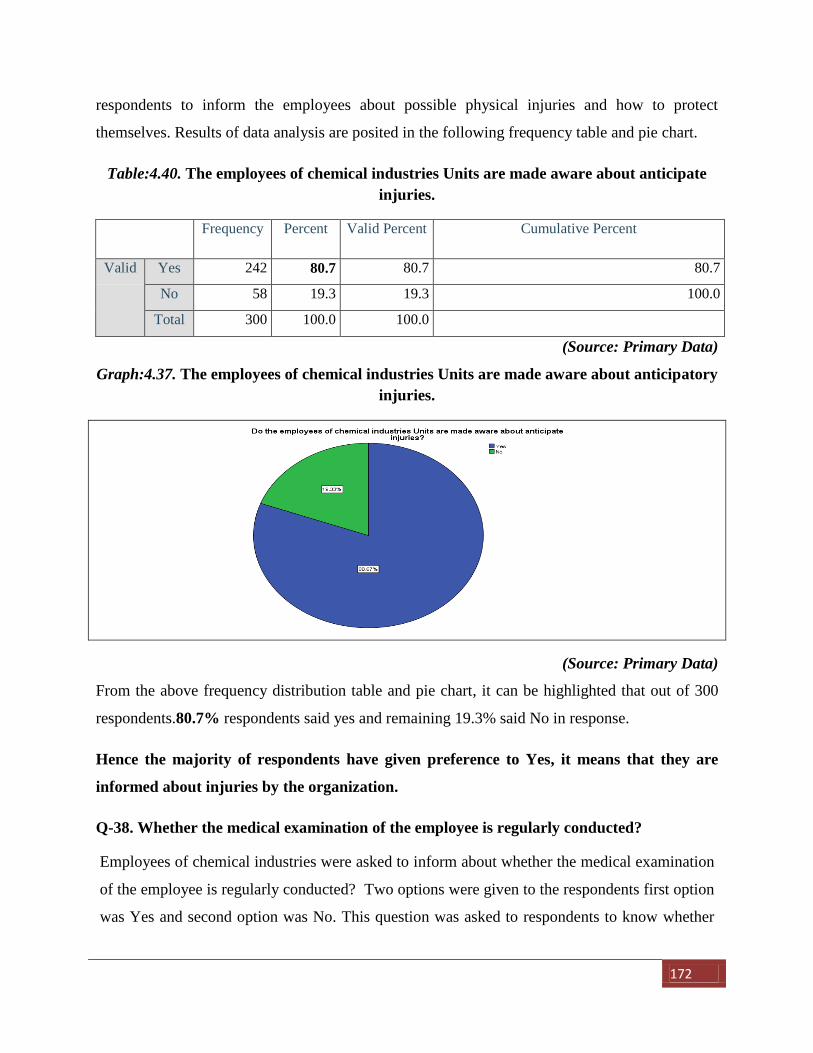
172
respondents to inform the employees about possible physical injuries and how to protect
themselves. Results of data analysis are posited in the following frequency table and pie chart.
Table:4.40. The employees of chemical industries Units are made aware about anticipate
injuries.
Frequency Percent Valid Percent Cumulative Percent
Valid Yes 242 80.7 80.7 80.7
No 58 19.3 19.3 100.0
Total 300 100.0 100.0
(Source: Primary Data)
Graph:4.37. The employees of chemical industries Units are made aware about anticipatory
injuries.
(Source: Primary Data)
From the above frequency distribution table and pie chart, it can be highlighted that out of 300
respondents.80.7% respondents said yes and remaining 19.3% said No in response.
Hence the majority of respondents have given preference to Yes, it means that they are
informed about injuries by the organization.
Q-38. Whether the medical examination of the employee is regularly conducted?
Employees of chemical industries were asked to inform about whether the medical examination
of the employee is regularly conducted? Two options were given to the respondents first option
was Yes and second option was No. This question was asked to respondents to know whether
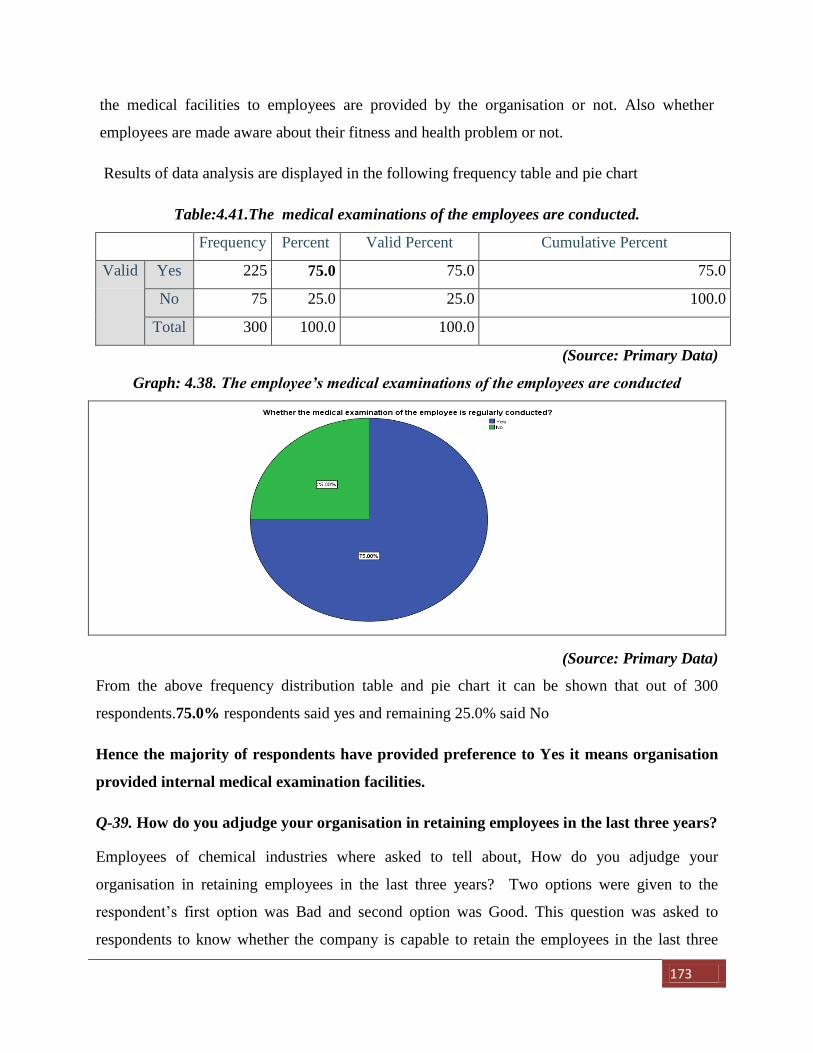
173
the medical facilities to employees are provided by the organisation or not. Also whether
employees are made aware about their fitness and health problem or not.
Results of data analysis are displayed in the following frequency table and pie chart
Table:4.41.The medical examinations of the employees are conducted.
Frequency Percent Valid Percent Cumulative Percent
Valid Yes 225 75.0 75.0 75.0
No 75 25.0 25.0 100.0
Total 300 100.0 100.0
(Source: Primary Data)
Graph: 4.38. The employee’s medical examinations of the employees are conducted
(Source: Primary Data)
From the above frequency distribution table and pie chart it can be shown that out of 300
respondents.75.0% respondents said yes and remaining 25.0% said No
Hence the majority of respondents have provided preference to Yes it means organisation
provided internal medical examination facilities.
Q-39. How do you adjudge your organisation in retaining employees in the last three years?
Employees of chemical industries where asked to tell about, How do you adjudge your
organisation in retaining employees in the last three years? Two options were given to the
respondent’s first option was Bad and second option was Good. This question was asked to
respondents to know whether the company is capable to retain the employees in the last three
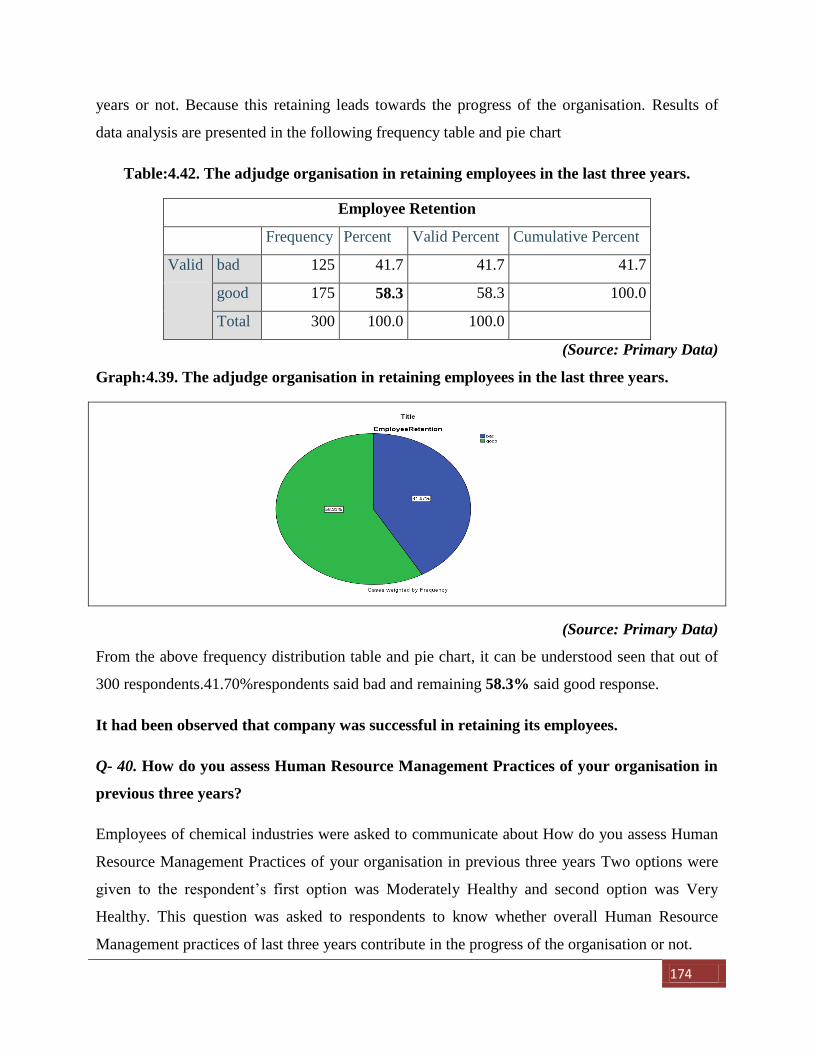
174
years or not. Because this retaining leads towards the progress of the organisation. Results of
data analysis are presented in the following frequency table and pie chart
Table:4.42. The adjudge organisation in retaining employees in the last three years.
Employee Retention
Frequency Percent Valid Percent Cumulative Percent
Valid bad 125 41.7 41.7 41.7
good 175 58.3 58.3 100.0
Total 300 100.0 100.0
(Source: Primary Data)
Graph:4.39. The adjudge organisation in retaining employees in the last three years.
(Source: Primary Data)
From the above frequency distribution table and pie chart, it can be understood seen that out of
300 respondents.41.70%respondents said bad and remaining 58.3% said good response.
It had been observed that company was successful in retaining its employees.
Q- 40. How do you assess Human Resource Management Practices of your organisation in
previous three years?
Employees of chemical industries were asked to communicate about How do you assess Human
Resource Management Practices of your organisation in previous three years Two options were
given to the respondent’s first option was Moderately Healthy and second option was Very
Healthy. This question was asked to respondents to know whether overall Human Resource
Management practices of last three years contribute in the progress of the organisation or not.
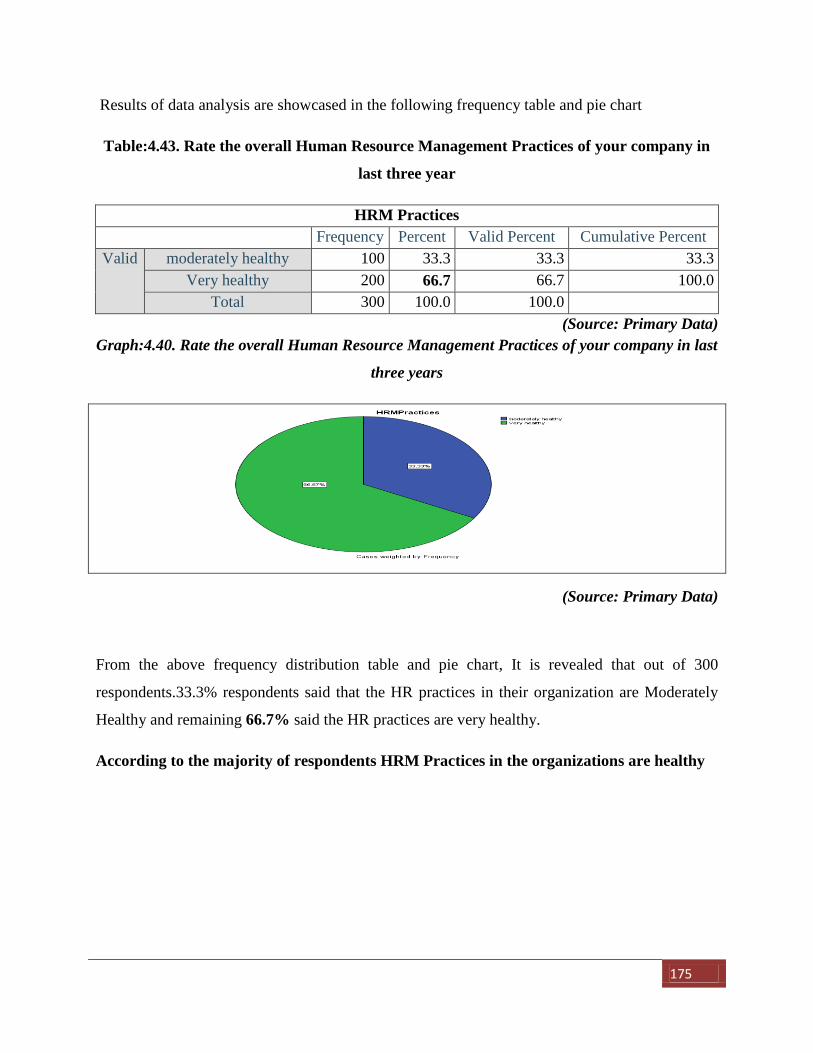
175
Results of data analysis are showcased in the following frequency table and pie chart
Table:4.43. Rate the overall Human Resource Management Practices of your company in
last three year
HRM Practices
Frequency Percent Valid Percent Cumulative Percent
Valid moderately healthy 100 33.3 33.3 33.3
Very healthy 200 66.7 66.7 100.0
Total 300 100.0 100.0
(Source: Primary Data)
Graph:4.40. Rate the overall Human Resource Management Practices of your company in last
three years
(Source: Primary Data)
From the above frequency distribution table and pie chart, It is revealed that out of 300
respondents.33.3% respondents said that the HR practices in their organization are Moderately
Healthy and remaining 66.7% said the HR practices are very healthy.
According to the majority of respondents HRM Practices in the organizations are healthy
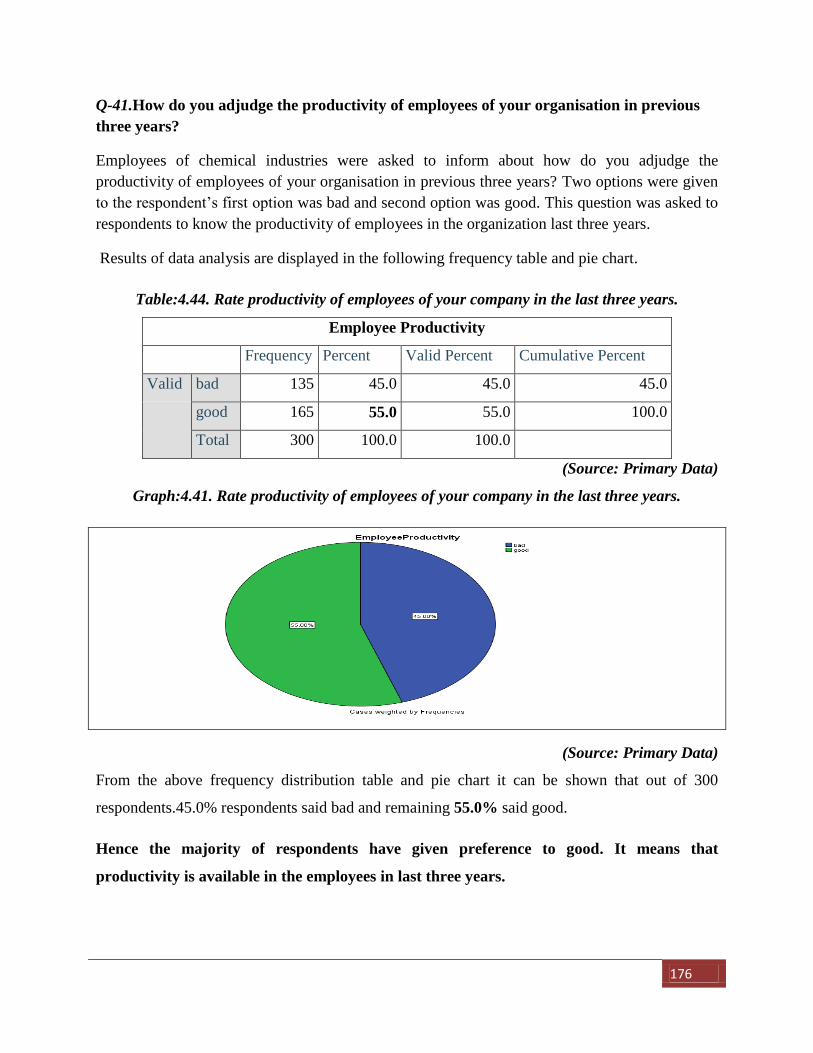
176
Q-41.How do you adjudge the productivity of employees of your organisation in previous
three years?
Employees of chemical industries were asked to inform about how do you adjudge the
productivity of employees of your organisation in previous three years? Two options were given
to the respondent’s first option was bad and second option was good. This question was asked to
respondents to know the productivity of employees in the organization last three years.
Results of data analysis are displayed in the following frequency table and pie chart.
Table:4.44. Rate productivity of employees of your company in the last three years.
Employee Productivity
Frequency Percent Valid Percent Cumulative Percent
Valid bad 135 45.0 45.0 45.0
good 165 55.0 55.0 100.0
Total 300 100.0 100.0
(Source: Primary Data)
Graph:4.41. Rate productivity of employees of your company in the last three years.
(Source: Primary Data)
From the above frequency distribution table and pie chart it can be shown that out of 300
respondents.45.0% respondents said bad and remaining 55.0% said good.
Hence the majority of respondents have given preference to good. It means that
productivity is available in the employees in last three years.
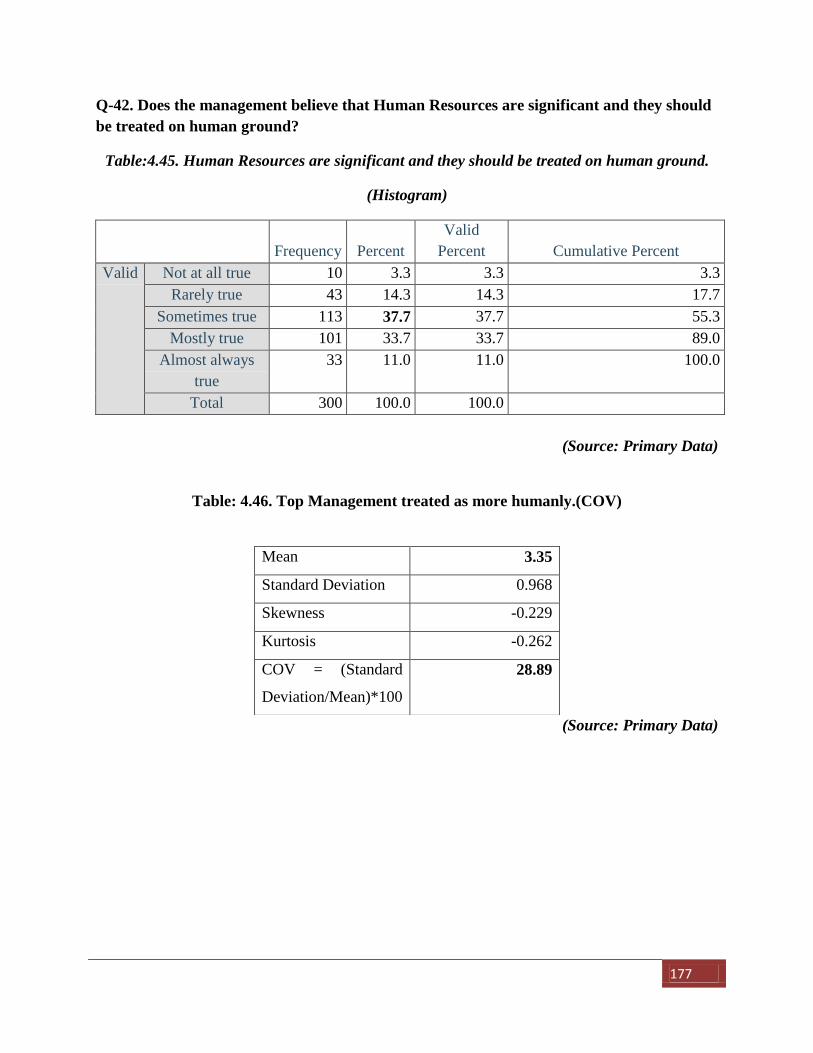
177
Q-42. Does the management believe that Human Resources are significant and they should
be treated on human ground?
Table:4.45. Human Resources are significant and they should be treated on human ground.
(Histogram)
Frequency Percent
Valid
Percent Cumulative Percent
Valid Not at all true 10 3.3 3.3 3.3
Rarely true 43 14.3 14.3 17.7
Sometimes true 113 37.7 37.7 55.3
Mostly true 101 33.7 33.7 89.0
Almost always
true
33 11.0 11.0 100.0
Total 300 100.0 100.0
(Source: Primary Data)
Table: 4.46. Top Management treated as more humanly.(COV)
(Source: Primary Data)
Mean 3.35
Standard Deviation 0.968
Skewness -0.229
Kurtosis -0.262
COV = (Standard
Deviation/Mean)*100
28.89
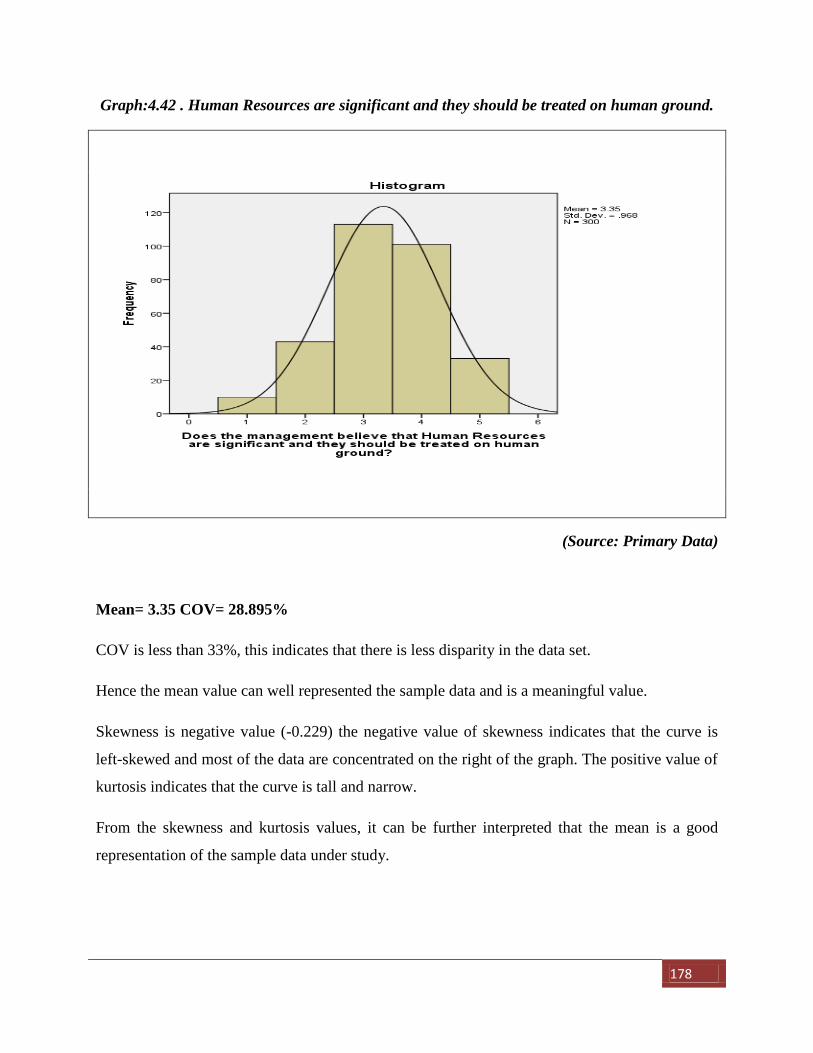
178
Graph:4.42 . Human Resources are significant and they should be treated on human ground.
(Source: Primary Data)
Mean= 3.35 COV= 28.895%
COV is less than 33%, this indicates that there is less disparity in the data set.
Hence the mean value can well represented the sample data and is a meaningful value.
Skewness is negative value (-0.229) the negative value of skewness indicates that the curve is
left-skewed and most of the data are concentrated on the right of the graph. The positive value of
kurtosis indicates that the curve is tall and narrow.
From the skewness and kurtosis values, it can be further interpreted that the mean is a good
representation of the sample data under study.

179
Hence it can be affirmed that employees of chemical industries MODERATELY AGREE
that top management believes that Human resources are an extremely important resource
and that they have to be treated more humanly.
Interpretation:-
From the frequency distribution table, it can be seen that 3.3% employees says that it is not at all
true that the top management believes that the Human resource are extremely important
resources and that the Human Resources to treated more humanly, 14.3% says it is that rarely
true, 37.7% says it is sometimes true 33.7% says that mostly true. 11% says it is almost always
true.
Hence majority of employees selected sometimes true option hence they believe that, top
management is not consistent in providing humanly treatment to subordinates.
Q-43. Advancement of subordinate is treated as an organic part of managers / officers job.
Table:4.47. Advancement of subordinate is treated as an organic part of managers /
officers job. (Histogram)
Frequency Percent Valid Percent Cumulative Percent
Valid Not at all true 7 2.3 2.3 2.3
Rarely true 26 8.7 8.7 11.0
Sometimes true 99 33.0 33.0 44.0
Mostly true 127 42.3 42.3 86.3
Almost always
true
41 13.7 13.7 100.0
Total 300 100.0 100.0
(Source: Primary Data)
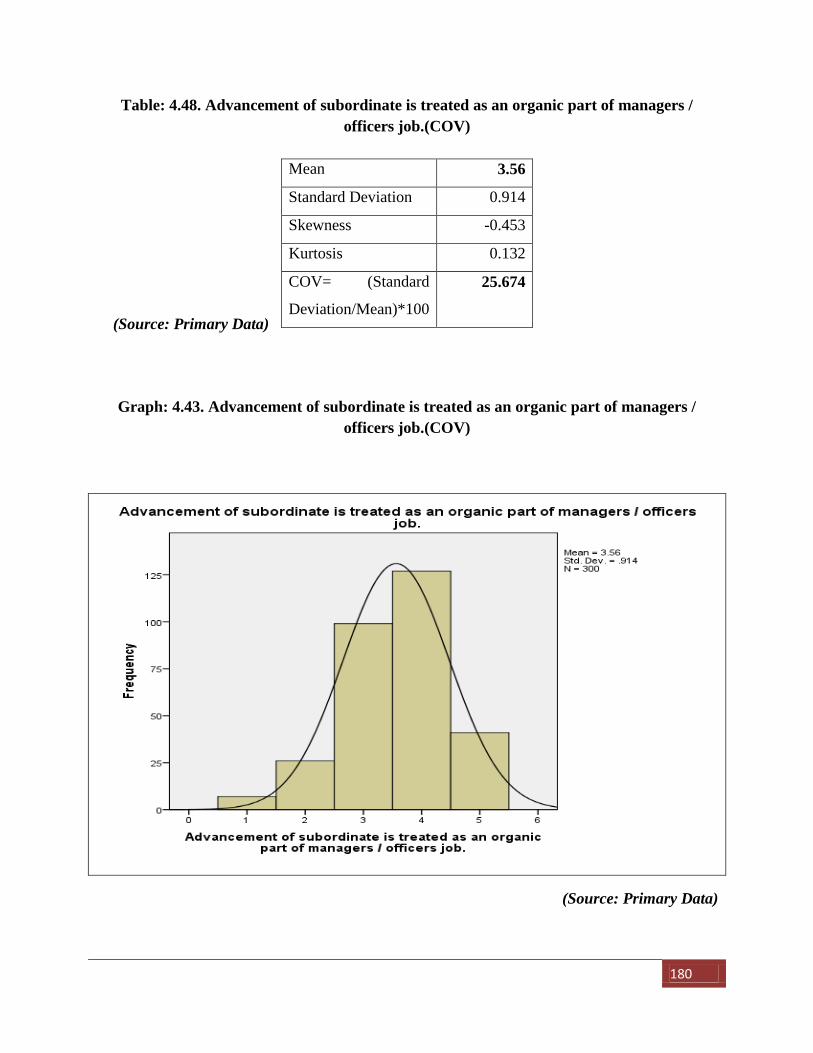
180
Table: 4.48. Advancement of subordinate is treated as an organic part of managers /
officers job.(COV)
(Source: Primary Data)
Graph: 4.43. Advancement of subordinate is treated as an organic part of managers /
officers job.(COV)
(Source: Primary Data)
Mean 3.56
Standard Deviation 0.914
Skewness -0.453
Kurtosis 0.132
COV= (Standard
Deviation/Mean)*100
25.674
181
Mean= 3.56 COV= 25.674 %
COV is less than 33% this shows that there is less disparity in the data set.
Hence the mean value can well represented the sample data and is a meaningful value.
Skewness is negative value (-0.453) the negative value of skewness indicates that the curve is
left skewness and most of the data for their variables are concentrate on the right of the graph.
The positive value of kurtosis indicates that the curve is short and spread.
From the skewness and kurtosis value it can be further interpreted that the mean value is a good
representation of the sample data under study.
Hence it can be conducted that employees of chemical industries moderately agree that the
development of subordinate is seen as an important part of their job by the manager /
officers here.
Interpretation:-
From the frequency distribution table it can be told that 2.3% employees says that the
development of subordinate is seen as an important part of their job by the manager / officers ,
8.7% says it is that rarely true, 33.% says it is sometimes true 42.3% says that mostly true.
13.7% says it is almost always true.
Hence majority of employees believe that, that the development of subordinate is seen as
an important part of their job by the manager / officers.
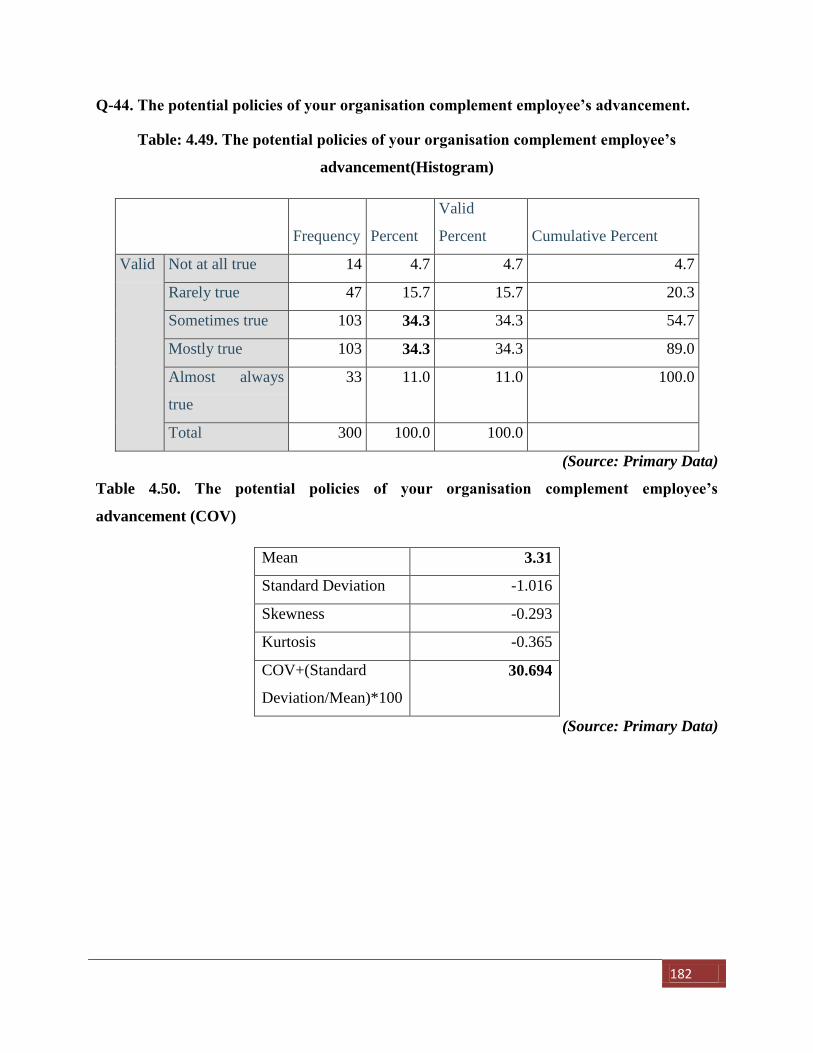
182
Q-44. The potential policies of your organisation complement employee’s advancement.
Table: 4.49. The potential policies of your organisation complement employee’s
advancement(Histogram)
Frequency Percent
Valid
Percent Cumulative Percent
Valid Not at all true 14 4.7 4.7 4.7
Rarely true 47 15.7 15.7 20.3
Sometimes true 103 34.3 34.3 54.7
Mostly true 103 34.3 34.3 89.0
Almost always
true
33 11.0 11.0 100.0
Total 300 100.0 100.0
(Source: Primary Data)
Table 4.50. The potential policies of your organisation complement employee’s
advancement (COV)
Mean 3.31
Standard Deviation -1.016
Skewness -0.293
Kurtosis -0.365
COV+(Standard
Deviation/Mean)*100
30.694
(Source: Primary Data)
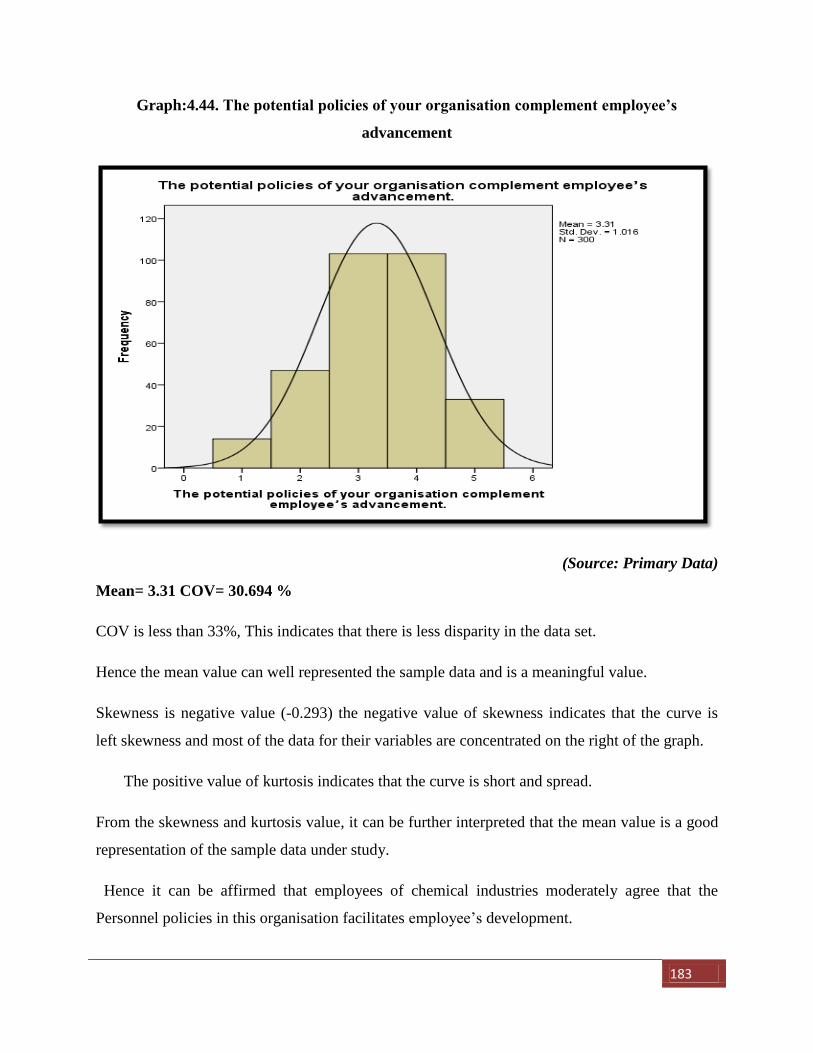
183
Graph:4.44. The potential policies of your organisation complement employee’s
advancement
(Source: Primary Data)
Mean= 3.31 COV= 30.694 %
COV is less than 33%, This indicates that there is less disparity in the data set.
Hence the mean value can well represented the sample data and is a meaningful value.
Skewness is negative value (-0.293) the negative value of skewness indicates that the curve is
left skewness and most of the data for their variables are concentrated on the right of the graph.
The positive value of kurtosis indicates that the curve is short and spread.
From the skewness and kurtosis value, it can be further interpreted that the mean value is a good
representation of the sample data under study.
Hence it can be affirmed that employees of chemical industries moderately agree that the
Personnel policies in this organisation facilitates employee’s development.
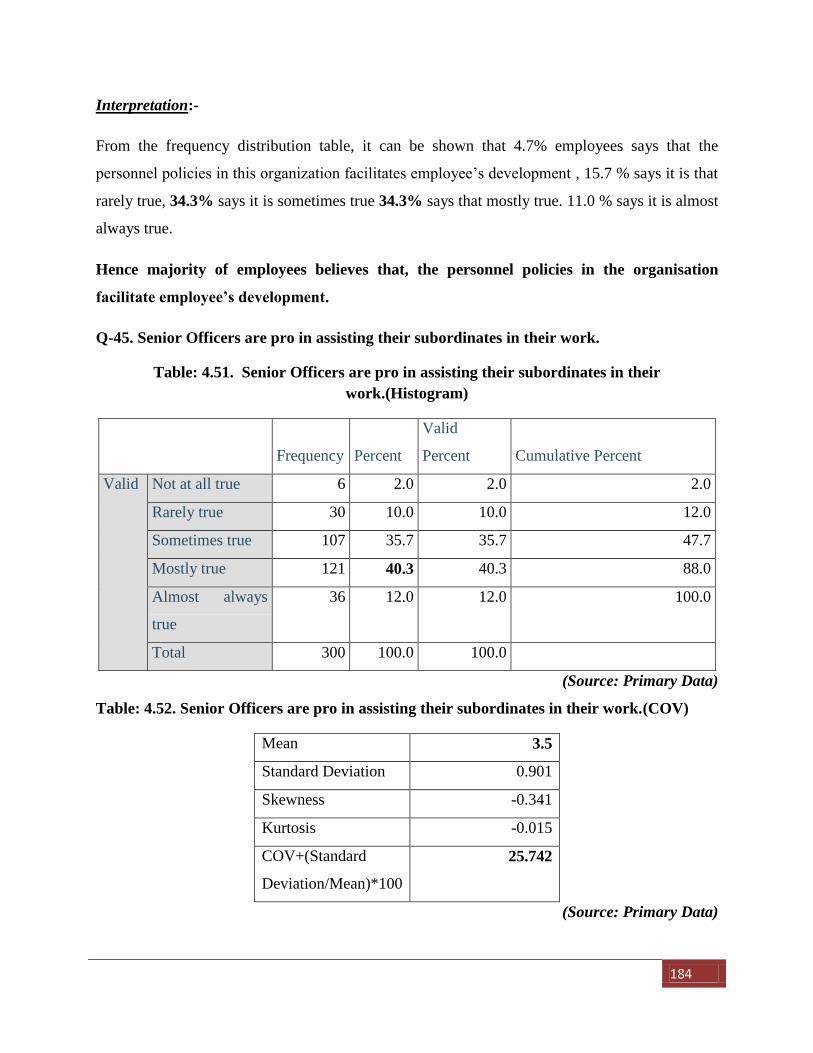
184
Interpretation:-
From the frequency distribution table, it can be shown that 4.7% employees says that the
personnel policies in this organization facilitates employee’s development , 15.7 % says it is that
rarely true, 34.3% says it is sometimes true 34.3% says that mostly true. 11.0 % says it is almost
always true.
Hence majority of employees believes that, the personnel policies in the organisation
facilitate employee’s development.
Q-45. Senior Officers are pro in assisting their subordinates in their work.
Table: 4.51. Senior Officers are pro in assisting their subordinates in their
work.(Histogram)
Frequency Percent
Valid
Percent Cumulative Percent
Valid Not at all true 6 2.0 2.0 2.0
Rarely true 30 10.0 10.0 12.0
Sometimes true 107 35.7 35.7 47.7
Mostly true 121 40.3 40.3 88.0
Almost always
true
36 12.0 12.0 100.0
Total 300 100.0 100.0
(Source: Primary Data)
Table: 4.52. Senior Officers are pro in assisting their subordinates in their work.(COV)
Mean 3.5
Standard Deviation 0.901
Skewness -0.341
Kurtosis -0.015
COV+(Standard
Deviation/Mean)*100
25.742
(Source: Primary Data)
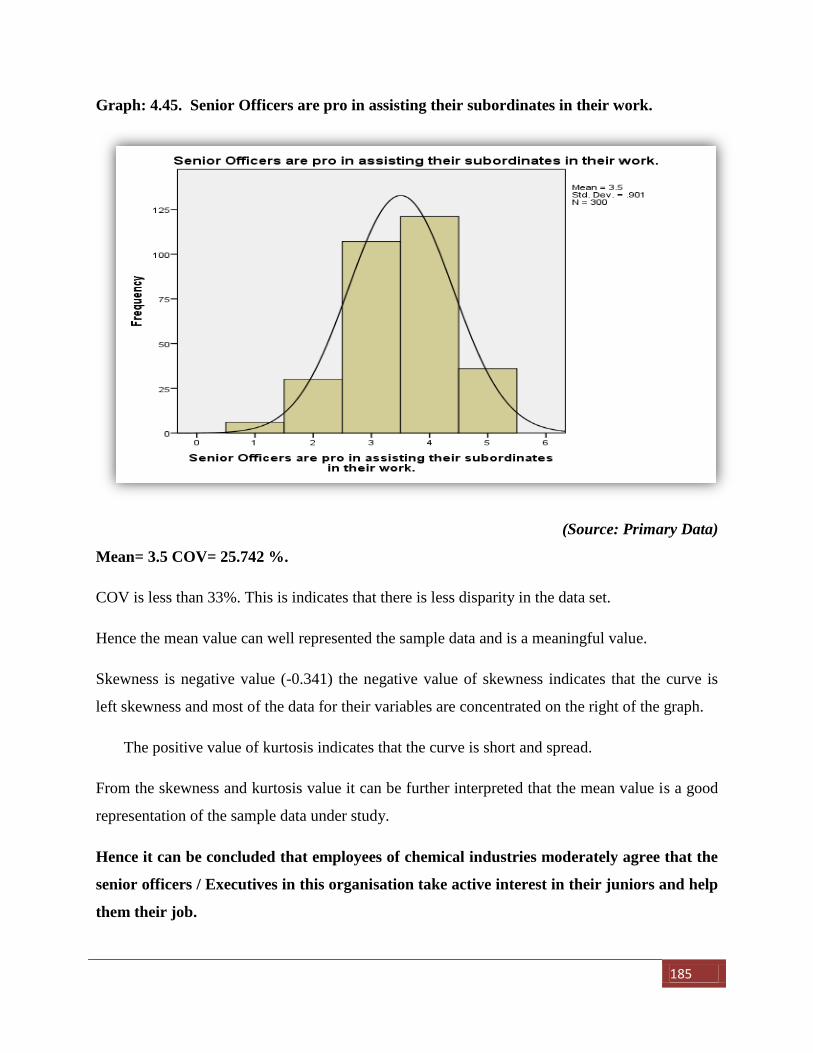
185
Graph: 4.45. Senior Officers are pro in assisting their subordinates in their work.
(Source: Primary Data)
Mean= 3.5 COV= 25.742 %.
COV is less than 33%. This is indicates that there is less disparity in the data set.
Hence the mean value can well represented the sample data and is a meaningful value.
Skewness is negative value (-0.341) the negative value of skewness indicates that the curve is
left skewness and most of the data for their variables are concentrated on the right of the graph.
The positive value of kurtosis indicates that the curve is short and spread.
From the skewness and kurtosis value it can be further interpreted that the mean value is a good
representation of the sample data under study.
Hence it can be concluded that employees of chemical industries moderately agree that the
senior officers / Executives in this organisation take active interest in their juniors and help
them their job.
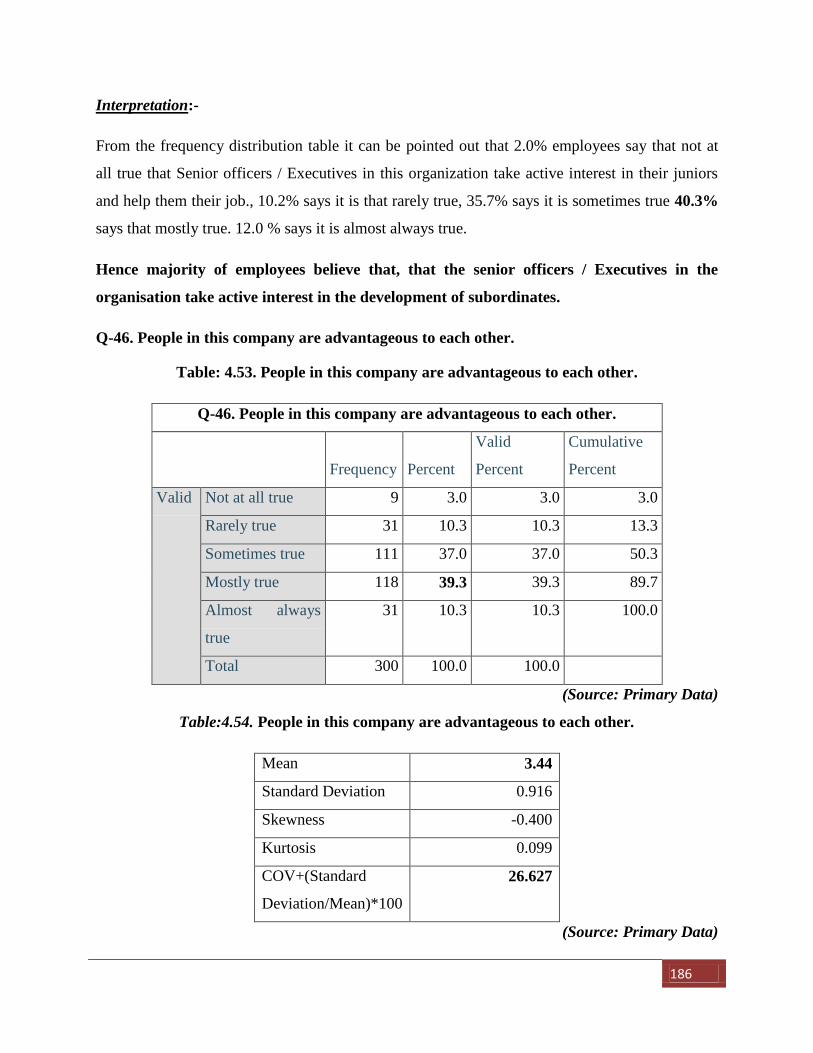
186
Interpretation:-
From the frequency distribution table it can be pointed out that 2.0% employees say that not at
all true that Senior officers / Executives in this organization take active interest in their juniors
and help them their job., 10.2% says it is that rarely true, 35.7% says it is sometimes true 40.3%
says that mostly true. 12.0 % says it is almost always true.
Hence majority of employees believe that, that the senior officers / Executives in the
organisation take active interest in the development of subordinates.
Q-46. People in this company are advantageous to each other.
Table: 4.53. People in this company are advantageous to each other.
Q-46. People in this company are advantageous to each other.
Frequency Percent
Valid
Percent
Cumulative
Percent
Valid Not at all true 9 3.0 3.0 3.0
Rarely true 31 10.3 10.3 13.3
Sometimes true 111 37.0 37.0 50.3
Mostly true 118 39.3 39.3 89.7
Almost always
true
31 10.3 10.3 100.0
Total 300 100.0 100.0
(Source: Primary Data)
Table:4.54. People in this company are advantageous to each other.
Mean 3.44
Standard Deviation 0.916
Skewness -0.400
Kurtosis 0.099
COV+(Standard
Deviation/Mean)*100
26.627
(Source: Primary Data)
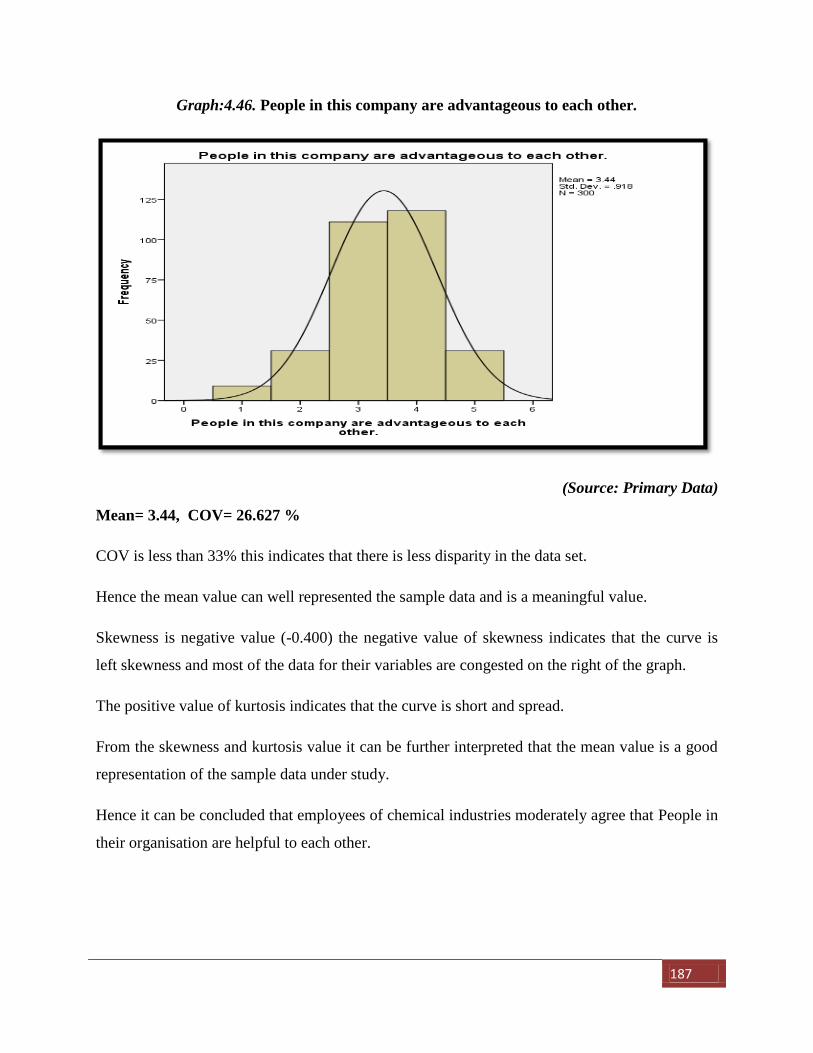
187
Graph:4.46. People in this company are advantageous to each other.
(Source: Primary Data)
Mean= 3.44, COV= 26.627 %
COV is less than 33% this indicates that there is less disparity in the data set.
Hence the mean value can well represented the sample data and is a meaningful value.
Skewness is negative value (-0.400) the negative value of skewness indicates that the curve is
left skewness and most of the data for their variables are congested on the right of the graph.
The positive value of kurtosis indicates that the curve is short and spread.
From the skewness and kurtosis value it can be further interpreted that the mean value is a good
representation of the sample data under study.
Hence it can be concluded that employees of chemical industries moderately agree that People in
their organisation are helpful to each other.
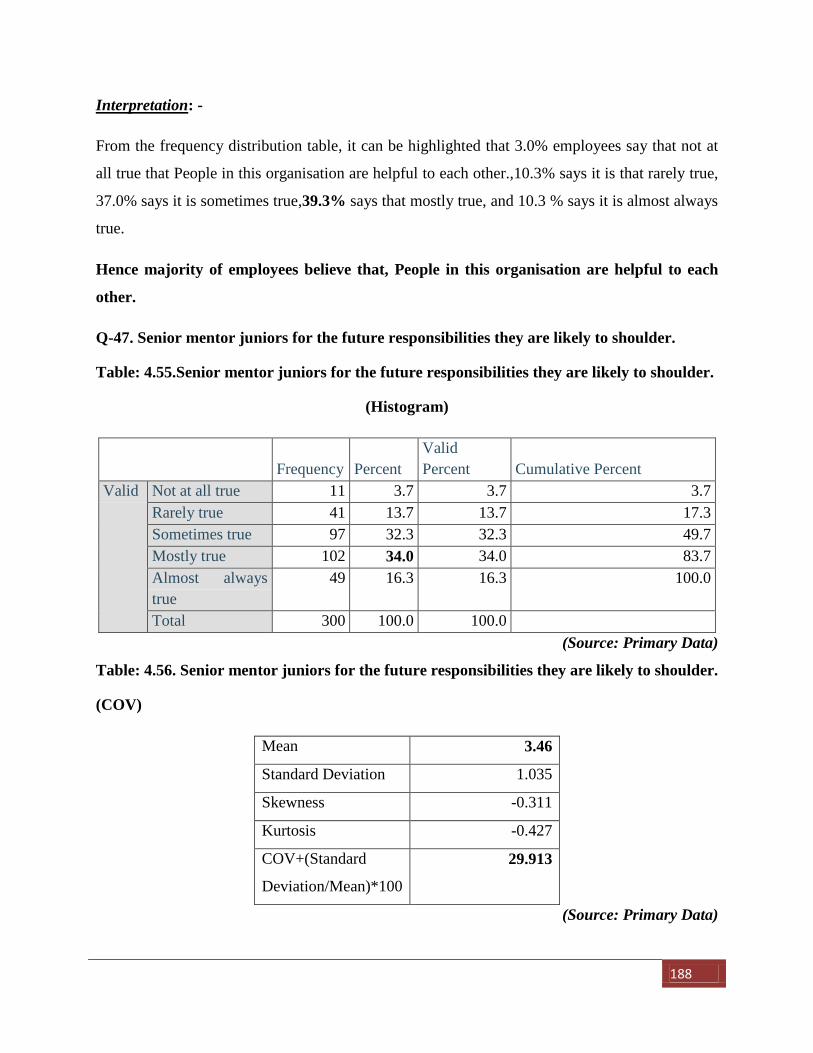
188
Interpretation: -
From the frequency distribution table, it can be highlighted that 3.0% employees say that not at
all true that People in this organisation are helpful to each other.,10.3% says it is that rarely true,
37.0% says it is sometimes true,39.3% says that mostly true, and 10.3 % says it is almost always
true.
Hence majority of employees believe that, People in this organisation are helpful to each
other.
Q-47. Senior mentor juniors for the future responsibilities they are likely to shoulder.
Table: 4.55.Senior mentor juniors for the future responsibilities they are likely to shoulder.
(Histogram)
Frequency Percent
Valid
Percent Cumulative Percent
Valid Not at all true 11 3.7 3.7 3.7
Rarely true 41 13.7 13.7 17.3
Sometimes true 97 32.3 32.3 49.7
Mostly true 102 34.0 34.0 83.7
Almost always
true
49 16.3 16.3 100.0
Total 300 100.0 100.0
(Source: Primary Data)
Table: 4.56. Senior mentor juniors for the future responsibilities they are likely to shoulder.
(COV)
Mean 3.46
Standard Deviation 1.035
Skewness -0.311
Kurtosis -0.427
COV+(Standard
Deviation/Mean)*100
29.913
(Source: Primary Data)
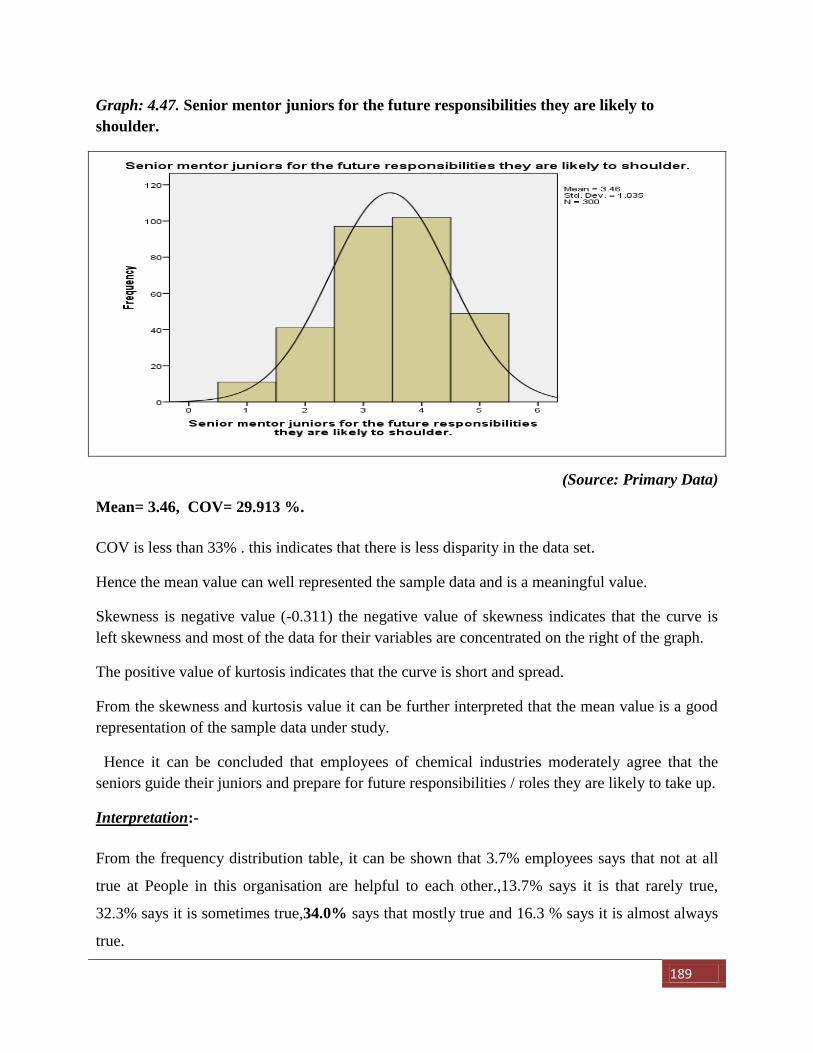
189
Graph: 4.47. Senior mentor juniors for the future responsibilities they are likely to
shoulder.
(Source: Primary Data)
Mean= 3.46, COV= 29.913 %.
COV is less than 33% . this indicates that there is less disparity in the data set.
Hence the mean value can well represented the sample data and is a meaningful value.
Skewness is negative value (-0.311) the negative value of skewness indicates that the curve is
left skewness and most of the data for their variables are concentrated on the right of the graph.
The positive value of kurtosis indicates that the curve is short and spread.
From the skewness and kurtosis value it can be further interpreted that the mean value is a good
representation of the sample data under study.
Hence it can be concluded that employees of chemical industries moderately agree that the
seniors guide their juniors and prepare for future responsibilities / roles they are likely to take up.
Interpretation:-
From the frequency distribution table, it can be shown that 3.7% employees says that not at all
true at People in this organisation are helpful to each other.,13.7% says it is that rarely true,
32.3% says it is sometimes true,34.0% says that mostly true and 16.3 % says it is almost always
true.
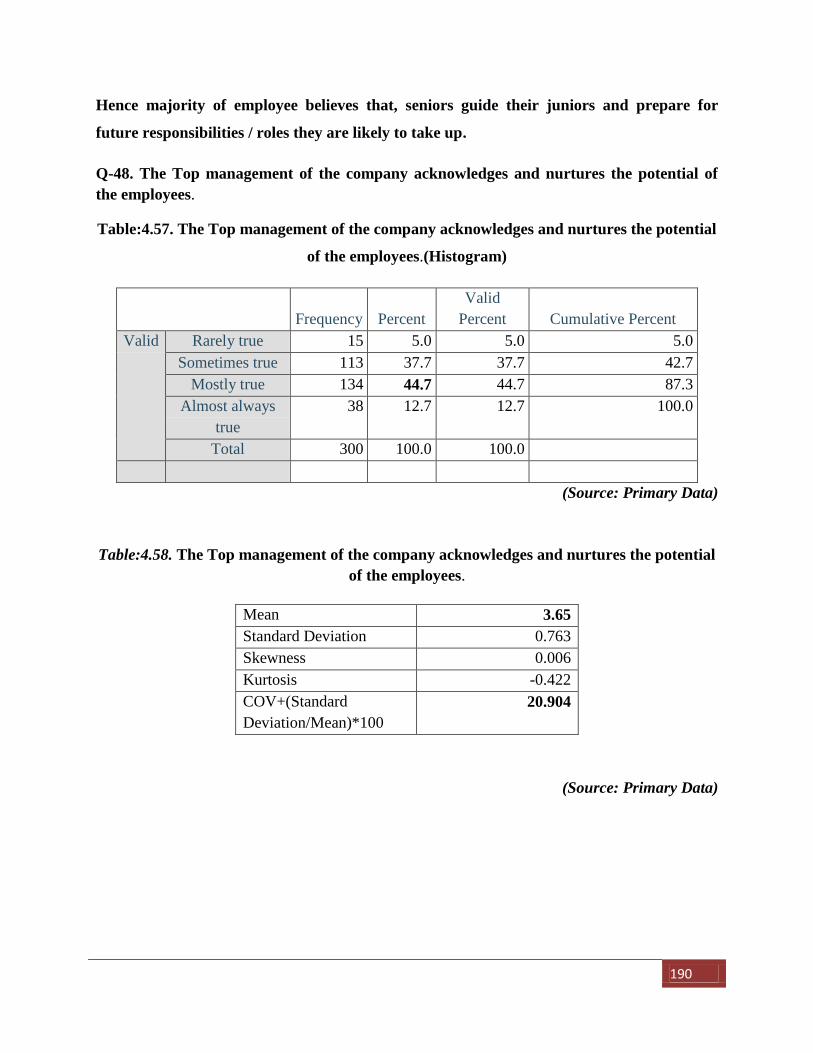
190
Hence majority of employee believes that, seniors guide their juniors and prepare for
future responsibilities / roles they are likely to take up.
Q-48. The Top management of the company acknowledges and nurtures the potential of
the employees.
Table:4.57. The Top management of the company acknowledges and nurtures the potential
of the employees.(Histogram)
Frequency Percent
Valid
Percent Cumulative Percent
Valid Rarely true 15 5.0 5.0 5.0
Sometimes true 113 37.7 37.7 42.7
Mostly true 134 44.7 44.7 87.3
Almost always
true
38 12.7 12.7 100.0
Total 300 100.0 100.0
(Source: Primary Data)
Table:4.58. The Top management of the company acknowledges and nurtures the potential
of the employees.
(Source: Primary Data)
Mean 3.65
Standard Deviation 0.763
Skewness 0.006
Kurtosis -0.422
COV+(Standard
Deviation/Mean)*100
20.904
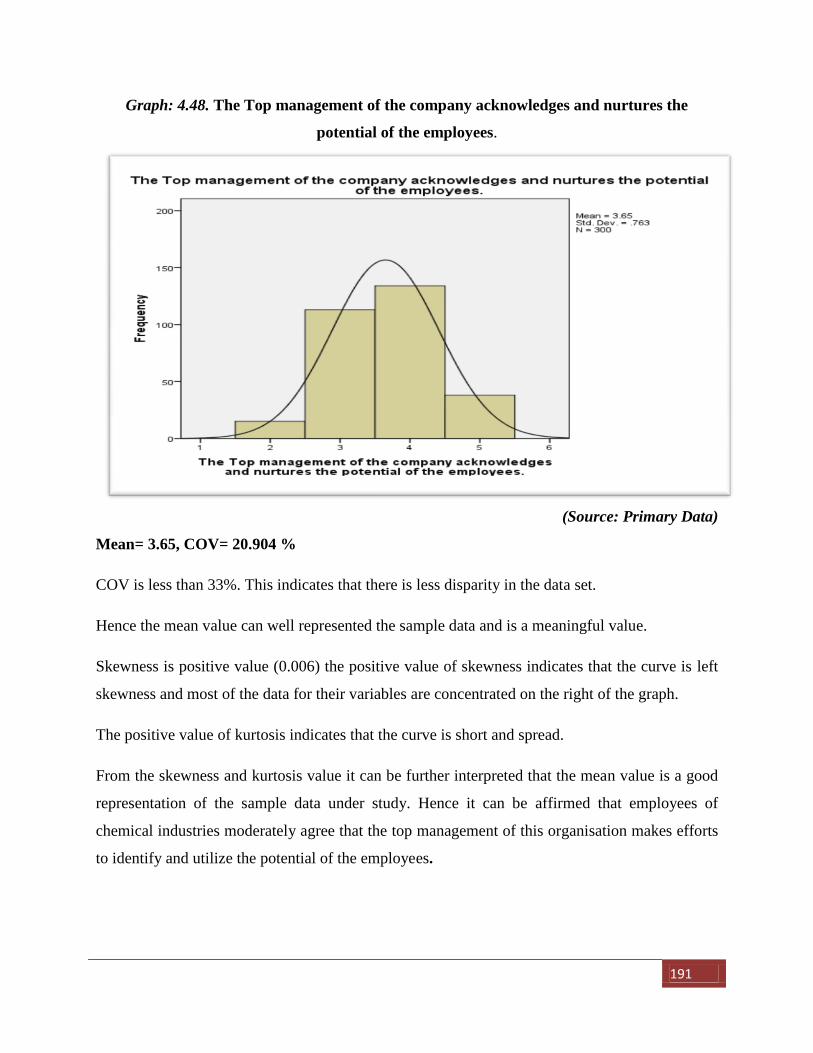
191
Graph: 4.48. The Top management of the company acknowledges and nurtures the
potential of the employees.
(Source: Primary Data)
Mean= 3.65, COV= 20.904 %
COV is less than 33%. This indicates that there is less disparity in the data set.
Hence the mean value can well represented the sample data and is a meaningful value.
Skewness is positive value (0.006) the positive value of skewness indicates that the curve is left
skewness and most of the data for their variables are concentrated on the right of the graph.
The positive value of kurtosis indicates that the curve is short and spread.
From the skewness and kurtosis value it can be further interpreted that the mean value is a good
representation of the sample data under study. Hence it can be affirmed that employees of
chemical industries moderately agree that the top management of this organisation makes efforts
to identify and utilize the potential of the employees.
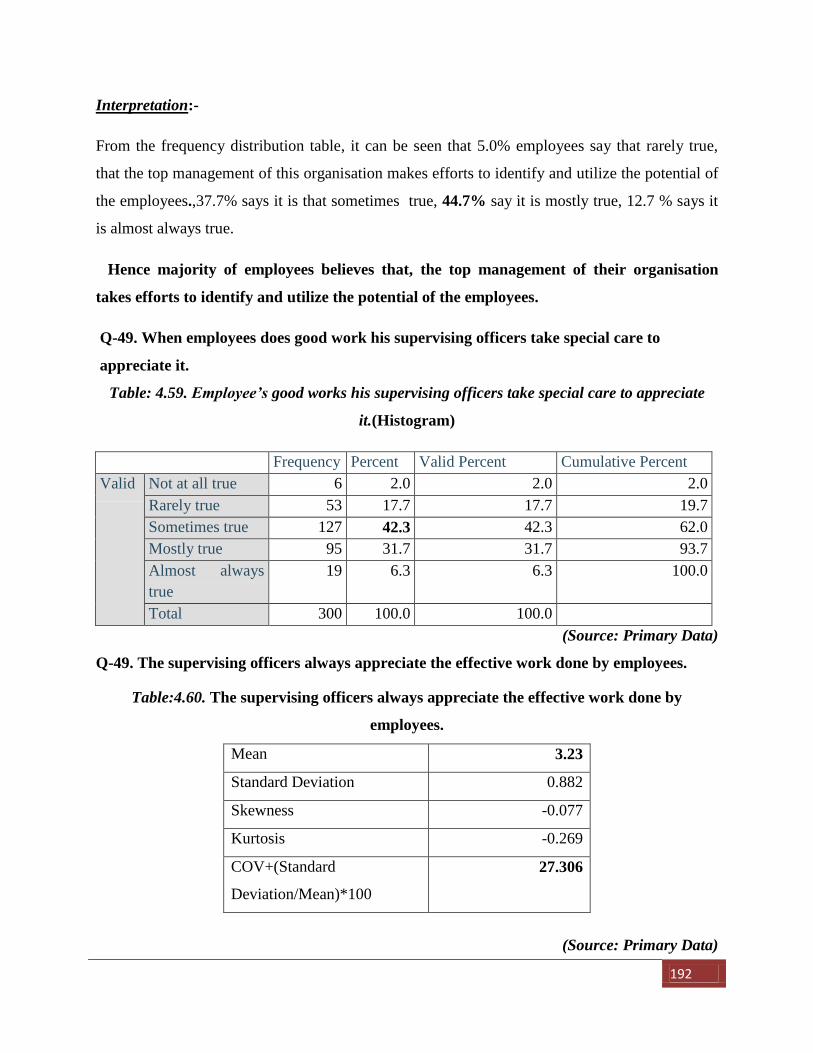
192
Interpretation:-
From the frequency distribution table, it can be seen that 5.0% employees say that rarely true,
that the top management of this organisation makes efforts to identify and utilize the potential of
the employees.,37.7% says it is that sometimes true, 44.7% say it is mostly true, 12.7 % says it
is almost always true.
Hence majority of employees believes that, the top management of their organisation
takes efforts to identify and utilize the potential of the employees.
Q-49. When employees does good work his supervising officers take special care to
appreciate it.
Table: 4.59. Employee’s good works his supervising officers take special care to appreciate
it.(Histogram)
Frequency Percent Valid Percent Cumulative Percent
Valid Not at all true 6 2.0 2.0 2.0
Rarely true 53 17.7 17.7 19.7
Sometimes true 127 42.3 42.3 62.0
Mostly true 95 31.7 31.7 93.7
Almost always
true
19 6.3 6.3 100.0
Total 300 100.0 100.0
(Source: Primary Data)
Q-49. The supervising officers always appreciate the effective work done by employees.
Table:4.60. The supervising officers always appreciate the effective work done by
employees.
(Source: Primary Data)
Mean 3.23
Standard Deviation 0.882
Skewness -0.077
Kurtosis -0.269
COV+(Standard
Deviation/Mean)*100
27.306
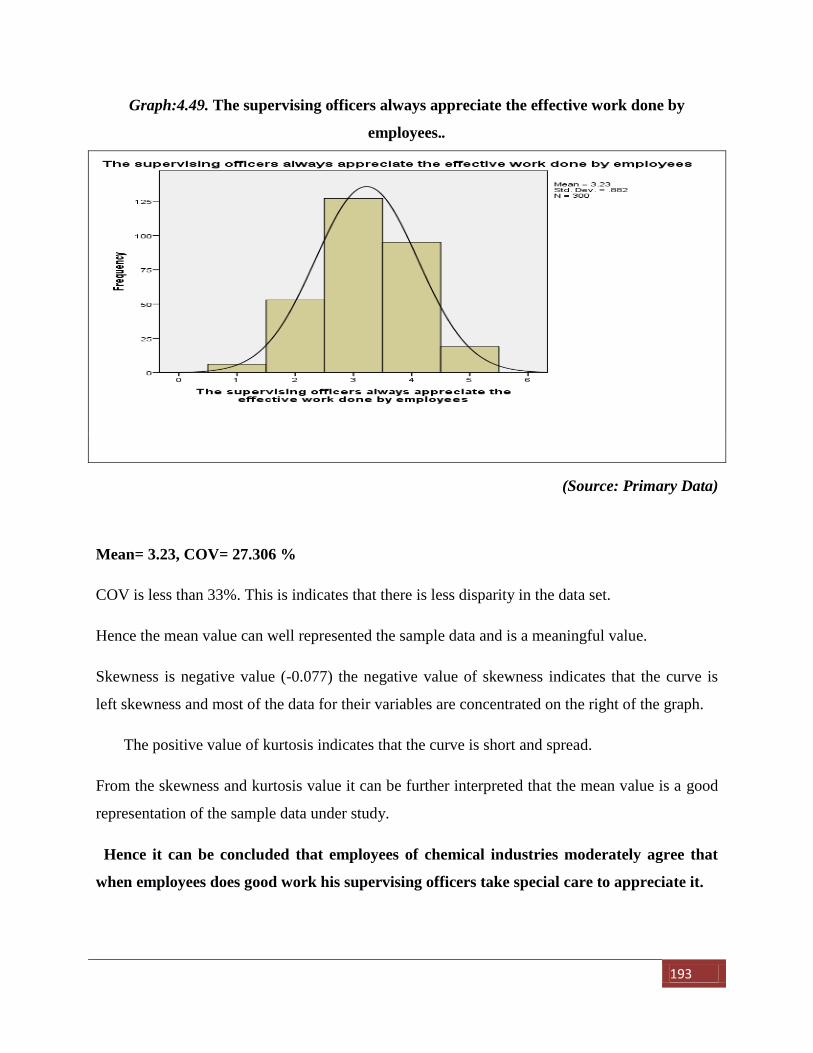
193
Graph:4.49. The supervising officers always appreciate the effective work done by
employees..
(Source: Primary Data)
Mean= 3.23, COV= 27.306 %
COV is less than 33%. This is indicates that there is less disparity in the data set.
Hence the mean value can well represented the sample data and is a meaningful value.
Skewness is negative value (-0.077) the negative value of skewness indicates that the curve is
left skewness and most of the data for their variables are concentrated on the right of the graph.
The positive value of kurtosis indicates that the curve is short and spread.
From the skewness and kurtosis value it can be further interpreted that the mean value is a good
representation of the sample data under study.
Hence it can be concluded that employees of chemical industries moderately agree that
when employees does good work his supervising officers take special care to appreciate it.
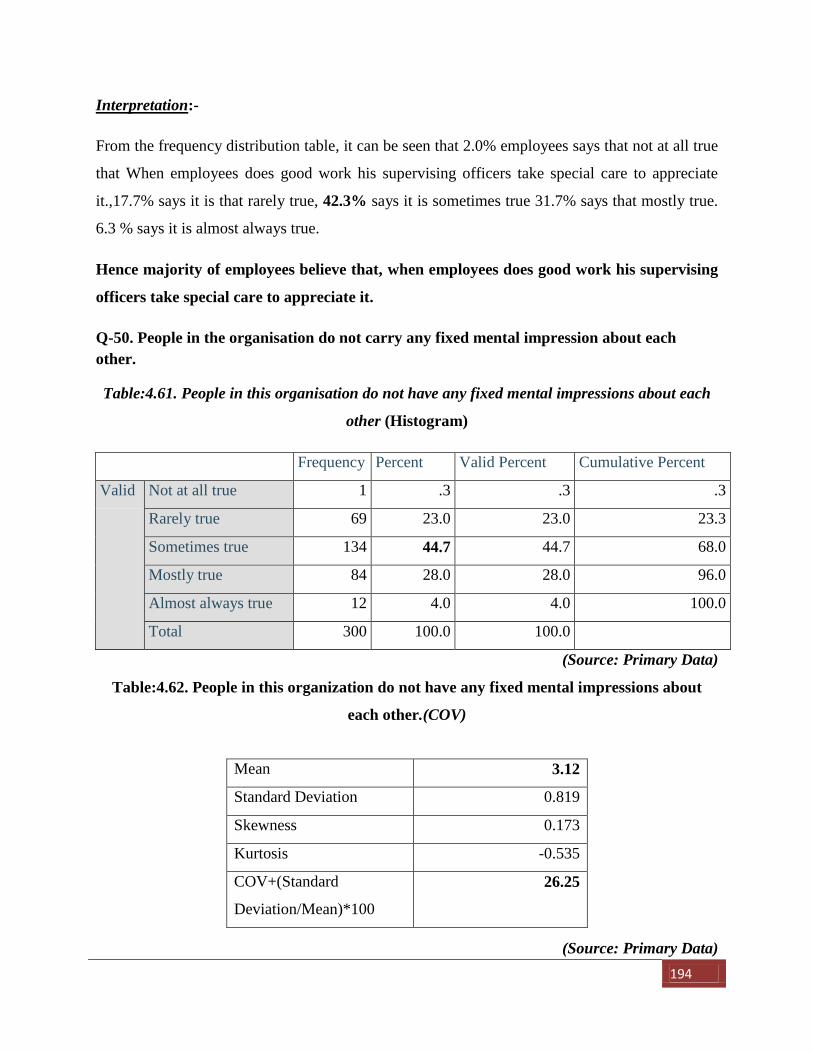
194
Interpretation:-
From the frequency distribution table, it can be seen that 2.0% employees says that not at all true
that When employees does good work his supervising officers take special care to appreciate
it.,17.7% says it is that rarely true, 42.3% says it is sometimes true 31.7% says that mostly true.
6.3 % says it is almost always true.
Hence majority of employees believe that, when employees does good work his supervising
officers take special care to appreciate it.
Q-50. People in the organisation do not carry any fixed mental impression about each
other.
Table:4.61. People in this organisation do not have any fixed mental impressions about each
other (Histogram)
Frequency Percent Valid Percent Cumulative Percent
Valid Not at all true 1 .3 .3 .3
Rarely true 69 23.0 23.0 23.3
Sometimes true 134 44.7 44.7 68.0
Mostly true 84 28.0 28.0 96.0
Almost always true 12 4.0 4.0 100.0
Total 300 100.0 100.0
(Source: Primary Data)
Table:4.62. People in this organization do not have any fixed mental impressions about
each other.(COV)
(Source: Primary Data)
Mean 3.12
Standard Deviation 0.819
Skewness 0.173
Kurtosis -0.535
COV+(Standard
Deviation/Mean)*100
26.25
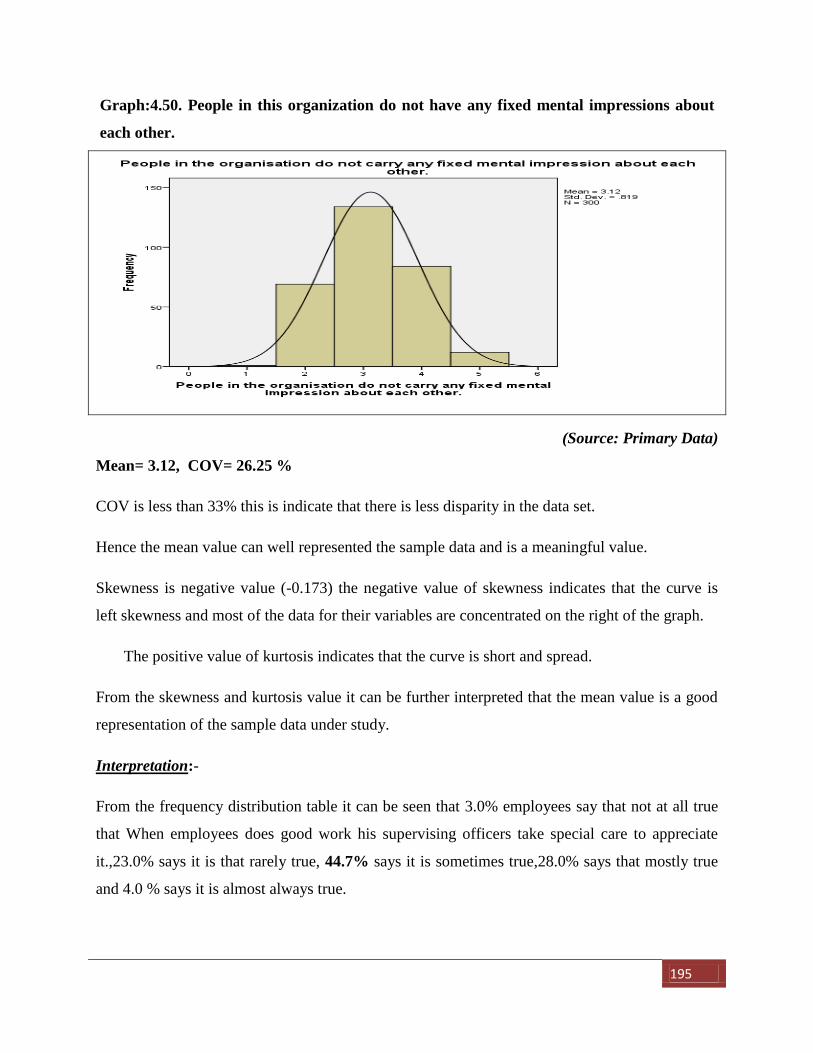
195
Graph:4.50. People in this organization do not have any fixed mental impressions about
each other.
(Source: Primary Data)
Mean= 3.12, COV= 26.25 %
COV is less than 33% this is indicate that there is less disparity in the data set.
Hence the mean value can well represented the sample data and is a meaningful value.
Skewness is negative value (-0.173) the negative value of skewness indicates that the curve is
left skewness and most of the data for their variables are concentrated on the right of the graph.
The positive value of kurtosis indicates that the curve is short and spread.
From the skewness and kurtosis value it can be further interpreted that the mean value is a good
representation of the sample data under study.
Interpretation:-
From the frequency distribution table it can be seen that 3.0% employees say that not at all true
that When employees does good work his supervising officers take special care to appreciate
it.,23.0% says it is that rarely true, 44.7% says it is sometimes true,28.0% says that mostly true
and 4.0 % says it is almost always true.
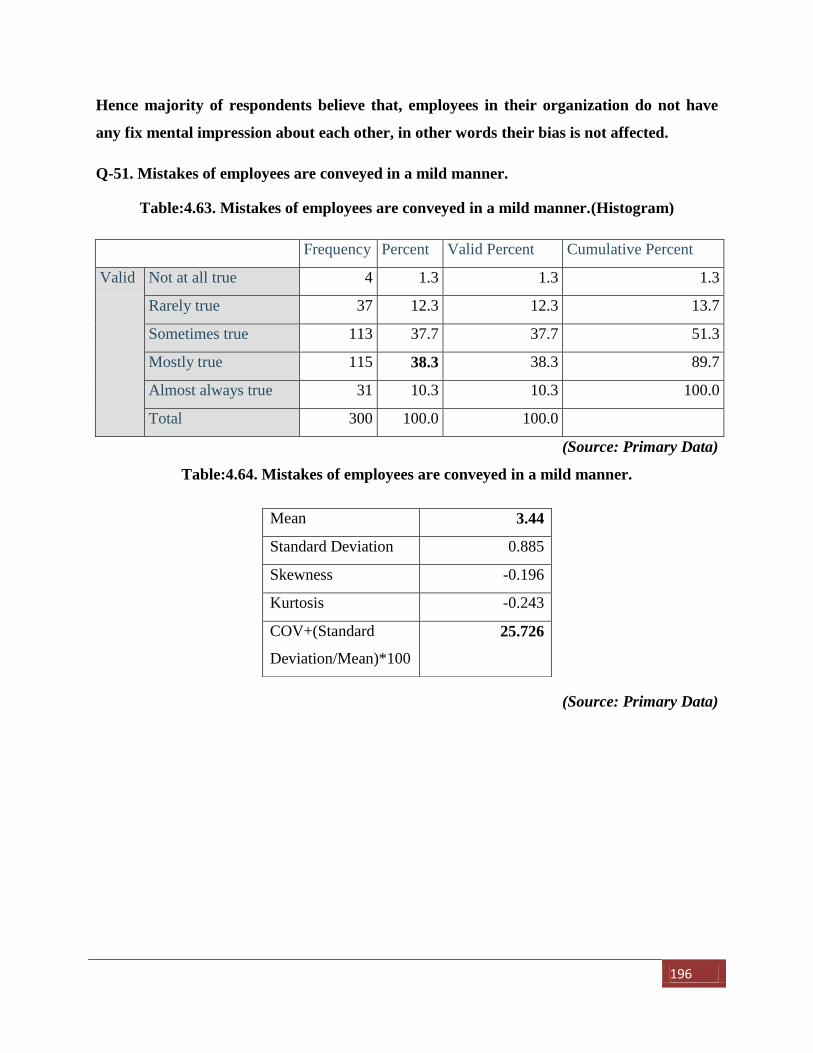
196
Hence majority of respondents believe that, employees in their organization do not have
any fix mental impression about each other, in other words their bias is not affected.
Q-51. Mistakes of employees are conveyed in a mild manner.
Table:4.63. Mistakes of employees are conveyed in a mild manner.(Histogram)
Frequency Percent Valid Percent Cumulative Percent
Valid Not at all true 4 1.3 1.3 1.3
Rarely true 37 12.3 12.3 13.7
Sometimes true 113 37.7 37.7 51.3
Mostly true 115 38.3 38.3 89.7
Almost always true 31 10.3 10.3 100.0
Total 300 100.0 100.0
(Source: Primary Data)
Table:4.64. Mistakes of employees are conveyed in a mild manner.
(Source: Primary Data)
Mean 3.44
Standard Deviation 0.885
Skewness -0.196
Kurtosis -0.243
COV+(Standard
Deviation/Mean)*100
25.726
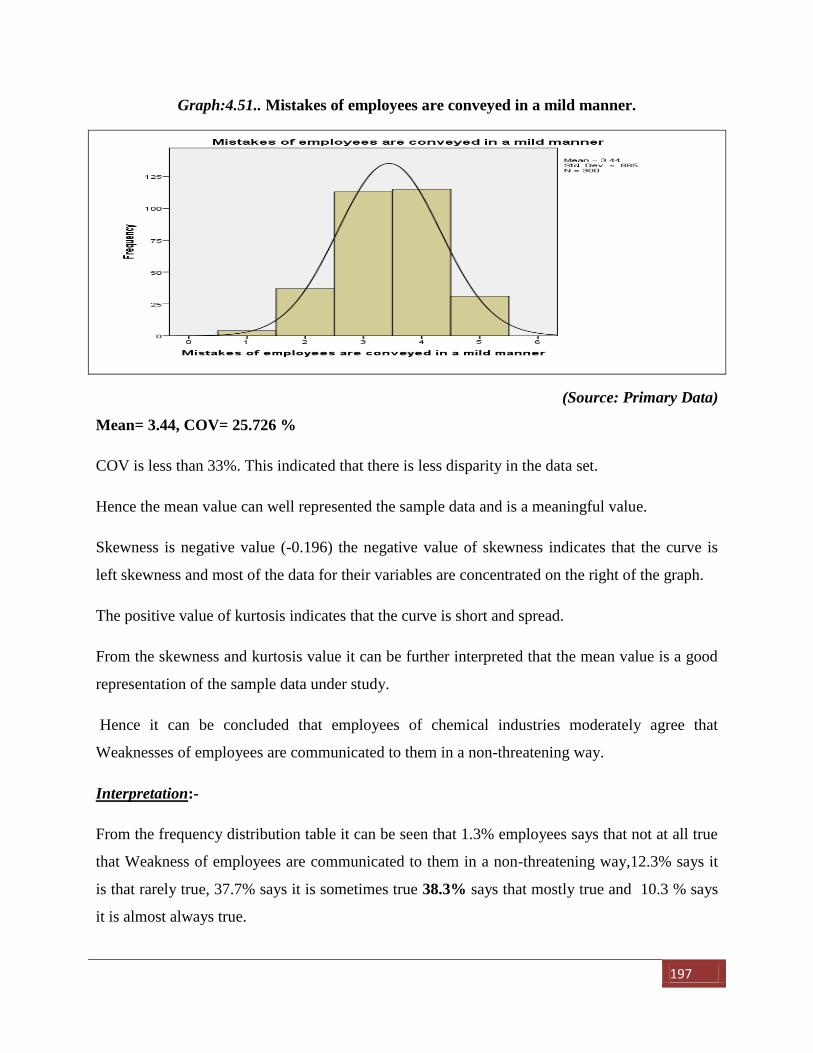
197
Graph:4.51.. Mistakes of employees are conveyed in a mild manner.
(Source: Primary Data)
Mean= 3.44, COV= 25.726 %
COV is less than 33%. This indicated that there is less disparity in the data set.
Hence the mean value can well represented the sample data and is a meaningful value.
Skewness is negative value (-0.196) the negative value of skewness indicates that the curve is
left skewness and most of the data for their variables are concentrated on the right of the graph.
The positive value of kurtosis indicates that the curve is short and spread.
From the skewness and kurtosis value it can be further interpreted that the mean value is a good
representation of the sample data under study.
Hence it can be concluded that employees of chemical industries moderately agree that
Weaknesses of employees are communicated to them in a non-threatening way.
Interpretation:-
From the frequency distribution table it can be seen that 1.3% employees says that not at all true
that Weakness of employees are communicated to them in a non-threatening way,12.3% says it
is that rarely true, 37.7% says it is sometimes true 38.3% says that mostly true and 10.3 % says
it is almost always true.
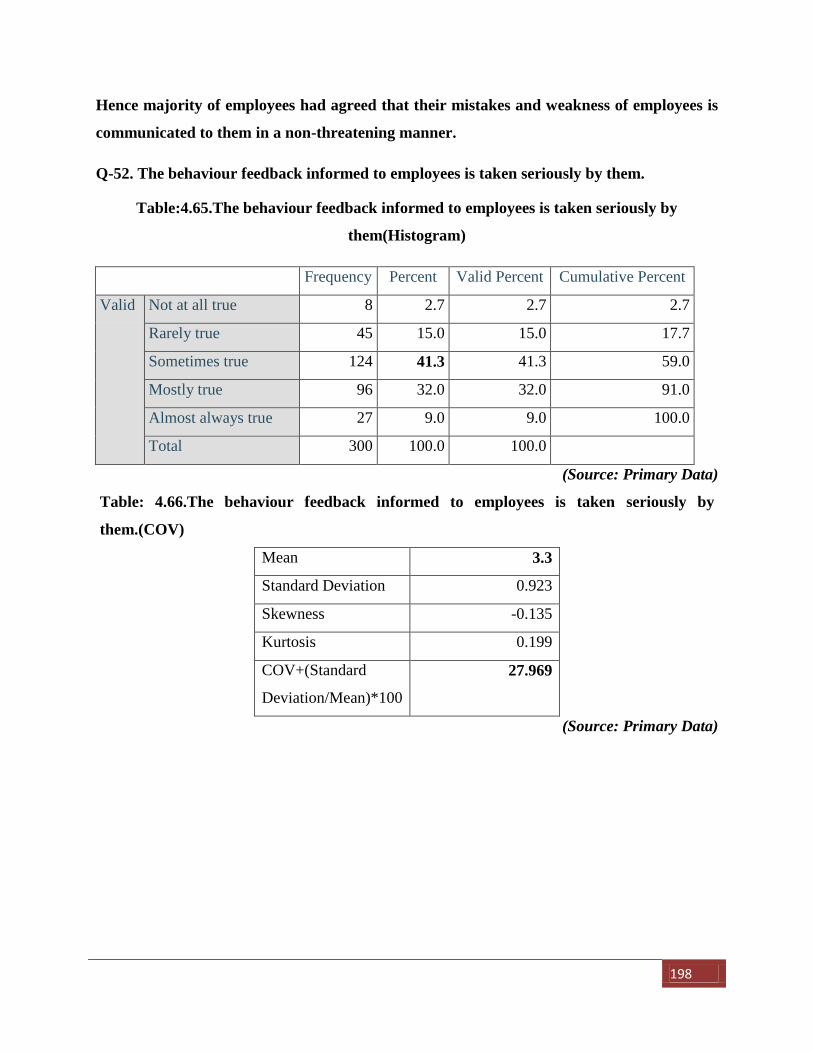
198
Hence majority of employees had agreed that their mistakes and weakness of employees is
communicated to them in a non-threatening manner.
Q-52. The behaviour feedback informed to employees is taken seriously by them.
Table:4.65.The behaviour feedback informed to employees is taken seriously by
them(Histogram)
Frequency Percent Valid Percent Cumulative Percent
Valid Not at all true 8 2.7 2.7 2.7
Rarely true 45 15.0 15.0 17.7
Sometimes true 124 41.3 41.3 59.0
Mostly true 96 32.0 32.0 91.0
Almost always true 27 9.0 9.0 100.0
Total 300 100.0 100.0
(Source: Primary Data)
Table: 4.66.The behaviour feedback informed to employees is taken seriously by
them.(COV)
Mean 3.3
Standard Deviation 0.923
Skewness -0.135
Kurtosis 0.199
COV+(Standard
Deviation/Mean)*100
27.969
(Source: Primary Data)
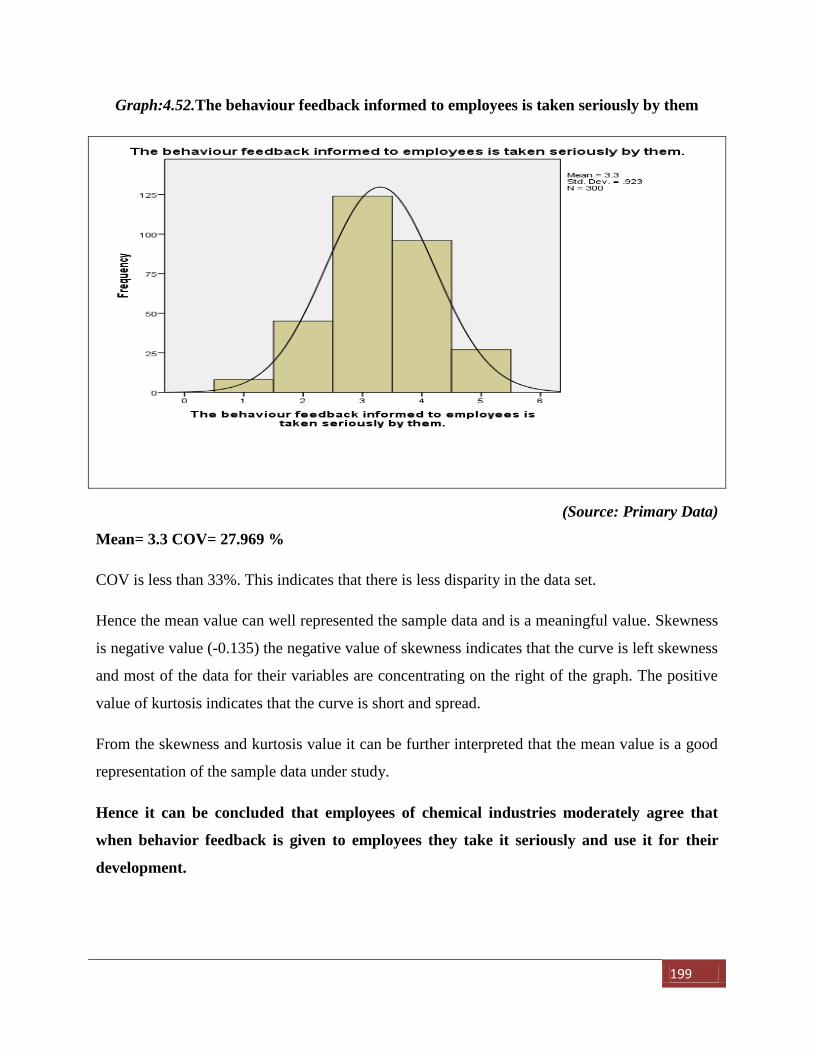
199
Graph:4.52.The behaviour feedback informed to employees is taken seriously by them
(Source: Primary Data)
Mean= 3.3 COV= 27.969 %
COV is less than 33%. This indicates that there is less disparity in the data set.
Hence the mean value can well represented the sample data and is a meaningful value. Skewness
is negative value (-0.135) the negative value of skewness indicates that the curve is left skewness
and most of the data for their variables are concentrating on the right of the graph. The positive
value of kurtosis indicates that the curve is short and spread.
From the skewness and kurtosis value it can be further interpreted that the mean value is a good
representation of the sample data under study.
Hence it can be concluded that employees of chemical industries moderately agree that
when behavior feedback is given to employees they take it seriously and use it for their
development.
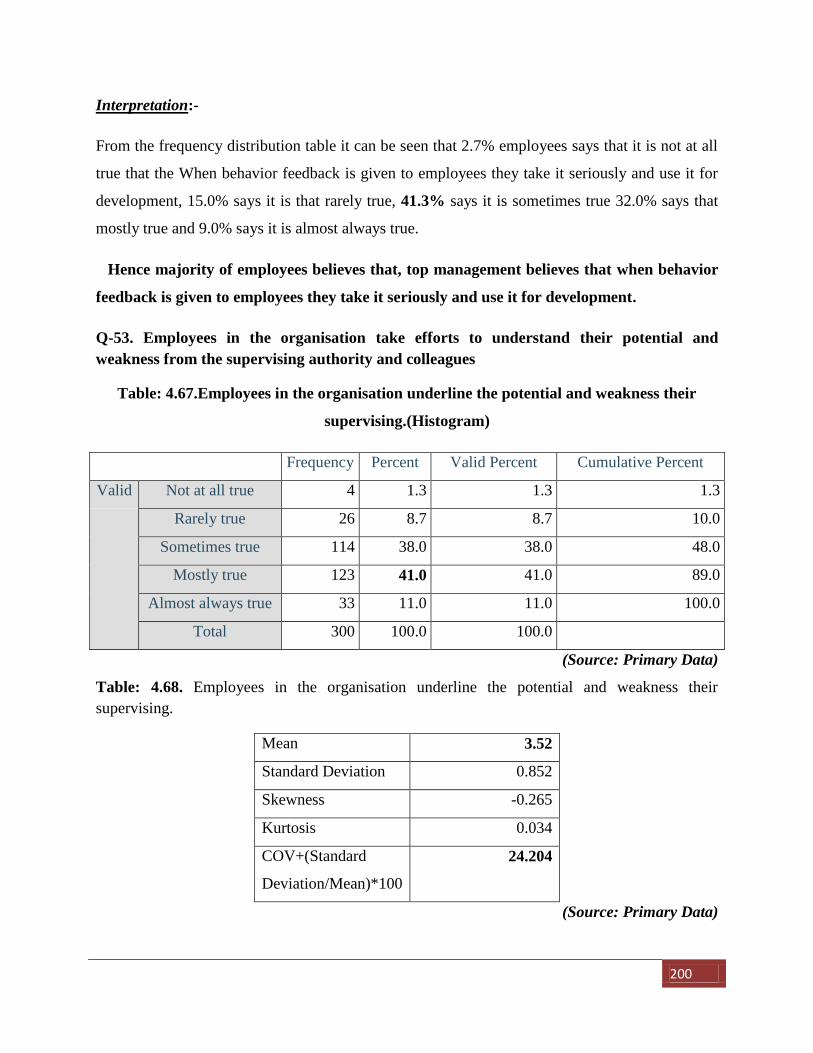
200
Interpretation:-
From the frequency distribution table it can be seen that 2.7% employees says that it is not at all
true that the When behavior feedback is given to employees they take it seriously and use it for
development, 15.0% says it is that rarely true, 41.3% says it is sometimes true 32.0% says that
mostly true and 9.0% says it is almost always true.
Hence majority of employees believes that, top management believes that when behavior
feedback is given to employees they take it seriously and use it for development.
Q-53. Employees in the organisation take efforts to understand their potential and
weakness from the supervising authority and colleagues
Table: 4.67.Employees in the organisation underline the potential and weakness their
supervising.(Histogram)
Frequency Percent Valid Percent Cumulative Percent
Valid Not at all true 4 1.3 1.3 1.3
Rarely true 26 8.7 8.7 10.0
Sometimes true 114 38.0 38.0 48.0
Mostly true 123 41.0 41.0 89.0
Almost always true 33 11.0 11.0 100.0
Total 300 100.0 100.0
(Source: Primary Data)
Table: 4.68. Employees in the organisation underline the potential and weakness their
supervising.
Mean 3.52
Standard Deviation 0.852
Skewness -0.265
Kurtosis 0.034
COV+(Standard
Deviation/Mean)*100
24.204
(Source: Primary Data)
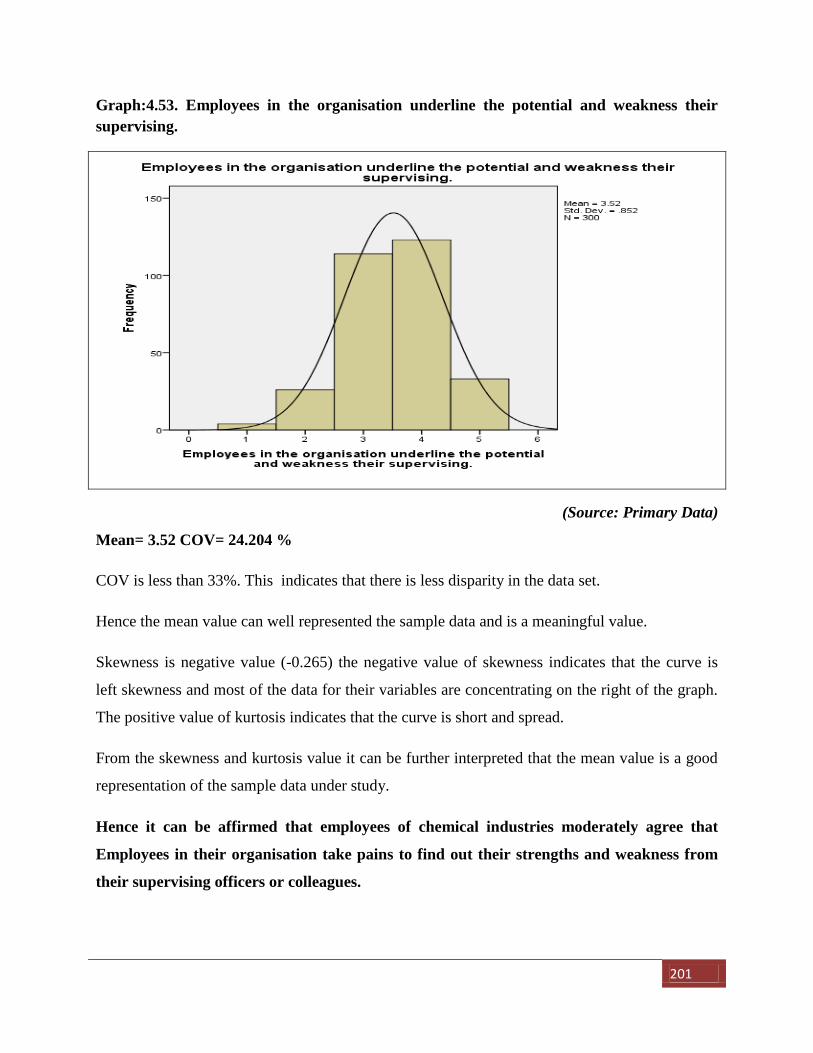
201
Graph:4.53. Employees in the organisation underline the potential and weakness their
supervising.
(Source: Primary Data)
Mean= 3.52 COV= 24.204 %
COV is less than 33%. This indicates that there is less disparity in the data set.
Hence the mean value can well represented the sample data and is a meaningful value.
Skewness is negative value (-0.265) the negative value of skewness indicates that the curve is
left skewness and most of the data for their variables are concentrating on the right of the graph.
The positive value of kurtosis indicates that the curve is short and spread.
From the skewness and kurtosis value it can be further interpreted that the mean value is a good
representation of the sample data under study.
Hence it can be affirmed that employees of chemical industries moderately agree that
Employees in their organisation take pains to find out their strengths and weakness from
their supervising officers or colleagues.
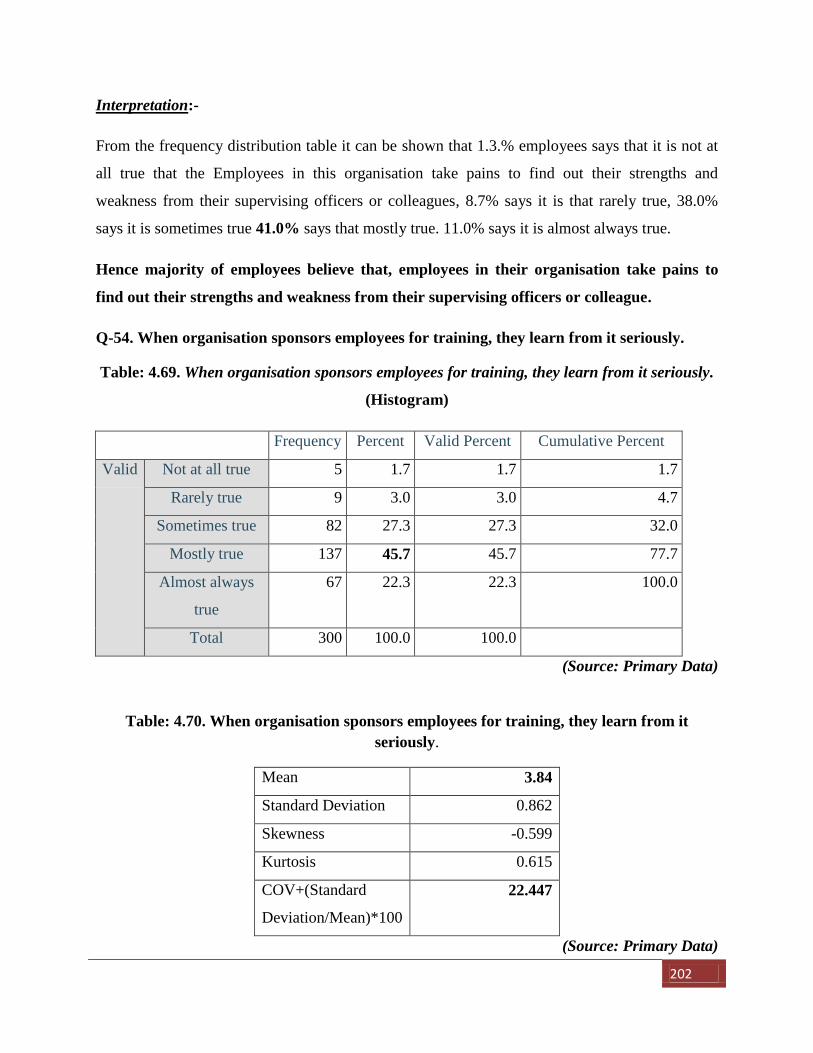
202
Interpretation:-
From the frequency distribution table it can be shown that 1.3.% employees says that it is not at
all true that the Employees in this organisation take pains to find out their strengths and
weakness from their supervising officers or colleagues, 8.7% says it is that rarely true, 38.0%
says it is sometimes true 41.0% says that mostly true. 11.0% says it is almost always true.
Hence majority of employees believe that, employees in their organisation take pains to
find out their strengths and weakness from their supervising officers or colleague.
Q-54. When organisation sponsors employees for training, they learn from it seriously.
Table: 4.69. When organisation sponsors employees for training, they learn from it seriously.
(Histogram)
Frequency Percent Valid Percent Cumulative Percent
Valid Not at all true 5 1.7 1.7 1.7
Rarely true 9 3.0 3.0 4.7
Sometimes true 82 27.3 27.3 32.0
Mostly true 137 45.7 45.7 77.7
Almost always
true
67 22.3 22.3 100.0
Total 300 100.0 100.0
(Source: Primary Data)
Table: 4.70. When organisation sponsors employees for training, they learn from it
seriously.
Mean 3.84
Standard Deviation 0.862
Skewness -0.599
Kurtosis 0.615
COV+(Standard
Deviation/Mean)*100
22.447
(Source: Primary Data)
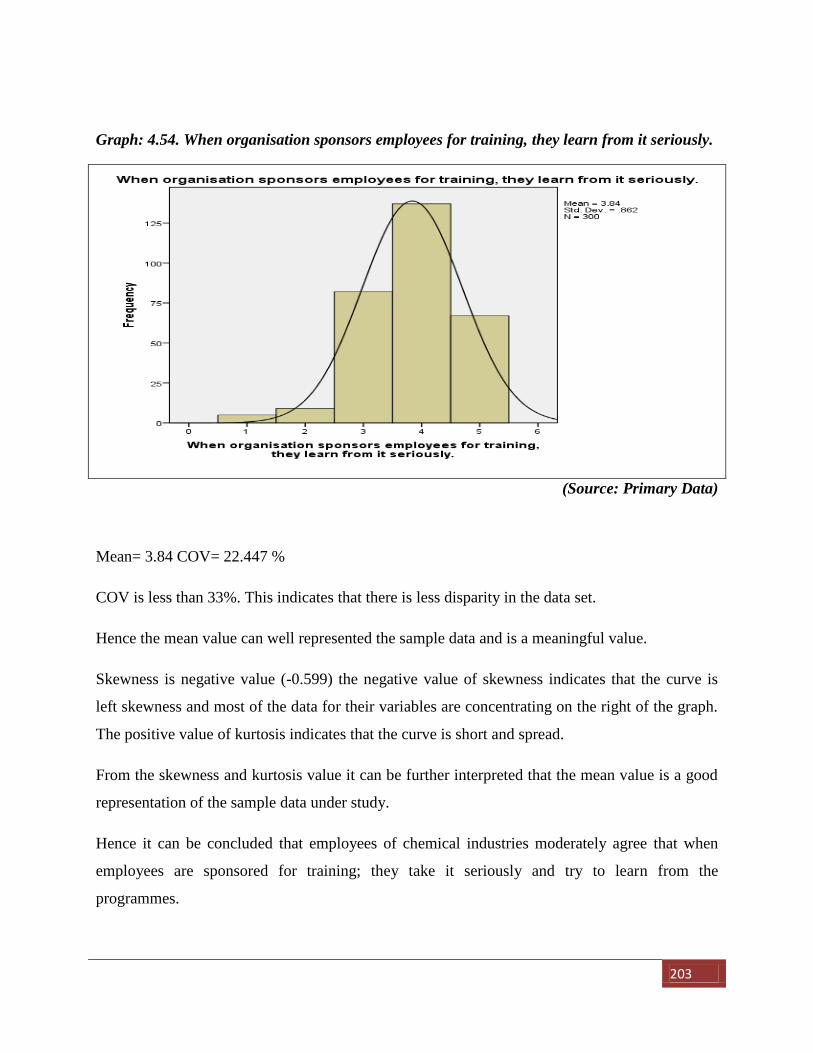
203
Graph: 4.54. When organisation sponsors employees for training, they learn from it seriously.
(Source: Primary Data)
Mean= 3.84 COV= 22.447 %
COV is less than 33%. This indicates that there is less disparity in the data set.
Hence the mean value can well represented the sample data and is a meaningful value.
Skewness is negative value (-0.599) the negative value of skewness indicates that the curve is
left skewness and most of the data for their variables are concentrating on the right of the graph.
The positive value of kurtosis indicates that the curve is short and spread.
From the skewness and kurtosis value it can be further interpreted that the mean value is a good
representation of the sample data under study.
Hence it can be concluded that employees of chemical industries moderately agree that when
employees are sponsored for training; they take it seriously and try to learn from the
programmes.
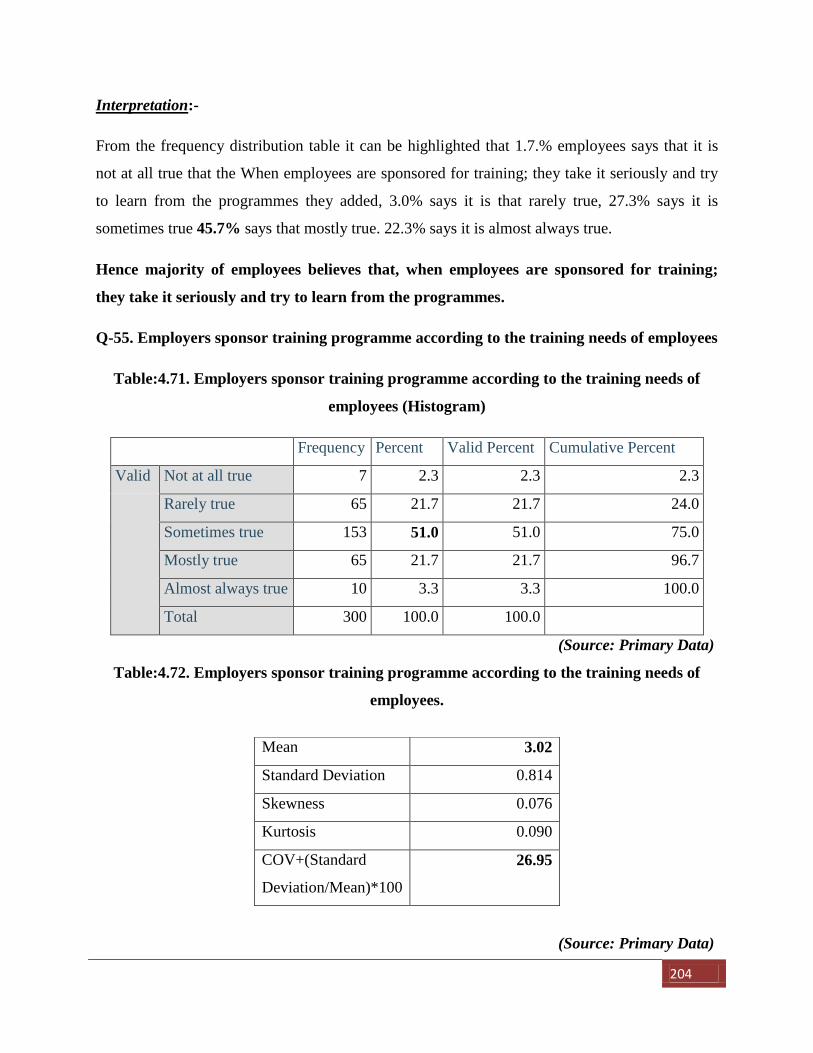
204
Interpretation:-
From the frequency distribution table it can be highlighted that 1.7.% employees says that it is
not at all true that the When employees are sponsored for training; they take it seriously and try
to learn from the programmes they added, 3.0% says it is that rarely true, 27.3% says it is
sometimes true 45.7% says that mostly true. 22.3% says it is almost always true.
Hence majority of employees believes that, when employees are sponsored for training;
they take it seriously and try to learn from the programmes.
Q-55. Employers sponsor training programme according to the training needs of employees
Table:4.71. Employers sponsor training programme according to the training needs of
employees (Histogram)
Frequency Percent Valid Percent Cumulative Percent
Valid Not at all true 7 2.3 2.3 2.3
Rarely true 65 21.7 21.7 24.0
Sometimes true 153 51.0 51.0 75.0
Mostly true 65 21.7 21.7 96.7
Almost always true 10 3.3 3.3 100.0
Total 300 100.0 100.0
(Source: Primary Data)
Table:4.72. Employers sponsor training programme according to the training needs of
employees.
(Source: Primary Data)
Mean 3.02
Standard Deviation 0.814
Skewness 0.076
Kurtosis 0.090
COV+(Standard
Deviation/Mean)*100
26.95
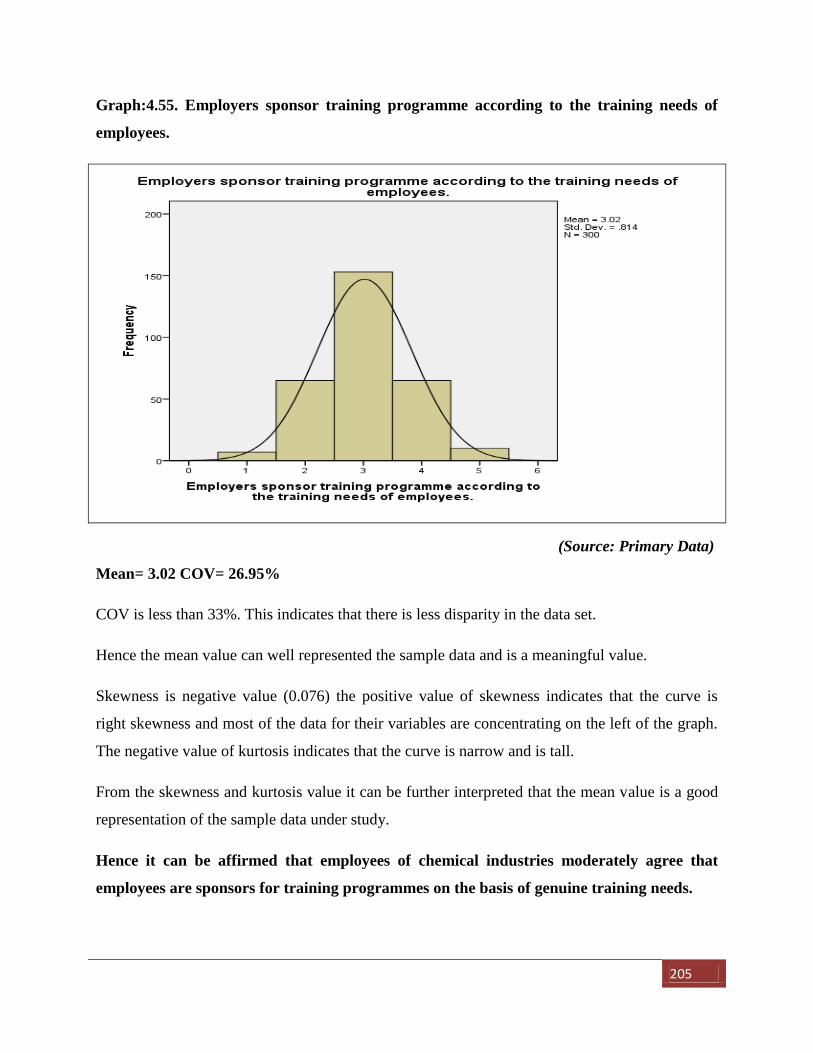
205
Graph:4.55. Employers sponsor training programme according to the training needs of
employees.
(Source: Primary Data)
Mean= 3.02 COV= 26.95%
COV is less than 33%. This indicates that there is less disparity in the data set.
Hence the mean value can well represented the sample data and is a meaningful value.
Skewness is negative value (0.076) the positive value of skewness indicates that the curve is
right skewness and most of the data for their variables are concentrating on the left of the graph.
The negative value of kurtosis indicates that the curve is narrow and is tall.
From the skewness and kurtosis value it can be further interpreted that the mean value is a good
representation of the sample data under study.
Hence it can be affirmed that employees of chemical industries moderately agree that
employees are sponsors for training programmes on the basis of genuine training needs.

206
Interpretation:-
From the frequency distribution table, it can be understood that 2.3.% employees says that it is
not at all true that the When employees are sponsors for training programmes on the basis of
genuine training needs, 21.7 % says it is that rarely true, 51.00% says it is sometimes true 21.7%
says that mostly true. 3.3% says it is almost always true.
Hence majority of employees believe that, Employees are sponsors for training
programmes on the basis of genuine training needs.
Q-56. Peoples are trustworthy towards each other in the organisation
Table:4.73. Peoples are trustworthy towards each other in the organisation.(Histogram)
Frequency Percent Valid Percent Cumulative Percent
Not at all true 11 3.7 3.7 3.7
Rarely true 62 20.7 20.7 24.3
Sometimes true 137 45.7 45.7 70.0
Mostly true 77 25.7 25.7 95.7
Almost always true 13 4.3 4.3 100.0
Total 300 100.0 100.0
(Source: Primary Data)
Table:4.74.. Peoples are trustworthy towards each other in the organisation.
(Source: Primary Data)
Mean 3.06
Standard Deviation 0.884
Skewness -0.066
Kurtosis -0.124
COV+(Standard
Deviation/Mean)*100
28.888
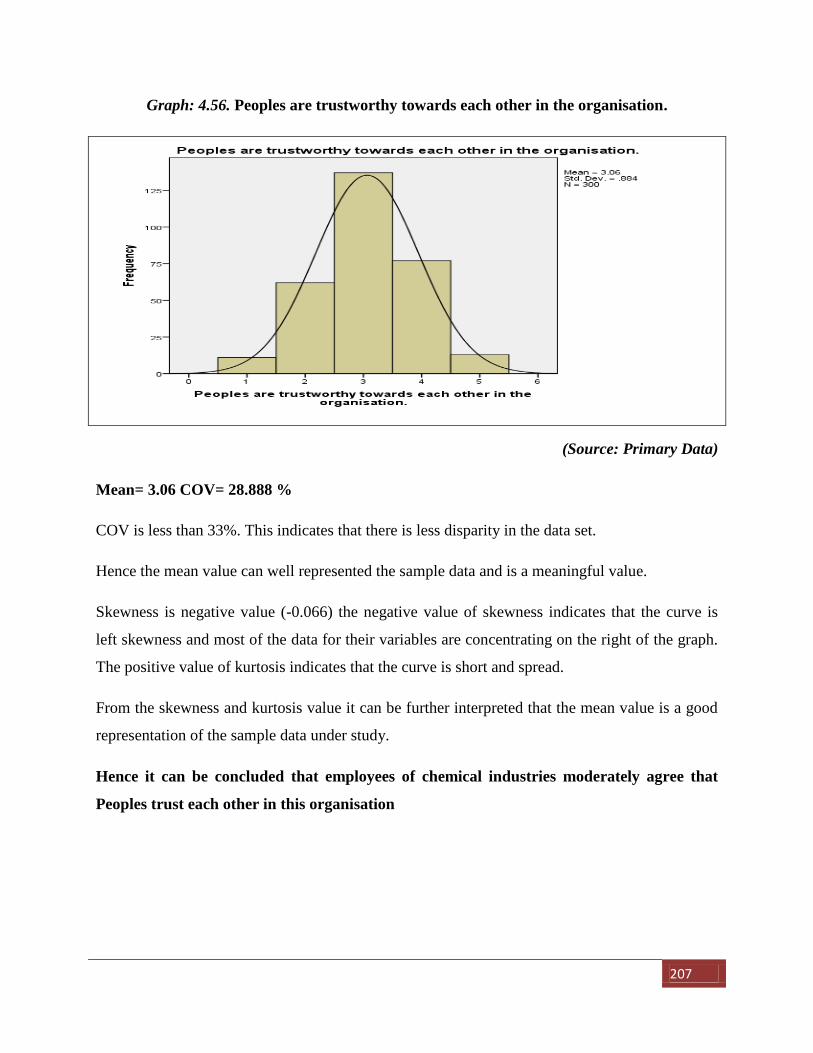
207
Graph: 4.56. Peoples are trustworthy towards each other in the organisation.
(Source: Primary Data)
Mean= 3.06 COV= 28.888 %
COV is less than 33%. This indicates that there is less disparity in the data set.
Hence the mean value can well represented the sample data and is a meaningful value.
Skewness is negative value (-0.066) the negative value of skewness indicates that the curve is
left skewness and most of the data for their variables are concentrating on the right of the graph.
The positive value of kurtosis indicates that the curve is short and spread.
From the skewness and kurtosis value it can be further interpreted that the mean value is a good
representation of the sample data under study.
Hence it can be concluded that employees of chemical industries moderately agree that
Peoples trust each other in this organisation
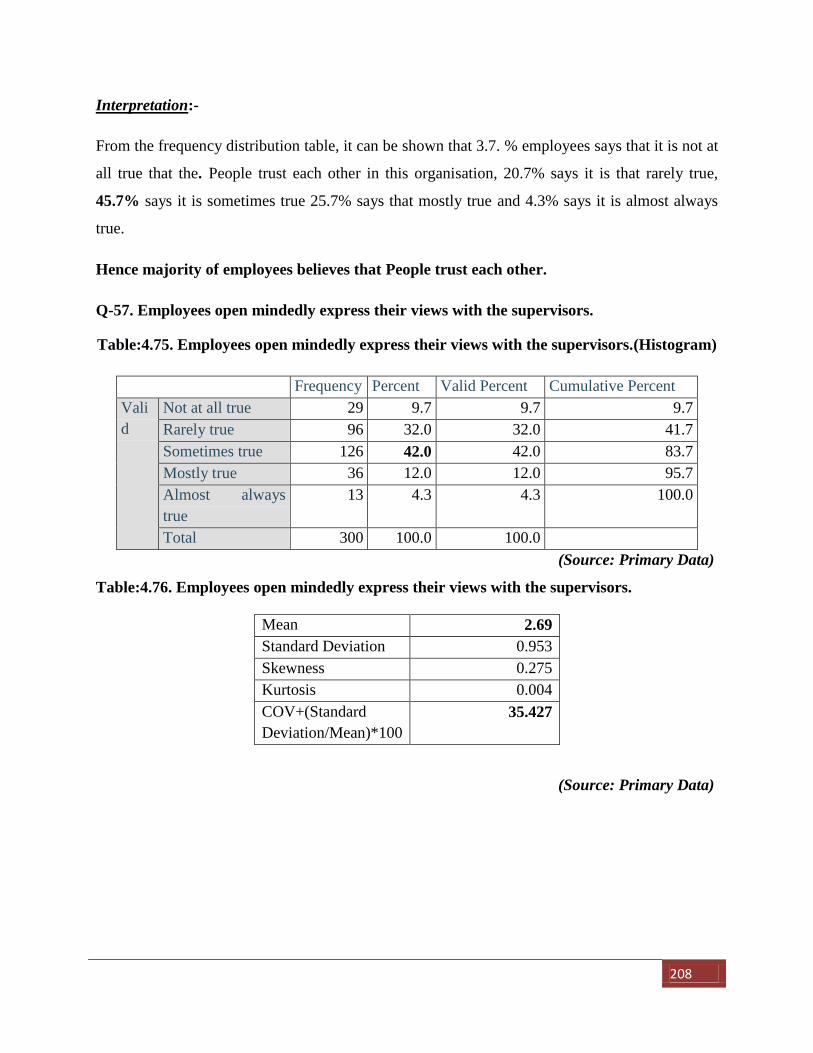
208
Interpretation:-
From the frequency distribution table, it can be shown that 3.7. % employees says that it is not at
all true that the. People trust each other in this organisation, 20.7% says it is that rarely true,
45.7% says it is sometimes true 25.7% says that mostly true and 4.3% says it is almost always
true.
Hence majority of employees believes that People trust each other.
Q-57. Employees open mindedly express their views with the supervisors.
Table:4.75. Employees open mindedly express their views with the supervisors.(Histogram)
Frequency Percent Valid Percent Cumulative Percent
Vali
d
Not at all true 29 9.7 9.7 9.7
Rarely true 96 32.0 32.0 41.7
Sometimes true 126 42.0 42.0 83.7
Mostly true 36 12.0 12.0 95.7
Almost always
true
13 4.3 4.3 100.0
Total 300 100.0 100.0
(Source: Primary Data)
Table:4.76. Employees open mindedly express their views with the supervisors.
(Source: Primary Data)
Mean 2.69
Standard Deviation 0.953
Skewness 0.275
Kurtosis 0.004
COV+(Standard
Deviation/Mean)*100
35.427
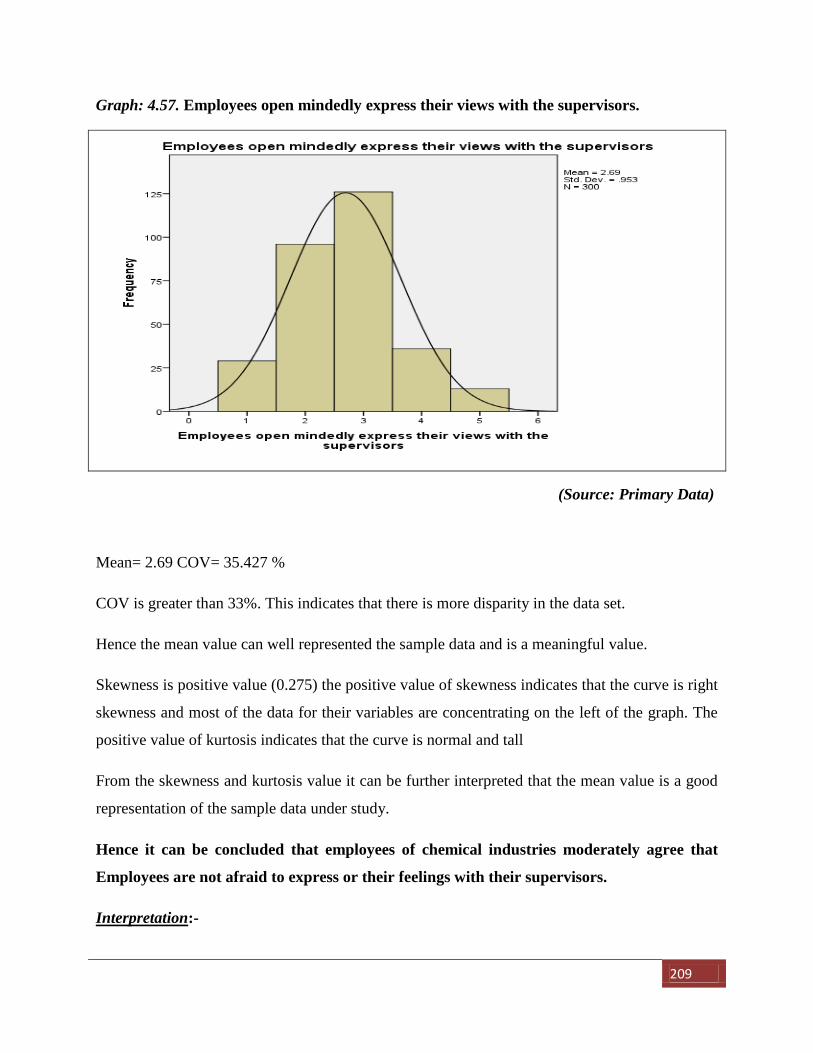
209
Graph: 4.57. Employees open mindedly express their views with the supervisors.
(Source: Primary Data)
Mean= 2.69 COV= 35.427 %
COV is greater than 33%. This indicates that there is more disparity in the data set.
Hence the mean value can well represented the sample data and is a meaningful value.
Skewness is positive value (0.275) the positive value of skewness indicates that the curve is right
skewness and most of the data for their variables are concentrating on the left of the graph. The
positive value of kurtosis indicates that the curve is normal and tall
From the skewness and kurtosis value it can be further interpreted that the mean value is a good
representation of the sample data under study.
Hence it can be concluded that employees of chemical industries moderately agree that
Employees are not afraid to express or their feelings with their supervisors.
Interpretation:-

210
From the frequency distribution table, it can be seen that 9.7 % employees says that it is not at all
true that the. Employees are not afraid to express or their feelings with their supervisors, 32.0%
says it is that rarely true, 42.0% says it is sometimes true 12.0% says that mostly true and 4.3%
says it is almost always true.
Hence majority of employees believe that Employees are not afraid to express or to share
their feelings and opinions with their supervisors.
Q-58.Authority open mindedly express their views with the subordinates
Table:4.77.Authority open mindedly express their views with the subordinates
Q-58.Authority open mindedly express their views with the subordinates
Frequency Percent
Valid
Percent Cumulative Percent
Valid Not at all true 27 9.0 9.0 9.0
Rarely true 74 24.7 24.7 33.7
Sometimes true 97 32.3 32.3 66.0
Mostly true 75 25.0 25.0 91.0
Almost always
true
27 9.0 9.0 100.0
Total 300 100.0 100.0
(Source: Primary Data)
Table:4.78.Authority open mindedly express their views with the subordinates
Mean 3.00
Standard Deviation 1.105
Skewness -0.007
Kurtosis -0.711
COV+(Standard
Deviation/Mean)*100
36.833
(Source: Primary Data)
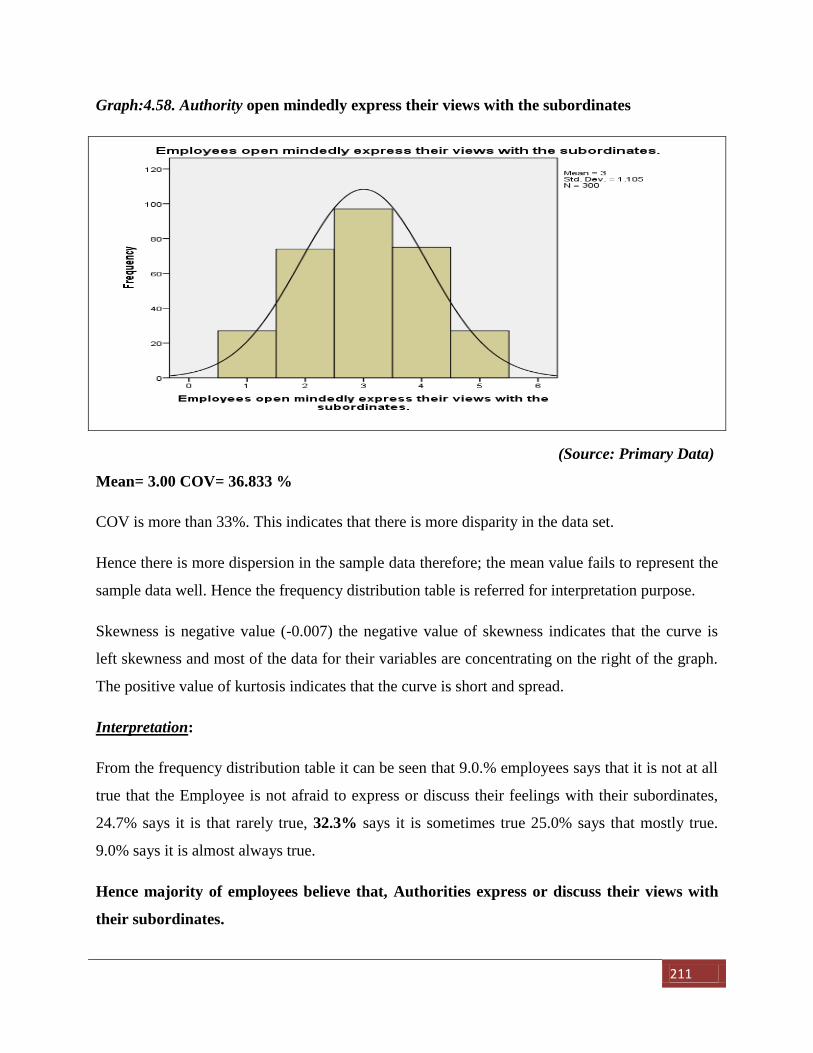
211
Graph:4.58. Authority open mindedly express their views with the subordinates
(Source: Primary Data)
Mean= 3.00 COV= 36.833 %
COV is more than 33%. This indicates that there is more disparity in the data set.
Hence there is more dispersion in the sample data therefore; the mean value fails to represent the
sample data well. Hence the frequency distribution table is referred for interpretation purpose.
Skewness is negative value (-0.007) the negative value of skewness indicates that the curve is
left skewness and most of the data for their variables are concentrating on the right of the graph.
The positive value of kurtosis indicates that the curve is short and spread.
Interpretation:
From the frequency distribution table it can be seen that 9.0.% employees says that it is not at all
true that the Employee is not afraid to express or discuss their feelings with their subordinates,
24.7% says it is that rarely true, 32.3% says it is sometimes true 25.0% says that mostly true.
9.0% says it is almost always true.
Hence majority of employees believe that, Authorities express or discuss their views with
their subordinates.
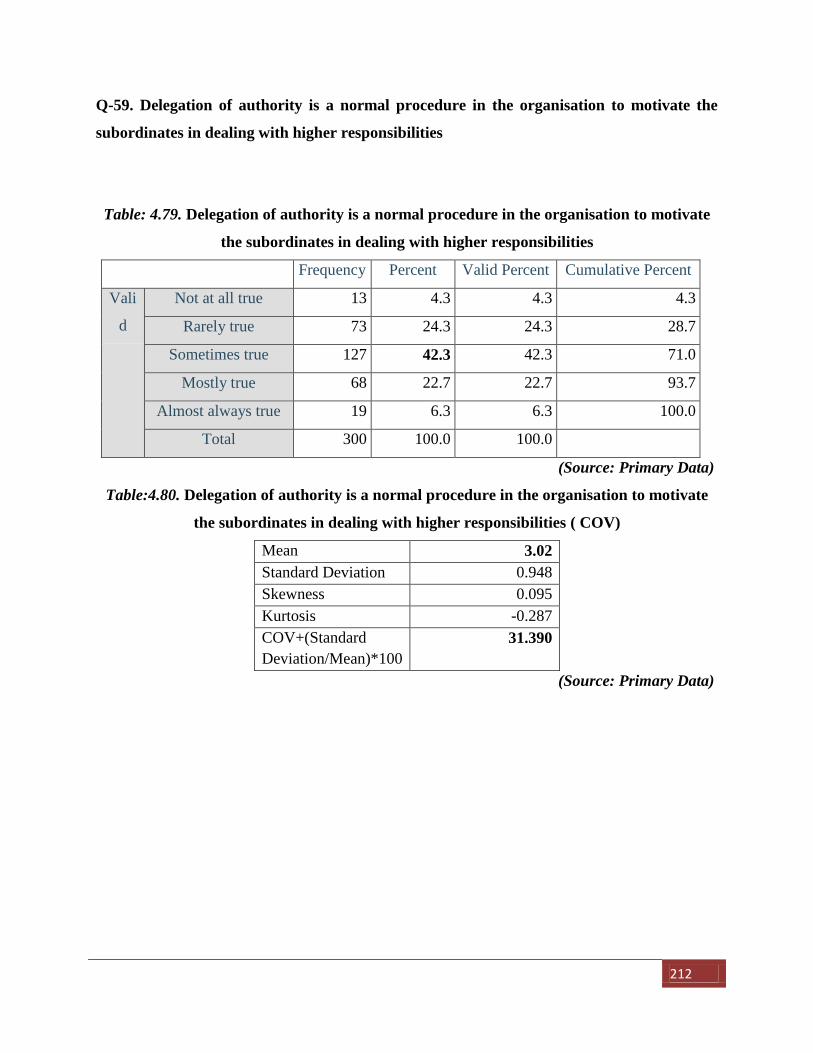
212
Q-59. Delegation of authority is a normal procedure in the organisation to motivate the
subordinates in dealing with higher responsibilities
Table: 4.79. Delegation of authority is a normal procedure in the organisation to motivate
the subordinates in dealing with higher responsibilities
Frequency Percent Valid Percent Cumulative Percent
Vali
d
Not at all true 13 4.3 4.3 4.3
Rarely true 73 24.3 24.3 28.7
Sometimes true 127 42.3 42.3 71.0
Mostly true 68 22.7 22.7 93.7
Almost always true 19 6.3 6.3 100.0
Total 300 100.0 100.0
(Source: Primary Data)
Table:4.80. Delegation of authority is a normal procedure in the organisation to motivate
the subordinates in dealing with higher responsibilities ( COV)
Mean 3.02
Standard Deviation 0.948
Skewness 0.095
Kurtosis -0.287
COV+(Standard
Deviation/Mean)*100
31.390
(Source: Primary Data)
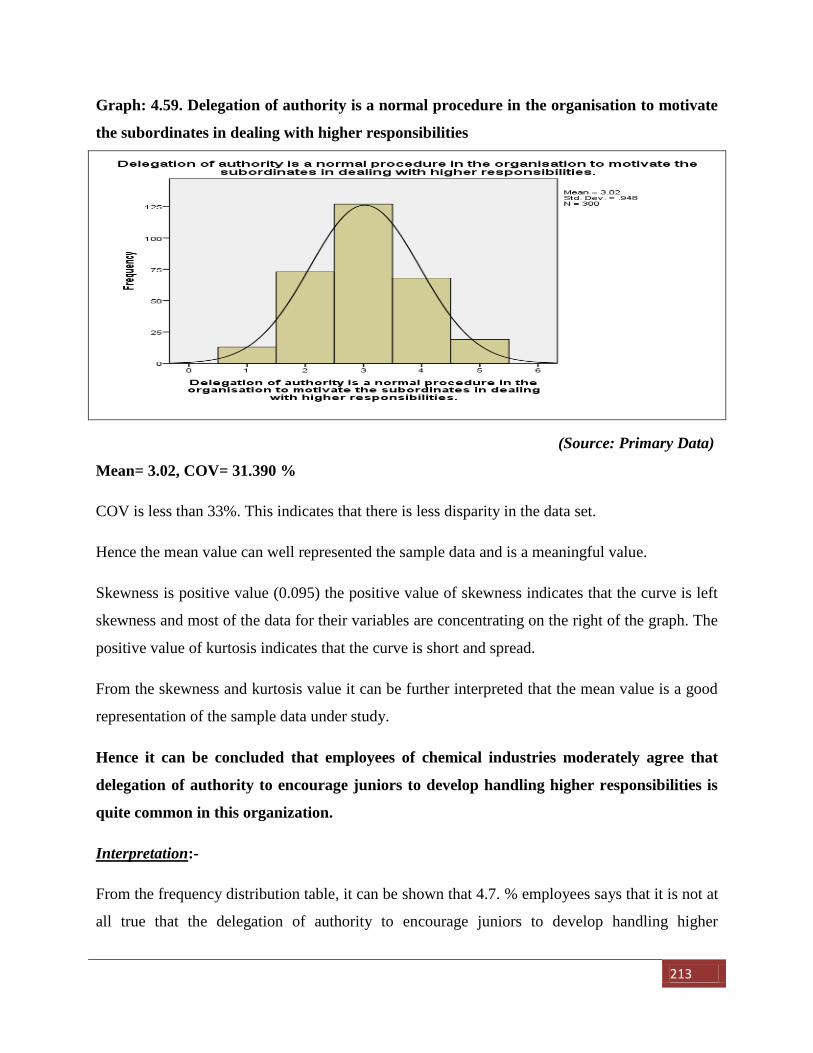
213
Graph: 4.59. Delegation of authority is a normal procedure in the organisation to motivate
the subordinates in dealing with higher responsibilities
(Source: Primary Data)
Mean= 3.02, COV= 31.390 %
COV is less than 33%. This indicates that there is less disparity in the data set.
Hence the mean value can well represented the sample data and is a meaningful value.
Skewness is positive value (0.095) the positive value of skewness indicates that the curve is left
skewness and most of the data for their variables are concentrating on the right of the graph. The
positive value of kurtosis indicates that the curve is short and spread.
From the skewness and kurtosis value it can be further interpreted that the mean value is a good
representation of the sample data under study.
Hence it can be concluded that employees of chemical industries moderately agree that
delegation of authority to encourage juniors to develop handling higher responsibilities is
quite common in this organization.
Interpretation:-
From the frequency distribution table, it can be shown that 4.7. % employees says that it is not at
all true that the delegation of authority to encourage juniors to develop handling higher
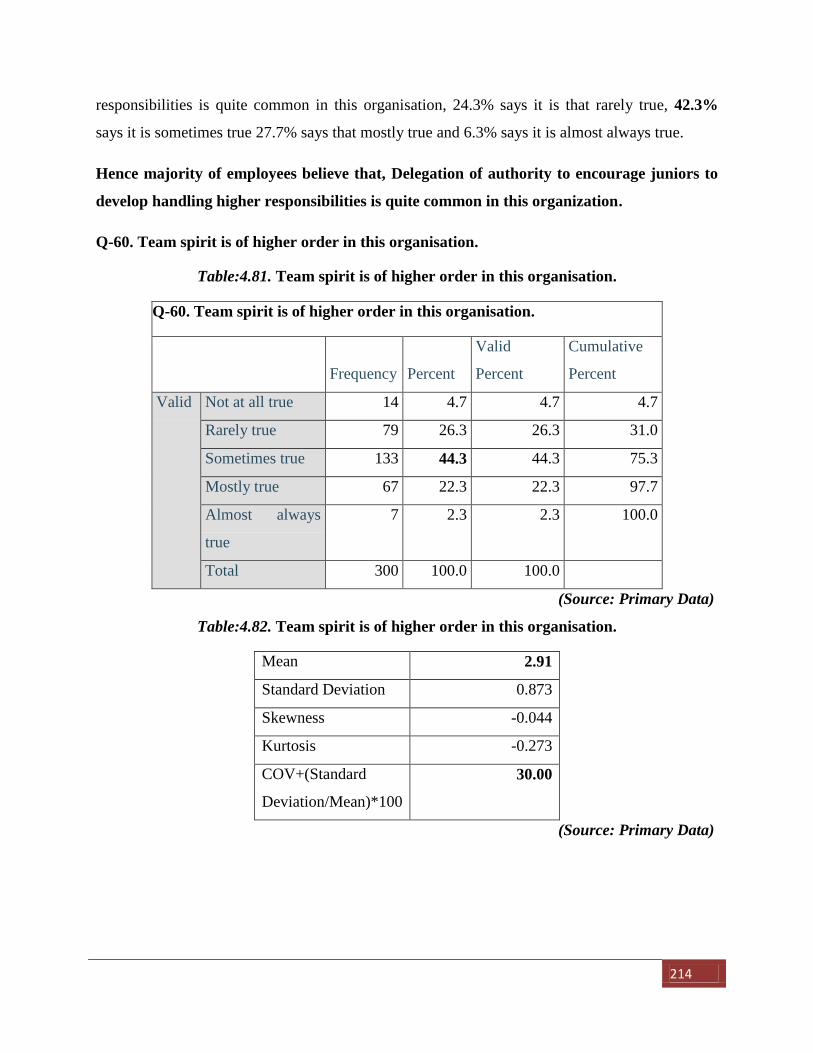
214
responsibilities is quite common in this organisation, 24.3% says it is that rarely true, 42.3%
says it is sometimes true 27.7% says that mostly true and 6.3% says it is almost always true.
Hence majority of employees believe that, Delegation of authority to encourage juniors to
develop handling higher responsibilities is quite common in this organization.
Q-60. Team spirit is of higher order in this organisation.
Table:4.81. Team spirit is of higher order in this organisation.
Q-60. Team spirit is of higher order in this organisation.
Frequency Percent
Valid
Percent
Cumulative
Percent
Valid Not at all true 14 4.7 4.7 4.7
Rarely true 79 26.3 26.3 31.0
Sometimes true 133 44.3 44.3 75.3
Mostly true 67 22.3 22.3 97.7
Almost always
true
7 2.3 2.3 100.0
Total 300 100.0 100.0
(Source: Primary Data)
Table:4.82. Team spirit is of higher order in this organisation.
Mean 2.91
Standard Deviation 0.873
Skewness -0.044
Kurtosis -0.273
COV+(Standard
Deviation/Mean)*100
30.00
(Source: Primary Data)
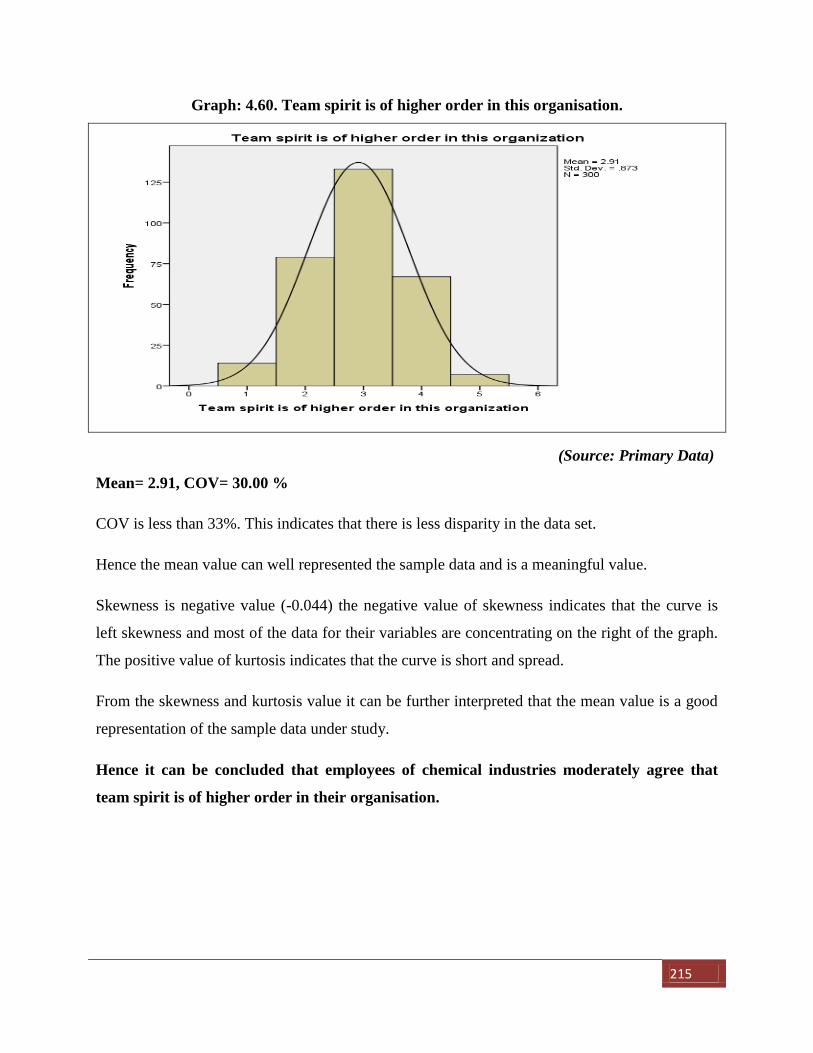
215
Graph: 4.60. Team spirit is of higher order in this organisation.
(Source: Primary Data)
Mean= 2.91, COV= 30.00 %
COV is less than 33%. This indicates that there is less disparity in the data set.
Hence the mean value can well represented the sample data and is a meaningful value.
Skewness is negative value (-0.044) the negative value of skewness indicates that the curve is
left skewness and most of the data for their variables are concentrating on the right of the graph.
The positive value of kurtosis indicates that the curve is short and spread.
From the skewness and kurtosis value it can be further interpreted that the mean value is a good
representation of the sample data under study.
Hence it can be concluded that employees of chemical industries moderately agree that
team spirit is of higher order in their organisation.
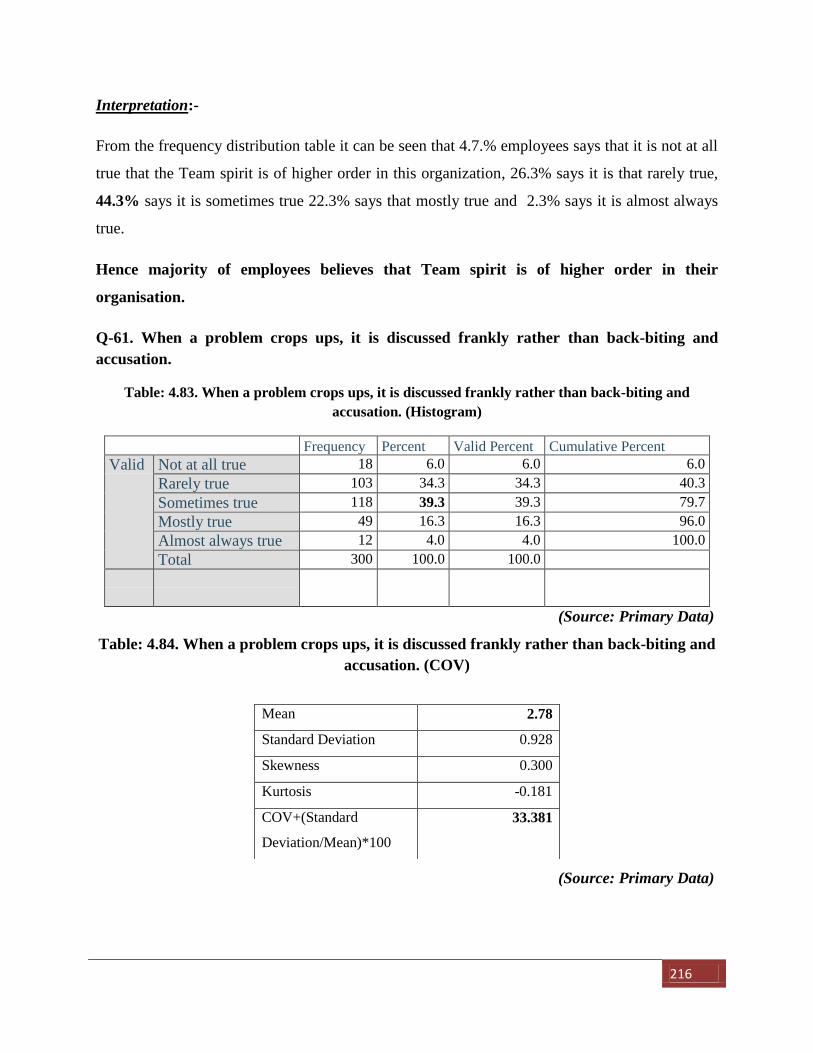
216
Interpretation:-
From the frequency distribution table it can be seen that 4.7.% employees says that it is not at all
true that the Team spirit is of higher order in this organization, 26.3% says it is that rarely true,
44.3% says it is sometimes true 22.3% says that mostly true and 2.3% says it is almost always
true.
Hence majority of employees believes that Team spirit is of higher order in their
organisation.
Q-61. When a problem crops ups, it is discussed frankly rather than back-biting and
accusation.
Table: 4.83. When a problem crops ups, it is discussed frankly rather than back-biting and
accusation. (Histogram)
Frequency Percent Valid Percent Cumulative Percent
Valid Not at all true 18 6.0 6.0 6.0
Rarely true 103 34.3 34.3 40.3
Sometimes true 118 39.3 39.3 79.7
Mostly true 49 16.3 16.3 96.0
Almost always true 12 4.0 4.0 100.0
Total 300 100.0 100.0
(Source: Primary Data)
Table: 4.84. When a problem crops ups, it is discussed frankly rather than back-biting and
accusation. (COV)
(Source: Primary Data)
Mean 2.78
Standard Deviation 0.928
Skewness 0.300
Kurtosis -0.181
COV+(Standard
Deviation/Mean)*100
33.381
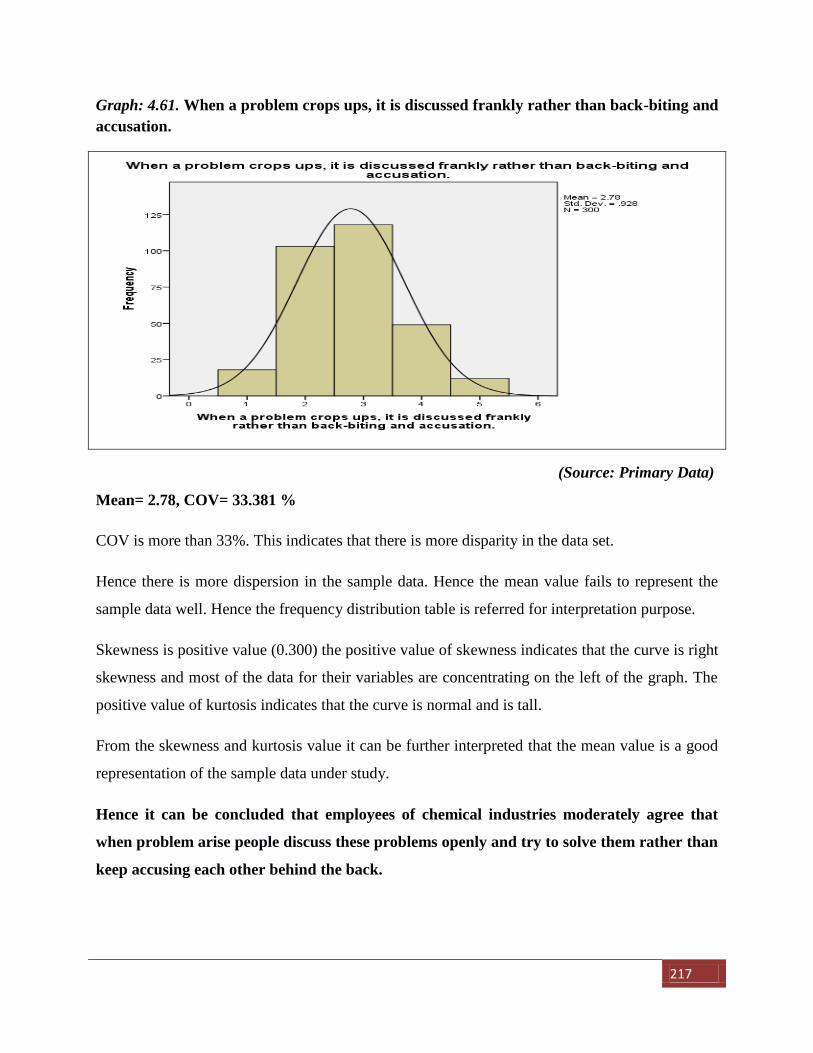
217
Graph: 4.61. When a problem crops ups, it is discussed frankly rather than back-biting and
accusation.
(Source: Primary Data)
Mean= 2.78, COV= 33.381 %
COV is more than 33%. This indicates that there is more disparity in the data set.
Hence there is more dispersion in the sample data. Hence the mean value fails to represent the
sample data well. Hence the frequency distribution table is referred for interpretation purpose.
Skewness is positive value (0.300) the positive value of skewness indicates that the curve is right
skewness and most of the data for their variables are concentrating on the left of the graph. The
positive value of kurtosis indicates that the curve is normal and is tall.
From the skewness and kurtosis value it can be further interpreted that the mean value is a good
representation of the sample data under study.
Hence it can be concluded that employees of chemical industries moderately agree that
when problem arise people discuss these problems openly and try to solve them rather than
keep accusing each other behind the back.
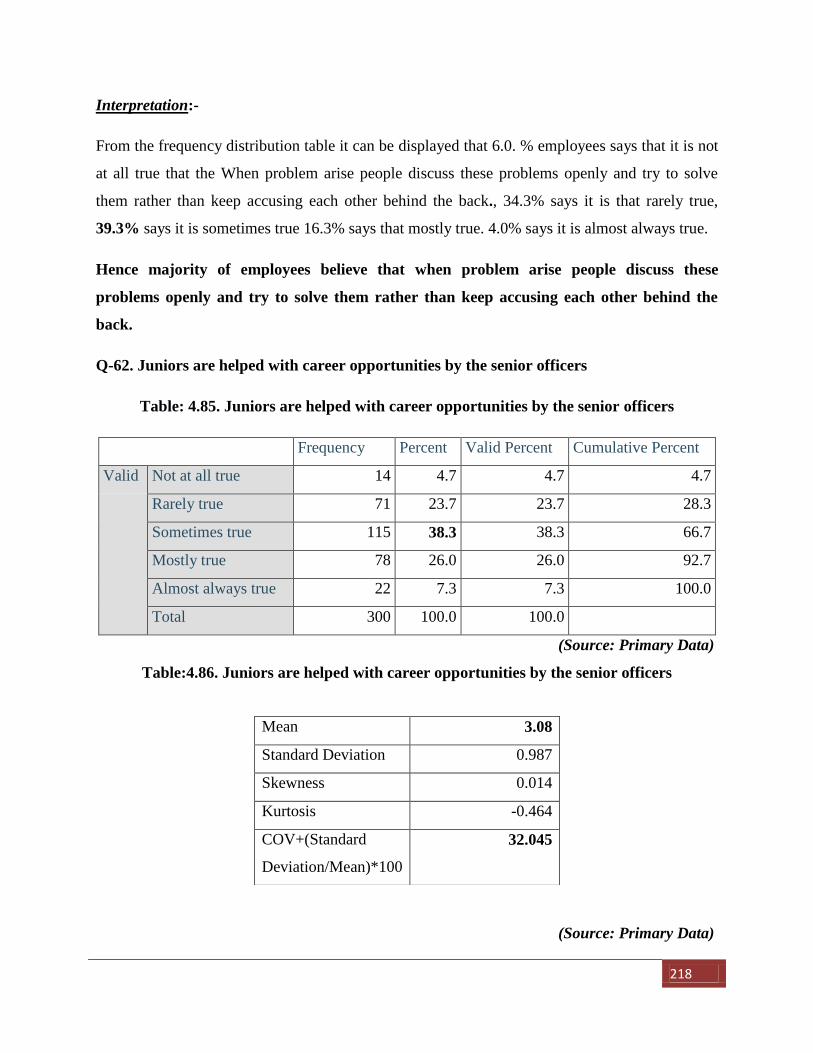
218
Interpretation:-
From the frequency distribution table it can be displayed that 6.0. % employees says that it is not
at all true that the When problem arise people discuss these problems openly and try to solve
them rather than keep accusing each other behind the back., 34.3% says it is that rarely true,
39.3% says it is sometimes true 16.3% says that mostly true. 4.0% says it is almost always true.
Hence majority of employees believe that when problem arise people discuss these
problems openly and try to solve them rather than keep accusing each other behind the
back.
Q-62. Juniors are helped with career opportunities by the senior officers
Table: 4.85. Juniors are helped with career opportunities by the senior officers
Frequency Percent Valid Percent Cumulative Percent
Valid Not at all true 14 4.7 4.7 4.7
Rarely true 71 23.7 23.7 28.3
Sometimes true 115 38.3 38.3 66.7
Mostly true 78 26.0 26.0 92.7
Almost always true 22 7.3 7.3 100.0
Total 300 100.0 100.0
(Source: Primary Data)
Table:4.86. Juniors are helped with career opportunities by the senior officers
(Source: Primary Data)
Mean 3.08
Standard Deviation 0.987
Skewness 0.014
Kurtosis -0.464
COV+(Standard
Deviation/Mean)*100
32.045
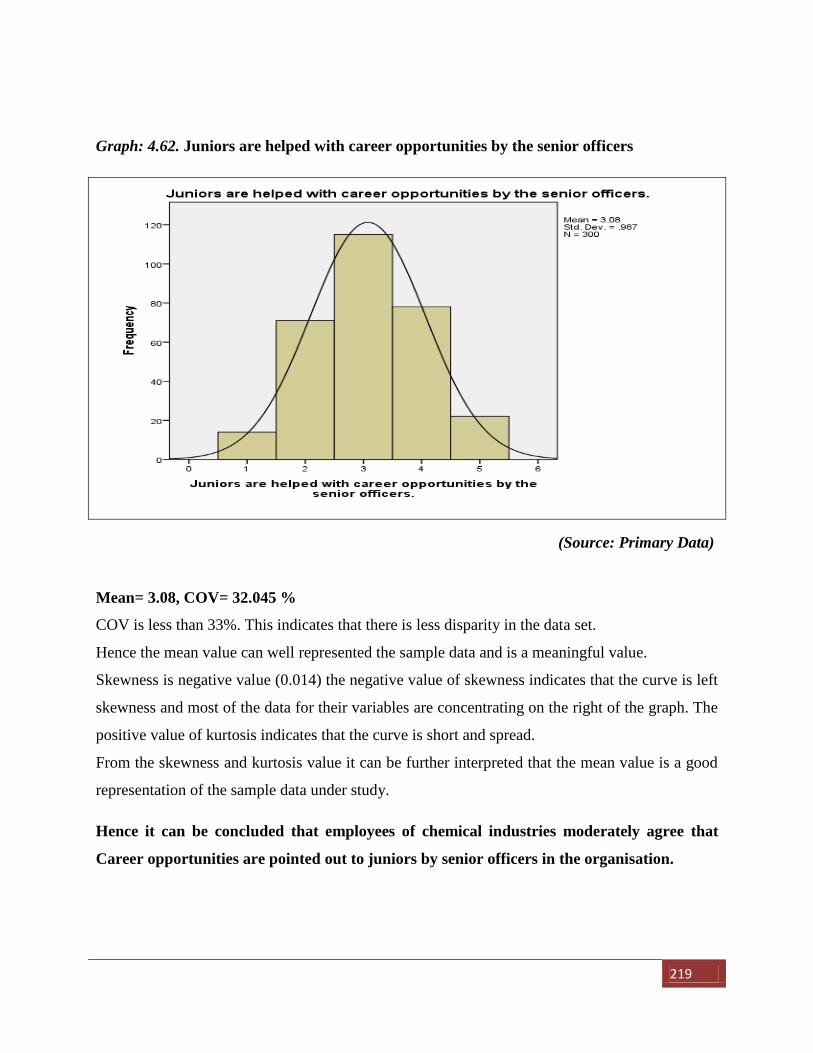
219
Graph: 4.62. Juniors are helped with career opportunities by the senior officers
(Source: Primary Data)
Mean= 3.08, COV= 32.045 %
COV is less than 33%. This indicates that there is less disparity in the data set.
Hence the mean value can well represented the sample data and is a meaningful value.
Skewness is negative value (0.014) the negative value of skewness indicates that the curve is left
skewness and most of the data for their variables are concentrating on the right of the graph. The
positive value of kurtosis indicates that the curve is short and spread.
From the skewness and kurtosis value it can be further interpreted that the mean value is a good
representation of the sample data under study.
Hence it can be concluded that employees of chemical industries moderately agree that
Career opportunities are pointed out to juniors by senior officers in the organisation.
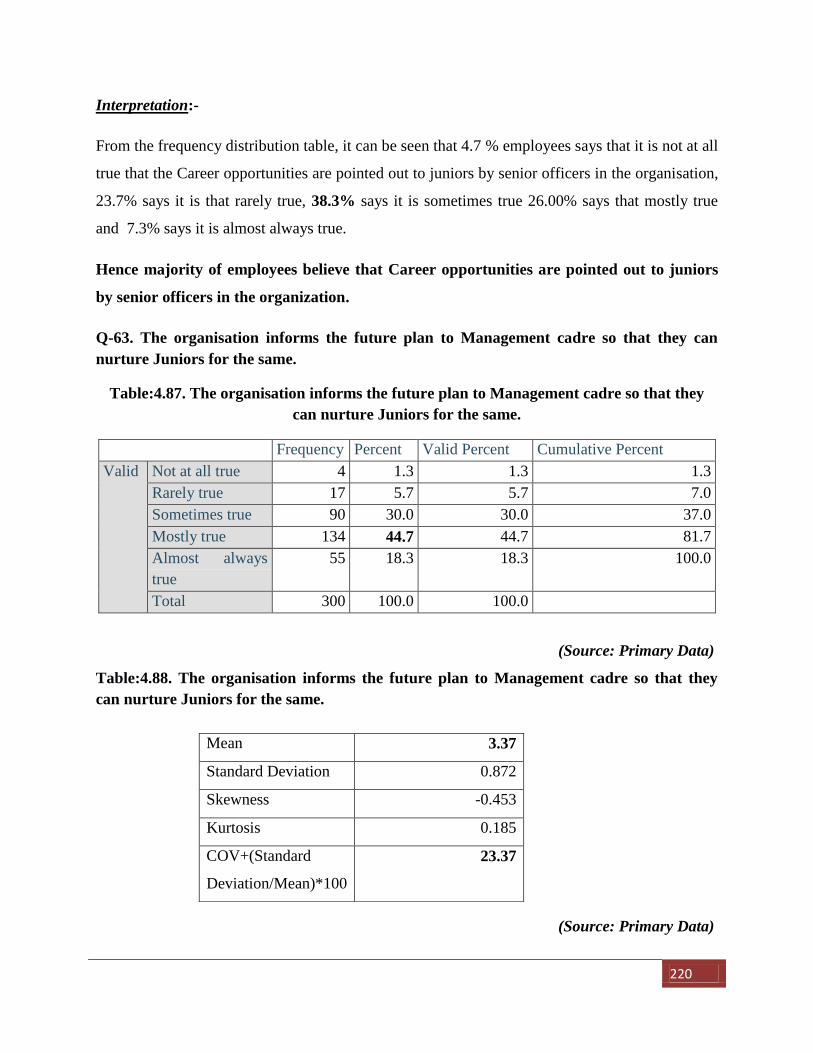
220
Interpretation:-
From the frequency distribution table, it can be seen that 4.7 % employees says that it is not at all
true that the Career opportunities are pointed out to juniors by senior officers in the organisation,
23.7% says it is that rarely true, 38.3% says it is sometimes true 26.00% says that mostly true
and 7.3% says it is almost always true.
Hence majority of employees believe that Career opportunities are pointed out to juniors
by senior officers in the organization.
Q-63. The organisation informs the future plan to Management cadre so that they can
nurture Juniors for the same.
Table:4.87. The organisation informs the future plan to Management cadre so that they
can nurture Juniors for the same.
Frequency Percent Valid Percent Cumulative Percent
Valid Not at all true 4 1.3 1.3 1.3
Rarely true 17 5.7 5.7 7.0
Sometimes true 90 30.0 30.0 37.0
Mostly true 134 44.7 44.7 81.7
Almost always
true
55 18.3 18.3 100.0
Total 300 100.0 100.0
(Source: Primary Data)
Table:4.88. The organisation informs the future plan to Management cadre so that they
can nurture Juniors for the same.
(Source: Primary Data)
Mean 3.37
Standard Deviation 0.872
Skewness -0.453
Kurtosis 0.185
COV+(Standard
Deviation/Mean)*100
23.37
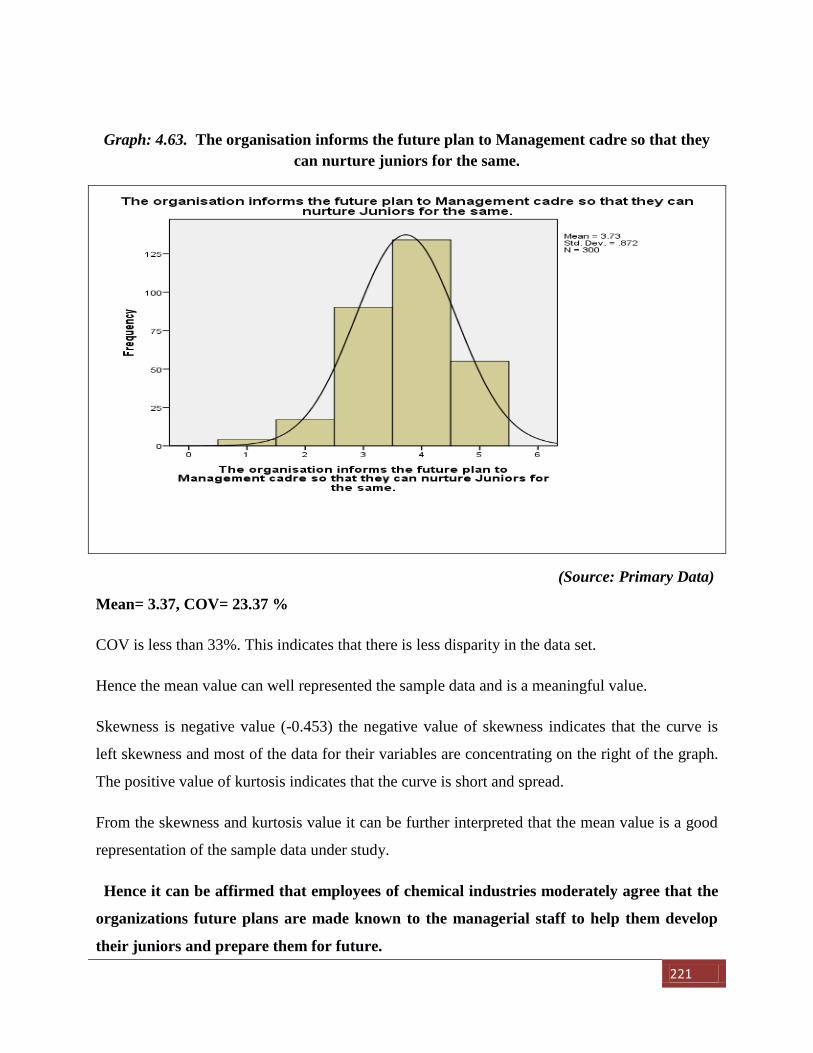
221
Graph: 4.63. The organisation informs the future plan to Management cadre so that they
can nurture juniors for the same.
(Source: Primary Data)
Mean= 3.37, COV= 23.37 %
COV is less than 33%. This indicates that there is less disparity in the data set.
Hence the mean value can well represented the sample data and is a meaningful value.
Skewness is negative value (-0.453) the negative value of skewness indicates that the curve is
left skewness and most of the data for their variables are concentrating on the right of the graph.
The positive value of kurtosis indicates that the curve is short and spread.
From the skewness and kurtosis value it can be further interpreted that the mean value is a good
representation of the sample data under study.
Hence it can be affirmed that employees of chemical industries moderately agree that the
organizations future plans are made known to the managerial staff to help them develop
their juniors and prepare them for future.
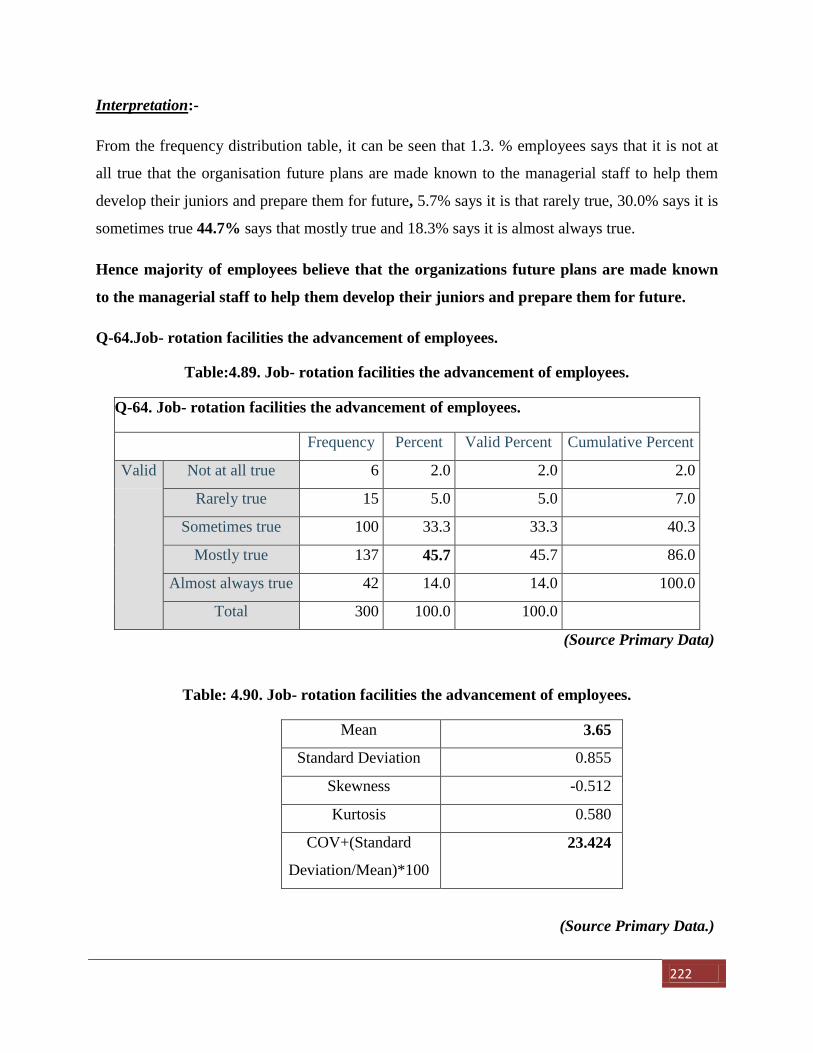
222
Interpretation:-
From the frequency distribution table, it can be seen that 1.3. % employees says that it is not at
all true that the organisation future plans are made known to the managerial staff to help them
develop their juniors and prepare them for future, 5.7% says it is that rarely true, 30.0% says it is
sometimes true 44.7% says that mostly true and 18.3% says it is almost always true.
Hence majority of employees believe that the organizations future plans are made known
to the managerial staff to help them develop their juniors and prepare them for future.
Q-64.Job- rotation facilities the advancement of employees.
Table:4.89. Job- rotation facilities the advancement of employees.
Q-64. Job- rotation facilities the advancement of employees.
Frequency Percent Valid Percent Cumulative Percent
Valid Not at all true 6 2.0 2.0 2.0
Rarely true 15 5.0 5.0 7.0
Sometimes true 100 33.3 33.3 40.3
Mostly true 137 45.7 45.7 86.0
Almost always true 42 14.0 14.0 100.0
Total 300 100.0 100.0
(Source Primary Data)
Table: 4.90. Job- rotation facilities the advancement of employees.
Mean 3.65
Standard Deviation 0.855
Skewness -0.512
Kurtosis 0.580
COV+(Standard
Deviation/Mean)*100
23.424
(Source Primary Data.)
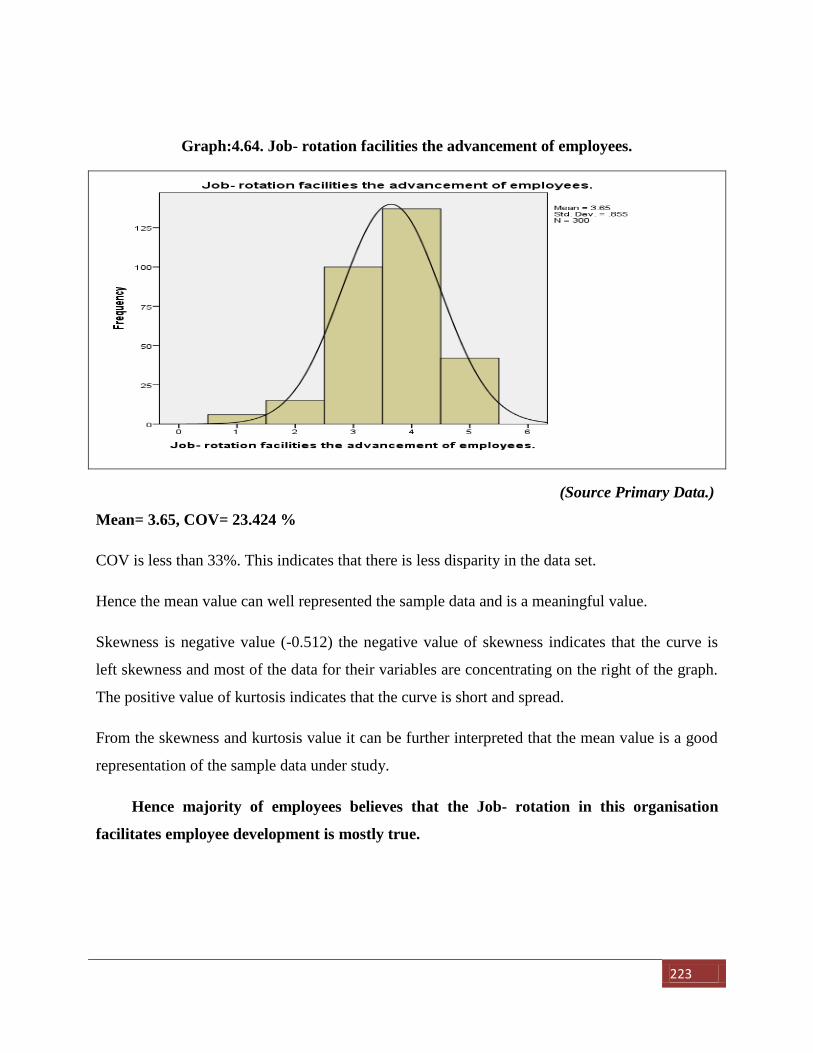
223
Graph:4.64. Job- rotation facilities the advancement of employees.
(Source Primary Data.)
Mean= 3.65, COV= 23.424 %
COV is less than 33%. This indicates that there is less disparity in the data set.
Hence the mean value can well represented the sample data and is a meaningful value.
Skewness is negative value (-0.512) the negative value of skewness indicates that the curve is
left skewness and most of the data for their variables are concentrating on the right of the graph.
The positive value of kurtosis indicates that the curve is short and spread.
From the skewness and kurtosis value it can be further interpreted that the mean value is a good
representation of the sample data under study.
Hence majority of employees believes that the Job- rotation in this organisation
facilitates employee development is mostly true.
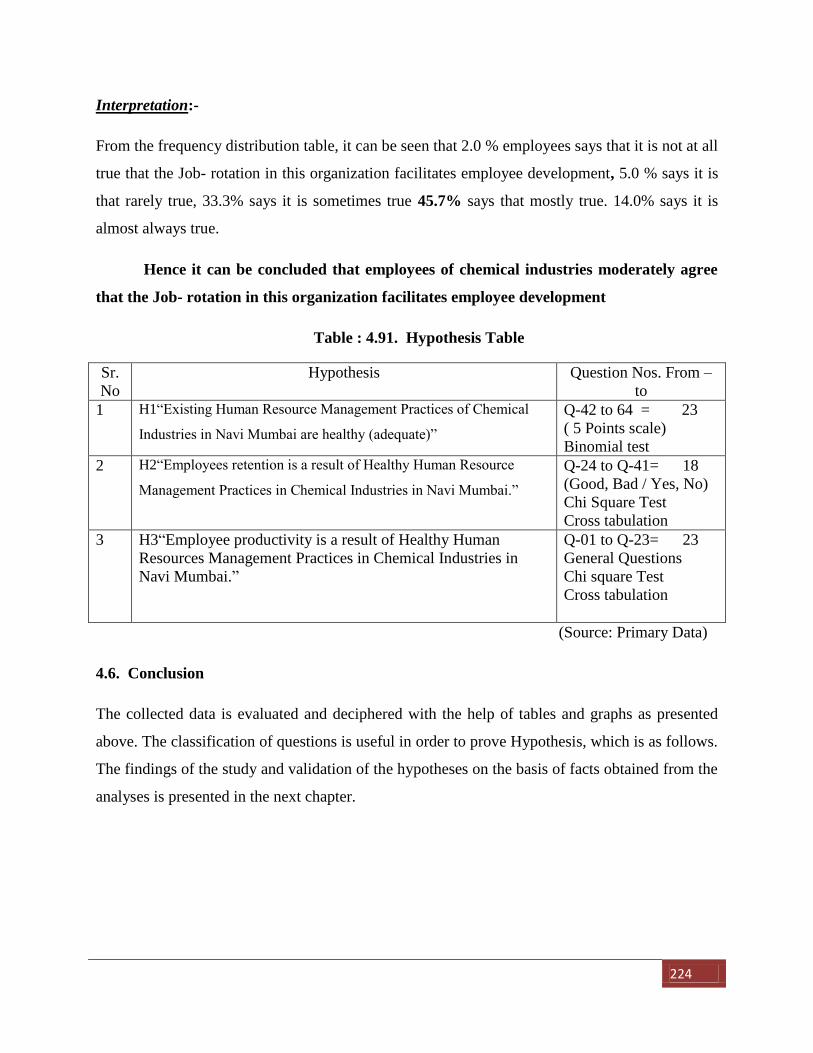
224
Interpretation:-
From the frequency distribution table, it can be seen that 2.0 % employees says that it is not at all
true that the Job- rotation in this organization facilitates employee development, 5.0 % says it is
that rarely true, 33.3% says it is sometimes true 45.7% says that mostly true. 14.0% says it is
almost always true.
Hence it can be concluded that employees of chemical industries moderately agree
that the Job- rotation in this organization facilitates employee development
Table : 4.91. Hypothesis Table
Sr.
No
Hypothesis Question Nos. From –
to
1 H1“Existing Human Resource Management Practices of Chemical
Industries in Navi Mumbai are healthy (adequate)”
Q-42 to 64 = 23
( 5 Points scale)
Binomial test
2 H2“Employees retention is a result of Healthy Human Resource
Management Practices in Chemical Industries in Navi Mumbai.”
Q-24 to Q-41= 18
(Good, Bad / Yes, No)
Chi Square Test
Cross tabulation
3 H3“Employee productivity is a result of Healthy Human
Resources Management Practices in Chemical Industries in
Navi Mumbai.”
Q-01 to Q-23= 23
General Questions
Chi square Test
Cross tabulation
(Source: Primary Data)
4.6. Conclusion
The collected data is evaluated and deciphered with the help of tables and graphs as presented
above. The classification of questions is useful in order to prove Hypothesis, which is as follows.
The findings of the study and validation of the hypotheses on the basis of facts obtained from the
analyses is presented in the next chapter.
225
Chapter 5
Findings, Conclusion, and Recommendations
5.1. Introduction
5.2. Findings
5.3. Conclusion.
5.3.1 Factor Analysis.
5.3.2 Hypotheses Testing
5.4. Suggestions and Recommendations.
5.4.1 Suggestions to HR Manager and Management of the Organization.
5.4.2 Suggestions to Government.
5.4.3. Suggestions to Employees.
5.1. Introduction
The collected data was evaluated and the same is presented in the earlier chapter, The facts
obtained from the analysis are presented in the chapter and hypotheses are tested on the basis of
these facts for its validity. Recommendations are also furnished to different stakeholders.
5.2 Findings.
Findings of the study
I. Finding in respect of Human Resource Management practices in Chemical Industries in
Navi Mumbai
1. Recruitment and Selection
a) It has been observed that company utilizes both internal and external sources of manpower
supplies. 64.7% of the respondents had confirmed this fact. (Ref. Page No-123)
b) 30% of the respondents have confirmed that company promotes its existing employees to fill
in the vacancies. (Ref. Page No-124)
226
c) It has been noticed that organization give preference for campus recruitment as external source
of the manpower supply 25% of the respondent had confirmed this fact.(Ref. Page No-126)
d) It had been observed that 40% of respondents have confirmed that organisation gives
preference to candidates from internal source while selecting the manpower. (Ref. Page No-127)
e) It had been observed that 51.67% respondents have confirmed that organisation does follow
uniform probation period for its employees. (Ref. Page No-128)
f) It had been observed that organisation provides regular appointment if performance of trainee
is satisfactory during probation period, confirmed this fact. (Ref. Page No-129)
g) According to 41. 3% respondents’ Differential placement method is most commonly used
method of placement in chemical industries of Navi Mumbai. (Ref. Page No-132)
2. Training and Development.
a) It had been observed that organisation provides induction training to its employees 54.3%
respondents have confirmed provision of induction training by employer. (Ref. Page No-133)
b) Effort was made to identify how organization provides training to its employees to enable
them to discharge new responsibility. 31.7 % respondents said that organisation provides in –
house training to its executives to make them ready to accept future responsibilities. (Ref. Page
No-134)
c) It had been observed that respondents have given preference to training that is essential if the
job or responsibility is changed. (Ref. Page No-136)
d) It had been observed that majority of respondents have given preference to “On the job
training” to cope up with new technological changes in the organization. (Ref. Page No-137)
e) 63.3% of respondents have confirmed existence of separate training department to provide
training to the employees in the organisation. (Ref. Page No-151)
f) Majority of respondents have confirmed that organization encourages employees by
sponsoring for higher educational program, arranging training programmers, guidance through
professionals. (Ref. Page No-152)
227
g) Majority of the respondents believes that personnel policies in the organisation facilitate
employee’s development. (Ref. Page No-182)
h) Majority of the respondents confirm that senior officers / executive’s in their organisation take
active interests in the development of subordinates. (Ref. Page No-184)
i) Majority of respondents had confirmed that employees in the organisation take efforts to find
out their strengths and weaknesses from their supervising officers or colleagues. (Ref. Page No-
200)
j) Majority of respondents had moderately agreed that when employees are sponsored for
training they take it seriously and try to learn from it. (Ref. Page No-202)
k) According to majority of respondents employer sponsors training programs on the basis of
genuine training needs. (Ref. Page No-204)
l) It was observed that senior officers pointed out career opportunities to juniors to help them in
career advancement. (Ref. Page No-218)
m) Majority of respondents had confirmed that managerial staff is aware of future plans of the
organisation and accordingly they nurture / develop their subordinates.(Ref. Page No-220)
3. Performance Evaluation / appraisal.
a) Majority of the respondents that is 31.33% confirmed that their immediate superior is
responsible for initiation and execution of Performance appraisal system. (Ref. Page No-143)
b) It had been observed that 54.7% respondents belong to organisation which follows common
performance appraisal system for all levels of officers in the organization. (Ref. Page No-145)
c) As per 39.3% respondent’s organization follows confidential appraisal system for
Performance appraisal. (Ref. Page No-146)
d) Performance Appraisal system is mainly used for job enrichment and salary decision (21%
each) followed by promotions (20 % ) Transfer ( 19.3%) and for other purpose. (Ref. Page No-
148)
228
e) As per majority the organisation took action immediately on receipt (35%) of appraisal report,
then at a time of promotion (34.7 %) and followed by at the time of increment (30.3%).(Ref.
Page No-149)
f) It had been observed that majority of respondents confirmed that performance appraisal report
plays major role in deciding training needs.(Ref. Page No-154)
g) According majority of the respondents when organisation provides behavioral feedback to the
employees they take it seriously and use it for their development. (Ref. Page No-198)
4. Employees Communication.
a) It had been observed that 62.3% respondents have confirmed existence of human resource
information system in the organisation.(Ref. Page No-139)
b) It had been observed that 44.7% confirm that the information is updated continuously in the
organisation. (Ref. Page No-140)
c) It had been observed that 39.3% respondents confirm use of Human Resource Information
System for deciding consideration of special project followed by increment (32.3%) and to
decide training (23.3%) requirement.(Ref. Page No-142)
d) It had been observed that 69% of the respondents had confirmed that a Notice Board is
installed in the premises of the organisation providing information to the employees and same is
used by the employees to obtain the information.(Ref. Page No-167)
e) It had been observed that majority of respondents have stated that they are informed about
injuries by the organization.(Ref. Page No-171)
f) Majority of respondents had agreed that their mistakes and weaknesses are communicated to
them in non-threatening manner. (Ref. Page No-196)
g) It had been observed that employees in the chemical industries in Navi Mumbai try to solve
problems by discussing it openly with collective efforts rather than accusing each other behind
the back.(Ref. Page No-216)
229
h) It had been observed that respondents confirmed that company provides information of
specific procedures to be carried out on the chemical outlets to avoid hazards that can be caused
by the same. (Ref. Page No-166)
5. Grievance Redressal
a) As per 64.67% respondents Grievance Redressal do exist in their organisation. (Ref. Page No-
157)
b) 79.7% respondents confirm that composition of Grievance redressal cell / Committee includes
employees. (Ref. Page No-158)
c) It had been observed that 67.75 respondents are satisfied with the decision of the grievance
redressal committee. (Ref. Page No-159)
6. Working Conditions.
a) 58.0 % respondents had confirmed that permanent equipment are supplied by the
organisation.(Ref. Page No-168)
b) Majority of the respondents (72.7%) are not satisfied with the equipment provided to them by
the organisation. (Ref. Page No-169)
c) 72.3% respondents had confirmed that internal facilities are provided by the organisation.
(Ref. Page No-170)
d) It had been observed that majority of respondents have stated that organisation provides
internal medical examination facilities.(Ref. Page No-172)
e) 42.3% respondents had agreed that advancement of subordinate is an organic part of
manager’s job. (Ref. Page No-179)
f) Majority of respondents had confirmed that delegation of higher responsibilities by superior is
a common practice in the chemical Industries of Navi Mumbai.(Ref. Page No-212)
g) According to respondents job rotation policies adopted by the organisation helps them in
advancement of their knowledge and enable them in career advancement. (Ref. Page No-222)
230
7. Retirement Benefits.
a) It had been observed that 67.0 % respondents have confirmed availability of retirement
benefits in their organisation. (Ref. Page No-162)
II. Findings in respect of the awareness in Chemical Industries about Human Resources
Management Practices.
a) It had been observed that 58.3% of the respondents confirm that the company is able to retain
its employee in last three years.(Ref. Page No-173)
b) It has been observed that the chemical industries in Navi Mumbai have healthy Human
Resources Management Practices as 66.77% respondents confirm this fact. (Ref. Page No-174)
c). It had been observed that 55.0% respondents in the chemical industries in Navi Mumbai have
confirmed that the productivity of employees and the organizations had increased in the last three
years.(Ref. Page No-176)
d) Majority of respondents (37.7%) believes that sometimes top management treats Human
Resource as significant and should be treated on Human ground. (Ref. Page No-177)
e) Majority of the respondents had confirmed that senior employees in the organisation trained
junior employees to prepare them for future responsibilities. (Ref. Page No-188)
f) According to majority the responsibility top management of the organisation takes efforts to
identify potential of its employees and nurture their potential’. (Ref. Page No-190)
g) Majority of employees confirmed that their supervising authority appreciates their efforts and
good work done by them. (Ref. Page No-192)
h) Majority of respondents had confirmed that people in their organization trust each other. (Ref.
Page No-206)
231
III. Finding in respect of constraints of related to Human Resource Management Practices
in chemical industries in Navi Mumbai.
a) Majority of respondents believes that employees in their organisation do not have any fixed
mental impression about each other in the other words there is no bias. (Ref. Page No-194)
b) Majority of respondents had confirmed that employees are not afraid to express or to share
their feelings and opinions with their supervisors. (Ref. Page No-208)
c) Majority of respondents had confirmed that authority express or discuss their views with their
subordinates. (Ref. Page No-210)
IV. Other Findings.
a) Majority of respondents have stated their preference for sponsors for higher education
programmes. (Ref. Page No-155)
b) As per 52.3% respondents confirmed that their organisation did not receive any special award
for the same. (Ref. Page No-164)
c) It had been observed that respondents are aware in respect of environmental issues and they
are actively taking care of the same. (Ref. Page No-165)
d) Respondents confirmed that people in their organisation are helpful to each other (Ref. Page
No-186)
e) It was agreed that team spirit among the employees of chemical industries is at higher level.
(Ref. Page No-214)
5.3. Conclusion
Based on above findings hypotheses of the study are tested for its validation it is presented below

232
5.3.1 Factor Analysis
Factor analysis is a data reduction technique. It is use to reduce a set of variables into a few
manageable factors. In the current study 20 variables have been used to measure Human
Resource Management practices in chemical industries of Navi Mumbai.
Factor analysis was performed to know if the 20 variables show overlap and can be combined
into a few manageable factors.
Table: 5.1. KMO and Bartlett’s Test
KMO and Bartlett's Test
Kaiser-Meyer-Olkin Measure of Sampling
Adequacy.
.542
Bartlett's Test of
Sphericity
Approx. Chi-Square 360.770
Df 190
Sig. .000
Bartlett’s test is testing a null hypothesis that variables are unrelated.
Bartlett test is significance (P<0.05), hence the Nulls rejected and it is concluded that
relationship exit between variables.
The KMO value is more than 0.5 indicting that relationship between variables is adequate for a
stable factor solution.
Table: 5.2: Total variance Explained.
Total Variance Explained
Component
Initial Eigen values Extraction Sums of Squared Loadings
Total % of Variance Cumulative % Total % of Variance
1 1.957 9.787 9.787 1.957 9.787
2 1.584 7.919 17.707 1.584 7.919
3 1.392 6.962 24.669 1.392 6.962
4 1.323 6.615 31.283 1.323 6.615
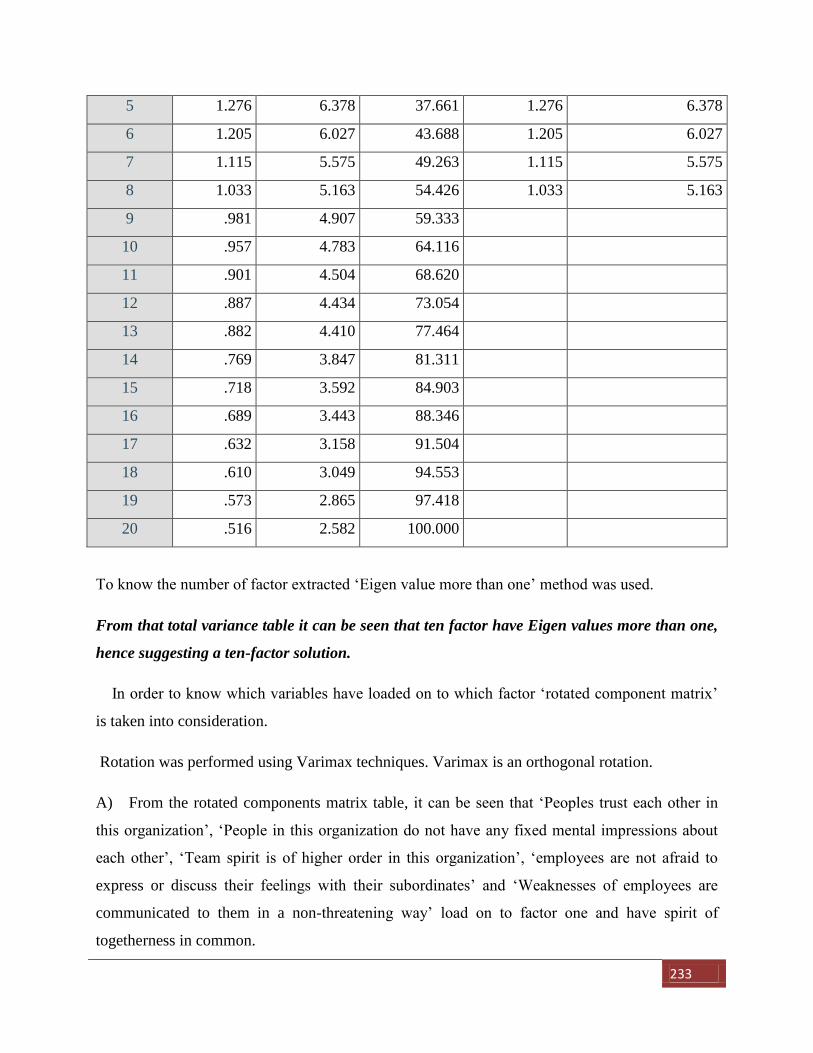
233
5 1.276 6.378 37.661 1.276 6.378
6 1.205 6.027 43.688 1.205 6.027
7 1.115 5.575 49.263 1.115 5.575
8 1.033 5.163 54.426 1.033 5.163
9 .981 4.907 59.333
10 .957 4.783 64.116
11 .901 4.504 68.620
12 .887 4.434 73.054
13 .882 4.410 77.464
14 .769 3.847 81.311
15 .718 3.592 84.903
16 .689 3.443 88.346
17 .632 3.158 91.504
18 .610 3.049 94.553
19 .573 2.865 97.418
20 .516 2.582 100.000
To know the number of factor extracted ‘Eigen value more than one’ method was used.
From that total variance table it can be seen that ten factor have Eigen values more than one,
hence suggesting a ten-factor solution.
In order to know which variables have loaded on to which factor ‘rotated component matrix’
is taken into consideration.
Rotation was performed using Varimax techniques. Varimax is an orthogonal rotation.
A) From the rotated components matrix table, it can be seen that ‘Peoples trust each other in
this organization’, ‘People in this organization do not have any fixed mental impressions about
each other’, ‘Team spirit is of higher order in this organization’, ‘employees are not afraid to
express or discuss their feelings with their subordinates’ and ‘Weaknesses of employees are
communicated to them in a non-threatening way’ load on to factor one and have spirit of
togetherness in common.
234
Hence this factor can be named as “Encouraging Team Spirit”.
B) From the rotated components matrix table, it can be seen that , ‘When problem arise people
discuss these problems openly and try to solve them rather than keep accusing each other behind
the back.’, ‘Employees are not afraid to express or discuss their feelings with their subordinates.
‘Lead on to factor one and have spirit of togetherness in common.
Hence this factor can be named as “Self Motivation”.
C) From the rotated components matrix table, it can be seen that, ‘The organizations future plans
are made known to the managerial staff to help them develop their juniors and prepare them for
future.’ ‘Job- rotation in this organization facilitates employee development’, ‘Lead on to factor
one and have spirit of togetherness in common.’
Hence this factor can be named as “Future Oriented / Future planning.”
D) From the rotated components matrix table, it can be seen that, ‘.When employees are
sponsored for training; they take it seriously and try to learn from the programmes they added.’,
‘Senior officers / Executives in this organization take active interest in their juniors and help
them their job.’ ‘The personnel policies in this organization facilitate employee’s development.’
Lead on to factor one and have spirit of togetherness in common.
Hence this factor can be named as “Organizational Activities/ Leadership Qualities.”
E) From the rotated components matrix table it can be seen that, ‘.The top management of this
organization makes efforts to identify and utilize the potential of the employees’, ‘Employees in
this organization take pains to find out their strengths and weakness from their supervising
officers or colleagues’ Lead on to factor one and have spirit of togetherness in common.
Hence this factor can be named as “Progressive Activities”.
F) From the rotated components matrix table it can be seen that, ‘Peoples in this organization are
helpful to each other’; ‘Employees are sponsors for training programmes on the basis of genuine
training needs. ‘lead on to factor one and have spirit of togetherness in common.
Hence this factor can be named as “Cooperativeness / Unity Strength”.
235
G) From the rotated components matrix table it can be seen that, ‘When behavior feedback is
given to employees they take it seriously and use it for development.’; ‘Development of
subordinate is seen as an important part of their job by the managers / officers here.’ Lead on to
factor one and have spirit of togetherness in common.
Hence this factor can be named as “Challenges to Progressive activities”.
H) From the rotated components matrix table it can be seen that, ‘The top management believes
that Human Resources are an extremely important resource and that they have to be treated more
humanly’, ‘When employee’s does good work his supervising officers take special care to
appreciate it. ‘lead on to factor one and have spirit of togetherness in common.
Hence this factor can be named as “Concentration on Employees to develop each other
employees”.
Hence factor analysis has successfully reduced, 64 variables into 8 manageable factors
Encouraging Team spirit, Self Motivation, Future Oriented/Future Planning, Organizational
Activities, Leadership Qualities, Progressive Activities, Cooperativeness / Unity Strength,
Challenges to Progressive activities and Concentration on Employees to Develop each other
employees in Human Resource Management practices in the organizations.
5.3.2 Hypothesis Testing.
Considering above findings and factor analysis following hypotheses are tested for its validity
Hypotheses
1. H1:“Existing Human Resource Management Practices of Chemical Industries in Navi
Mumbai are healthy (adequate).”
2. H2: “Employees retention is a result of Healthy Human Resource Management Practices
in Chemical Industries in Navi Mumbai”
3. H3: “Employee productivity is a result of healthy HRMP in Chemical Industries in Navi
Mumbai.”
236
1.“Existing Human Resource Management Practices of Chemical Industries in Navi
Mumbai are healthy (adequate).”
Statistical Test: Binomial Test.
Variables and Measurement
Employees of Chemical Industries were asked to comment on the following statement related to
the above a five point scale (5= Very healthy, 1= Less / Moderately healthy)
a. Encouraging Team spirit.
b. Self Motivation.
c. Future Oriented/Future Planning.
d. Organizational Activities, Leadership Qualities.
e. Progressive Activities.
f. Cooperativeness / Unity Strength.
g. Challenges to Progressive activities.
h. Concentration on Employees.
Cut point: the original 5 point scale was converted to 2- point scale using CUT POINT option
as “3” in IMBSPSS 21.Hence the newly created categories were
< = 3: Not adequate.
> 3: adequate.
Test Proportion: Test proportion was taken as 0.5. Since more than 50% of favorable responses
to a particular category suggest greater approval for this category. Hence P = 0.5
H0: P ≤ 0.5 (proportion of responses indicating “Existing Human Resource Management
Practices of Chemical Industries in Navi Mumbai are healthy (adequate).”, less than or equal to
50%)
H1: P> 0.5 (proportion of responses indicating “Existing Human Resource Management
Practices of Chemical Industries in Navi Mumbai are healthy (adequate).” is more than 50%)
Levels of significance < 0.05
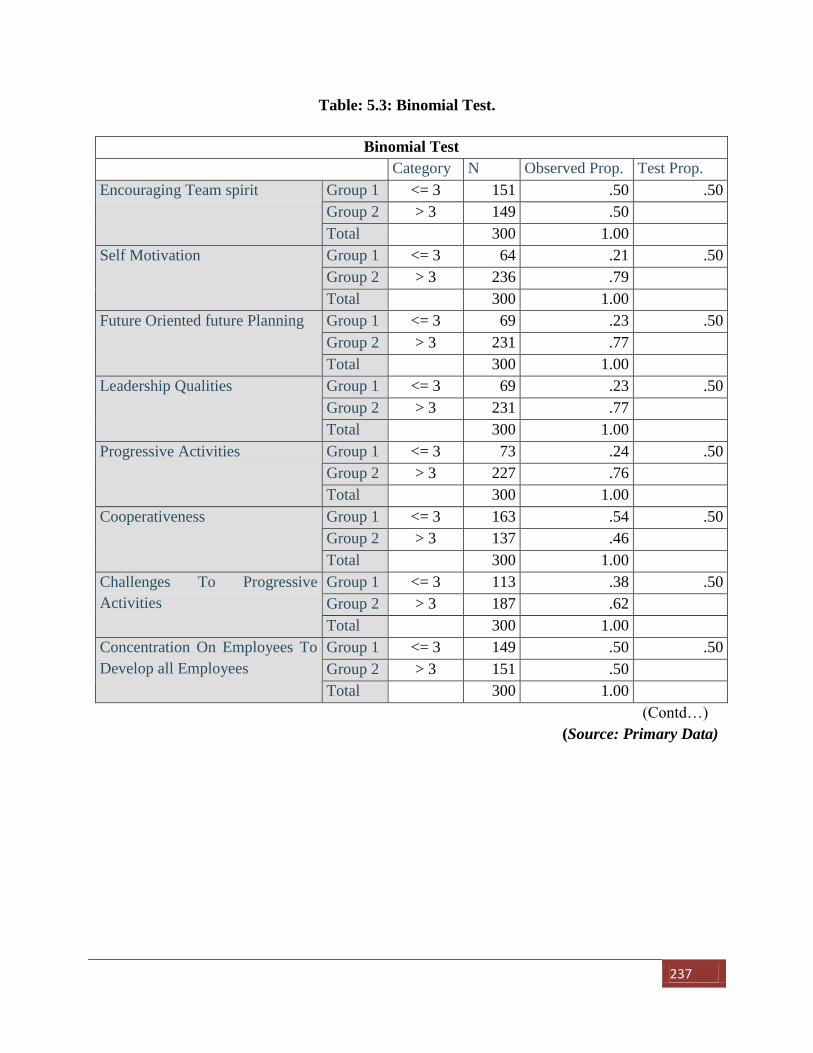
237
Table: 5.3: Binomial Test.
Binomial Test
Category N Observed Prop. Test Prop.
Encouraging Team spirit Group 1 <= 3 151 .50 .50
Group 2 > 3 149 .50
Total 300 1.00
Self Motivation Group 1 <= 3 64 .21 .50
Group 2 > 3 236 .79
Total 300 1.00
Future Oriented future Planning Group 1 <= 3 69 .23 .50
Group 2 > 3 231 .77
Total 300 1.00
Leadership Qualities Group 1 <= 3 69 .23 .50
Group 2 > 3 231 .77
Total 300 1.00
Progressive Activities Group 1 <= 3 73 .24 .50
Group 2 > 3 227 .76
Total 300 1.00
Cooperativeness Group 1 <= 3 163 .54 .50
Group 2 > 3 137 .46
Total 300 1.00
Challenges To Progressive
Activities
Group 1 <= 3 113 .38 .50
Group 2 > 3 187 .62
Total 300 1.00
Concentration On Employees To
Develop all Employees
Group 1 <= 3 149 .50 .50
Group 2 > 3 151 .50
Total 300 1.00
(Contd…)
(Source: Primary Data)
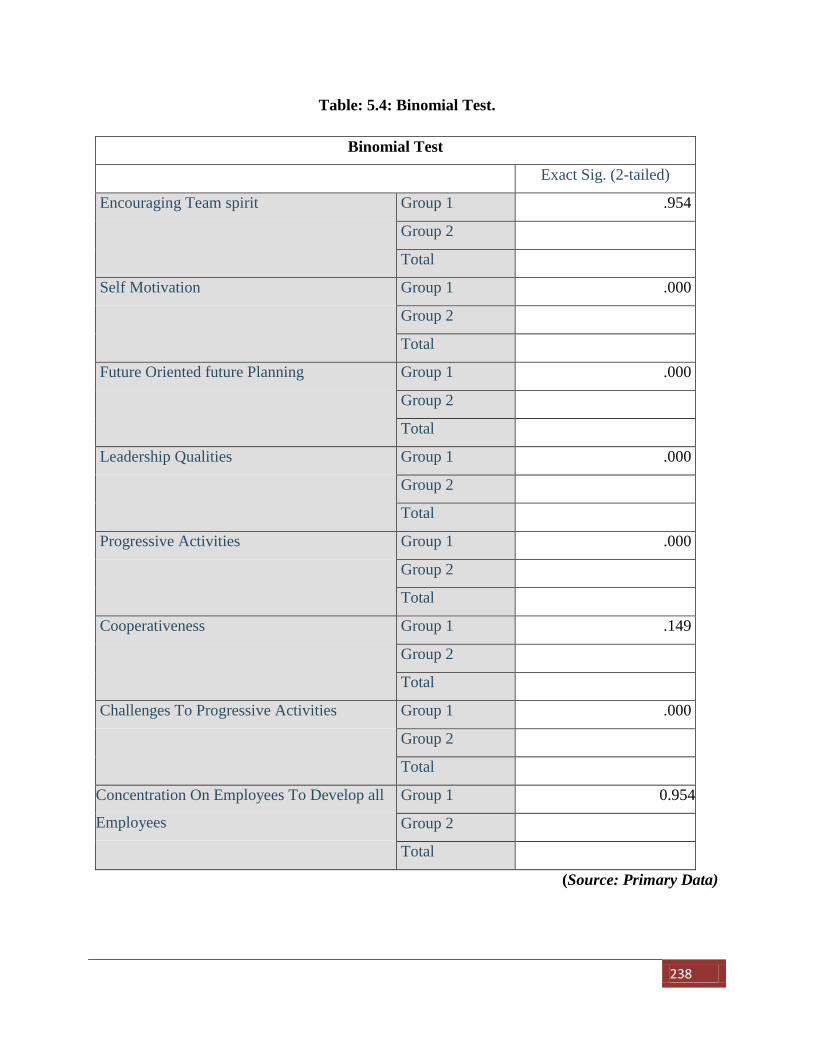
238
Table: 5.4: Binomial Test.
Binomial Test
Exact Sig. (2-tailed)
Encouraging Team spirit Group 1 .954
Group 2
Total
Self Motivation Group 1 .000
Group 2
Total
Future Oriented future Planning Group 1 .000
Group 2
Total
Leadership Qualities Group 1 .000
Group 2
Total
Progressive Activities Group 1 .000
Group 2
Total
Cooperativeness Group 1 .149
Group 2
Total
Challenges To Progressive Activities Group 1 .000
Group 2
Total
Concentration On Employees To Develop all
Employees
Group 1 0.954
Group 2
Total
(Source: Primary Data)
239
Interpretation:
a) Encouraging team spirit
Observed proportion: 0.5 Test proportion: 0.5, P = 0.954
Hence only 50% of the respondents agree that there is team spirit in change employee of the
organization
b) Self-Motivation
Observed Proportion: 0.79 test proportion 0.5, P= 0.000
Hence more than 50% of the respondents agree that employees of the organization self-
motivated.
c) Future Oriented / Future Planning
Observed Proportion.0.77 Test proportion 0.5, P= 0.000
Hence more than 50% of the respondent agrees that employees of the organisation are future
Oriented.
d) Leadership Qualities
Observed Proportion.0.77 Test proportion 0.5, P= 0.000
Hence more than 50% of the respondent agrees employees of the organization have leadership
qualities.
e) Progressive activities.
Observed Proportion.0.76 Test proportion 0.5, P= 0.000
Hence more than 50% of the respondent agrees that employees of the organisation are found in
progressive activities.
f) Cooperativeness
Observed Proportion.0.46 Test proportion 0.5, P= 0.149
240
Hence less than 50% of the respondents agree employees of the organization are not found
Cooperativeness.
g) Challenges to progressive activities
Observed Proporation.0.62 Test proportion 0.5, P= 0.000
Hence more than 50% of the respondent agrees those employees of the organization are found
challenges to progressive activities.
h) Concentration on employees to develop all employees.
Observed proportion: 0.5 Test proportion: 0.5, P = 0.954
Hence only 50% of the respondents agree that there is Concentration on employees to develop
all employees in change employee of the organization
Out of 8 variables, 5 variables have observed proportion more than 0.50 and P value less than
0.05, hence the hypothesis, ‘Human Resource Management Practices in Chemical Industries are
healthy (adequate) is proved’.
2.H2: “Employees retention is a result of Healthy Human Resource Management Practices
in Chemical Industries in Navi Mumbai”
Statistical Test: Chi square test
Variables and Measurement:
Employee retention is categorical variables measured using two response option, (1= bad, 2=
good)
Human resource Management Practices is also a categorical variable with two response options
(1= moderately healthy, 2= very healthy)
Levels of Significance: α = 0.05.
H0: Employee retention is independent of healthy HRM Practices.
H1 : Employee retention depends upon Healthy HRMP.
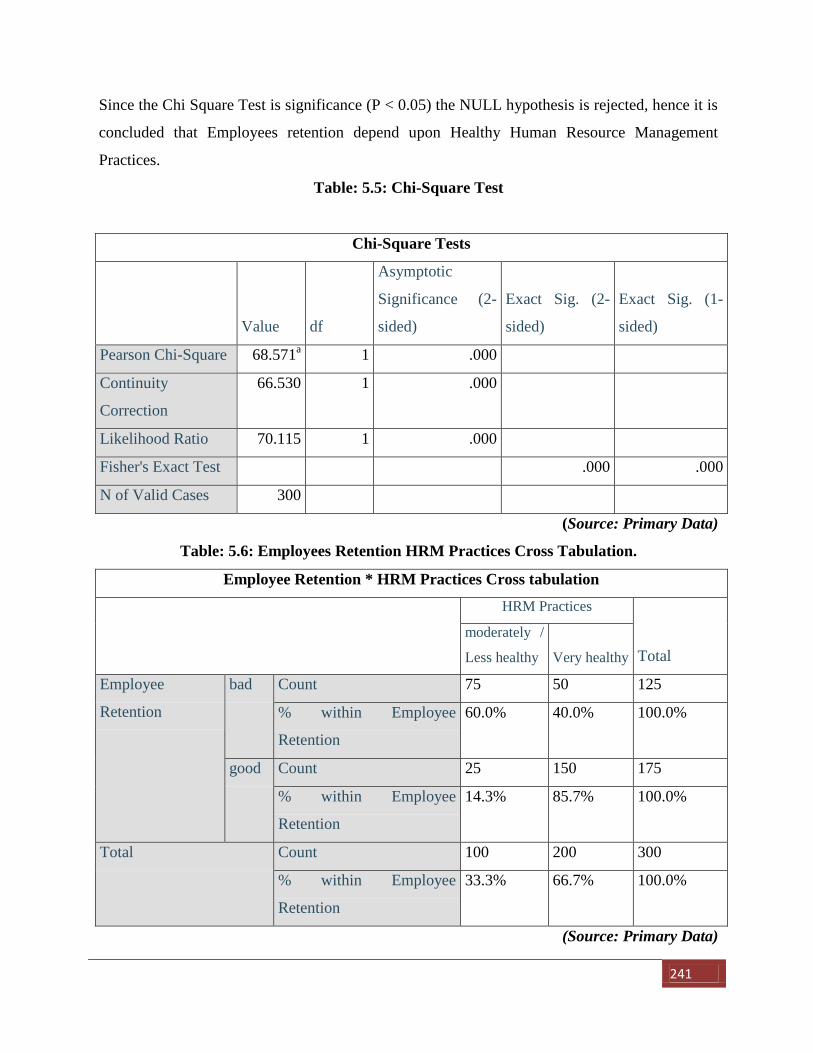
241
Since the Chi Square Test is significance (P < 0.05) the NULL hypothesis is rejected, hence it is
concluded that Employees retention depend upon Healthy Human Resource Management
Practices.
Table: 5.5: Chi-Square Test
Chi-Square Tests
Value df
Asymptotic
Significance (2-
sided)
Exact Sig. (2-
sided)
Exact Sig. (1-
sided)
Pearson Chi-Square 68.571a 1 .000
Continuity
Correction
66.530 1 .000
Likelihood Ratio 70.115 1 .000
Fisher's Exact Test .000 .000
N of Valid Cases 300
(Source: Primary Data)
Table: 5.6: Employees Retention HRM Practices Cross Tabulation.
Employee Retention * HRM Practices Cross tabulation
HRM Practices
Total
moderately /
Less healthy Very healthy
Employee
Retention
bad Count 75 50 125
% within Employee
Retention
60.0% 40.0% 100.0%
good Count 25 150 175
% within Employee
Retention
14.3% 85.7% 100.0%
Total Count 100 200 300
% within Employee
Retention
33.3% 66.7% 100.0%
(Source: Primary Data)

242
From the cross tabulation table it can be affirmed that out of the 175 respondents who said that
retention is good 85.7% agreed that HRMP are very healthy and out of the 125 employees who
said employee’s retention is bad, 60% agreed that HRMP are moderately healthy.
Hence it can be concluded that employee retention is result of healthy Human Resource
Management Practices.
3. H3: “Employee productivity is a result of healthy Human Resource Management
Practices in Chemical Industries in Navi Mumbai.”
Statistical test: - Chi square test.
Variable and Measurement:
Employee productivity is categorical variable measured using two response options (1=bad 2=
Good).
Human Resource management Practices is also categorical variable with two response options
(1= moderately/ Less healthy, 2= Very healthy)
H0 : Employee productivity is independent of healthy Human Resource Management Practices.
H1: Employee productivity depends upon healthy Human Resource Management Practices.
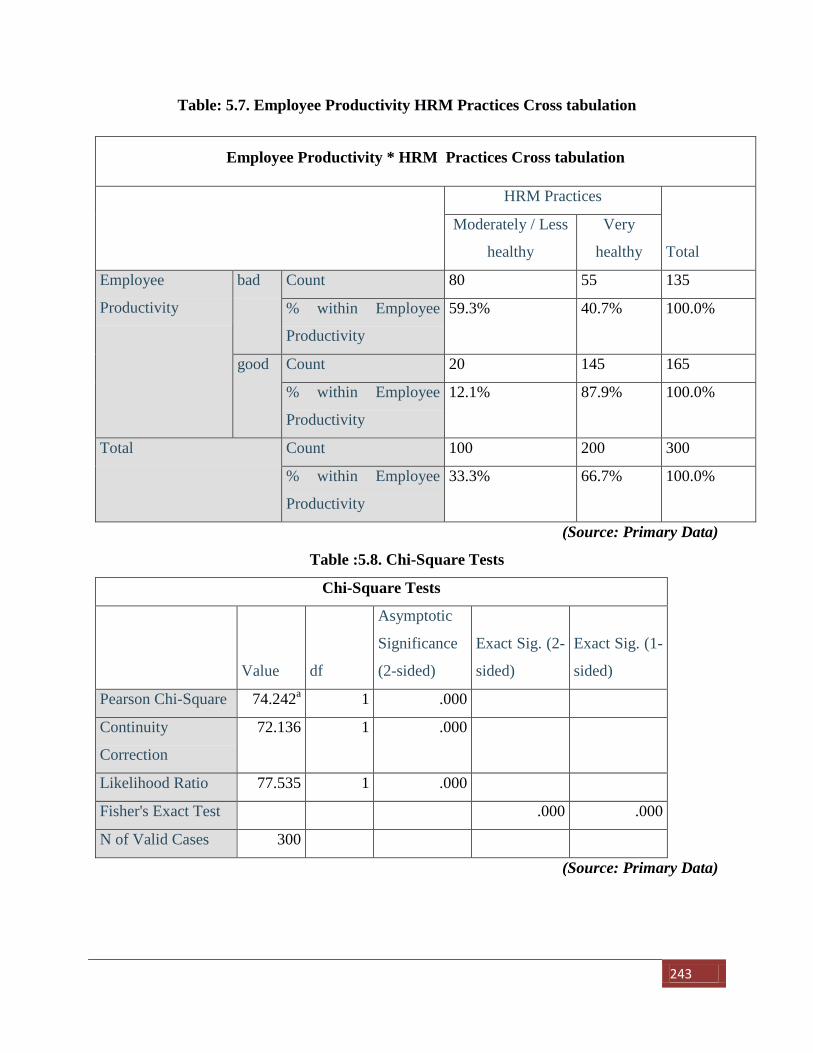
243
Table: 5.7. Employee Productivity HRM Practices Cross tabulation
Employee Productivity * HRM Practices Cross tabulation
HRM Practices
Total
Moderately / Less
healthy
Very
healthy
Employee
Productivity
bad Count 80 55 135
% within Employee
Productivity
59.3% 40.7% 100.0%
good Count 20 145 165
% within Employee
Productivity
12.1% 87.9% 100.0%
Total Count 100 200 300
% within Employee
Productivity
33.3% 66.7% 100.0%
(Source: Primary Data)
Table :5.8. Chi-Square Tests
Chi-Square Tests
Value df
Asymptotic
Significance
(2-sided)
Exact Sig. (2-
sided)
Exact Sig. (1-
sided)
Pearson Chi-Square 74.242a 1 .000
Continuity
Correction
72.136 1 .000
Likelihood Ratio 77.535 1 .000
Fisher's Exact Test .000 .000
N of Valid Cases 300
(Source: Primary Data)
244
From the cross table, it can be seen that out of 165 respondents who said that Employees
productivity is good, 87.9% agreed that Human Resource Management Practices are very healthy
and out of 135 employees who said that Employees productivity is Bad, 59.3% agreed that
Human resource Management Practices are Moderately healthy.
Hence it can be concluded that employee productivity is a result of healthy Human Resource
management Practices.
5.4. Research Problem:
Literature review enable to identify gaps and also to frame research problem for the study, the
research problem of the study is whether Human Resource Practices adopted in chemical
industries in Navi Mumbai are adequate?
5.5. Suggestions& Recommendations:
5.5.1 Suggestions to HR Manager and Management of the organization
1. Promotions: It is observed that very less number of employees are promoted to higher
positions, HR Manager and Management should give more opportunities to their existing
employees by considering them for promotions.( Ref. Page No-155,218)
2. Campus Recruitment: It is observed that organization focuses on Campus Recruitment
for manpower supply. It negatively affects the company as it loses opportunity to get
skilled workers. Company should apply scientific method for recruitment and selection. (
Ref. Page No-123 to 129)
3. Development of Employees: It had been observed that only 42% superiors delegate
responsibilities to their subordinates, the organization should bear in mind that there is
always a need for second line of human resources.( Ref. Page No-188,212)
4. Job Rotation: It is observed that proper job rotation policies need to be adopted for
development of different skill sets of the employees.(Ref. Page No- 222)
5. Performance Appraisal: Companies need to adopt scientific performance appraisal
methods for appraisal of its employees.( Ref. Page No-145,146)

245
6. Performance based remuneration: It is observed that employees of the Companies
need performance based remuneration than current increment system.(Ref. Page No- 148)
7. Immediate Penal Action should be avoided: It is observed that penal action is taken
against employees immediately; it is advised that companies should be more liberal while
taking penal action against employees.( Ref. P- No- 149)
8. Retirement Benefits: The management should come up with better retirement benefits to
the employees of the organization.(Ref. page No-162)
9. Social Activities: The Management of the organization should plan and execute social
activities for its employees, and for surrounding area. .(Ref. page No-164)
10. Training: The organizations should focus more on training of the employees. It is
observed that only 53% organization give preference for induction training.(Ref.P-
202,204)
5.5.2 Suggestions to Government
1. Implementation of Labour Laws: Government should effectively implement and
supervise compliance of labour law regulations in respect of grievance redressal for
chemical industries in Navi Mumbai.
2. Supervision of Laws related to Payment of remuneration: Government should
strictly implement laws related to payment remuneration.
3. Laws related to Women Employees: Government should supervise and ensure
effective implementation of labour laws specifically related to women employees.
4: Safety and Security: Government must ensure adherence of laws related to safety and
security of employees and environment.
5. Insurance Coverage and Medical Facilities: Government should ensure family
insurance cover should be provided to all employees along with medical facilities by the
employer.
246
6. Education Benefits: Government should enact law in respect of granting scholarship to
the bright students of employees.
7. Human Resource Accounting: Implementation of Human Resource Accounting in all
Chemical Industries of Navi Mumbai
5.5.3. Suggestions to Employees
1. Communication: Employees must take active participation in communication process,
employees must be aware about notices, circulars etc. displayed on Notice Board.(Ref.
Page No-206,208)
2. Training: Employees must emphasis on training before placement.(Ref. Page No-151)
3. Mutual Trust: Employees must develop mutual trust among each other and try to solve
problems by discussing it with each other and appropriate authority.(Ref. Page No-216)
4. Participation in Management: Employees are advised to increase their active
participation in Management of organization
5. Awareness: Employees specifically women employees are advised to study and obtain
knowledge in respect of various labour laws, employee benefit schemes and other
rules.(Ref. Page No- 167)
247
6. BIBLIOGRAPHY.
6.1. References:
6.2. Journals and Periodical.
6.3.Articles.
6.4. Websites:
6.1. References:
1. AgarwalaTanuja., Human Resource Management: The Emerging Trends", Indian Journal
'Industrial Relations, Vo1.37, No.3, 2002.
2. AnuradhaSharama, “Management and Job Performance” (1986) New Delhi Gain
Publication House.
3. Apparao P. B. “Personnel management in Small scale Industries” (1988), Deep and Deep
Publication house New Delhi.
4. Armstrong, Michael, A Hand book Of Human Resource Management, (8th
Edition),
(2001), Printed and Bounded in Great Britain by The Bath Press, Bath, Great Briton.
5. Aswathappa K., Reddy Sudarsana. G.,Business Environment for Strategic Management,
Second Revised and Enlarged Edition, 2011, ISBN- 978-93-5051-104-6, Himalaya
Publishing House.
6. Aswathappa, K. Human Resource management, (Text and Cases) (2011), Tata McGraw-
Hill Publishing Company Limited, New Delhi.
7. Aswathappa, K., Essentials of Production Management, Himalaya Publishing House,
Mumbai. 1998, ISBN- 81-7493-587-8.
8. Bedi R.V. , and Hundekar S.G, “International Human Resource Management”, (2009)
Vrinda Publication Pvt.Ltd, New Delhi
9. Bhagolivala, T.N. “ Personnel management and Industrial relation” (1999), Sahitya
Bhavan Publication , Agra.
10. BholanathDutta, HRM Review, Employment and Employability, ICFAI University Press
2009, Pg. 17.
11. Blum, M.L., Industrial Psychology and its Social foundations” (1966) Harper International
Publications, New York.
248
12. Burnett, Promotion Management, (1999) AITBS, Publisher and Distributor (Regd.) Delhi-
51.
13. Burton Gene, Thakur Manab, (1998) Management Today, Introduction to management
(Tata McGraw- Hill Publishing Company Limited, New Delhi.) ISBN No- 0-07-463110-1.
14. C.B.Mamoria and S.V.Gankar, Personnel management (text and Cases) (2008) Himalaya
Publishing House, Pune,1.
15. Choudhari, K. ,” Change in Organization”, (1980) Lavani Publication House, Mumbai.
16. Dale Yoder, “Personnel Management and Industrial Relations”,(1988) Prentice Hall of
India Publication, New Delhi,
17. Dale, Earnest, Management: Theory and Practices, 1978, International Student Edition,
McGrawHill International Book Company.
18. Davar R.S., Personal management and Industrial Relations, (Reprint 2011) Vikas
Publishing house Pvt Ltd, Tenth Revised Edition.
19. Davar, R.S., Personnel Management and Industrial Relations, 1988, Vikas Publishing
House Pvt. Ltd, New Delhi.
20. Davar, Rustom, S., Personnel Management and Industrial Relations, (10th edition) 1976,
Vikas Publishing House Pvt. Ltd, New Delhi.
21. David A. Decenzo, Stephen P. Robbins Fundamentals of Human Resource management
(8th Edition) John Wiley India, New Delhi 110002.
22. Deshpande A.S., Principles of Management and Personnel Management, Third Edition,
1987, Vora and Sons Publishers Private Limited Bombay-02.
23. Dipak Kumar Bhattacharya, Human Resource planning (2nd Edition) Excel Books, New
Delhi 110028.
24. Donald R Cooper, Pameela S. Sachindlar, “Business Research Methods”, (1998) Tata Mc
Grew Publications Company Ltd. New Delhi.
25. Dr. Aswathappa, K, Production management, (1998), Himalaya Publishing House, Pune.
26. Dr. BediRavindranath, Human Resource Management (Text and Cases) (2011) Himalaya
Publishing House, Mumbai 400004.
27. Dr. Murugan, M. Sakthivel, Management Principles and Practices, (2016), New age
International Publications, New Delhi.
249
28. Dr. Shajahan, S. Research Methodology, (text and cases)(2006), Jaico Publishing House
Mumbai.
29. Dr. Vaisishth, Neeru, Taxmann, Students Guide to Management, Second Edition, July
2003, Management: Concepts and Naturem- 15.
30. Drucker P.F.: "The Practice of Management,”. (1984) London, Heinemann, Publication.
31. Drucker PeterF.: The practice of management, (1990) New Delhi: Allied publishers Pvt.
Ltd.
32. DubrinAndrew, JLeadership,(Research Findings , Practice, and Skills) 5th
Edition (2008),
Biztantra, Management for the flat world, Delhi-02.
33. Dwivedi. R.S, Manpower management, 1984, Prentice-Hall of India, Pvt., Ltd., New
Delhi., ISBN 0-87692-047-4.
34. Dwivedi R.S., Management of Human Resources, (2000) Oxford & IBH Publishing Co.,
New Delhi.
35. FlippoE.B.: "Principles of Personnel Management;"(1976) (Fourth Ed), McGraw Hill,
KogakushaLtd.,Tokyo.
36. Flippo E.B.,” Principles of Personnel Management”, (1981) McGraw Hill Books Co,
Singapore.
37. Gary Dessler, “Human Resource Management” – 10 Edition, ,(2006) Florida International
University. Prentice, Hall of India Pvt. Ltd., New Delhi – 110 001.
38. Goel, S.L.,Modern Management Techniques, (1995), deep and Deep publication, New
Delhi-27.
39. Gupta, C.B. Human Resource management, (2010), Sultan Chand & Sons, Educational
Publishers, New Delhi, ISBN No- 978-81-8054-857-4.
40. Hannagan Tim, Management-Concepts & Practices, (1995), Macmillan India Ltd, SBN No
0333 93081-9.
41. Harrel T.W., “Industrial Psychology” (1997) Oxford& IBH Publishing Co, New
Delhi.HeinzWeihrich, Harold Koontz, (2006) Management – A global Perspective, (11th
Edition) (Tata McGraw- Hill Publishing Company Limited, New Delhi.).
250
42. Ian Beardwell& Len MaCmillan Human Resource Management, A contemporary
Perspective – Indian book’s publication Ltd., New Delhi 110002.
43. ICFAI Center for Management Research, Introduction to Human Resource Management,
Managing Careers, Hyderabad, India, ISBN 81-7881-978-3, 2004.
44. John W. Newstrom and Keith Davis. 11th Edition, Stress and Counseling: Organizational
Behavior, Tata McGraw-Hil, Delhi India, ISBN: 0-07-047264-5, 364-387.
45. Kerzner, Harold, Project Management, (A system approach to planning, Scheduling and
controlling) (2002) CBS, Publisher and Distributor New Delhi-02, International Publishers
New Delhi, ISBN:81-224-1506-7.
46. Khanka S.S., “Human resource Management” (text and cases) (2009) S. Chand and
Company Limited, New Delhi2009, Chapter 13 Internal mobility and Separation.
47. Khanka S.S., Human Resource management, (2011), S Chand & Company Ltd, New
Delhi- 55, ISBN No- 81-219-2300-X.
48. Khanzode V. V: “Human Resource Management” (1998): Ashish Publishing House, New
Delhi.
49. Kirk Patrick, D.L., Evaluating of Training and Development Handbook, (1987) McGraw-
Hill, New York,
50. Koontz O Dennell, Weihrich, Essentials Of Management, Fourth Edition, Mc Grew Hill,
International Editors, New Delhi.
51. Kothari,C.R.,(2008) Research Methodology ,Methods and Techniques, ,New age
international publishers, New Delhi 110002.
52. Krishnaswamy, O.R., “Human Resource Development” (1987) Rainbow Publications,
Coimbatore.
53. Kumar Ranjit, Research Methodology, 3rd
edition, Sage Publication India Pvt. Ltd, New
Delhi-44, (2012), ISBN- 978-81-321-0648-7(PB).
54. LatiffT.A.,” Training for Management” (2003) Starling Publications, New Delhi.
251
55. Luis R. Gomez - mejia, David B. Balkin, Robert L. Cardy, Managing Human Resources
(4th Edition) Pearson education, prentice Hall, New Delhi 110092.
56. McFarland, D.E., “Principles of Management.” (1968) McGraw Hill Book Co, New York.
57. Mamoria C.B, Rao, V.S.P. Personnel management, (text and Cases) Himalaya Publishing
House Pune, (2012), ISBN N0- 978-93-5051-468-9.
58. Managing Human Resources, Personnel Management in Indian Enterprises - R. S.
Dwivedi, Galgotia Publishing Company, New Delhi 110005.
59. Mathis, K.I. and Jackson. J.H., “Personnel Management” (1988) Tata Mc Grew Hill < New
Delhi.
60. Memoria, Memoria, Gankar. Dynamic Industrial Relations, (2011), Himalaya Publishing
House, Mumbai, ISBN No- 978-81-8318-140-6.
61. Menon P.S.K. A Comprehensive manual of Human Resource Management, (2012),
Himalaya Publishing House Pvt. Ltd., Mumbai-04., ISBN No- 978-93-5051-333-0.
62. Michael Armstrong, Human Resource Management Practices, 8th
Edition, (2001) British
Library cataloguing in publishing data, Great Britain be the Bath press, Bath USA.,ISBN-
07494 3393 0.
63. Michael V.P.: “Human Resource Management and Human Relation” (2001): Himalaya
Publishing House, Mumbai.
64. Michael, V.P., Human Resource Management and Human Relations, 2011, Himalaya
Publishing House Pvt. Ltd, ISBN-978-93-5024-998-7.
65. MonappaArun: ‘Managing Human Resource’: McMillan India Ltd., New Delhi.
66. Moorthy M.V.: “Human Resource Management” -(Psycho-Sociological Approach) (1992):
R&M Associates, Bangalore.
67. Morajkar,V.V,Kakade,M.D, Geet,S.D, Geet, A.S, Human resource Management,
NiraliPrakashan, Pune, (1999).
252
68. Murugan M, Sakthivel, Management Principles and Practices, 2004, New Age. The
author has focused in this reference book on management as a growing and developing
discipline.
69. Noe, Hollenbeck, Gerhart, ‘Human Resource Management’, Irwin McGraw Hill, 4th Ed.,
2003.
70. P.Jyothi, D.N.Venkatesh, (2006), Human Resources Management, Oxford University
Press.
71. Pardeshi P.C.,Human Resource Management, (1999), NiraliPrakashan, Pune.
72. Penny Hackett.: ‘Success in Management Personnel’ (1979): John MurryPublisshers Ltd.,
London.
73. Peter J. Dowling and Denice E. Welch (2004). International Human Resource
Management.
74. Prasad Lallan, Gulshan.S.S., Management Principles and Practice, 1998, S. Chand &
Company Ltd., Ram Nagar, Delhi-55, ISBN-81-219-0317-3.
75. Prasad, L. M., Human Resource Management, Sultan Chand & Sons, Educational
Publishers, New Delhi. (2006). ISBN N0 978-81-8054-769-0.
76. Punekar, S.D, Deodhar, S.B, Sankaran, Sarswathi, Labour Welfare, Trade Unionism and
Industrial Relations, (2012), Himalaya Publishing House, Nagpur, ISBN 978-93-5051-512-9.
77. Rao T.V., Human Resources Development: Experiences, Interventions and Strategies,
(1996) Sage Publication, New Delhi.
78. Rao, SubbaP. Personnel and Human Resource Management (text & Cases), (2000)
Himalaya Publishing House, Pune, Mumbai, ISBN- 81-7493-777-3.
79. Rao, Subba. P., Essentials of Human Resource Management and Industrial Relations,
Fifth Edition, 2012, Himalaya Publishing House, Mumbai, ISBN-978-93-5051-630-0.
80. Rao, T.V., HRD Audit: Evaluating the Human Resource Function for Business
Improvement, (1999) Response Books, New Delhi.
253
81. Rao, V.S.P.Human Resource Management, ( Text and Cases)(2005), Excel Books , New
Delhi, ISBN No- 81-7446-448-4.
82. Ravishankar S. and Mishra R.K.: “Management of Human Resource in Public
Enterprises” (1985): Vision Book Pvt. Ltd., New Delhi.
83. Raymond Note, “Human Resource Management – 5th Edition, 2007 A Note and Others.
Tata McGraw-Hill Publishing Company Ltd., New Delhi.
84. Robert A. Fazzal, Management Plans, 1994, IRWIN, Professional Publishing, Burr Ridge,
Illinois, New York.
85. Sadri, Sadri Jayashree., Human Resources Management in Modern India (Concepts and
Cases), 2013, Himalaya Publishing House Pvt, Ltd, ISBN-978-93-5097-099-7.
86. Sarma A.M., Aspect of Labour Welfare and Social Security, (2012), Himalaya Publishing
House, Pune.
87. Sarma, A.M., Aspects of Labour Welfare and Social Security, 2000, Himalaya Publishing
House.
88. Sarma, A.M.,Industrial Relation, (2012), Himalaya Publishing House, Mumbai, ISBN: 978-
93-5024-674-0.
89. Sarma, A.M.,Personnel and Human Resource Management. Third revised edition, 2000,
Himalaya Publishing House, ISBN- 81-7866-017-2.
90. Schuler R.S and Young B.: ‘Effective Personnel Management’ (2001): Harper and Raw
Publishers, Singapore.
91. SeemaSanghi, Human Resource Management, MaCmillan Publishers India Ltd., New
Delhi 110002, 2011.
92. SenRatan, Industrial Relations in India, (Shifting Paradigms) (2003), Macmillan India Ltd,
ISBN 1403 910294.
93. Sherlekar S. A.: Principles of Management – Himalaya Publishing House, Mumbai, 1984.
94. Sherlekar S.A. in his book Management (Value- Oriented Holistic Approach) 1977,
Himalaya publishing, Pune.
254
95. Singh Nisha, Human Resource Management, (2012), Himalaya Publishing House,
Mumbai. ISBN No- 978-93-5051-748-2.
96. Singh, Nirmal, Human Resource Management, (2012), Galgotia Publications Pvt. Ltd.,
New Delhi. ISBN- 81-7515-471-3.
97. Stoner James, Freeman R. Edward, Daniel Gilbert Jr. Management (6th Edition) Prentice
Hall of India Private Limited New Delhi-01 (2000).
98. Stoner, James. A, Faeeman, R. Edward, Daniel A. Gilbert, Management, (2000), Prentice
Hall of India Private Limited, New Delhi-01.
99. Towers Brain, “Handbook of Human Resource Management” (1998), Bean Books, New
Delhi-63, ISBN- 81-86104-55-X.
100. Tripathi. Personnel Management & Industrial Relations, (1997), Sultan Chand &
Sons Educational Publisher, New Delhi-2, ISBN No- 81-7014-181-8.
101. Varma, M.M., Aggarawal, Personnel management and Industrial Relations. 1987,
Forward Book Depot, Educational Publisher Post Box-No- 1489.
102. Verma M.M. and Aggarwal: “Personnel Management and Industrial Relations”
(1994): Forward Book Depot, Delhi.
103. Weihrich, Heinz, Koontz, Harold,Management –A Global Perspective, (2006) Tata
McGraw-Hills Publications limited New Delhi. ISBN No- 0-07-059856-8.
6.2. Journals and Periodical.
1. "The Hindu Speaks on Management" - 'Learning and Organization', 29th
April 1995.
2. A Report on Global chemical industry merger and Acquisition Outlook Feb-2014.
3. Abdul Aziz, Management, Personnel Management, Bibliography of Doctoral Dissertation.
(1972-78).
4. Ameru, M.A and Bamiduro, J.A. (2007). Impact Assessment of Employee Benefits in
work motivation: A path to higher productivity in India, Journal of the Faculty of Social and
Management Science, Nigeria, December 2009.
255
5. Ann P. Bartel (2004), Human Resource Management and Organizational Performance,
Evidence from Retail Banking, Industrial and Labour Relations Review, Cornell University,
Vol 57(2).
6. Azim M. Tahlil, “Human resource Management” Indian Journals of Industrial Relations,
(2000) Vol. No. 2.
7. BASF Report: 2012. Economic, Environment and Social Performance – BASF the Chemical
Company.
8. BholanathDutta, HRM Review, Employment and Employability, ICFAI University Press
2009, Pg. 17.
9. Chains Chemical Industry: The new Forces driving Changes: Chemicals and performance
Technologies – A New paradigm ahead? (2011)
10. Chattetji, S and Mukkerjee M, “Modern Objectives test and selections In Industries and
training Course” LokUdyog Monthly publications. (May 1998) Vol.-5.
11. Chemagility: A Global perspective on the world chemical Distribution Market - First panel
session: Chemical Distribution Industry Landscape Lisbon, May-22nd
2012.
12. Chemical Industry Profile: World Chemical Sale: Geographic Breakdown – 2007
13. Chemical Industry Profile: World Chemical Sales: Geographic breakdown - Facts and
figures – 2011.
14. Chemical Industry Vision 2010: A European Perspective by At Kearney (2012).
15. Christopher Daniel, J., 'Realizing People Philosophy of Organizations’, The Hindu speaks
of Management, 12' July 1995, page - 199.
16. Deenadayalan. K., "HRM past, present and future", The Hindu speaks on Management,
4' Oct. 1995, page .230.
17. Dhar B. Executive Appointment by promotions or Recruitment, Indian Management, Jan-
Feb-1999.Vol-5.
18. Facts and Figures -2012. The European Chemicals industry in a Worldwide perspective
(ECFIC) (2012)
256
19. Facts Driving Change Industry: The New Forces Diving Change: Chemical and
Performance Technology – A new paradigm ahead? (2011)
20. Global Chemical Outlook: Towards Sound Management of Chemical – Tends and
Changes- 2013.
21. Global outlook: The Chemical Industry of South Korea: Progress and Challenges American
Institute of Chemical Engneers-2011.
22. Gopala Krishna, H.N., Training and Development: A New Approach at BHEL, The Guest D
(2002). ‘Human Resource Management, Corporate Performance and Employee wellbeing:
Building the worker into HRM’. The Journal of Industrial Relations 44:3 335-358.
23. Guest D.E (2001), HRM, Research Confronts Theory, International Journal of HRM, 12
(7) 1092-1106.
24. HRD Newsletter Vol. 24 Issue:10 , January, 2009 -- Crisis : Boon or Bane for Recruitment
By Sunil Goel.
25. Human Resource Management Review, IUP Publications, EMPLOYEE RETENTION, April
2011.
26. Human Resource Management review, The ICFAI University Press, January 2009.
27. Human Resource Management review, The ICFAI University Press, Volume IX, Issue V,
May-2009.
28. Human Resource Management review, The ICFAI University Press, Volume IX, Issue VI,
June -2009.
29. Human Resource Management review, The ICFAI University Volume – IX, Issue –III,
Press, March 2009.
30. Human Resource Management reviews, The ICFAI University Press, Volume IX, Issue –
IV, April-2009.
31. Increased value? IBM Business Consulting Services –On Demand Business (2011),Indian
Journal of Training and Development, Vol. XXXIII, No..l& 2, January-June 2003.
Indian Institute of Management, Ahmadabad.
257
32. International federation report - of Pharmaceutical manufacturers association – The
Pharmaceutical and global health – Facts and figures 2014. (IFPMA)
33. J.S.Sodhi, (1998) Human Resource Management and Industrial Relations in India:- A
case study of Oriental Bank of Commerce, Management and change Volume .2, No.2, July-
Dec- 2000.
34. Mathrubootham. A, "Residual to Human Resource Management", The Hindu speaks on
Management, 22" April 1995, pp. 177, 18 1.
35. Mumbai Mirror, Human Resource Management and India’s Current production situation,
page 8 date 2-Aug-2016.
36. New Biocatalysts: Essential tools for a sustainable 21st Century: Chemical Industry: -
November – 1999.
37. OECD- Environmental Outlook for Chemical Industry – (2001) Organization for
Economic Co-operation and Development (OECD)
38. Pandit Y.V.L., Talent Retention Strategies In a Competitive Environment, NHRD Journal,
May 2007.
39. Pareek, Uday&Rao T.V., Human Resource Development Systems in Larsen & Toubro,
40. Rao T.V. (1999), HRD audit the HR function for Business Strategic Management Journal 13,
119-134.
41. Reaction: Strategy realignment in the global Chemical Industry – Chemical Magazine –
11th
Edition by KPMG –Cutting through Complexity.
42. Responsible Care: Global Character – Global Chemical Report: 2002-2012.
43. S. V. Kumar, A.B., "Developing Proactive Organizational Culture", The Hindu Speaks
on Management, 1" July 1995, p.67.
44. Safety and Health in the Use Chemical at work – World day for Safety and health and at
work – 28th
April 2014.
258
45. Sen, D., Jain, S., Jat, S. and Saha, R. (2008). Human Resource Accounting Information: Its
Impact on Internal Decision-Making. The Journal of Accounting and Finance, 22(1), Oct-
March.
46. Shankar Ravi, Employee benefits in India, an Introduction, Millennium White paper,
New Delhi, April 2013.
47. Sivakumar, A.B., "HRD for Results: the new agenda", The Hindu speaks on Management,
26' April 1995.
48. The Chemical Industry in a Demand world: Does your future hold volatility or increased
value? IBM Business Consulting Services – On Demand Business (2012)
49. The Economic benefit of Green Chemical Industry in the United States –By Blue green
Alliance May 2011.
50. The Economic benefits of a Green chemical Industry in the United States – By Blue
green alliance. May-2011
51. The Global Chemical Industry: Profile and Trends – Global Outlook for Chemical and
Waste Geneva, June 6, 2009.
52. Top 100 Chemical Companies Report.
53. University News, Leadership to Guide the Density of India. More Ankush. L. Feb-2012.
54. University News: Monthly Commentary on Indian Economics –Nov.2012. The Indian
Institute of Public Opinion, - Government Goes for Major Policies Changes.
55. University News: Recent Trends Challenges, and Opportunity.Nov-2012 Vol-6.
56. Varadhan, S.S., 'Achieving Performance advantage through people', The Hindu speaks
on Management, 14' June 1995. p. 195.
57. Waste Water Treatment in Chemical Industry – The Concepts and Current Technology –
Hydrology – Current Research 2014.
259
6.3. Articles.
1. Balwinder Singh, 2. Dr. SeemaDhawan, CMJ University, Shillong, Meghalaya, India,
Challenges Faced by H R Managers in the Contemporary Business Atmosphere, IJMBS
Vol. 3, Issue 2, April - June 2013, ISSN: 2230-9519 (Online) | ISSN: 2231-2463.
2. Dr. Khaliq Ahmad, Director, Management Centre, International Islamic University
Malaysia, Challenges and Practices in Human Resource Management of the Muslim World,
The Journal of Human Resource and Adult Learning Vol. 4, Num. 2, December 2008.
3. Francis C. AnyimPh.D , Cyril OselokaIkemefuna and Samuel E. Mbah, FCIPM,
FNIM, FABS, FCAI; Department of Industrial Relations and Personnel Management,
University of Lago. , Department of Industrial Relations and Personnel Management,
Faculty of Business Administration, University of Lagos. Human Resource Management
Challenges in Nigeria Under a Globalised Economy, International Journals of Economics
and management science Volume -1 No-4, -2011 PP 01-11.
4. Human resource management in Indian context in magazine International Journal of
Research in Applied, Natural and Social Sciences ISSN: 2321-8851; ISSN(P): Vol. 2, Issue
2, Feb 2014, 135-142 authors M. Ravibabu&AshgharEimani
5. Human Resource Management Practices: A Comprehensive Review, Pakistan Business
Review, January-2012,
6. ICFAI-“Introduction to Human Resource Management” (2004): ICFAI Center for
Management Research, Hyderabad.
7. Mahmoud Ezzamel Cardiff Business School Cardiff University, UK Simon Lilley School
of Management University of Keele, UK Adrian Wilkinson Loughborough University
Business School LoughBorough University, UK.
8. Mrs. EktaSrivastava, Dr. NishaAgarwal, The Emerging Challenges in Human
Resource Management, International Journals of Scientific & Technology Research
Volume -1 , Issue-6, July-2012, ISSN 2277-8616.
260
9. PankajTiwariShriChimanbhai Patel Institute of Management & Research
Ahmedabad-380051 (India) KaruneshSaxena Faculty of Management Studies,
MohanlalSukhadia University, Udaipur-313001, India,Human Resource Management
Practices : A Comprehensive Review.
10. PankajTiwariShriChimanbhai Patel Institute of Management & Research
Ahmedabad-380051 (India) KaruneshSaxena Faculty of Management Studies,
MohanlalSukhadia University, Udaipur-313001, India,
11. Patrick M. Wright, Cornell University Timothy M. Gardner, Brigham Young
University Lisa M. Moynihan, London Business School Human Resource Management
Journal, Vol. 13 No 3, 2003.
12. Patrick M. Wright, Cornell University, Timothy M. Gardner, Brigham Young
University, Lisa M. Moynihan, London Business School, Human Resource Management
Journal, Vol. 13 No 3, 2003, pages 21-36.
13. Rogers, E.W. and Wright, P.M. (1998). ‘Measuring organizational performance in strategic
human resource management: problems, prospects and performance information markets’.
Human Resource Management Review, 8, 311-331.
14. Shamas-UR-rehmanToor. (Corresponding Author) , PhD Candidate and Research Scholar
Department of Building, Faculty of Design and Environment, National University of
Singapore, Singapore, Problems and Challenges in Human Resource Management: Pakistan
Journal of Commerce and Social Sciences Vol.1 2008.
15. SyedAkhtaR , Daniel Z . Ding, and Gloria L . GE, Strategic HRM Practices and their
Impact on Company Performance in Chinese Enterprises, Human Resource Management,
spring 2008, Vol. 47, No. 1, Pp. 15–32,
16. Talent Management: Empirical Research Results in magazineInternational Journal of
Management and Commerce Innovations ISSN 2348-7585 (Online) Vol. 2, Issue 1, pp:
(289-295), - September 2014, author DikshaGarg, 2Kavita Rani.
261
6.4. Websites:
1. www.vidyanidhi.org (for duplication check)
2. www.isidev.org (to check articles appeared in around 125 Indian journals & newspapers)
3. www.igidr.ac.in (for e-journals and books in economics, banking and finance)
4. www.britishcouncil.org.in (books, e-journals of UK-paid service)
5. www.tiss.edu (research projects, research report, & research abstracts in social science
literature)
6. www.icssr.org (for fellowships, awards, sources, surveys in SS)
7. www.sosig.uk.in (a web portal on social science literature)
8. www.infolibrarian.com/ejls.htm (for free e-journals).
9. http://en.wikipedia.org/wiki/Human_resources retrieved on January 10, 2012.
10. . http://humanresources.about.com/od/glossaryh/f/hr_ management.htm retrieved on
January 28, 2015.
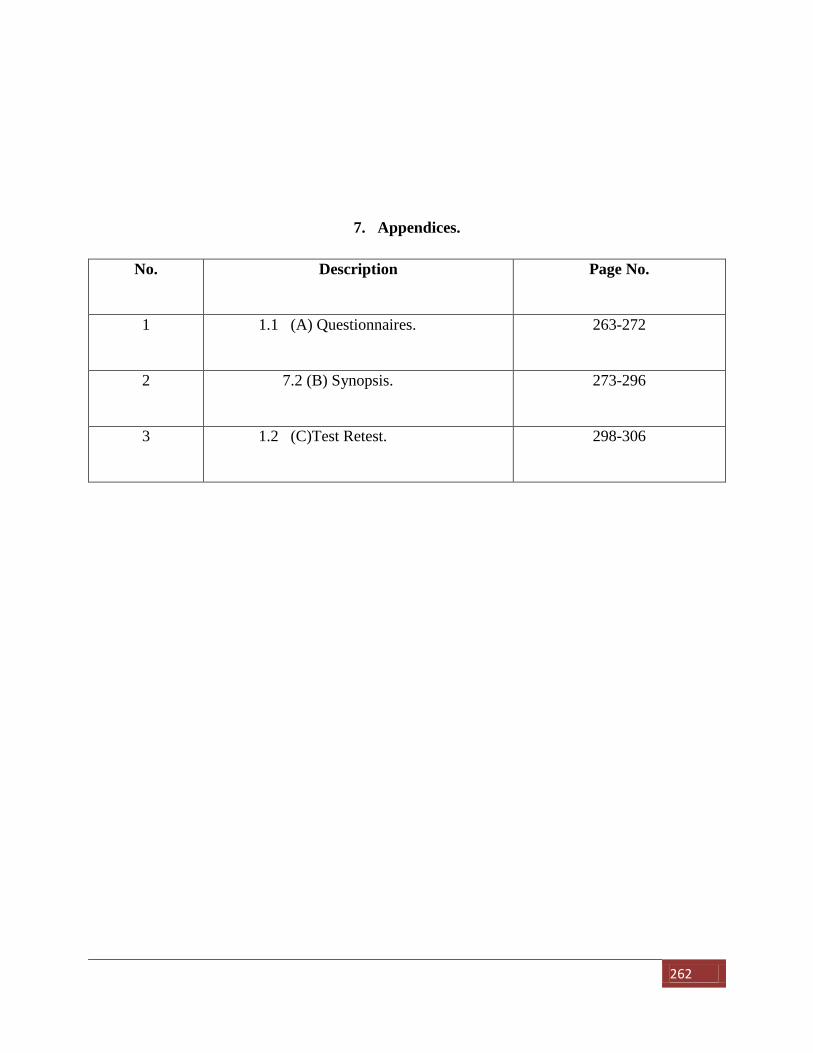
262
7. Appendices.
No. Description Page No.
1 1.1 (A) Questionnaires.
263-272
2 7.2 (B) Synopsis.
273-296
3 1.2 (C)Test Retest.
298-306
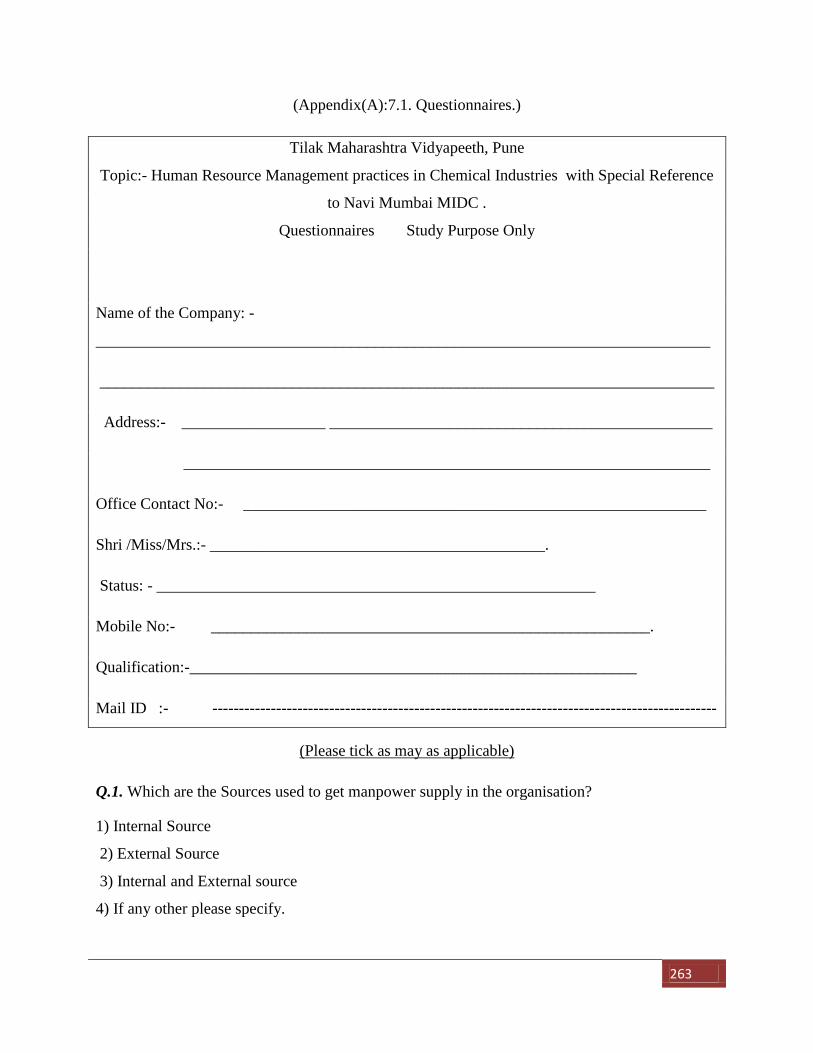
263
(Appendix(A):7.1. Questionnaires.)
Tilak Maharashtra Vidyapeeth, Pune
Topic:- Human Resource Management practices in Chemical Industries with Special Reference
to Navi Mumbai MIDC .
Questionnaires Study Purpose Only
Name of the Company: -
_____________________________________________________________________________
_____________________________________________________________________________
Address:- __________________ ________________________________________________
__________________________________________________________________
Office Contact No:- __________________________________________________________
Shri /Miss/Mrs.:- __________________________________________.
Status: - _______________________________________________________
Mobile No:- _______________________________________________________.
Qualification:-________________________________________________________
Mail ID :- -----------------------------------------------------------------------------------------------
(Please tick as may as applicable)
Q.1. Which are the Sources used to get manpower supply in the organisation?
1) Internal Source
2) External Source
3) Internal and External source
4) If any other please specify.
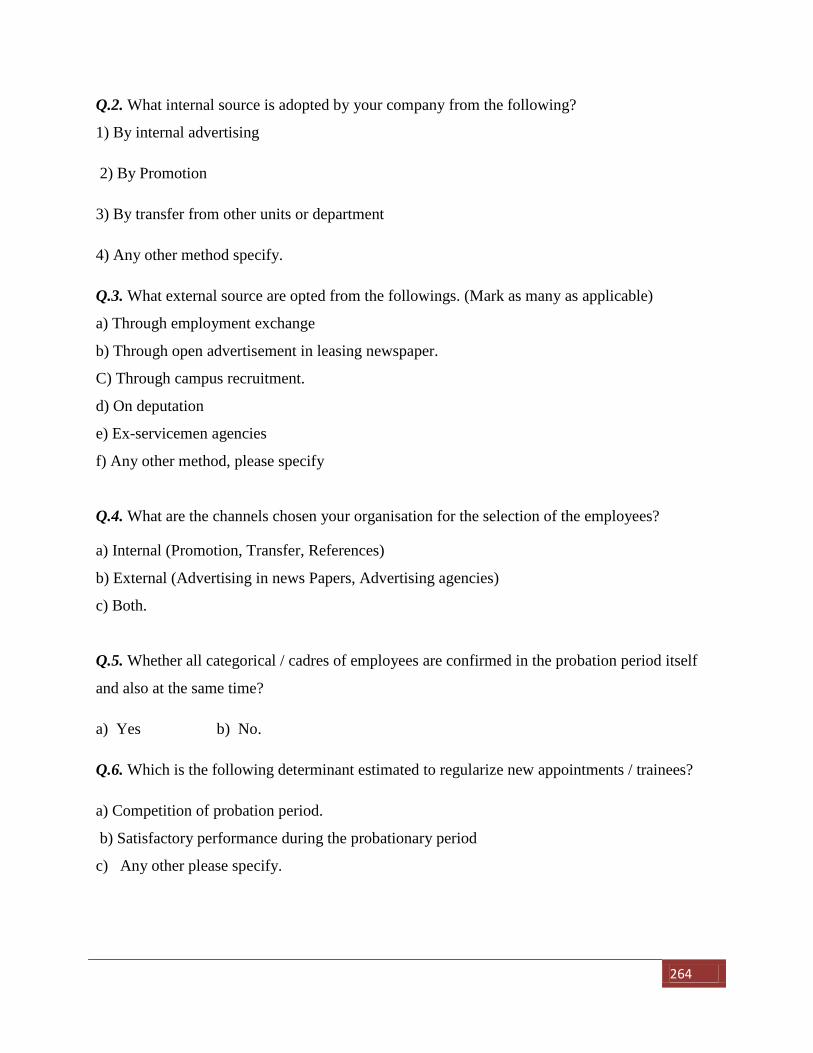
264
Q.2. What internal source is adopted by your company from the following?
1) By internal advertising
2) By Promotion
3) By transfer from other units or department
4) Any other method specify.
Q.3. What external source are opted from the followings. (Mark as many as applicable)
a) Through employment exchange
b) Through open advertisement in leasing newspaper.
C) Through campus recruitment.
d) On deputation
e) Ex-servicemen agencies
f) Any other method, please specify
Q.4. What are the channels chosen your organisation for the selection of the employees?
a) Internal (Promotion, Transfer, References)
b) External (Advertising in news Papers, Advertising agencies)
c) Both.
Q.5. Whether all categorical / cadres of employees are confirmed in the probation period itself
and also at the same time?
a) Yes b) No.
Q.6. Which is the following determinant estimated to regularize new appointments / trainees?
a) Competition of probation period.
b) Satisfactory performance during the probationary period
c) Any other please specify.
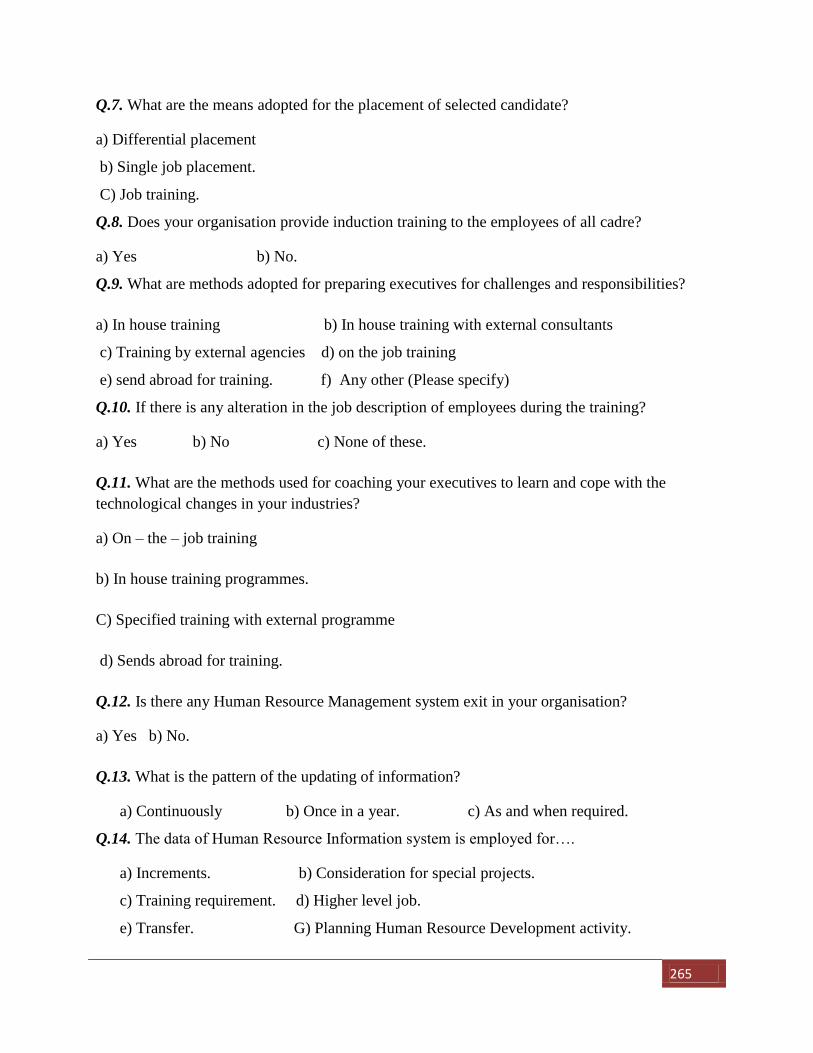
265
Q.7. What are the means adopted for the placement of selected candidate?
a) Differential placement
b) Single job placement.
C) Job training.
Q.8. Does your organisation provide induction training to the employees of all cadre?
a) Yes b) No.
Q.9. What are methods adopted for preparing executives for challenges and responsibilities?
a) In house training b) In house training with external consultants
c) Training by external agencies d) on the job training
e) send abroad for training. f) Any other (Please specify)
Q.10. If there is any alteration in the job description of employees during the training?
a) Yes b) No c) None of these.
Q.11. What are the methods used for coaching your executives to learn and cope with the
technological changes in your industries?
a) On – the – job training
b) In house training programmes.
C) Specified training with external programme
d) Sends abroad for training.
Q.12. Is there any Human Resource Management system exit in your organisation?
a) Yes b) No.
Q.13. What is the pattern of the updating of information?
a) Continuously b) Once in a year. c) As and when required.
Q.14. The data of Human Resource Information system is employed for….
a) Increments. b) Consideration for special projects.
c) Training requirement. d) Higher level job.
e) Transfer. G) Planning Human Resource Development activity.
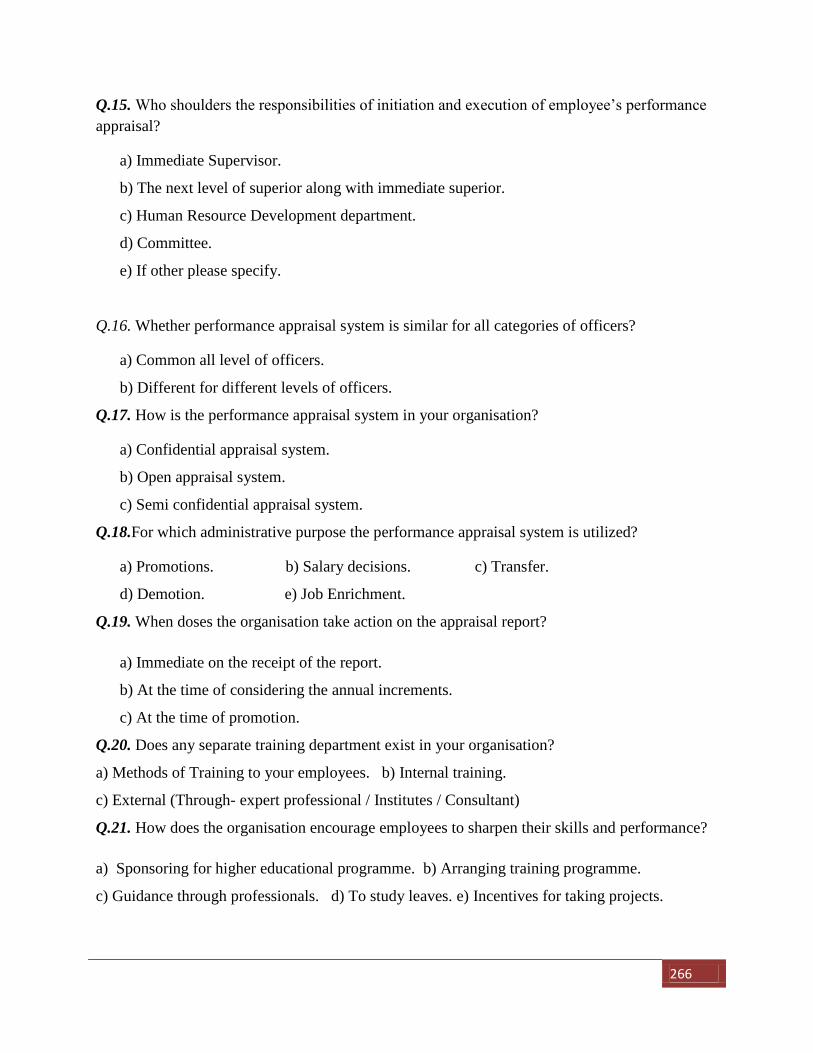
266
Q.15. Who shoulders the responsibilities of initiation and execution of employee’s performance
appraisal?
a) Immediate Supervisor.
b) The next level of superior along with immediate superior.
c) Human Resource Development department.
d) Committee.
e) If other please specify.
Q.16. Whether performance appraisal system is similar for all categories of officers?
a) Common all level of officers.
b) Different for different levels of officers.
Q.17. How is the performance appraisal system in your organisation?
a) Confidential appraisal system.
b) Open appraisal system.
c) Semi confidential appraisal system.
Q.18.For which administrative purpose the performance appraisal system is utilized?
a) Promotions. b) Salary decisions. c) Transfer.
d) Demotion. e) Job Enrichment.
Q.19. When doses the organisation take action on the appraisal report?
a) Immediate on the receipt of the report.
b) At the time of considering the annual increments.
c) At the time of promotion.
Q.20. Does any separate training department exist in your organisation?
a) Methods of Training to your employees. b) Internal training.
c) External (Through- expert professional / Institutes / Consultant)
Q.21. How does the organisation encourage employees to sharpen their skills and performance?
a) Sponsoring for higher educational programme. b) Arranging training programme.
c) Guidance through professionals. d) To study leaves. e) Incentives for taking projects.
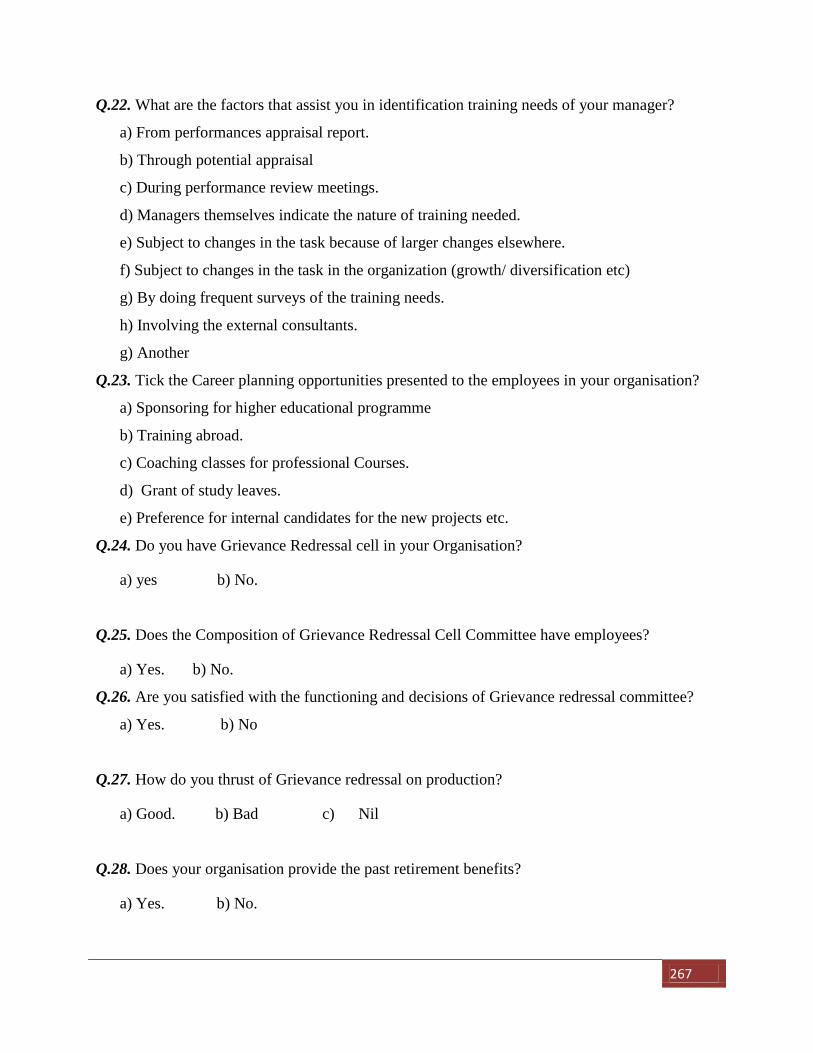
267
Q.22. What are the factors that assist you in identification training needs of your manager?
a) From performances appraisal report.
b) Through potential appraisal
c) During performance review meetings.
d) Managers themselves indicate the nature of training needed.
e) Subject to changes in the task because of larger changes elsewhere.
f) Subject to changes in the task in the organization (growth/ diversification etc)
g) By doing frequent surveys of the training needs.
h) Involving the external consultants.
g) Another
Q.23. Tick the Career planning opportunities presented to the employees in your organisation?
a) Sponsoring for higher educational programme
b) Training abroad.
c) Coaching classes for professional Courses.
d) Grant of study leaves.
e) Preference for internal candidates for the new projects etc.
Q.24. Do you have Grievance Redressal cell in your Organisation?
a) yes b) No.
Q.25. Does the Composition of Grievance Redressal Cell Committee have employees?
a) Yes. b) No.
Q.26. Are you satisfied with the functioning and decisions of Grievance redressal committee?
a) Yes. b) No
Q.27. How do you thrust of Grievance redressal on production?
a) Good. b) Bad c) Nil
Q.28. Does your organisation provide the past retirement benefits?
a) Yes. b) No.
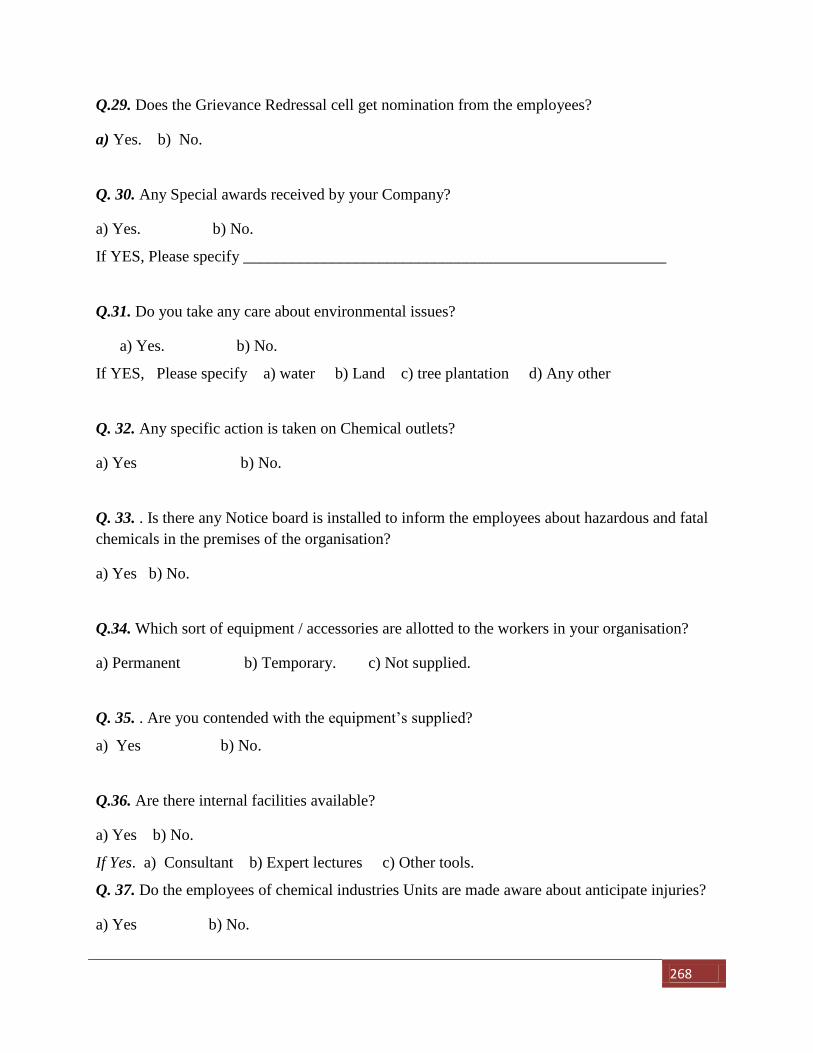
268
Q.29. Does the Grievance Redressal cell get nomination from the employees?
a) Yes. b) No.
Q. 30. Any Special awards received by your Company?
a) Yes. b) No.
If YES, Please specify _____________________________________________________
Q.31. Do you take any care about environmental issues?
a) Yes. b) No.
If YES, Please specify a) water b) Land c) tree plantation d) Any other
Q. 32. Any specific action is taken on Chemical outlets?
a) Yes b) No.
Q. 33. . Is there any Notice board is installed to inform the employees about hazardous and fatal
chemicals in the premises of the organisation?
a) Yes b) No.
Q.34. Which sort of equipment / accessories are allotted to the workers in your organisation?
a) Permanent b) Temporary. c) Not supplied.
Q. 35. . Are you contended with the equipment’s supplied?
a) Yes b) No.
Q.36. Are there internal facilities available?
a) Yes b) No.
If Yes. a) Consultant b) Expert lectures c) Other tools.
Q. 37. Do the employees of chemical industries Units are made aware about anticipate injuries?
a) Yes b) No.
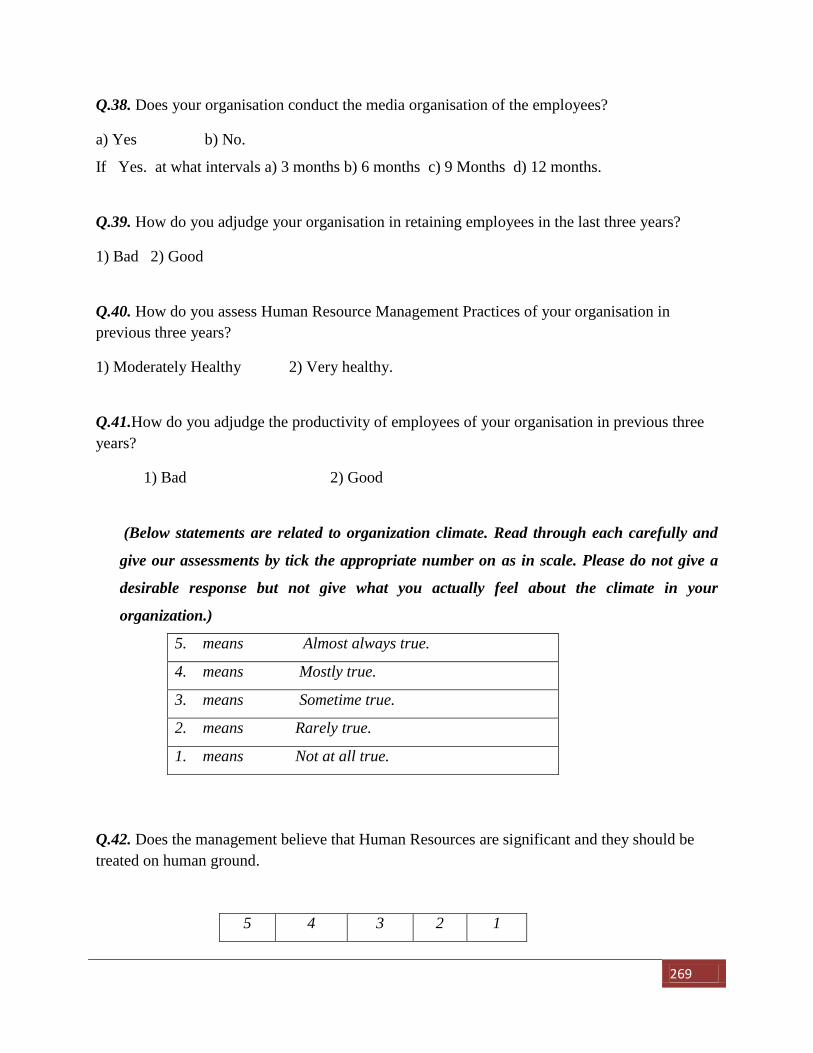
269
Q.38. Does your organisation conduct the media organisation of the employees?
a) Yes b) No.
If Yes. at what intervals a) 3 months b) 6 months c) 9 Months d) 12 months.
Q.39. How do you adjudge your organisation in retaining employees in the last three years?
1) Bad 2) Good
Q.40. How do you assess Human Resource Management Practices of your organisation in
previous three years?
1) Moderately Healthy 2) Very healthy.
Q.41.How do you adjudge the productivity of employees of your organisation in previous three
years?
1) Bad 2) Good
(Below statements are related to organization climate. Read through each carefully and
give our assessments by tick the appropriate number on as in scale. Please do not give a
desirable response but not give what you actually feel about the climate in your
organization.)
5. means Almost always true.
4. means Mostly true.
3. means Sometime true.
2. means Rarely true.
1. means Not at all true.
Q.42. Does the management believe that Human Resources are significant and they should be
treated on human ground.
5 4 3 2 1
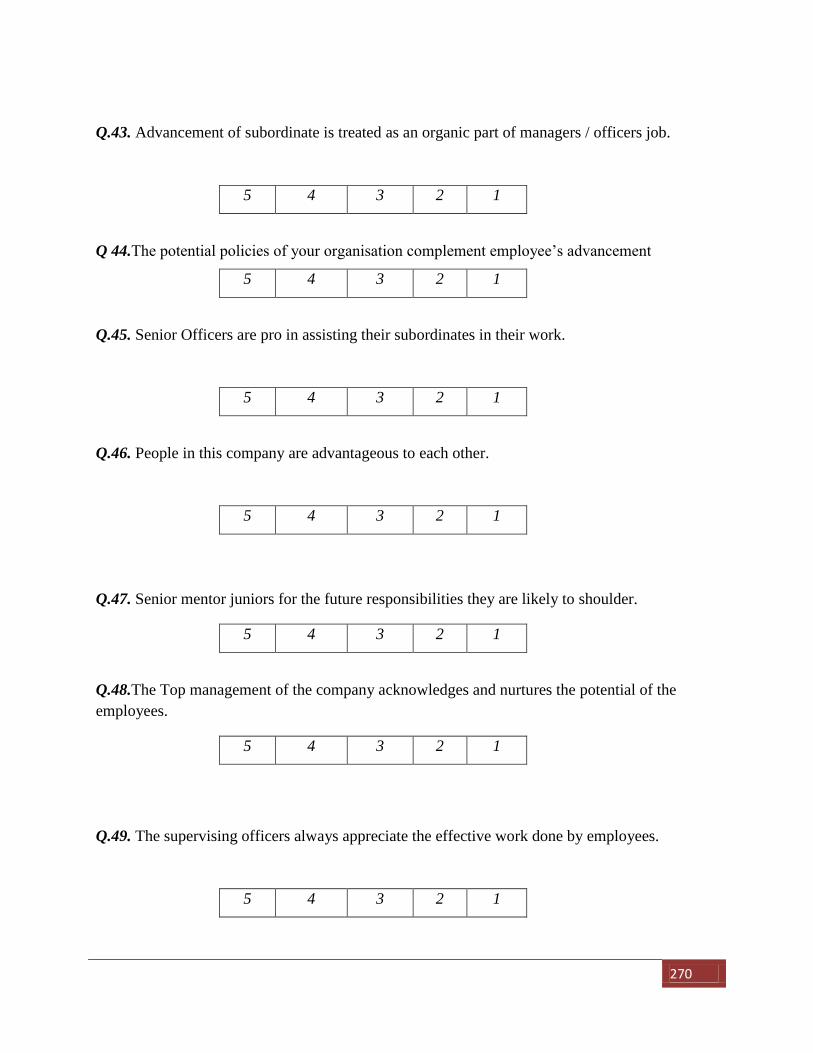
270
Q.43. Advancement of subordinate is treated as an organic part of managers / officers job.
5 4 3 2 1
Q 44.The potential policies of your organisation complement employee’s advancement
5 4 3 2 1
Q.45. Senior Officers are pro in assisting their subordinates in their work.
5 4 3 2 1
Q.46. People in this company are advantageous to each other.
5 4 3 2 1
Q.47. Senior mentor juniors for the future responsibilities they are likely to shoulder.
5 4 3 2 1
Q.48.The Top management of the company acknowledges and nurtures the potential of the
employees.
5 4 3 2 1
Q.49. The supervising officers always appreciate the effective work done by employees.
5 4 3 2 1
271
Q.50. People in the organisation do not carry any fixed mental impression about each other.
5 4 3 2 1
Q.51. Mistakes of employees are conveyed in a mild manner.
5 4 3 2 1
Q.52. The behaviour feedback informed to employees is taken seriously by them.
5 4 3 2 1
Q.53. Employees in the organisation underline the potential and weakness their supervising.
5 4 3 2 1
Q.54. When organisation sponsors employees for training, they learn from it seriously.
5 4 3 2 1
Q.55. Employers sponsor training programme according to the training needs of employees.
5 4 3 2 1
Q.56. Peoples are trustworthy towards each other in the organisation.
5 4 3 2 1
Q.57. . Employees open mindedly express their views with the supervisors.
5 4 3 2 1
272
Q.58.Employees open mindedly express their views with the subordinates.
5 4 3 2 1
Q.59. Delegation of authority is a normal procedure in the organisation to motivate the
subordinates in dealing with higher responsibilities.
5 4 3 2 1
Q.60. Team spirit is of higher order in this organisation.
5 4 3 2 1
Q.61.When a problem crops ups, it is discussed frankly rather than back-biting and accusation.
5 4 3 2 1
Q.62.. Juniors are helped with career opportunities by the senior officers.
5 4 3 2 1
Q.63. The organisation informs the future plan to Management cadre so that they can nurture
Juniors for the same.
5 4 3 2 1
Q.64. Job- rotation facilities the advancement of employees.
5 4 3 2 1
273
Appendices Part : (B ) : 7.2 Synopsis
Synopsis
“A STUDY OF HUMAN RESOURCE MANAGEMENTPRACTICES IN CHEMICAL
INDUSTRIES WITH SPECIAL REFERENCE TO NAVI MUMBAI. (2002 -12)”
SUBMITTEDTO THE
TILAK MAHARASHTRA VIDYAPEETH PUNE
FOR THE DEGREE OF DOCTOR OF PHILOSOPHY
In Subject
Under the board of Management studies
BY
Shri. Prakash Digambar Sawant
(Registration No. 15811001167)
Under the Guidance of
Dr. Vishnu N. Yadav
Principal
(S.N. College of Arts Commerce and Science, Bhayander, Dist:- Thane , Maharashtra)
June– 2018.
274
1: Part: A - RESEARCH OUTLINE.
1.1. Introduction.
1.2. Background of the study.
1.2.1. Importance of Chemical Industries
1.2.2. Industrial Profile of Navi Mumbai
1.3. Objectives of the study
1.4. Research problems.
1.5. Research Questions
1.6. Hypotheses
1.7. Limitations of the study
1.8. Research Design
1.9. Research Methodology and Techniques.
1.9.1. Primary Data.
1.9.1 A) Sample size computation
1.9.1 B) Sample size determination using mean method.
1.10. Secondary data
1.11. Statistical Technique Used.
1.12. Contribution of the Research work.
1.1 Introduction.
The economic development of a country is judged by the accumulation of resources. Living and
some non-living resources are important in achieving organizational goals. The livingresources
i.e. ‘Human Resource’ can never be under-estimated in the light of its viable contribution and
utility. The ‘human resource’ in any organization is capable of creating wonders. Chemical
Industries play a significant role in the economic development of the country. It meets the
growing needs of construction, power and mining industries besides fulfilling the various
requirements of country. The capital goods as well as the consumer goods sub-sectors of the
chemicals goods industries have made a substantial progress since the commencement of the
planning era. Considering such role, the management of the Human resource is also necessary in
chemical industries. To make proper use of all available resources, it is very important that the
right type of personnel must be available in the right time to the organization. Therefore, it
requires proper attention towards the recruitment, selection and training of the managerial as well
as non-managerial employees. Human resources are a valuable asset. In an organization human
resource should be made available as and when it is needed. This is the primary resource without
275
which other resources cannot be put to use. It is widely recognized that human resource is the
most significant resource of all resources needed to run an organization. Attention must be paid
towards acquiring, using, improving, upgrading and preserving such valuable assets. There
should be optimum utilization of human resources. It has been realized that the human resources
are the key resources in modern businesses and competitive economies. The nations and
Companies that perform well will be those that can generate and keep educated skilled and
experienced workers, managers and entrepreneurs. Management and planning of human
resources is a matter of great responsibility, skills and initiative and it poses constant challenges
to the virtuosity and innovative abilities of individuals. Human resource Management has gained
importance since professionalization of management is now regarded as a must for the successful
running of Industries/Enterprises. The main purpose of Human resource management is to
improve the productive conditions of the people in the organization by obtaining, developing,
utilizing, evaluating, maintaining and retaining employees. As a result, human resource
management is mostly concerned with planning; organizing, directing and controlling of the
procurement, compensation, integration and separation of human resource to the end those
individual, organizational and societal objectives are accomplished.
1.2 Background of the study.
1.2.1. Importance of Chemical Industries
Chemical Industries are responsible for production of several commodities required for modern
life style as well as growth of whole economy. Chemical industries cover most important facets
of life such as Agriculture, environment, Food, Hygiene, Décor, transportation etc. These
industries help us to live modern lifestyle
Chemical industries produce preservatives, taste enhancers, artificial flavors which enable us to
increase shelf life of food. This helps in thriving food industry and enables us to enjoy food from
every corner of the world.
More than 80% of the chemical industry concentrates on producing polymers, and plastics. They
are not only used in packing, but also in numerous other things, like wiring, furniture, clothing,
home décor, prosthesis and electronics. PVC piping, water tanks, huge storage containers are
made out of plastics.
276
Fertilizers, and pesticides aids in the agriculture and development. The green revolution has
happened only due to the advancement of chemical industry in India. Pharmaceutical industries
produce several drugs which are used in medicines, Chemical industries also produces several
commodities such as soaps, scents, perfumes, personal care products, detergents, cleaning agents
etc. which are used in our daily life and have become essential commodity for us. Chemical
industries also enable us for further research in bio-engineering, mutation development of
artificial human organs etc.
1.2.2. Industrial Profile of Navi Mumbai.
Navi Mumbai is a planned city established by government of Maharashtra with an intention to
provide an alternate path of growth and defuse pressure of population on Mumbai. Navi Mumbai
has two major industrial areas known as Thane Belapur MIDC and Taloja MIDC.
Thane – Belapur MIDC is one of the largest industrial region in India. It is situated between
Thane and Belapur and also known as TTC i.e. Trans Thane Creek. It is developed by MIDC. It
is spread over 27 Sq. Km. It 2200 units comprising small, medium and large units carrying
different activities. Chemical industries in prominent feature of this region and several
companies have set up their production facilities in the region. It includes Savita Chemical,
Haredelia, Wockhaeart NOCIL, etc.
Taloja MIDC is comparatively smaller than Thane Belapur MIDC. It spread over 2157.95 Acres
of land and situated 8Kms. Away from Panvel. It also has small medium and large industrial
units. it also has prominent chemical companies such as Deepak Fertilizers, Pidilite Industries,
Kokuyo Camlin, Hikal, Deepak Nitrate, Galaxy etc.
Both Industries MIDC are provides and direct and indirect employment to the people. It is
estimated that approx 3,00,000 peoples get direct or indirect employment due to the industries in
these 2 MIDC. As far as modern management is concerned whenever a employee is appointed
Human Resource practices need to be employed in the company.
277
1.3 Objectives of the study:
To study human resources Management practices prevailing in chemical industries.
To survey the awareness in the chemical industries about HRM practices
To identify the constraints of HRM practices in chemical industries.
1.4 Research problems.
Literature review enable to identify gaps and also to frame research problem for the study,
the research problem of the study is whether Human Resource Practices adopted in chemical
industries in Navi Mumbai are adequate.
1.5 Research Questions:
Human Resource Management practices are an evolving concept different practices are invented
by the organization. Whether the employees are working in chemical industries of Navi Mumbai
are satisfied with the different Human Resource Management Practices followed by the
organization.
1.6 Hypotheses:
H1: “Existing Human Resource Management Practices of Chemical Industries in Navi
Mumbai are healthy (adequate)”
H2: “Employees retention is a result of Healthy Human Resource Management Practices in
Chemical Industries in Navi Mumbai hence there is no shortage of skilled human resources in
chemical industries in Navi Mumbai”
H3: “Healthy HRMP of Chemical Industries in Navi Mumbai as enables the companies to
make the employees more productive.”
1.7 Limitations of the study:
1. Study period is only 2002 to 2012.
2. Geographical Limitations: The study is restricted to chemical Industries situated in Thane
Belapur MIDC Area in Navi Mumbai.
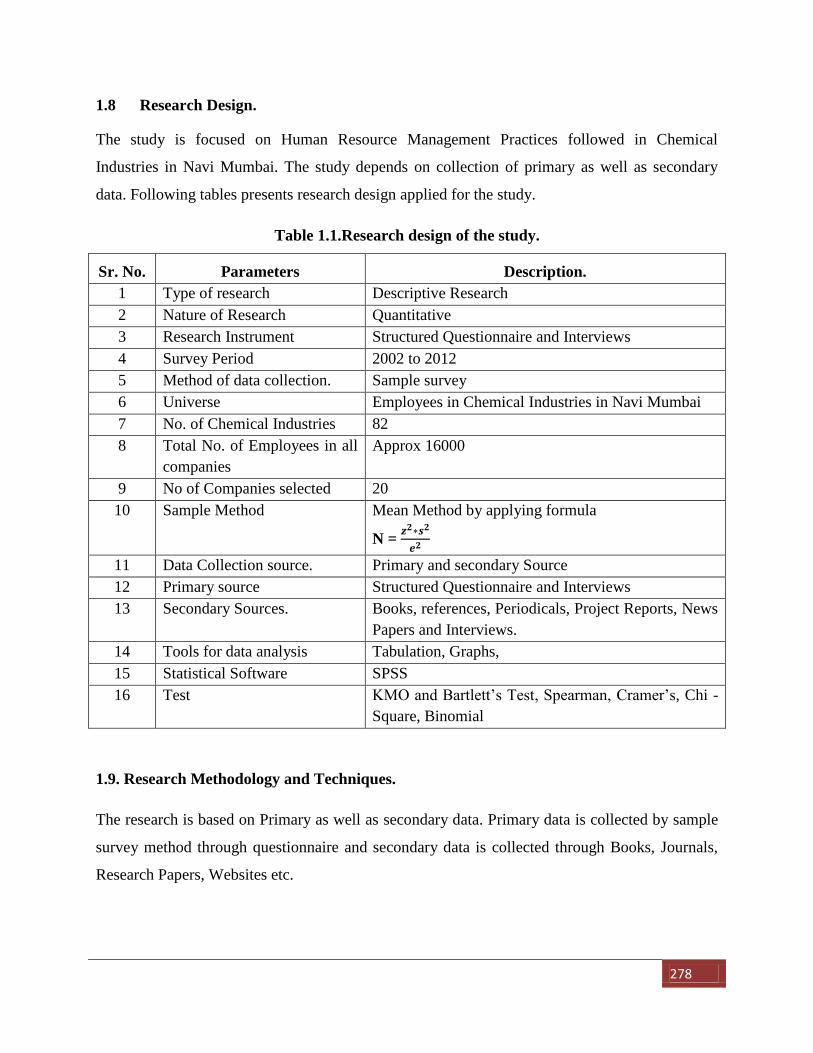
278
1.8 Research Design.
The study is focused on Human Resource Management Practices followed in Chemical
Industries in Navi Mumbai. The study depends on collection of primary as well as secondary
data. Following tables presents research design applied for the study.
Table 1.1.Research design of the study.
Sr. No. Parameters Description.
1 Type of research Descriptive Research
2 Nature of Research Quantitative
3 Research Instrument Structured Questionnaire and Interviews
4 Survey Period 2002 to 2012
5 Method of data collection. Sample survey
6 Universe Employees in Chemical Industries in Navi Mumbai
7 No. of Chemical Industries 82
8 Total No. of Employees in all
companies
Approx 16000
9 No of Companies selected 20
10 Sample Method Mean Method by applying formula
N =
11 Data Collection source. Primary and secondary Source
12 Primary source Structured Questionnaire and Interviews
13 Secondary Sources. Books, references, Periodicals, Project Reports, News
Papers and Interviews.
14 Tools for data analysis Tabulation, Graphs,
15 Statistical Software SPSS
16 Test KMO and Bartlett’s Test, Spearman, Cramer’s, Chi -
Square, Binomial
1.9. Research Methodology and Techniques.
The research is based on Primary as well as secondary data. Primary data is collected by sample
survey method through questionnaire and secondary data is collected through Books, Journals,
Research Papers, Websites etc.
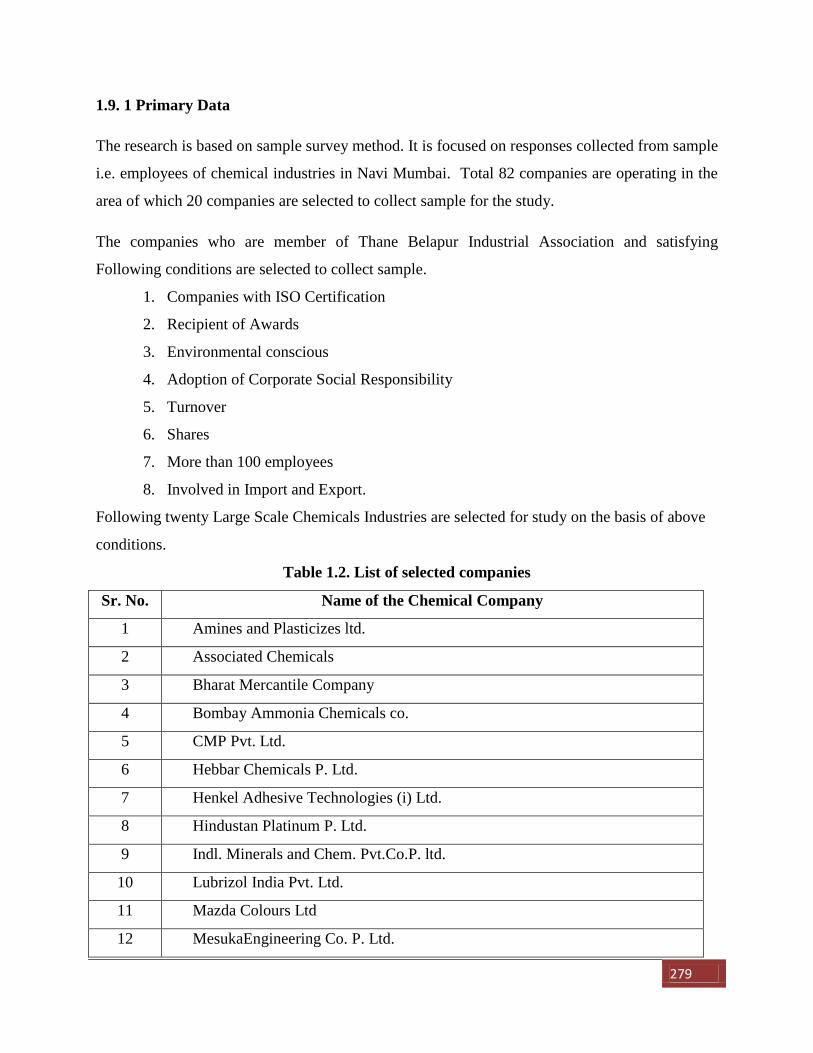
279
1.9. 1 Primary Data
The research is based on sample survey method. It is focused on responses collected from sample
i.e. employees of chemical industries in Navi Mumbai. Total 82 companies are operating in the
area of which 20 companies are selected to collect sample for the study.
The companies who are member of Thane Belapur Industrial Association and satisfying
Following conditions are selected to collect sample.
1. Companies with ISO Certification
2. Recipient of Awards
3. Environmental conscious
4. Adoption of Corporate Social Responsibility
5. Turnover
6. Shares
7. More than 100 employees
8. Involved in Import and Export.
Following twenty Large Scale Chemicals Industries are selected for study on the basis of above
conditions.
Table 1.2. List of selected companies
Sr. No. Name of the Chemical Company
1 Amines and Plasticizes ltd.
2 Associated Chemicals
3 Bharat Mercantile Company
4 Bombay Ammonia Chemicals co.
5 CMP Pvt. Ltd.
6 Hebbar Chemicals P. Ltd.
7 Henkel Adhesive Technologies (i) Ltd.
8 Hindustan Platinum P. Ltd.
9 Indl. Minerals and Chem. Pvt.Co.P. ltd.
10 Lubrizol India Pvt. Ltd.
11 Mazda Colours Ltd
12 MesukaEngineering Co. P. Ltd.
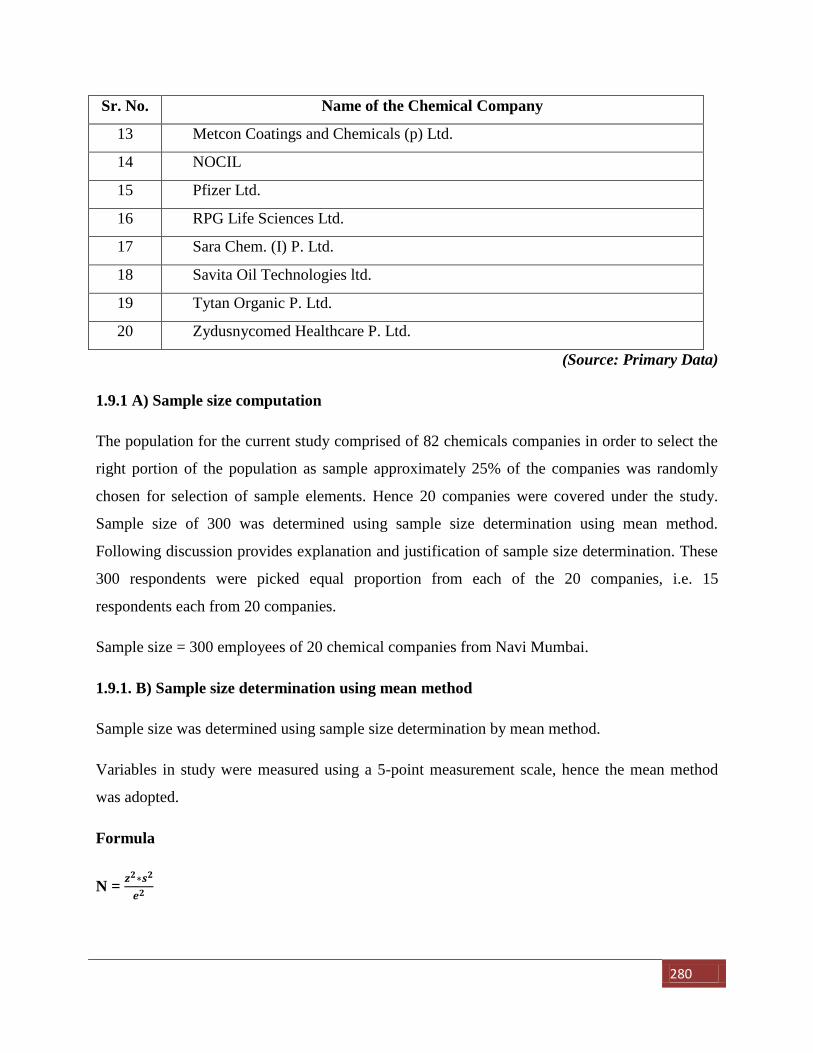
280
Sr. No. Name of the Chemical Company
13 Metcon Coatings and Chemicals (p) Ltd.
14 NOCIL
15 Pfizer Ltd.
16 RPG Life Sciences Ltd.
17 Sara Chem. (I) P. Ltd.
18 Savita Oil Technologies ltd.
19 Tytan Organic P. Ltd.
20 Zydusnycomed Healthcare P. Ltd.
(Source: Primary Data)
1.9.1 A) Sample size computation
The population for the current study comprised of 82 chemicals companies in order to select the
right portion of the population as sample approximately 25% of the companies was randomly
chosen for selection of sample elements. Hence 20 companies were covered under the study.
Sample size of 300 was determined using sample size determination using mean method.
Following discussion provides explanation and justification of sample size determination. These
300 respondents were picked equal proportion from each of the 20 companies, i.e. 15
respondents each from 20 companies.
Sample size = 300 employees of 20 chemical companies from Navi Mumbai.
1.9.1. B) Sample size determination using mean method
Sample size was determined using sample size determination by mean method.
Variables in study were measured using a 5-point measurement scale, hence the mean method
was adopted.
Formula
N =
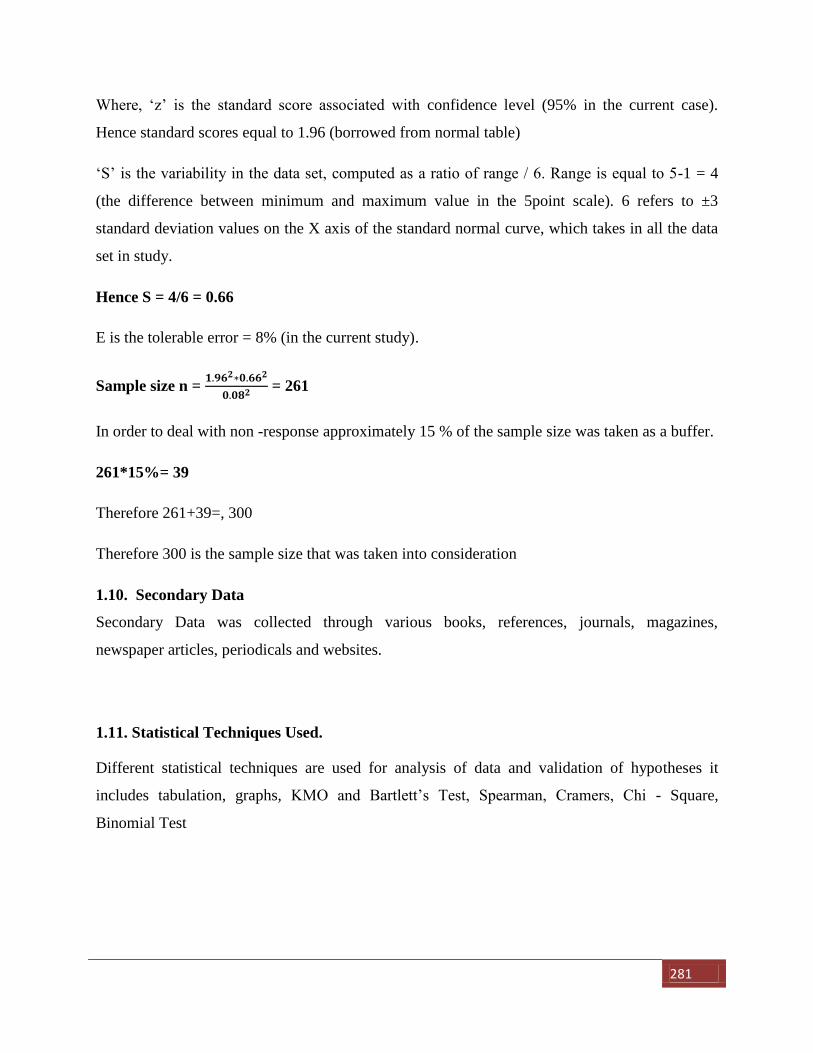
281
Where, ‘z’ is the standard score associated with confidence level (95% in the current case).
Hence standard scores equal to 1.96 (borrowed from normal table)
‘S’ is the variability in the data set, computed as a ratio of range / 6. Range is equal to 5-1 = 4
(the difference between minimum and maximum value in the 5point scale). 6 refers to ±3
standard deviation values on the X axis of the standard normal curve, which takes in all the data
set in study.
Hence S = 4/6 = 0.66
E is the tolerable error = 8% (in the current study).
Sample size n =
= 261
In order to deal with non -response approximately 15 % of the sample size was taken as a buffer.
261*15%= 39
Therefore 261+39=, 300
Therefore 300 is the sample size that was taken into consideration
1.10. Secondary Data
Secondary Data was collected through various books, references, journals, magazines,
newspaper articles, periodicals and websites.
1.11. Statistical Techniques Used.
Different statistical techniques are used for analysis of data and validation of hypotheses it
includes tabulation, graphs, KMO and Bartlett’s Test, Spearman, Cramers, Chi - Square,
Binomial Test
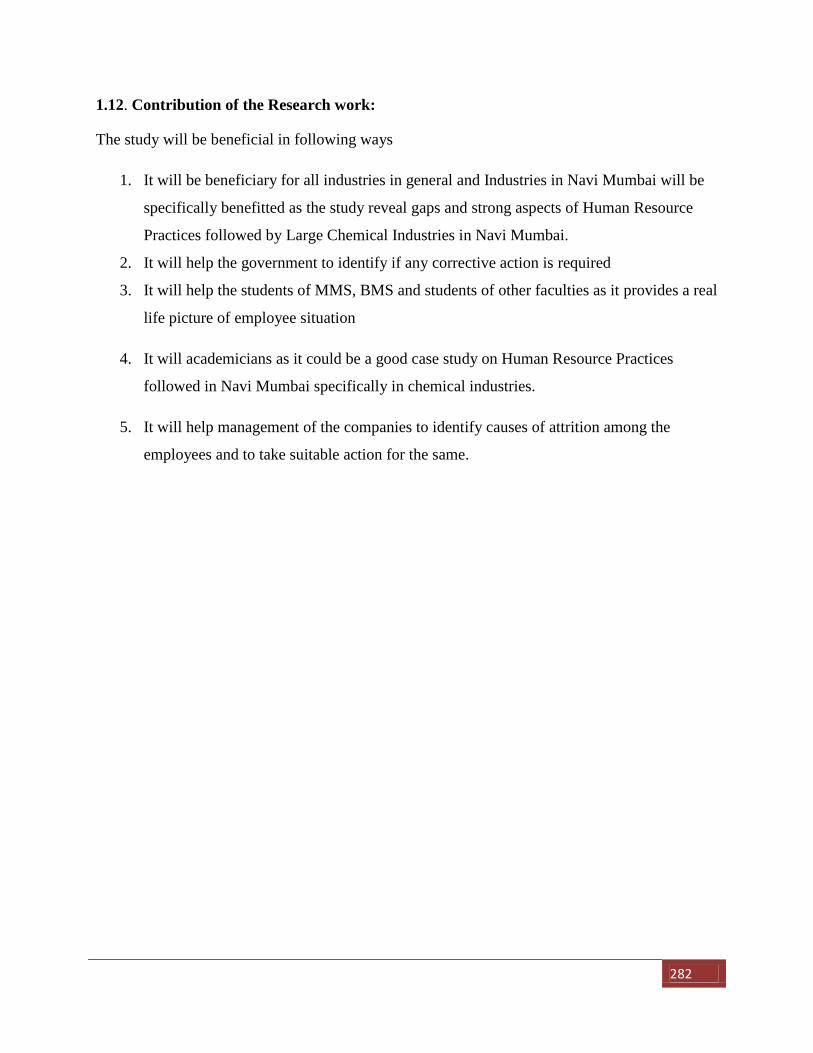
282
1.12. Contribution of the Research work:
The study will be beneficial in following ways
1. It will be beneficiary for all industries in general and Industries in Navi Mumbai will be
specifically benefitted as the study reveal gaps and strong aspects of Human Resource
Practices followed by Large Chemical Industries in Navi Mumbai.
2. It will help the government to identify if any corrective action is required
3. It will help the students of MMS, BMS and students of other faculties as it provides a real
life picture of employee situation
4. It will academicians as it could be a good case study on Human Resource Practices
followed in Navi Mumbai specifically in chemical industries.
5. It will help management of the companies to identify causes of attrition among the
employees and to take suitable action for the same.
283
2: Part: B CHAPTERS IN BRIEF.
a. Introduction
b. Literature Review.
c. Research Methodology.
d. Data Analysis.
e. Findings, Suggestions and Recommendations for the study.
2.1 Introduction.
In this chapter background for the HRM Practices and Industries in Navi Mumbai are
mentioned .the chapter also lead down foundation and background study of the research.
HRM Practices in Chemical Industries in Navi Mumbai. In this chapter various HRM
Practiced adopted by chemical Industries in Navi Mumbai were reviewed and presented,
which gives background for data the analysis at other related research.
2.2.Literature Review.
For the purpose of the study researcher had reviewed present study made on the subject
various books, magazines, periodicals, references, Articles newspapers, web sites were
reviewed. The review of each of materials is presented in the chapter and gaps were
identified for the further study.
2.3.Research Methodology.
In this Chapter research design is presented. Research design had lead down had provided
guidelines for the research that was conducted by the researcher. It mentions research
methodology adopted for the research. Samples and other basic elements required for the
research.
284
2.4.Data Analysis.
In this Chapter collected data is analyzed and presented. Data is tabulated and its findings
are presented in tables and graphs. Test and retest method also included in the chapter.
Reliability test were conducted and inducted in the chapter.
2.5.Findings, Suggestions and Recommendations for the study.
In this chapter various finding of the research are mentioned. The hypotheses for the study
were tested for its validation. The chapter contents finding of the research and hypothesis of
the study tested for its validation. Chapter also gives recommendation by the researcher the
different stake holders e.g. HRM Manager, Top management Government, etc. Following is
the some important recommendations.
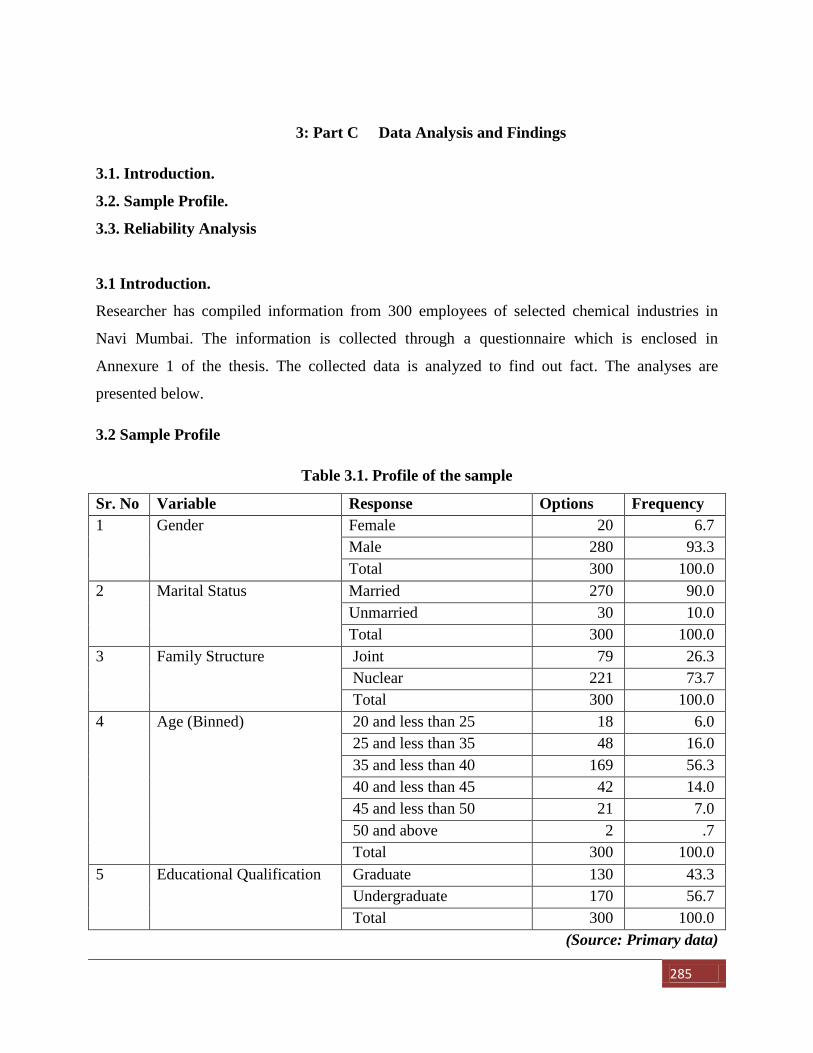
285
3: Part C Data Analysis and Findings
3.1. Introduction.
3.2. Sample Profile.
3.3. Reliability Analysis
3.1 Introduction.
Researcher has compiled information from 300 employees of selected chemical industries in
Navi Mumbai. The information is collected through a questionnaire which is enclosed in
Annexure 1 of the thesis. The collected data is analyzed to find out fact. The analyses are
presented below.
3.2 Sample Profile
Table 3.1. Profile of the sample
Sr. No Variable Response Options Frequency
1 Gender Female 20 6.7
Male 280 93.3
Total 300 100.0
2 Marital Status Married 270 90.0
Unmarried 30 10.0
Total 300 100.0
3 Family Structure Joint 79 26.3
Nuclear 221 73.7
Total 300 100.0
4 Age (Binned) 20 and less than 25 18 6.0
25 and less than 35 48 16.0
35 and less than 40 169 56.3
40 and less than 45 42 14.0
45 and less than 50 21 7.0
50 and above 2 .7
Total 300 100.0
5 Educational Qualification Graduate 130 43.3
Undergraduate 170 56.7
Total 300 100.0
(Source: Primary data)
286
3.3 Reliability Analysis
Reliability is the ability of the scale to produce consistent result. In the current study, the
reliability is confirmed using test-retest method. Test-retest method is quite in practice and state
forward method of validating reliability. In this method, the same instrument is administrated on
the same set of respondents on two different occasions. The two set of responses are then
correlated to assess reliability.
Spearman’s rho rank order correlation is use to correlate interval scale variables and phi
and Cramer’s V is to correlate categorical variables. Spearmen’s correlation coefficient value
more than 0.9 and Phi and Cramer’s V value more than 0.5 indicate reliability. (Ref Table 4.2 on
page no 110)
287
4: Part – D Finding Conclusion & Suggestions
4.1. Findings.
4.2. Conclusion, Validation of Hypotheses.
4.3. Variables and Measurement.
4.4 Suggestions & Recommendations
4.1 Findings
Researcher had presented findings are categorized as follows
Category - I Finding in respect of Human Resource Management practices in Chemical
Industries in Navi Mumbai
Category - II Findings in respect of the awareness in Chemical Industries about Human
Resources Management Practices.
Category - III Finding in respect of constraints of related to Human Resource Management
Practices in chemical industries in Navi Mumbai.
Category - IV Other Findings.
A detailed findings are presented in chapter – 5 of the thesis
4.2. Conclusion, Validation of Hypotheses
Hypotheses of the study are validated by applying appropriate statistical test as follows.
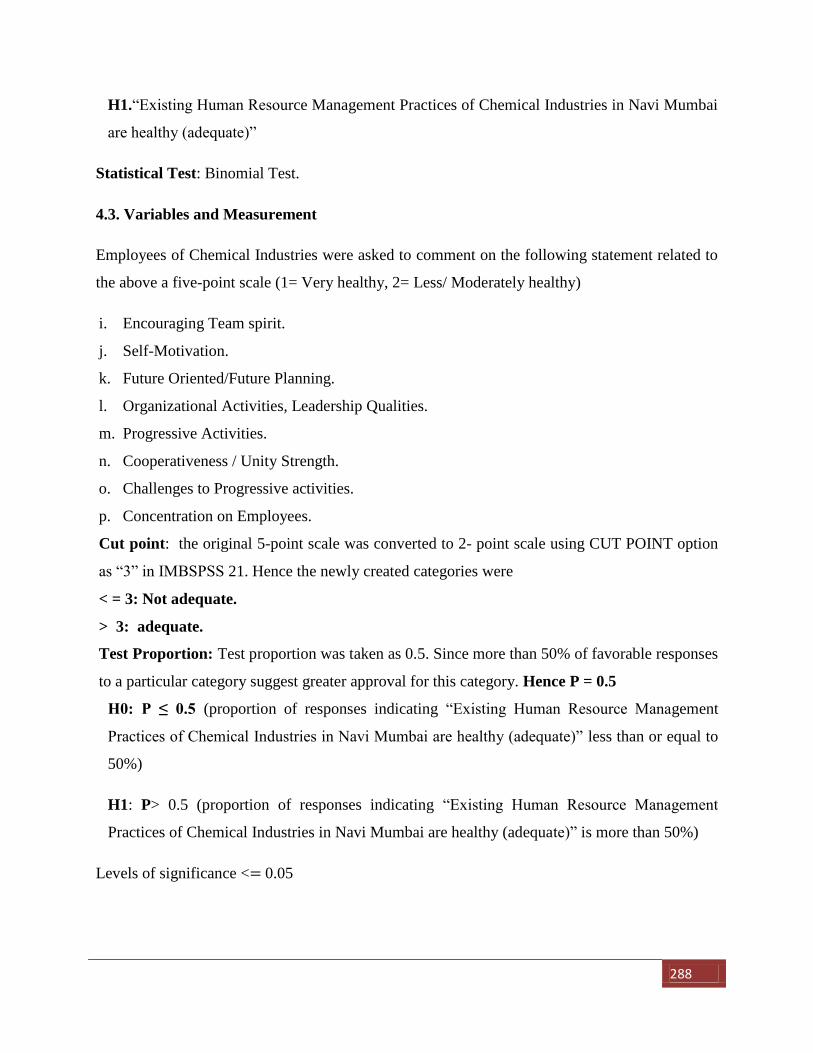
288
H1.“Existing Human Resource Management Practices of Chemical Industries in Navi Mumbai
are healthy (adequate)”
Statistical Test: Binomial Test.
4.3. Variables and Measurement
Employees of Chemical Industries were asked to comment on the following statement related to
the above a five-point scale (1= Very healthy, 2= Less/ Moderately healthy)
i. Encouraging Team spirit.
j. Self-Motivation.
k. Future Oriented/Future Planning.
l. Organizational Activities, Leadership Qualities.
m. Progressive Activities.
n. Cooperativeness / Unity Strength.
o. Challenges to Progressive activities.
p. Concentration on Employees.
Cut point: the original 5-point scale was converted to 2- point scale using CUT POINT option
as “3” in IMBSPSS 21. Hence the newly created categories were
< = 3: Not adequate.
> 3: adequate.
Test Proportion: Test proportion was taken as 0.5. Since more than 50% of favorable responses
to a particular category suggest greater approval for this category. Hence P = 0.5
H0: P ≤ 0.5 (proportion of responses indicating “Existing Human Resource Management
Practices of Chemical Industries in Navi Mumbai are healthy (adequate)” less than or equal to
50%)
H1: P> 0.5 (proportion of responses indicating “Existing Human Resource Management
Practices of Chemical Industries in Navi Mumbai are healthy (adequate)” is more than 50%)
Levels of significance < 0.05
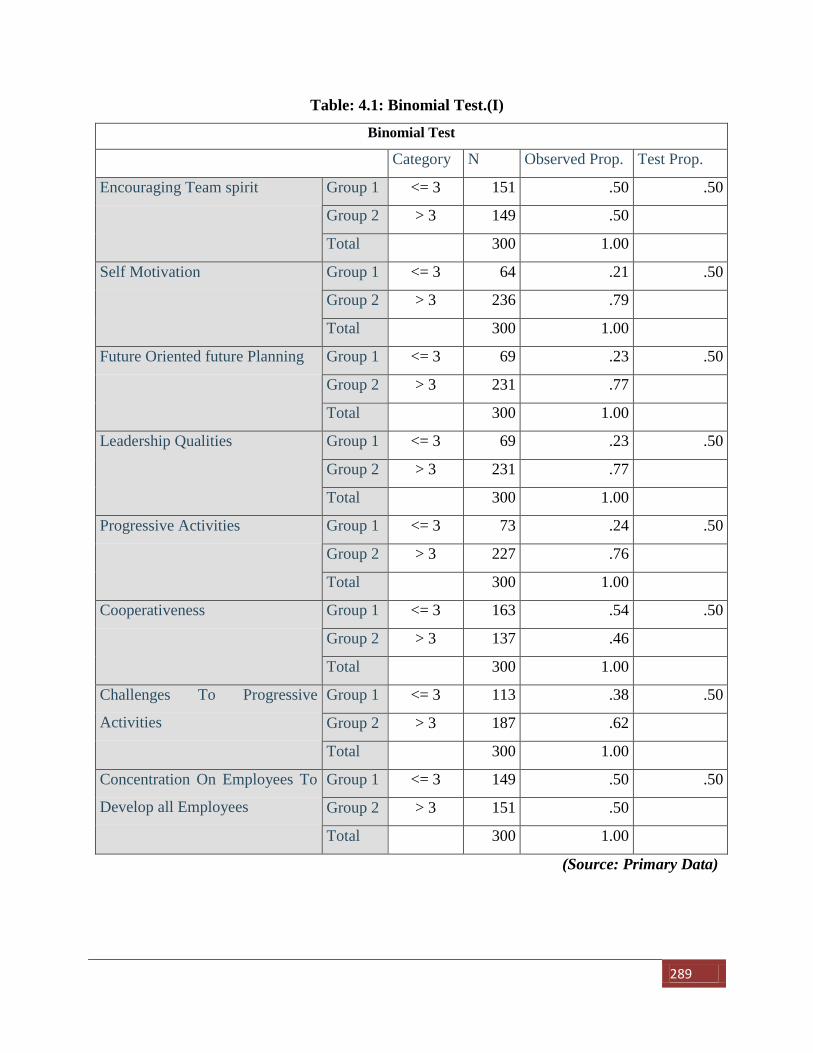
289
Table: 4.1: Binomial Test.(I)
Binomial Test
Category N Observed Prop. Test Prop.
Encouraging Team spirit Group 1 <= 3 151 .50 .50
Group 2 > 3 149 .50
Total 300 1.00
Self Motivation Group 1 <= 3 64 .21 .50
Group 2 > 3 236 .79
Total 300 1.00
Future Oriented future Planning Group 1 <= 3 69 .23 .50
Group 2 > 3 231 .77
Total 300 1.00
Leadership Qualities Group 1 <= 3 69 .23 .50
Group 2 > 3 231 .77
Total 300 1.00
Progressive Activities Group 1 <= 3 73 .24 .50
Group 2 > 3 227 .76
Total 300 1.00
Cooperativeness Group 1 <= 3 163 .54 .50
Group 2 > 3 137 .46
Total 300 1.00
Challenges To Progressive
Activities
Group 1 <= 3 113 .38 .50
Group 2 > 3 187 .62
Total 300 1.00
Concentration On Employees To
Develop all Employees
Group 1 <= 3 149 .50 .50
Group 2 > 3 151 .50
Total 300 1.00
(Source: Primary Data)
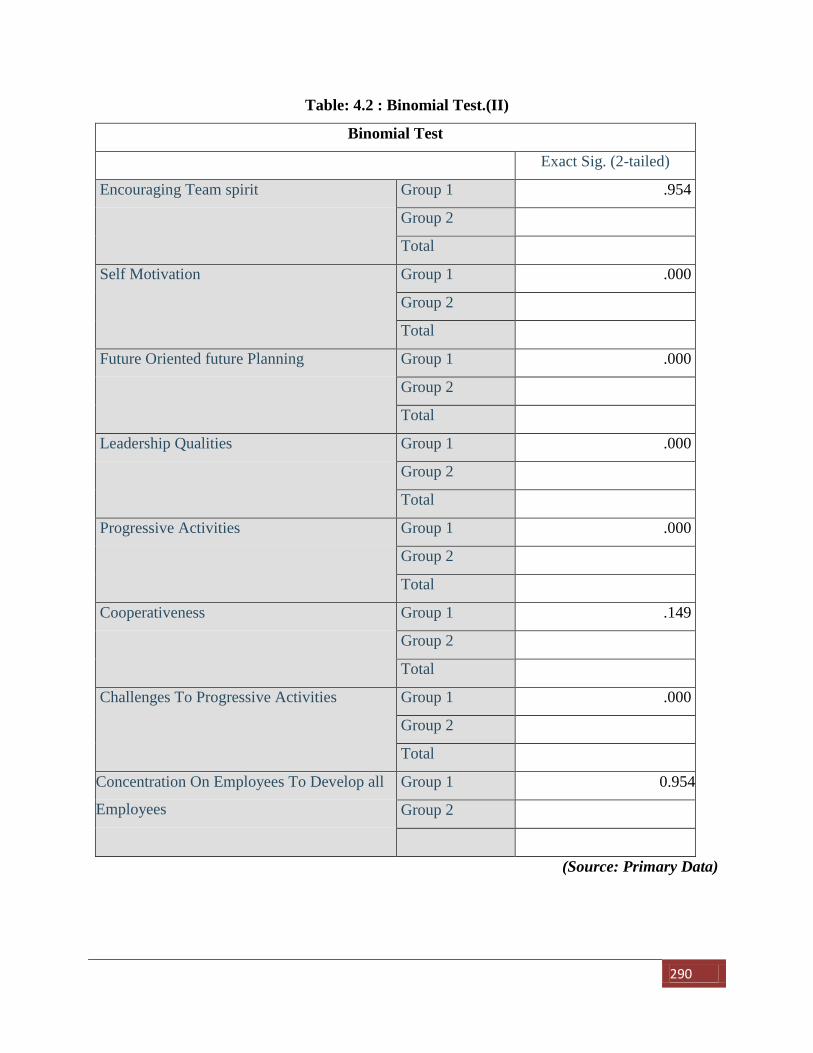
290
Table: 4.2 : Binomial Test.(II)
Binomial Test
Exact Sig. (2-tailed)
Encouraging Team spirit Group 1 .954
Group 2
Total
Self Motivation Group 1 .000
Group 2
Total
Future Oriented future Planning Group 1 .000
Group 2
Total
Leadership Qualities Group 1 .000
Group 2
Total
Progressive Activities Group 1 .000
Group 2
Total
Cooperativeness Group 1 .149
Group 2
Total
Challenges To Progressive Activities Group 1 .000
Group 2
Total
Concentration On Employees To Develop all
Employees
Group 1 0.954
Group 2
(Source: Primary Data)
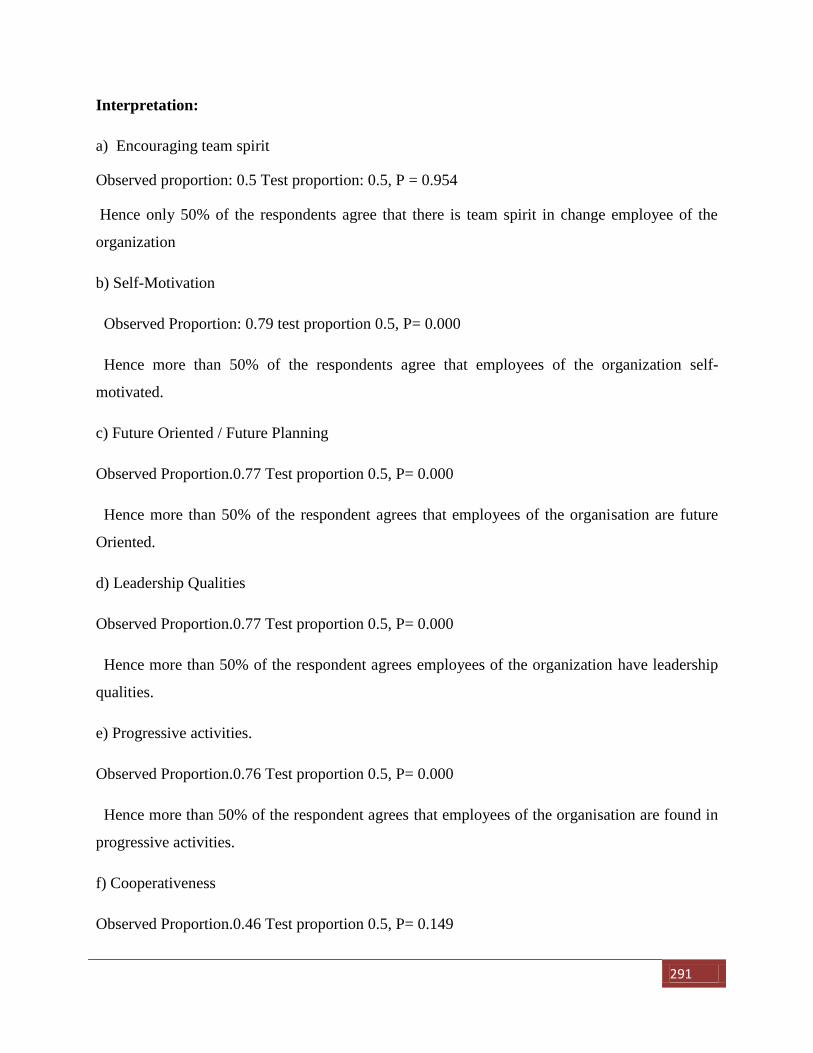
291
Interpretation:
a) Encouraging team spirit
Observed proportion: 0.5 Test proportion: 0.5, P = 0.954
Hence only 50% of the respondents agree that there is team spirit in change employee of the
organization
b) Self-Motivation
Observed Proportion: 0.79 test proportion 0.5, P= 0.000
Hence more than 50% of the respondents agree that employees of the organization self-
motivated.
c) Future Oriented / Future Planning
Observed Proportion.0.77 Test proportion 0.5, P= 0.000
Hence more than 50% of the respondent agrees that employees of the organisation are future
Oriented.
d) Leadership Qualities
Observed Proportion.0.77 Test proportion 0.5, P= 0.000
Hence more than 50% of the respondent agrees employees of the organization have leadership
qualities.
e) Progressive activities.
Observed Proportion.0.76 Test proportion 0.5, P= 0.000
Hence more than 50% of the respondent agrees that employees of the organisation are found in
progressive activities.
f) Cooperativeness
Observed Proportion.0.46 Test proportion 0.5, P= 0.149
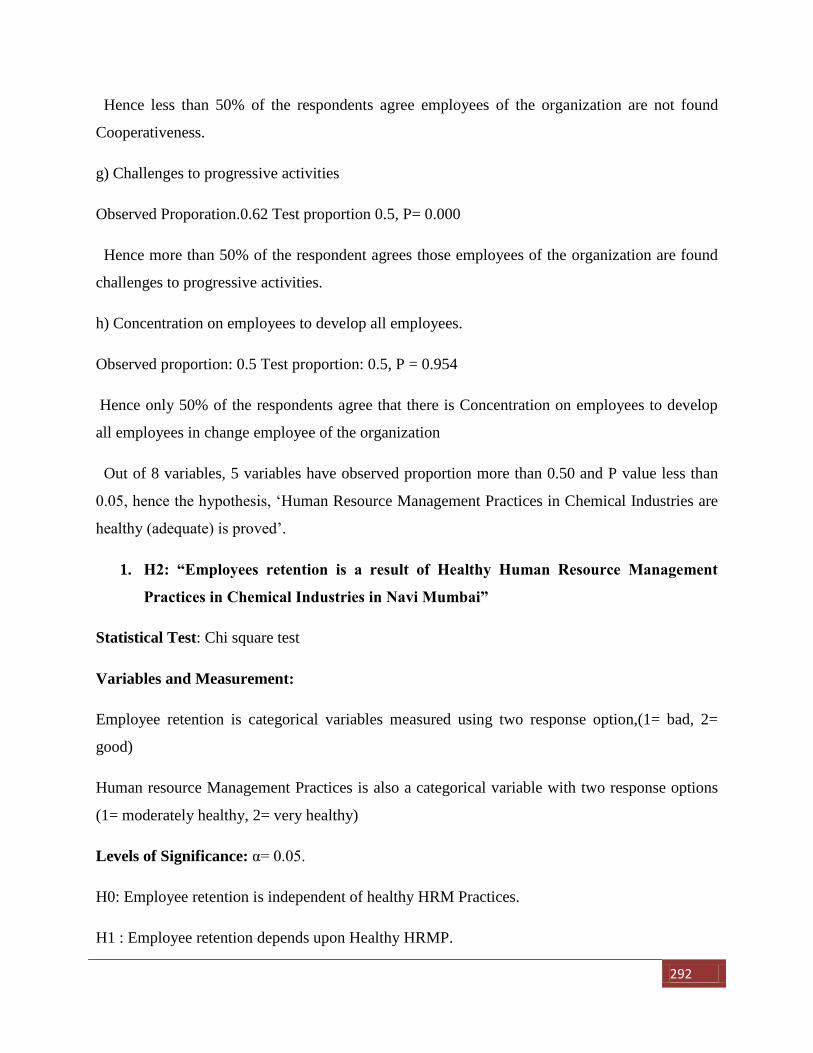
292
Hence less than 50% of the respondents agree employees of the organization are not found
Cooperativeness.
g) Challenges to progressive activities
Observed Proporation.0.62 Test proportion 0.5, P= 0.000
Hence more than 50% of the respondent agrees those employees of the organization are found
challenges to progressive activities.
h) Concentration on employees to develop all employees.
Observed proportion: 0.5 Test proportion: 0.5, P = 0.954
Hence only 50% of the respondents agree that there is Concentration on employees to develop
all employees in change employee of the organization
Out of 8 variables, 5 variables have observed proportion more than 0.50 and P value less than
0.05, hence the hypothesis, ‘Human Resource Management Practices in Chemical Industries are
healthy (adequate) is proved’.
1. H2: “Employees retention is a result of Healthy Human Resource Management
Practices in Chemical Industries in Navi Mumbai”
Statistical Test: Chi square test
Variables and Measurement:
Employee retention is categorical variables measured using two response option,(1= bad, 2=
good)
Human resource Management Practices is also a categorical variable with two response options
(1= moderately healthy, 2= very healthy)
Levels of Significance: α= 0.05.
H0: Employee retention is independent of healthy HRM Practices.
H1 : Employee retention depends upon Healthy HRMP.
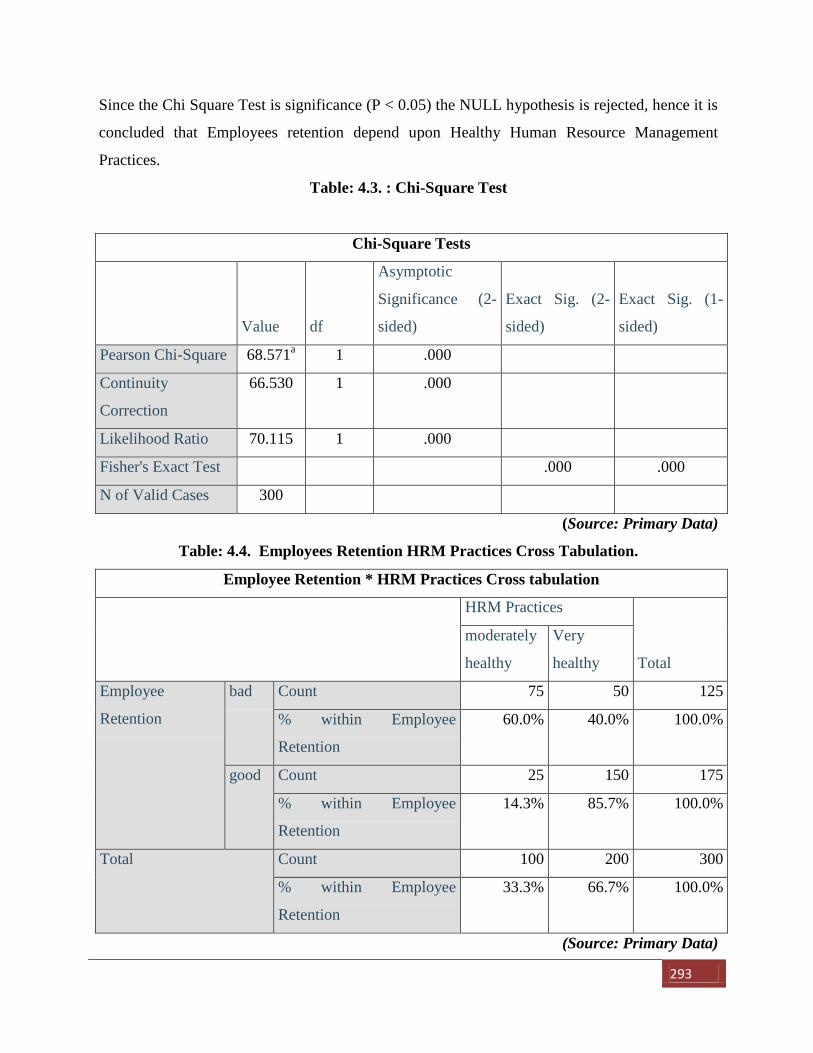
293
Since the Chi Square Test is significance (P < 0.05) the NULL hypothesis is rejected, hence it is
concluded that Employees retention depend upon Healthy Human Resource Management
Practices.
Table: 4.3. : Chi-Square Test
Chi-Square Tests
Value df
Asymptotic
Significance (2-
sided)
Exact Sig. (2-
sided)
Exact Sig. (1-
sided)
Pearson Chi-Square 68.571a 1 .000
Continuity
Correction
66.530 1 .000
Likelihood Ratio 70.115 1 .000
Fisher's Exact Test .000 .000
N of Valid Cases 300
(Source: Primary Data)
Table: 4.4. Employees Retention HRM Practices Cross Tabulation.
Employee Retention * HRM Practices Cross tabulation
HRM Practices
Total
moderately
healthy
Very
healthy
Employee
Retention
bad Count 75 50 125
% within Employee
Retention
60.0% 40.0% 100.0%
good Count 25 150 175
% within Employee
Retention
14.3% 85.7% 100.0%
Total Count 100 200 300
% within Employee
Retention
33.3% 66.7% 100.0%
(Source: Primary Data)

294
From the cross tabulation table it can be affirmed that out of the 175 respondents who said that
retention is good 85% agreed that HRMP are very healthy and out of the 125 employees who
said employee’s retention is bad, 60% agreed that HRMP are moderately healthy.
Hence it can be concluded that employee retention is result of healthy Human Resource
Management Practices.
2. H3: “Employee productivity is a result of healthy Human Resource Management
Practices in Chemical Industries in Navi Mumbai.”
Statistical test:- Chi square test.
Variable and Measurement:
Employee productivity is categorical variable measured using two response options (1=bad 2=
Good).
Human Resource management Practices is also categorical variable with two response options
(1= moderately healthy, 2= Very healthy)
H0 : Employee productivity is independent of healthy Human Resource Management Practices.
H1: Employee productivity depends upon healthy Human Resource Management Practices.
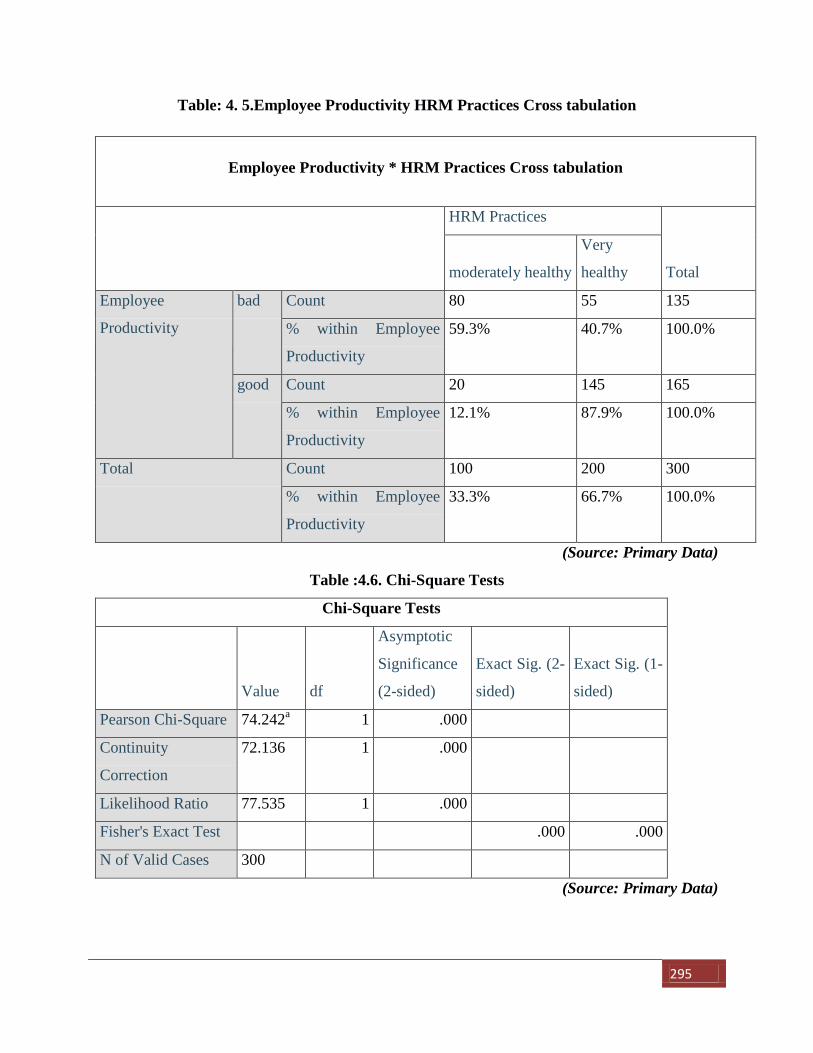
295
Table: 4. 5.Employee Productivity HRM Practices Cross tabulation
Employee Productivity * HRM Practices Cross tabulation
HRM Practices
Total moderately healthy
Very
healthy
Employee
Productivity
bad Count 80 55 135
% within Employee
Productivity
59.3% 40.7% 100.0%
good Count 20 145 165
% within Employee
Productivity
12.1% 87.9% 100.0%
Total Count 100 200 300
% within Employee
Productivity
33.3% 66.7% 100.0%
(Source: Primary Data)
Table :4.6. Chi-Square Tests
Chi-Square Tests
Value df
Asymptotic
Significance
(2-sided)
Exact Sig. (2-
sided)
Exact Sig. (1-
sided)
Pearson Chi-Square 74.242a 1 .000
Continuity
Correction
72.136 1 .000
Likelihood Ratio 77.535 1 .000
Fisher's Exact Test .000 .000
N of Valid Cases 300
(Source: Primary Data)
296
From the cross table, it can be seen that out of 165 respondents who said that Employees
productivity is good, 87.9% agreed that Human Resource Management Practices are very healthy
and out of 135 employees who said that Employees productivity is Bad, 59.3% agreed that
Human resource Management Practices are Moderately healthy.
Hence it can be concluded that employee productivity is a result good Human Resource
management Practices.
4.4. Suggestions & Recommendations
Researcher had provided suggestions to different stakeholders on the basis of his research. This
include
1. Suggestions to HR Manager and Management of the organization
2. Suggestions to Government
3. Suggestions to Employees
Detail suggestion are presented on page 244 Chapter 5 of the thesis
-----xox----

297
Appendices( C ) : 7.3: Test Retest
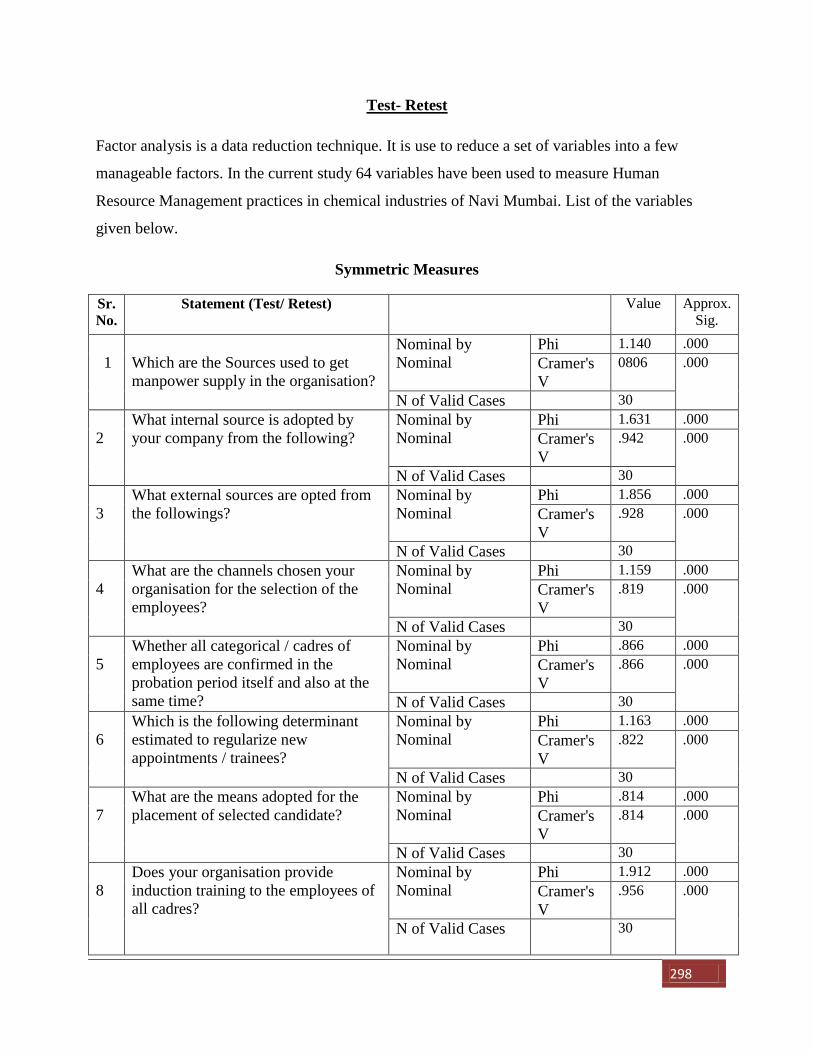
298
Test- Retest
Factor analysis is a data reduction technique. It is use to reduce a set of variables into a few
manageable factors. In the current study 64 variables have been used to measure Human
Resource Management practices in chemical industries of Navi Mumbai. List of the variables
given below.
Symmetric Measures
Sr.
No.
Statement (Test/ Retest) Value Approx.
Sig.
1
Which are the Sources used to get
manpower supply in the organisation?
Nominal by
Nominal
Phi 1.140 .000
Cramer's
V
0806 .000
N of Valid Cases 30
2
What internal source is adopted by
your company from the following?
Nominal by
Nominal
Phi 1.631 .000
Cramer's
V
.942 .000
N of Valid Cases 30
3
What external sources are opted from
the followings?
Nominal by
Nominal
Phi 1.856 .000
Cramer's
V
.928 .000
N of Valid Cases 30
4
What are the channels chosen your
organisation for the selection of the
employees?
Nominal by
Nominal
Phi 1.159 .000
Cramer's
V
.819 .000
N of Valid Cases 30
5
Whether all categorical / cadres of
employees are confirmed in the
probation period itself and also at the
same time?
Nominal by
Nominal
Phi .866 .000
Cramer's
V
.866 .000
N of Valid Cases 30
6
Which is the following determinant
estimated to regularize new
appointments / trainees?
Nominal by
Nominal
Phi 1.163 .000
Cramer's
V
.822 .000
N of Valid Cases 30
7
What are the means adopted for the
placement of selected candidate?
Nominal by
Nominal
Phi .814 .000
Cramer's
V
.814 .000
N of Valid Cases 30
8
Does your organisation provide
induction training to the employees of
all cadres?
Nominal by
Nominal
Phi 1.912 .000
Cramer's
V
.956 .000
N of Valid Cases 30
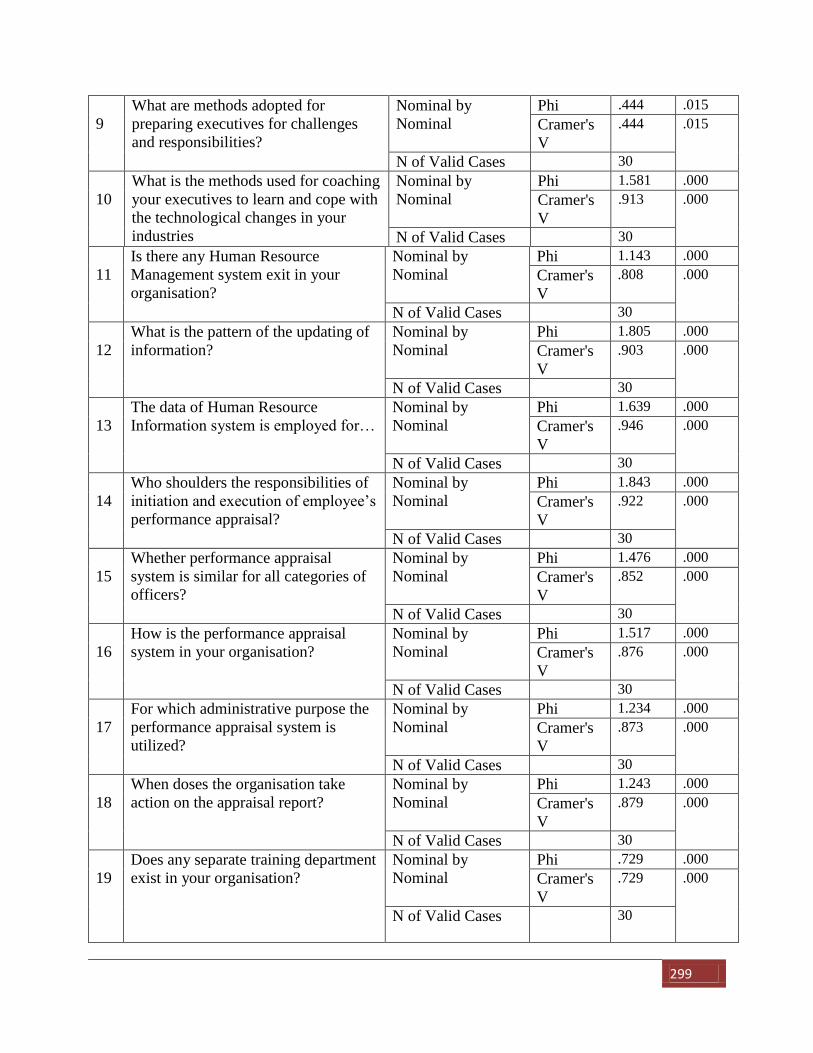
299
9
What are methods adopted for
preparing executives for challenges
and responsibilities?
Nominal by
Nominal
Phi .444 .015
Cramer's
V
.444 .015
N of Valid Cases 30
10
What is the methods used for coaching
your executives to learn and cope with
the technological changes in your
industries
Nominal by
Nominal
Phi 1.581 .000
Cramer's
V
.913 .000
N of Valid Cases 30
11
Is there any Human Resource
Management system exit in your
organisation?
Nominal by
Nominal
Phi 1.143 .000
Cramer's
V
.808 .000
N of Valid Cases 30
12
What is the pattern of the updating of
information?
Nominal by
Nominal
Phi 1.805 .000
Cramer's
V
.903 .000
N of Valid Cases 30
13
The data of Human Resource
Information system is employed for…
Nominal by
Nominal
Phi 1.639 .000
Cramer's
V
.946 .000
N of Valid Cases 30
14
Who shoulders the responsibilities of
initiation and execution of employee’s
performance appraisal?
Nominal by
Nominal
Phi 1.843 .000
Cramer's
V
.922 .000
N of Valid Cases 30
15
Whether performance appraisal
system is similar for all categories of
officers?
Nominal by
Nominal
Phi 1.476 .000
Cramer's
V
.852 .000
N of Valid Cases 30
16
How is the performance appraisal
system in your organisation?
Nominal by
Nominal
Phi 1.517 .000
Cramer's
V
.876 .000
N of Valid Cases 30
17
For which administrative purpose the
performance appraisal system is
utilized?
Nominal by
Nominal
Phi 1.234 .000
Cramer's
V
.873 .000
N of Valid Cases 30
18
When doses the organisation take
action on the appraisal report?
Nominal by
Nominal
Phi 1.243 .000
Cramer's
V
.879 .000
N of Valid Cases 30
19
Does any separate training department
exist in your organisation?
Nominal by
Nominal
Phi .729 .000
Cramer's
V
.729 .000
N of Valid Cases 30
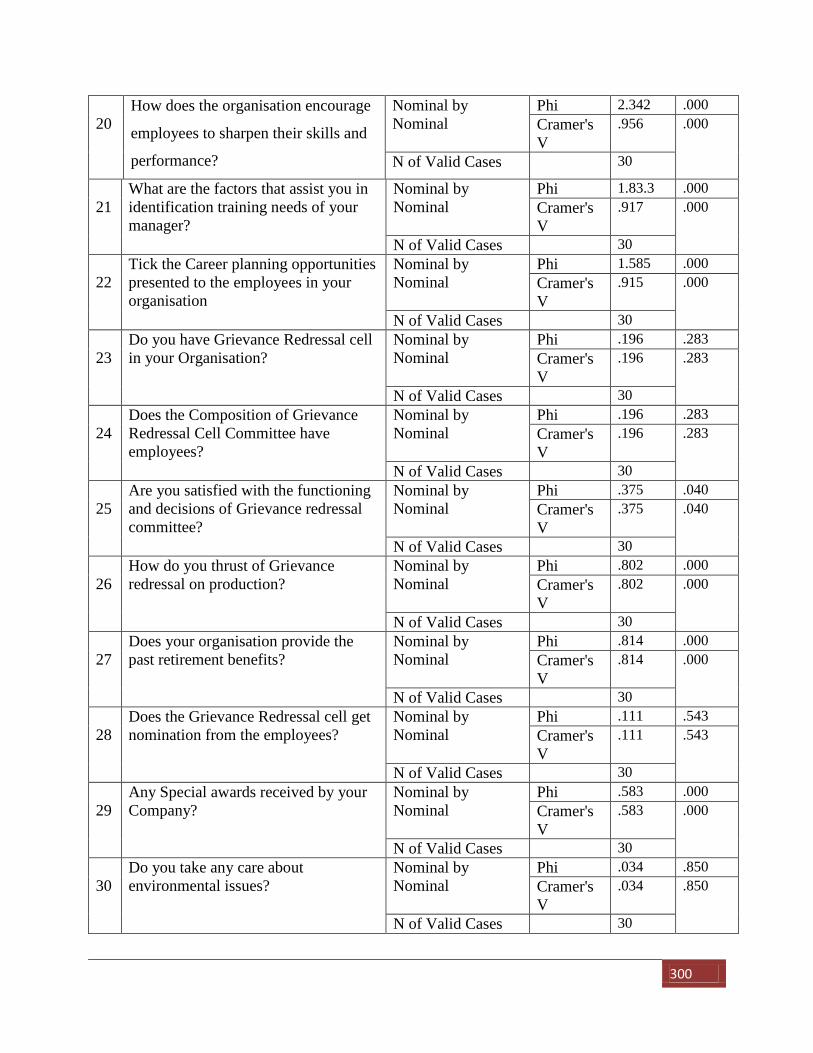
300
20
How does the organisation encourage
employees to sharpen their skills and
performance?
Nominal by
Nominal
Phi 2.342 .000
Cramer's
V
.956 .000
N of Valid Cases 30
21
What are the factors that assist you in
identification training needs of your
manager?
Nominal by
Nominal
Phi 1.83.3 .000
Cramer's
V
.917 .000
N of Valid Cases 30
22
Tick the Career planning opportunities
presented to the employees in your
organisation
Nominal by
Nominal
Phi 1.585 .000
Cramer's
V
.915 .000
N of Valid Cases 30
23
Do you have Grievance Redressal cell
in your Organisation?
Nominal by
Nominal
Phi .196 .283
Cramer's
V
.196 .283
N of Valid Cases 30
24
Does the Composition of Grievance
Redressal Cell Committee have
employees?
Nominal by
Nominal
Phi .196 .283
Cramer's
V
.196 .283
N of Valid Cases 30
25
Are you satisfied with the functioning
and decisions of Grievance redressal
committee?
Nominal by
Nominal
Phi .375 .040
Cramer's
V
.375 .040
N of Valid Cases 30
26
How do you thrust of Grievance
redressal on production?
Nominal by
Nominal
Phi .802 .000
Cramer's
V
.802 .000
N of Valid Cases 30
27
Does your organisation provide the
past retirement benefits?
Nominal by
Nominal
Phi .814 .000
Cramer's
V
.814 .000
N of Valid Cases 30
28
Does the Grievance Redressal cell get
nomination from the employees?
Nominal by
Nominal
Phi .111 .543
Cramer's
V
.111 .543
N of Valid Cases 30
29
Any Special awards received by your
Company?
Nominal by
Nominal
Phi .583 .000
Cramer's
V
.583 .000
N of Valid Cases 30
30
Do you take any care about
environmental issues?
Nominal by
Nominal
Phi .034 .850
Cramer's
V
.034 .850
N of Valid Cases 30
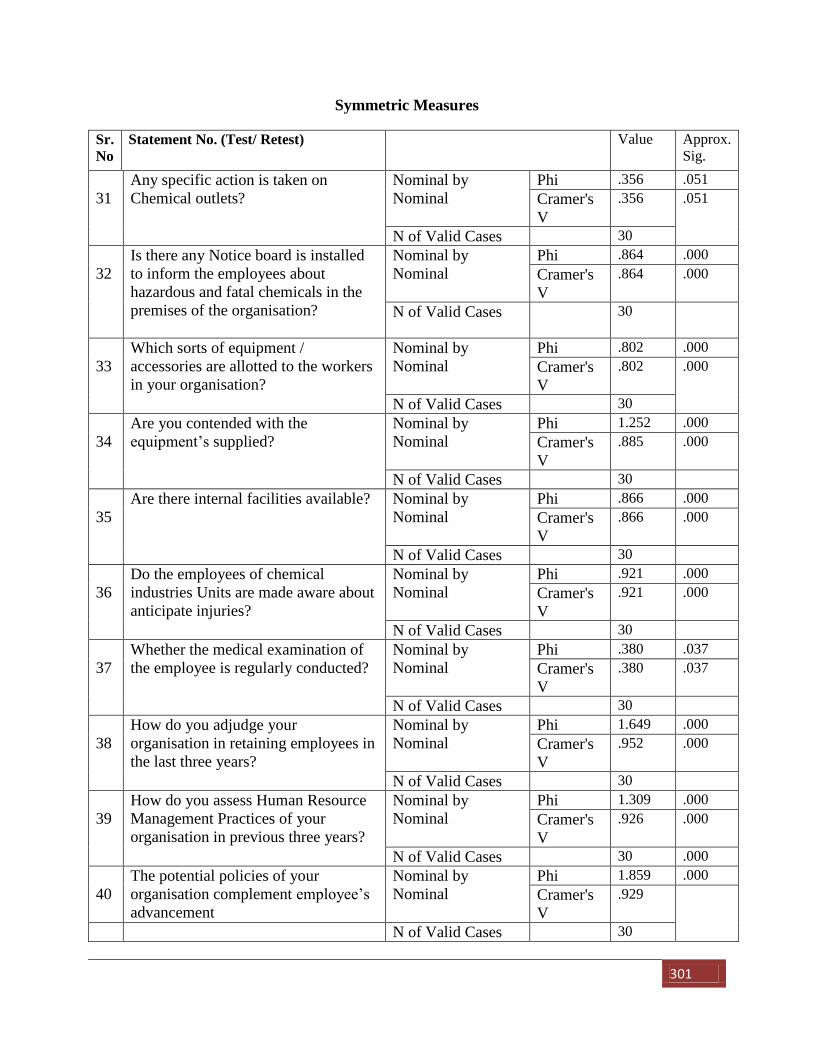
301
Symmetric Measures
Sr.
No
Statement No. (Test/ Retest) Value Approx.
Sig.
31
Any specific action is taken on
Chemical outlets?
Nominal by
Nominal
Phi .356 .051
Cramer's
V
.356 .051
N of Valid Cases 30
32
Is there any Notice board is installed
to inform the employees about
hazardous and fatal chemicals in the
premises of the organisation?
Nominal by
Nominal
Phi .864 .000
Cramer's
V
.864 .000
N of Valid Cases 30
33
Which sorts of equipment /
accessories are allotted to the workers
in your organisation?
Nominal by
Nominal
Phi .802 .000
Cramer's
V
.802 .000
N of Valid Cases 30
34
Are you contended with the
equipment’s supplied?
Nominal by
Nominal
Phi 1.252 .000
Cramer's
V
.885 .000
N of Valid Cases 30
35
Are there internal facilities available?
Nominal by
Nominal
Phi .866 .000
Cramer's
V
.866 .000
N of Valid Cases 30
36
Do the employees of chemical
industries Units are made aware about
anticipate injuries?
Nominal by
Nominal
Phi .921 .000
Cramer's
V
.921 .000
N of Valid Cases 30
37
Whether the medical examination of
the employee is regularly conducted?
Nominal by
Nominal
Phi .380 .037
Cramer's
V
.380 .037
N of Valid Cases 30
38
How do you adjudge your
organisation in retaining employees in
the last three years?
Nominal by
Nominal
Phi 1.649 .000
Cramer's
V
.952 .000
N of Valid Cases 30
39
How do you assess Human Resource
Management Practices of your
organisation in previous three years?
Nominal by
Nominal
Phi 1.309 .000
Cramer's
V
.926 .000
N of Valid Cases 30 .000
40
The potential policies of your
organisation complement employee’s
advancement
Nominal by
Nominal
Phi 1.859 .000
Cramer's
V
.929
N of Valid Cases 30
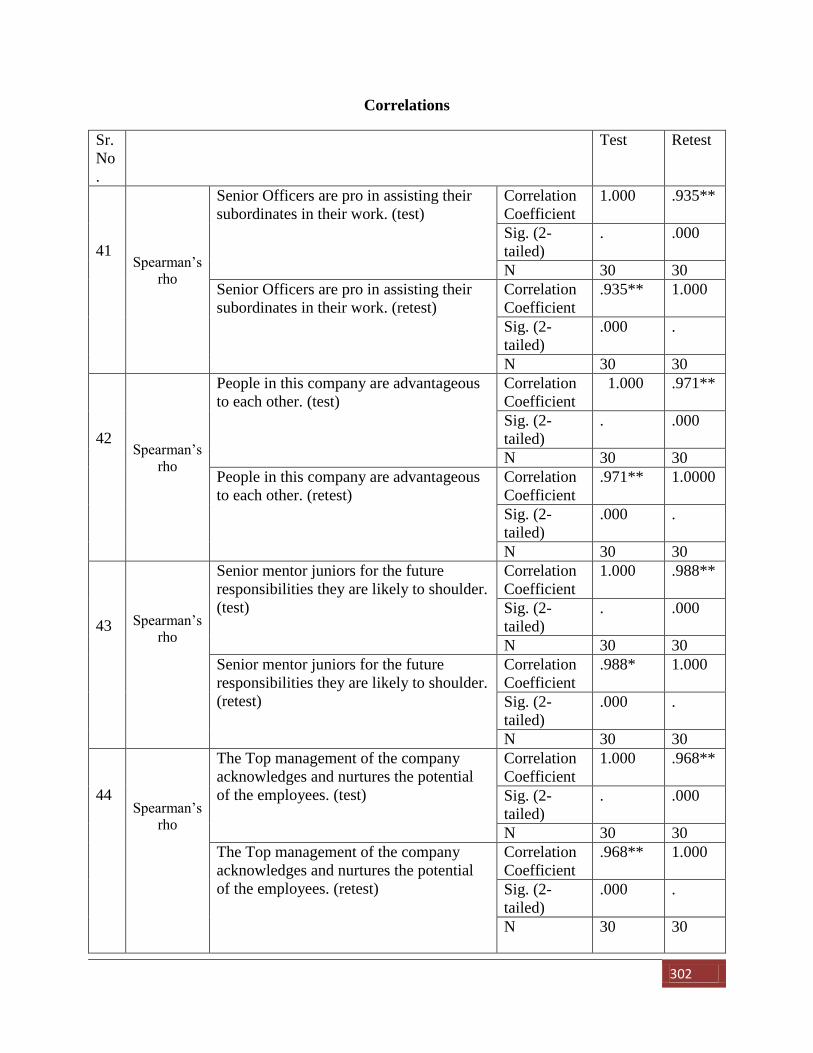
302
Correlations
Sr.
No
.
Test Retest
41
Spearman’s
rho
Senior Officers are pro in assisting their
subordinates in their work. (test)
Correlation
Coefficient
1.000 .935**
Sig. (2-
tailed)
. .000
N 30 30
Senior Officers are pro in assisting their
subordinates in their work. (retest)
Correlation
Coefficient
.935** 1.000
Sig. (2-
tailed)
.000 .
N 30 30
42
Spearman’s
rho
People in this company are advantageous
to each other. (test)
Correlation
Coefficient
1.000 .971**
Sig. (2-
tailed)
. .000
N 30 30
People in this company are advantageous
to each other. (retest)
Correlation
Coefficient
.971** 1.0000
Sig. (2-
tailed)
.000 .
N 30 30
43
Spearman’s
rho
Senior mentor juniors for the future
responsibilities they are likely to shoulder.
(test)
Correlation
Coefficient
1.000 .988**
Sig. (2-
tailed)
. .000
N 30 30
Senior mentor juniors for the future
responsibilities they are likely to shoulder.
(retest)
Correlation
Coefficient
.988* 1.000
Sig. (2-
tailed)
.000 .
N 30 30
44
Spearman’s
rho
The Top management of the company
acknowledges and nurtures the potential
of the employees. (test)
Correlation
Coefficient
1.000 .968**
Sig. (2-
tailed)
. .000
N 30 30
The Top management of the company
acknowledges and nurtures the potential
of the employees. (retest)
Correlation
Coefficient
.968** 1.000
Sig. (2-
tailed)
.000 .
N 30 30
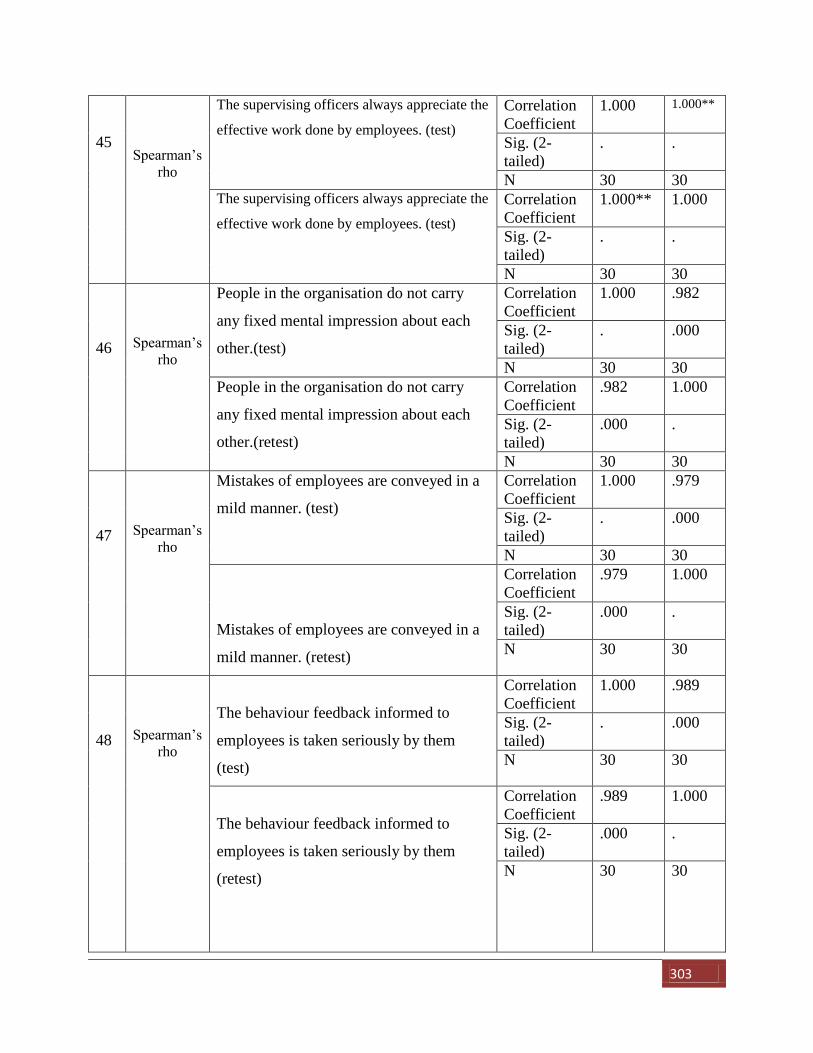
303
45
Spearman’s
rho
The supervising officers always appreciate the
effective work done by employees. (test)
Correlation
Coefficient
1.000 1.000**
Sig. (2-
tailed)
. .
N 30 30 The supervising officers always appreciate the
effective work done by employees. (test)
Correlation
Coefficient
1.000** 1.000
Sig. (2-
tailed)
. .
N 30 30
46
Spearman’s
rho
People in the organisation do not carry
any fixed mental impression about each
other.(test)
Correlation
Coefficient
1.000 .982
Sig. (2-
tailed)
. .000
N 30 30
People in the organisation do not carry
any fixed mental impression about each
other.(retest)
Correlation
Coefficient
.982 1.000
Sig. (2-
tailed)
.000 .
N 30 30
47
Spearman’s
rho
Mistakes of employees are conveyed in a
mild manner. (test)
Correlation
Coefficient
1.000 .979
Sig. (2-
tailed)
. .000
N 30 30
Mistakes of employees are conveyed in a
mild manner. (retest)
Correlation
Coefficient
.979 1.000
Sig. (2-
tailed)
.000 .
N 30 30
48
Spearman’s
rho
The behaviour feedback informed to
employees is taken seriously by them
(test)
Correlation
Coefficient
1.000 .989
Sig. (2-
tailed)
. .000
N 30 30
The behaviour feedback informed to
employees is taken seriously by them
(retest)
Correlation
Coefficient
.989 1.000
Sig. (2-
tailed)
.000 .
N 30 30
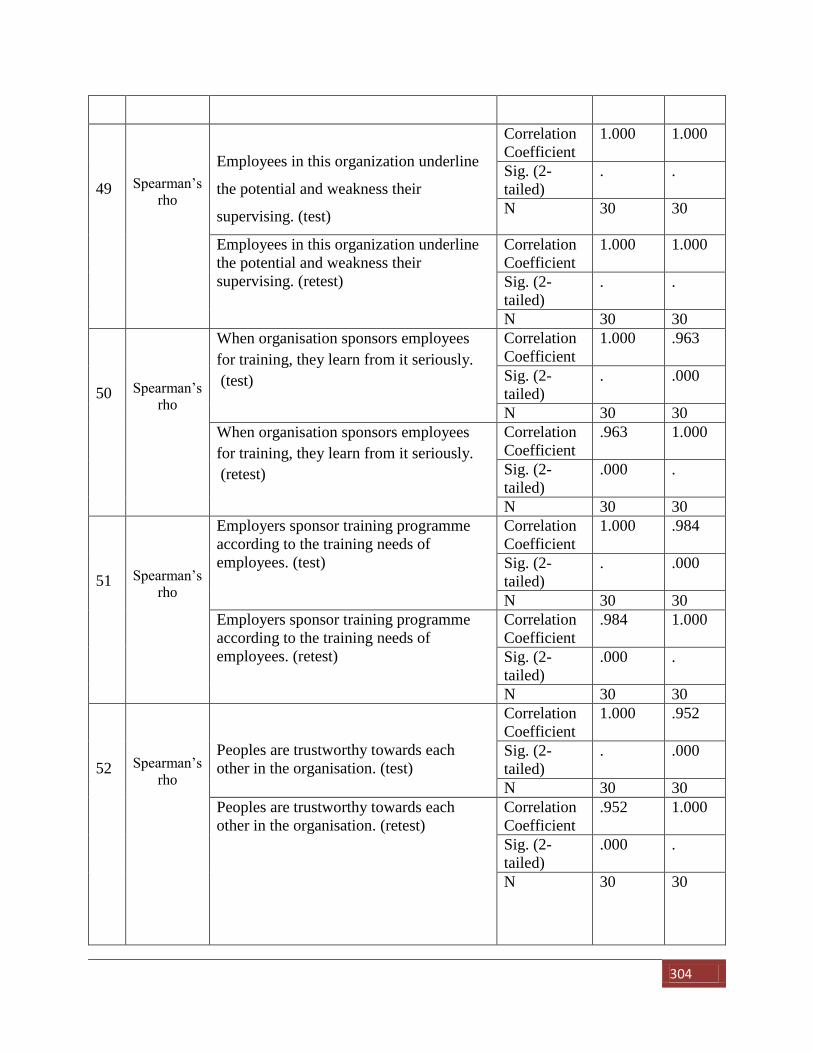
304
49
Spearman’s
rho
Employees in this organization underline
the potential and weakness their
supervising. (test)
Correlation
Coefficient
1.000 1.000
Sig. (2-
tailed)
. .
N 30 30
Employees in this organization underline
the potential and weakness their
supervising. (retest)
Correlation
Coefficient
1.000 1.000
Sig. (2-
tailed)
. .
N 30 30
50
Spearman’s
rho
When organisation sponsors employees
for training, they learn from it seriously.
(test)
Correlation
Coefficient
1.000 .963
Sig. (2-
tailed)
. .000
N 30 30
When organisation sponsors employees
for training, they learn from it seriously.
(retest)
Correlation
Coefficient
.963 1.000
Sig. (2-
tailed)
.000 .
N 30 30
51
Spearman’s
rho
Employers sponsor training programme
according to the training needs of
employees. (test)
Correlation
Coefficient
1.000 .984
Sig. (2-
tailed)
. .000
N 30 30
Employers sponsor training programme
according to the training needs of
employees. (retest)
Correlation
Coefficient
.984 1.000
Sig. (2-
tailed)
.000 .
N 30 30
52
Spearman’s
rho
Peoples are trustworthy towards each
other in the organisation. (test)
Correlation
Coefficient
1.000 .952
Sig. (2-
tailed)
. .000
N 30 30
Peoples are trustworthy towards each
other in the organisation. (retest)
Correlation
Coefficient
.952 1.000
Sig. (2-
tailed)
.000 .
N 30 30
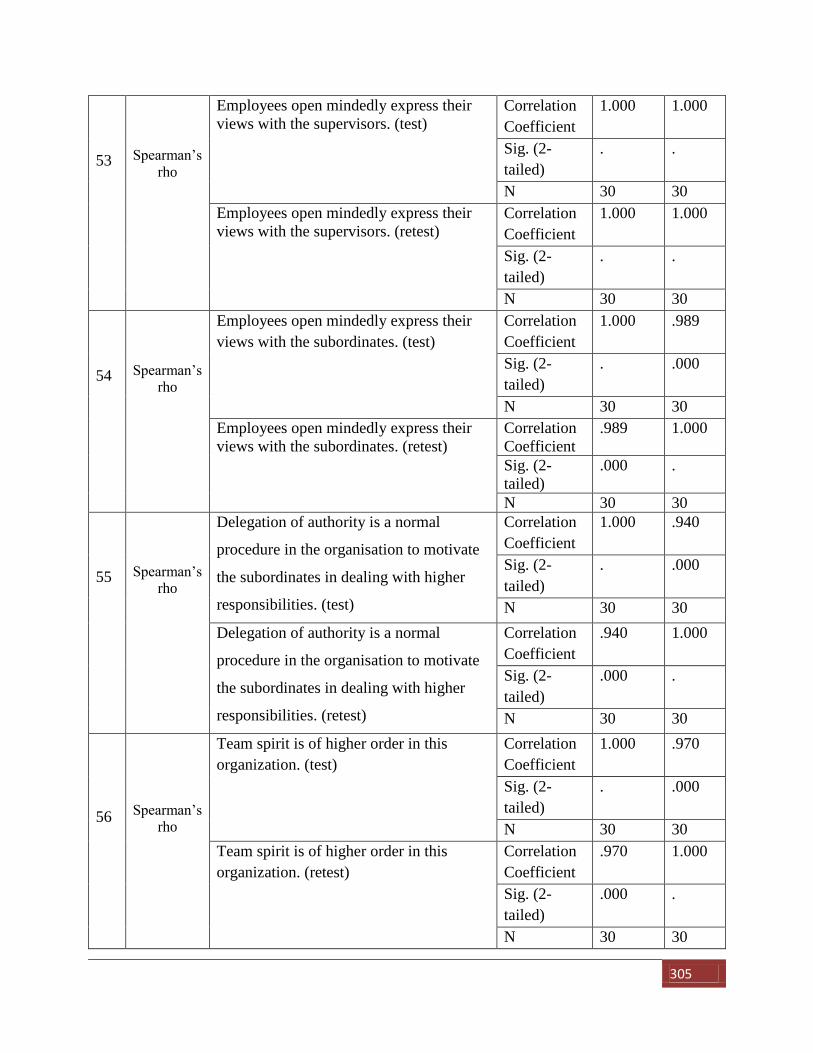
305
53
Spearman’s
rho
Employees open mindedly express their
views with the supervisors. (test)
Correlation
Coefficient
1.000 1.000
Sig. (2-
tailed)
. .
N 30 30
Employees open mindedly express their
views with the supervisors. (retest)
Correlation
Coefficient
1.000 1.000
Sig. (2-
tailed)
. .
N 30 30
54
Spearman’s
rho
Employees open mindedly express their
views with the subordinates. (test)
Correlation
Coefficient
1.000 .989
Sig. (2-
tailed)
. .000
N 30 30
Employees open mindedly express their
views with the subordinates. (retest)
Correlation
Coefficient
.989 1.000
Sig. (2-
tailed)
.000 .
N 30 30
55
Spearman’s
rho
Delegation of authority is a normal
procedure in the organisation to motivate
the subordinates in dealing with higher
responsibilities. (test)
Correlation
Coefficient
1.000 .940
Sig. (2-
tailed)
. .000
N 30 30
Delegation of authority is a normal
procedure in the organisation to motivate
the subordinates in dealing with higher
responsibilities. (retest)
Correlation
Coefficient
.940 1.000
Sig. (2-
tailed)
.000 .
N 30 30
56
Spearman’s
rho
Team spirit is of higher order in this
organization. (test)
Correlation
Coefficient
1.000 .970
Sig. (2-
tailed)
. .000
N 30 30
Team spirit is of higher order in this
organization. (retest)
Correlation
Coefficient
.970 1.000
Sig. (2-
tailed)
.000 .
N 30 30
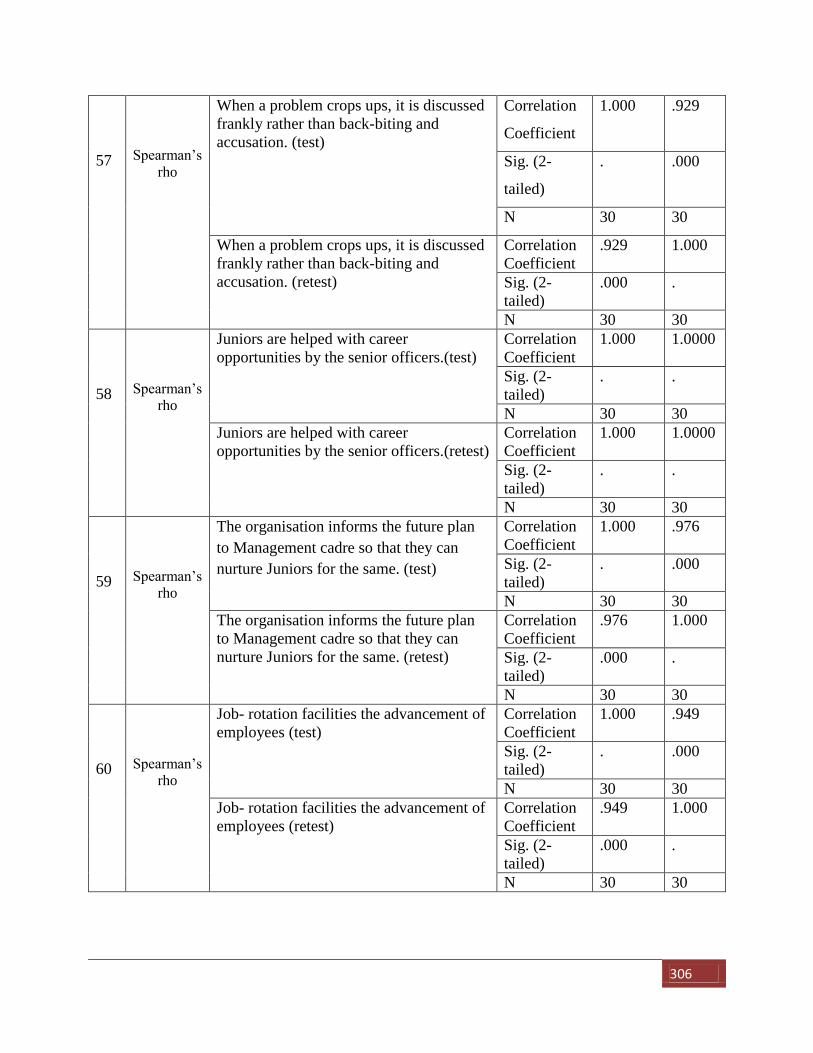
306
57
Spearman’s
rho
When a problem crops ups, it is discussed
frankly rather than back-biting and
accusation. (test)
Correlation
Coefficient
1.000 .929
Sig. (2-
tailed)
. .000
N 30 30
When a problem crops ups, it is discussed
frankly rather than back-biting and
accusation. (retest)
Correlation
Coefficient
.929 1.000
Sig. (2-
tailed)
.000 .
N 30 30
58
Spearman’s
rho
Juniors are helped with career
opportunities by the senior officers.(test)
Correlation
Coefficient
1.000 1.0000
Sig. (2-
tailed)
. .
N 30 30
Juniors are helped with career
opportunities by the senior officers.(retest)
Correlation
Coefficient
1.000 1.0000
Sig. (2-
tailed)
. .
N 30 30
59
Spearman’s
rho
The organisation informs the future plan
to Management cadre so that they can
nurture Juniors for the same. (test)
Correlation
Coefficient
1.000 .976
Sig. (2-
tailed)
. .000
N 30 30
The organisation informs the future plan
to Management cadre so that they can
nurture Juniors for the same. (retest)
Correlation
Coefficient
.976 1.000
Sig. (2-
tailed)
.000 .
N 30 30
60
Spearman’s
rho
Job- rotation facilities the advancement of
employees (test)
Correlation
Coefficient
1.000 .949
Sig. (2-
tailed)
. .000
N 30 30
Job- rotation facilities the advancement of
employees (retest)
Correlation
Coefficient
.949 1.000
Sig. (2-
tailed)
.000 .
N 30 30