a study of dms oxidation in the tropics: comparison of christmas island field observations of dms,...
TRANSCRIPT

Journal of Atmospheric Chemistry37: 137–160, 2000.© 2000Kluwer Academic Publishers. Printed in the Netherlands.
137
A Study of DMS Oxidation in the Tropics:Comparison of Christmas Island Field Observationsof DMS, SO2, and DMSO with Model Simulations
G. CHEN1, D. D. DAVIS1, P. KASIBHATLA 2, A. R. BANDY 3,D. C. THORNTON3, B. J. HUEBERT4, A. D. CLARKE4 andB. W. BLOMQUIST4
1School of Earth and Atmospheric Sciences, Georgia Institute of Technology, Atlanta, U.S.A.2School of Environment, Duke University, Durham, North Carolina, U.S.A.3Department of Chemistry, Drexel University, Philadelphia, Pennsylvania, U.S.A.4Department of Oceanography, University of Hawaii, Honolulu, U.S.A.
(Received: 3 May 1999; accepted: 27 January 2000)
Abstract. This study reports comparisons between model simulations, based on current sulfur mech-anisms, with the DMS, SO2 and DMSO observational data reported by Bandyet al. (1996) in their1994 Christmas Island field study. For both DMS and SO2, the model results were found to be inexcellent agreement with the observations when the observations were filtered so as to establish acommon meteorological environment. This filtered DMS and SO2 data encompassed approximatelyhalf of the total sampled days. Based on these composite profiles, it was shown that oxidation ofDMS via OH was the dominant pathway with no more than 5 to 15% proceeding through Cl atomsand less than 3% through NO3. This analysis was based on an estimated DMS sea-to-air flux of3.4× 109 molecs cm−2 s−1. The dominant source of BL SO2 was oxidation of DMS, the overallconversion efficiency being evaluated at 0.65± 0.15. The major loss of SO2 was deposition to theocean’s surface and scavenging by aerosol. The resulting combined first orderk value was estimatedat 1.6 × 10⁻⁵ s−1. In contrast to the DMS and SO2 simulations, the model under-predicted theobserved DMSO levels by nearly a factor of 50. Although DMSO instrument measurement problemscan not be totally ruled out, the possibility of DMSO sources other than gas phase oxidation of DMSmust be seriously considered and should be explored in future studies.
Key words: dimethyl sulfide, sulfur dioxide, DMS oxidation, SO2 wet/dry deposition.
1. Introduction
Dimethyl sulfide, DMS, is currently believed to be the dominant gas phase sul-fur species released from the world’s oceans. Present estimates suggest that thisoceanic source is about 60% of the total natural global sulfur released to the atmo-sphere (Berresheimet al., 1995). Given its importance, there have been numerousstudies which have had as their goal establishing the quantitative relationshipbetween DMS and atmospheric sulfate levels. These efforts have included cham-ber studies, detailed laboratory kinetic investigations, and field studies. Although

138 G. CHEN ET AL.
Figure 1. Abbreviated DMS oxidation scheme showing OH initiating abstraction and addi-tion channels.β’s denote branching ratios for elementary reactions andγ ’s represent overallconversion efficiency factors for multi-step processes. The symbol ‘?’ denotes processes forwhich no kinetic or field data exists to support the proposed reaction step. Chemical nota-tion: DMSO, dimethyl sulfoxide; DMSO2, dimethyl sulfone; MSIA, methane sulfinic acid;MSA(g), methanesulfonic acid; MSA(p) or MS methane sulfonate (Taken from Plate 3 ofDaviset al., 1999).
chamber studies seem to agree that SO2 is one of the major intermediate productsformed from DMS (e.g., Nikiet al., 1983; Grosjean, 1984; Hatakeyamaet al.,1985; Barneset al., 1989, 1993; Sørensenet al., 1996; Berresheimet al., 1995 andreferences therein), quantitative assessments of its importance under backgroundmarine conditions have been lacking. Thus, it remains as one of the larger un-certainties in our assessment of the conversion of DMS to sulfate. This point isillustrated in Figure 1 in that SO2 is shown as being a product of both the OH/DMSaddition as well as abstraction channels but without well defined values for theindependent branching ratios (e.g., see also results from Daviset al., 1998, 1999;Urbanski and Wine, 1999; Berresheimet al., 1995 and references therein).
Results from some of the early marine field studies have lead to further con-fusion concerning the yield of SO2 from DMS. For example, several studiesconducted in the early 1990s found no causal relationship between DMS and SO2
(e.g., Bandyet al., 1992; Thornton and Bandy, 1993). However, in a still later studycarried out by Yvonet al. (1996) in the central equatorial Pacific, involving someof the highest average DMS concentrations ever recorded (e.g., 431± 82 pptv),large diel fluctuations were observed in DMS but with very low concomitant values

A STUDY OF DMS OXIDATION IN THE TROPICS 139
being observed for SO2. Overall, for the five day sampling period reported, only onthe first day of observation was there a definable relationship between the productSO2 and DMS. The reported overall DMS to SO2 conversion efficiency was 27to 54%. Equally interesting, the diel trend in DMS was not explicable in terms ofmodeled values of OH, suggesting other potentially important oxidizing agents.In contrast to the above results, based on seasonally averaged DMS and SO2 datarather than diel profiles, the findings from Amsterdam Island in the Indian Oceanhave led investigators there to the conclusion that the coupling between DMS andSO2 is probably substantially greater than those cited by Yvonet al. (Putaudet al.,1992). But, in still another tropical study, Huebertet al. (1993), using ship-basedcollected SO2 samples with nearly one day integration time, found little evidenceof either a significant correlation or anticorrelations between DMS and SO2. Thehighest SO2 yields from earlier DMS field studies have been those reported for theequatorial Pacific site of Christmas Island. In both cases, the diel profiles in DMSand SO2 were found to be highly anticorrelated. The yields of SO2 in these twocases were 75± 20% (Daviset al., 1999) and 62± 6% (Bandyet al., 1996).
The objective of the current study is that of extending the initial analysis ofthe 1994 Christmas Island marine sulfur study carried out by Bandyet al. (1996),which involved no modeled chemistry, to include time-dependent modeling sim-ulations involving the chemical scheme shown in Figure 1. Thus, the goal is toprovide a more quantitative picture of the detailed DMS oxidation chemistry oc-curring in the tropical marine boundary layer (BL). The 1994 study has provideda unique opportunity for testing our DMS chemical oxidation concepts in thatit has provided the most extensive high temporal-resolution DMS and SO2 BLtropical-data heretofore available from a field program.
Key aspects of the DMS/OH oxidation chemistry examined in this study in-clude: (1) evaluating the magnitude of the DMS sea-to-air flux under upwellingconditions; (2) evaluating the magnitude of the SO2 yield from the DMS/OH reac-tion; (3) estimating the magnitude of DMS oxidation from Cl atoms; (4) assessingthe potential yield of DMSO from DMS oxidation; and (5) evaluating the budgetsof aerosol phase methyl sulfonate (MS) and nonseasalt sulfate (NSS) via gas phaseand heterogeneous chemical pathways.
2. Observational Database
The 1994 Christmas Island sulfur study encompassed two 5 day intensive samplingperiods, each period having continuous recordings of DMS and SO2. These intens-ives covered the time periods of 25–29 July and 2–6 August 1994. Located at 2◦Nand 157◦W, Christmas Island is well within the equatorial upwelling region, andthus, frequently experiences a greatly enhanced DMS flux as previously reportedby Cline and Bates (1983) and Bateset al. (1987, 1993). Additionally, during theJuly–August time period the island is typically under the strong influence of SEtrade-winds. Meteorological conditions can thus be characterized as involving a

140 G. CHEN ET AL.
stable atmosphere with little precipitation. Suffice to say, the latter conditions offeran ideal environment for studying DMS/OH oxidation chemistry.
During the 1994 study the gas phase sulfur species DMS, SO2, DMSO andDMSO2 were measured using a gas chromatography/mass spectrometry technique.All sulfur measurements were accompanied by isotopically labeled internal stand-ards to ensure a reliable calibration of each cryogenically collected sample (Bandyet al., 1996). For details concerning the experimental technique see Bandyet al.(1992, 1993). Other key parameters/chemical species measured included: O3, H2O,and UV flux (e.g., see Clarkeet al., 1996).
The aerosol data included observations of: total CN, size/number distribution,and aerosol chemical composition. The latter analysis involved the ionic species:sodium, ammonium, MS, and NSS. The aerosol chemical composition sampleswere obtained using open-faced 47 mm Teflon filters (Gelman Zeflour, 1µm poresize). These filter samples were extracted and analyzed using ion chromatography(Huebertet al., 1996a, b). Total CN number was determined using an ultrafinecondensation nucleus counter (UCN-TSI 3025; Dp> 3 nm) and a condensationnucleus counter (CN-TSI 3760, Dp> 15 nm). Total aerosol surface area was eval-uated from the size distribution data as defined by a scanning 17 bin differentialmobility analyzer (DMA-TSI 3071; 20 nm< Dp< 500 nm) (Clarkeet al., 1996).
During both intensive periods, the predominant wind was onshore, ranging fromthe east to southeast. With the exception of two days, no significant cloud develop-ments and/or precipitation events were encountered during the intensives (Huebertet al., 1996b; Bandy, private communication). A balloon based radiosonde sys-tem was launched every 6 hours to characterize the lower atmosphere’s verticalstructure. The BL height was typically found to range from 0.4 to 1.1 km with anaverage value of 0.8 km (Huebertet al., 1996b).
Figures 2(a, b) reveal the trends observed in DMS and SO2 as a function of localsun time during each intensive period. Quite clearly, a unique feature of these datais the degree to which both species display very substantial diel trends. Equallysignificant is the fact that the respective trends are anticorrelated such that themaximum in DMS levels occurs during a minimum in SO2 and vice-versa. Themagnitude of the variation in DMS is seen ranging from 70–160 pptv; whereas, forSO2 the absolute value is much lower, ranging from 40–70 pptv. Typically, DMSis seen passing through a maximum near sunrise (∼07:00 hrs) and a minimum at∼15:00 hrs. By contrast, SO2 levels pass through a minimum near 07:00 hrs and amaximum at 15:00 hrs. If the anticorrelation between DMS and SO2 is examinedfor individual days, the resulting R2 values are found to range from 0.45 to 0.85.The only other study showing such high R2 values is the recent 1996 PEM-TropicsA study (Daviset al., 1999). Recall, this study also was carried out at a locationquite close to Christmas Island.
The large daytime loss of DMS also strongly suggests that oxidation by OHwas a major factor. Similarly, the large increase in daytime SO2 implies that thisspecies was driven by a major photochemical source. In spite of this, as revealed

A STUDY OF DMS OXIDATION IN THE TROPICS 141
Figure 2. Observed Christmas Island diel variations in DMS and SO2 during: (a) 25–29 Julyand (b) 2–6 August 1994 (modified from Figure 1 of Bandyet al., 1996).

142 G. CHEN ET AL.
in Figures 2(a, b), both DMS and SO2 are seen undergoing rather large day-to-day variations. For example, the average DMS level is nearly a factor of 1.7 timeshigher on 29 July than on 27 July. Similarly, the DMS level observed during the firstintensive period was nearly 2 times greater than that observed during the second.Such differences can be contrasted to the model generated day-to-day variations inOH which were found to be no more than 30% when the two intensive samplingperiods were compared. Thus, variations in diel OH levels can only account for lessthan half of the observed DMS variation. This suggests that much of the differenceobserved in the day to day levels of DMS was probably a result of shifts in oneor more meteorological factors, although some variations in the DMS flux itselfcan not be totally ruled out. The most likely meteorological factors that couldcause such a large variation in DMS would involve either the BL height and/orthe degree of mixing between the BL and buffer Layer (BuL) (Note, the bufferlayer can be defined as the transition zone between the BL and free troposphereas previously defined by Russellet al. (1999)). Unfortunately, the detailed verticalmeteorological and chemical data required for testing these hypotheses were notavailable. For this reason, we have opted here to focus this study on the diel trendsin DMS and SO2 rather than trying to simulate the more complex day to day abso-lute variations in these species. Even so, it is recognized that the absence of detailedinformation on vertical mixing adds further uncertainty to our interpretation of thediel trends.
3. Approach and Model Description
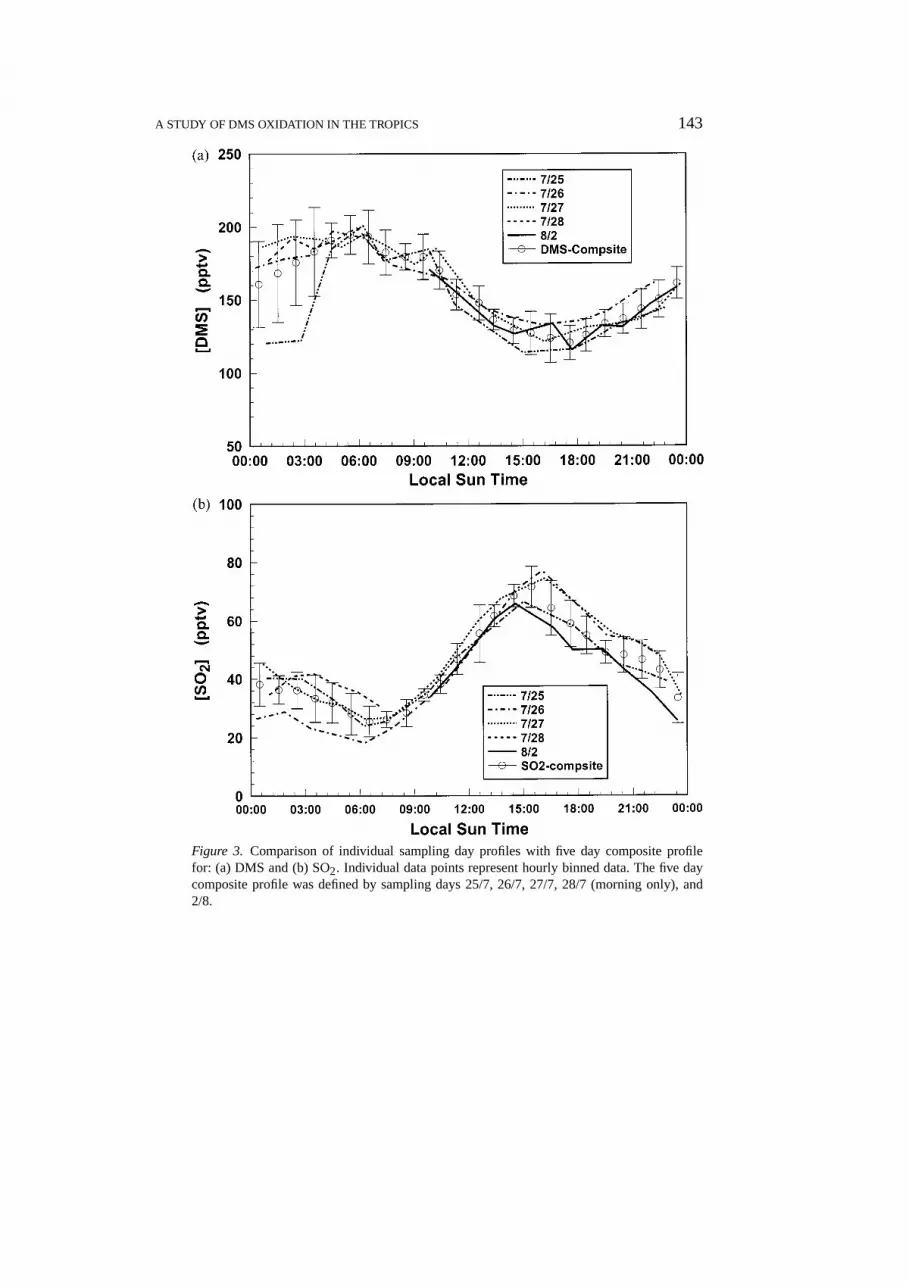
The general approach taken in this study has involved the comparison of experi-mental diel profiles of DMS and SO2 with those generated in model simulations.Unknown parameters in these simulations have been represented as adjustable vari-ables. Thus, their values have been determined by the ‘best fit’ to the observations.To minimize the effects from what was earlier described as significant ‘naturalvariability’ in the data, it was decided that a better characterization of the averagediel behavior of DMS and SO2 could be achieved if composite profiles for bothspecies were used. In our case, the process of constructing these composite profileswas carried out in three steps. First, all data from both intensives were binned asone hour averaged values. Second, from this initial composite profile, comparis-ons were then made to the profiles from each of the individual sampling days todetermine the extent to which a given day’s sampling average lies outside of onestandard deviation of the ensemble average. If∼50% or more of the data froma given day fell into the outlier category that day was removed. And third, aftereach removal of a given day’s data, a new ensemble average was calculated. Whatemerged from this three step filtering process was a subset of 5 sampling days,each of which had reasonably similar profile characteristics. The five samplingdays selected were: 25/7, 26/7, 27/7, 28/7 (morning only), and 2/8. As shown inFigures 3(a, b), the DMS and SO2 hourly averaged data for individual days nearly
A STUDY OF DMS OXIDATION IN THE TROPICS 143
Figure 3. Comparison of individual sampling day profiles with five day composite profilefor: (a) DMS and (b) SO2. Individual data points represent hourly binned data. The five daycomposite profile was defined by sampling days 25/7, 26/7, 27/7, 28/7 (morning only), and2/8.

144 G. CHEN ET AL.
all fall within 1 standard deviation of the composite average. We suspect that onthese particular days the critical meteorological factors mentioned earlier had quitesimilar characteristics.
The sulfur box model used in this investigation consisted of 14 reactions whichcollectively described the sources and sinks for nine different sulfur species, i.e.,DMS, DMSO, DMSO2, H2SO3, H2SO4, MSIA, MSA, SO2, and SO3. These 14reactions are included in the key DMS processes shown in Figure 1 and havebeen previously described in the literature (e.g., see Daviset al., 1998, 1999).The diel profile for each of the above sulfur species was generated by integratingthe appropriate time dependent differential equation. Each equation, therefore, de-scribed the BL mass balance for the species in terms of surface flux (if applicable),photochemical sources, photochemical sinks, parameterized vertical transport, andparameterized first order loss, including wet and dry deposition as well as scaven-ging by aerosol particles. Equation (1) shows the typical form that the differentialequation would take (in the case of the marine BL) in achieving a mass balance forsome arbitrary sulfur species ‘S’ (e.g., DMS, SO2, or DMSO).
d[S]BL
dt= F
h+ M
h([S]BuL − [S]BL)+ P(S)− L(S)[S]BL − kSL[S]BL . (1)
Here, the first term on the right hand side represents the oceanic source strength,where ‘F’ is defined as the sea-to-air flux and ‘h’ is the marine BL height. Thesecond term is a parameterized term defining the mass exchange between the BLand the overlaying BuL, where ‘M’ denotes the mixing parameter (defined as K/1Zwith ‘K’, the mixing coefficient, having units of cm2 s−1), and [S]BuL and [S]BL
represent BuL and BL concentrations of the species ‘S’. P(S) and L(S) define thephotochemical production rate and the first order destruction of the sulfur species‘S’, while kSL defines the first order rate coefficient for the physical removal of ‘S’via dry/wet deposition and/or aerosol scavenging.
Profiles for the photochemical oxidants OH and NO3 were evaluated using aphotochemical time-dependent box model containing full HOX/NOX/CH4/NMHCchemistry. The details of this model can be found in Chen (1995), Daviset al.(1996), Crawford (1997), and Crawfordet al. (1999). These independently gen-erated values of OH and NO3 were then coupled to the sulfur box model, thusdefining the time dependent profiles for oxidized sulfur. The values of O3 andH2O, the critical input parameters to the photochemical model, were taken to be themedians estimated from the on-site recorded observations. Values for NO and COwere those recorded during PEM-Tropics A, specifically those sorties carried outnear Christmas Island during the month of August. The median values for these twoparameters were 3 pptv and 60 ppbv, respectively. The observed UV Eppley datawas used to correct for cloud attenuation of the solar flux. For the days involvedin Figures 3(a, b), the average daytime cloud correction factor was estimated to be0.9. Given the above input conditions, the diel averaged OH level over the timeperiod of sampling was estimated at 1.5× 10⁶ molecs cm−3.
A STUDY OF DMS OXIDATION IN THE TROPICS 145
To evaluate the possible oxidizing impact from Cl atoms, a chlorine chemistrymodule was added to the existing HOx/sulfur photochemical model. This modulecontained 24 chlorine reactions encompassing both sources and sinks of 6 majorchlorine species (i.e., Cl, Cl2, ClO, HOCl, ClNO3, and HCl) as previously de-scribed by Crawfordet al. (1997). In this study, rather than using some arbitraryheterogeneous sea-salt source of chlorine, a constant Cl2 flux was employed as thesource. This source resulted in a build-up of Cl2 at night and thus resulted in asimulated Cl profile that showed highly elevated levels of early morning Cl atomssimilar to those reported by Keeneet al. (1990).
4. Results and Discussion
The results and discussion presented below cover several critical aspects of DMSoxidation chemistry. These include application of the mass balance/photochemicalmodeling approach to determine the DMS sea-to-air flux, an assessment of SO2
losses based on nighttime SO2 data, an assessment of the SO2 production efficiencyfrom oxidation of DMS by OH, an assessment of the SO2 production efficiencyfrom oxidation of DMS by Cl, and finally, an evaluation of the production and lossof DMSO under tropical marine BL conditions.
4.1. DMS FLUX ASSESSMENT
A mass-balance/photochemical modeling approach was used to evaluate theoceanic DMS flux. This approach has been previously cited in the literature fordata collected from ground bases, ship platforms, as well as from airborne plat-forms (Chenet al., 1999; Daviset al., 1999; Yvonet al., 1996; Ayerset al., 1995;Thompsonet al., 1993; Saltzman and Cooper, 1989). The typical form of this massbalance formulation is that shown in Equation (2):
d[DMS]BL
dt= FDMS
h− (kOH[OH] + kNO3[NO3])[DMS]BL −
− We
h(k[DMS]BL − [DMS]BuL) .
(2)
Here, it can be seen that the DMS flux can be estimated given that the BL heightis known and the photochemical loss plus dilution due to vertical mixing can beindependently evaluated. The photochemical loss term is defined by both OH andNO3 oxidation. (See later discussion in text involving oxidation by Cl atoms.) Thevertical mixing term is seen as the product of the vertical mixing ratio gradientand entrainment velocity. This term is designed to account for the mass exchangebetween the BL and BuL. Typically, the BuL DMS level is significantly lower thanthat in the BL.

146 G. CHEN ET AL.
Figure 4. Observed and model simulated diel profiles for DMS together with model simulateddiel profiles for OH and NO3. The observed profile was that defined by the five day DMScomposite profile. The estimated DMS flux is 3.4× 10⁹ molecs cm−2 s−1. The diel averagesfor OH and NO3 are 1.5 × 10⁶ and 2.6 × 10⁵ molecs cm−3, respectively. The five daycomposite profile was defined by sampling days 25/7, 26/7, 27/7, 28/7 (morning only), and2/8.
As recently discussed by Chenet al. (1999), a more robust approach toevaluating the DMS flux involves the use of Equation (3):
d[DMS]BL
dt= FDMS
EMD− (kOH[OH] + kNO3[NO3])[DMS]BL −
− 1
EMD
∫ hBuL
0w
(∂[DMS(z)]
∂z
)dz.
(3)
In this formulation, closure is attended at the top of the BuL and so both the BL andBuL’s are considered in the mass balance. The quantity EMD, equivalent mixingdepth, is then defined as the height of an imaginary DMS column containing allDMS but at BL concentration levels.
In this study, the formulation shown in Equation (2) was adopted due to a lackof vertical data for either DMS or the surrogate species CH3I. The BL height usedin our evaluation was 800 m as provided by Huebertet al. (1996b) and Clarkeet al. (1996). Given that both sampling intensives occurred over time periods thatmeteorologically were relatively quiet, with fair-weather cumulus persisting mostof this time, we have adopted here a mid range value for We of 0.4 cm s−1 (Stull,1988). This is also in reasonable agreement with the value derived independentlyby Huebertet al. (1996b).
A STUDY OF DMS OXIDATION IN THE TROPICS 147
From Figure 4, it can be seen that the model simulated DMS profile falls wellwithin the error bars of the composite observational profile. In fact, the averagedifference between these profiles is seen as being less than 15%. This level ofagreement suggests that the photochemically driven loss of DMS can be wellexplained by model generated OH profiles. The DMS flux estimated from oursimulations was 3.4±1.2× 10⁹ molecs cm−2 s−1, in excellent agreement with thevalue reported by Bandyet al. (1996) of 3.8± 0.8× 10⁹ molecs cm−2 s−1. Bandyet al.’s approach involved no assumption about photochemical processes. Theseinvestigators simply equated the DMS flux to the experimentally measured rateof loss of DMS as adjusted for dilution due to entrainment. An error propagationanalysis has revealed that the uncertainty in our model estimated flux is primarilycontrolled by two factors: the model estimated OH and the observational DMScomposite profile. Beyond the influence of the DMS flux itself, oxidation by OHwas found to be the dominant DMS controlling process, contributing 68% ofthe total. The impacts from entrainment and NO3 oxidation were 30% and 2%,respectively.
4.2. ASSESSMENT OF SO2 LOSS RATE AND DMS/SO2 PRODUCTION EFFICIENCY
The composite diel profiles for DMS and SO2 were used to evaluate both the SO2
loss rate as well as the DMS/SO2 production efficiency factor. Model simulationsinvolving BL SO2 were based on mass balance Equation (4):
d[SO2]BL
dt= P(SO2)− L(SO2)[SO2]BL + We
h([SO2]BuL − [SO2]BL). (4)
As discussed earlier, the quantity P(S) represents the photochemical source of SO2
which here has been broken down into three summary reactions:
DMS+OH⇒ multi-steps⇒ γ1SO2+ H2O+ Products, (R1)
DMS+OH(+O2)⇒ multi-steps⇒ γ2SO2+ β2DMSO++ HO2+ Products,
(R2)
DMS+ NO3⇒ multi-steps⇒ γ3SO2+ HNO3+ Products. (R3)
Process (R1) denotes the abstraction channel for the DMS/OH reaction while pro-cess (R2) defines SO2 production from the OH addition channel. Process (R3)represents that SO2 formed from the DMS/NO3 abstraction reaction. The symbolsγ1, γ2, andγ3 are the overall SO2 production efficiencies for Reactions (R1) to(R3), respectively.
Loss of SO2, denoted in Equation (4) by the term L(SO2), includes oxidationby OH, scavenging by aerosol, and dry deposition to the ocean’s surface. Theseprocesses are summarized below as Reactions (R4) and (R5).
SO2+OH⇒ multi-steps⇒ H2SO4(g) , (R4)

148 G. CHEN ET AL.
SO2+ AER/Dry DP⇒ multi-steps⇒ SO2 ↓ . (R5)
In Reaction (R5), we have lumped the aerosol scavenging and dry depositiontogether and taken both to be approximated by a first order loss process. Themagnitude of this loss rate was derived from the observed nighttime decay of SO2
as discussed in the text that follows.
4.2.1. Assessment of SO2 Loss
The time derivative for nighttime BL SO2 is governed by mass balance Equation(5):
d[SO2]BL
dt= γ3k3[NO3][DMS] + We
h([SO2]BuL − [SO2]BL)− k5[SO2]BL . (5)
The first term on the right hand side represents the SO2 production from theNO3/DMS reaction; the second term accounts for changes in the mixing ratio dueto vertical mixing between the BuL and BL; and the third term defines the physicalremoval of SO2 due to scavenging by aerosol and deposition to the ocean’s surface.As discussed earlier, the loss of DMS from Reaction (R3) was determined to be lessthan 3% of that from the OH/DMS reaction; however, this term still constitutes asmuch as 10% (assuming unity SO2 yield) of the total SO2 time derivative as definedby Equation (5); and thus, has been kept in the final equation.
For purposes of evaluating the first order SO2 loss rate,k5, we initially assumedthat the vertical mixing term, representing a potential loss of SO2, was smallcompared to both aerosol and sea surface losses. This assumption was based onthe following information: (1) that the magnitude of the entrainment velocity wassmall, i.e., 0.2–0.4 cm s−1 (e.g., see Stull, 1988), and (2) that the difference in theSO2 level between the BL and BuL was small. Although BuL SO2 levels were notobserved during the 1994 Christmas Island experiment, during two later airbornefield missions (e.g., NSF’s ACE-1 and NASA’s GTE PEM-Tropics A) observationsof SO2 both in the BL and BuL were recorded. These observations consistentlyshowed BuL SO2 levels to be equal to or lower than BL SO2 levels. For example,during ACE-1 the BuL average was 35% lower; whereas, for PEM-Tropics A it was10%. Based on these observations, vertical mixing can be seen as being a ratherminor loss term for BL SO2. (See more quantitatively treatment in text below).
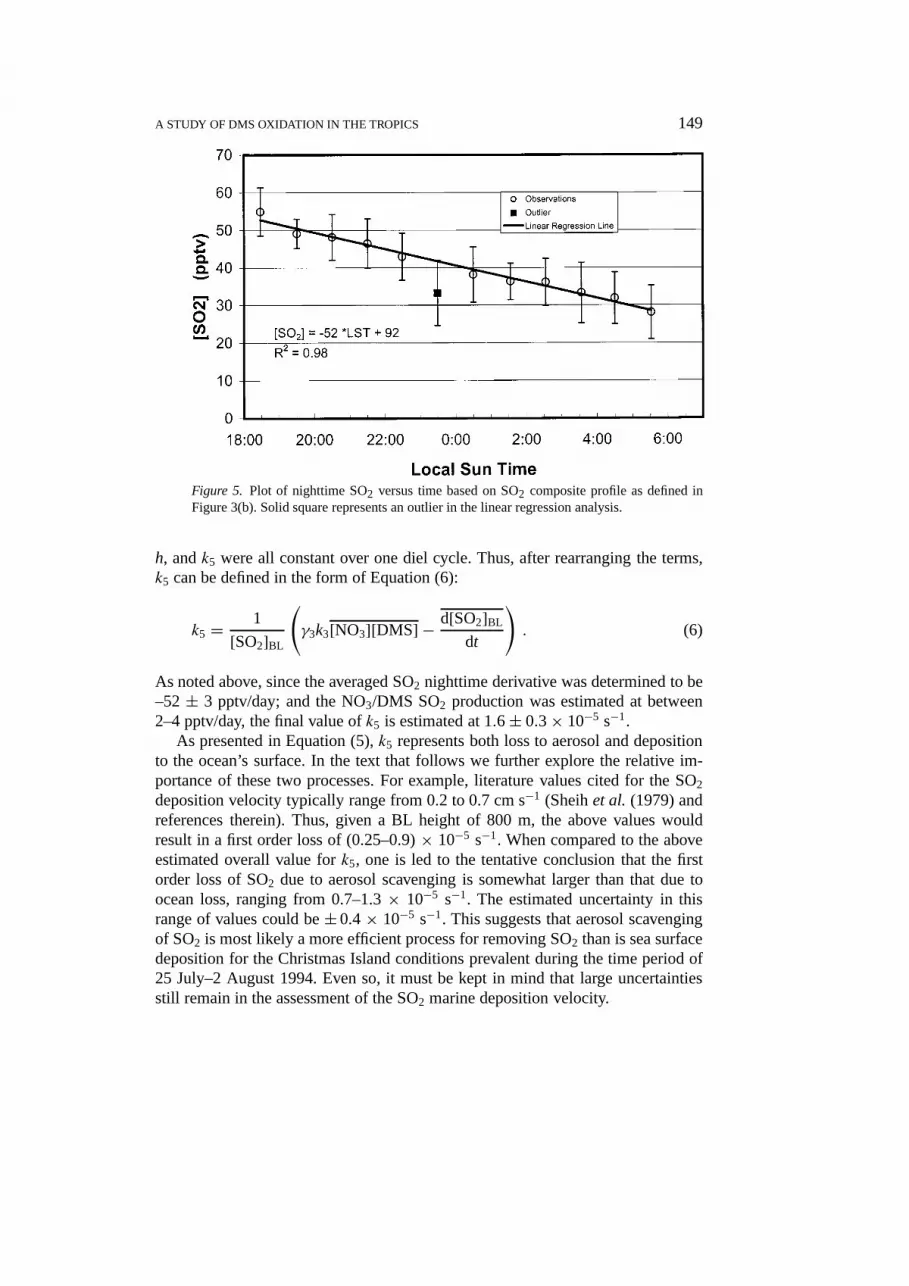
Figure 5 shows the SO2 nighttime decay profile. The data shown are the night-time data associated with those days included in our SO2 composite curve, e.g.,Figure 3(b). From here the SO2 nighttime decrease appears to be nearly linear withtime, and a quantitative evaluation of this loss, based on a regression analysis,resulted in an average time derivative of –52± 3 pptv/day. (Note, due to theshort nighttime viewing window relative to the SO2 lifetime (e.g., 15 hrs), it is notpossible from the observations to determine if the SO2 decay is actually linear orexponential.) To use this average time derivative to evaluatek5, we have formulateda time-averaged version of Equation (5) and made the further assumptions that We,
A STUDY OF DMS OXIDATION IN THE TROPICS 149
Figure 5. Plot of nighttime SO2 versus time based on SO2 composite profile as defined inFigure 3(b). Solid square represents an outlier in the linear regression analysis.
h, andk5 were all constant over one diel cycle. Thus, after rearranging the terms,k5 can be defined in the form of Equation (6):
k5 = 1
[SO2]BL
(γ3k3[NO3][DMS] − d[SO2]BL
dt
). (6)
As noted above, since the averaged SO2 nighttime derivative was determined to be–52± 3 pptv/day; and the NO3/DMS SO2 production was estimated at between2–4 pptv/day, the final value ofk5 is estimated at 1.6± 0.3× 10⁻⁵ s−1.
As presented in Equation (5),k5 represents both loss to aerosol and depositionto the ocean’s surface. In the text that follows we further explore the relative im-portance of these two processes. For example, literature values cited for the SO2
deposition velocity typically range from 0.2 to 0.7 cm s−1 (Sheihet al. (1979) andreferences therein). Thus, given a BL height of 800 m, the above values wouldresult in a first order loss of (0.25–0.9)× 10−5 s−1. When compared to the aboveestimated overall value fork5, one is led to the tentative conclusion that the firstorder loss of SO2 due to aerosol scavenging is somewhat larger than that due toocean loss, ranging from 0.7–1.3× 10⁻⁵ s−1. The estimated uncertainty in thisrange of values could be±0.4× 10⁻⁵ s−1. This suggests that aerosol scavengingof SO2 is most likely a more efficient process for removing SO2 than is sea surfacedeposition for the Christmas Island conditions prevalent during the time period of25 July–2 August 1994. Even so, it must be kept in mind that large uncertaintiesstill remain in the assessment of the SO2 marine deposition velocity.

150 G. CHEN ET AL.
In an effort to independently assess the loss of SO2 via deposition vs aerosolscavenging, we have also analyzed the Christmas Island non-sea-salt sulfate (NSS)data. NSS in a marine environment is primarily formed through the scavengingof SO2 followed by aqueous phase oxidation (Finlayson-Pitts and Pitts, 1986;Chameides and Stelson, 1992; Daviset al., 1999, and references therein). Far smal-ler contributions are made by the scavenging of gas phase H2SO4, produced fromReaction (R4) (Daviset al., 1999). The major loss of NSS is believed to be throughaerosol deposition to the ocean’s surface (Sieveringet al., 1992, and referencestherein). Since the NSS loading in the BL is mostly associated with submicronaerosol particles, its lifetime typically ranges from 2–5 days (Duceet al., 1991;Pueschel, 1995; Huebertet al., 1996b). Assuming then that SO2 aerosol scavengingand oxidation by OH define the major sources of NSS, the NSS formation rate forthe 1994 Christmas Island study can be evaluated via Equation (7):
F(NSS) = k4[OH][SO2] + k5[SO2] . (7)
Application of Equation (7), in conjunction with modeled generated OH profilesand the observational composite SO2 profile, reveals that the OH oxidation pathwayaccounts for only 6 pptv/day of NSS, while SO2 scavenging is estimated to producebetween 27 and 50 pptv/day. Thus, given the final estimated range for productionof 33–56 pptv/day, one would require that the NSS lifetime be in the range of4–7 days to maintain the observed steady-state median value of 220 pptv. (Anindependent analysis by Huebertet al. (1996b) suggests that as high as 74± 14pptv/day of NSS might be necessary to balance the NSS budget.) Thus, withinour stated uncertainties, a NSS balance could be achieved by assigning a relativelylow value to the SO2 deposition velocity, e.g., no larger than 0.25 cm s−1. In spiteof this result, one still can not rule out the possibility that a significantly higherdeposition velocity for SO2 might be operating in this environment provided thatthe further condition be imposed that there are significant unidentified sources forNSS besides that from SO2. For example, Bandyet al.(1992) and Linet al.(1993)have previously proposed SO3 as a possible NSS precursor. However, recent studiesby Davis et al. (1998, 1999) and Jeffersonet al. (1998), indicate that the latterpossibility is highly unlikely. While the latter finding would seem to limit thisavenue of exploration, as noted in Section 4.3, still other sulfur sources may yetbe identified that could contribute to the NSS budget.
4.2.2. DMS/SO2 Production Efficiency Based on OH Oxidation
As presented earlier in the text, one of the strongest arguments yet that SO2 isphotochemically generated from the oxidation of DMS is the observed sharp day-time increases in SO2 levels and the corresponding decrease in DMS (i.e., seeFigures 2(a, b). (Quite clearly there is little evidence here of any influence fromexternal non-DMS sources of SO2 such as from ship plumes (Corbettet al., 1997,1999). Thus, in the current study we have used the resulting SO2 composite profileto estimate the overall SO2 production efficiency from Reactions (R1) and (R2).

A STUDY OF DMS OXIDATION IN THE TROPICS 151
(Note, the omission of the NO3/DMS reaction as a source of SO2 reflects ourearlier assessment of this process which showed that daytime NO3 levels are solow as to make its contribution negligibly small.) According to Equation (4), themass balance equation for BL SO2 can be expressed as
d[SO2]BL
dt= γtotktot[OH][DMS] − (k5+ k4[OH])[SO2]BL , (8)
where
ktot = k1+ k2 andγtot = γ1k1+ γ2k2
k1+ k2.
Here, γtot is defined as the SO2 production efficiency from all OH/DMS reac-tions; whileγ1 andγ2, corresponding to Reactions (R1) and (R2), represent theSO2 production efficiencies for the independent OH/DMS abstraction and additionprocesses. The introduction ofγtot was required since neitherγ1 andγ2 could be in-dependently evaluated using the observational data. As discussed in Section 4.2.1,k5 denotes the overall SO2 loss due to aerosol scavenging and dry deposition. Re-call, that for the 1994 study these were the dominant loss processes. In this analysiswe have further assumed thatk5 did not vary significantly during one complete dielcycle. In this context, although one would expect some variation in vertical mixingbetween day and night, even if this were to change by a factor of 2, as noted earlier,the value for the first order loss of SO2 would change by no more than 15%. Thus,it appears that using a fixed value ofk5 to represent the overall SO2 loss is a quitereasonable approximation.
In our SO2 simulations the value ofγtot was treated as an adjustable parameterwhere the ‘best estimate value’ was defined by the best fit of the model generatedprofile to the observed SO2 composite profile. These are shown in Figure 6. Asseen here the model simulation actually reproduces the composite data profilequite well, being well within the one sigma uncertainty associated with the onehour averaged data. The ‘best fit’ curve corresponds to aγtot value of 0.65± 0.15,in excellent agreement with the independently generated non-photochemical as-sessment of 0.62± 0.06 reported by Bandyet al. (1996). The uncertainty quotedreflects the uncertainty associated with bothk5 (20%) and that resulting from themodel generated OH profile (15%).
Having defined the overall efficiency for production of SO2 from the DMS/OHreaction, there still remains the question how much of this total is associated withthe OH abstraction versus addition channels. Unfortunately, exact values can notbe obtained from this data base due to the absence of cleanly defined independentmarkers for each reaction channel. It is possible, however, to set limits on thesereaction channels. For example, because of the disparity in thek values for ad-dition and abstraction at 300 K, abstraction being 76% of the total while additioncontributes 24%, it can easily be shown that the maximum contribution that couldbe made by the addition channel alone would be 40% of the total (i.e., 0.24 out of0.65). This would be the case, if the yield of SO2 from the addition channel were

152 G. CHEN ET AL.
Figure 6. Observed and model simulated diel profiles for SO2. The overall DMS to SO2conversion efficiency is estimated at 0.65±0.15. The observed profile was that defined by thefive day SO2 composite profile as shown in Figure 3(b).
100%. On the other hand, taking the two extreme values forγ2 (addition) of 1.0and 0.0 results in values forγ1 of 0.55 and 0.85.
4.2.3. DMS/SO2 Production Efficiency Based on Cl Oxidation
In recent years, the role of Cl in DMS oxidation chemistry has been an importanttopic of discussion (Singh and Kasting, 1988; Singhet al., 1996; Chinet al., 1996;Yvon et al., 1996). This has been especially true in those cases where it appearsthat OH alone can not explain DMS oxidation rates (e.g., Chinet al., 1996; Yvonet al., 1996). Using the Christmas Island sulfur data base, we have been able tofurther examine this issue based on the composite profiles for DMS and SO2. Forexample, if chlorine reactions contribute significantly to the oxidation of DMS,the DMS sea-to-air flux would necessarily have been considerably higher thanthat estimated in Section 4.1 based on OH oxidation only. This follows from thefact that in the photochemical/mass-balance modeling approach the flux is inferredprimarily from the DMS photochemical loss rate. Thus, by neglecting an importantDMS photochemical loss process, the final result must be an underestimation ofthe actual flux. To test this hypothesis, our flux estimate was first compared againstthat estimated by Bandyet al. (1996). As noted earlier, the uniqueness of Bandyet al.’s approach is that it was not based on a photochemical mechanism. Recall,our flux estimate was found to be only 12% lower than Bandyet al.’s. Althoughthe uncertainties are significant in both approaches, the level of agreement between

A STUDY OF DMS OXIDATION IN THE TROPICS 153
the two independent approaches suggests a rather small contribution from chlorineoxidation.
A second way of looking at the chlorine oxidation question has involved ourmaking a detailed comparison of the observed and model simulated profiles ofSO2 and DMS. Our working hypothesis in this case was that if indeed Cl atoms didcontribute significantly to the oxidation of DMS, the introduction of this speciesinto our sulfur model would improve the fit between the model simulated DMSand SO2 profiles and those based on observations only. For theses simulations, weassumed a 24 hour constant Cl2 flux from sea-salt without concern about the de-tailed heterogeneous mechanism responsible. Based on this assumption, we foundthat a large morning Cl pulse was generated by the model, reflecting the buildup ofCl2 at night from the continuous chlorine source. This morning Cl pulse was foundto be an order of magnitude higher than the diurnal averaged Cl level, similar tothat reported previously by Keeneet al.(1990). In this setting, then, the Cl effect isfound to be most significant in the early morning hours when the Cl concentrationis near maximum. The magnitude of the chlorine flux in our model simulations wasadjusted so as to produce several different levels of ‘Cl effect’ as defined in terms ofrequired changes in the DMS flux. The ‘best estimate’ of the magnitude of this Cleffect was defined by that level which improved the ‘goodness-of-fit’ of DMSCalc
vs DMSObs. (The reference point in this comparison was once again the best DMSflux fit based on OH oxidation alone.) As shown in Figure 7(a), the introduction ofCl was found to slightly improve the fit between the model simulated DMS profileand that observed. This improvement was estimated at 15%, and thus, is reflectedin an increase in the DMS flux of 15%. The early morning peak Cl value wasestimated at 6×10⁴ atom cm−3 and the diel average value was 5×10³ atom cm−3.
By contrast, when the test was performed using the SO2 composite profile, evenmodest fluxes of chlorine were found to have a negative effect on the ‘goodness-of-fit’ for SO2 (see Figure 7(b)). In this case, the assumption was made that theCH3SCH2 radical resulting from the abstraction of an H atom by Cl atoms wouldgo on to react to form SO2 in much the same way that this radical reacts whenformed by OH. Taking the most favorable value forγ1, no more than a 5% increasein the DMS flux could be tolerated. Thus, the collective results from this study donot appear to support the idea that chlorine is a major player in the oxidation ofDMS in remote tropical marine environments. It is possible, however, that it couldcontribute from 5 to 15% to the oxidation of this sulfur species. This conclusionwould seem to be in concert with the results by Singhet al.(1996) which examinedthe global distribution of C2Cl4 as a means of estimating Cl atom levels in theMBL.
4.3. DMS/DMSO ASSESSMENT
As shown in Figure 1, DMSO is known to be a significant product from the additionchannel of the OH/DMS reaction. Not only has it been observed in laboratory

154 G. CHEN ET AL.
Figure 7. Comparison of model simulated diel profiles with observations, with/without Clchemistry for: (a) DMS and (b) SO2. The observed profiles were those defined by the five dayDMS and SO2 composite profiles as shown in Figures 3(a, b), respectively.
A STUDY OF DMS OXIDATION IN THE TROPICS 155
chamber investigations (Barneset al., 1996; Sørensenet al., 1996); but it alsohas been previously measured in field studies (Berresheimet al., 1993, 1998).In the current analysis, the approach taken in comparing model results with theDMSO observations was quite similar to that already discussed for SO2 derivedfrom DMS oxidation. In the DMSO case, however, the major unknown variablewas that associated with the branching ratioβ2 as shown in Figure 1 and as furtherdefined in terms of Reaction (R2).
The photochemical source of DMSO, P(DMSO), was evaluated using the quant-ity β2kadd[OH][DMS], β2 being an adjustable parameter. Loss of DMSO wasdefined in terms of OH oxidation and aerosol scavenging. For the OH oxidationpathway, we adopted thek value of Hyneset al. (1996) of 1×10⁻¹⁰ cm3 molecs−1
s−1. Aerosol scavenging of DMSO was evaluated using the sticking coefficientreported by De Bruynet al. (1994) (i.e., 0.048) in conjunction with an aerosolsurface area of 75µm2 cm−3 as defined for this same region during the PEM-Tropics A field program (Daviset al., 1999). Based on these two loss pathways,the DMSO lifetime was found to range from 70 min at night to 20 min at solar highnoon, with a diel averaged value of 43 min.
In our initial assessment ofβ2, we used the observed DMSO median valueas a constraint on the model. This resulted in an unrealistically high value ofβ2
being required to account for the observed DMSO level of 25 pptv, i.e., 47. Thisextraordinarily high value suggests that either there is a major shortcoming in ourunderstanding of the sources and sinks of DMSO and/or there are yet unknownproblems in the measurement of DMSO itself. In this context, an assessment ofthe propagated error resulting from uncertainties in reaction rate coefficients andOH model levels were found to be less than a factor of 3. However, potentiallymuch larger uncertainties could exist in our understanding of DMSO sources. Tofurther explore this issue, we examined the consistency between the reported levelsof DMSO and the measured levels of methane sulfonate (MS). Jeffersonet al.(1998) and Daviset al., (1998, 1999) have proposed that gas phase DMSO is animportant source of MS based on the fact that gas phase MSA can only explaina few percent of the measured MS level. Daviset al. (1999) estimated that fortropical marine BL conditions DMSO could contribute>75% of the observed MS,assuming a value ofβ2 of 0.8. If we assume in this study that all MS was formedthrough aerosol scavenging of DMSO, the estimated MS formation rate from me-dian DMSO levels would be 470 pptv/day. This value is about 80 times larger thanthe rate required to maintain the observed MS levels as reported by Huebertetal. (1996b). These results would therefore again argue that either DMSO sourcesand/or oxidation processes are not well understood or that difficulties exist in theDMSO measurements.
Since the model simulations employed to explain the observed levels of DMSOmet with little success, it follows that model predictions for DMS producedDMSO2 would meet with equally low success. What potentially was believed tobe of higher relevance here was the issue of the coupling between DMSO and

156 G. CHEN ET AL.
DMSO2. As shown in Figure 1, via a two step reaction process involving OH andO2, DMSO can be converted into DMSO2. The efficiency of this DMSO reactionis given by the branching coefficientβ5. In our model simulations we have usedHyneset al. (1996) totalk value (1× 10⁻¹⁰ cm3 molecs−1 s−1) for the OH/DMSOreaction and De Bruynet al.’s, (1994) measured value for the DMSO2 stickingcoefficient (i.e., 0.03) on aerosol and Daviset al.’s (1999) aerosol surface area(75 µm2 cm−3). These parameters resulted in a final estimated value forβ5 of0.05. This value suggests a ‘reasonable’ degree of coupling between observedDMSO and DMSO2. ‘Reasonable’ in this case means that the two species seemto scale to their respective lifetime estimates. It still does not resolve, however, theinconsistency between the observed levels of DMS and DMSO.
5. Summary and Conclusion
This study has critically examined, via model simulations, diel trends in observedDMS and SO2 at Christmas Island during July and August of 1994. These simula-tions have been found to reproduce the observed DMS and SO2 data exceptionallywell using a rather simplified chemical DMS oxidation scheme. On average, thedifference between the model results and observations was no more than 15%. Ofparticular, interest in these results was the finding that the diel trends in both DMSand SO2 are consistent with the notion that OH is the dominant oxidizing agent inthe MBL. In fact, the model simulations would suggest that the role of Cl atomswas no larger than 5–15% and that NO3, under the conditions of Christmas Island,was less than 5%.
Model simulations also permitted an evaluation of the overall SO2 productionefficiency from DMS. This resulted in a value of 0.65± 0.15. Both the estimatedDMS flux and conversion efficiency to SO2 were found to be within about 10% ofvalues reported by Bandyet al. (1996) using a nonphotochemical approach. Themodel simulations suggest that the OH/DMS abstraction channel is the dominantphotochemical SO2 source, resulting in a value forγ1 of between 0.5 and 0.8. Thetrue value is dependent on the efficiency assigned to the OH/DMS addition channelfor production of SO2, γ2. This could not be independently evaluated. As related toSO2 losses, the combined rate of SO2 aerosol scavenging and deposition to oceansurface was estimated at 1.6±0.3×10⁻⁵ s−1. However, based on the NSS aerosoldata collected at the same time, leads one to the tentative conclusion that aerosolscavenging of SO2 is significantly more important as a loss process than depositionto the ocean’s surface.
A significant negative result from this study was finding that model simula-tions failed very badly in reproducing the observed levels of DMSO and DMSO2.The observed levels of DMSO were also inconsistent with current thinking thatheterogeneous loss of gas phase DMSO to sea-salt aerosol is a major pathway tothe formation of MS. Overall, the predicted level of MS was nearly 20–25 timeslarger than that observed. Even so, we found that the relative levels of observed

A STUDY OF DMS OXIDATION IN THE TROPICS 157
DMSO and DMSO2 were quite consistent with what is currently known about therespective lifetimes for these two compounds.
Collectively, the above results leave one speculating that there may yet be an-other unidentified marine source of DMSO and/or that the oxidation of DMSO mayproceed along pathways that are not presently known. For example, recent labor-atory kinetic studies of the OH/DMSO system by Urbanskiet al. (1998) suggeststhat the dominant gas phase product from the OH reaction is methane sulfinic acid(MSIA). However, nothing is currently known about the further oxidation of thelatter species by OH.
Although new sulfur sources and new chemistry may be speculated on, theauthors cannot totally rule out the possibility that there may also exist unknownproblems with the measurements themselves. Clearly, the observation of abnor-mally high marine levels of DMSO is a centrally important one. It must beunderstood if we are to achieve a satisfactory understanding of the marine oxidationof DMS and its coupling to marine tropospheric aerosol formation and growth.Both new laboratory kinetic investigations involving DMSO and MSIA togetherwith extensive new field measurements of these species in conjunction with DMS,SO2, OH, and aerosol species are needed.
Acknowledgements
This work was supported in part by funds from the National Aeronautics and SpaceAdministration under grants NAGW-4908 (formerly NAGW-3770) and NAG-1-1769.
References
Ayers, G. P., Bentley, S. T., Ivy, J. P., and Forgan, B. W., 1995: Dimethylsulfide in marine air at CapeGrim, 41◦ S,J. Geophys. Res.100, 21,013–21,021.
Bandy, A. R., Scott, D. L., Blomquist, B. W., Chen, S. W., and Thornton, D. C., 1992: Low yieldsof SO2 from dimethyl sulfide oxidation in the marine boundary layer,Geophys. Res. Lett.19,1125–1127.
Bandy, A. R., Thornton, D. C., and Driedger III, A. R., 1993: Airborne measurements of sul-fur dioxide, dimethyl sulfide, carbon disulfide, and carbonyl sulfide by isotope dilution gaschromatography/mass spectrometry,J. Geophys. Res.98, 23, 423.
Bandy, A. R., Thornton, D. C., Blomquist, B. W., Chen, S., Wade, T. P., Ianni, J. C., Mitchell,G. M., and Nadler, W., 1996: Chemistry of dimethyl sulfide in the equatorial Pacific atmosphere,Geophys. Res. Lett.23, 741–744.
Barnes, I., Bastian, V., Becker, K. H., and Martin, D., 1989: Fourier Transform IR studies of thereactions of dimethyl sulfoxide with OH, NO3, and Cl radicals, in E. S. Saltzman and W. J.Cooper (eds),Biogenic Sulfur in the Environment, Am. Chem. Soc., Washington, D.C.
Barnes, I., Becker, K. H., and Patroescu, I., 1994: The tropospheric oxidation of dimethyl sulfide: Anew source of carbonyl sulfide,Geophys. Res. Lett.21, 2389–2392.
Barnes, I., Becker, K. H., and Patroescu, I., 1996: FTIR product study of the OH initiated oxidation ofdimethyl sulphide: Observation of carbonyl sulphide and dimethyl sulphoxide,Atmos. Environ.30, 1805–1814.

158 G. CHEN ET AL.
Bates, T. S., Lamb, B. K., Guenther, A., Dignon, J., and Stoiber, R. E., 1992: Sulfur emissions to theatmosphere from natural sources,J. Atmos. Chem.14, 315–337.
Bates, T. S., Cline, J. D., Gammon, R. H., and Kelly-Hansen, S. R., 1987: Regional and seasonalvariations in the flux of oceanic dimethylsulfide to the atmosphere,J. Geophys. Res.92, 2930–2938.
Bates, T. S., Kelly, K. C., and Johnson, J. E., 1993: Concentrations and fluxes of dissolved bio-genic gases (DMS, CH4, CO, CO2) in the equatorial Pacific during the SAGA 3 experiment,J.Geophys. Res.98, 16,969–16,977.
Berresheim, H., Eisele, F. L., Tanner, D. J., Covert, D. S., McInnes, L., and Ramsey-Bell, D. C.,1993: Atmospheric sulfur chemistry and cloud condensation nuclei (CCN) concentrations overthe northeastern Pacific coast,J. Geophys. Res.98, 12701–12711.
Berresheim, H., Wine, P., and Davis, D., 1995: Sulfur in the atmosphere, in H. B. Singh (ed.),Composition, Chemistry, and Climate of the Atmosphere, Van Nostrand Reinhold, New York,pp. 251–307.
Berresheim, H., Huey, J. W., Thorn, R. P., Eisele, F. L., Tanner, D. J., and Jefferson, A., 1998: Meas-urements of dimethylsulfide, dimethylsulfoxide, dimethylsulfone, and aerosol ions at PalmerStation, Antarctica,J. Geophys. Res.103, 1629–1637.
Chameides, W. L., and Stelson, A. W., 1992: Aqueous-phase chemical processes in deliquescent sea-salt aerosols: A mechanism that couples the atmospheric cycles of S and sea-salt,J. Geophys. Res.97, 20,565–20,580.
Chen, G., 1995: A study of tropospheric photochemistry in the subtropical/tropical North and SouthAtlantic, Dissertation, PhD Thesis, Georgia Inst. of Tech., Atlanta, GA.
Chen, G., Davis, D., Kasibhatla, P., Bandy, A., Thornton, D., and Blake, D., 1999: A mass-balance/photochemical assessment of DMS sea-to-air flux as inferred from NASA GTEPEM-West A and B observations,J. Geophys. Res.105(D5), 5,471–5,482.
Chin, M., Jacob, D. J., Gardner, G. M., Foreman-Fowler, M. S., and Spiro, P. A., 1996: A globalthree-dimensional model of tropospheric sulfate,J. Geophys. Res.101, 18,667–18,690.
Clarke, A.D., Li, Z., and Litchy, M., 1996: Aerosol dynamics in the equatorial Pacific MarineBoundary layer: Microphysics, diurnal cycles and entrainment,Geophys. Res. Lett.23, 733–736.
Cline, J. D. and Bates, T. S., 1983: Dimethyl sulfide in the equatorial Pacific Ocean: A natural sourceof sulfur to the atmosphere,Geophys. Res. Lett.10, 949–952.
Corbett, J. J. and Fischbeck, P. S., 1997: Emissions from ship,Science278, 823–824.Corbett, J. J., Fischbeck, P. S., and Pandis, S. N., 1999: Global nitrogen and sulfur inventories for
oceangoing ships,J. Geophys. Res.104(D3), 3,457–3,470.Crawford, J., 1997: An analysis of the photochemical environment over the western, north Pacific
based on airborne field observations, Dissertation, PhD Thesis, Georgia Inst. of Tech., Atlanta,GA.
Crawford, J., Davis, D., Olson, J., Chen, G., Liu, S., Gregory, G., Barrick, J., Sachse, G., Sand-holm, S., Heikes, B., Singh, H., and Blake, D., 1999: Assessment of upper tropospheric HOx
sources over the tropical Pacific based on NASA GTE/PEM data: Net effect on HOx and otherphotochemical parameters,J. Geophys. Res., in press.
Davis, D. D., Crawford, J., Chen, G., Chameides, W., Liu, S., Bradshaw, J., Sandholm, S., Sachse,G., Gregory, G., Anderson, B., Barrick, J., Bachmeier, A., Collins, J., Browell, E., Blake, D.,Rowland, S., Kondo, Y., Singh, H., Talbot, R., Heikes, B., Merrill, J., Rodriguez, J., and Newell,R. E., 1996: Assessment of the ozone photochemistry tendency in the western North Pacific asinferred from PEM-West A observations during the fall of 1991,J. Geophys. Res.101, 2111–2134.
Davis, D. D., Chen, G., Kasibhatla, P., Jefferson, A., Tanner, D., Eisele, F., Lenschow, D., Neff, W.,and Berresheim, H., 1998: DMS oxidation in the Antarctic marine boundary layer: Comparisonof model simulations and field observations of DMS, DMSO, DM SO2, H2SO4(g), MSA(g),and MSA(p), J. Geophys. Res.103, 1657–1678.

A STUDY OF DMS OXIDATION IN THE TROPICS 159
Davis, D., Chen, G., Bandy, A., Thornton, D., Eisele, F., Mauldin, L., Tanner, D., Lenschow, D.,Fuelberg, H., Huebert, B., Heath, J., Clarke, A., and Blake, D., 1999: Dimethyl sulfide oxidationin the equatorial Pacific: Comparison of model simulations with field observations for DMS,SO2, H2SO4(g), MSA(g), MS, and NSS,J. Geophys. Res.105(D5), 5,765–5,784.
De Bruyn, W. J., Shorter, J. A., Davidovits, P., Worsnop, D. R., Zahniser, M. S., and Kolb, C. E.,1994: Uptake of gas phase sulfur species methanesulfonic acid, dimethylsulfoxide, and dimethylsulfone by aqueous surfaces,J. Geophys. Res.99, 16,927–16,932.
Duce, R. A.et al., 1991: The atmospheric input of the trace species to the world ocean,GlobalBiogeochem. Cycles5, 191–259.
Finlayson-Pitts, B. and Pitts, J. N., 1986:Atmospheric Chemistry: Fundamentals and ExperimentalTechniques, Wiley, New York.
Grosjean, D., 1984: Photooxidation of methyl sulfide, ethyl sulfide, and methanethiol,Environ. Sci.Technol.18, 460–468.
Hatakeyama, S., Izumi, K., and Akimoto, H., 1985: Yield of SO2 and formation of aerosol in thephoto-oxidation of DMS under atmospheric conditions,Atmos. Environ.19, 135–141.
Huebert, B. J., Howell, S., Laj, P., Johnson, J. E., Bates, T. S., Quinn, P. K., Yegorov, V., Clarke, A. D.,and Porter, J. N., 1993: Observations of the atmospheric sulfur cycle on SAGA-3,J. Geophys.Res.98, 16,985–16,996.
Huebert, B. J., Zhuang, L., Howell, S., Noone, K., and Noone, B., 1996a: Sulfate, nitrate, methanes-ulfonate, chloride, ammonium, and sodium measurements from ship, island, and aircraft duringASTEX/MAGE, J. Geophys. Res.101, 4413–4423.
Huebert, B. J., Wylie, D. J., Zhuang, L., and Heath, J. A., 1996b: Production and loss of methanes-ulfonic and non-sea-salt sulfate in the equatorial Pacific marine boundary layer,Geophys. Res.Lett.23, 737–740.
Hynes, A. J. and Wine, P. H., 1996: The atmospheric chemistry of dimethylsulfoxide (DMSO)kinetics and mechanism of the OH+ DMSO reaction,J. Atmos. Chem.24, 23–37.
Jefferson, A., Tanner, D. J., Eisele, F. L., Huey, J. W., Davis, D. D., Chen, G., Torres, A., and Ber-resheim, H., 1998: OH oxidation chemistry and MSA formation in the coastal Antarctic boundarylayer,J. Geophys. Res.103, 1647–1656.
Keene, W. C., Pszenny, A. A. P., Jacob, D. J., Duce, R. A., Galloway, J. N., Schultz-Tokos, J. J.,Sievering, H., and Boatman, J. F., 1990: The geochemical cycling of reactive chlorine throughthe marine troposphere,Global Biogeochem. Cycles4, 407–430.
Lin, X., Chameides, W. L., Kiang, C. S., Stelson, A. W., and Berresheim, H., 1992: A model study ofthe formation of cloud condensation nuclei in remote marine areas,J. Geophys. Res.97, 18161–18172.
Niki, H., Maker, P. D., Savage, C. M., and Breitenbach, L. P., 1983: An FTIR study of the mechanismfor the reaction HO+ CH3SCH3, Int. J. Chem. Kinet.15, 647–654.
Pueschel, R. F., 1995: Atmospheric aerosols, in H. B. Singh (ed.),Composition, Chemistry, andClimate of the Atmosphere, Van Nostrand Reinhold, New York, pp. 251–307.
Putaud, J. P., Mihalopoulos, N., Nguyen, B. C., Campin, J. M., and Belviso, S., 1992: Seasonal vari-ations of atmospheric sulfur dioxide and dimethyl-sulfide concentrations at Amsterdam Island inthe Southern Indian Ocean,J. Atmos. Chem.15, 117–131.
Russell, L. M., Lenschow, D. H., Laursen, K. K., Krummel, P. B., Siems, S. T., Bandy, A. R.,Thornton, D. C., and Bates, T. S., 1998: Bidirectional mixing in an ACE-1 marine boundarylayer overlain by a second turbulent layer,J. Geophys. Res.103, 16411–16432.
Saltzman, E. S. and Cooper, W. J., 1989: Dimethyl sulfide and hydrogen sulfide in marine air,Biogenic Sulfur in the Environment, ACS Symposium Series393, 330–351.
Sheih, C. M., Wesely, M. L., and Hicks, B. B., 1979: Estimated dry deposition velocities of sulfurover the eastern United States and surrounding regions,Atmos. Environ.13, 1361–1368.

160 G. CHEN ET AL.
Sievering, H., Boatman, J., Gorman, E., Kim, Y., Anderson, L., Ennis, G., Luria, M., and Pandis, S.,1992: Removal of sulphur from the marine boundary layer by ozone oxidation in sea-salt aerosol,Nature360, 571–573.
Singh, H. B. and Kasting, J. F., 1988: Chlorine-hydrocarbon photochemistry in the marine tropo-sphere and lower stratosphere,J. Atmos. Chem.7, 261–285.
Singh, H. B., Thakur, A. N., Chen, Y. E., and Kanakidou, M., 1996: Tetrachloroethene as an indicatorof low Cl atom concentrations in the troposphere,Geophys. Res. Lett.23, 1529–1532.
Sørensen, S., Falbe-Hansen, H., Mangoni, M., Hjorth, J., and Jensen, N. R., 1996: Observation ofDMSO and CH3S(O)OH from the gas phase reaction between DMS and OH,J. Atmos. Chem.24, 299–315.
Stull, R. B., 1988:An Introduction to Boundary Layer Meteorology, Kluwer Academic Publishers,Norwell, Mass.
Thompson, A. M. et al., 1993: Ozone observations and a model of marine boundary layerphotochemistry during SAGA 3,J. Geophys. Res.98, 16,955–16,968.
Thornton, D. C. and Bandy, A. R., 1993: Sulfur dioxide and dimethyl sulfide in the central Pacifictroposphere,J. Atmos. Sci.17, 1–13.
Urbanski, S. P., Stickel, R. E., and Wine, P. H., 1998: Mechanistic and kinetic study of the gas-phasereaction of hydroxyl radical with dimethyl sulfoxide,J. Phys. Chem. A102, 10,522–10,529.
Urbanski, S. P. and Wine, P. H., 1999: Chemistry of gas phase organic sulfur-centered radicals, inZ. B. Alfassi (ed.),S-Centered Radicals, Wiley.
Yvon, S. A., Saltzman, E. S., Cooper, D. J., Bates, T. S., and Thompson, A. M., 1996: Atmosphericsulfur cycling in the tropical Pacific marine boundary layer (12ES, 135EW): A comparison offield data and model results, 2, Sulfur dioxide,J. Geophys. Res.101, 6911–6918.