a strategy to improve student's motivation levels in programming courses
TRANSCRIPT
Session F4F
978-1-4244-6262-9/10/$26.00 ©2010 IEEE October 27 - 30, 2010, Washington, DC 40th ASEE/IEEE Frontiers in Education Conference F4F-1
A Strategy to Improve Student’s Motivation Levels in Programming Courses
Scheila Wesley Martins, Antonio Jose Mendes and Antonio Dias Figueiredo
University of Coimbra, [email protected], [email protected], [email protected]
Abstract - In this paper we present and discuss a pedagogical strategy to promote programming learning. It was conceived to help students maximize their learning through the conscious assessment of their self-efficacy level, while they develop a suitable programming study behavior. We present and discuss the results of a two years experience conducted in the context of a Programming course at the University of Coimbra. In those experiences we used several instruments to assess different aspects, like motivation, self-efficacy and satisfaction with course activities and demonstrate an alternative model to make introductory programming courses more productive and attractive, increase motivation for learning and decrease dropout levels among students. Index Terms – Student motivation, Programming learning; Research Communities; Self-efficacy.
INTRODUCTION
Computer programming learning is known to be a difficult task for many students. Most teachers often refer low abstraction and problem solving abilities as the main causes for student difficulties [1]. However, we believe there is another important issue that really matters: the level of motivation students should reach to get really involved in the subject, and prevent them from quitting the course, even before they really try to overcome the natural and inherent learning difficulties created by programming characteristics. Today we often see students in classes simply quitting from trying to solve some problem, because they don’t see a solution immediately or their first attempt does not work as expected. So, in our view, motivation strategies must be developed and used if we want to help students to improve the academic skills they need to overcome their natural difficulties [2].
A good part of what we learn, either from will or need, involves motivation, and motivation for learning must be developed through a continuous maintenance process which includes intrinsic and extrinsic strategies, ways to evaluate, stimulate or change the individual appetence to do or not do something. Thus, rather than just being able to define a methodology of teaching-learning for programming, it would be interesting to be able to establish a set of strategies that show students that solving programming problems is an activity that they are fully capable of accomplishing. It is important to value contexts and establish a dynamics in
class that may motivate students to teamwork, giving evidence and making them aware that individual difficulties are surmountable so that they get ready to “learn to think”[3]. This should lead to a higher student commitment to their learning, including behavioral changes that may improve their performance throughout the course.
MOTIVATION AND ACADEMIC REFORM
The growing number of students in the university system has burdened the traditional academic model. In a short timeframe there was a growing demand that made the academia need to change their way of work and educational model, without a previous preparation to adequately respond to that demand. In Europe, the most important action in the last years has been the evolution of the Bologna process [4].
Facing the urgency in finding ways to manage this situation, academia often chooses processes that privilege administrative issues, which are not always the best solution under a didactic point of view. Although there is a need for a renovation in the academic life to better suit the new reality, it is a process that is under development and where the administrative reforms end up influencing the evolution of didactic processes.
As an example, introductory programming courses (CS1) usually present a high number of enrolled students, with a high level of heterogeneity among students in the same course. The teaching model of most programming courses in our department includes: • Theoretical classes (2 hours): all students enrolled
should attend a lecture; • Practical classes (2 hours): students enrolled are divided
into classes of up to 30 students to carry out practical lab activities under a professor supervision, and:
• Lab practical classes (2 hours): support classes, remedial work and clarification of doubts, non mandatory, oriented by course tutors. This model was implemented in the context of the
degree adaptation to Bologna requirements, aiming to make the student more independent, responsible for the construction of their own knowledge. Although the intentions were good, the results have not been positive, since the dropout rates and course retaking has not changed and has even increased in some cases. Students don’t seem ready to assume a leading role in their learning and their motivation, self esteem and will to learn are simply not good enough. This situation is particularly evident in lab practical classes where students are expected to develop
Session F4F
978-1-4244-6262-9/10/$26.00 ©2010 IEEE October 27 - 30, 2010, Washington, DC 40th ASEE/IEEE Frontiers in Education Conference F4F-2
independent work, having a tutor available to help when necessary. Most students simply miss those classes, and many times good students use them more than week students.
TEACHING TO THINK IN PROGRAMMING
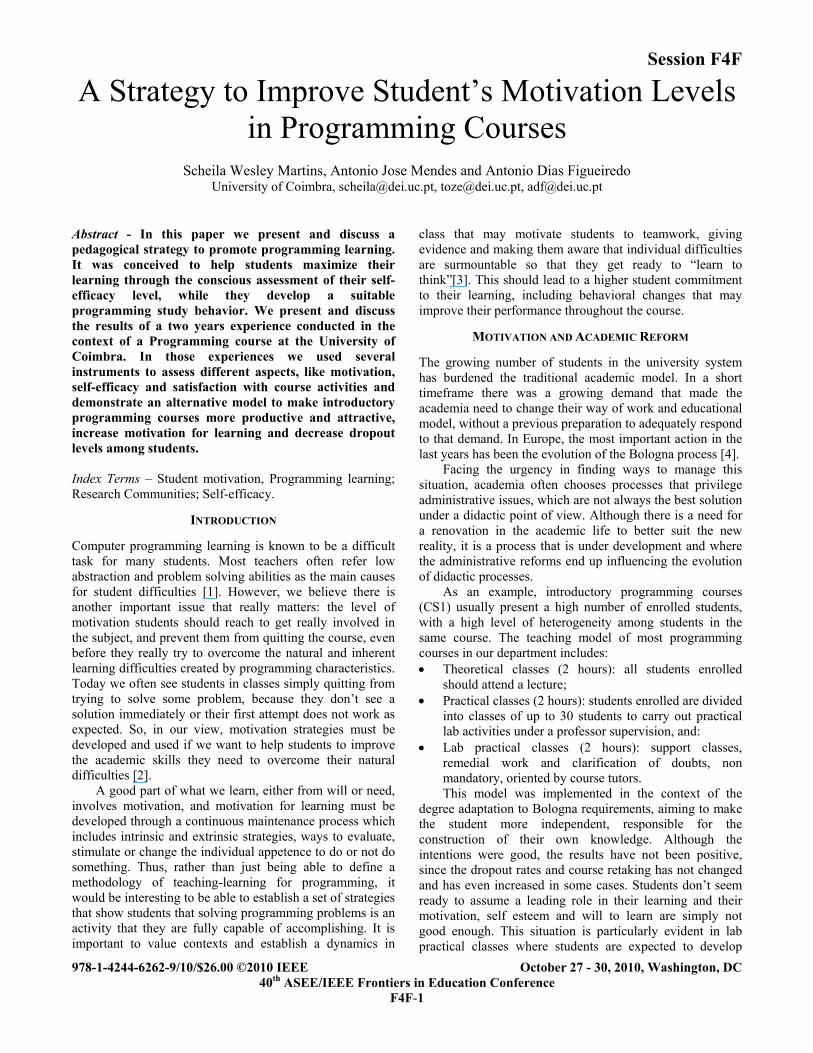
Our pedagogical strategy aims to define a set of recommendations regarding contexts and didactic activities, computational tools and motivational strategies that may assist the teacher in the definition of learning contexts for programming courses, as shown in figure 1. The goal is to identify conditions that may make programming learning more stimulating, minimizing drop-out intentions and making the student learn more and better.
FIGURE 1
PEDAGOGICAL STRATEGY
The proposal was developed under the perspective of learning communities, inspired by a metaphor of Mathew Lipman’s communities of inquiry [5]. We consider it a relevant abstraction for proposals involving the development of critical thinking and literary skills, and also as a strategy to improve the capacity to solve programming problems among university students [6].
In our view the course context should include didactic activities planned to strengthen the student’s involvement with the process of knowledge acquisition and development of competences to solve problems, through: teamwork and the motivation to practice their skills, in collaborative knowledge production through small projects and research activities, peer tutoring and continuous assessment.
The context can include computer based tools that might help learning, such as algorithm simulation tools or software to support competitions and testing of programs. To stimulate extra-curricular activities and to facilitate the monitoring and continuous assessment tasks, it is important to use a Learning Management System (LMS).
Motivational measures such as the self-efficacy, confidence, usefulness and satisfaction with the proposed activities should be checked regularly to support student guidance and to adequately direct the teacher’s efforts in student motivation or in the prevention of behaviors that may lead to students dropping out.
EXPERIMENTATION
The proposed strategy was developed in the context of the Programming course included in the Masters Degree in Design and Multimedia (MDM) at the University of Coimbra. The aim of this course is to develop basic programming knowledge that may allow students to follow other courses that require some programming knowledge.
Although it is a Masters, students usually don’t have any relevant programming experience, as they come from design and arts courses. The proposal was used in the academic year 2008/09 and, in an improved format, also in 2009/10. In the former the course had 15 students enrolled, while in the later we had 18 students enrolled. It is worth saying that the MDM started in 2008/09, so the Programming course didn’t exist before and comparative analysis with prior edition are not possible.
I. Pedagogic Strategy Approach
Instead of considering the usual distinction between theoretical, practical or lab classes, we consider all classes as spaces for knowledge construction and experimentation, making up a total of 6 weekly hours of work.
Bearing in mind the students’ artistic interest, we chose to use a context made of visual hands-on projects of growing complexity. The idea was to facilitate their involvement and interest in the course activities. The same reason led us to choose the Processing language [7]. It is a Java based language that facilitates the development of visual projects.
The course was structured according to the dynamics of Research Communities. The exercises and projects involved a need for research, especially the review of some algebra and mathematics concepts. The teacher closely followed each student’s activities and gave regular qualitative feedback about each group assignments. The Moodle LMS was used to support some tasks.
In the first year the course included individual seminars about artistic projects made in Processing, practical group work, discursive evaluation of peers’ works, a portfolio about programming art projects, and continuous assessment.
In the second year, three new tasks were included: individual programming challenges, mini-test simulation and mini-tests. Inspired in the JiTT challenges [8], small programming challenges were planned in specific moments, as a way to stimulate individual work, especially outside the classroom. These challenges include a self-evaluation component, making the student familiar with critical assessment. The mini-test simulation was the only non-scored task and was included to give students a test experience in less stressful conditions. The results were corrected and given back to students, so that they could be aware of their current level. Bad results were used to demonstrate the need for better study habits outside the classroom.
II. Pedagogic Strategy Evaluation
The small number of students made possible a close student monitoring. It also gave the opportunity for the teacher to know the students well, changing the class dynamics to an eminently research approach during the different activities.
In the first year we wanted to verify the coherence of our approach. We used a continuous assessment system during the different tasks. We also asked the students to make a biweekly reflexion about their satisfaction with their
Session F4F
978-1-4244-6262-9/10/$26.00 ©2010 IEEE October 27 - 30, 2010, Washington, DC 40th ASEE/IEEE Frontiers in Education Conference F4F-3
own performance, tasks, materials and class rhythm. This was used to introduce changes when necessary.
In the second year we also used several instruments to evaluate cognitive aspects related with motivation: a survey on study behaviors through the Inventory of Attitudes and Study Behaviors (IACHE) [9], an evaluation of the course development through Course Interest Survey (CIS) [10], an assessment of satisfaction with the activities through the Student Motivation Problem Solving Questionnaire (SMPSQ) [11] and a measurement of the students’ levels of self-efficacy [12] in relation with the language and the studied paradigm.
The IACHE tool is a survey developed by Portuguese researchers, which seek to assess features related with college students’ learning strategies. It includes cognitive, motivational and behavioral dimensions, distributed in five sub-scales: • Comprehensive focus, using reflection and deep
content analysis, which implies an higher effort and time in learning;
• Reproductive focus, the tendency to spend only a minimum effort on a superficial learning, based on memorization and contents reproduction;
• Involvement, or motivation, related essentially with requirements of intrinsic motivation;
• Organization, analyzes the indications of some organizational level on study activities;
• Competence personal perception, a measure on how students see their own competence in the course. The CIS is a tool inspired in John Keller’s Motivation
Model ARCS (Attention, Relevance, Confidence and Satisfaction). It gives information about the ARCS’ cognitive measures among students regarding a given e-learning course, such as: pedagogical approach, class rhythm, teaching practice, proposed activities, etc.
The SMPSQ survey proposed by Margolis allows students to express their success and failure expectations, and how much time and energy they are willing to invest to conclude a school task.
The self-efficacy is a motivation measure based on a self-analysis of the ability or inability of a student to perform a specific task. Self-efficacy scales for programming [13] can help keeping the student alert regarding the quality of their learning, offering them another perspective on the assessment of their capacities, different from essays and exams’ grades.
RESULTS
For the purpose of our description we will call the 2008/09 course MDM 1 and the 2009/10 course MDM 2. Most students of both courses were recent graduates from the BSc degrees in the areas of Design (Multimedia, Industrial or Communication) and Architecture with none or very little programming experience (a situation common to CS1 courses). The samples who answered our tests included 11 students in MDM 1 and 13 students in MDM 2.
The evaluation methods used in the two years were not equal, as some of the instruments were only included in the second year, as a consequence of the first year experience. In each survey, the questions were answered by students according to their level of accordance using a Likert scale: from 1 (means no, totally disagree or unconfident) to 5, 6 or 7 (means yes, totally agree or confident), depending on each survey. The answer 0 (means don’t know) is possible only in SMPSQ. The data was analised by statistical non-parametric tests (Wilcoxon-W and Mann-Whitney-U) and using the intensity levels of answers, to identify changes on students’ answers patterns. We assembled answers in three levels: low, average and high.
I. Interviews with first year students
In the final part of the course, the first year students answered an 8-question-interview based on the perspectives of the ARCS model. We collected information about their evaluation of the course and their experience in the Masters. The results were coherent with a content analysis made on their reflections. Some aspects should be pointed out: • From the 5 courses attended by students in that
semester, Programming and Internet Technologies caused more negative expectations due to the frustrating experiences many had gone through during their BSc;
• They connect good experiences with courses where there was a clear relationship between didactics and the teacher’s posture. They mentioned positive experiences in courses where they did not feel attracted by themes, but they felt inspired by the teacher;
• They considered Programming a good surprise among the courses they had attended, highlighting the way the course was conducted, the tool that was used and the assessment process; The summary of the aspects pointed out in the
interviews and biweekly reflexions is included in table I. TABLE I
SUMMARY OF ASPECT POINTED OUT BY STUDENTS POSITIVE NEGATIVE
Research activities 1 Mathematical examples 1 Code Analysis Activity 1 Arrays content 1 Team work1 First animation challenge 1 Class dynamics1 Lack of individual commitment 1 Peer assess activity2 Delay on feedback of grades 2 Continuous assessment2 Classes’ schedule 2 Artistic contexts proposed 2 Debug of Processing Environment 2
1 Higher level and 2- Lower level
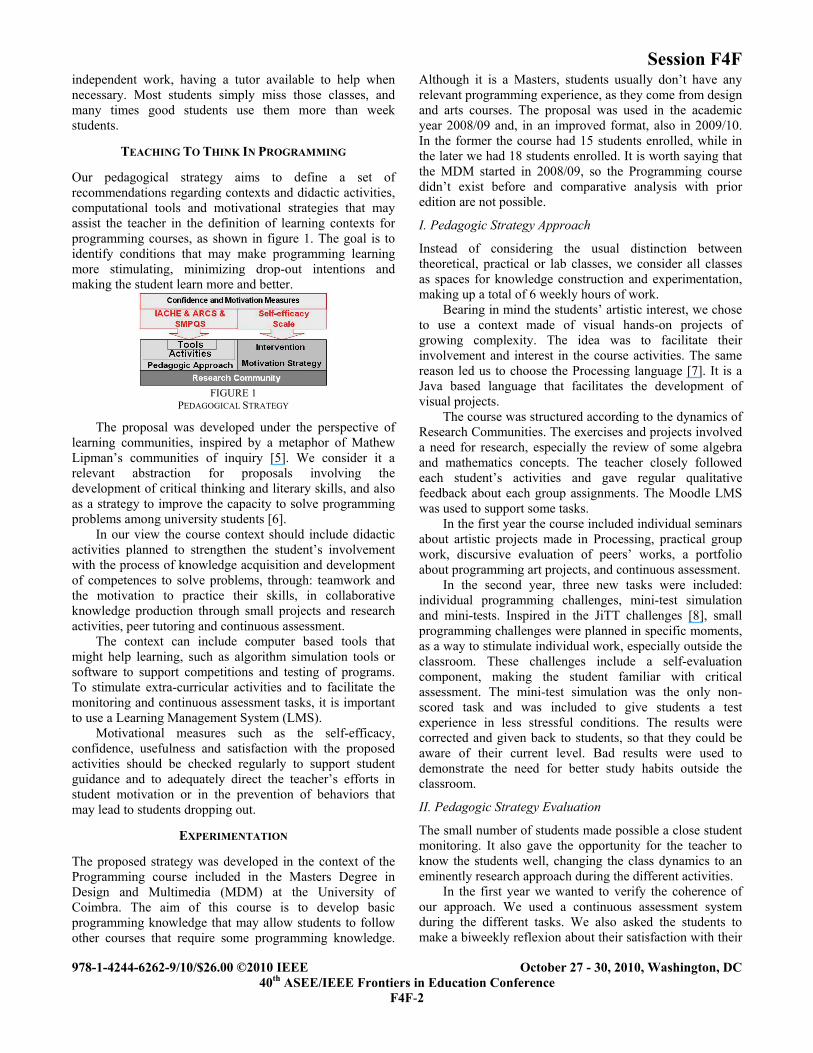
II. IACHE Results
The IACHE survey is divided into three parts. In our analysis we only considered the 44 statements from the first part. The average values obtained in the tests are described in table II. The statistical reference values (the minimal, the maximum and the average point) for the comprehensive and
Session F4F
978-1-4244-6262-9/10/$26.00 ©2010 IEEE October 27 - 30, 2010, Washington, DC 40th ASEE/IEEE Frontiers in Education Conference F4F-4
organization focus are given by (1) and for all other dimensions are given by (2).
35 x,60x10 m =<< (1)
28 x,48x8 m =<< (2)
Comparing the averages of the post-tests of the two samples, MDM 1 and MDM 2 (see table II), we conclude that except for the dimensions Involvement and Organization, all values decreased. The increase in these two dimensions shows that students have shown a high pre-disposition to the accomplishment of the course’s activities. The average of the comprehension level in both samples was higher than the reproductive level, which may be a result of the organization sense shown by students. In general, the averages in MDM 2 were better and more balanced than in MDM 1. The changes introduced in the second year may have contributed to these results.
TABLE II IACHE AVERAGES SUMMARY
PRE POST
I II III IV V I II III IV V MDM 2 42.6 29.9 21.5 36.6 31.4 39.9 28.1 25.0 33.1 31.4MDM 1 41.3 30.6 33.7 26.1 26.6
Comprehensive-I, Reproductive-II, Personal Perception-III, Involvement-IV, Organization-V
The no-parametric test results are presented in table III. First of all, we will compare the two experiments in MDM. Although the samples were small and MDM 1 students took only one test at the end of the experiment, the results of Mann-Whitney test (line 5 on table III) show that there are no significant behavior differences in the two samples, as expected. The average variations shown between the two groups at the end of the course cannot be regarded as statistically relevant, except in the case of organization (ρ=0.044), which could have resulted from the different activities included in MDM 2. Clearly this alteration required a higher effort from the students in MDM 2, as well as a higher involvement and better management of their time to meet the deadlines of the programming challenges.
TABLE III NO-PARAMETRIC TEST SUMMARY
I II III IV V
1 Negative Ranks (Pos < Pre) 7 10 2 9 8 2 Positive Ranks (Pos > Pre) 2 2 8 2 2 3 Ties (Pos = Pre) 3 0 2 1 2 4 (Wilcoxon-W) ρ-Value .085 .134 .021 .061 .0215 (Mann-Whitney-U) ρ-Value .756 .654 1.00 .777 .044
Comprehensive-I, Reproductive-II, Personal Perception-III, Involvement-IV, Organization-V
When we compare the pre-test and post-test averages in MDM 2 (table II) all values decreased, except for personal perception. However, the Wilcoxon test (lines 1 to 4 in table III) shows that this reduction cannot be regarded as statistically significant, because the average variation shown in involvement (ρ=0.061) isn’t much higher than the significance statistical test bounce (ρ=0.05). Only the variations shown in personal perception and organization (ρ = 0. 021) can be regarded as statistically relevant values.
The fact that a raise has been identified in personal perception is a sign of instability in the self-efficacy perceptions, and that the students’ level of trust in their own skills to be successful in programming learning had decreased. This is very important considering the prevention of dropout, which is one of main goals of our research.
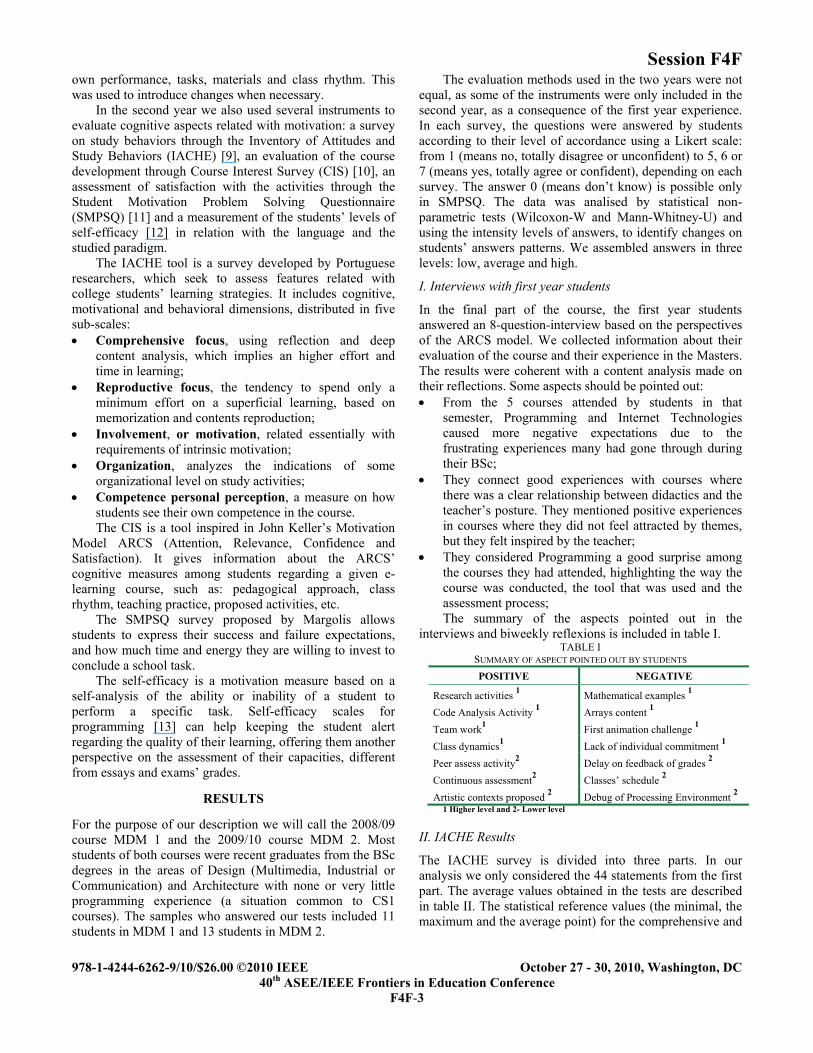
To make the intensity analyses in IACHE answers for comprehensive focus, reproductive focus, motivation and organization we considered three levels: low (answers 1 and 2), average (answers 3 and 4) and high (answers 5 and 6). For personal perception the analysis is carried out in the opposite way: low (answers 5 and 6) and high (answers 1 and 2). The results are shown in table IV.
TABLE IV IACHE INTENSITY LEVELS SUMMARY (%)
PRE (%) POST (%)
I II III IV V I II III IV V
MDM 2
Low 4 20 9 3 23 5 23 10 4 31 Avg 52 47 34 42 59 69 52 61 64 55 High 44 33 57 55 18 26 25 29 32 14
MDM 1
Low 8 20 26 11 47
Avg 56 41 39 48 46
High 36 39 35 41 7 Comprehensive-I, Reproduce-II, Personal Perception-III, Involvement-IV and Organization-V
The analysis per intensity level between MDM 1 and MDM 2 shows a decrease in the number of answers in the low and high levels, while there was an increase in the average level. If we consider that assessment in MDM 2 was more demanding, we can consider that its students have nevertheless shown more harmonious post-test cognitive indicators and less dispersion than MDM 1 students. Comparing the pre and post-tests in MDM 2 we can see a decrease in personal perception with many students moving from the high level to the average level. Therefore a better analysis of the trust and self-efficacy levels is recommended.
III. CIS Results
We used the CIS survey to measure the motivation levels, according to the ARCS model, aiming to discover how much motivation, confidence and satisfaction the students presented in the middle of the course. These results could be compared with the levels of motivation and personal perception already assessed with IACHE pre-test and would permit to evaluate the variation of the levels in those dimensions.
This instrument has 34 statements related with the same aspects of IACHE. The questions are organized in four dimensions related with attention, relevance, confidence and satisfaction. The statistical reference values for attention and confidence are given by (3) and for the relevance and satisfaction are given by (4). 24X0,4x8 m =<< (3)
27X,45x9 m =<< (4)
Session F4F
978-1-4244-6262-9/10/$26.00 ©2010 IEEE October 27 - 30, 2010, Washington, DC 40th ASEE/IEEE Frontiers in Education Conference F4F-5
A clearer conclusion for the analyzed behavior can be obtained from the analysis of the intensity levels. The results are summarized in table V. The analysis shows a higher concentration of answers in high level, which is good. However, the dimensions of confidence and satisfaction show a higher value in low level answers, which shows that some students’ level of trust wasn’t high at that time.
TABLE V CIS SURVEY INTENSITY LEVELS SUMMARY
CIS Dimension Mean Low (%) Mean (%) High (%)
Attention 27.75 8 43 49 Relevance 33.00 7 32 61 Confidence 28.50 20 28 52 Satisfaction 29.92 21 31 48
The high value of the relevance dimension brings a certain balance into the group. It is possible to say that the cognitive aspects measured up to that stage in the course were good, because the high average in relevance may be seen as a sign that students were fully aware of the importance of the course and were consciously committed.
IV. Self-efficacy Scale Results
The scale used for Processing was translated and adapted from a scale for Java [14]. It includes 32 statements concerning the tool, paradigm and problem solution. The analysis of self-efficacy followed the same process adopted with the IACHE test. The statistical reference values are given by (5). 128X,224x32 m =<< (5)
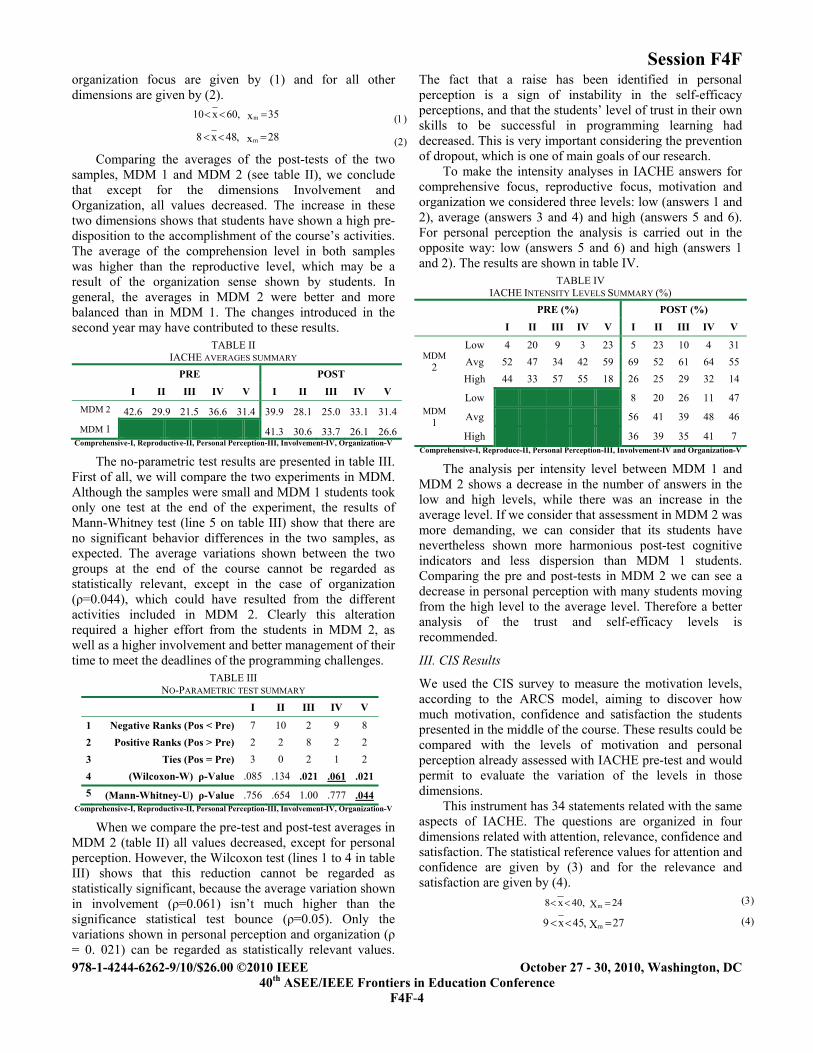
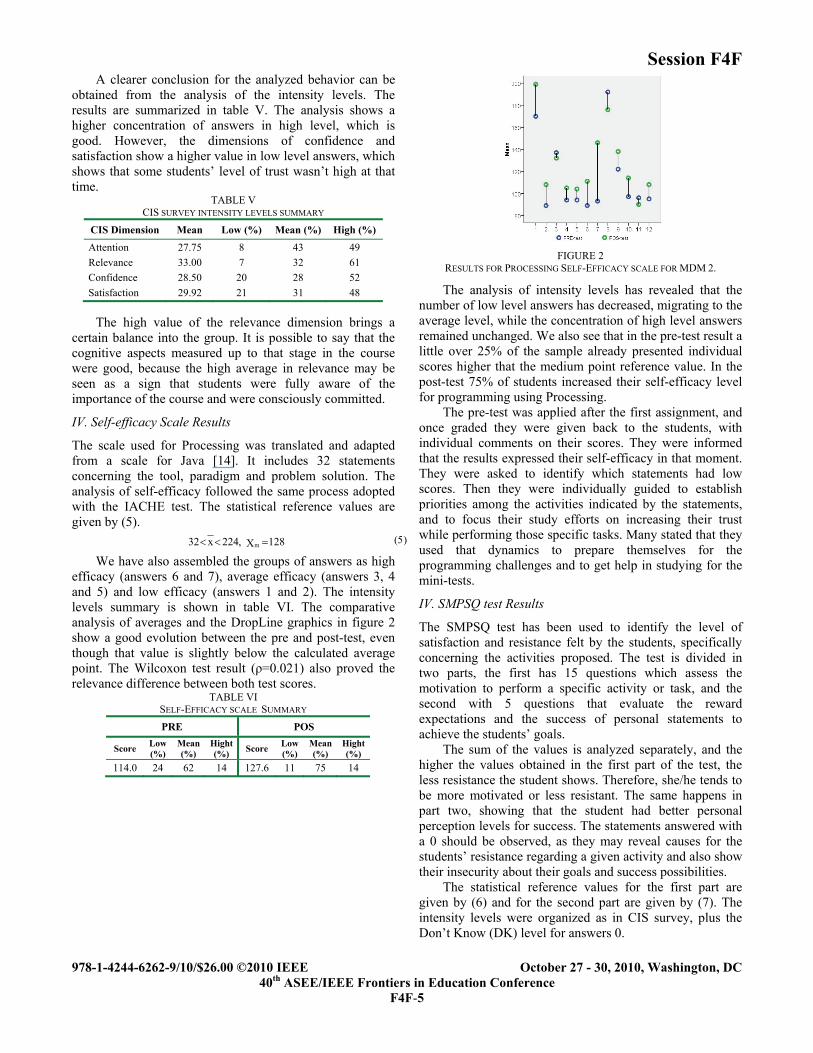
We have also assembled the groups of answers as high efficacy (answers 6 and 7), average efficacy (answers 3, 4 and 5) and low efficacy (answers 1 and 2). The intensity levels summary is shown in table VI. The comparative analysis of averages and the DropLine graphics in figure 2 show a good evolution between the pre and post-test, even though that value is slightly below the calculated average point. The Wilcoxon test result (ρ=0.021) also proved the relevance difference between both test scores.
TABLE VI SELF-EFFICACY SCALE SUMMARY
PRE POS
Score Low (%)
Mean (%)
Hight (%) Score Low
(%) Mean (%)
Hight (%)
114.0 24 62 14 127.6 11 75 14
FIGURE 2
RESULTS FOR PROCESSING SELF-EFFICACY SCALE FOR MDM 2.
The analysis of intensity levels has revealed that the number of low level answers has decreased, migrating to the average level, while the concentration of high level answers remained unchanged. We also see that in the pre-test result a little over 25% of the sample already presented individual scores higher that the medium point reference value. In the post-test 75% of students increased their self-efficacy level for programming using Processing.
The pre-test was applied after the first assignment, and once graded they were given back to the students, with individual comments on their scores. They were informed that the results expressed their self-efficacy in that moment. They were asked to identify which statements had low scores. Then they were individually guided to establish priorities among the activities indicated by the statements, and to focus their study efforts on increasing their trust while performing those specific tasks. Many stated that they used that dynamics to prepare themselves for the programming challenges and to get help in studying for the mini-tests.
IV. SMPSQ test Results
The SMPSQ test has been used to identify the level of satisfaction and resistance felt by the students, specifically concerning the activities proposed. The test is divided in two parts, the first has 15 questions which assess the motivation to perform a specific activity or task, and the second with 5 questions that evaluate the reward expectations and the success of personal statements to achieve the students’ goals.
The sum of the values is analyzed separately, and the higher the values obtained in the first part of the test, the less resistance the student shows. Therefore, she/he tends to be more motivated or less resistant. The same happens in part two, showing that the student had better personal perception levels for success. The statements answered with a 0 should be observed, as they may reveal causes for the students’ resistance regarding a given activity and also show their insecurity about their goals and success possibilities.
The statistical reference values for the first part are given by (6) and for the second part are given by (7). The intensity levels were organized as in CIS survey, plus the Don’t Know (DK) level for answers 0.
Session F4F
978-1-4244-6262-9/10/$26.00 ©2010 IEEE October 27 - 30, 2010, Washington, DC 40th ASEE/IEEE Frontiers in Education Conference F4F-6
45X,75x15 m =<< (6)
15X,25x5 m =<< (7)
The summary is presented in table VII. The statistic comparison between the activities mean didn’t show relevant differences. Despite that, intensity analyses shows that seminar and programming challenges activities were preferred by students.
TABLE VII SMPSQ SURVEY SUMMARY
Activities Mean DK (%)
Low (%)
Mean (%)
High (%) Part 1 Part 2
Seminar 50.08 15.33 1 5 32 62 Code Analysis 49.80 17.50 3 10 41 46 Mini-test Simulation 51.07 16.69 2 8 39 51 Programming Challenges 40.30 13.46 1 6 43 50
It was good to see the lower concentration in low and DK levels. However, it would be interesting to know why 3% of students’ chose 0 for code analysis activities.
III. Issues About Grades and Approvals
The approval rates in a course are a good measure to assess the results of its pedagogical strategy (93.33% in MDM1 and 80% in MDM2), though this measure is sometimes overrated. When we think about motivation, the drop-out levels may be more important than final grades. It would not be correct to reduce drop out and low motivation problems in programming learning only to the increase of the students’ averages.
In our strategy, grades are important, but being able to identify and minimize the conditions that led or can lead students to drop out is the main goal. We established the difference between failing and drop-out, because we believe they are two very different kind of students’ behavior. The former includes students that went to classes, did the assessments, made a real effort, but unfortunately didn’t reach the passing level. The later includes students who didn’t show up in most classes, clearly had problems with the different assessments, and, eventually, gave up.
In MDM 1, only one student didn’t pass the course, although he did not drop out. In MDM 2 three students chose not to participate in the final project, which means that they effectively dropped out. Two of them came to classes 30 days after they started, and it might have been harder for them. The third student dropped out almost all disciplines.
The teacher was pleased with the strategy, not only with the results obtained but also with class dynamics. Although there is an increase in his work, he recognizes that this approach has a good potential to promote learning. As MDM 1 was the first edition of the course, we don’t have previous editions that might be sources of comparison.
Currently we are conducting a new experiment, this time with graduation students enrolled in BSc. Design and Multimedia Degree. Although in the previous year Java was used, the good feedback from MDM students and teacher about Processing and the whole experience, motivated this
teacher to adopt some features of the strategy tested. This experiment takes place in the second semester of 2009/10.
CONCLUSIONS
The general evaluation of the first experiment in MDM 1 was considered positive either by students as well as by the course teacher, although there wasn’t the full support of all formal cognitive evaluation instruments currently proposed by the strategy. The experience was important to guide the necessary changes and to plan the second year. The need to use formal evaluation tools, and not only interviews, to validate the strategy’s results was clear.
The second experiment, MDM 2, was also considered positive, and it was able to catch the attention of other programming teachers who already made some changes to their didactic approach. Students’ enthusiasm and success convinced us that to increase students’ motivation to programming learning is a key issue. This strategy could be a good starting point to discuss the reform of current classes’ models, especially for CS1, to make them really more attractive and stimulating for students. Being very different from common approaches, we hope our proposal may contribute to a much needed debate on pedagogical practices in introductory programming.
REFERENCES
[1] Lahtinen, E., Ala-Mutka, K., and Järvinen, H.,“A study of the difficulties of novice programmers”, SIGCSE Bull., Vol. 37, No. 3, Sep. 2005, pp. 14-18.
[2] Roberts, E., “Strategies for encouraging individual achievement in introductory computer science courses”, SIGCSE Bull., Vol. 32, No.1, Mar. 2000, pp. 295-299.
[3] Wilson, B. C. and Shrock, S., “Contributing to success in an introductory computer science course: a study of twelve factors”, SIGCSE Bull., Vol 33, No. 1, Mar. 2001, pp. 184-188.
[4] The Bologna Declaration of 19 June 1999. Technical report, European Ministers of Education, Bologna, Italy, 1999. Accessible at http://www.bologna-bergen2005.no/Docs/00-Main_doc/990719 BOLOGNA_DECLARATION.PDF. Accessed on August 4, 2006
[5] Lipman, M., “Thinking in Education”, Cambridge University Press, 1st ed., 1991.
[6] Martins, S. W., “Um modelo computacional de apoio ao desenvolvimento do pensamento crítico”, MSc. thesis, Universidade Federal de Santa Catarina (UFSC), Brazil, May 2005.
[7] Greenberg, I., “Processing: Creative Coding and Computational Art”, Friends of Ed Press, 1st ed., 2007.
[8] Bailey, T. and Forbes, J., “Just-in-time teaching for CS0”, SIGCSE Bull., Vol 37, No. 1, Feb. 2005, pp. 366-370. DOI= http://doi.acm.org/10.1145/1047124.1047469
[9] Monteiro, S., Vasconcelos, R. M., and Almeida, L. S., “Rendimento Acadêmico: Influência dos métodos de estudos”, Proceedings of VII Congresso Português de PsicoPedagogia, University of Minho, 2005.
[10] Keller, J. M., “Motivational Design for Learning and Performance: The ARCS Model Approach (handbook)”, NY: Springer, 2009.
[11] Margolis, H. (January,2009). “Student Motivation: A Problem Solving Focus” [Online], Available http://www.reading2008.com/ MotivationProblem_Solving_Questionnaire-HowardMargolis-2009 Jan1-c.pdf
Session F4F
978-1-4244-6262-9/10/$26.00 ©2010 IEEE October 27 - 30, 2010, Washington, DC 40th ASEE/IEEE Frontiers in Education Conference F4F-7
[12] Bandura, A., “Self-efficacy: Toward a unifying theory of behavioral change”, Psychological Review, Vol. 84, No. 2, 1977, pp. 191-215.
[13] Ramalingam, V. and Wiedenbeck, S., “Development and Validation of Scores on a Computer Programming Self-Efficacy Scale and Group Analyses of Novice Programmer Self-Efficacy”, Journal of Educational Computing Research, Vol. 19, No.4, 1998, pp. 367-81.
[14] Askar, P. and DaVenport, D.,“An Investigation of Factors Related to Self-Efficacy for JAVA Programming Among Engineering Students”, The Turkish Online Journal of Educational Technology – TOJET, Vol. 8, Issue 1, Article 3, Jan. 2009.
AUTHOR INFORMATION
Scheila W. Martins, PhD student of Centre for Informatics and Systems (CISUC), University of Coimbra, Portugal; [email protected]. Antonio José Mendes, researcher of Centre for Informatics and Systems (CISUC), University of Coimbra, Portugal; [email protected] António Dias Figueiredo, researcher of Centre for Informatics and Systems (CISUC), University of Coimbra, Portugal; [email protected]