a spectral analysis of team dynamics and tactics in brazilian football please scroll down for...
TRANSCRIPT
This article was downloaded by: [b-on: Biblioteca do conhecimento online UTL]On: 27 September 2013, At: 04:26Publisher: RoutledgeInforma Ltd Registered in England and Wales Registered Number: 1072954 Registered office: Mortimer House,37-41 Mortimer Street, London W1T 3JH, UK
Journal of Sports SciencesPublication details, including instructions for authors and subscription information:http://www.tandfonline.com/loi/rjsp20
A spectral analysis of team dynamics and tactics inBrazilian footballFelipe Arruda Moura a , Luiz Eduardo Barreto Martins b , Ricardo O. Anido c , Paulo Régis C.Ruffino d , Ricardo M. L. Barros b & Sergio Augusto Cunha ba State University of Londrina, Sport Sciences Department , Londrina , Brazilb Campinas State University, Physical Education , Campinas , Brazilc University of Campinas, Institute of Computing , Brazild Campinas State University, Mathematics Department , Campinas , BrazilPublished online: 30 Apr 2013.
To cite this article: Felipe Arruda Moura , Luiz Eduardo Barreto Martins , Ricardo O. Anido , Paulo Régis C. Ruffino , RicardoM. L. Barros & Sergio Augusto Cunha (2013) A spectral analysis of team dynamics and tactics in Brazilian football, Journal ofSports Sciences, 31:14, 1568-1577, DOI: 10.1080/02640414.2013.789920
To link to this article: http://dx.doi.org/10.1080/02640414.2013.789920
PLEASE SCROLL DOWN FOR ARTICLE
Taylor & Francis makes every effort to ensure the accuracy of all the information (the “Content”) containedin the publications on our platform. However, Taylor & Francis, our agents, and our licensors make norepresentations or warranties whatsoever as to the accuracy, completeness, or suitability for any purpose of theContent. Any opinions and views expressed in this publication are the opinions and views of the authors, andare not the views of or endorsed by Taylor & Francis. The accuracy of the Content should not be relied upon andshould be independently verified with primary sources of information. Taylor and Francis shall not be liable forany losses, actions, claims, proceedings, demands, costs, expenses, damages, and other liabilities whatsoeveror howsoever caused arising directly or indirectly in connection with, in relation to or arising out of the use ofthe Content.
This article may be used for research, teaching, and private study purposes. Any substantial or systematicreproduction, redistribution, reselling, loan, sub-licensing, systematic supply, or distribution in anyform to anyone is expressly forbidden. Terms & Conditions of access and use can be found at http://www.tandfonline.com/page/terms-and-conditions
A spectral analysis of team dynamics and tactics in Brazilian football
FELIPE ARRUDA MOURA1, LUIZ EDUARDO BARRETO MARTINS2, RICARDO O. ANIDO3,PAULO RÉGIS C. RUFFINO4, RICARDO M. L. BARROS2, & SERGIO AUGUSTO CUNHA2
1State University of Londrina, Sport Sciences Department, Londrina, Brazil, 2Campinas State University, PhysicalEducation, Campinas, Brazil, 3University of Campinas, Institute of Computing, Brazil, and 4Campinas State University,Mathematics Department, Campinas, Brazil
(Accepted 18 March 2013)
AbstractThe purposes of this study were to characterise the total space covered and the distances between players within teams overten Brazilian First Division Championship matches. Filmed recordings, combined with a tracking system, were used toobtain the trajectories of the players (n = 277), before and after half-time. The team surface area (the area of the convex hullformed by the positions of the players) and spread (the Frobenius norm of the distance-between-player matrix) werecalculated as functions of time. A Fast Fourier Transform (FFT) was applied to each time series. The median frequency wasthen calculated. The results of the surface area time series median frequencies for the first half (0.63 ± 0.10 cycles · min-1)were significantly greater (P < 0.01) than the second-half values (0.47 ± 0.14 cycles · min-1). Similarly, the spread variablemedian frequencies for the first half (0.60 ± 0.14 cycles · min-1) were significantly greater (P < 0.01) than the second-halfvalues (0.46 ± 0.16 cycles · min-1). The median frequencies allowed the characterisation of the time series oscillations thatrepresent the speed at which players distribute and then compact their team formation during a match. This analysis canprovide insights that allow coaches to better control the team organisation on the pitch.
Keywords: spectral analysis, tactics, surface area, spread, time series
Introduction
A substantial amount of research has been per-formed to apply tools that provide detailed informa-tion about football matches and to supplyinformation for training enhancement and for theevaluation of teams during official matches. Severalof these studies used notational analysis methods toidentify patterns and systems of play (Barros, Cunha,Magalhães, & Guimarães, 2006; Bate, 1988;Garganta, Maia, & Basto, 1997; Hughes & Franks,2005; Reep & Benjamin, 1968; Yamanaka, Hughes,& Lott, 1993).
Recent research has analysed physical perfor-mance variables, such as player distances coveredand velocities (Barros et al., 2007; Bradley et al.,2009; Di Salvo et al., 2007; Di Salvo, Gregson,Atkinson, Tordoff, & Drust, 2009). These studieswere conducted with player automatic tracking sys-tems that allowed the position of an athlete to beidentified as a function of time throughout an entirematch. However, identifying the position of theteammates at each instant in time additionally allowsthe tactics and patterns of play to be analysed in a
sports context (Frencken, Lemmink, Delleman, &Visscher, 2011).
When a football team attacks, the players mustpreserve possession of the ball, moving throughempty pitch regions in the direction of the goal tocreate scoring opportunities. Alternatively, when ateam is defending, the players move to protect theirown goal and recover possession of the ball(Mitchell, 1996). Therefore, the way that playersorganise themselves on the pitch may reflect thestrategic actions defined by them or the recommen-dations established by the coach during the match ortraining sessions. Thus, the team surface area andspread are important variables that describe the orga-nisation of the players on the pitch and representtactical performance indicators (Cunha, Moura,Santiago, Castellani, & Barbieri, 2011; Frencken &Lemmink, 2009; Garganta et al., 1997; Hughes &Bartlett, 2002; Moura, Martins, Anido, Barros, &Cunha, 2012). In the literature, surface area isdefined as the total space covered by a team at eachinstant in time. In contrast, the concept of spreadhas been associated with a measure of the distancebetween teammates (Frencken et al., 2011; Moura
Correspondence: Felipe Arruda Moura, State University of Londrina, Sport Sciences Department, Londrina, Brazil. E-mail: [email protected]
Journal of Sports Sciences, 2013Vol. 31, No. 14, 1568–1577, http://dx.doi.org/10.1080/02640414.2013.789920
© 2013 Taylor & Francis
Dow
nloa
ded
by [
b-on
: Bib
liote
ca d
o co
nhec
imen
to o
nlin
e U
TL
] at
04:
26 2
7 Se
ptem
ber
2013
et al., 2012; Okihara et al., 2004; Yue, Broich,Seifriz, & Mester, 2008a).
Using these variables, researchers have sought tofind patterns describing team tactical behavioursduring a match (Moura et al., 2012; Okihara et al.,2004; Yue et al., 2008a) to obtain an improvedunderstanding of football dynamics and the relation-ships between attack and defence. These studiesshowed that the surface area and spread of a teamdecrease if it loses possession of the ball and thatthese variables increase if a team has possession.
The quantification of the team surface area andspread time series provides data about team tacticsand patterns of play during the match and, addition-ally, reveals interactions with the opposing team(Frencken & Lemmink, 2009; Yue et al., 2008a).Given that the surface area and spread oscillationsreflect the features of the distribution of the playerson the pitch during the match, the values of thesevariables will change as the team shifts its activitybetween attack and defence. Therefore, the frequen-cies represented by the time series may represent thespeed of team reorganisation during ball possessionexchanges.
For any signal represented by a time series, aspectral analysis can be performed to show the dis-tribution of the intensity of the signal fluctuations inthe frequency domain (Yue, Broich, Seifriz, &Mester, 2008b). By transforming the time series ofteam surface areas and spreads to the frequencydomain, analyses can be performed on the speed atwhich players expand and then contract their teamformations during defending and attacking plays.Recent studies (Moura et al., 2012; Yue et al.,2008a) have presented football team surface areasand spread time series. Visually, these time seriesappeared to include low frequencies because theprincipal oscillations of the signal were slow.However, these studies did not present quantitativedata on the frequencies of these time series.
Furthermore, recent studies have shown a reduc-tion in high-intensity runs by players from the first tothe second half (Barros et al., 2007; Bradley et al.,2009; Di Salvo et al., 2009; Rampinini, Impellizzeri,Castagna, Coutts, & Wisloff, 2009). If the oscilla-tions in the surface area and spread time seriesdepend on the velocities of the players, an interestingfactor to analyse is whether the frequencies in thesetime series change as well.
Therefore, a spectral analysis of the surface areaand the spread time series of football teams mayprovide valuable data for the understanding of sportsdynamics and of the tactical features of the sport.Thus, the purpose of this study was to characterisethe surface area and the spread time series of footballteams in the frequency domain during the first andsecond halves of a match. We hypothesised that a)
the surface area and the spread time series are char-acterised by low frequencies and b) these frequenciesdecrease in the second half of the match.
Methods
Data collection
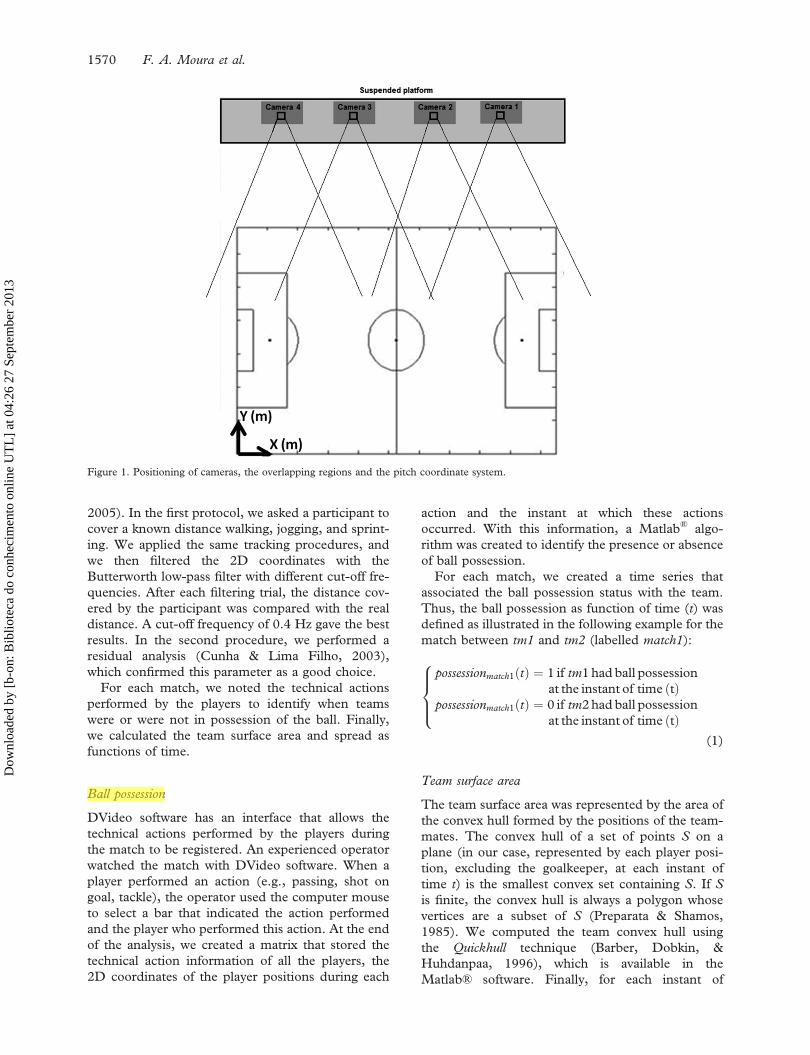
The Ethics Committee of the São Paulo StateUniversity approved this research. We analysed 20teams during official matches of the Brazilian FirstDivision Championship. To facilitate identification,teams were labelled tm1, tm2, … , tm20. Thematches were filmed by up to six digital cameras(30 Hz) from elevated positions in the stadiums.Each camera covered roughly one-quarter of thefootball pitch, and the regions covered by the cam-eras overlapped in some cases (Figure 1). After thematches, the images were transferred to computersand were synchronised with the identification ofevents that occurred in these overlapping regions,such as a kick by a player or a ball hitting the ground.Player positions as a function of time were thenobtained with an automatic tracking method.
Participants and automatic tracking methods
We obtained the trajectories of 277 football playersover all the analysed matches with the automatictracking methods in DVideo software (Figueroa,Leite, & barros, 2006a, 2006b), a tool developedfor research purposes. DVideo software has an auto-matic tracking rate of 94% of the processed frames,an average error of 0.3 m for the determination ofplayer position and an average error of 1.4% for thedistance covered (Figueroa et al., 2006b; Misuta,2009). Before each match, we obtained the coordi-nates of a set of specific points relative to the coor-dinate system associated with the pitch. Thecorresponding projections of these points in theimage were determined with DVideo software. Thehomography parameters of the image-object trans-formation were then calculated based on the DLT(Direct Linear Transformation) proposed by Abdel-Aziz and Karara (1971), and player two-dimensional(2D) coordinates relative to the pitch coordinatesystem were obtained.
The players of each team were labelled as p = 1, 2,…,14 (including goalkeeper, lineup players and sub-stitutes). Therefore, the 2D coordinates of eachplayer were defined as Xp(t) and Yp(t), where trepresents each instant of time in seconds. We fil-tered player trajectory with a Butterworth third-orderlow-pass digital filter with a cut-off frequency of 0.4Hz. This choice was based on two protocolsdescribed in previous studies (Misuta, 2004;Misuta, Menezes, Figueroa, Cunha, & Barros,
Team dynamics and tactics in Brazilian football 1569
Dow
nloa
ded
by [
b-on
: Bib
liote
ca d
o co
nhec
imen
to o
nlin
e U
TL
] at
04:
26 2
7 Se
ptem
ber
2013
2005). In the first protocol, we asked a participant tocover a known distance walking, jogging, and sprint-ing. We applied the same tracking procedures, andwe then filtered the 2D coordinates with theButterworth low-pass filter with different cut-off fre-quencies. After each filtering trial, the distance cov-ered by the participant was compared with the realdistance. A cut-off frequency of 0.4 Hz gave the bestresults. In the second procedure, we performed aresidual analysis (Cunha & Lima Filho, 2003),which confirmed this parameter as a good choice.
For each match, we noted the technical actionsperformed by the players to identify when teamswere or were not in possession of the ball. Finally,we calculated the team surface area and spread asfunctions of time.
Ball possession
DVideo software has an interface that allows thetechnical actions performed by the players duringthe match to be registered. An experienced operatorwatched the match with DVideo software. When aplayer performed an action (e.g., passing, shot ongoal, tackle), the operator used the computer mouseto select a bar that indicated the action performedand the player who performed this action. At the endof the analysis, we created a matrix that stored thetechnical action information of all the players, the2D coordinates of the player positions during each
action and the instant at which these actionsoccurred. With this information, a Matlab® algo-rithm was created to identify the presence or absenceof ball possession.
For each match, we created a time series thatassociated the ball possession status with the team.Thus, the ball possession as function of time (t) wasdefined as illustrated in the following example for thematch between tm1 and tm2 (labelled match1):
possessionmatch1 tð Þ ¼ 1 if tm1 had ball possessionat the instant of time tð Þ
possessionmatch1 tð Þ ¼ 0 if tm2 had ball possessionat the instant of time tð Þ
8>><>>:
(1)
Team surface area
The team surface area was represented by the area ofthe convex hull formed by the positions of the team-mates. The convex hull of a set of points S on aplane (in our case, represented by each player posi-tion, excluding the goalkeeper, at each instant oftime t) is the smallest convex set containing S. If Sis finite, the convex hull is always a polygon whosevertices are a subset of S (Preparata & Shamos,1985). We computed the team convex hull usingthe Quickhull technique (Barber, Dobkin, &Huhdanpaa, 1996), which is available in theMatlab® software. Finally, for each instant of
Figure 1. Positioning of cameras, the overlapping regions and the pitch coordinate system.
1570 F. A. Moura et al.
Dow
nloa
ded
by [
b-on
: Bib
liote
ca d
o co
nhec
imen
to o
nlin
e U
TL
] at
04:
26 2
7 Se
ptem
ber
2013
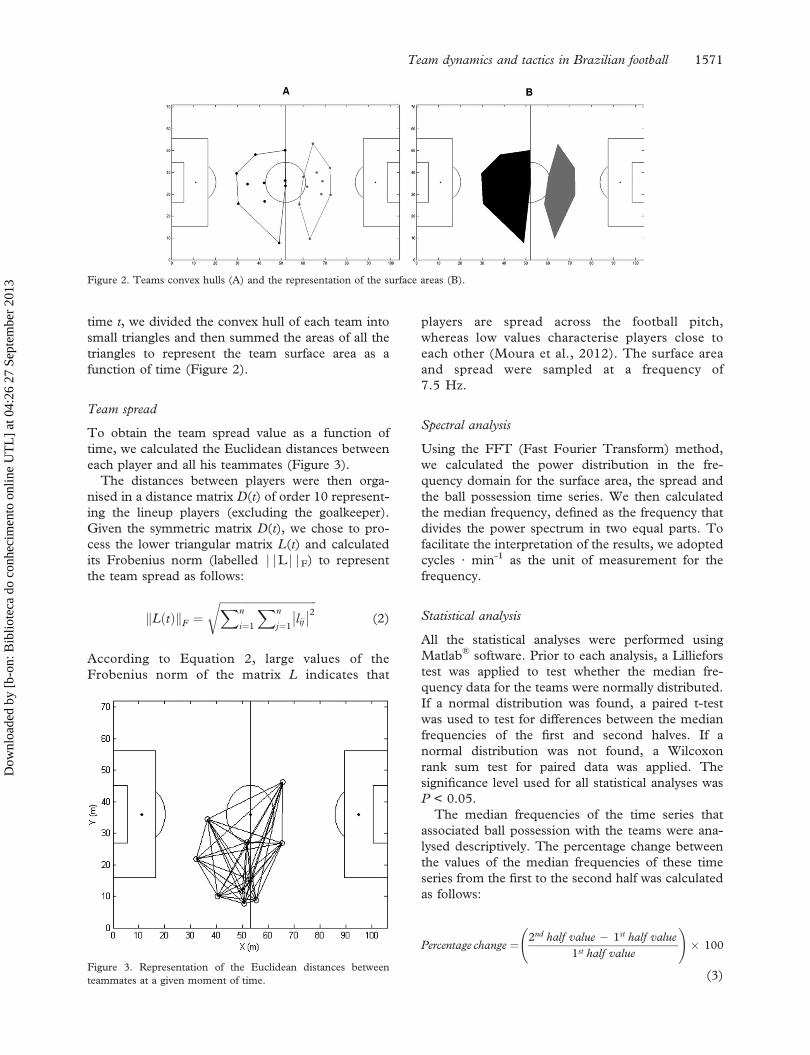
time t, we divided the convex hull of each team intosmall triangles and then summed the areas of all thetriangles to represent the team surface area as afunction of time (Figure 2).
Team spread
To obtain the team spread value as a function oftime, we calculated the Euclidean distances betweeneach player and all his teammates (Figure 3).
The distances between players were then orga-nised in a distance matrix D(t) of order 10 represent-ing the lineup players (excluding the goalkeeper).Given the symmetric matrix D(t), we chose to pro-cess the lower triangular matrix L(t) and calculatedits Frobenius norm (labelled ||L||F) to representthe team spread as follows:
kL tð ÞkF ¼ffiffiffiffiffiffiffiffiffiffiffiffiffiffiffiffiffiffiffiffiffiffiffiffiffiffiffiffiffiffiffiffiffiffiffiXn
i¼1
Xn
j¼1lij�� ��2r
(2)
According to Equation 2, large values of theFrobenius norm of the matrix L indicates that
players are spread across the football pitch,whereas low values characterise players close toeach other (Moura et al., 2012). The surface areaand spread were sampled at a frequency of7.5 Hz.
Spectral analysis
Using the FFT (Fast Fourier Transform) method,we calculated the power distribution in the fre-quency domain for the surface area, the spread andthe ball possession time series. We then calculatedthe median frequency, defined as the frequency thatdivides the power spectrum in two equal parts. Tofacilitate the interpretation of the results, we adoptedcycles · min-1 as the unit of measurement for thefrequency.
Statistical analysis
All the statistical analyses were performed usingMatlab® software. Prior to each analysis, a Lillieforstest was applied to test whether the median fre-quency data for the teams were normally distributed.If a normal distribution was found, a paired t-testwas used to test for differences between the medianfrequencies of the first and second halves. If anormal distribution was not found, a Wilcoxonrank sum test for paired data was applied. Thesignificance level used for all statistical analyses wasP < 0.05.
The median frequencies of the time series thatassociated ball possession with the teams were ana-lysed descriptively. The percentage change betweenthe values of the median frequencies of these timeseries from the first to the second half was calculatedas follows:
Percentage change ¼ 2nd half value � 1st half value
1st half value
!� 100
(3)
Figure 2. Teams convex hulls (A) and the representation of the surface areas (B).
Figure 3. Representation of the Euclidean distances betweenteammates at a given moment of time.
Team dynamics and tactics in Brazilian football 1571
Dow
nloa
ded
by [
b-on
: Bib
liote
ca d
o co
nhec
imen
to o
nlin
e U
TL
] at
04:
26 2
7 Se
ptem
ber
2013
Results
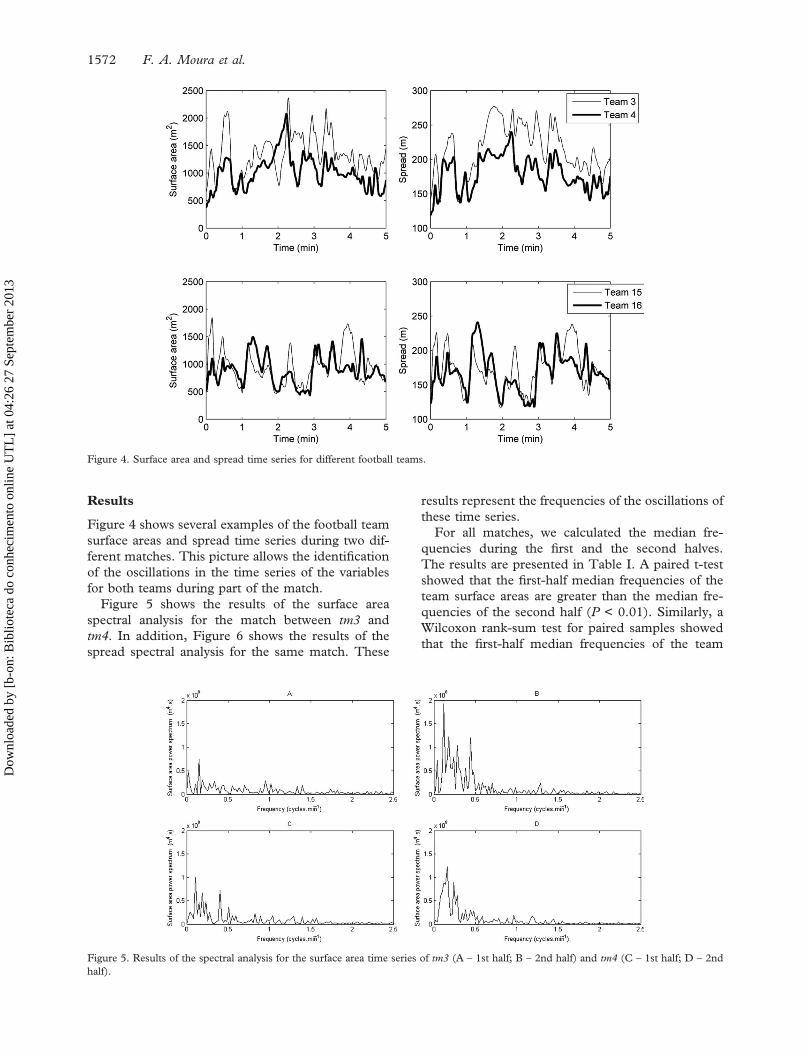
Figure 4 shows several examples of the football teamsurface areas and spread time series during two dif-ferent matches. This picture allows the identificationof the oscillations in the time series of the variablesfor both teams during part of the match.
Figure 5 shows the results of the surface areaspectral analysis for the match between tm3 andtm4. In addition, Figure 6 shows the results of thespread spectral analysis for the same match. These
results represent the frequencies of the oscillations ofthese time series.
For all matches, we calculated the median fre-quencies during the first and the second halves.The results are presented in Table I. A paired t-testshowed that the first-half median frequencies of theteam surface areas are greater than the median fre-quencies of the second half (P < 0.01). Similarly, aWilcoxon rank-sum test for paired samples showedthat the first-half median frequencies of the team
Figure 4. Surface area and spread time series for different football teams.
Figure 5. Results of the spectral analysis for the surface area time series of tm3 (A – 1st half; B – 2nd half) and tm4 (C – 1st half; D – 2ndhalf).
1572 F. A. Moura et al.
Dow
nloa
ded
by [
b-on
: Bib
liote
ca d
o co
nhec
imen
to o
nlin
e U
TL
] at
04:
26 2
7 Se
ptem
ber
2013
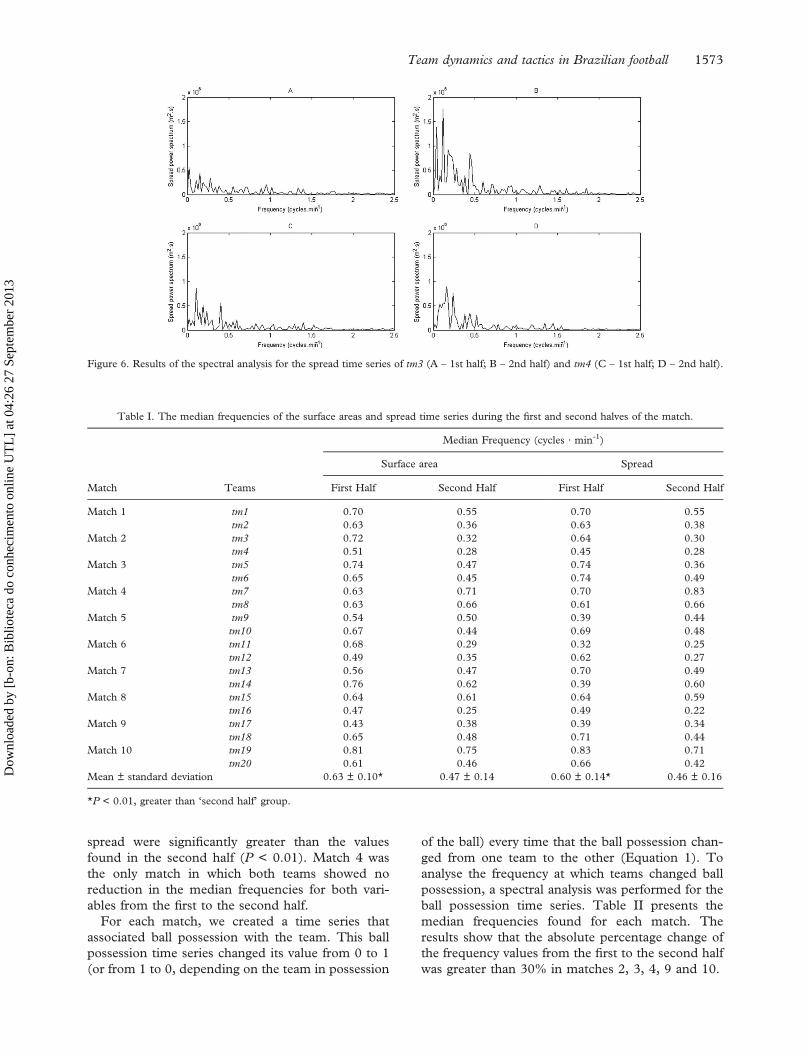
spread were significantly greater than the valuesfound in the second half (P < 0.01). Match 4 wasthe only match in which both teams showed noreduction in the median frequencies for both vari-ables from the first to the second half.
For each match, we created a time series thatassociated ball possession with the team. This ballpossession time series changed its value from 0 to 1(or from 1 to 0, depending on the team in possession
of the ball) every time that the ball possession chan-ged from one team to the other (Equation 1). Toanalyse the frequency at which teams changed ballpossession, a spectral analysis was performed for theball possession time series. Table II presents themedian frequencies found for each match. Theresults show that the absolute percentage change ofthe frequency values from the first to the second halfwas greater than 30% in matches 2, 3, 4, 9 and 10.
Table I. The median frequencies of the surface areas and spread time series during the first and second halves of the match.
Median Frequency (cycles · min-1)
Match Teams
Surface area Spread
First Half Second Half First Half Second Half
Match 1 tm1 0.70 0.55 0.70 0.55tm2 0.63 0.36 0.63 0.38
Match 2 tm3 0.72 0.32 0.64 0.30tm4 0.51 0.28 0.45 0.28
Match 3 tm5 0.74 0.47 0.74 0.36tm6 0.65 0.45 0.74 0.49
Match 4 tm7 0.63 0.71 0.70 0.83tm8 0.63 0.66 0.61 0.66
Match 5 tm9 0.54 0.50 0.39 0.44tm10 0.67 0.44 0.69 0.48
Match 6 tm11 0.68 0.29 0.32 0.25tm12 0.49 0.35 0.62 0.27
Match 7 tm13 0.56 0.47 0.70 0.49tm14 0.76 0.62 0.39 0.60
Match 8 tm15 0.64 0.61 0.64 0.59tm16 0.47 0.25 0.49 0.22
Match 9 tm17 0.43 0.38 0.39 0.34tm18 0.65 0.48 0.71 0.44
Match 10 tm19 0.81 0.75 0.83 0.71tm20 0.61 0.46 0.66 0.42
Mean ± standard deviation 0.63 ± 0.10* 0.47 ± 0.14 0.60 ± 0.14* 0.46 ± 0.16
*P < 0.01, greater than ‘second half’ group.
Figure 6. Results of the spectral analysis for the spread time series of tm3 (A – 1st half; B – 2nd half) and tm4 (C – 1st half; D – 2nd half).
Team dynamics and tactics in Brazilian football 1573
Dow
nloa
ded
by [
b-on
: Bib
liote
ca d
o co
nhec
imen
to o
nlin
e U
TL
] at
04:
26 2
7 Se
ptem
ber
2013
Discussion
In recent years, technological advances have allowedthe implementation of sophisticated match analysissystems during official sports competitions. Thesesystems have been widely used to quantify the phy-sical efforts of football players during matches(Carling, Bloomfield, Nelsen, & Reilly, 2008). Ifthe 2D coordinates of the players are known, it ispossible to understand important features of footballdynamics (Kim, 2006). The team surface area andspread help describe the organisation of the playerson the pitch and the interactions between attack anddefence (Moura et al., 2012).
In this study, we calculated the team surface areaas the area of the convex hull formed by the positionsof the teammates as a function of time. A previousstudy of Japanese football teams (Okihara et al.,2004) used the position of four players who werenear the boundary lines of the pitch to define aquadrangle. The area of the quadrangle then repre-sented the surface area occupied by the team. Thistype of quantification can suffer from the influenceof the position of one of these players on the areameasure and can overestimate the surface area value.Alternatively, the convex-hull method used in thisstudy generally considers a greater number of playersto determine the polygon vertices. Thus, the value ofthe surface area is less influenced by a given playerposition. In addition, because the convex hulldepends on a greater number of players, it maybetter represent team organisation as a whole.
We calculated the Frobenius norm of thedistance-between-player matrices as a team spreadmeasure. The Frobenius norm is one of the mostfrequently used matrix norms in linear algebra andprovides a measure of distance (Golub & Van Loan,1989) that, in our case, was used as a measure of thedistribution of the players across the pitch during thematch.
Using these variables calculated throughout thematch period with the identification of the times atwhich the team was or was not in possession of theball, we obtained time series that represented theplayer organisation on the pitch during the attackingand defending periods. Next, the time series wereanalysed in the frequency domain. This analysis pro-vides information about the frequencies at which theteam surface area and spread values increase andthen decrease. Previous studies (Moura et al.,2012; Okihara et al., 2004; Yue et al., 2008a) haveshown that if teams are attacking, the spread andsurface area values increase. In contrast, these vari-ables decrease if teams are defending. Thus, theoscillations in the time series of these variables arerelated to the team organisation on the pitch accord-ing to the purposes of attack or defence. Therefore,the frequencies of the surface area and spread timeseries are associated with the need and capability ofthe team to organise the players on the pitch asrapidly as possible. Greater frequencies indicatethat the players distribute themselves across thepitch and then adopt a compact structure morerapidly. These organisation patterns were verifiedacross all of the matches. The proposed analysis isinnovative because it is the first study that providesthis tactical information quantitatively and because itallows coaches to evaluate team behaviour duringofficial matches.
In this study, we present the median frequenciesof the surface area and the spread time series andfor the time series associated with ball possession(Table I). The dominant frequency (the frequencyassociated with the highest power spectrum value)and the mean frequency were not presented. Instead,we reported the median frequency. Based on thespectral analysis results in Figures 5 and 6, it ispossible to verify that frequencies in addition to thedominant frequency are associated with high power
Table II. The median frequencies of the time series for ball possession during the first and second halves of the match and the percentagechange.
Median Frequency (cycles · min-1) of the ball possession time series
Match First Half Second Half Percentage change (%)
Match 1 0.68 0.65 –4.8Match 2 0.72 0.34 –52.6Match 3 0.35 0.57 65.3Match 4 0.63 0.43 –32.3Match 5 0.90 0.76 –15.4Match 6 0.64 0.67 4.2Match 7 0.76 0.75 –1.8Match 8 0.93 0.78 –16.8Match 9 0.39 0.26 –32.5Match 10 0.48 0.31 –35.2Mean ± standard deviation 0.65 ± 0.20 0.55 ± 0.20
1574 F. A. Moura et al.
Dow
nloa
ded
by [
b-on
: Bib
liote
ca d
o co
nhec
imen
to o
nlin
e U
TL
] at
04:
26 2
7 Se
ptem
ber
2013
spectrum values. Thus, the particular analysis of thedominant frequency becomes complex and difficultto interpret. In contrast, the median frequency is lesssensitive to noise than the mean frequency and ismore commonly used (Grimshaw, Lees, Fowler, &Burden, 2006).
Our initial hypothesis was that the surface areaand the spread time series were distributed at lowfrequencies because the transition of the playersfrom expanded to compact when their team losespossession of the ball is slow. The hypothesis wasconfirmed, as all teams presented median frequen-cies lower than 1 cycle · min-1 (Table I). The resultsindicate that collective movements in football, asrepresented by surface area and spread, are usuallyslow and last more than 1 minute.
Additionally, the results showed that teams usuallydecrease the time series frequencies from the first tothe second half (Table I), confirming the secondhypothesis. These data may represent a tacticalchange by the team in the match or may be asso-ciated with a decrease in physical performance.Previous studies (Barros et al., 2007; Bradley et al.,2009; Di Salvo et al., 2009; Rampinini et al., 2009)have confirmed that there is a decline in the playerhigh-intensity runs in the second half compared withthe first half. Thus, the physical performance of theplayer may interfere directly with the tactical perfor-mance, as represented by the frequencies of the sur-face area and the spread time series.
Given the influence of the players closest to theboundary lines of the field (such as defenders, exter-nal defenders and forwards) on the surface areameasurement, a reduction in the median frequencyof this variable may be related to a reduction in thevelocities of these players. Alternatively, a decreasein the median frequency of the spread time seriesmay reflect a decrease in the velocity of the majorityof the players. A recent study (Moura et al., 2012)demonstrated that surface area and spread variablesare positively correlated, although they provide spe-cific information about the distribution of the playerson the pitch. This correlation may explain why themedian frequencies for both variables presented asimilar decreasing trend from the first to the secondhalf for the majority of the teams evaluated in thisstudy. If both teams showed a trend of increasingmedian frequencies for the surface area between thehalves of the match (match 4 – Table I), the samebehaviour was found for the spread median frequen-cies. These results confirmed the associationbetween the two quantities.
A recent study (Yue et al., 2008b) presented aspectral analysis of the geometrical centre (definedas the average of the coordinates of the teammates)
velocity of two teams during a German footballmatch. However, these authors used only figures topresent their results. Because no dominant or med-ian frequency was presented, the comparison of sucha study with ours is not feasible.
In addition, our results showed the median fre-quencies of the time series that associated ball pos-session with teams (Table II). These frequenciesrepresent how rapidly ball possession changesbetween teams during the match and thus reflectthe dynamics of defending and attacking plays.Higher frequency values indicate that teams changeball possession rapidly, and lower frequencies indi-cate that one or both teams are able to maintain ballpossession for longer periods. The results showedthat the median frequencies of the ball possessiontime series had an order of magnitude similar tothose of the surface area and spread time series.Therefore, there is a similarity relationship betweenthese variables that informs match dynamics and theinteractions between attack and defence. Future stu-dies may attempt to perform a detailed spectral ana-lysis of the ball possession time series for smallerperiods (i.e., for each 15 minute period) to under-stand how match dynamics change. The motivationfor these additional studies is the finding by thepresent study that the median frequencies changeddrastically from the first to the second half duringcertain matches (Table II).
The techniques described in the present studywere applied to Brazilian football teams. However,teams of different nationalities show different pat-terns of play (Yamanaka et al., 1993). Therefore,the spectral analysis of the surface area and thespread time series can be applied to teams fromdifferent nationalities, and the results can be com-piled in the literature. Previously, researchers identi-fied different patterns of play based on theinformation provided by the records of player tech-nical actions (Bate, 1988; Hughes & Churchill,2005; Hughes & Franks, 2005; Yamanaka et al.,1993), including attacking time, passes per posses-sion and shots on goal performed. Specifically, cer-tain studies (Hughes & Franks, 2005; Hughes,Robertson, & Nicholson, 1988; Tenga, Holme,Ronglan, & Bahr, 2010a, 2010b) evaluated the effec-tiveness of the “direct-play” or elaborate attacks.Nevertheless, these studies analysed only actionsoccurring when a team had possession of the ball.The spectral analysis of the surface area and thespread time series provides additional informationabout patterns of team organisation across the foot-ball pitch for both attack and defence.
Finally, it is important to highlight that the presentanalysis can be applied not only during official
Team dynamics and tactics in Brazilian football 1575
Dow
nloa
ded
by [
b-on
: Bib
liote
ca d
o co
nhec
imen
to o
nlin
e U
TL
] at
04:
26 2
7 Se
ptem
ber
2013
matches but also during training sessions to provideinsights for coaches and players to better controlteam organisation on the pitch according to theestablished strategy.
Conclusions
This study characterised football team surface areaand the spread time series in the frequency domainduring the first and second halves of matches. Thespectral analysis provided information about teamfeatures in each match.
The results confirmed that the surface area andthe spread time series were distributed at low fre-quencies and that the evaluated teams decreased themedian frequencies of these time series from the firstto the second half. In addition, a spectral analysis ofthe ball possession time series revealed patterns ofmatch dynamics and characterised the frequencies ofattack and defence by the teams.
The results of this study can provide valuable toolsfor controlling player organisation on the pitch andcan be used by football coaches during officialmatches and training sessions.
Acknowledgements
The authors would like to thank FAPESP, CAPES,CNPq and Rede Globo de Televisão.
References
Abdel-Aziz, Y. I., & Karara, H. M. (1971). Direct linear transfor-mation from comparator coordinates into object space coordinates inclose-range photogrammetry. Paper presented at the Proceedingsof the Symposium on Close-Range Photogrammetry, Illinois.
Barber, C. B., Dobkin, D. P., & Huhdanpaa, H. (1996). TheQuickhull algorithm for convex hulls. ACM Transactions onMathematical Software, 22(4), 469–483.
Barros, R. M. L., Cunha, S. A., Magalhães Jr., W. J., &Guimarães, M. F. (2006). Representation and analysis of soc-cer players’ actions using principal components. Journal ofHuman Movement Studies, 51, 103–116.
Barros, R. M. L., Misuta, M. S., Menezes, R. P., Figueroa, P. J.,Moura, F. A., Cunha, S. A., . . . Leite, N. J. (2007). Analysis ofthe distances covered by first division Brazilian soccer playersobtained with an automatic tracking method. Journal of SportsScience and Medicine, 6, 233–242.
Bate, R. (1988). Football chance: Tactics and strategy. In T.Reilly, A. Lees, K. Davis, & W. J. Murphy (Eds.), Science andfootball (pp. 293–301). London: E. & F. N. Spon.
Bradley, P. S., Sheldon, W., Wooster, B., Olsen, P., Boanas, P., &Krustrup, P. (2009). High-intensity running in English FAPremier League soccer matches. Journal of Sports Sciences, 27(2), 159–168.
Carling, C., Bloomfield, J., Nelsen, L., & Reilly, T. (2008). Therole of motion analysis in elite soccer: Contemporary perfor-mance measurement techniques and work rate data. SportsMedicine, 38(10), 839–862.
Cunha, S. A., & Lima Filho, E. C. (2003). Metodologia parasuavização de dados biomecânicos por função nãoparamétrica ponderada local robusta [Methodology for the
smooth of biomechanics data for functions distribution free].Brazilian Journal of Biomechanics, 1(6), 23–28.
Cunha, S. A., Moura, F. A., Santiago, P. R. P., Castellani, R. M.,& Barbieri, F. A. (2011). Futebol: Aspectos multidisciplinares parao ensino e treinamento [Football: multidisciplinary aspects forteaching and training]. Rio de Janeiro: Guanabara Koogan.
Di Salvo, V., Baron, R., Tschan, H., Calderon Montero, F. J.,Bachl, N., & Pigozzi, F. (2007). Performance characteristicsaccording to playing position in elite soccer. InternationalJournal of Sports Medicine, 28(3), 222–227.
Di Salvo, V., Gregson, W., Atkinson, G., Tordoff, P., & Drust, B.(2009). Analysis of high intensity activity in Premier Leaguesoccer. International Journal of Sports Medicine, 30(3), 205–212.
Figueroa, P. J., Leite, N. J., & Barros, R. M. L. (2006a).Background recovering in outdoor image sequences: An exam-ple of soccer players segmentation. Image and Vision Computing,24(4), 363–374.
Figueroa, P. J., Leite, N. J., & Barros, R. M. L. (2006b). Trackingsoccer players aiming their kinematical motion analysis.Computer Vision and Image Understanding, 101(2), 122–135.
Frencken, W., Lemmink, K., Delleman, N., & Visscher, C.(2011). Oscillations of centroid position and surface area ofsoccer teams in small-sided games. European Journal of SportScience, 11(4), 215–223.
Frencken, W. G. P., & Lemmink, K. A. P. M. (2009). Teamkinematics of small-sided soccer games. In T. Reilly & F.Korkusuz (Eds.), Science and football VI (pp. 161–166). NewYork, NY: Routledge.
Garganta, J., Maia, J., & Basto, F. (1997). Analysis of goal-scoringpatterns in European top level soccer teams. In T. Reilly,J. Bangsbo & M. Hughes (Eds.), Science and Football III, (pp.246–250). London: E & FN SPON.
Golub, G. H., & Van Loan, C. F. (1989). Matrix computations(2nd ed.). Baltimore, MD: Johns Hopkins University Press.
Grimshaw, P., Lees, A., Fowler, N., & Burden, A. (2006). Sport andexercise biomechanics. New York, NY: Taylor & Francis Group.
Hughes, M., & Churchill, S. (2005). Attacking profiles of success-ful and unsuccessful teams in Copa America 2001. In T. Reilly,J. Cabri, & D. Araújo (Eds.), Science and football V (pp. 222–228). London: Routledge.
Hughes, M., & Franks, I. (2005). Analysis of passing sequences,shots and goals in soccer. Journal of Sports Sciences, 23(5),509–514.
Hughes, M. D., & Bartlett, R. M. (2002). The use of performanceindicators in performance analysis. Journal of Sports Sciences, 20(10), 739–754.
Hughes, M. D., Robertson, K., & Nicholson, A. (1988). Ananalysis of the 1984 World Cup of Association Football. InT. Reilly, A. Lees, K. Davids & W. J. Murphy (Eds.), Scienceand Football (pp. 363–367) London: E & FN SPON.
Kim, S. (2006). Player's positional dependence of fractal behaviorsin a soccer game. Fractals-Complex Geometry Patterns andScaling in Nature and Society, 14(1), 71–76.
Misuta, M. S. (2004). Automatic tracking of soccer players trajectoriesusing videogrametry: Method validation and results analysis.(Unpublished Master degree thesis). UNICAMP, Campinas.
Misuta, M. S. (2009). Analysis of the automatic tracking of players incollective sports. (Unpublished Ph.D thesis). University ofCampinas, Campinas.
Misuta, M. S., Menezes, R. P., Figueroa, P. J., Cunha, S. A., &Barros, R. M. L. (2005). Representation and analysis of soccerplayers' trajectories. Paper presented at the XXth Congress of theInternational Society of Biomechanics, Cleveland, USA.
Mitchell, S. A. (1996). Approaches to teaching games: Improvinginvasion game performance. The Journal of Physical Education,Recreation and Dance, 2(2), 30–33.
Moura, F. A., Martins, L. E. B., Anido, R. O., Barros, R. M. L.,& Cunha, S. A. (2012). Quantitative analysis of Brazilian
1576 F. A. Moura et al.
Dow
nloa
ded
by [
b-on
: Bib
liote
ca d
o co
nhec
imen
to o
nlin
e U
TL
] at
04:
26 2
7 Se
ptem
ber
2013
football players' organisation on the pitch. Sports Biomechanics,11(1), 85–96.
Okihara, K., Kan, A., Shiokawa, M., Choi, C. S., Deguchi, T.,Matsumoto, M., & Higashikawa, Y. (2004). Compactness as astrategy in a soccer match in relation to a change in offence anddefense. Journal of Sports Sciences, 22(6), 515.
Preparata, F. P., & Shamos, M. I. (1985). Computational geometry:An introduction. New York, NY: Springer-Verlag.
Rampinini, E., Impellizzeri, F. M., Castagna, C., Coutts, A. J., &Wisloff, U. (2009). Technical performance during soccermatches of the Italian Serie A league: Effect of fatigue andcompetitive level. Journal of Science and Medicine in Sport, 12(1), 227–233.
Reep, C., & Benjamin, B. (1968). Skill and chance in associationfootball. Journal of the Royal Statistical Society, 134, 581–585.
Tenga, A., Holme, I., Ronglan, L. T., & Bahr, R. (2010a). Effectof playing tactics on achieving score-box possessions in a
random series of team possessions from Norwegianprofessional soccer matches. Journal of Sports Sciences, 28(3),245–255.
Tenga, A., Holme, I., Ronglan, L. T., & Bahr, R. (2010b). Effectof playing tactics on goal scoring in Norwegian professionalsoccer. Journal of Sports Sciences, 28(3), 237–244.
Yamanaka, K., Hughes, M., & Lott, M. (1993). An analysis ofplaying patterns in the 1990 World Cup for AssociationFootball. In T. Reilly, J. Clarys & A. Stibbe (Eds.), Scienceand Football II (pp. 206–214). London: E & FN SPON.
Yue, Z., Broich, H., Seifriz, F., & Mester, J. (2008a).Mathematical analysis of a soccer game. Part I: Individualand collective behaviors. Studies in Applied Mathematics, 121(3), 223–243.
Yue, Z., Broich, H., Seifriz, F., & Mester, J. (2008b). Mathematicalanalysis of a soccer game. Part II: Energy, spectral, and correla-tion analyses. Studies in Applied Mathematics, 121(3), 245–261.
Team dynamics and tactics in Brazilian football 1577
Dow
nloa
ded
by [
b-on
: Bib
liote
ca d
o co
nhec
imen
to o
nlin
e U
TL
] at
04:
26 2
7 Se
ptem
ber
2013