a secondary data archive for code-level debian metrics
TRANSCRIPT
A Secondary Data Archive for Code-Level Debian Metrics
Carter Kozak Elon University
Department of Computing Sciences Campus Box 2320
Megan Squire Elon University
Department of Computing Sciences Campus Box 2320
ABSTRACT In this paper, we describe a new process to collect, calculate, archive, and distribute interesting metrics for all the packages in the standard Debian GNU/Linux installation. Our method replicates and extends previous work done by other groups studying free and open source software systems (FLOSS) in three important ways. First, although there have been other previous studies that attempted to collect a large set of code-level metrics for a small set of projects, and there have been studies that generated a small set of metrics for the large Debian codebase, our project does both: we generate a larger set of metrics for the entire set of Debian packages. Second, our integration of new Debian metadata and additional code-level metrics not gathered before adds several additional layers for exploration. Finally, and most importantly, because we integrate our collection and analysis process into the automated FLOSSmole data store, we ensure timely, repeatable, and very easy comparison, replication and analysis by other groups. Thus our collection activity will continue in an automated fashion even after this paper is published, providing the foundation for additional studies to be conducted later, all freely accessible to any interested research group. After outlining our process, we discuss a few observations about the data, we outline some implications for the research community, and we present opportunities for further research.
Keywords Open source software, free software, libre software, Debian, Linux, GNU/Linux, C, FLOSS, F/OSS, source code, repository, comments, popularity, complexity.
1. INTRODUCTION Free, Libre, and Open Source Software (FLOSS) source code analysis projects typically work like this: first, researchers identify a target group of projects with source code available for download. They then examine the source code and / or metadata about those projects using automated software collectors and analyzers. The analysis process generates various metrics about the projects, such as lines of code or expression complexity. These metrics can be used to gauge characteristics of a project (size of project, complexity of code), or if gathered on multiple occasions, can be used to measure change in the projects over time. Furthermore, these metrics are sometimes used to attempt to assess factors like ‘health’ or ‘success’ of a project, or to determine the relative quality of the code or of particular contributions from developers.
Our inspiration for this project comes from a merger of ideas gleaned from several previous projects. We were interested in the wide variety of metrics produced in the now-defunct
SourceKibitzer project [1], and in papers similar to Spinellis [2]. These papers attempt to calculate a wide variety of interesting metrics from a given set of source code. ([1] used a collection of Java projects, and [2] compared C code in four different operating system kernels.) Second, we were interested in following up on a 2006 paper by Robles, Gonzalez-Barahona, Michlmayr, and Amor [3] which presented some basic metrics about seven years’ worth of data about the Debian GNU/Linux repository1 and its packages, and the related work found in their project Debian Counting2.
For our work, we were most interested in calculating the same cross-section of interesting source code-level metrics as [1] and [2], but we wanted to apply these to a corpus of projects that comprised a relatively stable and logical “unit”, such as the Debian GNU/Linux package distribution (as in [3]). Finally, and most importantly, we wanted to be able to easily and quickly replicate and extend this study again and again, saving the results after each run, so that the entire research community could benefit from the results over time, as described in the goals of the FLOSSmole project [4].
The outline of this paper is as follows. In Section 2, we first discuss the background of relevant FLOSS code-level software metrics research and discuss the various contributions of these previously published analysis papers and projects. We examine the methodologies used in several previous source code studies and discuss changes and additions that could be made. In Section 3, we explain our extension of these code studies to include the packages in the most current stable Debian GNU/Linux distribution. We present our method for collecting, parsing, and analyzing this data, and we outline what other pieces of metadata we were able to integrate into our final data set. We also present our method of ensuring that future replication studies of this same corpus of packages are easy and reliable. In Section 4, we discuss some of the results from this project, including some general observations about the data set. Finally, in Section 5 we discuss some limitations of this study and list some ideas for future work.
2. BACKGROUND SourceKibitzer was a project launched in 2007 with the mission to automate the analysis and distribution of low-level metrics for approximately 500 unrelated Java packages. The project lasted only one year, after which time the project leaders moved on to do other things. In addition to some brief stories in the industrial trade magazines, a few interesting papers were written that
1 http://debian.org 2 http://debian-counting.libresoft.es
mention SourceKibitzer data, for example [5] and [6]. During its active period, SourceKibitzer donated some of its metrics (data) to the FLOSSmole project for ongoing storage, but the code used to generate their analyses was not donated. (At the time of this writing, the FLOSSmole stores and publishes 8 months worth of donated SourceKibitzer data, from February 2007 to September 2007, for example [7].) In considering how to approach this paper, we became intrigued with the idea of replicating the type of analysis that SourceKibitzer did, but to choose a more cohesive and current set of projects that would be more meaningful as a set.
We were thus encouraged by a paper by Spinellis [2] which analyzes source code of four operating system kernels: the FreeBSD kernel, the GNU/Linux kernel, Solaris, and Windows. The author collected source code and generated dozens of metrics in the areas of file organization, code structure, code style, the use of the C preprocessor, and data organization. Each of these operating system kernels is compared in turn, using metrics found in the literature and calculated for this codebase by the author. The overall mission of that paper was to attempt to understand these projects from a software quality point of view.
Likewise, another paper [8] further examines FreeBSD in terms of developer contributions. FreeBSD is relevant since it is also a FLOSS project, and it is an operating system similar to Debian. However, this work does not study outside packages, only FreeBSD itself. The theme of this paper is that we can learn about how FreeBSD developers work by studying source code repository, bug database, and developer’s geographic coordinates. Then following several other efforts to collect and examine metrics for a number of projects (e.g. [9] and [5]), their later work describes a system to assess and store a variety of developer and project metrics in a reproducible way. The culmination of their work is implemented as a software evaluation tool set now called the Alitheia Core [10].
We also looked at works such as [3] and [11] that generate standard metrics for a number of other operating systems. In [3], the authors examine Debian source code and some metadata over seven years, specifically the number of packages, which programming languages were used, and the number of lines of code. Observations are made about packages that don’t change during a given time period (i.e. are not maintained), programming languages of choice, and growth of file sizes over time. [11] studies growth and evolution of the codebase of the Linux kernel and some BSD projects to determine if FLOSS projects follow the same sort of evolutionary “laws” proposed in earlier research on proprietary software (e.g. Lehman’s Laws). These works calculate source lines of code (SLOC) for each project as well as the change over time. (To count SLOC in Debian, [11] uses the SLOC-Count3 tool, a combination of tool and target that is also discussed in [12].) The authors of these studies have also started the Debian Counting project we mentioned previously. Debian Counting collects a wide variety of metrics on Debian, but has not yet been updated for the latest Debian release ‘squeeze’ as of this writing. Another related work is [13], which studies Ubuntu in terms of number of packages/modules, number of developers, and number of bugs fixed. These metrics were tracked over time through several releases, and the authors made observations about the evolution of software in the open source domain.
3 http://www.dweeler.com/sloccount
We were also interested in work that had been done to create The Ultimate Debian Database4. The UDD is a large collection of metadata about Debian packages that is gathered, cleaned, and released [19] as a database dump every two days.
Most of these projects do not seem to have been designed from the start to be replicated or to support replication, or to be used by anyone outside of the original publication team. The exceptions are the UDD and Debian-Counting, which do at least focus on the public consumption of data. UDD makes a large amount of metadata available, and Debian-Counting also makes available some metrics calculated by the researchers (for example, effort and cost estimates).
3. METHOD In this section we present our method for collecting, parsing, and analyzing Debian source code and metadata. We also present our method of ensuring that future replication studies of this same corpus of packages are easy and reliable by automating the collection of this data, and by integrating this data into the publicly-available FLOSSmole data store.
3.1 Collecting the Data The number of packages in the stable Debian main repository (main is the official Debian distribution; it includes all packages that are not non-free and not contrib) number about 15,000. This includes every piece of software required to boot a working system, from the bootloader and kernel, up to end user software such as web browsers and productivity tools. Our collector indexes the Debian http repository hosted by kernel.org and creates a list of the file paths. It is not necessary to save the full address because each mirror uses the same directory structure, so the mirror we use to fetch does not affect the filename. Once we have a fully-populated list of every source path, we run a download script that simultaneously fetches packages (two to four at a time) from a randomly selected official mirror. After the fetch script is finished, another script is run to populate the database with additional metadata on each package. This includes the file path on the local system, the project name (derived from the filename, but package name excludes version numbers and extensions), and a unique identification number called the datasource_id, used to differentiate between runs of our program.
3.2 Generating Metrics After collecting the entire package set as described above, we then untar and unzip each file and run our set of scripts for metrics generation. The metrics we collect were inspired by the lists given in [2], [3], and [11], but we also took inspiration from commonly-used metrics discussed in traditional software engineering texts such as [14], [15], and [16].
In this paper, we are primarily interested in metrics for the packages written in C or C++, which number ~8000 of the ~15,000 total packages in Debian. The metrics we have for the C/C++ packages are shown in Table 1, and then are described in more detail below. There are additional metrics and metadata that we are able to collect for every package regardless of programming language; those are described in the next section (3.3).
4 http://udd.debian.org
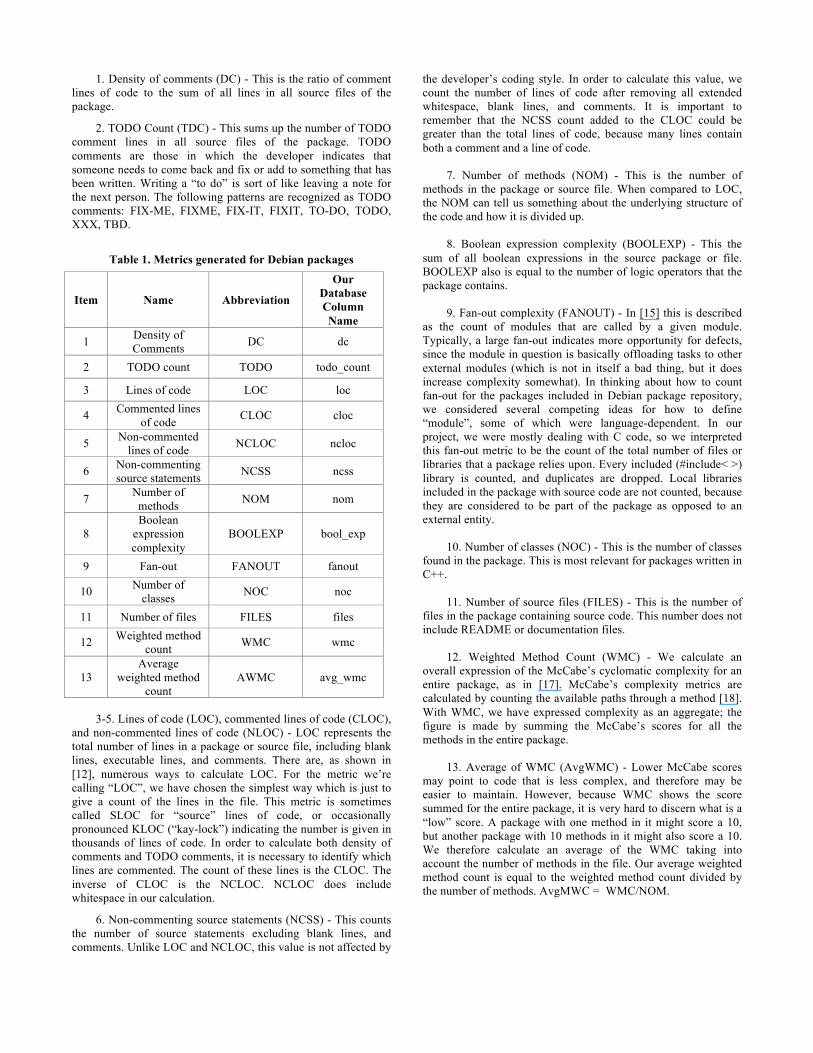
1. Density of comments (DC) - This is the ratio of comment lines of code to the sum of all lines in all source files of the package.
2. TODO Count (TDC) - This sums up the number of TODO comment lines in all source files of the package. TODO comments are those in which the developer indicates that someone needs to come back and fix or add to something that has been written. Writing a “to do” is sort of like leaving a note for the next person. The following patterns are recognized as TODO comments: FIX-ME, FIXME, FIX-IT, FIXIT, TO-DO, TODO, XXX, TBD.
Table 1. Metrics generated for Debian packages
Item Name Abbreviation
Our Database Column Name
1 Density of Comments DC dc
2 TODO count TODO todo_count
3 Lines of code LOC loc
4 Commented lines of code CLOC cloc
5 Non-commented lines of code NCLOC ncloc
6 Non-commenting source statements NCSS ncss
7 Number of methods NOM nom
8 Boolean
expression complexity
BOOLEXP bool_exp
9 Fan-out FANOUT fanout
10 Number of classes NOC noc
11 Number of files FILES files
12 Weighted method count WMC wmc
13 Average
weighted method count
AWMC avg_wmc
3-5. Lines of code (LOC), commented lines of code (CLOC),
and non-commented lines of code (NLOC) - LOC represents the total number of lines in a package or source file, including blank lines, executable lines, and comments. There are, as shown in [12], numerous ways to calculate LOC. For the metric we’re calling “LOC”, we have chosen the simplest way which is just to give a count of the lines in the file. This metric is sometimes called SLOC for “source” lines of code, or occasionally pronounced KLOC (“kay-lock”) indicating the number is given in thousands of lines of code. In order to calculate both density of comments and TODO comments, it is necessary to identify which lines are commented. The count of these lines is the CLOC. The inverse of CLOC is the NCLOC. NCLOC does include whitespace in our calculation.
6. Non-commenting source statements (NCSS) - This counts the number of source statements excluding blank lines, and comments. Unlike LOC and NCLOC, this value is not affected by
the developer’s coding style. In order to calculate this value, we count the number of lines of code after removing all extended whitespace, blank lines, and comments. It is important to remember that the NCSS count added to the CLOC could be greater than the total lines of code, because many lines contain both a comment and a line of code.
7. Number of methods (NOM) - This is the number of
methods in the package or source file. When compared to LOC, the NOM can tell us something about the underlying structure of the code and how it is divided up.
8. Boolean expression complexity (BOOLEXP) - This the
sum of all boolean expressions in the source package or file. BOOLEXP also is equal to the number of logic operators that the package contains.
9. Fan-out complexity (FANOUT) - In [15] this is described
as the count of modules that are called by a given module. Typically, a large fan-out indicates more opportunity for defects, since the module in question is basically offloading tasks to other external modules (which is not in itself a bad thing, but it does increase complexity somewhat). In thinking about how to count fan-out for the packages included in Debian package repository, we considered several competing ideas for how to define “module”, some of which were language-dependent. In our project, we were mostly dealing with C code, so we interpreted this fan-out metric to be the count of the total number of files or libraries that a package relies upon. Every included (#include< >) library is counted, and duplicates are dropped. Local libraries included in the package with source code are not counted, because they are considered to be part of the package as opposed to an external entity.
10. Number of classes (NOC) - This is the number of classes
found in the package. This is most relevant for packages written in C++.
11. Number of source files (FILES) - This is the number of
files in the package containing source code. This number does not include README or documentation files.
12. Weighted Method Count (WMC) - We calculate an
overall expression of the McCabe’s cyclomatic complexity for an entire package, as in [17]. McCabe’s complexity metrics are calculated by counting the available paths through a method [18]. With WMC, we have expressed complexity as an aggregate; the figure is made by summing the McCabe’s scores for all the methods in the entire package.
13. Average of WMC (AvgWMC) - Lower McCabe scores
may point to code that is less complex, and therefore may be easier to maintain. However, because WMC shows the score summed for the entire package, it is very hard to discern what is a “low” score. A package with one method in it might score a 10, but another package with 10 methods in it might also score a 10. We therefore calculate an average of the WMC taking into account the number of methods in the file. Our average weighted method count is equal to the weighted method count divided by the number of methods. AvgMWC = WMC/NOM.
3.3 Other Metadata Aside from just gathering Debian package source code and generating metrics on it, we also gathered additional sources of data about Debian, namely Debian Popularity Contest data and other available project metadata from the sources.gz file that ships with each Debian package. It is now also possible to get this data from the UDD [19], and in section 3.3.3 we discuss this at greater length.
3.3.1 Debian Popularity-Contest The Debian Popularity Contest5 is a set of statistics telling how users are accessing certain Debian packages. A Debian user can install the popularity-contest package, and that package will periodically report back to the Debian project what modules were used by each user. Each day the results are aggregated and released to show how “popular” each Debian package is. Since the popularity-contest statistics are released daily, but our Debian data is only collected approximately monthly, we decided to collect only the popularity-contest statistics that are available on the same day as our run. We may change this decision in the future as necessary. (Section 5 of this paper lists more ideas for limitations and proposed changes.) For early versions of this paper, we collected and loaded popularity-contest data into a separate database table from the rest of our Debian metrics.
3.3.2 Sources.gz Metadata As we learned in [3], each Debian package comes with a file called Sources.gz, containing some additional metadata that may be useful to describe packages, for example, build dependencies (i.e. which packages rely on which other packages to build). We decided to add it to our data collection.
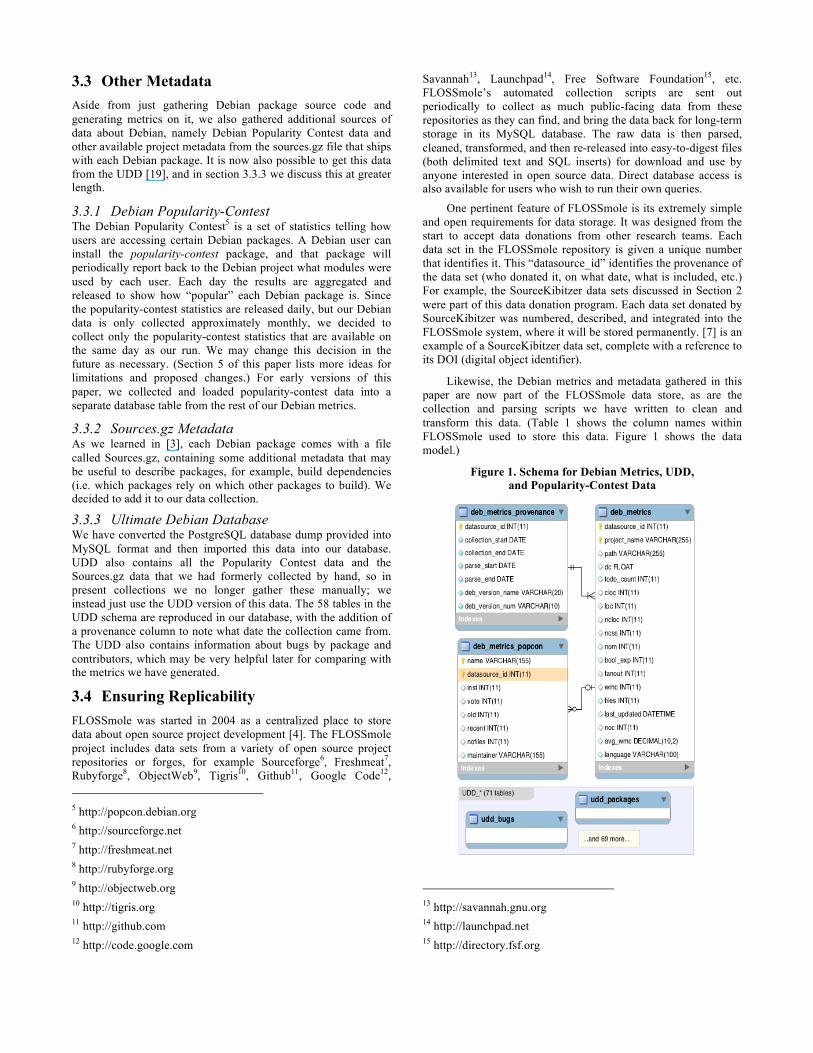
3.3.3 Ultimate Debian Database We have converted the PostgreSQL database dump provided into MySQL format and then imported this data into our database. UDD also contains all the Popularity Contest data and the Sources.gz data that we had formerly collected by hand, so in present collections we no longer gather these manually; we instead just use the UDD version of this data. The 58 tables in the UDD schema are reproduced in our database, with the addition of a provenance column to note what date the collection came from. The UDD also contains information about bugs by package and contributors, which may be very helpful later for comparing with the metrics we have generated.
3.4 Ensuring Replicability FLOSSmole was started in 2004 as a centralized place to store data about open source project development [4]. The FLOSSmole project includes data sets from a variety of open source project repositories or forges, for example Sourceforge6, Freshmeat7, Rubyforge8, ObjectWeb9, Tigris10, Github11, Google Code12, 5 http://popcon.debian.org 6 http://sourceforge.net 7 http://freshmeat.net 8 http://rubyforge.org 9 http://objectweb.org 10 http://tigris.org 11 http://github.com 12 http://code.google.com
Savannah13, Launchpad14, Free Software Foundation15, etc. FLOSSmole’s automated collection scripts are sent out periodically to collect as much public-facing data from these repositories as they can find, and bring the data back for long-term storage in its MySQL database. The raw data is then parsed, cleaned, transformed, and then re-released into easy-to-digest files (both delimited text and SQL inserts) for download and use by anyone interested in open source data. Direct database access is also available for users who wish to run their own queries.
One pertinent feature of FLOSSmole is its extremely simple and open requirements for data storage. It was designed from the start to accept data donations from other research teams. Each data set in the FLOSSmole repository is given a unique number that identifies it. This “datasource_id” identifies the provenance of the data set (who donated it, on what date, what is included, etc.) For example, the SourceKibitzer data sets discussed in Section 2 were part of this data donation program. Each data set donated by SourceKibitzer was numbered, described, and integrated into the FLOSSmole system, where it will be stored permanently. [7] is an example of a SourceKibitzer data set, complete with a reference to its DOI (digital object identifier).
Likewise, the Debian metrics and metadata gathered in this paper are now part of the FLOSSmole data store, as are the collection and parsing scripts we have written to clean and transform this data. (Table 1 shows the column names within FLOSSmole used to store this data. Figure 1 shows the data model.)
Figure 1. Schema for Debian Metrics, UDD, and Popularity-Contest Data
13 http://savannah.gnu.org 14 http://launchpad.net 15 http://directory.fsf.org
However, unlike the SourceKibitzer data, which is now a static and unchanging collection inside FLOSSmole (because the project no longer exists to collect new data from), new Debian data will continue to be collected on a regular basis into the future, as long as Debian exists, and as long as the data is freely available in a format that a script can process. (Older metrics from past releases of Debian data could also be integrated, as long as scripts were written to find, identify, gather, and process these older files. This is not the focus of our current paper, however.)
This means that researchers wishing to study standard software engineering metrics or metadata about Debian will be able to compare versions, starting with the October 2010, January 2011, and March 2011 releases discussed in this paper, and moving forward to whatever release is most current when they are doing their research. For example, it will be trivial to see how “lines of code” or “number of methods” (or any of the other items in 3.2 and 3.3 above) for a particular package have changed over time. New metrics can be added into the collection and parsing process, and those will be carried forward into future collections too. Problems with particular data sets can also be noted and corrected in a public way.
4. RESULTS Here we discuss some of the preliminary results from this replication and integration project. We list some interesting patterns we discovered and we make general observations about the Debian data sets.
4.1 Our Metrics Of course one of the first things we considered in this experiment was the size of the packages in the stable Debian main repository. When we sort packages by size, in lines of code (LOC) or any of the other size-based metrics (NOM, CLOC, NCLOC, FILES), the Linux 2.6 package itself dwarfs all others. We became interested in the also-rans in the size comparison: iceape (which has recently been discontinued), kompozer, iceweasel, and many of the KDE and Qt packages are all quite large, but none approach the size of the Linux kernel. (Database query is shown in Listing 9.1)
Are larger packages more logically complex? WMC is one measure of complexity [15] and number of methods (NOM) is one measure of size. Recall that AvgWMC = WMC/NOM. Linux has an AvgWMC of 3.79, and most packages in the large size range yield an average WMC of between 3 and 5. (Listing 9.2)
It can be fun to look for packages with extremely high values for AvgWMC, LOC, and FILES. For instance, the packages mn-fit and poker-eval are both in the Top 10 AvgWMC (63 and 42) but have very different numbers of files and methods, and very different WMC values. Which packages have introduced significantly new designs or large numbers of changes recently? In the following example we choose two different collections gathered in January and March 2011, represented by datasource_ids 246 and 261. (Listing 9.3) The results of this query pointed to several packages that had gone through massive changes in the number of files
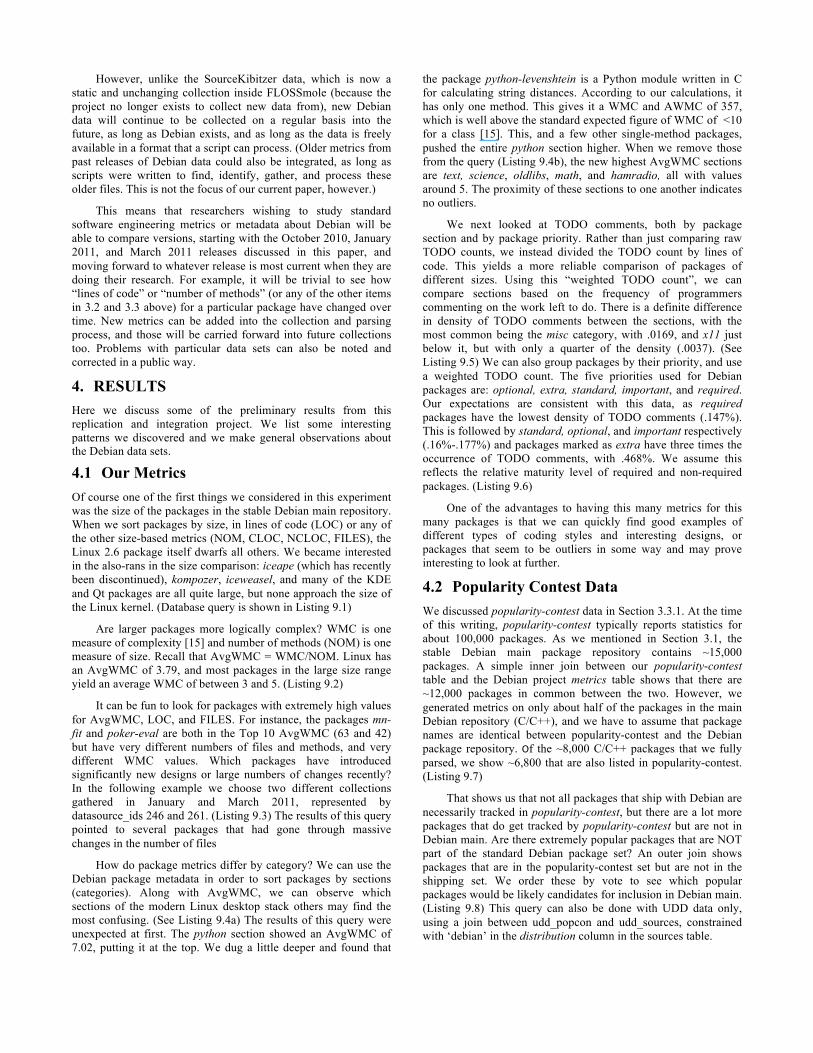
How do package metrics differ by category? We can use the Debian package metadata in order to sort packages by sections (categories). Along with AvgWMC, we can observe which sections of the modern Linux desktop stack others may find the most confusing. (See Listing 9.4a) The results of this query were unexpected at first. The python section showed an AvgWMC of 7.02, putting it at the top. We dug a little deeper and found that
the package python-levenshtein is a Python module written in C for calculating string distances. According to our calculations, it has only one method. This gives it a WMC and AWMC of 357, which is well above the standard expected figure of WMC of <10 for a class [15]. This, and a few other single-method packages, pushed the entire python section higher. When we remove those from the query (Listing 9.4b), the new highest AvgWMC sections are text, science, oldlibs, math, and hamradio, all with values around 5. The proximity of these sections to one another indicates no outliers.
We next looked at TODO comments, both by package section and by package priority. Rather than just comparing raw TODO counts, we instead divided the TODO count by lines of code. This yields a more reliable comparison of packages of different sizes. Using this “weighted TODO count”, we can compare sections based on the frequency of programmers commenting on the work left to do. There is a definite difference in density of TODO comments between the sections, with the most common being the misc category, with .0169, and x11 just below it, but with only a quarter of the density (.0037). (See Listing 9.5) We can also group packages by their priority, and use a weighted TODO count. The five priorities used for Debian packages are: optional, extra, standard, important, and required. Our expectations are consistent with this data, as required packages have the lowest density of TODO comments (.147%). This is followed by standard, optional, and important respectively (.16%-.177%) and packages marked as extra have three times the occurrence of TODO comments, with .468%. We assume this reflects the relative maturity level of required and non-required packages. (Listing 9.6)
One of the advantages to having this many metrics for this many packages is that we can quickly find good examples of different types of coding styles and interesting designs, or packages that seem to be outliers in some way and may prove interesting to look at further.
4.2 Popularity Contest Data We discussed popularity-contest data in Section 3.3.1. At the time of this writing, popularity-contest typically reports statistics for about 100,000 packages. As we mentioned in Section 3.1, the stable Debian main package repository contains ~15,000 packages. A simple inner join between our popularity-contest table and the Debian project metrics table shows that there are ~12,000 packages in common between the two. However, we generated metrics on only about half of the packages in the main Debian repository (C/C++), and we have to assume that package names are identical between popularity-contest and the Debian package repository. Of the ~8,000 C/C++ packages that we fully parsed, we show ~6,800 that are also listed in popularity-contest. (Listing 9.7)
That shows us that not all packages that ship with Debian are necessarily tracked in popularity-contest, but there are a lot more packages that do get tracked by popularity-contest but are not in Debian main. Are there extremely popular packages that are NOT part of the standard Debian package set? An outer join shows packages that are in the popularity-contest set but are not in the shipping set. We order these by vote to see which popular packages would be likely candidates for inclusion in Debian main. (Listing 9.8) This query can also be done with UDD data only, using a join between udd_popcon and udd_sources, constrained with ‘debian’ in the distribution column in the sources table.
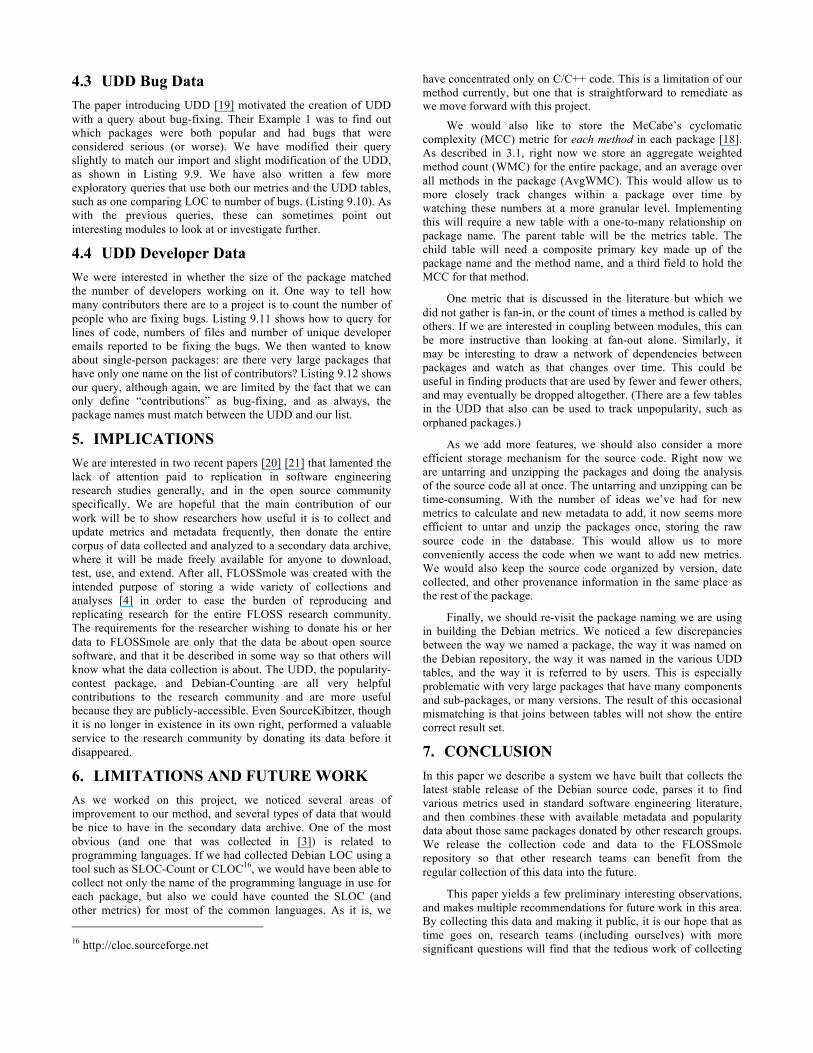
4.3 UDD Bug Data The paper introducing UDD [19] motivated the creation of UDD with a query about bug-fixing. Their Example 1 was to find out which packages were both popular and had bugs that were considered serious (or worse). We have modified their query slightly to match our import and slight modification of the UDD, as shown in Listing 9.9. We have also written a few more exploratory queries that use both our metrics and the UDD tables, such as one comparing LOC to number of bugs. (Listing 9.10). As with the previous queries, these can sometimes point out interesting modules to look at or investigate further.
4.4 UDD Developer Data We were interested in whether the size of the package matched the number of developers working on it. One way to tell how many contributors there are to a project is to count the number of people who are fixing bugs. Listing 9.11 shows how to query for lines of code, numbers of files and number of unique developer emails reported to be fixing the bugs. We then wanted to know about single-person packages: are there very large packages that have only one name on the list of contributors? Listing 9.12 shows our query, although again, we are limited by the fact that we can only define “contributions” as bug-fixing, and as always, the package names must match between the UDD and our list.
5. IMPLICATIONS We are interested in two recent papers [20] [21] that lamented the lack of attention paid to replication in software engineering research studies generally, and in the open source community specifically. We are hopeful that the main contribution of our work will be to show researchers how useful it is to collect and update metrics and metadata frequently, then donate the entire corpus of data collected and analyzed to a secondary data archive, where it will be made freely available for anyone to download, test, use, and extend. After all, FLOSSmole was created with the intended purpose of storing a wide variety of collections and analyses [4] in order to ease the burden of reproducing and replicating research for the entire FLOSS research community. The requirements for the researcher wishing to donate his or her data to FLOSSmole are only that the data be about open source software, and that it be described in some way so that others will know what the data collection is about. The UDD, the popularity-contest package, and Debian-Counting are all very helpful contributions to the research community and are more useful because they are publicly-accessible. Even SourceKibitzer, though it is no longer in existence in its own right, performed a valuable service to the research community by donating its data before it disappeared.
6. LIMITATIONS AND FUTURE WORK As we worked on this project, we noticed several areas of improvement to our method, and several types of data that would be nice to have in the secondary data archive. One of the most obvious (and one that was collected in [3]) is related to programming languages. If we had collected Debian LOC using a tool such as SLOC-Count or CLOC16, we would have been able to collect not only the name of the programming language in use for each package, but also we could have counted the SLOC (and other metrics) for most of the common languages. As it is, we 16 http://cloc.sourceforge.net
have concentrated only on C/C++ code. This is a limitation of our method currently, but one that is straightforward to remediate as we move forward with this project.
We would also like to store the McCabe’s cyclomatic complexity (MCC) metric for each method in each package [18]. As described in 3.1, right now we store an aggregate weighted method count (WMC) for the entire package, and an average over all methods in the package (AvgWMC). This would allow us to more closely track changes within a package over time by watching these numbers at a more granular level. Implementing this will require a new table with a one-to-many relationship on package name. The parent table will be the metrics table. The child table will need a composite primary key made up of the package name and the method name, and a third field to hold the MCC for that method.
One metric that is discussed in the literature but which we did not gather is fan-in, or the count of times a method is called by others. If we are interested in coupling between modules, this can be more instructive than looking at fan-out alone. Similarly, it may be interesting to draw a network of dependencies between packages and watch as that changes over time. This could be useful in finding products that are used by fewer and fewer others, and may eventually be dropped altogether. (There are a few tables in the UDD that also can be used to track unpopularity, such as orphaned packages.)
As we add more features, we should also consider a more efficient storage mechanism for the source code. Right now we are untarring and unzipping the packages and doing the analysis of the source code all at once. The untarring and unzipping can be time-consuming. With the number of ideas we’ve had for new metrics to calculate and new metadata to add, it now seems more efficient to untar and unzip the packages once, storing the raw source code in the database. This would allow us to more conveniently access the code when we want to add new metrics. We would also keep the source code organized by version, date collected, and other provenance information in the same place as the rest of the package.
Finally, we should re-visit the package naming we are using in building the Debian metrics. We noticed a few discrepancies between the way we named a package, the way it was named on the Debian repository, the way it was named in the various UDD tables, and the way it is referred to by users. This is especially problematic with very large packages that have many components and sub-packages, or many versions. The result of this occasional mismatching is that joins between tables will not show the entire correct result set.
7. CONCLUSION In this paper we describe a system we have built that collects the latest stable release of the Debian source code, parses it to find various metrics used in standard software engineering literature, and then combines these with available metadata and popularity data about those same packages donated by other research groups. We release the collection code and data to the FLOSSmole repository so that other research teams can benefit from the regular collection of this data into the future.
This paper yields a few preliminary interesting observations, and makes multiple recommendations for future work in this area. By collecting this data and making it public, it is our hope that as time goes on, research teams (including ourselves) with more significant questions will find that the tedious work of collecting
and parsing this data has already been done. We will eventually be able to ask questions that can only be answered by looking at multiple collections over time (such as time series). Finally, research teams (including but not limited to ours) can extend the reach of the FLOSSmole data by donating their own results, by suggesting new metrics to calculate, or by adding new metadata or adding other data sources. In this way, the Debian data becomes a rich resource, and analyzing it is truly a community effort.
8. ACKNOWLEDGEMENTS This work was partially funded by NSF 07-08767 (“Data and Analysis Archive for Research on Free and Open Source Software and its Development”). No endorsement implied.
9. CODE LISTINGS Datasource_ids have been listed as X and Y. Users should replace these with the ones reflecting a time period they are interested in from the FLOSSmole database.
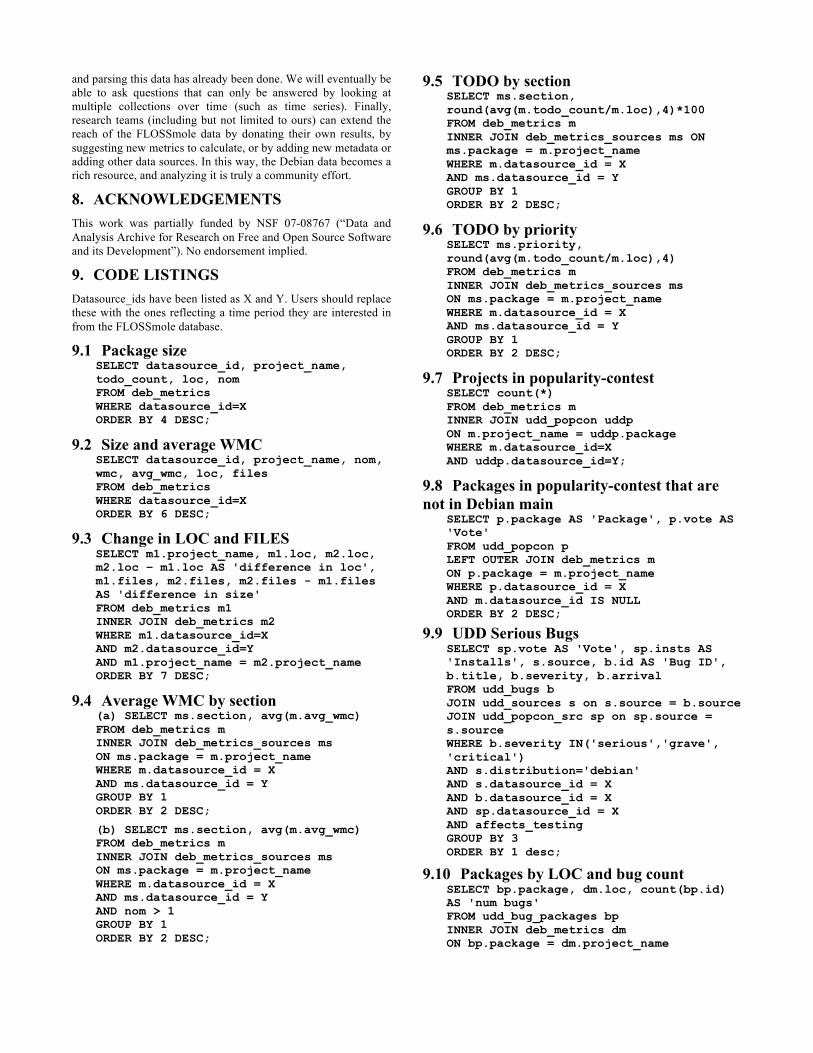
9.1 Package size SELECT datasource_id, project_name, todo_count, loc, nom FROM deb_metrics WHERE datasource_id=X ORDER BY 4 DESC;
9.2 Size and average WMC SELECT datasource_id, project_name, nom, wmc, avg_wmc, loc, files FROM deb_metrics WHERE datasource_id=X ORDER BY 6 DESC;
9.3 Change in LOC and FILES SELECT m1.project_name, m1.loc, m2.loc, m2.loc – m1.loc AS 'difference in loc', m1.files, m2.files, m2.files - m1.files AS 'difference in size' FROM deb_metrics m1 INNER JOIN deb_metrics m2 WHERE m1.datasource_id=X AND m2.datasource_id=Y AND m1.project_name = m2.project_name ORDER BY 7 DESC;
9.4 Average WMC by section (a) SELECT ms.section, avg(m.avg_wmc) FROM deb_metrics m INNER JOIN deb_metrics_sources ms ON ms.package = m.project_name WHERE m.datasource_id = X AND ms.datasource_id = Y GROUP BY 1 ORDER BY 2 DESC;
(b) SELECT ms.section, avg(m.avg_wmc) FROM deb_metrics m INNER JOIN deb_metrics_sources ms ON ms.package = m.project_name WHERE m.datasource_id = X AND ms.datasource_id = Y AND nom > 1 GROUP BY 1 ORDER BY 2 DESC;
9.5 TODO by section SELECT ms.section, round(avg(m.todo_count/m.loc),4)*100 FROM deb_metrics m INNER JOIN deb_metrics_sources ms ON ms.package = m.project_name WHERE m.datasource_id = X AND ms.datasource_id = Y GROUP BY 1 ORDER BY 2 DESC;
9.6 TODO by priority SELECT ms.priority, round(avg(m.todo_count/m.loc),4) FROM deb_metrics m INNER JOIN deb_metrics_sources ms ON ms.package = m.project_name WHERE m.datasource_id = X AND ms.datasource_id = Y GROUP BY 1 ORDER BY 2 DESC;
9.7 Projects in popularity-contest SELECT count(*) FROM deb_metrics m INNER JOIN udd_popcon uddp ON m.project_name = uddp.package WHERE m.datasource_id=X AND uddp.datasource_id=Y;
9.8 Packages in popularity-contest that are not in Debian main
SELECT p.package AS 'Package', p.vote AS 'Vote' FROM udd_popcon p LEFT OUTER JOIN deb_metrics m ON p.package = m.project_name WHERE p.datasource_id = X AND m.datasource_id IS NULL ORDER BY 2 DESC;
9.9 UDD Serious Bugs SELECT sp.vote AS 'Vote', sp.insts AS 'Installs', s.source, b.id AS 'Bug ID', b.title, b.severity, b.arrival FROM udd_bugs b JOIN udd_sources s on s.source = b.source JOIN udd_popcon_src sp on sp.source = s.source WHERE b.severity IN('serious','grave', 'critical') AND s.distribution='debian' AND s.datasource_id = X AND b.datasource_id = X AND sp.datasource_id = X AND affects_testing GROUP BY 3 ORDER BY 1 desc;
9.10 Packages by LOC and bug count SELECT bp.package, dm.loc, count(bp.id) AS 'num bugs' FROM udd_bug_packages bp INNER JOIN deb_metrics dm ON bp.package = dm.project_name
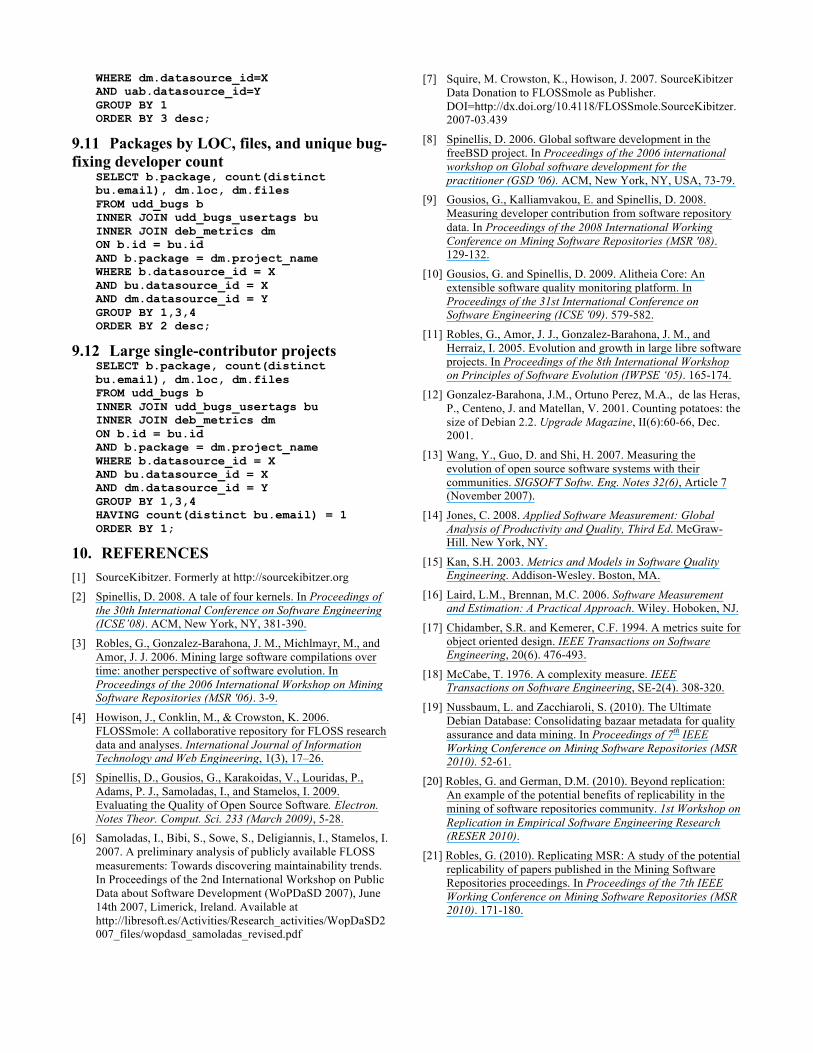
WHERE dm.datasource_id=X AND uab.datasource_id=Y GROUP BY 1 ORDER BY 3 desc;
9.11 Packages by LOC, files, and unique bug-fixing developer count
SELECT b.package, count(distinct bu.email), dm.loc, dm.files FROM udd_bugs b INNER JOIN udd_bugs_usertags bu INNER JOIN deb_metrics dm ON b.id = bu.id AND b.package = dm.project_name WHERE b.datasource_id = X AND bu.datasource_id = X AND dm.datasource_id = Y GROUP BY 1,3,4 ORDER BY 2 desc;
9.12 Large single-contributor projects SELECT b.package, count(distinct bu.email), dm.loc, dm.files FROM udd_bugs b INNER JOIN udd_bugs_usertags bu INNER JOIN deb_metrics dm ON b.id = bu.id AND b.package = dm.project_name WHERE b.datasource_id = X AND bu.datasource_id = X AND dm.datasource_id = Y GROUP BY 1,3,4 HAVING count(distinct bu.email) = 1 ORDER BY 1;
10. REFERENCES [1] SourceKibitzer. Formerly at http://sourcekibitzer.org
[2] Spinellis, D. 2008. A tale of four kernels. In Proceedings of the 30th International Conference on Software Engineering (ICSE’08). ACM, New York, NY, 381-390.
[3] Robles, G., Gonzalez-Barahona, J. M., Michlmayr, M., and Amor, J. J. 2006. Mining large software compilations over time: another perspective of software evolution. In Proceedings of the 2006 International Workshop on Mining Software Repositories (MSR '06). 3-9.
[4] Howison, J., Conklin, M., & Crowston, K. 2006. FLOSSmole: A collaborative repository for FLOSS research data and analyses. International Journal of Information Technology and Web Engineering, 1(3), 17–26.
[5] Spinellis, D., Gousios, G., Karakoidas, V., Louridas, P., Adams, P. J., Samoladas, I., and Stamelos, I. 2009. Evaluating the Quality of Open Source Software. Electron. Notes Theor. Comput. Sci. 233 (March 2009), 5-28.
[6] Samoladas, I., Bibi, S., Sowe, S., Deligiannis, I., Stamelos, I. 2007. A preliminary analysis of publicly available FLOSS measurements: Towards discovering maintainability trends. In Proceedings of the 2nd International Workshop on Public Data about Software Development (WoPDaSD 2007), June 14th 2007, Limerick, Ireland. Available at http://libresoft.es/Activities/Research_activities/WopDaSD2007_files/wopdasd_samoladas_revised.pdf
[7] Squire, M. Crowston, K., Howison, J. 2007. SourceKibitzer Data Donation to FLOSSmole as Publisher. DOI=http://dx.doi.org/10.4118/FLOSSmole.SourceKibitzer.2007-03.439
[8] Spinellis, D. 2006. Global software development in the freeBSD project. In Proceedings of the 2006 international workshop on Global software development for the practitioner (GSD '06). ACM, New York, NY, USA, 73-79.
[9] Gousios, G., Kalliamvakou, E. and Spinellis, D. 2008. Measuring developer contribution from software repository data. In Proceedings of the 2008 International Working Conference on Mining Software Repositories (MSR '08). 129-132.
[10] Gousios, G. and Spinellis, D. 2009. Alitheia Core: An extensible software quality monitoring platform. In Proceedings of the 31st International Conference on Software Engineering (ICSE '09). 579-582.
[11] Robles, G., Amor, J. J., Gonzalez-Barahona, J. M., and Herraiz, I. 2005. Evolution and growth in large libre software projects. In Proceedings of the 8th International Workshop on Principles of Software Evolution (IWPSE ‘05). 165-174.
[12] Gonzalez-Barahona, J.M., Ortuno Perez, M.A., de las Heras, P., Centeno, J. and Matellan, V. 2001. Counting potatoes: the size of Debian 2.2. Upgrade Magazine, II(6):60-66, Dec. 2001.
[13] Wang, Y., Guo, D. and Shi, H. 2007. Measuring the evolution of open source software systems with their communities. SIGSOFT Softw. Eng. Notes 32(6), Article 7 (November 2007).
[14] Jones, C. 2008. Applied Software Measurement: Global Analysis of Productivity and Quality, Third Ed. McGraw-Hill. New York, NY.
[15] Kan, S.H. 2003. Metrics and Models in Software Quality Engineering. Addison-Wesley. Boston, MA.
[16] Laird, L.M., Brennan, M.C. 2006. Software Measurement and Estimation: A Practical Approach. Wiley. Hoboken, NJ.
[17] Chidamber, S.R. and Kemerer, C.F. 1994. A metrics suite for object oriented design. IEEE Transactions on Software Engineering, 20(6). 476-493.
[18] McCabe, T. 1976. A complexity measure. IEEE Transactions on Software Engineering, SE-2(4). 308-320.
[19] Nussbaum, L. and Zacchiaroli, S. (2010). The Ultimate Debian Database: Consolidating bazaar metadata for quality assurance and data mining. In Proceedings of 7th IEEE Working Conference on Mining Software Repositories (MSR 2010). 52-61.
[20] Robles, G. and German, D.M. (2010). Beyond replication: An example of the potential benefits of replicability in the mining of software repositories community. 1st Workshop on Replication in Empirical Software Engineering Research (RESER 2010).
[21] Robles, G. (2010). Replicating MSR: A study of the potential replicability of papers published in the Mining Software Repositories proceedings. In Proceedings of the 7th IEEE Working Conference on Mining Software Repositories (MSR 2010). 171-180.