a quasi-experimental study examining the safety profile and comfort provided by two different...
TRANSCRIPT
A Quasi-Experimental Study Examiningthe Safety Profile and Comfort Providedby Two Different Blanket Temperatures
Lori T. Sutton, BSN, RN, CPAN, CCRN, Faye S. Baker, BSN, RN, CPAN,
Nan J. Faile, MS, RN, CCRP, Abbas Tavakoli, DrPH, MPH, ME
Surgical patients are often covered with warm blankets to alleviate the
Lori T. Sutton, B
Anesthesia Care
Baker, BSN, RN, CP
sion, Lexington Me
a Research Nurse C
Columbia, SC; and
istician, Universit
Columbia, SC.
Conflict of intere
Address correspo
cal Center, Phase
Boulevard, West
ltsutton@lexhealth
� 2012 by Ame
1089-9472/$36.
doi:10.1016/j.jo
Journal of PeriAnesth
discomfort of feeling too cold in the perioperative environment. The
goal of this study was to provide evidence to guide institutional blanket
warming policies by examining blanket thermal behavior and blanket
temperature preference of postoperative patients. The hypothesis was
that 155�F blankets are safe for patient use and provide a higher level
of thermal comfort to perioperative patients than do 110�F blankets.
A sample of 156 adult participants was randomized to the intervention
group (n5 76), who received 155�F blankets, or the control group
(n5 80), who received 110�F blankets. Participants were covered
neck to toe with the blankets in the postanesthesia care unit, and mea-
surements were obtained for 10 minutes. An infrared thermometer was
used to measure skin and blanket temperatures, and a numeric scale
was used to measure thermal comfort. Blanket cooling rates were exam-
ined along with the effect of blanket temperatures on participants’ skin
temperature, oral temperature, and thermal comfort rating. Mean blan-
ket temperatures for both groups were less than 93�F two minutes after
application. The intervention group showed higher skin temperatures
and thermal comfort throughout 10 minutes of data collection. The
results of this study support the hypothesis that it is safe to cover surgi-
cal patients with 155�F blankets. Results also indicate a correlation
between 155�F blankets and higher skin temperature and thermal
comfort.
Keywords: thermal comfort, blanket, PACU, temperature, research.
� 2012 by American Society of PeriAnesthesia Nurses
FEELING COMFORTABLY WARM is an impor-
tant aspect of overall comfort for patients in health
SN, RN, CPAN, CCRN, is a Staff Nurse, Post-
Unit, Lexington Medical Center; Faye S.
AN, is a Clinical Mentor, Perioperative Divi-
dical Center; Nan J. Faile, MS, RN, CCRP, is
oordinator, LexingtonMedical Center,West
Abbas Tavakoli, DrPH, MPH, ME, is a Stat-
y of South Carolina College of Nursing,
st: None to report.
ndence to Lori T. Sutton, Lexington Medi-
I Post-Anesthesia Care Unit, 2720 Sunset
Columbia, SC 29169; e-mail address:
.org.
rican Society of PeriAnesthesia Nurses
00
pan.2012.01.011
esia Nursing, Vol 27, No 3 (June), 2012: pp 181-192
care facilities. Warmed cotton blankets are used to
provide thermal comfort to patients in various hos-
pital departments as well as in outpatient centers
and physician offices. In the perioperative area, pa-
tients often complain of feeling too cold before
and after surgical procedures secondary to cool
ambient room temperatures, decreased physicalactivity, and thin hospital gowns. This perception
of cold may or may not be associated with hypo-
thermia, which is defined as a core temperature
at or below 96.8�F (36�C).1 For patients who per-
ceive cold when normothermic (core temperature
greater than 96.8�F),warmedblankets are a passive
warming measure that increase the feeling of
warmth by interfering with heat loss from theskin to the environment.2
181

182 SUTTON ET AL
It must be emphasized that passive warming with
cotton blankets is appropriate only for normother-
mic patientswho express subjectively feeling cold.
Warmed blankets do not increase the core body
temperature. Anesthetized patients can becomepoikilothermic3 and be at high risk for develop-
ment of hypothermia. For such patients, active
warming with forced air devices and warmed fluid
infusions are indicated to maintain or restore nor-
mothermia.1
Many patients describe the feeling of being cold as
the worst aspect of the hospital experience andmore unpleasant than pain. Frank et al4 describe re-
search indicating thermal comfort is influenced
more by skin temperature than by core tempera-
ture. They hypothesize this to be an adaptivemech-
anism that triggers heat-conserving behaviors such
as adding layers of clothing. According to this the-
ory, the drive to achieve thermal comfort may actu-
ally preventheat loss and subsequent hypothermia.
In addition to being unpleasant, the perception of
feeling cold is physiologically stressful and can trig-
ger autonomic effects that increase postoperative
complications. A patient who feels too cold can ex-
perience shivering, which increases heart rate and
blood pressure.5
Warming cabinets are designed specifically to
warm blankets used for patient care. Historically,
warming cabinet temperatures have been set arbi-
trarily. The warming cabinet temperature setting
became controversial in 2005 when the Emer-
gency Care Research Institute (ECRI) recommen-
ded that the temperature setting for cabinets
used to warm patient blankets be limited to a max-imum of 110�F. The ECRI recommendation de-
scribes reports of patients receiving burn injuries
when they were covered with blankets that were
too hot. However, in the article recommending
the 110�F limitation, the ECRI offered no specific
details of injuries related to warmed blankets.6
The authors of this article contacted ECRI to re-
quest further details regarding injuries caused bywarmed blankets. The ECRI representative re-
sponded that no other information was available.
ECRI identified the practice of storing patient care
liquids, such as those used for infusions and surgical
irrigations, in blanket cabinets as the primary ther-
mal injury hazard prompting the 110�F recommen-
dation. Because the thermal properties of water
cause it to be more dangerous than blankets, ECRI
research focused on establishing 110�F as a safe
temperature for infusion and irrigation fluids. Re-
sults indicated a danger of patient burns from sus-tained skin contact with bottles of liquid heated to
greater than 110�F; therefore, the recommendation
of that temperature as the maximum temperature
for heating patient care fluids. ECRI recommended
the same maximum temperature for blankets be-
cause they are frequently stored in the same cabinet
with fluids.6 Compliance with the ECRI 110�F tem-
perature limit for blanket warming cabinets hasbeen recommended by nursing organizations in-
cluding the Association of PeriOperative Registered
Nurses (AORN) and the American Society of Peri-
Anesthesia Nurses (ASPAN).7,8
The safety of warming blankets to higher than
110�F is supported by evidence: the known phys-
iology of burn injuries, the known physics of heattransfer from cotton blankets to skin, and previous
nursing research demonstrating rapid blanket
cooling on removal from the warmer. This evi-
dence will be discussed in the following para-
graphs.
Heat causes burn injury by causing coagulation
and circulatory stasis in tissue.9 Actual researchdemonstrating temperature and exposure time
necessary to burn human skin is scarce. Most pub-
lications related to thermal injury cite the seminal
thermal injury research published by Moritz and
Henriques10 in 1947. Moritz and Henriques circu-
lated heated water through tubes placed in con-
tact with live pigskin and measured the length of
time required to cause skin injury at various tem-peratures. They found that 48�C (118.4�F) was
the lowest temperature that could cause injury
more severe than simple redness. Edlich et al9
cite a temperature/length of exposure relationship
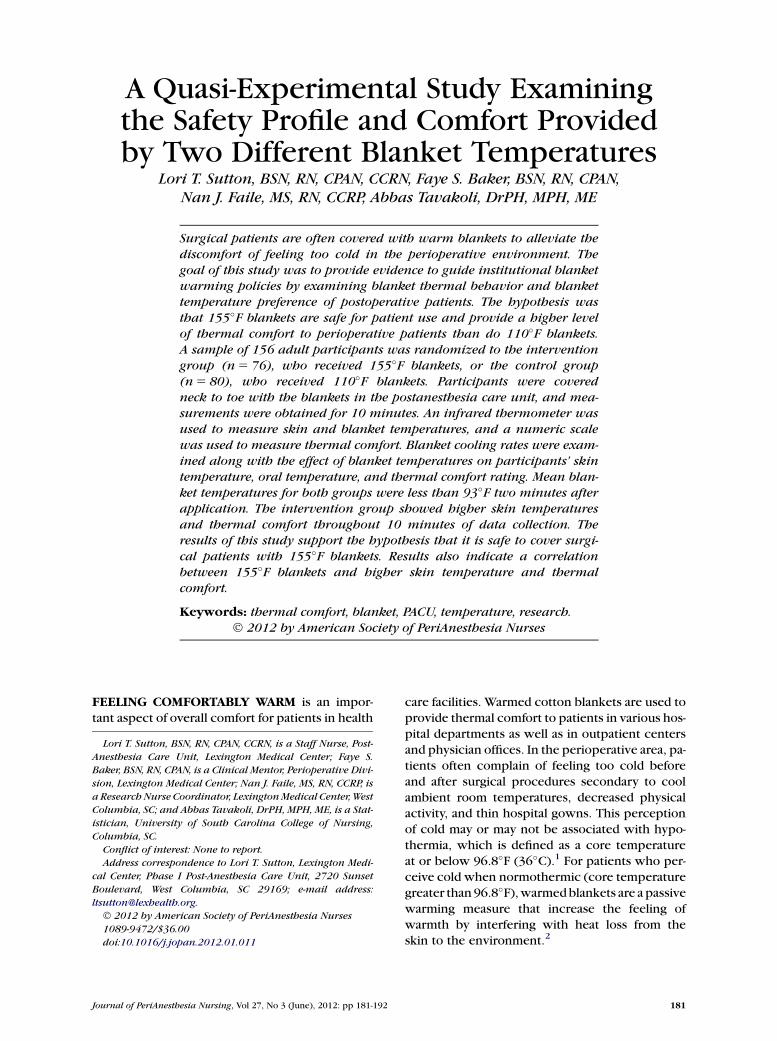
depicted in Figure 1, based on Moritz’s and Henri-
ques’ 1947 findings. Edlich et al9 found that
111.2�F is a critical temperature: if maintained
for longer than 6 hours, it will cause a cutaneousburn. Note that a temperature of 129.2�F (54�C)must be maintained for 1 minute to cause injury
and 123.8�F (51�C)must bemaintained for 15min-
utes to cause injury.
In order for a cutaneous burn to occur, heat energy
must be transferred from a warmer substance to
Figure 1. Relationshipbetween temperature anddurationofexposure indevelopmentof full-thicknessburn injury.
Reprinted with permission.9
BLANKET TEMPERATURE COMPARISON 183
the skin. The amount of heat energy transferred by
one substance to another depends largely on the
important physical property known as specific
heat. Specific heat refers to the amount of heat en-
ergy required to raise the temperature of one gram
of substance by one degree Celsius. Water can gain
or lose a large amount of heat energywith very little
change in its temperature because of its high spe-cific heat. ‘‘Even if the initial temperatures of two
materials are identical, the stored heat energy avail-
able fromwater ismuchmore likely to produce a se-
vere injury because the specific heat of water (the
most common cause of scald burns) is the highest
of all the gases, metals, and solids so far tested,
with the exception of ammonia and ether.’’9
Moon2, a biomedical engineer, applies the physics
of heat energy transfer to the fluid and blanket
question. The specific heat of water and skin is
very similar because skin is mostly water. When
a container of water-based fluid is placed in con-
tact with skin, the cooler substance will absorb
heat from the warmer substance until the temper-
atures meet halfway between the initial tempera-tures—the only heat energy lost being to the air
or carried away by circulatory flow. Cotton blan-
kets, on the other hand, differ from skin because
blankets are mostly cellulose. A large amount of
air contained in the fabric weave causes cotton
blankets to have approximately the same specific
heat as air. Moon2 explains how to use theoretical
physics to determine how heat transfers between
blanket and skin. By his calculation, if a 93�C(200�F) blanket is placed on 33�C (91.4�F) skin,the skin temperature will only rise to 33.8�C(92.8�F), well below the skin temperature neces-
sary to incur a thermal injury.
Blankets are not generally heated to a temperatureas high as 93�C (200�F) as described in Moon’s cal-
culation.2 Blog entries report warming cabinet
temperatures between 140�F and 180�F.11 Kossonet al12 published a study describing the measure-
ment of cooling rates for blankets heated to
145�F in warming cabinets. Budjoso13 describes
researching blankets heated to 150�F.
Kosson et al12 measured the rate of cooling for
145�F blankets at specific intervals after removing
the blankets from a warming cabinet. Average
blanket temperatures ranged from 91�F to 118�F,86�F to 105�F, and 85�F to 105�F at 0, 30, and 60
seconds, respectively. Importantly, after 30 sec-
onds, none of the blankets were hotter than
105�F, less than the critical temperature of111.2�F indicated by Edlich et al9 in Figure 1.
Although limited by small sample size and scien-
tific rigor, the Kosson et al12 findings indicate
that the blankets immediately lose large quantities
of heat energy when exposed to ambient air and
do not remain hot long enough to burn patients.
The authors recommended that other nurses
184 SUTTON ET AL
conduct similar studies to further establish the safe
temperature setting for blanket warming cabinets.
Budjoso’s13 study compared 110�F blankets with
150�F blankets. The study examined rate of blan-ket cooling and perceived warmth experienced
by a sample of three volunteer female health care
workers. Blankets starting at 110�F decreased to
a mean temperature of 103�F at application, 90�Fby 1 minute, and 83�F by 5 minutes. The 150�Fblankets decreased to a mean temperature of
138�F at placement, 100�F by 1 minute, and 84�Fat 5 minutes. By the end of the data collectiontime, all blankets approached room temperature.
The author also measured perceived warmth and
found that participants rated perceived warmth
higher with the higher temperature blankets.13
Limitations noted with this study include small
sample size and possible participant bias.
After institutions complied with lowering blankettemperatures to the 110�F recommendation, ECRI
received numerous complaints that 110�F blankets
lackednecessarywarmth to relieve chillingof hospi-
talized patients. In 2009, responding to numerous
requests to increase maximum allowable blanket
temperature, ECRI issued a new recommendation
that blankets could bewarmed to 130�F. ECRI statedthat the higher blanket temperatures were safebecause of increased awareness of the need to store
liquids at a lower temperature separately from
blankets. This revised ECRI recommendation does
not describe any research conducted to support
the selection of 130�F as the safe or optimum
temperature.14
Methods
The purpose of this study was to further exam-
ine the safety profile for warmed cotton blankets
and determine a temperature that provides ther-
mal comfort that is acceptable and safe for thepatient. Two warming cabinet temperature set-
tings were compared to determine baseline blan-
ket temperature effect on blanket temperature
change, skin temperature change, and patient
comfort level.
This study was conducted in a 26-bed post-
anesthesia care unit (PACU) in a 384-bed metropol-itan medical center. The perioperative area
performs approximately 16,000 surgeries per
year. Two warming cabinets were used, one with
a 155�F thermostat setting and one with a 110�Fthermostat setting. The cabinets both have upper
and lower doors. The blankets used for all phases
of this study are commonly referred to as bath blan-kets; they are thin, 100% cotton blankets stored
folded to 16-ply in the warming cabinets.
A newly purchased Fluke 63 laser-guided, infra-
red, instant read thermometer (Fluke Corpora-
tion, Everett, WA) was used to measure all
surface temperatures sampled. To measure the
temperature of an object with the Fluke 63,one only needs to aim and squeeze a trigger.
The thermometer emits a laser to light the ob-
ject’s surface at the measurement point. De-
signed specifically for noncontact temperature
measurement, it displays a digital temperature
readout measured from infrared energy radiated
by the object’s surface. This type of thermometer
was recommended as the most accurate methodfor surface temperature measurement by our bio-
medical technician and has been used in prior
studies.12,13 The Fluke 63 was calibrated when
manufactured, and its accuracy is certified in ac-
cordance with standards set by the National Insti-
tute of Standards and Technology. Additionally,
the laser causes the participant no discomfort
because it cannot be felt.
Oral temperatures were measured with the Welch
Allyn SureTemp Plus oral thermometer (Welch
Allyn Inc, San Diego, CA). The oral temperature
route was chosen because ASPAN cites ‘‘strong
evidence that it is the peripheral route that best
approximates core temperature.’’1 Welch Allyn
oral thermometers are used routinely for patienttemperature monitoring in our PACU and are
calibrated yearly by the in-house biomedical
department.
Thermal comfort was rated on a numeric scale
(Figure 2) from 0 (intense cold) to 10 (intense
warmth). This thermal comfort scale was adapted
from a scale used to research thermal comfortprovided by heated and cooled automobile seats.
This type of scale is commonly used in the envi-
ronmental comfort industry.15 The thermal com-
fort scale is also similar to the perceived warmth
scale described by Budjoso.13 The scale was
shown and explained to participants at the time
of consent.
0 10
Intense 5 Intensecold Not to hot warmth
or cold
Figure 2. Thermal comfort scale.
BLANKET TEMPERATURE COMPARISON 185
Three phases of blanket pretesting were con-
ducted to demonstrate blanket safety to Nursing
Administration and the Institutional Review Board
before enrolling patients in the study. The phase 1
pretest investigated the maximum temperature
blankets would attain in each warming cabinet.
This pretest began at 7 p.m. one evening. A princi-ple researcher emptied both cabinets and then
filled each cabinetwith room temperature blankets
until full. The doorwas taped shut to prevent open-
ing by other staff. An assistant researcher was
trained by the principle researcher to obtain hourly
temperature measurement of blankets in each cab-
inet for 12 hours. The cabinets were kept closed as
much as possible, then quickly opened, and tem-perature was measured at the top, middle, and bot-
tom of each stack in each cabinet.
Pretest phase 2 measured the temperature of each
blanket in each cabinet after allowing time for
maximum temperature to be attained. This was
done to determine the variability of blanket tem-
peratures with regard to location within the cabi-net. First, temperature indicated by the cabinet’s
digital readout was recorded. Then temperature
of each inner cabinet wall was measured, followed
by measurement of the temperature of the top and
bottom of each folded blanket in the cabinet.
Pretest phase 3 assessed rate of cooling for blan-
kets removed from the 155�F cabinet. In this phaseof testing, researchers began by estimating room
temperature by measuring the temperature of an
interior wall surface next to the stretcher being
used for testing. Temperature of the bed surface
was then measured. Blanket temperature was as-
sessed just prior to removing the blanket from
the warmer. Two blankets were removed, and
the still-folded blankets were carried approxi-mately 18 feet to a stretcher. Two primary investi-
gators worked together to quickly unfold the
blankets on the bed until they were double thick-
ness lengthwise and overlapped in the manner in
which they are used to cover patients in this
PACU. The warm blankets were then completely
covered with two overlapping room temperature
blankets. The blankets were quickly lifted, and
warmed blanket surface temperature was mea-
sured immediately on completion of layering,
then each minute for a total of 5 minutes.
The patient testing phase of this study was ap-
proved by the Institutional Review Board. In-
formed consent was obtained from each study
participant. A convenience sample of 156 partici-
pants took part in the patient testing phase. Our
statistician calculated that a sample of 100 to 150
would provide sufficient power to minimize thechance of making a type II error. The researchers
used a quasi-experimental design to compare the
two temperature settings: 155�F (intervention
group, n5 76) and 110�F (control group,
n5 80). Participants were randomly allocated to
one of the two groups using a computerized ran-
dom number generator. A coin flip was used to de-
termine that even-numberedparticipantswould bethe control group and odd-numbered participants
would be the intervention group.
Exclusion criteria included oral temperature below
96.8�F or greater than 100.4�F. These temperatures
indicate hypo- or hyperthermia as defined byASPAN
standards andwould require intervention to restore
normothermia.1 Participants were excluded if anoral temperature could not be measured for any
reason or if unable to communicate with the
researchers as required for the thermal comfort as-
sessment. For example, non-English speakingpartic-
ipants or unresponsive participants were excluded.
Other participants also were excluded because of
scheduling conflicts.
Datawere collected during the morning or early af-
ternoon. The warming cabinets were stocked in
the evening before data collection days to assure
that blankets had reached maximum temperature
prior to data collection. During data collection,
the upper cabinet was used to obtain blankets
only for study participants. The upper cabinets
were taped shut to prevent other staff from open-ing the cabinet and allowing unnecessary heat loss
from the blankets.
Each participant received standard preoperative
and intraoperative care, and data collection began
when the participant arrived in the PACU. First,
oral temperature was measured and the absence
24
56
Control Group Gender Distribution
Gender male
Gender female
30
46
Intervention Group Gender Distribution
Gender male
Gender female
6
2838
8
Control Group Age Distribution
18-30
31-50
51-70
Greater than 71
6
3228
10
Intervention Group Age Distribution
18-30
31-50
51-70
Greater than 71
General (30)
Gynecolo-gical (19)
Orthope-dic (10)
Neurolo-gical (14)
Head and Neck (5)
Vascular (1) Urological
(1)
Control Group Type of Surgery
General (27)
Gynecolo-gical (19)
Orthope-dic (15)
Neurologic-al (12)
Head and Neck (2) Urological
(1)
Intervention Group Type of Surgery
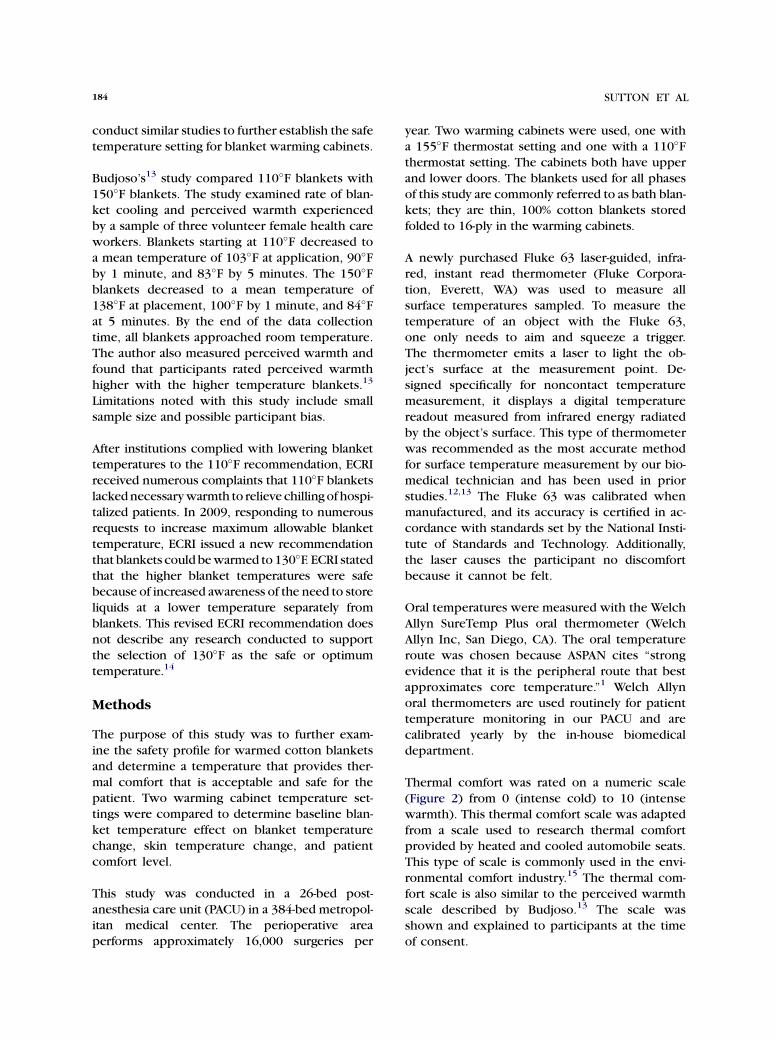
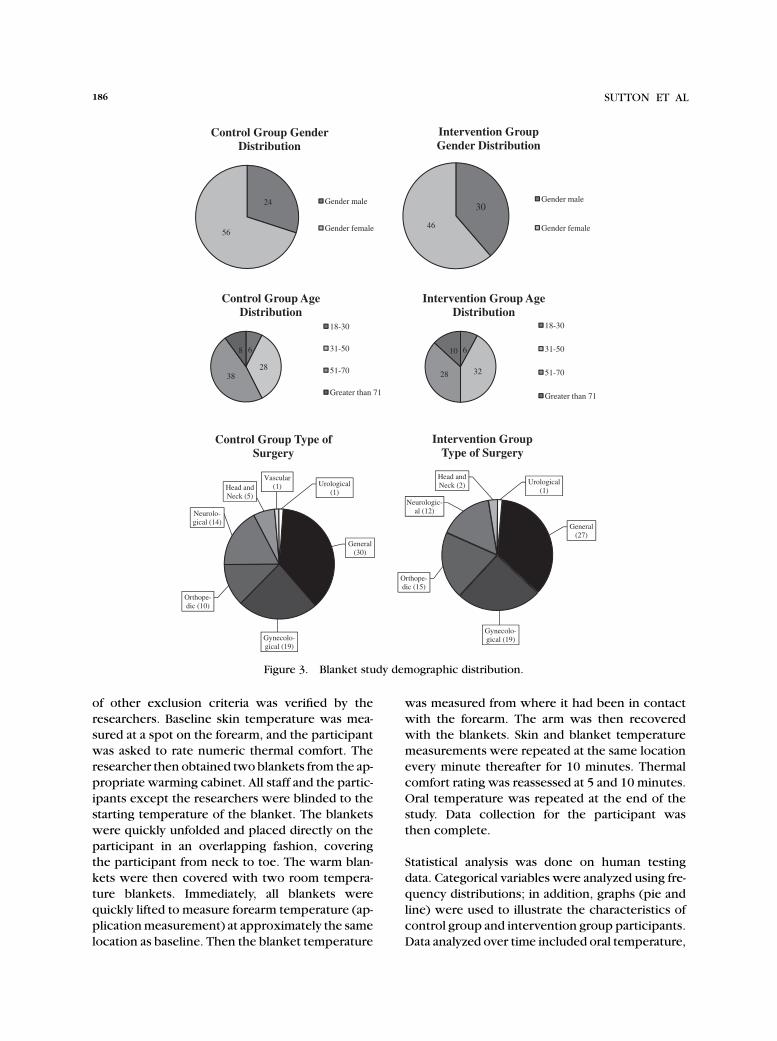
Figure 3. Blanket study demographic distribution.
186 SUTTON ET AL
of other exclusion criteria was verified by the
researchers. Baseline skin temperature was mea-sured at a spot on the forearm, and the participant
was asked to rate numeric thermal comfort. The
researcher then obtained twoblankets from the ap-
propriate warming cabinet. All staff and the partic-
ipants except the researchers were blinded to the
starting temperature of the blanket. The blankets
were quickly unfolded and placed directly on the
participant in an overlapping fashion, coveringthe participant from neck to toe. The warm blan-
kets were then covered with two room tempera-
ture blankets. Immediately, all blankets were
quickly lifted to measure forearm temperature (ap-
plicationmeasurement) at approximately the same
location as baseline. Then the blanket temperature
was measured from where it had been in contact
with the forearm. The arm was then recoveredwith the blankets. Skin and blanket temperature
measurements were repeated at the same location
every minute thereafter for 10 minutes. Thermal
comfort rating was reassessed at 5 and 10 minutes.
Oral temperature was repeated at the end of the
study. Data collection for the participant was
then complete.
Statistical analysis was done on human testing
data. Categorical variables were analyzed using fre-
quency distributions; in addition, graphs (pie and
line) were used to illustrate the characteristics of
control group and intervention group participants.
Data analyzed over time included oral temperature,
BLANKET TEMPERATURE COMPARISON 187
skin temperature, blanket temperature, and com-
fort level. For continuous variables, statistics were
used to compute measures of central tendency
(mean and median) and measures of spread (stan-
dard deviation and range). Because so many datawere being gathered over a span of time, General
Linear Model (GLM) analyses in SAS and MIXED
procedures (mixed linear model that allows statis-
tical inferences about data) for continuous out-
comes (skin temperature, blanket temperature,
oral temperature, and comfort level) were used to
examine the effects of time, group, and time by
group interaction. Data were statistically analyzedat four points during the study: at baseline, applica-
tion time, 5 minutes, and 10 minutes.
Analysis of time effect refers to the mean of all par-
ticipants at time 1 (baseline) compared with all
participants at time 2 (blanket application). Analy-
sis of group effect refers to the mean of all control
group participants at times 1 and 2 compared withthe mean of all intervention group participants at
times 1 and 2. Analysis of time by group interaction
effect refers to comparing each group at each time
with each other group at each other time.
Results
Phase 1 pretesting demonstrated that the blankets
warmed at different rates, depending on their loca-
tion in the warming cabinet. Baseline temperature
of the blankets was 71�F. Table 1 summarizes the
measurements from phase 1 pretesting.
Table 1. Pretest Phase 1: Time to MMaximum Tempera
110�F cabinet
Upper Cabinet
Time to MaximumTemperature
MaximumTemperature Achieved
Top 6 h 112�FMiddle 9 h 113�FBottom 9 h 111.5�F
Lower Cabinet
Top 8 h 109.5�FMiddle 9 h 111.5�FBottom 6 h 105�F
When the temperature of each blanket was mea-
sured in pretest phase 2, it was discovered that
there was variability of blanket temperature de-
pending on location within the cabinet. These
data are summarized in Table 2.
Phase 3 pretesting showed that mean temperature
of blankets before removal from the 155�F warmer
was 148.8�F. The researchers were amazed to find
that in the time it took to carry the blankets to the
stretcher and open them, the mean temperature
had already dropped to 119.4�F, a decrease of
29.4�F. Within 30 seconds after opening, themean temperature of the blanket dropped to
107.6�F and by 1 minute to 104.5�F. At completion
of phase 3, after 5 minutes, mean blanket temper-
atures were 96.8�F.
Of the 156 participants enrolled in the human test-
ing portion of the study, 80were randomized to the
control group and 76 were randomized to the in-tervention group. Figure 3 illustrates demographic
details of the groups. Level of significance was
P#.05 for all statistical analyses.
The mean oral temperature for the control group
was 97.84�F at baseline (time 1) and 97.85�F at
10 minutes (time 2). The mean oral temperature
for the intervention group was 97.91�F at baselineand 97.86�F at 10 minutes. Table 3 contains GLM
results and illustrates that there were no significant
differences in oral temperature means at any time
during data collection.
aximum Temperature and theture Achieved
155�F cabinet
Upper Cabinet
Time to MaximumTemperature
MaximumTemperature Achieved
2 h 156.5�F6 h 145�F6 h 149�F
Lower Cabinet
9 h 158.5�F11 h 148.5�F6 h 144�F
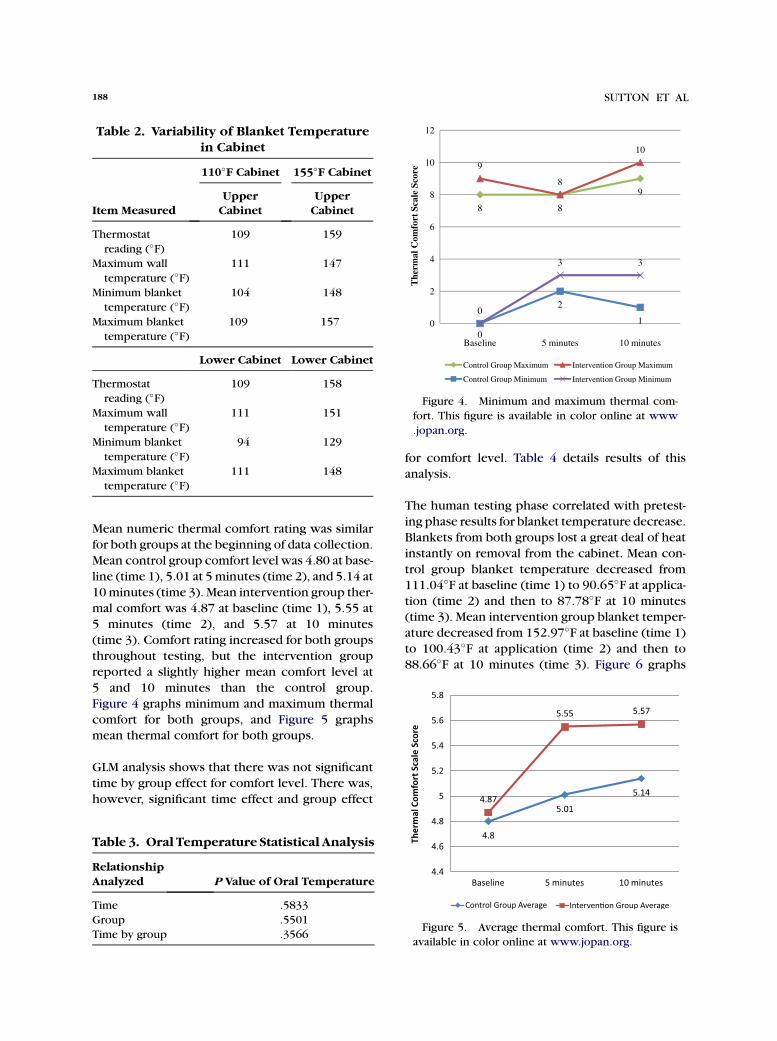
Table 2. Variability of Blanket Temperaturein Cabinet
Item Measured
110�F Cabinet 155�F Cabinet
UpperCabinet
UpperCabinet
Thermostat
reading (�F)109 159
Maximum wall
temperature (�F)111 147
Minimum blanket
temperature (�F)104 148
Maximum blanket
temperature (�F)109 157
Lower Cabinet Lower Cabinet
Thermostat
reading (�F)109 158
Maximum wall
temperature (�F)111 151
Minimum blanket
temperature (�F)94 129
Maximum blanket
temperature (�F)111 148
8 8
9
0
2
1
9
8
10
0
3 3
0
2
4
6
8
10
12
Baseline 5 minutes 10 minutes
The
rmal
Com
fort
Sca
le S
core
Control Group Maximum
Control Group Minimum
Intervention Group Maximum
Intervention Group Minimum
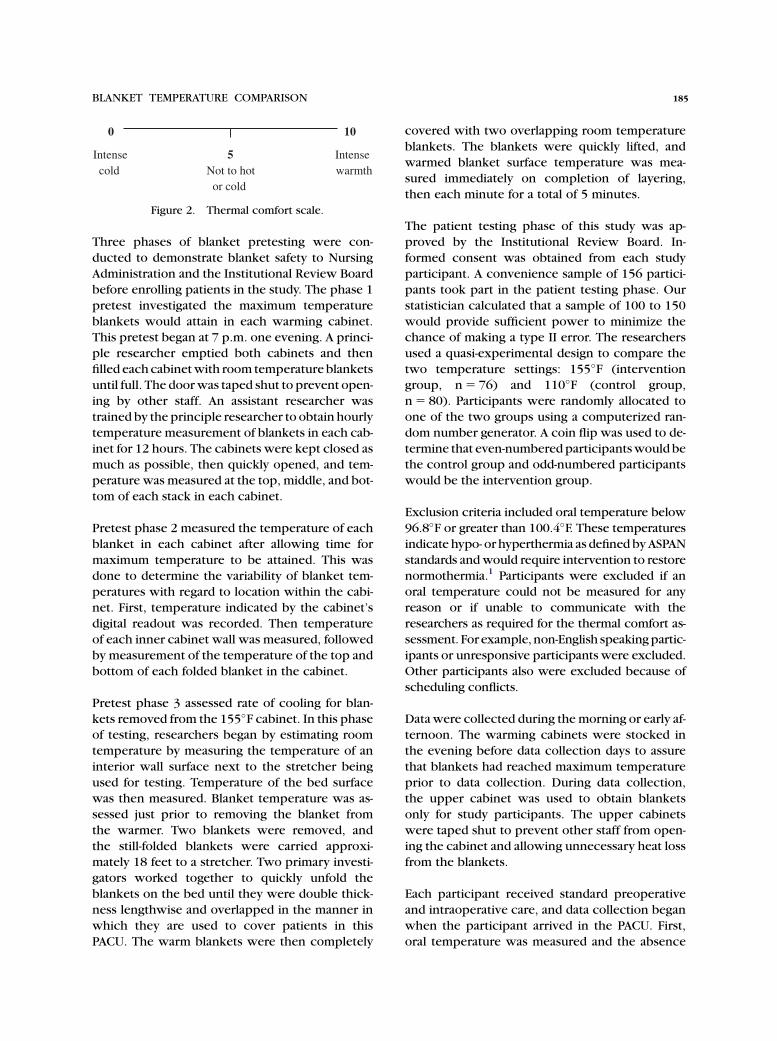
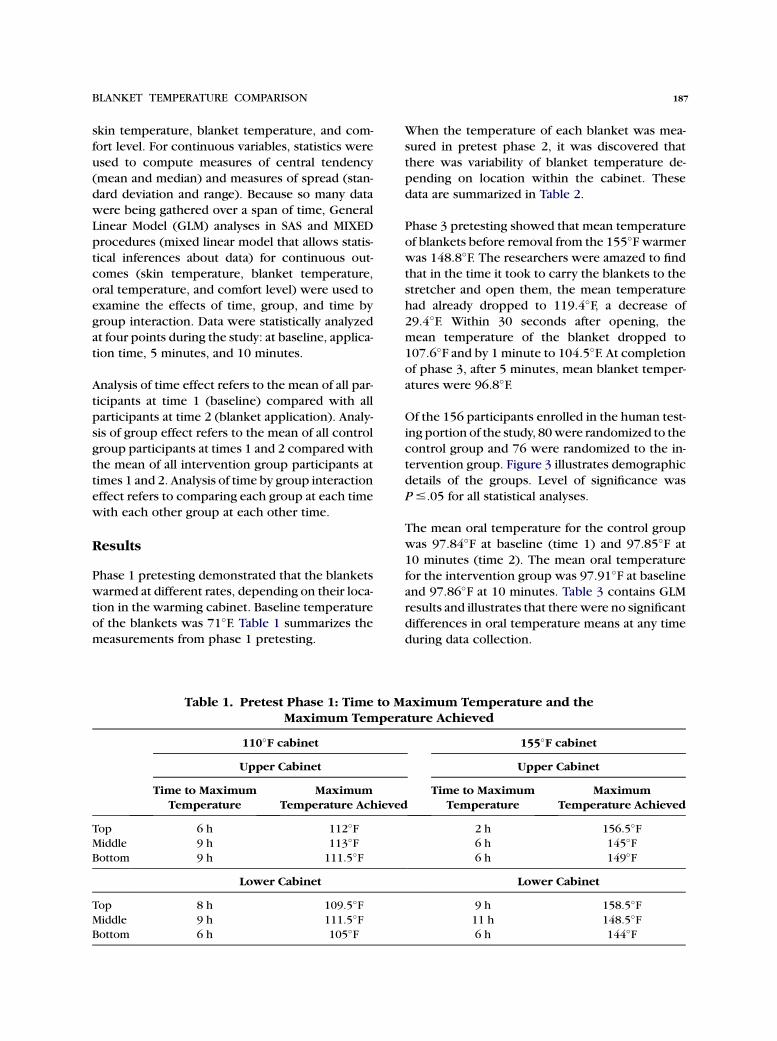
Figure 4. Minimum and maximum thermal com-
fort. This figure is available in color online at www
.jopan.org.
188 SUTTON ET AL
Mean numeric thermal comfort rating was similar
for both groups at the beginning of data collection.
Mean control group comfort level was 4.80 at base-
line (time 1), 5.01 at 5minutes (time 2), and 5.14 at
10minutes (time 3). Mean intervention group ther-mal comfort was 4.87 at baseline (time 1), 5.55 at
5 minutes (time 2), and 5.57 at 10 minutes
(time 3). Comfort rating increased for both groups
throughout testing, but the intervention group
reported a slightly higher mean comfort level at
5 and 10 minutes than the control group.
Figure 4 graphs minimum and maximum thermal
comfort for both groups, and Figure 5 graphsmean thermal comfort for both groups.
GLM analysis shows that there was not significant
time by group effect for comfort level. There was,
however, significant time effect and group effect
Table 3. Oral Temperature Statistical Analysis
RelationshipAnalyzed P Value of Oral Temperature
Time .5833
Group .5501
Time by group .3566
for comfort level. Table 4 details results of this
analysis.
The human testing phase correlated with pretest-
ing phase results for blanket temperature decrease.
Blankets from both groups lost a great deal of heat
instantly on removal from the cabinet. Mean con-
trol group blanket temperature decreased from
111.04�F at baseline (time 1) to 90.65�F at applica-tion (time 2) and then to 87.78�F at 10 minutes(time 3). Mean intervention group blanket temper-
ature decreased from 152.97�F at baseline (time 1)
to 100.43�F at application (time 2) and then to
88.66�F at 10 minutes (time 3). Figure 6 graphs
Figure 5. Average thermal comfort. This figure is
available in color online at www.jopan.org.
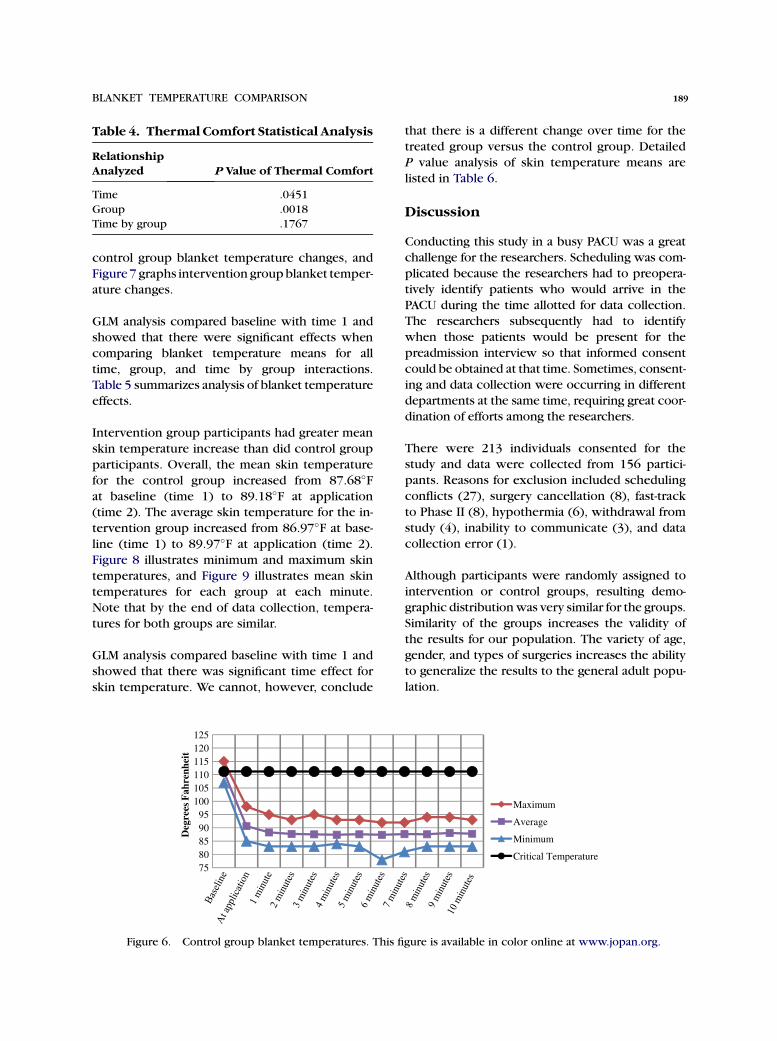
Table 4. Thermal Comfort Statistical Analysis
RelationshipAnalyzed P Value of Thermal Comfort
Time .0451
Group .0018
Time by group .1767
BLANKET TEMPERATURE COMPARISON 189
control group blanket temperature changes, and
Figure7 graphs intervention groupblanket temper-
ature changes.
GLM analysis compared baseline with time 1 and
showed that there were significant effects when
comparing blanket temperature means for all
time, group, and time by group interactions.Table 5 summarizes analysis of blanket temperature
effects.
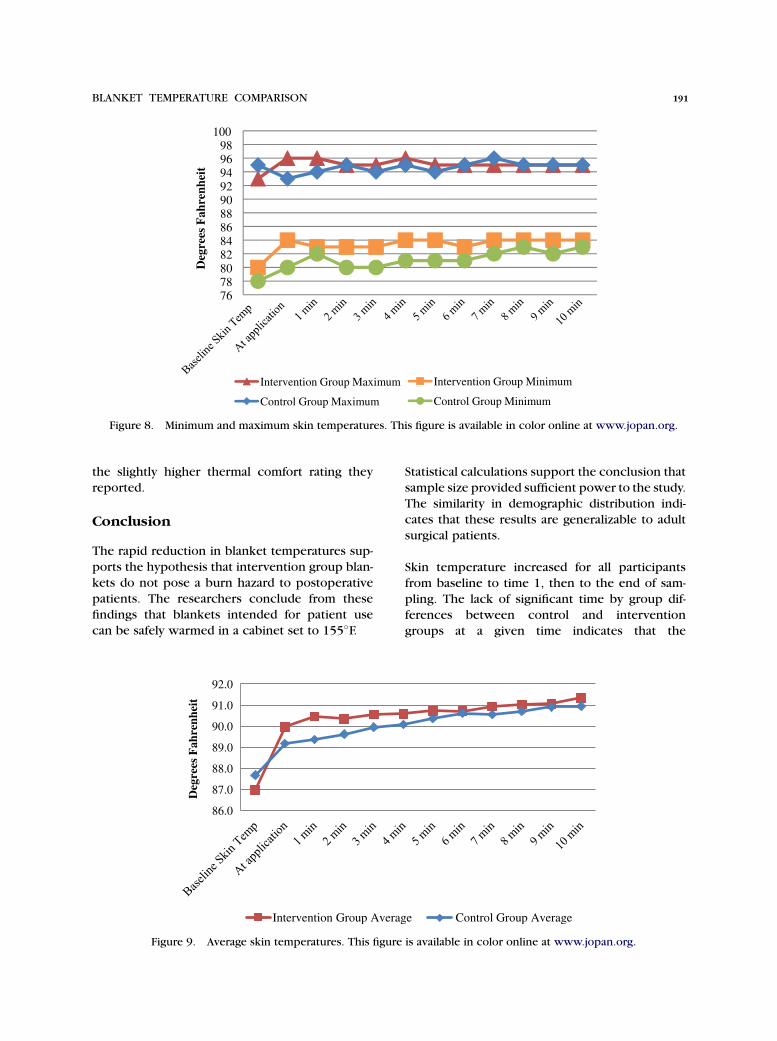
Intervention group participants had greater mean
skin temperature increase than did control group
participants. Overall, the mean skin temperature
for the control group increased from 87.68�Fat baseline (time 1) to 89.18�F at application(time 2). The average skin temperature for the in-
tervention group increased from 86.97�F at base-
line (time 1) to 89.97�F at application (time 2).
Figure 8 illustrates minimum and maximum skin
temperatures, and Figure 9 illustrates mean skin
temperatures for each group at each minute.
Note that by the end of data collection, tempera-
tures for both groups are similar.
GLM analysis compared baseline with time 1 and
showed that there was significant time effect for
skin temperature. We cannot, however, conclude
7580859095
100105110115120125
Deg
rees
Fah
renh
eit
Figure 6. Control group blanket temperatures. This fi
that there is a different change over time for the
treated group versus the control group. Detailed
P value analysis of skin temperature means are
listed in Table 6.
Discussion
Conducting this study in a busy PACU was a great
challenge for the researchers. Scheduling was com-
plicated because the researchers had to preopera-tively identify patients who would arrive in the
PACU during the time allotted for data collection.
The researchers subsequently had to identify
when those patients would be present for the
preadmission interview so that informed consent
could be obtained at that time. Sometimes, consent-
ing and data collection were occurring in different
departments at the same time, requiring great coor-dination of efforts among the researchers.
There were 213 individuals consented for the
study and data were collected from 156 partici-
pants. Reasons for exclusion included scheduling
conflicts (27), surgery cancellation (8), fast-track
to Phase II (8), hypothermia (6), withdrawal from
study (4), inability to communicate (3), and datacollection error (1).
Although participants were randomly assigned to
intervention or control groups, resulting demo-
graphic distributionwas very similar for the groups.
Similarity of the groups increases the validity of
the results for our population. The variety of age,
gender, and types of surgeries increases the abilityto generalize the results to the general adult popu-
lation.
Maximum
Average
Minimum
Critical Temperature
gure is available in color online at www.jopan.org.
75
85
95
105
115
125
135
145
155
165
Deg
rees
Fah
renh
eit
Maximum
Average
Minimum
Critical Temperature
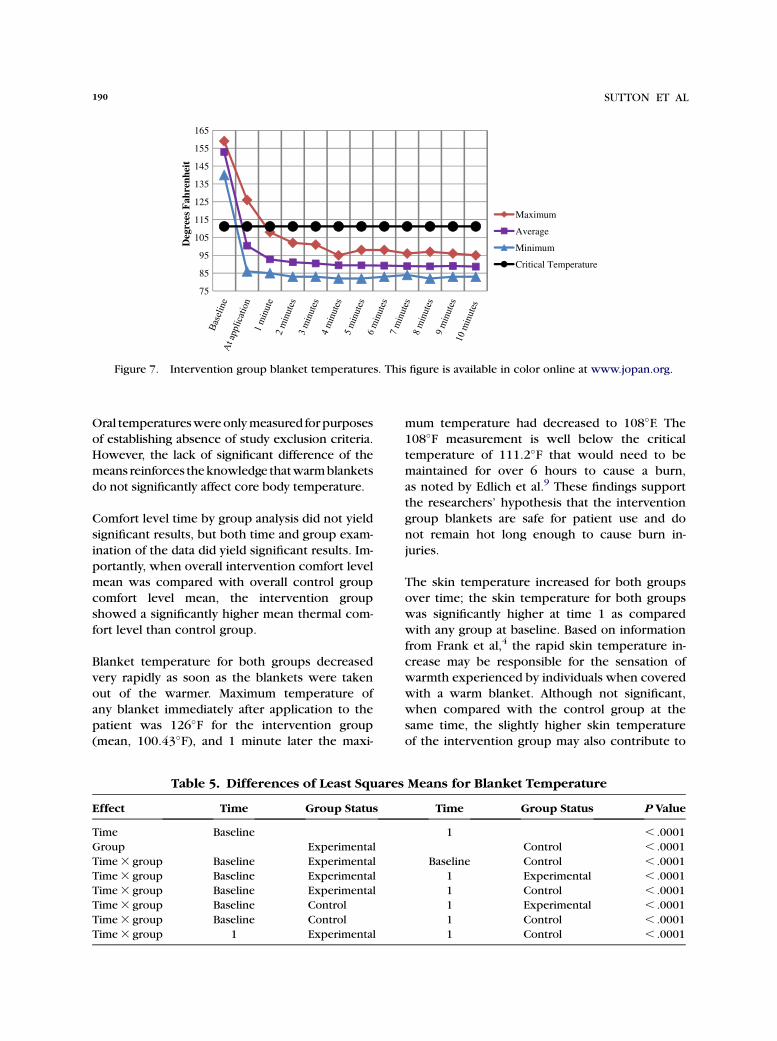
Figure 7. Intervention group blanket temperatures. This figure is available in color online at www.jopan.org.
190 SUTTON ET AL
Oral temperatureswereonlymeasured forpurposes
of establishing absence of study exclusion criteria.However, the lack of significant difference of the
means reinforces theknowledge thatwarmblankets
do not significantly affect core body temperature.
Comfort level time by group analysis did not yield
significant results, but both time and group exam-
ination of the data did yield significant results. Im-
portantly, when overall intervention comfort levelmean was compared with overall control group
comfort level mean, the intervention group
showed a significantly higher mean thermal com-
fort level than control group.
Blanket temperature for both groups decreased
very rapidly as soon as the blankets were taken
out of the warmer. Maximum temperature ofany blanket immediately after application to the
patient was 126�F for the intervention group
(mean, 100.43�F), and 1 minute later the maxi-
Table 5. Differences of Least Squares
Effect Time Group Status
Time Baseline
Group Experimental
Time3 group Baseline Experimental
Time3 group Baseline Experimental
Time3 group Baseline Experimental
Time3 group Baseline Control
Time3 group Baseline Control
Time3 group 1 Experimental
mum temperature had decreased to 108�F. The108�F measurement is well below the criticaltemperature of 111.2�F that would need to be
maintained for over 6 hours to cause a burn,
as noted by Edlich et al.9 These findings support
the researchers’ hypothesis that the intervention
group blankets are safe for patient use and do
not remain hot long enough to cause burn in-
juries.
The skin temperature increased for both groups
over time; the skin temperature for both groups
was significantly higher at time 1 as compared
with any group at baseline. Based on information
from Frank et al,4 the rapid skin temperature in-
crease may be responsible for the sensation of
warmth experienced by individuals when covered
with a warm blanket. Although not significant,when compared with the control group at the
same time, the slightly higher skin temperature
of the intervention group may also contribute to
Means for Blanket Temperature
Time Group Status P Value
1 , .0001
Control , .0001
Baseline Control , .0001
1 Experimental , .0001
1 Control , .0001
1 Experimental , .0001
1 Control , .0001
1 Control , .0001
767880828486889092949698
100
Deg
rees
Fah
renh
eit
Intervention Group Maximum
Control Group Maximum
Intervention Group Minimum
Control Group Minimum
Figure 8. Minimum and maximum skin temperatures. This figure is available in color online at www.jopan.org.
BLANKET TEMPERATURE COMPARISON 191
the slightly higher thermal comfort rating they
reported.
Conclusion
The rapid reduction in blanket temperatures sup-
ports the hypothesis that intervention group blan-
kets do not pose a burn hazard to postoperative
patients. The researchers conclude from these
findings that blankets intended for patient use
can be safely warmed in a cabinet set to 155�F.
86.0
87.0
88.0
89.0
90.0
91.0
92.0
Deg
rees
Fah
renh
eit
Intervention Group Averag
Figure 9. Average skin temperatures. This figure
Statistical calculations support the conclusion that
sample size provided sufficient power to the study.
The similarity in demographic distribution indi-
cates that these results are generalizable to adult
surgical patients.
Skin temperature increased for all participants
from baseline to time 1, then to the end of sam-
pling. The lack of significant time by group dif-
ferences between control and intervention
groups at a given time indicates that the
e Control Group Average
is available in color online at www.jopan.org.
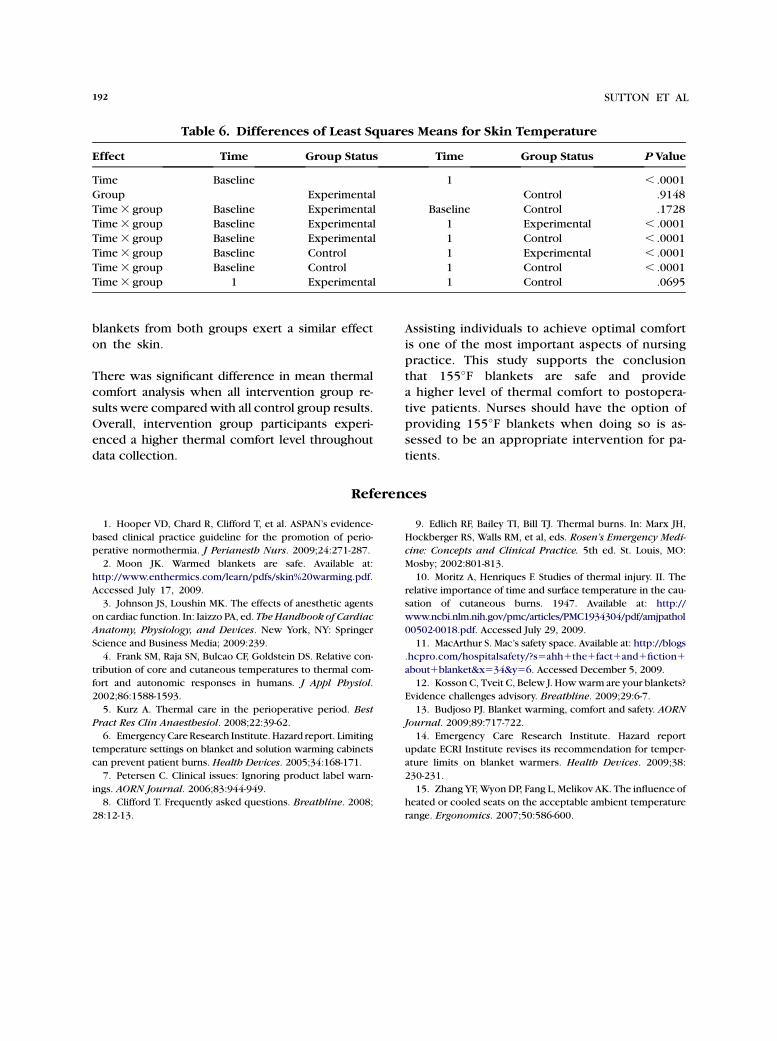
Table 6. Differences of Least Squares Means for Skin Temperature
Effect Time Group Status Time Group Status P Value
Time Baseline 1 , .0001
Group Experimental Control .9148
Time3 group Baseline Experimental Baseline Control .1728
Time3 group Baseline Experimental 1 Experimental , .0001
Time3 group Baseline Experimental 1 Control , .0001
Time3 group Baseline Control 1 Experimental , .0001
Time3 group Baseline Control 1 Control , .0001
Time3 group 1 Experimental 1 Control .0695
192 SUTTON ET AL
blankets from both groups exert a similar effect
on the skin.
There was significant difference in mean thermal
comfort analysis when all intervention group re-
sults were compared with all control group results.
Overall, intervention group participants experi-
enced a higher thermal comfort level throughout
data collection.
Assisting individuals to achieve optimal comfort
is one of the most important aspects of nursingpractice. This study supports the conclusion
that 155�F blankets are safe and provide
a higher level of thermal comfort to postopera-
tive patients. Nurses should have the option of
providing 155�F blankets when doing so is as-
sessed to be an appropriate intervention for pa-
tients.
References
1. Hooper VD, Chard R, Clifford T, et al. ASPAN’s evidence-
based clinical practice guideline for the promotion of perio-
perative normothermia. J Perianesth Nurs. 2009;24:271-287.
2. Moon JK. Warmed blankets are safe. Available at:
http://www.enthermics.com/learn/pdfs/skin%20warming.pdf.
Accessed July 17, 2009.
3. Johnson JS, Loushin MK. The effects of anesthetic agents
on cardiac function. In: Iaizzo PA, ed. TheHandbookof Cardiac
Anatomy, Physiology, and Devices. New York, NY: Springer
Science and Business Media; 2009:239.
4. Frank SM, Raja SN, Bulcao CF, Goldstein DS. Relative con-
tribution of core and cutaneous temperatures to thermal com-
fort and autonomic responses in humans. J Appl Physiol.
2002;86:1588-1593.
5. Kurz A. Thermal care in the perioperative period. Best
Pract Res Clin Anaesthesiol. 2008;22:39-62.
6. EmergencyCareResearch Institute. Hazard report. Limiting
temperature settings on blanket and solution warming cabinets
can prevent patient burns. Health Devices. 2005;34:168-171.
7. Petersen C. Clinical issues: Ignoring product label warn-
ings. AORN Journal. 2006;83:944-949.
8. Clifford T. Frequently asked questions. Breathline. 2008;
28:12-13.
9. Edlich RF, Bailey TI, Bill TJ. Thermal burns. In: Marx JH,
Hockberger RS, Walls RM, et al, eds. Rosen’s Emergency Medi-
cine: Concepts and Clinical Practice. 5th ed. St. Louis, MO:
Mosby; 2002:801-813.
10. Moritz A, Henriques F. Studies of thermal injury. II. The
relative importance of time and surface temperature in the cau-
sation of cutaneous burns. 1947. Available at: http://
www.ncbi.nlm.nih.gov/pmc/articles/PMC1934304/pdf/amjpathol
00502-0018.pdf. Accessed July 29, 2009.
11. MacArthur S. Mac’s safety space. Available at: http://blogs
.hcpro.com/hospitalsafety/?s5ahh1the1fact1and1fiction1about1blanket&x534&y56. Accessed December 5, 2009.
12. Kosson C, Tveit C, Belew J. Howwarm are your blankets?
Evidence challenges advisory. Breathline. 2009;29:6-7.
13. Budjoso PJ. Blanket warming, comfort and safety. AORN
Journal. 2009;89:717-722.
14. Emergency Care Research Institute. Hazard report
update ECRI Institute revises its recommendation for temper-
ature limits on blanket warmers. Health Devices. 2009;38:
230-231.
15. Zhang YF,WyonDP, Fang L, Melikov AK. The influence of
heated or cooled seats on the acceptable ambient temperature
range. Ergonomics. 2007;50:586-600.