a program evaluation of the basic supervisory development
TRANSCRIPT

Calhoun: The NPS Institutional Archive
Theses and Dissertations Thesis Collection
1985
A program evaluation of the basic supervisory
development seminar.
Blackburn, William Richard.
http://hdl.handle.net/10945/21506


DUDLEY KNOX LIBRARYNAVAL POSTGRADUATE SCHOOLMONTEREY, CALIFORNIA 03943


A PROGRAM EVALUATION OF THE BASIC SUPERVISORY
DEVELOPMENT SEMINAR
A Report
Presented to
the Faculty of the School of Education
San Diego State University
In Partial Fulfillment
of the Requirements for the Course
Education 795A and B Seminar
Dr. Al Merino
by
William Richard Blackburna
August, 1985
T222801

7^ f:
.\
ACKNOWLEDGEMENT
I would like to thank several individuals from the
Training Department of the Naval Civilian Personnel
Command Southwest Region. Mr. Ross Evans and Mr. Vern
Cooper were instrumental in the selection of the Basic
Supervisory Development Seminar as an appropriate topic
for the study and obtained the necessary authorization
for me to conduct the entire project. Without the able
assistance of their staff, it would have been impossible
to accomplish the mailing and receiving of the various
questionnaires in such an efficient and timely manner.
Additionally, I would like to express my appreci-
ation to Dr. Lawrence Solomon whose co-operation and
assistance throughout the project was invaluable. From
his advice during the initial consultations on the proper
design of the program evaluation to the administering of
the required pre-tests, he was always willing to contrib-
ute his time and experience towards the success of the
project
.
Finally, and most importantly, thanks must be given
to Dr. Al Merino, my faculty advisor, for his steadfast
guidance and sage advice throughout the various stages
of this project. Without his encouragement to start


early and plan thoroughly, a smooth completion of the
study would not have been possible.

IV
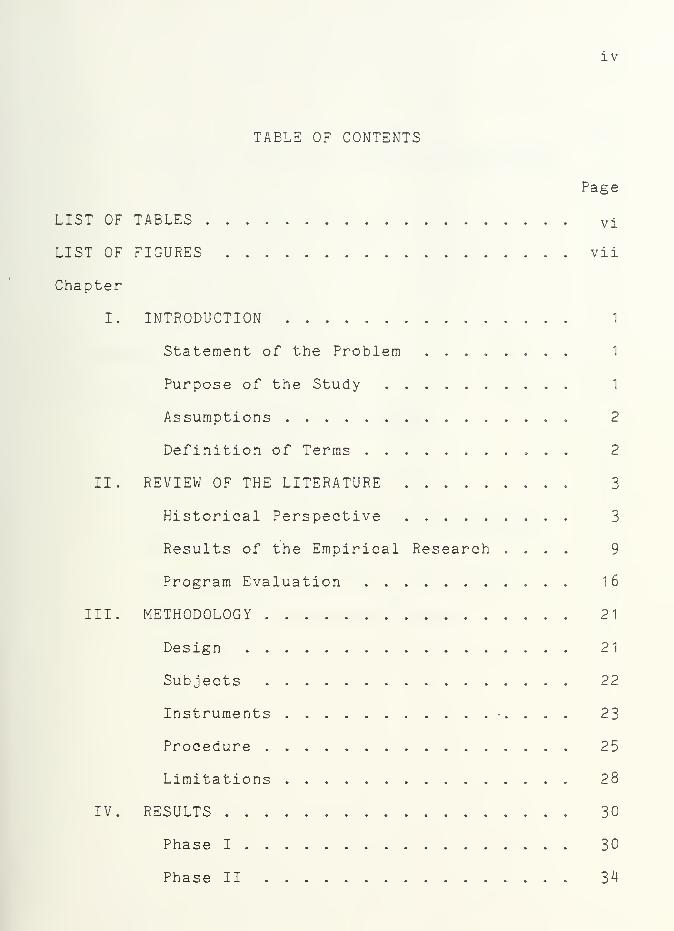
TABLE OF CONTENTS
Page
LIST OF TABLES Vi
LIST OF FIGURES vii
Chapter
I. INTRODUCTION 1
Statement of the Problem 1
Purpose of the Study 1
Assumptions 2
Definition of Terms 2
II. REVIEW OF THE LITERATURE ......... 3
Historical Perspective 3
Results of the Empirical Research .... 9
Program Evaluation 16
III. METHODOLOGY 21
Design 21
Subjects 22
Instruments 23
Procedure 25
Limitations 28
IV. RESULTS 30
Phase I 30
Phase II 34

V
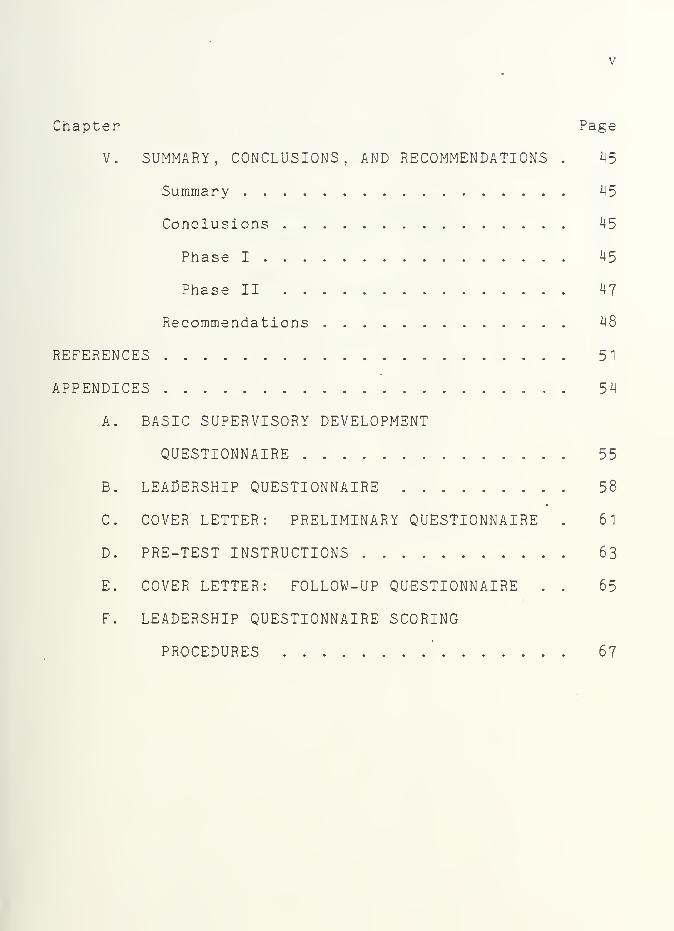
Chapter Page
V. SUMMARY, CONCLUSIONS, AND RECOMMENDATIONS . 45
Summary 45
Conclusions 45
Phase I 45
Phase II 47
Recommendations 48
REFERENCES 51
APPENDICES 54
A. BASIC SUPERVISORY DEVELOPMENT
QUESTIONNAIRE 55
B. LEADERSHIP QUESTIONNAIRE 58
C. COVER LETTER: PRELIMINARY QUESTIONNAIRE . 61
D. PRE-TEST INSTRUCTIONS 63
E. COVER LETTER: FOLLOW-UP QUESTIONNAIRE . . 65
F. LEADERSHIP QUESTIONNAIRE SCORING
PROCEDURES ' 67

VI
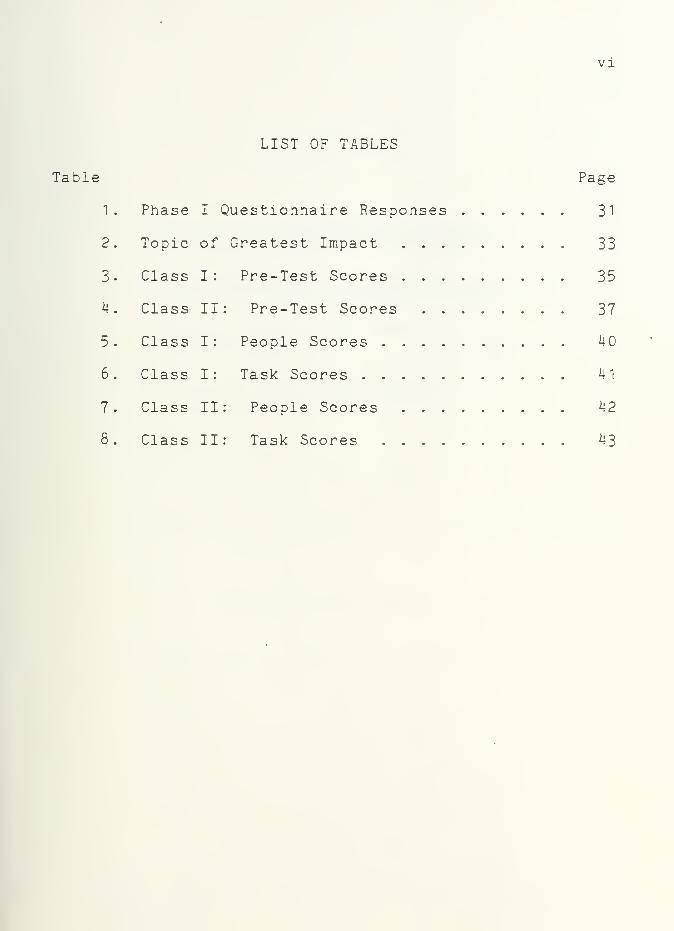
LIST OF TABLES
Table Page
1. Phase I Questionnaire Responses 31
2. Topic of Greatest Impact 33
3. Class I: Pre-Test Scores 35
4. Class II: Pre-Test Scores 37
5. Class I: People Scores 40
6. Class I: Task Scores 41
7. Class II: People Scores 42
8. Class II: Task Scores 43


LIST OF FIGURES
VII
Figure
1 .
3.
Checklist of the Steps in DeterminingEvaluation Purposes Requirements . .
Alternative Methods of Assessing Studentand Program Effectiveness
Results of Statistical Comparison ofPre-Test Scores
Results of Statistical Comparison ofPre-Test to Post-Test Scores ....
Page
18
20
38
39

CHAPTER I
INTRODUCTION
Statement of the Problem
Every year the U.S. Navy spends thousands of dollars
on training programs to increase the effectiveness and
leadership abilities of the supervisors within the Naval
Civilian Personnel Command. Presently there is no means
to measure the degree to which these courses are meeting
their instructional objectives. In most cases the sole
qualitative and quantitative evaluation of the courses
comes from end-of-course critiques completed by the
attendees
.
Purpose of the Study
The purpose of this study was to take one of these
courses and attempt to measure the degree to which it
was accomplishing its objectives. Specifically, the
Basic Supervisory Development Seminar was evaluated under
a two phase project. Phase I involved a survey of past
attendees to determine if adequate emphasis was placed on
the course content to meet their needs as supervisors
once back on the job. Phase II involved an evaluation of

three different sessions of the seminar to determine if
it had a significant influence on the leadership styles
of its attendees.
Assumptions
It was assumed that all individuals answered the
various questionnaires candidly and to the best of their
ability .
Definition of Terms
For the purpose of this study the following terms
will be defined as follows:
Concern for people - Refers to a leader's interest
in those behaviors that affect the welfare of his or
her subordinates.
Concern for task - Refers to a leader's interest in
those behaviors that initiate structure and more clearly
define the task involved.
Leadership style - The relationship between a
leader's "concern for task" and "concern for people" as
determined by the T-P Leadership Questionnaire (Pfeiffer
& Jones, 1974).

CHAPTER II
REVIEW OF THE LITERATURE
Historical Perspective
Before any attempt can be made, to evaluate the
effectiveness of a leadership training program, a basic
understanding of current leadership theories is required
In examining the wealth of information on the subject,
it becomes apparent that today the field of leadership
theory is as filled with controversy as it has been
since the turn of the century.
At the turn of the century the first attempts at
scientifically defining leadership theory were being
made by the trait theorists. It was their contention
that effective leaders were born with certain innate
abilities and characteristics that distinguished them
from their less effective counterparts. If these
desired qualities could be identified, they could form
the basis for future selection of successful leaders
with far more certainty than trying to train someone
without them. Unfortunately, after almost a half
century of intense research, no scientific consensus
emerged as to a definitive list of these much


sought-after traits.
It was also at the turn of the century that effici-
ency experts like Fredrick Taylor made the first sys-
tematic attempts to study management and organizations.
The goal of Taylor's "Scientific Method" was to reduce
all tasks to a series of mechanical movements which could
be analyzed and streamlined into the simplest, "best way"
to do the job. During the first quarter of the twentieth
century, the popularity of this philosophy led to a
strong emphasis on performance and productivity. It was
believed that the primary function of managers was to
set standards and see that employees meet those standards
(Dreilinger, McElheny & Robinson, 1982).
While the scientific method did make significant
contributions to the industrialization process, it
failed to solve the problems of low productivity and
worker interest. For this reason, in 1924 the now famous
Hawthorne experiments were launched. During various
experiments conducted at the Hawthorne Works of the
Western Electric Company in Chicago productivity soared.
However, no correlation could be determined between the
productivity and the variables that were altered within
the physical conditions of the assembly lines. After
exhaustive interviews with the subjects involved, it was

discovered that the incentive and motivation of the
workers were the key to the increased productivity.
The unaccustomed attention the workers received while
being consulted for ideas made them and their jobs
seem important for the first time. The significance
of these results in the history of modern management
cannot be over-exaggerated (Owens, 1 9 8 1 ) . After
Hawthorne , every serious management study had to become
two-dimensional, taking into account the psychological
and human aspects as well as the physical properties of
the workplace and worker.
As a result of the Hawthorne studies a major shift
occurred in the direction of a human relations orienta-
tion for management. Now the manager's primary function
became the motivation of employees in order to accomplish
the organization's goals (Dreilinger-, et al., 1982).
During this same period , theorists began to shift
to analysis of effective leader "behaviors" rather than
traits. It was felt that behaviors, unlike traits, were
observable, more exactly defined, and therefore, more
amenable to the methods of empirical research.
These behavior theorists were actively pursuing
research designed to categorize effective leader behaviors
Eventually, all of these behaviors were reduced to two

general categories: "initiating structure" and "con-
sideration." Structure behaviors involved clearly-
stating goals to achieve ," work . assignments,job struc-
tures, and other factors that let the workers know
what was expected of them. Consideration behaviors were
those related to the concern for, and personal interest
in, subordinates and their welfare. As the theorists
categorized these behaviors they began to notice that
different types of leaders shared certain groups of these
behaviors. Leadership style became the term used to
define a relatively enduring set of these behaviors which
were characteristic of the individual regardless of the
situation (Feidler, 197*1).
By the 1960's emphasis in the field had shifted
again, this time from behaviors to styles. Several
leadership style theories developed that attempted to
integrate the concerns for structure and consideration.
McGregor postulated that there were two general types
of organization climates that influence leadership
styles. In the traditional, "Theory X" organization,
the manager's role prescription is based on the premise
that workers are basically lazy, irresponsible and
disloyal, and therefore require a structuring, auto-
cratic supervisor. In contrast, a "Theory Y"


which McGregor favors, is based on the premise that
workers are inherently motivated, mature, and will do
a good job if provided with an environment based on
democratic procedures, participative decision-making,
and self-control (Fiedler, 197*0.
Another theory which shares the participative
philosophy of Theory Y is Blake and Mouton's Managerial
Grid. Their theory is based on a two-variable leader-
ship model which measures a leader's orientation towards
people and task. It characterizes the "9,9" leadership
style, which maximizes both concerns, as the single
best leadership style (Blake & Mouton, 1982).
Meanwhile, Hersey and Blanchard introduced their
Situational Theory of Management and started a con-
troversy with the Managerial Grid proponents that
continues today. Situationalism is similarly based on
the two variables of task and relationship orientation.
However, in contrast to the Managerial Grid's "one
best style," their model involves four leadership
styles, the appropriateness of which depends on the
maturity of the subordinates. These are high task/high
relationship, high task/low relationship, low task/high
relationship, and low task/low relationship (Blake &
Mouton, 1974).

The most recent major contribution to the leadership
field is Fiedler's Contingency Theory. He questions the
individual's ability to change his or her leadership
style and suggests that the key to determining style
effectiveness is the extent to which the leader can or
cannot influence followers (Sergiovanni , 1979). This
influence will be the result of three situational
variables: (1) leader-member relations, (2) task struc-
ture, and (3) position power. If the leader finds
himself in an unfavorable situation, rather than
attempting to change his or her style to be more
effective, the leader should modify the situational
variables to more closely match his or her style
(Fiedler, 1974).
From this brief synopsis of the evolution of leader-
ship theory it becomes evident that the process has
involved a shift in perspective. In the first half of
the century, theorists concentrated entirely on
internal traits, attitudes, and behaviors for the
answers. In the second half, the philosophy has shifted
to one that recognizes, more and more, the importance
of environmental factors, such as the leader's sub-
ordinates and work situation, in ultimately determining
his effectiveness.


Results of the Empirical Research
The ultimate test of any theory is the success of
its practical application to the real world. Since the
first publishings of empirical research on leadership in
1904, theorists have spent exhaustive efforts attempting
to support their theories with scientific results. A
major impetus to the field occurred during World War I
with the sudden importance in the selection and place-
ment of military officers. Since that time the over-
whelming part of leadership research has been conducted
in the U.S., and the field continues to be dominated by
U.S. researchers. The primary reasons appear to be the
financial support provided by this country and its
democratic ideology which enables anyone to rise to a
position of leadership (Fiedler, 1974).
The research was examined for evidence that sup-
ported the claims of the previously discussed theories,
with particular emphasis on their effects on group
performance. It was then examined for proof that
leadership training could, in fact, result in measur-
able improvement in leadership effectiveness.
As mentioned earlier, years of research by the trait
theorists created lengthy lists covering a wide range of

10
personality attributes but little consistency across
studies. Stogdill (1974) found only three traits con-
sistently high in many studies: intelligence, initiative,
and responsibility. If leadership effectiveness was due
to traits, an effective leader should be good across all
kinds of situations. Unfortunately, we know from real
life that this is not the case.
Research on behaviors as the key also failed , and
efforts shifted to styles. There has been a great deal
of research aimed at determining which leadership style
is the most effective. Unfortunately, the results have
been quite varied and depend, to a great deal, upon who
conducts the study.
As mentioned in the previous section, several
theories are based on measuring the leader's behavior in
'terms of his or her orientation towards consideration or
the initiation of structure. Examining the effects of
this emphasis on the group and its performance reveals
mixed results.
A consensus of studies show a high positive cor-
relation of consideration to employee satisfaction.
While not surprising, it should be pointed out that this
relationship speaks nothing of causality. An employee
may well become more satisfied when the leader's

11
consideration increases. On the other hand, it is
entirely possible that a leader tends to become more
considerate with a productive, satisfied group
(Fiedler, 197*0.
On the subject of productivity, structure has a
higher positive correlation than consideration. Studies
by Vroom (1960) indicate employee characteristics
determine which style is more effective. Employees high
in authoritarianism and low in the need for independence
performed better under more structured leaders , while
employees high in the need for independence and low
authoritarianism performed better under more considerate
leaders. Group cohesiveness appears to be related about
equally to consideration and structure in the positive
direction (Stogdill, 197*0.
Research dealing with Hersey and Blanchard's
Situational Leadership Model fails to give strong support
to their theory. Twenty-six studies aimed at connecting
leadership style and effectiveness found no consistent
positive correlation (Blake & Mouton, 1982). Their
prescriptive model for applying situation leadership
theory has conceptual inconsistencies, particularly in
the middle range levels of maturity (M-2 and M-3). The
validity of the LEAD diagnostic instrument for measuring

12
leader style, style range, and effectiveness is suspect
due to the seemingly arbitrary way Hersey and Blanchard
decided which style was most effective in several
situations (Graeff, 1983).
If one collectively groups Blake and Mouton's
Managerial Grid, McGregor's Theory Y, and several other
similar theories together as participative management,
there are a wide variety of students available to research
and analyze. As mentioned previously, high consideration
in most cases increases satisfaction and high structure
usually increases productivity. Several studies indi-
cate that high levels of both factors , as typified by
participative management, interact to influence both
productivity and satisfaction. For this reason,
Stodgill (1974) states that the most effective leaders
tend to be described high on both scales fitting the 9,9
style in terms of the Managerial Grid. Blake and
Mouton (1982) cite several studies where large corpora-
tions have significantly improved productivity by
switching the "9,9 M style of management. Probably the
greatest shortcoming of participative management is its
lack of consideration for the uniqueness of the situation.
Its main thrust is on what leaders do to followers, not
necessarily what followers do to leaders (Beck, 1982).

13
It appears that Fiedler's Contingency Model is one
of the best validated leadership theories today. The
Least Preferred Coworker (LPC) test, a personality meas-
ure, is the key variable in the theory. This instrument
has shown high internal consistency and test-retest
reliability. Using a leader's LPC score and a descrip-
tion of his or her situational favorableness , the theory
has demonstrated that it is highly predictive of leader
effectiveness in over thirty studies. These studies have
repeatedly shown that low LPC leaders (task-motivated)
perform best in situations where their power and influence
are either very high or low. High LPC leaders (relation-
ship-oriented) perform best in situations where their
power and influence are moderate (Fielder, 197*0. The
Contingency Theory is not without its shortcomings, how-
ever. One is its lack of specific guidance for someone
who scores in the mid-range on the LPC test (Csoka &
Bons, 1978).
What evidence does the research give to support the
claims that leadership training increases effectiveness?
Unfortunately, not much, and much of what has been done
was of poor design.
Many of the present leadership training programs
are geared around sensitivity training which concentrates
on group dynamics with a strong human relations

m
orientation. In general, it appears that this type of
training does change attitudes in the desired direction,
towards a greater relationship awareness. However, there
is little conclusive evidence that this training results
in change of overt behavior. Also, although the effects
of this training tend to increase the cohesiveness of
the group, it is often associated with a decrease in
group productivity (Stodgill, 1974).
Many of the training programs claim that they can
change one's leadership style. However, the results
tend to indicate that leadership styles are manifesta-
tions of our personalities, and as such, are extremely
difficult to change ( Sergiovanni , 1979).
It also appears that the effects of training will be
dependent upon a leader's task or relationship-orientation
Some evidence supports the premise that under certain
circumstances further training can, in fact, hinder a
leader's abilities. The Contingency Theory provides
quite accurate guidelines in predicting whether such
training will be beneficial or detrimental to performance.
Fiedler's Leader Match training program is one of
the few that has been able to demonstrate measurable
improvements in leader effectiveness fairly consistently,
as well as its highly desirable attribute of cost


15
effectiveness . It has shown significant results while
requiring less than twelve hours of total training
(Leister, Borden & Fiedler, 1977). While this program
seems to work, part of its success may be due simply
to its effects as a confidence builder. In several
studies attendees showed improved performance but
demonstrated a lack of understanding of the techniques
involved in changing the situational variables (Csoka
& Boris, 1978).
Overall, it appears that leadership training can be
effective in certain situations. However, measurable
results are often difficult to show. Training programs
that make strong guarantees of success and/or style
changes should be viewed with skepticism. In many
cases, leadership training is not needed as much as
changes in organizational practices and managerial skills
that tend to restrict employees' performance and pro-
ductivity (Dreilinger, et al., 1982). For this reason,
many of today's leadership programs incorporate train-
ing in such techniques as decision making, conflict
resolution, group facilitation, etc. It appears that
mastering these managerial skills may be as critical as
understanding the latest leadership theories.


16
Program Evaluation
How do we determine if a particular leadership
training program is effective; i.e., that as a result
of the change caused in the attendee , his or her group
is able to perform their assigned functions better?
This involves program evaluation, which has developed
into a completely independent field of study.
The term "program" is extremely broad in scope
and can fit a variety of descriptions. However, if we
limit our discussion to educational programs, these can
be defined as a combination of content, personnel,
activities, and resources organized so as to attain
specified goals and objectives (California State
Department of Education, 1979).
Even without this context, program evaluation can
be conducted for numerous reasons. Four major purposes
for program evaluation are
:
(1) Communicating with the public;
(2) Providing information to decision makers;
(3) Improving existing programs;
(4) Generating a sense of unity and growth.
Just as there are many reasons for conducting an
evaluation, the process itself can be accomplished


17
using a variety of methods. There are a great number of
books published today that serve as guides for this
process- Most agree that the evaluation process
involves three major phases: planning, conducting, and
using. The first, planning, involves determining the
evaluation's purposes and objectives. From this one
can develop a general evaluation plan which includes
determining its design and obtaining the necessary
assessment tools. The second phase, conducting, involves
both the collection and analysis of the required data.
The third and final phase, using, involves reporting the
results and applying the evaluation findings to future
recommendations (California State Department of Educa-
tion, 1979).
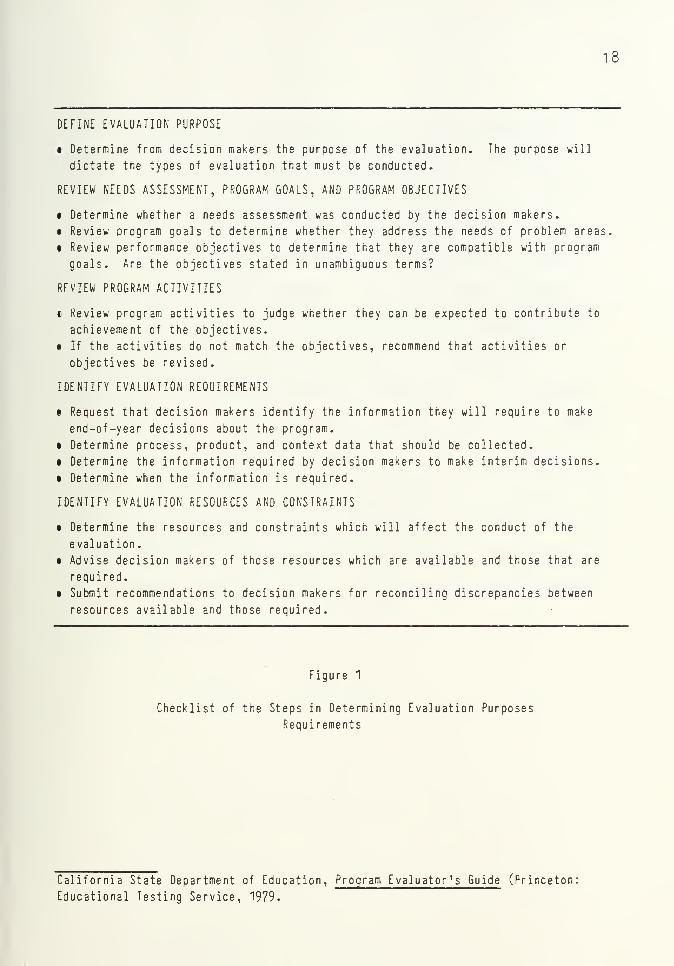
Probably the most critical and yet most neglected
phase is the initial one. Without proper planning,
tremendous amounts of effort and money can be expended
with little hope of obtaining meaningful data from which
significant conclusions can be drawn. The California
State Department of Education (1979) has developed a
fairly comprehensive checklist for guidance through
the initial steps of defining the evaluation's purposes
and requirements (see Figure 1).
Developing the evaluation plan depends to a great

18
DEFINE EVALUATION PURPOSE
• Determine from decision makers the purpose of the evaluation. The purpose will
dictate the types of evaluation that must be conducted.
REVIEW NEEDS ASSESSMENT, PROGRAM GOALS, AND PROGRAM OBJECTIVES
i Determine whether a needs assessment was conducted by the decision makers.
• Review program goals to determine whether they address the needs of problem areas,
i Review performance objectives to determine that they are compatible with program
goals. Are the objectives stated in unambiguous terms?
RFVIEW PROGRAM ACTIVITIES
$ Review program activities to judge whether they can be expected to contribute to
achievement of the objectives.
e If the activities do not match the objectives, recommend that activities or
objectives be revised.
IDENTIFY EVALUATION REQUIREMENTS
• Request that decision makers identify the information they will require to make
end-of-year decisions about the program.
• Determine process, product, and context data that should be collected.
• Determine the information required by decision makers to make interim decisions.
• Determine when the information is required.
IDENTIFY EVALUATION RESOURCES AND CONSTRAINTS
• Determine the resources and constraints which will affect the conduct of the
evaluation.
• Advise decision makers of those resources which are available and those that are
required.
• Submit recommendations to decision makers for reconciling discrepancies between
resources available and those required.
Figure 1
Checklist of the Steps in Determining Evaluation Purposes
Requirements
California State Department of Education, Program Evaluator's Guide (Princeton:
Educational Testing Service, 1979.

19
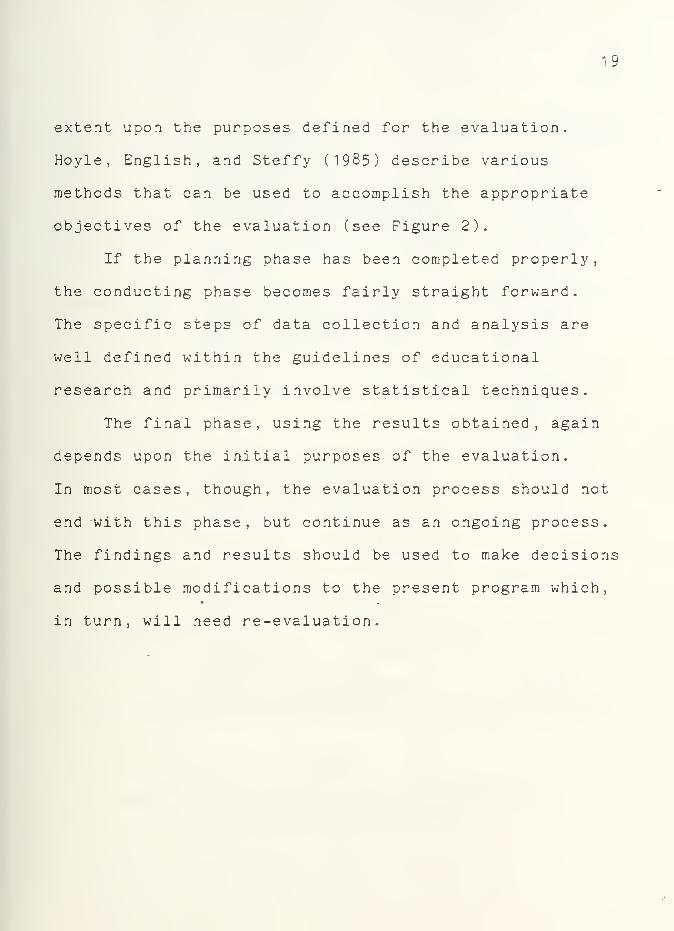
extent upon the purposes defined for the evaluation.
Hoyle , English, and Steffy (1985) describe various
methods that can be used to accomplish the appropriate
objectives of the evaluation (see Figure 2).
If the planning phase has been completed properly
,
the conducting phase becomes fairly straight forward.
The specific steps of data collection and analysis are
well defined within the guidelines of educational
research and primarily involve statistical techniques.
The final phase, using the results obtained, again
depends upon the initial purposes of the evaluation.
In most cases, though, the evaluation process should not
end with this phase, but continue as an ongoing process.
The findings and results should be used to make decisions
and possible modifications to the present program which,
in turn, will need re-evaluation.

20
TYPE DESCRIPTION PROTOGONISTS
Student Gain by To measure student performance and Ralph Tyler
Testing progress. Goal statements need to be Benjamin Bloom
specified; test score analysis of James Popham
discrepancy between goal and actuality. Mai Provus
Instituional Self- To review and increase staff effectiveness. National Study
study by Staff Committee work standards set by staff; of School
discussion Evaluation
Dressel
Blue Ribbon Panel To resolve crises and preserve the James Conant
institution. Prestigious panel; the Clark Kerr
visit; review of existing data and David Henry
documents.
Transaction To provide understanding of activities Louis Smith
Observation and values Parlett-Hamilton
Robert Rippey
Robert Stake
Management To increase rationality in day-to-day Leon Lassinger
Analysis decisions. Lists of options; Daniel Stufflebeam
estimates; feedback loops; costs; Marvin Alkin
efficiency Alan Thomas
Instructional To generate explanations and tactics Lee Cronbach
Research of instruction. Julian Stanley
Controlled conditions, Donald Campbell
multivariate analysis; bases for
generalization
Social Policy To aid development of institutional James Coleman
Analysis policies. David Cohen
Measures of social conditions and Carol Weiss
administrative implementation. Mosteller-Maynihan
Figure 2
Alternative Methods of Assessing Student and Program Effectiveness
(Hoyle, English, and Steffy, 1985)

21
CHAPTER III
METHODOLOGY
Design
The Basic Supervisory Development (BSD) Seminar is
a course that has been developed to meet some general
guidelines set by the Naval Civilian Personnel Command.
The course's instructional objectives are stated in a
general nature and no requirements are made of attendees
which demonstrate successful mastering of the material
presented . Attendance is the sole requirement for
completion of the course. These factors limited the
extent to which this program evaluation could be con-
ducted under the strict parameters discussed in Chapter
II. However, it was felt that meaingful information
could still be obtained if the proper design was
utilized. With this in mind, the study was designed to
meet two of the four major purposes for program evalu-
ation discussed in Chapter II:
(1) Provide information to decision makers;
(2) Improve existing programs.
Phase I of the study involved descriptive research

22
designed to measure attitudes of past attendees towards
the effectiveness and adequacy of the course content.
The resulting data could be used as guidelines for
future modification of course emphasis or content.
Phase II involved an experimental design with the Basic
Supervisory Development Seminar as the treatment or inde>
pendent variable, and the leadership styles of the
attendees as the dependent variable. This resulted in
the following null hypothesis:
There will be no significant change in the
leadership styles of people who attend the
BSD Seminar.
Here, again, the results could be used to determine
if the course was having the desired effect on its
attendees or whether re-direction/modification was
necessary
.
Subjects
All participants in this study were federal employees
of the Naval Civilian Personnel Command recently promoted
to, or soon to be eligible for, a first-line supervisory
position. Both the sample groups and the target popula-
tion consisted of males and females from multi-ethnic
backgrounds ranging in age from the mid-twenties to

23
mid-forties. The sample group (90 subjects) for Phase I
consisted of all attendees of the BSD Seminars held
from January 1984 to February 1985. Phase II involved
63 subjects, comprised of attendees from three
different sessions of the course held in May and June of
1985.
Instruments
Based upon seminar attendance and course outline
handouts, a personally designed questionnaire was used
in Phase I to survey the attitudes of past seminar
attendees (See Appendix A). The course content was
divided into six major topics. The questionnaire
utilized a five-point Likert scale to measure the extent
to which the attendees felt these six topics were
adequately covered, from "Requires More Emphasis" to
"Requires Less Emphasis." The attendees were also
asked to indicate which single topic had the greatest
impact on their leadership style /supervisory effective-
ness .
The questionnaire was assessed by the seminar's
developer /instructor and an education department pro-
fessor for its content validity. It was pre-tested on
a small pilot group to measure its readability and the


24
clarity of its instructions. The actual sample group
was restricted to those who had attended the seminar
within the past year in a'n attempt to assure reasonable
familiarization with the course content.
For Phase II, Pfeiffer and Jones* "T-P Leadership
Questionnaire" (see Appendix B) was used to obtain a
pre- and post-test measurement of the attendees'
leadership styles. This questionnaire was adapted from
the "Leadership Behavior Description Questionnaire,
Form XII" of the well known Ohio State Leadership
Studies (Sergiovanni , Metzcus & Burden, 1969). Dis-
cussions with Dr. Solomon, the course developer, were
a key factor in the selection of this particular instru-
ment. One of the stated goals of the seminar is to
encourage a participative style of leadership which is
characterized by a high concern for both people and
task. The T-P Leadership Questionnaire provides a
measurement of these two variables in a relatively short
and easy-to-administer test format. Respondents are
required to indicate how they would react to 35 items
which describe various aspects of leadership behavior.
From their responses scores are obtained that indicate
their concern for people and their concern for task.


25
Procedure
For Phase I all past attendees of the BSD Seminar
from January 1984 to February 1985 were mailed the BSD
Questionnaire along with a cover letter (see Appendix C)
and a pre-addressed , stamped, return envelope. The
administrative staff of the Naval Civilian Personnel
Command, Southwest Region's Training Department per-
formed this function, thus enabling use of the Department
of the Navy's letterhead and postal privileges. The
staff retained all returned questionnaires until they
were collected by the researcher for data analysis.
Phase II involved administering the Leadership
Questionnaire (see Appendix B) to several sessions of
the seminar before and after attending the course.
While use of the' same measurement for pre- and post-
tests introduced testing as a threat to the internal
validity of this phase, this shortcoming was outweighed
by the necessity of controlling for two other threats
to internal validity. A pre-test could be used to
determine initial differences between groups thus limit-
ing the effects of differential selection of subjects,
and could also be used to control for mortality in the
event that not all post-tests were returned.

26
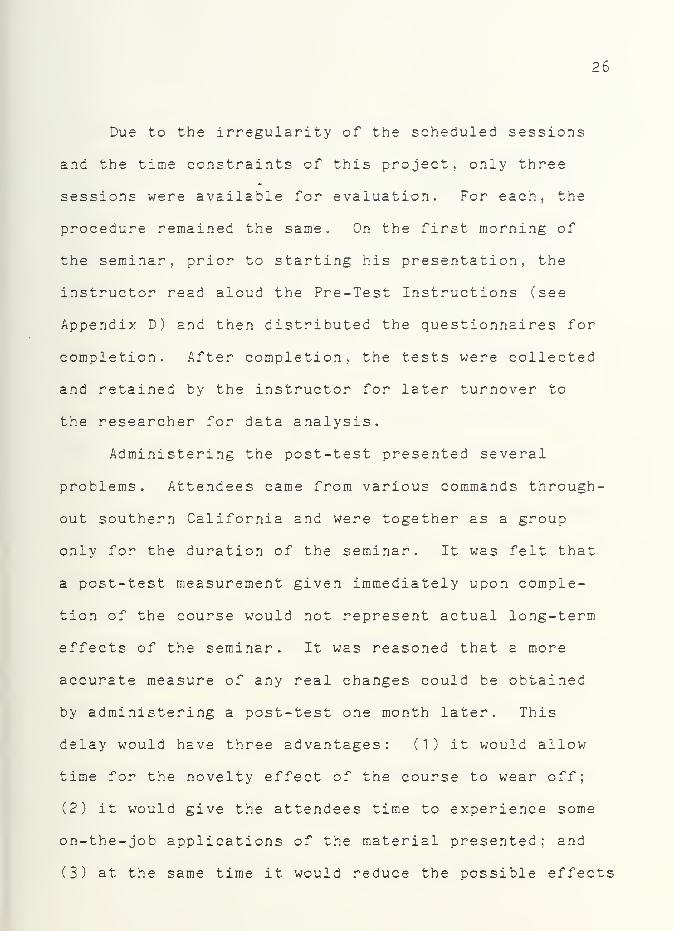
Due to the irregularity of the scheduled sessions
and the time constraints of this project, only three
sessions were available for evaluation. For each, the
procedure remained the same. On the first morning of
the seminar, prior to starting his presentation, the
instructor read aloud the Pre-Test Instructions (see
Appendix D) and then distributed the questionnaires for
completion. After completion, the tests were collected
and retained by the instructor for later turnover to
the researcher for data analysis.
Administering the post-test presented several
problems. Attendees came from various commands through-
out southern California and were together as a group
only for the duration of the seminar. It was felt that
a post-test measurement given immediately upon comple-
tion of the course would not represent actual long-term
effects of the seminar. It was reasoned that a more
accurate measure of any real changes could be obtained
by administering a post-test one month later. This
delay would have three advantages: (1) it would allow
time for the novelty effect of the course to wear off;
(2) it would give the attendees time to experience some
on-the-job applications of the material presented; and
(3) at the same time it would reduce the possible effects

27
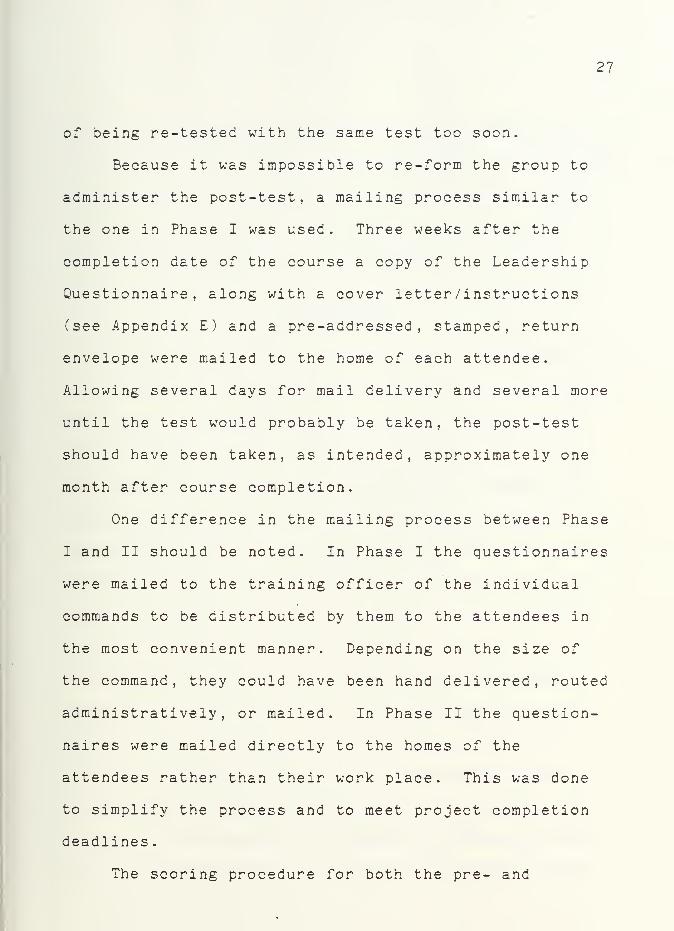
of being re-tested with the same test too soon.
Because it was impossible to re-form the group to
administer the post-test, a mailing process similar to
the one in Phase I was used. Three weeks after the
completion date of the course a copy of the Leadership
Questionnaire, along with a cover letter /instructions
(see Appendix E) and a pre-addressed , stamped, return
envelope were mailed to the home of each attendee.
Allowing several days for mail delivery and several more
until the test would probably be taken, the post-test
should have been taken, as intended, approximately one
month after course completion.
One difference in the mailing process between Phase
I and II should be noted. In Phase I the questionnaires
were mailed to the training officer of the individual
commands to be distributed by them to the attendees in
the most convenient manner. Depending on the size of
the command, they could have been hand delivered, routed
administratively, or mailed. In Phase II the question-
naires were mailed directly to the homes of the
attendees rather than their work place. This was done
to simplify the process and to meet project completion
deadlines .
The scoring procedure for both the pre- and

28
post-tests was modified slightly from that specified in
Pfeiffer and Jones (197-4). (See Appendix F.) To prevent
the attendees from becoming aware of the purpose of the
instrument, both the pre- and post-tests were scored by
the researcher rather than the attendees.
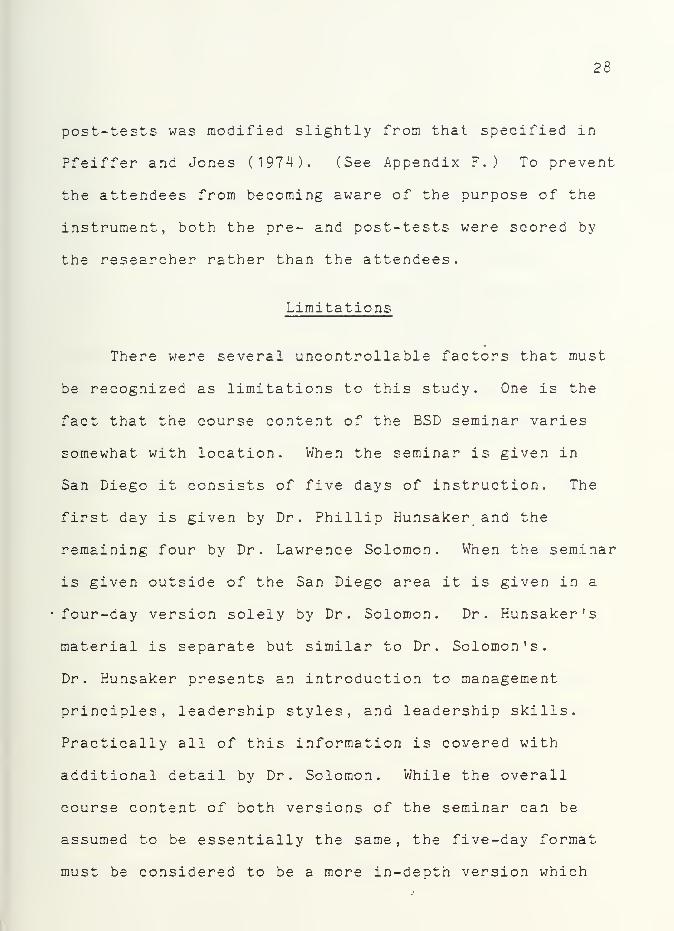
Limitations
There were several uncontrollable factors that must
be recognized as limitations to this study. One is the
fact that the course content of the BSD seminar varies
somewhat with location. When the seminar is given in
San Diego it consists of five days of instruction. The
first day is given by Dr. Phillip Hunsaker and the
remaining four by Dr. Lawrence Solomon. When the seminar
is given outside of the San Diego area it is given in a
four-day version solely by Dr. Solomon. Dr. Hunsaker 's
material is separate but similar to Dr. Solomon's.
Dr. Hunsaker presents an introduction to management
principles, leadership styles, and leadership skills.
Practically all of this information is covered with
additional detail by Dr. Solomon. While the overall
course content of both versions of the seminar can be
assumed to be essentially the same, the five-day format
must be considered to be a more in-depth version which

29
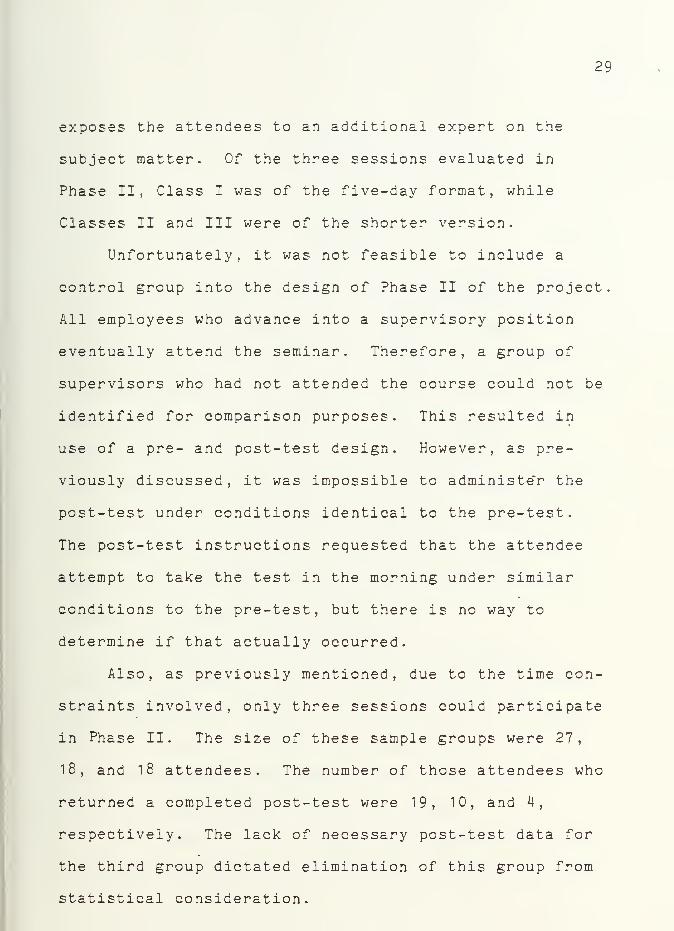
exposes the attendees to an additional expert on the
subject matter. Of the three sessions evaluated in
Phase II, Class I was of the five-day format, while
Classes II and III were of the shorter version.
Unfortunately, it was not feasible to include a
control group into the design of Phase II of the project.
All employees who advance into a supervisory position
eventually attend the seminar. Therefore, a group of
supervisors who had not attended the course could not be
identified for comparison purposes. This resulted in
use of a pre- and post-test design. However, as pre-
viously discussed, it was impossible to administe'r the
post-test under conditions identical to the pre-test.
The post-test instructions requested that the attendee
attempt to take the test in the morning under similar
conditions to the pre-test, but there is no way to
determine if that actually occurred.
Also, as previously mentioned, due to the time con-
straints involved, only three sessions could participate
in Phase II. The size of these sample groups were 27,
18, and 18 attendees. The number of those attendees who
returned a completed post-test were 19, 10, and 4,
respectively. The lack of necessary post-test data for
the third group dictated elimination of this group from
statistical consideration.

30
CHAPTER IV
RESULTS
Phase I
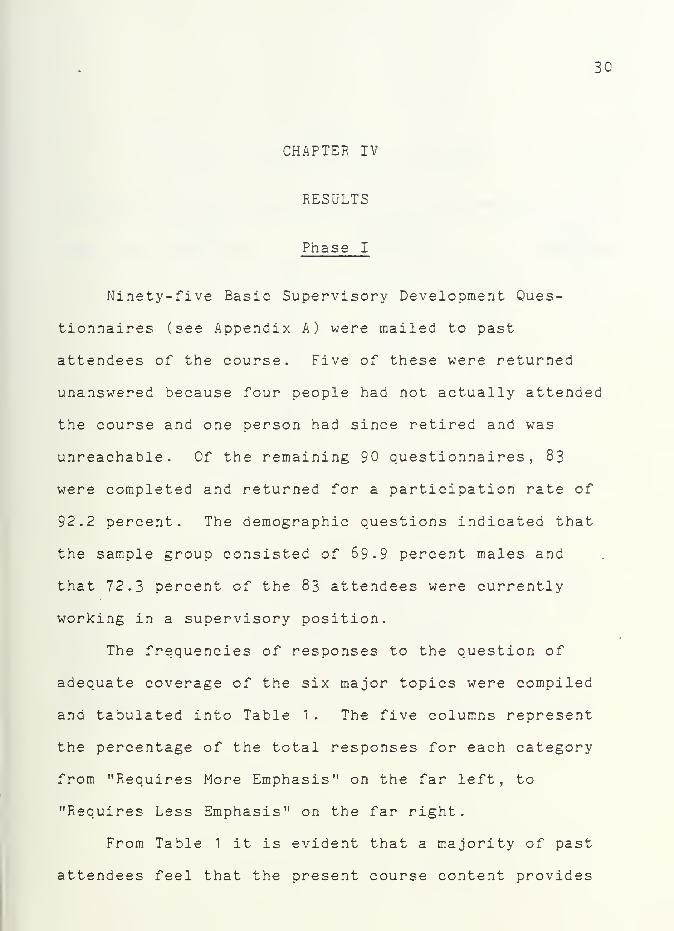
Ninety-five Basic Supervisory Development Ques-
tionnaires (see Appendix A) were mailed to past
attendees of the course. Five of these were returned
unanswered because four people had not actually attended
the course and one person had since retired and was
unreachable. Of the remaining 90 questionnaires, 83
were completed and returned for a participation rate of
92.2 percent. The demographic questions indicated that
the sample group consisted of 69.9 percent males and
that 72.3 percent of the 83 attendees were currently
working in a supervisory position.
The frequencies of responses to the question of
adequate coverage of the six major topics were compiled
and tabulated into Table 1 . The five columns represent
the percentage of the total responses for each category
from "Requires More Emphasis" on the far left, to
"Requires Less Emphasis" on the far right.
From Table 1 it is evident that a majority of past
attendees feel that the present course content provides


31
Table 1
Phase I Questionnaire Responses
More Adequate LessTopic No. Emphasis Coverage Emphasis
1 2.4 7.2 74.7 7.2 8.4
2 19.3 18.1 60.2 1 .2 1 .2
3 10.8'
25.3 60.2 3.6
4 18.1 19.3 56.6 6.0
5 13.3 24. 1 53.0 9.6
6 21 .7 28.9 43.4 4.8 1 .2
Table 1 represents the frequency of responses inpercentages for the six major topics of the seminar astaken from the BSD Questionnaire (see Appendix A). ForTopics Nos . 1 through 5 a clear majority felt that thepresent coverage of the topic was adequate. For TopicNo. 6, if the two degress of "More Emphasis" arecombined, a slight majority of 50.6 percent indicated a
desire for more emphasis of that subject matter.Topic No. 1 was the only topic which had a greatercombined percentage of responses desiring less coveragethan more
.

32
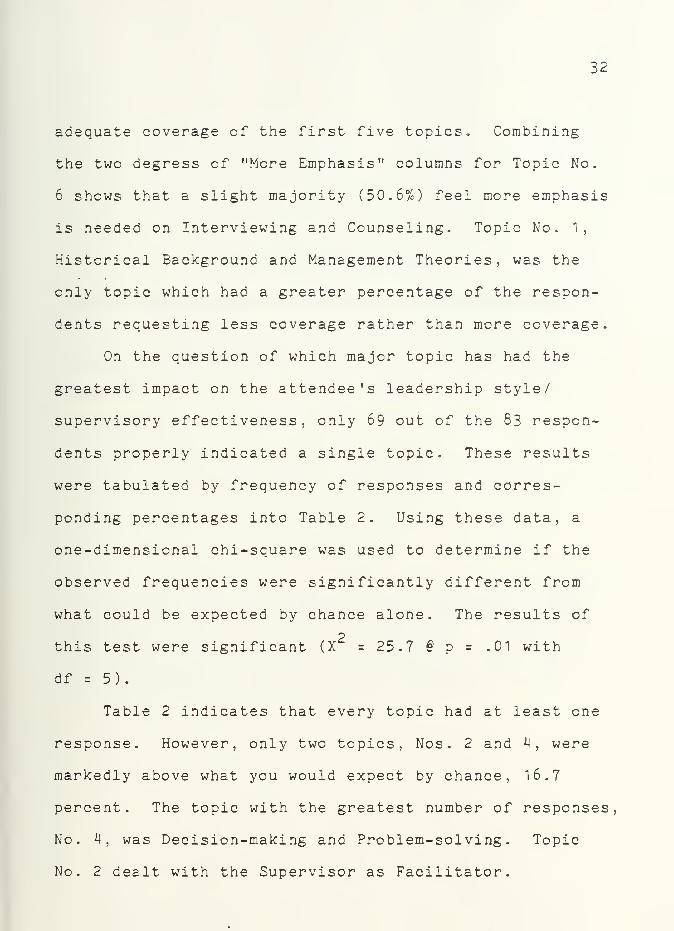
adequate coverage of the first five topics. Combining
the two degress of "More Emphasis" columns for Topic No.
6 shows that a slight majority (50.6%) feel more emphasis
is needed on Interviewing and Counseling. Topic No. 1,
Historical Background and Management Theories, was the
only topic which had a greater percentage of the respon-
dents requesting less coverage rather than more coverage.
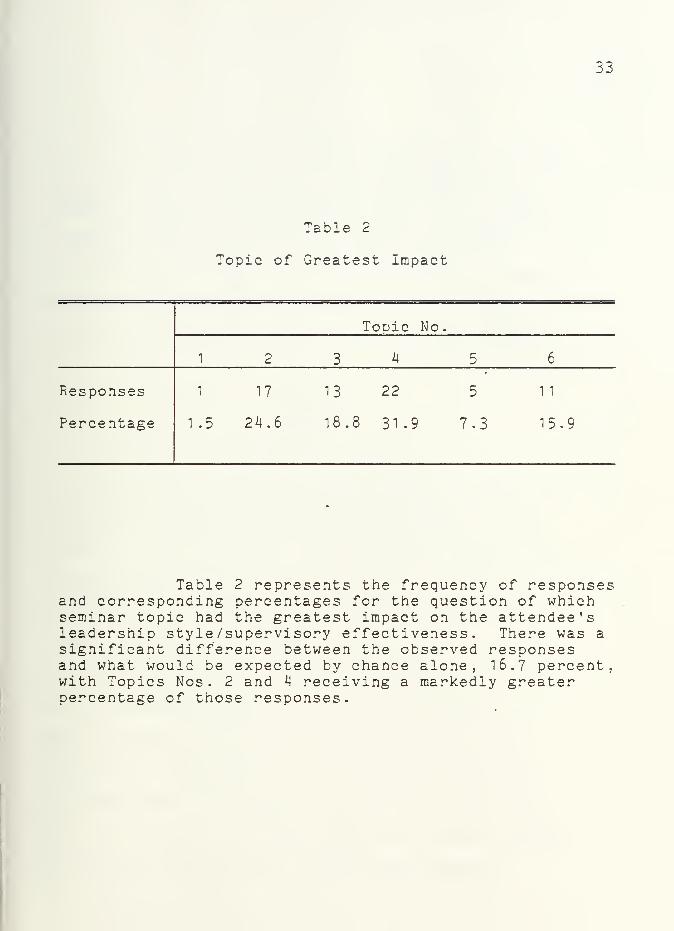
On the question of which major topic has had the
greatest impact on the attendee's leadership style/
supervisory effectiveness, only 69 out of the 83 respon-
dents properly indicated a single topic. These results
were tabulated by frequency of responses and corres-
ponding percentages into Table 2. Using these data, a
one-dimensional chi-square was used to determine if the
observed frequencies were significantly different from
what could be expected by chance alone. The results of
2this test were significant (X = 25.7 § p = .01 with
df = 5).
Table 2 indicates that every topic had at least one
response. However, only two topics, Nos . 2 and U, were
markedly above what you would expect by chance, 1 6 .
7
percent. The topic with the greatest number of responses,
No. 4, was Decision-making and Problem-solving. Topic
No. 2 dealt with the Supervisor as Facilitator.

33
Table 2
Topic of Greatest Impact
1
Topic No
Responses
Percentage
1 17 13 22 5 11
1.5 24. 6 18.8 31.9 7.3 15.9
Table 2 represents the frequency of responsesand corresponding percentages for the question of whichseminar topic had the greatest impact on the attendee'sleadership style /supervisory effectiveness. There was a
significant difference between the observed responsesand what would be expected by chance alone, 16.7 percent,with Topics Nos . 2 and H receiving a markedly greaterpercentage of those responses.


34
On the open-ended "Comments" section of the ques-
tionnaire, 38 respondents (45.8%) made some type of
comment. Of these, approximately half were strictly
laudatory comments directed at the course and /or
Dr. Solomon. The remaining half were specific recom-
mendations mostly geared towards areas of the course
that in their opinion required more or less emphasis.
Phase II
Pre-Test to Pre-Test Comparison:
As discussed in Chapter III, lack of returned
post-tests presented a problem in this phase of the
project. For this reason, Class III, with only four of
18 post-tests returned, was eliminated from statistical
consideration. In addition several statistical tech-
niques were used to determine if the lack of returned
post-tests affected the results of the other two classes
For both classes t-tests for independent samples were
used to compare the pre-test scores of those who did
not return a post-test with those who did return one.
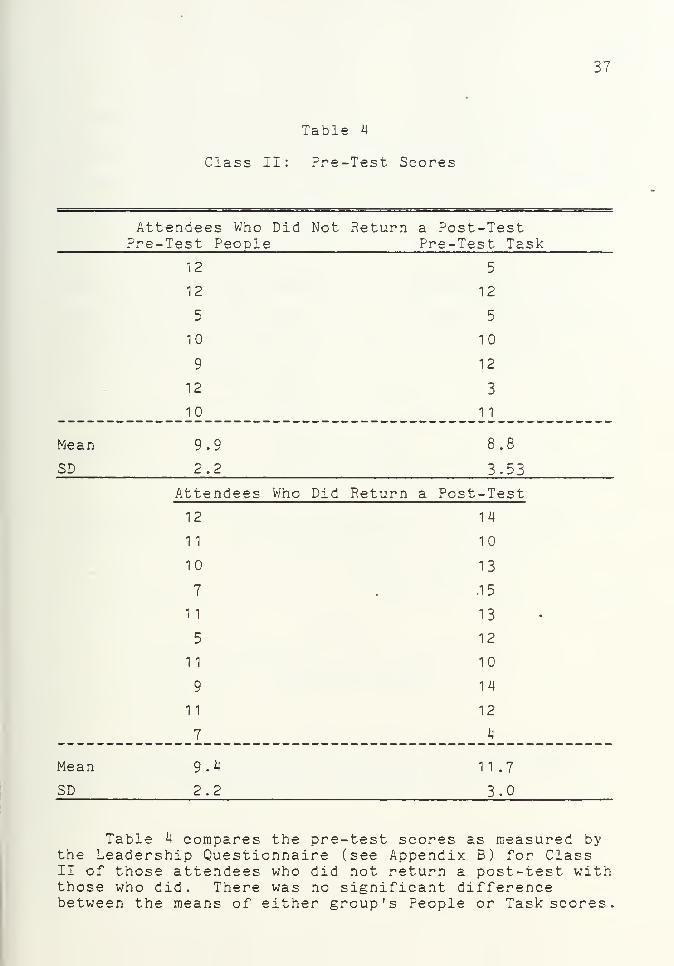
On Tables 3 and 4 the upper portion of the table repre-
sents the "people" and "task" scores for those attendees
who did not return a test, and the lower portion

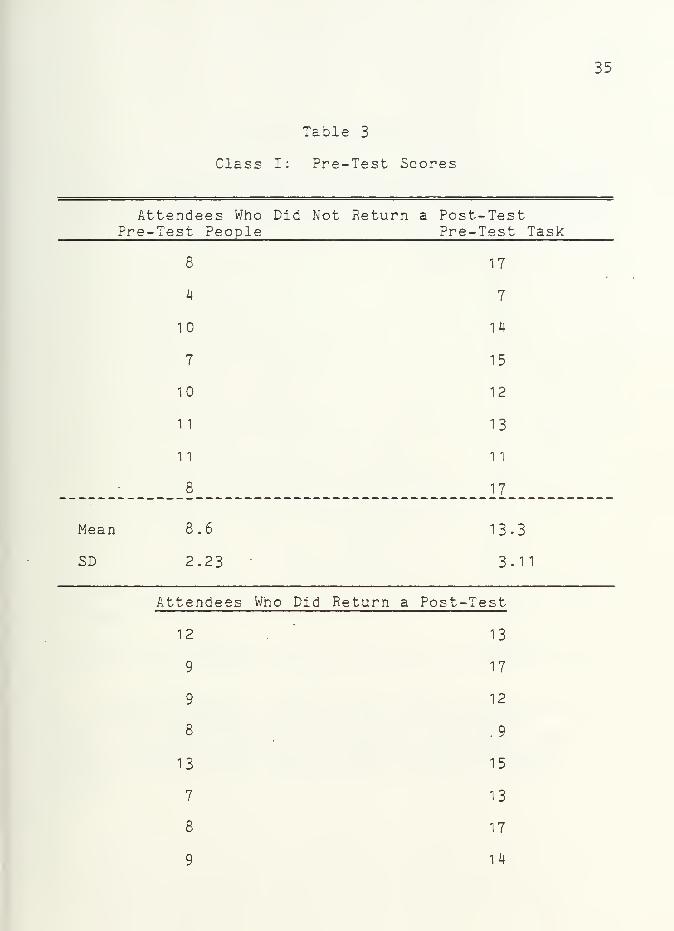
35
Table 3
Class I: Pre-Test Scores
Attendees Who Did Not Return a Post-TestPre-Test People Pre-Test Task
8
10
7
10
1 1
1 1
8
17
7
U15
12
13
1
1
17
Mean
SD
8.6
2.23
13.3
3.11
Attendees Who Did Return a Post-Test
12
9
9
8
13
7
8
9
13
17
12
.9
15
13
17

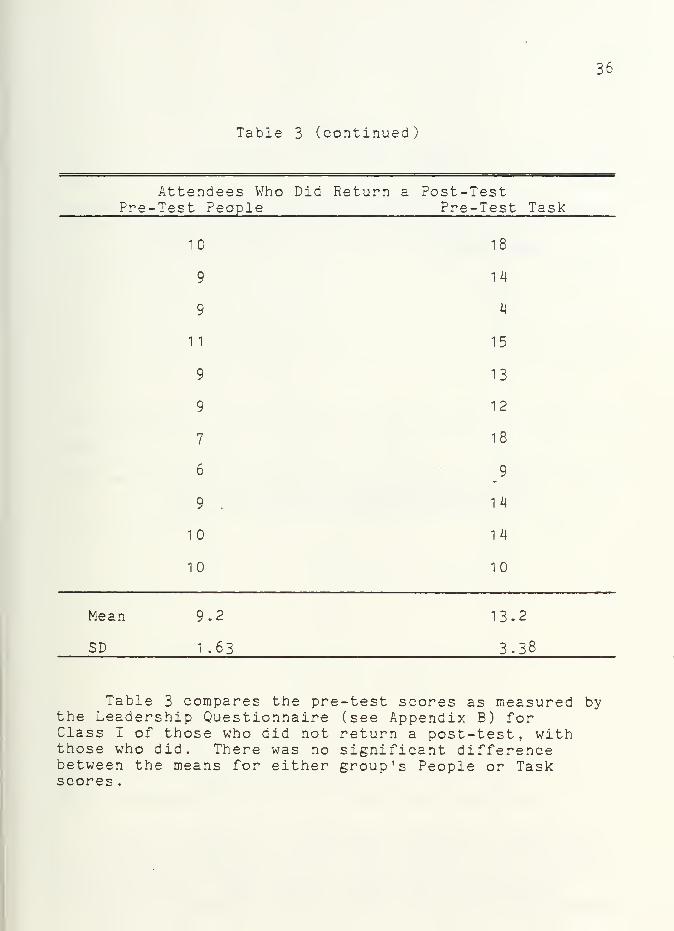
Table 3 (continued)
36
Attendees Who Did Return a Post-TestPre-Test People Pre-Test Task
10
9
9
1 1
9
9
7
6
9
10
10
18
Ik
15
13
12
18
^9
mm10
Mean
SD
9.2
1 .63
13.2
3.38
Table 3 compares the pre-test scores as measured bythe Leadership Questionnaire (see Appendix B) forClass I of those who did not return a post-test, withthose who did. There was no significant differencebetween the means for either group's People or Taskscores
.

37
Table 4
Class II: Pre-Test Scores
Attendees Who Did Not Return a Post-TestPre-Test People Pre-Test Task
12
12
5
10
9
12
10
5
12
5
10
12
3
1
1
Mean
SD
9.9
2.2
8.8
3.53
Attendees Who Did Return a Post-Test
12
1 1
10
7
1 1
5
1 1
9
1 1
7
1i|
10
13
.15
13
12
10
14
12
4
Mean
SD
9.4
2.2
1 1 .7
3.0
Table 4 compares the pre-test scores as measured bythe Leadership Questionnaire (see Appendix B) for ClassII of those attendees who did not return a post-test withthose who did. There was no significant differencebetween the means of either group's People or Task scores
.


38
represents the scores of those who did return one. As
Figure 3 indicates, for both classes, in all cases, the
t-tests failed to show a significant difference between
the scores of those attendees who returned a post-test
and those who did not return one. This lends statis-
tical support to the argument that although not all
post-tests were returned , those that were can still be
considered representative of the group as a whole.
Class I: t . =0.652people t, ,=0.70task
§ p= .01 and df=25
Class II t . =0.45people Hask- 1 ' 75
@ p = .01 and df=l6
Figure 3
Results of Statistical Comparison ofPre-Test Scores
T-tests for independent samples were calculated tocompare the scores of those not returning post-testswith those who did return post-tests. In all four casesthere was no significant difference found.

39
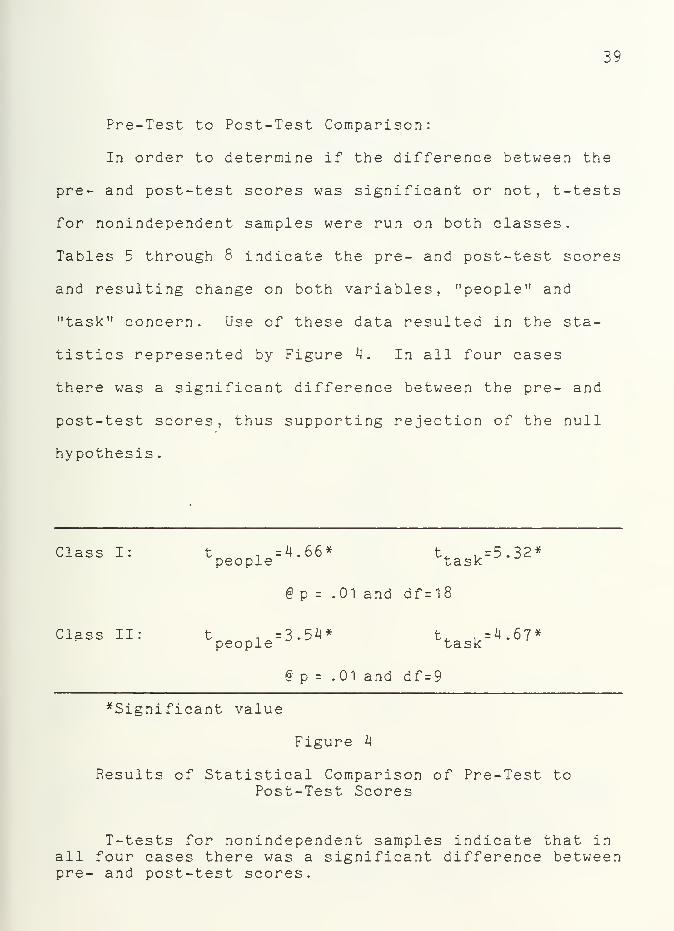
Pre-Test to Post-Test Comparison:
In order to determine if the difference between the
pre- and post-test scores was significant or not, t-tests
for nonindependent samples were run on both classes.
Tables 5 through 8 indicate the pre- and post-test scores
and resulting change on both variables, "people" and
"task" concern. Use of these data resulted in the sta-
tistics represented by Figure 4. In all four cases
there was a significant difference between the pre- and
post-test scores, thus supporting rejection of the null
hypothesis
.
Class I t . =4.66*people
t -6 ^2*rtask _D -^
p = .01 and df =18
Class II: t . =3-54*people t, ,=4.67*
task
@ p = .01 and df = 9
'Significant value
Figure 4
Results of Statistical Comparison of Pre-Test toPost-Test Scores
T-tests for nonindependent samples indicate that inall four cases there was a significant difference betweenpre- and post-test scores.

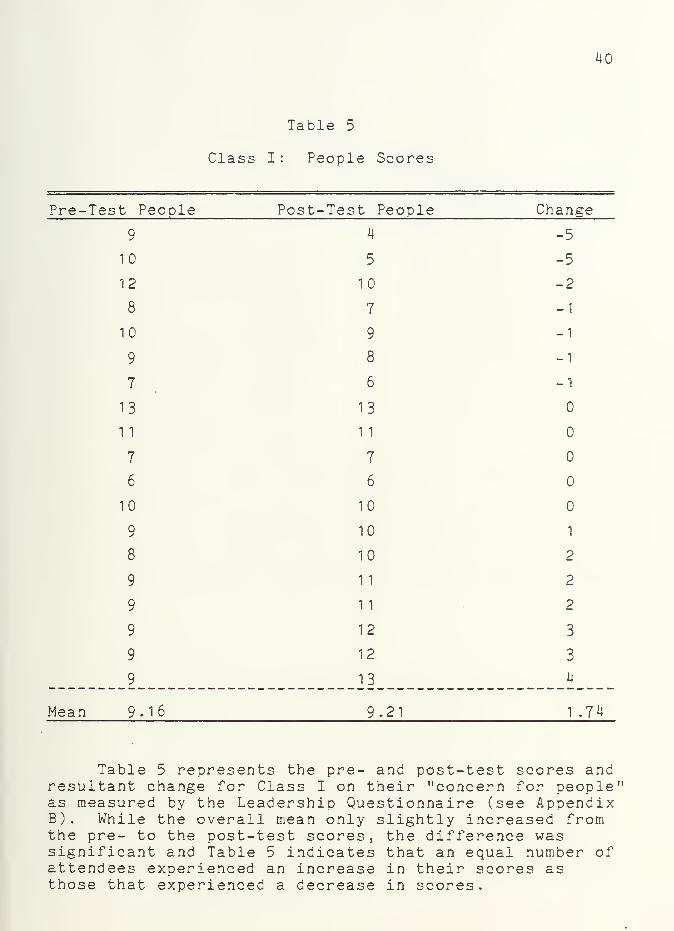
Table 5
Class I : People Scores
40
Pre-Test People Post-Test People Change
9
10
12
8
10
9
7
13
1
1
7
6
10
9
8
9
9
9
9
9
4
5
10
7
9
8
6
13
11
7
6
10
10
10
1 1
1 1
12
12
13
-5
-5
-2
-1
-1
-1
-1
1
2
2
2
3
3
4
Mean 9.16 9.21 1 .74
Table 5 represents the pre- and post-test scores andresultant change for Class I on their "concern for people"as measured by the Leadership Questionnaire (see AppendixB). While the overall mean only slightly increased fromthe pre- to the post-test scores , the difference wassignificant and Table 5 indicates that an equal number ofattendees experienced an increase in their scores asthose that experienced a decrease in scores.

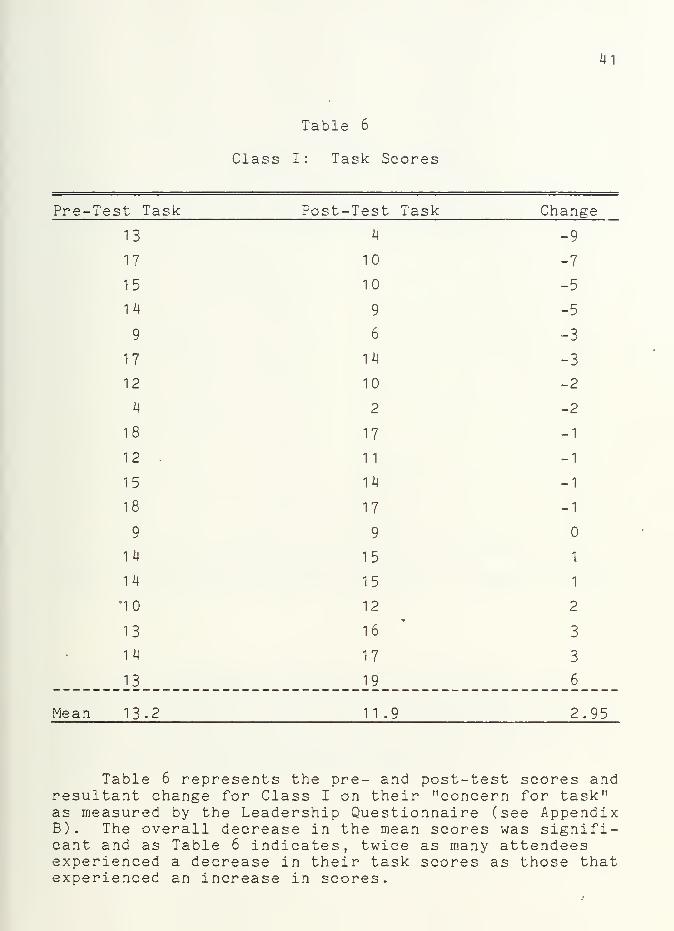
Table 6
Class I: Task Scores
41
Pre-Test Task Post-Test Task Change
13
17
15
14
9
17
12
4
18
12
15
18
9
14
14
*10
13
14
13
4
10
10
9
6
14
10
2
17
11
14
17
9
15
15
12
16
17
19
-9
-7
-5
-5
-3
-3
-2
-2
-1
-1
-1
-1
1
1
2
3
3
6
Mean 13.2 1 1 .9 2.95
Table 6 represents the pre- and post-test scores andresultant change for Class I on their "concern for task"as measured by the Leadership Questionnaire (see AppendixB). The overall decrease in the mean scores was signifi-cant and as Table 6 indicates, twice as many attendeesexperienced a decrease in their task scores as those thatexperienced an increase in scores.


Table 7
Class II : People Scores
42
Pre-Test People Post-Test People Change
1 1
12
1 1
5
I 1
7
I
I
9
10
7
Mean 9.4
9
11
10
5
1
1
8
12
10
12
1 1
9.9
-2
-1
-1
1
1
1
2
_4_
1.3
Table 7 represents the pre- and post-test scores andresultant change for Class II on their "concern forpeople" as measured by the Leadership Questionnaire (seeAppendix B). As with Class I, the difference in the meanscores was significant and in the positive direction. Inthis class more attendees experienced an increase in theirpeople scores than a decrease in scores.


43
Table 8
Class II: Task Scores
Pre-Test Task Post-Test Task Change
10 H -6
12 7 -5
10 6 -4
U 11 -3
12 10 -2
13 13
15 16 1
13 15 2
14 16 2
«!L _§_ _?_
Mean 11.7 10.6 2.7
Table 8 represents the pre- and post-test scoresand resultant change for Class II on their "concern fortask" as measured by the Leadership Questionnaire (seeAppendix B). As with Class I, the difference in themean scores was significant and in the negativedirection. There was also more attendees who experi-enced a decrease in their scores and the amount of thatchange was greater than those who experienced anincrease in scores.

44
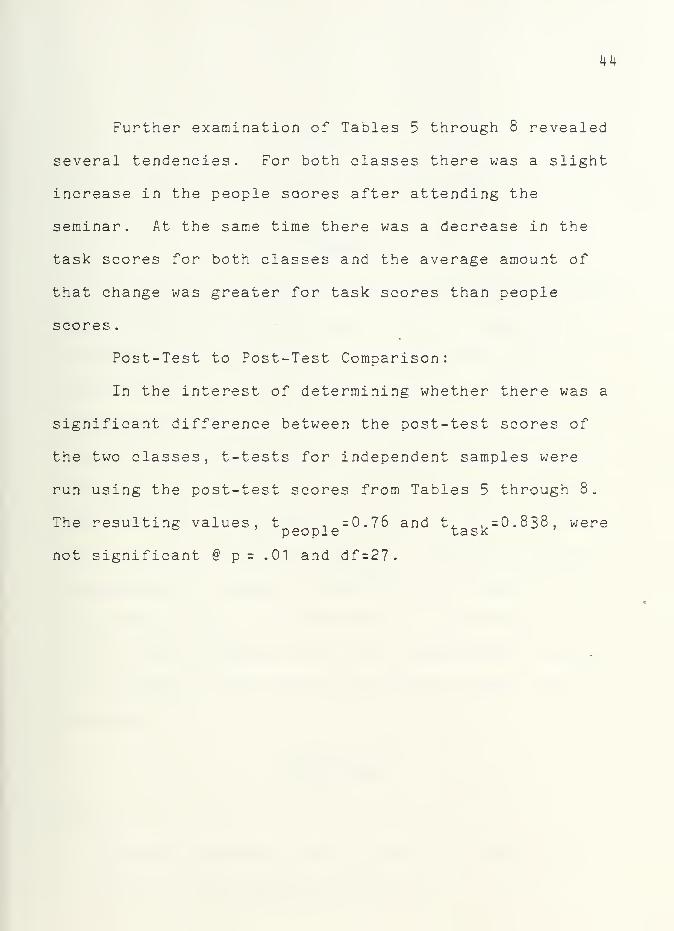
Further examination of Tables 5 through 8 revealed
several tendencies. For both classes there was a slight
increase in the people scores after attending the
seminar. At the same time there was a decrease in the
task scores for both classes and the average amount of
that change was greater for task scores than people
scores .
Post-Test to Post-Test Comparison:
In the interest of determining whether there was a
significant difference between the post-test scores of
the two classes, t-tests for independent samples were
run using the post-test scores from Tables 5 through 8.
The resulting values, t , =0.76 and t, , =0.838, were&' people task '
not significant § p = .01 and df=27.

45
CHAPTER V
SUMMARY, CONCLUSIONS, AND RECOMMENDATIONS
Summary
A two-phase program evaluation was conducted of the
Naval Civilian Personnel Command's Basic Supervisory
Development Seminar. Phase I involved descriptive
research based on a questionnaire survey of past
attendees to determine their attitudes on the appropri-
ateness of the course content. Results indicated that
the emphasis was appropriate on all but one of the six
major topics of the seminar. Phase II involved a pre-
test/post-test experimental design to determine whether
the seminar was having a significant influence on the
leadership styles of its attendees. The somewhat
limited results obtained did show a significant influence
on the sample groups that were involved in this part of
the study.
Conclusions
Phase I
Several conclusions can be drawn from the results
of Phase I of the program evaluation.


1
.
The sample group was highly representative of
the target population. If we consider all those eligible
for the BSD Seminar as the target population, the per-
centage of subjects responding to the survey, the time
duration involved , and the demographic percentages
reported, all lend strong support to the representative-
ness of the sample group.
2. Based on the experiences and opinions of past
attendees as expressed on the BSD Questionnaire , the
emphasis of the present course content appears to be
appropriate, with the possible exception of Topic No. 6.
It appears that some greater emphasis on Interviewing
and Counseling could be justified.
3. There was a significant difference in the
responses on the topic of greatest impact with Topic
No. 4, Decision-making and Problem-solving, being chosen
most often. However, the varied distribution of those
responses implies that the BSD Seminar is providing
meaningful guidance to attendees in differing areas.
4. Based upon the consensus of the comments from
past attendees, the BSD Seminar is rated highly as a
course which provides valuable guidance for the new
supervisor
.


M7
Phase II
Conclusions that can be drawn from the results of
Phase II are much more tenuous.
1
.
The external validity of Phase II lacks strong
support in several areas. The fact that data from only
two classes could be used, and that the sample sizes of
those returning post-tests were less than optimum,
severely limits the generalization of the results.
2. The original null hypothesis was rejected. For
the two classes involved, the BSD Seminar did have a
significant effect on the attendees ' leadership styles as
measured by the T-P Leadership Questionnaire. The ten-
dency in both classes was to increase the scores in their
concern for people. This is consistent with past research
that indicates this trend often occurs with human
relations-oriented leadership training. There was also
consistency between classes in the change of task scores,
but it was in the opposite direction. Although task
scores decreased , because they were consistently higher
than people scores on the pre-tests , the end result was
to more closely balance the two scores on the post-tests.
This equal concern for people and task is characteristic
of participative leadership.
3. While it appears from the conclusion above that

48
Dr. Solomon's goal towards participative leadership is
being achieved, before generalizing these results several
factors must be considered. Pretest-treatment interaction
could also have contributed to the results. The simple
fact that the pre-test was given may have increased the
attendees.' awareness to their people-task orientation.
Similarly, the Hawthorne effect, the fact that they were
involved in a special study , could have influenced the
results also.
4. Based solely on the results from the scores of
the two classes involved, there does not appear to be a
significant difference in the effects of the four-day
format seminar versus the five-day format.
Recommendations
Within the broad guidelines established by the
Naval Civilian Personnel Command, all indications from
this program evaluation imply that the BSD Seminar
is meeting its objectives effectively. It is felt that
some of the information obtained during this study can
be useful in making decisions on the direction this
seminar may take in the future. However, several recom-
mendations must be made with regards to the results of
this evaluation and to others that might follow.


49
Valid evaluation of the effectiveness of any course
which lacks clearly stated, measurable objectives is
extremely difficult. Unfortunately, many courses today
in civilian and military organizations alike, are
established with this inherent weakness. To prevent
the valuable loss of both time and money due to ineffec-
tive or misdirected courses, all programs should establish
clear instructional objectives that can be used as
accurate yardsticks to measure their success.
The theoretical nature of leadership training lends
to the on-going controversy over the most effective
styles and techniques for its measurement. While the
T-P Leadership Questionnaire utilized in this study
may accurately measure an individual's concern for people
and task, it must be realized that these represent
attitudes and not necessarily behaviors. To more accu-
rately measure the results and effects of this seminar
on their leadership styles, the attendees would have to
be observed in actual leadership situations before and
after the seminar. Unfortunately, such an involved
process was beyond the scope of this evaluation.
Nonetheless, valuable inferences could be made from
the type of results obtained in Phase II of this study.
However, more replications would be required before the

50
validity of generalizing those results could be strongly
supported
.
Several specific recommendations can be made if
replications are attempted in the future. Judging from
the differences in the percentages of questionnaires
returned between Phases I and II, it appears that mail-
ing to the work place rather than the home reaps
significantly better results.
While more replications of Phase II might yield a
significant difference in scores between the four-day
and five-day formats of the seminar, this alone would not
indicate superiority of one format over the other. The
material presented during the additional day covers much
more than just participative leadership. Therefore,
because of this varied content, additional evaluation
techniques would be required to determine if there is
justification for the extra day of instruction.


REFERENCES

52
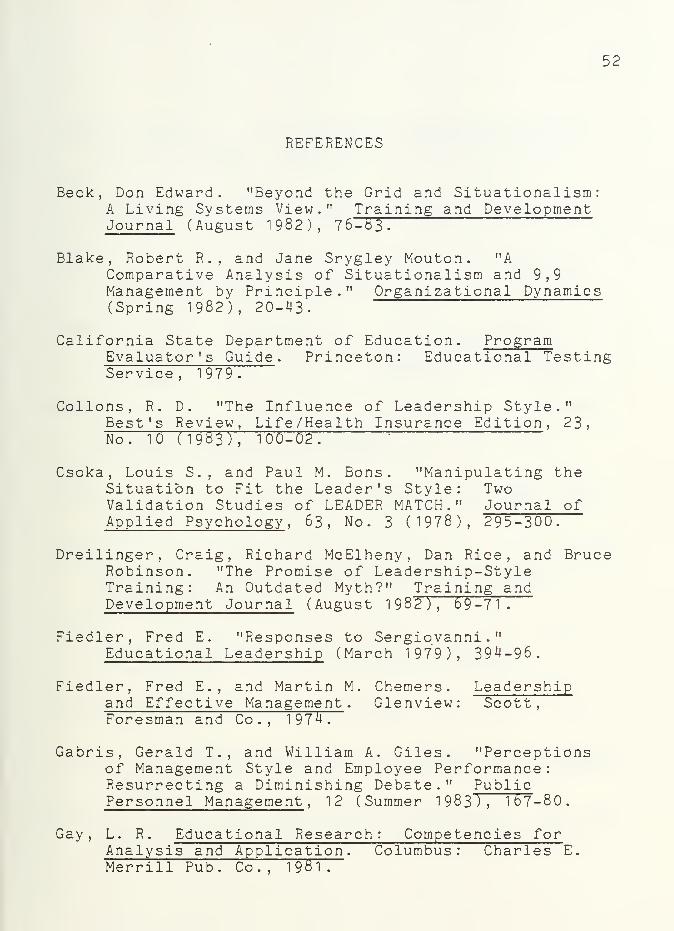
REFERENCES
Beck, Don Edward. "Beyond the Grid and Situationalism
:
A Living Systems View." Training and DevelopmentJournal (August 1982), 7S^W.
Blake, Robert R., and Jane Srygley Mouton. "AComparative Analysis of Situationalism and 9,9Management by Principle." Organizational Dynamics(Spring 1982), 20-43.
California State Department of Education. ProgramEvaluator's Guide . Princeton: Educational TestingService, 1979.
Collons, R. D. "The Influence of Leadership Style."Best's Review, Life/Health Insurance Edition , 23
,
No. 10 (1983), 100-02.!
Csoka , Louis S. , and Paul M. Bons. "Manipulating theSituation to Fit the Leader's Style: TwoValidation Studies of LEADER MATCH." Journal ofApplied Psychology , 63, No. 3 (1978), 295-300.
Dreilinger, Craig, Richard McElheny, Dan Rice, and BruceRobinson. "The Promise of Leadership-StyleTraining: An Outdated Myth?" Training andDevelopment Journal (August 1 982 ) , 69-71 .
Fiedler, Fred E. "Responses to Sergiovanni .
"
Educational Leadership (March 1979), 394-96.
Fiedler, Fred E. , and Martin M. Chemers
.
and Effective Management . GlenviewForesman and Co
., 1974.
LeadershipScott
,
Gabris , Gerald T., and William A. Giles. "Perceptionsof Management Style and Employee Performance:Resurrecting a Diminishing Debate." PublicPersonnel Management, 12 (Summer 1983T~i 1 67-80
.
Gay, L. R. Educational Research: Competencies forAnalysis and ApplicationMerrill Pub. Co
. , 1981 .
Columbus Charles E

53
Graeff, Claude L. "The Situational Leadership Theory:A Critical View." Academy of Management Review
,
8, No. 2 (1983) , 285-91 ".
Hoyle , John R. , Fenwick English, and Betty Steffy.Skills for Successful School Leaders . Arlington:American Association of School Administrators, 1985.
Jago , A. C, and V. H. Vroom. "Hierarchical Level andLeadership Style." Organizational Behavior andHuman Performance ,
1b ( 1977 ) , 131-45.
Leister, Albert, Donald Borden, and Fred E. Fiedler."Validation of Contingency Model LeadershipTraining: Leader Match." Academy of ManagementJournal , 20, No. 3 (1977), 464-70.
Metcalfe, B. M. "Leadership: Extrapolating from Theoryand Research to Practical Skills Training."Journal of Management Studies , 19 (July 1982),295-305.
Owens, James. "A Reappraisal of Leadership Theory andTraining." Personnel Administrator (November 1981),75-99.
Pfeiffer, J. William, and John E. Jones, eds. A Handbookof Structured Experiences for Human RelationsTraining, Volume I . San Diego: UniversityAssociates , 1974.
Sergiovanni, Thomas J. "Is Leadership the Next GreatTraining Robbery?" Educational Leadership(March 1979), 388-94.
Stogdill , R. Handbook of Leadership . New York: FreePress, 1974"^
Vroom, V. H. Some Personality Determinants of the Effectsof Participation . Englewood Cliffs: Prentice Hall,1960.
Williams, Ervin, ed . Participative Management: Co ncepts,Theory and Implementation '. Atlanta : PuDlisnmgServices Di v
., 1 976
.


APPENDICES

APPENDIX A
BASIC SUPERVISORY DEVELOPMENT
QUESTIONNAIRE


56
BASIC SUPERVISORY DEVELOPMENT
QUESTIONNAIRE
Listed below are six topics "that were covered in Dr. Solomon's "Basic
Supervisory Development" seminar. Based upon your job experiences since taking
the course f indicate with an ">;" the extent to which you -feel these areas wereadequately covered: Requires More Emphasis (More), Adequately Covered (Adeq),
Requires Less Emphasis (Less).
M ore Adeo Less Topic
i. Historical background/exposure to various-
theories o-f management (Scientific Management,
Maslow's Hierarchy o-f Needs, Theory X-Theory
Y, etc.).
2. The Supervisor as Facilitator (Stating the
problem,Supplying essential -facts, Defining the
area o-f -freedom, etc.)
3. Functions o-f Supervision (Planning,
Organizing, Controlling).
4. Decision-making and Problem-solving
(Autocratic, Consultative, and Group
Approaches).
5. Supervision through Participation
(Permissiveness and Controls).
6. Interviewing and Counseling (Objectives,
Pit-falls, Active Listenina, etc.).

57
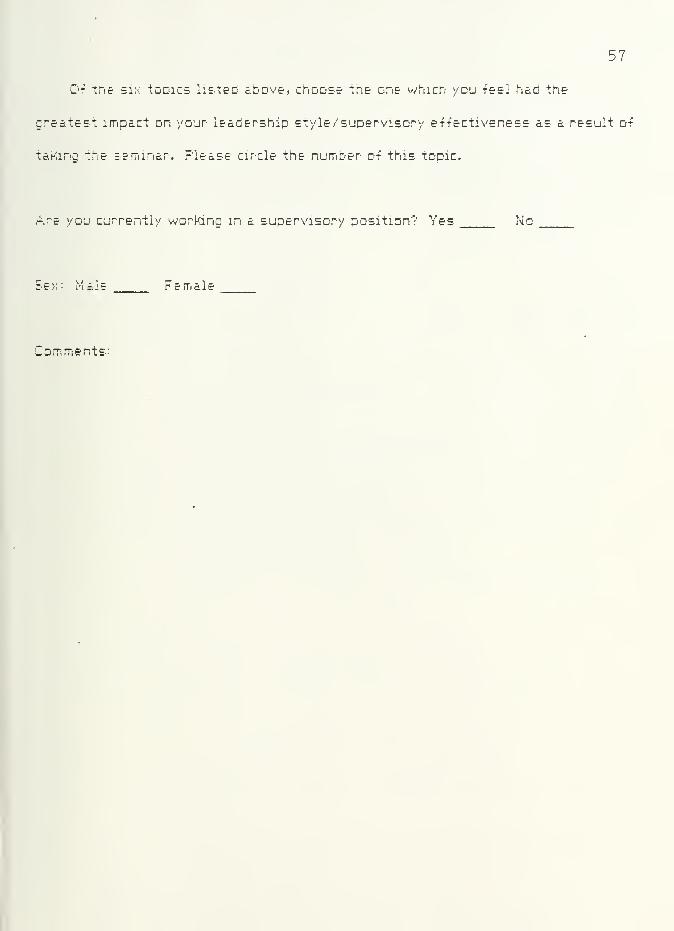
04 the six topics listed above* choose the one which you 4eel hid the
greatest impact on your leadership style/supervisory effectiveness as a result o-i
taking the seminar. Please circle the number o-f this topic.
Are you currently working in a supervisory position'"' Yes No
D&>! • n Ait F emale
Comments:


APPENDIX B
LEADERSHIP QUESTIONNAIRE

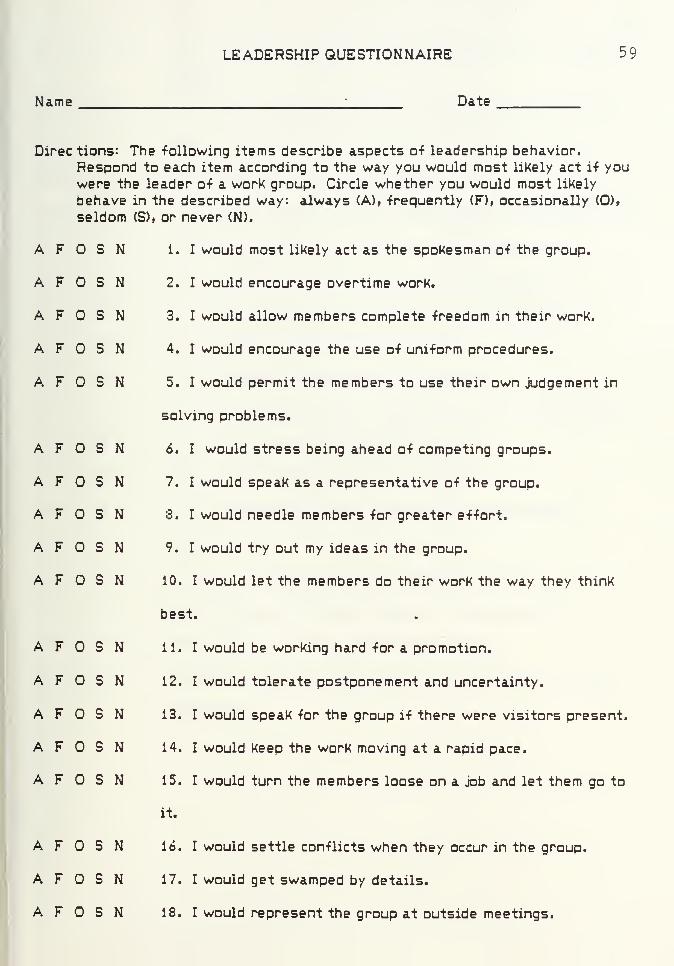
LEADERSHIP QUESTIONNAIRE 59
Name;
Date
Directions: The -following items describe aspects o-f leadership behavior.
Respond to each item according to the way you would most likely act if youwere the leader o-f a work group. Circle whether you would most likely
behave in the described way: always (A)» -frequently (F)» occasionally (0)»
seldom (S), or never (N).
A F S N 1. I would most likely act as the spokesman o-f the group.
A F S N 2. I would encourage overtime work.
A F S N 3.1 would allow members complete -freedom in their work.
A F S N 4. I would encourage the use o-f uni-form procedures.
A F S N 5.1 would permit the members to use their own judgement in
solving problems.
A F S N 6. I would stress being ahead o-f competing groups.
A F S N 7.1 would speak as a representative o-f the group.
A F S N 3.1 would needle members -for greater e-f-fort.
A F O S N 9.1 would try out my ideas in the group.
AFOSN 10. I would let the members do their work the way they think
best.
AFOSN 11. I would be working hard -for a promotion.
AFOSN 12. I would tolerate postponement and uncertainty.
AFOSN 13. I would speak -for the group i-f there were visitors present.
AFOSN 14. I would keep the work moving at a rapid pace.
AFOSN 15.1 would turn the members loose on a job and let them go to
it.
AFOSN 16.1 would settle conflicts when they occur in the group.
AFOSN 17. I would get swamped by details.
AFOSN 18. I would represent the group at outside meetings.

6"0
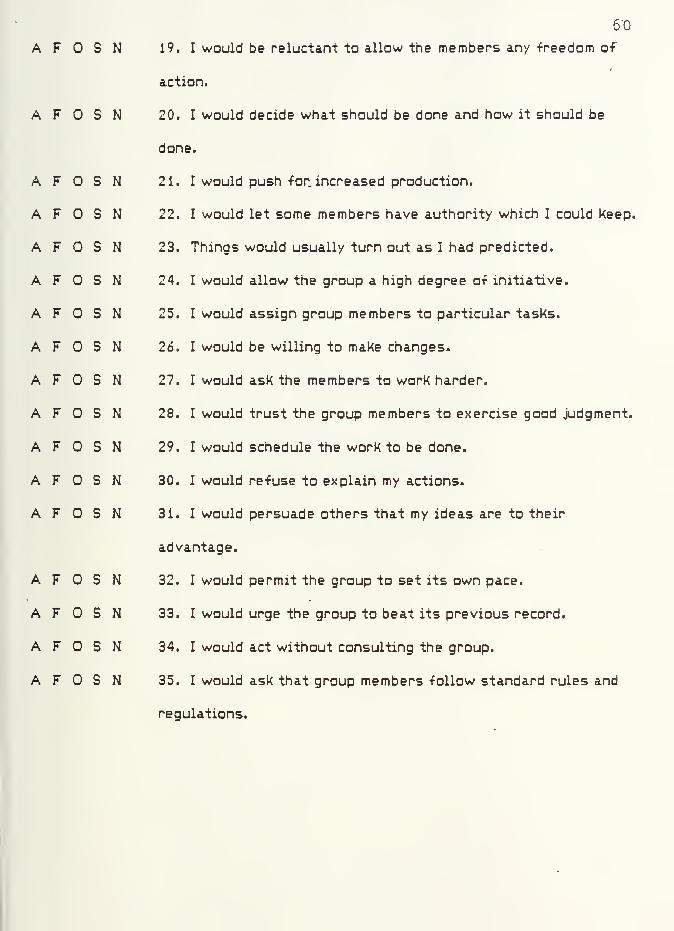
AFOSN 19. I would be reluctant to allow the members any freedom o-f
action.
AFOSN 20. I would decide what should be done and how it should be
done.
AFOSN 21. I would push -for. increased production.
AFOSN 22. I would let some members have authority which I could keep.
AFOSN 23. Things would usually turn out as I had predicted.
AFOSN 24. I would allow the group a high degree o-f initiative.
AFOSN 25. I would assign group members to particular tasks.
AFOSN 26. I would be willing to make changes.
AFOSN 27. I would ask the members to work harder.
AFOSN 28. I would trust the group members to exercise good judgment.
AFOSN 29. I would schedule the work to be done.
AFOSN 30. I would re-fuse to explain my actions.
AFOSN 31.1 would persuade others that my ideas are to their
advantage.
AFOSN 32. I would permit the group to set its own pace.
AFOSN 33. I would urge the group to beat its previous record.
AFOSN 34. I would act without consulting the group.
AFOSN 35. I would ask that group members -follow standard rules and
regulations.


APPENDIX C
COVER LETTER
PRELIMINARY QUESTIONNAIRE

DEPARTMENT OF THE NAVYNAVAL CIVILIAN PERSONNEL COMMAND
SOUTHWEST REGION880 FRONT STREET
SUITE S-S-29
SAN DIEGO. CALIFORNIA 92)88
62
IN REPLY REFER TC
From
NCPCSWR:RAE:ab1241011 March 1985
Training Director, Naval Civilian Personnel Command,Southwest Region
To: Participants
Subj: BASIC SUPERVISORY DEVELOPMENT
Encl : (1) Questionnaire
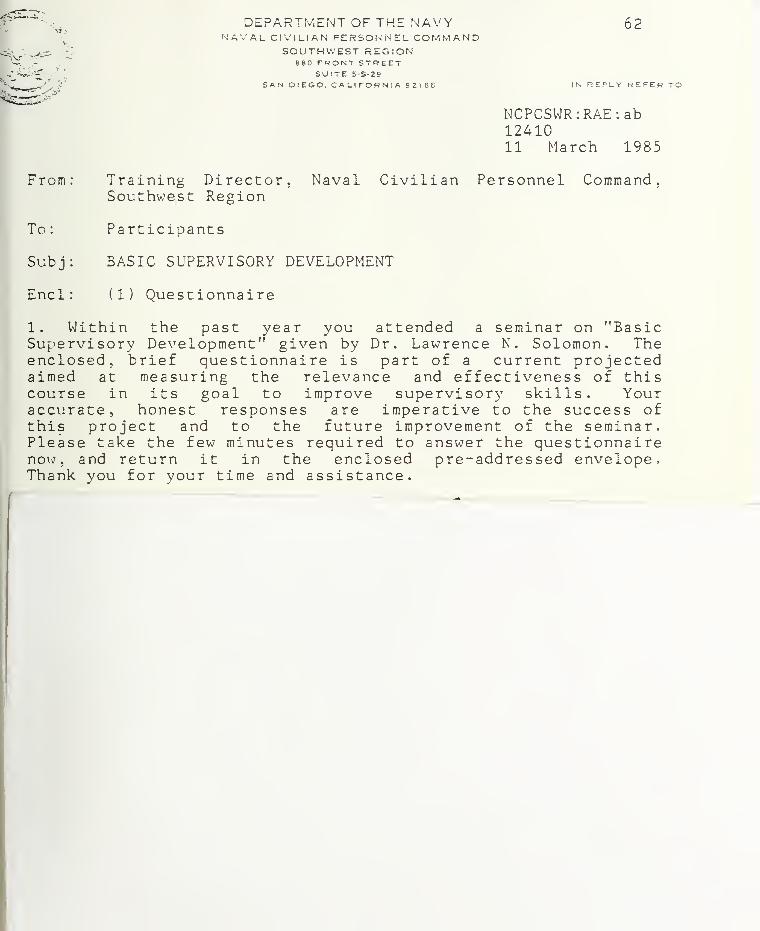
1. Within the past year you attended a seminar on "BasicSupervisory Development" given by Dr. Lawrence N. Solomon. Theenclosed, brief questionnaire is part of a current projectedaimed at measuring the relevance and effectiveness of thiscourse in its goal to improve supervisory skills. Youraccurate, honest responses are imperative to the success ofthis project and to the future improvement of the seminar.Please take the few minutes required to answer the questionnairenow, and return it in the enclosed pre-addressed envelope.Thank you for your time and assistance.

APPENDIX D
PRE-TEST INSTRUCTIONS

64PRE-TEST INSTRUCTIONS
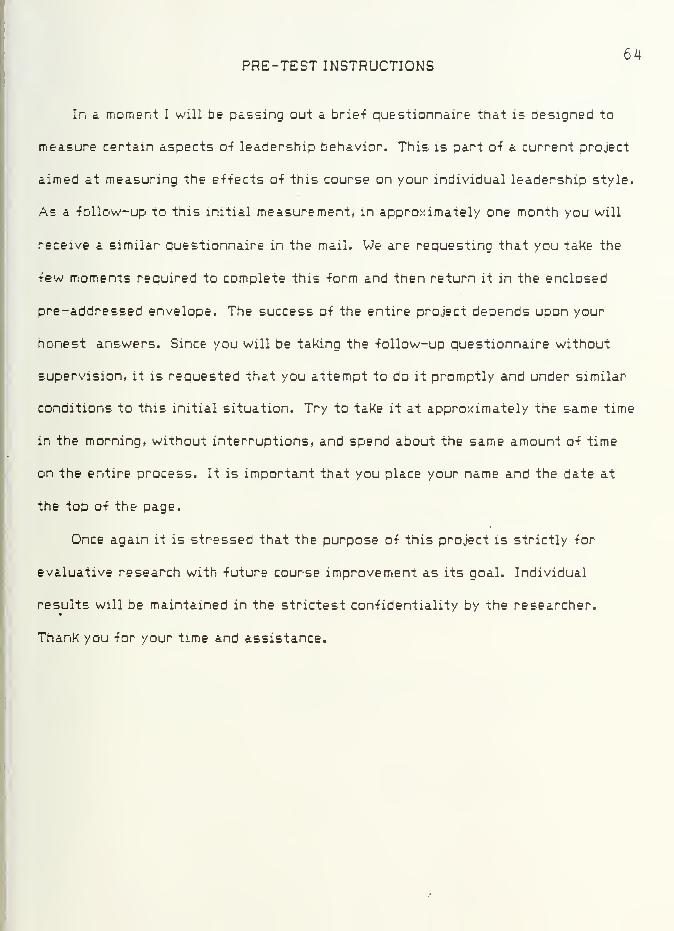
In a moment I will be passing out a brief questionnaire that is designed to
measure certain aspects o-f leadership behavior. This is part o-f a current project
aimed at measuring the e-f-fects o-f this course on your individual leadership style.
As a -follow-up to this initial measurement, in approximately one month you will
receive a similar questionnaire in the mail. We are requesting that you take the
tew moments required to complete this -form and then return it in the enclosed
pre-addressed envelope. The success o-f the entire project depends upon your
honest answers. Since you will be taking the -follow-up questionnaire without
supervision, it is reauested that you attempt to do it promptly and under similar-
conditions to this initial situation. Try to take it at approximately the same time
in the morning, without interruptions, and spend about the sarnie amount o-f time
on the entire process. It is important that you place your name and the date at
the top o-f the page.
Once again it is stressed that the purpose o-f this project is strictly -for
evaluative research with -future course improvement as its goal. Individual
results will be maintained in the strictest confidentiality by the researcher.
Thank you -for your time and assistance.

APPENDIX E
COVER LETTER
FOLLOW-UP QUESTIONNAIRE

DEPARTMENT OF THE NAVYNAVAL CIVILIAN PERSONNEL COMMAND
SOUTHWEST REGION8B0 FRONT STREET
SUITE 5-S-29SAN DIEGO, CALIFORNIA 92188
66
IN REPLY REFER TO:
NCPCSWR:DEJ:ym1241029 May 1985
From: Training Director, Naval Civilian Personnel Command,Southwest Region
To: Participants
Subj: BASIC SUPERVISORY DEVELOPMENT
Encl: (1) Questionnaire
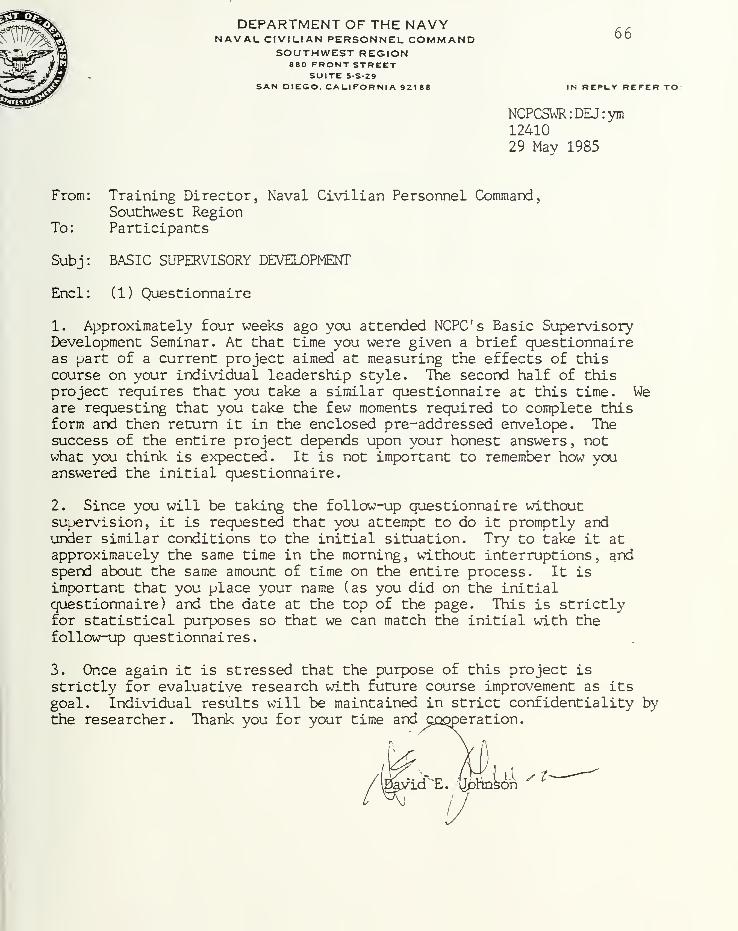
1. Approximately four weeks ago you attended NCPC's Basic SupervisoryDevelopment Seminar. At that time you were given a brief questionnaireas part of a current project aimed at measuring the effects of thiscourse on your individual leadership style. The second half of thisproject requires that you take a similar questionnaire at this time. Weare requesting that you take the few moments required to complete thisform and then return it in the enclosed pre-addressed envelope. Thesuccess of the entire project depends upon your honest answers , notwhat you think is expected. It is not important to remember how youanswered the initial questionnaire.
2. Since you will be taking the follow-up questionnaire withoutsupervision, it is requested that you attempt to do it promptly andunder similar conditions to the initial situation. Try to take it atapproximately the same time in the morning , without interruptions , andspend about the same amount of time on the entire process. It isimportant that you place your name (as you did on the initialquestionnaire) and the date at the top of the page. This is strictlyfor statistical purposes so that we can match the initial with thefollow-up questionnaires.
3. Once again it is stressed that the purpose of this project is
strictly for evaluative research with future course improvement as itsgoal. Individual results will be maintained in strict confidentiality bythe researcher. Thank you for your time and cooperation.
gnU ' ?

APPENDIX F
LEADERSHIP QUESTIONNAIRE SCORING
PROCEDURES

68
APPENDIX F
LEADERSHIP QUESTIONNAIRE SCORING PROCEDURES
(Excerpted from Pfeiffer & Jones, A Handbook ofStructured Experiences for Human Relations Training
,
1974..)
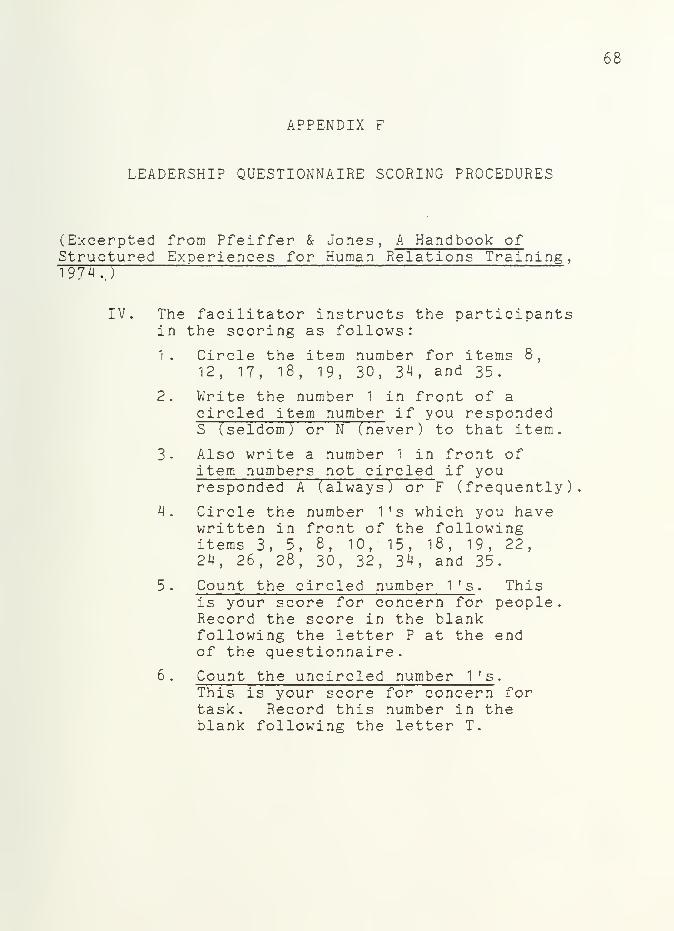
IV. The facilitator instructs the participantsin the scoring as follows:
1. Circle the item number for items 8,12, 17, 18, 19, 30, 34, and 35.
2. Write the number 1 in front of a
circled item number if you respondedS (seldom ) or N (never ) to that item.
3. Also write a number 1 in front ofitem numbers not circled if youresponded A (always ) or F (frequently)
4. Circle the number 1's which you havewritten in front of the followingitems 3, 5, 8, 10,15, 18, 19, 22,24, 26, 28, 30, 32, 34, and 35.
5
.
Count the circled number 1 's . Thisis your score for concern for people.Record the score in the blankfollowing the letter P at the endof the questionnaire.
6
.
Count the uncircled number 1's .
This is your score for concern fortask. Record this number in theblank following the letter T.


I 1
21V03U
ThesisB'5^5553 Blackburnc.l A program evalua-
tion of the basic
supervisory develop-
ment seminar.