a phase 1 dose-escalation study: safety, tolerability, and pharmacokinetics of fbs0701, a novel oral...
TRANSCRIPT

A phase 1 dose-escalation study: safety, tolerability, and pharmacokinetics of FBS0701, a novel oral iron chelator for the treatment of transfusional iron overload
by Hugh Young Rienhoff Jr., Vip Viprakasit, Lay Tay, Paul Harmatz,Elliott Vichinsky, Deborah Chirnomas, Janet L. Kwiatkowski, Amy Tapper,William Kramer, John B. Porter, and Ellis J. Neufeld
Haematologica 2010 [Epub ahead of print]
Citation: Rienhoff HY Jr., Viprakasit V, Tay L, Harmatz P, Vichinsky E, Chirnomas D,Kwiatkowski JL, Tapper A, Kramer W, Porter JB, and Neufeld EJ. A phase 1 dose-escalation study: safety, tolerability, and pharmacokinetics of FBS0701, a novel oral iron chelator for the treatment of transfusional iron overload.Haematologica. 2010; 95:xxx doi:10.3324/haematol.2010.034405
Publisher's Disclaimer. E-publishing ahead of print is increasingly important for the rapid dissemination of science.Haematologica is, therefore, E-publishing PDF files of an early version of manuscripts thathave completed a regular peer review and have been accepted for publication. E-publishingof this PDF file has been approved by the authors. After having E-published Ahead of Print,manuscripts will then undergo technical and English editing, typesetting, proof correction andbe presented for the authors' final approval; the final version of the manuscript will thenappear in print on a regular issue of the journal. All legal disclaimers that apply to the journal also pertain to this production process.
Haematologica (pISSN: 0390-6078, eISSN: 1592-8721, NLM ID: 0417435, www.haemato-logica.org) publishes peer-reviewed papers across all areas of experimental and clinicalhematology. The journal is owned by the Ferrata Storti Foundation, a non-profit organiza-tion, and serves the scientific community with strict adherence to the principles of openaccess publishing (www.doaj.org). In addition, the journal makes every paper publishedimmediately available in PubMed Central (PMC), the US National Institutes of Health (NIH)free digital archive of biomedical and life sciences journal literature.
Official Organ of the European Hematology AssociationPublished by the Ferrata Storti Foundation, Pavia, Italy
www.haematologica.org
Early Release Paper
Support Haematologica and Open Access Publishing by becoming a member of the European Hematology Association (EHA)and enjoying the benefits of this membership, which include free participation in the online CME program
Copyright 2010 Ferrata Storti Foundation.Published Ahead of Print on December 20, 2010, as doi:10.3324/haematol.2010.034405.

DOI: 10.3324/haematol.2010.034405
!"
"
A phase 1 dose-escalation study: safety, tolerability, and
pharmacokinetics of FBS0701, a novel oral iron chelator for
the treatment of transfusional iron overload
Hugh Young Rienhoff Jr.,1 Vip Viprakasit,
2 Lay Tay,
3 Paul Harmatz,
4 Elliott Vichinsky,
5
Deborah Chirnomas,6 Janet L. Kwiatkowski,
7 Amy Tapper
1, William Kramer,
1 John B. Porter,
8
and Ellis J. Neufeld6
1FerroKin BioSciences, Inc., San Carlos, CA;
2Department of Pediatrics, Siriraj Hospital,
Mahidol University, Bangkok, Thailand; 3IMVS, Division of Hematology, Adelaide, SA,
Australia; 4Hematology/Oncology, Children's Hospital & Research Center Oakland, Oakland,
CA, USA; 5Children's Hospital & Research Center Oakland, Oakland, CA, USA;
6Hematology,
Children's Hospital Boston, Boston, MA; 7Hematology Dept, Children’s Hospital, Philadelphia,
PA, USA, and 8Haematology, University College London, London, United Kingdom
Acknowledgments
The authors would like to thank Amber Jones, Maggie Neptune, Jennifer Peppe, and Laura Eichorn of
FerroKin BioSciences; Jennifer Braunstein and Pamela Boardman of Children’s Hospital, Boston;
Jacqueline Madden of Children’s Hospital & Research Center Oakland; Sage Green of Children’s
Hospital of Philadelphia.
Funding
This study was sponsored by FerroKin BioSciences and was supported, in part, with funds provided by
the National Center for Research Resources grant, UL1RR024131-01 (Harmatz). VV received supports
from the Thailand Research Fund and BIOTEC, Thailand.

DOI: 10.3324/haematol.2010.034405
#"
"
Abstract
Background. There remains a clinical need for a well-tolerated and safe iron chelator for the
treatment of transfusional iron overload. We described the pharmacokinetic properties and
safety data after 7 days of dosing FBS0701, a novel orally available, once-daily iron chealtor.
Design and Methods. This phase 1b dose-escalation study to assess the safety, tolerability,
pharmacokinetics and pharmacodynamics of FBS0701, a novel oral iron chelator for the
treatment of transfusional iron overload, was conducted in sixteen transfusionally iron
overloaded adult patients. FBS0701 was dosed daily for seven (7) days up to 32 mg/kg and was
well tolerated at all dose levels.
Results. Pharmacokinetics showed dose-proportionality, Cmax within 60-90 minutes of dosing,
rapid distribution at the predicted therapeutic doses and a plasma elimination half-life (t1/2) of
approximately 19 hours. There were no serious adverse events associated with the drug.
Conclusions. On the basis of these safety and pharmacokinetic data, FBS0701 warrants further
clinical evaluation in patients with transfusional iron overload.
(clintrials.gov identifier: NCT01186419)

DOI: 10.3324/haematol.2010.034405
$"
"
Introduction
Morbidity from iron overload remains a major problem in transfusion-dependent patients despite
recent advances in chelation therapy. Iron chelators in current use -- parenteral deferoxamine,
oral deferasirox and deferiprone -- are individually efficacious in many patients with transfusion-
dependent anemias, but each has limitations relating to safety, ease of administration, patient
acceptance, or a narrow therapeutic index (1). The novel oral chelator FBS0701, a member of
the desazadesferrithiocin class of siderophore-related tridentate chelators, binds Fe(III) with very
high affinity and selectivity over Fe(II) and other biologically important metals (2, 3, 4).
FBS0701 was selected for clinical development on the basis of its primary pharmacologic and
pharmacokinetic properties and the toxicity profile all of which suggested FBS0701 might offer
significant clinical advantages for patients with iron overload as compared to currently available
therapies (5). Extensive preclinical toxicological studies of FBS0701 consistently demonstrated
a higher no-observable-adverse-effect level (NOAEL) compared to deferasirox (ExJade®
,
Novartis) suggesting a favorable clinical safety profile especially with respect to nephrotoxicity
(6, 7). In this study, we report the results of the first multi-dose exposure of FBS0701 in iron
overloaded patients.""
"
"
"
"

DOI: 10.3324/haematol.2010.034405
%"
"
Design and Methods
This study was conducted in accordance with the World Medical Association Declaration of
Helsinki, good clinical practice (GCP), and International Clinical Harmonization (ICH)
guidelines and all applicable regulations governing human subject protections and approved by
Institutional Review Boards or local ethics committees at each site.
This study, Protocol Number Error! Reference source not found., was conducted to evaluate
the safety, tolerability, pharmacokinetics, and pharmacodynamics of FBS0701 in patients with
transfusional iron overload. This was a multi-center, open-label study of ascending multiple oral
doses of FBS0701. Four (4) cohorts of four (4) patients each were dosed sequentially with
FBS0701. Patients were dosed at 3 mg/kg, 8 mg/kg, 16 mg/kg, or 32 mg/kg once daily for seven
(7) days. The 7 day duration of the study was considered sufficient to accurately assess the
pharmacokinetics of FBS0701 at steady state plasma levels.
Patients
Patients eighteen years or older with documented transfusional iron overload requiring chronic
treatment with deferiprone, deferasirox or deferoxamine were eligible. Patients were
transfusion-dependent defined in this study as those requiring 8 or more transfusions per year.
The iron burden inclusion criteria were defined as: 1) liver iron concentrations (LIC) greater than
2 mg/g (dry weight, liver) as determined by R2 magnetic resonance imaging (MRI); 2) a cardiac
MRI T2* greater than 12 milliseconds; 3) serum ferritin in excess of 600 ng/mL.
Eligible and consented patients discontinued their regular chelation therapy for up to five days
during a wash-out period prior to their first dose of FBS0701. Dose cohorts and diagnoses are
shown in Table 1. Patients received FBS0701 in capsules taken orally in a fasted state. In this

DOI: 10.3324/haematol.2010.034405
&"
"
study, a standard pharmacokinetic protocol of plasma sampling was performed throughout the 7
days of dosing and continuing for three days after the last dose on Day 7.
Each dose level was separated by a minimum of three weeks to assess safety and tolerability
prior to escalating to the next dose level. Following initial dosing on Day 1, patients were
followed in the clinic on Days 3, 6, 7, 8, 9, 10 and 15 and then weekly thereafter for three weeks
for a total of 28 days following the last dose.
Study Assessments
Adverse Events were assessed at every clinic visit and between visits via telephone, from the
first dose through 28 days post-last dose (Day 35). Clinical and laboratory assessments were
monitored regularly beginning at Screening and during clinic visits throughout the study (see
Supplemental Data: Table 1). All clinical pathology determinations were performed at ACM
Laboratories, Ltd. in Bristol, England. Seventeen blood samples for pharmacokinetics were
collected: pre-dose on Days 1, 3, 6 and 7; 9 post-dose samples from 15 minutes to 8 hours on
Day 7; a single sample on Days 8, 9, 10 and 15. Urine was collected in pooled intervals of 0-
4, 4-8, and 8-24 hours after the last dose on Day 7 to assess FBS0701 and iron excretion.
Pharmacokinetic analysis
Actual blood sampling and urine collection times were used in all pharmacokinetic analyses. Per
protocol times were used to calculate mean plasma concentrations for graphical displays. A
formally validated bioanalytical method for quantifying total FBS0701 in human plasma and
urine was developed. The drug was extracted from plasma using solid phase extraction and
analyzed using high performance liquid chromatography with tandem mass spectrometric
determination, and d3-FBS0701 as an internal standard. The method was used to measure drug
DOI: 10.3324/haematol.2010.034405
'"
"
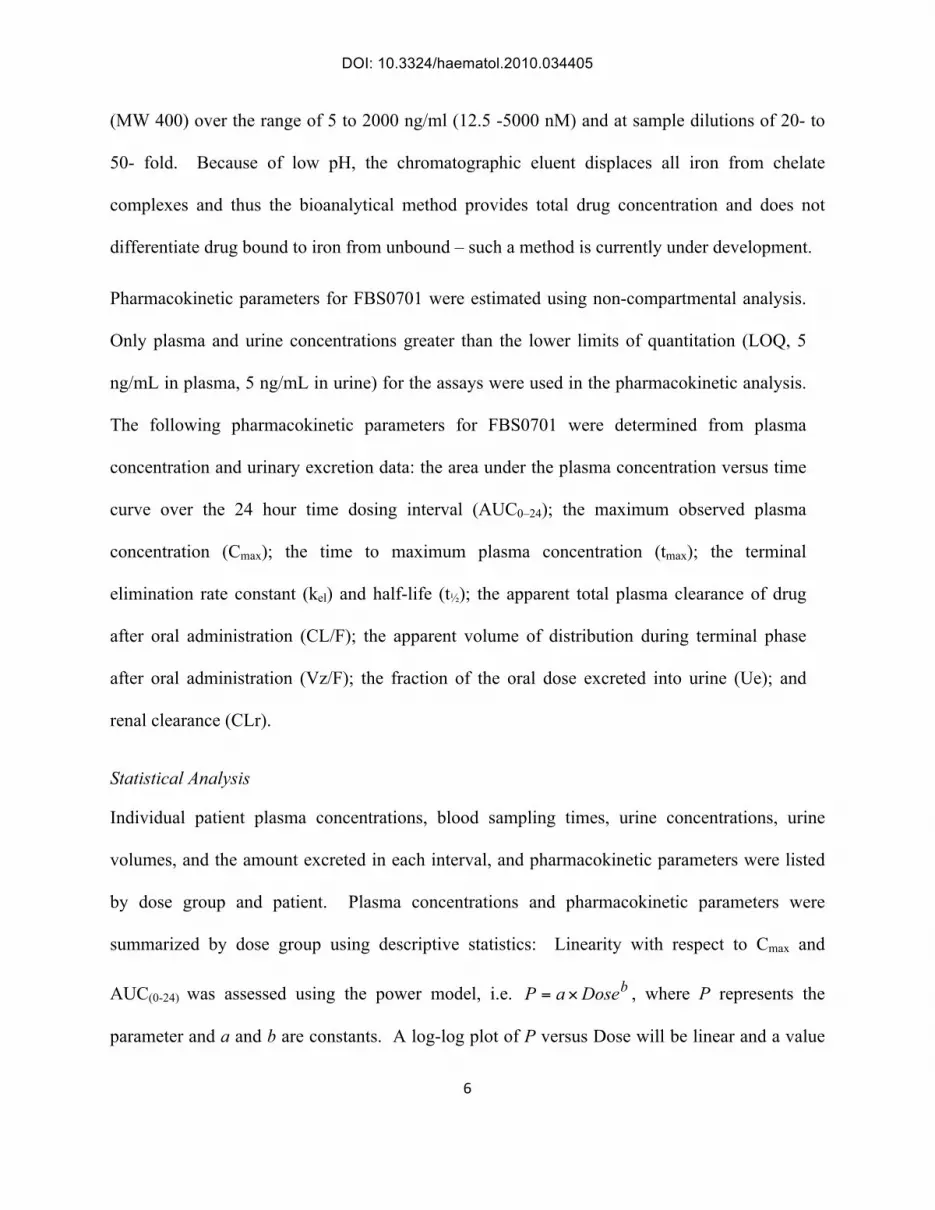
(MW 400) over the range of 5 to 2000 ng/ml (12.5 -5000 nM) and at sample dilutions of 20- to
50- fold. Because of low pH, the chromatographic eluent displaces all iron from chelate
complexes and thus the bioanalytical method provides total drug concentration and does not
differentiate drug bound to iron from unbound – such a method is currently under development.
Pharmacokinetic parameters for FBS0701 were estimated using non-compartmental analysis.
Only plasma and urine concentrations greater than the lower limits of quantitation (LOQ, 5
ng/mL in plasma, 5 ng/mL in urine) for the assays were used in the pharmacokinetic analysis.
The following pharmacokinetic parameters for FBS0701 were determined from plasma
concentration and urinary excretion data: the area under the plasma concentration versus time
curve over the 24 hour time dosing interval (AUC0–24); the maximum observed plasma
concentration (Cmax); the time to maximum plasma concentration (tmax); the terminal
elimination rate constant (kel) and half-life (t!); the apparent total plasma clearance of drug
after oral administration (CL/F); the apparent volume of distribution during terminal phase
after oral administration (Vz/F); the fraction of the oral dose excreted into urine (Ue); and
renal clearance (CLr).
Statistical Analysis
Individual patient plasma concentrations, blood sampling times, urine concentrations, urine
volumes, and the amount excreted in each interval, and pharmacokinetic parameters were listed
by dose group and patient. Plasma concentrations and pharmacokinetic parameters were
summarized by dose group using descriptive statistics: Linearity with respect to Cmax and
AUC(0-24) was assessed using the power model, i.e. bDoseaP != , where P represents the
parameter and a and b are constants. A log-log plot of P versus Dose will be linear and a value

DOI: 10.3324/haematol.2010.034405
("
"
of b of !1 indicates linearity. The equation was fit to the individual patient data using non-linear
least squares regression. Parameters were compared among doses using descriptive statistics.
Due to the small numbers of patients per panel, no formal statistical analyses were done.
Adverse Events
Adverse events (AEs) in this study were defined as any unexpected, unfavorable, harmful, or
pathologic change in a patient as indicated by physical signs or symptoms including intercurrent
illnesses or injuries and/or clinically significant laboratory abnormalities occurring over the
course of the 7 day treatment and 28 day post-treatment period. A serious adverse event (SAE)
was defined as an event that was fatal or life-threatening, requiring hospitalization, surgery, or
resulting in a persistent disability. All AEs and SAEs were assessed for their possible
relationship to the study drug.
Results
Patient and study completion
The study enrolled 16 patients and all completed the study. The primary hematological
diagnoses and demographics are listed in Table 1. (Additional demographic data and patient
medical history is provided in Supplementary Data Table 2 and 4.)
Pharmacokinetics
The mean pre-dose plasma concentrations were relatively constant from Day 3 through Day 8
(Supplemental Data Figure 1), suggesting that steady-state had been reached by Day 3,
consistent with the mean t! (16.2 to 21.3 h; Table 2) and the 24-hour dosing interval.
The mean plasma FBS0701 concentrations after the last dose on Day 7 are illustrated on linear
axes in Figure 1 (0 to 24 hours) and in semi-logarithmic axes in Figure 2 (0 to 192 hours).

DOI: 10.3324/haematol.2010.034405
)"
"
Plasma concentrations increased in a dose-related manner (Figure 1) and decayed at essentially
the same rate after all four doses (Figure 2) demonstrating linear pharmacokinetics. Mean values
for Cmax and AUC(0-24) also increased in a dose proportional manner (Table 2) and log-log plots
of the mean Cmax and AUC(0-24) (Figure 3) versus Dose were reasonably linear with slopes whose
approximate 95% confidence intervals included 1.0, providing further evidence of linear
pharmacokinetics. The median values for Tmax ranged from 1.00 to 1.49 h and were not dose
dependent (Table 2). There were no dose related trends in either CL/F or Vz/F and the mean
elimination half-life, t!, was independent of dose (Table 2).
The urinary recovery of FBS0701 was comparable across the four cohorts with mean recovery
ranging from 39.2% to 47.4% of the dose and mean renal clearance from 73.6 to 105 mL/min
(Table 2). As the protein binding of FBS0701 is 85%, filtration clearance, estimated as the
unbound fraction, 0.15, times the glomerular filtration rate, ~120 mL/min, would be ~18
mL/min. As CLr is ~5-fold greater than the filtration clearance, active tubular secretion is likely
a substantial component of the renal excretion of FBS0701. There was, however, no evidence of
saturation of renal clearance at the systemic exposures observed in this study.
Pharmacodynamics
In this study, urine was collected for 24 hours following last administration of FBS0701 on
Day 7. The concentration of urinary iron was measured in three aliquots – 0-4 hours; 4-8 hours;
8-24 hours. Iron was detected in the urine of all patients administered FBS0701 but amounts
were low and no significant dose-dependent trends in urinary iron excretion were evident (data
not shown).
Safety

DOI: 10.3324/haematol.2010.034405
*"
"
All sixteen patients who received FBS0701 were included in the safety analysis. The safety and
tolerability of each dose level was reviewed by the Principal Investigator (EN) and the FerroKin
Medical Monitor (HYR) prior to dose escalation. AEs, vital sign measurements, ECG results,
and laboratory assessments were reviewed to evaluate the safety and tolerability of each dose
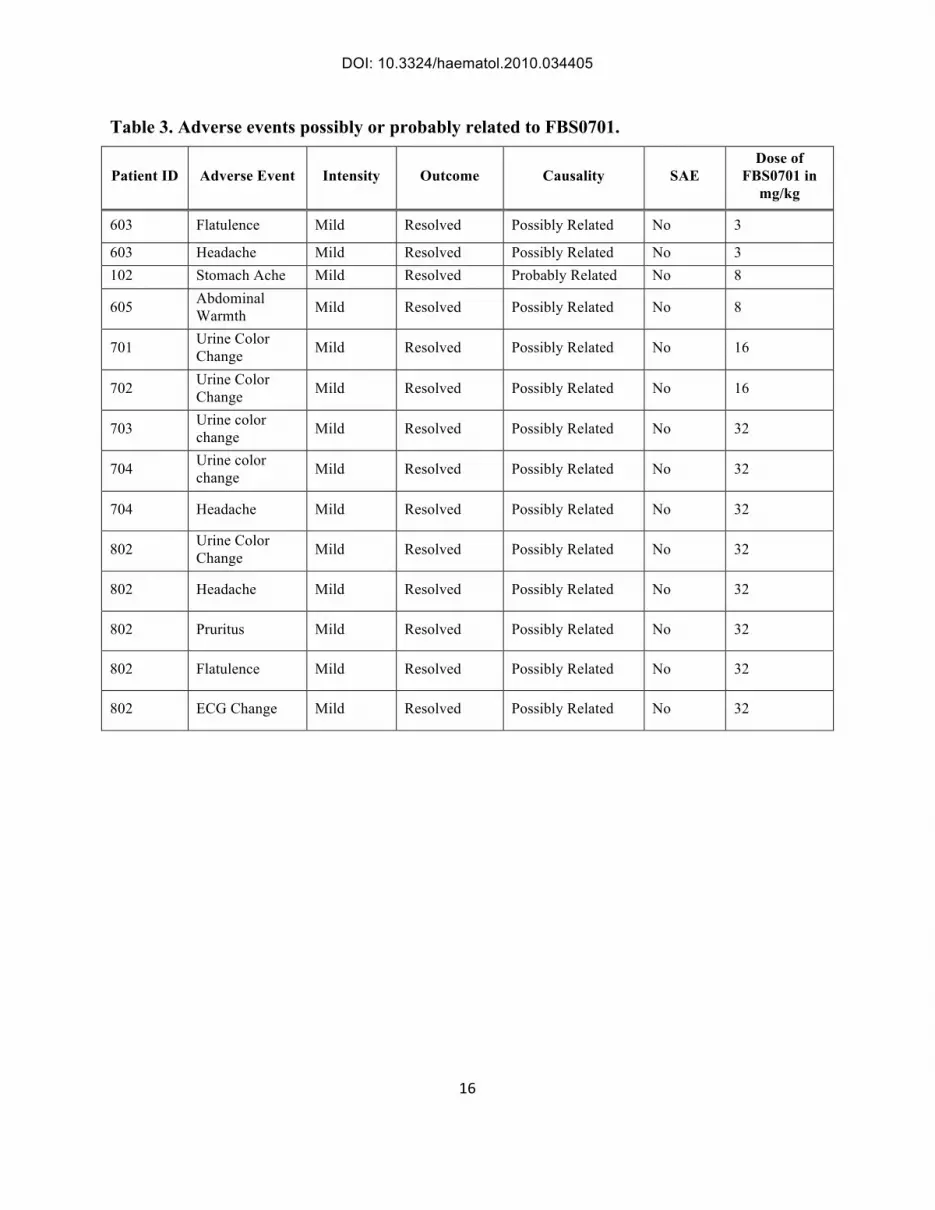
level of FBS0701. Treatment-emergent AEs were reported by 14 of the 16 patients; Table 3 lists
those AEs possibly or probably related to FBS0701. (For all AEs, see Supplementary Data:
Table 3). There was no evidence to suggest a relationship between dose-escalation and the
intensity or causality of AEs. Twenty-four adverse events were mild in intensity and 7 adverse
events were moderate in intensity. There was one SAE (Supplementary Data: Table 3). Patient
0501 with sickle cell disease (SCD) was admitted to the hospital for sickle cell pain 20 days after
the last dose of FBS0701. The three day hospital course was uncomplicated and the patient was
discharged in her baseline condition. The SAE was deemed unrelated to FBS0701 by the site
Principal Investigator. All AEs with the exception of sciatica have resolved without any further
medical intervention or follow-up. There were no deaths and no withdrawals due to adverse
events.
There were no statistically significant changes in biochemistry, hematology, or urinalysis nor any
deemed clinically significant or adverse. Specifically, there were no changes in serum
creatinine, blood urea nitrogen or urinalysis from pre-dose to Day 7 or to Day 15. There were no
changes in vital signs, physical examination, or ECGs from pre-dose values deemed adverse with
the exception of one patient with a change in QTc interval on Day 7. This finding was in a
fourth cohort patient (802) with SCD with a baseline QTc interval of 442 ms who was observed
four hours after the last dose on Day 7 to have a QTc interval of 462 ms without other ECG
changes or clinical symptomatology. A repeat ECG on Day 17, ten days after her last dose of

DOI: 10.3324/haematol.2010.034405
!+"
"
FBS0701 showed a QTc interval of 455 ms. This observation was not unexpected in a patient
with SCD (8).
Discussion
In this first multiple-dose study of FBS0701 in transfusionally iron overloaded patients, analysis
of the plasma concentration and urinary excretion data for FBS0701 after oral administration of 3
mg/kg, 8 mg/kg, 16 mg/kg, and 32 mg/kg indicated linear pharmacokinetics over that range of
doses. There were no apparent dose dependencies with respect to Tmax, CL/F, Vz/F, or t!. The
mean elimination half-life was ~19 hours and approximately 43% of the dose was recovered in
the urine. CL/F appears to be directly related to body weight, suggesting that weight-based
dosing is appropriate for FBS0701.
The t1/2 of ~19.2 hours suggests that once-daily dosing is feasible. Plasma levels of FBS0701
24 hours following the last dose were <1% of Cmax. This assay for FBS0701 does not distinguish
FBS0701 bound to iron from free drug, however, the presence of FBS0701 in the plasma at 24
hours post-dosing in the third and fourth dose cohorts at concentrations of ~1 "M allows for the
possibility that non-transferrin bound iron (NTBI) may be suppressed over the entire FBS0701
dosing cycle in patients taking predicted therapeutic doses of FBS0701; this assertion will need
to be tested directly by measuring NTBI and determining the proportion free drug to total drug in
plasma at various time points post-dosing.
The small amount of iron found in the urine at all FBS0701 dose levels is consistent with data in
rats in which 98% of iron excreted following a single dose of FBS0701 was found in bile (5).
The data in this study suggest that the fraction of the oral dose of FBS0701 not bound to iron is

DOI: 10.3324/haematol.2010.034405
!!"
"
largely excreted renally whereas the drug:iron complex is likely to be excreted predominantly via
the biliary route.
FBS0701 was well tolerated in the intended patient population of transfusional iron overloaded
patients. The frequency or severity of adverse events did not show any dose-dependency with
the exception of changes in urine color which were of no apparent clinical significance. The
most common AEs were headache (n=5), urine color change (n= 4) and flatulence (n= 2).
Significantly, there were no reports of changes in the frequency or character of stools in any of
the 16 patients over the 7 day dosing period as have been observed with other oral chelators over
this dosing period. Though patients with moderate-to-severe renal function were excluded from
the study, there were no instances in any patients of elevations in serum creatinine at any time
during the seven day dosing period or during the 28 day follow-up safety assessment period.
Similarly for liver function tests, there were no significant changes in those parameters.
In summary, FBS0701 was well tolerated for seven days in iron overloaded patients with
favorable pharmacokinetics at doses likely to be therapeutic. These results warrant further safety
and efficacy studies of FBS0701 in the iron overloaded patient population.
Authorship and Disclosures
EJN was the Lead Investigator. EJN and HYR take primary responsibility for the paper. EJN,
HYR, JP, EV and PH designed the protocol. VV, LT, PH, EV, DC, and JLK recruited the
patients. HR and WK performed the PK and other data analysis. AT coordinated the Chemical
and Materials Control (CMC) and analytical chemistry. HYR wrote the manuscript. HYR and
AT are employees of FerroKin BioSciences. EJN and PH received research support from
FerroKin BioSciences and Novartis.

DOI: 10.3324/haematol.2010.034405
!#"
"
References
1. Neufeld EJ. Oral chelators deferasirox and deferiprone for transfusional iron overload in
thalassemia major: new data, new questions. Blood. 2006;107(9):3436-41.
2. Hans-Ulrich Naegeli HZ. Stoffwechselprodukte von Mikroorganismen. 193. Mitteilung.
Ferrithiocin. Helvetica Chimica Acta. 1980;63:1400-6.
3. Hahn FE, McMurry TJ, Hugi A, Raymond KN. Coordination chemistry of microbial iron
transport. 42. Structural and spectroscopic characterization of diastereomeric
chromium(III) and cobalt(III) complexes of desferrithiocin. J Am Chem. Soc.
1990;112:1854-60.
4. Anderegg G, Raeber M. Metal complex formation of a new siderophore desferrithiocin
and of three related ligands. J. Chem. Soc., Chem. Commun. 1990; 17:1194-6.
6. Bergeron RJ, Wiegand J, McManis JS, Bharti N, Singh S. Design, synthesis, and testing
of non-nephrotoxic desazadesferrithiocin polyether analogues. J Med Chem.
2008;51(13):3913-23.
6. EMEA. Exjade®
(deferasirox) European Public Assessment Report.
http://www.emea.europa.eu/humandocs/Humans/EPAR/exjade/exjade.htm.
7. Galanello R, Piga A, Alberti D, Rouan M, Bigler H, Sechad R. Safety, tolerability and
pharmacokinetics of ICL670, a new orally active iron-chelating agent in patients with
transfusion-dependent iron overload due to "-thalassemia. J Clin Pharmacol.
2003;43(6):565-72.

DOI: 10.3324/haematol.2010.034405
!$"
"
8. Liem, R, Young, L, Thompson, A. Prolonged QTc interval in children and young adults
with sickle cell disease at steady state. Pediatr Blood Cancer. 2009;52: 842-6.
Table 1 Demographics and Hematologic Diagnosis of Iron Overload Patients
Cohort 1
(3 mg/kg)
2 #-thalassemia major
2 Sickle Cell Disease
Mean
age
19.3
M/F
1/3
Cohort 2
(8 mg/kg)
1 $–thalassemia ($o/$
o)
2 #-thalassemia major
1 Congenital Dyserythropoietic anemia
Mean
age
31.3
M/F
1/3
Cohort 3
(16 mg/kg)
4 #-thalassemia major Mean
age
29.8
M/F
1/3
Cohort 4
(32 mg/kg)
1 $-thalassemia hydrops ($o/$
o)
2 #-thalassemia/Hemoglobin E
1 Sickle Cell Disease
Mean
age
23.8
M/F
0/4

DOI: 10.3324/haematol.2010.034405
!%"
"
DOI: 10.3324/haematol.2010.034405
!&"
"
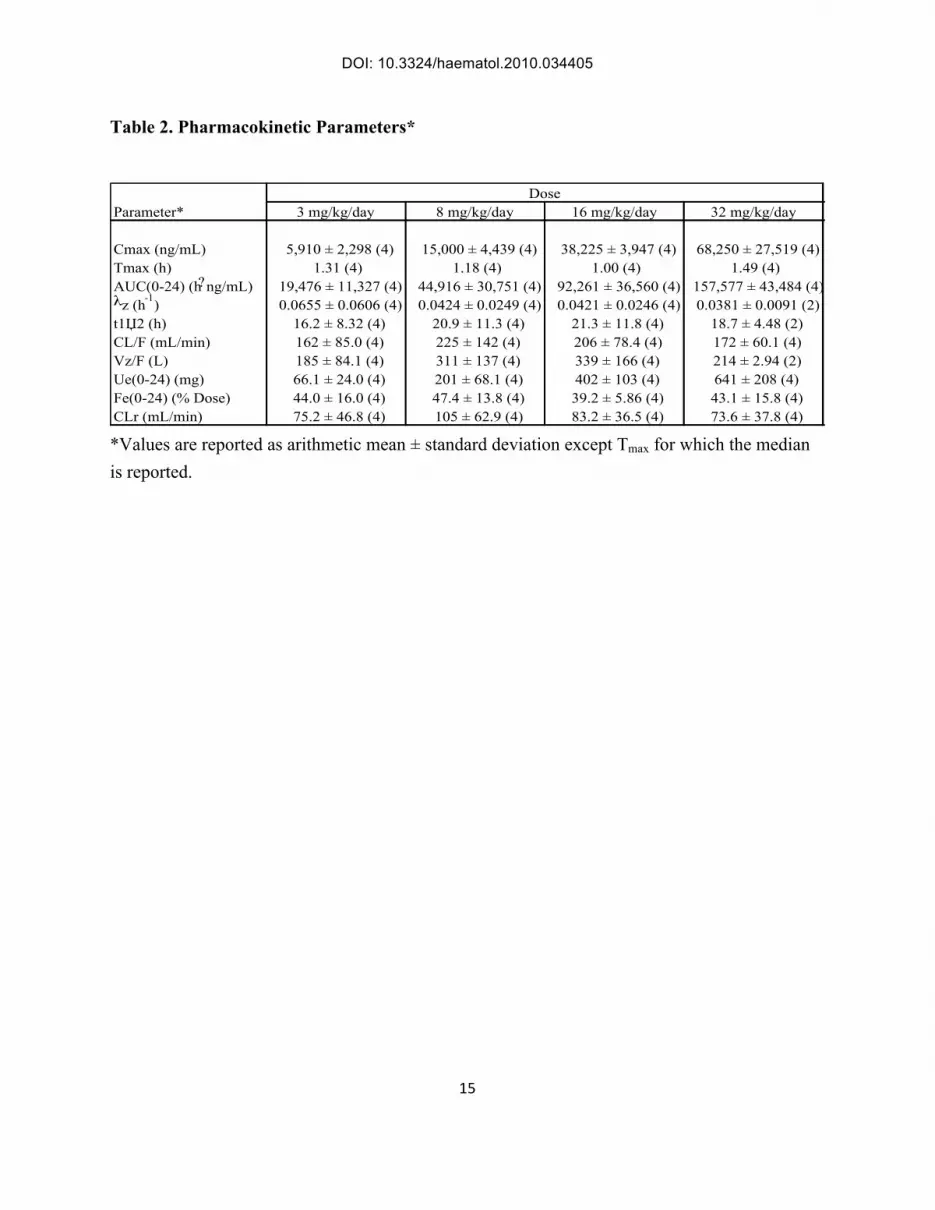
Table 2. Pharmacokinetic Parameters*
Parameter* 3 mg/kg/day 8 mg/kg/day 16 mg/kg/day 32 mg/kg/day
Cmax (ng/mL) 5,910 ± 2,298 (4) 15,000 ± 4,439 (4) 38,225 ± 3,947 (4) 68,250 ± 27,519 (4)
Tmax (h) 1.31 (4) 1.18 (4) 1.00 (4) 1.49 (4)
AUC(0-24) (h?ng/mL) 19,476 ± 11,327 (4) 44,916 ± 30,751 (4) 92,261 ± 36,560 (4) 157,577 ± 43,484 (4)!z (h
-1) 0.0655 ± 0.0606 (4) 0.0424 ± 0.0249 (4) 0.0421 ± 0.0246 (4) 0.0381 ± 0.0091 (2)
t1!2 (h) 16.2 ± 8.32 (4) 20.9 ± 11.3 (4) 21.3 ± 11.8 (4) 18.7 ± 4.48 (2)
CL/F (mL/min) 162 ± 85.0 (4) 225 ± 142 (4) 206 ± 78.4 (4) 172 ± 60.1 (4)
Vz/F (L) 185 ± 84.1 (4) 311 ± 137 (4) 339 ± 166 (4) 214 ± 2.94 (2)
Ue(0-24) (mg) 66.1 ± 24.0 (4) 201 ± 68.1 (4) 402 ± 103 (4) 641 ± 208 (4)
Fe(0-24) (% Dose) 44.0 ± 16.0 (4) 47.4 ± 13.8 (4) 39.2 ± 5.86 (4) 43.1 ± 15.8 (4)
CLr (mL/min) 75.2 ± 46.8 (4) 105 ± 62.9 (4) 83.2 ± 36.5 (4) 73.6 ± 37.8 (4)
Dose
*Values are reported as arithmetic mean ± standard deviation except Tmax for which the median
is reported.
DOI: 10.3324/haematol.2010.034405
!'"
"
Table 3. Adverse events possibly or probably related to FBS0701.
Patient ID Adverse Event Intensity Outcome Causality SAE
Dose of
FBS0701 in
mg/kg
603 Flatulence Mild Resolved Possibly Related No 3
603 Headache Mild Resolved Possibly Related No 3
102 Stomach Ache Mild Resolved Probably Related No 8
605 Abdominal
Warmth Mild Resolved Possibly Related No 8
701 Urine Color
Change Mild Resolved Possibly Related No 16
702 Urine Color
Change Mild Resolved Possibly Related No 16
703 Urine color
change Mild Resolved Possibly Related No 32
704 Urine color
change Mild Resolved Possibly Related No 32
704 Headache Mild Resolved Possibly Related No 32
802 Urine Color
Change Mild Resolved Possibly Related No 32
802 Headache Mild Resolved Possibly Related No 32
802 Pruritus Mild Resolved Possibly Related No 32
802 Flatulence Mild Resolved Possibly Related No 32
802 ECG Change Mild Resolved Possibly Related No 32

DOI: 10.3324/haematol.2010.034405
!("
"
Figure 1. Mean plasma concentrations of FBS0701 after oral administration on Day 7 of 3, 8,
16, or 32 mg/kg/day to patients with transfusional iron overload — linear axes, 0-
24 hours.
Figure 2. Mean plasma concentrations of FBS0701 after oral administration on Day 7 of 3, 8,
16, or 32 mg/kg/day to patients with transfusional iron overload — log- linear
axes, 0-192 hours.
Figure 3. Relationship between the mean Cmax and AUC(0-24) of FBS0701 after oral
administration on Day 7 of 3, 8, 16, or 32 mg/kg/day to patients with transfusional iron overload

DOI: 10.3324/haematol.2010.034405
!)"
"
Figure 1
Time Since Last Dose (h)
0 4 8 12 16 20 24
Conc (n
g/m
L)
0
15000
30000
45000
60000
75000
Cohort 1 - 3 mg/kg
Cohort 2 - 8 mg/kg
Cohort 3 - 16 mg/kg
Cohort 4 - 32 mg/kg
Figure 2
Time Since Last Dose (h)
0 24 48 72 96 120 144 168 192
Conc (n
g/m
L)
1
10
100
1000
10000
100000
Cohort 1 - 3 mg/kg
Cohort 2 - 8 mg/kg
Cohort 3 - 16 mg/kg
Cohort 4 - 32 mg/kg

DOI: 10.3324/haematol.2010.034405
!*"
"
Figure 3
Dose (mg/kg)
1 10 100
Cm
ax (n
g/m
L) o
r AU
C(0
-24) (h
?ng/m
L)
1000
10000
100000
1000000
Cmax slope = 1.060 ± 0.061
r! = 0.993
AUC(0-24) slope = 0.898 ± 0.030
r! = 0.998
.

DOI: 10.3324/haematol.2010.034405
1
Supplemental Data and Analyses
A phase 1 dose-escalation study: safety, tolerability, and
pharmacokinetics of FBS0701, a novel oral iron
chelator for the treatment of transfusional iron
overload

ii
Appendix I Individual Patient Actual Dosing Times (h) ................... 15
Appendix II Individual Patient Plasma Concentrations (ng/mL) ........ 16
Appendix III Individual Patient Blood Sampling Times (h) ................. 17
Appendix IV Mean ± Standard Deviation Plasma Concentrations ....... 18
Appendix V Individual Patient Urinary Excretion Data ...................... 19
Appendix VI Individual Patient Pharmacokinetic Parameters .............. 23
Appendix VII Descriptive Statistics for Pharmacokinetic
Parameters ....................................................................... 24
Appendix VIII Fit of the Power Model to Cmax and AUC(0-24) vs.
Total Dose ....................................................................... 25
Appendix IX Individual Patient Plasma FBS0701 Concentration
vs. Time Graphs — Linear AxesError! Bookmark not defined.
Appendix X Individual Patient Plasma FBS0701 Concentration
vs. Time Graphs — Semi-Logarithmic AxesError! Bookmark not defined.
Table 1: Adverse Events by Dose
Table 2: Summary of pharmacokinetic parameters for FBS0701 on Day 7
after oral administration of 3, 8, 16, or 32 mg/kg/day ! 7 days to
patients with transfusional iron overload. .................................................. 11
Figure 1: Mean pre-dose plasma concentrations of FBS0701 on Days 3, 5, and
7 and 24 hours after the last dose on Day 7 (Day 8) during oral
administration of 3, 8, 16, or 32 mg/kg/day ! 7 days to patients with
transfusional iron overload. ......................................................................... 7
Figure 2: Mean plasma concentrations of FBS0701 on Day 7 after oral
administration of 3, 8, 16, or 32 mg/kg/day ! 7 days to patients with
transfusional iron overload — linear axes. .................................................. 8
Figure 3: Mean plasma concentrations of FBS0701 on Day 7 after oral
administration of 3, 8, 16, or 32 mg/kg/day ! 7 days to patients with
transfusional iron overload — linear axes — initial 24 hours. .................... 9
Figure 4: Mean plasma concentrations of FBS0701 on Day 7 after oral
administration of 3, 8, 16, or 32 mg/kg/day ! 7 days to patients with
transfusional iron overload — semi-logarithmic axes. .............................. 10
Figure 5: Relationships between individual patient Cmax and total dose of
FBS0701 on Day 7 during oral administration of 3, 8, 16, or
32 mg/kg/day to patients with transfusional iron overload. ...................... 12
iii
Figure 6: Relationships between individual patient AUC(0-24) and total dose
of FBS0701 on Day 7 during oral administration of 3, 8, 16, or
32 mg/kg/day to patients with transfusional iron overload. ...................... 12
Figure 7: Relationship between individual patient FBS0701 CL/F and body
weight after oral administration of 3, 8, 16, or 32 mg/kg/day to
patients with transfusional iron overload. .................................................. 13
Figure 8: Individual patient amount excreted versus area under the curve for
individual urine collection intervals. ......................................................... 14

iv
Term Definition
AUC(0-24) Area under the plasma concentration-time curve over a 24-hour steady-
state dosing interval
CL/F Total plasma clearance uncorrected for bioavailability
CLr Renal clearance
Cmax Maximum plasma concentration
Cu Concentration of drug in the urine
F Bioavailability
Fe Fraction excreted unchanged in the urine
H hour
LC/MS/MS Liquid chromatography/mass spectrometry/mass spectrometry
LOQ Validated lower limit of the bioanalytical method
Kg kilogram
Mg milligram
mL milliliter
Ng nanogram
PK Pharmacokinetics
T time
t! Elimination half-life
Tmax Time of maximum plasma concentration
UE Amount excreted unchanged in the urine
Vu Volume of urine
Vz/F Volume of distribution uncorrected for bioavailability
"z Elimination rate constant

1
Safety
Table 1 Schedule of Assessments
Visit Name Screening Enroll-
ment
Start of
Treatment
Patient
at Home
(Contact
by
Phone)
Clinic
Visit
Clinic
Visit Last Day of Treatment Visit
Follow-up
Visits
Follow-
up
Safety
Visits
Study
Termination
Visit
Visit Date Days -45
to -1
Day -5
to -2 Day 1
Day 2
and
Day 4
and
Day 5
Day 3 Day 6
Day
7
Pre-
dose
Day
7
15 to
180
min
post
dose
Day 7
4 Hr.
post
dose
Day 7
8 Hr.
post
dose
Day 8
and
Day
15
Day
9
and
Day
10
Day 21
+ 2
and
Day 28
+ 2
Day 35 + 4
Informed Consent X
Inclusion/Exclusion X
Verify Patient
Eligibility X
Medical History X X
Complete PE X X
Limited PE X X X X
12-lead ECG X X
Vital Signs (HR,
BP,RR, Temp) X X X X X X X X
Height X
Weight X X X
Concomitant
Medications X X X X X X X X X X X
Adverse Event
Collection
X (post
dose) X X X X X X X X X
Hematology X
X X
Complete Serum
Biochemistry X X X

2
Coagulation
(PT/PTT) X X X
UA with
Microscopy X X X
Serum HCG
X
Urine Pregnancy
Test X X
c
24 Urine Collection
X (0
to 4
Hr)
X (4
to 8
Hr)a
Stop Current
Chelator Tx X
PK Blood Samples X
(pre-
dose)
X
(pre-
dose)
X
(pre-
dose)
X
(pre-
dose)
Xb
X X X
X
FBS0701 Dosing X X (at
home) X X X
Dispense FBS0701
for at-home dosing X X
Restart previous
chelator therapy X
d
a) Dispense third urine container to patient to collect urine from 8 to 24 hours post-last dose.
b) PK samples to be drawn post-dose at: 15, 30, 45, 60, 90, 120 and 180 minutes.
c) Urine pregnancy test on 15 only
d) Restart patient’s previous chelator on Day 15 if Principal Investor deems safe

1
Table 2 Patient Demographics
Treatment Subject ID Age (years) Sex Ethnicity Race
FBS0701: 3 mg/kg/d 0101 18 Female Not Hispanic or Latino White
0501 18 Female Not Hispanic or Latino Black or African American
0601 19 Female Not Hispanic or Latino Other, Specify: Lebanese
0603 22 Male Not Hispanic or Latino Black or African American
FBS0701: 8 mg/kg/d 0102 25 Female Not Hispanic or Latino Asian
0502 29 Female Not Hispanic or Latino Asian
0604 40 Female Not Hispanic or Latino White
0605 31 Male Not Hispanic or Latino White
FBS0701: 16 mg/kg/d 0503 41 Male Not Hispanic or Latino Asian
0701 22 Female Not Hispanic or Latino Asian
0702 18 Male Not Hispanic or Latino Asian
0801 38 Male Not Hispanic or Latino White
FBS0701: 32 mg/kg/d 0504 34 Female Not Hispanic or Latino Asian
0703 21 Female Not Hispanic or Latino Asian
0704 20 Female Not Hispanic or Latino Asian
0802 20 Female Not Hispanic or Latino Black or African American

2
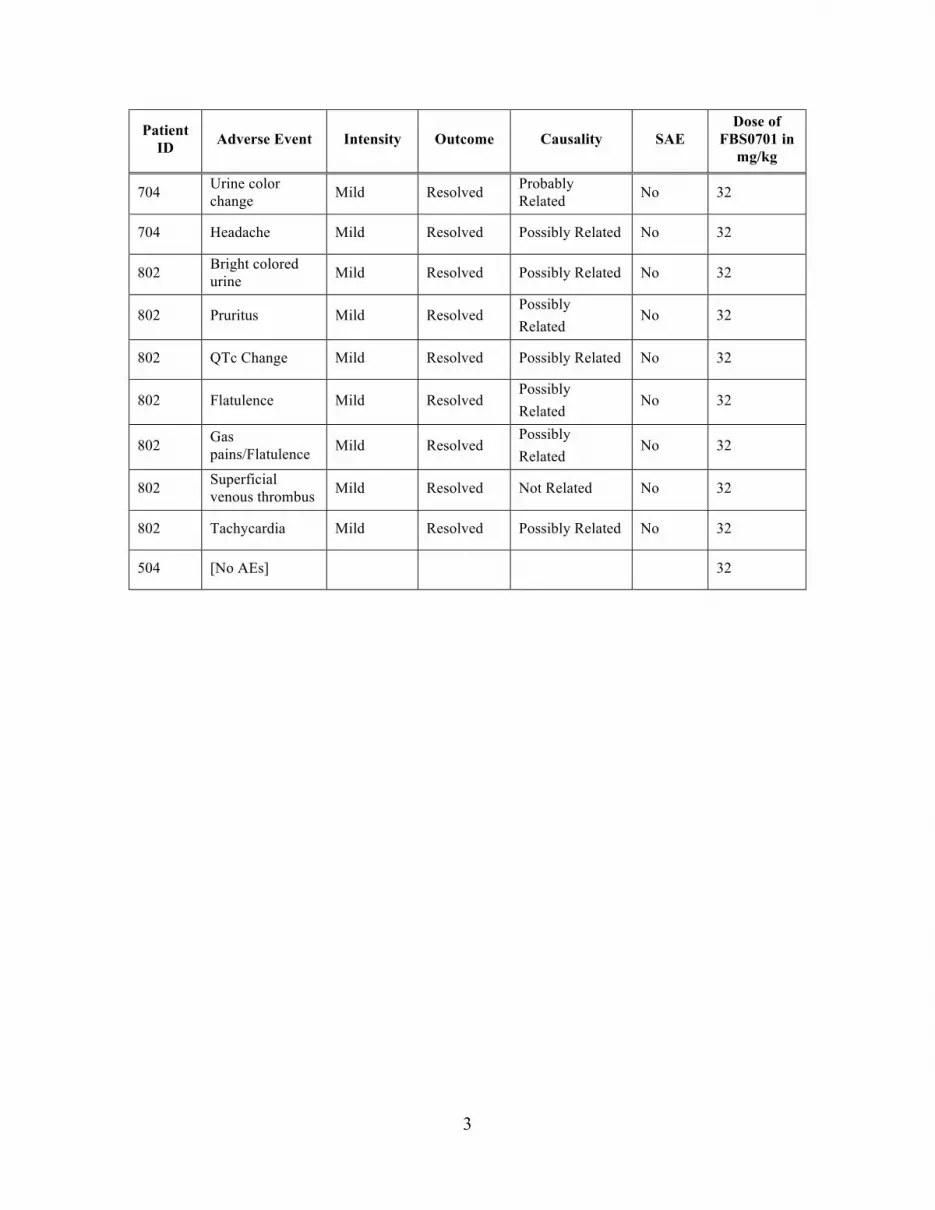
Table 3 All Adverse Events by Dose
Patient
ID Adverse Event Intensity Outcome Causality SAE
Dose of
FBS0701 in
mg/kg
101 Transfusion
Related Reaction Moderate Resolved Not Related No 3
101 Otitis Media Mild Resolved Not Related No 3
501 Insect Bite Mild Resolved Not Related No 3
501 Sickle Cell Crisis Moderate Resolved Not Related Yes 3
501 Low Back Pain Mild Resolved Not Related No 3
601 Inflammation at
Cannula Site Mild Resolved Not Related No 3
603
Upper
Respiratory Tract
Infection
Moderate Resolved Not Related No 3
603 Flatulence Mild Resolved Possibly Related No 3
603 Headache Mild Resolved Possibly Related No 3
102 Upper respiratory
tract infection Mild Resolved Not Related No 8
502 Left ankle sprain Moderate Resolved Not related No 8
604 [No AEs] 8
605 Abdominal
Warmth Mild Resolved Possibly Related No 8
701 Headache Mild Resolved Not Related No 16
701 Urine Color
Change Mild Resolved
Probably
Related No 16
701 Febrile Viral
Illness Mild Resolved Not Related No 16
702 Urine Color
Change Mild Resolved
Probably
Related No 16
503 Light headedness Mild Resolved Possibly Related No 16
503 Headache Moderate Resolved Not Related No 16
801 Right Shoulder
and Back Pain Mild Resolved Not Related No 16
801 5th
Digit abrasion Mild Resolved Not Related No 16
801 Blood in Urine Mild Resolved Probably
Related No 16
801 Sciatic Nerve
Pain Mild Resolved Not Related No 16
3
Patient
ID Adverse Event Intensity Outcome Causality SAE
Dose of
FBS0701 in
mg/kg
704 Urine color
change Mild Resolved
Probably
Related No 32
704 Headache Mild Resolved Possibly Related No 32
802 Bright colored
urine Mild Resolved Possibly Related No 32
802 Pruritus Mild Resolved Possibly
Related No 32
802 QTc Change Mild Resolved Possibly Related No 32
802 Flatulence Mild Resolved Possibly
Related No 32
802 Gas
pains/Flatulence Mild Resolved
Possibly
Related No 32
802 Superficial
venous thrombus Mild Resolved Not Related No 32
802 Tachycardia Mild Resolved Possibly Related No 32
504 [No AEs] 32
4
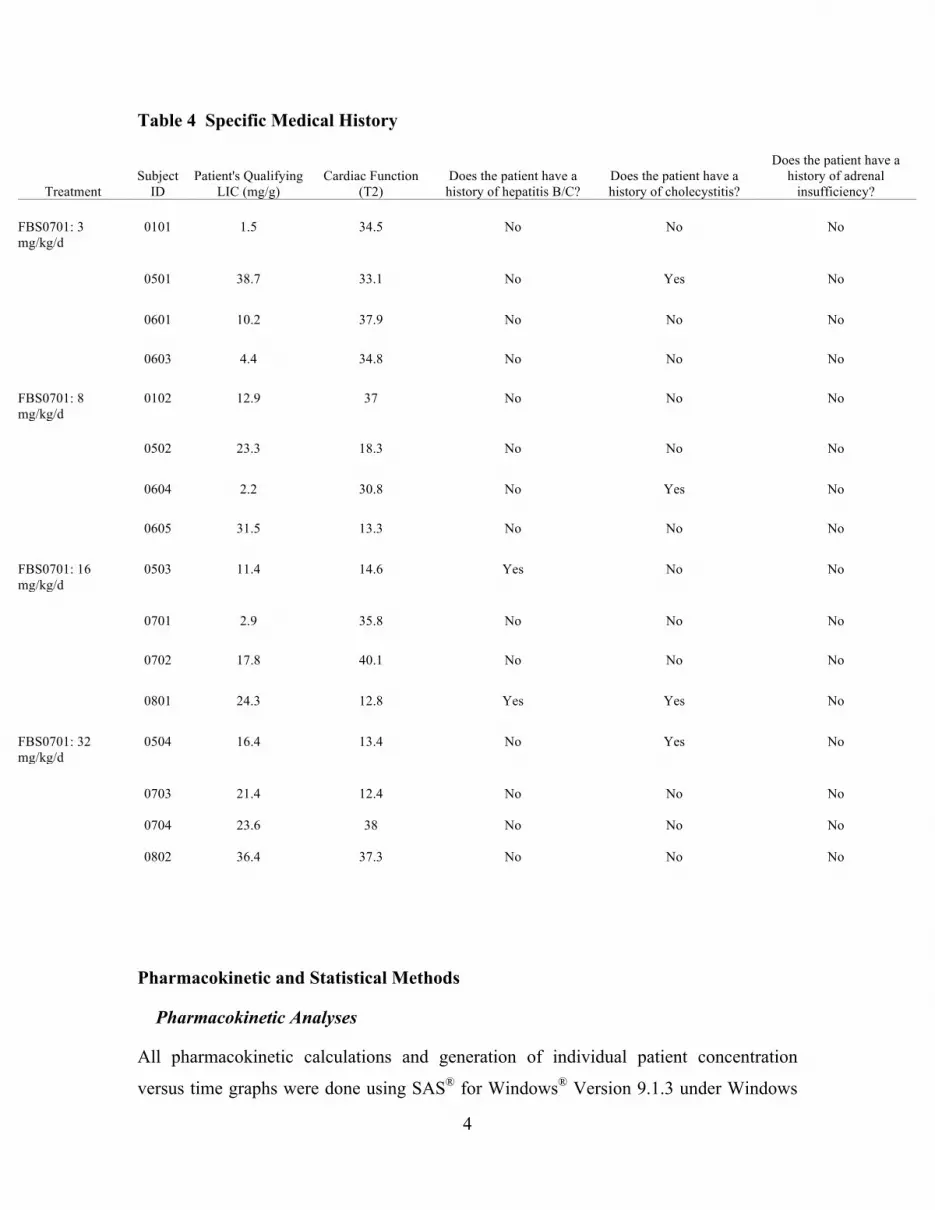
Table 4 Specific Medical History
Treatment
Subject
ID
Patient's Qualifying
LIC (mg/g)
Cardiac Function
(T2)
Does the patient have a
history of hepatitis B/C?
Does the patient have a
history of cholecystitis?
Does the patient have a
history of adrenal
insufficiency?
FBS0701: 3
mg/kg/d
0101 1.5 34.5 No No No
0501 38.7 33.1 No Yes No
0601 10.2 37.9 No No No
0603 4.4 34.8 No No No
FBS0701: 8
mg/kg/d
0102 12.9 37 No No No
0502 23.3 18.3 No No No
0604 2.2 30.8 No Yes No
0605 31.5 13.3 No No No
FBS0701: 16
mg/kg/d
0503 11.4 14.6 Yes No No
0701 2.9 35.8 No No No
0702 17.8 40.1 No No No
0801 24.3 12.8 Yes Yes No
FBS0701: 32
mg/kg/d
0504 16.4 13.4 No Yes No
0703 21.4 12.4 No No No
0704 23.6 38 No No No
0802 36.4 37.3 No No No
Pharmacokinetic and Statistical Methods
Pharmacokinetic Analyses
All pharmacokinetic calculations and generation of individual patient concentration
versus time graphs were done using SAS®
for Windows®
Version 9.1.3 under Windows

5
XP Professional. Graphs of mean plasma concentration and other in-text graphs were
prepared using SigmaPlot®
for Windows®
Version 11.
On Day 7, the maximum plasma concentration (Cmax) and time to Cmax (Tmax) were
taken directly from the data. The elimination rate constant, !z, was calculated as the
negative of the slope of the terminal log-linear segment of the plasma concentration-time
curve. The slope was determined from a linear regression of the natural logarithm of the
terminal plasma concentrations against time; at least 3 terminal plasma concentration
time points, beginning with the final concentration " LOQ, were selected for the
determination of !z and the regression had to have a coefficient of determination
(r!) " 0.9000. The range of data used for each patient was determined by visual
inspection of a semi-logarithmic plot of concentration vs. time. Elimination half life (t")
was calculated according to the following equation:
zt
!
693.0? =
Area under the curve over the 24-hour dosing interval [AUC(0-24)] was calculated using
the linear trapezoidal method.
Oral clearance (CL/F) and volume of distribution (Vz/F), uncorrected for bioavailability
(F) were calculated according to
)240(/
!=AUC
DoseFCL and
)240(/
!"=
AUCz
DoseFVz
#,
respectively.
For each urine collection interval, the amount of FBS0701 excreted (Ue) was calculated
from the concentration (Cu) and volume (Vu), i.e.
VuCuUe !=
and the total amount excreted over the 24-hour steady-state period was calculated by
summing the amounts from the individual intervals and was expressed as both milligrams
(Ue) and percent of dose (Fe).

6
Renal clearance (CLr) was calculated for the 24-hour steady-state period according to
)240(
)240(
!
!=AUC
UeCLr
where Ue and AUC are as previously defined.
Protocol Deviations
The Day 15 blood sample (336 h) for Patient #802 was collected on Day 17 (384 h).
Although this sample was included in all pharmacokinetic analyses, it was excluded from
the calculation of descriptive statistics for plasma concentrations (Appendix IV).
Detailed Analysis
The individual patient dosing times are listed in Appendix I. Individual patient FBS0701
plasma concentrations, actual sampling times, and mean plasma concentrations are listed
in Appendix II, Appendix III, and Appendix IV, respectively. The individual patient
FBS0701 urinary excretion data are contained in Appendix V. Appendix VI and
Appendix VII contain the individual patient pharmacokinetic parameters and the
associated descriptive statistics. The statistical analysis of the fit of the power model to
Cmax and AUC(0-24) vs. Total Dose is shown in Appendix VIII. The individual patient
plots of plasma concentration vs. time on linear and semi-logarithmic axes, respectively;
are in Appendix IX and Appendix X; the latter contains line segments indicating the
range of data used to estimate !z.
Pharmacokinetics
Attainment of Steady-State
Taking into account the small number of patients per cohort, with the exception of
Cohort 4 (32 mg/kg/day), the mean pre-dose plasma concentrations were relatively
constant from Day 3 through Day 8 (Figure 1), suggesting that steady-state had been
reached by Day 3, consistent with the mean t" (16.2 to 21.3 h; Table 1) and the 24-hour
dosing interval.
7
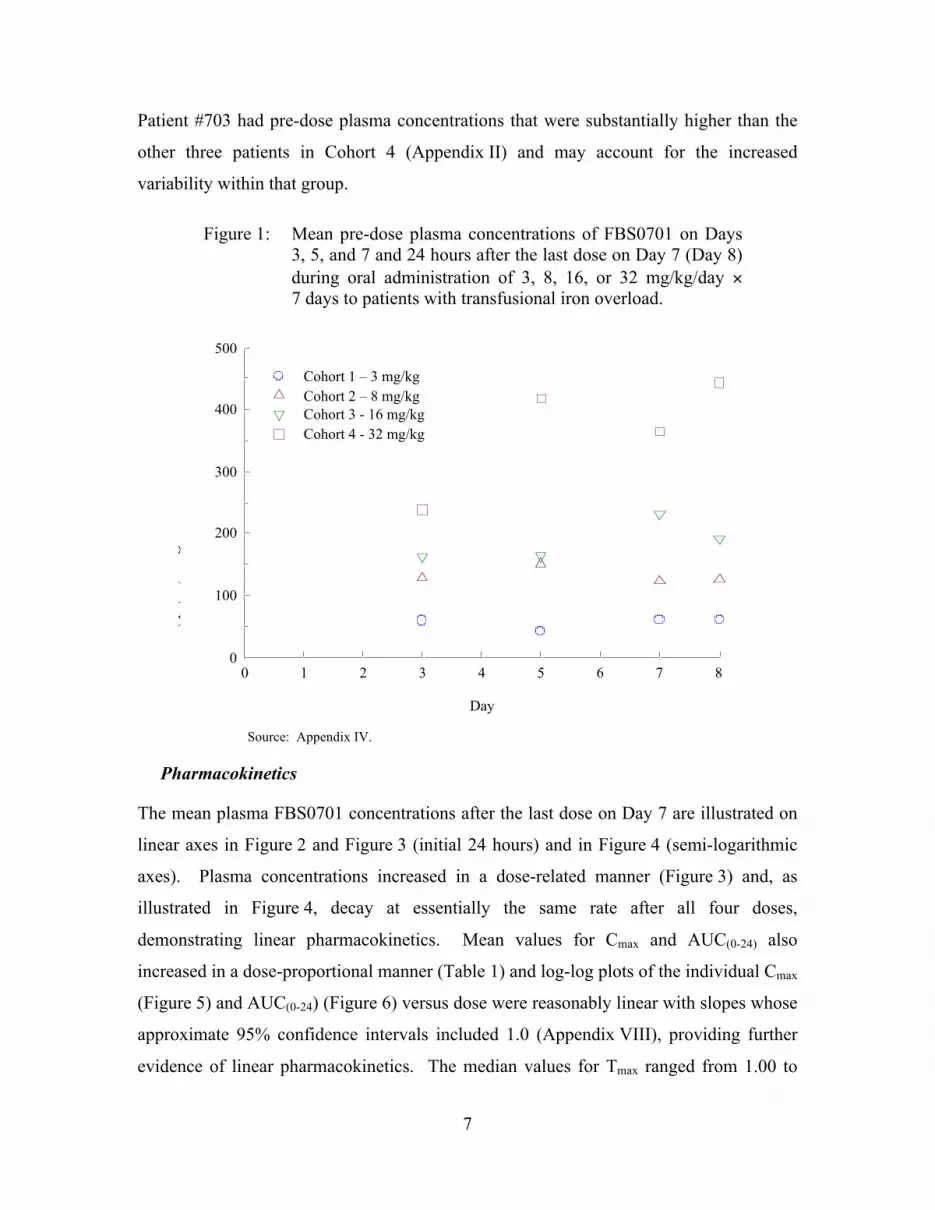
Patient #703 had pre-dose plasma concentrations that were substantially higher than the
other three patients in Cohort 4 (Appendix II) and may account for the increased
variability within that group.
Figure 1: Mean pre-dose plasma concentrations of FBS0701 on Days
3, 5, and 7 and 24 hours after the last dose on Day 7 (Day 8)
during oral administration of 3, 8, 16, or 32 mg/kg/day #
7 days to patients with transfusional iron overload.
Day
0 1 2 3 4 5 6 7 8
Conc (n
g/m
L)
0
100
200
300
400
500
Cohort 1 – 3 mg/kg
Cohort 2 – 8 mg/kg
Cohort 3 - 16 mg/kg
Cohort 4 - 32 mg/kg
Source: Appendix IV.
Pharmacokinetics
The mean plasma FBS0701 concentrations after the last dose on Day 7 are illustrated on
linear axes in Figure 2 and Figure 3 (initial 24 hours) and in Figure 4 (semi-logarithmic
axes). Plasma concentrations increased in a dose-related manner (Figure 3) and, as
illustrated in Figure 4, decay at essentially the same rate after all four doses,
demonstrating linear pharmacokinetics. Mean values for Cmax and AUC(0-24) also
increased in a dose-proportional manner (Table 1) and log-log plots of the individual Cmax
(Figure 5) and AUC(0-24) (Figure 6) versus dose were reasonably linear with slopes whose
approximate 95% confidence intervals included 1.0 (Appendix VIII), providing further
evidence of linear pharmacokinetics. The median values for Tmax ranged from 1.00 to

8
1.49 h and were not dependent on dose (Table 1). There were no dose-related trends in
either CL/F or Vz/F and the mean elimination half-life (t") ranged from 16.2 h to 21.3 h
and was independent of dose (Table 1).
Figure 2: Mean plasma concentrations of FBS0701 on Day 7 after oral
administration of 3, 8, 16, or 32 mg/kg/day # 7 days to
patients with transfusional iron overload — linear axes.
Time Since Last Dose (h)
0 24 48 72 96 120 144 168 192
Co
nc (n
g/m
L)
0
15000
30000
45000
60000
75000
Cohort 1 - 3 mg/kg
Cohort 2 - 8 mg/kg
Cohort 3 - 16 mg/kg
Cohort 4 - 32 mg/kg
Source: Appendix IV.

9
Figure 3: Mean plasma concentrations of FBS0701 on Day 7 after oral
administration of 3, 8, 16, or 32 mg/kg/day # 7 days to
patients with transfusional iron overload — linear axes —
initial 24 hours.
Time Since Last Dose (h)
0 4 8 12 16 20 24
Co
nc (n
g/m
L)
0
15000
30000
45000
60000
75000
Cohort 1 - 3 mg/kg
Cohort 2 - 8 mg/kg
Cohort 3 - 16 mg/kg
Cohort 4 - 32 mg/kg
Source: Appendix IV.

10
Figure 4: Mean plasma concentrations of FBS0701 on Day 7 after oral
administration of 3, 8, 16, or 32 mg/kg/day # 7 days to
patients with transfusional iron overload — semi-logarithmic
axes.
Time Since Last Dose (h)
0 24 48 72 96 120 144 168 192
Conc (n
g/m
L)
1
10
100
1000
10000
100000
Cohort 1 - 3 mg/kg
Cohort 2 - 8 mg/kg
Cohort 3 - 16 mg/kg
Cohort 4 - 32 mg/kg
Source: Appendix IV.

H.Y. Rienhoff, Jr. et al. FBS0701, a novel oral iron chelator
Supplementary Data
11
Table 1: Summary of pharmacokinetic parameters for FBS0701 on Day 7 after oral administration of
3, 8, 16, or 32 mg/kg/day ! 7 days to patients with transfusional iron overload.
Parameter* 3 mg/kg/day 8 mg/kg/day 16 mg/kg/day 32 mg/kg/day
Cmax (ng/mL) 5,910 ± 2,298 (4) 15,000 ± 4,439 (4) 38,225 ± 3,947 (4) 68,250 ± 27,519 (4)
Tmax (h) 1.31 (4) 1.18 (4) 1.00 (4) 1.49 (4)
AUC(0-24) (h?ng/mL) 19,476 ± 11,327 (4) 44,916 ± 30,751 (4) 92,261 ± 36,560 (4) 157,577 ± 43,484 (4)!z (h
-1) 0.0655 ± 0.0606 (4) 0.0424 ± 0.0249 (4) 0.0421 ± 0.0246 (4) 0.0381 ± 0.0091 (2)
t1!2 (h) 16.2 ± 8.32 (4) 20.9 ± 11.3 (4) 21.3 ± 11.8 (4) 18.7 ± 4.48 (2)
CL/F (mL/min) 162 ± 85.0 (4) 225 ± 142 (4) 206 ± 78.4 (4) 172 ± 60.1 (4)
Vz/F (L) 185 ± 84.1 (4) 311 ± 137 (4) 339 ± 166 (4) 214 ± 2.94 (2)
Ue(0-24) (mg) 66.1 ± 24.0 (4) 201 ± 68.1 (4) 402 ± 103 (4) 641 ± 208 (4)
Fe(0-24) (% Dose) 44.0 ± 16.0 (4) 47.4 ± 13.8 (4) 39.2 ± 5.86 (4) 43.1 ± 15.8 (4)
CLr (mL/min) 75.2 ± 46.8 (4) 105 ± 62.9 (4) 83.2 ± 36.5 (4) 73.6 ± 37.8 (4)
Dose
*Arithmetic mean ± standard deviation (N) except Tmax for which the median (N) is reported.
Source: Appendix IX.
H.Y. Rienhoff, Jr. et al. FBS0701, a novel oral iron chelator
Supplementary Data
12
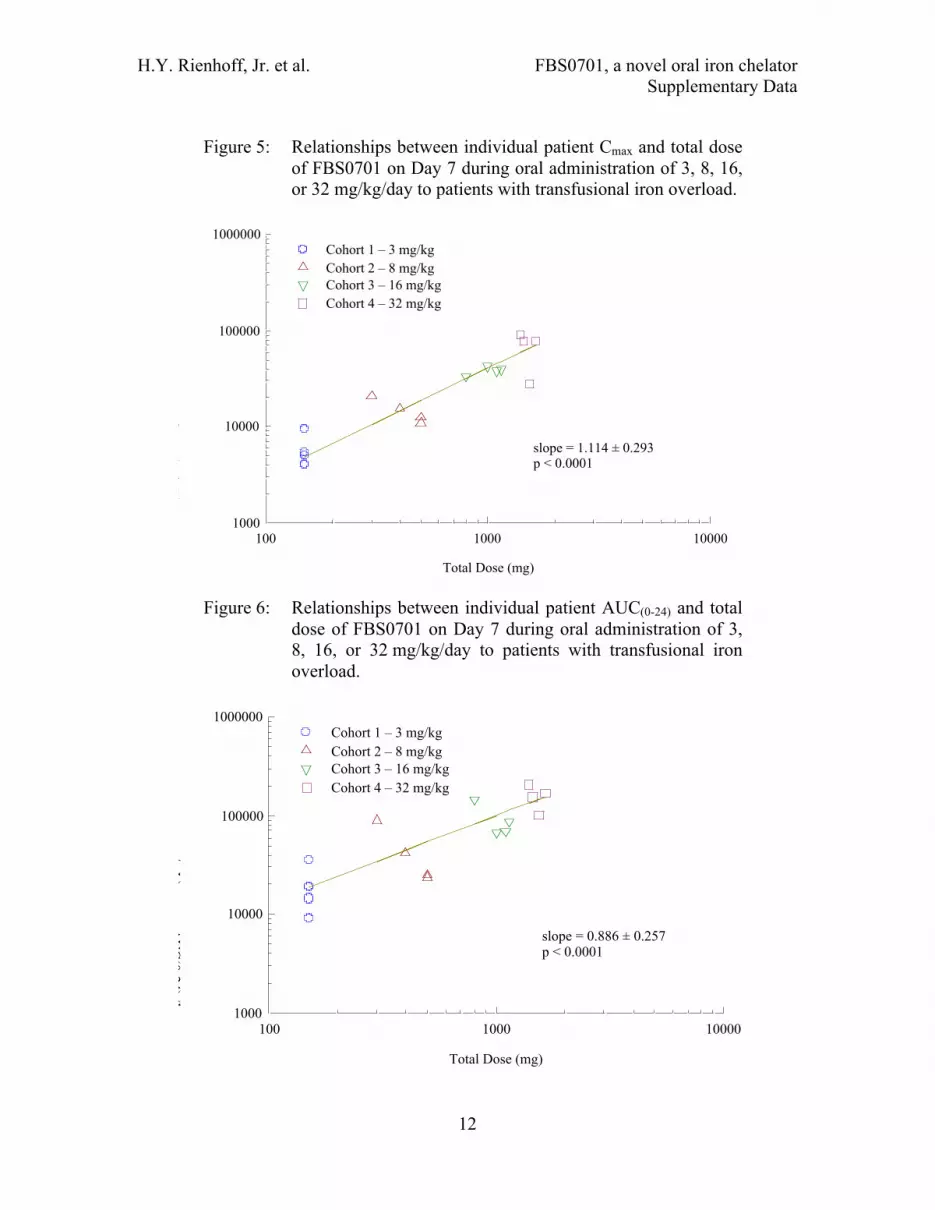
Figure 5: Relationships between individual patient Cmax and total dose
of FBS0701 on Day 7 during oral administration of 3, 8, 16,
or 32 mg/kg/day to patients with transfusional iron overload.
Total Dose (mg)
100 1000 10000
Cm
ax (n
g/m
L)
1000
10000
100000
1000000
slope = 1.114 ± 0.293p < 0.0001
Cohort 1 – 3 mg/kg
Cohort 2 – 8 mg/kg
Cohort 3 – 16 mg/kg
Cohort 4 – 32 mg/kg
Figure 6: Relationships between individual patient AUC(0-24) and total
dose of FBS0701 on Day 7 during oral administration of 3,
8, 16, or 32 mg/kg/day to patients with transfusional iron
overload.
Total Dose (mg)
100 1000 10000
AU
C(0
-24) (h
?ng/m
L)
1000
10000
100000
1000000
slope = 0.886 ± 0.257p < 0.0001
Cohort 1 – 3 mg/kg
Cohort 2 – 8 mg/kg
Cohort 3 – 16 mg/kg
Cohort 4 – 32 mg/kg

H.Y. Rienhoff, Jr. et al. FBS0701, a novel oral iron chelator
Supplementary Data
13
As illustrated in Figure 7, CL/F appears to be directly related to body weight, suggesting
that weight-based dosing may be appropriate for FBS0701. However, this is based on a
small number of patients and the need for a weight-based versus a fixed dose must be
confirmed with a larger sample size.
Figure 7: Relationship between individual patient FBS0701 CL/F and
body weight after oral administration of 3, 8, 16, or
32 mg/kg/day to patients with transfusional iron overload.
Weight (kg)
0 15 30 45 60 75
CL
/F (m
L/m
in)
0
100
200
300
400
Cohort 1 – 3 mg/kg
Cohort 2 – 8 mg/kg
Cohort 3 – 16 mg/kg
Cohort 4 – 32 mg/kg
Consistent with linear pharmacokinetics, the urinary recovery of FBS0701 was
comparable across the four cohorts, with mean recovery ranging from 39.2% to 47.4% of
the dose (Table 1). The mean renal clearance ranged from 73.6 to 105 mL/min (Table 1).
As the protein binding of FBS0701 is 85%, filtration clearance, estimated as the unbound
fraction, 0.15, times the glomerular filtration rate, ~120 mL/min, would be ~18 mL/min.
As CLr is ~5-fold greater than the filtration clearance, active tubular secretion is likely a
substantial component of the renal excretion of FBS0701.
Assessment of the Linearity of Renal Clearance
As indicated above, the mean CLr of FBS0701 ranged from 73.6 to 105 mL/min, ~5-fold
greater than filtration clearance, indicating that active tubular secretion is likely a

H.Y. Rienhoff, Jr. et al. FBS0701, a novel oral iron chelator
Supplementary Data
14
substantial component of the renal excretion of FBS0701. Active tubular secretion is an
excretion pathway that can potentially be saturated; however, if true, this would not affect
the absolute recovery, which is independent of dose (Table 1).
The amount excreted within a collection interval (UE) and the area under the curve for
that interval (AUC) are related via
AUCCLrUE !=
and thus a plot of UE versus AUC should be linear if there is no saturation of renal
clearance. As shown in Figure 8, within the limits of the small number of patients per
cohort and the variability intrinsic to estimating urinary excretion, there is a reasonably
linear relationship between UE and AUC up to an AUC of ~150,000 h!ng/mL, indicating
no apparent trends toward saturation.
Figure 8: Individual patient amount excreted versus area under the
curve for individual urine collection intervals.
AUC (h?ng/mL)
0 50000 100000 150000 200000
Ue (m
g)
0
100
200
300
400
Cohort 1 - 3 mg/kg
Cohort 2 - 8 mg/kg
Cohort 3 - 16 mg/kg
Cohort 4 - 32 mg/kg

Appendix I Individual Patient Actual Dosing Times (h) Body Total Actual Weight Dose Dose —————————————— Scheduled Dose Time (h)* —————————————— Cohort Patient (kg) (mg) (mg/kg) Day 1 Day 2 Day 3 Day 4 Day 5 Day 6 Day 7 —————————————————————————————————————————————————————————————————————————————————————————————————— 1 101 53.8 150 2.79 0.00 23.00 47.63 71.00 95.00 120.17 142.87 501 48.1 150 3.12 0.00 24.07 49.00 72.75 94.75 119.58 143.60 601 51.7 150 2.90 0.00 24.00 48.00 72.00 96.00 120.00 144.02 603 54.4 150 2.76 0.00 24.00 48.00 72.00 96.00 120.00 144.00 2 102 52.1 400 7.68 0.00 23.83 48.25 71.92 95.83 119.98 142.08 502 63.5 500 7.87 0.00 23.05 47.63 70.88 95.22 119.80 144.18 604 38.5 300 7.79 0.00 24.00 47.77 71.77 95.77 119.77 143.77 605 57.2 500 8.74 0.00 24.00 47.75 71.75 95.75 119.75 143.75 3 503 62.9 1,000 15.9 0.00 22.08 47.92 70.50 94.50 119.83 143.33 701 51.5 800 15.5 0.00 22.83 47.58 70.50 94.92 120.00 142.50 702 70.9 1,100 15.5 0.00 22.50 46.83 70.50 94.00 119.12 142.75 801 71.6 1,150 16.1 0.00 24.05 47.82 71.95 95.95 121.02 144.08 4 504 52.3 1,650 31.5 0.00 24.08 48.75 72.58 96.67 120.67 144.00 703 45.7 1,450 31.7 0.00 23.05 48.22 71.55 95.55 120.38 143.55 704 42.7 1,400 32.8 0.00 23.30 48.13 71.30 95.30 119.88 142.80 802 48.5 1,550 32.0 0.00 23.93 47.80 72.00 96.03 119.80 145.10 *Time since the first dose on Day 1

Appendix II Individual Patient Plasma Concentrations (ng/mL) ——————————————————————————————————————————————— Scheduled Time (h)* ———————————————————————————————————————————————— Day 1 Day 3 Day 5 ——————————————————————————————— Day 7 ———————————————————————————————— Day 8 Day 9 Day 10 Day 15 Cohort Patient 0 48 96 144 144.25 144.5 144.75 145 145.5 146 147 148 152 168 192 216 336 ——————————————————————————————————————————————————————————————————————————————————————————————————————————————————————————————————— 1 101 0.0 79.2 27.4 72.0 80.2 774 3,200 7,030 9,250 7,770 4,890 3,180 781 83.3 37.1 20.3 . 501 0.0 30.3 14.4 10.4 17.7 2,640 4,010 3,830 2,890 1,620 1,070 454 104 14.1 0.0 0.0 0.0 601 0.0 70.0 65.9 96.8 113.0 669 1,860 4,170 5,040 2,720 1,350 926 316 85.3 34.6 15.9 0.0 603 0.0 53.9 58.0 57.1 61.6 413 1,440 3,150 5,340 4,330 2,260 1,590 486 52.0 17.2 7.1 0.0 2 102 0.0 51.6 48.7 71.0 381.0 2,900 5,940 10,300 15,600 13,600 5,820 2,770 359 50.2 20.0 11.5 0.0 502 0.0 38.2 58.8 55.8 231.0 11,400 12,400 10,900 6,930 3,370 1,690 1,310 310 66.2 13.4 0.0 0.0 604 0.0 337.0 443.0 314.0 452.0 9,210 20,500 21,000 17,300 13,000 8,790 7,090 2,600 335.0 172.0 113.0 11.8 605 0.0 83.9 49.6 52.4 228.0 4,630 9,380 9,610 11,000 5,210 1,610 894 294 49.6 12.6 6.5 0.0 3 503 0.0 187.0 168.0 144.0 13,500.0 42,500 31,000 22,400 16,900 10,400 4,480 2,940 669 156.0 63.7 44.4 0.0 701 0.0 225.0 226.0 306.0 461.0 1,580 15,900 30,900 33,000 32,100 24,100 14,000 2,690 266.0 170.0 125.0 10.1 702 0.0 93.7 143.0 264.0 13,300.0 38,100 34,200 29,800 17,700 10,200 4,190 2,590 850 190.0 60.2 18.6 0.0 801 0.0 142.0 114.0 213.0 218.0 5,930 28,200 37,400 39,300 24,100 9,570 3,980 645 154.0 32.9 0.0 0.0 4 504 0.0 237.0 431.0 289.0 544.0 10,600 21,700 53,600 77,300 50,500 21,100 9,420 1,570 409.0 129.0 46.2 12.7 703 0.0 255.0 726.0 727.0 11,000.0 61,600 77,400 72,600 39,500 25,200 9,570 5,010 1,830 913.0 224.0 109.0 0.0 704 0.0 392.0 346.0 326.0 1,280.0 13,000 18,500 37,500 90,300 68,600 31,500 12,500 2,080 370.0 147.0 81.4 0.0 802 0.0 68.3 167.0 118.0 192.0 12,400 19,500 27,700 . 28,000 9,850 3,550 . 80.0 26.0 0.0 20.0 Assay LOQ = 5 ng/mL (. = no sample analyzed and/or reported) *Time since the first dose on Day 1

Appendix III Individual Patient Blood Sampling Times (h) ———————————————————————————————————————————————— Scheduled Time (h)* ————————————————————————————————————————————————— Day 1 Day 3 Day 5 ——————————————————————————————— Day 7 ——————————————————————————————— Day 8 Day 9 Day 10 Day 15 Cohort Patient 0 48 96 144 144.25 144.5 144.75 145 145.5 146 147 148 152 168 192 216 336 ————————————————————————————————————————————————————————————————————————————————————————————————————————————————————————————————————— 1 101 -1.00 47.00 95.33 142.83 143.12 143.37 143.62 143.87 144.37 144.87 145.87 146.87 150.87 166.67 190.75 214.92 . 501 -0.03 48.97 95.50 143.58 143.85 144.08 144.33 144.62 145.08 145.58 146.62 147.60 151.58 168.00 192.50 216.28 335.58 601 -0.35 47.38 95.45 143.52 144.27 144.52 144.77 145.02 145.52 146.02 147.02 148.02 152.00 168.02 192.00 216.02 336.07 603 -0.22 47.53 95.82 143.87 144.25 144.50 144.75 145.00 145.50 146.00 147.00 148.00 152.00 168.00 192.00 216.00 336.00 2 102 -0.25 48.05 95.92 141.83 142.33 142.58 142.83 143.08 143.58 144.13 145.08 146.08 150.13 168.17 192.42 216.08 335.83 502 -0.03 47.55 95.72 144.13 144.43 144.68 144.92 145.18 145.68 146.20 147.18 148.38 152.18 168.22 192.47 216.05 335.47 604 -0.33 47.57 95.50 143.23 144.02 144.27 144.52 144.77 145.27 145.77 146.77 147.83 151.77 167.85 191.77 215.77 335.83 605 -0.43 47.45 95.37 143.30 144.00 144.25 144.50 144.75 145.25 145.75 146.75 147.75 151.75 167.75 191.75 215.75 335.75 3 503 -0.58 47.83 119.78 143.30 143.58 143.83 144.08 144.35 144.83 145.37 146.33 147.32 151.33 167.88 191.67 215.58 335.80 701 -0.17 47.17 119.28 142.28 142.75 143.02 143.27 143.50 144.00 144.50 145.52 146.53 150.50 166.78 190.88 215.03 335.33 702 -0.08 46.62 118.58 142.67 143.02 143.25 143.52 143.75 144.23 144.78 145.75 146.77 150.75 166.73 190.72 214.73 334.53 801 -0.10 47.78 121.00 143.98 144.35 144.55 144.82 145.07 145.60 146.05 147.05 148.07 152.05 167.73 191.72 215.77 334.48 4 504 -0.17 48.67 120.25 143.92 144.27 144.50 144.75 145.00 145.50 146.03 147.02 148.00 152.00 168.50 192.52 216.17 336.42 703 -0.28 47.63 119.88 143.05 143.78 144.05 144.32 144.55 145.08 145.55 146.73 147.55 151.53 167.47 190.93 215.13 311.13 704 -0.17 47.43 119.22 142.35 143.05 143.28 143.57 143.83 144.32 144.82 145.83 146.80 150.80 166.77 190.72 214.63 334.63 802 -0.08 47.77 119.75 145.02 145.37 145.58 145.87 146.13 . 147.27 148.02 149.10 . 168.68 191.95 215.77 390.80 (. = no sample analyzed and/or reported) *Time since the first dose on Day 1

Appendix IV Mean ± Standard Deviation Plasma Concentrations* ———————————————————————————————————————————— Concentration (ng/mL) ———————————————————————————————————————————— Scheduled Cohort 1 Cohort 2 Cohort 3 Cohort 4 Time (h)* (3 mg/kg) (8 mg/kg) (16 mg/kg) (32 mg/kg) —————————————————————————————————————————————————————————————————————————————————————————————————————————————————————————————— 0.00 0.00 ± 0.00 (4) 0.00 ± 0.00 (4) 0.00 ± 0.00 (4) 0.00 ± 0.00 (4) 48.00 58.35 ± 21.42 (4) 127.68 ± 140.86 (4) 161.93 ± 56.74 (4) 238.08 ± 132.67 (4) 96.00 41.43 ± 24.50 (4) 150.03 ± 195.37 (4) 162.75 ± 47.59 (4) 417.50 ± 233.25 (4) 144.00 59.08 ± 36.35 (4) 123.30 ± 127.39 (4) 231.75 ± 69.77 (4) 365.00 ± 257.78 (4) 144.25 68.13 ± 39.77 (4) 323.00 ± 111.79 (4) 6,869.75 ± 7,541.58 (4) 3,254.00 ± 5,183.86 (4) 144.50 1,124.00 ± 1,021.98 (4) 7,035.00 ± 3,944.03 (4) 22,027.50 ± 21,249.93 (4) 24,400.00 ± 24,820.96 (4) 144.75 2,627.50 ± 1,188.60 (4) 12,055.00 ± 6,217.87 (4) 27,325.00 ± 8,001.41 (4) 34,275.00 ± 28,781.06 (4) 145.00 4,545.00 ± 1,710.08 (4) 12,952.50 ± 5,390.83 (4) 30,125.00 ± 6,145.66 (4) 47,850.00 ± 19,653.41 (4) 145.50 5,630.00 ± 2,648.53 (4) 12,707.50 ± 4,681.62 (4) 26,725.00 ± 11,187.60 (4) 69,033.33 ± 26,389.64 (3) 146.00 4,110.00 ± 2,681.80 (4) 8,795.00 ± 5,261.59 (4) 19,200.00 ± 10,783.63 (4) 43,075.00 ± 20,440.38 (4) 147.00 2,392.50 ± 1,740.77 (4) 4,477.50 ± 3,482.94 (4) 10,585.00 ± 9,342.60 (4) 18,005.00 ± 10,477.71 (4) 148.00 1,537.50 ± 1,190.02 (4) 3,016.00 ± 2,832.63 (4) 5,877.50 ± 5,447.08 (4) 7,620.00 ± 4,100.06 (4) 152.00 421.75 ± 285.97 (4) 890.75 ± 1,139.84 (4) 1,213.50 ± 988.58 (4) 1,826.67 ± 255.02 (3) 168.00 58.68 ± 33.40 (4) 125.25 ± 140.04 (4) 191.50 ± 52.34 (4) 443.00 ± 346.00 (4) 192.00 22.23 ± 17.26 (4) 54.50 ± 78.40 (4) 81.70 ± 60.46 (4) 131.50 ± 81.51 (4) 216.00 10.82 ± 9.07 (4) 32.76 ± 53.70 (4) 47.00 ± 55.09 (4) 59.15 ± 47.07 (4) 336.00 0.00 ± 0.00 (3) 2.95 ± 5.90 (4) 2.53 ± 5.05 (4) 4.23 ± 7.33 (3) *Arithmetic means and standard deviations (N). Values < LOQ were set equal to 0. *Time since the first dose on Day 1 The 336 h sample for Patient #802 was collected 48 hours late and is not included in the means.

Appendix V Individual Patient Urinary Excretion Data Time Since —— Sample Collection ——— —————————————————— Sample Data ——————————————————— First Dose Start Start End Start End Duration Conc Volume Amount Cohort Patient (h) Date Time Time* Time§ Time§ (h) (ng/mL) (mL) (mg) ————————————————————————————————————————————————————————————————————————————————————————————————————————— 1 101 148 12/15/2009 8:25 14:20 140.92 146.83 3.97 131,000 250 32.75 152 12/15/2009 14:20 18:20 146.83 150.83 7.97 53,200 55 2.93 168 12/15/2009 18:20 9:30 150.83 166.00 23.13 7,220 350 2.53 501 148 12/15/2009 9:45 13:55 143.50 147.67 4.07 330,000 180 59.40 152 12/15/2009 13:55 17:55 147.67 151.67 8.07 35,800 280 10.02 168 12/15/2009 17:55 9:40 151.67 167.42 23.82 3,530 860 3.04 601 148 12/06/2009 8:14 11:55 143.98 147.67 3.65 43,100 1,022 44.05 152 12/06/2009 11:55 16:08 147.67 151.88 7.87 43,000 233 10.02 168 12/06/2009 16:08 8:05 151.88 167.83 23.82 11,800 361 4.26 603 148 12/08/2009 7:43 11:39 143.95 147.88 3.88 67,700 1,004 67.97 152 12/08/2009 . . . . . . . . 168 12/08/2009 11:39 7:40 147.88 167.90 23.90 19,000 1,434 27.25 (. = no sample analyzed and/or reported) *End Time for the 8-24 hour collection may occur on the next calendar day §Time since the first dose on Day 1 Patient #603 did not produce any urine between 4 and 8 hours.

Appendix V Individual Patient Urinary Excretion Data Time Since —— Sample Collection ——— —————————————————— Sample Data ——————————————————— First Dose Start Start End Start End Duration Conc Volume Amount Cohort Patient (h) Date Time Time* Time§ Time§ (h) (ng/mL) (mL) (mg) ————————————————————————————————————————————————————————————————————————————————————————————————————————— 2 102 148 02/02/2010 8:45 12:46 142.08 146.10 4.02 262,000 900 235.80 152 02/02/2010 12:46 16:46 146.10 150.10 8.02 126,000 200 25.20 168 02/02/2010 16:46 7:45 150.10 165.08 23.00 11,500 200 2.30 502 148 01/19/2010 10:10 14:32 144.05 148.42 4.23 683,000 190 129.77 152 01/19/2010 14:32 18:35 148.42 152.47 8.28 111,000 220 24.42 168 01/19/2010 18:35 10:30 152.47 168.38 24.20 14,600 1,500 21.90 604 148 01/10/2010 7:30 11:33 143.67 147.72 3.95 108,000 712 76.90 152 01/10/2010 11:33 15:30 147.72 151.67 7.90 63,800 395 25.20 168 01/10/2010 15:30 7:30 151.67 167.67 23.90 18,700 760 14.21 605 148 01/10/2010 7:40 11:42 143.67 147.70 3.95 450,000 485 218.25 152 01/10/2010 11:42 15:35 147.70 151.58 7.83 34,200 545 18.64 168 01/10/2010 15:35 7:40 151.58 167.67 23.92 17,700 640 11.33 (. = no sample analyzed and/or reported) *End Time for the 8-24 hour collection may occur on the next calendar day §Time since the first dose on Day 1 Patient #603 did not produce any urine between 4 and 8 hours.
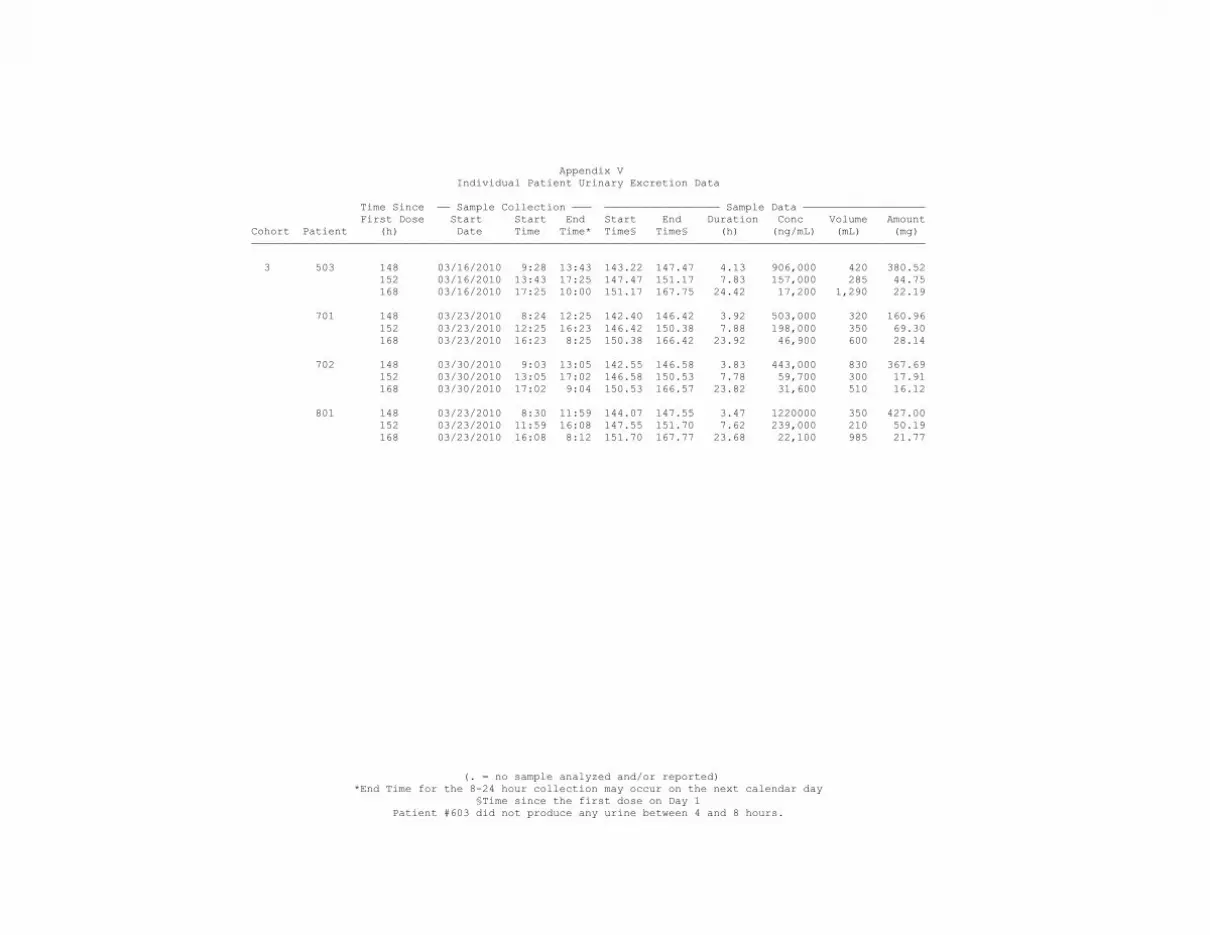
Appendix V Individual Patient Urinary Excretion Data Time Since —— Sample Collection ——— —————————————————— Sample Data ——————————————————— First Dose Start Start End Start End Duration Conc Volume Amount Cohort Patient (h) Date Time Time* Time§ Time§ (h) (ng/mL) (mL) (mg) ————————————————————————————————————————————————————————————————————————————————————————————————————————— 3 503 148 03/16/2010 9:28 13:43 143.22 147.47 4.13 906,000 420 380.52 152 03/16/2010 13:43 17:25 147.47 151.17 7.83 157,000 285 44.75 168 03/16/2010 17:25 10:00 151.17 167.75 24.42 17,200 1,290 22.19 701 148 03/23/2010 8:24 12:25 142.40 146.42 3.92 503,000 320 160.96 152 03/23/2010 12:25 16:23 146.42 150.38 7.88 198,000 350 69.30 168 03/23/2010 16:23 8:25 150.38 166.42 23.92 46,900 600 28.14 702 148 03/30/2010 9:03 13:05 142.55 146.58 3.83 443,000 830 367.69 152 03/30/2010 13:05 17:02 146.58 150.53 7.78 59,700 300 17.91 168 03/30/2010 17:02 9:04 150.53 166.57 23.82 31,600 510 16.12 801 148 03/23/2010 8:30 11:59 144.07 147.55 3.47 1220000 350 427.00 152 03/23/2010 11:59 16:08 147.55 151.70 7.62 239,000 210 50.19 168 03/23/2010 16:08 8:12 151.70 167.77 23.68 22,100 985 21.77 (. = no sample analyzed and/or reported) *End Time for the 8-24 hour collection may occur on the next calendar day §Time since the first dose on Day 1 Patient #603 did not produce any urine between 4 and 8 hours.

Appendix V Individual Patient Urinary Excretion Data Time Since —— Sample Collection ——— —————————————————— Sample Data ——————————————————— First Dose Start Start End Start End Duration Conc Volume Amount Cohort Patient (h) Date Time Time* Time§ Time§ (h) (ng/mL) (mL) (mg) ————————————————————————————————————————————————————————————————————————————————————————————————————————— 4 504 148 04/20/2010 9:25 13:40 143.83 148.08 4.08 549,000 525 288.23 152 04/20/2010 13:40 17:30 148.08 151.92 7.92 166,000 395 65.57 168 04/20/2010 17:30 9:50 151.92 168.25 24.25 46,700 530 24.75 703 148 04/27/2010 9:08 13:08 143.43 147.43 3.88 605,000 800 484.00 152 04/27/2010 13:08 17:08 147.43 151.43 7.88 88,300 590 52.10 168 04/27/2010 17:08 9:08 151.43 167.43 23.88 27,000 1,500 40.50 704 148 04/28/2010 8:26 12:26 142.73 146.73 3.93 1470000 450 661.50 152 04/28/2010 12:26 16:26 146.73 150.73 7.93 447,000 330 147.51 168 04/28/2010 16:26 8:22 150.73 166.67 23.87 90,800 390 35.41 802 148 04/20/2010 8:30 12:30 145.08 149.08 3.98 1550000 430 666.50 152 04/20/2010 12:30 16:30 149.08 153.08 7.98 276,000 275 75.90 168 04/20/2010 16:30 8:30 153.08 169.08 23.98 18,600 1,210 22.51 (. = no sample analyzed and/or reported) *End Time for the 8-24 hour collection may occur on the next calendar day §Time since the first dose on Day 1 Patient #603 did not produce any urine between 4 and 8 hours.

Appendix VI Individual Patient Pharmacokinetic Parameters Regression Final CMAX TMAX AUC(0-24) Start Time Time No. Points Regr Lambda_z t! CL/F Vz/F ——— Ue(0-24) ———— CLr Cohort Patient (ng/mL) (h) (hxng/mL) Nominal Actual C>=LOQ in Regr r" (/h) (h) (mL/min) (L) (mg) (% Dose) (mL/min) ———————————————————————————————————————————————————————————————————————————————————————————————————————————————————————————————————————————— 1 101 9,250.00 1.50 35,341.27 23.50 23.80 72.05 3 0.9928 0.02926 23.69 70.74 145.06 38.2 25.5 18.02 501 4,010.00 0.73 9,170.88 3.50 4.00 24.40 3 0.9381 0.15609 4.44 272.60 104.79 72.5 48.3 131.68 601 5,040.00 1.50 14,296.74 24.00 24.00 72.00 3 0.9981 0.03500 19.81 174.86 299.80 58.3 38.9 68.00 603 5,340.00 1.50 19,095.54 24.00 24.00 72.00 3 0.9959 0.04151 16.70 130.92 189.23 95.2 63.5 83.11 2 102 15,600.00 1.50 41,651.97 24.00 26.08 74.00 3 0.9817 0.03078 22.52 160.06 311.96 263.3 65.8 105.36 502 12,400.00 0.73 24,873.09 8.00 8.00 48.28 3 0.9885 0.07700 9.00 335.03 261.06 176.1 35.2 117.99 604 21,000.00 1.00 89,378.38 24.00 24.08 192.07 4 0.9963 0.01941 35.70 55.94 172.90 116.3 38.8 21.69 605 11,000.00 1.50 23,759.10 24.00 24.00 72.00 3 0.9606 0.04227 16.40 350.74 497.82 248.2 49.6 174.12 3 503 42,500.00 0.50 66,705.62 24.00 24.55 72.25 3 0.9423 0.02633 26.32 249.85 569.28 447.5 44.7 111.80 701 33,000.00 1.50 145,367.44 24.00 24.28 192.83 4 0.9965 0.01958 35.40 91.72 281.09 258.4 32.3 29.63 702 38,100.00 0.50 69,627.87 23.90 23.98 71.98 3 1.0000 0.04841 14.32 263.30 326.32 401.7 36.5 96.16 801 39,300.00 1.52 87,341.13 7.90 7.97 47.63 3 0.9903 0.07413 9.35 219.45 177.61 499.0 43.4 95.21 4 504 77,300.00 1.50 170,181.95 . . 192.42 . . . . 161.59 . 378.5 22.9 37.07 703 77,400.00 0.77 154,072.80 23.90 23.92 71.58 3 0.9633 0.04451 15.57 156.85 211.43 576.6 39.8 62.37 704 90,300.00 1.52 205,275.92 23.90 23.97 71.83 3 0.9843 0.03163 21.91 113.67 215.59 844.4 60.3 68.56 802 28,000.00 2.17 100,777.13 . . 245.70 . . . . 256.34 . 764.9 49.3 126.50 (. = parameter could not be estimated)
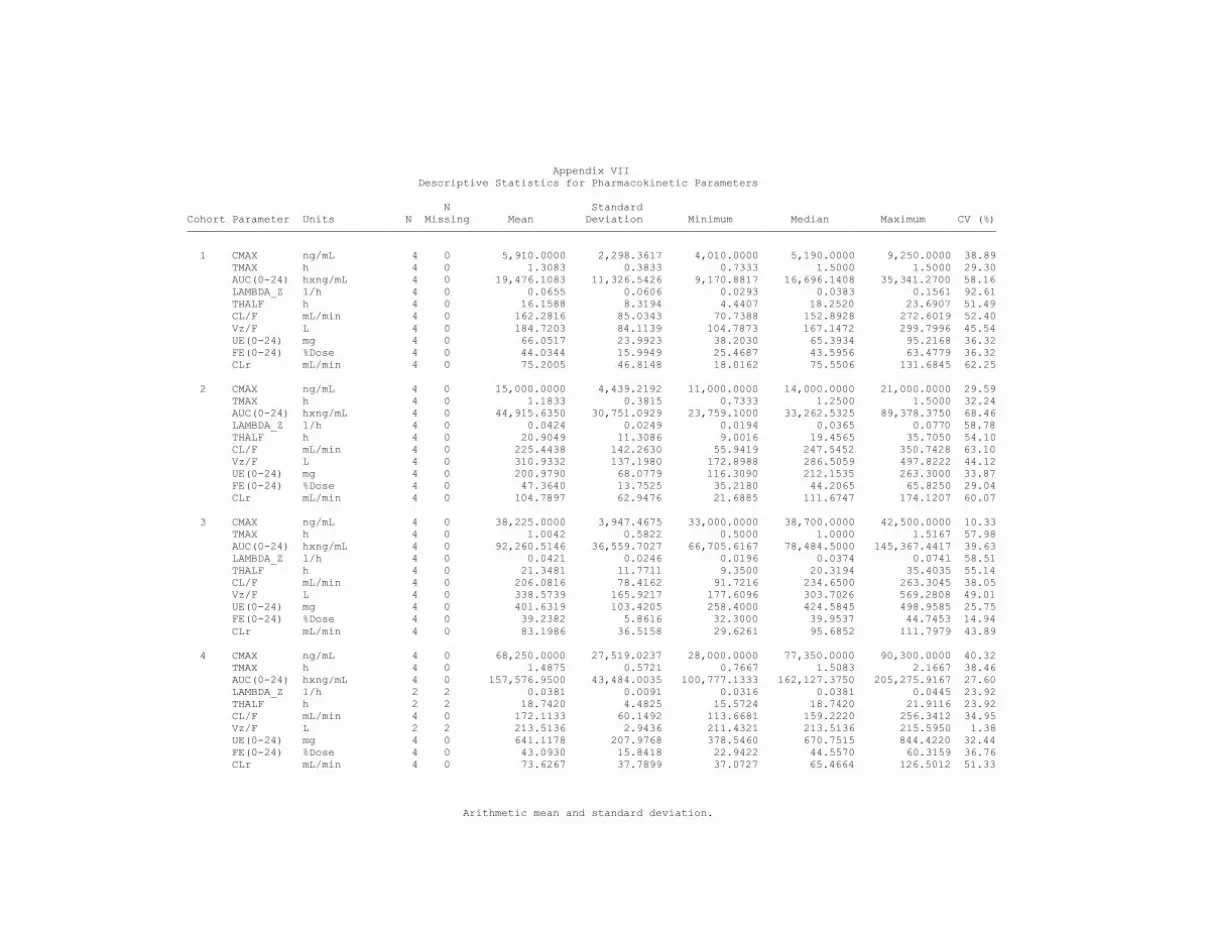
Appendix VII Descriptive Statistics for Pharmacokinetic Parameters N Standard Cohort Parameter Units N Missing Mean Deviation Minimum Median Maximum CV (%) —————————————————————————————————————————————————————————————————————————————————————————————————————————————————————————————— 1 CMAX ng/mL 4 0 5,910.0000 2,298.3617 4,010.0000 5,190.0000 9,250.0000 38.89 TMAX h 4 0 1.3083 0.3833 0.7333 1.5000 1.5000 29.30 AUC(0-24) hxng/mL 4 0 19,476.1083 11,326.5426 9,170.8817 16,696.1408 35,341.2700 58.16 LAMBDA_Z 1/h 4 0 0.0655 0.0606 0.0293 0.0383 0.1561 92.61 THALF h 4 0 16.1588 8.3194 4.4407 18.2520 23.6907 51.49 CL/F mL/min 4 0 162.2816 85.0343 70.7388 152.8928 272.6019 52.40 Vz/F L 4 0 184.7203 84.1139 104.7873 167.1472 299.7996 45.54 UE(0-24) mg 4 0 66.0517 23.9923 38.2030 65.3934 95.2168 36.32 FE(0-24) %Dose 4 0 44.0344 15.9949 25.4687 43.5956 63.4779 36.32 CLr mL/min 4 0 75.2005 46.8148 18.0162 75.5506 131.6845 62.25 2 CMAX ng/mL 4 0 15,000.0000 4,439.2192 11,000.0000 14,000.0000 21,000.0000 29.59 TMAX h 4 0 1.1833 0.3815 0.7333 1.2500 1.5000 32.24 AUC(0-24) hxng/mL 4 0 44,915.6350 30,751.0929 23,759.1000 33,262.5325 89,378.3750 68.46 LAMBDA_Z 1/h 4 0 0.0424 0.0249 0.0194 0.0365 0.0770 58.78 THALF h 4 0 20.9049 11.3086 9.0016 19.4565 35.7050 54.10 CL/F mL/min 4 0 225.4438 142.2630 55.9419 247.5452 350.7428 63.10 Vz/F L 4 0 310.9332 137.1980 172.8988 286.5059 497.8222 44.12 UE(0-24) mg 4 0 200.9790 68.0779 116.3090 212.1535 263.3000 33.87 FE(0-24) %Dose 4 0 47.3640 13.7525 35.2180 44.2065 65.8250 29.04 CLr mL/min 4 0 104.7897 62.9476 21.6885 111.6747 174.1207 60.07 3 CMAX ng/mL 4 0 38,225.0000 3,947.4675 33,000.0000 38,700.0000 42,500.0000 10.33 TMAX h 4 0 1.0042 0.5822 0.5000 1.0000 1.5167 57.98 AUC(0-24) hxng/mL 4 0 92,260.5146 36,559.7027 66,705.6167 78,484.5000 145,367.4417 39.63 LAMBDA_Z 1/h 4 0 0.0421 0.0246 0.0196 0.0374 0.0741 58.51 THALF h 4 0 21.3481 11.7711 9.3500 20.3194 35.4035 55.14 CL/F mL/min 4 0 206.0816 78.4162 91.7216 234.6500 263.3045 38.05 Vz/F L 4 0 338.5739 165.9217 177.6096 303.7026 569.2808 49.01 UE(0-24) mg 4 0 401.6319 103.4205 258.4000 424.5845 498.9585 25.75 FE(0-24) %Dose 4 0 39.2382 5.8616 32.3000 39.9537 44.7453 14.94 CLr mL/min 4 0 83.1986 36.5158 29.6261 95.6852 111.7979 43.89 4 CMAX ng/mL 4 0 68,250.0000 27,519.0237 28,000.0000 77,350.0000 90,300.0000 40.32 TMAX h 4 0 1.4875 0.5721 0.7667 1.5083 2.1667 38.46 AUC(0-24) hxng/mL 4 0 157,576.9500 43,484.0035 100,777.1333 162,127.3750 205,275.9167 27.60 LAMBDA_Z 1/h 2 2 0.0381 0.0091 0.0316 0.0381 0.0445 23.92 THALF h 2 2 18.7420 4.4825 15.5724 18.7420 21.9116 23.92 CL/F mL/min 4 0 172.1133 60.1492 113.6681 159.2220 256.3412 34.95 Vz/F L 2 2 213.5136 2.9436 211.4321 213.5136 215.5950 1.38 UE(0-24) mg 4 0 641.1178 207.9768 378.5460 670.7515 844.4220 32.44 FE(0-24) %Dose 4 0 43.0930 15.8418 22.9422 44.5570 60.3159 36.76 CLr mL/min 4 0 73.6267 37.7899 37.0727 65.4664 126.5012 51.33 Arithmetic mean and standard deviation.

Appendix VIII Fit of the Power Model to Cmax and AUC(0-24) vs. Total Dose The NLIN Procedure Dependent Variable CMAX Method: Gauss-Newton Iterative Phase Sum of Iter a b Squares 0 1.0000 1.0000 2.674E10 1 1.5988 1.2733 1.629E10 2 3.6040 1.1649 1.593E10 3 10.8875 1.0703 1.114E10 4 17.0039 1.1560 4.5272E9 5 17.7825 1.1228 3.0914E9 6 18.4515 1.1144 3.078E9 7 18.5123 1.1140 3.078E9 8 18.5139 1.1140 3.078E9 NOTE: Convergence criterion met. Estimation Summary Method Gauss-Newton Iterations 8 Subiterations 5 Average Subiterations 0.625 R 2.88E-7 PPC(a) 2.262E-6 RPC(a) 0.000086 Object 3.47E-10 Objective 3.078E9 Observations Read 16 Observations Used 16 Observations Missing 0 NOTE: An intercept was not specified for this model. Sum of Mean Approx Source DF Squares Square F Value Pr > F Model 2 2.483E10 1.242E10 56.47 <.0001 Error 14 3.078E9 2.1986E8 Uncorrected Total 16 2.791E10 All cohorts were combined for this analysis

Appendix VIII Fit of the Power Model to Cmax and AUC(0-24) vs. Total Dose The NLIN Procedure Approx Parameter Estimate Std Error Approximate 95% Confidence Limits a 18.5139 38.8544 -64.8203 101.8 b 1.1140 0.2927 0.4861 1.7418 Approximate Correlation Matrix a b a 1.0000000 -0.9989944 b -0.9989944 1.0000000 All cohorts were combined for this analysis

Appendix VIII Fit of the Power Model to Cmax and AUC(0-24) vs. Total Dose The NLIN Procedure Dependent Variable AUC24 Method: Gauss-Newton Iterative Phase Sum of Iter a b Squares 0 1.0000 1.0000 1.531E11 1 3.6876 0.8351 1.527E11 2 19.2061 1.1218 5.876E10 3 30.6632 1.0585 5.759E10 4 54.2280 0.9837 5.5E10 5 129.0 0.8746 4.88E10 6 210.5 0.8921 2.01E10 7 218.5 0.8870 2.01E10 8 219.5 0.8865 2.01E10 9 219.5 0.8864 2.01E10 NOTE: Convergence criterion met. Estimation Summary Method Gauss-Newton Iterations 9 Subiterations 9 Average Subiterations 1 R 4.817E-6 PPC(a) 0.000033 RPC(a) 0.000359 Object 3.615E-9 Objective 2.01E10 Observations Read 16 Observations Used 16 Observations Missing 0 NOTE: An intercept was not specified for this model. All cohorts were combined for this analysis

Appendix VIII Fit of the Power Model to Cmax and AUC(0-24) vs. Total Dose The NLIN Procedure Sum of Mean Approx Source DF Squares Square F Value Pr > F Model 2 1.358E11 6.788E10 47.28 <.0001 Error 14 2.01E10 1.4357E9 Uncorrected Total 16 1.559E11 Approx Parameter Estimate Std Error Approximate 95% Confidence Limits a 219.5 401.4 -641.4 1080.5 b 0.8864 0.2570 0.3352 1.4376 Approximate Correlation Matrix a b a 1.0000000 -0.9984171 b -0.9984171 1.0000000

H.Y. Rienhoff. Jr. et al. FBS0701, a novel oral iron chelator Supplementary Data
Individual Subject Plasma Concentration vs. Time Graphs — Linear Axes
DOI: 10.3324/haematol.2010.034405

H.Y. Rienhoff. Jr. et al. FBS0701, a novel oral iron chelator Supplementary Data
Individual Subject Plasma Concentration vs. Time Graphs — Linear Axes
DOI: 10.3324/haematol.2010.034405

H.Y. Rienhoff. Jr. et al. FBS0701, a novel oral iron chelator Supplementary Data
Individual Subject Plasma Concentration vs. Time Graphs — Linear Axes
DOI: 10.3324/haematol.2010.034405

H.Y. Rienhoff. Jr. et al. FBS0701, a novel oral iron chelator Supplementary Data
Individual Subject Plasma Concentration vs. Time Graphs — Linear Axes
DOI: 10.3324/haematol.2010.034405

H.Y. Rienhoff. Jr. rt al. FBS0701, a novel oral iron chelator Supplementary Data
Individual Subject Plasma Concentration vs. Time Graphs — Semi-Logarithmic Axes
DOI: 10.3324/haematol.2010.034405

H.Y. Rienhoff. Jr. rt al. FBS0701, a novel oral iron chelator Supplementary Data
Individual Subject Plasma Concentration vs. Time Graphs — Semi-Logarithmic Axes
DOI: 10.3324/haematol.2010.034405

H.Y. Rienhoff. Jr. rt al. FBS0701, a novel oral iron chelator Supplementary Data
Individual Subject Plasma Concentration vs. Time Graphs — Semi-Logarithmic Axes
DOI: 10.3324/haematol.2010.034405

H.Y. Rienhoff. Jr. rt al. FBS0701, a novel oral iron chelator Supplementary Data
Individual Subject Plasma Concentration vs. Time Graphs — Semi-Logarithmic Axes
DOI: 10.3324/haematol.2010.034405