a numerical study of the effect of normal stresses and elongational viscosity on entry vortex growth...
TRANSCRIPT
A Numerical Study of the Effect of Normal Stresses and Elongational Viscosity on Entry Vortex Growth and
Extrudate Swell
E. MITSOULIS," J. VLACHOPOULOS,
Department of Chemical Engineering McMaster University
Hamilton, Ontario, Canada L8S 4L7
and
F. A. MIRZA
Department of Civil Engineering and Engineering Mechanics McMaster University
Hamilton, Ontario, Canada L8S 4L7
A general-purpose finite element program has been used to simulate the flow of a typical polystyrene melt in the entry and exit regions of a slit die. Instead of using a general viscoelastic constitutive equation, simplified models were used that include correlations based on experimental data available in the litera- ture for the shear and elongational viscosities and the normal stresses. With such simple models convergence of the iterative scheme is extended to relatively high Deborah numbers (De = 5). The models predict vortex growth in the entry region and an increase of extrudate swell at the exit in qualitative agree- ment with experimental observations. It was found that the normal stresses are primarily responsible for these phenomena, while the elongational viscosity tends to increase the end (Bag- ley) correction and decrease the swelling.
INTRODUCTION
he numerical simulation of creeping flow fields T in the entry and exit region of a die has been the object of many investigations in recent years. While finite difference methods can be used for some of these problems, the main emphasis has been on finite elements because of their ability to incorporate complicated geometrical boundaries. Most of the work involving viscoelastic fluids has concentrated mainly on two problems, namely flow in a 4:l axisymmetric contraction and extrudate swell from long capillaries. Extensive reviews have been published recently (1, 2).
From the numerical viewpoint there are no spe- cial problems associated with the application of the finite element method to Newtonian and inelastic shear-thinning fluids under isothermal conditions. With nonisothermal problems, numerical instabili- ties are encountered when the Peclet number is sufficiently large. The instabilities can be elimi- nated by using upwinding techniques and/or by
refining the finite element grid (2, 3) . With visco- elastic fluid models the numerical schemes fail to converge at a certain value of elasticity level, which is usually expressed as a dimensionless Weissenberg number ( Ws) or Deborah number (De) or stress ratio (SR) (4).
There is a large amount of experimental data in the literature on flow through dies. While the ma- terials used are seldom adequately characterized from the rheological point of view, the following conclusions can be drawn: extrudate swell, excess pressure at the entry, exit pressure, and corner vortex size and intensity increase with the elasticity level (5) .
Viscoelastic fluid models that have been used so far in the numerical simulations by various investi- gators include the second-order fluid, the Crimi- nale-Ericksen-Filbey (CEF) fluid, the upper-con- vected Maxwell fluid, the White-Metzner fluid, the Oldroyd-B fluid, and the Phan Thien-Tanner fluid. The solution of any of the above models in the geometries encountered in entry and exit flow croblems poses many difficulties. Due to stress singularities at the entrance corner to the die and
677
' Present address Dept of Chemical Enginepring, Univ of Ottawd
POLYMER ENGINfERING AND SCIENCE, MID-AUGUST, 7985, YO/. 25, NO. 7 7
E. Mitsoulis, J. Vlachopoulos and F. A. Mirza
at the die exit, a large number of elements must be concentrated in these areas. This affects computer memory and time for the calculations. The models also include many terms and require numerical differentiation of velocities and velocity gradients which may introduce additional errors. To avoid this the stresses must enter the computations as primary variables along with velocities and pres- sure. This amounts to six unknowns per node for the two-dimensional (u , 0, p , T,,, ryy, r X y ) and seven unknowns per node for the axisymmetric problem
Despite the sophistication of the above models and the powerful numerical techniques employed, the results have not been encouraging in several aspects. A major difficulty has been the numerical breakdown for relatively low elasticity levels (De < I), while most viscoelastic phenomena become pro- nounced for De > 1. Except for the recent simula- tions by Crochet and Keunings (6, 7) the calcula- tions have been performed for low elasticity levels and therefore the results obtained are uninterest- ing. The upper De or Ws number limit for conver- gence depends, among other things, on the finite element grid used. Keunings and Crochet (7) report the surprising observation that the convergence limit for a Phan Thien-Tanner fluid in the entry flow problem was increased by 3.5 times when the size of the element near the reentrant corner was decreased by 5 . Several thousand variables and mainframe computer times in the tens of hours were required for some of these calculations.
With the exception of Keunings and Crochet’s work (7) all simulations have failed to predict the well-known vortex growth and excess pressure drop increase with shear rate for entry flow. However, exit pressures and extrudate swell results, although over a limited Deborah number range, are in qual- itative agreement with observations. It is not at all clear why most of the above models give reasonable predictions for the exit region of a die but totally erroneous results for the entry.
These findings and almost a decade’s stalemate with the numerical convergence of the above in- vented viscoelastic models led us to the conclusion that there is no future in pursuing further calcula- tions with models based on the principles of linear (or quasi-linear) viscoelasticity. Instead, a different approach is adopted here based on examining the effects of certain polymer melt properties. These include the shear viscosity, normal stresses, and elongational viscosity. Highly simplified constitu- tive models are used, which are valid in simple shear flow and employ correlations of material properties for a typical polystyrene melt. Our nu- merical simulations predict extrudate swell, exit pressures, excess entry pressure, and vortex size and strength increase in qualitative agreement with experimental observations on polymer melts.
CONSERVATION AND CONSTITUTIVE EQUATIONS
(u , w , p , Trr, 7 0 8 , 7 2 2 , T J .
For two-dimensional incompressible flow, the continuity equation can be written as
The equation of conservation of momentum for creeping flow (Re << I) simplifies to
(3 )
For two-dimensional flow, the constitutive equa- tion for a generalized Newtonian fluid takes the form
T x x = 4(Y)Ylrx ( 4 4
T x y = 4(Y)Yxy ( 4 4
where r](Y) is the apparent viscosity, which is, in general, a function of the magnitude of the rate-of- strain I Y I
1 . . ll2 1/2
1 Y 1 = [; I 4 = [? ,Y:Y,]
where
d 0 X du Y , , = 2 - - , p = 2 J
ax yy dy’
For engineering calculations, the most widely- used function for the apparent viscosity is the power law
r] = mlYJ”-’ (7) which usually describes adequately shear viscosity versus shear rate data for Y > 5 s-I.
Another useful representation is the Carreau model (8)
n-1 -
77 = 4”[1 + (m)21 (8) which is valid both for low (Newtonian) and high (power-law) shear rates.
In viscometric flows the first and second normal stress differences hl and N z , respectively, are given
(9)
by N1 = T,, - rYy = Ql(Y)Y:y
where Ql and Qz are the first and second normal stress coefficients. Like the viscosity 4 these are, in general, functions of the magnitude of the rate-of- strain 1 Y 1 .
Oda, et al. (9) have found that for a wide variety
678 POLYMER ENGINEERING AND SCIENCE, MID-AUGUST. 7985. Vol. 25. NO. 11
A Numerical Study of the Effect of Normal Stresses
of polystyrene (PS) melts, normal stress data obey a power-law relation of the form
N1 = A& (1 1) Recently, Han, et al. (10) have shown that such a correlation is also valid for several other polymer melts.
It is also well-known that Nz is much smaller than N1. To simplify the calculations we may assume \ kz = 0. Taking into account Eqs 9 and 11 we have
*I = A7 Yxy (12) b ’ h-2
We can now define a stress ratio S R as
where Y, is the shear rate for fully developed flow at the wall, X is a relaxation time, and their product De is the Deborah number. Thus, there is an equiv- alence between S R and De under the above defini- tions. In the present work we shall use the Deborah number defined by E q 13 as a measure of elasticity level.
In order to study the effect of normal stresses on the flow of polymer melts, we have used the above relations and assumptions to modify the constitutive equation of the generalized Newtonian fluid, which now takes the form
T x x = 7(Y)Yxx + *l(k)Y& (144
Tyy = 7 m y y (1 4b)
7 x y = 7(Y)YXY (1 4 4 It should be pointed out that the above simplified constitutive equations (Eqs 14) , which we call Model A, are-strictly speaking-valid in simple shear flows. Nevertheless, we shall employ Model A in nonviscometric flows such as entry and exit flows from dies. Our reasoning is based on the observation that in both situations there is a dorni- nant pow direction, namely the x-direction. Of course, Model A does not conform to the principles of tensorial invariance and objectivity of the stress tensor since its predictions depend upon the choice of the frame of reference. However, it is felt that such a model may be used to study the effect of first normal stress difference on the flow field.
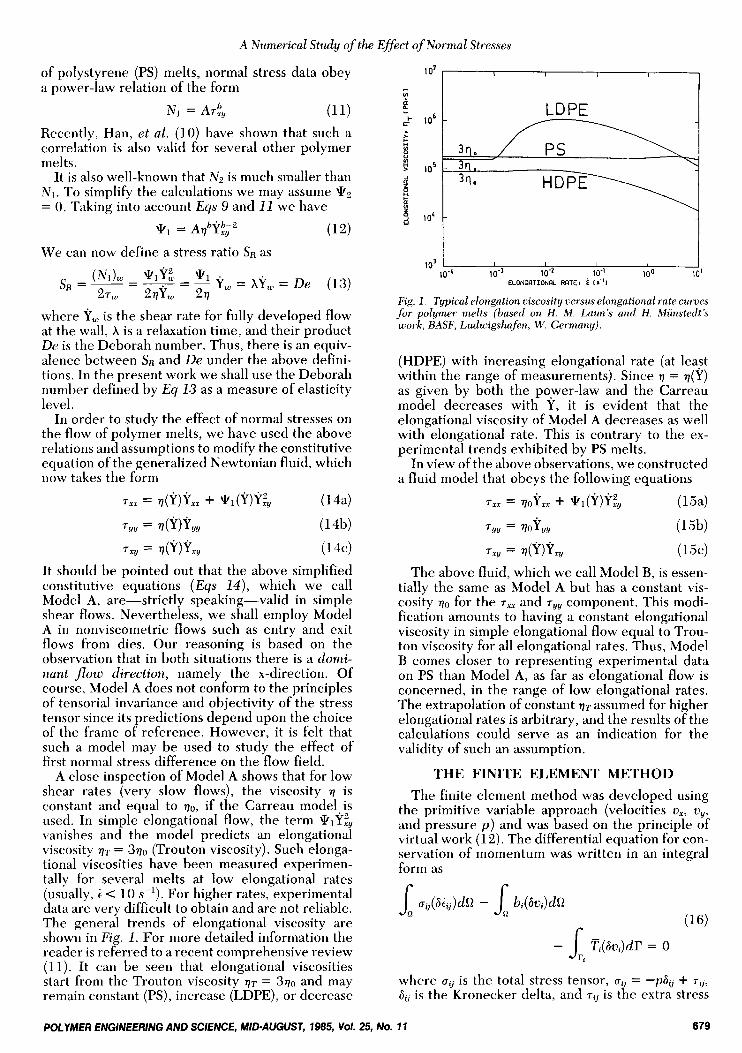
A close inspection of Model A shows that for low shear rates (very slow flows), the viscosity 7 is constant and equal to 30, if the Carreau mode1,is used. In simple elongational flow, the term \klYzy vanishes and the model predicts an elongational viscosity V T = 370 (Trouton viscosity). Such elonga- tional viscosities have been measured experimen- tally for several melts at low elongational rates (usually, t < 10 s-l). For higher rates, experimental data are very difficult to obtain and are not reliable. The general trends of elongational viscosity are shown in Fig. 1 . For more detailed information the reader is referred to a recent comprehensive review (1 1). It can be seen that elongational viscosities start froni the Trouton viscosity qT = 370 and may remain constant (PS), increase (LDPE), or decrease
I I I 1 10“ 10” 10-2 lo” 100 10’
ELONGRTIONRL RATE, e I S “ )
Fig. 1 . Typical elongation viscosity versus elongational rate curves for polymer melts (based on H . M . LaunH and H . Munstedt’s work, BASF, Ludwigshafen, W. Germany).
(HDPE) with increasing elongational rate (at least within the range of measurements). Since 7 = q(Y) as given by both the pqwer-law and the Carreau model decreases with Y, it is evident that the elongational viscosity of Model A decreases as well with elongational rate. This is contrary to the ex- perimental trends exhibited by PS melts.
In view of the above observations, we constructed a fluid model that obeys the following equations
(1 54 7 x x = 70Yxx + *l(Y)Yzy
Tyy = 7 0 y y y
7 x y = 7 ( Y ) Y x y (1 54 The above fluid, which we call Model B, is essen-
tially the same as Model A but has a constant vis- cosity 70 for the 7,, and T~~ component. This modi- fication amounts to having a constant elongational viscosity in simple elongational flow equal to Trou- ton viscosity for all elongational rates. Thus, Model B comes closer to representing experimental data on PS than Model A, as far as elongational flow is concerned, in the range of low elongational rates. The extrapolation of constant q T assumed for higher elongational rates is arbitrary, and the results of the calculations could serve as an indication for the validity of such an assumption.
THE FINITE ELEMENT METHOD The finite element method was developed using
the primitive variable approach (velocities ox, o,, and pressure p ) and was based on the principle of virtual work (12). The differential equation for con- servation of momentum was written in an integral form as
(1 6)
where a, is the total stress tensor, ug = -pa, + T ~ ~ ,
61i is the Kronecker delta, and T~~ is the extra stress
POLYMER ENGlNEERING AND SCIENCE, MID-AUGUST, 1985, Vol. 25, No. 1 1 679
E. Mitsoulis, 1. Vlachopoulos and F. A. Mirza
tensor; tij is half the rate-of-strain tensor, 6 i i j is half the virtual rate-of-strain tensor, vi is the velocity vector, 6vi is the virtual velocity vector, bi are the body forces, R is the volume, and Ti are the surface tractions applied on part of the boundary rt.
A second virtual work equation is required to incorporate incompressibility (continuity equation) and is of the following form:
where 6 p is the virtual pressure.
of the half rate-of-strain tensor iij In the above we have made use of the definition
It should be noted that because of the symmetry of the ti j tensor, we get i,, = tyx. Thus, only three rate- of-strain components are needed for two-dimen- sional flows. This simplifies the finite element for- mulation by using a rate-of-strain vector ( € 1 with the following components
The stress tensor uO is also reduced to a stress vector ( u ] with components u,,, uyy, u,,.
A constitutive relation between stresses and rates-of-strain is written in the form
1.1 = - P M + ID114 + (70) (20) where { I ] is the unit vector 6,, [D] is a constitutive matrix, and ( T ~ ) a stress vector that accounts for all possible stresses present in the fluid that cannot be included in the product [ D ] (i). For the generalized Newtonian fluid we have
2 v m 0
0
For Model A, [ D ] remains the same, while (70)
contains the extra *,Y:, term, i.e.
(22)
For Model B we have
270 0 0
(23 )
The flow domain was discretized into triangular elements with six nodes for the velocities and three nodes for pressure. Quadratic interpolation func- tions for velocities and linear interpolation func- tions for pressure were used, i.e.
(24)
where ( ) denotes a row vector, ( ] denotes a col- umn vector, " denotes nodal values, and Ni are the interpolation functions. The rate-of-strain vector (i] is then approximated by
where [ B ] is the Substitution o
3te-of-strain matrix
{;:} (25)
the approximations (Eqs 24 and 25) back to the integral equations (Eqs 16 and 17)
or
Equation 26c takes the final form
lKI (X"1 = IF1 where [ K ] is the global stiffness matrix containing the viscosity, (X") is the vector of unknown veloci-
680 POLYMER ENGlNEERlNG AND SCIENCE, MID-AUGUST, 7985, Vol. 25, NO. 1 1
A Numerical Study of the Effect of Normal Stresses
ties and pressures, and ( F ] is the global load vector containing the extra stresses { T O ) and boundary con- ditions (in the absence of body forces and surface tractions). The resulting algebraic system of equa- tions (E4 28) was solved by the Choleski decom- position method for banded symmetric matrices. Since both [ K ] and ( F ] are functions of { X " ] through the strain-rate dependent viscosity 7 and first nor- mal stress coefficient \kl, E4s 28 are nonlinear and iterations are needed. The iterative scheme used was based on direct substitution of the previous velocity field to update both [ K ] and (F), starting from the Newtonian solution of constant viscosity q and Q1 = 0. It was found that convergence was attained within 4 to 5 iterations for both Models A and B for relatively high Deborah numbers (in some cases up to 5.5) and that Model B had a much smoother convergence than Model A even for very high Deborah numbers. The overall good behavior of both models is apparently due to their simplicity. It is also believed that Model B exhibits a better convergence rate because of a stabilizing effect exerted by the constant viscosity on the solution while the contribution of \klY& increases in the T,,
component. From the solution of the velocity field the vortic-
ity w can be obtained from its definition
(29)
The Poisson equation for the stream function ?I(
v2\k = -0 (30) can then be solved to give the streamlines.
The solution of E4 30 has been obtained by using a finite element formulation for the stream function. Using the virtual work method, Eq 30 is written in an integral form as
where 6\k is the virtual stream function. The flow field is discretized into three-node tri-
angular elements by subdividing each velocity- pressure triangle into four stream function trian- gles. Linear interpolation functions for 9 are em- ployed, i.e.
* = ( N . I . ) (*"I (32)
(33)
Substitution of E4 32 into the integral E4 31 yields
[ S l W I + iol = (0 ) where [ S] is a stream function stiffness matrix and [w] is the load vector containing the vorticity. These are given by
The linear system of equations (E4 33) is solved for
the nodal unknowns \k" by the Choleski decompo- sition method. The stream function values are then normalized and contour plots are obtained for the streamlines.
RESULTS AND DISCUSSION Die Entry Flow
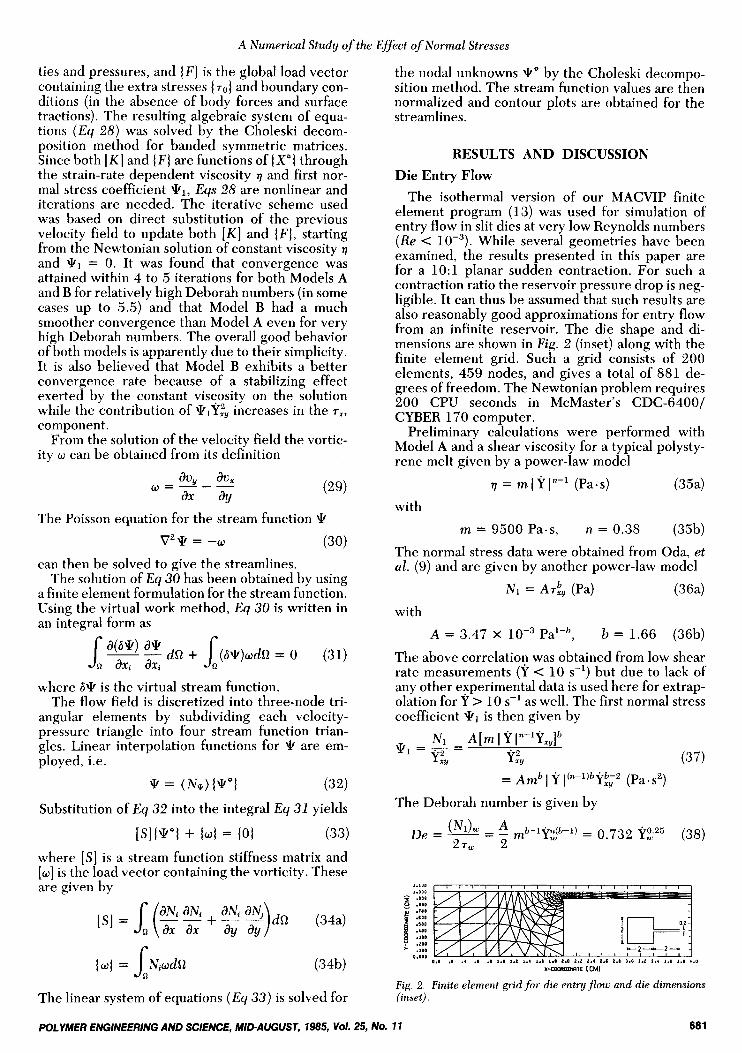
The isothermal version of our MACVIP finite element program (13) was used for simulation of entry flow in slit dies at very low Reynolds numbers (Re < While several geometries have been examined, the results presented in this paper are for a 10:l planar sudden contraction. For such a contraction ratio the reservoir pressure drop is neg- ligible. It can thus be assumed that such results are also reasonably good approximations for entry flow from an infinite reservoir. The die shape and di- mensions are shown in Fig. 2 (inset) along with the finite element grid. Such a grid consists of 200 elements, 459 nodes, and gives a total of 881 de- grees of freedom. The Newtonian problem requires 200 CPU seconds in McMaster's CDC-64001 CYBER 170 computer.
Preliminary calculations were performed with Model A and a shear viscosity for a typical polysty- rene melt given by a power-law model
7 = rn I Y ln--l (Pa-s) (354 with
m = 9500 Pa-s, n = 0.38 (35b) The normal stress data were obtained from Oda, et al. (9) and are given by another power-law model
N 1 = AT!& (Pa) (364 with
A = 3.47 X , b = 1.66 (36b)
The above correlation was obtained from low shear rate measurements (Y < 10 s-l) but due to lack of any other experimental data is used here for extrap- olation for Y > 10 s-' as well. The first normal stress coefficient \k1 is then given by
\ E l = - = N 1 A [ m I Y In-lYx,lb
y& Y:y (37) = Amb I $' I(n-1)b$'!i2 (Pa.s2)
The Deborah number is given by
I.. .t ., .I .I ..a ..z I., 1.c I.1 2.0 2.2 2.4 z.r I.1 1.0 3.2 1 . 4 1.c ,.a 4.0
X-CO[ROItmlE (CMI
Fig. 2. Finite element grid for die entryflow and die dimensions (inset).
POLYMER ENGINEERING AND SCIENCE, MID-AUGUST, 1985, Vol. 25, NO. 11 681
E . Mitsoulis, J. Vlachopoulos and F. A . Mirza
PS ( DOW678U) T=180°C
We note that De increases as Y, increases. For the finite element calculations we impose a
fully developed power-law velocity profile at the upstream and downstream planes, zero velocities at the wall (no slip condition) and zero uy component at the symmetry line. We also specify the pressure to be zero at one point (here at the exit wall). Runs were carried out for De = 2.15, 2.7, and 4.0. The vortex size and intensity remained essentially un- changed and close to the inelastic values (4) even for the case of such high elasticity level as De = 4 , which corresponds to Y, = 908 s-'. We conclude therefore that Model A with a power-law viscosity does not produce the strong vortices expected from experimental studies on polystyrene melts (14). The pressure drop was also found to decrease with elas- ticity, which again is not corroborated by general experimental trends for polymer melts (5, 15).
In our effort to represent more realistically the behavior of polymer melts we noticed that the flow in the reservoir corners remains very weak com- pared with the flow in the slit, even for high flow rates. Weak flows are basically Newtonian in shear, exhibiting a constant viscosity. Therefore the Car- reau model ( E q 8) comes much closer to represent- ing the Newtonian behavior at low shear rates and the shear-thinning behavior at high shear rates than the power-law model.
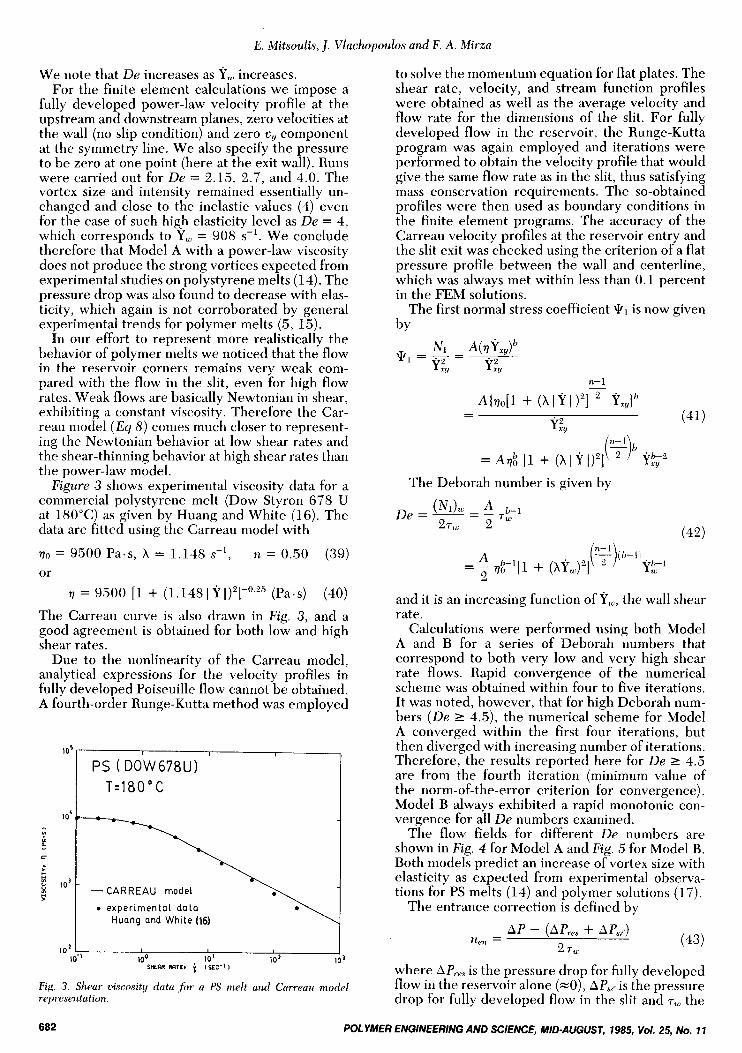
Figure 3 shows experimental viscosity data for a commercial polystyrene melt (Dow Styron 678 U at 180°C) as given by Huang and White (16). The data are fitted using the Carreau model with
vo = 9500 Pass, X = 1.148 s-', n = 0.50 (39) or
(40) The Carreau curve is also drawn in Fig. 3, and a good agreement is obtained for both low and high shear rates.
Due to the nonlinearity of the Carreau model, analytical expressions for the velocity profiles in fully developed Poiseuille flow cannot be obtained. A fourth-order Runge-Kutta method was employed
v = 9500 [l + (1.1481Y1)2]-0"5 (Pa-s)
- CARREAU model
rn experimental data Huong and White (16)
10' lol SHEW RRTE, i 1SEC-I I
Fig. 3. Shear viscosity data for a PS melt and Carreau model representation
to solve the momentum equation for flat plates. The shear rate, velocity, and stream function profiles were obtained as well as the average velocity and flow rate for the dimensions of the slit. For fully developed flow in the reservoir, the Runge-Kutta program was again employed and iterations were performed to obtain the velocity profile that would give the same flow rate as in the slit, thus satisfying mass conservation requirements. The so-obtained profiles were then used as boundary conditions in the finite element programs. The accuracy of the Carreau velocity profiles at the reservoir entry and the slit exit was checked using the criterion of a flat pressure profile between the wall and centerline, which was always met within less than 0.1 percent in the FEM solutions.
The first normal stress coefficient P1 is now given by
The Deborah number is given by
and it is an increasing function of Y,, the wall shear rate.
Calculations were performed using both Model A and B for a series of Deborah numbers that correspond to both very low and very high shear rate flows. Rapid convergence of the numerical scheme was obtained within four to five iterations. It was noted, however, that for high Deborah num- bers (De 2 4.5), the numerical scheme for Model A converged within the first four iterations, but then diverged with increasing number of iterations. Therefore, the results reported here for De 2 4.5 are from the fourth iteration (minimum value of the norm-of-the-error criterion for convergence). Model B always exhibited a rapid monotonic con- vergence for all De numbers examined.
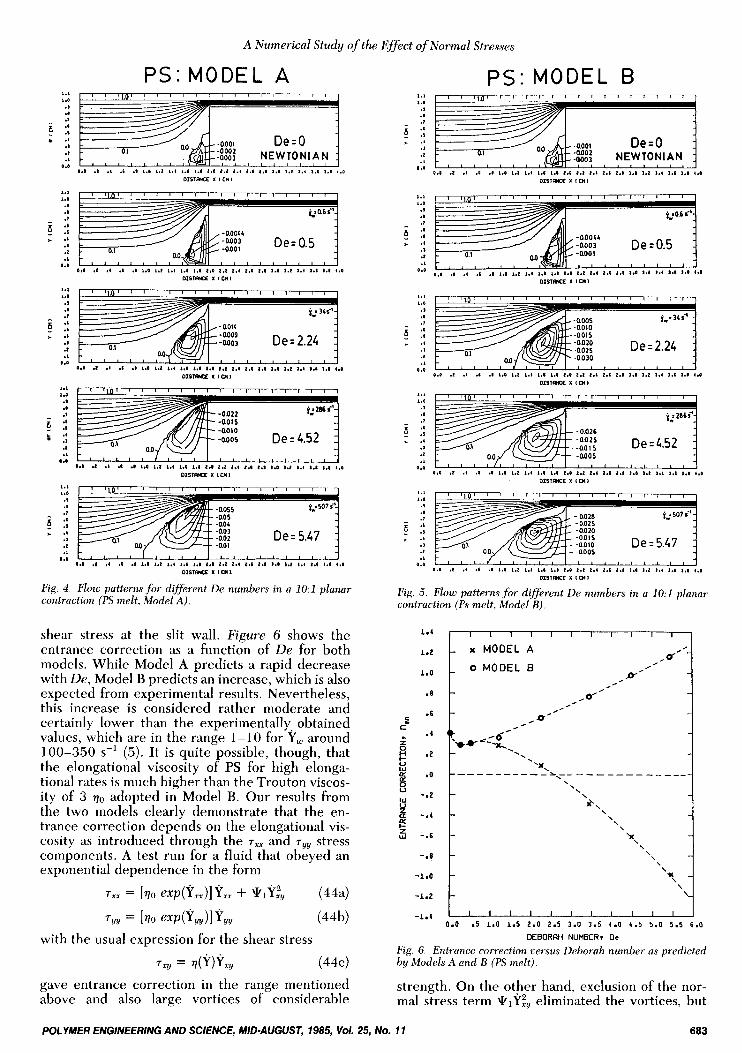
The flow fields for different De numbers are shown in Fig. 4 for Model A and Fig. 5 for Model B. Both models predict an increase of vortex size with elasticity as expected from experimental observa- tions for PS melts (14) and polymer solutions (17).
The entrance correction is defined by
(43) AP - (APres + AP,,?)
2 7, nen =
where A P,,, is the pressure drop for fully developed flow in the reservoir alone (=O), AP,! is the pressure drop for fully developed flow in the slit and T, the
682 POLYMER ENGINEERING AND SCIENCE, MID-AUGUST, 1985, Vol. 25, NO. 17
A Numerical Study of the Effect of Normal Stresses
PS:MODEL A PS:MODEL B I., L.0
3 I 1
5 :: .I 1 I L
0.0
I., 1.0
I I 7
6 :: > .a I
I I
0.0
1.1 1.0
1 I ,
! :: * .I
3 I I
0.0
1.1 1.0
Y I 1
a :: .4 I
I I
*.I
I., 1.0
1 I 1
6 :: c .a 1
I L
0.0
Fig. 4
0.0 .I .I .6 .I L.0 1.1 * . I L.6 *.I I .0 I . 1 I.' I . 6 I.1 1.0 1.1 I.' I.( I.* t.0
DISlME X I CM I
0.0 .I .4 .I .I I .0 L.1 1.4 1.1 1.I 1.0 1.1 1.6 I . ( 1.1 I.# 1.1 1.4 I.& 1.1 ,.a DISIIKE X I DI 1
-0.005 Dez4.52
0
0.0 .I .I .I .I 1.0 ,.I 1.4 1.6 &.I 1.0 1.1 I d I .6 I d 1.1 I d 1.4 1.6 1.) 4.0
DlSlFWX X I M I
Flow patterns for different De numbers in a 1 O : l vlanar contraction (PS melt, ModefA).
shear stress at the slit wall. Figure 6 shows the entrance correction as a function of De for both models. While Model A predicts a rapid decrease with De, Model B predicts an increase, which is also expected from experimental results. Nevertheless, this increase is considered rather moderate and certainly lower than the experimentally. obtained values, which are in the range 1-10 for Y, around 100-3.50 s-l (Fi). It is quite possible, though, that the elongational viscosity of PS for high elonga- tional rates is much higher than the Trouton viscos- ity of 3 ~0 adopted in Model B. Our results from the two models clearly demonstrate that the en- trance correction depends on the elongational vis- cosity as introduced through the r,, and ryy stress components. A test run for a fluid that obeyed an exponential dependence in the form
7,, = [m exp(Y,,)]Y,, + *lY& (44a)
7 Y Y = It0 exP(YYY)lYYY (44b)
7,y = 7(Y)YXY (444
with the usual expression for the shear stress
gave entrance correction in the range mentioned above and also large vortices of considerable
POLYMER ENGINEERING AND SCIENCE, MID-AUGUST, 1985, VOI. 25, NO.
1.0 .I .a .s .I L.O 1.1 1.4 1.6 1.8 1.0 1.1 1.1 1.6 1.1 1.0 1.1 1.1 a.1 1.1 1.8
0.0 92 .I .I .I I.0 1.: 1.1 1.1 ..I 1.0 1.1 1.1 I.I I . * 1.0 1.I I., 1,s I.* a.0
D I S l M E X i 01 I
1.0 .I .I .I .I 1.0 I .2 1.1 1.8 1.1 1.0 2.: I . * 2.r I.1 1.0 1.I I.* 1.t 1.1 4.0
D I S l W E X I W I
Flow patterns-for different De numbers in a 1O:l planar contraction (Ps melt, Model-B),
C 4.
c
z 0 H I- U w Ix Ix 0 u W
..
Y 2 a
z W
1.4
1.2
1.0
.8
-6
.4
.z
.O
-.z
-.4
-.6
-.8
-1.0
-1.2
-1.4 0.0 -5 1.0 1.5 2.0 2.5 3 . 0 3.5 4.0 4 . 5 5 .0 5.5 6.0
DEBORRH NUMBER? De
Fig. 6 . Entrunce correction versus DPhorah number as predicted by Models A and B (PS melt).
strength. On the other hand, exclusion of the nor- mal stress term \klY& eliminated the vortices, but
1 7 683
E . Mitsoulis, J. Vlachopoulos and F. A. Mirza
the entrance correction was even higher. These results seem to support the statement by White (5) that “a nonlinear increasing elongational viscosity in a fluid which does not exhibit shear flow normal stresses will not produce vortices”.
The reduction of entrance correction as the wall normal stress increases is fully in agreement with the ideas of Choplin and Carreau (18). Such a reduction means that as the normal stress increases the fluid is “pulled through” faster. The pulling action leads to vortex size and intensity increase for the appropriate balance of normal and shear stresses. The power-law model for shear viscos- ity failed to predict vortex growth because the apparent viscosity becomes unrealistically large as Y + 0 in the reservoir corner, thus giving rise to very high shear forces in the reservoir.
Die Exit Flow and Extrudate Swell It is well known that the flow of polymeric liquids
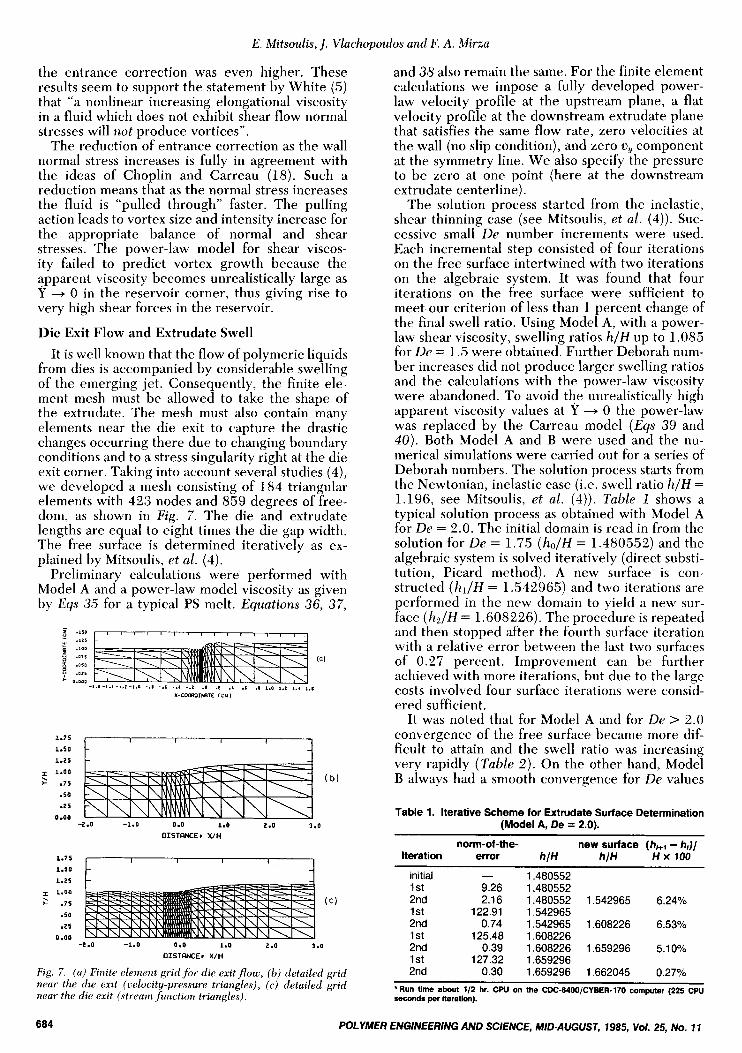
from dies is accompanied by considerable swelling of the emerging jet. Consequently, the finite ele- ment mesh must be allowed to take the shape of the extrudate. The mesh must also contain many elements near the die exit to capture the drastic changes occurring there due to changing boundary conditions and to a stress singularity right at the die exit corner. Taking into account several studies (4), we developed a mesh consisting of 184 triangular elements with 423 nodes and 859 degrees of free- dom, as shown in Fig. 7 . The die and extrudate lengths are equal to eight times the die gap width. The free surface is determined iteratively as ex- plained by Mitsoulis, et al. (4).
Preliminary calculations were performed with Model A and a power-law model viscosity as given by Eqs 35 for a typical PS melt. Equations 36, 37,
- I .,I0 , , , , , , , , , ,
1.25
1-00
* .75
-50
-25
0.00
. -2.0 -1.0 0.0 1.0 2.0 3 .O
DISTRNCE, XIH
-2.0 -1.0 0.0 1.0 2 .O 1 .O
OISTRNCEs XIH
Fig. 7 (a) Finite element grid f v r die exit flow, (h) detailed grid near the die exit (tielocity-pressure triangles), (c) detailed grid near the die exit (stream function triangles).
and 38 also remain the same. For the finite element calculations we impose a fully developed power- law velocity profile at the upstream plane, a flat velocity profile at the downstream extrudate plane that satisfies the same flow rate, zero velocities at the wall (no slip condition), and zero vY component at the symmetry line. We also specify the pressure to be zero at one point (here at the downstream extrudate centerline).
The solution process started from the inelastic, shear thinning case (see Mitsoulis, et al. (4)). Suc- cessive small De number increments were used. Each incremental step consisted of four iterations on the free surface intertwined with two iterations on the algebraic system. It was found that four iterations on the free surface were sufficient to meet our criterion of less than 1 percent change of the final swell ratio. Using Model A, with a power- law shear viscosity, swelling ratios h/H up to 1.085 for De = 1.5 were obtained. Further Deborah num- ber increases did not produce larger swelling ratios and the calculations with the power-law viscosity were abandoned. To avoid the unrealistically high apparent viscosity values at Y + 0 the power-law was replaced by the Carreau model (Eqs 39 and 40) . Both Model A and B were used and the nu- merical simulations were carried out for a series of Deborah numbers. The solution process starts from the Newtonian, inelastic case (i.e. swell ratio h/H = 1.196, see Mitsoulis, et al. (4)). Table 1 shows a typical solution process as obtained with Model A for De = 2.0. The initial domain is read in from the solution for De = 1.75 (ho/H = 1.480552) and the algebraic system is solved iteratively (direct substi- tution, Picard method). A new surface is con- structed (hl/H = 1.542965) and two iterations are performed in the new domain to yield a new sur- face (h2/H = 1.608226). The procedure is repeated and then stopped after the fourth surface iteration with a relative error between the last two surfaces of 0.27 percent. Improvement can be further achieved with more iterations, but due to the large costs involved four surface iterations were consid- ered sufficient.
It was noted that for Model A and for De > 2.0 convergence of the free surface became more dif- ficult to attain and the swell ratio was increasing very rapidly (Table 2). On the other hand, Model B always had a smooth convergence for De values
Table 1. Iterative Scheme for Extrudate Surface Determination (Model A, De = 2.0).
Iteration error hlH hlH H x 100 norm-of-the- new surface (h,+, - h,)/
1.480552 initial - 1 st 9.26 1.480552 2nd 2.16 1.480552 1.542965 6.24% 1 st 122.91 1.542965 2nd 0.74 1.542965 1.608226 6.53% 1 st 125.48 1.608226 2nd 0.39 1.608226 1.659296 5.1 0% 1 st 127.32 1.659296 2nd 0.30 1.659296 1.662045 0.27%
* Run time about 1/2 hr. CPU on the CDC-6400/CYBER-170 computer (225 CPU seconds per iteration).
684 POLYMER ENGINEERING AND SCIENCE, MID-AUGUST, 1985, Vol. 25, No. 17
A Numerical Study of the Effect of Normal Stresses
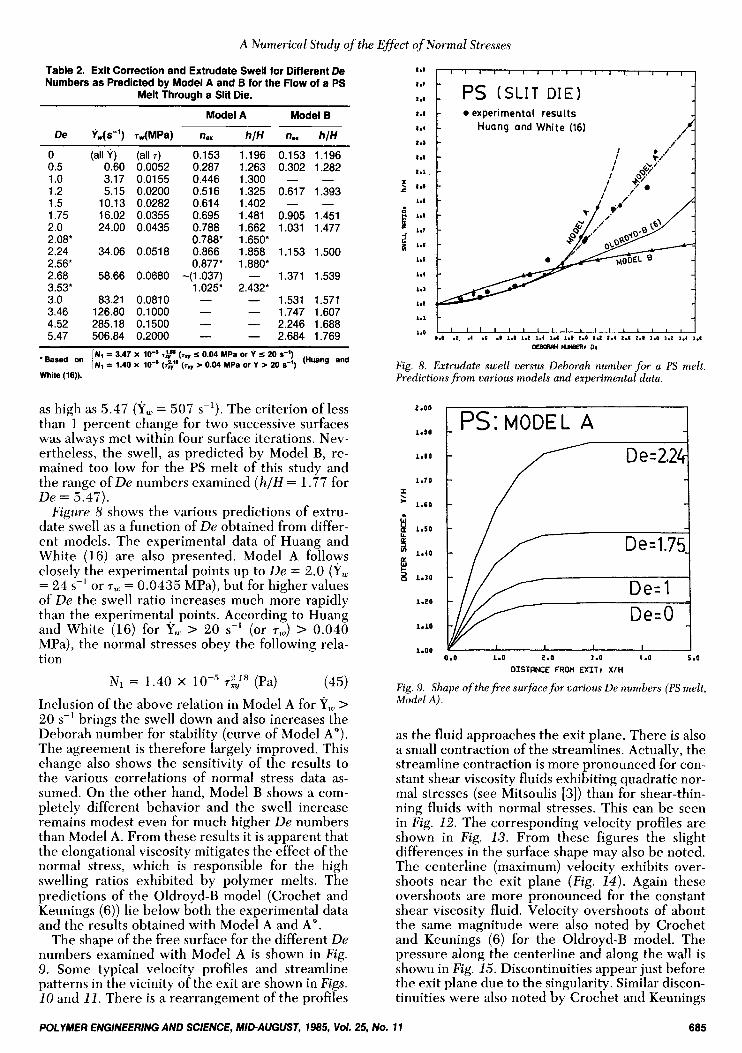
Table 2. Exit Correction and Extrudate Swell for Different De Numbers as Predicted by Model A and B for the Flow of a PS
Melt Through a Slit Die.
Model A Model 6
De VJs-') T$MPa) n, h/H n.. h/H
0 0.5 1 .o 1.2 1.5 1.75 2.0 2.08* 2.24 2.56' 2.68 3.53* 3.0 3.46 4.52 5.47
(all Y ) 0.60 3.17 5.15
10.13 16.02 24.00
34.06
58.66
83.21 126.80 285.18 506.84
(all T) 0.0052 0.01 55 0.0200 0.0282 0.0355 0.0435
0.051 8
0.0680
0.0810 0.1000 0.1500 0.2000
0.153 1.196 0.153 1.196 0.287 1.263 0.302 1.282
0.516 1.325 0.617 1.393
0.695 1.481 0.905 1.451 0.788 1.662 1.031 1.477 0.788* 1.650* 0.866 1.858 1.153 1.500 0.877* 1.88W
-(1.037) - 1.371 1.539 1.025' 2.432'
1.531 1.571 1.747 1.607
- 2.246 1.688 - - 2.684 1.769
0.446 1.300 - -
0.614 1.402 - -
- - - - -
~~~ ~
on IN, = 3.47 x 10- djj ( T ~ I 0.04 MPa or Y I 20 s-') INr = 1.40 x (A'' (7, > 0.04 MPa or Y 20 s-') (Huang and , - . -, . -,
White (16)).
as high as 5.47 (Yw = 507 s-l). The criterion of less than 1 percent change for two successive surfaces was always met within four surface iterations. Nev- ertheless, the swell, as predicted by Model B, re- mained too low for the PS melt of this study and the range of De numbers examined ( h / H = 1.77 for De = S.47).
Figure 8 shows the various predictions of extru- date swell as a function of De obtained from differ- ent models. The experimental data of Huang and White (16) are also presented. Model A follows closely the experimental points up to De = 2.0 (Y, = 24 sC1 or T, = 0.0435 MPa), but for higher values of De the swell ratio increases much more rapidly than the experimental points. According to Huang and White (16) for Y, > 20 s-l (or 7,) > 0.040 MPa), the normal stresses obey the following rela- tion
N1 = 1.40 X T : : ~ (Pa) (45) Inclusion of the above relation in Model A for Y, > 20 s-l brings the swell down and also increases the Deborah number for stability (curve of Model A"). The agreement is therefore largely improved. This change also shows the sensitivity of the results to the various correlations of normal stress data as- sumed. On the other hand, Model B shows a com- pletely different behavior and the swell increase remains modest even for much higher De numbers than Model A. From these results it is apparent that the elongational viscosity mitigates the effect of the normal stress, which is responsible for the high swelling ratios exhibited by polymer melts. The predictions of the Oldroyd-B model (Crochet and Keunings (6)) lie below both the experimental data and the results obtained with Model A and A".
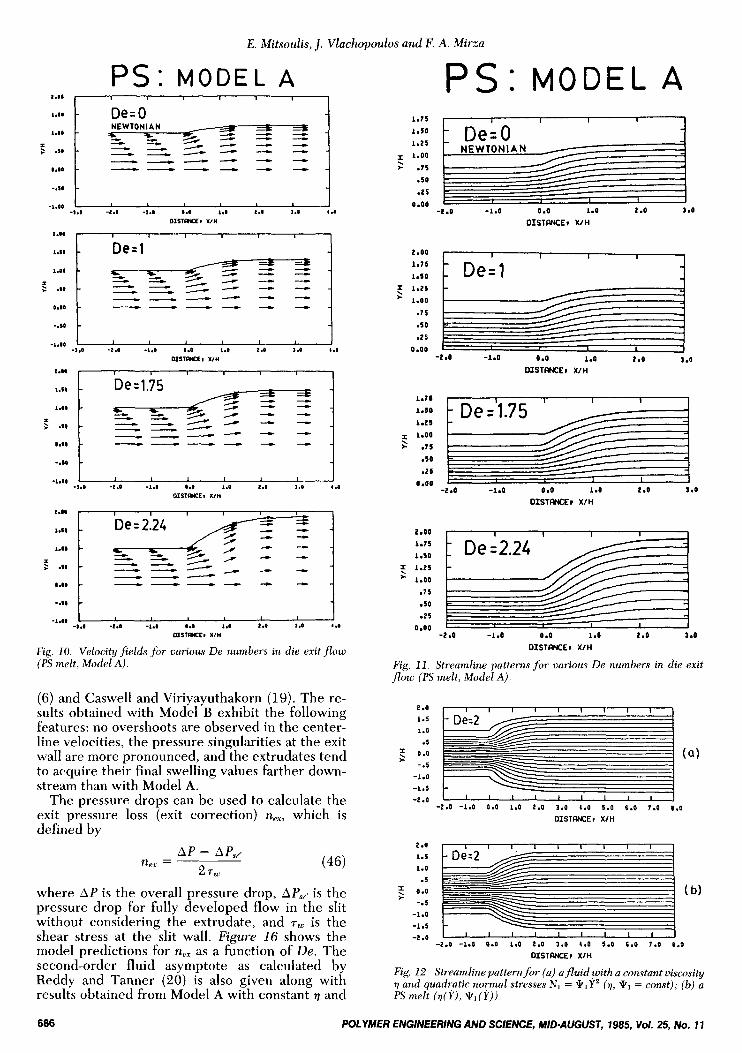
The shape of the free surface for the different De numbers examined with Model A is shown in Fig. 9. Some typical velocity profiles and streamline patterns in the vicinity of the exit are shown in Figs. 10 and 11. There is a rearrangement of the profiles
POLYMER ENGINEERING AND SCIENCE, MID-AUGUST, 1985, Vol. 25, NO.
0 experimental results ::: 1 Huang and White (16) 1.1
1.1
1.1
$ 1.0
1.1
E ::: 1.r
1.5
1.4
1.1
1.1
1.0 0.0 d .I a 4 .I -1 1.0 1.1 1.4 1.6 I d 1.0 1.1 1.4 2.6 2.8 1.0 1.2 1.4 1.r
Camm WemP 0.
Fig. 8. Extrudate swell versus Deborah number for a PS melt. Predictions from various models and experimental data.
2.00
1.30
l.tO
1.70
1.60
d 1.50
!i 1.40 8 2 1.30
1.20
1.10
1.00
Dez2.24- - -
- D e = 1.7 5-
D e = l De=O
-
I I
D e = 1.7 5-
D e = l De=O
-
I I I
0.0 1.0 2 .o 3.0 4 .o 5.0
DISTRNCE FROM EXIT, XIH
Fig. 9. Shape of the free surface for various De numbers (PS melt, Model A).
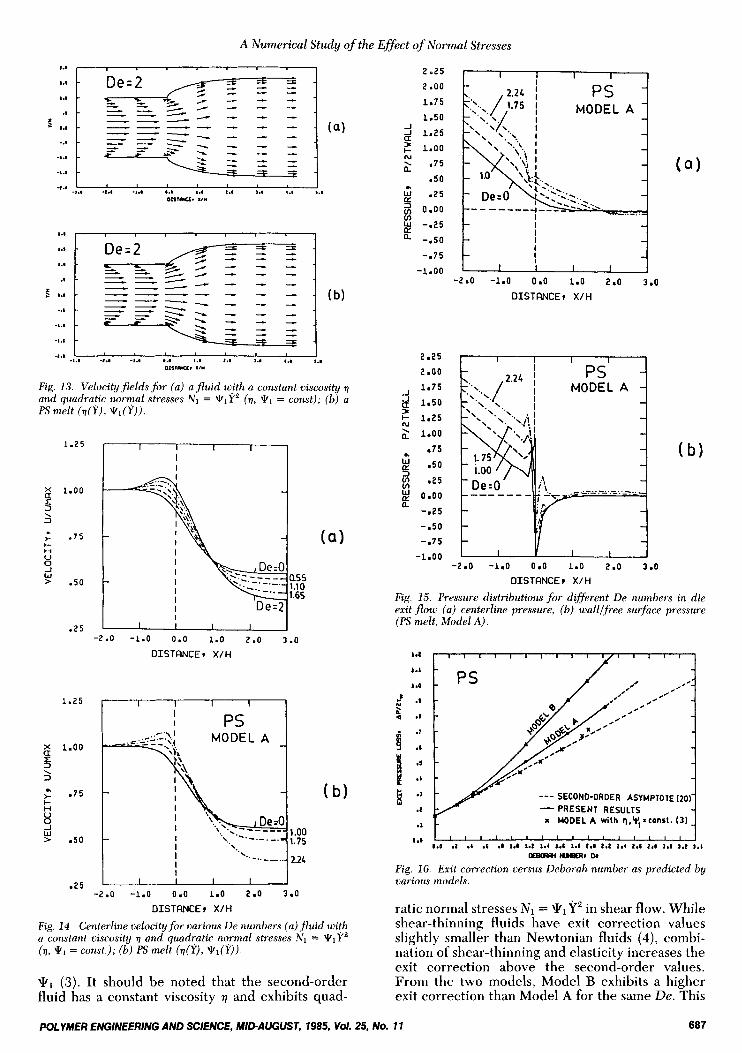
as the fluid approaches the exit plane. There is also a small contraction of the streamlines. Actually, the streamline contraction is more pronounced for con- stant shear viscosity fluids exhibiting quadratic nor- mal stresses (see Mitsoulis [ 3 ] ) than for shear-thin- ning fluids with normal stresses. This can be seen in Fig. 12. The corresponding velocity profiles are shown in Fig. 13. From these figures the slight differences in the surface shape may also be noted. The centerline (maximum) velocity exhibits over- shoots near the exit plane (Fig. 14 ) . Again these overshoots are more pronounced for the constant shear viscosity fluid. Velocity overshoots of about the same magnitude were also noted by Crochet and Keunings (6) for the Oldroyd-B model. The pressure along the centerline and along the wall is shown in Fig. 15. Discontinuities appear just before the exit plane due to the singularity. Similar discon- tinuities were also noted by Crochet and Keunings
11 685
E . Mitsoulis, J. Vlachopoulos and F. A. Mirza
PSI MODEL A P s : M O D E L A 1.75 I I I 1 1
1 De=O - NEWTONIAN /
1.50
1.25
1.00
.75
.so a 2 5 -.sa 1 i
2.00 , I I I I I
1 -2 .a -1.0 a .a 1.0 3.0
O I S T W E I X I H
De ='1.75 L 1.50 1.25 1.00
> .75 -50
.25 n ~ n n 1.11
-2 .a -1.0 0 .a 1.0 2 .O 3.0 OISTRKE, X I H
1 I I 1
De = 2.24 a - 2.00 I 1 I & ? - - - - - - / - - / - - - ---
1.75
1.50
5 1.25
.75
.so -25
0.00
* 1.00 t ---- - - 1 1
6 I -1.1 - a d -I.# 0.0 1.0 2.0 1.0 4.0
-1.m
D I S T R C E , X I H
Fig. 10. Velocity fields for various De numbers in die exit flow (PS melt, Model A).
-2.0 -1.0 0.0 1.0 2 .a 3.0
Streamline patterns for various De numbers in die exit melt, Model A).
DISTIYJCE# X I H
Fig. 11. flow (PS
(6) and Caswell and Viriyayuthakorn (19). The re- sults obtained with Model B exhibit the following features: no overshoots are observed in the center- line velocities, the pressure singularities at the exit wall are more pronounced, and the extrudates tend to acquire their final swelling values farther down- stream than with Model A.
The pressure drops can be used to calculate the exit pressure loss (exit correction) ner, which is defined by
2.0 , , , , , , , , , , , 1.5
1.0 .5
3 0.0
-.5
-1.0
-1.5
. . . . . . . * .
-2.0 -1.0 0.0 1.0 2.0 3.0 4.0 5.0 6.0 1.0 8.0
OISTANCEI XIH
2.0
1.5
1.0
.5
$ 0.0 -.5
-1.0
-1.5 -2.0
where A P is the overall pressure drop, AP, is the pressure drop for fully developed flow in the slit without considering the extrudate, and r, is the shear stress at the slit wall. Figure 16 shows the model predictions for nex as a function of De. The second-order fluid asymptote as calculated by Reddy and Tanner (20) is also given along with results obtained from Model A with constant 7 and
-2.0 -1.0 0.0 1.0 2.0 1.0 4.0 5.0 c.0 7.0 1.0
DISTRNCEi X I H
Fig 12. Streamline pattern for (a) afluid yi th a constant viscosity 1) and quadratic normal stresses N1 = *lYz (q, = const); (b) a PS melt (?(Y), q1(Y)).
686 POLYMER ENGINEERING AND SCIENCE, MID-AUGUST, 1985, Yo/. 25, NO. 11
A Numerical Study of the Effect of Normal Stresses
. -I " .' 2 .a .' -
2 a .I -
--- SECOND-ORDER ASYMPTOTE (20)- - PRESENT RESULTS I MODEL A wilh q.yC xconrt. 0 1 -
1.. I I
I PS I
I.. , f
2.25
2 .oo 1.75 1.50
-1 & 1.25
.?5
.so W - 2 5 E
v)
: 1.00 N
a L
3 0.00
& -.25
Q -.so -.75
-1.00
I -*.I -I.. -1.. I.. I.. I.. 3.. ,., I.,
- I . .
n ~ s i a c ~ r x i w
Fig. 13. Velocityfields for (a) afluid wjth a constant viscosity q and quadratic normal stresses N1 = *1Y2 (a, V1 = const); (b) a PS melt (q(Y) , *l(Y)).
1.25 I I
I I
1 I
; 1.00 x 3 3 \
; . 7 5 - I- n u 0 -1 w > .50 -
I
- 2 5 1 I 1 I
-2.0 -1.0 0.0 1.0 2 . 0 3 . 0
D I S T R N C E , X/H
2 1.00 3 3 ; .75
s I- H u
W > .so 1 .oo
1.75 I '.. I '..- ..-_... 2.24 I I
- 2 5 I I I I 1 -2.0 -1.0 0.0 1.0 2.0 3.0
DISTFINCE? X/H
2.25
2.00
-I 1.75
5 2 1.00
w .so 4 2 0.00
1.50
I- 1.25 N
.75
W - 2 5
a -.25 -.50
-.75
-2.0 -1.0 0.0 1.0 2.0 3 .0
O I S T R N C E ? X/H
-1.00 1 I Y I 1 -2.0 -1.0 0.0 1.0 2.0 3.0
OISTFINCE I X/ H
Fig. 15. Pressure distributions for different De numbers in die exit flow (a) centerline pressure, (b) walllfree surface pressure (PS melt, Model A).
1.t I I I I I I I I I I I I I I I I
0.8 .I .a .s .I 1.0 1.2 I d 1.6 1.1 2.4 2.1 1.1 2.6 2.) 3.0 3.2 1.4 4.4 I I ' ' I ' I ' I ' ' ' I I
Fig. 16. Exit correction versus Deborah number as predicted by various models.
ueoww H)BERl o*
ratic normal stresses N1 = \El q2 in shear flow. While Fig. 14. Centerline velocity for various De numbers (a) fluid with a constant viscosity q and quadratic normal stresses N1 = VIP2 (q, Y1 = const.); (b) PS melt (q(Y), *l(Y)).
Qkl ( 3 ) . It should be noted that the second-order fluid has a constant viscosity 7 and exhibits quad-
shear-thinning fluids have exit correction values slightly smaller than Newtonian fluids (4), combi- nation of shear-thinning and elasticity increases the exit correction above the second-order values. From the two models, Model B exhibits a higher exit correction than Model A for the same De. This
POLYMER ENGINEERING AND SCIENCE, MID-AUGUST, 7985, Vol. 25, No. 11 687
E . Mitsoulis, J. Vlachopoulos and F. A. Mirza
leads us to the conclusion that the effect of the elongational viscosity as introduced through the present models is to increase the exit correction.
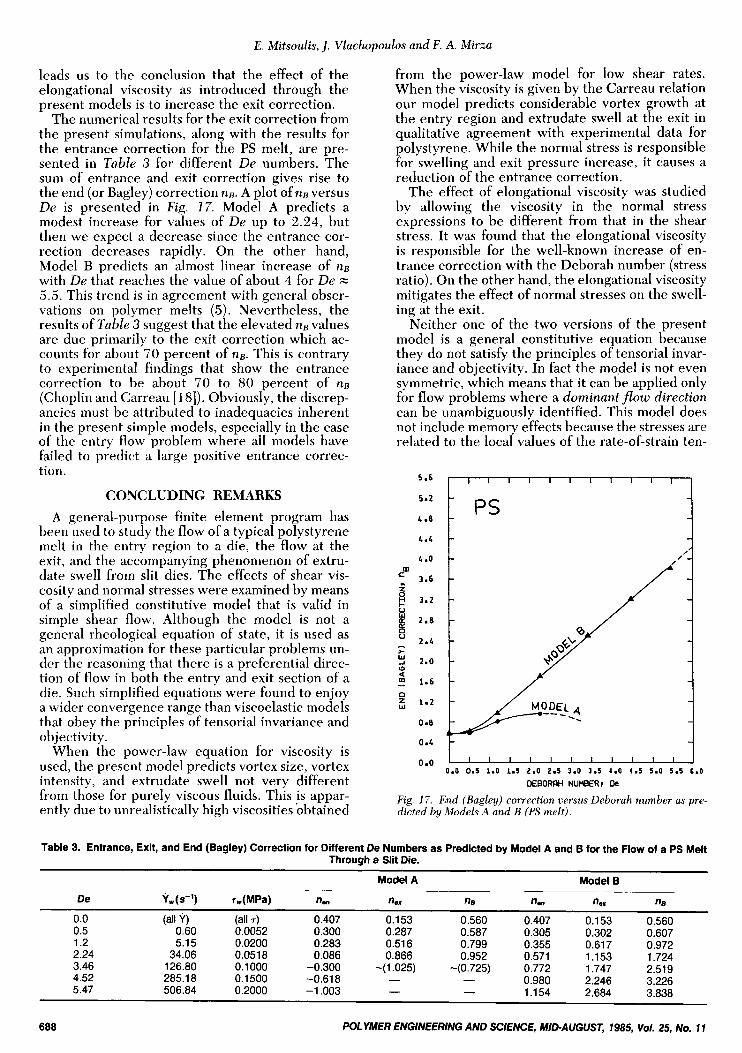
The numerical results for the exit correction from the present simulations, along with the results for the entrance correction for the PS melt, are pre- sented in Table 3 for different De numbers. The sum of entrance and exit correction gives rise to the end (or Bagley) correction nB. A plot of nB versus De is presented in Fig. 17. Model A predicts a modest increase for values of De up to 2.24 , but then we expect a decrease since the entrance cor- rection decreases rapidly. On the other hand, Model B predicts an almost linear increase of n B with De that reaches the value of about 4 for De = 5.5. This trend is in agreement with general obser- vations on polymer melts (5). Nevertheless, the results of Table 3 suggest that the elevated nB values are due primarily to the exit correction which ac- counts for about 70 percent of nB. This is contrary to experimental findings that show the entrance correction to be about 70 to 80 percent of nB (Choplin and Carreau [IS]). Obviously, the discrep- ancies must be attributed to inadequacies inherent in the present simple models, especially in the case of the entry flow problem where all models have failed to predict a large positive entrance correc- tion.
CONCLUDING REMARKS A general-purpose finite element program has
been used to study the flow of a typical polystyrene melt in the entry region to a die, the flow at the exit, and the accompanying phenomenon of extru- date swell from slit dies. The effects of shear vis- cosity and normal stresses were examined by means of a simplified constitutive model that is valid in simple shear flow. Although the model is not a general rheological equation of state, it is used as an approximation for these particular problems un- der the reasoning that there is a preferential direc- tion of flow in both the entry and exit section of a die. Such simplified equations were found to enjoy a wider convergence range than viscoelastic models that obey the principles of tensorial invariance and objectivity.
When the power-law equation for viscosity is used, the present model predicts vortex size, vortex intensity, and extrudate swell not very different from those for purely viscous fluids. This is appar- ently due to unrealistically high viscosities obtained
from the power-law model for low shear rates. When the viscosity is given by the Carreau relation our model predicts considerable vortex growth at the entry region and extrudate swell at the exit in qualitative agreement with experimental data for polystyrene. While the normal stress is responsible for swelling and exit pressure increase, it causes a reduction of the entrance correction.
The effect of elongational viscosity was studied by allowing the viscosity in the normal stress expressions to be different from that in the shear stress. It was found that the elongational viscosity is responsible for the well-known increase of en- trance correction with the Deborah number (stress ratio). On the other hand, the elongational viscosity mitigates the effect of normal stresses on the swell- ing at the exit.
Neither one of the two versions of the present model is a general constitutive equation because they do not satisfy the principles of tensorial invar- iance and objectivity. In fact the model is not even symmetric, which means that it can be applied only for flow problems where a dominant flow direction can be unambiguously identified. This model does not include memory effects because the stresses are related to the local values of the rate-of-strain ten-
5.6 I I I I I I I I I I I
5.2
4 .8
4.L
4 -0
f 3.6
8 3.2
L 2.6
2 . 4
-I 2.0
5 1.6
1.2
0.8
0.4
0 .0
m
z
I- u
6 u * W
0
-
0
0.0 0.5 1.0 1.5 2.0 2.5 3.0 3.5 4.0 4.5 5.0 5.5 6.0
DEBORAH NUMBER, De
Fig. 17. End (Bagley) correction versus Deborah number as pre- dicted by Models A and B (PS melt).
Table 3. Entrance, Exit, and End (Bagley) Correction for Different De Numbers as Predicted by Model A and B for the Flow of a PS Melt Through a Slit Die.
Model A Model B
De Yw(.S-') Tw(MPa) n, n, nB n, n.. nB 0.0 (all Y) (all T ) 0.407 0.153 0.560 0.407 0.153 0.560 0.5 0.60 0.0052 0.300 0.287 0.587 0.305 0.302 0.607 1.2 5.15 0.0200 0.283 0.51 6 0.799 0.355 0.61 7 0.972 2.24 34.06 0.0518 0.086 0.866 0.952 0.571 1.153 1.724 3.46 126.80 0.1000 -0.300 -(1.025) -(0.725) 0.772 1.747 2.519
0.980 2.246 3.226 4.52 285.18 0.1500 -0.61 8 - 1.154 2.684 3.838 5.47 506.84 0.2000 -1.003 - -
-
688 POLYMER ENGINEERING AND SCIENCE, MID-AUGUST, 1985, Vol. 25, NO. t i
A Numerical Study of the Effect of Normal Stresses
sor. Nevertheless the predictions have a striking similarity to other numerical calculations involving well-accepted constitutive equations. This is an in- dication that the terms required in the extra stress tensor for tensorial invariance and objectivity do not contribute much to the solution while they may accelerate the breakdown of the numerical schemes. The present model allows the introduc- tion of experimentally measured shear viscosity, elongational viscosity, and normal stresses so that direct comparisons can be made with experimental observations on polymer melt flows.
ACKNOWLEDGMENTS Financial assistance from the Natural Sciences
and Engineering Research Council of Canada is gratefully acknowledged.
NOMENCLATURE A [ B ] = Rate-of-strain matrix. b
hi = Body force, N . [ D ] = Constitutive matrix. De ( F ) = Force vector, N . H h {I)
12 sor, s - ~ .
[ K ] = Stiffness matrix. m = Consistency index, Pa-s”. N = Interpolation function, dimensionless. N1 = First normal stress difference, Pa. N 2 = Second normal stress difference, Pa. n = Power-law index, dimensionless. ng = End (Bagley) correction, dimensionless. nen = Entrance correction, dimensionless. nex = Exit correction, dimensionless. p = Pressure, Pa. Re = Reynolds number, dimensionless. r = Radial coordinate, cm. [ S] S R T = Surface traction, N/cm2. u
direction, cm/s. v v, vy w Ws = Weissenberg number, dimensionless. { X ” ) = Vector of nodal unknowns. z = Axial coordinate, cm. rt Y = Rate-of-strain, s-’. Y,
= Constant in power-law Eq 11 ,
= Exponent in power-law Eq 11 , dimension- less.
= Deborah number, E q 13, dimensionless.
= Half die gap, cm. = Half extrudate thickness, cm. = Vector containing the Kronecker deltas. = Second invariant of the rate-of-strain ten-
= Stream function stiffness matrix. = Stress ratio, E q 13, dimensionless.
= Velocity in x-direction, cm/s, velocity in r-
= Velocity in y-direction, cm/s. = Velocity in x-direction, cm/s. = Velocity in y-direction, cm/s. = Velocity in z-direction, cm/s.
= Boundary surface with specified tractions, cm2.
= Wall shear rate, s-’.
A P APre,y = Pressure drop in reservoir for fully devel-
APsf = Pressure drop in the slit for fully developed
6 6, = Kronecker delta, dimensionless. i-
7 = Viscosity, Pa.s. 00 = Zero-shear viscosity, Pa.s. 7T = Elongational viscosity, Pa.s. d
drical coordinates). X = Time constant, s . ~7 = Total stress, Pa. 7 = Extra stress, Pa. 70
7,
\kl
\ k 2 \k = Stream function, cm2/s. Q = Volume, em3.
‘ w = Vorticity, s-’.
= Total pressure drop, Pa.
oped flow, Pa.
flow, Pa. = Denotes virtual (arbitrary) change.
= Half rate-of-strain, s-’, elongational rate, s-’.
= Angle measured around the z-axis (cylin-
= Extra stress due to normal forces, Pa. = Wall shear stress, Pa. = First normal stress coefficient, Pa. s2. = Second normal stress coefficient, Pa. s2 .
REFERENCES
1. M. J. Crochet and K. Walters, Ann. Reo. Fluid Mech., 15,
2. E. Mitsoulis, J. Vlachopoulos, and F. A. Mirza, Poltlm. Proc. 241 (1983).
Eng., 1, 281 (1983). - 3. E. Mitsoulis. Ph.D. Thesis. DeDt. Chem. Em.. McMaster
Y ,
Univ., Hamilton, Ontario ( 1 9 8 4 .
Sci., 24, 707 (1984). 4. E. Mitsoulis, J. Vlachopoulos, and F. A. Mirza, Polym. Eng.
5. J. L. White, Appl. Polym. Symp . , 20, 1.55 (1973). 6 . M. J. Crochet and R. Keunings, J. Non-Newt. Fluid Mech.,
10, 339 (1982). 7. R. Keunings and M. J. Crochet, J . Non-Newt. Fluid Mech.,
14, 279 (1984). 8. R. B. Bird, R. C. Armstrong, and 0. Hassager, “Dynamics
of Polymeric Liquids,” Vol. I, J. Wiley, New York (1977). 9. K. Oda, 1. L. White, and E. S. Clark, Polvm. Eng. Sci., 18,
25 (1978).
Reuiews, 3, 1 (1983).
- 10. C. D. Han, Y. J. Kim, and H.-K. Chuang, Polym. Eng.
11. M. Takahashi,‘T. Masuda, and S. OnoEi, 1. SOC. Rheol. Ipn., _ _ _. 11, 13 (1983).
12. H. C. Martin and G. F. Carev. “Introduction to Finite Element Analysis,” McGraw-Hili, New York (1 973).
13. E. Mitsoulis, J. Vlachopoulos, and F. A. Mirza, “MACVIP- A Finite Element Program for Creeping Viscoelastic Flows,” Internal Report, Faculty of Engineering, McMaster Univer- sity, Hamilton, Ontario (1983).
14. J. L. White and A. Kondo,]. Non-Newt. Fluid Mech., 3, 41 (1 977).
15. E. B. Bagley and H. P. Schreiber, “Rheology, Vol. 5,” ed. F. R. Eirich, p. 93, Academic Press, New York (1969).
16. D. C. Huang and J. L. White, Polym. Eng. Sci., 19, 609 ( 1 979).
17. H. Nguyen and D. V. Boger, J. Non-Newt. Fluid Mech., 5 , 353 (1979).
18. L. Choplin and P. J. Carreau, J. Non-Newt. Fluid Mech., 9, 119, (1981).
19. B. Caswell and M. Viriyayuthakorn, 1. Non-Newt. Fluid . . Mech.,l2, 13 (1983).
20. K. R. Reddy and R. I. Tanner,]. Rheol., 22, 661 (1978).
POLYMER ENGINEERING AND SCIENCE, MID-AUGUST, 1985, Vol. 25, No. 11 689