a new otolith image contour descriptor based on partial reflection
TRANSCRIPT

A new otolith image contour descriptor basedon partial reflection
Ramon Reig-Bolaño & Pere Marti-Puig &
Antoni Lombarte & Jose Antonio Soria &
Vicens Parisi-Baradad
Received: 1 October 2009 /Accepted: 23 July 2010 /Published online: 18 August 2010# Springer Science+Business Media B.V. 2010
Abstract In this paper we propose a new contourdescriptor for reconstructing fish otolith contours thatuses half the number of coefficients needed by theclassical elliptical Fourier descriptors (EFDs) for thesame accuracy. The efficiency of the proposed shapedescriptor has been tested with two different species,Liza aurata and Liza ramada, belonging to the familyMugilidae (http://aforo.cmima.csic.es), and two popu-lations (from the USA and Canada) of the familyMerlucciidae. These groups are characterized by highsimilarity between species; therefore, accurate, detailedshape analyses of their otoliths can help to identify anddiscriminate morphologically close species or differentpopulations. For comparative purposes the descriptorwas also tested with specimens of Mullus barbatus(Family Mullidae). For a certain number of coefficients
(<50) the new descriptor clearly outperforms thereconstruction accuracy of the EFD.
Keywords Contour descriptors . Elliptic Fourierdescriptors . Shape analysis . Feature extraction
Introduction
Several authors have provided evidence that fishotolith shapes are species-specific (Shepherd 1910;Morrow 1976; Hecht and Appelbaum 1982; Gaemers1984; Akkiran 1985; L’Abée-Lund 1988) and inmany cases also population-specific (Messieh 1972;Postuma 1974; McKern et al. 1974; Neilson et al.1985; Saborido-Rey 1998; Smith 1992). Moreover,successful stock discriminations using otolith shapeanalyses have been reported by Casselman et al.(1981), Bird et al. (1986), Castonguay et al. (1991),Campana and Casselman (1993), Friedland and Red-din (1994), Rätz (1994) and Colura and King (1995).The variability in the sagitta otolith shape has beenrelated to genetic, ontogenetic and environmentalfactors (Lombarte et al. 2003). The effects of sex,stock, and environment on the shape of otoliths havealso been investigated (Begg and Brown 2000;Cardinale et al. 2004). On this basis, it is widelyaccepted that fish otolith shape analysis can be usedfor sex, age, population and species identificationstudies, and can provide necessary and relevant infor-mation for ecological studies.
Environ Biol Fish (2010) 89:579–590DOI 10.1007/s10641-010-9700-3
R. Reig-Bolaño (*) : P. Marti-Puig (*)Universitat de Vic (UVIC),C/ de la Laura 13,E-08500 Vic, Catalunya, Spaine-mail: [email protected]: [email protected]
A. LombarteInstitut de Ciències del Mar (CMIMA-CSIC),Passeig Marítim 37-49,E-08003 Barcelona, Catalunya, Spain
J. A. Soria :V. Parisi-BaradadUniversitat Politècnica de Catalunya (UPC),Av/ Víctor Balaguer,s/n, Vilanova i la Geltrú,Catalunya, Spain

Several methods are used to describe andcompare form in morphological studies, such asratios of linear dimensions, Euclidean distancematrix analysis, eigenshape analysis, and severalvariations of Fourier analysis (Chen et al. 2000;Iwata and Ukai 2002). The traditional approach tocontour feature extraction is based on expanding thecontour into a two-dimensional series by means ofelliptic Fourier analysis (Kuhl and Giardina 1982;Lestrel 1997). The data are reduced by selecting onlya set of coefficients for the expansion. Anotherapproach used is polar Fourier functions, which havebeen applied in stock discrimination studies based onfish otoliths (Bird et al. 1986; Castonguay et al.1991; Campana and Casselman 1993; Torres et al.2000). Polar Fourier functions are a series of radiioriginating from a barycentre of the study specimen;each radius can only intersect the perimeter once.However, it is possible for radii to intersect theperimeter at more than one point in otolith contoursthat are particularly convoluted, or when the rostrumhas significant curvature. Elliptical Fourier descriptors(EFDs) avoid this problem as they do not rely on aradiating centroid, and instead generate harmonics bycalculating x and y co-ordinates along the contour. Inanother work, Ponton (2006) compared EFDs withgeometric morphometrics based on landmarks andsemilandmarks for species identification and tovisualize how the otolith shape changes during growth.Shape geodesics are another recent shape descriptorapproach which outperforms the standard Fourierapproaches in classification results (Nasreddine et al.2009).
Appropriate feature extraction and compaction isessential for obtaining good results in automaticclassification systems. One of the major problemswhen complex data sets are classified is the number ofvariables involved. In pattern recognition and imageprocessing, feature extraction is a way of reducingdimensionality. Although EFDs can represent anyoutline when a large number of coefficients are used,in practical applications the number of harmonics islimited to a certain value (i.e., 40 coefficients; Parisi-Baradad et al. 2005; Piera et al. 2005; Tracey et al.2006); therefore, EFDs only represent an approxima-tion to the original contour.
In this paper we propose a new contour descriptorthat uses half the number of coefficients needed byEFDs. Moreover, it has fewer errors when the same
number of coefficients is used to reconstruct thecontour. The error was measured by comparing theoriginal outline with the reconstructed contour, whichwas obtained with a limited number of coefficients inthe transformed domain.
Materials and methods
Materials
The test material was taken from the AFOROdatabase, 1 a web based environment for shapeanalysis of fish otoliths (Lombarte et al. 2006). Thisdatabase provides an open online catalogue of otolithimages, and is associated with a shape analysismodule that uses pattern recognition techniques andapplies Fourier transform (FT), curvature scale space(CSS) and wavelet transform (WT). The site alsoimplements a search in an identification engine, usingquery images of otoliths. The method presented inthis paper has been tested with otoliths from twodifferent species belonging to the family Mugilidae,Liza aurata and Liza ramada, and also species fromtwo geographical populations (USA and Canada) ofMerluccius from the family Merlucciidae. Thesegroups are characterized by having high similaritybetween species; therefore, detailed shape analyses oftheir otoliths can help to identify and discriminatemorphologically close species. For comparative purposesthe descriptor has also been tested with specimens ofMullus barbatus.
Contour representation by elliptical Fourierdescriptors
An elliptical Fourier function perfectly describes aclosed curve with an ordered set of data points in atwo-dimensional plane. The function decomposes thecurve orthogonally into a sum of harmonically relatedellipses (Kuhl and Giardina 1982). These ellipses canbe combined to reconstruct an arbitrary approximationto the closed curve.
A closed contour with period T is defined by theevolution of its coordinates x(t) and y(t) along the
1 http://aforo.cmima.csic.es
580 Environ Biol Fish (2010) 89:579–590

variation t within the length of this contour, and canbe expanded as follows:
xðtÞ ¼ a0 þX1n¼1
ancos2pntT
� �þ bnsin
2pntT
� �� �ð1Þ
yðtÞ ¼ c0 þX1n¼1
cncos2pntT
� �þ dnsin
2pntT
� �� �ð2Þ
The coefficients an, bn, cn and dn are an alternative way ofperfectly describing the contour. The signal is character-ized and the information reduced by selecting a reducedset of 4N coefficients, which leads to the expression:
xN ðtÞ ¼ a0 þXNn¼1
ancos2pntT
� �þ bnsin
2pntT
� �� �ð3Þ
yN ðtÞ ¼ c0 þXNn¼1
cncos2pntT
� �þ dnsin
2pntT
� �� �ð4Þ
Given a contour obtained from an image, thecoefficients an, bn, cn and dn can be calculated asproposed by Kuhl and Giardina (1982) forconnectivity −8 and simplified (Abidi and Gonzalez1986) for connectivity −4.
At this point it is important to note that xN(t) andyN(t) only represent an approximation to the original
contour that improves as N increases. When aparticular value of N is chosen, it can be assumedthat with 4N+2 parameters the resulting approxima-tion is a valid characterization of the original contour.To use EFDs effectively, otolith images need to benormalized in order to be invariant to the imageacquisition conditions. The otolith contour is usuallynormalized for size and orientation: the coefficients a0and c0 are taken as 0 (this locates the centre of mass atthe origin), the rest of the coefficients are normalizedso that a1=1, and the main radial is normalized to 1.
Proposal of a new 2D contour descriptor
The new contour descriptor that we propose uses animage that has been normalized in size and orientation.Figure 1 shows a normalized otolith image on the leftand its contour inside a rectangular bounding box.
To obtain the contour trace the following steps areperformed:
1. Find the contour extrema in the left-right and up-down directions, and construct the smallestbounding rectangular box that encloses thecontour (see Fig. 1, right panel).
2. Compute a horizontally reflected version of thecontour. Extend the original rectangle and pastethe reflected image on the right.
Fig. 1 Otolith contour extraction from a normalized image. Normalized otolith image (left panel) with its contour inside an enclosingrectangular box (right panel)
Fig. 2 Representation of the contour symmetry carried out with respect to the right vertical axis defined by the enclosing box inFig. 1. The signal of interest is represented with a continuous line
Environ Biol Fish (2010) 89:579–590 581

3. Define the x-axis at the mid y-value in the extendedrectangle, and let the original contour be representedby the join between the upper part of the originalcontour and the lower part of the mirror image.
It is interesting to note that it is still possible toreconstruct the contour perfectly from the reflectedcontour pairs in Fig. 2.
4. The next step consists in performing uniform non-redundant sampling along the longitudinal axis of thesignal of interest, the pairs of coordinates (x,y)defining the reflected contour, to obtain y(k) :
a) where (xk, yk), for k=0··K-1, are the points ofthe mirrored contour
b) y0 is the position of the x axis.c) Let us define:
c.1) y kð Þ ¼ f xkð Þ ¼ yk � y0 For each xk thereis a unique value for yk. If multiple valuesof yk are possible, then we use the onewith the largest |yk-y0|.
c.2) y(k) has a unique value at every k. Thisfunction is an approximation of thereflected contour with a periodic function
of period T’ along the x axis. Note that T’has a length of K pixels.
The values of y(k) are the differences in the y coordinateswith the vertical position y0 of the x axis, for all the pixels ofx. This is equivalent to taking samples at sampling intervalsof x = k(T’/K), with k in the range (0, K-1).
This last step introduces losses in information. Thismeans that perfect contour reconstruction cannot beenachieved for all types of contours once this operationhas been performed. However, the advantage of thisstep is that it converts the signal of interest into adiscrete function, which we call y(k) (solid black linein Fig. 3). For comparison, the true values of theoriginal contour are also represented in the figure (greyline); most of the time the two signals overlap, andthey are only separate when the uniform non-redundantsampling does not represent the true contour.
In Fig. 4 we have magnified the central zone ofFig. 3 in order to show the error introduced by theuniform non-redundant sampling operation moreclearly. This section corresponds to one of the areasof the contour with most errors due to the sampling.
From function y(k) we can always easily recon-struct an approximation to the original contour byinverting the symmetry performed over the last half of
200 400 600 800 1000 1200
100
200
300
Fig. 3 The representation in a single figure of the function y(k)used to parameterize the signal, and the signal of interest. Thelatter is represented with a grey line. It is only visible in theconvoluted regions of the contour 100 200 300 400 500 600
100
150
200
250
300
350
Fig. 5 Differences between the reconstructed signal (blackline) and the true contour (grey line)
630 640 650
200
210
220
230
240
250
Fig. 4 Representation of the errors introduced by the uniformnon-redundant sampling operation. The original contour with adotted line, and y(k) with a continuous line
50 100 150 200 250 300 350 400 450 500 550
150
200
250
300
Fig. 6 Comparison of the reconstructed contours using theEFD M=24 (in a grey continuous line), and the new descriptorM=24 (in black), with the original contour (dashed line)
582 Environ Biol Fish (2010) 89:579–590

the samples of y(k); however, a perfect reconstructioncannot be achieved. The great advantage we haveobtained is that we have a one-dimensional function y(k) that can be developed into a one-dimensionalFourier series.
To compare the degree of approximation to theoriginal contour, Fig. 5 shows the reconstructed signal(with a black continuous line) and the true contour (with
a grey continuous line) in the same plot. The imageclearly shows the differences between the two contours,which are totally overlapped in most of the plot.
To complete the new descriptor computation, weobtain the Fourier series expansion of the discreteperiodical function y(k). The fundamental period of y(k)consists in K samples. Taking into account that the rangeof the digital frequencies (ωn) that can be represented in
Fig. 7 Comparison of thelower part of thereconstructed contoursusing M=40, 60, 80, 100(from top to bottom). Theoriginal contour isrepresented with a dottedline; the reconstruction withthe new descriptor is shownwith a continuous blackline; and the reconstructionwith the EFD is representedwith a continuous grey line
Fig. 8 Comparison of thelower part of thereconstructed contoursusing M=120, 160, 200,240 (from top to bottom).The original contour isrepresented with a dottedline, the reconstruction withthe new descriptor is shownwith a continuous blackline, and the reconstructionwith the EFD is representedwith a continuous grey line
Environ Biol Fish (2010) 89:579–590 583
the discrete domain is limited to the set of harmonicsgiven by the expression (Proakis and Dimtris 2007):
wn ¼ 2pK
n n ¼ 0; ::;K � 1 ð5Þ
then the discrete Fourier series expansion of y(k) takesthe form:
yðkÞ ¼ c0 þXK�1
n¼1
cncos2pK
nk
� �þ dnsin
2pK
nk
� �� �
k ¼ 0; ::;K � 1
ð6Þ
The yN approximation is carried out by selecting areduced set of 2N coefficients, with N<K.:
yN ðkÞ ¼ c0 þXNn¼1
cncos2pK
nk
� �þ dnsin
2pK
nk
� �� �
k ¼ 0; ::;K � 1
ð7Þ
Note that we obtain the same harmonic represen-tation order using only half the number of coefficientsrequired by elliptic Fourier descriptors. The coefficients
of the one-dimensional Fourier series can be obtainedvery quickly with the FFT (Fast Fourier Algorithm).The complex values provided by the FFT are a compactrepresentation of the two real coefficients given in theFourier series expansion (Cooley and Tukey 1965).
Results
A direct way of showing the advantages of the newdescriptor, with respect to EFDs, is by comparingthe contours reconstructed with the two methodsusing the same number of coefficients. First wevisually compared the data from a Liza ramadaspecimen. The otolith contour has different singular-ities, a rough region with localized sharp irregular-ities in the form of denticulations, and a smoothcurve in most of the other regions. The number ofcoefficients used for the EFD was M=4N, with N asthe order of harmonic decomposition; however, thenew contour descriptor used M=2N coefficients. To
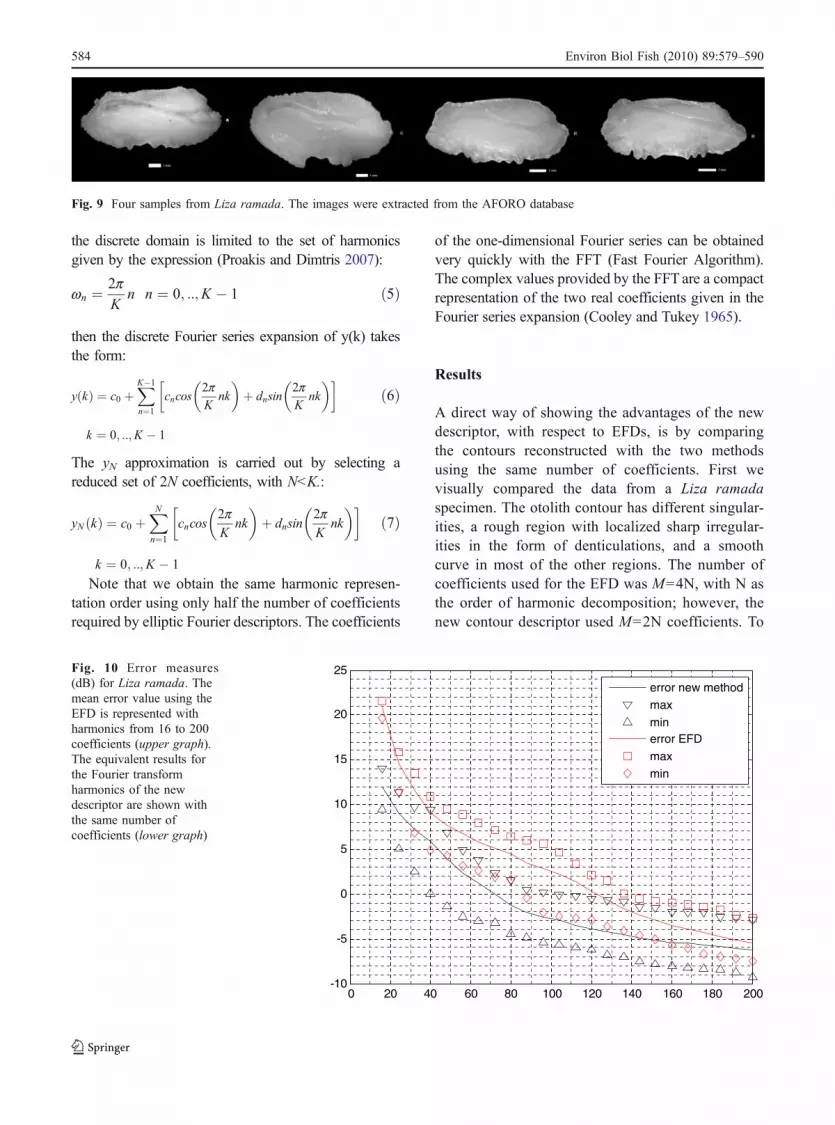
Fig. 9 Four samples from Liza ramada. The images were extracted from the AFORO database
0 20 40 60 80 100 120 140 160 180 200-10
-5
0
5
10
15
20
25
error new method
max
minerror EFD
max
min
Fig. 10 Error measures(dB) for Liza ramada. Themean error value using theEFD is represented withharmonics from 16 to 200coefficients (upper graph).The equivalent results forthe Fourier transformharmonics of the newdescriptor are shown withthe same number ofcoefficients (lower graph)
584 Environ Biol Fish (2010) 89:579–590

aid visual comparison, we have drawn the originalcontour and the contours reconstructed with the twodescriptors using a limited number of coefficients(M) in the same figure.
In Fig. 6 it is possible to compare the twodescriptors using the same number of coefficients(M=24). The new descriptor outperforms the EFDespecially in the lower part of the contour, and it isalso better in the upper part and the laterals. Acomparison of the two descriptors for differentvalues of M is shown in the next two figures. Tovisualize the results better, only the lower part of thecontour, where the differences are more visible, isrepresented.
In Figs. 7 and 8 it is clear that for M below 200,the new descriptor matches the original contour betterat all the represented points. In this example, for Mgreater than 200, the two descriptors match thecontour with practically the same accuracy.
Going one step further, to objectively comparethe contour descriptors and their capacity toreconstruct the original contour, we propose mea-suring the error. We measured the mean Euclideandistance of the reconstructed contour with respectto the original one for all the points on the contour.The original contour is C2, and the reconstructedcontour is C1. This measure is sometimes referred toas the Chamfer Distance (Rosenfeld and Pfaltz 1968;Gavrila 2000).
We measure the Chamfer Distance between closedcontours C1 and C2 where C1 ¼ x11; y11ð Þ; x12;ð½y12Þ; � ��; x1K ; y1Kð Þ�, and C2 ¼ x21; y21ð Þ; x22; y22ð Þ; � ��;½x2M ; y2Mð Þ� by using the minimum Euclidean distancedk between the feature k on C1 with respect to all thefeatures m of C2:
dk ¼ minm
ffiffiffiffiffiffiffiffiffiffiffiffiffiffiffiffiffiffiffiffiffiffiffiffiffiffiffiffiffiffiffiffiffiffiffiffiffiffiffiffiffiffiffiffiffiffiffiffiffiffiffiffiffix2k � x1mð Þ2 þ y2k � y1mð Þ2
q� �ð8Þ
Fig. 11 Four samples of Liza aurata. The images were extracted from the AFORO database
0 20 40 60 80 100 120 140 160 180 200-10
-5
0
5
10
15
20
25
error new method
max
minerror EFD
max
min
Fig. 12 Error measures(dB) for Liza aurata. Themean error value using theEFD is represented withharmonics from 16 to 200coefficients (upper graph).The equivalent results forthe Fourier transformharmonics of the newdescriptor are shown withthe same number ofcoefficients (lower graph)
Environ Biol Fish (2010) 89:579–590 585

as the average distance from all the points of C1 totheir closest point on C2
DchamferðC1;C2Þ ¼ 1
K
Xk2C1
dk ð9Þ
The following graphs represent the errors measuredfor the test groups of species Liza aurata and Lizaramada, and the species Merluccius bilinearis USAand Merluccius bilinearis CAN, and finally Mullusbarbatus. To carry out this preliminary control test weused about 5 to 10 samples of each species. Thesegraphics represent the error measured with respect tothe number of coefficients, from 16 to 200 harmonicvalues, used in the reconstruction. Each figure showsthe error results for one species, using the EFD andthe new descriptor. The maximum, minimum andmean error values for the EFD are represented. Thisdescriptor corresponds to the upper values, withgreater error measures. The lower part of each figureshows the error results using the new proposeddescriptor. The representation uses a logarithmic
vertical axis, measuring the errors in dB, 10·log(Dchamfer(C1,C2)).
We used five specimens to obtain the errormeasures for Liza ramada specimens, four of whichare represented in Fig. 9. In this case the results areclearly better over the full range with the newdescriptor. The mean error is represented in Fig. 10with a continuous line. The maximum and theminimum errors using the two methods (the EFDwith a limited number of coefficients, and the newdescriptor with the same number of coefficients) arealso represented: the maximum error for the EFD isrepresented with square symbols (□), and the mini-mum with diamonds (◊); the maximum error for thenew descriptor is represented with inverted deltas (V),and the minimum with deltas (Δ). These symbols areemployed for each value of M along the horizontalaxis, and M is the number of coefficients used toreconstruct the contours contours.
Ten specimens of Lisa aurata (Fig. 11) were usedto measure the errors. The error results (Fig. 12) aresimilar to those of Liza ramada, except that the mean
Fig. 13 Three samples of the contour of Merluccius bilinearis from the USA
0 20 40 60 80 100 120 140 160 180 200-15
-10
-5
0
5
10
15
20
error new method
max
minerror EFD
max
min
Fig. 14 Error measures(dB) for Merluccius bili-nearis (USA). The meanerror value using the EFD isrepresented with harmonicsfrom 16 to 200 coefficients(upper graph). The equiva-lent results for the Fouriertransform harmonics of thenew descriptor are shownwith the same number ofcoefficients (lower graph)
586 Environ Biol Fish (2010) 89:579–590

error curves cross at M=180 coefficients. We willdiscuss this later.
With the 14 Merluccius bilinearis from the USA(Fig. 13), the errors shown in Fig. 14 cross at M=200coefficients.
The other population of Merluccius bilinearis fromCanada (Fig. 15) was measured using 24 samples.The errors cross above M=200 (Fig. 16).
To represent a completely different case, we finallytested nine specimens of Mullus barbatus (Fig. 17).With this species the results are completely different.The mean errors cross at M=56 (Fig. 18); we willdiscuss this case later on.
Discussion
There are several results that need to be discussed,especially in relation to the error measures of the testspecimens. First, it should be stated that one of theweakest points of the descriptor presented here with
respect to EFDs is that the new descriptor introduceserror at the convoluted zones of the contour, as shownin Fig. 4. This is a consequence of reducing thedimensionality in the sampling process: for each pixelalong the horizontal axis of the reflected contour asingle value is used to represent the contour. The errorintroduced cannot be reversed; we could say that thenew descriptor is intrinsically a loosy descriptor. Thisis why EFD error is better than that of our descriptorfor M tending to K (the number of pixels thatprovides the resolution along the x axis). The EFDis an exact descriptor of the contour if we use 4Kcoefficients. However, when fewer coefficients areused, the new descriptor makes better contourreconstructions than the EFD. Analyzing the resultswe can see that for the majority of the testedspecimens (four out of five) the mean error valuescross at M greater than 180. After the crossing value,the EFD continues to improve as M increases and thenew descriptor stabilizes, because it is limited torepresenting the contour with a single value for each
Fig. 15 Three samples of the contour of Merluccius bilinearis from Canada
0 20 40 60 80 100 120 140 160 180 200-15
-10
-5
0
5
10
15
20
25
30
error new method
max
minerror EFD
max
min
Fig. 16 Error measures(dB) for Merluccius(Canada). The mean errorvalue using the EFD isrepresented with harmonicsfrom 16 to 200 coefficients(upper graph). Theequivalent results withFourier Transformharmonics of the newdescriptor are shown withthe same number ofcoefficients (lower graph)
Environ Biol Fish (2010) 89:579–590 587

horizontal pixel. Therefore, the new descriptor couldbe used successfully to reconstruct the contour of themajority of otoliths, especially if they do not have aparticularly convoluted outline. For M from 4 to 152,for a given value of error, the new descriptorreconstructs the contour with half the number ofcoefficients needed by the EFD. Moreover, weincluded in the study a specimen (Mullus barbatus)with a convoluted or crenated contour (Tuset et al.2008) along the horizontal axis. In this case the errorreconstructions cross at approximately M=52. In spiteof the convoluted contour, the new descriptor stillreconstructs the contours more accurately than theEFD in the range from M=4 to M=52. However,there are most likely other solutions to this case, forexample, reflecting the contour with respect to thevertical axis then using this axis to obtain thesamples; this could be seen as a change in the posenormalization of the otolith.
Finally, the effect of this new descriptor on theperformance of an automatic classification systemshould be studied further in more depth. The literatureon automatic classification of otoliths using imagecontour parameters indicates that reducing the dimen-sionality of the parameters leads to increased accuracyfor the whole classification system. For example, inour case half the number of coefficients are used toobtain the same reconstruction capability, or what isthe same thing, if the same number of parameters isused as in the EFD, we achieve a much betterrepresentation of the contour details. Tracey et al.(2006) used shape descriptors based on EFDscombined with size measures, and found that‘morphological differences are more related to grossshape rather than the finer characteristics’, and alsothat ‘there was no significant variability in otolith sizeor shape between sexes or between age classes withineach region’. It should be noted that the EFD used by
Fig. 17 Four samples from Mullus barbatus from the AFORO database
0 20 40 60 80 100 120 140 160 180 200-15
-10
-5
0
5
10
15
20
25
error new method
max
minerror EFD
max
min
Fig. 18 Error measures(dB) for Mullus barbatus.The mean error value usingthe EFD is represented withharmonics from 16 to 200coefficients (upper graph atthe beginning). The equiva-lent results for the Fouriertransform harmonics of thenew descriptor are shownwith the same number ofcoefficients (lower graph atthe beginning). Note that themean errors cross at M=55
588 Environ Biol Fish (2010) 89:579–590

the author was limited to 40 coefficients. The resultsobtained with our approach using the proposed newdescriptor with the same number of coefficients (i.e.40) or the EFD with more coefficients (at leastdoubling the number of coefficients) suggest that thishypothesis should be re-examined, as another possibleexplanation is that the number of coefficients used bythe author (i.e. 40) eliminated the finer characteristicsbefore the classification process.
Conclusion
In conclusion, we have presented a method forrepresenting the contour information of fish otolithsusing a set of coefficients as in the elliptic Fouriermethod. Although when all the coefficients areconsidered this new approach does not reconstructthe original contour perfectly and the elliptic Fourierdoes, it is important to keep in mind that in anapplication framework (stock analysis, species identi-fication, etc.) the systems applied in the analysiscommonly use a reduced set of coefficients (i.e., 40coefficients) in order to minimize the parameters inthe feature extraction process. Therefore, the contourapproximation given by this reduced set ofcoefficients is generally the one used for patternrecognition and classification applications. In thispaper, larger errors were introduced using thetruncated elliptic Fourier descriptor than when ourdescriptor was used. Furthermore, we obtainedequivalent contour representations with half thenumber of coefficients. We obtained contours thatwere closer to the true form using the same numberof parameters. These results are so clear that theyare presented qualitatively. The quadratic errormeasures obtained with a small population areconsistent with these results.
We can conclude that for a number of coefficientsranging from 4 to 52 the new descriptor clearlyoutperforms the reconstruction accuracy of EFDs forthe xy components, which means that it compactsinformation into fewer coefficients with the sameaccuracy for the represented data. This is verybeneficial for classification and pattern recognitionpurposes.
The next step, which is beyond the scope of thiswork, is to compare a complete classification systemusing these parameters and EFDs. We are still
working on this subject, and the preliminary resultsshould be ready soon.
This study evidences the potential benefits ofotolith shape analysis as a tool for sex, age,population and species identification studies, whichcan provide necessary and relevant information forecological studies.
Acknowledgement The authors would like to thank LRecasens, M Demestre, C Costa, N Ortega, H. Aguirre, D.Flescher and JL Butler as donors of the otoliths. We also thankthe anonymous reviewers for their helpful comments andsuggestions made during the review process of this paper
References
Abidi MA, Gonzalez RC (1986) Shape decomposition usingelliptic fourier descriptors. Proc. 18th IEEE SoutheastSympo. Sys. Theory, pp 53–61, Knoxvlle, TN USA
Akkiran N (1985) A systematic study on Carangidae (Pisces)employing the otolith characters in the Eastern Mediterranean.Bilj Notes Inst Oceanogr Ribar Split 63:1–9
Begg GA, Brown RB (2000) Stock identification of haddockMelanogrammus aeglefinus on Georges Bank based onotolith shape analysis. Trans Am Fish Soc 129:935–945
Bird JL, Eppler DT, Checkley DM (1986) Comparisons ofherring otoliths using Fourier-series shape-analysis. Can JFish Aquat Sci 43(6):1228–1234
Campana SE, Casselman JM (1993) Stock discrimination usingotolith shape analysis. Can J Fish Aquat Sci 50:1062–1083
Cardinale M, Doering-Arjes P, Kastowsky M, Mosegaard H(2004) Effects of sex, stock, and environment on the shapeof known-age atlantic cod (gadus morhua) otoliths.Fisheries and Aquatic Sciences 61(2):158–167
Casselman JM, Collins JJ, Crossman EJ, Ihssen PE, SpanglerGR (1981) Lake whitefish (Coregonus clupeaformis)stocks of the Ontario waters of Lake Huron. Can J FishAquat Sci 38:1772–1789
Castonguay M, Simard P, Gagnon P (1991) Usefulness ofFourier analysis of otolith shape for atlantic mackerel(Scomber scombrus) stock discrimination. Can J FishAquat Sci 48(2):296–302
Chen SYY, Lestrel PE, Kerr WJS, McColl JH (2000)Describing shape changes in the human mandible usingelliptical Fourier functions. Eur J Orthodont 22:205–216
Cooley JW, Tukey JW (1965) An algorithm for the machinecalculation of complex Fourier Series. Math Comput19:297–301
Colura RL, King TL (1995) Using scale and otolith morphologiesto separate spotted seatrout (Cynoscion nebulosus) collectedfrom two areas within Galveston Bay. In: Secor DH, DeanJM, Campana SE (eds) Recent developments in fish otolithresearch. University of South Carolina Press, Columbia, pp617–628
Friedland KD, Reddin DG (1994) Use of otolith morphology instock discriminations of Atlantic salmon (Salmo salar).Can J Fish Aquat Sci 51:91–98
Environ Biol Fish (2010) 89:579–590 589

Gaemers PAM (1984) Taxonomic position of the Cichlidae(Pisces, Perciformes) as demonstrated by the morphologyof their otoliths. Neth J Zool 34:566–595
Gavrila D (2000) Pedestrian detection from a moving vehicle.Proc. Europ. Conf. Computer Vision, Dublin, Ireland
Hecht T, Appelbaum S (1982) Morphology and taxonomicsignificance of the otoliths of some bathypelagic Anguilloideiand Saccopharyngoidei from the Sargasso Sea. HelgolMeeresunters 35:301–308
Iwata H, Ukai Y (2002) SHAPE: a computer program packagefor quantitative evaluation of biological shapes based onelliptic Fourier descriptors. J Hered 93:384–385
Kuhl FP, Giardina CR (1982) Elliptic Fourier features of aclosed contour. Comput Graph Image Process 18:236–258
L’Abée-Lund JH (1988) Otolith shape discriminates betweenjuvenile Atlantic salmon, Salmo salar, and brown trout,Salmo trutta. J Fish Biol 33:899–903
Lestrel PE (ed) (1997) Fourier descriptors and their applicationin biology. Cambridge University Press, UK, p 466
Lombarte A, Torres GJ, Morales-Nin B (2003) SpecificMerluccius otolith growth patterns related to phylogeneticsand environmental. J Mar Biol Ass UK 83:277–281
Lombarte A, Chic O, Parisi-Baradad V, Olivella R, Piera J,García-Ladona E (2006) A web-based environment forshape analysis of fish otoliths. The AFORO database. SciMar 70(1):147–152
McKern JL, Horton HF, Koski KV (1974) Development ofsteelhead trout (Salmo gairdneri) otoliths and their use for ageanalysis and for separating summer fromwinter races and wildfrom hatchery stocks. J Fish Res Board Can 31(8):1420–1426
Messieh SN (1972) Use of otoliths in identifying herring stocksin the Southern Gulf of St. Lawrence and adjacent waters.J Fish Res Board Can 29(8):1113–1118
Morrow JE (1976) Preliminary keys to otoliths of some adultfishes of the Gulf of Alaska, Bering Sea, and Beaufort Sea.NOAA Tech Rep NMFS Circ 420:1–32
Nasreddine K, Benzinou A, Fablet R (2009) Shape geodesics forthe classification of calcified structures: beyond Fouriershape descriptors. Fish Res 98(1–3):8–15
Neilson JD, Geen GH, Chan B (1985) Variability in dimensions ofsalmonid otolith nuclei: implications for stock identificationand microstructure interpretation. Fish Bull 83(1):81–89
Parisi-Baradad V, Lombarte A, García-Ladona E, Cabestany J,Piera J, Chic O (2005) Otolith shape contour analysisusing affine transformation invariant wavelet transformsand curvature scale space representation. Mar Freshw Res56:795–804
Piera J, Parisi-Baradad V, García-Ladona E, Lombarte A,Recasens L, Cabestany J (2005) Otolith shape featureextraction oriented to automatic classification with opendistributed data. Mar Freshw Res 56:805–814
Ponton D (2006) Is geometric morphometrics efcient forcomparing otolith shape of diferent fish species? ComputVis Image Underst 427267(6):750–757
Postuma KH (1974) The nucleus of the herring as a racialcharacter. J Cons Int Explor Mer 35(2):121–129
Proakis John G, Manolakis Dimtris G (2007) Digital signalprocessing, 4th edn. Pearsons Education.
Rätz HJ (1994) Assessment of the migration of Atlantic cod(Gadus morhua L.) between the stocks off West and EastGreenland in 1984–86 by means of otolith typing. JNorthw Atl Fish Sci 16:7–18
Rosenfeld A, Pfaltz JL (1968) Distance functions on digitalpictures. Pattern Recogn 1(1):33–61
Saborido-Rey F (1998) Differences in weight and length ofotoliths between populations of genus Sebastes in theNorth Atlantic. Poster, 2nd International Symposium onFish Otolith Research and Application. Bergen, 20–25June 1998. (Abstract in Moksness 1998)
Shepherd CE (1910) Comparisons of otoliths found in fishes.The Zoologist, London, Ser 4(14):292–298
Smith MK (1992) Regional differences in otolith morphologyof the deep slope red snapper Etelis carbunculus. Can JFish Aquat Sci 49:795–804
Torres GJ, Lombarte A,Morales-Nin B (2000) Sagittal otolith sizeand shape variability to identify geographical intraspecificdifferences in three species of the genus Merluccius. J MarBiol Assoc UK 80:333–342
Tuset VM, Lombarte A, Assuis CA (2008) Otolith atlas for theWestern Mediterranean, North and Central Eastern Atlantic.Sci Mar 72S1:7–198
Tracey SR, Lyle JM, Duhamelb G (2006) Application ofelliptical Fourier analysis of otolith form as a tool for stockidentification. Fish Res 77:138–147
590 Environ Biol Fish (2010) 89:579–590