a modelling project in poland the social and intellectual capital aspects
TRANSCRIPT

5
http://dx.doi.org/10.7896/j.1602 Studies in Agricultural Economics 118 (2016) 5-15
IntroductionThe current socio-economic development brings about
intensive changes in both sectoral and spatial aspects. Effec-tive management of these changes should involve forecast-ing the developments likely to occur in various domains with the aim of designing, on this basis, adequate policies. This was exactly the purpose for which the self-governmental authorities of the NUTS 2 region of Mazowieckie voivode-ship, the capital province of Poland, commissioned, through the intermediary of the Masovian Bureau of Regional Plan-ning, the project ‘Modelling of the social, economic and spatial transformations in Mazowieckie voivodeship’. This project constituted a component in a much wider undertak-ing ‘Development Trends of Mazovia’.2
The primary objective of this project was to develop an integrated computer tool to support the analysis and decision making with respect to the socio-economic processes of the province in the spatial setting, with the time horizon of 2025. The project involved the development of (a) a set of models of the social, economic and spatial changes; (b) a database of indicator values to be used in the modelling, founded on the data for the years 2002-2009 (updated later on until 2011 whenever possible); (c) forecasts / projections obtained with the use of the models; and (d) computer application, serving to set the parameters of models, as well as to run the models and determine the forecasts and projections, along with the respective data sets for potential further processing.
Following a short discussion of the state of the art in the broad topic of this research, we present the model system in its entirety. We then go on to show in more detail the devel-opment and the content of models pertaining to the domains of social and intellectual capital. After a few comments on
the computer application, implementing the entire system, we close with some conclusions.
The place in the state of the art
At the level of the entire system of models and the respective computer application, one is dealing with an unprecedented undertaking. This is due, primarily, to (a) the multiplicity of domains and related indicators modelled (altogether close to 100 variables from various domains), and the wide diversity of the character of the indicators included and (b) the fact that the vast majority of models refer to the basic (LAU 2) administrative units as the proper objects of modelling, all this within a single, consistent sys-tem. Thus, the issue is not just in the sheer numbers (100 meaningful output variables for 314 municipalities (gminas) over 25 years) which, in fact, were much bigger (as some of the indicators were further broken down into more par-ticular variables). The inhomogeneity of these dimensions constituted a challenge in itself. The indicator variables included such quantities as feminisation ratio, own revenues per capita of the municipal budget, investment propensity of the municipal authorities, an information society indicator, social exclusion, quality of the environment, technical infra-structure, transport accessibility, quality of life and degree of urbanisation. Furthermore, the municipalities, for which each model had to be implemented and run, varied between the capital city of Warszawa and peripheral rural communes with very weak commercial activity and population density of around 30 persons per km2.3
This made it diffi cult to adopt the methodologies that offer relatively comprehensive modelling tools, and that with explicit spatial aspect. Such models do exist (see, for example, Capello, 2007 and Capello and Fratesi, 2012 for MASST; Gardiner and Kancs, 2011 and Brandsma et al., 3 It must be emphasised that Mazowieckie voivodeship is in the socio-economic sense the most diversifi ed in Poland.
Konrad CZAPIEWSKI*, Krzysztof JANC**, Jan W. OWSIŃSKI*** and Przemysław ŚLESZYŃSKI*
A modelling project in Poland: the social and intellectual capital aspectsSeveral dozen simple forecasting models for a range of socio-economic indicators were developed for the NUTS 2 region of Mazowieckie voivodeship, the capital province of Poland, with 314 LAU 2 municipalities (gminas) being the basic units of modelling. Given that this set of municipalities encompasses the European-level agglomeration of Warszawa, several sub-regional centres, smaller towns and a multiplicity of small rural municipalities, the models refl ect quite a selection of social, economic and resource situations, including rural areas of varied characteristics. In view of the broad range of the subject matter, the number of indicators modelled (around 70) and the orientation at the basic administrative units, the undertaking is unprecedented. Social and intellectual capital-related aspects were included among those modelled and the paper focuses on these from the methodological and substantive points of view, presenting some of the results and the conclusions drawn from them. We show that construction of such a varied and versatile model system is feasible, that it can be useful for pragmatic purposes, and that individual models of indicators (phenomena) can effectively represent the processes that are of importance at the local scale and, through aggregation, also regionally. In particular, the diverse courses of processes in the space of municipality types can be checked and verifi ed.1
Keywords: forecasting models, empirical modelling, municipality, social capital, intellectual capital, model system
* Instytut Geografi i i Przestrzennego Zagospodarowania im. Stanisława Leszczyckiego PAN, Warszawa, Poland** Instytut Geografi i i Rozwoju Regionalnego Uniwersytet Wrocławski, Wrocław, Poland*** Instytut Badań Systemowych PAN, Newelska 6, 01-447 Warszawa, Poland. Corresponding author: [email protected]
1 The project was carried out in the years 2011-2013 by the Systems Research Insti-tute and the Institute of Geography and Spatial Organisation, both of the Polish Acad-emy of Sciences, by a team of 14 persons.2 See http://www.trendyrozwojowemazowsza.pl

Konrad Czapiewski, Krzysztof Janc, Jan W. Owsiński and Przemysław Śleszyński
6
2013 for RHOMOLO; Roeger and in’t Veld, 1997 and Ratto et al., 2008 for QUEST, and Varga and associates for the GMR family of models) and offer quite important capaci-ties. Even though these models, or approaches, differ sig-nifi cantly, we quote them here because they have become quite justly highly popular in the literature. Some of them make the spatial aspect more explicit and some lean towards specifi c issues such as innovation or fi scal policies. Yet none of them are capable of representing the processes considered at the level of a small rural community within an approach that treats such a community similarly to a European-level agglomeration. For instance, Varga (2007) goes down only to the NUTS 3 level in Hungary, and that just for quite a nar-row set of variables. None of these models can account for a serious proportion of the output variables (indicators) the project here presented was assumed to encompass.4
For several decades, attempts have been made to apply the classical form of the input-output (I/O) analysis, origi-nated by Wassili Leontief, to regional and local systems. Since the 1960s, hundreds of studies have been performed and many tools have been elaborated, as witnessed, for instance, by Hastings and Brucker (1993), Maki (1997) – one of the leading fi gures in the domain – or Bess and Ambargis (2011). This appealing and well-equipped approach is still frequently cited (e.g. Rohman, 2013), but nowadays mainly for rather narrow purposes (such as the broader effects of a single project or event). The I/O approach was not an option for the project at hand because it would require elaboration of the I/O tables at least for ‘representative’ municipalities which, apart from being beyond the capacity the project, would be, for many of the municipalities or their types, both highly unstable and hard to establish.
Among the more recently developing paradigms which are used to represent spatial dynamics and which allow for modelling of quite complex structures are the cellular autom-ata (CA). It was discovered early (Batty and Xie, 1994) that CA are a nice representation for the changes in space, with special emphasis on urban dynamics. With time, more complex processes started to be modelled (e.g. Ohgai et al., 2001) and the methodology has reached maturity in terms of tools and applications (see e.g. González et al., 2015). It is plausible to use municipalities as the granules of space in the CA models, but this methodology was not an option for us for two reasons. Firstly, the CA paradigm requires defi nite theories of spatial interrelations or infl uences which will have to be formulated and verifi ed for the multiplicity of domains encompassed by the model system developed. Secondly, the number of these domains and indicators is practically prohibitive for the CA approach.
Numerous models and techniques exist that are meant to represent the processes in various separate domains at the local level, but they concern either quite narrow subject areas, with a small set of variables accounted for, or are just the methodological proposals or software tools (see, for example, Marsal-Llacuna and Boada-Oliveras, 2013 for a technical tool, Kloha et al., 2005 for fi scal modelling, or
4 One should add that these models were often developed and used in order to refl ect the effects of European or national policies, as expressed through defi nite variables, rather than to represent the broadly conceived multiaspect development of individual communities.
Beigl et al., 2008 for waste management). The models devel-oped within the project, and forming the coherent system, were all based on the domain-proper expertise while main-taining a defi nite level of standardisation and user-related simplicity. The use of existing techniques or even ready tools might amount to a formidable effort in standardising among the various domains and indicators modelled.
The set of forecasting modelsEven though the primary purpose of the undertaking
described here was to provide a tool for the provincial plan-ning authority, there were several questions which were of interest for the developers of the system and of the indi-vidual models. The fi rst one was the very possibility of constructing the model system as here presented. This ques-tion concerned the design of particular models, their con-nections, information fl ow and the feasibility of computer implementation using simple equipment. This turned out to be possible. Regarding individual models, the most frequent and most important issue was the course of respective pro-cesses in various types of municipalities and the conclusions therefrom. Of special interest was the distinction between the cores, associated areas, developing areas and peripher-ies. Verifying certain existing convictions with this respect was one of the essential goals of the models, even though not directly formulated.
The set of domains and the fundamental assumptions
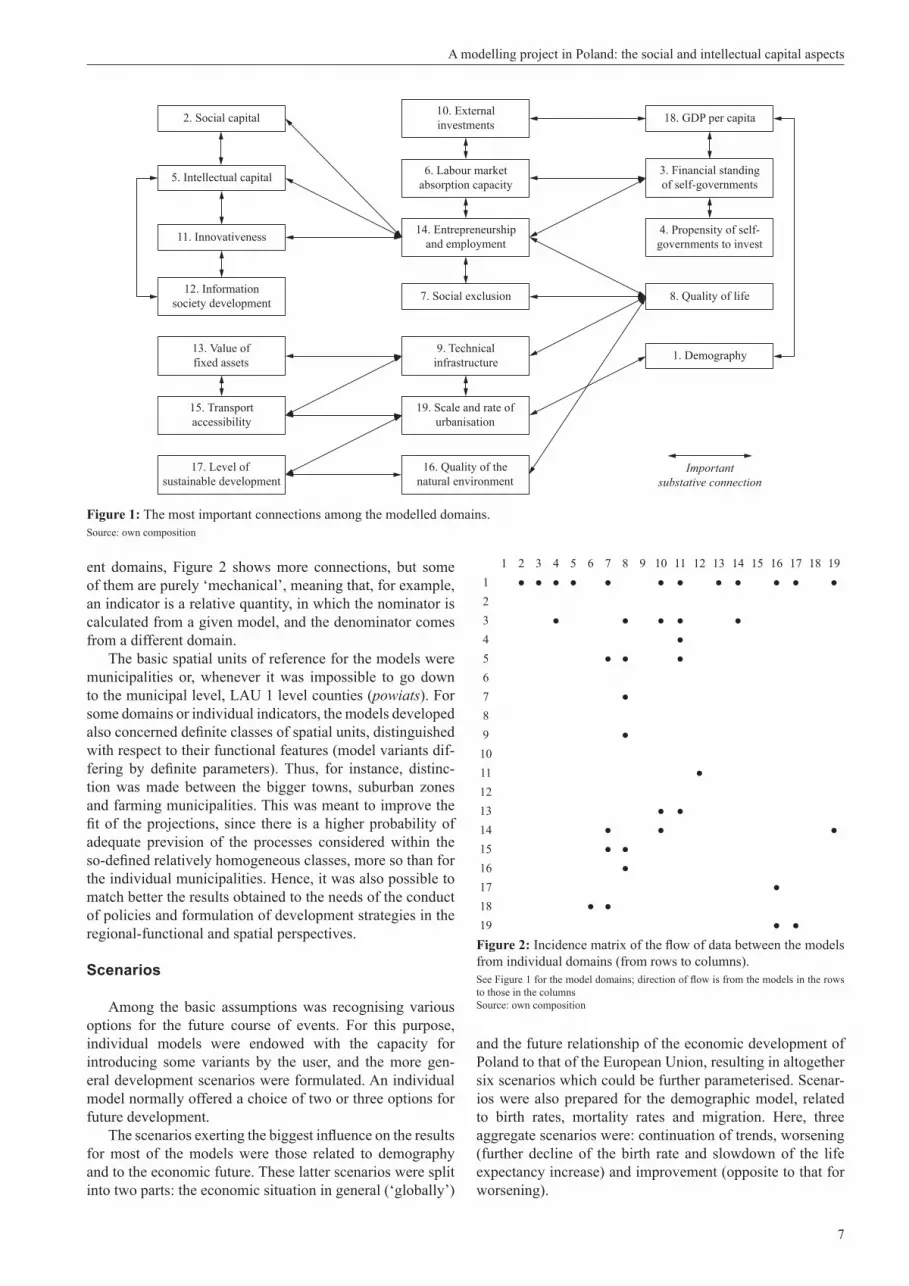
The outline for the system of models, with the list of domains and information-related connections, is shown in Figure 1. The fundamental principle in the development of the models was to base them on the trends and interrelations identifi ed with the use of the available data at least for the years 2002-2009 or, whenever possible, 1999-2011. The majority of the models were empirical models, as simple as possible, but accounting for the respective methodological and theoretical premises, proper for the individual domains or indicators, whenever it was possible and/or necessary. Thus, for each of the domains specifi ed, models were devel-oped separately, using different methodological prerequi-sites with domain-specifi c sets of variables and indicators. Yet the causal relationships and the assumptions made for other domains were also accounted for. In practice, this meant quite strong association, in many situations of truly stiff character, between the models of particular phenom-ena, often leading to feedback loops. Thus, for example, the demographic projections and the expected migratory infl ows exerted an infl uence on the indicators related to the labour market absorption capacity and to the fi nancial standing of the self-governmental authorities. An essential criterion of acceptance of models within the particular domains was their consistency, which can be understood as the possibility of using the results of some models in the others making up the system, both in substantive and technical terms.
Whereas Figure 1 emphasises the truly substantive infl u-ence of some indicators or variables on those from differ-
A modelling project in Poland: the social and intellectual capital aspects
7
ent domains, Figure 2 shows more connections, but some of them are purely ‘mechanical’, meaning that, for example, an indicator is a relative quantity, in which the nominator is calculated from a given model, and the denominator comes from a different domain.
The basic spatial units of reference for the models were municipalities or, whenever it was impossible to go down to the municipal level, LAU 1 level counties (powiats). For some domains or individual indicators, the models developed also concerned defi nite classes of spatial units, distinguished with respect to their functional features (model variants dif-fering by defi nite parameters). Thus, for instance, distinc-tion was made between the bigger towns, suburban zones and farming municipalities. This was meant to improve the fi t of the projections, since there is a higher probability of adequate prevision of the processes considered within the so-defi ned relatively homogeneous classes, more so than for the individual municipalities. Hence, it was also possible to match better the results obtained to the needs of the conduct of policies and formulation of development strategies in the regional-functional and spatial perspectives.
Scenarios
Among the basic assumptions was recognising various options for the future course of events. For this purpose, individual models were endowed with the capacity for introducing some variants by the user, and the more gen-eral development scenarios were formulated. An individual model normally offered a choice of two or three options for future development.
The scenarios exerting the biggest infl uence on the results for most of the models were those related to demography and to the economic future. These latter scenarios were split into two parts: the economic situation in general (‘globally’)
and the future relationship of the economic development of Poland to that of the European Union, resulting in altogether six scenarios which could be further parameterised. Scenar-ios were also prepared for the demographic model, related to birth rates, mortality rates and migration. Here, three aggregate scenarios were: continuation of trends, worsening (further decline of the birth rate and slowdown of the life expectancy increase) and improvement (opposite to that for worsening).
17. Level of sustainable development
1. Demography
2. Social capital
5. Intellectual capital
7. Social exclusion 8. Quality of life
11. Innovativeness
18. GDP per capita
14. Entrepreneurshipand employment
13. Value offixed assets
12. Informationsociety development
19. Scale and rate ofurbanisation
16. Quality of thenatural environment
15. Transportaccessibility
10. Externalinvestments
9. Technicalinfrastructure
6. Labour marketabsorption capacity
4. Propensity of self-governments to invest
3. Financial standingof self-governments
Importantsubstative connection
Figure 1: The most important connections among the modelled domains.Source: own composition
1 2 3 4 5 6 7 8 9 10 11 12 13 14 15 16 17 18 191 ● ● ● ● ● ● ● ● ● ● ● ●23 ● ● ● ● ●4 ●5 ● ● ●67 ●89 ●1011 ●1213 ● ●14 ● ● ●15 ● ●16 ●17 ●18 ● ●19 ● ●Figure 2: Incidence matrix of the fl ow of data between the models from individual domains (from rows to columns).See Figure 1 for the model domains; direction of fl ow is from the models in the rows to those in the columnsSource: own composition

Konrad Czapiewski, Krzysztof Janc, Jan W. Owsiński and Przemysław Śleszyński
8
Alongside these general scenarios were several other kinds of scenarios which applied to just one, or only a very limited number of models. The choice of scenarios is left to the user, with ‘defaults’ being, as a rule, the ‘business as usual’ or ‘least of changes’ ones. In just a few cases no options were offered to the user, mainly in view of diffi culty in calculations for these different options, and of the diffi -culty in formulating plausible ‘alternative futures’.
Source data, variables and indicators
The model calculations used some 250 kinds of source data. It was assumed in the project that these data shall possibly all originate from offi cial, well-established and publicly avail-able sources, in this case almost exclusively from the Local Data Base of the Polish Central Statistical Offi ce (BDL GUS). This concerns, in particular, the annual data for all the 314 municipalities of Mazowieckie voivodeship for population (17 age groups for both genders, i.e. 34 numbers, deaths and births, as well as migration data). Given that the basis for the demo-graphic models was constituted by the data for 12 consecutive years, we deal with close to half a million source data items.
Most of the 19 domains are represented by more than one indicator. There are altogether close to 70 such indica-tors being the proper subject of modelling. In addition, there are also a number of auxiliary, intermediate variables, also modelled, which are not formally treated as representing a given domain. Some of these intermediate variables are used in several models.
Thus, from the point of view of data processing we can speak of input data (mostly source data), intermediate vari-ables, having various characters and resulting from very dif-ferentiated transformations, and the proper indicators. In many cases indicators from one domain are used to calculate the indicators in other domains, and so are treated as interme-diate variables. These latter indicators might have a synthetic character (being an aggregate of several other indicators and/or intermediate variables), or might be a further transforma-tion, based on the input indicator and other quantities.
The spatial typological distinctions
Owing to the specifi c ‘cross-sectional’ character of Mazowieckie voivodeship, almost all types of municipali-ties existing in Poland5 are represented, especially those that can be treated as rural according to diverse perspectives. The models developed in many instances were calibrated for municipality types. Table 1 shows the classifi cation of municipalities adopted in the work and, at the same time, sheds light on the specifi c character of the province. The truly rural municipalities (i.e. excluding the urban and sub-urban ones) take a very important share in the province, and indeed very often parts of suburban municipalities also remain fully ‘rural’. Thus, in terms of numbers of units, 66 per cent of municipalities are rural; in terms of area they occupy 74.4 per cent of the province, and in terms of popula-tion either 35.6 per cent of the total (formally rural areas) or 23.9 per cent with the full exclusion mentioned. All this for a province with a European-scale agglomeration at its centre. There is a very wide range of municipality types, also among the rural ones, from highly developed and wealthy, down to peripheral, lagging and poor.
The models
Table 2 lists all the domains and summarises their con-tent, with the indicators and the auxiliary variables produced by corresponding models. There were altogether close to 100 separate models designed, developed and verifi ed, not counting their variants for particular classes of municipali-ties. The models featured quite diverse forms and degrees of diffi culty, including from the computational point of view. In some situations, even quite advanced analyses led to very simple models (see Gadomski and Owsiński, 2008 for a similar case).
In terms of numbers, the biggest and the most calculation-wise burdensome model was the demographic model, produc-5 The missing ones are, for example, tourist communes of the type encountered at the seaside, on the lakes or in the mountains.
Table 1: Typology of municipalities of Mazowieckie voivodeship used in the modelling project.
TypeNumber
Population number Area (km2)
Population density (persons per km2)Description Code in thousand % in towns
Core of the national and provincial capital (Warszawa) MS 1 1,714.4 100.0 517 3,315Suburban zone of Warszawa PSI 27 725.1 72.9 1,297 559Outer suburban zone of Warszawa PSE 31 393.0 33.6 2,897 136Cores of the urban areas of subregional centres MG 5 526.4 100.0 293 1,797Suburban zones of subregional centres PG 20 182.8 4.5 2,236 82County seats MP 22 433.9 82.7 1,871 232Intensive development of non-agricultural functions O 29 241.1 24.7 3,529 68Intensive development of farming R 112 615.1 4.9 13,912 44Extensive development, mainly farming E 67 390.3 4.2 9,006 43Totals 314 5,222.2 64.6 35,558 147Auxiliary divisionsMS+PSI+PSE 28 2,439.6 91.9 1,814 1,345MG+PG 25 709.2 75.4 2,529 280M+P 75 3,582.7 87.5 6,214 577O+R+E 208 1,246.5 8.5 26,448 47Agglomeration of Warszawa in the Spatial Development Plan for Mazowieckie voivodeship 40 2,645.5 88.5 2,724 971
Data source: Polish Central Statistical Offi ce

A modelling project in Poland: the social and intellectual capital aspects
9
ing at each run several hundred thousand numbers, summing up to several basic indicators for each of the municipalities with, of course, the possibility of aggregation to counties and the province as a whole. The essential methodological diffi -culty in the development of this model consisted in the possi-bly precise identifi cation of model parameters, given that the source data concerned fi ve-year age groups, and not year-by-year cohorts (see Owsiński and Kałuszko, 1998, for a similar model). Various kinds of results from this model were used in quite an important proportion of other models (indicators).
Social capital
Since there is no magnitude to be measured directly as ‘social capital’, and the defi nitions, which are largely opera-tional, differ widely, also in view of the availability of the data that can be used to represent the notion, some degree of arbitrariness is unavoidable. For the basic opinions, see
Coleman (1988), Putnam (1995), Fukuyama (1997, 2000), Cote (2001) and Bjørnskov (2006), and for those related to rural areas, especially in Poland, Heffner and Rosner (2002) and Kołodziejczyk (2003). The models developed by Janc (2009) and Czapiewski (2010) assumed, in the operational sense, that social capital was represented by the following magnitudes: NGO: the number of the non-governmental organisations per 10,000 inhabitants in a municipality; SPO: membership in the sports clubs and associations, also per 10,000 inhabitants of the municipality; and ART: member-ship of arts ensembles and associations and special interest groups (total number of members per 10,000 inhabitants of a municipality). As with many other models belonging to the system, the choice was guided by both the understanding of the meaning of ‘social capital’ and the availability of data, fulfi lling the assumptions of the project.
In all these cases, models for the future development of the respective variables until 2025 were based on past
Table 2: The list of domains and indicators used in the modelling project.
No. Domain name Indicators Comments1 Demography Population totals and according to age and sex groups, feminisation,
share of post-productive population etc.Models for municipality types; birth rate, mortality and migration scenarios.
2 Social capital Numbers of NGOs, sports clubs members, cultural and art groups mem-bers; also a synthetic indicator.
Three variables, treated as proxies, and an ‘artifi cial’ synthetic measure.
3 Financial standing of self-governments
Own and total revenues of local self-governments per capita, expendi-tures, investment expenditures; auxiliary: jobs per business, expenditures to revenues ratio.
Model types for municipality types, see Owsiński and Andrzejewski (2010).
4 Propensity of self-governments to invest
Investment-related expenditures, budget debt, current budget surplus, propensity to invest.
A model with assumed interaction with the user.
5 Intellectual capital University graduates, university students, companies with foreign share, a synthetic indicator.
Three basic variables and an ‘artifi cial’ synthetic indicator.
6 Labour market absorption capacity
Demand for labour (from GDP and productivity), auxiliary: productivity. Simple model based on variables from other domains.
7 Social exclusion Synthetic indicator (share of the elderly, transport-wise accessibility, share of university educated persons, unemployment); Gini-like measure of income inequality.
Two entirely different indicators.
8 Quality of life Synthetic indicator, based on variables from domains 3, 5, 7, 9, 15, 16 and 17.
Relative indicator based on seven variables, see Owsinski (2009).
9 Technical infrastructure Shares of inhabitants served by water supply, sewage system, water treatment.
Models for municipality types and levels attained; no synthetic indicator.
10 External investments Magnitude of external investments – value per capita. Model based on variables from other domains.
11 Innovativeness Two indicators, based on intellectual capital, magnitude structure of company population, municipal investments, and company investments.
12 Information society development
Two indicators, based on innovativeness (domain 11) and Internet in schools.
Two indicators, differing by schools con-sidered.
13 Value of fi xed assets Value of fi xed assets owned by public bodies, by companies, total value per capita, auxiliary: investments in self-governmental and in private sectors.
Very rough assessment.
14 Entrepreneurship and employment
Number of businesses, employment per business, unemployment, total employment, employment in manufacturing and service, auxiliary: proxy for employment in farming.
Models for municipality types.
15 Transport accessibility Expressed in numbers of people within a defi nite travel time outside and inside.
Based on road network and settlement sys-tem, see Komornicki et al. (2009).
16 Quality of the natural environment
Synthetic indicator (share of green areas and farmland, population den-sity, car number, and overbuilt area share).
Model partly based on variables from the domains 17 and 19.
17 Level of sustainable development
Anthropogenic pressure (number of cars, population density); sustainable development level (protected areas, forests, grasslands, physical plans); additionally: number of cars, grasslands, physical plans, protected areas, forests.
Partial models (e.g. representing number of cars), contributing to the overall indicators; see Solon (2008a,b).
18 GDP per capita Global GDP dynamics, and local dynamics, based on salary distribution. A simple macroeconomic model with six scenarios.
19 Scale and rate of urbanisation
Population density, overbuilt areas, persons employed in manufactur-ing and services; auxiliary: areas under residential and non-residential structures.
Some variables taken from other domains (see Śleszyński, 2007).
Source: own composition
Konrad Czapiewski, Krzysztof Janc, Jan W. Owsiński and Przemysław Śleszyński
10
data with, possibly, allowance for some scenarios. It was also assumed that models would differ for particular types of municipalities. A synthetic indicator was also proposed, in view of the explicit demand from the commissioning agency.
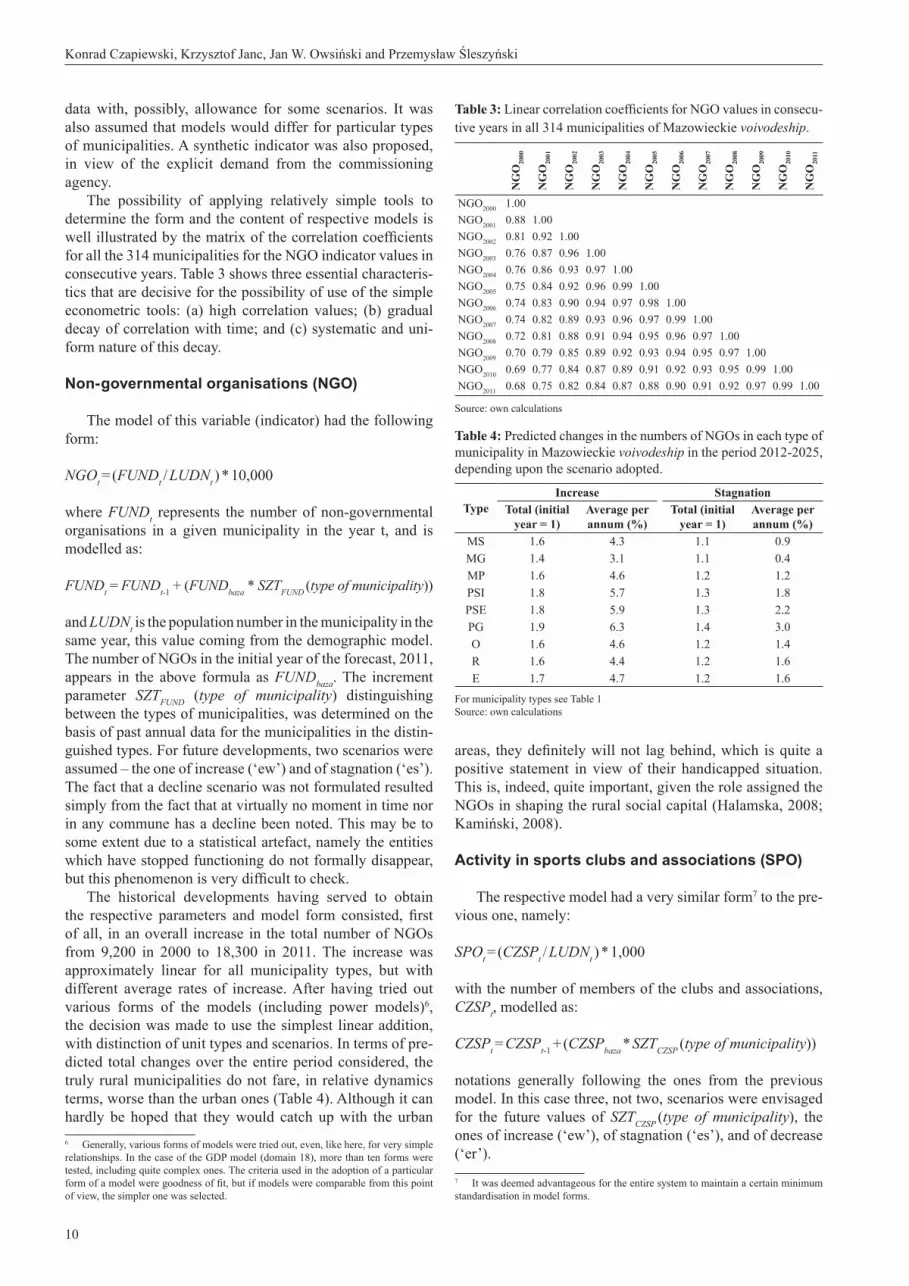
The possibility of applying relatively simple tools to determine the form and the content of respective models is well illustrated by the matrix of the correlation coeffi cients for all the 314 municipalities for the NGO indicator values in consecutive years. Table 3 shows three essential characteris-tics that are decisive for the possibility of use of the simple econometric tools: (a) high correlation values; (b) gradual decay of correlation with time; and (c) systematic and uni-form nature of this decay.
Non-governmental organisations (NGO)
The model of this variable (indicator) had the following form:
NGOt = (FUNDt / LUDNt ) * 10,000
where FUNDt represents the number of non-governmental organisations in a given municipality in the year t, and is modelled as:
FUNDt = FUNDt-1 + (FUNDbaza * SZTFUND (type of municipality))
and LUDNt is the population number in the municipality in the same year, this value coming from the demographic model. The number of NGOs in the initial year of the forecast, 2011, appears in the above formula as FUNDbaza. The increment parameter SZTFUND (type of municipality) distinguishing between the types of municipalities, was determined on the basis of past annual data for the municipalities in the distin-guished types. For future developments, two scenarios were assumed – the one of increase (‘ew’) and of stagnation (‘es’). The fact that a decline scenario was not formulated resulted simply from the fact that at virtually no moment in time nor in any commune has a decline been noted. This may be to some extent due to a statistical artefact, namely the entities which have stopped functioning do not formally disappear, but this phenomenon is very diffi cult to check.
The historical developments having served to obtain the respective parameters and model form consisted, fi rst of all, in an overall increase in the total number of NGOs from 9,200 in 2000 to 18,300 in 2011. The increase was approximately linear for all municipality types, but with different average rates of increase. After having tried out various forms of the models (including power models)6, the decision was made to use the simplest linear addition, with distinction of unit types and scenarios. In terms of pre-dicted total changes over the entire period considered, the truly rural municipalities do not fare, in relative dynamics terms, worse than the urban ones (Table 4). Although it can hardly be hoped that they would catch up with the urban 6 Generally, various forms of models were tried out, even, like here, for very simple relationships. In the case of the GDP model (domain 18), more than ten forms were tested, including quite complex ones. The criteria used in the adoption of a particular form of a model were goodness of fi t, but if models were comparable from this point of view, the simpler one was selected.
areas, they defi nitely will not lag behind, which is quite a positive statement in view of their handicapped situation. This is, indeed, quite important, given the role assigned the NGOs in shaping the rural social capital (Halamska, 2008; Kamiński, 2008).
Activity in sports clubs and associations (SPO)
The respective model had a very similar form7 to the pre-vious one, namely:
SPOt = (CZSPt / LUDNt ) * 1,000
with the number of members of the clubs and associations, CZSPt, modelled as:
CZSPt = CZSPt-1 + (CZSPbaza * SZTCZSP (type of municipality))
notations generally following the ones from the previous model. In this case three, not two, scenarios were envisaged for the future values of SZTCZSP (type of municipality), the ones of increase (‘ew’), of stagnation (‘es’), and of decrease (‘er’).7 It was deemed advantageous for the entire system to maintain a certain minimum standardisation in model forms.
Table 4: Predicted changes in the numbers of NGOs in each type of municipality in Mazowieckie voivodeship in the period 2012-2025, depending upon the scenario adopted.
TypeIncrease Stagnation
Total (initial year = 1)
Average per annum (%)
Total (initial year = 1)
Average per annum (%)
MS 1.6 4.3 1.1 0.9MG 1.4 3.1 1.1 0.4MP 1.6 4.6 1.2 1.2PSI 1.8 5.7 1.3 1.8PSE 1.8 5.9 1.3 2.2PG 1.9 6.3 1.4 3.0O 1.6 4.6 1.2 1.4R 1.6 4.4 1.2 1.6E 1.7 4.7 1.2 1.6
For municipality types see Table 1Source: own calculations
Table 3: Linear correlation coeffi cients for NGO values in consecu-tive years in all 314 municipalities of Mazowieckie voivodeship.
NG
O20
00
NG
O20
01
NG
O20
02
NG
O20
03
NG
O20
04
NG
O20
05
NG
O20
06
NG
O20
07
NG
O20
08
NG
O20
09
NG
O20
10
NG
O20
11
NGO2000 1.00NGO2001 0.88 1.00NGO2002 0.81 0.92 1.00NGO2003 0.76 0.87 0.96 1.00NGO2004 0.76 0.86 0.93 0.97 1.00NGO2005 0.75 0.84 0.92 0.96 0.99 1.00NGO2006 0.74 0.83 0.90 0.94 0.97 0.98 1.00NGO2007 0.74 0.82 0.89 0.93 0.96 0.97 0.99 1.00NGO2008 0.72 0.81 0.88 0.91 0.94 0.95 0.96 0.97 1.00NGO2009 0.70 0.79 0.85 0.89 0.92 0.93 0.94 0.95 0.97 1.00NGO2010 0.69 0.77 0.84 0.87 0.89 0.91 0.92 0.93 0.95 0.99 1.00NGO2011 0.68 0.75 0.82 0.84 0.87 0.88 0.90 0.91 0.92 0.97 0.99 1.00
Source: own calculations

A modelling project in Poland: the social and intellectual capital aspects
11
Despite the importance of this variable (Seippel, 2006), the data needed for model development were the scarcest of the three components: data were available for the munici-palities only for the years 2008 and 2010. The more aggre-gate data, those for NUTS 3 subregions (Mazowieckie voivodeship is composed of six subregions or podregions) show an increase at the beginning of the period 2002-2010, due to an increase in the number and intensity of different sports- and recreation-oriented events and ini-tiatives, but also, on the other hand, to the demographic change (decrease in the number of children and teenagers, in the second part of the period). Altogether, these data suggest, fi rstly, rather variable dynamics, although quite consistent among the subregions and, in view of the simi-lar consistency with the data for municipalities, a possi-bility of advancing rather reliable hypotheses concerning the further course of events. Yet, given the high degree of volatility, three scenarios were envisaged. The ultimately obtained coeffi cients used in the model were obtained from a study, performed in the framework of design of the model, relating the respective changes to the macroeco-nomic and demographic ones.
In this area the situation of rural municipalities is cer-tainly worse than in the case of NGOs (Table 5). The envis-aged dynamics are in almost all cases lower than for the more urbanised municipalities. This is largely due to the demographic shifts and means that the rural areas, which have been for decades the source of sportsmen and sports-women, shall soon cease to play such a role, irrespective of the signifi cance for the social capital.
Membership of arts ensembles and associations (ART)
A similar model was proposed for this variable, whose introduction can be advocated by referring to, for instance, Daly (2005):
ARTt = (CZAZt / LUDNt) * 10,000
with the number of members given as:
CZAZt = CZAZt-1 + (CZAZbaza * SZTCZAZ (type of municipality)).
In this case, for the future values of SZTCZAZ (type of municipality) only the distinction between the municipality types was envisaged. The data have been collected in the two-year cycle and so were available for the years 2003, 2005, 2007, 2009 and 2011. For the majority of municipality types (including all of the rural ones) a quite monotonic, though rather slow, upward trend has been observed, but there were three quite important exceptions: Warszawa (MS), show-ing a distinct drop at the end of the historical period after a signifi cant increase, and the suburban zone of Warszawa (PSI), which mimicked the same changes, though with much less pronounced dynamics. On the other hand, the cores of the urban zones of subregional centres (MG) have shown a distinct downward trend over the entire period 2003-2011.
This differentiation led to the necessity of trying out several model forms (altogether four model forms were tested for various municipality types) (Table 6). It can be
Table 5: Predicted changes in the numbers of members of sports clubs and associations in each type of municipality in Mazowieckie voivodeship in the period 2012-2025, depending upon the scenario adopted.
TypeIncrease Stagnation Decrease
Total (initial year = 1)
Average per annum (%)
Total (initial year = 1)
Average per annum (%)
Total (initial year = 1)
Average per annum (%)
MS 1.19 1.3 0.99 -0.1 0.79 -1.4MG 1.12 0.8 0.92 -0.5 0.72 -1.9MP 1.12 0.8 0.92 -0.5 0.72 -1.9PSI 1.31 2.1 1.11 0.7 0.91 -0.6PSE 1.23 1.5 1.03 0.2 0.83 -1.2PG 1.17 1.1 0.97 -0.2 0.77 -1.5O 1.10 0.7 0.90 -0.7 0.70 -2.0R 1.06 0.4 0.86 -1.0 0.66 -2.3E 1.11 0.7 0.91 -0.6 0.71 -1.9
For municipality types see Table 1Source: own calculations
Table 6: Model forms tried out for various types of municipality in Mazowieckie voivodeship and predicted changes in the numbers of members of arts ensembles and associations and special interest groups in the period 2012-2025.
Type Functional form Value of b Value of a R2 FPredicted changes
Total (initial year = 1) Average per annum (%)MS y = xa + b 12,112.91 0.29 0.795 27.161 1.5 3.6MG y = ax + b 10,667.87 -0.09 0.915 74.978 0.3 -4.9MP y = loga x + b 4,111.59 1,440.36 0.982 383.131 1.2 1.2PSI y = loga x + b 6,598.64 1,743.83 0.866 45.084 1.1 0.9PSE y = ax + b 2,065.67 381.40 0.989 646.044 1.9 6.8PG y = ax + b 285.65 139.13 0.987 529.341 2.2 8.8O y = ax + b 1,360.01 198.48 0.959 161.855 1.9 6.4R y = ax + b 3,212.38 92.83 0.825 32.980 1.3 1.8E y = ax + b 4,614.04 58.83 0.411 4.891 1.1 0.8
For municipality types see Table 1Source: own calculations

Konrad Czapiewski, Krzysztof Janc, Jan W. Owsiński and Przemysław Śleszyński
12
expected that the forces behind the dynamics shown were somewhat similar to those for SPO. Altogether, in view of the statistical results obtained, it was decided to propose only one future course of events for each of the municipal-ity types.
Intellectual capitalAlthough it might be expected that intellectual capital
can be measured with more objectivity than social capital (level of education, presence of – possibly local – high-tech companies, attraction for the intellectually intensive exter-nal companies etc.), it is clear that in this case, as well, all the potential contributing variables have to be treated as ‘better proxies’ or at most, rough, even if reasoned, approxi-mations. Three variables were again proposed, with the dis-tinction that the respective data do not always exist at the municipality level, and rightly so, since many phenomena related to intellectual capital cannot be perceived as proper for such small spatial and social units. These three vari-ables are: SWM – a proxy for the educational level of the population of a municipality (percentage share of university graduates in the population of the municipality aged 13 and more); STU – number of students per 10,000 inhabitants of a subregion (podregion); and PKZ – number of compa-nies with foreign capital share per 10,000 inhabitants of the municipality8.
Share of university graduates (SWM)
This model takes a very simple shape of:
SWMt = SWM0 + t * dSWM
with t being the number of years since the start of the projec-tion, and dSWM being the increment parameter, determined on the basis of the past data. It should be noted that most of the models here sketched are only weakly connected with the rest of the system, namely mainly through the population variables. The specifi cation of this particular model required the analysis of both the ‘internal’ dynamics of the share of persons having graduated and the ‘external’ one of the respective population numbers. On the basis of such analy-ses, the differentiation of the municipality types with respect to the levels and changes in shares of university graduates in respective populations is shown (Table 7).
Thus, the overall trend towards the fl attening of this dis-tribution, to the advantage of the rural areas, not only has occurred in the past but is expected also to continue in the next ten years. This fl attening, still far away from the even-ing out and shown here in purely relative terms (Table 8), has to be seen against the background of the very intensive process of increase in the numbers of university graduates in Poland and in Mazowieckie voivodeship. This aspect consti-tutes the subject of the next variable considered.
8 Anon. (2008) was an important source for this model development. In Polish con-ditions it was established that there exists a clear correlation between the characterisa-tion of presence of companies with foreign capital share and various observable ele-ments of intellectual capital on the local basis.
Share of university students in subregions (STU)
This simple model has a form similar to models related to social capital, that is:
STUt = (LSTUt / LUDNt ) * 10,000
with the number of students in a subregion, LSTUt, deter-mined through:
LSTUt = LSTUt-1 + (LSTUbaza * SZTLSTU )
where LSTUbaza is the value for the initial year of the fore-cast and SZTLSTU is the coeffi cient, estimated from the past data. As mentioned already, this set of variables is heavily dependent upon the demographic characteristics and these are expected to change substantially in the period consid-ered, meaning an important future decline in the numbers of young people in the 20-24 years age bracket. The change is actually faced by the tertiary education sector in Poland, especially the non-public tertiary education. Based on this premise and on the general trends in university enrolment (after a dramatic upward surge in the 1990s and a stabilisa-
Table 8: Shares of the university educated population in the total population exceeding 13 years of age of each type of municipality and in Mazowieckie voivodeship, and the absolute average annual changes thereof.
Type
Share of university graduates among those
aged at least 13 (%)
Absolute average annual change (%)
2002 2011 2025 2002-2011 2011-2025MS 25.3 39.0 51.8 1.5 0.9MG 14.3 25.6 35.1 1.3 0.7MP 9.7 19.5 26.8 1.1 0.5PSI 14.4 28.0 41.8 1.5 1.0PSE 8.2 18.3 26.8 1.1 0.6PG 4.7 11.0 18.4 0.7 0.5O 4.3 8.5 13.4 0.5 0.3R 3.4 8.5 13.4 0.6 0.3E 3.5 7.3 10.0 0.4 0.2Mazowieckie 14.2 24.4 33.4 1.1 0.6
For municipality types see Table 1Source: own calculations
Table 7: Ratios of the shares of university graduates in the popula-tions of each type of municipality in Mazowieckie voivodeship to the average for the entire province – historical and forecasted data.
TypeTrue ratios based on National Census data
Model-based ratios
1970 1978 1988 2002 2011 2025MS 2.38 2.14 2.02 1.80 1.60 1.55MG 0.61 0.78 0.89 1.01 1.05 1.05MP 0.35 0.45 0.53 0.69 0.80 0.80PSI 0.63 0.64 0.69 1.02 1.15 1.25PSE 0.23 0.29 0.36 0.58 0.75 0.80PG 0.06 0.11 0.15 0.33 0.45 0.55O 0.12 0.17 0.22 0.31 0.35 0.40R 0.06 0.10 0.14 0.24 0.35 0.40E 0.18 0.18 0.20 0.25 0.30 0.30Mazowieckie 1.00 1.00 1.00 1.00 1.00 1.00
For municipality types see Table 1Source: own calculations

A modelling project in Poland: the social and intellectual capital aspects
13
tion in the 2000s, a slight decline followed), the respective data, essential for the determination of values of the model coeffi cients, were obtained after tests with two kinds of mod-els for the particular subregions of Mazowieckie voivodeship (Table 9).
The number of companies with foreign capital (PKZ)
This model has an analogous form:
PKZt = (ZAGRt / LUDNt ) * 10,000
with the number of companies in question given as:
ZAGRt = ZAGRt-1 + (ZAGRbaza * SZTZAGR )
ZAGRbaza being the value for the base year of the forecast and SZTZAGR being the coeffi cient estimated from the past data. The dynamics of the number of companies with foreign capital share in the reference period, i.e. until 2011, in the particular types of municipalities, had been quite uniformly upward, with Warszawa again in the lead by almost an order of magnitude.
Based on these data, and on the test with two kinds of model forms (linear and power), the basis for the model coeffi cients was established as given in Table 10. No alterna-tive scenarios were envisaged for this variable, both in view of the quite consistent and smooth course of events in the past, and in view of lack of prerequisites for such alterna-tive futures. The potential increase for the ‘truly rural’ areas is somewhat lower than otherwise, although the rate of increase is distinctly higher for the municipalities with inten-sive agricultural activities, this phenomenon being not only quite understandable, but also already clearly visible.
Computer applicationThe project produced a computer application intended to
provide the users with a hands-on tool for obtaining forecasts and projections of the particular indicators for the selected units or aggregates, and for the selected scenarios. The appli-cation is easily installed and functions in the Java environ-ment, with special emphasis on the use with the Microsoft™ operational systems, but with a possibility of deploying with Linux as well. Although the models can be run for all the municipalities and/or for all the counties of the province, the application is not endowed with a mapping function, since an already existing mapping application was supposed to make use of the output from the respective models. The output from the model runs takes the form of graphics, as well as exportable tables of values. Some defi nite comparison func-tions are also available (comparison between selected units, or with the corresponding averages for the province). The development of the application was carried out in coopera-tion with the representatives of the commissioning body. A working relationship was established for this purpose, which added an important value to the fi nal product.
ConclusionsThis paper provides an insight into aspects of a much
bigger modelling project in Mazowieckie voivodeship which pertain to the issues of social and intellectual capi-tal. The respective analyses and the models, as well as projections, were performed at the municipality level, and the municipalities were grouped according to their char-acteristics, including those of rural character, with defi nite distinctions. Owing to this, it was possible to show how the rural areas of varying features fare against the urbanis-ing and urban ones. The general conclusion is that both the social capital and the intellectual capital, as defi ned in the operational sense for the purpose of this project, but on a much broader substantive basis, are expected to increase signifi cantly in rural areas of Mazowieckie voivodeship. This increase is, in relative terms, often more pronounced than in the urban space, but in most cases the existing gap shall persist and, in absolute terms, may even, for some of the variables considered, grow. Thus, while, generally, the respective distributions would become fl atter, further efforts must be made to overcome the still persisting, and sometimes sharpening, gradients in space. Another issue is that of the increasing divide between the more ‘advanced’ and more ‘backward’ rural areas. Although it appears only in some dimensions, attention has also to be turned towards this phenomenon. These exemplary conclusions not only illustrate the usefulness of the model system, but in them-selves constitute a response to quite important cognitive and applied questions.
Table 9: Predicted changes in the numbers of students in the sub-regions (podregions) of Mazowieckie voivodeship and the entire province in the years 2012-2025.
Subregion Total(initial year = 1)
Average per annum(%)
Ciechanowsko-płocki 0.3 -5.4Ostrołęcko-siedlecki 0.4 -4.3Miasto Warszawa 0.9 -0.4Radomski 0.3 -5.3Warszawski-wschodni 1.1 0.9Warszawski-zachodni 1.0 0.1Mazowieckie 0.9 -1.0
Source: own calculations
Table 10: Predicted changes in the numbers of companies with a share of foreign capital in each type of municipality in Mazowieckie voivodeship in the period 2012-2025.
Type Total (initial year = 1) Average per annum (%)MS 1.6 3.9MG 1.3 2.1MP 1.4 3.0PSI 1.7 5.2PSE 1.7 4.7PG 1.5 3.7O 1.2 1.2R 1.4 3.2E 1.2 1.6
For municipality types see Table 1Source: own calculations

Konrad Czapiewski, Krzysztof Janc, Jan W. Owsiński and Przemysław Śleszyński
14
[Rural non-governmental organisations]. Problemy Rozwoju Wsi i Rolnictwa. Warszawa: IRWiR PAN.
Hastings, S. and Brucker, S. (1993): An Introduction to Regional Input-Output Analysis, in D.M. Otto and T.G. Johnson (eds), Microcomputer Based Input-Output Modeling: Applications to Economic Development. Boulder CO: Westview Press.
Heffner, K. and Rosner, A. (2002): Czynniki specyfi czne wywiera-jące wpływ na potencjał rozwojowy obszarów wiejskich [Spe-cifi c factors, infl uencing the development potential of the rural areas], in Rosner, A. (ed.), Wiejskie obszary kumulacji barier rozwojowych, Problemy Rozwoju Wsi i Rolnictwa. Warszawa: IRWiR PAN, 133-152.
Janc, K. (2009): Zróżnicowanie przestrzenne kapitału ludzkiego i społecznego w Polsce [Spatial differentiation of the human and social capital in Poland]. Rozprawy Naukowe, 8. Wrocław: Instytut Geografi i i Rozwoju Regionalnego Uniwersytetu Wro-cławskiego.
Kamiński, R. (2008): Aktywność społeczności wiejskich. Lokalne inicjatywy organizacji pozarządowych [Activity of the rural communities. Local initiatives of the NGOs]. Problemy Roz-woju Wsi i Rolnictwa. Warszawa: IRWiR PAN.
Kloha, P., Weissert, C.S. and Kleine, R. (2005): Developing and Testing a Composite Model to Predict Local Fiscal Distress. Public Administration Review 65 (3), 313-323. http://dx.doi.org/10.1111/j.1540-6210.2005.00456.x
Kołodziejczyk, D. (2003): Kapitał społeczny w rozwoju obszarów wiejskich [Social capital in the development of rural areas], in B. Górz and Cz. Guzik (eds), Współczesne przeobrażenia i przyszłość polskiej wsi, Studia Obszarów Wiejskich 4. Warsza-wa: IGiPZ PAN, 27-37.
Komornicki, T., Śleszyński, P., Rosik, P. and Pomianowski, W., with Stępniak, M. and Siłka, P. (2009): Dostępność przestrzen-na jako przesłanka kształtowania polskiej polityki transporto-wej [Spatial accessibility as a premise for the shaping of the Polish transport policy]. Biuletyn KPZK, 241, Warszawa.
Maki, W. (1997): Accounting for local economic change in regional input-output modelling. Journal of Regional Analysis and Pol-icy 27 (2), 95-109.
Marsal-Llacuna, M.-L. and Boada-Oliveras, I. (2013): 3D-VUPID: 3D Visual Urban Planning Integrated data, in B. Murgante, S. Misra, M. Carlini, C. Torre, H.-Q. Nguyen, D. Taniar, B.O. Apduhan and O. Gervasi (eds), Computational Science and Its Applications – ICCSA 2013. Berlin-Heidelberg: Springer, part IV, 17-32. http://dx.doi.org/10.1007/978-3-642-39649-6_2
Ohgai, A., Igarashi, M. and Watanabe, K. (2001): Estimating the Changing Distributions of Population and Employees by Cel-lular Automata, in S. Bandini and T. Worsch (eds), Theory and Practical Issues on Cellular Automata. Proceedings of the Fourth International Conference on Cellular Automata for Re-search and Industry, Karlsruhe, Germany, 4-6 October 2000. London: Springer-Verlag. http://dx.doi.org/10.1007/978-1-4471-0709-5_12
Owsiński, J.W. and Kałuszko, A. (1998): The demography and its model, in J.W. Owsiński, (ed.), A Dynamic Model of Polish Economy in Transition. Polish Operational and Systems Re-search Society, Warszawa, 182-213.
Owsiński, J.W. and Andrzejewski, M. (2010): Rural municipalities in Poland: Development types, paths and perspectives. Prelimi-nary results – the spatial aspect, in A. Fieldsend (ed.), Linking Competitiveness with Equity and Sustainability: New Ideas for the Socio-Economic Development of Rural Areas. Rural Areas and Development Series 7 Warszawa: ERDN, 177-196.
Owsiński, J.W. (2009): How can we read out life quality assess-ments from the offi cial socio-economic data on Polish munici-palities? in W. Ostasiewicz (ed.), Quality of Life Improvement through Social Cohesion. Statystyka i Ryzyko. Research Paper
ReferencesAnon. (2008): Raport o kapitale intelektualnym Polski [Report on
the intellectual capital of Poland]. Warszawa: SGH, Giełda Pa-pierów Wartościowych and GUS.
Batty, M. and Xie, Y. (1994): From cells to cities. Environment and Planning B: Planning and Design 21, 31-48. http://dx.doi.org/10.1068/b21s031
Beigl, P., Lebersorger, S. and Salhofer, St. (2008): Modelling mu-nicipal solid waste generation: a review. Waste Management 28, 200-214. http://dx.doi.org/10.1016/j.wasman.2006.12.011
Bess, R. and Ambargis, Z.O. (2011): Input-Output Models for Impact Analysis: Suggestions for Practitioners Using RIMS II Multipliers. Paper presented at the 50th Southern Regional Sci-ence Association Conference, New Orleans, Louisiana, 23-27 March 2011.
Bjørnskov, Ch. (2006): The Multiple Facets of Social Capital. Eu-ropean Journal of Political Economy 22, 22-40. http://dx.doi.org/10.1016/j.ejpoleco.2005.05.006
Brandsma, A., Kancs, D., Monfort, P. and Rillaers, A. (2013): RHOMOLO: A Dynamic Spatial General Equilibrium Model for Assessing the Impact of Cohesion Policy. JRC Technical Report EUR 25957 EN. Brussel: European Commission.
Capello, R. (2007): A forecasting territorial model of regional growth: the MASST. Annals of Regional Science 41, 753-787. http://dx.doi.org/10.1007/s00168-007-0146-2
Capello, R. and Fratesi, U. (2012): Modelling Regional Growth: An Advanced MASST Model. Spatial Economic Analysis 7 (3), 293-318. http://dx.doi.org/10.1080/17421772.2012.694143
Coleman, J.S. (1988): Social Capital in the Creation of Human Capital. American Journal of Sociology 94, 95-120. http://dx.doi.org/10.1086/228943
Cote, S. (2001): The Contribution of Human and Social Capital. Canadian Journal of Policy Research 2, 29-36.
Czapiewski, K. (2010): Koncepcja wiejskich obszarów sukcesu społeczno-gospodarczego i ich rozpoznanie w województwie mazowieckim [The concept for the rural areas of socio-eco-nomic success and their identifi cation in the province of Maso-via]. Studia Obszarów Wiejskich, 22. Warszawa: IGiPZ PAN.
Daly, S. (2005): Social Capital and Cultural Sector. London: Lon-don School of Economics.
Fukuyama, F. (1997): Zaufanie. Kapitał społeczny a droga do do-brobytu (Polish translation of: Trust. The Social Virtues and the Creation of Prosperity, 1995). Warszawa: PWN.
Fukuyama, F. (2000): Wielki wstrząs (Polish translation of: The Great Disruption. Human Nature and the Reconstruction of So-cial Order, 1999). Warszawa: POLITEJA.
Gadomski, J. and Owsiński, J.W. (2008): Ekonometryczny model do badania wpływu unijnej i krajowej polityki rolnej na wy-niki polskiego rolnictwa [Econometric model for analysing the impact of the EU and national agricultural policies on the performance of Polish agriculture], in A. Kowalski and M. Wigier (eds), Rozwój sektora rolno-spożywczego w Polsce na tle tendencji światowych. Program Wieloletni 2005-2009, 101. Warszawa: IERiGŻ-PIB, 101-124.
Gardiner, B. and Kancs, D. (2011): RHOMOLO: A Dynamic Gen-eral Equilibrium Modelling Approach to the Evaluation of the EU’s Regional Policies. JRC Technical Report EUR 27318 EN. Brussel: European Commission.
González, P.B., Gómez-Delgado, M. and Benavente, F.-A. (2015): Vector-based Cellular Automata: exploring new methods of ur-ban growth simulation with cadastral parcels and graph theory, in Proceedings of the 4th International Conference on Comput-ers in Urban Planning and Urban Management, Cambridge MA, USA, 7-10 July 2015.
Halamska, M. (ed.) (2008): Wiejskie organizacje pozarządowe

A modelling project in Poland: the social and intellectual capital aspects
15
No. 73. Wrocław: Wrocław University of Economics, 50-63.Putnam, R. (1995): Demokracja w działaniu. Tradycje obywatel-
skie we współczesnych Włoszech (Polish translation of: Mak-ing Democracy Work: Civic Traditions in Modern Italy, 1993). Kraków: Społeczny Instytut Wydawniczy ZNAK.
Ratto, M., Roeger, W. and in’t Veld, J. (2008): QUEST III: An es-timated DSGE model of the euro area with fi scal and monetary policy. European Economy – Economic Papers 335. Brussel: European Commission.
Roeger, W. and in’t Veld, J. (1997): QUEST II. A Multi Country Business Cycle and Growth Model. European Economy - Eco-nomic Papers 123. Brussel: European Commission.
Rohman, I.K. (2013): The globalization and stagnation of the ICT sectors in European countries: An input-output analy-sis. Telecommunications Policy 37, 387-399. http://dx.doi.org/10.1016/j.telpol.2012.05.001
Solon, J. (2008a): Kierunki standaryzacji metod badań krajobrazu do celów praktycznych [Directions of standardization of meth-
ods of landscape study for practical purposes]. Przegląd Geo-grafi czny 80 (1), 39-54.
Solon, J. (2008b): Łąki, bociany i ludzie – powiązania między sys-temem przyrodniczym i systemem społeczno-ekonomicznym w województwie podlaskim [Meadows, storks and people – con-nections between the natural system and the socio-economic system in the province of Podlasie]. Czasopismo Geografi czne 79 (3), 244-255.
Seippel, Ø. (2006): Sport and Social Capital. Acta Sociologica 49, 169-183. http://dx.doi.org/10.1177/0001699306064771
Śleszyński, P. (2007): Szacowanie liczby i rozmieszczenia pracu-jących w dużym mieście na przykładzie Warszawy [Estimation of the number and distribution of the employed in a large city on the example of Warsaw]. Przegląd Geografi czny 79 (3-4), 533-566.
Varga, A. (2007): From the Geography of Innovation to Develop-ment Policy Analysis: The GMR-approach. Annals of Econom-ics and Statistics 87-88, 83-101.