a gis based character appraisal toolkit
TRANSCRIPT


Edited bySaviour Formosa
Future PreparednessTh ematic and Spatial Issues
for the Environment and Sustainability

Future Preparedness: Th ematic and Spatial Issues for the Environment and Sustainability is a double-blind peer-reviewed publication.
All rights reserved: © 2014 Th e Editor
Th is publication refl ects the views only of the authors, and the European Commission cannot be held responsible for any use which may be made of the information contained therein.
ISBN 978-99957-834-6-4 (paperback)ISBN 978-99957-834-7-1 (e-book)
Published by the Department of Criminology,Faculty for Social Wellbeing, University of Malta, Msida, Maltawww.um.edu.mt/criminologyin conjunction with the Malta Environment & Planning Authority, Floriana, Maltawww.mepa.org.mt
Production: Saviour FormosaCover: Saviour FormosaPrinted by: Gutenberg Press, Gudja - www.gutenberg.com.mt

To all those with Foresight
Th e ability to see in the future can only be wrought by delving into the past, identifying with the present and daring to look into the
possible and/or improbable
and to Ryan for pointing out relevant new realities and
virtual worlds we did not know even existed but served spatial thematics perfectly

ACKNOWLEDGMENTSTh anks goes to all those who made this book happen, the ERDF156 project experts, the University of Malta, the Malta Environment and Planning Authority, the Malta Resources Authority, the National Statistics Offi ce, the Environmental Health Directorate and the Planning and Priorities Coordination Department.
Th anks also goes to Professor Juanito Camilleri, Rector of the University, Perit Vincent Cassar, Chairman MEPA, Johann Buttigieg, CEO MEPA, Michael Pace Ross, DG NSO and their predecessors on the project as well as the dedicated staff from the Information Resources Unit, the Information Technology Unit, Communications Unit and Project Support Unit at the MEPA and partners who dedicated years on the project and all those off ered their input to the publication: Michelle Borg, Carlos Camenzuli, Gayle Camilleri Scerri, Sarah Cassar, Stephen Conchin, Claire Ellul, Suzanne Gauci, Peter Gingell, Omar Hili, Joseph Magro Conti, Maria Mallia, Claire Meli, Alan Pulis, Antonello Rizzo Naudi, George Said, Daniella Sammut, Dr Elaine Sciberras and Femia Matias Torrilla.
On an international academic front, words cannot express the editor’s appreciation to the experts who provided ongoing encouragement and support, mainly Professor Alexander Hirschfi eld from the University of Huddersfi eld, Derek Reeve from UNIGIS UK, Dr Paul Smits and Dr Max Craglia from the EU Joint Research Centre, Professor Beniamino Murgante from the University of Basilicata and Professor Lino Briguglio from the University of Malta.
Th e authors, who hail from four continents deserve a veritable round for the patience and endurance they showed in the drive for delivery: Carol Agius, René Attard, Dr John C. Betts, Professor Marc Bonazountas, Dr Malcolm Borg, James Brearley, Dr Marguerite Camilleri, Tim Camilleri, Sandro Cutajar, Roberta Debono, Ruth Debrincat, Carlos A. Espinal, Dr Saviour Formosa, Janice Formosa Pace, Dr Charles Galdies, Dr Timmy Gambin, Ashley Hili, Shane Hunter, Ing Nathalia Kisliakova, Dr David Mallia, Giacomo Martirano, Dr Anton Micallef, Maria Refalo, Ines Sanchez, Francesca Tamburini, Anestis Trypitsidis, Antonella Vassallo and Matthew Vella.
Finally, a word of appreciation to those thematic experts who peer-reviewed this publication, which employed a double-blind process.

TABLE OF CONTENTSContributors ..................................................................................................................................7
Introduction: Future Preparedness: the Environment & Sustainability ..............................19Saviour Formosa
Th e Th ings that Came to Pass
CHAPTER 1: ERDF 156 - Developing a National Environmental Monitoring Infrastructure and Capacity: Shift ing the State of Access .....................................................31Ashley Hili
CHAPTER 2: Further Improvement of the Implementation of the Aarhus Convention in Malta: A Review ...............................................................................................39Nathalia Kisliakova
Setting the Scene for Understanding the Realities of Space
CHAPTER 3: Can Building Footprint Extraction from LiDAR be Used Productively in a Topographic Mapping Context? .......................................................................................59Carol Agius and James Brearley
CHAPTER 4: Th e National Protective Inventory and Malta Scheduled Property Register: Malta’s Baseline for Cultural Heritage Protection and More ................................75René Attard and Matthew Vella
CHAPTER 5: Design of the Shared Environmental Information System (SEIS) and Development of a Web-Based GIS Interface ..................................................................85Marc Bonazountas, Giacomo Martirano, Tim Camilleri and Anestis Trypitsidis
CHAPTER 6: Setting an Integrated Soil Monitoring System for Malta: Strategy, Feasibility and Recommendations ........................................................................................ 101Sandro Cutajar
CHAPTER 7: High Resolution Agriculture Land Cover Using Aerial Digital Photography and GIS – A Case Study for Small Island States .......................................... 127Charles Galdies, John C. Betts, Antonella Vassallo and Anton Micallef

CHAPTER 8: Updating the Bathymetry of the Maltese Islands: a National-Scale Marine Survey Employing Interferometric Sonar .................................... 153Carlos A. Espinal and Shane Hunter
CHAPTER 9: Sustainability and Urban Conservation in Malta ..................................... 163David Mallia
CHAPTER 10: Th e Surrounding Habitat of Marina Algae in Malta .............................. 183Maria Refalo
Conceptualising the Future
CHAPTER 11: A GIS Based Character Appraisal Toolkit ............................................... 209Malcolm Borg and Saviour Formosa
CHAPTER 12: Information Needs for Environmental Policy Making: Some Orientations for the Future .................................................................................................... 225Marguerite Camilleri and Roberta Debono
CHAPTER 13: Spatial Conceptualisation as a Foundation for Social Interactionism in Virtual Worlds ......................................................................................... 237Saviour Formosa
CHAPTER 14: Th e Neo-Society: Realities of New Socio-Virtual Paradigms ................ 249Janice Formosa Pace
CHAPTER 15: Side Scan Sonar and the Management of Underwater Cultural Heritage .................................................................................................................... 259Timmy Gambin
CHAPTER 16: Assessment of the Maltese Environmental Matrix to Defi ne the Future Monitoring Strategy ............................................................................................. 271Ines Sanchez, Francesca Tamburini and Ruth Debrincat
Colour Imagery: .................................................................................................................... 305

CONTRIBUTORS
Carol Agius has over 20 years experience in topographic mapping and GIS. She currently works with the Malta Environment and Planning Authority (MEPA) within the Mapping Unit, Malta’s National Mapping Agency. She is responsible for the development and production of large-scale topographic datasets. Carol is also chair of the EuroGeographics Quality Knowledge Exchange Network, a group of quality experts from various European National Mapping Agencies. Carol holds an MSc in GIS from University of Huddersfi eld and is a Chartered Geographer (GIS).
Affi liation: Malta Environment & Planning Authority, Malta Email: [email protected]
René Attard holds an MSc in Geographic Information Science, Manchester Metropolitan University, UK and currently has an Executive II (Team Manager) position and manages the team reviewing applications assessed by the Urban Conservation Area Team of the Malta Environment and Planning Authority’s Development Services. Until recently he was responsible for the scheduling of buildings and management of the GIS aspect of the National Protective Inventory and Malta Scheduled Property Register within the Heritage Planning Unit of MEPA.
Affi liation: Malta Environment & Planning Authority, Malta Email: [email protected]
John C. Betts graduated B. Mech. Eng. (Hon.s) from the Faculty of Engineering of the University of Malta in 1991. In 2006 he graduated MSc in Astronomy from Swinburne University of Technology, Victoria, Australia. In 2008 he obtained his PhD in Engineering for his research on laser material deposition of ceramic-reinforced metal surfaces. Dr. Betts worked as research engineer on remote sensing with the Euro-Mediterranean Centre on Insular Coastal Dynamics of the University of Malta for a period of two and a half years before becoming assistant lecturer with the Dept of Metallurgy and Materials Engineering of the University. He became lecturer in 2008 on attaining his doctorate degree, and has lectured on materials engineering, engineering ceramics, ceramics and glass in conservation and materials selection since 2001; since 2009 he has also participated in lectures on scientifi c techniques for Archaeology students. He became head of the Dept in April 2011 and Dean of the Faculty of Engineering in May 2011, but still lectures and supervises students in the areas listed. His main research areas are laser deposition

8 Future Preparedness: Th ematic and Spatial Issues for the Environment and Sustainability
of metal powders and metal/ceramic blends, and materials selection techniques. He is also involved in ongoing research on the environmental degradation of fi bre-reinforced polymer composites. He has been part of the High-level Space Policy Group of the Malta Council for Science and Technology.
Affi liation: Metallurgy & Materials Engineering, Faculty of Engineering, University of Malta, Malta.
Email: [email protected]
Marc Bonazountas is a Civil Engineer. His expertise is in the entire broad spectrum of environmental sciences & engineering and in supporting peripheral domains of GIS, Infosociety and space technologies. Prof. Bonazountas has authored 600+ publications, proceedings and white papers, and is on the editorial board of several scientifi c journals & organisations. Tenured Professor, NTUA 1990+, School of Civil Engineering, Department of Water Resources & Environment; Member of the Scientifi c Management Committee of the European Environment Agency (EEA, 2007-2010); Chairman of the Environment & Sustainability Standing Committee of the European Council of Civil Engineers (ECCE, 2007-2010). He was with Arthur D. Little Inc, Cambridge, Massachusetts, USA (1976-87); with Rhein-Main-Donau AG, Germany (1972-73). He has managed 60+ major EC/RTD projects, has lead and guided 150+ major state-of-technology projects, has supervised 40+ major academic research projects.
Affi liation: Epsilon International SA, Greece. Email: [email protected]
Malcolm Borg is a planner by profession and training, and holds a PhD in planning and urbanisation from the University of Leeds, UK. In 2001, he was awarded a scholarship in heritage management, with research undertaken at La Sapienza in Rome and the Istituto Technico in Turin, and for the past 10 years, he has lectured in heritage management and economics of heritage at the Institute for Conservation Management and Cultural Heritage (ICMCH). Dr Borg worked in the planning sector for over 15 years, within the Environmental Management Unit of the Malta Environment and Planning Authority, and previously held posts of Policy Coordinator and Project Manager with the Ministry for Youth and the Arts, the Ministry for Urban Development and Roads, and the Ministry for Infrastructure, Transport and Communication. He was specifi cally engaged in the launching, development and monitoring of regeneration projects and the development of national policy related to urban development, planning, regeneration and the implementation of EU Directives and Charters. Dr Borg also compiled Development Briefs and Action Plans for the Dock No. 1 Project in Cottonera and the Vertical Connection in Valletta. He was also responsible for the Competition and Planning Brief

Contributors 9
for the Hagar Qim and Mnajdra Heritage Park (WHS) and the Tentative List for Malta UNESCO Sites. Dr Borg is a recognized URBACT Th ematic Expert and an UN Global Cities Compact Advisor. He is a project coordinator specialising in EU and International funded programmes. He is currently a private consultant with Arts and Culture Victoria and a member of the Planning Institute Australia.
Affi liation: Global Cities Institute, Australia. Email: [email protected]
James Brearley is an undergraduate student at Manchester Metropolitan University studying Physical Geography. James is currently working on an industrial placement with the Malta Environment and Planning Authority (MEPA) within the Mapping Unit, Malta’s National Mapping Agency. Th e current focus of his work is the research and manipulation of LiDAR data. Once the placement is over James will be returning to Manchester to complete his fi nal year at university.
Affi liation: Manchester Metropolitan University, United Kingdom. Email: [email protected]
Marguerite Camilleri has a doctorate in Environmental Policy from Cambridge University, UK, and is currently posted at the Ministry for Sustainable Development, the Environment and Climate Change, as National Environment Policy Coordinator. Her interests are in the area of environmental policy, sustainable development, environmental governance and the integration of sustainability concerns into land use planning.
Affi liation: Ministry for Sustainable Development, the Environment and Climate Change, Malta.
Email: [email protected]
Tim Camilleri is a subcontractor of EPSILON. He has multi-disciplinary experience in a variety of technologies, namely ERP, BI, GIS, Project Mgt, Design and Document Mgt. For the past 20 years lead various key projects in a broad spectrum of industries be they private or public whilst running technology innovator companies. Driven by business effi ciency goals , enabling technologies and integration.
Affi liation: GeoSYS Ltd, Malta. Email: [email protected]

10 Future Preparedness: Th ematic and Spatial Issues for the Environment and Sustainability
Sandro Cutajar is a geographer and planner by training. He has been working at the Malta Environment and Planning Authority since 1995 as Senior Planning Offi cer, where he has been involved in the preparation of various local plans and other subsidiary legislative instruments primarily within the Authority’s forward land use planning function. Since 2010, Sandro has provided extensive contribution, at consultation stage, to various multilateral, EU-related and national documentation relevant to soil protection in view of his duties as offi cer responsible for land planning issues within the Offi ce of the MEPA’s Environment Director. He is currently coordinating dissemination of best practice on soil protection monitoring including re-structuring of the same sector within the environmental arm of this Authority. Mr. Cutajar graduated with a B.A.(Hons.) degree in Contemporary Mediterranean Studies from the University of Malta (UoM). In 1999, he was awarded with an M.Sc. in Environmental Planning and Management from the International Environment Institute of the same University. Mr. Cutajar served also as a former National Focal Point for the United Nations Convention to Combat Desertifi cation in those Countries Experiencing Serious Drought and/or Desertifi cation, particularly in Africa (UNCCD). Between 1999 and 2003 he was also actively involved within the Malta Chamber of Planners. Since 2006, he practices as a freelance translator following achievement of a UoM post-graduate diploma.
Affi liation: Malta Environment and Planning Authority, Malta. Email: [email protected]
Roberta Debono has a Masters degree in Sustainable Development from Staff ordshire University, UK, having read a BA (Hons) in Geography at the University of Malta. She is currently posted as a the Ministry for Sustainable Development, the Environment and Climate Change, as Assistant National Environment Policy Coordinator, where she is involved in environmental and sustainable development policymaking and monitoring.
Affi liation: Ministry for Sustainable Development, the Environment and Climate Change, Malta. Email: [email protected]
Ruth DeBrincat has completed her post graduate degree in Sustainable Environmental Resources Management in 2010. Th is masters programme was jointly coordinated between James Madison University in the U.S. and the University of Malta with a strong emphasis on the analysis and integration of scientifi c information into policy and legal perspectives. She has conducted scientifi c research at the University of Malta following the Bachelor of Science (Honours) in Chemistry and Biology She is currently employed by AIS Environmental Ltd. as an environmental scientist.
Affi liation: Ais Environmental ltd, Malta. Email: [email protected]

Contributors 11
Carlos A. Espinal is an environmental engineer specialised in marine sciences and holds an MSc in aquaculture. He started his career in the oil and gas sector in South America, initially working in environmental and social impact assessments and quickly moving towards off shore oil exploration, where he became familiar with marine surveying and seismic remote sensing. Aft er moving to Europe to pursue graduate studies, Carlos relocated to Malta to work as consultant and engineer for the maritime and fi sh farming sectors as part of the AquaBioTech Group. During his stay, he has worked in North America, Asia and most of Europe in a wide range of aquaculture-related projects. Carlos has also participated as a consultant in more than fi ve European-funded research projects and is part of COST Action - a network for European cooperation in science and technology. In Malta, he undertook a national-scale bathymetric survey of the archipelago during 2012 and 2013. Today, he continues to work at sea during the summer season performing bathymetric, side-scan, sub-bottom and benthic surveys. Carlos is an accomplished user of wide swath interferometric sonar systems and enjoys spending hours of his day playing with sonar data, especially when he is not busy designing fi sh farms.
Affi liation: AquaBioTech Group, Malta. Email: [email protected]
Saviour Formosa has a PhD in spatio-temporal environmental criminology (University of Huddersfi eld 2007), having acquired an MSc in GIS (University of Huddersfi eld 2000) and a BA (Hons) in Sociology (University of Malta, 1994). He is a Senior Lecturer within the Department of Criminology, Faculty for Social Wellbeing, University of Malta. His main area of research is in spatio-temporal analysis of crime and its social and physical relationships using spatial information systems. His main expertise lies in the implementation of cross-thematic approaches and uses of the data cycle and management with emphasis in the thematic and spatial data structures, visualisation and socio-technic approaches to crime analysis. He has led projects on Aarhus, INSPIRE, ERDF, ISEC, ESPON and serves as contact point for various international fora. Dr. Formosa is a member of the European Society of Criminology, the founder of Malta Criminology Association and the Malta Association of Geographical Information, Fellow of the Royal Geographical Society and a Member of the Applied Criminology Centre at the University of Huddersfi eld. He has developed the www.crimemalta.com website which covers ongoing crime-related and spatial statistics in Malta.
Affi liation: Department of Criminology, Faculty for Social Wellbeing, University of Malta, Malta.
Email: [email protected]

12 Future Preparedness: Th ematic and Spatial Issues for the Environment and Sustainability
Janice Formosa Pace is a PhD Candidate in intergenerational transmission of crime at the University of Huddersfi eld, having acquired an MSc in forensic and legal psychology (University of Leicester 2003), a B.Psych (University of Malta, 1995) and a Diploma in Probation Services (University of Malta, 1996). She is a visiting Senior Lecturer within the Department of Criminology, Faculty for Social Wellbeing, University of Malta. Her main area of research is in the transmission of crime across the generations with emphasis on the period between 1950 and 2010 in the Maltese Islands. She is a member of the Prison Leave Advisory Board at the Corradino Correctional Facility in Malta. Her expertise lies in the development of routes for deviant children. Ms. Formosa Pace is a member of the Malta Criminology Association. She provides expertise to www.crimemalta.com.
Affi liation: Department of Criminology, Faculty for Social Wellbeing, University of Malta, Malta.
Email: [email protected]
Charles Galdies is a Lecturer with the Division of Environmental Management and Planning within the Institute of Earth Systems. He has received his Ph.D. in Remote Sensing and GIS from Durham University (UK) in 2005. He studied computer algorithms that are able to improve small-scale weather and ocean forecasting in the central Mediterranean region using novel remote sensing observations of the ocean and atmosphere. Dr Galdies also served as Chief Meteorological Offi cer of the Malta MetOffi ce from 2007 to 2011, and Deputy Executive Director of the International Ocean Institute Headquarters between 2003 and 2007. He is the Permanent Representative of the Government of Malta with the World Meteorological Organisation. Dr Galdies’ expertise focuses on weather and climate, the application of remote sensing for coastal, benthic and terrestrial ecological mapping, as well as environmental data processing and analysis. He has provided consultancy to the Food and Agriculture Organisation, the European Commission, the International Union for the Conservation of Nature (IUCN) and to private companies related to ecology and policy formulation.
Affi liation: Institute of Earth Systems, University of Malta. Email: [email protected]

Contributors 13
Timmy Gambin is a Senior Lecturer in the Department of Classics and Archaeology, University of Malta, from where he obtained a B.A. in History. Following his undergraduate studies, Dr Gambin went on to attain an M.A. in Maritime Archaeology and History at the University of Bristol in the UK where he continued his postgraduate studies by reading for a doctorate in Maritime Archaeology. Since 2001, he had been a visiting lecturer at the department and took up the post of Senior Lecturer in Maritime Archaeology in the spring of 2012. Over the past years, he has been involved in numerous collaborative research projects. Th e PaleoMed Project with the CNRS (Aix en Provence) is aimed at the reconstruction of ancient coastal landscapes and environments of the Maltese Islands. Th e multidisciplinary approach sees archaeologists working together with geomorphologists and palynologists. Th e Ancient Cisterns Project with CalPoly (USA) explores underground water management systems through the use of small remote operated vehicles armed with a variety of sensors. Dr Gambin also directed numerous off shore underwater surveys in various parts of the Mediterranean including Spain, Italy and Croatia.
Affi liation: Department of Classics and Archaeology, University of Malta. Email: [email protected]
Ashley Hili is a Senior Information Resources Offi cer in a National regulatory agency responsible for environment protection and development planning. She graduated with a Higher Certifi cate in Land Administration (Planning) in 1998 and subsequently with a Diploma in Planning in 2000, both from the University of Malta. She then graduated from the Manchester Metropolitan University with an M.Sc. in Geographical Information Systems (GIS) and Science in 2006. Ashley has worked for the Malta Environment and Planning Authority (MEPA) for the past 17 years , currently as a professional GIS expert, where she has contributed to diverse projects mainly in the fi eld of spatial research, data management and project coordination/leadership.
Affi liation: Malta Environment and Planning Authority, Malta. Email: [email protected]
Shane Hunter is the technical director of the AquaBioTech Group based out of Malta, but operating globally within the marine, aquaculture and fi sheries industry. Starting his career as a fi sh biologist, he now oversees the various divisions of the company and heads the company’s undertaking of aquatic risk assessments for international insurance companies and investment funds. Shane has also led a number of international marine surveys from both a biological and hydrographic perspective.
Affi liation: AquaBioTech Group, Malta Email: [email protected]

14 Future Preparedness: Th ematic and Spatial Issues for the Environment and Sustainability
Nathalia Kisliakova graduated as civil engineer in Bulgaria. Aft er several years in the fundamental research in the fi elds of wastewater treatment and waste management in Switzerland and Austria, she changed to the private industry and fi nally, to the International Aff airs Department of the Environment Agency Austria. In the described Twinning project in Malta, she acted as Resident Twinning Advisor.
Affi liation: International Aff airs Dept., Environment Agency, Umweltbundesamt, Austria Email: [email protected]
David Mallia is a manager in the Heritage Protection Unit at the Malta Environment and Planning Authority. Previously he was responsible for development control in Urban Conservation Areas for thirteen years and a member of the Heritage Advisory Committee for ten years. He was awarded two scholarships in Conservation at the Milan Polytechnic, his research studies focused on rural churches and fortifi cations (Masters Degree) and then on the origins and development of Maltese Vernacular Architecture (PhD). He is a founder member of the ICOMOS (Malta) committee, the editor of Melita Historica and Web-Master of the Malta Historical Society.
Affi liation: Malta Environment and Planning Authority, Malta. Email: [email protected]
Giacomo Martirano is an electronic engineer who graduated at Polytechnic of Milan (IT) in 1991, since 1991 to 1997 in the On-Board Spacecraft Systems Division at Alenia Aerospazio (today Th ales Alenia Space) and since 1997 cofounder and Technical Manager of Epsilon Italia, an independent SME active in Geographic Information, on behalf of which he was/is responsible for many international projects. He is deeply involved in the implementation of the INSPIRE Directive, with focus on the harmonisation and validation of spatial datasets and metadata. He is vice-chair of the Technical Committee TC 287 Geographic Information of CEN (European Standardisation Body) and, in the same Committee, Project Leader of part 5 Validation and Testing of the CEN/TC 287 multipart Technical Report TR 15449 on SDI. He is also member of the Geographic information Section of UNINFO (Italian Standardization Body)
Affi liation: Epsilon Italia. Email: [email protected]

Contributors 15
Anton Micallef holds a B.Sc. (Hons.) in Biological Sciences (Plymouth, UK); a Post-Graduate Diploma in Air & Water Pollution Control (London) and a PhD on “Beach Management in the Maltese Islands” (Swansea, Wales). Dr Micallef is a Senior Lecturer at the University of Malta and currently lectures within the Institute of Earth Systems at the University of Malta on various topics including, apart from his areas of specialisation, the Mediterranean coastal and marine environment, coastal hazards, coastal risk management and ocean systems. His area of specialisation is Coastal Geomorphology and Integrated Coastal Area Management, particularly that related to Beach Management. Since 1989, he has been the Director of the Euro-Mediterranean Centre on Insular Coastal Dynamics (ICoD), a Council of Europe specialized Centre pertaining to the EUR-OPA Major Hazards Agreement. Dr. Micallef has served as Chairman of the Committee of Directors of Specialised Centres and Vice Chairman of the Bureau of the Committee of Permanent Correspondents, under this Agreement. He has served as a faculty member of MedCoast Network (a Euro-Mediterranean network of scientists dedicated to coastal management in the Mediterranean and the Black Sea) since 1994. Dr Micallef has co-authored a text book on Beach Management and authored and co-authored several scientifi c publications and reports on coastal / beach management related issues.
Affi liation: Institute of Earth Systems, University of Malta Email: [email protected]
Maria Refalo graduated in the Geographic fi eld, shares interest in physical geography with respect to geospatial reference. Graduated in 2012 from the University of Malta with a B.A. Honours Degree in Geography aft er a three year intensive course which included both human and physical exploration of the Maltese geographical islands. Her undergraduate honours thesis entitled, “Distribution of marine algae along the coastline of the Maltese islands in relation to environmental factors”, scrutinised the development and actuality importance of algae species around the coast of the Malta and Gozo, whilst observing the environmental eff ects incurred to their natural habitat. As a student worker, she was given an experience in the Forward Planning Division for Gozo by the Malta Environment and Planning Authority (MEPA) back in 2012. Maria also undergone a Post Graduate Certifi cate in Education course and graduated again from the University of Malta in 2013 as a Geography Teacher. She taught Geography in secondary schools. However, she was always inclined to the world of Geographical Information System (GIS) which made her decide to opt for a career in the GIS fi eld.
Affi liation: Malta Environment and Planning Authority, Malta Email: [email protected]

16 Future Preparedness: Th ematic and Spatial Issues for the Environment and Sustainability
Ines Sanchez graduated in Environmental Sciences from the Universidad Autómoma de Madrid, Spain. She studied for her Masters in Environmental Sciences at the University of Wageningen, Netherlands with a specialization on Environmental politics. She has international working experience including consultancy projects in Uzbekistan and Uganda regarding water management. She is part of the Environmental Engineering Sector of ambiente s.c., and she coordinates international projects.
Affi liation: Ambiente sc, Italy. Email: [email protected]
Francesca Tamburini is an engineer of the Environment and the Territory. She is a valid expert on environmental regulations, from atmospheric emissions to water resource management, waste management and contaminated soils; within the Environmental Section she deals with problem solving tasks related to Environmental Impact Assessment and feasibility studies for public and private institutions which may be subject to regulatory procedures. She is expert on environmental law and urban planning for local authorities, as well as in research and analysis of environmental data. Actually she is part of the Environmental Engineering Sector of ambiente s.c. where she in charge of draft ing Strategic Environmental Assessment studies, Integrated Structural Plans, Urban development plans, area development plans, etc. Also she directly coordinates the team that designs and implements monitoring plans regarding the atmospheric and water component nationally and internationally..
Affi liation: Ambiente sc, Italy. Email: ft [email protected]
Anestis Trypitsidis is an urban planner and regional development engineer who graduated at University of Th essaly (UTH, MEng, 2010), MSc in Geoinformatics - Applied Geography and Spatial Planning, Department of Geography, Harokopio University of Athens (MSc, 2013). His expertise lies in aviation geomatics, in web-geoinformatics applications, and in SEIS-INSPIRE.
Affi liations: Epsilon International SA, Greece. Email: [email protected]

Contributors 17
Antonella Vassallo has a Master’s Degree in Biology and a fi rst degree in Biology and Chemistry from the University of Malta. Following her post-graduate education, she has worked in areas of research and application allowing her to obtain specifi c experience in environmental appraisal (ecology and vegetation analysis, both marine and terrestrial) and EIAs. In other work capacities, she has coordinated project applications and project implementation from various regional and international funding agencies in the course of her duties. In her previous post as Project Offi cer with the Euro-Mediterranean Centre on Insular Coastal Dynamics of the University of Malta, she was involved closely with the AGRISTAT project work and analysis underpinning this paper. Ms. Vassallo was previously a member of the Natural Heritage Advisory Committee (NHAC) of the local Malta Environment and Planning Authority (MEPA) advising on the environmental implications of development applications in environmentally sensitive areas or in sites outside the development zone. She has also served as a Board Member of the Malta Resources Authority (MRA); the Board is responsible for regulatory oversight on mineral, water and energy resources and for policy, planning and advisory on these matters. Other work also includes lecturing, research and organization of fi eldwork activities with the University of Malta. She is currently the Coordinator of the Global Training Programme with the International Ocean Institute (IOI) at its Headquarters in Malta. In this capacity, she is responsible for coordinating a number of capacity building and training programmes on behalf of IOI HQ, and the initiation, development and implementation of projects and partnerships with other universities, centres and organizations as necessary. She is currently the focal point within the IOI for the Master Degree in Ocean Governance off ered through the University of Malta.
Affi liations: International Ocean Institute, University of Malta, Malta. Email: [email protected]
Matthew Vella holds a Master of Heritage Conservation from the University of Sydney, Australia and was until recently responsible for managing the National Protective Inventory and Malta Scheduled Property Register databases on MEPA’s website during his tenure as Project Manager (Heritage) within the Heritage Planning Unit of MEPA. He was mainly responsible for the updating of the NPI to its current version, updating the website MSPR as available at present and creation of the web version of the NPI cards..
Affi liations: Malta Environment and Planning Authority. Email: [email protected]

18 Future Preparedness: Th ematic and Spatial Issues for the Environment and Sustainability

I N T R O D U C T I O N
Why Future Preparedness?Saviour Formosa
Why Future Preparedness and why even attempt to look into the future at a stage where the state of the environment is in such a constant rate of fl ux? Trying to understand what may come to pass tomorrow only takes a form when we know our present and how today is aff ected by our yesterday. Society is in transition and at a very rapid pace too. We cannot embrace one without the others and preparedness has never been more crucial. From understanding the diverse and contrasting social realities and the interactions between the environment, human capital and landuse to fathoming out the implications of legislative and operational tools on social cohesion, society faces major challenges. Challenges that can be understood through a dichotomy of interlinking activities: those purely based on scientifi c research and those striving for the implementation of on-the-ground operational processes.
Th is publication seeks to help us understand such worlds and delves into a review of the past, describes the state of current knowledge whilst striving to help open for readers a window into future activities: through spatial descriptors. Th e publication is structured into three sections that help readers to understand the context within which such a publication is set: the fi rst related to descriptors pertaining to the implementation of two major projects, the second section related to research that laid the groundwork for the present, whilst the fi nal section looks forward on new societies and research challenges.
Th e Th ings that Came to PassTh e fi rst section focuses on a documentary walkthrough of the implementation of the
ERDF156 project entitled “Developing National Environmental Monitoring Infrastructure and Capacity”, and the Twinning project MT/06/IB/EN/01 entitled “Further Institution Building in the Environment Sector”. Th e former project involved the monitoring of air, water, noise, radiation, soil and the marine environment as well as 3D terrestrial and bathymetric surveys. Th is project was co-fi nanced by the European Regional Development Fund, which provided 85% of the project’s funding and the Government of Malta, which fi nanced the rest under Operational Programme 1 - Cohesion Policy 2007-2013 - Investing in Competitiveness for a Better Quality of Life.

20 Future Preparedness: Th ematic and Spatial Issues for the Environment and Sustainability
Th e second project was aimed at supporting the Maltese Government in improving the implementation of the Aarhus Convention on public access to environmental information, public participation in environmental decision making and access to justice in environmental matters.
Th ese activities saw the joint interaction of such entities as the partners as well as countless other entities, NGOs and individuals who came together to try and understand what was required from the nation both in terms of international obligations but also as a safeguard to mitigate for sustainability. Th e latter, though an overused word, has become one with the social psyche but needs to be taken to the next level where deeds towards sustainability outnumber the theoretical approaches: we need action on how to morph such concepts into action.
In Chapter 1, Ashley Hili tackles the process through a description of the project initiated in 2010 and concluded in 2014, the targets and outcomes as based on an initial 3 year review (2006-2009) of the environmental obligations required for Malta’s adherence to environmental reporting. Th e project sought to ensure that should society undergo changes, the technologies would be in place to ensure the understanding of the resultant occurrences as well as enable continuous monitoring and reporting. Th e focus was on seven themes: six environmental (air, water, noise, radiation, soil and the marine environment), as well as focussing on the technologies required to deliver baseline and real-time parameter monitoring from remote and in-situ sources.
Nathalia Kisliakova in Chapter 2 details an overview of the thoughts and perceptions of a project that served as a precursor to the ERDF156. Th e Twinning project, entitled “Further Institution Building in the Environment Sector” aimed at supporting the Maltese Government in improving the implementation of the Aarhus Convention, was co-funded by the European Union and the Maltese Government under the 2006 Transition Facility Programme for Malta. Th e project was carried out by the Malta Environment & Planning Authority (MEPA) as Benefi ciary Institution and the Austrian Environment Agency as Lead Member State Partner and consisted of four components: the assessment of the current situation and development of recommendations; the implementation of recommendations; the development of guidance documents and the training and awareness-raising processes. Th e author takes the reader through a description of the project and how it benefi tted the Maltese society.
Setting the Scene for Understanding the Realities of SpaceInterestingly, mainly research based, the second section of the publication looks at
diverse initiatives, projects, research and implementation measures that helped enable the fulfi lment of various datacycle components relevant to high-end research targeted for decision making processes. Th e topics are various and whilst covering widely-diverse

Introduction: Why Future Preparedness? 21
themes, such come together in their common target to provide information for a better future. Whilst some are resultant from the ERDF project or from the Twinning project, and others hail from other disciplines related to the spatial fi eld. Th e meshing of the diff erent topics is aimed at gaining an understanding of what is really going on in the environmental, social and landuse domains in the Maltese Islands and how change can be mitigated for future preparedness. Ranging from a full datacycle approach from design, through data gathering, input, cleaning, analysis and reporting, the original research papers have helped establish the current research activities that serve as a baseline for future studies.
In Chapter 3, Carol Agius and James Brearley argue that the manual collection of topographic map detail is traditionally collected via manual methods, most oft en photogrammetric capture. Th is method is laborious, work-intensive, lengthy and hence, costly. In addition because photogrammetric capture methods are oft en time-consuming, by the time the capture has been achieved the information source, that is the aerial photography, is out of date. As a result, National Mapping Agencies (NMAs) aspire to discover methods of data capture that are effi cient, quick, and cost-eff ective while producing high quality outputs. Targeting Light Detection and Ranging (LiDAR) as a quick and economical method for obtaining cloud-point data which can be used for various applications, the paper explores whether building footprints extracted from LiDAR data can meet the quality and accuracy requirements of large and medium scale topographic mapping. Building footprints extracted from the LiDAR survey carried out for the ERDF156 project were compared with topographic data captured via traditional photogrammetric methods. Th ese fl ow line and results were examined to determine whether the results meet the required specifi cations of topographic mapping. Sample extractions from urban, rural, and coastal areas were explored to determine if the outputs from this method can be used productively to update and maintain large to medium scale datasets on a national scale.
René Attard and Matthew explore the Malta Environment and Planning Authority’s (MEPA) National Protective Inventory (NPI) and the Malta Scheduled Property Register and how the two have developed from basic tools when heritage protection and management in Malta was in its infancy to an eff ective part of the current planning system they are today. Th e NPI is a digital database comprised of data cards containing information on properties of cultural heritage signifi cance. It has evolved into a readily-accessible digital system from its origins emanating from the cumbersome Inventory of the European Cultural Heritage (IECH) system of heritage protection. Th e NPI database is linked to the Malta Scheduled Property Register which utilises the information from the NPI database to provide heritage professionals and the general public alike with vital information on built heritage property. Th e paper describes the evolution of the NPI

22 Future Preparedness: Th ematic and Spatial Issues for the Environment and Sustainability
and the MSPR, the changes carried out to both systems to make them more effi cient and user friendly by making use solely of the limited tools available to the public sector. In conclusion the paper reviews what could have been done for the system to be used nationwide inclusive of legislation other than the requirements emanating from the Environment and Development Planning Act.
Chapter 5 focuses on an implementation approach to data dissemination, where Marc Bonazountas, Giacomo Martirano, Tim Camilleri and Anestis Trypitsidis investigate the process employed to enable a SEIS Geoportal technology development which delivers one of the fi rst practical implementations of SEIS in the EU. It comprises of a set of Web and Desktop tools for monitoring, reporting and disseminating environmental data. It also supports the development of environmental policy according to the requirements of the EU as well as those of the government of Malta. Th e authors describe in detail the philosophy, concept and a set of high-level principles and workfl ow processes. Specifi cally, SEIS-Malta makes use of proprietary GIS and Geoportal Technologies combined with custom developed webservices providing the public and ERDF project partners with user-friendly interface. On a technical level, the paper focuses on data management/ingestion from the various monitoring stations and locations, on-line data editing, data export, metadata viewing, editing and managing, searching for metadata, automated reporting according to EEA requirements and reporting obligations. It also strives to enable the provision of environmental information to the public according to the Aarhus Directive as outlined by the Twinning Light project and the ERDF156.
Sandro Cutajar, in Chapter 6, highlights the issues inherent in the identifying the strategy and feasibility requirements partaking to the setting up of an integrated soil monitoring system for Malta. Th e issues pertain to structured soil information generation, the creation and updating of interoperable, INSPIRE-compliant digital mapping data and the comprehensive evaluation of measurable, time-bound and relevant issues. Th e author states that relatively recent activities in Malta have contributed to the consolidation of the Island’s environmental protection credentials. Th e author points out that the ERDF156 enabled the investigation of further fundamental regulatory aspects as required to adequately monitor local soil protection eff orts. Th is review shaped the identifi cation of priority research pointers and data parameters required to adequately manage soil health in a sustainable manner. Multi-criteria modelling of Maltese soils, utilising past information generated through MALSIS, is one of the selected components of the project meant to establish sound environmental monitoring tools. Moreover, description and analysis of preliminary fi ndings, emerging from implementation of a baseline survey, within the context of an emerging short and long-term information monitoring strategy, was also carried out with a view to achieve a robust evaluation of a pre-agreed set of indicators established for all degradation threats identifi ed in the Soil Th ematic Strategy.

Introduction: Why Future Preparedness? 23
Th is approach is expected to assist land managers and other stakeholders to better anticipate where more research is required so that a clear appreciation, of the state of degradation threats experienced in a standalone soil ecosystem setting, is appropriately mapped out. Consequently, the drawing up of suitable strategies, realistic measures and appropriately benchmarked targets, meant to protect this natural capital from complex land use competition occurring within this island Member State, is identifi ed as crucial for adoption.
An innovative approach to agriculture-related scholarship is described in Chapter 7, where Charles Galdies, John C. Betts, Antonella Vassallo and Anton Micallef research a process to develop a high resolution agriculture land cover using aerial digital photography and GIS. Th is study demonstrated for the fi rst time in Malta the collection of high precision farming statistics in relation to agriculture resource management. It makes use of a relatively cheap, digital aerial remote sensing and GIS mapping eff ort complemented with limited ground surveying data as part of the AGRISTAT Project. Th e generation of high resolution imagery in the region of 12-15 cm pixel resolution eliminated the need for extensive ground surveying. Th is project was aimed at the collection of spatial statistical data of the country’s agriculture productivity. Th is study shows how a national comprehensive survey can be carried out using a combination of minimal ground surveys, aerial remote sensing and GIS. Th e project also shows how high resolution mapping can further push the Corinne Land Cover (CLC) nomenclature scheme by an additional two classifi cation levels as a requirement of small scale, highly fragmented agricultural land cover that is typical of small islands.
Th e sea-going experts, Carlos A. Espinal and Shane Hunter review their ERDF156 input to deliver a fi rst hi-detail bathymetry of the Maltese Islands in Chapter 8. Such was possible through a national-scale marine survey employing interferometric sonar. As part of the requirements to the implementation of the Water Framework Directive, a study of the marine zone bounding up to one nautical mile from the baseline coast. Th e authors describe the full-scale topographic and bathymetric baseline survey of the Maltese Islands was performed between 2012 and 2013, acquiring data from the highest elevation point in the archipelago, down to a depth of 200 metres within the Island’s coastal territory. Whilst diverse technologies were employed in other parts of the project, inclusive of LiDAR-based topographic datasets, bathymetric LiDAR datasets, the authors were tasked with the role to collect wide-swath sonar-datasets, enabling Malta to create a full 3D model of the islands for future use in environmental monitoring, coastal management, archaeological research, navigation aids and marine infrastructure projects. Th is paper describes the planning, acquisition and delivery of bathymetric datasets of 415 square kilometres of Maltese seabed through the summers of 2012 and 2013 using interferometric wide-swath sonar along with a combination of licensed and open-source marine surveying and GIS

24 Future Preparedness: Th ematic and Spatial Issues for the Environment and Sustainability
soft ware packages. A description of the sensors, soft ware used, survey planning and undertaking, data processing and digital reconstruction of the Maltese Islands by merging data from the three above-mentioned sensors is reported.
David Mallia takes the readers back to land through his dissertation on sustainability and urban conservation in Malta in Chapter 9, with some interesting concepts and fl ashbacks. He argues that the establishment of the Planning Authority for Malta in 1992 lead to the writing and the implementation of a number of important policy documents which are still in force to date. Th e Structure Plan aimed to provide adequate tools for the eff ective regeneration and revitalisation of existing urban cores within the Maltese Islands. Th e author has analysed the number and quality of approved applications lodged with the authority over a number of years in order to build a statistical picture of the actual eff ectiveness of the development control process with regards to Urban Conservation Areas. Th e results indicate that not only has interest in UCA’s grown over the years, but that this has resulted in the rehabilitation of a considerable number of properties, some of which were formerly derelict and abandoned. Th ese indicate that new life has been injected into many UCA’s and the relatively low number of approved demolitions would indicate that the environmental impact - especially in terms of the amount of waste rubble generated - has been relatively low. Furthermore, the reuse of existing buildings has lead to a reduction in the take-up of new land. In this sense, the policies have encouraged the idea of “reduce, reuse and recycle” on an urban scale and this has resulted in a paradigm shift in which raising awareness about the characteristics of Maltese vernacular architecture and its value as an element have added to the defi nition of the national identity in an era of globalisation.
Th rough Chapter 10, Maria Refalo concludes this section through her study on the surrounding habitat of marine algae in Malta. Th e underlining aim of this analysis is aimed at understanding how algae live within parameters that are being imposed on them either through abiotic or biotic factors. Th ese consisted of sea temperature, pH, dissolved oxygen, orientation, open/closed sea, light intensity, wind force, pollution, accessibility, distance from wading depth to shoreline, slope of shoreline, length of shoreline, turbidity, chlorophyll a, Phosphates, and Nitrates. Th e macro-algal species collected from the study sites during the summer season were 18, having Jania rubens and Ulva sp. as the most abundant species all along the whole season. Jania rubens and Ulva sp. were dominant in almost all the points of the study sites. While only 13 macro-algae species were identifi ed during the winter season, Enteromorpha being the only macro-algal dominant species; this was the only macro-algal species present in almost all the points of the study sites. Sea temperatures and anthropogenic disturbances increased in summer, although the levels of chlorophyll a increased in winter. Th e turbidity readings were correlated with wind forces, while pH levels remained relatively constant throughout the whole study. Phosphates and

Introduction: Why Future Preparedness? 25
Nitrates tests gave opposing results; one decreased when the other increased. GIS mapping was used for each study site, in order to better visualise the presence of anthropogenic disturbance on the study sites through a buff er. An abundance of macro-algae species was present during the summer season, whereas the indicative factors fl uctuated according to the weather, environmental and anthropogenic disturbances present at the time.
Conceptualising the FutureTh e fi nal section builds on the previous in-depth studies and posits further ideas for
future research and innovation, an output that was so highly achieved by the research from the previous sections. Th e past and present are being fulfi lled by all the papers presented in this publication, with some experimental and theoretical emphasis being depicted in this section. Th ese papers range from heritage appraisal toolkits, through policy-making ensconced in evidence, to conceptualisation of virtual worlds as research tools and neo-societies, where in addition, the fi nal two papers ground readers back to real-world proposals for future research.
Malcolm Borg and Saviour Formosa, in Chapter 11 state that character appraisals are essential and vital in understanding an area through the drawing on urban conservation techniques and guidelines on how the use of a character appraisal toolkit may assist in developing sustainable plans and launching viable environmental management solutions. Th ere have been various attempts to create and adapt character appraisal toolkits especially in the realm of urban conservation or cultural landscape management but also in real estate with the application of economic and environmental indicators. Th e understanding of space through the collation of data and evidence may not necessarily give a holistic picture. Th e better understanding of an area may only be achieved through an integrated approach. Th is is more signifi cant in landscape appraisal. Th e multi-layering of data and specifi cations of a given area, site or heritage assets contribute directly to its character and value and the reading of the same. Moreover a given landscape or site may include a variety of complex systems with varying characteristics and dynamics determining value. Th is study delves into best practice guidelines in the realm of character assessment taking into consideration extant tools as in the case of; UNESCO criteria, ICOMOS Heritage@Risk assessment and the English Heritage approach. Th is paper considers the applications of Geographic Information Systems (GIS) as a tool to stimulate an integrated approach with reference to planning regimes and policy development mechanisms. Th is paper takes stock of various proposals developed in the past decade in the application of GIS for character appraisals and urban conservation and proposes a structure for an information model.
Marguerite Camilleri and Roberta Debono debate policymaking in Chapter 12. Th ey describe policymaking through recent good practice that has highlighted the need

26 Future Preparedness: Th ematic and Spatial Issues for the Environment and Sustainability
for evidence-based policy in all fi elds, including that of the environment. Th ere is an ongoing need for reliable information that may feed into the policymaking process. In the environmental fi eld, the putting into place of environmental monitoring processes and the regular publication of state of the environment reports have contributed signifi cantly to providing a better evidence base for policy. Th e EU-funded ERDF project has played an important role in upgrading national environmental monitoring programmes. Th is paper puts forward possible next steps to be taken in order to improve the evidence base to support national policy-making processes, including the monitoring of existing policies, in the environmental fi eld now that the data from the ERDF monitoring project is emerging. A key area where more information is required is the marine environmental fi eld, where the signifi cant costs involved are a challenge. Th e area of sustainable housing, where signifi cant research and innovation will be required in the move towards zero-energy housing, is also crucial. A third area of importance is integrated assessments. Th ese would need to highlight links between datasets such as environmental and health data, and economic and environmental data, for example in the context of green accounting and green jobs. Finally, on this basis, models will need to be developed that link environmental data to the socio-economic parameters that will enable the testing of various policy options.
Chapter 13 sees Saviour Formosa tackling spatial conceptualisation as a foundation for social interactionism in virtual worlds. He states that the acquisition of the concept of space is an essential requirement for immersive migration from the real to the virtual worlds. Knowledge of space and place posit a hard-to-acquire concept for the non technological person. Th e move from a techno-centric reality to a socio-technic one has aided the transposition of the non-technic disciplines to take up the virtual environments as the next level interactive domain. Initial activity would have come from the geographically-equipped disciplines, with eventual porting to the civil-protection-related disciplines and eventually to the social sciences and the arts. Th e resultant knowledge gain is yet to be fully established, as technology has outshone the actual transition, with most disciplines still struggling to understand the shift . Th is paper reviews the issue of knowledge of spaces, the eff orts made to acquire a reality-to-virtual transition, as pushed through the establishment of a spatial information system. Th e paper highlights the initial work carried out to create an initial gaming environment for social interactionism to occur. Th e target is that based on available gaming engines and focuses on the process employed to establish the launching environment. Th e DIKA model is employed through its Data acquisition of real space, it being given a meaning through spatial information, its conversion to 2D environments and in turn to 3D space as a Knowledge markup and the fi nal Action process employed to create the interactive space through the gaming engine.
Janice Formosa Pace, through Chapter 14, outlines the realities of new social

Introduction: Why Future Preparedness? 27
paradigms existent within a Neo-Society, where some people are bound to fall outside of social realities leading to the creation of a new poverty cycle. Th is situation shows that societies have rapidly morphed into complex entities that are creating both accessibility and new forms of neogeographic-poverty: that related to datacycles and information uptake in new forms. Th ose that have managed to partake to the opportunities provided by the web have new vistas to survive in, in contrast to the new poor who have limited or no access to information. Th is is a world that has been immersed in the world-wide-web (www) as far back as the early 1990s since the birth of the phenomenon. With the current university generation having been born in the early 1990s and the subsequent generation now in their secondary years, the access to spatial-knowledge should be wide-ranging, what with all the available online maps, New forms of data in spatial format are accessible to all, however few realise the implications of such a transitional change in wellbeing: whether entire societies or individuals. Whilst the www-parturition cohort (early 1990s – mid 2000s) live in-between worlds and have experienced the social-change phoenix that the web has become, the dichotomies of the older and the newer generations have no such luxuries. Th e older have lost out on the birthing pains and the rapid-turnover of knowledge required in the digital verse being thus lost in the physical domain, the newer ones have little idea of the realities in the physical world, being immersed in the digital domain.
Marine archaeologist Timmy Gambin partakes to an excellent process to take up side scan sonar as an essential tool for the management of underwater cultural heritage through his paper in Chapter 15. Th e author states that to date, the majority of shipwrecks discovered and documented in the Mediterranean are situated in waters shallower than the 50 meter contour. With an increase in technical diving and deep water exploration, this is a statistic than may change in the not too distant future. Given that the UNESCO convention on the protection of underwater cultural heritage puts emphasis on preservation of shipwrecks in-situ, it is imperative to look at ways in which such a directive can be implemented. Th is paper highlights the synergy between existing remote technologies and the management of underwater cultural heritage. Using examples from ongoing research projects, the author demonstrates how large-scale remote sensing surveys can make a major contribution to site management, which in turn facilitates decision-making.
Ines Sanchez, Francesca Tamburini and Ruth Debrincat dedicate Chapter 16 to undertake an assessment of the Maltese environmental matrix to defi ne the future monitoring strategy as researched within ERDF156. Malta, as a member state of the European Union, is obliged to comply with specifi c environmental monitoring standards and respective reporting obligations. Th is paper describes the main aspects of the proposal and its design method based on the analysis of the existing Maltese network, the legislation framework and the baseline surveys results in all the components of the

28 Future Preparedness: Th ematic and Spatial Issues for the Environment and Sustainability
environmental matrix. Th e baseline survey in coastal waters and inland waters brought about a reclassifi cation of sites based on the water quality status. It allowed the localisation of points with higher water quality disturbance and the areas with low anthropogenic pressures, hence, a reduction in the number of monitoring stations where the water quality was classifi ed as “high”. Th e local air monitoring network, consisting of four fi xed stations, aft er one year of measurements indicated traffi c as the most signifi cant air pollution source in Malta. In the soil matrix, the seven threats to the European soil were analyzed. Th e knowledge acquired represents an important basis for the implementation of long term strategies in accordance with the specifi c context and targets of each environmental component. Nevertheless, additional steps will be needed to be carried out in the short them before establishing defi nitive long term strategies, such as performing additional base line surveys in the case of soil and inland waters or analysing future monitoring outputs in the rest of the environmental matrix. Aft er doing so, Malta will be able to establish the fi nal characteristics of its environmental monitoring network.
In ConclusionIn 2006, MEPA, as project leader, in coordination with the partners Malta Environment
and Planning Authority, the University of Malta, the Malta Resources Authority, the National Statistics Offi ce and the Environmental Health Directorate, embarked on a process to upgrade and enhance national environmental monitoring infrastructure and capacity as well as serve as a launching pad for hi-end spatial system in the Maltese Islands. At the time, it was deemed as a veritable cliff -hanger decision if not a potentially impossible-to-manage project. Perseverance and a drive to tackle the diff erent themes and data sources in a holistic approach has resulted in the formulation of a monitoring strategy and a series of information systems, which deliver a new modus operandi for strategic and spatial analysis in the Maltese state. Th e project created eff ective tools for the monitoring of and reporting of environmental information in the air, water, noise, radiation, soil and the marine domains, which outputs have in turn ensured the creation of baseline studies for future trend analysis.
Between 2009 and 2014, the project and resultant studies provided a basemap from which various environmental studies could be carried out. Th ese include studies as required by the INSPIRE Directive, the Arhus Convention, the Corine Landcover Initiative, the Water Framework Directive and the Marine Strategy Framework Directive which are aimed to protect more eff ectively the territorial landmass and the marine environment and in turn eff ect the health of the region’s population. It will also serve as a tool for impact analysis of development planning, pollution and chemical prediction modelling, climate change monitoring as well as render recognition of features. It will also serve to aid enforcement offi cers to analyse the trends in security breaches and illegal development
Introduction: Why Future Preparedness? 29
as well as plan for potential health hazards. In addition, it will allow thematic experts to study, monitor, analyse and protect those areas that are vulnerable to degradation and exposure. Spin-off s from the results include updated nautical charts, viewshed analysis and cross-thematic studies in the physical, social and environmental domains.
Th e aim was to base the whole process on the integration of the requirements of the EEA (European Environment Agency) datafl ow process, the INSPIRE Directive, the Aarhus Convention, the Freedom of Information Act and the Public Sector Information Directive, In addition, this project targeted the development of a Shared Environment Information System, currently available at www.seismalta.org.mt. Such a large project and the extensive collaboration between theme experts, scholars, researchers, implementation entities, policy-makers and decision-takers, called for a legacy publication that would do the process, strategies, research and deliverables justice, an endeavour now complete.
In 2014, the multi-domain thematic and spatial issues targeted through this publication served to place the Maltese Islands a step closer to the implementation of such a knowledge gain. Th e diff erent themes investigated here serve both the environment and sustainability through their conceptualisation approaches and their stepped scientifi c approaches. Interestingly, from a concerted targeting of six environmental themes, the papers published herein range into wider arenas, once few would have attempted to bring about at the initiation of the exercise, but which proved the initiators right: leave an open space for research and the rest will come to pass. Such a state serves to depict the versatility of the research community in their drive to employ cross-discipline tools and technologies in order to understand their particular domain; whether past or present, theoretical or tangible, real or virtual.
Future Preparedness is a step closer to realisation

30 Future Preparedness: Th ematic and Spatial Issues for the Environment and Sustainability

C H A P T E R 1
ERDF 156 - Developing a National Environmental Monitoring Infrastructure and Capacity:
Shift ing the State of AccessAshley Hili
Introduction Malta, through an initiative spanning 9 years, has completed an exercise aimed at
obtaining a complete set of data that will serve as a basis for cross-thematic research. Th is is made achievable through the creation of essential datasets that will give the public, terrestrial and bathymetric baseline information for free. Such was made possible through an initiative as part of a project, entitled “Developing a National Environmental Monitoring Infrastructure and Capacity”.
Th e Malta Environment and Planning Authority (MEPA) was the lead partner of this project together with the University of Malta (UoM), the Malta Resources Authority (MRA), the Environmental Health Directorate (EHD) and the National Statistics Offi ce (NSO) as external partner organisations.
Th e project had a total budget of €4.9M, of which €4.8M was co-funded by ERDF (85%) and National Funds (15%) under the Operational Programme 1 – Investing in Competitiveness for a Better Quality of Life. MEPA’s funding contribution to this project was €180K. Of these, €4.26M were utilised due to savings pertaining to the tendering process.
Th e aim of this chapter is to describe the project aims, process and outcomes.
Rationale Th e environment provides a vital function to the Maltese economy, acting as a source
of both renewable and exhaustible resources, and as a sink for all emissions and waste generated by every economic and social activity. In spite of this familiarity between the environment and the economy, a reliable government policy aimed at preserving natural resources and managing the environment would be impossible without detailed, dependable, up-to-date and easily accessible information on the state of the environment.

32 Future Preparedness: Th ematic and Spatial Issues for the Environment and Sustainability
As a member of the EU and of the international community, Malta also has important obligations to report on the state of the environment and the eff ectiveness of policy measures addressing particular concerns, such as pollution. Failure to collect dependable and up-to-date environmental data, would not only make Malta more exposed to various environmental pressures due to poorly informed policy decisions, but will also subject the Islands to heavy economic penalties for non-compliance with EU reporting obligations that may exceed any potential costs of environmental monitoring.
Project Purpose and DescriptionTh e purpose of the project was to establish environmental monitoring strategies,
infrastructure, methodologies and capacity on a national level, through:
• Th e drawing up of an environmental monitoring strategy for the Maltese Islands;• Th e design and establishment of national monitoring programmes in the areas of air,
water, radiation, noise, soil and marine; • Th e compilation of baseline surveys leading to procurement of critical environmental
data in the mentioned areas;• An economic and social analysis of the use of marine waters, on the basis of which
realistic environmental targets can be set for the management of human activities aff ecting the marine environment.
• Th e delivery of environmental monitoring equipment for air, noise and radiation monitoring, information management systems and training on the practical use of the equipment and systems delivered.
Th e project was divided into ten diff erent Actionss, being:
Action 1 - Project Management Consultancy Services to assist in Project Preparation and Development.
Action 2 - Development of noise monitoring strategy & baseline survey: A strategy for the monitoring of ambient noise in Malta based on the requirements of the Directive, technical specifi cations for the supply of noise monitoring equipment and noise monitoring soft ware, the collection of all baseline data for noise mapping as required by the Directive, an interim model and noise maps; and expert recommendations on actions and measures.
Action 3 - Development of the Monitoring Strategy, Monitoring Programmes, and Baseline Surveys for the below themes:• Air: Assessment of EU community, national and multilateral regulatory framework,
Chapter 1: ERDF 156 - Developing a National Environmental Monitoring Infrastructure and Capacity 33
analysis of the current monitoring network and data management system, preliminary evaluation of the monitoring network compliance to the legal obligations, state of air quality; national emissions for modelling application, modelling, updating in defi nition of zones and agglomerations, strategy & criteria for the joint analysis of available data, defi nition of the monitoring network, compilation of the QA_QC procedures, the National Air Quality Reference Laboratory (NRL), assessment of alternative solutions for NRL, air quality monitoring reports, integrated assessment modelling system, components of an integrated assessment modelling system, defi nition of the possible future structures of the Malta Integrated Assessment Modelling System (MIAMS), and assessment of alternative solutions for the MIAMS.
• Water: Water legislation report, analysis of existing monitoring, comprehensive review of policy tools and legislative instruments, and development of a long-term strategy for water, recommendation to build institutional capacity, implementation plan for the monitoring strategy, an investigative monitoring plan; and surveys of coastal water reports.
• Radiation: Technical report, design of the programmes, rationale for the radiation monitoring system, feasibility study, report on soil monitoring, and report of water monitoring.
• Soil: Soil analysis, design of programmes, feasibility assessment of programmes, and soil monitoring survey analysis.
• Baseline surveys: Topographic LIDAR survey, aerial imagery, bathymetric LIDAR survey, and acoustic bathymetric scans.
Action 4 - Supply, installation, commissioning and testing of information resources systems and air monitoring systems:• Air Monitoring: Intercomparison exercise on particulate matters, mobile station to act
as a rapid response facility, monitoring of black dust source appointment, improved data capture - urban measurements, quality control, source contribution and pollution dispersion, emission inventory system,
• Licenses: MapInfo, Vertical Mapper, ArcInfo, Geomatica (LP360), Erdas IMAGINE Professional, ArcGIS Server, ArcPad 7, ArcGIS Spatial Analyst, 3D Analyst, Geostatistical, Analyst, Land Change,
• Hardware: ArcGIS Server, Storage Area Network and servers, GI workstations, Handheld 3D scanner, A3 Laser colour printer, GPS/GIS handheld receiver and accessories, Permanent Global Navigation Satellite System Station (GNSS) and geodetic receivers, Remote capture GPS receiver, and Satellite image - QuickBird, Landsat, EuroImage Geo-Eye-1.

34 Future Preparedness: Th ematic and Spatial Issues for the Environment and Sustainability
Action 5 - Information and dissemination services for the project: Print media, broadcast media, events, internet and websites, promotional material, and signage.
Action 6 - Design of Shared Environmental Information System (SEIS) and development of a web-based GIS interface: Review and analysis of MEPA’s national and EU-level requirements for the development and operation of the SEIS, taking into consideration all relevant factors, the design of Maltese component of SEIS, development and implementation of the SEIS, including a dedicated geo-portal; and training of MEPA staff on the use, operation, data analysis, maintenance and customisation of the developed SEIS.
Action 7 - Service Tender for a soil baseline survey: Baseline survey of soil quality with particular emphasis on monitoring specifi c components; and baseline surveys of pre-selected physical, chemical and biological parametres related to all known threats, which may be present in all local soil profi les, as identifi ed in the soil thematic strategy promoted by the European Commission. Surveys also investigate similar land degradation issues addressed at a global level focusing on adaptability to drought and desertifi cation risks, in accordance to a defi ned survey strategy.
Action 8 - Provision, installation, commissioning and testing noise mapping soft ware, hardware and measuring equipment: Mobile noise measurement and mapping fi eld survey rugged tablet computer, handheld sound level metres, vehicle with permanent telescopic mast, and noise measurement terminal with weather station, radar gun and video camera.
Action 9 - Provision, installation, commissioning and testing of environmental radiation monitoring equipment and early warning system: Environmental Monitoring Stations (EMS).
Action 10 - Service contract for the development of a long-term monitoring strategy for the marine environment, a social and economic analysis of the use of marine waters and costs of degradation, and baseline sediment survey in inland waters: ‘Sediments Baseline Survey’ for Inland Surface and Transitional Waters as per requirements of the Water Framework Directive (2000/60/EC), the Priority Substances Directive (2008/105/EC) and the Quality Assurance and Quality Control (QAQC) Directive (2009/90/EC); review of monitoring obligations pertaining to the marine environment and analysis of existing programmes, technical capacities and institutional arrangements; a long-term integrated National Marine Monitoring Strategy based on the most technically feasible, cost-eff ective and effi cient ways and means of delivering monitoring objectives for the

Chapter 1: ERDF 156 - Developing a National Environmental Monitoring Infrastructure and Capacity 35
area of marine waters. Th is marine strategy shall harmonize and streamline monitoring obligations stemming from the Marine Strategy Framework Directive with related EU Policies and Global and Regional monitoring obligations for the marine environment; a specifi c and detailed monitoring programme addressing the requirements of Article 11 of the MSFD (and Annex V). Th e monitoring programme shall include a series of assessment methodologies and technical specifi cations for the procurement of appropriate monitoring systems, equipment, hardware and soft ware, which are required to implement the Marine Monitoring Strategy and in particular the MSFD monitoring programme; a report outlining the possible approaches to undertake the economic and social analysis of the use of marine waters and costs of degradation stating assumptions and sensitivity of analysis, with a recommended way forward or preferred options and respective justifi cation; a report on the economic and social analysis of the use of the marine waters and of the costs of degradation of the marine environment as defi ned by the MSFD, stating assumptions and sensitivity of analysis and integration of this report in the MSFD Initial Assessment and duly fi lled-in MSFD reporting sheets on the economic and social analysis of the use of marine waters and of the costs of degradation.
Project OutputsMore specifi cally the project was aimed to:
• Deliver a national environmental monitoring strategy and a design of the monitoring programmes in the areas of air, water, radiation, noise, soil and marine. Th ese programmes were drawn up on the basis of a feasibility study which identifi ed the most technical and economical for the monitoring of the environmental state for the above mentioned areas. Th e environmental monitoring strategy and detailed monitoring programmes were designed to cover all monitoring requirements. Th e strategy includes detailed tender specifi cations for the procurement of equipment, systems, training and data collection requirements. It also provides a long-term strategic direction for environmental monitoring.
• Conduct baseline surveys, ensuring 100% baseline data coverage for the Maltese Islands, together with terrestrial spatial surveys and bathymetric surveys of coastal waters within 1 nautical mile which feeds into all plans, and policies that would require the use of such data, as well as reporting requirements to the EU.
• Procure, install, test and commission environmental monitoring equipment for air, radiation, noise and soil monitoring and train staff in its operation. Th is equipment and infrastructure based on the latest and cost-eff ective technologies will serve for many years, producing ongoing high quality monitoring data required for a variety of purposes, ranging from mandatory reporting to the EU to policy making and land use planning.

36 Future Preparedness: Th ematic and Spatial Issues for the Environment and Sustainability
• Deliver information management systems in line with the requirements of the EU Shared Information System initiative. Th is system is a crucial component of the project as it ensures that all environmental data is processed and disseminated in the most coherent and effi cient manner possible.
• Results of the project are disseminated to a wide range of stakeholders and the public. As a result, public awareness of issues pertaining to the environment will be improved, and better policy decisions can be taken in the fi eld of the environment – vastly improved public awareness, environmental data quality and availability are amongst a range of long lasting benefi ts that will not only reduce the costs of diverse planning processes, but will also provide for all environmental and planning policies to be more implementable in the long term.
Needs and RequirementsAt the time of the project cycle, environmental monitoring and reporting were
incomplete or had inexistent monitoring strategies, there was a lack of baseline environmental data, poorly developed monitoring infrastructure and limited human resource capabilities. Certain thematic areas required a full review, upgrading or development.
In the case of Air monitoring, infrastructure strengthening was one of the major requirements for this project. Th e air monitoring systems and procedures in place correspond to approximately 70% of the requirements for a complete national programme. Th is project aimed to increase monitoring capabilities to 100% by improving data quality and enhance particulate matter (PM) monitoring capability. Activities that were delivered through this project helped contribute to compliance with obligations under 11 EU legislative instruments (Directives, Decisions and Regulations), amounting to between 20% and 80% (depending on Directive) of all monitoring obligations stipulated by this legislation.
In the cases of Radiation and Noise monitoring, capacity had yet to be established. Th is project contributed to 100% of implementation of monitoring obligations of two key legislative instruments in these areas being the First National Environment Radioactivity Surveillance Plan (FNERSP), and the Directive 2002/49/EC - Assessment and Management of Environmental Noise.
In the fi eld of Water monitoring, the monitoring programme was very basic and required a complete revamp of the monitoring processes, systems and infrastructure. Th is project built capacity to enable Malta to implement the monitoring requirements for surface waters (inland, transitional and coastal waters up to 1 nautical mile from baseline) originating from the Directive 2000/60/EC - Water Framework Directive (WFD), Directive 91/676/EEC – the Nitrates Directive and Directive 91/271/EEC- the Urban Wastewater

Chapter 1: ERDF 156 - Developing a National Environmental Monitoring Infrastructure and Capacity 37
Treatment Directive (UWWTD), but excluding the Nature Protection Directives (the Habitats and Birds Directive). It was estimated that the project would improve the baseline data coverage and strategic direction. Th is was achieved by designing a water monitoring programme and conducting a comprehensive baseline survey covering 100% of the Maltese Islands.
Soil monitoring needed capability requirements to be established in its entirety. It was envisaged that the project ensured compliance with 50% of the monitoring obligations of the proposed Soil Framework Directive (SFD) and the associated EEA reporting obligations related to soil monitoring.
In addition, spatial datasets and location-positioning equipment were required to enable effi cient mapping and modelling of the environmental data collected and for the creation of environmental information systems.
Benefi ts: Who will benefi t from such a project?Th e following target groups were considered as main benefi ciaries from this project:
• Th e Government will benefi t through the improved availability and reliability of information on the state of the environment, which will enable the development of more informed and better targeted policy measures in all spheres of public policy, including fi scal, economic, social and environmental domains. In addition, through this project, the Government will acquire the necessary capacity within its institutions to sustain long-term eff ective and cost effi cient environmental monitoring programmes. Furthermore, the project would enable the Government to fully comply, and excel beyond compliance with the (EU environmental Acquis) monitoring obligations;
• Th e public will benefi t in the long-term by becoming more aware of the environmental trends aff ecting their health and quality of life, and the relation between these trends and human activities. Th e creation of a web-based environmental information system will allow the public to access quality fi rst hand environmental data, and see the cause and eff ect of human and economic activity on their surrounding environment. Furthermore, the public would benefi t from better Government regulation that would result from the improved provision of environmental information to Government decision makers, and ultimately, from a healthier environment;
• Th e business community will benefi t in the long-term by becoming more aware of the risks and opportunities stemming from environmental trends and their local impacts, and by receiving better and more targeted regulation and guidance from the Government. Th ose economic sectors that are especially more vulnerable to certain environmental risks, notably the tourism industry, would benefi t from an opportunity to enhance their competitiveness by introducing targeted measures to reduce their carbon footprint and adapt to negative environmental impacts such as better waste

38 Future Preparedness: Th ematic and Spatial Issues for the Environment and Sustainability
management. Also, it will benefi t from potential economic opportunities, stimulating long-term demand for environmental expertise, technology such as the supply of monitoring equipment and services like laboratory analysis. Furthermore, increased availability of quality environmental data will reduce the costs of environmental impact assessment processes, hence the cost and time of decision making on major development proposals;
• Th e scientifi c community will benefi t from the enhanced knowledge based on the state of the environment and environmental trends due to wider access and cross-thematic knowledge gain;
• MEPA and partners will benefi t as a result of the project being implemented as this will enable enhanced dissemination of information processes for use by MEPA internally Th e Planning Directorate will gain the capacity to undertake better informed decision making processes concerning both spatial and environmental aspects. Th e Corporate Services Directorate will be enabled to build its Information Resources knowledge base as well as reliable, GI and GPS systems. Th e information produced through the project will be benefi cial to the Environment Directorate, and will enable the Authority to give better directed advice to Government regards environmental policy making and implementation.
ConclusionPrincipal to all the eff orts undertaken, the major scope of the project remains the
guarantee of free dissemination of all data to the general public. Th is is the end result of an integrated assignment to adhere to the obligations as outlined by the Commission’s Communication COM (2008) 46 Final “Towards a Shared Environmental Information System (SEIS), the INSPIRE Directive and the Aarhus Convention. Public access was assured through the development of a viewing and analytical dissemination tool utilising a web portal, which is compliant to the EU’s SEIS.
Th e project served a thematic need, through the employment of a technological means in order to serve a higher purpose: that related to the social need.

C H A P T E R 2
Further Improvement of the Implementation of the Aarhus Convention in Malta:
A Review Nathalia Kisliakova
IntroductionTh e Twinning project MT/06/IB/EN/01 “Further Institution Building in the
Environment Sector” aimed at supporting the Maltese Government in improving the implementation of the Aarhus Convention on public access to environmental information, public participation in environmental decision making and access to justice in environmental matters.
Th e project was carried out by MEPA as Benefi ciary Institution and the Austrian Environment Agency as Lead Member State Partner. Th e project duration was 15 months as from 16th April 2008. Th e project was co-funded by the European Union and the Maltese Government under the 2006 Transition Facility Programme for Malta.
Th e project consisted of four components:• Component 1: Assessment of the current situation and development of
recommendations,• Component 2: Implementation of recommendations,• Component 3: Development of guidance documents,• Component 4: Training and awareness-raising.
In Component 1, the legal instruments and institutional arrangements in place for the implementation of the Aarhus Convention in Malta were assessed, and recommendations were drawn up on how to improve the existing situation with regard to public access to environmental information, public participation in environmental decision-making and access to justice in environmental matters.
In Component 2, the recommendations were discussed with a wide range of stakeholders, and consequently applied in the practice, establishing an effi cient and eff ective administrative system to implement the Aarhus Convention. Amongst other
40 Future Preparedness: Th ematic and Spatial Issues for the Environment and Sustainability
measures, its implementation formulated a series of agreements between the benefi ciary and key holders of environmental information in Malta, with the aim of securing the availability, timeliness and quality of environmental data, supported by effi cient information management systems.
In Component 3, guidelines were produced addressing the public authorities, the industry and the general public in Malta.
Component 4 provided training for public offi cers and awareness-raising for key stakeholders and the general public.
Th e most relevant project results are summarised below, as achieved under each Component.
Component 1: Assessment of the current situation and development of recommendations
Legal AnalysisGenerally, the Aarhus Convention and the related EU legislation are transposed into
the Maltese law. Positive trends exist amongst government and authorities to broaden the scope of acts and the rights of the public, as well as to progress towards greater transparency in their work, both in line with the requirements set by the Aarhus Convention.
Project recommendations included the following.
1. Access to Environmental Information: a) Lists of public authorities and their remits could be made publicly accessible, in
order to facilitate the general public towards optimised orientation in terms of the public authority being most appropriate to address with a request for environmental information.
b) Lists and registers of the information held by them could be disseminated in line with similar provisions envisaged in the proposal for Freedom of Information Act. An introduction of an “information offi cer” and of the single-counter-approach would be also in line with the practice widely accepted in EU operations.
c) Th e use could be promoted of electronic databases containing reports on the state of the environment, legislation, national plans and policies and international conventions. Provisions with regard to this would have bee required to be added to the national legislation.

Chapter 2: Further Improvement of the Implementation of the Aarhus Convention in Malta: A Review 41
2. Public Participation in Environmental Decision-makinga) A simplifi cation of the SEA procedure was envisaged through the merging of the
two rounds of consultation on the draft environmental report for consultations with the public based on the revised reports.
3. Access to Justice in Environmental MattersWith regard to the issue of legal remedies, the establishment of a review body under
the Environmental Protection Act was envisaged, similar to the Planning Appeals Board established under the Development Planning Act. Th is Review Body could also be open to appeals of NGOs and eventually other identifi ed stakeholders. It could also be considered to establish a right of any member of the public to challenge administrative acts in the sense of an actio popularis. Th is procedural institution can be applied in civil law and in consumer and environmental protection. Whereas normally an interest has to be stated to enter formally a procedure (e.g. permitting procedures) as a third party, under the actio popularis, everybody can “challenge” the respective act, i.e. in this context this means to fi le a complaint against the decision with an appeal board or a court of law. In other words, actio popularis broadens the legal standing from a limited group of people to everybody. Survey of Current Public Sector Implementation Procedures Implementing the Aarhus Convention.
a) Access to Environmental InformationTh e practice for public access to environmental information held by Maltese institutions
was deemed to be generally in line with the requirements of both the Aarhus Convention and the Freedom of Information Act pending adoption of various issues.
1. Type of environmental information held by public institutionsa) Specifi c confl icts between personal or business data protection and public access
rights need to be analysed case by case by the respective institutions.2. Opportunities for the public for online access to environmental dataa) As in all EU Member States, improvements in the subsequent years focused on
enhanced use of electronic information systems as recommended by Directive 2003/4/EC, in cooperation between the major institutional holders of environmental information on Malta.
b) It was therefore recommended to embark on a systematic inter-institutional cooperation exercise to establish a Maltese national portal for environmental information, for which the major partners - Department for Environmental Health (DfEH), Malta Resource Authority (MRA), National Statistics Offi ce (NSO) and MEPA – had already identifi ed on a technical level mutual interests and cooperation models. Such a national

42 Future Preparedness: Th ematic and Spatial Issues for the Environment and Sustainability
portal on environmental information will also facilitate the implementation of the Maltese participation in the European Shared Environmental Information System (SEIS) and in the harmonised European Spatial Data Infrastructure established by the INSPIRE Directive 2007/2/EC. A fi rst pilot demonstrator for inter-institutional portal was recommended to be developed in Component 2 of the current project. Th is pilot project was maintained for a specifi c period until the creation of a SEIS portal through which environmental information became more readily accessible, as resultant from further initiatives post this project.
Interestingly, this process was achieved through the ERDF156 project, an achievement that few other countries can term as their own. Th e Twinning and ERDF project meshed to provide society with a veritable and tangible outcome.
c) While focussing on electronic information tools and information mainly in English, suffi cient consideration will be required for providing also satisfactory information to those target groups or parts of the general public who still do not use electronic information services and/or require specifi c or general information in Maltese.
b) Public Participation in Environmental Decision-makingGood practice with regard to public participation exists in Malta, in particular on
the level of public consultation. As such examples identifi ed in this fi eld, public hearing exercises or the Code of Practice on Consultation developed by the benefi ciary were commended. However, the assessment of the participative procedures revealed potential for further improvement. Below, the need of action towards optimising the practice of public participation in Malta is summarised, represented by those issues and the respective recommendations which were considered of high priority.
1. Typical levels of public participationa) Th e quality of public consultation process is closely linked with the timeframes
available for its implementation. Th e existing timeframe of 15 days for objections for all projects was perceived as short. In line with the latest amendments to national legislation, an extension to a minimum of four weeks was envisaged.
b) With regard to the good practice of actively notifying the public concerned in major projects, a joint development of corresponding procedural standards was also envisaged for the larger non-major projects.
2. Costs and eventual fi nancial barriers for stakeholdersa) Options were sought for providing the interested general public with aff ordable or
free-of-charge expertise for interpreting architectural plans. Possible solutions could have included the provision of interpretation of complex technical contents at public hearings
Chapter 2: Further Improvement of the Implementation of the Aarhus Convention in Malta: A Review 43
on development application. b) Options were also sought for provision of expert and aff ordable assistance to persons
experiencing lack of specialised knowledge to formulate an appeal.
3. Training needs a) Awareness of the public rights and the resulting obligations for public authorities
holding environmental information in Malta in the context of the Aarhus Convention should be actively raised both among the general public and the civil servants. Th e benefi ts for both sides concerned by the implementation of the Convention should be communicated, for example, the possibility for the general public to participate directly in the environmental decision-making, and the facilitation for the public authorities towards more effi cient development permitting procedures, the latter being closely related to environmental decision-making.
b) Th e existing good practice of the EIAs could be encouraged, and information of its advantages should be disseminated, as example for confl ict reduction in the planning process.
c) Training could be provided for institutional staff on techniques for successful dealing with challenging situations and on how to create a positive, open and constructive atmosphere during e.g. public hearings. Examples for such challenges might include methods for dealing with polarisation (participants representing opposing views), or for steering a discussion in which a participant or group of participants gains dominant infl uence on the discussion process.
d) Training could be provided also for NGOs and the general public on techniques for successful avoidance of challenging situations and for a constructive concentration on eventual confl icting issues.
c) Access to Justice in Environmental MattersWith regard to the Access to Justice in Environmental Matters “pillar” of the Aarhus
Convention, good practice was demonstrated by the Voluntary Organisations Act (Act XXII of 2007), which granted juridical personality upon NGOs.
Potential fi elds for action of highest priority were identifi ed:
1. Opportunities for administrative and judicial appeala) Similar access to complaint procedures could be introduced for environmental
permits, such as was available during the project’s lifetime under the EIA, IPPC and

44 Future Preparedness: Th ematic and Spatial Issues for the Environment and Sustainability
Environmental Liability Regulations and the planned Environmental Permitting Regulations.
2. Costs currently involved should a judicial procedure be requireda) Art. 9 paragraph 4 of the Aarhus Convention requires that the procedures granting
access to justice should not be “prohibitively expensive”. With regard to this, particular attention is recommended to be paid to avoiding prohibitive fees which might result in the public not making use of the rights granted, respectively, options should be introduced for fee exemption for parties (e.g. NGOs, members of the public) who cannot aff ord them. A possibility that could be considered refers to the concept of legal aid centres, as existing in Austria, Hungary, Slovenia and other European countries.
3. Th e ombudsperson system in Maltaa) As a middle- and long-term perspective, a broadening of the rights of the MEPA
Auditor could be envisaged, for example following a concept similar to that applied under the Austrian Environmental Ombudsman System.
4. Th e standing of NGOs in open proceduresa) Th e current state of implementation of the Access to Justice in Environmental
Matters “pillar” of the Aarhus Convention in Malta could be improved by considering, for example, solutions similar to the concept of citizens groups with legal standing, as is the practice in Austria and Germany: if a comment is supported by 200 persons or more who have the right to vote in municipal elections in the host municipality or in a directly adjoining municipality at the time of expressing their support, this group of persons (citizens’ group) is granted, according to the Austrian EIA Act, locus standi in the development consent procedure for the project and is considered to be a party involved. Citizens’ groups having locus standi are also entitled to claim the observance of environmental provisions as a subjective right in the procedure and to complain to the Administrative Court or the Constitutional Court in Austria.
5. Availability of information on how to challenge other acts and omissions of public administration that violate environmental legislation
a) Provision of more information on the MEPA website on Access to Justice, and especially on the relevance of the “Voluntary Organisations Act”, in the environment sector could result in a relevant advantage for the NGOs in the context of an improved implementation of the Access to Justice in Environmental Matters “pillar”.
b) In view of the strong role of the NGOs in environmental planning, information could be provided on the MEPA website on the new “Voluntary Organisations Act” (how NGOs can register, etc.), as well as details on the connection with planning and environmental procedures (e.g. information on legal standing, right of appeal, etc.).
6. Communication of the rights of the general public (both individuals and NGOs) in

Chapter 2: Further Improvement of the Implementation of the Aarhus Convention in Malta: A Review 45
EIA, IPPC and SEA procedures and availability of assistance mechanisms for removing/reducing fi nancial and other barriers to Access to Justice in Environmental Matters
a) Stakeholders could be facilitated by providing information on the right of third party appeal for NGOs in permitting decisions and consider designation of an information offi cer for the issue of access to justice.
b) With regard to the implementation of appeal procedures in Malta, the duration of appeal procedures of a number of years was considered excessively long. Given the requirements of the Aarhus Convention (but also other international treaties) that legal remedies should be timely and eff ective, it was recommended to shorten (or otherwise improve) procedures at the Planning Appeals Board. Th e duration of the appeal procedure should ideally not exceed one year, and in regular cases should be around 6 months.
d) Systems AnalysisTh e Information Technology systems in the benefi ciary were deemed to be well
established and were being regularly updated in the light of the latest technological developments. Th is was supported by a quality-certifi ed system management which guarantees short response times to user requests. Th e priority need of action suggested in this project refers to the following key issue and respective recommendations.
1. Th e basis of solid competence enabled the benefi ciary to lead and facilitate the IT technical development of a Maltese national portal on environmental information in cooperation with the other main institutional holders of environmental information. Following the priorities arising from communication with the cooperating institutions, namely, the NSO, the MRA and the DfEH, priority should be given in a fi rst development phase to a pilot inter-institutional portal with four participating institutions (MEPA, NSO, MRA and DfEH) towards optimising the presentation of information also required for reporting to the European institutions.
2. Th e availability of suffi cient accompanying “metadata” or “methodological notes” on collected and presented environmental data had been identifi ed by all institutions as a major challenge to ensure that data or information is not re-used in a wrong context.
3. Th e introduction of a Content Management System on the website was deemed essential to considerably facilitate content update, harmonised design and integration of content into the envisaged pilot and, in future, full-scale inter-institutional portal.
4. Th e benefi ciary and partners made the best possible use of ICT and centralised
46 Future Preparedness: Th ematic and Spatial Issues for the Environment and Sustainability
information services to enhance the project outputs.
Component 2: Implementation of recommendations
1. Presentation of Assessment and Recommendations to Stakeholders Th e Aarhus project team presented the most relevant fi ndings from the assessment
phase and ideas on potential options for further improvement to the key stakeholders in Malta in the context of the Aarhus Convention, to the benefi ciary and to the three National Focal Points on the Aarhus Convention. Th e benefi ciary provides strategic guidance for the Planning and Environment Protection Directorates, and ensures that the organisation fulfi ls its legal obligations in an effi cient and eff ective way. Th e benefi ciary members have diff erent technical backgrounds, including, amongst others, urban planning, environmental health and urban conservation. As a result, all remits relating to the three “pillars” of the Aarhus Convention were represented.
2. Formulation of a Series of Agreements for Inter-Institutional Environmental Information Exchange
Th is activity concentrated on formulating fi rst agreements (Memoranda of Understanding – MoUs) between the benefi ciary and other Maltese public institutions-holders of environmental information, coinciding with the development of the pilot inter-institutional environmental portal. Th ree MoUs were concluded between the benefi ciary and its partners in the pilot portal development, i.e. the National Statistics Offi ce (NSO), the Malta Resources Authority (MRA) and the Department for Environmental Health (DfEH)). Th e MoUs facilitate the inter-institutional cooperation towards ensuring a smooth environmental information fl ow as well as effi cient and user-friendly communication of the information to the public as foreseen by the Aarhus Convention. Th e MoUs entered into force on 01.01.2009.
Similarly to the perspective for further institutions to join the pilot inter-institutional environmental portal at a later stage, agreements with them on environmental data exchange could be also arranged in the future. Th e consultation on the fi rst MoUs has demonstrated a commendable example for shaping an open and constructive discussion, which could prove a useful base for further consultation processes on inter-institutional environmental information exchange.
Th is system of MoUs was in turn employed in the running of the information fl ows emanating from the ERDF156, having been established as a staple from the Twinning project and fully employed by the benefi ciary and related parties.

Chapter 2: Further Improvement of the Implementation of the Aarhus Convention in Malta: A Review 47
3. Development of eff ective information management systems3.1 Development of a pilot inter-institutional environmental portalTh e implementation of this Activity addressed the practical provision of timely,
high-quality and easily accessible environmental information to the general public, as recommended during the assessment component of this project, as well as its prerequisite, the establishment of eff ective information management systems. Th e agreed solution to best meet the requirements of the Access to Environmental Information “pillar” of the Aarhus Convention considers embarking on a systematic inter-institutional cooperation exercise to establish a Maltese national portal for environmental information.
A fi rst pilot version of this inter-institutional portal was developed (http://www.ambjent.org.mt), with four institutions participating: MEPA, the NSO, the MRA and the DfEH. Th e portal was offi cially promoted during the training and awareness-raising seminars (visibility actions) for civil servants and the general public in Malta during 24.-26.03.2009. Th e pilot portal was foreseen to be gradually extended to link the environmental data held by all institutions, but was subsequenly superseded by the SEIS portal emanating from the ERDF156 project, which was launched on the link www.seismalta.org.mt.
Th e Twinning project portal was deemed necessary as it would have facilitated in turn the Maltese participation in the European Shared Environmental Information System (SEIS) and in the harmonised European Spatial Data Infrastructure established by the INSPIRE Directive 2007/2/EC which was subsequently transposed into Maltese law.
3.2 Synergies with the upcoming Shared Environmental Information SystemIn addition to the foreseen activities referring to the establishment of eff ective
systems for environmental information management in Malta, a review was carried out on preparedness of the Maltese Environmental Information System with regard to the development of the Shared Environmental Information System (SEIS) proposed by the European Commission (Commission Communication towards a Shared Environmental Information System (SEIS) [COM (2008) 46 fi nal]).
Key results of this review stated, that while the implementation of SEIS by the European Commission was still being shaped towards a Regulation or a Directive on electronic reporting of environmental information to be proposed in early 2010, both Malta and Austria were in a psoition to continue the ongoing developments of their national systems according to the general principles of the SEIS Communication, and that both countries should actively participate in the European technical pilot project on e-Reporting envisaged to be launched in autumn 2009. As at 2014, the SEIS work at EU level is still underway and has matured to incorporate other initiatives and datafl ows.
A further relevant result was the decision by the project partners on the electronic systems developed by the benefi ciary were to be documented within the European NESIS Network project (NESIS Network, in order to enhance a European Environmental

48 Future Preparedness: Th ematic and Spatial Issues for the Environment and Sustainability
Shared and Interoperable Information System) as national good-practice examples to be considered for the establishment of SEIS:
a) Th e Maltese Inter-institutional Environment Web Portal www.ambjent.org.mt established within this project (cf. previous section) in cooperation between MEPA, NSO, MRA and DfEH in its pilot version, i.e. provided access to information on air, waste and water, as described in the previous section.
b) MEPA e-Applications – the web-based system facilitating the electronic application to MEPA for environmental permits and activity notifi cation. Th e global aim and functionalities of the system are comparable to the Electronic Data Management (EDM) system developed by the Austrian environment administration.
c) Th e Reporting Obligations Database developed in order to facilitate the management of Maltese national reporting on European level. Th e logic and function of this application can provide valuable inspiration for the European e-Reporting pilot project.
In addition, the Austrian experts assisted their Maltese counterparts in preparing the NESIS good-practice forms for the Environment Portal and the Reporting Obligations Database. Also, the latest update of the NESIS Status Report on the National Environmental Information System for Austria was provided to the Maltese counterparts.
Component 3: Development of guidance documentsTh ree types of guidance documents on the Aarhus Convention were produced during
this project: 1. Guidelines for civil servants: these guidelines contained a detailed overview of the
contents of the Aarhus Convention and its interpretation within the Maltese context (legal framework and practical considerations with regard to the implementation mechanisms in place). Th e guidance documents for civil servants were published on the MEPA website.
2. Guidelines for the general public: these guidelines consisted of an overview and detailed versions, tailored to the needs and the interest of the members of the general public and their representatives, such as NGOs and Local Councils in Malta. Th e guidelines also marked the limits of the scope of the Convention, i.e. the circumstances are indicated when, for example, environmental information should not be released by the authorities (e.g. for reasons of national security or of personal data protection). Th e guidance documents are available, free of charge, on the MEPA website and could be freely used by all interested stakeholders.
3. Guidelines for the industry: these guidelines included a general Guidance Note on the Aarhus Convention for the industry, GBRs (General Binding Rules – GBRs) and on options to comply with it. A number of the GBRs had already been developed under a parallel MT-2004 Twinning Light Project “Improving regulatory eff ort and compliance

Chapter 2: Further Improvement of the Implementation of the Aarhus Convention in Malta: A Review 49
with EU environmental directives”. Under the project under discussion, these were adjusted to the specifi c requirements of the Convention, and in addition, further GBRs were developed. All GBRs were supplied also with explanatory guidance notes.
All guidance materials for the industry were published, online and free of charge, on the benefi ciary website.
Th e guidelines were promoted at the visibility seminars for civil servants (24.-25.03.2009) and for the general public (26.03.2009), as well as at the informative seminar on the guidelines for the industry (30.03.2009).
Component 4: Training and awareness-raising1. Visibility Actions on the Implementation of the Aarhus Convention in MaltaTh e guidelines for civil servants and for the general public were presented during
visibility actions organised for civil servants (24.-25.03.2009) and for NGOs, local councils and the public (26.03.2009) in Malta. Th e initially foreseen training and awareness-raising seminars were enhanced to the extent of visibility actions, in order to address as many civil servants and members of the general public as possible, in compliance with the core contents of the Aarhus Convention. Nominated civil servants from public agencies and institutions, the general public and its representatives (11 NGOs, the Association of the Local Councils and all 68 Local Councils in Malta) were invited.
Further to the basic contents of the guidelines, the visibility seminars focused also on specifi c legal and practical details, case examples and discussions. Also, the pilot inter-institutional environmental web portal www.ambjent.org.mt, as initiated and developed under the auspices of this Twinning project was presented and discussed in detail. In addition, another relevant initiative that was presented, although not under the auspices of the current project but advantageously coinciding with the visibility seminars and allowing for synergies to be exhausted, was the promotion at both visibility seminars of the consultation strategy on the implementation of the Water Framework Directive (WFD) in Malta.
All presentations, relevant links and respective guidelines were distributed among the participants within two weeks aft er the visibility actions, as announced at the events. A brochure informing on the core contents of the Aarhus Convention was also produced and distributed at the events, respectively, is freely available at the benefi ciary aft erwards. Th e guidelines were made available online, free of charge, at the the benefi ciary website:
a) for the general public;b) for civil servants;

50 Future Preparedness: Th ematic and Spatial Issues for the Environment and Sustainability
Th e highlights of the outcome of the visibility seminars are presented below.
1. Access to Environmental Information1. By facilitating the access to environmental information through the launch of the
pilot inter-institutional environmental web portal http://www.ambjent.org.mt within less than a year, the practice in Malta set a commendable example on the international level of fast action towards an optimal implementation of the Aarhus Convention under its fi rst “pillar”.
2. A further example of best practice on international level is the information and updated system for the progress of major developments and of development permit applications, off ered by MEPA.
2. Public Participation in Environmental Decision-making1. In Malta, commendable practice on public consultation and participation exists
in the case of EIA procedures. Th e procedures are transparent and clear and detailed. A further valuable attribute of the EIA procedure in Malta is the tendency of formulating policy options, i.e. of following the principle of aiming at alternatives (options). Th ese techniques and approach are recommended to be applied also to SEA procedures, which had been introduced within the environmental permitting in Malta during the lifetime of the project.
2. A further consideration recommended in the fi eld of public consultation refers to an early launch of negotiations on confl icting issues between the parties involved. A commendable option in cases of strong contradicting interests may further suggest to not directly include the parties themselves, but to entrust the negotiation process to neutral representatives, at least in the fi rst instance, in order to facilitate the achievement of a joint proposal.
3. For small countries like Malta it should not be excluded that NGOs might reach a point of “consultation fatigue” due to the small number of NGOs and the large spectrum of issues to be consulted on in public.
4. A fundamental prerequisite for successful public participation is to build trust among the parties. One of the best ways to involve stakeholders is to constitute “representative consultative” bodies, for example, stakeholder committees to draft legislation.
5. It could also be considered that stakeholders oft en might not distinguish between the results of the consultation process and the process itself, transferring their attitude to the achieved process results on the quality of the process.
6. Generally, it was recommended to consider training in negotiation skills for key national staff , in order to facilitate them in dealing with issues related to the implementation of the Aarhus Convention and in therefore preventing court-based procedures.

Chapter 2: Further Improvement of the Implementation of the Aarhus Convention in Malta: A Review 51
7. It was also generally recommended to evaluate participation exercises aft erwards, in order to enable identifi cation of strengths to further build on. A key question to be addressed to the general public in this context is whether the public understands the reasons for making the plan/project/ programme, in order to ensure that a clear distinction is made between the process and the result.
3. Access to Justice in Environmental Matters1. In terms of the third “pillar” of the Convention, namely Access to Justice in
Environmental Matters, the suitability of both the MEPA Auditor and the Appeals Board as an instrument was emphasised, because they represent a cost-effi cient means for legal redress (since the procedure does not require the employment of a lawyer and is not subject to the legal formalities of a Court) and from the legal point of view, they can off er a pre-stage to judicial review in this process.
4. General Conclusions on the Visibility Actions for Civil Servants and the General Public
1. It was generally noted that Malta is broadly in alignment with the legal provisions of the Aarhus Convention. In the event that the Convention may not be applied, the right of appeal is provided for within the benefi ciary institutional mechanisms that can be utilised, and fi nally, judicial review is provided for, even though it is not suggested that the latter is used before other means for remedies are exhausted. In general, low number of the participants having attended both visibility seminars, despite the publicity employed, may suggest that in the epoch of multimedia, seminars may oft en not be the only form to disseminate knowledge and to induce discussion, e.g. television and internet broadcast could be considered to be a more appropriate option for this purpose.
2. Seminar on the Aarhus Guidelines and General Binding Rules (GBRs) for the Industry
A workshop to disseminate the implications of the Aarhus Convention for the industry in Malta among civil servants was held on 30.03.2009. Th e seminar aimed at informing the public authorities on a large body of relevant material emerging from this Twinning project, inclusive of:
1. A Guidance Note on the Aarhus Convention for the industry,2. Proposed General Binding Rules for enterprises in Malta,3. Guidance to enterprises and good environmental practices,4. Details of the emerging system for environmental permitting in Malta.

52 Future Preparedness: Th ematic and Spatial Issues for the Environment and Sustainability
An overview was off ered to the participants of the new environmental permitting system in Malta and on how the associated administrative procedures will incorporate the provisions of the Aarhus Convention with regard to public participation procedures in permitting of industrial enterprises. A demonstration was also off ered at the seminar of how the recently pilot permitting system served as an important vehicle for obtaining feedback from enterprises on practical aspects of the emerging environmental permitting system. Finally, the implications were presented of the Aarhus convention for Small- and Medium-sized Enterprises (SMEs) MEs and for public bodies involved in the administration of the environmental permitting systems and development consent. Th e participants displayed a considerable level of interest in the topic, and a lively discussion on many of the issues in the presentations concluded the seminar. Th is indicated that also in future, the need for further information and clarifi cation will remain.
International Traineeships (Study Visits)1. Overview
Th is Activity allowed for experience exchange and for on-the-spot obtaining of tailored knowledge by Maltese civil servants, related to the daily implementation of the Aarhus Convention in other EU Members States (MS) beyond the scope of the visibility and training seminars in Malta.
At a relative weighting of 5:3:2 person training visits per theme, the distribution of the performed study visits among the three Aarhus “pillars” approximates well their actual relative importance in current Aarhus implementation activities also in other MS. Alternative opportunities had also been identifi ed and taken towards a maximal benefi t for the Benefi ciary Institution, such as:
a) to exhaust synergies between the Access to Environmental Information “pillar” of the Aarhus Convention under the auspices of this Twinning project and the current launch of pilot projects aiming at implementing the SEIS, and
b) to enable Maltese key experts to attend international conferences addressing the Aarhus Convention, e.g. conferences under the auspices of the Czech EU Presidency of the Council of the EU addressing the Aarhus “pillars” Access to Environmental Information and Access to Justice in Environmental Matters.

Chapter 2: Further Improvement of the Implementation of the Aarhus Convention in Malta: A Review 53
Figure 1: Aarhus “pillars”
Th e duration of the study visits could not be extended in all cases to the initially foreseen one week each. Th e reasons for this relate either to the actual availability of the staff at the MS institutions who acted as hosts, or the need for rescheduling of some of the study visits.
For the organisation of all study visits, including the additional ones, 25 institutions in 9 MS (UK, Ireland, Scotland, the Netherlands, Spain, Italy, the Czech Republic, Austria, Hungary) were contacted in total, respectively 64 MS offi cers, during the period 03.11.08 – 12.06.2009. Th e general conclusions which can be made on this Activity are that:
a) Most MS institutions lack human resources to supervise visiting experts and therefore refuse to act as hosts, something that Malta may face in the future when asked to host other countries’ experts.
b) Th e study visits are not attractive for the potential host institutions, because the latter cannot be reimbursed for their eff ort.
c) Th e study visit coordination is a signifi cantly time-consuming process until the potential host institution in another MS provides a clear statement on accepting or refusing to act as host. Upon confi rmation of the MS institution for accepting this role, a further period of time (several weeks) elapses for the preparation of the work programme. Th is impedes the successful organisation of the study visits within a limited timeframe.
d) Despite these disadvantageous factors, the study visits proved to be very fruitful, not only for the Maltese experts, but also for the host institutions in the MS: synergies were exhausted with interlinked initiatives, such as the upcoming implementation of the SEIS

54 Future Preparedness: Th ematic and Spatial Issues for the Environment and Sustainability
and the INSPIRE Directives on a national level, and mutual enrichment was achieved through knowledge and experience exchange related to practical tackling of these tasks.
2. Experience Exchange Seminar In continuation with the process of expanding on knowledge gain, on 24.06.2009, a
half-day experience exchange seminar was held in Malta for the Maltese experts who havd attended study visits in other EU Member States, in order to exchange their experience and inform on the knowledge gained during the study visits, with a particular emphasis on an interdisciplinary discussion towards contributing to further improvement of the daily implementation of the Aarhus Convention and towards effi cient fulfi lment of emerging obligations also under related upcoming EU initiatives (e.g. implementation of the SEIS and of the INSPIRE Directive), and therefore to ensure a sustainable dissemination of the results from the study visits.
Th e interdisciplinary discussions led during and aft er the presentations allowed for the following key conclusions for further actions to be drawn towards sustainably ensuring improved implementation of the Aarhus Convention and the related upcoming EU initiatives (SEIS, INSPIRE Directive, e-Reporting) aft er the end of the Twinning project:
2.1. Streamlining of the requests for environmental information In order to provide for a durable and effi cient management of incoming requests for
environmental information in the future, the related existing structures and procedures could be reviewed in the light of the following options emerging from the discussions:
a) streamlining of the incoming requests for environmental information, i.e. the requests should be collected, respectively, directed to a central receiving place, in order to ensure their being optimally processed,
b) mechanisms should be established allowing for the traceability of each request and its processing,
c) a policy should be elaborated on what information accompanying the processing of the requests could be released to the general public.
In order to ensure the successful overall tackling of this complex task, a task force group could be recommended to be established within the competent authority for the implementation of the Aarhus Convention in Malta.

Chapter 2: Further Improvement of the Implementation of the Aarhus Convention in Malta: A Review 55
2.2. Modernisation of the current procedures for reporting of national environmental information to the EC
Th e current datafl ow process is dependent on a series of approvals across diff erent agencies that form an effi cient fl ow that ensures Malta’s adherence to the reporting cycle.
2.3. Ensuring of implementability of law (Legal Notices) prior to their adoptionWith regard to further ensuring durable enforcement of environmental legislation
proposed in the future, the following actions may be considered:a) an amplifi ed inclusion of the Chamber of Advocates as a consultee in the Public
Participation and Consultation processes during the draft ing of Legal Notices,b) an amendment to the Environment Protection Act to include the remedy of appeal
before an independent administrative board, i.e. a measure similar to the appeal procedure contemplated in the Development Planning Act, and
c) handing down of more executive powers to planning and environment enforcement offi cials, in order to ensure a more eff ective all-round enforcement.
2.4. Defi nition of information to be released together with the requested environmental information
An interesting option with regard to the transparency of the processing of the requests for environmental information by the competent authority for the implementation of the Aarhus Convention is practiced, for example in the UK. Within the competent authority, a system has been set up to register the requests for environmental information and to follow them up. Th e requests are logged by the so-called Public Liason Unit into the system, and are further passed to the responsible unit handling the requested information. When replying to the applicant, the authority is entitled to release not only the information requested, but also any additional information related to the request, e.g. from emails to internal correspondence and public documents.
Th e establishing of a similar “Public Liason Unit” within the benefi ciary (as competent authority for the implementation of the Aarhus Convention in Malta) could:
a) be considered also an option towards greater transparency in the process of making environmental information public,
b) signifi cantly contribute to streamlining the incoming requests for environmental information, and
c) provide assistance in the policy development for defi ning of the information to be made public.

56 Future Preparedness: Th ematic and Spatial Issues for the Environment and Sustainability
2.5. Sustainable dissemination of the knowledge gained through the study visits in other EU MS
Th e knowledge gained by the Maltese civil servants / experts during their study visits in other EU MS was disseminated in two ways:
a) online through materials on the Aarhus Convention produced during this project and relevant for civil servants in Malta, and
b) proactively, through specifi c expert discussions on the respective technical issues within the individual concerned units in the public authorities in Malta.
ConclusionIn conclusion, this Twinning project served more than its targeted purpose. Away from
the various measures to identify lacunae, widen knowledge on the Aarhus Convention and initiate implementation measures, the project also eff ectively served as the launching pad for the ERDF project which took up the baton that sought to implement the dissemination of environmental information. In both arenas, the project has excelled and laid the groundwork for many a thematic aspect, ranging from theoretical approaches to implementation outcomes.

Chapter 2: Further Improvement of the Implementation of the Aarhus Convention in Malta: A Review 57
List of Abbreviations
CDR Central Data Repository (European Environment Agency)COCP Maltese Code of Organization and Civil Procedure COM European Commission Proposal for a DirectiveCOREPER Committee of Permanent RepresentativesDfEH Department for Environmental HealthDPA Development Planning Act (under the Maltese legislation)EC European CommissionEEA European Environment AgencyEIA Environmental Impact AssessmentEPA Environmental Protection Act (under the Maltese legislation)ESTAT (previously EUROSTAT) Statistical Offi ce of the European CommissionEU European UnionEUMA EU and Multilateral Aff airs Unit (MEPA)GBRs General Binding RulesGMO Genetically Modifi ed OrganismsINSPIRE Infrastructure for Spatial Information in the European Community, Directive 2007/2/ECIPPC Integrated Pollution Prevention and ControlLN Legal NoticeMEPA Malta Environment and Planning AuthorityMoU Memorandum of UnderstandingMRA Malta Resource AuthorityMS Member StateNESIS Network Network to enhance a European Environmental Shared and Interoperable Information SystemNFP National Focal PointNGO Non-governmental OrganisationNSO National Statistics Offi ceOPM Offi ce of the Prime MinisterPDS Project Description StatementSEA Strategic Environmental AssessmentSEIS Shared Environmental Information SystemSME Small- and Medium-sized EnterprisesUNECE United Nations Economic Commission for Europe WISE Water Information System for Europe

58 Future Preparedness: Th ematic and Spatial Issues for the Environment and Sustainability

C H A P T E R 3
Can Building Footprint Extraction from LiDAR be Used Productively in a Topographic Mapping Context?
Carol Agius and James Brearley
IntroductionLight Detection and Ranging (LiDAR) is a quick and economical method for obtaining
cloud-point data that can be used in various disciplines and a diversity of applications. LiDAR is a technique that is based on laser technology. Th e process looks at the two-way travel time of laser beams and measures the time and distance travelled between the laser sensor and the ground (Shan & Sampath, 2005). National Mapping Agencies (NMAs) have traditionally relied on manual methods, such as photogrammetric capture, to collect topographic detail. Th ese methods are laborious, work-intensive, lengthy and hence, costly. In addition because photogrammetric capture methods are oft en time-consuming, by the time the capture has been carried out, the information source, that is the aerial photography, is out of date (Jenson and Cowen, 1999). Hence NMAs aspire to exploit methods of data capture that are effi cient, quick, and cost-eff ective while producing high quality outputs, which is why the application of LiDAR within NMAs has been increasing.
One application that has seen signifi cant advances in the last decade is building footprint extraction (Shirowzhan and Lim, 2013). Th e buildings layer is a key reference dataset and having up-to-date, current and complete building information is of paramount importance, as can be witnessed with government agencies and the private sectors spending millions each year on aerial photography as a source for collecting building footprint information (Jenson and Cowen, 1999). In the last decade automatic extraction of building footprints from LiDAR data has improved suffi ciently to be of an acceptable accuracy for urban planning (Shirowzhan and Lim, 2013).
Th e most common and cost-eff ective outputs from LiDAR are Digital Surface Models (DSMs) and Digital Terrain Models (DTMs) (Priestnall et al., 2000). However it would be useful to use LiDAR to generate other outputs, such as building footprints. Although, research does indicate that the automatic detection of buildings has not yet been fully achieved (Awrangjeb et al., 2010) there is the hope in the future that the building footprints created from LiDAR data can be added to the large-scale basemaps. Th is is due to the fact

60 Future Preparedness: Th ematic and Spatial Issues for the Environment and Sustainability
that building capture using photogrammetric means is oft en labour intensive. Digital Surface Models are very useful at providing building locations, and LiDAR
in recent times has been considered as a cost eff ective and accurate method of creating DSMs (Hill et al., 2000). Th e creation of DSMs and DTMs can be seen as the fi rst inputs into one method for building extraction by subtracting the DSMs away from the DTMs. Th is process retains features above the terrain, such as buildings and vegetation. Th e process can be refi ned by fi ltering the resulting data on a height threshold to remove vegetation and other anomalies (Haithcoat et al., 2001; Kwak & Habib, 2013). Bayesian Network Classifi cation can be used to detect buildings based on the height diff erence between DSMs and DEMs (Ma, 2005). Th e rationale for this method is the assumption that separate surface features from ground elevation data are higher than the features from the surrounding surface (Priestnall et al., 2000). Th e Bayesian approach has been attempted to extract building footprint solely from LiDAR data whilst also attempting to retain the highest possible accuracy (Wang et al, 2006). Other methods have been tried for extracting building footprints from LiDAR.
Th e extraction of building footprints is oft en attempted by four steps that are oft en seen as successful: diff erentiating between ground and non ground points, identifying building features, determining building footprints and fi nally, generalising footprint boundaries (Kim & Shan, 2011). Some other current building extraction methods are attempting the use of Triangular Irregular Networks (TINs) polygons to be able to classify the buildings for the extraction (Alexander et al., 2009). Th ese TIN polygons are also used to help with the separation of buildings and vegetation based on the height diff erence. Th e use of TINs to categorise building was shown to be especially eff ective when there is a sudden change within elevation between the data (Alexander et al., 2008).
A morphological fi lter is oft en implemented to distinguish between terrain and non-terrain segments, and is viewed as a core action for building extraction (Elashker & Bethel, 2002). Once the original data has been fi ltered Shiravi et al. (2012) recommend trying various assessments by adding the height data to check that the buildings fi t the requirements. Th ese would be expected to give a high accuracy for building footprints from LiDAR data. In fact the dataset produced sometimes has more accurate height values than it does boundary lines, with water sometimes causing anomalies with the data recorded (Awrangjeb et al., 2010). Another issue with building footprint extraction from LiDAR arises when certain aspects are not always correctly removed because of ‘debris’ or small buildings being left over from the extraction process (Kim & Shan, 2011). A diff erent problem is holes within buildings and that closed polygons cannot be identifi ed automatically (Shirowzhan & Lim, 2013). Vegetation is an additional problem when extracting building foorprints from LiDAR data because vegetation and trees ‘interfere’ with the urban features, so selection and removal of these features, especially in the pre-

Chapter 3: Can Building Footprint Extraction from LiDAR be Used Productively in Topographic Mapping? 61
processing stages is recommended (Zhou & Neuman, 2013). Various authors suggest using intensity values to identify vegetation features, distinguishing the vegetation from buildings and terrain will facilitate the separation of the data (Th uy Vu, 2009; Goepfer et al., 2008).
MethodologyTh e LiDAR data acquired through the ERDF 156 project has a point density of 0.25
meters and the cloud points were classifi ed into three categories: ground, unassigned, and water. Th e scope of the exercise was to investigate how the point cloud data could be manipulated to extract building footprints. Comparing the resulting dataset with the existing buildings data captured photogrammetrically and orthophoto maps generated from aerial photography shot at the same time as the LiDAR survey will highlight and detect changes. Th e trials were carried out to investigate whether the LiDAR extracted data can potentially be used as a stop-gap to temporary update the building features on existing large-scale basemaps until the missing features can be captured photogrammetrically from aerial photography.
In order to extract the building footprints the method adopted was broken down into a number of diff erent stages. Th e techniques used were not based on the specifi c methods researched from previous work and studies; however the research provided an understanding of potential approaches to implement to achieve the desired objective. Th e LiDAR point cloud data was supplied in 1km x 1km tiles. Tiles in three sites were selected for the trials, the selection was based on the terrain, topographic content and the height variations of the built environment:
• Tigne Point in Sliema – dense urban coastal area with great variation in building heights ranging from 2 to 15 stories, with minimal ground urban vegetation and roof top gardens;
• Il-Maqluba in Gudja – undulating terrain, including a doeline, showing mixed urban and rural area typically depicting terraced fi elds bounded with thick rubble walls;
• Mosta – urban fabric of mostly homogenous building heights with adjacent watercourse valley and both natural and structured urbanised vegetation.
As mentioned previously, the supplied LiDAR point cloud data was only classifi ed into three categories: water, ground and unassigned. Th is meant that the unassigned category contained return data from buildings, vegetation, boats, vehicles, walls, power cables, and cranes besides other ‘noise’. Th e aim of the approaches adopted was to fi lter out just the building data from all the above-ground information captured by the LiDAR survey. Th e desired end result was building footprints, so the goal was to extract the outlines of the
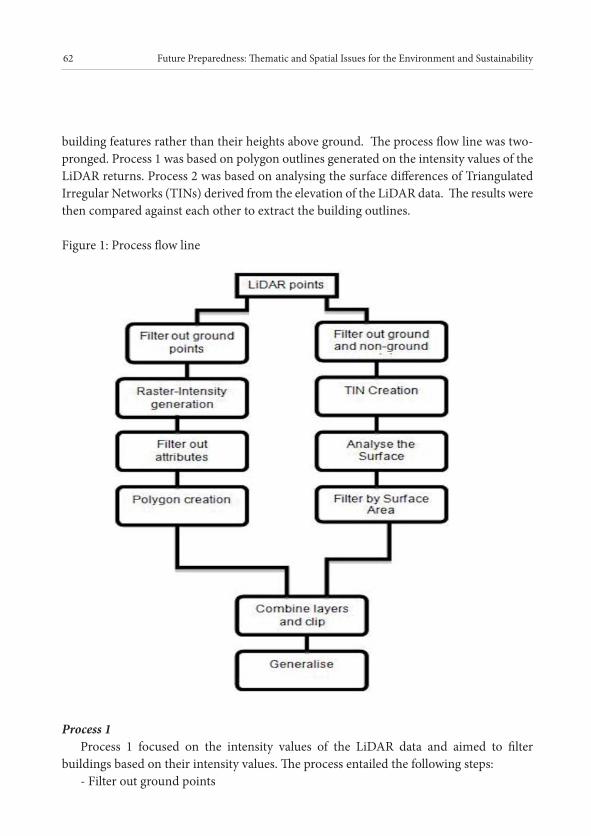
62 Future Preparedness: Th ematic and Spatial Issues for the Environment and Sustainability
building features rather than their heights above ground. Th e process fl ow line was two-pronged. Process 1 was based on polygon outlines generated on the intensity values of the LiDAR returns. Process 2 was based on analysing the surface diff erences of Triangulated Irregular Networks (TINs) derived from the elevation of the LiDAR data. Th e results were then compared against each other to extract the building outlines.
Figure 1: Process fl ow line
Process 1Process 1 focused on the intensity values of the LiDAR data and aimed to fi lter
buildings based on their intensity values. Th e process entailed the following steps:- Filter out ground points

Chapter 3: Can Building Footprint Extraction from LiDAR be Used Productively in Topographic Mapping? 63
Th e LiDAR data were supplied categorised in three classifi cations. For the fi rst step of Process 1 the points for each of the trial areas categorised as ‘unassigned’ were selected from the point cloud data. Th e unassigned points were fi rst returns from above ground features, which excluded roads, rock surfaces, soil and other ground-level surfaces.
-Raster Intensity GenerationA raster map based on the intensity values of the LiDAR returns was generated on the
points categorised as unassigned. Th e values of diff erent features on the resulting intensity raster maps were noted and compared to each other; these features included buildings, vegetation, vehicles and other features.
-Filter out on the intensity attributesIn the local context it was observed that vegetation has lower intensity values compared
to the buildings which oft en have higher intensity values; due to the refl ectance values that are returned from vegetation features. Th erefore fi ltering these lower values out removed the vegetation from the raster, leaving behind the points returned from building and vehicles which can be fi ltered out at a later date following further processing. One issue that arose from this process was that the diff erence in intensity values between buildings and vegetation was more marked in urban areas than in rural areas. Th is was due to the urban vegetation being ‘greener’, possibly from better irrigation compared to the more arid rural areas. In rural areas the intensity fi ltering also picked up rubble walls since these are composed of the same fabric as buildings.
- Polygon creationTh e fi ltering out based on intensity attributes produced raster maps which were
polygonised using standard soft ware tools.
Figure 2: Mosta - Filtered intensity map depicting buildings and vehicles

64 Future Preparedness: Th ematic and Spatial Issues for the Environment and Sustainability
Process 2Process 2 focused on fi ltering the data based on height values. Rather than work with
DEMs and DSMs this study opted to work with Triangulated Irregular Networks since TINs retain information such as surface area, volume, etc.
- Filter out ground and non-ground pointsIn Process 2 two point fi les for each of the trial areas were created. Th e fi rst was the raw
LiDAR point cloud data, all returns and all classifi cations. Th e second was the all returns of the points categorised as ‘unassigned’.
- TIN CreationTwo TINs were then created; the fi rst of the unfi ltered LiDAR points all returns and all
classifi cations shown in Figure 3 below. Th e second TIN was generated from all returns of the non-ground, unassigned points shown in Figure 4.
- Analyse the Surface Diff erenceTh e resulting two TINs were then compared against each other to determine the surface
diff erence between the ground points and the above-ground points. Th e end result was a dataset of polygons depicting above ground features which included buildings, vegetation, cars, fi eld boundaries and buses. An example of the output is shown in Figure 5 below.
- Filter by Surface AreaUsing area as a fi lter it is possible to eliminate objects that are much smaller than
buildings, such cars and small fi eld boundaries.
Figure 3: Mosta – TIN of all LiDAR returns all classifi cations

Chapter 3: Can Building Footprint Extraction from LiDAR be Used Productively in Topographic Mapping? 65
Figure 4: Mosta - TIN of all LiDAR returns ‘unassigned’
Figure 5: Surface diff erence between unassigned TIN and all classifi cations TIN
- Combining of TINs and Intensity ResultsOnce both processes were fi nalised the next step was to combine the results. Process
1, based on intensity fi ltering, produced a polygon dataset that contained buildings and vehicles but eliminated vegetation. Process 2 produced a polygon dataset that contained buildings and vegetation but eliminated all but the largest vehicles, example buses, and overhead cranes. Th e next step was to compare the two results against each other and remove the polygons that do not overlap. Only the common areas in both outputs were retained eliminating features that were not present. Th is resulted in the clean removal of

66 Future Preparedness: Th ematic and Spatial Issues for the Environment and Sustainability
both the vegetation and vehicles that would have been previously left behind should only one of the fi ltering methods have been used in isolation rather than in combination. Th is was largely successful, especially in the more developed areas such as Silema.
- GeneralisationTh e previous step resulted in a fairly clear selection of building footprints. However,
it was still necessary to carry out generalisation and smoothing to tidy any gaps in the buildings from where points were never assigned during the aerial survey. Th ese processes also simplifi ed the building footprints, making them more aesthetically pleasing.
Figure 6: Mosta - Resulting output building footprints aft er generalisation and smoothing
ResultsTh e results from the three trials were examined to establish the quality of outputs
and determine whether the data can be used productively. Th e outputs of all the three trial areas were compared with aerial imagery acquired in the same period as the LiDAR survey and against a buildings vector dataset acquired through photogrammetric capture from older low-fl ying aerial photography. Th e aims of the comparison were to investigate whether the polygons extracted did constitute a complete buildings dataset without either omitting building features or ‘inventing’ building polygons. Th e comparison was also useful to verify the positional accuracy and the shape of the building polygons extracted from LiDAR.
Spatiotemporal analysis of the LiDAR extracted building footprints against the older photogrammetrically captured building blocks was then carried out. Th e building footprints extracted from LiDAR were overlaid over the building footprints captured photogrammetrically in order to identify any polygons present in the LiDAR footprints but

Chapter 3: Can Building Footprint Extraction from LiDAR be Used Productively in Topographic Mapping? 67
not in the existing buildings layer. In theory these ‘new’ polygons represent changes in the buildings dataset since the last aerial photography, in other words new development on the ground that needs to be updated in the buildings dataset. Th e comparisons did highlight substantial development changes to the urban areas since the previous photogrammetric capture. In order to verify the authenticity of this assumption the highlighted polygons were compared against orthophotos produced from aerial photography shot in the same period as the LiDAR survey. Th e visual comparison backed up the assumption and verifi ed that the ‘new’ polygons are indeed new building features present on the orthophoto and missing from the current buildings dataset. Th ese changes are most likely due to the development of the areas since the previous photogrammetric capture had taken place.
Figure 7: Mosta showing photogrammetriclly captured buildings over an orthophoto (left ), and the change in development detected by LiDAR footprint extraction (right)
Positional accuracy is a measure of how closely the points in a dataset agree with the corresponding points in the real world. In large-scale topographic mapping at scales of 1:1250 typical positional accuracy is of <±1.0m (OS, 2005). Th e building footprints extracted from LiDAR were compared with the photogrammetrically captured building footprints and tested for positional accuracy; the results ranged from ±1.2m to ±1.5m, which are fair results. However it should be noted that the tests were carried out on a large-scale dataset not on ground survey data, so the positional accuracy of the results is less and cannot be deemed suffi cient for scales greater than 1:2500. Th is indicates that the LiDAR building footprints cannot be used to update directly to the current large-scale data, which is 1:1000 scale, without necessitating considerable manual editing and manipulation.

68 Future Preparedness: Th ematic and Spatial Issues for the Environment and Sustainability
Building shape is one aspect that suff ered from the extraction process. Th e most noticeable is the number of ‘holes’ generated in the building polygons from the extraction process. Th ese require further work to eliminate. Another issue that compromised the shape of the extracted building outlines where protruding balconies and terraces. Th ese not only created jagged edges which required smoothing but also distorted the shape by extending the building outline further than the actual footprint itself.
Figure 8: Sliema showing how protruding balconies extend the building outlines further than actual footprint, and superfl uous ‘holes’
Figure 9: Sliema showing how buildings in close proximity are joined into one polygon

Chapter 3: Can Building Footprint Extraction from LiDAR be Used Productively in Topographic Mapping? 69
Simplifying, smoothing and buff ering carried out on the dataset following the extraction process did introduce an element of distortion to the shape of the building footprints. In a few cases the process joined some close polygons together, this requires a certain amount of manual editing to correct. Th e fi nal output also suff ers from some round edges.
Th e Maltese rural landscape is typifi ed by centuries old rubble walls that divide and terrace the agricultural land. In more than a few cases these old walls have a thickness of a metre or more. Th ese features posed a problem when extracting building footprints from the LiDAR data because they were selected with the building features. Since these thick rubble walls are constructed from the same fabric they share the same intensity value range as stone buildings. Th e issue is compounded by the fact that long networks of thick rubble walls have a large surface area and cannot be selected and eliminated by a minimum area without also selecting and eliminating legitimate building footprints. By the same token boats and larger vehicles were not always eliminated because the objects had an area larger than small buildings. Th is issue required manual or semi-automatic processing by only selecting building footprints within development and urban zones, within coastal boundaries and eliminating objects within road polygons.
Figure 10: Gudja showing thick rubble walls selected with building features
A facet of urban landscape that caused problems was roof gardens, roof level vegetation, and roof-top sports grounds with artifi cial turf; because when urban vegetation was eliminated by fi ltering on intensity values, the buildings with vegetation at roof level were also selected. Th us these features were either completely eliminated or resulted in signifi cantly distorted building footprints.

70 Future Preparedness: Th ematic and Spatial Issues for the Environment and Sustainability
Figure 11: Sliema showing diffi culty in extracting building footprint of turf covered roof-top
ConclusionTh e results from the areas that have higher urban development, such as Sliema and
Mosta in these trials, show that this process is well suited to identifying the building footprints themselves. Th is is mainly due to the fact that there is less contrast in the landscape and surrounding features. While in the more rural areas the buildings have very similar characteristics to the rest of the landscape making the extraction of the building footprint less straightforward. Rural areas tend to be largely less developed in terms of building heights and overall volume of the buildings, besides having thick rubble walls that have very similar intensity values to the building features in these areas. Th erefore, removal of the rubble walls during the extraction process is more complicated. In some cases, ploughed fi elds within the rural areas also oft en displayed similar intensity values to the rubble walls and buildings themselves. Th is is unlike the vegetated areas within the more urban areas that were oft en greener, possibly due to better irrigation, rendering the intensity fi ltering and the removal of the vegetation slightly simpler. On the other hand in the urbanised areas garden rooft ops that contain vegetation did cause some extraction issues when fi ltering by attributes such as intensity. Th erefore identifying a specifi c value range was required. Th is then allowed removal of large areas of vegetation without having a great detrimental eff ect on building footprints on building features with rooft op garden.
Creating a fi ltered TIN and non-fi ltered TIN allowed the separation of ground points and non-ground points retaining, besides the building features, extra unwanted objects such as cars, large vehicles, boats and vegetation. However, attributes such as area proved very useful in this method by fi ltering out cars based on the surface area of the average

Chapter 3: Can Building Footprint Extraction from LiDAR be Used Productively in Topographic Mapping? 71
sized car. Filtering by area values did not completely eliminate other features such as rubble walls in the rural areas, even though the fi ltering values were increased slightly in the rural area, the values could not be increased greatly as increases by too large a value would potentially lead to the removal of footprints of smaller buildings.
From these trials it can be concluded that it is quick and easy to produce building footprints from LiDAR point cloud data. Th e method used here does produce a relatively complete building dataset, however this data cannot be used as a simple replacement to updating building features captured at large-scale. Th is is because the shape, detail and positional accuracy are not enough to satisfy the specifi cations of topographic mapping at scales of 1:2500 or larger. However the output can be useful at scales smaller than 1:2500. Further investigation of how this process can be improved is warranted since building edges are a crucial element in large-scale building footprints. One avenue of investigation that could potential enhance the process described in this paper is by classifying and extracting building features from aerial imagery (Yong & Huayi, 2008). Th ese results combined with the outputs from this research could potentially improve the accuracy and shape of the building footprints extracted from LiDAR.
Th e data would still require some manual manipulation to render the output aesthetically pleasing and to correct inadvertent omissions. Also, additional datasets, like urban development limits, coastal outlines and roads, will be required to fi lter out features such as thick rubble walls, cars and boats that seep through the extraction process and clutter the building footprint dataset.
Th e methods for building footprint generation and extraction have to take into consideration the diff ering landscape and terrain the point cloud data is depicting. In this case if the LiDAR surveys are carried out during the winter/spring periods in the Mediterranean, when the vegetation is the greenest, the intensity mapping and fi ltering out of vegetation would be facilitated due to higher contrast and higher intensity rates. All in all the results from these trials were rather promising; however it has to be borne in mind that the processes are not totally automatic and do not eliminate all manual intervention. Th e processes might not be as labour intensive as photogrammetric capture, but the results are also not as sharp and accurate as photogrammetric capture, especially at larger scales. However, these results are promising enough to be considered as an option for a quick and cheap system to detect change in building footprints and urban areas, and as an update at median scales.
72 Future Preparedness: Th ematic and Spatial Issues for the Environment and Sustainability
ReferencesAlexander, C., Smith-Voysey, S., Jarvis, C. & Tansey, K. (2009). Integrating building footprints and LiDAR elevation data to classify roof structures and visualise buildings Computers. Environment and Urban Systems, 33, 285-292.
Alexander, C., Tansey, K., Tate, N., Smith-Voysey, S. & Kaduk, J. (2008). Extraction of vegetation for topographic mapping from full-waveform airborne laser scanning data. Paper Presented at: SilviLase. Edinburgh, UK, 17th-19th September, 2008.
Awrangjeb, M., Ravanbakhsh, M. & Fraser,C. (2010). Automatic detection of residential buildings using LIDAR data and mutlispectral imagery. ISPRS Journal of Photogrammetry and Remote Sensing, 65, 457-467.
Elashker, A. & Bethel, J. (2002). Building Extraction Using LiDAR Data. Paper presented at: ASPRS-ACSM Annual Conference and FIG XXII Congress. Denver, Colorado, 10th-15th November, 2002.
Goepfer, J., Soergel, U., Heipke, C. & Brzank,A. (2008). An approach for fi ltering LiDAR data in coastal vegetated areas using intensity information and multiple echoes. Photogrammetry, Remote Sensing and Spatial Information Sciences, 37 (B3b), 219-226.
Goepfert,J., Soergel,U., & Brzank, A. (2008). Integration of intensity information and echo distribution in the fi ltering process of LiDAR data in vegetated areas. SilviLaser (8). Edinburgh, UK. 17th-19th September. Hill, R.
Haithcoat, T., Song, W. & Hipple, J. (2001). Automated Building Extraction and Reconstruction from LiDAR Data. Geographic Resources Centre. Available at: http://www.grc.missouri.edu/icrestprojarchive/NASA/FeatureExtraction-Buildings/REPYear2-build-extraction.pdf (accessed on 16 January 2014)
Hill, J., Graham, L. & Henry, R. (2000). Wide-Area Topographic Mapping and Applications Using Airborne LIght Detection and Ranging (LIDAR) Technology. Photogrammetric Engineering & Remote Sensing, 66 (8), 908-914.
Jensen, J. & Cowen, D. (1999). Remote Sensing of Urban/Suburban Infrastructure and Socio-Economic Attributes. Photogrammetric Engineering & Remote Sensing, 66(5), 611-622.
Kim, K. & Shan, J. (2011). Building footprints extraction of dense residential areas from LiDAR data. Paper Presented at: ASPRS 2011 Annual Conference. Milwaukee, Wisconsin, 1st-5th May, 2011.
Chapter 3: Can Building Footprint Extraction from LiDAR be Used Productively in Topographic Mapping? 73
Kwak, E. & Habib, A. (2013). Automatic representation and reconstruction of DBM from LiDAR data using Recursive Minimum Bounding Rectangle. Journal of Photogrammetry and Remote Sensing, 285-290.
Ma, R.(2005). DEM Generation and Building Detection from Lidar Data. Photogrammetric Engineering & Remote Sensing, 71 (7), 847-854.
Ordnance Survey. (2005). OS Mastermap: User Guide, Product Specifi cation. Southampton: Ordnance Survey.
Priestnall, G., Jaafar, J. & Duncan, A. (2000). Extracting urban features from LiDAR digital surface models. Computers, Environment and Urban Systems, 24, 65-79.
Shan, J. & Sampath, A. (2005). Urban DEM Generation from Raw Lidar Data: A Labeling Alogrithm and its Performance. Photogrammetric Engineering & Remote Sensing, 71(2), 217-226.
Shiravi, S., Zhong, M. & Beykaei, S. (2012). Accuracy assessment of building extraction using LiDAR data for urban planning/transportation applications. Paper Presented at: Conference of the Transportation Association of Canada. Fredericton, New Brunswick, 14th October, 2002.
Shirowzhan, S. & Lim, S. (2013). Extraction of Polygon Footprints from LiDAR Data in an Urban Environment. International Conference on Sustainable Design, Engineering, and Construction. Fort Worth, Texas, 7th-9th November 2012. Chong, W. Place of Publication American Society of Civil Engineers, 246-251.
Th uy Vu, T., Yamazaki, F. & Matsuoka, M. (2009). Multi-Scale Solution for building extraction from LiDAR and image data. International Journal of Applied Earth Observation and Geo-information, 11, 281-289.
Wang, O., Lodha, S. & Helmbold, D. (2006). A Bayesian Approach to Building Footprint Extraction from Aerial LIDAR Data. 3D Data Processing, Visualization, and Transmission, Th ird International Symposium. Chapel Hill, North Carolina. 14-16 June, 2006.
Yong, L. & Huayi, W. (2008). Adaptive building edge detection by combining LiDAR data and aerial images. Th e internal archives of the photogrammetry, remote sensing and spatial information sciences, 37, 197-202.
Zhou, Q-Y. & Neumann, U. (2013). Complete residential urban area reconstruction from dense aerial LiDAR point clouds. Graphical Models, 75, 118-125.

74 Future Preparedness: Th ematic and Spatial Issues for the Environment and Sustainability
C H A P T E R 4
Th e National Protective Inventory and Malta Scheduled Property Register: Malta’s Baseline for Cultural
Heritage Protection and MoreRené Attard and Matthew Vella
IntroductionStatutory heritage protection in the Maltese Islands fi rst started in 1925 with the
publication of the Antiquities (Protection) Act, which was followed by the Antiquities (Protection) List of 1932, amended in 1936 and 1939. Th e Antiquities (Protection) List was essentially a “shopping list” of properties meriting protection however the list was extremely basic and generic. Th e information provided varied depending on the familiarity with the sites by the people compiling the list at the time. No site plans were published with the list, indeed in certain cases a feature of a house in a street was the only feature being protected within a single locality which made locating the site in question diffi cult let alone its protection.
Apart from this, little was done however to protect heritage in Malta between 1939 and 1992 when the (then) Planning Authority was set up. Indeed, heritage protection by MEPA commenced in 1994 with the identifi cation of the most important archaeological sites and areas, delineation of Urban Conservation Areas for the fortifi ed cities around the harbour and the identifi cation of specifi c sites then under study through the Marsaxlokk Bay and North Harbours Local Plans. Protection of individual sites and buildings continued somewhat sporadically until 2006 when a thematic scheduling agenda was drawn up. Although a few groups of thematic scheduling had been carried out by then, most scheduling was undertaken depending on the studies being conducted at the time.
Th e NPI and MSPR, originally referred to as the List of Scheduled Property started off as little more than a list similar to the Antiquities List with the addition of pertinent information such as the proper address, images, a site plan denoting the extent and site curtilage if necessary, and other information required for planning purposes. In the late 2000s, the need was felt for better organisation of the information available and with it the better organisation of the NPI and creation of the MSPR.

76 Future Preparedness: Th ematic and Spatial Issues for the Environment and Sustainability
National Protective InventoryTh e NPI is the basis by which heritage is protected in Malta such that the formal
process for protection of heritage assets begins at this point. Defi ned in simple terms, the NPI is a collective digital database of data inventory cards containing information on diff erent properties which contain varying degrees of heritage signifi cance. Th e assessment of heritage signifi cance in Malta is based on international conventions and charters, and explores historical, architectural, scientifi c and social aspects. Th ose properties that are deemed to contain an acceptable level of signifi cance are then considered for formal individual protection. Th e NPI has its origins in the Inventory of the European Cultural Heritage (hereinaft er referred to as IECH) system as explained in detail in Borg and Formosa (2008), which commenced in Malta in 1964.
Th e IECH was eventually replaced by the NPI in line with the policies provided by the 1990 Structure Plan for the Maltese Islands. Whilst the original IECH and NPI data cards have evolved over the years, the concept behind these tools has always remained the same, that is to provide a record of, and information about properties with a potential to be protected as heritage assets. Indeed properties selected for protection are chosen based on the information provided by these cards, which also act as a record of those properties that have not yet acquired an appropriate level of heritage signifi cance to merit protection but may do so in the future.
Th e latest revision to the data inventory cards that form the NPI was carried out in 2007. Th is resulted in an increased volume of information and an improved structure held within the inventory. Depending on the availability of information, the revised NPI cards generally contain the following: architectural description, history including planning history, centre-point co-ordinates, photographs (both historical and current) and most importantly cultural heritage signifi cance. References to further information are also included when these are available. Th e NPI cards are designed in such a way as to allow the addition of newly acquired information at any stage. Th is is an important function since a frequent occurrence especially with regards to the NPI is the attainment of material, such as historical photographs, even aft er the completion of the data card. Th is fl exibility permits NPI data cards to be easily updated allowing the NPI to continuously evolve and therefore to become a library of information for heritage assets in Malta.
Th e NPI database can be viewed by anyone at the Malta Environment and Planning Authority (hereinaft er referred to as MEPA) premises, which is the competent authority for heritage management in Malta. It can also be accessed online at the MEPA website (MEPA, Undated). Th e NPI database is linked to the Malta Scheduled Property Register (hereinaft er referred to as MSPR) which utilises the information from the NPI database to provide information on protected built heritage. Th e MSPR will be discussed in more detail below.

Chapter 4: Th e National Protective Inventory and Malta Scheduled Property Register 77
Figures 1, 2 and 3: Example of NPI card as amended in 2007
Malta Scheduled Property RegisterTh e MSPR is essentially a database of protected immovable cultural heritage assets in
Malta. Th e MSPR owes its origin to what was known as the List of Scheduled Property. Th is list was developed shortly aft er the introduction of the Development Planning Act (DPA) of 1992 which, in addition to the 1990 Structure Plan for the Maltese Islands, equipped Maltese authorities with a sound legal framework that allowed the eff ective protection of Malta’s cultural and natural historical assets. Th e DPA has now been superseded by the Environment and Development Planning Act (EDPA) of 2010.
While the List of Scheduled Property provided some information on protected assets, it was originally stored in Geographic Information System (GIS) format as explained in Borg and Formosa (2008). Th is made querying information from the list rather effi cient especially when required data related to statistics on area, location and other spatial references. It was much more diffi cult to obtain information related to the actual number of protected assets however in view of certain sites being composed of a number of vector polygons delineating their value, typology or other features. Its conversion into a register providing more detailed information on individual, as well as groups of properties, eventually became necessary. As a result, in 2008 work began so as to convert the list into the MSPR of today.

78 Future Preparedness: Th ematic and Spatial Issues for the Environment and Sustainability
Th e project was a major exercise that spanned one year and included individually checking each site around the country (at the time there were about 2,200 protected properties) and correlating that information with the information contained in the Government Gazette, which is the offi cial national tool used to declare the protection of cultural assets. Th e information was included in a newly designed website with multiple search functions enabling users to search by numerous criteria. Indeed, as for the NPI, the MSPR is freely available to anyone who goes to the MEPA premises, or from the MEPA website. On the website the MSPR is available in two main digital formats: either as a searchable list of properties or through a GIS interface known as MapServer. Th e MSPR list was created aft er a process of sorting the data available on the GIS into individual sites rather than polygons as originally stored.
Figures 4 and 5: Screen shots of the MSPR search criteria and results obtained
By the end of 2013 the MSPR contained almost 3,000 entries consisting of Malta’s heritage including protected buildings, sites and areas. Th e project also included the linking of the MSPR and NPI so as to strengthen the capabilities of the two to provide information. Indeed the current versions of the MSPR and NPI are intertwined to such a point that it is diffi cult for either of them to function eff ectively without the other. While the MSPR contains the basic information required for statutory and planning purposes, the NPI contains more detail on the heritage asset that is being protected.

Chapter 4: Th e National Protective Inventory and Malta Scheduled Property Register 79
Where we are now and where we need to go
Th e updating / creation of the NPI cards and MSPR respectively has resulted in a boost to Maltese heritage in terms of providing more accurate and detailed information and improved accuracy, effi ciency and effi cacy in data compilation. Prior to the development of the MSPR, data compilation on protected property was a slow process that provided information whose validity was at times questionable. Th e reason for this was that since the main data depository was a vector Geographic Information System (GIS) database, there were at times multiple entries for a single property. Slight changes to the scheduling meant that the annual fi gures collected (at times manually) would become obsolete from one amendment to the next resulting in confl icting fi gures being provided for offi cial record purposes Th is is also somewhat refl ected in the statistics of this data being accessed from MEPA’s website as shown in Table 1 below.
Table 1: Access fi gures of the MSPR
2009 2010 2011 2012 20132,163 7,944 7,880 10,637 9,026
Of equal, if not greater importance is the fact that through the development of a web-based interface, and the increased use of internet in Malta, information on all types of Maltese heritage assets is now readily and easily available, which in turn allows the dissemination of information and increased knowledge for anyone interested in the subject matter, be it heritage and planning professionals or the general public alike. Th ese tools allow people to research some of the more obscure or less known elements of heritage thus promoting these assets.
Moreover, these tools remain relevant regardless of the legislation and policies of the time albeit slight changes may be required periodically depending on any changes to the legislation. While they owe their existence to legislation and policies, should they become legally redundant, their value as a planning and / or heritage tool will remain unchanged. Indeed, by being able to store accurate information that can be constantly updated, these tools act as an excellent historical record for current and future generations. Th ey are also used consistently by the Development Control Services within MEPA during assessment of planning applications for new development, restoration and other works. Th e stresses between heritage protection and development on a densely populated island are ever present (Camilleri, et al., 2012), and thus tools as described above will always be very helpful in these scenarios.

80 Future Preparedness: Th ematic and Spatial Issues for the Environment and Sustainability
Updating the information contained in these tools is a crucial component of heritage management as inaccurate or misleading information can result in the destruction of a heritage asset, or conversely the retention of one with limited value. Despite the fact that these tools allow the easy updating of the information within them, this nonetheless comes with challenges related to human and time resources, as well as coordination and consistency issues. Indeed, to be able to keep an up-to-date record of the heritage assets within these tools, one or more heritage professionals would be required to constantly carry out research and coordinate the updating process in a consistent manner. Th e need for good coordination is exacerbated by the fact that the two tools have to be updated separately such that the information on one property has to be added twice. Th erefore, unless properly managed, inconsistent information may be found on the NPI and MSPR respectively.
Further to the above, at present the GIS and word selection based searches have not been linked. Th is linkage is crucial for an all inclusive search of protected properties as a single search would cater both for people who prefer to search by maps and those who prefer word based searches. At present these two independent searches are located in two diff erent sections of the MEPA website.
Another factor to consider is public awareness. Th e new MSPR (with the integrated NPI) was only mentioned once in a newspaper article (New Make-over for MEPA website, 2009) upon its release back in 2009. Th ose who visit the MEPA website regularly are likely to come across these tools and those who deal with MEPA offi cials may be made aware of their existence. However, very little else has been / is being done to promote their existence and/or to show how these tools can be used and what they are used for. Word of mouth is the only marketing tool that is being relied on, mostly at the whim of MEPA offi cials. Th e need is being felt however to complete this system to ensure that basic information is at least available for each of the entries in the MSPR through the NPI. To date, a number of entries are not linked to data cards with the result that the public is at times requesting information that is not readily available. Th ere have been some suggestions including the compilation of a very basic card containing an image and/or site plan of the protected property. Although this suggestion is being considered, it will take time to implement in view of resources currently available and other priorities taking precedence.
From the above it follows that to remain relevant in the future a suffi cient and adequate amount of resources needs to be allocated to ensure appropriate updates are carried out. In this respect, consideration should be given to the conversion from standard soft ware available to a more database specifi c one, which may considerably reduce the workload for future maintenance and to make both databases in line with data management conventions. Furthermore, improved IT infrastructure in terms of linking the GIS and word-based searches is also necessary. Countries all over the world including England

Chapter 4: Th e National Protective Inventory and Malta Scheduled Property Register 81
(English Heritage, Undated), Australia (Commonwealth of Australia, Undated) and Canada (Parks Canada, Undated) have been providing these tools successfully for years and also provide the user with continuous improvement by publicly displaying registers and inventories of their heritage assets. While some countries simply provide a basic list of properties that are protected, others go as far as integrating GIS and three-dimensional elevations and cross sections into some of the well known. Th is is a direction that Malta may want to consider in a quest for ever-improving the availability of information. LIDAR (NOAA, 2013) Surveys of the Maltese Islands carried out in 2012 and 2013 (MEPA, Undated) can also be used to create 3-D maps of cultural landscapes, historic properties and historic natural landscapes amongst others.
Figure 6: Example of simple NPI card for use on MEPA’s website
With the recent expansion in internet mobility, chool children, tourists and professionals alike are now used to having GIS and other applications available at their fi ngertips. Th e increased use of smart phones in recent years has also led users to expect the same accessibility while on the move. In this regard, the extension of the NPI and MSPR tools to mobile applications should also be considered. Making these tools easily accessible

82 Future Preparedness: Th ematic and Spatial Issues for the Environment and Sustainability
(and tailored to suit) on these devices would have the added advantages of improving their awareness and access to them. A very tangible result might be the possibility of searching the MSPR or NPI databases for historic and/or protected properties in the vicinity of the user for example, extending awareness of historic properties locally to a completely new level.
Finally, more attention should be given to public awareness schemes, which should be integral to the system and not simply an aft er-thought. Irrespective of how good, informative and easy to use a database is, it may not succeed if the public are not aware of it. Th e project may also die a natural death if not enough use is made of the system.
ConclusionTh ere is no doubt that the MSPR and NPI are useful tools. Furthermore, as discussed,
legislation such as the current Environment and Development Planning Act of 2010, and policies stated within the 1990 Structure Plan for the Maltese Islands provide a solid foundation for their existence. However, these tools have so many benefi ts to them in terms of being useful to planning and heritage professionals as well as locals and tourists alike, that they are worth having irrespective of whether they are backed by legislation or policies. In these circumstances one can say that legislative tools become non-compulsory and possibly not even necessary other than to legally protect the heritage assets presented in these tools and as a checklist to ensure that protection is carried out in a legislatively correct manner. Indeed the MSPR and NPI are larger than current or future legislation as they provide valuable information for future generations to interpret Malta’s history.
While as discussed above the power of these tools cannot be underestimated, their usefulness is highly dependant on crucial factors with specifi c reference to a high level of co-ordination, accuracy and consistency. Without these elements, successful and informative databases are simply not achievable. Moreover public awareness schemes are also important, which as discussed should be integral to the system. Finally, in an age where technology changes occur rapidly it is important for these tools to keep up with the times in order to remain relevant.
As evidenced in this paper, like every other tool the NPI and MSPR have their pros and cons. However, if the right amount of eff ort is placed in them they have the potential to become a powerful tool that can be used by diff erent sectors to protect, manage, promote and showcase Malta’s rich and diverse heritage.

Chapter 4: Th e National Protective Inventory and Malta Scheduled Property Register 83
ReferencesBorg, M., & Formosa, S. (2008). Malta NPI Project: Developing a Fully Accessible Information System. In S. Wise, & M. Craglia (Eds.), GIS and evidence-based policy making, Innovations 10 (pp. 283-298). Florida: Taylor & Francis.
Camilleri, M., Hili, M., Magro Conti, J., Attard, R., Stevens, D., Gambin, M. T. (2012). Case Studies in Land Use Confl ict and Island Heritage Management: Malta. In Baldachino, G (Ed.), Extreme Heritage Management (pp. 47-74). Oxford: Berghahn Books.
Commonwealth of Australia. (Undated). Heritage places and lists. Retrieved February 1, 2014, from Australian Government - Department of the Environment: http://www.environment.gov.au/topics/heritage/heritage-places
English Heritage. (Undated). Th e National Heritge List for England. Available at: http://www.english-heritage.org.uk/professional/protection/process/national-heritage-list-for-england/ (accessed on 01 February 2013).
Government of Malta, 1925, Antiquities (Protection) Act, Act N. XI of 1925, Valletta: Malta.
Government of Malta, 1939, Antiquities (Protection) List, G.N. 338 of 1939, Valletta: Malta.
Government of Malta, 1992, Development Planning Act 1992, Act N. I of 1992, Valletta: Malta.
Government of Malta, 2010, Environment and Development Planning Act 2010, Act N. X of 2010, Valletta: Malta.
MEPA. (Undated). Innovative Technology to imorove Malta’s environment. Available at: http://www.mepa.org.mt/newslet24-article1 (accessed on 3 February 2014).
MEPA. (Undated). Malta Scheduled Property Register. Available at: http://www.mepa.org.mt/schedschedulingsearch (accessed on 31 January 2014).
MEPA. (Undated). MapServer. Available at: http://www.mepa.org.mt/mepa-mapserver (accessed on 31 January 2014).
MEPA. (Undated). National Protective Inventory. Available at: http://www.mepa.org.mt/national-protective-inventory (accessed on 31 January 2014).
MEPA. (Undated). Welcome to MEPA’s Geoportal. Available at: http://www.mepa.org.mt/mepa-mapserver (accessed on 31 January 2014).

84 Future Preparedness: Th ematic and Spatial Issues for the Environment and Sustainability
New Make-over for MEPA website. (2009, October 2). Th e Malta Independent.
NOAA. (2013, January 22). What is LIDAR? Available at: http://oceanservice.noaa.gov/facts/lidar.html (accessed on 31 January 2013).
Parks Canada. (Undated). Th e Canadian Register. Available at: http://www.historicplaces.ca/en/pages/register-repertoire.aspx (accessed on 1 February 2014).

C H A P T E R 5
Design of the Shared Environmental Information System (SEIS) and Development of a Web-Based GIS
InterfaceMarc Bonazountas, Giacomo Martirano, Tim Camilleri and Anestis Trypitsidis
IntroductionTh e Shared Environmental Information System (SEIS) is a collaborative initiative of
the European Commission (EC) and the European Environment Agency (EEA) aimed to establish an integrated and shared EU-wide environmental information system together with the Member States.
SEIS presents the European vision on environmental information interoperability. It is a set of high-level principles & workfl ow-processes that organize the collection, exchange, and use of environmental data & information aimed to:
• Modernise the way in which information required by environmental legislation is made available to member states or EC instruments;
• Streamline reporting processes and repeal overlaps or obsolete reporting obligations;• Stimulate similar developments at international conventions;• Standardise according to INSPIRE when possible; and • Introduce the SDI (spatial database infrastructure) principle EU-wide.
SEIS is a system and workfl ow of operations that off ers technical capabilities geared to meet concept expectations. In that respect, SEIS shows the way and sets up the workfl ow eff ectively in a standardise way (e.g, INSPIRE) to:• Collect Data from Spatial Databases, in situ sensors, statistical databases, earth
observation readings (e.g., EOS, GMES), marine observation using standard data transfer protocols (ODBC, SOS, ft p, etc).
• Harmonise collected data (including data check/data integrity) according to best practices proven to perform well, according to the INSPIRE Directive 2007/2/EC (1) Annexes I: II: III: plus INSPIRE Implementation Rules for data not specifi ed in abovementioned Annexes.

86 Future Preparedness: Th ematic and Spatial Issues for the Environment and Sustainability
• Harmonise collected data according to WISE (Water Information System from Europe) or Ozone-web.
• Process, aggregate harmonise data so to extract information in a format understandable by wider audiences (e.g., Eurostat, enviro-indicators).
• Document information to fulfi l national reporting obligations towards EU bodies (e.g., the JRC, EEA, DGENV, Eurostat)
• Store and publish information for authorised end-users (e.g., citizens, institutions).
Th is paper presents the development and integration of the SEIS-Malta Geoportal. Th e fi rst section outlines EU Regulations on INSPIRE and Aarhus Directives. Th e second covers the architecture and the implementation of SEIS-Malta Geoportal. Th e third discusses the results and successful implementation of the Geoportal.
Regulatory IssuesTh e Aarhus Directive (Directive 2003/4/EC) (2) provides legal grounds for citizens
to openly access environmental information held or produced by public authorities, including information on the state of the environment. In addition it provides people the right to inquire policies or measures taken on the state of human health and safety when this can be aff ected by the state of the environment.
Under this Directive, an applicant is entitled to obtain this information within one month of the request and without having to say why they require it, while in addition, public authorities are obliged to actively disseminate environmental information in their possession.
SEIS Malta makes data publicly available under interoperable services such as WMS, WFS and other, whilst providing access to reports on environmental status. For instance the data can be provided via map format accessible via the Geo-Portal from the offi cial website of the national public authority maintaining the data.
By using open and interoperable service, the SEIS dataset can be made also available through mapping applications and thus directly accessible not only to citizens but also to the private sector, research organizations and institutes like universities or university departments.
In addition, SEIS-Malta sets a set of principles to be followed as discussed earlier in this text. A key step to the implementation of SEIS is the modernization and revision of the Standardised Reporting directive 91/692/EC (3) along the lines of SEIS principles. Although the current standardised reporting directive (SRD) applies only to relatively small proportion of reporting obligations in environmental legislation, the envisaged provisions in the revised directive is to modernise the way in which the information is made available could cover essentially all of the more than 100 existing environmental

Chapter 5: Design of the Shared Environmental Information System (SEIS) and Web-Based GIS Interface 87
reporting obligations.During the development of SEIS-Malta several EU Directives were considered:
• Standardised Reporting Directive (SRD) (91/692/EEC): Th e purpose of this Directive is to rationalize and improve the provisions on the transmission of information and the publication of reports concerning certain Community Directives on the protection of the environment. Th is directive is mainly dealing with water protection and management, monitoring of atmospheric pollution and chemicals, industrial risk and biotechnology.
• INSPIRE Directive (2007/2/EC): INSPIRE is based on the infrastructures for spatial information established and operated by the 27 Member States of the European Union. Th e Directive addresses 34 spatial data themes needed for environmental applications, with key components specifi ed through technical implementing rules. Th is makes INSPIRE a unique example of a legislative “regional” approach.
• European Environment Information and Observation Network (EIONET): EIONET is a partnership network of the European Environment Agency (EEA) aiming to provide timely and quality-assured data, information and expertise for assessing the state of the environment in Europe and the pressures acting upon it.
Architecture and ImplementationTh is section provides:1. Overview of SEIS-Malta Architecture2. Description of the SEIS-Malta services3. Workfl ow for the creation of the INSPIRE geodatabase.
SEIS ArchitectureFigure 1 provides an overview of the architecture and components of the SEIS-Malta.
Details for each component follow.
Custom SEIS Web InterfaceTh e Custom SEIS Web Interface is based on ESRI’s Geoportal Technology. ESRI’s
Geoportal provides functionality that we can leverage not only to provide the users with a discovery portal (so users can fi nd SEIS-based resources held by MEPA) visualisation, download, registry, and feedback services, as well as metadata harvesting functionality, we can also enhance it to provide a customisable web interface with a map viewer that is already standards-based and cross-browser compliant. ESRI’s Geoportal proves that it is a solid choice for the development of the SEIS Portal. Th e Geoportal provides a highly tested codebase that can be deployed with minimum diffi culties and with a great measure of confi dence.
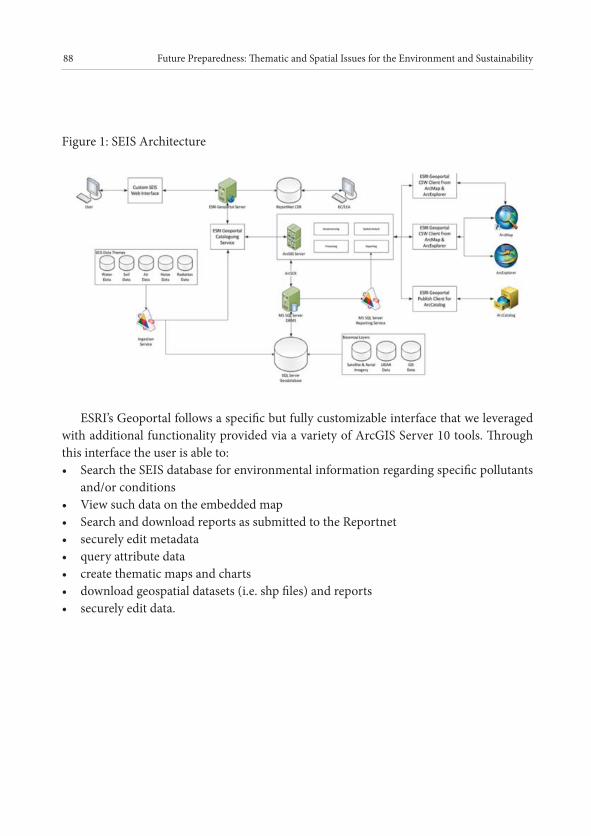
88 Future Preparedness: Th ematic and Spatial Issues for the Environment and Sustainability
Figure 1: SEIS Architecture
ESRI’s Geoportal follows a specifi c but fully customizable interface that we leveraged with additional functionality provided via a variety of ArcGIS Server 10 tools. Th rough this interface the user is able to:• Search the SEIS database for environmental information regarding specifi c pollutants
and/or conditions• View such data on the embedded map• Search and download reports as submitted to the Reportnet• securely edit metadata• query attribute data• create thematic maps and charts• download geospatial datasets (i.e. shp fi les) and reports• securely edit data.

Chapter 5: Design of the Shared Environmental Information System (SEIS) and Web-Based GIS Interface 89
Types of UsersFive diff erent types of users (user roles) are accommodated by the Geoportal:
Table 1: Types of UsersRole Functionality
Anonymous user Not required to login to the Geoportal to use some of its key functions. Th is group of users can access the public functions of the Geoportal, including: search, view results, and view resources.
Registered user Has access to the same functions as the anonymous user. In addition, a registered user can save searches and manage their user profi le. To become a registered user, click the Register link at the top of the Geoportal screen and fi ll out the profi le information.
Publisher Can register, upload, and create resources using the Geoportal. Resources that a publisher publishes to the Geoportal must be approved by the Geoportal Administrator before they are discoverable through the Geoportal search interface. Publishers are responsible for keeping their own resources - and the data items and services referenced by them - current and accessible. A publisher will see the Administration tab in the Geoportal interface aft er logging in.
Editor Th e Editor User has the same abilities as the Publisher User but with the added functionality of editing geospatial and attribute data.
Administrator Th e gatekeeper of the Geoportal. Has access to the Administration tab on the Geoportal interface and through that tab is able to see all resources maintained in the Geoportal by all publishers. Th e Geoportal Administrator handles the following activities:
• Review and approve posted resources
• Notify the Geoportal security administrators if someone should be made a publisher

90 Future Preparedness: Th ematic and Spatial Issues for the Environment and Sustainability
Data Th emes for SEISData Th emes covering the requirements for SEIS are the:• Air Data• Water Data (Bathing Water, Transitional & Coastal Water)• Soil Data• Noise Data• Radiation Data
Ingestion ServicesTh e Ingestion Services obtain, import and process data into the MS SQL Server (4)
SEIS database in near real-time as the data is delivered or produced by the sensors or other media. Th e Ingestion Service is an essential component of the infrastructure since it represents the main entry point for data ingestion.
Th e Ingestion Service is responsible for ingesting, pre-processing and storing data received from external sources of information, external stakeholders (users and services). Specifi cally, being an archiving and ingestion component, its responsibilities shall comprehend:
• Transparent retrieval of data from external sources;• Transparent ingestion of the retrieved data.Th e Ingestion Service additionally log all activities to allow the administrator to
analyse the evolution of the various processing performed. Th e SEIS Ingestion Service is responsible for handling ingestion, cataloguing and archival of geospatial data by making use of relevant services provided by the infrastructure (chaining them properly) to perform the following functionalities:
• Data Pre-processing, responsible for performing various actions on the ingested data such as to collect data (from variable and confi gurable sources – like a spreadsheet, text fi le, xml or some other structured document source or live from the sensor network), get that data into the INSPIRE-based RDBMS schema for each data theme and through the business logic implemented in this service, monitor values for example and react on atypical values.
ESRI ArcGIS Server 10SEIS is based on ESRI technologies; ArcGIS Server 10 (5) is used to serve the data
and users of the SEIS Component, acting as a Web GIS Server. ArcGIS Server 10 is fully compatible to the requirements, specifi cations and standards of the Open Geospatial Consortium (6) regarding the implementation of:

Chapter 5: Design of the Shared Environmental Information System (SEIS) and Web-Based GIS Interface 91
• WMS – Web Map Service• WFS – Web Feature Service• WCS – Web Coverage Service• WPS – Web Processing Service
For SEIS-Malta, WMS, WFS and WCS are used to implement the required functionality. Along these lines, ESRI’s update for ArcGIS Server 10 is conformant to the specifi cations of INSPIRE. Customization for items not inherently supported by the soft ware are provided (by the soft ware development team) on a need-to-be-developed basis following the Hybrid soft ware development technique described in MEPA’s user requirements.
Figure 2: ArcGIS Server Overview (7)
ArcGIS Server 10 approach is service oriented following the SOA – Service Oriented Architecture to creating and managing GIS Web Services as the abovementioned. Additionally it can be deployed in cloud environment should MEPA choose to do so.
ESRI ArcSDE 10 - SDETo connect to the RDBMS serving the data for SEIS, ArcGIS Server 10, ArcSDE
10 for Microsoft SQL Server is used. ArcSDE enables the usage of Relational Database Management Systems (RDBMS) for spatial data. Th e spatial data may then be used as part of a geodatabase.

92 Future Preparedness: Th ematic and Spatial Issues for the Environment and Sustainability
ProcessingData processing for SEIS-Malta is completely based on the processing capabilities
provided by ESRI ArcGIS Server 10. Th is soft ware provides a wide range of processing and analysis tools as well as the ability for the user to develop and deploy his/her own tools and models.
SEIS-Malta used as a reporting obligations facilitation mechanism and an Environmental Data Dissemination tool according to the Aarhus and INSPIRE Directives. Data capturing procedures and methodologies are to be followed for each theme according to the current business processes of the authorities involved in data collection, processing and delivery.
Th ese data is then to be acquired by the SEIS team of MEPA and through Data Ingestion Service to be uploaded to the Geoportal and made available to the public and to the registered users.
ReportingTh e Reporting Service for SEIS is based upon MS SQL Server Reporting Services
(SSRS). SSRS is a server-based report generation soft ware system that can be used to prepare and deliver a variety of interactive and printed reports and is administered via a web interface. Reporting services features a web services interface to support the development of custom reporting applications.
With Reporting Services setup for SEIS, the MEPA side user is able to create interactive, tabular, graphical, or free-form reports from relational, multidimensional, or XML-based data sources. Th ese reports can then be published in any format as mentioned above the user chooses. Th e user can also schedule the report processing or create and access reports on demand.
For example the person responsible for the air quality module can request from the Reporting Services a report with the collected data on air according to the standards set by the reporting obligations. Th us, he/she can create a report template where the Reporting Service will be based in order to query the database for the relevant data, fi ll the report with the appropriate values and deliver it at the requested time and with the requested fi le format i.e. Excel.
Especially used with XML-based data sources, the Reporting Services allow the user to query Web Services directly by parsing the XML structure of the SOAP (8) response.
GeoprocessingGeoprocessing is performing through ArcGIS Server 10 thus supporting various data
processing and tools/applications in a server/client based environment where the clients can be based on the power of the server for processing and serving.
Geoprocessing can be used to fi nd spatially intersecting data, create buff ers, create

Chapter 5: Design of the Shared Environmental Information System (SEIS) and Web-Based GIS Interface 93
spatial data unions, merge and dissolve spatial datasets thus creating basis for spatial queries and spatial analysis.
Th e MEPA-side user can use a Geoprocessing service to serve to the SEIS Geoportal visitors a set of Geoprocessing tools which either was developed during the implementation of the project or was already available from the ArcGIS Server 10. Th us, the Geoprocessing service is executed on the server and the results are served over the web to the users and visitors.
Design INSPIRE Geodatabases Th is sub-section presents the geodatabase model for each of the abovementioned data
themes.
AirTh e Αir geodatabase is designed according to the following steps most of them being
carried out in parallel:• Analysis of the target Data Model (INSPIRE Environmental Monitoring Facilities
Data Specifi cations v3.0rc3) (9);• Analysis of the Source Data (MEPA website + sample data provided by MEPA);• Conceptual design of the geodatabase according to INSPIRE EF Data Specifi cation;• Preparation and fi lling-in of the matching table;• Creation of the geodatabase structure with ArcGIS Diagrammer;• Import of the geodatabase in ArcGIS and SQLServer.
WaterTh e Bathing Water geodatabase is designed according to the following steps, most of
them carried out in parallel:• Analysis of the target Data Model (INSPIRE Environmental Monitoring Facilities
Data Specifi cations v3.0rc3);• Analysis of the Source Data (MEPA dataset xls + EIONET Data Dictionary Website –
WISE - Bathing Water Quality Reporting under Directive 2006/7/EC) (10);• Conceptual design of the geodatabase according to INSPIRE EF Data Specifi cation;• Preparation and fi lling-in of the matching table;• Creation of the geodatabase structure with ArcGIS Diagrammer;• Import of the geodatabase in ArcGIS and SQLServer.
Th e geodatabase for the Other Water themes is designed according to the steps:• Analysis of the information provided by MEPA, which for the other Water sub-themes
consisted of empty xls fi les corresponding to the EIONET reporting schemas uploaded

94 Future Preparedness: Th ematic and Spatial Issues for the Environment and Sustainability
by the Maltese authorities into the EIONET data repository.• Systematic research of all the applicable reporting schemas available in the EIONET
Data Dictionary Website;• Th orough analysis of the most updated versions of the relevant reporting schemas
available in the EIONET – Data Dictionary website and cross-check with the available uploaded Maltese datasets;
• Development of the geodatabase structure with ArcCatalog – ArcInfo;• Import of the EIONET – Data Dictionary dataset template (in the respective
geodatabase structure) using ArcCatalog – ArcInfoExport of geodatabase in XML Workspace Document using ArcCatalog – ArcInfo;
• Development and analysis of UML geodatabase schemas using ENTERPRISE ARCHITECT;
• Import of the geodatabases in SQLServer;All Water geodatabases follow the INSPIRE “compliant” structure designed on the
INSPIRE Environmental Monitoring Facilities Data Specifi cations v3.0rc3.
NoiseTh e geodatabase for the Noise theme is designed according to the steps:
• Analysis of the information provided by MEPA, which for the Noise theme consisted of links to the corresponding reports uploaded by the Maltese authorities into the EIONET data repository;
• Systematic research of all the applicable reporting schemas available in the EIONET Data Dictionary Website;
• Th orough analysis of the most updated versions of the relevant reporting schemas available in the EIONET – Data Dictionary website and cross-check with the available uploaded Maltese datasets;
• Creation of the geodatabase structure with ArcCatalog – ArcInfo;• Import of the EIONET – Data Dictionary dataset template (in the respective
geodatabase structure) using ArcCatalog – ArcInfo;• Export of geodatabase in XML Workspace Document using ArcCatalog – ArcInfo;• Creation and analysis of UML geodatabase schemas using ENTERPRISE ARCHITECT.• Import of the geodatabases in SQLServer.
SoilTh e Soil theme geodatabase is designed in adherence to the INSPIRE SOIL Data
Specifi cation, according to the steps:• Analysis of the target Data Model (INSPIRE SOIL Data Specifi cation v3.0rc3);• Conceptual design of the geodatabase structure according to INSPIRE SOIL Data

Chapter 5: Design of the Shared Environmental Information System (SEIS) and Web-Based GIS Interface 95
Specifi cation;• Preparation of the matching table;• Creation of the SQLServer geodatabase with GoLoader (Snowfl ake Soft ware);• Export of geodatabase in XML Workspace Document using ArcCatalog – ArcInfo;• Creation of the ESRI geodatabase using ArcCatalog – ArcInfo.
RadiationTh e Radiation geodatabase is designed according to the following steps, most of them
carried out in parallel:• Analysis of the target Data Model (INSPIRE Environmental Monitoring Facilities
Data Specifi cations v3.0rc3);• Analysis of the Source Data (MEPA dataset, EURDEP format);• Conceptual design of the geodatabase according to INSPIRE EF Data Specifi cation;• Preparation and fi lling-in of the matching table;• Creation of the geodatabase structure with ArcGIS Diagrammer;• Import of the geodatabase in ArcGIS and SQLServer.
Geodatabase ConversionTo convert the Geodatabase from the UML form to its MS SQL Server ArcGIS
Geodatabase the “Publish” command is used from ArcGIS Diagrammer. Th is way it can be exported to an “XML Workspace Document” which is an ESRI proprietary fi le format that allows exchange and share geodatabase schemas.
Th e “XML Workspace Document” fi le can be loaded into new or existing geodatabase using ArcCatalog. It is also possible to load the geodatabase structure in a SQLServer database, using an ArcSDE connection in ArcCatalog.
ResultsTh is fi nal section presents the SEIS-Malta Geoportal available at www.seismalta.org.
mt. For the SEIS–Malta Geoportal a new version of Geoportal has been developed taking into account the parameters like:• User friendliness;• Compliance and usage of MEPA’s infrastructure with regard to ESRI licenses and tools;• Ability to easily extend the interface;• Ability to easily add new databases or connect to diff erent GIS servers and services;• Addition of specifi c and extended WebGIS capabilities.

96 Future Preparedness: Th ematic and Spatial Issues for the Environment and Sustainability
Data Ingestion from monitoring stationsGeoportal is able to collect environmental data in near real-time from various
monitoring stations and locations. Specifi cally, these technologies are developed for the air (Figure 3) and bathing (Figure 4) water data themes. Th e air data model provides the possibility to use the same feature type to model objects at diff erent levels with the possibility to take into account the hierarchy, as in the case of stations and sensors. One table for each monitored pollutant has been created for storing the information about measures.
Figure 3: Air monitoring stations
Figure 4: Bathing water monitoring stations

Chapter 5: Design of the Shared Environmental Information System (SEIS) and Web-Based GIS Interface 97
On-Line Data EditingIn the Bathing Water one table for each monitored pollutant has been created, for
storing the information about the measures. All attributes and/or items with a multiplicity greater than one have been treated in separate tables, linkable to the feature type by means of joins using the unique ID.
As administrator, each theme expert of MEPA is able to perform online data editing via the editing tools provided through the MS SQL Server 2008 Management Studio as well as through the GIS interface provided via ArcGIS Desktop.
Data ExportTh e Geoportal contains an export tool which allows the user to export the selected
data to CSV format (Figure 5).
Figure 5: Export Selection set
MetadataFor Metadata, a dedicated database is available according to the Geonetwork
requirements in terms of supported RDBMS. Th e schema of the metadata database will adhere to the INSPIRE requirements on metadata for categories 1 and 3 and to EN-ISO 19115/19119 for categories 2, 4 and 5. In the occasions that metadata did not exist, it was create them from scratch. For the metadata editing the functionalities off ered by Geonetwork are used, whilst existing metadata are harmonised according to the target schema following metadata harmonisation procedures that took place.

98 Future Preparedness: Th ematic and Spatial Issues for the Environment and Sustainability
ReportingOne of the main objectives of SEIS is to be used as a reporting obligations facilitation
mechanism and an Environmental Data Dissemination tool according to the Aarhus and INSPIRE Directives. During the project implementation almost all data themes of Geodatabase were structured according to the latest reporting schemas link to Eionet data Repository.
General FunctionalitiesTh e main interface of the application is fully customizable with regard to its size. Th e
user will be greeted with the following interface when he/she initially links to the address of SEIS-Malta.
Th e SEIS Geoportal of Malta has multiple functionalities, such as:• 2D thematic visualization interface and 3D viewer• Feedback Services • Navigation Tools• GIS Tools and Functions: 13 Diff erent Basemaps, Map Contents, Legend, Map
contents Toolbox, Confi gure Layer, Filter & SQL Query, Confi gure the Auto-Updates (Th e user can select how oft en the application queries the databases or the selected layer for updated information), Show Attribute table, Filter Legends, Print, Timeline, Clustering data export (to csv format). All the above capabilities are available for the Maltese citizens through SEIS-Malta
Geoportal by providing state-of-the-art services. Further to this, within SEIS-Malta project our team produced a detailed user manual which will be released to the public.
ConclusionTh e SEIS-Malta Geoportal goal achieved the provision of a system that is based on
accessibility, easy data sharing and interoperability. Th e task was to maintain and improve the quality and availability of information required for environmental policy, in line with better regulation, while keeping the associated administrative burdens to a minimum, and fi nally to move away from a paper-based reporting to a system where information is managed as close as possible to its source and made available to users in open & transparent ways.

Chapter 5: Design of the Shared Environmental Information System (SEIS) and Web-Based GIS Interface 99
Figure 6: Spatial distribution of young males by Enumeration Area
Figure 7: Navigation Tools Figure 8: GIS Tools and Functions
Th e future steps of SEIS-Malta are linked to improvement or extension and include the installation of new themes, geoportal optimization (based on users’ feedback) and the implementation of SEIS technology in other countries.
100 Future Preparedness: Th ematic and Spatial Issues for the Environment and Sustainability
References1) INSPIRE Directive 2007/2EC. Available at: http://eur-lex.europa.eu/LexUriServ/LexUriServ.do?uri=OJ:L:2007:108:0001:0014:en:PDF (accessed on March 2014).
2) Aarhus Directive. Available at: http://ec.europa.eu/environment/aarhus/legislation.htm (accessed on March 2014).
3) Standardised Reporting directive: Available at: http://rod.eionet.europa.eu/instruments/541 (accessed on March 2014).
4) MS SQL Server. Available at: http://www.microsoft .com/en-us/sqlserver/default.aspx (accessed on March 2014).
5) ESRI ArcGIS Server 10.2. Available at: http://www.esri.com/library/brochures/pdfs/arcgis-server-functionality-matrix.pdf (accessed on March 2014).
6) Open Geospatial Consortium (OGC). Available at: http://www.opengeospatial.org (accessed on March 2014).
7) Image from ESRI. Available at: http://www.esri.com/soft ware/arcgis/arcgisserver/graphics/overview-diagram.jpg (accessed on March 2014).
8) SOAP (Simple Object Access Protocol). Available at: http://en.wikipedia.org/wiki/SOAP (accessed on March 2014).
9) INSPIRE Environmental Monitoring Facilities Data Specifi cations v3.0rc3. Available at: http://inspire.jrc.ec.europa.eu/documents/Data_Specifi cations/INSPIRE_DataSpecifi cation_EF_v3.0rc3.pdf (accessed on March 2014).
10) Bathing Water Quality Reporting under Directive 2006/7/EC. Available at: http://rod.eionet.europa.eu/obligations/531 (accessed on March 2014).
AcknowledgementsTh e SEIS-Malta project has been funded by the MEPA, Contract: CT3067/2010
– “Service Tender for the Design of the Shared Environmental Information System and development of a web-based GIS interface”. Th e success of the contract is made possible because of support received from MEPA and other partner staff , and in particular from: Dr. Saviour Formosa, Ashley Hili, Stephen Conchin, Chris Camilleri, Claudine Cardona, Joanne Vassallo, Mariela Dobreva, Matthew Yeomans, Dr Michael Nolle, Dr Elaine Sciberras, Sandro Cutajar, Nicholas Spiteri and others.

101
C H A P T E R 6
Setting an Integrated Soil Monitoring System for Malta: Strategy, Feasibility and Recommendations
Sandro Cutajar
IntroductionSince 2010, MEPA has embarked on a project (which attracted co-funded ERDF
assistance) (1) to develop a multi-thematic environment strategy that would lead to updating of its data/ information monitoring capabilities for a number of environmental sectors. Th e monitoring and continuous evaluation of soil properties is one important sector within this project. Essentially, a multi-criterion assessment of existing available information has been carried out with a view to objectively chart the most appropriate process to carry out a pilot fi eld sampling by testing a pre-agreed set of indicators. Th e latter were established aft er taking into consideration all degradation pressures threatening the continued sustainability of this resource.
Multi-criterion analysis was carried out by means of a limited set of soil-related datasets published in past editions of Malta’s State of the Environment Report in order to support a number of objectives stipulated within the Project’s ambitious Terms of Reference. Information was derived from earlier attempts to establish a soil information system for Malta.
All soil degradation threats, offi cially determined by the European Commission’s Technical Working Groups, have been taken into consideration within the aforementioned project and its research methodology with a view of establishing a shared GIS environment in accordance with state-of-the-art information dissemination standards.
Context and ObjectivesTh e Maltese National Environment Policy, as well as the European Commission’s
Seventh Environmental Action Programme (EAP) and the Soil Th ematic Strategy (STS), emphasize the need to monitor a wide range of soil indicators as a base for the development of eff ective and feasible strategies to eventually enable updatable soil protection plans. Besides the recently-unveiled EU’s Cohesion Strategy (2) for 2014-2020 adopted for Malta (under sub-heading 2.2: Environmental protection and improved management of natural resources and of waste) - which was itself quoting the National Climate Change

102 Future Preparedness: Th ematic and Spatial Issues for the Environment and Sustainability
Adaptation Strategy Consultation Document published in 2010 - emphasizes the need for Malta to have:
“… long term strategies (which) are essential for soil conservation and to increase soil organic matter which will render the land more able to cope with future climatic changes…”
Soil management also features amongst the country’s recently-established national thematic priorities (3) to attract future investment and funding opportunities. Local authorities published this statement under the heading ‘Climate Change adaptation, risk Prevention and Management’ with reference to the Programming of European Funds for Malta (PEFM) 2014-2020:
…Soil is one of Malta’s most important natural resources, with socio-economic and ecological importance. Malta’s soil resources are important for the maintenance of the ecosystem relating to health, agriculture and water management, as well as for supporting tourism and recreation-related activities in the countryside. Additionally, unsustainable practices and poor management within the agricultural sector are posing serious risks which are resulting in the lowering of soil quality through salinisation, erosion, soil sealing, soil contamination and desertifi cation.
In terms of sustainable development, an integrated approach to soil management is being adopted in order to undertake corrective action and identify and implement adaptive solutions that balance eff ective nutrient, crop, water, soil and land management. Additionally, eff orts to further protect against soil degradation and erosion will continue. Sustainable soil management will be supported by strengthened quality monitoring to ensure for on-going soil health diagnosis.
Eff orts will continue to be directed towards the dissemination of knowledge, the undertaking of training, the availability of technology to encourage the adoption and application of practices and methodologies that will remedy and improve the soil quality, protect it from erosion, secure its desalination and prevent further loss of organic matter. (PEFM, pp.68-69)
Legislative Framework and International DevelopmentsNo comprehensive overarching procedures exist at the national level, to address all
forms of soil degradation and spatial assessments of soil functions in a coordinated manner in order to ensure compatibility of methods and data with the STS and full coverage of provisions addressed by the European Commission’s proposed Soil Framework Directive (hereaft er referred to as pSFD).
Act X of 2010 (Environment and Planning Act) empowers the Malta Environment and Planning Authority (MEPA) to conduct measures to better regulate soil protection

Chapter 6: Setting an Integrated Soil Monitoring System for Malta 103
in terms of environment protection and land use planning. Article 8 (2) describes the Authority’s functions and indicates that the Authority is, amongst other, responsible for the formulation and implementation of policies related to the sustainable management of natural resources. In particular, sub-article 4 of the same provision stipulates that the Authority shall be responsible for the conduct of consultations and to undertake and promote research on such matters. Furthermore, it shall enable,
...the provision, of either alone or in collaboration with others, education, training and public awareness programmes relating to environment protection, and the sustainable management of the environment and natural resources.
Besides, Article 51 (5) of the same Act (under Part IV - 2. Th e Strategic Plan for Environment and Development), stipulates that,
for the preparation and review of the SPED, the Authority shall carry out surveys of those matters which aff ect the character and quality of the environment, its conservation and development, including but not limited to:
...(g) the conservation and preservation of natural and man-made resources....
In addition, Article 61 (2) (under section Part IV 4. Regulation and Orders) is also of relevance to sector under review in that provide context to empower Authority to undertake capacity building initiatives. Amongst other, the aforementioned Article states that,
without prejudice to the generality of sub-article (1), such regulations may in particular:...(d) give eff ect to any international treaty or instrument, including directives, regulations
and decisions, relating to any matter governed by this Act to which Malta may from time to time be a party or subject and to set up structures and make other provisions forthe implementation thereof;....
Meanwhile, it must be emphasized that agricultural soils data / information in Malta have been managed, since 2007, through a set of cross-compliance measures stemming from national reporting obligations related to the Common Agricultural Policy framework.
Maltese legislation, directly or indirectly addressing aspects of soil protection, can be found within the following legal instruments and/or initiatives:• 1973 Fertile Soil (Preservation) Regulations (and as amended);• 2012 National Environment Strategy (NEP);• 2012 Draft Strategic Plan for the Environment and Development (SPED);

104 Future Preparedness: Th ematic and Spatial Issues for the Environment and Sustainability
• CoGAP (4) & GAEC (5) - SMR (6) / Cross-Compliance (CAP):• Cross-Compliance related to EU Aid Applications in terms of the Paying Agency
Regulations, 2005 (7);• MEPA 2007 Policy and Design Guidance for Agriculture, Farm Diversifi cation &
Stables (regulating Outside Development Zone planning permits);• Various Waste Management regulations transposed into local action (e.g. Waste
Management (Landfi ll) Regulations, 2002 (LN 168 of 2002 as amended by LN 289 of 2002, LN 70 of 2007, LN 146 of 2007));
• Various Plant health protection regulations which address, amongst other, risks resulting from actual use of pesticides (incl. biocides) and their impact upon soil contamination and biodiversity (due to soils being an important source of the gene pool); and
• Birds and Habitat/ Natura 2000 regulations which include amongst other compensation payments to protect habitats by avoiding deterioration of agricultural soils.
On the other hand, regulatory protection of soil resources is not the subject of specifi c legally-binding provisions at European level. Indirectly, some soil quality rules are incorporated within other strategic sectors, such as waste management, agriculture and rural development. Attaining Union-wide legislation on soil protection is a challenging task, considering the transversal role that soil plays in environmental, or economic and social spheres already perceived as complex to manage, such as water, waste, pollution, industrial production, agriculture, pesticide use, urban planning and so on. Nonetheless, integration with existing legislation, at both Community and national levels is still required “to address areas aff ected by soil degradation and properly implement measures to reverse degradation processes” (Montanarella, 2014, p.9).
Below is a non-exhaustive list of initiatives undertaken to indirectly coordinate regulation of this resource:• Seventh Environmental Action Programme (to support Roadmap to a resource-
effi cient Europe under the Europe 2020 Strategy) (8); • Multi-Annual Financial Programme for 2014-18;• Horizon 2020 – Environment Working Programme (of measures);• Updated Common Agricultural Policy framework through a set of mandatory and
optional agri-environmental measures (supported by cross-compliance initiatives);• Climate Change Policy (Post-Kyoto & Post-Copenhagen debate, LULUCF) detailing
provisions adopted during the UNFCCC;• (Alternative) Energy Policy (Renewable Energies Directive); • Biodiversity Protection Policy (EU & National Biodiversity Strategy, Nature, Birds and
Habitats Directives, and so on);

Chapter 6: Setting an Integrated Soil Monitoring System for Malta 105
• Water Protection Policy (namely Water Framework and Groundwater Directives) • Forest Protection Policy (Forest FOCUS, ICP Forest); • Regional Strategy and Development Policies (INTERREG, Territorial Cohesion
Programmes);• Waste Policy (e.g. Biowaste, Sewage Sludge, Urban Wastewater, Landfi ll Directives
and other daughter directives); • Integrated Pollution Prevention and Control Directive (IPPC) and the recently enacted
Industrial Emissions Directive (IED);• EU thematic strategy for air quality, and integrated EU strategy for target values and
for transboundary pollution emissions established in the CAFE programme (Clean Air for Europe);
• European Commission’s Communication on “Planning and Environment – the territorial dimension”; and
• European Spatial Development Perspective (ESDP).
As an interim arrangement, this situation eff ectively means that any soil-related issues shall have to be included in each intervention when updating these regulatory instruments given the impact of soil on the general status of the environment. So far, the European Commission has prepared a Soil Th ematic Strategy (in 2004), a Communication from the Commission to the Council, the European Parliament, the European Economic and Social Committee and the Committee of the Regions and a draft Framework Directive (in 2006) to provide further impetus to harmonize practices adopted by Member States in relation to this sector.
On a global level, legislative framework, regulation and guidance, relevant to protection of various soil aspects, is broadly structured around a signifi cant number of non-EU legislative initiatives and/or multilateral agreements. Th e following is a (non-exhaustive) list of relevant instruments, policy measures, strategies and multilateral/ international initiatives and/or documents (9) where comprehensive action and guidance is directly or indirectly setting the scene for holistic protection of this non-renewable resource:• Multilateral Agreements (e.g. UN Conventions for Combating Degradation (UNCCD)
and its fl agship target of ‘Zero Net Land Degradation’ by 2050; some of the Aichi targets emerging from global CBD-related events; FAO’s Soil Biodiversity Initiative; and Rio+20’s statements on soil protection (included in approved document ‘THE FUTUE WE WANT’ all of which reinforce pioneering global declarations introduced during the 1992 UNCSD Conference of Parties);
• Bonn Memorandum on Soil Protection Policies in Europe (1998);• World Soil Policy (UNEP, 1982);• Food Safety & Food Security & 1982 World Soil Charter encouraged by FAO;

106 Future Preparedness: Th ematic and Spatial Issues for the Environment and Sustainability
• Global Earth Observation System of the Systems (GEOSS) initiative;• Council of Europe’s 1972 Soil Charter.
Persistent legal lacuna of specialized legislative instruments, comprehensively addressing the various facets of soil protection, have become even more problematic over the past decade as global soil degradation has intensifi ed.
Th is trend is likely to continue if global issues like the relentless lateral expansion of urbanized areas, conservation of soil organic matter, intensifi ed use of this natural resource through a widening range of agro-commercial activities and socio-economic impact of soil degradation on various categories of ecosystem services (e.g. cultural, regulatory), are not properly addressed at regional and national level within a focused yet consolidated legislative instrument.
Previous Nationwide Soil AssessmentsOn its part, the soil component of the environmental monitoring project, managed by
MEPA, in collaboration with the University of Malta, Environmental Health Directorate, the National Statistics Offi ce and Malta Resources Authority, was preceded by two important comprehensive initiatives related to soil protection in Malta. Th ese are briefl y described below:
(i) 1960 Nation-wide Survey by D.M.Lang Th is detailed soil survey, the fi rst of its kind for Malta, was carried out by Dr. D.M.Lang
during the 1950s. In essence, it had concluded that Maltese soils are mainly derived from local sediment geology, that is rock structure and composition, geomorphology and stratigraphy setup. Moreover, it was contended that all local soils are highly calcareous (i.e. parent material is predominantly calcium-carbonate), slow forming and closely related chemically with the natural and cultural landscapes prevailing at the time.
Th e study’s main objective was to provide basic qualitative descriptions of the soils (based on Kubiena’s classifi cation system) as an aid to agricultural planning. Within said project, Maltese soils formations were classifi ed under three broad categories: carbonate, xerorendzinas, terra and soil complexes. Subsequently, these were further subdivided into subtypes or series named aft er the localities where the fi rst examples were noted.
Essentially, Lang’s study measured the following set of indicators/parameters: total organic matter, C:N ratio, phosphorus as P2O2 total availability, total exchangeable cations, calcium carbonate and its active component, soil electrical conductivity and its pH and colour (10).

Chapter 6: Setting an Integrated Soil Monitoring System for Malta 107
(ii) 2004 Maltese Soil Information System (MALSIS)Th e multi-criterion model adopted for the project under review in this paper
(ERDF156) drew its major source of support from past Maltese soil data available to meet preliminary Soil Th ematic Strategy requirements. In essence, soil data was derived from metadata obtained from MapInfo-based workspaces showing datasets prepared on knowledge gained from the creation of a Maltese Soil Information System. Th e latter project entailed the setting up of a soil inventory and soil monitoring system at the national level, which was deemed to be a necessary condition for the elaboration of any strategic policy on soil and its eventual harmonization with the European-wide requirements.
While a detailed soil survey was carried out in 331 geo-referenced sites as part of MALSIS deliverables (much higher than the 40 monitoring points investigated for the 2012 soil baseline survey (i.e. Activity 5) included within the project under review , its laboratory tests do not match current ISO standards for data gathering, sample storage, laboratory accreditation processes and cost requirements which are essentially coming about as a result of better INSPIRE-led draft data reporting standards developed since 2007 and a wider range of soil quality information objectives mirroring contemporary knowledge about soils.
A follow-up to this 2004 project was, not carried out. and a closer inspection to its deliverables reveals that not all degradation threats (11), were addressed. As a matter of fact, said project indicated that Maltese authorities did make an eff ort to establish a structured evaluation of soil degradation threats such as erosion, organic matter decline, diff use and local contamination and salinisation. However, evaluation of sealing rates (a increasingly crucial land use issue), compaction conditions, local situation with reference to soil landsliding/ fl ooding, soil horizons biodiversity decline and desertifi cation components featuring in the aforementioned Strategy, were not within the remit of responsibilities delegated to agriculture authorities who managed this LIFE project.
Soil Th eme Deliverables for Environmental Monitoring – Activity ReportingTh e 2010-2013 project under review was designed along the following benchmarks:
i) Inception report A detailed document submitted to MEPA provides a broad description of scope of
work undertaken in relation to Project’s Activities 1 to 5 intended to address this project component.
ii) Activity 1: Legislative background reviewReport associated with this Activity provides an analysis of relevant (national,
108 Future Preparedness: Th ematic and Spatial Issues for the Environment and Sustainability
European, international) legislative and regulatory environment addressing aspects of soil management. Main objective entails the assessment of current status of environmental monitoring for soil theme.
iii) Activity 2: Setting of strategy Th e main purpose behind design of this activity comprises the development of a long-
term strategy for monitoring at the national, regional and local levels to comply with existing and emerging comprehensive project monitoring obligations for the soil theme. Th e monitoring strategy also includes recommendations for cross-thematic data analysis and models required for forecasting of the environmental theme.
Th is document the steps required for establishing an appropriate institutional structure covering this environmental theme. Administrative support would be required in order to establish a Soil Information Monitoring Unit (SIMU) tasked with facilitating the organisation of a soil quality monitoring network including a soil (data) information system which “is the key to understanding the soil resource” (MEPA, Activity Report 2, p.15).
Th e fi nal report also describes relevant driving forces, pressures, states and impacts aff ecting soil protection with reference to the pSFD. Th e document also includes defi nition of all soil degradation threats (i.e. erosion, desertifi cation, contamination, soil sealing and compaction, organic matter decline, landslide/soil fl ooding, salinization and biodiversity loss. It identifi es factors generating cause-eff ects associated with each specifi c threat.
Furthermore, the report also provides an extensive description and evaluation of indicators required in order to measure and appropriately evaluate level of each soil degradation threat.
Besides, Annexes associated with this Project deliverable also provide the following specifi c information:• a detailed description (defi nition, methodology used, analysis against SFD parameters)
of proposed indicators associated with the aforementioned soil degradation threats; • detailed listing of all soil screening values adopted in other Member States (limit,
trigger or intervention thresholds or clean-up levels to monitor an extensive set of substances or pollutants in order to mitigate or prevent potential contamination of this non-renewable resource); and
• the development of a land and groundwater monitoring strategy. An important component of this strategy entails the description of a Conceptual Site Model and preferred testing and evaluation methodology for baseline investigations in relation to land and groundwater contamination within and around installation complexes/ operating plants subject to IPPC regulations and Industrial Emissions Directive procedures).

Chapter 6: Setting an Integrated Soil Monitoring System for Malta 109
It also provides information about the soil characterization plan. Th is incorporates design and implementation of emergency corrective measures (ECMs) in case of soil contamination. Th is plan also has a procedure detailing development of a criteria-based sampling program, and planning process to implement direct surveys (e.g. drilling operational methodology, specifi cation for groundwater monitoring wells).
Annexes of this report also include detailed guidelines indicating how to implement an appropriate risk analysis (e.g. analysis of contamination exposure routes) and also parallel guidelines for remediation through several alternatives of biological treatment technologies (e.g. bioventing, enhance bioremediation, phytoremediation, composting, and so on) and physio-chemical treatment (e.g. oxidation, soil vapor extraction, washing, dehalogenation, bioslurping, and so on).
Monitoring of remediation processess (through sampling methods for in-situ and for ex-situ treatments) is also included in this voluminous fi nal report.
iv) Activity 3: Design of the Programmes Final report for this project phase incorporates a detailed defi nition of the short and
long term soil monitoring strategy, development of a multi-criteria evaluation soil model and choice of preferred strategy following analysis conducted on short-term monitoring. Preparation of a tender monitoring plan and related terms of reference are also included under this deliverable.
Annexes associated with this deliverable include the following components:• a detailed tabulation listing grid-based modelling values outlining soil degradation
risk potential over the entire Maltese land-based territory. Established values cover all degradation threats;
• a graphic illustration of multi-criteria model used to select investigated monitoring points to be tested during a soil baseline survey (refer to Activity 5);
• a set of maps showing georeferential information of each monitoring site subdivided by level of assessment required (e.g. basic, general and biodiversity points); and
• another set of maps indicating location of all monitoring sites (selected through aforementioned model) superimposed over areas identifi ed as potential high-medium-low risk sites for soil degradation.
Th e activity involved the creation of a detailed implementation plan to map out steps required to establish the monitoring programme for soil at the national, regional and local levels taking into account the current data gathering and reporting methodologies as employed through EU reporting procedures, European Environment Agency (EEA) datafl ows and other international commitments.

110 Future Preparedness: Th ematic and Spatial Issues for the Environment and Sustainability
v) Activity 4: Feasibility assessment of programmes Th is stage of the baseline monitoring programme for the soil theme describes the
diff erent phases for the managment of the soil monitoring network included a discussion of the estimated (operational and total) costs related to in-house technical capacity of human resources, procurement of laboratory facilities (layout, sample management structure, method validation, accreditation, operational and sampling standards and personnel complement), laboratory materials/ equipment required and fi eld surveying activities required in order to manage an ISO 17025-compliant service.
Final Activity 4 report provides details of operations related to the preparation of potential options for institutional capacity building for continuous soil monitoring (i.e. direct management and autonomy of the whole network (termed as in-house scenario); total sub-contracting management service of the monitoring network and analytical analysis (referred to as the outsourcing scenario) and/or direct management of soil monitoring network and outsourcing of the analytical activities to a laboratory overseas (the hybrid scenario) and proposes the most cost eff ective scenario from these three options.
Main aim of this part of the aforementioned EU-funded project was the development of cost-eff ective strategies and programmes which are designed to be effi cient and technically feasible. Feasibility study on the Management Information Systems and Executive Information Systems is required for the reporting cycle of the environmental data acquired during the project.
vi) Activity 5 : Development of comprehensive monitoring strategies and design of long term monitoring programmes
Th is deliverable incorporated the preparation of operational Terms of Reference to generate primary soil information. Th is ToR was issued for public consultation in the form of a Maltese departimental tender which was prepared in accordance to standard public tendering procedures. Point sampling methodology was adopted during this survey. Examination of a set of physio-chemical and biological parameters, to be tested in 40 monitoring sites, was eventually completed by January 2013.
Deliverable also included the compilation of an Analysis Report to describe and evaluate all information gathered during this survey and correlate this data with past local studies including but not limited to those described earlier in this paper. Th ereaft er, a recommended integrated course of action was established in accordance with the Project’s pre-agreed short term monitoring strategy.
Soil Radiation MonitoringA separate technical assessment, to investigate a set of radiation-related parameters,
was also carried out for the ERDF project under review.. Soil sampling was performed
Chapter 6: Setting an Integrated Soil Monitoring System for Malta 111
within a monitoring survey carried out from 30th May to 7th June 2012. Monitoring of specifi c radiation indicators included rural and background sites (representative sample covered some 60 sites). Selected sites were determined following a preliminary assessment of the Maltese Islands geology and land use.
Th e fi nal report describes the specifi c approach adopted to measure/ defi ne natural background value of 232Th , 238U and 7Be (natural radionuclides) and spatial distribution of 137Cs (artifi cial radionuclides). Gamma spectrometry was used to calculate the aforementioned radionuclides. Where it was not possible to detect directly a radionuclide concentration the value was obtained by measuring their daughter radionuclides and supposing secular equilibrium.
In this study 208Tl has been measured to determine 232Th and 214Bi to calculate 238U concentration. Top soil (0-20 cm) has been collected in order to investigate radionuclides.
Identifi cation of Soil Indicators for Baseline Survey to Evaluate All Degradation Th reats
Th e process to establish permanent systematic measurements, of a wide range of pre-agreed soil parameters, is described below. Identifi ed soil parameters were categorized within short-term and long-term monitoring strategies since project under review suff ered from a limited fi nancial allocation and was subject to tight milestones and reporting deadlines.
Short-term indicators with results providedTh e actual sampling survey, carried out during the fourth quarter of 2012, investigated
40 sites which were chosen by MEPA and their consultants as a representative profi le of the various soil types present within the Maltese Islands. All sampled sites were grouped into three classes: 20 ‘basic’ (reference code: ST), 4 biodiversity-related (reference code: BD) and 12 ‘generic’ (reference code: GP) monitoring points, respectively (12).
Th e 20 ‘basic’ points aforementioned include the investigation of a combined list of indicators associated with the following soil degradation threats: erosion, desertifi cation, organic matter decline, diff use contamination, salinization, soil fl ooding/ landsliding and compaction.
Specifi cally, all samples have been tested to generate the following reference information:• soil bulk density, • underlying rock formation, • soil profi le depth characteristics, • electrical conductivity, • soil texture,

112 Future Preparedness: Th ematic and Spatial Issues for the Environment and Sustainability
• soil typology unit and • an assessment of heavy metal contaminants (to determine the likelihood presence
of arsenic, cadmium, chromium, copper, lead, mercy, nickel and zinc quantities), hydrocarbons, pesticides and soil organic carbon which may be present within the topsoil and subsoil horizons.
Within the 12 ‘generic’ monitoring points, soil analysis indicators tested provide information about soil’s pH, moisture, texture, organic carbon and nitrogen content, ratio C:N, bulk density, calcium, potassium and phosphorus.
On the other hand, presence and concentrations of earthworms, micro-arthropods and microbial respiration have been studied within 4 pre-agreed monitoring sites in order to initiate a preliminary investigation of local topsoil and subsoil biodiversity qualities.
Subsequently, laboratory-based verifi cations (in the form of analytic reports) were carried out to report any traces/concentrations of the following contaminants within each soil sample: pesticides, herbicides, dithiocarbamates, fungicides-acilalanine, fungicides-benzimidazoles, fungicides dicarboximides-tiofl atalimides, fungicides – strobilurin, triazole fungicides – phyrimidine and other, insecticides – carbamate, pesticides chlorine nicotinic, oraganophosphurus insectides, insectides organioclorurates, insecticides phrethroid, growth regulators.
Moreover, a pre-agreed set of fi eldwork characteristics, addressing the various soil threats, has been prepared as part of Activity 2 of the ERDF project under review. Information requested is listed below for ease of reference: • type of degradation threat and indicator reference code;• a technical defi nition (with unit of measure in relation to international standards);• type of indicator (in relation to DPSIR framework);• indicator’s target and Strategy (objective/s and its importance within wider context
defi ning degradation threat sub-theme);• methodological description (procedure used, materials/equipment utilized,
benchmarks used, limitations to data acquisition, and so on);• evaluation of data needs and availability; and• additional relevant information (e.g. temporal coverage, intended/ required frequency
of updates, expected spatial resolution).
Long term indicators not yet tested in any contemporary research or evaluation initiativesIntensifi cation of Maltese soil data is expected for a 2 by 2 km grid and is expected
to cover around 80 monitoring points in order to address in greater detail the various soil sub-themes. Soil indicators identifi ed in this project, which are important in terms of future testing of sampled soil resources (once EU funding and national soil budget

Chapter 6: Setting an Integrated Soil Monitoring System for Malta 113
assistance are secured), are listed below. Desertifi cation – drainage, fi re risk, erosion protection, drought resistance, land use
intensiveness;Contamination – site characterization, dioxine, PCBs, organic chlorinated;Soil biodiversity loss – all macrofauna present in soil, acari sub-orders, nematodes,
bacteria and fungal DNA, bacteria and fungal activity. In Malta, this type of soil degradation threat can be monitored eff ectively once a repeat soil survey is carried out, at national level, to evaluate a total of 40 sampling points. Specifi c attention shall be taken to sample soil health conditions within environmentally-sensitive areas (that is, sites already scheduled for protection from development due to their ecological and scientifi c importance);
Soil sealing and compaction – land consumption, fragmentation, air capacity;Organic matter decline – soil organic peat, wild fi res, crop residue burning, exogenous
OM application (including farmland manure and biowaste), organic farming, cultivation practice;
Landsliding – soil depth (including the C horizon (13)), occurrence/ density of existing landslides (updated landslide inventories), bedrock structure and quality, climate. Long-term assessment of this degradation sub-theme involves the construction of 20 specifi c monitoring points.
Salinisation – sodium, magnesium, calcium, potassium, chloride, sulphate, profi le distribution, ion composition, pH/alkanity, cation exchange capacity, exchangeable sodium rate, determination of irrigated soil areas and chemical properties of irrigated water;
Eff ective calculation of hydraulic properties for the assessment of erosion and salinization may be achieved if soil data authorities distribute some 25 piezometers on a nation-wide basis.
2012 Soil Baseline Survey: Results and Emerging Preliminary ConclusionsTh is baseline sampling assessment, carried out as part of ERDF 156 project deliverables
described earlier in this paper, constituted a major source of primary scientifi c information gathered in relation to current soil conditions in Malta since the extensive MALSIS project completed in 2004. Its main conclusions, grouped by specifi c degradation threats, are described below:
(i) Decline in Organic Carbon Th e total organic carbon measured from samples collected during the baseline survey,
ranges from 0.4 to 2.3%. Prima facie, fi gures therefore compare well in terms of consistency with those of Lang, (1960) and MALSIS (2004).
Th e following conclusions (14) were reported with reference to the baseline survey

114 Future Preparedness: Th ematic and Spatial Issues for the Environment and Sustainability
data results associated with this soil degradation threat:
“For the purpose of this baseline study, the organic matter content of soil was determined for most of the sites. Considering the climatic characteristics of the region and soil management factors it was expected that the levels of organic matter in soil would be low. An analysis of the data indicate a mean organic matter level of 2.1% (S. Dev. + 0.1814 n=27) and minimum and maximum levels of 0.808 and 3.96% respectively. Th is average is considered to be low; however these levels are very similar to levels found in soils of this region. Th e data from this study were compared with soil organic matter data taken in 2002 and 2006”.
Th e mean soil organic matter content for 2002 was 1.9 % (S. Dev. + 0.685 n = 16) and in 2006 the mean was 2.1% (S. Dev. + 0.636 n = 16). Information regarding the location of the sites for both 2002 and 2006 was not available, however a statistical analysis comparison between 2006 data and 2013 data did not reveal any signifi cant change in organic matter content (p = 0.478) (Meli A., et.al, 2013, pp.68-69).
…the level of organic matter in these soils is rather low and that there was no change from that recorded in 2006. Th is is somehow an expected outcome considering the climatic conditions of the region and the fact that the majority of the sites are agricultural sites; cultivated soils in general have lower organic matter content than non-agricultural soil (Meli A., et.al, 2013, p.77).
(ii) ContaminationProject consultants entrusted with analyzing soil baseline survey fi ndings provided the
following conclusions with reference to diff use contamination:
…”the picture that emerges from this study suggests that for the majority of the soil sampled, the level of the PTEs (15) is within the NBVs (16) established for European soil. Only soil from sites ST01 and to a lesser extent ST03 indicate levels higher than NBV set for European soils of calcareous origin. Levels of organic contaminants (data not shown here) were also very low and should not pose any threat to the environment”.
Due to a small number of samples it was not possible to determine the PTEs NBV for local soil. It is recommended that for the purpose of establishing the NBVs for PTEs, the country will be divided in two domains, an urban domain that comprises mainly the inner harbour, outer harbour and the south east sectors, and a principal domain comprising the rest of the country, thus representing the rural areas. In order to establish the NBV at least a minimum number of 30 spatially distributed sample points, are required. Th e criteria for the determination of the NBVs should be based on ISO 19258:2011. “Soil quality: Guidance on

Chapter 6: Setting an Integrated Soil Monitoring System for Malta 115
the determination of background values” (ISO 2011) (Meli A., et.al, 2013, pp.76-77).
(iii) Soil SalinizationSoil salinity within the sampled points also appears to display characteristics typical of
encroaching desertifi cation process within the Mediterranean region:
…Salinity is on the high side, but again this is another characteristic of soils from arid or semi-arid regions. Th e fact that in some areas irrigation is carried out with water of relatively high conductivity further aggravates the situation (Meli A., et.al, 2013, p.77).
(iv) CompactionSignifi cant changes were observed with reference to soil compaction even though
analysis requires a larger representative sample in order to be compared with previous evaluations on a national level:
…Compaction is surprisingly high and diff ers substantially from what was reported in 2006. One should consider comparison of the methods used here and method used during the MALSIS survey before drawing conclusions in this respect. Recommendations for further surveys and studies are given in the text however the general aim of further studies should be to characterise the soils further and also more importantly to study the functioning of the soils and their response and reaction to external inputs. Meli A., et.al, 2013, p.77
(v) LandslidingOn landsliding, ERDF 156 project consultants generated a land hazard composite
map using limited data available from the MALSIS project. Subsequently land condition variables, where information is already available such as slope gradient steepness, geology, fault aspects and some major soil components (e.g. higher distribution of the clay, and silt soil types as per MALSIS kriged data), was also factored in.
Potential for landslide hazard was thereaft er categorized by assigning 5 categories to better display fi nal interim results (i.e. Very Low, Low, Medium, High, High and Very High probability of occurrence). Following that, geological formations were then evaluated against prevailing surface soil types formed by local clay-sand-silt ratios.
Map shown below (Figure 1) is the fi nal product of an evaluation of a series of composite maps showing the following geophysical conditions: • an overlay of sand, silt and clay areas; • GIS of a 1961 steepness of slope map;• analysis of the previous map showing steepness of slope to produce coloured slope
hazard values;

116 Future Preparedness: Th ematic and Spatial Issues for the Environment and Sustainability
• a geological map of Malta displaying formations and respective sub-categories; • a soil types map; • a map combining overall picture for slope, geology and soils typology; and • another geological map in this instance reduced to six types – those pertaining to the
upper coralline limestone, in conjunction with steepness and areas where soil content is present.
Figure 1: Landslide Hazard Map for Malta (aft er Meli et al., 2013, Map 3.8)
Preliminary conclusions reached by project consultants, in relation with local landsliding conditions in the Maltese Islands, are described below:
Results generally conform to Terracore satellite imagery and investigative report on rockfall hazard in the observation of the cliff s and the clay slopes that indicates that while several mechanisms can be simultaneously responsible of a single rockfall, the latter will be strongly conditioned by the local geological context with particular linkages to undermining of Upper Coralline Limestone over Blue Clay, though variations in temperature in faults cause scaling (Meli A., et. al, 2013, p.48).

Chapter 6: Setting an Integrated Soil Monitoring System for Malta 117
(vi) Other degradation threats It should be noted that surveying sample designed to measure soil biodiversity losses
was too small to merit a robust national assessment. Comparability with past studies is not possible as not even MALSIS addressed this degradation threat despite its rather spatially dense sampling monitoring system.
Information collected only indicated the soil microbial respiration of just four sample sites and the earthworm species. No fi gures were provided regarding number of earthworms and anthropod biomass and therefore it was concluded that biological status of local soils (let alone the entire biome) could not be determined at this point in time.
Similarly, a comparative evaluation of sealing patterns and soil desertifi cation was not possible at this juncture given that the two sub-themes were not directly measured during the Project’s baseline survey.
Recommendations for Future ResearchStructured assessment of all degradation threats impacting on local soils is thereby
recommended in order to encourage a holistic appreciation of this non-renewable natural resource.
Overarching proposalsA number of general issues and specifi c recommendations (related to the various
degradation sub-themes discussed in this paper) were recommended by the project’s consultant experts. Technical advice provided hereunder is important in relation to future soil surveys in Malta likely to be carried out as a follow-up to the 2012 baseline survey.
In a nutshell, improvements to survey quality are intended to address issues related to time, sample consistency, amount of tested samples, continuity or repeat monitoring to gauge changes in the resource’s characteristics, and the preparation of specifi c studies on parallel, (albeit related) themes all of which are intended to establish a more robust information base.
Th ese strategic issues (related to improvement of future survey methodology) are briefl y described below:• Project timing – In Malta seasonality may allow division into a dry and wet period.
Regularity in eff ecting the same seasonal period under study, or a diff erent one to observe any changing trends, shall need specifi c consideration.
• Sample consistency – Single samples are not advisable. As per MALSIS systems of procedure, a four-metre square grid around a GPS point in which some 25 subsets would be collected is deemed a more representative sample. Additionally, topsoil and subsoil should be diff erentiated whenever possible.
• Number of samples – Land area studied should be assessed thoroughly in order to

118 Future Preparedness: Th ematic and Spatial Issues for the Environment and Sustainability
produce a robust sampling and study strategy in accordance with ISO compliant procedures. A logical series of selected area points, non-single but composite, should be investigated and investigations should not be limited to single fi elds in an area but extended over a much larger area, to cover every locality and, where applicable, its immediate rural area. Th e MALSIS original number of 320 points, each per square kilometre grid, is more representative, though closer to half this number should provide the basis for more analytical options, given, as per MEPA’s 2004 data, that some 242 square kilometres are unbuilt land. Soil type, slopes and size of fi elds should be taken into consideration prior to soil sampling and measurements. Th e latter activity shall be carried out within a laboratory managed with an appropriate accreditation standard.
• Continuity – Th ere is an illogical break of continuity of the MALSIS baseline data with limitations to data availability and analysis. Building on MALSIS data with due correlation is the rational way forward. Th e presence of a soil scientist and an agriculturalist in the entity responsible for soil should ensure sustained conformity within a scientifi c dimension.
• Specifi c studies – Particular evaluations of soil property could necessitate more detailed studies than those eff ected, and at times, if needs be also incorporate new parameters and, in this regard, it is being recommended that infi ltration be included in desertifi cation and erosion studies. More detailed studies of coastline landscapes are also suggested.
Specifi c proposalsProject consultants recommended that the above considerations shall be supported
by a set of technical proposals, studies and processes to enable the widest structured coverage of all soil degradation sub-themes. All action points are outlined below for ease of reference:
(i) Sealing• Th e preparation of a Construction Code of Practice for the Sustainable Use of Soils on
Construction Sites;• Establish and monitor Good Practice Guideline for Soil Management; and• Conduct soil monitoring analysis through setting up of land use planning indicators.
(ii) Erosion and desertifi cation• Future soil sampling surveys should include more coastal, areas on steep slopes and
land exposed to the natural elements. Investigations should not be limited to single point sampling, but sampling should be extended over a much larger area. Linkage to erosion should also be considered.

Chapter 6: Setting an Integrated Soil Monitoring System for Malta 119
• Visual evidence indicates that soil is washed to the sea with the onset of the rainy season following the dry months of the year.
• Sampling assessment for each studied site/area shall also include a parallel survey of crop growth and crop rotation (i.e. land use intensity and vegetation patterns) as this a signifi cant factor confi rming erosion processes.
• Cropping history survey of site should be obtained. Th is study shall be supported by a land management and land use assessment which should be prepared to acknowledge the fact that land management is a signifi cant factor in terms of desertifi cation. Information covered by this assessment shall incorporate data about the following aspects: * Identifi cation of natural soil areas; * Agricultural cropland, and land use intensity (the latter should be determined
according to stocking rate even though it is not common locally); * Identifi cation of recreational areas (classifi ed according to the visitor loading); * Extent of quarried areas (to be assessed from their eff ect on erosion).
• An agricultural practice assessment should be prepared and the area under study assessed by a competent agricultural or soil specialist. A thorough vegetation growth survey should also be carried out. Th is should include information on percentage plant cover, and vegetation type. Th e type of vegetation has a direct eff ect on fi re risk assessment, erosion protection and drought resistance.
• Soil organic matter and soil water infi ltration quantity (or rate) should be determined for all sites together with soil salinity and SAR (17) or ESP (18);
• With regards to the parent material, more information such as clay content, and whether the parent material is consolidated or not, should be obtained.
• Inclusion and study of wind erosion particularly that resulting from saltation, suspension and creep;
• Th e use of soil erosion models other than RUSLE (19) especially those more adapted to the region such as WEPP (20) should be considered;
• Soil models (to accurately assess extent, scale and direction of erosion problem), adopted for the purpose of extending and integrating the outcome from the model over larger areas, requires a thorough survey of the area and a better sampling strategy; and
• A project to monitor and measure actual soil erosion in key sensitive areas should be undertaken.

120 Future Preparedness: Th ematic and Spatial Issues for the Environment and Sustainability
(iii) Contamination, organic matter decline, salinity, compaction• Further characterization of local soils and study their function, response and reaction
to external inputs;• Establish a local thresholds matrix for the various potential contaminants of this
resource by adopting a hybrid system established from the Italian, Dutch and German models;
• Determine and monitor PTEs and NBVs in local soils. Th e country should be divided in two domains; an urban domain that comprises mainly the inner harbour, outer harbour and the south east sectors, and a principal domain comprising the rest of the country, thus representing the rural areas for the purpose of establishing the NBVs for PTEs;
• In order to establish the NBV at least a minimum number of 30 spatially distributed sample points, are required. Th e criteria for the determination of the NBVs should be based on ISO 19258:2011 (21);
• Organic matter - At least carry out a survey every 5 years on selected sites to establish a trend on any fl uctuations. Th e sites studied should comprise both uncultivated and cultivated land, the latter representing land that is under intense cultivation, sustainable cultivation practice, forage land, irrigated, non-irrigated and fallow. Agricultural practice of all sites used for the study should also be monitored closely and recorded; and
• Monitor soil bulk density and/or soil strength to assess management change.
(iv) Landsliding (soil displacement)Recommendations for further research shall involve the surveying of more data
collection points with the proviso that there are more specifi c area studies through geomorpholigical studies. Th e latter shall also incorporate the use of:• Geomorphological fi eld surveys and mapping;• Soil/ clay core physical analysis also covering Atterberg Limits, Plasticity Index and
Activity Index including soil penetrometer readings plus piezometers to measure pore water pressures;
• Procurement of a Global Position System device plus extensometer / fi ssurimeter for monitoring purposes;
• Ground Penetrating Radar surveys correlated to hydrogeological implications;• Multi-temporal analysis of aerial photographs and digital photogrammetry to
determine extent of progression and directional fl ow of soiled land displacement (including but not limited to monitoring of mudslides);
• Synthetic Aperture Radar /Diff erential Interferometric SAR analysis Field surveys; • Specifi c studies on Blue Clay slopes with more comprehensive site coverage - both

Chapter 6: Setting an Integrated Soil Monitoring System for Malta 121
shoreline and inland;• Recording plus correlation of climatic data including rainfall intensity and
mareographic data; and• Retrospective research on landslide occurrence, plus landslide modelling and hazard
mapping with Joint Research Centre’s digital landslide database conformity.
(v) Soil biodiversity decline• Biomass studies should focus on both the diversity of the organisms in the soil and
their function. • As for the other physical and chemical parameters, examples from both cultivated and
uncultivated land should be investigated. • Soil with contrasting properties such as texture, structure, chemical properties
(contaminant level perhaps), location and management should be selected. Investigations should be carried out both seasonal initially and also repeated for a number of years in order to investigate seasonal variation patterns and long term trends.
• As the cost of such research could be signifi cantly high, long term experiments should be carried out only on a number of selected sites following thorough preliminary investigations. (Th is approach not only produces a clear point in time information on the biological status of local soil but also an understanding of how external factors might aff ect the soils’ biological properties over the years).
• Investigations should cover a quantitative aspect, type and number of organisms, as well as biochemical. Quantitative surveys should focus mainly on earthworms, nematodes, molluscs, and arthropods. Quantifi cation and species identifi cation should be according to standard protocol.
• Site surveys should not be restricted to single point sampling but the samples should be representative of the whole area taken in a line transect or grid pattern and should be taken in a way which can be repeated whenever required. With regards to microbial population studies, considering the low rate of cultivation, conventional culture methods should not be attempted, but the use of molecular techniques should be encouraged.
• From a microbial aspect, microbial activity and soil biochemistry would be a more important study. Th e microbial activity of diff erent soils, under diff erent management strategies should be investigated.
• Th e following (topic) areas were recommended for further detailed technical investigation: * nitrogen cycling activity that includes nitrogen fi xation, ammonia oxidation
and denitrifi cation;

122 Future Preparedness: Th ematic and Spatial Issues for the Environment and Sustainability
* local situation with reference tsoil respiration; * soil and fungal microbial biomass; * Nutrient cycling potential such as that involving phosphorus and sulphur; * degradation rates of specifi c substrates using specifi c enzyme assays such as
protease activity, arginine deaminase activity, phosphotiesterase activity and others; and
* humifi cation and organic matter degradation potential.
ConclusionCompletion of a local soil baseline survey, containing a wider range of parameters
investigated in accordance with prevailing contemporary data dissemination standards is, as the name suggests, the start of a long journey intended to introduce regular monitoring of soil quality in a consistent and comprehensive manner to signifi cantly improve primary soil data infrastructure in Malta.
Knowledge gaps regarding local soil monitoring require signifi cant funded (albeit focused) research eff orts and continuous integrated monitoring initiatives in order to eff ectively provide a realistic snapshot of current situation on the ground at equally distributed time intervals.
Emerging cross-cutting themes addressing soil protection and management highlight the following overarching targets:
i. the continued elaboration of a holistic (i.e. multi-layered) national soil strategy and its nested policies (with the latter developed primarily from existing Good Agricultural and Environmental Conditions (GAEC), stakeholder guidelines on Statutory Management Requirements (SMRs) and MEPA’s environment assessment process all of which systematically target a number of soil threats;
ii. the pressing ongoing need to enable robust multi-level soil data infrastructure, covering the various degradation threats, to monitor and evaluate the eff ectiveness of existing and future policies and current soil conservation practices;
iii. the need for structured communication and constant cooperation both between agricultural, environmental-resource authorities as well as between governmental and non-governmental stakeholders; and
iv. advertising of the necessary mix of mandatory and voluntary incentive-based instruments coupled with suffi cient information and better fi ne-tuned advisory service to the rural community i.e. farmers and landowners.
Preparation of sound multi-scale initiatives, to attain and build on the achievements and recommendations described in this paper, are urgently becoming a critical concern

Chapter 6: Setting an Integrated Soil Monitoring System for Malta 123
in order to provide comparability with similar information systems across the European Union. Furthermore, support recommendations outlined throughout this contribution undoubtedly coincide with commendable eff orts adopted by multi-national organizations such as the United Nations to introduce systemic global awareness about the complexities and hard choices that are required to protect this resource from depletion and cumulative degradation pressures.
Th e designation of 2015 as the International Year of Soils should provide further impetus towards similar project initiatives in Malta intended evaluate further the state of, and action taken to protect this vital natural heritage feature.
ReferencesAmbiente Sc, (2011). Service Tender for the Development of Environmental Montoring Strategy, and Environmental Monitoring Baseline Surveys – Technical Proposal (Lot 1). Operational Programme I – Cohesion Policy 2007-2013. Investing in Competitiveness for a Better Quality of Life, (further information online: www.ambientesc.it).
CEC (2002). Communication from the Commission to the Council, the European Parliament, the Economic and Social Committee and the Committee of the Regions. Towards a Th ematic Strategy for Soil Protection, COM (2002) 179 fi nal, Brussels.
Department of Contracts & Malta Environment and Planning Authority (2012). Service Tender for a Soil Baseline Survey. Tender No. T02/2012. Operational Programme I – Cohesion Policy 2007-2013. Investing in Competitiveness for a Better Quality of Life.
European Commission (2012). Position of the Commission Services on the development of Partnership Agreement and programmes in Malta for the period 2014-2020. Available at: http://ec.europa.eu/regional_policy/what/future/pdf/partnership/mt_position_paper.pdf (accessed on March 2014).
Lang D.M. (1960). Soils of Malta and Gozo. HMSO: London.
Malta Environment and Planning Authority, Ambiente Sc, (2013). Service Tender for the Development of Environmental Monitoring Strategy and Environmental Monitoring Baseline Surveys – Activity 4: Feasibility Assessment (Soil), version 3, Malta.
Malta Environment and Planning Authority, Ambiente Sc, (2013). Service Tender for the Development of Environmental Monitoring Strategy and Environmental Monitoring Baseline Surveys – Activity 2 (Soil), version 6, Malta.
Malta Environment and Planning Authority, Ambiente Sc, (2013). Service Tender for the Development of Environmental Monitoring Strategy and Environmental Monitoring

124 Future Preparedness: Th ematic and Spatial Issues for the Environment and Sustainability
Baseline Surveys – Activity 1: Analysis (Soil), version 3, (57 pp.), Malta.
Malta Environment and Planning Authority, Terracore Ltd, (2012). Soil Baseline Survey (T02_2012) – Activity 5: Final Report (Soil), Malta.
Malta Environment and Planning Authority, Ambiente Sc, (2012). Service Tender for the Development of Environmental Monitoring Strategy and Environmental Monitoring Baseline Surveys – Activity 3: Design of Programmes (Soil), version 4., Malta.
Malta Environment and Planning Authority, Ambiente Sc, (2012). Service Tender for the Development of Environmental Monitoring Strategy and Environmental Monitoring Baseline Surveys – Inception Report (Soil), version 7, Malta.
Malta Environment and Planning Authority, Act X of 2010, Environment and Development Planning Act. Available at: http://www.mepa.org.mt/LpDocumentDetails?syskey=%201260 (accessed on March 2014).
Meli A. et al. & Malta Environment and Planning Authority, Ambiente Sc, (2012). Service Tender for the Development of Environmental Monitoring Strategy and Environmental Monitoring Baseline Surveys – Activity 5: Analysis of Sampling Survey Results (Soil), version 2.
Montanarella, L. (2014). LIFE can help translate science and policy into practice. In LIFE and Soil protection. European Union: Environment Directorate-General publication brochure about LIFE Environment projects. DOI:10.2779/64447. Available at: http://ec.europa.eu/environment/life/publications/lifepublications/lifefocus/documents/soil_protection.pdf (accessed on March 2014).
National Soil Unit, Ministry for Rural Aff airs and the Environment, Malta. MALSIS, 2004. A Soil Information System for Malta. Ministry for Rural Aff airs and the Environment (LIFE00 TCY/M/036), Malta.
Terracore Ltd., (2013). Rockfall hazard report for the Malta Island. Assessment provided for the Ministry for Resources and Rural Aff airs, Malta.
Notes1) Developing National Environmental Monitoring Infrastructure and Capacity (ERDF156).
2) EU-wide Framework guidance is provided by Cohesion Policy Regulation, COM(2011) 612, and European Regional Development Fund, COM(2011) 614.

Chapter 6: Setting an Integrated Soil Monitoring System for Malta 125
3) Funding Priority 2: Sustaining an environmentally-friendly and resource-effi cient economy.
4) Code of Good Agricultural Practice.
5) Good Agricultural and Environmental Conditions.
6) Statutory Management Requirements.
7) Local cross-compliance is regulated through LN 346 of 2005 as amended by LN 207 of 2009.
8) Publication of a comprehensive report titled Th e State of Soil (issued by European Commission/ Joint Research Centre) may shed further insight at a continental level of constraints identifi ed (e.g. capacity building is not a priority in most MS) which are delaying progress related to a revised in-depth assessment of all soil degradation threats.
9) Some have binding legal obligations, most have a non-binding status.
10) Soil colour was determined according to the Munsell colour chart system notation guide.
11) as identifi ed by the Commission following preparation of its 2004 Soil Th ematic Strategy.
12) Th e values determined for the monitoring sites terms ‘general points’ have been compared to the values established for the monitoring sites classifi ed as ‘biodiversity points’ in order to correlate the information emerging from examining the biodiversity indicators to the entire Maltese territory.
13) Th e C-horizon is the unconsolidated material underlying the solum (A and B horizons). It may or may not be the same as the parent t material from which the solum formed. Th e C horizon forms as the R horizon weathers and rocks break up into smaller particles. Th e C horizon is below the zones of greatest biological activity and it has not been suffi ciently altered by soil genesis to qualify as a B horizon.).
14) Source: LOT 1, Soil Monitoring Analysis. Consolidated report, interpreting Soil Baseline Survey sampling results prepared in part fulfi llment of ERDF 156 project deliverables (Activity 5), as edited by AIS Environmental.
15) Potentially Toxic Elements.
16) National Background Values.

126 Future Preparedness: Th ematic and Spatial Issues for the Environment and Sustainability
17) Sodium Adsorption Ratio.
18) Exchangeable sodium percentage.
19) Revised Universal Soil Loss Equation.
20) Th e Water Erosion Prediction Project (WEPP) model – Th is is a process-based, distributed parameter, continuous simulation, erosion prediction model for use on personal computers running Windows 95/98/NT/2000/XP/Vista/Windows7. Th e current model version (v2012.8) available for download is applicable to hillslope erosion processes (sheet and rill erosion), as well as simulation of the hydrologic and erosion processes on small watersheds (information source: http://www.ars.usda.gov/Research/docs.htm?docid=10621).
21) “Soil Quality Guidance on the determination of background values” (ISO 19258:2011).

127
C H A P T E R 7
High Resolution Agriculture Land Cover Using Aerial Digital Photography and GIS:
A Case Study for Small Island StatesCharles Galdies, John C. Betts, Antonella Vassallo and Anton Micallef
IntroductionWith the advent of site-specifi c crop management, sustainability and profi tability, land
farming now requires information and technology-based management system to identify, analyse and manage spatial and temporal resource variability. Th is approach is being made increasingly possible by recent innovation in information technologies such as mobile devices, geographic information systems, positioning technologies (such as Geographical Position system), and Earth Observations. Such innovation now off ers a holistic approach to micro-manage agricultural resources. (Robert et al., 1994).
Basic mapping and farm-level record keeping is one of the fi rst precision agriculture practices that must be implemented in a typical productive agriculture operation (Stombaugh et al., 2001). Typical tasks include mapping of variations that occur in large-scale fi eld features such as vegetation stress, crop rotation, inventorying, irrigation, soil drainage and erosion, pest control, etc. Th e search for a low cost methodology that takes into account the growth of information technology in data capture and surveying, data processing, database creation and geographic information systems becomes mandatory in order to respond to such needs.
Th e study constitutes, for the fi rst time in Malta, the collection of high precision farming statistics that makes use of an inexpensive system for aerial mapping that requires minimal ground truthing. Th e eff ectiveness of such a method for small areas was later demonstrated by Galdies and Borg (2006) related to coastal and beach management in the Maltese islands. In the current case, digital aerial remote sensing enabled the accurate mapping of agricultural variables, and coupled with ground survey data, resulted in the production of precise, high resolution agricultural crop-cover maps. Additional information can be further derived from this data that can be used for the optimisation of micro agriculture practices.

128 Future Preparedness: Th ematic and Spatial Issues for the Environment and Sustainability
MethodologyFlight planning, aircraft and remote sensing equipment
Two sets each made up of three consecutive fl ight plans were conducted for data collection requirements. Th e Maltese islands were thus divided into three geographical sections (1) Gozo and Comino, (2) Malta west of Ghallies rock, and (3) Malta east of Ghallies rock.
For logistic purposes, the fl ights were planned as a series of lines running North-South across the islands. Th e set of images giving full coverage had the strictest requirements; the other image set was designed around the requirements for this set. For full stereophoto coverage of the islands one set of fl ights had to be carried out at 4500 feet altitude. A side overlap of 30% between one line of images and the next was required, as well as a 70% forward overlap, between one image and the next, to ensure suffi cient image overlap for photogrammetric purposes.
Th e aircraft selected for the missions was a Tecnam P-92J single engine high wing monoplane. Th is aircraft was not specifi cally designed for such surveying work, however it was easily adapted in line with engineering safety standards. In this case, two holes of diameter 70mm were cut in the fl oorplates, and two corresponding holes in the outer skin. A purpose-built camera mount was fi tted to the aircraft fl oor positioning the camera lenses in line with the holes.
Figure 1: Th e Tecnam single engine high wing monoplane used for the fl ight survey
Two Kodak digital cameras (DCS460/660), each with 3060 x 2036 CCD arrays, were used to acquire the aerial photographs. Each was fi tted with a fi lter eliminating near infrared light, permitting visible light only to be registered by the CCDs. Each camera was

Chapter 7: High Resolution Agriculture Land Cover Using Aerial Digital Photography and GIS 129
attached to an intervalometer which triggered the shutter at regular intervals to record the required images. Flying at around 90 knots at 4500 feet, and taking pictures every 10 seconds provided a horizontal pixel resolution of approximately 50 cm. Th e number of fl ight lines required were 27 for Gozo and Comino and 22 each for the east and west halves of Malta.
To obtain higher resolution imagery suited for crop identifi cation, one of the cameras was fi tted with a zoom lens set to f56 mm (compared to f28 mm for the standard camera set). Th is provided a pixel resolution of approximately 25 cm, although full lateral coverage was not obtained. In order to improve cover at this resolution, a second set of fl ights was fl own following the pattern of the fi rst but at 2000 feet altitude Th is meant that by using images taken with the camera with the standard f28 mm lens at the lower altitude and images taken with the camera with the zoom lens at high altitude and combining the two sets, close to full coverage would be obtained at this resolution. To fully utilize the available resources, the second camera was also installed, complete with zoom lens, for the second set of fl ights. Th e resulting pictures provide high resolution (12-15 cm) snapshots of locations which assist the identifi cation of vegetation.
During fl ight, a total of 6078 aerial photos were recorded on memory cards. Following each fl ight, the image data was transferred to data storage hard drives on computers for archiving and analysis.
Land cover classifi cationDue to the enhanced crop detail visible from the photographic set acquired, the
standard CORINE classifi cation was expanded by an additional 2 levels (i.e. CORINE level IV and V). Th ese additional levels group all other additional features related to permanent/temporary crops by exact type as well as information on type of fruit and forest trees which were now possible by the methodology used in this survey.
Ground truthingAround 2000 hectares were surveyed for permanent and temporary crops and related
artifi cial crop cover (mulches, greenhouses, plastic covers etc). Using 1:2500 maps, diff erent types of agriculture land cover, including irrigated and dry land, were surveyed during and aft er the aerial survey was being carried out. Due to the accuracy of the 1:2500 paper maps, individual fi elds were recognised and all relevant details, including information obtained directly from farmers were noted. All the geographic information was archived and divided into two separate sets: (1) used for photo-interpretation and classifi cation, and (2) reserved for the accuracy assessment of the fi nal thematic map using an error matrix based type of assessment.

130 Future Preparedness: Th ematic and Spatial Issues for the Environment and Sustainability
GIS database structureA fully inter-related database structure was created capable of making use of all spatial
data available (Figure 2). Th e database addressed the archiving and spatial documentation of all imagery collected for the survey. At the same time, data interpretation in the form of classifi ed GIS vectorized information was organised in a way as to provide relational and geographical links between diff erent CORINE classifi cation levels.
Figure 2: Relational spatial (GIS) database structure for AGRISTAT.
Using the structured query language (SQL), the following information was extracted from the spatial database:
• Th e total number of fi eld crop parcels (in general or by type) by local council;• Th e serial photo numbers, together with their centroid spatial coverage, archive name
on which particular parcels can be found;• Analysis of the total area of land covered by a particular crop type (in general or by
local council);

Chapter 7: High Resolution Agriculture Land Cover Using Aerial Digital Photography and GIS 131
• Statistical analysis of land coverage by local council;• Complete CORINE description of any CORINE code;• Location of all parcels covered by a particular crop type (e.g. potatoes, lettuce, carrots,
etc.) in a defi ned (local council or other) area;• Grouping the parcels by vegetation type/land area/local council.
Interpretation and classifi cation of crops from aerial imageryA set of aerial imagery covering a range of agricultural land type and usage were
selected as calibration sources to aid in the photo-interpretation (Figure 3). Th is calibration, which was based on the previously conducted ground surveys,
consisted of a digital collection of annotated parcels illustrative of the features and conditions to be identifi ed. Th is was instrumental for the proper interpretation of parcels in successive photographs, which depended on the similarity of such classifi ed parcels containing particular recognition elements. Th ese elements include shape, size, pattern, shadow, tone or colour, texture, association and site (Lilesand & Kiefer, 1994).
Figure 3: An example of a classifi ed 0.25m pixel resolution photograph of an intensively cultivated land area situated within the Pwales valley (St Paul’s Bay local council) (af: abandoned parcel of agricultural land; beans: broad beans).

132 Future Preparedness: Th ematic and Spatial Issues for the Environment and Sustainability
In addition to classifi ed aerial photographs a set of ground photographs were simultaneously used by the data entry operators to assist them to relate the above-mentioned photo-interpretation criteria with those as seen from the ground.
Apart from tone and texture, methods of cultivation and harvesting techniques were additional helpful elements used for photo-interpretation and CLC classifi cation. Th is was particularly true for crop types such as fodder, potatoes, onions/garlic and marrow.
Digitisation of parcelsTh e precise location of all fi eld parcels was identifi ed from a national digitised base
map (1:2500 scale). Acquisition of the relevant photography was done by overlaying the spatial photo archive layer on top of the base map. Having located the exact position of the parcel on both base map and photograph, parcels were vectorised and classifi ed according to the CORINE scheme (both attribute feature- and colour- code), taking into account the proportional size of the crop cover over its collocated digitised base map. A fi nal geographical atlas (available from the National Statistics Offi ce – NSO) showing agricultural CLC map at Level III and V for each local council area was produced as one of the output of this project (Appendix II).
Accuracy assessmentTh e most common form of expressing classifi cation accuracy is the error matrix
(also referred to as confusion matrix or contingency table). Error matrices compare, on a class-by-class basis, the relationship between known reference data (ground truth) and the corresponding results of the classifi cation procedure (vectorized crop coverage), recognised at the same location. Th e overall accuracy is the sum of the major diagonal (i.e. the correctly classifi ed parcels) divided by the total number of parcels in the error matrix. Th is value is the most commonly reported accuracy assessment statistic. Th e following accuracy indicators were also estimated according to Foody (2002): Producer’s accuracy and User’s Accuracy.
Ensuring objectivity and consistency during accuracy assessmentTo maintain objectivity of the accuracy assessment, the following conditions were
followed:1. Data were collected consistently from designated survey sites;2. A simple quality control procedure was developed and implemented for all steps of
data collection;3. Adequate training on crop identifi cation was given to farm surveyors prior to site
visits;4. Reference data were kept independent and separate of the training data used to

Chapter 7: High Resolution Agriculture Land Cover Using Aerial Digital Photography and GIS 133
calibrate and classify a number of photos as described above;5. Reference data were not reviewed until it was time to perform the assessment i.e. aft er
the classifi ed thematic map was produced following the interpretation of aerial photos and subsequent digitisation on GIS.
ResultsFigure 4 shows a land cover map giving agricultural land cover detail for the local
Council of Fontana, situated on the island of Gozo. Fontana is such a small locality that a reduced, yet perfectly legible map can be reproduced for the purpose of this paper. Grouping of parcel types at this level was done by aggregating the much more detailed information present at CLC level V to produce the statistical table 1 giving the area coverage in hectares by crop type (both temporary and permanent crops) as well as additional features such as artifi cial crop cover.
Th is was done for the entire agricultural area of the Maltese islands excluding urban, industrial areas and natural environments, arranged by local council in the form of a GIS atlas. Semi-natural and natural forests were also identifi ed and included in the vectorization process.
Note: In Figure 4, the class “Natural vegetation” refers to land principally occupied by agriculture with signifi cant areas of natural vegetation (CLC Class 2.4.3.).
Figure 4: Th ematic classifi ed agricultural land cover map for the Local Council of Fontana

134 Future Preparedness: Th ematic and Spatial Issues for the Environment and Sustainability
Table 1: Total number of hectares for the local council of Fontana according to the CLC level III; * Complex Cultivation Patterns; **Land principally Occupied by Agriculture (lpoba); Signifi cant Areas of Natural Vegetation
FONTANA, Gozo HectaresCORINE LEVEL III - LAND TYPE IN HECTARES2.1.1. NON-IRRIGATED ARABLE LAND 9.152.1.2. IRRIGATED LAND 1.952.2.1. VINEYARDS 0.182.2.2. FRUIT TREES 0.832.2.3. OLIVE TREES 0.042.3.1. PASTURES 4.962.4.2. CCP* 0.182.4.3. LPOBA** 11.872.4.4. AGRO-FORESTRY AREAS 0.003.1.2. CONIFEROUS TREES 0.013.2.3. SCLEROPHYLLOUS VEGETATION 1.27
Total Area Analysed/Council (Hectares) 30.44Total Council Area (Hectares) 47.37

Chapter 7: High Resolution Agriculture Land Cover Using Aerial Digital Photography and GIS 135
Table 2: Total number of hectares for the local council of Fontana according to the new CLC level V; * Complex Cultivation Patterns; **Land Principally Occupied by Agriculture (LPOBA); Signifi cant Areas of Natural Vegetation
FONTANA, Gozo Hectares
CORINE LEVEL V - CROP TYPE IN HECTARES
2.1.1.1.1.ONIONS GARLIC 0.30
2.1.1.2.1. BROAD BEANS 0.85
2.1.1.3. PLOUGHED FALLOW LAND 8.00
2.1.2.1.1. POTATOES 1.34
2.1.2.1.2. CARROTS 0.00
2.1.2.2. FRESH VEGETABLES 0.00
2.1.2.2.1. LETTUCE 0.02
2.1.2.2.3. TOMATOES 0.19
2.1.2.2.4. CAULIFLOWER/CABBAGES 0.12
2.1.2.2.7. KOHLRABI 0.04
2.1.2.3. NURSERIES 0.18
2.1.2.4.1. GREENHOUSES 0.04
2.2.1.1.1. VINEYARDS 0.18
2.2.2.1.1. STONE FRUIT TREES (PRUNUS spp.) 0.56
2.2.2.1.2. POMEGRANATE TREES 0.01
2.2.2.1.3. FIG TREES 0.22
2.2.2.1.4. CITRUS spp. 0.03
2.2.3.1.1. OLIVE TREES 0.04
2.3.1.1. GREEN FODDER 1.04
2.3.1.1.1. CLOVER 0.19
2.3.1.1.2. WHEAT 3.73
2.4.2. CCP* 0.18
2.4.3. LPOBA** 11.87
3.1.2.1.1. PINE TREES 0.01
3.2.3.1.1. EUCALYPTUS TREES 0.33
3.2.3.2.1. ACACIA TREES 0.02
3.2.3.2.2. CAROB TREES 0.92
Total Area Analysed/Council (Hectares) 30.41
Total Area of Council (Hectares) 47.37

136 Future Preparedness: Th ematic and Spatial Issues for the Environment and Sustainability
Accuracy assessmenti. Error matrix assessmentTo assess the accuracy of the classifi ed thematic map, an error-matrix based
assessment was applied. Th e error matrix for the CORINE levels III and V were produced by comparing collocated agriculture land parcels identifi ed and interpreted both ground survey versus those classifi ed by the fi nal land cover map.
Table 3 shows the number and type of Level III “reference” parcels that were identifi ed and recorded during the ground survey. A total of 1115 fi eld parcels were used to generate the error matrix of the agricultural land (Table 3).
Table 3: Number of reference data (in terms of number of distinct parcels according to CORINE level III) at the various sampling areas. See table A1 for reference to the CORINE codes)
Level III 2.1.1 2.1.2 2.2.1 2.2.2 2.2.3 2.3.1 2.4.2 2.4.3 2.4.4 3.1.2 3.2.3
Luqa 5 4 - - - 5 - - - 6
Gudja 12 5 1 1 - 27 - 5 - - 5
Gudja 2 6 1 - 11 - 1 - - 1
Zebbiegh 24 11 11 5 - 9 - 10 - - 2
Dwejra 5 14 3 1 - 6 - 7 - - 2
Naxxar 68 71 18 31 - 50 - 52 2 1 71
Fiddien 53 7 25 7 - 15 - 29 1 - 5
Mellieha 76 120 18 66 - 6 1 32 - - 15
Pwales 57 47 1 14 1 17 - 24 2 - 5
302 285 77 126 1 146 1 160 5 1 112

Chapter 7: High Resolution Agriculture Land Cover Using Aerial Digital Photography and GIS 137
Table 4: Error matrix for CORINE classifi cation at Level III between Reference data and Classifi ed data (see table A1 for reference to the CORINE codes)
Level III Classifi ed DataReference 2.1.1 2.1.2 2.2.1 2.2.2 2.2.3 2.3.1 2.4.2 2.4.3 2.4.4 3.1.2 3.2.3
2.1.1 270 14 4 - - 6 - 1 - - - 295
2.1.2 23 269 1 - 10 - 4 - - - 307
2.2.1 5 - 69 2 - - - - - - - 76
2.2.2 - - 2 124 - - - - - - - 126
2.2.3 - - - - 1 - - - - - - 1
2.3.1 3 - 1 - - 124 - 8 - - - 136
2.4.2 - - - - - - 1 - - - - 1
2.4.3 1 2 - - - 6 - 147 - - - 156
2.4.4 - - - - - - - 5 - - 5
3.1.2 - - - - - - - - 1 - 1
3.2.3 - - - - - - - - - 112 112
Total 302 285 77 126 1 146 1 160 5 1 112
Th e User’s and Producer’s accuracy for the relevant CORINE Level III classes are shown in table 5.
Table 5: User’s and Producer’s classifi cation accuracies for CORINE Level III land cover classes (see table A1 for reference to the CORINE codes)
Level III class User’s accuracy (%) Producer’s accuracy (%)2.1.1 89.4 91.52.1.2 94.4 87.62.2.1 89.6 90.82.2.2 98.4 98.42.2.3 100 1002.3.1 84.9 91.22.4.2 100 1002.4.3 91.9 94.22.4.4 100 1003.1.2 100 1003.2.3 100 100

138 Future Preparedness: Th ematic and Spatial Issues for the Environment and Sustainability
Th e absolute accuracy at CORINE Level III is calculated to be (1123/1216*100) = 92.35%. Th e User’s and Producer’s accuracy at CLC Level V are shown in Table 6.
Table 6: User’s and Producer’s accuracies for CORINE Level V land cover classes (see table A1 for reference to the CORINE codes).
CLC Level V class User’s accuracy (%) Producer’s accuracy (%)
2.1.1.1.1. 90.0 75.0
2.1.1.2.1. 81.3 65.0
2.1.1.2.2. n/a n/a
2.1.2.1.1. 88.0 95.0
2.1.2.1.2. 77.8 70.0
2.1.2.2.1. 100 33.3
2.1.2.2.2. 92.9 72.2
2.1.2.2.3. 96.4 81.8
2.1.2.2.4. 72.5 96.7
2.1.2.2.5. 100.0 50.0
2.1.2.2.6. 100.0 66.7
2.1.2.2.7. 50.0 60.0
2.1.2.2.8. 71.4 100.0
2.1.2.2.9. n/a n/a
2.1.2.4.1. 100.0 100.0
2.1.2.4.2. 100.0 88.6
2.1.2.4.3. 100.0 100.0
2.2.1.1.1. 93.5 97.3
2.2.2.1.1. 100.0 96.6
2.2.2.1.2. 100 100.0
2.2.2.1.3. 100.0 100.0
2.2.2.1.4. 75.0 100.0
2.2.2.1.5. n/a n/a
2.2.2.1.6. 66.7 100.0
2.2.3.1.1. 100.0 100.0
2.3.1.1.1. 66.7 100.0
2.3.1.1.2. 100.0 85.3
2.3.1.1.3. 42.9 100.0
2.3.1.1.4. 75.0 75.0

Chapter 7: High Resolution Agriculture Land Cover Using Aerial Digital Photography and GIS 139
In a similar way, the absolute accuracy at CORINE Level V was calculated to be 89.0%.
ii. Ground-truth validation
An additional ground truthing exercise to assess the accuracy of permanent crops, such as vines and citrus trees, was also carried out. A total of 12.68 hectares of land containing vines in Gozo (specifi cally, in Għajnsielem, Nadur and Żebbug) were selected from the land cover map and validated on site. Table 7 shows the percentage of mapped area analysed that matched with collocated fi elds containing vines.
Similarly, another ground truthing (i.e. independent verifi cation) survey was conducted, this time covering a total of 20.75 hectares in the primary viticulture locality of Mġarr, Malta. Th e survey resulted in a percentage accuracy of 97.5% of the total viticulture area analysed. It is interesting to note that out of the non-matched area of 0.52 hectares, 0.38 hectares were found to be covered by small fruit trees of the prunus type. Th e remaining unmatched fi elds consisted of ploughed fallow land. Th e total area surveyed amount to almost 13% of the total area of the locality of Mġarr, Malta.
It is observed that the majority of the mismatched land parcels pertained to those having very small vine stalks, situated in dry fi elds lacking irrigation. For this reason, it is doubtful whether these crops are productive at all. Th eir very small size has constituted a limiting factor for the present remote sensing technique to detect the smallest of features.
Table 7: Percentage match of congruence between mapped and collocated (surveyed) vineyard in various localities.
Locality Total mapped area verifi ed (in hectares)
Matched area (in hectares)
Non-matched area (in hectares)
Percentage hit
Għajnsielem 3.67 3.27 0.30 (a) 97.7%Żebbug, Gozo 3.34 2.93 0.41 87.7%Nadur 5.67 4.76 0.91 84.0%Mġarr, Malta 20.75 20.23 0.52 97.5%
(a) - of which 0.30 hectares contained vines that have been uprooted aft er the aerial survey was conducted (as confi rmed by farmers tilling the land).
In addition to vines, another 3 hectares of land containing citrus trees were verifi ed against the land cover map pertaining to this crop type situated in Nadur area (≈100 citrus orchard situated along San Blas road). Verifi cation resulted in 100% matching.

140 Future Preparedness: Th ematic and Spatial Issues for the Environment and Sustainability
Discussion
Sample design for ground surveysTh e ground survey exercise was designed to collect the main distribution and types of
samples from the designated areas. Th e selection of an eff ective sample design to collect valid reference data was one of the most important components that supported the validity of the accuracy assessment. Th e extent of area coverage during the ground survey was however, limited by its cost.
Because accuracy assessment assumes that the information displayed in the error matrix is a true representation of the map being assessed, an improperly gathered sample will produce meaningless results. Congalton and Green (1999) argue that a balance between what is statistically sound and what is practically attainable must be found. In their experience, a general guideline seems to collect a minimum of 50 samples for each category in the error matrix. Th is can be one of the main reasons why the error matrix and fi nal accuracy assessment of the land cover map pertaining to the CORINE Level III is much more robust and reliable than the Level V. It has to be kept in mind that the collection of data at each sample point can be very expensive, requiring that sample size be kept to a minimum to be aff ordable.
Th e number of samples for each category can however be adjusted based on the relative importance of that category within the objectives of the mapping or by the inherent variability within each of the categories. Th e relatively extensive ground survey over irrigated arable land, such as Pwales valley, Burmarrad, Mġarr and Mellieħa areas, reaching a total of 119.18 hectares or 91% of the total ground area covered, emphasizes this point. Th is was done in order to expand the CORINE classifi cation table with two additional levels giving higher detail than provided by similar national surveys carried out elsewhere.
Ground truth data was collected within a matter of days before collection of the aerial photos. Since the accuracy assessment reference data was collected at the beginning of the project before the land cover map was generated, it was not possible to stratify the data according to the fi nal map category. It was also not possible to have a collection of each map category that is proportional to total area allocation of each sample since the total area of each map class was still unknown at that time. Th is limitation can now be re-considered for future, similar aerial remote sensing projects.
Accuracy of ground surveysA certain degree of variability of detailed estimates of vegetation cover was evident but
only to a minor extent which cannot be precisely measured. It should be noted that the mapped estimates using aerial photos were much richer in detail than the data collected

Chapter 7: High Resolution Agriculture Land Cover Using Aerial Digital Photography and GIS 141
from the ground. Using ground estimates as reference data for aerial cover estimates can sometimes be rather a challenging task. Th is is due to a number of reasons, mainly originating from the laborious procedure to try to (1) identify exactly the parcel of land from the ground, (2) include all the detail in the space available on the survey sheet, and (3) to respect proportionality of fragmented coverage of diff erent crop types in the same land parcel. In addition, the rugged landscape and boundary walls, did not always off er full visibility of the content of these parcels.
Success of image coverageDue to common technical problems (such as civilian air-traffi c) and weather conditions
(such as strong winds) during the sequence of fl ight navigation, the airphoto coverage resulted in a 97.4% of the total area cover of the Maltese islands. Fortunately the remaining uncovered area included urban, industrial and environmental areas that did not fall within the requirements of the Project, including the small island of Filfl a.
Airphoto interpretationColoured RGB airphotos mode present some diffi culties when used to interpret crop
cover without any additional spectral information such as in the near-infrared and infrared region. Th is was particularly true for the identifi cation of a restricted range of crops such as kohlrabi and cabbages. While these two crop types are easily distinguishable from the ground, photo-interpreters were faced with two crop types that had to be diff erentiated on the basis of only their variation in colour. Th eir cultivation patterns and crop size are similar at maturation at the time of the fl ight survey. Th e resulting inaccuracy is refl ected in the Producer’s accuracy for this crop type (60%). On the other hand, caulifl ower (which as a CLC class comprises also cabbages) was easily identifi ed from their bluish-green tone seen in aerial photos. Th is is refl ected by the high Producer’s accuracy (96.7%).
Another low accuracy estimate was that for lettuce crops (33.3%). Mainly due to irrigation purposes, this crop type was found planted in small land parcels arranged in narrow rows (circa 2.5 x 40 m) adjacent to other diff erent crops, and therefore diffi cult to identify correctly. On the other hand, recognition of this crop type was made much easier when suffi ciently larger areas of fi eld parcels containing lettuce were available. Th is gave the photo-interpreters enough recognition elements to confi dently classify this crop type. Th is was also true for some other crop categories such as broccoli, beetroot and to a much lesser extent celery, which due their small size were also diffi cult to interpret from even the best quality aerial photos available.
Th e characterisation of the main variety of fruit trees at CORINE Level V using the present remote sensing technique proved to be quite suffi cient from an interpretation point of view. Unfortunately however, few samples were collected during the ground

142 Future Preparedness: Th ematic and Spatial Issues for the Environment and Sustainability
survey to allow a realistic accuracy assessment of the fi nal cover at Level V. Th e discrimination between citrus and prunus species proved to be easy from aerial photos. Th e discrimination between pyrus and prunus species was more challenging however, since the elements that characterise these two crop types at the time of the fl ight survey were not so much diff erent. Fortunately, when the aerial fl ights were conducted, prunus trees appeared greener than pyrus trees, and this was evidenced by ground truthing. Th e grouping together of these fruit trees at CORINE Level III presents therefore a higher confi dence in the overall accuracy (98%).
Another tree type that was very diffi cult to identify from aerial photos was pomegranate, the reason being that these tend to be found adjacent to boundary walls and sheltered by other tree types. Th ey show no spatial, systematic arrangement whatsoever that could have assisted their identifi cation. Th eir inclusion in the CORINE table was solely due to their presence from ground surveys.
One interesting class of tree included in the CORINE Level V list is small fruit trees (CLC class 2.2.2.1.6.). Th e digital photographic systems used in this study was able to capture new orchards showing typical plantations of small trees but providing no additional information on their type due to their small size. Th e association of these parcels of land with adjacent ones containing mature fruit trees suggest that these were also fruit trees. However, there is always a probability that this mapped category can be contaminated by other small trees having similar plantation patterns but are not fruit trees, such as trees of the sclerophyllous type.
Th e classifi cation of parcels containing olive trees was based on the identifi cation of a homogenous plantation of olive trees. Th erefore, this category does not exclude the presence of olive trees admixed with other vegetation of coniferous or sclerophyllous type. Th is is particularly true for areas such as is-Simar, Mizieb and l-Ahrax tal-Mellieha areas, where the predominant vegetation type consists of sclerophyllous or coniferous type. Within these coverages, solitary olive trees are also found distributed but were diffi cult to identify and digitise.
No major problems were encountered in the classifi cation of LPOBA (Land Principally Occupied By Agriculture, with signifi cant areas of natural vegetation). Th is category is easily discriminated from cultivated parcels of land. However, when such parcels are ‘cleaned’ from vegetation as a preparation for the spring-summer crops, they can be misinterpreted as harvested fodder and could therefore have been classifi ed as such. Th is would of course lead to a biased result in favour of a larger overall coverage by fodder. It is very diffi cult to assess this quantitatively unless a specifi c ground survey is designed to address this problem.

Chapter 7: High Resolution Agriculture Land Cover Using Aerial Digital Photography and GIS 143
Crop maturation and harvestingAn intimate knowledge of the progressive development of each crop was essential for
reliable identifi cation on aerial photos. Th e reliability of crop identifi cations on single-date photography was improved by scheduling the remote sensing survey during April when the most important crops are distinctly separable. If the aerial survey was further delayed then there was the chance of missing the inclusion of important crops in the fi nal land cover map because of harvesting.
In fact, due to unfavourable weather conditions, the aerial survey was conducted at a time when harvesting of important crops was already started. Th is included fodder and potatoes. Fortunately, their characteristic recognition elements were still traceable. Th is was assisted by including these features in the interpretation keys. In the case of fodder however, discrimination of the main types proved to be an impossible task from harvested parcels. Instead these were simply given a level III category – green fodder (CLC class 2.3.1.1.). It has to be noted that parcels containing homogenous coverage of mature green fodder were also identifi ed in extended areas such as clay slopes, which may not have been sown deliberately.
Quality controlTh e engagement of a team of airphoto interpreters, each with his/her own ability
to interpret aerial photos may have aff ected the quality of the fi nal interpretation. To minimise this, a fi nal quality control was made by the leading photo-interpreter by a fi nal “screening” of 90% of the entre thematic map, prior to the accuracy assessment. Th is ensured further harmonisation of the fi nal product as well as removing biases.
ConclusionTh e AGRISTAT Project successfully demonstrated the eff ective use of CCD-array,
digital cameras and their combination with GIS environments for precision agriculture mapping for small island states. Th is facility allows direct integration of external digital datasets, retains data integrity and enables unlimited recall for subsequent analysis. In-house data processing and management by local personnel led to a reduction in the overall cost of a fully comprehensive, one time agriculture survey with exceptional precision. Compared to surveys utilizing orbiting multispectral sensors, such as fused products from LANDSAT and SPOT (Galdies, 1998), this technique is ideally suited for small islands states where large scale thematic mapping is a national requirement.
For an enhanced mapping accuracy, it is recommended that an additional full set of colour infrared aerial photos should be acquired as to provide additional recognition elements (Avery & Berlin, 1992). One such element is the variable moisture content of

144 Future Preparedness: Th ematic and Spatial Issues for the Environment and Sustainability
crops as a discriminatory element between diff erent crop types.It is hoped that this case study can be used as a demonstration for future updating and
augmenting of existing data, as well as in the recording of agricultural information (such as seasonal crop rotation).
Acknowledgements
We would like to acknowledge the assistance of the National Statistics Offi ce, and of Dr Alex Koh, from Bath Spa University, for their strong support and cooperation in the execution of AGRISTAT Project.
ReferencesAvery, T.E. and Berlin, G.L. (1992) Fundamentals of Remote Sensing and airphoto interpretation, fi ft h edition In T.E. Avery and G.L. Berlin (Eds.), Prentice Hall.
Congalton, R.G. & Green K. (1999). Assessing the Accuracy of Remotely Sensed Data: Principles and Practices. In R. G. Congalton & K. Green (Eds.), Lewis Publishers.
Foody G.M. (2002). Status of land cover classifi cation accuracy assessment. Remote Sensing of Environment, 80, 185– 201.
Galdies C., (1998). Data Fusion of SPOT PAN and LANDSAT TM for land use classifi cation of small Mediterranean islands. Satellite-based observation: a tool for the study of the Mediterranean Basin, CNES, Tunisia, 23-27 November 1998.
Galdies, C., & Borg, J.A. (2006). Aerial remote sensing and spatial analysis of marine benthic habitats in St. George’s Bay (Malta). In A.Micallef, A. Vassallo & M. Cassar (Eds.), Proceedings of the Second International Conference on the Management of Coastal Recreational Resources - Beaches, Yacht Marinas and Coastal Ecotourism, 25th - 27th October 2006, Gozo, Malta, pp 81 - 87; Euro-Mediterranean Centre on Insular Coastal Dynamics, Foundation for International Studies, Valletta: Malta.
Graham & Koh A. (2002). Digital Aerial Survey: Th eory and Practice. ISBN 1-870325-98-2.
Lilesand T.M. & Kiefer R. W. (1994). Remote Sensing and Image Interpretation third edition. In T.M. Lilesand & R.W. Kiefer (Eds.), John Wiley & Sons, Inc.
Robert, P.C., Rust R.H., and Larson W.E.. (1994). In P.C. Robert et al. (Ed.), Site-specifi c management for agricultural systems. American Society of Agronomy, Madison, WI.

Chapter 7: High Resolution Agriculture Land Cover Using Aerial Digital Photography and GIS 145
Stombaugh, T.S., Mueller, T.G. Shearer, S.A. Dillon, C.R. and Henson. G.T. (2001). Guidelines for Adopting Precision Agriculture Practices, Publ. No: PA-2. Lexington, Kentucky. University of Kentucky Cooperative Extension Service.

146 Future Preparedness: Th ematic and Spatial Issues for the Environment and Sustainability
APPENDIX I

Chapter 7: High Resolution Agriculture Land Cover Using Aerial Digital Photography and GIS 147
APPENDIX 2
Th e Agristat Land-Cover Nomenclature
Th e AGRISTAT land cover nomenclature consists of fi ve levels according to the CORINE standard classifi cation method. Th e fi rst three levels are identical to CORINE specifi ed nomenclature, whereas the remaining successive levels (levels IV to V) have been added subject to the following criteria:
• Additional items included all the land covered by the corresponding level III items.• Newly created items are not related to more than one three-fi gure level III class. • Positive identifi cation from the high-resolution aerial photos at a pixel resolution of
not greater than 12-15cm.
Th ese additional layers are important in that they group all other additional features related to permanent/temporary crop type as well as information on type of trees.
CORINE Level III Class Defi nitions
Non-irrigated arable land (2.1.1.): Cereals, legumes, fodder crops, root crops and fallow land. According to the CORINE technical guidelines, ploughed land with no productive vegetal cover on the date of data acquisition belongs to this category.
Irrigated land (2.1.2.): According to CORINE technical guidelines, this class contains crops irrigated permanently and periodically, using a permanent infrastructure (irrigation channels, drainage network). Most of these crops cannot be cultivated without an artifi cial water supply.
Vineyards (2.2.1.): Areas planted with vines. Vineyards present a uniformly linear pattern on aerial photographs and are easily identifi able. Since grape cultivation requires a specifi c amount of spacing between individual rows, vineyards are not likely to be confused with diff erent row crops of similar height and texture.
Fruit trees (2.2.2.): Parcels planted with fruit trees: single or mixed fruit species, fruit trees associated with permanently grassed surfaces.
As a rule orchards are characterised by uniformly spaced rows of trees that give the appearance of a grid pattern. Orchards planted on level terrain (as are citrus orchards) are usually laid out in squares so that the same spacing exists between rows as between

148 Future Preparedness: Th ematic and Spatial Issues for the Environment and Sustainability
individual trees in the same row. On rolling to hilly terrain, tree rows may follow old cultivation terraces or land contours (as in peach and apple orchards).
For most orchards, the key identifi cation characteristics were row spacing, crown size and crown shape (oft en visible in shadow patterns on large scale photographs). Whether the plants are deciduous or evergreen was also of assistance.
Th is classifi cation code is especially used when orchards having a dense mixture of fruit trees are identifi ed and interpreted from aerial photos. Typical mixtures include pear, peaches and oranges. Th e range of diff erent fruit tree type identifi able by the aerial digital photographic system (ADPS) used for AGRISTAT system are included in Level V.
Fruit trees that have been recently planted and which cannot be characterised due to their small size are included in Level V as small fruit trees (2.2.2.1.6). Th eir small size and constant pattern as seen from aerial photos is easily recognisable by the ADPS.
Olive trees (2.2.3.): Homogenous areas planted with olive trees. Olive trees can also be found admixed within areas predominantly occupied by coniferous and sclerophyllous vegetation.
Th e classifi cation of parcels containing olive trees was based on the identifi cation of a homogenous plantation of olive trees. Th erefore, this category does not exclude the presence of other olive trees admixed with other vegetation predominantly consisting of coniferous or sclerophyllous type. Within these coverages, solitary olive trees are diffi cult to discriminate from aerial photos.
Pastures (2.3.1.): Areas showing dense grass cover, of fl oral composition, dominated by graminaceae, not under a rotation system. Mainly for grazing, but the fodder may be harvested mechanically.
Th e aerial survey was conducted at a time when fodder started to be harvested. Th e discrimination of the fodder types from recently harvested fodder fi elds was impossible. Instead harvested parcels were given a level III category – green fodder (2.3.1.1.). It has to be noted that parcels containing homogenous coverage of mature green fodder were also identifi ed in extended areas such as clay slopes, which may not have been sown deliberately.
Relevant heterogeneous agricultural areas include:
Complex cultivation patterns (2.4.2.): Juxtaposition of small parcels of diverse annual crops, pastures and/or permanent crops.
Such parcels were diffi cult to segment and characterise using the aerial remote sensing

Chapter 7: High Resolution Agriculture Land Cover Using Aerial Digital Photography and GIS 149
technique, but their occurrence was moderately rare.
Land principally occupied by agriculture, with signifi cant areas of natural vegetation (2.4.3.): Areas principally occupied by agriculture, interspersed with signifi cant natural areas.
Th ese parcels may, to a minor extent, include wild crops such as mixed type of fodder (oft en found on clay slopes) admixed with wild vegetation. Th ey are easily discriminated from cultivated parcels of land. However, when such parcels are ‘cleaned’ from vegetation as a preparation for the spring-summer crops, the resulting pattern from aerial photos can be misinterpreted as not-so-recent harvested fodder and could therefore have been classifi ed as such. It is very diffi cult to assess this bias quantitatively unless a specifi c ground survey is designed to address this problem.
Agro-forestry areas (2.4.4.): Annual crops or grazing land under the wooded cover of forestry species.
For the present classifi cation, this class includes forest trees, mainly related to coniferous, that are planted to serve a number of purposes, including shelter against wind and as fi eld borders.
Relevant forests and semi-natural areas include:
Coniferous (3.1.2.): Vegetation formation composed principally of trees, including shrub and bushes, where coniferous species predominate. May include olive trees admixed or scattered within coniferous vegetation.
Shrub and/or herbaceous vegetation associations:
Sclerophyllous (3.2.3.): bushy sclerophyllous vegetation. Comprises a dense vegetation association composed of numerous shrubs associated with siliceous soils in the Mediterranean environment. May include olive trees admixed or scattered within sclerophyllous vegetation.
Th is class may also contain olive trees admixed with the main varieties of sclerophyllous vegetation.
CORINE Level IV Class Defi nitions
Th e following description provides defi nitions of additional agriculture land cover

150 Future Preparedness: Th ematic and Spatial Issues for the Environment and Sustainability
classes.
Root crops (2.1.1.1.): Any crop cultivated in non-irrigated arable land whose edible portion is taken from under the ground. Th e range identifi able by the ADPS system are included in Level V.
Pulses (2.1.1.2.): Annual leguminous crops yielding from one to 12 grains or seeds of variable size, shape and colour within a pod. Th ey are used for both food and feed. Th e range identifi able by the ADPS system are included in Level V.
Ploughed fallow land (2.1.1.3.): Land that has been cultivated and left to rest without a crop for an extended period of time in order to accumulate soil moisture. Easily recognisable by the ADPS system.
Root crops (2.1.2.1.): Any crop cultivated in irrigated arable land whose edible portion is taken from under the ground. Th e range identifi able by the ADPS system are included in Level V.
Fresh vegetables (2.1.2.2.): Any group of crops cultivated in irrigated arable land that need warm weather to germinate and actively grow. Th e range identifi able by the ADPS system are included in Level V. However, in some cases local farming practices tend to cultivate small areas with diff erent types of vegetables sown very close together in such a way that their discrimination from aerial photos is not possible.
Nurseries (2.1.2.3.): Any group of small crops that have recently germinated and to be sown accordingly. No further discrimination between crop types under this class is possible by the ADPS system.
Crops under artifi cial cover (2.1.2.4.): Th is relates to those crops which require an artifi cial cover for faster maturation. Th e range identifi able by the ADPS system are included in Level V.
Floriculture (2.1.2.5.): Th e cultivation of fl owers, especially to be cut and sold, including fl owering plants and foliage plants, cut fl owers, greens, bedding plants (annual and perennial). Oft en found in restricted commercial sites with permanent cover.
Green fodder (2.3.1.1.): Arable land used to cultivate animal feed for the purpose to feed local livestock. Th e range of fodder type identifi able by the ADPS system are included

Chapter 7: High Resolution Agriculture Land Cover Using Aerial Digital Photography and GIS 151
in Level V. Parcels of land highly suggestive of harvested fodder are given this classifi cation code.
Pinaceae (3.1.2.1.): Trees forming part of the family of Pinaceae; pine family; Type: Gymnosperm family; Part of Coniferalis
Cupressaceae (3.1.2.2.): Trees forming part of the family Cupressaceae; Genus Cupressus; Type of gymnosperm family; Part of Cupressaceae
Myrtaceae (3.2.3.1.): Evergreen trees, up to 50 feet tall, very fast growing. Typical example is eucalyptus.
Fabaceae (3.2.3.2.): Trees forming part of the family Fabaceae; Plants belonging to the Leguminosae (now Fabaceae) family. Fruits are simple, dry, dehiscent which splits along two seams edible legumes.
Due to the enhanced resolution that is off ered by the ADPS, an additional two CORINE columns were added. Th e fi nal, fi ft h column consists of the individual crop type as diff erentiated by the ADPS according to their corresponding level III class.
THE ATLAS
Th e fi nal Atlas (available from the National Statistics Offi ce – NSO) consists of a set of full-colour agriculture land cover maps accompanied by tables containing related land cover statistics. Th is data is organised according to the geographical classifi cation for the Republic of Malta as based on the Nomenclature Des Unités Territoriales Statistiques (Nuts), as follows:
MT011 SOUTHERN HARBOUR DISTRICTMT012 NORTHERN HARBOUR DISTRICTMT013 SOUTH EASTERN DISTRICTMT014 WESTERN DISTRICTMT015 NORTHERN DISTRICTMT026 GOZO AND COMINO
Land cover maps of localities having no agricultural land cover data have been omitted.

152 Future Preparedness: Th ematic and Spatial Issues for the Environment and Sustainability
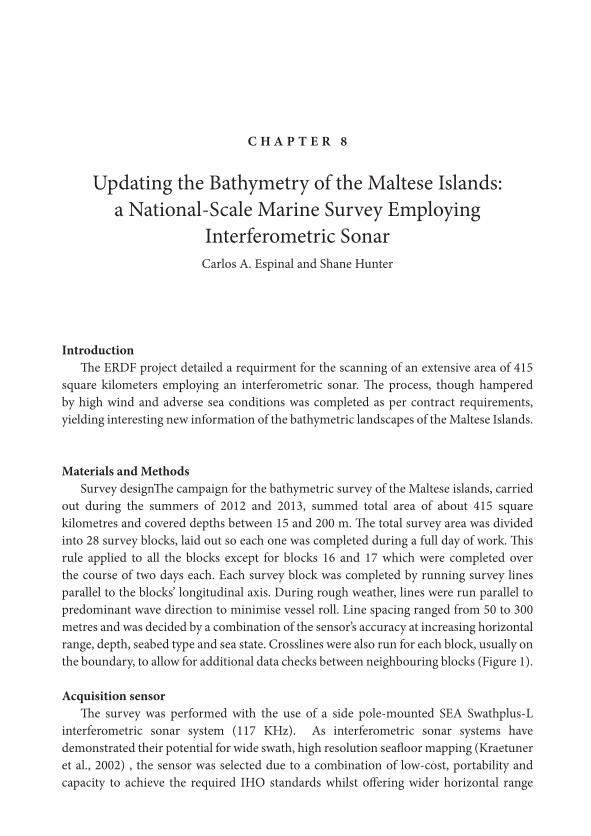
C H A P T E R 8
Updating the Bathymetry of the Maltese Islands: a National-Scale Marine Survey Employing
Interferometric SonarCarlos A. Espinal and Shane Hunter
IntroductionTh e ERDF project detailed a requirment for the scanning of an extensive area of 415
square kilometers employing an interferometric sonar. Th e process, though hampered by high wind and adverse sea conditions was completed as per contract requirements, yielding interesting new information of the bathymetric landscapes of the Maltese Islands.
Materials and Methods Survey designTh e campaign for the bathymetric survey of the Maltese islands, carried
out during the summers of 2012 and 2013, summed total area of about 415 square kilometres and covered depths between 15 and 200 m. Th e total survey area was divided into 28 survey blocks, laid out so each one was completed during a full day of work. Th is rule applied to all the blocks except for blocks 16 and 17 which were completed over the course of two days each. Each survey block was completed by running survey lines parallel to the blocks’ longitudinal axis. During rough weather, lines were run parallel to predominant wave direction to minimise vessel roll. Line spacing ranged from 50 to 300 metres and was decided by a combination of the sensor’s accuracy at increasing horizontal range, depth, seabed type and sea state. Crosslines were also run for each block, usually on the boundary, to allow for additional data checks between neighbouring blocks (Figure 1).
Acquisition sensorTh e survey was performed with the use of a side pole-mounted SEA Swathplus-L
interferometric sonar system (117 KHz). As interferometric sonar systems have demonstrated their potential for wide swath, high resolution seafl oor mapping (Kraetuner et al., 2002) , the sensor was selected due to a combination of low-cost, portability and capacity to achieve the required IHO standards whilst off ering wider horizontal range

154 Future Preparedness: Th ematic and Spatial Issues for the Environment and Sustainability
compared to multibeam echosounders, which translated in savings in terms of acquisition times and mobilization costs. Th e Swathplus-L is capable of achieving maximum horizontal ranges of 300m at 100m depths and depths up to 300m. With the sensor confi guration used for this project, it was found that soft bottom sediments and sea states beyond force 3 reduced the sensor’s horizontal range by around 20%. Th e sensor, according to the manufacturer, is capable of achieving IHO Special order at close range (up to 130 metres horizontal range at 100 metres depth) and IHO 1A at 170 metres horizontal tange at 100 metres depth. Subsequent orders are achieved at further range. Th e required IHO 1A standard was achieved throughout the survey.
Figure 1: Survey blocks
Auxiliary sensorsBathymetry systems require the input from satellite positioning systems in order to
geolocate each recorded sounding. In addition, vessel movement, which will have a direct infl uence over the direction of the sound pulses, must be recorded and off set against the each sonar ping. Finally, sound refraction through the water column due stratifi cation must be accounted for. During this survey a Garmin diff erential GPS and a Hemisphere

Chapter 8: Updating the Bathymetry of the Maltese Islands 155
Crescent vector diff erential GPS were used for positioning. Heading input was acquired from the position sensor’s heading data strings. Vessel pitch, heave and roll were recorded using a SMC IMU-108 from ShipMotion limited mounted on the sonar head. Speed of sound profi les were recorded using a Valeport Mini SVP.
Vertical position and geoidTh e bathymetric survey was acquired in WGS84 with soundings corrected to chart
datum. Tide tables were recorded in real time inside the Grand Harbour in Valletta by Transport Malta and supplied during post-processing. Chart-datum corrected data was later merged with data from LiDAR and bathymetric LiDAR surveys undertaken during the project.
Patch testsA total of fi ve patch tests were carried out during the development of the project. Th e
patch tests followed classic dual-transducer calibration procedures whereby: • Five port/starboard overlapping lines were run to encounter and calibrate roll off sets.
Roll off set lines where performed on areas of fl at seabed.• Two parallel lines running in opposite directions, preferably over sloping seabed were
run to encounter and calibrate roll off sets. • Two parallel lines running in the same direction and at speeds of 2 knots and 7 knots
were over sloping seabed to encounter and calibrate timing error off sets• Running several parallel lines close to a seabed feature were run to detect heading
off sets.
Correction of off sets was performed using Swath Grid Processor, a gridding and calibration soft ware provided by the sonar manufacturer off set values were input into the sonar acquisition soft ware for surveying aft er the patch test.
Data processing With SwathPLUS and other similar intereferometric sonars, data is processed in real
time. During processing, speed of sound corrections and statistical fi lters are applied to eliminate outliers, backscatter noise and increase the overall accuracy of the soundings.
Th e statistical fi lters controls are managed on the computer interphase of the sonar acquisition soft ware. Typically data is fi ltered for:• Low amlitude: poor signals coming from the sound backscatter which either too
distant or not valid. • Slant range: which discards data from a given slant range value input by the operator. • Phase confi dence: SWATHplus calculates depths by looking at the phases of the

156 Future Preparedness: Th ematic and Spatial Issues for the Environment and Sustainability
returning sonar signals at the transducers. Th e soft ware uses several calculations to corroborate patters of phase response related to a particular angle of return. If the results from those calculations are not consistent, the sample is considered noise.
• Angle proximity: the angle values of a number of neighbouring samples are compared in the search for consistency.
• Median values: a fi lter which takes the median of a set number of samples gathered both at depth and horizontal range.
• Along-track consistency: the along track fi lter searches for consistency on the bathymetry as the boat moves forward. Th is fi lter looks for soundings that should “make sense” compare to recently recorded soundings. Th is fi lter is used carefully by the operator in areas with extreme underwater relief in Malta.
In addition, boresight and box (gate) fi lters were used at times to aggressively fi lter data during moments of strong external noise or to resolve extreme underwater relief manually.
Data post processing Although real-time gathered data is useful to keep quality control underway and to
ensure proper coverage, post processing was used off -site to review the data, eliminate further noise and outliers, add tide corrections and export the datasets to other fi le formats for further quality control. Data post processing was performed by reproducing the acquired datasets on the sonar’s acquisition soft ware and re-applying statistical fi lters to achieve the desired results.
Data types and formatsData from the acquisition sensor was acquired on the sensor’s proprietary formats
(.sxr for unprocessed fi les, .sxp for processed fi les). Bathymetric data was exported onto gridded .xyz fi les for rapid mapping, survey progress checks, sensor calibration control and preliminary quality control. For fi nal delivery, ungridded .xyza fi les (essentially a .xyz fi le containing an additional column for amplitude values) were created.
Interferometric sonar systems can also provide usable sidescan data in shallow waters, mostly due to their vessel-mounted confi guration. Whenever needed, processed data was exported into sidescan .xtf for confi rmation of underwater features of interest in shallow water.
Soft wareFor data acquisition, post processing and export of ungridded data, Swath Processor
from SEA was used. Generation of gridded data, grid analysis, sensor calibration and

Chapter 8: Updating the Bathymetry of the Maltese Islands 157
generation of raster datasets was achieved using Grid Processor, another soft ware package delivered with the acquisition sensor by the manufacturer.
Survey planning was done using a combination of Hypack Offi ce (www.hypack.com) and Quantum GIS (www.qgis.org). Hypack Offi ce was used for plotting of survey blocks and survey lines whilst Quantum GIS was used for general mapping of the whole survey in both pre-acquisition and post-acquisition stages. Generation of other outputs such as sidescan mosaics, TIN models and gridded point cloud datasets were performed using Hypack Offi ce.
ResultsAt the end of the survey, around two hundred survey lines were run, with additional
lines used for calibration purposes, equipment testing or mapping of signifi cant seabed features such as wrecks or underwater cliff s.
Figure 2 shows a typical low-resolution gridded raster dataset used for rapid mapping. Depending on the survey extents, grid bin size was set between 1 and 5 metres as bin size was limited by computing power. Smaller bin grid sizes were also used to develop higher defi nition datasets of features of interest.
Figure 2: Low resolution raster mosaic of East Malta (September, 2012). Raster datasets in this image were mosaiced in Hypack and later added as a raster layer in Quantum GIS, where they can be easily exported into other visualisation soft ware such as Google Earth.

158 Future Preparedness: Th ematic and Spatial Issues for the Environment and Sustainability
Figure 3a and 3b: Th e Rozi, a sunken tugboat used as an artifi cal reef off Cirkewwa (NW Malta). Th is 3D point cloud model was generated on a grid with a bin size of 80 cm.

Chapter 8: Updating the Bathymetry of the Maltese Islands 159
Vertical uncertainty of the data recorded automatically by the acquisition soft ware. Th is uncertainty was >1metre in most occasions. However, as interferometric wide swath sonars are essentially angle measuring instruments, it is expected that vertical uncertainties increase with horizontal range. Highest vertical uncertainties were recorded to be <2 metres at horizontal ranges between 170 and 250 metres operating in water depths beyond 150 metres.
Horizontal uncertainties are directly related to the performance of the position sensor and these were recorded to be sub-metre at all times.
Across-track coverage varied depending on the range of each sonar pulse (ping) which in turn was set up by the operator depending on sea state conditions, type of seabed, external electrical noise and water depth. Long ping ranges (>200m) resulted in across track coverage of <15 soundings per metre on every ping. On the contrary, across-track coverage was increased at shorter ping ranges. Ping ranges of <100m usually resulted in >40 soundings per metre per ping.
Along track coverage depends on vessel speed, ping repetition frequency and to a lesser extent, depth. In deeper water application (>150m) along track coverage was kept at an average of 3 metres. In shallower waters (<100m) where more coverage was required, along-track was kept, on average, at 0.5 metres.
Discussion Interferometric wide swath sonar systems off er lower capital cost than multibeam
echsounders (MBES) whilst keeping acceptable performance, especially in shallow waters. Th e capacity of these sensors to achieve longer horizontal ranges is translated into more survey coverage and therefore, lower operational cost.
Th e data produced by the sensor was able to achieve the standard for the survey aft er quality checks by the client, which included accuracy comparisons with bathymetric LiDAR data acquired during the course of the project carried out by Pelydryn in 2012. Interferometric sonar systems off er much higher across track resolution than beam forming sensors due to the nature of the acoustic footprint of a transmit pulse versus the acoustic footprint of a formed beam (Kraeutner et al, 2010).
However, with these types of sensors, it is known that acoustic noise and scattering of the sound pulses can increase the standard deviation between soundings and thus, the sensor’s acquisition soft ware relies on taking a large number of samples to reduce uncertainty to acceptable levels during the processing of the data. In his work, Gostnell (2004) , compares the performance of an interferometric sonar (GeoAcoustics GeoSwath) with two MBES (Reson 8125 and Simrad EM3002) and found that although standard deviations from GeoSwath were 3 to 5 times higher, a higher number of samples lead to girdded datasets of similar quality to those from the MBES.

160 Future Preparedness: Th ematic and Spatial Issues for the Environment and Sustainability
Th is characteristic entitles that data accuracy also relies on the capacity of the user to perform the data processing appropriately, as the soundings are not processed by the hardware, as in the case of MBES.
Soft ware-processed data gives the additional advantage of re-visiting acquired datasets in the case errors have been encountered during acquisition. Sensor misalignments, speed of sound profi les and tide data can be corrected post-acquisition (within a reasonable time window) with no major loss of quality. Re-visiting acquired data is also a useful tool for the operator to practice with fi ltering techniques that better adapt to each situation (rough weather, extreme underwater relief, detection of features).
Among the sensor’s limitations, the high propensity to electrical noise was the main one. Careful arrangement of earthing wires and cable management was crucial in order to acquire data of acceptable quality. Th e system off ers a maximum horizontal range of 300 metres and 100 metres of depth, for a total swath width of 600 metres. Th is performance was achieved in areas of sandy/rocky seabed (N coast of Malta) which off er a clear return of the sound pulses. Horizontal range was reduced at depths beyond 150 metres and signifi cantly reduced (<200m) in areas of soft sediments at these depths (S coast of Malta).
Lastly, the pole-mounted nature of the system makes it prone to motion artefacts (especially roll). Th is will limit the use of the sensor in small vessels to Beaufort conditions of no more than force 3 and requires of careful weather observations and survey line planning to minimize vessel motion as much as possible. In general, although technically speaking the sensor can achieve depths of 300 metres, its suitability for small vessels of opportunity make this system a better performer in shallower, less exposed areas.
ConclusionIn conclusion, interferometric wide swath sonar systems provide an aff ordable option
for mapping of large extensions of underwater territory. Th e simplicity of the systems make them a fl exible tool for surveying on a wide variety of environments (harbours, open seas, coastal waters), albeit requiring careful attention by the user during all the surveying process. In this project, the sensor proved to reach IHO 1A accuracy requirements and provide bathymetric data of acceptable quality for the involved parties.
ReferencesGostnell, C., (2004). Effi cacy of an interferometric sonar for hydrographic surveying: Do interferometers warrant an in depth examination? Th e Hydrographic Journal, 118. 17-24.
Kraeutner, P.H., Bird, J.S., Charbonneau, B., Bishop, D., and Hegg, F.., (2002). Multiangle Swath Bathymetry Sidescan quantitative performance analysis. OCEANS ‘02 MTS/IEEE, Volume 4, pp. 2253 – 2263.

Chapter 8: Updating the Bathymetry of the Maltese Islands 161
Kraeutner, P.H., Butowski, M., Zielinski, A., and Bradle, C., (2010). Footprint scattering and beam pattern eff ects on bias errors in swath bathymetry sidescan sonar system. European Conference on Underwater Acoustics, 2010. 5 – 9 July 2010, Istanbul, Turkey.
AcknowledgementsTh e authors would like to off er special thanks to Ms. Veronica Bermudez (survey intern
at AquaBioTech, 2012), which contributed extensively during the surveying campaign.

162 Future Preparedness: Th ematic and Spatial Issues for the Environment and Sustainability

C H A P T E R 9
Sustainability and Urban Conservation in MaltaDavid Mallia
IntroductionMalta is a small island state which has been independent since 1964 and which joined
the European Union in 2004. It has a very high population density and the continuous rise in the standard of living since World War II has resulted in a great expansion in urban development. Furthermore, during this period, the resident population within the historic village centres has declined continuously (Blouet, 1978). Th e increased pressure for development on virgin land, coupled with a desire to conserve the traditional dwellings in the historic centres, has lead to the initiation of a conservation programme within these urban conservation areas (UCA’s). Th is has encouraged sustainable development by making eff ective use of existing housing stock, thereby reducing the need for new housing and, at the same time, conserving traditional housing for future generations. Th is is in line with various International UNESCO charters which state that the adequate re-use of historic buildings is essential in ensuring their continued conservation.
Th e drawing up of a Structure Plan for Malta (PSD, 1990), the Development Planning Act (1992) and the establishment of the Planning Authority (1992), which includes a specifi c unit for urban conservation, were instrumental in promoting the conservation and reuse of traditional dwellings as desirable up-market residences and this has considerably increased the available housing stock. Th e approval of the Structure Plan for the Maltese Islands brought about a revolution in the Maltese Planning System, which has been largely implemented by the Planning Authority and, since 2002 the Malta Environment and Planning Authority (MEPA). In particular, chapter fi ft een of the Structure Plan deals with Conservation and contains eighteen policies, which form the basis of the conservation strategy currently in force. One of the principal goals of these policies was the establishment of Urban Conservation Areas. Prior to this, the Temporary Provisions Schemes had defi ned what are known as Village Cores and these were subsequently studied in greater detail by means of a process which was fi nally completed by the approval of the Local Plans, in which the Urban Conservation Areas, and more recently, the Design Priority Areas, have been defi ned and been given specifi c policies. Another key document, which has had considerable infl uence in steering change within Urban Conservation Areas, is
164 Future Preparedness: Th ematic and Spatial Issues for the Environment and Sustainability
the “Design Guidance for Development within UCA’s” (PA, 1995). More general policies are given by the “Policy and Design Guidelines 2007” (MEPA, 2007). No description of these policy documents will be given here since they are all readily available online at: www.mepa.org.mt the MEPA website.
One of the fi rst decisions taken by the Authority, soon aft er it was constituted, was the setting up of a Heritage Advisory Committee. Th e committee involvement in the development control process was gradually increased until by 1997 all applications falling within a UCA or village core boundary were being assessed by it. Th e committee not only examined the applications before giving its advice, but carried out site-inspections on approximately 30% of the applications referred to it.
Other organisational changes within the Authority that had a direct bearing on UCA’s were the establishment of a UCA Team and a Development Control Commission (the deciding body for development planning applications at the time) specifi cally constituted to decide applications falling within UCA’s.
In 2008 MEPA’s development control procedures were reformed by the introduction of a number of processes aimed at streamlining the application processing. Prior to submission of a “full development application”, any proposal was “screened” to give an indication of its compliance with development control policy. Prospective applicants and their architects received a “screening letter” in response to a planning proposal, outlining major concerns as well as suggestions for overcoming any confl ict with policy. Initially, the screening process was meant to be a simple review of a planning proposal, however it was soon realised that the contents of any screening letter were binding and that anything not mentioned in the screening letter could not be brought up during the subsequent processing of the application. As a result screening letters, particularly with regards to proposals within UCA’s, became detailed documents. It has been said that the screening process may discourage prospective applicants, but it is also true that they are presented with a clear picture of what to expect before they pay for a full development application.
Following this brief exposition of the history of MEPA’s approach to the development of UCA’s an assessment has been made of the results of the time and eff ort expended towards this aim. A number of enquiries have been considered and the analysis and results are presented here together with the conclusions reached. However before examining these results, it is pertinent to point out that conservation is a process that goes far beyond romantic antiquarianism, although this suggestion is oft en made. Our heritage is a valuable asset because it not only defi nes who and what the Maltese really are, but given its numerous unique features, it becomes a material asset that can make a positive contribution to economic prosperity and quality of life. Not only does heritage give us a sense of identity but it is one of the factors that persuade tourists to visit our islands. For it is our monuments: major and minor, that are the most attractive feature of our homeland.

Chapter 9: Sustainability and Urban Conservation in Malta 165
An example of this is the success of the museum called Th e Limestone Heritage (Zammit, 2002) which explains the traditional process of quarrying our building stone in what was formerly a disused quarry.
Sustainability IssuesTh e disappearance of buildings and entire areas within settlements represents not
only a loss of historic monuments and context, but also a detriment to the culture of a society. Th is is a situation that is both ecologically and economically unacceptable, particularly within the fragile microcosm of the Maltese context. Th e relative isolation of islands generally means that rates of change were formerly slow and sustainable. However the globalisation of economy, transport and communications has accelerated these rates of change to beyond the limits of sustainability. (Mallia, 2005) Rapid and widespread demolition of buildings erodes the traditions and culture of a people by removing the long-established context in which they developed at rates which are detrimental to their conservation. Figures 1 and 2 illustrate the dramatic change of the traditional 19th Century Neo-Classical townscape of Malta which was totally obliterated during the late 20th century.
Urban Conservation is also directly related to the issue of sustainable inert waste generation. Th e small land area of the Maltese Islands - a mere 320 sq. km - has meant that the disposal of waste has never been easy. In particular, trends in building development, which began aft er World War II, have generated tonnes of inert building rubble from demolished buildings. Initially disused quarries all over the island were used to dispose of this waste, but the ever increasing amount of building waste generated by more powerful and effi cient machines soon fi lled all of them. A waste disposal site was designated at the North of the Island and in thirty years this has grown to be a mountain nearly 100 metres high (E.U. 2002) and covering an area of some 40 hectares. Gas emissions from this site aff ect a fair portion of the island. Unfortunately over 70% of this mountain is composed of inert solid building waste and the greater part of this comes from demolished buildings. Th e rehabilitation of the existing site would take over twenty years. Figure 3 illustrates the scale of the landfi ll and fi gure 4 shows that the area it covers is equivalent to that of a small settlement on Malta. It is clear that rate of increase in rubble is not sustainable and that a reduction in the number of buildings demolished each year would have a direct result in the reduction of the growth of this environmental hazard.

166 Future Preparedness: Th ematic and Spatial Issues for the Environment and Sustainability
Figure 1: Th e ‘Chalet’ area of Sliema: the Neo-Classical townscape of Malta. (circa 1900)
Figure 2: Th e same view in the late 20th century: an unsustainable rate of change.

Chapter 9: Sustainability and Urban Conservation in Malta 167
Figure 3: Th e land fi ll ‘mountain’, 70% of which is inert building waste.
Figure 4: Satellite photo of Malta showing the land fi ll (within a circle).

168 Future Preparedness: Th ematic and Spatial Issues for the Environment and Sustainability
Conservation and reuse of existing building stock also drastically reduces the need for the extraction of new limestone. Th is non-renewable resource is the principal traditional building material and, given the limited size of the Maltese Islands, is a precious resource which needs to be quarried in a sustainable manner. Th e reuse of old building stone has gained popularity in recent years but only in restoration projects.
Geographical Outline of the Maltese IslandsOn a clear day, the low lying islands (Bonanno, 1997) of the Maltese Archipelago
are (probably) visible from southern Sicily (Dennis, 1972). Th e Maltese Archipelago is composed of two principal islands: Malta and Gozo and a number of minor islands which include Comino, Cominotto and Filfl a. Situated at Lat. 36deg N and Long. 14deg 20min E, the islands are nearly at the centre of the Mediterranean Sea. To the west of the Islands, the Mediterranean is at its narrowest and therefore since earliest times Malta’s fi ne harbours were of great benefi t to seafarers. Th roughout the ages, the strategic importance of the islands has made them attractive to conquerors wishing to rule the sea and colonisers wishing to control trade. Although they form a sovereign state, the islands are surprisingly small and the limited land area has always posed a grave limitation to the development of the islands.
Other restrictive factors, which formed part of the criticism levelled by the commission sent by the Order of St John to examine the islands in 1524 prior to their acceptance of the islands as their new base in 1530 (Vella, 1980), included a lack of permanent rivers or other water source and a severe lack of trees. Th e soil is very shallow, which limited the crops that could be grown, and indeed the islands were dependent on subsidised grain imports from Sicily for their survival. In view of the frequent pirate raids on the islands, fi shing was a hazardous activity and furthermore much of the land near the coast could not be exploited fully. Furthermore, the islands have no commercially exploitable natural resources. Th ese factors must have made the loss of Rhodes much more poignant to the Knights.
It is not surprising that the population of the islands remained relatively low until recent times. An estimate of 10,000 has been made for the year 1420 (Wettinger, 1969), however it has also been pointed out that there were several disastrous pirate raids during which as many as 3,000 persons were carried off into slavery, which represents some 30% of the population. Indeed, following the 1551 raid on Gozo, some 5000 persons were taken into captivity and few if any ever returned (Fiorini, 1986). Th e population rose to some 20,000 during the early days of the Order’s rule and by 1675 it had reached some 60,000 (Fiorini, 1983). At this time, the security of the island had been greatly improved by the Order’s fortifi cation network however, repeated plague epidemics kept the population down (De Piro, 1833). Indeed the population only reached the 200,000 mark at the beginning of the

Chapter 9: Sustainability and Urban Conservation in Malta 169
20th century, at a time when emigration to North Africa was reaching its peak (Attard, 2003). During the 20th century improvements to health, hygiene and medicine have lead to a doubling of the population which now stands at just over 400,000. Th is makes the Maltese Islands one of the most densely populated countries in the world.
Essential Characteristics of Maltese Vernacular ArchitectureTh e essential characteristic of Maltese architecture is the use of the local limestone
to construct every part of the building with the exception of doors – as shown in fi gure 5 (Tonna, 1992). Th is is because the islands have never had trees tall enough to enable their use as structural materials. Th e morphology and elements of the Maltese vernacular, as well as their nomenclature are largely derived from Arab traditional architecture (DeLucca, 1985). Th e mashrabiyya is one traditional element (Fathy, 1986) which was translated from timber into stone in Maltese vernacular architecture. Th e most surprising aspect of this building technology is the fact that even the roofs were made of long stone slabs supported on corbels (Mahoney 1988). Th is method of construction is not unique since similar stone roof slabs are also widely found in the Nabatean cities of the Hauran in Syria and Jordan, such as Umm al-Jimal (DeVries, 1993).
Figure 5: Th e all stone Maltese building technique (Tonna, 1992)
Th ese cities were largely abandoned aft er the earthquake of 747 C.E., whereas the earliest building in Malta cannot be dated before the 14th century C.E. and thus it is still uncertain how the particular technology was transferred to Malta (Hughes, 1956). Th e roofi ng system is composed of a series of stone slabs supported on projecting corbels to

170 Future Preparedness: Th ematic and Spatial Issues for the Environment and Sustainability
permit a greater span, which can reach a maximum of three metres (Tonna, 1998). Th ese corbels are known as kileb in Maltese and the word is said to derive from the Arabic verb ‘to strengthen’ (Serracino-Inglott, 1985).
Figure 6: Th e Maltese streetscape: unifi ed by the ubiquitous use of limestone
Despite an absence of drawings, the evolution of Maltese domestic buildings can be deduced by careful examination of early notarial documents (Wettinger, 2006), some of which describe the one-fl oor dwellings in some detail. Generally, the typical dwelling had the following characteristics as illustrated in fi gure 7 (Mallia, 2002):
• Entrance from the street directly into the courtyard through a covered passageway known as a sqifa (ةفيقس), which did not permit passers-by to look directly into the courtyard.
• A series of independent rooms (ةفرغ), each of which was accessed directly from the courtyard and which had no windows onto the street. Th is is a typical Mediterranean feature.
• All rooms are constructed in the traditional manner described above and the principal room generally faces south or south-east.
• A principal room, called the majlis (سلجم) , generally provided with low stone benches at the perimeter, called dokkena (ةنّكد), which also served as beds at night.

Chapter 9: Sustainability and Urban Conservation in Malta 171
Figure 7: Th e traditional Maltese House
Gradually, more European characteristics were incorporated into the buildings, in particular the addition of an upper level, possibly owing to a lack of space (Mahoney, 1996). Staircases, which were originally open to the skies became covered and more monumental. Th e addition of an open loggia overlooking the courtyard at fi rst fl oor enabled the inhabitants to continue the tradition of sleeping outside in the summer (Mallia, 2002). Th is replaced the older tradition of building a reed ‘arish (شيرع) on the roof (DeLucca, 1993). Façades, too, became more ornamental and elements of late Sicilian Gothic and Italian Renaissance found their way into the city’s streetscape (Braun, 1944).
Th e monumental baroque buildings, which were built in Mdina following the earthquake of 1693, have completely diff erent characteristics and are built in accordance with the norms of the period (Schembri, 2000). Th us arches and vaults replace the traditional

172 Future Preparedness: Th ematic and Spatial Issues for the Environment and Sustainability
roofi ng techniques (Farrugia 1999), however the more humble dwellings continued to be built in the traditional manner. Th ese diff erences are refl ected in the streetscapes which one experiences as one walks around the city since there is a sharp contrast between the extrovert baroque main streets and the introverted mediaeval quarters. However, despite the obvious disparity in styles, the use of the same limestone as the only building material gives a harmonious character to the city (England and Th ake, 1999).
Data Collection and Analysis
BackgroundSince its inception, various studies (PA, 1999; Agius-Scicluna, 2001; PA, 2001; Mallia,
2002), publications and programmes have been initiated by the Planning Authority and these have encouraged and assisted people to take up the challenge of restoring a traditional dwelling and converting it into a modern residence. Amongst others, these include:
• the establishment of a Heritage Advisory Committee to advise on the conservation of traditional dwellings;
• the setting up of an UCA team specifi cally to deal with development applications within historic cores;
• the defi nition of UCA boundaries for over 60 historic settlements;• the publication of Guidelines for development control with UCA’s, (PA, 1995);• the publication of explanatory information in both English and Maltese written
specifi cally for people wishing to restore a property within a UCA;• the setting up of a ‘restoration grant schemes’, aimed at providing grants for the
restoration of traditional timber balconies and, post-2008, domestic restoration projects by private individuals (investi f ’darek).
Th e philosophy behind these publications and the policy thrust followed was that “Conservation must never be regarded as a negative process, or as mere antiquarianism. Responsibility towards the historical environment goes beyond simply preventing destruction, essential though it is. It involves actively caring for the heritage, maintaining it in good physical condition making it readily accessible for study, enjoyment, recreation and tourism. Above all it means ensuring that to the fullest possible extent, the heritage remains in active use as an integral part of the living and working community, a material asset that makes a positive contribution to economic prosperity and quality of life.” (CE, 1998)

Chapter 9: Sustainability and Urban Conservation in Malta 173
Th e data sets examined are those covering the years 1993 - 2013. Th e data for 1993 is scanty and somewhat unreliable while that for 2013 is necessarily incomplete since not all applications submitted in that year have been determined yet. However it is felt that enough data is available to make a reliable assessment on which to base the conclusions which this paper will propose. For the range of years considered, the datasets compiled are the total number of applications, the number of applications falling within a UCA and the locality of these applications, the number of approved applications involving demolition of the site and the locality of these applications. Th e analysis carried out is based on various percentages, which express the various criteria being considered for comparison. Results are categorised by the local councils of Malta which are illustrated in Figure 8.
Figure 8: Th e Maltese Islands and administrative divisions (Local Councils) (source MEPA)
Data AnalysisTh e fi rst question asked is whether the UCA’s are decaying, crumbling and retrograde
areas? Whether there is any interest in development within UCA’s. Furthermore one may wish to enquire whether the development-control policies and guidelines for UCA’s act as a stimulus or disincentive for their vitalisation.

174 Future Preparedness: Th ematic and Spatial Issues for the Environment and Sustainability
Figure 9: Percentage of all Planning Applications falling within UCA’s
Th e graph in fi gure 9 shows the percentage of all applications in a particular calendar year which fall within a UCA. It will be seen that on average approximately 22% of all full development applications submitted to MEPA fall within a UCA. Until 1995, the percentage of applications was smaller and this is because the UCA’s were still in the process of being designated. More surprising is the unusually high percentage sustained in 2002 which was just over 26.5%. A more detailed analysis of the full development applications submitted within UCA’s for that year reveals that there were over two hundred applications submitted for the installation of domestic satellite dishes. Th e amendment to the Development Notifi cation Ordnance in May 2005 put an end to this surge in applications because the installation of satellite dishes was redefi ned as permitted development, which does not need a full development permit. Th is unexpected number can be more readily understood if one considers that this was the fi rst time that the price of satellite receivers fell to the extent that it was possible for a considerable portion of the Maltese public to watch the world cup football matches from Korea on satellite in the comfort of their own homes.
Incidentally, this high fi gure also shows that the UCA’s are inhabited by a vibrant population that is up to date with the latest technological development … a far cry from the suggestions of muzew [museum] or presepju [diorama] that are sometimes heard regarding the eff ects of the UCA development control policies. In fact the survival and success of these areas is the result of their ability to meet society’s current needs which preserving the traditional characteristics which give a sense of familiarity to the localities.

Chapter 9: Sustainability and Urban Conservation in Malta 175
It also highlights the attention which is required in analysing such raw data.Th e next enquiry was what percentage of applications falling within UCA’s were
granted permission for the demolition of the existing building. Th e rationale behind this query was to ascertain the general condition of the buildings within UCA’s and whether the inhabitants of the UCA’s were anxious to sell their property to speculators in order to get rich quickly. It is considered that the total demolition of an existing building is not a conservative process but a destructive one, which not only causes a considerable change in the urban fabric and density but also contributes negatively to the ever increasing volume of inert waste which these islands are generating.
Figure 10 shows that the graph indicates that an almost steady 12% as the average of the permitted demolitions within all the UCA’s over the study period. Th e data for 2013 is not complete because a considerable number of 2013 applications are still being processed and have not yet been decided. Exceptions were 2003, 2004 and 2006 when the fi gure shot up to over 14%. One cannot blame the requests for satellite dishes from the previous year for this upsurge; since these did not generally involve demolition(!) However, the highest percentage of demolitions approved within UCA’s occurred in 2012, when this amounted to 14.63% … the reasons for this increase must be sought elsewhere - and the advent of a general election may have had a signifi cant bearing.
Figure 10: Percentage demolitions within Urban Conservation Areas each year

176 Future Preparedness: Th ematic and Spatial Issues for the Environment and Sustainability
Consideration of the corollary of this statistic indicates that the rest of the applications within UCA’s are either refused permissions or approvals for other – hopefully more conservative – modes of development. It may be argued that the relatively low percentages of permitted demolitions within UCA’s would tend to indicate that there is a considerable amount of conservative development going on, even though the demolition of a single building oft en has a considerable impact on the streetscape. In this regard it is pertinent to point out that the Authority’s policies tend to accept a degree of sensitive change especially where such a change would extend the building’s useful life. Th is approach results in wider benefi ts through urban regeneration and the improved economic viability of an area, as well as a reduction in the volume of inert waste generated.
Th e success of these policies can be seen in particular UCA’s where the property is advertised in estate agents’ brochures as ‘converted’ or ‘ripe for conversion’. A worrying development in recent years is the wording of application descriptions to disguise the true nature of the development. Since the 2008 reform, the approval of the total demolition of a building means that a third party appeal can be made against a permit. Application descriptions are now couched in vague terms which avoid the use of the word ‘demolition’, even though a cursory glance at the drawings indicates quite clearly that the greater part of the existing building is being razed to the ground. It is hoped that this loophole will be closed by ensuring that the application description refl ects the spirit, not just the letter, of the intended development.
Th e numbers of permitted demolitions were re-analysed by local council in order to understand which UCA’s were under the greatest re-development pressures as shown in Figure 11. Th e graph indicates that the UCA of the village of Mellieha has an extremely high rate of demolitions permitted with respect to the number of applications submitted. A reason for this could be the very small number of applications submitted in what is actually one of the more recent settlements in Malta. Th e UCA’s of Dingli, B’Bugia, Xewkija, St Paul’s Bay, Nadur and Zebbug (Gozo) also have a relatively high rate of demolition. Th ese UCA’s are under the greatest pressure for re-development and some of these localities may come as a surprise to some. However, greater incentive may be necessary to induce less destructive change in these localities before their essential character is lost forever.
Trend Analysis and ImplicationsTh e analysis of the data under study has revealed that there is a lively interest in
the development of UCA’s in the Maltese Islands indicated by the percentage of full-development applications aff ecting sites within them. Th is means that the historic cores of our settlements are being subjected to considerable transformation and this is probably the surest proof that they are still alive and inhabited by an active portion of our society, who has either taken a conscious decision to move into a historic setting or has always

Chapter 9: Sustainability and Urban Conservation in Malta 177
lived there and not wished to move away. At this point one should mention that the ingress of new people into an existing community should not be considered as a negative trend. New inhabitants quite oft en occupy properties which have been vacant for some time and only they, it seems, have the courage to take on the conversion and conservation of these dilapidated properties.
Terms such as gentrifi cation are simplistic in that they imply that people are being forced out of their homes by richer outsiders. However, these defi nitions ignore the concept of social mobility in which people may choose to move to a new locality if they wish to and they also have the right to buy and sell their property. Moreover, population movements, whether at the macro or micro level, have occurred continuously throughout history and these have contributed to the evolution of societies rather than their decay. Th is is particularly relevant at a time when Malta is receiving large numbers of immigrants who are slowly but surely changing the population structure. Decay is only said to occur when the population of an area ages and is not renewed. Like the abandoned village of “Hal Millieri”, such a settlement is doomed to die.
Figure 11: Total Granted Demolitions sorted by Local Councils
Th e type of applications being submitted indicate that not only is there a considerable amount of development taking place within UCA’s but that on the whole a considerable portion of this development is of a conservative nature. Th is means that the existing historic fabric of the UCA’s is being modernised and reused but that the essential characteristics are being retained. Th is implies that not only the intensity but also the rate

178 Future Preparedness: Th ematic and Spatial Issues for the Environment and Sustainability
of change within UCA’s are being controlled by MEPA’s policies and that these controls are not stifl ing requests for sensitive developments in many UCA’s. However, there are a number of UCA’s where development pressures are such as to endanger the character of the area because a high demolition rate implies a fast rate of change and a considerable increase in the intensity of development. For some areas, the knell has already sounded and it may be pointless to attempt to conserve at this late hour. However, many positive results of current UCA development control policy can be noted if only one takes the time to look for them.
Many buildings in numerous UCA’s have been rehabilitated, although it appears that some UCA’s are more fashionable than others and this increased ‘desirability’ has lead directly to increased conservation, possibly as a result of the higher prices that property can command in these localities. MEPA’s direct intervention, as in the Valletta Air-Conditioning Unit Exercise has lead to the removal of a considerable number of unsightly air conditioning units from the facades as well as the upgrading of a number of shop fronts. Such proactive intervention has led to a signifi cant improvement in the ambiance of a number of streets. Perhaps the most surprising observation in the data presented is the increase in the number of applications in Valletta. Th is is considered to be a positive process. Despite the more rigid development control criteria in place for the UNESCO World Heritage Site, Valletta is attracting more attention and therefore the regeneration process of the city is a reality.
ConclusionAnalysis of the number and quality of approved planning applications lodged over
a number of years has enabled the formulation of a statistical picture of the actual eff ectiveness of the development control process with regards to UCA’s.
Th e results indicate that not only has interest in UCA’s grown over the years, but that this has resulted in the rehabilitation and sustainable re-use of a considerable number of existing properties, some of which were formerly derelict and abandoned. Th e restoration carried out has saved traditional heritage from certain destruction and conserved it for present and future enjoyment. It has encouraged tourism and renewed social life by internal-growth and migration into former ‘no-go’ areas of the island. Conservation, as opposed to demolition, will reduce the generation of building waste and the consumption of fresh non-renewable building materials to sustainable levels.
Malta’s UCA’s continue to be areas of special character that still attract people to live within them. Th e inhabitants of the UCA’s are a dynamic population that renews itself by both migration as well as internal growth. Th e requests for development attest to the continued interest that manifests itself within these historic localities. Public consciousness has evolved over the years and the ideas behind heritage conservation and

Chapter 9: Sustainability and Urban Conservation in Malta 179
the reuse of the existing historic fabric have achieved wide esteem. However, the balance is always dynamic and the function of Development Control is to remain vigilant and curb excessively destructive and short sighted schemes in favour of more balanced long-term conservative plans in which the proposals are commensurate with urban regeneration and the achievement of higher environmental standards. Th e experience, which the Authority has gained over the years, now forms a compendium of possible solutions which are oft en suggested to would be developers, either before an application is submitted or during the application process itself. A measure of sustainability would appear to have been achieved and this is comforting.
ReferencesAgius Scicluna, G. (2001). Monitoring micro-scale development within urban conservation areas, Unpublished BE&A Dissertation, University of Malta.
Attard, L, (2003). Profi les in Maltese Migration, Malta.
Blouet, B.W. (1978). War and rural settlement in Malta, in Transactions. Institute of British Geographers, v. 3 n. 3, London.
Bonanno, A. (1997). Malta: An Archaeological Paradise, Malta.
Braun, H. (1944). Introduction to Maltese Architecture, Malta.
Council of Europe, (1998). Measures to promote the Integrated Conservation of Historic Complexes, Strasburg.
De Piro, Baron G.M. (1833). Ragguaglio Storico della Pestilenza, Livorno, Italy.
DeLucca, D. (1985). Islamic Architectural Manifestations in 18th century Mdina, in Hyphen. Journal of Melitensia and the Humanities, vol IV no. 5, Malta.
DeLucca, D. (1993). Maltese Vernacular Architecture. In B. Farmer & H. Louw (Eds.), Companion to contemporary architectural thought, London.
Dennis, N. (1972). An Essay on Malta, England.
DeVries, B. (1993). Th e Umm al-Jimal project (1981-1992). In Annual of the Department of Antiquities of Jordan, Amman.
England, R. & Th ake, C.G. (1999). Mdina: citadel of memory, Malta.
EU (2002). Committee on the Environment, Public Health and Consumer Policy.

180 Future Preparedness: Th ematic and Spatial Issues for the Environment and Sustainability
Summary note of the Environment Committee Delegation to Malta, 18-19 April 2002.
Farrugia, C. (1999). Maltese mediaeval building elements. Unpublished BE&A dissertation, University of Malta.
Fathy, H. (1986). Natural energy and vernacular architecture, Chicago.
Fiorini, S. (1983). Status Animarum. In Melita Historica, vol. 8 (no. 4), pp.325-343, Malta.
Fiorini, S. (1986). Th e Resettlement of Gozo aft er 1551. In Melita Historica, vol. 9 (no. 3) pp. 203-244, Malta.
Hughes, J.Q. (1956). Th e building of Malta during the period of the Knights of St John of Jerusalem 1530-1795, London.
Mahoney, L. (1988). A history of Maltese architecture from Ancient Times up to 1800, Malta.
Mahoney, L. (1996). 5000 years of Architecture in Malta, Malta.
Mallia, D. (2002). L’architettura autoctona maltese: origini, sviluppo e conservazione nella città di Mdina. Unpublished Ph.D thesis, Milan Polytechnic.
Mallia, D. (2005). ‘Prejudice and Preservation’ in acts of the International Conference: ‘Cultural and Natural Heritage in the large islands of the Mediterranean, Rhodes.
Malta Environment and Planning Authority [MEPA], (2007). Policy and Design Guidance 2007. Floriana, Malta
Planning Authority [PA], (1995). Development Control within Urban Conservation Areas. Design Guidance, Malta.
Planning Authority [PA], (1999). Bieb u Ghatba: il-harsien tal-wirt mibni, Malta.
Planning Authority [PA], (2001). Mdina – conservation area strategy and guidelines, Malta.
Planning Services Division [PSD]. (1992). Malta Structure Plan, Malta, 1992.
Schembri, S. (2000). Th e analysis of doors and windows as indicators of architectural evolution on the Maltese Islands. Unpublished BE&A dissertation, University of Malta.
Seracino-Inglott, E. (1985). Il-Miklem Malti (A Maltese etimological dictionary, volume 6), Malta.

Chapter 9: Sustainability and Urban Conservation in Malta 181
Tonna, J. (1992). Architectural and Urbanistic tradition in Malta in Collected Papers of the University of Malta, Malta.
Tonna, J. (1998). Dwelling settlements and tradition: Th e interpretation of high and folk traditions in Malta. In Collected papers of the University of Malta. Malta
Vella, H.C.R. (1980). Th e earliest description of Malta, Lyons 1536 (translated and annotated by Jean Quintin d’Arutun), Malta.
Wettinger, G. (2006). Kliem Malti Qadim, Malta.
Wettinger, G. (1969). Th e Militia List of 1419-20. In Melita Historica, Vol. 5, (no. 2), pp. 80-106, Malta.
Zammit, V. (2002). Th e Limestone Heritage, Malta.
NotesPortions of this work were presented during the Fift h International Conference on Sustainable Architecture and Urban Development, CSAR, Tripoli, Libya, 2009.


C H A P T E R 1 0
Th e Surrounding Habitat of Marine Algae in MaltaMaria Refalo
IntroductionTh e study of algae has been conducted throughout the ages recreating multiple times
scientifi c research with the latest technology and development that renders the results more effi cient and reliable. In the Maltese scenario certain advances have not been backed up with the local situation and therefore they lack the real counterpart issue of what in reality we can observe. Th e Maltese Islands have undergone several infrastructural changes, which in some cases altered the natural setting. Th e arena of algae in relation to the anthropogenic disturbance being imposed on them has not been scrutinised in depth. Th is study aims to focus on such fi eld in order to have real life analyses of the environment that surrounds us. In order to homogenise an array of features, biotic and abiotic factors have been emphasised on. Chemical tests are part of the lab analysis that consume most of the time since the water samples are very critical to the study. Th e time span required for the data collection and tests to be carried out is one of the issues for such data to create a determinative pattern.
Th eoretical IssuesAn inevitable infrastructural change was bound to be carried along the Maltese and
Gozitan coastline, such improvements were made as a detriment upon the environment. In eff ect 17 factors are being investigated in order to analyse whether anthropogenic infl uence on the marine environment, especially the alga habitat was aff ected. Th ese biotic and abiotic factors will be refl ecting how the alga population is counter eff ected over the period of summer and winter weather, two climatic extremities. In such perspective it is the promotion of what conditions are favourable and which are inhibiting the growth of algae across the coastal zone, which is accurately defi ned in Th e Coastal Strategic Topic Paper (2002);
“...a geographical space incorporating land and sea areas within which the natural processes interact to create a unique dynamic system. It also incorporates those activities on land and at sea where human activities are directly infl uenced by or can infl uence the quality
184 Future Preparedness: Th ematic and Spatial Issues for the Environment and Sustainability
of the natural resources.”
Th e biological spectrum classifi es algae as being marine plants, as they form part of the kingdom Chromista, specifi cally Metaphytae. In reality algae are free fl oating when compared to other that are attached to the seafl oor within the inner continental shelf. Th is favourable position gives abundant isolation for photosynthesis since they are mainly found in the neritic zone which forms part of the photic zone, hence the sunlight. Although they were considered to be plants, they lack the true roots, stems, leaves, fl owers, or seeds and embryos of a real plant. Th e anatomical research on algae considers them as primitive plants and can be found in the colour spectrum of red, green, and brown. Th e vast majority of these algae are phytoplankton, microscopic, and unicellular, which can reach the size of giant kelp. Algae are part of an ecosystem and as Durrant (2003) defi nes, it is an “....ecological community together with its environment, functioning as a unit”.
Whilst simultaneously using the whole biosphere as its support. Th ey can be considered organisms since they fi t the criteria of being an individual form of life. Furthermore, algae have a body of organelles as well as other parts that can work together in order to carry out the various processes of life that form part of an ecosystem.
MethodologyTh e Maltese archipelago consists of a relatively small land cover, this gave the
possibility to select beaches that represent the islands’ local context. In this regard, Dwejra Bay (inland), Dahlet Qorrot, Anchor Bay, Gnejna Bay, Manoel Island, and Pretty Bay were chosen. Th e coast along the Maltese Islands was defi ned by Waugh (2002) as: “...the narrow zone where the land and sea overlap and directly interact. Terrestrial, atmospheric, marine and human processes ad their interrelationship aff ect its overall development. Th e coast is the most varied and rapidly changing of all landforms and ecosystems.”
Th e geological period of the Maltese Islands composed of fi ve strata dates back to 24 million years ago as visualised in Figure 1. Th e Islands’ coastline was throughout this period of time hit by constant wave actions, hence altered to the present coast formations. Meaning that this creates all the diff erent habitats for the algae.
Malta having a Northeast tilt exposes the diff erent layers to the diff erent meteorological conditions and which therefore makes certain areas more susceptible to erosion and metamorphosis (land alteration). Such eff ects takes place due to the diverse unconsolidated sediments that the layers are formed of, thus the terminology of sedimentary rocks. Th e diff erent composition gives each stratum a diff erent time span in which the degree of erosion can make distinctive eff ect on the rock. As a matter of fact each study site presents a unique geological formation and according to the specifi c stratum found exposed on site, it will incorporates a diff erent level of erosion, due to the climatic conditions that it encounters.

Chapter 10: Th e Surrounding Habitat of Marine Algae in Malta 185
Figure 1: A geological map of Malta showing the diff erent layers across the island
Source: http://english.fossiel.net/system/images/geolkaart/malta.png
Figure 2: NASA satellite image showing the Maltese Islands marked with the sites under investigation
In Figure 2 spatiality of the selected study sites is shown. Starting from the Gozitan Island the selected beach is Dwejra Bay in particularly the inland sea that is enclosed within the steep cliff s. Th e only way that such sea water can be replenished is through a small natural

186 Future Preparedness: Th ematic and Spatial Issues for the Environment and Sustainability
tunnel. Th e study site was broken down into three segments, in which distinctive level of anthropogenic disturbance can be noticed. On opposing scenery characteristics, Dahlet Qorrot, has an open sea and a high wind factor that is distinguished easily. Th e study site from where data collection was taken is a jetty. It is continuously disturbed as it is a man made jetty, nevertheless algae formation can be easily noted. Th e third study site is located on the Northwest side of Malta, Anchor Bay at Popeye’s Village. Th e close relationship that this bay has with the aforementioned village brings a negative anthropogenic disturbance specifi cally during the summer. Also when noting the presence of ducks in the bay.
Another study site is Gnejna Bay, a diff erent perspective is the fact that the location of data collection is sheltered. Th is aspect renders the majority of the litter to be transported with more ease with certain climatic conditions. Next is Manoel Island which is divided into three segments. Th is was made due to the high degree of anthropogenic and animal infl uence present in the area. Th e last study site was Pretty Bay, at the very end of the bay. Th is was made intentionally due to the transportation and the breakdown of the pollutants. An important feature in this study site is the presence of the Malta Freeport exactly opposite to the focused points. Th e study site was segmented into two points since purposes of the site vary from swimming to horse cleaning or as a jetty; this highlights the degree of anthropogenic disturbance that this area has. Also to be noted is the very close proximity to dwellings.
A comparison of the two weather extremities that the Maltese Islands face during the year was also under investigation. Analysis of data collection revealed that during the time span of the study, both weather conditions had reached an extra pitch into their extremity. Th is is due to the highest temperature on July 18th 2011 with a fi gure of 37.7OC , while coldest and wettest during February 2012 since 1923 , with an actual mean temperature of 10.2OC whereas normally is 12.4OC. Th e latter month reached its highest temperature of 15.9OC on February 3rd and the lowest on the 14th of February with a temperature of 3.6OC. As a matter of fact even hail on Enteromorpha (ref. Figure 3) was found during the winter season. Also the amount of rainfall during this month was twice as much the average expected, with a fi gure of 132.6mm. Whilst the sea temperature was almost one degree higher than it normally should be.
A characteristic of this study was the utilisation of lab analysis through a water quality test of chlorophyll a, Nitrates, Turbidity and Phosphates. One vital fact while conducting lab analysis would be, not to have the water sample tainted with human intervention, as this could result in distorted data. Th e off site analyses were done at San Lucjan Laboratories (Malta Aquaculture Research Centre) where they needed to be carried out within a short time span. Other tests such as sea temperature, pH and dissolved oxygen were done in situ through the utilisation of digital instruments. Th e other data factors were recorded on paper onsite as well. Standard procedure practice of the aforementioned

Chapter 10: Th e Surrounding Habitat of Marine Algae in Malta 187
tests and observations were carried out as to follow guidelines. A photographic evidence to show algae captured in their natural environment was also taken, as to serve as a point of reference if any further investigation was needed during the identifi cation of the algae specie under the microscope. Once the algae were collected, drying and identifi cation was needed to be followed. Th e drying method needed to be done as soon as possible so that they would not die in prior to the drying process, otherwise identifi cation of specie would be much more diffi cult. Th e latter identifi cation would serve as a benefi t to cross-reference it with the water quality data gathered in situ.
Limitations are experienced primarily through the uncontrollable weather conditions and the delay in arrival of the quartz cuvettes.
Figure 3: Hail on Enteromorpha
Source: M. Refalo
Results and DiscussionTh e relation of algae with the anthropogenic disturbance and the surrounding
environmental results can be analysed as implementation is fi nalised. Th e structure of this chapter incorporates three approaches of the results; the summer and winter physical conditions found on the study sites while carrying out a comparative analysis. Next would be the chemical lab analysis. Th e fi ndings were fi nalised aft er an extensive laboratory tests and mathematical formulas incorporated in the procedure.

188 Future Preparedness: Th ematic and Spatial Issues for the Environment and Sustainability
1. A comparative analysis of summer and winter conditionsData collection handled throughout the summer season collected specimens of
macro-algae organisms. In these climatic conditions diverse algae species fl ourished more, reaching collection data of eighteen alga species. Th e data regarding temperature showed that the highest sea temperature reached 28OC which is almost 10OC lower than that of the air temperature recorded. A vital component for a healthy ecosystem, is, the level of dissolved oxygen in water, this plays a crucial part in also determining the water quality. Results showed that for the summer period the mean sea dissolved oxygen level was that of 104.7%, meaning it is a considerable ample amount in the sea water. On the other hand the lowest mean sea dissolved oxygen level is that of 90% in Dwejra and Manoel Island. Such results shows that as a fact no presence of Hypoxia could be recorded.
Th roughout the summer season the pH level of the water was recorded to average 8.3. Th is is a refl ection that the water quality is also within the desirable level. During the summer season, in all the study sites anthropogenic disturbance could be recorded, as such this may have contributed to the abundance of macro algae. Th e highest level of specimens collected in one site was at Dahlet Qorrot. A noticeable factor was that two dominant species stood out, namely, Jania rubens and Ulva sp. Nevertheless the latter were not found in all the study sites.
2. Results emerging from the data collected during the winter seasonTh e winter season showed a decrease in the amount of algae collected throughout the
study sites, which resulted into one prevailing alga specie, Enteromorpha (Figure 4). During the winter season, weather conditions decreased considerably, this may be the
cause of the fi ve less algae species collected. A factor that should be taken into notice is the fact that the average sea temperature was one degree higher than the air temperature, even if it was one of the coldest winters aft er a considerable amount of years.
Parameters such as dissolved oxygen and pH were also recorded having a positive result. Th e levels are 117% being the highest level reached at Manoel Island even though anthropogenic disturbance remained as that of summer, whereas the last one still ranged at eight respectively. Another infl uential parameter is the albedo level that decreases due to the fact that winters having a considerable degree of cloud overcast shadowing most of the light intensity magnitude. A positive remark to this season was the fact that pollution decreased at a substantial level due to the diminished pupil fl ow.
3. Summer and winter compared Th e desirable level of pH has been reached throughout the data collection as the levels
attained varied between 7.6 and 8.4. Th is gave an underlying perspective of the habitat within which the algae live. For the dissolved oxygen levels healthy standard levels were

Chapter 10: Th e Surrounding Habitat of Marine Algae in Malta 189
collected as levels should not be less than 80%. Th e aspects of orientation, open/closed sea comes into conjunction with wind force since it comes into eff ect to the way everything collides together and creates a fl uctuating environment unique to every bay. Along with this, it is to mention that such movements created currents and therefore turbulence within the water, acting as an advantage since pollutants would be broken down. On the other hand the sea at Dahlet Qorrot, was both agitated during the summer and winter season, having the latter with stronger winds. With regards to the other parameters, minimal fl ux was recorded throughout both seasons. Th e most evidential change was seen in the temperature drop from summer to winter, alongside with this alga (Figure 5) also decreased respectively.
Figure 4: An abundance of Enteromorpha during the winter season
Th e temperature distinction that was recorded in the seasons shows that algae needs warm climate in order to fl ourish and grow over a shorter period of time, meaning that winter is a hibernation stage for these marine organisms (Figure 5). Nevertheless the reduction of anthropogenic disturbances may have also had an impact on which algae fl ourish most. As a result to this there were mainly temperature, wind force and pollution that directly aff ected the environment; meaning that the physical indicators were almost within the same degree.

190 Future Preparedness: Th ematic and Spatial Issues for the Environment and Sustainability
Figure 5: Summer and Winter respectively showing the diff erence between the two temperature results and analysis within the two seasons
From the physical factors that were chosen in the study, temperature stood out prominently. As a result to the latter fact, chlorophyll a was another indicator which can help detect the state of the marine habitat. Correlation of these two parameters is presented in Graph 1.
Graph 1: Summer sea temperature compared with the level of chlorophyll a in water
Th e fl uctuations as seen in Graph 1 , shows that the level of chlorophyll a increased as temperature did so too. Th e highest level of chlorophyll a was found at the second highest temperature which stood at 27OC. An interesting factor with this result is that both readings were taken on the same day of data collection, nevertheless the study sites made a distinctive diff erence in the chlorophyll a results.

Chapter 10: Th e Surrounding Habitat of Marine Algae in Malta 191
Winter sea temperature compared to chlorophyll a level in waterIn the winter season the results for chlorophyll a results reached the highest level
recorded in this study. With a contradicting factor of rough winds, cold temperatures and also hail throughout the data collection. Manoel Island study site had the highest chlorophyll a level. In comparison with the other study sites in perspective of this chemical, a relatively higher levels were recorded, this means that such climatic conditions favoured chlorophyll a (Graph 2).
Graph 2: Winter sea temperature compares with the level of chlorophyll a in water
In relation of the seasons chlorophyll a results showed that the environment for the marine algae was not compromised, hence the desirable levels were reached especially during the winter season for photosynthesis to be carried out.
Th e next comparison of results will focus on the dissolved oxygen level present in the sea water in perspective of the sea temperatures recorded. Th e presence of dissolved oxygen helps to create a sustainable life within the aquatic nature.
Summer sea temperatures compared with the level of Dissolved Oxygen in waterTh e collected results of dissolved oxygen when compared with the sea temperatures
obtained, a simultaneous increase could be observed in both variables. Th e healthy parameter of dissolved oxygen can be low as 90% in marine water (Graph 3).

192 Future Preparedness: Th ematic and Spatial Issues for the Environment and Sustainability
Graph 3: Summer temperatures compared with the level of Dissolved Oxygen in water
Winter Sea temperatures compared with the level of Dissolved Oxygen in waterOn the contrary to the previous results the comparison between the winter season and
dissolved oxygen did not indicate any correlation. Th e dissolved oxygen results showed that they decreased throughout the winter season, hence cold temperatures do not favour the marine environment. Th e most favourable levels of dissolved oxygen in this study stood at 117%, at Manoel Island study site. A contradicting comparison is, the fact that the same study site mentioned had the lowest (90%) dissolved oxygen during the summer data collection. An inverse proportion could also be observed with the highest level of dissolved oxygen in summer, and same site having one of the lowest levels of dissolved oxygen during the winter season, at Gnejna study site. Results of both seasons have shown that dissolved oxygen fl uctuates according to the sea temperature present at the surface of the water (Graph 4).
Graph 4: Winter sea temperatures compared with the level of Dissolved Oxygen in water

Chapter 10: Th e Surrounding Habitat of Marine Algae in Malta 193
Th e presented results will show the data collection of chlorophyll a compared with turbidity during both seasons.
Summer chlorophyll a compared with Turbidity levelCarrying out analyses with the results of chlorophyll a and turbidity was not easy to
be defi ned as most of the turbidity levels stood at zero, there was only one reading that diff ered from the rest, which stood at fi ve which was recorded at Dwejra inland sea. A favourable aspect of the latter mentioned study site was the fact that the water was stable and undulations were minimal. A comparable result was that the highest turbidity level was found at the same site of the second lowest result for the chlorophyll a.
Graph 5: Summer chlorophyll a compared with Turbidity level
Winter chlorophyll a compared with Turbidity levelOn the contrary to the fi rst data collection, the winter season rendered results to be
rather high. As collated from the summer season results same study site was also with a high degree of turbidity, being Dahlet Qorrot (Graph 6). As predicted for the winter season, strong winds prevailed, so much that even large amount of brown algae was washed along the shore. Th is helped to also note that the wind force and turbidity created in the water, contributed to pull off Posidonia oceanica from the open sea (Figure 6).
Th e level of turbidity recorded at Dahlet Qorrot was relatively high to the point that it has aff ected the level of chlorophyll a at the same time. Such results were expected as both indicators are inversely proportional when collecting data. As a matter of fact, the highest chlorophyll a level had a zero level of turbidity. Th e diff erence between the turbidity levels and chlorophyll a varied with that of turbidity mark 17, chlorophyll a tripled in its rate (0.6616Cμg/L vs. 0.2208 Cμg/L) (Graph 6).

194 Future Preparedness: Th ematic and Spatial Issues for the Environment and Sustainability
Graph 6: Winter chlorophyll a compared with Turbidity level
Figure 6: A photo showing the huge amount of Posidonia oceanica in Dahlet Qorrot (photo taken by author)
Th e next section shows the results and comparison between Phosphates and Nitrates.
Summer Phosphates compared with Nitrates level Th e summer reason obtained results reveilved that Phospates were almost all 0.02mg/L,
this signify that limited correlation exists with Nitrates. As from the Nirates level results show that they have fl uctuated hence correlation between the these two variants could not be established (Graph 7).

Chapter 10: Th e Surrounding Habitat of Marine Algae in Malta 195
Graph 7: Summer Phosphates and Nitrates level
Winter phosphates compared with Nitrates levelTh roughout the winter season results showed that there has been an alteration. In
comparison of these two, correlation could not be established since in both cases, the highest results were with almost every lowest variable of the other. In view of the Phosphates and Nitrates results relationship between the two was negligible (Graph 8).
Graph 8: Winter Phosphates and Nitrates Level
Next section depicts the comparison between pH and Nitrates levels have been compared.
Summer pH compared with Nitrates levelIn this study the pH levels remained relatively consistent, varying around the fi gure
of eight. As it is projected in Graph 9 when the variable of pH level decreases, the other variable does not fl uctuate accordingly. It was noted that the lowest two readings of pH

196 Future Preparedness: Th ematic and Spatial Issues for the Environment and Sustainability
had a diff erence of almost 10mg/L among them. It must be noted that in these both readings they had diff erent orientations, since the sites were Dahlet Qorrot and Anchor Bay. In another point of view the highest pH reading (8.6) obtained when correlated with the Nitrates results showed that there is 0.21mg/L diff erence between the highest level of the same test. Th e fi nal view of this comparison showed that the pH level does not aff ect the level of Nitrates in the sea water.
Graph 9: Summer pH and Nitrates level
Winter pH compared with Nitrates level Graph 10 is showing that pH levels during the winter season have all nearly changed,
this gives an indication that the sea water have undergone some chemical changes. Whilst the level of Nitrates in the water have decreased by more than half of the results obtained in the summer season. Graph 10 shows that there is a correlation, as the highest pH level had the lowest Nitrates level and the minimum level of pH level had the highest Nitrates level. Simply showing that Nitrates level decreases as the pH level increases.
Analysing the pH results, they show that during the winter season the constant fi gure has slightly increased along the diff erent study sites.
Th e fi nal set of graphs will present the Dissolved oxygen and Nitrates level results for both seasons.
Summer Dissolved Oxygen compared with Nitrates in waterTh e dissolved oxygen and Nitrates levels in Graph 11 indicate that there is a negative
correlation, this is due to the fact that there is no stable relationship between the two variants. In locations where the same results were obtained for the dissolved oxygen, the change in Nitrate value did not always correspond. Th is is especially true when taking into account the fact that two of the results for dissolved oxygen and Nitrates were both taken in Malta; this variation was noted to be substantial. As a result, the researcher could not establish a relationship between these two variants for the summer season.

Chapter 10: Th e Surrounding Habitat of Marine Algae in Malta 197
Graph 10: Winter pH and Nitrates level
Graph 11: Summer Dissolved Oxygen compared with Nitrates level in water
Winter Dissolved Oxygen compared with Nitrates Th e same scenario of the summer season (Graph 12) was repeated throughout the
winter season, although the Nitrates levels has decreased considerably. A variation in the results was that the highest and lowest readings both had the lowest reading of Nitrates. whereas the highest levels of Nitrates correspond with the medial values of the results. Th is means that both values have declined during the seasonal period, hence it concludes that no relationship exists between the two variants.

198 Future Preparedness: Th ematic and Spatial Issues for the Environment and Sustainability
Graph 12: Winter Dissolved Oxygen compared with Nitrates level in water
GIS visualisation of study sites compared with a set anthropogenic boundary Map 1: Maltese Islands with the study sites

Chapter 10: Th e Surrounding Habitat of Marine Algae in Malta 199
A representation of the Maltese Islands is shown in Map 1, showing the study sites with a red star which better visualise the location of the site. Th e map also incorporates the limits of the development of buildings. It is clear that the Central-South of Malta is highly developed. In accordance to this it can be easily estimated the degree of anthropogenic disturbance on the area on daily basis. Certain locations are not surrounded with a yellow layer, however at a micro scale of the town area reveals the habitation area.
Dahlet Qorrot study site with anthropogenic disturbance Dahlet Qorrot is a small location at the end of its council, as Map 2 indicates the area
of Dahlet Qorrot on the Gozo Island is not within the yellow layer parameter, however adjacent council is. At the study site a summer residence can be noticed, also in the area there is a main jetty in order to disembark boats into the sea. Th e buff er indicated in the insert shows the radius of the anthropogenic disturbance that the area is prone to. Th e main disturbance happens on land however the sea aspect is also compromised. It is shown through the seaward zone which becomes the supralittoral zone on the study site.
Dwejra Study site with anthropogenic disturbance
Th e second study site at Gozo is Dwejra, the inland sea (Map 3). Th is locality is not permanently habituated, nevertheless tourists and Maltese citizens visit all year round, hence anthropogenic disturbance is compromised on daily basis. Th e study site is located near the summer residences and in the inland sea area, which gives a great deal of anthropogenic disturbance especially during the summer season. Furthermore during good weather conditions and throughout the summer period boat trips are made routinely to go outside the inland through the natural tunnel. A positive note, activity diminishes in winter.
Anchor Bay study site with anthropogenic disturbance
Th is study site is part of the only permanent structure (Popeye’s Village) present in the area. As presented in Map 4 , the area does not have the yellow layer since there is not any residents. Th e peak season for Popeye’s Village is throughout the summer season, hence Anchor Bay is also automatically compromised due to the heavy infl ux of people. Th is gives the anthropogenic disturbance a higher degree of how to be maintained, since summer is busy and in winter no activity takes place. Th e buff er zone visualised in Map 4 is therefore only present for the summer season. For the purpose of this study only a part of the bay was chosen, however the entire bay is aff ected since it is retreated in the cliff s and takes the form of a basin.
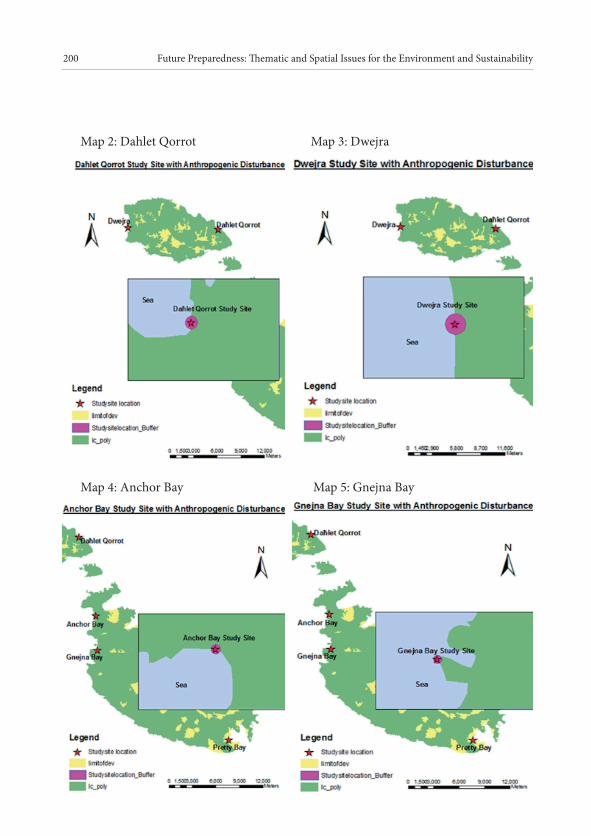
200 Future Preparedness: Th ematic and Spatial Issues for the Environment and Sustainability
Map 2: Dahlet Qorrot Map 3: Dwejra
Map 4: Anchor Bay Map 5: Gnejna Bay

Chapter 10: Th e Surrounding Habitat of Marine Algae in Malta 201
Map 6: Manoel Island Map 7: Pretty Bay
Gnejna Bay study site with anthropogenic disturbanceTh e study site of Gnejna Bay is situated in the outskirts of Mgarr town area (ref. Map 5),
at the mouth of the stream . Surrounding the bay there are numerous summer residences, and as a matter of fact there is a summer residence in front of the chosen area for data collection. Being a popular bay throughout the summer season it brings with it numerous anthropogenic disturbances. During the winter season the bay is restored to its natural attributes, and for this reason the buff er representing the anthropogenic disturbance was eliminated.
Manoel Island study site with anthropogenic disturbanceTh e location of this study site is situated on another island in very close proximity to
the mainland through a man-made bridge. Th e actual island is not layered with yellow, however the surrounding area of Sliema is densely populated and very busy (ref. Map 6). Th e nearby area of the study site is surrounded by maintenance works on boats that are regularly performed on land. Th e island has no residential buildings, however the site is used for bathing horses as well, apart from being a jetty. In this regard anthropogenic disturbance cannot go unnoticed throughout the year, therefore full buff er all year round.

202 Future Preparedness: Th ematic and Spatial Issues for the Environment and Sustainability
Pretty Bay study site with anthropogenic disturbanceFor the South of Malta, Pretty Bay was chosen for the study site, as shown in Map 7. It
is being highlighted with the yellow layer, due to the urbanised location it is situated in. As seen in the insert map, the development limit of the area is in very close proximity to the sea side. Th e bay is quite stretched out, however the study site chosen was the last part of the bay. Th is chosen site purposes are for swimming, being a jetty and also bathing of horses, apart from this, opposite to study site there is the Freeport operating around the clock. Th e scenario shows that anthropogenic disturbance is carried throughout the year. An adverse impact is the waste collected from the street, which is washed off to the sea. Th e buff er zone outlined in the GIS map is utilised in both seasons due to the disturbance created.
Conclusion
Implementation of the physical factors and chemical tests were completed in order to analyse if any correlation exists between the variables, also with the algae aggregation. Th e data collection of the marine algae showed that they increased during the summer season whereas they decreased during the winter season. Th e diff erence in the species abundance between the seasons was that of fi ve marine algae, as a result for the summer season Jania rubens and Ulva sp. were the dominant throughout the summer season and Enteromopha during the winter season.
In each of the six study sites distinguishing environmental factors were imposed on them, this reacted in a contradicting way in certain areas. Weather extremities were faced having the lowest sea temperature of 12.2oC, which was last recorded 89 years ago. From all sites as expected wind forces increased as light density decreased, in comparison with the summer data collection. Anthropogenic disturbance showed that it has contributed to the blooming of algae.
Th e chemical tests determined that pH was stable for both seasons. Healthy parameters were observed for Dissolved Oxygen, during the summer season, the highest percentage recorded was that of 118, while during the winter season showed a slight decline, having the lowest percentage stood at 90.Turbidity, results remained zero for the summer season and reached the 17 mark for the winter season.
Lab analysis showed that chlorophyll a increased considerably during the winter season, particularly Manoel Island results, being that 0.06616Cμg/L is double the result of the summer season. Results for chlorophyll a were noted to be contradicting. Within the same perspective Phosphates results showed that winter season had more elevated outcomes when compared with the summer season. Having 0.28mg/L during the winter

Chapter 10: Th e Surrounding Habitat of Marine Algae in Malta 203
and close to none during the summer season. Contrarily Nitrate levels increased in the summer season and decreased throughout the winter season.
Th e aim of this study was proven correct as the interrelationship between the mentioned environmental factors and the habitat of algae does in reality exist since the macro-algae increased during the summer season. A longer time frame is suggested for cross-analysis in order to conclude a pattern for the Maltese Islands.
ReferencesAbout Wied ta’ Daħlet Qorrot. (2012, April 5). Available at: http://www.gezgeen.com/map-2818112/MT/wadi/Wied-ta’-Da%C4%A7let-Qorrot (accessed on November 2013).
Anchor Bay: Malta. (2012, April 6). Available at: http://geographic.org/geographic_names/name.php?uni=-27845&fi d=3997&c=malta (accessed on November 2013).
Burkholder. J.M. (1998), Implications of Harmful Microalgae and Heterotrophic Dinofl agellates in Management of Sustainable Marine Fisheries. Ecological Applications Supplement: Ecosystem Management for Sustainable Marine Fisheries, Vol. 8, No. 1, pp. S37-S62
Chambers, C.O. (1912). Th e Relation of Algae to Dissolved Oxygen and Carbon-Dioxide. With Special Reference to Carbonates, Missouri Botanical Garden Annual Report, Vol. 1912, pp. 171-207.
Channel Islands National Marine Sanctuary, Measuring the Properties of Sea Water. (2012, April 10). Available at: http://channelislands.noaa.gov/pcw2/pcwprop.html (accessed on November 2013).
Chemistry and the Aquarium: Phosphorus: Algae’s Best Friend. (2012, April 11). Available at: http://www.advancedaquarist.com/2002/9/chemistry (accessed on November 2013).
Chlorophyll. (2012, March 26) Available at: http://www.chm.bris.ac.uk/motm/chlorophyll/chlorophyll_h.htm (accessed on November 2013).
Deidun, A, Lanfranco, E, Mifsud, C, Stevens, D, Schembri, M, Curmi, L, Howson, C, Mercer, T, Sotheran, I & Foster Smith , R. (1991). Th e Climate of the Maltese Islands, Baseline Ecological Data Collection from the Marine Area around Fifl a (Malta Central Mediterranean). University of Malta, Msida.
Diapoulis, A., Koussouris, T. & Savas, H. (July 1988). Biogeographical Affi nities of Marine Algae in the Saronikos Gulf, Athens, Greece. GeoJournal, Vol. 17, No. 1, pp. 85-89.

204 Future Preparedness: Th ematic and Spatial Issues for the Environment and Sustainability
Dissolved Oxygen. (2012, April 18). Available at: http://www.krisweb.com/stream/do.htm (accessed on November 2013).
Durrant, A. & Boyd, B. (2003). Introduction to Algae. West Minister Salt Lake City, Utah
Dwejra Lake – Inland Sea in Malta. (April, 2012, April 5) Available at: Available at: http://www.best-of-european-union.eu/2011/05/17/dwerja-lake-inland-sea-in-malta/ (accessed on November 2013).
Dwejra Map – Satellite Images of Dwejra. Available at: http://www.maplandia.com/malta/dwejra/ (accessed on November 2013).
EPA Guidance Manual: Turbidity Provision. April, 1999.
Gauci, R. (2013). Coastal Processes and Landforms, Lecture Notes, University of Malta.
Geological Map of Maltese Islands (2012, March 21). Available at: http://english.fossiel.net/system/geolkaart/malta.png (accessed on November 2013).
Gorman, D., (2009). Land-to-Sea Connectivity: Linking Human-Derived Terrestrial Subsidies to Subtidal Habitat Change on Open Rocky Coasts. Available at: http://www.esajournals.org/doi/abs/10.1890/08-0831.1 (accessed on 15 May 2014).
Gnejna Bay. (2012, April 6) Available at: http://www.traveljournals.net/explore/malta/map/m28360/gnejna_bay.html (accessed on November 2013)
Hereu, B., Zabala, M. & Sala, E. (2008), Multiple Controls of Community Structure and Dynamics in a Sublittoral Marine Environment. Ecology, Vol. 89, no. 12, pp. 3423-3435.
Huggett, R. J. (2009). Fundamentals of Geomorphology (2nd ed.). New York and Canada, USA: Routledge.
Introduction to Taxonomy. (2012, April, 10) Available at: http://www.geog.ubc.ca/biodiversity/efl ora/IntroductiontoPlantTaxonomy.html (accessed on November 2013).
Larkum, A. W. D. & Drew, E. A. (1967). Th e Vertical Distribution of Attached Marine Algae in Malta. Journal of Ecology, Vol. 55, No. 2, pp. 361-371.
Lipkin, Y. & Safriel, U. (1971). Intertidal Zonation on Rocky Shores at Mikhmoret (Mediterranean Israel). Journal of Ecology, Vol. 59, no. 1, pp. 1-30.
Malta Airport Met Offi ce. (2012, April, 7) Available at: http://www.maltairport.com/weather/page.asp?p=17148&l=1 (accessed on November 2013).

Chapter 10: Th e Surrounding Habitat of Marine Algae in Malta 205
Malta Focal Point. (2012, March 29) Available at: http://www.emwis- mt.org/documentation/context/physical%20factors_fi les/Geology.htm (accessed on November 2013).
Malta Satellite NASA. (2012, April 5) Available at: http://en.wikipedia.org/wiki/File:Malta_satellite_NASA.jpg (accessed on November 2013).
Malta International Airport, July 2011: Drier and warmer than climate average. (2012, April, 7) Available at: http://www.maltairport.com/page.asp?n=newsdetails&i=9773 (accessed on November 2013).
Malta International Airport, Th ird Coldest February since 1923 with more than twice the average rainfall. (2012, April 7) Available at: http://www.maltairport.com/page.asp?n=newsdetails&i=9794 (accessed on November 2013).
Marti, E. & Sabater, F. (1996). High Variability in Temporal and Spatial Nutrient Retention in Mediterranean. Ecology, Vol. 77, No. 3, pp. 854-869.
Manoel Island. (2012, April, 6) Available at: http://www.traveljournals.net/explore/malta/map/m29068/manoel_island.html (accessed on November 2013).
Marine Nitrogen Cycle. (2012, April 10) Available at: http://www.eoearth.org/article/Marine_nitrogen_cycle (accessed on November 2013).
Marine Aquariums: pH and Alkalinity. (2012, April 18) Available at: http://www.aquaticcommunity.com/marineaquarium/ph.php (accessed on November 2013).
MEPA, (2007). Base Maps, Malta Environment and Planning Authority, Floriana: Malta.
Nitrate, and Ways to Control It in Saltwater Aquariums. (2012, April 10) Available at: http://saltaquarium.about.com/od/nitratecontrol/ss/nitratecontrol.htm (accessed on November 2013).
Nitrogen Cycle. (2012, April, 11) Available at: http://www.google.com.mt/imgres?um=1&hl=mt&sa=N&tbm=isch&tbnid=6tULT0eRhxggEM:&imgrefurl=http://reefaquariumtrials.blogspot.com/2010_07_01_archive.html&docid=jJexpqJvRW7bMM&imgurl=http://2.bp.blogspot.com/_itQU3CcowS8/TEtKYFFEp_I/AAAAAAAAAFo/rXxhCpl8mz8/s1600/Aquarium_Nitrogen_Cycle.png&w=968&h=613&ei=2r2ET7TkJNPY4QTfg8jHBw&zoom=1&biw=1366&bih=542&iact=rc&dur=421&sig=111290150186223180624&page=2&tbnh=139&tbnw=219&start=10&ndsp=15&ved=1t:429,r:0,s:10,i:86&tx=87&ty=95 (accessed on November 2013).
Pedly, M. & Highes Clarke, M & Galea, P. (2002). Limestone Isles in a crystal Sea: Th e

Geology of the Maltese Islands. PEG, Malta
Pinet, Paul R. (2009). Invitation to Oceanography 5th edition. Jones and Bartlett Publishers: LLC.
Planning Authority (2002). Coastal Strategy Topic Paper. Floriana: Malta.
Photosynthetic Pigments. (2012, March, 26) Available at: http://www.ucmp.berkeley.edu/glossary/gloss3/pigments.html (accessed on November 2013).
Phosphate in Sea Water. (2012, April 11) Available at: http://www.aquacare.de/info/tipps/e1po4.htm (accessed on November 2013).
Phosphates in the Aquarium. (2012, April 11). Available at: http://freshaquarium.about.com/od/watercare/a/phosphates.htm (accessed on November 2013).
Pretty Bay. (2012, April 6). Available at: http://www.traveljournals.net/explore/malta/map/m29313/pretty_bay.html (accessed on November 2013).
Refalo, M. (2012). Distribution of marine algae along the coastline of the Maltese Islands in relation to environmental factors, Unpublished Bachelor of Arts Dissertation, University of Malta.
Robarts, R. D. & Zohary. T. (1987). Temperature eff ects on photosynthetic capacity, respiration, and growth rates of bloom forming cyanobacteria. New Zealand Journal of Marine and Freshwater Research, 21:3, 391-399.
Russell B. D., & Connell. S. D., (Jul., 2009). Ecological Applications, Vol. 19, No. 5 pp. 1114-1126.
Setchell, W. A., (1917). Geographical Distribution of the Marine Algae. Science, New Series, Vol. 45, No. 1157, pp. 197-204.
Setchell, W. A., (1915), Th e Law of Temperature Connected with the Distribution of the Marine Algae. Annals of the Missouri Botanical Garden, Vol. 2, No. 1/2, Anniversary Proceedings, pp. 287-30.
Strahler. A & Strahler. A,.(2005). Physical Geography: Science and Systems of the Human Environment (3rd ed.), John Wiley & Sons. Inc.
Th e Eff ect of Diff erent Levels of Nitrate and Phosphate on the Macroinvertebrate Populations in Diff erent Streams. Available at: http://www.tjhsst.edu/~ibet/0506/science/tbrobst.htm (accessed on November 2013).
Waugh, D. (2002). Geography and Integrated Approach (3rd Ed.). UK: Nelson 2000.
Weather Forecast Available at: http://www.maltaweather.com/climate.shtml [Accessed on 19th March 2012] (accessed on November 2013).
What is the role of Chlorophyll? (2012, April 10) Green plants and chlorophyll. Available at: http://www.webexhibits.org/causesofcolor/7A.html (accessed on November 2013).

What is the Nitrogen Cycling Process in Marine Saltwater Aquarium? (2012, April 11) Available at: http://saltaquarium.about.com/od/bionitrogencycle/a/What-Is-Th e-Nitrogen-Cycling-Process-In-A-Marine-Saltwater-Aquarium.htm (accessed on November 2013).
What Is the ph of Salt Water? (2012, April 18) Available at: http://www.ehow.com/about_5098328_ph-salt-water.html (accessed on November 2013).
Why oxygen dissolved in water is important. (2012, May 8) Available at: http://www.lenntech.com/why_the_oxygen_dissolved_is_important.htm (accessed on November 2013).

208 Future Preparedness: Th ematic and Spatial Issues for the Environment and Sustainability

C H A P T E R 1 1
A GIS Based Character Appraisal ToolkitMalcolm Borg and Saviour Formosa
IntroductionA Background to Th e Evolution of Character Appraisals
Th e evolution of character appraisals is closely connected to the development of British planning legislation. Section 69 of the Planning (Listed Building and Conservation Areas) Act 1990 defi nes conservation areas as ‘areas of special architectural or historic interest, the character or appearance of which it is desirable to preserve or enhance’ (1). British local planning authorities have the statutory obligation to identify and designate such areas (2). Th ese areas may vary in character, form and size and may contain listed buildings. On the other hand these may also exist as cultural landscapes with a sense of place “created by diff erent components such as unlisted traditional buildings, historic street patterns, open spaces, trees, boundary walls, views or even sites of human activity such as market places, which combine to provide special character (3)”. British Local Planning Authorities (LPA) are bound through sections 70 and 71 to survey areas and designate conservation areas. In prescribing these areas it has become essential to compile conservation area character appraisals (4).
In a drive to create eff ective character appraisals English Heritage compiled successive guidelines. A series of ‘best practice’ guidelines were fi rst compiled in 2005 with a ‘Guidance on conservation area appraisals’ (English Heritage 2005) and ‘Guidance on the management of conservation areas’ (English Heritage 2005). Th ese consultation documents were further supported by a series of publications namely; ‘Understanding Place: an Introduction’ (English Heritage 2010), ‘Understanding Place: Historic Area Assessments in a Planning and Development Context’ (English Heritage 2010), and ‘Understanding Place: Characterisation and Spatial Planning’ (English Heritage 2011). Th e last in the series is ‘Valuing Places: Good Practice in Conservation Areas’ (English Heritage 2011) which proposes approaches and techniques adopting the principle of constructive and sustainable conservation.
Th e document ‘Valuing Places: Good Practice in Conservation Areas’ essentially highlights the importance of character appraisals and its benefi ts in delineating urban conservation areas (UCAs) and managing development control systems within UCAs;

210 Future Preparedness: Th ematic and Spatial Issues for the Environment and Sustainability
An appraisal will help local authorities to develop a management plan for the conservation area because it analyses what is positive and negative, and identifi es opportunities for benefi cial change or the need for additional protection and restraint (5).
Th e principles set out in the document are connected to the exogenous eff ects or impacts of character appraisals. Character appraisals may have positive eff ects on real estate and on the property market. Th ese have the possibility to valorise the historical fabric and channel new developments and enhance character through design. Character appraisals are also important in the sphere of education and academia because they integrate the multi-layers of history through landscape. Character appraisals give a full historical overview of the urban context and map the evolution and transformation of the area under study (6).
Th e second section of this valuable document sets out the process of character appraisals which follows a stepped approach with; an audit of heritage assets, an assessment of condition and defi nition of boundary. Th e document is forward looking with section 3 proposing eff ective management and launching of management plans through community engagement and applying a ‘development team’ approach (7). Eff ective management based on character appraisals leads to the elaboration of planning strategies which may include; “Local Plan policies, guidance, regeneration strategy, enhancement schemes, street and traffi c management, trees, open space and green infrastructure strategy, enforcement and remediation strategy” (8). Th e necessity of fi ne tuning the application of character appraisals and to develop guidance to compile these assessments was signifi cant. Th is demand resulted in the creation of toolkits directed at ‘best practice’ in the methodology of applying diverse criteria for these assessments.
Toolkits for Character AppraisalsIn the past 20 years Local Councils spurred the creation of toolkits for character
appraisals in the United Kingdom. One of the most signifi cant contributions to the development of character appraisal toolkits comes through Oxford City Council in 2008 (9). In partnership with the Oxford Preservation Trust and English Heritage, Oxford City Council directed its capacity building project with a mission.
Th e Toolkit was developed in response to a need to improve the robustness of assessments of character that inform planning decisions. It will be used to enhance the assessments made by a number of participants in the planning process including developers, council offi cers and members of the public (10).
Th e development of the toolkit went through a full consultation process and was supported by an online questionnaire. Th e working group which included Oxford University and the Civic Society had an ambitious brief.
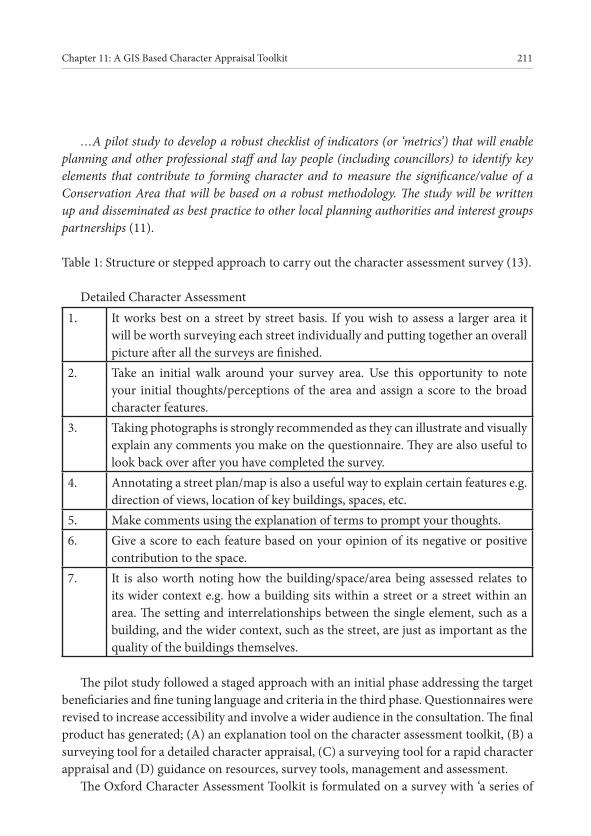
Chapter 11: A GIS Based Character Appraisal Toolkit 211
…A pilot study to develop a robust checklist of indicators (or ‘metrics’) that will enable planning and other professional staff and lay people (including councillors) to identify key elements that contribute to forming character and to measure the signifi cance/value of a Conservation Area that will be based on a robust methodology. Th e study will be written up and disseminated as best practice to other local planning authorities and interest groups partnerships (11).
Table 1: Structure or stepped approach to carry out the character assessment survey (13).
Detailed Character Assessment1. It works best on a street by street basis. If you wish to assess a larger area it
will be worth surveying each street individually and putting together an overall picture aft er all the surveys are fi nished.
2. Take an initial walk around your survey area. Use this opportunity to note your initial thoughts/perceptions of the area and assign a score to the broad character features.
3. Taking photographs is strongly recommended as they can illustrate and visually explain any comments you make on the questionnaire. Th ey are also useful to look back over aft er you have completed the survey.
4. Annotating a street plan/map is also a useful way to explain certain features e.g. direction of views, location of key buildings, spaces, etc.
5. Make comments using the explanation of terms to prompt your thoughts.6. Give a score to each feature based on your opinion of its negative or positive
contribution to the space.7. It is also worth noting how the building/space/area being assessed relates to
its wider context e.g. how a building sits within a street or a street within an area. Th e setting and interrelationships between the single element, such as a building, and the wider context, such as the street, are just as important as the quality of the buildings themselves.
Th e pilot study followed a staged approach with an initial phase addressing the target benefi ciaries and fi ne tuning language and criteria in the third phase. Questionnaires were revised to increase accessibility and involve a wider audience in the consultation. Th e fi nal product has generated; (A) an explanation tool on the character assessment toolkit, (B) a surveying tool for a detailed character appraisal, (C) a surveying tool for a rapid character appraisal and (D) guidance on resources, survey tools, management and assessment.
Th e Oxford Character Assessment Toolkit is formulated on a survey with ‘a series of

212 Future Preparedness: Th ematic and Spatial Issues for the Environment and Sustainability
themed questionnaires’ (12). Th ese are designed to prompt the assessment of those assets and features that might contribute to the character of the area, building or space. Th ese themes give the option of a numerical score which rate or give a value and signifi cance to the character of the asset. Th e scores may be subjective but the intention is to analyse comparatively trends by diff erent individuals compiling the survey. Th e toolkit also suggests a 3-stepped approach in compiling the survey; (A) initial assessment or reaction, (B) the survey and (C) a fi nal reaction. Th ere is no prescribed methodology for the application of the survey. However the document recommends a structure to maximise the potential of the survey.
Applying Character Appraisals: Th e Maltese Planning System
Th e application of character appraisals in the Maltese planning context did not arise through the legal obligations connected to the Development Planning Act (1992). Although similarly to the British Town and Planning Act 1990 the Maltese planning regime places an obligation on the Planning Authority (now the Malta Environment and Planning Authority) to schedule, list and protect heritage assets the formulation of character appraisals is not part of the legal or policy framework. Section 46 of the Development Planning Act (1992) refers to the listing and scheduling of assets.
Th e Authority shall prepare, and from time to time review, a list of areas, buildings, structures and remains of geological, palaeontological, cultural, archaeological, architectural, historical, antiquarian, artistic or landscape importance, as well as areas of natural beauty, ecological or scientifi c value (hereinaft er referred to as “scheduled property”) which are to be scheduled for conservation and may in respect of all or any one or more of the scheduled property make conservation orders to regulate their conservation…
However the obligation of assigning Urban Conservation Areas (UCAs) falls within the parameters of the ‘Structure Plan of the Maltese Islands’, specifi cally through policy UCO2 (14).
POLICY UCO 2: Provisional boundaries of Urban Conservation Areas will be defi ned for designation purposes, and precise boundaries will be specifi ed in the relevant Local Plans. Th e village core boundaries contained in the Temporary Planning Schemes shall be used as provisional boundaries. Th e Planning will amend the boundaries of designated Urban Conservation Areas and designate additional Areas as appropriate for the fulfi lment of its conservation objectives (15).
Th rough the development related pressure on the Local Plans and through the policy recommendations the Malta Planning Authority induced the compilation of Character Appraisals in 1999 with a joint pilot project focusing on the old city of Mdina. Th e joint project was developed by the Heritage Team of the Environment Management Unit and

Chapter 11: A GIS Based Character Appraisal Toolkit 213
a study group from the Town and Regional Planning Department of Dundee University in Scotland (16). Th e compilation of the character assessment for the Mdina Urban Conservation Area was supported by a re-assessment of the National Protective Inventory (NPI) and the development of a GIS based NPI. Th e whole exercise was directed at the better management of conservation and sustainable development in the area. Th e development of the digital NPI was based on the Council of Europe criteria for inventories for cultural heritage assets. Th e focus on Mdina was twofold; (1) it was vital in directing sustainable development and attenuate negative development impact and (2) Mdina had been proposed as a UNESCO World Heritage Site in the tentative list and therefore necessitated a management plan. In planning terms the digital planning tool for Mdina was crucial because in a digitally oriented development control system the NPI could assist in determining planning applications. Th e NPI was also further extended to include streets and spaces following the grading regime or system adopted for buildings.
Th e Initial GIS Structures
An initial project employing image-mapping and a webGIS option was initiated in the mid-2000s, which system created an early prototype system. Th is was based on the creation of spatial entities and attribute designations that were integrated with the digitised card material (Borg & Formosa, 2008).
Th e systems were based on graphic interfaces, where scheduled property was activated by simply clicking on an image which activated the data portal relevant to that property as well as text boxes and property imagery (Figure 1).
Figure 1: Interactive Image-Mapping system and Data Portal.

214 Future Preparedness: Th ematic and Spatial Issues for the Environment and Sustainability
Th e subsequent technologies employed for the Mdina Heritage Management System (HMS) were based on web-server technology, followed by plans for full Web-GIS systems. In sequence, this was followed by an initiation of a 3D modelling information system, which aimed to create a model of the city of Mdina in 3D allowing the GIS specialist to analyse the planning developments in real-time 3D, create a digital mirror of the town and analyse the impact of development. Th e use of early 3D modelling systems, GIS-add on applications such as raster generators (the systems were all vector-based at the time), helped create the fi rst outputs (Figure 2).
Figure 2.: 3D Mapping System – Urban Structures and Topographic Integration
Th e concept was conceived for development around a VRML model. Th is would allow users to access the city model and other linked spatial information, which would have extracted data from the HMS. Figure 3 depicts the process entailed in converting the vector data to raster and to the eventual 3D model (Borg & Formosa, 2008).
Th e conceptual model, as envisaged, was still based on the vector structure employed in the national planning agency, but early on the authors stated that the process should be an augmented one, technologies that were still 6 years away from being developed. Borg and Formosa (2008) proposed that the solution was through the generation of an immersive building and topographic model. Th e technologies available at the time were used as surrogates towards this advanced system with data integration proposed through accessibility made possible by Image-Maps and map-server options. Th e resultant information system was envisaged to deliver a layered approach where users could access data that is available in an immersive clickable scenario through direct links to 3D models of buildings within historic cities. In addition, the system would incorporate links to multimedia, imagery, walkthroughs, HMS data, and access to a dynamic array of live information systems. Interestingly, the linkages between the diff erent technologies has become a reality through the internet over the period to date. Th e internet made such

Chapter 11: A GIS Based Character Appraisal Toolkit 215
multimedia approaches a matter of fact, pushing the boundaries of the dissemination process. Th is was further enhanced through the transposition of diverse legislative tools that at the time had not yet been integrated into the Maltese system (OJ, 2003a; OJ, 2003b; OJ, 2007; Government of Malta, 2012; EC, 2014).
Figure 3a-d: 3D Mapping System – Urban Structures and Topographic Integration
Th e Next StepsTh is innovation was followed by other character appraisals directed at facilitating the
assessment and planning control in UCAs. Th e second project which followed similar assessment criteria and using the same tools were Pieta’ and Kirkop (1999-2002). Th e
Figure 3a: Th e MapInfo stage Figure 3b: Conversion to a grid fi le – building heights through Vertical Mapper
Figure 3c: Th e pseudo 3D interface Figure 3d: Integrating orthophotos for polygon analysis with the 3D interface

216 Future Preparedness: Th ematic and Spatial Issues for the Environment and Sustainability
three pilots were later used to assess the eff ects on Urban Conservation Areas and in the compilation of the section on Conservation for the Structure Plan Review (2005) (17). Following these developments in 2008 the Ministry for Urban Development and Roads developed a character appraisal to direct the ‘Marsascala Action Plan - A Transit Village for a Sustainable Community’ and assist the compilation of project design briefs. Heritage Enterprise produced two main character appraisals between 2009 and 2011.
To develop the Valletta Action Plan through the co-funded Urbact project HERO and following ‘best practice’ a pilot area over the Marsamxett quarters was drawn-up. Th e HERO project which was based on the application of the Cultural Heritage Integrated Management Plan (CHIMP) was an opportunity to develop an Action Plan for the said area using Council of Europe and UNESCO parameters. Th is was further supplemented by a full character appraisal commissioned by the Valletta Local Council. Th e REPAIR Urbact project for Paola which had as its deliverable an Action Plan also used as a platform a character appraisal aft er the draft ing of a baseline study. Th e character appraisal was deployed for planning and design and was crucial in the development of the heritage trail and interconnecting World Heritage Sites.
Toolkits: Th e Maltese Experience Th rough Other Applications Th e application of character appraisals has been a precursor in fi ne tuning toolkits
geared specifi cally for strategic and action planning. In 2000 Heritage@Risk assessment criteria published by ICOMOS were for the fi rst time used as a tool in the Maltese context. Heritage@Risk remains a signifi cant tool to determine character and value of an asset. Th e project considered twelve sites from diff erent categories but of critical value (18).
Heritage@Risk assessment is based on a survey determined by fi ve set criteria (please refer to table 2). As in the case of character appraisal methods mentioned the structure also involves a scoring sheet with varying levels of risk within each set criterion. ‘All the sites were therefore gauged in a holistic and standard format to provide an as objective as possible picture of the situation.’ Th e critical assets were prioritised with a forecast of setting rapidly rehabilitation, restoration, maintenance and monitoring programmes. Some of these sites were not only of national signifi cance, but were of universal value, and therefore were specifi cally targeted for management under an international conventions and charters regime (19).
In developing a more objective toolkit the Research and Information Team and the Heritage Management Team at the Planning Authority formulated a digital matrix with these elaborated criteria to record surveys and the extrapolate results (20). Th is matrix is important because it is supplementary and complimentary to the National Protective Inventory (now connected to the Scheduled Property Register) and in a proactive way supports ‘sustainable conservation’ policy implementation through sensible and sensitive

Chapter 11: A GIS Based Character Appraisal Toolkit 217
interventions. Heritage@Risk also assists as a tool in gauging value even for the purposes of economics of culture or heritage economics as it indicates the value of an asset through loss or damage and assists in calculating interventions. In most situations in valorising character through appraisals Heritage@Risk was a signifi cant tool to further assess the value of a system or a group or complex of systems.
Table 2: Heritage@Risk criteria following ICOMOS conventions (21).
1. Maintenance Defi ciency2. Risks from Social and Collective Behaviour3. Insuffi cient Conservation Standards4. Development-Related Risks5. Compromised Values.
Th e demand to develop toolkits for assessment in the realm of heritage and culture is on the rise especially because experts and professionals in the fi eld seek to substantiate value not only through qualitative data but also quantitatively through the analysis of indicators and statistical data. Th e application of a GIS based toolkit for cultural assessment was considered again in 2013. Th e need for digitising a toolkit for assessing fortifi ed cities in Malta was contemplated through the surveys spearheaded by the Task Group working on the ‘Circles of Sustainability Assessments’ propelled by UN Global Compact Cities Programme through the Global Cities Institute (22). Th e Task Group composed of; political and administrative representatives from the cities, urban and environmental planning experts and citizens through the last quarter of 2013 applied the assessment on the fortifi ed cities of the Inner Harbour of Malta with the support of European Walled Towns. Th e cities included; Valletta, Floriana, Paola, Vittoriosa, Cospicua and Senglea (23).
Table 3: Th e perspectives for the ‘Circles of Sustainability Assessments’ (24)
1. Identity and Engagement2. Creativity and Recreation 3. Memory and Projection4. Beliefs and Ideas5. Gender and Generations6. Enquiry and Learning7. Health and Wellbeing

218 Future Preparedness: Th ematic and Spatial Issues for the Environment and Sustainability
Th e ‘Circles of Sustainability Assessment’ concentrated on the fourth domain culture. Th e results were presented in the Paola International Integrated Heritage Management Conference (December 2013). Th e results were presented supported by a paper following the criteria set by the questionnaire and therefore substantiated through ‘a major essay on the urban area using the questions to guide the writing’ and ‘assigning metrics-based indicators to each point on the scale’ (25). Th e Task Group went a step further as it was interested in graft ing the results spatially and in the process it investigated the possibility of dovetailing these indicators to other area based environmental indicators. Th e questionnaire based tool makes use of a number of domains, sub-domains also referred to as perspectives and aspects. Th e questionnaire gives a further possibility of gauging the aspects through a scoring system (26).
New GIS Technologies and Extending Character Appraisal ToolsNew methodologies entail the uptake of new technologies. Having been instrumental
in the conceptualisation of methods of dissemination in the mid-2000s, as described in the HMS exercise described earlier, the GIS-based toolkit employed a decade later, again took up new methodologies to investigate the study areas through the application of the ‘Circles of Sustainability Assessments’. From base-mapping exercises to fully immersive technologies, the new exercise elicited vital analytical outputs. Figure 4 depicts the vector-based output that integrated the model statistics in a 2D mode.
Figure 4: 2D models for perspectives for the ‘Circles of Sustainability Assessments’ applications. Th ese will ultimately also sustain the compilation of Character Assessments

Chapter 11: A GIS Based Character Appraisal Toolkit 219
Preparing for the potential creation of an interactive 3D model of the islands, inclusive of the NPI, would require the uptake of various technologies and legislative tools, inclusive of diverse European Union directives (Formosa, 2012). Such was required due to the changes emanating from international and national initiatives and projects (GEO, 2014; OJ, 2003a; OJ, 2003b; OJ, 2007; Government of Malta, 2012; EC, 2014; MEPA 2009; MEPA, 2014).
Th e new process also entailed a series of steps that employed raster mapping as its core functions. Th e results allowed for the depiction of a series of spatial information structures, which, using the relative visualisation tools, would in turn result in the generation of real immersive information systems.
Figure 5 depicts the base layers created from a series of LIDAR data sheets pertaining to the Mdina area. Th is was made possible through the implementation of an ERDF project entitled Developing National Environmental Monitoring Infrastructure and Capacity [8], which involves monitoring of air, water, soil, radiation and noise and 3D terrestrial and bathymetric surveys. Th is project co-fi nanced by the European Regional Development Fund, which provided 85% of the funding and the Government of Malta, which fi nances the rest under Operational Programme 1 - Cohesion Policy 2007-2013 - Investing in Competitiveness for a Better Quality of Life. Th e results from this project included terrestrial and bathymetric data covering the entire nation as well as 1 nautical mile from the baseline coast, at points of (0.25m – terrestrial) and 1m (bathymetric) resolution.
Figure 5: Initial Conversion steps (a) Mdina sheets integration in LasTools and (b) Mdina side perspective.
(a) (b)
Taking the process one step further entailed the sourcing of dissemination technologies. Th is has been initiated and is under investigation for its potential to provide the tool for the realisation of the earlier exercise. Various tools were investigated and whilst dedicated

220 Future Preparedness: Th ematic and Spatial Issues for the Environment and Sustainability
applications are available for the purpose of this exercise, an interactive tool was readily available, one with a low learning curve. Th e application under review, Minecraft , is based on a simple block concept which provides an environment with the main elements required for this exercise (27). Whilst technically a game engine, the applications is instrumental in providing for the management of the spatial component and also providing access to the alteration of the virtual spaces. Th e immersive component empowers users with potential for the alteration of the surroundings, develop buildings, create scenarios and collaborate with other persons.
Figure 6: (a) 1m block conversion output – top perspective and the (b) Main square walkabout view.
(a) (b)
Figure 6 depicts the result of the Figure 5 2D to 3D conversion. Various potential information systems can be integrated in such serious game environments allowing for the study of social interactivities that also depict the fi ndings from the Heritage@Risk outputs.
Towards a Comprehensive Toolkit for Character AppraisalsBuilding on the experience gained through the fi ne tuning of toolkits for character
appraisals and other applications which are based on urban conservation management or related assessments a comprehensive toolkit should facilitate planning processes. A comprehensive toolkit will facilitate the data gathering processes and provide a GIS based tool which is accessible to all. In a world where urban planning is moving towards ‘decentralization and democratization where the actors may realise the set goals on a regional and local level rather than through a top-down approach’ a comprehensive toolkit for character appraisals will enhance good governance through a digital driven dynamic public consultation instrument (28).

Chapter 11: A GIS Based Character Appraisal Toolkit 221
ReferencesAntonio, A., Astin, H., & Cress, C. (2000). Community service in higher education: A look at the nation’s faculty. Review of Higher Education, 23(4), 373-398.
Baldwin, R. G. (1996). Faculty career stages and implications for professional development. In D. Finnegan, D. Webster, & Z. F. Gamson (Eds.), Faculty and faculty issues in colleges and universities (2nd ed.). Boston, MA: Pearson Custom Publishing.
Borg M. and Formosa S., (2008), Th e Malta NPI project: Developing a fully-accessible information system, In Wise S., and Craglia M., (Eds.), GIS and evidence-based policy making, Innovations 10. Taylor & Francis, Boca Raton, Florida. ISBN 978-0-8493-8583-4
EC (European Commission), (2014, February 10). Shared Environment Information System. Available at: http://ec.europa.eu/environment/seis/ (accessed 12 January 2014)
English Heritage (2011). Understanding Place: Conservation Area Designation, Appraisal and Management. Available at: http://www.english-heritage.org.uk/publications/understanding-place-conservation-area/ (accessed on 15 March 2014)
Formosa S., (2012), Soaring Spaces: the Development of an Integrated Terrestrial and Bathymetric Information System for the Maltese Islands In Buhmann E., Ervin S., and Pietsch M., (Eds.): Peer Reviewed Proceedings of Digital Landscape Architecture 2012, Anhalt University of Applied Sciences. Wichmann Verlag, Berlin
Formosa, S. & Borg, M. (2002). Th e Malta NPI Project: Developing a fully-accessible information system, GISRUK 2002 Conference, Sheffi eld U.K.
GEO (Group on Earth Observations). (2014, Feburary 5) Available at: http://www.earthobservations.org/index.shtml (accessed 12 January 2014)
Government of Malta, (2012). Freedom of Information Act, CAP496. Valletta, Malta.
MEPA (Malta Environment & Planning Authority), (2009). Developing National Environmental Monitoring Infrastructure and Capacity, MEPA, Floriana, Malta.
MEPA (Malta Environment & Planning Authority), (2014, February 10). Shared Environmental Information System. Available at: http://www.seismalta.org.mt (accessed 12 January 2014)
Morison, S.E. (1936). Harvard College in the seventeenth century. Cambridge, Massachusetts: Harvard University Press.

222 Future Preparedness: Th ematic and Spatial Issues for the Environment and Sustainability
OJ (Offi cial Journal of the European Union), (2003a). Directive 2003/4/EC of the European Parliament and of the Council of 28 January 2003 on Public access to environmental information and repealing Council Directive 90/313/EEC (Aarhus), L 041 , 14/02/2003 P. 0026 – 0032 (28 January 2003).
OJ (Offi cial Journal of the European Union), (2003b). Directive 2003/98/EC of the European Parliament and of the Council of 17 November 2003 on the re-use of public sector information, L 345, 31/12/2003.
OJ (Offi cial Journal of the European Union), (2007). Directive 2007/2/EC of the European Parliament and of the Council of 14 March 2007 establishing an Infrastructure for Spatial Information in the European Community (INSPIRE), L108, Volume 50 (25 April 2007).
Notes1) Town and Planning Act 1990 [online], http://www.legislation.gov.uk/ukpga/1990/8/part/II/chapter/II/crossheading/local-plans.
2) Op.cit.
3) MacCullagh, R., Conservation Areas, [online], http://www.buildingconservation.com/articles/conservareas09/conservareas09.htm
4) Op.cit.
5) English Heritage (2011). Understanding Place: Conservation Area Designation, Appraisal and Management, Helm, 5.
6) Op.cit.
7) Op.cit.
8) Op.cit.
9) Th ere were other toolkits for character assessments and appraisals namely; the Staff ord County Council, Edinburgh World Heritage, Th e Civic Trust of Wales and other tools listed on the Placemaking Workshop [online], http://www.bathnes.gov.uk/sites/default/files/sitedocuments/Planning-and-Building-Control/Planning-Policy/Placemaking-Plan/toolkits.pdf
10) Oxford City Council (2011),Report on how the toolkit was developed with our community partners, [online], http://www.oxford.gov.uk/PageRender/decP/CharacterAppraisalToolkit.htm

Chapter 11: A GIS Based Character Appraisal Toolkit 223
11) Op.cit.
12) Oxford City Council (2011), Oxford Character Assessment Toolkit: detailed character assessment, [online], http://www.oxford.gov.uk/PageRender/decP/CharacterAppraisalToolkit.htm
13) Op.cit.
14) Th e Development Planning Act (1992) [online], http://www.mepa.org.mt/LpDocumentDetails?syskey=29
15) Structure Plan for the Maltese Islands - Draft Final Written Statement and Key Diagram (December 1990) full written statement [online], http://www.mepa.org.mt/lpg-structureplan
16) Th e team was coordinated by; Dr Malcolm Borg, Mr Bill Richardson (Planning Authority, Malta) and Mr Neil Grieve (University of Dundee, Scotland)
17) Structure Plan Review (2005), [online], http://www.mepa.org.mt/lpg-structureplanreview
18) ICOMOS World Report on Monuments and Sites in danger 2000-2001, [online], http://www.international.icomos.org/risk/2001/malt2001.htm
19) Op.cit.
20) Th e project team was led and coordinated by Dr Saviour Formosa and Dr Malcolm Borg.
21) Op.cit.
22) Urban Profi le Process Tool, [online], http://citiesprogramme.com/aboutus/our-approach/circles-of-sustainability
23) Th e task group was led by Dr Malcolm Borg in collaboration with Dr Saviour Formosa responsible for statistical analysis and Mr Victor Sladden advisor to European Walled Towns. Professor Paul James Director of the Global Cities Institute supervised the exercise.
24) Op.cit.
25) Urban Profi le Process Tool, [online], http://citiesprogramme.com/aboutus/our-approach/circles-of-sustainability

224 Future Preparedness: Th ematic and Spatial Issues for the Environment and Sustainability
26) Op.cit.
27) Minecraft is a game about breaking and placing blocks. At fi rst, people built structures to protect against nocturnal monsters, but as the game grew players worked together to create wonderful, imaginative things. [online], https://minecraft .net/.
28) Borg, M., ‘Corradino Lines Recreational Park, Management Plan (2013), quoting Geospatialworld [online],http://www.geospatialworld.net/paper/business/ArticleView.aspxaid=30413#sthash.vYzAkclq.dpuf.

C H A P T E R 1 2
Information Needs for Environmental Policy Making: Some Orientations for the Future
Marguerite Camilleri and Roberta Debono
IntroductionRecent good practice has highlighted the need for evidence-based policy in all fi elds,
including that of the environment (1). Th ere is an ongoing need for reliable information to inform the policymaking process. A strong evidence-base also contributes to more robust design and assessment of policy options. In the environmental fi eld, the putting in place of environmental monitoring processes and the regular publication of state of the environment reports have contributed signifi cantly to providing a better evidence base for policy. Th e EU-funded ERDF project has played an important role in upgrading national environmental monitoring programmes, and further related projects also addressing particular thematic areas in the environmental fi eld are planned for the next structural funding period up to 2020. Th is paper puts forward a set of orientations for the future to be taken into account in order to improve the evidence base to support national environmental policy-making processes, including the monitoring of existing policies, now that the data from the ERDF monitoring project is becoming available. Th e basis of the analysis is the authors’ work on monitoring the implementation of the National Environment Policy and previously on state of the environment reporting.
Background: Th e Need for a Strong Evidence-Base for Environmental PolicyTh e Rio+20 Summit highlighted in its outcome document ‘Th e Future We Want’ the
importance of a strong evidence-base for policy. Its section on institutional framework capacity for sustainable development aims to:
76 (g) Promote the science-policy interface through inclusive, evidence-based and transparent scientifi c assessments, as well as access to reliable, relevant and timely data in areas related to the three dimensions of sustainable development...
Furthermore, one of the roles of the planned High-level Political Forum, a major

226 Future Preparedness: Th ematic and Spatial Issues for the Environment and Sustainability
outcome of Rio+20, is to ‘Enhance evidence-based decision-making at all levels’ (para 85l).
At a European Union (EU) Level, Priority Objective Five of the nine priority objectives of the EU’s 7th Environment Action Programme (7th EAP) (2) is ‘to improve the knowledge and evidence base for Union environment policy.’ In para 71, the 7th EAP highlights the following fi ve knowledge gaps at an EU level:i. complex issues related to environmental change, such as the impact of climate
change and natural disasters, the implications of species loss for ecosystem services, environmental thresholds and ecological tipping points, planetary boundaries, systemic risks and society’s ability to cope with them, mapping and assessing ecosystem services, understanding the role of biodiversity in underpinning such services, as well as understanding how biodiversity adapts to climate change and how the loss of biodiversity aff ects human health;
ii. the interplay between socio-economic and environmental factors, sustainable consumption and production patterns, how the costs and benefi ts of action and the costs of inaction can be considered more accurately, how changes in individual and societal behaviour contribute to environmental outcomes and how Europe’s environment is aff ected by global megatrends;
iii. uncertainties surrounding the human health and environmental implications of endocrine disruptors, the combined eff ects of chemicals, certain chemicals in products and certain nanomaterials;
iv. chemical exposure and toxicity; v. clear overview of GHG measurement, monitoring and data collection, which is
currently incomplete for key sectors.
Th e 7th EAP highlights the need to continue to develop and improve environmental information systems since ‘certain new and emerging issues arising from rapid technological developments that outpace policy, such as nanomaterials and materials with similar properties, unconventional energy sources, carbon capture and storage and electromagnetic waves, pose risk management challenges and can give rise to confl icting interests, needs and expectations.’ It stresses that to avoid ‘increasing public concern and potential hostility to new technologies ... [t]here is ... a need to ensure a broader, explicit societal debate about the environmental risks and possible trade-off s that we are willing to accept in the light of sometimes incomplete or uncertain information about emerging risks and how they should be handled. A systematic approach to environmental risk management will improve the Union’s capacity to identify and act upon technological developments in a timely manner, while providing reassurance to the public.’

Chapter 12: Information Needs for Environmental Policy Making 227
Key commitments emerging from the 7th EAP related to the fi ft h priority objective are listed in Box 1 below.
Box 1: Commitments from the EU 7th EAP regarding Priority Objective 5 (to improve the knowledge and evidence base for Union environment policy)
In order to improve the knowledge and evidence base for Union environment policy, the 7th EAP shall ensure that by 2020 (3): (a) policy-makers and stakeholders have a more informed basis for developing and implementing environment and climate policies, including understanding the environmental impacts of human activities and measuring the costs and benefi ts of action and the costs of inaction; (b) the understanding of, and the ability to evaluate and manage, emerging environmental and climate risks are greatly improved; (c) the environment science-policy interface is strengthened, including the accessibility of data for citizens and the contribution of citizens’ science; (d) the impact of the Union and its Member States in international science-policy fora is enhanced in order to improve the knowledge base for international environment policy.
Th is requires, in particular: (i) coordinating, sharing and promoting research eff orts at Union and Member State level with regard to addressing key environmental knowledge gaps, including the risks of crossing environmental tipping-points and planetary boundaries; (ii) adopting a systematic and integrated approach to risk management, particularly in relation to the evaluation and management of new and emerging policy areas and related risks as well as the adequacy and coherence of regulatory responses. Th is could help to stimulate further research on the hazards of new products, processes and technologies; (iii) simplifying, streamlining and modernising environmental and climate change data and information collection, management, sharing and re-use, including the development and implementation of a Shared Environmental Information System; (iv) developing a comprehensive chemical exposure and toxicity knowledge base which draws on data generated without animal testing where possible. Continuing the Union’s coordinated approach to human and environmental biomonitoring including, where appropriate, standardisation of research protocols and assessment criteria; (v) intensifying cooperation at international, Union and Member State level on the environment science-policy interface.

228 Future Preparedness: Th ematic and Spatial Issues for the Environment and Sustainability
On a national level, the National Environmental Policy (NEP) contains a policy to: ‘improve research and information about the environment.’ Th e NEP states in its section on policy implementation that ‘[e]nvironmental information is an essential building-block for good policy.’ It also notes that ‘[r]esearch is a prerequisite for information provision, as it lays the groundwork for developing monitoring systems as well as for evaluating and improving policy responses.’
Relevant measures in the policy include ensuring that all major environmental media are covered by environmental monitoring programmes (3.4.1) (which the ERDF project that is the subject of this publication has gone a long way towards achieving), and measure 3.4.5, which aims to strengthen the environmental policy research function within Government. Other related NEP measures that highlight particular areas of environmental policy call for the investigation of the sources of signifi cant risk factors in terms of soil contamination (2.3.31), for the setting up of an integrated maritime information system (2.3.12), for research and development in the aquaculture fi eld (2.3.25), for an adequate waste information system (2.3.36), for the preparation of national impact scenarios on climate change (2.6.3), and for an adequate knowledge-base, including baseline information, about national biodiversity and ecosystems (2.6.14). Furthermore NEP Pilot Project 3 calls for research and development into more effi cient use of resources in the construction sector.
Considerations Emerging from the NEP Monitoring ProcessTh e NEP is the subject of a robust monitoring system whereby its over 250 monitoring
indicators are kept under observation. Th e process of gathering monitoring data has pointed to gaps in a number of areas. In the section on the green economy, data gaps are found in the area of green jobs, green accounting, organisations with environmental certifi cation, and whether contracts for goods and services falling under the product groups covered by green public procurement are encouraging eco-innovation. In the fi eld of environmental health, linked data on environment and health is not yet available, although certain important studies linking air quality and children’s health have been carried out (4). An Environmental Health Inequalities Report for Malta (5) was also published in 2013, which linked social, environmental and health data in innovative ways.
In the section on resources, the major data-gaps relate to an update to the mineral resources lifespan projections, marine and coastal quality data, and the risk factors aff ecting soil quality. As one of the key measure promoted by the NEP, information on current levels of pedestrianisation in the various localities is also required, and is not yet available. Th e NEP monitoring process also identifi es that while better compliance is one of the NEP’s key pillars for improving policy implementation, data on the impact of

Chapter 12: Information Needs for Environmental Policy Making 229
general binding rules on the local environment, and enforcement complaints is not readily available.
Some Key Research and Information Needs for MaltaOn the basis of the above considerations, as well as previous experience in state of
the environment reporting, this paper highlights four areas of particular concern. First, a key area where information remains a challenge is the marine environmental fi eld, where the signifi cant costs involved present challenges. Another key area is that of sustainable housing, where signifi cant research and innovation will be required in the move towards zero-energy housing in line with national obligations. At another level there is a need for integrated assessments that highlight the links between datasets such as environmental and health data, and the economic and environmental data, with examples of data needs in the latter case relating to green accounting and green jobs. Finally, on this basis, integrated models will need to be developed that link the environmental data to socio-economic parameters to facilitate the testing of various policy options and measures.
Th e marine environmentOne of the key areas where more information is required is the marine environmental
fi eld, where the higher cost of data gathering presents particular challenges. Th e NEP in its measure 2.3.12 calls for an integrated maritime information system structured to refl ect EU monitoring requirements. Th e EU monitoring requirements emerge from the Water Framework Directive (WFD) (covering the coastal area up to 12 Nm), the Marine Strategy Framework Directive (MSFD) (which covers the area between the 12 Nm boundary and the 25Nm Fisheries Management and Conservation Zone covering marine waters where a Member State has and/or exercises jurisdictional rights, in accordance with the United Nations Convention on the Law of the Sea), and the Habitats and Wild Birds Directives. Th e integrated maritime information system is envisaged to draw together information both about the state of the environment in terms of biological and chemical status, as well as overlying information about trends in economic and social pressures having an impact on marine areas, such as fi sheries, aquaculture, maritime shipping and off shore infrastructure. Th e commissioning of such a joint database would facilitate a clearer understanding of the implications of policy measures.
Some of this information has already been gathered, for example as part of the Initial Assessment undertaken to implement Article 8 of the MSFD. Th e Initial Assessment covers characteristics, current environmental status (based on an analysis of chemical, physical and biological characteristics pertaining to the marine and pressures and impacts thereon on the marine area), and an economic and social analysis of the use of those waters and of the cost of degradation of the marine environment. Th e wide-ranging

230 Future Preparedness: Th ematic and Spatial Issues for the Environment and Sustainability
scope of this type of assessment allows for more powerful analysis of the implications of policy options, as discussed later in this paper in the section on integrated assessments. Important ecological and chemical monitoring data for the coastal area has also been made available by means of the fi rst comprehensive baseline monitoring carried out as part of the implementation of the First Water Catchment Management Plan 2011-2015, which implements the WFD in coastal areas. Th e Initial Assessment noted above, which was undertaken as part of the initial requirements of the MFSD, incorporates part of the data generated by this baseline monitoring of coastal waters. Malta is committed to address some of the data gaps pertaining to the marine environment, as identifi ed by the MSFD Initial Assessment, through the development and implementation of the MSFD monitoring programme, which is due in 2014.
Other information related to marine biodiversity has been gathered as part of the implementation of Article 17 of the Habitats Directive, however there are still data gaps related to the marine environment. Malta’s Article 17 report (6) indicates that 15.4 percent of priority species under the Directive remain of unknown status, 7 out of 8 of which are marine species. Th e two LIFE projects (Migrate and Baħar) should lead to additional information on the marine environment, which should feed into the next Article 17 report. Further initiatives will also be considered to address data on marine species not covered through ongoing projects (7).
Sustainable housingA second knowledge-gap relates to the fi eld of sustainable housing and the relationship
between energy consumption and the built environment more generally. Signifi cant research and innovation in this area is required as Malta seeks to implement its obligations in relation to the 2010 EU Directive on energy performance in buildings (8). Th is Directive indicates that by end December 2018 all new public buildings (of specifi c dimensions and uses) will need to be nearly zero-energy, a criteria that will apply to all new buildings by end December 2020. Th e University of Malta is already working in this fi eld, looking at a range of issues related to energy use and the built environment, ranging from building materials to retro-fi tting of existing building, behavioural aspects of zero-energy building, and innovative concepts such as green roofs (9).
NEP Pilot Project 3 highlights the importance of this area, identifying the need for more research, including policy research, on resource use in the construction sector (see Box 2). Th is pilot project lists particular knowledge gaps in three areas of the built environment: re-use and recycling of stone; the characteristics of vacant property and possible policy options to address them; and, retro-fi tting existing buildings to improve their resource effi ciency.

Chapter 12: Information Needs for Environmental Policy Making 231
Box 2: Extracts from NEP Pilot Project 3
Th e effi cient use of stone, land, energy and water resources in the construction sector is constrained by three factors: the low level of re-use and recycling of stone; the large stock of vacant property (10); and, the lack of knowledge in the area of retro-fi tting the various types of existing properties to make them more energy- and water-effi cient. In order to address these issues in a coordinated manner, it is necessary to examine the reasons for the high levels of vacant property in the Maltese Islands, and which policy options and measures would be most suitable to address the vacancy rate. In addition there is need for research and development to propose technological options for the improved quarrying, re-use and recycling of stone. Research into policy options and measures to encourage the re-use and recycling of stone, based on observations of operational constraints in current major projects, is also required. Perhaps one of the most urgent research needs, because it relates to legal obligations with a fi xed timeframe, relates to the Energy Performance in Buildings. In this respect it becomes an urgent research priority to examine various technical options for the retrofi tting of existing buildings, and to examine policy options and measures that may be used to encourage the retrofi tting and upgrading, with a view to re-occupation of existing buildings in particular areas (historic, early-modern, recent). In the case of historical areas, the study should address what is needed for the buildings to support living communities in the 21st Century.
Integrated assessmentsDue to the complexity of environmental interactions, integrated assessments that
identify and characterise links between the physical environment and socio-economic drivers and impacts are increasingly necessary. Some of these integrated assessments are called for within environmental directives (such as the MSFD) or mentioned (as noted above) in high-level policy documents such as the 7th EAP, which inter alia calls for further work within environmental health on human and environmental biomonitoring. Candidate areas for such type of assessments are therefore datasets linking environmental and health data, and those linking economic and environmental data. Th e NEP monitoring process, as noted above, identifi es signifi cant data gaps in these areas where integrated assessments are required: the green economy (e.g. green jobs and green accounting) and environmental health.
Integrated modelsFurther to the gathering of integrated datasets, models will need to be developed that
link environmental data to socio-economic parameters, which will enhance capacity for

232 Future Preparedness: Th ematic and Spatial Issues for the Environment and Sustainability
testing policy options. Th e principal reason why models are required is the complexity of environmental interactions (between the diff erent media), as well as the complexity of the interactions between human activities and the environment. Modelling is currently used to generate data (11) and also for testing of economic measures in the socio-economic fi eld.
What is envisaged here are models that can be used to predict both the socio-economic and environment outcomes of particular policy options and measures. In certain policy areas the need for such models is already necessitated through EU-related obligations – for example in the area of air quality. As per Annex XV of the Air Quality Framework Directive, information to be provided under Article 23 (air quality plans) includes an ‘estimate of the improvement of air quality planned and of the expected time required to attain these objectives’, which requires a model of the complex interactions between environmental and anthropogenic variables that aff ect air quality. Although such integrated models are required, this does not mean that there are no signifi cant challenges involved, primary of which is likely to be the dearth of long time series data on environmental quality.
Further ObservationsA few further observations are appropriate before closing. First, it is important that
steps are taken to ensure that the results of environmental monitoring can be used by a variety of stakeholders. Open access to environmental data, in line with the Aarhus Convention and the 7th EAP’s concerns regarding citizens’ science, will allow more and better use of the data and will also increase public trust in the data and the systems that underlie it. Th is is one of the strengths of the ERDF monitoring project, and the Shared Environmental Information System model it incorporates. Th e integrated assessments and modelling exercises that are the subsequent fruit of monitoring programmes should also be made available.
Second, the issue of capacity to use publicly-available information needs to be borne in mind. Sophisticated computer skills and soft ware are not widely available (or accessible), so information needs to be presented in a variety of formats to be accessible to a range of users, ranging from raw data that requires sophisticated soft ware to access, to easily-understandable and attractively-presented information of the ilk of state of the environment reports.
Th ird, in relation to the scope of environmental and related monitoring programmes, it might be useful to bear in mind the following issues as national monitoring programmes are designed and updated. Th e fi rst concerns what parameters to monitor: Professor Victor Axiak of the University of Malta, at a recent conference on the Mediterranean Environment (12), cautioned about focussing national monitoring programmes solely on parameters identifi ed in legal requirements emanating out of the EU aquis, as some environmental

Chapter 12: Information Needs for Environmental Policy Making 233
issues might be particular to Malta. He mentioned the example of soil quality issues due to activities such as fi reworks. In such a case the monitoring of perchlorates would be imperative, while perchlorates are not listed as priority substances by the EU. Another and related matter concerns timeliness, as our monitoring programmes become more sophisticated and seek to serve national as well as international policy processes, the need for more timely information that might not always match the monitoring cycles enshrined in EU Directives is increasingly becoming apparent.
ConclusionTh is paper has sought to outline some of the knowledge gaps currently existing in the
fi eld of environmental information, as well as some orientations on the type of assessment, included integrated assessment, that would pave the way for the development of integrated models for policy analysis, which are increasingly required. It is important that these orientations for the future are taken into account when designing the next generation of environmental monitoring programmes. While addressing the major knowledge gaps that still exist, it is important to address also the interlinkages between policy areas, so that key relationships, including spatial relationships, may be identifi ed and addressed. Given these orientations, and the considerations outlined above, it is important that adequate and ongoing resources are allocated for environmental and related monitoring programmes.
AcknowledgementsOur thanks go to colleagues in the various sectors who gave invaluable advice: Claudine
Cardona and Miraine Rizzo of MEPA regarding coastal and marine data respectively, Marie Th erese Gambin from MEPA on biodiversity, Silvan Zammit from NSO on residential vacancy, Dr Karen Vincenti and Dr Christine Baluci from the Department of Environmental Health on environmental health, and Professor Victor Axiak for his comments on environmental monitoring. Finally, we are also grateful to Dr Saviour Formosa for his general advice and enthusiasm.
ReferencesBalzan, M.V. and Bonnici, J.J., (2004). Increased prevalence in asthma related symptoms on exposure to heavy traffi c. European Respiratory Journal; 24: Suppl. 48, 140s. In G. Schembri, (2007), Traffi c, diesel and asthma: A literature review. Malta Medical Journal, 20: 04).
Department for Health Regulation, Ministry for Health, (2013). Environmental Health Inequalities in Malta: Assessment Report. Published in collaboration with the World Health Organization European Centre for Environment and Health of the World Health

234 Future Preparedness: Th ematic and Spatial Issues for the Environment and Sustainability
Organization Regional Offi ce for Europe. Available at: http://www.euro.who.int/__data/assets/pdf_fi le/0016/243160/Environmental-Health-Inequalities-in-Malta.pdf (accessed on 13 March 2014).
MEPA (Malta Environment and Planning Authority), (2013, March 10). [On-line] Habitats Directive: Report on Implementation Measures. Malta: MEPA. Available at: http://cdr.eionet.europa.eu/mt/eu/art17/envue53pa (accessed on 10 March 2014).
MTCE (Ministry for Tourism, Culture and the Environment), (2012). National Environment Policy. Malta: MTCE. Available at: http://www.tsdu.gov.mt/environment-nep (accessed on 10 March 2014).
Notes
1. See for example, the EU 7th Environmental Action Programme (DECISION No 1386/2013/EU of the European Parliament and of the Council of 20 November 2013 on General Union Environment Action Programme to 2020 ‘Living well, within the limits of our planet’ [Text with EEA relevance]).
2. DECISION No 1386/2013/EU of the European Parliament and of the Council of 20 November 2013 on a General Union Environment Action Programme to 2020 ‘Living well, within the limits of our planet’ (Text with EEA relevance).
3. Para 73.
4. For example, Balzan M.V. and Bonnici J.J., (2004). Increased prevalence in asthma related symptoms on exposure to heavy traffi c. European Respiratory Journal; 24: Suppl. 48, 140s. (cited in Schembri, G. [2007]. Traffi c, diesel and asthma: A literature review. Malta Medical Journal; 20: 04). Other work is also in progress, such as the RESPIRA project. Available at: http://www.respira-project.com/ (accessed on 14 March 2014).
5. Department for Health Regulation, Ministry for Health, (2013). Environmental Health Inequalities in Malta: Assessment Report. Published in collaboration with the World Health Organization European Centre for Environment and Health of the World Health Organization Regional Offi ce for Europe. Available at: http://www.euro.who.int/__data/assets/pdf_fi le/0016/243160/Environmental-Health-Inequalities-in-Malta.pdf (accessed 13 March 2014).
6. Malta Environment and Planning Authority, (2013). Habitats Directive: Report on Implementation Measures. Malta: Malta Environment and Planning Authority. Available

Chapter 12: Information Needs for Environmental Policy Making 235
at: http://cdr.eionet.europa.eu/mt/eu/art17/envue53pa (accessed on 10 March 2014).
7. Available at: http://www.mepa.org.mt/biodiversity-projects (accessed on 10 March 2014).
8. Directive 2010/31/EU of the European Parliament and of the Council of 19 May 2010 on the energy performance of buildings.
9. Available at: http://www.um.edu.mt/ben/faculty (accessed on 10 March 2014).
10. Note that the NEP cites the fi gure for permanent vacancy at 22% of dwelling stock. Th e 2011 Census uses diff erent categories to describe vacancy, with the result that only the total vacancy rate can be compared with the 2005 fi gure: in this regard the data indicates that total vacancy increased by four percentage points between 2005 and 2011, from 28% to 32% or from 53,136 to 71,080 dwellings.
11. See for example the provisions for use of models in the 2008 Air Quality Framework Directive – preambular paragraph 6: ‘Where possible modelling techniques should be applied to enable point data to be interpreted in terms of geographical distribution of concentration. Th is could serve as a basis for calculating the collective exposure of the population living in the area.’ Available at: http://eur-lex.europa.eu/LexUriServ/LexUriServ.do?uri=OJ:L:2008:152:0001:0044:EN:PDF (accessed 13 March 2014).
12. GID Parmenides VI, ODMED, Observatory for the Development of the Mediterranean, a Tool for Decision makers, 12-14th November 2013, Valletta University Campus, Valletta, Malta.

236 Future Preparedness: Th ematic and Spatial Issues for the Environment and Sustainability

237
C H A P T E R 1 3
Spatial Conceptualisation as a Foundation for Social Interactionism in Virtual Worlds
Saviour Formosa
IntroductionIn a world relatively recently immersed in the virtual domain, sprung upon unsuspecting
newbies still struggling to understand what a 20k computer could deliver, few anticipated the massive change that was about to be wrought by technology. One generation later and new opposing dichotomies still exist: the techno-centric world and those techno-phobic or the still skeptic. Th ose lucky enough to be caught in the revolution understand the realities impinging on both worlds, but those lost in the analogue reality and the new generation that grew up with virtual access seem to be lost in their own concept of space. It is diffi cult to conceptualise living without the digital version, but such is still a reality for some who still cling to hardcopies, atlases and paper, whilst equally perplexing that the new generations do not access such but immerse themselves in virtual worlds that may yet represent real space, which in turn has resulted in the loss of linkages to the real world. Case in point is the need to establish mental connections of place between the two worlds: the availability of online map services, but few really understand their physical space and the inherent relationships between the players in their routine activity.
Th e scope of this paper is to visualise a socio-technic approach that creates virtual worlds that are understandable to new users, those who have yet to venture in the virtual immersive domain and build their worlds for eventual interactivity. It is futile for the social sciences to continue their century-old practices when dealing with the realities of the new society; counseling, sociology, social psychology, criminology as well as other natural sciences inclusive of medicine cannot abide by. Th eir need is imperative to understand the new domains in order to come up with new actions to understand the interactionism pertaining to the new societies that inhabit apparent alien domains. What Tim Berners-Lee unleashed in 1989 (1) through his world wide web (WWW) proposal (Berners-Lee, 1989) is still under study, even though it has taken over social change. Th is paper posits a process employed in Malta to bridge the gap, by creating a seed that transposes the real and understandable world to the uninitiated through the creation of a place they understand: a map of the islands.

238 Future Preparedness: Th ematic and Spatial Issues for the Environment and Sustainability
In Search of SpaceAccess to online tools and information has spread rapidly, with inter-generational
access to services such as email, browsing, recreation and retail, amongst other activities. Th e access itself is made available through 2D or pseudo-3D, though 3D technologies are emergent. Interestingly, the knowledge of place features highly in daily activity, exiting one’s dwelling, travelling to school/work/recreation, walking in known places, returning home until a pattern is established. Such known places take on a concept of space due to the interactivities with one’s social and psychological interactionism dynamics: meeting people, congregating and interacting with signifi cant others. Such is the reality of known space that specifi c theories such as Routine Activity Th eory (Cohen and Felson, 1979) have sought to understand how people interact in everyday life and how others study such interaction of their illicit deeds.
Th is concept is established as the basic tenet for the porting of the real world to the virtual one as it is one that is experienced by all, non-technics and the technic generation.
Such is the best concept for analysis as this physical interactionism is taking on a parallel shape in virtual worlds: meeting in known spaces in such worlds as 2D constructs as are social media (Facebook is an example) and in 3D constructs such as Second life. Gaming enthusiasts have attempted to bridge the gap with such creations as modules or fi les that depict some kind of known place (SimCity), the Sims, whilst others have taken on a national dimension (such as fl ight simulators) (2), though on an ad hoc basis and rarely immersive. Th is study depicts the steps taken to establish a dataset that establishes a baseline structure for world building, through the transposition of the known space that all generations are cognizant of, or at least cognizant of the known space. Th e creation of a national-level dataset encompassing the entire Maltese terrestrial and bathymetric (up to 1 nautical mile from the baseline coast) zone, should enable users to interact in worlds that can be related to the real world, whilst allowing for the creation of new scenarios for the academic and professional domains, wherein they can create scenarios both for social and physical change, as against sole gaming. Th e main scope for testing this in a gaming scenario, was also facilitated through the availability of technology development in this fi eld that moves away from high-end expensive proprietary systems to low-cost and highly accessible systems created for the game engine evolution.
Understanding Interactive SpaceTh e initial steps to understand known space was accomplished through an introductory
study on how far users are aware of their known place. Whilst the wider scope was aimed at understanding whether users know the reality around them and in the wider spaces, the focus was maintained on the knowledge of national space through the depiction of the national map of the islands. Studies show that such a process is highly diffi cult for all

Chapter 13: Spatial Conceptualisation as a Foundation for Social Interactionism in Virtual Worlds 239
users (Grasland, 2007), the higher the expected perceived space is investigated. Th e study included the depiction of a map of the World, a map of Europe, a map of the Maltese Islands and a neighbourhood map.
Figure 1: Islands’ depiction across the age groups
As knowledge of known space deteriorated with wider places and due to the fact that it is diffi cult to verify the neighbourhood-level accuracy, the Maltese Islands level was

240 Future Preparedness: Th ematic and Spatial Issues for the Environment and Sustainability
deemed best to understand how far they know their real space. Th e fi ndings were surprising due to the fact that such an image was abstractly defi ned
but highly erroneous in detail enhancement. Th e need to create an environment that was both national (in order to aid users become cognizant of their space) as well as highly detained an recognizable at their ‘neighbourhood’ level was established. Th is was required to ensure that such knowledge is not lost of the subsequent generations, whose daily activities are increasingly more virtual with lessening forays into the real physical world (Virtual Human Interactive Lab, 2014).
Figures 1a-f depict some maps drawn of the islands, with Gozo faring worse than Malta, the latter sporting the classic fi sh-shape depicted in classic accounts. Th is outcome is found irrespective of island of provenance, but shows the diffi culty encountered in the transforming a thought process (mental shape) into a meaningful image. And this is bound to get worse as successive generations are losing touch with the physical world and entering the neo-geographic one situated in virtual space.
Creating the Virtual Spaces: First Steps in DIKA
Th e acquisition of the concept of space is an essential requirement for immersive migration from the real to the virtual worlds. Knowledge of space and place posit a hard-to-acquire concept for the non technological person. Th e move from a techno-centric reality to a socio-technic one has aided the transposition of the non-technic disciplines to take up the virtual environments as the next level interactive domain. Th e resultant knowledge gain is yet to yet fully established, as technology has outshone the actual transition, with most disciplines still struggling to understand the shift . Th is paper reviews the issue of knowledge of spaces, the eff orts made to acquire a reality-to-virtual transition, as pushed through the establishment of a spatial information system. Th e DIKA model detailing the datacycle process was employed in this process through its data acquisition of real world coordinates, it being given a meaning through spatial information systems as are GIS, its conversion to 2D environments (raster mapping) and in turn to 3D space (vrml, obj, stl) as a knowledge markup (recognition of known space in the virtual environment and the fi nal action process employed to create the interactive space through a gaming engine).
Conceptualisation and Actuation: the ERDF Mechanism Th e data used in this study was that emanating from a major project funded under the
European Regional Development Fund (ERDF), specifi cally through the project entitled Developing National Environmental Monitoring Infrastructure and Capacity (MEPA, 2009).
Th e project’s baseline data was acquired specifi cally for the terrestrial and bathymetric areas of the Maltese Islands which also included innovative imagery captures such as

Chapter 13: Spatial Conceptualisation as a Foundation for Social Interactionism in Virtual Worlds 241
oblique imagery and Light Detection and Ranging (LIDAR) data. A bathymetric survey of coastal waters within 1 nautical mile (nm) off the baseline coastline, complemented the survey. Th e data capture included the following outputs:• LIDAR Scan: Terrestrial (Topographic Light Detection and Ranging);• Results - Digital Surface Model (DSM) and Digital Terrain Model (DTM) (316 km.sq);• LIDAR Scan: Bathymetric aerial survey - depths of 0 m to 15m within 1 nautical mile
from the Maltese coastline (38 km.sq) – capture was reliable up to 50m depth, highly exceeding requirements;
• Bathymetric Scan: Acoustic (side scan sonar);• Digital Surface Model and an acoustic information map of sea bed (415 km.sq); • High resolution oblique aerial imagery and derived orthophoto mosaic and tiled
imagery of the Maltese Islands (316 km.sq);• Satellite imagery (GeoEye, RapidEye, Quickbird) (316 km.sq).
Th e outputs were made possible through a the creation of baseline data having a sole aim of the provision of an Open Data structure where the series of 3D aerial and bathymetric surveys which will facilitate the dissemination of data to the general public.
GIS and Integrative Results Spatial Data, or geographical information systems, refers to those information streams
that deal with location: data as it is related to a point in space. Th ese are generally known as geographical information systems that allow one to view data in the form of a static image, a dynamic map or an online interactive system. Systems in place include the MEPA mapserver, the ERDF SEIS (Shared Environmental Information System) (MEPA, 2009), the EEA geoservers, GoogleMaps, BingMaps and other similar systems. Since interactionism happens somewhere, the requirement for authoritative reference geospatial data is vital for all branches of central government. Th is necessitates the need for an increased awareness of the value of ‘place’ and ‘location’ as vital components in eff ective decision making and for linking public-sector information together. It is important to distinguish between levels of reference maps:- while free or web-based mapping are suffi cient in locating the nearest restaurant, central government dealing with national and societal interests, and in some cases life-critical situations like disaster management, requires authoritative and quality-assured geospatial data at a national level. Taking this process to the next level; that of interactionism within a virtual world, one can operate through an interactive engine such as a gaming application, Th e latter serves as a higher-generation tool that sits on the proprietary or GI-domain technology (Formosa, 2012). Th e creation of such technologies follows various legislative transpositions from European Directives or United Nation conventions such as SEIS (European Commission, 2014), GEO - Global Earth Observation

242 Future Preparedness: Th ematic and Spatial Issues for the Environment and Sustainability
(GEO, 2014), PSI - Public Sector Information (OJ, 2003a), INSPIRE - Infrastructure for Spatial Information in the European Community (OJ, 2007), Aarhus - Public access to environmental information (OJ, 2003b) and FOI - Freedom of Information (Government of Malta, 2012).
Whilst GIS allowed for a visualisation basal-output, in order to process the data for immersive analysis, a number of steps were required to integrate diff erent datasets inclusive of satellite imagery (Figure 2a), thematic data (Figure 2b), terrestrial lidar (Figure 2c), terrestrial and bathymetric lidar (Figure 2d), orthoimagery (Figure 2e), oblique imagery (Figure 2f), underwater data points (Figure 2g), and multisource data integration (Figure 2h).
Th e process to establish an integrative interactionist medium has long been the target, particularly due to the fact that for one to target Open Data structures, a strategy is required to ensure the uptake by all entities involved in the process to acquire, share and integrate data. Th e current scenario where an ad hoc and sporadic framework exists is untenable, even more so when Malta is required to establish its requirements based on the INSPIRE Directive and Malta’s subsequent transposition of the same Directive. GIS technology is very useful, allowing many diff erent departments and the public access to the same basemaps and database. Th is means that each entity does not have to keep separate versions of other departments’ maps and data in order to use them for their own needs. Features or attributes need to be modifi ed and updated on only one basemap and database and then be shared by everyone. By creating a shared database, entities and the general public benefi t from the work of each other. Data is collected once and used many times. Departments can portray mapped information at whatever scale they require, using the colours or symbols they want and accompany the maps with text and reports tailored to meet their needs.
Th rough international processes such as GEO, governments and their agencies are utilizing GIS technology because it off ers a way of understanding and dealing with complex spatial problems by organising the data, viewing their spatial associations, performing multiple analyses, and synthesizing results into maps and reports. Th is has now become a prerequisite for international collaboration and data integration, such as the EU’s activities to ensure data harmonisation; one such example being the creation of the Corine Land Cover across all the EU states and neighbouring countries. Other works relate to ESPON (3), CDDA (4), bathymetric and terrestrial data gathering through GMES (5), GEO, (6) GEOSS (7), Copernicus (8) and other initiatives.

Chapter 13: Spatial Conceptualisation as a Foundation for Social Interactionism in Virtual Worlds 243
Figure 2: Integrative Steps

244 Future Preparedness: Th ematic and Spatial Issues for the Environment and Sustainability
Transposition from Isolationist Domains to Immersive Virtuality
Stepping into the voidMalta’s forays into the integrative aspect were initiated early through an initial project
employing Census image-mapping exercise incorporating a webGIS option which was initiated in the mid-2000s (Borg and Formosa, 2008) (Figure 3a). Th is activity was followed by initial steps to take the 2D option to a 3D one, hampered at the time by available technologies, particularly the crude raster-mapping tools available, which rendered images in low-resolution modes for such analysis as illegal development (Figure 3b), pseudo-3D height analysis (Figure 3c), normalized data extraction (Figure 3d), the fi rst height-data and imagery integration (Borg and Formosa, 2008) (Figure 3e) and early 3D systems employing ArcScene (Conchin, 2005) (Figure 3f).
Figure 3: Th e transformative process

Chapter 13: Spatial Conceptualisation as a Foundation for Social Interactionism in Virtual Worlds 245
Are there enough blocks?Th e process analysed for this study related to that employed in the conversion of
various datasets emanating from the ERDF156, a process that required the transposition of the bathymetric and terrestrial data from a lidar height point to a 3D visualisation structure. Th is was initially taken up through the implementation of lineage protocols that recorded the steps undertaken in line with the INSPIRE Directive, to be followed by a series of analytical processes (3d-ifi cation) that converted the lidar data depicting the citadel of Mdina (Figure 4a) to a raster image or a tin fi le (Figure 4b) that is viewable in a 3D format. Th e raster image is cleaned of outliers and ported to a bridging application that converts the raster imagery to the respective format for immersive experience. Two applications were used for this process with the converter being Worldpainter (Figure 4c) and the game engine being Minecraft (Figure 4d).
Figure 4: 3d-ifi cation process

246 Future Preparedness: Th ematic and Spatial Issues for the Environment and Sustainability
With the potential for rapid expansion of the virtuality to other domains, inclusive of other gaming technology, such as Unity3D, the age-old Simcity take on a specifi c dimension for social interactionism, particularly as the generational shift towards virtuality is made complete. In term of GIS technology, this development could also result in gaming integration in these information systems, allowing for scenario building and testing, a step above today’s dedicated thematic modules that allow one to view but not interact.
On the other hand the porting of the reality domain to the masses is already here.
ConclusionSocial interactionism and place have been found a strange bedfellow, with gaming
technology bridging the perceived abyss between the social disciplines and the nature of the technological beast. Th ey study sought to understand those tools that could be used to turn a concept of place into a research tool for spatial analysis, with gaming engines being the best placed for such interactivity. Geographical information systems may have sought to bring visualisation to socio-technics and the general public, but the inherent learning curve posited a problem for interactivity. Gaming applications and intermediate conversion tools served the basis for the push to the creation of virtual worlds that are loyal to the real one, inherently due to their being resultant of real world coordinates.
Th e resultant recognition of place within a virtual world in turn helps to create a legacy of space, knowledge and recollection of moments in time should informational packets be tagged to the 3dimensional points.
ReferencesBerners-Lee, T., (1989). Information Management: A Proposal. Available at: http://www.w3.org/History/1989/proposal.html (accessed on 10 February 2014).
Borg, M., and Formosa, S., (2008). Th e Malta NPI project: Developing a fully-accessible information system, IN S. Wise and M. Craglia (Eds.), GIS and evidence-based policy making, Innovations 10. Taylor & Francis, Boca Raton, Florida.
Cohen, L.E., and Felson, M., (1979). Social Change and Crime Rate Trends: A Routine Activities Approach. American Sociological Review, 44: 588-608.
Conchin, S., (2005). Investigating the development of 3D-GIS technologies for Spatial Planning ~ A Malta Study, Unpublished dissertation for MSc, Manchester Metropolitan University : UK.

Chapter 13: Spatial Conceptualisation as a Foundation for Social Interactionism in Virtual Worlds 247
Government of Malta, (2012). Freedom of Information Act, CAP496. Valletta: Malta.
Formosa, S., (2012). Soaring Spaces: the Development of an Integrated Terrestrial and Bathymetric Information System for the Maltese Islands, IN E. Buhmann, S. Ervin S, and M. Pietsch (Eds.), Peer Reviewed Proceedings of Digital Landscape Architecture 2012. Anhalt University of Applied Sciences, Wichmann Verlag : Berlin
Grasland, C., (2007). Europe in the World: Territorial Evidence and visions, ESPON Project 3.4.1, Luxembourg,
Group on Earth Observations, (2014, February 5). Available at: http://www.earthobservations.org/index.shtml (accessed on 10 February 2014).
Malta Environment & Planning Authority, (2009). Developing National Environmental Monitoring Infrastructure and Capacity. MEPA, Floriana: Malta.
Malta Environment & Planning Authority, (2014, February 10). [On-line] Shared Environmental Information System. Available at: http://www.seismalta.org.mt (accessed on 10 February 2014).
Offi cial Journal of the European Union, (2003a). Directive 2003/98/EC of the European Parliament and of the Council of 17 November 2003 on the re-use of public sector information, L 345, 31/12/2003.
Offi cial Journal of the European Union, (2003b). Directive 2003/4/EC of the European Parliament and of the Council of 28 January 2003 on Public access to environmental information and repealing Council Directive 90/313/EEC (Aarhus), L 041 , 14/02/2003 P. 0026 – 0032 (28 January 2003).
Offi cial Journal of the European Union, (2007). Directive 2007/2/EC of the European Parliament and of the Council of 14 March 2007 establishing an Infrastructure for Spatial Information in the European Community (INSPIRE), L108, Volume 50 (25 April 2007).
European Commission, (2014). (2014, February 10). Shared Environment Information System. Available at: http://ec.europa.eu/environment/seis/ (accessed on 10 February 2014).
Virtual Human Interactive Lab, (2014, March 10). [On-line] Transformed Social Interaction. Available at: http://www.vhl.stanford.edu (accessed on 10 February 2014).

248 Future Preparedness: Th ematic and Spatial Issues for the Environment and Sustainability
Notes(1) Available at: http://www.w3.org/History/1989/proposal.html (accessed on 30 March 2014)
(2) Available at: http://www.maltascenery.net (accessed on 30 March 2014)
(3) ESPON – European Spatial Planning Observatory Network
(4) CDDA – Common Database on Designated Areas
(5) GMES – Global Monitoring for Environment and Security
(6) GEO – Group on Earth Observations
(7) GEOSS – Global Earth Observation System on Systems
(8) Copernicus – Previously known as GMES, is the European Programme for the establishment of a European capacity for Earth Observation

249
C H A P T E R 1 4
Th e Neo-Society: Realities of New Socio-Virtual Paradigms
Janice Formosa Pace
IntroductionTh inking of space as a construct is by no means an easy feat. Transpose that concept
from a real environment to a virtual space and blocks are not readily discernible. Th is is a world that has been immersed in digital otherness as far back as the early 1990s since the birth of the world wide web (WWW) proposal. Th ere exist two dichotomies: those pertaining to the younger generation and those to the older ones, where the former are aware of the digital fantastic worlds and the latter know the real haptic worlds, one where they can still remember that there was a time when a map was something one sought from a bookshop as against one that prompts one with the name of the street, the direction to turn, an occasional warning of a speed camera… In such a scenario, the older generation would be expected to know the physical world to a high degree and less that related to immersive technology; on the other hand the younger generation with their instant maps and online access would be expected to have a greater knowledge of their surroundings through the same access.
Knowledge of one’s geographic and social-spatial realitiesAs an initial fi eld study to understand how far knowledge of one’s surrounding is
on the ground across the generations, 74 persons aged between 11 and 54 of both sexes were invited to draw 4 diff erent kinds on maps, each within a 10-minutes time-span: i) a map of the World, ii) a map of Europe, iii) a map of the Maltese Islands and iv) their neighbourhood map. Th e scope was to understand their knowledge of the physical place they live in, with a focus for this study being placed on the easily identifi able map of the Islands (iii) carried out. Th e islands are small enough to visualise in their entirety, with a veritable pointer to the fi sh shape of the Island of Malta with a highly specifi c human-boar heads shape. Th is exercise serves as the fi rst step to acquire an insight into the expected images resultant from the initial fi eld survey: most persons were expected to draw the fi sh shape as such would serve as a pointer to the level of knowledge of their conceptual locational framework that each inhabitant should know when going about their daily

250 Future Preparedness: Th ematic and Spatial Issues for the Environment and Sustainability
lives. Th is outcome would then serve to analyse what would be required in terms of levels of data for visualisation and immersion methodologies which would allow persons to understand what their surroundings look like in an online mode.
Th eir Conceptual Depiction of Place – the virtual adeptsTh e analysis shows that very few people are conceptually aware of their surroundings,
even for such a small place as are the Maltese Islands. Interestingly, as against the expected results, some very interesting outputs showed that the knowledge is limited in both shape and placement of the same islands. Even when compensating for the diffi culties encountered in the conversion of a thought process into a physically-drawn image, the results are still striking in that some do not resemble the islands at all.
Most worrying in this exercise was the omission or total displacement of the island of Gozo which was displaced to the east, north or not at all. In terms of the shape of the island of Gozo, the double head structure is not employed as an association between the thought and the depiction and such a diffi cult shape is rarely remembered. In the case of Malta, the fi sh fi gure was only evident in a few drawings.
Further discussions showed that some persons do not even have an idea of what the south of the island looks like, having rarely travelled there, even though the major industries, the airport, the Grand Harbour and the fi shing villages are situated there: all the more vital the requirement to move the spatial aspects from the physical to the virtual. Th is study is ongoing to discern the level of awareness of one’s space and how it can be translated to a virtual world, which is no longer an abstract concept but an inevitable technological evolution, where humans move most of their activity into virtual space.
Th eir Conceptual Depiction of Place – those still groundedA further study (Formosa and Formosa Pace, 2013) showed that the relationship
between spatial statistics and the perceptions of administrators and other participants in the Social dynamic (Politics, Religions, Education, Family and Economy) diff er widely. Few actually perceive their reality as the data and information pertaining to their reality is depicting it.
A detailed three-year study of three thematic pivots sought to study crime, social issues, and landuse (CRISOLA) as an example for the proposed virtual research mentioned above. CRISOLA structures as covered by this project sought to understand the outcomes of the realities faced by the people on the ground, the experts in the implementation agencies pertaining to the three pivots as well as the administrators who manage the day-to-day running of the areas.
Th e project’s emphasis on the spatial analysis of crime through an immersive process was aimed at investigating the relationships between the activity and the social and urban

Chapter 14: Th e Neo-Society: Realities of New Socio-Virtual Paradigms 251
spaces they occur in. Th e horizontal approach is evident where GI data layers are created for each activity and the relevant correlations investigated. Th is process builds a visual map of the off ences, the social relationships they pertain to and the landuse aspects they partake in. Th e project attempts to identify the linkages between the socio-economic/cultural parameters towards an understanding of poverty and deprivation as a surrogate for social and community health, the off ences as a measure of attractiveness of an area and focuses on off ender data as a measure of social disorganisation and the landuse zoning as a measure of affl uence, leading to an understanding of opportunity structures.
Th e horizontal dynamics resulted in the identifi cation of the social-spatial constitution of the areas which leads to a social-zoning structure which identifi ed whether an area is taken up by a specifi c zoning type, whether the activity that pertains to that area is related to the economic activity dominant in the area. In turn, the study sought to review the presence of criminal-spatial constitution of the areas which leads to the creation of maps outlining the crime-zoning structure and that of the physical constitution of areas leading to a landuse-zoning structure. Th e study builds up an understanding of the study areas’ dynamics and the relative impact on social capital and social cohesion, that on security and safety and that on spatial capital. Th e analytical results would in turn aid the researchers to propose policy change based on a pivot of social change, criminological change and landuse change as based on the main fi nding in the area under question.
Th e Comparative Approach – Spatial Analysis and PerceptionA comparative exercise was held between the data emanating from the statistical
outputs and the perception of the experts and administrators. Th is comparison was held throughout the areas and in this analysis the generic trends are reviewed in order to understand the issue at NUTS3 (Malta and Gozo as distinct Islands).Th e process entailed the depiction of all the three JANUS pivots of crime, social and landuse issues. All the zones were mapped and layered in the same map, allowing for a review of the overlaps between the diff erent pivots: crime, social and landuse. Interestingly the perception of the diff erent stakeholders varies by pivot and by the location in itself, depending on the thematic perceptions they have of the locality as well as knowledge of the physical area itself. In some cases, such was lacking but in others the level of detail was such that the outcomes proved consonant with the target to mitigate the thematic problems being faced in the area.
Taking the concept a step further towards community safety in a virtualityOne can debate why such a study is required is based on the need to understand one’s
physical surroundings in order to understand the next level to take up a vital discussion of virtual space in the political, social and economic worlds. Th e world has evolved and

252 Future Preparedness: Th ematic and Spatial Issues for the Environment and Sustainability
there is a whole new defi nition for encroachment, which has become anthropomorphised and taken residence in our lives through the virtual portal. Not simply access but pure immersion. No longer the domain of the real world, privacy has become something surreal where access to gadgets and the virtual world has placed us in real-time touch with the rest of the world (the entire world not simply that which revolves around our personal space) most oft en without us noticing or even wanting.
But where does this take us? From a personal space situation to an immersive one, we have actually made the world both safer and less secure: contradictory but true. Safer as in we have knowledge that loved ones are safe and one knows their location and cohesion remoulds itself to strengthen ties, something that modern and post-modern society has eroded and led to an increase in crimes such as crimes against the elderly, theft s from residences, amongst such cases. On the dark side all this virtual immersions has actually given a boost to cyber off enders to monitor victims and time their predation.
Another unobtrusive but potentially dangerous situation concerns the use of everyday gadgets such a simple TV. Not so simple nowadays but every household is connected to some company or other. Cases of monitoring by rogue technicians in other countries has been documented: review what criminologists call the routine activity theory and notice that one’s daily activities follow a set pattern: switch on the TV, watch the news, the kids watch their cartoons, the partner watches the endless survival series, watch the news again and then off to sleep again. Once one goes abroad or off to work the TV goes dormant giving a message that the occupants have exited the building. Even more so, some people are taking the habit of leaving the TV on whilst off on a holiday: who can take more than a few hours watching the same station, let alone a whole week. A rogue technician of offi cer could trace such an action and take their time to act.
Virtual worlds have also been taken to the next step where people can live ‘real’ interactive lives online, building businesses, relationships and many a replica of the real real world. Virtual criminals have fi ne tuned their activity and destroyed such livelihoods, scammed people through illicit money-making ventures, created virtual businesses that disappear in an instant, and a thousand other activities, most dangerous being identity theft . Second Life is a case in point where such activity has resulted in lost economic and personality theft . Many a person sits in a British jail, with the justice system none the wiser on who they were born as.
Post-Normality and in the Neo-SocietyWith a perceptual shrinkage of one’s personal space moving from a socially-cohesive
arena where everyone has a social role in a community, today’s structure is leading to an anomic society. With the exponential increase of high-density residential areas, the mind-set has moved away from a social-role one to a more hedonistic structure: the personal

Chapter 14: Th e Neo-Society: Realities of New Socio-Virtual Paradigms 253
space within a dwelling unit has become really personal and there is little time for social activity. Th is situation has resulted in residents becoming totally alienated from their surroundings inclusive of who the next door neighbours are, even worse than a NIMBY scenario where at least the backyard is still known... Th is does not point to a return of a stifl ing past governed by strict political, religious and community mores, but it is a reality that has fuelled the rearing of the dark-side head of social interactionism. Crimes committed in residential areas, in social and community facilities, in commercial areas as well as in the streets have taken an other-wordly reality. Why should one bother to report an off ence or even to protect oneself from a potential off ence when there is little time to interact with the immediate vicinity and its goings’-on?
A Way ForwardCommunities cannot live without individuals and vice versa. In a growing anomic
society, individuals are too busy to look aft er the locality before it tips and becomes too stigmatized to come back to normality – ask anyone which is the ‘worst’ town in Malta and nine out of ten responses relate to the same town… It is here that the administrative units locally termed local councils need to put their due share. Th ey are doing their utmost within the confi nes of the current legislation but need to involve the individual to participate in a neural-network styled interaction with continuous feedback that ensures that vandals and potential off enders are thwarted beforehand. A real-time socio-technic monitoring system is required that balances the protection of an individual’s privacy whilst ensuring that the social and community areas are given a vibrant comeback (Cosgrove, 2006).
Th eoretical approaches to understanding the concept of space: a study through criminology
Environmental criminology an serve as the base element for the study of virtualisation and its inherent interactionism due to its understanding of relations related to social activity and the surroundings they occur in. Also called urban ecology, environmental criminology is the study of crime and victimization in its relation to place and space. It is also described as ‘the geography of crime and ‘the ecology of crime’, and attempts to develop an insight into the analysis of the relationships between place, crime and off ending (Bottoms and Wiles, 2001).
Environmental criminology takes into account the boundaries within which people act, such as work spaces, meeting-points and recreational areas. It explores the spatial concepts inherent in the wider scenario of criminal activity, such as the widening reaches of off enders due to access to new technologies and inventions (better vehicles, instant mobile communication devices), as well as ‘zoning’ policies instituted by planning authorities and transport. Interesting to note is the opportunity for emerging crime scenarios where

254 Future Preparedness: Th ematic and Spatial Issues for the Environment and Sustainability
off enders engage in computer crime that does not recognise any border or state, with the off ender using remote technology to commit an off ence from fraud to pornography.
Historical development of the theoryTh e main infl uence for the study of environmental criminology grew from the work of
the Chicago School of Sociology, with the main proponents being Shaw and McKay, and their 1930s’ theory of social disorganisation. Th is was based on urban work by Park and Burgess in the 1920s, who created the concept of human ecology (Maguire, M. Morgan, R. and Reiner, R., 1997; 308). Burgess’s zone model of urban development conceptualised that there are fi ve concentric zones in a city where each zone is characterised by diff erent types of residents who migrate away (transit) from the centre as their status improves. Over time, growing cities would engulf other peripheral towns that would become zones of transition themselves. Since urban areas contain disproportionately high rates of social problems, the larger the city the higher the concentration of poverty, welfare dependency and crime (Maguire et al, 1997; 308). It would be interesting to study how such will eve love in the virtual worlds.
Th is is further enhanced due to the boundaries imposed by such phenomena as urban sprawl, where inelastic cities are created, that have no opportunity to keep on expanding. Such boundaries do not exist in virtuality and poverty is more related to access to the networks as against to goods, which is where no forms off ences are forming in the virtual world through technologically-new off ence categories and theft of access nodes/bandwidth in the real world to be able to access that same virtuality.
Other researchers covered diff erent socio-economic/socio-cultural aspects. Schmid (1960) identifi ed 6 types of hypothesis that could be used to account for patterns of crime. Th ese were: i) the “ecological segregation/contingent control” hypothesis where high frequencies of crime refl ect opportunities, ii) the “drift ” hypothesis - certain areas attract off enders, iii) the “diff erential association/cultural transmission” hypothesis - areas characterised by distinct sub-cultural patterns of delinquency and crime, iv) the “social alienation” hypothesis - areas characterised by social problems, v) the “anomie” hypothesis - delinquency is a disruption of the collective order, and v) the “illegitimate means/diff erential opportunities” hypothesis - diff erentials in access to illegitimate means.
Other sociological theories on delinquency areas are based on a threefold structure (Gill, 1977): i) the “ecological approach” investigating why people live where they do, ii) the “sub-cultural approach” that analysis how localised and distinctive life styles exist, and iii) the “social reaction approach” that highlights how labels are given to individuals and areas. Will such areas exist in online worlds, will they segregate those with higher-speed access, those with higher bandwidths, access to major servers, access to protocols and tech skills?

Chapter 14: Th e Neo-Society: Realities of New Socio-Virtual Paradigms 255
Gidden’s theory of Structuration (Giddens, 1984), which may serve the project in its study of virtual interactivity, has again brought to the fore the agenda that sociological studies must be based on the analysis of ‘social practices ordered across space and time’, which theory refl ects the take-off point of the Chicagoan School. Bottoms and Wiles (1997) have taken up the concepts of space and time as the major point of departure for environmental criminology studies, stating that Giddens’ concept is central to its theoretical base. Th ey bring as evidence his explanations on humans as knowledgeable agents, practical consciousness, his move away from the traditional dualism of objectivism and subjectivism, the duality of structures as both motivators and constraining agents, as well as the importance of routine activity. Structures result in a practical consciousness that is able to follow regular patterns in space and time. One needs to understand how place, over time, is part of the practical consciousness of social actors who engage in behaviour, including actions defi ned as criminal (Bottoms and Wiles, 2001: 19).
Th e Case for Techno-Centric and Socio-Technic approachesData analysis in the diverse domains has traversed a path that evolved from one
employing purely techno-centric approaches based on the concentration of technology as the fulcrum for research to one that is gathering pace towards the implementation of such technologies as a tool for the social sciences. Th is evolution is being successfully used for a wide range of functions including policy-making, implementation and monitoring interventions on levels of such areas as environmental monitoring to landuse assessment to crime analysis. Th is migration to the data as against the technology as the major focal point has resulted in a wider legacy disseminated through real-time and updated systems that allow socio-economic and related data to be mapped and displayed either on an intranet or on the internet. As an example, the latter, through Web-GIS functionality has enabled users to view crime in the neighbourhood as well as report crime on-line. Most current tools still leave much to be desired but they are being improved to an extent that real full web-maps will soon be regarded as the main modus operandi enabling real-time research. Th e functions enable regular monitoring and updating of data, though work is still required to automatically transform that data to information and eventually to knowledge leading to eff ective policymaking.
Th e socio-technic approach took off due to the initiation of the analysis process outlined by CMAP has in their criminological process which was based on the concept of creating information based on the analysis of the what, why, who, when, where, why not and how phenomena (W6H). Such data phenomena has helped users build a real or virtual structure that pushes the data remit away from the pure technology to what actually constitutes the data remit.
Analysts seek to investigate each of the W6H pivots to identify patterns to reach

256 Future Preparedness: Th ematic and Spatial Issues for the Environment and Sustainability
conclusions whether correlations between the thematic variables exist or not. Th e six pivots can be investigated as follows (CMAP, 2002):• What data categories were identifi ed? What routines can be identifi ed? What
relationships are there between the social variables and other variables?;• Why did an activity occur? Why did the interviewee partake in the activity
(commonalities of a pattern – root cause of a social problem)?;• Who carried out the activity? Who witnessed the action? Who was the participant and
the other person (target profi ling)?;• When did an activity occur (temporal analysis)?;• Where did the activity occur? Where did the target hail from (geographic analysis –
environmental analysis) – (opportunity and routine activity)?;• How did an activity occur (deductive approach - classifi cation and modus operandi
analysis)?;• Why not investigate unrelated variables to elicit if some type of relationship exists
(correlation between data layers)?
Th e way forwardIn a rapidly developing world where the introduction of massive online information
systems has enabled both the scientist and the general public to interact with remotely-located data from across the globe, the reality of access to data and eventually to information is slowly bringing forth the realisation that decades-old barriers to access to data still need to be overcome. Data availability suff ers from a plethora of scourges that have left entire countries with a dearth of reliable baseline information, particularly small states which have limited human capacity to manage the whole datacycle in the physical, social and environmental domains. Th e main limitations include the fact that there are few homogeneous structures in operation, which governance situation has rendered data gathering agencies as a series of independent hoarding kingdoms, where data ‘ownership’ is seen as a private not as a corporate or a national aff air thus the main users instead of being custodians transform themselves as the private owners of such data.
Other more technical issues include the fact that there are too many standards to follow, data is not dynamic (gathered ad hoc as a one-off and not real-time), data is not quality assured/controlled, queries are not organised and recorded, data is not secured – (‘illegal’ use of storage on personal storage devices and other digital media) and that versioning is not practiced. In addition, even where the data is available, there is an upsurge in requests for access to such data which has increased drastically since the www changed society as never before. Th e www changed a medium that was at best techno-centric to one that is now essentially socio-technic. Increasing requirements for bandwidth has resulted in a need for a reanalysis of Dahrendorff ’s access issue in contemporary worlds, both real and

Chapter 14: Th e Neo-Society: Realities of New Socio-Virtual Paradigms 257
virtual, where not all society has access to the information through on-line services.
Th e proposed plan of workTh e sustainable tourism section has identifi ed the need for the consolidation of, upgrading of or launching of new experiences that will enhance the social and environmental capital that the real world is so rich in and which can be ported to the online virtuality. Th e main aim of the proposal is to ensure that: • surveys are carried out in order to gain knowledge on the number of visitors to the
area: by time, type, purpose, etc; • information is gathered and compiled on the areas from the diff erent sources and
compiled in an information node in the locality; • an interactive tool is created enabling visitors to gain knowledge on the area and
maintain a healthy upgrading of the identifi ed areas; • an impetus is given to market the green-space psycho/socio/physico eff ects have on
society; and • a hi-end technological product is developed to create a 3D model of the areas for
virtual interactive social interactionism.
ConclusionUnderstanding virtuality for non-technics is not an easy concept and this paper sought to understand those theoretical and technological issues impinging on the implementation of a project that would attempt to analyse the relationships between real society, virtuality and the inherent social interactionism. Th e starting point where participants were asked to identify a known space was used as the fulcrum to understand current realities as well as to draft a plan of action to further study the mental perceptions of space through the input of psychologists, sociologist, technologists and futurists. Th is is only the fi rst step towards realisation of a long-term study that will attempt to understand the neo-society, even as it is evolving at a rapid rate. Th e interactions across the generations is even more vital if society aims to preserve some semblance of the past through the older generation’s knowledge, which worlds pose as a grounding zone for today’s younger and the subsequent future generations.
ReferencesBottoms, A.E. and Wilesb P., (1997). Environmental Criminology, IN M. Maguire, R. Morgan and R. Reiner, (1997), Th e Oxford Handbook of Criminology. Oxford University Press, Oxford.
Bottoms, A.E. and Wiles P.W., (2001). Explanations of Crime and Space, In D.J. Evans,

258 Future Preparedness: Th ematic and Spatial Issues for the Environment and Sustainability
N.R. Fyfe and D.T. Herbert, (2001). Crime, Policing and Place: Essays in Environmental Criminology. Routledge, London, ISBN 0-415-04990-3.
CMAP, (June 2003). Advances crime mapping techniques, Results of the First Invitational Advanced Crime Mapping Topics Symposium. June 2001, Denver Colorado.
Cosgrove, D. (2006). Carto-City. In Else/Where: Mapping New Cartographies of Networks and Territories; J. Abrams and P. Hall (Eds.), Minneapolis, University of Minnesota Design Institute.
Ekblom, P. (2001). Th e Conjunction of Criminal Opportunity: A framework for crime reduction toolkits, Policing and Reducing Crime Unit Research, Development and Statistics Directorate Home Offi ce.
Formosa, S. and Formosa Pace, J. (2013). Integrative Approaches to Understanding the CRISOLA Phenomenology, in S. Scicluna, S. Formosa and J. Azzopardi (Eds.) (2013). Indicators for Crime Prevention in the Mediterranean: JANUS II, University of Malta, Msida, Malta, ISBN: 978-99957-834-2-6.
Fritz, N., (2002). Th e Growth of a Profession: A research means to a public safety end, IN Advances crime mapping techniques, Results of the First Invitational Advanced Crime Mapping Topics Symposium. June 2001, Denver Colorado, CMAP.
Gill, O. (1977). Luke Street, Housing Policy, Confl ict and Th e Social Creation of a Delinquent Area. London: Macmillan.
Giddens, A. (1984). Th e Constitution of Society: Outline of the Th eory of Structuration. Polity Press, Cambridge.
Hochstetler, A., Copes, H. and DeLisi, M., (2002). Diff erential association in group and solo off ending. Journal of Criminal Justice, Volume 30, Issue 6, November-December 2002, Pages 559-566.
Maguire, M. Morgan, R. and Reiner, R. (Eds.), (1997). Th e Oxford Handbook of Criminology (2nd Edition), Oxford University Press, New York.
Schmid, C.F., (1960). Urban Crime Area: Part I, American Sociological Review, 25, 1960, pg.527-542; Urban Crime Areas: Part II, American Sociological Review. 25, 1960, pg. 655-678.
259
C H A P T E R 1 5
Side Scan Sonar and the Management of Underwater Cultural Heritage
Timmy Gambin
IntroductionTh is chapter deals with side scan sonar, not because I believe it is superior to other
available technologies but rather because it is the tool that I have used in the context of a number of off shore surveys. It is therefore opportune to share an approach that I have developed and utilised in a number of projects around the Mediterranean. Th ese projects were conceptualised together with local partners that had a wealth of local experience in the countries of operation. Over time it became clear that before starting to plan a project it is always important to ask oneself the obvious question – but one that is oft en overlooked: “what is it that we are setting out to achieve”? All too oft en, researchers and scientists approach a potential research project with blinkers. Such an approach may prove to be a hindrance to cross-fertilisation of ideas as well as to inter-disciplinary cooperation.
Th erefore, the aforementioned question should be followed up by a second query: “and who else can benefi t from this project?” Benefi ciaries may vary from individual researchers of the same fi eld such as archaeologists interested in other more clearly defi ned historic periods (World War II, Early Modern shipping etc) to other researchers who may be interested in specifi c studies (African amphora production for example). Finally there may also be researchers from other disciplines such as marine biology, marine geology and volcanology. From the same data sets gathered by marine archaeologists such scientists can study and consider a variety of interests which may including, but not limited to, habitat mapping, seabed classifi cation and the identifi cation of submerged volcanic vents.
Answers to such questions may not be immediately forthcoming but it is essential to keep potential collaborations in mind when planning methodologies. In the light of this it would be opportune to explore the resolutions and other desiderata that fellow marine scientists require when planning their surveys. Although it may prove impossible to match their exact parameters it could well be that some small compromises are made in order to accommodate these requirements. Given that the expenses related to off shore survey are very elevated, it is hardly conceivable that the data acquired with adapted parameters

260 Future Preparedness: Th ematic and Spatial Issues for the Environment and Sustainability
will be refused by fellow marine scientists. Such a practice does not only make economic sense but is also good scientifi c etiquette. Such selfl ess cooperation may lead to scientifi c reciprocation with data eventually fl owing both ways.
Th e use of Side Scan Sonar in the Field of Underwater Cultural HeritageIn the fi eld of maritime archaeology, side scan technology can be employed for a
number of objectives, namely:
1) Th e survey of a known shipwreckA shipwreck may have been discovered through other means (such as the snagging of
fi shing nets, by sponge divers etc.) other than archaeological survey. Modern wrecks are oft en charted by hydrographic vessels and their position noted on published navigational charts. In the case of such sites, side scan sonar can be used to establish the overall current condition. Following an initial survey that will be used as a baseline study, subsequent surveys will be used to determine aspects such as site degradation, scouring and site integrity.
2) Th e search for and location of an important eventTh e sea has witnessed numerous naval battles that range in size from battles between
individual vessels to epic proportions. Some of the latter include Actium and Lepanto (Abulafi a 2011: 428-451). Side scan sonar can prove invaluable to discover and record traces of such battles especially when the bulk of the objects being sought are small and dispersed. Such objects may include bronze rams (from ancient war galleys) and canon from the Early Modern period. To date, except for the so-called Marsala Punic Warship, no other warship has been detected from ancient times (Frost et al. 1976). Th is because the ancient trireme was more likely to break up and fragment into smaller pieces rather than sink in its entirety.
3) Th e search for and location of an important shipwreck (aft er research in archives) In more recent times, the loss of a vessel was oft en recorded. Such records could
be produced by, amongst others, survivors, court cases and even insurance companies. Numerous archives throughout the world house countless such accounts. Researchers oft en resort to archival research in order to learn of the location of a specifi c shipwreck. Such records hardly ever contain precise coordinates due to a number of reasons. Th ey do however give a general area within which one may plan a survey in order to search for the vessel.

Chapter 15: Side Scan Sonar and the Management of Underwater Cultural Heritage 261
4) Broad or “blind” survey Th is method can be compared to fi eld-working in terrestrial archaeology whereby
archaeologists walk along pre-determined transects to record and collect archaeological material. In the case of off shore remote sensing, the sonar is towed along pre-determined survey lines and data gathered systematically. Th e digital side scan systems enable the creation of mosaics with total coverage of the area of study. Th is enables the production of an archaeological map with essential information on the cultural remains recorded that are fully geo-referenced. Such broad surveys enable the coverage of large tracts of seabed.
ImplicationsGiven that the ‘broad survey’ covers such large tracts of seabed in deep (beyond 60
meters depth) it is more than likely that such areas are unexplored by humans. Th is diff ers to the early days of underwater archaeology when the fi rst discoveries of ancient shipwrecks were made by early divers such as those collecting sponges and corals. George Bass cited these as “the most important contributors of knowledge to the underwater archaeologist” (Bass 1966: 49). Th e advent of sport diving in the 1950s led to a massive increase of underwater sites being discovered and – more oft en than not – being looted. Th e evolution of the diving archaeologist saw the emphasis on singular site excavations such as Albenga (Lamboglia 1952). Th is approach was retained as the main thrust of many a research agenda for a number of decades. Today, in the northern Mediterranean at least, one can safely say that the majority of sites situated below the 50 meter contour (and that are not covered by silt, sand, Posidonia Oceanica etc.) have to some extent or another been discovered. In the southern Mediterranean, the situation diff ers due to the slow pace with which SCUBA diving has spread in the region.
Th is leads me to what I refer to as the ‘new frontier’. Th us, at this point, it is relevant to ask what if 60 years ago, a young archaeologist suggested to a pioneer of SCUBA diving that within their lifetime SCUBA diving would become a widespread hobby practised by millions all over the world? My assumption is that the diver would not have believed such a situation possible. Today, the archaeological community is in the same position as the aforementioned fi ctitious archaeologist with the pertinent question to ask today being: “will diving down to 120 meters become widespread within our lifetime?” Courses in technical diving have become widespread and the cost of equipment is plummeting. Based on the increasing numbers of technical divers and the proliferation of new and safer technical equipment, diving to 100 meters, will over the next 20 years, almost certainly become increasingly popular and doable for a signifi cantly larger part of the population (than it is today).
With this in mind it is essential to consider that with regard to undiscovered shipwrecks beyond 50 meters the archaeological community fi nds itself very much in the

262 Future Preparedness: Th ematic and Spatial Issues for the Environment and Sustainability
same situation as underwater archaeologists did 50 years ago. If no proactive measures are taken it will be technical divers who will be reaching undiscovered sites.
Th ere are a number of advantages that today’s underwater archaeologist have over their predecessors:
• Th anks to the pioneers of underwater archaeology, techniques for excavation and conservation are not only fully developed and established but they are also accepted among the broader archaeological community (Bowens, A. 2008).
• International conventions and local legislations exist and provide a broader framework within which one may work on sites as well as manage and protect these same sites.
• Th e availability of technologies for the study of sites situated at great depths (Søreide 2011: 9-22).
• Most important of all: the archaeological community now has the benefi t of hindsight – mistakes can be learnt from and avoided. Today’s archaeologists can continue to build on the valuable work of the pioneers.
Remote Sensing to the RescueGiven the fi nancial crisis that has hit the world’s economy sine 2008, resources for
culture and heritage are very limited. Furthermore, our knowledge of ancient shipbuilding techniques, amphora studies and site formation processes are at a satisfactory point. Th e pressures of excavation and recovery on the limited resources available to authorities are perceptible throughout the Mediterranean and beyond. Stores and warehouses are literally bursting at the seams with pottery fragments, lead anchors, whole amphorae and other miscellaneous pieces. Th e modern-day costs of excavation, and more importantly, conservation and preservation make these activities very hard to undertake in today’s economic reality. It is harder and harder to justify full blown underwater excavations when jobs in the heritage sector are being lost and objects from excavations increase pressure on the abovementioned reserve collections and their curators.
Furthermore, the UNESCO convention on underwater cultural heritage clearly declares that the fi rst option with submerged archaeological sites is ‘preservation in-situ’.
However, how can one start planning the in-situ management of underwater cultural heritage in waters where we know little if anything at all? Th e answer lies in the abovementioned broad/blind survey. Before moving on to the methodologies and concepts involved in broad surveys it is important to highlight the cost eff ectiveness of this work. With a relatively limited budget one may organise and conduct a 5 day survey and cover a large area of approximately 20 square kilometres. Th ese parameters are, of course, dependant on variables such as weather conditions, power of winch and choice of line spacing and overlap.

Chapter 15: Side Scan Sonar and the Management of Underwater Cultural Heritage 263
When planning a broad/blind survey a major choice that needs to be made is to determine where to work. Th is decision can be infl uenced by a number of factors such as whether a site that is threatened by construction or dredging (this should however be fi nanced by the developer); in the case of a unit such as a local heritage authority the area can form part of a systematic coverage of the seabed within its area of jurisdiction.
If no such factors bear any infl uence then one must consider theoretical areas that I refer to as ‘zones of convergence’. To expand on this notion – the majority of a ship’s journey is carried out on the open sea. However, there are certain points along the journey where vessels will have to converge into a narrower more restricted area. Examples of such zones are the following:
• Off shore islands – vessels converge on these to use them as temporary anchorages or simply as waypoints (Figure 1);
Figure 1: Th e island of Stromboli - a well known and used waypoint in antiquity
Source: T. Gambin
• Harbours – vessels would have to approach the harbour mouth in order to complete their journey;
• Channels/Straits – vessels would make for these to avoid longer journeys;• Other areas of navigational importance such as large headlands.
Many of the abovementioned examples are synonymous with dangers to navigation (Morton 2001: 185-93). It is true that off shore islands off ered havens but they could also prove to be fatal for ships as such islands had dangerous reefs etc. in their surrounding waters (Gambin 2012). Channels, straits and headlands are oft en known for their particular winds, wave and current patterns that produce unpredictable sea conditions in

264 Future Preparedness: Th ematic and Spatial Issues for the Environment and Sustainability
very localised areas – conditions that even today are very hard to forecast. However, such conditions did not deter mariners from taking the calculated risk of shortening voyages by sailing in the vicinity of these features.
Such zones of convergence provide a mathematically higher probability of locating shipwrecks – if nothing else, this statement is made on the assumption that more ships navigating in these areas (which are in turn more treacherous than normal) leads to a higher possibility for the loss of vessels. Th erefore, if no specifi c area has been selected for the survey it may be opportune to keep such locations in mind when considering where to work.
Once such an area has been located then it is imperative to ask another set of questions. Th ese are more site-specifi c:
• Have archaeological remains been brought up from the area from waters up to 50 meters deep? Th e local partner or even a quick visit to the local museum will soon answer this question. Local divers and fi shermen may also provide a lot information - albeit a little sketchy. If objects have been located in shallower waters there is a higher probability factor of fi nding objects in deeper waters. What caused vessels to be lost in shallow waters may have also caused them to sink in deeper waters.
• Are there dangers to shipping present in the area? Reefs, low-lying rocks, peculiar weather patterns, headlands etc. What constitutes a danger to shipping today would have been more so in the pre-modern era when pilots and mariners depended on their own knowledge and did not possess charts and other modern navigational aids. (Figure 2).
• Was the area important to ancient maritime routes? Here, it is safe to assume that if the area of survey lies within a heavily used maritime route then vessels would have travelled in the zone in great numbers. Th is subsequently increases the chances for the presence of shipwrecks.
• Is/was trawling practiced in the area? Trawling is a serious threat to underwater cultural heritage however not all trawled areas are devoid of underwater sites.
• Is seabed topography conducive to available equipment? Towed systems - such a side scan sonar - are more conducive to being utilised in areas where the seabed is relatively fl at. A very important factor is sediment deposition. Th ere are areas (such as river mouths) where sediment deposition is so frequent and heavy that anything over 100 years old (or even less) is probably buried deep in the mud or sand.
• Has a similar survey been carried out? Aft er highlighting the economic crisis aff ecting the heritage sector, it would be a waste of resources should valid work be replicated.

Chapter 15: Side Scan Sonar and the Management of Underwater Cultural Heritage 265
Th us it is critical to check whether data for that area is available from other sources. Th ese may include but are not limited to: surveys carried out for marine reserves, habitat mapping and/or hydrographic survey.
Figure 2: A typical off shore rock that poses a danger to shipping
Source: T. Gambin
Once all of the above considerations are taken into account then the more complete the background research should become. However, one must keep in mind that there are never any guarantees with regard to such queries. For example, trawling may be prohibited in the area of survey but it may have been practised anyway.
Proposed MethodologyTh e survey equipment used for the suggested methodology should preferably consist
of a dual frequency fully digitised side scan sonar system with medium (circa 400KHz) and high (circa 900KHz) frequencies available. Th e tow fi sh will be towed by a purpose-built survey vessel or any other vessel that can take the necessary equipment on board and that is capable of keeping in a straight course. Such a vessel should have the least windage possible. Th is will reduce the eff ect of the winds and the waves on the vessel, thus making navigation steadier. Th e ideal speed for a small survey vessel should be of around 3 knots. Another essential consideration is that of the time required to turn the vessel in order to bring it onto the next survey line. Great caution must be given during this manoeuvre so as to ensure that the tow fi sh does not dive suddenly and plunge into the seabed. Such an operation takes time, and thus must be kept in mind when planning the duration of the planned project.

266 Future Preparedness: Th ematic and Spatial Issues for the Environment and Sustainability
Th e side scan sonar system will be interfaced to a precision GPS which will ensure that all data captured during the survey will be geo-referenced. All navigation and survey line setup and control will be handled by the native soft ware of the sonar system. Tow fi sh and target positioning will be done using a layback algorithm embedded in the system’s soft ware.
Th e proposed methodology is divided into two phases. Phase one will consist of a long range high altitude survey using the medium frequency setting on the sonar (circa 400 KHz). Th is will facilitate the quick coverage of the entire area. Th e foremost aim of this phase is to create a mosaic map of survey area with details of seabed topography and geology. Line spacing for this phase should be set at 160 meters and the the sonar set at a 100 meter range giving a swath coverage of 200 meters (Figure 3). Th is setting will provide ample overlap for the stitching of the mosaic. Th is approach, which includes the gathering of initial bottom intelligence, will greatly reduce the risk of hitting seafl oor obstructions and will ensure the acquisition of optimal data. It is envisaged that some of the survey methodology for the second phase will need to be modifi ed and tuned further aft er the completion of phase one.
Figure 3: Line spacing for an archaeological survey using side scan sonar
Source: T. Gambin
In phase 2, the tow fi sh will be ‘fl own’ much closer to the bottom on short range and high frequency (circa 900 KHz) so as to obtain higher resolution sonar data of targets identifi ed in phase one. Given that initial sonar data will give the operator a clear idea of the target height and of the surrounding topography such an operation can, if planned and executed meticulously, be completed with minimal risk. Th ere are two ways of running survey lines for this part of the survey and these are not mutually exclusive. A

Chapter 15: Side Scan Sonar and the Management of Underwater Cultural Heritage 267
pre-determined line can provide guidance as to the line that the vessel and sonar must move. Alternatively, the operator can give instructions to the skipper as to the direction and location of the singular survey route. During this phase it is essential to obtain sonar data of the target with the tow fi sh running parallel to the target. Such an approach will facilitate the acquisition of data necessary for target recognition and measurement (Figure 4).
Figure 4: A 900Khz sonar image of an amphora shipwreck
Source: Ministero dei Beni Culturali/T. Gambin

268 Future Preparedness: Th ematic and Spatial Issues for the Environment and Sustainability
Once all the data are collected from both phases these will be processed into a mosaic and subsequently saved as a high resolution geo-tiff so the data can be used in GIS processing soft ware (Figure 5). Maps will also be saved in formats that are conducive to the use of other soft ware suites including CAD. An analysis of all bottom targets will follow and this should include a comprehensive target report showing target images, exact locations and measurements. Th e latter will consist of target length, with and approximate height. A report with high-resolution sonar imagery will contribute to any subsequent ground-truthing that may be planned - be this with a remote operated vehicle and/or through the use of technical divers. Th e aforementioned post-processing can be done using soft ware suites that are specifi cally designed for this purpose. Th ese soft ware suites generally create sub-folders that contain data in formats that are compatible to various GIS soft ware.
Figure 5: Sonar mosaic projected in 3D using Google Earth
Source: T. Gambin/G. Kozak
Concluding RemarksOnce deliverables become available, local authorities fi nd themselves in a better
position to take more informed decisions that will aff ect the long-term protection and management of the sites discovered in the context of the survey.
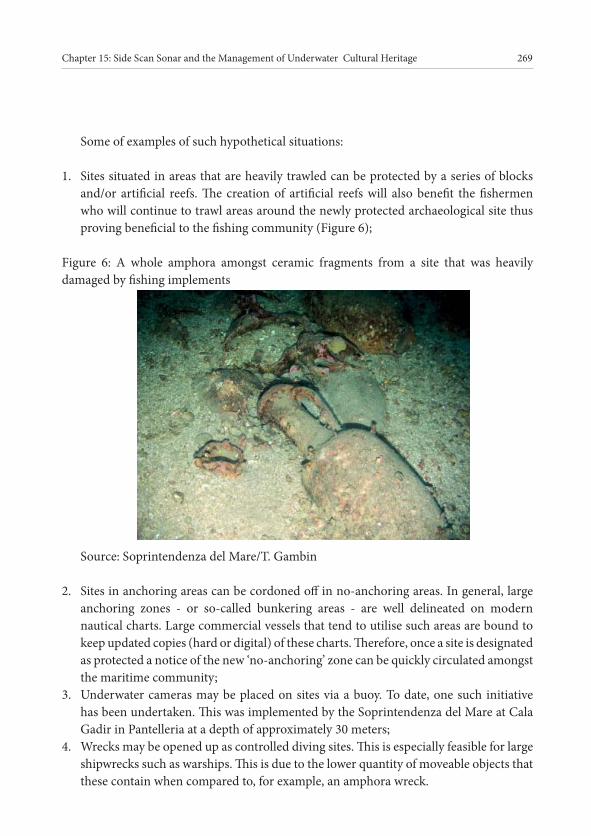
Chapter 15: Side Scan Sonar and the Management of Underwater Cultural Heritage 269
Some of examples of such hypothetical situations:
1. Sites situated in areas that are heavily trawled can be protected by a series of blocks and/or artifi cial reefs. Th e creation of artifi cial reefs will also benefi t the fi shermen who will continue to trawl areas around the newly protected archaeological site thus proving benefi cial to the fi shing community (Figure 6);
Figure 6: A whole amphora amongst ceramic fragments from a site that was heavily damaged by fi shing implements
Source: Soprintendenza del Mare/T. Gambin
2. Sites in anchoring areas can be cordoned off in no-anchoring areas. In general, large anchoring zones - or so-called bunkering areas - are well delineated on modern nautical charts. Large commercial vessels that tend to utilise such areas are bound to keep updated copies (hard or digital) of these charts. Th erefore, once a site is designated as protected a notice of the new ‘no-anchoring’ zone can be quickly circulated amongst the maritime community;
3. Underwater cameras may be placed on sites via a buoy. To date, one such initiative has been undertaken. Th is was implemented by the Soprintendenza del Mare at Cala Gadir in Pantelleria at a depth of approximately 30 meters;
4. Wrecks may be opened up as controlled diving sites. Th is is especially feasible for large shipwrecks such as warships. Th is is due to the lower quantity of moveable objects that these contain when compared to, for example, an amphora wreck.

270 Future Preparedness: Th ematic and Spatial Issues for the Environment and Sustainability
However, many of the above considerations may also place the site at risk by bringing it to the attention of rogue divers/looters. But, whatever the risks involved there can be little doubt that using such technologies for the discovery and management of underwater sites puts heritage authorities in a much better position than they were prior to acquiring this knowledge.
ReferencesAbulafi a, D. (2011). Th e Great Sea: A Human History of the Mediterranean. Oxford Universty Press: Oxford.
Bass, G. (1966). Archaeology Under Water. Praeger: New York.
Bowens, A. (Ed.), (2008). Underwater Archaeology: Th e NAS Guide to Principles and Practice. Nautical Archaeology Society: UK
Frost, H. et al., Lilybaeum, Roma, Accademia Nazionale dei Lincei, 1981 [supplement to Notizie degli Scavi di Antichità, XXX (1976)], 119-123, 127-129.
Gambin, T., (2012). Central Mediterranean Islands and satellite ports for ancient Rome In S. Keay (Ed.), Rome, Portus and the Mediterranean (Archaeological Monographs of the British School at Rome – 21. Th e British School at Rome: London.
Lamboglia, N., (1952). La Nave Romana di Albenga in Rivista di Studi Liguri 18: 213-223.
Morton, J., (2001). Th e role of the environment in ancient Greek seafaring. Mnemosyne, Bibliotheca Classica Batava Supplementum, Brill.
Søreide, F., (2011). Ships from the Depths: Deepwater Archaeology. Texas A&M University Press: USA.

271
C H A P T E R 1 6
Assessment of the Maltese Environmental Matrix to Defi ne the Future Monitoring Strategy
Ines Sanchez, Francesca Tamburini and Ruth Debrincat
IntroductionAs a member of the EU and of the international community, Malta has important
obligations to report on the state of the environment and the eff ectiveness of policy measures addressing particular concerns, such as pollution (Regional Environmental Center, 2008). Failure to collect reliable and up-to-date environmental data would make Malta exposed to various environmental pressures due to poorly informed policy decisions, which could eventually also lead to economic implications (European Commission, 2014a). Under this context Malta is in the process of implementing the EU legislative framework regarding the environmental themes of air, water, radiation and soil. Prior to the implementation of the project “Development of environmental monitoring strategy and environmental monitoring baseline surveys”, air and water data from the Maltese environmental network were already available, though data coverage presented some lacunas, whereas radiation and soil network system was not in place, hence minimum baseline data was available. Th erefore, the long term monitoring strategic proposal discussed in this article has been designed as a primary tool to improve the state of the environment as well as to be in compliance with the EU Directives related with nature conservation.
Th eoretical IssuesTh e following section introduces the main EU environmental legislation which
establishes the regulatory framework for the long-term monitoring strategy.
Water: Inland waters and CoastalTh e Directive 2000/60/EC of the European Parliament and of the Council of 23
October 2000 establishes a framework for community action in the fi eld of water policy. Th e latter is better known as the Water Framework Directive (WFD) which creates an innovative approach for water management based on river basins, the natural geographical and hydrological units, and sets specifi c deadlines for member states to achieve ambitious

272 Future Preparedness: Th ematic and Spatial Issues for the Environment and Sustainability
environmental objectives for aquatic ecosystems. Th e purpose of the WFD is to establish a legal framework to protect and restore water quality across Europe and ensure its long term and sustainable use. It also establishes a new concept – that water resources should not be protectes solely for human consumption and use but inherently have a value and are important for ecosystems (Offi cial Journal of the European Communities, 2000a).
AirTh e two European Directives of greatest relevance to this air quality assessment are:
2008/50/EC and 2004/107/EC (European Commision, 2014b).Directive 2008/50/EC incorporates, in a single directive, the previous existing
legislation acts issued between 1996 and 2002: • Air quality Framework directive (Directive 96/62/EC). • First Daughter Directive (1999/30/EC). • Second Daughter Directive (200/69/EC) • Th ird Daughter Directive (2002/3/EC) except for the Directive 2004/107/EC relating
the Arsenic, Cadmium. Mercury, Nickel and Benzo(a)pyrene that remains in force.
Th e main aim of this Directive is to maintain, and whenever possible, improve the air quality to protect the health of humans, vegetation and ecosystems. It sets up air quality objectives, plans, monitoring requirements and methods as well as the pollutants’ target and limit values to assess the state of the air quality in each member state (European Commision, 2014b).
Directive 2004/107/EC of the European Parliament and of the Council of 15 December 2004 relating to Arsenic, Cadmium, Mercury, Nickel and Polycyclic Aromatic Hydrocarbons in ambient air (the Fourth Daughter Directive) is the fi nal stage in the process launched by framework Directive 96/62/EC of recasting the European legislation on the presence of pollutants posing a risk to human health. Given that the substances involved are human carcinogens, and that there is no identifi able threshold below which they do not pose a risk to human health, the Directive applies the principle of lowest possible exposure to them (European Commision, 2014b).
RadiationUnder Article 35 of the EURATOM Treaty, each member state of European Union
is required to establish the facilities necessary to carry out continuous monitoring of the levels of radioactivity in the environment. An independent assessment is conducted periodically by the European Commission to verify the operation and effi ciency of member states’ facilities (European Commission, 2000).
In addition, Article 36 of the EURATOM Treaty requires that data gathered from

Chapter 16: Assessment of the Maltese Environmental Matrix to Defi ne the Future Monitoring Strategy 273
this monitoring be communicated periodically to the European Commission (European Commission, 2000).
Commission Recommendation 2000/473/EURATOM (European Commission, 2000) on the application of Article 36 of the EURATOM treaty gives specifi c guidance on the monitoring of the levels of radioactivity in the environment for the purpose of assessing the exposure of the population as a whole (Offi cial Journal of the European Communities, 2000b). Th is recommendation gives specifi c guidance as to the structure of monitoring networks, the media that should be sampled, the types of measurements, the radionuclides to be monitored and the sampling frequencies.
SoilOn September 22nd 2006, the European Commission adopted a Soil Th ematic
Strategy which consists of: communication from the Commission to the other European Institutions, a proposal for a framework Directive (a European law), and an impact assessment (European Comission, 2014c).
Th e overall objective of the EU Strategy is protection and sustainable use of soil, based on the following guiding principles:
1) Preventing further soil degradation and preserving its functions.2) Restoring degraded soils to a level of functionality consistent at least with current
and intended use, thus also considering the cost implications of the restoration of soil.
Th is recognises that certain threats, such as erosion, organic matter decline, compaction, salinisation and landslides, occur in specifi c risk areas which must be identifi ed.
MethodologyTh e methodology followed to design the long term monitoring involved the following
steps in the diff erent elements of the environmental matrix:
Water: Coastal and Inland waters1) Analysis of existing legislation and regulatory framework: Th e WFD has been transposed into Maltese legislation under the Environment
Protection Act (Chapter 435) and the Malta Resources Authority Act (Chapter 423) through the Water Policy Framework Regulations (LN 194 of 2004), which entered into force on April 23rd 2004. LN 194 of 2004 defi nes the Malta Resources Authority (MRA) as the competent authority for groundwater and inland surface waters, with the exception of inland surface waters protected under the Development Planning Act (1992 as amended) or the Environment Protection Act (2001). Such inland surface waters are placed under the competency of the Malta Environment and Planning Authority (MEPA), which is also

274 Future Preparedness: Th ematic and Spatial Issues for the Environment and Sustainability
responsible for coastal waters.2) Analysis and assessment of the current status of environmental monitoring
networks Aft er reviewing and analysing the existing legislation and directives related to the
monitoring of inland surface, transitional and coastal waters, it was concluded that to date there is no comprehensive and integrated water monitoring program for surface waters in Malta. Th e only monitoring program that exists is for bathing waters which is coordinated by the Department of Environmental Health.
3) Performing a baseline survey. Due to the lack of baseline data the results obtained from the baseline surveys and
monitoring programs carried out for inland surface, transitional and coastal waters between 2012/2013 were critical for this long term monitoring strategy.
Figure 1 and Table 1 describe the 10 inland surface water bodies where the baseline surveys were carried out.
Table 1: Inland and Transitional Water Bodies of the Maltese Islands
R e f e r e n c e Code
Name Latitude Longitude Length in km /Area in km2
Water body Type
MT201 Is-Salini 5 56.50 N 14 25.21 E 0.8 TransitionalMT202 Il-Magħluq
ta’ Marsascala35 51.46 N 14 33.46 E 0.3 Transitional
MT203 Il-Ballut ta’ Marsaxlokk
35 50.24 N 14 32.59 E 0.1 Transitional
MT301 B a ħ r i j a V a l l e y System
35 53.75 N 14 20.20 E 1.794 Watercourse
MT302 Wied il-Luq 35 51.31 N 14 24.21 E 1.395 WatercourseMT303 Wied il-
Lunzjata36 2.21 N 14 14.3 E 0.654 Watercourse
MT401 Is-Simar 35 56.48 N 14 22.56 E 0.032 StandingMT402 L-Għadira 35 58.15 N 14 20.52 E 0.044 StandingMT403 Il-Qattara 36 3.7 N 14 11.35 E 0.001 StandingMT404 L- G ħ a d i r a
ta’ Sarrafl u36 2.16 N 14 11.59 E 0.002

Chapter 16: Assessment of the Maltese Environmental Matrix to Defi ne the Future Monitoring Strategy 275
Figure 1: Th e Inland and Transitional Water Bodies of the Maltese Islands
Source: MEPA (2011a)

276 Future Preparedness: Th ematic and Spatial Issues for the Environment and Sustainability
SamplingFigure 2 and Figure 3 represent the water bodies and the specifi c points in which the
sampling was performed. Table 2 provides additional information of the specifi c locations.
Figure 2: Coastal Maltese water bodies [9]
Figure 3: Sampling points for chemical and physicochemical elements and biological monitoring at Coastal Waters

Chapter 16: Assessment of the Maltese Environmental Matrix to Defi ne the Future Monitoring Strategy 277
Table 2: Sampling points for chemical and physicochemical elements and Biological Monitoring at Coastal Waters
WFD Water Body Sites lat (°N) long (°E)
MTC101 CN01-2 36 01.814 14 12.989
MTC101 CS01 36 04.350 14 10.546
MTC101 CN01-1 36 03.181 14 11.171
MTC102 CN02-1 36 04.506 14 15.610
MTC102 CS02 36 04.269 14 17.060
MTC103 CN03-1 36 01.027 14 16.999
MTC103 CN03-2 36 01.664 14 18.073
MTC103 CN03-3 35.98. 917 14.33. 866
MTC103 CN03-4 36.03.550 14.23.506
MTC103 CN03-5 36.01.321 14.34.265
MTC103 CN03-6 36.00.605 14.35.076
MTC103 CS03 36 00.334 14 21.710
MTC104 CN04-1 35 58.503 14 21.787
MTC104 CN04-2 35.97.764 14.33.317
MTC104 CN04-3 35.90.697 14.45.111
MTC104 CN04-4 35 57.028 14. 23.357
MTC104 CN04-5 35.93.557 14.48.830
MTC104 CN04-6 35 55.183 14 29.759
MTC104 CN04-7 35.89.384 14.44.717
MTC104 CP04-1 35 56.635 14 29.236
MTC104 CP04-2 35 57.738 14 26.073
MTC105 CN05-1 35 54.041 14 30.181
MTC105 CN05-2 35.89.611 14.51.579
MTC105 CP05 35 54.164 14 31.512
MTC106 CN06-1 35 51.978 14 33.958
MTC106 CN06-2 35.87.434 14.51.431
MTC106 CP06-1 35 53.222 14 34.116
MTC106 CP06-2 35.87.434 14.51.431
MTC107 CN07-1 35.83.735 14.57.189
MTC107 CN07-2 35 50.035 14 33.028
MTC107 CN07-3 35 49.741 14 32.163
MTC107 CN07-4 35.87.434 14.51.431

278 Future Preparedness: Th ematic and Spatial Issues for the Environment and Sustainability
WFD Water Body Sites lat (°N) long (°E)
MTC107 CP07 35 49.227 14 33.270
MTC108 CN08-1 35.83.185 14.41.734
MTC108 CS08 35 48.491 14 29.221
MTC109 CN09-1 35 57.549 14 20.143
MTC109 CS09 35 55.665 14 19.882
In order to fulfi l the requirements of Directive 2013/39/EU, the baseline surveys collected robust scientifi c data on the physicochemical, hydro-morphological and biological quality elements of the coastal, inland surface and transitional waters designated in 2005.
Th e biological parameters sampled included of phytoplankton, macroalgae, angiosperms, and benthic invertebrates.
Th e measured physico-chemical quality elements for seawaters have been aggregated in three main groups:• Group A: Physicochemical parameters supporting biological quality elements; these
are required to be measured at most monitoring sites (Refer to Directive 2000/60/EC); • Group B: Priority substances to be measured in water. Th ese are split in oils (Group
B1) and miscellaneous (Group B2) (Refer to Directive 2008/105/EC, Annex I);• Group C: Substances to be measured in sediments (Refer to Directive 2008/105/EC,
Annex I).
Th e schedule of the sampling was performed according to the information given in Table 3.
Table 3: Sampling schedule
Sampling Dates Water Sediment BiotaCoastal Monthly basis from
May 2012 to July 2013.
1st August to mid August 2012
End of June/ early August 2012.
Inland Monthly basis from February 2012 to January 2013
August 2012November 2012December 2012February 2013

Chapter 16: Assessment of the Maltese Environmental Matrix to Defi ne the Future Monitoring Strategy 279
Assessment of the baseline survey results
For data assessment the criteria indicated in Table 4 and Table 5 were applied:
Table 4: Evaluation criteria for biological parametersWater Parameter Index VariablesCoastal Chlorophyll a
concentrationAngiosperms Rapid Easy Index Macroalgae: Th e CARLIT index
Benthic Number of species (S) Richness (Margalef, D) Abundance (N: ind/m2)Diversity (Shannon Wiener, H’) Equitability (Pielou, J).
Macroinvertebrate species
AZTI Marine Biotic Index (AMBI)
Inland Benthic macro invertebrates
SWI: Shannon-Weiner Index, EBI: Extended Biotic Index, CBS: Chandler Biotic Score.

280 Future Preparedness: Th ematic and Spatial Issues for the Environment and Sustainability
Table 5: Evaluation criteria for chemical parameters
Parameters Matrix Reference Classifi cation CriteriaP r i o r i t y substances and other pollutants
Water Annual average EQS , (Directive 2008/105/EC)
Moderate/Poor 1 parameters > EQS
Good high All parameters < EQS
Sediments Italian EQS Moderate/Poor 1 parameters > EQS
Good high All parameters < EQS
AirAnalysis of existing legislation and regulatory framework: • Th e Maltese Legal Notice 478/2010 (Ambient Air Quality Regulations) transposes
two main European Directives on the ambient air quality: Directive 2004/107/EC (Government of Malta, 2011) relating to arsenic, cadmium, mercury and nickel and polycyclic aromatic hydrocarbons in ambient air and Directive 2008/50/EC on ambient air quality and cleaner air for Europe.
• Analysis and assessment of the current status of environmental monitoring networks
Th e air quality monitoring network in Malta comprises two diff erent monitoring systems (Stacey and Bush, 2002): automated monitoring system providing near real-time data for many pollutants (5 monitoring stations and passive sampling tubes (131 monitoring sites).
Th e fi ve real-time monitoring stations (refer to Table 6) are located in diff erent zones, with diff erent territorial characteristics (e.g. land use, morphology, etc.), demography and emission sources (traffi c, industrial, etc.).
Th e local fi xed station network is in compliance with the monitoring requirements of the Directive 2008/50/EC with regards to the sampling sites, pollutants monitored, sampling locations, zoning and air assessment of the zones or agglomerations.
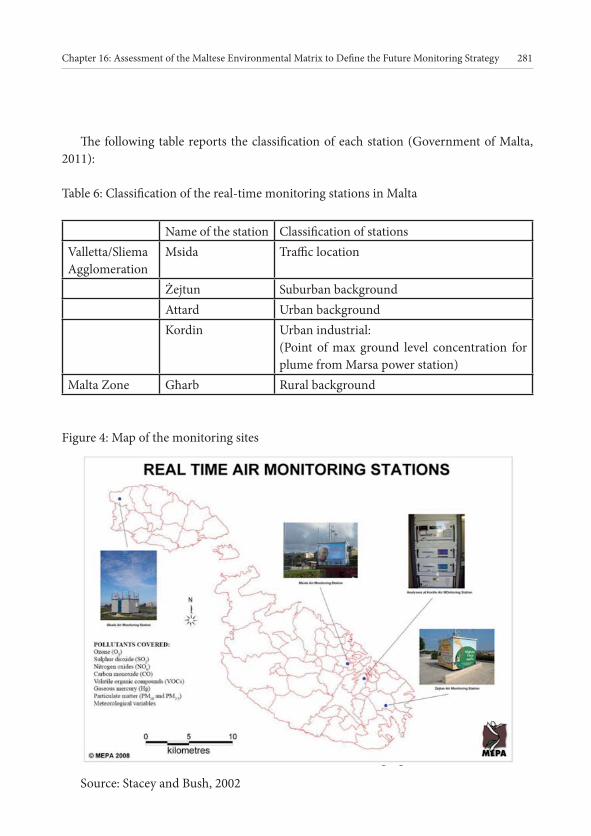
Chapter 16: Assessment of the Maltese Environmental Matrix to Defi ne the Future Monitoring Strategy 281
Th e following table reports the classifi cation of each station (Government of Malta, 2011):
Table 6: Classifi cation of the real-time monitoring stations in Malta
Name of the station Classifi cation of stationsValletta/SliemaAgglomeration
Msida Traffi c location
Żejtun Suburban backgroundAttard Urban backgroundKordin Urban industrial:
(Point of max ground level concentration for plume from Marsa power station)
Malta Zone Għarb Rural background
Figure 4: Map of the monitoring sites
Source: Stacey and Bush, 2002

282 Future Preparedness: Th ematic and Spatial Issues for the Environment and Sustainability
Performing a baseline survey Th e objective of this survey was to determine the PM10 concentration in Malta for
one year (minimum requested time interval by the L.N. 478/2010 in order to assess the air quality in Malta), using the reference sampling and measurement method stated in the L.N. 478/2010 (Ambient Air Quality Regulations) in order to have a more accurate assessment of the air quality during the time interval considered and also, to evaluate any possible relationship between pollutant concentrations, pollutant sources, location and time of the year.
Th e monitoring sites were located in the same place as those for the four fi xed air monitoring stations in Malta (refer to Figure 4).
Th e general description of these stations is given in the next paragraphs. Table 7 summarises the station characteristics:
Table 7: Site locations, classifi cation and monitoring dates.Site name Location Site classifi cation Monitoring datesGħarb 36°4’4.9” N
14°12’11”E114m ASL
Rural From 01/03/2012 to 28/02/2013
Msida 35°53’51.4” N 14°29’28” E2m ASL
Urban - Traffi c From 01/03/2012 to 28/02/2013
Kordin 35°52’55.1” N 14°30’40.4” E40m ASL
Industrial From 01/03/2012 to 28/02/2013
Żejtun 35°51’13.5” N 14°32’24” E56m ASL
Suburban background
From 01/03/2012 to 28/02/2013
Assessment of the baseline survey resultsIn order to evaluate the PM10 average concentrations during the monitoring time,
the values were confronted with the relative limit values imposed by the Maltese national legislation
Table 8 summarizes the requirements laid down in the L.N. 478/2010 for the specifi c pollutants considered in this analysis.

Chapter 16: Assessment of the Maltese Environmental Matrix to Defi ne the Future Monitoring Strategy 283
Table 8: Limit values for the protection of human health – L.N. 478/2010Pollutant Averaging period Limit value M i n i m u m
Data capturePM10 One day 50 μg/m3 not to be exceeded more
than 35 times a calendar year90%
Calendar year 40 μg/m3 90%
Radiation1) Analysis of existing legislation and regulatory framework
Due to ts small size, Maltese authorities consider Malta as a single region for the purpose of assessing radiological exposure in line with the Recommendation 200/473/Euratom. In order to meet the requirements of the Euratom Treaty’s Articles 35 and 36, the National Surveillance Plan (NSP) was performed and approved by the l Radiation Protection Board (RPB), which is appointed by the Prime Minister under the provisions of the Nuclear Safety and Radiation Protection Regulations (LN44/03).
Th e NSP was designed to be in-line with the practices set out in Commission Recommendation 2000/473/Euratom on the application of article 36 of the Euratom Treaty which seeks to observe the minimum level of these practices and the implementation of the measurement systems and procedures is not yet mature, and some elements of the plan are still partially incomplete.
Table 9: Summary of current Radioactivity Surveillance Plan for Malta managed by MEPASampling Stations
Sampling Frequency
Measurementfrequency (Nr. samples)
Radion-uclide
Number LocationAir – continuous dose rate
1 (fi xed) Malta- Kordin Continuous Dose rate
Air particulates
1 (fi xed) Malta- Kordin Continuous Weekly 7Be, 137Cs
Coastalwaters
3 North, Centre and South
Quarterly Quarterly 40K, 137Cs
Soil 5 Malta Annually Annually 40K, 137Cs, 60Co

284 Future Preparedness: Th ematic and Spatial Issues for the Environment and Sustainability
2) Analysis and assessment of the current status of environmental monitoring networks: MEPA’s remit in “Th e National Environment Radioactivity Surveillance Plan
for Malta” (European Commission, 2008) was partitioned in four separate actions: monitoring external ambient gamma dose rate; monitoring of airborne radioactivity, marine monitoring and monitoring of soil.
Th e principal characteristics of radiological monitoring plan of Malta, i.e. sampling stations, sampling frequency, measurement frequency and radionuclides, are summarized in Table 9 for each investigated medium.
3) Performing a baseline survey Ionising radiation survey of coastal waters, coastal sediments and soils was carried Ionisation radiation surveys were carried out along the Maltese coastline during which
samples of coastal waters and sediments were collected and analysed. Soil samples from all over the three islands were also collected to enable the establishing of a baseline survey of artifi cial radionuclides.
Coastal waters: during the pilot survey carried out in June 2012, 9 water samples were collected from the coastal water bodies showed in Figure 5. MTC 101, MTC 104 and MTC 108 were then the three points which were consequently sampled on a quarterly basis.
Figure 5: Coastal water bodies

Chapter 16: Assessment of the Maltese Environmental Matrix to Defi ne the Future Monitoring Strategy 285
SedimentsSediments: 12 samples of sediments were collected between the 1 August and the 22
August 2012 from the points indicated in Figure 6. Th ese points were only sampled once during this assessment.
Soil sampling: 60 soil samples were collected across the Maltese Islands as represented in the map below. Th is sampling exercise was carried out between the 30 May and the 6 June 2012 (refer to Figure 6).
Figure 6: Marine sediments: sampling sites
4) Assessment of the baseline survey results
Gamma spectrometry was used to calculate radionuclides concentration of:- Cs-137, Co-60 and other radionuclides detectable by gamma spectrometry (artifi cial
radionuclides). Data results of survey were treated with advanced statistical soft ware in order to
estimate the radiation level from made-man sources, as well as to compile a database for radioactivity levels on the Maltese Islands, in compliance with the requirements of the European Union (Art. 35 Euratom Treaty).

286 Future Preparedness: Th ematic and Spatial Issues for the Environment and Sustainability
Figure 7: Location of sampling points in Maltese Islands.
Soil1) Analysis of existing legislation and regulatory framework
In Malta, soil protection and management are traditionally divided between two diff erent fi elds of law: land-use (spatial) planning and environment protection. Actually, a third fi eld of law is taking shape: agricultural and rural aff airs in view of the multitude of obligations emerging from certain Directives on related themes and the Common Agricultural Policy. Consequently, Maltese legislation is mostly concentrated in procedures associated with agricultural production (code of Good Agricultural Practice, GAEC measures, Cross-compliance) and on transportation of soils. Th e latter activity is regulated by Act XXIX of 1973 (LN104/1973): Fertile Soil (Preservation) Regulations – Subsidiary legislation Chapter 236 of the Laws of Malta (and as amended) which specifi cally prevents site owners from construction development over soil profi les.
Additionally, in March 2010, Government launched a process to develop Malta’s National Environment Policy (NEP) (Government of Malta, 2014). Th e NEP is a comprehensive environmental policy covering all sectors and natural resources.
Th e soil is one of the fundamental Malta’s Environmental objectives concerning with using resources effi ciently and sustainably of the NEP.
Th e NEP highlights Malta’s high rate of urbanisation, together with the intensifi cation of agricultural practices in certain sites, as the main pressures on soil.

Chapter 16: Assessment of the Maltese Environmental Matrix to Defi ne the Future Monitoring Strategy 287
2) Analysis and assessment of the current status of environmental monitoring networks.Malta’s process towards EU accession led to the fi rst systematic soil survey of the
Maltese Islands initiated by the then National Soil Unit. Th e development of a Soil Information System for the Maltese Islands: MALSIS LIFE
00 TCY/M/036 Vella, 2001), proved to be a major turning point in establishing a wealth of soil information and equipping Malta’s public sector with the technical expertise to describe, assess, monitor and manage soils in a sustainable way.
Th is project was launched in March 2002 by the then Ministry for Agriculture and Fisheries and was completed in February 2004. Th e MALSIS consisted of a national grid-based inventory of the soil resources at 1km intervals, totalling approximately 280 sites in Malta, Gozo and Comino.
Data collected in the MALSIS database covered soil features of Maltese Islands based on :• Soil type;• Bulk Density in gcm-3; • Texture (Clay, Sand, Silt %);• CEC in cmol+kg-1 ;• CaCO3 ingkg-1; • Electrical conductivity in μScm-1; • Organic Carbon in kg; • Soil Contamination;• Land Use
3) Performing a baseline surveyIn order to optimise the results derived from this investigation, a multi-criteria strategy
was applied. Th e diff erent soil threats were determined individually by the available data on the output of 2004 Malta Soil Information System (MALSIS).
Th is analysis provided a fi nal returning output, which allows the identifi cation of the high, medium and low risk areas.

288 Future Preparedness: Th ematic and Spatial Issues for the Environment and Sustainability
Figure 8: Soil Multicriteria Map
Th e fi nal sampled monitoring points (refer to Figure 6 and Figure 7), investigated in the survey were divided in 24 basic points, in which the following indicators are assessed:
• Bulk density• Rock • Soil Depth • Soil Electrical Conductivity • Soil Texture • Soil Typological Unit • Heavy metal contaminants • Hydrocarbon • Pesticides • Soil Organic Carbon
4 biodiversity points where the following indicators are examined:• Earthworms • Micro-arthropods

Chapter 16: Assessment of the Maltese Environmental Matrix to Defi ne the Future Monitoring Strategy 289
• Microbial Respiration• Soil Analysis (pH, Moisture, Soil texture, Soil Organic Carbon, Nitrogen content,
Ratio C:N, Bulk, Density, Calcium, Potassium, Phosphorous)• 12 point basic in which the following parameters are investigated:• Soil Analysis (pH, Moisture, Soil texture, Soil Organic Carbon, Nitrogen content,
Ratio C:N, Bulk Density, Calcium, Potassium, Phosphorus).
Figure 9: Soil sampling points
Results
Inland WatersTh e baseline survey, which covered one year, provided a short-term representation of
the environmental condition of ten inland water bodies in the Maltese Islands. Based on the assessment of benthic macro invertebrates, the baseline report concluded the water quality status for the ten water bodies (refer to Table 10). Th e results showed that all the ten sites have been subject to some form of alteration and deviations from natural, undisturbed conditions. Only two stations in two separate sites (Magħluq ta’ Marsascala inner basin and Ballut ta’ Marsaxlokk) attained good water status temporarily using Shannon-Weiner Index and one site (Qattara) attained Class II status temporarily using Chandler Biotic Score.

290 Future Preparedness: Th ematic and Spatial Issues for the Environment and Sustainability
Table 10: Water quality status for the ten water bodies as concluded from the baseline study carried out in 2012 from the assessment of benthic macro invertebratesWater body Station Water quality
status/ classAssessment method(SWI: Shannon-Weiner Index, EBI: Extended Biotic Index, CBS: Chandler Biotic Score)
Salini Eastern canal Poor/ Bad SWIWestern canal Poor/ Bad SWI
Maghluq ta’ Marsascala Inner basin Good/ Moderate SWIOuter basin Poor SWI
Ballut ta’ Marsaxlokk Good/ Moderate/ Bad SWIWied il-Bahrija Upstream Class IV/ V EBI
Midstream Class III/ IV EBIDownstream Class IV/ V EBI
Wied il-Luq Upstream Class III/ IV EBIMidstream Class IV/ V EBIDownstream Class IV EBI
Wied il-Lunzjata Upstream Class III/ IV EBIMidstream Class IV EBIDownstream Class IV EBI
Simar Inner basin Class III/ IV CBSOuter basin Class III/ IV CBS
Ghadira Inner basin Class III/ IV/ V CBSOuter basin Class III/ IV CBS
Qattara Class II/ III CBSClass III/ IV EBI
Ghadira ta’ Sarrafl u Class V CBSClass V EBI
Coastal watersBiological parametersTh e results of the survey (refer to Table 11)show that the nine coastal water bodies
were found to be of good quality with rare exceptions. Most of the monitoring stations under investigation recorded “high status” for the large majority of the analysed biological quality elements, only few monitoring stations were classifi ed “moderate status”.

Chapter 16: Assessment of the Maltese Environmental Matrix to Defi ne the Future Monitoring Strategy 291
Table 11: Biological Quality Element results. Empty cells refer to no scheduled sample collection
Sampling site Macroalgae P. oceanica Benthic invertebrates
Phytoplankton
CN01-1 High High High HighCN01-2 High High High GoodCS01 High High HighCS02 High High High HighCN02 - 1 High High GoodCN03-1 Good Good High HighCN03-2 Good High ModerateCN03-3 High High CN03-4 Good High CN03-5 High CN03-6 High High CS03 High High High HighCN04-1 Good High High GoodCN04 - 3 High CN04-4 Good Good Good GoodCN04 - 5 Good High CN04-6 High Good GoodCN04-7 High CP04-1 High High High GoodCP04-2 Good High Good GoodCN05-1 Good High PoorCP05 Moderate Good ModerateCN06-1 High Good ModerateCN06-2 Good CP06-1 Good Good High ModerateCP06-2 Good Good High CN071 Good High CN07-2 Moderate Moderate Moderate
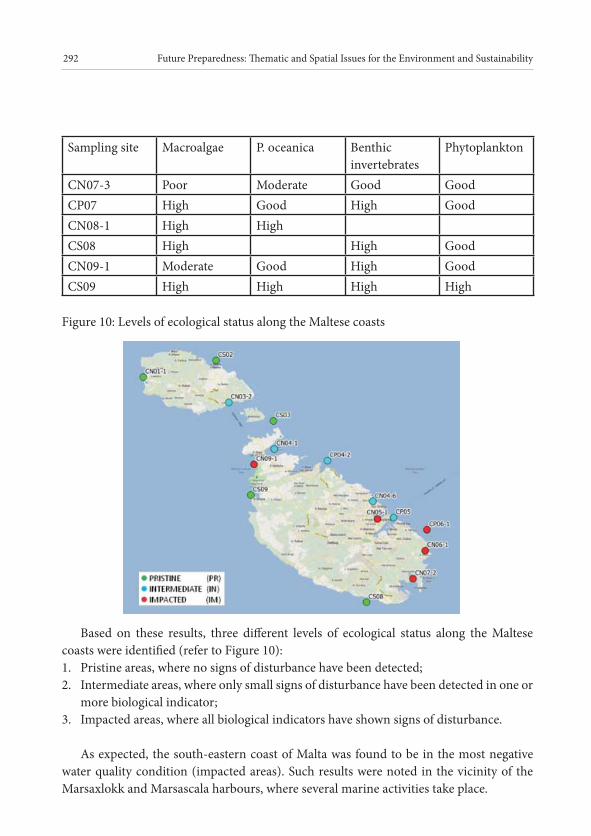
292 Future Preparedness: Th ematic and Spatial Issues for the Environment and Sustainability
Sampling site Macroalgae P. oceanica Benthic invertebrates
Phytoplankton
CN07-3 Poor Moderate Good GoodCP07 High Good High GoodCN08-1 High High CS08 High High GoodCN09-1 Moderate Good High GoodCS09 High High High High
Figure 10: Levels of ecological status along the Maltese coasts
Based on these results, three diff erent levels of ecological status along the Maltese coasts were identifi ed (refer to Figure 10): 1. Pristine areas, where no signs of disturbance have been detected; 2. Intermediate areas, where only small signs of disturbance have been detected in one or
more biological indicator; 3. Impacted areas, where all biological indicators have shown signs of disturbance.
As expected, the south-eastern coast of Malta was found to be in the most negative water quality condition (impacted areas). Such results were noted in the vicinity of the Marsaxlokk and Marsascala harbours, where several marine activities take place.

Chapter 16: Assessment of the Maltese Environmental Matrix to Defi ne the Future Monitoring Strategy 293
Chemical parametersA classifi cation of the sites based on the results from the water and sediment monitoring
is reported in Table 12.
Table 12: Chemical Quality Element results. Empty cells refer to no scheduled sample collection
Sampling site EQS water EQS sediment CN01-1CN01-2CS01CS02 Moderate/poor Good/high CN02-1 Good/high CN03-1CN03-2 Moderate/poor Good/high CS03 Moderate/poor Good/high CN04-1 Good/high Good/high CN04-2CN04-3CN04-4 Good/high CN04-5CN04-6CP04-1 Moderate/poor Moderate/poor CP04-2CN05-1 Moderate/poor Moderate/poor CP05 Moderate/poor Moderate/poor CN06-1CP06-1 Moderate/poor Moderate/poor CP06-2 Moderate/poor CN07-1 Good/high Good/high CN07-2 Moderate/poor CN07-3 Good/high CP07 Moderate/poor Good/high CS08CN09-1CS09 Moderate/poor Good/high

294 Future Preparedness: Th ematic and Spatial Issues for the Environment and Sustainability
AirTh e daily limit value of 50 μg/m3 for PM10 were exceeded in all four monitoring
points (refer Figure 11). Several peak values were also noted in diff erent months. No signifi cant trends could be identifi ed as the average PM10 concentrations assumed high values in diff erent time intervals. Table 13 summarises the main statistical parameters computed over the entire dataset.
Figure 11: PM10 histogram plot for the entire duration of the monitoring campaign without the extreme monitoring day (i.e. 2012/03/10).
Table 13: Summary table for PM10 data for the total monitoring period
Għarb Msida Kordin Żejtun Average [μg/m3] 23.26 38.96 32.88 35.67Exceedance LV [50 μg/m3] 13 70 36 42Median [μg/m3] 20.54 36.03 29.19 30.80Standard Deviation [μg/m3] 13.05 18.44 17.32 17.73Minimum [μg/m3] 1.83 2.56 7.15 12.65Maximum [μg/m3] 141.86 156.89 171.30 140.26valid data [#] 337 341 336 334data capture [%] 80% 81% 80% 80%

Chapter 16: Assessment of the Maltese Environmental Matrix to Defi ne the Future Monitoring Strategy 295
As expected, both the highest PM10 average concentration and number of exceedances were found in Msida while, conversely, the lowest are in Għarb followed by Kordin and Żejtun. Th is means that Msida is generally infl uenced by quite high concentrations due to traffi c emissions (that also lead to many limit exceedances) but seems less infl uenced by high isolated PM10 concentrations probably due to natural sources.
RadiationTh e results from the baseline survey are shown below.
SoilTh e statistical approach utilised in the study allowed the identifi cation of 3 populations
for each radionuclide investigated and the observation of geological map indicated that the lithology is the major factor controlling the behaviour of each population (refer Table 14). Each population was characterised by a Normal or Lognormal distribution, respectively. Concentration of Cs-137 in sediments is generally low (refer Figure 12), in fact the highest concentration value detected is 0.41 Bq/kg.
Table 14: Main statistical parameters of mass-based concentrations of 137Cs in Malta topsoil samples.Pop. N % Median Mean 95% perc. 99% perc. Std. Dev.
mg/kg mg/kg mg/kg mg/kg mg/kgA 8 13.8 4.8 4.8 5.4 5.6 0.34B 41 70.7 1.3 1.5 2.9 4.1 0.76C 9 15.5 0.13 0.16 0.34 0.51 0.10
WaterCs-137 results(refer Figure 13) in coastal water are aligned with concentration data
measured in Mediterranean Sea (Marine Pollution Bulletin, 2008).In MTC104 and MTC108 sampling points, the concentration values of Cs-137 in
marine water were comprised between 1.7 and 2.4 Bq/m3. Th e maximum concentration value was measured in MTC108, at a depth of 5 mt.

296 Future Preparedness: Th ematic and Spatial Issues for the Environment and Sustainability
Figure 12: Simplifi ed geological map of Malta Islands, showing the geographical distribution of the three individual populations of 137Cs separated through the partitioning approach of Sinclair.
Figure 13: Box Plot of Cs-137 concentration value

Chapter 16: Assessment of the Maltese Environmental Matrix to Defi ne the Future Monitoring Strategy 297
SoilTh e picture that emerges from this study suggested that for the majority of the soil
sampled, the level of the Potential Toxic Elements (PTE) is within the National Background Volumes (NBV) established for European soil (European Soil Bureau, 2014). Due to a small number of samples it was not possible to determine the PTEs NBV for Maltese soil. It was recommended that for the purpose of establishing the NBVs for PTEs, the country should be divided in two domains, an urban domain that comprises mainly the inner harbour, outer harbour and the south east sectors, and a principal domain comprising the rest of the country, thus representing the rural areas. In order to establish the NBV at least a minimum number of 30 spatially distributed sample points, are required. Th e criteria for the determination of the NBVs should be based on ISO 19258:2011.
With regards to organic matter, salinity and bulk density, these results showed that the level of organic matter in these soils was rather low and that there was no change from that recorded in 2006. Th is was somehow an expected outcome considering the climatic conditions of the region and the fact that the majority of the sites were agricultural sites; cultivated soils in general have lower organic matter content than non-agricultural soil. Salinity was on the high side, but again this is another characteristic of soils from arid or semi-arid regions. Th e fact that in some areas irrigation is carried out with water of relatively high conductivity further aggravates the situation. Compaction was surprisingly high and diff ered substantially from what was reported in 2006. One should consider comparison of the methods used here and method used during the MALSIS survey before drawing conclusions in this respect.
Recommendations
Inland watersDue to the short-term nature of the 2012 baseline data and the lack of previous
baseline information prior to the implementation of the project, another baseline study is recommended to be carried out for the following parameters:• Parameters indicative of all biological quality elements;• Parameters indicative of all hydro-morphological quality elements;• Parameters indicative of all general physico-chemical quality elements;• Priority list pollutants and other pollutants discharged in signifi cant quantities in the
river basin or sub-basin.
A three-year gap has been recommended to carry out the next baseline study, which coincides with the year 2015 when the target for ‘good ecological status’ and ‘favourable conservation status’ under the WFD and the Habitats Directive respectively need to

298 Future Preparedness: Th ematic and Spatial Issues for the Environment and Sustainability
be achieved. Th e 2015 baseline study should follow the requirements of surveillance monitoring in line with the WFD. Accordingly the monitoring frequency for parameters indicative of physico-chemical and hydro morphological quality elements should be monthly for the duration of one year. In the case of biological quality elements, monitoring should be carried out at least quarterly during the same year.
Table 15: Proposed future monitoring point for Inland watersWater Body Physico-
c h e m i c a l parameters
Priority substances
Biological P h y t o -plankton
Quality Macro invertebrates
ElementsFish
Amphibians
Salini √ √ √ √ √ N/AMaghluq ta’ Marsascala
√ √ √ √ √ N/A
Ballut ta’ Marsaxlokk
√ √ √ √ N/A N/A
Simar √ √ √ √ √ N/AGhadira √ √ √ √ √ N/AWied il-Bahrija
√ √ N/A √ N/A √
Wied il-Luq √ √ N/A √ N/A √Wied ix-Xlendi/
√ √ N/A √ N/A √
Wied il-Lunzjata/
√ √ N/A √ N/A √
Wied tal-Ghancija
√ √ N/A √ N/A √
Qattara √ √ √ √ √ √Ghadira ta’ Sarrafl u
√ √ √ √ √ √
Th e monitoring schedule following the 2015 baseline study would depend on the outcome of the respective results, which should be also interpreted in light of the results obtained in the 2012 baseline data. Should the 2015 baseline studies be considered to provide suffi cient information, a monitoring programme consistent with the WFD guidelines was recommended to be undertaken envisaging a surveillance monitoring on a six-year cycle followed by fi ve years of operational monitoring (Table 15).

Chapter 16: Assessment of the Maltese Environmental Matrix to Defi ne the Future Monitoring Strategy 299
Table 16: Proposed future monitoring point for Biological elements in coastal waters
WFD Water body
Monitoring point P h y t o p lankton
Macroalgae Angiosp erms
B e n t h i c Invertebrate fauna
H y d r o m orphological
Pristine (PR)MTC 101 CN 01 1 x x x x xMTC 102 CS 02 x x x x xMTC 103 CS 03 x x x x xMTC 108 CS 08 x x x xMTC 109 CS 09 x x x x x
Intermediate (IN)
MTC 103 CN 03 2 x x x x xMTC 104 CN 04 1 x x x x xMTC 104 CP 04 2 x x x xMTC 104 CN 04 6 x x x xMTC 105 CP 05 x x x x
Impacted (IM)MTC 109 CN 09 1 x x x xMTC 107 CN 07 2 x x x xMTC 105 CN 05 1 x x x xMTC 106 CP 06 1 x x x x xMTC 106 CN 06 1 x x x
Th e baseline study on priority substances and other pollutants of national concern in the water phase recommended that the ten water bodies should be monitored as follows:• Annually (in December or January) for the whole list of forty-seven chemicals analysed
in the same study;• Bi-monthly (every 2 months) for the dichloromethane, di(2-ethylhexyl)phthalate,
fl uoranthene, lead, mercury, nickel, trichloromethane and perchlorates.
Coastal watersBased on the results the future monitoring strategy was designed (refer Table 16). It
was agreed that a reduction in the number of monitoring stations was required, especially in the coastal zones, where anthropogenic pressures were found to be low and the water

300 Future Preparedness: Th ematic and Spatial Issues for the Environment and Sustainability
quality status was classifi ed as “high”. With regards to the frequency it was agreed that the fi rst year should establish a
strong and extensive baseline data which up till now is limited in the Maltese Islands. It is also necessary to perform hydrological monitoring of the coastal waters in the future, specifi cally where anthropogenic pressures have been recorded or can be expected to occur, as such anthropogenic pressures have a strong infl uence on the BQE status.
Th e monitoring stations proposed for chemical water monitoring were identifi ed as those classifi ed moderate/poor for water quality or sediment status(refer Table 17).
With regards to the frequency the following has been proposed: for group A, a monthly monitoring survey should be carried out at least for the fi rst year, aft erwards and depending on the results obtained, a quarterly monitoring survey might be enough. For group B1 and B2 a monthly monitoring survey is being suggested. For group C, sampling for the analysis of sediments should be held once a year, which is thought to be suffi cient.
Table 17: Proposed future monitoring point for Chemical elements in coastal watersWFD Water Body Mon. Site Ref. Code Chemical Quality Elements
A B1 B2 C1 C2MTC101 CN01-2 x MTC101 CS01 x MTC101 CN01-1 x MTC102 CN02-1 x x xMTC102 CS02 x x x x xMTC103 CN03-1 x MTC103 CN03-2 x x x x xMTC103 CN03-3MTC103 CN03-4MTC103 CN03-5MTC103 CN03-6MTC103 CS03 x x x x xMTC104 CN04-1 x x xMTC104 CN04-2 xMTC104 CN04-3MTC104 CN04-4 x x xMTC104 CN04-5 x
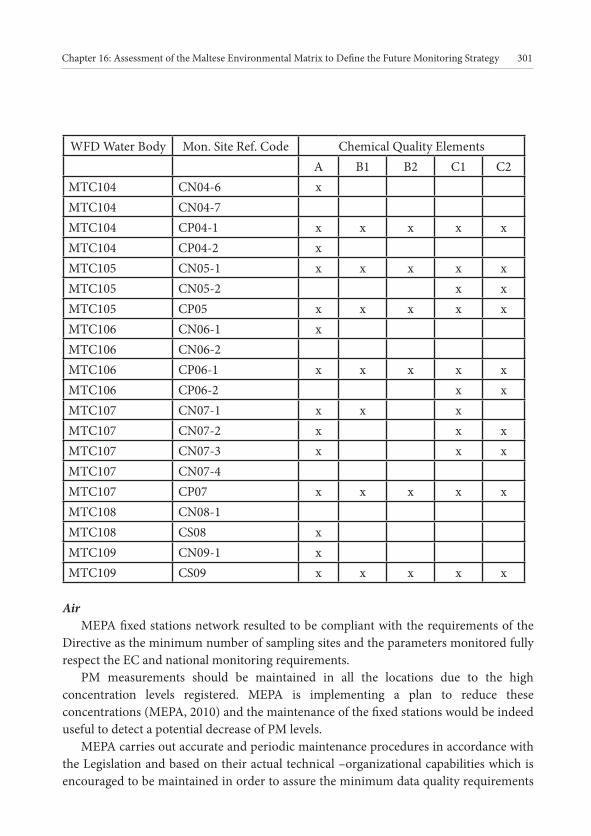
Chapter 16: Assessment of the Maltese Environmental Matrix to Defi ne the Future Monitoring Strategy 301
WFD Water Body Mon. Site Ref. Code Chemical Quality Elements A B1 B2 C1 C2
MTC104 CN04-6 xMTC104 CN04-7MTC104 CP04-1 x x x x xMTC104 CP04-2 xMTC105 CN05-1 x x x x xMTC105 CN05-2 x xMTC105 CP05 x x x x xMTC106 CN06-1 xMTC106 CN06-2MTC106 CP06-1 x x x x xMTC106 CP06-2 x xMTC107 CN07-1 x x xMTC107 CN07-2 x x xMTC107 CN07-3 x x xMTC107 CN07-4MTC107 CP07 x x x x xMTC108 CN08-1MTC108 CS08 xMTC109 CN09-1 xMTC109 CS09 x x x x x
AirMEPA fi xed stations network resulted to be compliant with the requirements of the
Directive as the minimum number of sampling sites and the parameters monitored fully respect the EC and national monitoring requirements.
PM measurements should be maintained in all the locations due to the high concentration levels registered. MEPA is implementing a plan to reduce these concentrations (MEPA, 2010) and the maintenance of the fi xed stations would be indeed useful to detect a potential decrease of PM levels.
MEPA carries out accurate and periodic maintenance procedures in accordance with the Legislation and based on their actual technical –organizational capabilities which is encouraged to be maintained in order to assure the minimum data quality requirements

302 Future Preparedness: Th ematic and Spatial Issues for the Environment and Sustainability
established by the Directive.
RadiationTable 18 summarizes the monitoring details for each environmental medium specifying
the radionuclide’s that should be identifi ed; the sampling periodicity, the number and the location of the sampling points in which measurements should be carried out.
Table 18: Proposed monitoring plan for radioactivityMedia Radionuclides Sampling frequency Location
Particulate matter Artifi cial Alpha and Beta. Radon and Th oron
Cs-137, and other selectable nuclides, up to a maximum of 8
Continuously. Benghisa, Attard, Gozo
Fall out (precipitation and deposition)
Cs-137, Beta residual Monthly MEPA
Gamma dose rate Gamma dose absorbed Continuously Benghisa, Attard, Gozo and Kordin.
Coastal water bodies Cs-137, beta residual Six monthly MTC101, MTC104, MTC108
Coastal sediments Cs-137, Th -232, U-238, K-40 Six monthly MTC101, MTC104, MTC108 (*)
Marine biota (bivalves) Cs-137 Six monthly MTC101, MTC104, MTC108
Soil Cs-137, Th -232, U-238, K-40, Beta residual
Yearly (*)
(*) Th e n.15 points are suggested in par. 3.7.2.1 of the document “Technical Report on Activity 3 – Design of the Programmes (Radiation – Lot 1)” (February 2013)
SoilFollowing the baseline survey and the evaluation of the results retrieved, a set of
recommendations for further studies were presented. Th ese are required to ensure that the conclusions are made with more confi dence, reliability and representativeness.
A greater number of sampling points have to be investigated to have a more robust baseline assessment. Th e points should not be limited to single fi elds in specifi c areas but extended over larger stretches to cover the whole territory. A number of variables have to be taken into consideration in the choice of the sampling points as these determine the

Chapter 16: Assessment of the Maltese Environmental Matrix to Defi ne the Future Monitoring Strategy 303
quality of the results emanating from the study. Soil type, slope steepness and size of fi elds are among such variables. Representativeness also needs to be taken into consideration, hence the sampling points should encompass the various land characteristics such as soil samples from coastal areas, from steeper slopes, from areas more prone to erosion amongst others. Th is would lead to a thorough analysis upon which a clearer strategic monitoring plan on this thematic area can be based.
ConclusionMalta, as part of the European Union, needs to comply with several obligations
regarding the protection, conservation and restoration of its natural environment. By the implementation of this project and its outputs, Malta has taken an important step forward towards this goal. Th e knowledge and conclusions acquired during the implementation of this project represents an important basis for the implementation of long term strategies in accordance with the specifi c context and targets of each environmental component. It will allow Maltese authorities to use its resources effi ciently when aiming to achieve their environmental goals. Nevertheless, additional steps will be needed to be carried out in the short term before establishing defi nitive long term strategies, such as performing additional base line surveys in the case of soil and inland waters or analysing future monitoring outputs in the rest of the environmental matrix. Aft er doing so, Malta will be able to establish the fi nal characteristics of its environmental monitoring network.
ReferencesEuropean Commission, (2000): Nuclear energy. Available at: http://ec.europa.eu/energy/nuclear/radiation_protection/legislation_en.htm (accessed on 10 March 2014)
European Commission, (2008). Maltese monitoring network for environmental radioactivity. Available at: http://ec.europa.eu/energy/nuclear/radiation_protection/doc/art35/tech_report_malta_2008.pdf (accessed on 10 March 2014)
European Commission, (2014a). Additional tools Implementation of Community environmental legislation. Available at: http://ec.europa.eu/environment/legal/implementation_en.htm (accessed on 10 March 2014)
European Commision, (2014b): Air Quality, current legislation. Available at: http://ec.europa.eu/environment/air/quality/legislation/existing_leg.htm (accessed on March 2014)
European Comission, (2014c). Soil themathic strategy. Available at: http://ec.europa.eu/environment/soil/three_en.htm (accessed on 10 March 2014)

304 Future Preparedness: Th ematic and Spatial Issues for the Environment and Sustainability
European Soil Bureau, (2014). Heavy metals and organic matter content of European soils. Joint Research Center. Available at: http://ec.europa.eu/environment/waste/sludge/pdf/heavy_metals_feasibility_study.pdf (accessed on 10 March 2014)
Government of Malta, (2011). Service Tender for the Development of Environmental Monitoring Strategy and Environmental Monitoring Baseline Surveys. Malta.
Government of Malta, (2014). National Environment Policy. Available at: https://secure2.gov.mt/tsdu/environment-nep?l=1 (accessed on 10 March 2014)
Offi cial Journal of the European Communities, (2000a). Directive, 2000. Directive 2000/60/EC of the European Parliament and of the council of 23 October 2000 establishing a framework for community action in the fi eld of water policy. Offi cial Journal of the European Communities, L 327, 1–72.
Offi cial Journal of the European Communities, (2000b). Commission Recommendation (2000): of 8 June 2000 on the application of Article 36 of the Euratom Treaty concerning the monitoring of the levels of radioactivity in the environment for the purpose of assessing the exposure of the population as a whole. published (OJ L-191 of 27/07/2000 page 37): Available at: http://ec.europa.eu/energy/nuclear/radioprotection/doc/legislation/00473_en.pdf (accessed on 10 March 2014)
Marine Pollution Bulletin, (2008). 137Cs baseline levels in the Mediterranean and Black Sea: A cross-basin survey of the CIESM Mediterranean Mussel Watch programme 5th International Conference on Marine Pollution and Ecotoxicology. Elsevier, Vol 57, Issue 6-12, 801-806.
MEPA, (2010). Th e Air Quality Plan for the Maltese Islands. Available at: http://www.mepa.org.mt/fi le.aspx?f=4367 (accessed on 10 March 2014)
MEPA, (2011a). Th e Water Catchment Management Plan for the Maltese Islands. Malta Environment and Planning Authority, Floriana: Malta.
Regional Environmental Center, (2008). Handbook on the Implementation of EC Environmental Legislation. Available at: http://ec.europa.eu/environment/enlarg/pdf/handbook_impl_ec_envi_legisl.pdf (accessed on 10 March 2014)
Stacey, B. and Bush T., (2002). Preliminary assessment of air quality in Malta. Available at: http://www.mepa.org.mt/mt/environment/airquality/docs/PreliminaryAssess2002.pdf (accessed on 10 March 2014)
Vella, S. (2001). Soil Information in the Maltese Islands. Options Méditerranéennes: Série B. Etudes et Recherches; n. 34, pages 171-191.

Colour Imagery 305
C O L O U R I M A G E R Y
Th is section depicts colour versions of selected images from the chapters
Chapter 3
Figure 3: Mosta – TIN of all LiDAR returns all classifi cations
Figure 5: Surface diff erence between unassigned TIN and all classifi cations TIN
Figure 4: Mosta - TIN of all LiDAR returns ‘unassigned’
Figure 6: Mosta - Resulting output building footprints aft er generalisation and smoothing

306 Future Preparedness: Th ematic and Spatial Issues for the Environment and Sustainability
Figure 7: Mosta showing photogrammetriclly captured buildings over an orthophoto (left ), and the change in development detected by LiDAR footprint extraction (right)
Figure 8: Sliema showing how protruding balconies extend the building outlines further than actual footprint, and superfl uous ‘holes’
Figure 9: Sliema showing how buildings in close proximity are joined into one polygon

Colour Imagery 307
Figure 10: Gudja showing thick rubble walls selected with building features
Figure 11: Sliema showing diffi culty in extracting building footprint of turf covered roof-top
Chapter 4
Figure 6: Example of simple NPI card for use on MEPA’s website

308 Future Preparedness: Th ematic and Spatial Issues for the Environment and Sustainability
Chapter 4
Figure 5: Export Selection set
Chapter 5
Figure 1: Landslide Hazard Map for Malta (aft er Meli et al., 2013, Map 3.8)

Colour Imagery 309
Chapter 6
Figure 3: An example of a classifi ed 0.25m pixel resolution photograph of an intensively cultivated land area situated within the Pwales valley (St Paul’s Bay local council) (af: abandoned parcel of agricultural land; beans: broad beans).
Figure 4: Th ematic classifi ed agricultural land cover map for the Local Council of Fontana

310 Future Preparedness: Th ematic and Spatial Issues for the Environment and Sustainability
Chapter 8
Figure 2: Low resolution raster mosaic of East Malta (September, 2012). Raster datasets in this image were mosaiced in Hypack and later added as a raster layer in Quantum GIS, where they can be easily exported into other visualisation soft ware such as Google Earth.
Figure 3a and 3b: Th e Rozi, a sunken tugboat used as an artifi cal reef off Cirkewwa (NW Malta). Th is 3D point cloud model was generated on a grid with a bin size of 80 cm.

Colour Imagery 311
Chapter 10
Figure 1: A geological map of Malta showing the diff erent layers across the island
Figure 5: Summer and Winter respectively showing the diff erence between the two temperature results and analysis within the two seasons

312 Future Preparedness: Th ematic and Spatial Issues for the Environment and Sustainability
Chapter 11
Figure 1: Interactive Image-Mapping system and Data Portal
Figure 3a: Th e MapInfo stage Figure 3b: Conversion to a grid fi le – building heights through Vertical Mapper
Figure 3c: Th e pseudo 3D interface Figure 3d: Integrating orthophotos for polygon analysis with the 3D interface

Colour Imagery 313
Figure 4: 2D models for perspectives for the ‘Circles of Sustainability Assessments’ applications. Th ese will ultimately also sustain the compilation of Character Assessments
Figure 6: (a) 1m block conversion output – top perspective and the (b) Main square walkabout view.
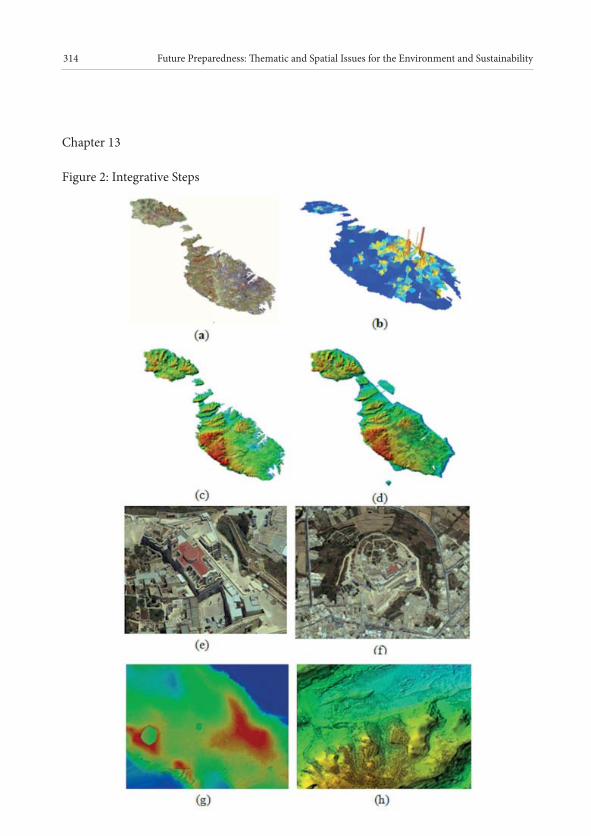
314 Future Preparedness: Th ematic and Spatial Issues for the Environment and Sustainability
Chapter 13
Figure 2: Integrative Steps

Colour Imagery 315
Figure 3: Th e transformative process

316 Future Preparedness: Th ematic and Spatial Issues for the Environment and Sustainability
Figure 4: 3d-ifi cation process
Chapter 15
Figure 1: Th e island of Stromboli - a well known and used waypoint in antiquity
Source: T. Gambin
Figure 2: A typical off shore rock that poses a danger to shipping
Source: T. Gambin

Colour Imagery 317
Figure 3: Line spacing for an archaeological survey using side scan sonar
Source: T. Gambin
Figure 4: A 900Khz sonar image of an amphora shipwreck
Source: Ministero dei Beni Culturali/T. Gambin

318 Future Preparedness: Th ematic and Spatial Issues for the Environment and Sustainability
Figure 5: Sonar mosaic projected in 3D using Google Earth
Source: T. Gambin/G. Kozak
Chapter 16
Figure 6: A whole amphora amongst ceramic fragments from a site that was heavily damaged by fi shing implements
Source: Soprintendenza del Mare/T. Gambin
Figure 7: Location of sampling points in Maltese Islands.

Colour Imagery 319
Figure 8: Soil Multicriteria Map
Figure 9: Soil sampling points

Figure 10: Levels of ecological status along the Maltese coasts
