a gaussian process based framework for white matter fiber tracts and bundles, applications to fiber...
TRANSCRIPT

A Gaussian Process based framework for white matterfiber tracts and bundles, applications to fiber clustering
Demian Wassermann1, Luke Bloy2, Ragini Verma2, and Rachid Deriche1
1Odyssee Project Team, INRIA Sophia Antipolis - Mediterranee, 2004 Route des Lucioles,Sophia-Antipolis, 06902, France
2University of Pennsylvania, Radiology, 3600 Market St., Philadelphia, PA 19104, USA
Abstract. With the increasing importance of fiber tracking in diffusion tensorimages for clinical needs, there has been a growing demand for an objective math-ematical framework to perform quantitative analysis of white matter fiber bundlesincorporating their underlying physical significance. This paper presents such anovel mathematical framework that facilitates mathematical operations betweentracts using an inner product based on Gaussian processes, between fibers whichspan a inner product space. This space facilitates combination of fiber tracts, ren-dering operations like tract membership to a bundle or bundle similarity simple.Based on this framework, we have designed an automated unsupervised cluster-ing method that does not require manual initialization nor an a priori knowl-edge of the number of clusters. Quantitative analysis can now be performed onthe clustered tract volumes across subjects thereby avoiding the need for pointparametrization of these fibers, or the use of medial or envelope representationsas in previous work. Subsequently, the applicability of the unsupervised cluster-ing framework has been demonstrated on a 16 subject dataset.
1 Introduction
By modeling the anisotropic diffusion process of water molecules in biological tis-sues, diffusion magnetic resonance imaging (MRI) provides biologically and clinicallyrelevant information, aiding in the characterization of tissue micro-structure and archi-tectural organization in vivo [1]. Diffusion information within each voxel can be syn-thesized in the form of a diffusion tensor. Then, brain connectivity can be assessed byassembling the tensors into tracts using fiber tracking methods, streamline tractographybeing one of them [2]. Streamline tractography [2] recovers white matter fiber tractsfrom a seed voxel by following the principal direction of the diffusion tensor thus esti-mating white matter fiber tracts as three dimensional curves on the white matter. Whitematter fiber tracts can then be grouped into fiber bundles based on anatomic knowl-edge [3, 4], prominent examples of fiber clusters being the Cortico Spinal Tract (CST)or the Corpus Callosum (CC).
In this paper, we address the important problem of analyzing fiber bundles, whichhas become a very active research area, with the aim of determining tract-based differ-ences induced by pathology, see for instance Kubicki et al [5]. We propose a frameworkfor tract-based analysis based on an inner product space for tracts and bundles whose in-ner product operation serves as a measure of overlapping in space among bundles. One
2 Demian Wassermann, Luke Bloy, Ragini Verma, and Rachid Deriche
of the applications of this framework is the automated clustering of bundles, whosesimilarity is now quantifiable on the basis of spatial overlapping.
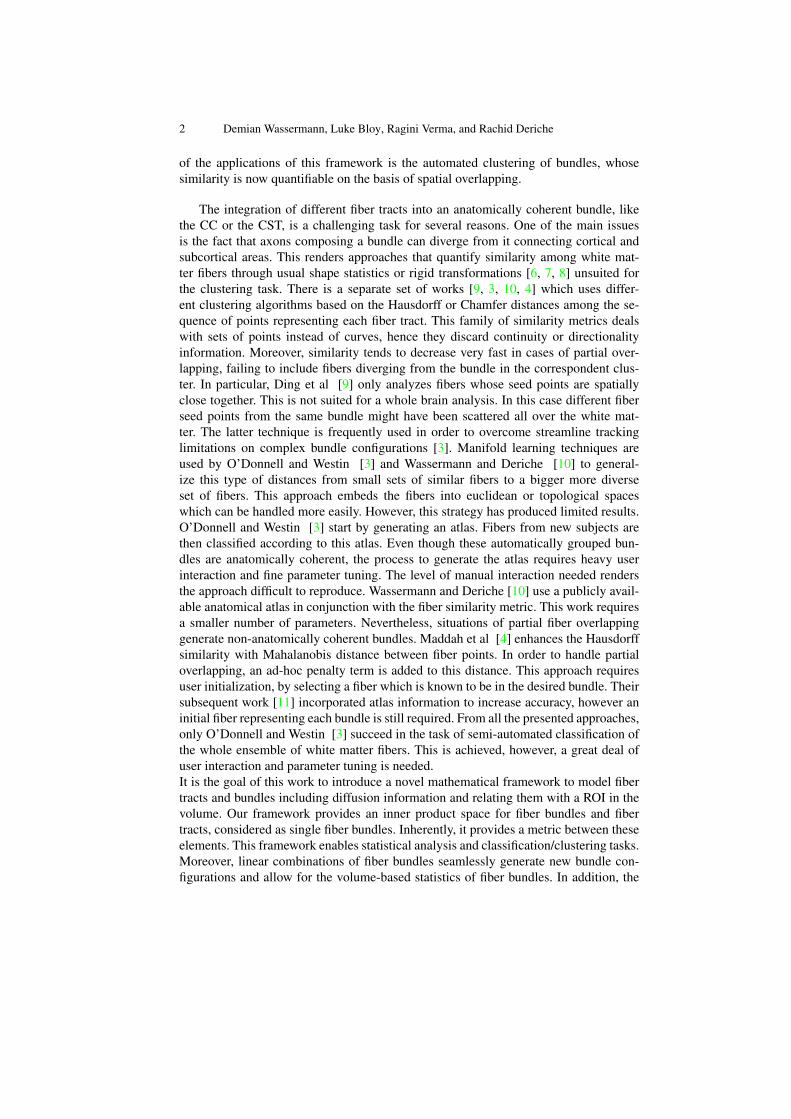
The integration of different fiber tracts into an anatomically coherent bundle, likethe CC or the CST, is a challenging task for several reasons. One of the main issuesis the fact that axons composing a bundle can diverge from it connecting cortical andsubcortical areas. This renders approaches that quantify similarity among white mat-ter fibers through usual shape statistics or rigid transformations [6, 7, 8] unsuited forthe clustering task. There is a separate set of works [9, 3, 10, 4] which uses differ-ent clustering algorithms based on the Hausdorff or Chamfer distances among the se-quence of points representing each fiber tract. This family of similarity metrics dealswith sets of points instead of curves, hence they discard continuity or directionalityinformation. Moreover, similarity tends to decrease very fast in cases of partial over-lapping, failing to include fibers diverging from the bundle in the correspondent clus-ter. In particular, Ding et al [9] only analyzes fibers whose seed points are spatiallyclose together. This is not suited for a whole brain analysis. In this case different fiberseed points from the same bundle might have been scattered all over the white mat-ter. The latter technique is frequently used in order to overcome streamline trackinglimitations on complex bundle configurations [3]. Manifold learning techniques areused by O’Donnell and Westin [3] and Wassermann and Deriche [10] to general-ize this type of distances from small sets of similar fibers to a bigger more diverseset of fibers. This approach embeds the fibers into euclidean or topological spaceswhich can be handled more easily. However, this strategy has produced limited results.O’Donnell and Westin [3] start by generating an atlas. Fibers from new subjects arethen classified according to this atlas. Even though these automatically grouped bun-dles are anatomically coherent, the process to generate the atlas requires heavy userinteraction and fine parameter tuning. The level of manual interaction needed rendersthe approach difficult to reproduce. Wassermann and Deriche [10] use a publicly avail-able anatomical atlas in conjunction with the fiber similarity metric. This work requiresa smaller number of parameters. Nevertheless, situations of partial fiber overlappinggenerate non-anatomically coherent bundles. Maddah et al [4] enhances the Hausdorffsimilarity with Mahalanobis distance between fiber points. In order to handle partialoverlapping, an ad-hoc penalty term is added to this distance. This approach requiresuser initialization, by selecting a fiber which is known to be in the desired bundle. Theirsubsequent work [11] incorporated atlas information to increase accuracy, however aninitial fiber representing each bundle is still required. From all the presented approaches,only O’Donnell and Westin [3] succeed in the task of semi-automated classification ofthe whole ensemble of white matter fibers. This is achieved, however, a great deal ofuser interaction and parameter tuning is needed.It is the goal of this work to introduce a novel mathematical framework to model fibertracts and bundles including diffusion information and relating them with a ROI in thevolume. Our framework provides an inner product space for fiber bundles and fibertracts, considered as single fiber bundles. Inherently, it provides a metric between theseelements. This framework enables statistical analysis and classification/clustering tasks.Moreover, linear combinations of fiber bundles seamlessly generate new bundle con-figurations and allow for the volume-based statistics of fiber bundles. In addition, the

Title Suppressed Due to Excessive Length 3
framework handles cases of partial fiber overlapping naturally. Finally we show the ap-plicability of our framework by performing full brain tractography clustering without apriori knowledge of the number of clusters.
2 A Mathematical framework for white matter fibers and bundles
In this section we develop an inner product space for white matter fibers and bundles,constructing this in order to provide important operations between bundles in a naturalmanner. To begin with, the linear combination of our space combines several fibers intoa fiber bundle, thus following the anatomical idea that a bundle is composed of fibers.Moreover, the inner product operation of our space quantifies bundle similarity takinginto account partial overlapping and does not rely on point correspondences. Finally, aswe model bundles with stochastic processes, producing a tract probability map for eachbundle is a natural operation.
We model each fiber tract F as a blurred indicator function yF : p∈R3→R. Thisblurred indicator function has a maximal level set which corresponds to F . Moreover,yF is blurred in accordance to the underlying diffusion tensor field, thus followingdiffusion of water molecules along the fiber. As we show in subsection 2.1, GaussianProcesses (GP) provide a fit framework for yF integrating spatial and diffusion infor-mation. To be more precise, the blurred indicator function yF (p) is modeled by theGP
yF (p)∼GP(y∗F (p), cF (p,p′)),where the mean function y∗F (p) and covariance function cF (p,p′) are the parameters ofthis stochastic process. These two functions are inferred from the tractography of eachfiber. That is, from the sequence of points f = f1, . . . , f|f | estimated by tractographyof the anatomical bundle F and from the corresponding sampling on its tensor fieldΣ(f1), . . . , Σ(f|f |).
(a) F1 (b) F2 (c) F3 (d) F4 (e) ΣiFi4
Fig. 1. Mean indicator function for four fiber tracts (a-d), as described in subsection 2.1,and mean indicator function for the bundle formed by their addition according to ourframework (e). Blue color means that the bundle is more likely to cross that voxel whilered color means it is not likely that the bundle traverses that voxel. Fibers were manuallyselected from a full brain tractography and belong to the the Cingulate Cortex sectionof the Cingulum (CgC).
Using our framework we are able to combine N fibers into a bundle with a simpleaverage operation in our inner product space. The GP which corresponds to the indicator
4 Demian Wassermann, Luke Bloy, Ragini Verma, and Rachid Deriche
function of a fiber bundle B, is obtained through the mean Gaussian Processes of singlefibers or smaller bundles composing it,
yB(p) =1N
N∑i=1
yFi(p)∼GP
(1N
N∑i=1
yFi(p);1N2
N∑i=1
cFi(p,p′)
). (1)
An example of this is shown in fig. 1, where indicator functions for four fiber tracts andthe obtained function for the bundle combining them can be seen.
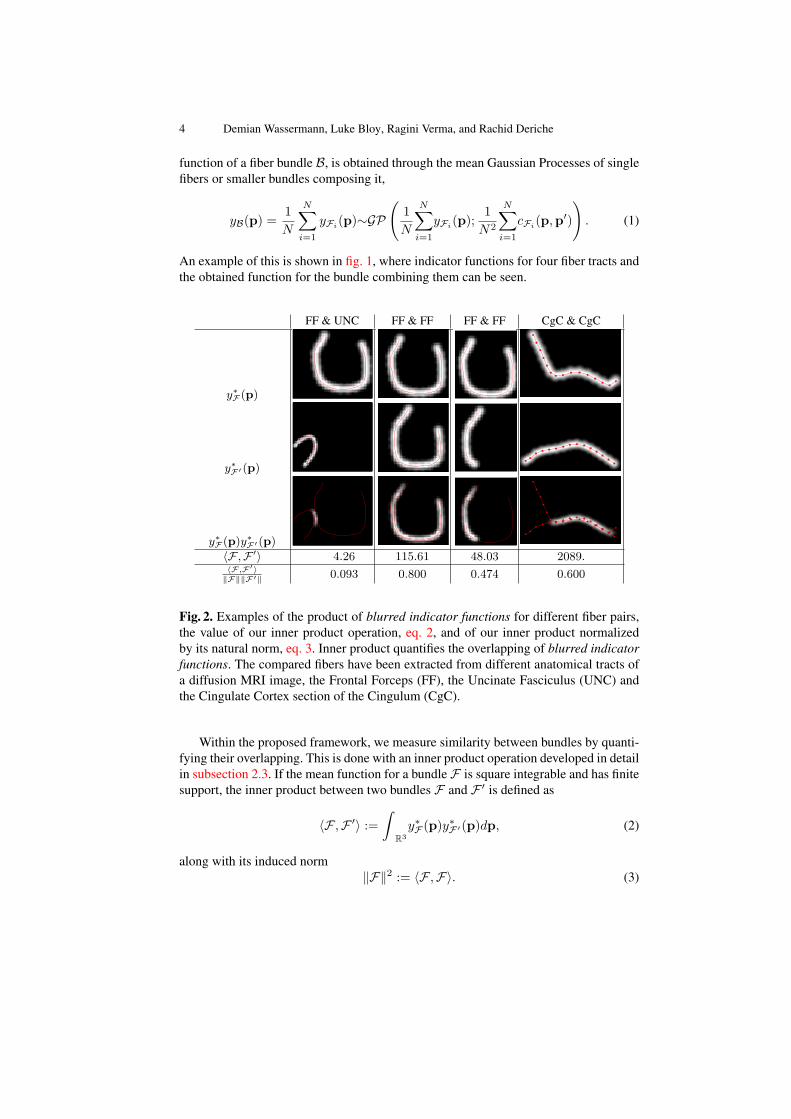
FF & UNC FF & FF FF & FF CgC & CgC
y∗F (p)
y∗F′(p)
y∗F (p)y∗F′(p)
〈F ,F ′〉 4.26 115.61 48.03 2089.〈F,F′〉‖F‖‖F′‖ 0.093 0.800 0.474 0.600
Fig. 2. Examples of the product of blurred indicator functions for different fiber pairs,the value of our inner product operation, eq. 2, and of our inner product normalizedby its natural norm, eq. 3. Inner product quantifies the overlapping of blurred indicatorfunctions. The compared fibers have been extracted from different anatomical tracts ofa diffusion MRI image, the Frontal Forceps (FF), the Uncinate Fasciculus (UNC) andthe Cingulate Cortex section of the Cingulum (CgC).
Within the proposed framework, we measure similarity between bundles by quanti-fying their overlapping. This is done with an inner product operation developed in detailin subsection 2.3. If the mean function for a bundle F is square integrable and has finitesupport, the inner product between two bundles F and F ′ is defined as
〈F ,F ′〉 :=∫
R3y∗F (p)y∗F ′(p)dp, (2)
along with its induced norm‖F‖2 := 〈F ,F〉. (3)

Title Suppressed Due to Excessive Length 5
The value of this inner product and the inner product normalized by its induced normin different real scenarios is shown in fig. 2.
In the following sections, we provide the grounds to represent fibers and bundles,show how to infer the mean and covariance functions and derive an expression for eq. 2.Finally, we provide an operation in order to calculate the tract probability map for abundle, illustrated in fig. 3.
2.1 Single fibers as Gaussian Processes
Gaussian Processes (GP) are a rich mathematical framework that has been used in awide variety of research fields. Examples of this are machine learning [12, 13], spatialstatistics and modeling of observational data [14]. Furthermore, they are also related tokernel machines and radial basis functions [14, 13]. In this work we take advantage ofthe GP as a parametric representation of fiber bundles. Particularly, we take advantageof the capability to incorporate different types of hypotheses into the model. Moreover,this representation provides a natural inner product space, which we develop in sub-section 2.3, along with a natural method to calculate tract probability maps, developedin subsection 2.4.
The parametric representation of a single fiber bundle is based on two hypotheses.Firstly, smoothness: due to the fact that fiber bundles in the brain do not have sharpangles [15], we assume that they are at least twice differentiable. Moreover, we considerthat a least curved trajectory joining the sample points of a fiber represents that fiber ina most probable manner. Secondly, diffusion associated uncertainty: the uncertainty ofthe position of each point on the bundle can be modeled by the water diffusion profileat that position [1].
Using these two hypotheses, we write yF (p), the GP for the indicator function offiber F , y(p) for clarity, as the combination of two other GPs, y(p) := z(p) + ε(p).The process z(p) represents the smoothness of the trajectory in space, its parametersare inferred from the point sequence obtained through the tractography of a fiber: f =f1, . . . , f|f |⊂R3. The process ε(p) adds a variability to the fiber at p using full diffu-sion information and it is inferred from the tensor field over the fiberΣ(f1), . . . , Σ(f|f |).In the following sections, we show that z(p) and ε(p) can be modelled as GPs by char-acterizing them through covariance functions.
Smoothness We formulate a probabilistic prior for the probability of a function z(·)being the indicator function of a fiber. From the hypotheses that an indicator functionwith smaller curvature is a more probable representation of a given trajectory and thatthe original trajectory F is C2. We express these hypotheses as the probabilistic prior
− log(P z(·)) =12
∫Ω
|D2z(p)|2dp + const, Ω⊂R3 (4)
where the linear operator D maps z(·) to its derivative. Then, we characterize z(·) fromthis prior. To begin with, we rewrite the prior over a finite sampling pii⊂Ω. Letting[z(pi)]i be the column vector of values of z(·) at each sampled point, we reformulate

6 Demian Wassermann, Luke Bloy, Ragini Verma, and Rachid Deriche
eq. 4 as
− log(P [z(pi)]i) =12
[z(pi)]Ti D
2(D2)T [z(pi)]i + const (5)
which is the p.d.f of a multivariate Gaussian with covariance matrix
S = (D2(D2)T )−1 = (D4)−1.
Hence, the function z(·) is represented by the GP,
z(p)∼GP(z∗(p), s(p,p′)).
In order to fully characterize the GP for z(p), we need to find an explicit formulation fors(p,p′). We do this by first rewriting S = (D4)−1 as D4S = I . This reveals s(p,p′)to be the Green function of the fourth derivative operator [16, 14]∫
Ω
D4(u,w)s(w,v)dw = δ(u− v). (6)
Next, the solution for eq. 6 inside a sphere in R3 of radius R is
s(p,p′) := ψ(‖p− p′‖),ψ(r) =
2|r|3 − 3Rr2 +R3 r≤R0 r > R
, (7)
where the constants have been chosen such that s(p,p′) is a positive semi-definite sym-metric function. Hence, we have fully characterized the probabilistic space of functionswhich describes the blurred indicator function for a smooth trajectory. Furthermore,the covariance function in eq. 7 is equivalent to a bounded thin-plate spline regularizer,which accurately models smooth spatial data [14].
Diffusion associated uncertainty We now represent the diffusion information of apoint in the trajectory by a blurring GP at that point. The usual practice in GP literatureis to model uncertainty at a given point by an isotropic blurring function [12]. In ourcase, we use anisotropical blurring at every given point sampled from the fiber by meansof a second covariance function based on Diffusion Tensor information. This covariancefunction is built with convolution kernels: Let g(·) be the GP of an isotropic blurringfunction, then its convolution with a kernel k(·),
ε(p) =∫k(w;p)g(w)dw
is a GP with covariance function [17],
u(p,p′) =∫k(w;p)k(w;p′)dw. (8)
We express the blurring kernel k(·;p) as the probability of a particle going from p tow in a time t in terms of the Diffusion Tensor Σ(p) [1]:
k(w;p) = P w|p, t, Σ(p) = 12π4t|Σ(p)|e
− 14t (w−p)TΣ−1(p)(w−p).

Title Suppressed Due to Excessive Length 7
Then, by performing the integral in eq. 8, we write the covariance function for theanisotropical blurring process as,
u(p,p′) =(4πt
∣∣∣Σ+Σ′
2
∣∣∣)− 12e− 1
2t (p′−p)T
„Σ+Σ′
2
«−1
(p′−p),
where Σ = Σ(p) and Σ′ = Σ(p′). The blurring at each point is represented by a zeromean GP,
ε(p) ∼ GP (0, u(p,p′)) .
Gaussian Process representation of a fiber Finally, we write the GP formulation forthe blurred indicator function of the fiber,
y(p)∼GP(y∗(p) = z∗(p); c(p,p′) = s(p,p′) + u(p,p′)
). (9)
2.2 Calculating the indicator function value distribution for a test point
We want to calculate a p.d.f. for the value of y(·) at a test point p∈R3. This is a simpleoperation as we have the GP representation of the indicator function y(·) for a trajectoryF . The p.d.f. of y(p), given the tractographed point sequence f = f1, . . . , f|f |⊂R3
and its corresponding tensor field Σ = Σ(f1), . . . , Σ(f|f |)⊂SPD(3) are character-ized as a Gaussian-distributed random variable. More precisely, y(p) is the Gaussiandistribution,
(y(p)|f , Σ,p)∼G(y∗(p), σ2(p)
)(10)
due to marginalization properties of the GPs [12]. Setting y(p) to take the constantvalue l when p is a point that belongs to the fiber trajectory F , the mean and covariancefunctions can be calculated in the following way [12]:
y∗(p) = STf Cff1l σ2(p) = sp − STf C−1ff Sf , (11)
where [Sf ]i = [s(fi,p)]i, [Cff ]ij = [c(fi, fj)]ij with 1 ≤ i, j ≤ |f |, 1 is the vectorwith all ones and sp = s(p,p); the functions s(·, ·) and c(·, ·) were defined in eq. 7and eq. 9. This formulation is equivalent to “train” a Gaussian Process-based regressionwith values l at the sampled fiber points and 0 everywhere else. The parameter R istaken as the minimal distance between two consecutive points in f . Examples of blurredindicator functions can be seen in figures 1 and 2.
2.3 Calculating the deterministic inner product between two fiber bundles
In order to produce an inner product space for fiber bundles, we must provide an innerproduct operation. We have previously shown the definition of this operation in eq. 2.In this section we show its derivation.
We look for an inner product that quantifies fiber bundle overlapping in a deter-ministic manner. This simplifies the mathematical treatment of our inner product space,
8 Demian Wassermann, Luke Bloy, Ragini Verma, and Rachid Deriche
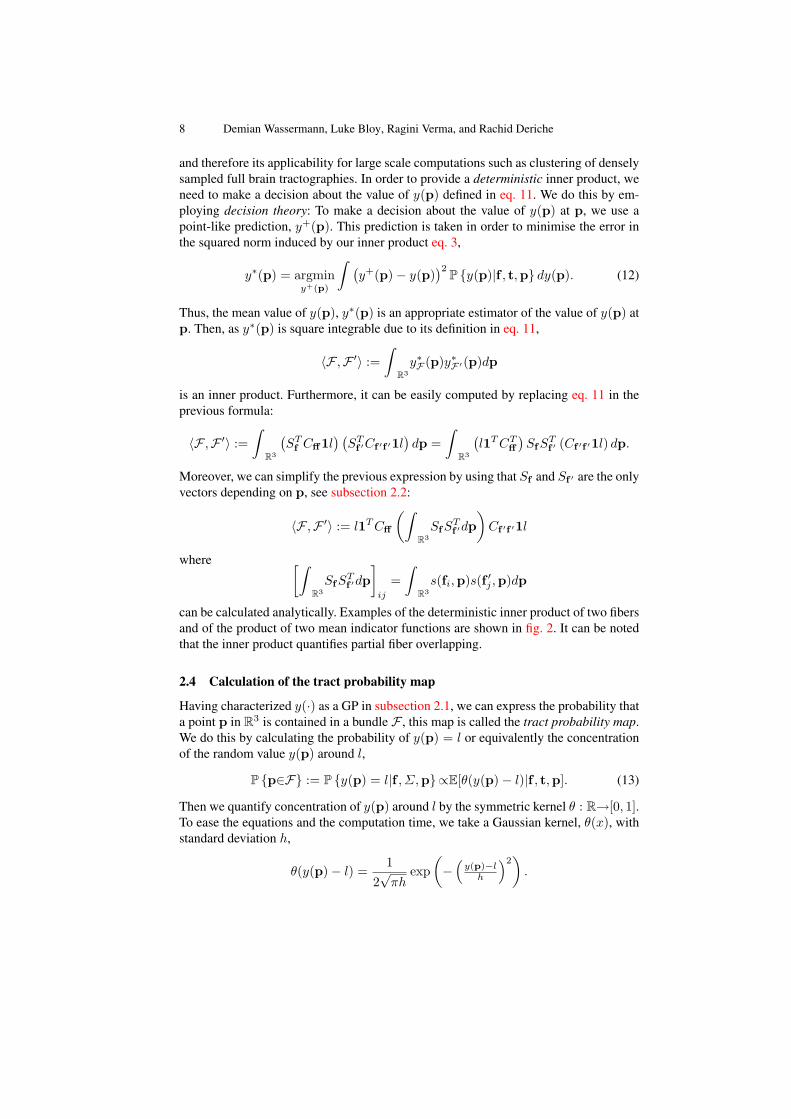
and therefore its applicability for large scale computations such as clustering of denselysampled full brain tractographies. In order to provide a deterministic inner product, weneed to make a decision about the value of y(p) defined in eq. 11. We do this by em-ploying decision theory: To make a decision about the value of y(p) at p, we use apoint-like prediction, y+(p). This prediction is taken in order to minimise the error inthe squared norm induced by our inner product eq. 3,
y∗(p) = argminy+(p)
∫ (y+(p)− y(p)
)2 P y(p)|f , t,p dy(p). (12)
Thus, the mean value of y(p), y∗(p) is an appropriate estimator of the value of y(p) atp. Then, as y∗(p) is square integrable due to its definition in eq. 11,
〈F ,F ′〉 :=∫
R3y∗F (p)y∗F ′(p)dp
is an inner product. Furthermore, it can be easily computed by replacing eq. 11 in theprevious formula:
〈F ,F ′〉 :=∫
R3
(STf Cff1l
) (STf ′Cf ′f ′1l
)dp =
∫R3
(l1TCTff
)SfS
Tf ′ (Cf ′f ′1l) dp.
Moreover, we can simplify the previous expression by using that Sf and Sf ′ are the onlyvectors depending on p, see subsection 2.2:
〈F ,F ′〉 := l1TCff
(∫R3SfS
Tf ′dp
)Cf ′f ′1l
where [∫R3SfS
Tf ′dp
]ij
=∫
R3s(fi,p)s(f ′j ,p)dp
can be calculated analytically. Examples of the deterministic inner product of two fibersand of the product of two mean indicator functions are shown in fig. 2. It can be notedthat the inner product quantifies partial fiber overlapping.
2.4 Calculation of the tract probability map
Having characterized y(·) as a GP in subsection 2.1, we can express the probability thata point p in R3 is contained in a bundle F , this map is called the tract probability map.We do this by calculating the probability of y(p) = l or equivalently the concentrationof the random value y(p) around l,
P p∈F := P y(p) = l|f , Σ,p∝E[θ(y(p)− l)|f , t,p]. (13)
Then we quantify concentration of y(p) around l by the symmetric kernel θ : R→[0, 1].To ease the equations and the computation time, we take a Gaussian kernel, θ(x), withstandard deviation h,
θ(y(p)− l) =1
2√πh
exp(−(y(p)−lh
)2).

Title Suppressed Due to Excessive Length 9
Then, we calculate eq. 13 as
E[θ(y(p)− l)|f , t,p] =∫θ(y(p)− l)P y(p)|f , t,p dy(p)
which leads to
P p∈F∝E[θ(y(p)− l)|f , t,p] =1
2√π(h2 + σ2(p))
, (14)
where h is a bandwidth parameter and σ2(p) is defined in eq. 11. Then, the tract prob-ability map for a bundle F on a domain Ω is calculated by evaluating P p ∈ F atevery point p ∈ Ω. In order to illustrate the probabilistic map for a bundle, color-codedsurfaces and a probability map over an FA image for anatomical bundles are shown infig. 3. These tract probabilistic maps are highly similar to the ones obtained by manualseeding by Hua et al [18] on DTI images and to the ones obtained by means of chemicalstaining [19]. This two previous works have shown that these tract probability mapsare an appropriate tool to perform statistics on white matter fiber bundles.
(a) B1: right CG (b) B2: right CST (c) B3: left CST (d) B4 : FF
Fig. 3. Iso-probability surfaces for manually selected fiber bundles, fig. (a-c), and tractprobability map over FA for an automatically obtained bundle, fig. (d), see section 3.The probability at each voxel is calculated using eq. 14. Coloring for fig. (a-c) is asfollows, Blue: P p∈Bi = .01, Yellow: P p∈Bi = .2, Red: P p∈Bi = .6.
3 Clustering Algorithm
Taking advantage of the mathematical framework for fiber bundles given in section 2,we propose a stochastic process-based agglomerative clustering algorithm. This algo-rithm is executed over a full brain tractography generating a dendogram. This dendo-gram can then be interactively explored in order to choose the desired granularity of theclustering without reprocessing the data. Furthermore, as a hierarchical agglomerativealgorithm it has several desirable properties. To begin with, convergence is guaranteedby the finite number of elements to cluster. Next, the number of clusters does not haveto be known a priori. Furthermore, outliers are incorporated to clusters during the late

10 Demian Wassermann, Luke Bloy, Ragini Verma, and Rachid Deriche
stages of the process if at all, are therefore easily distinguishable from clustered bun-dles. All of these characteristics make our clustering algorithm effective and robust forclassifying white matter fibers from a full brain tractography into anatomically coherentbundles.
Our clustering algorithm applied to a full brain tractography is as follows,
1. Given a full brain tractography F = Fi, with 1 ≤ i ≤ |F |, calculate the set ofstochastic processes representing each fiber Y = yFi
(p).2. Initialize the clustering as the set of single fiber bundles B = Bi, where Bi is a
set (bundle) formed by a single fiber, Fi, and 1 ≤ i ≤ |F |.3. Initialize the set of edges in the dendogram: T = 4. While there is a pair of different bundles B,B′ in B, s.t. 〈B,B′〉 > 0
(a) Select two different bundles B,B′ such that 〈B,B′〉 = maxC,C′∈B〈C, C′〉.(b) Remove the bundles B and B′ from B and add the bundle B + B′.(c) Add the edge (B,B′) to the dendogram T .
The output of this algorithm is a dendogram T , more precisely set of trees where eachedge represents the joining of two bundles. Information about automatical selection ofthe bundles based on anatomical knowledge can be found in [20]
A main advantage of our framework within this clustering algorithm is that themost important operation in step 4, the inner product among bundles described in sub-section 2.3, is fast and simple to compute. More precisely, when the selected bundlesare composed by several fibers, B = F1, . . . ,FN and B′ = F ′1, . . . ,F ′M, this op-eration is carried out in a simple manner within our framework: According to eq. 1 andeq. 2,
〈B,B′〉 =
⟨1N
N∑i=1
yFi(p),1M
M∑j=1
yF ′j (p)
⟩.
Then, using the linearity and symmetry properties of the inner product operation, theprevious equation becomes
〈B,B′〉 =1
NM
N∑i=1
M∑j=1
⟨yFi
(p), yF ′j (p)⟩. (15)
Thus, once the matrix of inner products have been calculated for every pair of fibers inthe full brain tractography F , the algorithm works by simply performing linear opera-tions on the rows of this matrix.
4 Experiments
Whole-brain DWI datasets were acquired from 16 healthy volunteers (30.05 +- 7.05years, 8 Male ) on a Siemens Trio 3T scanner with 1.71x1.71mm2 in-plane resolution,2mm thick slices, six unweighted images and 64 diffusion weighted images (b=1000s/mm2) acquired with non-collinear diffusion sensitizing gradients. DTI images foreach subject were computed and deformably registered, using DTI-DROID [21], to a

Title Suppressed Due to Excessive Length 11
(a) Selected tracts, left (b) Selected tracts, right (c) Bundle coherence
Fig. 4. Results. Figures (a) and (b) show selected Bundles automatically found usingthe algorithm in section 3. Shown bundles are the uncinate fasciculus (fig. a, red), thefornix (fig. a, blue), the superior longitudinal fasciculus (fig. a, beige), the cingulum (fig.a, green) the inferior longitudinal fasciculus (fig. b, beige), the inferior fronto-occipitalfasciculus (fig. b, blue) and the pyramidal tract (fig. b, white) . Fig (c), Dice’s coefficienton 4 bundles for 16 subjects.
DTI atlas [22]. Full brain tractography was performed following [3]. Then, the cluster-ing algorithm based on our mathematical framework presented in section 3 was applied.Selected clusters with anatomical meaning for a single subject is shown in fig. 4. Clustercoherence among subjects was assessed through the identification of several anatomicalbundles by an expert on the clustering outcome. Then, the left and right cingulum (CG),the right (IFO) and the left uncinate fasciculus (lUNC) were selected and the Dice su-perposition coefficient was calculated against manually clustered bundles on the atlas,see fig. 4(c). Further information about bundle selection based on anatomical priors andfiner statistical analysis can be found in [20]. High variability on the superposition onthe UNC and IFO bundles is coherent with chemical-staining white matter studies onwhite matter tracts [19].
5 Discussion
In this work we presented a Gaussian process based framework that enables the seam-less representation of fiber tracts and fiber bundles while incorporating a priori diffu-sion information. We have shown that this Gaussian Process representation naturallyprovides useful operations among white matter bundles, similarity quantification, com-bination of fibers into bundles and tract probability maps. Furthermore, We describedhow to estimate the corresponding Gaussian Process from discrete samplings of a fibertract. Finally, have shown that our framework spans an inner product space which isappropriate for white matter fiber clustering , and we validated this by clustering 16healthy volunteers.
References
[1] Basser, P., Pierpaoli, C.: Microstructural and physiological features of tissues elucidated byquantitative-diffusion-tensor MRI. J. Mag Res B 111(3) (1996) 209–219

12 Demian Wassermann, Luke Bloy, Ragini Verma, and Rachid Deriche
[2] Mori, S., Crain, B.J., Chacko, V.P., Zijl, P.C.M.V.: Three-dimensional tracking of axonalprojections in the brain by magnetic resonance imaging. Ann Neur 45(2) (1999) 265–269
[3] O’Donnell, L.J., Westin, C.F.: Automatic tractography segmentation using a high-dimensional white matter atlas. IEEE TMI 26(11) (nov 2007) 1562–1575
[4] Maddah, M., Grimson, W.E.L., Warfield, S.K., Wells, W.M.: A unified framework for clus-tering and quantitative analysis of white matter fiber tracts. MIA (2008) 191–202
[5] Kubicki, M., McCarley, R., Westin, C., Park, H., Maier, S., Kikinis, R., Jolesz, F., Shenton,M.: A review of diffusion tensor imaging studies in schizophrenia. J Psych Res 41(1-2)(2007) 15–30
[6] Batchelor, P.G., Calamante, F., Tournier, J.D., Atkinson, D., Hill, D.L.G., Connelly, A.:Quantification of the shape of fiber tracts. MRM 55(4) (2006) 894–903
[7] Corouge, I., Fletcher, P.T., Joshi, S., Gouttard, S., Gerig, G.: Fiber tract-oriented statisticsfor quantitative diffusion tensor mri analysis. MIA 10(5) (2006) 786–798
[8] Leemans, A., Sijbers, J., Backer, S.D., Vandervliet, E., Parizel, P.: Multiscale white matterfiber tract coregistration: a new feature-based approach to align diffusion tensor data. MRM55(6) (Jun 2006) 1414–1423
[9] Ding, Z., Gore, J., Anderson, A.: Classification and quantification of neuronal fiber path-ways using diffusion tensor MRI. MRM 49 (2003) 716–721
[10] Wassermann, D., Deriche, R.: Simultaneous manifold learning and clustering: Groupingwhite matter fiber tracts using a volumetric white matter atlas. In: MICCAI Workshops.(2008)
[11] Maddah, M., Zollei, L., Grimson, W.E.L., Westin, C.F., Wells, W.M.: A mathematicalframework for incorporating anatomical knowledge in DT-MRI analysis. In: ISBI. (2008)
[12] MacKay, D.J.C.: Introduction to gaussian processes. In: Neural Networks and MachineLearning. Volume 168 of NATO ASI. Springer (1998) 133–165
[13] Rasmussen, C.E., Williams, C.K.I.: Gaussian Processes for Machine Learning. The MITPress (2006)
[14] Wahba, G.: Spline Models for Observational Data. Soc Ind Math (1990)[15] Basser, P., Pajevic, S., Pierpaoli, C., Duda, J., Aldroubi, A.: In vivo fiber tractography using
DT-MRI data. Magnetic Resonance in Medicine 44(4) (2000) 625–632[16] Williams, O., Fitzgibbon, A.: Gaussian process implicit surfaces. In: Gaussian Proc. in
Practice. (2007)[17] Paciorek, C., Schervish, M.: Spatial modelling using a new class of nonstationary covari-
ance functions. Environmetrics (London, Ont.) 17(5) (2006) 483[18] Hua, K., Zhang, J., Wakana, S., Jiang, H., Li, X., Reich, D.S., Calabresi, P.A., Pekar, J.J.,
van Zijl, P.C.M., Mori, S.: Tract probability maps in stereotaxic spaces: Analyses of whitematter anatomy and tract-specific quantification. NeuroImage 39(1) (2008) 336–347
[19] Burgel, U., Amunts, K., Hoemke, L., Mohlberg, H., Gilsbach, J.M., Zilles, K.: White mat-ter fiber tracts of the human brain: Three-dimensional mapping at microscopic resolution,topography and intersubject variability. NeuroImage 29(4) (2006) 1092 – 1105
[20] Wassermann, D., Bloy, L., Kanterakis, E., Verma, R., Deriche, R.: Unsupervised WhiteMatter Fiber Clustering and Tract Probability Map Generation: Applications of a GaussianProcess framework for White Matter Fibers. Research Report RR-7005, INRIA (2009)
[21] Yang, J., Shen, D., Davatzikos, C., Verma, R.: Diffusion Tensor Image Registration UsingTensor Geometry and Orientation Features. In: MICCAI. (2008)
[22] Wakana, S., Jiang, H., Nagae-Poetscher, L., van Zijl, P., Mori, S.: Fiber Tract–based Atlasof Human White Matter Anatomy. Radiology 230 (2004) 77