a deep optical/near-infrared catalog of serpens
TRANSCRIPT

arX
iv:1
002.
1595
v1 [
astr
o-ph
.SR
] 8
Feb
201
0Astronomy & Astrophysicsmanuscript no. lspezzi˙Serpens˙ref c© ESO 2010February 8, 2010
A deep optical/near-infrared catalog of SerpensL. Spezzi1, B. Merın2, I. Oliveira3,4, E.F. van Dishoeck4,5, and J.M. Brown5
1 Research and Scientific Support Department, European SpaceAgency (ESA-ESTEC), P.O. Box 299, 2200 AG Noordwijk, TheNetherlands
2 European Space Astronomy Center, European Space Agency (ESA-ESAC), P.O. Box Apdo. de correos 78, 28691 Villanueva de laCanada, Madrid, Spain
3 California Institute of Technology, Division for Geological and Planetary Sciences, MS 150-21, Pasadena, CA 91125, USA4 Sterrewacht Leiden, Leiden University, P.O. Box 9513, 2300RA Leiden, The Netherlands5 Max Planck Institut fur Extraterrestrische Physik, Giessenbachstrasse 1, 85748 Garching, Germany
Received ; accepted
ABSTRACT
Context.Aims. We present a deep optical/near-infrared imaging survey of the Serpens molecular cloud. This survey constitutes the comple-mentary optical data to the Spitzer ”Core To Disk” (c2d) Legacy survey in this cloud.Methods. The survey was conducted using the Wide Field Camera at the Isaac Newton Telescope. About 0.96 square degrees wereimaged in theR andZ filters, covering the entire region where most of the young stellar objects identified by the c2d survey arelocated. 26524 point-like sources were detected in bothR andZ bands down toR ≈24.5 mag andZ ≈23 mag with a signal-to-noiseratio better than 3. The 95% completeness limit of our catalog corresponds to 0.04 M⊙ for members of the Serpens star forming region(age 2 Myr and distance 260 pc) in the absence of extinction. Adopting the typical extinction of the observed area (AV ≈7 mag), weestimate a 95% completeness level down to M≈0.1 M⊙. The astrometric accuracy of our catalog is 0.4 arcsec with respect to the2MASS catalog.Results. Our final catalog contains J2000 celestial coordinates, magnitudes in theR andZ bands calibrated to the SDSS photometricsystem and, where possible,JHKS magnitudes from 2MASS for sources in 0.96 square degrees in the direction of Serpens. Thisdata product has been already used within the frame of thec2d Spitzer Legacy Project analysis in Serpens to study the star /diskformation and evolution in this cloud; here we use it to obtain new indications of the disk-less population in Serpens.Conclusions.
Key words. stars: catalogs – stars: formation – stars: low-mass, browndwarfs – ISM: clouds – ISM: individual objects: Serpens
1. Introduction
The Spitzer Legacy Survey “Molecular Cores to Planet FormingDisks” (c2d; Evans et al. 2003) offered a singular opportunityfor a major advance in the study of star and planet formation.Thanks to its sensitivity and vawelength coverage, Spitzeral-lowed us to address for the first time long-standing challengessuch as disk formation and dispersal, the physical and chemi-cal evolution of the circumstellar material and, in particular, toprobe the inner planet-forming region of disks on the basis ofstatistically significant samples (see, e.g., Lada et al. 2006).
One of the star-forming regions included in the c2d survey isthe Serpens molecular cloud. Because of its proximity (260 pc;Straizys et al. 1996) and young age (2-6 Myr; Oliveira et al.2009), this cloud is particularly well-suited for studies of veryyoung low-mass stars and sub-stellar objects. The c2d survey inSerpens has provided evidence of sequential star formationinthis cloud progressing from SW to NE and culminating in themain Serpens Core with its cluster of Class 0 objects (Kaas etal.2004; Harvey et al. 2007); moreover,the surface densityofyoung stars in this region is much higher, by a factor of 10-100,than that of the other star-forming regions mapped by the c2dteam (Evans et al. 2009) and includes22% of the c2d sourcesclassified as “transitional” disks. This makes Serpens the bestregion for obtaining a complete, well-defined sample of multi-
Send offprint requests to: L. Spezzi, e-mail:[email protected]
wavelength observations of young stars and sub-stellar objectsin a possible evolutionary sequence to build up a “template”sample for the study of disk evolution up to a few Myr withina single, small, well defined region. To this aim, the c2d Teamhas conducted several surveys, from X-ray to millimeter wave-lengths, and spectroscopic follow-ups of the newly discoveredpopulation of young stars in Serpens, making this cloud onlythethird star-forming region after Taurus and IC 348 for which suchan unbiased dataset exists (Goodman 2004; Harvey et al. 2007;Enoch et al. 2007; Oliveira et al. 2009, 2010).
In this paper we present the optical/near-infrared (NIR)imaging data collected within the frame of the c2d survey inSerpens. These data represent one of the critical ingredients toanchor the studies of envelopes and disks to the properties ofthe central stars, including those without infrared excess. Indeed,deep XMM-Newton data of the same field revealed a sample ofnew sources, mostly candidate weak-line T Tauri stars (WTTSs),half of which have no counterpart in other catalogs (Brown etal.2010). Moreover, Comeron et al. (2009) recently reported on alarge-scale optical survey of the Lupus star-forming complexwhich, in combination with NIR data from the 2MASS cata-log, unveiled a large population of stars and brown dwarfs (BDs)that have lost their inner disks on a timescale of a few Myrs orless. This discovery stresses the important unknowns that stillpersist in the observational characterisation of young very low-

2 L. Spezzi et al.: A deep optical/near-infrared catalog of Serpens
mass objectsand in the time-scales and mechanisms for diskdissipation.
The outline of this paper is as follows: in Sect. 2 and 3 we de-scribe the observations and data reduction procedure, withpar-ticular emphasis on the photometric completeness and astromet-ric accuracy of the final optical/NIR catalog. In Sect. 4 we dis-cuss the use of this catalog within the frame of the c2d Team’sanalysis in Serpens and investigate its disk-less population. Ourconclusions are drawn in Sect. 5.
2. Observations
The imaging observations presented in this work were carriedout from 13 to 17 May 2008 using the Wide Field Camera(WFC) at the 2.5m Isaac Newton Telescope (INT), which is lo-cated at the Roque de Los Muchachos Observatory (La Palma,Spain). The data were collected by Ignas Snellen as part of anobserving practicum for Leiden University astronomy students.
The WFC is a four-chip mosaic of thinned AR coated EEV4K×2K devices. Each CCD has an useful imaging area of2048×4100 pixels with a pixel scale of 0.333 arcsec/pixel, cover-ing a total field of view 34×34 arcmin with small gaps of∼ 20′′
between adjacent chips. The average CCD read-out noise andgain are 7 e− and 2.8 e−/ADU, respectively.
A total of 3 fields were observed in the direction of Serpens(R.A.=18h29m49s, Dec.=+01d14m48s), covering the entire re-gion where most of the young stellar objects (YSOs) identi-fied by the Spitzer c2d survey are located (Fig. 1). Imageswere obtained through theR (λc=6260 Å, FWHM=1380 Å)andZ (λc=9100 Å, FWHM=1370 Å) filters approximately cov-ering the Sloan Digital Sky Survey (SDSS)r ′ and z′ bands(Fukugita et al. 1996). The total sky-area observed in each filteris 0.96 square degrees. Each observation in each filter was splitinto several individual exposures (ditherings), shiftingthe tele-scope pointing by∼1 arcmin between consecutive exposures;this allows us to cover the gaps between the CCDs and avoidsaturation of bright sources in the field. The exposure time foreach dithering was 120 sec in both theR andZ bands. In or-der to recover the photometry for bright sources saturated inthese long-time exposures, a series of short-time exposures (i.e.10 sec per dithering in both filters) of the same sky-area wasalso performed. The summary of these observations is reportedin Table 1. A standard Landolt field was also observed in bothfilters for absolute flux calibration purposes (Sect. 3.3).
3. Data reduction
The raw images were processed using the IRAF1 mscredpack-age and a number of scriptsad hocdeveloped both under IRAFand under IDL2. We followed the steps for the WFC data reduc-tion pipeline (Irwin & Lewis 2001) developed by the CambridgeAstronomical Survey Unit (CASU), responsable for the process-ing and archiving of the dataset from the INT Wide Field Survey(WFS; McMahon et al. 2001).
3.1. Pre-reduction
Since the bias level tends to vary, the images were first correctedfor overscan and trimmed using the bias and trim sections as
1 IRAF is distributed by NOAO, which is operated by the Associationof Universities for Research in Astronomy, Inc., under contract to theNational Science Foundation.
2 Interactive Data Language.
Table 1. Journal of the observations.
Field Date Filter Texp Seeing Air Mass(R.A.,Dec.) (d/m/y) (min) (”)
Serpens1 13/05/08 R 120×4 1.5 1.50(18:28:43,+00:24:46) 17/05/08 R 10×1 2.0 1.14
15/05/08 Z 120×9 1.5 1.1717/05/08 Z 10×1 2.1 1.14
Serpens2 14/05/08 R 120×9 1.6 1.15(18:28:57,+01:02:54) 17/05/08 R 10×1 2.0 1.15
15/05/08 Z 120×4 1.5 1.1617/05/08 Z 10×1 1.5 1.15
Serpens3 14/05/08 R 120×9 1.6 1.15(18:28:36,-00:09:51) 17/05/08 R 10×1 1.6 1.15
17/05/08 Z 10×1 2.3 1.15
L 104† 13/05/08 R 2×1 1.2 1.22(12:41:68,-00:34:11) 13/05/08 Z 5×1 1.3 1.19
† Standard star field.
specified in the FITS headers. For each night in which observa-tions for our program were performed, twilight flat frames werethen combined to obtain the night master flat, which was thenused to correct the science images. The corrected images arees-sentially linear to∼2% over the full range. Bad pixels and partialcolumns have been replaced using the bad pixel mask files avail-able from the WFS homepage3.
The Z-band images suffer from significant sky fringes. Inorder to remove them, we subtracted from eachZ-band imagethe fringing pattern frame available from the WFS homepagescaled by a specific factor to account for the amplitude of thefringes in the individual science frames.
3.2. Astrometry and co-addition of images
The astrometric calibration and relative flux scaling be-tween ditherings were obtained using the c-version ofASTROMETRIX4 (M. Radovich, private communication). Thistool performs a global astrometric solution that takes overlap-ping sources falling on adjacent CCDs in different ditheringsinto account. For each pointing, the astrometric solution wascomputed using the USNO-B1.0 catalogue (Monet et al. 2003)as a reference. Within the global astrometry process, the astro-metric solution was constrained for each CCD by both the po-sitions from the USNO-B1.0 catalogue and those from overlap-ping sources in all the other CCDs.
The co-addition of the dithered images for a given filter andpointing was performed using the SWARP tool (Bertin 2008).The final stacked image is a 6k × 6k frame where each pixelvalue is the median flux of the co-added ditherings normalisedto the total exposure time and relative to the airmass and atmo-spheric transparency of the first frame in the dithering set.Theabsolute astrometric precision of our images is about 0.4 arcsec,slightly lower than RMS accuracy of the USNO-B1.0 catalogue(0.2 arcsec); the astrometric precision has been also confirmedby a cross-check with the 2MASS point-source catalog (Fig. 2).The internal RMS, computed from overlapping sources in differ-ent exposures, is within 0.05 arcsec, indicating the good perfor-mance of ASTROMETRIX.
3 http://www.ast.cam.ac.uk/ wfcsur/technical/pipeline/4 See also:http://www.na.astro.it/∼radovich/wifix.htm

L. Spezzi et al.: A deep optical/near-infrared catalog of Serpens 3
Fig. 1. IRAS 100µm dust emission map of the Serpens dark cloud. The contours, from 55 to 190 MJy× sr−1 in steps of 9 MJy× sr−1,are also drawn (white lines). The continuous line defines thearea covered by the three INT+WFC pointings, while the dashed lineis the area observed by Spitzeras part of the c2d Survey. The stars are the YSO candidates identified by the Spitzer c2d Survey.
3.3. Photometric calibration
Instrumental magnitudes were reported to the standard SDSSphotometric system (Fukugita et al. 1996). To this aim, theStetson’s standard star field L 104 (Stetson 2000)was ob-served in theRZfilters. By using the IRAF packagephotcal, wefirst performed the aperture photometry for the standard stars,obtaining their instrumental magnitudes (r0 and z0) correctedfor atmospheric extinction and normalised to the exposure time.Then, the transformation coefficients, namely zero point (ZP)and colour term (c), from the WFC-INT system to the SDSSstandard system were determined by a linear fitting of the fol-lowing equations:
r ′ = r0 + cR · (r0 − z0) + ZPR (1)
z′ = z0 + cZ · (r0 − z0) + ZPZ (2)
wherer ′ andz′ are the standard magnitudes of Landolt’s stars inthe SDSS system.
The mean transformation coefficients determined in our ob-serving run are reported in Table 2.
Using these coefficients, instrumental magnitudes (seeSect. 3.4) for the observed sources in Serpens have been con-verted to the SDSS photometric system, which is nearly an AB
system. Thus, magnitudes in our catalog can be turned into fluxdensities using the correction from SDSS zeropoints to AB ze-ropoints and the AB zeropoint flux density5:
correctionZPR = 0 magF0
r ′ = 2.7769E-12W · cm−2 · µm−1
correctionZPZ = 0.02 magF0
z′ = 1.3153E-12W · cm−2 · µm−1
3.4. The catalog extraction
The source extraction and photometry from each stacked imagein each filter were performed by using the 2.5 version of theSExtractor tool by Bertin & Arnouts (1996). SExtractor exploitsthe aperture photometry technique, which is the faster and bestapproach for uncrowded fields such as the one considered here.In particular, we adopted the SExtractor adaptive aperturemag-nitudes (magauto), which are estimated from a flexible ellipticalaperture around each detected object; this method is expected togive the most precise magnitudes for very faint objects which
5 Seehttp://www.sdss.org/dr6/algorithms/fluxcal.html.

4 L. Spezzi et al.: A deep optical/near-infrared catalog of Serpens
Fig. 2. Residuals of the coordinates obtained by us for thesources in the surveyed area in Serpens with respect to thosefrom the 2MASS catalog.
Table 2. Mean photometric calibration coefficients for ourWFC-INT observing run.
Filter K† ZP c
R 0.0734 25.30±0.03 -0.033±0.024Z 0.0103 23.52±0.03 0.021±0.022
† K =mean atmospheric extinction coefficients for La Palma.‡ ZP= photometric zero point (see Eq. 2).∗ c= photometric colour term (see Eq. 2).
may appear extended. The detection threshold was set in orderto select all the sources having a signal-to-noise ratio (σ) greaterthan 3. The background is locally estimated from a ring shapedregion surrounding the star.
The output catalogs contain for each source an identificationnumber, right ascension and declination in degree at J2000,in-strumental magnitudes and relative errors, and two SExtractormorphological parameters, namely the extraction flag (FLAGS)and the isophotal area above the threshold (ISOAREAIMAGE).These last parameters were used to clean the catalogs from spu-rious detections, such as cosmic ray hits, bad pixels, saturated ortruncated sources too close to the image boundaries, etc.
In Figure 3 we show as an example the internal photomet-ric errors of all the point-like sources detected in our long-timeexposures plotted against the magnitude for theRZ filters; therelative exponential fits are over-plotted. Table 3 summarises thesaturation limit and the limiting magnitude achieved at the10σ,5σ and 3σ level in each filter for both the long time exposuresand the short ones.
Our final catalog contains celestial coordinates (R.A. andDec. at J2000) andRZphotometry for each point-like object de-tected in our survey above the 3σ level. Each entry in the catalog
Fig. 3. Photometric errors versus magnitudes and relative ex-ponential fits for all the point-like sources detected in the0.96 square degrees area surveyed in Serpens. Photometry isfrom our long-time exposures (Sect.2).
was further complemented with near-infraredJHKS photome-try by cross-matching it with the 2MASS Point Source Catalog(limiting magnitudeKS ≈15.5; Skrutskie et al. 2006). A match-ing radius of 2 arcsec was defined, which appears to be sufficientgiven that more than 90% of the matches corresponded to differ-ences between the 2MASS positions and those determined by usof less than 1 arcsec. When more than one 2MASS source wasfound within the 2 arcsec circle, the one closer to the positionderived from our observations was chosen as the counterpart.
3.5. Completeness
The completeness of our catalogue was estimated in the standardway by inserting artificial stars into the images and recoveringthem using the same extraction procedure as for the real objects(Sect. 3.4); the fraction of recovered artificial objects provides ameasure of the completeness.
We used the DAOPHOT II standalone package to performthe exercise (Stetson 1987). We first use thePSFtask to extractfrom the R and Z mosaics the relative PSF models. Then weinserted in each mosaic 1000 artificial sources using theaddstartask; this number should not alter the crowding statistics in theimages significantly. The profile for the artificial sources wasgenerated by using the relative PSF model, while their positionsare randomly distributed over the entire area of the mosaic andtheir magnitudes range uniformly between the detection andthesaturation limits in the relative filter (see Table 3).
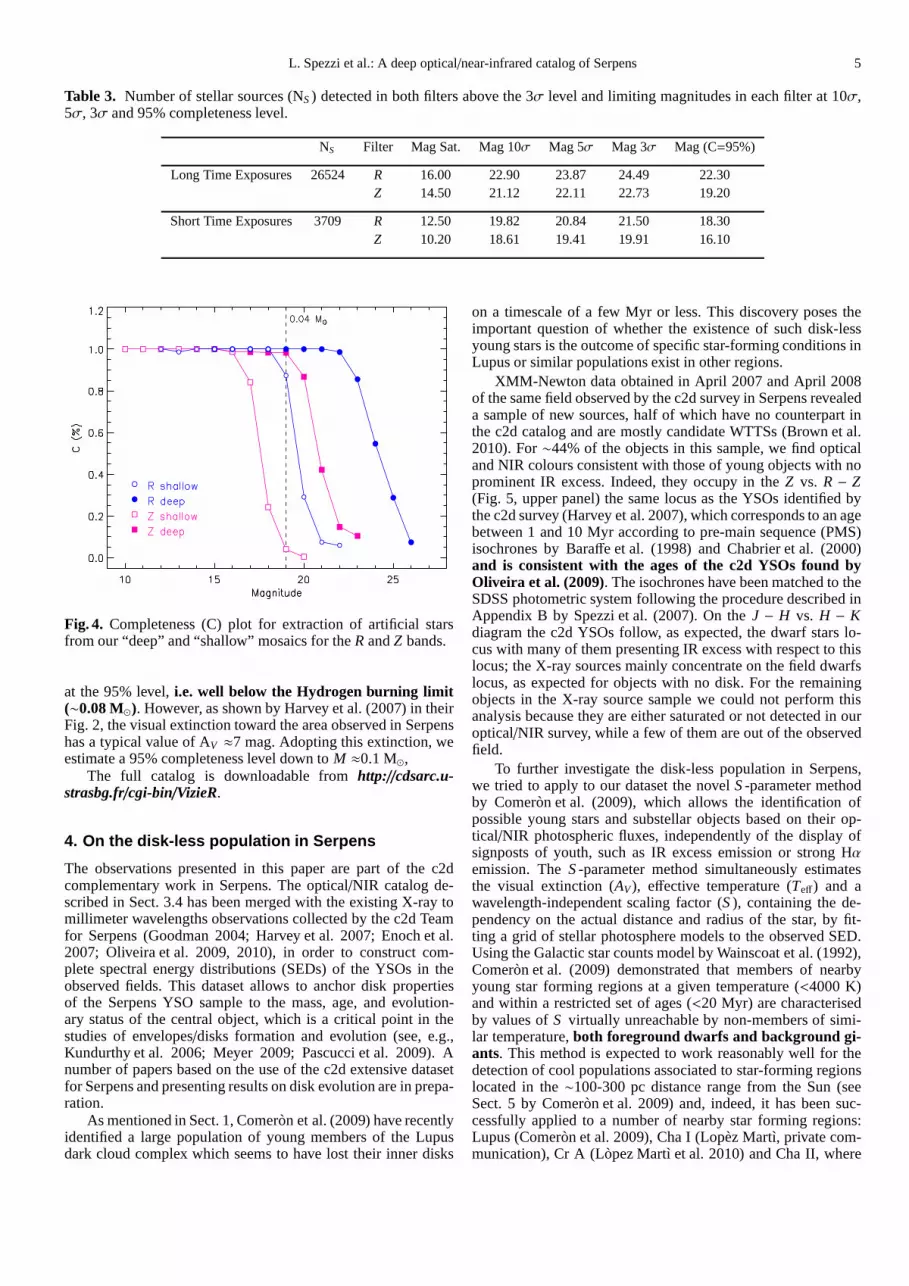
Figure 4 shows the fraction of recovered artificial objects as afunction of magnitude from both the deep and shallow mosaicsfor the R andZ filters. The corresponding magnitude limits at95% completeness level (C=95%) are reported in Table 3.
In the absence of extinction (AV=0), assuming a typical agefor Serpens members of 2-6 Myr (Oliveira et al. 2009), a dis-tance of 260 pc (Straizys et al. 1996) and using the theoreti-cal isochrones and evolutionary tracks by Baraffe et al. (1998)and Chabrier et al. (2000)and the completeness limits fromTable 3, our optical survey would be complete down to 0.04M⊙
L. Spezzi et al.: A deep optical/near-infrared catalog of Serpens 5
Table 3. Number of stellar sources (NS) detected in both filters above the 3σ level and limiting magnitudes in each filter at 10σ,5σ, 3σ and 95% completeness level.
NS Filter Mag Sat. Mag 10σ Mag 5σ Mag 3σ Mag (C=95%)
Long Time Exposures 26524 R 16.00 22.90 23.87 24.49 22.30Z 14.50 21.12 22.11 22.73 19.20
Short Time Exposures 3709 R 12.50 19.82 20.84 21.50 18.30Z 10.20 18.61 19.41 19.91 16.10
Fig. 4. Completeness (C) plot for extraction of artificial starsfrom our “deep” and “shallow” mosaics for theR andZ bands.
at the 95% level,i.e. well below the Hydrogen burning limit(∼0.08 M⊙). However, as shown by Harvey et al. (2007) in theirFig. 2, the visual extinction toward the area observed in Serpenshas a typical value of AV ≈7 mag. Adopting this extinction, weestimate a 95% completeness level down toM ≈0.1 M⊙,
The full catalog is downloadable fromhttp://cdsarc.u-strasbg.fr/cgi-bin/VizieR.
4. On the disk-less population in Serpens
The observations presented in this paper are part of the c2dcomplementary work in Serpens. The optical/NIR catalog de-scribed in Sect. 3.4 has been merged with the existing X-ray tomillimeter wavelengths observations collected by the c2d Teamfor Serpens (Goodman 2004; Harvey et al. 2007; Enoch et al.2007; Oliveira et al. 2009, 2010), in order to construct com-plete spectral energy distributions (SEDs) of the YSOs in theobserved fields. This dataset allows to anchor disk propertiesof the Serpens YSO sample to the mass, age, and evolution-ary status of the central object, which is a critical point inthestudies of envelopes/disks formation and evolution (see, e.g.,Kundurthy et al. 2006; Meyer 2009; Pascucci et al. 2009). Anumber of papers based on the use of the c2d extensive datasetfor Serpens and presenting results on disk evolution are in prepa-ration.
As mentioned in Sect. 1, Comeron et al. (2009) have recentlyidentified a large population of young members of the Lupusdark cloud complex which seems to have lost their inner disks
on a timescale of a few Myr or less. This discovery poses theimportant question of whether the existence of such disk-lessyoung stars is the outcome of specific star-forming conditions inLupus or similar populations exist in other regions.
XMM-Newton data obtained in April 2007 and April 2008of the same field observed by the c2d survey in Serpens revealeda sample of new sources, half of which have no counterpart inthe c2d catalog and are mostly candidate WTTSs (Brown et al.2010). For∼44% of the objects in this sample, we find opticaland NIR colours consistent with those of young objects with noprominent IR excess. Indeed, they occupy in theZ vs. R − Z(Fig. 5, upper panel) the same locus as the YSOs identified bythe c2d survey (Harvey et al. 2007), which corresponds to an agebetween 1 and 10 Myr according to pre-main sequence (PMS)isochrones by Baraffe et al. (1998) and Chabrier et al. (2000)and is consistent with the ages of the c2d YSOs found byOliveira et al. (2009). The isochrones have been matched to theSDSS photometric system following the procedure describedinAppendix B by Spezzi et al. (2007). On theJ − H vs. H − Kdiagram the c2d YSOs follow, as expected, the dwarf stars lo-cus with many of them presenting IR excess with respect to thislocus; the X-ray sources mainly concentrate on the field dwarfslocus, as expected for objects with no disk. For the remainingobjects in the X-ray source sample we could not perform thisanalysis because they are either saturated or not detected in ouroptical/NIR survey, while a few of them are out of the observedfield.
To further investigate the disk-less population in Serpens,we tried to apply to our dataset the novelS-parameter methodby Comeron et al. (2009), which allows the identification ofpossible young stars and substellar objects based on their op-tical/NIR photospheric fluxes, independently of the display ofsignposts of youth, such as IR excess emission or strong Hα
emission. TheS-parameter method simultaneously estimatesthe visual extinction (AV), effective temperature (Teff) and awavelength-independent scaling factor (S), containing the de-pendency on the actual distance and radius of the star, by fit-ting a grid of stellar photosphere models to the observed SED.Using the Galactic star counts model by Wainscoat et al. (1992),Comeron et al. (2009) demonstrated that members of nearbyyoung star forming regions at a given temperature (<4000 K)and within a restricted set of ages (<20 Myr) are characterisedby values ofS virtually unreachable by non-members of simi-lar temperature,both foreground dwarfs and background gi-ants. This method is expected to work reasonably well for thedetection of cool populations associated to star-forming regionslocated in the∼100-300 pc distance range from the Sun (seeSect. 5 by Comeron et al. 2009) and, indeed, it has been suc-cessfully applied to a number of nearby star forming regions:Lupus (Comeron et al. 2009), Cha I (Lopez Martı, private com-munication), Cr A (Lopez Martı et al. 2010) and Cha II, where

6 L. Spezzi et al.: A deep optical/near-infrared catalog of Serpens
Fig. 5. Z vs. R − Z and J − H vs. H − K diagrams forthe YSOs in Serpens selected by the c2d survey (circles)and the optical/NIR counterparts of the X-ray sources iden-tified by Brown et al. (2010) (squares).Upper panel: Thelines are the PMS isochrones by Baraffe et al. (1998) andChabrier et al. (2000) transformed by us into the SDSS photo-metric system. The arrow representsAV=2 reddening vector(Weingartner & Draine 2001).Lower panel: The solid curveshows the relation between the colour indices for main sequencestars (lower branch) and giants (upper branch), together with therelative reddening bands (dashed lines).The dash-dot lineis theT Tauri star locus by Meyer et al. (1997). The object magnitudesare derreddened using the typical extinction in the observed area(AV ≈7 mag) and the extinction curve by Weingartner & Draine(2001).
it provides the same results as in Spezzi et al. (2007). We ap-plied the S-parameter method to the optical/NIR dataset forSerpens; we find that in this case theS-parameter histogramat any temperature range shows no clear separation betweenthe member candidates and the background/foreground contam-inants and, as a consequence, the method produces an unreliablesample of member candidates,which is also not compatiblewith the XMM-detected sources in the same area of the sky.There are recent indications (see Sect. 2.3 by Merın et al. 2008)that Galactic models may fail at reproducing stellar countsat
low galactic latitude and, indeed, Serpens lies very close to thegalactic plane (b ≈+5.4 deg). Moreover, Serpens is located at260 pc from the Sun, i.e. at the limit of the validity range oftheS-parameter method. Since all the other clouds on which themethod has been tested are closer to the Sun and have highergalactic latitude than Serpens, we conclude that the unluckycombination of distance and position of this cloud preventstheS-parameter method from giving useful results.
5. Conclusions
We presented an optical/NIR catalog (R andZ filters) of 26524point-like sources in 0.96 square degrees in the direction ofSerpens down to R≈25. These data were collected using theWFC camera at the INT within the frame of the Spitzer c2d sur-vey in Serpens. The catalog was also complemented withJHKSphotometry from 2MASS and has been merged with the exist-ing X-ray to millimeter wavelengths observations collected bythe c2d Team for Serpens to study the envelop/disk formationand evolution and its dependency on the stellar properties.Anumber of paper based on this comprehensive catalog are nowpublished or in preparation (Merın et al. 2010a,b; Oliveira et al.2010; Brown et al. 2010).
In this paper we used the optical/NIR catalog to investi-gate the disk-less population in Serpens. Because of the dis-tance and low galactic latitude of this cloud, theS-parametersmethod by Comeron et al. (2009), suitable for the identificationof young objects independently of any signature of youth, failsin distinguishing young cloud members from field contaminants.However, a sample of new WTTS candidates has been identifiedin Serpens on the basis of XMM-Newton observations. Our op-tical/NIR photometry suggests a very young age (.10 Myr) andno NIR excess emission for about 44% of them, supporting theirWTTS nature.
Acknowledgements.This publication makes use of data products from theTwo Micron All Sky Survey, which is a joint project of the University ofMassachusetts and the Infrared Processing and Analysis Center/CaliforniaInstitute of Technology, funded by NASA and the National Science Foundation.We also acknowledge extensive use of the SIMBAD database, operated at CDSStrasbourg. We thank Ignas Snellen and the students from Leiden Observatoryfor taking these INT data in service time. We thank Mario Radowich for the con-cession of ASTROMETRIX. We are also grateful to F. Comeron,J.M. Alcala,H. Bouy, B. Lopez Martı, R. Jayawardhana and the Spitzer c2d Team for usefuldiscussions and suggestions. We are also grateful to many others, in particular toSalvatore Spezzi.
ReferencesBaraffe I., Chabrier G., Allard F. & Hauschildt P.H. 1998, A&A 337, 403Bertin E. & Arnouts S. 1996, A&A Supp. 117, 393Bertin E. 2007,SWARP v2.17.0 User’s guideBrown J. et al. 2010, in preparationChabrier G., Baraffe I., Allard F. & Hauschildt P. 2000, ApJ 542, 464Comeron F., Spezzi L. & Lopez Martı B. 2009, A&A 500, 1045Enoch M.L., Glenn J., Evans N.J. II et al. 2007, ApJ 666, 982Evans N.J. II, Allen L.E., Blake G.A. et al. 2003, PASP 115, 965Evans N.J. II, Dunham M.M., Jorgensen J.K. et al. 2009, ApJS 181, 321Fukugita M., Ichikawa T., Gunn J.E. et al. 1996, AJ 111, 1748Goodman A.A. 2004, ASPC 323, 171Harvey P., Mern B., Huard T.L. et al. 2007, ApJ 663, 1149Irwin M. & Lewis J. 2001, New AR 45, 105Kaas A.A., Olofsson G., Bontemps S. et al. 2004, A&A 421, 623Kundurthy P., Meyer M.R., Robberto M. et al. 2006, AJ 132, 2469Lada C.J., Muench A.A., Luhman K.L. et al. 2006, AJ 131, 1574Lopez Martı B., Spezzi L., Merın B. et al. 2010, A&A, submittedMcMahon R.G., Walton N.A., Irwin M.J. et al. 2001, New AR 45, 97Meyer M.R., Calvet N. & Hillenbrand L.A. 1997, ApJ 114, 288Meyer M.R. 2009, IAUS 258, 111

L. Spezzi et al.: A deep optical/near-infrared catalog of Serpens 7
Merın B., Jorgensen J., Spezzi L. et al. 2008, ApJS 177, 551Merın B. et al. 2010, in preparationMerın B. et al. 2010, in preparationMonet D.G., Levine S.E., Canzian B. et al. 2003, AJ 125, 984Oliveira I., Merın B., Pontoppidan K.M. et al. 2009, ApJ 691, 672Oliveira I. et al. 2010, in preparationPascucci I., Apai D., Luhman K. et al. 2009, ApJ 696, 143Spezzi L., Alcala J.M., Frasca A. et al. 2007, A&A 470, 281Stetson P.B. 1987, PASP 99, 191Stetson, P.B. 2000, PASP 112, 925Straizys V., Cernis K. & Bartasiute S. 1996, Baltic Astron. 5, 125Skrutskie M.F., Cutri R.M., Stiening R. et al. 2006, AJ 131, 1163Wainscoat R.J., Cohen M., Volk K. et al. 1992, ApJS 83, 111Weingartner J.C. & Draine B.T. 2001, ApJ 548, 296