a cscw requirements engineering case tool: development and usability evaluation
TRANSCRIPT
Seediscussions,stats,andauthorprofilesforthispublicationat:https://www.researchgate.net/publication/260515664
ACSCWRequirementsEngineeringCASETool:Developmentandusabilityevaluation
ARTICLEinINFORMATIONANDSOFTWARETECHNOLOGY·AUGUST2014
ImpactFactor:1.05·DOI:10.1016/j.infsof.2014.02.009
READS
429
5AUTHORS,INCLUDING:
MiguelA.Teruel
UniversityofCastilla-LaMancha
16PUBLICATIONS46CITATIONS
SEEPROFILE
ElenaNavarro
UniversityofCastilla-LaMancha
98PUBLICATIONS350CITATIONS
SEEPROFILE
VíctorLópez-Jaquero
UniversityofCastilla-LaMancha
92PUBLICATIONS644CITATIONS
SEEPROFILE
PascualGonzález
UniversityofCastilla-LaMancha
155PUBLICATIONS555CITATIONS
SEEPROFILE
Allin-textreferencesunderlinedinbluearelinkedtopublicationsonResearchGate,
lettingyouaccessandreadthemimmediately.
Availablefrom:MiguelA.Teruel
Retrievedon:04February2016
-1-
A CSCW Requirements Engineering CASE Tool:
Development and Usability Evaluation
Miguel A. Teruel
LoUISE Research Group, Computing Systems Department, University of Castilla- La Mancha
Avda. España s/n, 02071 Albacete (Spain)
Elena Navarro1
LoUISE Research Group, Computing Systems Department, University of Castilla- La Mancha
Avda. España s/n, 02071 Albacete (Spain)
tel +34 967 599 200 ext. 2624, fax +34 967 599 343
Víctor López-Jaquero
LoUISE Research Group, Computing Systems Department, University of Castilla- La Mancha,
Avda. España s/n, 02071 Albacete (Spain)
Francisco Montero
LoUISE Research Group, Computing Systems Department, University of Castilla- La Mancha
Avda. España s/n, 02071 Albacete (Spain)
Pascual González
LoUISE Research Group, Computing Systems Department, University of Castilla- La Mancha
Avda. España s/n, 02071 Albacete (Spain)
1Corresponding author
-2-
A CSCW Requirements Engineering CASE Tool:
Development and Usability Evaluation
Abstract.
Context. CSRML Tool 2012 is a Requirements Engineering CASE Tool for the Goal-Oriented Collaborative
Systems Requirements Modeling Language (CSRML).
Objective. This work aims at evaluating the usability of CSRML Tool 2012, thus identifying any possible
usability flaw to be solved in the next releases of the application, as well as giving a general overview on how
to develop a DSL tool similar to the one evaluated in this work by means of Visual Studio Modelling SDK.
Method. In this evaluation, which was reported by following the ISO/IEC 25062:2006 Common Industry
Format for usability tests, 28 fourth-course Computer Science students took part. They were asked to carry
out a series of modifications to an incomplete CSRML requirements specification. Usability was assessed by
measuring the task’s completion rate, the elapsed time, number of accesses to the help system of the tool and
the instructor’s verbal assistance. The participants’ arousal and pleasantness were assessed by analyzing both
facial expressions and a USE questionnaire.
Results. In spite of obtaining high usability levels, the test outcome revealed some usability flaws that should
be addressed.
Conclusion. The important lessons learnt from this evaluation are also applicable to the success of other
usability tests as well as to the development of new CASE tools.
Highlights.
– Six metrics were used to measure effectiveness, efficiency and satisfaction
– Facial expression analysis was used to assess users’ satisfaction throughout the test
– The evaluation of tool was reported by applying the ISO/IEC 25062:2006
– We found some flaws in the tool, despite its good usability figures
– The lessons learnt are presented to help in other usability assessment studies
Keywords: usability evaluation, CASE tool, CSRML, requirements engineering, CSCW, ISO/IEC
25062:2006
1. Introduction
Usability is defined by the International Standard Organization (ISO 9241-11, [36]) as “the extent to which a
product can be used by specified users to achieve specified goals with effectiveness, efficiency and satisfaction
in a specified context of use”. That means that if a product (a software application in our case) does not provide
effectiveness, efficiency and satisfaction to its users, it is not usable, and therefore will probably not be used.
This was the case of Google Wave [64], a web application that was part email, part micro-blogging service, part
instant messaging, part collaborative discussion tool, and so on. Its creators said that “it would set a new
benchmark for interactivity”, but the truth is that this tool had too many features to allow it to be usable and so
forced Google to discontinue its development 2 years after its public preview due to very low usage.
Nevertheless, the Wave issue can be considered an isolated failure among the large list of Google successes. In
fact, its search engine is the most widely used probably due to its usability [21]. When a user requests the Google
search engine to find webpages, images, videos, news or whatever, it is very likely for him/her to find what
he/she was looking for (effectiveness) in a considerably short period of time (efficiency) and finally being

-3-
satisfied with the simple search procedure and its results (satisfaction). Taking into account these three features,
we are able to deduce why almost everybody uses Google: it is usable.
However, not only web applications need to achieve usability, but every piece of software endowed with a
user interface (UI) must be usable. For this reason in this work we evaluate the usability of a computer-aided
software engineering (CASE) tool in the form of a Requirements Engineering (RE) CASE tool. The object of
this assessment is the CSRML Tool 2012 (hereinafter abbreviated to CT’12), the CASE tool supporting CSRML
(Collaborative Systems Requirements Modeling Language)[61] which is a Goal-Oriented RE language [41] able
to model the special sort of requirements which are needed to specify a Computer Supported Cooperative Work
(CSCW) system. These requirements, which are based on the management of the system participants and their
capabilities, the specification of the tasks they are supposed to perform, and the awareness of the other task
participants (see Section 2), make CSRML a really graphically complex language. The UI of the tool must be
complete enough to deal with all the CSRML modeling elements, including 5 different diagram editors with
cross-referencing facilities. As the understandability of CSRML had already been validated empirically by
means a family of experiments [62], in this work the usability of a tool supporting all CSRML features is
evaluated to assess the extent to which users are able to specify CSCW requirements by using it. Thus, by
evaluating the usability of the CSRML CASE tool it will be possible to improve it according to any usability
flaws detected. Indeed, the more usable the CT’12 is, the more likely it is that the requirements of CSCW
systems will be properly specified by it, thus avoiding several potential sources of error, such as missed
information, incorrect translation of requirements to written natural language, etc. [66].
With this aim, a usability test was documented by using the ISO/IEC Common Industry Format (CIF) for
usability tests [38]. We also applied different evaluation techniques, one for the definition of the experimental
tasks [15] and two others for evaluating user satisfaction by measuring their emotions [20] and gathering their
opinion through a survey [43] to enrich this usability test. 28 fourth-course Computer Science students
participated in this test. They were asked to carry out a set of tasks on an incomplete CSRML requirements
specification corresponding to an on-line collaborative multiplayer game. The usability of the tool was measured
by several variables such as tasks completion rate, elapsed time, a satisfaction questionnaire and user
pleasantness and arousal when using the tool (gathered by analyzing video recordings of their facial
expressions). It is worth highlighting the importance of carrying out usability evaluations [3] as part of the CT'12
development process. As shown in this work, it has enabled us to find several usability flaws that are being
addressed in the next version of CT’12 to be launched shortly. A general instructional overview of how to
develop a DSL tool like CT’12 is also included to be used by the community as a guide to developing and
evaluating new DSL CASE tools.
This paper is structured as follows: after this introduction, in Section 2 related work is discussed. In Section 3
the DSL tool development process and the usability test report are presented in accordance with the ISO/IEC
CIF. In Section 4 the previously presented report results are analysed and Section 5 discusses the threats to the
validity of this evaluation. Section 6 summarizes the lessons learnt from the test and finally Section 7 presents
our conclusions and further work.
2. Related Work
CT’12 is a CASE tool that supports the specification of CSCW (Computer Supported Cooperative Work)
requirements using CSRML language [61]. Hence, CSRML is a Goal-Oriented Requirements Engineering (RE)
-4-
language inspired by the i* framework [12][42], focusing on the specification of the special kind of requirements
that collaborative systems usually have [59]. These special kinds of software systems are studied under the
CSCW discipline, which addresses “how collaborative activities and their coordination can be supported by
means of computer systems” [11]. Examples of collaborative systems are on-line games [56], social networks
[65], collaborative document editors [7][63] or virtual reality applications [55][32] among many others. When
specifying a CSCW system, special kinds of requirements regarding collaboration, communication and
coordination among users (a.k.a. 3C) must therefore be specified [23]. Another important consideration when
developing CSCW systems is the awareness of the other people with whom the 3C tasks are performed. This
awareness [6] implies a knowledge of who is available to participate, where the other people are working, when
a certain artifact was modified, etc. However, the problem here is that the awareness requirements are difficult or
even impossible to represent by using the classical RE techniques [59]. In order to solve this issue CSRML was
developed to support complete and detailed specifications of CSCW systems, by enriching i* with 3C and
awareness capabilities. Concretely, CSRML implements the Workspace Awareness (WA) framework proposed
by [30], which is the most widely accepted awareness interpretation in the CSCW community.
A wide range of RE CASE tools are available [10]. For example, some tools support the UML Use Cases RE
technique [14], such as Rational RequisitePro [69], a broadly industry-accepted commercial tool which is able to
manage requirements, and support both traceability and team-work. Supporting Goal-Oriented RE, the
Organization Modeling Environment (OME) [68] is a graphical tool for specifying and analyzing requirements
by using the Goal-Oriented techniques i* [12] and NFR [19]. Based on OME and implemented as an open-
source Eclipse plug-in [29], OpenOME was released to expand OME capabilities with some other new features
such as forward and backwards requirements analysis [33]. Closely related to i*, J-PRiM [27] supports modeling
and analyzing requirements by means of a reengineering process, analyzing an existing system and representing
it with several alternative hierarchies of i* elements. However, as far as we are aware, there is no RE technique
or tool able to deal with CSCW systems requirements [60]. For this reason, both CSRML and CT’12 were
created in order to make good this lack of CSCW RE support, enabling the specification of collaborative systems
and emphasizing WA requirements.
Continuing in a different vein, a considerable amount of work has been done on usability measurement based
on a wide range of measures such as task completion, accuracy, error rates, precision and understanding, among
many others [34][24]. For example, the international standard ISO/IEC 25010:2011 Systems and software
Quality Requirements and Evaluation (SQuaRE, [37]) defines a software quality model as a composition of five
characteristics: effectiveness, efficiency, satisfaction, freedom from risk and context coverage. This standard is
applicable to the quality evaluation of both systems and software products. Closely related to this quality
standard is the ISO/IEC 25060:2010 [39], which provides a general overview of the Common Industry Format
(CIF) framework. The ISO/IEC 25062:2006 defines the structure of a usability test report [38] and standardizes
the information that must be reported when performing usability tests with users, replacing the industry’s
proprietary formats and providing several advantages, such as the reduction of staff training times or the
standardization of test results documentation. From another point of view, and related to the usability evaluation
of model-driven (MDD) tools, Condori-Fernández et al. [15] presented a framework for usability evaluation of
MDD tools under similar conditions. In this framework, the authors propose a combination of methods to
measure whether the test participants perform the tasks used to evaluate the usability of the tool in an optimal

-5-
way, as well as an example of how user satisfaction can be measured by observing their facial expressions. A
different framework for the evaluation of CASE tools is proposed in [53], which focuses on the evaluation of
learnability, considered as one of the usability sub-characteristics in [37]. This framework makes the evaluation
by means of a questionnaire on the learnability of CASE tools based on several criteria, such as ease of learning,
familiarity, consistency and predictability.
Returning to the user satisfaction questionnaire issue, several of these can be found in the usability literature
[4]. The System Usability Scale (SUS) questionnaire [8] is probably one of the most commonly used surveys to
gather user’s perceptions of usability. The SUS questionnaire is based on 10 items with 5 response options (1 –
strongly disagree, 5 – strongly agree). Nevertheless, in spite of its massive usage, the items of this test did not
map well with the ISO usability definition [26], namely effectiveness, efficiency and satisfaction [36] and it also
has some terms really hard to understand by non-native English speakers, as for instance the word
“cumbersome” [25]. More recently, Lund presented the USE questionnaire [43] in order to help user interface
designers to find usability errors. This survey, which has been used successfully by many companies around the
world, has 30 questions grouped in four different categories (usefulness, ease of use, ease of learning and
satisfaction) that must be answered on a 7-point Likert scale. It also encourages users to fill in a personal
comment at the end of the survey regarding the most positive and negative aspects they found which could
contribute to future design considerations of the evaluated software.
There is also a great deal of usability evaluations applied to several Computer Science sub-fields in the
literature. For example, Mensvoort et al. [46] evaluated the usability of optically simulated haptic feedback
without using mechanical force feedback devices, by measuring the effectiveness, efficiency and satisfaction (by
means of a non-standard questionnaire). The authors’ conclusion was that in some aspects it works even better
than mechanically simulated haptics, resulting in lower error rates, more satisfaction, and a higher index of
performance. Edwards et al. [22] performed an evaluation of the Electronic Health Records (systematic
collection of electronic health information on individual patients or populations) of a pediatric hospital system,
by using the Heuristic Walkthrough method (HW) [52] through three clinical tasks. They proved that HW can be
a useful tool for evaluating and improving this kind of system and also, thanks to the test outcomes, they made
some changes in the system configuration and training materials, which helped to avoid usability problems.
Peevers et al. [50] compared the usability of three different SMS (cell phone messages) input formats when
performing banking transactions by measuring their efficiency, effectiveness and satisfaction through a non-
standard 18-item questionnaire. The authors concluded that, among the three evaluated SMS alternatives
(abbreviations, numbers and free-form), the first two obtained almost the same result in all metrics, the last one
being the worst alternative regarding both completion time and user satisfaction (especially for older
participants). In the Virtual Reality field, Martinez et al. [45] evaluated the usability of several novel interaction
techniques for virtual environments. On the basis of the three usability factors (efficiency, effectiveness and user
satisfaction) defined in [36], they compare four different system prototypes by means of two experimental tasks,
finding some relevant evidence for the interaction technique for adaptation features and user confusion when
mixing natural and non-natural techniques.
The work done by Gutwin et al. [31] has a direct relationship to WA. In this study, they conducted a usability
test on several user interfaces with different WA levels, i.e. including a combination of miniature views, radar
views, multi-user scrollbars, glance functions and “what you see is what I do” views. By means of observation,
-6-
questionnaires, and interviews, they finally concluded that the two widgets based on miniature overviews of the
workspace (miniature and radar displays) were particularly useful in layout tasks, both for individual activities
and for maintaining WA. Condori-Fernández et al. [15] conducted a usability evaluation using the above
mentioned frameworkfor the evaluation of a CASE tool named INTEGRANOVA. Users with three different
levels of experience (novice, medium and expert) performing easy, medium and hard tasks participated in the
experiment. Some of the evaluation outcomes were that there was no difference between novice and medium
user’s efficiency and also that novice and medium users could only complete the easier tasks. Finally, they found
by analyzing users’ facial expressions that novice and medium users tended to get more stressed as task
complexity increased.
In this work, a usability test for evaluating CT’12 is presented according to its efficiency, effectiveness and
satisfaction, similar to the criteria presented in this section. Certain techniques are used, such as measuring
emotions, which proved to be highly successful in other studies, as well as other more classical techniques which
focused on the measurement of elapsed time or completion rates. Nevertheless, as far as we are aware, no studies
exist in which the usability testing of a CASE tool has been performed by combining the ISO CIF standard with
facial expression analysis. In this work we therefore use both of these elements in order to take advantage of the
benefits that each one has shown when used in isolation.
3. Usability Report
This section deals with our experimental method, the design of the experiment, the procedure followed and the
results obtained, in accordance with the template provided by the ISO/IEC 25062:2006 international standard
[38]. The method was designed to comply with the ISO/IEC’s Common Industry Format (CIF) for usability test
reports. Hence, this section has been organized by following the ISO/IEC 25062:2006, which standardizes the
types of information to be captured in tests with users, so that the test procedure can be replicated. The CIF
includes some guidelines to specify information on user demographics, task descriptions, the context of the test
(including the equipment used), the environment in which the test is conducted, and the protocol by which the
subjects and the test administrator(s) interact, as well as the particular metrics chosen to code the findings of the
study. Therefore, as recommended by the ISO/IEC in the CIF, a test summary is presented in Section 3.1 and
continues with a brief description of the tool evaluated in Section 3.2. In Section 3.3 the usability test method is
described and the results obtained are given in Section 3.4.
3.1. Executive Summary
CT’12[57] is a RE tool developed in 2012 aimed at guiding users through the requirements specification process
of a CSCW system, using the CSRML requirements modeling language [61]. A usability test was conducted on
using CT’12 to perform a series of modifications to the requirements specification of a collaborative multiplayer
game.
Table 1.Performance Results Summary
Assisted
Task
Completion
Rate
Unassisted
Task
Completion
Rate
Mean Unassisted
Task
Completion
Time
Assistances Efficiency
99.55% 89.29% 30’ 57” 11 3’ 31”time/unassisted correct
task
Twenty eight fourth-year Computer Science students participated in this study. Each participant performed 10
modeling tasks using CT’12: four of the tasks were easy, three medium and three were difficult. There were 6
-7-
dependent metrics: unassisted task completion rate; time to task completion; number of assistances; context-
sensitive help accesses; the facial expression observed while performing the tasks and the USE questionnaire
[43] results, which was filled in at the end to obtain qualitative exploratory data. The mean task completion time
of all 28 participants was 31 minutes for all the tasks, with an unassisted task completion rate of 89.29% (see
Table 1).
3.2. Introduction
This section briefly describes the object of the usability test as well as our objectives. Section 3.2.1 describes a
CT’12 walkthrough test and Section 3.2.2 sums up our evaluations.
3.2.1. Full Product Description
This section describes the application evaluated in this work, together with the general process for developing a
CASE tool for a domain-specific language (DSL) in Visual Studio as applied to developing CT’12.
CSRML Tool 2012
CSRML Tool 2012 [57] is a CASE tool which deals with CSRML requirements models. This tool is able to
represent all the CSRML elements and relationships, as well as support its diagram organization and validate the
models created by checking whether they conform to the CSRML metamodel (among other design restrictions).
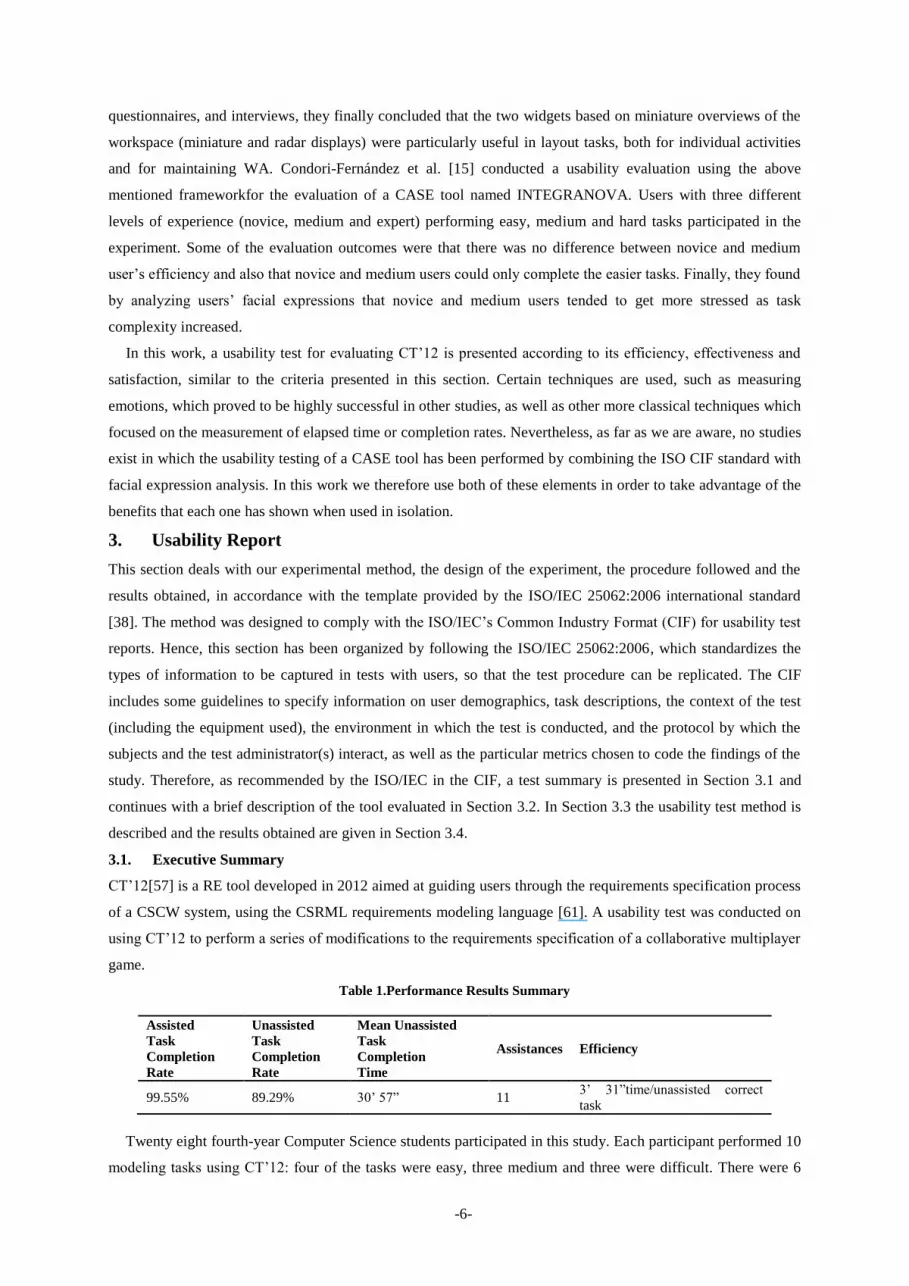
Work area BrowserToolbox
Messages Element Properties Figure 1. CT’12 running under Microsoft Visual Studio 2012 and Windows 8
This tool, whose interface can be seen in Figure 1, was developed as a Microsoft Visual Studio 2012
extension by implementing the CSRML metamodel using VMSDK [16] and coding the graphical elements and
validation procedures. This tool enables a complete CSCW system to be specified and validated by means of the
5 different types of CSRML diagrams (their interrelationships and purposes are shown in Figure 2), which are:
Group Hierarchy Diagram (GHD): this diagram depicts the different stakeholders (and their groups) involved
in a CSCW system by using actors and groupactors, respectively.
System Goals Diagram (SGD): this diagram is used to identify the goals of the CSCW system. Each one of
these goals will be assigned to the actors and groupactors involved in their achievement.

-8-
Responsibility Diagram (RDs): each one of these diagrams corresponds to one of the goals identified in the
SGD. In a RD diagram, both the roles played by the actors and the tasks the actors are responsible for are
specified.
Task Refinement Diagrams (TRDs): in a TRD diagram, the tasks previously identified in RD diagrams are
decomposed into individual tasks and 3C tasks that support Workspace Awareness features [30].
Quality factors diagram (QFD): in these diagrams, the quality factors that contribute to achieve the main
softgoals (quality factors), identified in the RD diagram, are specified.
Figure 2. CSRML diagram hierarchy
Thanks to this tool, the most complex CSRML elements can be easily specified. This was possible by coding
the graphical elements that VMSDK does not support natively, since it only supports basic shapes such as
circles, ellipses or rectangles. In addition, since VMSDK does not support natively multiple views (diagrams)
per model, it was implemented successfully by using a novel Visual Studio extension named ModelBus [48].
This extension supports creating references to elements in other diagrams, thus maintaining consistency among
the diagrams. In order to differentiate the original elements from their references, the latter are denoted in the
CT’12 toolbox and model explorer with the name of the diagram where they must be originally defined and also,
when these references are dropped in the diagram, their name is shown in italics to differentiate them from the
original element. The original element can also be easily edited by double-clicking its reference. Furthermore,
CT’12 supports model validation in three different ways (Figure 3):
Design-time validation: The graphical editor does not allow users to add incorrect elements to certain
diagrams or to connect elements with incorrect links.
Meta-model validation: CT’12 allows users to check whether the specified model conforms to the CSRML
meta-model.
Other validations: The validation procedure checks other potential sources of inconsistencies, such as
recursive tasks, goal decompositions (as shown in Figure 3) and duplicated references among models.

-9-
Figure 3. CT’12 validating a CSRML TRD diagram
Regarding integration with Visual Studio, several wizards and item templates have been created allowing the
users to proceed as with any other Visual Studio project. For instance, by using one of these wizards, new
CSRML projects can be created made up of 5 empty diagrams. Also, there is another wizard to add new
diagrams to the models. This tool [57] was deployed by using the Visual Studio Gallery. Thus, any Visual Studio
2012 user who wants to install this extension can do so directly from the Visual Studio extension manager. Once
CT’12 is installed, the user will be notified when a new version of the extension is available so it can be
upgraded automatically. Finally, a context-sensitive help component is available to the user which is integrated
into the Visual Studio help system. This help component includes a description of all the elements and diagrams
in CSRML, as well as several tutorials covering the most complex aspects of the tool. Further information can be
found in a demo video which shows the tool’s features in detail [57]. The following section deals with the
process of creating a DSL such as CT’12.
Beyond Visual Studio: Developing Integrated Extensions
Needless to say, Microsoft Visual Studio is one of the most widely used Integrated Development Environments
(IDE) in developing applications for Windows desktop computers, tablets and smartphones, as well as websites
and services. However, not everybody knows that Visual Studio can be extended by means of custom plugins
that will enrich this IDE with a whole new set of capabilities. For example, Visual Studio can support new
languages, deal with new external data sources, or enable developers to customize the version control, among
other capabilities that its Software Development Kit (SDK) offers [49]. A new graphical language, CSRML, was
recently added to Visual Studio. The support for this language could have been developed by using one of the
IDE’s two facilities. First, the Visual Studio language services could have been used to manually code the new
language, simply by dealing with its syntax and graphical representation (if any) manually. However
Visualization and Modeling SDK (VMSDK) was finally used because it greatly facilitates the development and
inclusion of new Domain Specific Languages (DSL) in Visual Studio thanks to the support it offers. The
development process of a DSL, which was applied to provide support to CSRML using VMSDK, is described
below in order to highlight the good support it offers:
1. Define the metamodel: the first step when creating a DSL with VMSDK is to create the metamodel by
specifying its elements and relationships. VMSDK provides a graphical metamodel editor (left side of Figure
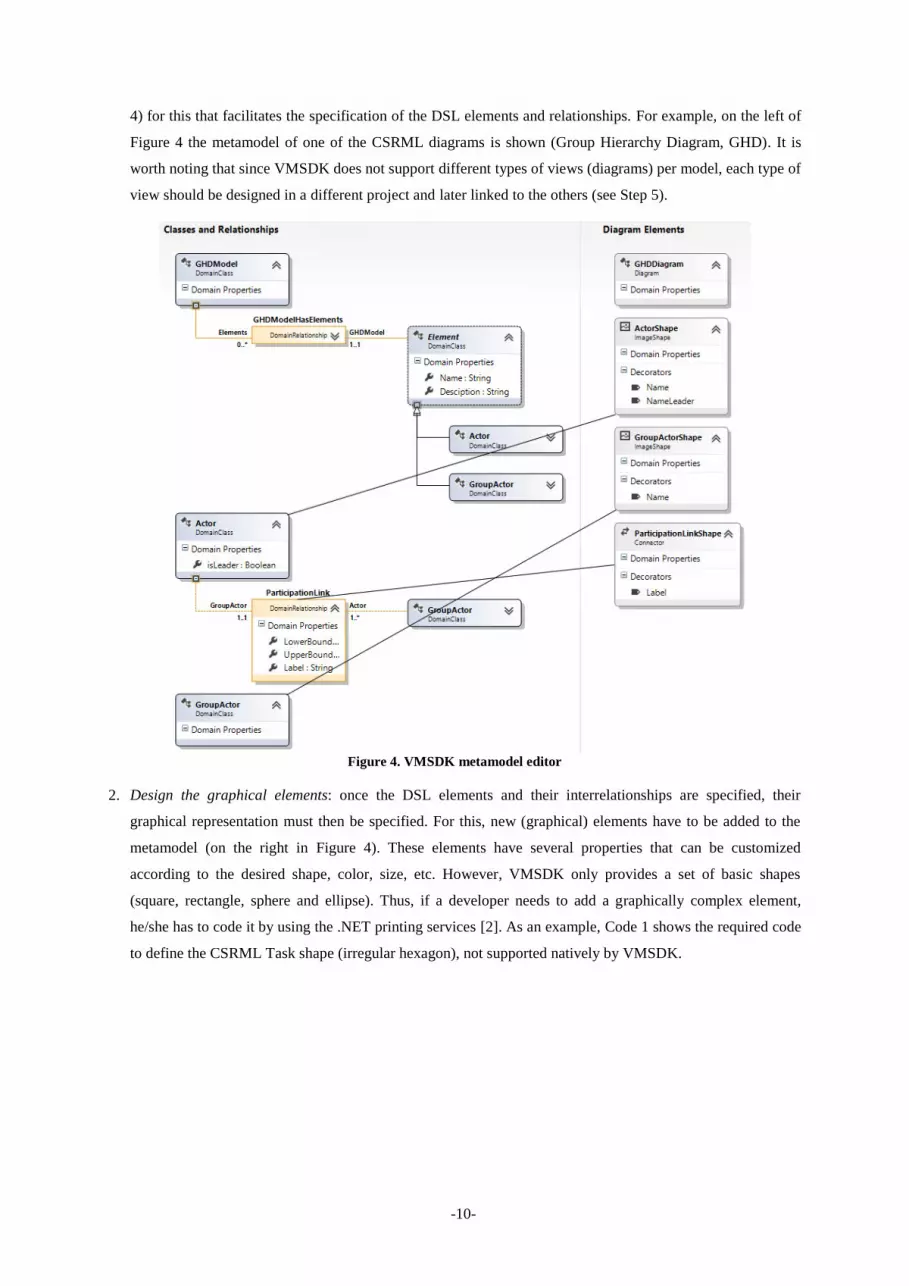
-10-
4) for this that facilitates the specification of the DSL elements and relationships. For example, on the left of
Figure 4 the metamodel of one of the CSRML diagrams is shown (Group Hierarchy Diagram, GHD). It is
worth noting that since VMSDK does not support different types of views (diagrams) per model, each type of
view should be designed in a different project and later linked to the others (see Step 5).
Figure 4. VMSDK metamodel editor
2. Design the graphical elements: once the DSL elements and their interrelationships are specified, their
graphical representation must then be specified. For this, new (graphical) elements have to be added to the
metamodel (on the right in Figure 4). These elements have several properties that can be customized
according to the desired shape, color, size, etc. However, VMSDK only provides a set of basic shapes
(square, rectangle, sphere and ellipse). Thus, if a developer needs to add a graphically complex element,
he/she has to code it by using the .NET printing services [2]. As an example, Code 1 shows the required code
to define the CSRML Task shape (irregular hexagon), not supported natively by VMSDK.

-11-
Code 1. Implementation of a custom graphical definition for a CSRML Task
3. Relate the metamodel elements to their graphical definition: once both Steps 1 and 2 have been carried out,
the elements and their graphical definition must be related to each other by means of graphical links. Also,
the decorators of the graphical elements (i.e., icons or texts used for the graphical shapes) have to be mapped
to the attributes of the metamodel elements with the DSL details editor. Thanks to this facility, when a user
creates a shape in the editor to model an element it changes dynamically according to its attributes. An
example of this task can be seen in Figure 4, where the black lines represent the relationship among
metamodel elements and graphical definitions. Some of the decorators used in our tool can be seen on the
right of Figure 4. Finally, in order to map a decorator with a metamodel attribute, the DSL Details editor
must be used. Figure 5 shows an example of the mapping of a decorator in the CSRML Task element,
mapping the decorator “Name” with the property “Name” of the metamodel element “Task”. As can be seen
on the right, this decorator will be shown only when the “Kind” element is equal to “Communication,
Coordination, Collaboration or Individual”.
Figure 5. DSL Details editor for attributes and decorators mapping
class TaskShapeGeomerty : RectangleShapeGeometry { public override GraphicsPath GetPath(IGeometryHost geometryHost) { RectangleF targetRect = RectangleD.ToRectangleF(geometryHost.GeometryBoundingBox); GraphicsPath path = base.UninitializedPath; path.Reset(); PointF[] points = { new PointF(0, 0.5f), new PointF(1, 0), new PointF(17, 0), new PointF(18, 0.5f), new PointF(17, 1), new PointF(1, 1) }; path.AddPolygon(points); RectangleF currentBounds = path.GetBounds(); float scaleX = targetRect.Width / currentBounds.Width; float scaleY = targetRect.Height / currentBounds.Height; Matrix scaleTransform = new Matrix(); scaleTransform.Scale(scaleX, scaleY); path.Transform(scaleTransform); currentBounds = path.GetBounds(); Matrix translationTransform = new Matrix(); translationTransform.Translate(targetRect.Left - currentBounds.Left, targetRect.Top - currentBounds.Top); path.Transform(translationTransform); return path; } }

-12-
4. Define the DSL browser and toolbar: the next step is related to how users will interact with the developed
DSL. The VMSDK provides the support needed to design toolbars that show users the elements and
relationships they can add to a diagram. It also supports the development of DSL browsers (tree-shaped
graphs showing all the diagram elements) that can be customized to show the elements and attributes
specifically needed by the DSL. Figure 6 gives an example of how a toolbar is created with the DSL Explorer
tool. It shows the toolbar elements and relationships (left) and the properties of the selected element, namely
Actor (right).
Figure 6. CSRML Group Hierarchy Diagram toolbox editor
5. Link diagrams: as has already been mentioned, VMSDK does not support different views of a model,
although this limitation can be overcome by using ModelBus [48]. With this support, when the same element
is to be included in two or more diagrams, the user can specify the element in one diagram and the other
diagrams will have references to this element. ModelBus not only enables references to elements to be
created, but also to complete diagrams. Figure 7 shows the ModelBus specific properties editor which was
used to link CSRML task references on Task Refinement Diagrams (TRD) to the tasks on Responsibility
Diagrams (RD).
-13-
Figure 7. ModelBus specific properties editor
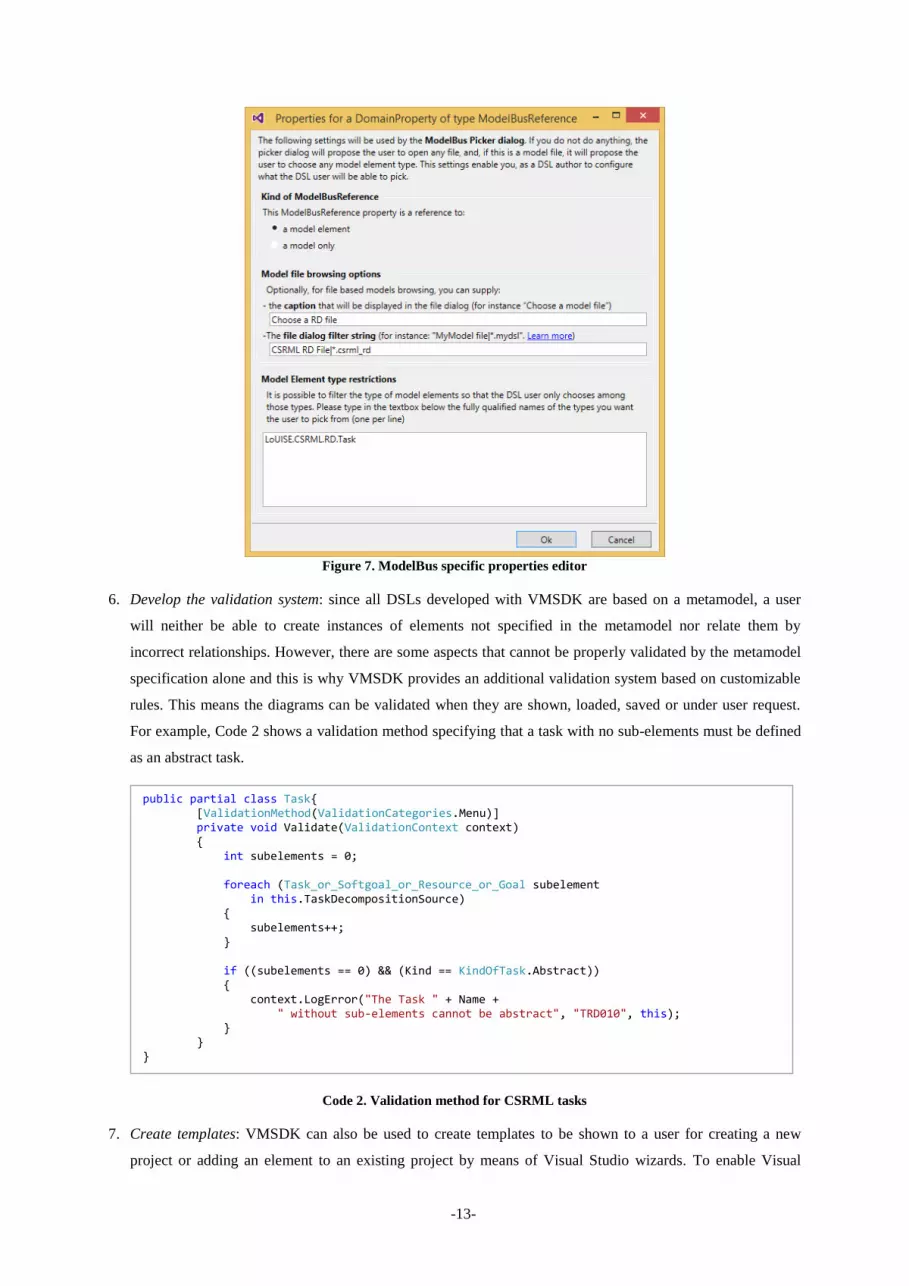
6. Develop the validation system: since all DSLs developed with VMSDK are based on a metamodel, a user
will neither be able to create instances of elements not specified in the metamodel nor relate them by
incorrect relationships. However, there are some aspects that cannot be properly validated by the metamodel
specification alone and this is why VMSDK provides an additional validation system based on customizable
rules. This means the diagrams can be validated when they are shown, loaded, saved or under user request.
For example, Code 2 shows a validation method specifying that a task with no sub-elements must be defined
as an abstract task.
Code 2. Validation method for CSRML tasks
7. Create templates: VMSDK can also be used to create templates to be shown to a user for creating a new
project or adding an element to an existing project by means of Visual Studio wizards. To enable Visual
public partial class Task{ [ValidationMethod(ValidationCategories.Menu)]
private void Validate(ValidationContext context) { int subelements = 0; foreach (Task_or_Softgoal_or_Resource_or_Goal subelement in this.TaskDecompositionSource) { subelements++; } if ((subelements == 0) && (Kind == KindOfTask.Abstract)) { context.LogError("The Task " + Name + " without sub-elements cannot be abstract", "TRD010", this); }
} }

-14-
Studio to show our customized wizards, we need to add an empty project template to our DSL, thus
providing the basic scaffolding to start the projects. To facilitate adding new elements with the “new element
wizard”, additional templates could be added to the DSL project (one for each type of diagram in our DSL).
To do this we need to add new projects of the type “Extensibility / Item – Project Template”. This project
will have an XML file that will enable us to customize our template. For example, Code 3 shows the XML
template file for the CSRML GHD diagram.
Code 3. New element template for CSRML GHD
8. Document the DSL: the DSL should be documented to provide the user with an appropriate help system. The
first step is to document the “description” field of every item (e.g. element, relationship, toolbar button, etc.)
so that whenever a user is modeling and the mouse pointer hovers over an element or relationship, some
information about it will be displayed. This basic help system can be complemented by extending the Visual
Studio integrated help, i.e. creating a set of HTML pages that will be added to the current Visual Studio
documentation. If this extension is available, users can either press “F1” when an item is selected or browse
the entire help in order to access the DSL documentation. However, each version of Visual Studio has a
different help system architecture. In Visual Studio 2012, this documentation must be compliant with
Microsoft Help Viewer 2.0 (an HTML-based help system).
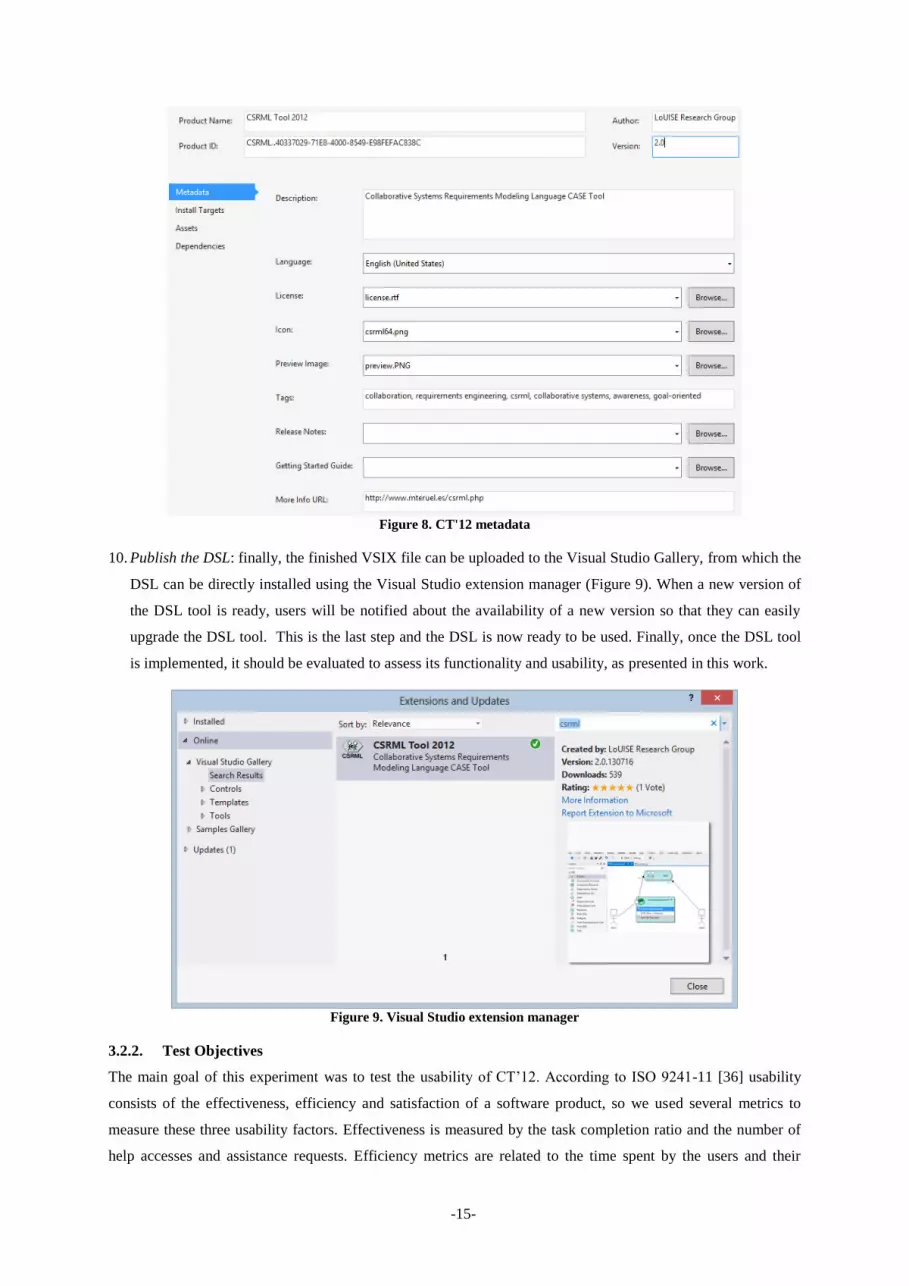
9. Create the VSIX file: a VSIX file is a container for new functionality (plug-ins) for Visual Studio. This means
that in order to deploy our DSL a VSIX project must be created. This project should include all the libraries
of the DSL diagrams developed, as well as the templates for new projects/elements. It should also be
provided with additional metadata on the DSL, such as its version, license and URLs in which users can find
additional information (Figure 8).
<?xml version="1.0" encoding="utf-8"?> <VSTemplate Version="3.0.0" Type="Item" xmlns="http://schemas.microsoft.com/developer/vstemplate/2005"> <TemplateData> <Name>CSRML GHD diagram</Name> <Description>Adds a new CSRML GHD diagram</Description> <Icon>ghd.ico</Icon> <TemplateID>6fd938b6-ec38-4a06-a1fd-99d2221ac28d</TemplateID> <ProjectType>CSharp</ProjectType> <RequiredFrameworkVersion>2.0</RequiredFrameworkVersion> <NumberOfParentCategoriesToRollUp>1</NumberOfParentCategoriesToRollUp> <DefaultName>GHD.csrml_ghd</DefaultName> </TemplateData> <TemplateContent> <ProjectItem TargetFileName="$fileinputname$.csrml_ghd"> GHD1.csrml_ghd </ProjectItem> <ProjectItem TargetFileName="$fileinputname$.csrml_ghd.diagram"> GHD1.csrml_ghd.diagram </ProjectItem> </TemplateContent> </VSTemplate>
-15-
Figure 8. CT'12 metadata
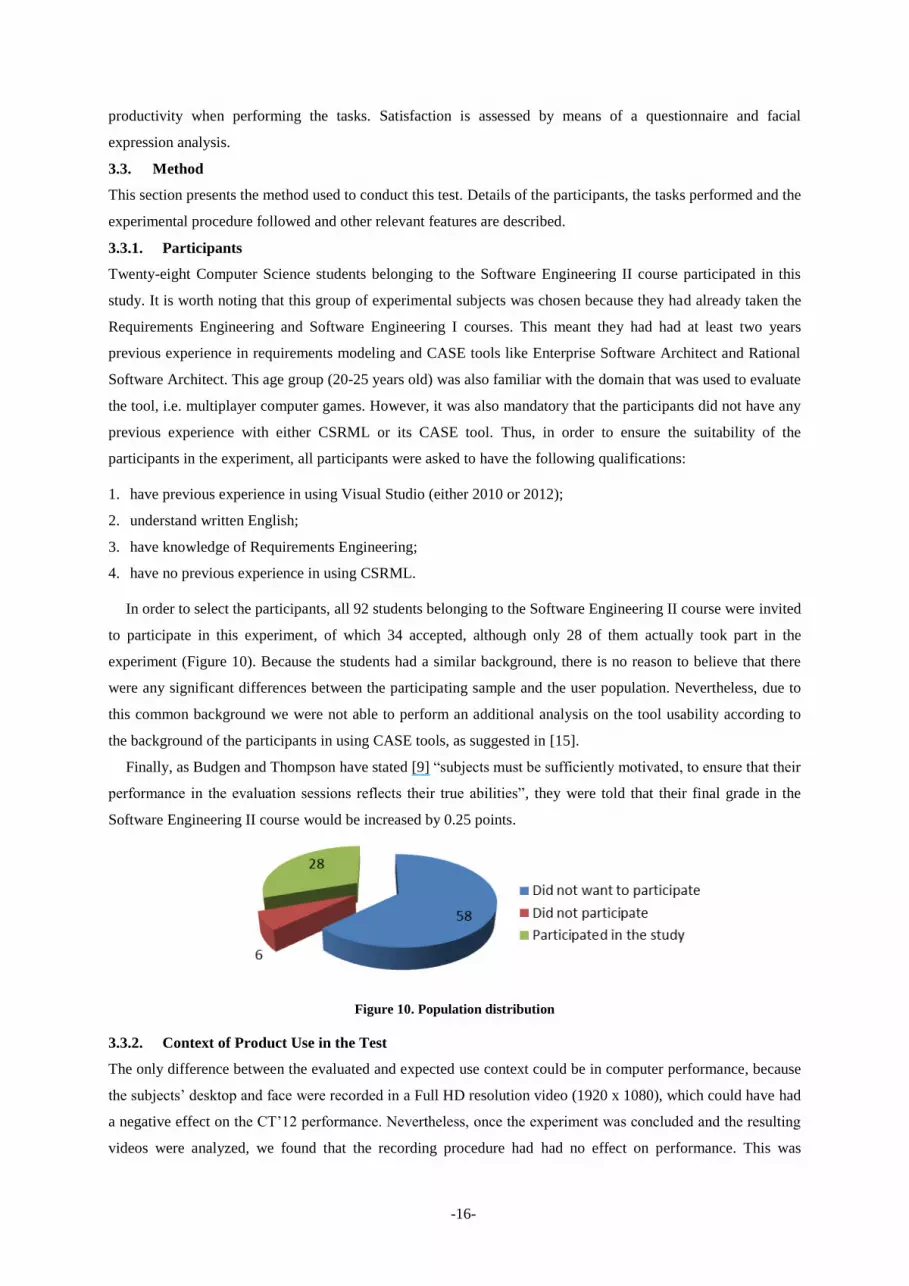
10. Publish the DSL: finally, the finished VSIX file can be uploaded to the Visual Studio Gallery, from which the
DSL can be directly installed using the Visual Studio extension manager (Figure 9). When a new version of
the DSL tool is ready, users will be notified about the availability of a new version so that they can easily
upgrade the DSL tool. This is the last step and the DSL is now ready to be used. Finally, once the DSL tool
is implemented, it should be evaluated to assess its functionality and usability, as presented in this work.
Figure 9. Visual Studio extension manager
3.2.2. Test Objectives
The main goal of this experiment was to test the usability of CT’12. According to ISO 9241-11 [36] usability
consists of the effectiveness, efficiency and satisfaction of a software product, so we used several metrics to
measure these three usability factors. Effectiveness is measured by the task completion ratio and the number of
help accesses and assistance requests. Efficiency metrics are related to the time spent by the users and their
-16-
productivity when performing the tasks. Satisfaction is assessed by means of a questionnaire and facial
expression analysis.
3.3. Method
This section presents the method used to conduct this test. Details of the participants, the tasks performed and the
experimental procedure followed and other relevant features are described.
3.3.1. Participants
Twenty-eight Computer Science students belonging to the Software Engineering II course participated in this
study. It is worth noting that this group of experimental subjects was chosen because they had already taken the
Requirements Engineering and Software Engineering I courses. This meant they had had at least two years
previous experience in requirements modeling and CASE tools like Enterprise Software Architect and Rational
Software Architect. This age group (20-25 years old) was also familiar with the domain that was used to evaluate
the tool, i.e. multiplayer computer games. However, it was also mandatory that the participants did not have any
previous experience with either CSRML or its CASE tool. Thus, in order to ensure the suitability of the
participants in the experiment, all participants were asked to have the following qualifications:
1. have previous experience in using Visual Studio (either 2010 or 2012);
2. understand written English;
3. have knowledge of Requirements Engineering;
4. have no previous experience in using CSRML.
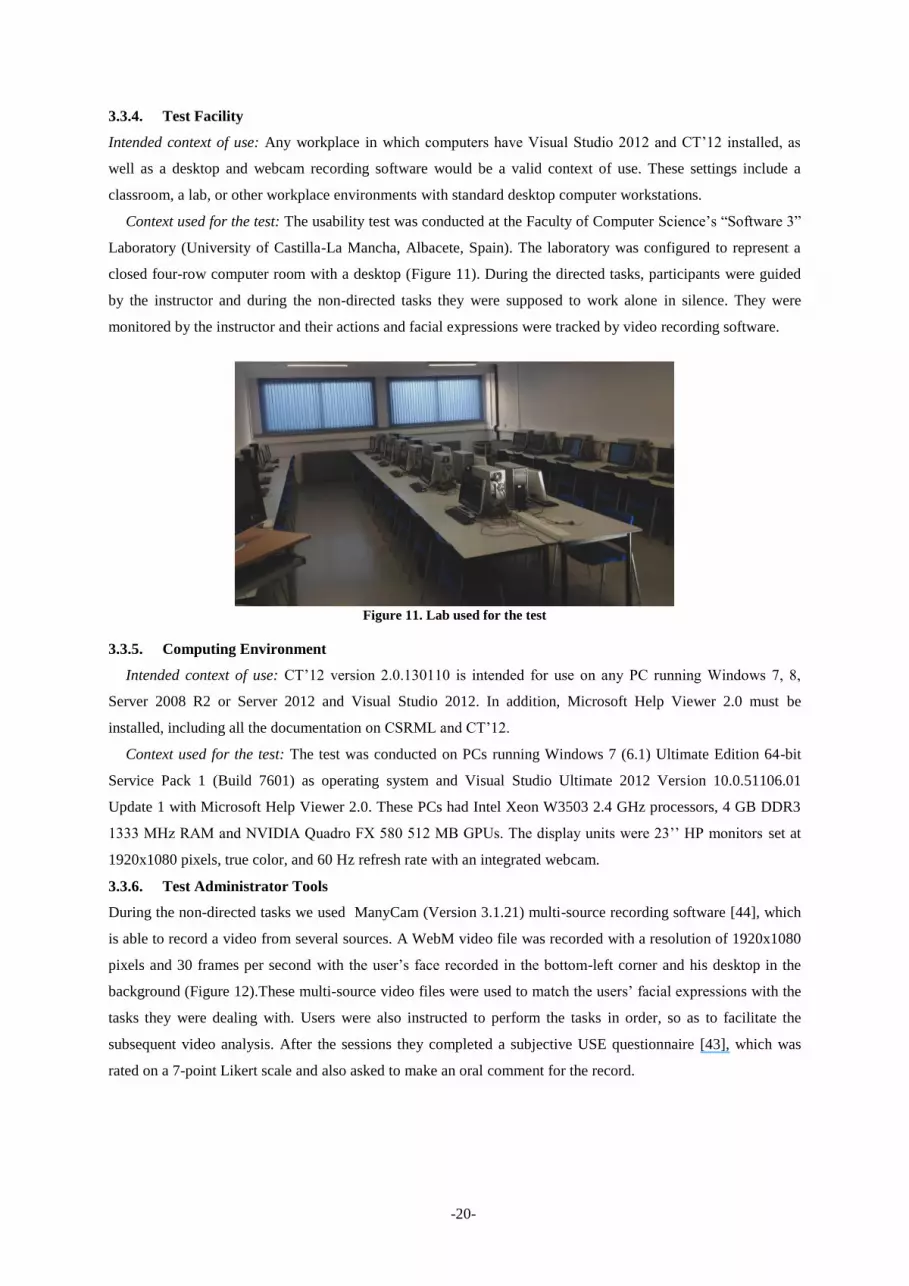
In order to select the participants, all 92 students belonging to the Software Engineering II course were invited
to participate in this experiment, of which 34 accepted, although only 28 of them actually took part in the
experiment (Figure 10). Because the students had a similar background, there is no reason to believe that there
were any significant differences between the participating sample and the user population. Nevertheless, due to
this common background we were not able to perform an additional analysis on the tool usability according to
the background of the participants in using CASE tools, as suggested in [15].
Finally, as Budgen and Thompson have stated [9] “subjects must be sufficiently motivated, to ensure that their
performance in the evaluation sessions reflects their true abilities”, they were told that their final grade in the
Software Engineering II course would be increased by 0.25 points.
Figure 10. Population distribution
3.3.2. Context of Product Use in the Test
The only difference between the evaluated and expected use context could be in computer performance, because
the subjects’ desktop and face were recorded in a Full HD resolution video (1920 x 1080), which could have had
a negative effect on the CT’12 performance. Nevertheless, once the experiment was concluded and the resulting
videos were analyzed, we found that the recording procedure had had no effect on performance. This was

-17-
because the video recording was done by a low priority system process which only uses the system’s idle
resources and the video frame rate was reduced when the computer was in a high load state.
3.3.3. Tasks
Description of task scenarios: Because CSRML is a RE language for CSCW systems, we selected a task
scenario based on an online collaborative application. The Age of Empires Online strategy game [47] was
chosen because the subjects were more familiar with computer games than other more “formal” CSCW
environments. The subjects were given a CSRML project containing an incomplete and error-filled specification
[66] of the aforementioned game and they had to perform 18 modifications on it (8 modifications directed during
the training session and 10 non-directed subsequently). The CSRML project provided comprised 7 different
CSRML files (one diagram per file), which included the elements shown in Table 2.
Table 2. Provided CSRML project size (in number of elements)
GHD SGD RD
PlaySkirmish
TRD
Attack
TRD
Build
TRD
DevelopEconomy
QFD
ProvideAQuality
GamingExperience
Actors 3 (3)*
Awareness
Resources 3 2
Goals 4 1
GroupActors 2 (3)*
Resources 5
Roles 4 (3)* (3)* (2)*
Softgoals 2 12 (1)*
Tasks 3 4 (1)* 10 (1)* (1) 12 (1)*
* The number of references to elements specified in other diagrams is shown in parentheses
The students first performed 8 tasks during the training session guided by the instructor, to familiarize them with
all the features of CT’12. They then had to perform by themselves the other non-directed tasks, by using the tool
context-sensible integrated help (F1 help) as the only reference, although if they were not able to perform the
task with the F1 they could ask for the instructor’s help (this would be recorded in the final results). Table 3 and
Table 4 show both the directed and non-directed tasks used in the experiment, the type of CSRML diagram that
each task was related to, the skills needed to carry out the tasks and their difficulty level (which was established
according the number of steps required to carry out each task following the recommendations from [15]).
Table 3. Tasks performed under direction
Task Diagram Skills (Model element/property affected) Difficulty
D1 TRD Add Elements (Goal, Softgoal, Task, Resource) Easy
D2 TRD Link Elements (Task Decomposition Link) Easy
D3 TRD
Add Elements (Task)
Link Elements (Task Decomposition Link, Participation Link)
Change Properties (Kind of Task)
Easy
D4 TRD Validate
Change Properties (Cardinality) Medium
D5 TRD
Add Elements (Task)
Link Elements (Task Decomposition Link, Participation Link)
Change Properties (Kind, Importance, Cardinality)
Medium
D6 TRD
Add Elements (Task, Awareness Resource)
Link Elements (Task Decomposition Link, Participation Link)
Change Properties (Kind, Importance, Cardinality)
Delete Links (Participation Link)
Expand Awareness Resource
Add Elements Awareness
Hard
D7 QFD Create Diagrams Medium
D8 QFD Create References (Softgoal)
Add Elements (Softgoal) Hard

-18-
Link Elements (Contribution Link)
Change Properties (Name)
Table 4. Non-directed tasks to perform
Task Diagram Skills Difficulty
ND1 GHD
Add Elements (Actor)
Link Elements (Participation Link)
Change Properties (Leadership, Cardinality)
Easy
ND2 SGD
Add Elements (Goal)
Link Elements (Participation Link, Task Decomposition Link)
Change Properties (Cardinality)
Easy
ND3 RD
Add Elements (Role)
Link Elements (Playing Link, Responsibility Link)
Change Properties (Guard Condition)
Easy
ND4 TRD
Expand Awareness Resource
Add Awareness Elements
Change Properties (Kind, Importance)
Medium
ND5 TRD
Add Elements (Task)
Link Elements (Task Decomposition Link, Participation Link)
Change Properties (Kind of Element, Importance)
Medium
ND6 TRD
Create References (Role)
Link Elements (Participartion Link)
Change Properties (Cardinality)
Medium
ND7 TRD
DeleteLinks (Participation Link)
Add Elements (Awareness Resource)
ChangeProperties (Role and Task in The Awareness Connector)
Hard
ND8 TRD Validate Diagrams
Delete Links (Task Decomposition Link) Hard
ND9 TRD
Create Diagrams (TRD)
Add Elements (Task)
Link Elements (Participation Link)
ChangeProperties (Cardinality, Importance)
Create References (Task, Role)
Hard
ND10 QFD Add Elements (Softgoal)
Link Elements (Contribution Link) Easy
It is worth noting here that the difficulty of the tasks was assigned by following the guidelines of the
framework for evaluating model-driven tools developed by Condori-Fernández [15]. This framework divides
tasks into activities and activities into steps. Two aggregation stages are then carried out. The first aggregation
stage is computed by calculating the ratio between the number of steps in each difficulty and the total number of
steps necessary to carry out the activity being aggregated. The second aggregation is computed by dividing the
sum of all the previous ratios for each difficulty level by the number of activities in the task being aggregated.
The results of applying these guidelines to obtain the difficulty level for each task in our study are shown in
Table 3 and Table 4. Additionally, two examples of how these calculations were performed are illustrated in both
Table 5 (easy task) and Table 6 (hard task). For example, task ND1 (Table 5) is divided into four different
activities. The first of these (Add elements) is divided again into three steps: select the elements from the toolbar
(easy difficulty), drag elements into the work area (null difficulty) and drop them (null difficulty).Therefore, the
ratios for this activity are 1/3 and 2/3 for the difficulties Easy and Null, respectively, since there is one easy step
and two null steps, and the total number of steps is three. Finally, the row ND1 calculates the percentage of each
difficulty level for task ND1.This percentage is computed by dividing the sum of all the ratios for each difficulty
level by the total number of activities in the task. For instance, the average difficulty percentage is
(2/4+1/3+2/5)/4 (i.e. 0.308, or 30.8%). However, the percentages of easy and null difficulties are 52.5% and

-19-
16.7%, respectively. Therefore, task ND1 is classified as easy, since the higher percentage corresponds to easy
difficulty (52.5%).
Table 5. Calculation of difficulty for task ND1
Activity Hard Medium Easy Null
A1. Add Elements (Actor) 1/3 2/3
A2. Link Elements (Participation Link) 2/4 2/4
A3. Change Properties (Leadership) 1/3 2/3
A4. Change Properties (Cardinality) 2/5 3/5
Task ND1 (2/4+1/3+2/5) / 4 (1/3+2/4+2/3+3/5) / 4 (2/3) / 4 0.308 0.525 0.167
P(ND1) 30.8% 52.5% 16.7%
Table 6. Calculation of difficulty for task ND9
Activity Hard Medium Easy Null
A1. Create Diagrams
(TRD) 4/6 1/6 1/6
A2. Add Elements (Task) 1/3 2/3
A3. Link Elements
(Participation Link) 2/4 2/4
A4. Change Properties (Cardinality)
2/5 3/5
A5. Change Properties
(Importance) 1/3 1/3 1/3
A6. Create References
(Task) 6/8 2/8
A7. Create References (Role)
6/8 2/8
Task ND9
(4/6+1/3+6/8+6/8) /
7
(1/6+2/4+2/5+1/3+2/8+2/8) /
7
(1/3+2/4+3/5+1/3) /
7
(1/6+2/3) /
7
0.357 0.271 0.252 0.119
P(ND9) 35.7% 27.1% 25.2% 11.9%
Why tasks were selected: These tasks were selected because they provide a full coverage of the CT’12’s
capabilities (adding, modifying, deleting and verifying different elements, relationships, references and
diagrams). Additionally, as can be seen in these tables, the task difficulty was gradually increased throughout the
test in order to evaluate the students’ reactions when dealing with tasks at different difficulty levels.
Task source: The tasks required from the participants were defined by the five CSRML language creators and
five external usability experts (not related to CSRML) belonging to SymbiaIT, a software development
company. The key consideration was the inclusion of every task that could be performed during the specification
of a CSCW system with CSRML.
Task data given to participants: Regarding the materials and documentation given to the students, there was
no material for the directed tasks, as they followed the instructor during the training session. For the non-directed
tasks they were given a document in which the 10 to-do tasks were explained in both textual and graphical
format, showing the initial and final state of the diagram that the task was related to (see Annex 1).
Task performance criteria: A task was considered successful if its outcome fully corresponded to the
expected result. That means that if a task was only partially complete, it was not considered successful. The final
score for each participant was the sum of all successfully completed tasks, obtaining results ranging from 0% to
100%.
-20-
3.3.4. Test Facility
Intended context of use: Any workplace in which computers have Visual Studio 2012 and CT’12 installed, as
well as a desktop and webcam recording software would be a valid context of use. These settings include a
classroom, a lab, or other workplace environments with standard desktop computer workstations.
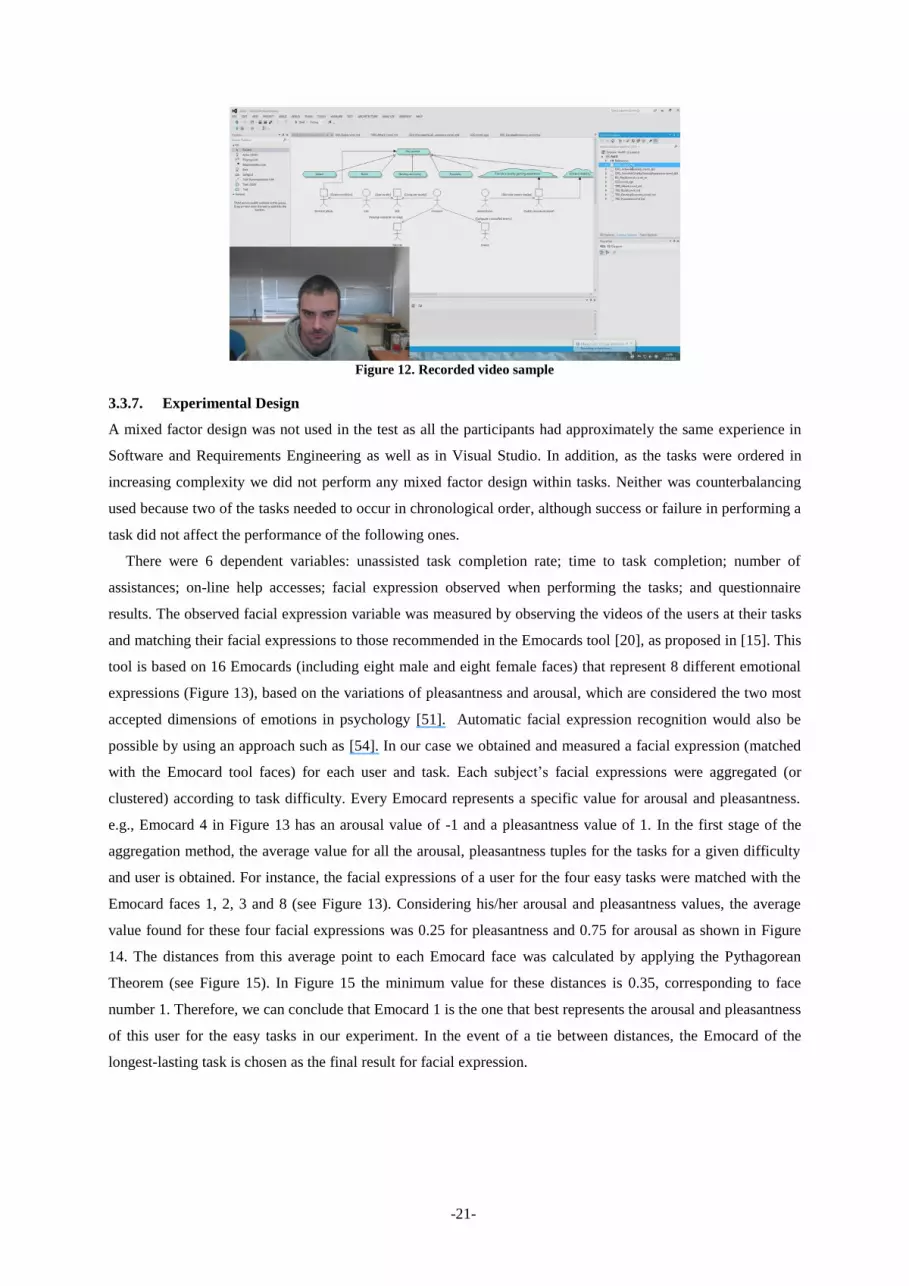
Context used for the test: The usability test was conducted at the Faculty of Computer Science’s “Software 3”
Laboratory (University of Castilla-La Mancha, Albacete, Spain). The laboratory was configured to represent a
closed four-row computer room with a desktop (Figure 11). During the directed tasks, participants were guided
by the instructor and during the non-directed tasks they were supposed to work alone in silence. They were
monitored by the instructor and their actions and facial expressions were tracked by video recording software.
Figure 11. Lab used for the test
3.3.5. Computing Environment
Intended context of use: CT’12 version 2.0.130110 is intended for use on any PC running Windows 7, 8,
Server 2008 R2 or Server 2012 and Visual Studio 2012. In addition, Microsoft Help Viewer 2.0 must be
installed, including all the documentation on CSRML and CT’12.
Context used for the test: The test was conducted on PCs running Windows 7 (6.1) Ultimate Edition 64-bit
Service Pack 1 (Build 7601) as operating system and Visual Studio Ultimate 2012 Version 10.0.51106.01
Update 1 with Microsoft Help Viewer 2.0. These PCs had Intel Xeon W3503 2.4 GHz processors, 4 GB DDR3
1333 MHz RAM and NVIDIA Quadro FX 580 512 MB GPUs. The display units were 23’’ HP monitors set at
1920x1080 pixels, true color, and 60 Hz refresh rate with an integrated webcam.
3.3.6. Test Administrator Tools
During the non-directed tasks we used ManyCam (Version 3.1.21) multi-source recording software [44], which
is able to record a video from several sources. A WebM video file was recorded with a resolution of 1920x1080
pixels and 30 frames per second with the user’s face recorded in the bottom-left corner and his desktop in the
background (Figure 12).These multi-source video files were used to match the users’ facial expressions with the
tasks they were dealing with. Users were also instructed to perform the tasks in order, so as to facilitate the
subsequent video analysis. After the sessions they completed a subjective USE questionnaire [43], which was
rated on a 7-point Likert scale and also asked to make an oral comment for the record.
-21-
Figure 12. Recorded video sample
3.3.7. Experimental Design
A mixed factor design was not used in the test as all the participants had approximately the same experience in
Software and Requirements Engineering as well as in Visual Studio. In addition, as the tasks were ordered in
increasing complexity we did not perform any mixed factor design within tasks. Neither was counterbalancing
used because two of the tasks needed to occur in chronological order, although success or failure in performing a
task did not affect the performance of the following ones.
There were 6 dependent variables: unassisted task completion rate; time to task completion; number of
assistances; on-line help accesses; facial expression observed when performing the tasks; and questionnaire
results. The observed facial expression variable was measured by observing the videos of the users at their tasks
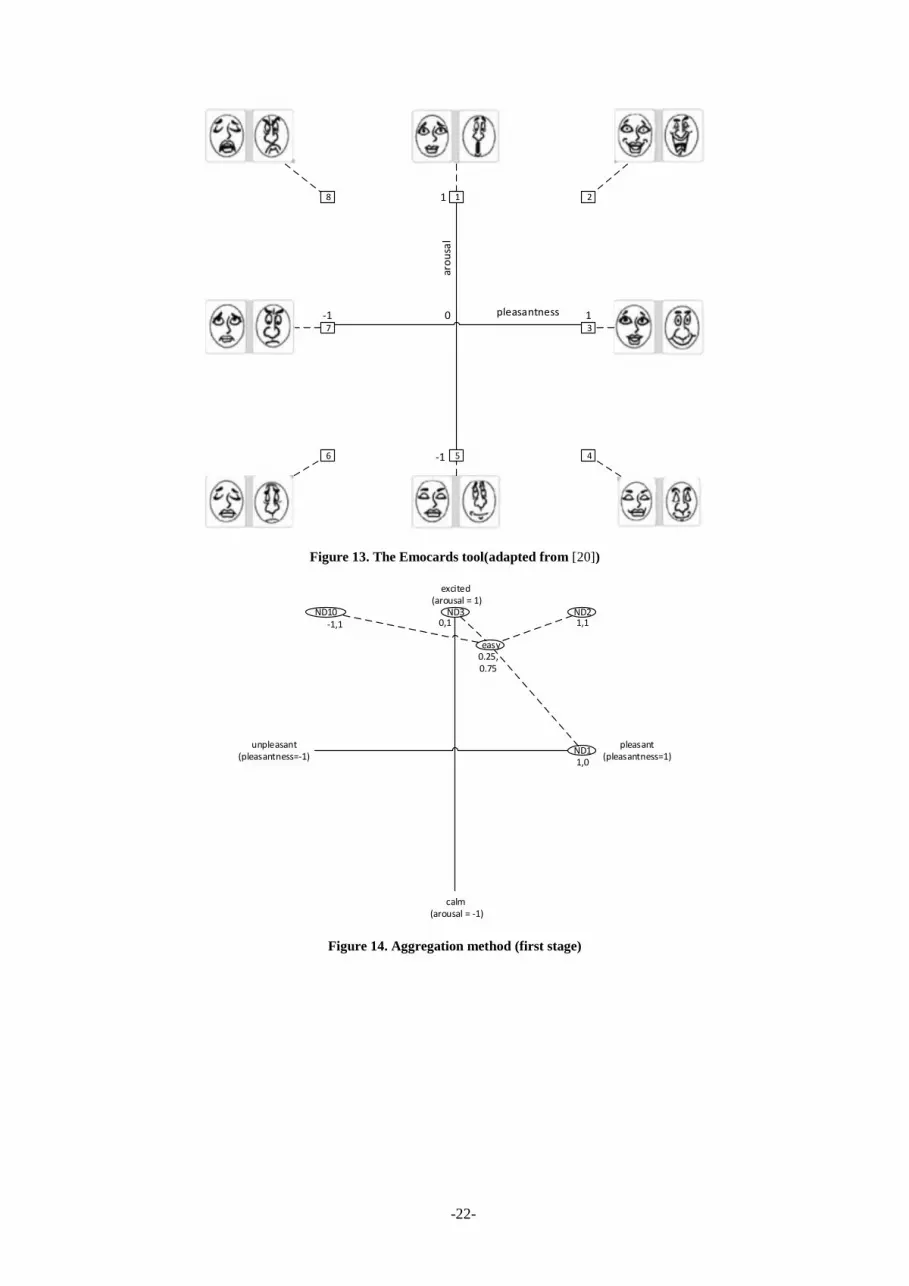
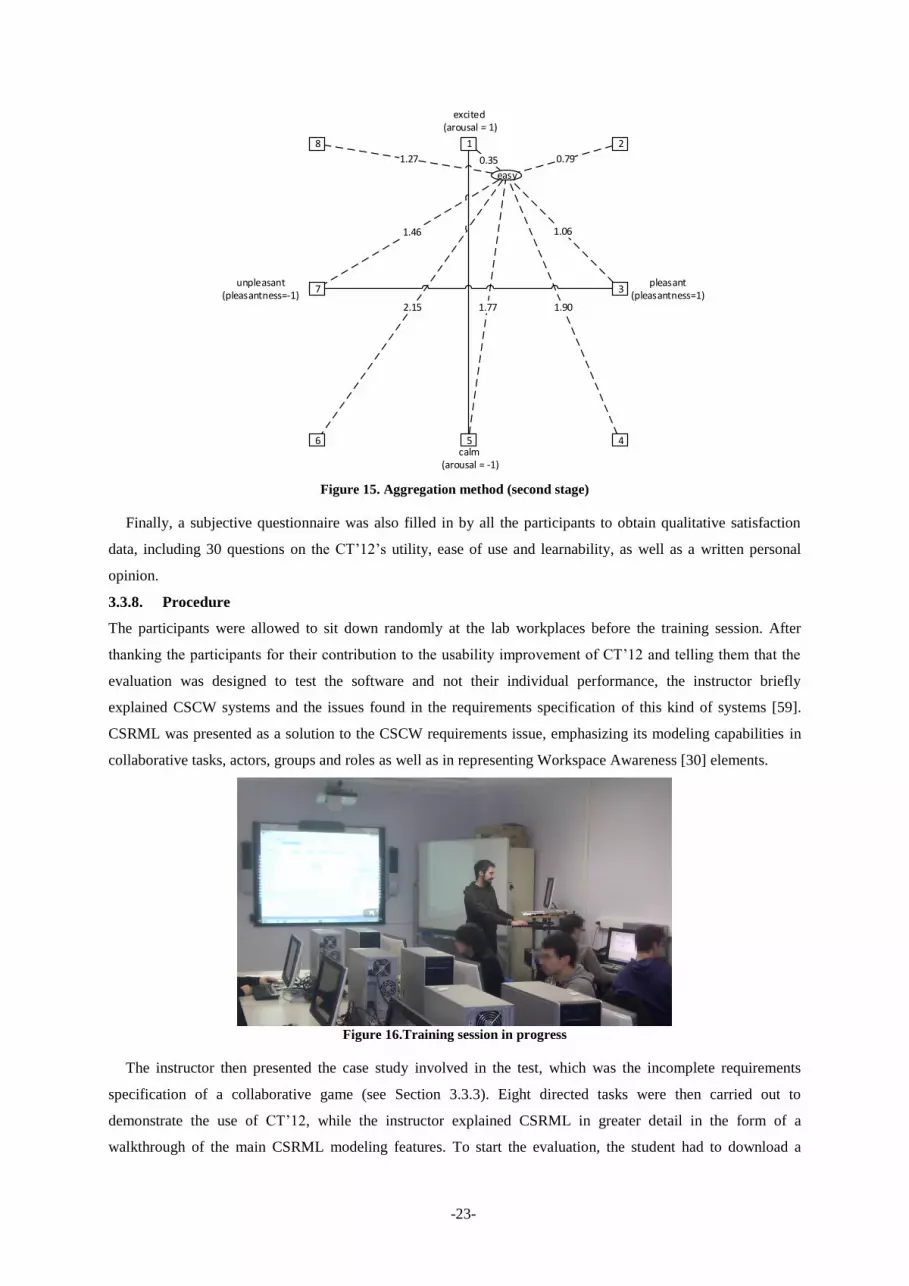
and matching their facial expressions to those recommended in the Emocards tool [20], as proposed in [15]. This
tool is based on 16 Emocards (including eight male and eight female faces) that represent 8 different emotional
expressions (Figure 13), based on the variations of pleasantness and arousal, which are considered the two most
accepted dimensions of emotions in psychology [51]. Automatic facial expression recognition would also be
possible by using an approach such as [54]. In our case we obtained and measured a facial expression (matched
with the Emocard tool faces) for each user and task. Each subject’s facial expressions were aggregated (or
clustered) according to task difficulty. Every Emocard represents a specific value for arousal and pleasantness.
e.g., Emocard 4 in Figure 13 has an arousal value of -1 and a pleasantness value of 1. In the first stage of the
aggregation method, the average value for all the arousal, pleasantness tuples for the tasks for a given difficulty
and user is obtained. For instance, the facial expressions of a user for the four easy tasks were matched with the
Emocard faces 1, 2, 3 and 8 (see Figure 13). Considering his/her arousal and pleasantness values, the average
value found for these four facial expressions was 0.25 for pleasantness and 0.75 for arousal as shown in Figure
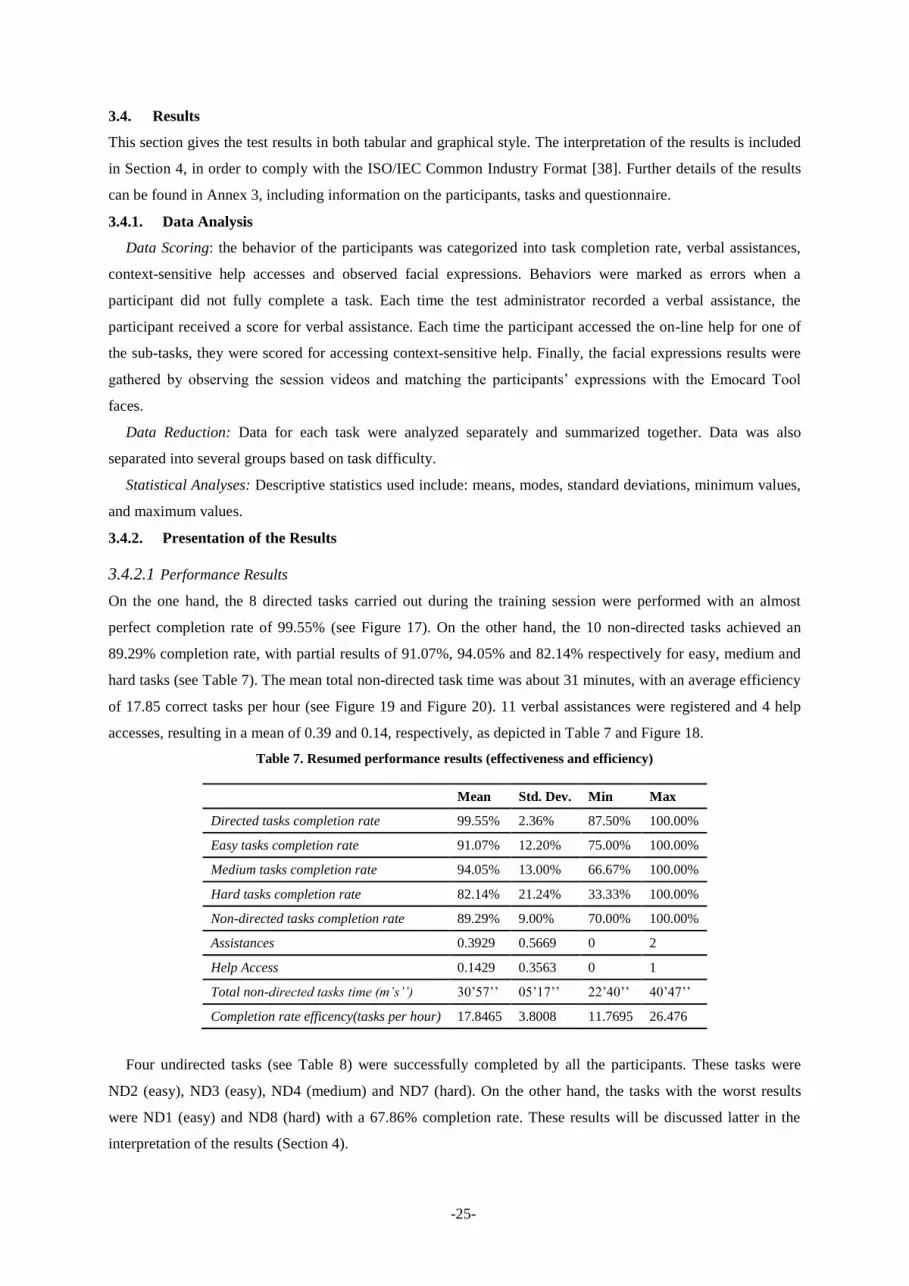
14. The distances from this average point to each Emocard face was calculated by applying the Pythagorean
Theorem (see Figure 15). In Figure 15 the minimum value for these distances is 0.35, corresponding to face
number 1. Therefore, we can conclude that Emocard 1 is the one that best represents the arousal and pleasantness
of this user for the easy tasks in our experiment. In the event of a tie between distances, the Emocard of the
longest-lasting task is chosen as the final result for facial expression.
-22-
pleasantness
aro
usa
l
1 2
3
5
7
46
8
-1
-1
1
10
Figure 13. The Emocards tool(adapted from [20])
unpleasant(pleasantness=-1)
excited (arousal = 1)
calm (arousal = -1)
pleasant(pleasantness=1)
ND1
ND10 ND2ND3
easy0.25,0.75
1,1
1,0
-1,1 0,1
Figure 14. Aggregation method (first stage)
-23-
unpleasant(pleasantness=-1)
excited (arousal = 1)
calm (arousal = -1)
easy
pleasant(pleasantness=1)
1 2
3
5
7
46
8
0.35 0.79
1.06
1.901.772.15
1.46
1.27
Figure 15. Aggregation method (second stage)
Finally, a subjective questionnaire was also filled in by all the participants to obtain qualitative satisfaction
data, including 30 questions on the CT’12’s utility, ease of use and learnability, as well as a written personal
opinion.
3.3.8. Procedure
The participants were allowed to sit down randomly at the lab workplaces before the training session. After
thanking the participants for their contribution to the usability improvement of CT’12 and telling them that the
evaluation was designed to test the software and not their individual performance, the instructor briefly
explained CSCW systems and the issues found in the requirements specification of this kind of systems [59].
CSRML was presented as a solution to the CSCW requirements issue, emphasizing its modeling capabilities in
collaborative tasks, actors, groups and roles as well as in representing Workspace Awareness [30] elements.
Figure 16.Training session in progress
The instructor then presented the case study involved in the test, which was the incomplete requirements
specification of a collaborative game (see Section 3.3.3). Eight directed tasks were then carried out to
demonstrate the use of CT’12, while the instructor explained CSRML in greater detail in the form of a
walkthrough of the main CSRML modeling features. To start the evaluation, the student had to download a

-24-
Visual Studio project containing the incomplete requirements specification for the case study from the Virtual
Learning Environment of the University of Castilla-La Mancha. They then performed the directed tasks under
the guidance of the instructor, who also taught them how to use the CT’12’s integrated help system .This training
session lasted for 30 minutes (see Figure 16), after which the participants were free to express any doubts about
what had been explained. Only one requested further information on how to browse the CSRML documentation,
so this was explained again. The students, who were supposed to be able to use CT’12 at that point, were then
asked to perform the non-directed tasks. This included starting the video recording application before starting the
tasks, stopping it at the end and uploading the Visual Studio project for evaluation. There was no time limit for
the tasks. After the last task was complete, the participants were asked to fill in a subjective questionnaire.
Finally, after the project evaluation, the participants’ marks were increased by 0.25 points out of 10.
3.3.9. Participant General Instructions
The participants were told that, because they were performing an individual test, they were not allowed to
interact with the other participants, although they could ask the instructor for assistance if they were not able to
perform a task after using the F1 help. The number of assistances provided to each participant was registered in
the results (see Figure 18).
3.3.10. Participants’ Task Instructions
Please see Annex 1 for an example of the tasks performed by the participants. A list with both directed and
undirected tasks, as well as their difficulty level and the skills required for the performance can also be found in
Section 3.3.3. Further information on the test material given to the participants can be found in [58].
3.3.11. Usability Metrics
3.3.11.1 Effectiveness
Completion Rate: Defined as the percentage of participants who completed each non-directed sub-task
correctly. It was divided by the difficulty level, establishing different completion rates for easy, medium and
hard tasks. The completion rate for the directed task was included, although not considered as a usability metric
but as an indicator of how much benefit the participants had obtained from the training session.
Number of references to the manual: number of separate references made to the F1 help, obtained from the
session videos.
Assistances: Assistance was defined as verbal help given by the test administrator to guide a participant to the
next step in completing a task.
3.3.11.2 Efficiency
Task time: The amount of time to complete each non-directed task, extracted from the video.
Completion rate efficiency: Mean non-directed completion rate/mean task time.
3.3.11.3 Satisfaction
Questionnaire: At the end of the session, the participants completed a subjective questionnaire based on USE
[43] to address satisfaction issues with CT’12. Subjects rated the questionnaire on a 7-point Likert scale and
made a textual comment. Scores were given for each participant’s perception of: utility, ease of use, learnability
and global satisfaction.
Observed facial expressions: Numeric values according to the Emocard pattern observed (see Section 3.3.7)
for easy, medium and hard tasks.
-25-
3.4. Results
This section gives the test results in both tabular and graphical style. The interpretation of the results is included
in Section 4, in order to comply with the ISO/IEC Common Industry Format [38]. Further details of the results
can be found in Annex 3, including information on the participants, tasks and questionnaire.
3.4.1. Data Analysis
Data Scoring: the behavior of the participants was categorized into task completion rate, verbal assistances,
context-sensitive help accesses and observed facial expressions. Behaviors were marked as errors when a
participant did not fully complete a task. Each time the test administrator recorded a verbal assistance, the
participant received a score for verbal assistance. Each time the participant accessed the on-line help for one of
the sub-tasks, they were scored for accessing context-sensitive help. Finally, the facial expressions results were
gathered by observing the session videos and matching the participants’ expressions with the Emocard Tool
faces.
Data Reduction: Data for each task were analyzed separately and summarized together. Data was also
separated into several groups based on task difficulty.
Statistical Analyses: Descriptive statistics used include: means, modes, standard deviations, minimum values,
and maximum values.
3.4.2. Presentation of the Results
3.4.2.1 Performance Results
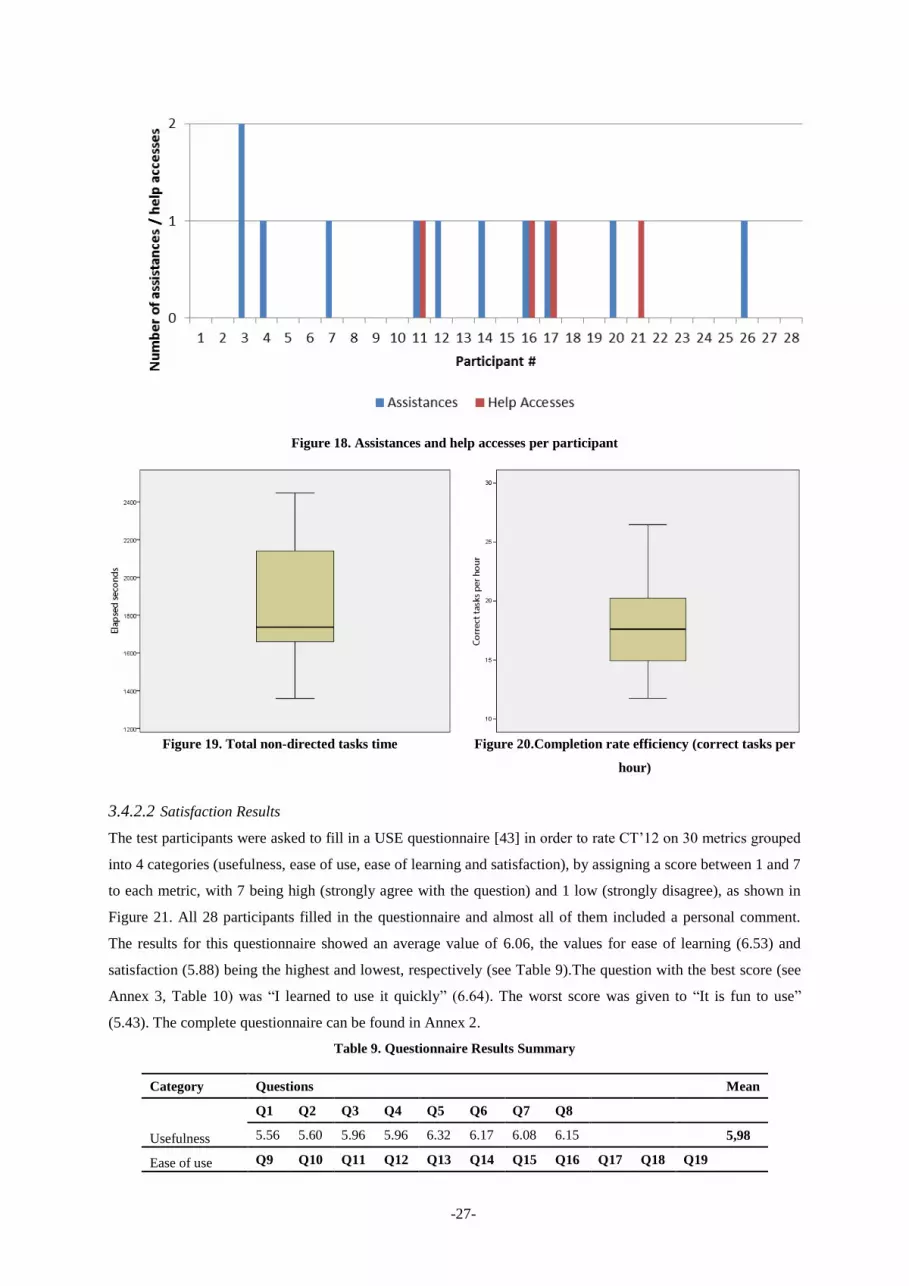
On the one hand, the 8 directed tasks carried out during the training session were performed with an almost
perfect completion rate of 99.55% (see Figure 17). On the other hand, the 10 non-directed tasks achieved an
89.29% completion rate, with partial results of 91.07%, 94.05% and 82.14% respectively for easy, medium and
hard tasks (see Table 7). The mean total non-directed task time was about 31 minutes, with an average efficiency
of 17.85 correct tasks per hour (see Figure 19 and Figure 20). 11 verbal assistances were registered and 4 help
accesses, resulting in a mean of 0.39 and 0.14, respectively, as depicted in Table 7 and Figure 18.
Table 7. Resumed performance results (effectiveness and efficiency)
Mean Std. Dev. Min Max
Directed tasks completion rate 99.55% 2.36% 87.50% 100.00%
Easy tasks completion rate 91.07% 12.20% 75.00% 100.00%
Medium tasks completion rate 94.05% 13.00% 66.67% 100.00%
Hard tasks completion rate 82.14% 21.24% 33.33% 100.00%
Non-directed tasks completion rate 89.29% 9.00% 70.00% 100.00%
Assistances 0.3929 0.5669 0 2
Help Access 0.1429 0.3563 0 1
Total non-directed tasks time (m’s’’) 30’57’’ 05’17’’ 22’40’’ 40’47’’
Completion rate efficency(tasks per hour) 17.8465 3.8008 11.7695 26.476
Four undirected tasks (see Table 8) were successfully completed by all the participants. These tasks were
ND2 (easy), ND3 (easy), ND4 (medium) and ND7 (hard). On the other hand, the tasks with the worst results
were ND1 (easy) and ND8 (hard) with a 67.86% completion rate. These results will be discussed latter in the
interpretation of the results (Section 4).

-26-
Table 8. Task Completion Results Summary
Kind of task Difficulty Task Mean Std. Dev.
Directed
Easy
D1 100% 0%
D2 100% 0%
D3 100% 0%
Medium
D4 100% 0%
D5 96.43% 18.90%
D7 100% 0%
Hard D6 100% 0%
D8 100% 0%
Non-directed
Easy
ND1 67.86% 47.56%
ND2 100% 0%
ND3 100% 0%
ND10 96.43% 18.90%
Medium
ND4 100% 0%
ND5 85.71% 35.63%
ND6 96.43% 18.90%
Hard
ND7 100% 0%
ND8 67.86% 47.56%
ND9 78.57% 41.79%
Figure 17. Task Completion Results
-27-
Figure 18. Assistances and help accesses per participant
Figure 19. Total non-directed tasks time
Figure 20.Completion rate efficiency (correct tasks per
hour)
3.4.2.2 Satisfaction Results
The test participants were asked to fill in a USE questionnaire [43] in order to rate CT’12 on 30 metrics grouped
into 4 categories (usefulness, ease of use, ease of learning and satisfaction), by assigning a score between 1 and 7
to each metric, with 7 being high (strongly agree with the question) and 1 low (strongly disagree), as shown in
Figure 21. All 28 participants filled in the questionnaire and almost all of them included a personal comment.
The results for this questionnaire showed an average value of 6.06, the values for ease of learning (6.53) and
satisfaction (5.88) being the highest and lowest, respectively (see Table 9).The question with the best score (see
Annex 3, Table 10) was “I learned to use it quickly” (6.64). The worst score was given to “It is fun to use”
(5.43). The complete questionnaire can be found in Annex 2.
Table 9. Questionnaire Results Summary
Category Questions Mean
Usefulness
Q1 Q2 Q3 Q4 Q5 Q6 Q7 Q8
5.56 5.60 5.96 5.96 6.32 6.17 6.08 6.15
5,98
Ease of use Q9 Q10 Q11 Q12 Q13 Q14 Q15 Q16 Q17 Q18 Q19
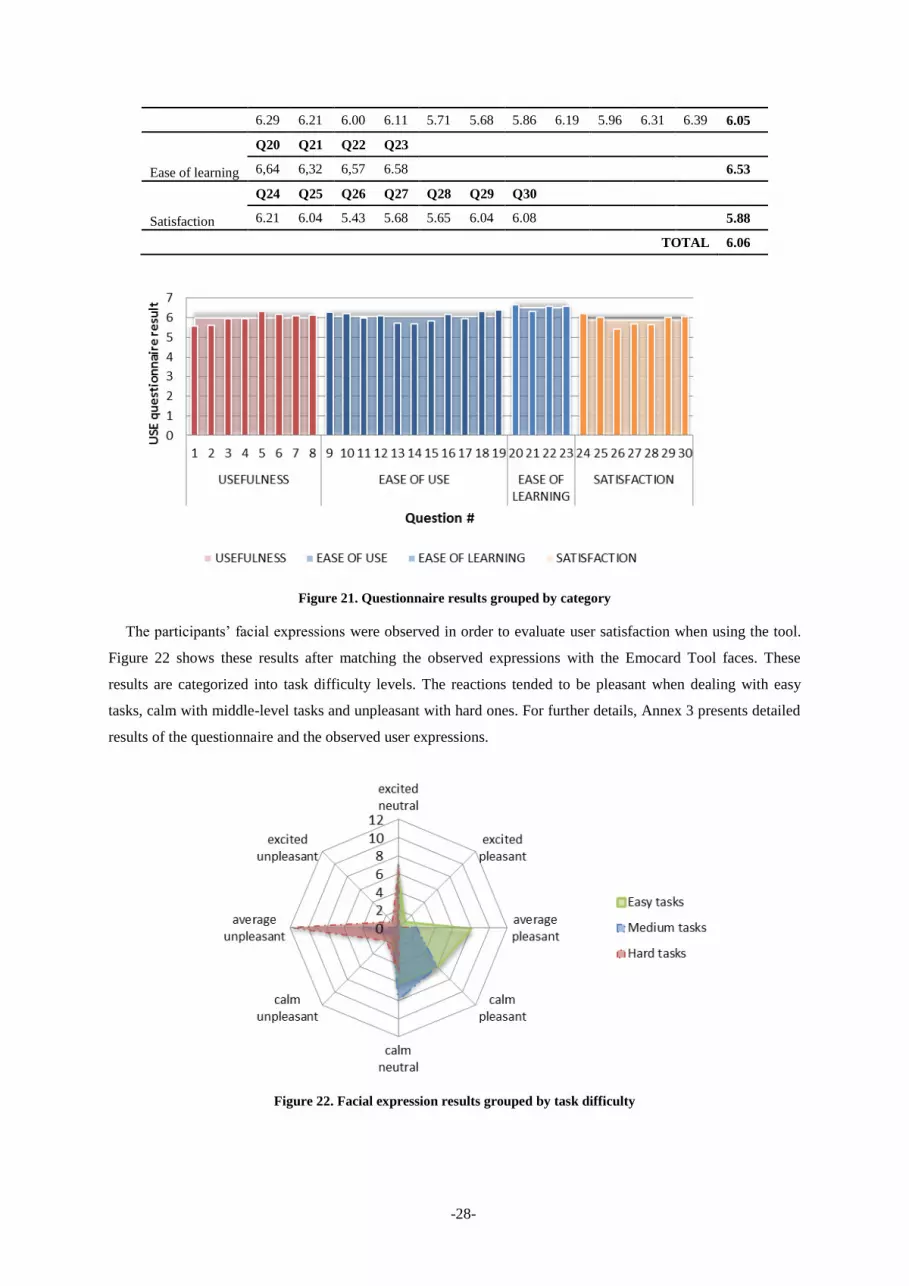
-28-
6.29 6.21 6.00 6.11 5.71 5.68 5.86 6.19 5.96 6.31 6.39 6.05
Ease of learning
Q20 Q21 Q22 Q23
6,64 6,32 6,57 6.58
6.53
Satisfaction
Q24 Q25 Q26 Q27 Q28 Q29 Q30
6.21 6.04 5.43 5.68 5.65 6.04 6.08
5.88
TOTAL 6.06
Figure 21. Questionnaire results grouped by category
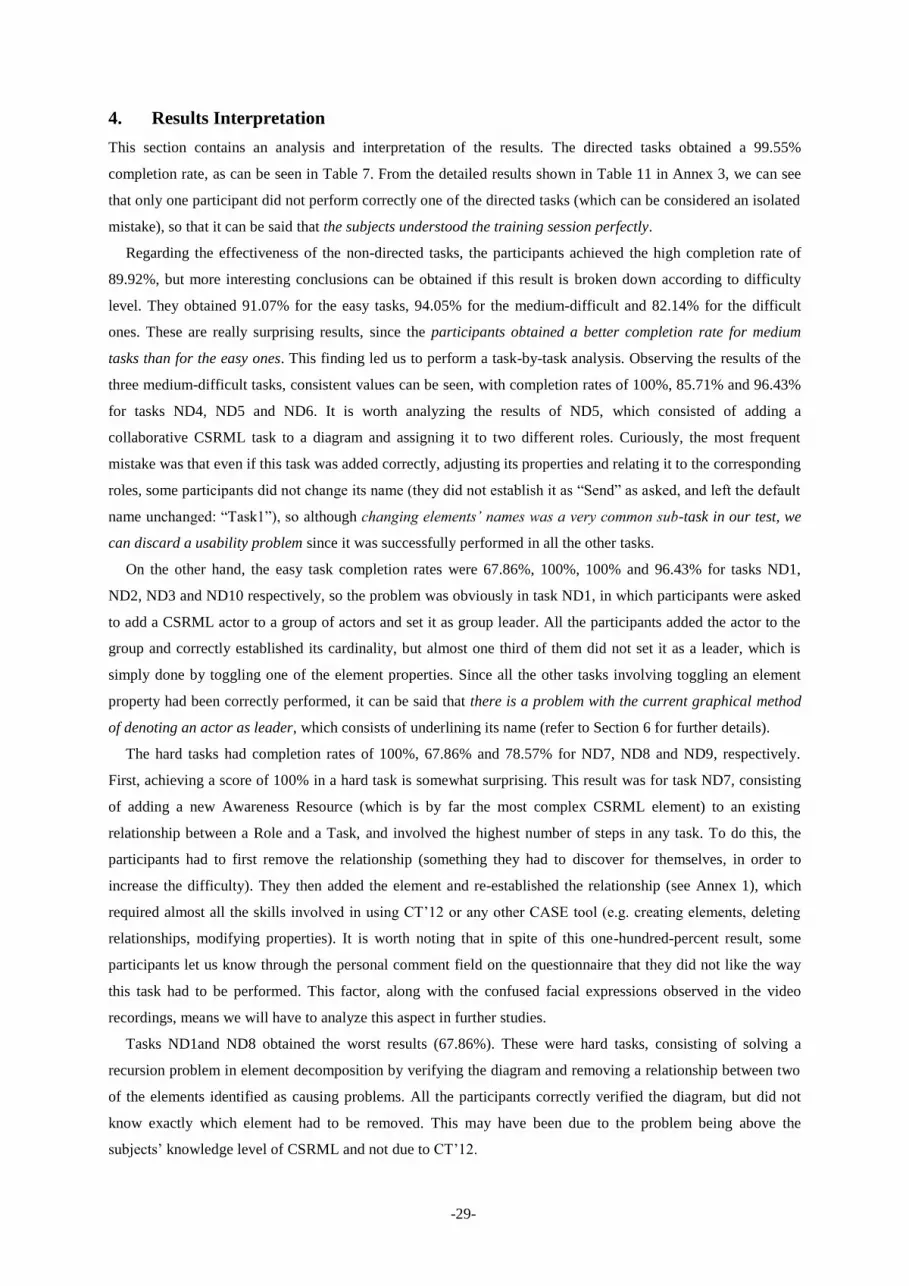
The participants’ facial expressions were observed in order to evaluate user satisfaction when using the tool.
Figure 22 shows these results after matching the observed expressions with the Emocard Tool faces. These
results are categorized into task difficulty levels. The reactions tended to be pleasant when dealing with easy
tasks, calm with middle-level tasks and unpleasant with hard ones. For further details, Annex 3 presents detailed
results of the questionnaire and the observed user expressions.
Figure 22. Facial expression results grouped by task difficulty
-29-
4. Results Interpretation
This section contains an analysis and interpretation of the results. The directed tasks obtained a 99.55%
completion rate, as can be seen in Table 7. From the detailed results shown in Table 11 in Annex 3, we can see
that only one participant did not perform correctly one of the directed tasks (which can be considered an isolated
mistake), so that it can be said that the subjects understood the training session perfectly.
Regarding the effectiveness of the non-directed tasks, the participants achieved the high completion rate of
89.92%, but more interesting conclusions can be obtained if this result is broken down according to difficulty
level. They obtained 91.07% for the easy tasks, 94.05% for the medium-difficult and 82.14% for the difficult
ones. These are really surprising results, since the participants obtained a better completion rate for medium
tasks than for the easy ones. This finding led us to perform a task-by-task analysis. Observing the results of the
three medium-difficult tasks, consistent values can be seen, with completion rates of 100%, 85.71% and 96.43%
for tasks ND4, ND5 and ND6. It is worth analyzing the results of ND5, which consisted of adding a
collaborative CSRML task to a diagram and assigning it to two different roles. Curiously, the most frequent
mistake was that even if this task was added correctly, adjusting its properties and relating it to the corresponding
roles, some participants did not change its name (they did not establish it as “Send” as asked, and left the default
name unchanged: “Task1”), so although changing elements’ names was a very common sub-task in our test, we
can discard a usability problem since it was successfully performed in all the other tasks.
On the other hand, the easy task completion rates were 67.86%, 100%, 100% and 96.43% for tasks ND1,
ND2, ND3 and ND10 respectively, so the problem was obviously in task ND1, in which participants were asked
to add a CSRML actor to a group of actors and set it as group leader. All the participants added the actor to the
group and correctly established its cardinality, but almost one third of them did not set it as a leader, which is
simply done by toggling one of the element properties. Since all the other tasks involving toggling an element
property had been correctly performed, it can be said that there is a problem with the current graphical method
of denoting an actor as leader, which consists of underlining its name (refer to Section 6 for further details).
The hard tasks had completion rates of 100%, 67.86% and 78.57% for ND7, ND8 and ND9, respectively.
First, achieving a score of 100% in a hard task is somewhat surprising. This result was for task ND7, consisting
of adding a new Awareness Resource (which is by far the most complex CSRML element) to an existing
relationship between a Role and a Task, and involved the highest number of steps in any task. To do this, the
participants had to first remove the relationship (something they had to discover for themselves, in order to
increase the difficulty). They then added the element and re-established the relationship (see Annex 1), which
required almost all the skills involved in using CT’12 or any other CASE tool (e.g. creating elements, deleting
relationships, modifying properties). It is worth noting that in spite of this one-hundred-percent result, some
participants let us know through the personal comment field on the questionnaire that they did not like the way
this task had to be performed. This factor, along with the confused facial expressions observed in the video
recordings, means we will have to analyze this aspect in further studies.
Tasks ND1and ND8 obtained the worst results (67.86%). These were hard tasks, consisting of solving a
recursion problem in element decomposition by verifying the diagram and removing a relationship between two
of the elements identified as causing problems. All the participants correctly verified the diagram, but did not
know exactly which element had to be removed. This may have been due to the problem being above the
subjects’ knowledge level of CSRML and not due to CT’12.
-30-
The completion rate of ND9 was 78.57% (quite high for a hard task). This task was by far the most complete,
as the subjects had to deal with elements, relationships, diagrams and cross references. Initially, we believed that
the main source of mistakes would be the cross-referencing system, implemented by using ModelBus (see
Section 3.2.1), but we were wrong. In fact, the medium-difficulty task ND6 consisted basically of creating a
cross reference between diagrams through an element, and it obtained a 96.46% (only one participant did not
understand the cross-referencing system). However, in task ND9 there was no common error, but rather an
assortment of mistakes due to the complexity of this task. Perhaps there was one common mistake, consisting of
adding a new element to a diagram instead of adding a reference to the same element which was already defined
in a different diagram. It can therefore be considered that method of identifying a reference to an element is not
sufficiently clear (the element’s name is shown in italics), but unlike task ND1, it can be checked by validating
the diagram.
Once the task results have been analyzed, the interpretation of the other dependent values is performed,
starting with the number of help accesses and verbal assistances. First of all, we found a surprising result: the
participants asked for verbal assistance 11 times but only used the integrated help system 4 times (Figure 19).
Therefore, although they were told to try the help system before asking for assistance, they preferred the
instructor’s verbal help rather than using the tool context-sensitive help, which prevented us from properly
assessing the usability of the help system. Nevertheless, it is worth noting two interesting facts: first, not all the
verbal assistance was directly related to CT’12, but two of them were about the Visual Studio interface.
Secondly, three participants asked for assistance and also used the help system and in all of the three cases, the
aim of the help access and verbal assistance was different, the participants were able to solve the problem at
hand with verbal or computer assistance, but never with both.
Regarding completion time, it can be seen in Table 7 that the participants took an average of 30’57” minutes
to finish the non-directed tasks, with a maximum of 40’47” and minimum of 22’40” (Figure 19). The fastest
participant, who neither used the help system nor asked for assistance, obtained a 100% completion rate in
22’40”, close to the 19 minutes of the reference time obtained by a CSRML expert. The times obtained are thus
highly satisfactory for users who had never used CSRML.
Directly connected to completion time, the efficiency results relate the participants’ accuracy in performing
the tasks to the elapsed time, for which an average efficiency result of 17.8465 correct tasks per hour (ct/h) was
obtained, with individual results ranging from 11.7695 to 26.4706 ct/h (see Figure 20).As the CSRML expert
obtained an efficiency of 31.5789 ct/h, the average participant obtained 56.51% of an expert’s efficiency, which
is a high figure for a user unfamiliar with CSRML.
After analyzing efficiency, the satisfaction results are interpreted. This interpretation starts with facial
expressions, shown in Figure 22 and expanded in Figure 23. As can be seen, when the participants dealt with
easy tasks, they tended to behave pleasantly, but as the difficulty increased, this tendency changed to a calmer
and less pleasant behavior, probably because they started getting used to interacting with CT’12 during the
medium tasks. Nevertheless, when they finally had to deal with the hard tasks, there was a drastic change to
more unpleasant behavior, due to the high complexity. As for arousal, in this last task difficulty category, there
is no straightforward tendency, but a protruding average arousal behavior. This last result for arousal (average
instead of calm) led us to discount unpleasantness due to fatigue (corresponding to the calm-unpleasant 6th
emotion in Figure 13). It was also observed that when the participants reached the easy task ND10 their

-31-
expression generally changed to a more pleasant one, but was still an average-arousal. Finally, besides showing
the users’ tendency to behave calmly and pleasantly when dealing with easy and medium tasks, but feeling
unpleasantness with the hard ones, these results confirm the pre-assigned task difficulty levels used in our study.
This means that the tasks that we considered easy were in fact easy for the participants (as were the medium and
hard).
Figure 23. Facial expression results
To finish with the interpretation of the results, we analyzed the questionnaire outcomes. Broadly speaking, the
results obtained were satisfactory, with an average result for the whole questionnaire of 6.06, taking into
account that the questions were answered in a scale from 1 (strongly disagree) to 7 (strongly agree). The 40
questions were grouped into 4 categories (usefulness, ease of use, ease of learning and satisfaction), with ease of
learning being the most positive. Thus, this result not only contributes to assessing the usability of CT’12, but
also confirms, as did the directed task completion rate, that the training session was very successful as the
participants soon learned how to use the tool.
On the other hand, although the results obtained for the other 3 categories were similar (5.98, 6.05 and 5.88),
only one question obtained less than 5.5 points in the questionnaire. This was Nº 26, about whether the tool was
fun to use. Despite the less-positive result, we can discard a usability flaw related to this question, since fun was
not one of CT’12’s usability goals. As for the personal comments in the questionnaire, mainly positive reviews
were obtained such as the ease of solving errors or the simplicity and intuitiveness of the user interface (Figure
24 shows the word cloud generated from the user’s comments). Finally, conflicting opinions regarding Visual
Studio were obtained. Some participants appreciated the integration of CT’12 with Visual Studio but, on the
other hand some were not too keen on using this Microsoft development suite.
Figure 24. Word cloud generated from the questionnaire personal comments
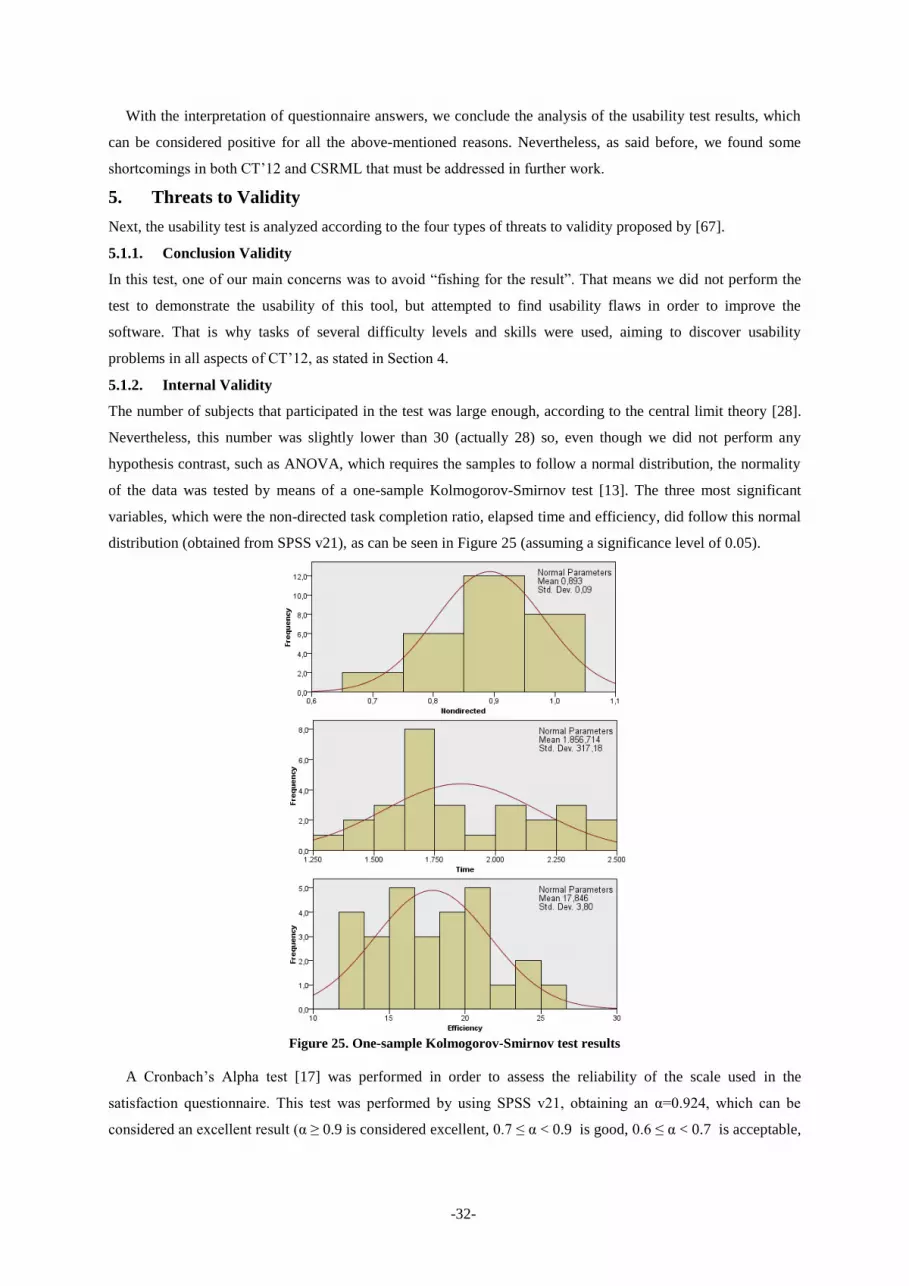
-32-
With the interpretation of questionnaire answers, we conclude the analysis of the usability test results, which
can be considered positive for all the above-mentioned reasons. Nevertheless, as said before, we found some
shortcomings in both CT’12 and CSRML that must be addressed in further work.
5. Threats to Validity
Next, the usability test is analyzed according to the four types of threats to validity proposed by [67].
5.1.1. Conclusion Validity
In this test, one of our main concerns was to avoid “fishing for the result”. That means we did not perform the
test to demonstrate the usability of this tool, but attempted to find usability flaws in order to improve the
software. That is why tasks of several difficulty levels and skills were used, aiming to discover usability
problems in all aspects of CT’12, as stated in Section 4.
5.1.2. Internal Validity
The number of subjects that participated in the test was large enough, according to the central limit theory [28].
Nevertheless, this number was slightly lower than 30 (actually 28) so, even though we did not perform any
hypothesis contrast, such as ANOVA, which requires the samples to follow a normal distribution, the normality
of the data was tested by means of a one-sample Kolmogorov-Smirnov test [13]. The three most significant
variables, which were the non-directed task completion ratio, elapsed time and efficiency, did follow this normal
distribution (obtained from SPSS v21), as can be seen in Figure 25 (assuming a significance level of 0.05).
Figure 25. One-sample Kolmogorov-Smirnov test results
A Cronbach’s Alpha test [17] was performed in order to assess the reliability of the scale used in the
satisfaction questionnaire. This test was performed by using SPSS v21, obtaining an α=0.924, which can be
considered an excellent result (α ≥ 0.9 is considered excellent, 0.7 ≤ α < 0.9 is good, 0.6 ≤ α < 0.7 is acceptable,
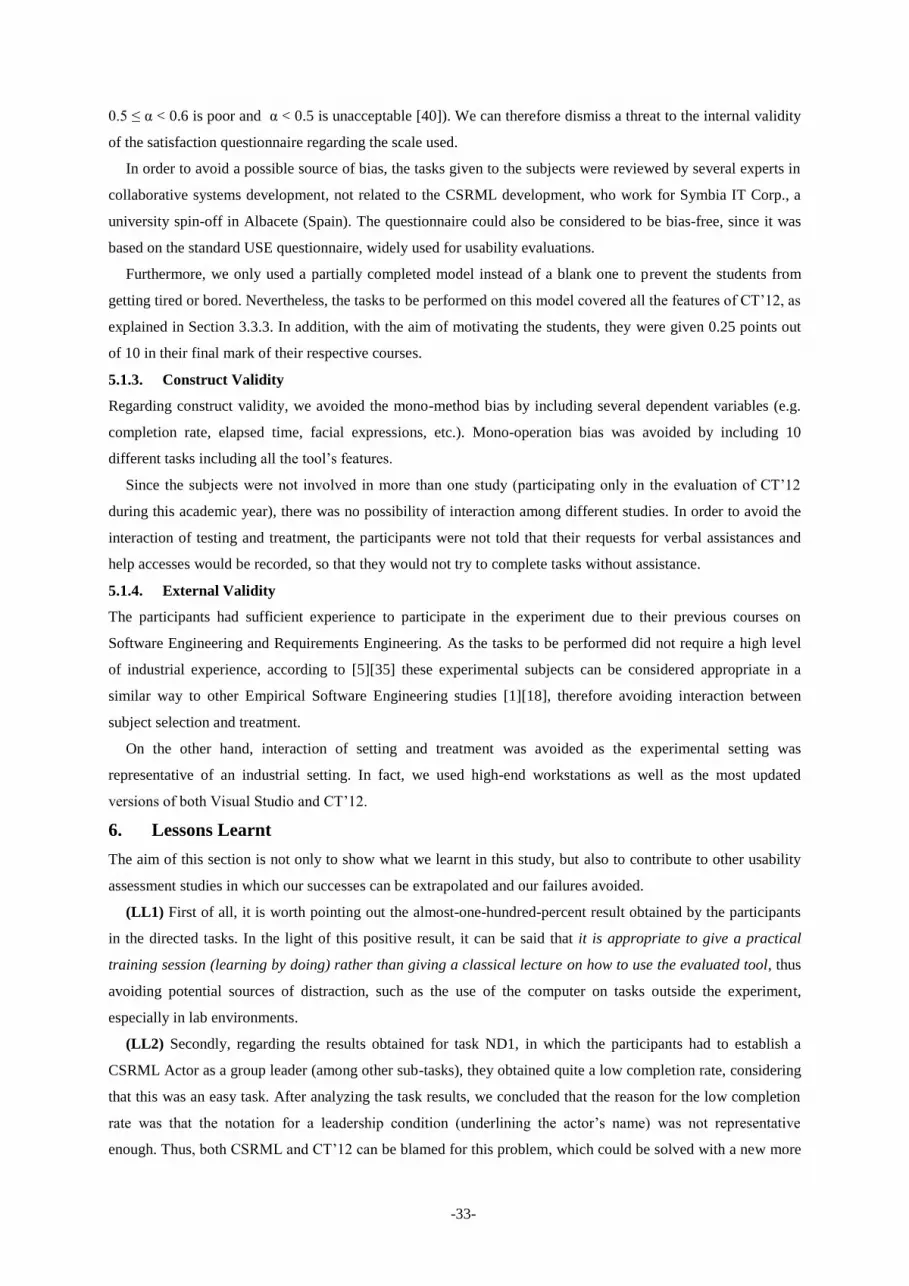
-33-
0.5 ≤ α < 0.6 is poor and α < 0.5 is unacceptable [40]). We can therefore dismiss a threat to the internal validity
of the satisfaction questionnaire regarding the scale used.
In order to avoid a possible source of bias, the tasks given to the subjects were reviewed by several experts in
collaborative systems development, not related to the CSRML development, who work for Symbia IT Corp., a
university spin-off in Albacete (Spain). The questionnaire could also be considered to be bias-free, since it was
based on the standard USE questionnaire, widely used for usability evaluations.
Furthermore, we only used a partially completed model instead of a blank one to prevent the students from
getting tired or bored. Nevertheless, the tasks to be performed on this model covered all the features of CT’12, as
explained in Section 3.3.3. In addition, with the aim of motivating the students, they were given 0.25 points out
of 10 in their final mark of their respective courses.
5.1.3. Construct Validity
Regarding construct validity, we avoided the mono-method bias by including several dependent variables (e.g.
completion rate, elapsed time, facial expressions, etc.). Mono-operation bias was avoided by including 10
different tasks including all the tool’s features.
Since the subjects were not involved in more than one study (participating only in the evaluation of CT’12
during this academic year), there was no possibility of interaction among different studies. In order to avoid the
interaction of testing and treatment, the participants were not told that their requests for verbal assistances and
help accesses would be recorded, so that they would not try to complete tasks without assistance.
5.1.4. External Validity
The participants had sufficient experience to participate in the experiment due to their previous courses on
Software Engineering and Requirements Engineering. As the tasks to be performed did not require a high level
of industrial experience, according to [5][35] these experimental subjects can be considered appropriate in a
similar way to other Empirical Software Engineering studies [1][18], therefore avoiding interaction between
subject selection and treatment.
On the other hand, interaction of setting and treatment was avoided as the experimental setting was
representative of an industrial setting. In fact, we used high-end workstations as well as the most updated
versions of both Visual Studio and CT’12.
6. Lessons Learnt
The aim of this section is not only to show what we learnt in this study, but also to contribute to other usability
assessment studies in which our successes can be extrapolated and our failures avoided.
(LL1) First of all, it is worth pointing out the almost-one-hundred-percent result obtained by the participants
in the directed tasks. In the light of this positive result, it can be said that it is appropriate to give a practical
training session (learning by doing) rather than giving a classical lecture on how to use the evaluated tool, thus
avoiding potential sources of distraction, such as the use of the computer on tasks outside the experiment,
especially in lab environments.
(LL2) Secondly, regarding the results obtained for task ND1, in which the participants had to establish a
CSRML Actor as a group leader (among other sub-tasks), they obtained quite a low completion rate, considering
that this was an easy task. After analyzing the task results, we concluded that the reason for the low completion
rate was that the notation for a leadership condition (underlining the actor’s name) was not representative
enough. Thus, both CSRML and CT’12 can be blamed for this problem, which could be solved with a new more
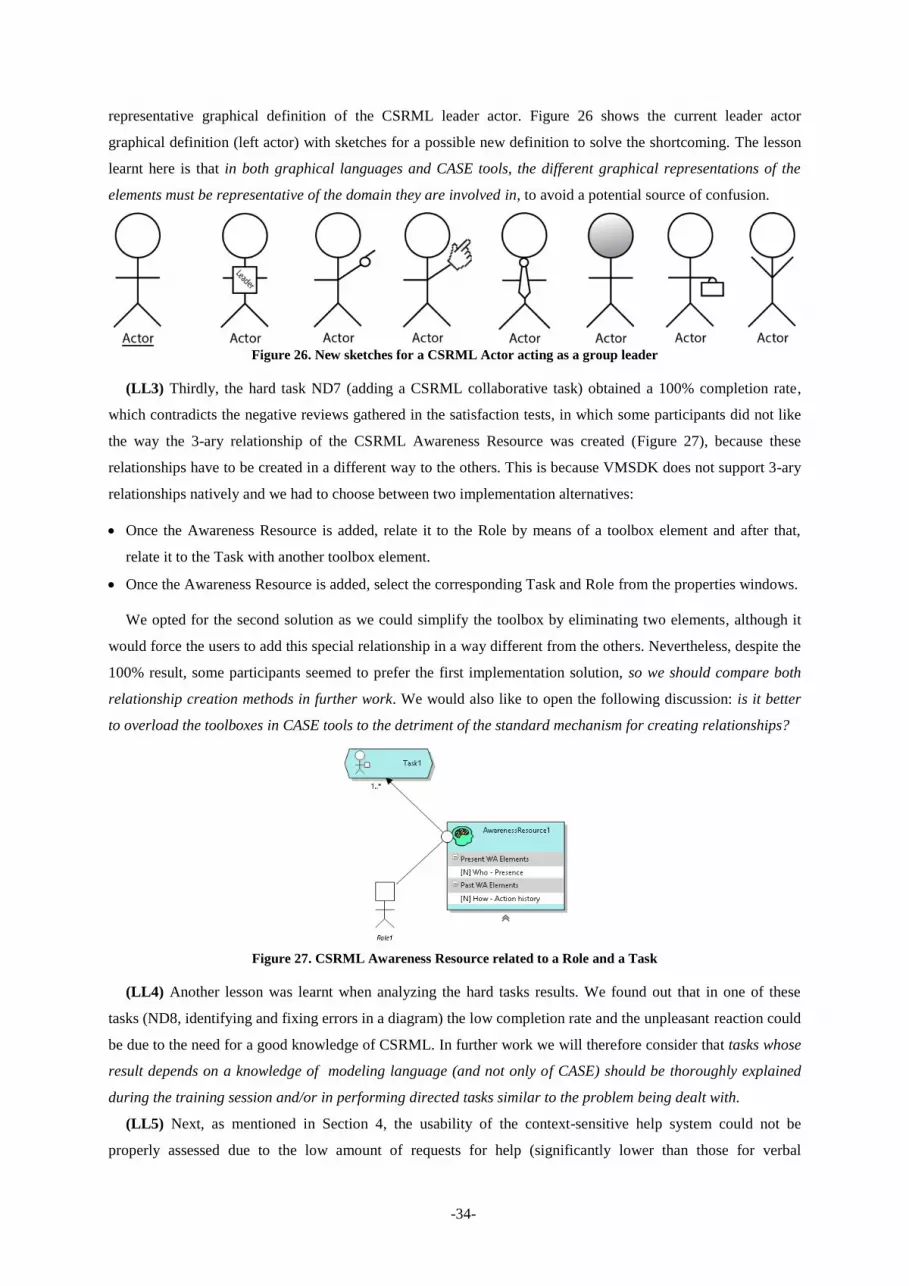
-34-
representative graphical definition of the CSRML leader actor. Figure 26 shows the current leader actor
graphical definition (left actor) with sketches for a possible new definition to solve the shortcoming. The lesson
learnt here is that in both graphical languages and CASE tools, the different graphical representations of the
elements must be representative of the domain they are involved in, to avoid a potential source of confusion.
Figure 26. New sketches for a CSRML Actor acting as a group leader
(LL3) Thirdly, the hard task ND7 (adding a CSRML collaborative task) obtained a 100% completion rate,
which contradicts the negative reviews gathered in the satisfaction tests, in which some participants did not like
the way the 3-ary relationship of the CSRML Awareness Resource was created (Figure 27), because these
relationships have to be created in a different way to the others. This is because VMSDK does not support 3-ary
relationships natively and we had to choose between two implementation alternatives:
Once the Awareness Resource is added, relate it to the Role by means of a toolbox element and after that,
relate it to the Task with another toolbox element.
Once the Awareness Resource is added, select the corresponding Task and Role from the properties windows.
We opted for the second solution as we could simplify the toolbox by eliminating two elements, although it
would force the users to add this special relationship in a way different from the others. Nevertheless, despite the
100% result, some participants seemed to prefer the first implementation solution, so we should compare both
relationship creation methods in further work. We would also like to open the following discussion: is it better
to overload the toolboxes in CASE tools to the detriment of the standard mechanism for creating relationships?
Figure 27. CSRML Awareness Resource related to a Role and a Task
(LL4) Another lesson was learnt when analyzing the hard tasks results. We found out that in one of these
tasks (ND8, identifying and fixing errors in a diagram) the low completion rate and the unpleasant reaction could
be due to the need for a good knowledge of CSRML. In further work we will therefore consider that tasks whose
result depends on a knowledge of modeling language (and not only of CASE) should be thoroughly explained
during the training session and/or in performing directed tasks similar to the problem being dealt with.
(LL5) Next, as mentioned in Section 4, the usability of the context-sensitive help system could not be
properly assessed due to the low amount of requests for help (significantly lower than those for verbal

-35-
assistance). We therefore learned a really important lesson regarding an issue that can be solved in future
usability tests in two different ways: the participants are either not allowed to request the instructor’s assistance
at all, and can only use the integrated help system, or they can still ask for the instructor’s assistance, but if the
problem can be solved by the help system, the instructor will tell them to use it and not provide him/her with any
further assistance.
(LL6) Another positive aspect we can consider from the results is that facial expression analysis was really
useful in assessing user satisfaction. In fact, if only the questionnaire results had been taken into account to
measure usability (obtaining 6.06 points out of 7), we could have considered the participants to be generally
satisfied. This would have prevented us from finding out important problems, such as the one mentioned in LL4,
which could be difficult or even impossible to discover without this kind of analysis. It can also be used to detect
fatigue during the test, thus discarding a possible threat to the validity of the experiment.
(LL7) Finally, it is worth noting that the use of the ISO/IEC CIF standard for usability test reports [38]
facilitated the presentation of this evaluation. This standard provides a set of guidelines for reporting usability
assessments, and includes examples which were a source of inspiration to us. The CIF also includes a detailed
checklist of all the required and recommended elements that must be addressed in a usability report, which we
followed step by step in this work. Of particular importance is that in our experience it can be said that it is easier
to perform this sort of assessment following this standard, and we can recommend its use in evaluating CASE
tools or any other software with a user interface. However, the downside is that this standard lacks guidelines /
examples for analyzing the test results, and focuses only on their presentation. We expect to be able to use these
lessons in future usability assessments and CASE tools developments.
7. Conclusions and Further Work
This work describes the usability evaluation of CSRML Tool 2012 (CT’12), the CASE tool that provides support
to CSRML [61], in which twenty-eight fourth-year Computer Science students took part. The participants had to
complete 8 directed tasks during a training session and continue with another 10 non-directed tasks (grouped in 3
difficulty levels), whose results would be used to measure the tool’s usability. Besides task completion rates,
other dependent values were considered, such as total elapsed time, the number of verbal assistances, context-
sensitive help accesses or the participants’ facial expressions recorded during the test. The participants were also
asked to complete a subjective USE questionnaire [43] in order to measure their satisfaction when using the tool.
One of the most important results is the 99.55% average completion rate for the directed tasks, which, along
with the ease of learning category questions in the questionnaire (6.53 in a scale from 1 to 7), shows that it is
advisable to give the participants a preliminary practical training session rather than a theoretical lecture in order
to teach them how to use a CASE tool in a more enjoyable way and to avoid sources of distraction, especially in
lab environments (for example, using the computer during the lecture). Another interesting result was that the
completion rate for easy tasks was lower than the one obtained for medium-difficult tasks. After analyzing the
results tasks by task, we concluded that the graphical representation of the CSRML Actor element should be
redesigned, as when this Actor is a group leader its name is underlined, something that is not directly related to
the leadership condition. Thus, this type of graphical elements in CT’12 (or in any other CASE tool) should be
more descriptive of what it represents. In addition, we also assessed the usability of the tool when creating cross
references among several diagrams (not natively supported by VMSDK, the framework used to implement
CT’12). But although we considered the implemented cross referencing relationship too complex, the test results
-36-
did not back up this hypothesis, obtaining a completion rate of 96.43% in the task directly related to our
referencing mechanism. Moreover, the CT’12 help system could not be evaluated properly in this test because
only 4 help accesses were registered, versus 11 requests for the instructor’s verbal assistance. In spite of this
issue, and after checking the results, the four participants that used the help system correctly performed the task
for which they needed help. Also directly related to efficiency, the participants took an average time of 30’57’’
to complete the non-directed tasks, with a completion rate efficiency of 17.8465 correct tasks per hour.
Comparing these results with those obtained by our reference CSRML expert (19’00’’ and 31.5789 correct tasks
per hour), highly acceptable efficiency figures were obtained since the participants had never used either
CSRML or CT’12 before.
The participants’ satisfaction was analyzed in two different ways. On one hand, their faces were recorded
during the performance in order to assess their satisfaction. When they performed easy tasks they tended to react
pleasantly, but as the difficulty increased this tendency changed to a calmer but less pleasant behavior. It is also
worth pointing out that this dynamic change in the participants’ behavior could not have been detected only by
the satisfaction questionnaire, which basically provided positive results. Finally, when the participants performed
the hard tasks, their pleasure changed drastically to the other extreme. Nevertheless, we found that in one of the
hard tasks, the unpleasant behavior could have been due to their lack of familiarity with CSRML. This lesson
can be of use for future usability assessments: tasks whose results depend mainly on knowledge of modeling
language (not only of CASE tool) should be thoroughly explained and/or demonstrated during the training
session. The satisfaction of using the tool was measured by a questionnaire, which obtained a high overall result
of 6.06 (scaling between 1 and 7), which was higher than the ease-of-learning questions, as mentioned above.
We obtained positive comments from the free comments field in the questionnaire, such as its ease of solving
errors or the simplicity and intuitiveness of the user interface.
From these results we can conclude that CT’12 achieves a high level of usability, but it also has several flaws
that must be addressed. In further work we aim to change the graphical definition of some of the CSRML
elements (and consequently CT’12) in order to solve the problems with the Actor element and then assess
whether CSRML users understand this graphically redefined element. In addition, since some of the participants
did not like the CT’12 mechanism of adding three-ary relationships (different to the two-way relationships, as
mentioned in Section 4), a question must be raised: is it better to overload the toolboxes in CASE tools to the
detriment of the standard mechanism for creating relationships? In future work we will perform an empirical
evaluation of two different CT’12 versions; one with enough elements to standardize adding relationships, and
the other similar to the current version, in which these special relationships are created by means of an element
context menu.
Acknowledgements
This research has been funded by the Spanish Ministry of Economy and Competitiveness and by the FEDER
funds of the EU under the project Grant insPIre (TIN2012-34003). It has also been funded by Spanish Ministry
of Education, Culture and Sport thanks to the FPU scholarship (AP2010-0259). We would like to thank the
members of SymbiaIT and the fourth-year Computer Science students of the University of Castilla-La Mancha
for their valuable collaboration.

-37-
References
[1] S. Abrahão, E. Insfran, J.A. Carsí, M. Genero, Evaluating requirements modeling methods based on user
perceptions: A family of experiments, Inf. Sci. 181 (16) (2011) 3356–3378.
[2] P.G. Aitken, .NET Graphics and Printing: A Comprehensive Tutorial and Reference for Developers,
Optimax Pub, 2003.
[3] C. Ardito, P. Buono, D. Caivano, Usability evaluation: a survey of software development organizations.,
23rd International Conference on Software Engineering and Knowledge Engineering (SEKE’11), Eden
Roc Renaissance Miami Beach (USA), 2011, pp. 282–287.
[4] A. Bangor, P.T. Kortum, J.T. Miller, An Empirical Evaluation of the System Usability Scale, Int. J. Hum.
Comput. Interact. 24 (6) (2008) 574–594.
[5] V.R. Basili, F. Shull, F. Lanubile, Building Knowledge through Families of Experiments, IEEE Trans.
Softw. Eng. 25 (4) (1999) 456–473.
[6] F. Belkadi, E. Bonjour, M. Camargo, N. Troussier, B. Eynard, A situation model to support awareness in
collaborative design, Int. J. Hum. Comput. Stud. 71 (1) (2013) 110–129.
[7] I. Blau, A. Caspi, What Type of Collaboration Helps? Psychological Ownership, Perceived Learning and
Outcome Quality of Collaboration Using Google Docs, Chais conference on instructional technologies
research, 2009, pp. 48–55.
[8] J. Brooke, SUS - A quick and dirty usability scale, Usability Eval. Ind. (1996) 189–194.
[9] D. Budgen, M. Thomson, CASE tool evaluation: experiences from an empirical study, J. Syst. Softw. 67
(2) (2003) 55–75.
[10] J.M. Carrillo de Gea, J. Nicolás, J.L. Fernández Alemán, A. Toval, C. Ebert, A. Vizcaíno, Requirements
engineering tools: Capabilities, survey and assessment, Inf. Softw. Technol. 54 (10) (2012) 1142–1157.
[11] P.H. Carstensen, K. Schmidt, Computer Supported Cooperative Work: New Challenges to Systems Design,
in: K. Itoh (Ed.), Handbook of Human Factors, Asakura Publishing, Tokyo (Japan), 1999, pp. 1–24.
[12] J. Castro, M. Kolp, J. Mylopoulos, A requirements-driven development methodology, 13th Int. Conf. On
Advanced Information Systems Engineering (CAiSE’01), Springer-Verlag, London, UK, 2001, pp. 108–
123.
[13] W.G. Cochran, G.M. Cox, Experimental designs, Wiley, New York, 1992.
[14] A. Cockburn, Writing Effective Use Cases, Addison-Wesley Professional, 2000.
[15] N. Condori-Fernández, J.I. Panach, A.I. Baars, T. Vos, Ó. Pastor, An empirical approach for evaluating the
usability of model-driven tools, Sci. Comput. Program. 78 (11) (2013) 2245–2258.
[16] S. Cook, G. Jones, S. Kent, A.C. Wills, Domain-Specific Development with Visual Studio DSL Tools,
Addison-Wesley Professional, 2007.
[17] L.J. Cronbach, R.J. Shavelson, My Current Thoughts on Coefficient Alpha and Successor Procedures,
Educ. Psychol. Meas. 64 (3) (2004) 391–418.
[18] J.A. Cruz-Lemus, M. Genero, M.E. Manso, S. Morasca, M. Piattini, Assessing the understandability of
UML statechart diagrams with composite states—A family of empirical studies, Empir. Softw. Eng. 14 (6)
(2009) 685–719.
[19] L.M. Cysneiros, E. Yu, Non-Functional Requirements Elicitation, in: J.C.S. do Prado Leite and J.H. Doorn
(Eds.), Perspectives on Software Requirements, Springer US, 2004, pp. 115–138.
-38-
[20] P.M.A. Desmet, Measuring Emotions: Development and application of an instrument to measure emotional
responses to products, in: M.A. Blythe et al. (Eds.), Funology: From Usability to Enjoyment, Springer,
2003, pp. 1–13.
[21] D. Dudek, A. Mastora, M. Landoni, Is Google the answer? A study into usability of search engines, Libr.
Rev. 56 (3) (2007) 224–233.
[22] P.J. Edwards, K.P. Moloney, J.A. Jacko, F. Sainfort, Evaluating usability of a commercial electronic health
record: A case study, Int. J. Hum. Comput. Stud. 66 (10) (2008) 718–728.
[23] C.A. Ellis, S.J. Gibbs, G. Rein, Groupware: some issues and experiences, Commun. ACM 34 (1) (1991)
39–58.
[24] A. Fernandez, E. Insfran, S. Abrahão, Usability evaluation methods for the web: A systematic mapping
study, Inf. Softw. Technol. 53 (8) (2011) 789–817.
[25] K. Finstad, The System Usability Scale and Non-Native English Speakers, J. usability Stud. 1 (4) (2006)
185–188.
[26] K. Finstad, The Usability Metric for User Experience, Interact. Comput. 22 (5) (2010) 323–327.
[27] G. Grau, X. Franch, S. Avila, J-PRiM: A Java Tool for a Process Reengineering i* Methodology, 14th
IEEE International Requirements Engineering Conference (RE’06), IEEE, 2006, pp. 359–360.
[28] C.M. Grinstead, J.L. Snell, Introduction to Probability, American Mathematical Society, 2006.
[29] R.C. Gronback, Eclipse Modelling Project: A Domain-Specific Language Toolkit, Addison-Wesley, 2009.
[30] C. Gutwin, S. Greenberg, A Descriptive Framework of Workspace Awareness for Real-Time Groupware,
Comput. Support. Coop. Work 11 (3) (2002) 411–446.
[31] C. Gutwin, M. Roseman, S. Greenberg, A usability study of awareness widgets in a shared workspace
groupware system, ACM Conference on Computer Supported Cooperative Work (CSCW’96), ACM Press,
Boston (USA), USA, 1996, pp. 258–267.
[32] S. Honda, H. Tomioka, T. Kimura, T. Oosawa, K. Okada, Y. Matsushita, A company-office system
“Valentine” providing informal communication and personal space based on 3D virtual space and avatars,
Inf. Softw. Technol. 41 (6) (1999) 383–397.
[33] J. Horkoff, Y. Yu, E. Yu, OpenOME: An Open-source Goal and Agent-Oriented Model Drawing and
Analysis Tool, 5th International i* Workshop (iStar’11), 2011, pp. 154–156.
[34] K. Hornbæk, Current practice in measuring usability: Challenges to usability studies and research, Int. J.
Hum. Comput. Stud. 64 (2) (2006) 79–102.
[35] M. Höst, B. Regnell, C. Wohlin, Using Students as Subjects—A Comparative Study of Students and
Professionals in Lead-Time Impact Assessment, Empir. Softw. Eng. 5 (3) (2000) 201–214.
[36] ISO 9241-11, Ergonomic requirements for office work with visual display terminals ( VDTs ) - Part 11 :
Guidance on usability, 1998.
[37] ISO/IEC 25010, Systems and software engineering - Systems and software Quality Requirements and
Evaluation (SQuaRE) - System and software quality models, 2011.
[38] ISO/IEC 25062, Software engineering—Software product Quality Requirements and Evaluation
(SQuaRE)—Common Industry Format (CIF) for usability test reports, 2006.
-39-
[39] ISO/IEC TR 25060:2010, Systems and software engineering -- Systems and software product Quality
Requirements and Evaluation (SQuaRE) -- Common Industry Format (CIF) for usability: General
framework for usability-related information, 2010.
[40] P. Kline, Handbook of Psychological Testing, Routledge, 1999.
[41] J. Lee, N.-L. Xue, J.-Y. Kuo, Structuring requirement specifications with goals, Inf. Softw. Technol. 43 (2)
(2001) 121–135.
[42] L. López, X. Franch, J. Marco, Making Explicit Some Implicit i* Language Decisions, in: M. Jeusfeld et
al. (Eds.), 30th International Conference on Conceptual Modeling (ER’11), Springer Berlin Heidelberg,
Berlin, 2011, pp. 62–77.
[43] A.M. Lund, Measuring Usability with the USE Questionnaire, STC Usability SIG Newsl. 8 (2) (2001).
[44] ManyCam, ManyCam, http://www.manycam.com/, accessed: April 17, 2013.
[45] D. Martinez, S. Kieffer, J. Martinez, J.P. Molina, B. Macq, P. Gonzalez, Usability evaluation of virtual
reality interaction techniques for positioning and manoeuvring in reduced, manipulation-oriented
environments, Vis. Comput. 26 (6-8) (2010) 619–628.
[46] K. van Mensvoort, D.J. Hermes, M. Van Montfort, Usability of optically simulated haptic feedback, Int. J.
Hum. Comput. Stud. 66 (6) (2008) 438–451.
[47] Microsoft Corporation, Age of Empires Online, http://www.ageofempiresonline.com, accessed: February
11, 2014.
[48] Microsoft Corporation, Integrating Models by using Visual Studio Modelbus,
http://msdn.microsoft.com/en-us/library/ff519531.aspx, accessed: February 11, 2014.
[49] K. Nayyeri, Professional Visual Studio Extensibility, Wrox, 2008.
[50] G. Peevers, G. Douglas, M.A. Jack, A usability comparison of three alternative message formats for an
SMS banking service, Int. J. Hum. Comput. Stud. 66 (2) (2008) 113–123.
[51] J.A. Russell, A circumplex model of affect., J. Pers. Soc. Psychol. 39 (6) (1980) 1161–1178.
[52] A. Sears, Heuristic Walkthroughs: Finding the Problems Without the Noise, Int. J. Hum. Comput. Interact.
9 (3) (1997) 213–234.
[53] M. Senapathi, A Framework for the Evaluation of CASE tool learnability in Educational Environments, J.
Inf. Technol. Educ. 4 (2005) 61–84.
[54] J. Staiano, M. Menéndez, A. Battocchi, A. De Angeli, N. Sebe, UX_Mate: from facial expressions to UX
evaluation, Proceedings of the Conference on Designing Interactive Systems (DIS ’12), ACM Press, New
York, New York, USA, 2012, p. 741.
[55] A. Sutcliffe, A. Alrayes, Investigating user experience in Second Life for collaborative learning, Int. J.
Hum. Comput. Stud. 70 (7) (2012) 508–525.
[56] A. Tang, J. Massey, N. Wong, D. Reilly, W.K. Edwards, Verbal coordination in first person shooter games,
ACM 2012 conference on Computer Supported Cooperative Work (CSCW’12), ACM Press, Seattle
(USA), 2012, p. 579.
[57] M.A. Teruel, CSRML Tool 2012, http://bit.ly/CSRMLTool, accessed: February 11, 2014.
[58] M.A. Teruel, E. Navarro, V. López-Jaquero, F. Montero, P. González, Usability Evaluation of a CSCW
Requirements Engineering CASE Tool – Usability Test Material, Albacete, 2013.
-40-
[59] M.A. Teruel, E. Navarro, V. López-Jaquero, F. Montero, P. González, An empirical evaluation of
requirement engineering techniques for collaborative systems, 15th Annual Conference on Evaluation &
Assessment in Software Engineering (EASE’11), IET, Durham, UK, 2011, pp. 114–123.
[60] M.A. Teruel, E. Navarro, V. López-Jaquero, F. Montero, P. González, Comparing Goal-Oriented
Approaches to Model Requirements for CSCW, in: L.A. Maciaszek and K. Zhang (Eds.), Evaluation of
Novel Approaches to Software Engineering, Springer-Verlag Berlin Heidelberg, 2012, pp. 169–184.
[61] M.A. Teruel, E. Navarro, V. López-Jaquero, F. Montero, P. González, CSRML: A Goal-Oriented
Approach to Model Requirements for Collaborative Systems, in: M. Jeusfeld et al. (Eds.), 30th
International Conference on Conceptual Modeling (ER’11), Springer Berlin Heidelberg, Brussels,
Belgium, 2011, pp. 33–46.
[62] M.A. Teruel, E. Navarro, V. López-Jaquero, F. Montero, J. Jaen, P. González, Analyzing the
Understandability of Requirements Engineering Languages for CSCW Systems: A Family of Experiments,
Inf. Softw. Technol. 54 (11) (2012) 1215–1228.
[63] M.H. Tran, G.K. Raikundalia, Y. Yang, Using an experimental study to develop group awareness support
for real-time distributed collaborative writing, Inf. Softw. Technol. 48 (11) (2006) 1006–1024.
[64] G. Trapani, A. Pash, The complete guide to Google Wave, 3ones Inc, 2010.
[65] A. Vasalou, A.N. Joinson, D. Courvoisier, Cultural differences, experience with social networks and the
nature of “true commitment” in Facebook, Int. J. Hum. Comput. Stud. 68 (10) (2010) 719–728.
[66] G.S. Walia, J.C. Carver, A systematic literature review to identify and classify software requirement errors,
Inf. Softw. Technol. 51 (7) (2009) 1087–1109.
[67] C. Wohlin, P. Runeson, M. Höst, M.C. Ohlsson, B. Regnell, A. Wesslén, Experimentation in Software
Engineering, Springer Berlin Heidelberg, Berlin, Heidelberg, 2012.
[68] E. Yu, Y. Yu, Organization Modelling Environment (OME), http://www.cs.toronto.edu/km/ome/,
accessed: February 11, 2014.
[69] P. Zielczynski, Requirements Management Using IBM® Rational® RequisitePro®, IBM Press, 2007.
-41-
Annex 1 – Example of a Task Used in the Study2
ND7. In the TRD Attack, add an Awareness Resource named Flare the map to the participation of the Role
Skirmish player in the Task Establish attack point.
Figure 28. Task ND7 initial (top) and final (bottom) diagram states
2The whole test material given to the participants can be found in [58]
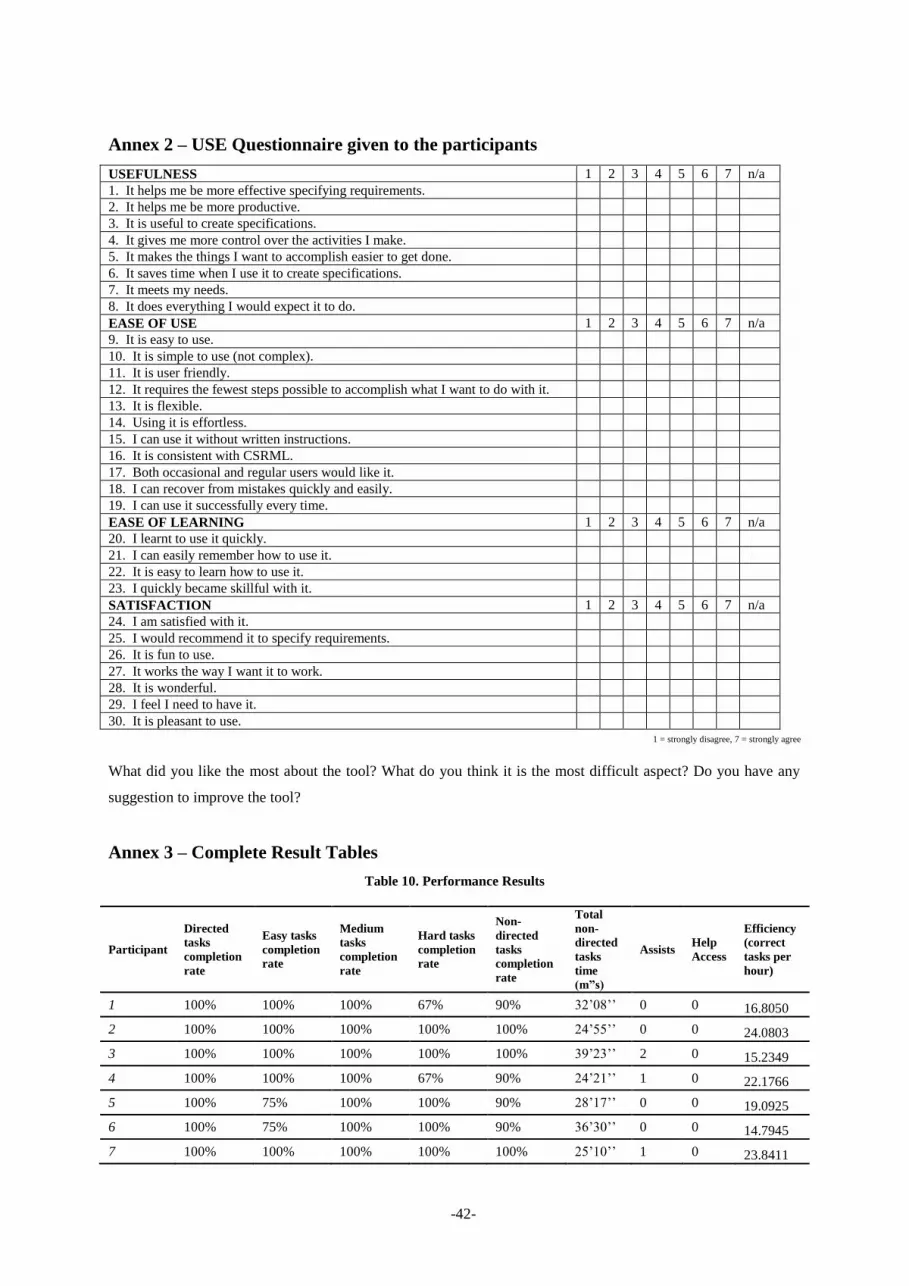
-42-
Annex 2 – USE Questionnaire given to the participants
USEFULNESS 1 2 3 4 5 6 7 n/a
1. It helps me be more effective specifying requirements.
2. It helps me be more productive.
3. It is useful to create specifications.
4. It gives me more control over the activities I make.
5. It makes the things I want to accomplish easier to get done.
6. It saves time when I use it to create specifications.
7. It meets my needs.
8. It does everything I would expect it to do.
EASE OF USE 1 2 3 4 5 6 7 n/a
9. It is easy to use.
10. It is simple to use (not complex).
11. It is user friendly.
12. It requires the fewest steps possible to accomplish what I want to do with it.
13. It is flexible.
14. Using it is effortless.
15. I can use it without written instructions.
16. It is consistent with CSRML.
17. Both occasional and regular users would like it.
18. I can recover from mistakes quickly and easily.
19. I can use it successfully every time.
EASE OF LEARNING 1 2 3 4 5 6 7 n/a
20. I learnt to use it quickly.
21. I can easily remember how to use it.
22. It is easy to learn how to use it.
23. I quickly became skillful with it.
SATISFACTION 1 2 3 4 5 6 7 n/a
24. I am satisfied with it.
25. I would recommend it to specify requirements.
26. It is fun to use.
27. It works the way I want it to work.
28. It is wonderful.
29. I feel I need to have it.
30. It is pleasant to use.
1 = strongly disagree, 7 = strongly agree
What did you like the most about the tool? What do you think it is the most difficult aspect? Do you have any
suggestion to improve the tool?
Annex 3 – Complete Result Tables
Table 10. Performance Results
Participant
Directed
tasks
completion
rate
Easy tasks
completion
rate
Medium
tasks
completion
rate
Hard tasks
completion
rate
Non-
directed
tasks
completion
rate
Total
non-
directed
tasks
time
(m”s)
Assists Help
Access
Efficiency
(correct
tasks per
hour)
1 100% 100% 100% 67% 90% 32’08’’ 0 0 16.8050
2 100% 100% 100% 100% 100% 24’55’’ 0 0 24.0803
3 100% 100% 100% 100% 100% 39’23’’ 2 0 15.2349
4 100% 100% 100% 67% 90% 24’21’’ 1 0 22.1766
5 100% 75% 100% 100% 90% 28’17’’ 0 0 19.0925
6 100% 75% 100% 100% 90% 36’30’’ 0 0 14.7945
7 100% 100% 100% 100% 100% 25’10’’ 1 0 23.8411

-43-
8 100% 100% 100% 67% 90% 36’25’’ 0 0 14.8284
9 100% 75% 100% 33% 70% 27’55’’ 0 0 15.0448
10 100% 75% 100% 67% 80% 34’56’’ 0 0 13.7405
11 100% 100% 100% 67% 90% 40’33’’ 1 1 13.3169
12 100% 75% 100% 100% 90% 28’13’’ 1 0 19.1376
13 100% 75% 100% 100% 90% 27’54’’ 0 0 19.3548
14 88% 75% 100% 33% 70% 27’43’’ 1 0 15.1533
15 100% 100% 100% 100% 100% 33’24’’ 0 0 17.9641
16 100% 100% 100% 100% 100% 28’00’’ 1 1 21.4286
17 100% 100% 100% 100% 100% 29’45’’ 1 1 20.1681
18 100% 100% 67% 67% 80% 27’48’’ 0 0 17.2662
19 100% 100% 100% 100% 100% 29’42’’ 0 0 20.2020
20 100% 100% 67% 100% 90% 26’35’’ 1 0 20.3135
21 100% 100% 100% 67% 90% 27’37’’ 0 1 19.5534
22 100% 100% 67% 67% 80% 29’36’’ 0 0 16.2162
23 100% 100% 100% 67% 90% 26’25’’ 0 0 20.4416
24 100% 100% 67% 67% 80% 37’30’’ 0 0 12.8000
25 100% 75% 100% 67% 80% 40’47’’ 0 0 11.7695
26 100% 75% 100% 100% 90% 33’28’’ 1 0 16.1355
27 100% 75% 67% 100% 80% 38’48’’ 0 0 12.3711
28 100% 100% 100% 100% 100% 22’40’’ 0 0 26.4706
Mean 99.55% 91.07% 94.05% 82.14% 89.29% 30’57’’ 0.39 0.14 17.8465
Std. Dev. 2.36% 12.20% 13.00% 21.24% 9.00% 05’17’’ 0.57 0.36 3.8008
Min 87.50% 75.00% 66.67% 33.33% 70.00% 22’40’’ 0.00 0.00 11.7695
Max 100.00% 100.00% 100.00% 100.00% 100.00% 40’47’’ 2.00 1.00 26.4706
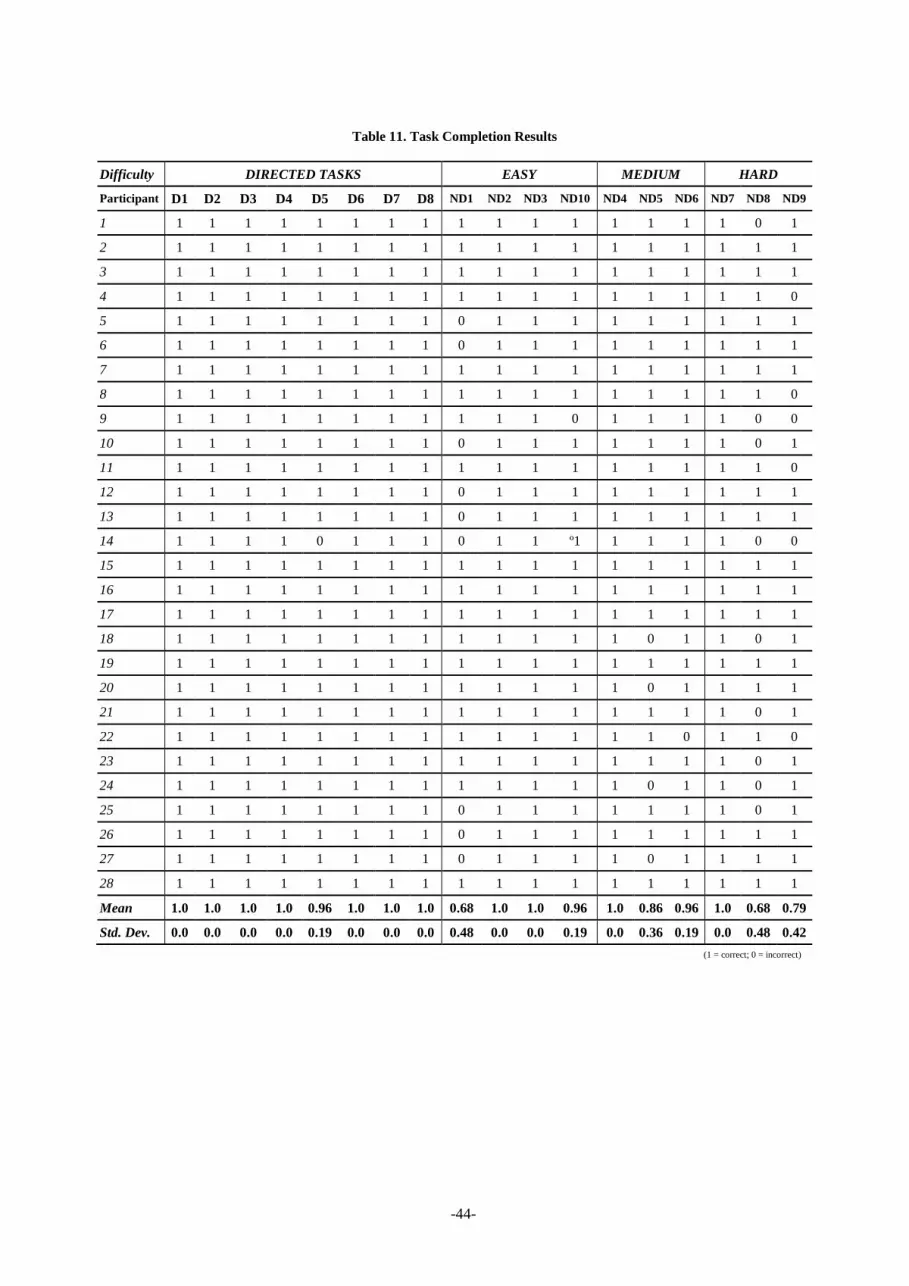
-44-
Table 11. Task Completion Results
Difficulty DIRECTED TASKS EASY MEDIUM HARD
Participant D1 D2 D3 D4 D5 D6 D7 D8 ND1 ND2 ND3 ND10 ND4 ND5 ND6 ND7 ND8 ND9
1 1 1 1 1 1 1 1 1 1 1 1 1 1 1 1 1 0 1
2 1 1 1 1 1 1 1 1 1 1 1 1 1 1 1 1 1 1
3 1 1 1 1 1 1 1 1 1 1 1 1 1 1 1 1 1 1
4 1 1 1 1 1 1 1 1 1 1 1 1 1 1 1 1 1 0
5 1 1 1 1 1 1 1 1 0 1 1 1 1 1 1 1 1 1
6 1 1 1 1 1 1 1 1 0 1 1 1 1 1 1 1 1 1
7 1 1 1 1 1 1 1 1 1 1 1 1 1 1 1 1 1 1
8 1 1 1 1 1 1 1 1 1 1 1 1 1 1 1 1 1 0
9 1 1 1 1 1 1 1 1 1 1 1 0 1 1 1 1 0 0
10 1 1 1 1 1 1 1 1 0 1 1 1 1 1 1 1 0 1
11 1 1 1 1 1 1 1 1 1 1 1 1 1 1 1 1 1 0
12 1 1 1 1 1 1 1 1 0 1 1 1 1 1 1 1 1 1
13 1 1 1 1 1 1 1 1 0 1 1 1 1 1 1 1 1 1
14 1 1 1 1 0 1 1 1 0 1 1 º1 1 1 1 1 0 0
15 1 1 1 1 1 1 1 1 1 1 1 1 1 1 1 1 1 1
16 1 1 1 1 1 1 1 1 1 1 1 1 1 1 1 1 1 1
17 1 1 1 1 1 1 1 1 1 1 1 1 1 1 1 1 1 1
18 1 1 1 1 1 1 1 1 1 1 1 1 1 0 1 1 0 1
19 1 1 1 1 1 1 1 1 1 1 1 1 1 1 1 1 1 1
20 1 1 1 1 1 1 1 1 1 1 1 1 1 0 1 1 1 1
21 1 1 1 1 1 1 1 1 1 1 1 1 1 1 1 1 0 1
22 1 1 1 1 1 1 1 1 1 1 1 1 1 1 0 1 1 0
23 1 1 1 1 1 1 1 1 1 1 1 1 1 1 1 1 0 1
24 1 1 1 1 1 1 1 1 1 1 1 1 1 0 1 1 0 1
25 1 1 1 1 1 1 1 1 0 1 1 1 1 1 1 1 0 1
26 1 1 1 1 1 1 1 1 0 1 1 1 1 1 1 1 1 1
27 1 1 1 1 1 1 1 1 0 1 1 1 1 0 1 1 1 1
28 1 1 1 1 1 1 1 1 1 1 1 1 1 1 1 1 1 1
Mean 1.0 1.0 1.0 1.0 0.96 1.0 1.0 1.0 0.68 1.0 1.0 0.96 1.0 0.86 0.96 1.0 0.68 0.79
Std. Dev. 0.0 0.0 0.0 0.0 0.19 0.0 0.0 0.0 0.48 0.0 0.0 0.19 0.0 0.36 0.19 0.0 0.48 0.42
(1 = correct; 0 = incorrect)
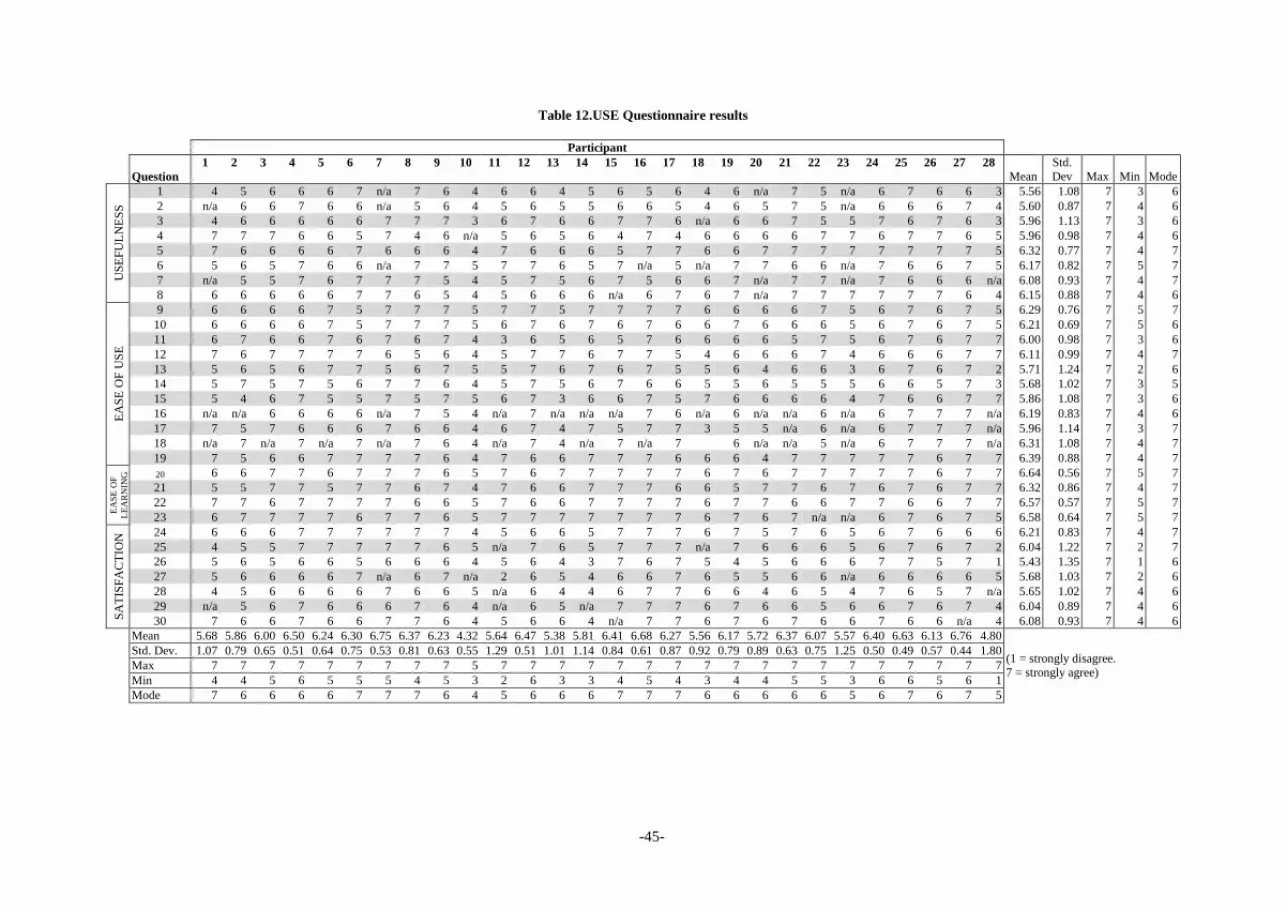
-45-
Table 12.USE Questionnaire results
Participant
Question
1 2 3 4 5 6 7 8 9 10 11 12 13 14 15 16 17 18 19 20 21 22 23 24 25 26 27 28
Mean
Std.
Dev Max Min Mode
US
EF
UL
NE
SS
1 4 5 6 6 6 7 n/a 7 6 4 6 6 4 5 6 5 6 4 6 n/a 7 5 n/a 6 7 6 6 3 5.56 1.08 7 3 6
2 n/a 6 6 7 6 6 n/a 5 6 4 5 6 5 5 6 6 5 4 6 5 7 5 n/a 6 6 6 7 4 5.60 0.87 7 4 6
3 4 6 6 6 6 6 7 7 7 3 6 7 6 6 7 7 6 n/a 6 6 7 5 5 7 6 7 6 3 5.96 1.13 7 3 6
4 7 7 7 6 6 5 7 4 6 n/a 5 6 5 6 4 7 4 6 6 6 6 7 7 6 7 7 6 5 5.96 0.98 7 4 6
5 7 6 6 6 6 7 6 6 6 4 7 6 6 6 5 7 7 6 6 7 7 7 7 7 7 7 7 5 6.32 0.77 7 4 7
6 5 6 5 7 6 6 n/a 7 7 5 7 7 6 5 7 n/a 5 n/a 7 7 6 6 n/a 7 6 6 7 5 6.17 0.82 7 5 7
7 n/a 5 5 7 6 7 7 7 5 4 5 7 5 6 7 5 6 6 7 n/a 7 7 n/a 7 6 6 6 n/a 6.08 0.93 7 4 7
8 6 6 6 6 6 7 7 6 5 4 5 6 6 6 n/a 6 7 6 7 n/a 7 7 7 7 7 7 6 4 6.15 0.88 7 4 6
EA
SE
OF
US
E
9 6 6 6 6 7 5 7 7 7 5 7 7 5 7 7 7 7 6 6 6 6 7 5 6 7 6 7 5 6.29 0.76 7 5 7
10 6 6 6 6 7 5 7 7 7 5 6 7 6 7 6 7 6 6 7 6 6 6 5 6 7 6 7 5 6.21 0.69 7 5 6
11 6 7 6 6 7 6 7 6 7 4 3 6 5 6 5 7 6 6 6 6 5 7 5 6 7 6 7 7 6.00 0.98 7 3 6
12 7 6 7 7 7 7 6 5 6 4 5 7 7 6 7 7 5 4 6 6 6 7 4 6 6 6 7 7 6.11 0.99 7 4 7
13 5 6 5 6 7 7 5 6 7 5 5 7 6 7 6 7 5 5 6 4 6 6 3 6 7 6 7 2 5.71 1.24 7 2 6
14 5 7 5 7 5 6 7 7 6 4 5 7 5 6 7 6 6 5 5 6 5 5 5 6 6 5 7 3 5.68 1.02 7 3 5
15 5 4 6 7 5 5 7 5 7 5 6 7 3 6 6 7 5 7 6 6 6 6 4 7 6 6 7 7 5.86 1.08 7 3 6
16 n/a n/a 6 6 6 6 n/a 7 5 4 n/a 7 n/a n/a n/a 7 6 n/a 6 n/a n/a 6 n/a 6 7 7 7 n/a 6.19 0.83 7 4 6
17 7 5 7 6 6 6 7 6 6 4 6 7 4 7 5 7 7 3 5 5 n/a 6 n/a 6 7 7 7 n/a 5.96 1.14 7 3 7
18 n/a 7 n/a 7 n/a 7 n/a 7 6 4 n/a 7 4 n/a 7 n/a 7
6 n/a n/a 5 n/a 6 7 7 7 n/a 6.31 1.08 7 4 7
19 7 5 6 6 7 7 7 7 6 4 7 6 6 7 7 7 6 6 6 4 7 7 7 7 7 6 7 7 6.39 0.88 7 4 7
EA
SE
OF
LE
AR
NIN
G
20 6 6 7 7 6 7 7 7 6 5 7 6 7 7 7 7 7 6 7 6 7 7 7 7 7 6 7 7 6.64 0.56 7 5 7
21 5 5 7 7 5 7 7 6 7 4 7 6 6 7 7 7 6 6 5 7 7 6 7 6 7 6 7 7 6.32 0.86 7 4 7
22 7 7 6 7 7 7 7 6 6 5 7 6 6 7 7 7 7 6 7 7 6 6 7 7 6 6 7 7 6.57 0.57 7 5 7
23 6 7 7 7 7 6 7 7 6 5 7 7 7 7 7 7 7 6 7 6 7 n/a n/a 6 7 6 7 5 6.58 0.64 7 5 7
SA
TIS
FA
CT
ION
24 6 6 6 7 7 7 7 7 7 4 5 6 6 5 7 7 7 6 7 5 7 6 5 6 7 6 6 6 6.21 0.83 7 4 7
25 4 5 5 7 7 7 7 7 6 5 n/a 7 6 5 7 7 7 n/a 7 6 6 6 5 6 7 6 7 2 6.04 1.22 7 2 7
26 5 6 5 6 6 5 6 6 6 4 5 6 4 3 7 6 7 5 4 5 6 6 6 7 7 5 7 1 5.43 1.35 7 1 6
27 5 6 6 6 6 7 n/a 6 7 n/a 2 6 5 4 6 6 7 6 5 5 6 6 n/a 6 6 6 6 5 5.68 1.03 7 2 6
28 4 5 6 6 6 6 7 6 6 5 n/a 6 4 4 6 7 7 6 6 4 6 5 4 7 6 5 7 n/a 5.65 1.02 7 4 6
29 n/a 5 6 7 6 6 6 7 6 4 n/a 6 5 n/a 7 7 7 6 7 6 6 5 6 6 7 6 7 4 6.04 0.89 7 4 6
30 7 6 6 7 6 6 7 7 6 4 5 6 6 4 n/a 7 7 6 7 6 7 6 6 7 6 6 n/a 4 6.08 0.93 7 4 6
Mean 5.68 5.86 6.00 6.50 6.24 6.30 6.75 6.37 6.23 4.32 5.64 6.47 5.38 5.81 6.41 6.68 6.27 5.56 6.17 5.72 6.37 6.07 5.57 6.40 6.63 6.13 6.76 4.80
(1 = strongly disagree.
7 = strongly agree)
Std. Dev. 1.07 0.79 0.65 0.51 0.64 0.75 0.53 0.81 0.63 0.55 1.29 0.51 1.01 1.14 0.84 0.61 0.87 0.92 0.79 0.89 0.63 0.75 1.25 0.50 0.49 0.57 0.44 1.80
Max 7 7 7 7 7 7 7 7 7 5 7 7 7 7 7 7 7 7 7 7 7 7 7 7 7 7 7 7
Min 4 4 5 6 5 5 5 4 5 3 2 6 3 3 4 5 4 3 4 4 5 5 3 6 6 5 6 1
Mode 7 6 6 6 6 7 7 7 6 4 5 6 6 6 7 7 7 6 6 6 6 6 5 6 7 6 7 5
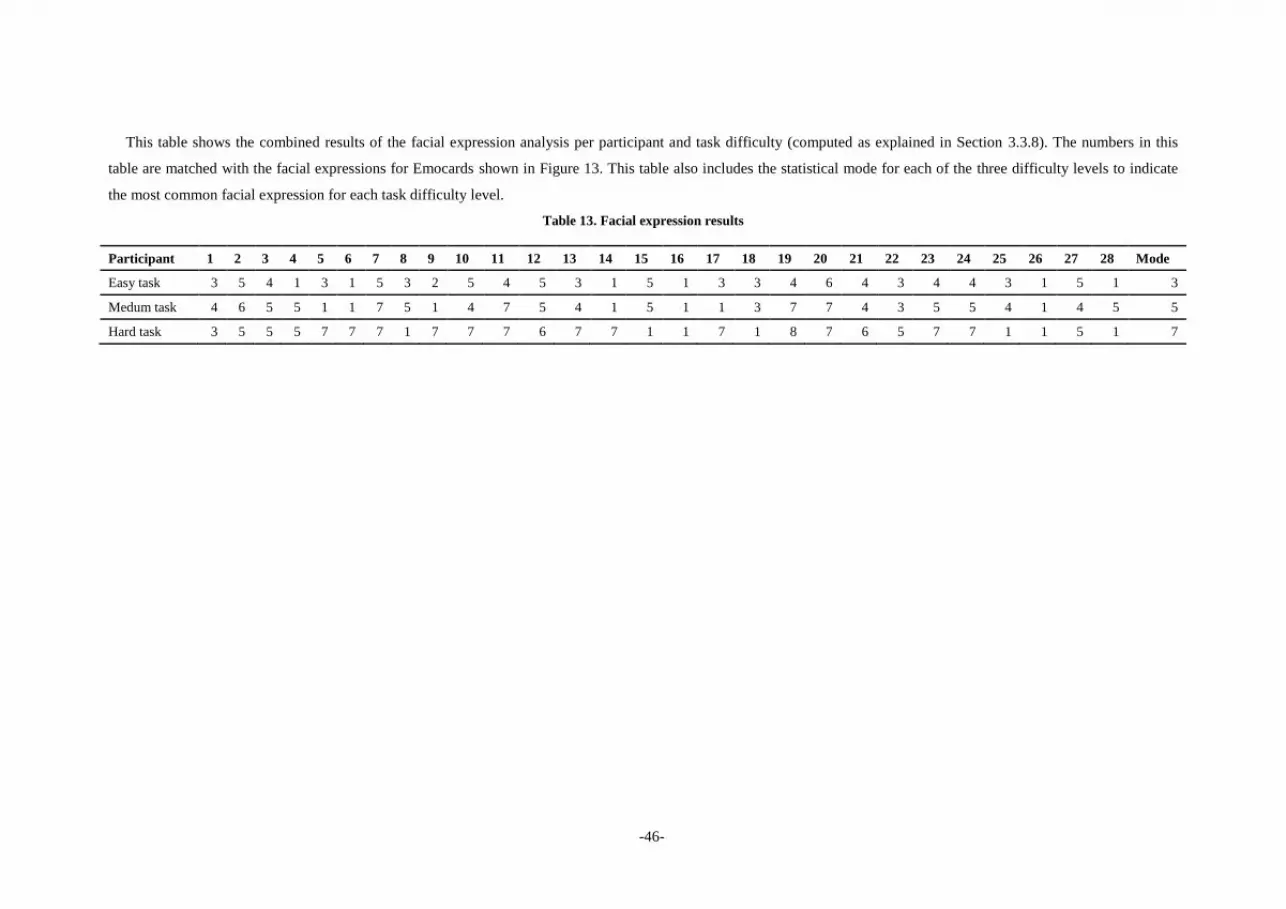
-46-
This table shows the combined results of the facial expression analysis per participant and task difficulty (computed as explained in Section 3.3.8). The numbers in this
table are matched with the facial expressions for Emocards shown in Figure 13. This table also includes the statistical mode for each of the three difficulty levels to indicate
the most common facial expression for each task difficulty level.
Table 13. Facial expression results
Participant 1 2 3 4 5 6 7 8 9 10 11 12 13 14 15 16 17 18 19 20 21 22 23 24 25 26 27 28 Mode
Easy task 3 5 4 1 3 1 5 3 2 5 4 5 3 1 5 1 3 3 4 6 4 3 4 4 3 1 5 1 3
Medum task 4 6 5 5 1 1 7 5 1 4 7 5 4 1 5 1 1 3 7 7 4 3 5 5 4 1 4 5 5
Hard task 3 5 5 5 7 7 7 1 7 7 7 6 7 7 1 1 7 1 8 7 6 5 7 7 1 1 5 1 7