a computational framework for the study of creativity and innovation in design: effects of social...
TRANSCRIPT
JS Gero (ed), Design Computing and Cognition'04, 499-517 © 2004 Kluwer Academic Publishers, Dordrecht, Printed in the Netherlands
A COMPUTATIONAL FRAMEWORK FOR THE STUDY OF CREATIVITY AND INNOVATION IN DESIGN: EFFECTS OF SOCIAL TIES
RICARDO SOSA, JOHN S GERO University of Sydney, Australia
Abstract. This paper describes a socio-cognitive framework to study the interaction between designers and social groups. Experimentation with situational factors of creativity is presented. In particular, social ties in a population of adopters are shown to shape the way in which designers are considered as change agents of their societies.
1. Introduction
Creative design is widely recognised as one of the foundations for social change (Gero 1996). This paper explores some fundamentals of the relationship between designers and social groups. Our motivation is to understand how individual actions can be determined by collective conditions and in turn trigger structural changes. Conventional research focuses on distinct units of analysis, i.e. personal or social processes separately (Conte et al 2001).
An increasingly accepted approach to the study of creativity is based on the relation between individual-generative and group-evaluative processes. Under this view, creativity is seen as a social construct (Saunders and Gero 2001) or communal judgment (Gardner 1993) where the creative individual is considered not in isolation but in interaction with an environment of physical and social dimensions. Being socially constructed, standards of what constitutes creative solutions evolve (Simonton 2000). This requires a broader inquiry of design that extends the unit of study outside the cognitive dimension to include the social aspect of creativity (Amabile 1983).
The term creativity is polysemous and ambiguous. In the literature it refers to aesthetic appeal, novelty, quality, unexpectedness, uncommonness, peer-recognition, influence, intelligence, learning, and popularity (Runco and Pritzker 1999). In this paper creativity is defined by a set of complementary processes including adoption of a solution by a population, nomination by specialists or gatekeepers and colleague recognition.

500 R SOSA AND JS GERO
Innovation is defined by the diffusion of a solution across a population of adopters (Rogers 1995). This paper presents an artificial society of adopters and designers as an empirical test-bed where qualitative generalisations about the nature of creative behaviour can be grounded.
2. Socio-Cognitive Agent Architecture
The dominant architecture of rational agency divides the system into two explicit parts: agent and environment (Wooldridge 2000). The rational agent is the sole causal determinant of behaviour whilst changes in the environment may reflect the impact of actions by other agents or external effects. Under such view, social interaction is contained as part of the external state. In the prototypical ant colony, behaviour is determined by a fixed reaction to pheromone levels present in the environment. However, the behaviour of more complex and social individuals is not expected to be hardwired as a reaction to environmental stimuli.
For a social agent it is important to perceive more than environmental expressions. Interpretations of who laid the pheromone trail and with what intentions become key determinants of social behaviour. Individual learning helps but it is not feasible for every agent to learn at all times in a complex environment. Individual determinants are complemented by reliance on group support. Societies provide collective cues that are not necessarily expressed in the physical environment. The main difference between a physical and a social environment is that the former may exist independently from the agents that inhabit it. Agents and physical environments can be explicitly defined and treated as separate entities. However, a social environment is a function of the aggregate effect of agent interaction over time. Whilst no single agent has control over its society, the emergent structure of a social environment feeds back and co-determines individual states and behaviours.
Social norms and conventions can clearly co-determine individual behaviour in design. In our agent architecture there is a place for a range from individual to social mechanisms mediating the agent-environment divide. Figure 1 shows a schematic definition of our architecture where agent-environment interaction is mediated by layers that range from individual to collective characteristics.
Agent behaviour M in an environment E can thus be defined as:
M = ∑ { mi-n [S(mi-n ^ E’)] } (1)
where individual behaviour M is determined by the sum of internal state mi-n and construed situation S. Internal states consists of components mi-n such as perceptions, goals, preferences, skills, knowledge, and actions. Environment E is perceived by a bounded agent as interpreted external state E’. Situation

A COMPUTATIONAL FRAMEWORK TO STUDY CREATIVITY 501
S is therefore a function of the combination of internal and interpreted external state. For instance, a perceived external state may be a measure of group pressure. However, perceived group pressure by itself has no meaning, i.e., it is not a situation but a passive contextual feature. Perceived group pressure becomes part of a situation when construed in combination with a relevant internal state such as a certainty or extroversion threshold. Equivalent group pressure perceived by agents with different internal states may indeed lead to the construction of entirely different situations, eg. compliance or assertiveness. Equivalent contexts may thus generate different behaviours within different situations. When situational factors are strong determinants, agent behaviour is normalised whereas if personal factors mi dominate, behaviour is more differentiated across a population. Under this view, individual differences in isolation are insufficient to explain behaviour.
Figure 1. The social agent: behaviour is determined by a combination of individual and shared components
The Asch compliance paradigm (1951) illustrates the nature of our agent architecture. In this widely replicated experiment test subjects that respond correctly in isolation tend to be influenced by associates of the experimenter when placed within certain social settings. In some situations subjects tend to comply with group judgements even when clearly wrong. Within this paradigm, personal factors partially determine behaviour. If a test subject has certain individual characteristics such as high extroversion (Eysenck 1991) it tends to avoid compliance. Situational factors complement the determination of behaviour. If a test subject is asked to respond earlier in the task or if a previous participant differs and breaks unanimity the subject tends to differ and provide an independent response. Resulting behaviour can only be explained by a combination of individual and situational conditions.
Different insights were extracted from the verbal account of yielding subjects from the original experiment after conditions were revealed (Asch 1951). Influence effects fell into three categories: distorted perception, distorted judgement, and distorted action. These sources of behaviour can be mapped onto internal components mi-n of complier subjects as a function of their appraisal of the situation:
M = ∑ { A : perceptioni[S(E'i)]

502 R SOSA AND JS GERO
B : judgementi[S(E'i)] C : actioni[S(E'i)] } (2) where E'i represents a perceived collective state of unanimity and S the
complier's appraisal of a situation within which sufficient conditions exist for distortion. Individuals from group A have their perceptions distorted and their behaviour M is subsumed by group influence. Judgements and actions are distorted in groups B and C respectively. The first two resemble informative influence whilst the third is a type of normative influence.
2.1. MULTI-AGENT SYSTEM
The defining characteristics of social agents would have no relevance separate from a social group. Figure 2 shows a diagram of our multi-agent system where components mn,i become part of the group structure. As agents interact group structures emerge and mediate their interaction with the environment.
Figure 2. Socio-cognitive architecture where behaviour components become part of emergent group structures
These structures are shared by agents at different times causing them to exhibit different degrees of normalised behaviour. For instance, perceptions may become collectively biased, preferences may be emphasised by groups at different times, and socially permissible actions may be established. The collective state of a society N can thus be defined as:
N = { Mi-n[Si-n] } (3)
where state N is a function of agents’ behaviour Mi-n codetermined by internal states and their situation Si-n. A situation can be defined at the individual level as shown in eq. 1 and it can also be shared by a group as defined in eq. 3 above. A shared situation is perceived by a group of agents as a result of the combination of internal states and perceived external state. Extending the previous example, at the individual level a situation may be one of compliance whilst at the group level it may be a situation of unanimity. These are corresponding interpretations of one common collective structure, i.e., group pressure.

A COMPUTATIONAL FRAMEWORK TO STUDY CREATIVITY 503
Individual behaviour under this view is defined as a function of the agent and the situation. This approach supports equivalent agents acting differently within different situations, and different agents acting similarly within similar situations.
Social agents inhabit more than one social space, i.e. they have adjacency relations to other agents in multiple social environments simultaneously. For instance, an individual may have different positions in kinship and work structures. Other approaches like cellular automata conflate physical and social location into a notion of neighbourhoods (Schelling 1971). Each social space can be modelled with different parameters: social tie strength and number of ties are the structural properties addressed in this paper.
This architecture is used to implement a model of design beyond internal thinking processes. Key actors including consumers or adopters of artefacts, opinion leaders and designers are modelled as social agents. Individual and situational factors are included in the design of experiments to inspect phenomena related to creativity and innovation.
3. Adoption Framework
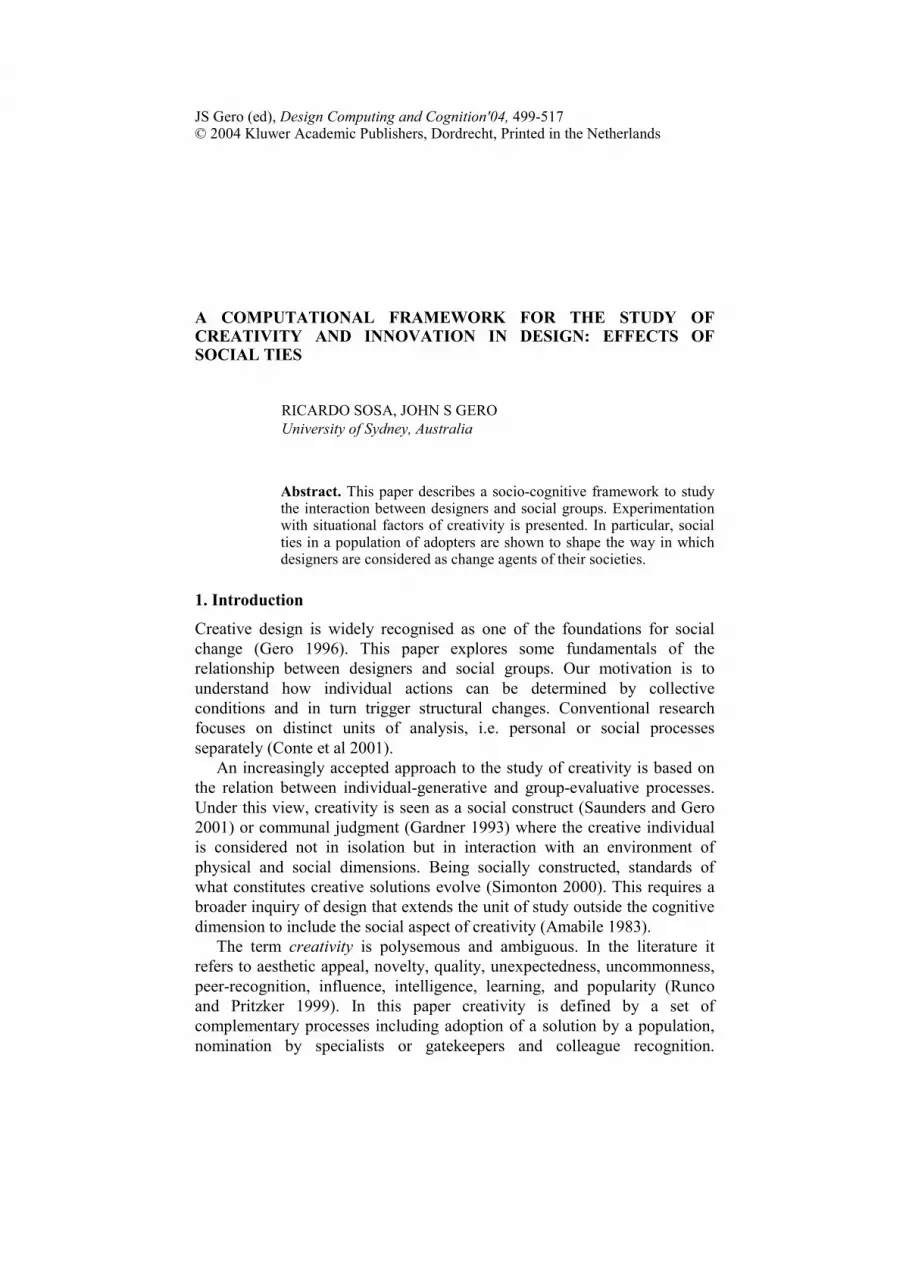
A multi-agent system is implemented based on a population of adopter agents and their social interaction. Adopter behaviour consists of evaluating available solutions and deciding to adopt or abstain. Solutions are formulated in a simple linear representation as shown in Figure 3(a). This representation is chosen because it provides a number of intuitive geometric features as well as multiple interpretations and emergence. The objective is to support compromise in a multi-objective decision making and negotiation of requirements, which are typical of design problems (Goel 1994).
Adopters evaluate artefacts according to individual perception V and preference F values. Variation of perception enables different interpretations across a population as shown in Figure 3(b). Variation of preferences (0.0 ≤ F ≤ 1.0) enables different decisions based on shared interpretations.
Perception is implemented by a shape-recognition algorithm executed independently by every individual adopter. Every adopter agent executes a search for closed shapes with a branch limit V. This search renders a set of closed shapes G that stands for the artefact’s features perceived by each adopter. Perception traits V are assigned from a Gaussian distribution. This reasoning mechanism is computationally expensive and is scheduled at intervals of adoption. Adopters do not learn individually at every time-step but base their decisions on approximations that they update regularly. This representation refers to the idea that in human populations there may be a number of distinct but overlapping views of an artefact’s features, i.e. adopter segmentation. Variation of percepts across a population is controlled by the standard deviation of V. Different studies may consider different
504 R SOSA AND JS GERO
percept variation assuming more subjective or more normalised interpretation across a target population.
Figure 3. (a) Sample artefact and (b) a range of shapes that adopters may perceive
3.1. ADOPTION DECISION
The adoption decision process consists of a multivariate evaluation where adopters seek to maximise conflicting criteria. Criteria attached to this representation include factors such as number of shapes, ratio of shapes aligned along horizontal and vertical axes, preferred number of sides, intersection or overlapping of shapes and similar shape bounds. The performance of an artefact is estimated by each adopter following:
P = { [ (G/Gmin) + (V(+-2)/G) + (alignX/G) + (alignY/G) + (ints/G) + (bounds/G)] / (G2-G) } (4)
where artefact performance P provides a measurement based on an individualised set G of perceived features. The sum of number of shapes (size of G), ratio of shapes with V(+-2) number of sides, ratio of shapes horizontally aligned (alignX), ratio of shapes vertically aligned (alignY), ratio of shape intersection (ints) and ratio of similar bounds (bounds) normalised over the combinatorial size of G.
Ratings P of artefacts under evaluation are compared by each adopter reaching an adoption decision where Gmax is the artefact with preferred features as follows:
Gmax = { Ci-n [(Pmax - Pmean) (Bi-n)] } (5)
where adoption choice Gmax refers to the artefact’s perceived features that lead in the criterion Ci-n, i.e. with the largest performance differentiation (Pmax - Pmean). Biases Bi-n are weights between 0.0 and 1.0 that adopters incorporate in the form of individual preferences or can be externally manipulated by the experimenter. The shape of Gmax shows an implicit ‘novelty’ criterion by which adopters tend to choose artefacts that they perceive to have the highest differentiation from others. Adoption is therefore a function of how competing artefacts compare at that time. To be adopted an artefact needs to perform well in a criterion that other artefacts do not meet and it helps if such criterion is positively biased by adopters’ preferences. Preferences evolve over time following a mechanism of habituation U. As adopters choose the best available artefact, their

A COMPUTATIONAL FRAMEWORK TO STUDY CREATIVITY 505
preference for the criterion best satisfied by that artefact is gradually increased.
U = { Fi += Ci} (6)
3.2. VERIFICATION
This adoption framework provides a method to manipulate perceptions V and preferences F for verification purposes. Figure 4 shows a verification run where a set of artefacts is randomly generated and made available to a population of 100 adopters.
Figure 4. A verification run where the weight of criterion FalignX is externally
increased. As a result, a majority (83 of a 100 population) chooses the artefact that performs best in the horizontal alignment criterion.
The group’s preference for shapes aligned in the horizontal axis is externally increased by assigning extra weight to the criterion FalignX. As a result of this bias, adopters tend to choose the artefact with the highest performance in this criterion, i.e. where all shapes are horizontally aligned. However, not all adopters’ decisions converge since perceptions V are not homogeneous.
3.3. ADOPTION SATISFACTION
Adopter satisfaction is computed as a measure of quality. In the adoption decision, if the choice criterion Ci-n equals the leading preference of an adopter, its satisfaction level is set to a maximum discrete value. Else, if the choice criterion is one standard deviation above the mean of the adopter's preferences, then the satisfaction level is set to a medium level. Otherwise, the agent has adopted an artefact that performs best in a criterion that is of little relevance to the adopter and its satisfaction level is set to a minimum. An adopter may abstain from adoption if no difference is perceived between artefacts, i.e. iff Pi-n is equal for all artefacts and Gmax = �.
3.4. SOCIAL INTERACTION
At every iteration step, adopters rely on social interaction to validate their perceptions, spread preferences and in general to conduct their adoption decisions. To this end different social spaces L are defined where adopters

506 R SOSA AND JS GERO
interact. At initial time adopter agents are randomly assigned a location on each space. These social spaces have different rules of interaction and development. Two aspects addressed in this paper are social tie strength (T) and neighbourhood size (H).
Ties are interaction links between nodes in a social network and represent the relationship between adopter agents (nodes) in a social space (Wasserman and Faust 1994). T is determined by the probability that associated nodes may interact over a period of time (Granovetter 1973). Strong social ties exist between nodes in a kinship network, whilst weak ties exist in networks where casual encounters occur between strangers or acquaintances. H is determined by the number of links from a node -also called ego-centred networks (Wasserman and Faust 1994). In our framework we implement a basic notion of tie strength as a probability 0.0 ≤ T ≤ 1.0 that any possible pair of adopter agents will remain in adjacent positions at the next time step. T ≈ 0.0 brings higher social mobility, i.e. adopter agents are shuffled more often and get to interact with different adopters over any given period. In contrast, T ≈ 1.0 bonds adopter together causing a decrease in social mobility, i.e. adopter agents remain in their same neighbourhoods interacting with the same agents for longer periods of time.
3.5. INFLUENCE DOMINANCE
A social space L1 in this framework is set where adopters exchange preferences F. Within a second social space L2 percepts G are traded. A third space is set where agents exchange adoption decisions Gmax. In all spaces H has an initial value of 2 that varies during a system run according to the influence that an adopter exerts on others. More influential adopters have larger neighbourhoods. Adopters can be located in social spaces with particular assumptions according to the hypothesis under inspection. For instance, the purchase of cars may be shaped by influence interaction in kinship networks whilst that of mobile phones may be strongly influenced by peer networks. Figure 5 shows a sample influence structure where an adopter with high dominance D has a large neighbourhood H = 6.
Figure 5. Influence structure in a sample space. Adopters are represented by rectangles, influence dominance by arrows. Vertical axis plots influence dominance
D. Neighbourhood size increases with dominance.

A COMPUTATIONAL FRAMEWORK TO STUDY CREATIVITY 507
The distribution of influence dominance D in an adopter population is measured by the Gini coefficient, a summary statistic of inequality. The Gini coefficient γ is used in studies of wealth distribution where group resources are limited and exchanged among members of a population. Influence can be seen as analogous to wealth in that it is generated by the interaction between two agents where one may increase its share at the expense of another. When γ ≈ 1.0 influence is concentrated by a few adopters and more stable dominance hierarchies exist. In contrast, when γ ≈ 0.0, influence is more distributed among adopters. More formally,
γ = { ∑ [(|di - di+1|) / Dmean] / (2 D2) } (7)
where the difference of every possible pair of dominance values (di - di+1) is divided by the mean of the entire dominance set of the population (Dmean). The relative mean difference (γ) is obtained by dividing the sum of pair differences by the square of the size of the dominance set (D2) (Dorfman 1979).
At initial time agents are randomly assigned extroversion thresholds X in every social space (Eysenck 1991). An adopter agent is assigned different X in different social spaces. Extroversion values are not fixed during a system run but change as a result of exerting influence over other agents.
Exchange between any pair of adopters starts by a comparison of their extroversion thresholds X. In the social space where preferences F are exchanged, the adopter agent with the higher extroversion of the pair influences the less extrovert adopter on the criterion with the highest preference. A negotiation process occurs by which the influenced adopter increases its preference by half the difference between their preferences. However, if the chosen artefact of both adopters is the same and their preferences too similar, the more extrovert changes its focus of attention by shifting its preference to another criterion. This is a way to implement uniformity-avoidance and novelty-seeking behaviour, i.e. “pi is an adopter’s top preference until it perceives that pi is commonplace”. Within other social spaces different content is exchanged following a similar approach. More formally influence I between adopters i and j is of the form:
Ii-j = |Xi - Xj| { Fj += [(Fi - Fj) (0.5)] } (8)
where the more extrovert adopter i influences less extrovert j. Negotiation occurs as the target preference F of agent j approaches agent i by a ratio of their difference. The exchange of percepts V and adoption choices Gmax in their corresponding social spaces takes place in the same form.
Whilst the details of this interaction can be fine-tuned to match a theory or observations, the key idea is that adopter agents exchange building blocks of their adoption process. This way even if an influential adopter is successful in spreading its preferences and percepts, the adoption decisions

508 R SOSA AND JS GERO
of influenced adopters need not converge. Namely, adopters with equal top preferences may still perceive artefacts differently and therefore reach different adoption decisions as shown in Figure 4.
In ergodic systems such as 2-dimensional cellular automata, a population converges from any initial random configuration. In contrast, when exchange occurs in more than one social space, the population may not converge as time � ∞ due to random walks being transient (Sosa and Gero, 2003).
3.6. OPINION LEADERSHIP AND GATEKEEPING
Promoters are opinion leaders whose dominance D increases at least one standard deviation above the mean as a result of social interaction. At initial time the set of promoters R is empty. As a result of social interaction over time, adopter populations form social structures of hierarchy. These structures can be determined by various exchange processes. An adopter population may have characteristics that enable many agents to gain opinion leadership temporarily or may generate only a limited number of stable opinion leaders. Whilst in the former γ ≈ 0.0 supports social mobility, the latter exhibits social stability and γ ≈ 1.0. Namely,
R = { di > (Dmean + Dstdev) } (9)
where a promoter R consists of every adopter whose dominance is greater than one standard deviation above the mean of group dominance D. The role of promoters in this framework is to form a two-way bridge between adopters and designers. Firstly, they serve as adoption models providing designers with positive feedback for reinforcement learning. Secondly, promoters become gatekeepers of the field given their ability to nominate artefacts for entry into the artefact repository Y, i.e. a collection of artefacts that defines the material culture of a population (Feldman et al 1994).
Since the number of promoters is by definition a small ratio of the adopter population, they are more likely to spend more real and computational resources in analysing available artefacts. With an adopter background, promoters follow the standard adoption decision process described above but also gain access to more detailed evaluation criteria.
The artefact repository Y is initialised with an entry threshold ε = 0. During a system run ε is increased supporting a notion of group progress by which the entry bar is raised with every entry. Two possible entry modes are addressed in this paper. Promoters can nominate artefacts that either increase the population's threshold of entry ε or perform well in different criteria than existing entries. Promoters evaluate artefacts using geometric descriptions like orthogonal rotation, uniform scale, and reflective symmetry. The nomination of artefacts by promoters occurs at a control rate specified by the
A COMPUTATIONAL FRAMEWORK TO STUDY CREATIVITY 509
experimenter. Figure 6 shows sample repository entries as nominated by promoters based on their geometric relationships.
Entry threshold ε to repositories has a decay mechanism A of the form:
A = { ε −= (0.05ε) } (10)
where ε decays marginally over time. A is executed when promoters fail to nominate qualified entries above ε.
Figure 6. Sample entries to the repository. Geometric relationships can be recognised within artefact shapes including scale, rotation, and symmetry.
Adopters and promoters provide the first elements of our definition of creativity. A creative design must be recognised and adopted by a population. Cumulative adoption of artefacts addresses a notion of popularity (Simonton 2000). It must also be selected by gatekeepers, i.e. experts representative of their social group. This selection is based on rules of entry that evolve as artefacts and societies change. Critics’ choice addresses the idea that creativity is judged by relevant arbiters (Gardner 1993; Feldman et al 1994). Lastly, adopter categories enable classification on the basis of when they choose an artefact (Rogers 1995).
4. Design Behaviour
At initial step, the size of a group of designer agents is determined as a ratio of the adopter population. Initial artefacts are configured and assigned to each designer. Designer agents are given a set of standard constraints to which their artefacts must comply. Designers’ knowledge and adopter bases, recognition levels, and repository entries are all set to zero at the beginning of a system run. Knowledge base refers to domain rules that designer agents generate and apply during a simulation. Adopter base is defined by cumulative adoption. Recognition is given by peer designers that imitate features of an existing solution. At initial time the role of designer agents is to present their artefacts for adopters’ assessment. The details of the design task are determined by the adopter group decisions and the ability of competing designers to generate solutions. The goal of designers in this system is to consistently generate artefacts that are chosen by adopters, are selected by critics, and are imitated by peers.
The execution of design behaviour can be parameterised according to the hypotheses under consideration. Namely, design update and adoption rates

510 R SOSA AND JS GERO
can be assumed to be periodical or synchronous. In this paper we assume that design occurs at adoption intervals during which adopters execute their decisions and interact socially. Variations of these assumptions are required to model different product markets and industries, requiring particular experimentation scenarios.
Designers may engage in different types of behaviour at any given time depending on a number of internal and external factors. Contingent design strategies can be seen as the product of the confluence of these conditions. The term strategy is used as adaptation of behaviour that appears to serve an important function in achieving the goal of being adopted, short-listed and influential. As determined by a strategy, design behaviour seeks to increment adopters’ satisfaction levels and extend adopter base by capitalising on relative superiority (competition), by exploiting weaknesses of competitors, or by seeking artefact differentiation or diversification.
Designer agents seek a type of contingent strategy where they learn a design rule, i.e. an instance of domain knowledge tied to the artefact representation. In this case a design rule is made of artefact feature, target criterion and target perception. Rules are generated based on the designer’s model of the population's adoption process. In order to do this, designers establish contracts with promoters that adopt their artefacts. This is a way to implement positive feedback since otherwise a designer would not have access to target criteria and target perception, i.e. a promoter may be an adopter of a competing artefact or may be abstaining from adopting. Having access to a framework of adoption, a designer can emulate the collective decision process by generating hypotheses of possible alternative artefacts.
Designers evaluate and change the configuration of their artefacts in order to improve performance along the modelled adoption criteria provided by promoters. Namely, designers sort the lines of their artefacts according to their contribution to the formation of perceived shapes. Designers are able to delete or generate new lines as a function of adopter perception V. Hypotheses consist of informed changes to current artefacts. In particular features that do not contribute to good performance are randomly replaced. Hypotheses are then evaluated following the multi-criteria adoption function of equations 4 and 5. A design rule λ consists of artefact changes that increase its performance along a target criterion.
λ = { Gh = ∆P : Ci } (11)
where a hypothesised feature Gh results in an increment of artefact performance P in a presumed criterion Ci. The positive value of ∆ stands for the improvement ratio of λ.
Processing abilities and synthetic abilities are assigned at initial time to each designer. Processing refers to the capacity of designers to generate and retrieve domain rules, whilst synthesis controls the number of hypotheses

A COMPUTATIONAL FRAMEWORK TO STUDY CREATIVITY 511
that designers can generate before having to transform their artefacts. In this paper designers are assigned constant abilities at initial time. However, abilities gradually increase as a function of design behaviour. These two parameters determine individual differences across designers. This enables experimentation with the impact of individual factors on creativity, but is beyond the scope of this paper.
If a designer is not able to generate new domain knowledge, it seeks a strategy to apply existing design rules λ. Here two assumptions can be implemented: domain knowledge may have private or public access. If private, every designer agent only has access to their own rules, whilst in public mode all designers have access to all existing rules.
Apply = { λ = ∆P : Ci } (12)
where an existing rule λ that improves performance P in a target criterion C is applied to an artefact. If a designer is not able to generate or apply relevant knowledge, the last option is to imitate other designers. Imitation is the simplest form of collective learning, i.e. blind learning since information about features, criteria, and perception is missing. Imitation is defined as the transfer of a random feature G. Designers whose artefacts have low adoption rates imitate artefacts with higher rates. This is acknowledged as peer recognition given to the designer of the source artefact. Recognition from colleagues indicates the influence of a designer and further extends its processing and synthetic abilities.
Designers may address the perceived group’s choice criterion Ci or they may determine an alternative target criterion. This choice is a function of perceived adopter preferences F and estimated artefact performance P. If a designer considers that its artefact’s performance is competitive (i.e. equal or above mean adopter preference) capitalisation is chosen and alternatives are sought to improve performance on the choice criterion (exploit relative superiority). If estimated performance is instead low on adopter preferences then designers seek to differentiate their artefacts from the highly competitive industry by selecting their best performing criterion.
Competition = P ≥ Fmean (13)
Differentiation = P < Fmean (14)
Designer agents in this system are not equipped with creative abilities per se. The aim is not to introduce special traits to assess the effects of agents’ creativeness as assessed by the experimenter. Instead, all designers are assigned equivalent sets of mechanisms. No extraordinary process within the individual is hardwired but in time agent interaction renders a social self-organised construct of how a designer may exhibit behaviour considered creative within its society.

512 R SOSA AND JS GERO
Strategic Differentiation Index (SDI) is an index estimated collectively by adopters that reflects the perceived differentiation across the available artefacts (Nattermann 2000). With a design system initialised in a converged state, SDI = 0.0. As designers seek to generate artefacts that differ from other available artefacts SDI > 0.
SDI = { ∑ (Pvar / Ci-n) } (15)
where SDI is the sum of mean performance variance for all criteria as estimated by the adopter population.
This social framework encapsulates some of the characteristics of design problems including ill-structuredness and interpretation; decomposability; incremental solutions; hypothesis generation; negotiable and nomological constraints; no right or wrong answers; and delayed feedback (Goel 1994).
Design behaviour complements our definition of creativity. Adoption rate is a trend measure used to determine what designer is imitated at a particular time step. Peer-recognition is considered a necessary element in the creativity literature (Runco and Pritzker 1999). The contribution of each designer to domain knowledge is interpreted as transformation of the design space (Gero 1996), learning, experience, and the ten-year rule (Runco and Pritzker 1999). Extension and exhaustion of the design space (i.e., rule generation and application) refer to exploratory-transformational creativity (Boden 1999). The number of hypotheses generated resembles idea productivity. The number of entries selected by gatekeepers gives a measure of a designer’s contribution to the repository or domain (Feldman et al 1994). The limit on hypothesis generation and constraints on representation addresses the relationship between constraints and creativity (Amabile 1983).
A designer is considered creative by its social group when it reaches large adopter groups, its artefacts are entered into the repository, other designers imitate its artefacts, it transforms the design space by formulating knowledge, and its adopters have high satisfaction levels. In general experimentation with this framework consists of exploring the effects that both individual and situational factors have on determining the creativity of designers.
5. Experiment: Social Ties
This experiment addresses the role of social ties in the formation of influence structures in a population and the associated effects on creativity and innovation. Tie strength T is implemented as the frequency of contact between adopters (Marsden and Campbell, 1984). A series of simulations are run where the initial configuration of adopters and designers is kept constant and the strength of social ties T is the independent variable. Monte Carlo

A COMPUTATIONAL FRAMEWORK TO STUDY CREATIVITY 513
runs are conducted to explore the range 0.0 ≤ T ≤ 1.0 over 7500 iterations in populations of 10 agents. This explores the range where agents remain in their social location at all times to where agents change social locations at all times, respectively. Preliminary runs showed that dependent variables stabilise between 2500 and 5000 iterations. The resulting dataset is then filtered in order to exclude outliers, i.e. values 1.5 standard deviations from the mean. All the following results represent means of 10 simulation runs. Each simulation run is initialised in a converged state to avoid biases in the form of random initial artefact configurations. Therefore at iteration step 0, adopters perceive no differentiation between artefacts and all abstain from adopting. It is only after a designer first modifies an artefact that adoption commences.
5.1. DOMINANCE HIERARCHIES
As T increases, social mobility is seen to decrease causing agents to interact more often with a stable group of neighbours. As a result, influence is more concentrated (γ ≈ 1.0), i.e. a few adopters exert dominance over others. In contrast, as T decreases, social mobility increases and agents have contact within a varying neighbourhood. In such conditions, influence structures of dominance are more distributed (γ ≈ 0.0), i.e. hierarchies become more flat. Figure 7 shows a scatter plot and power-law relation of tie strength T and Gini coefficient γ.
Distance Weighted Least Squares
0.37
0.38
0.39
0.4
0.41
0.42
0.43
0.44
0.45
Tie strength T
Gin
i Coeffic
ient
1.0 0.0
Figure 7. A power law function is empirically demonstrated for tie strength and Gini coefficient (T = 0.45 γ -0.039)
5.2. GATEKEEPING EFFECTS
The formation of dominance structures shows unexpected effects in adoption and design behaviour. On the one hand an inverse correlation is shown
T = 0.45 γ -0.039
R2 = 0.9207

514 R SOSA AND JS GERO
between tie strength T and number of entries to the repository Y. Lower T is correlated with larger repositories as shown in Figure 8, Pearson = 0.6706 N = 30 p = 0.001.
This phenomenon may be due to the nature of the promoter role and is particularly insightful in relation to gatekeeping (Feldman et al 1994). In societies with rigid influence hierarchies (T ≈ 1.0) there is less variation in adopters that play the promoter role. Therefore interpretations that serve to evaluate artefacts for entry remain constant over time. In contrast, in societies with lower T and therefore where influence is distributed rather than concentrated there is a higher change rate of gatekeepers. Consequently, more diverse evaluations of artefacts mean more artefacts are submitted to the repository. As an effect, designers in general tend to receive more recognition for their work.
Gate-keeping Effects
0
100
200
Tie strength T
Rep
osito
ry s
ize
Y
1.0 0.0 Figure 8. Social spaces with high tie strengths tend to produce smaller repositories
The mean score of repository entries is also correlated with variations in tie strength T, Pearson = 0.5657 N = 30 p = 0.002. This demonstrates that large repositories contain artefacts ascribed with higher quality. It is of special interest that the size of the design space defined by designer agents increases by manipulating a situational factor such as T. The connection between high mean scores and large repository sizes is better illustrated by the decay mechanism of the repository in eq. 10. In simulation runs where artefacts are submitted more often to Y, these are required to exceed the entry threshold ε and must have, by definition, higher scores assigned by promoters.
5.3. DIFFERENTIATION EFFECTS
The differentiation of design artefacts is measured through the Strategic Differentiation Index (SDI) (Nattermann 2000). These experiments show that SDI decreases with higher T and has the opposite effect as T decreases.

A COMPUTATIONAL FRAMEWORK TO STUDY CREATIVITY 515
In other words, designers operating on tight social spaces where influence structures are rigid tend to generate more similar artefacts. The same designers operating on better distributed influence social spaces have a tendency towards higher differentiation, Pearson = 0.5755 N = 30 p = 0.004.
5.4. PROMINENCE EFFECTS
Lastly, effects on the size and nature of adopter groups are addressed. Monte Carlo runs where tie strength T is the independent variable consistently show that T is positively correlated with adopter group size, Pearson = 0.608 N = 26 p = 0.001. This illustrates that low tie strengths increase abstention. On the other hand, T is also correlated with distribution of adoption defined as the ratio of smallest and largest adopter groups as shown in Figure 9, Pearson = 0.6796 N = 26 p = 0.001. Namely, in social spaces where T ≈ 0.0 and influence is more distributed, adopters tend to abstain more and their choice tends to be more closely distributed across designers. In contrast, T ≈ 1.0 increases total adoption and concentration of choices. In other words, the competitiveness between designers and their prominence can be determined by the way in which their evaluating groups organise.
Prominence Effects
0
0.1
0.2
0.3
0.4
0.5
0.6
0.7
0.8
0.9
Tie strength T
Adoption G
ap
1.0 0.0 Figure 9. Social spaces with high tie strengths (T ≈ 1.0) tend to produce higher
variation between adopter groups’ sizes
5.5. SUMMARY
The experiments presented in this section suggest that creativity transcends the individual domain. Patterns of creative figures show that characteristics external to the individual may indeed determine who and how is considered creative in a society. Graham, Einstein, Picasso and Freud have been characterised as extraordinary creators. Whilst their personality traits and abilities have little in common (Gardner 1993), similarities exist between the structures of the fields within which they operated. Namely, a few powerful

516 R SOSA AND JS GERO
critics rendered influential judgements about the quality of their work (Feldman et al 1994).
Our experiments illustrate a fundamental idea about the nature of creativity and innovation, i.e. that a situational factor that regulates the way in which adopters interact may have a significant effect on how both designers and adopter groups operate. The implications are that by observing the performance of designers alone it is not possible to put forward conclusions about their individual characteristics. Instead, the cause of behaviour could be a situational factor that defines not the designers but their evaluators.
6. Discussion
In this paper a social framework for the study of creativity and innovation in design has been introduced and used to experiment with a situational factor of creativity in design. Factors that regulate aggregate behaviour of a population of adopters are shown to affect the way designers operate and their impact as change agents of their societies. A corollary of these types of studies is that the understanding of creativity will require the extension of the unit of study outside the cognitive realm of the design process and into the social-psychology of design. Computational creativity has a fundamental role in supporting experimentation of socio-cognitive interactions. Future experiments will target:
• relationship between popularity and critics' recognition • impact of knowledge privatisation on innovation (i.e. patents) • types of unexpected consequences of diffusion of innovations • transition from 'herding' to innovation • characterisation of tipping points and population size effects Situations seem adequate units of analysis to model the link between
cognition and social change. A creative situation (i.e. one within which designers with different characteristics are likely to trigger a social change) could be typified to complement the dominance of studies that focus on the creative personality.
Acknowledgements
This research is supported by an International Postgraduate Research Scholarship and a University of Sydney International Postgraduate Award. Computing resources are provided by the Key Centre of Design Computing and Cognition.
References
Amabile, TM: 1983, The Social Psychology of Creativity, Springer-Verlag, New York.

A COMPUTATIONAL FRAMEWORK TO STUDY CREATIVITY 517
Argyle, M, Furnham, A and Graham JA: 1981, Social Situations, Cambridge University Press, Cambridge.
Asch, SE: 1951, Effects of group pressures upon the modification and distortion of judgment, in H Guetzkow (ed), Groups, Leadership, and Men, Carnegie Press, Pittsburgh, pp. 177-190.
Boden, M: 1999, Computer models of creativity, in R Sternberg (ed), Handbook of Creativity, Cambridge University Press, Cambridge, pp.351-372.
Conte R, Edmonds B, Moss S and Sawyer RK: 2001, Sociology and social theory in agent based social simulation, Computational and Mathematical Organization Theory 7(4): 183-205.
Dorfman, R: 1979, Formula for Gini coefficient, Review of Economics Statistics 61: 146-9. Eysenck, HJ: 1991, Dimensions of personality, Personality and Individual Differences 12:
773-90. Feldman, DH, Csikszentmihalyi, M, and Gardner, H: 1994, Changing the World, A
Framework for the Study of Creativity, Praeger, Westport. Gardner, H: 1993, Creating Minds, An Anatomy of Creativity Seen Through the Lives of
Freud, Einstein, Picasso, Stravinsky, Eliot, Graham and Gandhi, Basic Books, New York Gero, JS: 1996, Creativity, emergence and evolution in design: concepts and framework,
Knowledge-Based Systems 9(7): 435-448. Goel, V: 1994, A comparison of design and nondesign problem spaces, Artificial Intelligence
in Engineering 9(1): 53-72. Granovetter, MS: 1973, The strength of weak ties, American Journal of Sociology 78(6):
1360-80. Howe, MJA, Davidson, JW, and Sloboda, JA: 1999, Innate traits: reality or myth?, in SJ Ceci
and WM Williams (eds), The Nature-Nurture Debate, The Essential Readings, Blackwell, Malden, pp. 258-289.
Marsden, PV and Campbell, K: 1984, Measuring tie strength, Social Forces 63(2): 482-501. Nattermann, PM: 2000, Best practice does not equal best strategy, The McKinsey Quarterly
2000(2): 38-45. Rogers, EM: 1995, Diffusion of Innovations, The Free Press, New York. Ross, L and Nisbett, R: 1991, The Person and the Situation, McGraw-Hill, New York. Runco, M and Pritzker, S (eds): 1999, Encyclopedia of Creativity, AcademicPress, San Diego. Saunders, R and Gero, JS: 2001, The digital clockwork muse, in G Wiggins (ed), AISB'01
Symposium on AI and Creativity in Arts and Science, University of York, York, pp.12-21. Schelling, K: 1971, Dynamic models of segregation, Mathematical Sociology 1: 143-186. Simon, HA: 2001, Creativity in the arts and the sciences, The Kenyon Review 23(2): 203-221. Simonton, DK: 2000, Creative development as acquired expertise: theoretical issues and an
empirical test, Developmental Review 20: 283-318. Sosa, R and Gero, JS: 2003, Social change: exploring design influence, in D Hales, B
Edmonds, E Norling and J Rouchier (eds), Multi-Agent Based Simulation III, Lecture Notes in Artificial Intelligence, 2927, Springer, Berlin, pp. 106-119.
Wasserman, S and Faust, K: 1994, Social Network Analysis: Methods and Applications, Cambridge University Press, Cambridge.
Wooldridge, M: 2000, Reasoning About Rational Agents, MIT Press, Cambridge.

518