a complete metabolic and structural study of mirna responsible for autism
TRANSCRIPT
1
A REPORT
ON
A COMPLETE METABOLIC AND STRUCTURAL STUDY OF miRNA
RESPONSIBLE FOR AUTISM
BY
BISWA PRASANNA MISHRA 2008B1A1609H
UNDER THE SUPERVISION OF
Dr. Savitha Govardhan
Assistant Professor
BIRLA INSTITUTE OF TECHNOLOGY & SCIENCE (BITS) PILANI, HYDERABAD
APRIL, 2012
2
A REPORT
ON
A COMPLETE METABOLIC AND STRUCTURAL STUDY OF miRNA
RESPONSIBLE FOR AUTISM
BY
BISWA PRASANNA MISHRA 2008B1A1609H MSc. (BIO) & B.E.(CHEM)
Submitted in partial fulfilment of the
Computer Projects BITS C331
UNDER THE SUPERVISION OF
Dr. Savitha Govardhan
Assistant Professor
DEPARTMENT OF BIOLOGICAL SCIENCES
BIRLA INSTITUTE OF TECHNOLOGY & SCIENCE, PILANI-HYDERABAD
CAMPUS
April, 2012
3
CERTIFICATE
This is to certify that the report entitled, “A COMPLETE METABOLIC AND STRUCTURAL
STUDY OF miRNA RESPONSIBLE FOR AUTISM” and submitted by Biswa Prasanna Mishra,
ID No. 2008B1A1609H, in partial fulfillment of the requirements of BITS C331 Computer
Projects embodies the work done by him/her under my supervision.
Signature of the supervisor
Name:
Designation:
Date:
4
Acknowledgements
I would like to thank Dr. Savitha Govardhan, my COP Instructor, Department of Biological
Sciences, who guided me through the course of this project and for giving valuable suggestions
regarding the same.
I am greatly indebted to Ms. Priyanka Purkayastha, RS in Department of Biological Sciences for
her continued guidance and assistance during this project. I am also thankful to other Research
Scholars for their support.
5
Abstract
Autism is a disorder of neural development characterized by impaired social
interaction and communication, and by restricted and repetitive behavior. Autism affects
information processing in the brain by altering how nerve cells and their synapses connect and
organize; how this occurs is not well understood. It is one of three recognized disorders in the
autism spectrum (ASDs), the other two being Asperger syndrome, and Pervasive Developmental
Disorder-Not Otherwise Specified (commonly abbreviated as PDD-NOS). Autism can be caused
by various sources, one of them being miRNA, the one being studied in this project. We try to
know the causal miRNA species and then try to do a detailed structural study and validation. The
structural study would include using various tools and internet servers to predict the secondary
and tertiary structures of the miRNA sequence and their go for validation using MolProbity.
6
Table of Contents
Acknowledgements………………………………………………………..4
Abstract……………………………………………………………………5
Autism
Characteristics………………………………………………………8
Causes……………………………………………………………….8
Mechanism…………………………………………………………10
Screening…...................................................................................15
Diagnosis…………………………………………………………...15
MicroRNA………………………………………………………………...17
miRNA and disease….............................................................................24
Nucleic Acid Secondary Structure………………………………………..26
Taxonomy of Algorithms………………………………………………....28
Secondary Structure Elements…………………………………………....30
Secondary Structure Visualization…………………………………….....32
Identifying Secondary Structure Constraints…………………………….37
Generating Tertiary Structures…………………………………………....40
Visualizing Tertiary Structure……………………………………………..42
Alignment…………………………………………………………………..45
Validation…………………………………………………………………..46
Results and Discussion…………………………………………………….47
References…………………………………………………………………..48
7
Introduction: Autism is a disorder of neural development characterized by impaired social
interaction and communication, and by restricted and repetitive behavior. These signs all begin
before a child is three years old. Autism affects information processing in the brain by altering
how nerve cells and their synapses connect and organize; how this occurs is not well
understood. It is one of three recognized disorders in theautism spectrum (ASDs), the other two
being Asperger syndrome, which lacks delays in cognitive development and language,
and Pervasive Developmental Disorder-Not Otherwise Specified (commonly abbreviated as
PDD-NOS), which is diagnosed when the full set of criteria for autism or Asperger syndrome are
not met.
Autism has a strong genetic basis, although the genetics of autism are complex and it is unclear
whether ASD is explained more by rare mutations, or by rare combinations of common genetic
variants. In rare cases, autism is strongly associated with agents that cause birth defects
Controversies surround other proposed environmental causes, such as heavy metals, pesticides or
childhood vaccines; the vaccine hypotheses are biologically implausible and lack convincing
scientific evidence. The prevalence of autism is about 1–2 per 1,000 people worldwide; however,
the Centers for Disease Control and Prevention (CDC) reports approximately 9 per 1,000
children in the United States are diagnosed with ASD. The number of people diagnosed with
autism has increased dramatically since the 1980s, partly due to changes in diagnostic practice;
the question of whether actual prevalence has increased is unresolved.
Parents usually notice signs in the first two years of their child's life. The signs usually develop
gradually, but some autistic children first develop more normally and
then regress. Early behavioral or cognitive intervention can help autistic children gain self-care,
social, and communication skills. Although there is no known cure, there have been reported
cases of children who recovered. Not many children with autism live independently after
reaching adulthood, though some become successful. An autistic culture has developed, with
some individuals seeking a cure and others believing autism should be accepted as a difference
and not treated as a disorder.
Characteristics: Autism is a highly variable neurodevelopmental disorder that first appears
during infancy or childhood, and generally follows a steady course without remission. Overt
8
symptoms gradually begin after the age of six months, become established by age two or three
years, and tend to continue through adulthood, although often in more muted form. It is
distinguished not by a single symptom, but by a characteristic triad of symptoms: impairments in
social interaction; impairments in communication; and restricted interests and repetitive
behavior. Other aspects, such as atypical eating, are also common but are not essential for
diagnosis. Autism's individual symptoms occur in the general population and appear not to
associate highly, without a sharp line separating pathologically severe from common traits.
Causes: It has long been presumed that there is a common cause at the genetic, cognitive, and
neural levels for autism's characteristic triad of symptoms. However, there is increasing
suspicion that autism is instead a complex disorder whose core aspects have distinct causes that
often co-occur.
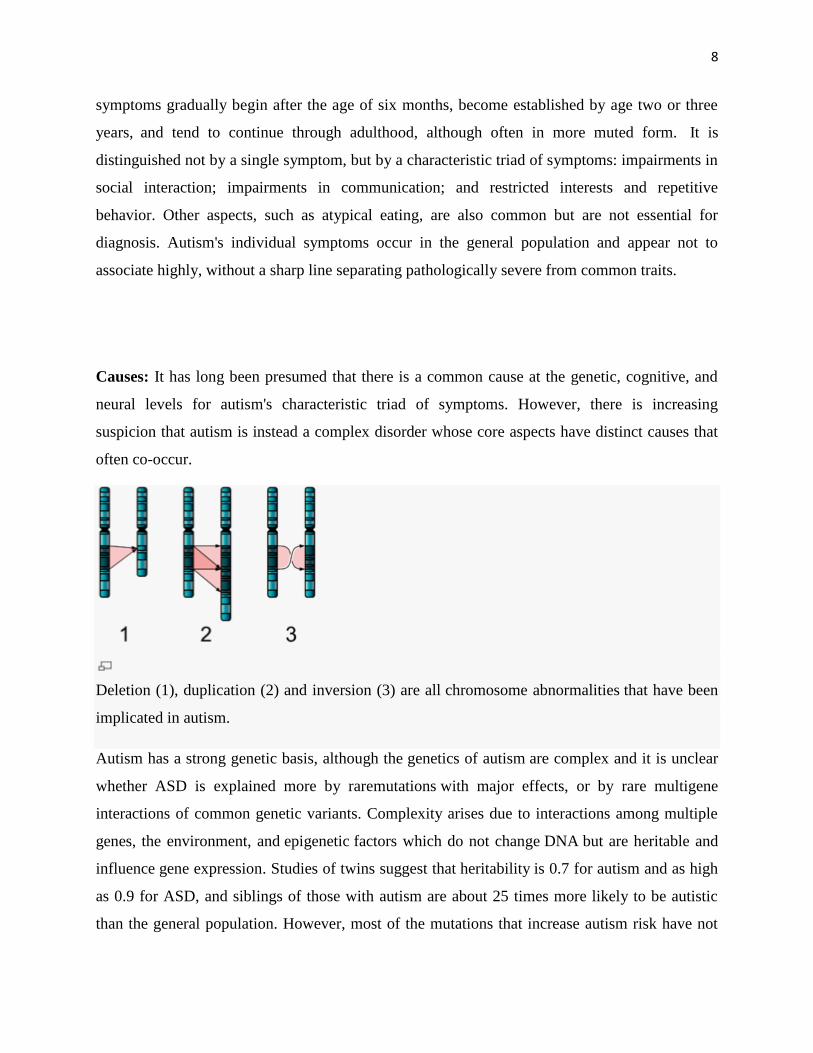
Deletion (1), duplication (2) and inversion (3) are all chromosome abnormalities that have been
implicated in autism.
Autism has a strong genetic basis, although the genetics of autism are complex and it is unclear
whether ASD is explained more by raremutations with major effects, or by rare multigene
interactions of common genetic variants. Complexity arises due to interactions among multiple
genes, the environment, and epigenetic factors which do not change DNA but are heritable and
influence gene expression. Studies of twins suggest that heritability is 0.7 for autism and as high
as 0.9 for ASD, and siblings of those with autism are about 25 times more likely to be autistic
than the general population. However, most of the mutations that increase autism risk have not
9
been identified. Typically, autism cannot be traced to a Mendelian (single-gene) mutation or to a
single chromosome abnormality, and none of the genetic syndromes associated with ASDs have
been shown to selectively cause ASD. Numerous candidate genes have been located, with only
small effects attributable to any particular gene. The large number of autistic individuals with
unaffected family members may result from copy number variations—
spontaneous deletions or duplications in genetic material during meiosis. Hence, a substantial
fraction of autism cases may be traceable to genetic causes that are highly heritable but not
inherited: that is, the mutation that causes the autism is not present in the parental genome.
Several lines of evidence point to synaptic dysfunction as a cause of autism. Some rare mutations
may lead to autism by disrupting some synaptic pathways, such as those involved with cell
adhesion. Gene replacement studies in mice suggest that autistic symptoms are closely related to
later developmental steps that depend on activity in synapses and on activity-dependent changes.
All known teratogens (agents that cause birth defects) related to the risk of autism appear to act
during the first eight weeks from conception, and though this does not exclude the possibility
that autism can be initiated or affected later, it is strong evidence that autism arises very early in
development.
Although evidence for other environmental causes is anecdotal and has not been confirmed by
reliable studies, extensive searches are underway. Environmental factors that have been claimed
to contribute to or exacerbate autism, or may be important in future research, include certain
foods, infectious disease, heavy metals, solvents, diesel exhaust, PCBs,
phthalates and phenols used in plastic products, pesticides, brominated flame
retardants, alcohol, smoking, illicit drugs, vaccines, and prenatal stress, although no links have
been found, and some have been completely disproven.
Parents may first become aware of autistic symptoms in their child around the time of a routine
vaccination. This has led to unsupported theories blaming vaccine "overload", a vaccine
preservative, or the MMR vaccine for causing autism. The latter theory was supported by a
litigation-funded study that has since been shown to have been "an elaborate fraud". Although
these theories lack convincing scientific evidence and are biologically implausible, parental
concern about a potential vaccine link with autism has led to lower rates of childhood
10
immunizations, outbreaks of previously controlled childhood diseases in some countries, and the
preventable deaths of several children.
Mechanism: Autism's symptoms result from maturation-related changes in various systems of
the brain. How autism occurs is not well understood. Its mechanism can be divided into two
areas: the pathophysiology of brain structures and processes associated with autism, and
the neuropsychological linkages between brain structures and behaviors. The behaviors appear to
have multiple pathophysiologies.
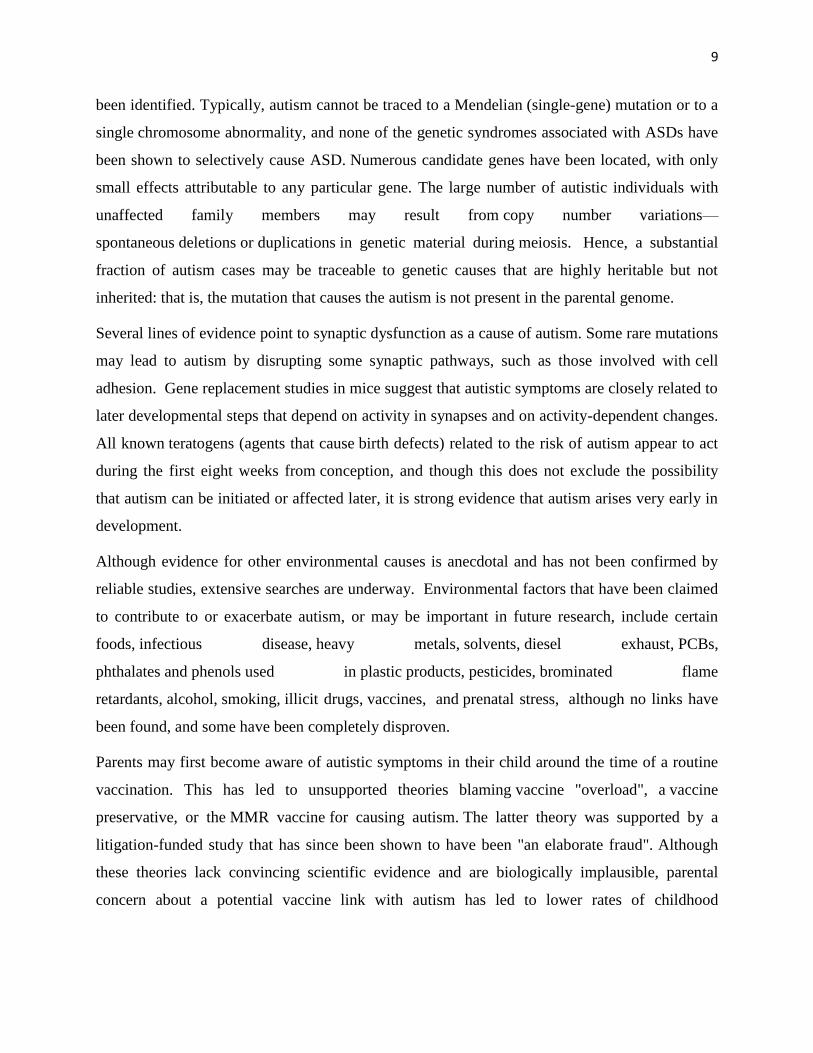
Pathophysiology
Autism affects the amygdala, cerebellum, and many other parts of the brain.[
Unlike many other brain disorders, such as Parkinson's, autism does not have a clear unifying
mechanism at either the molecular, cellular, or systems level; it is not known whether autism is a
few disorders caused by mutations converging on a few common molecular pathways, or is (like
intellectual disability) a large set of disorders with diverse mechanisms. Autism appears to result
from developmental factors that affect many or all functional brain systems, and to disturb the
11
timing of brain development more than the final product. Neuroanatomicalstudies and the
associations with teratogens strongly suggest that autism's mechanism includes alteration of
brain development soon after conception. This anomaly appears to start a cascade of
pathological events in the brain that are significantly influenced by environmental factors. Just
after birth, the brains of autistic children tend to grow faster than usual, followed by normal or
relatively slower growth in childhood. It is not known whether early overgrowth occurs in all
autistic children. It seems to be most prominent in brain areas underlying the development of
higher cognitive specialization. Hypotheses for the cellular and molecular bases of pathological
early overgrowth include the following:
An excess of neurons that causes local over connectivity in key brain regions.
Disturbed neuronal migration during early gestation.
Unbalanced excitatory–inhibitory networks.
Abnormal formation of synapses and dendritic spines, for example, by modulation of
the neurexin–neuroligin cell-adhesion system, or by poorly regulated synthesis of synaptic
proteins. Disrupted synaptic development may also contribute to epilepsy, which may
explain why the two conditions are associated.
Interactions between the immune system and the nervous system begin early during
the embryonic stage of life, and successful neurodevelopment depends on a balanced immune
response. Aberrant immune activity during critical periods of neurodevelopment is possibly part
of the mechanism of some forms of ASD. Although some abnormalities in the immune system
have been found in specific subgroups of autistic individuals, it is not known whether these
abnormalities are relevant to or secondary to autism's disease processes. Asautoantibodies are
found. in conditions other than ASD, and are not always present in ASD, the relationship
between immune disturbances and autism remains unclear and controversial.
The relationship of neurochemicals to autism is not well understood; several have been
investigated, with the most evidence for the role of serotonin and of genetic differences in its
transport. The role of group I metabotropic glutamate receptors (mGluR) in the pathogenesis
of fragile X syndrome, the most common identified genetic cause of autism, has led to interest in
the possible implications for future autism research into this pathway. Some data suggest an
increase in several growth hormones; other data argue for diminished growth factors. Also,
12
some inborn errors of metabolism are associated with autism, but probably account for less than
5% of cases.
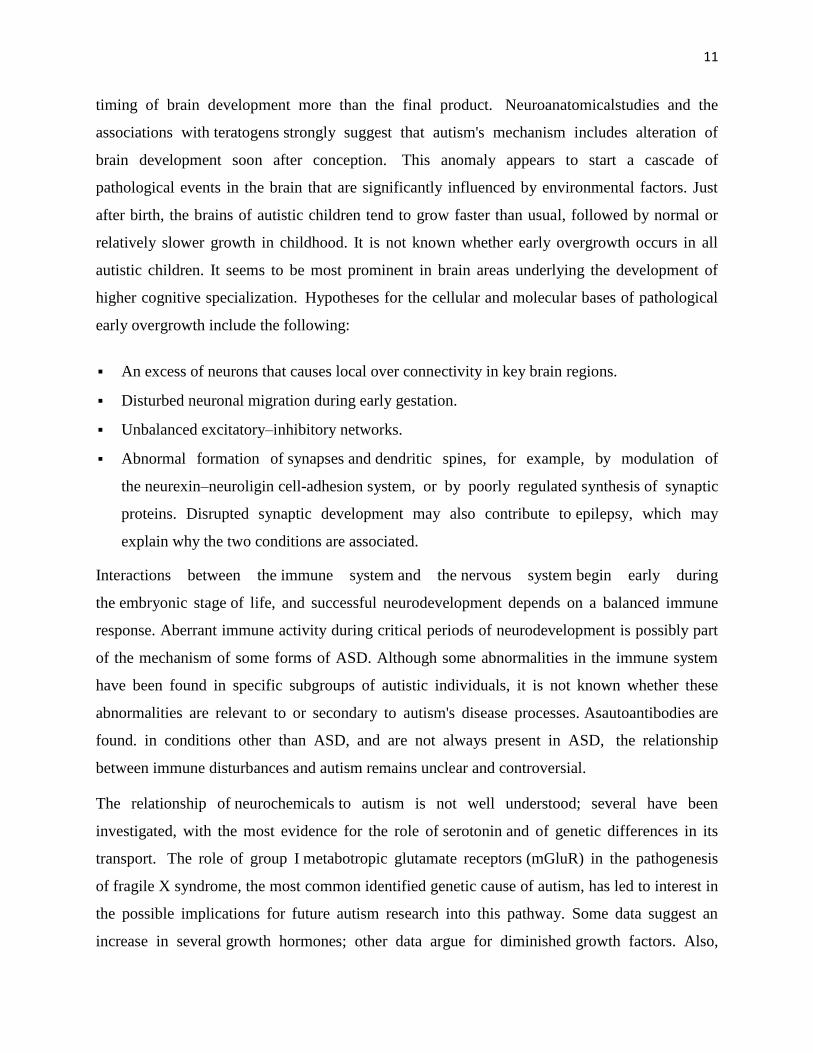
The mirror neuron system (MNS) theory of autism hypothesizes that distortion in the
development of the MNS interferes with imitation and leads to autism's core features of social
impairment and communication difficulties. The MNS operates when an animal performs an
action or observes another animal perform the same action. The MNS may contribute to an
individual's understanding of other people by enabling the modeling of their behavior via
embodied simulation of their actions, intentions, and emotions. Several studies have tested this
hypothesis by demonstrating structural abnormalities in MNS regions of individuals with ASD,
delay in the activation in the core circuit for imitation in individuals with Asperger syndrome,
and a correlation between reduced MNS activity and severity of the syndrome in children with
ASD. However, individuals with autism also have abnormal brain activation in many circuits
outside the MNSand the MNS theory does not explain the normal performance of autistic
children on imitation tasks that involve a goal or object.
Autistic individuals tend to use different areas of the brain (yellow) for a movement task
compared to a control group (blue).[
ASD-related patterns of low function and aberrant activation in the brain differ depending on
whether the brain is doing social or nonsocial tasks. In autism there is evidence for reduced
functional connectivity of the default network, a large-scale brain network involved in social and
emotional processing, with intact connectivity of the task-positive network, used in sustained
attention and goal-directed thinking. In people with autism the two networks are not negatively
13
correlated in time, suggesting an imbalance in toggling between the two networks, possibly
reflecting a disturbance of self-referential thought. A 2008 brain-imaging study found a specific
pattern of signals in the cingulate cortex which differs in individuals with ASD.
The underconnectivity theory of autism hypothesizes that autism is marked by underfunctioning
high-level neural connections and synchronization, along with an excess of low-level
processes. Evidence for this theory has been found in functional neuroimaging studies on
autistic individuals and by a brainwave study that suggested that adults with ASD have local
overconnectivity in the cortex and weak functional connections between thefrontal lobe and the
rest of the cortex. Other evidence suggests the underconnectivity is mainly within
each hemisphere of the cortex and that autism is a disorder of the association cortex.
From studies based on event-related potentials, transient changes to the brain's electrical activity
in response to stimuli, there is considerable evidence for differences in autistic individuals with
respect to attention, orientiation to auditory and visual stimuli, novelty detection, language and
face processing, and information storage; several studies have found a preference for nonsocial
stimuli. For example, magnetoencephalography studies have found evidence in autistic children
of delayed responses in the brain's processing of auditory signals.
In the genetic area, relations have been found between autism and schizophrenia based on
duplications and deletions of chromosomes; research showed that schizophrenia and autism are
significantly more common in combination with 1q21.1 deletion syndrome. Research on
autism/schizophrenia relations for chromosome 15 (15q13.3), chromosome 16 (16p13.1) and
chromosome 17 (17p12) are inconclusive.
Neuropsychology
Two major categories of cognitive theories have been proposed about the links between autistic
brains and behavior.
The first category focuses on deficits in social cognition. The empathizing–systemizing
theory postulates that autistic individuals can systemize—that is, they can develop internal rules
of operation to handle events inside the brain—but are less effective at empathizing by handling
events generated by other agents. An extension, the extreme male brain theory, hypothesizes that
autism is an extreme case of the male brain, defined psychometrically as individuals in whom
14
systemizing is better than empathizing; this extension is controversial, as many studies
contradict the idea that baby boys and girls respond differently to people and objects.
These theories are somewhat related to the earlier theory of mind approach, which hypothesizes
that autistic behavior arises from an inability to ascribe mental states to oneself and others. The
theory of mind hypothesis is supported by autistic children's atypical responses to the Sally–
Anne test for reasoning about others' motivations,[103]
and the mirror neuron system theory of
autism described in Pathophysiology maps well to the hypothesis. However, most studies have
found no evidence of impairment in autistic individuals' ability to understand other people's basic
intentions or goals; instead, data suggests that impairments are found in understanding more
complex social emotions or in considering others' viewpoints.
The second category focuses on nonsocial or general processing. Executive
dysfunction hypothesizes that autistic behavior results in part from deficits in working memory,
planning, inhibition, and other forms of executive function. Tests of core executive processes
such as eye movement tasks indicate improvement from late childhood to adolescence, but
performance never reaches typical adult levels. Strength of the theory is predicting stereotyped
behavior and narrow interests; two weaknesses are that executive function is hard to measure and
that executive function deficits have not been found in young autistic children.
Weak central coherence theory hypothesizes that a limited ability to see the big picture underlies
the central disturbance in autism. One strength of this theory is predicting special talents and
peaks in performance in autistic people. A related theory—enhanced perceptual functioning—
focuses more on the superiority of locally oriented and perceptualoperations in autistic
individuals. These theories map well from the underconnectivity theory of autism.
Neither category is satisfactory on its own; social cognition theories poorly address autism's rigid
and repetitive behaviors, while the nonsocial theories have difficulty explaining social
impairment and communication difficulties. A combined theory based on multiple deficits may
prove to be more useful.
Screening: About half of parents of children with ASD notice their child's unusual behaviors by
age 18 months, and about four-fifths notice by age 24 months.
15
No babbling by 12 months.
No gesturing (pointing, waving bye-bye, etc.) by 12 months.
No single words by 16 months.
No two-word spontaneous (not just echolalic) phrases by 24 months.
Any loss of any language or social skills, at any age.
US and Japanese practice is to screen all children for ASD at 18 and 24 months, using autism-
specific formal screening tests. In contrast, in the UK, children whose families or doctors
recognize possible signs of autism are screened. It is not known which approach is more
effective. Screening tools include the Modified Checklist for Autism in Toddlers (M-CHAT), the
Early Screening of Autistic Traits Questionnaire, and the First Year Inventory; initial data on M-
CHAT and its predecessor CHAT on children aged 18–30 months suggests that it is best used in
a clinical setting and that it has low sensitivity (many false-negatives) but good specificity (few
false-positives). It may be more accurate to precede these tests with a broadband screener that
does not distinguish ASD from other developmental disorders. Screening tools designed for one
culture's norms for behaviors like eye contact may be inappropriate for a different culture.
Although genetic screening for autism is generally still impractical, it can be considered in some
cases, such as children with neurological symptoms and dysmorphic features.
Diagnosis: Diagnosis is based on behavior, not cause or mechanism. Autism is defined in
the DSM-IV-TR as exhibiting at least six symptoms total, including at least two symptoms of
qualitative impairment in social interaction, at least one symptom of qualitative impairment in
communication, and at least one symptom of restricted and repetitive behavior. Sample
symptoms include lack of social or emotional reciprocity, stereotyped and repetitive use of
language or idiosyncratic language, and persistent preoccupation with parts of objects. Onset
must be prior to age three years, with delays or abnormal functioning in either social interaction,
language as used in social communication, or symbolic or imaginative play. The disturbance
must not be better accounted for by Rett syndrome or childhood disintegrative disorder. ICD-
10 uses essentially the same definition.
Several diagnostic instruments are available. Two are commonly used in autism research:
the Autism Diagnostic Interview-Revised (ADI-R) is a semistructured parent interview, and the
Autism Diagnostic Observation Schedule (ADOS) uses observation and interaction with the
16
child. The Childhood Autism Rating Scale (CARS) is used widely in clinical environments to
assess severity of autism based on observation of children.
A pediatrician commonly performs a preliminary investigation by taking developmental history
and physically examining the child. If warranted, diagnosis and evaluations are conducted with
help from ASD specialists, observing and assessing cognitive, communication, family, and other
factors using standardized tools, and taking into account any associated medical conditions. A
pediatric neuropsychologist is often asked to assess behavior and cognitive skills, both to aid
diagnosis and to help recommend educational interventions. Adifferential diagnosis for ASD at
this stage might also consider mental retardation, hearing impairment, and a specific language
impairment such as Landau–Kleffner syndrome. The presence of autism can make it harder to
diagnose coexisting psychiatric disorders such as depression.
Clinical genetics evaluations are often done once ASD is diagnosed, particularly when other
symptoms already suggest a genetic cause. Although genetic technology allows clinical
geneticists to link an estimated 40% of cases to genetic causes, consensus guidelines in the US
and UK are limited to high-resolution chromosome and fragile X testing. Agenotype-first model
of diagnosis has been proposed, which would routinely assess the genome's copy number
variations. As new genetic tests are developed several ethical, legal, and social issues will
emerge. Commercial availability of tests may precede adequate understanding of how to use test
results, given the complexity of autism's genetics. Metabolicand neuroimaging tests are
sometimes helpful, but are not routine.
ASD can sometimes be diagnosed by age 14 months, although diagnosis becomes increasingly
stable over the first three years of life: for example, a one-year-old who meets diagnostic criteria
for ASD is less likely than a three-year-old to continue to do so a few years later. In the UK the
National Autism Plan for Children recommends at most 30 weeks from first concern to
completed diagnosis and assessment, though few cases are handled that quickly in practice. A
2009 US study found the average age of formal ASD diagnosis was 5.7 years, far above
recommendations, and that 27% of children remained undiagnosed at age 8 years. Although the
symptoms of autism and ASD begin early in childhood, they are sometimes missed; years later,
adults may seek diagnoses to help them or their friends and family understand themselves, to
17
help their employers make adjustments, or in some locations to claim disability living allowances
or other benefits.
Underdiagnosis and overdiagnosis are problems in marginal cases, and much of the recent
increase in the number of reported ASD cases is likely due to changes in diagnostic practices.
The increasing popularity of drug treatment options and the expansion of benefits has given
providers incentives to diagnose ASD, resulting in some overdiagnosis of children with uncertain
symptoms. Conversely, the cost of screening and diagnosis and the challenge of obtaining
payment can inhibit or delay diagnosis. It is particularly hard to diagnose autism among
the visually impaired, partly because some of its diagnostic criteria depend on vision, and partly
because autistic symptoms overlap with those of common blindness syndromes or blindisms.
MICRO RNA
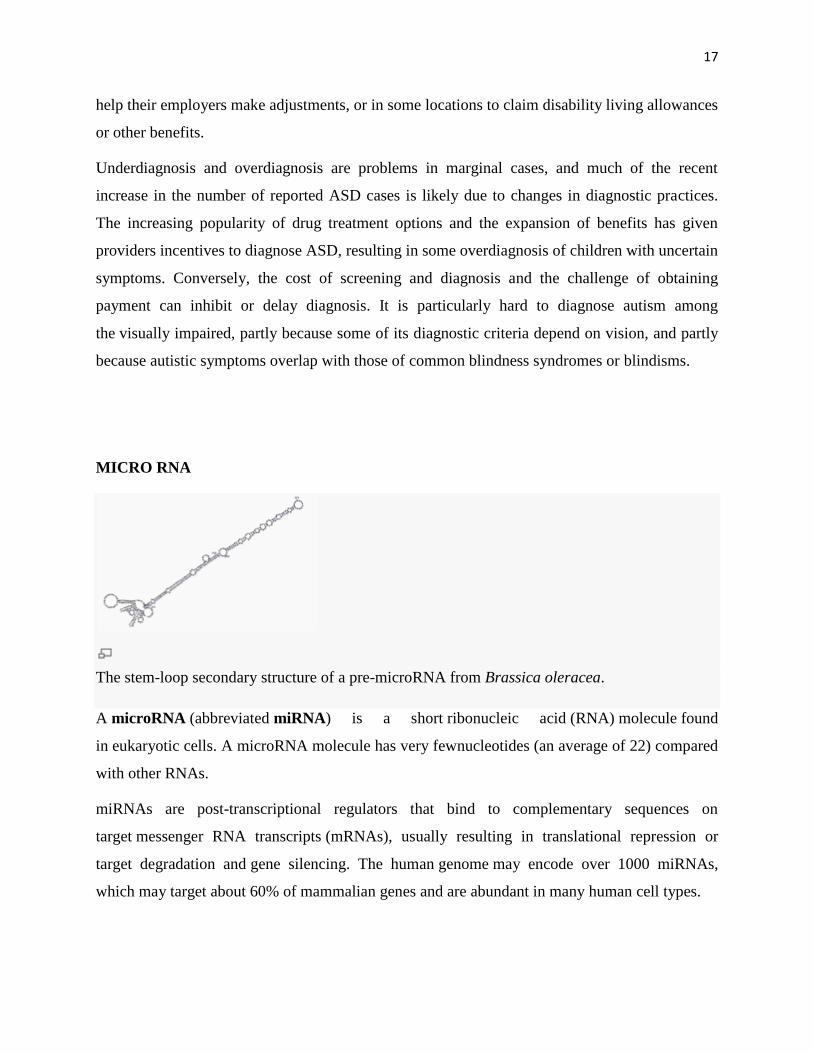
The stem-loop secondary structure of a pre-microRNA from Brassica oleracea.
A microRNA (abbreviated miRNA) is a short ribonucleic acid (RNA) molecule found
in eukaryotic cells. A microRNA molecule has very fewnucleotides (an average of 22) compared
with other RNAs.
miRNAs are post-transcriptional regulators that bind to complementary sequences on
target messenger RNA transcripts (mRNAs), usually resulting in translational repression or
target degradation and gene silencing. The human genome may encode over 1000 miRNAs,
which may target about 60% of mammalian genes and are abundant in many human cell types.
18
miRNAs show very different characteristics between plants and metazoans. In plants the miRNA
complementarity to its mRNA target is nearly perfect, with no or few mismatched bases. In
metazoans, on the other hand, miRNA complementarity typically encompasses the 5' bases 2-7
of the microRNA, the microRNA seed region, and one miRNA can target many different sites on
the same mRNA or on many different mRNAs. Another difference is the location of target sites
on mRNAs. In metazoans, the miRNA target sites are in the three prime untranslated
regions (3'UTR) of the mRNA. This is how microRNA may target several mRNAs. In plants,
targets can be located in the 3' UTR but are more often in the coding region itself. MiRNAs are
well conserved in eukaryotic organisms and are thought to be a vital and evolutionarily ancient
component of genetic regulation.
The first miRNAs were characterized in the early 1990s.However, miRNAs were not recognized
as a distinct class of biological regulators with conserved functions until the early 2000s. Since
then, miRNA research has revealed multiple roles in negative regulation (transcript degradation
and sequestering, translational suppression) and possible involvement in positive regulation
(transcriptional and translational activation). By affecting gene regulation, miRNAs are likely to
be involved in most biological processes. Different sets of expressed miRNAs are found in
different cell types and tissues.
Aberrant expression of miRNAs has been implicated in numerous disease states, and miRNA-
based therapies are under investigation.
Nomenclature: Under a standard nomenclature system, names are assigned to experimentally
confirmed miRNAs before publication of their discovery. The prefix "mir" is followed by a dash
and a number, the latter often indicating order of naming. For example, mir-123 was named and
likely discovered prior to mir-456. The uncapitalized "mir-" refers to the pre-miRNA, while a
capitalized "miR-" refers to the mature form. miRNAs with nearly identical sequences bar one or
two nucleotides are annotated with an additional lower case letter. For example, miR-123a would
be closely related to miR-123b. Pre-miRNAs that lead to 100% identical mature miRNAs but
that are located at different places in the genome are indicated with an additional dash-number
suffix. For example, the pre-miRNAs hsa-mir-194-1 and hsa-mir-194-2 lead to an identical
mature miRNA (hsa-miR-194) but are located in different regions of the genome. Species of
origin is designated with a three-letter prefix, e.g., hsa-miR-123 is a human (Homo
19
sapiens)miRNA and oar-miR-123 is a sheep (Ovis aries) miRNA. Other common prefixes
include 'v' for viral (miRNA encoded by a viral genome) and 'd' for Drosophila miRNA (a fruit
fly commonly studied in genetic research). When two mature microRNAs originate from
opposite arms of the same pre-miRNA, they are denoted with a -3p or -5p suffix. (In the past,
this distinction was also made with 's' (sense) and 'as' (antisense)). When relative expression
levels are known, an asterisk following the name indicates an miRNA expressed at low levels
relative to the miRNA in the opposite arm of a hairpin. For example, miR-123 and miR-123*
would share a pre-miRNA hairpin, but more miR-123 would be found in the cell.
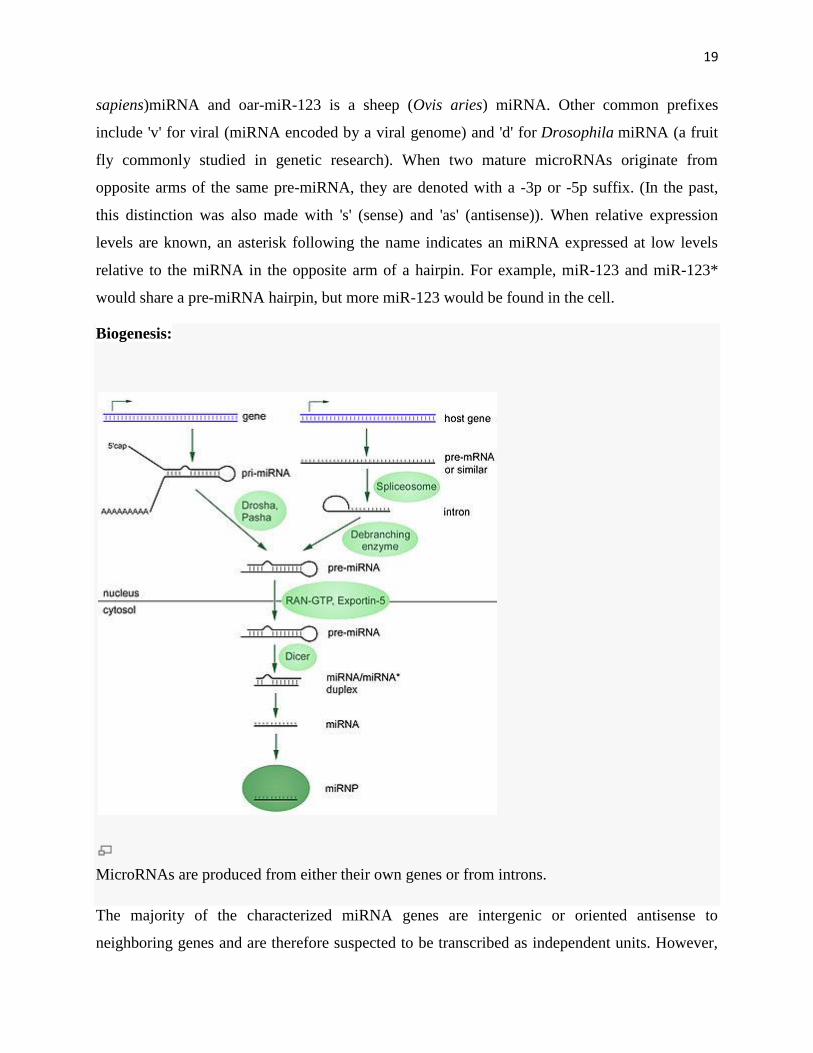
Biogenesis:
MicroRNAs are produced from either their own genes or from introns.
The majority of the characterized miRNA genes are intergenic or oriented antisense to
neighboring genes and are therefore suspected to be transcribed as independent units. However,
20
in some cases microRNA gene is transcriped together with its host gene and this provides a mean
for coupled regulation of miRNA and protein-coding gene As much as 40% of miRNA genes
may lie in the introns of protein and non-protein coding genes or even in exons of long
nonprotein-coding transcripts. These are usually, though not exclusively, found in a sense
orientation, and thus usually are regulated together with their host genes. Other miRNA genes
showing a common promoter include the 42-48% of all miRNAs originating from polycistronic
units containing multiple discrete loops from which mature miRNAs are processed, although this
does not necessarily mean the mature miRNAs of a family will be homologous in structure and
function. The promoters mentioned have been shown to have some similarities in their motifs to
promoters of other genes transcribed by RNA polymerase II such as protein coding genes. The
DNA template is not the final word on mature miRNA production: 6% of human miRNAs show
RNA editing (IsomiRs), the site-specific modification of RNA sequences to yield products
different from those encoded by their DNA. This increases the diversity and scope of miRNA
action beyond that implicated from the genome alone.
Transcription
miRNA genes are usually transcribed by RNA polymerase II (Pol II). The polymerase often
binds to a promoter found near the DNA sequence encoding what will become the hairpin loop
of the pre-miRNA. The resulting transcript is capped with a specially-modified nucleotide at the
5’ end, polyadenylated with multipleadenosines (a poly(A) tail), and spliced. Animal miRNAs
are initially transcribed as part of one arm of an ∼80 nucleotide RNA stem-loop that in turn
forms part of a several hundred nucleotides long miRNA precursor termed a primary miRNA
(pri-miRNA)s. When a stem-loop precursor is found in the 3’ UTR, a transcript may serve as a
pri-miRNA and a mRNA. RNA polymerase III (Pol III) transcribes some miRNAs, especially
those with upstream Alu sequences, transfer RNAs (tRNAs), and mammalian wide interspersed
repeat (MWIR) promoter units.
Nuclear processing
A single pri-miRNA may contain from one to six miRNA precursors. These hairpin loop
structures are composed of about 70 nucleotides each. Each hairpin is flanked by sequences
necessary for efficient processing. The double-stranded RNA structure of the hairpins in a pri-
miRNA is recognized by a nuclear protein known as DiGeorge Syndrome Critical Region
21
8(DGCR8 or "Pasha" in invertebrates), named for its association with DiGeorge Syndrome.
DGCR8 associates with the enzyme Drosha, a protein that cuts RNA, to form the
"Microprocessor" complex. In this complex, DGCR8 orients the catalytic RNase III domain of
Drosha to liberate hairpins from pri-miRNAs by cleaving RNA about eleven nucleotides from
the hairpin base (two helical RNA turns into the stem). The product resulting has a two-
nucleotide overhang at its 3’ end; it has 3' hydroxyl and 5' phosphate groups. It is often termed as
a pre-miRNA (precursor-miRNA).
pre-miRNAs that are spliced directly out of introns, bypassing the Microprocessor complex, are
known as "Mirtrons." Originally thought to exist only in Drosophila and C. elegans, mirtrons
have now been found in mammals.
Perhaps as many as 16% of pri-miRNAs may be altered through nuclear RNA editing. Most
commonly, enzymes known as adenosine deaminases acting on RNA (ADARs)
catalyze adenosine to inosine (A to I) transitions. RNA editing can halt nuclear processing (for
example, of pri-miR-142, leading to degradation by the ribonuclease Tudor-SN) and alter
downstream processes including cytoplasmic miRNA processing and target specificity (e.g., by
changing the seed region of miR-376 in the central nervous system).
Nuclear export
pre-miRNA hairpins are exported from the nucleus in a process involving the nucleocytoplasmic
shuttle Exportin-5. This protein, a member of the karyopherin family, recognizes a two-
nucleotide overhang left by the RNase III enzyme Drosha at the 3' end of the pre-miRNA
hairpin. Exportin-5-mediated transport to the cytoplasm is energy-dependent, using GTP bound
to the Ran protein.
Cytoplasmic processing
In cytoplasm, the pre-miRNA hairpin is cleaved by the RNase III enzyme Dicer.[50]
This
endoribonuclease interacts with the 3' end of the hairpin and cuts away the loop joining the 3' and
5' arms, yielding an imperfect miRNA:miRNA* duplex about 22 nucleotides in length. Overall
hairpin length and loop size influence the efficiency of Dicer processing, and the imperfect
nature of the miRNA:miRNA* pairing also affects cleavage. Although either strand of the
duplex may potentially act as a functional miRNA, only one strand is usually incorporated into
the RNA-induced silencing complex (RISC) where the miRNA and its mRNA target interact.
22
Biogenesis in plants
miRNA biogenesis in plants differs from metazoan biogenesis mainly in the steps of nuclear
processing and export. Instead of being cleaved by two different enzymes, once inside and once
outside the nucleus, both cleavages of the plant miRNA is performed by a Dicer homolog,
called Dicer-like1 (DL1). DL1 is only expressed in the nucleus of plant cells, which indicates
that both reactions take place inside the nucleus. Before plant miRNA:miRNA* duplexes are
transported out of the nucleus its 3' overhangs are methylated by a RNA
methyltransferaseprotein called Hua-Enhancer1 (HEN1). The duplex is then transported out of
the nucleus to the cytoplasm by a protein called Hasty (HST), an Exportin 5 homolog, where
they disassemble and the mature miRNA is incorporated into the RISC.
The RNA-induced silencing complex
The mature miRNA is part of an active RNA-induced silencing complex (RISC) containing
Dicer and many associated proteins. RISC is also known as a microRNA ribonucleoprotein
complex (miRNP); RISC with incorporated miRNA is sometimes referred to as "miRISC."
Dicer processing of the pre-miRNA is thought to be coupled with unwinding of the duplex.
Generally, only one strand is incorporated into the miRISC, selected on the basis of its
thermodynamic instability and weaker base-pairing relative to the other strand. The position of
the stem-loop may also influence strand choice. The other strand, called the passenger strand
due to its lower levels in the steady state, is denoted with an asterisk (*) and is normally
degraded. In some cases, both strands of the duplex are viable and become functional miRNA
that target different mRNA populations.
Members of the Argonaute (Ago) protein family are central to RISC function. Argonautes are
needed for miRNA-induced silencing and contain two conserved RNA binding domains: a PAZ
domain that can bind the single stranded 3’ end of the mature miRNA and a PIWI domain that
structurally resembles ribonuclease-H and functions to interact with the 5’ end of the guide
strand. They bind the mature miRNA and orient it for interaction with a target mRNA. Some
argonautes, for example human Ago2, cleave target transcripts directly; argonautes may also
recruit additional proteins to achieve translational repression. The human genome encodes eight
23
argonaute proteins divided by sequence similarities into two families: AGO (with four members
present in all mammalian cells and called E1F2C/hAgo in humans), and PIWI (found in the germ
line and hematopoietic stem cells).
Additional RISC components include TRBP [human immunodeficiency virus (HIV)
transactivating response RNA (TAR) binding protein], PACT (protein activator of the interferon
induced protein kinase (PACT), the SMN complex, fragile X mental retardation protein (FMRP),
and Tudor staphylococcal nuclease-domain-containing protein (Tudor-SN).
Cellular functions: The function of miRNAs appears to be in gene regulation. For that purpose,
a miRNA is complementary to a part of one or more messenger RNAs (mRNAs). Animal
miRNAs are usually complementary to a site in the 3' UTR whereas plant miRNAs are usually
complementary to coding regions of mRNAs. Perfect or near perfect base pairing with the target
RNA promotes cleavage of the RNA. This is the primary mode of plant miRNAs. In animals
miRNAs more often have only partly the right sequence of nucleotides to bond with the target
mRNA. The match-ups are imperfect. Animal miRNAs inhibit protein translation of the target
mRNA (this exists in plants as well but is less common). MicroRNAs that are partially
complementary to a target can also speed up deadenylation, causing mRNAs to be degraded
sooner. For partially complementary microRNAs to recognise their targets, nucleotides 2–7 of
the miRNA (its 'seed region') still have to be perfectly complementary. miRNAs occasionally
also cause histone modification and DNA methylation of promoter sites, which affects the
expression of target genes.
Unlike plant microRNAs, the animal microRNAs target a diverse set of genes. However, genes
involved in functions common to all cells, such as gene expression, have relatively fewer
microRNA target sites and seem to be under selection to avoid targeting by microRNAs.
dsRNA can also activate gene expression, a mechanism that has been termed "small RNA-
induced gene activation" or RNAa. dsRNAs targeting gene promoters can induce potent
transcriptional activation of associated genes. This was demonstrated in human cells using
synthetic dsRNAs termed small activating RNAs (saRNAs), but has also been demonstrated for
endogenous microRNA.
24
Interactions between microRNAs and complementary sequences on genes and
even pseudogenes that share sequence homology are thought to be a back channel of
communication regulating expression levels between paralogous genes. Given the name
"competing endogenous RNAs" (ceRNAs), these microRNAs bind to "microRNA response
elements" on genes and pseudogenes and may provide another explanation for the persistence of
non-coding ("junk") DNA.
miRNA and Disease
miRNA and inherited diseases
A mutation in the seed region of miR-96 causes hereditary progressive hearing loss. A mutation
in the seed region of miR-184 causes hereditary keratoconus with anterior polar cataract.
Deletion of the miR-17~92 cluster causes skeletal and growth defects.
miRNA and cancer
Several miRNAs have been found to have links with some types of cancer. MicroRNA-21 is one
of the first microRNAs that was identified as an oncomiR.
A study of mice altered to produce excess c-Myc — a protein with mutated forms implicated in
several cancers — shows that miRNA has an effect on the development of cancer. Mice that
were engineered to produce a surplus of types of miRNA found in lymphoma cells developed the
disease within 50 days and died two weeks later. In contrast, mice without the surplus miRNA
lived over 100 days. Leukemia can be caused by the insertion of a viral genome next to the 17-92
array of microRNAs leading to increased expression of this microRNA.
Another study found that two types of miRNA inhibit the E2F1 protein, which regulates cell
proliferation. miRNA appears to bind to messenger RNA before it can be translated to proteins
that switch genes on and off.
25
By measuring activity among 217 genes encoding miRNA, patterns of gene activity that can
distinguish types of cancers can be discerned. miRNA signatures may enable classification of
cancer. This will allow doctors to determine the original tissue type which spawned a cancer and
to be able to target a treatment course based on the original tissue type. miRNA profiling has
already been able to determine whether patients with chronic lymphocytic leukemia had slow
growing or aggressive forms of the cancer.
Transgenic mice that over-express or lack specific miRNAs have provided insight into the role of
small RNAs in various malignancies.
A novel miRNA-profiling based screening assay for the detection of early-stage colorectal
cancer has been developed and is currently in clinical trials. Early results showed that blood
plasma samples collected from patients with early, resectable (Stage II) colorectal cancer could
be distinguished from those of sex-and age-matched healthy volunteers. Sufficient selectivity and
specificity could be achieved using small (less than 1 mL) samples of blood. The test has
potential to be a cost-effective, non-invasive way to identify at-risk patients who should undergo
colonoscopy.
Another role for miRNA in cancers is to use their expression level as a prognostic, for example
one study on NSCLC samples found that low miR-324a levels could serve as a prognostic
indicator of poor survival, another found that either high miR-185 or low miR-133b levels
correlated with metastasis and poor survival in colorectal cancer.
miRNA and heart disease
The global role of miRNA function in the heart has been addressed by conditionally inhibiting
miRNA maturation in the murine heart, and has revealed that miRNAs play an essential role
during its development. miRNA expression profiling studies demonstrate that expression levels
of specific miRNAs change in diseased human hearts, pointing to their involvement
in cardiomyopathies. Furthermore, studies on specific miRNAs in animal models have identified
distinct roles for miRNAs both during heart development and under pathological conditions,
including the regulation of key factors important for cardiogenesis, the hypertrophic growth
response, and cardiac conductance.
26
miRNA and the nervous system
miRNAs appear to regulate the nervous system. Neural miRNAs are involved at various stages
of synaptic development, including dendritogenesis (involving miR-132, miR-134 andmiR-
124), synapse formation and synapse maturation (where miR-134 and miR-138 are thought to be
involved). Some studies find altered miRNA expression inschizophrenia.
NUCLEIC ACID SECONDARY STRUCTURE
The secondary structure of a nucleic acid molecule refers to the base-pairing interactions within a
single molecule or set of interacting molecules, and can be represented as a list of bases which
are paired in a nucleic acid moleculeThe secondary structures of biological DNA's and RNA's
tend to be different: biological DNA mostly exists as fully base paired-double helices, while
biological RNA is single stranded and often forms complicated base-pairing interactions due to
its increased ability to form hydrogen bonds stemming from the extra hydroxyl group in
the ribose sugar.
In a non-biological context, secondary structure is a vital consideration in the rational design of
nucleic acid structures for DNA nanotechnology and DNA computing, since the pattern of
basepairing ultimately determines the overall structure of the molecules.
SECONDARY STRUCTURE PREDICTION
One application of bioinformatics uses predicted RNA secondary structures in searching
a genome for noncoding but functional forms of RNA. For example, microRNAs have canonical
long stem-loop structures interrupted by small internal loops. A general method of calculating
probable RNA secondary structure is dynamic programming, although this has the disadvantage
that it cannot detect pseudoknots or other cases in which base pairs are not fully nested. More
general methods are based on stochastic context-free grammars. A web server that implements a
type of dynamic programming is Mfold.
For many RNA molecules, the secondary structure is highly important to the correct function of
the RNA — often more so than the actual sequence. This fact aids in the analysis of non-coding
RNA sometimes termed "RNA genes". RNA secondary structure can be predicted with some
27
accuracy by computer and many bioinformatics applications use some notion of secondary
structure in analysis of RNA.
Secondary RNA Structure
This chapter gives an overview of the secondary RNA structure prediction problem. It
starts out by formally describing the secondary structure prediction problem as suggested
by Zuker [14]. It describes the different types of algorithms and the classifications that
these algorithms fall into. The chapter explains the issues and deficiencies of the
algorithms. There is a section which describes the structural elements that the secondary
structure is made of. Finally, the chapter describes all ways in which the secondary
structure has been visualized.
Secondary Structure Formal Description
RNA secondary structure refers to the two dimensional shape that RNA would physically
fold into under natural conditions. As RNA folds back on itself it forms hydrogen bonds
at complimentary base pair locations. These hydrogen bonds formed by the pairing of
complementary Watson-Crick bases as well as the weaker wobble pair G-U are described
as canonical base pairs.
Formally, the secondary structure of RNA can be described as suggested by Zuker [14] as
follows: An RNA sequence is represented by R as R = r1, r2, r3, …., rn, where ri
is
28
called the Ith nucleotide. Each ri belongs to the set {A, C, G, U}. A secondary structure,
or folding, on R is a set S of ordered pairs, written as i,j, 1 <= i <= j <= n satisfying: 18
1. j – i > 4
2. If i,j and i’,j’ are 2 base pairs, (assuming without loss in generality that i <= i’),
then either:
a. i = i’ and j = j’ (they are the same base pair),
b. i < j < i’ < j’ (i,j precedes i’, j’), or
c. i < i’ < j’ < j (i,j includes i’,j’).
Item 2c above disallows pseudoknots which occur when two base pairs, i,j and i’,j’
satisfy the condition i < i’ < j < j’[14]. The formal description does not account for
pseudoknots for several reasons. First, the algorithms which try to predict the secondary
structure through energy minimization are not able to handle pseudoknots. Energy
minimization algorithms can not handle pseudoknots because it is beyond current
scientific understanding how to assign energy values to the structures created by
psuedoknots. Secondly, pseudoknots are not considered because the dynamic
programming based algorithms are not able to handle the loop structures created by
pseudoknots.
Taxonomy of Algorithms
There are several methods used in the laboratory in order to determine the secondary and
tertiary structure of RNA. These methods include x-ray crystallography and nuclear
magnetic resonance spectroscopy [15]. The problem with these methods is that they are
29
very expensive and time consuming to produce the secondary structure results. It would
be tremendously preferable if a computer based algorithm could be created which would
accurately calculate the secondary structure in mere seconds. This has been the focus of
many researches for the past several decades. There are many types of algorithms which
have been devised which endeavor to fulfill this goal but the algorithms can be
categorized into two main types, deterministic and stochastic [13].
Deterministic
There are a whole host of algorithms which fit into the classification of deterministic.
The one fact that is common to all algorithms of this type is that the correct next step in
the algorithm only depends on the current state of the algorithm. There is no point in the 19
algorithm at which there are several next steps that could happen with some unknown
way to choose between them. Algorithms that fall into this category are
Minimum Free Energy such as Zuker’s algorithm [14], Kinetic Folding such as
Martinez [16], 5’ – 3’ Folding [13], Partition Function [13], and Maximum Matching
such as Nussinov [8]. Kinetic Folding and 5’ – 3’ Folding are able to determine
pseudoknots.
Stochastic
The common theme between all the stochastic algorithms is that they are based on
probabilities. One such example is based on a special Monte Carlo procedure know as
Simulated Annealing [17]. The Simulated Annealing algorithm is able assign
30
probabilities to for both the opening and closing of single base pairs. This allows the
algorithm to account for a wide range of secondary structures.
Issues with Algorithms
The main issue with all the computer based algorithms is that they are no more than first
order approximations of the actual secondary structure which would occur in nature. The
determination of secondary structure is by no means an exact science. Furthermore, the
structure which the algorithm calculates to be the optimal structure might not be the most
biologically correct. Many of the algorithms allow for suboptimal structures to be
calculated as well taking into account this anomaly.
Secondary Structure Elements
All RNA secondary structures are composed of several basic structural shapes which
occur naturally when RNA folds back on its self. These basic structures are usually
depicted as two dimensional pictures which indicate the positions where base pair bonds
occur. The regions where base pairs stack on top of each other and form into helical
regions are called stems or stacking pairs (See Figure 3.1 Stacking Pairs). Sections of
RNA which occur at either the start or end of the sequence that are not part of any
structure are called unstructured single strands or free ends (See Figure 3.1 Joint and 20
Free Ends). All other structures formed by RNA are variations of loop structures which
occur when a section of RNA loops around on its self and is bounded by base pairs.
Hairpin loops are loops which occur at the end of a stem and consist of three or more
31
base pairs because a three base pair loop is the smallest biologically feasible loop (See
Figure 3.1 Hairpin Loop). Hairpin loops are sometime referred to as stem loops but the
hairpin name stuck because the loops resemble a hairpin. A bulge which occurs in a
single strand of a stem is referred to as a bulge loop (See Figure 3.1 Bulge). When
bulges occur on both strands of a stem an interior loop is formed (See Figure 3.1
Interior Loop). When loops occur which have three of more branches (stems) extending
out of the loop then a multi-branched loop of formed (See Figure 3.1 Multiple Loop).
The last type of loop is referred to as a pseudoknot. A pseudoknot occurs when bases
inside a loop are bonded with bases in another section of the RNA which is outside the
bounding stem of the loop. Psuedoknots occur relatively infrequently as compared to the other
RNA structure elements.
32
Secondary Structure Visualizations
The human mind is not capable of comprehending problems which have large amounts of
data in strictly numerical or character formats. The RNA secondary structure problem is
one such problem where any given RNA sequence could be hundreds of bases in length
and that fact makes it necessary to devise methods to help the human mind comprehend
the data. In order to increase the comprehension of the RNA secondary structure
problem, many types of visualizations have been devised which represent the data in
alternate formats so that the largest amount of intuitive understanding can be gained from
the depictions.
String Representation
The simplest form of representing an RNA sequence is strictly by the bases which make
up the sequence (See Figure 3.2). A string is formed where the characters in the string
represent the four RNA bases. The characters in the string are positioned as to represent
the ordering of the bases in the RNA sequence.
AACGGAACCAACAUGGAUUCAUGCUUCGGCCCUGGUCGCG
RNA in String Representation
Bracketed Representation
The bracketed representation is one of the simplest ways to visualize the secondary
structure of RNA. This representation is sometimes referred to as bracket dot notation
because of the brackets and dots used in the representation [31]. The bracketed
representation consists of using the string representation of RNA on one line and then on
33
a line directly below the string representation a sequence of open or close brackets and
dots are used to represent nucleotides which are bonded as pairs (See Figure 3.3). If a
bond exists between nucleotides at position i and position j then an open bracket ‘(‘ is
used at position i and a close bracket ‘)’ is used at position j to represent the bond. If no
bond exists then a dot is placed at the nucleotide position to represent that no bond exists. 22
For every open bracket there must be a corresponding closing bracket to represent the
pairs.
AACGGAACCAACAUGGAUUCAUGCUUCGGCCCUGGUCGCG
(())(((.)(()))((((()).())(())))((..)).).
Figure 3.3. Secondary Structure in Bracketed Representation
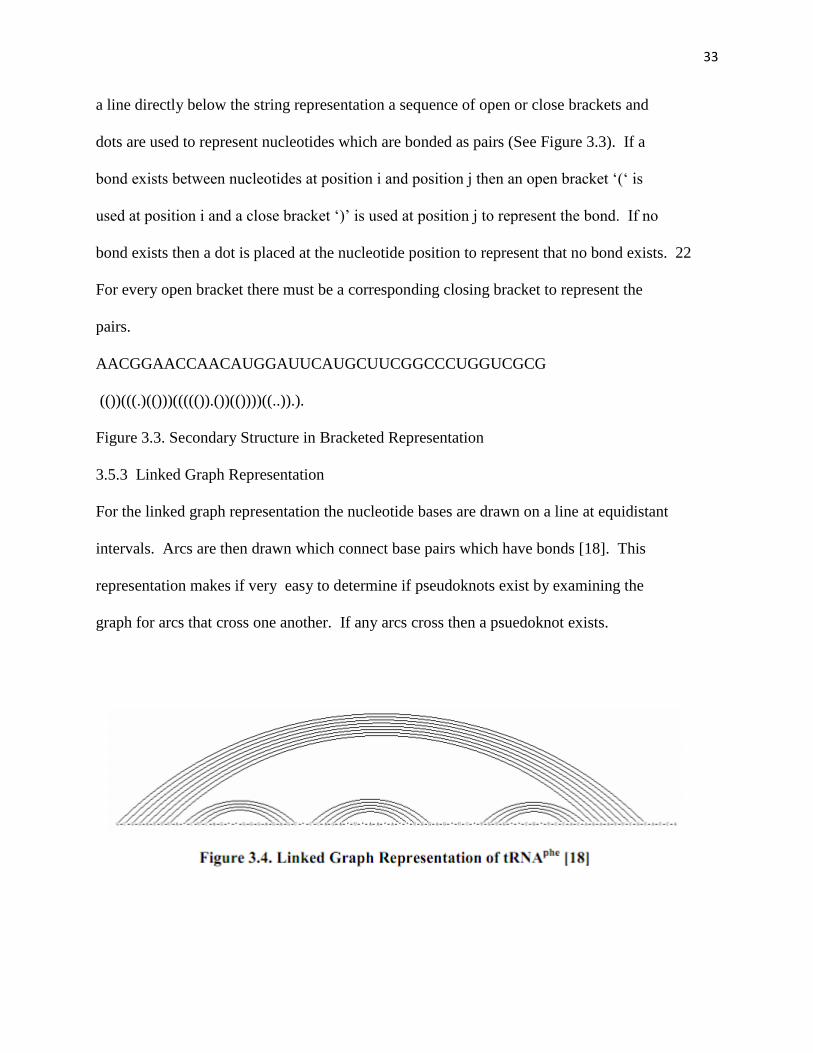
3.5.3 Linked Graph Representation
For the linked graph representation the nucleotide bases are drawn on a line at equidistant
intervals. Arcs are then drawn which connect base pairs which have bonds [18]. This
representation makes if very easy to determine if pseudoknots exist by examining the
graph for arcs that cross one another. If any arcs cross then a psuedoknot exists.
34
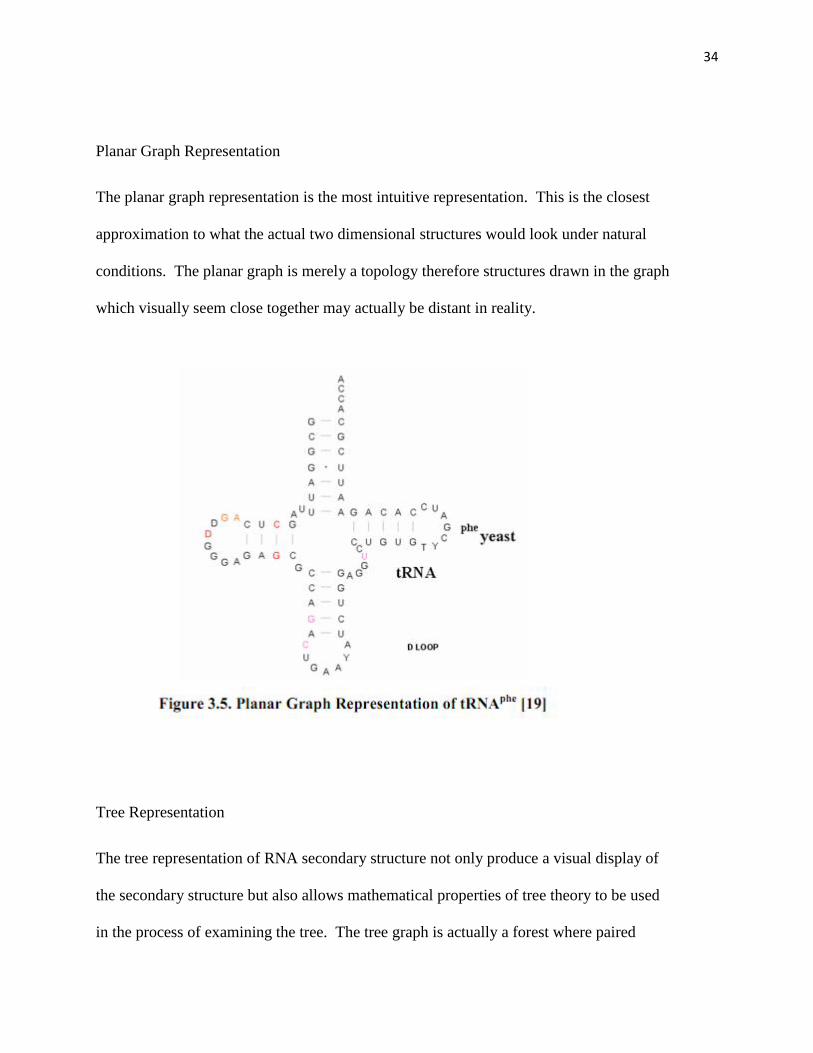
Planar Graph Representation
The planar graph representation is the most intuitive representation. This is the closest
approximation to what the actual two dimensional structures would look under natural
conditions. The planar graph is merely a topology therefore structures drawn in the graph
which visually seem close together may actually be distant in reality.
Tree Representation
The tree representation of RNA secondary structure not only produce a visual display of
the secondary structure but also allows mathematical properties of tree theory to be used
in the process of examining the tree. The tree graph is actually a forest where paired
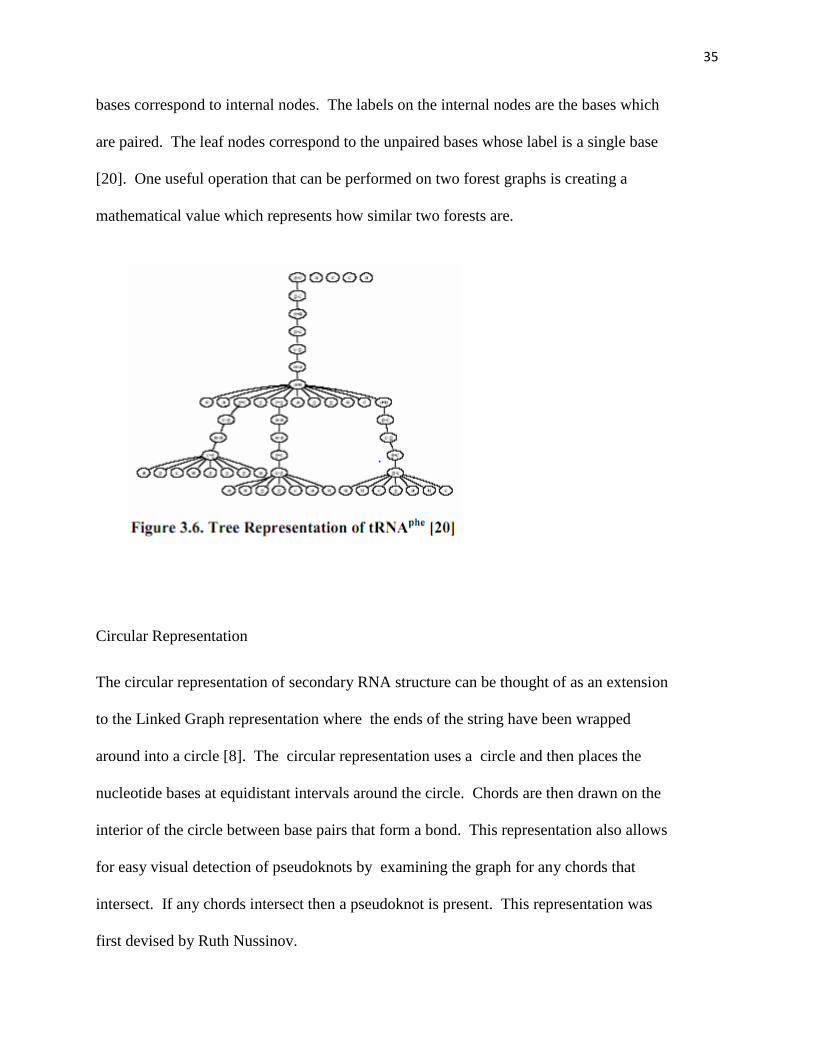
35
bases correspond to internal nodes. The labels on the internal nodes are the bases which
are paired. The leaf nodes correspond to the unpaired bases whose label is a single base
[20]. One useful operation that can be performed on two forest graphs is creating a
mathematical value which represents how similar two forests are.
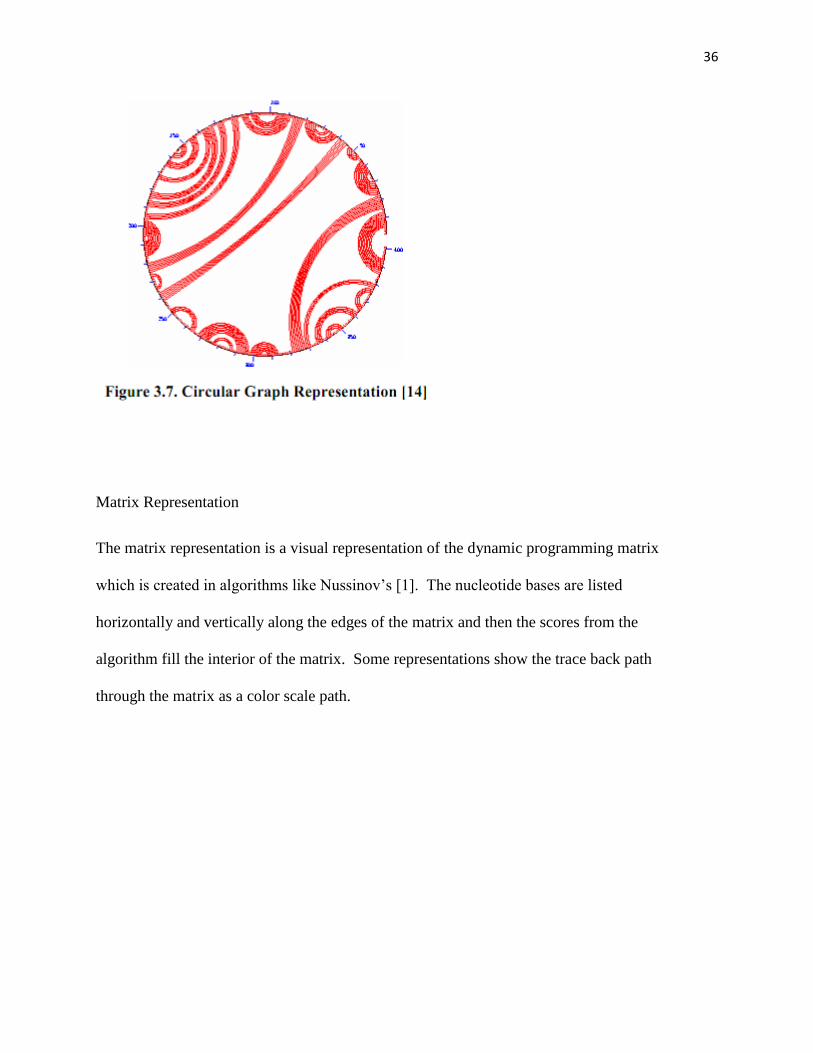
Circular Representation
The circular representation of secondary RNA structure can be thought of as an extension
to the Linked Graph representation where the ends of the string have been wrapped
around into a circle [8]. The circular representation uses a circle and then places the
nucleotide bases at equidistant intervals around the circle. Chords are then drawn on the
interior of the circle between base pairs that form a bond. This representation also allows
for easy visual detection of pseudoknots by examining the graph for any chords that
intersect. If any chords intersect then a pseudoknot is present. This representation was
first devised by Ruth Nussinov.
36
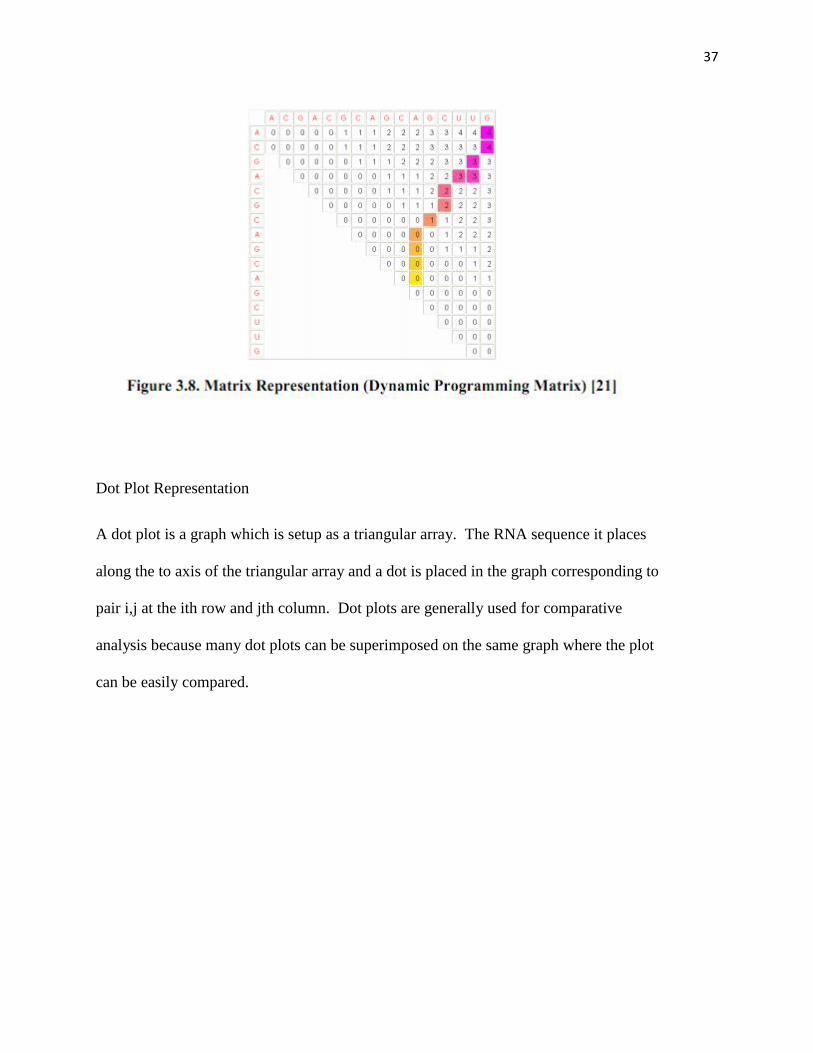
Matrix Representation
The matrix representation is a visual representation of the dynamic programming matrix
which is created in algorithms like Nussinov’s [1]. The nucleotide bases are listed
horizontally and vertically along the edges of the matrix and then the scores from the
algorithm fill the interior of the matrix. Some representations show the trace back path
through the matrix as a color scale path.
37
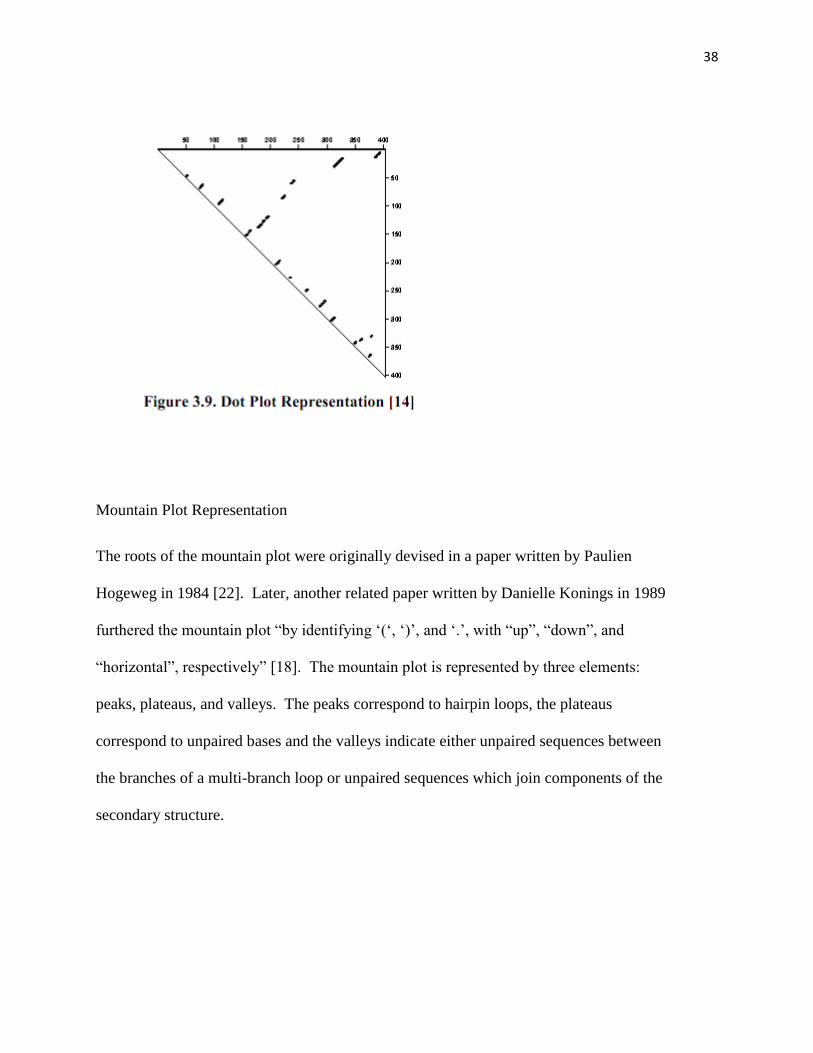
Dot Plot Representation
A dot plot is a graph which is setup as a triangular array. The RNA sequence it places
along the to axis of the triangular array and a dot is placed in the graph corresponding to
pair i,j at the ith row and jth column. Dot plots are generally used for comparative
analysis because many dot plots can be superimposed on the same graph where the plot
can be easily compared.
38
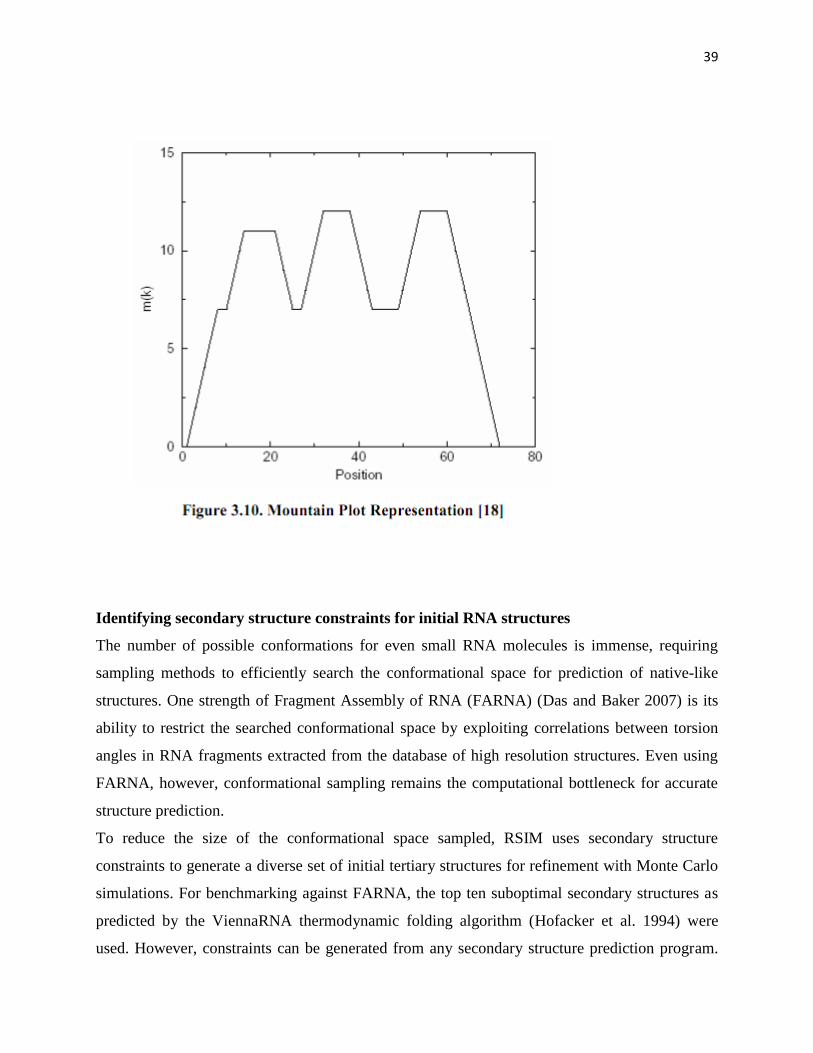
Mountain Plot Representation
The roots of the mountain plot were originally devised in a paper written by Paulien
Hogeweg in 1984 [22]. Later, another related paper written by Danielle Konings in 1989
furthered the mountain plot “by identifying ‘(‘, ‘)’, and ‘.’, with “up”, “down”, and
“horizontal”, respectively” [18]. The mountain plot is represented by three elements:
peaks, plateaus, and valleys. The peaks correspond to hairpin loops, the plateaus
correspond to unpaired bases and the valleys indicate either unpaired sequences between
the branches of a multi-branch loop or unpaired sequences which join components of the
secondary structure.
39
Identifying secondary structure constraints for initial RNA structures
The number of possible conformations for even small RNA molecules is immense, requiring
sampling methods to efficiently search the conformational space for prediction of native-like
structures. One strength of Fragment Assembly of RNA (FARNA) (Das and Baker 2007) is its
ability to restrict the searched conformational space by exploiting correlations between torsion
angles in RNA fragments extracted from the database of high resolution structures. Even using
FARNA, however, conformational sampling remains the computational bottleneck for accurate
structure prediction.
To reduce the size of the conformational space sampled, RSIM uses secondary structure
constraints to generate a diverse set of initial tertiary structures for refinement with Monte Carlo
simulations. For benchmarking against FARNA, the top ten suboptimal secondary structures as
predicted by the ViennaRNA thermodynamic folding algorithm (Hofacker et al. 1994) were
used. However, constraints can be generated from any secondary structure prediction program.
40
The web server CompaRNA (T Puton, K Rother, Ł Kozłowski, E Tkalińska, and J Bujnicki, in
prep.) provides a continuously updated ranking of RNA secondary structure prediction programs,
with CentroidFold (Hamada et al. 2009; Sato et al. 2009), Contrafold (Do et al. 2006), and
McQFold (Metzler and Nebel 2008) performing the best in pairwise comparison tests. MC-Fold
(Parisien and Major 2008) is not currently evaluated by the CompaRNA server but is also an
excellent choice.
Generating tertiary structures with guided fragment assembly
Programs such as RNA2D3D (Martinez et al. 2008) can rapidly generate a tertiary structure for a
given secondary structure. However, the generated tertiary structure often has steric clashes or
unrealistic loop conformations. Additionally, we sought to generate a diverse set of initial
tertiary structures, a goal not currently possible in RNA2D3D. RSIM provides an automated
method to convert a secondary structure into a series of fragment assembly steps to ensure that
each base-pairing constraint is met.
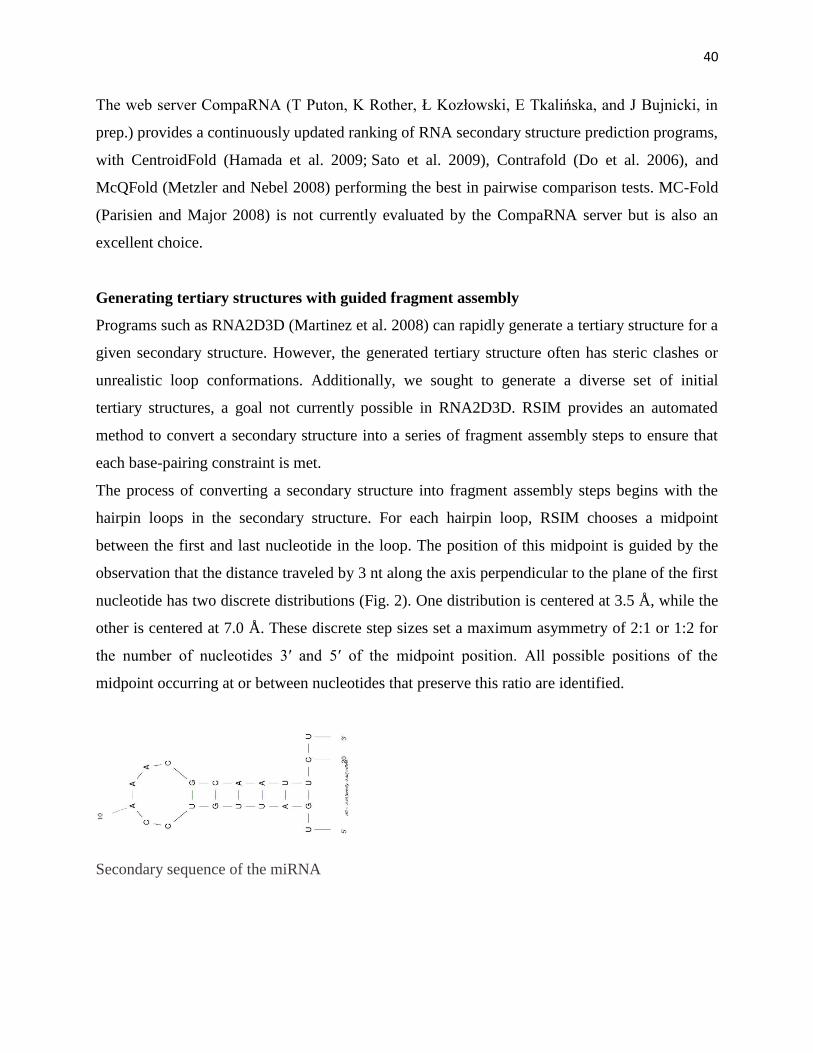
The process of converting a secondary structure into fragment assembly steps begins with the
hairpin loops in the secondary structure. For each hairpin loop, RSIM chooses a midpoint
between the first and last nucleotide in the loop. The position of this midpoint is guided by the
observation that the distance traveled by 3 nt along the axis perpendicular to the plane of the first
nucleotide has two discrete distributions (Fig. 2). One distribution is centered at 3.5 Å, while the
other is centered at 7.0 Å. These discrete step sizes set a maximum asymmetry of 2:1 or 1:2 for
the number of nucleotides 3′ and 5′ of the midpoint position. All possible positions of the
midpoint occurring at or between nucleotides that preserve this ratio are identified.
Secondary sequence of the miRNA
41
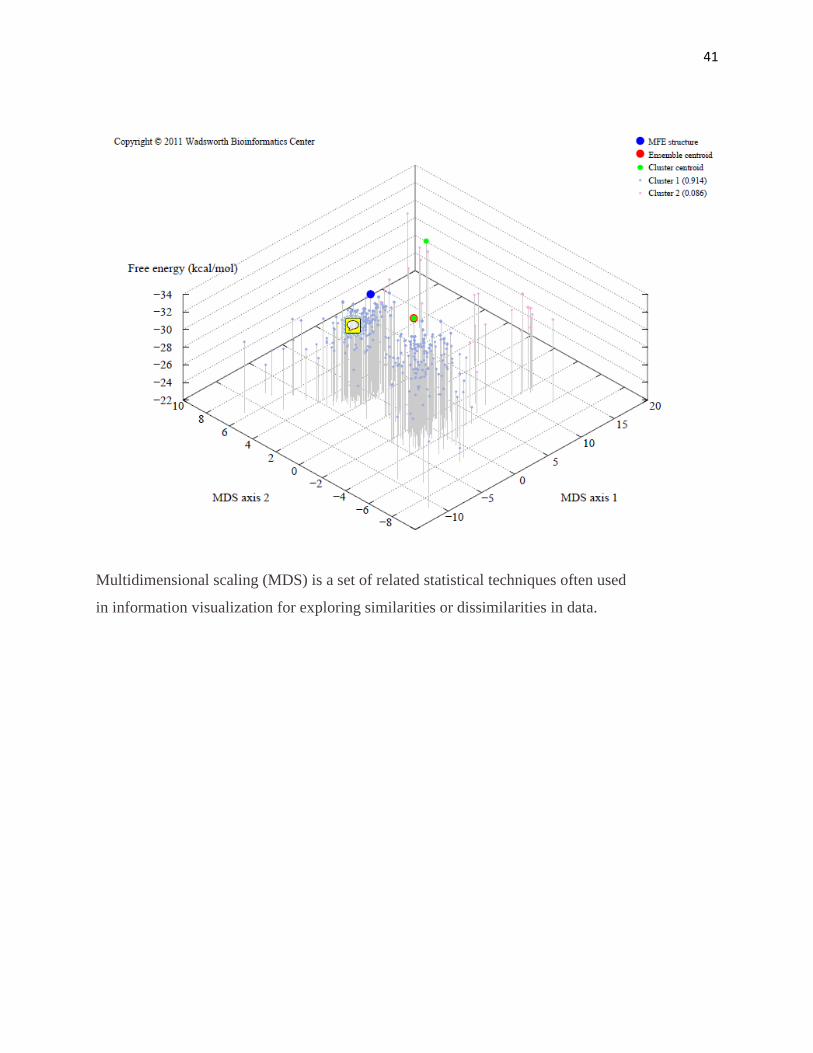
Multidimensional scaling (MDS) is a set of related statistical techniques often used
in information visualization for exploring similarities or dissimilarities in data.
42
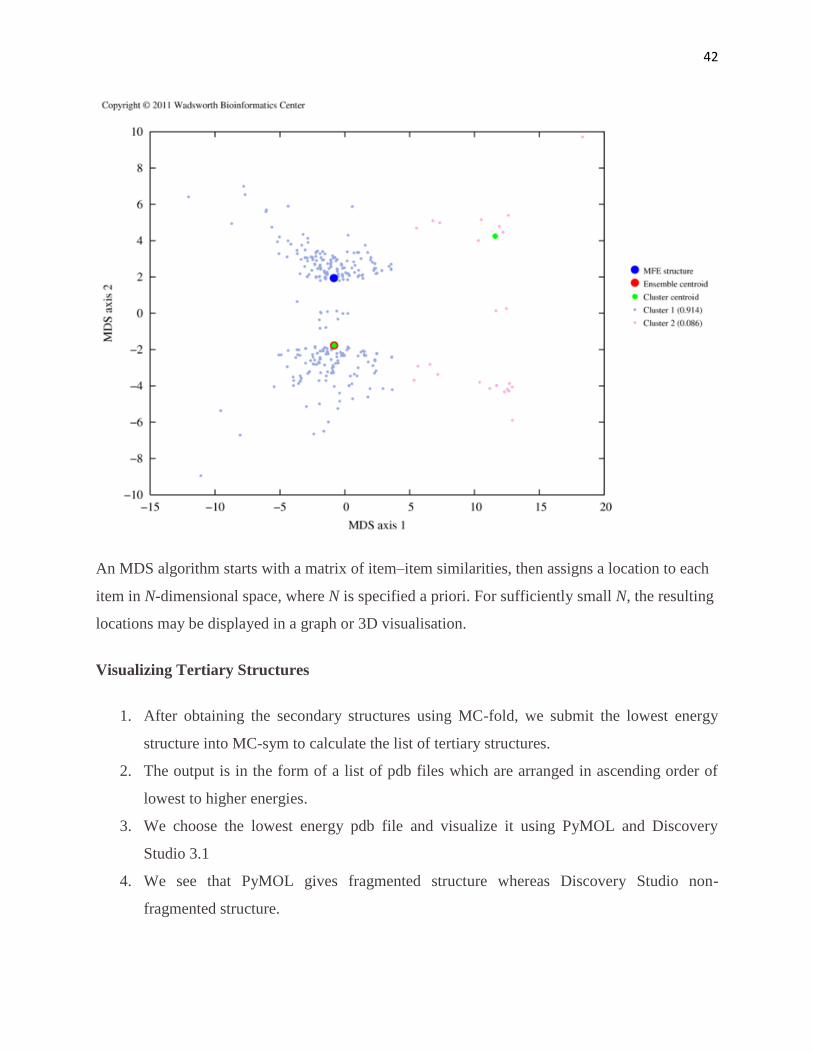
An MDS algorithm starts with a matrix of item–item similarities, then assigns a location to each
item in N-dimensional space, where N is specified a priori. For sufficiently small N, the resulting
locations may be displayed in a graph or 3D visualisation.
Visualizing Tertiary Structures
1. After obtaining the secondary structures using MC-fold, we submit the lowest energy
structure into MC-sym to calculate the list of tertiary structures.
2. The output is in the form of a list of pdb files which are arranged in ascending order of
lowest to higher energies.
3. We choose the lowest energy pdb file and visualize it using PyMOL and Discovery
Studio 3.1
4. We see that PyMOL gives fragmented structure whereas Discovery Studio non-
fragmented structure.
43
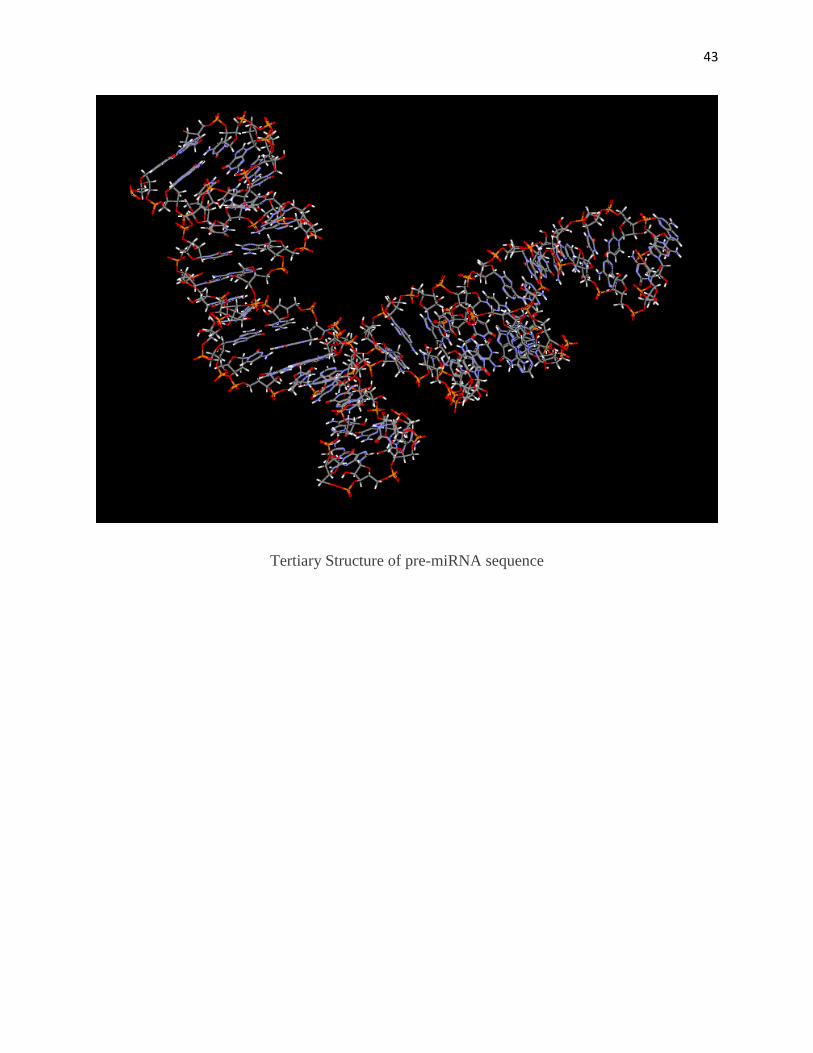
Tertiary Structure of pre-miRNA sequence
44
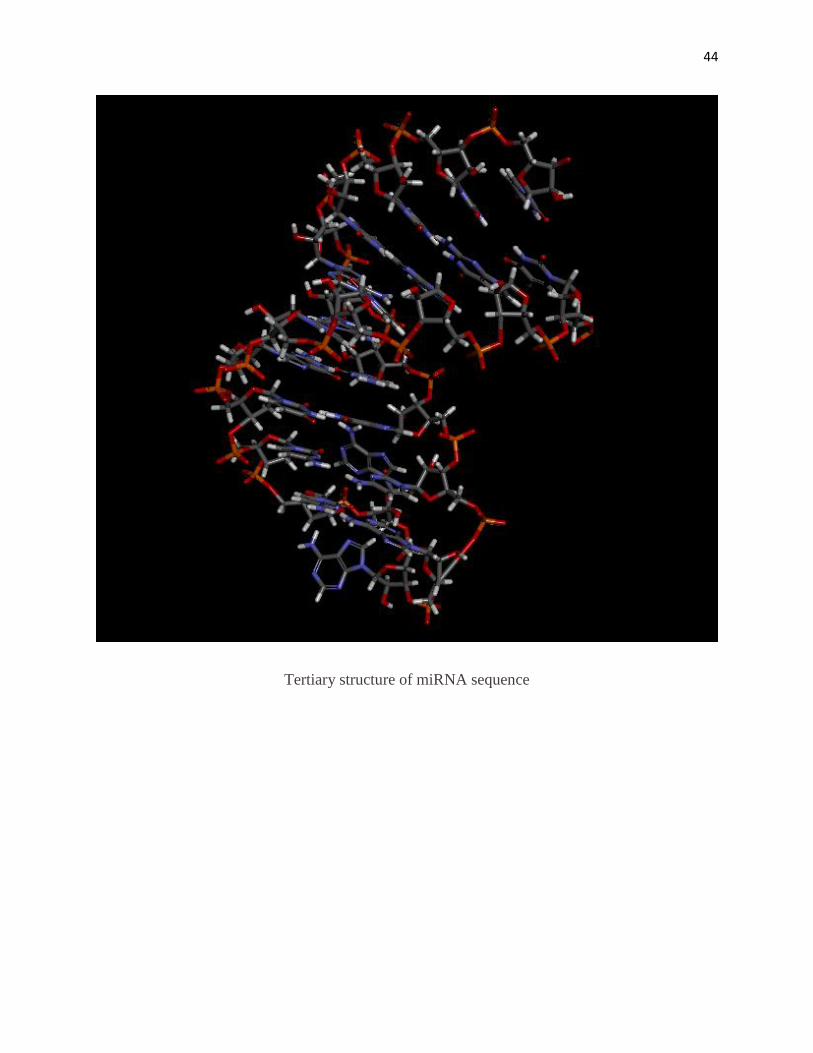
Tertiary structure of miRNA sequence
45
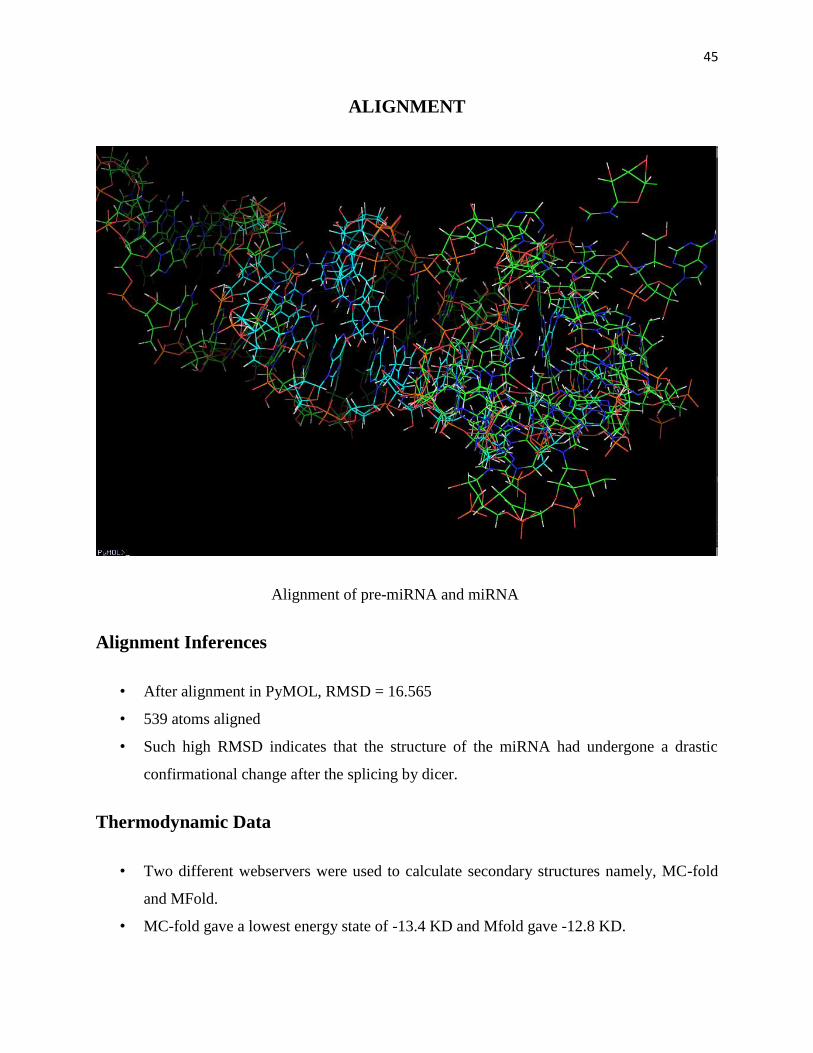
ALIGNMENT
Alignment of pre-miRNA and miRNA
Alignment Inferences
• After alignment in PyMOL, RMSD = 16.565
• 539 atoms aligned
• Such high RMSD indicates that the structure of the miRNA had undergone a drastic
confirmational change after the splicing by dicer.
Thermodynamic Data
• Two different webservers were used to calculate secondary structures namely, MC-fold
and MFold.
• MC-fold gave a lowest energy state of -13.4 KD and Mfold gave -12.8 KD.
46
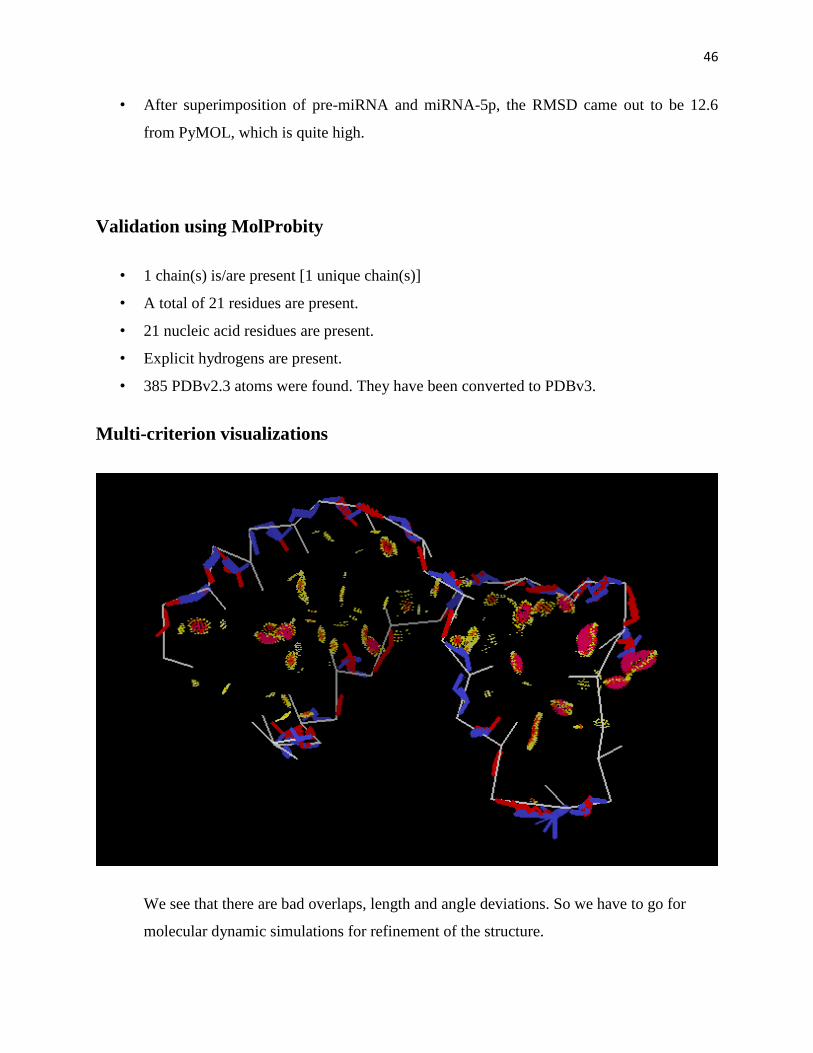
• After superimposition of pre-miRNA and miRNA-5p, the RMSD came out to be 12.6
from PyMOL, which is quite high.
Validation using MolProbity
• 1 chain(s) is/are present [1 unique chain(s)]
• A total of 21 residues are present.
• 21 nucleic acid residues are present.
• Explicit hydrogens are present.
• 385 PDBv2.3 atoms were found. They have been converted to PDBv3.
Multi-criterion visualizations
We see that there are bad overlaps, length and angle deviations. So we have to go for
molecular dynamic simulations for refinement of the structure.
47
As disease-specific miRNAs are identified, the validation of novel targets within a disease
pathway of interest may lead to novel therapeutic strategies. Therefore, it is critically important
to be able to identify and validate miRNA/mRNA target pairs. Although not perfect,
computational algorithms and ΔG analyses allow for the identification of putative
miRNA/mRNA targets. Once identified, the authenticity of a functional miRNA/mRNA target
pair can be validated by fulfilling four criteria. First, miRNA/mRNA target interaction must be
verified. Second, the predicted miRNA and mRNA target gene must be co-expressed. Third, a
given miRNA must have a predictable effect on target protein expression. That is, if a gene is a
true target of a given miRNA, its miRNA mimic will decrease the target gene expression level
while a miRNA ASO inhibitor will increase the target gene expression level. Fourth and final,
miRNA-mediated regulation of target gene expression should equate to altered biological
function.
Results and Discussion
• Tertiary structure prediction is essential for drug design.
• We can synthesize crystals depending upon the validation study and inject it into the
bloodstream which will alter the respective metabolic pathways in autism.
• If a miRNA sequence is suppressed, the drug will try activating it.
• If over–activated, drug tries to compensate by decreasing its activity.
48
References
1. Bailor MH, Sun X, Al-Hashimi HM. 2010. Topology links RNA secondary structure with
global conformation, dynamics, and adaptation. Science 327:202–206.
2. Ban N, Nissen P, Hansen J, Moore PB, Steitz TA. 2000. The complete atomic structure
of the large ribosomal subunit at 2.4 Å resolution. Science 289:905–920.
3. Blount KF, Uhlenbeck OC. 2005. The structure-function dilemma of the hammerhead
ribozyme. Annu Rev Biophys Biomol Struct 34: 415–440.
4. Cassiday LA, Maher LJ III.. 2001. In vivo recognition of an RNA aptamer by its
transcription factor target. Biochemistry 40: 2433–2438.
5. Cassiday LA, Lebruska LL, Benson LM, Naylor S, Owen WG, Maher LJ III.. 2002.Bindi
ng stoichiometry of an RNA aptamer and its transcription factor target. Anal
Biochem 306: 290–297.
6. Das R, Baker D. 2007. Automated de novo prediction of native-like RNA tertiary
structures. Proc Natl Acad Sci 104: 14664–14669.
7. Das R, Karanicolas J, Baker D. 2010. Atomic accuracy in predicting and designing
noncanonical RNA structure. Nat Methods 7: 291–294.
8. Ding F, Sharma S, Chalasani P, Demidov VV, Broude NE, Dokholyan NV. 2008.Ab
initio RNA folding by discrete molecular dynamics: From structure prediction to folding
mechanisms. RNA 14: 1164–1173.
9. Do CB, Woods DA, Batzoglou S. 2006. CONTRAfold: RNA secondary structure
prediction without physics-based models. Bioinformatics 22: e90–e98.
10. Flores SC, Wan Y, Russell R, Altman RB. 2010. Predicting RNA structure by multiple
template homology modeling. Pac Symp Biocomput 2010: 216–227.

49

50