a comparison of greenhouse gas emissions in the residential sector of major canadian cities
TRANSCRIPT
Cite as: Mohareb, E.A., & Mohareb, A.K., 2014. A comparison of greenhouse gas emissions in the residential sector of major Canadian cities. Canadian Journal of Civil Engineering 41 (4), 285-293
A Comparison of Greenhouse Gas Emissions in the Residential
Sector of Major Canadian Cities
Eugene A. Mohareb; Department of Civil Engineering, University of Toronto, 35 St. George
St., Toronto, ON. [email protected]
Adrian K. Mohareb; ClearLead Consulting, 108-245 Fell Ave., North Vancouver, BC.
Abstract: One of the most significant sources of greenhouse gas (GHG) emissions in Canada is
the buildings sector, with over 30% of national energy end-use occurring in buildings. Energy use
must be addressed in order to reduce emissions from the buildings sector, as nearly 70% of all
Canada’s energy used in the residential sector comes from fossil sources. An analysis of GHG
emissions from the existing residential building stock for the year 2010 has been conducted for
six Canadian cities with different climates and development histories: Vancouver, Edmonton,
Winnipeg, Toronto, Montreal and Halifax. Variation across these cities is seen in their 2010 GHG
emissions, due to climate, characteristics of the building stock, and energy conversion
technologies, with Halifax having the highest per capita emissions at 5.55 tCO2e/capita and
Montreal having the lowest at 0.32 tCO2e/capita. The importance of the provincial electricity grid’s
carbon intensity is emphasized, along with era of construction, occupancy, floor area and climate.
Approaches to achieving deep emissions reductions include innovative retrofit financing and city
level residential energy conservation by-laws; each region should seek location-appropriate
measures to reduce energy demand within its residential housing stock, as well as associated
GHG emissions.
Keywords: Climate Change; Greenhouse Gases; Cities; Residential Energy Use; Building Stock
Acknowledgments
The authors would like to thank Prof. Christopher A. Kennedy for his input related to this work.
This work is made possible by funding from the people of Canada through the Natural Sciences
and Engineering Research Council.
Cite as: Mohareb, E.A., & Mohareb, A.K., 2014. A comparison of greenhouse gas emissions in the residential sector of major Canadian cities. Canadian Journal of Civil Engineering 41 (4), 285-293
1. Introduction
The motivation to reduce greenhouse gas (GHG) emissions has grown in recent years as
scientific evidence of climate change and its potential impacts have become widely recognized
(Doran and Zimmerman 2009). It has been suggested that cities contribute over 70% of global
energy-related CO2 emissions (IEA 2008). A trend towards urbanization has been observed both
internationally and within Canada, with the percentage of Canadians living within cities has
reached 80% (UN ESA 2013; Statistics Canada 2010). The potential for urbanization in Canada
to further increase GHG emissions growth is supported by two observations. First, settlement size
demonstrates a super-linear power law relationship with gross domestic product (observed in the
US, China and Germany), suggesting higher incomes as urbanization occurs (Bettencourt et al,
2007). Secondly, a positive relationship between income and greenhouse gas emissions has also
been suggested, which may lead to higher per capita emissions (Wilson et al, 2013a; Wilson et
al, 2013b). As a result, in order to address the challenge presented by climate change, a special
focus must be placed on reducing the climate impact of urban infrastructure.
Globally, cities have become early champions for action towards GHG emission reductions (FCM
2013). As a result, many Canadian cities have begun the process of quantifying the sources of
these emissions. One of the key contributing sectors is the buildings sector. Given that buildings
are long-lived and that deep energy efficiency retrofitting activities have high costs, absolute
reductions in GHG emissions from buildings will be difficult to attain (Mohareb and Kennedy
2012). The residential sector also warrants attention since ownership is broadly distributed (as
are, consequently, energy decision makers) and this sector contributes a significant proportion to
urban emissions. As an example, the City of Toronto has estimated that nearly 25% of
community emissions were attributable to the residential sector (City of Toronto 2007). Similarly,
according to the Province of BC’s Community Energy and Emissions Inventory, 23% of the GHG
emissions in Metro Vancouver come from the residential sector (Climate Action Secretariat 2013).
The IPCC (2007) has suggested that Annex I countries should aim to reduce emission by 80-95%

Cite as: Mohareb, E.A., & Mohareb, A.K., 2014. A comparison of greenhouse gas emissions in the residential sector of major Canadian cities. Canadian Journal of Civil Engineering 41 (4), 285-293
by 2050 from a 1990 baseline, and many cities internationally have chosen to adopt this target
(including both Toronto and Vancouver).
The goal of this research is to quantify residential GHG emissions for six major Canadian cities by
using a bottom-up modeling approach. Quantification of emissions was accomplished using the
Pathways to Urban Reductions in Greenhouse gas Emissions, or PURGE, model. To this point,
residential emissions have generally not been disaggregated in urban inventories; doing so
allows for novel comparisons of GHG emissions from end uses, building types and energy
sources from houses in the six cities selected. As well, this study will determine how GHG
emissions from the residential sector differ in cities across Canada, and suggest the reasons for
these differences. This quantification exercise will highlight the specific challenges facing the
residential sector in different Canadian cities in meeting the IPCC’s targeted emission reductions
and achieving carbon neutrality.
2. Methodology
2.1 Residential Housing Stocks of Six Canadian Cities
Six major Canadian cities were selected, based on population size, as well as differences in
climate, eras of development, energy sources and types of buildings prevalent in their building
stock. A summary of key statistics for the Census Metropolitan Areas (CMAs) examined is
presented in Table 1.
A number of factors dictate urban housing stock dynamics, such as population growth, regional
economic development, immigration policy, geographic constraints and geopolitical dynamics.
One example would be the surge in population in the province of Alberta due to oil sands
development, with Alberta growing by 10.8% between 2006 and 2011, compared to the national
average of 5.9% (Statistics Canada 2012; Mansell & Schlenker 2006).
Cite as: Mohareb, E.A., & Mohareb, A.K., 2014. A comparison of greenhouse gas emissions in the residential sector of major Canadian cities. Canadian Journal of Civil Engineering 41 (4), 285-293
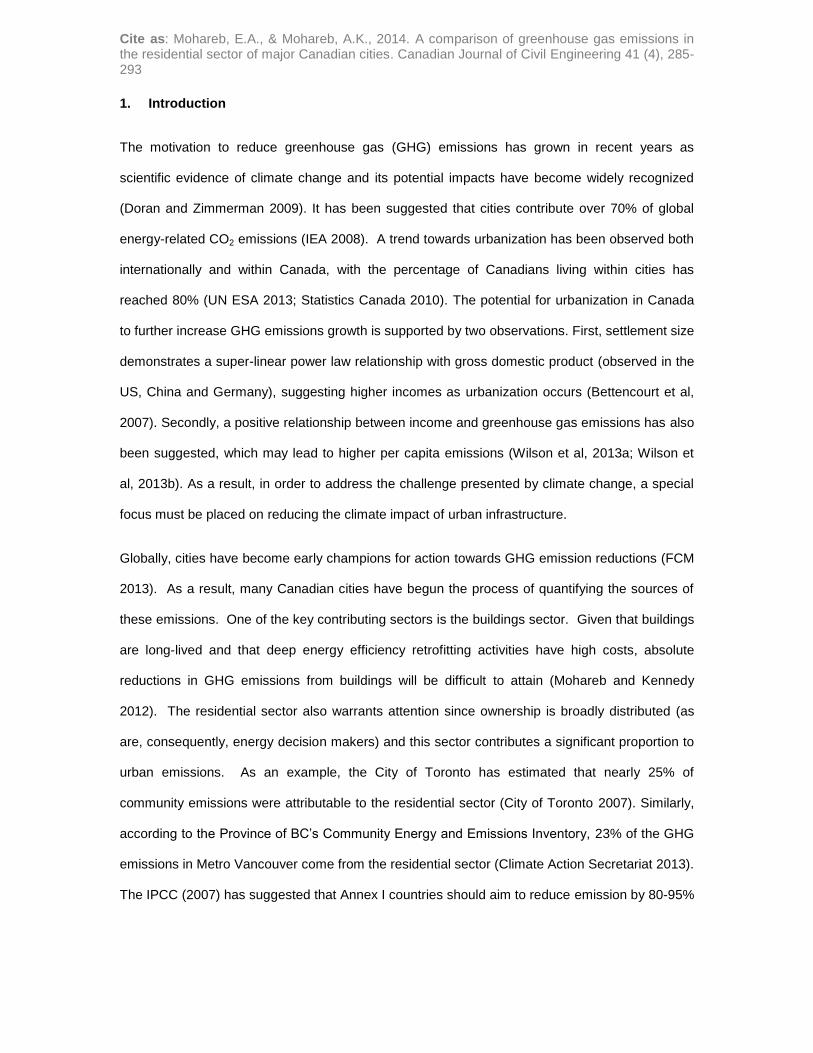
Table 1: Summary Statistics of Six Canadian Cities (based on CMA's; Statistics Canada, 2011;
Degreedays.net)
Census Metropolitan
Area
Population (2011)
Population Density
(2011; per km
2)
Building Stock1 (2006)
HDD (Base= 18
oC) % SFA % SFD % MUR
Vancouver 2,419,733 803 25.4% 33.8% 40.1% 2929
Edmonton 1,196,342 123 15.2% 58.6% 24.5% 5867
Winnipeg 762,759 138 8.2% 62.9% 28.2% 5540
Toronto 5,838,838 945 20.7% 41.3% 37.9% 3613
Montreal 3,908,723 898 17.2% 32.6% 49.7% 4042
Halifax 408,198 71 14.3% 51.0% 32.1% 4051
SFA = Single Family Attached Units; SFD = Single Family Detached Units; MUR = Multi-Unit Residential; HDD = Heating Degree Days (at International Airport);
1Figures do not total 100% as
moveable dwellings are not included
The age distribution of buildings in various cities is another important factor in calculating GHG
emissions. Building envelope characteristics are associated with the era of construction, varying
due to building codes and owner-initiated retrofitting initiatives over time. Building codes have
included more energy-saving measures over time, resulting in lower heating energy demand per
unit of floor area (OEE 2012a). As well, other building characteristics also vary over time; some
examples include the use of window walls in modern high rise multi-unit residences (due to their
low cost, perceived market demand and ease of installation; Kesik 2011) and the increases in
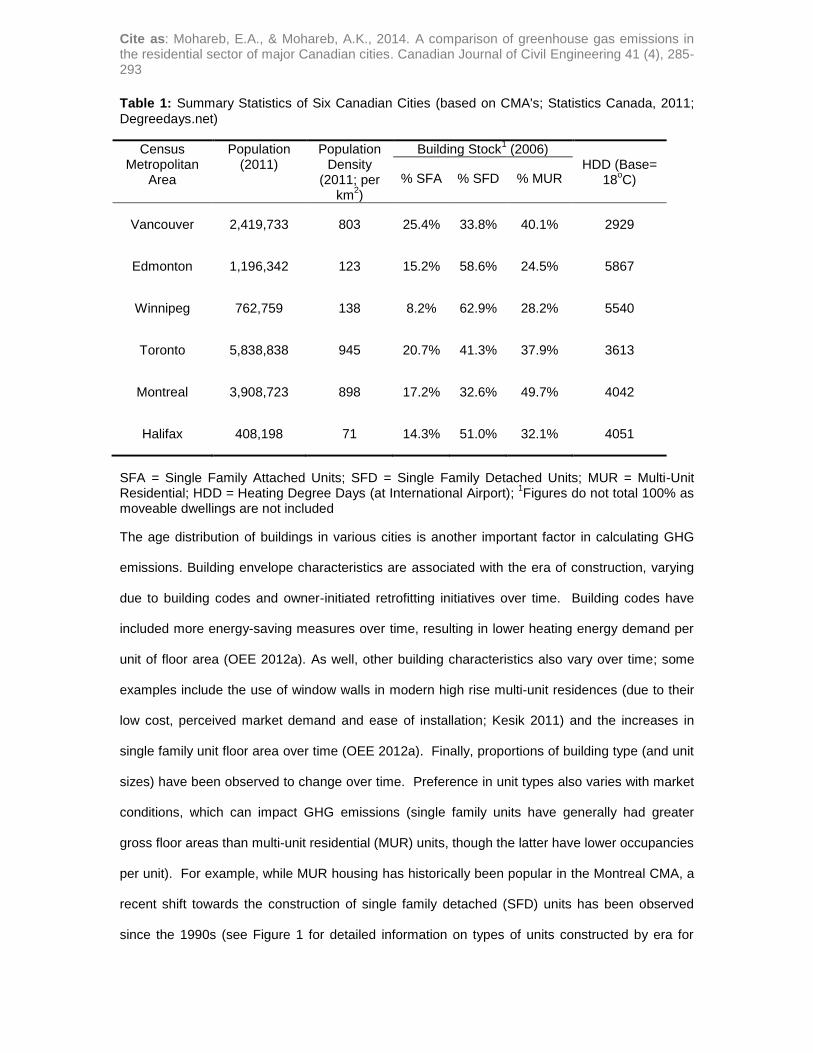
single family unit floor area over time (OEE 2012a). Finally, proportions of building type (and unit
sizes) have been observed to change over time. Preference in unit types also varies with market
conditions, which can impact GHG emissions (single family units have generally had greater
gross floor areas than multi-unit residential (MUR) units, though the latter have lower occupancies
per unit). For example, while MUR housing has historically been popular in the Montreal CMA, a
recent shift towards the construction of single family detached (SFD) units has been observed
since the 1990s (see Figure 1 for detailed information on types of units constructed by era for
Cite as: Mohareb, E.A., & Mohareb, A.K., 2014. A comparison of greenhouse gas emissions in the residential sector of major Canadian cities. Canadian Journal of Civil Engineering 41 (4), 285-293
each of the study cities). Additionally, histograms detailing the 2006 building stock by era of
construction are seen in Figure 2.
Figure 1: Types of Units Constructed in Various Eras by City, 2006 (Statistics Canada 2006)
Vancouver
Edmonton
Winnipeg
Toronto
Montreal
Halifax
0.0%
10.0%
20.0%
30.0%
40.0%
50.0%
60.0%
MUR
SFA
SFD
0.0%
10.0%
20.0%
30.0%
40.0%
50.0%
60.0%
70.0%
80.0%
MUR
SFA
SFD
0.0%
10.0%
20.0%
30.0%
40.0%
50.0%
60.0%
70.0%
80.0%
MUR
SFA
SFD0.0%
10.0%
20.0%
30.0%
40.0%
50.0%
60.0%
MUR
SFA
SFD
0.0%
10.0%
20.0%
30.0%
40.0%
50.0%
60.0%
70.0%
MUR
SFA
SFD0.0%
10.0%
20.0%
30.0%
40.0%
50.0%
60.0%
70.0%
MUR
SFA
SFD
Cite as: Mohareb, E.A., & Mohareb, A.K., 2014. A comparison of greenhouse gas emissions in the residential sector of major Canadian cities. Canadian Journal of Civil Engineering 41 (4), 285-293
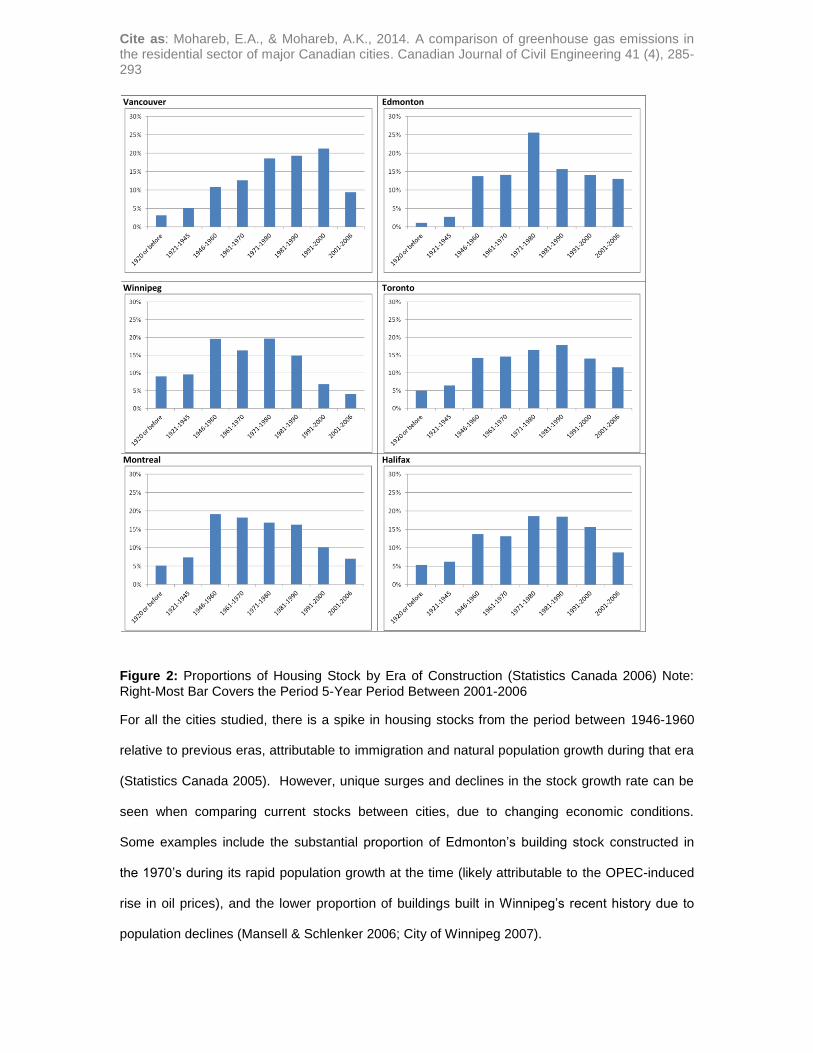
Figure 2: Proportions of Housing Stock by Era of Construction (Statistics Canada 2006) Note:
Right-Most Bar Covers the Period 5-Year Period Between 2001-2006
For all the cities studied, there is a spike in housing stocks from the period between 1946-1960
relative to previous eras, attributable to immigration and natural population growth during that era
(Statistics Canada 2005). However, unique surges and declines in the stock growth rate can be
seen when comparing current stocks between cities, due to changing economic conditions.
Some examples include the substantial proportion of Edmonton’s building stock constructed in
the 1970’s during its rapid population growth at the time (likely attributable to the OPEC-induced
rise in oil prices), and the lower proportion of buildings built in Winnipeg’s recent history due to
population declines (Mansell & Schlenker 2006; City of Winnipeg 2007).
Vancouver
Edmonton
Winnipeg
Toronto
Montreal
Halifax
Cite as: Mohareb, E.A., & Mohareb, A.K., 2014. A comparison of greenhouse gas emissions in the residential sector of major Canadian cities. Canadian Journal of Civil Engineering 41 (4), 285-293
2.2 The PURGE Model
The PURGE model is a method for quantifying and projecting urban GHG emissions over time
from buildings, private transportation, and waste (Mohareb and Kennedy 2012). In this study, the
residential building GHG module is applied to quantify emissions from the building stock in 2010.
Modeled data allows for the estimation of GHG emissions attributable to specific eras of
construction and types of residence, on a per capita basis; this could not be achieved from data
provided by utilities, as information on housing characteristics or occupancy are not publicly
available. The PURGE model has been validated through a comparison with recent GHG
inventory data from Civic Action (2011); results from building sector energy consumption (natural
gas and electricity) using the PURGE model differed from 2008 and 2009 GHG inventories using
utility data by less than 10%. The Office of Energy Efficiency’s (OEE) energy end-use database
(OEE 2012a), microdata from the 2006 census (Statistics Canada 2006) and population growth
figures from the 2011 Canadian census are used to quantify GHG from the building technology
stock in the CMAs of interest to this study. The most recently available data from all sources
were applied if 2010 data were not accessible. Projections of housing stock change between
2006-2010 were applied based on the most recently available census microdata (2006), holding
the proportion of dwelling type constructed constant from the most recently available building
characteristics data (2001-2006). Additionally, dwelling sizes (i.e. floor area) of new construction
are held constant from 2006-2010 as well, based on sizes from the previous census period.
Detailed tables of inputs applied to the PURGE model are provided in the “Supplementary
Materials” section. Error associated with changes in new building stock characteristics in this
period will have a minimal impact, given that the overwhelming majority of citizens (~95%) in
each city are still housed in buildings constructed before 2006.
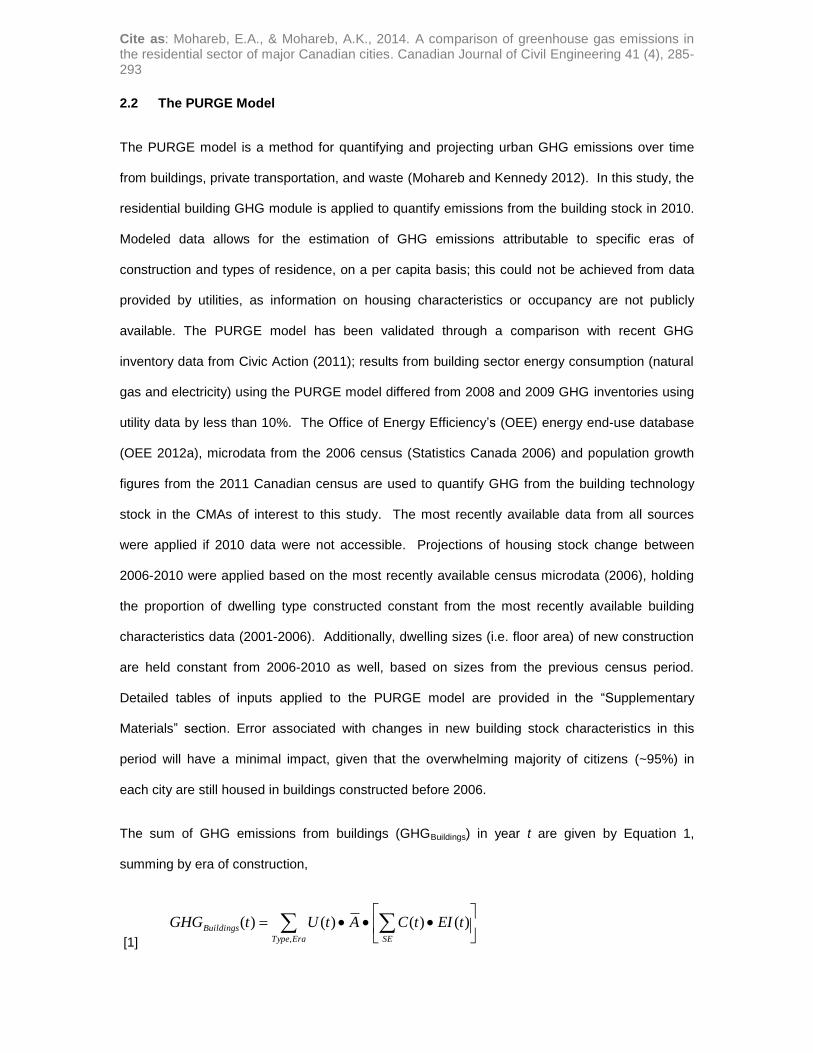
The sum of GHG emissions from buildings (GHGBuildings) in year t are given by Equation 1,
summing by era of construction,
[1]
EraType SE
Buildings tEItCAtUtGHG,
)()()()(
Cite as: Mohareb, E.A., & Mohareb, A.K., 2014. A comparison of greenhouse gas emissions in the residential sector of major Canadian cities. Canadian Journal of Civil Engineering 41 (4), 285-293
where, in year t, U is the total number of units of a given unit type and era, A is the average floor
space of the building type from a given era (m2), SE is the secondary energy type for a , C is the
consumption of a secondary energy type for a given building type and era (either electrical or
fossil energy; GJ/m2) and EI is emissions intensity of the energy source used (CO2e/m
2). A
variation on Equation 1 is applied for calculating domestic hot water demand (GHGDHW) (Equation
2),
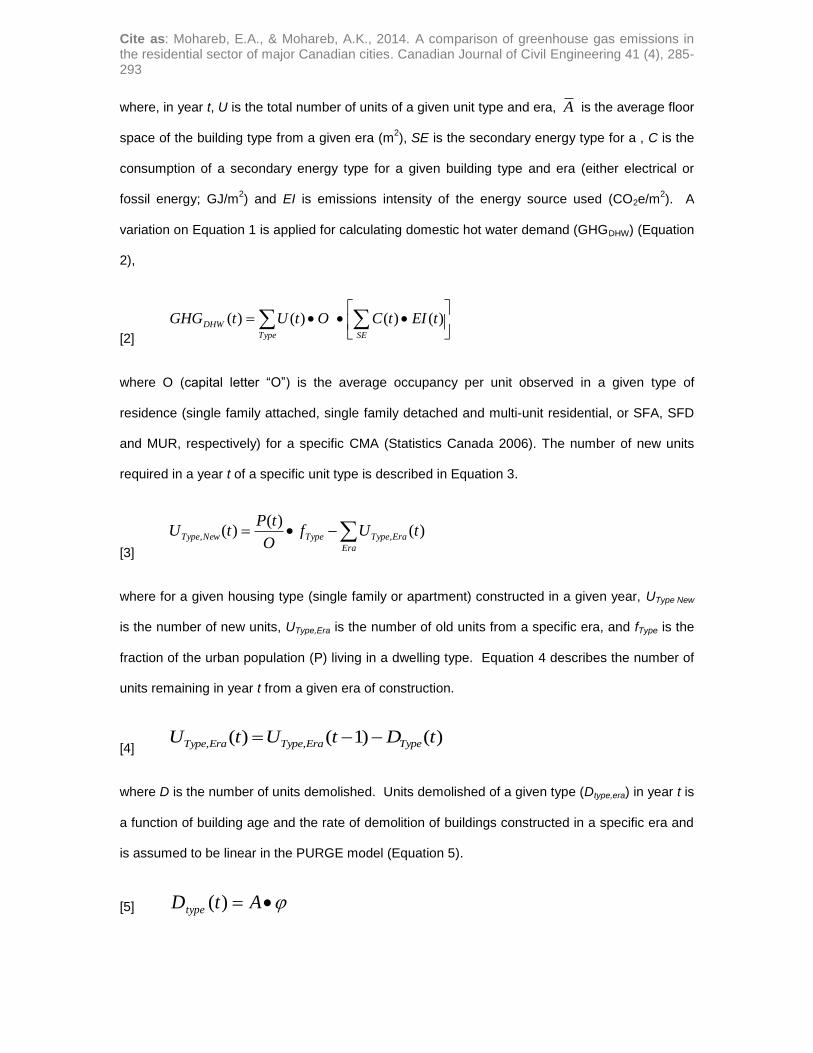
[2]
Type SE
DHW tEItCOtUtGHG )()()()(
where O (capital letter “O”) is the average occupancy per unit observed in a given type of
residence (single family attached, single family detached and multi-unit residential, or SFA, SFD
and MUR, respectively) for a specific CMA (Statistics Canada 2006). The number of new units
required in a year t of a specific unit type is described in Equation 3.
[3]
)()(
)( ,, tUfO
tPtU
Era
EraTypeTypeNewType
where for a given housing type (single family or apartment) constructed in a given year, UType New
is the number of new units, UType,Era is the number of old units from a specific era, and fType is the
fraction of the urban population (P) living in a dwelling type. Equation 4 describes the number of
units remaining in year t from a given era of construction.
[4] )()1()( ,, tDtUtU TypeEraTypeEraType
where D is the number of units demolished. Units demolished of a given type (Dtype,era) in year t is
a function of building age and the rate of demolition of buildings constructed in a specific era and
is assumed to be linear in the PURGE model (Equation 5).
[5] AtDtype )(
Cite as: Mohareb, E.A., & Mohareb, A.K., 2014. A comparison of greenhouse gas emissions in the residential sector of major Canadian cities. Canadian Journal of Civil Engineering 41 (4), 285-293
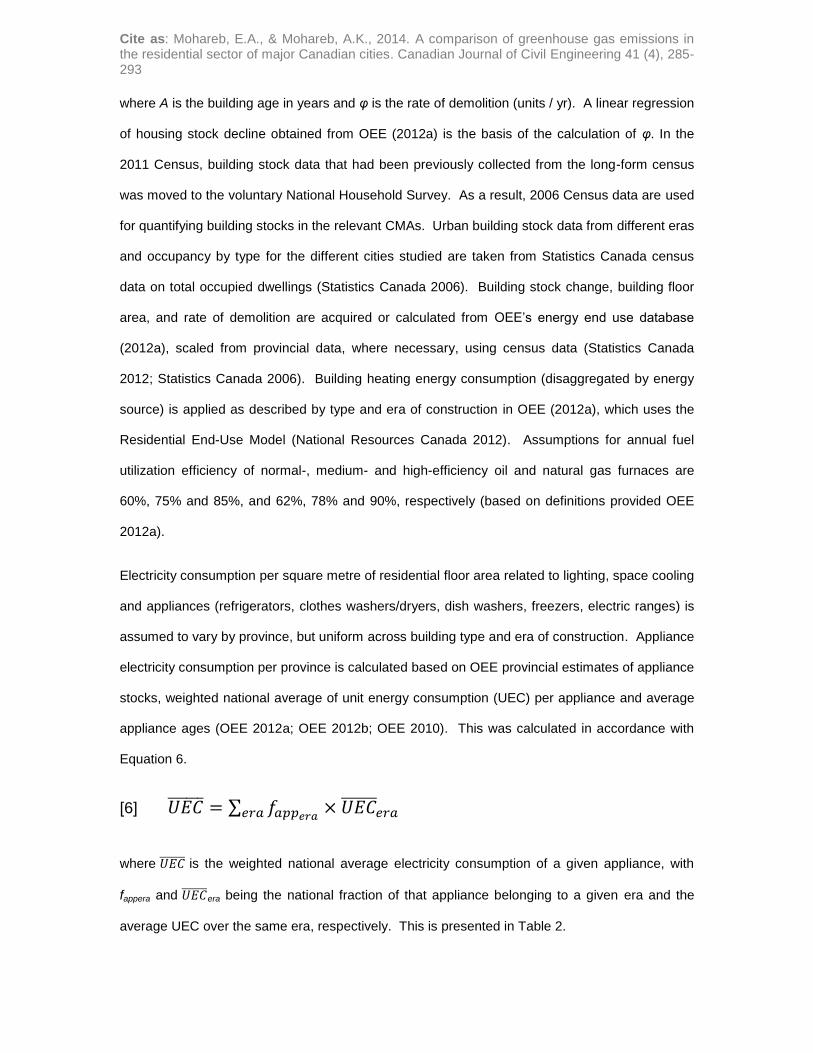
where A is the building age in years and φ is the rate of demolition (units / yr). A linear regression
of housing stock decline obtained from OEE (2012a) is the basis of the calculation of φ. In the
2011 Census, building stock data that had been previously collected from the long-form census
was moved to the voluntary National Household Survey. As a result, 2006 Census data are used
for quantifying building stocks in the relevant CMAs. Urban building stock data from different eras
and occupancy by type for the different cities studied are taken from Statistics Canada census
data on total occupied dwellings (Statistics Canada 2006). Building stock change, building floor
area, and rate of demolition are acquired or calculated from OEE’s energy end use database
(2012a), scaled from provincial data, where necessary, using census data (Statistics Canada
2012; Statistics Canada 2006). Building heating energy consumption (disaggregated by energy
source) is applied as described by type and era of construction in OEE (2012a), which uses the
Residential End-Use Model (National Resources Canada 2012). Assumptions for annual fuel
utilization efficiency of normal-, medium- and high-efficiency oil and natural gas furnaces are
60%, 75% and 85%, and 62%, 78% and 90%, respectively (based on definitions provided OEE
2012a).
Electricity consumption per square metre of residential floor area related to lighting, space cooling
and appliances (refrigerators, clothes washers/dryers, dish washers, freezers, electric ranges) is
assumed to vary by province, but uniform across building type and era of construction. Appliance
electricity consumption per province is calculated based on OEE provincial estimates of appliance
stocks, weighted national average of unit energy consumption (UEC) per appliance and average
appliance ages (OEE 2012a; OEE 2012b; OEE 2010). This was calculated in accordance with
Equation 6.
[6]
where is the weighted national average electricity consumption of a given appliance, with
fappera and era being the national fraction of that appliance belonging to a given era and the
average UEC over the same era, respectively. This is presented in Table 2.
Cite as: Mohareb, E.A., & Mohareb, A.K., 2014. A comparison of greenhouse gas emissions in the residential sector of major Canadian cities. Canadian Journal of Civil Engineering 41 (4), 285-293
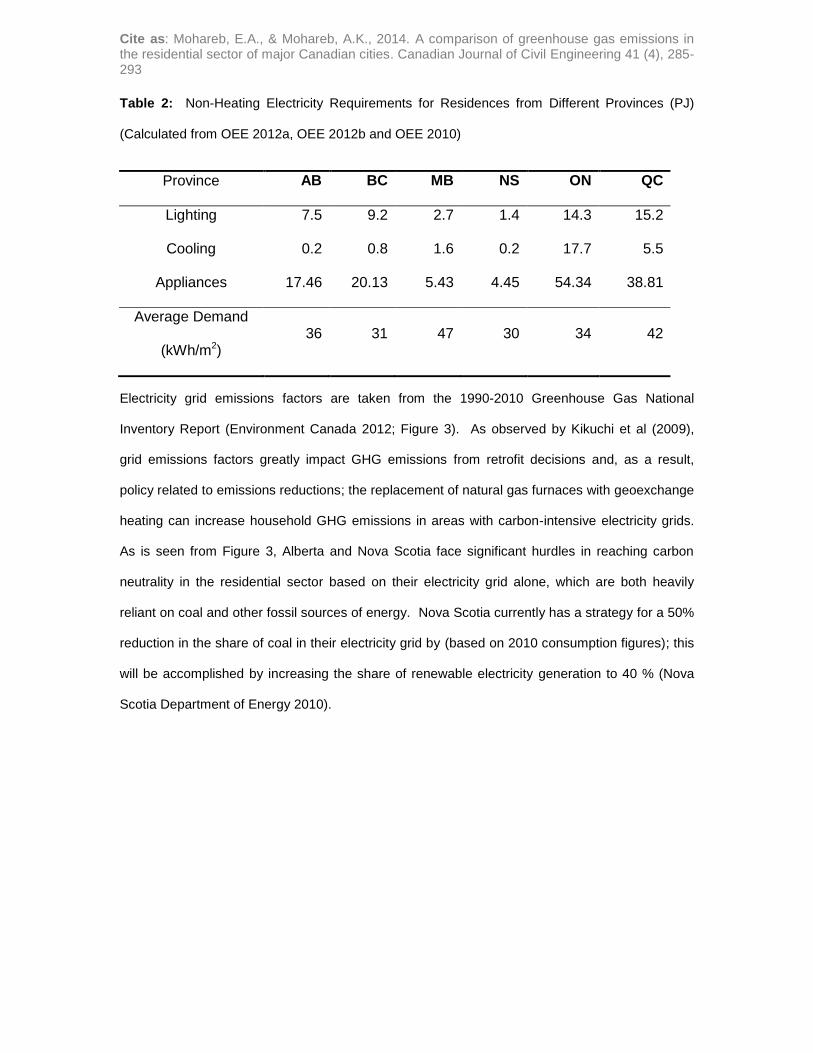
Table 2: Non-Heating Electricity Requirements for Residences from Different Provinces (PJ)
(Calculated from OEE 2012a, OEE 2012b and OEE 2010)
Province AB BC MB NS ON QC
Lighting 7.5 9.2 2.7 1.4 14.3 15.2
Cooling 0.2 0.8 1.6 0.2 17.7 5.5
Appliances 17.46 20.13 5.43 4.45 54.34 38.81
Average Demand
(kWh/m2) 36 31 47 30 34 42
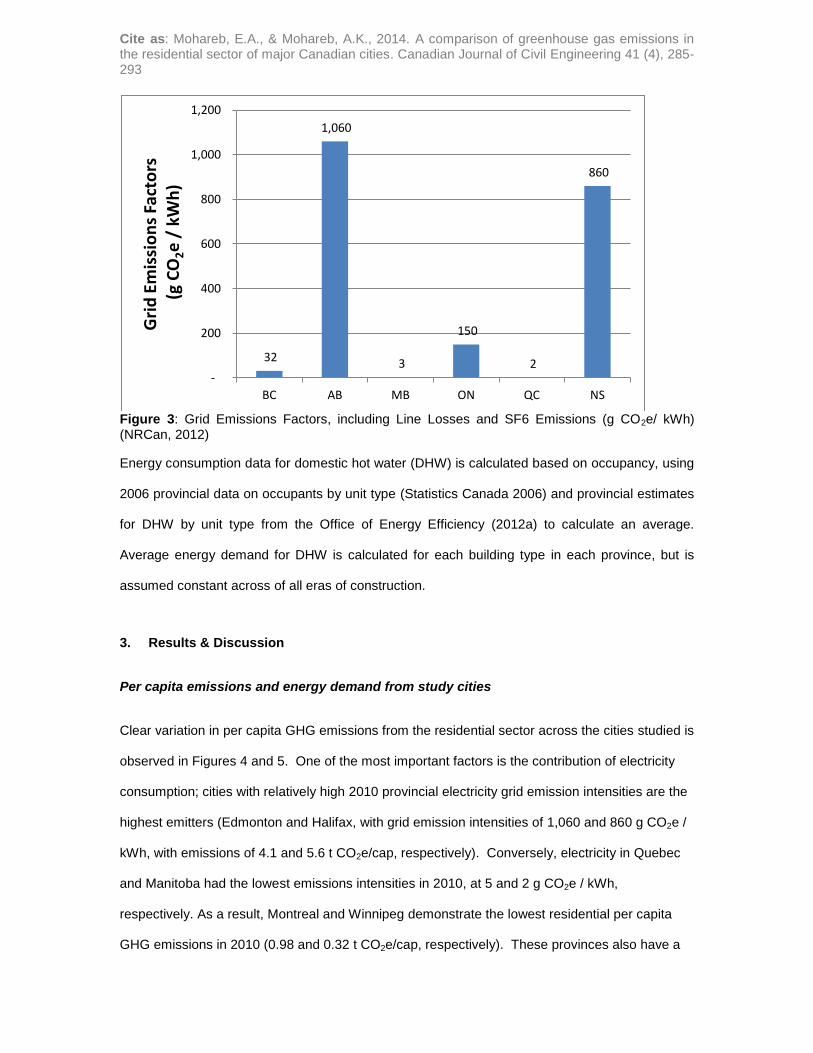
Electricity grid emissions factors are taken from the 1990-2010 Greenhouse Gas National
Inventory Report (Environment Canada 2012; Figure 3). As observed by Kikuchi et al (2009),
grid emissions factors greatly impact GHG emissions from retrofit decisions and, as a result,
policy related to emissions reductions; the replacement of natural gas furnaces with geoexchange
heating can increase household GHG emissions in areas with carbon-intensive electricity grids.
As is seen from Figure 3, Alberta and Nova Scotia face significant hurdles in reaching carbon
neutrality in the residential sector based on their electricity grid alone, which are both heavily
reliant on coal and other fossil sources of energy. Nova Scotia currently has a strategy for a 50%
reduction in the share of coal in their electricity grid by (based on 2010 consumption figures); this
will be accomplished by increasing the share of renewable electricity generation to 40 % (Nova
Scotia Department of Energy 2010).
Cite as: Mohareb, E.A., & Mohareb, A.K., 2014. A comparison of greenhouse gas emissions in the residential sector of major Canadian cities. Canadian Journal of Civil Engineering 41 (4), 285-293
Figure 3: Grid Emissions Factors, including Line Losses and SF6 Emissions (g CO2e/ kWh) (NRCan, 2012)
Energy consumption data for domestic hot water (DHW) is calculated based on occupancy, using
2006 provincial data on occupants by unit type (Statistics Canada 2006) and provincial estimates
for DHW by unit type from the Office of Energy Efficiency (2012a) to calculate an average.
Average energy demand for DHW is calculated for each building type in each province, but is
assumed constant across of all eras of construction.
3. Results & Discussion
Per capita emissions and energy demand from study cities
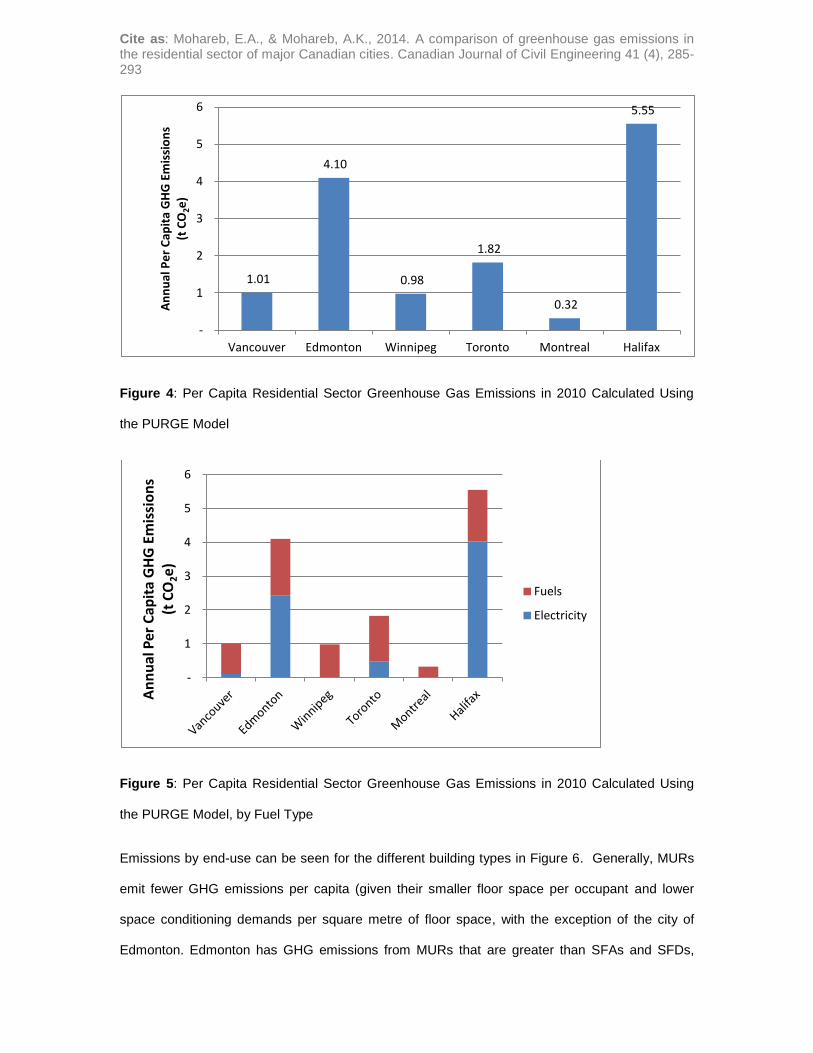
Clear variation in per capita GHG emissions from the residential sector across the cities studied is
observed in Figures 4 and 5. One of the most important factors is the contribution of electricity
consumption; cities with relatively high 2010 provincial electricity grid emission intensities are the
highest emitters (Edmonton and Halifax, with grid emission intensities of 1,060 and 860 g CO2e /
kWh, with emissions of 4.1 and 5.6 t CO2e/cap, respectively). Conversely, electricity in Quebec
and Manitoba had the lowest emissions intensities in 2010, at 5 and 2 g CO2e / kWh,
respectively. As a result, Montreal and Winnipeg demonstrate the lowest residential per capita
GHG emissions in 2010 (0.98 and 0.32 t CO2e/cap, respectively). These provinces also have a
32
1,060
3
150
2
860
-
200
400
600
800
1,000
1,200
BC AB MB ON QC NS
Gri
d E
mis
sio
ns
Fact
ors
(
g C
O2e
/ k
Wh
)

Cite as: Mohareb, E.A., & Mohareb, A.K., 2014. A comparison of greenhouse gas emissions in the residential sector of major Canadian cities. Canadian Journal of Civil Engineering 41 (4), 285-293
high prevalence of electric heat, further improving their emissions relative to provinces reliant on
fossil fuel heating. As well, Halifax has higher per capita residential GHG emissions due to the
prominence of fuel oil in home heating applications; fuel oil has an emissions factor (t CO2e / GJ)
that is nearly 40% greater than natural gas, which is the preferred home heating fuel in many
other areas. Direct heating-related GHG emissions were mitigated somewhat in Montreal,
Vancouver and Halifax, where appreciable percentages of households rely on wood as a heating
fuel (see Supplementary Materials, Table S.8 for details). It should be noted that lifecycle
emissions associated with using wood as a fuel source are not negligible, and require
replacement of harvested biomass to achieve carbon neutrality (McKechnie et al, 2011).
Cite as: Mohareb, E.A., & Mohareb, A.K., 2014. A comparison of greenhouse gas emissions in the residential sector of major Canadian cities. Canadian Journal of Civil Engineering 41 (4), 285-293
Figure 4: Per Capita Residential Sector Greenhouse Gas Emissions in 2010 Calculated Using
the PURGE Model
Figure 5: Per Capita Residential Sector Greenhouse Gas Emissions in 2010 Calculated Using
the PURGE Model, by Fuel Type
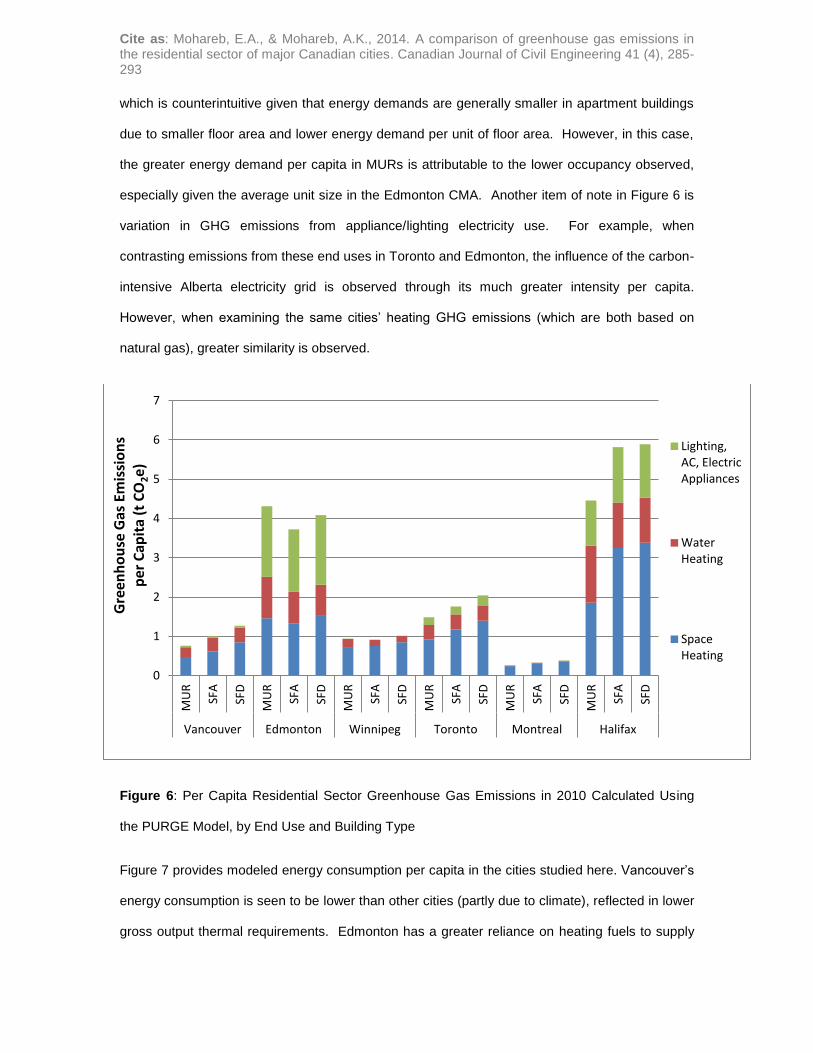
Emissions by end-use can be seen for the different building types in Figure 6. Generally, MURs
emit fewer GHG emissions per capita (given their smaller floor space per occupant and lower
space conditioning demands per square metre of floor space, with the exception of the city of
Edmonton. Edmonton has GHG emissions from MURs that are greater than SFAs and SFDs,
1.01
4.10
0.98
1.82
0.32
5.55
-
1
2
3
4
5
6
Vancouver Edmonton Winnipeg Toronto Montreal Halifax
An
nu
al P
er
Cap
ita
GH
G E
mis
sio
ns
(t
CO
2e)
-
1
2
3
4
5
6
An
nu
al P
er C
apit
a G
HG
Em
issi
on
s
(t C
O2e)
Fuels
Electricity
Cite as: Mohareb, E.A., & Mohareb, A.K., 2014. A comparison of greenhouse gas emissions in the residential sector of major Canadian cities. Canadian Journal of Civil Engineering 41 (4), 285-293
which is counterintuitive given that energy demands are generally smaller in apartment buildings
due to smaller floor area and lower energy demand per unit of floor area. However, in this case,
the greater energy demand per capita in MURs is attributable to the lower occupancy observed,
especially given the average unit size in the Edmonton CMA. Another item of note in Figure 6 is
variation in GHG emissions from appliance/lighting electricity use. For example, when
contrasting emissions from these end uses in Toronto and Edmonton, the influence of the carbon-
intensive Alberta electricity grid is observed through its much greater intensity per capita.
However, when examining the same cities’ heating GHG emissions (which are both based on
natural gas), greater similarity is observed.
Figure 6: Per Capita Residential Sector Greenhouse Gas Emissions in 2010 Calculated Using
the PURGE Model, by End Use and Building Type
Figure 7 provides modeled energy consumption per capita in the cities studied here. Vancouver’s
energy consumption is seen to be lower than other cities (partly due to climate), reflected in lower
gross output thermal requirements. Edmonton has a greater reliance on heating fuels to supply
0
1
2
3
4
5
6
7
MU
R
SFA
SFD
MU
R
SFA
SFD
MU
R
SFA
SFD
MU
R
SFA
SFD
MU
R
SFA
SFD
MU
R
SFA
SFD
Vancouver Edmonton Winnipeg Toronto Montreal Halifax
Gre
enh
ou
se G
as E
mis
sio
ns
p
er C
apit
a (t
CO
2e)
Lighting, AC, Electric Appliances
Water Heating
Space Heating
Cite as: Mohareb, E.A., & Mohareb, A.K., 2014. A comparison of greenhouse gas emissions in the residential sector of major Canadian cities. Canadian Journal of Civil Engineering 41 (4), 285-293
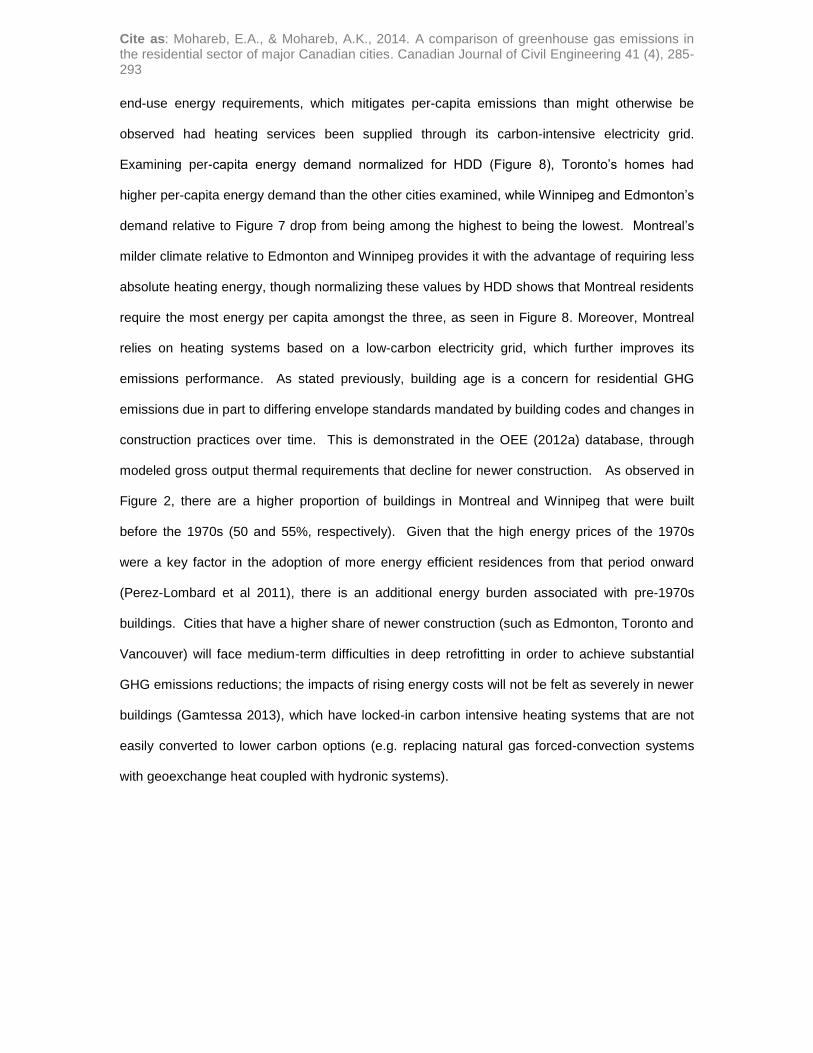
end-use energy requirements, which mitigates per-capita emissions than might otherwise be
observed had heating services been supplied through its carbon-intensive electricity grid.
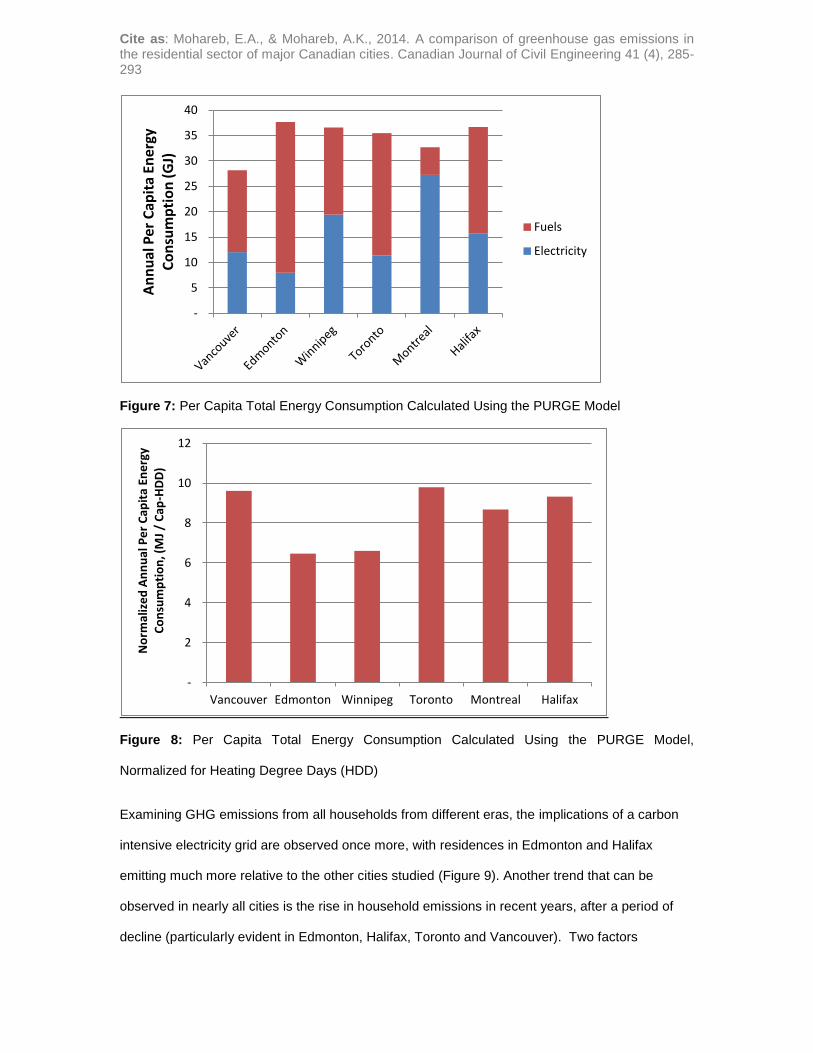
Examining per-capita energy demand normalized for HDD (Figure 8), Toronto’s homes had
higher per-capita energy demand than the other cities examined, while Winnipeg and Edmonton’s
demand relative to Figure 7 drop from being among the highest to being the lowest. Montreal’s
milder climate relative to Edmonton and Winnipeg provides it with the advantage of requiring less
absolute heating energy, though normalizing these values by HDD shows that Montreal residents
require the most energy per capita amongst the three, as seen in Figure 8. Moreover, Montreal
relies on heating systems based on a low-carbon electricity grid, which further improves its
emissions performance. As stated previously, building age is a concern for residential GHG
emissions due in part to differing envelope standards mandated by building codes and changes in
construction practices over time. This is demonstrated in the OEE (2012a) database, through
modeled gross output thermal requirements that decline for newer construction. As observed in
Figure 2, there are a higher proportion of buildings in Montreal and Winnipeg that were built
before the 1970s (50 and 55%, respectively). Given that the high energy prices of the 1970s
were a key factor in the adoption of more energy efficient residences from that period onward
(Perez-Lombard et al 2011), there is an additional energy burden associated with pre-1970s
buildings. Cities that have a higher share of newer construction (such as Edmonton, Toronto and
Vancouver) will face medium-term difficulties in deep retrofitting in order to achieve substantial
GHG emissions reductions; the impacts of rising energy costs will not be felt as severely in newer
buildings (Gamtessa 2013), which have locked-in carbon intensive heating systems that are not
easily converted to lower carbon options (e.g. replacing natural gas forced-convection systems
with geoexchange heat coupled with hydronic systems).
Cite as: Mohareb, E.A., & Mohareb, A.K., 2014. A comparison of greenhouse gas emissions in the residential sector of major Canadian cities. Canadian Journal of Civil Engineering 41 (4), 285-293
Figure 7: Per Capita Total Energy Consumption Calculated Using the PURGE Model
Figure 8: Per Capita Total Energy Consumption Calculated Using the PURGE Model,
Normalized for Heating Degree Days (HDD)
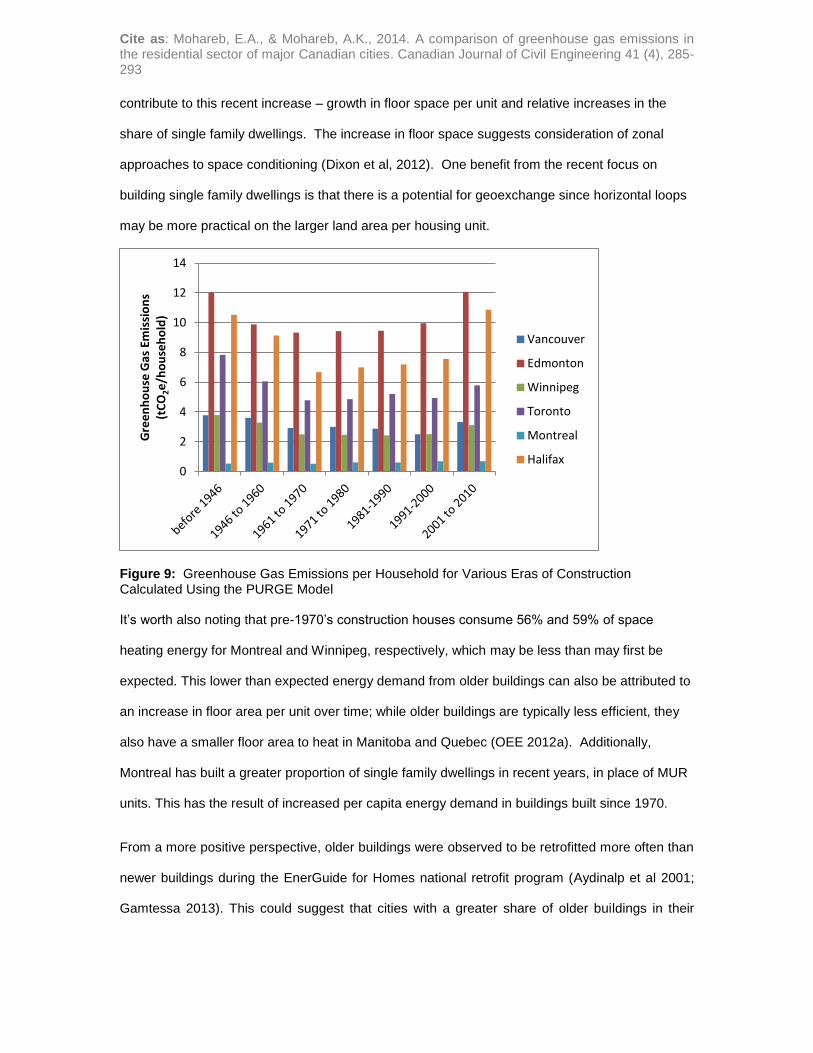
Examining GHG emissions from all households from different eras, the implications of a carbon
intensive electricity grid are observed once more, with residences in Edmonton and Halifax
emitting much more relative to the other cities studied (Figure 9). Another trend that can be
observed in nearly all cities is the rise in household emissions in recent years, after a period of
decline (particularly evident in Edmonton, Halifax, Toronto and Vancouver). Two factors
-
5
10
15
20
25
30
35
40
An
nu
al P
er C
apit
a En
ergy
C
on
sum
pti
on
(G
J)
Fuels
Electricity
-
2
4
6
8
10
12
Vancouver Edmonton Winnipeg Toronto Montreal Halifax
No
rmal
ize
d A
nn
ual
Pe
r C
apit
a En
erg
y C
on
sum
pti
on
, (M
J /
Cap
-HD
D)
Cite as: Mohareb, E.A., & Mohareb, A.K., 2014. A comparison of greenhouse gas emissions in the residential sector of major Canadian cities. Canadian Journal of Civil Engineering 41 (4), 285-293
contribute to this recent increase – growth in floor space per unit and relative increases in the
share of single family dwellings. The increase in floor space suggests consideration of zonal
approaches to space conditioning (Dixon et al, 2012). One benefit from the recent focus on
building single family dwellings is that there is a potential for geoexchange since horizontal loops
may be more practical on the larger land area per housing unit.
Figure 9: Greenhouse Gas Emissions per Household for Various Eras of Construction Calculated Using the PURGE Model It’s worth also noting that pre-1970’s construction houses consume 56% and 59% of space
heating energy for Montreal and Winnipeg, respectively, which may be less than may first be
expected. This lower than expected energy demand from older buildings can also be attributed to
an increase in floor area per unit over time; while older buildings are typically less efficient, they
also have a smaller floor area to heat in Manitoba and Quebec (OEE 2012a). Additionally,
Montreal has built a greater proportion of single family dwellings in recent years, in place of MUR
units. This has the result of increased per capita energy demand in buildings built since 1970.
From a more positive perspective, older buildings were observed to be retrofitted more often than
newer buildings during the EnerGuide for Homes national retrofit program (Aydinalp et al 2001;
Gamtessa 2013). This could suggest that cities with a greater share of older buildings in their
0
2
4
6
8
10
12
14
Gre
en
ho
use
Gas
Em
issi
on
s (t
CO
2e
/ho
use
ho
ld)
Vancouver
Edmonton
Winnipeg
Toronto
Montreal
Halifax

Cite as: Mohareb, E.A., & Mohareb, A.K., 2014. A comparison of greenhouse gas emissions in the residential sector of major Canadian cities. Canadian Journal of Civil Engineering 41 (4), 285-293
housing stock may be more successful in incentivizing home-owners to upgrade to more efficient
technologies and, potentially, to undertake deep retrofits.
Building types, floor area per unit type/era, and residence occupancy will also have a marked
effect in the calculation of GHG emissions. Modeled data presented in OEE (2012a) show MUR
units generally demand less thermal energy, followed by SFA and SFD (with an exception to this
ranking observed in Edmonton, where SFUAs require less heating per unit area than MURs; see
discussion above). As stated previously, the provincial average of floor area by building type
generally increases over time (OEE 2012a). While this increases energy demand for conditioned
spaces, this increase would generally be overshadowed by decreases in energy demand per unit
area. Finally, occupancy per unit type obtained from census microdata (Statistics Canada 2006)
has an impact on per capita GHG emissions and energy demand; while SFD/SFAs often have
greater total floor area, they also generally have higher occupancies which can produce the result
that MUR occupants have higher per capita emissions (as is the case with Edmonton).
Challenges in Achieving an 80% Reduction in Residential GHG Emissions
Municipalities require unique, context-specific approaches to reduce GHG emissions from the
residential building stock. Quantification of this sector on whole is promoted by the Federation of
Canadian Municipalities’ Partners for Climate Protection program (FCM 2013). This study
provides greater clarity to identify where emissions are most prominent in the Canadian building
stock through the examination of six representative cities. The following is a discussion of how
the sources of these emissions may be addressed.
There can be split incentives for energy efficiency upgrades in the housing sector between the
energy users and those who pay utility costs, particularly in the rental market. In the case where
the tenant pays the costs of utilities, the property owner has limited incentive to complete retrofit
projects that could reduce energy demand. Additionally, there is evidence that renters use more
energy because they are often offered lower efficiency appliances, due to lower capital costs for
property owners (Davis 2010). Alternatively, in a case where the landlord pays utility bills, the

Cite as: Mohareb, E.A., & Mohareb, A.K., 2014. A comparison of greenhouse gas emissions in the residential sector of major Canadian cities. Canadian Journal of Civil Engineering 41 (4), 285-293
occupant has the option to consume energy without consideration of the financial repercussions.
One alternative would be to impose a by-law that requires the publishing of rental unit energy
consumption data, so that full rental costs are understood and an incentive is created for
landlords to address energy demand (Davis and Levine 2012). The same could be done for non-
rental building energy labelling at point of sale. Other solutions include high efficiency appliance
and energy efficient envelope rebates, city-level residential energy conservation ordinances
(where residential sales or major retrofits must be accompanied by energy efficiency
improvements), subsidized direct install programs, creative financing options that encourage
energy efficiency (e.g. “green” leases, utility on-bill financing, local improvement charges and
property-assessed clean energy loans), and increasing general public awareness of the benefits
of reducing energy consumption (Williams 2008).
The emergence of consumer electronics and appliances as major energy end-uses must be
considered for future municipal plans targeting carbon neutrality, in light of the finding that
heating/cooling no longer dominate US residential energy use (USEIA 2011). While provincial
averages in appliance ownership were incorporated into the calculations above, consumer
electronics (computers, DVD players, TVs, etc.) and other small appliances (microwaves,
blenders, etc.) were not. As both the numbers of personal electronic devices per household and
housing thermal efficiency increases, the relative contribution of these end-uses to household
energy demand will increase. Additionally, energy switching from fuels to electricity (through a
conversion towards air-source heat pumps and geoexchange systems) to meet other end-use
requirements will alter daily demand profiles, which is especially of concern in jurisdictions where
renewable electricity resources do not dominate the baseload and/or peaking electricity supply
(Nova Scotia or Alberta), or where electricity supply expansion currently includes fossil sources
(such as natural gas-fired generation in Ontario).
Given that 80-90% reductions in residential GHG emissions are suggested for developed
countries such as Canada (IPCC 2007) in order to avoid increasing global average temperatures
by more than 2oC, a combination of occupant behaviour change and adoption of low-carbon
Cite as: Mohareb, E.A., & Mohareb, A.K., 2014. A comparison of greenhouse gas emissions in the residential sector of major Canadian cities. Canadian Journal of Civil Engineering 41 (4), 285-293
technologies will be necessary. Low-carbon energy sources, high-efficiency systems (e.g. district
energy) and the elimination of fossil fuel-based heating are needed in each jurisdiction if
Canadian cities are to achieve carbon neutrality. Differing scales of investment will be required in
each region to achieve these goals. While short-term policy to promote the switching of heating
to electric sources (geoexchange or air-source heat pumps) may result in higher emissions in
jurisdictions with carbon-intensive electricity grids, there may be a short-term benefit to their
adoption due to the growth of technical expertise, as well as greater public awareness and
acceptance. Though the elimination of fossil fuel-based heating energy services within the
residential sector will likely require increased electrical grid capacity and overall electricity
demand, there is significant potential to meet this increase with low-carbon alternatives in the
long-term (i.e. small-scale hydro, wind, solar, geothermal). Leadership for low-carbon electricity
strategies must be taken with the ultimate goal of providing a clean grid (which is generally
becoming more economically attractive as solar PV and wind prices continue to decline; Hurlbut
et al 2013), given the need to drastically reduce GHG emissions in developed nations, and the
potential for increases in total residential electricity demand as population and adoption of
consumer electronics increase. The importance of behavioural change cannot be overlooked,
since even aggressive technology adoption may not produce emission reductions on the scale
desired (Mohareb and Kennedy 2013). Reducing space conditioning demand through more
sophisticated thermostats and improved energy use feedback technologies represent two ways
that GHG reduction can be achieved through behaviour changes (Moon and Han 2011;
Granderson et al 2011).
Very aggressive building retrofits must be part of the path to carbon neutrality in the Canadian
housing stock. For example, retrofitting activities observed during Canada's recent federal
ecoENERGY program did not achieve demand reductions in individual homes on the scale
suggested by the IPCC's 2050 targets (80-95% below 1990 emissions) (Mohareb and Kennedy
2012). Additionally, energy codes for buildings should track best practices in energy efficient
building construction. The concept of future-proof buildings needs to be considered in these
energy code improvements, where forthcoming low-carbon technologies or behaviour changes
Cite as: Mohareb, E.A., & Mohareb, A.K., 2014. A comparison of greenhouse gas emissions in the residential sector of major Canadian cities. Canadian Journal of Civil Engineering 41 (4), 285-293
can be implemented in the face of energy pricing uncertainty (Georgiadou et al 2012). Improved
integration of the building supply chain, multi-project alliances between design/construction firms
(for increased knowledge transfer), and improved consumer understanding of the benefits of
energy efficient technologies to strengthen market demand will help to incentivize builders
towards greater adoption of high performance buildings and enable sector-wide growth in energy
efficient construction and retrofit capacity (Sheffer and Levitt 2010).
The scale of retrofits / reconstruction required to drastically reduce GHG emissions from the
building stock necessitates alternative funding schemes to ensure wide-spread adoption of new
systems (for a discussion of potential life-cycle costs for single family units, see Dong et al. 2005).
Carbon pricing has a valuable role to play in moving Canadians towards a low-carbon building
stock (NRTEE 2009), generating revenue from utilities and increasing incentives to reduce
energy consumption (including behaviour). For example British Columbia’s carbon tax has
resulted in a 15% reduction in petroleum fuel consumption, with new revenues allowing the
reduction of other provincial taxes by $300 million (Sustainable Prosperity 2012). Revenues from
such schemes can be used to subsidize costs to property owners in reducing energy demand
through deep retrofits or reconstruction. Residents in cities with high current residential GHG
emissions face risks associated with carbon pricing, in addition to risks associated with fossil
energy price volatility, with potential impacts on the livability of these cities in the future for lower-
income residents. Innovative provincial and municipal policies (such as Ontario’s local
improvement charges and Vancouver’s HELP program; Ontario Ministry of Municipal Affairs and
Housing 2013; City of Vancouver 2013) to finance energy retrofits or renewable energy projects
should be leveraged in the short-term to address high project capital costs and reduce these
risks.
In summary, in order to achieve absolute emissions reductions on the scale suggested by the
IPCC (2007), the Canadian residential sector will require a number of aggressive actions. A
preliminary list is provided here, though further research assist in identifying the value of each of
these. The preliminary GHG mitigation list includes:

Cite as: Mohareb, E.A., & Mohareb, A.K., 2014. A comparison of greenhouse gas emissions in the residential sector of major Canadian cities. Canadian Journal of Civil Engineering 41 (4), 285-293
i. switching furnace fuels to low carbon heating systems (e.g. geoexchange);
ii. eliminating fossil fuel electricity generation to facilitate the adoption of established low-
carbon technologies where they are appropriate;
iii. adopting district energy heating systems (especially biomass-based systems);
iv. deep building envelope retrofitting or large-scale reconstruction of the existing building
stock;
v. behavioural change in energy use (especially targeting lower space conditioning energy
demand);
Additionally, the following measures would also deter the growth of future emissions:
vi. a greater proportion of MURs in the housing stock (which can also address transportation
energy demand when combined with appropriate urban planning policy);
vii. rapid revision of the building code to drastically reduce energy consumption levels
(including provisions such as mandatory heat recovery ventilators, reductions in air
leakage, southward orientation of buildings, compulsory solar thermal/PV-readiness and
higher insulation requirements), as is being targeted in the European Union and the State
of California (European Parliament, 2010; California Public Utilities Commission, 2008);
and
viii. addressing the split incentive for energy efficiency between property owners and renters.
Limitations to the PURGE Model
There are limitations to the data applied in this study that should be discussed, as impacts will be
observed in the results provided above. First, much of the energy end-use data is derived from
the OEE (2012a) database, developed through their end-use model, not from actual end-use
data. Second, appliance stocks, floor area and hot water consumption are taken from provincial
estimates, and may not accurately represent differences observed in urban centres. Finally,
occupancy per unit type (MUR, SFA, and SFD) is assumed to be constant, due to the absence of
Cite as: Mohareb, E.A., & Mohareb, A.K., 2014. A comparison of greenhouse gas emissions in the residential sector of major Canadian cities. Canadian Journal of Civil Engineering 41 (4), 285-293
data that might indicate otherwise. It is possible that more spacious dwellings also have higher
occupancies, which would result in per capita emissions being shifted downwards slightly.
4. Conclusions
The six cities assessed in this article face different challenges in reducing GHG emissions; it is
important to note the importance of type of secondary energy involved in residential systems
(hydro-based electric versus natural gas versus fuel oil). Occupancy, building type and floor area
per unit are also seen to influence per capita emissions. Ages of buildings also impact current
and future GHG emissions, through the quality of building envelopes and the economics of
retrofits. If Canadian cities are going to significantly reduce GHG emissions, barriers to improving
the energy efficiency of the building stock (such as split incentives, unattractive financing options
and unambitious energy codes) must be addressed in an aggressive fashion in the years towards
2050.
References
Aydinalp, M., Ferguson, A., Fung, A., and Ugursal, I.V., 2001. EnerGuide for Houses Database
Analysis. Canadian Residential Energy End-Use Data and Analysis Centre (CREEDAC)
Report to Natural Canada, April 3, 2001.
Bettencourt, L.M.A., Lobo, J., Helbing, D., Kuhnert, C. and West, G.B., 2007. Growth, innovation
scaling and the pace of life in cities. Proceedings of the National Academy of Sciences,
104(17), 7301-7306.
California Public Utilities Commission, 2008. California Long-Term Energy Efficiency Strategic
Plan. [Online] Available at:
http://www.cpuc.ca.gov/NR/rdonlyres/D4321448-208C-48F9-9F62-
1BBB14A8D717/0/EEStrategicPlan.pdf, Accessed February 27, 2014
Cite as: Mohareb, E.A., & Mohareb, A.K., 2014. A comparison of greenhouse gas emissions in the residential sector of major Canadian cities. Canadian Journal of Civil Engineering 41 (4), 285-293
City of Vancouver, 2013. Home Energy Loan Program. [Online] Available HTTP:
https://www.vancity.com/Loans/TypesOfLoans/HomeEnergy/, Accessed April 23, 2013
City of Winnipeg, 2007. Population, Housing and Economic Forecasts for Winnipeg CMA and the
City of Winnipeg. Prepared by the City of Winnipeg CAO Secretariat. [Online] Available HTTP:
http://www.winnipeg.ca/cao/pdfs/population_forecast.pdf, Accessed March 18, 2013.
Civic Action, 2011. The Living City Report Card 2011. [Online] Available HTTP:
http://www.thelivingcity.org/lcrc/LivingCityReportCard_web_r1.pdf. Accessed July 28, 2013.
Climate Action Secretariat 2013. Metro Vancouver Regional District - 2010 Community Energy
and Emissions Inventory. [Online] Available HTTP:
http://www.env.gov.bc.ca/cas/mitigation/ceei/RegionalDistricts/Metro-
Vancouver/ceei_2010_metro-vancouver_regional_district.pdf. Accessed December 29, 2013.
Davis L.W., 2010. Evaluating the Slow Adoption of Energy Efficient Investments: Are Renters
Less Likely to Have Energy Efficient Appliances? Working Paper from the Energy Institute at
Haas. [Online] Available HTTP: http://bit.ly/10gXmcQ. Accessed March 24, 2013.
Davis L.W., and Levine, D.I., 2012. Renting Inefficiency. [Online] Available HTTP:
http://energyathaas.wordpress.com/2012/11/26/renting-inefficiency/. Accessed April 10, 2013.
Dong B., Kennedy C., and Pressnail K., 2005. Comparing Life-Cycle Implications of Building
Retrofit and Replacement Options. Canadian Journal of Civil Engineering, 32(6), 1051–1063
Doran, P. T. and M. K. Zimmerman, 2009. Examining the scientific consensus on climate change.
Eos 90(3): 22-23.
Environment Canada, 2012. National Inventory Report 1990-2010: Greenhouse Gas Sources and
Sinks in Canada. [Online] Available HTTP: http://www.ec.gc.ca/. Accessed March 13, 2013.
Cite as: Mohareb, E.A., & Mohareb, A.K., 2014. A comparison of greenhouse gas emissions in the residential sector of major Canadian cities. Canadian Journal of Civil Engineering 41 (4), 285-293
European Parliament, 2010. Directive 2010/31/EU. [Online] Available HTTP: http://eur-
lex.europa.eu/LexUriServ/LexUriServ.do?uri=OJ:L:2010:153:0013:0035:EN:PDF, Accessed
February 27, 2014.
Federation of Canadian Municipalities, 2013. Federation of Canadian Municipalities – Partners
for Climate Protection. [Online] Available HTTP: http://www.fcm.ca/, Accessed August 9, 2013
Gamtessa S.F., 2013. An Explanation of Residential Energy-Efficiency Retrofit Behaviour in
Canada. Energy and Buildings, 57, 155-164.
Georgiadou, M.C., Hacking, T., and Guthrie, P., 2012. A Conceptual Framework for Future-
Proofing the Energy Performance of Buildings. Energy Policy, 47, 145-155.
Granderson, J., Piette, M.A., and Ghatikar, G., 2011. Building Energy Information Systems –
User Case Studies. Energy Efficiency, 4, 17-30.
IEA, 2008. World Energy Outlook. International Energy Agency.
IPCC, 2007. Climate Change 2007: Mitigation. Cambridge University Press, Cambridge, United
Kingdom and New York, NY, USA. See Chapter 13, Box 13.7.
Kesik, T, 2011. The Glass Condo Conundrum. [Online] Available HTTP:
http://www.cbc.ca/toronto/features/condos/pdf/condo_conundrum.pdf, Accessed March 20,
2013.
Kikuchi, E., Bristow, D. and Kennedy, C.A. 2009. Evaluation of region-specific residential energy
systems for GHG reductions: Case studies from Canadian cities. Energy Policy, 37, 1257-1266.
Mansell, R.L. and Schlenker, R., 2006. Energy and the Alberta Economy – Past and Future
Impacts and Implications. Paper No.1 of the Alberta Energy Futures Project, ISEEE, University
of Calgary. [Online] Available HTTP: http://bit.ly/11dAQOH, Accessed March 19, 2013.

Cite as: Mohareb, E.A., & Mohareb, A.K., 2014. A comparison of greenhouse gas emissions in the residential sector of major Canadian cities. Canadian Journal of Civil Engineering 41 (4), 285-293
McKechnie J., Colomb, S., Chen, J., Mabee, W., and Maclean, H.L., 2011. Forest Bioenergy or
Forest Carbon? Assessing Trade-Offs in Greenhouse Gas Mitigation with Wood-Based
Biofuels. Environmental Science and Technology,45, 789-795.
Mohareb, E.A. and Kennedy, C.A, 2012. Greenhouse Gas Emission Scenario Modeling for
Cities using the PURGE Model. Journal of Industrial Ecology, 16(6), 875-888.
Mohareb, E.A. and Kennedy, C.A., 2014. Scenarios of Technology Adoption towards Low-
Carbon Cities. Energy Policy. 66: 685 – 693.
Moon, J.W., and Han, S.H., 2011. Thermostat Strategies Impacts on Energy Consumption in
Residential Buildings. Energy and Buildings, 43, 338-346.
Hurlbut, D.J., McLaren J., Gelman R., 2013. Beyond Renewable Portfolio Standards – An
Assessment of Regional Supply and Demand Conditions Affecting the Future of Renewable
Energy in the West. National Renewable Energy Research Lab Report NREL/TP-6A20-57830
August 2013.
National Research Council, 2010. Updating the Model National Energy Code for Buildings.
[Online] Available HTTP: http://www.nrc-cnrc.gc.ca/, Accessed April 10, 2013.
National Round Table on Environment and the Economy, 2009. Achieving 2050: a Carbon
Pricing Policy for Canada. ISBN 978-0-662-06538-8
Natural Resources Canada 2012. Residential End-Use Model, Ottawa, 2012.
Nova Scotia Department of Energy, 2010. Renewable Action Plan. [Online] Available HTTP:
http://www.gov.ns.ca/energy/resources/EM/renewable/renewable-electricity-plan.pdf.
Accessed April 23, 2013.
Office of Energy Efficiency, 2010. 2007 Survey of Household Energy Use – Data Tables. [Online]
Available HTTP: http://oee.nrcan.gc.ca/, Accessed April 9, 2013.

Cite as: Mohareb, E.A., & Mohareb, A.K., 2014. A comparison of greenhouse gas emissions in the residential sector of major Canadian cities. Canadian Journal of Civil Engineering 41 (4), 285-293
Office of Energy Efficiency, 2012a. Comprehensive Energy Use Database, 1990-2010. [Online]
Available HTTP: http://oee.nrcan.gc.ca, Accessed March 14, 2013.
Office of Energy Efficiency 2012b. Energy Consumption of Major Household Appliances –
Trends for 1990-2010. [Online] Available HTTP: http://oee.nrcan.gc.ca/, Accessed April 9,
2013.
Ontario Ministry of Municipal Affairs and Housing, 2013. Local Improvement Charges. [Online]
Available HTTP: http://bit.ly/17GN1XT, Accessed April 10, 2013.
Perez-Lombard, L., Ortiz, J., Coronel, J.F., and Maestre, I.R., 2011. A Review of HVAC Systems
Requirements in Building Energy Regulations. Energy and Buildings, 43(2-3), 255-268
Dixon, E., Richman, R. C. and Pressnail, K. D., 2012. Nested Thermal Envelope Design
construction: Achieving significant reductions in heating energy use, Energy and Buildings,
2012 54 215-224.
Sheffer, D.A., and Levitt, R.E., 2010. The Diffusion of Energy Saving Technologies in the
Building Sector: Structural Barriers and Possible Solutions. Working Paper #57. Collaboratory
for Research on Global Projects. [Online] Available HTTP: http://stanford.io/173whZG,
Accessed April 11, 2013
Statistics Canada, 2010. Canada’s Population Becoming More Urban. [Online] Available HTTP:
http://www.statscan.gc.ca, Accessed October 22, 2012.
Statistics Canada, 2005. Population Growth and Components, 1851-2001 Censuses. [Online]
Available HTTP, http://bit.ly/173wbBg. Accessed March 1, 2013.
Statistics Canada, 2006. Census of Population, Statistics Canada catalogue no. 97-559-
XCB2006024
Statistics Canada, 2011. Census of Population, Statistics Canada catalogue no. 97-559-
XCB2006024
Cite as: Mohareb, E.A., & Mohareb, A.K., 2014. A comparison of greenhouse gas emissions in the residential sector of major Canadian cities. Canadian Journal of Civil Engineering 41 (4), 285-293
Statistics Canada, 2012. Census Profiles, 2011 Census. Statistics Canada catalogue no. 98-
316-XWE. Ottawa. Released October 24, 2012.
Sustainable Prosperity, 2012. British Columbia’s Carbon Tax Shift – The First Four Years.
[Online] Available HTTP: http://www.sustainableprosperity.ca/dl872&display, Accessed April 23,
2013.
United Nations Department of Economic and Social Affairs, 2013. World Urbanization Prospects
– the 2011 Revision. [Online] Available HTTP: http://esa.un.org/unup/, Accessed December
21, 2013
United States Energy Information Administration, 2011. Share of Household Energy Used by
Appliances and Consumer Electronics Increases in US Homes. [Online] Available HTTP:
http://1.usa.gov/11gBGYb, Accessed March13, 2013
Williams, B., 2008. Overcoming Barriers to Energy Efficiency for Rental Housing. Master in City
Planning Thesis, Massachusetts Institute of Technology. [Online] Available HTTP:
http://bit.ly/173vWpN, Accessed April 18, 2013.
Wilson, J., Spinney, J., Millward, H., Scott, D., Hayden, A., and Tyedmers, P., 2013a. Blame the
exurbs, not the suburbs: Exploring the distribution of greenhouse gas emissions within a city
region. Energy Policy, 62(1329-1335).
Wilson, J., Tyedmers, P., and Grant, J., 2013b. Measuring environmental impact at the
neighbourhood level. Journal of Environmental Planning and Management, 56, 42 – 60.