a comparative study between scientific publications and patents: a case of a neglected disease,...
TRANSCRIPT

A comparative study between scientific publications and patents: a caseof a neglected disease, Leishmaniasis
Ricardo BARROS SAMPAIO (*, **), Bernard DOUSSET (***)[email protected], [email protected]
(*) Universidade de Brasilia - UnB (Brasil) ; (**) FIOCRUZ Brasilia (Brasil)(***) IRIT Université Paul Sabatier, Toulouse (France) ; (****) Ecole Supérieure de Commerce de Toulouse
(France)
Mots clefs : Veille scientifique et technologique, bibliométrie, graphes, réseaux sociaux,géostratégie, visualisation, interactivité, maladies négligée, leishmaniasis Keywords: Scientific and technological vision, bibliometrics, graphs, social networks, geo-strategy, visualization, interactivity, neglected diseases, leishmaniasisPalabras clave : Vision científica y tecnológica, bibliometría, gráficos, redes sociales, geo-estrategia, visualización, interactividad, enfermedades negligenciadas, leishmaniasis
RésuméL'objectif principal de cette recherche était de mettre en avant des méthodes qui pourraient aider etnourrir les gestionnaires de la santé de prendre des décisions sur les maladies négligées et les plusprécises sur la leishmaniose. Le présent ouvrage est une étude comparative évaluer les facteurs présentésdans un environnement de recherche à travers l'analyse des publications scientifiques et dans le secteurde la santé à travers l'analyse des brevets et comment ces deux zones sont reliées entre elles, le caséchéant. Au cours de cette recherche, nous avons appliqué des méthodes de données et d'analyse des réseauxsociaux dans la recherche, le traitement et l'analyse de ces informations et des réseaux en évaluant lesrelations entre les entités, les chercheurs et les brevets au fil des années. Autre tentative de ce

travail était de cartographier les intérêts sur la leishmaniose parmi les pays du monde et de sa dynamiquesur les 13 dernières années.
Abstract The main objective of this research was to bring forward methods that might help and nourish healthmanagers take decisions about neglected diseases, and more specific on Leishmaniasis. The present work isa comparative study evaluating factors presented within a research environment through the analysis ofscientific publications and within the health industry through the analysis of patents and how those twoareas are interconnected, if so. During the course of this research we applied methods of Data and SocialNetwork Analysis in the search, treatment and analysis of such information and networks by evaluating therelationships between the entities, researchers, and patents along the years. Another attempt of this workwas to map the interests on Leishmaniasis among the countries in the world and its dynamics on the past 13years.
1 IntroductionThe research universe defined for this study is on Leishmaniasis disease contained in the so-called
neglected tropical diseases (NTD). The term NTD, which has been used since the mid 1990s, has become a
“brand-name” referring to a group of diseases that are especially endemic in low-income populations living
in tropical and subtropical countries [1]. However, up to this date, there are no clear or agreed
definitions for what constitute a neglected disease. According to the 2010 report from the World Health
Organization (WHO) “Working to Overcome the Global Impact of Neglected Tropical Diseases” the NTDs affects
more than 1 billion people around the world.
The known diseases are defined by the WHO as types I, II and III where Leishmaniasis is considered a type
III disease. This definition is followed by a great number of health organizations and ministries around
the world. The definition in itself brings different concepts together including the wealth of a country
between rich and poor; the state of its development between developed and developing and most importantly
a measure of the burden of diseases by the incidence of the disease within the population (CEWG 2012). The
definitions themselves are combined such that:
Type I diseases: are incident in both rich and poor countries, with large numbers of vulnerable
populations in each.
Type II diseases: are incident in both rich and poor countries, but with a substantial proportion of
the cases in poor countries.

Type III diseases: are those that are overwhelmingly or exclusively incident in developing
countries.
With regard to investments in the area, those diseases do not receive adequate attention for its treatment
and eradication, which perpetuates the condition of people who are exposed to them [2]. In order to treaty
the problems involved with NTDs, or Leishmaniasis specifically, it is necessary to understand its
complexity. One of the ways to help this situation through research is to provide methods to analyze the
context using a number of different instruments and approaches. The study of scientific publications and
patents is part of what is involved and this present work intends to show some of its benefits.
In regard to scientific publications, there are a number of databases that catalogue journals on specific
areas. Those databases are a very rich environment to understand the research world with information such
as countries involved on research, number of publications per year and collaboration among institutions,
countries and researchers. However, due to the large number of publications, journals and databases it is
necessary to define clear methods that can bring valuable information at the right time. The analysis of
patents is also used to measure and understand the growth or declined interest of countries and
organizations within the NTD context. Through its analysis a great number of information might surface,
such as companies and research institutions involved, countries health and economical policies and others.
A number of publications on co-authorship and patents on NTDs specific diseases have been published in
recent years. It’s imperative that new tools and approaches being developed focus on facilitating public
policy planning and foster the management of innovation in countries’ public health systems [3]. On
Leishmaniasis a recent bibliometric study [1] used one of the databases included in our work, helping

making a comparison of the results. One of the results found was that the number of publications on the
area has increased considerably on past years. A comparison with results from another research [4] has
also been made in regards to the same database using a co-authorship analysis.
2 Data Analysis of a Neglected DiseaseThe research universe on Leishmaniasis for this paper has been made through the analysis of two different
databases, PubMed and PASCAL, for scientific publications and one agency, The United States Patent and
Trademark Office (USPTO) for patents and patent’ applications. The reason behind the use of two different
databases on scientific publications was to analyze if there were significant differences that might bias
ones research. The access to the databases occurred during the month of May and June, 2013. We have
decided to take into consideration only the publications and patents from 2000 to 2012 included.
2.1 Method for Data TreatmentFor the data treatment and analyses we used the software Tetralogie. The software allows (several and
remote users) to conduct strategic analysis from heterogeneous textual data through analysis of
conventional and innovative methods. With statistical methods and exploratory data analysis methods, it
shows strategic information such as actors identity, mobility, emergence and evolution of topics, concepts
and terminology. Another feature of the software is that it allows graphical visualization for
understanding human activities and their interactions as well as their evolution in a decision-making
perspective. It combines static and dynamic visualization where the static aspect is based on a

representation space, in which the precepts of graph theory are applied. The dynamic visualization applies
features and capabilities to further understand evolution of the data and facts in respect to time.
Tetralogie allowed us to identify the role of data within the structure, analyzing their neighborhood,
filtering, k-core, transitivity, back to the source documents, to partition the graph or to focus on its
structural features[5].
2.2 Database
The research have been made taking into consideration authors of articles and patents, countries where
those authors were from, journals used for the scientific publications besides companies, universities and
research institutions involved on both articles and patents. For all the information analysed the years of
publication for scientific publications and of deposit for the patents were added to the analysis in order
to understand the dynamics of the area within the past 12 years. The PubMed platform, which holds the
Medline Database, was used for the research as one of the databases. PubMed is a free database accessing
references and abstracts on life sciences and biomedical topics. Data files were retrieved from PubMed
with the Medical Subject Headings (MeSH) terms or descriptors “Leishmaniasis” and “Leishmania” for title
and abstract, for the years 2000 to 2012. The second database used for the scientific publications was
PASCAL. Pascal is a multidisciplinary and multilingual bibliographic database. It covers most of the
worlds’ literature in Science, Technology and Medicine since 1973. The same search terms, dates and review
of the data applied to PubMed was applied to PASCAL. After reviewing the data we decided to discard all
the articles which contained the word “clinical” explicitly on their titles or abstracts. We decided for

this path on the bases that clinical trials is a post discovery phase which might bias the understanding
of innovative contribution on the area and the consequent interest of scientific community and
corporations. For the patents we have used the USPTO web site for the data retrieval. The search terms
used had the same characteristics as for the scientific publications plus the medicines used to treat the
illness as stated on the United States National Institute of Health (NIH) web site
(http://www.ncbi.nlm.nih.gov/ access june 2013); sodium stibogluconate, meglumine antimoniate, macrolide,
benzamidine, phosphorylcholine and neomycin.
2.2.1 PubMed and PASCAL scientific publications
The scientific databases are both well known and largely used by the academic community. Their differences
however could help future researches taking into consideration aspects that might be important for more
precise studies. The total number of publications between both databases diverge almost 3 folds for PubMed
having a total of 9,210 articles for the period with the filtering mentioned before against 3,650
publications in PASCAL. The total number of Journals has also a great difference with PubMed covering
1,114 journals while PASCAL covers 362. This difference suggests that PuBMed has a much higher coverage in
terms of absolute numbers. However, PASCAL has a more detailed qualification of the data concerning the
countries where the authors are coming from. This is an important information if ones research aims to
understand which countries are making the most contribution and the cooperation existent on research
world. A difference in regards to country publications rank was noticed on the total number of articles
per country, where USA, France, Belgium, Tunisia and Turkey had one or two places higher ranked in PASCAL,

while Italy is 5 times lowered ranked. We also analyse the average of information per article concerning
MESH words and key words per article but it was not found any significant difference among the databases.
2.2.2 Patents
For the patents we used the USPTO database, retrieving data for patents that has already been published as
well as patents applications. The total number of patents and applications found were respectively 810 and
680. The number of authors for those patents and applications were respectively 1,610 and 1,435. We will
discuss further on how those authors interact with each other showing a clear difference from
collaboration in comparison to academic researchers. In respect to the number of companies or
organizations whom own the patent there are further analysis that must be done in regards to the
applications, which shows in most cases not the owner but its legal representative. In total there were
332 different organizations for the patents and 217 for the applicants. Out of those organizations 15 of
them have 5 or more patents and 9 of them has 5 or more applications with United States, Japan and Germany
alone with more than 50% of all the patents and applications on the area.
3 ResultsOne of the results of our study was the absolute number of publications for each database per year as
shown on figure 1. Figure 1 shows a steady increase for the scientific publications with a greater ratio
for PubMed in comparison to PASCAL. For the year 2012 the PASCAL data shows a decrease in numbers of
publications compared to 2011, however this might happen due to a delay on the processing of new

publications. This difference for the year 2012 for PASCAL database deserves a further study. As for the
patents and patents’ applications the number of deposits have reached its peak between the years 2003 and
2005 with patents reaching 57 deposits for the year 2003 and applications 101 deposits for the year 2005.
However, due to a processing delay for patents, which might take from 2 to 12 years in some cases, the
actual numbers of approved patents might change significantly and the consequent results in regards to the
interest in the area through the study of patents is not conclusive.
The comparison between the academic and commercial publications and deposits is an interest issue,
especially due to its differences. The countries with most scientific publications are not necessarily the
ones with the highest patents applications, with an exception of USA, which demonstrate a different form
of approaching on both areas and a lack of penetration on patents from countries with highest incidence of
the disease. A correlation in regards to the numbers of publications and deposits are not to be found,
maybe in great reason for the different processing time. On the other hand, the problem for developing
countries and the number of people affected by those illnesses has forced emerging countries such as
Brazil and India to invest on scientific research. Another very important player on the area are the Non
Governmental Agencies (NGO), such as Medecins Sans Frontiers (MSF) and Drugs for Neglected Diseases initiative
(DNDi), which has helped bring lowered prices medicines and treatments for the needs. The study of the
NGOs are not part of our study, however we understand its great influence.

Figure 1 – Total Number of Scientific Publications
Concerning the journals used by the researchers for publications the 20 most frequent journals in PASCAL
where found amongst the first 30 journals in PuBMed. On the other hand, out of the 20 journals most used
by researchers on PubMed only 9 were found amongst PASCAL database. A list of the first 20 journals for
each database is shown on table 1 with the numbers of publications for the period analyzed on the left
column. Noticed that the first journals on PASCAL database, marked with the arrowed lines, are all present
on PubMed but it doesn’t hold true for the other way around.
The study of the journals and its publications might help understand the interest that the journals might
have. For the purpose of this study we concerned ourselves with the absolute number of publications in
order to understand the increase or decrease of interest over the years. We have not used the impact

factor for each journal in this study because we understand that there is a further analysis that might be
necessary. This analysis is concerned with the characteristic of each journal. Some journals want to be on
the leading edge of scientific publications, other journals might start publications in a certain area
only after a few years that a topic became settled among the scientific community. This type of study
would help understand and better qualify journals and its time of entrance on the field.
Table 1 - Journals with most Publications from 2000 to 2012
On tables 2 to 5 we show the number of publications for each database by year and per country. The first
two tables, 2 and 3, shows the publications for PASCAL and PubMed. It can be seen that there is very few

differences among the leading countries concerning the total number of publications with Brazil, USA,
India, UK and France as the top 5 countries. In regard to the years we can see a steady increase in
publications over the years, as shown also in figure 1, with a decrease for the year 2012 for PASCAL
database. On all the tables we show on the second line the sum for that specific year concerning all the
publications and not only the countries shown on the table.
Table 2 - PASCAL Number of publications by country and year Table 3 - PubMed Number of publications by
country and year
Figures 2 and 3 show the data on tables 2 and 3 in a graph format without the total sum.

Figure 2 – PASCAL top countries Publications Figure 3 – PubMed Top countries Publications
The same data used on table 2 and 3 is showing on figures 4 to 5 in terms of publications and patents per
country. The figures only show the sum over the 12 year period. The lighter the green the greater the

number of publications and patents. The countries in red or orange have no recorded publication or patent
on the databases used. This map can give an idea of how spread is the scientific publications and patents
around the world.
Figure 4 – PASCAL – Global view of Scientific Publications Figure 5 – PubMed - Global view of Scientific Publications
As for the patents and applications, the tables 4 and 5, we have both USA and Japan as the main countries
with patents over the disease with countries in west Europe following the lead. As we have mentioned, the
countries most affected by the diseases have small influence on the production, with India being the only
one among the first 10 countries for applications. Concerning the number of patents over the years we
can’t see an increase in interest over the area which diverges from the scientific community publications.
Table 4 - Number of Patent publications by country and year Table 5 - Number of Patent applications
by country and year

3.1 Author Turnover
Another approach on our study have been done on author turnover for scientific publications attempting to
understand how often there are new people coming in to the field and if experienced researchers are
leaving to other areas of study. This analysis might show how settled an area of research is and how it
brings interest for new scientists. This analysis must take into consideration the mean time for a
researcher to reach 5 publications on the area. Due to this delay in time for the publications we have
analysed publications from 1949 to 2012, however the last 6 years, from 2006, and mark in grey, should not

be taken into consideration. If an author publishes an article after 4 years of not publishing on the area
he is considered, on our measures, a new entrant or start. If an author, after publishing on the field
stop publishing for at least 4 years, on the fifth year he is marked as leaving the field or stop. The
graph on figure 6 shows that there was a great instability of people leaving and entering the field but by
the year 1988 it became stable with an absolute steady increase of researchers on the area since there has
been always more people entering than leaving. The absolute number of new entrants has grown each year.
Figure 6 – Author Turn Over
Figure 7 brings the same information for author turnover using factorial Correspondence Analysis [6]. A
Correspondence Analysis method takes as input a cross value over time and publications per author, for
example, and outputs its distribution of values and variables over a multi dimension table. The years, as

shown in the top left part of the figure and pointed out in red on the bigger picture, show the years
spread across the quadrants in a two dimension view. The circles in yellow show the concentrations of
authors which have published around those periods.

Figure 7 – PubMed – Author Turnover with 10 or more publications
A great majority of authors are in the field through out the entire period (centre of the graph) while
others have written mostly around the year 2000, or around years 2010 to 2012 on leftmost and rightmost
circles on the figure. The bottom circle show authors which have written in the begin of the period and
have come back again on the last years. We can also see that the top right quadrant is the densest
demonstrating a greater concentration of authors.

Figure 8 – Patent co-authorship

3.2 Social Network
Another line of study for the data collected for this work was the co-authorship on scientific
publications and patents. People working together might demonstrate a type of relationship in which “most
people who have written a paper together will know one another quite well” [7]. However this might not
hold true for all the cases. In our study we have found 3 papers with more than 100 contributors for
PubMed and 2 papers with more than 60 contributors for PASCAL. Those high numbers might suggest that on
some cases the researchers do not necessarily know each other “quite well”. Those articles with a high
number of contributors are not the average, as the numbers of Authors per Article (6,24 and 5,47 for
PubMed and PASCAL) have shown but must be taken into consideration, specially when reviewing the
clustering coefficient [8]. The clustering coefficient measures network ‘‘clustering’’ or
‘‘transitivity,’’ which is the probability that two of a scientist’s coauthors have themselves coauthored
a paper. In science a high clustering coefficient would suggest that people are working together quite
often, while a very detached network, as in patents, might suggest that people very rarely contribute with
people outside its group. By removing some of the clinical trial papers from our database, some of the
articles with an average of high contributors per paper have also been taken away.
For the scientific publications we used a similar approach from Newmans’ coauthorship paper [4]. In his
article he used three different databases to understand the relationship amongst authors in a field. One
of the databases used were the Medline, also used on our research. The difference however was that Newman
analysed all the fields on Medline together, while in our case we restricted ourselves to Leishmaniasis.
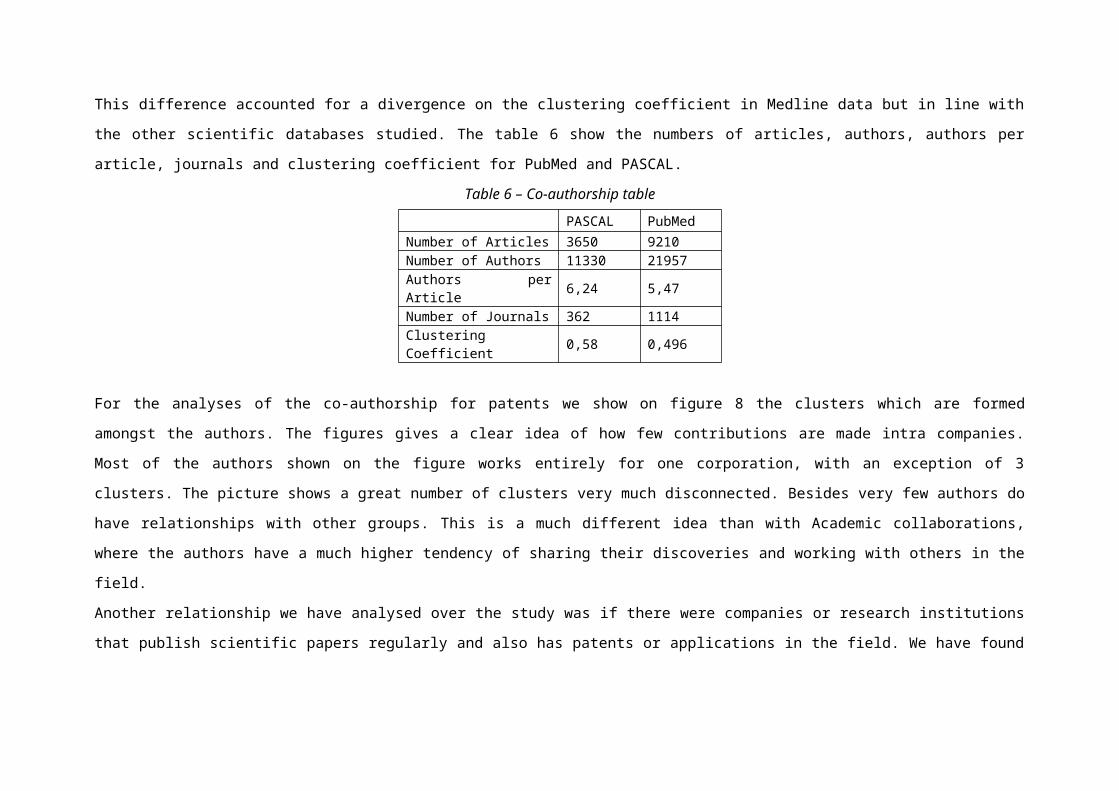
This difference accounted for a divergence on the clustering coefficient in Medline data but in line with
the other scientific databases studied. The table 6 show the numbers of articles, authors, authors per
article, journals and clustering coefficient for PubMed and PASCAL.
Table 6 – Co-authorship table
For the analyses of the co-authorship for patents we show on figure 8 the clusters which are formed
amongst the authors. The figures gives a clear idea of how few contributions are made intra companies.
Most of the authors shown on the figure works entirely for one corporation, with an exception of 3
clusters. The picture shows a great number of clusters very much disconnected. Besides very few authors do
have relationships with other groups. This is a much different idea than with Academic collaborations,
where the authors have a much higher tendency of sharing their discoveries and working with others in the
field.
Another relationship we have analysed over the study was if there were companies or research institutions
that publish scientific papers regularly and also has patents or applications in the field. We have found
PASCAL PubMedNumber of Articles 3650 9210Number of Authors 11330 21957Authors perArticle 6,24 5,47
Number of Journals 362 1114ClusteringCoefficient 0,58 0,496

35 organizations among universities and research institutions, both private and governmental, which worked
on both areas. The name of the organizations are shown on table 7.
Table 7 – Organizations that has scientific publications and patents
Consejo Superior DeInvestigaciones Cientificas
Rosalind Franklin University OfMedicine And Science
Corixa Corporation Swiss Tropical And Public HealthInstitute
Council Of Scientific &Industrial Research
The Ohio State University
Emory University The Salk Institute For BiologicalStudies
Fundacao Oswaldo Cruz The University Of MississippiGeorgia State University Tokai UniversityHoshi University Universidad De GranadaIndian Council Of MedicalResearch
Universite Laval
Infectious Disease ResearchInstitute
Universite Pierre Et Marie Curie
Institut De Recherche Pour LeDeveloppement
University Of Alabama At Birmingham
Institut National De LaRecherche Agronomique
University Of Bern
Institut Pasteur University Of MississippiInstitut Pasteur De Tunis University Of Strathclyde

Intervet International B.V. University Of VictoriaJohns Hopkins University Virginia Polytechnic Institute And
State UniversityMcgill University Washington UniversityNational Institutes Of Health Yale UniversityRockefeller University
4 ConclusionThis study was an attempt to bring forward some methods to analyze data focusing on a Leishmaniasis, a
neglected disease. We have used data and network analysis tools on scientific databases and patents. This
line of research have been made by different authors before and now we aimed at bringing together some of
the techniques used.
As for the findings on the field we can say that there have been an increase interest by the scientific
community over the years by the increase number of publications and a steady growth of new scientists on
the area. In regard to the countries investing on the area, new players are coming forward, specially
among the countries with high rate of neglected disease incidence, such as Brazil and India. For
corporations we have not found an increase in interest over the area but was interest to see that the
patents were mainly applied by a small group of countries such as USA, Japan and western Europe, specially
France, UK and Germany. As for the collaboration we could see that on science there are higher levels of
collaboration but in business or patents the collaboration is highly avoided. However recent studies have
shown an interest over the field by median and small size pharmaceuticals due to public and private

partnerships involving some of the NGOs in the area. This line of research deserve a further study in
order to understand how those different groups interact with each other.
5 Bibliography
[1] J. M. Ramos, G. Gonzalez-Alcaide, e M. Bolanos-Pizarro, “Bibliometric analysis of leishmaniasisresearch in Medline (1945-2010)”, Parasit. Vectors, vol. 6, p. 55, mar. 2013.
[2] C. M. Morel, S. J. Serruya, G. O. Penna, e R. Guimarães, “Co-authorship Network Analysis: A PowerfulTool for Strategic Planning of Research, Development and Capacity Building Programs on NeglectedDiseases”, PLoS Negl Trop Dis, vol. 3, no 8, p. e501, ago. 2009.
[3] A. G. Vasconcellos e C. M. Morel, “Enabling Policy Planning and Innovation Management through PatentInformation and Co-Authorship Network Analyses: A Study of Tuberculosis in Brazil”, PLoS ONE, vol. 7, no
10, p. e45569, out. 2012.[4] M. E. J. Newman, “Coauthorship networks and patterns of scientific collaboration”, Proc. Natl. Acad. Sci.,
vol. 101, no suppl_1, p. 5200–5205, jan. 2004.[5] B. Gay e B. Dousset, “Cartographie de réseaux d’alliances et analyse stratégique”, Ingénierie Systèmes
Inf., vol. 11, no 2, p. 37–51, abr. 2006.[6] J.-P. Benzécri, Correspondence analysis handbook. New York: Marcel Dekker, 1992.[7] M. E. J. Newman, “The structure of scientific collaboration networks”, Proc. Natl. Acad. Sci. U. S. A., vol.
98, no 2, p. 404–409, jan. 2001.[8] D. J. Watts e S. H. Strogatz, “Collective dynamics of `small-world’ networks”, Nature, vol. 393, p.
440–442, jun. 1998.[9] World Health Organisation (WHO) Consultative Expert Working Group on Research and Development. 2012.
“Defining Disease Types I, II and III”. http://www.who.int/phi/3-background_cewg_agenda_item5_disease_types_final.pdf