a characterization of four b16 murine melanoma cell sublines molecular fingerprint and proliferation...
TRANSCRIPT

Danciu et al. Cancer Cell International 2013, 13:75http://www.cancerci.com/content/13/1/75
PRIMARY RESEARCH Open Access
A characterization of four B16 murine melanomacell sublines molecular fingerprint andproliferation behaviorCorina Danciu1, Alexandra Falamas2, Cristina Dehelean1*, Codruta Soica1, Heinfried Radeke3,Lucian Barbu-Tudoran4, Florina Bojin5, Simona Cîntă Pînzaru2* and Melania F Munteanu6
Abstract
Background: One of the most popular and versatile model of murine melanoma is by inoculating B16 cells in thesyngeneic C57BL6J mouse strain. A characterization of different B16 modified cell sub-lines will be of real practicalinterest. For this aim, modern analytical tools like surface enhanced Raman spectroscopy/scattering (SERS) and MTTwere employed to characterize both chemical composition and proliferation behavior of the selected cells.
Methods: High quality SERS signal was recorded from each of the four types of B16 cell sub-lines: B164A5,B16GMCSF, B16FLT3, B16F10, in order to observe the differences between a parent cell line (B164A5) and otherderived B16 cell sub-lines. Cells were incubated with silver nanoparticles of 50–100 nm diameter and thenanoparticles uptake inside the cells cytoplasm was proved by transmission electron microscopy (TEM)investigations. In order to characterize proliferation, growth curves of the four B16 cell lines, using different cellnumbers and FCS concentration were obtained employing the MTT proliferation assay. For correlations doublingtime were calculated.
Results: SERS bands allowed the identification inside the cells of the main bio-molecular components such as:proteins, nucleic acids, and lipids. An "on and off" SERS effect was constantly present, which may be explained interms of the employed laser power, as well as the possible different orientations of the adsorbed species in thecells in respect to the Ag nanoparticles. MTT results showed that among the four tested cell sub-lines B16 F10 isthe most proliferative and B164A5 has the lower growth capacity. Regarding B16FLT3 cells and B16GMCSF cells,they present proliferation ability in between with slight slower potency for B16GMCSF cells.
Conclusion: Molecular fingerprint and proliferation behavior of four B16 melanoma cell sub-lines were elucidatedby associating SERS investigations with MTT proliferation assay.
Keywords: B16 cells, SERS, TEM, MTT, Doubling time
BackgroundSkin cancer including both melanoma and the non-melanoma forms represent an increasing pathologyamong other types of cancer. Spectroscopic methodsplay a vital part in all areas of science and are the maintool of modern chemistry for the identification of
* Correspondence: [email protected]; [email protected] of Pharmacy, University of Medicine and Pharmacy “Victor Babes”,EftimieMurgu Square, No. 2, 300041 Timişoara, România2Biomedical Physics, Biomedical, Theoretical Physics, and MolecularSpectroscopy Department, Faculty of Physics, Babes-Bolyai University,Kogalniceanu 1, RO 400084 Cluj-Napoca, RomâniaFull list of author information is available at the end of the article
© 2013 Danciu et al.; licensee BioMed CentralCommons Attribution License (http://creativecreproduction in any medium, provided the or
molecular structures. They were applied in the lastperiod for the diagnosis and pathology evolution sur-veillance on skin carcinoma, more frequent on non-melanoma types [1]. Raman spectroscopy is an analyticaltechnique based on inelastic scattering of monochro-matic light, usually from a laser source that allows che-mical characterization of molecules in a sample. Inrecent years, the scientific world demanded a growingnumber of noninvasive diagnostic and nondestructivestructure analysis tools; in consequence laser Ramanspectroscopy has been playing an increasingly impor-tant role in analytical science, especially in biomedical
Ltd. This is an Open Access article distributed under the terms of the Creativeommons.org/licenses/by/2.0), which permits unrestricted use, distribution, andiginal work is properly cited.

Danciu et al. Cancer Cell International 2013, 13:75 Page 2 of 12http://www.cancerci.com/content/13/1/75
analysis [2]. Each molecule has a unique fingerprint ofRaman peaks [3,4], thus Raman spectroscopy has beensuccessfully applied for the investigation of cells [5],biological tissues [6] as well as in vivo applications [7].Raman signals can be enhanced by many orders ofmagnitude when the probed molecules are attached tometallic nanostructures (e.g. colloidal gold, silver nano-particles) but with the observation that Raman scatteringtakes place in the high local optical fields of these struc-tures [8]. Compared to the Raman signal of cells, thestrongly amplified SERS signal allows much shorter ac-quisition times. In this manner, SERS can provide nanoscale information about the biology of cells [9], enablingthus early diagnosis of diseases before the morphologychanges. By introducing the silver nanoparticles insidethe cells and acquiring SERS signal from the junctionsbetween the metal nanoparticles and the adsorbed mo-lecular components, information about the molecularcomposition of the investigated sample can be obtained.However, a complete understanding of the intracellularuptake, transport, metabolism and subcellular distribu-tion of nanostructured materials remains limited. Never-theless, overall findings reported that live cells trapnanoparticles of proper dimension in vesicles, hamper-ing them to get into nucleus, although the SERS signalsfrom cells were assigned mostly to vibrational modes ofnucleus components. An “on and off” blinking effect hasbeen reported for most experiments of this type [10],and the lack of reproducibility in SERS signal was ratherjudged as a need to optimize the nano architectures ra-ther than taking into account the “live” system, i.e. livecell, where biological processes are rolling on.Proliferation behavior has been analyzed by MTT
(3-(4,5-dimethylthiazol-2-yl)-2,5-diphenyltetrazolium bro-mide) assay. It presents the advantage of being an inex-pensive assay and among a variety of non-radioactiveviability assessments, the MTT test developed byMossmanis still one of the most versatile and popularassays [11]. In order to support this statement standsome of the latest articles in the field [12-15]. Regard-ing the cell lines involved in this study: B164A5 is acell line derived from a skin melanoma of a C57BL/6strain mouse, showing fibroblast-like characteristics,which produce melanin. Cells may lose ability to pro-duce pigmentation in long term culture [16]. B16-F10was derived from the parent B16 line by selection forthe ability to form lung colonies in vivo after intravenous injection and subsequently established in vitroafter 10 (B16-F10) cycles of lung colony formation [17].B16-GMCSF cells represent a variant of the B16-F10 linetransduced by using an MFG retroviral vector encodingmurine GM-CSF [18]. It has been shown that vaccin-ation with irradiated B16 tumor expressing granulo-cyte macrophage colony-stimulating factor (GM-CSF;
Gvax) promotes rejection of established murine melano-mas [19]. In case of B16-FLT 3, murine B16 melanomacells where transfected with the gene for the Flt3-L cyto-kine (FLT3-Fvax), which also has the role of promotingthe rejection of established murine melanomas [20].We investigated here the nanoparticles uptake into live
cells and the Raman amplification signal from the mainbio molecular components present in four B16 murinecell lines, with the aim of correlating these findings withthe cell growth and the chemical composition of eachcell line. The study appraises the ability of the SERStechnique to evaluate the cell status and chemical chan-ges correlated with the spectroscopic signal. Such ap-proach would be of crucial importance in early diagnosisof diseases and evaluation of therapy according to themorphological changes. In order to see their “behavior”,evaluation of cell growth curves was carried throughMTT proliferation assay. Cell proliferation was assessedby monitoring the conversion of MTT to formazan,process catalyzed by mitochondrial dehydrogenase en-zymes [11]. Previous studies on cancer cells have corre-lated results obtained by MTT assay with spectroscopicmethods [21].
Materials and methodsB164A5 cells were acquired from Sigma Aldrich(ECACC and Sigma Aldrich, origin Japan stored UK),B16F10, B16GMCSF, and B16FLT3 cell lines were kindlyprovided by Prof. Dr. Med. H. Radeke, Goethe Univer-sitätsklinikum, Frankfurt am Main, Germany. Dulbecco’sModified Eagle’s Medium (DMEM), Phosphate-bufferedsaline (PBS), Penicillin/Streptomycin mixture, HEPES4-(2-hydroxyethyl)-1-piperazineethanesulfonic acid andTrypsin where acquired from Gibco; Fetal Calf Serum(FCS), EDTA, Trypan Blue, glutaraldeyde, AgNO3, triso-dium citrate where acquired from Sigma Aldrich; MTTcell proliferation kit was acquired from Roche, Germany.The complete growth medium for this cells is Dulbecco’sModified Eagle’s Medium (DMEM), supplemented with10% fetal calf serum (FCS), 1% Penicillin/Streptomycinmixture (Pen/Strep, 10,000 IU/ml) and 2% HEPES4-(2-hydroxyethyl)-1-piperazineethanesulfonic acid. Thecells were cultured by incubation at 37°C in 5% CO2 at-mosphere. When the confluence was 70-80% (every twoor three days) the cells were passed using 0.25%Trypsin- 1 mM EDTA solution followed by centrifuga-tion (5 minutes, 1200 rpm) and replated in T75 cultureflasks at a sub-cultivation ratio of 1:10 to ensure optimalproliferation.
Surface enhanced Raman scattering analysisFor the SERS analysis cells where washed with PBS, tryp-sinised, inactivated with medium Dulbecco’s ModifiedEagle’s Medium (DMEM), supplemented with 10% fetal

Danciu et al. Cancer Cell International 2013, 13:75 Page 3 of 12http://www.cancerci.com/content/13/1/75
calf serum (FCS) and 1% Penicillin/Streptomycin mixture(Pen/Strep, 10,000 IU/ml) and 2% HEPES 4-(2-hydroxye-thyl)-1-piperazineethanesulfonic acid, centrifuged 5 min.at 1200 rpm; medium was removed, cells where resuspen-ded in new medium and replanted in Lab-Tek™ ChamberSlides, using a volume of 1 ml medium/ chamber and anumber of 15.000 cells per each chamber. After 24 h cellswhere incubated with 50 μL colloidal silver in eachchamber. After another 24 h of incubation mediumwas removed, cells where washed with PBS twice antafterwards fixed with a 50–50 mixture (v/v) of methanoland acetone 10 minutes at -20C. The SERS measurementswere performed on the culture chamber slides.Silver colloid was prepared through the Lee Meisel
method [22]. Briefly, 100 ml of a 1 mM AgNO3 threedistilled aqueous solution was heated to 93-100°C andthen 2 ml of a 1% trisodium citrate solution was added.The mixture was kept in constant (previously achieved)temperature for about 1 hour and then was allowed tocool down to the room temperature. The resultant col-loidal mixture was of dark grey color. Finally, the col-loidal solution was centrifuged at 1200 rotations/min,for 5 min.For the SERS measurements a dispersive high per-
formance micro-Raman spectrometer, BrukerSenterrawith high spatial and spectral resolution was employed.The 633 nm laser line was focused on the cells througha 50x objective. The exposure time for each spectrumwas 0.5 to 1 s and the spectra were acquired by focusingthe laser at different points on the fixed cells. The powerof the laser was set to 5 mW. Each spectrum was the re-sult of 5 acquisitions.
Transmission electron microscopy (TEM) analysisIn order to prove that nanoparticles of colloidal silverwhere incorporated into the cell TEM analyze was made.For the cells the same conditions where respected as forthe SERS analysis: volume of 1 ml medium/ chamberand a number of 15.000 cells per each chamber. After24 h cells from each chamber where incubated with50 μL colloidal silver prepared after standard protocols.After another 24 h of incubation medium was removed,cells where washed with PBS twice. The cells attached tothe membrane of Falcon Cell Culture Insert wereprefixed for one hour with glutaraldeyde (2.5% in PBS),rinsed 3 times in PBS, and post fixed for one hour in os-mium acid (2% in PBS). Dehydration was done in gradedacetone in distilled water dilutions, followed by infil-tration with Epon resin. Sections of about 100 nm, ob-tained on a diamond knife (Diatome) with Leica UC6ultramicrotome were post-stained with lead citrate anduranyl acetate. The collodion-carbon coated 400 meshCu grids were examined with a Jeol JEM 1010 transmis-sion electron microscope (JEOL, Japan).
Doubling timeBriefly, for the determination of doubling time cells werecounted with the haemocytometer using trypan blue.After trypsinization and centrifugation, 20 μl cell sus-pension was well mix with 20 μl trypan blue in anEppendorf and from this mixture 20 μl were introducedin the counting camera of the haemocytometer. Thenumber of live cells was counted using a hand tallycounter. Afterwards it was calculated the total numbercorresponding to the suspension taken into study. Thedoubling time was measured for each cell line two timesper week. The number of weeks taken into study was 4.
MTT assayFor the spectrophotometric characterization of the fourB16 cell lines by MTT 3-(4,5-Dimethylthiazol-2-yl)-2,5-diphenyltetrazolium bromide, a yellow tetrazole) assay100 μl cell suspension containing: 15 000 cells, 10 000cells, 6 000 cells, 3000 cells of the four types of B16 mel-anoma cells were seeded into a 96-well microplate andattached to the bottom of the well. After 24 hours100 μL of new medium containing 10% FCS, 5% FCS,1% FCS, and 0% FCS was added. Cells were kept in theseconditions for 24 h. In day three 10 μl MTT reagentfrom a 5 mg/mL stock solution were introduced in eachwell. The intact mitochondrial reductase converted andprecipitated MTT as purple crystals during a 4 h contactperiod. After four hours the precipitated crystals weredissolved in 100 μL of solubilisation solution. Finally, thereduced MTT was spectrophotometrically analyzed at570 nm, using the 656 nm reference of an ELISA reader.
StatisticsThe Prism software package (Graph Pad Prism 4.03 forWindows) was used for data presentation. Data from atleast three experiments are presented as mean ± SD.One way Anova followed by Bonferroni post-test wasused to determine the statistical significance between vari-ous experimental groups; *, **, and *** indicate p<0.05,p<0.01 and p<0.001, respectively.
Results and discussionTEM investigationsThe colloidal nanoparticles present an absorption max-imum at 420 nm and a full width at half maximum of50 nm. TEM images of the silver colloid exhibited bothspheroidal (50 to 100 nm diameter) and rod-like shapeswith lengths ranging from 100 to 200 nm and about30–40 nm rod diameter. The plasma membrane is asemi-permeable boundary between the cell and its out-side environment, and the mechanisms employed for aparticle to get into the cell are: diffusion, osmosis, activetransport, and endocytosis. For small and non-polar mo-lecules free diffusion is possible, instead bigger particles

Danciu et al. Cancer Cell International 2013, 13:75 Page 4 of 12http://www.cancerci.com/content/13/1/75
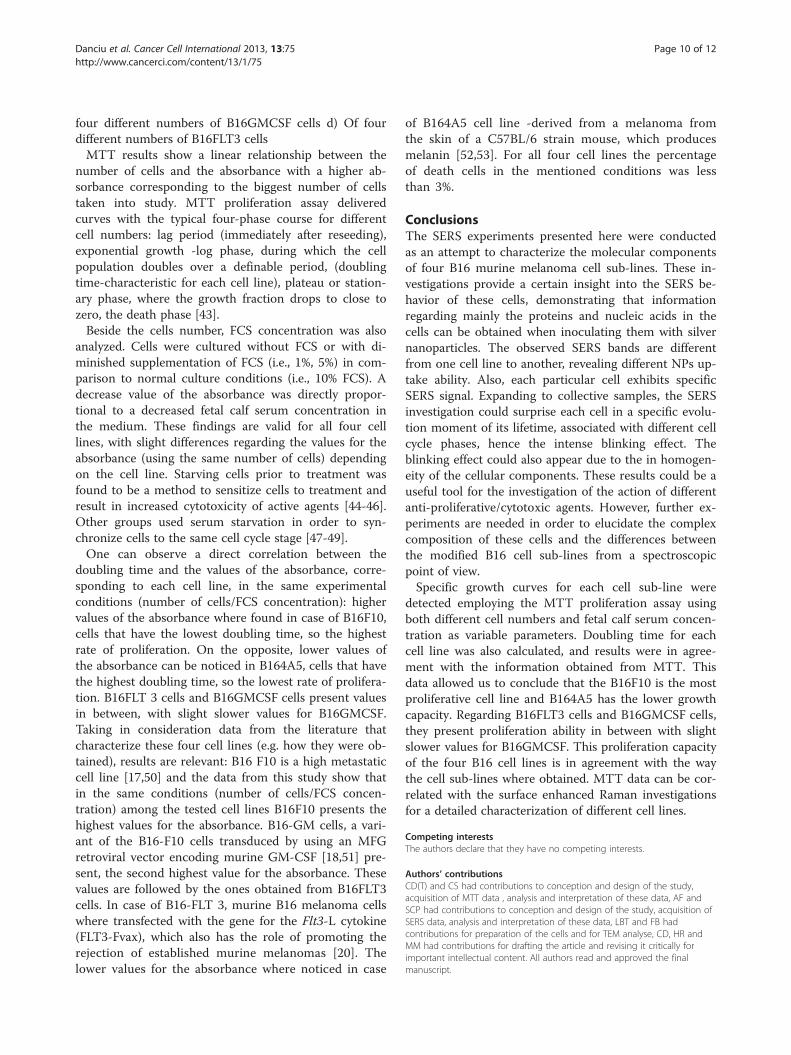
are incapable of crossing the plasma membrane and re-quire uptake mechanisms such as endocytosis [23]. Dueto negative charge of the cell surface, positively chargednanoparticles are preferentially taken up by living cellsand the smaller particles were internalized by caveolin -independent pathway. The large nanoparticles penetra-ted the membrane by endocytosis, clathrin - dependent[24]. TEM observation revealed the nanoparticles uptakeinto the cytoplasm through both diffusion and endocyto-sis. Images demonstrate that the silver nanoparticlespenetrated the cell membrane and were found inside theorganelles and cytoplasm with perinuclear localization,free or surrounded by vesicles (Figure 1). Due to size of
Figure 1 TEM image of silver nanoparticles inside the cytoplasm. a –B
particles they cannot cross the nuclear pores and no par-ticles were found in the cell nucleus. They mainly loca-lized in the early and late lysosome, but they are alsofound in other organelles such as mitochondria andendoplasmic reticulum. Free aggregates appear by rapiduptake and lysosome by passing due to conjugating pro-tein transduction domains to the surface of the nanopar-ticle. Localization at the level of mitochondria is realizedby the presence of extra nuclear DNA [25]. These dataare consistent with other experiments which underlinethat silver nanoparticles penetrate the cells membraneand can be used for the detection of the SERS signal[26,27]. Their aggregation is possible in the growth
164A5 cells; b –B16F10 cells; c –B16GMCSF cells; d –B16FLT3 cells.

Danciu et al. Cancer Cell International 2013, 13:75 Page 5 of 12http://www.cancerci.com/content/13/1/75
medium and due to their increased size endocytosis isassumed [28]. Analyzing a big number of cells from eachof the four cell lines, it can be remarked that for all fourB16 cell lines taken into study, incorporation was madeboth by diffusion and endocytosis, with no particular dif-ferences between the B16 cell lines. Pictures from eachcell line can be observed in Figure 1 TEM images ofsilver nanoparticles inside the cytoplasm (Figure 1a –B164A5 cells; Figure 1b –B16F10 cells; Figure 1c –B16GMCSF cells; Figure 1d–B16FLT3 cells).
SERS analysisPrior to the acquisition of the SERS spectra, cells with-out silver colloid were also investigated. No signal wasrecorded from these cells, without any exception. Whenexcited with the 785 nm laser line, the silver colloid in-cubated cells exhibited allow Raman signal, mostly co-vered by a broad fluorescence. Only an intense bandlocated at 234 cm-1 band, which might indicate the silvernanoparticles attached to the intra-cellular componentsand a broad band centered at 1380 cm-1 (data not shownhere). On the other hand, when the cells were excitedwith the 633 nm laser line, intense SERS spectra wereacquired. This laser line falls closer to the absorptionmaximum of the colloidal nanoparticles, thus a betterenhancement is observed.The SERS signal collected from different points across
a cell exhibited a specific spectral shape, consistent withthe nanoparticles accumulation. An enhanced Ramansignal was obtained from the molecular species in theclose vicinity of the nanoparticles. Since the laser spotencompasses an area of signal collection which depends
Figure 2 Time dependence SERS spectra acquired from a B164A5 cel
on the objective magnification (i.e. 50x, NA 0.45), bothregions, with and without nanoparticles, can fall in thelaser spot and scatter the radiation. However, an in-teresting phenomenon was observed even for the signalacquired from the same focal spot, upon multiple accu-mulations. Such changes are illustrated in Figure 2 for aB164A5 cell. (Figure 2 Time dependence SERS spectraacquired from a B164A5 cell. Excitation 633 nm. Laserpower 5 mW) The SERS spectra show intense bursts ofStokes shifted photons in an “on and off” manner ex-hibiting considerable fluctuations in both signal inten-sities and frequencies, over the course of the acquisitionof 4 spectra in a total of 40 s. This phenomenon knownas "blinking SERS" has been observed by different re-search groups [29,30]. The sudden appearance and dis-appearance of the SERS spectra was evidenced mainlyfor single molecule SERS experiments [8].Regardless of the fluctuations of the SERS signal from
one acquisition to another, some bands could still becorrelated. These are located at 233, 385, 431, 478, 1188,1320, 1386, 1413, and 1620 cm-1. The amide I band ofproteins around 1656 cm-1 is absent from the spectra,which is consistent with our previous observations re-garding the SERS signals from biological molecules [31].A tentative assignment of the main SERS bands isfurther proposed based on the current literature in thefield [32]. The enhanced band at 227 cm-1 can be repre-sentative to the Ag-N mode when N-containing mole-cules are adsorbed to the Ag nanosurface. The 820 cm-1
band in spectrum c) could be assigned to out of planevibrations of tyrosine. The 1188 cm-1 band in spec-trum c), assigned to phenylalanine and in general to
l. Excitation 633 nm. Laser power 5 mW.

Danciu et al. Cancer Cell International 2013, 13:75 Page 6 of 12http://www.cancerci.com/content/13/1/75
C-N stretching vibrations of proteins, is highly amplified,while in spectrum a) it has a much weaker intensity andappears shifted to 1180 cm-1. The 1232 cm-1 band may in-dicate the presence of the amide III band of proteins [33],while the 1620 cm-1 band seen in spectrum c) could beassigned to amide I vibrations, as well as C-C vibrations oftyrosine and tryptophan [34]. The 1320 cm-1 band ob-served in spectrum c), decreases in amplitude in spec-trum a) and is shifted towards smaller wavenumbers.Similar situation is observed for the 1413 cm-1 band,which decreases in intensity in spectrum a) and the1524 cm-1 band in spectrum c), which is completely ab-sent from spectrum a).Similar SERS bands were reported in the current lite-
rature based on SERS studies of cells. Kang et al. repor-ted among others, the 1386, 1413, 1477, 1590, 1610 cm-1
bands and concluded while investigating cell apoptosisof HELA cells, that SERS signal strengths changed overtime [35]. The 1386 cm-1 band was assigned to nucleo-tides, proteins, while the 1477 cm-1 band was attributedto CH2 and CH3 bending vibrations of lipids and pro-teins [10]. DNA contributions have also been observedin these spectra, such as the 787 cm-1 band, observed inspectrum a) and assigned to DNA backbone [33], as wellas the 1413 cm-1 band assigned to amino acids andCOO- asymmetric stretching vibrations. From the ana-lysis of the SERS spectra, we can conclude that thenanoparticles are found mostly in the vicinity or at-tached to proteins, as well as nucleic acids.The nanoparticles were found in all other B16 cell
lines investigated in this study and a tentative assign-ment of the main reproducible SERS bands indicated
Figure 3 Time dependence SERS spectra acquired from two differentwhile spectra d)-f) are characteristic for the second cell. Excitation 633 nm.
mostly the presence of proteins and nucleic acids. TheSERS signal varied a lot from one acquisition to another,an effect which may be caused by the cellular events thattake place in the live cells, as well by the inhomogeneityof the cellular composition and the nanoparticles dis-tribution. Figure 3 Time dependence SERS spectra ac-quired from two different B16GMCSF cells. Spectra a)-c)are representative for the first cell, while spectra d)-f )are characteristic for the second cell. Figure 3 presents atime series dependence of SERS spectra acquired fromthe same spot focused on two different B16GMCSF cells.The spectra are presented in order to investigate the re-producibility of the signal from one acquisition to an-other and two cells were chosen to better observe thebiochemical similarities and differences between cells ofthe same sub-line.Some of the main bands seen in the spectra character-
istic to the first cell (spectra a)-c) in Figure 3) are locatedat 224, 370, 574, 641, 955, 1193, 1309, 1414, 1506, 1563,1611, and 1693 cm-1. However, slight wavenumber shiftsand intensity fluctuations can be observed in these spec-tra from one acquisition to another. An intense band isobserved around 224 cm-1 in all spectra. The 370 cm-1
band can be seen in the bottom two spectra as a sharpamplified band, while in the upper spectrum the bandsdisappears completely. The same case can be seen forthe 574, 641, and 955 cm-1, while the latter vibrationalmode appears shifted with 3 cm-1 in the middle spec-trum. Some of the common bands in the SERS spectraare present at 1193, 1414, 1506, 1563, and 1611 cm-1.The 1193 cm-1 band can be assigned to nucleotides orproteins (tyrosine and phenylalanine), the 1414 cm-1 is
B16GMCSF cells. Spectra a)-c) are representative for the first cell,Laser power 5 mW.

Danciu et al. Cancer Cell International 2013, 13:75 Page 7 of 12http://www.cancerci.com/content/13/1/75
assigned to amino acids, the 1506 cm-1 to nucleic acidbases, while the 1563 cm-1 is assigned to amide II bandof proteins [10].A similar situation is observed for the second cell, as
well. Two bands appear in the bottom two spectra in thelow wavenumber region, at 504 and 859 cm-1. The859 cm-1 which is shifted in spectrum e) to 861 cm-1 isassigned to tyrosine/collagen. The same spectra show anintense 926 cm-1, which is completely absent in spec-trum d). The phenylalanine band appears shifted from1005 cm-1 in the bottom spectrum, to 1010 cm-1 in themiddle one, and 989 cm-1 in spectrum d). Going towardshigher wavenumbers, the same vibration modes can beseen in the bottom two spectra: 1236, 1253, 1295, 1369,1464, and 1552 cm-1. Some of these, such as the 1355,1486, and 1565 appear in spectrum d) as well, althoughslightly shifted and presenting fluctuations in their inten-sities. Based on the current literature in the field [33,34],a tentative assignment of these SERS modes, is proposed.Protein contributions can be observed at 1565 cm-1 as-signed to amide II or tryptophan, at 1253 cm-1 character-istic to amide III, 1295 cm-1 assigned to CH deformationvibrations, 1071 cm-1 assigned to C-N stretching vibra-tions, the phenylalanine band at 1005 cm-1, and proline at926 cm-1. Lipids contributions were observed at 1292 cm-
1 characteristic of CH bending vibrations and nucleic acidswere present at 1486 cm-1, assigned to guanine and aden-ine nucleic acid bases, and 832 cm-1 is assigned to DNAbackbone vibrations.Figure 4 shows the SERS results characteristic to the
B16FLT3 cell sub-line. The SERS spectra were recorded
Figure 4 Time dependence SERS spectra acquired from two differentspectra c)-d) are characteristic to the second cell. Excitation 633 nm. Laser
at 5 s interval from each, from two different cells.Figure 4 Time dependence SERS spectra acquired fromtwo different B16FLT3 cells. Spectra a)-b) are represen-tative for the first cell, while spectra c)-d) are charac-teristic to the second cell. The SERS spectra acquiredfrom the first investigated cell present apart from the238 cm-1, the 443, 1144, 1204, 1308, and 1415 cm-1
common bands. Although, slight wavenumber shifting canstill be observed, as is the case of 1308 or 1415 cm-1, thewavenumber shifts are not as big as in previous cases. Thesecond investigated cell presented even more reproducibleSERS spectra. Some of the common bands seen here arelocated at 233, 735, 929, 1117, 1244, 1410, and 1546 cm-1.These were reported by other research groups workingwith cells and nanoparticles and they were assigned toproline at 929 cm-1, C-N stretching vibrations of proteinsat 1144 cm-1, tryptophan or phenylalanine at 1204 cm-1,amide III or adenine and thymine nucleic acids at1241 cm-1, deoxyribose COO- stretching vibrations at1415 cm-1, and tryptophan at 1546 cm-1 [32-34]. Thespectral differences observed in the 1700–1500 cm-1
range, where apart from the amide I band, C-C and C=Nstretching modes are present, can be assigned to specificbiochemical changes due to cell proliferation [31].The last analyzed cell line was B16F10. These cells
presented particularly weak SERS signal. The spectrapresented in Figure 5 show typical SERS signal acquiredfrom this line. Figure 5 Typical SERS spectra collectedfrom the B16F10 cells upon incubation with Ag nano-particles. Group a) and b) represent signals collectedfrom two distinct cells, whereas c-e are spectra collected
B16FLT3 cells. Spectra a)-b) are representative for the first cell, whilepower 5 mW.

Figure 5 Typical SERS spectra collected from the B16F10 cells upon incubation with Ag nanoparticles. Group a) and b) represents signalscollected from two distinct cells, whereas c), d) and e) are spectra collected from melanoma skin tissue (B16 cells injection) incubated withnanoparticles. The spectral details of a) are shown in the right side. Excitation 633 nm. Laser power 5 mW
Danciu et al. Cancer Cell International 2013, 13:75 Page 8 of 12http://www.cancerci.com/content/13/1/75
from melanoma skin tissue (B16 cells injection) incu-bated with nanoparticles. For the investigation of thiscell sub-line, the spectra were acquired by moving thelaser spot from one place to another in a conglomerateof cells. The recorded signal was different compared tothe previous cell lines and presented more backgroundnoise than usual. The SERS spectra collected from thetwo groups of cells presented here show similar vibra-tional modes, regardless of the fact that the spectra col-lected from the second group of cells, are very weak inintensity. The strongest band observed in these spectrais located at 230 cm-1. Other bands are observed at 648,995, and the two broad bands in the fingerprint regioncentered at 1299, 1336, and 1525 and 1555 cm-1, re-spectively. Some of these bands were reported by pre-vious SERS studies of cells, as well [10,34] and wereassigned to amide II, tryptophan (1555 cm-1), CH2, CH3
bending vibrations of proteins (1336 cm-1), proteinsamide III (995 cm-1), CCH bending and ring breathingvibration modes of tyrosine or O-P-O stretching vibra-tion of DNA/RNA (830 cm-1). Based on our previousstudies focusing on the investigation of the SERS signalfrom tissues [36], we believe that the clearly resolvedbands around 1300 cm-1 are attributable to the nucleicspecies.Looking at the overall shape of these spectra, we no-
ticed they resemble well the SERS spectra acquired fromex vivo mice skin tissue samples immersed in colloidalsilver solution (group c) in Figure 5). The autopsy tissuessamples were collected from a mice specimen injectedwith B16 cells. The tissue characteristic reproducibleSERS bands are located at 1573, 1330, 1231, 955, 681,481, and 236 cm-1 [37]. The spectra acquired from thecells are presented here in comparison to tissue SERS
spectra, in order to point out the similarity betweenthem and thus, the bio-molecular composition betweenthese melanin producing cells and the skin tissue.
MTT proliferation assayAfter characterizing the four B16 cell sub-lines from aspectroscopic point of view growth curves of the fourB16 cell lines where analyzed employing the MTT pro-liferation assay. For a better characterization of the pro-liferative activity also doubling time was calculated usingthe formula presented below, where q1 represents thenumber of cells at time t1 and q2 represents the numberof cellsat time t2.
Td ¼ t2−t1ð Þ � log 2ð Þlog q2
q1
� � :
Assuming a constant growth rate (increase per unit oftime is proportional to the current quantity), the resultsshowed that B164A5 cells present the longest doublingtime, 24 h. The lowest value vas obtained for B16F10cells, 17.2 h. For the transduced B16GMCSF cells doub-ling time was 17.9 h and for the transfected B16FLT3cells the value was 18.4 h. The first conclusion after thisassay is that B16F10 cells have the smallest doublingtime so the biggest multiplication ratio while B164A5cells have the biggest doubling time so the smallestmultiplication ratio. B16GMCSF cells and B16FLT3 cellspresent values in between, with a slight higher value inthe case of B16FLT3 cells. Results can be seen in Figure 6Values obtained for the doubling time of the four celllines. In another study Ohira et al. found the doub-ling time of B16F10 cells 20.1 h, while Yerlikaya et al.found the doubling time of B16F10 cells 14.2 h [38,39].

Figure 6 Doubling time of the four B16 cell sublines asrevealed by trypan blue assay.
Figure 7 (a,b,c,d): Growth curves employing different number of cellscell line; b) B16F10 cell line; c) B16GMCSF cell line; d) B16FLT3 cell lin
Danciu et al. Cancer Cell International 2013, 13:75 Page 9 of 12http://www.cancerci.com/content/13/1/75
Probably variable values are found by different researchgroups because of different chosen compositions of thegrowing medium. Qarawi et al. estimated that the doub-ling time for B16 cells is approximately 24 h [40].After doubling time was found for each cell line, MTT
assay was employed in order to characterize the growthcurves. Different number of cells 15 000 cells, 10 000cells, 6000 cells, 3000 cells of each cell line and also dif-ferent fetal calf serum (FCS) concentrations: 10%, 5%,1%, and 0% where used as variable parameters. FCS isthe most widely used growth supplement for cell culturemedia of eukaryotic cells because of its high content ofembryonic growth promoting factors and low level ofantibodies. Changing the optimal concentration of FCSprovided in protocols is directly proportional with chan-ges in cell proliferation [41,42]. Results can be seen inFigure 7a, b, c, d: Absorption using different concentra-tions of FCS a) Of four different numbers of B164A5cells b) Of four different numbers of B16F10 cells c) Of
and different FCS concentrations corresponding to a) B164A5e.
Danciu et al. Cancer Cell International 2013, 13:75 Page 10 of 12http://www.cancerci.com/content/13/1/75
four different numbers of B16GMCSF cells d) Of fourdifferent numbers of B16FLT3 cellsMTT results show a linear relationship between the
number of cells and the absorbance with a higher ab-sorbance corresponding to the biggest number of cellstaken into study. MTT proliferation assay deliveredcurves with the typical four-phase course for differentcell numbers: lag period (immediately after reseeding),exponential growth -log phase, during which the cellpopulation doubles over a definable period, (doublingtime-characteristic for each cell line), plateau or station-ary phase, where the growth fraction drops to close tozero, the death phase [43].Beside the cells number, FCS concentration was also
analyzed. Cells were cultured without FCS or with di-minished supplementation of FCS (i.e., 1%, 5%) in com-parison to normal culture conditions (i.e., 10% FCS). Adecrease value of the absorbance was directly propor-tional to a decreased fetal calf serum concentration inthe medium. These findings are valid for all four celllines, with slight differences regarding the values for theabsorbance (using the same number of cells) dependingon the cell line. Starving cells prior to treatment wasfound to be a method to sensitize cells to treatment andresult in increased cytotoxicity of active agents [44-46].Other groups used serum starvation in order to syn-chronize cells to the same cell cycle stage [47-49].One can observe a direct correlation between the
doubling time and the values of the absorbance, corre-sponding to each cell line, in the same experimentalconditions (number of cells/FCS concentration): highervalues of the absorbance where found in case of B16F10,cells that have the lowest doubling time, so the highestrate of proliferation. On the opposite, lower values ofthe absorbance can be noticed in B164A5, cells that havethe highest doubling time, so the lowest rate of prolifera-tion. B16FLT 3 cells and B16GMCSF cells present valuesin between, with slight slower values for B16GMCSF.Taking in consideration data from the literature thatcharacterize these four cell lines (e.g. how they were ob-tained), results are relevant: B16 F10 is a high metastaticcell line [17,50] and the data from this study show thatin the same conditions (number of cells/FCS concen-tration) among the tested cell lines B16F10 presents thehighest values for the absorbance. B16-GM cells, a vari-ant of the B16-F10 cells transduced by using an MFGretroviral vector encoding murine GM-CSF [18,51] pre-sent, the second highest value for the absorbance. Thesevalues are followed by the ones obtained from B16FLT3cells. In case of B16-FLT 3, murine B16 melanoma cellswhere transfected with the gene for the Flt3-L cytokine(FLT3-Fvax), which also has the role of promoting therejection of established murine melanomas [20]. Thelower values for the absorbance where noticed in case
of B164A5 cell line -derived from a melanoma fromthe skin of a C57BL/6 strain mouse, which producesmelanin [52,53]. For all four cell lines the percentageof death cells in the mentioned conditions was lessthan 3%.
ConclusionsThe SERS experiments presented here were conductedas an attempt to characterize the molecular componentsof four B16 murine melanoma cell sub-lines. These in-vestigations provide a certain insight into the SERS be-havior of these cells, demonstrating that informationregarding mainly the proteins and nucleic acids in thecells can be obtained when inoculating them with silvernanoparticles. The observed SERS bands are differentfrom one cell line to another, revealing different NPs up-take ability. Also, each particular cell exhibits specificSERS signal. Expanding to collective samples, the SERSinvestigation could surprise each cell in a specific evolu-tion moment of its lifetime, associated with different cellcycle phases, hence the intense blinking effect. Theblinking effect could also appear due to the in homogen-eity of the cellular components. These results could be auseful tool for the investigation of the action of differentanti-proliferative/cytotoxic agents. However, further ex-periments are needed in order to elucidate the complexcomposition of these cells and the differences betweenthe modified B16 cell sub-lines from a spectroscopicpoint of view.Specific growth curves for each cell sub-line were
detected employing the MTT proliferation assay usingboth different cell numbers and fetal calf serum concen-tration as variable parameters. Doubling time for eachcell line was also calculated, and results were in agree-ment with the information obtained from MTT. Thisdata allowed us to conclude that the B16F10 is the mostproliferative cell line and B164A5 has the lower growthcapacity. Regarding B16FLT3 cells and B16GMCSF cells,they present proliferation ability in between with slightslower values for B16GMCSF. This proliferation capacityof the four B16 cell lines is in agreement with the waythe cell sub-lines where obtained. MTT data can be cor-related with the surface enhanced Raman investigationsfor a detailed characterization of different cell lines.
Competing interestsThe authors declare that they have no competing interests.
Authors’ contributionsCD(T) and CS had contributions to conception and design of the study,acquisition of MTT data , analysis and interpretation of these data, AF andSCP had contributions to conception and design of the study, acquisition ofSERS data, analysis and interpretation of these data, LBT and FB hadcontributions for preparation of the cells and for TEM analyse, CD, HR andMM had contributions for drafting the article and revising it critically forimportant intellectual content. All authors read and approved the finalmanuscript.
Danciu et al. Cancer Cell International 2013, 13:75 Page 11 of 12http://www.cancerci.com/content/13/1/75
AcknowledgmentsDuring the research described in this paper, the first author, Corina Danciu,benefitted by a grant from the PhD program POSDRU/88/1.5/S/63117.The work was also supported by the UMFT grant 15250/19.12.2012.
Author details1Faculty of Pharmacy, University of Medicine and Pharmacy “Victor Babes”,EftimieMurgu Square, No. 2, 300041 Timişoara, România. 2Biomedical Physics,Biomedical, Theoretical Physics, and Molecular Spectroscopy Department,Faculty of Physics, Babes-Bolyai University, Kogalniceanu 1, RO 400084Cluj-Napoca, România. 3Pharmazentrum Frankfurt/Center for Drug Research,Development and Safety, Clinic of J.W. Goethe University, Theodor-Stern-Kai7, 60590 Frankfurt, Germany. 4Electron Microscopy Center Faculty of Biology& Geology "Babes-Bolyai", University of Cluj-Napoca, 5-7 Clinicilor Street,400006 Cluj-Napoca, Romania. 5Department of Physiology and Immunology,University of Medicine and Pharmacy "Victor Babes", Eftimie Murgu Square,No. 2, 300041 Timisoara, Romania. 6Department of Clinical Laboratory andSanitary Chemistry, “Vasile Goldis” University, 1 Feleacului Str., Arad 310396Romania.
Received: 17 March 2013 Accepted: 15 July 2013Published: 26 July 2013
References1. Lieber CA: In-vivo nonmelanoma skin cancer diagnosis using Raman
microspectroscopy. Lasers Surg Med 2008, 40(7):461–467.2. Xie W, Su L, Aiguo L, Shen A, Materny A, Hua J: Application of surface-
enhanced Raman scattering in cell analysis. J Raman Spectrosc 2011,42(6):1248–1254.
3. De Gelder J, De Gussem K, Vandenabeele P, Moens L: Reference databaseof Raman spectra of biological molecules. J Raman Spectrosc 2007,38:1133–1147.
4. Movasaghi Z, Rehman S, Rehman I: Raman spectroscopy of biologicalsamples. App spectrosc rev 2007, 42(2):493–541.
5. Notingher I: Raman Spectroscopy Cell-based Biosensors (review). Sensors2007, 7(8):1343–1358.
6. Nijssen A, Bakker Shut T, Heule F, et al: Discriminating basal cell carcinomafrom its surrounding tissue by Raman spectroscopy. The J of Inv Derm2002, 119(1):64–69.
7. Caspers PJ, Lucassen GW, Carter EA, Bruining HA, Pupples GJ: In vivoconfocal Raman microspectroscopy of the skin: noninvasivedetermination of molecular concentration profiles. The J of Inv Derm2001, 116(3):434–442.
8. Nie S, Emory SR: Probing single molecules and single nanoparticles bysurface-enhanced Raman scattering. Science 1997, 275:1102–1106.
9. Kneipp K, Haka AS, Kneipp H, Badizadegan K, Yoshizawa N, Boone C,Shafer-Peltier KE, Motz JT, Dasari RR, Feld SM: Surface-enhanced Ramanspectroscopy in single living cells using gold nanoparticles. App Spectrosc2002, 56(2):150–154.
10. Kneipp J, Kneipp H, Wittig B, Kneipp K: Novel optical nanosensors forprobing and imaging live cells. Nanomed 2010, 6:214–226.
11. Mosmann T: Rapid colorimetric assay for cellular growth and survival:application to proliferation and cytotoxicity assays. J of Immun Met 1983,65(1–2):55–63.
12. Babu PA, Latha GS, Prasad SB, Rao R: In vitro anti-cancer activities of fewanti-hypertensive agents against carcinoma of cervix by MTT assay.J of Pharma Res & Rev 2011, 1:1–3.
13. Ciofani G, Danti S, D’Alessandro D, Moscato S, Menciassi A: Assessingcytotoxicity of boron nitride nanotubes: interference with the MTT assay.Biochem Biophys Res Comm 2010, 394(2):405–411.
14. Iqbal M, Ijaz A, Aleem M, Rehman H, Yousa MS: Assessment of Nili-Ravibuffalo (Bubalusbubalis) semen by MTT reduction assay. S Afric J of AnimSci 2010, 39(1):294–301.
15. Meerloo J, Kaspers GJ, Cloos J: Cell sensitivity assays: the MTT assay. Met inMolec Biol 2011, 731:237–245.
16. Teicher BA: Tumor models in cancer research. In B16 Murine melanoma.Edited by Alvarez E. New Jersey: Humana press inc; 2002:73–87.
17. Fidler IJ: The relationship of embolie homogeneity, number, size andviability to the incidence of experimental metastasis. Eur J Cancer 1973,9:223–227.
18. Kumar R, Yoneda J, Fidler IJ, Dong Z: GM-CSF-transduced B16 melanomacells are highly susceptible to lysis by normal murine macrophages andpoorly tumorigenic in immune-compromised mice. J Leukoc Biol 1999,65(1):102–108.
19. Curran M, Allison JP: Tumor vaccines expressing Flt3 ligand synergizewith CTLA-4 blockade to reject preimplanted tumors. Canc Res 2009,69(19):7747–7755.
20. Vargas P, Cortés C, Vargas L, Rosemblatt M, Bono MR: Immunization withantigen-pulsed dendritic cells significantly improves the immuneresponse to weak self-antigens. Immunobiol 2006, 211(1–2):29–36.
21. Franco Lopes D: Viscum album citotoxicity in caco-2 cells (in vitro)analyzed by dispersive Raman spectroscopy. Int J High Dilution Res 2008,7(23):118–119.
22. Lee PC, Meisel D: Adsorption and surface-enhanced Raman of dyes onsilver and gold sols. J Phys Chem 1982, 86(17):3391–3395.
23. Doherty GJ, McMahon HT: Mechanisms of endocytosis. Annu Rev Biochem2009, 78:857–902.
24. Lai SK, Hida K, Man ST, Chen C, Machamer C, Schroer TA, Hanes J:Characterization of the intracellular dynamics of a non-degradativepathway accessed by polymer nanoparticles. J Control Rel 2008,125(2):107–111.
25. Thurn KT, Brown EMB, Wu A, Vogt S, Lai B, Maser J, Paunesku T, Woloschak GE:Nanoparticles for applications in cellular imaging. Nanoscale Res Lett 2007,2:430–441.
26. Jain KK: Application of nanobiotechnology in cancer therapeutics. InPharm Persp of Cancer Ther. New York: Springer; 2009:245–268.
27. Zhang Y, Hong H, Cai W: Imaging with Raman spectroscopy. Curr PharmBiotechnol 2010, 11(6):654–661.
28. Le’vy R, Shaheen U, Cesbron Y, Se’e V: Gold nanoparticles delivery inmammalian live cells: a critical review. Nano review 2010, 1:4889.
29. Doering WE, Nie S: Single-molecule and single-nanoparticle SERS:examining the roles of surface active sites and chemical enhancement.J Phy sChem B 2002, 106(2):311–317.
30. Qian XM, Nie SM: Single-molecule and single-nanoparticle SERS: fromfundamental mechanisms to biomedical applications. Chem Soc Rev 2008,37:912–920.
31. CintaPinzaru S, Falamas A, Dehelean CA: Molecular conformation changesalong the malignancy revealed by optical nanosensors. J Cell Mol Med2013, 17:277–286.
32. Tang HW, Yang XB, Kirkham J, Smith DA: Probing intrinsic and extrinsiccomponents in single osteosarcoma cells by near-infrared surface-enhanced Raman scattering. Anal Chem 2007, 79(10):3646–3653.
33. Tang HW, Yang XB, Kirkham J, Smith DA: Chemical probing of singlecancer cells with gold nanoaggregates by surface-enhanced Ramanscattering. App Spectr 2008, 62(10):1060–1069.
34. El-Said WA, Kim TH, Kim H, Choi JW: Detection of effect ofchemotherapeutic agents to cancer cells on gold nanoflowerpatterned substrate using surface-enhanced Raman scattering andcyclic voltammetry. Biosens and Bioelectr 2010, 26(4):1486–1492.
35. Kang J, Gu H: Probing of cancer cell apoptosis by SERS and LSCM. InInternational Symposium on Photoelectronic Detection and Imaging 2009:Laser Sensing and Imaging, Proc. SPIE 7382; 2009. 73824H.
36. CintaPinzaru S, Dehelean CA, Falamş A, Leopold N, Lehene C: Cancer tissuescreening using surface enhanced Raman scattering. In Proceedings of theSPIE, 7376; 2010. 73760T.
37. CintaPinzaru S, Dehelean CA, Falamas A, Soica C, Ciurlea S, Danciu C, et al:Cellular events in four B16 melanoma cell lines revealed by SERS. InEuropean CLINAM & ETPN Summit. Basel,Switzerland; 2013:208–210.Conference proceedings 6/2013.
38. Ohira T, Ohe Y, Heike Y, Podack ER, Olsen KJ, Nishio K, Nishio M,Miyahara Y, Funayama Y, Ogasawara H, et al: In vitro and in vivogrowth of B16F10 melanoma cells transfected with interleukin-4cDNA and gene therapy with the transfectant. J of Canc Res ClinOncol 1994, 120(11):631–635.
39. Yerlikaya A, Erin N: Differential sensitivity of breast cancer and melanomacells to proteasome inhibitor Velcade. Int J Mol Med 2008, 22(6):817–823.
40. Qarawi MA, Carrington S, Blagbrough IS, Moss SH, Pouton CW:Optimization of the MTT assay for B16 murine melanoma cells andits application in assessing growth inhibition by polyamines andnovel polyamine conjugates. Pharm Pharmacol Commun 1997,3(5–6):235–239.

Danciu et al. Cancer Cell International 2013, 13:75 Page 12 of 12http://www.cancerci.com/content/13/1/75
41. Leelavatcharamas V, Emery AN, al-Rubeai M: Growth and interferon-gammaproduction in batch culture of CHO cells. Cytotechnol 1994, 15(1–3):65–71.
42. Kiss R, Camby I, Duckworth C, De Decker R, Salmon I, Pasteels JL, Danguy A,Yeaton P: In vitro influence of Phaseolus vulgaris, Griffonia simplicifolia,concanavalin A, wheat germ, and peanut agglutinins on HCT-15,LoVo, and SW837 human colorectal cancer cell growth. Gut 1997,40(2):253–261.
43. Novakovic GV, Freshney RI: Culture of cells for tissue engineering. In Basicprinciples of cell culture. Edited by Freshney RI. Hoboken, New Jersey: JohnWiley & Sons, Inc; 2006:3–23.
44. Holmström TH, Tran SE, Johnson VL, Ahn NG, Chow CS, Eriksson JE:Inhibition of mitogen-activated kinase signaling sensitizes HeLa cells toFas receptor-mediated apoptosis. Mol Cell Biol 1999, 19(9):5991–6002.
45. Alas S, Bonavida B: Rituximab inactivates signal transducer andactivation of transcription 3 (STAT3) activity in B-Non-Hodgkin’slymphoma through inhibition of the interleukin 10 Autocrine/Paracrineloop and results in down-regulation of Bcl-2 and sensitization tocytotoxic drugs. Cancer Res 2001, 61:5137–5144.
46. Ahn JH, Park SM, Cho HS, Lee MS, Yoon JB, Vilcek J, Lee TH: Non-apoptoticsignaling pathways activated by soluble Fas ligand in serum-starvedhuman fibroblasts. J Biol Chem 2001, 276(50):47100–47106.
47. Cooper S: Reappraisal of serum starvation, the restriction point, G0, andG1 phase arrest points. FASEB J 2003, 17:333–340.
48. Hyun S, Lee G, Kim D, Kim H, Lee S, Nam D, Jeong Y, Kim S, Yeom S,Kang S, Han J, Lee B, Hwang W: Production of nuclear transfer-derivedpiglets using porcine fetal fibroblasts transfected with the enhancedgreen fluorescent Protein1. Bio of reprod 2003, 69:1060–1068.
49. Kim U, Shu CW, Dane KY, Daugherty SP, Wang JYJ, Soh HT: Selection ofmammalian cells based on their cell-cycle phase using dielectrophoresis.PNAS 2007, 104(52):20708–20712.
50. Nicolson GL, Brunson KW, Fidler IJ: Specificity of arrest, survival, and growthof selected metastatic variant cell lines. Canc Res 1978, 38:4105–4111.
51. Deventer HW, Serody SJ, McKinnon KP, Clements C, Brickey WJ, Ting JPY:Transfection of macrophage inflammatory protein 1α into B16 F10melanoma cells inhibits growth of pulmonary metastases but notsubcutaneous tumors. The J of Immun 2002, 169:1634–1639.
52. Riley V: Enzymatic determination of transmissible replicating factorsassociated with mouse tumors. Ann N Y Acad Sci 1963, 100:762–790.
53. Silagi S: Control of pigment production in mouse melanoma cellsin vitro. Evocation and maintenance. J Cell Biol 1969, 43:263–274.
doi:10.1186/1475-2867-13-75Cite this article as: Danciu et al.: A characterization of four B16 murinemelanoma cell sublines molecular fingerprint and proliferationbehavior. Cancer Cell International 2013 13:75.
Submit your next manuscript to BioMed Centraland take full advantage of:
• Convenient online submission
• Thorough peer review
• No space constraints or color figure charges
• Immediate publication on acceptance
• Inclusion in PubMed, CAS, Scopus and Google Scholar
• Research which is freely available for redistribution
Submit your manuscript at www.biomedcentral.com/submit