(91) ui_thesis_adekoya_b.b._anthropological_1994.pdf
TRANSCRIPT
AN ANTHROPOLOGICAL STUDY OF THE
ABO BLOOD GROUP DISTRIBUTION
AMONGST THE YORUBA OF NIGERIA
BY
BOLA BABATUNDE ADEKOYA
B.Sc. Zoology Honours (Ibadan)
M.Sc. Archaeology (Ibadan)
A THESIS IN THE DEPARTMENT OF ARCHAEOLOGY
AND ANTHROPOLOGY SUBMITTED TO THE FACULTY
OF SCIENCE IN PARTIAL FULFILMENT OF THE
REQUIREMENTS FOR THE DEGREE OF
DOCTOR OF PHILOSOPHY
UNIVERSITY OF IBADAN, IBADAN, NIGERIA
JUNE, 1994.UNIVERSITY
OF I
BADAN LIBRARY
ii
ABSTRACT
Twenty-five (25) sub-groups of the Yoruba language sub-family
in Nigeria were identified based on such similarities as:
territory, dialect, descent, cultural and economic ties. The ABO
blood group samples and records of the identified Yoruba sub-groups
were analysed and evaluated. These Yoruba sub-groups included:
Akoko, Akure, Awori, Bunu, Egba, Egbado. Ekiti, Eko, Ibarapa,
Ibolo, Ife, Igbomina, Ijebu, Ijesa, Ijumu, Ikale, Ilaje, Ilorin,
Kabba, Ondo, Owo, Owu, Oyo, Remo and Yagba.
Frequency distribution and percentiles of the ABO blood groups in
each Yoruba sub-groups were determined through statistical analysis
and subjected to X2 distribution analysis to detect deviation
significance levels about the expected mean of ABO blood groups for
the Yoruba language sub-family.
The majority of the individual blood group types within the
Yoruba sub-groups were of the type 'O'. Percentiles and frequencies
for this blood group type for each Yoruba sub-group exhibited two
distinct mean pulses.
The mean percentiles for the type 'O' blood group were 51.6%
and 55% with mean frequency values of 0.718 and 0.742 respectively,
indicating the presence of two dialect groups within the Yoruba
-A
UNIVERSITY
OF I
BADAN LIBRARY
iiilanguage sub-family.
The Yoruba sub-groups hereby identified from the ABO blood
sample analysis and subseguently classed into two dialect groups
coincide with the "i" and "u" linguistic dialect areas into which
the Yoruba territory of Nigeria is divided, thus confirming the
existence of a definite anthropological divide of the Yoruba
language sub-family.
UNIVERSITY
OF I
BADAN LIBRARY
ACKNOWLEDGEMENTS
I acknowledge with great thanks to God, the assistance and varied support of the following:
My Supervisor: Prof. B.W. Andah for consistent guidance,
critique and considerable assistance on literature and analytical
options throughout the duration of the work. My co-supervisor, Dr.
B . A. Ogunsanwo for incessant interest, professional inputs and
thorough preparations on haematological techniques necessary to see
the research work to fruition. My laboratory guides, Messers Idris
Salihu and Bola Oduniyi for enabling me to acquire some nodding
acquaintance of basic haematological (laboratory) methods within
the shortest possible time. My loving wife, Sr.(Mrs.) F.A. Adekoya
for her understanding and ebullient enthusiasm in assisting the
progress of the work all through its duration. Prof. (Mrs.) M .A .
Sowunmi, for critique, gift of literature and encouragement. Prof.
S. Afolabi Toye, for literature assistance and information on the
sub-groups of the Kwara Yoruba. Dr. J.O. Sanwo, on the genetical
aspects of blood group inheritance in man and financial support.
Dr. D.A, Aremu for literature and information on the sub-groups of
Kwara Yoruba. Dr. P.A. Oyelaran for Kogi Yoruba materials and
history. Dr & Mrs. Jimi Adesina for synthesis, critique, financial
support and computer analysis. Dr. (Mrs.) C.Y. Jeje for structural
iv ' y
UNIVERSITY
OF I
BADAN LIBRARY
Vcritique and support. Dr. Archibong 0. Ekpo (G.Boss) for
consistent support and multivariate assistance. Chief Bisi Rodipe
(Bisrod) for financial support and encouragement. Dr. & Dr(Mrs)
P .A. Araoye for assistance on sampling at Ilorin. Sr. (Mrs.) 0
Adeoye for assistance on the sampling of the Ibolo, Igbomina and
Yagba sub-groups. Prince A. Sulu-Gambari for information on the
settlement history of the Ilorin sub-group. Sr.(Mrs.) Toyin Oworu
for information on the settlement history of the Remo sub-group and
incessant stationery assistance throughout the duration of the
work.
Dr. & Mrs O.Oyewo for the assistance on the Ibolo. Mr. 0.
Moody for information and literature on the Yagba sub-group. Engr.
& Sr. (Mrs.) Oguntusin for considerable financial support and
encouragement.Mr. G.O. Bakare for support and assistance on the
history of the Ibarapa sub-group. Mr Paul Bolorunduro for
assistance and information on the Ijumu, Kabba, Yagba and Bunu sub
groups. Mrs Lola Salihu for the assistance on the sampling of the
Oyo sub-group.
Mrs. C.O. Oyebade for the sampling of the Ibarapa sub-group.
Engr. & Sr. (Mrs.) Jimi Omoliki for accommodation, support and
encouragement. Dr. (Mrs.) K.O. Ekpo for encouragement and
structural critique. Mr. & Mrs S.A.M. Adebowale for support and
UNIVERSITY
OF I
BADAN LIBRARY
VIgoodwill. Messers Musa Kadzai, Jerome Afeikhena, Kayode Jagun for
mathematical analysis, statistical analysis and support
respectively.Mrs. 0.Elliot and Mrs. G.T. Omole for varied support
and assistance. Messers Kunle Ogunkoya and Kunle Odufuye for the
sampling of the I lor in sub-group. Engr. and Mrs P.B. Sanu for
literature recoveries from Britain, support and goodwill. Mrs. O.A.
Olawunmi for documentation support. Mrs. R.O. Komaiya, Mrs 0 Ajayi,
Mrs. Dunni Sowole and Mr Olu Olaoyenikan for documentation work. Mr
& Mrs 0 Dosunmu for literature support. Dr & Mrs K.B. Olurin for
statistical analysis, structural critique and encouragement. Dr.
and Mrs G.N. Ugwuzor for encouragement. Mr & Mrs 0 Obayeju for
financial and moral support throughout the duration of the research
period. Mr. B. Oyewo for assistance at the U.C.H. blood bank,
Ibadan. Miss Kehinde Odufuye for communication support and
incessant assistance. Sr. (Mrs.) W. Olabisi Odusote for
encouragement. Miss T.O. Ayansanwo for support and goodwill. Miss
F.O.A. Ajayi for support and consistent literature search.
Dr. O.A Sodeinde for considerable assistance on bio-statistics
and structural critique. For literature search and recoveries made
from overseas, I thank Madam M.A. Odufuye (U.S.A.),Mr & Mrs Dele
Oladoja (California, U.S.A.) Engr. Wale Odufuye (Chicago, U.S.A.),
Kunle and Pelumi Odufuye (Britain) and Engr. Folorunso Oladeinde
UNIVERSITY
OF I
BADAN LIBRARY
vii
(Britain).
I am particularly grateful to Mr Tunde Adeyemi (Temple and
Golders, Itamogiri, Ijebu Imushin) for literature support on the
Owu sub-group. Similar thanks are due to: Mr. & Mrs Mojisola
Oyenuga (N.T.C., Ibadan) for consistent varied support. Dr. C.A.
Folorunso for incessant literature support and encouragement; Dr.
0.A. Ayinla for interest and profound goodwill; Dr. & Mrs. Temitayo
Jaiyesimi for assistance and goodwill; Dr. & Mrs Segun Olunuga for
literature support and goodwill.
Special cognisance is taken of the assistance of the numerous
staff of blood banks at the State hospitals, and health posts of
the Yoruba sub-groups sampled. For the material, financial and
varied assistance from many family members, relations and friends
too numerous to mention here, I am very grateful.
UNIVERSITY
OF I
BADAN LIBRARY
CERTIFICATION
I certify that this work was carried out by Bola Babatunde,
Adekoya in the Department of Archaeology and Anthropology,
University of Ibadan, Ibadan, Nigeria.
(Supervisor)Prof. B.W. Andah,
& A . (Lond.) ;M.Phil. (Lond.); Ph.D (Berkeley)
Professor, Department of Archaeology and Anthropology
University of Ibadan
1 Zoo-Supervisor)D^/ B.A. Ogunsanwo
M.B.B.S. (Ibadan); F.M.C. (Path),
Acting Head, Department of Heamatology, University College Hospital, Ibadan.
F.W.A.C.P.
JUNE, 1994UNIVERSITY
OF I
BADAN LIBRARY
IX
DEDICATION
To
my Son,
BUNMI BABAJIDE ADEKOYA
in acknowledgement
of his reflection of God's love
UNIVERSITY
OF I
BADAN LIBRARY
XTABLE OF CONTENTS
PageTITLE i
ABSTRACT ii
ACKNOWLEDGEMENTS iv
CERTIFICATION viii
DEDICATION ix
TABLE OF CONTENTS XLIST OF FIGURES xiii
LIST OF TABLES xvii
LIST OF APPENDICES xviii
CHAPTER ONE: INTRODUCTION 1
General Background 1The Importance of ABO Blood Group Study 1Language as Discriminant 5ABO Blood Groups: Anthropological Works 8Aims of Study 13Scope of the Study 16The Study Location Area: Territory and Sub-groups' Locations 24
CHAPTER TWO: LITERATURE REVIEW 27
Earlier Work on the Yoruba and Yorubaland 27 Linguistics 27 Archaeology 35 History 38 Yoruba History 42 History of Yoruba Sub-groups 44UNIV
ERSITY O
F IBADAN LI
BRARY
xi
CHAPTER THREE: BIOLOGICAL METHODS AND ANALYSIS 86
Biological Methods in Studying Human Groups 86Biological Data in West Africa 86ABO Blood Group as marker in population studies 89 ABO Blood Group: Antigens and Antibodies 89ABO Grouping Data of the Yoruba: Findings 97Methods of Analysis 100ABO Blood Grouping: Principles and Procedures 102Statistical Analysis 107
CHAPTER FOUR: RESULTS OF THE ABO BLOOD GROUP ANALYSISOF THE YORUBA SUB-GROUPS 112
Blood Groups: Distribution, Percentiles,and Gene Frequencies 112
Blood Group Maps 112Blood Groups in Samples of Yoruba Sub-Groups 112Percentiles of Blood Groups 116Gene Frequencies of Blood Groups 118Analysis of Variance (Anova) Results:
Blood Group Percentiles 120Analysis of Variance (Anova) Results:
Blood Group Gene Frequencies 126Chi-Square (Matrix) Values for the Significance of Difference in the ABO Blood GroupDistribution in the Yoruba Sub-groups 136Bar charts of the Blood Group Values of the Yoruba Sub-groups 133
CHAPTER FIVE: DISCUSSION OF THE RESULTS OF THE ABOBLOOD GROUPING OF THE YORUBA SUB GROUPS 142
Dominance of Blood Group 'O' 142Two Yoruba Dialect Groups 142Biological Partition 144Correlation of Biological and Linguistic
Evidences 145Anthropological Divide of the Yoruba Sub-Family 145 Negroid Marker: Blood Group XB' 147Dilution Influence: Gene - A trends 149
UNIVERSITY
OF I
BADAN LIBRARY
Xll '
Occurence of Cancer of the Stomach 151 Influences of Boundary Yoruba Sub-Groups 153 Higher Tendency for the Occurence of Ulcer 155 Genetic variation within the Yoruba
Dialect Groups 155 Chi-Square Martix Analysis 157 Partition Into Two Dialect Groups 161 Varying Values of Significant Differences 165 Order of Sub-groups Based on X2 Values 165 Partition of Yoruba Sub-Groups Based on
Anova Results 171 Overlaps Within the Anova Results 173 Blood Group 'B' Distribution: Negritude 174 Blood Group 'A' Distribution: Cancer 175 Blood Group '0' Distribution: Ulcer and Dilution 175 Overlaps and Yoruba Sub-Groups' Boundaries 176 Ife and the Advent of the "i" -dialect Group 176 Possible Derivation of Yoruba Dialect Groups 178 Biological Implications of Intrusions at Ife 180 The Place of Oduduwa 180
CHAPTER SIX: SUMMARY AND CONCLUSIONS 182
Summary of the Discussions of Results 182Dominance of Blood Group 'O' 182Two Yoruba Dialect Groups 182Blood Group 'B' Distribution:
Measure of Negritude 183Blood Group 'A' Distribution: Cancer and
Dilution 183Boundary Effects Between Yoruba Sub-Groups 184Blood Group '0' Distribution: Ulcer Tendencies 184Genetic variation within the Yoruba 185Sources of Derivation of Yoruba Dialect Groups 186The Primacy of Ife and the Place of Oduduwa 188Conclusions 190
'«*REFERENCES 193
APPENDICES 206UNIVERSITY
OF I
BADAN LIBRARY
xiii
LIST OF FIGURES
Fig 1: Nigeria (Ethnic Groups) Showing Yorubaland 2
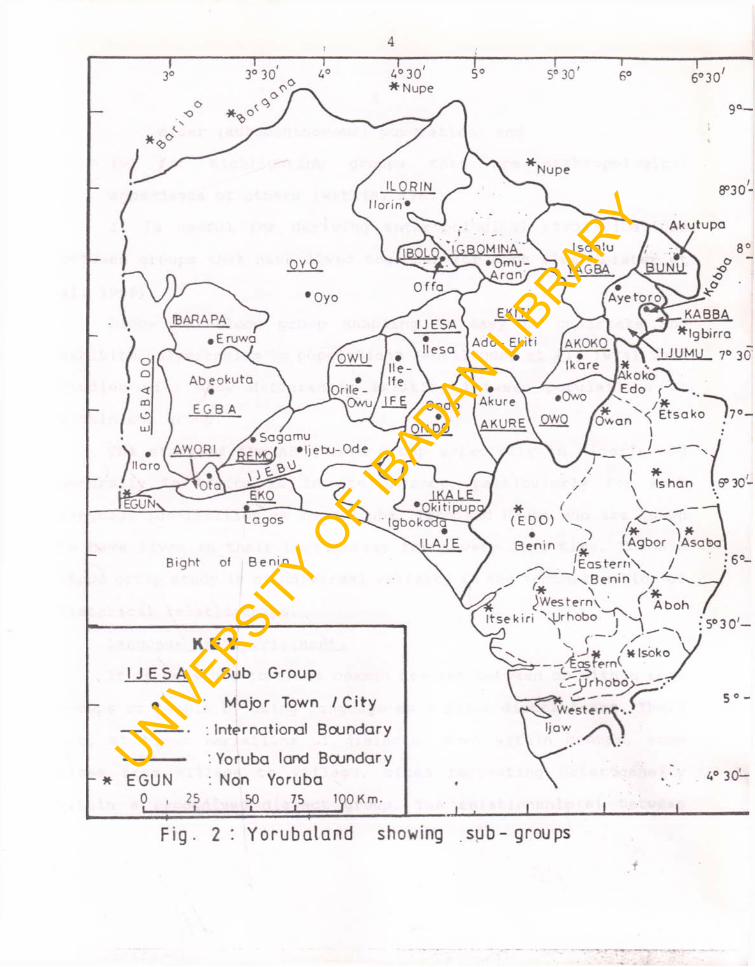
Fig 2 : Yorubaland Showing Sub-Groups 4
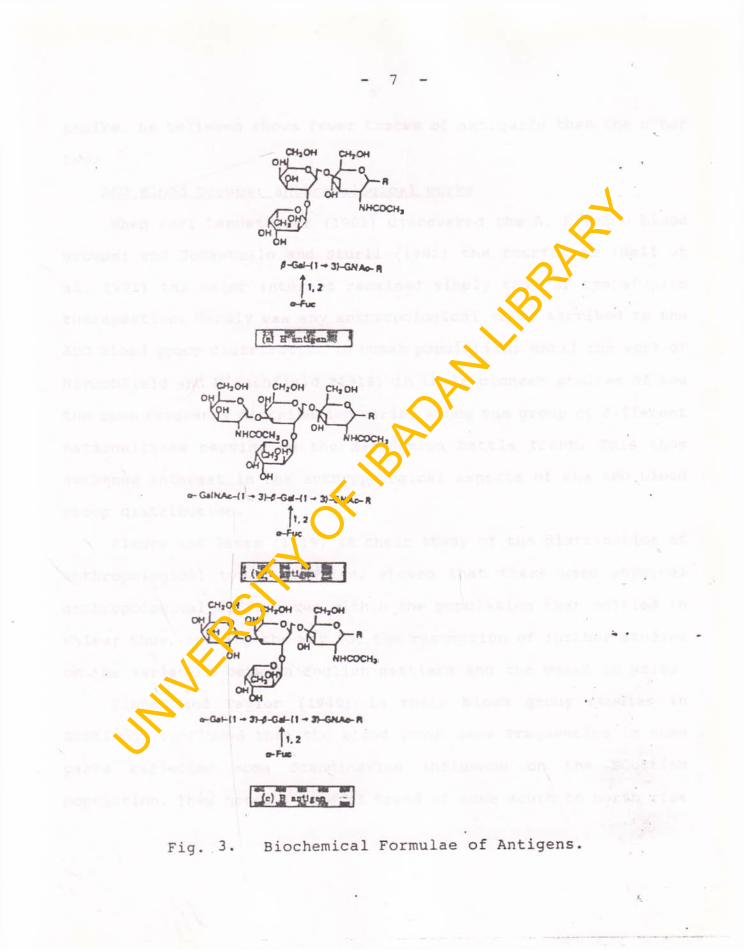
Fig 3 : Biochemical Formulae of Antigens 7
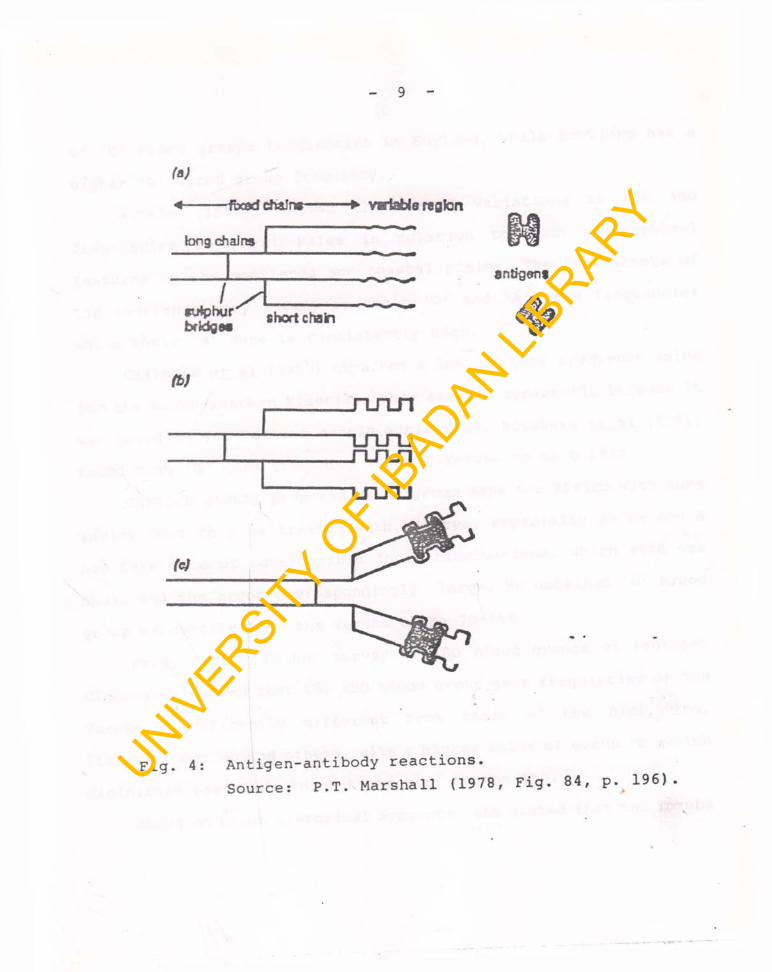
Fig 4: Antigen-Antibody Reactions 9
Fig 5: Kogi State showing Yoruba Sub-Groups 14
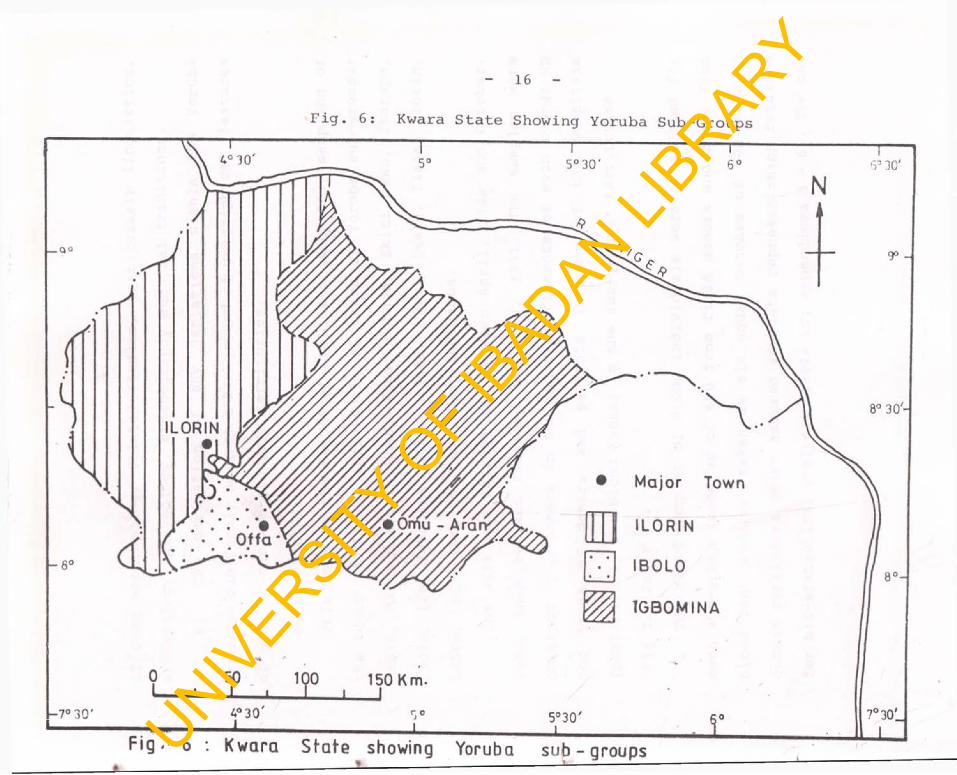
Fig 6: Kwara State showing Yoruba Sub-Groups 16
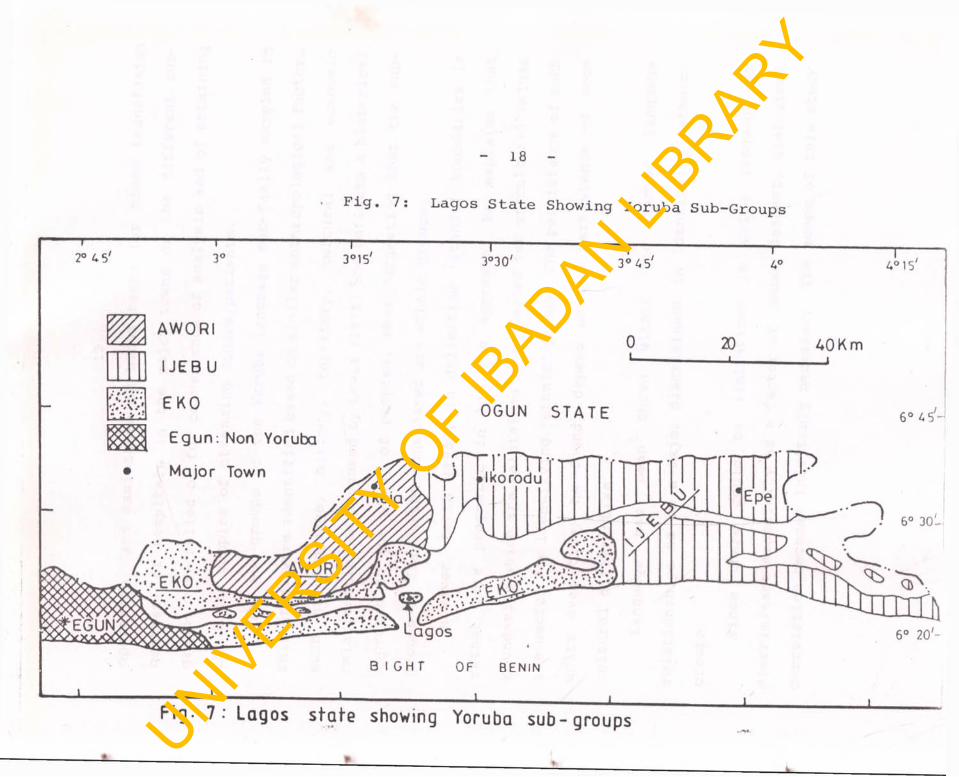
Fig 7: Lagos State showing Yoruba Sub-groups 18
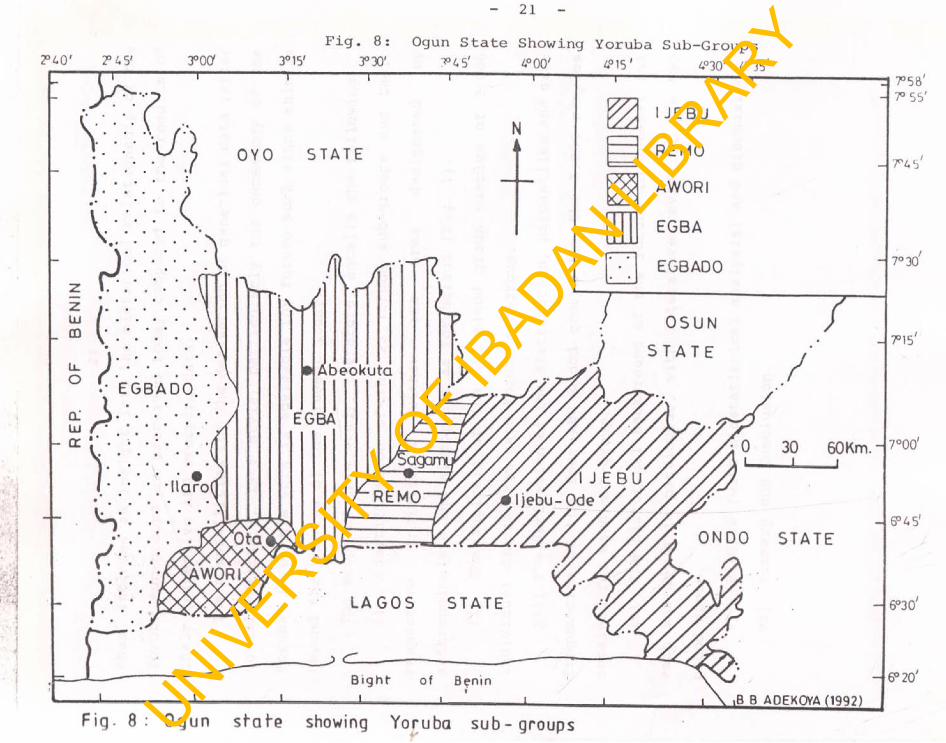
Fig 8: Ogun State showing Yoruba Sub-Groups 21
Fig 9: Ondo State showing Yoruba Sub-Groups 23
Fig 10: Osun State Showing Yoruba Sub-Groups 26
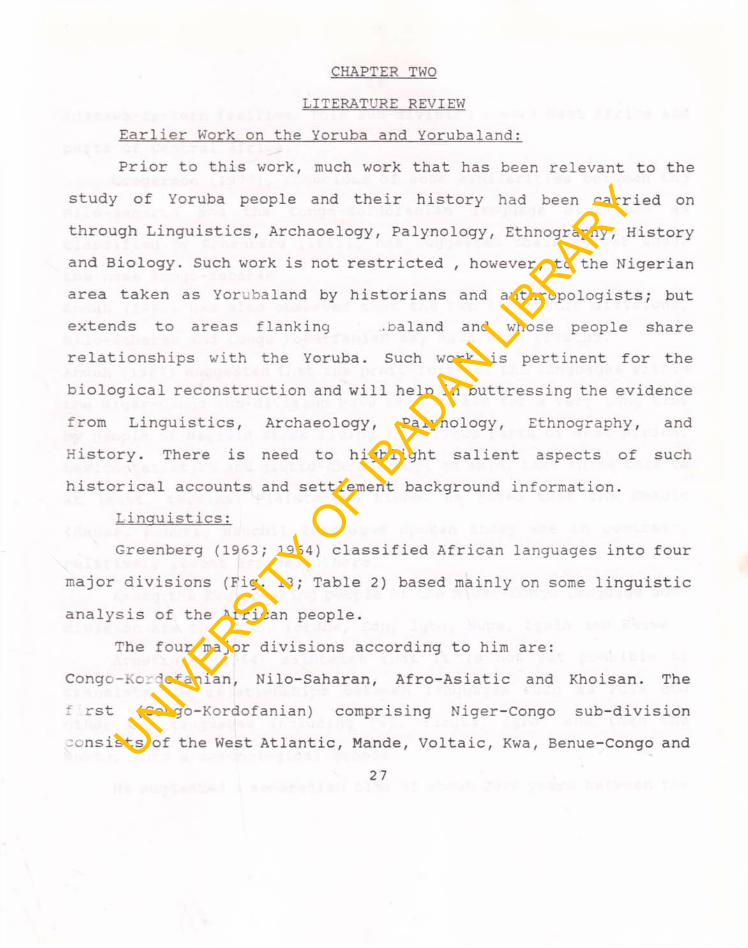
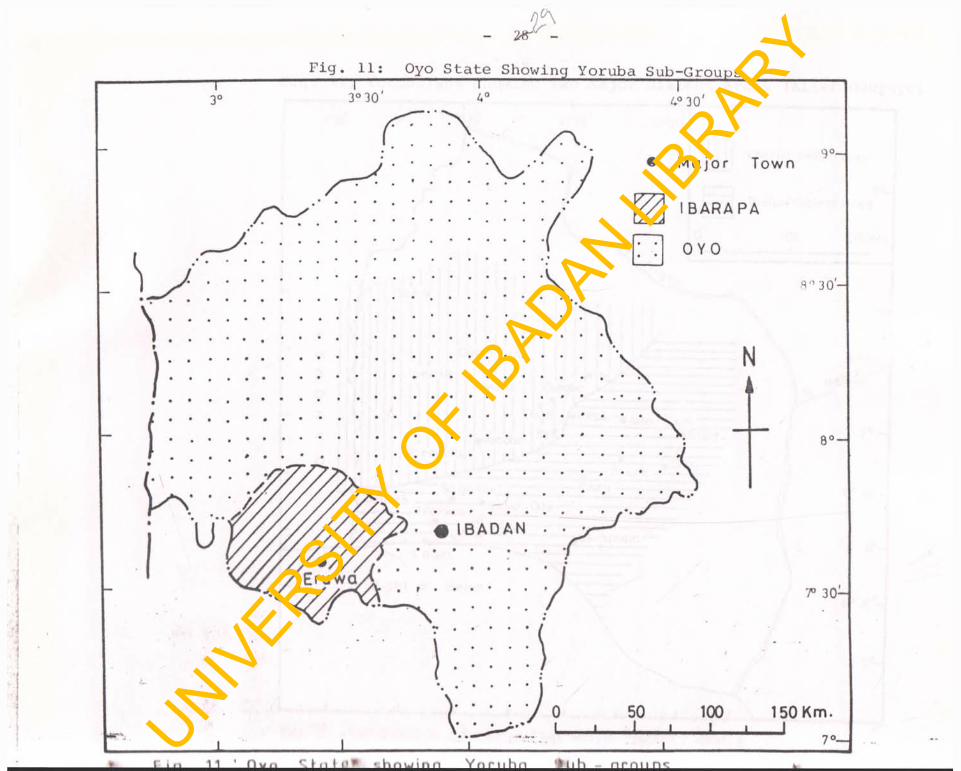
Fig 11: Oyo State showing Yoruba Sub-groups 28
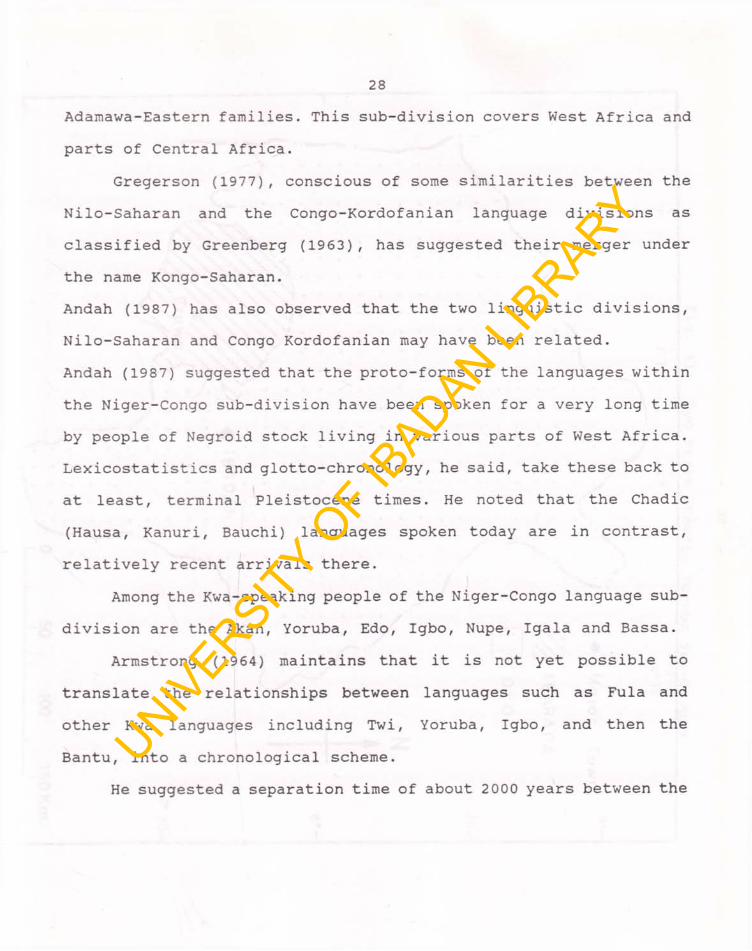
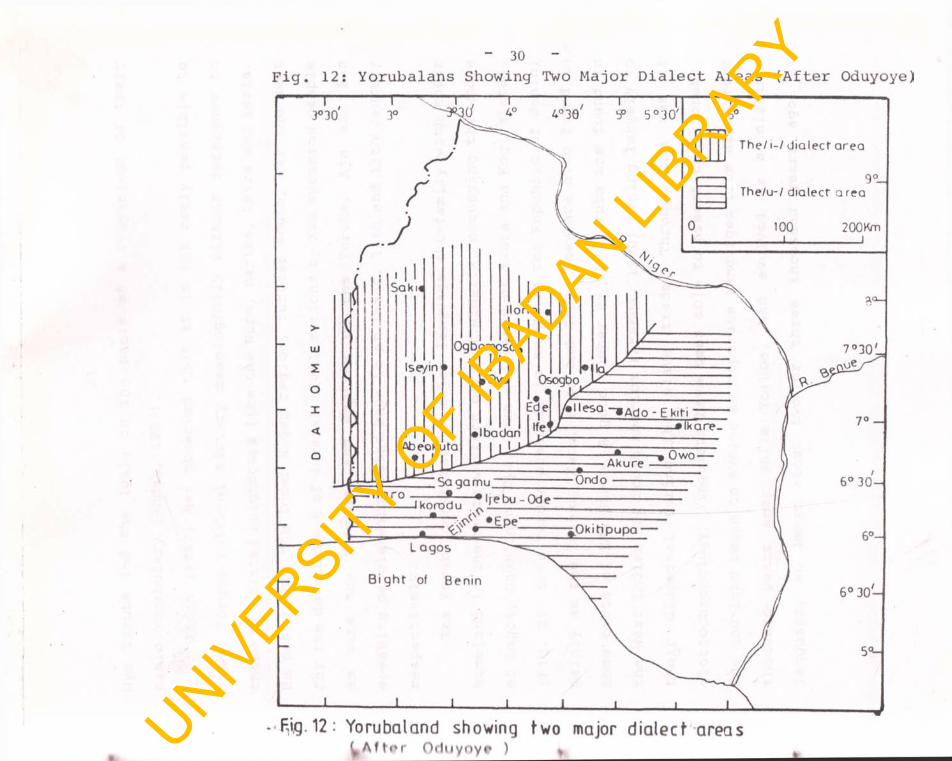
Fig 12: Yorubaland: Showing Major Dialect Areas (After Oduyoye) 30
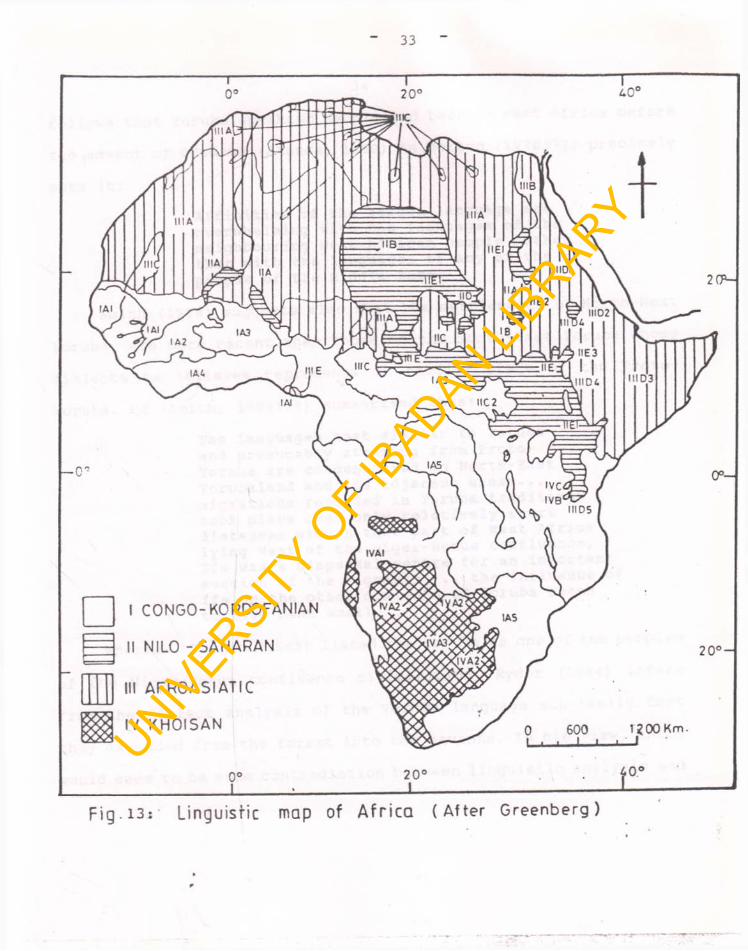
Fig 13: Linguistic Map of Africa (After Greenberg) 33
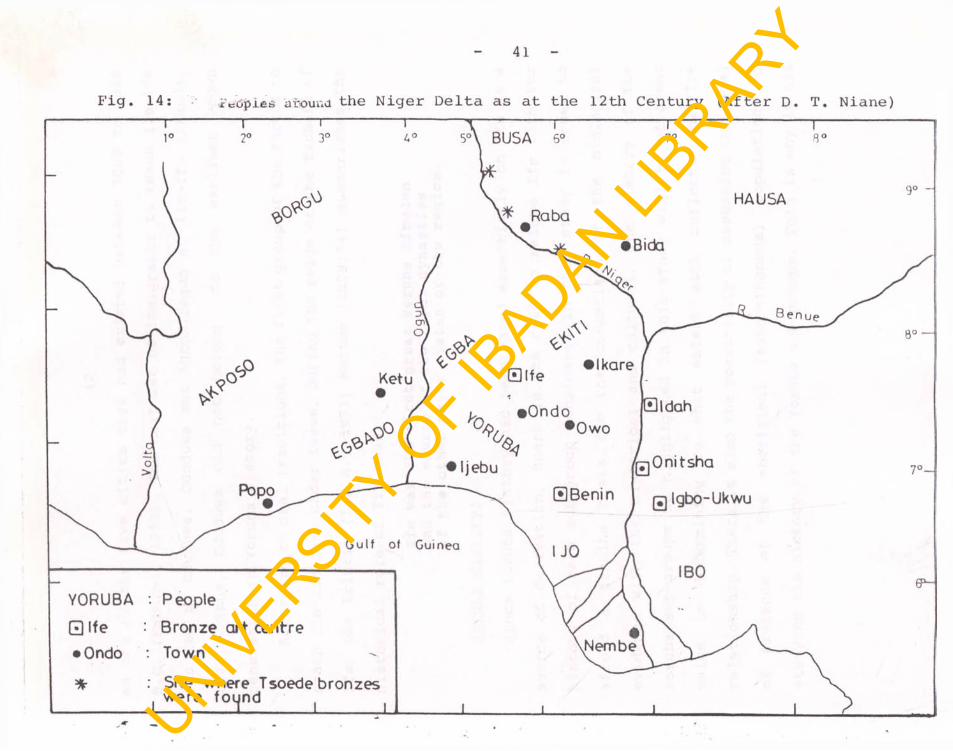
Fig 14: Peoples around the Niger Delta: As at the 12th century (After D.T. Niane) 41
Fig 15: Yoruba Territory Between 1100 - 1500 A.D. (After Ryder) 43
Fig 16: Nigeria (Ancient States) in the 16thcentury (After Lafene) . 45UNIV
ERSITY O
F IBADAN LI
BRARY
47
49
51
113
115
117
119
121
123
125
127
129
131
133
xiv
17: Nigeria (Ancient States) By 17th - 18thCentury (After Ajayi & Espie)
18: Yorubaland and nearby states before1800 A.D.(After Isichei).
19: Map of Africa showing Egypt, Nubiaand Arabia
20: Multiple Bar chart of ABO Blood GroupDistribution (in Yoruba sub-groups)
21: Multiple Bar Chart of ABO Blood GroupDistribution (Dialect Groups
22: Multiple Bar Chart of ABO Blood GroupPercentiles: In Dialect Groups
23: Bar charts of ABO Blood Group GeneFrequencies: In Dialect Groups
24: Bar Charts of Blood Group 'A' inSamples: In Dialect Groups
25: Bar Charts of Blood Group 'B' inSamples: In Dialect groups
26: Bar Charts of Blood Group 'AB' in samples: In Dialect Groups.
27 Bar Charts of Blood Group 'O' in Samples: In Dialect Groups.
28 Bar Charts of blood Group 'A' (Percentiles) In Dialect Groups
29 Bar Charts of Blood Group 'B' (Percentlies) In Dialect Groups
30 Bar Charts of Blood Group 'AB' (Percentiles) In Dialect GroupsUNIV
ERSITY O
F IBADAN LI
BRARY
XVFig: 31 Bar Charts of Blood Group 'O'
(Percentiles) In Dialect Groups
Fig: 32 Bar Charts of Blood Group 'A'(Gene Frequencies) In Dialect Groups.
Fig: 33 Bar Charts of Blood Group 'B'(Gene Frequencies) In Dialect Groups
Fig: 34 Bar Charts of Blood Group 'AB'(Gene Frequencies In Dialect Groups
Fig: 35 Bar Charts of Blood Group 'O'(Gene Frequencies) In Dialect Groups
Fig: 36 Comparative Average Percentiles and Frequencies of Blood Group 'A'In Dialect Groups
Fig: 37 Comparative Average Percentiles and Frequencies of Blood Group 'B'In Dialect Groups
Fig: 38 Comparative Average Percentiles and Frequencies of Blood Group 'AB'In Dialect Groups
Fig: 39 Comparative Average Percentiles and Frequencies of Blood Groups 'O'In Dialect Groups
Fig: 40 Blood Group Map of Yoruba Sub-Groups: Gene 'A'
Fig: 41 Blood Group Map of Yoruba Sub-Groups Gene 'B"
Fig: 42 Blood Group Map of Yoruba Sub-Groups: Gene 'AB'
Fig: 43 Blood Group Map of Yoruba Sub-Groups: Gene '0'
137
139
141
143
146
148
150
154
156
158
160
135
162
UNIVERSITY
OF I
BADAN LIBRARY
XVI
Fig: 44 Blood Group Map of Yoruba Dialect Groups:Gene 'A' 164
Fig: 45 Blood Group Map of Yoruba Dialect Groups:Gene 'B' 166
Fig: 46 Blood Group Map of Yoruba Dialect Groups:Gene 'AB' 168
Fig: 47 Blood Group Map of Yoruba Dialect Groups:Gene 'O' 170
Fig 48 Yorubaland: Showing Dialect Groups(Based on Blood Groups' Partitions) 172
UNIVERSITY
OF I
BADAN LIBRARY
xvii
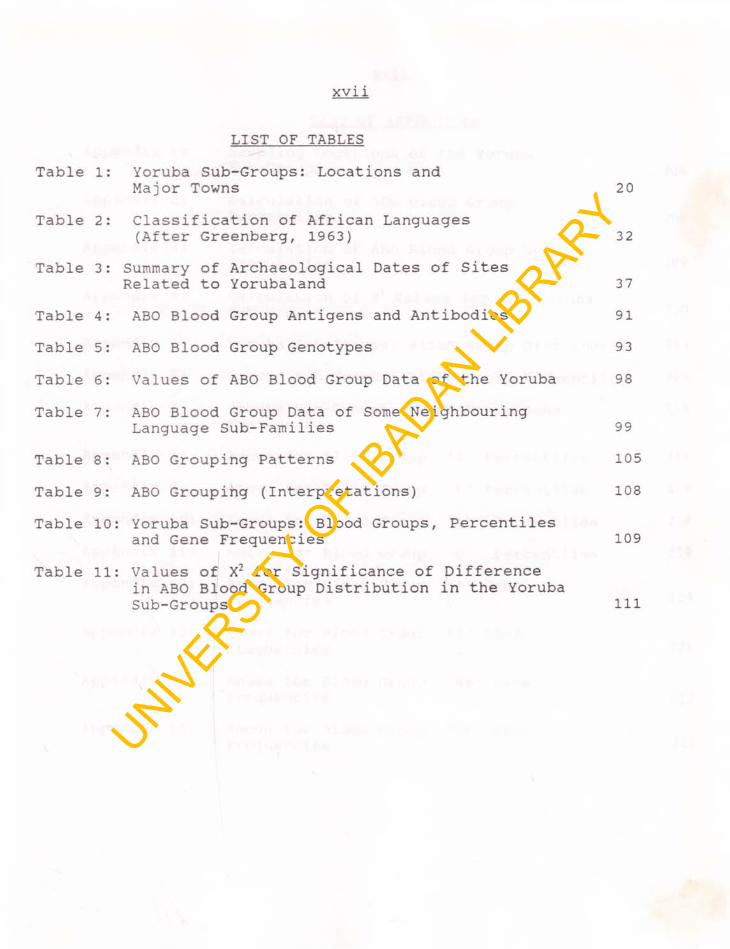
LIST OF TABLES
Table 1: Yoruba Sub-Groups: Locations and Major Towns 20
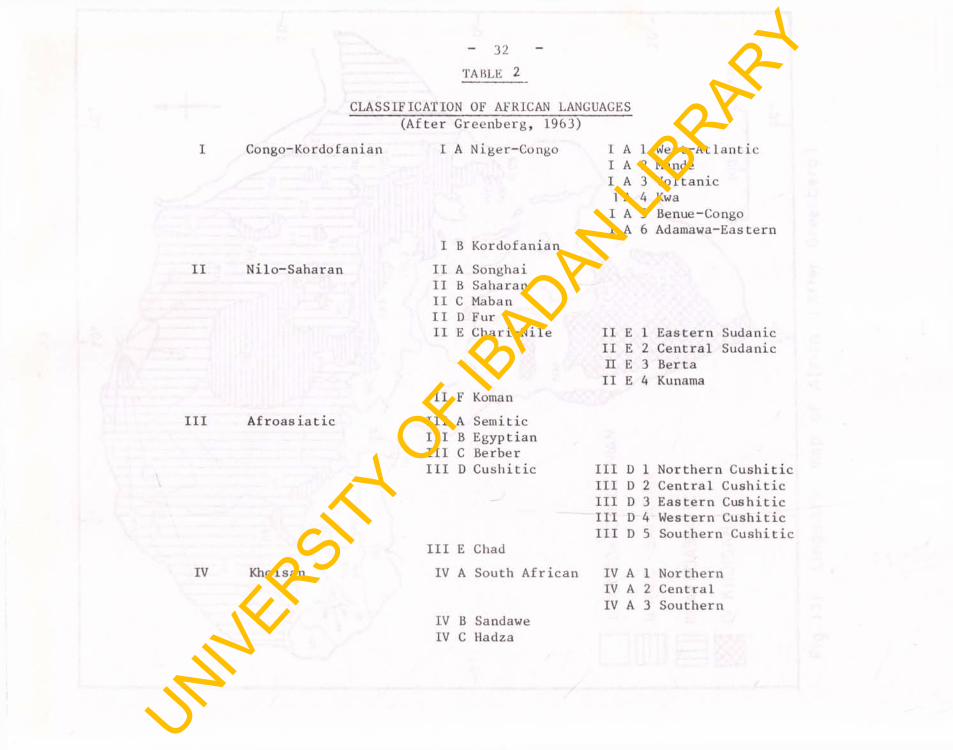
Table 2: Classification of African Languages (After Greenberg, 1963) 32
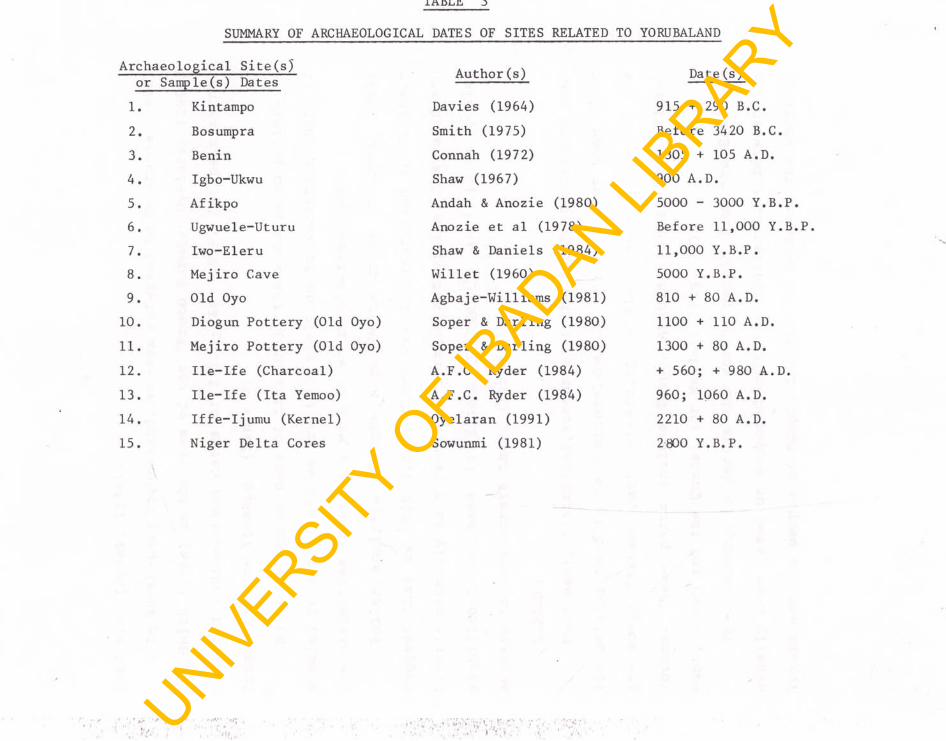
Table 3: Summary of Archaeological Dates of Sites Related to Yorubaland 37
Table 4 : ABO Blood Group Antigens and Antibodies 91
Table 5: ABO Blood Group Genotypes 93
Table 6: Values of ABO Blood Group Data of the Yoruba 98
Table 7: ABO Blood Group Data of Some Neighbouring Language Sub-Families 99
Table 8: ABO Grouping Patterns 105
Table 9: ABO Grouping (Interpretations) 108
Table 10: Yoruba Sub-Groups: Blood Groups, Percentiles and Gene Frequencies 109
Table 11: Values of X2 for Significance of Difference in ABO Blood Group Distribution in the Yoruba Sub-Groups 111
UNIVERSITY
OF I
BADAN LIBRARY
xviii • 1
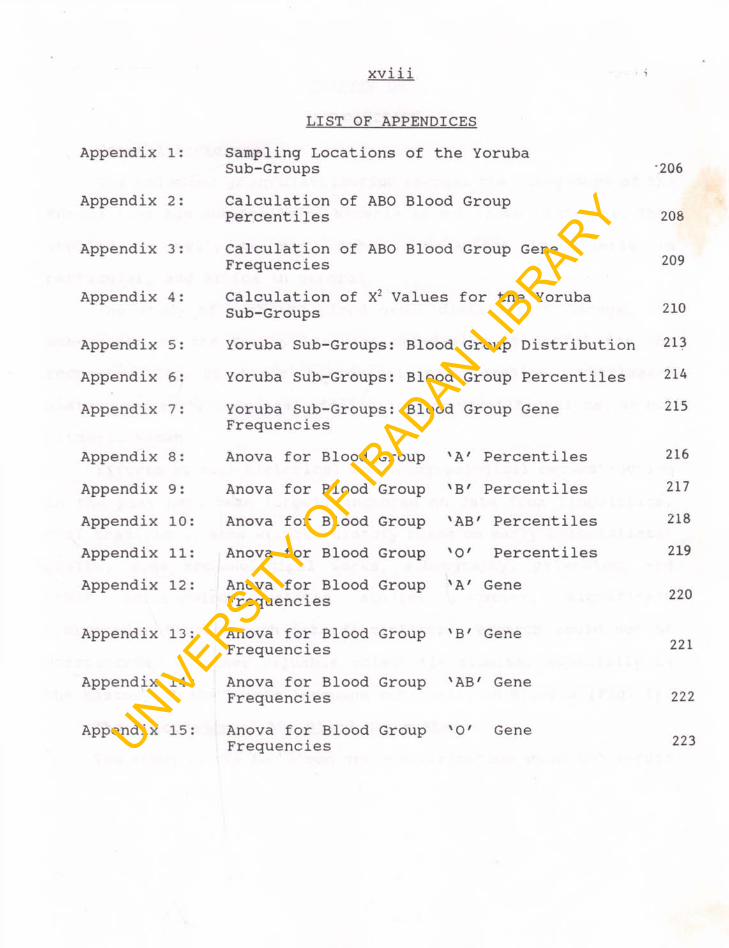
LIST OF APPENDICES
Appendix 1: Sampling Locations of Sub-Groups
the Yoruba-206
Appendix 2: Calculation of ABO Blood Group Percentiles 208
Appendix 3: Calculation of ABO Blood Group Gene Frequencies 209
Appendix 4: Calculation of X2 Values for the Yoruba Sub-Groups 210
Appendix 5: Yoruba Sub-Groups: Blood Group Distribution 213
Appendix 6: Yoruba Sub-Groups: Blood Group Percentiles 214
Appendix 7: Yoruba Sub-Groups: Blood Group Gene Frequencies
215
Appendix 8: Anova for Blood Group 'A' Percentiles 216
Appendix 9: Anova for Blood Group 'B' Percentiles 217
Appendix 10: Anova for Blood Group 'AB' Percentiles 218
Appendix 11: Anova for Blood Group 'O' Percentiles 219
Appendix 12: Anova for Blood Group Frequencies
'A' Gene 220
Appendix 13: Anova for Blood Group Frequencies
'B ' Gene 221
Appendix 14: Anova for Blood Group Frequencies
'AB' Gene222
Appendix 15: Anova for Blood Group Frequencies
'O' Gene 223UNIVERSITY
OF I
BADAN LIBRARY
CHAPTER ONE
INTRODUCTION
General Background
The ABO blood group distribution amongst the sub-groups of the
Yoruba language sub-family of Nigeria is not known in detail. This
applies as well, to many other populations in Nigeria in
particular, and Africa in general.
The study of such ABO blood group distribution amongst the
sub-groups of the Yoruba language sub-family is useful for the
reconstruction of their historical relationships, settlement
history and anthropological affiliations or stratifications, as not
hitherto known.
Efforts at such historical and anthropological reconstruction
in the past have been largely anchored on data from linguistics,
oral traditions, some written history based on early colonialists'
visits, some archaeological works, ethnography, palynology and
other anthropology related studies. However, significant
discoveries through such interdisciplinary research could not be
corroborated by other valuable scientific studies, especially on
the history of the Yoruba language sub-family in Nigeria (Fig. 1) .
The Importance of ABO Blood Group Study
The study of the ABO blood group distribution among the Yoruba
1
UNIVERSITY
OF I
BADAN LIBRARY
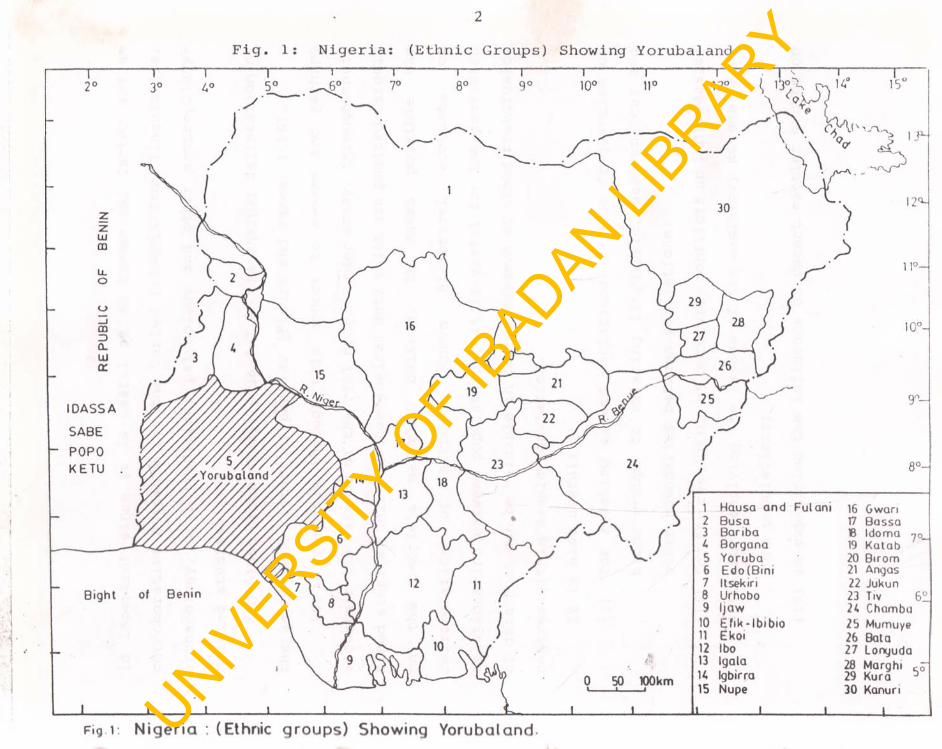
2Fig. 1: Nigeria: (Ethnic Groups) Showing Yorubaland
Fig 1. Nigeria : (Ethnic groups) Showing Yorubaland
. _ _ _ _ _ _ _ _ _ _ _ _ _ _ _ _ _
UNIVERSITY
OF I
BADAN LIBRARY
3is important since it is useful as an historical factor and as
corroborative evidence for the varied accounts from linguistics,
archaeology, oral tradition, palynology and other anthropology-
related studies.
ABO blood group study is useful in the sharper delineation of
the settlement history of peoples (Fleure and James, 1916).
It is possible through this source to assess and perhaps
ascertain the make-up of the real people under study, through their
blood samples, unlike archaeological data which are posited largely
on the people's material culture. It makes possible the
corroboration of hitherto known historical accounts of
relationships between populations. It is useful for the provision
of data that can be valuable in the management of blood transfusion
centres within sample population.
It is also useful:
(i) for relating marked variations in gene frequencies of
blood groups to existing linguistic, geographical and
other boundaries between populations;
(ii) for the resolution of paternity conflicts on individuals;
(iii) for resolving the issues of the migratory movements of
some populations;
(iv) in explaining the influence of recent settler groups on
UNIVERSITY
OF I
BADAN LIBRARY
I 4
Fig. 2 : Yorubaland showing sub-groups
f
UNIVERSITY
OF I
BADAN LIBRARY
5
older (authochthonous) population; and
(v) for highlighting groups that are anthropological
appendages of others (Watkin, 1963).
It is useful for deriving anthropological stratifications
between groups that have lived together for some time (Lister et
al. 1966).
Since ABO blood group sampling is easy to undertake and
exhibits polymorphism in populations (Worllegde, et al. 1974) Such
studies will show differences existing between populations or
within one group.
The study of the ABO blood group especially in Nigeria and
generally in Africa is in its infancy, particularly for sucht
language sub-families as the Yoruba, Igbo and Hausa who are known
to have lived in their territories for a very long time. The ABO
blood group study is of universal validity in the reconstruction of
historical relationships.
Language as Discriminant.
It is possible to trace common descent between or within some
groups or people by using language as a major discriminant. There
are, at times variations of dialects, even within groups, some
times from village to village, often reflecting heterogeneity
within a recognised dialect group. The relationship(s) between
UNIVERSITY
OF I
BADAN LIBRARY
6
language and common descent must, always be well studied.
Oduyoye (1972:25) classified the Yoruba into two: the "i" and
the "u" dialect units. He said that:
The /i—/ and /u-/ dialect distintion coincides with a shibolleth /siboleth dialect distinction: wherever the speakers of the /i-/ dialect say the sibilant sh, the speakers of the /u-/ dialects say the sibilant s, and vice-versa. The common dialect has drawn its features from both groups: it has the /i—/ and not the /u-/. But it chooses its sibilant and shibilant forms according to the practice of the /u-/ dialect group. Examples are:
Ovo/Ibadan "Yam" Isu "Work" Ise
Ondo-Ekiti/Iiebu-IiesaUsuUse
Adetugbo (1973) identified three main Yoruba dialect units.
Two of these, which he believed exhibit the characteristics of
greatest antiquity and hence of older settlement status constitute
the central group which includes: Ife, Ilesa, and Ekiti areas; and
the south-eastern group (including Ondo, Owo, Ikale, Ilaje, and
Ijebu areas). He believed all these were within the forest zone by
the twelfth century.
The third group of dialects in Adetugbo's (1973)
classification, includes: Oyo, Osun, Ibadan and the northern Egba
area; this north-western group historically associated with the Oyo
UNIVERSITY
OF I
BADAN LIBRARY
7
o- CUlNAc-<l - S-GfiAe- Aft. 2
o-fvc
r a n k 'll
«-0»M1 - 9>-t-GS-t1 - n-GMAe-Rt«.»o-Fue
c) J E&U1!
Fig. 3. Biochemical Formulae of Antigens
UNIVERSITY
OF I
BADAN LIBRARY
8empire, he believed shows fewer traces of antiquity than the other
two.
ABO Blood Groups: anthropological works
When Karl Landsteiner (1901) discovered the A, B and O blood
groups; and Decastello and Sturli (1902) the fourth, AB (Bell et
al, 1971) the major interest remained simply that of transfusion
therapeutics. Hardly was any anthropological value ascribed to the
ABO blood group distribution in human populations until the work of
Hirschfield and Hirschfield (1919) in their pioneer studies of how
the gene frequency distribution varied among the group of different
nationalities serving on the Macedonian battle front. This thus
awakened interest in the anthropological aspects of the ABO blood
group distribution.
Fleure and James (1919) in their study of the distribution of
anthropological types in Wales, showed that there were physical
anthropological differences within the population that settled in
Wales; thus, opening the way for the resumption of further studies
on the variation between English settlers and the Welsh in Wales.
Fisher and Taylor (1940) in their blood group studies in
Scotland, concluded that the blood group gene frequencies in some
parts reflected some Scandinavian influence on the Scottish
population. They noted a general trend of some south to north rise
UNIVERSITY
OF I
BADAN LIBRARY
9
(a)
-fbcad chalrw- -* ■ vwtaMe region
long chairs
______ i/ /
bridgeshort chain
antigen*
(b)
ru mT-TLTUr u u i
T-TLTU
Fig. 4: Antigen-antibody reactions.Source: P.T. Marshall (1978, Fig. 84, p.̂ 196) .UNIV
ERSITY O
F IBADAN LI
BRARY
10in 'O' blood groups frequencies in England, while Scotland has a
higher 'O' blood group frequency.
Watkin (1952), showed the marked variations in the ABO
frequencies in rural Wales in relation to such geographical
features as the moorlands and coastal plains. The inhabitants of
the moorlands vary widely in their 'O' and 'A' gene frequencies
while their 'B' gene is consistently high.
Chalmers et al (1953) obtained a low 'B' gene frequency value
for the south-western Nigerians they sampled apparently because it
was based on Yoruba/Bini sample admixtures. Blumberg et al (1961)
found high 'B' gene frequency for the Yoruba to be 0.2815
Garlick (1962) prepared blood group maps for Africa with some
advice that they be treated with reserve, especially as he could
not take care of considerable local fluctuations, which size was
small and the error correspondingly large. He obtained 'O' blood
group percentiles for the Yoruba to be 70-75%.
Hardy (1962) in her survey of ABO blood groups of southern
Nigerians, showed that the ABO blood group gene frequencies of the
Yoruba significantly different from those of the Bini, Ibo,
Itsekiri, Urhobo and others, with a higher value of group 'B' which
diminished eastwards through the Bini to the Ibo.
Based on known historical accounts, she stated that the Yoruba
UNIVERSITY
OF I
BADAN LIBRARY
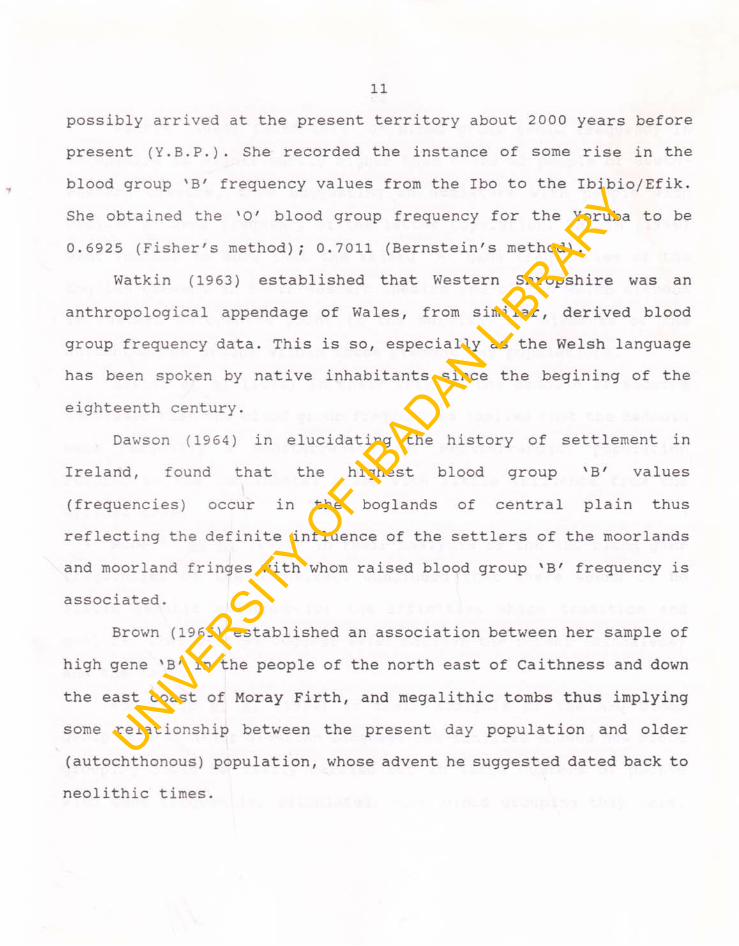
11possibly arrived at the present territory about 2000 years before
present (Y.B.P.). She recorded the instance of some rise in the
blood group 'B' frequency values from the Ibo to the Ibibio/Efik.
She obtained the '0' blood group frequency for the Yoruba to be
0.6925 (Fisher's method); 0.7011 (Bernstein's method).
Watkin (1963) established that Western Shropshire was an
anthropological appendage of Wales, from similar, derived blood
group frequency data. This is so, especially as the Welsh language
has been spoken by native inhabitants since the begining of the
eighteenth century.
Dawson (1964) in elucidating the history of settlement in
Ireland, found that the highest blood group 'B' values
(frequencies) occur in the boglands of central plain thus
reflecting the definite influence of the settlers of the moorlands
and moorland fringes with whom raised blood group 'B' frequency is
associated.
Brown (1965) established an association between her sample of
high gene 'B' in the people of the north east of Caithness and down
the east coast of Moray Firth, and megalithic tombs thus implying some relationship between the present day population and older
(autochthonous) population, whose advent he suggested dated back to
neolithic times.
UNIVERSITY
OF I
BADAN LIBRARY
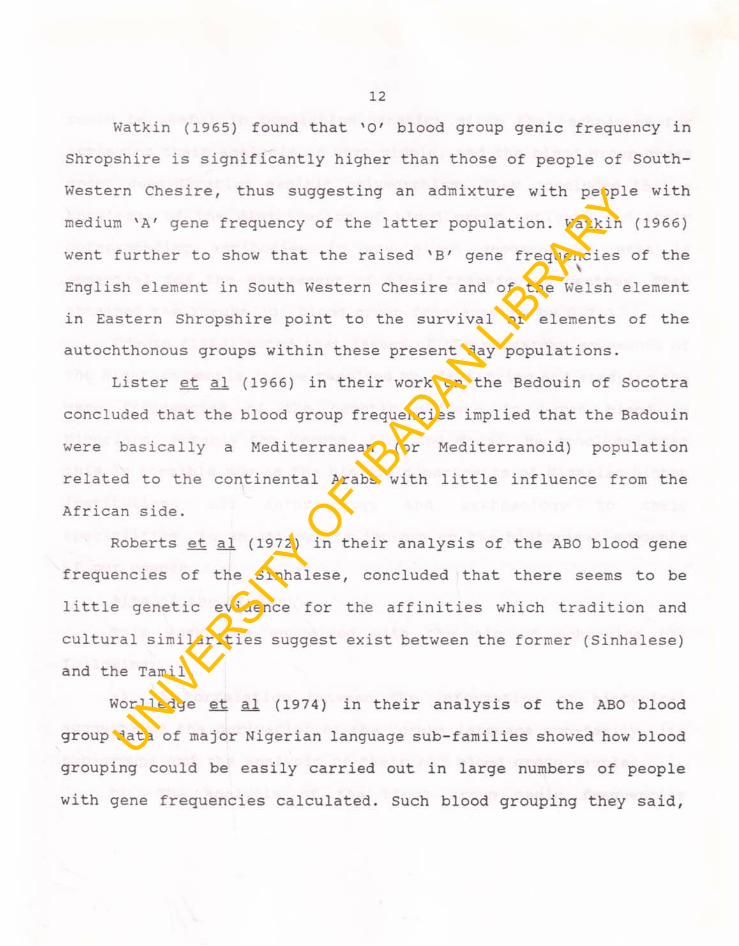
12Watkin (1965) found that 'O' blood group genic frequency in
Shropshire is significantly higher than those of people of South-
Western Chesire, thus suggesting an admixture with people with
medium 'A' gene frequency of the latter population. Watkin (1966)
went further to show that the raised 'B' gene frequencies of the
English element in South Western Chesire and of the Welsh element
in Eastern Shropshire point to the survival of elements of the
autochthonous groups within these present day populations.
Lister et a_l (1966) in their work on the Bedouin of Socotra
concluded that the blood group frequencies implied that the Badouin
were basically a Mediterranean (or Mediterranoid) population
related to the continental Arabs with little influence from the
African side.
Roberts et a_l (1972) in their analysis of the ABO blood gene
frequencies of the Sinhalese, concluded that there seems to be
little genetic evidence for the affinities which tradition and
cultural similarities suggest exist between the former (Sinhalese)
and the Tamil.
Worlledge et al (1974) in their analysis of the ABO blood
group data of major Nigerian language sub-families showed how blood
grouping could be easily carried out in large numbers of people
with gene frequencies calculated. Such blood grouping they said,
UNIVERSITY
OF I
BADAN LIBRARY
13
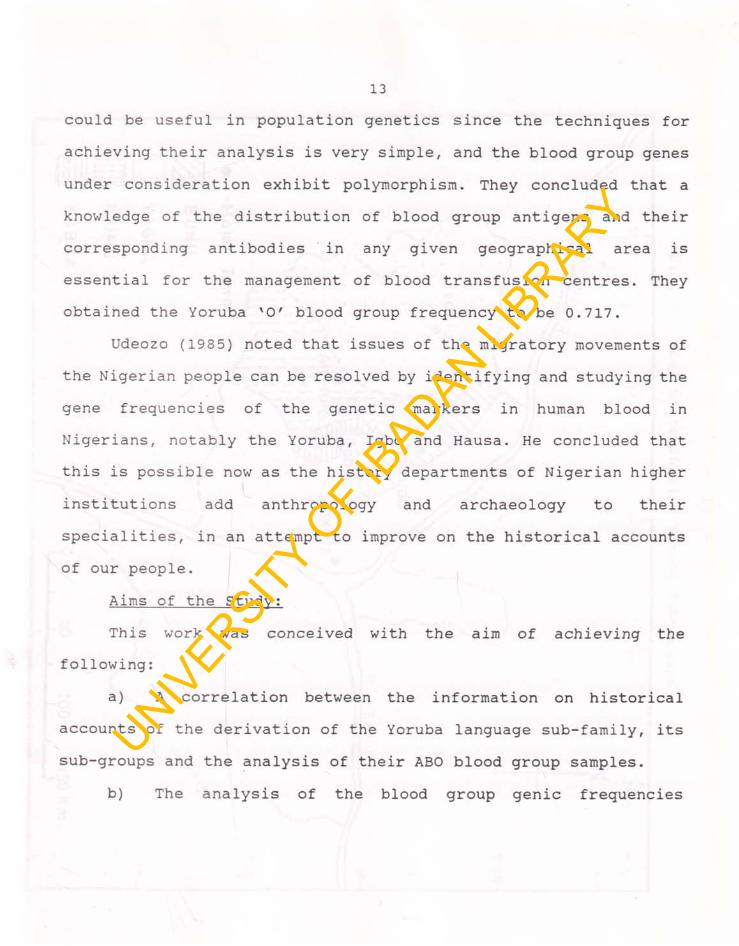
could be useful in population genetics since the techniques for
achieving their analysis is very simple, and the blood group genes
under consideration exhibit polymorphism. They concluded that a
knowledge of the distribution of blood group antigens and their
corresponding antibodies in any given geographical area is
essential for the management of blood transfusion centres. They
obtained the Yoruba 'O' blood group frequency to be 0.717.
Udeozo (1985) noted that issues of the migratory movements of
the Nigerian people can be resolved by identifying and studying the
gene frequencies of the genetic markers in human blood in
Nigerians, notably the Yoruba, Igbo and Hausa. He concluded that
this is possible now as the history departments of Nigerian higher
institutions add anthropology and archaeology to their
specialities, in an attempt to improve on the historical accounts
of our people.
Aims of the Study;
This work was conceived with the aim of achieving the
following:
a) A correlation between the information on historical
accounts of the derivation of the Yoruba language sub-family, its
sub-groups and the analysis of their ABO blood group samples.
b) The analysis of the blood group genic frequencies
UNIVERSITY
OF I
BADAN LIBRARY
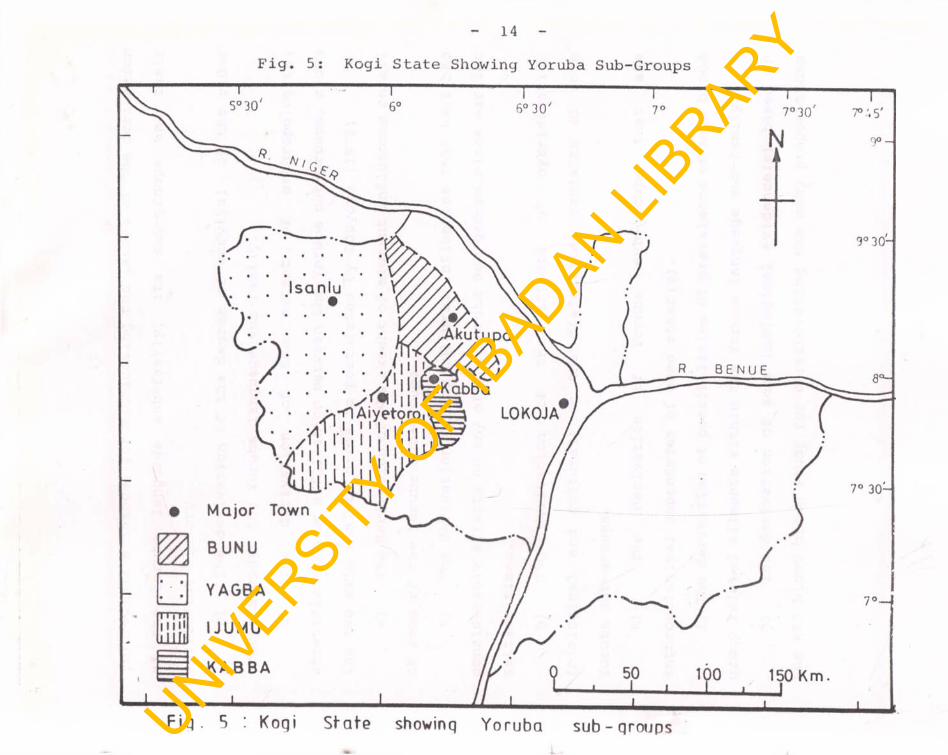
14
Fig. 5: Kogi State Showing Yoruba Sub-Groups
UNIVERSITY
OF I
BADAN LIBRARY
15(biological evidence) for elucidating the issues of the derivation
of the Yoruba language sub-family, its sub-groups and their
settlement history.
c) The derivation of the degree of survival of the older
groups amongst the Yoruba language sub-family.
d) The derivation of the extent of anthropological
stratification or affiliation between the Yoruba sub-groups, along
the two main dialect areas as postulated by Oduyoye (1972).
e) The derivation of the extent of migrant influences on all
or some of the Yoruba sub-groups.
f) The derivation of any cultural influences that have had
considerable effects on any of the Yoruba sub-groups since earlier\
settler times.
g) The derivation of the effects of hybridization
(biological and cultural) on the dialectical variants of some
Yoruba sub-groups.
h) The derivation of Yoruba sub-groups that are
anthropological appendages of some other(s).
i) The derivation of possibilities of prevalence of some blood
group related ailments within the Yoruba language sub-family.
j) The derivation of some biological evidence(s) based on
the ABO blood group study for corroborating the many propositions
UNIVERSITY
OF I
BADAN LIBRARY
16
Fig. 6: Kwara State Showing Yoruba Sub-Groups
UNIVERSITY
OF I
BADAN LIBRARY
17
of some anthropology related studies, particularly linguistics,
archaeology, palynology, ethonography and oral traditions.
k) The derivation of any variations within the Yoruba
language sub-family against a background of geographical features
of some of the sub-groups's territories.
Scope of Study
This work is the result of field and laboratory sampling of
the blood of 75,000 individuals of these 25 Yoruba sub-groups:
Akoko, Akure, Awori, Bunu, Egba, Egbado, Ekiti, Eko, Ibarapa,
Ibolo, Ife, Igbomina, Ijebu, Ijesa, Ijumu, Ikale, Ilaje, Ilorin,
Kabba, Ondo, Owo, Owu, Oyo, Remo and Yagba.
The work was carried out between April, 1988 and October,
1990; then between February and July, 1991. The samples were
obtained from donors in the major settlements of each sub-group
and those of donors and patients in some of the hospitals
(particularly the blood banks) in the sub-groups' territories
(Fig 2.; Table 1).
The blood samples of 3,000 individuals were considered for
each sub-group (made up of 600 from field donors and 2,400 from
blood bank samples) taken as six equal batches of 500 each to
obtain replicates which assured adequate representation required
for bio-statistical analysis (table 10; appendices 5 - 6) . The co-
UNIVERSITY
OF I
BADAN LIBRARY
18
Fig. 7: Lagos State Showing Yoruba Sub-Groups
~T—3°2° A 5' 3°157 3°30'
^ AWORI
M EKJE B U
0
~l---3° AS'
0L.
2,° 4° 15'
20_L_ 40 Km
_i
OGUN S T A T E 6° AS/ i
Fig. 7 : Lagos state showing Yoruba sub-groupsUNIVERSITY
OF I
BADAN LIBRARY
19
operation and assistance of blood banks (or blood transfusion
centres) of hospitals in the major towns of the different sub
groups were relied on for convenience of analysis and of obtaining
the blood samples of attending donors/patients.
The sub-groups of the Yoruba language sub-family sampled in
this study were identified based on similar anthropological factors
such as language, history, territory, cultural and economic relationships as proposed by Lewis (1978) who reflects a historical
approach to the study of peoples, thus suggesting that the sub
groups of the Yoruba considered are ethnic groups.
However, Barth (1969) in delimiting 'ethnic' boundaries is
rather more pragmatic in his own approach. He explains that
boundaries which are maintained by a limited set of cultural values
are useful for identifying 'ethnic' groups. The persistence of such
units over time, he found, depend on the persistence of some
cultural differentiae.
Language has been shown within the larger language
relationships to be a major discriminant in identifying 'ethnic'
groups.
Since there could be limitations in using language as
discriminant especially as a factor of common descent, biological
correlation becomes inevitably necessary. The scope of this study
UNIVERSITY
OF I
BADAN LIBRARY
20
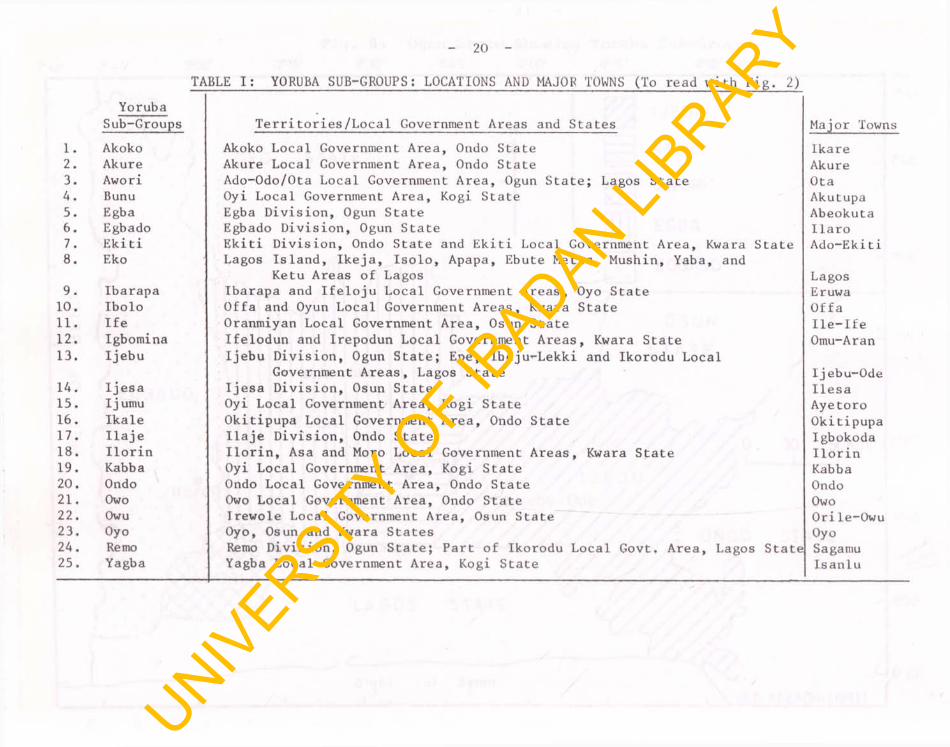
TABLE I; YORUBA SUB-GROUPS: LOCATIONS AND MAJOR TOWNS (To read with Fig. 2)Yoruba
Sub-Groups Territories/Local Government Areas and States Major Towns1. Akoko Akoko Local Government Area, Ondo State lkare2. Akure Akure Local Government Area, Ondo State Akure3. Awori Ado-Odo/Ota Local Government Area, Ogun State; Lagos State Ota4. Bunu Oyi Local Government Area, Kogi State Akutupa5. Egba Egba Division, Ogun State Abeokuta6. Egbado Egbado Division, Ogun State Haro7. Ekiti Ekiti Division, Ondo State and Ekiti Local Government Area, Kwara State Ado-Eki ti8. Eko Lagos Island, Ikeja, Isolo, Apapa, Ebute Metta, Mushin, Yaba, and
Ketu Areas of Lagos Lagos9. Ibarapa Ibarapa and Ifeloju Local Government Areas, Oyo State Eruwa10. Ibolo Offa and Oyun Local Government Areas, Kwara State Offa11. Ife Oranmiyan Local Government Area, Osun State Ile-Ife12. Igbomina Ifelodun and Irepodun Local Government Areas, Kwara State Omu-Aran13. Ijebu Ijebu Division, Ogun State; Epe, Ibeju-Lekki and Ikorodu Local
Government Areas, Lagos State Ijebu-Ode14. Ijesa Ijesa Division, Osun State Ilesa15. Ijumu Oyi Local Government Area, Kogi State Ayetoro16. Ikale Okitipupa Local Government Area, Ondo State Okitipupa17. Ilaje Ilaje Division, Ondo State Igbokoda18. Ilorin Ilorin, Asa and Moro Local Government Areas, Kwara State Ilorin19. Kabba Oyi Local Government Area, Kogi State Kabba20. Ondo Ondo Local Government Area, Ondo State Ondo21. Owo Owo Local Government Area, Ondo State Owo22. Owu Irewole Local Government Area, Osun State Orile-Owu23. Oyo Oyo, Osun and Kwara States Oyo24. Remo Remo Division, Ogun State; Part of Ikorodu Local Govt, Area, Lagos State Sagamu25. Yagba Yagba Local Government Area, Kogi State Isanlu
UNIVERSITY
OF I
BADAN LIBRARY
REP
.
21
2%0' TU5' TOC/Fig. 8: Ogun State Showing Yoruba Sub-Groups
3° 30' 3°*. 5' A0 0 0' 4° 15 '
0 Y 0 STATEi
--------- 1--- ,-------------- -
IJEBU
REMO
AWORI
EGBA
• EGBADO
OS U N
/ S T A T E
30 60Km.]---- j
B i g h t o f B e n i nIJ--------l
T 30
7°15
7° 00 '
6PA5'
6°30
6° 20'
Fig. 8 : Ogun shahe showing Yoruba sub-groupsUNIVERSITY
OF I
BADAN LIBRARY
22
thus, includes an insight into the historical relationship of the
Yoruba sub-groups as perceived today compared to the results of
their respective ABO grouping data.
The possibilities for the derivation of genetical data (after
Cavalli-Sforza's, 1966 style) particularly the genealogy of the
Yoruba, from this work is advisable for future work since this is
beyond the purview of the present study.
The scope of this study, therefore, entails the following:
i) Identification of the 25 Yoruba sub-groups and their
respective individuals within the area designated by
anthropologists and historians as Yorubaland (Fig. 1).
ii) The analysis of the ABO blood group samples of 3,000
individual donors from each Yoruba sub-group.
iii) The derivation of the distribution, percentiles and gene
frequencies of the four ABO blood groups for the 3,000 samples
obtained for each sub-group.
iv) The historical background of the Yoruba in general and
each sub-group in particular, with literature review of the ABO
blood group.
v) Results (with biostatistical analysis) and discussion.
vi) Summary and Conclusion.UNIVERSITY
OF I
BADAN LIBRARY
UNIVERSITY
OF I
BADAN LIBRARY
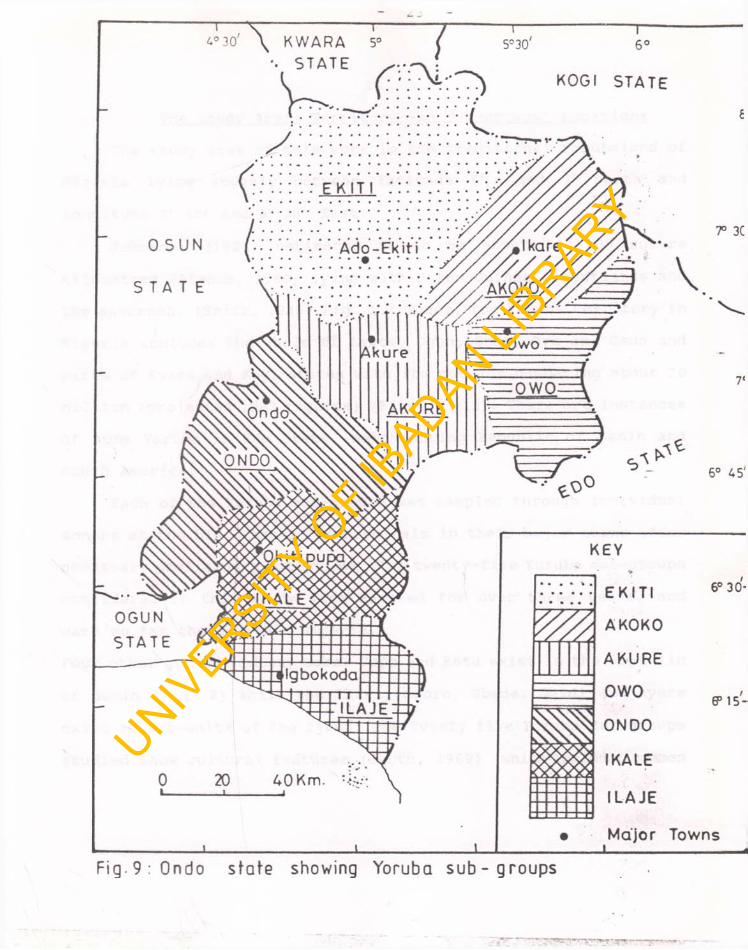
24
The Study Area: Territory and Sub-groups' Locations
The study area of this work is the traditional Yorubaland of
Nigeria lying roughly between latitude 6° and 9° North and
longitude 2° 30' and 6° 30' East.
Johnson, (1921) estimated it to be about 181,300 square
kilometres (Atanda, 1980) lying within the Guinea forestlands and
the savannah. (Smith, 1988; Fig. 1.) Today, the Yoruba territory in
Nigeria includes the whole of Lagos, Ogun, Ondo, Oyo and Osun and
parts of Kwara and Kogi states with its peoples numbering about 20
million (projected 1963 figures) (Figs. 5 -11). There are instances
of some Yoruba in Edo State, neighbouring Republic of Benin and
South America.
Each of the Yoruba sub-groups was sampled through individual
donors at the blood banks of hospitals in their major towns after
necessary preliminary interviews. The twenty-five Yoruba sub-groups
considered in this study were sampled for over three years, and
were so far those within Nigeria.
Four other groups: Idasa, Sabe, Popo and Ketu exist in the Republic
of Benin (Fig. 2) while the Ikiri, Oworo, Gbede. Ogidi and Ayere
exist as sub-units of the Ijumu. The twenty five Yoruba sub-groups
studied show cultural features (Barth, 1969) which include: commonUNIVERSITY
OF I
BADAN LIBRARY
25language (or dialect), common territory, common descent, common
economic, cultural and administrative ties (Lewis, 1978). These
twenty five Yoruba sub-groups are shown with their major towns
(Figs. 5-11) and locations within the entire territory (Table 1;
Fig. 2) .
UNIVERSITY
OF I
BADAN LIBRARY
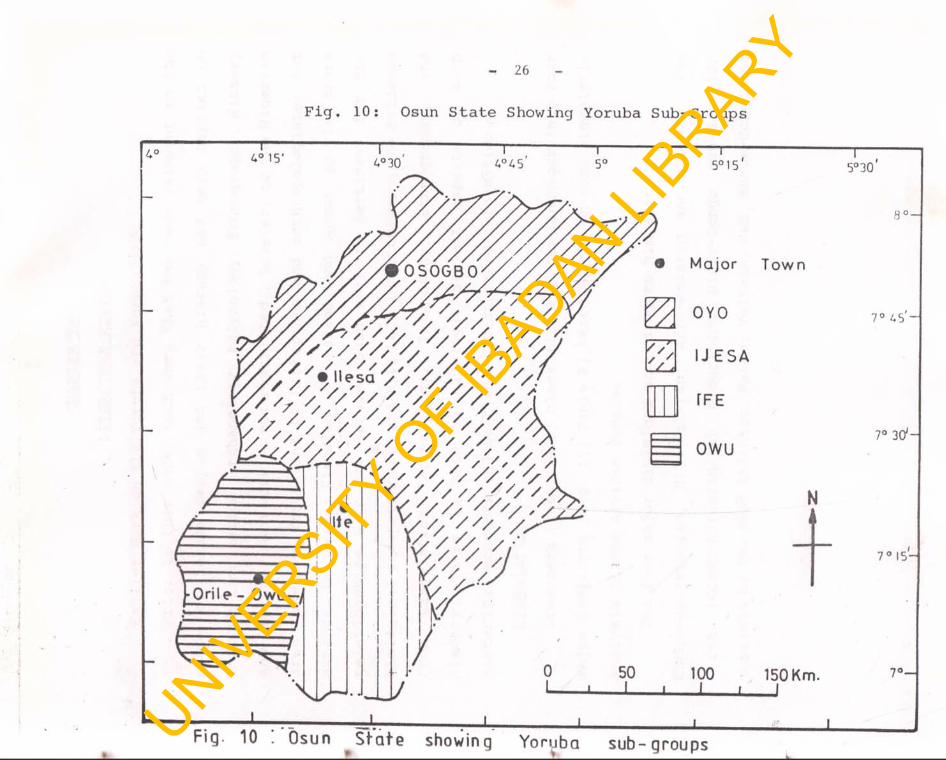
26
Fig. 10: Osun State Showing Yoruba Sub-Groups
UNIVERSITY
OF I
BADAN LIBRARY
CHAPTER TWO
LITERATURE REVIEW
Earlier Work on the Yoruba and Yorubaland:
Prior to this work, much work that has been relevant to the
study of Yoruba people and their history had been carried on
through Linguistics, Archaoelogy, Palynology, Ethnography, History
and Biology. Such work is not restricted , however, to the Nigerian
area taken as Yorubaland by historians and anthropologists; but
extends to areas flanking .Daland and whose people share
relationships with the Yoruba. Such work is pertinent for the
biological reconstruction and will help in buttressing the evidence
from Linguistics, Archaeology, Palynology, Ethnography, and
History. There is need to highlight salient aspects of such
historical accounts and settlement background information.
Linguistics;
Greenberg (1963; 1964) classified African languages into four
major divisions (Fig. 13; Table 2) based mainly on some linguistic
analysis of the African people.
The four major divisions according to him are:
Congc-Kordofanian, Nilo-Saharan, Afro-Asiatic and Khoisan. The
f rst (Congo-Kordofanian) comprising Niger-Congo sub-division
consists of the West Atlantic, Mande, Voltaic, Kwa, Benue-Congo and
27
UNIVERSITY
OF I
BADAN LIBRARY
28
Adamawa-Eastern families. This sub-division covers West Africa and
parts of Central Africa.
Gregerson (1977), conscious of some similarities between the
Nilo-Saharan and the Congo-Kordofanian language divisions as
classified by Greenberg (1963), has suggested their merger under
the name Kongo-Saharan.
Andah (1987) has also observed that the two linguistic divisions,
Nilo-Saharan and Congo Kordofanian may have been related.
Andah (1987) suggested that the proto-forms of the languages within
the Niger-Congo sub-division have been spoken for a very long time
by people of Negroid stock living in various parts of West Africa.
Lexicostatistics and glotto-chronology, he said, take these back to
at least, terminal Pleistocene times. He noted that the Chadic
(Hausa, Kanuri, Bauchi) languages spoken today are in contrast,
relatively recent arrivals there.
Among the Kwa-speaking people of the Niger-Congo language sub
division are the Akan, Yoruba, Edo, Igbo, Nupe, Igala and Bassa.
Armstrong (1964) maintains that it is not yet possible to
translate the relationships between languages such as Fula and
other Kwa languages including Twi, Yoruba, Igbo, and then the
Bantu, into a chronological scheme.
He suggested a separation time of about 2000 years between the
UNIVERSITY
OF I
BADAN LIBRARY
UNIVERSITY
OF I
BADAN LIBRARY
- 30
- Ri,g.12: Yorubaland showing two major dialect areas ^ A f t r r O r l t i y o y r ) t
. ■
UNIVERSITY
OF I
BADAN LIBRARY
31
Oyo Yoruba and the Igala on the basis of a comparison of their
basic vocabulary (Andah, 1987).
Andah (1987) has observed that it is not realy possible to
study Yoruba cultural history meaningfully without reference to
those of related neighbours like the Nupe, Bariba, Ebira and Igala.
He noted that the lower Niger region, further south, was the seat
for the development of several civilizations by Kwa speaking people
as were the kingdoms and empires of the Yoruba, Aja and Edo
speaking people which dates back to at least, 11th and 13th century
respectively.
The Yoruba constitute a major language sub-family with their
homeland in the south-western part of Nigeria, occupying the whole\
of Lagos, Ogun Ondo, Oyo, Osun and parts of Kwara and Kogi states,
(Fig. 2). Some Yoruba presence is known in the Republic of Benin;
mainly as the Idassa, Ketu, Popo and Sabe. They are also found in
some parts of Edo State. A good number of the Yoruba are found in
the West Indies and South America (Atanda, 1980) owning largely to
their dispersal during the slave trade. Through the use of
glottochronology, linguists have been able to assert that Yoruba,
Edo and Igbo began to evolve as separate languages from about four
thousand years ago; while Yoruba, had evolved as a distinct
language, at least about two or three thousand years ago. It
UNIVERSITY
OF I
BADAN LIBRARY
CLASSIFICATION OF AFRICAN LANGUAGES
Congo-Kordofanian
Nilo-Saharan
Afroasiatic
Khoisan
(After Greenberg, 1963)I A Niger-Congo I A 1 West-Atlantic
I A 2 MandeI A 3 Voltanic1A A KwaI A 5 Benue-CongoI A 6 Adamawa-Eas tern
I B KordofanianII A SonghaiII B SaharanII C MahanII D FurII E Chari-Nile II E 1 Eastern Sudanic
II E 2 Central Sudanicn E 3 Bertaii E A Kunama
II F RomanIII A SemiticIII B EgyptianIII C BerberIII D Cushitic h i D 1 Northern Cushitic
h i D 2 Central Cushitich i D 3 Eastern Cushitich i D A Western Cushitich i D 5 Southern Cushitic
III E ChadIV A South African IV A 1 Nor them
IV A 2 CentralIV A 3 Southern
IV B SandaweIV C Hadza
UNIVERSITY
OF I
BADAN LIBRARY
33
Fig. 1 3 : Linguistic map of Africa (After Greenberg)
UNIVERSITY
OF I
BADAN LIBRARY
34
follows that Yoruba speaking people had been in West Africa before
the advent of Oduduwa (Atanda, 1980) As Horton (1970:71) precisely
puts it:
A f f i n i t i e s o f t h e Y o r u b a l a n g u a g e a r e o v e r w h e l m i n g w i t h t h e l a n g u a g e s o f t h e n e i g h b o u r i n g West A f r i c a n p e o p l e r a t h e r t h a t w i t h t h e l a n g u a g e s o f a n y o f t h e p e o p l e o f t h e M i d d l e E a s t .
Smith (1988) suggests also that the settlements of North-West
Yoruba, are more recent than those of the North-East Yoruba whose
dialects he believes represents an earlier stage of the Proto-
Yoruba. He (Smith, 1988:16) summarised thus:
The l a n g u a g e s most s i m i l a r t o Y o r u b a and p r e s u m a b l y st em m ing fro m P r o t o - Y o r u b a a r e c o n c e n t r a t e d i n N o r t h - E a s t Y o r u b a l a n d and i t s a d j a c e n t a r e a s . . . m i g r a t i o n s r e c o r d e d i n Y o r u b a t r a d i t i o n s t o o k p l a c e o v e r o n l y r e l a t i v e l y s h o r t d i s t a n c e s w i t h i n t h a t p a r t o f West A f r i c a l y i n g West o f t h e N i g e r - B e n u e c o n f l u e n c e ,I f e was a d i s p e r s a l c e n t r e f o r an i m p o r t a n t s e c t i o n o f t h e m i g r a n t s . . . t h e i n f l u e n c e o f I f e on t h e o t h e r d i a l e c t s o f Y o r u b a seems t o h a v e b een s m a l l .
Whereas, Tamuno (1965) listed the Yoruba as one of the peoples
of the Niger-Benue confluence civilization, Ryder (1984) infers
from the dialect analysis of the Yoruba language sub-family that
they expanded from the forest into the savanna. In his view, there
would seem to be some contradiction between linguistic analysis andUNIVERSITY
OF I
BADAN LIBRARY
35
historical tradition; contradictions attributed by some to be due
to movement of secondary population from the forest to the savanna
and vice versa.
Oduyoye (1972) had partitioned the Yoruba language sub-family
into two dialect groups: the "i" and "u" based on a
shiboleth/siboleth dialect distinction. He thus, divided Yorubaland
into two dialects areas (Fig.12). Adetugbo (1973) identified three
main Yoruba dialect groups. Two of these which he believed were of
greater antiquity, and hence of older settlement; are the central
group (comprising Ife, Ilesha and Ekiti areas) and the South-
Eastern group (the Ondo, Owo, Ikale and Ilaje and Ijebu areas.)
According to him, all the areas of these listed Yoruba sub
groups fell entirely within the forest zone in the twelfth century.
The third group of dialects embraces Oyo, Osun, Ibadan, and
the northern Egba area: which he said, were historically associated
with the Oyo empire and shows fewer traces of antiquity than the
other two (Table 1; Fig.2).
Archaeology:
Research in Archaeology over the years has provided evidence
regarding the early history of populations of early Yorubaland and
areas westwards and eastwards and eastwards of it (Table 3).
To the West of Yorubaland in the Akan culture area, we have
UNIVERSITY
OF I
BADAN LIBRARY
36
information ranging from identified industrial complex at Kintampo
dated to 915 + 290 BC. (Davies, 1964) to late Stone Age levels at
Bosumpra predating 3420 B.C. (Smith, 1975).
In the Edo and Igbo speaking areas, eastwards of Yorubaland, it
would seem that the early city of Benin was in existence by 1305 +
105 A.D. (Connah, 1972) while at Igbo-Ukwu, there was already in
existence, a sophisticated Bronze-casting tradition in the 10th
century (900 A.D.), Thurstan Shaw (1967). A late Stone Age complex
dated between 5000-3000 Y.B.P. was reported for Afikpo by Andah and
Anozie (1980): while at Ugwelle-Uturu, earlier Stone Age materials
have been identified as pre-dating 11,000 Y.B.P., although precise
dates are yet to be obtained (Anozie et aJL. , 1978) . Within
Yorubaland, skeletal remains have been dated to 11, 000 Y.B.P. at
Iwo-Eleru (Thursan Shaw and Daniels, 1984). At Mejiro cave, some
late Stone Age artefact are dated to 5000 Y.B.P. (Willet, 1960),
while excavations at the ancient settlement of Old Oyo indicate the
existence of a town settlement at around 810 +80 A.D. (Agbaje
Williams, 1981) and levels containing potsherds have been dated to
1,100 + 110 A.D. (Diogun pottery); 1300 + 80 A.D (Mejiro Pottery)
(Soper and Darling, 1980). Charcoal dates of +560 and 980 A.D. were
obtained from a pre-town occupation for Ile-Ife, while dates of
two potsherd floors at Ita Yemoo have been dated to 960 A.D. and
UNIVERSITY
OF I
BADAN LIBRARY
X A d LiE j
SUMMARY OF ARCHAEOLOGICAL DATES OF SITES RELATED TO YORUBALAND
Archaeological Site(s)’ or Sample(s) Dates Author(s) Date (s)
1. Kintampo Davies (1964) 915 + 290 B.C.2. Bosumpra Smith (1975) Before 3420 B.C.3. Benin Connah (1972) 1305 + 105 A.D.4. Igbo-Ukwu Shaw (1967) 900 A.D.5. Afikpo Andah & Anozie (1980) 5000 - 3000 Y.B.P.6. Ugwuele-Uturu Anozie et al (1978) Before 11,000 Y.B.P.7. Iwo-Eleru Shaw & Daniels (1984) 11,000 Y.B.P.8. Mejiro Cave Willet (1960) 5000 Y.B.P.9. Old Oyo Agbaje-Williams (1981) 810 + 80 A.D.10. Diogun Pottery (Old Oyo) Soper & Darling (1980) 1100 + 110 A.D.11. Mejiro Pottery (Old Oyo) Soper & Darling (1980) 1300 + 80 A.D.12. Ile-Ife (Charcoal) A.F.C. Ryder (1984) + 560; + 980 A.D.13. Ile-Ife (Ita Yemoo) A.F.C. Ryder (1984) 960; 1060 A.D.14. Iffe-Ijumu (Kernel) Oyelaran (1991) 2210 + 80 A.D.15. Niger Delta Cores Sowunmi (1981) 2800 Y.B.P.
UNIVERSITY
OF I
BADAN LIBRARY
38
1060 A .D . (Ryder, 1984).
In North-East Yorubaland, an area referred to by Atanda (1980)
and Smith (1988) as the home of the 'Proto Yoruba' Oyelaran (1991)
obtained radio-carbon dates of 2210 + 80 Y.B.P. for palm kernel
fragments from Itaakpa. (Table 3)
Not much can be made of this until the associated pottery is
studied in detail and we are in a position to ascertain what, if
any affinities these have with known Yoruba traditions.
Pollen analysis of some Niger-Delta cores (Sowunmi, 1981)
suggest that by 2800 Y.B.P. there was deforestation in Southern
Nigeria probably as a result of farming activities. The rapid and
significant increase in Elaeis guineensis (oil palm) pollen
appears to corroborate this. (Table 3)
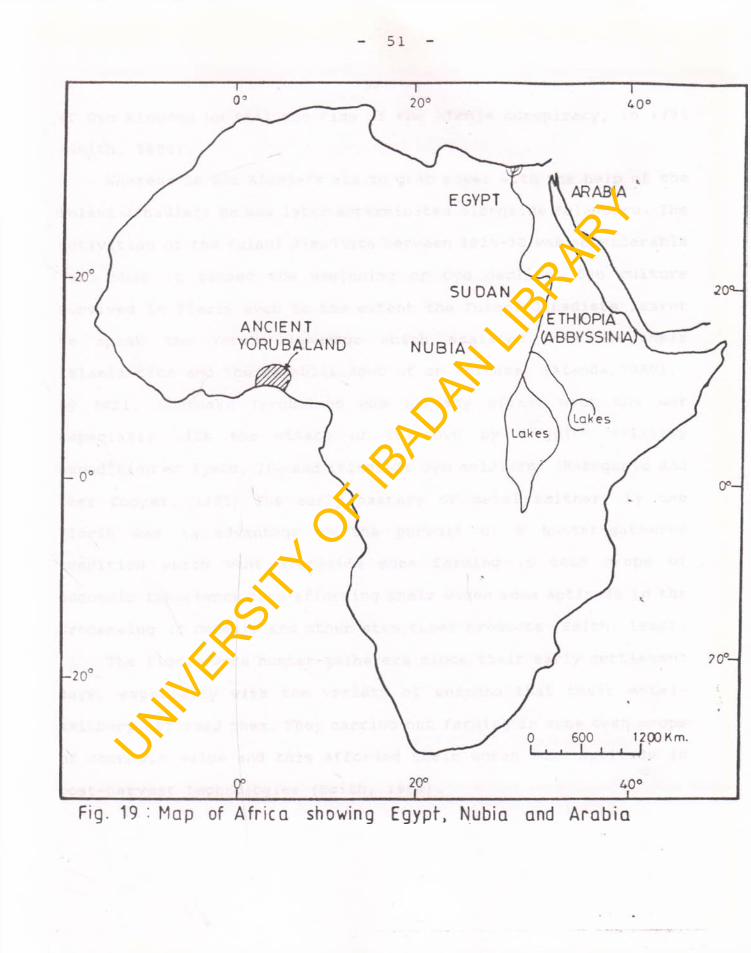
HistoryMost early historical accounts of the Yoruba concerning pre-
Ife origins tend to be distinguished by the fact that they claim
the North Eastern parts of Africa as the original home of the
Yoruba. These parts include Egypt, Arabia, Nubia, Axum, Tigre,
Punt, Sudan and the Quadai (or Waddai) (Fig. 19).
The tendency to derive the Yoruba people from the East has
usually been based on supposed cultural similarities between the
Yoruba and the people of Egypt. Examples of such are the works of
UNIVERSITY
OF I
BADAN LIBRARY
39Johnson (1921) and Lucas (1948). This notion of Egyptian derivation
has remarkable similarities with the historical accounts of some
other West African groups (Aderibigbe, 1965). It is generally
suggested that Arab-inspired military campaigns, thought to have
assumed serious proportions between A.D. 632-1099, at the death of
prophet Mohammed (Gibney, 1978; Hirsch 1993) was the cause of
southerly migrations that could have given rise to movements into
areas south of the Sahara.
However, trade routes into Africa were said to have emerged
between 1500-1200 B.C. once the Arab domesticated the dromedary
camel (Gibney, 1978).
Smith (1988) believes that the Arab conquest of North Africa
in the seventh century might have resulted in movements which
eventually completed the assimilation of some people by the Yoruba
in their present homeland.
According to Aderibigbe (1965): "there is no longer the old
tendency to accept the idea of Yoruba migration from Egypt without
question." It is now generally agreed that, in actual fact, there
have been no systematic attempts to derive genuine migrations for
the Yoruba or other language sub-families. The idea of migration
from the East is to be thus, approached cautiously. The basic
concepts of rules for studying migratory movements based on
•>9
UNIVERSITY
OF I
BADAN LIBRARY
40archaeological evidence have never been employed. There is there
fore no basis of cultural facts to support the claims of such
migrations. Islamic and Biblical affiliations are being used to
fabricate history; a manner of "mythologizing history".
It is reasonable from the mythological historical accounts
associating the Yoruba with peoples of the middle east of Africa
to conclude that these are mere speculations! Ile-Ife represents
the earliest identified stage in the development of Yoruba culture,
which most probably took place towards the end of the first
millennium, 1000 A. D . Ife is usually thought to be the first
settlement of the Yoruba while other towns were formed by the
different sub-groups that migrated northwards or southwards,
absorbing or driving away the original settlers (Lucas, 1948).
It was from this base that the Yoruba extended their sway over
the aboriginal inhabitants called the Ugbo (Atanda,1980) about whom
little is known, creating other settlements as they advanced
southwards (Aderibigbe, 1965).
From the stone, bronze and iron works as well as the
remarkable terracottas retrieved from archaeological and historical
contexts, it is clear that the Yoruba attained a high level of
culture at Ife.
Ife was said to have been listed by Herodotus (484 - 424 B.C.)
UNIVERSITY
OF I
BADAN LIBRARY
41
UNIVERSITY
OF I
BADAN LIBRARY
42as one of the five cities that had existed between 3000 to 1000
B.C. (Fabunmi, 1985). The next set of immigrants to reach Ile-Ife
was led by Oduduwa. Oduduwa met Agbomiregun at Ile-Ife (Atanda,
1980). Thus, Oduduwa did not belong to the earliest known
generation in Yoruba history.
According to oral traditions, the first group of the Yoruba to
reach Ile-Ife came under Iwase, during the reign of the Esumare of
Ife, Oba Erinrin (I.D.A., 1991) Horton (1979:74) summarisses the
historical role of Ife thus:
I f e was t h e f i r s t g r e a t Y o r u b a K in g d o m and t h e s o u r c e o f t h e r o y a l d y n a s t i e s o f t h e o t h e r m a j o r s t a t e s o f t h e r e g i o n .
Yoruba History:i
Since Yoruba history had been based essentially on Ife as a
source of derivation, there is the need to relate Ife with the
history of each sub-group considered in this study in order to
afford a genuine basis for the comparison of the biological
evidence with the historical and cultural. The history of the
Yoruba sub-groups as highlighted in this study will be of great
value in determining to what extent each reflects the Ife
relationship. There is also the possibility of assessing the level
of presence of the aboriginal (autochthonous) populations by
studying the history of the Yoruba sub-groups. This is why it has
UNIVERSITY
OF I
BADAN LIBRARY
43
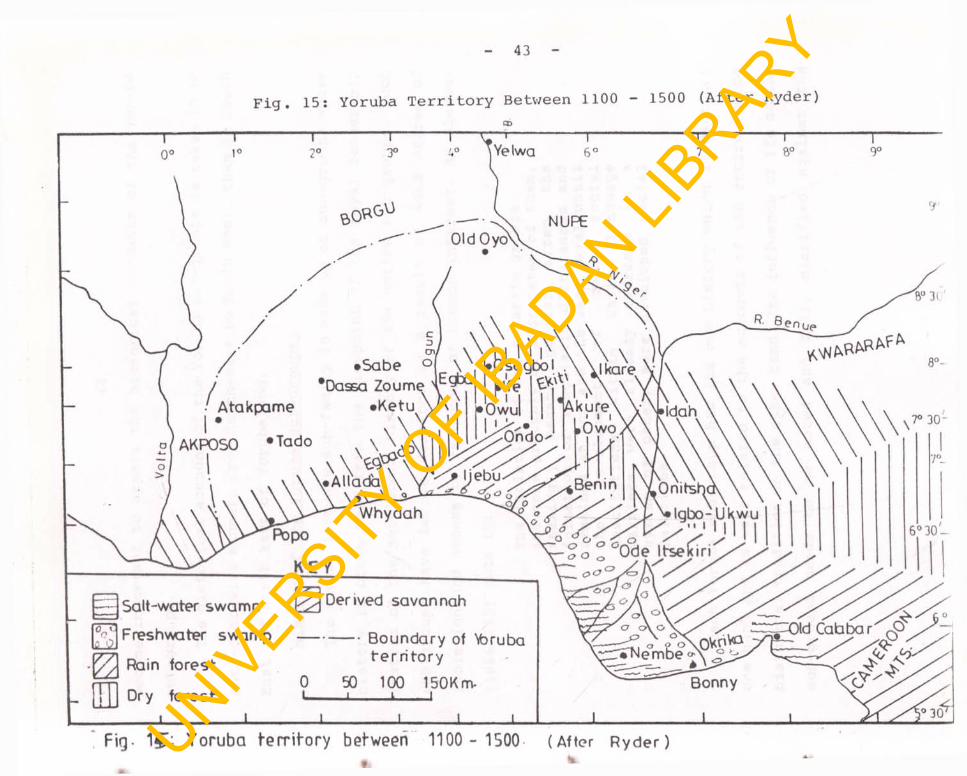
Fig. 15: Yoruba Territory Between 1100 - 1500 (After Ryder)CD
UNIVERSITY
OF I
BADAN LIBRARY
44become important to assess the historical accounts of the Yoruba sub-groups.
The historical account of the Yoruba sub-groups is taken in an
anti-clockwise manner, from North-West to South West, then to South
East and North East of Yorubaland.
History of the Yoruba Sub-Groups:
The Yoruba language sub-family is made up of sub-groups whose
history is often told from the viewpoint of the royal leadership
instead of the settlement history of the entire sub-groups. Such
sub-groups have become distinct as a result of some degree of
isolation and access to resources of common interest. As Alexeev
(1986:265) puts it:
The i s o l a t i o n o f t h e s e p a r a t e g r o u p s and more p r o b a b l y o f a g g r e g a t e s o f t h em , s e e m i n g l y became g r e a t e r a f t e r t h e f o r m a t i o n o f l i n g u i s t i c d i f f e r e n c e s and r e m a i n e d a t one and t h e same l e v e l u n t i l t h e d e v e l o p m e n t o f many s o c i a l i n s t i t u t i o n s w i t h i n w h i c h l a n g u a g e b a r r i e r s were a l r e a d y overcom e i n a s y s t e m o f o t h e r , more d e v e l o p e d s o c i a l r e l a t i o n s .
Each Yoruba sub-group has its own history which is distinct
one hand and as well related to the accounts of the entire Yoruba
historical tradition on the other hand. The influence of Ife on the
sub-groups needs to be noted and fully clarified against the
UNIVERSITY
OF I
BADAN LIBRARY
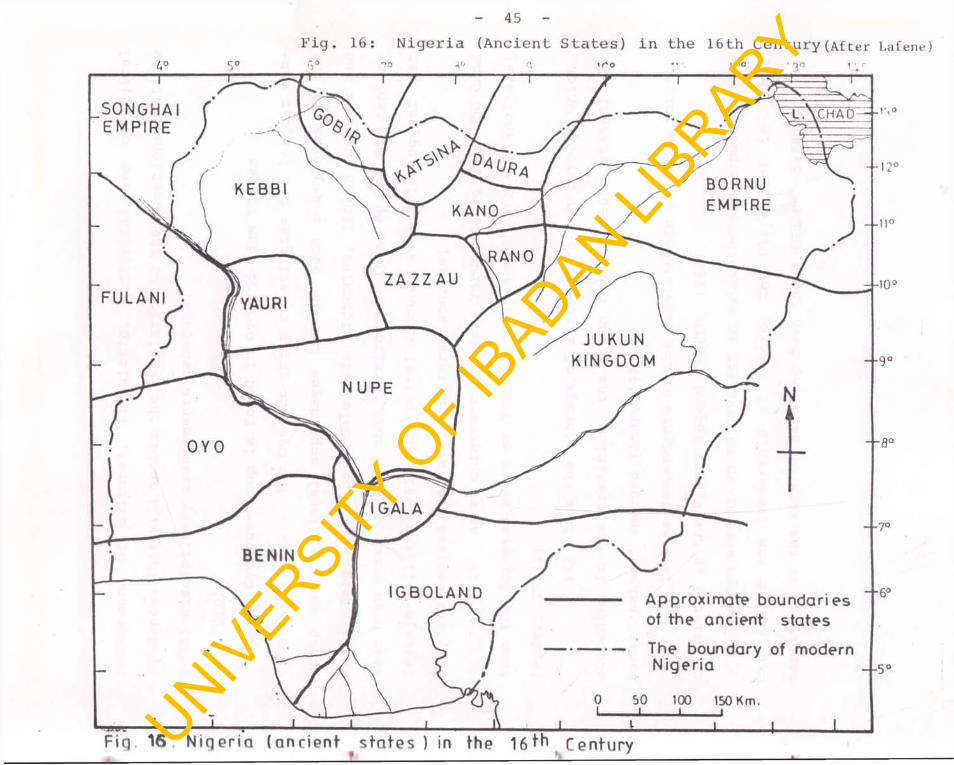
45Fig. 16: Nigeria (Ancient States) in the 16th Century (After Lafene)
UNIVERSITY
OF I
BADAN LIBRARY
46background of cultural, linguistic, historical and biological
evidence. This will enable the resolution of the questions that the
multi-disciplinary assessments generate.
Ovo:
The Oyo sub-group is found in Oyo and Osun States
(Fig. 10 and 11). The Oyo sub-group constitutes the largest sub
group whose cultural appendages include such sub-groups as the
Awori, Egba , Ibarapa, Ibolo, Ife, Igbomina, Ilorin and Owu and
have been known to be in this territory at least by the 8th century
(Agbaje-Williams,1981). Historical accounts available suggest that
they are derived from at least three sources:
i) as an outgrowth of older Yoruba sub-groups who came
from the forested areas of Yorubaland (based on dialect analysis)
(Ryder, 1984) ;ii) from the lineage of Karbogari's son through which,
according to one tradition, the seven bastard Hausa states: the
banza 'bakwai' emerged (Adamu,1984);
iii) as descendants of the same lineage with the Borgana
as related in the Kistra legend (Smith, 1988)
The Oyo were known to have met an autochthonous population at
Oko (under the leadership of Egboro, the Oloyokoro) in that
territory at the time of settling down there (Smith, 1988).
UNIVERSITY
OF I
BADAN LIBRARY
47
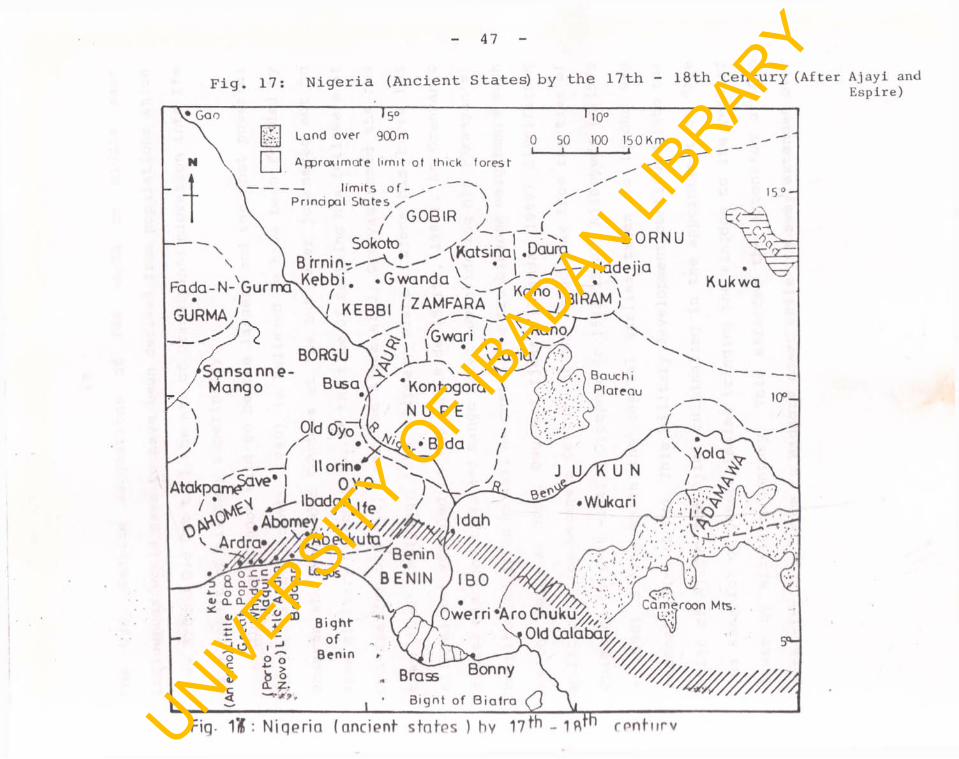
Fig. 17: Nigeria (Ancient States) by the 17th - 18th Century (After
* 5°L a n d o v e r 9 0 0 m
A p p r o x im a t e l i m i t o f th ic k f o r e s t
110°
0 50 100 150 Km.1 __i___ i „ i
\) /
— limits of —Principal States
/ GOBIR •' '/Sokoto ^ ^ ^ Katsina i .Daura
/ ______ (/ --- 1 ~ BORNU
N l \ * i -- Hadejiac a m xr...rr0^vKebbi. .Gw anda V /" \ . \Fada-N-GurmaN '7 ( • , Kan<AOIDAM\
• ’ X / KEBBI [ZAMFARA ^J l . W i f . \
BORGU A o * vZaria //Sansanne- /a?/ n— ✓ 'VMango Busa.V/ *Kontogora \
Kukwa
150 —
W
GURMA/
\ / N U P E\
BauchiPlateauN 10° -
✓ ' /_______ /
Atakpam^3̂ * !
Idah
Old Oyo^V *llo rin * n \ / j u / R U N
0 Y 0 ,/ • Ibadan j |e / ' . Wuikari
•Abomey. % / ' //////^>/
— ----- - / B e n m V '/////,y— < b e n i n ; i b o ^
. , ■>" *>B i q h f " ( / 7 ^ 0 w e r n *A r ° .C h U k U ^ , of
Benin
\\ Yola
- V '
*- o O T) CT t -n ^ O.CT ofi CD? £ t
Cameroon Mts.
| Old Calabap^
Brass BonnyBignt of Biafra
5*-
Fiq. 1ft: N ig e r ia (ancient- s ta te s ) hv 1 7 ^ - 1 r e n t u r v
A ja y i and E s p i r e )
UNIVERSITY
OF I
BADAN LIBRARY
48
The Oyo, despite suggestions of far north or middle east
influences would seem to have been derived from populations which
grew around Old Oyo till the era of Oranmiyan's migration into Ife
as a result of military superiority.
The Oyo kingdom said to be the largest and the most powerful
in Yorubaland (Atanda, 1980) is believed to have been founded by
Oranyan who succeeded Oduduwa at Ife but later journeyed out on
some military expendition. At the time of settling his followers at
Oyo-Ile (or Old Oyo) near the Ajaka hill, Oranyan named the new
town 'Oyo' implying: 'the slippery place', since his horse has
slipped and stumbled on the hillside (Smith, 1988). At Oranyan's
demise his sons Ajaka and Sango ruled consolidating his (Oranyan's)
territorial gains as well as curtailing troublesome neighbours such
as the Borgana, Nupe, Owu and Ijesa. (Atanda, 1980) Significant
militarisation became a feature of the kingdom as from the time of
Onigbogi (c.1580 -1542); Orompoto (c.1542-1580); Ajiboyede (c.1580
- 1590) during which the capital earlier taken to Igboho was
reconstituted at Oyo. This military development continued into the
reign of Ajagbo and Ojigi culminating in the appointment of "Are
Ona kakanfo" or Generalissimo bringing the kingdom to its peak of
power by mid-18th century. This afforded the extension of Oyo
authority from Jebba to Badagry coast while its sway extended over
UNIVERSITY
OF I
BADAN LIBRARY
49
JI
J
X
B E N I N
X
ss ’ ,
N ik k i* : • >/-—1̂Karhama'/ • J1 —
l \ ] • • I gboho • ' ii fir{!\ # ?( • 'WIJUUM
w m w d '■'■■ egbV<
r ■ * *
N I G E R I A1 Bida
llor̂n" \ \rf : :. ottun. N^\
'KeK ^ ^ IGBIRA)• f9 Own/
X ~ " i
arri
The Ono Ki ngdom in 1760
^ Dahomey in 1780
VX'
Kingdom of Benin (showing expansions) Igboland
XModernNationalBoundaries
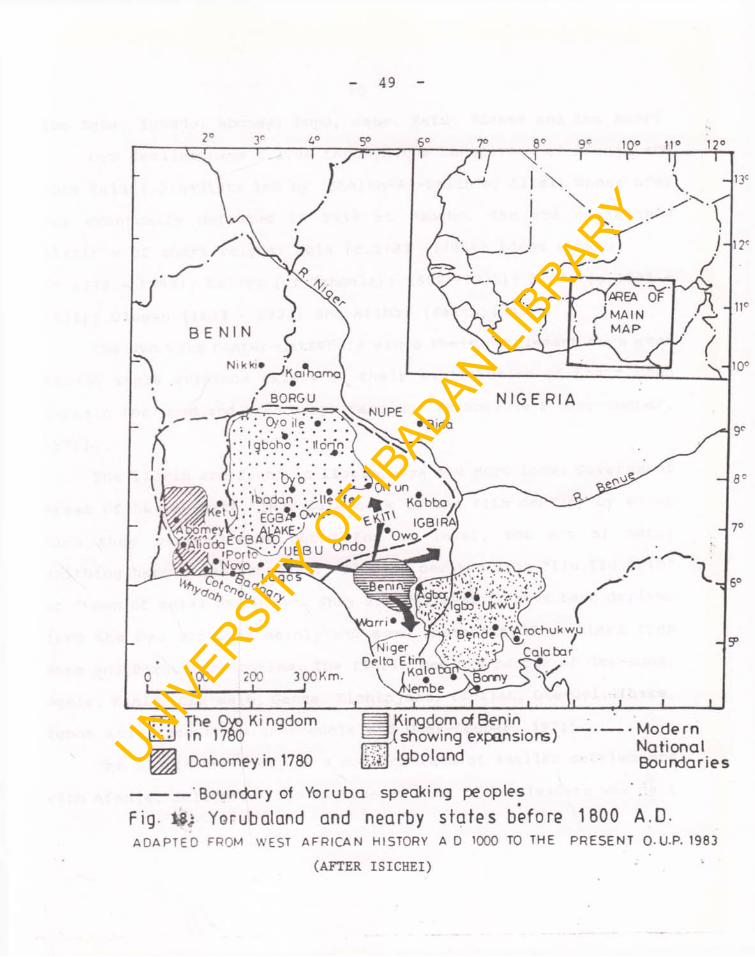
--------------Boundary of Voruba speaking peoplesFig i& j Yorubaland and nearby states before 1800 A.D.ADAPTED FROM WEST AFRICAN HISTORY A D 1000 TO THE PRESENT O-U-P. 1983
(AFTER ISICHEI)
UNIVERSITY
OF I
BADAN LIBRARY
50the Egba, Egbado, Abomey, Popo, Sabe. Ketu, Idassa and the Awori.
Oyo decline came c.1796 through the conspiracy of Afonja and
some Fulani Jihadists led by (Sheikh-Al-Salih or Alimi) whose army
was eventually defeated in 1838 at Osogbo. The era occasioned
Alafin's of short reigns: Aole (c.1789 -1796); Adebo & Maku
(c.1796 - 1799); Majotu (or Mansola) ; 1802 -1831); Amodo (c.1831 -
1833); Oluewu (1833 - 1836) and Atiba. (Smith,1988).
The Oyo were hunter-gatherers since their settlement days even
though ample evidence exists of their exploitation of their open
terrain for food and tree crops farming. (Mabogunje & Omer-Cooper,
1971).
The Ilorin are found in Ilorin, Asa and Moro Local Government
Areas of Kwara State. They date back to the 11th century by which
time they were already noted for at least, the art of metal
smithing hence, the ethnonym: "Ilorin" derived from "Ilu Ilo irin"
or "town of metal smithery". They are believed to have been derived
from the Oyo and Egba mainly and some instances of settlers from
Nupe and Borgu territories. The Ilorin met the people of Oke-suna,
Ogele, Kanla, Oke-male, Ganma, Elehinjare, Idofian, Oke-Oyi, Ibare,
Igbon and Iresa there (Mabogunje and Omer-Cooper, 1971).
The Ilorin territory of a conglomerate of smaller settlements
with Afonja, Solagberu, Ojo Isekuse as some of the leaders was part
UNIVERSITY
OF I
BADAN LIBRARY
51
UNIVERSITY
OF I
BADAN LIBRARY
52of Oyo kingdom up till the time of the Afonja conspiracy, in 1796
(Smith, 1988).
Whereas it was Afonja's aim to grab power with the help of the
Fulani Jihadists he was later exterminated alongside Solagberu. The
activities of the Fulani Jihadists between 1820-38 was considerable
such that it caused the beginning of Oyo decline. Oyo culture
survived in Ilorin even to the extent the Fulani Jihadists learnt
to speak the Yoruba language which assisted them in their
islamization and the establishment of an Emirate. (Atanda,1980).
By 1821, Southern Yorubaland was already aflame with the war
especially with the attack of the Owu by a joint military
expedition of Ijebu, Ife and itinerant Oyo soldiers. (Mabogunje and
Omer Cooper, 1971) The early mastery of metal smithery by the
Ilorin was an advantage in the pursuit of a hunter-gatherer
tradition which went alongside some farming in cash crops of
economic importance thus affording their women some aptitude in the
processing of cereals and other stem tuber products (Smith, 1988) .
The Ilorin were hunter-gatherers since their early settlement
days, especially with the variety of weapons that their metal-
smithery afforded them. They carried out farming in some cash crops
of economic value and this afforded their women some aptitude in
post-harvest technologies (Smith, 1988).
UNIVERSITY
OF I
BADAN LIBRARY
53
Ibolo:
The Ibolo (or Igbolo) are found today in Offa and Oyun local
Government Areas of Kwara State. The major settlements of the Ibolo
include: Offa, Ippe or (Ipe), Erin-ile, Ilemona or (Illemona),
Igosun, Ira or (Irra), Ijagbo and Igbana. They are believed to have
been in this territory by the 10th century, at least when the
earliest settlers said to have been of Oyo extraction came even
though some more recent settlers claim Ife derivation. This seems
to be confirmed by the fact that the Ibolo still celebrate a
"Moremi" festival annually in remembrance of the Ife episode with
the Ugbo (or Ubo) forest dwellers.
The people of Offa and its immediate district are often called
"Ibolo" (or Igbolo) meaning: "oil palm gatherers."
Oluwole, the founding father of the Ibolo kingdom as well as
nine of his successors were said to be of Oyo extraction, hence
their loyalty to the Alafin. The capital at Offa was subject of
Nupe and Ilorin imperialism which was resisted. They are oil-palm
processors in addition to having a hunter-gatherer tradition and a
subsistent farming custom of food and cash crop cultivation (Smith,
1988)
Owu:
The Owu are today found mainly in Irewole local Government
UNIVERSITY
OF I
BADAN LIBRARY
54
Area of Osun State and elsewhere in Igbo-Owu (Kwara State), Abudu
(Edo State), Owu-Ijebu and Owu-Egba (Ogun State), Ajebandele
(Ogun/Ondo State boundary), Ago-Owu (Lagos State) and Owu-Orile
near Oyo in Oyo State. The Owu in Osun State are indigenous to
their territory while those in Kwara, Edo, Ogun, Ondo, Oyo and
Lagos states are reported to have arrived there after the collapse
of the Owu kingdom in 1821 (Mabogunje and Omer-Cooper, 1971)
intermixing with Oyo, Ijebu, Ondo, Igbomina, Edo and the Egba. The
Owu Kingdom is believed to be one of the earliest and oldest of
Yoruba kingdoms (Mabogunje & Omer-Cooper, 1971; Atanda, 1980). The
evidence that by the 15th century, Owu settlement in Osun State
(Fig. 10) had become a military outpost of the Oyo empire is true.
The ethnonym "Owu" is said to have been derived from "one who
sobs" in reference to the manner in which its patriarchal
Asunkungbde (meaning: "one who cries to earn a crown") is said to
have obtained his crown from Oduduwa, his maternal grandfather,
thus implying a relationship (Mabogunje & Omer-Cooper, 1971). Owu
as a military outpost was effective in fulfilling Alafin's military
behests especially against the Ife. The combined attack by the
Ijebu, Ife and free Oyo soldiers in 1821 led to its fall causing
some widespread dispersal of its people into other territories of
the Yoruba.
UNIVERSITY
OF I
BADAN LIBRARY
55The Owu were effective hunter gatherers with a tradition of farming
in economic crops while the produce were sold at the popular Apomu
market under its control. (Mabogunje and Omer-Cooper, 1971).
Ibarapa:
The Ibarapa are found in Ibarapa and Ifeloju local government
Areas of Oyo State where they probably have been by the 16th
century at the peak of the Oyo Empire. The territory was originally
made up of seven towns: Eruwa, Lanlate, Igbo-Ora, Igangan, Tapa,
Aiyete and Idere. This sub-group derives its name from "Ibara-pa" -
meaning "the melon splits" , referring to the people's prowess at
planting melon as an economic crop. The Ibarapa still remain a
farming people to this date and have acquired a distinctness in
melon cultivation which sets them aside from the Oyo from which
they are believed to have been largely derived. They farmed mainly
in melon and other legumes such as cowpea, pigeon pea and some cash
crops. Their hunting activities were limited to the forested
patches of their largely open grassland territory. The earliest
settlers were the people of Oniki whom subsequent settlers met
there especially at the fall of Oyo empire (c.1800) and Owu
(c.1821) (Mabogunje & Omer-Cooper, 1971).
Subsequent settelments in Ibarapa territory were also peopled
by Nupe (especially at Tapa);Ijesa and Oyo migrants. They are
UNIVERSITY
OF I
BADAN LIBRARY
56
normally classified with the "Oke-Ogun" people, especially because
they are settled northwards of the Ogun river from where they had
to fight several survival wars against marauders especially the
Nupe, Borgana, Abomey and Oyo.
Eruwa, one of its settlements grew as a centre for yam
cultivation. Lanlate, another settlement was peopled by the
migrants from "Ilanla", hence its name "Ibi Ilanla te do" -
meaning: "the place the Ilanla found". Igbo-Ora was founded as a
farmland settlement and was peopled mostly by farming migrants.
Igangan was founded by the Oniki said to have come from Ife. Tapa
was predominantly peopled by the Nupe migrants hence, its name.
They, however, got absorbed language-wise into the autochthonous
population. Aiyete was founded as a coglomeration of smaller
settlements hence its name: "Ibi aiye te" -meaning, "where the
world (people) found". Idere was founded by the Onidere, an Oyo
migrant.
If e :
The Ife are located today in Oranmiyan local government Area
and its immediate districts in Osun State where they probably have
been by the 5th century (Ryder, 1984) even though occupation there
is reported as having taken place in at least two successions: the
first up till about 1500 A.D. and the reorganisation subsequent to
UNIVERSITY
OF I
BADAN LIBRARY
57this decline (Ryder, 1984).
The Ife are believed to have met the autochchonous Ugbo (or
Ubo) dwellers in this territory on their arrival and the traditions
of clashes related refer to the struggle for control that ensued
between both groups over land and leadership.
Ile-Ife was said to have been the major spiritual and
political centre of the Yoruba between the 9th and 12th century
(Willet, 1967).
Ife would seem to have been subject to successive peopling
from sources which seem to include: Ila, Oyo, and even Oba-Ile near
Akure which probably antedated the last settlement (Smith, 1988).
Iwase who is said to have led the earliest migration to Ife
met Oba Erinrin, Esumare of Ife there. (Odukoya, 1968). The Oduduwa
leadership was said to have emerged after succeeding in the
leadership tussle with the aboriginal people at Ife (Atanda, 1980).
The Ife society of then was very organised as reflected in the
considerable work of art: bronze figures and terracottas.
The Ife have been farmers of cash crops (cocoa, kolanut and
cashew) and cereals, the patterns of which featured prominently on
their pottery from archeological recoveries. Maize cob patterns
were also a major feature of recoveries from the occupation phase
of around the 15th century (Ryder, 1984).
UNIVERSITY
OF I
BADAN LIBRARY
58Ec?ba:
The Egba are found in Odeda, Owode/Obafemi, Ifo, Abeokuta
North and Abeokuta South local governments of Ogun State. They are
also found in parts of Agege Local Government of Lagos State. The
Egba, whose territory once extended beyond Ibadan area (Mabogunje
and Omer-Cooper, 1971) are known to have been in possession of that
territory before at least, the 15th century when the earliest
colonial visitors encountered them.
The Egba are usually said to have been derived from two
sources: mainly the Egba Oke-Ona and Egba Gbagura from Oyo, the
Egba Ake and Egba Owu from Ile-Ife and Orile-Owu respectively and
are believed to be in the main to be offshoots of the Oyo (Biobaku,
1990) especially because they were part of the Oyo empire until its
collapse in A.D. 1800. They probably were the earliest settlers of
their present territory.
The term "Egba" is a contraction of the original name of
"Egbalugbo" or "wanderers towards the forest" (Smith, 1988) with a
territory stretching from Ijaiye, near Ibadan (northwards) around
River Oba and to Ebute-Meta (southwards) , then from Ijebu territory
(eastwards) to Ipokia and River Yewa (westwards).
The Egba kingdom existed as a federation, made up of four
provinces: Gbagura, Ake, Oke-Ona and Owu. Of these, Gbagura was the
UNIVERSITY
OF I
BADAN LIBRARY
59
largest with 144 towns, 72 of which was under the Onigun of Ilugun.
The Owu came to Egba territory at the destruction of Owu-Ipole
in Oyo empire, around 1821 under the Olowu with towns such as
Erunmu, Okolo, Owu (capital) and Mowo (Ajisafe, 1972).
Despite claims of Ile-Ife derivation, the Egba would seem to
have been migrants from the nothern parts of Yoruba territory
especially near Oyo. Oyo rule over the Egba was terminated by the
Lisabi-led revolt between 1890 - 1897. /The Egba were hunter-gatherers during their early settler days
as "wanderers in the forest " (Biobaku, 1957) since when they have
advanced into farming in root crops which they process into food
products such as "Lafun" (Cassava flour).
Egbado:
The Egbado are found in the Egbado division (which includes
Egbado-North and Egbado-South Local Government Areas) in Ogun State
and appear to have been here (Fig. 2) before the 12th century
(Atanda, 1980) by which time Benin influence reached this territory
with a mixture of settlers said to include: the Anago, Popo, Sabe,
Ketu, Ohori, Egun, Benin, Ife, Oyo, Mahin, Awori and the Idassa.
The term "Egbado" was originally used to describe the Yoruba
sub-group settled near the River (Yewa) and it means: "Egba do" or
"wanderers near the River (Yewa)" who were under Oyo rule up till
UNIVERSITY
OF I
BADAN LIBRARY
60its demise in 1800 A.D. (Folayan, 1967) with Badagry becoming
tributary to Lagos in 1830.
The Egbado were hunter-gatherers as well as farmers of
distinction. The womenfolk process cereals and cassava while a few\
are engaged in fishing along the Yewa river and other major
streams.
Awori:
The Awori presently inhabit Ado-Odo/Ota Local Government of
Ogun State, the Lagos Island, and parts of Ojo and Badagry Local
Government Areas of Lagos State. They have living in their midst,
some Egun (another non-Yoruba subgroup).
They are believed to have come mainly from the norhtern parts
of the Yoruba territory, especially Ile-Ife.
According to historical sources, the Awori, an itinerant
people, were emissaries of Oduduwa who came annually to fulfil his
spiritual behests of offerings on the Ogun River (Smith, 1988).
Oral traditions has it that a clay plate of offerings normally
terminated the annual rituals and that at one of such festivals,
the plate which traditionally stays afloat the river suddenly sank
hence the ethnonym: "Awori"meaning: "the plate sank" (Atanda, 1980;
Fabunmi, 1985). Apparently, they were the earliest settlers in the
sandy expanse that eventually became Lagos; settling first at Iseri
UNIVERSITY
OF I
BADAN LIBRARY
61near the Ogun River bank under the leadership of their head hunter,
Ogunfuminire, whose lineage is said to be from the royal house of
Oduduwa at Ile-Ife.
The Awori would seem to have been migrants from Ile-Ife but
seem to be contradicted by the fact that they owe their royal house
largely to the invading Benin expedition of between 1603 and 1861
(Egbarevba, 1960) especially on Lagos island.The Awori, possibly because of the nature of their habitat,
are adept at fishing while they, practiced some subsistent farming
on their sparse landed areas. Their fisherfolk population also
engaged in trading, interacting with the Edo, Mahin (from Ilaje
territory) , the Ijebu, Egba, Egbado, Egun and Anago. They were said
to have engaged in some hunting-gathering as their oral traditions
revealed, but were limited by the swampy forest fringes of their
territory.
Remo:
The Remo are located in Remo division made up of Sagamu and
Ikenne Local Government Areas of Ogun State and parts of Ikorodu
Local Government Area in Lagos State.
It seems that they have been in this territory somewhere
between the 9th and 16th centuries at a time when Ikorodu migrants
from Remo encampments arrived there (I.D.A., 1991). They (Remo)
UNIVERSITY
OF I
BADAN LIBRARY
62apparently derive from three main sources:
i) Iremo quarters, Ile-Ife (Remo Mirror, 1987);
ii) Ijebu-Ode (Ogunkoya, 1956);
iii) Ugbo in Ilaje territory (I.D.A., 1991).
The migrant Remo (mainly Offin, Makun, Epe, and Soyindo) met
the autochthonuos people of Ilara (under the leadership of Alara)
in this territory, between the 15th-16th century. According to
settlement historical sources, the earliest inhabitants in Remo
territory were followers of Arisu (leader of a second migration
into Ijebu-Ode) and a brother of the patriarchal Ijebu-king, Olu-
Iwa believed to have arrived at about the 9th century (I.D.A.,
1991).
They settled first at Ilara under the Alara of Ilara hence,
the term: "Ijebu to Alara mo" later said to have been shortened to
"Ijebu-Remo" meaning: "the Ijebu that Alara is moulding".
Another tradition says that the leaders of the Remo sub-group
came from "iremo quarters of Ile-Ife (Remo Mirror, 1987) hence the
name "Remo". The Remo constitutes the second largest group of the
Old Ijebu kingdom and were subjects of the Akarigbo at Offin
alongside with the Ewusi of Makun, Elepe and other Remo Obas.
Sagamu developed as an important defence outpost which became a
federation of 14 Remo settlements by 1872, although the pact was
UNIVERSITY
OF I
BADAN LIBRARY
63supposed to include thirty three small towns. The 14 settlements
included: Offin, Makun, Ado, Epe, Batoro, Oko, Raniken, Igbepa,
Ibido, Ipoji, Ijagba, Latawa, Sonyindo, and Ijokun.
Whereas, the iremo claim seems to suggest that the Remo
belonged to the pre-Obanta (12th-14th) century migrant group, the
fact that the preceeding Alara (15th - 16th century) came earlier
than their royal migrants in 1866 led by Oba Igimsoje seem to
suggest that their royal leadership were probably of the later
stream of migrants from Benin/Ondo territories of between the 15th
- 16th centuries who sojourned in Ijebu-Ode before moving into this
territory to dominate an autochthonous population.
The Remo traditionally engaged in farming, planting cash and
food crops. Kola and Cocoa were major crops of economic value they
cultivated. They also engaged in extensive processing in cassava
(Gari) and cereal products with which they engaged in trading,
initially through barter with water-faring travellers (including
colonialists) around Ikorodu.
Ijebu:
The Ijebu are located today in the Ijebu division of Ogun
State, and the Ibeju-Lekki, Eti-Osa, Ikeja, Somolu, Epe, and
Ikorodu local government Areas of Lagos State. Oral traditions
suggest that the leader of the Awujale dynasty, Olu-Iwa arrived in
UNIVERSITY
OF I
BADAN LIBRARY
64Ijebu in the 9th century. This is questionable given that the same
traditions report that Olu-Iwa has sojourned at Ife with Oduduwa on
his way to Ijebu and the fact that Oduduwa's Ife does not predate
the 10th century. The Olu-Iwa entourage met the Idoko, Idokunnusi
and the people of Eredo in this territory on arrival whom they
eventually came to control in a territory originally delimited by
the historical ramparts: "Eredo" (Lloyd, 1959).
The term "Ijebu" is said to mean a "flourishing essence"
according to popular folklore (I.D.A., 1991). One school of thought
claims that the Ijebu are descendants of the Jebusites mentioned in
the Holy Bible (Genesis 10:16; I Chronicle 11:14), according to
Odukoya (1963:5)
The second migration was led by Ajogun Ogboroganda (otherwise
called "Obanta") who is said in oral tradition to be the grandson
of Olu-Iwa and son of Oduduwa and Gborowo (Olu-Iwa's daughter) from
Ile-Ife. It was he (Obanta) whose military abilities opportuned him
the chance to consolidate the Awujale dynasty (Ogunkoya,1956).
Another migration from Benin territory (mainly Ijamo) was led by
the 10th Awujale Obaruwa, alongside some lesser one from Ondo
territory. These were said to have assured some solidarity which
sustained the Ijebu during the 19th century Yoruba wars, especially
with arms supplied by European traders with whom they were
UNIVERSITY
OF I
BADAN LIBRARY
65acquainted (Ayandele,1992). Obanta's arrival in Ijebu between the
12th-14th century also contradict the notion that he could have
been Olu-Iwa's grandson (Ogunkoya, 1956). His migration from the
direction of the Benin/Ondo territories seems to support a probable
Benin or Ondo (or Ilaje) relationship. The autochthonous population
in Ijebu territory were hunter-gatherers with practices of some
subsistent farming in cash and food crops. They traded extensively
with early colonial visitors in textiles and other farm products at
Ejirin, said to be West Africa's largest market at that
time. (I.D.A., 1991) .
Eko:
The Eko (or Eko-Yoruba) as well as the aboriginal Awori
inhabit Lagos island, mainland and adjoining areas like Ikeja,
Ebute-meta, Ido, Yaba, Isolo, Apapa, Mushin and Agege in Lagos
State. The Eko comprise an amalgam of descendants from the Awori,
Ijebu, Mahin, Benin, Nupe, Ife, Ijesa, Egun, Anago, Egbado, Ketu,
Egba, Creoles of Sierra Leonean extraction and some Brazilians. The
term "Eko" meaning:"camp" is a Benin (Bini) word, coined by the
military expedition of Oba Orogba about 1603 A . D . (Egharevba, 1960)
which established a war-camp on Lagos island to further its
expansionist interests. The Benin remained in control up till 1861
when the British came in to establish colonial rule (Egharevba,
UNIVERSITY
OF I
BADAN LIBRARY
661960; Smith, 1988) The other migrants of the Eko possibly met the
aboriginal Awori whom they subsequently outnumbered especially as
a result of trade-influenced settlements in and around the Lagos
island. The Eko would appear to have been present by at least, the
15th century when the earliest Portuguese visitors came in 1492.
Lagos, derived from "Lago de Curamo" was first cited in a
Portuguese map of 1845 and writing of Darte Pacheco (1931) in
"Esmeraldo de situ orbis" (Smith, 1988).
The Eko, despite its Awori aboriginal derivation would seem to
have been derived from various sub-group sources including Benin.
The royal house of Ife claimed by the Awori would seem to have been
probably more due to the Benin royal house of Oba Orogba
(Egharevba, 1960) . The fact that the Eko is variously derived would
imply that an amalgam of such sources of derivation is now
obtainable as against the possibility of an Awori aboriginal
expression.
A primary occupation of the Eko is fishing, having acquired
their skills from the Mahin, Awori, Egun, and Ijebu fishing
communities. They engaged in farming where substantial land
afforded it. Their position as intermediaries between colonial
visitors and other people as from the 14th century predisposed them
to engage in a trading culture yet unsurpassed by other Yoruba sub-
UNIVERSITY
OF I
BADAN LIBRARY
67groups.
Ilai e :
The Ilaje, found today in the Ilaje division of Ondo State,
are believed to have been there since the 8th century being one of
the first settlers alongside the "Ifore" and "Idoko".
Their major towns include: Atijere, Igbokoda, Igbolomi, Igbo-
egunrin, Okesiri, Mahin, Aiyetoro, Ugbonla, Ugbo, Idi-Ogba, Zion
and Ereke. They have lived successfully with their neighbouring
sub-groups: Ijo, (or Ijaw) Ondo, Ikale, Benin, Ijebu and the
Itsekiri. With their homestead amongst the creeks, canals, lagoons,
estuaries and the seashore, the Ilaje are mainly fisherfolk and
water bound traders having become acquainted with the art of water
exploration for centuries. Their settlements are divided into two
categories: Mahin and Ugbo (Smith, 1988) .
While the Ilaje, like other Yoruba sub-groups would claim Ife
derivation their sources of derivation would seem to be relate to
the "Okun Yoruba" and other related populations North-East of
Yorubaland where the "proto-Yoruba" known to be acephalous (Smith,
1988) are said to have been derived. The fact that the Ilaje have
no genuine royal traditions seem to contradict any strong Ife or
Benin relationships.
The Ugbo category are administered under the Olugbo of Ugbo.
UNIVERSITY
OF I
BADAN LIBRARY
68There is tendency to believe that the Ilaje (especially the Ugbo)
are related to the earliest, pre-Oduduwa forest settlers at Ife
with whom he had to struggle for the control of power and land
subsequent to his domination at Ife.
Ikale:
The Ikale who presently live behind the creeks, lagoons and
coast-line in the Okitipupa Local government area of Ondo State are
said to have been there at least, by the 10th century. Apparently,
they had relations with the Benin under Ewuare the great and may
have been derived from Ife, Ondo and Benin sources. The Ikale have
had centuries of trading relationships with their neighbouring sub
groups such as: Ondo, Ilaje, Benin, Ijebu and the Itsekiri.
They were supposed to have left Ile-Ife during a festival when
drumming was prohibited, hence, the name: "Kale" which means "no
drumming". This therefore, became the sub-group's name: "Ikale"
(Fabunmi, 1985).
Their major towns include: Okitipupa, Ode-Aye, Ode-Irele,
Igbotako, Akinfosile, Ilutitun, and Ebute-Irele.
The Abodi of Ikoya exercised supreme traditional authority on
the Ikale in the pre-colonial era (Smith,1988). However, the fact
that they are largely acephalous seem to contradict the strong Ife
relationship suggested by Fabunmi (1985); the absence of strong
UNIVERSITY
OF I
BADAN LIBRARY
69royal institutions would rather support probably the peopling by an
autochthonous population related to the North-East 'Okun Yoruba'
with later (15th-16th century) influence from Ife and Benin.
They farmed in cash and other crops while their women
processed many food products. They have townships that were self-
governing and independent, with some senior age-sets as the
leadership.
Ondo:
Traditions of the Ondo who live presently in the Ondo Local
Government Area of Ondo State suggest that they have been there
since at least, the 10th century when the "Ifore" and "Idoko"
arrived there.
They are believed to have been derived from Ife mainly, and
then Benin (partially) . According to settlement historical sources,
the "Ifore" and "Idoko" were hunter/gatherers, who settled at Ededo
or Ode-Ondo, the present site of Ondo. The term "Ondo" means
"settlers" (Smith, 1988) . The royal dynasty from Ife established by
"Pupupu" came under the leadership of Uja and Akunnara, two of
Oduduwa's warriors. Under Airo, the kingdom was put on a firm
footing (Atanda,1980).
The royal house of Ondo that is said to be of Ife derivation
shows greater Benin influence. The possibly that the settlement
UNIVERSITY
OF I
BADAN LIBRARY
70pattern in Ondo territory has been greatly influenced by both Benin
and Ife is not in doubt.
The Ondo are famed in all of Yorubaland for their hunting
prowess which seems to derive principally from their experiences as
one of the foremost sub-groups that invaded the forested areas as
hunters and gatherers.
They farm cash and food crops presently and process palm-oil,
cereals and cassava.
Akure:
The Akure are located in the Akure Local Government Area of
Ondo State, Nigeria. They are probably one of the aboriginal
settler sub-groups of the Yoruba. They are said to have been
derived from Oba-Ile (the domain of the important excavation site
of Iwo-Eleru) Atanda (1980) claims that Oba-Ile's peopling predated
the settling at Ile-Ife, and it has been suggested on these grounds
that they have been in their present abode since at least, before
the 5th century, when they started to move out beyond the immediate
forest environment of Oba-Ile for greater farmland and
hunting/gathering access.
According to the people's oral tradition, farming, especially
in food and cash crops; and hunting seem to have been very
important activities of the early settler Akure populations largely
UNIVERSITY
OF I
BADAN LIBRARY
71because they were endowed with fertile, forested arable lands upon
which such crops could thrive. Hunting/gathering certainly grew
from the early days of proliferation from Oba-Ile ( a village
domain near Iwo-Eleru rock shelter) and Epe.
The Akure are believed to have been derived from at least,
four major sources: Oba-Ile, autochthonous Isikan and Isolo; then
the Edo (or Benin); the latter are today found in Igiso, Eyinke and
Oritagun quarters under the leadership of the Olotu-Ekiran or the
Adowere (or Edowere) . The Edo derived are styled the "Ado-Akure" or
"Edo-Akure" to this day (Smith, 1988). The name "Akure" derives
from "Akun-re" which means: "bead cut" and apparently resulted from
the fact that the wrist beads (Akun" of Omoloju, son of Iyangede of
Epe), cut at the spot when he was trying to clear a bush-path on a
farm between Isikan and Oke-Aro junctions on Arakale road.
The first "Oba" of Akure was said to be the grandson of
Oduduwa.
That the Akure are derived from some settlements that pre
dated Ile-Ife would seem to suggest that they are related to the
"Proto-Yoruba" populations of the North-East of Yorubaland (Smith,
1988) . The influence of Ife, Ijesa, Ekiti and Benin would seem to
have arrived much later.
Owa Atakunmosa, seventh ruler of the Ijesa, while on a journey
UNIVERSITY
OF I
BADAN LIBRARY
72to exile in Benin passed through Akure and gave his daughter in
marriage to the Oba Ajanpada Oriya.
The son called Ogunja Olufadeji, on ascending the throne of
Akure changed his title from Ajanpada to "Deji" of Akure which is
the title in use up to the present day.
Owo:
The Owo who are believed to have been mainly derived from Ife
and Benin sources probably came to their abode in Owo Local
Government Area of Ondo State by the 11th century (Ashara, 1951).
They met the "Efene" on their arrival there (Ryder, 1984) under the
rulership of EJefene (M.O.I., Ondo State, n.d.)
According to historical sources, the founding father ofi
today's Owo was Ojugbelu (or Ojugbolu) from Ife and his reign has
been put in the begining of the eleventh century (Ashara, 1951).
Ojugbolu was said to be the younger brother of an Oba of Benin,
both of whom left Ile-Ife at the same time (M.O.I., Ondo State,
n.d).
On leaving Ife, Ojugbelu halted at Uji (or Ujin) and then at
Upafa (or Utapafa Hill); south of the present kingdom (Atanda,
1980; M.O.I., Ondo State, n.d.; Smith, 1988). from Utapafa, he
moved his followers to Oke-Imade (Atanda, 1980) , then to Igbo
Ogurata (or Igbo Oguwata) now called Okiti Asegbo, centre town of
UNIVERSITY
OF I
BADAN LIBRARY
73present Owo (Atanda, 1980). The group under the Olowo Imade is
thought to have finally met the "Efene" at Okiti Asegbo on arrival
there (M.O.I., Ondo State, n.d.), they initially lived amicably
together but later had to settle the issue of supremacy by force of
arms. Cultural similarities between Benin and Owo are evident in
their brass-casting, wood sculptures, terracota and Ivory described
as intermediate between Yoruba and Benin styles (Smith, 1988).
The fact that autochthonous Efene were met and dominated by
royal groups (warlords) said to be of Ife and Benin sources mainly
points to the fact that royal traditions came after the 10th
century to most Yoruba sub-group territories. The autochthonous
populations would seem to have been derived through migrations from
local populations related to neighbouring sub-groups. The Owo
particularly reflect substantial Benin influence in its royal house
and art traditions.
The Owo are hunters, farmers and metalsmiths. They farm in
arable and cash crops of economic value.
Ii esa;
The Ijesa are said to have been in their present abode (Ijesa
division of Osun State) since about the 10th century.
Their traditions indicate that they are derived primarily from
Ife although contacts with Benin is also well established during
UNIVERSITY
OF I
BADAN LIBRARY
the reign of Atakunmosa (7th ruler of the Ijesa) whose son also
ruled in Akure as Deji (Smith, 1983). The Ijesa met an
autochthonous population who were the people of IIowa, Hare and
Onila whom the Ajaka migration met there (Smith, 1983).
The Ijesa kingdom was said to have been founded by Ajaka (or
Ajibogun), a son of Oduduwa (Smith, 1988) who successfully got him
(Oduduwa) sea-water to help treat his blindness. Whereas, Ajaka led
his followers to a place called Igbadaye where he died (Atanda,
1980), his son, Owa Okile apparently extended control to a place
called IIowa, then Ilemure (re-named Ibokun) where he displaced
Ita, a king he found already installed there. While at Ibokun, he
also brought under his control the town of Ilare, whose rulerI(Alare) claimed Ife descent. The next Owa, Owari moved to Ilaye
(Atanda,1980) which came to be called Ipole-Ijesa after his death.
The fifth reign, brought Owa Oge who chose Ilesa, whose original
ruler he made second in rank and named Obanla. Other rulers around
Ilesa were similarly subjugated, giving rise to what came to be
called the Ijesa kingdom (Atanda,1980) .
The Ijesa claim of derivation should include: Oyo (Ibadan),
Benin and Akure apart from Ile-Ife since populations from these
other Yoruba sub-groups have been known to settle within their
territory. The Ijesa would therefore seen to have been derived from
UNIVERSITY
OF I
BADAN LIBRARY
75these sources apart from the aboriginal population met in the
territory.
The Ijesa had to resist pressures from Nupe, Benin and Old
Oyo. They maintained their independence until they were overrun in
the nineteenth century by the Ibadan who rose to power at the fall
of the Oyo kingdom (Atanda, 1980).
The Ijesa have hunting/gathering traditions which they still
maintain till today. They farm in cash crops such as Cocoa, Kola
and Cashew and food crops, particularly "Okro" which is still a
major feature of their farm-based rural economy. The women process
food in pots which they make extensively hence the ethnonym:
"Ijesa" meaning: "the pottery makers". Smith, (1988) contends that
it may also mean "town of the gods".
Ekiti:
Ekiti traditions indicate that the autochthonous people in the
Ekiti division of Ondo State and in the Ekiti Local Government
(alongside the Igbomina) in Kwara State were living in their
present homeland by the 14th century. They principally descended
from the aboriginal Ilesun and then Benin (or Edo) settlers; from
Ife and Benin sources.
The term "Ekiti" denotes: "a country of hills" being a good
description of the territory's physical features.
UNIVERSITY
OF I
BADAN LIBRARY
76Ekiti kingdoms were founded around towns with crowned Oba (Ilu
Alade) and said to be city states limited by mountainous physical
features, each claiming descent from Ife via Benin (Smith, 1988).
These were the sixteen (16) Ekiti principalities, which were
economically linked but politically independent of one another.
They were: Owore led by Otun; Ijero under the Ajero; Ado under
the Ewi (or Elewi);Ikole under the Elekole; Ara under the Alara;
Efon Alaye under the Alaiye; Ido under the Olojudo; Ogotun under
the Ologotun; Igbo-Odo (Imesi) under the Oloja-Oke; Oye under the
Oloye; Omuo under the Olomuro; Ire under the Onire; Ise under the
Arinjale; Ita under the Onitaji and Akure which later opted out, to
be on its own.
Benin imperialism prevented Ekiti unity considerably before
1800 (Atanda, 1980) . However, under Ibadan military pressures, the
16 states formed Ekiti parapo in the 19th century. The Ewi of Ado-
Ekiti (formerly named "Awamaro" - restless one) came through Benin
hence the term "Ado" (equivalent of Edo) is used as prefix.
The fact of Ilesun and Benin derivation sources of the Ekiti
seem to suggest limited Ife influence. The royal house of Ado-Ekiti
and even the patriarchal "Ewi" seem to have been principally of
Benin influence; a fact that is reflected in today's royal
ornaments and regalia of the Ewi of Ado-Ekiti.
UNIVERSITY
OF I
BADAN LIBRARY
77The Ekiti have been hunters/gatherers within their hilly
domain. They also farmed a lot of food and cash crops of
considerable arable land available to them.
Akoko:
The Akoko are presently in the Akoko Local Government Area of
Ondo State of Nigeria (Table 1; Fig.9). They live on the hilly
outline of the North East Yorubaland fringes; a situation which
provided them with immense security in the days of frequent warfare
with neighbouring sub-groups.
They have been in this territory since at least, the ninth
century, as a confederation of independent village settlements,
each with a political administration and territory which was
religiously guarded (Smith, 1988). The Akoko are believed to have
been largely derived from three main courses: Yoruba (often
including traditional Ife connection), Afenmai and Benin, (Smith,
1988/89) ; and to have become an independent entity circumscribed
territorially (Atanda, 1980) due to subsequent interaction and
negotiations between the different settler-village dependencies.
The Akoko seem to have been derived from the "Proto-Yoruba"
(Smith, 1988) in addition to Afenmai and Benin sources. The fact
that their territory was more accessible to populations around the
North-East of Yorubaland appear to imply that they have had a
UNIVERSITY
OF I
BADAN LIBRARY
78little Ife influence. The acephalous nature of the sub-group also
seem to show that Ife and Benin influences came late to the sub
group's territories.
Iiumu;
The Ijumu (with sub-units of Gbede, Ikiri, Ayere and Ogidi)
living in Oyi Local Government Area of Kogi State (Fig.5) are said
to have been here from at least, 3000 Y.B.P. (Bolorunduro, 1990)
and were descendants of the hill-living people around the North-
East Yorubaland or the "Okun" Yoruba (Ijagbemi). They are said to
be the autochthonous people indigenous to this area of the hill
deities or "Ebora" (Oyelaran, 1991).
The Ijumu constitute one of the principal sub-groups of the
North-East Yoruba found around the Niger-Benue confluence and very
much related linguistically to the Itsekiri and Igala (Smith,
1988). The Ijumu, Yagba, Bunu and Kabba (or Owe) are part of the
"Proto-Yoruba" of the North-East Yorubaland; the area of the
archaeological work of Iffe-Ijumu where Oyelaran (1991) dated palm
kernel fragments to 2210 + 80 Y.B.P. The Ijumu were said to be
hunter gatherers in those early days and it seems that they first
came to this area under the leadership of the Owa who first settled
in Gbede area. Aiyetoro emerged as an active centre of the kingdom,
controlling 17 villages. The other major towns in the territory
UNIVERSITY
OF I
BADAN LIBRARY
79are: Aiyegunle, Odokoro, Iyah, Ogidi, Iyamoye and Aiyere. Iyara is
the traditional capital of the Ijumu territory. They are farmers
and metalsmiths presently and their women process palm-oil and
kernel oil in addition to products from cereals and stem tubers.
Kabba:
The Kabba (or Owe) are found in present day Kabba town and its
township districts in the Oyi Local Government Area (Fig. 5) of
Kogi State, such as: Gbelenko, Aiyetoro-Egunbe, Okedayo, Onakiti
and Egbeda. Like other "Okun", the Kabba were essentially
acephalous (Ijagbemi, 1987) and the notion of an Ife migration is
regarded as "charter myth". They are closely related to the Oworo
who live alongside them in the area with other "Okun" Yoruba\
notably Bunu, Ijumu and Yagba (Ijagbemi, 1987) who are believed to
have been there since at least, 3000 Y.B.P.. The Kabba are
indigenous to this area among the autochthonous people termed
"proto Yoruba" (Atanda, 1980; Smith, 1988).
The name Kabba is believed to have been derived from "Oke-
Aba", the site of the original settlement.
Whereas the Kabba have been known to be indigenous to this
area with little or no influence from Ife, the possibility of some
derivation from neighbouring Ebira, Nupe Benin, Igala and other
"Okun" Yoruba cannot be ruled out.
UNIVERSITY
OF I
BADAN LIBRARY
80The Kabba are farmers, having established a tradition of
hunting and gathering over the years alongside subsistence farming.
The women process palm-oil, kernel oil and cereal products.
Bunu:
The Bunu (Abinu or Abunu) are of Oyi Local Government Area of
Kogi State (Table 1; Fig.5). They claim to have been in this
territory by at least, 3000 Y.B.P. and to have been derived
principally from the hilly range of areas around the North-East
portion of the Yoruba territory, around the Niger-benue confluence
(Ijagbemi,1987). The Bunu are among the earliest settlers in the
North-East portion of Yorubaland, an area said to be the home of
"proto-Yoruba" (Atanda, 1980; Smith,1988). They are part ofIautochthonous people of this area and are essentially acephalous
(Ijagbemi,1987). According to settlement historical sources, the
people have always been there with hardly any link with Ife
(Bolorunduro, personal communications, 1990), except for recent
claims of relationship by some chiefs, possibly stemming from
migrations said to have been from Ile-Ife and Oyo-Ile (Smith,
1988). Majority of the Bunu have been there before the advent of
Oduduwa (Smith, 1988). There is ample linguistic relationship with
some other neighbouring people such as Igala, Nupe and Bariba.
The Bunu are essentially farmers even though a tradition
UNIVERSITY
OF I
BADAN LIBRARY
81of hunting/gathering had existed. The processing in food and cash
crops is reasonably prevalent especially among their womenfolk.
Palm-oil processing is a major occupation here.
Yaqba:
The Yagba, in the Yagba Local Government Area of Kogi State
(Fig. 5) constitute the largest of the "Okun" Yoruba said to be
indigenous to the North-Eastern part of Yorubaland since at least
3000 Y.B.P. (Ijagbemi, 1987).
The major Yagba settlements include: Isanlu, Egbe, Odo-Ere,
Igbakuru, Odo-Eri, Mopa, Amuro, Ijagbe, Okere, Ogga, Okunran Ejuku,
Jege, Ilae, Ogbom, Ejigba, Akata and Ololoke. They were tributary
to the Nupe who appointed a local administrator: "Ajele" or "Ogba"
for the prompt collection of tributes (Ijagbemi, 1987).
The founder of the Yagba kingdom is reported to be a woman who
was affectionately called "Iya-Agba" meaning: "elderly woman" by he
people. The ethnonym: "Yagba" was derived from "Iya-Agba". She had
settled her people at Akata at first (Bolorunduro: personal
communications, 1990) . The earliest leaders (priest and chiefs) of
the Yagba were said to be the descendants of this great woman. They
eventually dispersed into the territory to find other towns.
Though there is a considerable connection between the Yagba
and other "Okun" Yoruba yet the influences of other neighbouring
UNIVERSITY
OF I
BADAN LIBRARY
82peoples is likely to have been important in the settlement pattern.
The fact of their being acephalous seem to suggest little or no Ife
influence.
Kelae for instance, found Egbe as a centre of great
agricultural activity hence the name: "E gbe" meaning: "cultivate".
The Yagba practiced hunting/gathering for centuries in the
hilly range of the North-East confluence area of Yorubaland. They
are presently farmers especially as evident in the name of one of
their major towns: "E gbe!" The womenfolk engage in palm-oil and
kernel oil processing alongside the preparation of cereal food
products.
Igbomina:
The Igbomina (or Igbonna) who are at present in Irepodun and
Ifelodun Local Government Areas of Kwara State, have apparently
been living there since at least, the 11th century at the advent of
the earliest settlers from Oyo. They comprise a mixture of Oyo
settlers of successive migrations, and some claimants of Ife and
Ila derivation.
The name Igbomina (or Igbonna) derives from "Ugbo mo ona"
meaning: "the wand (or stump) knows the way" : an indication that
the staff or wand used by their ancestral leader was useful in
finding their way to their present domain. Their domain bestraddles
UNIVERSITY
OF I
BADAN LIBRARY
83the forest and the savannah (Smith, 1988). The ancestor of the
Olupo called Igwana was said to have come from Ife but paid
tribute to Alafin. Igbomina/Oyo relations are said to have been
long-standing. The Igbomina are interspersed by some Ekiti. They
are regarded as being Oyo with Ekiti sympathies (Smith, 1988).
The major contradiction in the setting of the Igbomina would
seem to be the fact of their royal traditio said to be of Ife
derivation and paying tribute to Alafin. The suggestion that they
are Oyo with Ekiti sympathies appear to show a mixture of Oyo
migrants with neighbouring Ekitis who probably submit to Ife
derivation because of common Ila descent of some of its migrant
which they share with Ife.iAs part of Ila kingdom, the Igbomina had towns such as: Oke-
Ila, Ora, Oke-Ewu, Aran, Apa, Oro, Ajase, Isin, Igbaja. All these
towns recognised Ila as their traditional headquarters (Atanda,
1980) and remained under the Orangun of Ila until the nineteenth
century when their solidarity was shattered by Ilorin imperialism
(Atanda, 1980).
The principal ruler of the Igbomina appears to be the Olomu of
Omu-Aran who is today overshadowed by the Olupo of Ajase-ipo
(Atanda, 1990) due largely to some powerful traditional oil in the
possession of the latter.
UNIVERSITY
OF I
BADAN LIBRARY
84The Igbomina were harrassed by Ijesa and Nupe raiders on their
territory. Their position was maintained by dint of furious
activities which they had consolidated with Oyo. The Igbomina are
farmers with some hunting/gathering background. Their women
processed many farm products into a variety of edible foods.
Linkages in Yoruba History
Available linguistic, archaeological, and historical evidence
thus appear to suggest that the Yoruba have had close interactions
with a number of its neighbouring language sub-families: Nupe,
Bariba, Bassa, Benin, (Edo), Igala, Ebira (or Igbira) , Ijo (or
Ijaw), Itsekiri, and Urhobo. Horton 1979: 82) states in this regard
as follows:i
A n c e s t r a l Y o r u b a p o p u l a t i o n was p a r t o f a l a r g e r d i s p e r s a l , n o t fro m t h e M i d d l e E a s t , b u t from t h e g e n e r a l a r e a o f t h e N i g e r - B e n u e c o n f l u e n c e .
Smith (1988:11) on his part assesses the linkages and
summarises thus:
I f t h e b r o a d c o n c l u s i o n f r o m t h e l i n g u i s t i c e v i d e n c e i s a c c e p t e d , t h e n t h e t r a d i t i o n s o f o r i g i n w h i c h a r e p r e s e r v e d by t h e Y o r u b a seem t o r e f e r t o movem ents o v e r o n l y c o m p a r a t i v e l y s h o r t d i s t a n c e s o r l e s s p r o b a b l y , to t h e a d v e n t o f a s m a l l g r o u p o f c o n q u e r o r s who q u i c k l y became a s s i m i l a t e d w i t h t h e i r new s u b j e c t s . I t seems l i k e l y t h a t i n e i t h e r c a s e movement was from t h e g r a s s l a n d ,
UNIVERSITY
OF I
BADAN LIBRARY
85where cultivation was earlier advanced and where there might be some population pressure, into the forest, and the legend of Oduduwa and the royal progeny of Ife may be a distant memory of such a movement.To speculate beyond this point is hazardous, since new myths are all too easily created. There has, for example, been a tendency in recent writing about African history to attribute the origin of most states to the conquest of the people of one culture by people of another, postulating a sharp distinction between the rulers and the ruled. Stereo typing of this kind usually results in over-simplication and other distortions, for while most states in the world developed under the stimulus of older states, their origins are many and diverse. Meanwhile, new materials on the subsequent history of the Yoruba is being uncovered and as more is established about what may be called their middle ages, this should in turn shed light on earlier times. But this kind of reconstruction has special dangers for the historians, whose study permits generalizations but has no laws and whose material is unpredictable humanity; extrapolation unsupported by evidence should usually be left to scientists and mathematicians. Early Yoruba history now waits, not over-hopefully, upon archaeology and its ancillary sciences.
UNIVERSITY
OF I
BADAN LIBRARY
CHAPTER THREE
BIOLOGICAL METHODS AND ANALYSIS
Biological Methods in Studying Human Groups
The Biological aspects of the data on a population, especially one
that is known to have lived together for some time such as the
Yoruba, serves to provide some information on the extent of
interbreeding. Biological data are valuable especially where they
are required to elaborate on the archaeological, historical,
cultural and linguistic evidence available (Hiernaux, 1974). They
will as well help to reveal the extent of expressivity of the
influence of exotic populations which historical and cultural
accounts are often found to suggest. Biological data are able to
also show the extent of internal wandering (or active
interbreeding) that has progressed within a population under study.
The extent of biological diversity is also detectable in the
assessment of the biological evidence with one or more populations
(Hiernaux, 1974).
Biological Data in West Africa:
Biological data in terms of skeletal remains in West Africa
and particularly in the area classified as Yorubaland by historians
and anthropologists, are scanty and generally not often well
86
UNIVERSITY
OF I
BADAN LIBRARY
87preserved for well-known environmental reasons such as high acidity
and rapid oxidation. A few notable finds are available which can
assist in the biological reconstruction of the past, generally in
West Africa and Yorubaland in particular.
The Iwo-Eleru skull dated to 11,000 Y.B.P. and inferred to
have belonged to a proto-negroid population (Brothwell and Shaw,
1971) is one of the few that may well give an insight into the
antecedents of the Yoruba. Skeletal remains found may not
necessarily relate in all cases to the present day population in
the area as Huizinga et al (1967) found with the radiocarbon dating
of Tellem cave skulls found in today's Dogon territory.
Whereas, anthropometric measurements are useful in assessing
biological variation Hiernaux (1974) found that environment could
also influence biological characters. This, he said, could be
either through the expression of the genotype or through allelic
changes or frequencies in populations. He stressed that human
populations can evolve independently if they exhibit considerable
endogamy with little or no barrier to internal mating.
Such endogamous population(s) he concluded present some suitable
instances for describing human biological variation and attempting
to explain such in terms of genetical evolution.
Hiernaux (1974) noted that biological evidence indicates that
UNIVERSITY
OF I
BADAN LIBRARY
88the effects of exotic populations especially from Northern and
Eastern Africa have been moderate based on biological evidence,
especially as interbreeding has been highly active and the sub-
saharan African populations present strong barriers to penetration.
He said that recent exotic influences had played minor and
localized roles in populations. He observed that other factors of
genetic change; drift and selection may blur the impact of genetic
admixture especially of older instances. Hiernaux (1974:55)
therefore, cautions that biological characters must be relied on
when trying to assess the importance of genetic mixture. This, he
said, is because:
The p r o c l a i m e d a n c e s t o r s o f a p o p u l a t i o n may r e p r e s e n t o n l y a " g l a m o r o u s " g r o u p whose c o n t r i b u t i o n t o t h e p r e s e n t ge ne p o o l was t r i f l i n g . . . t h e l a n g u a g e o f a s m a l l g r o u p o f i m m i g r a n t s may be t o t a l l y a d o p t e d by a l a r g e p o p u l a t i o n ; and be w i d e l y a d o p t e d w i t h a minimum o f c o r r e s p o n d i n g gene f l o w , w h i c h may h a v e been too m o d e s t t o be d e t e c t a b l e .
Hiernaux (1974) also advised against unjustified pooling
biases in the sampling of sub-saharan populations having noted that
the level of genetic variation was very high and that only a
minority of the units can be grouped.
Cavalli-Sforza (1966) for his part cautions on the population
acceptance of conclusions made on population structure studies, as
UNIVERSITY
OF I
BADAN LIBRARY
39according to him, there could always be some alternative
explanations!
ABO Blood groups as marker in population studies.
The ABO blood group system has been found to be a very useful
means of providing biological data for corroborating historical,
archaeological, cultural and linguistic evidence. (Hiernaux, 1974)
However, data on the ABO blood groups of many sub-saharan
populations are either non-existent, scanty or unrepresentative of
their distribution over known biotope.
Hiernaux (1974:65) in recognition of the importance of the ABO
blood group as vital markers within such populations has summarized
the point thus:l
When we f i n d two p o p u l a t i o n s d i f f e r i n g i n t h e f r e q u e n c y o f b l o o d g r o u p s , we know f o r s u r e t h a t t h e d i f f e r e n c e i s g e n e t i c a l : b l o o d g r o u p s a r e s t r i c t l y d e t e r m i n e d by h e r e d i t y and no c i r c u m s t a n c e i n t h e l i f e o f an i n d i v i d u a l c a n c h a n g e h i s b l o o d g r o u p .T h i s h o l d s t r u e f o r a l l s y s t e m s o f h e r e d i t y v a r i a n t s o f b l o o d s u b s t a n c e s .
ABO Blood group: Antigens and Antibodies
The discovery of the A, B and 0 blood groups by Landsteiner in 1901
and the fourth blood group AB, by Decastello and Sturli in 1902
helped to attain a great landmark in transfusion therapeutics (Race
and Sanger, 1968). The four groups are determined by the presence
UNIVERSITY
OF I
BADAN LIBRARY
90or absence in the red blood cells of the blood group antigens A and
B (Table 4) and therefore, the blood group of the individual is A,
B, AB or 0 (O denoting the absence of A and B) (Boorman and Dodd,
1970).
Landsteiner's (1901) discovery has also become an important
milestone in the field of anthropology because the settlement
history of a population could be correlated with blood group
distribution gene frequencies (Watkin, 1966).
Alongside the antigenes A and B found in the red blood cells are
also the antibodies anti-A and anti-B, which occur as agglutinins
in the sera of individuals whose red cells lack the corresponding
agglutinogen (or antigen) Boorman and Dodd (1970). The antigen and!antibodies present in the four groups are as in Table 4.
Antigens present on a person's red cells are inherited. Each
antigen is controlled by a gene which is a unit of inheritance.
Variants of a gene are called alleles or allelomorphs for that
trait (Bell et al, 1972). Human blood group inheritance is thus
governed by multiple alleles. These alleles feature in ABO blood
group inheritance.
UNIVERSITY
OF I
BADAN LIBRARY
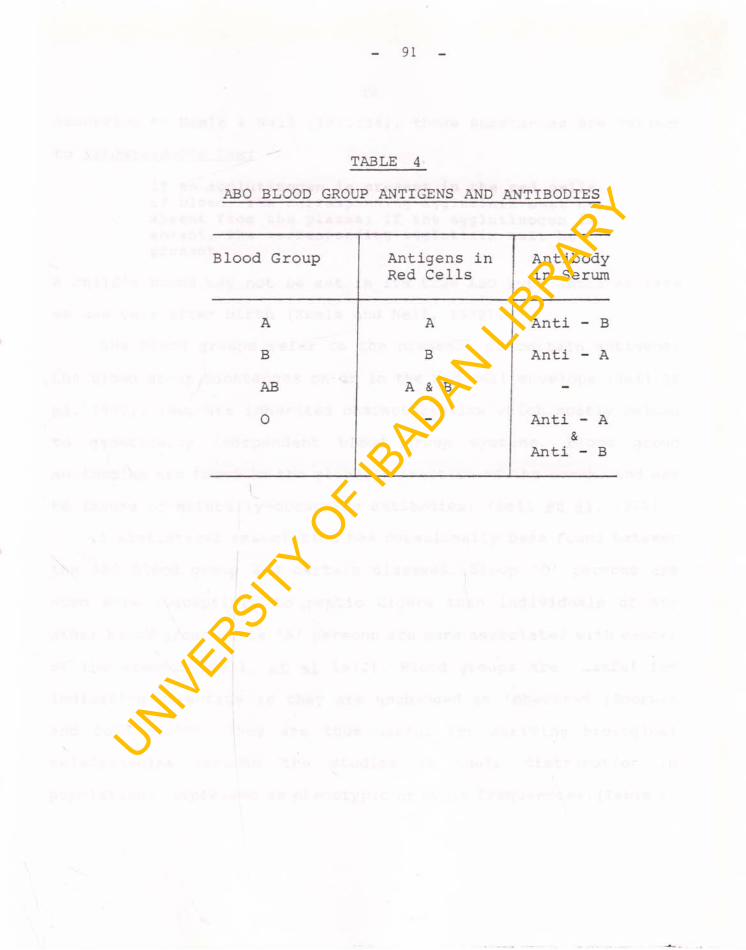
91
TABLE 4
ABO BLOOD GROUP ANTIGENS AND ANTIBODIES
Blood Group Antigens in Red Cells
Antibody in Serum
A A Anti - B
B B Anti - A
AB A & B -
0 Anti - A &
Anti - B
|
UNIVERSITY
OF I
BADAN LIBRARY
92According to Keele & Neil (1972:34), these substances are subject
to Landsteiner's Law:
If an a g g l u t i n o g e n i s p r e s e n t i n t h e r e d c e l l s of b l o o d , t h e c o r r e s p o n d i n g a g g l u t i n i n m u s t be a b s e n t fro m t h e p l a s m a ; i f t h e a g g l u t i n o g e n i s a b s e n t , t h e c o r r e s p o n d i n g a g g l u t i n i n m u s t be p r e s e n t .
A child's blood may not be set in its true ABO type until as late
as one year after birth (Keele and Neil, 1972).
The Blood groups refer to the presence of certain antigens,
the blood group substances on or in the red cell envelope (Bell et
al. 1972) . They are inherited characteristics which mostly belong
to genetically independent blood group systems. Blood group
antibodies are found in the globulin fraction of the serum, and mayl
be immune or naturally-occurring antibodies, (Bell et a_l, 1972) .
A statistical association has occasionally been found between
the ABO blood group and certain diseases. Group '0' persons are
much more susceptible to peptic ulcers than individuals of any
other blood group while 'A' persons are more associated with cancer
of the stomach (Bell, et ai 1972). Blood groups are useful for
indicating parentage as they are unchanged as inherited (Boorman
and Dodd, 1970). They are thus useful for deriving biological
relationships through the studies of their distribution in
populations, expressed as phenotypic or genic frequencies.(Table 5)
UNIVERSITY
OF I
BADAN LIBRARY
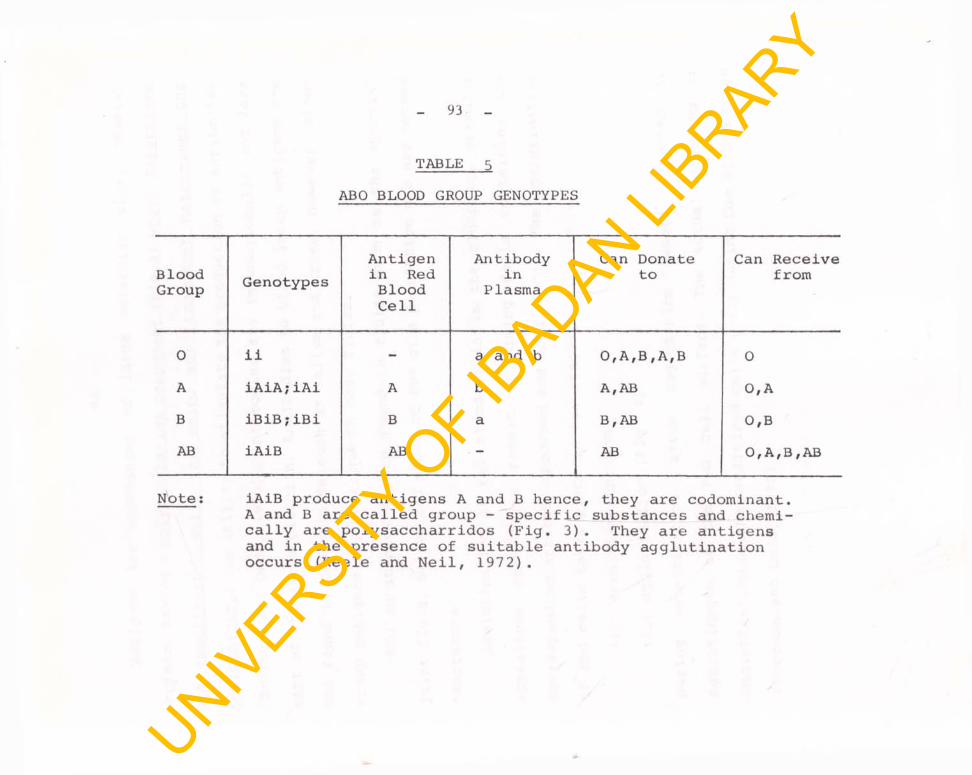
93
ABO BLOOD GROUP GENOTYPES
TABLE 5
BloodGroup Genotypes
Antigen in Red Blood Cell
Antibodyin
PlasmaCan Donate
toCan Receive
from
0 ii - a and b 0,A,B,A,B 0A iAiA;iAi A b A, AB 0, AB iBiB;iBi B a B, AB 0 ,BAB iAiB AB - AB 0, A,B, AB
Note: iAiB produce antigens A and B hence, they are codominant.A and B are called group - specific substances and chemically are polysaccharridos (Fig. 3). They are antigens and in the presence of suitable antibody agglutination occurs (Keele and Neil, 1972).
UNIVERSITY
OF I
BADAN LIBRARY
94
Antigens are substances of large molecular size, usually
protein, having a polysaccharide component (Fig.3) which determines
the specificity, while the amino acid component determines the
antigenicity; the ability to stimulate the production of antibodies
(Boorman and Dodd, 1970). Antibodies are immunoglobulin and form
part of the serum globulin. Antibodies to blood group antigens are
not found in body fluids such as saliva and urine. However, blood
group antigens may be found in body fluids.
ABO substances may be found in fluids such as the synovial
joint fluid, saliva and semen of 80% of a population who are termed
'secretors'.
Agglutination of red blood cells is the clumping, granular
appearance seen as a result of mixing cells containing the
corresponding antibody (Boorman and Dodd, 1970). The agglutination
of red cells takes place in two stages:
(i) sensitization; and
(ii) agglutination (Fig. 4).
During sensitization, serum agglutinins become attached to
agglutinogen on the red cell surface. The actual clumping or
agglutination of the sensitized cells occur during the second stage
(Boorman and Dodd, 1970).UNIVERSITY
OF I
BADAN LIBRARY
95
According to Boorman and Dodd (1970: 1):
An A n t i g e n i s a n y s u b s t a n c e w h i c h , when i n t r o d u c e d p a r e n t a l l y i n t o a n i n d i v i d u a l who h i m s e l f l a c k s t h e s u b s t a n c e , s t i m u l a t e s t h e p r o d u c t i o n o f a n a n t i b o d y , and w h i c h , when m ixe d w i t h t h e a n t i b o d y , r e a c t s s p e c i f i c a l l y w i t h i t i n some o b s e r v a b l e way.
Substances, such as poly-saccharides which may be weakly antigenic
with some amino-acids contributing in some way to specificity, are
called HAPTENS, often in body fluids like saliva secretion (Boorman
and Dodd, 1970).
Ever since the discoveries of Landsteiner (1901) and
Decastello and Sturli (1902), knowledge of blood group distribution
has been used as an important tool for studying human populations.
Peculiarities in genic frequencies could help to relate groups with
settlement history, particularly high frequency of one blood group
within a population. (Dawson, 1964). Sometimes, some relationship
could be drawn from the association of certain blood group
frequencies in present populations and earlier ones (Brown, 1965).
Groups that are anthropological appendages of others could be
discovered through blood group investigation showing similar values
of genic frequencies (Watkin, 1963). Garlick's (1962) maps of blood
groups in Africa was a follow-up of the work of Mourant et al
(1958) which he said could only be improved through detailed work
that can strike out to cope with local fluctuations.
UNIVERSITY
OF I
BADAN LIBRARY
96Hardy (1962) found a gradual diminution in the 'B' gene
frequency passing from the Yoruba to Bini to the Onitsha-Ibo until
the Eastern Ibo. She got the Yoruba 'O' blood group gene frequency
to be 0.7011.
Watkin (1966) showed that no important anthropological divide
exists between two populations showing no significant difference in
the ABO blood group distribution. He also noted the influence of
migrant groups on the inhabitants of an area and explained how the
existence of a blood group associated with earlier human
settlements could point to the survival of autochthonous people.
Lister et al (1966) found the frequency for the 'O' blood
group of the Bedouin Arabs of Soccotra to be 0.6667. El Hassan et
al (1968) found the frequency of the 'O' blood group of the Beja of
Sudan to be 0.53 even though they believed that the result showed
a mixing of Negroid and East Mediterranean Caucausoid components,
thus suggesting the need for more detailed work on East
Mediterranean people and Africans South of the Sahara.
Ikin et al (1969) obtained the 'O' blood group frequency of the
Burmese to be 0.2892 with a genic frequency of 0.16667. Roberts et
al (1972) obtained the genic frequency of the Sinhalese of Ceylon
to be 0.123.
Worlledge et al (1974) worked on 26,027 donor samples of the
UNIVERSITY
OF I
BADAN LIBRARY
97Yoruba to obtain an 'O' blood group percentage as 51.5 and genic
frequency of 0.717. This value compared with those of some
neighbouring language sub-families of the Yoruba (Table 7).
Abdullahi (1976) obtained the 'O' blood group genic frequency
of Arabs in Basrah to be 0.621. He noted how the effect of the
genetic isolation of a group due to social and geographical
barriers could inhibit gene exchange with other region's
population.
Mitchel and Sunderland (1978) showed how the effect of very
large numbers of immigrant population in proportion to total
population of the indegenous inhabitants of a territory, could be
of considerable genetic influence on the ABO blood group
frequencies, if these immigrants' frequencies reflect some
dominance or dilution.
Attai et al (1985) showed that the blood group percentage of
a subgroup could be influenced by other boundary groups. Some of
such groups have been shown by other workers to exhibit the stated
ABO blood group percentiles and gene frequencies (Table 6).
ABO Grouping Data of the Yoruba: Findings
Research by earlier workers on the ABO blood grouping of the
Yoruba have so far been largely based on the assumption that there
was considerable biological homogeneity within the Yoruba language
UNIVERSITY
OF I
BADAN LIBRARY
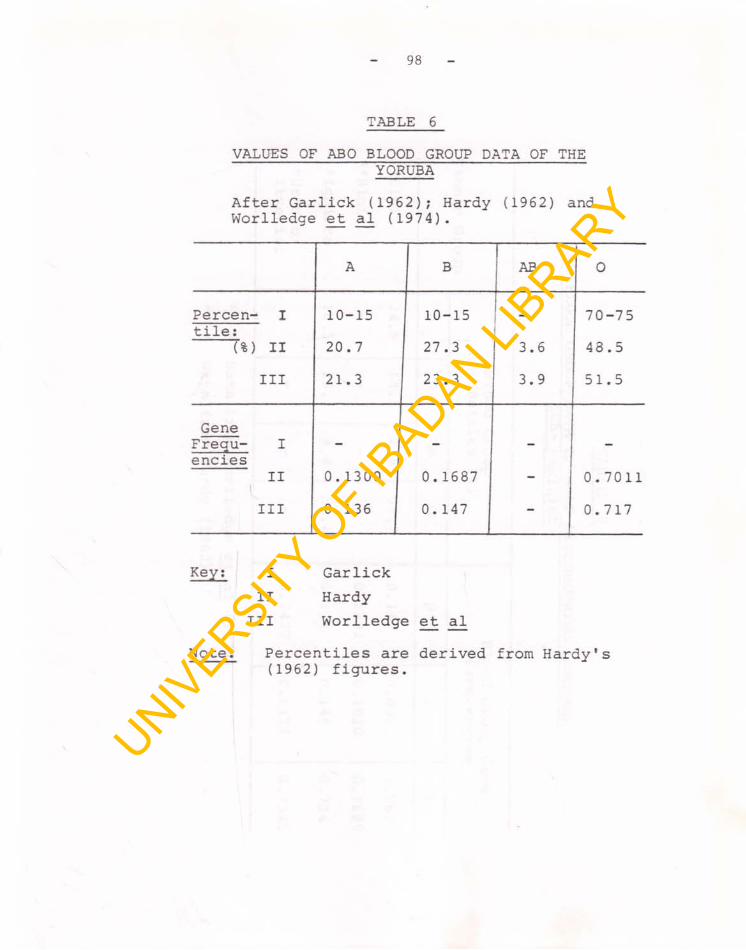
98
VALUES OF ABO BLOOD GROUP DATA OF THE YORUBA
TABLE 6
After Garlick (1962); Hardy (1962) and Worlledge et al (1974).
A AB O
Percen- I 10-15 10-15 70-75tile:
(%) II 20.7 27.3 3.6 43.5
III 21.3 23.3 3.9 51.5
GeneFrequ- I - - - -encies
\II 0.1300 0.1687 - 0.7011
III 0.136 0.147 - 0.717
Key: I GarlickII Hardy
III Worlledge <et al
Note: Percentiles are derived from Hardy's (1962) figures.
UNIVERSITY
OF I
BADAN LIBRARY
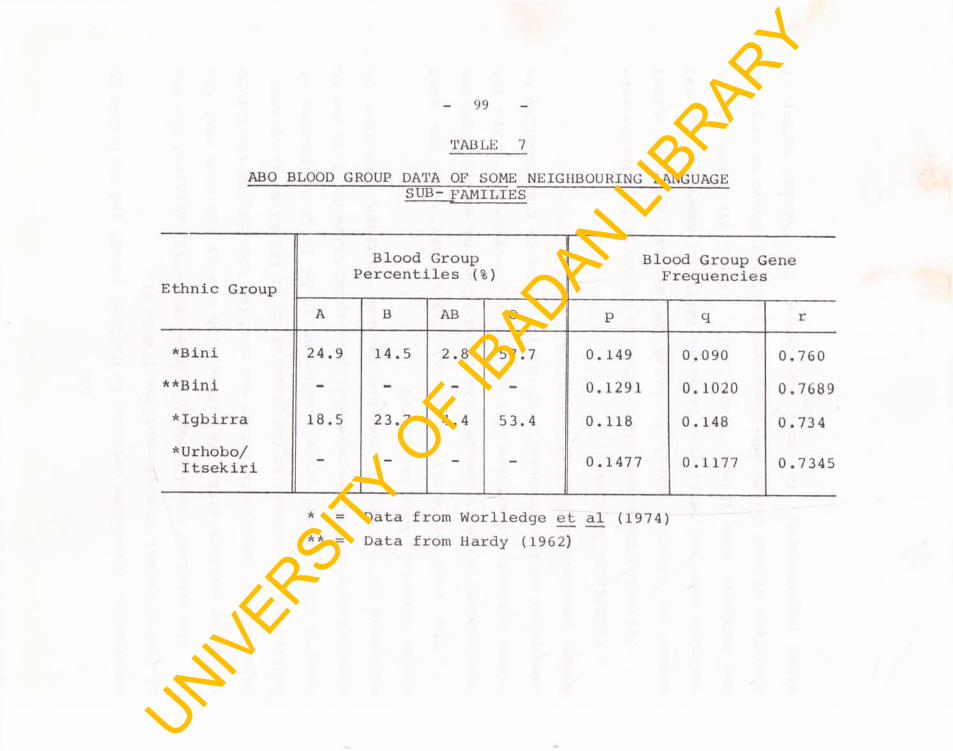
99
ABO BLOOD GROUP DATA OF SOME NEIGHBOURING LANGUAGESUB- FAMILIES
TABLE 7
Ethnic GroupBlood Group
Percentiles (%)Blood Group Gene
Frequencies
A B AB o P q r
*Bini 24.9 14.5 2.8 57.7 0.149 0.090 0.760**Bini - - - - 0.1291 0.1020 0.7689*Igbirra 18.5 23.7 4.4 53.4 0.118 0.148 0.734*Urhobo/Itsekiri 0.1477 0.1177 0.7345
* = Data from Worlledge et al (1974)** = Data from Hardy (1962)
UNIVERSITY
OF I
BADAN LIBRARY
100sub-family. The values obtained by Garlick (1962) and Worlledge et
al (1974) reveal such assumptions (Table 6).
The range of blood group 0 values (70% -75%) obtained for the
Yoruba by Garlick (1962) is rather high due to the fact that the
major discriminant of territory was used for identifying the Yoruba
individuals considered in the preparation of ABO blood group maps.
Hardy's (1962) blood group 0 value of 48.5% is an indication of
dilution compared to the more widely accepted value of 51.5% due to
Worlledge et al (1974) possibly because Southern Nigerians in
Yoruba territory were considered.
The work of Worlledge et al (1974) has been the most
representative and thorough ABO blood grouping analysis of the
Yoruba hitherto undertaken. Its limitation, however was m the its
assumption of the homogeneity of the Yoruba hence its inability to
detect possible biological partitions.
Methods of Analysis:
Following the proper identification of twenty five Yoruba sub
groups in Nigeria (Table 1) based on similar anthropological
features such as: territory, language (dialect) descent, cultural
and economic ties (Barth, 1969; Lewis, 1978), six towns in the
territory of each Yoruba sub-group were randomly chosen as sampling
sites (Appendix 1) . For most sub-groups, the average number of
UNIVERSITY
OF I
BADAN LIBRARY
101townships per territory is 10. The sampling average of 6 replicates is then assumed as being sufficiently representative. The 3,000 samples considered are taken as conveniently representative; made up of 500 blood samples per batch (or replicates) of 6 for each of the sub-groups. Blood bank donor sources make the sampling extremely ramdomised and useful for undisturbed sampling.
Blood samples were obtained from individual donors of these identified Yoruba sub-groups, based on: surnames, claim of membership of sub-group by such donors, native place and parental history of about two generations ago claimed by donor in accordance with the method adopted by Hardy (1962). The blood banks of hospitals in the selected towns were used for the convenience of meeting donor-patients who form the bulk of the blood group sampling exercise. The limitation of the blood bank records is that donors could only provide needed information based on structured questionnaires assisting the blood sampling.Blood sample records of identifiable donor-patients of each subgroup were also used in line with the method of Worlledge et al (1974). These blood bank-based records and the field samples afforded the 3000 individuals from each Yoruba sub-group considered in this study.
The collection of blood samples, blood grouping analysis and
UNIVERSITY
OF I
BADAN LIBRARY
102blood group records took place between April, 1988 and October 1990; then February to July, 1991. The statistical analysis was carried out between August 1991 and April 1992.
ABO Blood grouping: Principles and ProceduresThe ABO blood group system makes it possible to divide a
population into four groups: A, B, AB and 0 (O denoting the absence of A and B) Blood group antigens A and B present or absent in the red blood cells make the determination of the four ABO blood groups possible. Boorman and Dodd, (1970). Corresponding to the antigens A and B are antibodies anti-A (q() and anti-B (/*) which occur in the sera of individuals whose red blood cells lack the correspondingantigen. It is through agglutination reaction of the red cells that
\the blood group of an individual is determined. The individuals cells are either tested with standard Anti-A and Anti-B sera (reagent) or by testing the serum (blood fluid) with standard red cells of groups A and B. The methods are used in blood grouping as a check and to assure reliability. (Boorman and Dood, 1970).
Genuine agglutination differs from rouleax formation (or blood cell piling) which can be due to:
i) a disturbance of the albumin - globulin balance especially in patients with acute infection.
ii) drying up of blood smear.
UNIVERSITY
OF I
BADAN LIBRARY
103
iii) high concentration of cell suspension (Boorman and Dodd, 1970).
The materials used in the blood grouping analysis included: stainless steel lancets, porcelain tiles, Physiological saline (0.85 - 0.90%), Dropper pipettes, Walgreen's 91% alcohol, cotton wool, cold flask, Anti A, Anti B and Anti A+B grouping sera, Stainless steel tray, Stainless steel cup, wooden swab, glass bottles and glass beakers.
All the materials listed above were carried in a clean bag, with the exception of the blood grouping sera (Anti-A, Anti-Band Anti A+B) which were always put into the cold flask to avoid deterioration which can encourage bacterial growth and hence 'bacteriogenic agglutination' (Dacie & Lewis, 1984) which is false.
At the sampling centres, all these materials were kept on the stainless steel tray. The stainless steel cup was always used to contain alcohol-soaked cotton swab. Blood samples taken were introduced into the glasses bottles with the aid of the dropper pipette.
Before the grouping sera were used, they were first of all tested with blood samples of known ABO groups mixed with physiological saline (2 -5% of blood in saline). These were set aside as control to ascertain the potency of the sera which had
UNIVERSITY
OF I
BADAN LIBRARY
104
been carried in the cold flask to avoid deterioration.Each blood sampling procedure was then carried out as follows:
Cotton swab soaked in 91% alcohol is used to clean an uprightly- held thumb of donor. The thumb was then pricked with a stainless lancet until blood drops emerged.
The blood drops were pipetted off and dropped carefully into a sample bottle. The pipette was then used to withdraw aliquot parts of blood (2 - 5% by volume) into sample bottles containing saline solution of known volume. For instance, 0.2ml of blood sample was introduced into a sample bottle containing 9.8ml of saline solution.
A drop each of this blood/saline mixture was then pipette outiand placed onto a clean side of a white tile at three points
marked: Anti-A; Anti-B; and Anti A+B to ensure the addition of correct grouping sera. One drop of anti sera was added to each drop of blood/saline mixture. Mixing was then done with a separate wooden spatula in each case to hasten reaction.
The blood/saline drops were observed for agglutination reactions within 5 minutes (Table 8). Beyond this, any agglutination is disregarded since false positive reaction(s) may then be noticed afterwards, especially due to drying up. This procedure ensures that the cells in the blood sample are used to
UNIVERSITY
OF I
BADAN LIBRARY
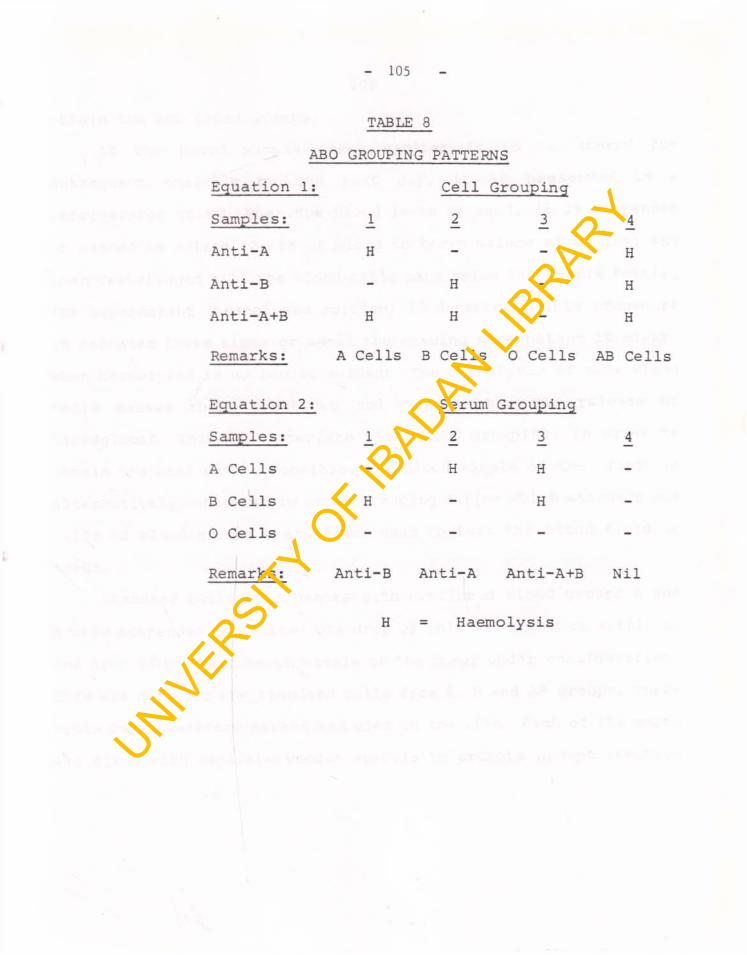
105
TABLE 8ABO GROUPING PATTERNS
Equation Is Samples: 1
Cell2
Groupinq3 4
Anti-A H - - HAnti-B - H - HAnti-A+B H H - H
Remarks: A Cells B Cells 0 Cells AB Cells
Equation 2: Samples: 1
Serum2
Grouping3 4
A Cells - H H -B Cells H - H -
0 Cells - - - -
Remarks: Anti-B Anti-A Anti-A+B Nil
H = Haemolysis
UNIVERSITY
OF I
BADAN LIBRARY
106
obtain the ABO blood groups.If the blood sample taken earlier is to be stored for
subsequent analysis by the next day, it is preserved in a refrigerator at 4°C. When the blood is to be used, it is suspended or washed in saline (2 -5% of blood to known volume of saline) and then centrifuged till the blood cells pack below the sample bottle. The supernatant (heamolysed portion) is decanted . This procedure is repeated three times or until the ensuing supernatant is clear, when heamolysis is no longer evident. The haemolysis of some blood cells causes their breakdown and consequently the release of haemoglobin. This can interfere with blood grouping. In order to obtain the best result possible, the blood sample of the donor is alternatively subjected to serum grouping during which standard red cells of blood groups A and B are used to test the blood fluid or serum.
Standard cells from donors with confirmed blood groups A and B were suspended in saline. One drop of this was added on a tile to one drop of the neat serum sample of the donor under consideration. This was done for the standard cells from A, B and AB groups. Three spots were therefore marked and used on the tile. Each of the spots was mixed with separate wooden spatula to promote prompt reactionUNIV
ERSITY O
F IBADAN LI
BRARY
107
of the constituents. Agglutination reaction was observed during the first five minutes of this serum grouping. The interpretation of this result was based on the fact that blood group 'A' persons carry anti-B in their sera while blood group 'B' persons carry anti-A; blood group 'O' persons carry anti A+B, and blood group AB individuals carry neither. The ABO blood grouping pattern is as elucidated in Table 8
The samples 1,2,3 and 4 considered in both equations (Table 8) can be thus interpreted as in Table 9.
Used glassware, especially pipettes, sample bottles, tiles were washed thoroughly in alcohol to afford adequate sterilization before re-use.
Statistical Analysis:Blood group records obtained for each Yoruba sub-group were
recorded, then subjected to the calculation of percentiles and gene frequencies (Table 10) after the methods of Race and Sanger (1968); Boorman and Dodd (1970); and Worlledge et al (1974). (For details, see Appendices 6 - 15).
The replicates obtained for blood group records (appendices 4 -6) were subjected to analysis of variance (Anova) tests to detect the levels of significant differences, interactions (or overlaps) within the Yoruba sub-groups (Appendices 6 -15). (Bailey, 1959);
UNIVERSITY
OF I
BADAN LIBRARY
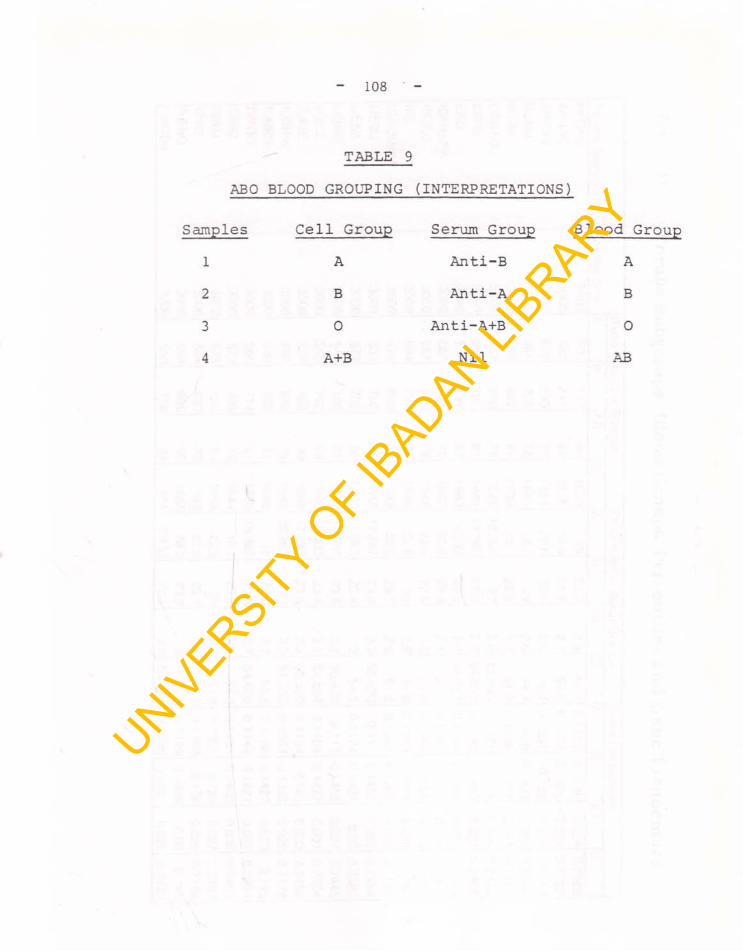
108
TABLE 9ABO BLOOD GROUPING (INTERPRETATIONS)
Samples Cell Group Serum Group Blood (1 A Anti-B A2 B Anti-A B3 0 Anti-A+B 04 A+B Nil AB
UNIVERSITY
OF I
BADAN LIBRARY
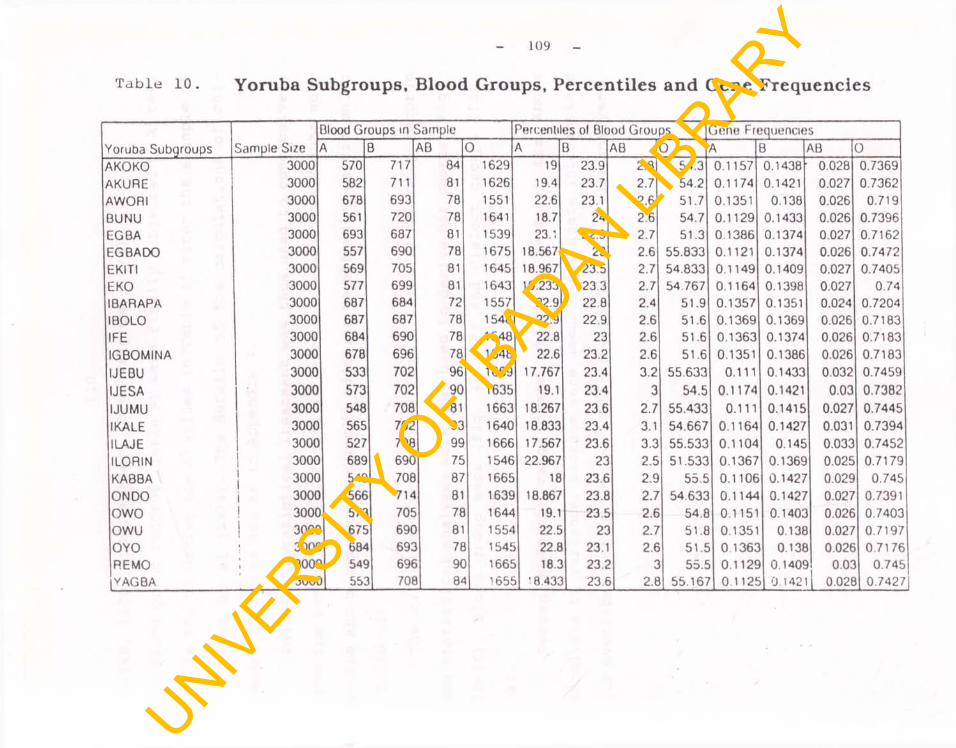
Table 10. Yoruba Subgroups, Blood Groups, Percentiles and Gene Frequencies
Yoruba Subgroups
Blood Groups in Sample Percentiles ol Blood Groups Gene FrequenciesSample Size A B AB O A B AB O A B AB 0
AKOKO 3000 570 717 84 1629 19 23.9 2.8 54.3 0.1157 0.1438 0.028 0.7369
AKURE 3000 582 711 81 1626 19.4 23.7 2.7 54.2 0.1174 0.1421 0.027 0.7362AWORI 3000 678 693 78 1551 22.6 23.1 2.6 51.7 0.1351 0.138 0.026 0.719BUNU 3000 561 720 78 1641 18.7 24 2.6 54.7 0.1129 0.1433 0.026 0.7396EG BA 3000 693 687 81 1539 23.1 22.9 2.7 51.3 0.1386 0.1374 0.027 0.7162EGBADO 3000 557 690 78 1675 18.567 23 2.6 55.833 0.1121 0.1374 0.026 0.7472EKITI 3000 569 705 81 1645 18.967 23 5 2.7 54.833 0.1149 0.1409 0.027 0.7405EKO 3000 577 699 81 1643 19.233 23.3 2.7 54.767 0.1164 0.1398 0.027 0.74IBARAPA 3000 687 684 72 1557 22.9 22 8 2.4 51.9 0.1357 0.1351 0.024 0.7204IBOLO 3000 687 687 78 1548 22.9 22.9 2.6 51.6 0.1369 0.1369 0.026 0.7183IFE 3000 684 690 78 1548 22.8 23 2.6 51.6 0.1363 0.1374 0.026 0.7183IGBOMINA 3000 678 696 78 1548 22.6 23.2 2.6 51.6 0.1351 0.1386 0.026 0.7183
IJEBU 3000 533 702 96 1669 17.767 23.4 3.2 55.633 0.111 0.1433 0.032 0.7459
IJESA 3000 573 702 90 1635 19.1 23.4 3 54.5 0.1174 0.1421 0.03 0.7382
IJUMU 3000 548 708 81 1663 18.267 236 2.7 55.433 0.111 0.1415 0.027 0.7445
IKALE 3000 565 702 93 1640 18.833 23.4 3.1 54.667 0.1164 0.1427 0.031 0.7394
ILAJE 3000 527 708 99 1666 17.567 23.6 3.3 55.533 0.1104 0.145 0.033 0.7452ILORIN 3000 689 690 75 1546 22.967 23 2.5 51.533 0.1367 0.1369 0.025 0.7179KABBA 3000 540 708 87 1665 18 23.6 2.9 55.5 0.1106 0.1427 0.029 0.745
ON DO 3000 566 714 81 1639 18.867 23.8 2.7 54.633 0.1144 0.1427 0.027 0.7391OWO 3000 573 705 78 1644 19.1 23 5 2.6 54.8 0.1151 0.1403 0.026 0.7403OWU 3000 675 690 81 1554 22.5 23 2.7 51.8 0.1351 0.138 0.027 0.7197OYO ! 3000 684 693 78 1545 22.8 23.1 2.6 51.5 0.1363 0.138 0.026 0.7176REMO ; 3ooc 549 696 90 1665 183 23.2 3 55.5 0.1129 0.1409 0.02 0.745
|YAGBA 300C 552 708 84 1 1655 • 8.433 23.6 2.8 55.167 0.1125 0.1421 I o.o2e 0.7427
UNIVERSITY
OF I
BADAN LIBRARY
110Clarke, 1530, 1980; Parker, 1979; Walpole, 1974).The blood group records (Table 9) were finally subjected to X2 test (Table 10) to derive the X2 values in Table 11 after the example of Worlledge et a_l (1974). The details of the calculations of chi- square X2 values are as in Appendix 4.
This last statistical treatment was thus used to conclusively show the extent of significant differences between the Yoruba subgroups ABO blood group values in addition to affording partitioning (Table 11) .
The values so far obtained from all the blood group records and statistical analyses were then used to derive bar charts (Figs. 20-35), Blood group maps (Fig. 40 -47) and dialect groups (Fig. 48) .
Duncan multiple range tests which is part of the Anova (Analysis of variance) package were used to elucidate interactions (or overlaps) and partitions within the Yoruba sub-groups analysed.
UNIVERSITY
OF I
BADAN LIBRARY
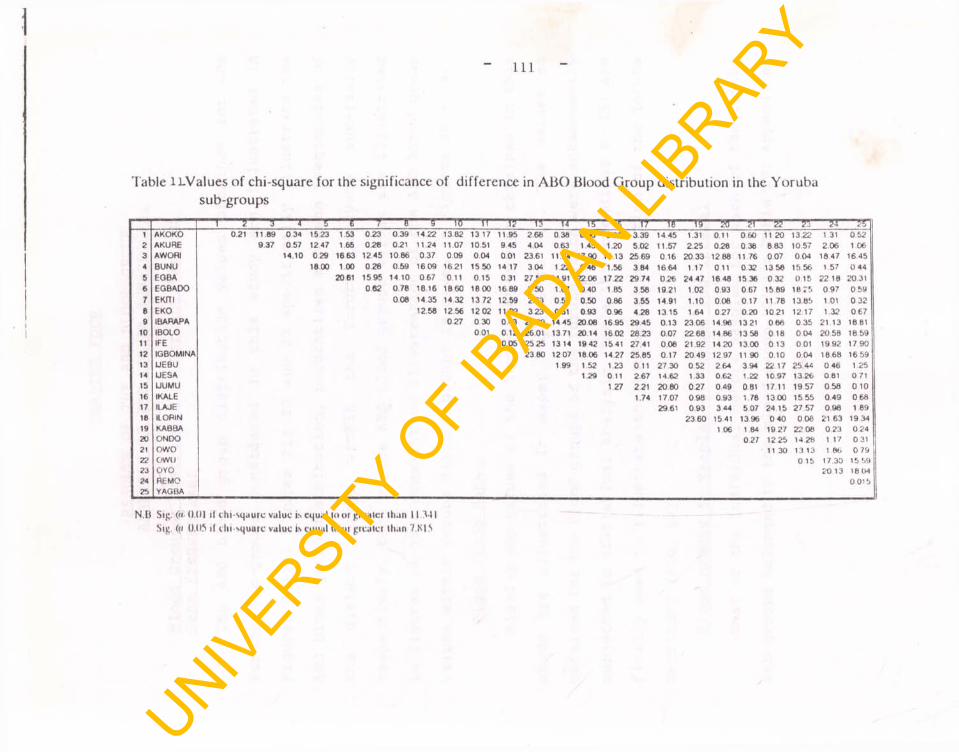
1
- I l l
Table lLValues of chi-square for the significance of difference in ABO Blood Group distribution in the Yoruba sub-groups
— i— r — r— r— r— r— r— r-------9 10 11 — rr— rr 14 “ rr- r r — rr“ T T — t r 20 21 — 7T T T — ? r “ T T1 AKOKO 0.21 11.89 0 34 15 23 1 53 0.23 0 3 9 14 22 1382 13 17 11.95 2 6 6 038 0.90 0 6 8 3 39 14 45 1.31 0 11 0 6 0 11 20 13.22 1 31 0 522 AKURE 9.37 0 5 7 1247 1.65 0 28 0.21 11.24 11.07 10.51 9 45 4.04 0 6 3 1.45 1.20 5.02 11.57 2 2 5 0.28 0 36 8 8 3 10.57 2.06 1.063 AWORI 14.10 0 2 9 1663 1245 1086 0.37 0.09 0 0 4 0.01 23.61 11.94 17.90 14.13 25 69 0 16 20 33 1288 11 76 0 07 0.04 18 47 16 454 BUNU 1800 1 00 0 2 8 0.59 1609 1621 1550 14 17 304 1 22 0 4 6 1.56 3 84 1664 1.17 O i l 0 32 13 56 15 56 1.57 0 445 EGBA 20 61 15 95 14 10 0 6 7 0 11 0.15 0 31 27 58 1491 22 06 1722 2974 0.26 24 47 1648 1536 0 3 2 0 15 22 18 20.316 EQBADO 0 6 2 0 7 8 18 16 1860 1800 16 89 2 5 0 1.67 0 40 1 85 3 5 8 19.21 1 02 0.93 0 67 15 89 18 75 0 97 0 5 97 EKJTI 0 0 8 14 35 1432 13 72 1259 2.63 0 52 0.50 086 3 5 5 14 91 1.10 0 08 0 17 11 78 13.85 1.01 0 328 EKO 12.58 1256 1202 11.02 3 23 0.51 0 9 3 0 9 6 4 28 1315 1.64 0.27 0.20 1021 12.17 1.32 0 6 79 IBARAPA 0 2 7 0 30 0 4 3 26 99 1445 20 06 1695 29 45 0.13 2 30 6 14.96 13 21 0 6 6 0.35 21.13 16.81
10 IBOLO 001 0 12 26 01 1371 20 14 1602 28.23 0.07 22 68 14.86 1358 0 18 0 0 4 20.58 18 5911 IFE 0 0 5 25 25 13 14 19 42 1541 27.41 0.06 21.92 14 20 13 00 0 13 0.01 1992 17 9012 IGBOMINA 23.80 1207 1806 14.27 25.85 0.17 2 0 4 9 1297 11.90 0.10 0 04 18 68 16 5913 UEBU 1.99 1 52 1.23 0 11 27 30 0 52 264 3 94 22 17 25 44 0 46 1.2514 UESA 1.29 0.11 2 67 14.62 1.33 0 6 2 1.22 10 97 13.26 0 81 0 7115 UUMU 1 27 221 20 80 0 2 7 0 4 9 081 17.11 1957 0 5 8 0 1016 IKALE 1.74 17 07 0 9 8 0.93 1 78 1300 1555 0 4 9 0 6 817 ILAJE 29 61 0 9 3 3 4 4 5 07 24 15 27 57 0 9 8 1 8918 ILOPIN 2 36 0 15 41 1396 0 40 0 0 8 21 63 19 3419 KABBA 1.06 1 84 19 27 22 08 0 2 3 0 2 420 ONDO 0 27 12 25 14 28 1 17 0 3121 OWO 11 30 13 13 1 86 0 7922 OWU 0 15 17.30 15 5923 OYO 2-0 13 18 0424 REMO 0 01525 YAGBA
N.B Sig. (ti 0.01 if chi-sqaurc value is equal to or greater than 11341 Sig. O' 0.05 if tin squuic value is equal lout greater Ilian 7.815
UNIVERSITY
OF I
BADAN LIBRARY
CHAPTER FOURRESULTS OF THE ABO BLOOD C-ROUP
ANALYSIS OF THE YORUBA SUB-GROUPS.Blood Groups: Distribution. Percentiles andGene Frequencies:The ABO blood group distribution values obtained for the
Yoruba sub-groups considered in this study are illustrated in Figures 20-35. Figures 21; 22 and 23 specifically illustrate the ABO blood group distribution, percentiles and gene frequencies of the dialect groups within the Yoruba language sub-family respectively. Each of the ABO blood groups values are illustrated in figures 24-35 A comparative illustration of the ABO blood group values within Yoruba dialect groups is given in Figures 36 - 39.
Blood Group MapsBlood group values of the Yoruba sub-groups obtained in this
study are illustrated in maps: Figures 40 -47. The values soobtained for the blood groups of the Yoruba which were subsequently subjected to statistical analysis (Table 10; Appendices 8 -15) are finally used to illustrate the biological partition of the Yoruba territory (Fig. 48).
Blood groups in Samples of Yoruba Sub-Groups:Most of the individual donors sampled for each of the Yoruba
sub-groups belonged to the blood group 'O' (in Table 10; Appendices112
UNIVERSITY
OF I
BADAN LIBRARY
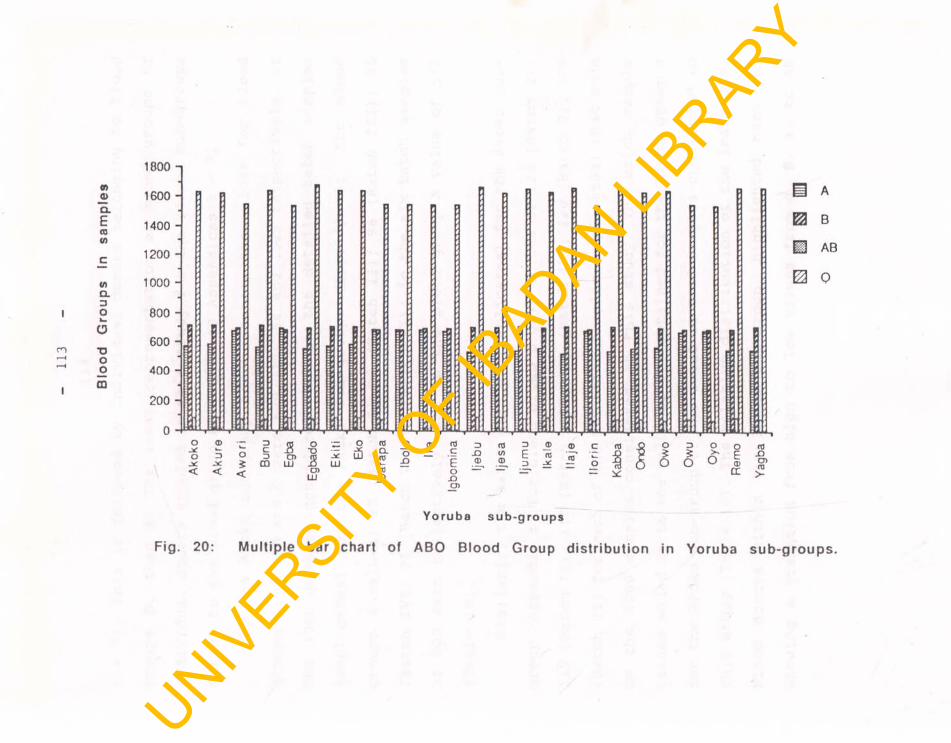
Blo
od
G
rou
ps
In
sam
ple
s
1800 n
Y o ru b a s u b - g r o u p s
Fig. 20: M ultip le bar chart of ABO B lood Group d is tr ib u tio n in Yoruba sub-g roup s.
UNIVERSITY
OF I
BADAN LIBRARY
114
5 - 7). This is followed by individual donors belonging to blood groups B, then A. The least representation of blood groups of individual donors sampled in this study for the Yoruba sub-groups belong to the blood group AB (Table 10 Appendices 5 - 7).
In the Akoko sub-group for instance, the values for blood groups A, B, AB and 0 were 570,717, 84 and 1629 respectively, of the 3000 samples considered. Within the detailed batch samples (replicates) for the Akoko sub-groups (Appendix 5) , the blood groups A values: 95 (Batch I) 55 (Batch II) ; 96 (Batch III) ; 95 (Batch IV); 94 (Batch V); 95 (Batch VI); in the six batch samples of 500 each collectively made up the blood group A value of 570 (Table 10).
Similarly, the batch samples (replicates) for the Akoko subgroup (Appendix 5) for blood group B gave values of 120 (Batch I); 119 (Batch II); 118 (Batch III); 121 (Batch IV); 120 (Batch V); 119 (Batch VI) for each of the 500 batch samples (replicates) that made up the 3000 samples considered in this study. The batch sample values added up to the value of 717 obtained for the blood group B for the Akoko sub-group of the total of 3000 samples considered in this study (Table 10). The relative distribution of the individual blood donors within the Akoko sub-group, highlighted here and showing a gradation from high to low values from 0, B, A, to AB
UNIVERSITY
OF I
BADAN LIBRARY
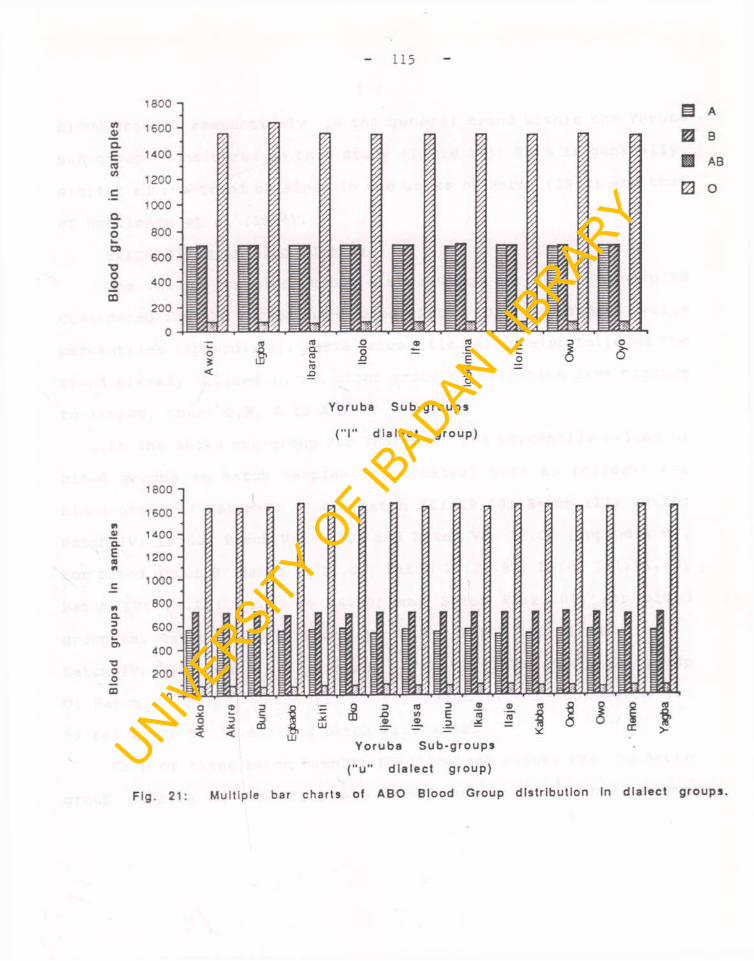
Blo
od
g
rou
ps
In
sa
mp
les
Blo
od
g
rou
p
in
sam
ples
115
1800
1600
1400
1200
1000
800
600
400
200
0
o>
m a E3 B
H AB
□ O
Yoruba S u b -g ro u p s
( " I ” d ia le c t g ro u p )
1800
1600
1400
1200
1000 -
800
600 -
400 - H
200 *
01
I
m
; / / /i■:*
1
i
o ®° 1< <
DCcS 5 t§ 3 CO D ®
-O CO E 99 .2, D I I*Y o ru b a S u b -g ro u p s
( " u " d ia le c t g ro u p )
Fig. 21: M ult ip le bar charts of ABO B lood Group d is t r ib u t io n in d ia le c t g ro up s .
UNIVERSITY
OF I
BADAN LIBRARY
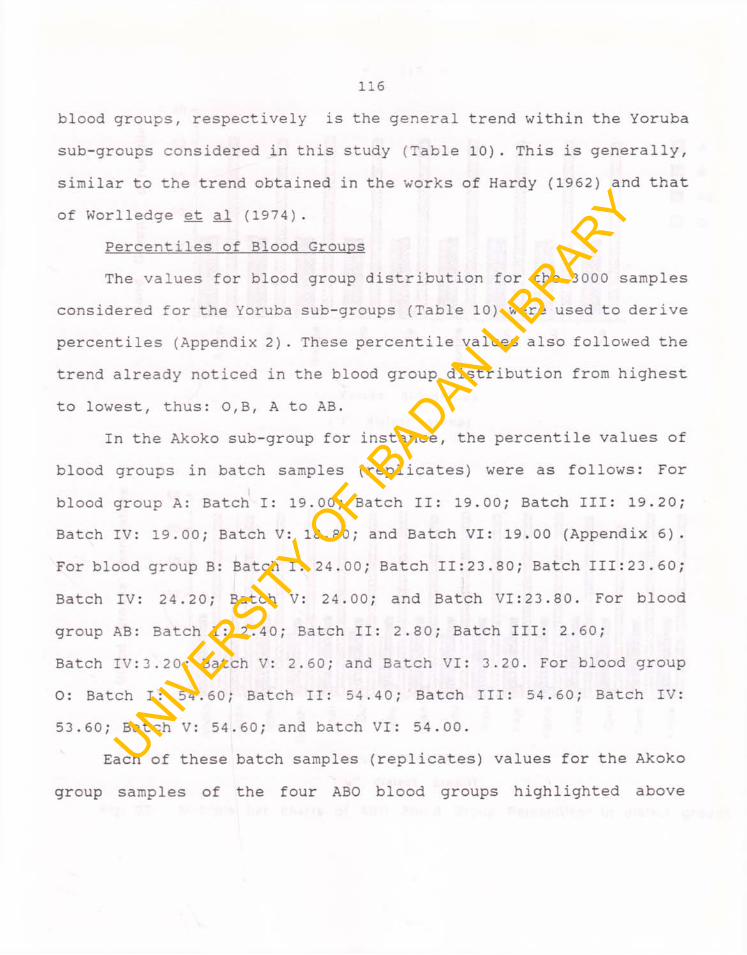
116
blood groups, respectively is the general trend within the Yoruba sub-groups considered in this study (Table 10). This is generally, similar to the trend obtained in the works of Hardy (1962) and that of Worlledge et al (1974).
Percentiles of Blood GroupsThe values for blood group distribution for the 3000 samples
considered for the Yoruba sub-groups (Table 10) were used to derive percentiles (Appendix 2) . These percentile values also followed the trend already noticed in the blood group distribution from highest to lowest, thus: 0,B, A to AB.
In the Akoko sub-group for instance, the percentile values of blood groups in batch samples (replicates) were as follows: For blood group A: Batch I: 19.00; Batch II: 19.00; Batch III: 19.20; Batch IV: 19.00; Batch V: 18.80; and Batch VI: 19.00 (Appendix 6). For blood group B: Batch I: 24.00; Batch 11:23.80; Batch 111:23.60; Batch IV: 24.20; Batch V: 24.00; and Batch VI:23.80. For blood group AB: Batch I: 2.40; Batch II: 2.80; Batch III: 2.60;Batch IV:3.20; Batch V: 2.60; and Batch VI: 3.20. For blood group O: Batch I: 54.60; Batch II: 54.40; Batch III: 54.60; Batch IV: 53.60; Batch V: 54.60; and batch VI: 54.00.
Each of these batch samples (replicates) values for the Akoko group samples of the four ABO blood groups highlighted above
UNIVERSITY
OF I
BADAN LIBRARY
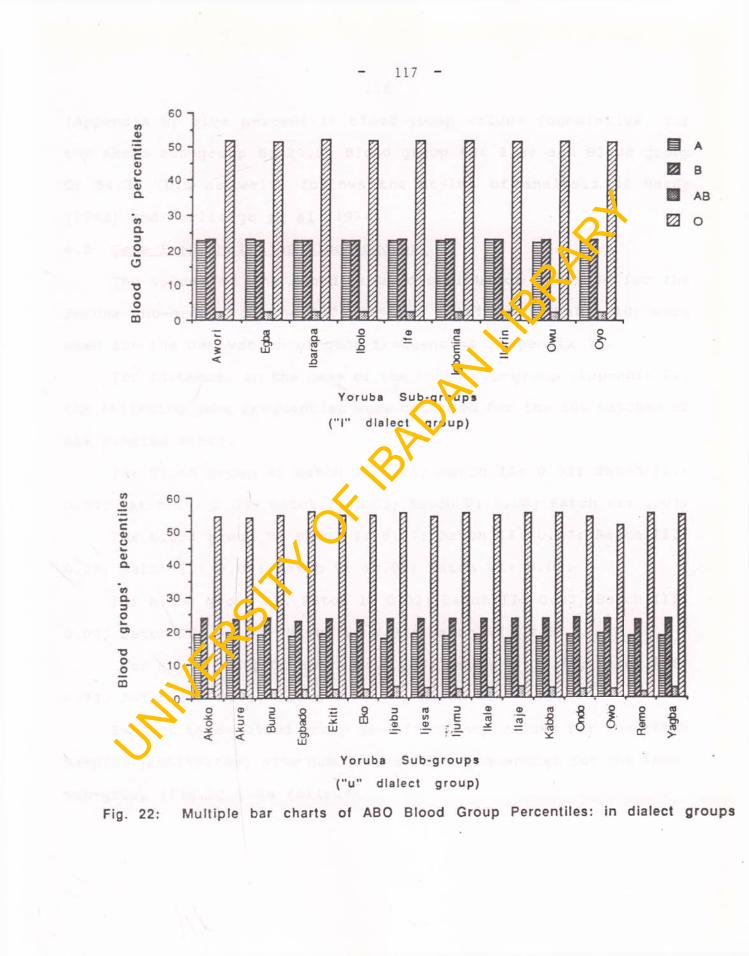
Blo
od
G
rou
ps'
p
erc
en
tile
s
117
60 -|
50
40 -
30 -
20 -
10 -
0
ESI B
M AB
H O
Yoruba S u b -g ro u p s
( " I " d ia le c t g ro u p )
tno
coow0>Cl
V)Q.3Oi—o>
■ooom
60 -
50 -
40 -
30 -
20 -
10 -
0! I t
oXOx<DX<
DCD
CD5
-O
LU
UJ
D 03 Dn tn E 03® r D
2.m I03Yoruba S u b -g ro u p s
( " u " d ia le c t g ro u p )
a>cc >
Fig. 22: Multiple bar charts of ABO Blood Group Percentiles: in dialect groups
UNIVERSITY
OF I
BADAN LIBRARY
118
(Appendix 6) give percentile blood group values (cumulative) for the Akoko sub-group B: 23.9; Blood group A B : 2.8; and Blood group 0: 54.3. This as well, follows the styles of analysis of Hardy(1962) and Worlledge et al (1974).4.5 Gene Frequencies of Blood Groups:
The values of the blood group distribution obtained for the Yoruba sub-groups of the 3000 samples considered (Table 10) were used for the derivation of gene frequencies (Appendix 3).
For instance, in the case of the Akoko sub-group (Appendix 7) , the following gene frequencies were obtained for the 500 batches of six samples sites.
For Blood group A: Batch I: 0.02; Batch II: 0.02; Batch III: 0.03; Batch IV: 0.03; Batch IV 0.03; Batch V: 0.02; Batch VI: 0.03.
For blood group B: Batch I: 0.07; Batch II: 0.07; Batch III: 0.07; Batch IV: 0.08; Batch V: )0.07; Batch VI: 0.08.
For blood group AB: Batch I: 0.02; Batch II: 0.03; Batch III: 0.03; Batch IV: )0.03; Batch V: 0.03; Batch VI: 0.03.
For Blood group 0: Batch I: 0.074; Batch II: 0.74; Batch III: 0.74; Batch IV: 0.73; Batch V: 0.74; Batch VI: 0.73.
Each of these blood group gene frequency values for the batch samples (replicates) give cumulative gene frequencies for the Akoko sub-group (Fig.23 ) as follows:
UNIVERSITY
OF I
BADAN LIBRARY
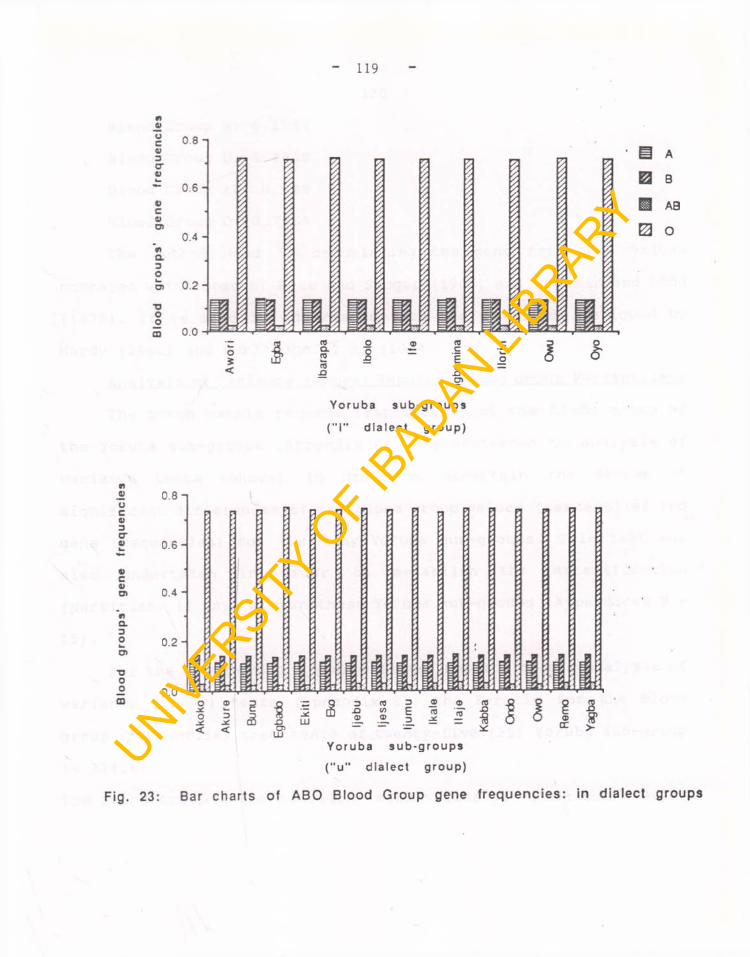
Blo
od
g
rou
ps
' g
en
e
fre
qu
en
cie
s
119
ocV3O'0>
TJOOCD
0 .8 -i
- 0.6-vc«o»
0a3O
0.4 -
5) 0.2 -
0.0 ■
o5<
Yoruba s u b -g ro u p s
( " I " d ia le c t g ro u p )
( " u " d ia le c t g ro up )
Fig. 23: Bar charts of ABO Blood Group gene frequencies: in dialect groups
UNIVERSITY
OF I
BADAN LIBRARY
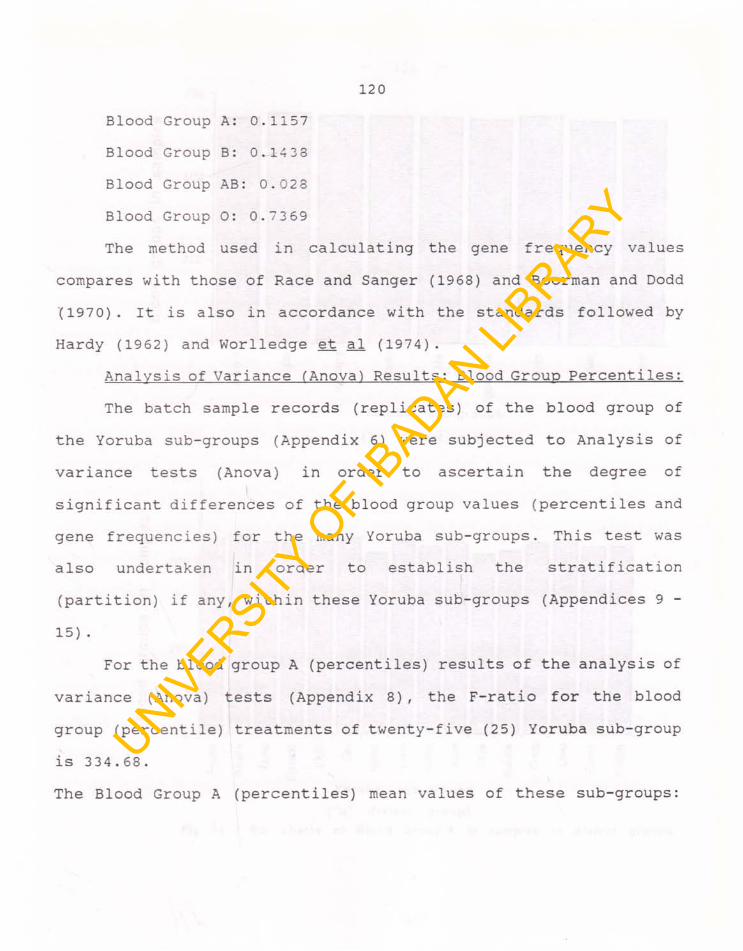
120Blood Group A: 0.1157 Blood Group B: 0.1433 Blood Group AB: 0.028 Blood Group 0: 0.7369The method used in calculating the gene frequency values
compares with those of Race and Sanger (1968) and Boorman and Dodd (1970). It is also in accordance with the standards followed by Hardy (1962) and Worlledge et al (1974).
Analysis of Variance fAnova) Results: Blood Group Percentiles; The batch sample records (replicates) of the blood group of
the Yoruba sub-groups (Appendix 6) were subjected to Analysis ofvariance tests (Anova) in order to ascertain the degree of
lsignificant differences of the blood group values (percentiles and gene frequencies) for the many Yoruba sub-groups. This test was also undertaken in order to establish the stratification (partition) if any, within these Yoruba sub-groups (Appendices 9 - 15) .
For the blood group A (percentiles) results of the analysis of variance (Anova) tests (Appendix 8) , the F-ratio for the blood group (percentile) treatments of twenty-five (25) Yoruba sub-group is 334.68.The Blood Group A (percentiles) mean values of these sub-groups:
UNIVERSITY
OF I
BADAN LIBRARY
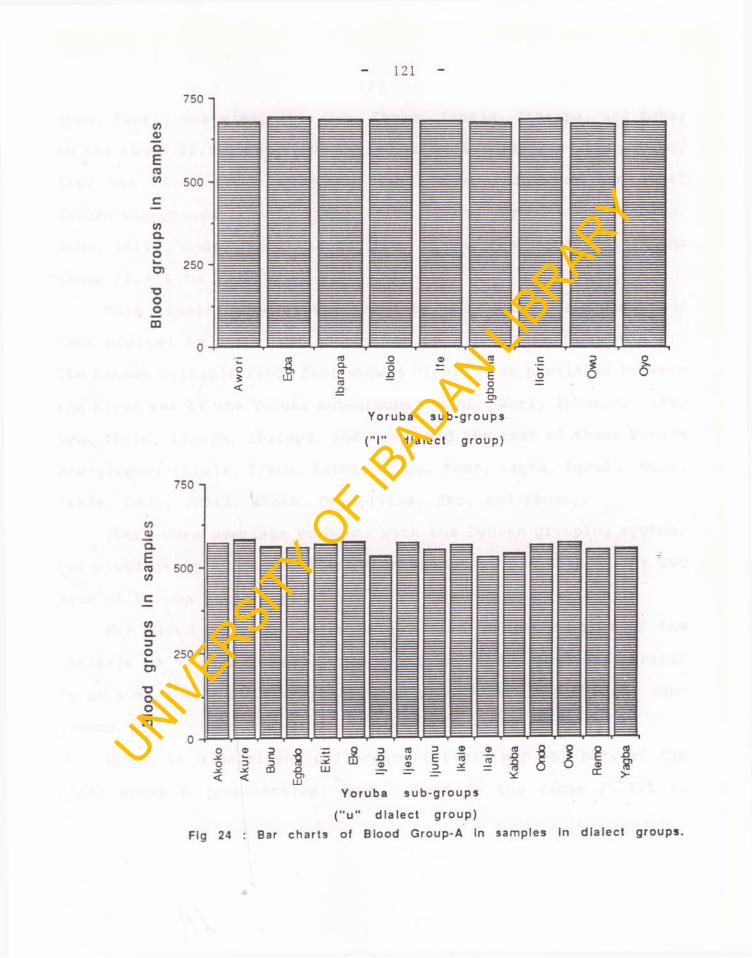
121
750 -i
10«CLErow 500 c
tOCL3Oo> 250T3OoCQ
V)_0JCLEroto
c
toQ.3Ok_D)■oOom
Y o rub a s u b -g ro u p s
( " u " d ia le c t g ro u p )
Fig 24 : Bar c h a r ts of B lood G roup-A in samples in d ia le c t g roups.
UNIVERSITY
OF I
BADAN LIBRARY
122(Owu, Awori, Igbomina, Ife, Oyo, Ibolo, Ilorin, Ibarapa, and Egba) in the range 22.50% to 23.10% varied significantly (df= 24; p>0.05) from the blood group A (percentiles) mean values of the other Yoruba sub-groups (Ilaje, Ijebu, Kabba, Ijumu, Remo, Yagba, Egbado, Bunu, Ikale, Ondo, Ekiti, Akoko, Owo, Ijesa, Eko and Akure) in the range 17.57% to 19.40%.
This significance is confirmed by the Duncan multiple range test applied on the means of the Yoruba sub-groups (Appendix 8). The Duncan multiple range test showed clearly the partition between the first set of the Yoruba sub-groups: (Owu, Awori, Igbomina. Ife, Oyo, Ibolo, Ilorin, Ibarapa, and Egba) and the rest of these Yoruba sub-groups: (Ilaje, Ijebu, Kabba, Ijumu, Remo, Yagba, Egbado, Bunu, Ikale, Ondo, Ekiti, Akoko, Owo, Ijesa, Eko, and Akure).
There were overlaps evident, with the Duncan grouping system, for blood group A (percentiles) mean values within each of the two sets of Yoruba sub-groups.
For blood group B (percentiles) mean values results of the Analysis of variance (Anova) tests (Appendix 9), gave the F-ratio to be 5.67 for the treatments of the twenty-five (25) Yourba subgroups .
There is significant difference (df=24: p>0.05) between the blood group B (percentiles) mean values in the range 22.87% to
UNIVERSITY
OF I
BADAN LIBRARY
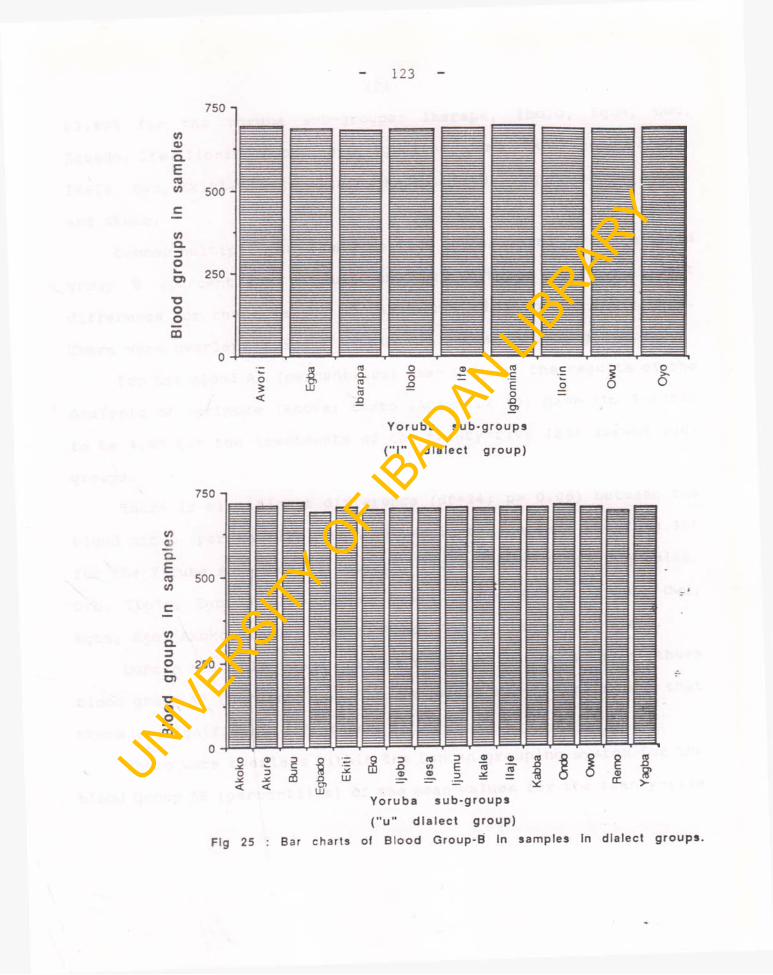
123
750 i
oiY o ru b a s u b -g ro u p s
( " I " d ia le c t g ro u p )
( " u " d ia le c t g ro u p )
Fig 25 : Bar charts of B lood Group-B In samples In d ia lect g ro u p s .
UNIVERSITY
OF I
BADAN LIBRARY
124
23.90% for the Yoruba sub-groups: Ibarapa, Ibolo, Egba, Owu, Egbado, Ife, Ilorin, Awori, Oyo, Igbomina, Remo, Eko, Ijebu, Ijesa, Ikale, Owo, Ekiti, Ilaje, Ijumu, Kabba, Yagba, Akure, Bunu, Ondo, and Akoko.
Duncan multiple range test applied on the means of these blood group B (percentiles) values show that there is significant difference for these values of the twenty-five Yoruba sub-groups. There were overlaps evident within the Duncan grouping system.
For the blood AB (percentiles) mean values, the results of the Analysis of variance (Anova) tests (Appendix 10) gave the F-ratio to be 4.00 for the treatments of the twenty-five (25) Yoruba subgroups .
There is significant difference (df=24; p> 0.05) between the blood group (percentiles) mean values in the range 2.41% to 3.30% for the Yoruba sub-groups: Ibarapa, Ilorin, Owo, Awori, Igbomina, Oyo, Ibolo, Egbado, Ife, Bunu, Ekiti, Ondo, Akure, Ijumu, Owu, Egba, Eko, Akoko, Yagba, Kabba, Remo, Ijesa, Ikale and Ijebu.
Duncan multiple range test carried out on the means of these blood group AB (percentiles) for the Yoruba sub-groups showed that there is significant difference.
There were overlaps within the Duncan grouping system for the blood group AB (percentiles) of the mean values for the twenty-five
UNIVERSITY
OF I
BADAN LIBRARY
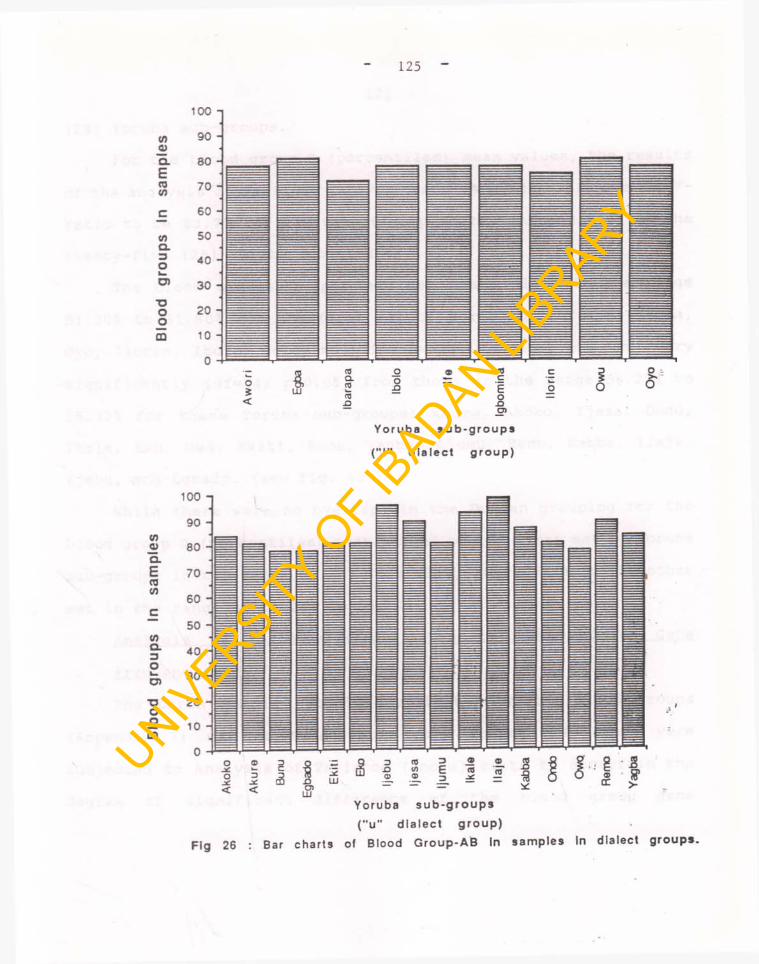
Blo
od
grou
ps
In
sam
ples
125
Yoruba s u b - g r o u p s
( " I " d ia le c t g ro u p )
in0)CLErain
c
inCL3Ok_CT■aoom
100
90
80 H
70
60
50 -j
40 -j
30
20
10
0 o ®O 3< <
3 o ~ 5? 3 CO 3 ©C
<3W ^ n lu 5 f
CO©
E3
COj C ®tr
28*>-Yoruba s u b - g r o u p s
( "u " d ia le c t g ro u p )
Fig 26 : Bar charts of Blood G ro u p -A B In sam p les In d ia lect g ro u p s .
UNIVERSITY
OF I
BADAN LIBRARY
126
(25) Yoruba sub-groups.For the blood group 0 (percentiles) mean values, the results
of the analysis of variance (Anova) tests (Appendix 11) gave the F- ratio to be 83.77 for the six (6) replicates (Appendix 6) of the twenty-five (25) Yoruba sub-groups.
The blood groups 0 (percentiles) mean values in the range 51.30% to 51.80% for the first set of Yoruba sub-groups: (Egba, Oyo, Ilorin, Ibolo, Igbomina, Ife, Awori, Ibarapa, and Owu) vary significantly (df=24; p<0.05) from those in the range 54.20% to 55.33% for these Yoruba sub-groups: Akure, Akoko, Ijesa, Ondo, Ikale, Eko, Owo, Ekiti, Bunu, Yagba, Ijumu, Remo, Kabba, Ilaje, Ijebu, and Egbado. (see Fig. 31.)
While there were no overlaps in the Duncan grouping for the blood group O (percentiles) mean values of the first set of Yoruba sub-groups in the range 51.30% to 51.80%, there were in the other set in the range of 54.20% to 55.83%.
Analysis of Variance (Anova) Results: Blood Group GeneFrequencies:The batch sample records (replicate) of the blood groups
(Appendix 7) of the twenty-five (25) Yoruba sub-groups were subjected to Analysis of Variance (Anova) tests to ascertain the degree of significant difference of the blood group gene
UNIVERSITY
OF I
BADAN LIBRARY
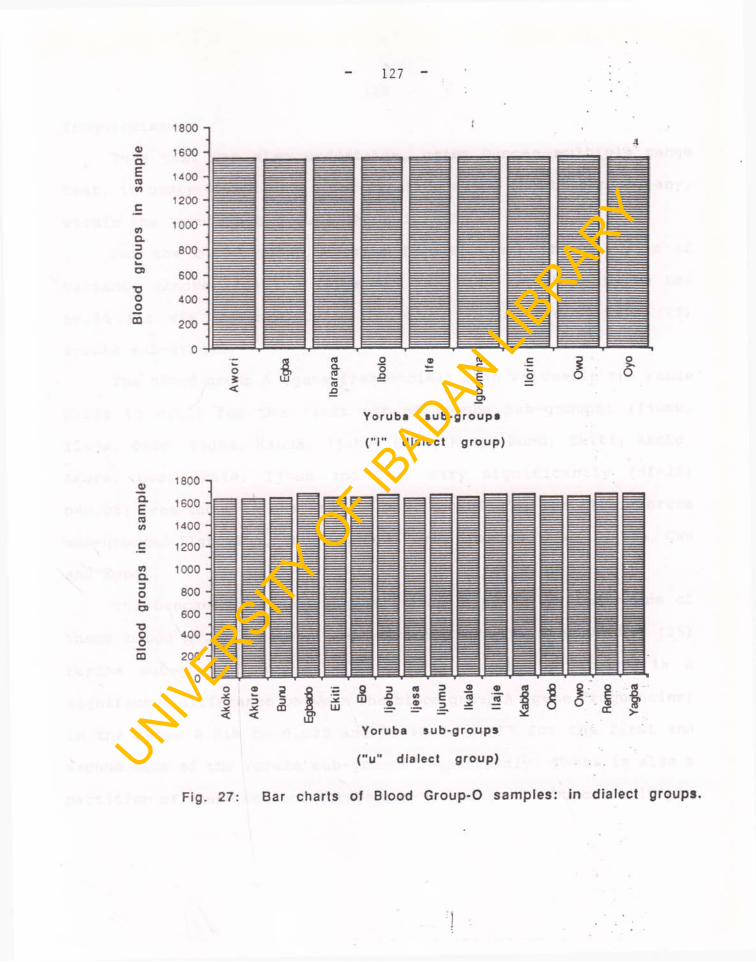
Blo
od
gro
up
s in
sa
mp
le
Blo
od
g
rou
ps
in
sam
ple
127
1800
1600
1400
1200
1000
800
600
400
200
5 \l 1OO
© <3 c
i L < jD
n i5
o
o>
Yoruba s u b - g r o u p s
( " I " d ia le c t g ro u p )
Yoruba s u b -g ro u p s
( " u " d ia le c t g ro u p )
Fig. 27: Bar charts of Blood G roup*0 sam ples: in d ialect groups.
UNIVERSITY
OF I
BADAN LIBRARY
128
frequencies.This test was also undertaken, using Duncan multiple range
test, in order to ascertain the stratification (partition) if any, within the Yoruba sub-groups (Appendix 12).
For the blood group A (gene frequencies), the analysis of Variance (Anova) results (Appendix 12) gave the F-ratio to be: 66.76 for six (6) replicates (Appendix 7) of twenty-five (25) Yoruba sub-groups.
The blood group A (gene frequencies) mean values in the range 0.018 to 0.030 for the first set of Yoruba sub-groups: (Ijumu, Ilaje, Ondo, Yagba, Kabba, Ijebu, Egba, Remo, Bunu, Ekiti, Akoko, Akure, Owo, Ikale, Ijesa and Eko) vary significantly (df=24;
ip<0.05) from those in the range 0.048 to 0.057 for the other Yoruba sub-groups: (Igbomina, Ibolo, Awori, Oyo, Ibarapa, Ilorin, Ife, Owu and Egba).
The Duncan multiple range test was applied on the means of these blood group A (gene frequencies) for the twenty-five (25) Yoruba sub-groups (Appendix 12) , and showed that there is a significant difference between the blood group A (gene frequencies) in the range 0.018 to 0.030 and 0.048 to 0.057 for the first and second sets of the Yoruba sub-groups respectively. There is also a partition of these sets of Yoruba sub-groups in the Duncan multiple
UNIVERSITY
OF I
BADAN LIBRARY
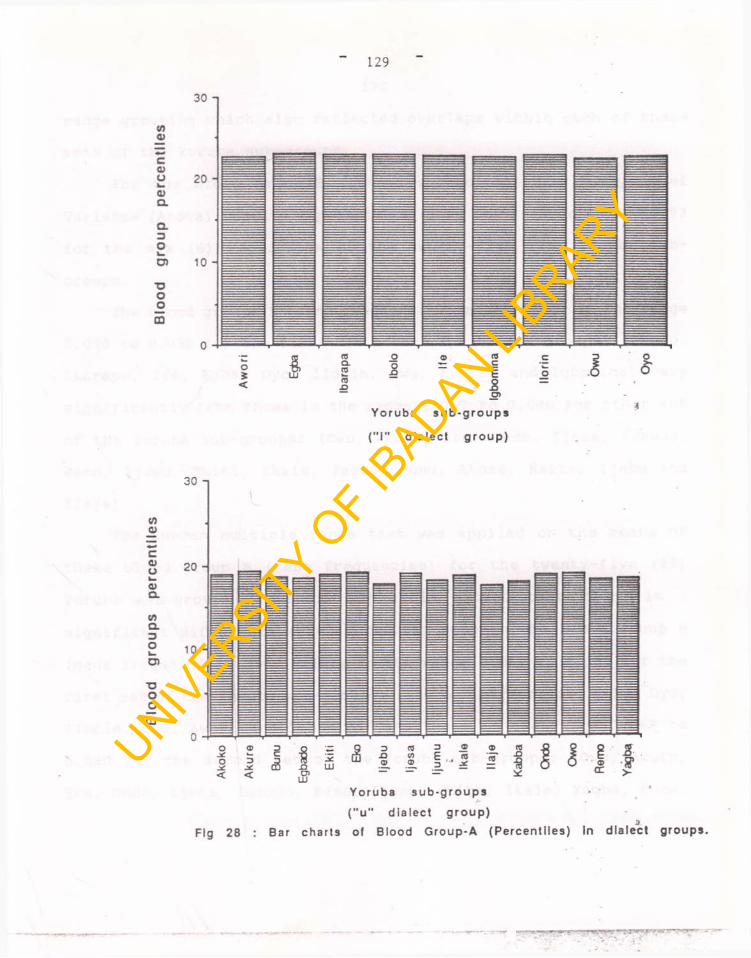
Blo
od
grou
ps
perc
entil
es
129
v> o>couk_<DCL
Q.3Oi_CT
■oOoCD
Yoruba s u b - g r o u p s
( " I " d ia le c t g ro u p )
Yoruba s u b -g ro u p s
( " u " d ia le c t g ro u p )St
Fig 28 : Bar charts ot B lood G roup-A (P e rcen t i les ) In d ia lec t g roups .
UNIVERSITY
OF I
BADAN LIBRARY
130
range grouping which also reflected overlaps within each of these sets of the Yoruba sub-groups.
For the blood group B (gene frequencies), the Analysis of Variance (Anova) results (Appendix 13) gave the F-ratio to be 30.93 for the six (6) replicates of the twenty-five (25) Yoruba subgroups .
The blood groups B (gene frequencies) mean values in the range 0.050 to 0.058 for the first set of the Yoruba sub-groups: (Ibolo, Ibarapa, Ife, Egba, Oyo, Ilorin, Owu, Awori, and Igbomina) vary significantly from those in the range 0.067 to 0.080 for other set of the Yoruba sub-groups: (Owo, Akure, Eko, Ondo, Ijesa, Egbado, Remo, Ijumu, Ekiti, Ikale, Yagba, Bunu, Akoko, Kabba, Ijebu and Ilaje) .
The Duncan multiple range test was applied on the means of these blood group B (gene frequencies) for the twenty-five (25) Yoruba sub-groups (Appendix 13). This showed that there is a significant difference (df=24; p<0.05) between the blood group B (gene frequencies) mean values in the range 0.050 to 0.058 for the first set of the Yoruba sub-groups: (Ibolo, Ibarapa,Ife, Egba, Oyo, Ilorin, Owu, Awori and Igbomina) and those in the range 0.067 to 0.080 for the second set of the Yoruba sub-groups: (Owo, Akure, Eko, Ondo, Ijesa, Egbado, Remo, Ijumu, Ekiti, Ikale, Yagba, Bunu,
UNIVERSITY
OF I
BADAN LIBRARY
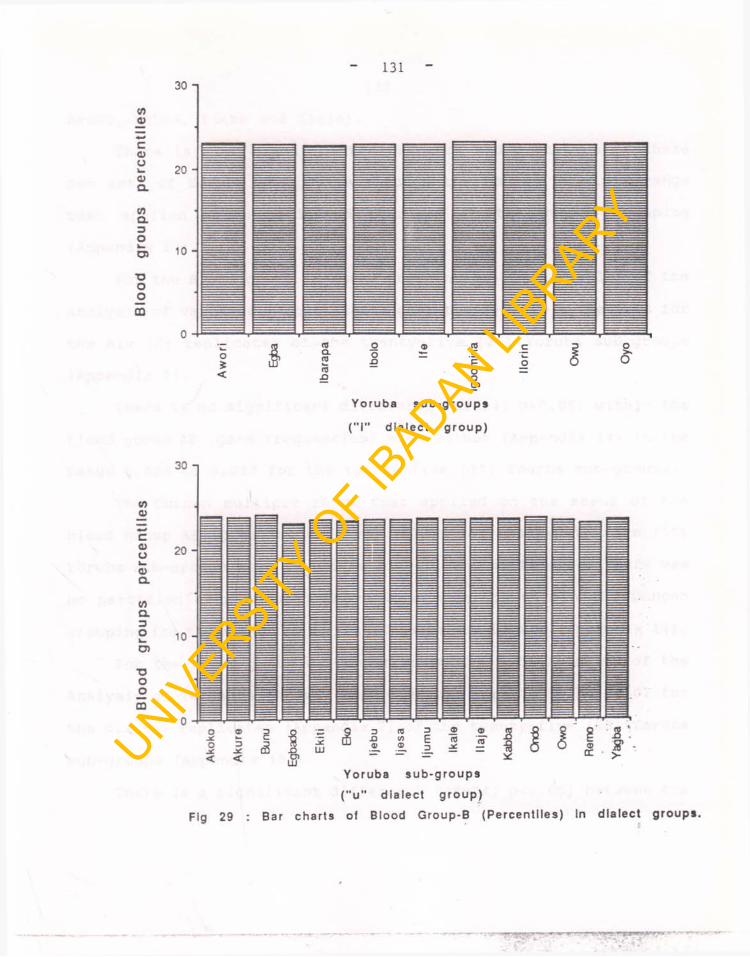
Blo
od
g
rou
ps
p
erc
en
tile
s
Blo
od
g
rou
ps
p
erc
en
tile
s
131
Yoruba s u b -g ro u p s
( " I " d ia le c t g ro u p )
30 i
20 -
10 -
o ®jC >-O 3< <
Fig 29
D o <3 D ts DC ■Q *5 H5 </> E ns5 _Q LUrr»
UJ
25 i 2 :i ■ ? -
Yoruba s u b -g ro u p s
( " u " d ia le c t g ro u p )
Bar ch a r ts of Blood Group-B (P e rcen t i les ) in d ia le c t g ro up s .
UNIVERSITY
OF I
BADAN LIBRARY
132
Akoko, Kabba, Ijebu and Ilaje).There is also significant difference and partition of these
two sets of Yoruba sub-groups through the Duncan multiple range test applied which reflected overlaps in the Duncan grouping (Appendix 13).
For the Blood group AB (gene frequencies), the results of the analysis of variance (Anova) tests gave the F-ratio to be 2.32 for the six (6) replicates of the twenty-five (25) Yoruba sub-groups(Appendix 7).
There is no significant difference (df=24; p>0.05) within the blood group AB (gene frequencies) mean values (Appendix 14) in the range 0.020 to 0.033 for the twenty-five (25) Yourba sub-groups.
The Duncan multiple range test applied on the means of the blood group AB (gene frequencies) values for the twenty-five (25) Yoruba sub-groups also showed no significant difference. There was no partition even though, there were overlaps within the Duncan grouping for the twenty-five (25) Yoruba sub-groups (Appendix 14) .
For the blood group O (gene frequencies), the results of the Analysis of variance (Anova) test gave the F-ratio to be 38.01 for the six (6) replicates (Appendix 7) of the twenty-five (25) Yoruba sub-groups (Appendix 15).
There is a significant difference (df=24; p<0.05) between the
UNIVERSITY
OF I
BADAN LIBRARY
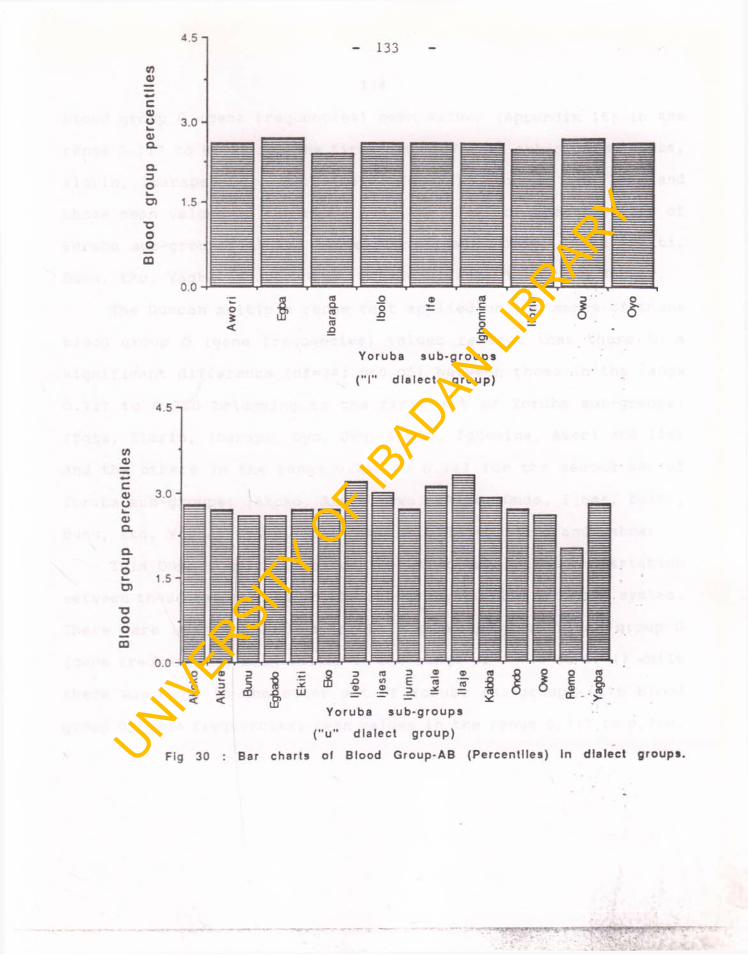
Blo
od
g
rou
p
pe
rce
nti
les
4.5133
4.5
3 .0 -
1.5 - ;
0.0 • oXoje.
® 3 — 9 ^ 3 CT3 £ o Ok—3
<
C3
CD|-Dif f
12UJ
<0a> E
3^ j? S £ns O * ° =--f
Fig 30
Y o rub a s u b -g ro u p s
( "u " d ia le c t g ro u p )
Bar charts of B lood G roup-AB (P e rcen ti les ) In d ia lec t g roups.UNIVERSITY
OF I
BADAN LIBRARY
134
blood group 0 (gene frequencies) mean values (Appendix 15) in the range 0.717 to 0.720 for the first set of Yoruba sub-groups: (Egba, Ilorin, Ibarapa, Oyo, Owu, Ibolo, Igbomina, Awori, and Ife) and those mean values in the range 0.738 to 0747 for the other set of Yoruba sub-groups (Akoko, Akure, Owo, Ikale, Ondo, Ijesa, Ekiti, Bunu, Eko, Yagba, Ijumu, Remo, Egbado, Ilaje, Ijebu and Kabba).
The Duncan multiple range test applied on the means of these blood group O (gene frequencies) values reflect that there is a significant difference (df=24; p<0.05) between those in the range 0.717 to 0.720 belonging to the first set of Yoruba sub-groups: (Egba, Ilorin, Ibarapa, Oyo, Owu, Ibolo, Igbomina, Awori and Ife) and the others in the range 0.738 to 0.747 for the second set of Yoruba sub-groups: (Akoko, Akure, Owo, Ikale, Ondo, Ijesa, Ekiti, Bunu, Eko, Yagba, Ijumu, Remo, Egbado, Ilaje, Ijebu and Kabba).
This Duncan multiple range test also established a partition between these two sets of Yoruba sub-groups in its grouping system. There were overlaps within Yoruba sub-groups with blood group O (gene frequencies) mean values in the range of 0.738 to 0.747 while there was none in the other set of Yoruba sub-groups with blood group 0 (gene frequencies) mean values in the range 0.717 to 0.720.
UNIVERSITY
OF I
BADAN LIBRARY
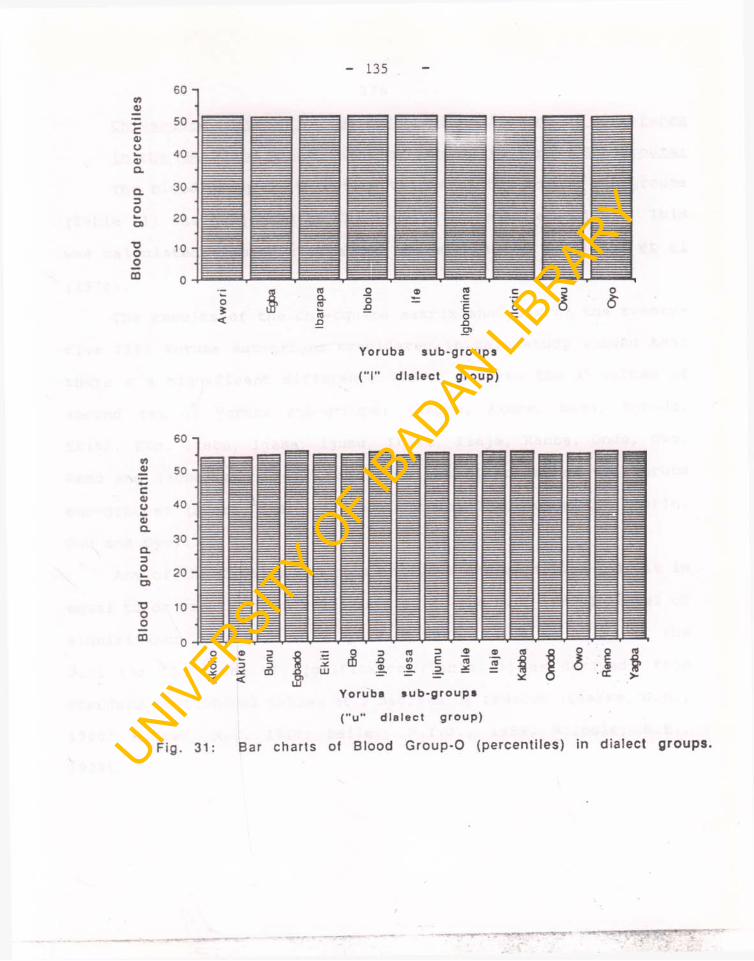
Blo
od
g
rou
p
pe
rce
ntil
es
Blo
od
9
rou
P P
erc
en
tile
s
13560 - i
at
Yoruba s u b -g ro u p s
( " I " d ia le c t g ro u p )
Yoruba s u b - g r o u p s
( " u " d ia le c t g ro u p )
Fig. 31: Bar charts of Blood G roup-0 (percentiles) in dialect groups.UNIVERSITY
OF I
BADAN LIBRARY
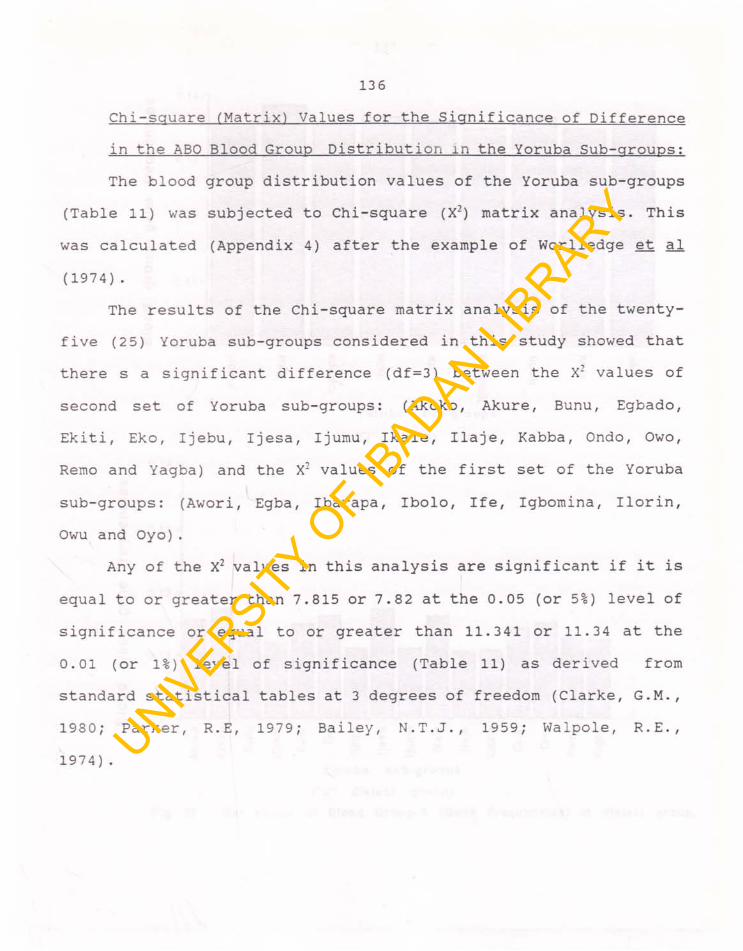
136
Chi-square (Matrix) Values for the Significance of Difference in the ABO Blood Group Distribution in the Yoruba Sub-groups: The blood group distribution values of the Yoruba sub-groups
(Table 11) was subjected to Chi-square (X2) matrix analysis. This was calculated (Appendix 4) after the example of Worlledge et al (1974) .
The results of the Chi-square matrix analysis of the twenty- five (25) Yoruba sub-groups considered in this study showed that there s a significant difference (df=3) between the X2 values of second set of Yoruba sub-groups: (Akoko, Akure, Bunu, Egbado, Ekiti, Eko, Ijebu, Ijesa, Ijumu, Ikale, Ilaje, Kabba, Ondo, Owo, Remo and Yagba) and the X2 values of the first set of the Yoruba sub-groups: (Awori, Egba, Ibarapa, Ibolo, Ife, Igbomina, Ilorin, Owu and Oyo).
Any of the X2 values in this analysis are significant if it is equal to or greater than 7.815 or 7.82 at the 0.05 (or 5%) level of significance or equal to or greater than 11.341 or 11.34 at the 0.01 (or 1%) level of significance (Table 11) as derived from standard statistical tables at 3 degrees of freedom (Clarke, G.M., 1980; Parker, R.E, 1979; Bailey, N.T.J., 1959; Walpole, R.E.,1974) . UNIV
ERSITY O
F IBADAN LI
BRARY
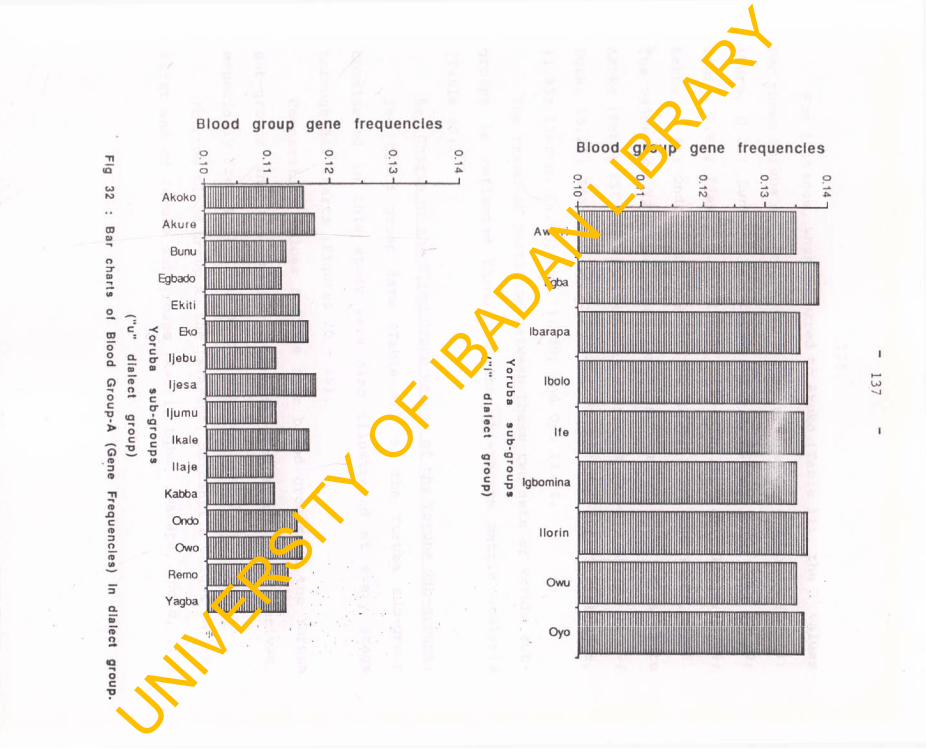
Yo
rub
a
su
b-g
rou
ps
("u"
dia
lec
t g
rou
p)
Fig
32
: B
ar
ch
arts
o
f B
loo
d
Gro
up
-A
(Ge
ne
F
req
ue
nc
ies
) In
dia
lec
t g
rou
p.
/
Blood group gene frequencies
O O O O 0.14
dia
lec
t g
rou
p)
Blood group gene frequencies
Corto
ocTJ
Awori
Egba
Ibarapa
Ibolo
Ife
Igbomina
Morin
Owu
Oyo
0.14
UNIVERSITY
OF I
BADAN LIBRARY
138
For instance, when compared to Akoko (Table 11), the X2 values for these Yoruba sub-groups are not significantly different (df=3): Akure, 0.21; Bunu, 0.34; Egbado, 1.53; Ekiti, 0.23; Eko, 0.39; Ijebu, 2.68; Ijesa, 0.38; Ijumu, 0.90; Ikale, 0.68; Ilaje, 3.39; Kabba, 1.31; Ondo, 0.11; Owo, 0.50; Remo, 1.31; and Yagba, 0.52. The values of X2 these other Yoruba sub-groups when compared to Akoko (Table 11) are significantly different (df=3): Awori, 11.89; Egba, 15.23; Ibarapa, 14.22; Ibolo, 13.82; Ife, 13.17; Igbomina, 11.95; Ilorin, 14.45; Owu, 11.20; and Oyo 13.22.
The trend of partition between these two sets of Yoruba subgroups is reflected throughout the chi-square matrix analysis (Table 11).
Bar Charts of the Blood Group Values of the Yoruba Sub-groups:The blood group data (Table 10) of the Yoruba sub-group
considered in this study were also illustrated at every stage through Bar Charts (Figures 20 - 35) .
Comparative values for the four blood groups of the Yoruba sub-groups and two emerging dialect groups are thus derived, especially from the values of the Figures 36 - 39.
For the blood group A, the (average) percentile values for the first set of Yoruba sub-groups (Awori, Egba, Ibarapa, Ibolo, Ife,UNIV
ERSITY O
F IBADAN LI
BRARY
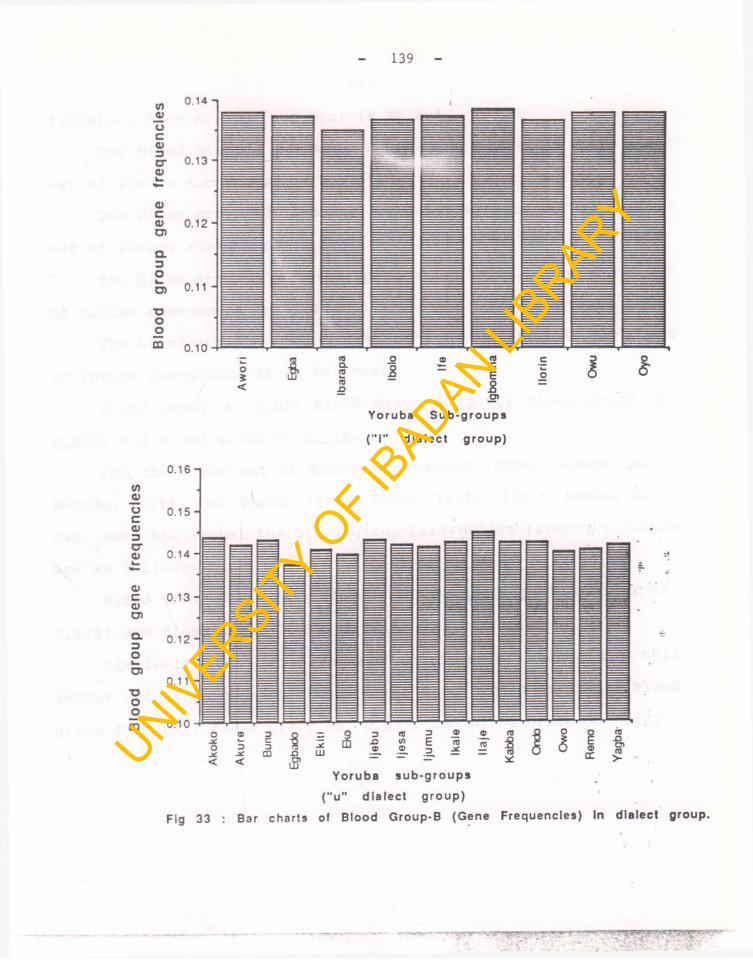
Blo
od
grou
p ge
ne
freq
uenc
ies
139
Y o rub a s u b -g ro u p s
( " u " d ia le c t g ro u p )
of B lood Group-B (Gene Frequencies) In d ia lec t
< < $
Fig 33 : Bar charts g roup .
UNIVERSITY
OF I
BADAN LIBRARY
140
Igbomina, Ilorin, Owu, and Oyo) is 22.80%.The blood group B percentile (average) value for this first
set of Yoruba sub-groups is 23.23%.The blood group AB (average) percentile value for this first
set of Yoruba sub-groups is 2.5%.The blood group 0 (average) percentile value of the first set
of Yoruba sub-groups is 51.6%.The blood group (average) frequency values for this first set
of Yoruba sub-groups is as follows:Blood group A: 0.05; Blood group B: 0.06; Blood group AB:
0.026; and Blood group O: 0.718.For the other set of Yoruba sub-groups (Akoko, Akure, Bunu,
Egbado, Ekiti, Eko, Ijebu, Ijesa, Ijumu, Ikale, Ilaje, Kabba, Ondo, Owo, Remo and Yagba) the Blood group percentiles (average) values are as follows:
Blood group A: 18.64%; Blood group B: 23.52%; Blood group AB: 2.84%; and Blood group 0: 55.0%.
Similarly, the gene frequencies (average) values for this latter set of Yoruba sub-groups are : Blood group A: 0.823; Blood group B: 0.072; Blood group AB: 0.029; and Blood group O: 0.742.
UNIVERSITY
OF I
BADAN LIBRARY
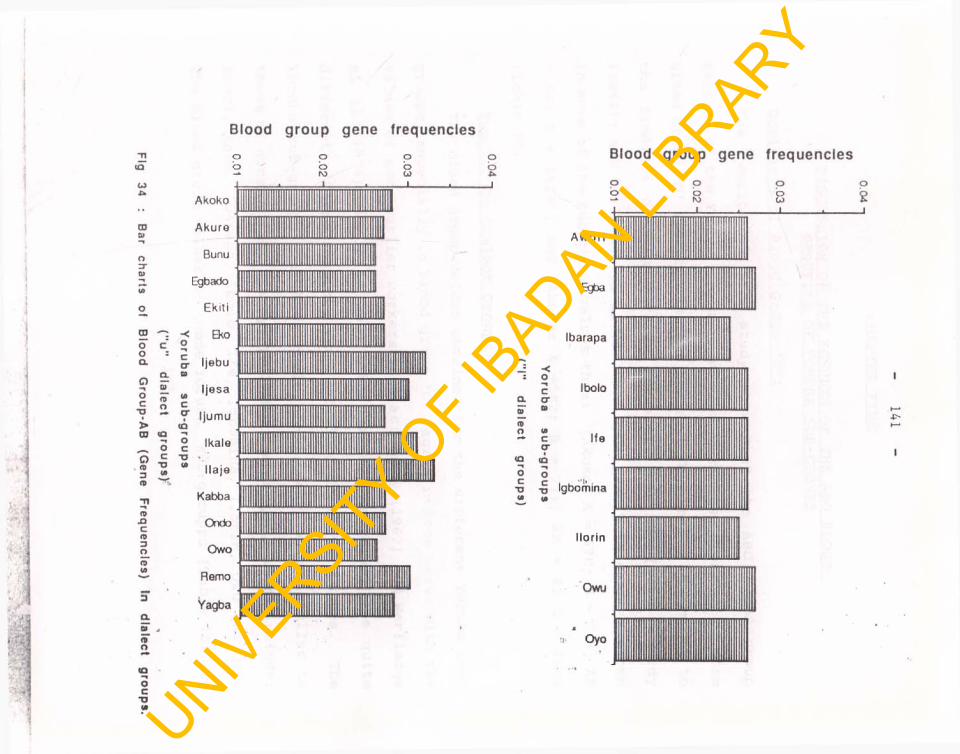
Yo
rub
a
3u
b-g
rou
p3
("u"
dia
lec
t g
rou
ps)?
Fig
34 :
Ba
r ch
arts
of
Blo
od
G
rou
p-A
B
(Ge
ne
F
req
ue
ncie
s) In
d
iale
ct
gro
up
s.
Blood group gene frequencies
wo
dia
lec
t g
rou
ps
)
Blood group gene frequencies
p o p 0.04
UNIVERSITY
OF I
BADAN LIBRARY
CHAPTER FIVE
DISCUSSION OF THE RESULTS OF THE ABO BLOOD GROUPING OF YORUBA SUB-GROUPS
Dominance of Blood Group 'O':The results of this study show that the ABO blood group
samples of the Yoruba language sub-family has the presence of more blood group ' O ' individuals than others. This result is similar to the findings of some earlier workers: Garlick (1962); Hardy(1962); and Worlledge et al (1974). This result is seen as shown in some of the sub-group values thus: (Akoko: A = 57 0; B = 717; AB = 84; 0 = 1629); and (Akure: A =582; B = 711; AB = 81 0 = 1626(Table 10).
Two Yoruba Dialect Groups:The blood group values obtained for the different Yoruba sub
groups, especially in blood group 'O', agree in some cases with the values of some earlier workers such as: Hardy (1962) and Worlledge et al (1974), while in some other cases, the values are quite different. There is a new range of blood group 'O' values. The Yoruba sub-groups that have their blood group values similar to those of some workers (Hardy: 1962; Worlledge et al: 1974) include: Awori, Egba, Ibarapa, Ibolo, Ife, Igbomina, Ilorin, Owu and Oyo. The blood group values of these Yoruba sub-groupps (Table 10) are
142
UNIVERSITY
OF I
BADAN LIBRARY
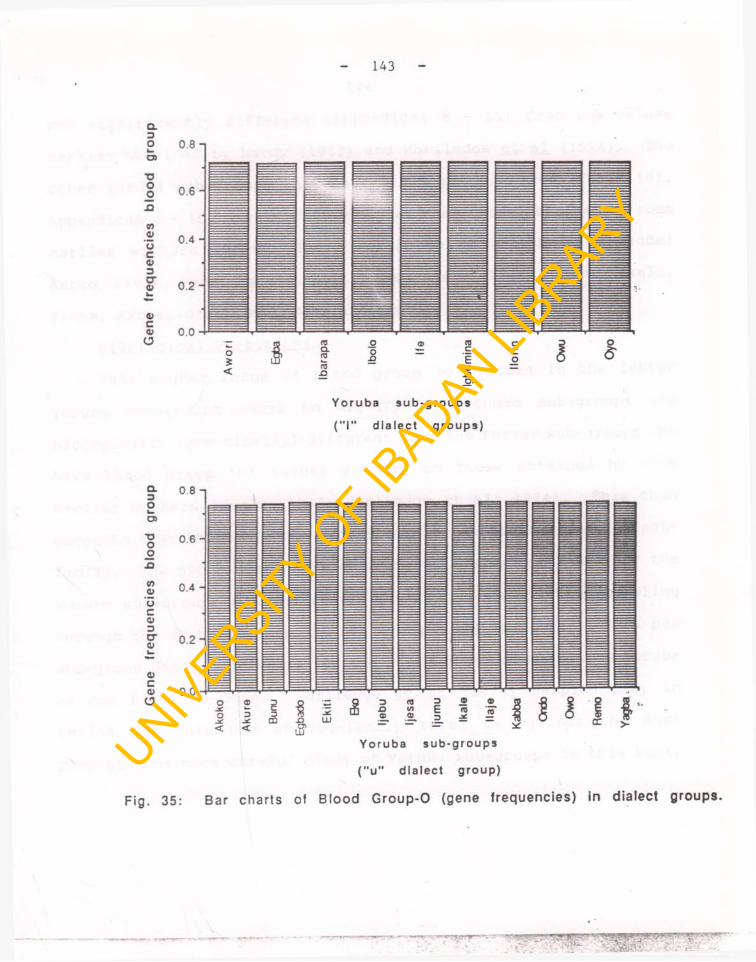
Gen
e fr
eq
ue
nci
es
bloo
d gr
oup
Gen
e fr
eq
ue
nci
es
blo
od
g
rou
p
143
Y o ru b a s u b -g ro u p s
( " I " d ia le c t g ro u p s )
Y o ru b a s u b -g ro u p s
( " u " d ia le c t g ro u p )
Fig. 35: Bar charts of B lood G roup-0 (gene frequencies) in dialect groups.
UNIVERSITY
OF I
BADAN LIBRARY
144
not significantly different (Appendices 8 - 15) from the values earlier obtained by Hardy (1962) and Worlledge et a_l (1974). The other Yoruba sub-groups that have blood group values (Table 10), Appendices 8 - 15) significantly higher than those obtained by some earlier workers (Hardy: 1962; Worlledge et al: 1974) include: Akoko, Akure, Bunu, Egbado, Ekiti, Eko, Ijebu, Ijesa, Ijumu, Ikale, Ilaje, Kabba, Ondo, Owo, Remo and Yagba.
Bilolooical Partition:This higher range of blood group 'O' values in the latter
Yoruba sub-groups seems to signify that these sub-groups are biologically (genetically) different from the former sub-groups who have blood group 'O' values similar to those obtained by some earlier workers (Hardy: 1962; Worlledge et ad: 1974). This thus suggests that there are two groups within the Yoruba language subfamily. The two ranges of blood group 'O' values obtained for the Yoruba sub-groups are the result of more representative sampling through the 25 treatments (Yoruba sub-groups) and 6 replicates per sub-group used as criteria for the blood group study of the Yoruba as not hitherto done. Worlledge et al (1974) sampled only in Ibadan and this was at sub-family level as against the more complete and more careful study of Yoruba sub-groups in this work.UNIV
ERSITY O
F IBADAN LI
BRARY
145
Correlation of Biological and Linguistic Evidence:The two groups of the Yoruba sub-groups set apart through
their blood group values, especially the blood group 'O', significantly enough, would appear to coincide with the two dialect areas: -i, and -u of Yorubaland (Fig. 12) proposed by Oduyoye (1972). This thus, shows that there is a biological divide within the Yoruba language sub-family obtained through the blood group values (Table 10); which coincides with the dialect areas ("i" and "u") proposed by Oduyoye (1972) based on linguistic distinction. There thus seems to be remarkable correlation between the biological divide and the cultural (language) grouping. This constitutes a very significant illustration of a possible link between culture and biology as the coincidence of the two groupings, based on two different parameters, is likely to be more than fortuitous.Anthropological Divide of the Yoruba Language Sub-Family:
These two dialect groups of the Yoruba language sub-family are located as follows:
"i-" dialect group (North-West and part of South-WestYorubaland).
"u-" dialect group (North-East, South, East and part of South- West Yorubaland). (see Fig. 12)
UNIVERSITY
OF I
BADAN LIBRARY
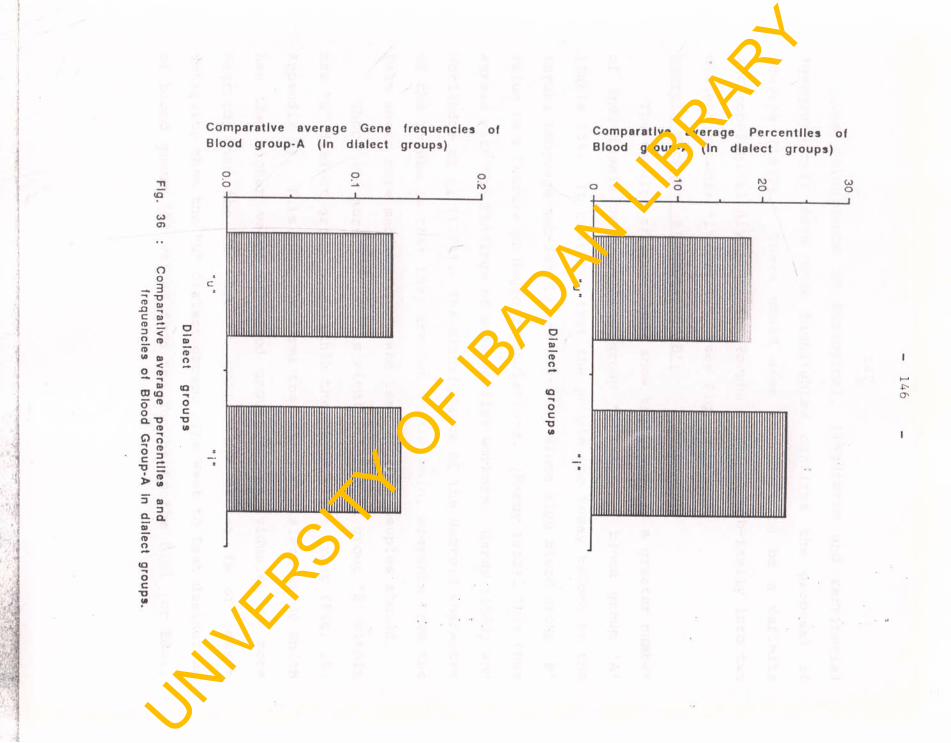
Fig
. 36
: C
om
pa
rative
a
vera
ge
p
erc
en
tiles
a
nd
freq
ue
ncie
s o
f B
loo
d
Gro
up
-A
In d
iale
ct g
rou
ps
Com parative average Gene frequencies of B lood group-A (In d ia lect groups)
C om parative average P e rcen t i les of Blood group-A (In d ia lect g roups)
UNIVERSITY
OF I
BADAN LIBRARY
147
The coincidence of biological, linguistic and territorial (geographical) data thus highlighted confirms the proposal of Oduyove (1972). There would seem therefore to be a definite anthropological divide of the Yoruba language sub-family into two dialect groups: "i" and "u". (see Fig. 48,)Negroid Marker: Blood Group 'B':
The results of this study show that there is a greater number of individuals in the blood group 'B' than in blood group 'A' (Table 10). It confirms that the people who today belong to the Yoruba language sub-family are Negroid, since high blood group 'B' value is a feature of Negroid populations. (Hardy 1962). This thus agrees with the findings of some earlier workers. Hardy (1962) and Worlledge et al (1974). The significance of the Negroid character of the Yoruba is that they are not in the main, migrants from the East where more mediterranean and less Negroid peoples abound.
There are more individuals within the blood group 'B' within the "u" dialect group than within the "i" dialect group (Fig. 25; Appendix 5). This thus, confirms that the "u" dialect group which has the higher value of blood group 'B' individuals, is more Negroid than the "i" dialect group; the latter is of lesser antiquity than the "u" dialect group. The West to East diminution of blood group 'B' values from the Yoruba to the Bini (or Edo) ,
UNIVERSITY
OF I
BADAN LIBRARY
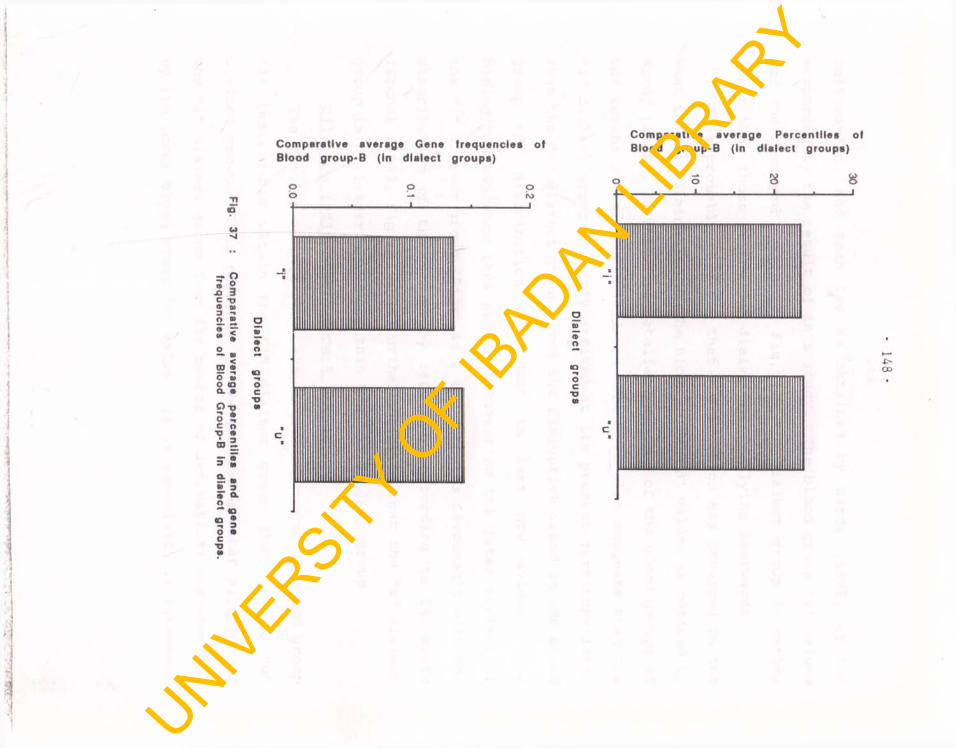
Fig. 37
: C
omparative
average percentiles
and gene
frequencies of
Blood G
roup-B
in dialect
groups.
I
Comparative average Gene frequencies of Blood group-B (in dialect groups)
Comparative average Percentiles of Blood group-B (In dialect groups)
o
<o“1oc*o«o
OoJL
O
148 -
UNIVERSITY
OF I
BADAN LIBRARY
149
Onitsha-Ibo, and then Ibo as obtained by Hardy (1962) it not supported by the result of this study. The blood group 'B' values for the Westward (Table 10; Fig. 41) "i" dialect group is rather lower than those of the "u" dialect group, lying Eastwards.
This probably suggests that a disruption has occurred in the West to East diminution of the blood group 'B' values as noticed by Hardy (1962), in this more detailed sampling of the blood groups of the Yoruba sub-groups considered here. It also suggests that the "i" dialect group probably arrived at its present territory later than the "u" dialect group hence the disruptive trend in the blood group 'B ' distribution from West to East now evident. The biological evidence thus obtained sugesting the later arrival of the "i" dialect group (Figs. 45 & 48) compares favourably with the distribution of the Yoruba by 1800 A.D. according to Elizabeth Isichei (1983) Fig.18. This further suggests that the "i" dialect group is of lesser antiquity than the "u" dialect group.
Dilution Influences: Gene-A Trends:The results of this study show a greater number of blood group
'A' individuals within the "i" dialect group than in the "u" dialect group. This possibly is evidence of greater dilution of the "i" dialect group from its source of derivation; corroborated by its lower blood group 'O' value. It is especially in agreement
UNIVERSITY
OF I
BADAN LIBRARY
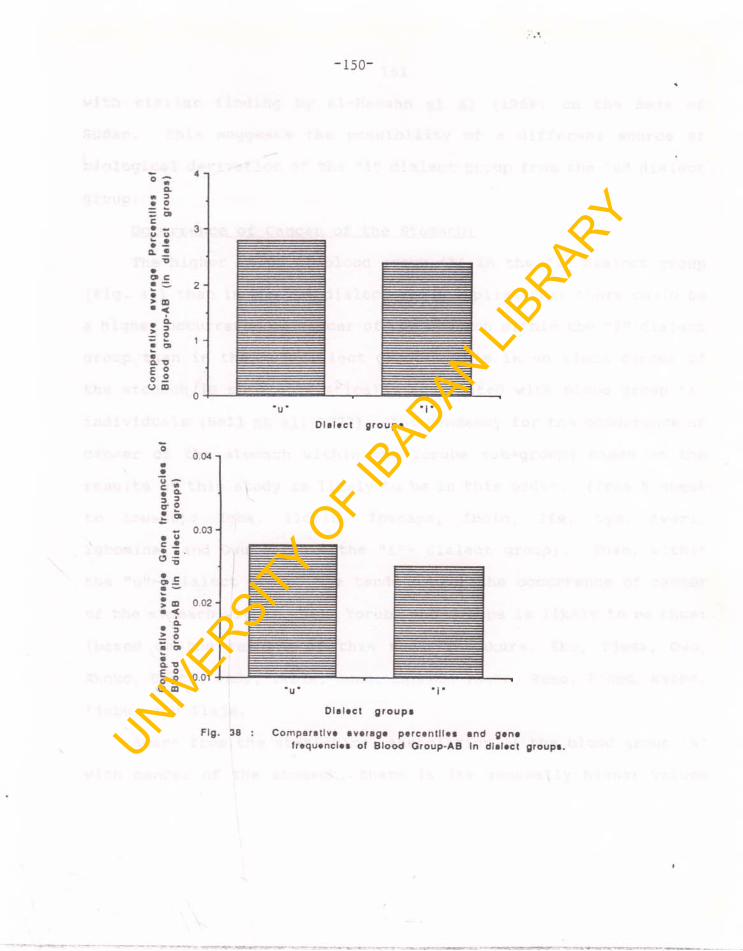
Co
mp
ara
tiv
e
av
era
ge
P
erc
en
tile
s
of
Co
mp
ara
tiv
e
ave
rag
e
Ge
na
tr
aq
ua
nc
laa
o
f B
loo
d
gro
up
.AB
(I
n
dia
lec
t g
rou
ps
)B
loo
d
gro
up
-AB
(I
n
dia
lec
t g
rou
ps
)
-150-
D la le c t g ro u p s
D ia le c t g r o u p s
Fig. 38 : C om para t ive avaraga p e rc e n t i le s and genefrequencies of B lo o d Group-AB In d ia lect groups.UNIV
ERSITY O
F IBADAN LI
BRARY
151with similar finding by El-Hassan et al (1968) on the Beja of Sudan. This suggests the possibility of a different source of biological derivation of the "i" dialect group from the "u" dialect group.
Occurrence of Cancer of the Stomach:The higher value of blood group 'A' in the "i" dialect group
(Fig. 44) than in the "u" dialect group implies that there could be a higher occurrence of cancer of the stomach within the "i" dialect group than in the "u" dialect group. This is so since cancer of the stomach is more statistically associated with blood group ' A '
individuals (Bell et al, 1972). The tendency for the occurrence of cancer of the stomach within the Yoruba sub-groups based on the results of this study is likely to be in this order: (from highest to lowest): Egba, Ilorin, Ibarapa, Ibolo, Ife, Oyo, Awori, Igbomina, and Owu (within the "i"- dialect group). Then, within the "u"- dialect group, the tendency for the occurrence of cancer of the stomach within these Yoruba sub-groups is likely to be thus: (based on the results of this study) . Akure, Eko, Ijesa, Owo, Akoko, Ekiti, Ondo, Ikale, Bunu, Egbado, Yagba, Remo, Ijumu, Kabba, Ijebu, and Ilaje.
Apart from the statistical association of the blood group 'A' with cancer of the stomach, there is its generally higher values
UNIVERSITY
OF I
BADAN LIBRARY
(Table 10) in the "i" dialect Yoruba sub-groups occuring alongside the lower values of the blood groups 'B' and 'O'. This possibly implies more marked dilution and intrusion influences within the Yoruba sub-groups in the "i" dialect group as well as lower degrees of negritude based on the lower blood group 'B' values as well as lower degrees of antiquity as their lower blood group 'O' values shown.
These higher values of blood group 'A' within the "i" dialect Yoruba sub-groups is in this decreasing order: Egba, Ilorin, Ibarapa, Ibolo, Ife, Oyo, Awori, Igbomina, and Owu. Within the "u" dialect Yoruba sub-groups, there are generally lower blood group "A" values (Table 10) occuring alongside higher values of blood groups 'B ' and 'O' suggesting that there were less marked dilution and intrusion influences in the Yoruba sub-groups of this dialect group. The higher blood groups 'B ' and 'O' values as well imply that there are higher degrees of negritude (often associated with high blood group 'B' gene frequencies) and antiquity (shown by higher 'O' blood group values) within the 'u' dialect Yoruba subgroups in this decreasing order: Akure, Eko, Ijesa, Owo, Akoko, Ekiti, Ondo, Ikale, Bunu, Egbado, Yagba, Remo, Ijumu, Kabba, Ijebu and Ilaje.
152 ' >
UNIVERSITY
OF I
BADAN LIBRARY
153Influences on Boundary Yoruba sub-groups:
The results of this study show that there has been some influence on the boundary sub-groups of the two Yoruba dialect groups. The tendency for higher numbers in the blood group 'O' values is evident in such boundary Yoruba sub-groups as : Ibarapa (51.9%); Owu (51.8%); Awori (51.7%); Ife (51.6%); Igbomina (51.6%). This tendency is due possibly to the influences of the "u" dialect Yoruba sub-groups on these stated "i" dialect sub-groups with blood values a bit higher than the value of 51.5% obtained for Yoruba by Worlledge et al (1974) and shown comparatively by Ilorin (51.533%); Oyo (51.5%); and Egba (51.3%). The possibility for the antiquity or remoteness of time of settlement of these "i" dialect Yoruba is likely to be thus: (in order of greater antiquity to lesser): Ibarapa, Owu, Awori, Ife, Igbomina, Ilorin, Oyo and Egba (Table 10) . Thus, it can be said that the Ekiti and Yagba influenced the Igbomina; the Ijesa must have had some influence on the Owu and Ife, while the Ijebu must have influenced the Owu. The Awori must been influenced by the Eko and the Egbado while the Egba would have been influenced by the Egbado and Remo. The Egbado influence on the Ibarapa is as well very likely as a spill-over of boundary influences (Fig. 48). Based on the blood group 'O' values of the "u" diaclect Yoruba, the possibility of an order of antiquity based
UNIVERSITY
OF I
BADAN LIBRARY
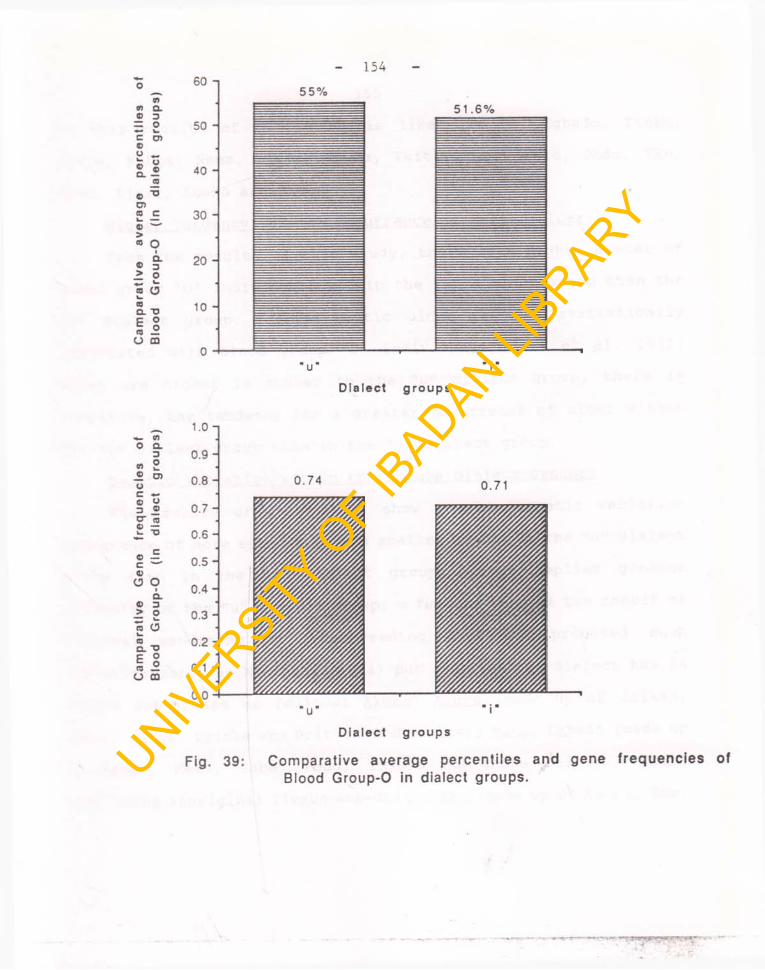
Cam
para
tlve
G
ene
freq
uenc
ies
of
Cam
para
tive
av
erag
e pe
rcen
tile
s of
Blo
od
Gro
up-0
(In
di
alec
t gr
oups
) B
lood
G
roup
-O
(In
dial
ect
grou
ps)
154
D i a l e c t g r o u p s
1.0 -i
0.9
0.8 -
0.7 -
0.6 -
0.5 -
0.4 -
0.3 ■
0.2
0.1 H
0.0
Fig. 39:
0 . 7 4
D i a l e c t g r o u p s
0 .7 1
*• j n
C o m p a r a t i v e a v e r a g e p e r c e n t i l e s a n d g e n e f r e q u e n c i e s of Blood G r o u p - 0 in d ia lect groups .UNIVERSITY
OF I
BADAN LIBRARY
155on this results of this study is likely to be: Egbado, Ijebu, Ilaje, Kabba, Remo, Ijumu, Yagba, Ekiti, Owo, Ikale, Ondo, Eko, Bunu, Ijesa, Akoko and Akure.
Higher Tendency for the Occurrence of peptic ulcer:From the results of this study, there is a higher number of
blood group 'O' individuals within the "u" dialect group than the "i" dialect group. Since peptic ulcer is more statistically associated with blood group 'O' individuals (Bell et aj,, 1972) which are higher in number in the "u" dialect group, there is therefore, the tendency for a greater occurrence of ulcer within the "u" dialect group than in the "i" dialect group.
Genetic variation within the Yoruba Dialect Groups:The results of this study show greater genetic variation
(existence of more sub-groups and smaller units) in the "u" dialect group than in the "i" dialect group. This implies greater antiquity of the "u" dialect group; a feature that is the result of internal wandering or interbreeding that has promoted such recombinations, as Hiernaux (1974) put it. The "u" dialect has 16 Yoruba sub-groups as follows: Akoko; Akure (made up of Isikan, Isolo, Igiso, Eyinke and Oritagun sub-units); Bunu. Egbado (made up of Anago, Ketu, Sabe, Popo, Idassa sub-units mainly); Ekiti (including aboriginal Ilesun sub-unit); Eko (made up of Awori, Edo,
UNIVERSITY
OF I
BADAN LIBRARY
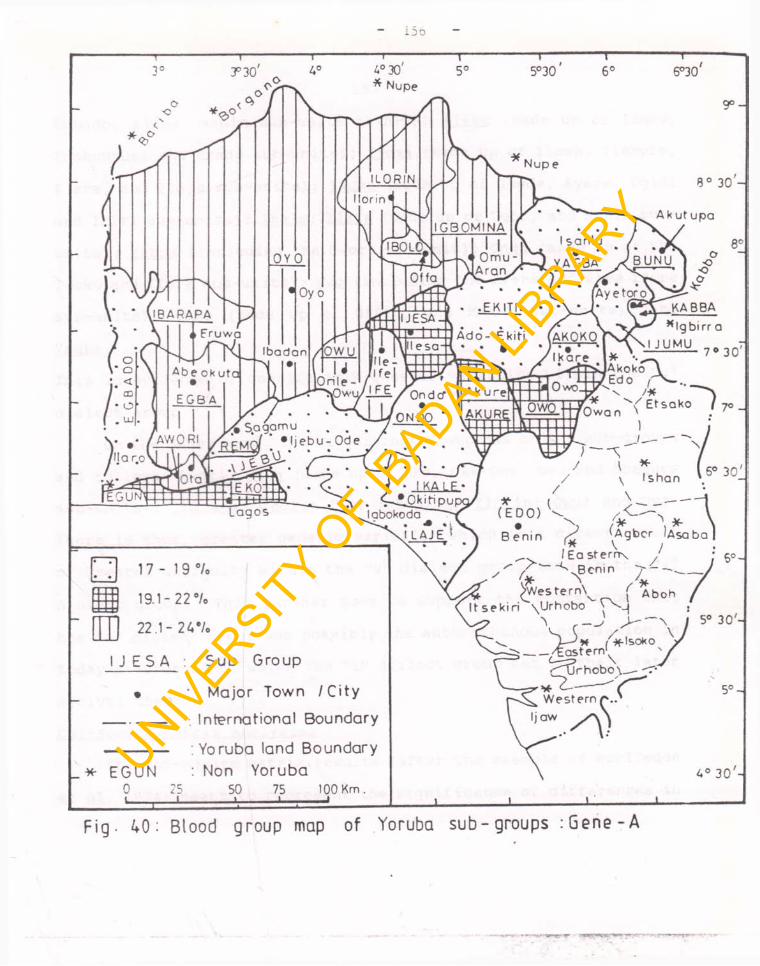
Fig- 40: Blood group map of Yoruba sub-groups : Gene -A
UNIVERSITY
OF I
BADAN LIBRARY
157Egbado, Ijebu, Mahin sub-units mainly); Iiebu (made up of Idoko, Idokunnusi and Eredo sub-units) ; Iiesa (made up of Ilowa, Ilemure, Hare, and Ilaye sub-units) ; Iiumu (made up of Gbede, Ayere, Ogidi and Ikiri sub-units) ; Ikale; Ilaie (made up of Ugbo, and Mahin subunits) ; Kabba (including the Oworo sub-unit); Ondo (made up of the Idoko and Ifore sub-units); Owo (including the Efene and some Ifore sub-units); Remo (made up of Offin, and Makun sub-units); and Yaqba.This is evidence of considerable genetic variation within the "u" dialect group.
On the other hand, the "i" dialect group has only 9 sub-groups and follows: Awori; Egba (made up of Ake, Oke-Ona, Owu and Gbagura sub-units); Ibarapa; Ibolo; Ife; Iqbomina; Ilorin; Owu; and Oyo. There is thus, greater genetic variation which is a direct result of greater antiquity within the "u" dialect group than in the "i" dialect group. This further goes to support the contention that the "u" dialect group was possibly the autochthonous population in today's Yorubaland, which the "i" dialect group met on their later arrival there.Chi-Square Matrix Analysis:
The Chi-square matrix results (after the example of Worlledge et al, 1974) meant to represent the significance of differences in
UNIVERSITY
OF I
BADAN LIBRARY
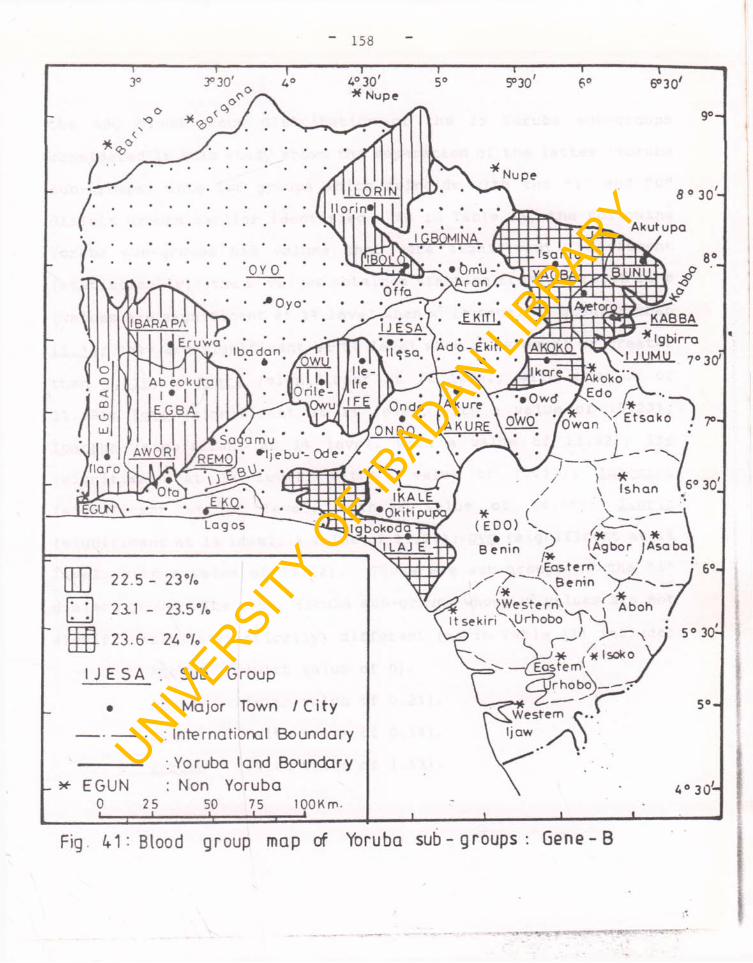
158
Fig. 41". Blood group map of Yoruba sub-groups: Gene-B
UNIVERSITY
OF I
BADAN LIBRARY
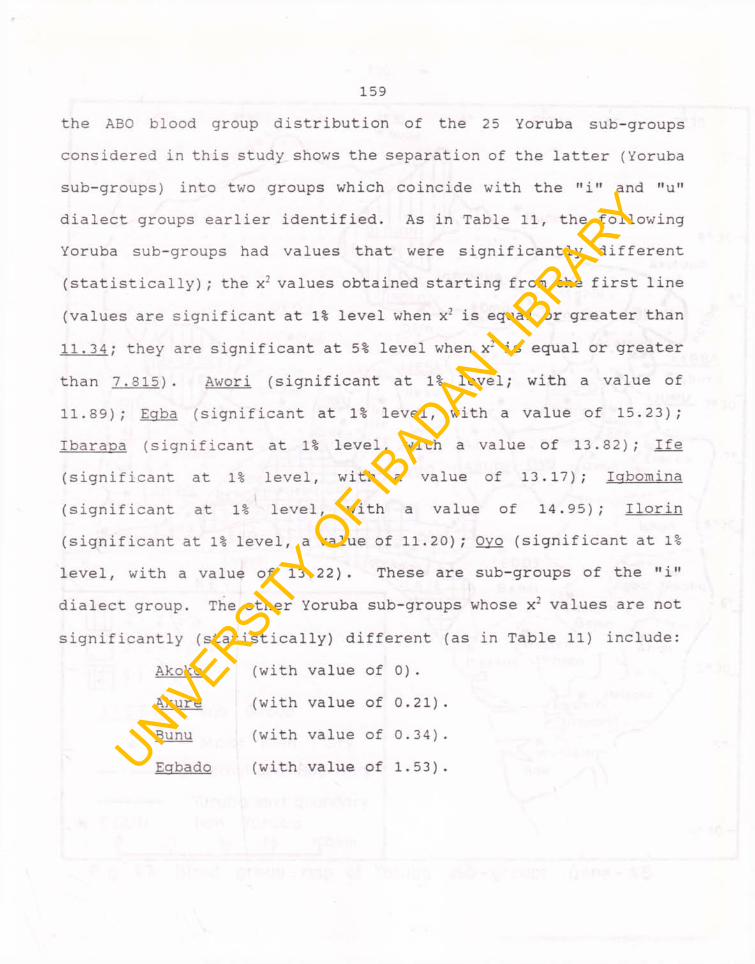
159the ABO blood group distribution of the 25 Yoruba sub-groups considered in this study shows the separation of the latter (Yoruba sub-groups) into two groups which coincide with the "i" and "u" dialect groups earlier identified. As in Table 11, the following Yoruba sub-groups had values that were significantly different (statistically); the x2 values obtained starting from the first line (values are significant at 1% level when x2 is equal or greater than 11.34; they are significant at 5% level when x2 is equal or greater than 7,815) . Awori (significant at 1% level; with a value of11.89); Egba (significant at 1% level, with a value of 15.23); Ibarapa (significant at 1% level, with a value of 13.82); Ife (significant at 1% level, with a value of 13.17); Iqbomina (significant at 1% level, with a value of 14.95); Ilonn (significant at 1% level, a value of 11.20); Ovo (significant at 1% level, with a value of 13.22). These are sub-groups of the "i" dialect group. The other Yoruba sub-groups whose x2 values are not significantly (statistically) different (as in Table 11) include:
Akoko (with value of 0).Akure (with value of 0.21).Bunu (with value of 0.34).
(with value of 1.53).EgbadoUNIVERSITY
OF I
BADAN LIBRARY
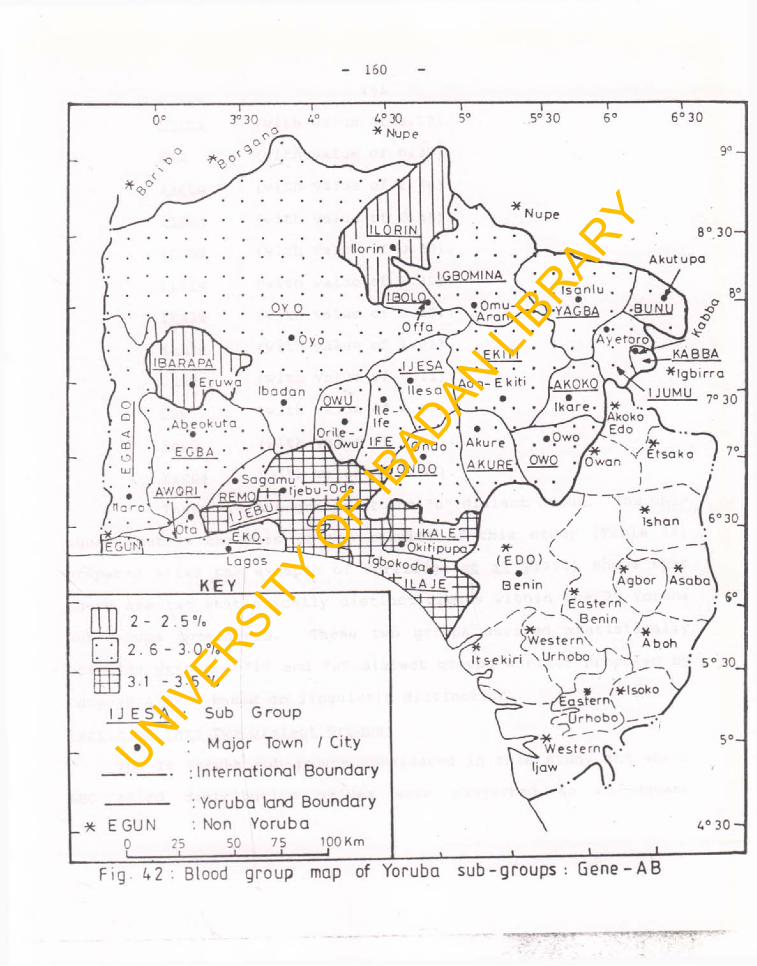
160
2 - 2 .5 °/o
2. 6 - 3.0 7.
3.1 - 3 • 5 %
J E 5 A : Su b G r o u p
M a j o r Tow n / C i ty
i n t e r n a t i o n a l B o u n d a r y
: Y o r u b a land B o u n d a r y •. Non Y o r u b a
I t s e k i r i NUrhobo\ ' /
\ J * / y - l s o k o - ^ E a s t e r n x
r 'TJrhobo)—
Westernf\ •
_ * E G U N
5 ° 30_
5° —
4° 30 —0L £0_ L _ 50_L_ 75
__ L.100 Km —I
Fig. U2 ■ Blood group map of Yoruba sub-groups: Gene-AB
UNIVERSITY
OF I
BADAN LIBRARY
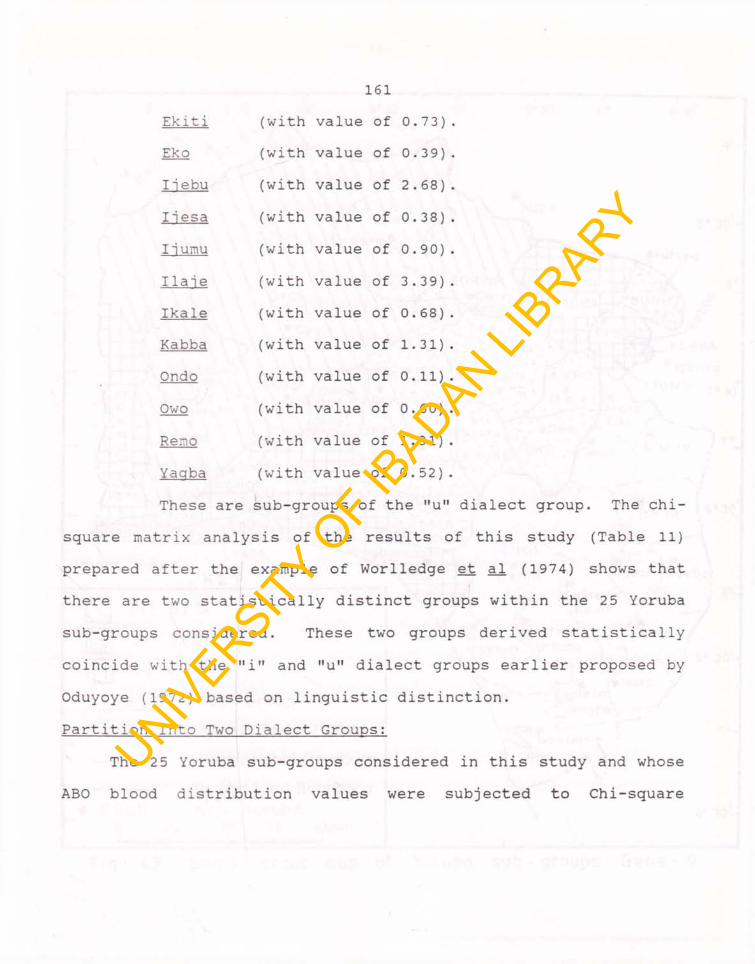
161Ekiti (with value of 0.73) .Eko (with value of 0.39) .Iiebu (with value of 2.68).Iiesa (with value of 0.38).Iiumu (with value of 0.90).Ilaie (with value of 3.39).Ikale (with value of 0.68) .Kabba (with value of 1.31).Ondo (with value of 0.11).Owo (with value of 0.60).Remo (with value of 1.31).Yaqba (with value of 0.52).These are sub-groups of the "u" dialect group. The chi-
square matrix analysis of the results of this study (Table 11) prepared after the example of Worlledge et al (1974) shows that there are two statistically distinct groups within the 25 Yoruba sub-groups considered. These two groups derived statistically coincide with the "i" and "u" dialect groups earlier proposed by Oduyoye (1972) based on linguistic distinction.Partition Into Two Dialect Groups:
The 25 Yoruba sub-groups considered in this study and whose ABO blood distribution values were subjected to Chi-square
UNIVERSITY
OF I
BADAN LIBRARY
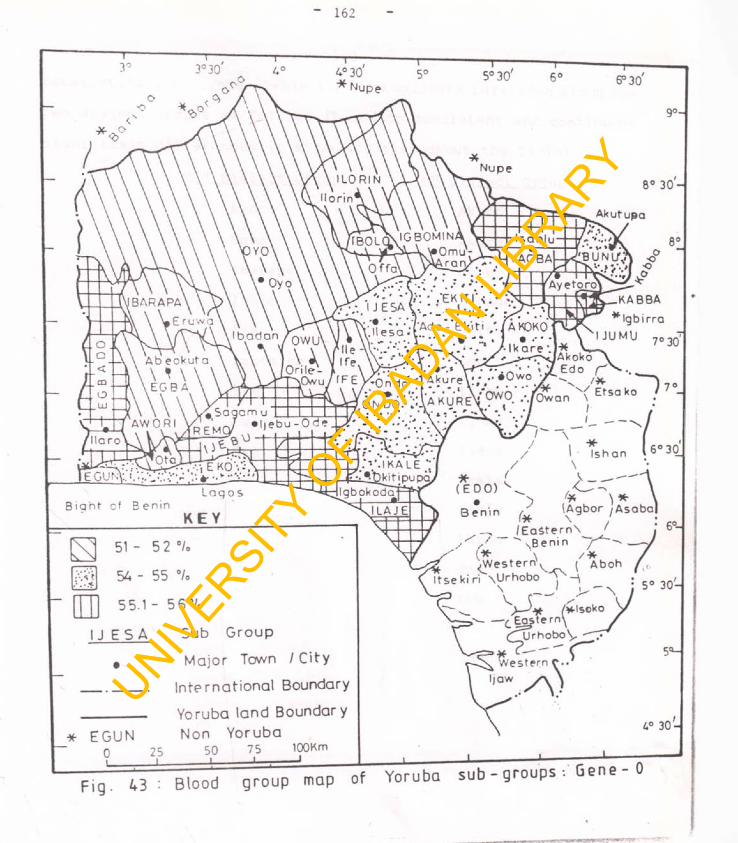
162
Akufupa
Ngbirra IJUMU 7o30'
A, .'*■ " ) 7o• * • • ‘ \ >'nwn • f n t „ _ Etsa ko t ' ■ A K u R e\ VWj° . “ I Owan \
9°-
8° 30
8°
Bight of Benin
5 1 - 5 2 °lo
54 - 55 °lo
55.1 - 5 6s/.
I J E S A S u b G r o u p
M a j o r Town / C i t y
I n t e r n a t i o n a l B o u n d a ry
__ Y o r u b a la n d B o u n d a r y
1 X, */ I Ishan/ \* . < \ _( EDO) b * i - / lAgbor/Asaba
/Ea£tern\ / ■' 6°“
y ' ( * \^ ^Western'^ 1 AbohItsek iri \Urhobo ‘y - A\ __J > " \
S J -5° 30-
— ( _ g g s t e r n \ fyUr-hoboy
Western e ..•jaw y \ )
* E G U N N o n Y o r u b a75 100Km_l
5°-
30-
UNIVERSITY
OF I
BADAN LIBRARY
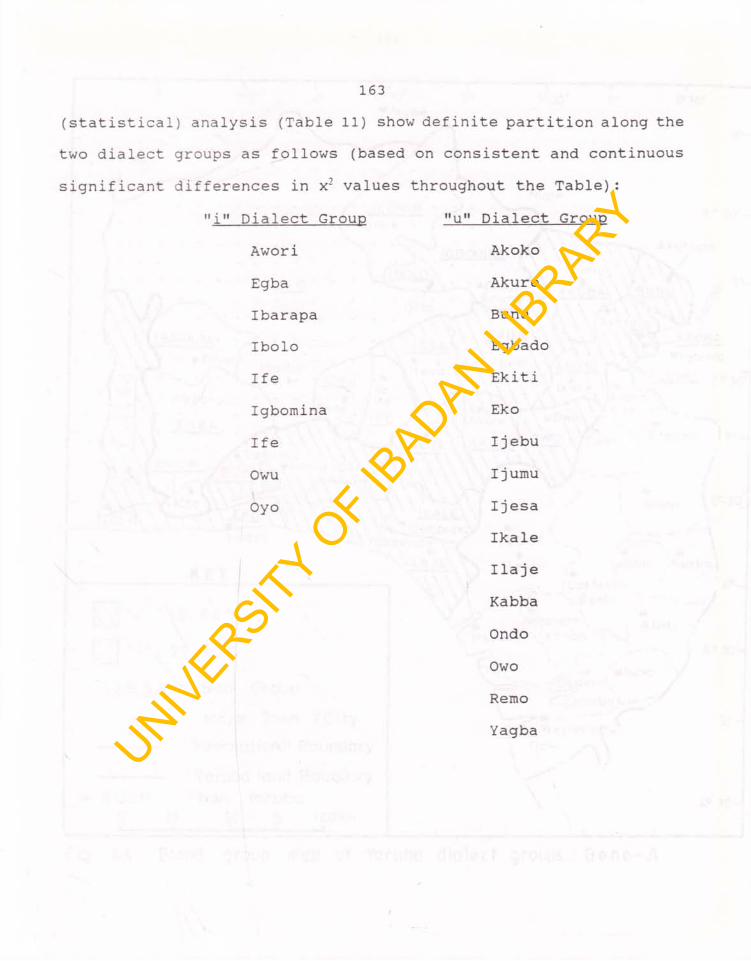
163(statistical) analysis (Table 11) show definite partition along the two dialect groups as follows (based on consistent and continuous significant differences in x2 values throughout the Table):
"i" Dialect Group "u" Dialect GroupAwori AkokoEgba AkureIbarapa BunuIbolo EgbadoIfe EkitiIgbomina EkoIfe I jebuOwu I jumuOyo I jesa
IkaleIla jeKabbaOndoOwoRemoYagba
UNIVERSITY
OF I
BADAN LIBRARY
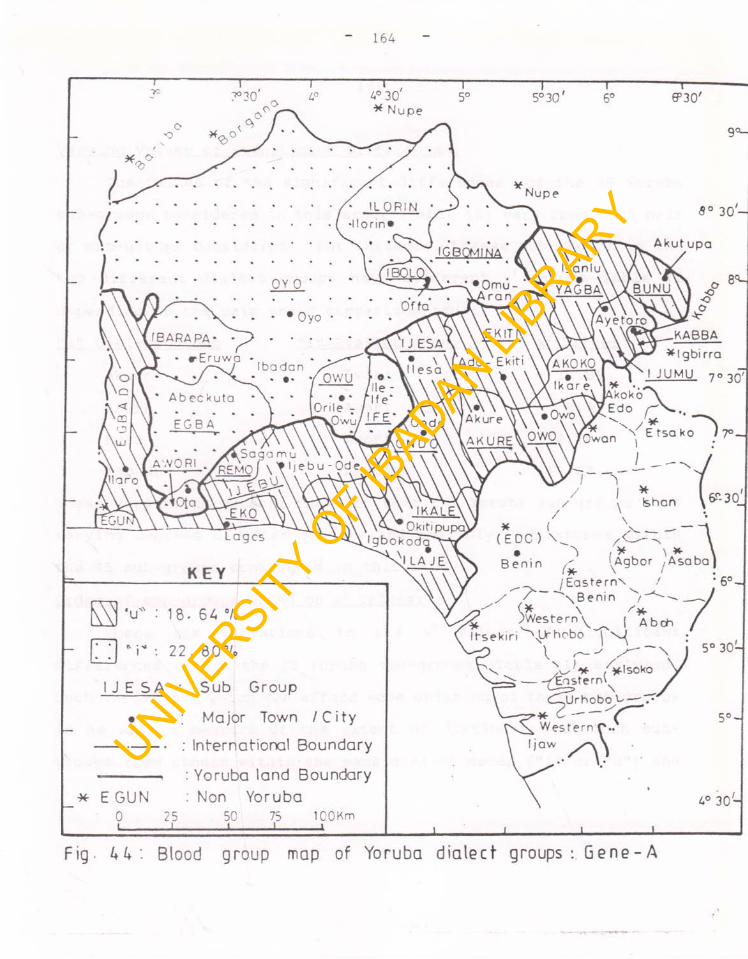
164
Fig. 4 4 : Blood group map of Yoruba dialect groups G en e-A
UNIVERSITY
OF I
BADAN LIBRARY
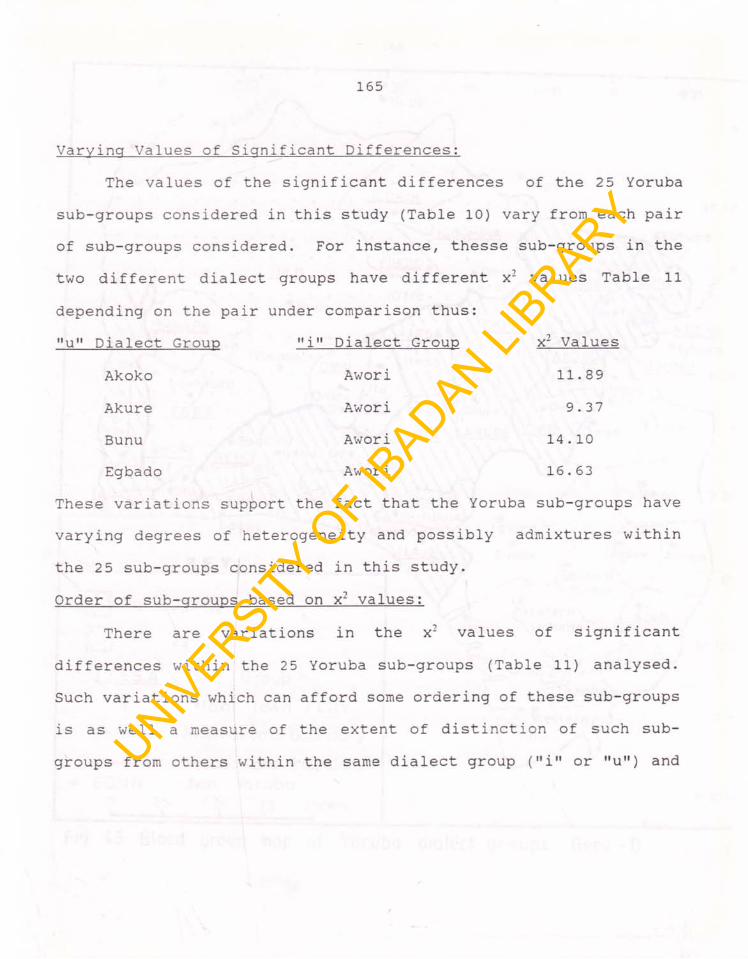
165
Varying Values of Significant Differences:The values of the significant differences of the 25 Yoruba
sub-groups considered in this study (Table 10) vary from each pair of sub-groups considered. For instance, thesse sub-groups in the two different dialect groups have different x2 values Table 11 depending on the pair under comparison thus:"u" Dialect Group '*i*' Dialect Group x2 Values
Akoko Awori 11.89Akure Awori 9.37Bunu Awori 14.10Egbado Awori 16.63
These variations support the fact that the Yoruba sub-groups have varying degrees of heterogeneity and possibly admixtures within the 25 sub-groups considered in this study.Order of sub-groups based on x2 values:
There are variations in the x2 values of significant differences within the 25 Yoruba sub-groups (Table 11) analysed. Such variations which can afford some ordering of these sub-groups is as well a measure of the extent of distinction of such subgroups from others within the same dialect group ("i" or "u") andUNIV
ERSITY O
F IBADAN LI
BRARY
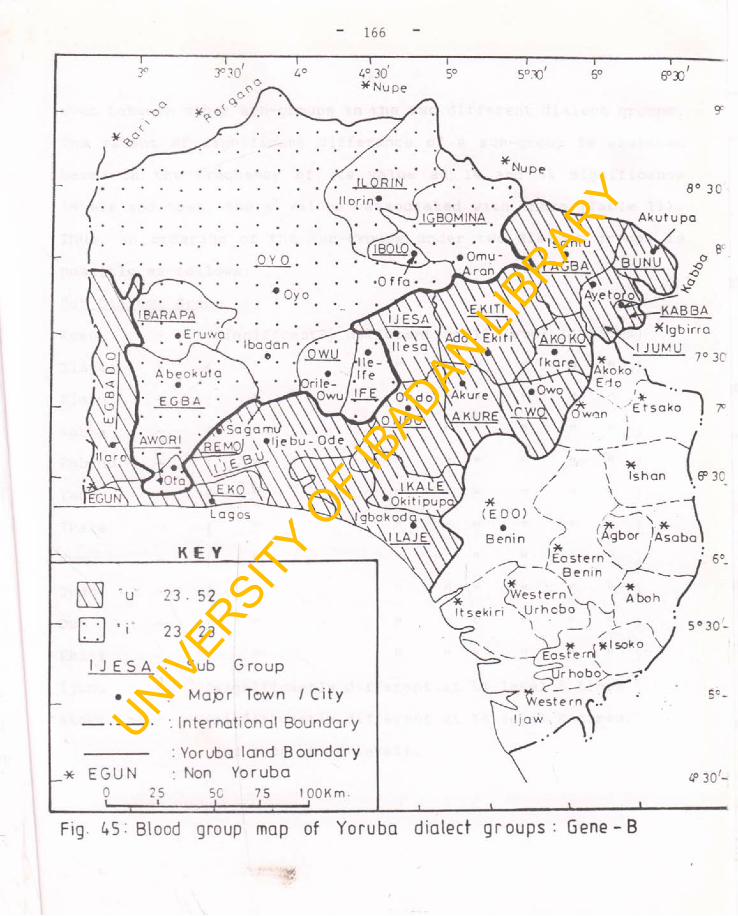
166
0 -u 23 • 52
- 23 . 23
1 J E S A Sub G r o u p
• M a j o r T o w n / C i t y-- . --- . : I n t e r n a t i o n a l B o u n d a r y
. Y o r u b a l a n d B o u n d a r yE G U N : Non Y o r u b a
0 2 i---r_. 5 50 75 lOOKm.------- i------L_-----1
5 ° 30 -
<P 30'-
Fig ^ 5 ' B l o o d group map of Yoruba dialect groups: 6 e n e -B
UNIVERSITY
OF I
BADAN LIBRARY
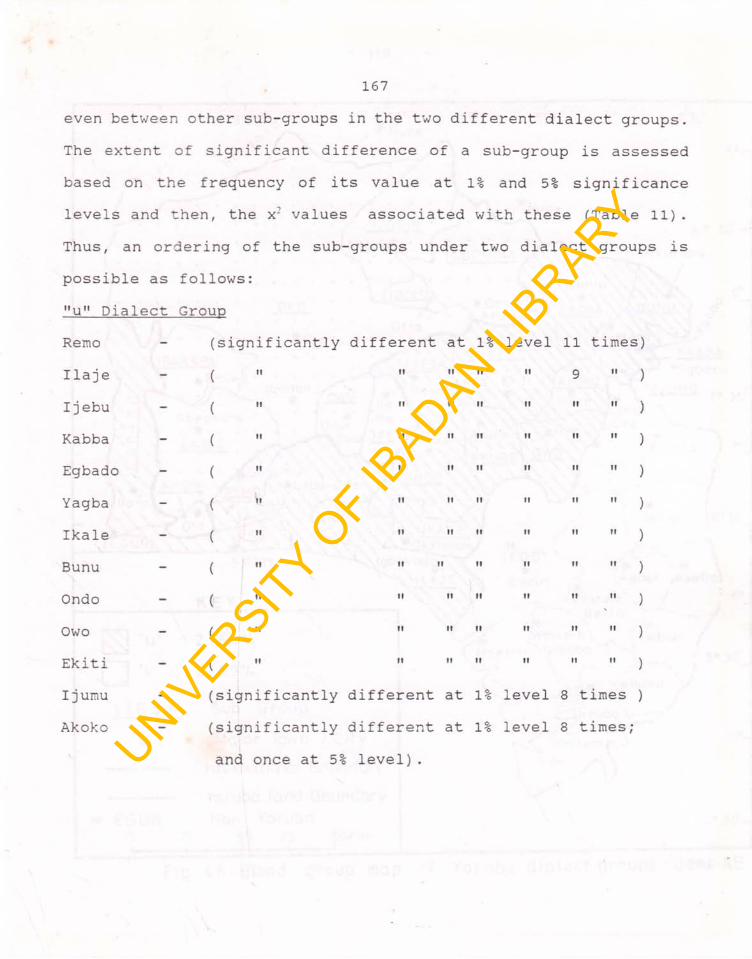
167even between other sub-groups in the two different dialect groups. The extent of significant difference of a sub-group is assessedbased on the freguency of its value at 1% and 5% significancelevels and then, the x: values associated with these (Table 11).Thus, an ordering of the sub-groups under two dialect groups ispossible as follows:"u" Dialect GroupRemo - (significantly different at 1% level 11 times)Ila je - £ II I t I I II II 9 " )I jebu - ̂ I f II II I t II II I I )
Kabba - £ II I I I t II I t II I I j
Egbado - ̂ I I I I I t I I II II I I J
Yagba - ̂ II II II I t II II I I ^
Ikale - £ II I I It II II II I I J
Bunu - £ I t I I 1 II II II I I ^
Ondo - ̂ II I I I t II II II I I ^
Owo - ̂ I I I I I t I I II II I I j
Ekiti - £ I t I I I t II II II I I J
I jumu - (significantly different at 1% level 8 times )Akoko - (significantly different at 1% level 8 times;
and once at 5% level) .UNIVERSITY
OF I
BADAN LIBRARY
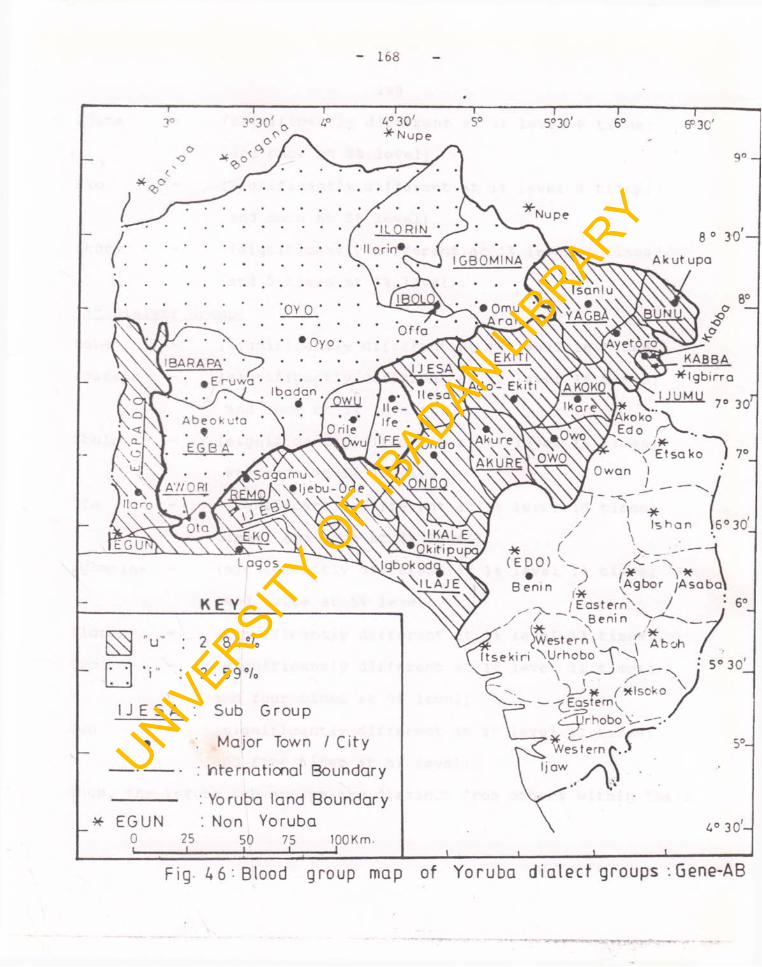
168
UNIVERSITY
OF I
BADAN LIBRARY
169Ijesa - (significantly different at 1% level 8 times;
and once at 5% level).Eko - (significantly different at 1% level 8 times;
and once at 5% level).Akure - (significantly different at 1% level 4 times;
and 5 times at 5% level)."i" Dialect Group:Egba (significantly different at 1% level 16 times).Ibarapa (significantly different at 1% level 15 times;
and once at 5% level).Ibolo (significantly different at 1% level 15 times;
and once at 5:% level).Ife (significantly different at 1% level 15 times;
times; and once at 5% level) •Igbomina (significantly different at 1% level 14 times;
and twice at !5% level).Ilorin (significantly different at 1% level 13 times).Oyo (significantly different at 1% level 12 times;
and four times at 5% level).Owu (significantly different at 1% level 11 times;
and five times at 5% level).Thus, the Yoruba sub-groups are distinct from others within their
UNIVERSITY
OF I
BADAN LIBRARY
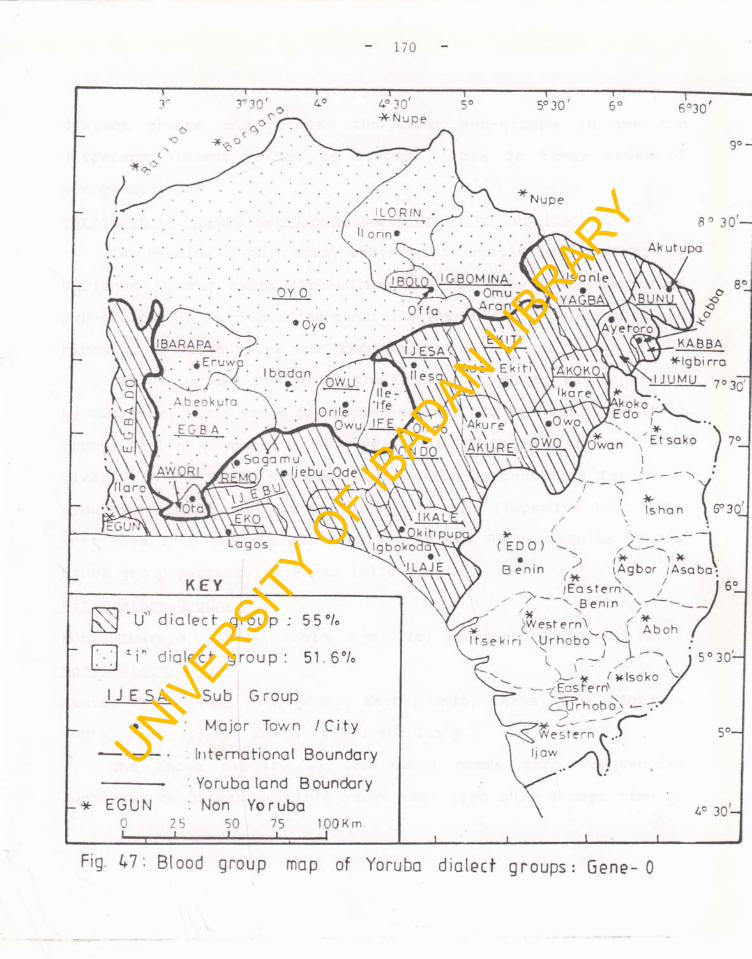
170
Fig. 47. Blood group map of Yoruba dialect groups: Gene- 0
UNIVERSITY
OF I
BADAN LIBRARY
171dialect groups and between the other sub-groups in the two different dialect groups as listed. This is their order of homogeneity.Partition of Yoruba Sub-Groups Based on Anova Results:
The results of this study subjected to statistical Analysis of Variance (Anova) tests (Appendices 8 - 15) show that the Yoruba sub-groups can be classified generally into two groups based on the blood group percentiles and frequencies.
The two groups into which the Yoruba sub-groups are separated by Duncan multiple range test coincide with the "i" and "uM dialect groups earlier proposed by Oduyoye (1972) . This separation is seen clearly in the Anova results (blood group percentiles) for blood group A (Appendix 8) , and blood group 'O' (Appendix 11) . The partition into two dialect groups from the Anova results of the blood group percentiles is as follows:"i" Dialect Group:Egba, Ibarapa, Ilorin, Ibolo, Oyo, Ife, Igbomina, Awori and Owu. "u" Dialect Group:Akure, Eko, Ijesa, 0wo; Akoko, Ekiti, Ondo, Ikale, Bunu, Egbado, Yagba, Remo, Ijumu, Kabba, Ijebu and Ilaje.
The Anova results of the blood group gene frequencies subjected to Duncan multiple range test also show a partition of
UNIVERSITY
OF I
BADAN LIBRARY
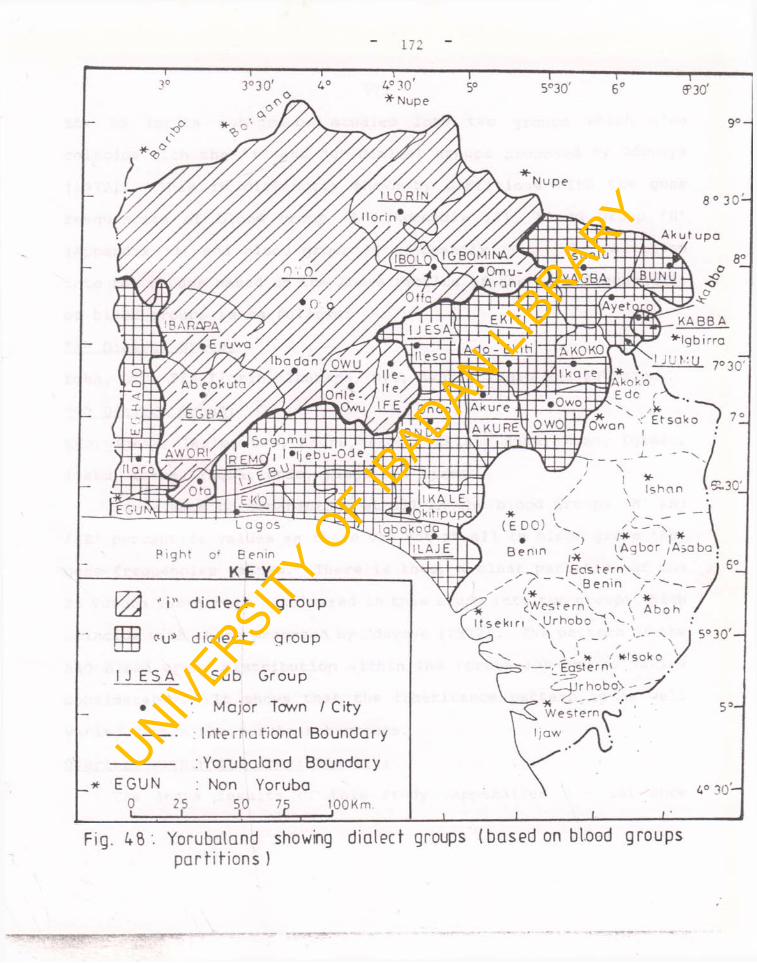
172
Fig. 48 ' . Yorubaland showing dialect groups ( based on blood groups p a r t i t io n s )
UNIVERSITY
OF I
BADAN LIBRARY
173the 25 Yoruba sub-groups studied into two groups which also coincide with the "i" and "u" dialect groups proposed by Oduyoye (1972). This is distinctly shown by partitions with the gene frequencies of blood group 'A' (Appendix 12), blood group 'B' (Appendix 13) and blood group '0' (Appendix 15). The partition into the groups based on the Anova results of the gene frequencies of blood groups is as follows:"i" Dialect Group:Egba, Owu, Ife Ilorin, Ibarapa, Oyo, Awori, Ibolo and Igbomina. "u" Dialect Group:Eko, Ijesa, Ikale, Owo, Akure, Akoko, Ekiti, Bunu, Remo, Egbado, Ijebu, Kabba, Yagba, Ondo, Ilaje and Ijumu.
There were no separations at all in the blood groups ' B ' and 'AB' percentile values as there was not at all in blood group 'AB' gene frequencies values. There is thus, a clear partition of the 25 Yoruba sub-groups considered in this study into two groups which coincide with those proposed by Oduyoye (1972) . The pattern of the ABO blood group distribution within the Yoruba sub-groups varied considerably. It shows that the inheritance pattern is as well varied within the Yoruba sub-groups.Overlaps within the Anova Results:
The Anova results of this study (Appendices 8 - 15) show
UNIVERSITY
OF I
BADAN LIBRARY
174overlaps as seen with the Duncan grouping for all the blood groups of the 25 Yoruba sub-groups considered.
There are more overlaps within the Duncan grouping for blood groups 'B' and 'AB' percentiles (Appendices 9 and 10) as well as in the Duncan grouping for blood groups 'B' and 'AB' gene frequencies (Appendices 13 and 14) . This is evidence of greater recombinations within the blood groups 'B' and 'AB' within the Yoruba sub-groups.
There are also more overlaps within the Yoruba sub-groups of the "u" dialect group than those of the "i" dialect group (Appendices 8 - 15) . This is also evidence of greaterheterogeneity of the "u" dialect group than the "i" dialect group. This corroborates earlier deductions of greater genetic variation and antiquity of the "u" dialect group than the "i" dialect group, a phenomenon which Hiernaux (1974) said was caused by more active interbreeding or internal wandering and hence recombinations over longer period of time. The "u" dialect group is possibly the older autochthonous group based on the Anova results of this study. Blood Group "B" Distribution: Negritude
The distribution of blood group 'B' within 25 Yoruba subgroups considered in this study and shown by the Anova results, indicate that the "u" dialect group has higher and more overlapping group 'B' values than the "i" dialect group. This is an evidence
UNIVERSITY
OF I
BADAN LIBRARY
175that the Yoruba sub-groups in the "u" dialect group display a greater degree of Negritude, antiquity and genetic variation than the Yoruba sub-groups in the "i" dialect group.
Blood Group ' A ' Distribution: Cancer of the stomach The Anova results of the blood group distribution of the 25
Yoruba sub-groups considered in this study show the occurrence of higher blood group 'A' values in the "i" dialect group than in the "u" dialect group. The tendency for a higher prevalence of cancer of the Stomach within the "i" dialect group than in the "u" dialect group is possible (Appendices 8 and 12) since cancer of the stomach is more statistically associated with blood group 'A' individuals (Bell et al, 1972).Blood Group v0' Distribution: Ulcer and Dilution
The Anova results of the blood group distribution of the 25 Yoruba sub-groups considered in this study show that there is the occurrence of higher blood group 'O' values within the "u" dialect group (with greater interactions as revealed by the Duncan grouping) than in the "i" dialect group. This implies that there is a higher possibility of a greater tendency of peptic ulcer within the "u" dialect group than in the "i" dialect group. It also points to the fact that the "i" dialect group must have been more diluted especially with its lower blood group 'O' values, which is
UNIVERSITY
OF I
BADAN LIBRARY
176similar to the finding of El-Hassan et a_l. (1968) on their work on the Beja of Sudan.Overlaps and Yoruba Sub-groups' Boundaries
The Anova results of the blood group distribution of the 25 Yoruba sub-groups considered in this study show considerable overlaps (or interactions) between the Yoruba sub-groups(Appendices 8 - 15) under the Duncan grouping system. This is a clear indication that the present boundaries of the Yoruba subgroups which are politically delineated would not agree exactly with one based on the biological partitions of the Yoruba subgroups. There is hardly any Yoruba sub-group considered in thisstudy which is homogenous. Each reflect some admixtures in varying
\degrees.Ife and the Advent of the "i" Dialect Group:
The results of this study suggest that the growth of royal dynasties began in Yorubaland with the advent of the "i" dialect group to Ife. This it seems was predicated on the fact that the "i" dialect group probably developed superior military abilities required to achieve this intrusion while it sojourned at its early settlements around Mejiro (5,000 Y.B.P.), and Old Oyo. (Soper and Darling, 1980) . This intrusion into Ife possibly gave a chance to the rise of Oduduwa at Ife between the 10th and 12th centuries.
UNIVERSITY
OF I
BADAN LIBRARY
177The "i" dialect group within the Yoruba blood group samples does not show the continuity of a diminution of blood group 'B' from West to East as observed by Hardy (1972) from Yoruba to Benin and then the Ibo. This distruption suggest the intrusion of the "i" dialect group later than the "u" dialect group. The intrusion of the "i" dialect group is also seen in the distribution of its subgroups within Yorubaland (compare Figs.18 & 48) like a wedge into some autochthonous sub-groups.
The fact that the "i" dialect group chooses its lingual (dialect) shiboleth and sibilant forms according to the practice of the "u" dialect group (Oduyoye, 1972) is evidence of some later arrival into Yorubaland (Fig. 48).
The higher values of blood group 'B' (a Negro marker) within the "u" dialect group than within the "i" dialect group (Fig. 25) is an indication of lesser antiquity and Negritude of the latter ("i") dialect group.
Archaeological sites associated with settlements (Table 3) indicate earlier occupation of areas North-East and South-East of Yorubaland. This also suggests earlier occupation and greater antiquity of the Yoruba sub-groups there now. Ife seems to have an earlier spiritual centre, especially based on charcoal dated to the 5th century (Ryder, 1934). It possibly became a major centre of
UNIVERSITY
OF I
BADAN LIBRARY
173Yoruba dispersal as Aderibigbe (1965) puts it; affording the rise of small bands of dominant royal dynasty groups which got absorbed into other sub-groups' territories (Smith, 1988). Thus, Yoruba influence and growth proliferated as from then since only the Oyo- Yoruba (or the "i" dialect group) was ever addressed as Yoruba up till 1900 A.D. (Wallerstein, 1960). Besides, the "u" dialect group which possibly comprises the major autochthonous sub-groups seems to have been acephalous before the 10th - 15th centuries, based on historical accounts. (Ijagbemi, 1987). There is the greatpossibility that the post-Oduduwa dispersal from Ife was due to anarchy, hence the tendency to associate many Yoruba sub-groups' derivation with Ife since the time of the dispersal is common in the rendition of their oral traditions.Possible Derivation of Yoruba Dialect Groups:
The results of this study coupled with some archaeological evidence on the Mejiro cave materials dated to 5000 Y.B.P. (Willet, 1960), and those of Old Oyo (810 + 80 A.D.) (Agbaje-Williams, 1981); Diogun Pottery, Old Oyo (1100 + 110 A.D.), (Soper and Darling, 1980); Mejiro Pottery: Old Oyo (1300 + 80 A.D.) (Soper and Darling, 1980) suggest that the "i" dialect group possibly grew from some nearby local population around North-West Yorubaland migrating later Eastwards and Southwards as a result of its
UNIVERSITY
OF I
BADAN LIBRARY
179military superiority as from the 10th century and dominating Ife as from the rise of Oduduwa.
The "u" dialect group grew possibly from the area of the Niger-Benue confluence, around the homeland of the 'Okun' Yoruba (Ijagbemi, 1937) or from a population referred to as 'proto Yoruba' (Atanda, 1930: Smith, 1988). This is possible since their blood group values (percentiles and gene frequencies) are not as significantly different from values obtained for neighbouring Nupe, Ebira and Bini by Worlledge et aj, (1974) (Table 5). Besides, the results of the blood group analysis in this study suggest that the "u" dialect group is of greater antiquity than its "i" dialect counterpart, and that it is probably made up of the major autochthonous Yoruba sub-groups. The extent of its ancient community by 1800 A.D. is as seen in Fig. 18. (Isichei, 1983).
The fact that the common Yoruba language has drawn its features from both dialect groups is noteworthy but that the "i" dialect group chooses its sibilant(s) and shiboleth(sh) forms according to the practice of the "u" dialect group (Oduyoye, 1972) implies that the latter settled in the Yoruba territory first. This is possibly proof that the "u" dialect group spoke the language first and was made up of the major autochthonous subgroups. The "i" dialect group possibly acquired some version of
UNIVERSITY
OF I
BADAN LIBRARY
180the language at its advent or intrusion into the Yoruba territory as from about the 10th century.Biological Implications of Intrusions at Ife:
The fact that Ife experienced intrusion between the 10th - 12th century with the coming into prominence of Oduduwa and later during the rise of the Oyo empire (about 15th century) and then Ibadan forces, must have possibly occasioned frequent displacements of the populations in and around Ife which is evident from the result of this study which shows that Ife and some other Yoruba sub-groups in the "i" dialect groups must have been subject of inter-mixing by some elements of the "u" dialect group. The blood group 'O' percentiles of such sub-group is as follows: Awori(51.7%); Owu (51.8%); Ife (51.6%); Igbomina (51.9%); and Ibarapa (51.9%). Ife and these sub-groups have thus shown that there are instances of elements of the "u" dialect group within its sample populations since Worlledge et aj. (1974) obtained the blood group '0' percentile value for the "i" dialect territory to be 51.5%. The Place of Oduduwa:
The coming into prominence of Oduduwa at Ife was possibly due to the military superiority of the "i" dialect group which he led there, thus overcoming the autochthonous people. There is no basis, therefore, to justify the claim that Oduduwa was a
UNIVERSITY
OF I
BADAN LIBRARY
181progenitor of the Yoruba race when he only came with the group that invaded Ife between the 10th - 12th centuries. The notion of Oduduwa as a major factor in the development of royal dynasties in Yorubaland can be sustained. The claim of his having been the progenitor of the Yoruba race is rather far fetched from the results of this study.
UNIVERSITY
OF I
BADAN LIBRARY
CHAPTER SIXSUMMARY AND CONCLUSIONS
Summary of the Discussions of Results:In Summary, the study reflect the following:Dominance of Blood Group "0":Most individuals (51.6 - 55%) sampled in this study belong to
the blood group "0". This affords a predictive model to be developed mainly on the blood group "0" especially as regards the Yoruba population, as done by some earlier workers: Garlick (1962); Hardy (1962); and Worlledge et al. (1974).
Two Yoruba Dialect Groups:The 25 Yoruba sub-groups considered in this study belong to
two Yoruba dialect groups as follows:"i" Dialect Group:Awori, Egba, Ibarapa, Ibolo, Ife, Igbomina, Ilorin, Owu, and Oyo."u" Dialect Group: <Akoko, Akure, Bunu, Egbado, Ekiti, Eko, Ijebu, Ijumu, Ijesa, Ikale. Ilaje, Kabba, Ondo, Owo, Remo and Yagba.This partition is based on statistical analysis (through Chi-
square and Anova analysis) of the biological differences (blood group gene frequencies) . The same biological values were then
182
UNIVERSITY
OF I
BADAN LIBRARY
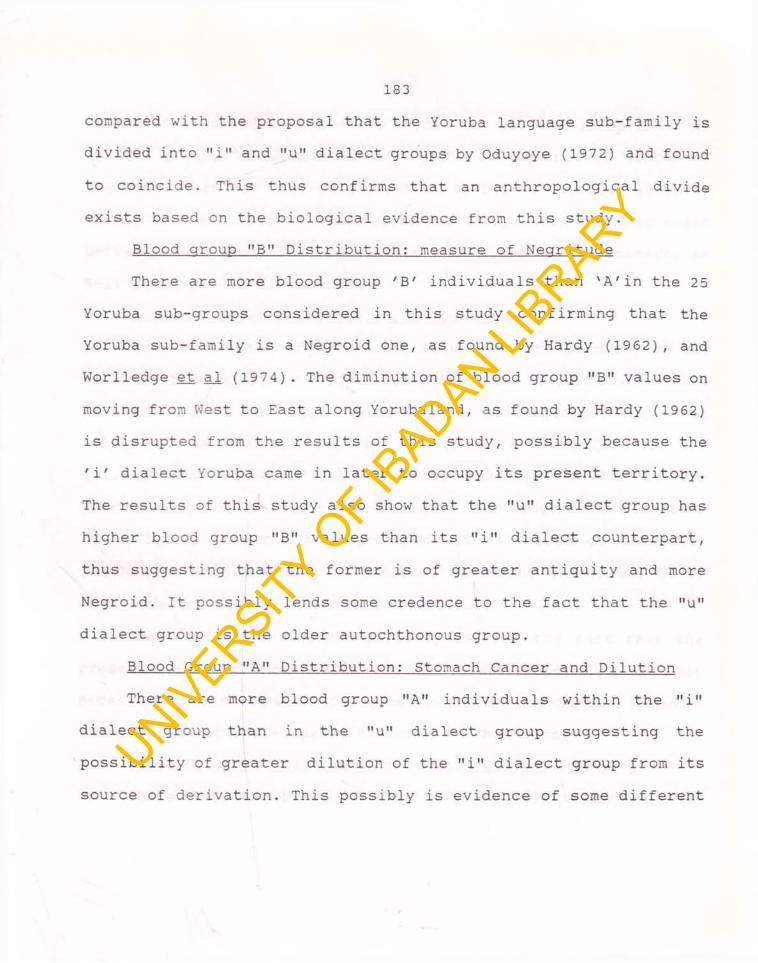
183
compared with the proposal that the Yoruba language sub-family is divided into "i" and "u" dialect groups by Oduyoye (1972) and found to coincide. This thus confirms that an anthropological divide exists based on the biological evidence from this study.
Blood group "B" Distribution: measure of Nearitude There are more blood group 'B' individuals than 'A'in the 25
Yoruba sub-groups considered in this study confirming that theYoruba sub-family is a Negroid one, as found by Hardy (1962), andWorlledge et al (1974) . The diminution of blood group "B" values on moving from West to East along Yorubaland, as found by Hardy (1962) is disrupted from the results of this study, possibly because the 'i' dialect Yoruba came in later to occupy its present territory. The results of this study also show that the "u" dialect group hashigher blood group "B" values than its "i" dialect counterpart,thus suggesting that the former is of greater antiquity and more Negroid. It possibly lends some credence to the fact that the "u" dialect group is the older autochthonous group.
Blood Group "A" Distribution: Stomach Cancer and Dilution There are more blood group "A" individuals within the "i"
dialect group than in the "u" dialect group suggesting the possibility of greater dilution of the "i" dialect group from its source of derivation. This possibly is evidence of some different
UNIVERSITY
OF I
BADAN LIBRARY
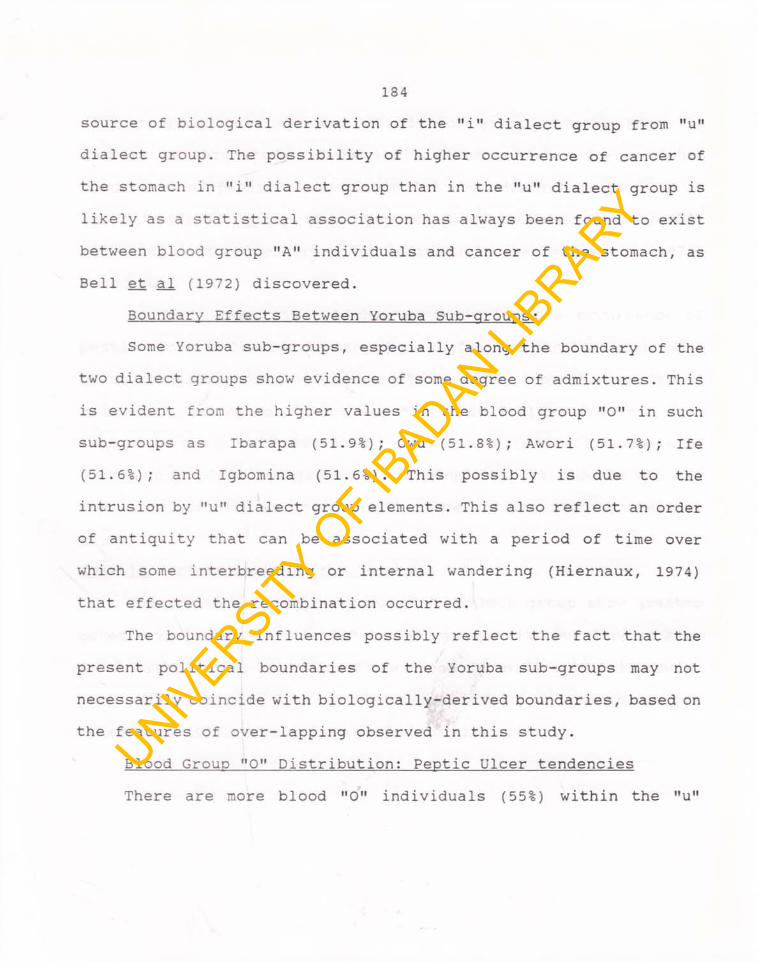
184
source of biological derivation of the "i" dialect group from "u" dialect group. The possibility of higher occurrence of cancer of the stomach in "i" dialect group than in the "u" dialect group is likely as a statistical association has always been found to exist between blood group "A" individuals and cancer of the stomach, as Bell et al (1972) discovered.
Boundary Effects Between Yoruba Sub-groups:Some Yoruba sub-groups, especially along the boundary of the
two dialect groups show evidence of some degree of admixtures. This is evident from the higher values in the blood group "0" in such sub-groups as Ibarapa (51.9%); Owu (51.8%); Awori (51.7%); Ife (51.6%); and Igbomina (51.6%). This possibly is due to the intrusion by "u" dialect group elements. This also reflect an order of antiquity that can be associated with a period of time over which some interbreeding or internal wandering (Hiernaux, 1974) that effected the recombination occurred.
The boundary influences possibly reflect the fact that the present political boundaries of the Yoruba sub-groups may not necessarily coincide with biologically-derived boundaries, based on the features of over-lapping observed in this study.
Blood Group "0" Distribution: Peptic Ulcer tendenciesThere are more blood "0" individuals (55%) within the "u"
UNIVERSITY
OF I
BADAN LIBRARY
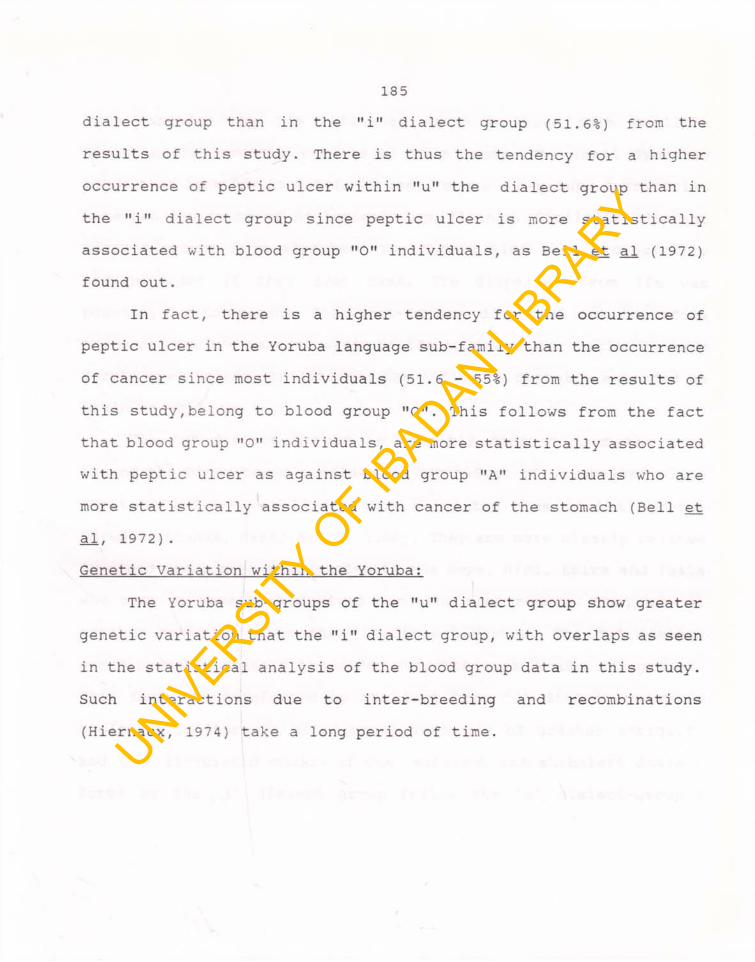
185
dialect group than in the "i" dialect group (51.6%) from the results of this study. There is thus the tendency for a higher occurrence of peptic ulcer within "u" the dialect group than in the "i" dialect group since peptic ulcer is more statistically associated with blood group "0" individuals, as Bell et al (1972) found out.
In fact, there is a higher tendency for the occurrence of peptic ulcer in the Yoruba language sub-family than the occurrence of cancer since most individuals (51.6 - 55%) from the results of this study,belong to blood group "0". This follows from the fact that blood group "0" individuals, are more statistically associated with peptic ulcer as against blood group "A" individuals who are more statistically associated with cancer of the stomach (Bell et al, 1972) .Genetic Variation within the Yoruba:
The Yoruba sub-groups of the "u" dialect group show greater genetic variation that the "i" dialect group, with overlaps as seen in the statistical analysis of the blood group data in this study. Such interactions due to inter-breeding and recombinations (Hiernaux, 1974) take a long period of time.
UNIVERSITY
OF I
BADAN LIBRARY
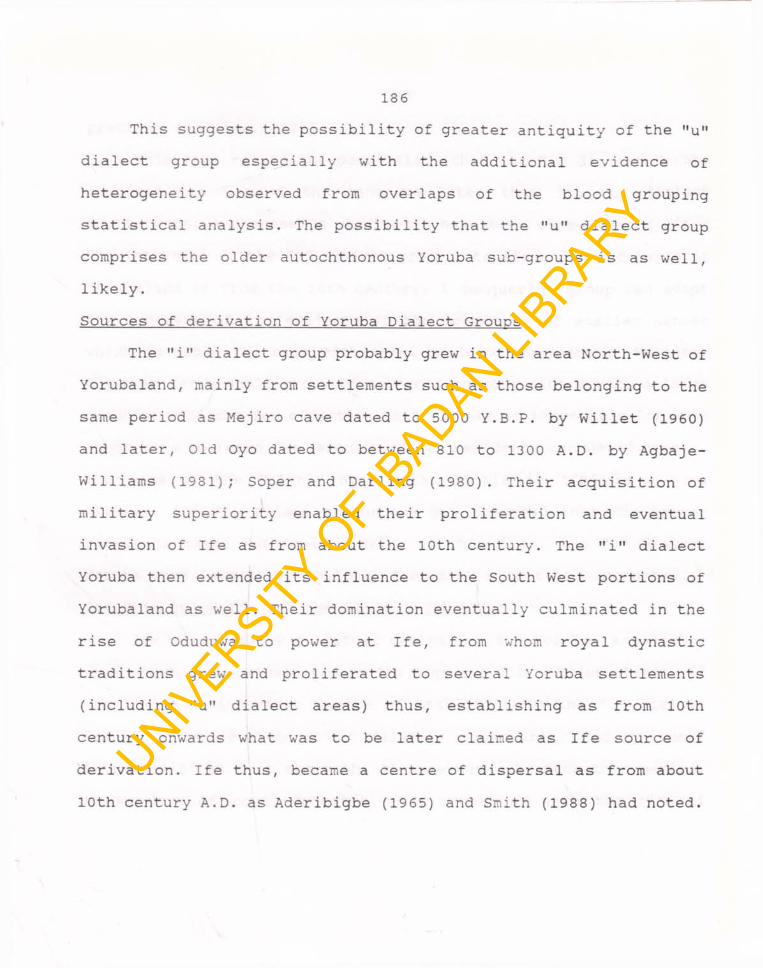
136
This suggests the possibility of greater antiquity of the "u" dialect group especially with the additional evidence of heterogeneity observed from overlaps of the blood grouping statistical analysis. The possibility that the "u" dialect group comprises the older autochthonous Yoruba sub-groups is as well, likely.Sources of derivation of Yoruba Dialect Groups
The "i" dialect group probably grew in the area North-West of Yorubaland, mainly from settlements such as those belonging to the same period as Mejiro cave dated to 5000 Y.B.P. by Willet (1960) and later, Old Oyo dated to between 810 to 1300 A.D. by Agbaje- Williams (1931); Soper and Darling (1980). Their acquisition of military superiority enabled their proliferation and eventual invasion of Ife as from about the 10th century. The "i" dialect Yoruba then extended its influence to the South West portions of Yorubaland as well. Their domination eventually culminated in the rise of Oduduwa to power at Ife, from whom royal dynastic traditions grew and proliferated to several Yoruba settlements (including "u" dialect areas) thus, establishing as from 10th century onwards what was to be later claimed as Ife source of derivation. Ife thus, became a centre of dispersal as from about 10th century A.D. as Aderibigbe (1965) and Smith (1988) had noted.
UNIVERSITY
OF I
BADAN LIBRARY
187
This explains why Ife influence seems to have been neglible biologically from the results of this study. The small dynastic bands that left Ife to settle in many Yoruba sub-groups territories were too few to be of biological significance. Similarly, distant migrant groups from elsewhere would have also been biologically insignificant if they ever came. The dispersal from Ife was possibly due to anarchy. This post-Oduduwa dispersal was, therefore the basis for the general claim of Ife source of derivation by many Yoruba oral (royal) traditions; the influence probably extended to Benin as well.
The "u" dialect Yoruba is possibly derived from the area around the Niger-benue confluence, North-East of Yorubaland since about 3000 Y.B.P. at least; this being the home of the 'proto- Yoruba' (Atanda, 1980; Smith, 1988). They are more closely related by blood group gene frequencies to the Nupe, Bini, Ebira and Igala who seem to have been derived from the same source. They are of greater antiquity that the "i" dialect Yoruba. The "u" dialect group probably contain the older autochthonous Yoruba sub-groups. This fact is reinforced by the fact that "u" dialect group is biologically (through blood group evidence) of greater antiquity and that linguistic choice of the sibilant and shiboleth dialect forms by the ' i ' dialect group follow the 'u' dialect-group's
UNIVERSITY
OF I
BADAN LIBRARY
188
practice (Oduyoye, 1972).This thus raises the possibility that the "i" dialect Yoruba
acquired the use of the language later than its "u' dialect counterpart; a phenomenon which must have been consolidated after the intrusion of the "i" dialect group into Ife and other parts of Yorubaland as from the 10th century. A conquering group can adopt the language of its subjects if the former is of smaller number which is often the case with small bands of conquerors. Besides, the need for a small group of subjects to communicate with a large group of subjects for effective control make it inevitable for such conquerors to learn the language of its resident, conquered people. The case of the Fulani invasion at Ilorin in 1796 is a good example. The few Fulani conquerors got absorbed into the larger Yoruba language sub-family! Prior to this time, the "u" dialect Yoruba were largely acephalous, from many historical accounts.The Primacy of Ife and the Place of Oduduwa:
Ife was an early spiritual centre for the Yoruba, especially from charcoal remains dated to 5th century, A.D. (Ryder, 1984). It was thus, an important centre of attraction to the ' i" dialect Yoruba whose development of military superiority led to their intrusion of it from about the 10th century. As from this period, a new wave of royal dynastic pattern emerged with the rise of
UNIVERSITY
OF I
BADAN LIBRARY
189
Oduduwa to power at Ife, leading to the growth of similar traditions that eventually spread to most of Yorubaland often by royal dynastic groups who however, appear to be biologically insignificant compared to the autochthonous populations. The primacy of Ife in Yoruba oral traditions was established only as from about the 10th century. Ife influence is thus, biologically limited. It was thus an eventual centre of Yoruba dispersal.
The fact that Ife had witnessed upheavals, especially military, which must have promoted the mixing of autochthonous and migrant peoples is possibly responsible for its slightly higher blood group values, implying that some "u" dialect features may be found around its territory despite the fact that it is essentially in the "i" dialect group from the results of this study. This is corroborated by blood group "O" value which is 51.6%. The same feature may be said to be probably applicable to such a nearby subgroup as the Owu which has blood group "0" value of 51.8%. The two show evidence of "u" dialect admixtures, even though at an insignificant level.
The opportunistic rise of Oduduwa at Ife as from about the 10th century afforded him the status of the propagator of the royal dynastic influences over most Yoruba sub-groups' territories hence its acknowledgements in Yoruba royal oral traditions. His
UNIVERSITY
OF I
BADAN LIBRARY
190
recognition as the fore-runner of the present wave of the royal dynastic traditions in Yorubaland is acceptable.
The fact that he rose to power in Ife about the 10th - 12th century is a confirmation of the assertion that he did not belong to the earliest known generation of the Yoruba (Atanda, 1980) and could thus, not have been the progenitor of the Yoruba race! The historical accounts of Ife and Oduduwa as related, often by royal historians, is based on this migration to Ife as from about the 10th century. It often does not talk of autochthonous peoples or sub-groups before the advent of Oduduwa.Conclusions:
From the results of this study, the following can beIconcluded:
The Yoruba language sub-family, which is evidently Negroid in biological content is subject to some anthropological partition into two dialect groups: "i" and "u" based on blood group evidence from this study which linguistic, historical, archaeological, and statistical data apppear to corroborate.
The 25 Yoruba sub-groups considered in this study reveal that there is a higher tendency for the occurrence of peptic ulcer than cancer of the stomach within its population; a feature which also reflects the possibility of a higher level of occurrence of peptic
UNIVERSITY
OF I
BADAN LIBRARY
191
ulcer in the "u" dialect group than in its "i" dialect counterpart, and vice versa.The display of a high level of heterogeneity within the Yoruba is evident; more so in the "u" dialect group than in its "i" dialect counterpart, confirming the greater antiquity and autochthony of the "u" dialect group.
The primacy of Ife was established as from about the 10th century when Oduduwa rose to power there becoming a major influence in the subsequent spread of the present royal dynastic traditions throughout most of Yorubaland. The fact that Ife had always existed before the advent of Oduduwa implies that he was not part of the earliest known Yoruba, and therefore, could not have been the progenitor of the Yoruba race as claimed in many royal historical traditions.
The limitations of Yoruba history is to be found in the partial accounts of royal historians which is often only limited to the emergence of royal dynasties after Oduduwa's rise to power at Ife. The true historical account of many autochthonous populations of Yoruba sub-groups when derived along with the existing royal historical accounts will make Yoruba history complete.
The results of this study showing the partition of the Yoruba language sub-family into: ("i" and "u") dialect groups is the
UNIVERSITY
OF I
BADAN LIBRARY
192
results of finer sampling methods employed in this study as not hitherto carried out for the Yoruba ABO blood group analysis. It is then possible to derive further partitions with more discrete sampling methods in future.
\
UNIVERSITY
OF I
BADAN LIBRARY
R E F E R E N C E S
PUBLISHED WORKS
ABDULLAHI, N. F. (1976), "Human Blood Groups in Basrah".MAN Vol.2. No. 2. pp. 239.242.
ADAMU, M. (1984), "The Hausa and their neighbours in the central Sudan." In: General History of Africa. IV African from the Twelfth to the sixteenth century.(Editor. D. T. Niane) California; Heinemann. Unesco pp. 226-300.
ADERIBIGBE, A.A.B. (1965), "People of Southern Nigeria". In:A Thousand Years of West African History. (Editors: Ajayi, J.F.A.and I. Espie). Ikeja, Lagos. Thomas Nelson and Sons Ltd. pp. 191 - 216.
ADETUGBO, A. (1973), "The Yoruba language in Yoruba history."In: Sources of Yoruba history (Editor: S.O. Biobaku)Oxford; Clarendon Press, pp. 175 - 204.
AJAYI, J.F. ADE and IAN ESPIE (1965) In: A Thousand Years ofWest African History. Ikeja, Lagos. Thomas Nelson and Sons Ltd. pp 253 - 266.
AJISAFE, A.K. (1972) In: A History of Abeokuta. Abeokuta; The Hardcore society, pp. 1 - 3 9 .
193
UNIVERSITY
OF I
BADAN LIBRARY
194
ALEXEEV, V.P. (1986) In: The Origin of the Human Race. Moscow; Progress Publishers, pg. 265.
AMONI, I.J. (1978) In: A Sketch-Map History of West AfricaA.D.1000 to Present Day, pg. 23.
ANDAH, B.W. (1978) "Population and Language History of Tropical Africa." Editors: B. W. Andah and A. I. Okpoko. Ibadan; West African Journal of Archaeology, pp. 53 - 85.
ANOZIE, F.N.; V.E. CHIKWENDU; and A.C. UMEJI (1978)"Discovery of a major Prehistoric site at Ugwuele-Uturu, Okigwe." Ibadan; W.A.J.A. Vol. 8, pp. 171-1 76 .
ARMSTRONG, R.G. (1964) In: The study of West African Languages, Ibadan; Ibadan University Press, pp. 1 - 19.
ASHARA, CHIEF M.B. (1951) In: The History of Owo.Owo; The Author, pp. 1 - 11.
ATANDA, J.A. (1980) In: An introduction to Yoruba History.Ibadan; Ibadan University Press, pp. 1 - 1 8 .
AYANDELE, E .A . (1992) In: The Iiebu of Yorubaland 1850 - 1950.Politics. Economy and Society. Ibadan; Heinemann Educational Books (Nigeria) Pic. pp. 1 - 2 9 .
BARTH, F. (1969) (Editor) In: Ethnic Groups and Boundaries Boston; Little, Brown, pp. 9 - 3 8 .
BELL, G.H.; J.N. DAVIDSON; and D. EMSLIE-SMITH (1972).
UNIVERSITY
OF I
BADAN LIBRARY
195
In: Textbook of Physiology and Biochemistry (8thedition). London; Longman Group Ltd. pp. 410 - 414.
BAILEY, N.T.J. (1959) In: Statistical Methods in Biology.London; The English Language Book society and the English University Press Ltd. pp. 100 - 116.
BIOBAKU, S.O. (1957) In: The Egbas and their Neighbours, 1842-1872. Oxford; Clarendon Press, pp. 1 - 1 5 .
BLUMBERG, B.S.; IKIN, E.W.P and A .E. MOURANT (1961)."The blood groups of the Pastoral Fulani of Northern Nigeria and the Yoruba of Western Nigeria". American Journal of Physical Anthropology. No. 19; pp. 195 - 201.
BOORMAN, K.E. and DODD, B.E. (1970) In: An introduction to Blood Group Serology, (4th edition), London; J. & A. Churchill, pp. 1 - 4 6 .
BROWN, E.S. (1965) "Distribution of the ABO and Rhesus (D) blood group in the north of Scotland." London; Heredity. 20. pp. 289 - 303.
CAVALLI-SFORZA, L.L. (1966) "Population structure and humanevolution". Proceedings of the Royal Society, B., 164, pp. 362 - 379.
CHALMERS, J.N.M.; IKIN, E.W.and MOURANT, A.E. (1953) "The ABO,MNS and Rh blood groups of the Nigerians". Annals of
UNIVERSITY
OF I
BADAN LIBRARY
196
Eugenics, No. 17. pp. 168 - 176.CLARKE, G.M. (1980) In: Statistics and Experimental Design (2nd
edition.) London; Edward Arnold Publishers Ltd. pp. 33 - 41.
CONNAH, G. (1975); In: The Archaeology of Benin. Oxford; Clarendon Press, pp. 1 - 31.
CROWDER, M. (1966) In: The Story of Nigeria. (Revised Edition) London; Faber and Faber, pp. 1 - 5 2 .
DACIE, SIR JOHN V. and S.M. LEWIS (1984) In: Aspects ofPractical Haematology. 6th edition. London; Churchill, pp. 337 - 340.
DAVIES, O. (1964) In: The Ouarternarv in the Coastlands ofGuinea■ Glasgow; Jackson, Son and Co. pp. 239 - 247.
DAWSON, G.W.P. (1964) "The frequencies of the ABO and Rh (D)blood group in Ireland from a sample of 1 in 18 of the population." Annals of Human genetics. 28, pp. 49 - 59.
DUZE, M. (1970) In: Primary Atlas for the Bendel State of Nigeria. Nigeria; Macmillan, pg. 16.
DUZE, M. L& OJO, AFOLABI (1982) In: Macmillan Senior School Atlas. Nigeria; Macmillan, pp. 26 - 30.
EGHAREVBA, J.U. (1982) In: A History of Benin. (3rd edition)Ibadan; Ibadan University Press, pp 1 - 42.
UNIVERSITY
OF I
BADAN LIBRARY
197
EL HASSAN, A.M.; M. C. GODBER; A. C. KOPEC; A . E . MOURANT; D.TILLS; and H.LEHMAN (1968): The Hereditary blood factors of the Beja of Sudan". MAN, Vol. 3, No. 2. pp. 272 - 283 .
FABUNMI, M.A. (1985) In: Ife. The genesis of Yoruba Race Ikeja, Lagos; John West Publications Ltd., pp. 1 - 38.
FISHER, R . A . & TAYLOR, G.L. (1940) "Scandinavian influence inScottish ethnology". Nature. 145, 590. pp.313 - 327.
FLEURE, H. J. & JAMES, T. C. (1916) "Geographical distribution of Anthropological types in Wales" Journal of the Royal Anthropological Insitute, 46, pp 35 - 172.
GARLICK, J.P. (1962) "Blood Group Maps of Africa". Journal of African History, Vol. Ill, No. 2 pp. 297 - 300.
GIBNEY, FRANK (editor) (1978) In: The Arabs. People and power. New York; Bantam/Brittanica Books, pp 20 - 21.
GREENBERG, J.H. (1963) In Languages of Africa.The Hague; Mouton. pp 1 - 30
GREENBERG, J.H. (1964) "Historical inferences from linguistic research in sub-Saharan Africa." In: Boston University papers in African History. Vol. 1 pp. 3 - 15.
GREGERSON, E.A. (1977) In: Language in Africa. London; Gordon and
UNIVERSITY
OF I
BADAN LIBRARY
198 ‘
Breach, pp. 27 - 36.HARDY, J. (1962) "The ABO blood groups of Southern Nigerians and
their relation to the history of the area". Journal of the Royal Anthropological Institute of Great Britain and Ireland. No. 92. 223 - 231.
HIERNAUX, J. (1974) In: The People of Africa. Peoples of the World (Series Editor: Sonia Cole). London; Weidenfeld and Nicolson. pp. 55 - 65
HIRSCH, ELLEN (1993) Editor In: Facts about Israel Jerusalem.Israel Information Centre. Pg.50.
HORTON, R. (1979): "Ancient Ife: a reassessment".Journal of the Historial Society of Nigeria. Vol. 9, No. 4. pp. 71 - 74
HUIZINGA, J.N.F., BIRNIE-TELLIER, and E.V. GLANVILLE (1967)"Description and Carbon - 14 dating of Tellem cave skulls from the Mali Republic: a comparison with other Negroid Groups.(I + II) "Koniki. Nederi. Akademie Van Wetenschappen - Amsterdam. Series C, Vol. 70, No 3. pp 388 - 367.
IKIN, E.W.; H. LEHMANN; A.E. MOURANT; and H. THEIN (1966).The Blood Groups and Haemoglobins of the Burmese." MAN,
UNIVERSITY
OF I
BADAN LIBRARY
199
Vol. 4, No. 1 . pp. 118 - 122ISICHEI, E. (1983) In: West African History A. D. 1000 to the
present day. Ibadan. Oxford University press Pg. 26.JOHNSON, S. (1921) In: The History of the Yorubas. C.M.S.
Bookshops, Lagos, pp. 1 - 2 5 .
KEELE, A.A. & E. NEIL (1971) In: Samson Wright's AppliedPhysiology (12th edition) London; Oxford University Press, pp. 34 - 35.
LAFENE, J. (1980) Editor: In: Evans Junior Atlas for SocialStudies. Ibadan; Evans, pp. 14 - 26.
LEWIS, J. (1978) In: Anthroplogy Made Simple. London; W.H. Allen, pp.56 - 72.
LISTER, R.W.; N.W.M. ORR; B BOTTING; E.W. IKIN, A. E . MOURANT; and H. LEHMANN (1966): "The Blood Groups and Haemoglobin of the Bedouin of Socotra". MAN Vol. I No. 1 . pp. 82 - 86.
LUCAS, J. O. (1948) In: The Religion of the Yorubas. Lagos;C.M.S. Bookshop, pp. 291 - 338.
LLOYD, D.C. (1959) "Sungbo's Eredo." Odu Vol. 7 pp.15-22MABOGUNJE, A.L. and J.D. OMER-COOPER (1971) In: Owu in Yoruba
History. Ibadan; Ibadan University Press, pp 1 - 71.
UNIVERSITY
OF I
BADAN LIBRARY
200
MARSHALL,
MITCHELL,
MOURANT,
NIANE, D
ODUKOYA,
ODUYOYE,
OGUNKOYA,
PARKER,
P.T. (1978) In: Biology Advanced Level (3rd Edition) Great Britain; Macdonald and Evans Handbooks, pg. 196. R.J. and E. SUNDERLAND (1978) "ABO and Rh Blood Groups in the Isle of Man". MAN Vol. 13. No. 4 . pp. 580 - 590.
A. E.; A .C . KOPEC; and K. DOMANIEWAKA SOBCZAK (1958) In: The ABO blood Groups: Comprehensive tables and maps of world distribution. Oxford; Blackwell, pp 58-64.
i T . (1984) Editor: In: General History of Africa. IV.Africa from the Twelfth to the Sixteenth century. California; Heinemann Unesco pg. 342.I.B. (1968) In: History of Iiebu (Part 1) Ijebu-Ode; Tanimehin-Ola Press pg. 5
M. (1972) In: Yoruba Names. Their Structure and meanings. Ibadan; Daystar Press, pg. 25.T.O. (1956) "The Early History of Ijebu".Journal of the History Society of Nigeria. Vol. 1 No. 1. pp. 48-58
:.E. (1979) In: Introductory Statistics for Biology. 2ndEdition. London; Edward Arnold (Publishers) Ltd. pp.6 8 - 89.
RACE, R.B & R. SANGER (1968) In: Blood Groups in Man. (5th edition)
UNIVERSITY
OF I
BADAN LIBRARY
201
Oxford; Blackwell, pp 1 - 37.REMO MIRROR (1987) "How Sagamu came into existence." Pg. 12;
Vol. 1 No.l October 1987. Sagamu; Remo Mirror Media Ltd. (Editor: Remi Beyioku)
ROBERTS, D.F.; C.K. CREEN and K.P. ABEYARATNE (1972): "Blood groups of the Sinhalese". MAN Vol. 7, No. 1. pp. 122-127.
RYDER, A.F.C. (1984) "From Volta to Cameroon". In: General History of Africa. IV. Africa from the Twelfth to the Sixteenth century. (Editor:D.T. Niane) California; Heinemann/Unesco pp. 339 - 370.
SHAW, T (1967) "The mystery of the buried bronzes: discoveries at Igbo-Ukwu, Eastern Nigeria". Nigeria Mag. 92: pp 55-74.
SHAW, T and S.G.H. DANIELS (1984) "Excarvations at Iwo Eleru, Ondo State, Nigeria". W.A.J.A. Vol. 14. pp. 29-30.
SHAW, T. & D. BROTHWELL (1971) "A late upper pleistocene proto-West African negro from Nigeria. MAN 6, 2 . pp. 221-227.
SMITH, A.B. (1975) "Radiocarbon dates for Bosumpra cave, Abetifi, Ghana" Proc. Prehist. Soc. 41 pp. 179-182.
SMITH, R.S. (1988) In: Kingdom of the Yoruba. (3rd Edition) London, James Currey Ltd. pp.3-137.
SOPER, R. and P. DARLING (1980) "The walls of Oyo-Ile". W.A.J.A.Vol. 10 pp. 68-81.
UNIVERSITY
OF I
BADAN LIBRARY

202
SOWUNMI, M.A. (1981) "Aspects of Late Quaternary vegetational changes in West Africa". J. Bioqeoq. Vol. 8 pp.457-474.
TAMUNO, T.M. (1965) "Peoples of the Niger-Benue Confluence". In: A Thousand Years of West African History. (Editors: Ajayi, J.F.A. & I. Espie) Ikeja, Lagos; Thomas Nelson and Sons Ltd. pp.206-216.
WALLERSTEIN, I. (1960) "Ethnicity and National Intergration in West Africa". Cahiers ' d 'Etudes Africaines No. 3 Vol. 1, October, 1960 pp. 129-139.
WALPOLE
WATKIN,
WATKIN,
WATKIN,
WATKIN,WATKIN,
R.E. (1974) In: Introduction to Statistics.(2nd Edition) New York; Macmillian Publishing Company, pp. 267-277.
I.M. (1952) "Blood group in Wales and the Marches". MAN. 52, 83-86.
I.M. (1956) "ABO Blood group and racial characteristics in rural Wales". London; Heredity 10, pp.161-193.
I.M. (1960) "A Viking settlement in Little England beyond Wales: ABO blood group evidence". MAN 60 pp 148-53.
I.M. (1961) "Welsh Surnames". Man 61, pp 88-9I.M. (1963) "English and Welsh racial elements in Western
Shrosphire and in adjacent Welsh borderland; ABO blood group evidence. "Journal of Anthropological Institute.
UNIVERSITY
OF I
BADAN LIBRARY
203
94, pp.52-65.WATKIN, I.M. (1965): "ABO blood groups, human history and language
in Hereforshire with special reference to the low B frequency in Europe". London; Heredity, No 20; pp.83-95.
WATKIN, I.M. (1966) "An Anthropological study of Eastern Shropshire and South-Western Chesire ABO Blood-groups". MAN. Vol. 1 No. 3, pp.375-385.
WILLET, F. (1960) "Investigation at Old-Oyo 1956-57: an interim report". Journal Hist-Soc. Nig. Vol. 2, No. 1, pp.59-77.
WORLLEDGE, S.M.; S.E. OGIEMUDIA; C.O. THOMAS; B.N. IKOKU andL.LUZZATO (1974):"Blood groups antigens and Antibodies in Nigeria." Annals of Tropicals Medicine and Parasitology. Vol. 68, No.3 pp 249-264.
UNPUBLISHED WORKSAGBAJE-WILLIAMS, B. (1983) "A contribution to the Archaeology of
Old Oyo" Ph.D. Thesis. Ibadan, University of Ibadan, pp. 1-56.
ARIFALO, S.O. (1966), "An analysis and comparison of the Legends of Origin of Akure" An original Essay for B.A. (Special Honours) History. Ile-Ife, Obafemi Awolowo University, pp. 1-71.
ATTAI, E.D.E; A.A. OBOT, and R. OKPARA (1965). "Blood Group
UNIVERSITY
OF I
BADAN LIBRARY
204
BIOBAKU,
FOLAYAN,
I.D.A.
IJAGBEMI
(M.O.I.)
distribution in blood donors of Cross River State Origin". Abstracts of the Nigerian Society of Heamatoloav and Blood transfusion. (Calabar) Annual Scientific Conference, pg.35.S.O. (1990) " The History of the Egba". In: Lisabi Day Commemorative Programme. Abeokuta. pp.1-14.KOLA (1967) "Egbado in the Nineteenth Century". M.A. Thesis. Ibadan, University of Ibadan, pp. 1-24.
(Ijebu-Ode Development Association)(1991) "The History of Ijebu. " Ijebu-Ode; Obanta Day Festival Programme pp. 7-11, 26th October, 1991.
, A. (1987) "Change and Incorporation in the Niger-Benue Confluence Area: The case of "Okun" Yoruba." Paper presented at a Conference on Confluence Nigerians at Lokoja 27th September - 2nd October, 1987. pp. 1-35.
Ministry of Information (n.d.) In: Ado-Ekiti. Town series, spotlighting major towns, Akure; Ondo State of Nigeria, pp. 1-5.(n.d) In: Akure, Town Series, spotlighting major towns, Akure Ondo State of Nigeria, pp. 1-7(n.d.) In: Ondo, Town series, spotlighting major towns,
UNIVERSITY
OF I
BADAN LIBRARY
205 '
Akure; Ondo State of Nigeria, pp. 1-6.(n.d.) In: Owo. Town series, spotlighting major towns, Akure, Ondo State of Nigeria, pp.1-9
OYELARAN, P.A. (1991): Archaeological and Palaeoenvironmental investigations in Iffe-Ijumu area of Kwara State, Nigeria. 11 Ph. D. Thesis Department of Archaeology and Anthropology, Ibadan, University of Ibadan, pp.1-24.
UDEOZO,I.O.K. (1985) "Gene Frequencies of ABO blood group inthree major Nigerian Tribes". Abstracts of the Nigerian Society for Haematology and Blood Transfusion (Calabar; Annual Scientific Conference), pg 29.
PERSONAL COMMUNICATIONBOLORUNDURO, PAUL (1990) A young man of about 35 years from
Aiyetoro in Ijumu district who gave basic information on the Ijumu sub-group and other "Okun" Yoruba sub-groups.
UNIVERSITY
OF I
BADAN LIBRARY
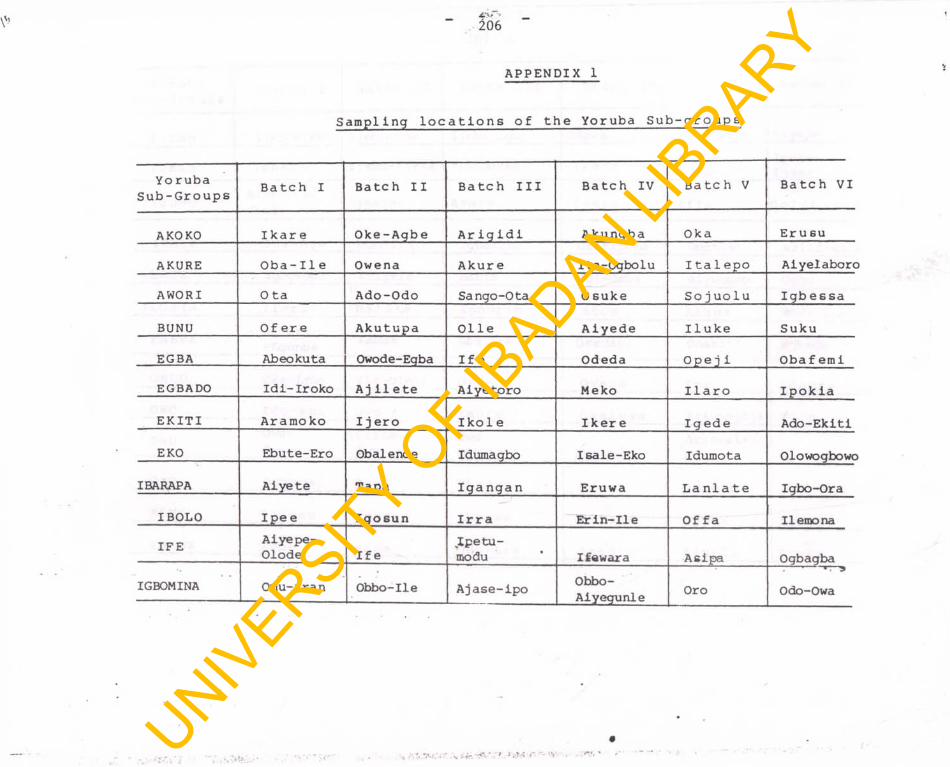
APPENDIX 1
S a m p l i n g l o c a t i o n s o f t h e Yor uba S u b - g r o u p s
Y o r ub aS u b - G r o u p s B a t c h I B a t c h I I B a t c h I I I B a t c h IV B a t c h V B a t c h VI
AKOKO I k a r e Oke- Agb e Ar i g i d i Akungba Oka Er u su
AKURE O ba - l i e Owena Akur e Ita-Ogbolu I t a 1 epo Aiyelaboro
AWORI 0 t a Ado-Odo Sango-Ota 0 s uke So j u o 1 u I g b e s s a
BUNU Of e r e Aku t u p a Ol l e A i y e d e I l u k e Suku
EG BA Abeokuta Owode-Egba I f o Odeda Ope j 1 Oba f emi
EGBADO Id i - I r oko A j 1 1 e t e Aiyetoro Meko I l a r o I p o k i a
EKITI Aramoko I j e r o I k o l e I k e r e I g e d e Ado-Ekit i
EKO Ebute-Ero Obalende Idumagbo Isale-Eko Idumota Olowogbowo
IBARAPA Aiyete Tapa I g a n g a n Eruwa La n l a t e Igbo-Ora
IBOLO I p e e I g o s u n I r r a E r i n - l i e Of f a Ilemona
IFE Aiyepe-Olode I f e
JLpetu-modu Ifewara Asipa Ogbagba
IGBOMINA Omu-aran Obbo-Ile A j a s e - i p o Obbo-Aiyegunle Oro Odo-Owa
UNIVERSITY
OF I
BADAN LIBRARY
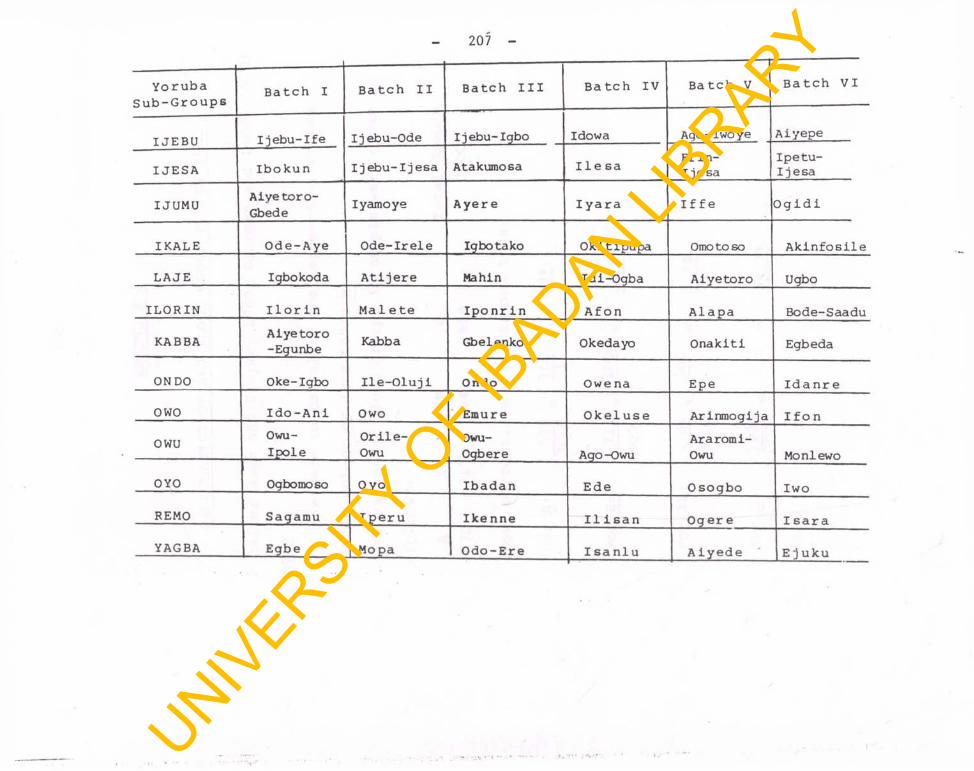
207
Y or u b aS u b - G r o u p s
B a t c h I B a t c h I I B a t c h I I I B a t c h IV B a t c h V B a t c h VI
I JEBU I j e b u - I f e I j ebu-Ode Ijebu-Igbo Idowa Ago-Iwoye Aiyepe
I J E S A I b o k u n I j e b u - I j e s a Atakuraosa 1 1 e s a Erin- I j e s a
Ipetu- I j e s a
IJUMU Aiyetoro-Gbede Iyamoye Ayer e I y a r a I f f e Og i d i
I KALE Ode-Aye Ode- I re l e Igbotako Okit ipupa Omotoso A k i n f o s i l e
LA J E Igbokoda A t i j e r e Mahin Idi-Ogba Aiyetoro Ugbo
ILORIN I l o r i n Ma 1 e t e Ipo nr i n Af on Al a p a Bode-Saadu
KABBA Aiyetoro-Egunbe Kabba Gbelenko Okedayo Onakit i Egbeda
ONDO Oke-Igbo I l e - O l u j i Ondo Owe na Epe I d a n r e
OWO I d o - A n i Owo Emure O k e l u s e Arinmogi ja I f o n
OWUOwu-Ipole
Or i l e -Owu
Owu-Ogbere Ago-Owu
Araromi-Owu Monlewo
OYO Ogbomoso Oyo I b a d a n E de 0 s o g b o Iwo
REMO Sagamu I p e r u Ike nne 1 1 i s a n Og e r e I s a r a
YAGBA Egbe Mopa Odo- Er e I s a n l u A i y e d e E j uku
UNIVERSITY
OF I
BADAN LIBRARY
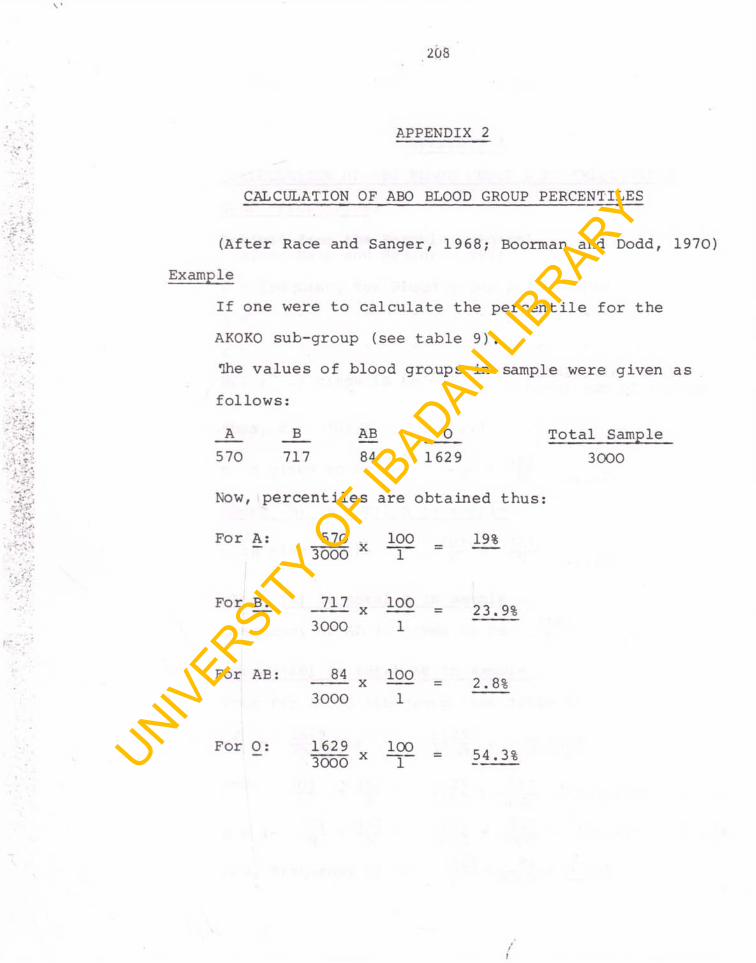
20S
A P P E N D I X 2
C A LC U LA T IO N OF ABO BLOOD GROUP P E R C E N T IL E S
( A f t e r R a c e and S a n g e r , 1 9 6 8 ; Bo o rm an and D odd , 1970 )
E x a m p le
I f o n e w e re t o c a l c u l a t e t h e p e r c e n t i l e f o r t h e
AKOKO s u b - g ro u p (s e e t a b l e 9 ) .
The v a l u e s o f b lo o d g ro u p s in s a m p le w e r e g iv e n a s
f o l l o w s :
A B A B 0 T o t a l S a m p le570 717 84 1629 3000
Now, p e r c e n t i l e s a r e o b t a in e d t h u s :
F o r A : 5703000 X 100
119%
F o r Bj_ 717 X 100 23 . 9%3000 1
F o r A E : 84 X 100 2 . 8%3000 1
F o r 0 : 16293000 X 100
1 54 .3%3000UNIVERSITY
OF I
BADAN LIBRARY
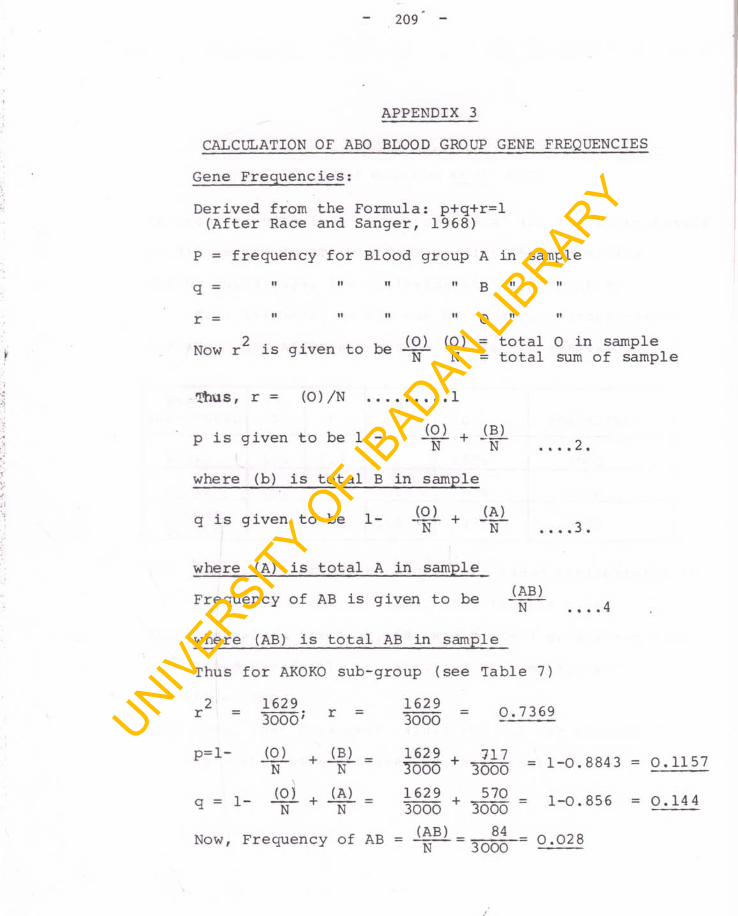
209
A P P E N D I X 3
CALCULATION OF ABO BLOOD GROUP GENE FREQUENCIES Gene Frequencies:Derived from the Formula: p+q+r=l (After Race and Sanger, 1968)
P = frequency for Blood group A in sampleq _ ii H H H g n n
= II II II II Q II II
Now r is given to be (0) (0) = total 0 in sampleN N = total sum of sample
T h u s , r = (0)/N .........1
p is given to be 1 - r 3 N N 2
where (b) is total B in sample
q is given to be 1- (0) , (A)N N 3
• • • «
where (A) is total A in sample Frequency of AB is given to be (AB)
N ___ 4where (AB) is total AB in sample Thus for AK0K0 sub-group (see Table 7)2 1629 1629
r 3000' r = 3000P=l- (0) (B) _ 1629
N N 3000„ _ , (0) q - i - n + (A)
N16293000
Now, Frequency of AB (AB)N
0.7369
+ J i l l = 1-0.8843 = 0.11573000570
300084
3000
= 1-0.856 = 0.144
0.028
UNIVERSITY
OF I
BADAN LIBRARY
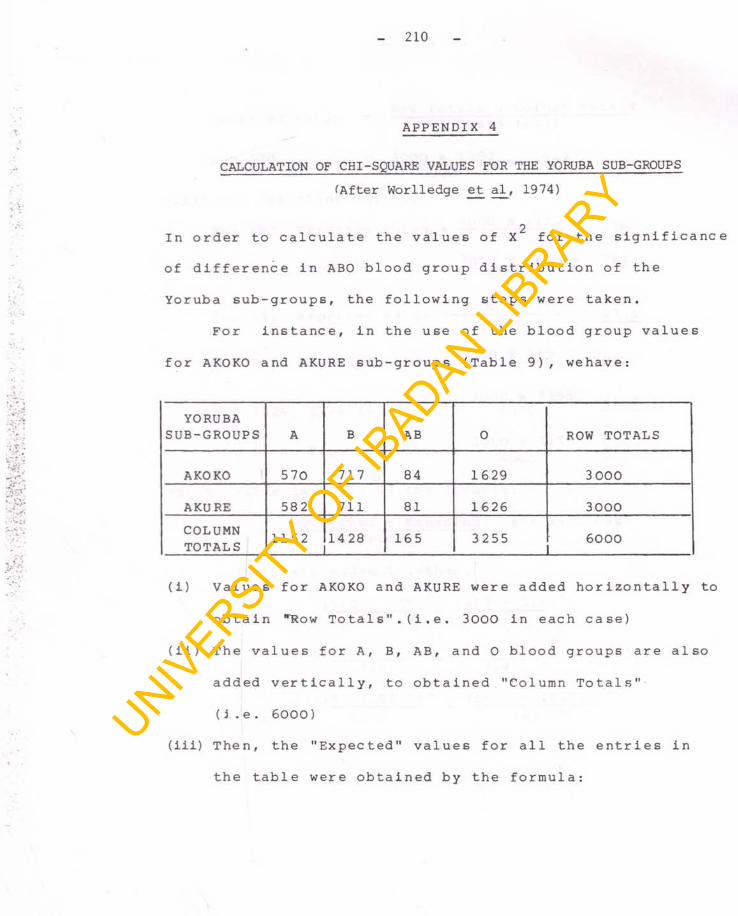
APPENDIX 4
CALCULATION OF CHI-SQUARE VALUES FOR THE YORUBA SUB-GROUPS
(After Worlledge e t a l , 1974)
2I n o r d e r t o c a l c u l a t e t h e v a l u e s o f X f o r t h e s i g n i f i c a n c e
o f d i f f e r e n c e i n ABO b l o o d g r o u p d i s t r i b u t i o n o f t h e
Y o r u b a s u b - g r o u p s , t h e f o l l o w i n g s t e p s we r e t a k e n .
F o r i n s t a n c e , i n t h e u s e o f t h e b l o o d g r o u p v a l u e s
f o r AKOKO and AKURE s u b - g r o u p s ( T a b l e 9 ) , w e h a v e :
YORUBASUB-GROUPS A B AB 0 ROW TOTALS
AKO KO 570 717 84 1 6 2 9 3 000
AKURE 582 711 81 1626 3 0 0 0
COLUMNTOTALS 1 1 5 2 1428 165 3255 6000
( i ) V a l u e s f o r AKOKO and AKURE w e r e a d d e d h o r i z o n t a l l y t o
o b t a i n "’Row T o t a l s " . ( i . e . 3 0 0 0 i n e a c h c a s e )
( i i ) The v a l u e s f o r A, B, AB, a n d 0 b l o o d g r o u p s a r e a l s o
a d d e d v e r t i c a l l y , t o o b t a i n e d " Column T o t a l s "
( i . e . 6 0 00 )
( i i i ) T h e n , t h e " E x p e c t e d " v a l u e s f o r a l l t h e e n t r i e s i n
t h e t a b l e w er e o b t a i n e d b y t h e f o r m u l a :
UNIVERSITY
OF I
BADAN LIBRARY
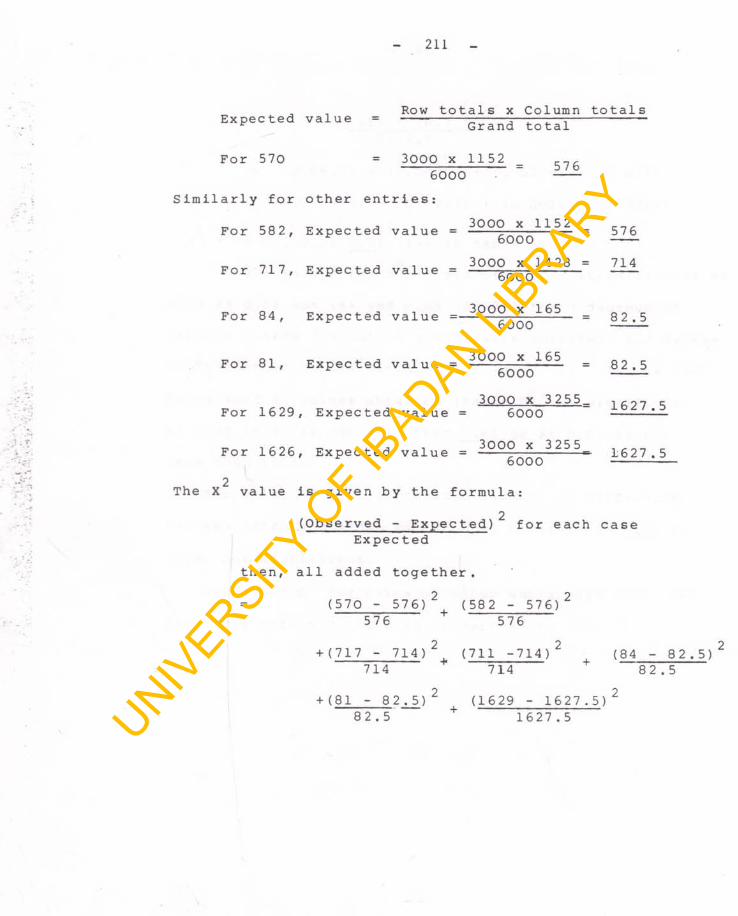
E x p e c t e d v a l u e Row t o t a l s x C o lu m n t o t a l s G r a n d t o t a l
F o r 570 3 0 0 0 x 1 1 5 2 6 0 0 0
576
S i m i l a r l y f o r o t h e r e n t r i e s :
F o r 5 8 2 ,
F o r 7 1 7 ,
F o r 8 4 ,
F o r 8 1 ,
F o r 1629
F o r 1626
E x p e c t e d v a l u e =
E x p e c t e d v a l u e =
E x p e c t e d v a l u e =
E x p e c t e d v a l u e =*
E x p e c t e d v a l u e
E x p e c t e d v a l u e
3 0 0 0 x 11526 0 0 0
3 0 0 0 x 1428 =6000
3 0 0 0 x 1656000
3 0 0 0 x 1656 0 0 0
3 0 0 0 x 3 2 5 5 _ 6000
3 0 0 0 x 3255 6 0 0 0
The X v a l u e i s g i v e n b y t h e f o r m u l a :
576
714
8 2 . 5
8 2 . 5
1 6 2 7 . 5
1 6 2 7 . 5
2(O b s e r v e d - E x p e c t e d ) f o r e a c h c a s e
E x p e c t e d
t h e n , a l l a d d e d t o g e t h e r .
2 2( 5 7 0 - 576) ( 5 82 - 576)576 ' 576
+ (717 - 714) 2 (711 - 7 1 4 ) 2 (84 - 8 2 . 5 ) 2714 " 714 8 2 . 5
+ (81 - 8 2 . 5 ) 2 ( 1 6 2 9 - 1 6 2 7 . 5 ) 28 2 . 5 1 6 2 7 . 5UNIV
ERSITY O
F IBADAN LI
BRARY
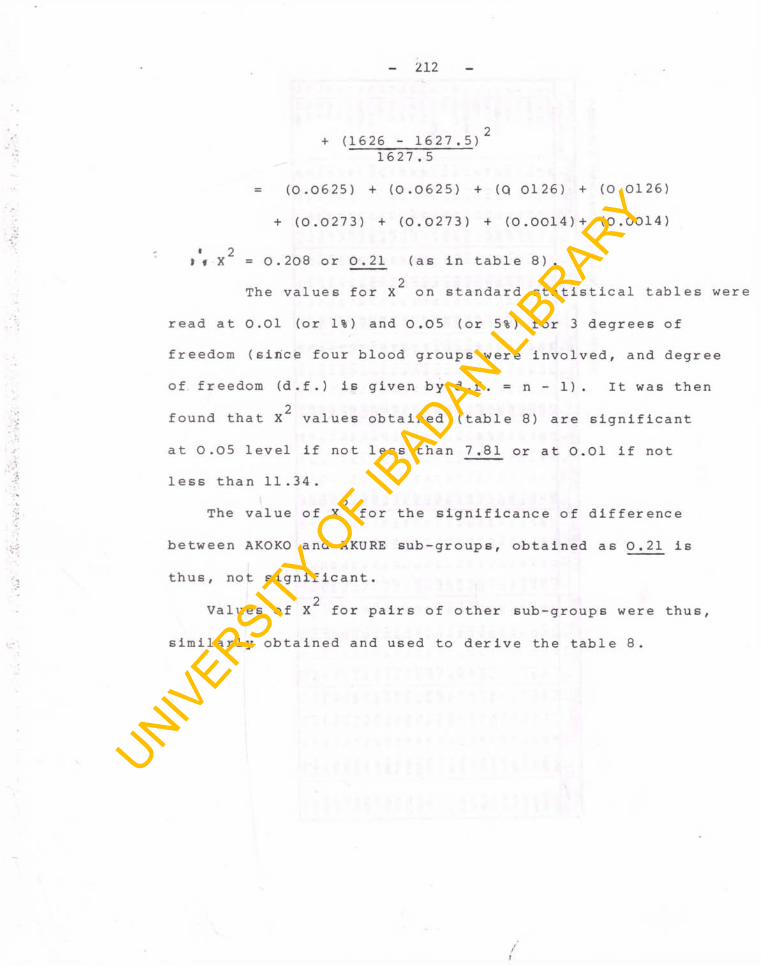
212
+ ( 1626 - 1 6 2 7 . 5 ) 21 6 2 7 . 5
= ( 0 . 0 6 2 5 ) + ( 0 . 0 6 2 5 ) + (Q 0 1 2 6 ) + ( 0 . 0 1 2 6 )
+ ( 0 . 0 2 7 3 ) + ( 0 . 0 2 7 3 ) + ( 0 . 0 0 1 4 ) + ( 0 . 0 0 1 4 )
• 2i « X = 0 . 2 0 8 o r 0 . 2 1 ( a s i n t a b l e 8 ) .2The v a l u e s f o r X on s t a n d a r d s t a t i s t i c a l t a b l e s w e r e
r e a d a t 0 . 0 1 ( o r 1%) and 0 . 0 5 ( o r 5%) f o r 3 d e g r e e s o f
f r e e d o m ( s i n c e f o u r b l o o d g r o u p s w e r e i n v o l v e d , and d e g r e e
o f f r e e d o m ( d . f . ) i s g i v e n b y d . f . = n - 1) . I t was t h e n
2f o u n d t h a t X v a l u e s o b t a i n e d ( t a b l e 8) a r e s i g n i f i c a n t
a t 0 . 0 5 l e v e l i f n o t l e s s t h a n 7 . 8 1 o r a t 0 . 0 1 i f n o t
l e s s t h a n 1 1 . 3 4 .2
The v a l u e o f X f o r t h e s i g n i f i c a n c e o f d i f f e r e n c e
b e t w e e n AKOKO a n d AKURE s u b - g r o u p s , o b t a i n e d a s 0 . 2 1 i s
t h u s , n o t s i g n i f i c a n t .
2V a l u e s o f X f o r p a i r s o f o t h e r s u b - g r o u p s we r e t h u s ,
s i m i l a r l y o b t a i n e d and u s e d t o d e r i v e t h e t a b l e 8 .
t
UNIVERSITY
OF I
BADAN LIBRARY
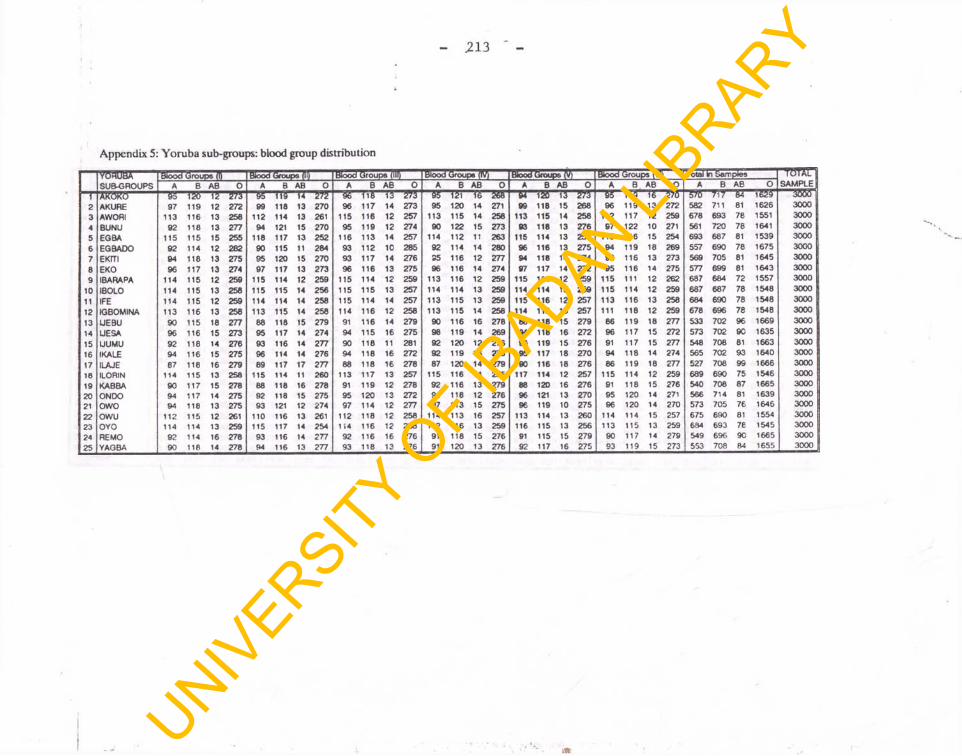
213
Appendix 5: Yoruba sub-groups: blood group distributionUNIV
ERSITY O
F IBADAN LI
BRARY
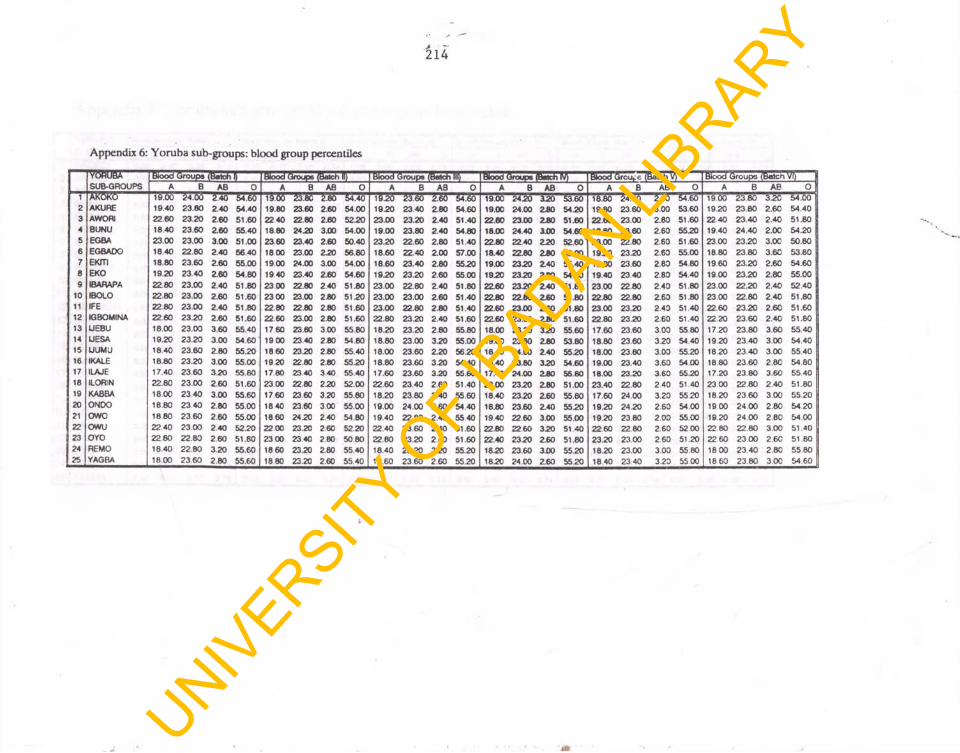
Appendix 6: Yoruba sub-groups: blood group percentilesUNIV
ERSITY O
F IBADAN LI
BRARY
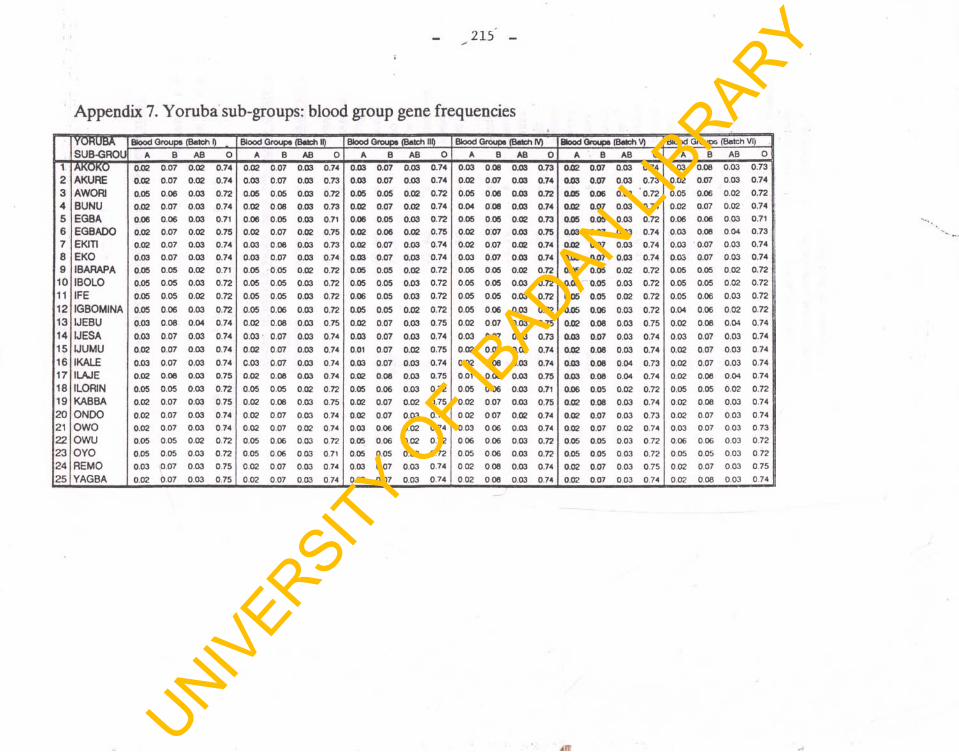
215
Appendix 7. Yoruba sub-groups: blood group gene frequencies
UNIVERSITY
OF I
BADAN LIBRARY
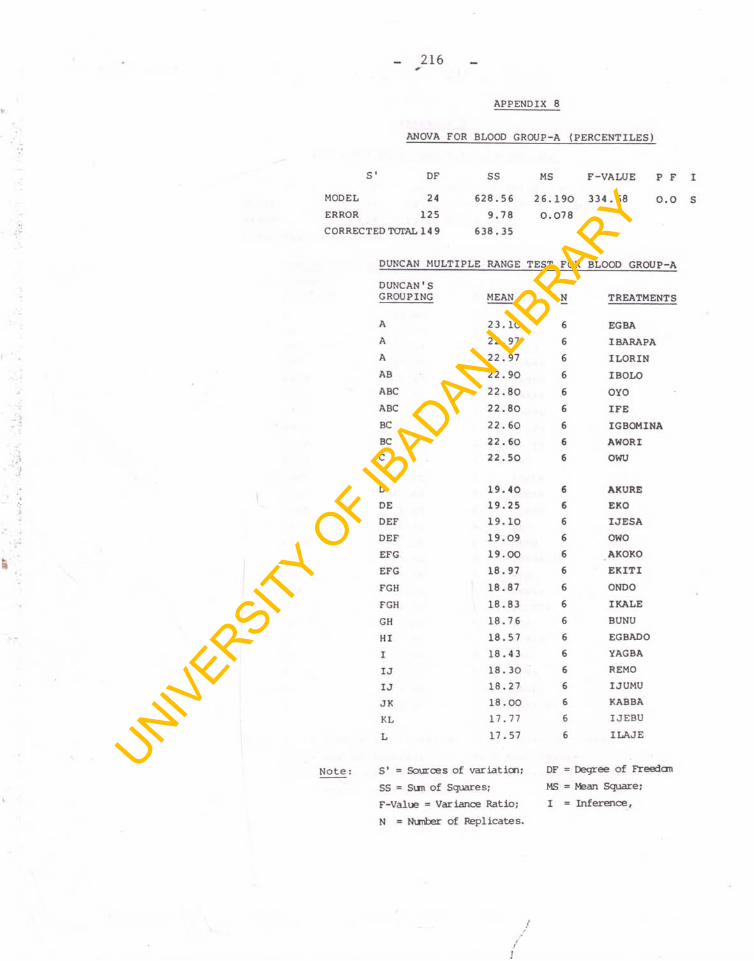
216
APPENDIX 8
ANOVA FOR BLOOD GROUP-A (PERCENTILES)
S' DF SS MS F-VALUE P FMODEL 24 628.56 26. 190 334.68 0.0ERROR 125 9.78 0. 078CORRECTED TOTAL 14 9 638.35
DUNCAN MULTIPLE RANGE TEST FOR BLOOD GROUP-ADUNCAN'S GROUPING MEAN N TREATMENTSA 2 3.10 6 EG BAA 22.97 6 IBARAPAA 22.97 6 ILORINAB 22.90 6 IBOLOABC 22.80 6 OYOABC 22.80 6 IFEBC 22.60 6 IGBOMINABC 22.60 6 AWORIC 22.50 6 OWU
D 19.40 6 AKUREDE 19.25 6 EKODEF 19.10 6 IJESADEF 19.09 6 OWOEFG 19.00 6 AKOKOEFG 18.97 6 EKITIFGH 18.87 6 ONDOFGH 18.83 6 I KALEGH 18.76 6 BUNUHI 18.57 6 EGBADOI 18.43 6 YAGBAIJ 18.30 6 REMOIJ 18.27 6 IJUMUJK 18.00 6 KABBAKL 17.77 6 IJEBUL 17.57 6 ILAJE
Note: S' = Sources of variation; DF = Degree of FreedomSS = Sun of Squares; MS = Mean Square;F-Value = Variance Ratio; I = Inference,N = Nunber of Replicates.
I
UNIVERSITY
OF I
BADAN LIBRARY
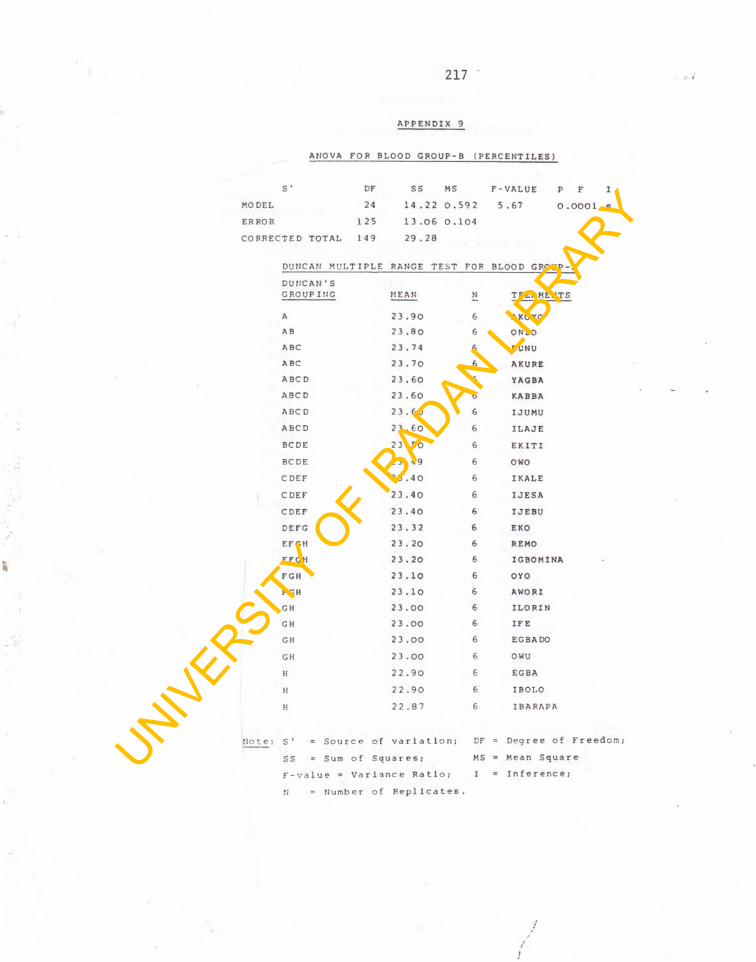
217
APPENDIX 9
ANOVA FOR BLOOD GROUP-B (PERCENTILES)
s ' DF ss MS F - V A L U E P F IM O D E L 24 1 4 . 2 2 0 . 5 9 2 5.67 0 . 0 0 0 1 sE R R O R 125 1 3 .06 0 . 1 0 4C O R R E C T E D T O T A L 149 2 9 . 2 8
D U N C A N M U L T I P L E R A N G E T E S T FOR B L O O D G R O U P - BD U N C A N 'S G R O U P I N G M E A N N T R E A M E N T S
A 2 3 . 9 0 6 A K O K OAB 2 3 . 8 0 6 O N DOABC 23.74 6 B U N UABC 2 3 . 7 0 6 A K U R EA B C D 2 3 . 6 0 6 Y A G B AABC D 23 . 60 6 K A B B AABC D 2 3 . 6 0 6 I J U M UA B C D 2 3 . 6 0 6 ILAJEBCD E 2 3 . 5 0 6 EKITIBCDE 23.49 6 O W OC DEF 2 3 . 4 0 6 I K A L EC D E F 2 3 . 4 0 6 I J E S AC DEF 2 3 . 4 0 6 I J E B UDE F G 23.32 6 E K OE F G H 2 3 . 2 0 6 R E M OEFG H 2 3 . 2 0 6 I G B O M I N AF G H 2 3 . 1 0 6 O Y OFGH 2 3 . 1 0 6 A W O RIGH 2 3 . 0 0 6 I L O R I NGH 2 3. 0 0 6 IFEGH 2 3 . 0 0 6 E G B A D OGH 2 3 . 0 0 6 O W UH 2 2 . 9 0 6 EGB A
H 2 2 . 9 0 6 IBOLO
H 2 2 . 8 7 6 I B ARAPA
S' = S o u r c e of v a r i a t i o n ; DF = D e g r e e of F:
SS = Sum o f S q u a r e s ; MS = Mean S q u a r e
F - v a l u e = V a r i a n c e Ratio; I = I nference;
N = N u m b e r of P e p l i c a t es
1
UNIVERSITY
OF I
BADAN LIBRARY
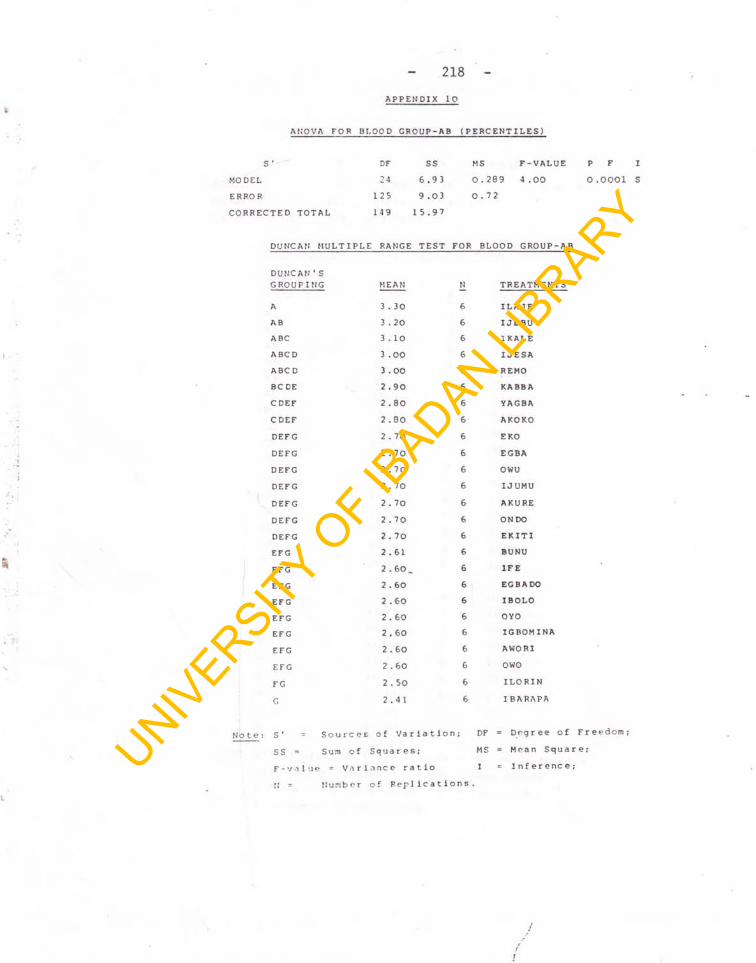
218APPENDIX 10
ANOVA FOR BLOOD CROUP-AB (PERCENTILES)
s • DF SS M S F-VALUE P F I
M O D E L 2 4 6.93 0.289 4 .00 0.0001 SE R R O R 125 9 .03 0.72C O R R E C T E D T O T A L 149 15.97
DUNCAN MULTIPLE RANGE TEST FOR BLOOD GROUP-AB
DUNCAN * SGROUP IMG MEAN N TREATMENTS
A 3 . 30 6 ILAJEAB 3 . 20 6 IJEBUABC 3 .10 6 I KALEABCD 3 .00 6 IJESAABCD 3.00 6 REMOBCDE 2.90 6 KABBACDEF 2.80 6 YAGBACDEF 2 . 8 0 6 AKOKODEFG 2 . 70 6 EKODEFG 2.70 6 EGBADEFG 2.70 6 OWUDEFG 2.70 6 IJUMUDEFG 2.70 6 AKUREDEFG 2 . 70 6 ON DODEFG 2 . 70 6 EKITIEFG 2.61 6 BUNUEFG 2.60. 6 IFEEFG 2.60 6 EGBADOEFG 2.60 6 IBOLOEFG 2.60 6 OYOEFG 2,60 6 IGBOM INAEFG 2.60 6 AWORIEFG 2 . 6 0 6 OWOFG 2 . 50 6 ILORINC, 2 . 41 6 IBARAPA
S ’ = Sources of Variation; SS “ Sum of Squares;F-value = Variance ratio N = Number of Replications
DF = Deg r eMS = MeanI Infer
e of Fr eedom;Square;enc e ;UNIV
ERSITY O
F IBADAN LI
BRARY
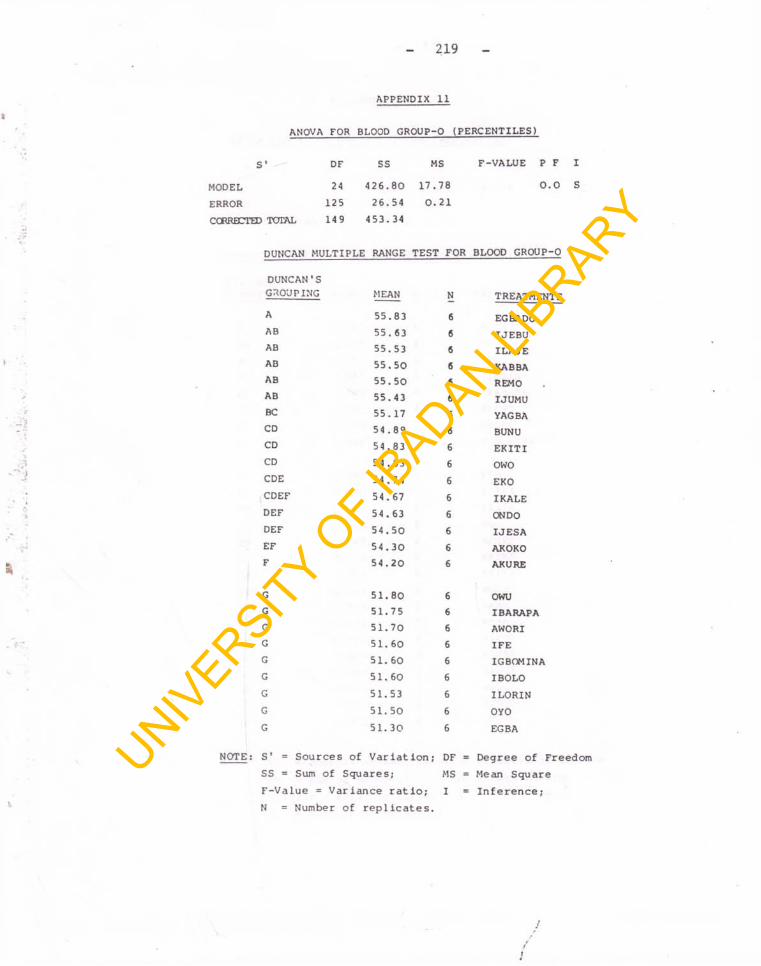
219
APPENDIX 11
ANOVA FOR BLOOD GROUP-O (PERCENTILES)
S' DF SS MS F-VALUE P F IMODEL 24 426.80 17.78 0.0 SERROR 125 26.54 0.21CORRECTED TOTAL 149 453.34
DUNCAN MULTIPLE RANGE TEST FOR BLOOD GROUP-O
DUNCAN'SGROUPING MEAN N TREATMENTSA 55.83 6 EGBADOAB 55.63 6 IJEBUAB 55.53 6 ILAJEAB 55.50 6 KABBAAB 55.50 6 REMOAB 55.43 6 IJUMUBC 55.17 6 YAGBACD 54.89 6 BUNUCD 54.83 6 EKITICD 54.83 6 OWOCDE 54.74 6 EKOCDEF 54.67 6 I KALEDEF 54.63 6 ONDODEF 54.50 6 IJESAEF 54.30 6 AKOKOF 54.20 6 AKURE
G 51.80 6 OWUG 51.75 6 IBARAPAG 51.70 6 AWORIG 51.60 6 IFEG 51. 60 6 IGBOMINAG 51.60 6 IBOLOG 51.53 6 ILORING 51.50 6 OYOG 51.30 6 EG BA
NOTE: S' = Sources of Variation; DF = Degree of Freedom SS = Sum of Squares; MS = Mean SquareF-Value = Variance ratio; I = Inference;N = Number of replicates.
UNIVERSITY
OF I
BADAN LIBRARY
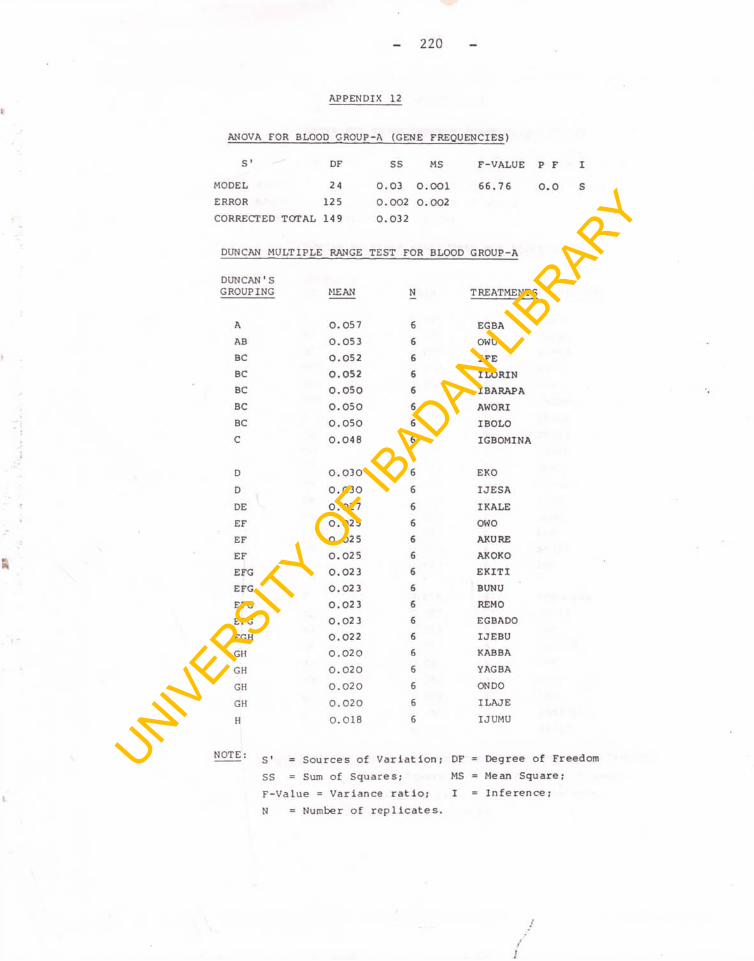
220
APPENDIX 12 IANOVA FOR BLOOD GROUP -A (GENE FREQUENCIES)
S' DF SS MS F-VALUE 1MODEL 24 0.03 0.001 66.76 iERROR 125 0.002 0.002CORRECTED TOTAL 149 0.032
DUNCAN MULTIPLE RANGE TEST FOR BLOOD GROUP-A
DUNCAN'SGROUPING MEAN N TREATMENTS
A 0.057 6 EGBAAB 0.053 6 OWUBC 0.052 e IFEBC 0.052 6 ILORINBC 0.050 6 IBARAPABC 0.050 6 AWORIBC 0.050 6 IBOLOC 0.048 6 IGBOMINA
D 0.030 6 EKOD 0.030 6 IJESADE 0.027 6 I KALEEF 0.025 6 OWOEF 0.025 6 AKUREEF 0.025 6 AKOKOEFG 0.023 6 EKITIEFG 0.023 6 BUNUEFG 0.02 3 6 REMOEFG 0.02 3 6 EGBADOFGH 0.022 6 IJEBUGH 0.020 6 KABBAGH 0.020 6 YAGBAGH 0.020 6 ON DOGH 0.020 6 ILAJEH 0.018 6 IJUMU
N0T5 : s' = Sources of Variation; DF = Degree of FreedomSS = Sum of Squares; MS = Mean Square;F-Value = Variance ratio; I = Inference;N = Number of replicates.
t
UNIVERSITY
OF I
BADAN LIBRARY
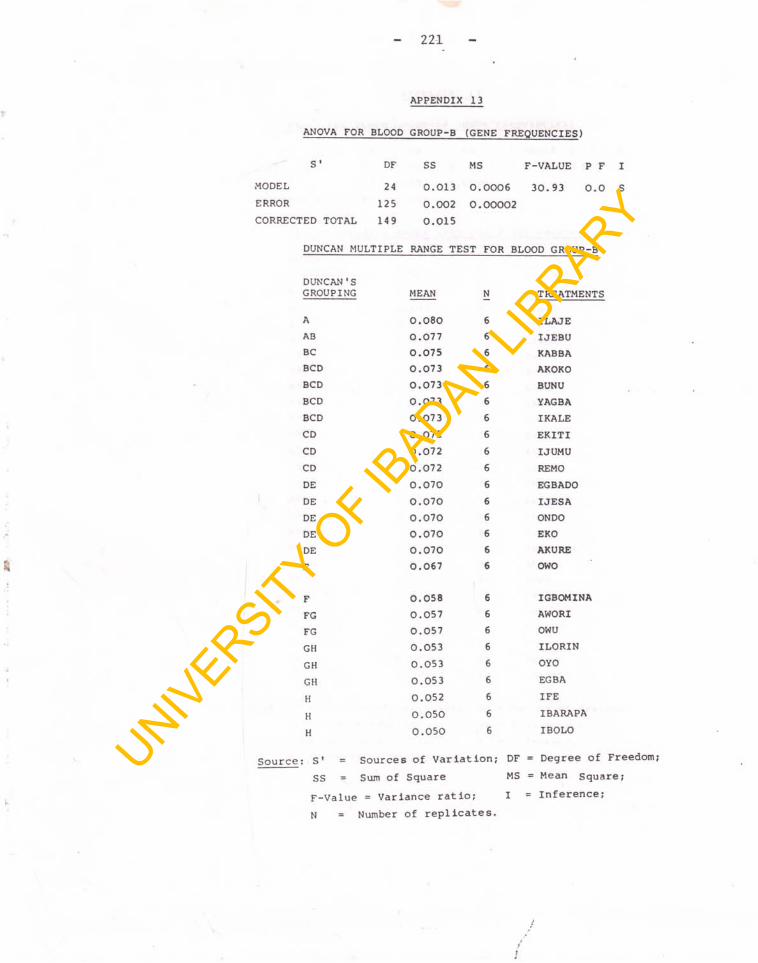
221
APPENDIX 13
ANOVA FOR BLOOD GROUP-B (GENE FREQUENCIES)
S ' DF SS MS F-VALUE P F IMODEL 24 0.013 0.0006 30.93 0.0 SERROR 125 0.002 0.00002CORRECTED TOTAL 149 0.015
DUNCAN MULTIPLE RANGE TEST FOR BLOOD GROUP-B
DUNCAN'S GROUPING MEAN N TREATMENTS
A 0.080 6 ILAJEAB 0.077 6 IJEBUBC 0.075 6 KABBABCD 0.073 6 AKOKOBCD 0.073 6 BUNUBCD 0.073 6 YAGBABCD 0.073 6 I KALECD 0.072 6 EKITICD 0.072 6 IJUMUCD 0.072 6 REMODE 0.070 6 EGBADODE 0.070 6 IJESADE 0.070 6 ONDODE 0.070 6 EKODE 0.070 6 AKUREE 0.067 6 OWO
F 0.058 6 IGBOMINAFG 0.057 6 AWORIFG 0.057 6 OWUGH 0.053 6 ILORINGH 0.053 6 OYOGH 0.053 6 EG BAH 0.052 6 IFEH 0.050 6 IBARAPAH 0.050 6 IBOLO
: S' = Sources of Variation; DF = Degree of FreedomSS = Sura of Square MS = Mean Square;F-Value = Variance ratio; I = Inference;N Number of replicates.
/
UNIVERSITY
OF I
BADAN LIBRARY
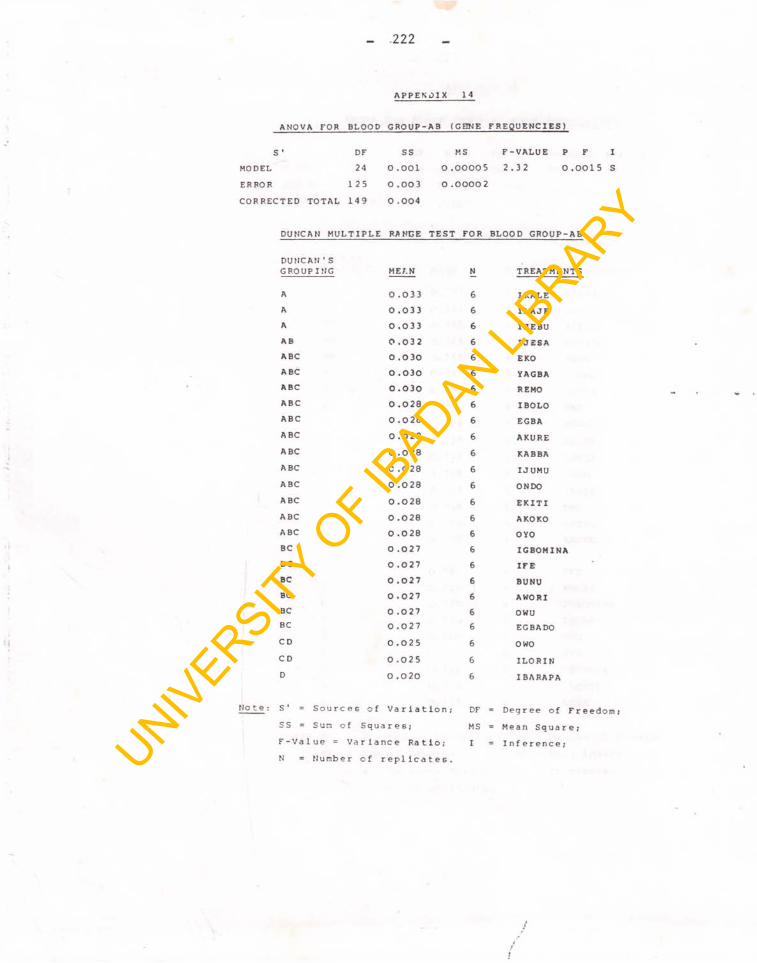
.222
A P P E N 0 IX 14
ANOVA FOR BLOOD CROUP-AB (GHNE FREQUENCIES)
s ' DF ss MS F-VALUE P F IMODEL 24 0.001 0 .00005 2.32 0 .0015 sERROR 125 0.003 0 .00002CORRECTED TOTAL 149 0.004
DUNCAN MULTIPLE RANGE TEST FOR BLOOD GROUP-AB
DUNCAN ’ SGROUPING MEAN N TREATMENTS
A 0 .033 6 I KALEA 0 .033 6 ILAJEA 0 .033 6 IJEBUAB 0.032 6 IJ ESAABC 0 ,030 6 EKOABC 0.030 6 YAGBAABC 0 .030 6 REMOABC 0 .028 6 IBOLOABC 0 .028 6 EGBAABC 0 .028 6 AKUREABC 0 .028 6 KABBAABC C .028 6 IJUMUABC 0 .028 6 ON DOABC 0.028 6 EKITIABC 0 .028 6 AKOKOABC O .028 6 OYOBC 0 .027 6 IGBOMINABC 0.027 6 IFEBC 0.027 6 BUNUBC 0.027 6 AWORIBC 0 .027 6 OWUBC 0.027 6 EGBADOCD 0.025 6 OWOCD 0.025 6 ILORIND 0.020 6 IBARAPA
S ' = Sources of Variation; DF « Degree of FreedomSS = Sun of Squares; MS = Mean Square;F-Value = Variance Ratio; I Inference;N Number of replicates.
/
UNIVERSITY
OF I
BADAN LIBRARY
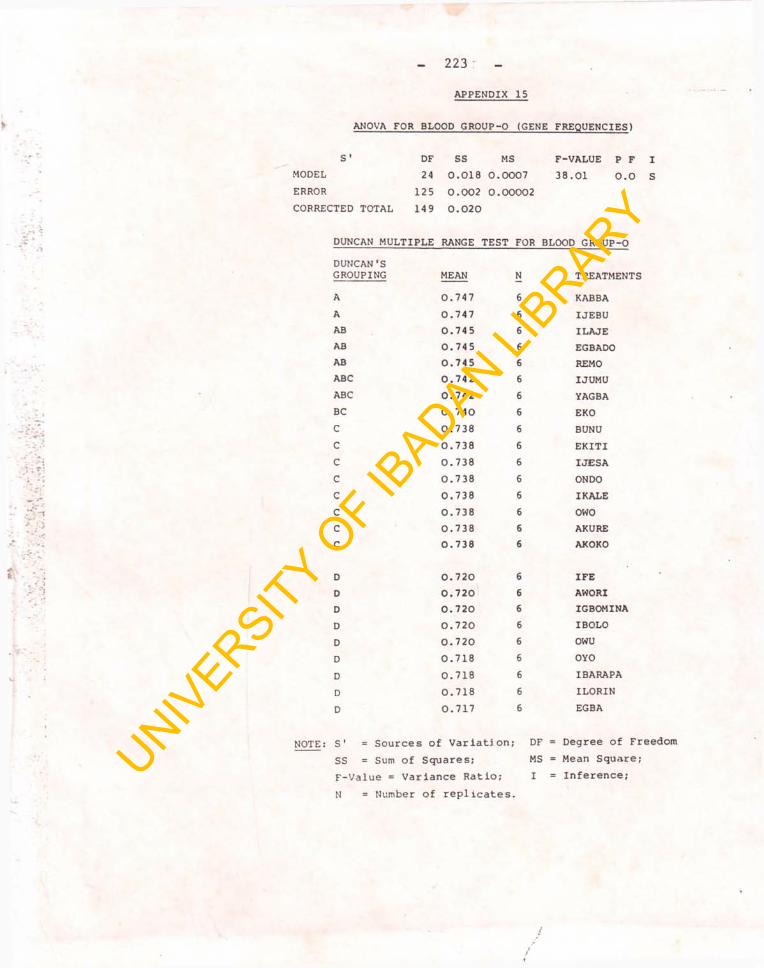
223
APPENDIX 15
ANOVA FOR BLOOD GROUP-O (GENE FREQUENCIES)
S ' DF SS MS F-VALUE P FMODEL 24 0.018 0.0007 38.01 0.0ERROR 125 0.002 0.00002CORRECTED TOTAL 149 0.020
DUNCAN MULTIPLE RANGE TEST FOR BLOOD GROUP-ODUNCAN 'SGROUPING MEAN N TREATMENTSA 0.747 6 KABBAA 0.747 6 IJEBUAB 0.745 6 ILAJEA B 0.745 6 EGBADOAB 0.745 6 REMOABC 0.742 6 IJUMUABC 0.742 6 YAGBABC 0.740 6 EKOC 0.738 6 BUNUC 0.738 6 EKITIC 0.738 6 IJESAC 0.738 6 ONDOC 0.738 6 IKALEC 0.738 6 OWOC 0.738 6 AKUREC 0.738 6 AKOKO
D 0. 720 6 IFED 0.720 6 AWORID 0.720 6 IGBOMINAD 0.720 6 IBOLOD 0.720 6 OWUD 0.718 6 OYOD 0.718 6 IBARAPAD 0.718 6 ILORIND 0.717 6 EGBA
NOTE: S' = Sources of Variation; SS = Sum of Squares; F-Value = Variance Ratio;N = Number of replicates.
DF = Degree of Freedom MS = Mean Square;I = Inference;UNIV
ERSITY O
F IBADAN LI
BRARY