3448110vol02.pdf - world bank document
TRANSCRIPT

December 28, 2005
Document of the World Bank
Report No. 34481-IN
IndiaUnlocking Opportunities forForest-Dependent People in India(In Two Volumes) Volume II: Appendixes
Agriculture and Rural Development Sector UnitSouth Asia Region
Rep
ort N
o. 3
44
81
-INIn
dia U
nlo
cking O
pp
ortu
nities fo
r Forest-D
epen
den
t Peop
le in In
dia V
olu
me II
Pub
lic D
iscl
osur
e A
utho
rized
Pub
lic D
iscl
osur
e A
utho
rized
Pub
lic D
iscl
osur
e A
utho
rized
Pub
lic D
iscl
osur
e A
utho
rized


Contents
Appendix 1 . Description o f Study Methods in Jharkhand. Assam. and Madhya Pradesh .. 1 Background ......................................................................................................... 1 Jharkhand ............................................................................................................ 1 Assam ................................................................................................................. 4 Madhya Pradesh ................................................................................................. 9 National Report ................................................................................................... 10
Appendix 2 . Structure of the Indian Secondary Forest Industry ........................................... 11 India’s Small Scale Sector .................................................................................. 11 Structure o f India’s Forest-Based Industries ...................................................... 11 The Paper and Paper Board Industry .................................................................. 12 The Wood-Based Panel Industry ........................................................................ 12 Sawmill ing and Wood Working ......................................................................... 13 Non-timber Forest Products ................................................................................ 13 Safety Matches ................................................................................................... 14 Wood Carving .................................................................................................... 14 Community-Based Production Enterprises: Joint Forest Management ............. 14
Constraints to India’s Small Scale Forest Enterprises ........................................ 16
Farm Forestry .................................................................................................... 15 Social and Economic Benefi ts o f SSFEs ............................................................ 15
Appendix 3 . Fiscal Analysis o f the Forest Sector ..................................................................... 19
Appendix 4 . National and State Legal and Policy Frameworks ............................................. 23 K e y National Legal and Policy Milestones ........................................................ 23 Central Issues with State Legal Frameworks for JFM ........................................ 26 Legal and Policy Conflicts .................................................................................. 28 PESA-Panacea for Community-Based Forestry? ............................................. 29 Examples o f Conflicts and Contradictions with PESA and Forestry ................. 30
Appendix 5 . Community Livelihoods in Assam. Jharkhand and Madhya Pradesh ............. 33 Background ........................................................................................................ 33 Tribals and Tr ibal Characteristics in India ......................................................... 34 What are Forest Livelihoods? ............................................................................. 37 Livel ihood Patterns in the Focal States .............................................................. 38 Forest Livelihoods and Linkages with Rural and Tribal Development in the
Three Focal States ............................................................................................ 46 Appendix 6 . Community Forestry Institutions in Maharashtra ............................................ 48
Appendix 7 . Forest Management Planning Systems ............................................................... 49
Appendix 8 . Linking Overstory Management to Nontimber Forest Production .................. 52
Appendix 9 . Market Analysis for Selected Products and States ............................................. 54 Saw Timber-Jharkhand and Madhya Pradesh Case Study ............................... 54
Bamboo-Assam Case Study ............................................................................. 61 Kendu Leaf-Jharkhand and Madhya Pradesh Case Study ............................... 57

Medicinal Plants and Aromatic Oils-Madhya Pradesh and Assam .................. 65 Fuelwood ........................................................................................................... 69
Appendix 10 . Forest Fiscal Systems and Analysis ................................................................... 71 What i s a Forest Fiscal System? ......................................................................... 71 What are the M a i n Issues in India? ..................................................................... 71
Appendix 11 . Preliminary Economic Appraisal of JFM Forest Management Options ...... 76
Appendix 12 . Community Forestry Models and Forest Poverty Pathways .......................... 78
Appendix 13 . Poverty Impact Monitoring System ................................................................... 80
Appendix 14 . Institutional Options-Roles and Responsibilities for Key Actors in Reformed Community-Based Forestry ............................................................. 91
Appendix 15 . What i s the Potential for Increased Revenues from Community-Based Forestry? ........................................................................................................... 93
Case Study f rom Jharkhand ................................................................................ 93 Extending the Mode l to a National Level ........................................................... 95
Background ........................................................................................................ 93
References ................................................................................................................................. 100
Tables Table A l . l , Typology for village selection in Jharkhand ............................................................ 3 Table A1.2. Workshop regional characteristics - Assam ............................................................. 7 Table A l . 3 . Vil lage typology for f ield surveys ........................................................................... 9 Table A2.1. Number o f units o f medium and large wood-based industries ................................ 11 Table A2.2. Structure o f India’s pulp and paper industry ............................................................ 12 Table A2.3, Estimated annual production o f selected nontimber forest products ....................... 13
Table A5.1, K e y socio-economic indicators, focal states ............................................................ 33 Table A5.2. Land holdings by household group, Jharkhand 1992 .............................................. 34 Table A5.3, Population characteristics, main tribal states ........................................................... 34 Table A5.4. Poverty in tribal groups ............................................................................................ 35 Table A5.5. L ivel ihood patterns, case study village Jharkhand, Assam ...................................... 39 Table A5.6. L ivel ihood calendar o f a typical forest-fringe household in Assam ........................ 40 Table A5.7. Permanent income sources by quartile, Jhabua ....................................................... 42 Table A5.8. Global case studies o f forest environmental Income .............................................. - 4 4 Table A5.9. Relative importance o f various means o f the Livel ihood ........................................ 45 Table A6.1. Contrasting community forest Institutions ............................................................... 48
Table A4.1. Conflicts between 1980 Forest Conservation A c t and 1988 National Forest Policy28
Table A9.1, SWOT analysis o f Hindustan Paper Corporation Nagaon mill ............................... 63 Table A9.2. Bamboo supply chain pricing analysis: comparison o f growers based 5
kilometers and 85 kilometers .............................................................................. 64
Table A10.2. Estimated net revenue shares for alternative forest models and scenarios ............. 73 Table A10.3. Mean revenue and expenditure per hectare, selected states, 1992-2000 ................. 74 Table A1 1.1. Estimated economic returns to alternative forestry options .................................... 76
Table A1O.l. Benefit sharing schemes in the focal states ............................................................. 72
.. 11

Table A14.1, Options for revised institutional roles and responsibilities for community-
Table A14.2. Proposed key functions o f forest department to support community-based based forestry ................................................................................................... 91
forestry ............................................................................................................. 92 Table A1 5.1. Potential forest product supply from reformed JFM programs-Jharkhand ......... 93 Table A1 5.2. Potential forest product supply fi-om reformed JFM program-National
perspective ....................................................................................................... 96 Table A15.3. Data and assumptions for national projections o f revenue from reformed J F M .... 96
Figures Figure A1 . 1 . Figure A1.2. Figure A3.1. Figure A3.2. Figure A3.3. Figure A3.4. Figure A5.1. Figure A5.2. Figure A5.3. Figure A8.1. Figure A9.1. Figure A12.1 Figure A12.2. Figure A1 5.1. Figure A15.2. Figure A15.3. Figure A15.4.
Location o f selected villages for field surveys ................................................... 4 Location o f regional consultative workshops ..................................................... 7 Real central plan expenditures for MOEF 1992-03 to 2003-04 ......................... 19 Real plan expenditures o n forestry 1992193 . 2002103 ...................................... 20 Budget shares, Forestry and Wildlife. MOEF .................................................... 21 Real state forestry expenditures. Assam and Madhya Pradesh 1995-2002 ........ 22 Livel ihood components ...................................................................................... 37 Permanent income shares. Jhabua ...................................................................... 43 Natural resource permanent income shares. Jhabua ........................................... 44 Sustainability issues with Sal management ........................................................ 52 Cost allocations for kendu leaf. Jharkhand ......................................................... 61 Community-based forest continuum ................................................................... 78 The forest l ivelihood path and community forestry ............................................ 79 Income projections for Jharkhand case study ..................................................... 95 Total forest income projections. reformed national J F M .................................... 97 Total state revenue projections, reformed national JFM .................................... 97 Income per community projections. reformed national JFM .............................. 98
Boxes B o x A4.1. B o x A4.2 B o x A5.1. B o x A5.2. Traditional functions o f village councils ................................................................... 36 B o x A7.1. Attributes o f efficient resource assessment systems ................................................ 49 B o x A9.1, B o x A9.2. Kendu leaf regulatory system ................................................................................... 58 B o x A9.3. Challenges for developing new bamboo products ................................................... 65 B o x A9.4. Positive and negative features o f patchouli .............................................................. 68 B o x A9.5. What role does NEDFI play in patchouli marketing? ............................................... 69 B o x A1O.l. What i s economic rent? ............................................................................................. 71
Policy qualifications o n forest rights ......................................................................... 24 Examples o f follow-on acts, ru les and regulations, Madhya Pradesh ....................... 27 Munda relationships with the land ............................................................................ 35
Impact o f harvesting and transit rules in Jharkhand .................................................. 57
... 111


Appendix 1. Description o f Study Methods in Jharkhand, Assam, and Madhya Pradesh
Background
Sector studies were conducted in three states: Jharkhand, Assam, and Madhya Pradesh. All three are important because o f their high poverty levels and the heavy dependence o f poor people on forests for livelihoods. The three states offer good contrast in terms o f the scale o f the resource base, forest cover types, forest utilization, history and scope o f JFM, forestry institutional capacities, and local legal, policy, and regulatory frameworks to support community-based forestry.
Jharkhand
Jharkhand covers an area o f 79,714 square kilometers, o f which about 23,000 square kilometers i s forested (52 percent dense forest and 48 percent open forest). About 78 percent o f the state’s population o f 27 m i l l i on people l ive in rural areas.
About 16 mi l l ion people in more than 10,000 villages situated in and around forests are dependent on forest resources for timber, fuel, and nontimber products. Recent assessment o f rural poverty in India identifies Jharkhand to be o f particular concern because the absolute numbers o f poor are high and increasing. In Jharkhand 64 percent o f the rural people are below the poverty line, and the proportion o f poor in forested areas i s even higher. Forest fringe communities represent about 60 percent o f the total state population and more than 90 percent o f the state’s tribal people. Jharkhand’s tribal groups strongly identify culturally, and they use the forests for subsistence, as a safety net, and as a source o f supplemental income.
The Forest Department’s Vis ion 2010 strategy accentuates the need to shift the focus o f forestry programs toward efficient and effective decentralized management o f forest resources through village-level institutions. The strategy also highlights a growing concern over forest cover degradation f rom human and livestock pressures. Recent surveys indicate 12,000 square kilometers o f degraded forest cover.
J F M i s expanding rapidly in Jharkhand. The state’s goal i s to register 10,000 committees by 2010, up from the current level o f 3,358.
T o address the key questions and provide objective solutions, a team o f highly respected and experienced international and national consultants was recruited. The team addressed forest management planning systems, forest resource assessment systems, the state legal framework and key issues, marketing systems for selected products, and institutional structures around community forestry. I t also assessed community livelihoods, forest use, and perceptions o f forestry and JFM. International consultants dealt with marketing, forest management, and resource assessment and worked closely with local counterparts identified with the assistance o f the Jharkhand forest department over a period o f about three weeks. F ie ld missions included key informant interviews with relevant stakeholders in the private and public sector and in c iv i l society, as wel l as f ie ld visi ts to communities involved in JFM at various stages o f progress. The national legal specialist in forest and environmental l aw gathered crit ical legal documents for review and worked closely with the team to identify legal and regulatory issues that hinder

communities f rom increasing forest livelihoods. An international environmental lawyer reviewed the legal material to provide objective analyses o f issues and suggested solutions. A highly respected national research institute (The Energy Research Institute [TERI]) undertook the institutional assessment and gathered broad input from communities in conjunction with local community support organizations. The forest department identified technical counterparts for each consultant specialist to assist with information collection and organizing field visits. T o facilitate an integrated study approach, team members met frequently both in the capital (Ranchi) and during f ie ld visi ts to share ideas and information and to discuss potential technical and pol icy reforms.
The social and institutional work undertaken by TERI was a critical component o f the integrated study, providing a “people’s perspective” and valuable insight on social and institutional aspects of community forestry. The TEN inputs were derived f rom a literature review, results f rom three one-day stakeholder workshops across the state, and detailed field studies in six communities. The three workshops were representative o f the three main forest types in the state (dry deciduous forests in north-western Jharkhand, moist deciduous forests in southern part o f the state, and mixed forests in the east). They also focused o n areas with a significant number o f J F M committees according to forest department records, which also encompassed a high distribution of the major tribal groups in the state, in particular the Munda, Oraon, Santhal, and Ho. The tribal groups in the state have traditionally been located in specific parts o f the state. Their socio- cultural practices have been associated in different ways with the forests. Therefore, the concentration zone o f tribal groups was considered as one o f the important criteria for selection o f the regions for the workshops. In addition, the selection o f regions for workshop was also based on the presence o f local community support organizations for organizing and facilitating the workshops, and grassroots experience o f various issues related to poverty reduction and natural resource based livelihood improvement in the state. Based on these parameters, three districts: Seraikela in South Chotanagpur, Hazaribagh in Nor th Chotanagpur, and Dumka in Santhal Pargana region were selected for a workshop. Workshop participants were identified in consultation with local community support organizations and Jharkhand forest department. Participants mainly comprised o f tribal village members f rom the three regions and included women, socio-economically backward castes, as wel l as a few village heads. A balance was sought among those who had not been part o f any progradproject as wel l as a few members o f other community support organization led projectshelf-initiated forest protection groups f rom the regions to facilitate better sharing o f experiences. In addition, a few representatives o f other local community support organizations, researchers working specifically on forestry issues in the region, and one representative o f the local forest department office, were invited to share information and village perspectives on forest management, use o f forests, local livelihoods and so forth The workshop objectives were to create a regional context for the baseline information to be gathered in the six selected study villages and triangulate information emerging in the secondary literature review; facilitate a discussion among the village representatives and local organizations about institutional and pol icy issues relevant to forest resource management; provide a space and opportunity for people to voice their concerns on priority issues; exchange information among villages about comparative forest resource use and promising models o f community management; identify leader communities and their characteristics; identify constraints and opportunities for community or j o in t forest management or income generation, including policy and regulatory barriers, tenure and access and use rights, structure o f markets, location o f markets, and nature o f demand and competition; and gain a consensus on villages to be studied in-depth within that region.
2

A typology (table A1 .1) developed by the Wor ld Bank and other stakeholders’ was used to select six villages (figure A1 .1) for more detailed field assessment was made using information f rom the workshops. The methodology adopted for the village surveys was a m i x o f both Participatory Rural Appraisal (PRA) tools for collecting village level information and a questionnaire survey for collection information at the household level. These tools helped gather information mainly in group meetings held in the beginning o f the survey. The tools were helpful in establishing rapport with the villagers. The mapping exercises undertaken in the beginning were useful, as it encouraged villagers f rom different hamlets to gather at one place. This helped in explaining the purpose o f study and also in deciding samples for household level surveys. Twenty to twenty-five household were selected from each village for a detailed questionnaire survey. In total two to three days were spent in each village. T o further understand a broader perspective on some o f the main issues and “triangulate” the information, key informant interviews were conducted with resource persons f rom the forest department and community support organizations. The objectives o f the field studies were to: prepare profiles o f forest-dependent communities, groups and people; understand local development and priorities; ascertain contribution o f forests to local subsistence and income livelihoods; understand community institutions and issues surrounding JFM and broader rural development, local forest management issues and key opportunities and constraints in promoting community based forestry and livelihood improvement activities.
M o i s t Sal
Mo is t Sal
Dry Sal
Dry Sal
M i x e d
M i x e d ldry Sal
Chaibasa Degraded Near main road Yes Nontraditional Thakura Guttu
Seraikela Dense Distant f rom road N o Traditional Rueudih
Hazaribagh Degraded Distant f r o m road N o Traditional Hathyari
Hazaribaeh Dense Near main road Yes Nontraditional Murumkalan
Dumka Dense Distant f r o m road Yes Traditional Upar Murgathal i
Dumka Degraded Near ma in road N o Nontraditional Semra Ghaeharbari
The reporting process was highly collaborative to promote. an integrated assessment o f community forestry challenges and opportunities in Jharkhand. The legal, forest management, forest resource assessment and marketing consultants reviewed each other’s reports to ensure consistency and accuracy. The background papers were presented to the Jharkhand forest department by the task manager and valuable feedback was used to make revisions.
Forest Trends (Washington, DC); Jharkhand forest department, and community support organizations.
3

Figure Al.1. Location of selected villages for field surveys’
... ........ . .......... . . ....... ..... 1 JHARKHAND~
i B I H A R
W E S T B E N G A L
C H H A T T I S G A R H
Map not to scale Copyright Q 2005 www.mapsoflndla.con
Source: Maps o f Ind ia (map used with permission).
Assam
One-third o f Assam’s total land area o f 78,438 square kilometers i s forested. The state’s forests are among the most biodiversity r i ch in South Asia. However, forests are under threat f rom il legal harvesting, fire, overgrazing, and encroachment. High population growth, flooding, and migrants from neighboring ‘states are cited as major causes o f forest encroachment. Almost 20 percent o f the reserved and protected area forests are subject to various levels o f encroachment. The state’s forest policy, developed in 2004, outlines a number o f progressive strategies and programs related to JFM, forest product marketing, biodiversity conservation, and forest eco-tourism. J F M i s just beginning to be implemented and i s a major thrust o f the new forest policy.
The same team and approach was used in Assam as in Jharkhand over a period o f about three weeks. The same approach to social and institutional work undertaken by TEN in Jharkhand was repeated in Assam and again was a critical component o f the integrated study, providing a “people’s perspective” and valuable insight o n social and institutional aspects surrounding community forestry. The f ie ld study was conducted in two phases. In the f i rst phase, four regional workshops were organized to gather a broad understanding o f the issues across different regions
Maps have proved a challenge for Jharkhand. Ve ry recent revisions o f district boundaries (and creation o f four new districts) are no t reflected on many digital thematic maps.
4

o f the state. In the second phase, detailed village surveys were undertaken to gather l ivelihood and social/demographic data at the household level, as separate case studies.
The workshops were aimed to get a consensus on the villages to be surveyed in the second phase o f the study and also issues, which needed detailed investigation in the field survey. Specific objectives included: creating a regional context for the baseline information to be measured over time in the selected study villages and triangulate information emerging in the secondary literature review; facilitating a discussion among the village representatives and local organizations about institutional and pol icy issues relevant to forest resource management and provide a space and opportunity for people to voice their concerns on priority issues; exchanging information among villages about comparative forest resource use and promising models o f community management; identifying leader communities and their characteristics; identifying constraints and opportunities for community or jo in t forest management or income generation; and gaining consensus on villages to be studied in-depth within that region, within the parameters o f the forest village typology. The selection o f regions for the workshops was done in consultation with the Assam Forest Department. It took account o f the following variables:
Physiographic regions: The state o f Assam can be divided into three main regions, namely the Brahmaputra valley, the hills o f Karb i Anglong and Nor th Cachar and the Barak valley. The Brahmaputra valley covers 72 percent o f the state’s total area with 18 districts. The hills o f Ka rb i Anglong and Nor th Cachar are mainly confined to the districts o f Karb i Anglong and Nor th Cachar Hills. The Barak valley, an active floodplain, in the southern part o f the state covers 3 districts. The selection o f districts to ho ld the workshops aimed at representing a l l three regions. However, conducting a workshop in the region o f the hills was not possible due to instable polit ical conditions. The workshops in this report thus represent the Brahmaputra region where three workshops were conducted, representing upper and lower Brahmaputra valley. The fourth workshop was conducted in the district o f Cachar, representing the Barak valley region.
Forest type and cover: The four major forest types found in the state can be broadly classified as tropical wet evergreen forests, tropical semi-evergreen forests, tropical moist deciduous forests, and sub-tropical broadleaved hill forests. Tropical wet evergreen forests are found mainly in the eastern and southern state parts o f the state. Tropical semi-evergreen forests are found in southern and northwestern parts o f the state. Tropical moist deciduous forests are found in central, western and northwestern parts o f the state and the tropical broadleaved hill forests in hilly regions of the state, especially in Nor th Cachar and Karb i Anglong districts. However, i t needs to be mentioned here that the above distribution pattern i s only indicative as usually a mixed pattern i s observed with one district i tsel f containing 2-3 forest types. However due to instable polit ical conditions in the hill districts, we were not able to conduct survey in sub-tropical broadleaved hill forest areas. However, in order to compensate for this survey was conducted in the adjoining Cachar district.
Status of JFM: Since JFM program has already been initiated by the forest department in the state f rom 1998 and has been amended in 2004, the status o f JFM program, in terms o f number o f committees formed by the forest department in different circle was considered as one o f criteria for selecting the districts. The districts for workshops were selected from those regions, which had significant number o f EM committees as per the records o f the forest department.
M a j o r tr ibal groups: The tribal groups in the state have traditionally been located in specific parts o f the state and based on their socio-cultural and resource use practices have been associated in different ways with the forests in and around them. In Assam the tribal population i s broadly categorized into the plain tribes and the hill tribes. The tribes in the hill regions are s t i l l associated with the practice o f slash and bum agriculture. All the economic activities and cultural practices

of such tribes have traditionally revolved around this resource use practice. In the Barak valley, the Khasi tribe i s associated with the practice o f “pan jhum, ” which i s considered as having significantly different implications o n forestry management. At the same time, the valley i s also home to a large number o f tea-garden laborers (considered as tribal populations in other states o f India), The increasing number o f unemployment amongst these groups i s also having a significant impact on forestry management in the region. The Bodo, one o f the major plain tribes, involved mainly in agriculture, i s another example o f the variance in the impact o f resource use and socio- cultural practices o n forestry management. Therefore, the concentration zone o f tribal groups was considered as one o f the important criteria for selection o f the regions for the workshops.
Presence o f a respectable local community support organization: The selection o f regions for workshop was also done taking into consideration the presence o f local NGOs not only for organizing and facilitating the workshops but also for their grassroots experience o n various issues related to poverty reduction and livelihood improvement in the state. Therefore, selection of NGOs was done taking into consideration their activities related to natural resource management, promotion o f education and income generation activities for poor including women and their experience o f working with the forest department.
Based on these parameters, as mentioned above, three districts in the Brahmaputra valley, Tinsukia, Kamrup, and Kokhrajhar, and one district in the Barak valley, Cachar, were selected for the workshop (figureAl.2). More details on the characteristics o f each workshop site are shown in table A1.2.
The participants for the workshops were identified in consultation with local CSOs and forest department. They mainly comprised o f tribal village members f rom the two regions including women, socio-economically backward communities as well as a few village heads. These members were identified considering o n balance mix o f those who have not been part o f any progradproject as well as a few members o f other ongoing projectshelf-initiated forest protection groups f rom the regions to facilitate better sharing o f experiences. In addition to these, a few representatives o f other local CSOs, researchers working specifically on forestry issues in the region and representatives o f forest department wherever possible, were invited to gather information and village perspectives o n the variation within each region in forest management, use, and livelihoods and so forth The specific details on profiles o f participants are given in detail in the findings o f each workshop.
The workshops were organized in a manner to ensure broad participation by various groups as well as better understanding o f issues and priorities o f different groups. Hence, the approach adopted was to encourage an open discussion on each o f the identified topics given in the terms o f reference. This ensured understanding o f the range o f variation among villages o f the region, different viewpoints and perspectives o f various groups, identification o f some o f the main problems and concerns, knowledge o f positive experiences and models adopted by some groups and so forth and collective information about forestry and livelihood situation in the region.
6

F i g u r e A1.2. Loca t ion of regional consultative workshops
.- . . -,---,--
I Source: TEN 2005 (map used with permission).
Cachar Barak Tropical and semi- Karimganj evergreen
Kokrajhar Brahmaputra Tropical moist deciduous (mixed deciduous)
moist deciduous
W e t Evermeen
Kamrup Brahmaputra Tropical
Tinsukia Brahmaputra Tropical
21 JFM committees in Cachar, 18 in Karimganj Dimasas, Khasis, Barmans,
1.3 percent in Cachar and 0.3 percent in Karimganj. Tribal groups represented by
Tripuras and Halams. 33.7 percent o f districts population. M a i n l y Bodo community.
9.9 percent
18 J F M 5.8 percent committees.
Deshbandhu Club
Green Forest Conservation
Shram-o- Shristi
Ed-En and MAA
7

The starting session o f workshops were focused o n introduction o f the participants, explanation about the purpose o f the workshop, br ie f presentation about the characteristics o f the region and sharing o f experiences o f some o f locally well-known initiatives o f community efforts in forest protection and income generation activities. Of the identified topics for discussion, that is, forest tenure and resource management, utilization o f forest resource, forest product marketing and forest management arrangements, the f i r s t topic was discussed with all participants to get experience o f diverse range o f stakeholder present in the workshop. The discussion o f second and third topic was organized in small sub-groups to understand the diversity o f different groups, These groups then presented their discussions to the other groups. Discussions on forest management arrangements were done again in full house with al l the participants, which not only enabled the discussion o n different experiences but also identification o f regions and few villages for further in-depth study.
The limitations o f the workshops could be mainly categorized into those related to time constraint and coordination o f workshops. Given the short time for organizing the consultations, the participants were invited through the local CSOs and the forest department. Therefore, in some cases (for example, in the Cachar workshop), there were more participants who were resource persons o f the projects undertaken by the local CSO. However, during the process o f coordination o f the workshops, by forming groups o f project and nonproject beneficiaries it was ensured that a l l the groups had enough space to share their experience. The lack o f time also led to diff iculty in cross-checking the workshop arrangements, which in the case o f the Cachar workshop resulted in the under representation o f JFM villages. However, this gap was fi l led by the enthusiastic participation of the forest department representatives and the wel l informed CSO participants and community members, who were aware o f the program. N o t having been able to facilitate a workshop in the h i l l s region due to the unstable polit ical conditions was considered as a major l imitation in the study. However, the workshop at Kokrajhar, a newly formed autonomous council, was an attempt to provide an understanding o f issues related to forestry management under such an administrative set up. In the coordination o f the workshop, flexibility was maintained to accommodate discussions o n issues besides the identified topics. Also considering the time factor, the discussions o f themes l ike forest product collection and marketing were combined into one session.
In the second phase, village level surveys were conducted, subsequent to the regional workshops, with the broad a im to further investigate the issues raised in the workshops and prepare a detailed case study o f the selected villages. The villages were selected using the typology given in the terms o f reference and taking into consideration the suggestions made by the participants o f the workshops as well as by the forest department. Based o n this, eight villages were selected for the in-depth survey (table A1.3).
The methodology adopted for the village surveys was a mix o f both participatory rural appraisal tools for collecting village level information and questionnaire survey for collection information at the household level. The information f rom these tools was collected mainly in group meetings held in the beginning o f the survey. The tools were helpful in establishing rapport with the villagers quickly. The mapping exercises undertaken in the beginning were useful, as it encouraged villagers f rom different hamlets to gather at one place. This helped in explaining the purpose o f study and also in deciding samples for household level surveys. Since the total number o f household in the selected villages varied, taking time schedule o f the study into consideration, 25-30 households were selected from each village for questionnaire survey. In total, two days were spent in each village. In addition to the village level surveys, to further understand some o f the issues and ‘triangulate’ the information, interviews were conducted with resource persons from forest department and CSOs.
8

As mentioned previously, not having been able to conduct a survey, due to polit ical instability in the h i l ls region was a major limitation. However during the village survey, this limitation manifested itself while conducting surveys in both the Barak and the Brahmaputra regions. The team was unable to go into villages located in the interior forest areas. Even in villages were permission was granted, there was a considerable limitation as the team was strongly advised not to spend more than a duration o f three hours in a village for security purposes. In the district o f Kokrajhar, the team was under the constraint o f carrying out the survey with accompanying security personnel and the constraint o f carrying out the sample survey according to the selection criterion and in the presence o f the Councils representatives.
Table A1.3. Village typology for field surveys
Tropical semi- evergreen Forests
Tropical semi- evergreen Forests
Tropical moist deciduous forests mixed deciduous)
Tropical moist deciduous forests mixed deciduous)
Tropical Wet Evergreen Forest
Tropical Wet Evergreen Forest
Tropical moist deciduous forests
Tropical moist
Karimganj Karimganj Dense
Cachar Cachar Degraded
Kokrajhar Haltugaon Degraded
Kokrajhar Kachugaon Dense
Tinsukia Digboi Degraded
Tinsukia Digboi Dense
Kamrup Kamrup Degraded West
Kamrup Kamrup Dense
Accessible
Restricted access
Accessible
Restricted access
Restricted access
Accessible
Restricted access
Accessible
JFM Forest
N o JFM Revenue
JFM Forest
N o JFM Forest
N o JFM Revenue
JFM Forest
N o JFM Revenue
JFM Revenue
Korikhai
Maruacherra
Bishmuri
Demdema
Paharpur
Soraipung
Chakrapani
Garopara deciduous forests East
a Based on observed communication l i n k s (difficulty in access) Additional criteria
The task manager presented a summary o f the results to the forest department for feedback and to aid in revision o f background papers.
Madhya Pradesh
About 75 percent o f Madhya Pradesh’s population o f 66 mi l l ion l ive in rural areas. The total land base i s 308,242 square kilometers, o f which about 77,265 square kilometers are forest cover (57 percent dense forest and 43 percent open forest). The state government i s also increasingly concerned over forest cover degradation f rom human and livestock pressures. Current estimates show 32 mi l l ion livestock uni ts in the state. About 21 m i l l i on people in more than 22,000 villages situated within 5 kilometers o f forests are dependent o n forest resources for timber, fuel, and nontimber products. An estimated 37 percent o f the rural people are below the poverty line, and
9

the proportion o f poor in forested areas i s even higher. About 25 mi l l ion people comprise o f tribal people and scheduled castes. Madhya Pradesh’s tribal groups strongly identify with forests for subsistence and cultural reasons, as a safety net, and as a source o f supplemental income. The Forest Department’s recent Vis ion 2020 strategy emphasizes investment and management o n state, private and community forests for multiple objectives including environmental security, poverty alleviation o f forest-dependent communities, and bridging the gap between supply and demand o f various forest products. A key pil lar o f many o f the specific sub-strategies i s greater empowerment o f forest-dependent communities with respect to forest management responsibilities and authority. JFM i s wel l developed with almost one-third o f the total forest area under community management. Madhya Pradesh has more J F M committees than any other state and has the country’s largest area o f Teak plantation.
A slightly modif ied approach was used in Madhya Pradesh to reduce costs and take advantage o f other ongoing work in the state. The same team o f national and international consultants gathered relevant data and other information through intensive field work. However, f ie ld surveys and workshops for communities were not held due to the availability o f similar information f rom a broad range o f other studies o n JFM, community perceptions o f forestry, forestry and natural resources livelihoods, tribals, and so forth. Desk studies were used to collect and distill this information into a background paper. Further, tribal groups in Jharkhand are very similar to those in Madhya Pradesh and much o f the research done for Jharkhand was applicable in Madhya Pradesh. The task manager presented a summary o f the findings to the Madhya Pradesh forest department for feedback and to aid in revising the background papers.
National Report
The background papers drafted for research in the three states contributed heavily to the development o f a national report on JFM, augmented by a broad range o f national and international material on community forestry, marketing, livelihoods and policy. In i t ia l results from the state studies were presented to the National Forest Commission in December 2004 and valuable comments received that aided in drafting the national report. The presentation team also included experts f rom Mexico, Honduras and China, as wel l as experts with wide international experience in community forestry. The material prepared for these sessions was also extremely valuable in drafting the national report. The f i rs t draft o f the national report was reviewed internally by staff in Agriculture and Rural Development-South Asia. Comments and suggestions helped shape a second draft, which was then evaluated by seven peer reviewers both f rom inside and outside the W o r l d Bank, as we l l as four anonymous reviewers in India.
10

Appendix 2. Structure o f the Indian Secondary Forest Industry
Paper m i l l s
India’s Small Scale Sector
21
India’s small scale sector (all types o f industry) i s an important component o f the Indian economy and contributes significantly to industrial output, exports and employment. This sector has seen steady growth during the past decade. The number o f units increased from 2.38 mi l l ion in 1993- 94 to 3.44 m i l l i on in 2001-02. During the same period the production increased from Rs2,416.48 b i l l ion to Rs6,903.96 b i l l ion and employment f rom 13.93 mi l l ion to 19.34 mi l l ion. Exports increased f rom Rs290.68 b i l l ion in 1994- 95 to Rs697.97 b i l l ion in 2000-01. The sector plays a major role in India’s exports and contributes 45-50 percent o f total exports (about 35 percent directly and 15 percent through merchant exporters, trade houses and export houses). It i s estimated that a m i l l i on rupees o f investment in fixed assets in the small-scale sector leads to production o f goods and/or services worth Rs4.62 m i l l i on annually, with an approximate value addition o f ten percentage points. This sector also creates the largest employment opportunities outside agriculture.
Newsmint
Within the forestry sector, the focus has traditionally been on large enterprises. The Small Scale Forestry Enterprise (SSFE) sector, which processes the majority o f forest products and provides employment to mi l l ions o f poor people, has not received the attention it deserves. India has a very large number o f poor (c. 260 mill ion) and indigenous peoples (c. 80 million), many o f whom depend o n forest-based livelihoods. Mi l l ions o f poor people earn their livelihood through fuelwood and nontimber forest product collection and through small scale pulp, paper, wood based panel sawmilling, joinery and furniture and safety match manufacture and through processing and sale o f wood carvings, sports goods and other products nonforest timber product- based SSFEs alone provide up to 50 percent o f the income o f 20-30 percent o f the rural labor force in India (Government o f India 1999).
5
Structure of India’s Forest-based Industries
India’s National Forestry Act ion Program documents the number o f medium and larger scale wood based industries in the country some o f which could provide opportunities for additional I F C investment (see Table A2.1).
Table A2.1. Number of units of medium and large wood-based industries
Drawn directly from a discussion note (World Bank 2005a)
11

The Paper and Paper Board Industry
Less than 5,000 5,000-10,000 10,000-20,000 20,000-33,000 More than 33,000
Paper and paperboard production i s an important forest-based industry in India. I t is estimated that in 1993, there were 380 paper mills functioning in the country, o f which 359 (94 percent) were small mills having an installed capacity o f less than 30,000 metric tons per year (Pradhan and Bar ik 1999). The current capacity-wise breakdown o f the industry i s shown in table A2.2.
140 112 88 32 34
The total installed capacity for paper and paper board i s estimated to be 3.9 mi l l ion metric tons but the actual production i s about 2.6 mi l l ion metric tons (Government o f India 1999). I t i s estimated that 66 percent o f the installed capacity i s in small units (Pradhan and Bar ik 1999). Actual production o f smaller scale I units has been reported as 1.7 mi l l ion metric tons. Of raw material used by the pulp and paper industry wood accounts for 43 percent, ago-based fiber (mainly bagasse and straw ) - 28 percent and waste paper - 29 percent
The hand made paper industry, a traditional craft, i s a recognized village industry under the Khadi and Vil lage Industries A c t and receives special assistance from the Khadi and Vil lage Industries Commission. It generally utilizes textile fiber derived from rags, gunny bags, cotton linters and other waste material. According to an estimate made a few years ago, the total annual production o f handmade paper by the cottage industry was just 5,000 metric tons with a sale value o f about Rs40 mi l l ion. Most o f this paper i s used for greeting cards and certain stationery items.
The Wood-Based Panel Industry
There are three major wood-based panel products that are manufactured in India - plywood, including veneers, blockboards and flush doors; fiberboard; and particle board. SSFEs play an important role in the manufacture o f a l l o f these products. According to an estimate made a few years ago, there were 480 p lywood factories in the country, o f which 418 (87 percent) were in the small-scale sector (Federation o f Indian Plywood and Panel Industry 2004)
At the time o f the most recent survey there were 14 decorative veneer units, with an installed capacity o f 33 mi l l ion square meters. It i s not known, however, h o w many o f these were in the small-scale sector. The current annual capacity o f decorative veneer units i s estimated to be 33 m i l l i on square meters. There were 98 units that were producing flush doors and blockboards with an annual production o f 7.6 m i l l i on square meters. O f these, 98 units small scale units accounted for nearly a quarter o f production. In 1993 there were 1 1 particleboard manufacturing units in the country with a total installed capacity o f 85,000 metric tons, while licenses for six more units had been granted with an additional capacity o f 87,000 metric tons. There were three fiberboard mills in India with a total installed capacity o f 57, 000 metric tons. In addition, there were two units manufacturing medium density fiberboard with an installed capacity o f 65,000 metric tons. Fresh licenses had also been granted to one hardboard plant with o f 20,000 metric tons capacity and
12

seven medium density fiberboard plants with a total capacity o f 207,000 metric tons. The total annual capacity o f particleboard and fiberboard units at present i s estimated to be about 207,000 metric tons.
Myrobalans Sal (Shorea robusta) seeds Mahua (Madhuca latifolia) seeds
Other seeds N e e m (Azadirachta indica) seeds
Sawmilling and Wood Working
132,250 709,700 697 600
57.500 115,000 -
I t i s estimated that there are about 23,000 sawmills in India. Ninety-eight percent o f these are in the small category with annual l og intake up to 3,000 cubic meters. Annual production capacity i s estimated at 27 mi l l ion cubic meters, but capacity utilization i s estimated to be 50-64 percent. The last survey undertaken estimated that about 140,000 workers were employed in the sawmill ing industry. I t was estimated that small sawmills accounted for 82 percent o f the total sawn timber in the country. The main uses of the sawn wood are for construction (28 percent); production o f boxes (18 percent); joinery (27 percent); furniture (1 1 percent); Sleepers (8 percent); and other uses (8 percent)
Gum (karaya) Resin (from Pines) Katha
Wood working i s a traditional industry in India producing furniture, doors, windows, panels, sports goods, handicrafts, shoelasts and heels, textile mill accessories (bobbins and shuttles), and so forth In addition, truck and bus body building and the manufacture o f agricultural implements are also important wood-based industries which consume a large quantity o f wood. I t i s estimated that construction o f the body o f each truck consumes 6.25 cubic meters o f sawn timber. A large number o f wooden agricultural implements are manufactured each year. Mos t o f the work i s done in small-scale units or by individual artisans. According to a f ie ld estimate, the total annual consumption o f wood for this purpose was about 4 mi l l ion metric tons and there were 54,975 wood working units in the small-scale sector.
15,000 45.000
5.750
Non-timber Forest Products
Tans and dyes Bamboo Fibers and flosses Beedi leaves Lac
India's forests y ie ld a large number o f diverse nontimber forest products. Estimated annual production o f some o f the commercially important nontimber forest products i s given in table A2.3.
222,900 4,7 16,600
15,000 ' 360,000
30,000
Table A2.3. Estimated annual production of selected nontimber
I Essential oils I 3.160 1
13

Safety Matches
There are about 12,000 safety match making units in the country, and all except five are in the small-scale and cottage industries category. Eighty-two percent o f the production i s in the small- scale and cottage sectors. The industry as a whole employs 250,000 people out o f which only 6,000 are in the large scale mechanized sector.
Wood Carving
India has a well-developed traditional wood carving industry. The major wood carving centers are located in the states o f Uttar Pradesh (Saharanpur and Nagina); Rajasthan (Jodhpur); Arunachal Pradesh (Tirap); Gujarat (Surat and Mahuva); Kerala (Kochi, Ernakulum, Trichur and Thiruvananthapuram); Jammu; Kashmir; and Madhya Pradesh. In India there are about 90,000 carving centers and the number o f registered artisans i s reported to be 260,000. The actual number o f artisans i s perhaps higher: for example in Kerala, while there are 3,400 registered artisans, a survey by a private organization revealed that there were 6,000 wood artisans in Thiruvananthapuram alone. The number o f people indirectly involved in the industry i s much higher. For instance, in Saharanpur District o f Uttar Pradesh, it i s estimated that while 50,000 to 87,000 people are directly involved in wood carving industry, about 350,000 people are indirectly dependent o n it (Centre for International Forestry Research 2002; Wor ld Wildlife Fund 2003).
The industry gets i t s raw material f rom the Forest Department as wel l as farmers. The consumption i s high. In Saharanpur alone, i t i s estimated that about 25 truck loads o f wood are consumed per day by the industry, which translates into roughly 90,614 cubic meters per year. I t i s estimated that 2,010 cubic meters o f wood are consumed by the industry in Kerala. The main products made are boxes, figurines, idols, jewelry boxes, incense boxes and stick holders, candle stands, photo fiames, coaster sets, letter racks, stationery holders, pipe stands, tobacco jars, tables, screens and carved furniture (World Wi ld l i fe Fund 2003).
Exporters play a key role in the industry. They obtain orders f rom foreign buyers and get the products manufactured in their own units. If they are unable to produce the volumes required, they outsource some production to artisans o n a contract basis. India i s one o f the largest producers o f wood carved products in the world. Exports amounted to Rs4.344 b i l l ion in 2000- 01, The main importing countries are the United States (25 percent) and the United Kingdom (12 percent)
Community-Based Production Enterprises: Joint Forest Management
The J F M program, under which local community groups and the Forest Department jo in t ly protect and manage the forest patches adjoining a village and share the benefits, i s n o w over a decade old. Many o f the EM Committees have started producing forest products such as poles, timber, grasses and other nontimber forest products on a regular basis and thus have emerged as important community-based forestry production enterprises. However, market constraints are an issue and few communities if any, are producing timber for sale as roundwood, or processing logs into lumber.
14

Farm Forestry
The provisions o f the Forest (Conservation) Ac t (1980) and the National Forest Policy (1988) effectively prevent a direct role for the corporate private sector on government’s. legally classified ‘forest lands’, which cover 97 percent o f the forest area. Outside government forest lands there are restrictions presented by statutory ceilings on the amount o f agricultural land that can be held by individual owners. Thus, the creation o f large-scale private plantations on either forest or nonforest lands i s currently almost impossible.
The net result o f this legislation i s that farmers are now major producers o f industrial wood in India, The growth o f farm forestry in some areas such as Uddham Singh Nagar in Uttaranchal and Prakasam in Andhra Pradesh for example creates opportunities to promote the expansion o f existing and establishment o f new wood-based SSFEs. I t i s estimated that Uddham Singh Nagar and Prakasam districts alone produce 0.2-0.28 mi l l ion metric tons and 0.65-0.7 mi l l ion metric tons respectively o f farm grown wood annually. In terms o f value, it i s estimated that wood worth Rs650 m i l l i on and Rs560 m i l l i on respectively i s produced annually in Uddham Singh Nagar and Prakasam districts. Thus, just two districts (or rather parts o f these districts) are producing nearly 1 m i l l i on metric tons o f wood annually valued at more than Rs1,200 mill ion. Many wood-based enterprises have sprung up in areas where abundant farm grown wood i s available.
However, despite these positive farm forestry developments there i s a growing shortage o f roundwood for many industries in many areas o f India.
Social and Economic Benefits of SSFEs
SSFEs play an important role in improving rural livelihoods, especially for the poor. This not only reduces pressure o n scarce agricultural land but also decreases stress out-migration f rom rural areas into cities, where the poor often end up living in slums under sub-human conditions. Some o f the characteristics o f SSFEs that indicate their suitability for generating local l ivelihood opportunities for the poor and other vulnerable groups include the fact they are small in size and are often household based; they are predominantly rural and frequently seasonal; they are labor intensive and use simple technologies; they require very l o w capital inputs; they are accessible to l o w income and socially disadvantaged groups; they provide direct benefits to the local economy; and women are heavily involved, often forming a majority o f the labor force.
Landless and poor women often fo rm a significant proportion o f the labor force in many SSFEs. Even among landed farmers, earnings f rom SSFEs usually improve their income security and reduce pressures that lead to over-exploitation o f the agricultural land base SSFEs also boost the local economy through local purchase o f r a w material for example, farm grown timber f rom farmers, and improve the technical sk i l ls o f the workers. As the capacity o f agriculture to generate additional livelihoods progressively declines, more and more rural people turn toward employment in SSFEs and other small-scale enterprises.
A feature o f the Indian SSFE sector i s that while most o f the forests are owned by the government, the bulk o f SSFEs are in the private sector. I t i s estimated that more than 90 percent of India’s wood based products are presently manufactured in the private sector SSFEs are an important players in the forestry sector. As noted earlier, 98 percent o f sawmills in India are small, but they produce as much as 82 percent o f the sawn timber in the country. About 87 percent o f p lywood factories and 94 percent o f paper mills also fa l l in the small enterprise category. I t i s estimated that the wood processing industries in India process about 24-30 mi l l ion cubic meters o f wood per year, the bulk o f which i s processed by SSFEs.
15
It i s clear f rom the above account that the Indian SSFE sector i s very diverse and encompasses a wide range o f activities ranging f rom production or collection o f products such as fuelwood, poles and nonforest products; their processing either by hand (for example, leaf plate stitching) or by modem machinery, and marketing at every level ranging f rom barter at the local level to export t o international markets. The Indian SSFE sector produces a wide range o f products such as poles, fuelwood, charcoal, sawn timber, furniture, veneer, plywood, blockboard, fiberboard, particle board, paper, safety matches sports goods, handicrafts, herbal medicines and other nontimber forest products.
Due to the diversity o f products, markets and policies, it i s diff icult to make generalizations for the entire SSFE sector. However there are several emerging investment opportunities constraints to development and anticipated shifts in the structure size and location o f SSFEs that could provide a starting point for International Finance Corporation (IFC) and Wor ld Bank engagement.
Constraints to India’s Small Scale Forest Enterprises
The key constraints faced by SSFEs in India are:
e
e
Despite the past success o f farm forestry a growing shortage o f quality raw material due to felling bans and restrictions on extraction in several states. Growing concerns over environmental and labor issues. In recent years, many court rulings have resulted in the closure o f forest produce processing industries on account o f enhanced environmental concerns. Since economic liberalization there has been growing competition f rom cheap imports and a trend toward removal o f protective policies, such as reservation. Indian SSFEs are generally quite inefficiently run, the quality o f products i s poor and there i s lack o f standardization - thus they are quite uncompetitive internationally. There i s an urgent need to improve both technical and business management and to attract foreign investment especially in medium scale industries. Diff iculties o f market access. Stringent application o f an international intellectual property rights regime i s also l ikely adversely to affect marketing prospects for some Indian SSFEs.
e
e
Since it i s in these latter areas that I F C and the Bank both have the potential to play a useful role this next section discusses those possibilities.
Raw material shortages. Some o f the larger forest industries such as W I M C O (a match company) and several pulp and paper mills have been successful in engaging farmers located close to their mills as outgrowers. Earlier loan schemes had mixed results but current outgrower schemes under which companies raise and sell high quality clonal eucalyptus seedlings and guarantee farmers a reasonable and guaranteed price are proving more successful. For example about 9,000 farming families are now involved producing about 85 percent o f the BILT Corporation’s annual wood requirement.
BET‘S chief executive officer has made the point that such schemes could be accelerated if there existed a mechanism for allowing access to government forest lands by companies that would be willing to collaborate with local communities in raising pulpwood as a cash crop. This has long been a polit ically sensitive issue because o f the risk o f preventing access by poorer families to essential fuelwood and grazing lands. In fact such leasehold arrangements are explicitly debarred by the 1980 Forest Conservation A c t and 1988 Forest Policy. However a number o f factors
16

suggest that i t might make sense for I F C and the Bank to engage in very exploratory dialogue with government o n the possibility o f p i lot scale testing under very strictly controlled circumstances o f a scheme under which partnership arrangements might be introduced for areas o f degraded JFM community owned forest to be earmarked for pulpwood or other types o f industrial wood production. These pi lot schemes would need to worked out through carefully structured and transparently negotiated contractual arrangements that would fully engage and protect the interests o f local communities, provide improved seedlings and technical assistance to participating families and a guaranteed minimum price for the wood to be produced.
One o f the reasons for suggesting this approach i s that some J F M schemes are running into marketing constraints for the output o f their woodlands. IFC's Corporate Citizenship Facil ity could be an appropriate vehicle for testing such pi lot scale business /community partnership schemes in India. A scheme along these same lines in Kenya i s in an advanced stage o f processing with a client company.
What i s being suggested above as a p i lo t scheme for the pulp and paper industry could feasibly be relevant to other types o f industry in India. For example, many other SSFEs are facing raw material shortages and are unable to utilize their installed capacity. Capacity utilization i s only 50 percent for plywood, 41 percent for decorative veneers, 41 percent for particle board and 60 percent for fiberboard (Government o f India 1999). The sports goods industry i s facing an acute shortage o f conventional sports goods timbers such as mulberry, ash and wi l low.
Similarly, Saharanpur's wood carving industry has started facing raw material shortages after the Supreme Court ordered the closure o f a l l unlicensed sawmills on 4 March 1997. Further, the state government imposed a 12.5 percent Sales Tax o n wood brought f rom outside the state. I t i s estimated that due to the Supreme Court's ban, Saharanpur's handicrafts industry has suffered a loss o f Rs280 -300 m i l l i on (World Wi ld l i fe Fund 2003).
The safety match industry i s facing shortage o f raw material, especially o f veneer quality wood. According to one estimate, the projected shortfall for the year 2000 was 900,000 cubic meters. Whi le farm forestry plantations, especially poplar, have increased raw material availability in the north, most match units are located far away in south India.
Environmental concerns and judicial activism. The Supreme Court order to close unlicensed sawmills mentioned above i s not an isolated case. There i s a generally greater awareness about environmental issues and the judiciary has passed several judgments to protect forests and the environment, which have adversely affected several SSFEs. The most important court case for the forestry sector in recent years i s the ongoing case o f T.N. Godavannan Thirumulpad v. Un ion o f India, under which, starting in December 1996, the Supreme Court o f India has issued sweeping directions to oversee the enforcement o f forest laws across the nation. Some o f the important directions o f the court affecting forest-based industries were as follows:
0
0
0
The fell ing o f a l l trees in al l forest was to remain suspended except in accordance with a working p lan approved by the Central Government. Licenses given to al l wood-based industries (in the Nor th East) were suspended. A complete ban was introduced on the movement o f cut trees and timber f rom any seven north eastern states o f the country either by rail, road or water ways. The Indian railways and state governments were directed to take a l l measures necessary to ensure strict compliance o f these directions. Railways were asked to shift immediately to concrete sleepers instead o f using wooden sleepers. Defense establishments were also asked to find alternatives to various wood-based products.
17

Economic liberalization and the WTO regime. With increasing trade liberalization and tougher environmental standards now being applied to many straw and bagasse mills some smaller sized agricultural crop waste based pulp and paper mills are finding i t increasingly diff icult to survive (for example, a study by Rao 2001) indicated that 21 1 such mills had already been closed).
Secondly, GO1 i s moving to adoption o f measures that will facilitate direct foreign investment. For example the regime o f licensing has been reduced to seven industries and this l i s t n o longer includes the pulp and paper industry. This means that large industries can now freely enter many fields where earlier their entry was restricted. In recent years as many as 39 products have been de-reserved: 15 items o n 3 April 1997,9 items on 3 February 1999, 1 i tem o n 1 January 2001 and 14 items o n 29 June 200 1.
In short, i t seems possible that foreign investment could be attracted for expansion o f a few existing pulp and paper or construction o f new mills o f an economic size that would be able to withstand foreign competition. A lso for expansion and upgrading the efficiency o f many o f India’s medium scale wood base panel (plywood, medium density fiberboard, etc) plants (which in turn will create increased market opportunities farm forestry and the output f rom JFM owned forests). If that hypothesis i s correct this trend i s l ikely to create significant opportunities for further IFC investment. IFC has had much experience o f financing both pulp and wood based panel industries in many different countries.
Poor management and technical ski l ls . Many SSFEs suffer f rom inefficient operations and poor quality o f products resulting in loss o f markets. For example, the sawmill ing industry in India i s highly inefficient. The conversion rate i s very low. I t i s estimated that the conversion yield f rom log fo rm to graded sawn timbers i s only 45-50 percent, as compared to 55-65 percent in developed countries. Only 560 sawmills are following Indian Standards on grading and produce only 2.4 percent sawn graded timber. Wood waste produced by sawmills i s rarely put to any commercial use, with nearly 90 percent o f it being used as fuel. Seasoning and preservative treatment o f wood i s not common. Air seasoning o f wood i s carried out by only 470 mills and only 7 percent o f the sawn wood produced i s kiln seasoned. Wood treatment i s even rarer. A pressure impregnation facility i s available in only 1 18 units and a mere 0.4 percent o f sawn wood i s treated with wood preservatives.
18

Appendix 3. Fiscal Analysis o f the Forest Sector
Real expenditures f rom the centre are rising to meet timber supply challenges. At the national level, Ministry o f Environment and Forestry (MOEF) allocates central plan financial resources to forestry programs both through individual states, and independent national activities such as research and development. These funds make up the majority o f public resources allocated for capital investment and recurrent costs in forest management in India. In nominal terms, the MOEF central p lan expenditures were about Rs990 Crore in 2002-03 (about $220 million), representing roughly four percent o f national GDP. These expenditures are spread across four main budget centers in MOEF: Environment; Forests and Wildlife; National Afforestation and Eco-development Board; and the National River Conservation D i r e ~ t o r a t e . ~ In real terms (1993 = loo), public expenditures across these four thrusts have increased f rom just under Rs300 Crore in 1992-93, to Rs543 Crore in 2002-03, representing aggregate real growth o f 81 percent (figure A3. l), or an annual average o f 8.1 percent over the 10- year period.
Figure A3.1. Real central plan expenditures from MOEF 1992-03 to 2003-04
600
500 h E 2 400 E - .- v 300
100
0
National Afforestation, Eco-Development Forests &Wildlife National River Conservation
13 Environment
Source; MOEF Annual Reports, various years.
The budget headings most closely aligned to “forest management” are Forests and Wildlife, and those o f the National Afforestation and Eco-Development Board. In real terms, the total budget for these elements has increased fi-om Rs192 Crore to Rs247 Crore between 1992-93 and 2002- 03, or about 29 percent over the 10 year period (2.9 percent per year o n an average basis (figure
Environment comprises o f national environmental management and protection services ; Forests and Wi ld l i fe covers management programs for forestry, community forestry and wildlife; National Afforestation and Eco-development Board delivers the National Afforestation Program (NAP) through Forest Development Agency structures in each state and JFM committees, National Ac t i on Plan to Combat Desertification, and grants to voluntary organizations; National River Conservation Directorate implements r iver system management, po l lu t ion control, monitoring.
19

A3.2). Of interest i s the steady increase in expenditures by the National Afforestation and Eco- Development Board, which delivers the National Afforestation Program (NAP). The NAP i s comprised o f four sub-programs including Non-Timber Forest Products (nonforest timber product); Integrated Afforestation and Eco-Development Scheme (IAEDS); Area Oriented Fuelwood and Fodder Project (AOFFP); and Association o f Scheduled Tribes and Rural Poor (ASTRP). Countering this increase in budget however, i s the worrying dip in real budget expenditures for Forestry and Wildlife from 2001-02 and the fact that the nominal allocation for 2003-04 were the same as the previous year (Rs265 Crore). This i s cause for concern since the Forestry and Wi ld l i fe budget underpins forest management activities such as research and development, and forest inventory surveys, which are fundamental to monitoring and improving the performance o f forest management programs. A breakdown o f the Forestry and Wildl i fe outlays (figure A3.3), based on averages over 1998-89 to 2001-02 shows that the budget i s
among five major program areas, with
F i g u r e A3.2. Rea l plan expenditures o n forest ry 1992/93 - 2002/03
inadequate funding. In addition to central plan
the majority if funds directed to Research, Development, Education and Training.'
-Forests & Wildlife P National Afforestation, Eco-Development - -Total
A main feature o f Figure A3.3 i s the relatively l o w share allocated for forest surveys and policy, which are critical elements to
300
0
support to local Forest Departments. Another concern i s delivery o f central p lan expenditures relative to budget allocations. Of the four N A P components delivered by the National Afforestation and Eco- Development Board between 1997/98 and 2001/02, on average 71 percent o f sanctioned budgets were released for expenditure. The lowest performing component was the ASTRP with 55 percent o f budgets released over the three year period. This i s worrying since these expenditures are directed at tribal communities, who are a major group o f forest dwellers. A main conclusion o f the previous analysis i s that MOEF, through central p lan allocations, i s providing the bulk o f finance for capital investment in forest management for plantations (through community programs), and recurrent forest research, protection, monitoring and inventory. Whi le real expenditures are rising, questions remain about how we l l these are supporting the ongoing evolution o f EM at the state level.
Forest Survey supports national forest cover surveys by Forest Survey o f India in Derhadun; Forest Pol icy deals with pol icy development and forest sector information; Forest Protection includes programs to reduce losses from fire, insects and disease; Strengthen Forest D iv i s ion provides support to forest agency infiastucture; Research, Development, Education and Training supports the Ind ian Counci l o f Forest Research and Education, and several national forest research institutes including genetics, plywood, coastal and marine management, wildlife and forestry. I t also supports environmental and natural resource training programs and curricula development and the training programs for Indian Forest Service.
20

Figure A3.3. Budget shares, forestry and wildlife, MOEF
Strengthen Forest Forest
Protection 9%
Forest Policy 4 yo
Education, Training
Forest Survey 4 %
Source: MOEF Annual reports, various years.
Real state budgets are rising slowly but mainly cover recurrent costs. In Madhya Pradesh6, forest department real expenditures from state allocations (1993=100), increased from Rs2.8 b i l l ion ($61 mill ion) in 1992 to Rs3.0 b i l l ion ($66 mill ion) in 2002 (figure A3.4). The rising trend to 1999 was due to budget support f rom the Wor ld Bank J F M project in the state. As Figure 8 illustrates, since the closure o f the project, real expenditures are not much higher than they were in 1995. About 75 percent o f these nonplan expenditures are for recurrent costs o f f ie ld operations (Territorial and Production) and commercial harvesting. By contrast, research and training account for less than two percent o f the total recurrent expenditures funded by the state. A high proportion o f the recurrent expenditures in Madhya Pradesh cover staff salaries and benefits, which has doubled every f ive years to stay in l ine with inflation (JPS 2002). National transfers through central programs averaged about Rs2.4 b i l l ion $53 mill ion) f rom 1997-98 to 2001-02. In Assam, real state budget allocations for forestry peaked in 1999, declined and then have slowly increased to 1999 levels. Mos t nonplan expenditures are for recurrent costs and mainly cover salaries. The state has few funds for capital investment; virtually a l l investment resources come from national forestry programs. In Jharkhand’, the allocation o f annual state budget to forestry in undivided Bihar forest department was less than 0.7 percent; this figure i s now three percent. Non-plan operating budgets are about Rsl b i l l ion ($22 million), with 70 percent spent o n forest management. This would include forest establishment and production. Salaries, overheads and travel are funded through a separate nonplan budget o f about Rsl b i l l ion through the Principle Chief Conservator o f Forests. The focus o f expenditures i s clearly on f ie ld activities l inked with forest establishment and rehabilitation. A worrying feature, common to the other two states, i s the
Detailed budget data were available from the Forest Department ’ Detailed budget figures were on ly available for 2002-03
21

relatively small budget allocations to critical supporting forest management functions such as inventory, planning and research.
Figure A3.4. Real state forestry expenditures, Assam and Madhya Pradesh 1995-2002
4500
4000
3500
3000
tf 2500
E 2000
1500
1000
500
0
v)
c 0
K
1995 1996 1997 1998 1999 2000 2001 2002
1 -Madhya Radesh -Assam 1
Source: JPS Associates 2002 and World Bank 2005b.
22

Appendix 4. National and State Legal and Policy Frameworks
Key National Legal and Policy Milestones
Indian Forest Act, 1878 The expansion o f the Indian railway system at the turn o f the 19th century led to the development o f the Indian Forest Ac t in 1878. In the Act, individual states were recognized as sole proprietors o f classified forest lands. State forest lands were defined as lands not fall ing under ‘continuous’ cultivation or ‘permanent’ settlement. Traditional forest practices, including grazing, forest-based gathering, and forest-based shifting cultivation were generally rejected as a basis for allocating private property rights when forests were demarcated. According to a Forest Department resolution in 1890, previously defined rights o f access and use were to be redefined by Government as ‘privileges’ for specific tribes, castes, villages and organizations. This marks the beginning in a long history o f alienation o f traditional rights, which has persisted to the present. The A c t i s generally viewed as vesting exceptionally strong powers in the government for control over forest resources.
Indian Forest Act, 1927 The new Ac t incorporated few substantive changes over the 1878 Ac t and it remains the primary legislative basis for state forest management today. After Independence in 1947, the Government o f India formally adopted the 1927 Act. Under the new Indian Constitution, forests were placed within a ‘state list’, which gave state legislatures a primary right to make forest laws. It also gave the state wide powers to control forests and land not under government ownership, including use o f expropriation. One main objective o f the 1927 Indian Forest Act’ was to consolidate laws relating to forests, transit o f produce, and duty levied on timber and nontimber forest products. A striking feature in the Ac t i s the absence o f any definition of forest or forestland. The recent attempt by the Supreme Court to assign a meaning to the t e r m ‘forest’ as per the dictionary definit ion has seen a spate o f legal interventions due to i t s wide ambit. Recent interpretations could even cover trees on private lands. Forest may include private, common pastureland or cultivable land.g The Ac t also reinforced the three classes o f forests established in the 1878 Forest Act; namely reserve, protected and village forests. Of the three forest categories established by the Indian Forest A c t 1927, the most restricted to communities for local use i s reserved forest, identified as having high commercial values and amenable to sustained commercial timber exploitation. Stronger state control of reserved forests was sought, which involved either the relinquishment, or transferal of other claims and rights through a settlement process, although very occasionally, l imi ted access was granted (Lawbuary 1999). Reserved forests may be constituted by the State government on any forestland or wasteland, which i s the property o f the government or over which the government has proprietary rights. Mos t uses by local people were prohibited unless specifically allowed by a forest officer in the course o f settlement. lo
National Forest Policy, 1952 The National Policy o f 1952 promoted the colonial goals o f industrial forestry. The 1952 pol icy also classified the forest of India, whether state or privately owned, into four categories; Protection Forests, National Forests, Vil lage Forests and Tree Lands. The pol icy also declared that village communities should not be permitted to use forests at the cost o f “national interest,”
* Along with amendments made to Ss. 2 (4A), 26 (l), 33(1), 42, 52,66A, 67, 68 and 79
Lexis Nexis Butterworths lo Indian Forest Act 1927, Sections 3-26.
See Upadhyay S. and Upadhyay V; 2002; Hand Book on Forest and Wildlife Laws and the Environment;
23

which was identif ied with defense, communications and vital industries. Emphasis was la id on conversion of l o w value mixed forests to high value plantation o f commercial species. Commercial exploitation and degradation o f India’s forests increased dramatically after 1947 in a post-independent India. The 1952 National Forest Policy guidelines were largely directed toward the supply o f cheap timber and nontimber forest products for state-sponsored industrialization and modernization. Concessions were leased to large contractors at l o w rental rates and encouraged high rates o f harvesting often at unsustainable rates. Given the status o f monitoring systems at the time, the authorities were hard pressed to track forest loss with any precision. The policy also emphasized scientific conservation, which involved further regulation o f local rights and restrictions o f privileges o f users o f the forest. The policy supported the need to restrict forest rights for communities, which may have had traditional rights prior to the Forest Acts o f 1878 and 1927.
Indian Wildlife (Protection) Act I972 This Ac t lays out the legal framework governing India’s system o f protected areas such as national parks. With respect to forests, i t defines very tight restrictions pertaining to the removal o f specified plants f rom protected areas. The legal framework under this Ac t i s much more restrictive for communities inside or adjacent to designated protected areas due to concerns over loss o f biodiversity. However, this gives rise to a dual system o f community rights and responsibilities. Those inside or adjacent to protected areas and participating in a community natural resource management program generally enjoy fewer rights and benefits than JFM communities outside 5 kilometers in reserved and protected forests. Confusion arises when communities are o n or close to the 5-kilometer boundary.
National Commission on Agriculture, 1976 The National Commission o n Agriculture 1976 also supported industrial use o f forest” with a focus on clear fell ing o f valuable mixed forests and planting cleared areas with suitable fast growing species yielding higher returns. The 1976 Commission also identified the need to provide small timber, fuelwood and fodder for the rural population. However, this was subject to some qualification (box A4.1). In 1976, forestry was added to the concurrent l i s t o f the Constitution o f India, meaning that the Centre and States would share responsibility and control over forest matters. Although the Government o f India retains the power to legislate on forestry issues, this can only occur after consulting the states. The responsibility o f administering the forests remained primarily with the state government.
Forest Conservation Act, 1980 The Forest Conservation A c t 1980, allowed the Government o f India, through Ministry o f Environment and Forests (MOEF) to fight growing deforestation and indiscriminate timber harvesting (Khan and Pi l la i 2001). Timber leases were gradually phased out. The A c t also sought to regain further control over forests by restricting the state government’s power to de-reserve” a forest. I t also restricted the use o f forest land for nonforestry purposes without the pr ior approval o f the central government. In 1988 two more important provisions were added where clear fell ing
Report o f the National Commission on Agriculture, 1976, Divan and Rosencranz (2001) ’* To remove a designated forest from the “reserved” category to allow use o f the land for other purposes
24

of natural forests were prohibited without the permission o f the Central Government. Further leasing o f forest land to private individual, community or corporations were also brought within the purview o f the Central Government. The Ac t prevents states f rom allocating forest title to encroachers. Subsequent moves to regularize encroachment have been l imi ted to people moving into forest areas prior to 1980. Contravention o f the provisions o f the Ac t could entail simple imprisonment extendable to fifteen days; The Ac t i s also provided for punishment for offenders from government department^.'^ The Forest Conservation A c t becomes critical in the context o f participatory management o f forests. While it provides some important accountability measures with respect t o State government actions, narrow interpretations o f the Act’s restrictions on nonforest uses could limit the types o f activities that could be initiated under JFM.
National Forest Policy, 1988 The National Forest Policy o f 1988 was a total paradigm shift vis-a-vis the earlier two policies. Unl ike the industrial use oriented policy statements o f 1952 and 1976, the 1988 pol icy gives major emphasis o n the ecological roles o f forests, and envisages that the rights and concessions from forests are to be primarily for bona-fide use o f communities living within and around the forest areas, especially tribals. Such communities are required to be motivated to protect and develop such forests f rom which they derive their b e n e f i t ~ . ’ ~ The pol icy also stipulates that the rights and concessions relating to forest produce o f tribal community and other poor living within and near forests must be fully protected. The domestic requirements o f fuel-wood, fodder, minor forest produce and construction timber should be the f i rst charge o n forest produce. I t i s also envisaged that these and substitute materials shall be made available through appropriate means.” With domestic energy, fuelwood would be substituted as far as practicable with alternative sources l ike biogas, solar energy, liquid petroleum gas, etc.16 The pol icy further stipulated that any diversion o f forestland should be subject to careful scrutiny by specialists and consider social and environmental costs. The pol icy i s a strong guiding document that influences the executive as we l l as the judiciary through decisions o f the courts.” Notwithstanding the laudable objectives o f the policy, the necessary corollary changes are not yet fully reflected in formal law. The policy also discourages clear fell ing in well-stocked natural forests, but not in plantations (Khan and Pi l la i 200 1).l8 Therefore, working plans based on accepted silviculture models for managing natural forests, and which could be implemented by communities, become ineffective instruments for addressing the broader range o f community needs. Plantations, whi le providing a source o f commercial timber, do not have the ecological basis to support the richer mix o f timber and nonforest timber products that are often desired by communities. The pol icy has been criticized for calling for forest conservation without offering practical options for implementation, and sustaining the all-encompassing role o f the forest departments, including the contradictory functions o f being both the forest authority, and operating as a public enterprise in commercial forest production.
Additional Policy Circulars from MOEF MOEF has issued a number o f important and very positive pol icy changes through government orders, or “circulars,” but in many cases implementation has been fragmented and uneven. For example, a 1990 pol icy circular made i t possible for state governments to engage communities in
l3 See Section 3-A and 3-B o f the Forest Conservation Act, 1980. l4 Section 4.3.4.2 o f the Forest Policy, 1988
l6 Section 4.3.5, Forest Policy 1988 l7 A case in point i s the on-going T.N. Godavarman case in the Supreme Court where the main petition has been filed in order to give effect to the forest policy o f 1988. ’* The policy was given legal footing by amending the Forest Conservation Ac t 1980.
Section 4.3.4.3 o f the Forest Policy, 1988. 15
25

shared forest management (making JFM a reality), but states were not mandated to do so. As a result, progress with JFM across India has been uneven. Another 1990 circular provided guidance o n resolving tenure disputes at the state level, but this has not been fully implemented. As another example, in February 2000, MOEF issued a circular requesting that J F M committees be registered under the Societies Registration Ac t in recognition that JFM committees had weak legal standing in most states. Another circular provided for special dispensations for tribals. Further, the guidelines called for 50 percent o f the JFM committee general members, and 1/3 o f the executive be women. The guidelines also indicated that JFM should be extended f rom degraded forests to include good forest areas. The guidelines also requested J F M to be supported by micro-plans prepared after detailed P R A exercises, and with clear market linkages, especially for nontimber forest products. State governments were requested to constitute divisional and state-level representative forums or working groups as conflict resolution bodies. The guidelines also provided mechanisms for benefit-sharing and indicated that these schemes should be transparent. Finally, the guidelines called for concurrent monitoring programs. Whi le these kinds o f guidelines represent a clear recognition o f key legal and pol icy issues in community forestry, implementation has been weak at the field level.
Central Issues with State Legal Frameworks for JFM
The concept o f JFM i s a central feature o f the 1988 National Forest Policy, and was accordingly initiated and endorsed by a l l State and Un ion Territories. However, there have been n o accompanying changes in the national legal framework for JFM. Instead, J F M i s operational through administrative orders (government orders) that have l i t t le legal underpinning; this i s the situation in Jharkhand and Madhya Pradesh. The government order (or circular) i s simply a set o f guidelines that are to be followed to carry out the JFM program, following the direction in the national JFM circular and any subsequent circulars. Therefore in case o f any conflict with the Indian Forest A c t 1927 or Forest Conservation A c t 1980, the national J F M circular and state-level government orders may be overridden by these legislations. These resolutions are easy to modify, which on one hand lends flexibility, but o n the other, deprives them o f being certain and legally secure. Since JFM has not been formalized under any l aw in states such as Jharkhand and Madhya Pradesh, i t s provisions cannot be challenged in, or be enforced by a court o f law. In a few states including Uttar Pradesh, Himachal Pradesh, Jammu & Kashmir and Assam, J F M i s l inked to state legislation through an amendment. The draft J F M resolution attempts to formalize the process under the Assam Forest Regulation, 1891, This may give the JFM program in Assam a stronger legal footing at the state level. However in al l three states including Assam, most forests continue to be looked upon as property o f the State and management responsibilities are delegated to local communities through J F M as an administrative arrangement; therefore JFM falls far short o f any real devolution o f power to local communities. Another legal issue at the state level i s the actual process o f constituting a J F M committee. Whi le the process i s well- defined in the JFM resolutions o f each state, it needs to be reviewed based on legal analyses. All three states have a range o f historic resource rights held by tribals that are not well-recognized by current JFM pol icy and legal frameworks.
One fall-out o f the uncertain legal status i s the diff iculty in addressing encroachment issues. I t i s very diff icult to prosecute people encroaching o n forests allocated under a JFM Resolution. Also, where JFM i s initiated with only one village in a small forest area supporting several villages, the other villages may be excluded fkom accessing the forest, even where they may have historic forest rights to these resources. In Madhya Pradesh, evolving state legislation raises potential conflicts with historic “nistar” rights, which are historic rights to gather basic needs for rural l i fe
26

form the forest, and can include timber, fuelwood, grazing lands and fodder (box A4.2).19 I t i s not clear i f villages converting to J F M keep their nistar rights. If so, there i s potential for conflict with broader forest management goals o f the forest department. Whi le the nistar rights are protected under law, in reality the JFM resolution without legal foundation appears to take precedence in the field. The resolutions also generally state that once a committee i s constituted, the jurisdiction o f the committee shall be decided by the district forest officer o n deliberations with the committee. Yet the discretion o f the officer to decide the jurisdiction can run contrary to the existing rights regimes o f the people living in the particular area.
I t i s also unlikely the district forest officer will have the legal competence to address certain tenurial securities, especially in protected forest areas where JFM i s prevalent. The binding instrument to be concluded between the forest department and the community participating in the J F M program i s the Memorandum o f Understanding (MOU). The MOU i s not a legal contract. It i s also heavily weighted in favor o f the government. For example, the right to recall, the right to proceed with or disband a JFM program tends to vest exclusively with the district forest officer. A jo in t program implies an equal sharing o f power but this i s missing in the MOUs used in al l three states. Under current J F M resolutions in each state, the district forest officer i s usually the competent authority for registration o f the committee with Forest Department, but there are
16. Section 237 (l), Madhya Pradesh Land Revenue Code, 1959.
27

serious legal questions about this process. Registration i s a legal process, which i s normally done under the Indian Registration Act, or other institutional registration acts such as the Society Registration Act, The Cooperative Society Act, and the Trust Acts. Any such power given to the district forest officer for committee registration without proper legal authority would not be tenable in law. Therefore any such registration process by an incompetent authority vis-a-vis registration would be legally invalid. The M O E F Guidelines o f 2000 suggests the registration o f J F M committees as societies under the Societies Registration Act, 1860. But, legal questions arise f rom this suggestion. The Societies Registration Act 1860 i s an Ac t to improve the legal condition o f societies for promotion o f literature, art, science and for diffusion o f knowledge as wel l as for charitable purposes. This fundamentally i s at variance with the basic objective o f JFM, which i s an incentive-based management strategy.
Legal and Policy Conflicts
Part o f the problem with the current legal framework for J F M i s contradictions between progressive pol icy intentions and existing law. As an example, the amended Forest Conservation A c t 1980 and the National Forest Policy 1988 contain a number o f conflicting articles (table A4.1).
improved and their production enhanced (section 3.5).
Degraded lands should be made available o n lease or o n the basis o f a tree patta scheme to individuals and institutions (section 4.2.4).
Rights and concessions enjoyed by the tribals should be f i l ly protected (section
Domestic requirement o f tribals should be the first charge o n forest produce (section
Land laws should be modi f ied to facilitate individuals to undertake tree farming on their o w n land (section 4.2.4).
4.3.4.3).
4.3.4.3).
horticulture crops, palms, o i l bearing and medicinal plants o n forest lands, unless pr ior permission o f the Government o f Ind ia has been taken.
Forest Conservation A c t bans assignment or lease o f forest land to the people or institutions not whol ly owned by government.
Rights and concessions, including grazing, should always remain related to the carrying capacity o f forests (section 4.3.4.1).
MFPs and substitute materials should be made available through conveniently located depots at reasonable prices (same section).
Appropriate regulations should govern the fel l ing o f trees o n private holding (same section).
I
Source: Saxena 2005 - personal communication.
At the state level, the case o f horticulture in Jharkhand illustrates the complexities o f the current legal framework. Under subsection 1 o f Section 6 o f the Bihar Land Reforms Ac t 1950, al l lands used for horticulture and, which were in Khas possession o f a tenure holder are deemed to be settled by the state as Raiyati. Land used for horticultural purposes includes growing h i t s , flowers, or vegetables. Therefore, such lands which are in Khas possession o f the landlord and which were used for growing f ru i ts , flower and vegetables have to be treated as Raiyati land. As per Clause A o f section 2 3 A o f the Bihar Tenancy Ac t 1885, they are entitled to cut down trees or bamboos standing on such lands, and to appropriate the flowers, fruits, or other products.
28

However, o n lands which are used for growing nonfmit-bearing trees, the state s t i l l has control over such trees. Subject to local customs or usage, the incidents o f homestead tenancy which are provided under section 182 o f the Bihar Tenancy Ac t 1885, are to be regulated by the provisions applicable to Raiyati lands. Even here, the provisions o f clause 23A o f that Ac t comes into play, especially with respect o f trees on such lands. The trees standing on such lands thus belong exclusively to the outgoing landlords irrespective o f whether these are h i t or nonfmit-bearing ones.
PESA - Panacea for Community-Based Forestry?
Another key legal and policy initiative was the 73rd Constitutional Amendment o f 1992, which specified three levels o f local institutions; village level (gram sabha); block level, and district level.20 The amendment supports the government o f India's goal for decentralization o f governance and gives panchayat raj institutions a statutory mandate, potential to raise local finances through taxation. Under the Panchayat Extension to Scheduled Areas Act, 1996 (PESA), gram sabha or village assemblies in Scheduled Areas were endowed with powers over community resources generally and more specifically with ownership o f minor forest produce. The Panchayats along with the gram sabha has been further empowered, among other things to prevent alienation o f land in the Scheduled Areas and to take appropriate action to restore any unlawfully alienated land o f a Scheduled Tribe; and the power to manage village markets. The 731d amendment also provided for a more inclusive body at the village level; namely gram sabha, which consists o f all the adult villagers. Whi le the Panchayats are administrative and polit ical bodies, the gram sabha i s the real representative o f the village community. The Panchayat Raj A c t i s based on the Indian Constitution and as such, has a stronger legal footing than J F M circulars, government orders or even legislation that may be in conflict.
I t i s imperative to understand the implications o f the new panchayat regime, through the original Constitutional amendment and the subsequent PESA 1996, especially on tribal self-rule l aw and marketing o f nontimber forest products. One o f the basic tenets o f the PESA 1996 i s that state legislations o n Panchayats shall be in accordance with customary laws, social and religious practices, and traditional management practices o f community resources, which includes forests. Further, the PESA emphasizes the competence o f gram sabha in safeguarding and preserving traditions and customs o f the people, their cultural identity, community resources, and customary mode o f dispute resolution. I t can be safely assumed that such community resources would invariably include forest resources especially o n community land. Panchayats in Scheduled Areas have due legal backing through the PESA, while J F M committees originate f rom government orders or resolutions, which are revocable. The J F M committees are specific natural resource management bodies with n o legal standing, whi le the Panchayats, being institutions o f self governance and supported under both the constitution o f India and supporting legislation, have strong legal backing to perform a variety o f functions l ike village administration, and social and economic development, which logically could include management o f natural resources. In general, while the intention o f many states has been to implement PESA in i t s full spirit, the ground reality i s that they are subject to rules framed by the state government, availability o f funds, and other laws in force. It i s entirely possible for Panchayats to override the decisions o f J F M committees, for example with distribution o f benefits. Whi le PESA has been greeted in some circles as a panacea for accelerating community forestry, the reality i s far different.
2o I a m indebted to N.C. Saxena for providing a wealth o f examples o f conflicts between PESA and forestry legislation and pol icy. These are included directly in the fo l lowing section as identified.
29

Examples of Conflicts and Contradictions with PESA and Forestry
According to PESA, Panchayats and gram sabhas are the owners o f nontimber forest products, but Forest Departments often contend that villages do not have control over reserved forests, as these are outside village boundaries, and therefore PESA i s not applicable to reserved forests. This i s a legal issue, and even the two Ministries in Government o f India, Rural Development and Environment and Forests ho ld different viewsz1 about the applicability o f PESA over reserved forests, about the inclusion o f Kendu and bamboo in the nonforest timber products to be controlled by Panchayats. Secondly, there are contradictions between J F M and PESA too, as JFM encouraged small community based informal groups, whereas PESA recognizes formal Panchayats and gram sabhas. Even the revised JFM guidelines issued by the Ministry o f Environment and Forests in 2000 do not specifically mention PESA, indicating the l o w importance given to i t s provisions and their potential bearing o n the J F M framework in Schedule V areas by the central Ministry.
Several NGOs working o n J F M have preferred JFM committees over Panchayats as the organizational unit for managing the resource and sharing benefits. It i s undoubtedly easier for them (and also for Forest Department) to deal with new and informal organizations that they create and find rather than contend with the rough-and-tumble o f ‘political’ and statutory Panchayats. Operationalizing the provisions o f PESA has thus several practical problems, and n o definitive answers have yet been obtained to the question o f ownership o f nonforest timber product by gram sabhas. The third set o f problem has arisen because many states, such as Orissa, have tried to dilute the provisions o f PESA, though it had n o legal jurisdiction to do so, as PESA i s a Central Act.
Fol lowing the Central PESA Act, the Government o f Orissa enacted the Orissa Ac t for the State. However, the Orissa A c t appears to want to circumscribe the constitutional provisions o f the Central Ac t by adding a clausez2 ’consistent with relevant laws in force’ whi le incorporating the constitutional provision concerning the competence o f the gram sabha to manage community resources and dispute resolution as per the customs and traditions o f the people. Thus, tribals can have ownership rights over M i n o r Forest Produce, but only if the relevant laws in force allow for it. This i s a clear violation o f the Constitutional Provision o f the Central A c t since in case o f any inconsistency the relevant state laws have to be changed instead o f negating the rights granted to gram sabha as per the Central A c t in this regard.
Section 4 (m) (ii) o f this A c t provides that - “while endowing Panchayats in the Scheduled Areas with such powers and authority as may be necessary to enable them to function as institutions o f self-government, a State legislature shall ensure that the Panchayats at the appropriate level and the gram sabha are endowed specifically with the ownership o f minor forest produce.”
Further, PESA required that state government would change i t s existing laws wherever these were not in consistent with the central legislation. However, Orissa government has done just the opposite.
” M O E F tried to reconcile the differences in 1999 through a pol icy circular, but this has had l i t t le effect in the field.
22 M a n y other states have also di luted the Government o f India PESA Act. Both the Gujarat and Maharashtra Acts make ownership subject to the relevant state acts o n nontimber forest products. The Maharashtra state A c t leaves bamboo and cane out o f the l i s t o f nontimber forest products over which ownership i s granted to the panchayats.
30

Despite the fact that the Central Ac t clearly provides ownership (not just control) o f nontimber forest products to gram sabhas, the Ministry o f Environment and Forests set up an ‘expert committee’ to consider what comprises nontimber product and what does ‘ownership’ mean. The expert committee recommended that ownership meant revenue from sale o f usufructory rights, that is, the right to net revenues from nontimber product, after retaining the administrative expenses o f the department, and not right o f control. The committee also argued that bamboo and cane, two important products for the poor, are not forest timber products.
In Andhra Pradesh too, there i s a clear contradiction between PESA and GOM 173 dt. 7/12/96 of the Environment, Forest, Science and Technology Department. The usufructory rights o f user groups called Vana Samrakshana Samitis (VSS) prescribed therein include, “(a) All Non-Timber Forest Produce except those for which the state holds monopoly rights. However the right to collection shall remain with the VSS members, if they so desire. The members shall be paid the collection charges upon delivery o f the produce as per the rates fixed by the Government.” I t can also be seen that there i s a contradiction between the ‘ownership’ vesting in gram Panchayats/sabhas clause and the monopoly rights vested in GCC. GOMs 173 also entitles VSS to 100 percent share in timber and bamboo harvested as prescribed in the microplan. Whether bamboo constitutes major or minor forest produce i s also an unsettled question.
Another problem with the Orissa legislation i s that instead o f giving clear rights to gram sabha, space has been kept in the state l a w for involvement o f higher order panchayati raj institutions instead. Thus the spirit o f the Government o f India Ac t with focus on empowerment o f the gram sabha has not been followed in Orissa. This i s again a violation o f the Central Ac t which explicitly forbids usurpation o f powers o f a lower level panchayat by a higher level panchayat.
Such indifference to PESA can be seen in many other states too. The irony i s that while PESA remains unimplemented, Government o f India has proposed amending Schedule V o f the Constitution itself t o open up tribal areas for commercial exploitation by national and multi- national corporate interests.
In Jharkhand, panchayat elections have yet to take place. Jharkhand i s the only state in India without Panchayats. When election take place, local authorities may find that the Bihar Forest Produce (Regulation o f Trade) A c t 1984, folded into Jharkhand at bifurcation, presents a State marketing monopoly in the trade o f nationalized timber and nontimber forest products. Under the 1984 Act, the State may appoint agents to purchase and trade o f forest produce on i t s behalf. N o person other than the Government or i t s agent shall purchase, transport, import or export the specified forest produce.23 Thus al l the primary collectors24 who gather the designated forest produce have to sell i t to the designated agent o f the State, at depots established by the State and at a price determined by the State. Thus, there i s a clear confl ict between the Bihar Forest Produce (Regulation o f Trade) A c t 1984, and the PESA as the latter vests local authorities in Scheduled Areas with ‘marketing’ rights over forest produce, while the former legislation seeks to regulate by creating a state monopoly.
In Madhya Pradesh, soon after the 73rd amendment, the State Panchayat Raj Adhiniyam, 199325 was enacted. Whi le the gram panchayat26 was made responsible for the plantation and preservation o f panchayat forests, i t was subject to the availability o f funds within the Gram Panchayat, which in practice have been limited. Control and management o f such forests were
23 Sec 5 o f The Bihar Forest Produce (Regulation o f Trade) Act, 1984 24 Sec 2 (4) o f The Bihar Forest Produce (Regulation o f Trade) Act, 1984 25 Act 1 o f 1993 26 (Act 3 o f 2001). This Act renamed the MP Panchayati Raj Act as Madhya Pradesh (Panchayat Raj Avam Gram Swaraj) Adhiniyam, 1993.
31

clearly state's responsibility. Various amendments have been made in the principal Act. By 1997, amendments gave the Zi l la Parishad an advisory role to the state government in respect to protection o f environment and social forestry. In 1999 (Madhya Pradesh Ac t 5 o f 1999), the gram sabha was entrusted with the management o f natural resources including water, land and forests. However, in case o f a conflict, the specific laws dealing with the natural resource take precedence. The Madhya Pradesh Transit (Forest Produce) Rules, 2OOOZ7 empower the Gram Panchayat to issue passes for the transit o f forest produce, within or outside the state o f Madhya Pradesh, but these passes can also be issued by the district forest officer. There i s enough legal space available in the PESA to allow Panchuyats a greater role in forest management but the contradictions and limitations brought by the existing forestry legal framework must be addressed.
Assam stands on a different legal footing. PESA i s not applicable to Assam, as it i s only applicable to fifth schedule areas and not sixth schedule which encompasses the autonomous districts o f Assam. The Assam Panchayat A c t 1994 extends to the whole o f Assam in rural areas except the Autonomous Districts under the sixth schedule o f the constitution.28 Some important functions assigned to PRIs include development o f wastelands, village grazing lands and preventing their unauthorized alienation and use, promotion o f social forestry, farm forestry, fuel plantation, and fodder development. Zi l la Parishads are responsible for marketing o f minor forest produce raised in community lands. However the JFM Resolution does not make this distinction o f Autonomous Districts and the rest o f the Districts and makes i t universally applicable. This i s bound to create conflict with the District Council in the scheduled districts. Although as regards nonforest timber product there i s less possibility o f conflict in this functional role with forest department, because Assam does not have a state marketing board for nonforest timber products.
I t i s critical that the institutional links between government decentralization pol icy (through Panchayats or local authorities) and administrative decentralization such as through J F M and i t s user groups be better understood and strengthened. Panchuyats, being elected bodies have a strong vertical and horizontal reach. Yet Panchayats lack capacities, are often plagued with internal politics and domination by elites. Experience in other parts o f India (World Bank 2004a) suggest that fiscal decentralization through local authorities can create problems o f local expenditure discretion, revenue generation and collection, and mandates that exceed capacity to deliver. Many local organizations do not perform as quickly or effectively as anticipated, raising questions about their viability, fairness, and sustainability (World Bank 2004). However, a global study o f natural resource decentralization identified many positive outcomes to decentralization involv ing natural resources Ribot (2004). These include local governments demonstrating capacity and initiative in natural resource management; empowering local people to protect their forests; increased revenues to local councils and local people; stronger roles for disadvantaged groups in natural resource management; and cases o f sustained forest management
27 Enacted under Indian Forest Act, 1927 28 North Cachar Hills and Karbi Anglong District and Bodoland Territorial Council;
32

Appendix 5. Community Livelihoods in Assam, Jharkhand, and Madhya Pradesh
Madhya Pradesh Assam
Background
195 11,438 I 0.394 37 64 35 I 0.95 0.13 339 11,755 I 0.386 36 64 27 1 0.55 0.09
Assam, Jharkhand, and Madhya Pradesh share a number o f common socio-economic features (table A5.1). First, the three states are poor based on income per capita and human development indices fall ing wel l below the national average. In addition, the percentage o f people below the poverty l ine i s much higher than the national average. Second, the share o f agriculture out o f total state gross domestic product i s higher than the figure for a l l India, suggesting a relatively high dependence o n agriculture for economic activity. Average land holdings in Jharkhand and Assam are less than the national average. Population densities in Jharkhand and Assam are slightly higher than the national average. Madhya Pradesh’s population density i s 66 percent lower than the national average. Literacy rates among people over 15 years o f age are higher than the national average, with the exception o f Jharkhand. Forest cover per capita in Jharkhand and Assam i s just slightly below the national average, while Madhya Pradesh i s significantly higher. On i t s own, Madhya Pradesh accounts for almost 12 percent o f the national forest cover.
Al l India
TableA5.1. K e v socioeconomic indicators. focal states
324 I 18,912 I 0.472 I 26 I 61 I 21 I 0.75 0.10
These broad statistics are useful for comparisons, but may understate the actual poverty situation in rural areas. As an example, in Jharkhand, poverty i s higher in rural areas and i s an important factor in forest encroachment. An estimated 76 percent o f rural people (mostly f rom tribal groups) l ive under the poverty line. The phenomenon o f chronic poverty, including a high degree o f uncertainty about the l ivelihood base, often coincides with two particular ago-ecological and socio-economic conditions: first, dry land regions characterized by frequent failure o f crops and sporadic employment opportunities, leading to high level o f unprotected r isks o f l ivelihood security among the poor; and second, forest-based economies, especially in hilly regions with predominance o f tribal populations who have l imi ted access to natural resources, information and markets (2004; 2005). Jharkhand provides a good example, where tribal people are closely connected with forests for livelihoods, and where agriculture i s often characterized by single crop paddy rice dependent o n rainfall. Agriculture opportunities are constrained by the high percentage of marginal farmers with very small land holdings (table A5.2).*’ Almost 70 percent o f a l l rural households in Jharkhand are l imi ted to an average o f 0.37 hectares o f land, which i s inadequate to sustain family nutrit ion with r ice paddy, restricts mixed farming and ecologically sound cultivation, and does not al low for fields to be shared with children as they grow up and marry. The small average land holding, l o w productivity o f agriculture, and l imi ted opportunities to earn nonfarm income f rom other resources such as forests, leads to migration as an important coping
29 Source: Mishra 2001.
3 3

strategy for people in many rural areas o f Jharkhand. Rural people are vulnerable to periods o f shortfalls in income. At the same time, vulnerability in poor, rural areas i s a function o f both the
2 and the abil ity t o cope with exogenous shocks such as crop failure and/or loss o f health. These factors can lead to high- interest private debt f rom money lenders to meet costs o f purchasing food, or social and customary expenses, for Source: TERI 2004. example with a funeral or wedding. Due to lack o f access to institutional credit, private money lenders constitute the only available source for credit (see Mosse and others 2002).
probability and size o f income,
Tribals and Tribal Characteristics in India
About 742 m i l l i on people, or 72.2 percent o f India’s population l ive in rural areas. Of these, 88.8 m i l l i on belong to scheduled tribes. The Indian Constitution identifies scheduled tribes according to criteria l ike geographical isolation, cultural traits and “backwardness.” F rom 1971 to 2001, the ST population in India has increased by an average o f 4.5 percent per year, compared to the general population increase o f 2.9 percent over the same period. Tribals now comprise 8.6 percent o f the national population. They are distributed across the country, encompassing 10 neighboring states (table A5.3). The scheduled tribes are mainly concentrated in the so-called ‘Tribal Bel t ’ o f central India, with a second concentration in the Northeast. The Tribal Bel t represents a distinct geo-cultural region and i s home to the main tribal groups throughout India (Gonds, Santhals, Oraons, Mundas, and Khonds) as wel l as hundreds o f subtribes, each with distinctive dialects, specific customs and traditions. Tribals represent a significant share o f the total state population, particularly in Chattisgarh, Jharkhand, Orissa, Madhya Pradesh, Gujarat and Rajasthan. Also, with one exception (Maharashtra), more than 90 percent o f the tribal population lives in rural areas. Of interest to this report i s the linkage between tribals and forests. The Chota Nagpur plateau running east to west across theses tribal states, contains the majority o f the forest area in India, and includes much o f Chattisgarh, Jharkhand, Orissa, Madhya
Table A5.3. PoDulation characteristics. main tribal states
Pradesh and smaller areas-of Maharashtra, and West Bengal. For example, out o f the 45 districts in Madhya Pradesh, 14 are forest-rich districts inhabited by almost 80 percent o f the tribal population (Census o f India 199 1). Tribals generally dwel l in forested and hilly areas, and depend on forests for their cultural and spiritual needs, and to varying degrees, their economic needs.
34

There i s a fa i r ly strong link between chronic rural poverty and natural forests (Sunderlin and others 2004). The tribal communities in Jharkhand, Madhya Pradesh and Assam are among the poorest groups in society (table A5.4), although there i s wide variation in the percentage o f people below the poverty l ine compared with state averages, In Madhya Pradesh, there i s a 19 point variation, whi le in Assam the difference i s only 3 points. South-West Madhya Pradesh, dominated by tribals, represents one o f the seven regions having the highest incidence o f rural poverty in India. In 1993-94 over 60 percent o f the rural households in the region were poor, o f which about 42 per cent were severely poor.
Source: Census o f Ind ia (2001 census).
According to Shah and Sah (2004), the fo l lowing are the key factors explaining the highest incidence o f poverty in tribal regions: (1) tribals’ l o w bargaining capacity; (2) their l o w degree o f polit ical representation and poor quality o f local governance; and (3) constrained access to forest, land, and water. The issue o f control, power and access to natural resources i s contentious both at economic and polit ical level for tribal groups. At the economic level, there tends to be increasing resentment among tribals that outsiders and nontribal people (including industrialists, merchants, traders, mine-owners, government employees and contractors) can often access water and forests that historically used to be theirs. This manifests i t s e l f to the political level with several tribal activist groups not content with the loss o f historic rights over forest land, which they see as a compromise o f their demand o f self-rule or autonomy. In turn, this i s a major factor contributing to insurgency, particularly in Assam and Jharkhand.
Among some o f the tribes common to Jharkhand and Madhya Pradesh, a distinction i s often made between adivasi (tribal people), sadan (long-settled other backward castes o f nontribal origin) and diku (outsiders). Adivasi societies are considered different f rom caste Hindu societies as they are based on equality and not o n hierarchy, they have remote habitation, have a intimate relationship with the natural habitat, and that have animistic forms o f religion (see Kothar i 2000; Mandelbaum 1970; Sharma 2001 ; Weiner 1978). Neighboring nonadivasis l ike blacksmiths (Lohar), potters (Karnar), shepherds (Gau), basket makers (Mahali) and others, can “transform into adivasi’ (adivasi-hokotanako) by marrying tribal women, adopting tribal clans and takmg part in (and contributing to) tribal religious festivals. By doing so, they are said to acquire the right o f being buried in those lands, that is, they acquire land inheritance rights. Conversely, any adivasi can become diku, if helshe behaves in a manner that i s unacceptable (diku:e baiotana). Mundas who leave their villages and migrate to cities for seasonal or permanent work do become diku if they neglect and disrespect their own people and their ancestral practices by not going back to the village for religious festivals, by ignoring the teaching of the ancestors (hararn hoko ora), changed way o f thinking (diku uru:) and by treating their tribal fellows in a dishonest way. Tribals are attached to their land economically, spiritually and culturally (box A5.1). The memorial stones o f the Mundas in
35

Jharkhand and Madhya Pradesh are a symbol o f belonging to the tribe and o f owning land in the village (Verardo 2003). The tribal, regardless o f his wealth and social position, i s not fully integrated in the community unless he owns some land in i t s area. Only land ownership and farming seem to give the feeling o f a full integration into the tribe (Van Exem 1992). Traditional socio-political systems extend f rom the village to the cluster and regional levels. Village and cluster leaders belong to the clan o f the pioneers o f the area. When a new settlement i s founded, the eldest among the pioneers becomes the specialist o f the sacred and the one younger to him becomes the village-head. Although their position i s hereditary, downward accountability i s ensured by the fact that they are pr imus inter pares and villagers can at any time nominate a different person in case they misbehave. Village councils are often responsible for a number o f traditional tasks (box A5.2), many o f which could be adopted as part o f greater legal responsibilities for community natural resource management.
Clusters o f 10-20 villages constitute the next level o f socio-political organization. In Oraon areas, these clusters are called Parhas and are headed by a Parha-raja; in Santhali areas, they are called pargana, headed by a m a j i parda, in Ho areas they are calledpir, headed by a Manki, and in Munda areas they are called Parha or Manki-patti and headed by a Manki. Historians and sociologists have argued that the clusters marked an advance f rom socio-political hunting groups and grouped men o f several clans together (Roy 1912), or that they constitute unions o f a number o f villages o f the same clan located around the original village, that is, they were kin based and that an increase in population caused the formation o f these groupings (Sachidananda 1979). I t i s argued that these socio-political systems have been a feature o f a l l tr ibal areas since “the beginning o f time.” Kin-based clusters have in certain areas being replaced by administrative boundaries that do not reflect the social reality on the ground. This i s especially true in areas with a mixed tribal and nontribal population.
While the economic exploitation, land alienation, and displacements have a l l affected the scheduled tribes in the state, a further complicating influence in local decision making i s the decline in traditional institutions. M a n y tribals have a very long tradition o f Tribal-Governance Systems, which conflicts with the conventional wisdom o f recognizing them as a homogenous group. Government devolution programs to panchayat ra j institutions through PESA, or sector- driven programs such as J F M do not usually recognize the unique characteristics o f forest dwellers including tribals. This can reduce the effectiveness o f these program thrusts and the impact on poverty. This can reduce the effectiveness o f these program thrusts and the impact on poverty.
36

37

Livelihood Patterns in the Focal States
Jharkhand -smallholder farming with forests as a safety net The six case study villages selected for Jharkhand provide certain village-specific and some general idea o f the socio-economic situation o f forest-dependent communities in the state o f Jharkhand (table A5.5). Tribals account for between 80 and 100 percent o f the village population; the one outlier i s Munam Kalen with 25 percent. In terms o f infrastructure and development, villages in al l the regions were found to be backward. Inadequate provision o f water, both for drinking purposes and irrigation, i s a common feature across a l l the villages. The livelihood system in these villages i s mainly agrarian, complemented by income f rom labor.
In the Porahat area o f West Singhbhum, “Bir-horoko” are the people (Horoko) who l ive in thick forests (Bir), and practice hunting- gathering activities; “Buru-horoko” are the people who live in the secondary forest (Bum), and practice slush-and-burn cultivation; and “Hoko” are the people who l ive in permanent villages and practice mixed, settled cultivation.
Landholding size i s very small in the villages with about two-thirds o f the farmers fall ing in the category o f marginal, with less than 1 hectare. As a result, agriculture can only provide sustenance for six to seven months; for rest o f the year people have to look for other sources o f income. People usually migrate to work in mines or factories in villages that are situated close to industrial towns. On average, agriculture was the primary occupation in 60 percent o f a l l households, and various forms o f labor (unskilled, skilled) in 32 percent o f a l l households. Community variations in livelihood patterns can be explained on the basis o f ethnic characterization, resource endowment and access, and use o f productive resources. All villages were interacting with degraded forests o f variable quality, usually f rom il legal harvesting in the past, The average forest area per capita i s 0.09 hectares, equal to the state average slightly below the national average o f 0.1 hectares. The average i s heavily skewed by the figure o f 0.18 hectares from West Singhbum district (Thakura Guutu village).
T w o o f the districts (Seraikela and Dumka) have very l o w per capita forest cover (0.06 hectares and 0.03 hectares respectively). Based on the evidence f rom the field, forests in the six villages were used mainly for seasonal subsistence, and also as a safety ne t to augment poor agriculture performance. As could be seen in some villages, with the availability o f alternative opportunities (particularly wage labor), people have shifted away from the use o f forest products. In general, a l l communities used the forest, but primarily for subsistence fuelwood and fodder. Fuelwood supplied an average o f 86 percent o f energy needs, and ranged between 50 and 100 percent. On the other hand, fodder f rom the forest provided about 55 percent o f input requirements for domestic livestock. On average, gross values were Rs2,356 (fuelwood) and Rs8,507 (fodder) per household per year. Gross values ranged f rom Rs982-Rs3,367/household (fuelwood) and Rs7,665-Rs14,042/household (fodder). Poles played a minor role in forest livelihoods with an average household using between 6-10 poles every three years for minor construction. Bamboo was used in only one o f the six villages surveyed for domestic construction. The surveys clearly found that the use o f nontimber forest products was mainly for subsistence. W h i l e some villages reported periodic sales o f a few products in local markets, people could not specify the quantity collected or sold. In general, the village surveys infer a l o w level o f commercial sales o f forest products, due in part to poor access to markets f rom degraded roads, isolated and l o w levels o f production, and l o w awareness o f markets outside o f local trading areas.
38


The average distance to a larger town was 17 kilometers, a long distance for people without transport and wishing to sell products characterized by high collection times and l o w market prices. Tr ibal villages in the areas close to forests were found to have a higher dependence o f forest produce, and in particular, subsistence fuelwood and fodder.
Assam: Smalllzolder farmers and shifting cultivation are dominant The tribal groups in Assam have traditionally been located in specific parts o f the state and their resource use practices have varied based on their socio-cultural preferences. Hill tribes continue to be engaged in slash and bum agriculture and al l their economic and cultural practices have traditionally revolved around this. In the Barak valley, the Khasi tribe i s associated with the practice o f ‘pan jhum’ o f harvesting betel leaves (pan) and shifting cultivation (jhum). Bodos, one o f the major p la in tribes in the northeast, are involved mainly in agriculture. Rabhas l ive in the jungle tracts where the Himalayan Mountains meet the plains o f Bengal. The eight case study villages surveyed are a mix of smallholder farmers, shifting cultivation, and landless (table 5.5). Tribals were only recorded in five o f the eight villages surveyed. The level o f infrastructure and development i s very similar to the results f rom Jharkhand, although villages are about one-third the population. Across the eight villages, 76 percent o f households reported agriculture as the primary occupation, significantly higher than in Jharkhand. Agriculture i s mostly rainfed but some areas have a traditional method o f irrigation through a network o f canals called Dongs. The main agricultural crops grown are paddy, pulses, mustard, vegetables and jute. Besides agriculture, the villagers also collect fuelwood, mushroom, nontimber products, and fishing for subsistence. Mos t villagers keep livestock such as cows, bullocks, buffaloes and goats. Due to l o w returns f rom agriculture, l ivelihood from labor was the primary occupation o f 17 percent o f a l l households surveyed, and forms an important secondary form o f income for many farmers as opportunities arise within the seasonal farming system (table A5.6).
Source: Discussions with villagers during background study field surveys.
Forest department, o i l companies and stone quarries are the main sources o f employment. The daily wage rate for the men varies f rom Rs 40-50 per day. In addition, during February, March and April some men f rom landless households migrate to nearby urban areas, in particular Guwahati, in order to work as daily wage laborers. All eight villages were adjacent to degraded forests, but the observation was made that forest quality in these villages was much worse than in Jharkhand. T w o o f the four districts (Kohrajhar - 0.15 hectares and Tinsukia - 0.13 ha) had per capita forest cover wel l above the state average o f 0.09 ha. The remaining two districts were significantly lower than the state average. All eight communities used the forest, but again, primarily for subsistence fuelwood and fodder. Fuelwood supplied an average o f 79 percent o f energy needs, and ranged between 57 and 100 percent. Fodder f rom the forest provided about 64
40

percent of the feed requirements for domestic livestock. On average, gross values were Rs2,440 (fuelwood) and Rs10,992 (fodder) per household per year. Gross values ranged from Rs975- Rs3,780/household (fuelwood) and Rs2,563-Rs l9,495/household (fodder). Poles also played a minor role in forest livelihoods. On the other hand, the gross value o f bamboo was almost nine times that o f poles for domestic construction. Mos t communities collect a variety o f nontimber forest products, mainly for subsistence use. Women are mostly engaged in collection o f nontimber forest products. Exploitation by middlemen and n o value addition were cited as the ma in reasons for l o w financial returns and poor incentives to engage in commercial activities. In addition, people lacked information about markets for specific products.
The average distance to a larger town was the same as in Jharkhand (17 kilometers). In general, agriculture (including shifting cultivation) i s the predominant source o f livelihood, however the forest offers a safety net for many villagers, due to small landholdings, l o w productivity and credit unavailability.
Madhya Pradesh: Low levels of forest dependence across income groups The tribal relationship with forests in Madhya Pradesh can be roughly classified according to the landscape and livelihood system: upland systems, mixed systems, and lowland systems. Tribal communities in upland systems live in small, scattered settlements located near or within reserve or protected forests, and are under transition f rom pure forest dependence to a mixed forest/agriculture/wage labor system due to resettlement, and declining forest productivity. M i x e d systems, located in middle watersheds, are partially hilly areas with communities having a higher reliance o n agriculture. Farming i s mainly single crop with some paddy and vegetable cultivation. Lowland systems are located in lower watersheds and communities have relatively l i tt le forest access. They tend to be more multi-ethnic, have smaller but more intensively farmed landholdings and o w n more bullocks. Double cropping i s more common and, where irrigation i s available, even a third crop may be grown.
Forest-based communities in Madhya Pradesh, and in particular tribal communities, are among the poorest and least developed in the state. The literacy percentage among tribal groups in Madhya Pradesh i s 22 percent compared to 64 percent for the state as a whole. Southwest Madhya Pradesh, home to a significant share o f the state's forest cover and a concentrated area o f tribals, represents one o f the seven regions having highest incidence o f rural poverty in India. In 1993-94 over 60 percent o f the rural households in the region were poor, o f which about 42 percent were severely poor. Whereas the incidence o f poverty has declined both in the state as we l l as in Southwest region, as many as 65 percent o f rural households s t i l l remain below the poverty line. Tribal groups dominate forest communities in Madhya Pradesh. An intensive survey o f 40 villages in the forest districts o f Krishna and Kurnool (Alsop and others 2002) found that tribals constituted 68 percent o f the village population, wel l above the rate in Assam and slightly higher than the communities surveyed in Jharkhand. About 55 percent o f the villagers surveyed had n o education, and an additional 28 percent only primary education. Average land holdings were very small, with 55 percent o f respondents being marginal farmers with less than 1 hectare. Agriculture, forests and labor constitute pr imary l ivelihood systems, with livestock and fish rearing being closely integrated in the farming systems. Service provision and small-scale processing and marketing also seem to play an important role among a number o f artisan castes and tribal groups. Women's work i s regarded as crucial for the survival o f tribal households in terms o f provisioning for food, income earning, as we l l as management o f resources. Agriculture in the study area i s predominantly rainfed and monocropped, with only about four percent being under irrigation. Less than 25 percent o f the gross-cropped area i s double cropped. Paddy i s the major crop accounting for about 60 to 70 percent o f the cultivated land during the khar i f season. Cultivation practices among tribals remain primitive, even though most tribes are familiar with
41

wet rice as wel l as shifting cultivation. Agriculture generally provides household food security for two to six months o f the year for the majority o f farming households. It i s estimated that average households in upland systems are only able to meet 20- 40 percent o f their food requirements; those in the middle system 30-40 percent and those in lowland systems 50-70 percent o f their needs. Inadequate food security i s compelling tribals, especially those in the upland and mixed systems, to depend increasingly on purchased foods to meet their minimum survival needs. Impoverished villagers have to choose between migrating for wage work or resorting to unsustainable harvesting of f irewood for survival income. With planning horizons in tribal societies being short, agriculture i s aimed at short-term food sufficiency for a few months. Exploitation by market forces has impacted livelihoods from nontimber forest product in the past, These stand threatened further with increased deforestation. Food insecurity peaks in the post- sowing monsoon period (August-September) and again in March when the khar i f harvest has been exhausted. In the past, most tribals were able to cover most o f the shortfall with foods gathered from the forests. Forest degradation and curtailed forest access has reduced the availability o f natural foods o n which they depended. Many tribals have become caught in a debt trap because o f the precariousness o f their food security situation.
Livestock
A seminal study by Narain and others (2005) examined livelihood patterns in 550 households in forest fringe communities in the Jhabua district o f Madhya Pradesh, and more importantly, measured specific components of household income and subsequent dependence o n natural resources, including forests (table A5.7). 30 The Jabhua district i s characterized by literacy rates o f 37 percent. Agriculture i s predominantly rainfed and i s the primary occupation o f 91 percent o f villagers surveyed. The district’s land base i s 54 percent agriculture land, 19 percent forest cover, and 27 percent degraded land. Based o n estimates o f permanent income across household income quartiles, i t i s apparent that the disparity in income levels i s quite significant across the top and bottom income quartiles. In particular, the total permanent income o f the richest quartile i s almost seven times that o f the lowest group. Agriculture, natural resources, home enterprises, wage employment and transfer income increase directly with household income. Livestock income increases over the f i rs t three income quartiles and then declines in the top quartile. O f more interest i s the share o f household income and how this changes over the four income quartiles (figure A5.2). The figure shows that as household income increases, the share o f
125 I 184 1 218 I 179
Enterprises I NaturalResources I 187 I 354 I 490 I 1,136 I
51 I 144 246 1,216 Employment 597 I 1,466
I Financial Business I -243 I -227 I -446 I -131 1 2,087 4,630
Transfers
Source: Narain and others 2005.
134 I 148 1 250 1357
income from agriculture declines, being offset by increases in wage employment and home enterprise income. For the lowest quartile, which could include the poorest marginal farmers and landless, agriculture
Tota l I 2,401 I 4,515 1 6,689
30 Permanent income sources include income f r o m agriculture, livestock rearing, common property resource collection, household enterprises, wage employment, financial transactions and transfers. Income i s measured as the difference between total revenue (market based or imputed for subsistence goods) and total input costs incurred, mainly for agriculture. Common property resources included fuelwood, construction polesitimber, fodder, mahua flowers and seeds, kendu leaves, and dung. For the majori ty o f households, the income f r o m these activities i s simply the gross revenue.
16,202
42

accounts for more than 60 percent o f permanent household income. Employment accounts for another 25 percent. Natural resources from common areas accounts for only 8 percent o f permanent income.
Figure A5.2. Permanent income shares, Jhabua
Lowest 25% 25-50% 50-75% Top 25%
Pe rma ne nt Income Qua rti I es
Agriculture Livestock Natural Resources rn Enterprises Employment Financial Business
Transfers
Source: Narain and others 2005.
I t i s interesting to note that the share o f permanent income f rom natural resources i s fairly stable across the four income quartiles at 7-8 percent. An interesting result i s that natural resource dependence (the share o f total income from natural resources) does not decline as household income increases. The patterns in figure A5.2 tend to support the more general findings f rom field surveys in Jharkhand and Assam that agriculture and wage employment are the primary occupations and income sources in communities bordering forests. With respect to natural resources alone, the analysis f rom Jhabua (figure A5.3) shows that the share o f fuelwood income from total natural resources income declines as household income increases. This i s due largely to other forms o f energy (LPG, electric generators) becoming more affordable and the opportunity cost o f time spent collecting fuelwood becoming too high. These findings are shared by other studies showing that fuelwood collection will decrease with wealth because o f increased opportunity costs o f labor and changes in preferences (Banyopadhyay and Shyamsundar 2004; Bardhan and others 2002). A similar pattern i s found for “other” natural resources, which would include nontimber products. For the most part, these products require intensive collection efforts to y ie ld what i s usually a l o w value product, in the absence o f value addition and access to more efficient markets. The share o f fodder income f rom natural resource income increases with household income largely because richer families own more assets in the fo rm o f livestock. H o w do these results fit with broader global experiences? Vedeld and others (2004) synthesized research case studies o n forest dependency f rom East Africa, South America, Asia and Lat in America. The results show a range o f average relative shares o f environmental incomes out o f total household incomes, f rom 5 percent as a l o w outcome, and 42 percent as the higher outcome (table A5.8). The Jabhua case study in Madhya Pradesh found the share o f permanent natural resource income f rom total household income at 7-8 percent, slightly above the lower values suggested in table A5.1. On the other hand, the forest environmental income in the lower case o f
43

$173 i s equivalent to about Rs7,8OO, far above the values found by Narain and others (2005) in the Madhya Pradesh studies.
m
c v)
i E 8 - m -
!E I
Figure A5.3. Natural resource permanent income shares, Jhabua
60
50
40
30
20
10
0 Lowest 25% 25-50% 50-75% Top 25%
Permanent Income Quartile
1 W Fuelwood 0 Poles 0 Fodder Other 1 Source: Nara in and others 2005.
In summary, a combination o f resources (agriculture, forests, and labor) contributes to rural livelihoods in forest fringe areas in the Indian states examined. Experiences from the f ie ld suggest that the degree and nature o f dependence o n forests and livelihood options differs f rom one community to another (table A5.9). Villages closer to towns will rely less o n forest for livelihoods and more o n agriculture and wage labor. On the other hand, villages in more remote areas will have to re ly more on agriculture and forestry. The communities examined in this study earn very l i t t l e cash income f rom forests. Subsistence minor products, as wel l as fuelwood and fodder are the main
:st income ($ PPP) I 173 I 743 I 837 I evels (vears) 4.8 I 4.4 I market (km) 7.9 I 34.7 I
's (2004).
Jharkhand and Assam, but in terms o f total household income, nontimber products play a very minor role at present. Of note, none o f the communities surveyed mentioned timber as a contributor to household welfare. This i s due to several reasons. First, the main priority i s food security and forests are valuable to them as they provide subsistence food products to satisfy their immediate needs. Second, they know that Sal trees are necessary for forest products to flourish. Third, tribal people may not be keen in using the some species for commercial purposes as they are by nature, adverse to trade and commerce. Finally, there i s opposition between the state's
44

interest in timber as opposed to communities’ interest in forest products, and the insensitivity and lack o f cultural awareness o f state policies in this matter.
Wi th predominantly tribal population and
Predominantly tribal population, close to a
With predominantly nontribal population
at distant location from town (traditional)
town (nontraditional)
(with NGO support) With JFM activities With self-initiated forest protection act iv i t ies
Near urban towns/industrial towns/mining I ++ I + I + I + + - +++ ++ + +
++ + ++ ++
+++ + ++ +
++ + + ++ ++ ++ + ++
(+ LOW; ++Moderate; +++High)
Source: TERI 2004,2005.
F ie ld experience suggests that even where communities are interested in pursuing commercial timber production, in J F M programs they view timber as belonging to the state. Where there i s n o JFM, communities may feel the resources belong to them, but have n o access to efficient marketing channels. For some communities, Sal trees are sacred and should not be cut down. Moreover, they realize that Sal trees are necessary for the growth o f minor forest products critical for their survival during the lean season. Sustained and legal timber harvesting i s where significant revenues could accrue to some communities. I t i s clear that in the communities surveyed, forests do contribute to rural livelihoods but primarily through seasonal collection o f low-value subsistence products. The few which are sold commercially attract l o w market prices in return for high collection costs. Where forests are highly degraded, this situation i s exacerbated as people have to travel further to collect products. In a study o f Chhattisgarh areas that were heavily forested a few decades ago, the distance required to collect fuelwood, fodder and minor nontimber forest products has increased four-fold in 20 years (Saxena, 2002). The critical issue, which needs to be emphasized i s that f rom the communities examined in the three focal states, the l ivelihood potential o f forests remain underutilized and provide l itt le hope to communities as a pathway out o f poverty. Lessons can be learnt f rom other Asian countries l ike China where community/farm forestry has been very successful. In 158 counties o f Southern China, farmers get as much as 40 percent o f their total income from the forest industry through commercial sales o f timber, poles and pulpwood (People’s Dai ly Online 2004). At the same time however, improving forest livelihoods in most communities in India must be integrated into broader rural l ivelihood initiatives such as agriculture intensification and marketing.
45

Forest Livelihoods and Linkages with Rural and Tribal Development in the Three Focal States
In the three states surveyed, priorities for rural development assistance made by members o f village communities were remarkably similar. In particular, communities generally want:
Improved agricultural production mainly through irrigation (check dams, ponds, water pumps) to allow two crops to be harvested each year and diversification into cash crops Safe drinking water and simple hand pumps Assistance with village-based income generating activities (sewing, weaving) Access to the electricity net Improved roads and better transport facilities Better access to education and health facilities
0
0
0
0
0
0
I t i s clear f rom the previous analysis that the majority o f forest-fringe communities are primarily dependent o n agrarian-based economies, with forests playing an important supporting role through provision o f subsistence fuelwood, fodder and l imi ted nontimber forest products on a seasonal basis for some people, and as a safety net for others. F rom f ie ld experience, the current J F M model, based primarily o n rehabilitating degraded forests, will have a l imited immediate impact o n rural development and poverty alleviation. Until communities are able to access better quality forests for timber and commercial nontimber forest products, and/or degraded forests mature, agriculture development i s key to lifting the poorest segment o f the population out o f poverty. But agriculture and forest development initiatives in remote forest fringe communities must also be complemented by infrastructure development (roads, electricity), health and education improvements, and development o f social capital in communities. Following Falconer and Arnold (1988), forests are elements o f complex rural environments, and forestry alone cannot always alter basic social, economic and polit ical factors at the root o f poverty and inequity. The importance o f trees and tree products in rural economies will vary f rom community to community and also between households within a community. Their use and role within the household economy are changing as rural areas become increasingly commercialized, forest resources are progressively degraded, and farm productivity declines.
Field surveys suggest that other rural development agencies (aside f rom forest department) are not always reaching remote forest fringe communities and providing effective service delivery. This raises some diff icult pol icy issues. State government agencies such as Agriculture, M ino r Irrigation, Rural Development, and Tribal Welfare have specific rural development mandates but are not always well-integrated with forest development, nor do they have the necessary structures or human resource capacity to reach remote forest-based communities. A study in Northeast India (Darlong and R o y 2005) found weak linkages between the indigenous community institutions, local authorities, forest department and external organizations. In addition, there was minimal coordination between government agencies dealing with natural resource management and community forestry. Financial resources do not appear to be the main problem; in Jharkhand for example, state agencies such as Rural Development and Tribal Welfare are consistently underspending annual budget appropriations. Nationally only 55 percent o f central allocations to the Association o f Scheduled Tribes and Rural Poor are actually disbursed. At the same time, state forest departments do have a f ie ld presence (albeit spread thinly) in remote forest areas but lack the mandate, resources and training to deliver broader rural development programs. Field evidence suggests that forest department i s gradually building t rus t and respect in more remote forest areas through FDA programs that include modest entry point activities such as check dams. Communities have in some cases, raised expectations that forest department wil l deliver a wider range o f development needs. Yet forest department i s l imi ted in h o w wel l they can address
46

broader development needs. This situation presents a paradoxical service delivery issue; forest department has a stronger comparative advantage in field “reach” but lacks the necessary budget, rural development expertise, and mandate to effectively provide a wider range o f needed development options to Forest-based communities. At the same time, because o f i t s higher visibility in more remote areas, villagers often expect the forest department to provide for rural development needs (Tiwary 2004). Conversely, state agencies with a clear mandate for rural development, have the expertise and larger budgets than forest department, but are challenged to provide effective service delivery.
Compounding the service delivery issue i s poor integration between Forestry Departments and more traditional rural development agencies. Forest development to remote forest communities i s through the Forest Development Agency (FDA) system. FDAs can be constituted as a registered society under Societies Registration Act. The executive body o f the FDA i s chaired by the Conservator o f Forests with the Divisional Forest Officer as Member Secretary. Experts f rom other l ine agencies are usually represented but have n o voting rights, and may not always take part in meetings. JFM committees are represented through 15 nominees from the general body, o f which seven must be women. On average, one FDA will represent 25-50 JFM committees. In addition there are specific provisions for undertaking entry point activities for the community throughout the project period and beyond. The FDA executive committee also includes representatives f rom PanchayatslDistrict Councils. Concurrently, broader rural development funds f low mainly to communities in less remote areas through the District Rural Development Agencies (DRDA) system. Concerns were expressed by forest department staff about the l imited involvement o f rural development agencies within the FDA structure. At the same time, rural development agencies expressed concern that collaboration with the Forest Department and i s not as strong as desired. Having in essence, two parallel systems for rural development incurs major transaction costs and limits communities on both “sides” f rom accessing investment funds and expertise for broader rural development that includes both forestry and nonforestry initiatives.
47

Appendix 6. Community Forestry Institutions in Maharashtra
A study by Ghate (2003) shed light on the functioning o f three main types o f community-based forest institutions. These are a self-initiated committee that shifts to JFM; a self-initiated committee established with the help o f a CSO; and finally a community that only had a formal J F M committee (table A6.1).
Population ST percent Landholding (ha) Forest (halcapita) History prior to J F M
Post JFM Benefits
Post J F M Weaknesses
Sustainability
Source: Gha
173 70
0.8 to 1.1
The community i s located on revenue land. Af ter a land survey in 1989, the community init iated informal steps to protect forests within i t s revenue boundaries. I t adopted rules for protection and harvesting. Over the next 10 years, the community forestry institution f inct ioned well, but lack o f finds and poor technical knowledge spurred linkages with the forest department, leading to J F M beginning in 1998. M o r e secure rights to harvest nontimber product; 85 hectares plantation was established; rules self-made and well-understood; t imber revenues to b e shared equally between vil lage and forest department
Poor communication and coordination between vil lage and forest department; n o system o f auditing community financial records; village has lost autonomy for many forestry decisions; female participation in decision making i s l ow . Possible, based o n historic commitment. Need to b e stricter on sanctions. Forest department must improve coordination and support. 2003.
393 96
0.4 to 2.8 2.4
In 1995, a CSO worked with the community to build social capital through self-help groups and capacity building. Forests were degraded and a decision was made to j o i n a JFM program in 2001, The CSO continued to work with the community to develop i t s own rules for forest use, protection and conflict management. The committee has male and female members f r o m every household. Flexible rules are perceived as fair and legitimate. 60 hectares plantation was established. Improved awareness o f rights, responsibilities and knowledge systems. M o r e confident dealings with forest department. Tree nursery set up and an agreement reached with forest department for seedling purchase. Growing dependence o n CSO. The CSO approach i s to placate a l l groups in the village, leading to poor adherence to, and implementation o f rules in the absence o f strong sanctions.
Likely, based o n support f r o m CSO and forest department. But dependence o n CSO must b e reduced. Good coordination with forest department.
161 100
0.8 to 1.1 2.1
rhis i s a sparsely populated village with good quality forest but i t was inder pressure f rom other villages Nhile local forest guard looked the i ther way. A neighboring vil lage i a d init iated a J F M approach and Markegaon villagers felt t h s 3pproach was worthwhile. A local forest protection committee was xeated in 1997 and became a registered J F M committee in 2000.
Forest related work has provided local employment by forest department. Funds are available for development work by forest authorities. J F M has provided better clarity over boundaries and stronger legal protection against incursion by outsiders.
Community has l i t t le understanding o f J F M rules and regulations. Forest department has small role in framing rules, f ixing penalties or dealing with infractions. Committee meetings rarely attended by Forest Guard.
Unlikely. Weak controls over i l legal harvesting. Committee not functioning properly. Lack o f community and forest department interest.
48

Appendix 7, Forest Management Planning Systems
Sustainable forest management depends on a strong underlying policy and legal framework, efficient property rights, clear management goals with provision for stakeholder consultations, competent management institutions, and effective long-term planning. In particular, long-term planning requires a good understanding o f the state o f the forest resource for a specific area, and h o w and why i t i s changing over time. Basing forest pol icy and management planning decisions o n weak resource inventory information can result in unsustainable resource use, with long-term consequences o n forest health, biodiversity conservation, and the socio-economic welfare o f Forest-based communities, both large and small3’ Forests are dynamic ecosystems comprising o f different vegetative and nonvegetative species, ages and quality. Impacts f rom human (encroachment, harvesting, grazing) and natural causes (fire, insects and disease) al l contribute to the shifting quantity and quality of forest resources in any particular area. Considering a forest managed pr imari ly for timber and nontimber prod~cts ,~ ’ an effective resource assessment system would normally incorporate a number o f important features (box A7.1). Resource assessment systems should provide information to satisfy a range o f stakeholders. Communities need local forest resource information for micro-planning and monitoring. Forest management agencies need forest resource information for management planning at division level, which can also be aggregated to the state or even national level to provide an overview for outlook studies, pol icy formulation and analysis, and long-term strategies. Central government planning and finance agencies require macro-level infomat ion for economic planning, revenue forecasting, pol icy development and sector outlook studies. The scientific community needs resource assessment information to support applied research and development. Finally, where forests are largely under public ownership, the general public has a right to timely and accurate information about the state o f the forest and h o w it i s changing.
3 1 Large communities, h igh ly dependent o n industrial forestry enterprises, are quite vulnerable to socio- economic impacts from unsustainable forest extraction, collapse o f resource stocks and closure o f forestry operation. This i s also the case where forests support valuable biodiversity and a large eco-tourism industry. In small communities, where forests are part o f a mix o f livelihoods, people can fa l l back o n agriculture and continue to use the forest for fuelwood, grazing, and minor produce as survival mechanisms. ’’ As would be the case with the majori ty o f community-based forest operations in India
49

Management plans facilitate articulation and execution o f forest sector policy and development objectives at different levels, f rom community micro-plans to a large forest division. Management plans are important for four reasons. First, they are an administrative and economic necessity, given the large potential values inherent in forests. Second, management planning focuses analyses to in form decision making about short, intermediate and long-term forest sector and development goals. Third, the plans provide a public record o f proposed forest management actions. Finally, management plans give evidence o f stewardship, particularly with public forests and public forest management agencies. Management planning should be responsive to changing goals, conditions, and resource pressures and incorporate mechanism for meaningful public participation. Forest managers require information on current and forecast demand for timber and nontimber forest products for commercial and noncommercial uses from forests under their jurisdiction. This implies that forest management agencies have access to timely and accurate market statistics and trends (domestic and foreign), relevant economic analyses, changing technologies in wood product applications and substitutes, and so forth Further, this kind o f information must be available to forest officers involved in implementing management planning at division and community levels. Forests can take a generation to mature, and silviculture decisions made early in stand development can determine the future structure, composition and product mix available to harvest for domestic and commercial use. A simple decision about what species to plant, or choosing between planting, coppice management or managing natural regeneration, can have major long-term economic implications.
Indian forest policy33 requires that 10-year working plans are prepared and approved for each Forest Div is ion before any harvesting operation can take place. Each working plan covers al l reserve and protected forests under i t s jurisdiction and describes the bio-geo-physical features, forest resources, management objectives, the work to be executed during the period covered by the plan, and proposed costs. Objectives generally relate to: increasing forest cover and improvement o f i t s quality; protection and rehabilitation o f degraded forests; soil and water conservation; wi ld l i fe protection; and fulfilling the demand for minor forest products o f local people, mainly through EM. Work ing Plans tend to be quite comprehensive and can take up to 2- 3 years to reach approval stage. There are n o formal mechanisms for public consultation. Once approved by MOEF, the working plans form the basis for a l l forestry work to be undertaken in the Divis ion over the next decade. Collectively, the plans in form forest sector budget allocations f rom State and Central governments. Forest resource information i s gathered from a variety o f sources including low-intensity state forest inventory assessment (conducted as part o f the bi- annual Forest Survey o f India surveys o f forest cover), and growth and yield data o f mixed quality. The quality o f this information varies f rom state to state.34 T o achieve various management objectives, state forests are divided into working circles, which define management interventions for specific forest types. Working circles can overlap to provide flexibility for management treatments within each forest division. Some common working circles are: Improvement (thinning existing forests), Rehabilitation (managing natural regeneration, enrichment planting), Plantations (major planting operations); Protection (from fire, grazing); Bamboo (managing bamboo stands); and Reclamation (reforesting o ld mining areas). The concept and approach to developing and applying working plans and working circles has a long history and tradition in India.
33 Although not a legal document, certain aspects o f Work ing Plans have a legal status through recent Supreme Court rulings, for example the MOEF review and approval process. 34 A few states such as Madhya Pradesh and Andhra Pradesh, are n o w developing more intensive and fair ly progressive inventory and mapping systems to provide better quality forest inventory information.
50

With the advent o f formal35 JFM in India, forest departments now prepare micro-plans with participating c ~ m r n u n i t i e s . ~ ~ These plans are also prepared on a 10-year cycle and generally include basic socio-economic information about the village, local forest resources to be shared with the community, development needs, and proposed forest management treatments over the planning period. Local inventory assessment i s usually quite limited, with l i t t le or n o f ie ld measurements. Prescribed silviculture treatments such as planting, thinning, and where permitted, harvesting, are guided by the management regimes identified for the division-level working circles. Non-timber forest products are often included in the micro-plan, but this may range f rom a simple listing o f species used by the community, to an assessment o f market potential and development strategies for emerging products. The micro-plans are usually prepared by the district forest officer, with assistance from local Foresters and Range Officers over a period o f 1-3 weeks, depending o n the level o f interaction with the J F M committee and Executive Committee. The plan i s approved by the regional forest department Conservator o f Forests. The 10-year forest management goals are then translated into annual work plans by the local district forest officer and staff for implementation. As funds become available f rom State and central sources, forest- based activities identified in the annual plan are delivered.
35 As opposed to informal systems where some communities were managing surrounding forests without forest department assistance and without a formal JFM framework 36 According to most JFM Resolutions, these plans are supposed to b e prepared with the cooperation o f community members through the JFM Committee. The level o f community participation varies however, by state and by the interest o f the local forest department officer; in some states, the forest department writes the plans without much local input. In others, communities are more active participants.
51

Appendix 8. Linking Overstory Management to Nontimber Forest Production
A study in Orissa (Bhattacharya and Prasad 1998) suggested that longer term forest sustainability can be put at risk f rom both a traditional focus o n managing a Sal dominant m o n o ~ u l t u r e ~ ~ for timber, and an alternative where communities may be following inappropriate management practices for other nontimber forest products (figure AS. 1).
Figure A8.1. Sustainability issues with Sal management S a l F o r e s t
( F r a g m e n t e d a n d C o p p i c e d )
F o r e s t R e s o u r c e u s e a n d p e r c e p t i o n s o f t h e l o c a l p e o p l e
+ C o n t r o l a g a i n s t f e l l i n g
1 I S a l M o n o c u l t u r e
F r e q u e n t S a l seed c o l l e c t i o n b y l o c a l p e o p l e
R a r e n a t u r a l r e g e n e r a t i o n
L e a f l i t t e r s w e e p i n g
H e a r t - r o t in t i m b e r
C o p p i c e v i g o r n o t c o n f i r m e d
E x t e n s i v e S a l l e a f h a r v e s t i n g
N o T i m b e r
N o n - s a l t rees
R a t e e s t a b l i s h m e n t o f the non- sa l species as m a t u r e t rees
I Forest tree diversi ty reduced to almost n i l at the canopy leve l
U n s u s t a i n a b l e S a l F o r e s t E c o s y s t e m
ource: (Bhattacharya and Prasad 1998).
Adhering to traditional Sal closed canopy management with controls against fell ing can eventually result in a lack o f natural regeneration and poor coppice vigor that wil l reduce Sal timber yields. O n the other hand, where Sal forests are deemed to have l o w timber potential in the f i r s t place, poor management o f non-Sal species can reduce forest diversity and nontimber forest
37 A l though Sal i s not the dominant tree species in Assam, it presently forms the majori ty o f sawlogs. The lessons o f the Orissa study in Figure A8 .1 could relate to other forest stand types such as Teak where certain nontimber forest products g row in the understory o f mature and semi-mature stands.
52

product. In bo th cases, longer-term ecological sustainability i s at risk and sustainable livelihood opportunities diminished. Management prescriptions for other species that may provide ecological support to important nontimber forest products are usually given litt le prominence (Bhattacharya and Prasad 1998). Many field and senior forest department staff recognize the importance o f these “nontraditional” forest species. Yet forest management goals directly expressed through traditional rehabilitation and plantation working circle silviculture prescriptions are often to develop a forest suitable for pole and timber production with crown closure greater than 40 percent and where the dominant trees comprise over 80 percent o f the stocking (Kumar 2002). The problem with nontimber forest products i s that many species can flourish in forest openings (where crown closure i s less than 40 percent. A strong case can be made therefore, that following traditional management regimes for commercial poles and timber, may ultimately reduce the quantity o f nontimber products available to villagers for subsistence or commercial sale. It i s also important for traditional knowledge o f forest management to be integrated into forest management components o f micro-plans. Over time, local people wi l l often devise their o w n silviculture and forest production systems that in many instances lead to biologically sustainable outcomes (Foppes and Ketphanh 2000). Field studies seemed to suggest that few foresters had any knowledge o f traditional silviculture practices, nor were mechanisms in place to systematically record local management approaches, link them to ongoing research programs for f ie ld testing and refinement, and ultimately disseminate this knowledge to both f ie ld foresters and other communities.
53

Appendix 9. Market Analysis for Selected Products and States
SAW TIMBER - Jharkhand and Madhya Pradesh Case Study
Market Structures
In terms o f market structure in India, timber i s a relatively undifferentiated commodity, with competition for domestic markets f rom overseas suppliers such as Indonesia, Malaysia and Nigeria. The domestic industry i s characterized by l o w vertical integration, with small and inefficient sawmills processing a mix o f local and imported logs. State monopolies on high value timber marketing provide effective barriers to private sector l og supply through legal harvesting. In Madhya Pradesh, Teak and Sal account for about 41 percent o f the total growing stock in dense forests. The state i s the largest producer o f natural forest timber in the country; and i t s Teak timber i s o f exceptional quality. Teak and Sal account for over 60 percent and 80 percent respectively o f the sales value o f timber harvested in the state. The sustainable cut for the next f ive years has been estimated by the Forest Department at about 190,000 cubic meters per year.38 About 40 percent o f l og sales are to other states. In addition, a large but nonquantified proportion o f the timber sawn within the State by 2,400 sawmills, i s sold in semi-converted form to out-of- state buyers. Total revenues from timber harvesting by the Forest Department each year are about Rs3.8 b i l l ion ($84 milli~n).~’ As indicated earlier in the report, about 75 percent o f total nonplan expenditures are to support timber harvesting and marketing. From 2002 budget figures, this works out to roughly Rs2.7 b i l l ion ($59 mill ion). Another organization, the Madhya Pradesh Rajya Van Vikas Nigram Limited (State Forestry Development Corporation (FDC)) i s the second largest owner o f teak plantations in India. The FDC has 232,000 hectares o f forestry land and i s currently planting 4,000-5,000 ha/year. I t i s currently obtaining thinning revenue f rom sales o f poles and small sawlogs. In 2002/03, sales revenue was Rs173 mi l l ion ($3.8 mill ion). The FDC logs and poles are auctioned using the same system and upset pricing levels as those set by the forest department. The F D C has been a relatively innovative financier o f plantation forests in the State. The Central and State Governments have contributed Rs98 mi l l ion o f equity funds to establish and expand the FDC. In March 2003, i t borrowed a further Rs400 mi l l ion o f bank funds to finance expansion. I t i s now able to raise loans without government guarantees and repay loans f rom thinning revenue. In effect i t has been a useful vehicle to augment State budgetary funding available for rehabilitation o f degraded forest department forestry land.
In Jharkhand, the dominant timber species i s Sal. The state’s climate and soils can produce very high quality, large diameter Sal logs for the sawmill industry. At present however, only 3,000 cubic meters o f logs are legally harvested f rom salvage cutting operations in the state, with an additional 2,000 cubic meters estimated to be cut illegally.40 A small part o f the domestic supply originates f rom private farms in the state. Out o f the about 150 licensed sawmills and wood cutting shops in the state, only 60 are currently operating full-time and produce about 20,000
38 Currently augmented by another 200,000 cubic meters f r o m harvesting operations ahead o f dam projects. 39 Statistics relating to production f r o m private farms, sales o f logs and sawn timber to other states, and the impor t o f timber f r o m other states and f r o m overseas, although obtainable f rom transit permit data, i s no t compiled. 40 Prior to the 1997 Supreme Court restrictions o n clear fel l ing in India, annual log production in Jharkhand was estimated at 30,000 cubic meters. L o g production i s constrained pending approval o f working plans by MOEF
54

cubic meters o f rough lumber.41 Logs from Jharkhand’s forests represent about 30 percent o f total input for the 60 full-time mills. The remaining balance o f l og input (27,000 cubic meters) i s f rom overseas (mainly Nigeria, Malaysia and Indonesia), and neighboring states where sawlog production i s occurring. The economic hauling distance for logs in India i s an estimated 500 hlometers, which provides a l o g source to Jharkhand mills from an areas covering al l o f West Bengal and Bihar, most o f Chhattisgarh and Orissa, and about one-half o f Uttar Pradesh and Madhya Pradesh. Foreign logs tend to be shipped through Calcutta. Local lumber production o f 20,000 cubic meters meets only 20 percent o f the domestic demand in Jharkhand. The remaining lumber demand o f 80,000 cubic meters i s met through imports from other states. In addition to timber for lumber production, an estimated 25,000 poles are produced f rom local forests, mainly Sal but also species such as eucalyptus f rom private farms.
Market Conduct
In Madhya Pradesh harvesting i s seasonal, normally undertaken from September to June.42 Selling i s mainly by auction through 38 major commercial depots in the State. Material available for auction i s graded in to lots varying from 0.5 cubic meters to 5 cubic meters. Attendance at auctions i s normally in the range o f 100 to 300 potential buyers, many f rom other states such as Jharkhand. Minimum or “upset” prices are set based on an average o f previous sale prices. At this time, 80 to 90 percent o f product i s sold at auctions with the balance sold at upset prices after auctions. The Forest Department auction system appears to be w o r h n g well. F rom interviews undertaken with sawmillers, there i s general acceptance and satisfaction with the auction system. Several complained that upset prices were too high. Recent changes in the auction rules allow the department to sell unsold logs at less than the upset price after three auctions has helped substantially reduce the incidence o f unsold o ld and decaying logs. L o g prices vary considerably between species, depots and grades due to wide ranging differences in product length, diameter and quality. Over the past three years Teak l og prices have remained relatively stable. The weighted average price for teak logs i s Rs13,550 per cubic meter (within a range o f Rs5,275 per cubic meter to Rs28,133 per cubic meter), about three times that o f Sal logs, and 7.5 times that o f miscellaneous species.
In Jharkhand, prices along the Sal l o g h m b e r value chain vary considerably between suppliers and producers due to wide ranging differences in product length, width and quality. For example, the price o f Sal logs purchased o n the open market (FOB mill) f rom domestic, other states or other countries ranges from Rs7,800 per cubic meter to Rs16,OOO per cubic meter. The Forest Department depot price ranges f rom Rs5,164 per cubic meter to Rs17,OlO per cubic meter. Field data show that prices f rom logs supplied f rom department depots were significantly higher than logs imported from other states or even overseas suppliers l ike Nigeria or Malaysia. Prices for Sal logs and lumber in Ranchi markets appear to be 20-40 percent higher than in most other regions o f India. The Indian Council o f Productivity and Research publications show that prices reported for Ranchi for Sal logs and sawn timber, are above average prices for the other eight centers for
41 Calculations are based o n an estimated lumber recovery factor o f 60 percent. This means that 1 cubic meters o f logs yields 212 foot board measure o f lumber (1.2 cubic meters). The remainder o f the l og remains as sawdust, slabs and ends. Mill owners suggested a LFW o f as much as 80 percent, but this did not match with the antiquated equipment and wide saw k e r f observed. Eff icient sawmills in N o r t h America with the best technology can usually on l y achieve LFWs o f 60-75 percent.
The work was hampered by l im i ted data available in each state o n the timber product market structure, for example volumes, origins and prices o f l og supply, lumber production, sales volumes and market demand. This reinforces the problem cited in the previous chapter o f inadequate forest sector information.
42
55

which they collect prices. Ranchi appears to have the highest l og prices and i s second only to Kolkata for Sal sawn timber prices.
Market Performance and Impact on Livelihoods: Key Issues
In comparison with Jharkhand, the production and marketing o f timber in Madhya Pradesh i s performing w e l l and i s a net exporter o f sawn timber. Most o f the wood that can be sustainably cut f rom state commercial forests i s being marketed. There i s also l itt le evidence o f illegal wood in the market.43 Significant supply expansion will occur f rom commercial plantations owned by the government in the next several decades. A critical point with the Madhya Pradesh system i s whether an approach that accounts for Rs2.7 bi l l ion in operating costs for harvesting and marketing operations, financed by state budget allocations, and generating Rs3.8 bi l l ion in gross revenues, i s the most efficient approach from a public pol icy perspective. If the state were to gradually ease itself out o f the commercial timber harvesting and marketing business, three principal questions arise; first, what could the Rs2.7 b i l l ion in state transfers to the forest department be used for; second, how could the state generate an equivalent net revenue o f Rsl .1 b i l l ion f rom alternative marketing systems; and third, what alternative systems could be used? In Jharkhand and Assam, the same questions apply, but on a much smaller scale. In Jharkhand, there i s a significant imbalance between local sawmill capacity, active production levels, local l og supply, and local lumber demand. In both states, l og and lumber prices f rom the open market and government depots have become more aligned in the past decade as the volume o f imported logs and lumber has increased, particularly in Jharkhand. Government harvesting and marketing structures carry high overhead costs. In Jharkhand for example, the fixed harvesting overheads for one coupe could be as high as Rs5 1,000 over nine months for wages, and small structures on site. With small marketing depots, the fixed costs for a year could be as much as Rs195,OOO for staff wages, land rental, and maintenance. As indicated earlier in this report, 76 percent o f Madhya Pradesh’s recurrent nonplan budget (or $65 mi l l ion) i s supporting timber production, harvesting, and territorial structures, a high proportion o f which i s for staff costs. T w o key issues need to be addressed with respect to improving community livelihoods through timber market systems.
First, communities need space to engage in timber marketing. Timber provides a huge opportunity for communities to generate forest revenues. At present however, neither state provides mechanisms for JFM communities to easily engage in commercial timber marketing for nominated species outside o f government structures with i t s inherent restrictions and opaque revenue sharing systems. In Madhya Pradesh, plantations o f the Forest Department and Forest Development Corporation are integrated with J F M operations, but committees in dense, high quality forests generally only provide protection functions in return for minor forest produce, the chance to be employed in forest operations, and a share o f f inal net timber revenues.44 The Forest Department presently sees l itt le space for communities in these forests to assume more management and marketing responsibilities. There i s general resistance to upset an existing marketing system that i s competing reasonably we l l with imported logs, albeit with state subsidies. Committees in degraded forests however, may have more flexibil i ty in forest design through the micro-planning process, but timber marketing i s s t i l l constrained by the legal and regulatory framework. In Jharkhand, there i s almost n o legal timber harvesting at present. The
~~~
43 In discussions with sawmillers, they estimated that the level o f i l legal wood in the Bhopal market was less than 10 percent 44 I t was understood f r o m f ie ld exercises that on ly one community had shared in timber revenues f r o m h igh quality forests. Details o n the volume o f timber, quality and net revenue shared with the community were not available f r o m the Forest Department.
56

future could offer a much different scenario however, as more working plans are approved and assuming communities are given greater opportunities for harvesting and marketing timber f rom forests. The current JFM resolution allows an option for communities to market nonlisted timber, however, there are presently n o structures or institutions in place to provide effective market intelligence, access to marketing channels within and outside the state, and technical assistance to improve log quality. Also, the legal framework restricts sales to lower-valued nonlisted timber species. The opportunity for value addition, where communities group together and operate a small sawmil l t o capture economies o f scale and higher resource rents, has not been given serious attention within the government. In both states, a transition period will occur over the next decade with J F M committees having gained additional institutional experience and, timber f rom formerly degraded forests beginning to enter the market as poles and small sawlogs. The challenge i s to establish market systems that al low communities to choose marketing channels for a l l timber species, and values the efficiencies o f community managed timber (flexibil i ty o f volumes, mult ip le delivery points and l o w costs associated with harvesting and protection o f logs) as wel l as l o w cost value addition to cater to differentiated clientele.
Second, restrictions on timber felling and transport need to be relaxed. This issue affects timber supply f rom both communities and private farms. Part o f the problem i s the ambiguity that s t i l l exists over the ownership o f trees on private land and Forest Department land. The laborious permitting system to remove privately grown trees provides a strong disincentive to private commercial growing o f trees on private land (box A9.1). In Jharkhand, private farmers can sell Sal logs under the terms o f the Bihar Forest Produce (regulation and Trade) Act, 1984. However, they must be offered for sale to the Forest Department f i r s t at the scheduled rates less a 15 percent commission for marketing. If the department does not wish to handle the sale it can give clearance for the private grower to harvest and sell on his or her own behalf but transit permits are s t i l l required. In both states, a point will eventually be reached where JFM committees become the principle tenure form o n forest land and in providing many forests management functions. The transit permit system together with the rules governing the hours o f operation o f sawmills and the elaborate perpetual inventory record system that sawmills have to keep are a l l examples of outdated regulations that should be reviewed in the light o f JFM and enlightened regulatory development.
KENDU LEAF - Jharkhand and Madhya Pradesh case study
Market Structures
The leaves o f Diospyros melanoxylon, popularly known as kendu (or tendu), are o f high economic value because o f their use in ro l l ing bidi (country cigarettes). Throughout India, kendu
57

leaves and bidis are estimated to provide 106 mi l l ion person days in collecting activities and 675 m i l l i on person days in processing o f products. The Kendu leaves sought by the market are normally collected over a 15- to 20-day period between late April and early June, depending on when the first monsoon rains fall. The long term prospect for Kendu leaf trade (and bidi cigarettes) i s considered by traders to be stable to slowly reducing, with a longer term outlook o f further slow reductions in volume, because o f increasing competition f rom regular cigarettes, chewing tobacco, pun masala and government publicity to reduce smoking (International Labor Office 2003). Bo th Madhya Pradesh and Jharkhand regulate the trade in Kendu leaves (box A9.2). In 2003, Jharkhand production represented about 10 percent o f the Indian market with an estimated 90 to 95 percent sold to manufacturers in neighboring states. Madhya Pradesh State i s the largest producer o f tendu leaves in India with about 25 percent o f the Indian market. Although local producers and forest department officials feel the trend in bidi production i s declining, data o n bidi tobacco production do not support this view. On the other hand, the longer- term domestic demand outlook i s not optimistic due to anti-smoking, tobacco-free programs, and competition f rom chewing tobacco gradually taking hold in India (International Labor Office 2003).
The Kendu market structure in Jharkhand involves interaction between the Jharkhand State Forest Development Corporation, licensed traders who operate as middlemen between the corporation and communities and manufacturers, and insurgents. The collection begins at village level with the Jharkhand State Forest Development Corporation nominating collection villages in designated forest areas. A number o f collection villages are then aggregated into lots, which are tendered out t o a small and well-established group o f licensed traders in the private sector. During the collection season, the leaves are plucked manually by the forest dwellers, sorted and tied in small bundles. The leaves are delivered to collection centers and wages paid by traders to the collectors at the rate per bag fixed by the corporation at the beginning o f the year. Lea f bundles are then dried and packed in gunny bags. These are then stored in an official bonded warehouse for grading and forward sale to bidi manufacturers outside the state. A system o f advance auctioning has been in place since 1994. Naxalites al low villagers and traders to operate in insurgent areas in return for a share o f the traded value.
The Madhya Pradesh State M i n o r Forest Produce (Trading and Development Cooperative Federation) oversees a supporting structure o f cooperative unions and primary cooperative societies who handle collection and storage o f leaves. Membership o f these societies comes only from leaf pluckers. One cooperative society generally serves 10 to 15 villages. At the secondary level, 83 district forest produce unions were formed mainly as a conduit for financing and for auctioning leaves. The Federation i s the apex level institution. After the formation o f the separate Chhattisgarh State in 2000, the new Madhya Pradesh State remained with 58 district unions and 1066 primary forest produce societies. Up until 2003, a l l leaves were transferred f rom the cooperative societies to cooperative union rented warehouses, where the leaves were auctioned. In 2003, 302 out o f the 1,033 selling units moved to a system o f advance tenderinghelling o f the
58

whole production o f a unit prior to the commencement o f the season with the purchaser being responsible for storage and transport. Under the new pre-season bidding system the purchaser bids for an agreed fixed quantity o f bags and can be required to purchase up to a further 25 percent o f bags if available at the tender price per bag. Payment for both methods i s by installment or (if sooner than uplifting dates) when the leaves are removed f rom the warehouse. The reason for the change in methods was to encourage greater competition, and increase efficiency in drying and transport.
Market Conduct
In Jharkhand, the value chain for Kendu leaves involves critical stages and a wide range o f costs. The first main payment i s made to the primary collector (that is, villagehousehold collectors) by the trader and i s set by the Jharkhand State Forest Development Corporation annually in advance for the whole state as an averaged fixed amount per bag irrespective o f quality. In 2003, this fixed collection cost was Rs425hag. The second main cost component i s the royalty payable by the trader to the JSFDC. In 2003, the average royalty per bag was Rs168. The third major step in the value chain i s the sale o f the product by the traders to bidi manufacturers. The selling prices depend on grade and quality, and ranges from about Rsl, 120htandard bag to zero. Traders bear a high risk with n o assurance o f profit. In between the init ial purchase o f Kendu leaves in the field and the final sale to bidi manufacturers, a number o f formal and informal taxes exist, ranging f rom state taxes at Rs40 per bag, extortion payments to Naxalites o f about Rs60 per bag.45 Whi le some traders suggest they can earn an average 15 percent prof i t per bag, the data suggest that on average, the total cost structure adds up to about Rs908 per bag, which i s near the high end o f the price range. Clearly, some traders would have lost money o n their sales.
In Madhya Pradesh? cooperative societies receive Rs5 18 per bag fi-om the apex federation, o f which Rs400 i s pa id to collectors. The remaining R s l l 8 are used to offset society costs, 20 percent o f which are for administration and overheads. Since 1995, the Federation has also been returning 20 percent o f i t s net income to societies, who in turn pay out the amount as a bonus to collectors after deducting administration expenses. In 2003 this payment was Rs82.2 mi l l ion or equivalent to a further Rs40 per standard bag. In addition the Federation operates a l i f e insurance scheme for collectors. The Federation pays a 20 percent o f net income into a fund for “Development o f Nonwood Products and Regeneration o f Forests.” In 1999, Rs124 mi l l ion was distributed with 6 percent spent on various nontimber forest product related projects and the balance on forest p r~ tec t i on .~ ’ The remaining 30 percent o f Federation net income i s placed into a fund designated as being for infrastructural projects including, warehouses, schools, cooperative society offices, office equipment, road construction/maintenance, residences, water supplies, medical centers, irrigation, and similar works.
Market Performance and Impact on Livelihoods
There are five critical inefficiencies in the current Kendu marketing system in both states.
M a r k e t signals do not reach collectors. First and foremost, the current system does not allow market forces to operate at a l l points along the value chain, where quality would be rewarded
45 In some insurgent areas, traders are “asked” to pay an additional surcharge per bag to collectors for high quality leaves. This can be as much as Rsl75ibag. 46 A full value-chain cost analysis was not possible for Madhya Pradesh, given the data available. 47 The most recent year where a breakdown o f expenditure f r o m this fund could be obtained was 1999
59

with higher prices, and signals would be sent to villagers that quality i s important, with an incentive to improve quality. Collectors are simply paid a wage per bag and are pure price takers in a monopsony where they must sell their product to the designated trader (in Jharkhand) or Society (Madhya Pradesh). In Jharkhand particularly, most villagers are totally disconnected from market information about price and quality relationships; interviews with communities suggest most people have l i t t l e or n o idea about market trends and price structures based o n grade and quality. Given l o w education and literacy levels, the collectors are also in a very weak position to ensure they receive even the listed price per bag from traders. The system o f an average fixed payment to a l l collectors does not encourage quality differentiation and quality improvement by the collector. The current system encourages maximum quantity collection at village level with the main concern o f the villager being to ensure that the leaves are only above minimum reject quality. I t ensures the villager a guaranteed price, but these prices bear n o relation to the wider market trends in India for Kendu leaves and bidi manufacturing.
Limited technical services are available to communities. On the supply side, there are very limited technical advisory services available to villagers o n how to improve product quality. The current system o f f ixed payment with n o premiums for quality to the collectors does not encourage better management of coppicing of Kendu bushes. Cutting o f coppices about 45 to 50 days before harvesting i s recognized as the main mechanism for improving leaf quality. The best quality leaves only appear 2 to 3 years after coppicing i s commenced. Neither the Jharkhand State Forest Development Corporation nor Madhya Pradesh Federation have been consistently promoting and training collectors in coppice management in recent years. There i s a need for more systematic capacity building at the community level.
Unsold lots result in high wastage. An outcome o f the current market system i s that in some years a proportion o f the crop goes unsold by traders to bidi manufacturers. In 2003, an estimated 51 percent o f a l l Kendu lots in Jharkhand remained unsold by traders after collection f rom villagers due to poor quality and subsequent l o w prices f rom bidi manufacturers relative to the cost structures involved. This represents about 400,000 bags purchased f rom villagers at a cost o f Rs170 m i l l i on ($3.8 mill ion) that were not onward sold by traders to bidi manufacturers. The problem also exists in Madhya Pradesh but at a much smaller scale.
Trading organizations are overly dependent on Kendu. Although Jharkhand State Forest Development Corporation and the Madhya Pradesh Federation have a legislated marketing monopoly over several nontimber forest products (Kendu leaves, Sal seed, mahua seed, harra nut and mahulan leaves), they are totally dependent o n Kendu leaf marketing for operating revenues. On average, these organizations generate close to 100 percent o f their total revenues through Kendu marketing. In the case o f Jharkhand, the JSFDC employs between 600 and 700 staff throughout the state, and for the 2003 fiscal year generated a net prof i t o f only Rs300,OOO ($6,700), which represents less than a one percent return o n sales revenue. In Madhya Pradesh, the market structure appears to be dominated by Forest Department influence with n o clear plans to further empower and ultimately let community producers manage their business affairs. At the union and society level, a Forest Department Range Officer or Forest Guard i s signatory to a l l bank accounts and a member o f the respective uniodcooperative management committee. The current collection and marketing system, in the eastern tendu patta belt o f the state deploys virtually a l l department f ie ld staff during the six-week collection season, which i s a questionable use o f department field staff relative to more appropriate core business functions such as forest monitoring and protection. Recent changes in the tendering system wil l l ikely reduce direct involvement by department staff, but even after these changes, the structure leaves primary collectors with only a passive role in the collection and marketing system, and few incentives to improve product quality.
60

Collectors could receive a higher share of total revenue. A central issue in Jharkhand i s the share o f total revenue going to community collectors. In 2003, village collectors received Rs425 per bag, or about 46 percent o f the total costs o f Rs908 per bag along the value chain (figure A9. 1). In terms o f local livelihoods, i t means that an average adult collector can earn about Rs2,000 per season.48 Surveys in communities suggested that the average net returns to people, after allowing for time for collection and carrying to depots, ranged f rom Rs70 to Rs150 per bag, or between 16 percent and 35 percent o f the farm gate price. The average royalty paid to corporation by traders for the allocation o f licenses in 2003 was Rs168,
Figure A9.1. Cost allocations for Kendu leaf, Jharkhand
Naxalites
Trader 24%
Source: Background studies, Jharkhand
which represents a loss o f Rs168 per bag that communities could have received in the absence o f the royalty, or an additional 28 percent in gross income per bag under a different marketing system. Based on 800,000 bags auctioned under lots in 2003 and assuming they would a l l be filled, this represents a potential incremental gain o f Rs134 mi l l ion ($3 mill ion) that could have f lowed to participating communities as additional income. A counterpoint however, i s that even if private traders could deal directly with communities without having to pay the Jharkhand State Forest Development Corporation a royalty, how much o f the Rs168 would actually be captured by communities as opposed to higher margins for the traders? The answer to this question would depend o n the marketing system used, for example an auction by communities (perhaps through a marketing cooperative) with strong competition f rom private traders where higher market prices might result, versus a system with litt le competition, or worse, collusion by buyers where market prices would l ikely be lower. In contrast, the systems used in Madhya Pradesh provide a lower base price Rs400 per bag but also al low for a share o f overall Federation profits, which for the previous season were Rs40 per bag. In terms o f which system i s better for collectors, the Madhya Pradesh approach o f creating cooperative societies and unions provides similar payments per bag, and the added benefits o f subsidized l i fe insurance, plus modest technical input from department staff. On the other hand, there i s s t i l l a considerable way to go to fully empower villagers at the society and union levels to manage the collection, distribution and finances associated with Kendu marketing.
BAMBOO - Assam Case Study
Market Structure
The Nor th East region has the largest reserves o f bamboo in India but litt le has been done to fully commercialize i t s potential. Assam has 29 species o f bamboo, covering an estimated 8,213 square
48 A person, on an average, can collect 100 to 200 bundles per day, depending upon supply o f the leaves (Prasad and Bhatnagar, 1991). Usual ly the whole fami ly i s involved in leaf plucking but o n an average an adult can make up to Rs 100 a day in the season. F o r a 20 day season, this represent about Rs2,000.
61

kilometers representing about 10 percent o f the area o f the State, or 35 percent o f the forest area. The current growing stock has been estimated by the forest department as 13 mi l l ion metric tons. The annual harvest o f bamboo in the State i s estimated at 7.5 mi l l ion green metric tons. Some 2.5 mi l l ion households are engaged in the production o f bamboo in the state. Technically the trade in bamboo grown in reserve forests i s governed by the Assam Forest Regulations, 1891. The Assam DEF does not enforce i t s legal right to control bamboo trade f rom bamboo grown on private land. In addition it does not enforce i t s right to require transit permits under the powers vested to i t for the transport o f privately grown bamboo. Assam has a diversified and a slowly growing market for bamboo, but n o comprehensive end-use analysis has ever been done for bamboo in the state. The largest single market for bamboo i s the manufacture o f pulp and paper. Other important markets in order o f importance are housing construction (including temporary structures), rural fencinghmplements, fuel, packaging and baskets, and nonresidential construction. The 100 percent Government owned Hindustan Paper Corporation has two medium sized pulp and paper mills in the State located at Nagaon and Cachar, uti l izing about 800,000 metric tons o f green bamboo. About 450,000 metric tons or 55 percent o f this input i s supplied f rom reserve forests in Assam (45 percent for the Nagaon mill and 60 percent for the Cachar mill). The remaining 45 percent i s drawn from private fanners. The Hindustan Paper Corporation harvests about 60 percent o f the reserve forest bamboo volume that i s currently available and economically viable. The remaining 40 percent i s regarded as sub-economic when compared with private household bamboo that can be purchased.
Market Conduct
Bamboo f rom reserve forest areas, although technically available for sale on a tender system to any market, has been harvested in the past under lease agreements and “Industry Orientated Plans” between the government and the corporation as fiber for their two pulp and paper mills in the State. Bamboo i s purchased on a stumpage basis with the corporation arranging harvesting and transport. The stumpage was revised f rom Rs62.50/metric tons to Rs300 per metric ton in September 2003. The revised price agreement applies until 2007, and allows for an annual 5 percent stumpage increase f rom 2003 until 2007. An examination o f the corporation pulp mill at Nagaon shows an 11 percent return o n historical investment and a 10 percent return o n sales. Bo th these ratios are regarded as above average in the international pulp and paper markets. T h e mill has an historical investment cost o f Rs.2,870 mi l l ion and the 2002/03 sales turnover was Rs3,100 mi l l ion. I t s prof i t return in term o f paper sold i s Rs2,890 (about $65) per metric ton; in the current depressed wor ld paper market this i s also regarded as reasonably high.49 It has recently announced plans to increase capacity and output by 30 percent over the next two years. A brief Strengths-Weaknesses-Opportunity-Threats analysis in terms o f future outlook for the mill indicated a relatively strong outlook (table A9.1). Growing and marketing o f farmer grown bamboo for pulp and paper production i s an important source o f farmer income in the State. In 2003 about 200,000 metric tons o f green bamboo to the Nagaon Mill was farmer grown. About 150,000 metric tons o f privately grown bamboo was supplied to the Cachar Mill. Privately grown bamboo i s preferred as it i s f rom species that have a higher basic density (yielding a higher weight o f fiber) and using the buying systems applied by the mills i t i s marginally cheaper than bamboo f rom Reserve Forests. The corporation operates a relatively complex collection and buying system for farmer grown bamboo. For the Nagaon Mill, the corporation operates a system of 10 “checkpoints” or delivery centers through the state. The operation o f these delivery points i s tendered every two years and minimum volumes to be supplied to each checkpoint are contracted
49 Pulp and paper m i l l s in Ind ia are shielded f r o m international competit ion by impor t tariffs, which at 35 percent, are the highest in the South Asia region
62

out to a single bidder who organizes “Working Agents” at each checkpoint to manage the cash payments to farmers/village headmen and also the transport to mill.
Located in the centre o f a favorable bamboo resource growing area. Monopo ly access to bamboo in an oversupplied resource situation. By international standards the weighted average cost o f pu lpwood landed at mill (currently about Rs1170 per metric ton ($26) for a weighted average transport distance o f 200 kilometers) i s be low average. Self sufficiency in electricity and not subject to the unreliable electricity situation being faced by most industries in the state. Strong domestic markets for i t s production. Twenty years o f experience and established production infrastructure in the state.
Seasonal resource supply resulting in the need for large stockpil ing for the wet season f rom April to October. State ownership with the inherent pol i t ical interference and bureaucracy. Poor roads and logistical problems with raiVriver transport.
0 Heightened unrest in region. A need to import f r o m other states a l l production inputs except wood fiber and coal.
Expansion o f the Nagaon mill to take advantage o f the abundant Reserve Forest and increasing farmer- grown resource. An opportunity to rapidly increase resource through the promotion o f fast growing hardwoods in conjunction with JFM support activities o n degraded forest land. Privatization should al low greater autonomy in decision makingiless pol i t ical interference, ease o f raising increased capital, greater responsiveness to market signals and probable longer term cost efficiencies. Paper and paperboard demand in India i s expected to grow at about 7 percent a year f r o m the current 7 mi l l i on metric tons a year to 10 m i l l i on metric tons a year by 2010. An opportunity to increase the quality and unit value o f paper production through the incorporation o f fast
A relatively old, small and l o w technology mill by international standards. An urgent need for refurbishment, expansion and greater mechanization if the mill i s remain internationally competitive. Reduced tariffs and increased competit ion in the future f r o m imported paper as Ind ia reduces i t s protection to local industries.
Market Performance and Impact on Livelihoods
The commercial market for bamboo reveals some interesting anomalies:
The system for purchasing bamboo for pulp supports farmers, but has cross-subsidies. A system o f cross-subsidization i s used to purchase private bamboo; higher cost supplies f rom the more distant parts o f the state are subsidized by lower cost bamboo closer to the mills. The pr ic ing system i s aimed at securing an adequate volume o f bamboo to meet production targets, from the closest sources to the mill, but at the lowest weighted average cost. The average landed cost o f reserve forest bamboo at the Nagaon mill i s Rs1,275/metric ton. Growers within 5 kilometers o f the Nagaon mill receive Rs979 per metric ton (paying their own transport) whi le growers 85 kilometers f rom the mill receive Rs1,175 per metric ton. F rom the viewpoint o f farmers and JFM communities involved in bamboo production, the current pricing system allows more distant suppliers o f bamboo to receive a fair price covering the cost o f production. On the other hand, in common with most subsidies, i t distorts normal market pr ic ing signals and creates anomalies. The total costs for delivered bamboo f rom both suppliers are Rs773 per metric ton and
63

Rs336/metric ton respectively. Based on notif ied mill prices for bamboo f rom these distances, the ne t revenue for the grower 5 kilometers away i s Rs64 per metric ton, and for the growers 85 kilometers away it i s Rs402 per metric ton (table A9.2). If both growers received the average mill price of Rs1,275 per metric ton, the net revenue position o f the growers would change Growers 85 kilometers would have a net revenue o f Rs502/metric ton and those 5 kilometers Rs939 per metric ton away respectively. Compared to the actual situation, the growers close to the mill are “losing” Rs296 per metric ton whi le growers 85 kilometers away are losing RslOO per metric ton. If a highly competitive market for bamboo existed and prices paid to farmers actually reflected cost differentials, the growers closer to the mill would have a stronger incentive to produce bamboo, whi le farmers further f rom the mill might look more carefully at their decisions to invest in bamboo.
Table A9.2. Bamboo Supply Chain Pricing Analysis: Comparison of Growers Based 5km and 85 km Value Chain Process Grower 85 km from mill -traders Grower 5 km from mill -direct supply
Rs402 Net revenue Rs643 Net revenue
Rs120 Felling and cleaning Rs30 Loading local transport Rs53 for 8.8% purchase tax
Rs120 Felling and cleaning Rs30 Loading local transport Rs86 For 8.8% purchase tax
Grower household in village
t 1 t
t
Designated headmanlorganizer Rs20 for headmanlorganizer RslOO for transport to checkpoint RslOO for transport to mill
Working agent at checkpoint Rs20 for working agent I
Rs350 for transport Rs80 for contractor 1 Contractor for mill
Rsl,175/tonne delivered at mill Rs979 delivered at mill Pulp mill
Source: Background studies, Assam
New market opportunities for bamboo exist but are difficult to exploit. Three examples f rom Assam illustrate this point and highlight key lessons (box A9.3). First, Timpack Private Ltd, set up a bamboo based panel product mill in 2001 across the border in Meghalaya. M a i n products are woven bamboo mat board, woven bamboo mat composite with wood veneer plywood, bamboo mat corrugated sheet, and bamboo particle board uti l izing fines o f bamboo from the Nagaon pulpmill. I t i s an exciting attempt to use modern equipment for bamboo products that can compete directly with wood based products. I t has an investment o f Rs140 m i l l i on ($3 mill ion) in the plant and working capital and currently employ 75 staff but i s yet to return a profit. Some o f their main challenges to date have been market resistance to bamboo based products as a quality product; bamboo i s more di f f icul t and expensive to process than wood; e) the species o f bamboo available in the Nor th East Region are relatively diff icult to utilize compared with species available in China.
Second, a small bamboo processing industry manufactures raw joss sticks for sale to industries that make incense sticks for religious and cultural purposes. It has invested about Rs1.5 mi l l ion and employed a staff of 30 people. I t purchases bamboo stems directly f rom local farmers within a 5-kilometer radius. The business i s one year o ld and only marginally profitable. I t sells mainly to manufacturers in Kolkata with reasonably strong markets. I t s main challenges are a lack o f
64

reliable machinery (it was using small-scale Indian and Taiwanese manufacturing equipment) and unreliable electricity (the area was prone to lose electricity supply for three to five hours a day).
Third, a bamboo cottage industry makes small seats (stools) at a refugee camp at Lampara about 1.5 hours to the west o f Guwahati. The small operation employs 400 people. Stool makers purchase their bamboo stems from farmers within a radius o f 1.5 kilometers of their camp. The average return on labor for a person day o f input i s Rs30-Rs40. Vil lage craft workers sell partly to wholesalers in Guwahati, and partly at a local “haat.” Wholesalers provide transport and mark up their stools by 40 to 50 percent. Prices for their stools have gone up by about 30 percent over the past 5 years, however over the same period they claimed that the price o f bamboo had risen by 50 percent. The business i s seasonal with l o w demand and l o w prices during the dry season and vice versa.
MEDICINAL PLANTS AND AROMATIC OILS - Madhya Pradesh and Assam
Background
India has 16 agroclimatic zones, 45,000 different plant species and 15,000 medicinal plants. The “Indian Systems o f Medicine” have identified 1,500 medicinal plants, o f which 500 species are widely used in the preparation o f drugs. The effectiveness o f these drugs mainly depends upon the proper use and sustained availability o f genuine raw materials. The domestic market o f Indian systems o f medicine and homoeopathy has been estimated at about Rs40,OOO mi l l ion ($890 million). There i s also a growing demand for natural products including items o f medicinal value/pharmaceuticals, food supplements and cosmetics in both domestic and international markets. According to ICS-UNIDO (2004), the international market o f herbal products i s estimated to be $62 bil l ion. Yet India’s share in the global export market o f medicinal plants related trade i s just 0.5 percent. Aromatic oils are another potentially important forest product, with expanding global markets and l imi ted supply. The market structures for medicinal plants and aromatic oils in most states o f India are generally weak and largely focused on local trading. External market channels are not wel l identified and communities have l i t t le information about how to exploit them. There are inherent complexities involved in managing harvesting and marketing o f these products. First, the supply varies f rom year to year and i s usually seasonal. Second, products often have a lack o f uniformity in color and quality. Third, people gathering these products f rom the forest can usually produce small volumes, raising a number o f collection, pricing, and transport challenges. Fourth, the supply chains tend to be long and the primary collector often gets only a fraction o f the final price due to monopsony situations with middlemen. The middlemen are also usually the moneylenders that provide credit to the villagers during lean season with the crop or land as collateral. Fifth, lack o f grading mechanisms, storage
65

facilities, market information, and restrictions on harvesting, transport and marketing o f some nontimber forest products reduces the incentive for people to invest time and resources in sound management. Until recently, most forest departments took l itt le interest in these products as they fell outside the traditional nationalized timber and nontimber forest products (such as kendu), and appeared to have l i t t l e revenue potential. As such, most o f these products fall outside the restrictive legal and regulatory framework associated with so-called listed or nationalized species such as Teak or Kendu. Of the three states examined, Madhya Pradesh has made the most progress in reforming market systems for medicinal plants. For aromatic oils, Assam has developed a model that shows good promise.
New Approaches for Marketing Medicinal Plants: The Case o f Madhya Pradesh
In 1995 the Madhya Pradesh State M ino r Forest Produce (Trading and Development) Cooperative Federation took a leading role in the development o f minor forest products and in particular important developments in the marketing o f medicinal and aromatic plants. The Federation began by assisting primary collection societies in selling nonnationalized nontimber timber product by offering fixed purchasing rates for a small selection o f plants with market potential including aonla, mahul patta, mahua seeds and achar. Taking the example o f aonla, pr ior t o the intervention o f the Federation, collectors were receiving Rs0.50-Rs1.00 per kg f rom market traders. Payment rates by the Federation were fixed at Rs2.50-Rs6.50, depending on location and market demand. The range o f nontimber forest products was then gradually widened. The state government has recently approved a “Strategy for Development o f Medicinal and Aromatic Plants (MAPs) f rom 2004/05 to 2008/09.” The strategy plans an increase in area under cultivation o f MAPS f rom the present 10,000 hectares to 50,000 hectares, and the production o f M A P S f rom the present 20,000 metric tons to 40,000 metric tons. Related to this i s the desire to increase employment by about 2 mi l l ion person days/year and attract herbal industries to the State. The strategy has several main elements relating to MAPs:
Develop People’s Protected Areas (PPAs) in 12 locations in 10 districts. These would uti l ize funding f rom the 20 percent ne t income redistributed from Kendu trading. At present, PPAs are protecting about 45,000 hectares o f forests for M A P collection. Harvesting o f MAPs from these areas i s linked to other Federation-funded processing, and marketing initiatives to increase the income o f collectors and other rural people involved in adding value. A center i s being developed in the Katni” district for conservation and development o f medicinal plants as wel l as providing health cover to people o f the area uti l izing traditional medicines. Initiate a funding scheme for farmers. The National Medicinal Plants Board (NMPB) in 2002 started a contestable funding scheme o f financial assistance to farmers for cultivation o f medicinal plants. With assistance f rom the Federation, 367 proposals have been approved by the N M P B with financial assistance o f Rs87 mi l l ion ($2 mill ion) f lowing to small fanners. Establish marketing outlets. T o improve marketing o f MAPs, the Federation has funded a series o f retail outlets known as Sujeevuni Ayuwed. The f i rst outlet was set up in Bhopal in 2002 and has been followed by similar outlets in Balaghat, Chhindwara, Satna, Ka tn i and Seoni. Currently 80 different herbal products are being sold. The centers also have ayurvedic doctors providing l o w cost consultations and medical advice to customers. Products produced by the primary societies are being marketed under the brand name Vindhya Herbal, which i s being promoted by the Federation as an umbrella brand and with distinctive packaging and
Ka tn i i s in the Amarkantak plateau region that i s r i ch l y endowed with medicinal plants - some o f w h i c h are exclusive to the region
66

labeling. The Federation i s also participating in national and international trade fairs with i t s branded range o f products. Facilitate value addition through processing. Ten value addition initiatives have been supported by the Federation including incense sticks, honey processing, bamboo handicrafts, traditional medicine manufacturing, and aromatic o i l distillation. A state-of-the-art processing plus training centre was completed in December 2004 at Barkheda Pathani on the outskirts o f Bhopal. This center i s planned to act as a model for other similar centers in the State. Promote private farmer participation. The N M P B has sanctioned four promotional projects with the twin objectives o f development and conservation o f medicinal plants. The Federation has been designated to coordinate these four projects, which aim to promote private participation in on-farm cultivation o f medicinal and aromatic plants to reduce the pressure o n natural forest extraction where sustainability i s at risk. The Federation i s providing a 30 percent subsidy o n the total project cost. Fol lowing preparation o f district plans, soft loan funding i s provided to primary societies to take up identified opportunities. By the end o f 2004, Rs20 mi l l i on had been lent by the Federation. Improve market information. A Marketing Information System for 37 medicinal plants and 44 other nontimber forest product i s being operated by the State Forest Research Institute. Funding assistance has been provided by the Federation. Price information i s collected f rom about 100 markets through the State and published quarterly. Unfortunately n o email or website system for distributing data has yet been established. The institute has also supported MAP developments through: a) identification o f endangered species; b) mass multiplication o f commercially important MAPS; c) studies on the variability o f aonla fruit; d) processing techniques for various MAPS and other nontimber forest product.
New Approaches for Marketing Aromatic Oils: The Case of Assam
Patchouli (Pogostemon cablin) i s a perennial herbaceous plant o f the Lamiaceae family and grows in a number o f South East Asian countries. The dry leaves o f the species can be distilled to y ie ld aromatic o i l used in perfumes, medicine and processed food. Patchouli o i l has remarkable staying power and i s an important fixative ingredient in the manufacture o f fine perfumes and cosmetics. Consumption o f patchouli worldwide i s about 2000 metric tons per year with the U S A being the largest market (about 500 metric tons per year). In India, consumption o f patchouli o i l has reached 300 metric tons per year. India has an import requirement for about 290 metric tons per year and currently produces the balance o f 10 metric tons per year. India’s production level i s expected to r ise to 20 metric tons in 2004. Indonesia remains the world’s largest producer and exporter at about 1,500 metric tons per year and thus supplies about 75 percent o f the wor ld requirement. Indonesia however, has continued to source most o f i t s supply f rom wild uncultivated sources and i s seeing a decline in production and o i l quality. Up to the year 2002, patchouli o i l had a wor ld market price o f about Rs800/kg. ($17-$18 per kilogram). After a sharp increase in 2002, prices have remained stable at between $35-$40 per kilogram. (Rs1,500- 1,800). The plant i s suited to Assam’s climate and soils, and as an aromatic plant, i t can be established on reserve forest land as part o f accepted forest management activity. Also, as a nonindigenous plant to the State there are n o issues o f royalties or possible restrictions relating to endangered species status. There are many positive attributes relative to modest risk factors (box A9.4). Once in production, one hectares o f patchouli can generate an average o f Rs44,OOO each year in net revenue for three years. A strong partnership between the State and the private sector has been developed to plan and strategically develop patchouli production and marketing. The partnership has the fol lowing features:
67

0 Forest department takes a lead role in applied research. The forest department Silvicultural Div is ion i s conducting trials as part of i t s research into germination, propagation and standardization o f nursery techniques for patchouli. It also works closely with the Research and Development Centre for Medicinal and Aromatic Plants, at Khetri, established recently by the Nor th East Development Finance Corporation (NEDFI).
NEFDI i s the main networking and development partner. NEDFI has the mandate to both provide credit and facilities for promotion, expansion and modernization industrial, certain agricultural, fisheries, and agrihorticultural activities. I t s prime objective i s to attract new investment into the region. Their interest started with feasibility studies o f 43 products/processes that appeared to have prospects in the region. Medicinal and aromatic plants were ranked very high in this analysis. More detailed work on medicinal and aromatic plants identified Patchouli as one o f six prospects that should be further researched and promoted. This was followed by independent market research including visiting the U S A and then planting two pi lot patchouli projects. Once they were convinced that patchouli had high potential, further steps were initiated (box A9.5). The AJMAL Group establishes local processing facilities. A J M A L has core businesses in aganvood and perfumes, and the largest buyer o f patchouli in India. I t has set up a research centre, part o f i t s Flower Valley Agrotech Ltd. subsidiary, at Hoja i for a range o f medicinal and aromatic plants. I t has 20 hectares o f i t s own plantings, and a distillation plant for extracting oil. I t i s also actively promoting contract production. A community support organization works with small farmers to help build local capacities. The Shanti Sadhana Ashram i s active with patchouli farmers to provide training.
68

Patchouli i s a case study that has a number o f interesting lessons for the development and marketing o f other plants that could benefit forest fringe communities. The work being undertaken by the Government, development banks, research and promotion agencies and the private sector to find a new, profitable and appropriate crop for small farmers i s an excellent model o f what can be achieved through collaboration between State and the private sector. The development o f patchouli has been market lead and then followed by intensive research o f a l l factors affecting production and profitability; I t s need for shade makes it ideally suited as an intercrop under tree crops, or suitable for growing under programs for reforesting degraded forest areas. Under JFM, patchouli appears to have a potential to be a significant future source o f income to forest-dependent communities. The above program i s s t i l l operating at a very small scale. The challenge in Assam i s to extend the patchouli model to other high potential nontimber forest products, where the forest department role i s supportive, around a core business function o f applied research and development in an environment that empowers communities, rather than focusing o n appropriating marketing functions, rents and decision making.
FUELWOOD
At the national scale, the fuelwood business i s estimated to have an annual turnover o f about $17 b i l l ion (MOEF 2000) and i s a source o f l ivelihood for over 11 mi l l ion people, making it largest employer (formal and informal) in the Indian energy sector. About ha l f the fiber supply i s obtained f rom timber plantations; the other ha l f fi-om natural forests, both as l og removals and lopping o f branches and sweeping forest residue (Mahapatra 2003). Fuelwood i s the primary drain o n forests in India. In Assam for example, the estimated sustainable harvest o f fuelwood i s 1.5 m i l l i on metric tons per year versus consumption o f 5.2 mi l l ion metric tons. The community surveys in Jharkhand and Assam revealed that households relied on fuelwood for about 80 percent o f their energy needs, primarily for cooking. National surveys suggest a figure of 75 percent among a l l rural households for cooking (UNDP/World Bank 2003). An estimated 59 percent o f rural households obtained their wood f rom home grown sources or free collection, Only 2 1 percent paid for their wood, with the balance a combination o f the two sources. F rom the same study, nearly one-quarter o f households reported nobody purchasing fuelwood, which suggests a lack o f commercial markets. A household will purchase fuelwood if the cost o f collecting and transporting it to their homes by themselves i s greater than the local market price. Households selling fuelwood will do so when the cost o f transport to markets i s fairly low, based o n distance and road condition. Markets are generally o f two forms. One i s a semi-commercial market through forest department channels where plantation supplies are sold to large commercial
69

buyers, The second and more common approach i s with individuals (usually women) engaged in smaller-scale fuelwood trading to other households or middlemen. The women usually receive very l o w returns on investments o f time and energy. An example f rom Orissa highlighted the case o f one woman who walked an average o f nine kilometers each day to collect and deliver 35 kilograms o f fuelwood for a net return o f Rs15 ($0.33). This i s about 20 percent o f the official wage rate for unskilled labor (Mahapatra 2003).
Meeting fuelwood demands in states such as Assam and improving l ivelihood opportunities requires innovative solutions. The lack o f organized community institutions, particularly for women, means that collection and sales are l e f t to individuals with l i t t le market power when dealing with commercial collectors who will transport the wood to more distant urban markets. There i s virtually n o private sector investment in fuelwood plantations with communities at present but for a state l ike Assam, the need for investment i s overwhelming. I t i s estimated that i t will take up to one m i l l i on hectares o f fuelwood plantations in Assam to satisfy the domestic demand and completely eliminate the pressure put onto natural forests. Financing these investments and incorporating the plantations into a community forest model are pressing needs.
70

Appendix 10. Forest Fiscal Systems and Analysis
What I s a Forest Fiscal System?
An efficient forest fiscal system, coupled with resource tenure and security, should underpin the allocation and use o f public forest resources by communities and the private sector. Forest resources have an inherent economic value, defined as economic rent (see box. A1O.l). The fiscal system will identify a range o f measures governing the capture and distribution o f this init ial resource value, for example, by identifying various taxes, fees and royalties o n the resource, and/or the underlying forest land. In addition, the fiscal system will identify where revenues can be captured further along the value chain as pr imary products are transformed and value added. As an example, mature saw timber o n government land could be harvested by a private contractor or community under some form o f license or permit in return for a royalty on every cubic meters cut and hauled to the roadside. The royalty and any permit fees would capture a portion o f the economic rent value. These logs would then be sold to sawmills, which would then transform the logs to lumber and sell i t to distributors or tertiary producers such as furniture manufacturers. Along the value chain, governments could assess various sales taxes, additional permit fees, etc, to generate further public revenues f rom the wood products. In addition, the income tax system can capture more revenues f rom downstream production. The fiscal system wil l identify how these revenues are then distributed, to whom, and for what purpose. Experience shows that a well designed and effectively implemented forest fiscal system can be more progressive instrument to increase the forest sector contribution to growth and development than a narrow regulatory-based approach (Oksanen 2004).
What Are the Main Issues in India?
T h e system i s not efficient. With respect to JFM, the current forest fiscal system in India can be described as highly regulated, with high transaction costs, and focused o n a narrow range o f revenue generation. Considering the primary forest resources, under J F M Resolutions the DEF returns a percentage o f net revenues f rom commercial timber and pole sales to communities after accounting for their own harvesting, marketing and certain overhead costs. Benefit-sharing schemes are promoted by DEF in every state as an incentive for communities to participate in the J F M program. In some ways, the system i s similar to a traditional calculation o f stumpage, however there are a number o f anomalies. First, the states are not trying to derive stumpage estimates to charge the resource user; the principal goal i s more to recover operating costs and distribute part o f the surplus back to communities for forestry and social development. Second, costs used in deriving the net returns to communities and the state are based on administered DEF averages rather than actual costs by division or block, which would vary by timber size, operating conditions, transport distances to the l o g yard, and so forth Third, the costs are based on government systems, which may be more inefficient than comparable operations in the private
71

sector, Calculating resource rents with inflated costs would reduce the rental value. Problems extend beyond commercial timber; the current fiscal system does not usually assess royalties or other forest products such as medicinal plants, which may have fairly high commercial values. Only modest permit charges may be assessed, which would l ikely not capture the rent value o f these resources. Finally, subsistence products are provided free o f charge to communities.
Current benefit-sharing schemes need to be more transparent. Most states are gradually improving the share o f benefits f rom forest production to communities over time, but in the absence o f a national policy, individual states apply different share ratios (table A1O.l). As mentioned earlier in this report, allocating communities free access to subsistence nontimber forest products i s not really providing new benefits, but it does reduce potential conflicts with the forest department and allows the community to protect their assigned forest more vigorously. Commercial products such as timber provide financial benefits to communities but field surveys indicated many villagers were not clear o n the actual sharing ratio and virtually nobody seemed to know how the actual revenue share would be derived. A common practice across the three states (and in a l l other states) i s for the forest department to calculate timber revenue shares based o n net values, that is, the
Tablc m Assam
Jharkhand
Madhya Pradesh
Source: B:
Free access and consumption
Free access and consumption
and consumption
Free access
50 percent o f net revenues for thinning revenues and 25 percent o f net revenues f r o m timber o n existing high forest t o individual community 100 percent o f net revenues for second rotation to individual community 90 percent o f net revenues to individual community
VFPC in degraded forests: 100 percent o f net revenues at district level shared by a l l JFM communities in district
net revenues at district level shared by a l l J F M communities in district
FPC in high forest: 80 percent o f
;ground studies for focal states.
gross revenues less certain costs incurred by the forest department in the establishment, maintenance, felling, and marketing o f the timber strand over one full rotation, including department overheads. In theory, this i s reasonable. The state i s investing in timber production and may wish to recoup some or al l o f i t s costs f rom f inal product revenues. At the same time, the community should be compensated for i t s costs (for protection and stand maintenance) through i t s share. But the process for deriving the actual net shares tends to be very complex and opaque. The team was unable to find documentation that presented a clear and consistent description o f h o w net revenues are derived and in particular, what costs are included. In the absence o f this kind o f information, communities are in an exceptionally weak position to challenge revenue sharing results. I t i s entirely possible that net revenues returned to communities could be very low, or even zero, depending o n what costs are included. Providing better and more transparent information to communities would al low them to judge the merits o f any benefit-sharing scheme and gauge their level o f support.
72

Evaluating benefit-sharing on a year to year basis may not follow sound economics. Assam and Jharkhand pro-rate costs and revenues on an annual basis back to individual communities. Madhya Pradesh calculates net revenues on a district basis. These approaches may yield the wrong results. Costs and revenues f l ow over the entire rotation period. If a forest i s established on degraded lands, both the community and the forest department will bear costs for several years until revenues begin to flow, perhaps from certain nontimber forest products and bamboo. Revenues f rom timber thinning and poles could take as long as 20 years, and the final timber harvest 60 years or more. Evaluating benefit-sharing over one year ignores in i t ia l capital investments and subsequent maintenance costs that would have occurred. With costs, how are major capital investments (such as planting) that occur once in a selected forest handled, compared with annual costs such as plantation maintenance? An alternative approach i s to estimate the present value and distribution o f revenues and costs over the full rotation. T o promote wider debate, Assam was used as an example based on the three models in the analysis of forest management options (Appendix 9); the scenario with the highest NPV was evaluated in terms o f present values o f net revenues. For al l scenarios, communities were assumed to be responsible for forest protection costs. The forest department was responsible for forest establishment and maintenance costs, harvesting and overheads during fell ing and marketing. T o simplify the analysis, an average revenue sharing o f 50-50 was applied to al l species, thinning, and final felling. The results (table A10.2) show that for the models and scenarios selected, none achieve a 50-50 ratio based o n the present value o f net revenues. Mode l 1 comes closest to attaining the 50-50 ratio. In model 3, the community actually accrues more than 100 percent o f the net revenues (forest department accrues a negative percentage share). In al l case, the community has the highest percentage o f net benefits and the trend shows that as forest management shif ts f rom managing existing high forest to establishing new forests o n degrade.d areas, the community share o f net revenues increases. The results are sensitive to changes in forest structure, costs and revenue contributions, and in particular timber prices. The analysis suggests that a blanket benefit-sharing scheme, while conceptually simple, may not represent the wide range o f forest conditions in any state when basic economic analysis i s applied.
Planting to restock degraded forest o f 159 hectares
Manage regeneration to restock degraded forest o f 159 hectares
Table A10.2. Estimated net revenue shares for alternative forest models and scenarios.
J M i x e d forest, balance with a l l Community 69 products DEF 31 M i x e d forest, balance with a l l Community 111 products DEF -_
Existing, regulated forest o n 159 Timber plus subsistence hectares nontimber forests product
Forest revenues captured by state governments are low. Data for 1999-2000 suggest that the revenue generating capacity o f forest resources i s quite l o w in India (table A10.3). The data represent revenues collected by the forest department on behalf o f the state government; expenditures are state nonplan outlays. Revenues do not include those f rom marketing corporations, only f rom forest departments. Whi le a range o f revenue flows are evident (from Rs4 per hectare in Manipur, to just over Rs1,000 per hectare in Kerala), the mean for a l l o f India i s Rs277 per hectare ($6.16). Evaluating the selected states, the mean revenue per hectares i s Rs199 per hectare ($4.42 per hectare), and the median only Rs103 per hectare ($2.29). Assam and
73

Jharkhand are w e l l below the all-India mean, as well as the mean and median for the selected states, Revenue flows are logically going to be variable across states, as it depends o n factors such as the area o f productive forest within the total recorded forest area, actual forest productivity, the scale o f timber and nontimber forest product extraction, product mix, and level o f revenue capture by the forest department. In this regard, i t i s easy to see why Madhya Pradesh has fairly high revenues per hectare, given i t s large commercial Teak and Sal timber operations.
Goa Karnataka Tami l N a d u Assam
IJharkhand 74 798 -724 10.81
243 777 -534 3.20 465 866 -40 1 1.86
54 277 -222 5.09
69 I
~
Andhra Pradesh Jammu and Kashrmr Raj asthan Kerala
Madhva Pradesh Manipur
847 I
133 307 -175 2.32 224 386 -162 1.72 70 208 -138 2.99
1009 1137 -127 1.13 4 127 -123 33.53
404 525 -121 1.30
-778 I
Nagaland Arunachal Pradesh
Orissa Meghalaya
12.27 I
19 127 -108 6.58 30 59 -30 1.99 65 72 -7 1.11
164 160 4 0.98
Mean selected states Med ian selected states
199 515 -317 6.08 103 347 -150 2.65
m I n d & 277 I 388 I -111 I 1.40 I
With expenditures, the mean for al l India i s Rs388 per hectare, while the mean and median for the selected states are Rs5 15 and Rs347 respectively. Jharkhand has one o f the highest expenditure figures, whi le Madhya Pradesh i s wel l above the mean for a l l India. Assam i s below the mean, reflecting the small budget allocations relative to i t s forest area. The net revenue per hectares figures show that with the exception o f one state (Orissa), a l l states spend more money o n forest management than they earn. The negative states range f rom Rs-1,419 per hectare in Gujarat to Rs-7 per hectare in Meghalaya. In terms o f spending per rupee earned f rom the forest, the mean for al l India i s Rs1.40. Madhya Pradesh i s close to the national average, while the ratios for Assam and Jharkhand are fa i r ly high. These figures are meant to illustrate that at the state level, the forest departments are not covering their costs, represented by state government allocations. It i s important to emphasize that the “negative” figures are neither good nor bad. Such a judgment must be weighed against current state po l icy for fiscal performance o f l i ne departments. If the current pol icy goal i s cost recovery or to earn positive net revenues then the states are in general,
74

fail ing miserably. Conversely, the state o f the forest may limit revenue generation, while also demanding high levels o f investment to improve sustainability. In this regard, if the central plan expenditures were taken into account, which for most states i s the main source o f capital investment funds, then the negative values would be significantly higher.
75

Appendix 11. Preliminary Economic Appraisal of JFM Forest Management Options
over nonforest t imber products M i x e d forest, balance with a l l
As a means o f encouraging debate, three simple models were developed for a Sal/Teak dominant forest using Assam cost and revenue data to compare financial returns f rom different traditional forest products across several alternative management scenarios (table A1 1. l)?
53 53 53 13.2
00, commercia
53 I I r - - --- -- I I I
M o d e l 3. Manage regeneration to restock degraded forest o f 159 hectares Commercial timber focus only I 159 1 0 1 0 1 13.3 M i x e d forest. bamboo focus I 95 I 47 I 17 I 15.8
I products Source: Background studies. author’s estimates
’’ The model i s based o n a forest o f 159 hectares (the average size o f a JFM forest in Assam). Three management scenarios are used. One i s an existing, good quality, Teak dominant forest already under uneven-aged management for timber, poles, minor forest produce and bamboo production. Bamboo has a 10 year rotation. Poles are assumed to be harvested when they reach 20 years o f age f r o m nonteak species, teak timber at 60 years. The second scenario i s a degraded forest entirely planted for timber, poles and bamboo. The third scenario i s a completely degraded area where natural regeneration i s managed for poles, and timber. Bamboo i s also planted in gaps. With model 2, commercial teak poles are harvested f rom thinnings at ages 15, 20, and 30 years. nontimber products are available after 15 years, subsistence and nonteak commercial poles after 30 years. In model, 3 the comparative commercial thinning ages for teak are 10, 15, and 25 years. Other poles ( f rom nonteak species) are harvested after 20 years. Nontimber forest product revenues f l ow f r o m year 10. Al l scenarios are evaluated over a 60 year period. Costs include forest protection by the community, site preparation, planting, maintenance and harvesting. Al l costs and production estimates were derived f r o m available DEF data in Assam, inferences f r o m other states, and consultant reports. Revenues are based o n very conservative average fa rm gate prices. Teak commercial poles are Rs7,000 per cubic meter. Other nonteak poles for subsistence, are (Rs50 per stem), timber (Rsl1,OOO per cubic meter), and bamboo (Rs80,OOO per hectare). Subsistence poles and nontimber forest product values are accounted for in revenue calculations. The opportunity cost o f capital i s assumed to be 12 percent and i s used to calculate net present value. Information o n bamboo growth and yield supplemented f rom Mohamed and Appanah (1998).
76

Mode l 1 represents a situation where resource holders are managing an existing, good quality (dense) teak dominant forest already under effective regulation, and using uneven-aged stand management and selection harvesting. This model would certainly be close to some o f the high quality teak or mixed teak plantations under JFM management in Madhya Pradesh. Models 2 and 3 represent an alternative situation where J F M communities and DEF are faced with rehabilitating degraded forest land and need to establish a new forest. In these situations, greater flexibility exists to establish a new forest in terms o f species selection and distribution across the site. M o d e l 2 i s the traditional approach o f afforestation with high investment costs for planting stock and planting operations. Model 3 offers an alternative approach o f managing the existing natural regeneration with enrichment planting on part o f the area. These situations parallel the case where degraded forests are assigned to JFM committees. The results illustrate a number o f interesting trends. First, model 1 shows that pure timber production yields a NPV o f Rs35.7 mi l l ion, Manoharan (2000) suggests that managing multi-species forests for timber and nontimber products can increase annual revenue flows by between 20 and 32 percent compared with forests management solely for timber. By augmenting timber production with subsistence nontimber product in part o f the forest understory, the NPV increases to Rs36.3 mill ion. However, if the area o f timber production i s reduced to allow more intensive production o f nontimber product for commercial sales (at higher prices) mixed with a small amount o f bamboo, then the NPV declines. Fo r a high quality forest managed primarily for teak sawlogs, under regulation on a selective cutting basis, commercial timber and pole production offers extremely high returns to the resource holder; the nontimber products under the managed forest can add incremental economic value. A clear policy recommendation i s to allocate participating communities a forest area already regulated and under sustainable forest management and timber and/or production (with enrichment planting or other minor treatments. Second, when faced with degraded lands, the most efficient option i s to try and manage the existing natural regeneration rather than undertake expensive forest planting operations. Third, with the last two forest models, bamboo i s a lucrative investment; but overall, a mixed forest with timber, and/or poles, bamboo and nontimber product offers the highest returns. The results suggest that during micro-planning, the JFM communities and DEF should consider putting at least some o f the allocated forest area into bamboo and nontimber product production. This would also provide diversity against forest product market fluctuations in any one product, and against species-targeted insect and disease attack. However, decisions about long-term forest structure should be market driven. The simple economic models used in these estimates illustrate the kind o f analyses that DEF should be undertaking to provide department field staff and communities with better information about forest management options in the micro-planning process.
77

Appendix 12. Community Forestry Models and Forest Poverty Pathways
J F M represents one model for community-based forestry. A range o f community forestry approaches exist within a continuum where a government centered model i s on one side and a community centered model o n the other (figure A12.1). The government centered model roughly represents the old command and control model in India a few decades ago with a focus on industrial forestry and commercial plantations. The community centered model approximates several examples o f community forestry that have developed in Lat in America, particularly in Mexico where communities own the land and resource, develop management plans and market their own forest products (see GTF, GTZ and WWF 2001). The current JFM model in India appears to s i t somewhere in between these two endpoints with shared roles, responsibilities and benefits. The primary focus o f JFM in India i s s t i l l largely around forest protection and conservation with the state retaining most o f the control over forest management, regulation, monitoring, timber harvesting, and forest product marketing. JFM i s a dynamic process however, and i s continuing to evolve.
Generally, rural communities around the wor ld use forest resources in three ways (figure A12.2). First i s exploiting forests as a safety net, where food and cash income are obtained during periods o f short-term hardship such as cutting fuelwood or fodder to se l l in local markets during a drought or when the household head loses his or her job. Second i s when forests support ongoing consumption through subsistence and cash income, for example nonforest timber products (fruits, medicinal plants, etc), fodder, or selling a few poles.
State Centered State ownership of land and forests State develops management plans State harvesting, marketing systems Focus on commercial plantations State provides forest most protection State implements management Communities provide local labor Limited access to subsistence products State retains al l forest revenue
Figure A12.1. Community-based forest continuum
Community Centered Community owns land and forests Community develops management plans Community-led harvesting and marketing Communities may have minor processing Commercial and subsistence products Communities provide most protection Communities implement management Communities provide labor State collects upstream sales taxes
JFM - India State owns most land and forests Communities have subsistence rights State harvesting and marketing for major
Revenue sharing for commercial products Communities share protection costs
commercial products
78

These consumptive forest uses might be a seasonal activity as part o f the household’s normal l ivelihood pattern, mixed with agriculture or wage employment. Income may be limited however, due to poor integration with open markets. Typically, most commercial sales o f minor forest products would be in local trading markets. The third way a community can use forests i s when the resource provides a major source o f household income. Forest activities would be maintained in economies with a high level o f integration to more developed markets in the region and beyond, perhaps even offshore for specialized products.
Figure 12.2.The forest livelihood path and community forestry
Where most forest based communities
in India are now
I Source; Vedeld and others 2004.
Where forest based communities in India should be
The broader goal o f community-based forestry i s to move f rom the le f t side o f Figure 12.2 toward the right side, where forests are a major part o f the community’s economic base and in addition to subsistence products, commercial forest products are sold in local urban, national, and in some cases, even international markets.
79

Appendix 13. Poverty Impact Monitoring System To measure the success o f community-based forestry to deliver improved livelihoods to people, a monitoring system i s required. The current JFM system i s characterized by a fairly weak system for monitoring changes in livelihood and contributions to poverty reduction. Ongoing work by CIFOR, funded by the Wor ld Bank, i s developing a simple method and set o f tools for monitoring forest-based livelihoods and poverty impacts f rom community forestry. The pi lot work i s being undertaken in Jharkhand, India.
Poverty Impact Assessment of Joint Forest Management in
J harkhand India
Rural Week hosted by PROFOR and ESSD Forests Team Session on “Forest Livelihoods and Vulnerability”
Washington, D.C. March 31, 2005, 2:OO-4:OO pm
Deep Narayan Pandey Center for International Forestry Research (CIFOR)
Bogor, Indonesia [email protected]
Four conceptual positions on forests and livelihoods ...
I.
2.
3.
4.
But, more or less, the consensus is that:
“ ... a purely conservation approach to natural
Livelihoods and forests as separate policy realms
Livelihoods insecurity as a constraint on forest conservation
Forest conservation must not compromise livelihoods
Livelihoods improvement depends on forest conservation
resources, including forestry, is not likely to work.” India CAS 2004; Para 77.
Sayer and Campbell 2004, Adams et al. 2004, Warner 2000, Pandey 1996)
80

But the synergies on ecological and human-well being are required.. .
o Both forest conservation and livelihoods improvement are necessary.
o Need to monitor livelihoods impact and operate in an adaptive and socially accountable manner.
o Policies and systems that ignore diverse - but inseparable relationships between forests and livelihoods, risk collapse.
“In further scaling up Bank support for rural livelihoods it will be important to have a strong feedback loop to build lessons learned in to the design of new projects” --India CAS 2004; Para 81.
, . . But, how to find “win-win combinations for conservation and poverty reduction” as CAS, Para 77 desires?
We need to learn and adapt ... Objectives of the CIFOR/PROFOR Study, Jharkhand
1. Develop livelihoods assessment tools
l Livelihoods measurement (baseline and impact assessment)
Livelihoods monitoring (indicators-based)
2. Conduct livelihoods assessment and analysis
3. Spatial analysis of poverty and forests
81

o 22.5% of the total state's population (26.91 million) are
o 28.5% of total geographic area (79,714 km2) is
o Forest-fringe communities represent 60% of the total
o More than 60% of state's population is placed below
tri bals
forested,
population and over 90% of the tribal people.
the poverty line.
Yet, no studies on forest livelihoods; no monitoring systems to help stakeholders pursue adaptation
Why Jharkhand?
BIHAR h
1 1 ' 1 Source FSI, State o f Forest Reuort 2001 PA Str'ahr*''"av 1
o Forest-fringe communities represent 60% of the total population and over 90% of the tribal people.
o More than 60% of state's population is placed below the poverty line. 1
t, no studies on forest livelihoods; no monitoring -
systems to help stakeholders pursue adaptation
82

Why Jharkhand?
o Rural Infrastructure Development Index in Jharkhand is among the poorest compared to other states in India.
o Thus, at least to begin with, there are limited omortunities for livelihoods awav from natural
I .
resources.
role in livelihoods. o Therefore, forests will continue to play a crucial
o The dynamics need to be studied.
Livelihoods Focus of JFM in Jharkhand
o JFM has great potential, but also strong critics
o Working plans and Microplans have explicit
o Forest Department makes strong claims about
livelihood objectives
their contributions to livelihoods, but no credible studies
scrutiny - need to be able to monitor/evaluate impact and adapt
o Forestry and foresters are under increasing
o World Bank emphasizes poverty alleviation
83

Building a livelihoods monitoring tool
o Vigorous attempts are being made to understand the contribution of natural resources to poverty reduction.
o JFM is attempting to integrate forestry and livelihoods.
o The achievements of these initiatives may be difficult to assess without a credible system for monitoring
o If JFM is to meet the twin objectives of ecological and human well-being, monitoring holds great promise.
Indicator-based monitoring tool
o Quick, frequent, and low cost village-level assessment of livelihoods status and change.
much more costly to implement. o Household level indicators are more difficult and
o But, monitoring will be done in con'unction with the household-survey which will al 1 ow:
detailed, household level analysis of livelihood status and change, and calibration of the indicators-based monitoring tool.
84

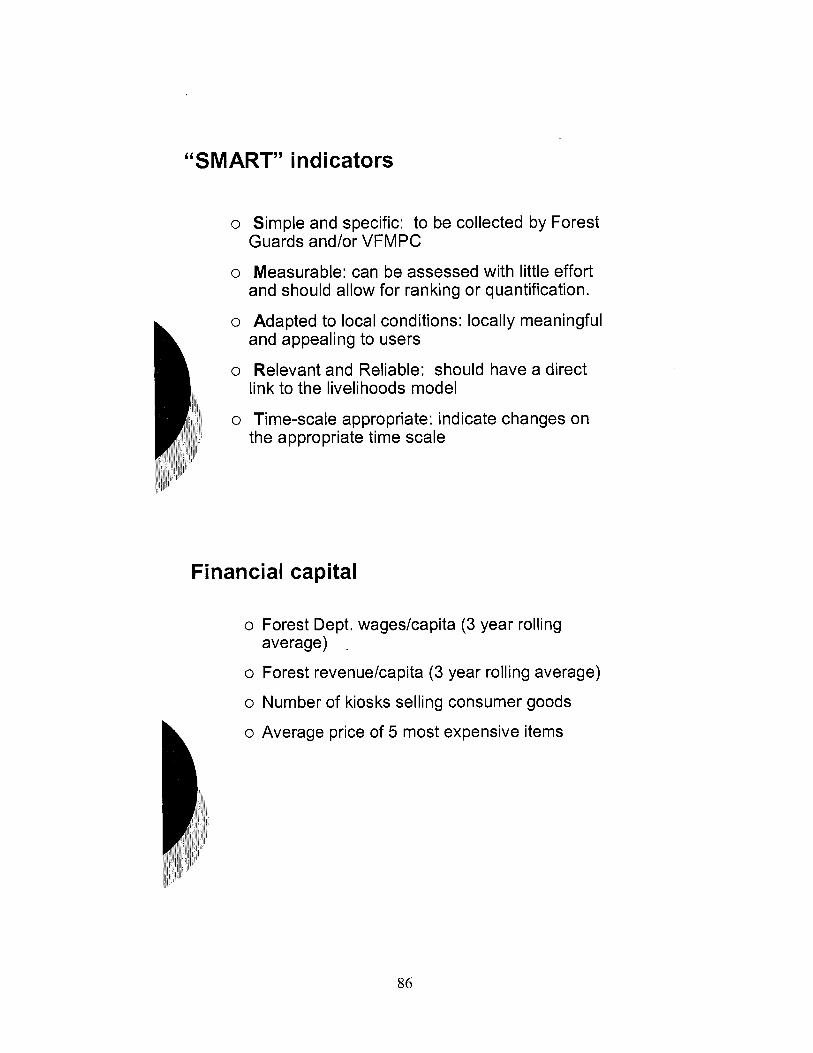
“SMART” i ndi cators
o Simple and specific: to be collected by Forest Guards and/or VFMPC
o Measurable: can be assessed with little effort and should allow for ranking or quantification.
o Adapted to local conditions: locally meaningful and appealing to users
o Relevant and Reliable: should have a direct link to the livelihoods model
o Time-scale appropriate: indicate changes on the appropriate time scale
Financial capital
o Forest Dept. wagedcapita (3 year rolling
o Forest revenuekapita (3 year rolling average)
o Number of kiosks selling consumer goods
average) .
86

o Number of pukka houseslcapita
o Number of houses with electrical servicelcapita
o Number of motorcycleslcapita
o Number of Functioning wellslcapita
o Average travel time(or cost?) to nearest market
o Area of irrigated landlcapita
o Number of functioning tractorslcapita
o Number of functioning water pumpslcapita
Natural Capital
o Standing volume of timberlcapita o Area of productive fruit tree plantation/capita o Area of key NTFP/capita o Number of livestock (in cattle equivalents)/capita o Average time spent collecting fuelwood per
o Average time spent collecting water per household
o Value of annual timber production (3 year rolling
o Value of annual firewood production/capita o Value annual NTFP (nationalized NTFPs)
o Annual rice production (kg.)/capita
household per month
per month
ave rag e)/ca p ita?
productionlcapita
87

Human capital
0
0
0
0
0
0
Infant mortality/capita
Number of deaths during dry season/capita
Percentage of school age children attending school
Average age of school leaving
Number of people that work outside village on a daily basis per capita
Number of people that leave village to work outside for extended periods per capita
Social capital
o Proportion of adult population participating in VFMPC
o Proportion of VFMPC members that are women
o Number of VFMPC meetings and attendance
o Number of other citizens’ groups active in the village
o Collective selling of agricultural or forest products results in improved prices (yh)
88

I / I
I Adaptation I Modification I improvement A Y -L 7
Resilient lhrellhoods 7
[ - ,Sustainableforest$
Red u ci n g vu I ne ra bi I i ty / i n creasi n g resi I ie n ce Source: Pandey 2005
Pre-conditions for implementation of the monitoring tool
o The key challenge is a lack of accountability and motivation to apply sciencehew learning.
o Donors action to build innovative mechanisms of accountability in lending projects for monitoring livelihoods impact of JFM
o Large investments of time and money for capacity- building, for both:
enhancing the understanding about the inseparable relationship between the ecological and livelihoods dimensions of forestry, and
training in the implementation of the livelihoods monitoring tool.
89

Caveats and caution! o Indicators-based tool is useful to get quick and
comprehensive (large number of villages) overviews of conditions and directions of change at the village scale, but the detail will be limited.
o Household survey will give details, but it is sample- based and so also not appropriate for monitoring.
o We need a trade off to balance the need of knowledge production through monitoring and household survey tools.
o Finally, livelihoods monitoring tool is not something that will meet all needs related to the production of knowledge, but as one element of that.
Emerging Opportunities
o CIFOR has developed and pre-tested the tool incorporating the science and local knowledge.
o The World Bank is planning major, multi-state investment in forestry and livelihoods
o Monitoring tool may provide baseline and subsequent studies to know the status and impact of i n te rve n t io ns .
o Learning in Jharkhand will provide critical insights for the effective implementation of multi-state projects.
90

l---
+

Table A14.2. Proposed key functions o f forest department to support community-based forestry
Forest management, technical advisory and extension services
development
mapping and information management
Forest marketing technical services
Policy, planning, and economics
Reviewing and approve micro-plans 0
Providing community l iaison and general support services
Providing targeted extension services to communities (possibly shared with outsourced agencies, or eventually o n contract to communities) Delivering f ield demonstrations, technology transfer focused o n community needs Supporting community enforcement efforts against i l legal access and cutting Providing support for major confl ict management Delivering applied research and development o n silviculture in key species identif ied in micro-plans, especially nontimber forest products, and building l i n k s with regional and national institutes Maintaining forest inventory baseline and change data f r o m micro-plans, working plans, Forest Survey o f India and other sources Maintaining functional geographic information systerms to support community level and division level management planning and mapping
Facil itating linkages with strong research organizations, development banks and private sector for marketing and value addition, quality improvement Gathering regular local and external market data Disseminating market data to communities through mass media, web based services
Informing forest management planning and decision-making at community and division level, and guide forest pol icy development. Undertaking economic analyses o f alternative silviculture models for non- traditional l ivel ihood species, agro-forestry options, fuelwood plantations, mixed cropping systems, bamboo plantations, and so forth Maintaining a data base o f forest statistics, Producing annual reports, and publishing periodic statistical reports o n forestry for publ ic dissemination, Developing and maintaining a web site to provide another medium for publ ic
0
access to this information
92

Appendix 15. What I s the Potential for Increased Revenues from Community-Based Forestry?
Background
Major opportunities exist for achieving the livelihood potential f rom the forest through appropriate reforms. I t i s important t o see how the long-term productive potential o f the forest can be achieved, identifying the appropriate institutional arrangements, what species and products are best suited for the forest eco-types in the State, and how product flows can be increased to meet market demands. It must be remembered that the economic contribution f rom J F M forests at present i s minimal, reflecting the original program goals o f forest protection and rehabilitation. But, as these forests mature, especially on formerly degraded areas and for nonlisted forest species that are not subject to restrictive marketing arrangements, the scope for increased forest revenues i s felt to be fairly high.
Case Study from Jharkhand
An example f rom Jharkhand illustrates the potential gains in total income from increasing forest productivity and market access. The stated objective o f the forest department Vis ion 2010 i s to increase the number o f JFM committees to 10,000. Currently, the average forest area under a J F M committee i s about 252 hectares. Extending this average to 10,000 J F M committees would put virtually al l o f the recorded forest area under co-management. This expansion i s unlikely to happen in the next six years. A more conservative and perhaps, realistic scenario might be to have 6,000 committees operating by 2012 and 10,000 committees operating effectively through community-based management by the year 2020. Also, the projected increase in well-stocked forest f rom Vision 2010 could be assumed to occur over a longer time period, say to 2020 as well. Based o n these conservative assumptions, average community forest area o f 252 hectares, and the estimated number o f committees, the projected total forest area and area o f well-stocked forest could see very significant increases in the next 16 years (table A15.1).
d
Source; Jharkhand Forest Department.
These projections o f forest growth can be used to develop various scenarios o f forest production and income growth for communities and the state to the year 2020. Each scenario i s based on a modest area of well-stocked forest assigned to a commurtity that would be under active management for timber and nontimber forest products as wel l as a certain area o f forest land under bamboo production. N o t a l l the forest i s assumed to be used for timber production due to slope, poor quality sites in some areas, and so forth Also, communities may set their own priorities for forest production, conservation, and so forth Timber production i s based on a selective felling regime. Nontimber forest products are produced under the timber cover and/or
93

degraded forest land. Bamboo i s grown on degraded forests. Fuelwood and fodder are gathered from the timber production forest.
A scenario o f l o w growth assumes that communities manage and market 20 percent o f their forest for sawlog production, 20 percent for nontimber forest product, and a 5 percent for bamboo production. The remaining ha l f o f the forest i s held for broader conservation. A moderate growth scenario assumes with better market access, communities manage and market 35 percent o f their forest for timber, another 35 percent for nontimber forest product, and 10 percent for bamboo production. A high growth scenario assumes fairly high market integration allowing 50 percent o f the forest i s managed and sold for sawlogs, 50 percent for nontimber forest product (under the timber cover), and 15 percent for bamboo on degraded forest land. Given the average community forest size o f 252 hectares in Jharkhand, these percentages are not unrealistic.
For sawlogs, a real stumpage value o f Rs7,500 per cubic meter i s assumed. For nontimber forest products, an average value o f Rs2,000 per hectare i s used, based on Chopra and others (2002). With bamboo, i t i s assumed the material i s used for pulping, with an average stumpage value o f Rs300 per metric ton and an average o f 8 metric tons per hectares harvest. Timber stumpage i s based o n average log price at mill o f Rs15,000 per cubic meter and allowing 50 percent deductions for harvest and transport costs. For bamboo, average production i s 20 metric tons per hectare, with fell ing volumes o f 40 percent, and farm gate prices for pulp o f Rs300 per metric ton.
N o value addition i s assumed for nontimber forest product so the prices are very conservative. Timber quality i s average and reflects reasonable prices for Sal logs for timber. Bamboo i s for pole production rather than pulp and paper. Subsistence fodder and fuelwood are not included to simplify the analysis. Environmental service values such as carbon sequestration are not included.
For simplicity, i t i s assumed that communities retain 90 percent o f commercial revenues and pay the state a 10 percent tax on income on al l commercial sales. Subsistence production i s free o f charge.
The three scenarios are not meant to be precise but rather should be viewed as a tool for stimulating debate, indicating the magnitude o f potential revenues that can be unlocked, even with very conservative assumptions. The m i x o f species, farm gate prices, etc, can al l be revised in many combinations. But, using the models and assumptions chosen, the results are instructive for longer-term forest pol icy in Jharkhand. Based o n the three scenarios, the total potential annual income f rom the forest ranges f rom Rs710 m i l l i on to Rs13,200 m i l l i on (figure A15.1). Depending o n the scenario, total revenue per community ranges f rom about Rs190,OOO to Rs1,200,000 per year, Finally, the total revenue for the state (based on a 10 percent share o f total income) and income per hectare increase significantly both over time, and as a higher proportion o f the forest i s under active community management.
These projections should be viewed as highly conservative. Actual potentials could be many times higher if nontimber forest products are more aggressively managed and marketed, including value addition and local processing. Similarly, bamboo production and income could increase significantly if local processing capacity was established in some communities or groups o f communities. Further, the estimates only refer to potential commercial values. Subsistence values of fuelwood, medicinal plants and forest foods are not included. The main message i s that the asset value o f Jharkhand’s forest resources has great upside potential as community forestry expands and forest productivity improves. Communities could conceivably be earning commercial incomes o f an average o f ha l f a m i l l i on rupees per year under fa i r ly modest growth and market assumptions, and wel l over a mi l l ion rupees annually under more optimistic
94

assumptions. Finally, the state could increase the current average revenues per hectares f rom the present Rs69 to several hundred rupees per year. In the longer-term, the annual incremental production f r o m community co-managed forest areas could far exceed local state demand projections. This raises the opportunity to develop export markets for forest products (other Indian states and for some products offshore markets), which in turn would generate increased local direct and indirect incomes. Even with this simple analysis, it i s clear that community forestry, coupled with investments in increasing forest productivity could be a mechanism to substantially expand rural incomes and provide enhanced revenues to the state through downstream taxes. Yet this potential will not be realized until state governments begin to address a number o f fundamental issues and constraints that are hindering more effective development o f community forestry livelihood opportunities.
Figure A15.1. Income projectioi Total potential forest income
14COO
12000
13000
a" 8000 0 1 6003
40CO
2030
2004 2012 2020
I O L O W SCENARIO .MODERATE SCENARIO OHIGH SCENARIO 1 Total potential state forest revenues
2004 2012 2020
IElLOW SCENARIO .MODERATE SCENARIO DHIGH SCENARIO 1
for Jharkhand case studv Potential forest income per community
1 200 003
1 000 OCO
800 000
IRs) 600000
4CO 000
203 000
0 2004 2012 2020
0 - O h SCEhAR 0 .MODERATE SCEhAR 0 O n Gr l SCEhAR.0
Potential state forest revenues per hectare
700
600
500
400
330
203
100
C
(R*J
2C04 2012 202c
IULOW SCENARIO .MODERATE SCENARIO DHIGH SCENARIO 1
~
Extending The Model T o A National Level
Applying the same assumptions to a national level i s possible f rom data in Volume I, Chapter I1 o n national JFM. The same percentages o f dense forest and improvements in mean annual increment are used from the Jharkhand case. However, the number o f committees remains static at just under 85,000; in the national case, the analysis will therefore eliminate growth effects f rom increasing scale (Table A15.2). In this case, growth i s due only to improved forest productivity and access to markets for basic timber, bamboo and nontimber forest product commodities. Results are shown in table A1 5.3 and fol lowing charts (Figures A1 5.2 -A1 5.4).
95

Table A15.2. Potential forest product supply from reformed JFM programs -
Number o f C F M committees operating effectively Estimated co-managed area (ha)
Area o f well-stocked forest under comanagement (ha) Mean annual increment (cubic meters per hectare per year) Potential sustainable fiber Droduction (cubic meters Der vear)
Percentage dense, well-stocked forest ( percent)
84,632 84,632 84,632 17,33 1,950 17,33 1,950 17,33 1,950
51 63 75 8,839,295 10,919,129 12,998,963
0.75 1 .oo 1.50 6.629.472 10.919.129 19.498.446
Table A15.3. D a t a and assumptions for national projections of revenue f r o m reformed JFM
Number of CFM Committees Area of well-stocked forest mean annual increment forest
LOW SCENARlO Sawlog income (million Rs) Bamboo income (million Rs) NTFP income (million Rs) Total income (million Rs) Average income per ha (Rs) Total revenue per community (Rs) Total revenue for state (million Rs) Average state revenuelha
MODERATE SCENARlO Sawlog income (million Rs) Bamboo income (million Rs) NTFP income (million Rs) Total income (million Rs) Average income per ha (Rs) Total revenue per community (Rs) Total revenue for state (million Rs) Average state revenuelha
HlGH SCENARlO Sawlog income (million Rs) Bamboo income (million Rs) NTFP income (million Rs) Total income (million Rs) Average income per ha (Rs) Total revenue per community (Rs) Total revenue for state (million Rs) Average state revenuelha
Price assumptions Logs (Rslm3) NTFP (Rslha) Bamboo (Rsltonne)
3358 431571
0.75
2004
486 52
173 71 0
1645 190274
71 165
850 104 302
1255 2909
336450 126 291
1214 155 432
41 73 i aoi
482626 1 a0 41 7
7500 2000
300
Jharkhand 6000
952540 1
201 2
1429 114
1924 2020
192 202
381
288620
2500 229 667
3396 3565
509371 340 357
3572 343 95 3
5110 7301 22
51 1
4867
487
10000
1.5 I agoooo
2020
4253 227 756
5235 2770
471177 524 277
7442 454
1323 921 a 4878
829663
488 922
10631 680 i 890
6985 1188149
13202
1320 699
84,632 8839295
0.75
2004
9944 1061 3536
14541 1645
154629 1454
165
17402 2121
2571 1 2909
273421 2571
291
6188
24861 3182 8839
36882
3688
41 73 392213
41 7
National 84,632
1091 91 29 1
201 2
16379 1310
22057 2020
234556 2206 202
4368
28663
38927
3893
2621 7643
3565 41 3957
357
40947 3931
1091 9 55797
5110 593358
5580 51 1
84,632 12998963
1.5
2020
29248 1560 5200
36007 2770
3601 277
382910
51183 31 20 9099
63402
674239 6340
4878
488
731 19
12999 4680
90798 6985
965568 9080 699
96
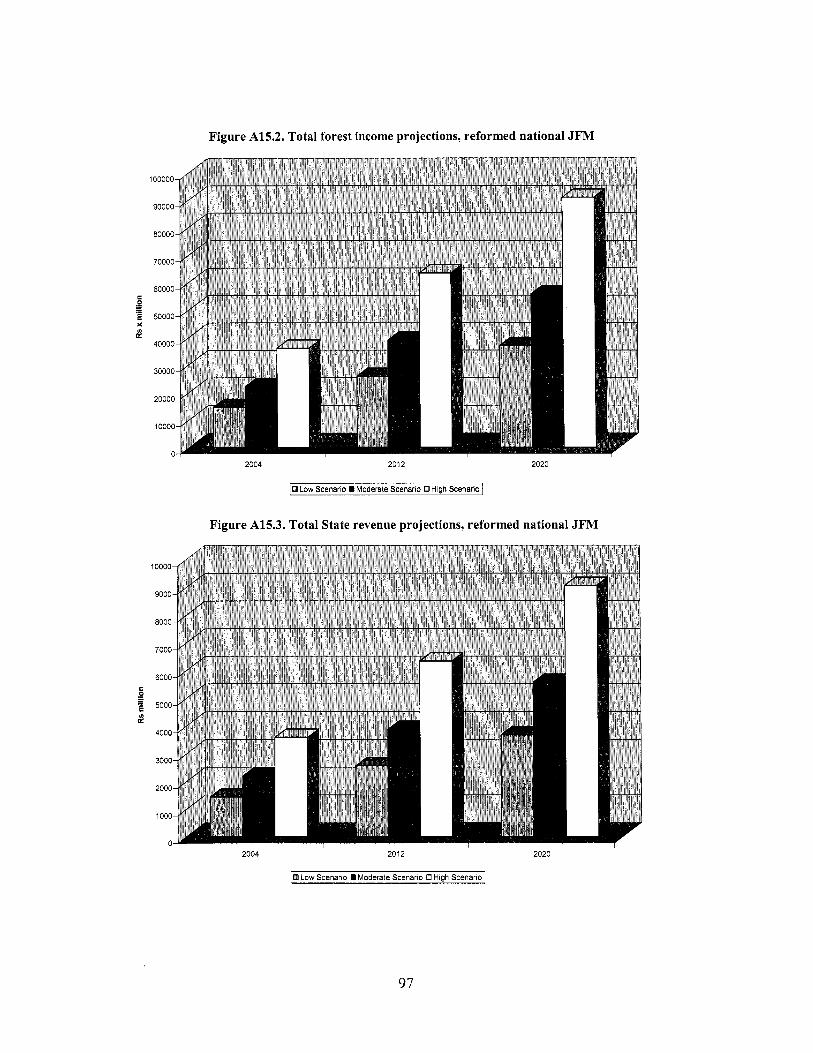
Figure A15.2. Total forest income projections, reformed national JFM
2004 2012 2020
10 Lon Scenar o Mooerate Scenar o 0 n gn Scenano
Figure A15.3. Total State revenue projections, reformed national JFM
2004 2012 2020
[ 19 Low Scenario Moderate Scenario 0 High Scenano 1
97

Figure A15.4. Income per community projections, reformed national JFM
2004 2012 2020
10 Low Scenario Moderate Scenario 0 High Scenario ~
The results show significant increases in total forest income, revenue per community, state revenue and state revenue per hectares when forest productivity i s improved and communities have access to direct markets. Simply by considering the l o w scenario as one where J F M reforms are limited, and the high scenario where reforms are broader and market potential i s being more fully exploited, the benefits o f reforms are clear. Total forest income could rise f rom an estimated $222 mi l l ion in 2004 (with the lowest scenario) to about $2 b i l l ion per year in 2020 (under the most optimistic scenario). Further, with a 20 percent increase in nonforest timber product prices due to local quality improvements and modest value addition, and 10 percent increases in timber and bamboo prices f rom quality enhancements, annual market-based incomes increase by just over 11 percent or $220 m i l l i on in 2020 in the most favorable scenario. Communities will continue to enjoy subsistence benefits f rom the forest. The imputed net subsistence values o f fuelwood and fodder would continue and i s valued at $1.1 b i l l ion per year.’* Conservation values are also important. From Chopra and others (2002) ecological and eco-tourism benefits increase net income f rom 1.07 percent to 2.40 percent o f GDP; this represents a difference o f $6.2 b i l l ion f rom the entire forest cover in India. Given that J F M forests currently represent 27 percent o f total forest cover, a simple assumption i s that 27 percent o f these gains ($1.7 bil l ion) could be derived fi-om JFM forests as they mature and begin to generate these conservation values. This model i s very simple and produces order o f magnitude estimates. More complex models could be based o n refined growth and y ie ld estimates, more precise data on prices and costs, and different assumptions about how the “typical” JFM forest i s allocated between various outputs.
52 Based o n 8.4 m i l l i on families (or households) invo lved with JFM (f rom Bahuguna and others 2004); average gross subsistence value for fuelwood and fodder f r o m case studies in Jharkhand and Assam (see Appendix 5 ) ; and assuming net values are a conservative 50 percent o f gross values to account for collection time.
98

Commercial fuelwood could be another option for increased value addition f rom the forest. Also, with better market access, villagers could be induced to increase forest stocking on their private land holdings. If some communities engage in lucrative aromatic oils or medicinal plants for international markets, net returns could rise dramatically. Another avenue that could open up to allow some communities to increase incomes would be secondary processing. There i s n o reason why more progressive communities (or a small consortium o f communities) could not develop sawmilling capacity on site. Despite the simplicity o f the model, it shows the potential l ivelihood improvement and state revenues.
As with Jharkhand, communities could earn up to Rsl mi l l ion per year f rom sustainable production, based on very conservative assumptions about prices, markets, and so forth Assuming 200 households, this represents Rs5,OOO per household per year f rom forestry, assuming revenues are shared equally. If land-owners got involved in agro-forestry to supply commercial pulp, fuelwood or timber markets, they could easily increase their net earnings by several thousand rupees per hectares per year.
Another benefit i s the contribution to balance o f payments. Given the current timber deficit o f up to 39 mi l l i on cubic meters, the potential timber production f rom existing JFM forests by 2020 could meet up to ha l f this deficit. If community forestry continues to expand nationally, i t i s possible for domestic production to meet most o f the domestic demand for timber, assuming it can be produced at competitive costs compared to imports.
99

References
Adams, W. M., Aveling, R., Brockington, D., Dickson, B., Elliott, J., Hutton, J., Roe, D., Vira, B. and Wolmer, W. 2004. Biodiversity conservation and the eradication o f poverty. Science 306: 1146-1 149.
Alsop, R., D. Sjoblom, C. Namazei, and P. Patil. 2002. “Community-Level User Groups in Three World Bank-Aided Projects: D o They Perform As Expected?” World Bank ESSED Social Development Paper No. 40, Washington, DC.
Bardhan, P, J. Baland, S. Das, D. Mookherjee, and R. Sarkar. 2002. “The Environmental Impact o f Poverty: Evidence from Firewood Collection in Rural Nepal.” University o f East Anglia, Norwich
Banyopadhyay, S. and P. Shyamsundar 2004. “Fuelwood Consumption and Participation in Community Forestry in India.” World Bank Policy Research Working Paper No. 3331, Washington
Battacharya, P., and R. Prasad. 1998. “Integrated Options for Forest Management in India.” Indian Inst i tute o f Forest Management, Bhopal.
Belcher, B. 2005. Monitoring Livelihood Impacts o f Community Forest Management: Definitions, Criteria and Indicators, February 2005, Center for International Forestry Research, Indonesia.
Centre for International Forest Research. 2002. “Planning for woodcarving in the 2lSt century.” CIFOR Infobrief. April 2002. No. 1. Bogor, Indonesia.
Chopra, K., B. Bhatttacharya, and P. Kumar 2002. “Contribution o f Forestry Sector to Gross Domestic Product (GDP) in India.” Inst i tute o f Economic Growth. Delhi University
Darlong, V., and I. Roy 2005. “Improving Linkages: Local Government, forest department, and Indigenous Communities.” In Community Forestry in Northeast India: Recommendations for Action, ed. M. Poffenberger. Community Forestry Alliance for Northeast India and Community Forestry International, Santa Barbara, California
Divan, S., and A. Rosencranz 2001. Environmental Law and Policy in India. New Delhi: Oxford University Press.
Falconer, J., and John Amold. 1988. “Forests, Trees and Household Food Security.” Social Forestry Network Paper 7a., Food and Agriculture Organization, Rome.
Federation o f Indian Plywood and Panel Industry 2004. Industry statistics for 200 1. New Delhi.
Foppes, J., and S. Ketphanh 2000. “Forest Extraction or Cultivation? Local Solutions from Lao PDR.” Paper prepared for seminar The Evolution and Sustainability o f Intermediate Systems
Between Extractivism and Plantations. CIFOR-FOREASIA, 28 June-1 July 2000, Lofoten Norway
100

Ghate, R. 2003. “Ensuring Collective Action in Participatory Forest Management.” South Asia Network for Development and Environmental Economics, Working Paper No. 3-03. August. Kathmandu, Nepal
Government o f India. 1976. Report o f the National Commission on Agriculture, 1976, Part E, Forestry. New Delhi.
. 2001, Census o f India. Delhi.
GTF, GTZ and WWF. 2001. “Toward Policies o f Community Forest Management and Certification in Latin America.” Proposal for Santa Cruz Workshop.
Indian A g o Paper Mills Association. Various years. Pulp and paper statistics, India.
Indian Centre for Science and High Technology and United Nations Industrial Development Organization 2004. Regional workshop on quality control o f medicinal plant products in South-East Asia. July 23-34, 2004, Kuala Lumpur.
Indiastat.com. Various years. Available at www.Indiastat.com/.
International Labour Office. 2003. “Making Ends Meet: Bidi Workers in India today: A Survey of Four States.” I L O Working Paper, Geneva.
JPS Associates. 2002. “Madhya Pradesh and Chhattisgarh Forestry Fiscal Trend Analysis.” New Delhi.
Khan, I., and M. Pillai, eds. 2002. “India’s Forestry Sector: A Review o f Policy, Legal and Institutional Framework.” World Bank Technical Note, Washington, DC.
Kothari, S. 2000. “To Be Governed or Self-Governed?’ Adivasi, July 16. The Hindu. National Newspaper
Kumar, S. 2002. “Does ‘Participation’ in Common Pool Resource Management Help the Poor? A Social Cost-Benefit Analysis o f Joint Forest Management in Jharkhand, India.” World Development 30 (5): 763-82.
Lawbuary, J. 1999. “Reclaiming the Forests? People’s Participation in Forest Management, East India.” Thesis submitted in partial fulfillment o f Bsc. Honors, Human Environmental Science, King’s College, London.
Mahapatra, R. 2003. “The Multi-Bil l ion Dollar Fuelwood Trade I s the Last Resort for India’s Poor.” Infochange News and Features, June. m.infochangeindia.org
Maps o f India 2004. Political map o f Jharkhand. Mapsofindia.com
Mandelbaum, D.G. 1970. Society in India. Vol. 11: Change and Continuity. Berkeley and Los Angeles: University o f California Press.
Manoharan, T.R. 2000. “Natural Resource Accounting: Economic Valuation o f Intangible Benefits o f Forests.” R I S Discussion Paper No. 04/2000. Research and Information System for the Nonaligned and other Developing Countries, New Delhi.
101

Ministry o f Environment and Forests. 2000. “National Forest Act ion Plan.” Delhi.
2001a. Forest Statistics o f India. Delhi
2001b. Forest Survey o f India. Dheradun.
Mishra, R.K. 2001. Selected Plan Statistics o f Jharkhand, Bihar and India at a Glance. Data Bank, B AU-ATCO .
Mohamed, A., and S. Appanah 1998. “Bamboo Resources Conservation and Util ization in Malaysia.” In A.N. Rao and V. Ramanatha Rao, eds. Proceedings of Training Course Cum Workshop, M a y 10-1 7, Kunming and Xishuanbanna, Yunnan, China.
Mosse, D., S. Gupta, M. Mehta, V. Shah, and J. Rees. 2002. “Brokered Livelihoods: Debt, Labour Migrat ion and Development in Tribal Western India.” Journal of Development Studies 38 (5): 59-88.
Narain, U, Gupta, S. and K. van? Veld. 2005. “Poverty and the Environment: Exploring the Relationship between Household Incomes, Private Assets, and Natural Assets.” Draf t Working Paper. Resources for the Future, Washington, DC.
National Planning Commission. Various years. “Budget Estimates for Government o f India.” Delhi
Oksanen, T. 2004. “Introduction to Forest Fiscal Systems.” In Reforming Forest Fiscal Systems: An Overview o f Country Approaches and Experiences.” Proceedings o f international workshop o n “Reforming Fiscal Systems to Promote Poverty Reduction and Sustainable Forest Management,” held October 19-21,2003, at the Wor ld Bank, Washington, D C
Pandey, Deep. 2003. Livelihood Improvements through Multifunctional Forestry Systems in India. Unpublished research background paper for Wor ld Bank
Pandey, D. N. 1996. Beyond vanishing woods: participatory survival options for wildlife, forests and people. Himanshu Publications, Udaipur, India, pp 222.
People’s Dai ly Online. 2004. “China Becomes One o f World’s Biggest Furniture Exporters.” September 20. www.english.peopledaily.com.cn/
Pradhan, G. and K. Barik, 1999, ‘Total Factor Productivity Growth in Developing Economies: A Study o f Selected Industries in India ’, Economic and Polit ical Weekly, July 31, 1999, pp. M92-M97.
Prasad, R., and P. Bhatnagar. 1990. “Socio-Economic Potential o f M ino r Forest Produce in Madhya Pradesh.” SFRl Bulletin No. 26, State Forest Research Institute, Jabalpur, India.
Rao, H.K. 2001 ,. “A Study o n Agrarian Structure, Agricultural Growth, and Rural Poverty Linkages.” National Institute o f Rural Development, Hyderabad.
102

Ribot, J. 2004. Waiting for Democracy: The Politics of Choice in Natural Resource Decentralization. Washington, DC: World Resources Institute.
Roy, S.C. 1912. TheMundas and Their Country. Calcutta: Thacker & Co.
Sachidananda, P. 1979. The Changing Munda. New Delhi: Concept Publishing Company.
Saxena, N.C. 2002. “Fuelwood Production through Wasteland Development: Some Policy Issues.” In Institutionalizing Common Pool Resources, D.K. Marothia, ed. New Delhi: Concept Publishing Company.
Sayer, J. A. and Campbell, B. M. 2004.The Science o f Sustainable Development: Local Livelihoods and the Global Environment. Cambridge University Press, Cambridge, UK.
Shah, Amita, and D.C. Sah. 2004. “Poverty among Tribal people in Madhya Pradesh: Has Anything Changed over Time? Journal of Human Development 5 (2): 241-63.
Sharma, B.D. 2001. Tribal Affairs in India: A Crucial Transition. New Delhi: Sahyog Pustak Kuteer Trust.
The Energy Research Insti tute 2004. Social and institutional assessment for Assam. Background paper prepared for World Bank.
. 2005. “Socioeconomic and Institutional Assessment for Forest Sector Analysis in Assam.” Report prepared for World Bank, October, Delhi.
Tiwary, M. 2004. Participatory Forest Policies, Politics and Institutions in India: Joint Forest Management in Jharkhand and West Bengal. Aldershot, United Kingdom: Ashgate Press.
UNDP (United Nations Development Programme)/World Bank. 2003. India: Access of the Poor to Clean Household Fuels. Washington, DC.
Upadhyay, S., and V. Upadhyay. 2002. Handbook on Forest Laws, Wildlife Laws, and the Environment. Vol. 1. Delhi: Lexis Nexis Butterworths.
Van Exem, A. 199 1. Basic Socio-Economic Attitudes of Chotanagpur Tribal people. Ranchi: Catholic Co-Operative Society. Jharkhand, India
Vedeld, P., A. Angelsen, E. Sjaastad, and G. Berg. 2004. “Counting on the Environment: Forest Incomes for the Rural Poor.” World Bank Environmental Economics Series Paper No. 98, June, Washington, DC.
Verardo, B. 2003. “Rebels and Devotees o f Jharkhand: Social, Religious and Political Transformations among the Adivasis o f Northern India.” Unpublished Ph.D. thesis, University o f London.
Vitebsky, P. 1993. Dialogues with the Dead: The Discussion of Mortality among the Sora of Eastern India. Cambridge: Cambridge University Press.
Weiner, M. 1978. Sons of the Soil: Migration and Ethnic Conflict in India. Princeton, NJ: Princeton University Press.
103

Wor ld Bank 2004. Fiscal decentralization to rural governments. South Asia Rural Development Unit. W o r l d Bank. Report No. 26654-IN. January 2004. Washington Dc .
Wor ld Bank 2005a. Small-medium scale forest enterprises in India - Opportunities for IFC and W o r l d Bank engagement. Discussion note. Agriculture and Rural Development Forest Team. Washington DC.
.2005b. “Project Performance Assessment Report : Madhya Pradesh Forestry Development Project. Operations Evaluation Department, March 7, Washington, DC.
Wor ld Wi ld l i fe Fund 2003. Relevance o f Forest Certification to the Wood carving Industry in India, Discussion paper. Delhi.
wb13057 M:\GRANT\India ESW-Forestry\Jharkhand\FINAL DRAFT REPORT\Final Report Annexes-Edited V012 Nov30.doc 12/01/2005 10:47:00 P M
104