22nd_mdtr_2014.pdf - malaysian society nephrology
TRANSCRIPT
Assoc iat ion of D ia lys isMedical Assistants and Nurses
Malaysian Society of Nephrology
Edited by:Goh BLOng LMLim YN
With contributions from:Ghazali A, Lim YN, Goh BL, Ong LM, Liu WJ, Lee ML, Phillip NJ, A Halim, S. Prasad M,
Kok LS, Clare Tan HH, Shahnaz S, Sunita B, Rosnawati Y, Chew SM, Lee DG
i
i
Sponsors:Malaysian Society of Nephrology
Association of Dialysis Medical Assistants and Nurses
The National Renal Registry is funded with grants from:The Ministry of Health Malaysia
RocheAIN Medicare
Baxter HealthcareFresenius Medical Care
22nd REPORT OFTHE MALAYSIAN DIALYSIS& TRANSPLANT REGISTRY
2014
ii
December 2015© National Renal Registry, MalaysiaISSN 1675-8862
Published by:
The National Renal RegistryMalaysian Society of NephrologySuite 15-13A, VUE ResidencesNo. 102, Jalan Pahang53000 Kuala LumpurMalaysia
Telephone : (603) 4065 0107Fax : (603) 4065 0107e-mail : [email protected] site : http://www.msn.org.my
Important information:1. This report is copyrighted. However it may be freely reproduced without the permission of the
National Renal Registry. Acknowledgment would be appreciated. Suggested citation is: BL Goh and LM Ong (Eds) Twenty second Report of the Malaysian Dialysis and Transplant 2014, Kuala Lumpur 2015
2. This report is published electronically on the website of the National Renal Registry at: http://www.msn.org.my
iii
ACKNOWLEDGEMENTS
The Malaysian Dialysis and Transplant Registry of the National Renal Registry would like to thank each and everyone who have in one way or another
contributed to the success of the Malaysian Dialysis and Transplant Registry.
In particular we would like to thank the following:
The Nephrologists, physicians and staff of the Dialysis and Transplant follow-up centres: thank you for participating in the Registry.
The success of the Registry depends on you.
The Ministry of Health, Malaysia for financial support andother support seen and unseen;
The Clinical Research Centre, in particular Dr. Goh Pik Pin and Dr. Jamaiyah Haniff for their tireless effort in supporting the work of registries.
For their generous support:-
RocheAIN Medicare
Baxter Healthcare Fresenius Medical Care
Lucenxia
iv
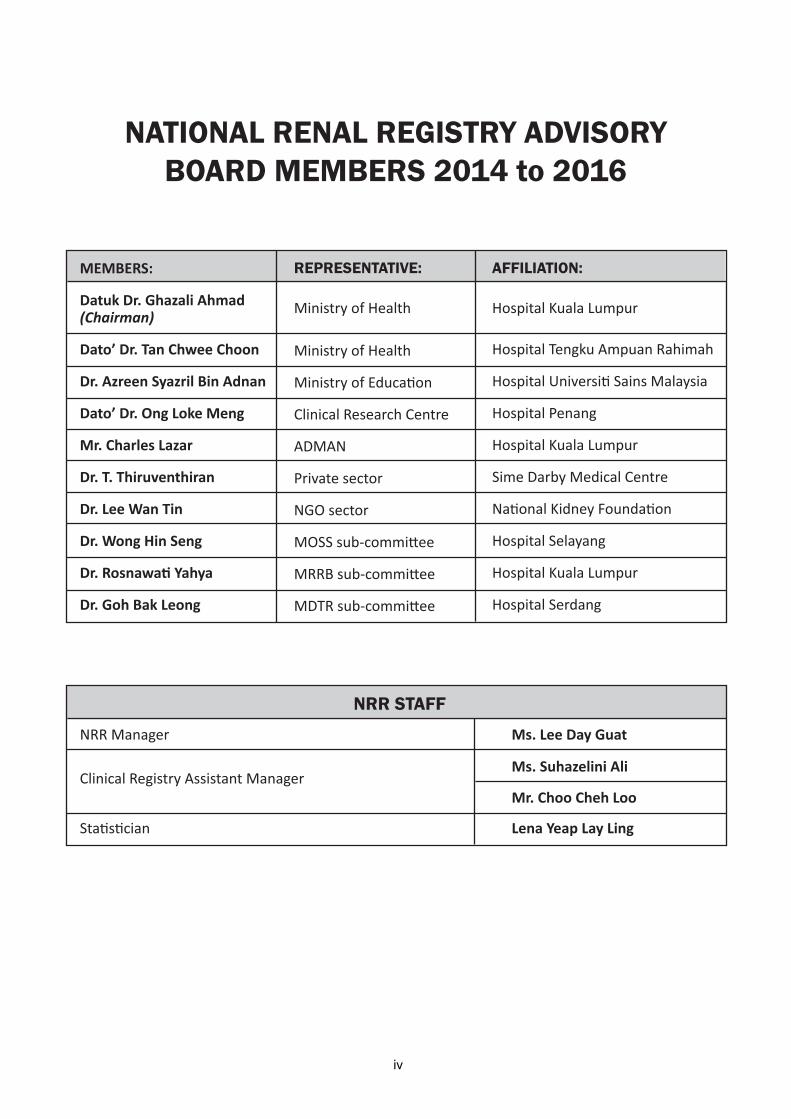
MEMBERS:
Datuk Dr. Ghazali Ahmad (Chairman)
Dato’ Dr. Tan Chwee Choon
Dr. Azreen Syazril Bin Adnan
Dato’ Dr. Ong Loke Meng
Mr. Charles Lazar
Dr. T. Thiruventhiran
Dr. Lee Wan Tin
Dr. Wong Hin Seng
Dr. Rosnawati Yahya
Dr. Goh Bak Leong
REPRESENTATIVE:
Ministry of Health
Ministry of Health
Ministry of Education
Clinical Research Centre
ADMAN
Private sector
NGO sector
MOSS sub-committee
MRRB sub-committee
MDTR sub-committee
AFFILIATION:
Hospital Kuala Lumpur
Hospital Tengku Ampuan Rahimah
Hospital Universiti Sains Malaysia
Hospital Penang
Hospital Kuala Lumpur
Sime Darby Medical Centre
National Kidney Foundation
Hospital Selayang
Hospital Kuala Lumpur
Hospital Serdang
NATIONAL RENAL REGISTRY ADVISORY BOARD MEMBERS 2014 to 2016
v
The Malaysia Dialysis and Transplant Registry (MDTR) collects information on patients with end
stage renal disease (ESRD) on renal replacement therapy (RRT) in Malaysia.
Objectives:
The objectives of the registry are as follows:
1. Describe the natural history of ESRD. The registry shall describe the characteristics of patients
with ESRD, its management, and patient survival and quality of life outcomes with treatment;
and shall describe variation thereof across different groups, healthcare sectors or geographic
regions, and its secular trend over time in Malaysia.
2. Determine effectiveness of treatments for ESRD. The registry shall determine clinical
effectiveness and cost effectiveness of treatments of ESRD in real-world clinical practices in
Malaysia.
3. Monitor safety and harm of products and services used in the treatment of ESRD. The registry
shall serve as an active surveillance system for the occurrence of unexpected or harmful events
for products and services.
4. Evaluating access to and quality of treatment services for ESRD. The registry shall assess
differences between providers or patient populations based on performance measures that
compare treatments provided or outcomes achieved with "gold standards" (e.g.,
evidence-based guidelines) or comparative benchmarks for specific health outcomes (e.g.,
risk-adjusted survival rates). Such programs may be used to identify disparities in access to
care, demonstrate opportunities for improvement, establish differentials for payment by third
parties, or provide transparency through public reporting.
5. To maintain the national renal transplant waiting list electronically – the eMOSS or electronic
Malaysian Organ Sharing System. The dialysis registry shall maintain and update patients on
dialysis who do not have contraindications to kidney transplantation onto the national renal
transplant waiting list according to published agreed criteria. This list is available on the web for
ready access by the transplant physicians any time a deceased kidney becomes available.
ABOUT THE MALAYSIAN DIALYSISAND TRANSPLANT REGISTRY (MDTR)……..
Registry design:
This is a multi-center, observational
cohort study designed to evaluate
the health outcomes of patients with
ESRD undergoing treatment at
participating clinical centres. Patient
inclusion criterion is deliberately
broad and shall include any patient
vi
Registry design:
This is a multi-center, observational cohort study designed to evaluate the health outcomes of
patients with ESRD undergoing treatment at participating clinical centres. Patient inclusion criterion
is deliberately broad and shall include any patient with a confirmed diagnosis of ESRD.
There is no prescribed study visits. Patient shall attend the clinical site as and when required per the
standard of care at the site. Required data shall be collected as they become available.
A clinical site shall notify all new patients to the registry, and shall continue to do so until the
termination of the registry. Patients shall be follow-up for life.
Participation. Site shall notify the patients’ treatment to the registry in a calendar year of its
participation. A site shall similarly notify patients during each year of its participation in the
registry.
Registry study population:
The registry study population consists of male or female patients with ESRD to be recruited from
participating sites in Malaysia. Participation in this study is voluntary. However, in accordance with
the Private Health-care Facilities Act 1998 (AKTA 586), all dialysis health facility are required to
submit data to the Malaysian Dialysis and Transplant Registry (MDTR).
All clinical centres or sites that satisfy the following selection criteria will be invited to participate:
1. This registry is opened to all clinical sites that provide RRT services for patients with ESRD in
Malaysia.
2. Each site shall have a Principal Investigator who is also a licensed physician / Surgeon and a
qualified professional experienced with ESRD management.
3. Each site shall appoint a Site Coordinator (SC). The SC is the person at the participating clinical
site who is responsible for all aspects of registry management and data collection at site, and
who will liaise with the Clinical Registry Manager (CRM) and Clinical Registry Assistant (CRA) at
the Registry Coordinating Centre (RCC).
4. Each site shall accept responsibility for data collection, as well as for ensuring proper record
keeping and registry document filing.
5. Each site shall agree to comply with the registry procedures and shall be willing to be subjected
to ongoing review of data by CRM or CRA or other representative of MDTR. This may include
one or more site visits by prior arrangement
Patient eligibility criteria:
All new patients with ESRD undergoing treatment at a participating clinical site are eligible for
entry into the registry.
In addition, a site may opt to enter existing patients on follow-up at the site into the registry.
vii
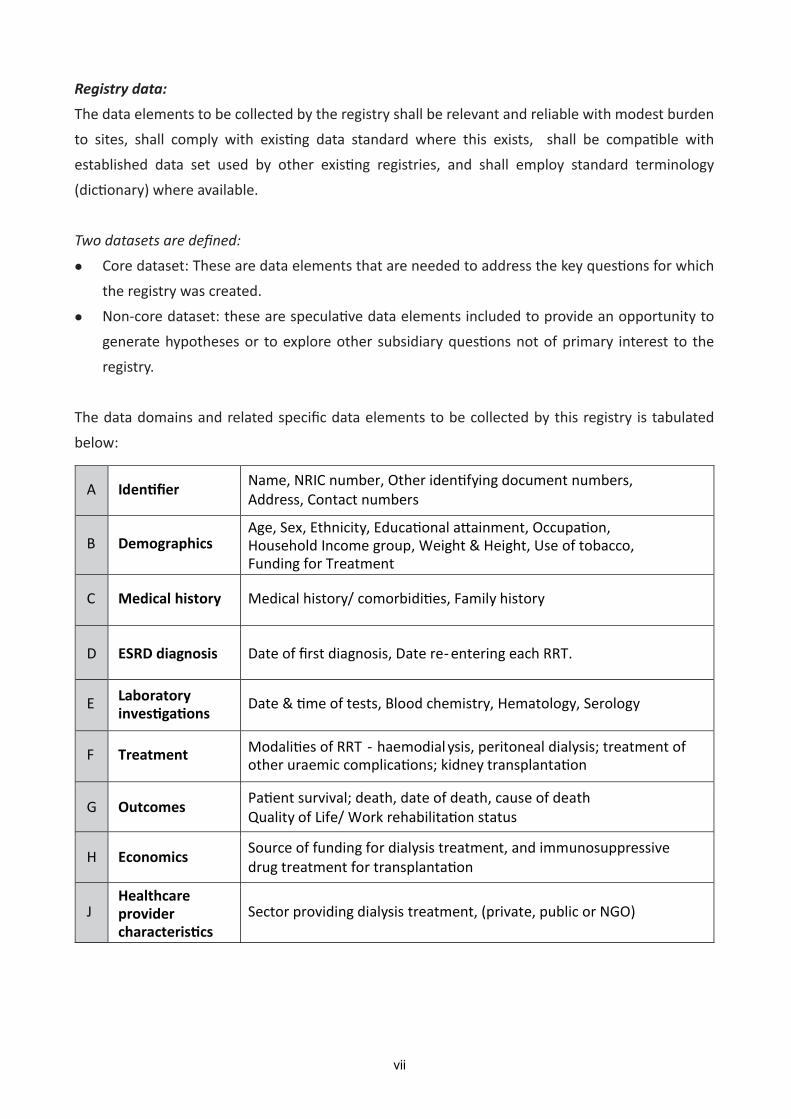
Registry data:
The data elements to be collected by the registry shall be relevant and reliable with modest burden
to sites, shall comply with existing data standard where this exists, shall be compatible with
established data set used by other existing registries, and shall employ standard terminology
(dictionary) where available.
Two datasets are defined:
Core dataset: These are data elements that are needed to address the key questions for which
the registry was created.
Non-core dataset: these are speculative data elements included to provide an opportunity to
generate hypotheses or to explore other subsidiary questions not of primary interest to the
registry.
The data domains and related specific data elements to be collected by this registry is tabulated
below:
A
Identifier Name, NRIC number, Other identifying document numbers,
Address, Contact numbers
B
Demographics Age, Sex, Ethnicity, Educational attainment, Occupation,
Household Income group, Weight & Height, Use of tobacco, Funding for Treatment
C
Medical history
Medical history/ comorbidities, Family history
D
ESRD diagnosis
Date of first diagnosis, Date re- entering each RRT.
E Laboratory
investigations Date & time of tests, Blood chemistry, Hematology, Serology
F
Treatment Modalities of RRT - haemodial ysis, peritoneal dialysis; treatment of
other uraemic complications; kidney transplantation
G
Outcomes Patient survival; death, date of death, cause of death
Quality of Life/ Work rehabilitation status
H Economics Source of funding for dialysis treatment, and immunosuppressive drug treatment for transplantation
J Healthcare provider characteristics
Sector providing dialysis treatment, (private, public or NGO)
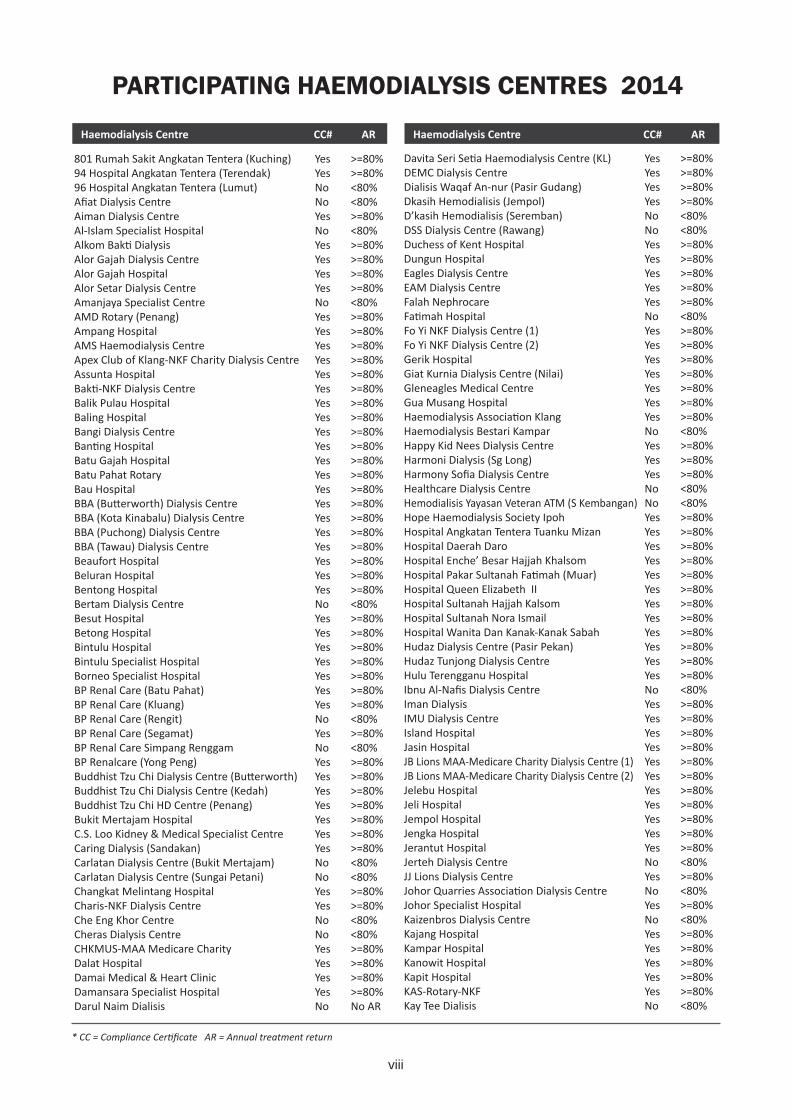
801 Rumah Sakit Angkatan Tentera (Kuching) Yes >=80%94 Hospital Angkatan Tentera (Terendak) Yes >=80%96 Hospital Angkatan Tentera (Lumut) No <80%Afi at Dialysis Centre No <80%Aiman Dialysis Centre Yes >=80%Al-Islam Specialist Hospital No <80%Alkom Bak Dialysis Yes >=80%Alor Gajah Dialysis Centre Yes >=80%Alor Gajah Hospital Yes >=80%Alor Setar Dialysis Centre Yes >=80%Amanjaya Specialist Centre No <80%AMD Rotary (Penang) Yes >=80%Ampang Hospital Yes >=80%AMS Haemodialysis Centre Yes >=80%Apex Club of Klang-NKF Charity Dialysis Centre Yes >=80%Assunta Hospital Yes >=80%Bak -NKF Dialysis Centre Yes >=80%Balik Pulau Hospital Yes >=80%Baling Hospital Yes >=80%Bangi Dialysis Centre Yes >=80%Ban ng Hospital Yes >=80%Batu Gajah Hospital Yes >=80%Batu Pahat Rotary Yes >=80%Bau Hospital Yes >=80%BBA (Bu erworth) Dialysis Centre Yes >=80%BBA (Kota Kinabalu) Dialysis Centre Yes >=80%BBA (Puchong) Dialysis Centre Yes >=80%BBA (Tawau) Dialysis Centre Yes >=80%Beaufort Hospital Yes >=80%Beluran Hospital Yes >=80%Bentong Hospital Yes >=80%Bertam Dialysis Centre No <80%Besut Hospital Yes >=80%Betong Hospital Yes >=80%Bintulu Hospital Yes >=80%Bintulu Specialist Hospital Yes >=80%Borneo Specialist Hospital Yes >=80%BP Renal Care (Batu Pahat) Yes >=80%BP Renal Care (Kluang) Yes >=80%BP Renal Care (Rengit) No <80%BP Renal Care (Segamat) Yes >=80%BP Renal Care Simpang Renggam No <80%BP Renalcare (Yong Peng) Yes >=80%Buddhist Tzu Chi Dialysis Centre (Bu erworth) Yes >=80%Buddhist Tzu Chi Dialysis Centre (Kedah) Yes >=80%Buddhist Tzu Chi HD Centre (Penang) Yes >=80%Bukit Mertajam Hospital Yes >=80%C.S. Loo Kidney & Medical Specialist Centre Yes >=80%Caring Dialysis (Sandakan) Yes >=80%Carlatan Dialysis Centre (Bukit Mertajam) No <80%Carlatan Dialysis Centre (Sungai Petani) No <80%Changkat Melintang Hospital Yes >=80%Charis-NKF Dialysis Centre Yes >=80%Che Eng Khor Centre No <80%Cheras Dialysis Centre No <80%CHKMUS-MAA Medicare Charity Yes >=80%Dalat Hospital Yes >=80%Damai Medical & Heart Clinic Yes >=80%Damansara Specialist Hospital Yes >=80%Darul Naim Dialisis No No AR
Davita Seri Se a Haemodialysis Centre (KL) Yes >=80%DEMC Dialysis Centre Yes >=80%Dialisis Waqaf An-nur (Pasir Gudang) Yes >=80%Dkasih Hemodialisis (Jempol) Yes >=80%D’kasih Hemodialisis (Seremban) No <80%DSS Dialysis Centre (Rawang) No <80%Duchess of Kent Hospital Yes >=80%Dungun Hospital Yes >=80%Eagles Dialysis Centre Yes >=80%EAM Dialysis Centre Yes >=80%Falah Nephrocare Yes >=80%Fa mah Hospital No <80%Fo Yi NKF Dialysis Centre (1) Yes >=80%Fo Yi NKF Dialysis Centre (2) Yes >=80%Gerik Hospital Yes >=80%Giat Kurnia Dialysis Centre (Nilai) Yes >=80%Gleneagles Medical Centre Yes >=80%Gua Musang Hospital Yes >=80%Haemodialysis Associa on Klang Yes >=80%Haemodialysis Bestari Kampar No <80%Happy Kid Nees Dialysis Centre Yes >=80%Harmoni Dialysis (Sg Long) Yes >=80%Harmony Sofi a Dialysis Centre Yes >=80%Healthcare Dialysis Centre No <80%Hemodialisis Yayasan Veteran ATM (S Kembangan) No <80%Hope Haemodialysis Society Ipoh Yes >=80%Hospital Angkatan Tentera Tuanku Mizan Yes >=80%Hospital Daerah Daro Yes >=80%Hospital Enche’ Besar Hajjah Khalsom Yes >=80%Hospital Pakar Sultanah Fa mah (Muar) Yes >=80%Hospital Queen Elizabeth II Yes >=80%Hospital Sultanah Hajjah Kalsom Yes >=80%Hospital Sultanah Nora Ismail Yes >=80%Hospital Wanita Dan Kanak-Kanak Sabah Yes >=80%Hudaz Dialysis Centre (Pasir Pekan) Yes >=80%Hudaz Tunjong Dialysis Centre Yes >=80%Hulu Terengganu Hospital Yes >=80%Ibnu Al-Nafi s Dialysis Centre No <80%Iman Dialysis Yes >=80%IMU Dialysis Centre Yes >=80%Island Hospital Yes >=80%Jasin Hospital Yes >=80%JB Lions MAA-Medicare Charity Dialysis Centre (1) Yes >=80%JB Lions MAA-Medicare Charity Dialysis Centre (2) Yes >=80%Jelebu Hospital Yes >=80%Jeli Hospital Yes >=80%Jempol Hospital Yes >=80%Jengka Hospital Yes >=80%Jerantut Hospital Yes >=80%Jerteh Dialysis Centre No <80%JJ Lions Dialysis Centre Yes >=80%Johor Quarries Associa on Dialysis Centre No <80%Johor Specialist Hospital Yes >=80%Kaizenbros Dialysis Centre No <80%Kajang Hospital Yes >=80%Kampar Hospital Yes >=80%Kanowit Hospital Yes >=80%Kapit Hospital Yes >=80%KAS-Rotary-NKF Yes >=80%Kay Tee Dialisis No <80%
PARTICIPATING HAEMODIALYSIS CENTRES 2014
Haemodialysis Centre CC# AR Haemodialysis Centre CC# AR
viii
* CC = Compliance Cer fi cate AR = Annual treatment return
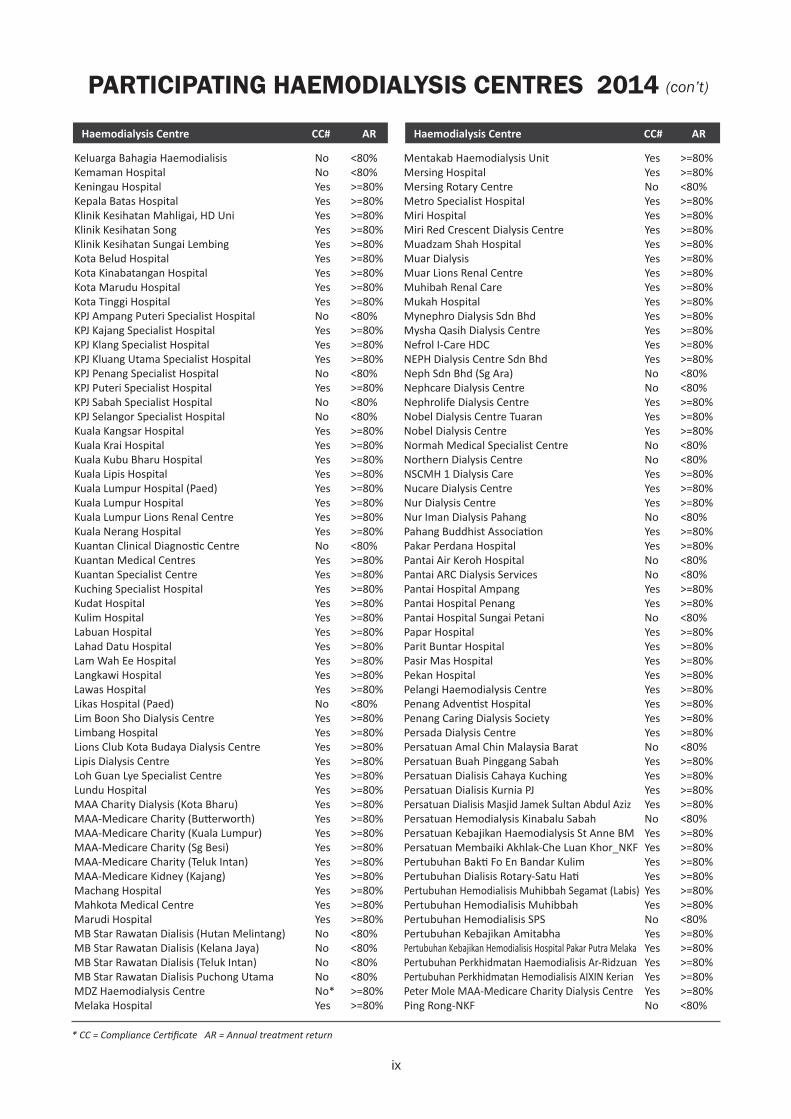
Keluarga Bahagia Haemodialisis No <80%Kemaman Hospital No <80%Keningau Hospital Yes >=80%Kepala Batas Hospital Yes >=80%Klinik Kesihatan Mahligai, HD Uni Yes >=80%Klinik Kesihatan Song Yes >=80%Klinik Kesihatan Sungai Lembing Yes >=80%Kota Belud Hospital Yes >=80%Kota Kinabatangan Hospital Yes >=80%Kota Marudu Hospital Yes >=80%Kota Tinggi Hospital Yes >=80%KPJ Ampang Puteri Specialist Hospital No <80%KPJ Kajang Specialist Hospital Yes >=80%KPJ Klang Specialist Hospital Yes >=80%KPJ Kluang Utama Specialist Hospital Yes >=80%KPJ Penang Specialist Hospital No <80%KPJ Puteri Specialist Hospital Yes >=80%KPJ Sabah Specialist Hospital No <80%KPJ Selangor Specialist Hospital No <80%Kuala Kangsar Hospital Yes >=80%Kuala Krai Hospital Yes >=80%Kuala Kubu Bharu Hospital Yes >=80%Kuala Lipis Hospital Yes >=80%Kuala Lumpur Hospital (Paed) Yes >=80%Kuala Lumpur Hospital Yes >=80%Kuala Lumpur Lions Renal Centre Yes >=80%Kuala Nerang Hospital Yes >=80%Kuantan Clinical Diagnos c Centre No <80%Kuantan Medical Centres Yes >=80%Kuantan Specialist Centre Yes >=80%Kuching Specialist Hospital Yes >=80%Kudat Hospital Yes >=80%Kulim Hospital Yes >=80%Labuan Hospital Yes >=80%Lahad Datu Hospital Yes >=80%Lam Wah Ee Hospital Yes >=80%Langkawi Hospital Yes >=80%Lawas Hospital Yes >=80%Likas Hospital (Paed) No <80%Lim Boon Sho Dialysis Centre Yes >=80%Limbang Hospital Yes >=80%Lions Club Kota Budaya Dialysis Centre Yes >=80%Lipis Dialysis Centre Yes >=80%Loh Guan Lye Specialist Centre Yes >=80%Lundu Hospital Yes >=80%MAA Charity Dialysis (Kota Bharu) Yes >=80%MAA-Medicare Charity (Bu erworth) Yes >=80%MAA-Medicare Charity (Kuala Lumpur) Yes >=80%MAA-Medicare Charity (Sg Besi) Yes >=80%MAA-Medicare Charity (Teluk Intan) Yes >=80%MAA-Medicare Kidney (Kajang) Yes >=80%Machang Hospital Yes >=80%Mahkota Medical Centre Yes >=80%Marudi Hospital Yes >=80%MB Star Rawatan Dialisis (Hutan Melintang) No <80%MB Star Rawatan Dialisis (Kelana Jaya) No <80%MB Star Rawatan Dialisis (Teluk Intan) No <80%MB Star Rawatan Dialisis Puchong Utama No <80%MDZ Haemodialysis Centre No* >=80%Melaka Hospital Yes >=80%
Mentakab Haemodialysis Unit Yes >=80%Mersing Hospital Yes >=80%Mersing Rotary Centre No <80%Metro Specialist Hospital Yes >=80%Miri Hospital Yes >=80%Miri Red Crescent Dialysis Centre Yes >=80%Muadzam Shah Hospital Yes >=80%Muar Dialysis Yes >=80%Muar Lions Renal Centre Yes >=80%Muhibah Renal Care Yes >=80%Mukah Hospital Yes >=80%Mynephro Dialysis Sdn Bhd Yes >=80%Mysha Qasih Dialysis Centre Yes >=80%Nefrol I-Care HDC Yes >=80%NEPH Dialysis Centre Sdn Bhd Yes >=80%Neph Sdn Bhd (Sg Ara) No <80%Nephcare Dialysis Centre No <80%Nephrolife Dialysis Centre Yes >=80%Nobel Dialysis Centre Tuaran Yes >=80%Nobel Dialysis Centre Yes >=80%Normah Medical Specialist Centre No <80%Northern Dialysis Centre No <80%NSCMH 1 Dialysis Care Yes >=80%Nucare Dialysis Centre Yes >=80%Nur Dialysis Centre Yes >=80%Nur Iman Dialysis Pahang No <80%Pahang Buddhist Associa on Yes >=80%Pakar Perdana Hospital Yes >=80%Pantai Air Keroh Hospital No <80%Pantai ARC Dialysis Services No <80%Pantai Hospital Ampang Yes >=80%Pantai Hospital Penang Yes >=80%Pantai Hospital Sungai Petani No <80%Papar Hospital Yes >=80%Parit Buntar Hospital Yes >=80%Pasir Mas Hospital Yes >=80%Pekan Hospital Yes >=80%Pelangi Haemodialysis Centre Yes >=80%Penang Adven st Hospital Yes >=80%Penang Caring Dialysis Society Yes >=80%Persada Dialysis Centre Yes >=80%Persatuan Amal Chin Malaysia Barat No <80%Persatuan Buah Pinggang Sabah Yes >=80%Persatuan Dialisis Cahaya Kuching Yes >=80%Persatuan Dialisis Kurnia PJ Yes >=80%Persatuan Dialisis Masjid Jamek Sultan Abdul Aziz Yes >=80%Persatuan Hemodialysis Kinabalu Sabah No <80%Persatuan Kebajikan Haemodialysis St Anne BM Yes >=80%Persatuan Membaiki Akhlak-Che Luan Khor_NKF Yes >=80%Pertubuhan Bak Fo En Bandar Kulim Yes >=80%Pertubuhan Dialisis Rotary-Satu Ha Yes >=80%Pertubuhan Hemodialisis Muhibbah Segamat (Labis) Yes >=80%Pertubuhan Hemodialisis Muhibbah Yes >=80%Pertubuhan Hemodialisis SPS No <80%Pertubuhan Kebajikan Amitabha Yes >=80%Pertubuhan Kebajikan Hemodialisis Hospital Pakar Putra Melaka Yes >=80%Pertubuhan Perkhidmatan Haemodialisis Ar-Ridzuan Yes >=80%Pertubuhan Perkhidmatan Hemodialisis AIXIN Kerian Yes >=80%Peter Mole MAA-Medicare Charity Dialysis Centre Yes >=80%Ping Rong-NKF No <80%
PARTICIPATING HAEMODIALYSIS CENTRES 2014 (con’t)
Haemodialysis Centre CC# AR Haemodialysis Centre CC# AR
ix
* CC = Compliance Cer fi cate AR = Annual treatment return
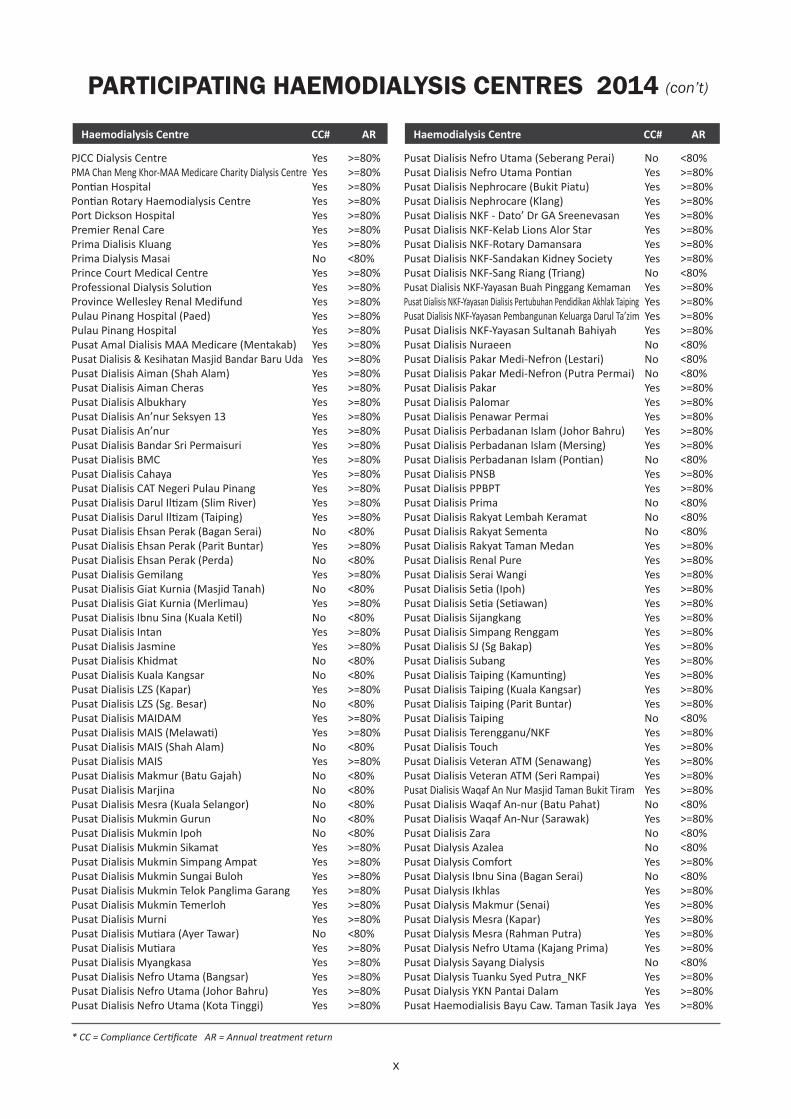
PJCC Dialysis Centre Yes >=80%PMA Chan Meng Khor-MAA Medicare Charity Dialysis Centre Yes >=80%Pon an Hospital Yes >=80%Pon an Rotary Haemodialysis Centre Yes >=80%Port Dickson Hospital Yes >=80%Premier Renal Care Yes >=80%Prima Dialisis Kluang Yes >=80%Prima Dialysis Masai No <80%Prince Court Medical Centre Yes >=80%Professional Dialysis Solu on Yes >=80%Province Wellesley Renal Medifund Yes >=80%Pulau Pinang Hospital (Paed) Yes >=80%Pulau Pinang Hospital Yes >=80%Pusat Amal Dialisis MAA Medicare (Mentakab) Yes >=80%Pusat Dialisis & Kesihatan Masjid Bandar Baru Uda Yes >=80%Pusat Dialisis Aiman (Shah Alam) Yes >=80%Pusat Dialisis Aiman Cheras Yes >=80%Pusat Dialisis Albukhary Yes >=80%Pusat Dialisis An’nur Seksyen 13 Yes >=80%Pusat Dialisis An’nur Yes >=80%Pusat Dialisis Bandar Sri Permaisuri Yes >=80%Pusat Dialisis BMC Yes >=80%Pusat Dialisis Cahaya Yes >=80%Pusat Dialisis CAT Negeri Pulau Pinang Yes >=80%Pusat Dialisis Darul Il zam (Slim River) Yes >=80%Pusat Dialisis Darul Il zam (Taiping) Yes >=80%Pusat Dialisis Ehsan Perak (Bagan Serai) No <80%Pusat Dialisis Ehsan Perak (Parit Buntar) Yes >=80%Pusat Dialisis Ehsan Perak (Perda) No <80%Pusat Dialisis Gemilang Yes >=80%Pusat Dialisis Giat Kurnia (Masjid Tanah) No <80%Pusat Dialisis Giat Kurnia (Merlimau) Yes >=80%Pusat Dialisis Ibnu Sina (Kuala Ke l) No <80%Pusat Dialisis Intan Yes >=80%Pusat Dialisis Jasmine Yes >=80%Pusat Dialisis Khidmat No <80%Pusat Dialisis Kuala Kangsar No <80%Pusat Dialisis LZS (Kapar) Yes >=80%Pusat Dialisis LZS (Sg. Besar) No <80%Pusat Dialisis MAIDAM Yes >=80%Pusat Dialisis MAIS (Melawa ) Yes >=80%Pusat Dialisis MAIS (Shah Alam) No <80%Pusat Dialisis MAIS Yes >=80%Pusat Dialisis Makmur (Batu Gajah) No <80%Pusat Dialisis Marjina No <80%Pusat Dialisis Mesra (Kuala Selangor) No <80%Pusat Dialisis Mukmin Gurun No <80%Pusat Dialisis Mukmin Ipoh No <80%Pusat Dialisis Mukmin Sikamat Yes >=80%Pusat Dialisis Mukmin Simpang Ampat Yes >=80%Pusat Dialisis Mukmin Sungai Buloh Yes >=80%Pusat Dialisis Mukmin Telok Panglima Garang Yes >=80%Pusat Dialisis Mukmin Temerloh Yes >=80%Pusat Dialisis Murni Yes >=80%Pusat Dialisis Mu ara (Ayer Tawar) No <80%Pusat Dialisis Mu ara Yes >=80%Pusat Dialisis Myangkasa Yes >=80%Pusat Dialisis Nefro Utama (Bangsar) Yes >=80%Pusat Dialisis Nefro Utama (Johor Bahru) Yes >=80%Pusat Dialisis Nefro Utama (Kota Tinggi) Yes >=80%
Pusat Dialisis Nefro Utama (Seberang Perai) No <80%Pusat Dialisis Nefro Utama Pon an Yes >=80%Pusat Dialisis Nephrocare (Bukit Piatu) Yes >=80%Pusat Dialisis Nephrocare (Klang) Yes >=80%Pusat Dialisis NKF - Dato’ Dr GA Sreenevasan Yes >=80%Pusat Dialisis NKF-Kelab Lions Alor Star Yes >=80%Pusat Dialisis NKF-Rotary Damansara Yes >=80%Pusat Dialisis NKF-Sandakan Kidney Society Yes >=80%Pusat Dialisis NKF-Sang Riang (Triang) No <80%Pusat Dialisis NKF-Yayasan Buah Pinggang Kemaman Yes >=80%Pusat Dialisis NKF-Yayasan Dialisis Pertubuhan Pendidikan Akhlak Taiping Yes >=80%Pusat Dialisis NKF-Yayasan Pembangunan Keluarga Darul Ta’zim Yes >=80%Pusat Dialisis NKF-Yayasan Sultanah Bahiyah Yes >=80%Pusat Dialisis Nuraeen No <80%Pusat Dialisis Pakar Medi-Nefron (Lestari) No <80%Pusat Dialisis Pakar Medi-Nefron (Putra Permai) No <80%Pusat Dialisis Pakar Yes >=80%Pusat Dialisis Palomar Yes >=80%Pusat Dialisis Penawar Permai Yes >=80%Pusat Dialisis Perbadanan Islam (Johor Bahru) Yes >=80%Pusat Dialisis Perbadanan Islam (Mersing) Yes >=80%Pusat Dialisis Perbadanan Islam (Pon an) No <80%Pusat Dialisis PNSB Yes >=80%Pusat Dialisis PPBPT Yes >=80%Pusat Dialisis Prima No <80%Pusat Dialisis Rakyat Lembah Keramat No <80%Pusat Dialisis Rakyat Sementa No <80%Pusat Dialisis Rakyat Taman Medan Yes >=80%Pusat Dialisis Renal Pure Yes >=80%Pusat Dialisis Serai Wangi Yes >=80%Pusat Dialisis Se a (Ipoh) Yes >=80%Pusat Dialisis Se a (Se awan) Yes >=80%Pusat Dialisis Sijangkang Yes >=80%Pusat Dialisis Simpang Renggam Yes >=80%Pusat Dialisis SJ (Sg Bakap) Yes >=80%Pusat Dialisis Subang Yes >=80%Pusat Dialisis Taiping (Kamun ng) Yes >=80%Pusat Dialisis Taiping (Kuala Kangsar) Yes >=80%Pusat Dialisis Taiping (Parit Buntar) Yes >=80%Pusat Dialisis Taiping No <80%Pusat Dialisis Terengganu/NKF Yes >=80%Pusat Dialisis Touch Yes >=80%Pusat Dialisis Veteran ATM (Senawang) Yes >=80%Pusat Dialisis Veteran ATM (Seri Rampai) Yes >=80%Pusat Dialisis Waqaf An Nur Masjid Taman Bukit Tiram Yes >=80%Pusat Dialisis Waqaf An-nur (Batu Pahat) No <80%Pusat Dialisis Waqaf An-Nur (Sarawak) Yes >=80%Pusat Dialisis Zara No <80%Pusat Dialysis Azalea No <80%Pusat Dialysis Comfort Yes >=80%Pusat Dialysis Ibnu Sina (Bagan Serai) No <80%Pusat Dialysis Ikhlas Yes >=80%Pusat Dialysis Makmur (Senai) Yes >=80%Pusat Dialysis Mesra (Kapar) Yes >=80%Pusat Dialysis Mesra (Rahman Putra) Yes >=80%Pusat Dialysis Nefro Utama (Kajang Prima) Yes >=80%Pusat Dialysis Sayang Dialysis No <80%Pusat Dialysis Tuanku Syed Putra_NKF Yes >=80%Pusat Dialysis YKN Pantai Dalam Yes >=80%Pusat Haemodialisis Bayu Caw. Taman Tasik Jaya Yes >=80%
PARTICIPATING HAEMODIALYSIS CENTRES 2014 (con’t)
Haemodialysis Centre CC# AR Haemodialysis Centre CC# AR
x
* CC = Compliance Cer fi cate AR = Annual treatment return
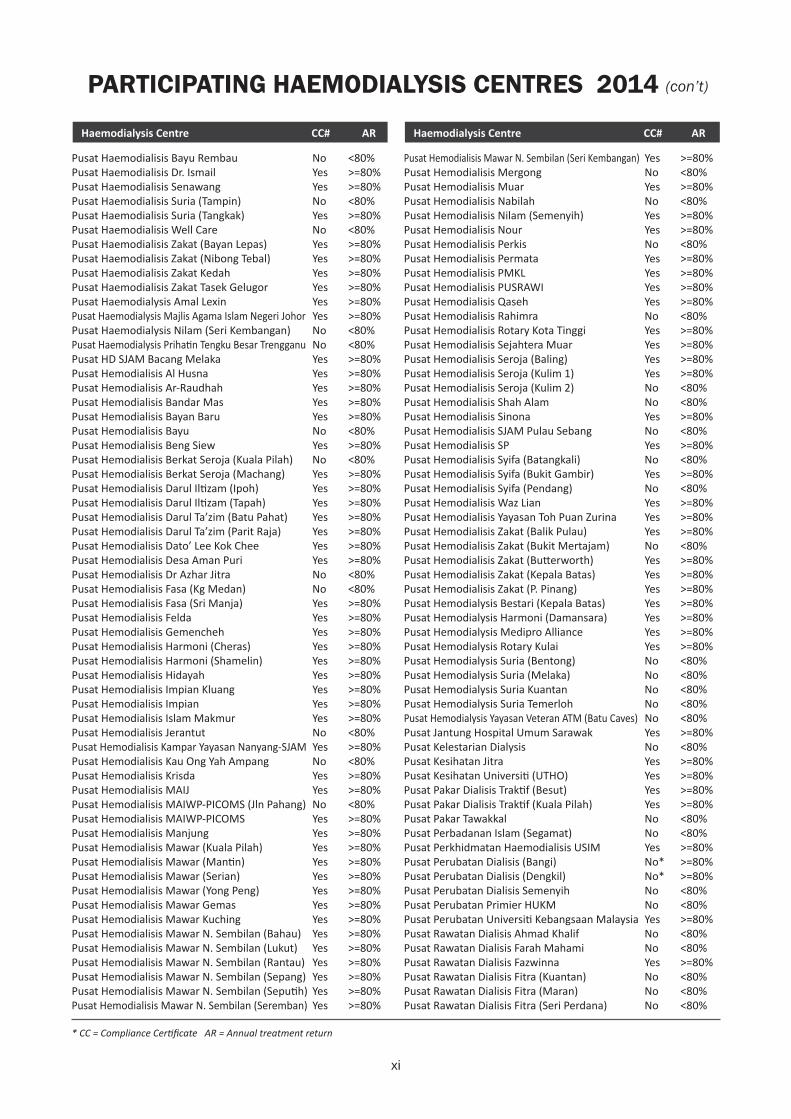
Pusat Haemodialisis Bayu Rembau No <80%Pusat Haemodialisis Dr. Ismail Yes >=80%Pusat Haemodialisis Senawang Yes >=80%Pusat Haemodialisis Suria (Tampin) No <80%Pusat Haemodialisis Suria (Tangkak) Yes >=80%Pusat Haemodialisis Well Care No <80%Pusat Haemodialisis Zakat (Bayan Lepas) Yes >=80%Pusat Haemodialisis Zakat (Nibong Tebal) Yes >=80%Pusat Haemodialisis Zakat Kedah Yes >=80%Pusat Haemodialisis Zakat Tasek Gelugor Yes >=80%Pusat Haemodialysis Amal Lexin Yes >=80%Pusat Haemodialysis Majlis Agama Islam Negeri Johor Yes >=80%Pusat Haemodialysis Nilam (Seri Kembangan) No <80%Pusat Haemodialysis Priha n Tengku Besar Trengganu No <80%Pusat HD SJAM Bacang Melaka Yes >=80%Pusat Hemodialisis Al Husna Yes >=80%Pusat Hemodialisis Ar-Raudhah Yes >=80%Pusat Hemodialisis Bandar Mas Yes >=80%Pusat Hemodialisis Bayan Baru Yes >=80%Pusat Hemodialisis Bayu No <80%Pusat Hemodialisis Beng Siew Yes >=80%Pusat Hemodialisis Berkat Seroja (Kuala Pilah) No <80%Pusat Hemodialisis Berkat Seroja (Machang) Yes >=80%Pusat Hemodialisis Darul Il zam (Ipoh) Yes >=80%Pusat Hemodialisis Darul Il zam (Tapah) Yes >=80%Pusat Hemodialisis Darul Ta’zim (Batu Pahat) Yes >=80%Pusat Hemodialisis Darul Ta’zim (Parit Raja) Yes >=80%Pusat Hemodialisis Dato’ Lee Kok Chee Yes >=80%Pusat Hemodialisis Desa Aman Puri Yes >=80%Pusat Hemodialisis Dr Azhar Jitra No <80%Pusat Hemodialisis Fasa (Kg Medan) No <80%Pusat Hemodialisis Fasa (Sri Manja) Yes >=80%Pusat Hemodialisis Felda Yes >=80%Pusat Hemodialisis Gemencheh Yes >=80%Pusat Hemodialisis Harmoni (Cheras) Yes >=80%Pusat Hemodialisis Harmoni (Shamelin) Yes >=80%Pusat Hemodialisis Hidayah Yes >=80%Pusat Hemodialisis Impian Kluang Yes >=80%Pusat Hemodialisis Impian Yes >=80%Pusat Hemodialisis Islam Makmur Yes >=80%Pusat Hemodialisis Jerantut No <80%Pusat Hemodialisis Kampar Yayasan Nanyang-SJAM Yes >=80%Pusat Hemodialisis Kau Ong Yah Ampang No <80%Pusat Hemodialisis Krisda Yes >=80%Pusat Hemodialisis MAIJ Yes >=80%Pusat Hemodialisis MAIWP-PICOMS (Jln Pahang) No <80%Pusat Hemodialisis MAIWP-PICOMS Yes >=80%Pusat Hemodialisis Manjung Yes >=80%Pusat Hemodialisis Mawar (Kuala Pilah) Yes >=80%Pusat Hemodialisis Mawar (Man n) Yes >=80%Pusat Hemodialisis Mawar (Serian) Yes >=80%Pusat Hemodialisis Mawar (Yong Peng) Yes >=80%Pusat Hemodialisis Mawar Gemas Yes >=80%Pusat Hemodialisis Mawar Kuching Yes >=80%Pusat Hemodialisis Mawar N. Sembilan (Bahau) Yes >=80%Pusat Hemodialisis Mawar N. Sembilan (Lukut) Yes >=80%Pusat Hemodialisis Mawar N. Sembilan (Rantau) Yes >=80%Pusat Hemodialisis Mawar N. Sembilan (Sepang) Yes >=80%Pusat Hemodialisis Mawar N. Sembilan (Sepu h) Yes >=80%Pusat Hemodialisis Mawar N. Sembilan (Seremban) Yes >=80%
Pusat Hemodialisis Mawar N. Sembilan (Seri Kembangan) Yes >=80%Pusat Hemodialisis Mergong No <80%Pusat Hemodialisis Muar Yes >=80%Pusat Hemodialisis Nabilah No <80%Pusat Hemodialisis Nilam (Semenyih) Yes >=80%Pusat Hemodialisis Nour Yes >=80%Pusat Hemodialisis Perkis No <80%Pusat Hemodialisis Permata Yes >=80%Pusat Hemodialisis PMKL Yes >=80%Pusat Hemodialisis PUSRAWI Yes >=80%Pusat Hemodialisis Qaseh Yes >=80%Pusat Hemodialisis Rahimra No <80%Pusat Hemodialisis Rotary Kota Tinggi Yes >=80%Pusat Hemodialisis Sejahtera Muar Yes >=80%Pusat Hemodialisis Seroja (Baling) Yes >=80%Pusat Hemodialisis Seroja (Kulim 1) Yes >=80%Pusat Hemodialisis Seroja (Kulim 2) No <80%Pusat Hemodialisis Shah Alam No <80%Pusat Hemodialisis Sinona Yes >=80%Pusat Hemodialisis SJAM Pulau Sebang No <80%Pusat Hemodialisis SP Yes >=80%Pusat Hemodialisis Syifa (Batangkali) No <80%Pusat Hemodialisis Syifa (Bukit Gambir) Yes >=80%Pusat Hemodialisis Syifa (Pendang) No <80%Pusat Hemodialisis Waz Lian Yes >=80%Pusat Hemodialisis Yayasan Toh Puan Zurina Yes >=80%Pusat Hemodialisis Zakat (Balik Pulau) Yes >=80%Pusat Hemodialisis Zakat (Bukit Mertajam) No <80%Pusat Hemodialisis Zakat (Bu erworth) Yes >=80%Pusat Hemodialisis Zakat (Kepala Batas) Yes >=80%Pusat Hemodialisis Zakat (P. Pinang) Yes >=80%Pusat Hemodialysis Bestari (Kepala Batas) Yes >=80%Pusat Hemodialysis Harmoni (Damansara) Yes >=80%Pusat Hemodialysis Medipro Alliance Yes >=80%Pusat Hemodialysis Rotary Kulai Yes >=80%Pusat Hemodialysis Suria (Bentong) No <80%Pusat Hemodialysis Suria (Melaka) No <80%Pusat Hemodialysis Suria Kuantan No <80%Pusat Hemodialysis Suria Temerloh No <80%Pusat Hemodialysis Yayasan Veteran ATM (Batu Caves) No <80%Pusat Jantung Hospital Umum Sarawak Yes >=80%Pusat Kelestarian Dialysis No <80%Pusat Kesihatan Jitra Yes >=80%Pusat Kesihatan Universi (UTHO) Yes >=80%Pusat Pakar Dialisis Trak f (Besut) Yes >=80%Pusat Pakar Dialisis Trak f (Kuala Pilah) Yes >=80%Pusat Pakar Tawakkal No <80%Pusat Perbadanan Islam (Segamat) No <80%Pusat Perkhidmatan Haemodialisis USIM Yes >=80%Pusat Perubatan Dialisis (Bangi) No* >=80%Pusat Perubatan Dialisis (Dengkil) No* >=80%Pusat Perubatan Dialisis Semenyih No <80%Pusat Perubatan Primier HUKM No <80%Pusat Perubatan Universi Kebangsaan Malaysia Yes >=80%Pusat Rawatan Dialisis Ahmad Khalif No <80%Pusat Rawatan Dialisis Farah Mahami No <80%Pusat Rawatan Dialisis Fazwinna Yes >=80%Pusat Rawatan Dialisis Fitra (Kuantan) No <80%Pusat Rawatan Dialisis Fitra (Maran) No <80%Pusat Rawatan Dialisis Fitra (Seri Perdana) No <80%
PARTICIPATING HAEMODIALYSIS CENTRES 2014 (con’t)
Haemodialysis Centre CC# AR Haemodialysis Centre CC# AR
xi
* CC = Compliance Cer fi cate AR = Annual treatment return
Pusat Rawatan Dialisis Fitra Pekan Yes >=80%Pusat Rawatan Dialisis Fungates Superfl ow-NKF Yes >=80%Pusat Rawatan Dialisis Good Health-NKF (Kg Pandan) Yes >=80%Pusat Rawatan Dialisis Hidayah No <80%Pusat Rawatan Dialisis Islah (Batu Caves) Yes >=80%Pusat Rawatan Dialisis Islah (BM) Yes >=80%Pusat Rawatan Dialisis Islah (KL) Yes >=80%Pusat Rawatan Dialisis Islah (Kota Bharu) No <80%Pusat Rawatan Dialisis Islah (Kuala Terengganu) Yes >=80%Pusat Rawatan Dialisis Islah (Prima Sri Gombak) Yes >=80%Pusat Rawatan Dialisis Islah (Selayang) Yes >=80%Pusat Rawatan Dialisis Lions-NKF (Penang) No <80%Pusat Rawatan Dialisis MUIS-NKF Yes >=80%Pusat Rawatan Dialisis Mukmin Yes >=80%Pusat Rawatan Dialisis Nefro Utama (Masjid Tanah) Yes >=80%Pusat Rawatan Dialisis Nefro Utama (Puchong) Yes >=80%Pusat Rawatan Dialisis Nefro Utama (Setapak) No <80%Pusat Rawatan Dialisis Puteri Zulaikha Yes >=80%Pusat Rawatan Dialisis Tun Abdul Razak-NKF Kuantan Yes >=80%Pusat Rawatan Fitra (Muadzam) Yes >=80%Pusat Rawatan Haemodialisis Wan Nong No <80%Pusat Rawatan Hemodialisis Felina Yes >=80%Pusat Rawatan Hemodialisis Tunku Sarina Yes >=80%Pusat Rawatan Perbadanan Islam (Kota Tinggi) Yes >=80%Pusat Waqaf An-nur (Senawang) Yes >=80%Putera Bistari Dialysis Centre Yes >=80%Putra Haemodialysis Centre No <80%Putra Medical Centre No <80%Putrajaya Hospital Yes >=80%Putri Haemodialysis Centre (Ipoh) Yes >=80%PWRM (BM) Dialysis Centre Yes >=80%Quality Dialysis (Batang Berjuntai) No <80%Quality Dialysis Care (Bangi) No <80%Quality Dialysis Care (Cheras) Yes >=80%Quality Dialysis Care (Gurun) Yes >=80%Quality Dialysis Care (Jerantut) No <80%Quality Dialysis Care (Kangar) Yes >=80%Quality Dialysis Care (Klang) No <80%Quality Dialysis Care (Kota Kinabalu) Yes >=80%Quality Dialysis Care (Meru) Yes >=80%Quality Dialysis Care (Pendang) Yes >=80%Quality Dialysis Care (Sabak Bernam) Yes >=80%Quality Dialysis Care (Sg Besar) Yes >=80%Quality Dialysis Care (Sg. Petani Selatan) No <80%Quality Dialysis Care (Sg. Petani Utara) Yes >=80%Quality Dialysis Care (Sg. Siput) Yes >=80%Quality Dialysis Care (Tanjung Karang) Yes >=80%Quality Dialysis Care (Wangsa Maju) Yes >=80%Queen Elizabeth Hospital Yes >=80%Raja Perempuan Zainab II Hospital No <80%Raja Permaisuri Bainun Hospital Yes >=80%Ranau Hospital Yes >=80%Raub Dialysis Centre Yes >=80%Rawatan Dialisis Bukit Tinggi Yes >=80%Rawatan Hemodialisis Persatuan Persemdian Hindu Yes >=80%Rejang Medical Centre Yes >=80%Renal Associates Yes >=80%Renal Care (Ipoh Specialist) Yes >=80%Renal Care (Kedah) Yes >=80%Renal Care Dialysis Services Yes >=80%
Renal Dialysis Centre Yes >=80%Renal Life Dialysis Centre Yes >=80%Renal Link (Penang) Yes >=80%Renal Team Dialysis Centre (Ara Damansara) Yes >=80%Renal Therapy Services Yes >=80%Renal-Link (Kelantan) Yes >=80%Rotary Club of Johor Bahru Haemodialysis Centre Yes >=80%S.P. Menon Dialysis Centre (Klang) No <80%S.P. Menon Dialysis Centre (Kuala Lumpur) Yes >=80%S.P. Menon Dialysis Centre (Petaling Jaya) Yes >=80%Saratok Hospital Yes >=80%Sarawak General Hospital Yes >=80%Sarikei Hospital Yes >=80%Sayang Dialysis (Seremban) No <80%Sayang Dialysis Selayang Yes >=80%Seberang Jaya Hospital Yes >=80%Segamat Hospital Yes >=80%Selama Hospital No <80%Selayang Hospital (Paed) Yes >=80%Selayang Hospital Yes >=80%Semporna Hospital Yes >=80%Sentosa Medical Centre Yes >=80%Serdang Hospital Yes >=80%Seremban Specialist Hospital Yes >=80%Seri Benut Dialysis Yes >=80%Seri Manjung Hospital Yes >=80%Serian Hospital Yes >=80%Se u Hospital Yes >=80%Sg Siput Hospital Yes >=80%Sibu Hospital Yes >=80%Sibu Kidney Founda on Yes >=80%Sik Hospital Yes >=80%Sime Darby Medical Centre Parkcity No <80%Sime Darby Medical Centre Subang Jaya No <80%Simunjan Hospital Yes >=80%Sinar Haemodialysis (Batu Pahat) Sdn Bhd Yes >=80%Sinar Haemodialysis (Cawangan Batu Pahat) Yes >=80%Sinar Hemodialisis (Melaka) Yes >=80%Sipitang Hospital Yes >=80%SJ Dialysis Centre (Bidor) Yes >=80%SJ Dialysis Centre (Ipoh) Yes >=80%SJ Dialysis Centre (Seberang Jaya) Yes >=80%SJAM-KPS Haemodialysis Centre 1 (Raja Muda Musa) Yes >=80%SJAM-KPS Haemodialysis Centre 11 (Shah Alam) Yes >=80%SJAM-KPS Haemodialysis Centre 12 (Balakong) Yes >=80%SJAM-KPS Haemodialysis Centre 2 (Klang) No <80%SJAM-KPS Haemodialysis Centre 3 (Ban ng) No <80%SJAM-KPS Haemodialysis Centre 5 (Rawang) Yes >=80%SJAM-KPS Haemodialysis Centre 6 (Kuala Selangor) Yes >=80%SJAM-KPS Haemodialysis Centre 8 (Sibu) Yes >=80%SJAM-KPS Haemodialysis Centre 9 (Raub) No <80%SJAM-KPS Pusat Hemodialisis Centre 10 (Bintulu) Yes >=80%SJAM-KPS Pusat Hemodialisis Centre 15 (Ipoh) Yes >=80%SJAM-KPS Pusat Hemodialisis Pandan (Sta on17) No <80%SJAM-KPS Pusat Hemodialisis Serdang Raya (Sta on14) Yes >=80%SJAM-KPS Pusat Hemodialisis Tasik Puteri Yes >=80%Slim River Hospital (Tanjong Malim) Yes >=80%Smartcare Dialysis Centre (Subang Jaya) Yes >=80%Smartcare Dialysis Clinic (Cheras) Yes >=80%Sri Aman Hospital Yes >=80%
PARTICIPATING HAEMODIALYSIS CENTRES 2014 (con’t)
Haemodialysis Centre CC# AR Haemodialysis Centre CC# AR
xii
* CC = Compliance Cer fi cate AR = Annual treatment return
Sri Kota Medical Centre Yes >=80%Subang Dialysis Centre No <80%Sultan Abdul Halim Hospital Yes >=80%Sultan Haji Ahmad Shah Hospital Yes >=80%Sultan Ismail Hospital (Paed) Yes >=80%Sultan Ismail Hospital Yes >=80%Sultanah Aminah Hospital Yes >=80%Sultanah Bahiyah Hospital Yes >=80%Sultanah Nur Zahirah Hospital No <80%Sungai Bakap Hospital Yes >=80%Sungai Buloh Hospital Yes >=80%Sunway Medical Centre (2) No <80%Sunway Medical Centre Yes >=80%Superkids Trinity-NKF Dialysis Centre Yes >=80%Systemic Dialysis Centre (2) No <80%Systemic Dialysis Centre Yes >=80%Syukur Dialisis (Petaling Jaya) Yes >=80%Syukur Dialisis (Puchong) Yes >=80%Syukur Dialisis (Shah Alam) Yes >=80%Taiping Hospital Yes >=80%Taiping Medical Centre Yes >=80%Tambunan Hospital Yes >=80%Tampin Hospital Yes >=80%Tan Sri Muhyiddin Charity Dialysis Centre No <80%Tanah Merah Hospital Yes >=80%Tangkak Hospital Yes >=80%Tangkak Lions Renal Centre Yes >=80%Tanjung Karang Hospital Yes >=80%Tapah Hospital Yes >=80%Tawau Hospital Yes >=80%Teluk Intan Hospital Yes >=80%Temenggong Seri Maharaja Tun Ibrahim Hospital Yes >=80%Tenang Haemodialysis Centre Yes >=80%Tenang Haemodialysis Jasin No <80%Tengku Ampuan Afzan Hospital (Paed) Yes >=80%Tengku Ampuan Afzan Hospital Yes >=80%Tengku Ampuan Jemaah Hospital Yes >=80%Tengku Ampuan Rahimah Hospital Yes >=80%
Tengku Anis Hospital Yes >=80%Tenom Hospital Yes >=80%The Kidney Dialysis Centre (1) No <80%The Kidney Dialysis Centre (2) Yes >=80%The Nayang-NKF Dialysis Centre Yes >=80%The Penang Community HD Society Yes >=80%Timberland Medical Centre Yes >=80%Total Kidney Care Haemodialysis Yes >=80%TSC Renal Care Yes >=80%Tuanku Ampuan Najihah Hospital Yes >=80%Tuanku Fauziah Hospital Yes >=80%Tuanku Ja’afar Hospital (Paed) Yes >=80%Tuanku Ja’afar Hospital Yes >=80%Tuaran Hospital Yes >=80%Tulips Dialysis Centre Yes >=80%Tumpat Hospital Yes >=80%Tung Shin Hospital & Yayasan Nanyang Press Yes >=80%Tung Shin Hospital No <80%Unit Hemodialisis Komun Kodiang Yes >=80%Universi Kebangsaan Malaysia Bangi Yes >=80%Universi Sains Malaysia Hospital No <80%University Malaya Medical Centre No <80%University Malaya Specialist Centre No <80%Woh Peng Cheang Seah Yes >=80%Yakin Haemodialysis Yes >=80%Yakin Jaya Haemodialysis No <80%Yan Hospital Yes >=80%Yayasan Dialysis Pendidikan Akhlak Perak-NKF Ipoh Yes >=80%Yayasan Kebajikan SSL Puchong Yes >=80%Yayasan Kebajikan SSL Yes >=80%Yayasan Rotary Kluang Yes >=80%YKN Dialisis Kota Bharu Yes >=80%YKN Dialisis Kuala Pilah Yes >=80%YKN Dialisis Rompin No <80%YKN Dialisis Sabah Yes >=80%Zaharah Dialisis Center (Jitra) No <80%Zhi En Dialysis Centre Yes >=80%
PARTICIPATING HAEMODIALYSIS CENTRES 2014 (con’t)
Haemodialysis Centre CC# AR Haemodialysis Centre CC# AR
xiii
* CC = Compliance Cer fi cate AR = Annual treatment return
PARTICIPATING PD CENTRES 2014
Peritoneal Dialysis Centre CC# AR Peritoneal Dialysis Centre CC# AR
96 Hospital Angkatan Tentera (Lumut) No <80%Besut Hospital Yes >=80%Duchess of Kent Hospital Yes >=80%Hospital Pakar Sultanah Fa mah (Muar) Yes >=80%Kemaman Hospital Yes >=80%Kuala Lumpur Hospital (Paed) Yes >=80%Kuala Lumpur Hospital No <80%Likas Hospital (Paed) Yes >=80%Melaka Hospital Yes >=80%Miri Hospital Yes >=80%Normah Medical Specialist Centre No <80%Pantai Hospital Batu Pahat Yes >=80%Prince Court Medical Centre Yes >=80%Pulau Pinang Hospital (Paed) Yes >=80%Pulau Pinang Hospital Yes >=80%Pusat Perubatan Universi Kebangsaan Malaysia Yes >=80%Queen Elizabeth Hospital Yes >=80%Raja Perempuan Zainab II Hospital No <80%Raja Permaisuri Bainun Hospital Yes >=80%
Sarawak General Hospital Yes >=80%Selayang Hospital (Paed) Yes >=80%Selayang Hospital Yes >=80%Serdang Hospital Yes >=80%Se u Hospital Yes >=80%Sultan Haji Ahmad Shah Hospital No <80%Sultan Ismail Hospital (Paed) Yes >=80%Sultanah Aminah Hospital Yes >=80%Sultanah Bahiyah Hospital Yes >=80%Sultanah Nur Zahirah Hospital No <80%Taiping Hospital Yes >=80%Tawau Hospital Yes >=80%Tengku Ampuan Afzan Hospital (Paed) Yes >=80%Tengku Ampuan Afzan Hospital No <80%Tengku Ampuan Rahimah Hospital Yes >=80%Tuanku Ja’afar Hospital (Paed) Yes >=80%Tuanku Ja’afar Hospital Yes >=80%Universi Sains Malaysia Hospital No <80%University Malaya Medical Centre Yes >=80%
PARTICIPATING TRANSPLANT FOLLOW-UP CENTRES 2014
Renal Transplant Follow-Up Centre CC# AR Renal Transplant Follow-Up Centre CC# AR
Assunta Hospital Yes >=80%Bintulu Hospital Yes >=80%Duchess of Kent Hospital Yes >=80%Dungun Hospital Yes >=80%Fan Medical Renal Clinic No No ARHospital Enche’ Besar Hajjah Khalsom Yes >=80%Hospital Sultanah Nora Ismail Yes >=80%Kemaman Hospital Yes >=80%Klinik Dr Choo & Liew Yes >=80%KPJ Ampang Puteri Specialist Hospital No <80%Kuala Lumpur Hospital (Paed) Yes >=80%Kuala Lumpur Hospital Yes >=80%Labuan Hospital Yes >=80%Melaka Hospital Yes >=80%Mersing Hospital Yes >=80%Miri Hospital Yes >=80%Pakar Sultanah Fa mah Muar Hospital Yes >=80%Pon an Hospital Yes >=80%Prince Court Medical Centre Yes >=80%Pulau Pinang Hospital Yes >=80%Pusat Perubatan Universi Kebangsaan Malaysia Yes >=80%
Queen Elizabeth Hospital Yes >=80%Raja Perempuan Zainab II Hospital Yes >=80%Raja Permaisuri Bainun Hospital Yes >=80%Sarawak General Hospital Yes >=80%Segamat Hospital Yes >=80%Selayang Hospital Yes >=80%Serdang Hospital Yes >=80%Sibu Hospital Yes >=80%Sultan Haji Ahmad Shah Hospital Yes >=80%Sultan Ismail Hospital (Paed) Yes >=80%Sultan Ismail Pandan Hospital Yes >=80%Sultanah Aminah Hospital Yes >=80%Sultanah Bahiyah Hospital Yes >=80%Sultanah Nur Zahirah Hospital Yes >=80%Taiping Hospital Yes >=80%Tawau Hospital No <80%Tg. Ampuan Afzan Hospital Yes >=80%Tg. Ampuan Rahimah Hospital Yes >=80%Tuanku Ja’afar Hospital Yes >=80%Universi Sains Malaysia Hospital Yes >=80%University Malaya Medical Centre Yes >=80%
xiv
* CC = Compliance Cer fi cate AR = Annual treatment return
* CC = Compliance Cer fi cate AR = Annual treatment return
CONTRIBUTING AUTHORSSNOITUTITSNI SROHTUA ELTIT RETPAHC
xv
1 ALL RENAL REPLACEMENT latipsoH rupmuL alauK ogN maY miL
THERAPY IN MALAYSIA latipsoH rupmuL alauK damhA B ilazahG
latipsoH gnadreS gnoeL kaB hoG aN tauG yaD eeL onal Renal Registry
2 DIALYSIS IN MALAYSIA
latipsoH gnadreS gnoeL kaB hoG latipsoH rupmuL alauK damhA B ilazahG
latipsoH rupmuL alauK ogN maY miL latipsoH gnaneP gneM ekoL gnO
aN tauG yaD eeL onal Renal Registry
3 DEATH AND SURVIVAL ON DIALYSIS
latipsoH gnayaleS gneS niH gnoW ertneC lacideM ayalaM ytisrevinU uahC eeT gneK
latipsoH gnaneP gneM ekoL gnO tsilaicepS rohoJ avedahsenaG .M L/A arhtsiduY
4 QOL AND REHABILITATION OUTCOMES
latipsoH hanimA hanatluS nuiJ neW uiL
ON DIALYSIS PATIENT IN MALAYSIA
Christopher Lim Thiam Seong University Putra MalaysialatipsoH gnayaleS ihZ oahZ naT rehtsE
ertneC lacideM yawnuS gniM eeW naT aF hanatluS rakaP latipsoH nreJ auH woeY @ aiY mah
5 PAEDIATRIC RENAL REPLACEMENT
latipsoH rafa’aJ uknauT eeL gniM eeL
THERAPY
latipsoH rupmuL alauK ogN maY miL latipsoH gnaneP gnuT weihC waiL retsnyL
latipsoH liamsI natluS eeP nasuS niB halizaJ naW Wan Ismail Selayang Hospital
latipsoH rupmuL alauK nihC koY paY
6 MANAGEMENT OF ANAEMIA
Philip N. Jeremiah KPJ Ampang Puteri Specialist Hospital
IN DIALYSIS PATIENTS
latipsoH gnayaleS kaehC nooB eeB latipsoH rupmuL alauK damhA B ilazahG
ertneC lacideM ayalaM ytisrevinU nuK ooS miL ,latipsoH II baniaZ naupmereP ajaR nassaH naW niB imilaH lunsaH naW
7 NUTRITIONAL STATUS ON DIALYSIS
Abdul Halim Bin Abdul Gafor Pusat Perubatan Universi Kebangsaan aisyalaM
latipsoH iriM eeH gneK hoK avakaliT Karupaiah Faculty of Allied Health Sciences
aisyalaM naasgnabeK ytisrevinU anretnI eewS weiS eehC einniW onal Medical University
8BLOOD PRESSURE CONTROL AND
ayaJ gnabuS ertneC lacideM ybraD emiS niT naW eeL
DYSLIPIDAEMIA
latipsoH rupmuL alauK nadnanavaB .V P/A atinuS .B latipsoH hanimA hanatluS gnoeS iaL iooH
ytisrevinU RAT mihK gnE gN ayaJ gnabuS ertneC lacideM ybraD emiS noneM dasarP .S
9 CHRONIC KIDNEY DISEASE
latipsoH gnadreS gnoeL kaB hoG
MINERAL AND BONE DISORDERS
latipsoH hayihaB hanatluS auH nehC gnihC latipsoH gnaneP selgaenelG nuS iaL koK
latipsoH gnaniP ualuP gnoF weY weiL Wan Ahmad Hafi z Adnan Bin Wan Md Adnan University Malaya Medical Centre
tsilaicepS rohoJ avedahsenaG .M L/A arhtsiduY
10 HEPATITIS ON DIALYSIS
Clare Tan Hui Hong Sarawak General HospitallatipsoH horeK riA iatnaP iaW koY wohC latipsoH lareneG kawaraS nooS ieW iiH ecnerwaL
,latipsoH nuniaB irusiamreP ajaR gnooL kehC hoL )hopI( ertneC sisylaidomeaH irtuP ieM euS oeT
11 HEAEMODIALYSIS PRACTICES
latipsoH hamihaR naupmA ukgneT noohC eewhC naT MSUPP nandA niB lirzayS neerzA
latipsoH miluK )nayrB( neM gnohC gnoeL niB neelroN Zulkarnain Sim Tengku Ampuan Rahimah Hospital
latipsoH hamihaR naupmA ukgneT nahK suadriF hahS zanhahS
12 CHRONIC PERITONEAL DIALYSIS
B. Sunita A/P V. Bavanandan Kuala Lumpur Hospital
PRACTICES
ayaJ gnarebeS latipsoH ahconaM najahB atinA niB yliL Mushahar Tuanku Ja’afar Hospital
latipsoH rupmuL alauK bahaW ludbA niB imiaZ damahoM latipsoH rafa’aJ uknauT nasahtaviS narahahduS
13 RENAL TRANSPLANTATION
Rosnawa latipsoH rupmuL alauK ayhaY latipsoH hanimA hanatluS gnoeS iaL iooH
ertneC lacideM ayalaM ytisrevinU gneP koK gN ayruS Bin Yakob Selayang Hospital
latipsoH gnayaleS gneS niH gnoW
xvi
FOREWORD
After a significant delay, the 22nd MDTR report is finally out, thanks to everyone who had made this possible. We now have a total of 758 dialysis centres in the whole nation; 714 of which provide In-Centre Haemodialysis (ICHD) services and 44 provide PD services. Additionally, three public renal transplant centres and several others which provide outpatient post transplant follow-up services submitted data related to renal transplant outcomes.
The dominant role provided by the private sector in ICHD services continue to strengthen. 54.3% of all the dialysis centres were operated by the private sector compared to 20.5% in NGO and 25.1% public sector respectively.
The remarkable growth in the dialysis units should rightly be accompanied by similar increase in commitments to maintain high quality standards of care and compliance with existing regulatory requirements. As data submission to National Renal Registry (NRR) is mandated by the regulation which governs haemodialisis provision, it is important to highlight the gap between the various providers on the compliance rate with data submission to NRR. In 2014, only 61.2% of the private HD centres were compliant with data submission compared to 83.3% in NGO sector and 91.5% MOH centres.
With 7055 new patients and almost 35,000 prevalent patients recorded in 2014, it became clear that the number of patients will not just continue to increase but did so faster than what was previously predicted by the health authority.
Paradoxically and unfortunately, these phenomenalgrowth of dialysis provision especially for haemodialysis patients, was not accompanied by a corresponding rise in the number of kidney transplants performed in the country. Worse still, the incident and prevalent number of transplant patients were lower in 2014 compared to the previous year. This reduction partly resulted from a significant decrease of the number of patients returning home from transplantation performed overseas and the continued loss of transplanted kidneys due to various reasons.
On dialysis funding, there is a disturbing trend of a reduction in the proportion of government funding (53.6%) compared to 60% four years previously. There is higher percentage of self funded dialysis treatment for new patients (31.2%) compared to previous years. Whether this is real or otherwise will require further investigations. Despite the high number of prevailing HD units and the application of zoning rule by the regulator, at least 57 new HD centres were recorded in 2014, 44 of which were established by the private sector. Peritoneal Dialysis continued to receive support from public and alternative funding agencies as a viable alternative form of renal replacement therapy. Of the incident patients, PD utilization has increased to 13% in 2014 compared to 10-12 percent previously. With the strong support from all sectors, together with increased awareness amongst the public, patients, healthcare staffs and funding agencies, it is possible that the publicly funded PD preferred policy, will see stronger future role for the modality in this country.
Last but not least, on behalf of the Advisory Committee of National Renal Registry, I wish to take this important opportunity to acknowledge the continuing supports and cooperation given by everyone, especially the data providers, biostatistician, all the Expert Panel members for various chapters, the Editors, Financial Sponsors, Ministry of Health (Malaysia), Malaysian Society of Nephrology and all the management staffs of National Renal Registry, without which, this useful annual report will not meet the readers.
Thank you
Datuk Dr Ghazali AhmadChairmanAdvisory Committee 2014 - 2016National Renal Registry
iii tnemegdelwonkcA vi srebmeM draoB yrosivdA RRN
About The Malaysian Dialysis and Transplant Registry (MDTR v Par cipa iiix - iiiv sertneC siyslaidomeaH gn Par cipa vix sertneC sisyslaiD laenotireP cinorhC gn Par cipa vix sertneC pu-wolloF tnalpsnarT gn Contribu vx srohtuA gn
ivx droweroF Chapters & Sec xix - iivx sno
xxvii - xx selbaT fo tsiL xxxiv - xxviii serugiF fo tsiL
Execu xxxv yrammuS ev Abbreva xxxvii no
Chapter 1 ALL RENAL REPLACEMENT THERAPY IN MALAYSIA 1 2 WOLF DNA KCOTS 1.1 NOITCES 3 ETAR NOISIVORP TNEMTAERT 2.1 NOITCES
Chapter 2 DIALYSIS IN MALAYSIA 5 6 )troper yrtsiger( AISYALAM NI SISYLAID FO NOISIVORP 1.2 NOITCES 6 NOISIVORP TNEMTAERT SISYLAID 1.1.2
2.1.2 GEOGRAPHIC DISTRIBUTION7 NOITUBIRTSID REDNEG 3.1.2 8 NOITUBIRTSID EGA 4.1.2 01 TNEMTAERT SISYLAID ROF GNIDNUF 6.1.2 11 ROTCES YB STNEITAP SISYLAID FO NOITUBIRTSID 7.1.2 21 ESAESID LANER YRAMIRP 8.1.2
SECTION 2.2 DIALYSIS PROVISION IN MALAYSIA (Centre survey report) 13 2.2.1 GROWTH IN DIALYSIS IN MALAYSIA BY STATE AND SECTOR 13
82 SERTNEC SISYLAID NI REWOPNAM 9.2.2
Chapter 3 DEATH AND SURVIVAL ON DIALYSIS 13 23 SISYLAID NO HTAED 1.3 NOITCES 33 SISYLAID NO LAVIVRUS TNEITAP 2.3 NOITCES 33 YTILADOM SISYLAID FO EPYT YB LAVIVRUS TNEITAP 1.2.3 43 SISYLAID GNITRATS FO RAEY YB LAVIVRUS TNEITAP 2.2.3 53 SISYLAID GNITRATS TA EGA YB LAVIVRUS TNEITAP 3.2.3 63 SUTATS CITEBAID YB LAVIVRUS TNEITAP 4.2.3 73 ERTNEC YB STNEITAP ECNEDICNI FO LAVIVRUS 3.3 NOITCES
3.3.1 SURVIVAL OF INCIDENT HAEMODIALYSIS PATIENTS 2005-2013 BY CENTRE 3783 ERTNEC YB STNEITAP DP ECNEDICNI FO LAVIVRUS 2.3.3
3.4.1 ADJUSTED HAZARD RATIO FOR MORTALITY OF DIALYSIS PATIENTS 39 3.4.2 ADJUSTED HAZARD RATIO FOR MORTALITY OF HAEMODIALYSIS PATIENTS 42 3.4.3 ADJUSTED HAZARD RATIO FOR MORTALITY OF PERITONEAL DIALYSIS PATIENTS 44 3.4.4 RISK ADJUSTED MORTALITY RATE BY HAEMODIALYSIS CENTRES 46
74 SERTNEC DP YB ETAR YTILATROM DETSUJDA KSIR 5.4.3
CONTENTS
xvii
Chapter 4 QUALITY OF LIFE AND REHABILITATION OUTCOMES OF PATIENTS ON DIALYSIS 49 SECTION A QoL INDEX SCORE 50 SECTION B WORK RELATED REHABILITATION 53 Chapter 5 PAEDIATRIC RENAL REPLACEMENT THERAPY 55 SECTION A RRT PROVISION FOR PAEDIATRIC PATIENTS 56 SECTION B DISTRIBUTION OF PAEDIATRIC DIALYSIS PATIENTS 57 SECTION C PRIMARY RENAL DISEASE 61 SECTION D TYPES OF RENAL TRANSPLANTATION 61 SECTION E SURVIVAL ANALYSIS 61 SECTION F HAEMODIALYSIS PRACTICE 65 SECTION G ANAEMIA TREATMENT 66
Chapter 6 MANAGEMENT OF ANAEMIA IN PATIENTS ON DIALYSIS 69 SECTION 6.1 TREATMENT FOR ANAEMIA IN PATIENTS ON DIALYSIS 70 SECTION 6.2 IRON STATUS ON DIALYSIS 74 SECTION 6.3 HAEMOGLOBIN OUTCOMES ON DIALYSIS 82
Chapter 7 NUTRITIONAL STATUS ON DIALYSIS 87 SECTION 7.1 SERUM ALBUMIN LEVELS ON DIALYSIS 88 SECTION 7.3 NUTRITIONAL PARAMETERS 93
Chapter 8 BLOOD PRESSURE CONTROL AND DYSLIPIDAEMIA IN PATIENTS ON DIALYSIS 95 8.1 BLOOD PRESSURE CONTROL ON DIALYSIS 96 8.2 DYSLIPIDAEMIA IN DIALYSIS PATIENTS 103
Chapter 9 CHRONIC KIDNEY DISEASE - MINERAL AND BONE DISORDER 113 SECTION 9.1 TREATMENT OF HYPERPHOSPHATAEMIA 114 SECTION 9.2 SERUM CALCIUM AND PHOSPHATE CONTROL 115 SECTION 9.3 SERUM PARATHYROID HORMONE CONTROL 126
Chapter 10 HEPATITIS ON DIALYSIS 133 SECTION A PREVALENCE 134 SECTION B CENTER VARIATION 135
Chapter 11 HAEMODIALYSIS PRACTICES 139 SECTION 11.1 VASCULAR ACCESS AND ITS COMPLICATIONS 140 SECTION 11.2 HD PRESCRIPTION 142 SECTION 11.3 TECHNIQUE SURVIVAL ON DIALYSIS 151
Chapter 12 PERITONEAL DIALYSIS 157 SECTION 12.1 MODALITIES AND PRESCRIPTION OF PD (TABLES 12.1.1 -12.1.4) 158 SECTION 12.2 CHIEVEMENT OF SOLUTE CLEARANCE AND PERITONEAL TRANSPORT 162 SECTION 12.3 TECHNIQUE SURVIVAL ON PD 165
xviii
CONTENTS (con’t)
SECTION 12.4 ERITONITIS 174
Chapter 13 RENAL TRANSPLANTATION 179 SECTION 13.1 STOCK AND FLOW 180 SECTION 13.2 RECIPIENTS’ CHARACTERISTICS 182 SECTION 13.3 TRANSPLANT PRACTICES 184 13.3.1 TYPE OF RENAL TRANSPLANTATION 184 13.3.2 BIOCHEMICAL DATA 185 13.3.3 IMMUNOSUPPRESSION MEDICATIONS 186 13.3.4 NON IMMUNOSUPPRESSION MEDICATIONS 187 SECTION 13.4 TRANSPLANT OUTCOMES 189 13.4.1 POST-TRANSPLANT COMPLICATIONS 189 13.4.2 DEATHS AND GRAFT LOSS 189 SECTION 13.5 PATIENT AND GRAFT SURVIVAL 191 13.5.1 PATIENT SURVIVAL 191 13.5.2 GRAFT SURVIVAL 192 13.5.3 PATIENT SURVIVAL BY TYPE OF TRANSPLANT 193 13.5.4 GRAFT SURVIVAL ACCORDING TO TYPE OF TRANSPLANT 194 13.5.5 OUTCOME OF LIVING RELATED RENAL TRANSPLANTATION 195 13.5.6 OUTCOME OF COMMERCIAL CADAVERIC TRANSPLANTATION 196 SECTION 13.6 CARDIOVASCULAR RISK IN RENAL TRANSPLANT RECIPIENTS 198 13.6.1 RISK FACTORS FOR ISCHAEMIC HEART DISEASE (IHD) 198 13.6.2 BLOOD PRESSURE CLASSIFICATION ACCORDING TO JNC VI CRITERIA, 2010-2014 200 13.6.3 LEVEL OF ALLOGRAFT FUNCTION 201 13.6.4 BODY MASS INDEX 201 13.6.5 LDL CHOLESTEROL 202 13.6.6 BLOOD PRESSURE CONTROL 203 SECTION 13.7 QOL INDEX SCORE IN RENAL TRANSPLANT RECIPIENTS 204
APPENDIX I DATA MANAGEMENT I - IV APPENDIX II ANALYSIS SETS, STATISTICAL METHODS AND DEFINITIONS V - X
xix
CONTENTS (con’t)
Table 1.1: Stock and fl ow of RRT, Malaysia 2005 2014 2 Table 1.2: New dialysis acceptance rate and new transplant rate per million popula on, 2005-2014 3 Table 2.1.1(a): Stock and fl ow-Haemodialysis Pa ents 2005-2014 6 Table 2.1.1(b): Stock and fl ow- Chronic PD Pa ents 2005-2014 6 Table 2.1.1(c): Haemodialysis Treatment Rate per million popula on 2005-2014 6 Table 2.1.1(d): Chronic PD Treatment Rate per million popula on 2005-2014 6 Table 2.1.2: Dialysis Treatment Rate by state, per million popula on 2005-2014 7 Table 2.1.3(a): Dialysis Treatment Rate by Gender, per million male or female popula on 2005-2014 7 Table 2.1.3(b): Gender Distribu on of Dialysis Pa ents 2005-2014 8 Table 2.1.4(a): Dialysis Treatment Rate by Age Group, per million age group popula on 2005-2014 8 Table 2.1.4(b): Percentage Age Distribu on of Dialysis Pa ents 2005-2014 9 Table 2.1.5: Method and Loca on of Dialysis Pa ents 2005-2014 10 Table 2.1.6: Funding for Dialysis Treatment 2005-2014 11 Table 2.1.7: Distribu on of Dialysis Pa ents by Sector 2005-2014 11 Table 2.1.8: Primary Renal Diseases 2005-2014 12 Table 2.2.1: Number and density of Dialysis Centres in Malaysia by State and Sector, Year 2000 to 2014 13 Table 2.2.2: Number and density of HD centres in Malaysia by State and Sector, Year 2000 to 2014 16 Table 2.2.3: Number and density of PD centres in Malaysia by State and Sector, Year 2000 to 2014 17 Table 2.2.4: Number and density of HD machines in Malaysia by State and Sector, 2005-2014 19 Table 2.2.5: Number and Prevalence Rate of Dialysis Pa ents (HD & PD) in Malaysia by State and Sector, 2000-2014 21 Table 2.2.6: Number and Prevalence Rate of Hemodialysis Pa ents in Malaysia by State and Sector, 2000-2014 23 Table 2.2.7: Number and Prevalence Rate of PD Pa ents in Malaysia by State and Sector, 2000-2014 24 Table 2.2.7: Number and Prevalence Rate of PD Pa ents in Malaysia by State and Sector 2000-2014 24 Table 2.2.8: HD Capacity to Pa ent Ra o among HD Centres in Malaysia by State and Sector, 2000-2014 26 Table 2.2.9: Number & density of Cer fi ed Dialysis Nurses/ Medical technicians in Malaysia by State and Sector, 2000-2014 28 Table 3.1.1: Deaths on dialysis 2005-2014 32 Table 3.1.2: Causes of death on dialysis 2005-2014 33 Table 3.2.1: Pa ent survival by dialysis modality analysis 33 Table 3.2.2: Unadjusted pa ent survival by year of entry, 2005-2014 34 Table 3.2.3: Unadjusted pa ent survival by age 35 Table 3.2.4: Unadjusted pa ent survival by diabetes mellitus status 36 Table 3.4.1: Adjusted hazard ra o for mortality of dialysis pa ents uncensored for change of modality (2005-2014) 40 Table 3.4.2: Adjusted hazard ra o for mortality of HD pa ents uncensored for change of modality (2005-2014 cohort) 42 Table 3.4.3: Adjusted hazard ra o for mortality of PD pa ents uncensored for change of modality (2005-2014 cohort) 45
LIST OF TABLES
xx
xxi
LIST OF TABLES (con’t)
Table 4.1: Cumula ve distribu on of QoL-Index score in rela on to dialysis modality, all dialysis pa ents 2005-2014 50 Table 4.2: Cumula ve distribu on of QoL-Index score in rela on to DM, all dialysis pa ents 2005-2004 50 Table 4.3: Cumula ve distribu on of QoL-index score in rela on to gender, all dialysis pa ents 2005-2014 51 Table 4.4: Cumula ve distribu on of QoL-index score in rela on to age, all dialysis pa ents 2005-2014 51 Table 4.5: Cumula ve distribu on of QoL-Index score in rela on to year of entry, HD pa ents 2005-2014 52 Table 4.6: Cumula ve distribu on of QoL-Index score in rela on to year of entry, PD pa ents 2005-2014 52 Table 4.7: Work related rehabilita on in rela on to modality, dialysis pa ents, 2005-2014 53 Table 4.8: Work related rehabilita on in rela on to year of entry, HD pa ents 2005-2014 53 Table 4.9: Work related rehabilita on in rela on to year of entry, PD pa ents 2005-2014 53 Table 5.1: Stock and fl ow of Paediatric Renal Replacement Therapy (RRT), 2005-2014 56 Table 5.2: Paediatric dialysis and transplant rates per million age related popula on, 2005-2014 57 Table 5.3(a): Dialysis treatment rate by state, per million state age related popula on, 2005-2014 58 Table 5.3(b): New dialysis pa ents by state, 2005-2014 58 Table 5.4: Number of new dialysis and transplant pa ents by gender, 2005-2014 58 Table 5.5: New RRT rate, per million age related popula on by age group, 2005-2014 59 Table 5.6: New dialysis by treatment modality, 2005-2014 60 Table 5.7: New dialysis by sector, 2005-2014 60 Table 5.8: Primary renal disease by sex among new dialysis pa ents, 2005-2014 61 Table 5.9: Types of renal transplanta on, 2005-2014 61 Table 5.10(a): Pa ent survival by dialysis modality analysis (not censored with change of modality), 2005-2014 62 Table 5.10(b): Pa ent survival by dialysis modality analysis (censored with change of modality), 2005-2014 62 Table 5.11: Causes of death in dialysis pa ents, 2005-2014 63 Table 5.12: Dialysis technique survival by modality, 2005-2014 63 Table 5.13: Reasons for drop-out from PD program, 2005-2014 64 Table 5.14: Transplant gra survival, 2005-2014 64 Table 5.15: Causes of gra loss, 2005-2014 65 Table 5.16: Vascular access on haemodialysis, 2005-2014 65 Table 5.17(a): Distribu on of prescribed Kt/V, HD pa ents 2010-2014 65 Table 5.17(b): Distribu on of delivered Kt/V, HD pa ents 2010-2014 65 Table 5.17(c): Distribu onof URR, HD pa ents 2010 2014 66 Table 5.18: Treatment for anaemia, HD pa ents 2005-2014 66 Table 5.19: Distribu on of transferrin satura on on Erythropoie n, HD pa ents 2005-2014 66 Table 5.20: Distribu on of transferrin satura on on Erythropoie n, PD pa ents 2005-2014 67 Table 5.21: Distribu on of ESA dose (u/kg/wk), 2005-2014 67 Table 6.1.1: Treatment for anaemia, HD pa ents 2005-2014 70 Table 6.1.2: Treatment for anaemia, PD pa ents 2005-2014 70
xxii
LIST OF TABLES (con’t)
Table 6.1.3: Varia on in Erythropoiesis-S mula ng Agents (ESAs) u liza on (% pa ents) 17 4102-5002 ,sertnec DH gnoma
Table 6.1.4: Varia on in ESAs u liza on (% pa ents) among PD centres, 2005-2014 71 Table 6.1.5: Varia on in mean weekly ESAs dose (u/week) among HD centres, 2005-2014 72 Table 6.1.6: Varia on in mean weekly ESAs dose (u/week) among PD centres, 2005-2014 72 Table 6.1.7: Varia on in use of blood transfusion (% pa ents) among HD centres, 2005-2014 73 Table 6.1.8: Varia on in use of blood transfusion (% pa ents) among PD centres, 2005-2014 73 Table 6.2.1: Distribu on of serum ferri n without ESAs, HD pa ents 2005-2014 74 Table 6.2.2: Distribu on of serum ferri n without ESAs, PD pa ents 2005-2014 74 Table 6.2.3: Distribu on of serum ferri n on ESAs, HD pa ents 2005-2014 75 Table 6.2.4: Distribu on of serum ferri n on ESAs, PD pa ents 2005-2014 75 Table 6.2.5: Distribu on of transferrin satura on without ESAs, HD pa ents, 2005-2014 76 Table 6.2.6: Distribu on of transferrin satura on without ESAs, PD pa ents, 2005-2014 76 Table 6.2.7: Distribu on of transferrin satura on on ESAs, HD pa ents, 2005-2014 77 Table 6.2.8: Distribu on of transferrin satura on on ESAs, PD pa ents, 2005-2014 77 Table 6.2.9(a): Varia on in median serum ferri n among pa ents on ESAs, HD centres,
87 4102-5002 Table 6.2.9(b): Propor on of pa ents on ESAs with serum ferri n ≥100 ng/ml, HD centres 78 Table 6.2.9(c): Median transferrin satura on among pa ents on ESAs, HD centres 79 Table 6.2.9(d): Propor on of pa ents on ESAs with transferrin satura on ≥ 20%, HD centres 79 Table 6.2.10(a): Varia on in median serum ferri n among pa ents on ESAs, PD centres 2005-2014 80 Table 6.2.10(b): Propor on of pa ents on ESAs with serum ferri n ≥100 ng/ml, PD centres 80 Table 6.2.10(c): Median transferrin satura on among pa ents on ESAs, PD centres 81 Table 6.2.10(d): Propor on of pa ents on ESAs with transferring satura on ≥20%, PD centres 81 Table 6.3.1: Distribu on of haemoglobin concentra on without ESAs, HD pa ents 2005-2014 82 Table 6.3.2: Distribu on of haemoglobin concentra on without ESAs, PD pa ents 2005-2014 82 Table 6.3.3(a): Distribu on of haemoglobin concentra on on ESAs, diabetes HD pa ents 2005-2014 83 Table 6.3.3(b): Distribu on of haemoglobin concentra on on ESAs, non-diabetes HD pa ents
38 4102-5002 Table 6.3.4(a): Distribu on of haemoglobin concentra on on ESAs, diabetes PD pa ents 2005-2014 84 Table 6.3.4(b): Distribu on of haemoglobin concentra on on ESAs, non-diabetes PD pa ents
48 4102-5002 Table 6.3.5(a): Varia on in median haemoglobin level among pa ents on ESAs, HD centres 2005-2014 85 Table 6.3.5(b): Propor on of pa ents on ESAs with haemoglobin level > 10g/dL, HD centres 85 Table 6.3.6(a): Varia on in median haemoglobin level among pa ents on ESAs, PD centres 2005-2014 86 Table 6.3.6(b): Propor on of pa ents on ESAs with haemoglobin level >10g/dL, PD centres 86 Table 7.1.1: Distribu onof serum albumin,HD pa 88 4102-5002 ,stne Table 7.1.2: Distribu on of serum albumin, PD pa 88 4102-5002,stne Table 7.1.3: Varia on in propor on of pa ents with serum albumin ≥ 40g/L among HD centres
98 4102-5002 Table 7.1.4: Varia on in propor on of pa ents with serum albumin ≥ 40g/L among PD centres
98 4102-5002 Table 7.2.1: Distribu on of BMI, HD pa 09 4102 5002,stne Table 7.2.2: Distribu on of BMI, PD pa 09 4102 5002 stne Table 7.2.3: Varia on in propor on of pa ents with BMI ≥18.5 among HD centres 2005-2014 91 Table 7.2.4: Varia on in propor on of pa ents with BMI ≥ 18.5 among PD centres 2005 2014 91
xxiii
LIST OF TABLES (con’t)
Table 7.2.5: Varia on in propor on of pa ents with BMI ≥18.5 and serum albumin ≥40 g/dL among HD centres 2005-2014 92 Table 7.2.6: Varia on in propor on of pa ents with BMI ≥18.5 and serum albumin ≥40 g/dL among PD centres 2005-2014 92 Table 7.3.1: Nutri onal parameters between HD and PD pa ents, 2014 93 Table 7.3.2(a): Nutri onal parameters between diabe c and non diabe c HD pa ents, 2014 93 Table 7.3.2(b): Nutri onal parameters between diabe c and non diabe c PD pa ents, 2014 93 Table 7.3.3(a): Distribu on of serum albumin and BMI by dura on of dialysis among HD pa ents, 2005-2014 94 Table 7.3.3(b): Distribu on of serum albumin and BMI by dura on of dialysis among PD pa ents, 2005-2014 94 Table 8.1.1: Distribu on of pre dialysis systolic blood pressure, HD pa ents 2005-2014 96 Table 8.1.2: Distribu on of pre dialysis systolic blood pressure, PD pa ents 2005-2014 97 Table 8.1.3: Distribu onof pre dialysis diastolic blood pressure, HD pa ents 2005-2014 97 Table 8.1.4: Distribu on of pre dialysis diastolic blood pressure, PD pa ents 2005-2014 98 Table 8.1.5(a): Median systolic blood pressure among HD pa ents, HD centres 98 Table 8.1.5(b): Median diastolic blood pressure among HD pa ents, HD centres 99 Table 8.1.5(c): Propor on of HD pa ents with pre dialysis blood pressure <140/90 mmHg, HD centres 99 Table 8.1.6(a): Median systolic blood pressure among PD pa ents, PD centres 2005-2014 100 Table 8.1.6(b): Median diastolic blood pressure among PD pa ents, PD centres 2005-2014 100 Table 8.1.6(c): Propor on of PD pa ents with pre dialysis blood pressure <140/90 mmHg, PD centres 2005-2014 101 Table 8.1.7(a): Correla on of blood pressure profi le and death, cardiovascular death and ischaemic heart disease, dialysis pa ents 2005-2014 102 Table 8.1.7(b): Hazard ra o for death in each of the blood pressure categories, 2005-2014 103 Table 8.2.1: Distribu on of serum cholesterol, HD pa ents 2005-2014 103 Table 8.2.2: Distribu on of serum cholesterol, PD pa ents 2005-2014 104 Table 8.2.3: Distribu on of serum triglyceride, HD pa ents 2005-2014 105 Table 8.2.4: Distribu on of serum triglyceride, PD pa ents 2005-2014 105 Table 8.2.5(a): Median serum cholesterol level among HD pa ents, HD centres 2005-2014 106 Table 8.2.5(b): Propor on of HD pa ents with serum cholesterol <5.3mmol/L, HD centres 2005-2014 106 Table 8.2.5(c): Median serum triglyceride level among HD pa ents, HD centres 2005-2014 107 Table 8.2.5(d): Propor on of HD pa ents with serum triglyceride <2.1 mmol/L, HD centres 107 Table 8.2.6(a): Median serum cholesterol level among PD pa ents, PD centres 2005-2014 108 Table 8.2.6(b): Propor on of PD pa ents with serum cholesterol <5.3 mmol/L, PD centres 2005-2014 108 Table 8.2.6(c): Median serum triglyceride level among PD pa ents, PD centres 2005-2014 109 Table 8.2.6(d): Propor on of PD pa ents with serum triglyceride < 2.1 mmol/L, PD centres 2005-2014 109 Table 8.2.7(a): Rela onship of diff erent categories of cholesterol levels with death, dialysis pa ents 2005-2014 110 Table 8.2.7(b): Hazard ra o for death in each of the total cholesterol categories, dialysis pa ent 2005-2014 111 Table 9.1.1: Phosphate Binder in HD pa ents, 2005-2014 114
xxiv
Table 9.1.2: Phosphate Binder in PD pa ents, 2005-2014 114 Table 9.1.3: Phosphate Binders by Sector in HD pa ents 115 Table 9.2.1: Distribu on of corrected serum calcium, HD pa ents 2005-2014 116 Table 9.2.2: Distribu on of corrected serum calcium, PD pa ents 2005-2014 116 Table 9.2.3: Distribu on of serum phosphate, HD pa ents 2005-2014 117 Table 9.2.4: Distribu on of serum phosphate, PD pa ents 2005-2014 117 Table 9.2.5: Distribu on of corrected calcium x phosphate product, HD pa ents 2005-2014 118 Table 9.2.6: Distribu on of corrected calcium x phosphate product, PD pa ents 2005-2014 118 Table 9.2.7(a): Varia on in corrected median serum calcium level among HD centres 2005-2014 119 Table 9.2.8(a): Varia on in corrected median serum calcium level among PD centres 2005-2014 119 Table 9.2.7(b): Propor on of pa ents with serum calcium 2.1 to 2.37 mmol/L, HD centres, 2005-2014 120 Table 9.2.8(b): Propor on of pa ents with serum calcium 2.1 to 2.37 mmol/L, PD centres 120 Table 9.2.9(a): Varia on in median serum phosphate level among HD centres, 2005-2014 121 Table 9.2.10(a): Varia on in median serum phosphate levels among PD centres 2005-2014 121 Table 9.2.9(b): Propor on of pa ents with serum phosphate 1.13-1.78 mmol/L, HD centres 2005-2014 122 Table 9.2.10(b): Propor on of pa ents with serum phosphate 1.13-1.78 mmol/L, PD centres 2005-2014 122 Table 9.2.9(c): Propor on of pa ents with serum phosphate 0.8-1.3 mmol/L, HD centres 2014 123 Table 9.2.10(c): Propor on of pa ents with serum phosphate 0.8-1.3 mmol/L, PD centres 2014 123 Table 9.2.11(a): Varia on in corrected median calcium x phosphate product HD centres 2005-2014 124 Table 9.2.12(a): Varia on in corrected median calcium x phosphate product PD centres 2005-2014 124 Table 9.2.11(b): Propor on of pa ents with corrected calcium x phosphate <4.5 mmol2/L2, HD centres 2005-2014 125 Table 9.2.12(b): Propor on of pa ents with corrected calcium x phosphate <4.5 mmol2/L2, PD 2005-2014 125 Table 9.3.1(a): Treatment of hyperparathyroidism in HD pa ents, 2005-2014 126 Table 9.3.1(b): Treatment of hyperparathyroidism in PD pa ents, 2005-2014 126 Table 9.3.2(a): Distribu on of iPTH, HD pa ent 2005-2014 127 Table 9.3.2(b): Distribu on of iPTH, diabe c HD pa ents 2005-2014 127 Table 9.3.2(c): Distribu on of iPTH, non-diabe c HD pa ents 2005-2014 128 Table 9.3.3(a): Distribu on of iPTH, PD pa ents 2005-2014 128 Table 9.3.3(b): Distribu on of iPTH, diabe c PD pa ents, 2005-2014 129 Table 9.3.3(c): Distribu on of iPTH, non diabe c PD pa ents 2005-2014 129 Table 9.3.4(a): Varia on in iPTH among HD centres 2005-2014 130 Table 9.3.4(b): Varia on in propor on of pa ents with iPTH 150-300pg/ml, HD centres 2005-2014 130 Table 9.3.5(a): Varia on in median iPTH among PD pa ents 2005-2014 131 Table 9.3.5(b): Propor on of pa ents with iPTH 150-300pg/ml 131 Table 10.1: Prevalence of posi ve HBsAg and posi ve An -HCV at annual survey, HD pa ents 2005-2014 134 Table 10.2: Prevalence of posi ve HBsAg and posi ve An -HCV at annual survey, PD pa ents 2005-2014 134 Table 10.3: Varia on in Propor on of pa ents with posi ve HBsAg at annual survey among HD centres, 2005-2014 135 Table 10.4: Varia on in propor on of pa ents with posi ve HBsAg at annual survey among PD centres, 2005-2014 135
LIST OF TABLES (con’t)
xxv
LIST OF TABLES (con’t)
Table 10.5: Varia on in propor on of pa ents with posi ve an -HCV at annual survey 631 4102-5002 ,sertnec DH gnoma
Table 10.6: Varia on in propor on of pa ents with posi ve an -HCV at annual survey 631 4102-5002 ,sertnec DP gnoma 041 4102-5002 ,sisylaidomeah no ssecca ralucsaV :1.1.11 elbaT
Table 11.1.2: Diffi cul 041 4102-5002 ,ssecca ralucsav htiw troper se Table 11.1.3: Complica 141 4102-5002 ,ssecca ralucsav htiw detroper sno Table 11.2.1: Blood 241 4102-5002 ,sretnec DH ni setar wflo
341 4102-5002 ,keew rep snoisses DH fo rebmuN :2.2.11 elbaT Table 11.2.3: Dura 341 4102-5002 ,DH fo no
441 4102-5002 ,sretnec DH ni sepyt enarbmem resylaiD :4.2.11 elbaT 541 4102-5002 ,sretnec DH ni ycneuqerf esuer resylaiD :5.2.11 elbaT
Table 11.2.6(a): Distribu on of prescribed Kt/V, HD pa 541 4102-5002 stne Table 11.2.6(b): Distribu on of delivered Kt/V, HD pa 641 4102-0102 stne Table 11.2.6(c): Distribu on of URR, HD pa 741 4102 0102 stne Table 11.2.7(a): Varia on in median blood flow rates in HD pa ents, HD centers, 2005-2014 147 Table 11.2.7 (b): Propor on of pa ents with blood flow rates > 300 ml/min, HD centers 2005-2014 146 Table 11.2.7(c): Propor on of pa ents with 3 HD sessions per week, HD centers 2005-2014 146 Table 11.2.7(d): Median prescribed Kt/Vin HD pa ents, HD centers 2005-2014 149 Table 11.2.7(e): Propor on of pa 941 4102-5002 ,3.1 V/tK debircserp htiw stne Table 11.2.7(f): Median delivered Kt/Vin HD pa ents, HD centers 2010-2014 150 Table 11.2.7(g): Propor on of pa ents with delivered Kt/V 1.2, HD centers 2010-2014 150 Table 11.2.7(h): Median URR among HD pa 051 4102-0102 sretnec DH ,stne Table 11.2.7(i): Propor on of HD pa ents with URR 65%, HD centers 2010-2014 151
151 4102-5002 ,yrtne fo raey yb lavivrus euqinhcet detsujdanU :)a(1.3.11 elbaT Table 11.3.1(b): Unadjusted technique survival by year of entry (censored for death &
251 4102-5002 ,)tnalpsnart 351 4102-5002 ,ega yb lavivrus euqinhcet detsujdanU :)a(2.3.11 elbaT
Table 11.3.2(b): Unadjusted technique survival by age (censored for death& transplant), 2005-2014 154 Table 11.3.3(a): Unadjusted technique survival by diabetes status, 2005-2014 155 Table 11.3.3(b): Unadjusted technique survival by diabetes status (censored for death &
551 4102-5002 ,)tnalpsnart 851 4102-5002 ,semiger sisylaid laenotireP :1.1.21elbaT 951 4102-5002 ,ygolotcennoc DPAC :2.1.21 elbaT 951 4102-5002 ,yad rep segnahcxE fo rebmuN DPAC :a3.1.21 elbaT 951 4102-5002 ,yad rep semulov llewd DPA :b3.1.21 elbaT 061 4102 5002 ,DP mrofreP otecnatsissA :4.1.21 elbaT
Table 12.1.5(a): PD Treatment Rate by Age Group, per millionage group popula on 2005-2014 161 Table 12.1.5(b): Percentage Age Distribu on of PD Pa 161 4102-5002 stne Table 12.1.6(a): PD Treatment Rate by Gender, permillion male or female popula on 2005-2014 161 Table 12.1.6(b): Gender Distribu onof PD Pa 261 3102-4002 stne Table 12.2.1: Distribu on of delivered Kt/V, PD pa 261 4102- 5002 stne Table 12.2.2: Varia on in propor on of pa ents with Kt/V ≥ 1.7 per week among PD centres,
361 4102-5002 Table 12.2.3: Peritoneal transport status by PET D/P crea nine at 4 hours, new PD pa ents
361 4102-5002 461 egatniv sisylaid htiw )TEP( sutatS tropsnarT laenotireP :4.2.21 elbaT
xxvi
461 emuloV enirU laudiseR :5.2.21 elbaT Table 12.3.1(a): Unadjusted technique survival by era 2005-2009 and 2010-2014
561 )tnalpsnart dna htaed rof derosnecnu( Table 12.3.1(b): Unadjusted technique survival by era 2005-2009 and 2010-2014
661 )tnalpsnart dna htaed rof derosnec( Table 12.3.2(a): Unadjusted technique survival by age (uncensored for death and transplant) 166 Table 12.3.2(b): Unadjusted technique survival by age (censored for death and transplant) 167 Table 12.3.3(a): Unadjusted technique survival by gender (uncensored for death and transplant) 168 Table 12.3.3(b): Unadjusted technique survival by gender (censored for death and transplant) 169 Table 12.3.4(a): Unadjusted technique survival by diabetes status (uncensored for death and
961 4102-5002 ,)tnalpsnart Table 12.3.4(b): Unadjusted technique survival by diabetes status (censored for death and
071 )tnalpsnart 071 4102-5002 ,V/tK yb lavivrus euqinhcet detsujdanU :5.3.21 elbaT
Table 12.3.6: Adjusted hazard ra 171 4102-5002 ,ytiladom fo egnahc rof o 271 4102-5002 ,margorp DP morf tuo-pord rof snosaeR :)a(7.3.21 elbaT
Table 12.3.7(b): Drop-out rate from PD program with me on treatment, 2005-2014 173371 )4102-5002( DP no emiT :8.3.21 elbaT
Table 12.4.1: Varia on in peritoni s rate (pt-month/epi) among PD centres, 2005-2014 174 Table 12.4.2 (a): Causa ve organism in PD peritoni 571 4102-5002 ,s Table 12.4.3(a): Outcome of peritoni s by causa 671 9002-5002 ,msinagro ev Table 12.4.3(b): Outcome of peritoni s by causa 771 4102-0102 ,msinagro ev Table 12.4.4: Risk factors influ uencing peritoni 871 4102-5002 ,etar s Table 13.1.1: Stock and fl ow of renal transplanta 081 4102-5002 ,no Table 13.1.2: New transplant rate permillion popula on (pmp), 2005-2014 180 Table 13.1.3: Transplant prevalence rate per million popula on (pmp), 2005-2014 180 Table 13.1.4: Place of transplanta 181 4102-5002 ,no Table 13.2.1: Renal transplant recipients’ characteris 381 4102-5002 ,sc
381 4102-5002 ,eruliaf laner egats dne fo sesuac yramirP :2.2.31 elbaT Table 13.3.1: Type of renal transplanta 481 4102-5002 ,no
581 4102-0102 ,atad lacimehcoiB :2.3.31 elbaT Table 13.3.3: Immunosuppressive Medica 781 4102-0102 ,sno Table 13.3.4: Non immunosuppressive medica 881 4102-0102 ,sno Table 13.4.1: Post transplant complica 981 4102-0102 ,sno Table 13.4.2: Transplant pa ent death rate and gra 091 4102-5002 ,ssol
091 4102-5002 ,stneipicer tnalpsnart ni htaed fo sesuaC :3.4.31 elbaT Table 13.4.4: Causes of gra 191 4102-5002 ,eruliaf Table 13.5.1(a): Pa 191 4102-5002 ,lavivrus tne Table 13.5.1(b): Risk factors for transplant pa 291 4102-5002 lavivrus tne Table 13.5.2(a): Gra 291 4102-5002 ,lavivrus Table 13.5.2(b): Risk factors for transplant gra 391 4102-5002 lavivrus Table 13.5.3: Unadjusted pa ent survival by type of transplant, 2005-2014 194 Table 13.5.4: Gra 491 4102-5002 ,tnalpsnart fo epyt yb lavivrus Table 13.5.5(a): Pa ent survival by year of transplant (Living related transplant, 2005-2014) 195 Table 13.5.5(b): Gra survival by year of transplant (Living related transplant, 2005-2014) 196 Table 13.5.6(a): Pa ent survival by year of transplant (Commercial cadaver transplant, 2005-2014) 197 Table 13.5.6(a): Gra survival by year of transplant (Commercial cadaver transplant, 2005-2014) 197
LIST OF TABLES (con’t)
xxvii
LIST OF TABLES (con’t)
Table 13.6.1: Risk factors for IHD in renal transplant recipients at year 2010-2014 198 Table 13.6.2(a): Systolic BP, 2010-2014 200 Table 13.6.2(b): Diastolic BP, 2010-2014 200 Table 13.6.3: CKD stages, 2010-2014 201 Table 13.6.4: BMI, 2010-2014 201 Table 13.6.5(a): LDL, 2010-2014 202 Table 13.6.5(b): Total cholesterol, 2010-2014 202 Table 13.6.5(c): HDL, 2010-2014 203 Table 13.6.6(a): Treatment for hypertension, 2010-2014 203 Table 13.6.6(b): Distribu on of systolic BP without an hypertensives, 2010-2014 203 Table 13.6.6(c): Distribu on of diastolic BP without an hypertensives, 2010-2014 204 Table 13.6.6(d): Distribu on of systolic BP on an hypertensives, 2010-2014 204 Table 13.6.6(e): Distribu on of diastolic BP on an hypertensives, 2010-2014 204 Table 13.7.1: Cumula ve distribu on of QoL-Index score in rela on to dialysis modality, transplant recipient pa ents 2005-2014 204 Table 13.7.2: Cumula ve distribu on of QoL-Index score in rela on to diabetes mellitus, transplant recipient pa ents 2005-2014 205 Table 13.7.3: Cumula ve distribu on of QoL-Index score in rela on to gender, transplant recipient pa ents 2005-2014 205 Table 13.7.4: Cumula ve distribu on of QoL-Index score in rela on to age, transplant recipient pa ents 2005-2014 205 Table 13.7.5: Cumula ve distribu on of QoL-Index score in rela on to year of entry, transplant recipient pa ents 2005-2014 206
xxviii
Figure 1.1: Stock and fl ow of RRT, Malaysia 2005-2014 2 Figure 1.2: New dialysis acceptance and new transplant rate, 2005-2014 4 Figure 1.3: Dialysis and transplant prevalence rate per million popula on, 2005-2014 4 Figure 2.1.3(a): Dialysis Treatment Rate by Gender 2005-2014 7 Figure 2.1.3(b): Gender Distribu on of Dialysis Pa ents 2005-2014 8 Figure 2.1.4(a): Dialysis Treatment Rate by Age Group 2005-2014 9 Figure 2.1.4(b): Age Distribu on of Dialysis Pa ents 2005-2014 9 Figure 2.1.5: Method and Loca on of Dialysis Pa ents 2005-2014 10 Figure 2.1.6: Funding for Dialysis Treatment 2005-2014 11 Figure 2.1.7: Distribu on of Dialysis Pa ents by Sector 2005-2014 12 Figure 2.1.8: Primary Renal Diseases for New Dialysis Pa ents 2005-2014 13 Figure 2.2.1(a): Number of Dialysis Centre in Malaysia by Sector, 2000 to 2014 15 Figure 2.2.1(b): Number of Dialysis Centre in Malaysia by State and Sector in 2014 15 Figure 2.2.4(a): Number of HD machines in Malaysia by Sector from Year 2000 to 2014 20 Figure 2.2.4(b): Number of HD machines in Malaysia by State and Sector in Year 2014 20 Figure 2.2.5(a): Number of Dialysis Pa ent (HD+PD) in Malaysia by Sector from 2000-2014 22 Figure 2.2.5(b): Number of Dialysis Pa ent (HD+PD) in Malaysia by State and Sector in 2014 22 Figure 2.2.8(a): HD Capacity to Pa ent Ra o among HD Centres in Malaysia by State and Sector, 2000-2014 28 Figure 2.2.8(b): HD Capacity to Pa ent Ra o among HD Centres in Malaysia by State and sector, 2013 28 Figure 2.2.9(a): Number of Cer fi ed Dialysis Nurses/ Medical technicians in Malaysia by Sector, 2000-2014 30 Figure 2.2.9(b): Number of Cer fi ed Dialysis Nurses/ Medical technicians in Malaysia by State and Sector, 2013 30 Figure 3.1.1: Death rates on dialysis 2005-2014 32 Figure 3.2.1(b): Pa ent survival by dialysis modality analysis (not censored for change of modality) 34 Figure 3.2.2: Unadjusted pa ent survival by year of entry, 2005-2014 35 Figure 3.2.3: Unadjusted pa ent survival by age 36 Figure 3.2.4: Unadjusted pa ent survival by diabetes mellitus status 36 Figure 3.3.1(a): Varia on in pa ent survival at 1-year among HD centres adjusted for age and diabetes mellitus status, 2005-2013 37 Figure 3.3.1(b): Funnel plot at 1-year among HD centres adjusted for age and diabetes mellitus status, 2005-2013 cohort 37 Figure 3.3.1(c): Varia on in pa ent survival at 5-years among HD centres adjusted for age and diabetes mellitus status, 2005-2009 37 Figure 3.3.1(d): Funnel plot for pa ent survival at 5-years among HD centres adjusted age and diabetes mellitus, 2005-2009 cohort 37 Figure 3.3.2(a): Varia on in pa ent survival at 1-year among PD centres adjusted for age and diabetes mellitus, 2005-2013 38 Figure 3.3.2(b): Funnel plot at 1-year among PD centres adjusted for age and diabetes mellitus status, 2005-2013 cohort 38 Figure 3.3.2(c): Varia on in pa ent survival at 5-years among PD centres adjusted for age and diabetes mellitus, 2005-2009 38 Figure 3.3.2(d): Funnel plot for pa ent survival at 5-years among PD centres adjusted age and diabetes mellitus, 2005-2009 cohort 38
LIST OF FIGURES
xxix
LIST OF FIGURES (con’t)
Figure 3.4.1(a): Adjusted hazard ra o for mortality of dialysis pa ents uncensored for change of modality by diastolic blood pressure (2005-2014 cohort) 41 Figure 3.4.1(b): Adjusted hazard ra o for mortality of dialysis pa ents uncensored for change of modality by serum phosphate (2005-2014 cohort) 41 Figure 3.4.1(c): Adjusted hazard ra o for mortality of dialysis pa ents uncensored for change of modality by hemoglobin (2005-2014 cohort) 42 Figure 3.4.2: Adjusted hazard ra o for mortality of HD pa ents uncensored for change of modality by Kt/V (2005-2014 cohort) 44 Figure 3.4.4(a): Varia ons in RAMR by HD centre, 2013 47 Figure 3.4.4(b): Funnel plot of RAMR by HD centre, 2013 47 Figure 3.4.5(a): Varia ons in RAMR by PD centres, 2012 47 Figure 3.4.5(b): Funnel plot for RAMR by PD centres, 2012 47 Figure 4.1: Cumula ve distribu on of QoL-Index score in rela on to dialysis modality, all dialysis pa ents 2005-2014 50 Figure 4.2: Cumula ve distribu on of QoL-Index score in rela on to DM, All Dialysis pa ents, 2005-2014 50 Figure 4.3: Cumula ve distribu on of QoL-Index score in rela on to gender, all dialysis pa ents, 2005-2014 51 Figure 4.4: Cumula ve distribu on of QoL-Index score in rela on to age, all dialysis pa ents, 2005-2014 51 Figure 4.5: Cumula ve distribu on of QoL-Index score in rela on to year of entry, HD pa ents 2005-2014 52 Figure 4.6: Cumula ve distribu on of QoL-Index score in rela on to year of entry, PD pa ents 2005-2014 52 Figure 5.1(a): Incidence cases of RRT by modality in children under 20 years old, 2005-2014 56 Figure 5.1(b): Prevalence cases of RRT by modality in children under 20 years old, 2005-2014 56 Figure 5.2: Incidence and prevalence rate per million age related popula on, 2005-2014 57 Figure 5.4: Number of new dialysis and transplant pa ents by gender, 2005-2014 59 Figure 5.5: New RRT rate by age group, 2005-2014 59 Figure 5.6: New dialysis by treatment modality, 2005-2014 60 Figure 5.7: New dialysis by sector, 2005-2014 60 Figure 5.10(a): Pa ent survival by dialysis modality analysis (not censored with change of modality), 2005-2014 62 Figure 5.10(b): Pa ent survival by dialysis modality analysis (censored with change of modality), 2005-2014 62 Figure 5.12: Dialysis technique survival by modality, 2005-2014 63 Figure 5.14: Transplant gra survival, 2005-2014 64 Figure 6.1.3: Varia on in ESAs u liza on (% pa ents) among HD centres, 2014 71 Figure 6.1.4: Varia on in ESAs u liza on (% pa ents) among PD centres, 2014 71 Figure 6.1.5: Varia on in mean weekly ESAs dose (u/week) among HD centres, 2014 72 Figure 6.1.6: Varia on in mean weekly ESAs dose (u/week) among PD centres, 2014 72 Figure 6.1.7: Varia on in use of blood transfusion (% pa ents) among HD centres, 2014 73 Figure 6.1.8: Varia on in use of blood transfusion (% pa ents) among PD centres, 2014 73 Figure 6.2.1: Cumula ve Distribu on of serum ferri n without ESAs, HD pa ents 2005-2014 74 Figure 6.2.2: Distribu on of serum ferri n without ESAs, PD pa ents 2005-2014 74 Figure 6.2.3: Cumula ve distribu on of serum ferri n on ESAs, HD pa ents 2005-2014 75 Figure 6.2.4: Cumula ve distribu on of serum ferri n on ESAs, PD pa ents 2005-2014 75
xxx
LIST OF FIGURES (con’t)
Figure 6.2.5: Cumula ve distribu on of transferrin satura on without ESAs, HD pa 67 4102-5002 stne Figure 6.2.6: Cumula ve distribu on of transferrin satura on without ESAs, PD pa 67 4102-5002 stne Figure 6.2.7: Cumula ve distribu on of transferrin satura on on ESAs, HD pa ents 2005-2014 77 Figure 6.2.8: Cumula ve distribu on of transferrin satura on on ESAs, PD pa ents 2005-2014 77 Figure 6.2.9(a): Varia on in median serum ferri n among pa ents on ESAs, HD centres 2014 Figure 6.2.9(b): Varia on in propor on of pa ents on ESAs with serum ferri n ≥100 ng/ml,
87 4102 sertnec DH Figure 6.2.9(c): Varia on in median transferring satura on among pa ents on ESAs HD centres 2014 79 Figure 6.2.9(d): Varia on in propor on of pa ents on ESAs with transferring satura on ≥ 20%,
97 4102 sertnec DH Figure 6.2.10(a): Varia on in median serum ferri n among pa ents on ESAs, PD centres 2014 Figure 6.2.10(b): Varia on in propor on of pa ents on ESAs with serum ferri n ≥ 100ng/ml,
08 4102 sertnec DP Figure 6.2.10(c): Varia on in median transferrin satura on among pa ents on ESAs, PD centres 2014 81 Figure 6.2.10(d): Varia on in propor on of pa ents on ESAs with transferrin satura on ≥20 %,
18 4102 sertnec DP Figure 6.3.1: Cumula ve distribu on of haemoglobin concentra on without ESAs, HD pa 28 4102-5002 stne Figure 6.3.2: Cumula ve distribu on of haemoglobin concentra on without ESAs, PD pa 28 4102-5002 stne Figure 6.3.3(a): Cumula ve distribu on of haemoglobin concentra on on ESAs, diabetes HD pa 38 4102-5002 stne Figure 6.3.3(b): Cumula ve distribu on of haemoglobin concentra on on ESAs, non-diabetes HD pa 38 4102-5002 stne Figure 6.3.4(a): Cumula ve distribu on of haemoglobin concentra on on ESAs, diabetes PD pa 48 4102-5002 stne Figure 6.3.4(b): Cumula ve distribu on of haemoglobin concentra on on ESAs, non-diabetes PD pa 48 4102-5002 stne Figure 6.3.5(a): Varia on in median haemoglobin level among pa ents on ESAs, HD centres 2014 85 Figure 6.3.5(b): Varia on in propor on of pa ents on ESAs with haemoglobin level > 10g/dL,
58 4102 sertnec DH Figure 6.3.6(a): Varia on in median haemoglobin level among pa ents on ESAs, PD centres 2014 86 Figure 6.3.6(b): Varia on in propor on of pa ents on ESAs with haemoglobin level >10g/dL,
68 4102 ,sertnec DP Figure 7.1.1: Cumula ve distribu on of serum albumin, HD pa ents 2005 2014 88 Figure 7.1.2: Cumula ve distribu on of serum albumin, PD pa ents 2005 2014 88 Figure 7.1.3: Varia on in propor on of pa ents with serum albumin ≥ 40g/L, HD centres 2014 89 Figure 7.1.4: Varia on in propor on of pa ents with serum albumin ≥ 40g/L, PD centres 2014 89 Figure 7.2.1: Cumula ve distribu on of BMI, HD pa 09 4102 5002 stne Figure 7.2.2: Cumula ve distribu on of BMI, PD pa 09 4102 5002 stne Figure 7.2.3: Varia on in propor on of pa ents with BMI ≥18.5 among HD centres 2014 91 Figure 7.2.4: Varia on in propor on of pa ents with BMI ≥18.5 among PD centres 2014 91 Figure 7.2.5: Varia on in propor on of pa ents with BMI ≥18.5 and serum albumin
≥ 29 4102 sertnec DH gnoma Ld/g 04
78
80
xxxi
LIST OF FIGURES (con’t)
Figure 7.2.6: Varia on in propor on of pa ents with BMI ≥18.5 and serum albumin ≥40 g/dL among PD centres 2014 92 Figure 8.1.1: Cumula ve distribu on of predialysis systolic blood pressure, HD pa ents 2005-2014 96 Figure 8.1.2: Distribu on of pre dialysis systolic blood pressure, PD pa ents 2005-2014 96 Figure 8.1.3: Cumula ve distribu on of pre dialysis diastolic blood pressure, HD pa ents 2005-2014 97 Figure 8.1.4: Cumula ve Distribu on of pre dialysis diastolic blood pressure, PD pa ents 2005-2014 97 Figure 8.1.5(a): Varia on in median systolic blood pressure among HD pa ents, HD centres 2014 99 Figure 8.1.5(b): Varia on in median diastolic blood pressure among HD pa ents, HD centres 2014 99 Figure 8.1.5(c): Varia on in propor on of HD pa ents with pre dialysis blood pressure ≤140/90 mmHg, HD centers 2014 100 Figure 8.1.6(a): Varia on in median systolic blood pressure among PD pa ents, PD centres 2014 100 Figure 8.1.6(b): Varia on in median diastolic blood pressure among PD pa ents, PD centres 2014 101 Figure 8.1.6(c): Varia on in propor on of PD pa ents with pre dialysis blood pressure ≤140/90 mmHg, PD centres 2014 101 Figure 8.1.7(a): Rela onship between blood pressure and death in dialysis pa ents 2005-2014 102 Figure 8.2.1: Cumula ve distribu on of cholesterol, HD pa ents 2005-2014 104 Figure 8.2.2: Cumula ve distribu on of cholesterol (mmol/L), PD pa ents 2005-2014 104 Figure 8.2.3: Cumula ve distribu on of serum triglyceride, HD pa ents 2005-2014 105 Figure 8.2.4: Cumula ve distribu on of serum triglyceride, PD pa ents 2005-2014 105 Figure 8.2.5(a): Varia on in median serum cholesterol level among HD pa ents, HD centres 2014 106 Figure 8.2.5(b): Varia on in propor on of pa ents with serum cholesterol <5.3 mmol/L, HD centres 2014 106 Figure 8.2.5(c): Varia on in median serum triglyceride level among HD pa ents, HD centers 2014 107 Figure 8.2.5(d): Varia on in propor on of pa ents with serum triglyceride <2.1mmol/L, HD centers 2014 107 Figure 8.2.6(a): Varia on in median serum cholesterol level among PD pa ents, PD centres 2014 108 Figure 8.2.6(b): Varia on in propor on of pa ents with serum cholesterol <5.3 mmol/L, PD centres 2014 108 Figure 8.2.6(c): Varia on in median serum triglyceride level among PD pa ents, PD centres 2014 109 Figure 8.2.6(d): Varia on in propor on of pa ents with serum triglyceride <2.1 mmol/L, PD centres 2014 109 Figure 8.2.7(a): Rela onship between serum cholesterol categories and death, dialysis pa ents 2005-2014 110 Figure 9.2.1: Cumula ve distribu on of corrected serum calcium, HD pa ents 2005-2014 116 Figure 9.2.2: Cumula ve distribu on of corrected serum calcium, PD pa ents 2005-2014 116 Figure 9.2.3: Cumula ve distribu on of serum phosphate, HD pa ents 2005-2014 117 Figure 9.2.4: Cumula ve distribu on of serum phosphate, PD pa ents 2005-2014 117 Figure 9.2.5: Cumula ve distribu on of corrected calcium x phosphate product, HD pa ents 2005-2014 118 Figure 9.2.6: Cumula ve distribu on of corrected calcium x phosphate product, PD pa ents 2005-2014 118 Figure 9.2.7(a): Varia on in median serum calcium among HD pa ents, HD centres 2014 119 Figure 9.2.8(a): Varia on in median serum calcium level among PD pa ents, PD centres 2014 119 Figure 9.2.7(b): Varia on in propor on of pa ents with serum calcium 2.1 to 2.37 mmol/L, HD centres 2014 120 Figure 9.2.8(b): Varia on in propor on of pa ents with serum calcium 2.1 to 2.37 mmol/L, PD centres 2014 120
xxxii
LIST OF FIGURES (con’t)
Figure 9.2.9(a): Varia on in median serum phosphate level among HD pa ents, HD centres 2014 121 Figure 9.2.10(a): Varia on in median serum phosphate level among PD pa ents, PD centres 2014 121 Figure 9.2.9(b): Varia on in propor on of pa ents with serum phosphate 1.13-1.78 mmol/L, HD centres 2014 122 Figure 9.2.10(b): Varia on in propor on of pa ents with serum phosphate 1.13-1.78 mmol/L, PD centres 2014 122 Figure 9.2.9(c): Varia on in propor on of pa ents with serum phosphate 0.8-1.3 mmol/L, HD centres 2014 123 Figure 9.2.10(c): Varia on in propor on of pa ents with serum phosphate 0.8-1.3 mmol/L, PD centres 2014 123 Figure 9.2.11(a): Varia on in median corrected calcium x phosphate product among HD pa ents, HD centres 2014 124 Figure 9.2.12(a): Varia on in median corrected calcium x phosphate product among PD pa ents, PD centres 2014 124 Figure 9.2.11(b): Varia on in propor on of pa ents with corrected calcium x phosphate product <4.5 mmol2/L2, HD centres 2014 125 Figure 9.2.12(b): Varia on in propor on of pa ents with corrected calcium x phosphate product <4.5 mmol2/L2, PD centres, 2014 125 Figure 9.3.2(a): Cumula ve distribu on of iPTH, HD 2005-2014 127 Figure 9.3.2(b): Cumula ve distribu on of iPTH, diabe c HD pa ents 2005-2014 127 Figure 9.3.2(c): Cumula ve distribu on of iPTH, non-diabe c HD pa ents 2005-2014 128 Figure 9.3.3(a): Cumula ve distribu on of iPTH, PD pa ents 2005-2014 128 Figure 9.3.3(b): Cumula ve distribu on of iPTH, diabe c PD pa ents 2005-2014 129 Figure 9.3.3(c): Cumula ve distribu on of iPTH, non diabe c PD pa ents 2005-2014 129 Figure 9.3.4(a): Varia on in median iPTH among HD pa ents, HD centres 2014 230 Figure 9.3.4(b): Varia on in propor on of pa ents with iPTH 150-300pg/ml, HD centres, 2014 130 Figure 9.3.5(a): Varia on in median iPTH among PD pa ents, PD centres, 2014 131 Figure 9.3.5(b): Varia on in propor on of pa ents with iPTH 150-300pg/ml, PD centres 2014 131 Figure 10.3: Varia on in propor on of pa ents with posi ve HBsAg among HD centres, 2014 135 Figure 10.4: Varia on in propor on of pa ents with posi veHBsAg among PD centres, 2014 135 Figure 10.5: Varia on in propor on of pa ents with posi ve an HCV among HD centres, 2014 136 Figure 10.6: Varia on in propor on of pa ents with posi vean HCV among PD centres, 2014 136 Figure 11.2.1: Blood fl ow rates in HD centers, 2005 2014 142 Figure 11.2.4: Dialyser membrane types in HD centers, 2005 2014 144 Figure 11.2.6(a): Cumula ve distribu on of prescribed Kt/V, HD pa ents 2005-2014 146 Figure 11.2.6(b): Cumula ve distribu on of delivered Kt/V, HD pa ents 2010-2014 146 Figure 11.2.6 (c): Cumula ve distribu on of URR, HD pa ents 2010-2014 146 Figure 11.2.7 (a): Varia on in median blood fl ow rates in HD pa ents among centers 2014 147 Figure 11.2.7 (b): Varia on in Propor on of pa ents with blood fl owrates >= 300 ml/min among HD centers 2014 147 Figure 11.2.7(c): Varia onin propor on of pa ents with 3 HD sessions per week among HD centers 2014 148 Figure 11.2.7(d): Varia on in median prescribed Kt/Vin HD pa ents among HD centers 2014 148 Figure 11.2.7(e): Varia on in propor on of pa ents with prescribed Kt/V 1.3 among HD centers 2014 149 Figure 11.2.7(f): Varia on in median delivered Kt/Vin HD pa ents among HD centers 2014 149
xxxiii
LIST OF FIGURES (con’t)
Figure 11.2.7(g): Varia on in propor on of pa ents with delivered Kt/V 1.2, HD centers 2014 150 Figure 11.2.7(h): Varia on in median URR among HD pa ents, HD centers 2014 150 Figure 11.2.7(i): Varia on in propor on of pa ents with URR ≥ 65% among HD centers 2014 151 Figure 11.3.1(a): Unadjusted technique survival by year of entry, 2005-2014 152 Figure 11.3.1(b): Unadjusted technique survival by year of entry (censored for death & transplant), 2005-2014 152 Figure 11.3.2(a): Unadjusted technique survival by age, 2005-2014 154 Figure 11.3.2(b): Unadjusted technique survival by age (censored for death& transplant), 2005-2014 154 Figure 11.3.3(a): Unadjusted technique survival by diabetes status, 2005-2014 155 Figure 11.3.3(b): Unadjusted technique survival by diabetes status (censored for death & transplant), 2005-2014 155 Figure 12.1.4(a): Assistance to Perform CAPD, 2005-2014 160 Figure 12.1.4(b): Assistance to Perform APD, 2005-2014 160 Figure 12.2.1: Cumula ve distribu on of delivered Kt/V, PD pa ents 2005-2014 163 Figure 12.2.2: Varia on in propor on of pa ents with Kt/V ≥ 1.7 per week among PD centres 2005-2014 163 Figure 12.2.5: Residual Urine Volume in prevalent PD pa ents (2014) 164 Figure 12.3.1a: Unadjusted technique survival by era 2005-2009 and 2010-2014 (uncensored for death and transplant) 166 Figure 12.3.1(b): Unadjusted technique survival by era 2005-2009 and 2010-2014 (censored for death and transplant) 166 Figure 12.3.2(a): Unadjusted technique survival by age (uncensored for death and transplant) 168 Figure 12.3.2(b): Unadjusted technique survival by age (censored for death and transplant) 168 Figure 12.3.3(a): Unadjusted technique survival by gender (uncensored for death and transplant) 168 Figure 12.3.3(b): Unadjusted technique survival by gender (censored for death and transplant) 168 Figure 12.3.4(a): Unadjusted technique survival by Diabetes status (uncensored for death and transplant) 169 Figure 12.3.4(b): Unadjusted technique survival by diabetes status (censored for death and transplant) 169 Figure 12.3.5: Unadjusted technique survival by Kt/V, 2005-2014 170 Figure 12.3.7(a): Reasons for drop-out from PD program, 2005-2014 173 Figure 12.4.1: Varia on in peritoni s rate among PD centres, 2014 175 Figure 12.4.2(b) Causa ve organism in PD peritoni s, 2005-2014 176 Figure 12.4.3(a): Outcome of peritoni s by causa ve organism, 2005-2009 177 Figure 12.4.3(b): Outcome of peritoni s by causa ve organism, 2010-2014 177 Figure 12.4.3(c): Comparison of peritoni s outcome by causa ve organism by era, 2005-2009 & 2009-2014 178 Figure 13.1.1: Stock and fl ow of renal transplanta on,2005-2014 180 Figure 13.1.2 (a): New transplantrate, 2005-2014 181 Figure 13.1.2 (b): Transplant prevalence rate, 2005-2014 181 Figure 13.1.4(a): Places of transplanta on,2005-2014 181 Figure 13.1.4(b): Place of transplanta on within Malaysia 181 Figure 13.4.2(a): Transplant recipient death rate, 2005-2014 190 Figure 13.4.2(b): Transplant recipient gra loss rate, 2005-2014 190 Figure 13.5.1(a): Pa ent survival, 2005-2014 191 Figure 13.5.2(a): Gra survival, 2005-2014 192 Figure 13.5.3: Pa ent survival by type of transplant, 2005-2014 194
xxxiv
LIST OF FIGURES (con’t)
Figure 13.5.4: Gra survival by type of transplants, 2005-2014 194 Figure 13.5.5(a): Pa ent survival by year of transplant (Living related transplant, 2005-2014) 196 Figure 13.5.5(b): Gra survival by year of transplant (Living related transplant, 2005-2014) 196 Figure 13.5.6(a): Pa ent survival by year of transplant (Commercial cadaver transplant, 2005-2014) 197 Figure 13.5.6(b): Gra survival by year of transplant (Commercial cadaver transplant, 2005-2014) 197 Figure 13.6.1(a): Venn diagram for pre and post transplant complica ons (in %) at year 2010 199 Figure 13.6.1(b): Venn diagram for pre and post transplant complica ons (in %) at year 2011 199 Figure 13.6.1(c): Venn diagram for pre and post transplant complica ons (in %) at year 2012 199 Figure 13.6.1(d): Venn diagram for pre and post transplant complica ons (in %) at year 2013 199 Figure 13.6.1(e): Venn diagram for pre and post transplant complica ons (in %) at year 2014 199 Figure 13.6.2(a): Systolic BP, 2010-2014 200 Figure 13.6.2(b): Diastolic BP, 2010-2014 200 Figure 13.6.3: CKD stages by year 201 Figure 13.6.4: BMI, 2010-2014 201 Figure 13.6.5(a): LDL, 2010-2014 202 Figure 13.6.5(b): Total cholesterol, 2010-2014 202 Figure 13.6.5(c): HDL, 2010-2014 203 Figure 13.7.1: Cumula ve distribu on of QoL-Index score in rela on to dialysis modality, transplant recipient pa ents 2005-2014 204 Figure 13.7.2: Cumula ve distribu on of QoL-Index score in rela on to diabetes mellitus, transplant recipient pa ents 2005-2014 205 Figure 13.7.3: Cumula ve distribu on of QoL-Index score in rela on to gender, transplant recipient pa ents 2005-2014 205 Figure 13.7.4: Cumula ve distribu on of QoL-Index score in rela on to age, transplant recipient pa ents 2005-2014 206 Figure 13.7.5: Cumula ve distribu on of QoL-Index score in rela on to year of entry, transplant recipient pa ents 2005-2014 206
xxxv
EXECUTIVE SUMMARY
In 2014, there were 34,767 patients receiving dialysis in Malaysia, and this was a two and a half fold
increase from 13,356 in 2005. While the new intake of dialysis patients was only 3,167 in 2005, this
had more than doubled to 7,055 in 2014. The equivalent incidence and prevalence of patients on
dialysis were 234 and 1,155 per million population in 2014. Among the incident dialysis patients,
13.4% were on peritoneal dialysis (PD) while only 10% of the prevalent dialysis patients were on PD.
The increase in the dialysis population was mainly contributed by the rapid growth in private
haemodialysis in the last 10 years. There was also significant demographic change in dialysis
population in Malaysia as patients above 55 years old made up 58% of all new dialysis patients in
2014 versus 52% in 2005. A staggering 61% of end stage kidney disease was reported to be caused by
diabetes mellitus in 2014, versus 55% in 2005.
The increase in haemodialysis (HD) centres was mainly contributed by the private dialysis centres
which had almost tripled over the last 10 years. Non-governmental organisation (NGO) centres had
increased by 50% over the same period of time, while the growth in Ministry of Health (MOH) had
plateaued since 2006. Most of the increases in the private occurred in the more economically
developed west coast states of Peninsular Malaysia. Although the public, NGO and private sector
provided 29%, 22% and 49% of overall dialysis treatment in 2014 respectively, the government
provided 62.3% of total funding for dialysis. However, 85% of new dialysis patients younger than 20
years of age were on government-funded dialysis programmes.
The annual death rate on dialysis in 2014 was 12%. In 2014, the death rate was 12% among
haemodialysis patients while peritoneal dialysis patients had an annual death rate of 16%. Majority
of dialysis patients died due to cardiovascular disease and this was probably due to the increasing
number of elderly and diabetic patients undergoing dialysis. Death from infection remained as the
second commonest cause of death. Despite attempts at adjusting for multiple variables contributing
to death, there still exist wide variations in adjusted mortality rates between dialysis centres.
In 2014, 91% of HD patients and 82% of PD patients received Erythropoeisis Stimulating Agents.
However, the concern was that a substantial percentage of these patients still received blood
transfusions (12 to 18%). In 2014, more than 70% of dialysis patients achieved
calcium-phosphate-product < 4.5 mmol2/L2. However, more than 45-49% of dialysis patients were at
risk of low bone turn over disease with iPTH <150pg/ml. Majority (92% of HD and 86% of PD patients)
were on calcium based phosphate binders. The use of non-calcium based phosphate binders
remained low at 3%.
xxxvi
EXECUTIVE SUMMARY (con’t)
We had achieved improvement over the years in terms of achieving target haemoglobin, control of
calcium-phosphate-product <4.5mmol2/L2, and dyslipidaemia. However, malnutrition and blood
pressure control still require further improvement. There were also suggestions that nutritional
markers such as low serum albumin, extremely low phosphate levels, low BMI and very low
cholesterol levels seem to predict worse outcome. Interestingly, these parameters can also reflect
chronic inflammation. There were also demonstrable variations in the achievement of these various
targets between dialysis centres. The contributing factors may be case mix, adequacy of funding for
the different medications required, and adequacy of dialysis and medical care.
HD patients run the risk of hepatitis infection due to nosocomial transmission. However, over the
years, we have seen an encouraging decline in its prevalence with lower seroconversion rates. This
was largely due to constant surveillance and strict implementation of infection control protocols
within HD facilities throughout the country. PD patients consistently have lower HCV prevalence
compared to HD.
2014 marked the first time there were 9 PD centres with more than 150 PD patients. There were 8
private PD centres reported to NRR and one of the private PD centres has more than 30 patients. In
2014, 13.3% of the total PD population was on APD, and this is a big leap from a meager of 3.6% in
2005.
Despite the rapid increase in dialysis population, the number of kidney transplantation performed in
patients had remained very low. There were only 63 kidney transplantations done in the country in
2014. The transplantation rate had dropped to the lowest rate of 3 per million population compared
to 6 per million in 2005. The patient survival rates were 96%, 91% and 84% at 1- year, 5-years and
10-years respectively. Graft survival rate at 1-year was 93%, 5-years 83% and 10-years 67%.
xxxvii
ABBREVIATIONS AR Annual treatment return
ARBs Angiotensin II Receptor Blockers
ACE Angiotensin-Converting Enzyme
ADPKD Adult polycystic kidney disease
ALT Alanine transaminase
APD Automated Peritoneal Dialysis
BMI Body Mass Index
BP Blood pressure
CAPD Continuous Ambulatory Peritoneal Dialysis
CC# Award of Compliance Certificate
CCPD/APD Continuous cycling peritoneal dialysis/automated peritoneal dialysis
CI Concentration Index
CKD Chronic kidney disease
CNI calcineurin inhibitors
CRA Clinical Registry Assistant
CRC Clinical Research Centre
CRF Case report form
CRM Clinical Registry Manager
CsA Cyclosporine
CVD Cardiovascular Disease
DAPD Daytime Ambulatory Peritoneal Dialsysis
DM Diabetes Mellitus
DOQI Dialysis Outcome Quality Initiative
DRI Direct Renin Inhibitors
eMOSS Malaysian Organ Sharing System (Renal)
ESRD End Stage Renal Disease
FMC Fresenius Medical Care
GDP Gross domestic product
GN Glomerulonephritis
GNI Gross National Income
Hb Haemoglobin
HbsAg Hepatitis B antigen
HCV Hepatitis C virus
HD Haemodialysis
HDL High-density lipoprotein cholesterol
HKL Kuala Lumpur Hospital
HR Hazard Ratio
ITT Intention to treat
iPTH Intact parathyroid hormone
JNC Joint National Committee on managementof hypertension
KDIGO Kidney Disease Improving Global Outcomes
Kt/V Number used to quantify hemodialysis and peritoneal dialysis treatment adequacy
LDL Low-density lipoprotein cholesterol
LQ Lower quartile
MDTR Malaysian Dialysis and Transplant Registry
MOH Ministry of Health, Malaysia
MRRB Malaysian Registry of Renal Biopsy
MSN Malaysian Society of Nephrology
NGO Non-governmental organization
NODAT New onset of diabetes after transplantation
NRIC National Registration Identity Card
NRR National Renal Registry, Malaysia
PD Peritoneal dialysis
PET D/P peritoneal transport status dialysate and plasma (D/P ratio)
pmp per million population
PPUKM Pusat Perubatan Universiti Kebangsaan Malaysia
pmarp per million age related population
QoL Quality of Life
ref Reference
RCC Registry coordinating centre
RRT Renal replacement therapy
SC Site coordinator
SDP Source data producer
SE standard error
SLE Systemic Lpus Eythematosus
SMR Standardised Mortality Ratio
Tx transplant
UMMC University Malaya Medical Centre,
UQ Upper quartile
URR Urea reduction rate
HPT Hypertension

22nd Report of theMalaysian Dialysis and Transplant Registry ALL RENAL REPLACEMENT THERAPY IN MALAYSIA
Chapter 1
ALL RENAL REPLACEMENT THERAPYIN MALAYSIA
Lim Yam NgoGhazali AhmadGoh Bak LeongLee Day Guat
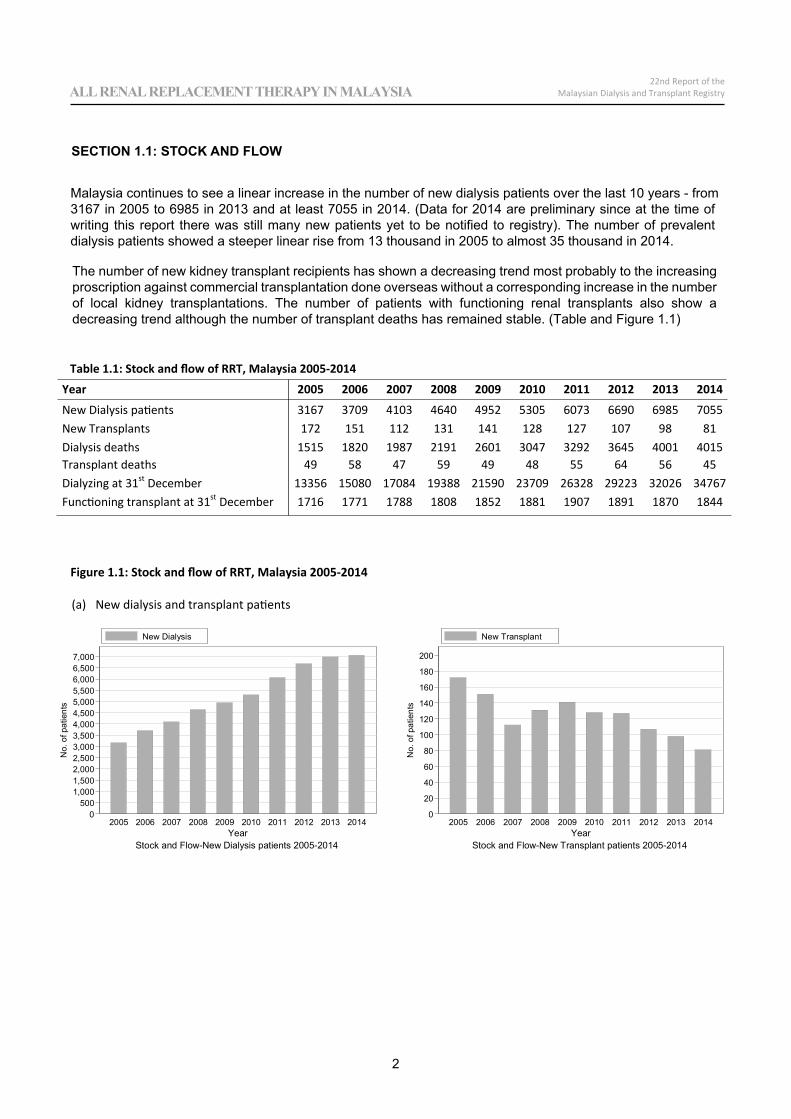
2
22nd Report of theMalaysian Dialysis and Transplant RegistryALL RENAL REPLACEMENT THERAPY IN MALAYSIA
Table 1.1: Stock and flow of RRT, Malaysia 2005 2014
Year 2005 2006 2007 2008 2009 2010 2011 2012 2013 2014
New Dialysis patients 3167 3709 4103 4640 4952 5305 6073 6690 6985 7055New Transplants 172 151 112 131 141 128 127 107 98 81Dialysis deaths 1515 1820 1987 2191 2601 3047 3292 3645 4001 4015Transplant deaths 49 58 47 59 49 48 55 64 56 45Dialyzing at 31st December 13356 15080 17084 19388 21590 23709 26328 29223 32026 34767Functioning transplant at 31st December 1716 1771 1788 1808 1852 1881 1907 1891 1870 1844
Figure 1.1: Stock and flow of RRT, Malaysia 2005 2014
(a) New dialysis and transplant patients
0500
1,0001,5002,0002,5003,0003,5004,0004,5005,0005,5006,0006,5007,000
No.
of p
atie
nts
2005 2006 2007 2008 2009 2010 2011 2012 2013 2014Year
Stock and Flow-New Dialysis patients 2005-2014
New Dialysis
0
20
40
60
80
100
120
140
160
180
200
No.
of p
atie
nts
2005 2006 2007 2008 2009 2010 2011 2012 2013 2014Year
Stock and Flow-New Transplant patients 2005-2014
New Transplant
SECTION 1.1: STOCK AND FLOW
Malaysia continues to see a linear increase in the number of new dialysis patients over the last 10 years - from3167 in 2005 to 6985 in 2013 and at least 7055 in 2014. (Data for 2014 are preliminary since at the time of writing this report there was still many new patients yet to be notified to registry). The number of prevalent dialysis patients showed a steeper linear rise from 13 thousand in 2005 to almost 35 thousand in 2014.
The number of new kidney transplant recipients has shown a decreasing trend most probably to the increasing proscription against commercial transplantation done overseas without a corresponding increase in the number of local kidney transplantations. The number of patients with functioning renal transplants also show a decreasing trend although the number of transplant deaths has remained stable. (Table and Figure 1.1)
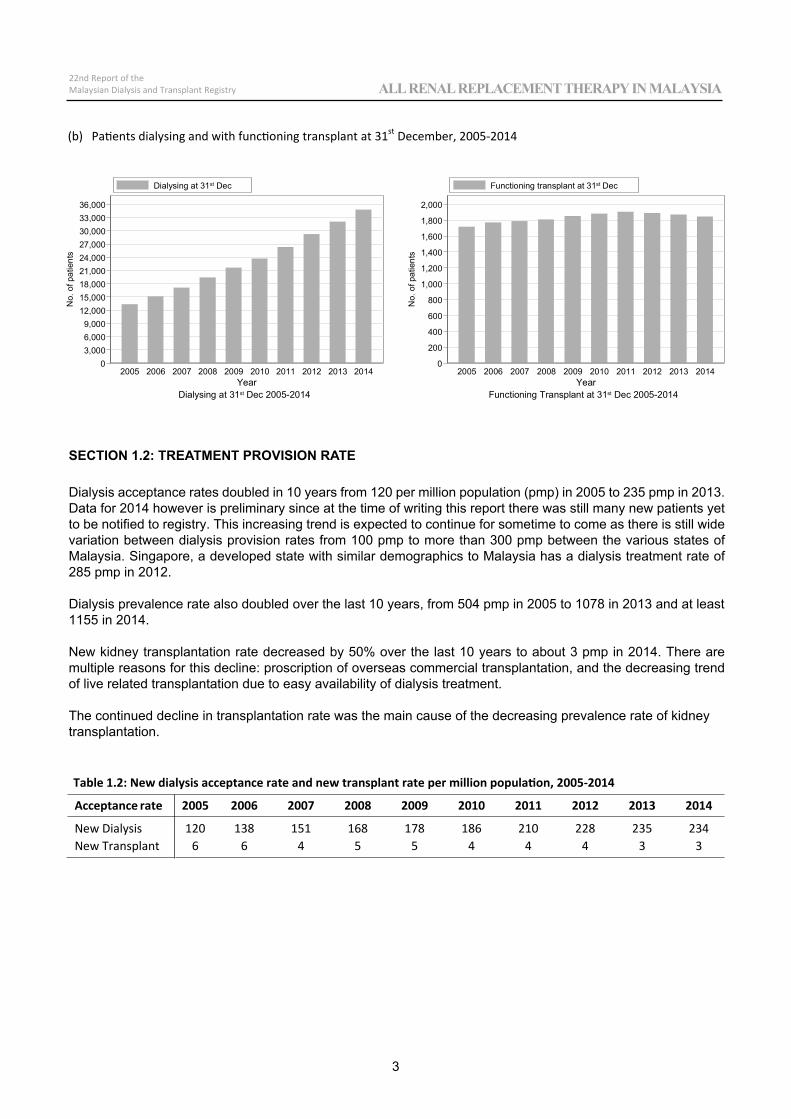
3
22nd Report of theMalaysian Dialysis and Transplant Registry ALL RENAL REPLACEMENT THERAPY IN MALAYSIA
(b) Patients dialysing and with functioning transplant at 31st December, 2005 2014
03,0006,0009,000
12,00015,00018,00021,00024,00027,00030,00033,00036,000
No.
of p
atie
nts
2005 2006 2007 2008 2009 2010 2011 2012 2013 2014Year
Dialysing at 31st Dec 2005-2014
Dialysing at 31st Dec
0
200
400
600
800
1,000
1,200
1,400
1,600
1,800
2,000
No.
of p
atie
nts
2005 2006 2007 2008 2009 2010 2011 2012 2013 2014Year
Functioning Transplant at 31st Dec 2005-2014
Functioning transplant at 31st Dec
Table 1.2: New dialysis acceptance rate and new transplant rate per million population, 2005 2014
Acceptance rate 2005 2006 2007 2008 2009 2010 2011 2012 2013 2014
New Dialysis 120 138 151 168 178 186 210 228 235 234New Transplant 6 6 4 5 5 4 4 4 3 3
SECTION 1.2: TREATMENT PROVISION RATE
Dialysis acceptance rates doubled in 10 years from 120 per million population (pmp) in 2005 to 235 pmp in 2013. Data for 2014 however is preliminary since at the time of writing this report there was still many new patients yet to be notified to registry. This increasing trend is expected to continue for sometime to come as there is still wide variation between dialysis provision rates from 100 pmp to more than 300 pmp between the various states of Malaysia. Singapore, a developed state with similar demographics to Malaysia has a dialysis treatment rate of 285 pmp in 2012.
Dialysis prevalence rate also doubled over the last 10 years, from 504 pmp in 2005 to 1078 in 2013 and at least 1155 in 2014.
New kidney transplantation rate decreased by 50% over the last 10 years to about 3 pmp in 2014. There are multiple reasons for this decline: proscription of overseas commercial transplantation, and the decreasing trend of live related transplantation due to easy availability of dialysis treatment.
The continued decline in transplantation rate was the main cause of the decreasing prevalence rate of kidneytransplantation.
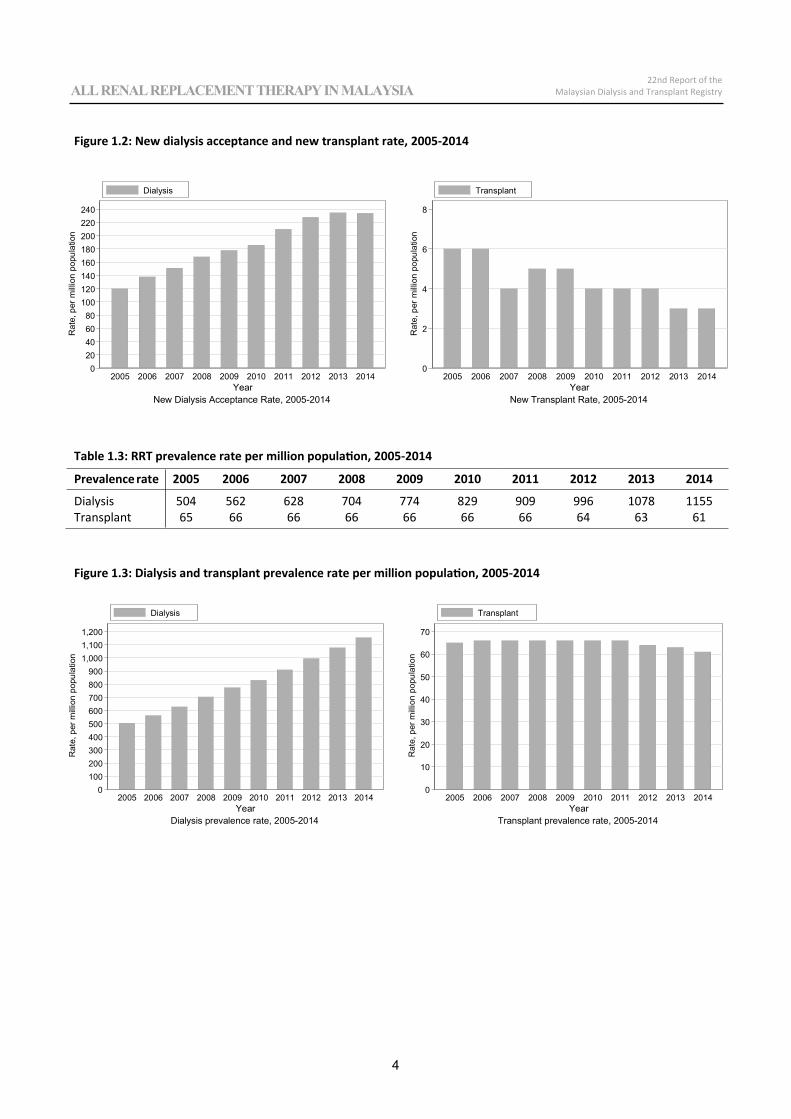
4
22nd Report of theMalaysian Dialysis and Transplant RegistryALL RENAL REPLACEMENT THERAPY IN MALAYSIA
Figure 1.2: New dialysis acceptance and new transplant rate, 2005 2014
020406080
100120140160180200220240
Rat
e, p
er m
illio
n po
pula
tion
2005 2006 2007 2008 2009 2010 2011 2012 2013 2014Year
New Dialysis Acceptance Rate, 2005-2014
Dialysis
0
2
4
6
8
Rat
e, p
er m
illio
n po
pula
tion
2005 2006 2007 2008 2009 2010 2011 2012 2013 2014Year
New Transplant Rate, 2005-2014
Transplant
Table 1.3: RRT prevalence rate per million population, 2005 2014
Prevalence rate 2005 2006 2007 2008 2009 2010 2011 2012 2013 2014
Dialysis 504 562 628 704 774 829 909 996 1078 1155Transplant 65 66 66 66 66 66 66 64 63 61
Figure 1.3: Dialysis and transplant prevalence rate per million population, 2005 2014
0100200300400500600700800900
1,0001,1001,200
Rat
e, p
er m
illio
n po
pula
tion
2005 2006 2007 2008 2009 2010 2011 2012 2013 2014Year
Dialysis prevalence rate, 2005-2014
Dialysis
0
10
20
30
40
50
60
70
Rat
e, p
er m
illio
n po
pula
tion
2005 2006 2007 2008 2009 2010 2011 2012 2013 2014Year
Transplant prevalence rate, 2005-2014
Transplant
Chapter 2
DIALYSIS IN MALAYSIA
Goh Bak LeongLim Yam Ngo
Ong Loke MengGhazali AhmadLee Day Guat
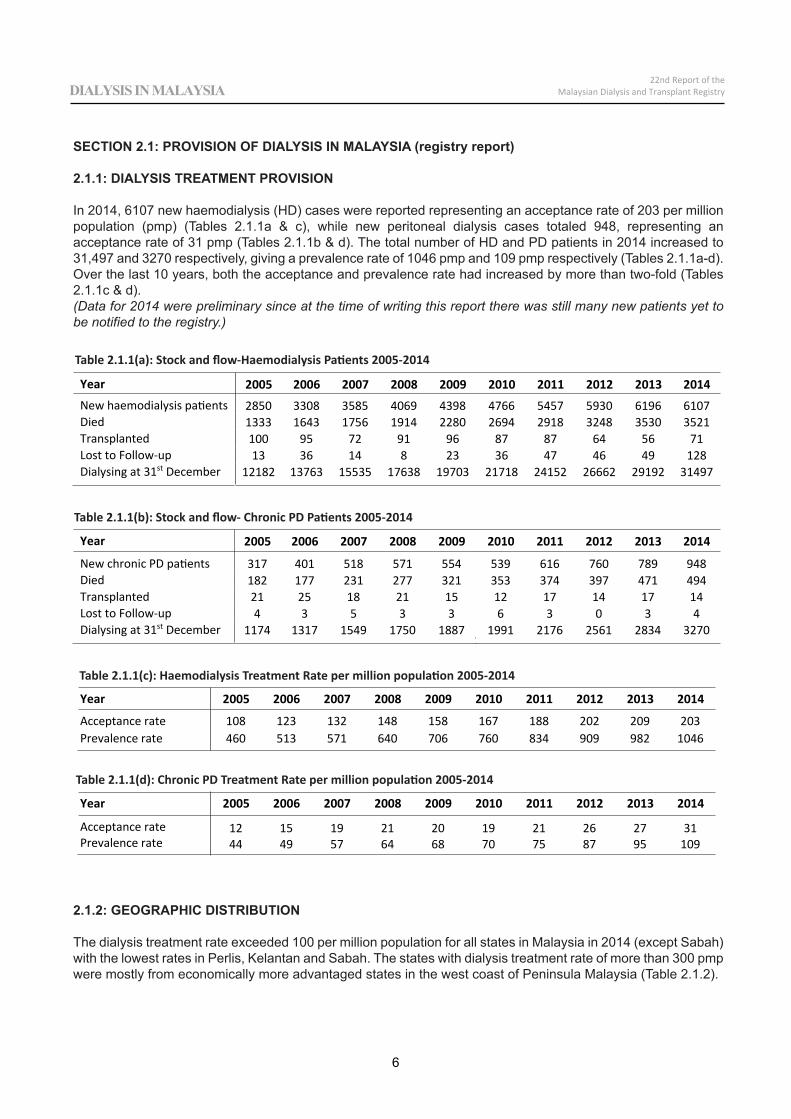
Year 2005 2006 2007 2008 2009 2010 2011 2012 2013 2014New haemodialysis patients 2850 3308 3585 4069 4398 4766 5457 5930 6196 6107Died 1333 1643 1756 1914 2280 2694 2918 3248 3530 3521Transplanted 100 95 72 91 96 87 87 64 56 71Lost to Follow up 13 36 14 8 23 36 47 46 49 128Dialysing at 31st December 12182 13763 15535 17638 19703 21718 24152 26662 29192 31497
Year 2005 2006 2007 2008 2009 2010 2011 2012 2013 2014
New chronic PD patients 317 401 518 571 554 539 616 760 789 948Died 182 177 231 277 321 353 374 397 471 494Transplanted 21 25 18 21 15 12 17 14 17 14Lost to Follow up 4 3 5 3 3 6 3 0 3 4Dialysing at 31st December 1174 1317 1549 1750 1887 1991 2176 2561 2834 3270
Year 2005 2006 2007 2008 2009 2010 2011 2012 2013 2014
Acceptance rate 108 123 132 148 158 167 188 202 209 203Prevalence rate 460 513 571 640 706 760 834 909 982 1046
Year 2005 2006 2007 2008 2009 2010 2011 2012 2013 2014
Acceptance rate 12 15 19 21 20 19 21 26 27 31Prevalence rate 44 49 57 64 68 70 75 87 95 109
6
22nd Report of theMalaysian Dialysis and Transplant RegistryDIALYSIS IN MALAYSIA
SECTION 2.1: PROVISION OF DIALYSIS IN MALAYSIA (registry report)
2.1.1: DIALYSIS TREATMENT PROVISION
In 2014, 6107 new haemodialysis (HD) cases were reported representing an acceptance rate of 203 per million population (pmp) (Tables 2.1.1a & c), while new peritoneal dialysis cases totaled 948, representing an acceptance rate of 31 pmp (Tables 2.1.1b & d). The total number of HD and PD patients in 2014 increased to 31,497 and 3270 respectively, giving a prevalence rate of 1046 pmp and 109 pmp respectively (Tables 2.1.1a-d). Over the last 10 years, both the acceptance and prevalence rate had increased by more than two-fold (Tables 2.1.1c & d). (Data for 2014 were preliminary since at the time of writing this report there was still many new patients yet to be notified to the registry.)
2.1.2: GEOGRAPHIC DISTRIBUTION
The dialysis treatment rate exceeded 100 per million population for all states in Malaysia in 2014 (except Sabah) with the lowest rates in Perlis, Kelantan and Sabah. The states with dialysis treatment rate of more than 300 pmp were mostly from economically more advantaged states in the west coast of Peninsula Malaysia (Table 2.1.2).
Table 2.1.1(a): Stock and flow-Haemodialysis Patients 2005-2014
Table 2.1.1(b): Stock and flow- Chronic PD Patients 2005-2014
Table 2.1.1(c): Haemodialysis Treatment Rate per million population 2005-2014
Table 2.1.1(d): Chronic PD Treatment Rate per million population 2005-2014
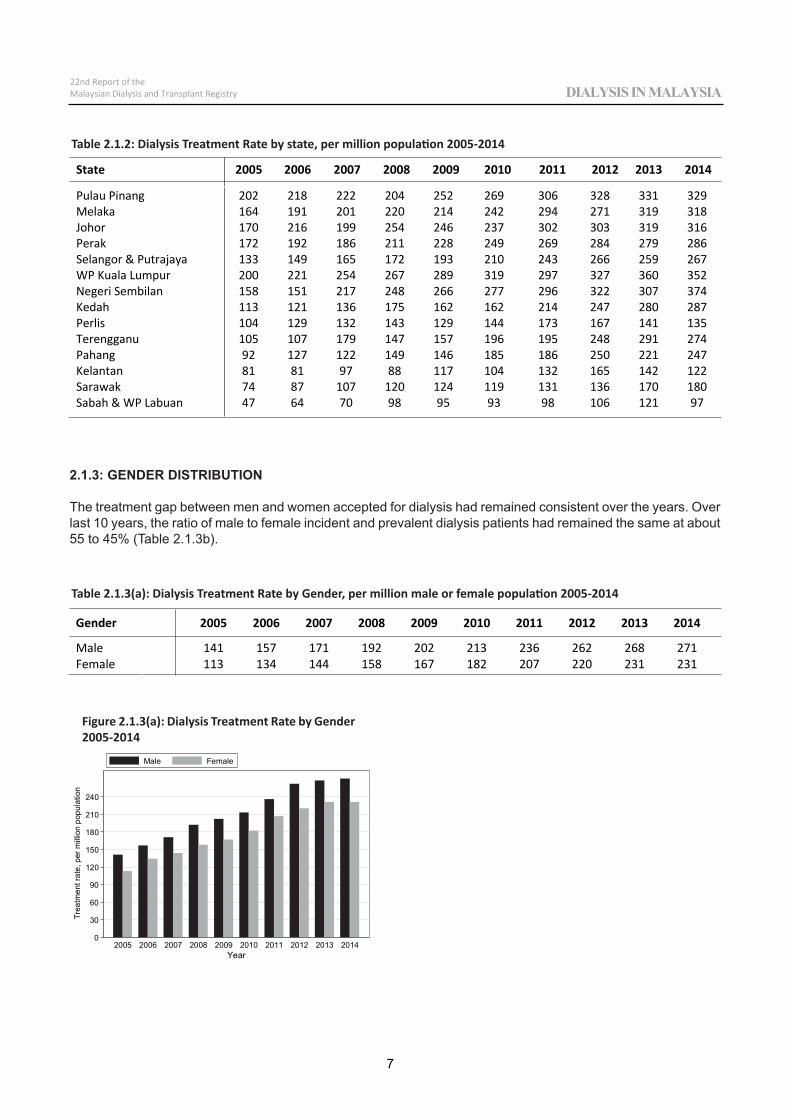
State 2005 2006 2007 2008 2009 2010 2011 2012 2013 2014
Pulau Pinang 202 218 222 204 252 269 306 328 331 329Melaka 164 191 201 220 214 242 294 271 319 318Johor 170 216 199 254 246 237 302 303 319 316Perak 172 192 186 211 228 249 269 284 279 286Selangor & Putrajaya 133 149 165 172 193 210 243 266 259 267WP Kuala Lumpur 200 221 254 267 289 319 297 327 360 352Negeri Sembilan 158 151 217 248 266 277 296 322 307 374Kedah 113 121 136 175 162 162 214 247 280 287Perlis 104 129 132 143 129 144 173 167 141 135Terengganu 105 107 179 147 157 196 195 248 291 274Pahang 92 127 122 149 146 185 186 250 221 247Kelantan 81 81 97 88 117 104 132 165 142 122Sarawak 74 87 107 120 124 119 131 136 170 180Sabah & WP Labuan 47 64 70 98 95 93 98 106 121 97
Gender 2005 2006 2007 2008 2009 2010 2011 2012 2013 2014
Male 141 157 171 192 202 213 236 262 268 271Female 113 134 144 158 167 182 207 220 231 231
0
30
60
90
120
150
180
210
240
Trea
tmen
t rat
e, p
er m
illion
pop
ulat
ion
2005 2006 2007 2008 2009 2010 2011 2012 2013 2014Year
Male Female
7
22nd Report of theMalaysian Dialysis and Transplant Registry DIALYSIS IN MALAYSIA
Table 2.1.2: Dialysis Treatment Rate by state, per million population 2005-2014
Table 2.1.3(a): Dialysis Treatment Rate by Gender, per million male or female population 2005-2014
2.1.3: GENDER DISTRIBUTION
The treatment gap between men and women accepted for dialysis had remained consistent over the years. Over last 10 years, the ratio of male to female incident and prevalent dialysis patients had remained the same at about 55 to 45% (Table 2.1.3b).
Figure 2.1.3(a): Dialysis Treatment Rate by Gender 2005-2014
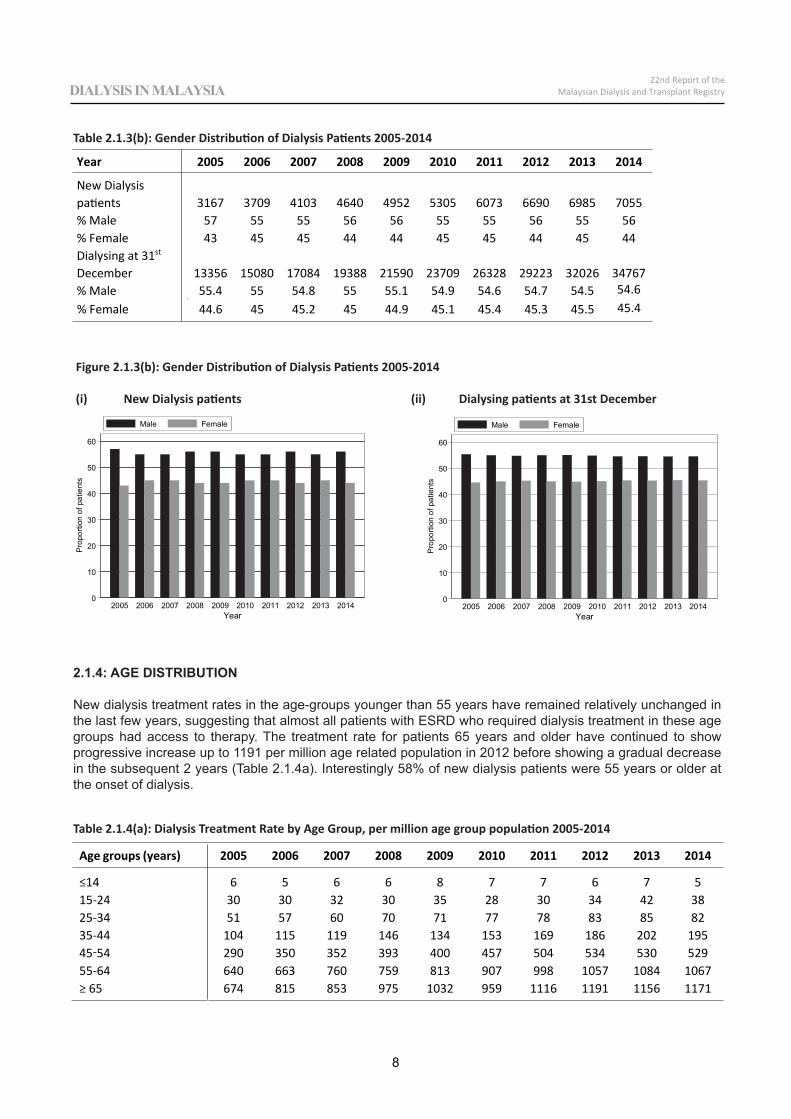
Age groups (years) 2005 2006 2007 2008 2009 2010 2011 2012 2013 2014
14 6 5 6 6 8 7 7 6 7 515 24 30 30 32 30 35 28 30 34 42 3825 34 51 57 60 70 71 77 78 83 85 8235 44 104 115 119 146 134 153 169 186 202 19545 54 290 350 352 393 400 457 504 534 530 52955 64 640 663 760 759 813 907 998 1057 1084 1067
65 674 815 853 975 1032 959 1116 1191 1156 1171
0
10
20
30
40
50
60
Prop
ortio
n of
pat
ient
s
2005 2006 2007 2008 2009 2010 2011 2012 2013 2014Year
Male Female
0
10
20
30
40
50
60Pr
opor
tion
of p
atie
nts
2005 2006 2007 2008 2009 2010 2011 2012 2013 2014Year
Male Female
Year 2005 2006 2007 2008 2009 2010 2011 2012 2013 2014
New Dialysispatients 3167 3709 4103 4640 4952 5305 6073 6690 6985 7055% Male 57 55 55 56 56 55 55 56 55 56% Female 43 45 45 44 44 45 45 44 45 44Dialysing at 31st
December 13356 15080 17084 19388 21590 23709 26328 29223 32026 34767% Male 55.4 55 54.8 55 55.1 54.9 54.6 54.7 54.5 54.6% Female 44.6 45 45.2 45 44.9 45.1 45.4 45.3 45.5 45.4
8
22nd Report of theMalaysian Dialysis and Transplant RegistryDIALYSIS IN MALAYSIA
Table 2.1.3(b): Gender Distribution of Dialysis Patients 2005-2014
Table 2.1.4(a): Dialysis Treatment Rate by Age Group, per million age group population 2005-2014
Figure 2.1.3(b): Gender Distribution of Dialysis Patients 2005-2014 (i) New Dialysis patients (ii) Dialysing patients at 31st December
2.1.4: AGE DISTRIBUTION
New dialysis treatment rates in the age-groups younger than 55 years have remained relatively unchanged in the last few years, suggesting that almost all patients with ESRD who required dialysis treatment in these age groups had access to therapy. The treatment rate for patients 65 years and older have continued to show progressive increase up to 1191 per million age related population in 2012 before showing a gradual decrease in the subsequent 2 years (Table 2.1.4a). Interestingly 58% of new dialysis patients were 55 years or older at the onset of dialysis.
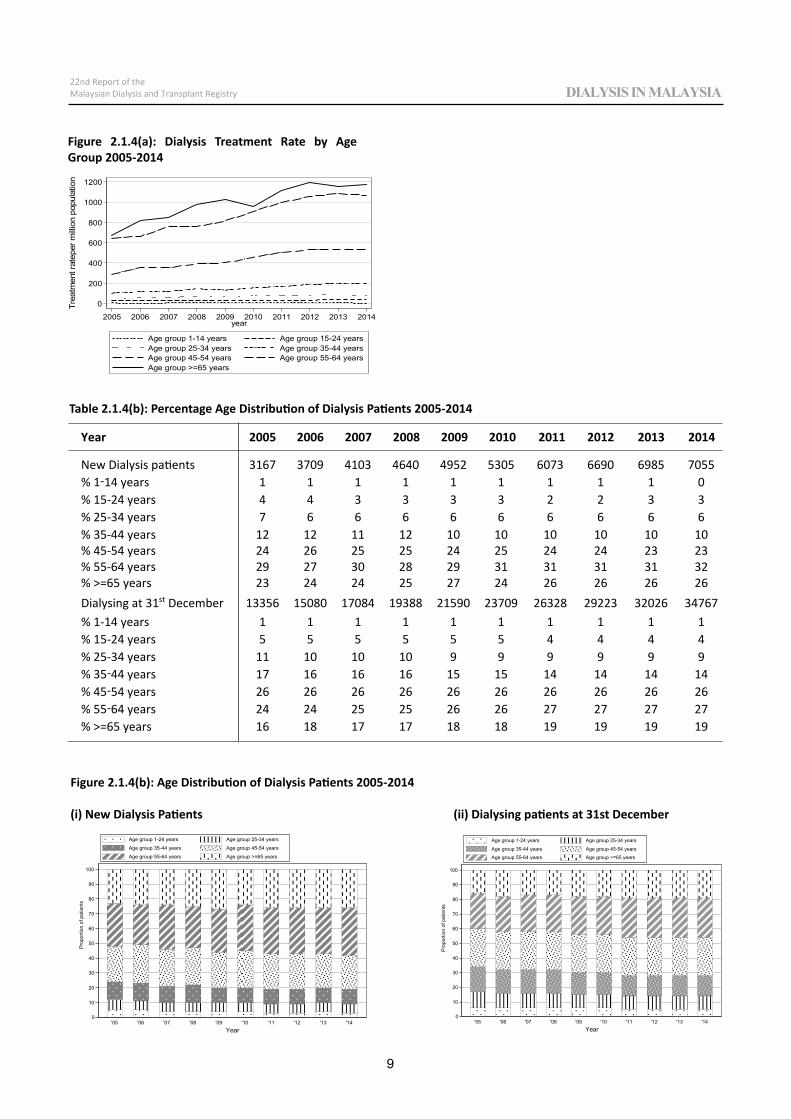
0
10
20
30
40
50
60
70
80
90
100
Pro
porti
on o
f pat
ient
s
'05 '06 '07 '08 '09 '10 '11 '12 '13 '14Year
Age group 1-24 years Age group 25-34 years
Age group 35-44 years Age group 45-54 years
Age group 55-64 years Age group >=65 years
0
10
20
30
40
50
60
70
80
90
100
Prop
ortio
n of
pat
ient
s
'05 '06 '07 '08 '09 '10 '11 '12 '13 '14Year
Age group 1-24 years Age group 25-34 years
Age group 35-44 years Age group 45-54 years
Age group 55-64 years Age group >=65 years
Year 2005 2006 2007 2008 2009 2010 2011 2012 2013 2014
New Dialysis patients 3167 3709 4103 4640 4952 5305 6073 6690 6985 7055% 1 14 years 1 1 1 1 1 1 1 1 1 0% 15 24 years 4 4 3 3 3 3 2 2 3 3% 25 34 years 7 6 6 6 6 6 6 6 6 6% 35 44 years 12 12 11 12 10 10 10 10 10 10% 45 54 years 24 26 25 25 24 25 24 24 23 23% 55 64 years 29 27 30 28 29 31 31 31 31 32% >=65 years 23 24 24 25 27 24 26 26 26 26Dialysing at 31st December 13356 15080 17084 19388 21590 23709 26328 29223 32026 34767% 1 14 years 1 1 1 1 1 1 1 1 1 1% 15 24 years 5 5 5 5 5 5 4 4 4 4% 25 34 years 11 10 10 10 9 9 9 9 9 9% 35 44 years 17 16 16 16 15 15 14 14 14 14% 45 54 years 26 26 26 26 26 26 26 26 26 26% 55 64 years 24 24 25 25 26 26 27 27 27 27% >=65 years 16 18 17 17 18 18 19 19 19 19
0
200
400
600
800
1000
1200
2005 2006 2007 2008 2009 2010 2011 2012 2013 2014year
Age group 1-14 years Age group 15-24 yearsAge group 25-34 years Age group 35-44 yearsAge group 45-54 years Age group 55-64 yearsAge group >=65 years
Trea
tmen
t rat
eper
milli
on p
opul
atio
n
9
22nd Report of theMalaysian Dialysis and Transplant Registry DIALYSIS IN MALAYSIA
Figure 2.1.4(a): Dialysis Treatment Rate by Age Group 2005-2014
Table 2.1.4(b): Percentage Age Distribution of Dialysis Patients 2005-2014
Figure 2.1.4(b): Age Distribution of Dialysis Patients 2005-2014 (i) New Dialysis Patients (ii) Dialysing patients at 31st December
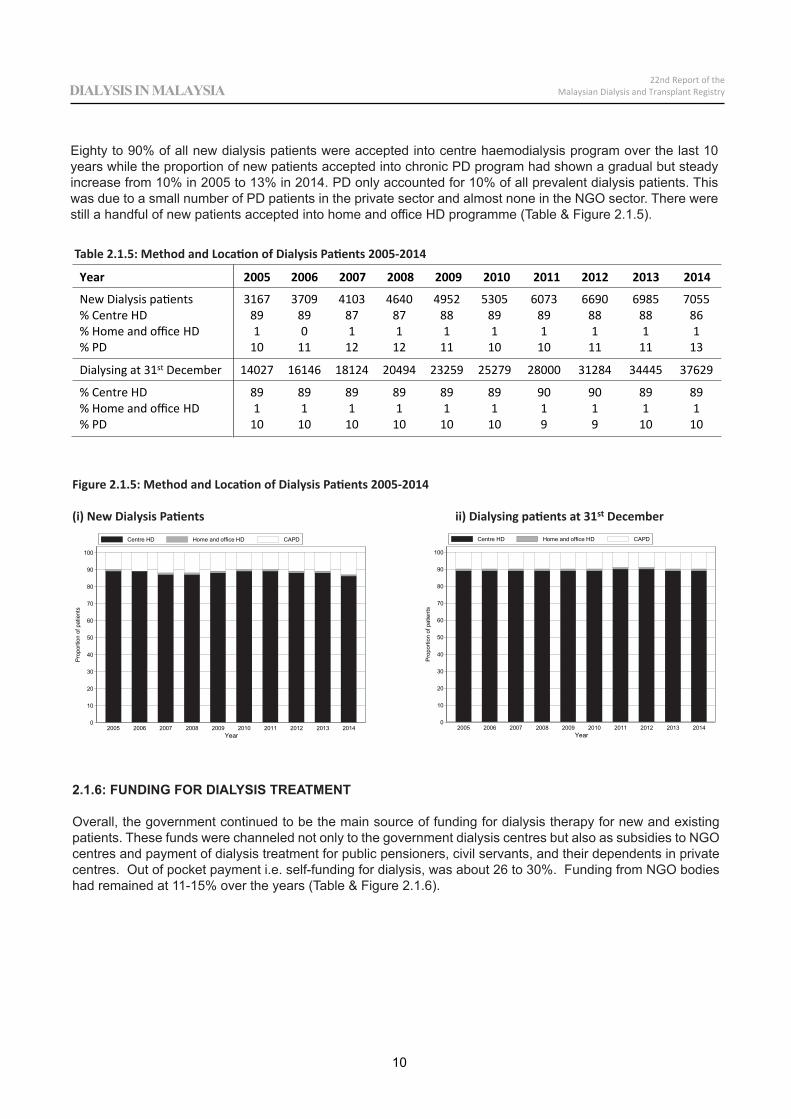
Dialysing at 31st December 14027 16146 18124 20494 23259 25279 28000 31284 34445 37629
% Centre HD 89 89 89 89 89 89 90 90 89 89% Home and office HD 1 1 1 1 1 1 1 1 1 1% PD 10 10 10 10 10 10 9 9 10 10
0
10
20
30
40
50
60
70
80
90
100
Pro
porti
on o
f pat
ient
s
2005 2006 2007 2008 2009 2010 2011 2012 2013 2014Year
Centre HD Home and office HD CAPD
0
10
20
30
40
50
60
70
80
90
100
Pro
porti
on o
f pat
ient
s
2005 2006 2007 2008 2009 2010 2011 2012 2013 2014Year
Centre HD Home and office HD CAPD
Year 2005 2006 2007 2008 2009 2010 2011 2012 2013 2014
New Dialysis patients 3167 3709 4103 4640 4952 5305 6073 6690 6985 7055% Centre HD 89 89 87 87 88 89 89 88 88 86% Home and office HD 1 0 1 1 1 1 1 1 1 1% PD 10 11 12 12 11 10 10 11 11 13
10
22nd Report of theMalaysian Dialysis and Transplant RegistryDIALYSIS IN MALAYSIA
Eighty to 90% of all new dialysis patients were accepted into centre haemodialysis program over the last 10 years while the proportion of new patients accepted into chronic PD program had shown a gradual but steady increase from 10% in 2005 to 13% in 2014. PD only accounted for 10% of all prevalent dialysis patients. This was due to a small number of PD patients in the private sector and almost none in the NGO sector. There were still a handful of new patients accepted into home and office HD programme (Table & Figure 2.1.5).
Table 2.1.5: Method and Location of Dialysis Patients 2005-2014
Figure 2.1.5: Method and Location of Dialysis Patients 2005-2014 (i) New Dialysis Patients ii) Dialysing patients at 31st December
2.1.6: FUNDING FOR DIALYSIS TREATMENT
Overall, the government continued to be the main source of funding for dialysis therapy for new and existing patients. These funds were channeled not only to the government dialysis centres but also as subsidies to NGO centres and payment of dialysis treatment for public pensioners, civil servants, and their dependents in private centres. Out of pocket payment i.e. self-funding for dialysis, was about 26 to 30%. Funding from NGO bodies had remained at 11-15% over the years (Table & Figure 2.1.6).
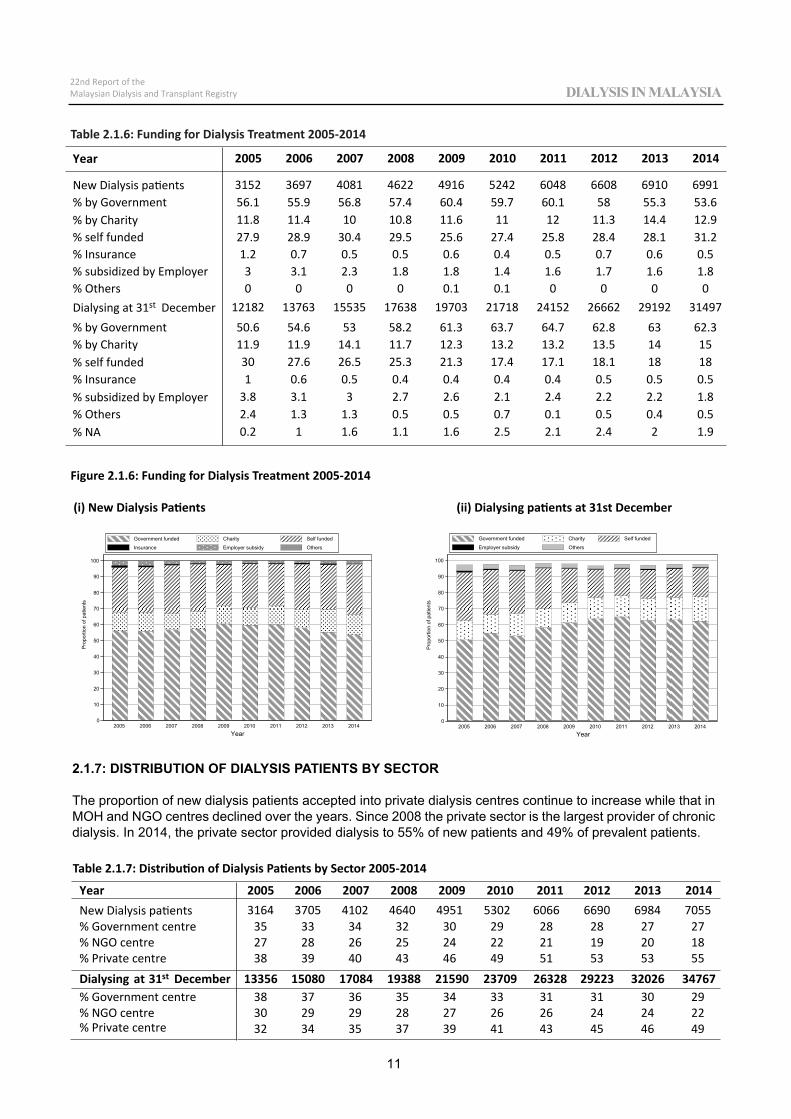
Year 2005 2006 2007 2008 2009 2010 2011 2012 2013 2014New Dialysis patients 3164 3705 4102 4640 4951 5302 6066 6690 6984 7055% Government centre 35 33 34 32 30 29 28 28 27 27% NGO centre 27 28 26 25 24 22 21 19 20 18% Private centre 38 39 40 43 46 49 51 53 53 55Dialysing at 31st December 13356 15080 17084 19388 21590 23709 26328 29223 32026 34767% Government centre 38 37 36 35 34 33 31 31 30 29% NGO centre 30 29 29 28 27 26 26 24 24 22% Private centre 32 34 35 37 39 41 43 45 46 49
Year 2005 2006 2007 2008 2009 2010 2011 2012 2013 2014
New Dialysis patients 3152 3697 4081 4622 4916 5242 6048 6608 6910 6991% by Government 56.1 55.9 56.8 57.4 60.4 59.7 60.1 58 55.3 53.6% by Charity 11.8 11.4 10 10.8 11.6 11 12 11.3 14.4 12.9% self funded 27.9 28.9 30.4 29.5 25.6 27.4 25.8 28.4 28.1 31.2% Insurance 1.2 0.7 0.5 0.5 0.6 0.4 0.5 0.7 0.6 0.5% subsidized by Employer 3 3.1 2.3 1.8 1.8 1.4 1.6 1.7 1.6 1.8% Others 0 0 0 0 0.1 0.1 0 0 0 0Dialysing at 31st December 12182 13763 15535 17638 19703 21718 24152 26662 29192 31497% by Government 50.6 54.6 53 58.2 61.3 63.7 64.7 62.8 63 62.3% by Charity 11.9 11.9 14.1 11.7 12.3 13.2 13.2 13.5 14 15% self funded 30 27.6 26.5 25.3 21.3 17.4 17.1 18.1 18 18% Insurance 1 0.6 0.5 0.4 0.4 0.4 0.4 0.5 0.5 0.5% subsidized by Employer 3.8 3.1 3 2.7 2.6 2.1 2.4 2.2 2.2 1.8% Others 2.4 1.3 1.3 0.5 0.5 0.7 0.1 0.5 0.4 0.5% NA 0.2 1 1.6 1.1 1.6 2.5 2.1 2.4 2 1.9
Table 2.1.6: Funding for Dialysis Treatment 2005-2014
11
22nd Report of theMalaysian Dialysis and Transplant Registry DIALYSIS IN MALAYSIA
2.1.7: DISTRIBUTION OF DIALYSIS PATIENTS BY SECTOR
The proportion of new dialysis patients accepted into private dialysis centres continue to increase while that in MOH and NGO centres declined over the years. Since 2008 the private sector is the largest provider of chronic dialysis. In 2014, the private sector provided dialysis to 55% of new patients and 49% of prevalent patients.
Figure 2.1.6: Funding for Dialysis Treatment 2005-2014 (i) New Dialysis Patients (ii) Dialysing patients at 31st December
Table 2.1.7: Distribution of Dialysis Patients by Sector 2005-2014
0
10
20
30
40
50
60
70
80
90
100
Pro
porti
on o
f pat
ient
s
2005 2006 2007 2008 2009 2010 2011 2012 2013 2014Year
Government funded Charity Self funded
Employer subsidy Others
0
10
20
30
40
50
60
70
80
90
100
Pro
porti
on o
f pat
ient
s
2005 2006 2007 2008 2009 2010 2011 2012 2013 2014Year
Government funded Charity Self funded
ydisbus reyolpmEecnarusnI Others
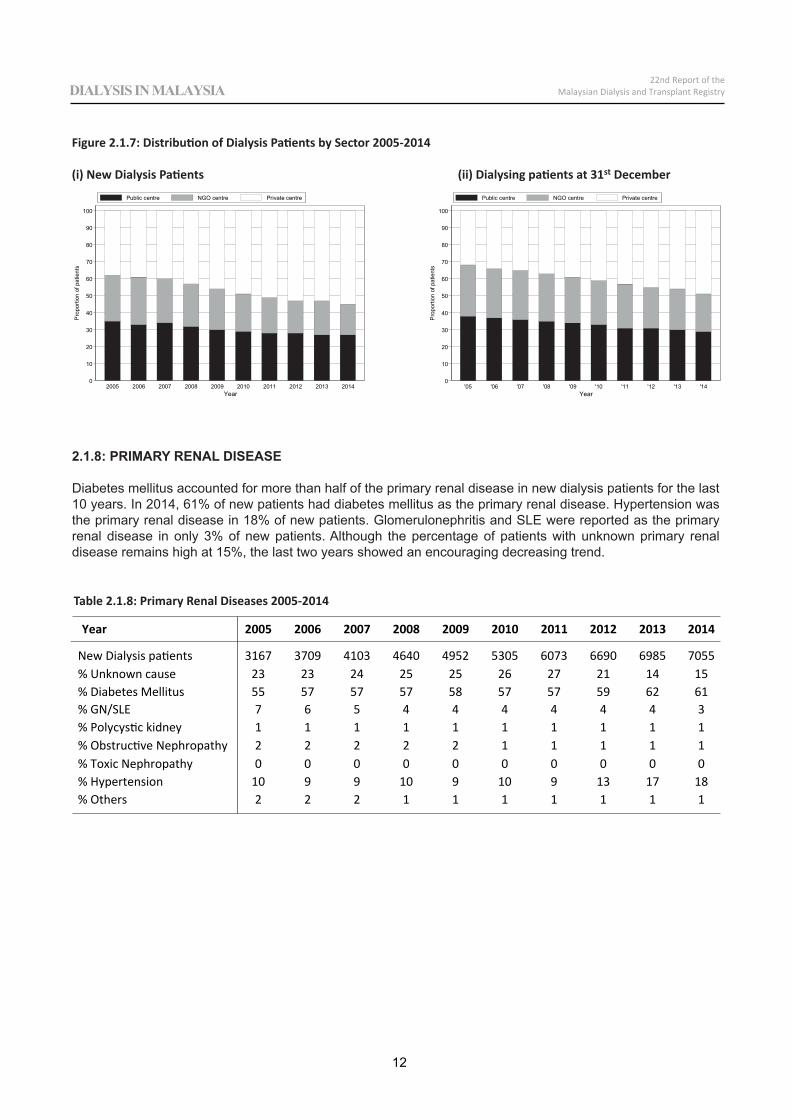
Year 2005 2006 2007 2008 2009 2010 2011 2012 2013 2014
New Dialysis patients 3167 3709 4103 4640 4952 5305 6073 6690 6985 7055% Unknown cause 23 23 24 25 25 26 27 21 14 15% Diabetes Mellitus 55 57 57 57 58 57 57 59 62 61% GN/SLE 7 6 5 4 4 4 4 4 4 3% Polycystic kidney 1 1 1 1 1 1 1 1 1 1% Obstructive Nephropathy 2 2 2 2 2 1 1 1 1 1% Toxic Nephropathy 0 0 0 0 0 0 0 0 0 0% Hypertension 10 9 9 10 9 10 9 13 17 18% Others 2 2 2 1 1 1 1 1 1 1
0
10
20
30
40
50
60
70
80
90
100
Pro
porti
on o
f pat
ient
s
'05 '06 '07 '08 '09 '10 '11 '12 '13 '14Year
Public centre NGO centre Private centre
0
10
20
30
40
50
60
70
80
90
100
Pro
porti
on o
f pat
ient
s
2005 2006 2007 2008 2009 2010 2011 2012 2013 2014Year
Public centre NGO centre Private centre
12
22nd Report of theMalaysian Dialysis and Transplant RegistryDIALYSIS IN MALAYSIA
Figure 2.1.7: Distribution of Dialysis Patients by Sector 2005-2014 (i) New Dialysis Patients (ii) Dialysing patients at 31st December
2.1.8: PRIMARY RENAL DISEASE
Diabetes mellitus accounted for more than half of the primary renal disease in new dialysis patients for the last 10 years. In 2014, 61% of new patients had diabetes mellitus as the primary renal disease. Hypertension was the primary renal disease in 18% of new patients. Glomerulonephritis and SLE were reported as the primary renal disease in only 3% of new patients. Although the percentage of patients with unknown primary renal disease remains high at 15%, the last two years showed an encouraging decreasing trend.
Table 2.1.8: Primary Renal Diseases 2005-2014
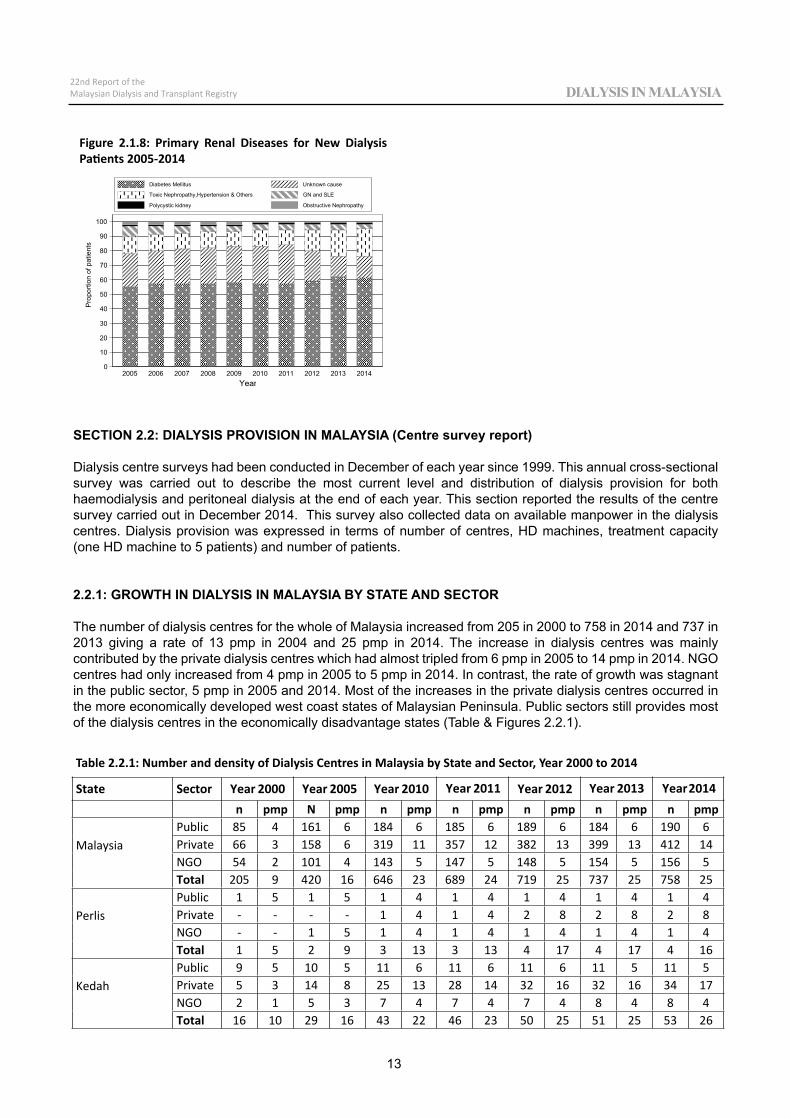
13
22nd Report of theMalaysian Dialysis and Transplant Registry DIALYSIS IN MALAYSIA
Figure 2.1.8: Primary Renal Diseases for New Dialysis Patients 2005-2014
SECTION 2.2: DIALYSIS PROVISION IN MALAYSIA (Centre survey report)
Dialysis centre surveys had been conducted in December of each year since 1999. This annual cross-sectional survey was carried out to describe the most current level and distribution of dialysis provision for both haemodialysis and peritoneal dialysis at the end of each year. This section reported the results of the centre survey carried out in December 2014. This survey also collected data on available manpower in the dialysis centres. Dialysis provision was expressed in terms of number of centres, HD machines, treatment capacity (one HD machine to 5 patients) and number of patients.
2.2.1: GROWTH IN DIALYSIS IN MALAYSIA BY STATE AND SECTOR
The number of dialysis centres for the whole of Malaysia increased from 205 in 2000 to 758 in 2014 and 737 in 2013 giving a rate of 13 pmp in 2004 and 25 pmp in 2014. The increase in dialysis centres was mainly contributed by the private dialysis centres which had almost tripled from 6 pmp in 2005 to 14 pmp in 2014. NGO centres had only increased from 4 pmp in 2005 to 5 pmp in 2014. In contrast, the rate of growth was stagnant in the public sector, 5 pmp in 2005 and 2014. Most of the increases in the private dialysis centres occurred in the more economically developed west coast states of Malaysian Peninsula. Public sectors still provides most of the dialysis centres in the economically disadvantage states (Table & Figures 2.2.1).
n pmp N pmp n pmp n pmp n pmp n pmp n pmp
MalaysiaPublic 85 4 161 6 184 6 185 6 189 6 184 6 190 6Private 66 3 158 6 319 11 357 12 382 13 399 13 412 14NGO 54 2 101 4 143 5 147 5 148 5 154 5 156 5Total 205 9 420 16 646 23 689 24 719 25 737 25 758 25
PerlisPublic 1 5 1 5 1 4 1 4 1 4 1 4 1 4Private 1 4 1 4 2 8 2 8 2 8NGO 1 5 1 4 1 4 1 4 1 4 1 4Total 1 5 2 9 3 13 3 13 4 17 4 17 4 16
KedahPublic 9 5 10 5 11 6 11 6 11 6 11 5 11 5Private 5 3 14 8 25 13 28 14 32 16 32 16 34 17NGO 2 1 5 3 7 4 7 4 7 4 8 4 8 4Total 16 10 29 16 43 22 46 23 50 25 51 25 53 26
State Sector Year 2000 Year 2005 Year 2010 Year 2011 Year 2012 Year 2013 Year2014
Table 2.2.1: Number and density of Dialysis Centres in Malaysia by State and Sector, Year 2000 to 2014
0
10
20
30
40
50
60
70
80
90
100
Prop
ortio
n of
pat
ient
s
2005 2006 2007 2008 2009 2010 2011 2012 2013 2014Year
esuac nwonknUsutilleM setebaiD
Toxic Nephropathy,Hypertension & Others GN and SLE
yhtaporhpeN evitcurtsbOyendik citsycyloP
n pmp N pmp n pmp n pmp n pmp n pmp n pmp
MalaysiaPublic 85 4 161 6 184 6 185 6 189 6 184 6 190 6Private 66 3 158 6 319 11 357 12 382 13 399 13 412 14NGO 54 2 101 4 143 5 147 5 148 5 154 5 156 5Total 205 9 420 16 646 23 689 24 719 25 737 25 758 25
PerlisPublic 1 5 1 5 1 4 1 4 1 4 1 4 1 4Private 1 4 1 4 2 8 2 8 2 8NGO 1 5 1 4 1 4 1 4 1 4 1 4Total 1 5 2 9 3 13 3 13 4 17 4 17 4 16
KedahPublic 9 5 10 5 11 6 11 6 11 6 11 5 11 5Private 5 3 14 8 25 13 28 14 32 16 32 16 34 17NGO 2 1 5 3 7 4 7 4 7 4 8 4 8 4Total 16 10 29 16 43 22 46 23 50 25 51 25 53 26
Kedah & PerlisPublic 10 5 11 5 12 5 12 5 12 5 12 5 12 5Private 5 3 14 7 26 12 29 13 34 15 34 15 36 16NGO 2 1 6 3 8 4 8 4 8 4 9 4 9 4Total 17 9 31 15 46 21 49 22 54 24 55 24 57 25
Pulau PinangPublic 7 5 11 8 11 7 11 7 11 7 9 6 9 5Private 11 8 12 8 27 17 31 19 35 22 35 21 37 22NGO 6 5 14 10 20 13 21 13 22 14 23 14 23 14Total 24 18 37 25 58 37 63 40 68 42 67 41 69 42
PerakPublic 7 3 19 8 20 8 20 8 20 8 18 7 19 8Private 6 3 18 8 31 13 37 15 39 16 42 17 41 17NGO 5 2 12 5 13 5 14 6 14 6 13 5 13 5Total 18 9 49 22 64 27 71 30 73 30 73 30 73 30
Selangor & WPPutrajaya
Public 7 2 14 3 19 3 19 3 19 3 18 3 18 3Private 12 3 37 8 86 15 100 18 103 18 107 18 107 18NGO 9 2 17 4 26 5 26 5 27 5 28 5 28 5Total 28 7 68 14 131 23 145 26 149 26 153 26 153 26
WP KualaLumpur
Public 14 10 14 9 15 9 14 8 14 8 10 6 9 5Private 12 8 26 17 29 17 30 18 31 18 31 18 33 19NGO 6 4 11 7 18 11 18 11 16 9 17 10 17 10Total 32 23 51 33 62 37 62 37 61 36 58 33 59 34
Selangor & WPPutrajaya & WPKL
Public 21 4 28 4 34 5 33 4 33 4 28 4 27 4Private 24 4 63 10 115 16 130 18 134 18 138 18 140 18NGO 15 3 28 4 44 6 44 6 43 6 45 6 45 6Total 60 11 119 19 193 27 207 28 210 28 211 28 212 28
Negeri SembilanPublic 5 6 8 8 10 10 10 10 10 9 10 9 10 9Private 1 1 2 2 17 17 18 17 19 18 21 20 23 21NGO 3 3 4 4 7 7 8 8 8 8 8 7 8 7Total 9 10 14 15 34 33 36 35 37 35 39 36 41 38
MelakaPublic 2 3 4 5 4 5 4 5 5 6 5 6 5 6Private 7 11 11 15 19 23 18 22 19 23 18 21 19 22NGO 2 3 3 4 5 6 5 6 5 6 5 6 5 6Total 11 17 18 24 28 34 27 32 29 34 28 33 29 34
Johor Public 9 3 14 5 16 5 16 5 16 5 17 5 17 5Private 7 3 22 7 43 13 49 14 52 15 55 16 55 16
14
22nd Report of theMalaysian Dialysis and Transplant RegistryDIALYSIS IN MALAYSIA
State Sector Year 2000 Year 2005 Year 2010 Year 2011 Year 2012 Year 2013 Year2014
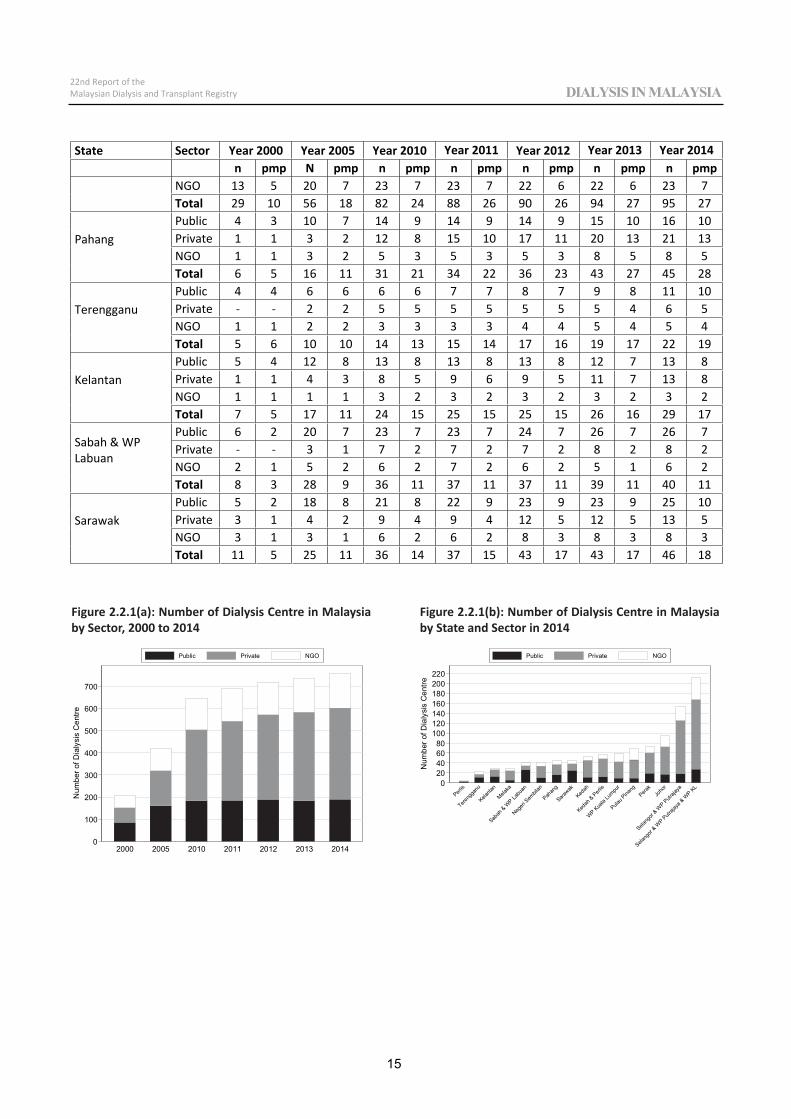
State Sector Year 2000 Year 2005 Year 2010 Year 2011 Year 2012 Year 2013 Year 2014n pmp N pmp n pmp n pmp n pmp n pmp n pmp
NGO 13 5 20 7 23 7 23 7 22 6 22 6 23 7Total 29 10 56 18 82 24 88 26 90 26 94 27 95 27
PahangPublic 4 3 10 7 14 9 14 9 14 9 15 10 16 10Private 1 1 3 2 12 8 15 10 17 11 20 13 21 13NGO 1 1 3 2 5 3 5 3 5 3 8 5 8 5Total 6 5 16 11 31 21 34 22 36 23 43 27 45 28
TerengganuPublic 4 4 6 6 6 6 7 7 8 7 9 8 11 10Private 2 2 5 5 5 5 5 5 5 4 6 5NGO 1 1 2 2 3 3 3 3 4 4 5 4 5 4Total 5 6 10 10 14 13 15 14 17 16 19 17 22 19
KelantanPublic 5 4 12 8 13 8 13 8 13 8 12 7 13 8Private 1 1 4 3 8 5 9 6 9 5 11 7 13 8NGO 1 1 1 1 3 2 3 2 3 2 3 2 3 2Total 7 5 17 11 24 15 25 15 25 15 26 16 29 17
Sabah & WPLabuan
Public 6 2 20 7 23 7 23 7 24 7 26 7 26 7Private 3 1 7 2 7 2 7 2 8 2 8 2NGO 2 1 5 2 6 2 7 2 6 2 5 1 6 2Total 8 3 28 9 36 11 37 11 37 11 39 11 40 11
SarawakPublic 5 2 18 8 21 8 22 9 23 9 23 9 25 10Private 3 1 4 2 9 4 9 4 12 5 12 5 13 5NGO 3 1 3 1 6 2 6 2 8 3 8 3 8 3Total 11 5 25 11 36 14 37 15 43 17 43 17 46 18
0
100
200
300
400
500
600
700
Num
ber o
f Dia
lysi
s C
entre
2000 2005 2010 2011 2012 2013 2014
Public Private NGO
020406080
100120140160180200220
Num
ber o
f Dia
lysi
s C
entre
Perlis
Tereng
ganu
Kelanta
n
Melaka
Sabah
& WP La
buan
Negeri
Sem
bilan
Pahan
g
Sarawak
Kedah
Kedah
& Perlis
WP Kuala
Lumpu
r
Pulau Pina
ngPera
kJo
hor
Selang
or & W
P Putraja
ya
Selang
or& W
P Putraja
ya &
WP
KL
Public Private NGO
15
22nd Report of theMalaysian Dialysis and Transplant Registry DIALYSIS IN MALAYSIA
Figure 2.2.1(a): Number of Dialysis Centre in Malaysia by Sector, 2000 to 2014
Figure 2.2.1(b): Number of Dialysis Centre in Malaysia by State and Sector in 2014
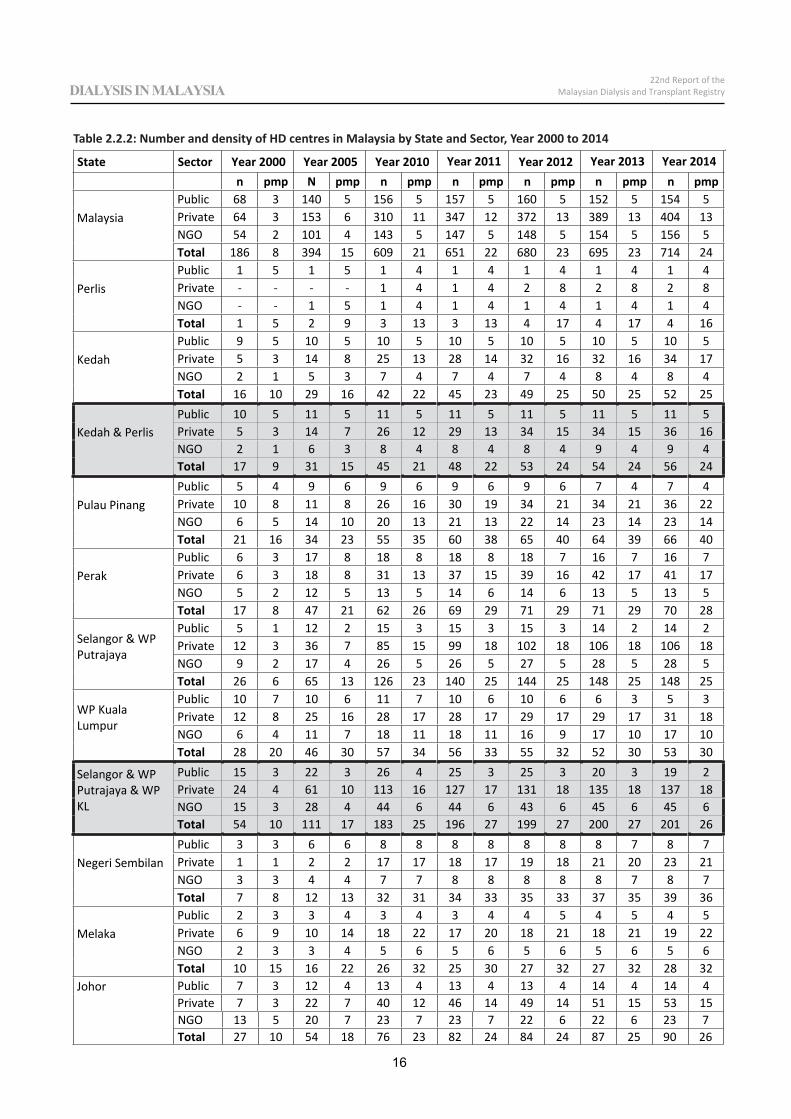
n pmp N pmp n pmp n pmp n pmp n pmp n pmp
MalaysiaPublic 68 3 140 5 156 5 157 5 160 5 152 5 154 5Private 64 3 153 6 310 11 347 12 372 13 389 13 404 13NGO 54 2 101 4 143 5 147 5 148 5 154 5 156 5Total 186 8 394 15 609 21 651 22 680 23 695 23 714 24
PerlisPublic 1 5 1 5 1 4 1 4 1 4 1 4 1 4Private 1 4 1 4 2 8 2 8 2 8NGO 1 5 1 4 1 4 1 4 1 4 1 4Total 1 5 2 9 3 13 3 13 4 17 4 17 4 16
KedahPublic 9 5 10 5 10 5 10 5 10 5 10 5 10 5Private 5 3 14 8 25 13 28 14 32 16 32 16 34 17NGO 2 1 5 3 7 4 7 4 7 4 8 4 8 4Total 16 10 29 16 42 22 45 23 49 25 50 25 52 25
Kedah & PerlisPublic 10 5 11 5 11 5 11 5 11 5 11 5 11 5Private 5 3 14 7 26 12 29 13 34 15 34 15 36 16NGO 2 1 6 3 8 4 8 4 8 4 9 4 9 4Total 17 9 31 15 45 21 48 22 53 24 54 24 56 24
Pulau PinangPublic 5 4 9 6 9 6 9 6 9 6 7 4 7 4Private 10 8 11 8 26 16 30 19 34 21 34 21 36 22NGO 6 5 14 10 20 13 21 13 22 14 23 14 23 14Total 21 16 34 23 55 35 60 38 65 40 64 39 66 40
PerakPublic 6 3 17 8 18 8 18 8 18 7 16 7 16 7Private 6 3 18 8 31 13 37 15 39 16 42 17 41 17NGO 5 2 12 5 13 5 14 6 14 6 13 5 13 5Total 17 8 47 21 62 26 69 29 71 29 71 29 70 28
Selangor & WPPutrajaya
Public 5 1 12 2 15 3 15 3 15 3 14 2 14 2Private 12 3 36 7 85 15 99 18 102 18 106 18 106 18NGO 9 2 17 4 26 5 26 5 27 5 28 5 28 5Total 26 6 65 13 126 23 140 25 144 25 148 25 148 25
WP KualaLumpur
Public 10 7 10 6 11 7 10 6 10 6 6 3 5 3Private 12 8 25 16 28 17 28 17 29 17 29 17 31 18NGO 6 4 11 7 18 11 18 11 16 9 17 10 17 10Total 28 20 46 30 57 34 56 33 55 32 52 30 53 30
Selangor & WPPutrajaya & WPKL
Public 15 3 22 3 26 4 25 3 25 3 20 3 19 2Private 24 4 61 10 113 16 127 17 131 18 135 18 137 18NGO 15 3 28 4 44 6 44 6 43 6 45 6 45 6Total 54 10 111 17 183 25 196 27 199 27 200 27 201 26
Negeri SembilanPublic 3 3 6 6 8 8 8 8 8 8 8 7 8 7Private 1 1 2 2 17 17 18 17 19 18 21 20 23 21NGO 3 3 4 4 7 7 8 8 8 8 8 7 8 7Total 7 8 12 13 32 31 34 33 35 33 37 35 39 36
MelakaPublic 2 3 3 4 3 4 3 4 4 5 4 5 4 5Private 6 9 10 14 18 22 17 20 18 21 18 21 19 22NGO 2 3 3 4 5 6 5 6 5 6 5 6 5 6Total 10 15 16 22 26 32 25 30 27 32 27 32 28 32
Johor Public 7 3 12 4 13 4 13 4 13 4 14 4 14 4Private 7 3 22 7 40 12 46 14 49 14 51 15 53 15
State Sector Year 2000 Year 2005 Year 2010 Year 2011 Year 2012 Year 2013 Year 2014
16
22nd Report of theMalaysian Dialysis and Transplant RegistryDIALYSIS IN MALAYSIA
Table 2.2.2: Number and density of HD centres in Malaysia by State and Sector, Year 2000 to 2014
NGO 13 5 20 7 23 7 23 7 22 6 22 6 23 7Total 27 10 54 18 76 23 82 24 84 24 87 25 90 26
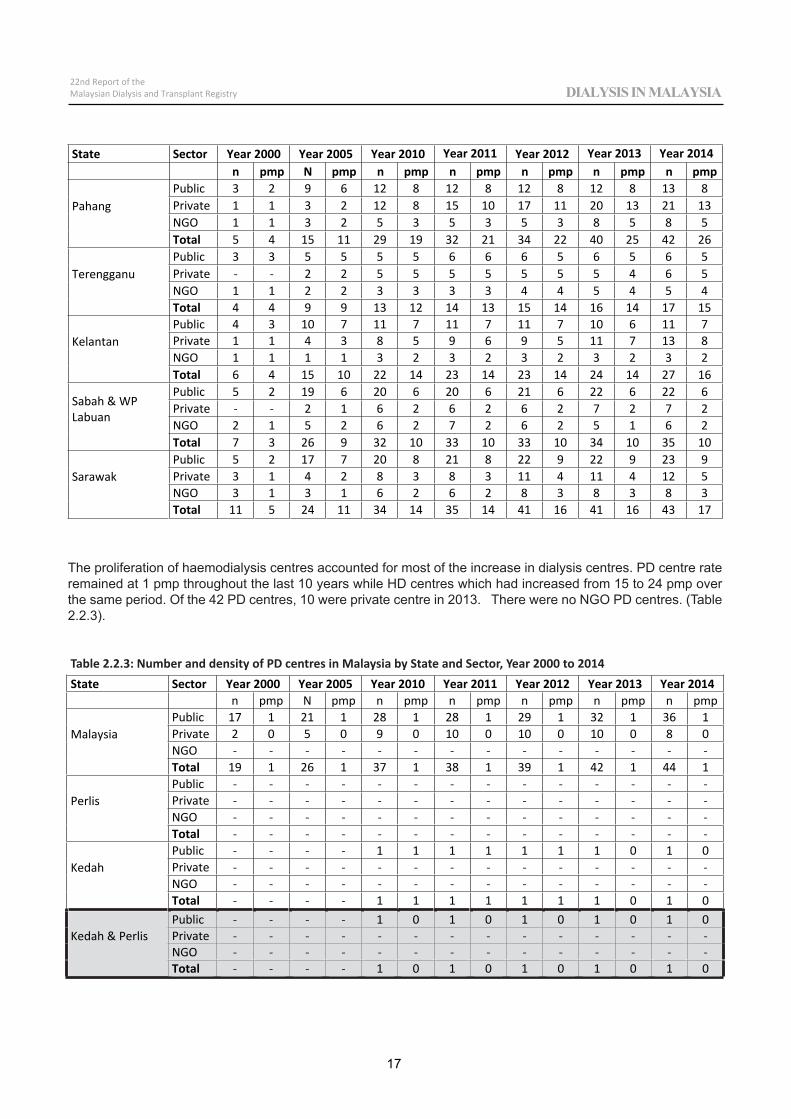
State Sector Year 2000 Year 2005 Year 2010 Year 2011 Year 2012 Year 2013 Year 2014n pmp N pmp n pmp n pmp n pmp n pmp n pmp
PahangPublic 3 2 9 6 12 8 12 8 12 8 12 8 13 8Private 1 1 3 2 12 8 15 10 17 11 20 13 21 13NGO 1 1 3 2 5 3 5 3 5 3 8 5 8 5Total 5 4 15 11 29 19 32 21 34 22 40 25 42 26
TerengganuPublic 3 3 5 5 5 5 6 6 6 5 6 5 6 5Private 2 2 5 5 5 5 5 5 5 4 6 5NGO 1 1 2 2 3 3 3 3 4 4 5 4 5 4Total 4 4 9 9 13 12 14 13 15 14 16 14 17 15
KelantanPublic 4 3 10 7 11 7 11 7 11 7 10 6 11 7Private 1 1 4 3 8 5 9 6 9 5 11 7 13 8NGO 1 1 1 1 3 2 3 2 3 2 3 2 3 2Total 6 4 15 10 22 14 23 14 23 14 24 14 27 16
Sabah & WPLabuan
Public 5 2 19 6 20 6 20 6 21 6 22 6 22 6Private 2 1 6 2 6 2 6 2 7 2 7 2NGO 2 1 5 2 6 2 7 2 6 2 5 1 6 2Total 7 3 26 9 32 10 33 10 33 10 34 10 35 10
SarawakPublic 5 2 17 7 20 8 21 8 22 9 22 9 23 9Private 3 1 4 2 8 3 8 3 11 4 11 4 12 5NGO 3 1 3 1 6 2 6 2 8 3 8 3 8 3Total 11 5 24 11 34 14 35 14 41 16 41 16 43 17
State Sector Year 2000 Year 2005 Year 2010 Year 2011 Year 2012 Year 2013 Year 2014n pmp N pmp n pmp n pmp n pmp n pmp n pmp
MalaysiaPublic 17 1 21 1 28 1 28 1 29 1 32 1 36 1Private 2 0 5 0 9 0 10 0 10 0 10 0 8 0NGOTotal 19 1 26 1 37 1 38 1 39 1 42 1 44 1
PerlisPublicPrivateNGOTotal
KedahPublic 1 1 1 1 1 1 1 0 1 0PrivateNGOTotal 1 1 1 1 1 1 1 0 1 0
Kedah & PerlisPublic 1 0 1 0 1 0 1 0 1 0PrivateNGOTotal 1 0 1 0 1 0 1 0 1 0
17
22nd Report of theMalaysian Dialysis and Transplant Registry DIALYSIS IN MALAYSIA
Table 2.2.3: Number and density of PD centres in Malaysia by State and Sector, Year 2000 to 2014
The proliferation of haemodialysis centres accounted for most of the increase in dialysis centres. PD centre rate remained at 1 pmp throughout the last 10 years while HD centres which had increased from 15 to 24 pmp over the same period. Of the 42 PD centres, 10 were private centre in 2013. There were no NGO PD centres. (Table 2.2.3).
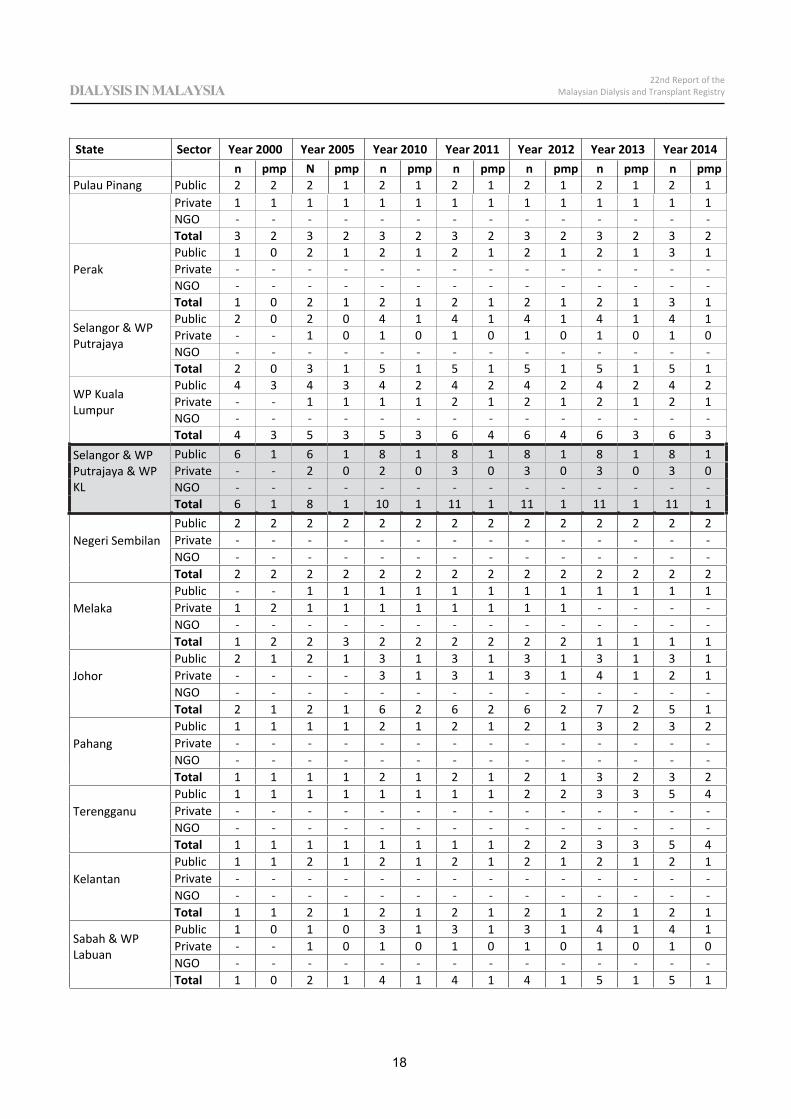
Private 1 1 1 1 1 1 1 1 1 1 1 1 1 1NGOTotal 3 2 3 2 3 2 3 2 3 2 3 2 3 2
PerakPublic 1 0 2 1 2 1 2 1 2 1 2 1 3 1PrivateNGOTotal 1 0 2 1 2 1 2 1 2 1 2 1 3 1
Selangor & WPPutrajaya
Public 2 0 2 0 4 1 4 1 4 1 4 1 4 1Private 1 0 1 0 1 0 1 0 1 0 1 0NGOTotal 2 0 3 1 5 1 5 1 5 1 5 1 5 1
WP KualaLumpur
Public 4 3 4 3 4 2 4 2 4 2 4 2 4 2Private 1 1 1 1 2 1 2 1 2 1 2 1NGOTotal 4 3 5 3 5 3 6 4 6 4 6 3 6 3
Selangor & WPPutrajaya & WPKL
Public 6 1 6 1 8 1 8 1 8 1 8 1 8 1Private 2 0 2 0 3 0 3 0 3 0 3 0NGOTotal 6 1 8 1 10 1 11 1 11 1 11 1 11 1
Negeri SembilanPublic 2 2 2 2 2 2 2 2 2 2 2 2 2 2PrivateNGOTotal 2 2 2 2 2 2 2 2 2 2 2 2 2 2
MelakaPublic 1 1 1 1 1 1 1 1 1 1 1 1Private 1 2 1 1 1 1 1 1 1 1NGOTotal 1 2 2 3 2 2 2 2 2 2 1 1 1 1
JohorPublic 2 1 2 1 3 1 3 1 3 1 3 1 3 1Private 3 1 3 1 3 1 4 1 2 1NGOTotal 2 1 2 1 6 2 6 2 6 2 7 2 5 1
PahangPublic 1 1 1 1 2 1 2 1 2 1 3 2 3 2PrivateNGOTotal 1 1 1 1 2 1 2 1 2 1 3 2 3 2
TerengganuPublic 1 1 1 1 1 1 1 1 2 2 3 3 5 4PrivateNGOTotal 1 1 1 1 1 1 1 1 2 2 3 3 5 4
KelantanPublic 1 1 2 1 2 1 2 1 2 1 2 1 2 1PrivateNGOTotal 1 1 2 1 2 1 2 1 2 1 2 1 2 1
Sabah & WPLabuan
Public 1 0 1 0 3 1 3 1 3 1 4 1 4 1Private 1 0 1 0 1 0 1 0 1 0 1 0NGOTotal 1 0 2 1 4 1 4 1 4 1 5 1 5 1
Pulau Pinang Public 2 2 2 1 2 1 2 1 2 1 2 1 2 1
State Sector Year 2000 Year 2005 Year 2010 Year 2011 Year 2012 Year 2013 Year 2014n pmp N pmp n pmp n pmp n pmp n pmp n pmp
18
22nd Report of theMalaysian Dialysis and Transplant RegistryDIALYSIS IN MALAYSIA
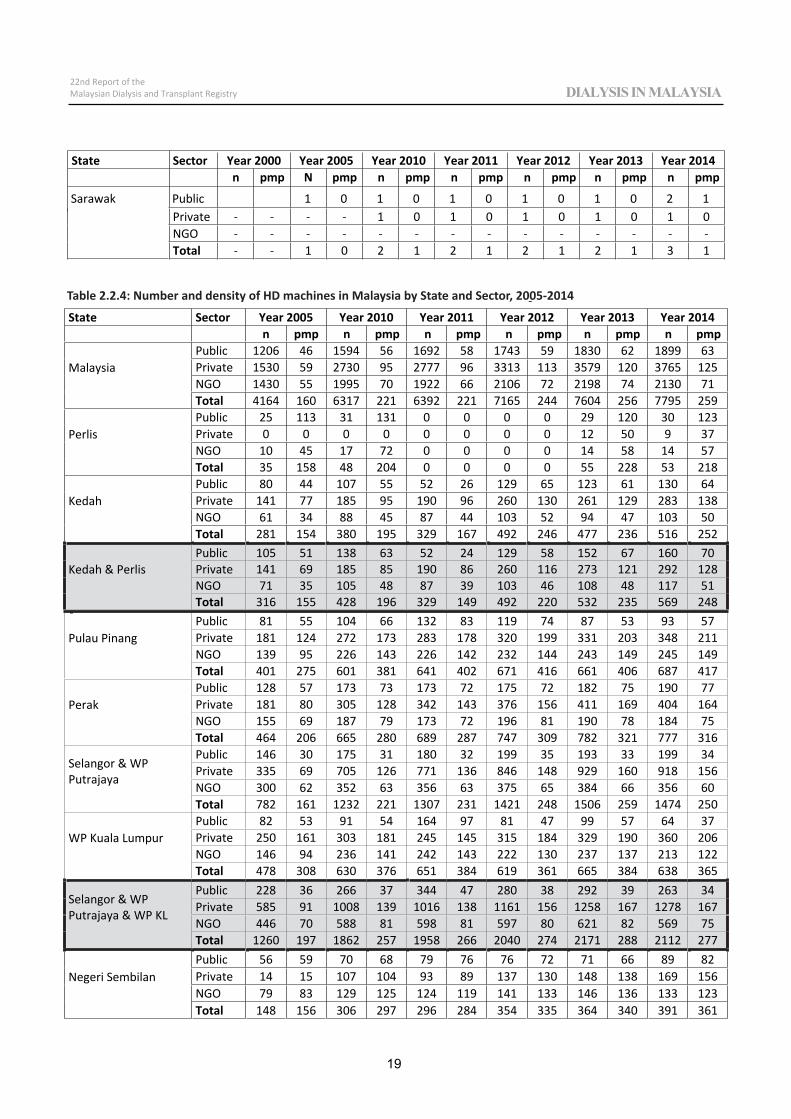
State Sector Year 2000 Year 2005 Year 2010 Year 2011 Year 2012 Year 2013 Year 2014n pmp N pmp n pmp n pmp n pmp n pmp n pmp
Private 1 0 1 0 1 0 1 0 1 0NGOTotal 1 0 2 1 2 1 2 1 2 1 3 1
State Sector Year 2005 Year 2010 Year 2011 Year 2012 Year 2013 Year 2014n pmp n pmp n pmp n pmp n pmp n pmp
MalaysiaPublic 1206 46 1594 56 1692 58 1743 59 1830 62 1899 63Private 1530 59 2730 95 2777 96 3313 113 3579 120 3765 125NGO 1430 55 1995 70 1922 66 2106 72 2198 74 2130 71Total 4164 160 6317 221 6392 221 7165 244 7604 256 7795 259
PerlisPublic 25 113 31 131 0 0 0 0 29 120 30 123Private 0 0 0 0 0 0 0 0 12 50 9 37NGO 10 45 17 72 0 0 0 0 14 58 14 57Total 35 158 48 204 0 0 0 0 55 228 53 218
KedahPublic 80 44 107 55 52 26 129 65 123 61 130 64Private 141 77 185 95 190 96 260 130 261 129 283 138NGO 61 34 88 45 87 44 103 52 94 47 103 50Total 281 154 380 195 329 167 492 246 477 236 516 252
Kedah & PerlisPublic 105 51 138 63 52 24 129 58 152 67 160 70Private 141 69 185 85 190 86 260 116 273 121 292 128NGO 71 35 105 48 87 39 103 46 108 48 117 51Total 316 155 428 196 329 149 492 220 532 235 569 248
Pulau PinangPublic 81 55 104 66 132 83 119 74 87 53 93 57Private 181 124 272 173 283 178 320 199 331 203 348 211NGO 139 95 226 143 226 142 232 144 243 149 245 149Total 401 275 601 381 641 402 671 416 661 406 687 417
PerakPublic 128 57 173 73 173 72 175 72 182 75 190 77Private 181 80 305 128 342 143 376 156 411 169 404 164NGO 155 69 187 79 173 72 196 81 190 78 184 75Total 464 206 665 280 689 287 747 309 782 321 777 316
Selangor & WPPutrajaya
Public 146 30 175 31 180 32 199 35 193 33 199 34Private 335 69 705 126 771 136 846 148 929 160 918 156NGO 300 62 352 63 356 63 375 65 384 66 356 60Total 782 161 1232 221 1307 231 1421 248 1506 259 1474 250
WP Kuala LumpurPublic 82 53 91 54 164 97 81 47 99 57 64 37Private 250 161 303 181 245 145 315 184 329 190 360 206NGO 146 94 236 141 242 143 222 130 237 137 213 122Total 478 308 630 376 651 384 619 361 665 384 638 365
Selangor & WPPutrajaya & WP KL
Public 228 36 266 37 344 47 280 38 292 39 263 34Private 585 91 1008 139 1016 138 1161 156 1258 167 1278 167NGO 446 70 588 81 598 81 597 80 621 82 569 75Total 1260 197 1862 257 1958 266 2040 274 2171 288 2112 277
Negeri SembilanPublic 56 59 70 68 79 76 76 72 71 66 89 82Private 14 15 107 104 93 89 137 130 148 138 169 156NGO 79 83 129 125 124 119 141 133 146 136 133 123Total 148 156 306 297 296 284 354 335 364 340 391 361
Sarawak Public 1 0 1 0 1 0 1 0 1 0 2 1
19
22nd Report of theMalaysian Dialysis and Transplant Registry DIALYSIS IN MALAYSIA
Table 2.2.4: Number and density of HD machines in Malaysia by State and Sector, 2005-2014
Sarawak Public 1 0 1 0 1 0 1 0 1 0 2 1
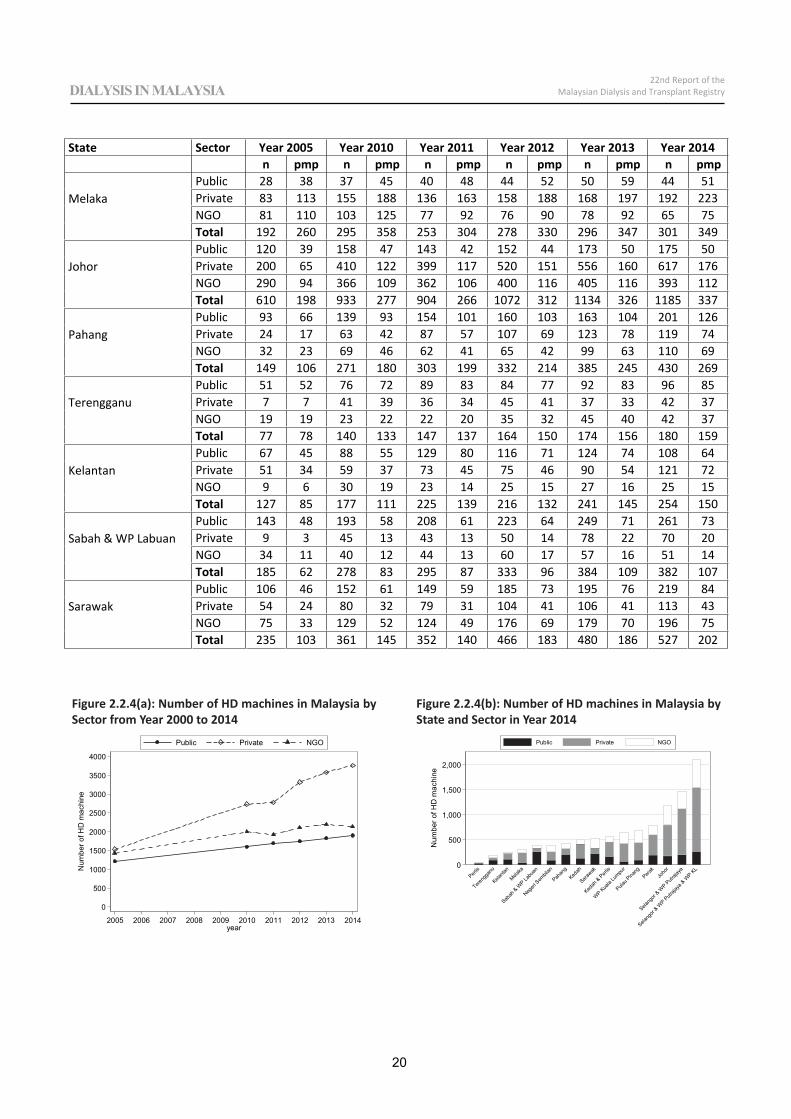
State Sector Year 2005 Year 2010 Year 2011 Year 2012 Year 2013 Year 2014n pmp n pmp n pmp n pmp n pmp n pmp
MelakaPublic 28 38 37 45 40 48 44 52 50 59 44 51Private 83 113 155 188 136 163 158 188 168 197 192 223NGO 81 110 103 125 77 92 76 90 78 92 65 75Total 192 260 295 358 253 304 278 330 296 347 301 349
JohorPublic 120 39 158 47 143 42 152 44 173 50 175 50Private 200 65 410 122 399 117 520 151 556 160 617 176NGO 290 94 366 109 362 106 400 116 405 116 393 112Total 610 198 933 277 904 266 1072 312 1134 326 1185 337
PahangPublic 93 66 139 93 154 101 160 103 163 104 201 126Private 24 17 63 42 87 57 107 69 123 78 119 74NGO 32 23 69 46 62 41 65 42 99 63 110 69Total 149 106 271 180 303 199 332 214 385 245 430 269
TerengganuPublic 51 52 76 72 89 83 84 77 92 83 96 85Private 7 7 41 39 36 34 45 41 37 33 42 37NGO 19 19 23 22 22 20 35 32 45 40 42 37Total 77 78 140 133 147 137 164 150 174 156 180 159
KelantanPublic 67 45 88 55 129 80 116 71 124 74 108 64Private 51 34 59 37 73 45 75 46 90 54 121 72NGO 9 6 30 19 23 14 25 15 27 16 25 15Total 127 85 177 111 225 139 216 132 241 145 254 150
Sabah & WP LabuanPublic 143 48 193 58 208 61 223 64 249 71 261 73Private 9 3 45 13 43 13 50 14 78 22 70 20NGO 34 11 40 12 44 13 60 17 57 16 51 14Total 185 62 278 83 295 87 333 96 384 109 382 107
SarawakPublic 106 46 152 61 149 59 185 73 195 76 219 84Private 54 24 80 32 79 31 104 41 106 41 113 43NGO 75 33 129 52 124 49 176 69 179 70 196 75Total 235 103 361 145 352 140 466 183 480 186 527 202
0
500
1000
1500
2000
2500
3000
3500
4000
Num
ber o
f HD
mac
hine
2005 2006 2007 2008 2009 2010 2011 2012 2013 2014year
Public Private NGO
0
500
1,000
1,500
2,000
Num
ber o
f HD
mac
hine
Perlis
Tereng
ganu
Kelanta
n
Melaka
Sabah
& WP La
buan
Negeri
Sem
bilan
Pahan
gKed
ah
Sarawak
Kedah
& Perlis
WP
Kuala
Lumpu
r
Pulau P
inang
Perak
Joho
r
Selang
or & W
P Putr
ajaya
Selang
or &
WP Putr
ajaya
& W
PKL
Public Private NGO
20
22nd Report of theMalaysian Dialysis and Transplant RegistryDIALYSIS IN MALAYSIA
Figure 2.2.4(b): Number of HD machines in Malaysia by State and Sector in Year 2014
Figure 2.2.4(a): Number of HD machines in Malaysia by Sector from Year 2000 to 2014
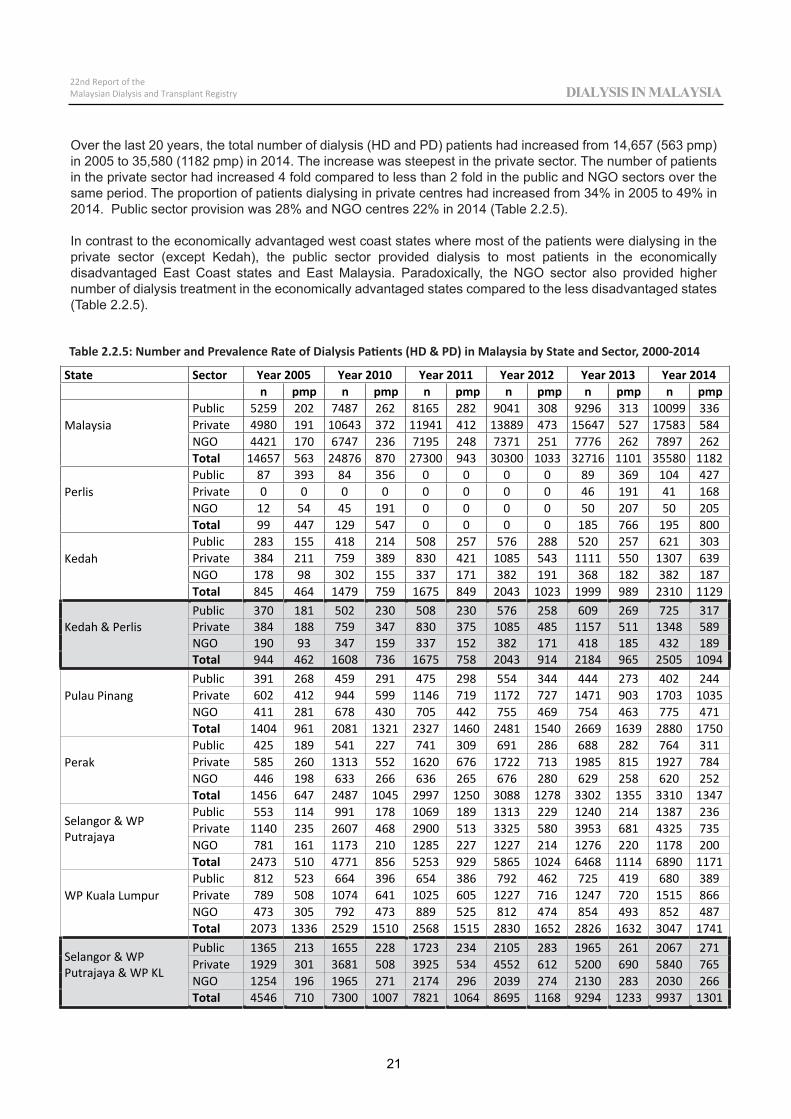
State Sector Year 2005 Year 2010 Year 2011 Year 2012 Year 2013 Year 2014n pmp n pmp n pmp n pmp n pmp n pmp
MalaysiaPublic 5259 202 7487 262 8165 282 9041 308 9296 313 10099 336Private 4980 191 10643 372 11941 412 13889 473 15647 527 17583 584NGO 4421 170 6747 236 7195 248 7371 251 7776 262 7897 262Total 14657 563 24876 870 27300 943 30300 1033 32716 1101 35580 1182
PerlisPublic 87 393 84 356 0 0 0 0 89 369 104 427Private 0 0 0 0 0 0 0 0 46 191 41 168NGO 12 54 45 191 0 0 0 0 50 207 50 205Total 99 447 129 547 0 0 0 0 185 766 195 800
KedahPublic 283 155 418 214 508 257 576 288 520 257 621 303Private 384 211 759 389 830 421 1085 543 1111 550 1307 639NGO 178 98 302 155 337 171 382 191 368 182 382 187Total 845 464 1479 759 1675 849 2043 1023 1999 989 2310 1129
Kedah & PerlisPublic 370 181 502 230 508 230 576 258 609 269 725 317Private 384 188 759 347 830 375 1085 485 1157 511 1348 589NGO 190 93 347 159 337 152 382 171 418 185 432 189Total 944 462 1608 736 1675 758 2043 914 2184 965 2505 1094
Pulau PinangPublic 391 268 459 291 475 298 554 344 444 273 402 244Private 602 412 944 599 1146 719 1172 727 1471 903 1703 1035NGO 411 281 678 430 705 442 755 469 754 463 775 471Total 1404 961 2081 1321 2327 1460 2481 1540 2669 1639 2880 1750
PerakPublic 425 189 541 227 741 309 691 286 688 282 764 311Private 585 260 1313 552 1620 676 1722 713 1985 815 1927 784NGO 446 198 633 266 636 265 676 280 629 258 620 252Total 1456 647 2487 1045 2997 1250 3088 1278 3302 1355 3310 1347
Selangor & WPPutrajaya
Public 553 114 991 178 1069 189 1313 229 1240 214 1387 236Private 1140 235 2607 468 2900 513 3325 580 3953 681 4325 735NGO 781 161 1173 210 1285 227 1227 214 1276 220 1178 200Total 2473 510 4771 856 5253 929 5865 1024 6468 1114 6890 1171
WP Kuala LumpurPublic 812 523 664 396 654 386 792 462 725 419 680 389Private 789 508 1074 641 1025 605 1227 716 1247 720 1515 866NGO 473 305 792 473 889 525 812 474 854 493 852 487Total 2073 1336 2529 1510 2568 1515 2830 1652 2826 1632 3047 1741
Selangor & WPPutrajaya & WP KL
Public 1365 213 1655 228 1723 234 2105 283 1965 261 2067 271Private 1929 301 3681 508 3925 534 4552 612 5200 690 5840 765NGO 1254 196 1965 271 2174 296 2039 274 2130 283 2030 266Total 4546 710 7300 1007 7821 1064 8695 1168 9294 1233 9937 1301
21
22nd Report of theMalaysian Dialysis and Transplant Registry DIALYSIS IN MALAYSIA
Over the last 20 years, the total number of dialysis (HD and PD) patients had increased from 14,657 (563 pmp) in 2005 to 35,580 (1182 pmp) in 2014. The increase was steepest in the private sector. The number of patients in the private sector had increased 4 fold compared to less than 2 fold in the public and NGO sectors over the same period. The proportion of patients dialysing in private centres had increased from 34% in 2005 to 49% in 2014. Public sector provision was 28% and NGO centres 22% in 2014 (Table 2.2.5).
In contrast to the economically advantaged west coast states where most of the patients were dialysing in the private sector (except Kedah), the public sector provided dialysis to most patients in the economically disadvantaged East Coast states and East Malaysia. Paradoxically, the NGO sector also provided higher number of dialysis treatment in the economically advantaged states compared to the less disadvantaged states (Table 2.2.5).
Table 2.2.5: Number and Prevalence Rate of Dialysis Patients (HD & PD) in Malaysia by State and Sector, 2000-2014
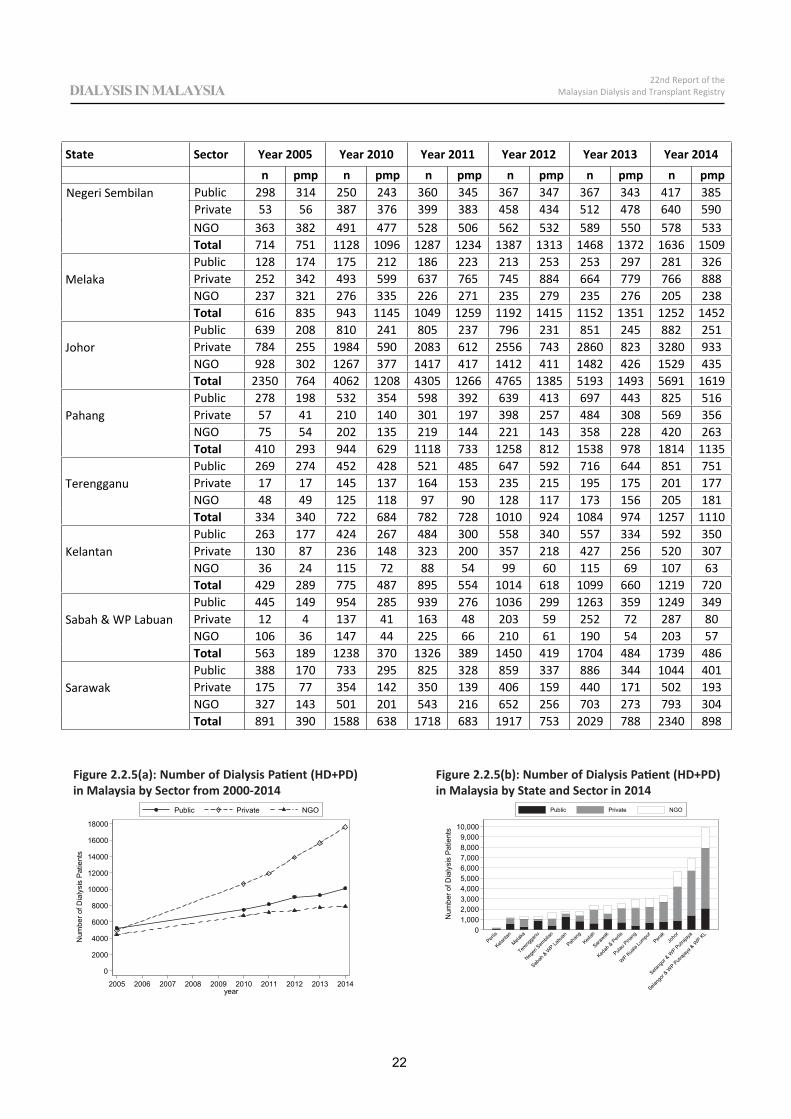
State Sector Year 2005 Year 2010 Year 2011 Year 2012 Year 2013 Year 2014n pmp n pmp n pmp n pmp n pmp n pmp
NGO 363 382 491 477 528 506 562 532 589 550 578 533Total 714 751 1128 1096 1287 1234 1387 1313 1468 1372 1636 1509
MelakaPublic 128 174 175 212 186 223 213 253 253 297 281 326Private 252 342 493 599 637 765 745 884 664 779 766 888NGO 237 321 276 335 226 271 235 279 235 276 205 238Total 616 835 943 1145 1049 1259 1192 1415 1152 1351 1252 1452
JohorPublic 639 208 810 241 805 237 796 231 851 245 882 251Private 784 255 1984 590 2083 612 2556 743 2860 823 3280 933NGO 928 302 1267 377 1417 417 1412 411 1482 426 1529 435Total 2350 764 4062 1208 4305 1266 4765 1385 5193 1493 5691 1619
PahangPublic 278 198 532 354 598 392 639 413 697 443 825 516Private 57 41 210 140 301 197 398 257 484 308 569 356NGO 75 54 202 135 219 144 221 143 358 228 420 263Total 410 293 944 629 1118 733 1258 812 1538 978 1814 1135
TerengganuPublic 269 274 452 428 521 485 647 592 716 644 851 751Private 17 17 145 137 164 153 235 215 195 175 201 177NGO 48 49 125 118 97 90 128 117 173 156 205 181Total 334 340 722 684 782 728 1010 924 1084 974 1257 1110
KelantanPublic 263 177 424 267 484 300 558 340 557 334 592 350Private 130 87 236 148 323 200 357 218 427 256 520 307NGO 36 24 115 72 88 54 99 60 115 69 107 63Total 429 289 775 487 895 554 1014 618 1099 660 1219 720
Sabah & WP LabuanPublic 445 149 954 285 939 276 1036 299 1263 359 1249 349Private 12 4 137 41 163 48 203 59 252 72 287 80NGO 106 36 147 44 225 66 210 61 190 54 203 57Total 563 189 1238 370 1326 389 1450 419 1704 484 1739 486
SarawakPublic 388 170 733 295 825 328 859 337 886 344 1044 401Private 175 77 354 142 350 139 406 159 440 171 502 193NGO 327 143 501 201 543 216 652 256 703 273 793 304Total 891 390 1588 638 1718 683 1917 753 2029 788 2340 898
0
2000
4000
6000
8000
10000
12000
14000
16000
18000
Num
ber o
f Dia
lysi
s P
atie
nts
2005 2006 2007 2008 2009 2010 2011 2012 2013 2014year
Public Private NGO
01,0002,0003,0004,0005,0006,0007,0008,0009,000
10,000
Num
ber o
f Dia
lysi
s Pa
tient
s
Perlis
Kelanta
n
Melaka
Tereng
ganu
Negeri
Sem
bilan
Sabah
&W
PLa
buan
Pahan
gKed
ah
Sarawak
Kedah
& Perl
is
Pulau P
inang
WP Kua
la Lu
mpur
Perak
Joho
r
Selang
or & W
P Putraja
ya
Selang
or & W
P Putraja
ya &
WP K
L
Public Private NGO
Negeri Sembilan Public 298 314 250 243 360 345 367 347 367 343 417 385Private 53 56 387 376 399 383 458 434 512 478 640 590
22
22nd Report of theMalaysian Dialysis and Transplant RegistryDIALYSIS IN MALAYSIA
Figure 2.2.5(a): Number of Dialysis Patient (HD+PD) in Malaysia by Sector from 2000-2014
Figure 2.2.5(b): Number of Dialysis Patient (HD+PD) in Malaysia by State and Sector in 2014
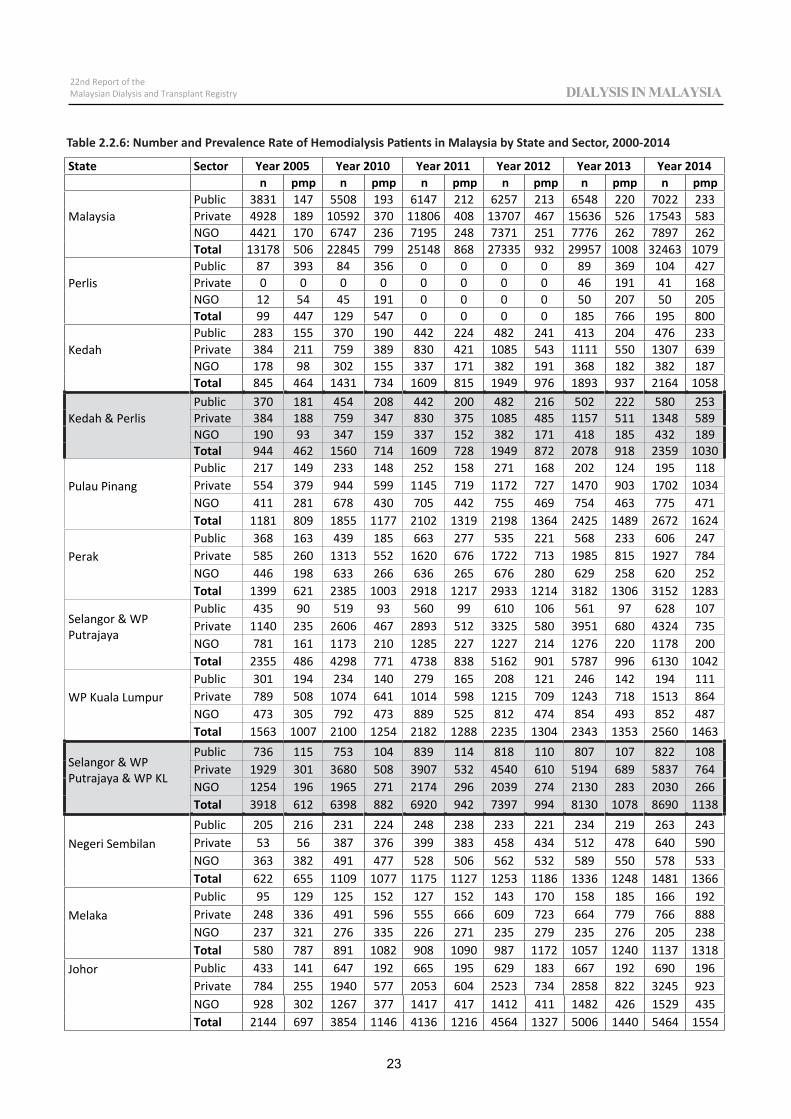
State Sector Year 2005 Year 2010 Year 2011 Year 2012 Year 2013 Year 2014n pmp n pmp n pmp n pmp n pmp n pmp
MalaysiaPublic 3831 147 5508 193 6147 212 6257 213 6548 220 7022 233Private 4928 189 10592 370 11806 408 13707 467 15636 526 17543 583NGO 4421 170 6747 236 7195 248 7371 251 7776 262 7897 262Total 13178 506 22845 799 25148 868 27335 932 29957 1008 32463 1079
PerlisPublic 87 393 84 356 0 0 0 0 89 369 104 427Private 0 0 0 0 0 0 0 0 46 191 41 168NGO 12 54 45 191 0 0 0 0 50 207 50 205Total 99 447 129 547 0 0 0 0 185 766 195 800
KedahPublic 283 155 370 190 442 224 482 241 413 204 476 233Private 384 211 759 389 830 421 1085 543 1111 550 1307 639NGO 178 98 302 155 337 171 382 191 368 182 382 187Total 845 464 1431 734 1609 815 1949 976 1893 937 2164 1058
Kedah & PerlisPublic 370 181 454 208 442 200 482 216 502 222 580 253Private 384 188 759 347 830 375 1085 485 1157 511 1348 589NGO 190 93 347 159 337 152 382 171 418 185 432 189Total 944 462 1560 714 1609 728 1949 872 2078 918 2359 1030
Pulau PinangPublic 217 149 233 148 252 158 271 168 202 124 195 118Private 554 379 944 599 1145 719 1172 727 1470 903 1702 1034NGO 411 281 678 430 705 442 755 469 754 463 775 471Total 1181 809 1855 1177 2102 1319 2198 1364 2425 1489 2672 1624
PerakPublic 368 163 439 185 663 277 535 221 568 233 606 247Private 585 260 1313 552 1620 676 1722 713 1985 815 1927 784NGO 446 198 633 266 636 265 676 280 629 258 620 252Total 1399 621 2385 1003 2918 1217 2933 1214 3182 1306 3152 1283
Selangor & WPPutrajaya
Public 435 90 519 93 560 99 610 106 561 97 628 107Private 1140 235 2606 467 2893 512 3325 580 3951 680 4324 735NGO 781 161 1173 210 1285 227 1227 214 1276 220 1178 200Total 2355 486 4298 771 4738 838 5162 901 5787 996 6130 1042
WP Kuala LumpurPublic 301 194 234 140 279 165 208 121 246 142 194 111Private 789 508 1074 641 1014 598 1215 709 1243 718 1513 864NGO 473 305 792 473 889 525 812 474 854 493 852 487Total 1563 1007 2100 1254 2182 1288 2235 1304 2343 1353 2560 1463
Selangor & WPPutrajaya & WP KL
Public 736 115 753 104 839 114 818 110 807 107 822 108Private 1929 301 3680 508 3907 532 4540 610 5194 689 5837 764NGO 1254 196 1965 271 2174 296 2039 274 2130 283 2030 266Total 3918 612 6398 882 6920 942 7397 994 8130 1078 8690 1138
Negeri SembilanPublic 205 216 231 224 248 238 233 221 234 219 263 243Private 53 56 387 376 399 383 458 434 512 478 640 590NGO 363 382 491 477 528 506 562 532 589 550 578 533Total 622 655 1109 1077 1175 1127 1253 1186 1336 1248 1481 1366
MelakaPublic 95 129 125 152 127 152 143 170 158 185 166 192Private 248 336 491 596 555 666 609 723 664 779 766 888NGO 237 321 276 335 226 271 235 279 235 276 205 238Total 580 787 891 1082 908 1090 987 1172 1057 1240 1137 1318
Johor Public 433 141 647 192 665 195 629 183 667 192 690 196Private 784 255 1940 577 2053 604 2523 734 2858 822 3245 923
23
22nd Report of theMalaysian Dialysis and Transplant Registry DIALYSIS IN MALAYSIA
Table 2.2.6: Number and Prevalence Rate of Hemodialysis Patients in Malaysia by State and Sector, 2000-2014
NGO 928 302 1267 377 1417 417 1412 411 1482 426 1529 435Total 2144 697 3854 1146 4136 1216 4564 1327 5006 1440 5464 1554
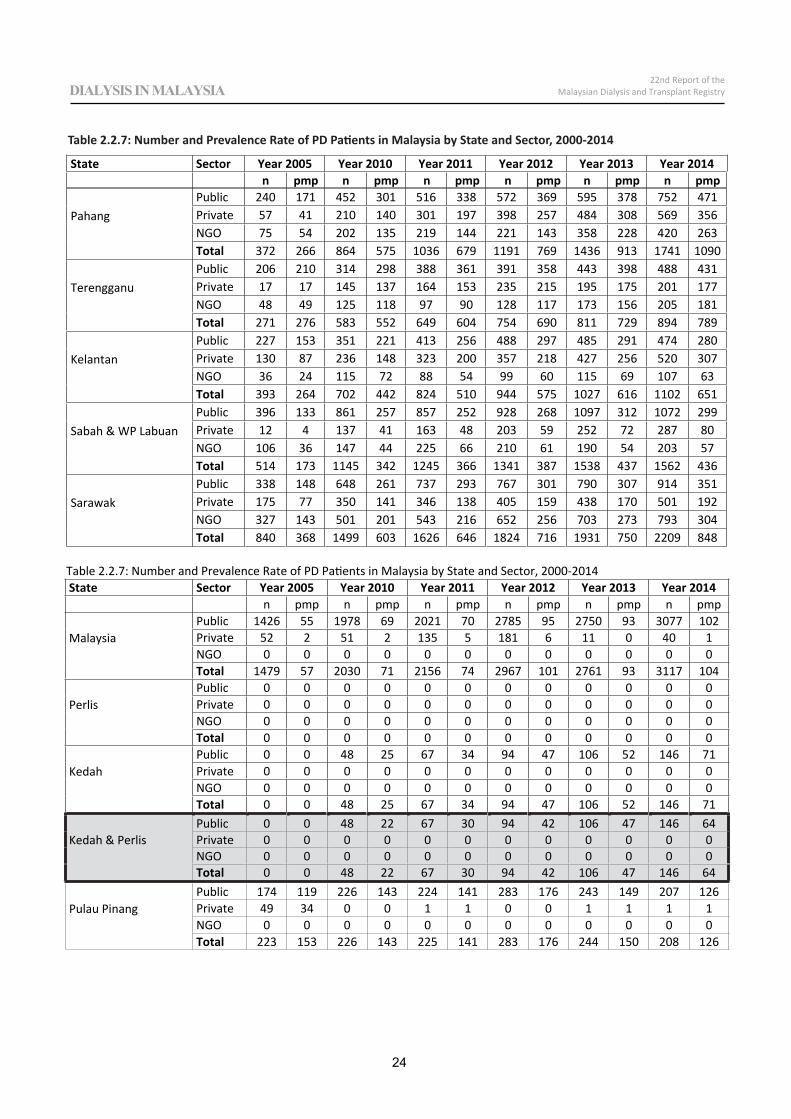
State Sector Year 2005 Year 2010 Year 2011 Year 2012 Year 2013 Year 2014n pmp n pmp n pmp n pmp n pmp n pmp
PahangPublic 240 171 452 301 516 338 572 369 595 378 752 471Private 57 41 210 140 301 197 398 257 484 308 569 356NGO 75 54 202 135 219 144 221 143 358 228 420 263Total 372 266 864 575 1036 679 1191 769 1436 913 1741 1090
TerengganuPublic 206 210 314 298 388 361 391 358 443 398 488 431Private 17 17 145 137 164 153 235 215 195 175 201 177NGO 48 49 125 118 97 90 128 117 173 156 205 181Total 271 276 583 552 649 604 754 690 811 729 894 789
KelantanPublic 227 153 351 221 413 256 488 297 485 291 474 280Private 130 87 236 148 323 200 357 218 427 256 520 307NGO 36 24 115 72 88 54 99 60 115 69 107 63Total 393 264 702 442 824 510 944 575 1027 616 1102 651
Sabah & WP LabuanPublic 396 133 861 257 857 252 928 268 1097 312 1072 299Private 12 4 137 41 163 48 203 59 252 72 287 80NGO 106 36 147 44 225 66 210 61 190 54 203 57Total 514 173 1145 342 1245 366 1341 387 1538 437 1562 436
SarawakPublic 338 148 648 261 737 293 767 301 790 307 914 351Private 175 77 350 141 346 138 405 159 438 170 501 192NGO 327 143 501 201 543 216 652 256 703 273 793 304Total 840 368 1499 603 1626 646 1824 716 1931 750 2209 848
Table 2.2.7: Number and Prevalence Rate of PD Patients in Malaysia by State and Sector, 2000 2014State Sector Year 2005 Year 2010 Year 2011 Year 2012 Year 2013 Year 2014
n pmp n pmp n pmp n pmp n pmp n pmp
MalaysiaPublic 1426 55 1978 69 2021 70 2785 95 2750 93 3077 102Private 52 2 51 2 135 5 181 6 11 0 40 1NGO 0 0 0 0 0 0 0 0 0 0 0 0Total 1479 57 2030 71 2156 74 2967 101 2761 93 3117 104
PerlisPublic 0 0 0 0 0 0 0 0 0 0 0 0Private 0 0 0 0 0 0 0 0 0 0 0 0NGO 0 0 0 0 0 0 0 0 0 0 0 0Total 0 0 0 0 0 0 0 0 0 0 0 0
KedahPublic 0 0 48 25 67 34 94 47 106 52 146 71Private 0 0 0 0 0 0 0 0 0 0 0 0NGO 0 0 0 0 0 0 0 0 0 0 0 0Total 0 0 48 25 67 34 94 47 106 52 146 71
Kedah & PerlisPublic 0 0 48 22 67 30 94 42 106 47 146 64Private 0 0 0 0 0 0 0 0 0 0 0 0NGO 0 0 0 0 0 0 0 0 0 0 0 0Total 0 0 48 22 67 30 94 42 106 47 146 64
Pulau PinangPublic 174 119 226 143 224 141 283 176 243 149 207 126Private 49 34 0 0 1 1 0 0 1 1 1 1NGO 0 0 0 0 0 0 0 0 0 0 0 0Total 223 153 226 143 225 141 283 176 244 150 208 126
24
22nd Report of theMalaysian Dialysis and Transplant RegistryDIALYSIS IN MALAYSIA
Table 2.2.7: Number and Prevalence Rate of PD Patients in Malaysia by State and Sector, 2000-2014
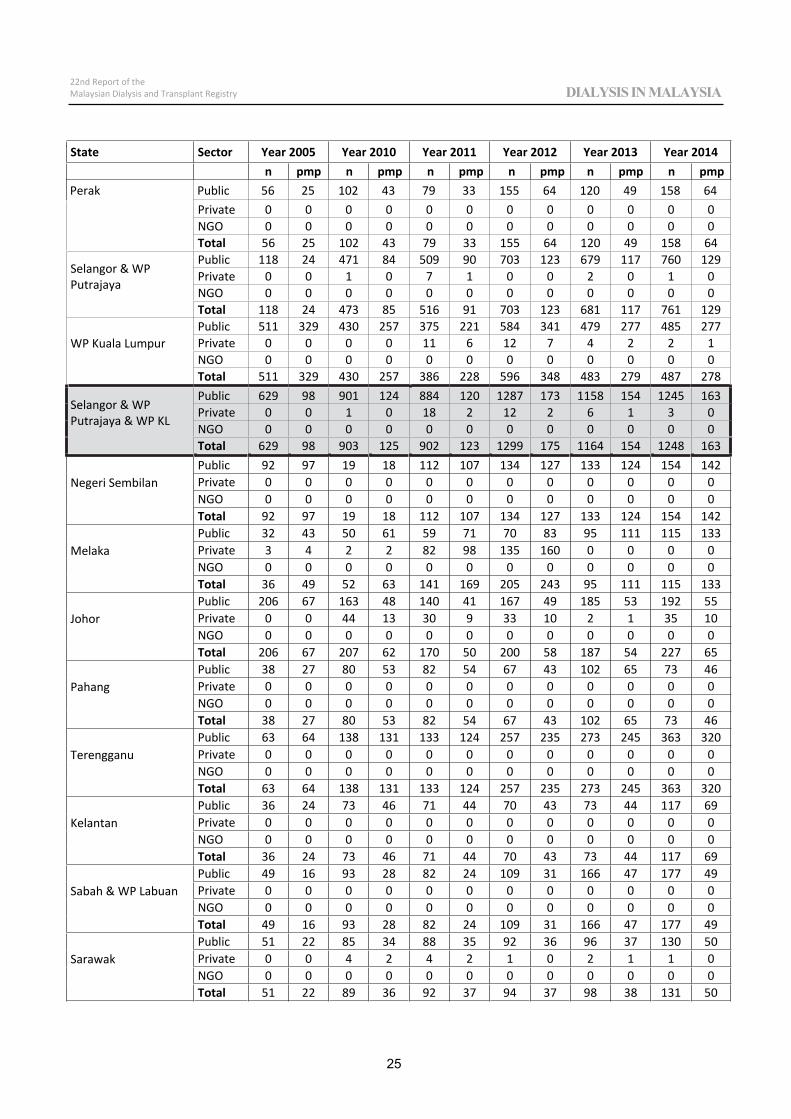
State Sector Year 2005 Year 2010 Year 2011 Year 2012 Year 2013 Year 2014n pmp n pmp n pmp n pmp n pmp n pmp
Private 0 0 0 0 0 0 0 0 0 0 0 0NGO 0 0 0 0 0 0 0 0 0 0 0 0Total 56 25 102 43 79 33 155 64 120 49 158 64
Selangor & WPPutrajaya
Public 118 24 471 84 509 90 703 123 679 117 760 129Private 0 0 1 0 7 1 0 0 2 0 1 0NGO 0 0 0 0 0 0 0 0 0 0 0 0Total 118 24 473 85 516 91 703 123 681 117 761 129
WP Kuala LumpurPublic 511 329 430 257 375 221 584 341 479 277 485 277Private 0 0 0 0 11 6 12 7 4 2 2 1NGO 0 0 0 0 0 0 0 0 0 0 0 0Total 511 329 430 257 386 228 596 348 483 279 487 278
Selangor & WPPutrajaya & WP KL
Public 629 98 901 124 884 120 1287 173 1158 154 1245 163Private 0 0 1 0 18 2 12 2 6 1 3 0NGO 0 0 0 0 0 0 0 0 0 0 0 0Total 629 98 903 125 902 123 1299 175 1164 154 1248 163
Negeri SembilanPublic 92 97 19 18 112 107 134 127 133 124 154 142Private 0 0 0 0 0 0 0 0 0 0 0 0NGO 0 0 0 0 0 0 0 0 0 0 0 0Total 92 97 19 18 112 107 134 127 133 124 154 142
MelakaPublic 32 43 50 61 59 71 70 83 95 111 115 133Private 3 4 2 2 82 98 135 160 0 0 0 0NGO 0 0 0 0 0 0 0 0 0 0 0 0Total 36 49 52 63 141 169 205 243 95 111 115 133
JohorPublic 206 67 163 48 140 41 167 49 185 53 192 55Private 0 0 44 13 30 9 33 10 2 1 35 10NGO 0 0 0 0 0 0 0 0 0 0 0 0Total 206 67 207 62 170 50 200 58 187 54 227 65
PahangPublic 38 27 80 53 82 54 67 43 102 65 73 46Private 0 0 0 0 0 0 0 0 0 0 0 0NGO 0 0 0 0 0 0 0 0 0 0 0 0Total 38 27 80 53 82 54 67 43 102 65 73 46
TerengganuPublic 63 64 138 131 133 124 257 235 273 245 363 320Private 0 0 0 0 0 0 0 0 0 0 0 0NGO 0 0 0 0 0 0 0 0 0 0 0 0Total 63 64 138 131 133 124 257 235 273 245 363 320
KelantanPublic 36 24 73 46 71 44 70 43 73 44 117 69Private 0 0 0 0 0 0 0 0 0 0 0 0NGO 0 0 0 0 0 0 0 0 0 0 0 0Total 36 24 73 46 71 44 70 43 73 44 117 69
Sabah & WP LabuanPublic 49 16 93 28 82 24 109 31 166 47 177 49Private 0 0 0 0 0 0 0 0 0 0 0 0NGO 0 0 0 0 0 0 0 0 0 0 0 0Total 49 16 93 28 82 24 109 31 166 47 177 49
SarawakPublic 51 22 85 34 88 35 92 36 96 37 130 50Private 0 0 4 2 4 2 1 0 2 1 1 0NGO 0 0 0 0 0 0 0 0 0 0 0 0Total 51 22 89 36 92 37 94 37 98 38 131 50
Perak Public 56 25 102 43 79 33 155 64 120 49 158 64
25
22nd Report of theMalaysian Dialysis and Transplant Registry DIALYSIS IN MALAYSIA
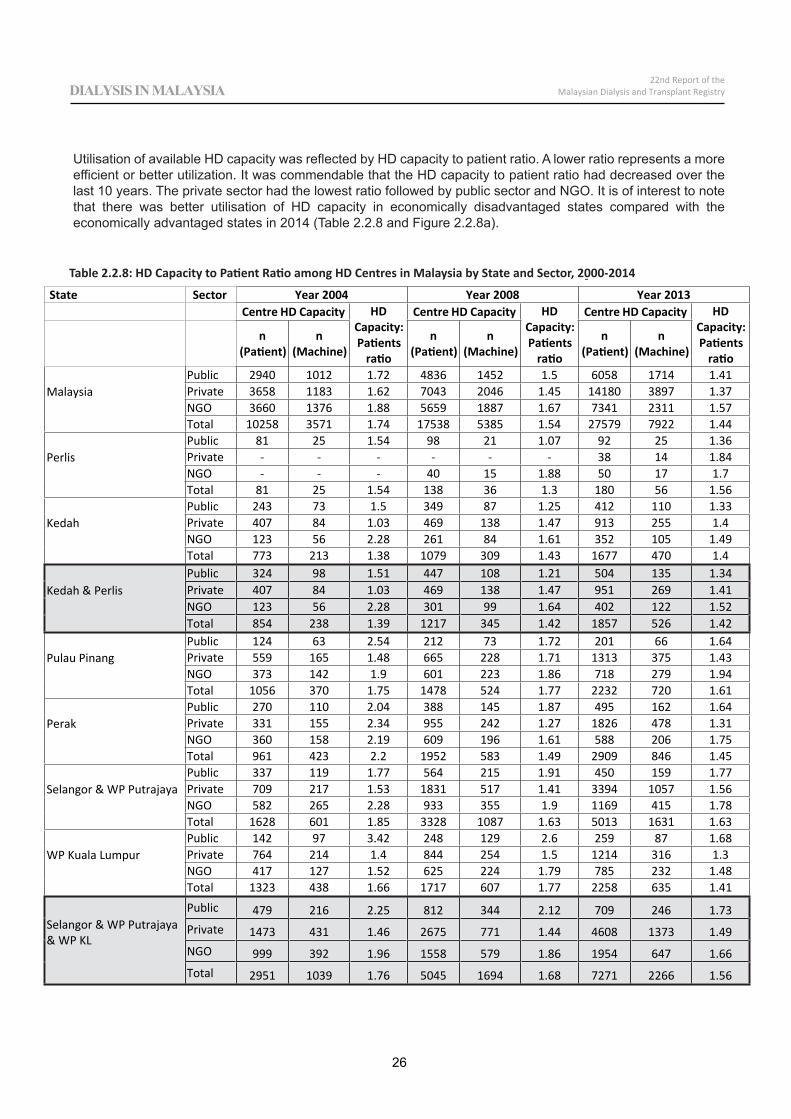
State Sector Year 2004 Year 2008 Year 2013Centre HD Capacity HD
Capacity:Patients
ratio
Centre HD Capacity HDCapacity:Patients
ratio
Centre HD Capacity HDCapacity:Patients
ratio
n(Patient)
n(Machine)
n(Patient)
n(Machine)
n(Patient)
n(Machine)
MalaysiaPublic 2940 1012 1.72 4836 1452 1.5 6058 1714 1.41Private 3658 1183 1.62 7043 2046 1.45 14180 3897 1.37NGO 3660 1376 1.88 5659 1887 1.67 7341 2311 1.57Total 10258 3571 1.74 17538 5385 1.54 27579 7922 1.44
PerlisPublic 81 25 1.54 98 21 1.07 92 25 1.36Private 38 14 1.84NGO 40 15 1.88 50 17 1.7Total 81 25 1.54 138 36 1.3 180 56 1.56
KedahPublic 243 73 1.5 349 87 1.25 412 110 1.33Private 407 84 1.03 469 138 1.47 913 255 1.4NGO 123 56 2.28 261 84 1.61 352 105 1.49Total 773 213 1.38 1079 309 1.43 1677 470 1.4
Kedah & PerlisPublic 324 98 1.51 447 108 1.21 504 135 1.34Private 407 84 1.03 469 138 1.47 951 269 1.41NGO 123 56 2.28 301 99 1.64 402 122 1.52Total 854 238 1.39 1217 345 1.42 1857 526 1.42
Pulau PinangPublic 124 63 2.54 212 73 1.72 201 66 1.64Private 559 165 1.48 665 228 1.71 1313 375 1.43NGO 373 142 1.9 601 223 1.86 718 279 1.94Total 1056 370 1.75 1478 524 1.77 2232 720 1.61
PerakPublic 270 110 2.04 388 145 1.87 495 162 1.64Private 331 155 2.34 955 242 1.27 1826 478 1.31NGO 360 158 2.19 609 196 1.61 588 206 1.75Total 961 423 2.2 1952 583 1.49 2909 846 1.45
Selangor & WP PutrajayaPublic 337 119 1.77 564 215 1.91 450 159 1.77Private 709 217 1.53 1831 517 1.41 3394 1057 1.56NGO 582 265 2.28 933 355 1.9 1169 415 1.78Total 1628 601 1.85 3328 1087 1.63 5013 1631 1.63
WP Kuala LumpurPublic 142 97 3.42 248 129 2.6 259 87 1.68Private 764 214 1.4 844 254 1.5 1214 316 1.3NGO 417 127 1.52 625 224 1.79 785 232 1.48Total 1323 438 1.66 1717 607 1.77 2258 635 1.41
Selangor & WP Putrajaya& WP KL
Public 479 216 2.25 812 344 2.12 709 246 1.73Private 1473 431 1.46 2675 771 1.44 4608 1373 1.49NGO 999 392 1.96 1558 579 1.86 1954 647 1.66Total 2951 1039 1.76 5045 1694 1.68 7271 2266 1.56
26
22nd Report of theMalaysian Dialysis and Transplant RegistryDIALYSIS IN MALAYSIA
Utilisation of available HD capacity was reflected by HD capacity to patient ratio. A lower ratio represents a more efficient or better utilization. It was commendable that the HD capacity to patient ratio had decreased over the last 10 years. The private sector had the lowest ratio followed by public sector and NGO. It is of interest to note that there was better utilisation of HD capacity in economically disadvantaged states compared with the economically advantaged states in 2014 (Table 2.2.8 and Figure 2.2.8a).
Table 2.2.8: HD Capacity to Patient Ratio among HD Centres in Malaysia by State and Sector, 2000-2014
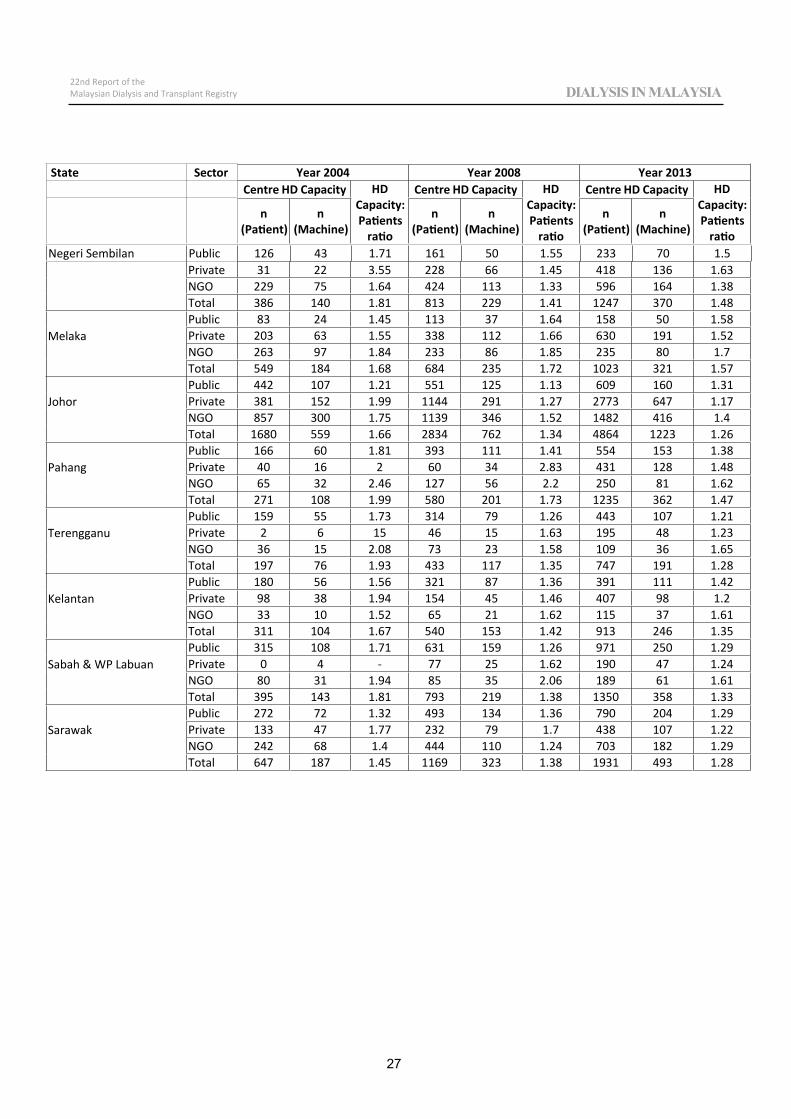
State Sector Year 2004 Year 2008 Year 2013Centre HD Capacity HD
Capacity:Patientsratio
Centre HD Capacity HDCapacity:Patientsratio
Centre HD Capacity HDCapacity:Patientsratio
n(Patient)
n(Machine)
n(Patient)
n(Machine)
n(Patient)
n(Machine)
Private 31 22 3.55 228 66 1.45 418 136 1.63NGO 229 75 1.64 424 113 1.33 596 164 1.38Total 386 140 1.81 813 229 1.41 1247 370 1.48
MelakaPublic 83 24 1.45 113 37 1.64 158 50 1.58Private 203 63 1.55 338 112 1.66 630 191 1.52NGO 263 97 1.84 233 86 1.85 235 80 1.7Total 549 184 1.68 684 235 1.72 1023 321 1.57
JohorPublic 442 107 1.21 551 125 1.13 609 160 1.31Private 381 152 1.99 1144 291 1.27 2773 647 1.17NGO 857 300 1.75 1139 346 1.52 1482 416 1.4Total 1680 559 1.66 2834 762 1.34 4864 1223 1.26
PahangPublic 166 60 1.81 393 111 1.41 554 153 1.38Private 40 16 2 60 34 2.83 431 128 1.48NGO 65 32 2.46 127 56 2.2 250 81 1.62Total 271 108 1.99 580 201 1.73 1235 362 1.47
TerengganuPublic 159 55 1.73 314 79 1.26 443 107 1.21Private 2 6 15 46 15 1.63 195 48 1.23NGO 36 15 2.08 73 23 1.58 109 36 1.65Total 197 76 1.93 433 117 1.35 747 191 1.28
KelantanPublic 180 56 1.56 321 87 1.36 391 111 1.42Private 98 38 1.94 154 45 1.46 407 98 1.2NGO 33 10 1.52 65 21 1.62 115 37 1.61Total 311 104 1.67 540 153 1.42 913 246 1.35
Sabah & WP LabuanPublic 315 108 1.71 631 159 1.26 971 250 1.29Private 0 4 77 25 1.62 190 47 1.24NGO 80 31 1.94 85 35 2.06 189 61 1.61Total 395 143 1.81 793 219 1.38 1350 358 1.33
SarawakPublic 272 72 1.32 493 134 1.36 790 204 1.29Private 133 47 1.77 232 79 1.7 438 107 1.22NGO 242 68 1.4 444 110 1.24 703 182 1.29Total 647 187 1.45 1169 323 1.38 1931 493 1.28
Negeri Sembilan Public 126 43 1.71 161 50 1.55 233 70 1.5
27
22nd Report of theMalaysian Dialysis and Transplant Registry DIALYSIS IN MALAYSIA
1.2
1.3
1.4
1.5
1.6
1.7
1.8
1.9
2
HD
Cap
acity
to P
atie
nt R
atio
2004 2005 2006 2007 2008 2009 2010 2011 2012 2013year
Public Private NGO
0
.5
1
1.5
2
HD
Cap
acity
to P
atie
nt R
atio
Joho
r
Sarawak
Tereng
ganu
Sabah
& WP La
buan
Kelanta
nKed
ah
WP Kuala
Lumpu
r
Kedah
& Perlis
Perak
Pahan
g
Negeri
Sem
bilan
Perlis
Selang
or & W
P Putr
ajaya
&W
P Kua
la Lu
mpur
Melaka
Pulau Pina
ng
Selang
or & W
P Putr
ajaya
State
Public Private NGO
28
22nd Report of theMalaysian Dialysis and Transplant RegistryDIALYSIS IN MALAYSIA
Figure 2.2.8(a): HD Capacity to Patient Ratio among HD Centres in Malaysia by State and Sector, 2000-2014
Figure 2.2.8(b): HD Capacity to Patient Ratio among HD Centres in Malaysia by State and sector, 2013
2.2.9: MANPOWER IN DIALYSIS CENTRES
The number of registered dialysis nurses/medical technicians in Malaysia increased from 1260 (49 pmp) in 2004 to 2421 (82 pmp) in 2013. Overall, the public sector had consistently higher dialysis technician/nurse to population ratio followed by the private sector. Despite its gradual improvement, the NGO sector continued to have the lowest dialysis staff to population ratio compared to the other two sectors.
In 2013, the highest density of certified staff was recorded in Negeri Sembilan, Melaka, Kuala Lumpur and Pulau Pinang. Public sector had the highest density of staff in all states except Selangor, Kuala Lumpur, Pulau Pinang, Johor and Melaka where private centres dominate (Table 2.2.9).
State Sector Year 2004 Year 2008 Year 2013n pmp n pmp n pmp
MalaysiaPublic 755 29 1023 37 1162 39Private 309 12 488 18 905 31NGO 196 8 259 9 354 12Total 1260 49 1770 64 2421 82
PerlisPublic 11 49 11 47 12 50Private 3 12NGO 3 13 3 12Total 11 49 14 60 18 75
KedahPublic 59 33 65 34 72 36Private 25 14 37 19 62 31NGO 8 4 12 6 17 8Total 92 51 114 59 151 75
Kedah & PerlisPublic 70 34 76 35 84 37Private 25 12 37 17 65 29NGO 8 4 15 7 20 9Total 103 51 128 59 169 75
Table 2.2.9: Number & density of Certified Dialysis Nurses/ Medical technicians in Malaysia by State and Sector, 2000-2014
State Sector Year 2004 Year 2008 Year 2013n pmp n pmp n pmp
Pulau PinangPublic 50 34 61 39 70 43Private 43 29 56 36 79 49NGO 23 16 29 19 44 27Total 116 79 146 93 193 119
PerakPublic 74 34 102 43 111 46Private 29 13 45 19 91 37NGO 15 7 23 10 31 13Total 118 54 170 71 233 96
Selangor & WP PutrajayaPublic 63 14 105 21 101 18Private 61 13 123 25 245 43NGO 39 8 48 10 57 10Total 163 35 276 56 403 70
WP Kuala LumpurPublic 75 47 79 47 55 32Private 56 35 59 35 97 56NGO 18 11 33 20 34 20Total 149 94 171 102 186 107
Selangor & WP Putrajaya & WP KLPublic 138 22 184 28 156 21Private 117 19 182 27 342 46NGO 57 9 81 12 91 12Total 312 50 447 67 589 79
Negeri SembilanPublic 44 47 60 61 76 71Private 7 7 18 18 40 37NGO 13 14 19 19 23 21Total 64 68 97 98 139 130
Melaka Public 15 21 21 28 39 46
29
22nd Report of theMalaysian Dialysis and Transplant Registry DIALYSIS IN MALAYSIA
Private 20 28 33 44 40 47NGO 17 24 12 16 15 18Total 52 73 66 88 94 110
JohorPublic 81 27 83 26 95 27Private 33 11 63 19 127 37NGO 37 12 40 12 61 18Total 151 49 186 58 283 81
PahangPublic 46 32 78 52 94 60Private 5 4 8 5 33 21NGO 4 3 8 5 13 8Total 55 39 94 63 140 89
TerengganuPublic 42 43 45 44 60 54Private 6 6 8 8 14 13NGO 4 4 5 5 12 11Total 52 54 58 57 86 77
KelantanPublic 58 39 74 46 85 51Private 10 7 15 9 26 16NGO 2 1 4 2 2 1Total 70 47 93 58 113 68
Sabah & WP LabuanPublic 76 25 120 37 160 47Private 1 0 5 2 14 4NGO 6 2 6 2 10 3Total 83 27 131 40 184 54
SarawakPublic 61 27 119 49 132 51Private 13 6 18 7 34 13NGO 10 4 17 7 32 12Total 84 37 154 63 198 77
0
200
400
600
800
1000
1200
Num
ber o
f Nur
ses/
Med
ical
Tec
hnic
ians
2004 2005 2006 2007 2008 2009 2010 2011 2012 2013year
Public Private NGO
0
100
200
300
400
Num
ber o
f Nur
ses/
Med
ical
Tec
hnic
ians
Perlis
Tereng
ganu
Melaka
Pahang
Kelanta
n
Sabah & W
P Labu
anKed
ah
WP Kuala
Lumpu
r
Kedah
& Perl
is
Negeri
Sembil
an
Pulau P
inang
Sarawak
Perak
Joho
r
Selang
or &WP P
utraja
ya
Selango
r & W
P Putr
ajaya
&WP Kua
la Lu
mpur
State
Public Private NGO
30
22nd Report of theMalaysian Dialysis and Transplant RegistryDIALYSIS IN MALAYSIA
Figure 2.2.9(a): Number of Certified Dialysis Nurses/ Medical technicians in Malaysia by Sector, 2000-2014
Figure 2.2.9(b): Number of Certified Dialysis Nurses/ Medical technicians in Malaysia by State and Sector, 2013
Chapter 3
DEATH AND SURVIVALON DIALYSIS
Wong Hin Seng Ong Loke Meng
Table 3.1.1: Deaths on dialysis 2005-2014
Year 2005 2012 2013 2014
Number of dialysispatients at riskDialysis deathsDialysis death rate%Number of HD patients at riskHD deathsHD death rate%Number of PD patients at riskPD deathsPD death rate %
0
5
10
15
20
Dea
th ra
te
'05'05 '06 '07 '08 '09 '10 '11 '12 '13 '14Year
Annual death rate on PD Annual death rate on HD
32
22nd Report of theMalaysian Dialysis and Transplant RegistryDEATH AND SURVIVAL ON DIALYSIS
SECTION 3.1: DEATH ON DIALYSIS
The annual death rate on dialysis in 2014 was 12.0% (Table 3.1.1). The annual death rate among haemodialysis patients was 11.6% while peritoneal dialysis patients had an annual death rate of 16.1%.
The annual death rate among haemodialysis patients remained relatively unchanged over the last 10 years and ranged from 12-13% (Figure 3.1.1). The annual death rate of patients on chronic peritoneal dialysis (PD) began to increase in mid 2000’s and appeared to have improved over the last 3 years.
The difference in annual death rate between the two modalities persisted over the last 10 years and is partly contributed by the negative selection of patients for peritoneal dialysis.
Figure 3.1.1: Death rates on dialysis 2005-2014
Cardiovascular disease remained the main cause of death and in 2014 accounted for 37% of all death. Death at home accounted for another 16% and a majority of these deaths were probably due to cardiovascular events. Death from sepsis has increased over the last 6 years and has now became the second most common cause of death; accounting for 24% of all death in 2014.
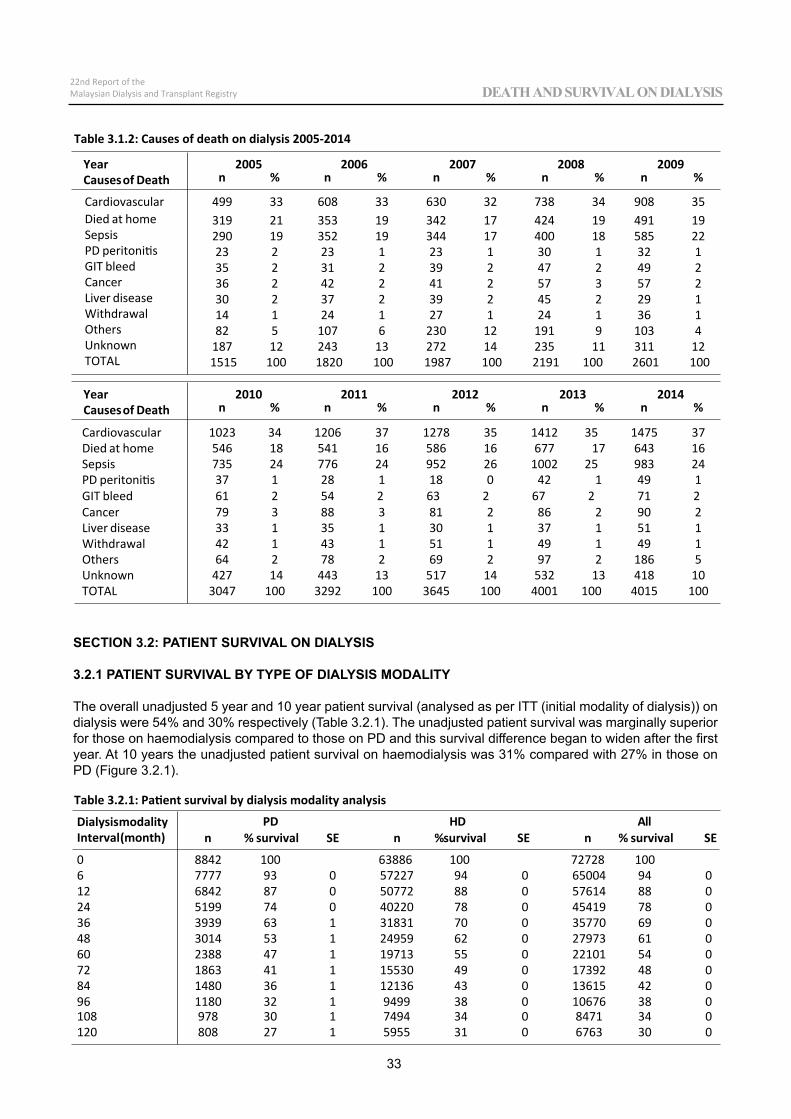
Died at home 319 21 353 19 342 17 424 19 491 19Sepsis 290 19 352 19 344 17 400 18 585 22PD peritonitis 23 2 23 1 23 1 30 1 32 1GIT bleed 35 2 31 2 39 2 47 2 49 2Cancer 36 2 42 2 41 2 57 3 57 2Liver disease 30 2 37 2 39 2 45 2 29 1Withdrawal 14 1 24 1 27 1 24 1 36 1Others 82 5 107 6 230 12 191 9 103 4Unknown 187 12 243 13 272 14 235 11 311 12TOTAL 1515 100 1820 100 1987 100 2191 100 2601 100
Cardiovascular 1023 34 1206 37 1278 35 1412 35 1475 37Died at home 546 18 541 16 586 16 677 17 643 16Sepsis 735 24 776 24 952 26 1002 25 983 24PD peritonitis 37 1 28 1 18 0 42 1 49 1GIT bleed 61 2 54 2 63 2 67 2 71 2Cancer 79 3 88 3 81 2 86 2 90 2Liver disease 33 1 35 1 30 1 37 1 51 1Withdrawal 42 1 43 1 51 1 49 1 49 1Others 64 2 78 2 69 2 97 2 186 5Unknown 427 14 443 13 517 14 532 13 418 10TOTAL 3047 100 3292 100 3645 100 4001 100 4015 100
Table 3.2.1: Patient survival by dialysis modality analysis
DialysismodalityInterval(month)
PD llADHn % survival SE n %survival SE n % survival SE
0 8842 100 63886 100 72728 1006 7777 93 0 57227 94 0 65004 94 012 6842 87 0 50772 88 0 57614 88 024 5199 74 0 40220 78 0 45419 78 036 3939 63 1 31831 70 0 35770 69 048 3014 53 1 24959 62 0 27973 61 060 2388 47 1 19713 55 0 22101 54 072 1863 41 1 15530 49 0 17392 48 084 1480 36 1 12136 43 0 13615 42 096 1180 32 1 9499 38 0 10676 38 0
Table 3.1.2: Causes of death on dialysis 2005-2014
YearCausesof Death
2005 2006 2007 2008 2009n % n % n % n % n %
Cardiovascular 499 33 608 33 630 32 738 34 908 35
33
22nd Report of theMalaysian Dialysis and Transplant Registry DEATH AND SURVIVAL ON DIALYSIS
YearCausesof Death
2010 2011 2012 2013 2014n % n % n % n % n %
SECTION 3.2: PATIENT SURVIVAL ON DIALYSIS
3.2.1 PATIENT SURVIVAL BY TYPE OF DIALYSIS MODALITY
The overall unadjusted 5 year and 10 year patient survival (analysed as per ITT (initial modality of dialysis)) on dialysis were 54% and 30% respectively (Table 3.2.1). The unadjusted patient survival was marginally superior for those on haemodialysis compared to those on PD and this survival difference began to widen after the first year. At 10 years the unadjusted patient survival on haemodialysis was 31% compared with 27% in those on PD (Figure 3.2.1).
108 978 30 1 7494 34 0 8471 34 0120 808 27 1 5955 31 0 6763 30 0
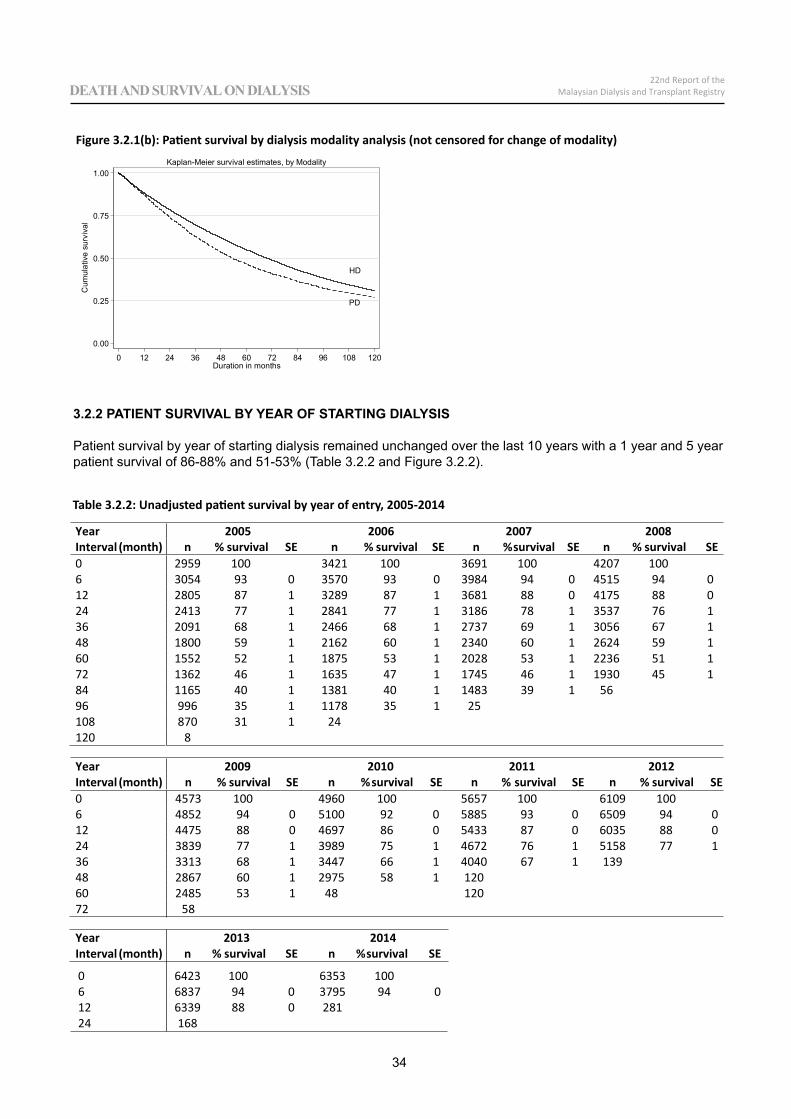
YearInterval (month)
2005 2006 2007 2008n % survival SE n % survival SE n %survival SE n % survival SE
0 2959 100 3421 100 3691 100 4207 1006 3054 93 0 3570 93 0 3984 94 0 4515 94 012 2805 87 1 3289 87 1 3681 88 0 4175 88 024 2413 77 1 2841 77 1 3186 78 1 3537 76 136 2091 68 1 2466 68 1 2737 69 1 3056 67 148 1800 59 1 2162 60 1 2340 60 1 2624 59 160 1552 52 1 1875 53 1 2028 53 1 2236 51 172 1362 46 1 1635 47 1 1745 46 1 1930 45 184 1165 40 1 1381 40 1 1483 39 1 5696 996 35 1 1178 35 1 25108 870 31 1 24120 8
YearInterval (month)
2009 2010 2011 2012n % survival SE n %survival SE n % survival SE n % survival SE
0 4573 100 4960 100 5657 100 6109 1006 4852 94 0 5100 92 0 5885 93 0 6509 94 012 4475 88 0 4697 86 0 5433 87 0 6035 88 024 3839 77 1 3989 75 1 4672 76 1 5158 77 136 3313 68 1 3447 66 1 4040 67 1 13948 2867 60 1 2975 58 1 12060 2485 53 1 48 12072 58
YearInterval (month)
HD
PD
0.00
0.25
0.50
0.75
1.00
Cum
ulat
ive
surv
ival
0 12 24 36 48 60 72 84 96 108 120Duration in months
Kaplan-Meier survival estimates, by Modality
34
22nd Report of theMalaysian Dialysis and Transplant RegistryDEATH AND SURVIVAL ON DIALYSIS
Figure 3.2.1(b): Patient survival by dialysis modality analysis (not censored for change of modality)
3.2.2 PATIENT SURVIVAL BY YEAR OF STARTING DIALYSIS
Patient survival by year of starting dialysis remained unchanged over the last 10 years with a 1 year and 5 year patient survival of 86-88% and 51-53% (Table 3.2.2 and Figure 3.2.2).
Table 3.2.2: Unadjusted patient survival by year of entry, 2005-2014
061224
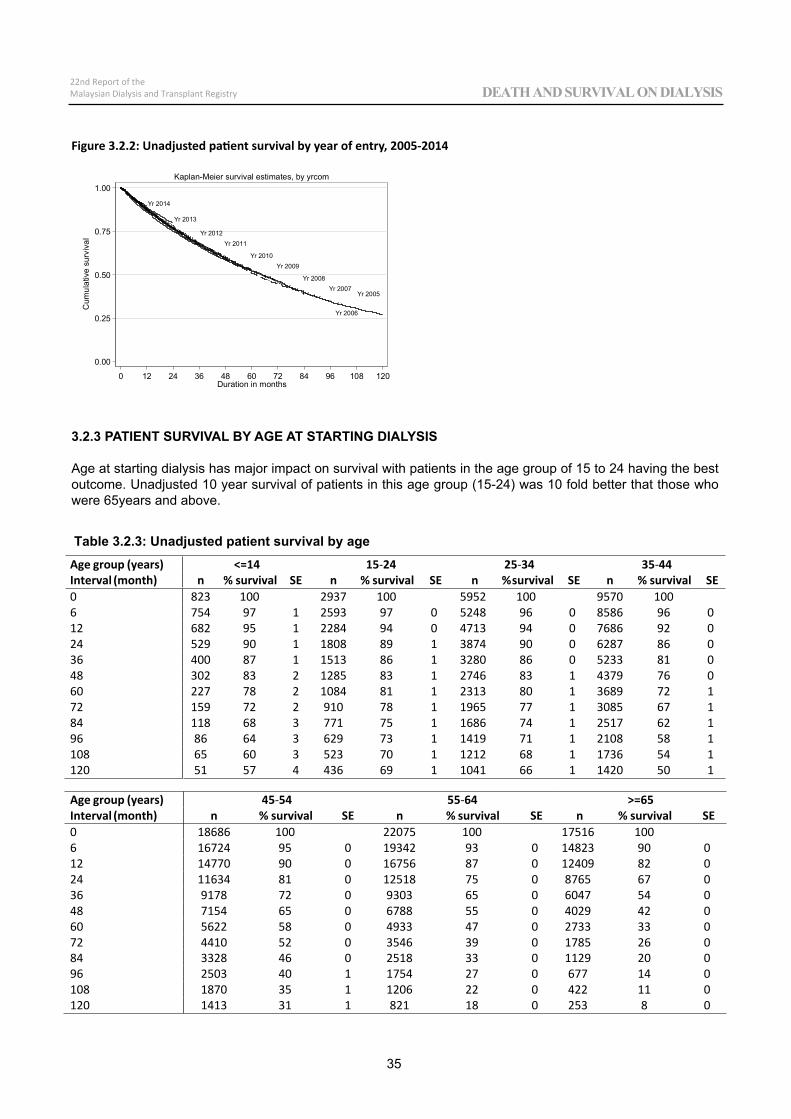
Table 3.2.3: Unadjusted patient survival by age Age group (years)Interval (month)
<=14 15 24 25 34 35 44n % survival SE n % survival SE n %survival SE n % survival SE
0 823 100 2937 100 5952 100 9570 1006 754 97 1 2593 97 0 5248 96 0 8586 96 012 682 95 1 2284 94 0 4713 94 0 7686 92 024 529 90 1 1808 89 1 3874 90 0 6287 86 036 400 87 1 1513 86 1 3280 86 0 5233 81 048 302 83 2 1285 83 1 2746 83 1 4379 76 060 227 78 2 1084 81 1 2313 80 1 3689 72 172 159 72 2 910 78 1 1965 77 1 3085 67 184 118 68 3 771 75 1 1686 74 1 2517 62 196 86 64 3 629 73 1 1419 71 1 2108 58 1108 65 60 3 523 70 1 1212 68 1 1736 54 1120 51 57 4 436 69 1 1041 66 1 1420 50 1
Age group (years)Interval (month)
45 54 55 56=>46n % survival SE n % survival SE n % survival SE
0 18686 100 22075 100 17516 1006 16724 95 0 19342 93 0 14823 90 012 14770 90 0 16756 87 0 12409 82 024 11634 81 0 12518 75 0 8765 67 036 9178 72 0 9303 65 0 6047 54 048 7154 65 0 6788 55 0 4029 42 060 5622 58 0 4933 47 0 2733 33 072 4410 52 0 3546 39 0 1785 26 0
Yr 2014
Yr 2013
Yr 2012Yr 2011
Yr 2010Yr 2009
Yr 2008Yr 2007
Yr 2006
Yr 2005
0.00
0.25
0.50
0.75
1.00
Cum
ulat
ive
surv
ival
0 12 24 36 48 60 72 84 96 108 120Duration in months
Kaplan-Meier survival estimates, by yrcom
35
22nd Report of theMalaysian Dialysis and Transplant Registry DEATH AND SURVIVAL ON DIALYSIS
Figure 3.2.2: Unadjusted patient survival by year of entry, 2005-2014
3.2.3 PATIENT SURVIVAL BY AGE AT STARTING DIALYSIS
Age at starting dialysis has major impact on survival with patients in the age group of 15 to 24 having the best outcome. Unadjusted 10 year survival of patients in this age group (15-24) was 10 fold better that those who were 65years and above.
84 3328 46 0 2518 33 0 1129 20 096 2503 40 1 1754 27 0 677 14 0108 1870 35 1 1206 22 0 422 11 0120 1413 31 1 821 18 0 253 8 0
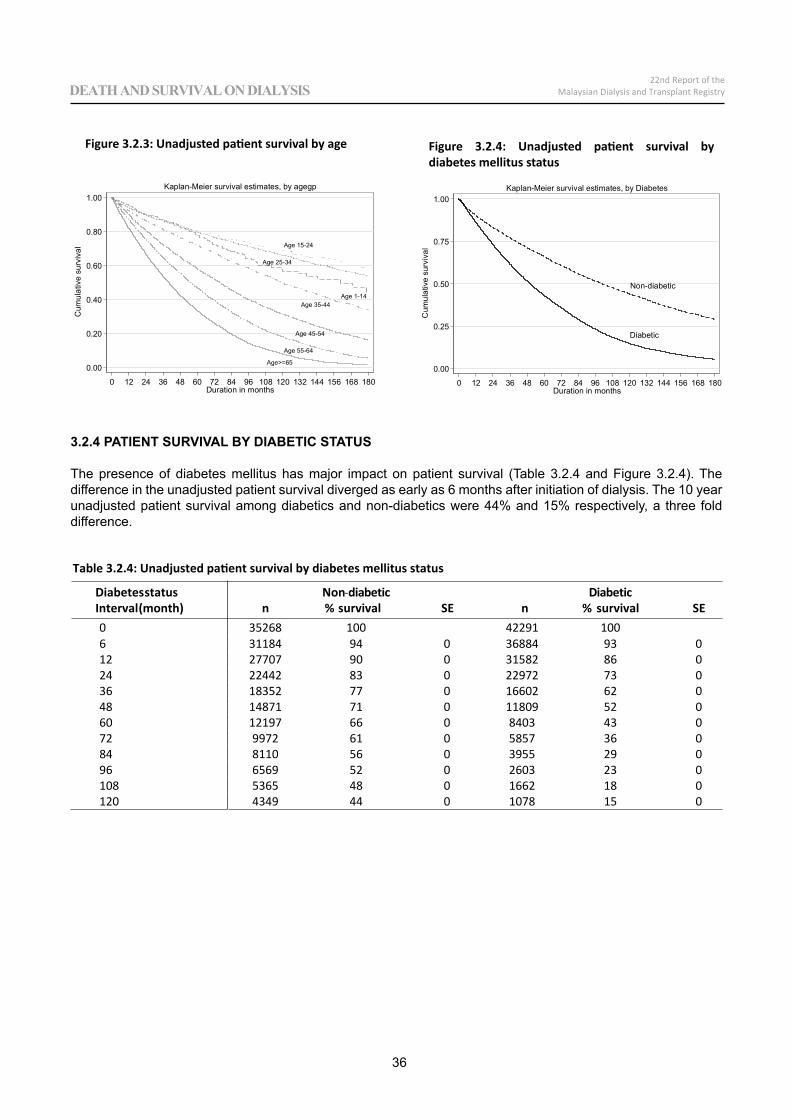
Table 3.2.4: Unadjusted patient survival by diabetes mellitus status
DiabetesstatusInterval(month)
Non citebaiDcitebaidn % survival SE
0 35268 100 42291 1006 31184 94 0 36884 93 012 27707 90 0 31582 86 024 22442 83 0 22972 73 036 18352 77 0 16602 62 048 14871 71 0 11809 52 060 12197 66 0 8403 43 072 9972 61 0 5857 36 084 8110 56 0 3955 29 096 6569 52 0 2603 23 0108 5365 48 0 1662 18 0120 4349 44 0 1078 15 0
Age>=65
Age 55-64
Age 45-54
Age 35-44
Age 25-34
Age 15-24
Age 1-14
0.00
0.20
0.40
0.60
0.80
1.00
Cum
ulat
ive
surv
ival
0 12 24 36 48 60 72 84 96 108 120 132 144 156 168 180Duration in months
Kaplan-Meier survival estimates, by agegp
36
22nd Report of theMalaysian Dialysis and Transplant RegistryDEATH AND SURVIVAL ON DIALYSIS
Diabetic
Non-diabetic
0.00
0.25
0.50
0.75
1.00
Cum
ulat
ive
surv
ival
0 12 24 36 48 60 72 84 96 108 120 132 144 156 168 180Duration in months
Kaplan-Meier survival estimates, by Diabetes
Figure 3.2.3: Unadjusted patient survival by age Figure 3.2.4: Unadjusted patient survival by diabetes mellitus status
3.2.4 PATIENT SURVIVAL BY DIABETIC STATUS
The presence of diabetes mellitus has major impact on patient survival (Table 3.2.4 and Figure 3.2.4). The difference in the unadjusted patient survival diverged as early as 6 months after initiation of dialysis. The 10 year unadjusted patient survival among diabetics and non-diabetics were 44% and 15% respectively, a three fold difference.
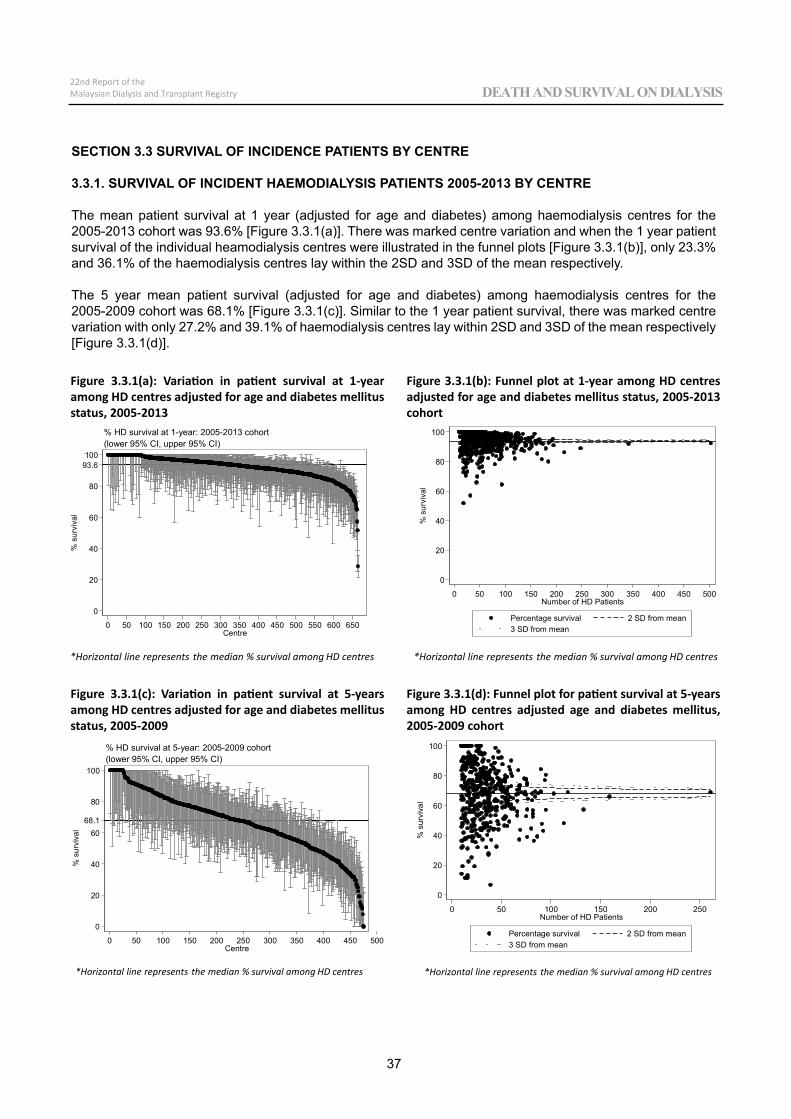
*Horizontal line represents the median % survival among HD centres *Horizontal line represents the median % survival among HD centres
0
20
40
60
80
10093.6
% s
urvi
val
0 50 100 150 200 250 300 350 400 450 500 550 600 650Centre
(lower 95% CI, upper 95% CI)% HD survival at 1-year: 2005-2013 cohort
0
20
40
60
80
100%
sur
viva
l
0 50 100 150 200 250 300 350 400 450 500Number of HD Patients
Percentage survival 2 SD from mean3 SD from mean
37
22nd Report of theMalaysian Dialysis and Transplant Registry DEATH AND SURVIVAL ON DIALYSIS
Figure 3.3.1(a): Variation in patient survival at 1-year among HD centres adjusted for age and diabetes mellitus status, 2005-2013
Figure 3.3.1(b): Funnel plot at 1-year among HD centres adjusted for age and diabetes mellitus status, 2005-2013 cohort
Figure 3.3.1(c): Variation in patient survival at 5-years among HD centres adjusted for age and diabetes mellitus status, 2005-2009
Figure 3.3.1(d): Funnel plot for patient survival at 5-years among HD centres adjusted age and diabetes mellitus, 2005-2009 cohort
SECTION 3.3 SURVIVAL OF INCIDENCE PATIENTS BY CENTRE
3.3.1. SURVIVAL OF INCIDENT HAEMODIALYSIS PATIENTS 2005-2013 BY CENTRE
The mean patient survival at 1 year (adjusted for age and diabetes) among haemodialysis centres for the 2005-2013 cohort was 93.6% [Figure 3.3.1(a)]. There was marked centre variation and when the 1 year patient survival of the individual heamodialysis centres were illustrated in the funnel plots [Figure 3.3.1(b)], only 23.3% and 36.1% of the haemodialysis centres lay within the 2SD and 3SD of the mean respectively.
The 5 year mean patient survival (adjusted for age and diabetes) among haemodialysis centres for the 2005-2009 cohort was 68.1% [Figure 3.3.1(c)]. Similar to the 1 year patient survival, there was marked centre variation with only 27.2% and 39.1% of haemodialysis centres lay within 2SD and 3SD of the mean respectively [Figure 3.3.1(d)].
*Horizontal line represents the median % survival among HD centres *Horizontal line represents the median % survival among HD centres
0
20
40
60
80
100
68.1
% s
urvi
val
0 50 100 150 200 250 300 350 400 450 500Centre
(lower 95% CI, upper 95% CI)% HD survival at 5-year: 2005-2009 cohort
0
20
40
60
80
100
% s
urvi
val
0 50 100 150 200 250Number of HD Patients
Percentage survival 2 SD from mean3 SD from mean
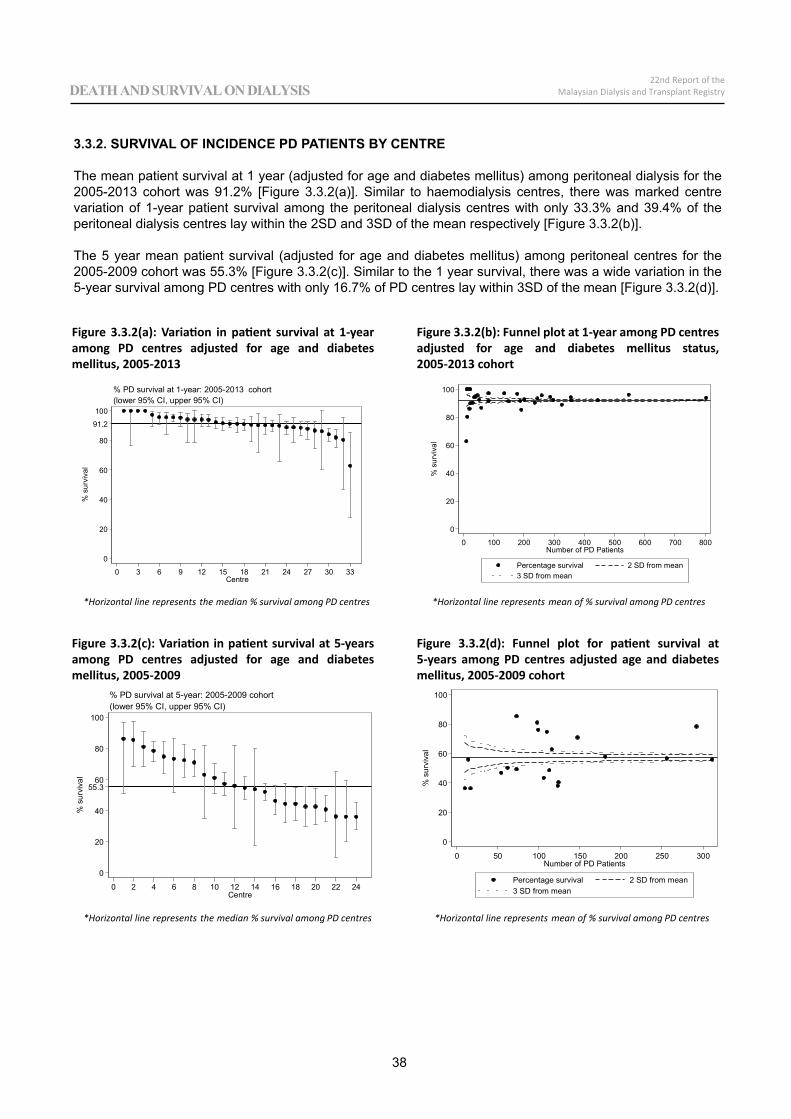
*Horizontal line represents the median % survival among PD centres *Horizontal line represents mean of % survival among PD centres
0
20
40
60
80
100
91.2
% s
urvi
val
0 3 6 9 12 15 18 21 24 27 30 33Centre
(lower 95% CI, upper 95% CI)% PD survival at 1-year: 2005-2013 cohort
0
20
40
60
80
100
% s
urvi
val
0 100 200 300 400 500 600 700 800Number of PD Patients
Percentage survival 2 SD from mean3 SD from mean
38
22nd Report of theMalaysian Dialysis and Transplant RegistryDEATH AND SURVIVAL ON DIALYSIS
3.3.2. SURVIVAL OF INCIDENCE PD PATIENTS BY CENTRE
The mean patient survival at 1 year (adjusted for age and diabetes mellitus) among peritoneal dialysis for the 2005-2013 cohort was 91.2% [Figure 3.3.2(a)]. Similar to haemodialysis centres, there was marked centre variation of 1-year patient survival among the peritoneal dialysis centres with only 33.3% and 39.4% of the peritoneal dialysis centres lay within the 2SD and 3SD of the mean respectively [Figure 3.3.2(b)].
The 5 year mean patient survival (adjusted for age and diabetes mellitus) among peritoneal centres for the 2005-2009 cohort was 55.3% [Figure 3.3.2(c)]. Similar to the 1 year survival, there was a wide variation in the 5-year survival among PD centres with only 16.7% of PD centres lay within 3SD of the mean [Figure 3.3.2(d)].
Figure 3.3.2(a): Variation in patient survival at 1-year among PD centres adjusted for age and diabetes mellitus, 2005-2013
Figure 3.3.2(b): Funnel plot at 1-year among PD centres adjusted for age and diabetes mellitus status, 2005-2013 cohort
Figure 3.3.2(c): Variation in patient survival at 5-years among PD centres adjusted for age and diabetes mellitus, 2005-2009
Figure 3.3.2(d): Funnel plot for patient survival at 5-years among PD centres adjusted age and diabetes mellitus, 2005-2009 cohort
*Horizontal line represents the median % survival among PD centres *Horizontal line represents mean of % survival among PD centres
0
20
40
60
80
100
55.3
% s
urvi
val
0 2 4 6 8 10 12 14 16 18 20 22 24Centre
(lower 95% CI, upper 95% CI)% PD survival at 5-year: 2005-2009 cohort
0
20
40
60
80
100
% s
urvi
val
0 50 100 150 200 250 300Number of PD Patients
Percentage survival 2 SD from mean3 SD from mean
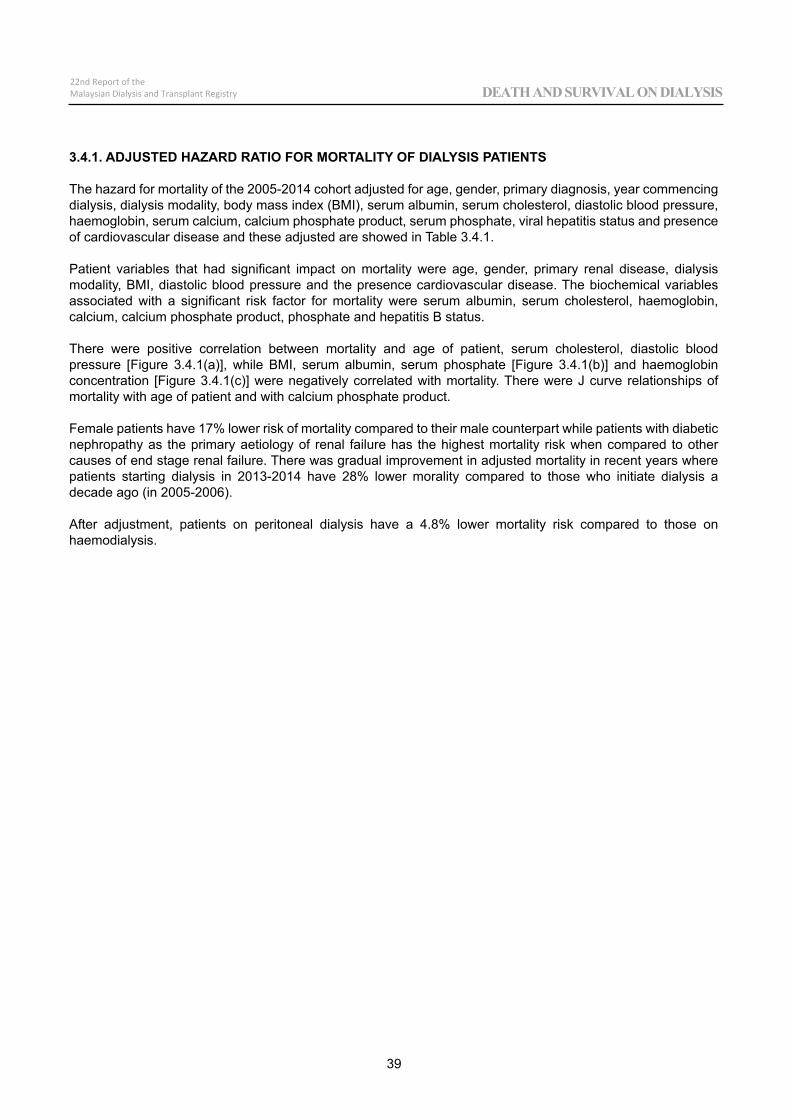
39
22nd Report of theMalaysian Dialysis and Transplant Registry DEATH AND SURVIVAL ON DIALYSIS
3.4.1. ADJUSTED HAZARD RATIO FOR MORTALITY OF DIALYSIS PATIENTS
The hazard for mortality of the 2005-2014 cohort adjusted for age, gender, primary diagnosis, year commencing dialysis, dialysis modality, body mass index (BMI), serum albumin, serum cholesterol, diastolic blood pressure, haemoglobin, serum calcium, calcium phosphate product, serum phosphate, viral hepatitis status and presence of cardiovascular disease and these adjusted are showed in Table 3.4.1.
Patient variables that had significant impact on mortality were age, gender, primary renal disease, dialysis modality, BMI, diastolic blood pressure and the presence cardiovascular disease. The biochemical variables associated with a significant risk factor for mortality were serum albumin, serum cholesterol, haemoglobin, calcium, calcium phosphate product, phosphate and hepatitis B status.
There were positive correlation between mortality and age of patient, serum cholesterol, diastolic blood pressure [Figure 3.4.1(a)], while BMI, serum albumin, serum phosphate [Figure 3.4.1(b)] and haemoglobin concentration [Figure 3.4.1(c)] were negatively correlated with mortality. There were J curve relationships of mortality with age of patient and with calcium phosphate product. Female patients have 17% lower risk of mortality compared to their male counterpart while patients with diabetic nephropathy as the primary aetiology of renal failure has the highest mortality risk when compared to other causes of end stage renal failure. There was gradual improvement in adjusted mortality in recent years where patients starting dialysis in 2013-2014 have 28% lower morality compared to those who initiate dialysis a decade ago (in 2005-2006).
After adjustment, patients on peritoneal dialysis have a 4.8% lower mortality risk compared to those on haemodialysis.
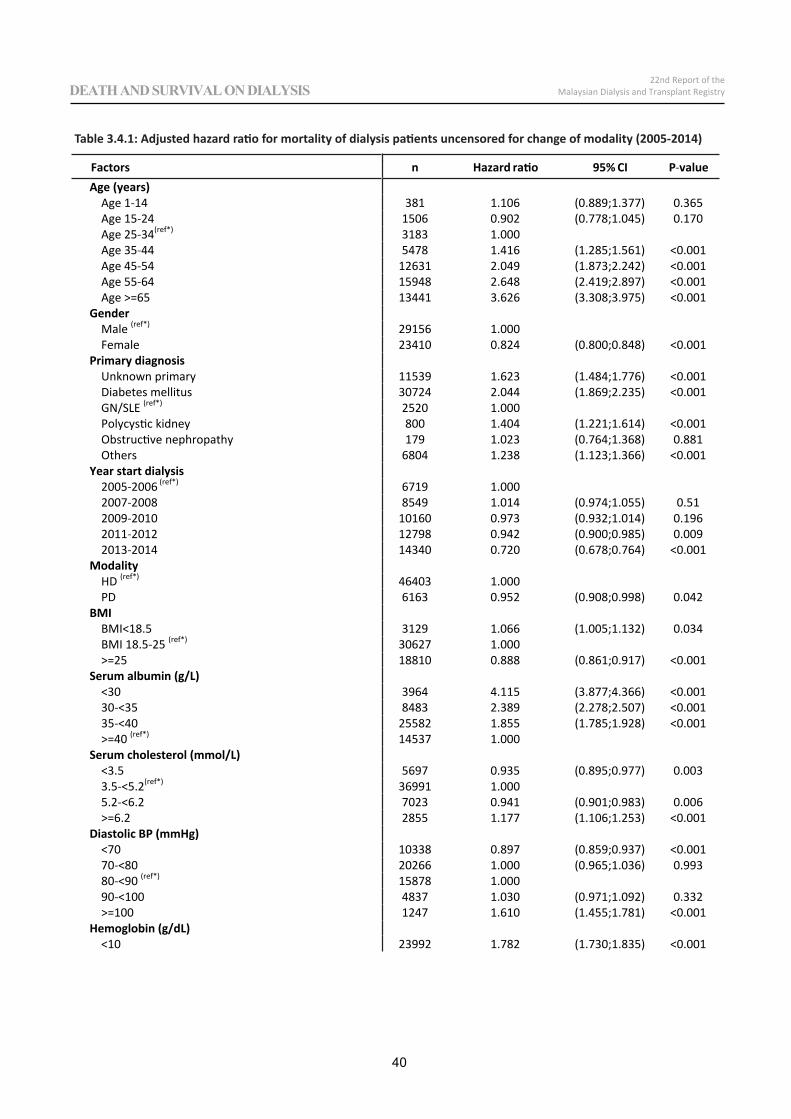
Factors n Hazard ratio 95% CI P valueAge (years)
Age 1 14 381 1.106 (0.889;1.377) 0.365Age 15 24 1506 0.902 (0.778;1.045) 0.170Age 25 34(ref*) 3183 1.000Age 35 44 5478 1.416 (1.285;1.561) <0.001Age 45 54 12631 2.049 (1.873;2.242) <0.001Age 55 64 15948 2.648 (2.419;2.897) <0.001Age >=65 13441 3.626 (3.308;3.975) <0.001
GenderMale (ref*) 29156 1.000Female 23410 0.824 (0.800;0.848) <0.001
Primary diagnosisUnknown primary 11539 1.623 (1.484;1.776) <0.001Diabetes mellitus 30724 2.044 (1.869;2.235) <0.001GN/SLE (ref*) 2520 1.000Polycystic kidney 800 1.404 (1.221;1.614) <0.001Obstructive nephropathy 179 1.023 (0.764;1.368) 0.881Others 6804 1.238 (1.123;1.366) <0.001
Year start dialysis2005 2006 (ref*) 6719 1.0002007 2008 8549 1.014 (0.974;1.055) 0.512009 2010 10160 0.973 (0.932;1.014) 0.1962011 2012 12798 0.942 (0.900;0.985) 0.0092013 2014 14340 0.720 (0.678;0.764) <0.001
ModalityHD (ref*) 46403 1.000PD 6163 0.952 (0.908;0.998) 0.042
BMIBMI<18.5 3129 1.066 (1.005;1.132) 0.034BMI 18.5 25 (ref*) 30627 1.000>=25 18810 0.888 (0.861;0.917) <0.001
Serum albumin (g/L)<30 3964 4.115 (3.877;4.366) <0.00130 <35 8483 2.389 (2.278;2.507) <0.00135 <40 25582 1.855 (1.785;1.928) <0.001>=40 (ref*) 14537 1.000
Serum cholesterol (mmol/L)<3.5 5697 0.935 (0.895;0.977) 0.0033.5 <5.2(ref*) 36991 1.0005.2 <6.2 7023 0.941 (0.901;0.983) 0.006>=6.2 2855 1.177 (1.106;1.253) <0.001
Diastolic BP (mmHg)<70 10338 0.897 (0.859;0.937) <0.00170 <80 20266 1.000 (0.965;1.036) 0.99380 <90 (ref*) 15878 1.00090 <100 4837 1.030 (0.971;1.092) 0.332>=100 1247 1.610 (1.455;1.781) <0.001
Hemoglobin (g/dL)<10 23992 1.782 (1.730;1.835) <0.001
40
22nd Report of theMalaysian Dialysis and Transplant RegistryDEATH AND SURVIVAL ON DIALYSIS
Table 3.4.1: Adjusted hazard ratio for mortality of dialysis patients uncensored for change of modality (2005-2014)
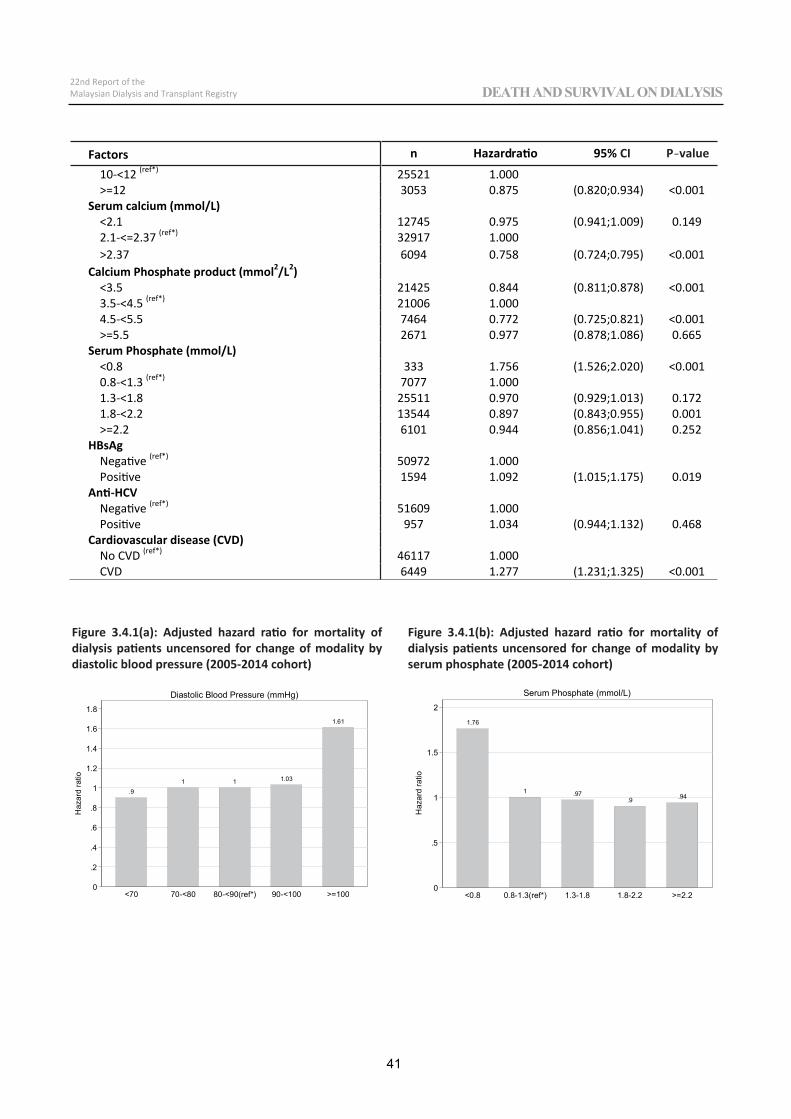
Factors n Hazardratio 95%
10 <12 (ref*) 25521 1.000>=12 3053 0.875 (0.820;0.934) <0.001
Serum calcium (mmol/L)<2.1 12745 0.975 (0.941;1.009) 0.1492.1 <=2.37 (ref*) 32917 1.000>2.37 6094 0.758 (0.724;0.795) <0.001
Calcium Phosphate product (mmol2/L2)<3.5 21425 0.844 (0.811;0.878) <0.0013.5 <4.5 (ref*) 21006 1.0004.5 <5.5 7464 0.772 (0.725;0.821) <0.001>=5.5 2671 0.977 (0.878;1.086) 0.665
Serum Phosphate (mmol/L)<0.8 333 1.756 (1.526;2.020) <0.0010.8 <1.3 (ref*) 7077 1.0001.3 <1.8 25511 0.970 (0.929;1.013) 0.1721.8 <2.2 13544 0.897 (0.843;0.955) 0.001>=2.2 6101 0.944 (0.856;1.041) 0.252
HBsAgNegative (ref*) 50972 1.000Positive 1594 1.092 (1.015;1.175) 0.019
Anti HCVNegative (ref*) 51609 1.000Positive 957 1.034 (0.944;1.132) 0.468
Cardiovascular disease (CVD)No CVD (ref*) 46117 1.000CVD 6449 1.277 (1.231;1.325) <0.001
.91 1 1.03
1.61
0
.2
.4
.6
.8
1
1.2
1.4
1.6
1.8
Haz
ard
ratio
<70 70-<80 80-<90(ref*) 90-<100 >=100
Diastolic Blood Pressure (mmHg)
41
22nd Report of theMalaysian Dialysis and Transplant Registry DEATH AND SURVIVAL ON DIALYSIS
1.76
1 .97.9 .94
0
.5
1
1.5
2
Haz
ard
ratio
<0.8 0.8-1.3(ref*) 1.3-1.8 1.8-2.2 >=2.2
Serum Phosphate (mmol/L)
Figure 3.4.1(a): Adjusted hazard ratio for mortality of dialysis patients uncensored for change of modality by diastolic blood pressure (2005-2014 cohort)
Figure 3.4.1(b): Adjusted hazard ratio for mortality of dialysis patients uncensored for change of modality by serum phosphate (2005-2014 cohort)
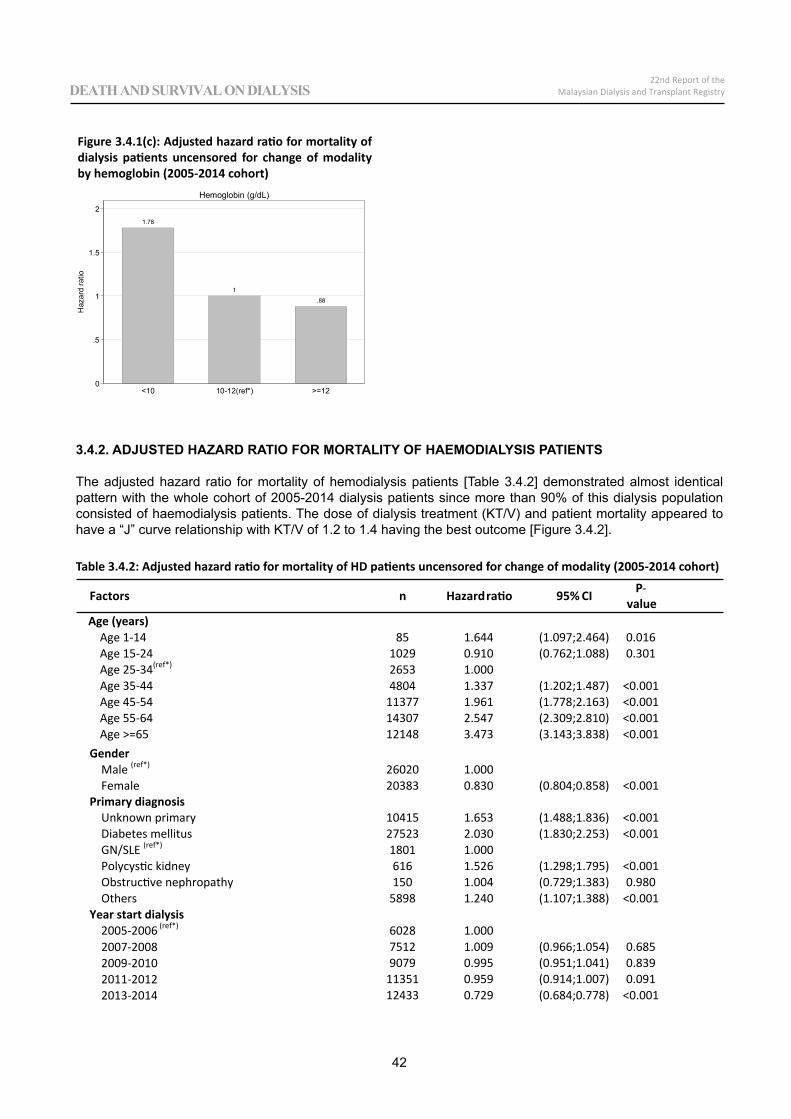
Factors n Hazardratio 95% CI Pvalue
Age (years)Age 1 14 85 1.644 (1.097;2.464) 0.016Age 15 24 1029 0.910 (0.762;1.088) 0.301Age 25 34(ref*) 2653 1.000Age 35 44 4804 1.337 (1.202;1.487) <0.001Age 45 54 11377 1.961 (1.778;2.163) <0.001Age 55 64 14307 2.547 (2.309;2.810) <0.001Age >=65 12148 3.473 (3.143;3.838) <0.001
1.78
1
.88
0
.5
1
1.5
2
Haz
ard
ratio
<10 10-12(ref*) >=12
Hemoglobin (g/dL)
42
22nd Report of theMalaysian Dialysis and Transplant RegistryDEATH AND SURVIVAL ON DIALYSIS
Figure 3.4.1(c): Adjusted hazard ratio for mortality of dialysis patients uncensored for change of modality by hemoglobin (2005-2014 cohort)
3.4.2. ADJUSTED HAZARD RATIO FOR MORTALITY OF HAEMODIALYSIS PATIENTS
The adjusted hazard ratio for mortality of hemodialysis patients [Table 3.4.2] demonstrated almost identical pattern with the whole cohort of 2005-2014 dialysis patients since more than 90% of this dialysis population consisted of haemodialysis patients. The dose of dialysis treatment (KT/V) and patient mortality appeared to have a “J” curve relationship with KT/V of 1.2 to 1.4 having the best outcome [Figure 3.4.2].
Table 3.4.2: Adjusted hazard ratio for mortality of HD patients uncensored for change of modality (2005-2014 cohort)
GenderMale (ref*) 26020 1.000Female 20383 0.830 (0.804;0.858) <0.001
Primary diagnosisUnknown primary 10415 1.653 (1.488;1.836) <0.001Diabetes mellitus 27523 2.030 (1.830;2.253) <0.001GN/SLE (ref*) 1801 1.000Polycystic kidney 616 1.526 (1.298;1.795) <0.001Obstructive nephropathy 150 1.004 (0.729;1.383) 0.980Others 5898 1.240 (1.107;1.388) <0.001
Year start dialysis2005 2006 (ref*) 6028 1.0002007 2008 7512 1.009 (0.966;1.054) 0.6852009 2010 9079 0.995 (0.951;1.041) 0.8392011 2012 11351 0.959 (0.914;1.007) 0.0912013 2014 12433 0.729 (0.684;0.778) <0.001
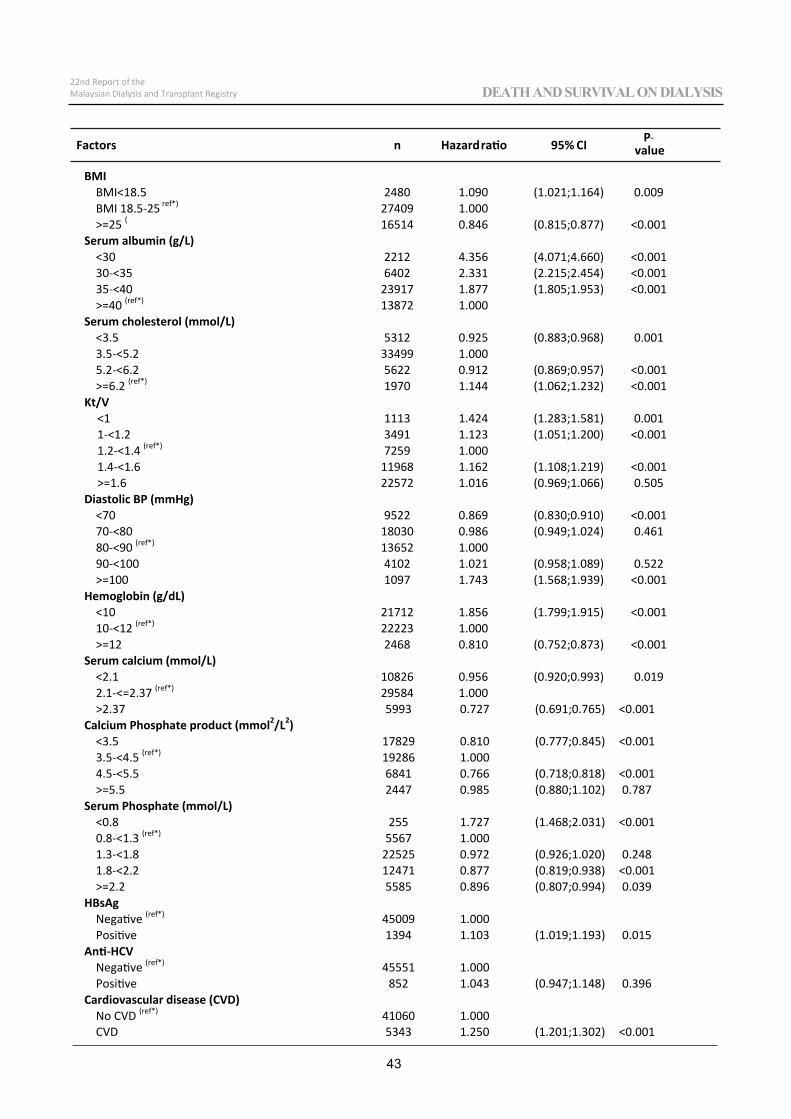
Factors n Hazardratio 95% CI Pvalue
43
22nd Report of theMalaysian Dialysis and Transplant Registry DEATH AND SURVIVAL ON DIALYSIS
BMIBMI<18.5 2480 1.090 (1.021;1.164) 0.009BMI 18.5 25 ref*) 27409 1.000>=25 ( 16514 0.846 (0.815;0.877) <0.001
Serum albumin (g/L)<30 2212 4.356 (4.071;4.660) <0.00130 <35 6402 2.331 (2.215;2.454) <0.00135 <40 23917 1.877 (1.805;1.953) <0.001>=40 (ref*) 13872 1.000
Serum cholesterol (mmol/L)<3.5 5312 0.925 (0.883;0.968) 0.0013.5 <5.2 33499 1.0005.2 <6.2 5622 0.912 (0.869;0.957) <0.001>=6.2 (ref*) 1970 1.144 (1.062;1.232) <0.001
Kt/V<1 1113 1.424 (1.283;1.581) 0.0011 <1.2 3491 1.123 (1.051;1.200) <0.0011.2 <1.4 (ref*) 7259 1.0001.4 <1.6 11968 1.162 (1.108;1.219) <0.001>=1.6 22572 1.016 (0.969;1.066) 0.505
Diastolic BP (mmHg)<70 9522 0.869 (0.830;0.910) <0.00170 <80 18030 0.986 (0.949;1.024) 0.46180 <90 (ref*) 13652 1.00090 <100 4102 1.021 (0.958;1.089) 0.522>=100 1097 1.743 (1.568;1.939) <0.001
Hemoglobin (g/dL)<10 21712 1.856 (1.799;1.915) <0.00110 <12 (ref*) 22223 1.000>=12 2468 0.810 (0.752;0.873) <0.001
Serum calcium (mmol/L)<2.1 10826 0.956 (0.920;0.993) 0.0192.1 <=2.37 (ref*) 29584 1.000>2.37 5993 0.727 (0.691;0.765) <0.001
Calcium Phosphate product (mmol2/L2)<3.5 17829 0.810 (0.777;0.845) <0.0013.5 <4.5 (ref*) 19286 1.0004.5 <5.5 6841 0.766 (0.718;0.818) <0.001>=5.5 2447 0.985 (0.880;1.102) 0.787
Serum Phosphate (mmol/L)<0.8 255 1.727 (1.468;2.031) <0.0010.8 <1.3 (ref*) 5567 1.0001.3 <1.8 22525 0.972 (0.926;1.020) 0.2481.8 <2.2 12471 0.877 (0.819;0.938) <0.001>=2.2 5585 0.896 (0.807;0.994) 0.039
HBsAgNegative (ref*) 45009 1.000Positive 1394 1.103 (1.019;1.193) 0.015
Anti HCVNegative (ref*) 45551 1.000Positive 852 1.043 (0.947;1.148) 0.396
Cardiovascular disease (CVD)No CVD (ref*) 41060 1.000CVD 5343 1.250 (1.201;1.302) <0.001
1.42
1.12
1
1.16
1.02
0
.5
1
1.5
Haz
ard
ratio
<1 1-<1.2 1.2-<1.4(ref*) 1.4-<1.6 >=1.6
KT/V-HD
44
22nd Report of theMalaysian Dialysis and Transplant RegistryDEATH AND SURVIVAL ON DIALYSIS
Figure 3.4.2: Adjusted hazard ratio for mortality of HD patients uncensored for change of modality by Kt/V (2005-2014 cohort)
3.4.3. ADJUSTED HAZARD RATIO FOR MORTALITY OF PERITONEAL DIALYSIS PATIENTS
The adjusted hazard ratio for peritoneal dialysis patients [Table 3.4.3] showed similarity to the whole cohort of 2005-2014 dialysis patients. However gender, and viral hepatitis status were not independent risk factors for mortality in peritoneal dialysis patients. These differences may partly be contributed by the smaller number of peritoneal dialysis patients in this cohort.
Unlike haemodialysis patients, there was a negative correlation between KT/V and mortality of patients on peritoneal dialysis.
Factors P value
Age (years)Age 1 14 296 1.968 (1.348;2.874) <0.001Age 15 24 477 1.412 (1.040;1.917) 0.027Age 25 34(ref*) 530 1.000Age 35 44 672 1.713 (1.338;2.194) <0.001Age 45 54 1254 2.372 (1.881;2.993) <0.001Age 55 64 1641 2.945 (2.332;3.719) <0.001Age >=65 1293 4.255 (3.357;5.393) <0.001
GenderMale (ref*) 3136 1.000Female 3027 0.978 (0.886;1.080) 0.663
Primary diagnosisUnknown primary 1124 1.324 (1.094;1.603) 0.004Diabetes mellitus 3201 2.063 (1.700;2.505) <0.001GN/SLE (ref*) 719 1.000Polycystic kidney 184 1.149 (0.865;1.525) 0.338Obstructive nephropathy 29 0.907 (0.442;1.859) 0.790Others 906 1.203 (0.971;1.489) 0.091
Year start dialysis2005 2006 (ref*) 691 1.0002007 2008 1037 1.013 (0.902;1.136) 0.8332009 2010 1081 0.871 (0.770;0.986) 0.0282011 2012 1447 0.887 (0.780;1.008) 0.0662013 2014 1907 0.667 (0.564;0.789) <0.001
BMIBMI<18.5 649 1.327 (1.130;1.559) 0.001BMI 18.5 25(ref*) 3218 1.000>=25 2296 0.992 (0.910;1.082) 0.863
Serum albumin (g/L)<30 1752 2.690 (2.230;3.245) <0.00130 <35 2081 1.914 (1.595;2.297) <0.00135 <40 1665 1.238 (1.028;1.492) 0.024>=40 (ref*) 665 1.000
Serum cholesterol (mmol/L)<3.5 385 1.066 (0.914;1.243) 0.4163.5 <5.2(ref*) 3492 1.0005.2 <6.2 1401 1.082 (0.978;1.197) 0.126>=6.2 885 1.229 (1.090;1.386) 0.001
Kt/V<1.7 3706 1.106 (0.978;1.251) 0.1091.7 <2.0 (ref*) 1758 1.000>=2.0 699 0.606 (0.478;0.768) <0.001
Diastolic BP (mmHg)<70 816 1.168 (1.029;1.325) 0.01670 <80 2236 1.029 (0.934;1.134) 0.56080 <90 (ref*) 2226 1.00090 <100 735 1.153 (0.986;1.348) 0.074>=100 150 0.984 (0.691;1.401) 0.931
Hemoglobin (g/dL)
45
22nd Report of theMalaysian Dialysis and Transplant Registry DEATH AND SURVIVAL ON DIALYSIS
Table 3.4.3: Adjusted hazard ratio for mortality of PD patients uncensored for change of modality (2005-2014 cohort)
Factors CI P value
<10 2280 1.354 (1.239;1.479) <0.00110 <12 (ref*) 3298 1.000>=12 585 1.127 (0.982;1.292) 0.088
Serum calcium (mmol/L)<2.1 1919 1.113 (1.013;1.223) 0.0262.1 <=2.37 (ref*) 3333 1.000>2.37 911 1.002 (0.886;1.132) 0.977
Calcium Phosphate product (mmol2/L2)<3.5 3596 1.156 (1.019;1.312) 0.0243.5 <4.5 (ref*) 1720 1.0004.5 <5.5 623 0.944 (0.773;1.154) 0.577>=5.5 224 1.039 (0.744;1.452) 0.821
Serum Phosphate (mmol/L)<0.8 78 1.993 (1.499;2.650) <0.0010.8 <1.3 (ref*) 1510 1.0001.3 <1.8 2986 0.980 (0.886;1.084) 0.6951.8 <2.2 1073 1.013 (0.838;1.223) 0.897>=2.2 516 1.321 (0.983;1.777) 0.065
HBsAgNegative (ref*) 5963 1.000Positive 200 0.976 (0.797;1.195) 0.814
Anti HCVNegative (ref*) 6058 1.000Positive 105 0.959 (0.723;1.271) 0.77
Cardiovascular disease (CVD)No CVD (ref*) 5057 1.000CVD 1106 1.323 (1.202;1.456) <0.001
46
22nd Report of theMalaysian Dialysis and Transplant RegistryDEATH AND SURVIVAL ON DIALYSIS
3.4.4 RISK ADJUSTED MORTALITY RATE BY HAEMODIALYSIS CENTRES
There were marked centre variations in risk adjusted mortality rate (RAMR) of haemodialysis patients and the median RAMR for HD centres was 19.5 [Figure 3.4.4(a)]. When adjusted for the size of haemodialysis centres using funnel plot, only 56.5% and 70.2% of haemodialysis centres were within the 95% CI and 99% CI of the median RAMR respectively [Figure 3.4.4(b)].
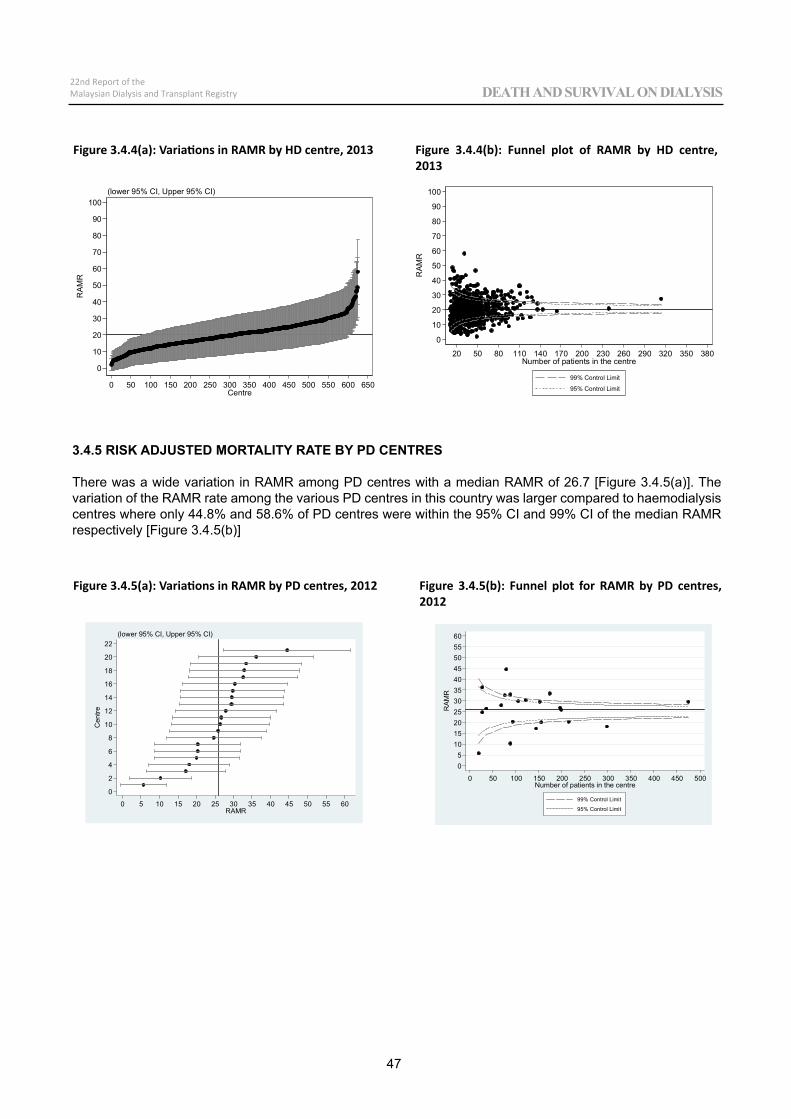
0
10
20
30
40
50
60
70
80
90
100
RA
MR
0 50 100 150 200 250 300 350 400 450 500 550 600 650Centre
(lower 95% CI, Upper 95% CI)
0
10
20
30
40
50
60
70
80
90
100
RA
MR
20 50 80 110 140 170 200 230 260 290 320 350 380Number of patients in the centre
99% Control Limit
95% Control Limit
0
2
4
6
8
10
12
14
16
18
20
22
Cen
tre
0 5 10 15 20 25 30 35 40 45 50 55 60RAMR
(lower 95% CI, Upper 95% CI)
05
1015202530354045505560
RA
MR
0 50 100 150 200 250 300 350 400 450 500Number of patients in the centre
99% Control Limit
95% Control Limit
47
22nd Report of theMalaysian Dialysis and Transplant Registry DEATH AND SURVIVAL ON DIALYSIS
Figure 3.4.4(a): Variations in RAMR by HD centre, 2013 Figure 3.4.4(b): Funnel plot of RAMR by HD centre, 2013
Figure 3.4.5(a): Variations in RAMR by PD centres, 2012 Figure 3.4.5(b): Funnel plot for RAMR by PD centres, 2012
3.4.5 RISK ADJUSTED MORTALITY RATE BY PD CENTRES
There was a wide variation in RAMR among PD centres with a median RAMR of 26.7 [Figure 3.4.5(a)]. The variation of the RAMR rate among the various PD centres in this country was larger compared to haemodialysis centres where only 44.8% and 58.6% of PD centres were within the 95% CI and 99% CI of the median RAMR respectively [Figure 3.4.5(b)]

22nd Report of theMalaysian Dialysis and Transplant Registry ALL RENAL REPLACEMENT THERAPY IN MALAYSIA
23rd Report of theMalaysian Dialysis and Transplant Registry
QUALITY OF LIFE AND REHABILITATIONOUTCOMES OF PATIENTS ON DIALYSIS
Chapter 4
QUALITY OF LIFE AND REHABILITATIONOUTCOMES OF PATIENTS ON DIALYSIS
Liu Wen Jiun Chew Thian Fook
Christopher Lim Thiam Seong Tan Wee Ming
Yia @ Yeow Hua Jern
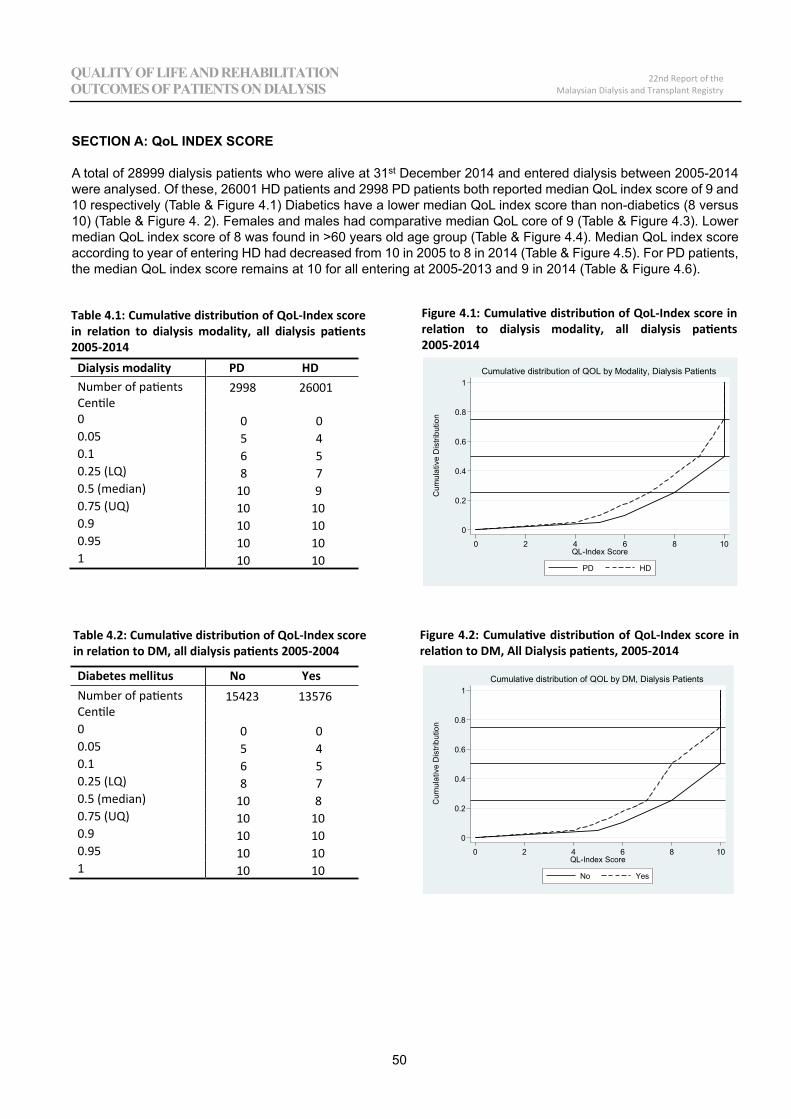
50
Dialysis modality PD HD Number of patients 2998 26001 Centile0 0 0 0.05 5 4 0.1 6 5 0.25 (LQ) 8 7 0.5 (median) 10 9 0.75 (UQ) 10 10 0.9 10 10 0.95 10 10 1 10 10
Diabetes mellitus No Yes Number of patients 15423 13576 Centile0 0 0 0.05 5 40.1 6 50.25 (LQ) 8 7 0.5 (median) 10 8 0.75 (UQ) 10 10 0.9 10 10 0.95 10 10 1 10 10
0
0.2
0.4
0.6
0.8
1
Cum
ulat
ive
Dis
tribu
tion
0 2 4 6 8 10QL-Index Score
No Yes
Cumulative distribution of QOL by DM, Dialysis Patients
0
0.2
0.4
0.6
0.8
1
Cum
ulat
ive
Dis
tribu
tion
0 2 4 6 8 10QL-Index Score
PD HD
Cumulative distribution of QOL by Modality, Dialysis Patients
22nd Report of theMalaysian Dialysis and Transplant RegistryOUTCOMES OF PATIENTS ON DIALYSIS
QUALITY OF LIFE AND REHABILITATION
00
00
22nd Report of theMalaysian Dialysis and Transplant Registry OUTCOMES OF PATIENTS ON DIALYSIS
QUALITY OF LIFE AND REHABILITATION
SECTION A: QoL INDEX SCORE
A total of 28999 dialysis patients who were alive at 31st December 2014 and entered dialysis between 2005-2014 were analysed. Of these, 26001 HD patients and 2998 PD patients both reported median QoL index score of 9 and 10 respectively (Table & Figure 4.1) Diabetics have a lower median QoL index score than non-diabetics (8 versus 10) (Table & Figure 4. 2). Females and males had comparative median QoL core of 9 (Table & Figure 4.3). Lower median QoL index score of 8 was found in >60 years old age group (Table & Figure 4.4). Median QoL index score according to year of entering HD had decreased from 10 in 2005 to 8 in 2014 (Table & Figure 4.5). For PD patients, the median QoL index score remains at 10 for all entering at 2005-2013 and 9 in 2014 (Table & Figure 4.6).
Figure 4.2: Cumulative distribution of QoL-Index score in relation to DM, All Dialysis patients, 2005-2014
Figure 4.1: Cumulative distribution of QoL-Index score in relation to dialysis modality, all dialysis patients 2005-2014
Table 4.1: Cumulative distribution of QoL-Index score in relation to dialysis modality, all dialysis patients 2005-2014
Table 4.2: Cumulative distribution of QoL-Index score in relation to DM, all dialysis patients 2005-2004
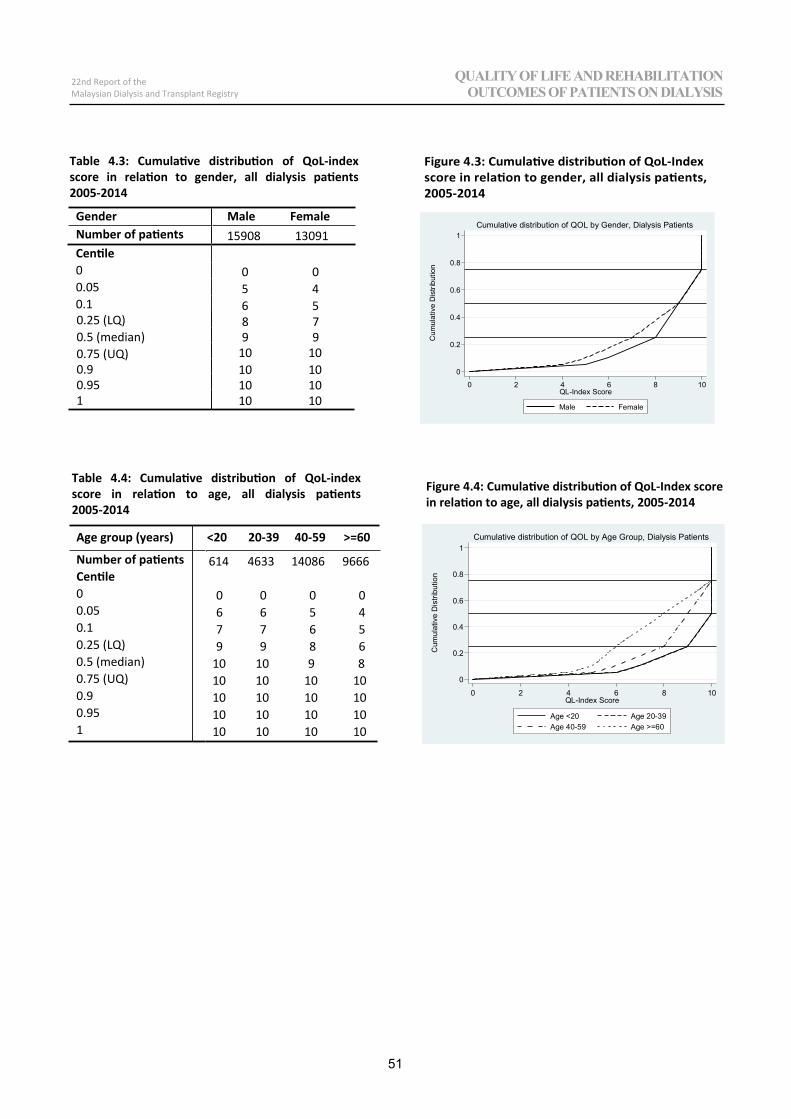
0.25 (LQ) 8 7 0.5 (median) 9 9 0.75 (UQ) 10 10 0.9 10 10 0.95 10 10 1 10 10
0
0.2
0.4
0.6
0.8
1
Cum
ulat
ive
Dis
tribu
tion
0 2 4 6 8 10QL-Index Score
Male Female
Cumulative distribution of QOL by Gender, Dialysis Patients
Age group (years) <20 20-39 40-59 >=60
Number of patients 614 4633 14086 9666Centile 0 0 0 0 0 0.05 6 6 5 4 0.1 7 7 6 5 0.25 (LQ) 9 9 8 6 0.5 (median) 10 10 9 80.75 (UQ) 10 10 10 10 0.9 10 10 10 10 0.95 10 10 10 10 1 10 10 10 10
0
0.2
0.4
0.6
0.8
1
Cum
ulat
ive
Dis
tribu
tion
0 2 4 6 8 10QL-Index Score
Age <20 Age 20-39Age 40-59 Age >=60
Cumulative distribution of QOL by Age Group, Dialysis Patients
Gender Male Female Number of patients 15908 13091 Centile0 0 0 0.05 5 4 0.1 6 5
51
22nd Report of theMalaysian Dialysis and Transplant Registry OUTCOMES OF PATIENTS ON DIALYSIS
QUALITY OF LIFE AND REHABILITATION
Figure 4.4: Cumulative distribution of QoL-Index score in relation to age, all dialysis patients, 2005-2014
Table 4.3: Cumulative distribution of QoL-index score in relation to gender, all dialysis patients 2005-2014
Figure 4.3: Cumulative distribution of QoL-Index score in relation to gender, all dialysis patients, 2005-2014
Table 4.4: Cumulative distribution of QoL-index score in relation to age, all dialysis patients 2005-2014
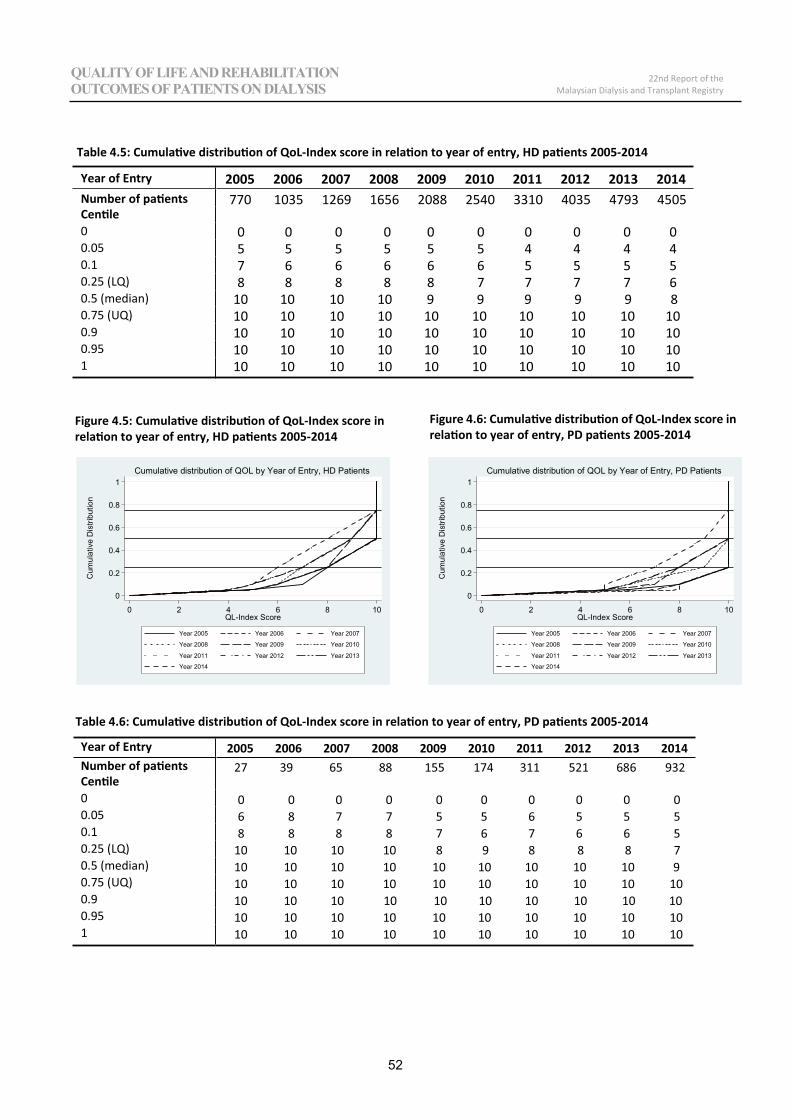
Table 4.5: Cumulative distribution of QoL-Index score in relation to year of entry, HD patients 2005-2014
Year of Entry 2005 2006 2007 2008 2009 2010 2011 2012 2013 2014 Number of patients 770 1035 1269 1656 2088 2540 3310 4035 4793 4505 Centile00.05 0.1 0.25 (LQ) 0.5 (median) 0.75 (UQ) 0.9 0.95 1
0
0.2
0.4
0.6
0.8
1
Cum
ulat
ive
Dis
tribu
tion
0 2 4 6 8 10QL-Index Score
Year 2005 Year 2006 Year 2007
Year 2008 Year 2009 Year 2010
Year 2011 Year 2012 Year 2013
Year 2014
Cumulative distribution of QOL by Year of Entry, HD Patients
0
0.2
0.4
0.6
0.8
1
Cum
ulat
ive
Dis
tribu
tion
0 2 4 6 8 10QL-Index Score
Year 2005 Year 2006 Year 2007
Year 2008 Year 2009 Year 2010
Year 2011 Year 2012 Year 2013
Year 2014
Cumulative distribution of QOL by Year of Entry, PD Patients
Table 4.6: Cumulative distribution of QoL-Index score in relation to year of entry, PD patients 2005-2014
Year of Entry 2005 2006 2007 2008 2009 2010 2011 2012 2013 2014 Number of patients Centile00.05 0.1 0.25 (LQ) 0.5 (median) 0.75 (UQ) 0.9 0.95 1
52
22nd Report of theMalaysian Dialysis and Transplant RegistryOUTCOMES OF PATIENTS ON DIALYSIS
QUALITY OF LIFE AND REHABILITATION
Figure 4.5: Cumulative distribution of QoL-Index score in relation to year of entry, HD patients 2005-2014
Figure 4.6: Cumulative distribution of QoL-Index score in relation to year of entry, PD patients 2005-2014
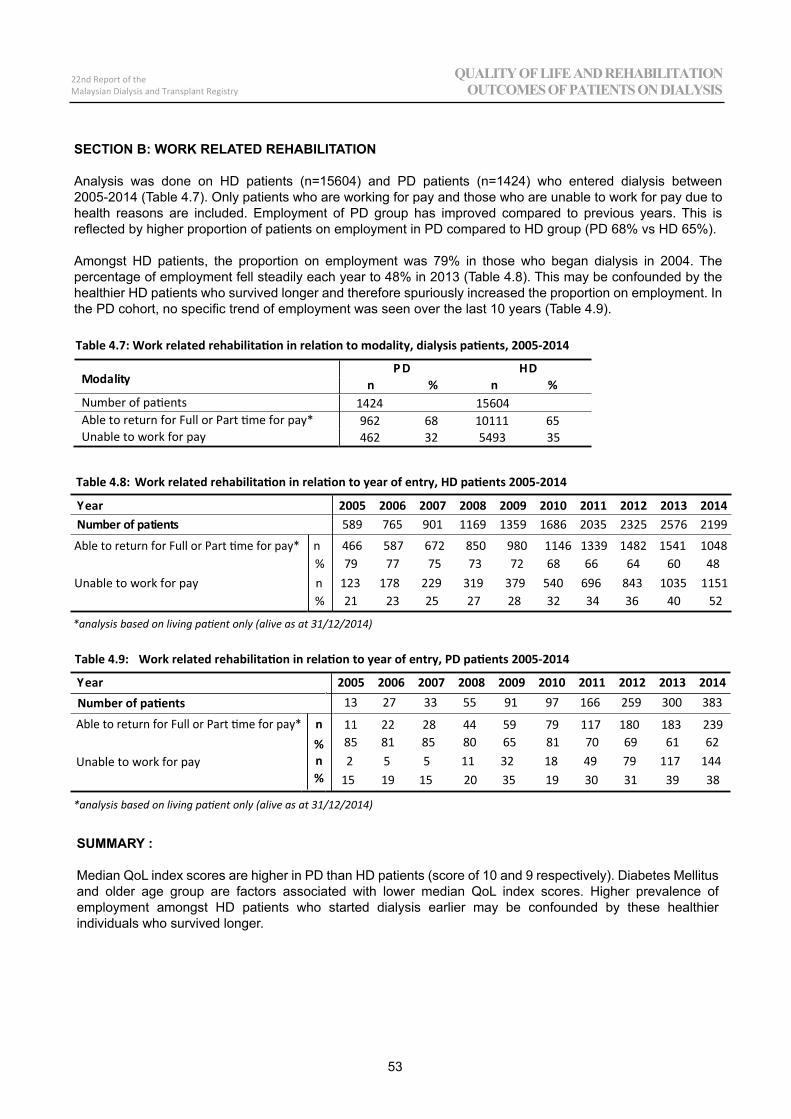
Table 4.7: Work related rehabilitation in relation to modality, dialysis patients, 2005-2014
DH DP ytiladoM % n % n
Number of patients 1424 15604 Able to return for Full or Part time for pay* 962 68 10111 65 Unable to work for pay 462 32 5493 35
Table 4.8: Work related rehabilitation in relation to year of entry, HD patients 2005-2014
41023102 2102 1102010290028002700260025002 raeY99126752 5232 5302686195319611 109 567 985 stneitap fo rebmuN
*analysis based on living patient only (alive as at 31/12/2014)
Table 4.9: Work related rehabilitation in relation to year of entry, PD patients 2005-2014
Number of patients 13 27 33 55 91 97 166 259 300 383
Able to return for Full or Part time for pay* n
n
11 22 28 44 59 79 117 180 183 239 % 85 81 85 80 65 81 70 69 61 62
Unable to work for pay 2 5 5 11 32 18 49 79 117 144 % 15 19 15 20 35 19 30 31 39 38
*analysis based on living patient only (alive as at 31/12/2014)
53
22nd Report of theMalaysian Dialysis and Transplant Registry OUTCOMES OF PATIENTS ON DIALYSIS
QUALITY OF LIFE AND REHABILITATION
QUALITY OF LIFE AND REHABILITATION
SUMMARY :
Median QoL index scores are higher in PD than HD patients (score of 10 and 9 respectively). Diabetes Mellitus and older age group are factors associated with lower median QoL index scores. Higher prevalence of employment amongst HD patients who started dialysis earlier may be confounded by these healthier individuals who survived longer.
SECTION B: WORK RELATED REHABILITATION
Analysis was done on HD patients (n=15604) and PD patients (n=1424) who entered dialysis between 2005-2014 (Table 4.7). Only patients who are working for pay and those who are unable to work for pay due to health reasons are included. Employment of PD group has improved compared to previous years. This is reflected by higher proportion of patients on employment in PD compared to HD group (PD 68% vs HD 65%).
Amongst HD patients, the proportion on employment was 79% in those who began dialysis in 2004. The percentage of employment fell steadily each year to 48% in 2013 (Table 4.8). This may be confounded by the healthier HD patients who survived longer and therefore spuriously increased the proportion on employment. In the PD cohort, no specific trend of employment was seen over the last 10 years (Table 4.9).
41023102 2102 1102010290028002700260025002 raeY

22nd Report of theMalaysian Dialysis and Transplant Registry ALL RENAL REPLACEMENT THERAPY IN MALAYSIA
Chapter 5
PAEDIATRIC RENAL REPLACEMENTTHERAPY
Lee Ming LeeLim Yam NgoLynster Liaw
Susan PeeWan Jazilah Wan Ismail
Yap Yok Chin
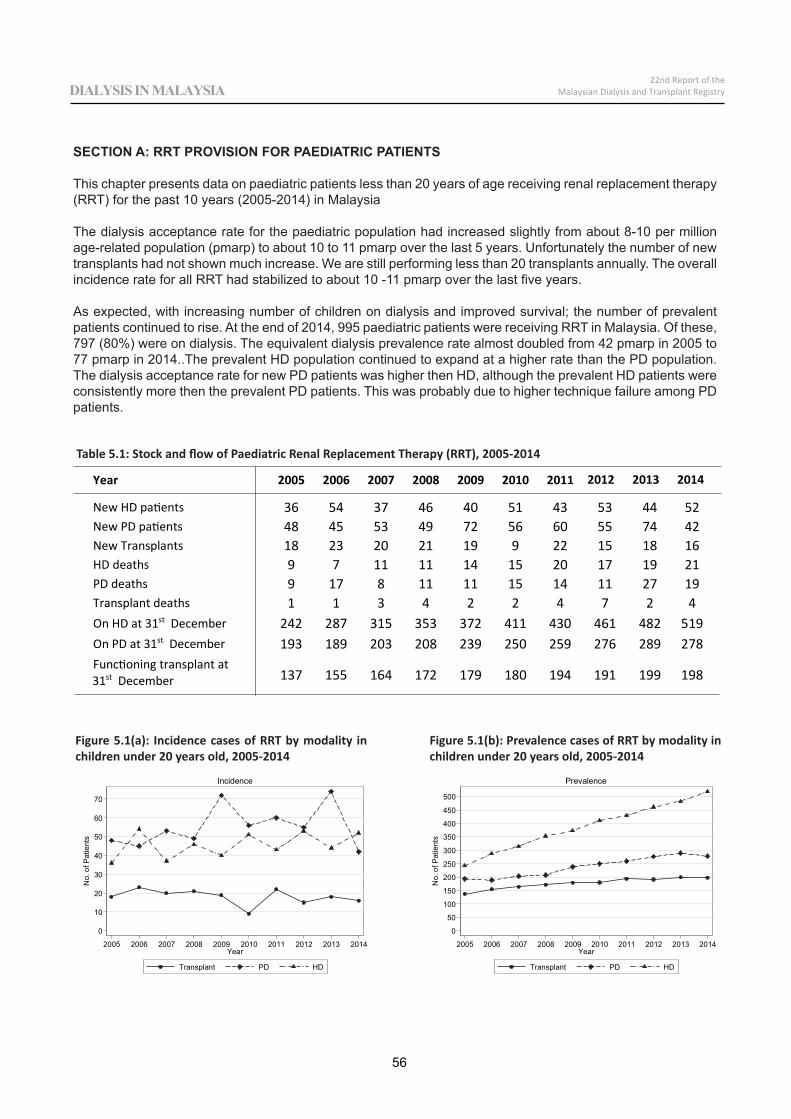
Year 2005 2006 2007 2008 2009 2010 2011 2012 2013 2014
New HD patients 36 54 37 46 40 51 43 53 44 52New PD patients 48 45 53 49 72 56 60 55 74 42New Transplants 18 23 20 21 19 9 22 15 18 16HD deaths 9 7 11 11 14 15 20 17 19 21PD deaths 9 17 8 11 11 15 14 11 27 19Transplant deaths 1 1 3 4 2 2 4 7 2 4On HD at 31st December 242 287 315 353 372 411 430 461 482 519On PD at 31st December 193 189 203 208 239 250 259 276 289 278Functioning transplant at31st December 137 155 164 172 179 180 194 191 199 198
56
22nd Report of theMalaysian Dialysis and Transplant RegistryDIALYSIS IN MALAYSIA
SECTION A: RRT PROVISION FOR PAEDIATRIC PATIENTS
This chapter presents data on paediatric patients less than 20 years of age receiving renal replacement therapy (RRT) for the past 10 years (2005-2014) in Malaysia
The dialysis acceptance rate for the paediatric population had increased slightly from about 8-10 per million age-related population (pmarp) to about 10 to 11 pmarp over the last 5 years. Unfortunately the number of new transplants had not shown much increase. We are still performing less than 20 transplants annually. The overall incidence rate for all RRT had stabilized to about 10 -11 pmarp over the last five years.
As expected, with increasing number of children on dialysis and improved survival; the number of prevalent patients continued to rise. At the end of 2014, 995 paediatric patients were receiving RRT in Malaysia. Of these, 797 (80%) were on dialysis. The equivalent dialysis prevalence rate almost doubled from 42 pmarp in 2005 to 77 pmarp in 2014..The prevalent HD population continued to expand at a higher rate than the PD population. The dialysis acceptance rate for new PD patients was higher then HD, although the prevalent HD patients were consistently more then the prevalent PD patients. This was probably due to higher technique failure among PD patients.
0
10
20
30
40
50
60
70
No.
of P
atie
nts
2005 2006 2007 2008 2009 2010 2011 2012 2013 2014Year
Transplant PD HD
Incidence
0
50
100
150
200
250
300
350
400
450
500
No.
of P
atie
nts
2005 2006 2007 2008 2009 2010 2011 2012 2013 2014Year
Transplant PD HD
Prevalence
Figure 5.1(a): Incidence cases of RRT by modality in children under 20 years old, 2005-2014
Figure 5.1(b): Prevalence cases of RRT by modality in children under 20 years old, 2005-2014
Table 5.1: Stock and flow of Paediatric Renal Replacement Therapy (RRT), 2005-2014
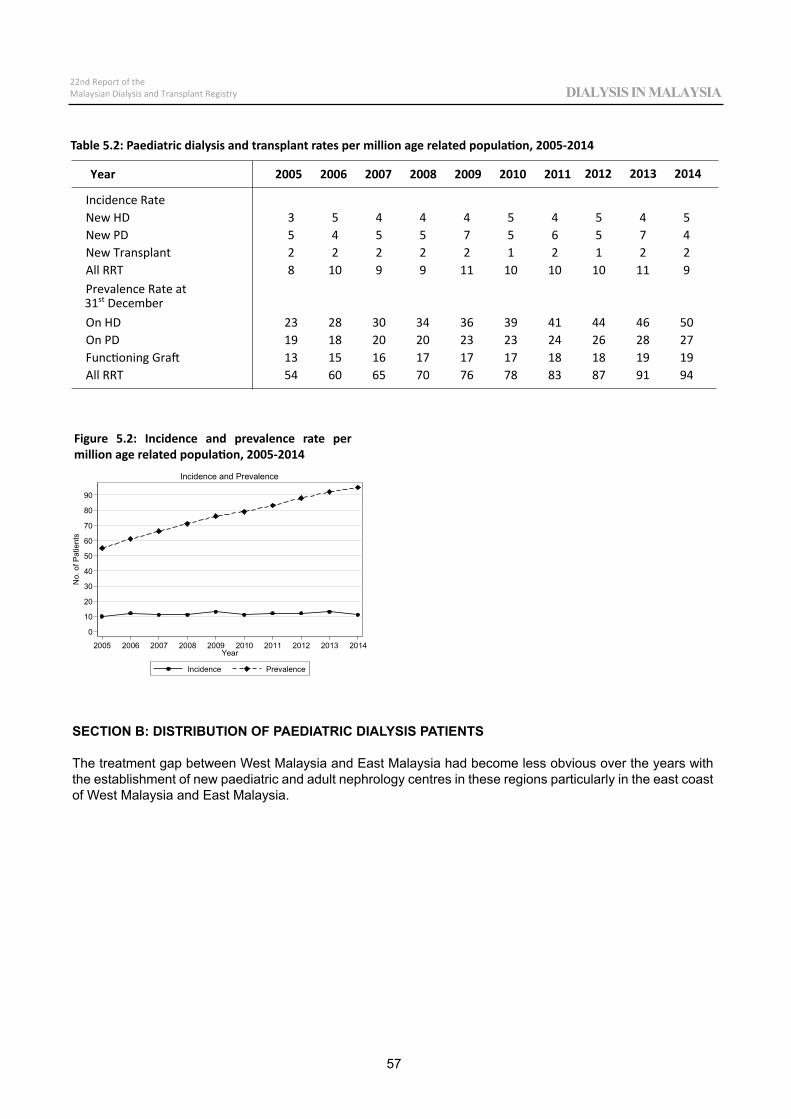
Incidence RateNew HD 3 5 4 4 4 5 4 5 4 5New PD 5 4 5 5 7 5 6 5 7 4New Transplant 2 2 2 2 2 1 2 1 2 2All RRT 8 10 9 9 11 10 10 10 11 9Prevalence Rate at31st DecemberOn HD 23 28 30 34 36 39 41 44 46 50On PD 19 18 20 20 23 23 24 26 28 27Functioning Graft 13 15 16 17 17 17 18 18 19 19All RRT 54 60 65 70 76 78 83 87 91 94
0
10
20
30
40
50
60
70
80
90
No.
of P
atie
nts
2005 2006 2007 2008 2009 2010 2011 2012 2013 2014Year
Incidence Prevalence
Incidence and Prevalence
57
22nd Report of theMalaysian Dialysis and Transplant Registry DIALYSIS IN MALAYSIA
Table 5.2: Paediatric dialysis and transplant rates per million age related population, 2005-2014
Year 2005 2006 2007 2008 2009 2010 2011 2012 2013 2014
Figure 5.2: Incidence and prevalence rate per million age related population, 2005-2014
SECTION B: DISTRIBUTION OF PAEDIATRIC DIALYSIS PATIENTS
The treatment gap between West Malaysia and East Malaysia had become less obvious over the years with the establishment of new paediatric and adult nephrology centres in these regions particularly in the east coast of West Malaysia and East Malaysia.
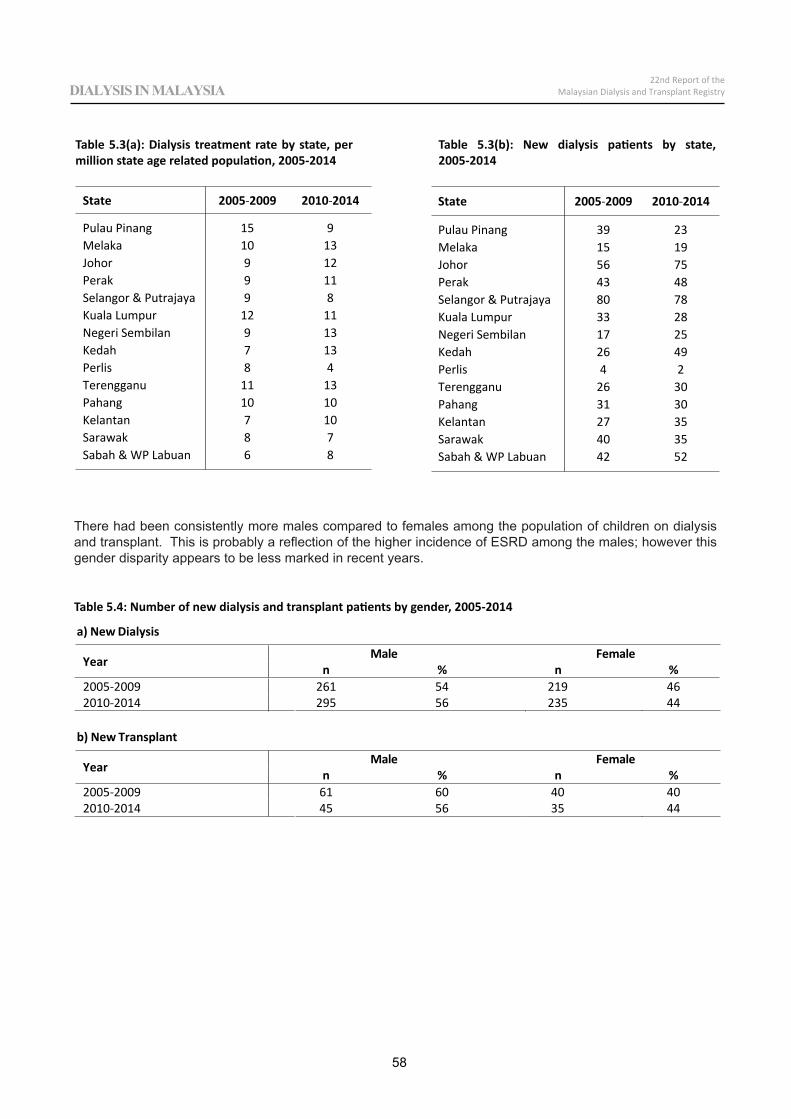
a) New Dialysis
Year elameFelaMn % n %
2005 2009 261 54 219 462010 2014 295 56 235 44
b) New Transplant
Year elameFelaMn % n %
2005 2009 61 60 40 402010 2014 45 56 35 44
State 2005 2009 2010 2014
Pulau Pinang 15 9Melaka 10 13Johor 9 12Perak 9 11Selangor & Putrajaya 9 8Kuala Lumpur 12 11Negeri Sembilan 9 13Kedah 7 13Perlis 8 4Terengganu 11 13Pahang 10 10Kelantan 7 10Sarawak 8 7Sabah & WP Labuan 6 8
State 2005 2009 2010 2014
Pulau Pinang 39 23Melaka 15 19Johor 56 75Perak 43 48Selangor & Putrajaya 80 78Kuala Lumpur 33 28Negeri Sembilan 17 25Kedah 26 49Perlis 4 2Terengganu 26 30Pahang 31 30Kelantan 27 35Sarawak 40 35Sabah & WP Labuan 42 52
Table 5.3(a): Dialysis treatment rate by state, per million state age related population, 2005-2014
Table 5.3(b): New dialysis patients by state, 2005-2014
58
22nd Report of theMalaysian Dialysis and Transplant RegistryDIALYSIS IN MALAYSIA
There had been consistently more males compared to females among the population of children on dialysis and transplant. This is probably a reflection of the higher incidence of ESRD among the males; however this gender disparity appears to be less marked in recent years.
Table 5.4: Number of new dialysis and transplant patients by gender, 2005-2014
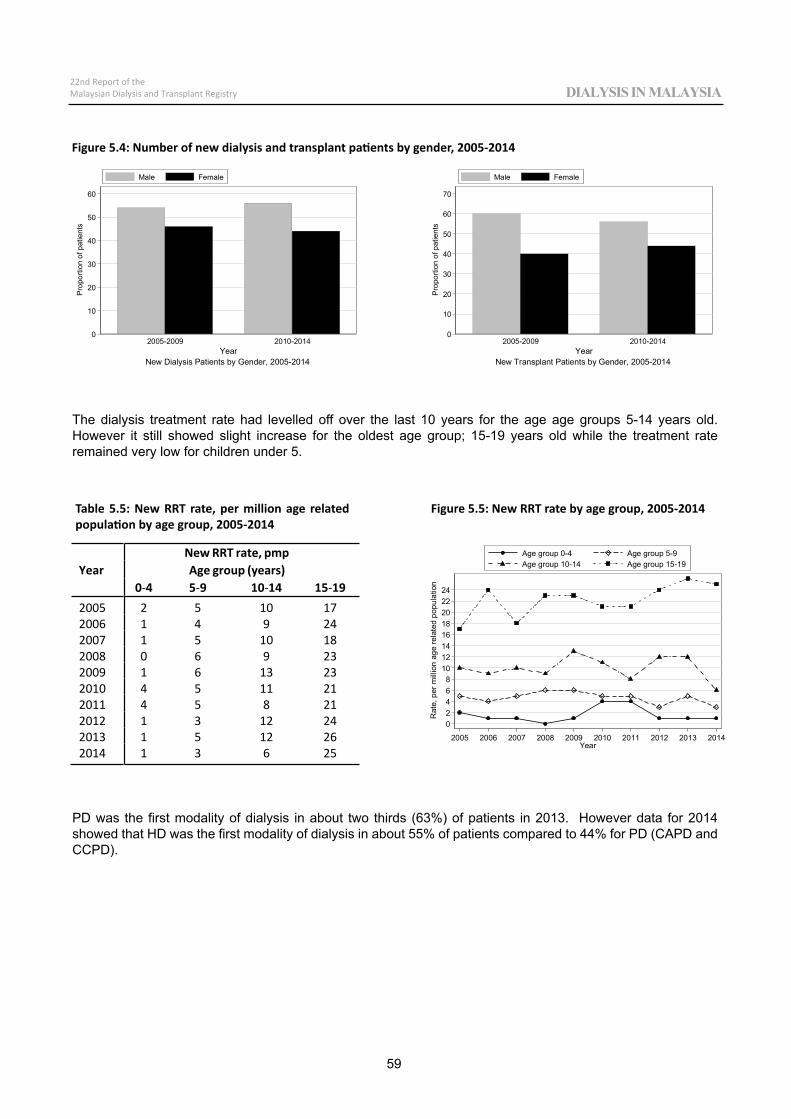
YearNew RRT rate, pmpAge group (years)
0 4 5 9 10 14 15 192005 2 5 10 172006 1 4 9 242007 1 5 10 182008 0 6 9 232009 1 6 13 232010 4 5 11 212011 4 5 8 212012 1 3 12 242013 1 5 12 262014 1 3 6 25
0
10
20
30
40
50
60
Pro
porti
on o
f pat
ient
s
4102-01029002-5002Year
New Dialysis Patients by Gender, 2005-2014
Male Female
0
10
20
30
40
50
60
70
Pro
porti
on o
f pat
ient
s
4102-01029002-5002Year
New Transplant Patients by Gender, 2005-2014
Male Female
02468
1012141618202224
Rat
e, p
er m
illio
n ag
e re
late
d po
pula
tion
2005 2006 2007 2008 2009 2010 2011 2012 2013 2014Year
Age group 0-4 Age group 5-9Age group 10-14 Age group 15-19
59
22nd Report of theMalaysian Dialysis and Transplant Registry DIALYSIS IN MALAYSIA
Figure 5.4: Number of new dialysis and transplant patients by gender, 2005-2014
The dialysis treatment rate had levelled off over the last 10 years for the age age groups 5-14 years old. However it still showed slight increase for the oldest age group; 15-19 years old while the treatment rate remained very low for children under 5.
PD was the first modality of dialysis in about two thirds (63%) of patients in 2013. However data for 2014 showed that HD was the first modality of dialysis in about 55% of patients compared to 44% for PD (CAPD and CCPD).
Table 5.5: New RRT rate, per million age related population by age group, 2005-2014
Figure 5.5: New RRT rate by age group, 2005-2014
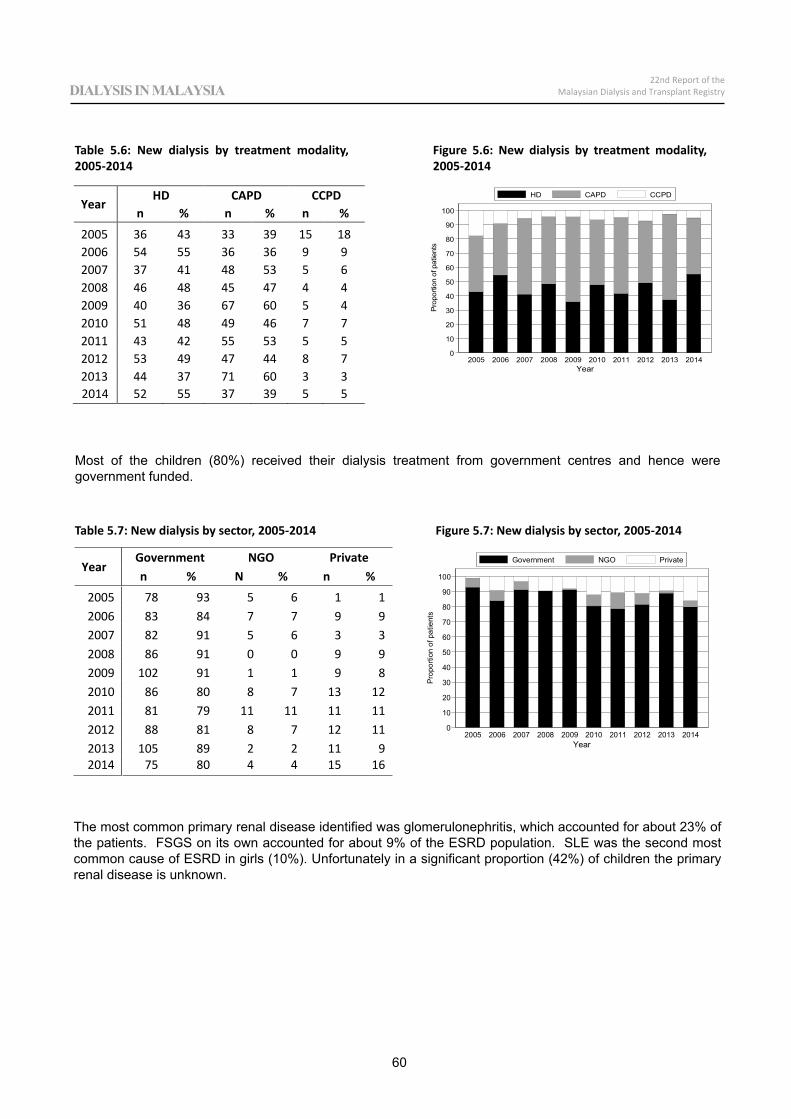
YearGovernment NGO Privaten % N % n %
2005 78 93 5 6 1 12006 83 84 7 7 9 92007 82 91 5 6 3 32008 86 91 0 0 9 92009 102 91 1 1 9 82010 86 80 8 7 13 122011 81 79 11 11 11 112012 88 81 8 7 12 112013 105 89 2 2 11 92014 75 80 4 4 15 16
0
10
20
30
40
50
60
70
80
90
100
Prop
ortio
n of
pat
ient
s
2005 2006 2007 2008 2009 2010 2011 2012 2013 2014Year
HD CAPD CCPD
0
10
20
30
40
50
60
70
80
90
100
Pro
porti
on o
f pat
ient
s
2005 2006 2007 2008 2009 2010 2011 2012 2013 2014Year
Government NGO Private
Year HD CAPD CCPD
n % n % n % 2005 36 43 33 39 15 18 2006 54 55 36 36 9 9 2007 37 41 48 53 5 6 2008 46 48 45 47 4 4 2009 40 36 67 60 5 4 2010 51 48 49 46 7 7 2011 43 42 55 53 5 5 2012 53 49 47 44 8 7 2013 44 37 71 60 3 3 2014 52 55 37 39 5 5
60
22nd Report of theMalaysian Dialysis and Transplant RegistryDIALYSIS IN MALAYSIA
Table 5.6: New dialysis by treatment modality, 2005-2014
Figure 5.6: New dialysis by treatment modality, 2005-2014
Table 5.7: New dialysis by sector, 2005-2014 Figure 5.7: New dialysis by sector, 2005-2014
Most of the children (80%) received their dialysis treatment from government centres and hence were government funded.
The most common primary renal disease identified was glomerulonephritis, which accounted for about 23% of the patients. FSGS on its own accounted for about 9% of the ESRD population. SLE was the second most common cause of ESRD in girls (10%). Unfortunately in a significant proportion (42%) of children the primary renal disease is unknown.
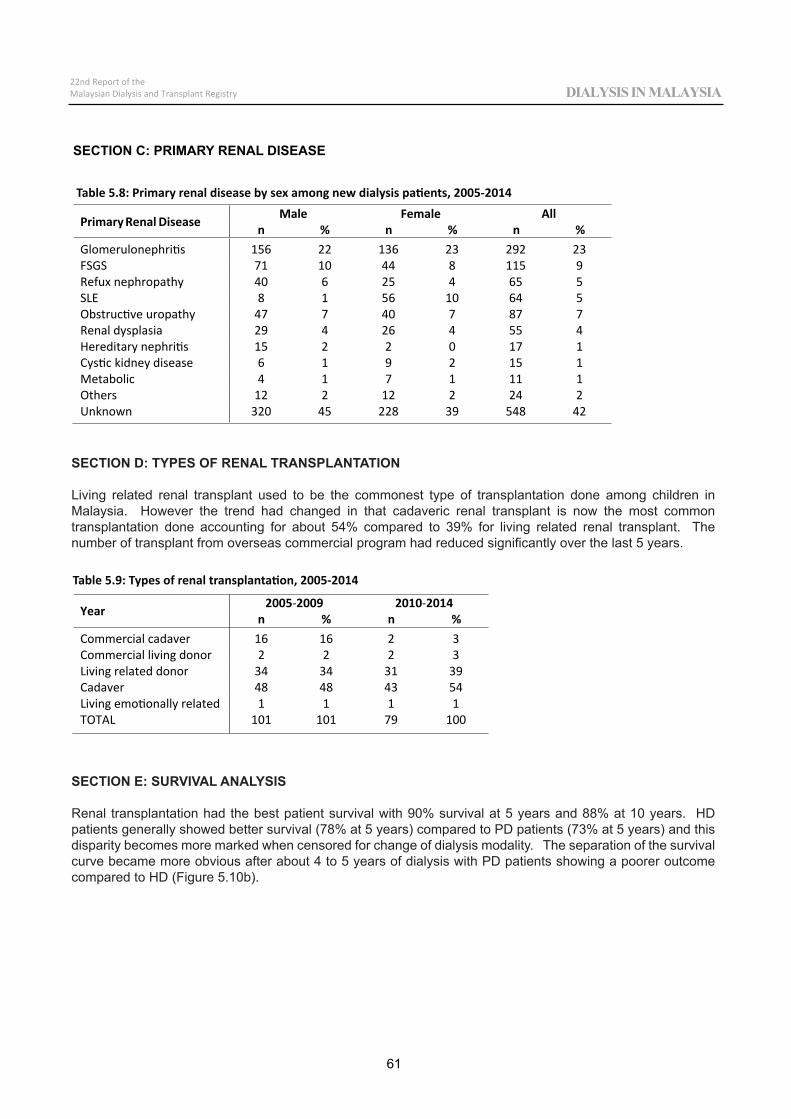
Primary Renal Disease Male Female Alln % n % n %
Glomerulonephritis 156 22 136 23 292 23FSGS 71 10 44 8 115 9Refux nephropathy 40 6 25 4 65 5SLE 8 1 56 10 64 5Obstructive uropathy 47 7 40 7 87 7Renal dysplasia 29 4 26 4 55 4Hereditary nephritis 15 2 2 0 17 1Cystic kidney disease 6 1 9 2 15 1Metabolic 4 1 7 1 11 1Others 12 2 12 2 24 2Unknown 320 45 228 39 548 42
Year 2005 2009 2010 2014n % n %
Commercial cadaver 16 16 2 3Commercial living donor 2 2 2 3Living related donor 34 34 31 39Cadaver 48 48 43 54Living emotionally related 1 1 1 1TOTAL 101 101 79 100
61
22nd Report of theMalaysian Dialysis and Transplant Registry DIALYSIS IN MALAYSIA
Table 5.8: Primary renal disease by sex among new dialysis patients, 2005-2014
Table 5.9: Types of renal transplantation, 2005-2014
SECTION D: TYPES OF RENAL TRANSPLANTATION
Living related renal transplant used to be the commonest type of transplantation done among children in Malaysia. However the trend had changed in that cadaveric renal transplant is now the most common transplantation done accounting for about 54% compared to 39% for living related renal transplant. The number of transplant from overseas commercial program had reduced significantly over the last 5 years.
SECTION E: SURVIVAL ANALYSIS
Renal transplantation had the best patient survival with 90% survival at 5 years and 88% at 10 years. HD patients generally showed better survival (78% at 5 years) compared to PD patients (73% at 5 years) and this disparity becomes more marked when censored for change of dialysis modality. The separation of the survival curve became more obvious after about 4 to 5 years of dialysis with PD patients showing a poorer outcome compared to HD (Figure 5.10b).
SECTION C: PRIMARY RENAL DISEASE
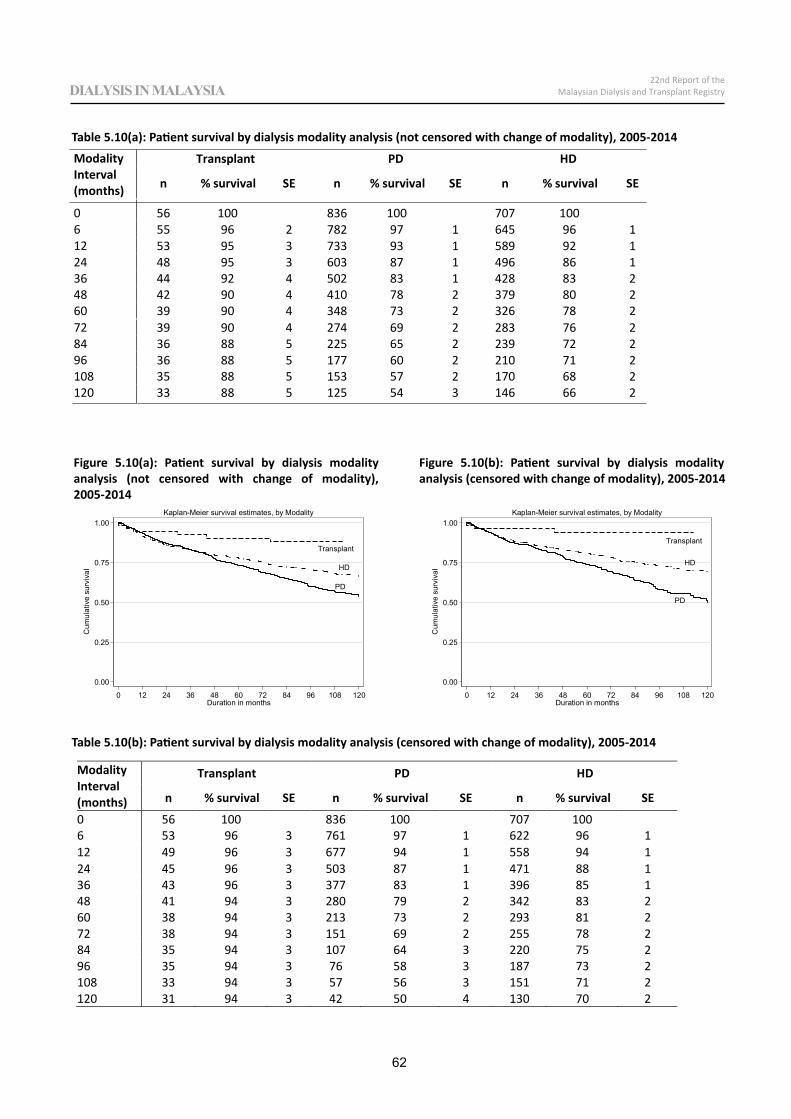
Transplant
HD
PD
0.00
0.25
0.50
0.75
1.00
Cum
ulat
ive
surv
ival
0 12 24 36 48 60 72 84 96 108 120Duration in months
Kaplan-Meier survival estimates, by Modality
Transplant
HD
PD
0.00
0.25
0.50
0.75
1.00
Cum
ulat
ive
surv
ival
0 12 24 36 48 60 72 84 96 108 120Duration in months
Kaplan-Meier survival estimates, by Modality
62
22nd Report of theMalaysian Dialysis and Transplant RegistryDIALYSIS IN MALAYSIA
Table 5.10(a): Patient survival by dialysis modality analysis (not censored with change of modality), 2005-2014
Table 5.10(b): Patient survival by dialysis modality analysis (censored with change of modality), 2005-2014
ModalityInterval(months)
Transplant PD HD
n % survival SE n % survival SE n % survival SE
0 56 100 836 100 707 1006 55 96 2 782 97 1 645 96 112 53 95 3 733 93 1 589 92 124 48 95 3 603 87 1 496 86 136 44 92 4 502 83 1 428 83 248 42 90 4 410 78 2 379 80 260 39 90 4 348 73 2 326 78 272 39 90 4 274 69 2 283 76 284 36 88 5 225 65 2 239 72 296 36 88 5 177 60 2 210 71 2108 35 88 5 153 57 2 170 68 2120 33 88 5 125 54 3 146 66 2
Figure 5.10(a): Patient survival by dialysis modality analysis (not censored with change of modality), 2005-2014
Figure 5.10(b): Patient survival by dialysis modality analysis (censored with change of modality), 2005-2014
Modality Interval (months)
Transplant PD HD
n % survival SE n % survival SE n % survival SE
0 56 100 836 100 707 100 6 53 96 3 761 97 1 622 96 1 12 49 96 3 677 94 1 558 94 1 24 45 96 3 503 87 1 471 88 1 36 43 96 3 377 83 1 396 85 1 48 41 94 3 280 79 2 342 83 2 60 38 94 3 213 73 2 293 81 2 72 38 94 3 151 69 2 255 78 2 84 35 94 3 107 64 3 220 75 2 96 35 94 3 76 58 3 187 73 2 108 33 94 3 57 56 3 151 71 2 120 31 94 3 42 50 4 130 70 2
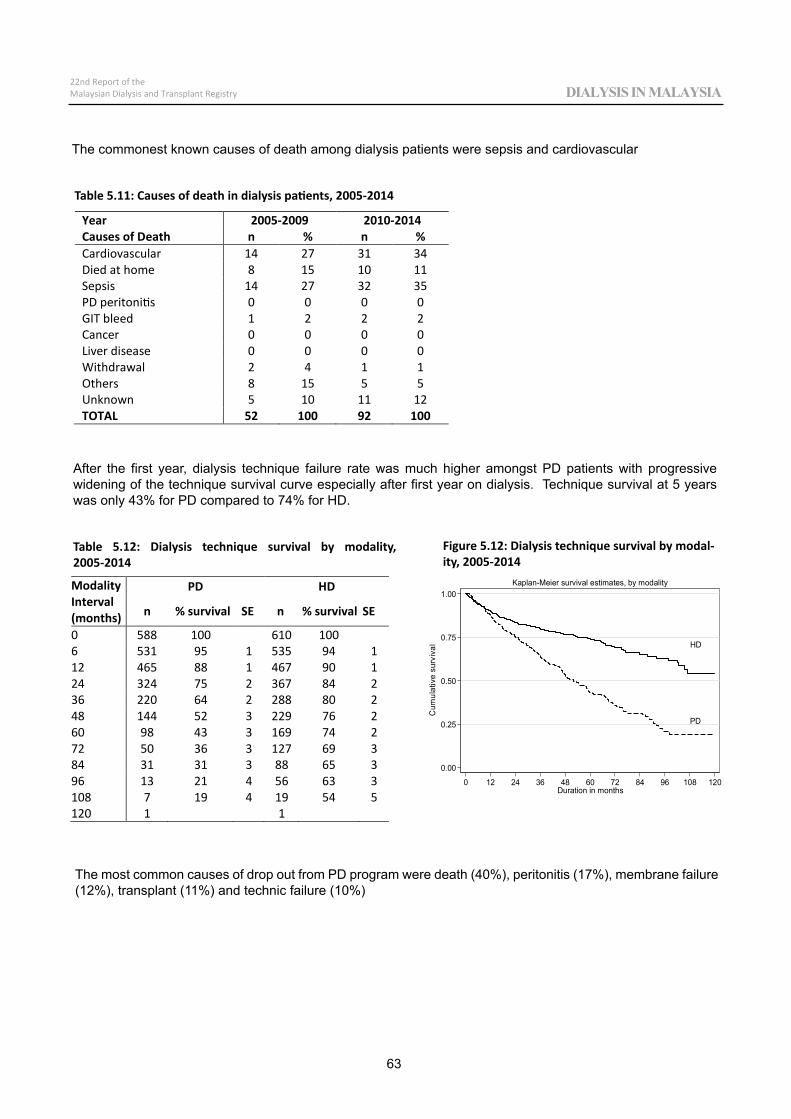
HD
PD
0.00
0.25
0.50
0.75
1.00
Cum
ulat
ive
surv
ival
0 12 24 36 48 60 72 84 96 108 120Duration in months
Kaplan-Meier survival estimates, by modality
63
22nd Report of theMalaysian Dialysis and Transplant Registry DIALYSIS IN MALAYSIA
Year Causes of Death
2005-2009 2010-2014 n % n %
Cardiovascular 14 27 31 34 Died at home 8 15 10 11 Sepsis 14 27 32 35 PD peritonitis 0 0 0 0 GIT bleed 1 2 2 2 Cancer 0 0 0 0 Liver disease 0 0 0 0 Withdrawal 2 4 1 1 Others 8 15 5 5 Unknown 5 10 11 12 TOTAL 52 100 92 100
Table 5.11: Causes of death in dialysis patients, 2005-2014
After the first year, dialysis technique failure rate was much higher amongst PD patients with progressive widening of the technique survival curve especially after first year on dialysis. Technique survival at 5 years was only 43% for PD compared to 74% for HD.
The commonest known causes of death among dialysis patients were sepsis and cardiovascular
Modality Interval (months)
PD HD
n % survival SE n % survival SE
0 588 100 610 100 6 531 95 1 535 94 1 12 465 88 1 467 90 1 24 324 75 2 367 84 2 36 220 64 2 288 80 2 48 144 52 3 229 76 2 60 98 43 3 169 74 2 72 50 36 3 127 69 3 84 31 31 3 88 65 3 96 13 21 4 56 63 3 108 7 19 4 19 54 5 120 1 1
Table 5.12: Dialysis technique survival by modality, 2005-2014
Figure 5.12: Dialysis technique survival by modal-ity, 2005-2014
The most common causes of drop out from PD program were death (40%), peritonitis (17%), membrane failure (12%), transplant (11%) and technic failure (10%)
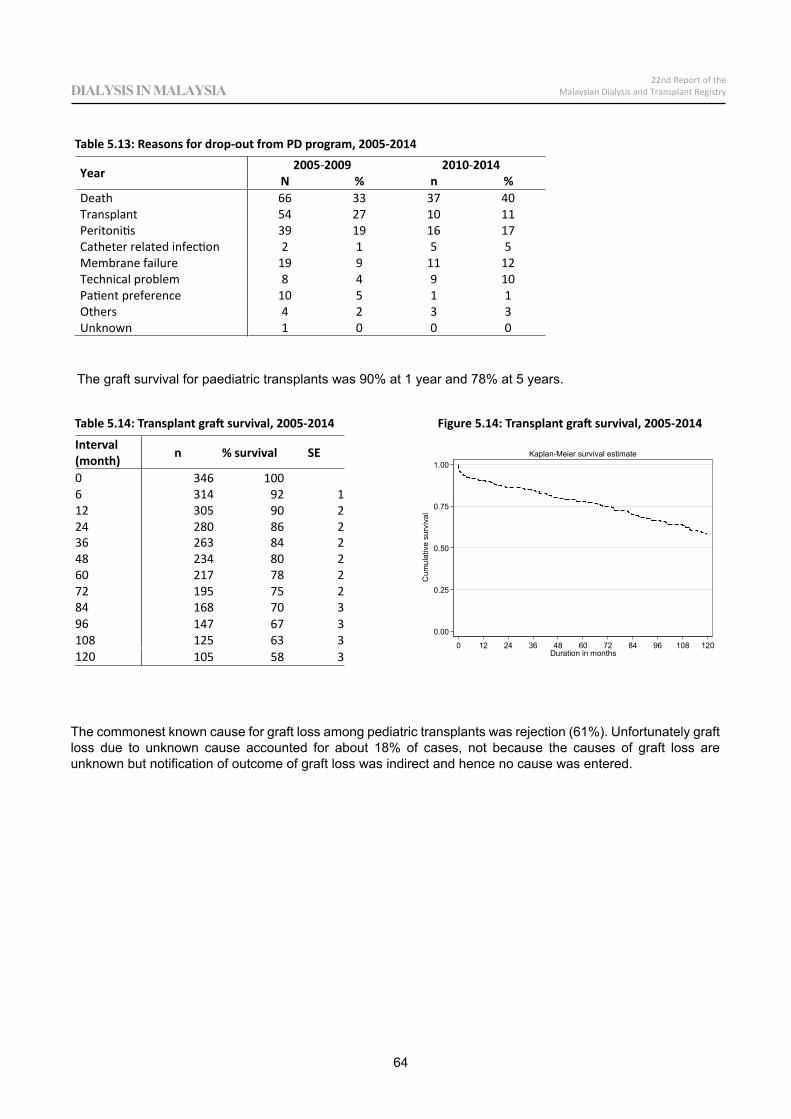
120 105 58 3
0.00
0.25
0.50
0.75
1.00
Cum
ulat
ive
surv
ival
0 12 24 36 48 60 72 84 96 108 120Duration in months
Kaplan-Meier survival estimate
Year 2005 2009 2010 2014N % n %
Death 66 33 37 40Transplant 54 27 10 11Peritonitis 39 19 16 17Catheter related infection 2 1 5 5Membrane failure 19 9 11 12Technical problem 8 4 9 10Patient preference 10 5 1 1Others 4 2 3 3Unknown 1 0 0 0
Interval(month) n % survival SE
0 346 1006 314 92 112 305 90 224 280 86 236 263 84 248 234 80 260 217 78 272 195 75 284 168 70 396 147 67 3108 125 63 3
64
22nd Report of theMalaysian Dialysis and Transplant RegistryDIALYSIS IN MALAYSIA
Table 5.13: Reasons for drop-out from PD program, 2005-2014
Table 5.14: Transplant graft survival, 2005-2014 Figure 5.14: Transplant graft survival, 2005-2014
The graft survival for paediatric transplants was 90% at 1 year and 78% at 5 years.
The commonest known cause for graft loss among pediatric transplants was rejection (61%). Unfortunately graft loss due to unknown cause accounted for about 18% of cases, not because the causes of graft loss are unknown but notification of outcome of graft loss was indirect and hence no cause was entered.
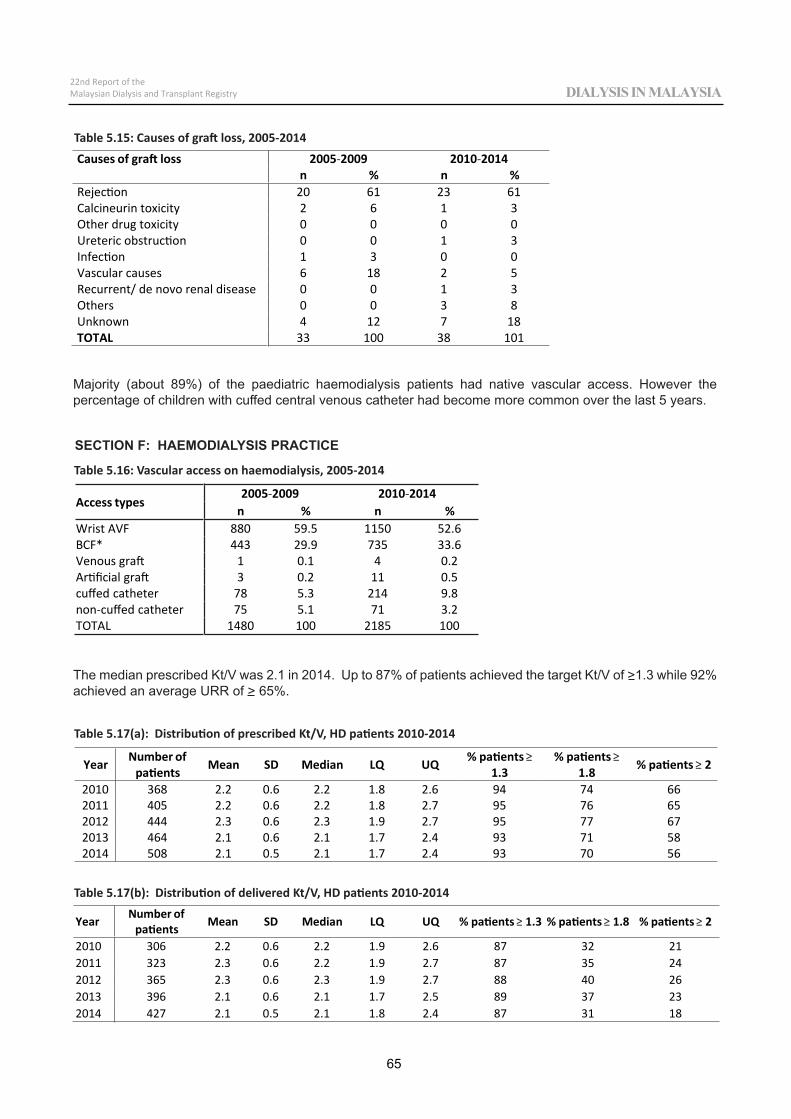
Causes of graft loss 2005 2009 2010 2014n % n %
Rejection 20 61 23 61Calcineurin toxicity 2 6 1 3Other drug toxicity 0 0 0 0Ureteric obstruction 0 0 1 3Infection 1 3 0 0Vascular causes 6 18 2 5Recurrent/ de novo renal disease 0 0 1 3Others 0 0 3 8Unknown 4 12 7 18TOTAL 33 100 38 101
65
22nd Report of theMalaysian Dialysis and Transplant Registry DIALYSIS IN MALAYSIA
Majority (about 89%) of the paediatric haemodialysis patients had native vascular access. However the percentage of children with cuffed central venous catheter had become more common over the last 5 years.
The median prescribed Kt/V was 2.1 in 2014. Up to 87% of patients achieved the target Kt/V of >1.3 while 92% achieved an average URR of > 65%.
Table 5.15: Causes of graft loss, 2005-2014
Table 5.16: Vascular access on haemodialysis, 2005-2014
Table 5.17(a): Distribution of prescribed Kt/V, HD patients 2010-2014
Table 5.17(b): Distribution of delivered Kt/V, HD patients 2010-2014
Access types2005 2009 2010 2014
n % n %Wrist AVF 880 59.5 1150 52.6BCF* 443 29.9 735 33.6Venous graft 1 0.1 4 0.2Artificial graft 3 0.2 11 0.5cuffed catheter 78 5.3 214 9.8non cuffed catheter 75 5.1 71 3.2TOTAL 1480 100 2185 100
Year Number ofpatients Mean SD Median LQ UQ % patients
1.3% patients
1.8 % patients 2
2010 368 2.2 0.6 2.2 1.8 2.6 94 74 662011 405 2.2 0.6 2.2 1.8 2.7 95 76 652012 444 2.3 0.6 2.3 1.9 2.7 95 77 672013 464 2.1 0.6 2.1 1.7 2.4 93 71 582014 508 2.1 0.5 2.1 1.7 2.4 93 70 56
Year Number ofpatients Mean SD Median LQ UQ % patients 1.3 % patients 1.8 % patients 2
2010 306 2.2 0.6 2.2 1.9 2.6 87 32 212011 323 2.3 0.6 2.2 1.9 2.7 87 35 242012 365 2.3 0.6 2.3 1.9 2.7 88 40 262013 396 2.1 0.6 2.1 1.7 2.5 89 37 232014 427 2.1 0.5 2.1 1.8 2.4 87 31 18
SECTION F: HAEMODIALYSIS PRACTICE

Table 5.17(c): Distributionof URR, HD patients 2010 2014
Year Number of patients Mean SD Median LQ UQ % patients 65%
2010 326 75.4 7.5 76 70.1 81 922011 369 76.1 7 76.7 72.1 81.3 922012 396 75.8 8.1 77.1 71.2 81.5 912013 420 76.4 7.4 77.2 71.6 81.8 942014 463 75.7 7.7 76.3 71.4 80.6 92
66
22nd Report of theMalaysian Dialysis and Transplant RegistryDIALYSIS IN MALAYSIA
SECTION G: ANAEMIA TREATMENT
The percentage of children treated with erythropoietin had reached a plateau of about 92% to 94% for the last 8 years. Similarly the proportion of children receiving parenteral iron continued to show an upward trend up to 45% in 2014 while the percentage of children on oral iron remained around 54-55%. The percentage of children who received blood transfusion had increased slightly in 2014 to about 17%.
Table 5.18: Treatment for anaemia, HD patients 2005-2014
Table 5.19: Distribution of transferrin saturation on Erythropoietin, HD patients 2005-2014
The median transferrin saturation has consistently been above 30%. About 91% of children had transferrin saturation greater than 20%
Year Number of patients % on Erythropoietin % received bloodtransfusion % on oral iron % received
parenteral iron2005 219 88 14 76 182006 272 89 18 71 272007 294 93 14 73 252008 340 92 17 59 362009 373 92 16 57 392010 379 92 13 57 372011 421 93 14 56 362012 460 92 14 57 382013 485 94 12 55 422014 524 92 17 54 45
Year Number of patients Mean SD Median LQ UQ % Patients20 %
2005 166 36.7 16.4 32.6 24.4 44.5 892006 210 36 15.6 32.7 25 44 882007 244 33.7 14.9 31.1 23.4 40 862008 286 35 15.7 31.9 24.1 41.9 862009 317 35.1 16 31.9 24.9 42.2 862010 320 35.2 16.1 31.7 24.3 42.8 852011 365 33.2 14.5 30.8 23.5 38 852012 385 33 13.4 30.2 24.4 40 882013 404 32.7 13.4 30.5 23.9 38.6 872014 434 33.4 13.8 30.5 25.1 39 88
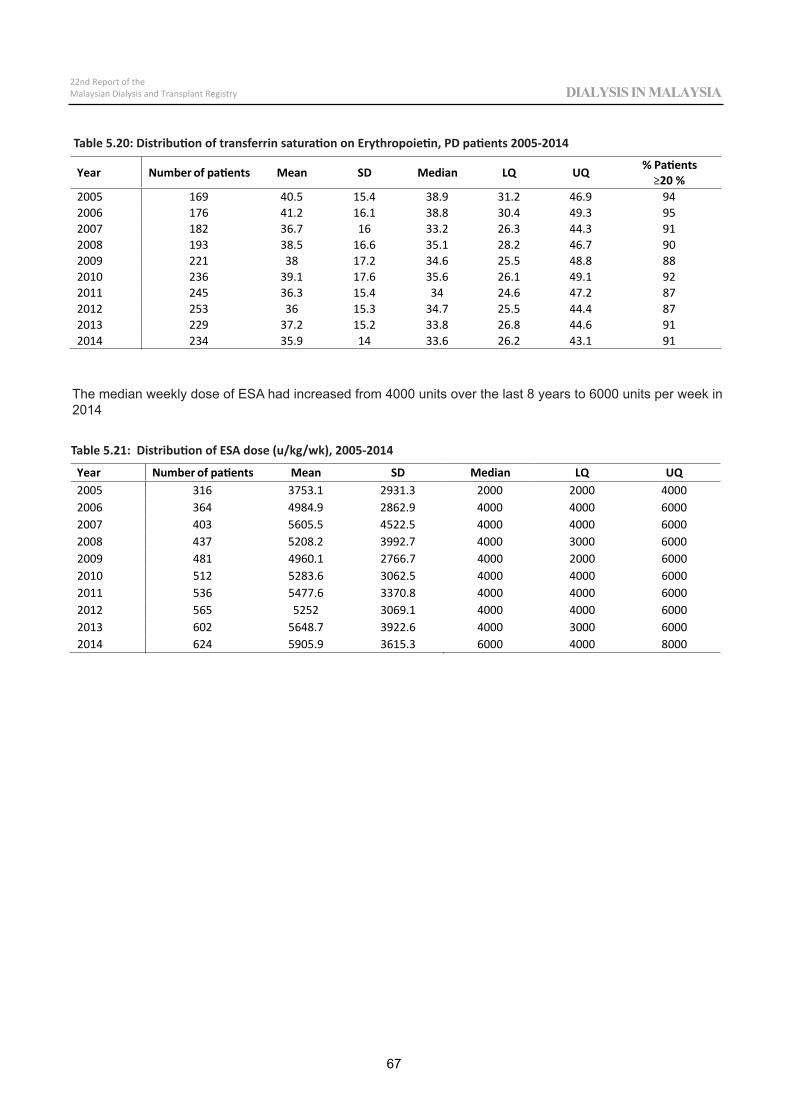
Table 5.20: Distribution of transferrin saturation on Erythropoietin, PD patients 2005-2014
Table 5.21: Distribution of ESA dose (u/kg/wk), 2005-2014
The median weekly dose of ESA had increased from 4000 units over the last 8 years to 6000 units per week in 2014
Year Number of patients Mean SD Median LQ UQ % Patients20 %
2005 169 40.5 15.4 38.9 31.2 46.9 942006 176 41.2 16.1 38.8 30.4 49.3 952007 182 36.7 16 33.2 26.3 44.3 912008 193 38.5 16.6 35.1 28.2 46.7 902009 221 38 17.2 34.6 25.5 48.8 882010 236 39.1 17.6 35.6 26.1 49.1 922011 245 36.3 15.4 34 24.6 47.2 872012 253 36 15.3 34.7 25.5 44.4 872013 229 37.2 15.2 33.8 26.8 44.6 912014 234 35.9 14 33.6 26.2 43.1 91
Year Number of patients Mean SD Median LQ UQ2005 316 3753.1 2931.3 2000 2000 40002006 364 4984.9 2862.9 4000 4000 60002007 403 5605.5 4522.5 4000 4000 60002008 437 5208.2 3992.7 4000 3000 6000
67
22nd Report of theMalaysian Dialysis and Transplant Registry DIALYSIS IN MALAYSIA
2009 481 4960.1 2766.7 4000 2000 60002010 512 5283.6 3062.5 4000 4000 60002011 536 5477.6 3370.8 4000 4000 60002012 565 5252 3069.1 4000 4000 60002013 602 5648.7 3922.6 4000 3000 60002014 624 5905.9 3615.3 6000 4000 8000

22nd Report of theMalaysian Dialysis and Transplant Registry ALL RENAL REPLACEMENT THERAPY IN MALAYSIA
Chapter 6
MANAGEMENT OF ANAEMIAIN PATIENTS ON DIALYSIS
Philip N. JeremiahBee Boon CheakGhazali B Ahmad
Lim Soo KunWan Hasnul Halimi Bin Wan Hassan
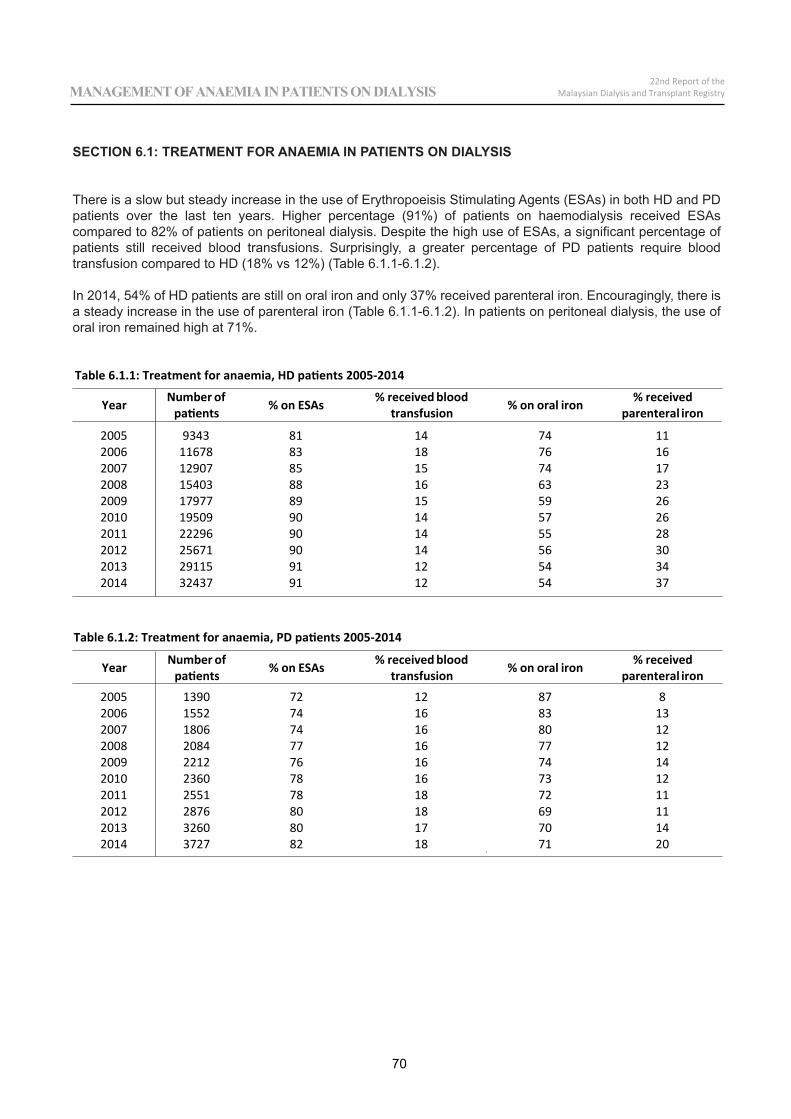
Table 6.1.1: Treatment for anaemia, HD patients 2005-2014
Table 6.1.2: Treatment for anaemia, PD patients 2005-2014
Year Number ofpatients % on ESAs % received blood
transfusion % on oral iron % receivedparenteral iron
2005 9343 81 14 74 112006 11678 83 18 76 162007 12907 85 15 74 172008 15403 88 16 63 232009 17977 89 15 59 262010 19509 90 14 57 262011 22296 90 14 55 282012 25671 90 14 56 302013 29115 91 12 54 342014 32437 91 12 54 37
Year Number ofpatients % on ESAs % received blood
transfusion % on oral iron % receivedparenteral iron
2005 1390 72 12 87 82006 1552 74 16 83 132007 1806 74 16 80 122008 2084 77 16 77 122009 2212 76 16 74 142010 2360 78 16 73 122011 2551 78 18 72 112012 2876 80 18 69 112013 3260 80 17 70 142014 3727 82 18 71 20
70
22nd Report of theMalaysian Dialysis and Transplant RegistryMANAGEMENT OF ANAEMIA IN PATIENTS ON DIALYSIS
SECTION 6.1: TREATMENT FOR ANAEMIA IN PATIENTS ON DIALYSIS
There is a slow but steady increase in the use of Erythropoeisis Stimulating Agents (ESAs) in both HD and PD patients over the last ten years. Higher percentage (91%) of patients on haemodialysis received ESAs compared to 82% of patients on peritoneal dialysis. Despite the high use of ESAs, a significant percentage of patients still received blood transfusions. Surprisingly, a greater percentage of PD patients require blood transfusion compared to HD (18% vs 12%) (Table 6.1.1-6.1.2).
In 2014, 54% of HD patients are still on oral iron and only 37% received parenteral iron. Encouragingly, there is a steady increase in the use of parenteral iron (Table 6.1.1-6.1.2). In patients on peritoneal dialysis, the use of oral iron remained high at 71%.
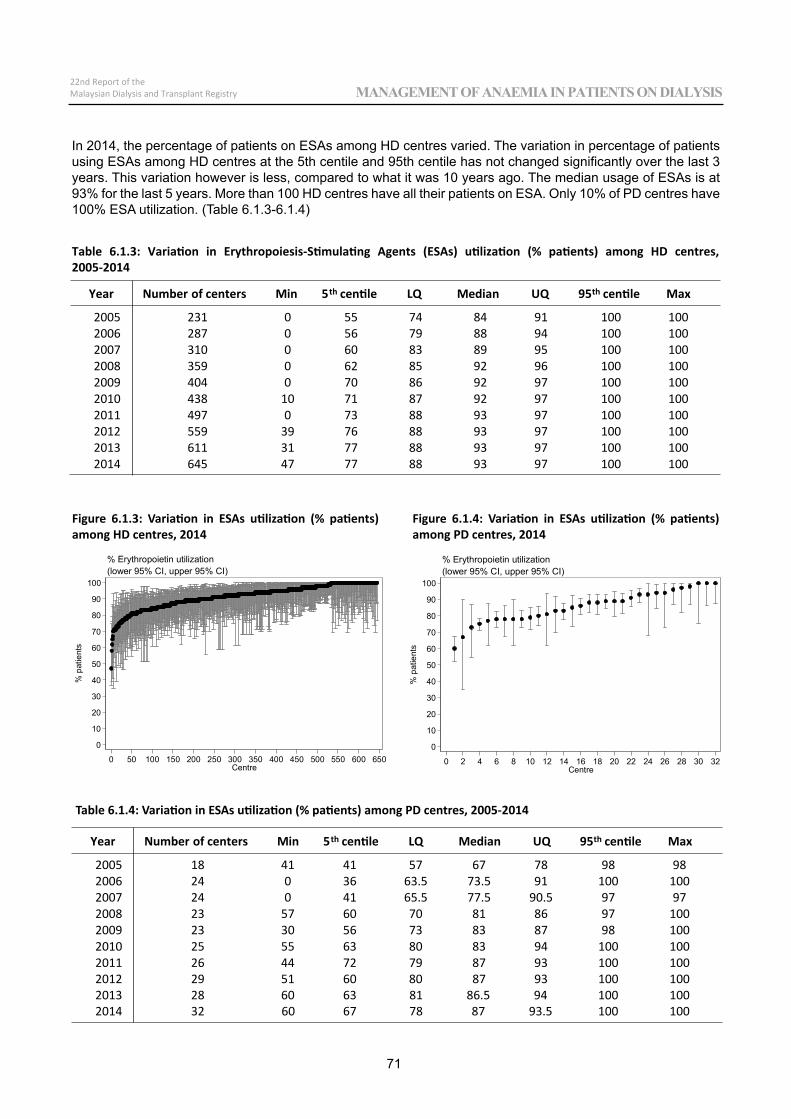
2005 231 0 55 74 84 91 100 1002006 287 0 56 79 88 94 100 1002007 310 0 60 83 89 95 100 1002008 359 0 62 85 92 96 100 1002009 404 0 70 86 92 97 100 1002010 438 10 71 87 92 97 100 1002011 497 0 73 88 93 97 100 1002012 559 39 76 88 93 97 100 1002013 611 31 77 88 93 97 100 1002014 645 47 77 88 93 97 100 100
71
22nd Report of theMalaysian Dialysis and Transplant Registry MANAGEMENT OF ANAEMIA IN PATIENTS ON DIALYSIS
In 2014, the percentage of patients on ESAs among HD centres varied. The variation in percentage of patients using ESAs among HD centres at the 5th centile and 95th centile has not changed significantly over the last 3 years. This variation however is less, compared to what it was 10 years ago. The median usage of ESAs is at 93% for the last 5 years. More than 100 HD centres have all their patients on ESA. Only 10% of PD centres have 100% ESA utilization. (Table 6.1.3-6.1.4)
Year Number of centers Min 5th centile LQ Median UQ 95th centile Max
Table 6.1.3: Variation in Erythropoiesis-Stimulating Agents (ESAs) utilization (% patients) among HD centres, 2005-2014
0
10
20
30
40
50
60
70
80
90
100
% p
atie
nts
0 2 4 6 8 10 12 14 16 18 20 22 24 26 28 30 32Centre
(lower 95% CI, upper 95% CI)% Erythropoietin utilization
2005 18 41 41 57 67 78 98 982006 24 0 36 63.5 73.5 91 100 1002007 24 0 41 65.5 77.5 90.5 97 972008 23 57 60 70 81 86 97 1002009 23 30 56 73 83 87 98 1002010 25 55 63 80 83 94 100 1002011 26 44 72 79 87 93 100 1002012 29 51 60 80 87 93 100 1002013 28 60 1002014 32 60 100
0
10
20
30
40
50
60
70
80
90
100
% p
atie
nts
0 50 100 150 200 250 300 350 400 450 500 550 600 650Centre
(lower 95% CI, upper 95% CI)% Erythropoietin utilization
Figure 6.1.3: Variation in ESAs utilization (% patients) among HD centres, 2014
Figure 6.1.4: Variation in ESAs utilization (% patients) among PD centres, 2014
Table 6.1.4: Variation in ESAs utilization (% patients) among PD centres, 2005-2014
Year Number of centers Min 5th centile LQ Median UQ 95th centile Max
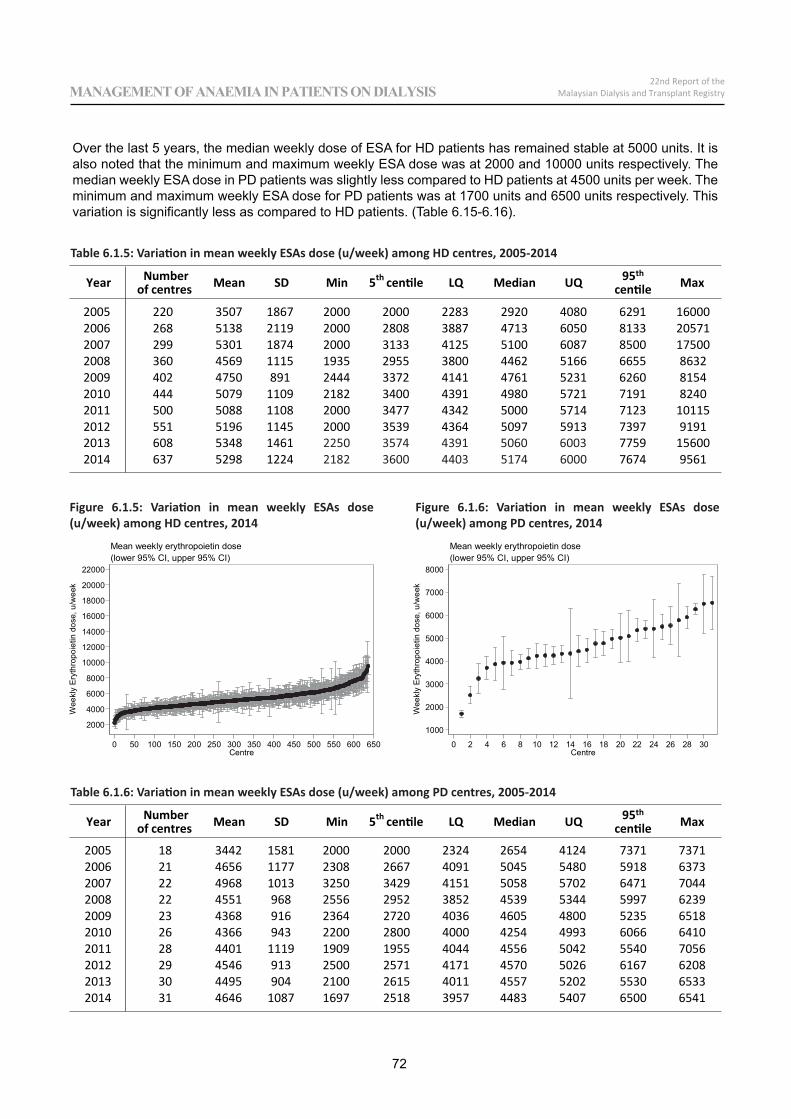
2005 220 3507 1867 2000 2000 2283 2920 4080 6291 160002006 268 5138 2119 2000 2808 3887 4713 6050 8133 205712007 299 5301 1874 2000 3133 4125 5100 6087 8500 175002008 360 4569 1115 1935 2955 3800 4462 5166 6655 86322009 402 4750 891 2444 3372 4141 4761 5231 6260 81542010 444 5079 1109 2182 3400 4391 4980 5721 7191 82402011 500 5088 1108 2000 3477 4342 5000 5714 7123 101152012 551 5196 1145 2000 3539 4364 5097 5913 7397 91912013 608 5348 1461 7759 156002014 637 5298 1224 7674 9561
Year Numberof centres Mean SD Min 5th centile LQ Median UQ 95th
centile Max
2000
4000
6000
8000
10000
12000
14000
16000
18000
20000
22000
Wee
kly
Eryt
hrop
oiet
in d
ose,
u/w
eek
0 50 100 150 200 250 300 350 400 450 500 550 600 650Centre
(lower 95% CI, upper 95% CI)Mean weekly erythropoietin dose
1000
2000
3000
4000
5000
6000
7000
8000
Wee
kly
Eryt
hrop
oiet
in d
ose,
u/w
eek
0 2 4 6 8 10 12 14 16 18 20 22 24 26 28 30Centre
(lower 95% CI, upper 95% CI)Mean weekly erythropoietin dose
2005 18 3442 1581 2000 2000 2324 2654 4124 7371 73712006 21 4656 1177 2308 2667 4091 5045 5480 5918 63732007 22 4968 1013 3250 3429 4151 5058 5702 6471 70442008 22 4551 968 2556 2952 3852 4539 5344 5997 62392009 23 4368 916 2364 2720 4036 4605 4800 5235 65182010 26 4366 943 2200 2800 4000 4254 4993 6066 64102011 28 4401 1119 1909 1955 4044 4556 5042 5540 70562012 29 4546 913 2500 2571 4171 4570 5026 6167 62082013 30 4495 904 2100 2615 4011 4557 5202 5530 65332014 31 4646 1087 1697 2518 3957 4483 5407 6500 6541
Table 6.1.5: Variation in mean weekly ESAs dose (u/week) among HD centres, 2005-2014
Table 6.1.6: Variation in mean weekly ESAs dose (u/week) among PD centres, 2005-2014
Figure 6.1.5: Variation in mean weekly ESAs dose (u/week) among HD centres, 2014
Figure 6.1.6: Variation in mean weekly ESAs dose (u/week) among PD centres, 2014
Year Numberof centres Mean SD Min 5th centile LQ Median UQ 95th
centile Max
Over the last 5 years, the median weekly dose of ESA for HD patients has remained stable at 5000 units. It is also noted that the minimum and maximum weekly ESA dose was at 2000 and 10000 units respectively. The median weekly ESA dose in PD patients was slightly less compared to HD patients at 4500 units per week. The minimum and maximum weekly ESA dose for PD patients was at 1700 units and 6500 units respectively. This variation is significantly less as compared to HD patients. (Table 6.15-6.16).
72
22nd Report of theMalaysian Dialysis and Transplant RegistryMANAGEMENT OF ANAEMIA IN PATIENTS ON DIALYSIS
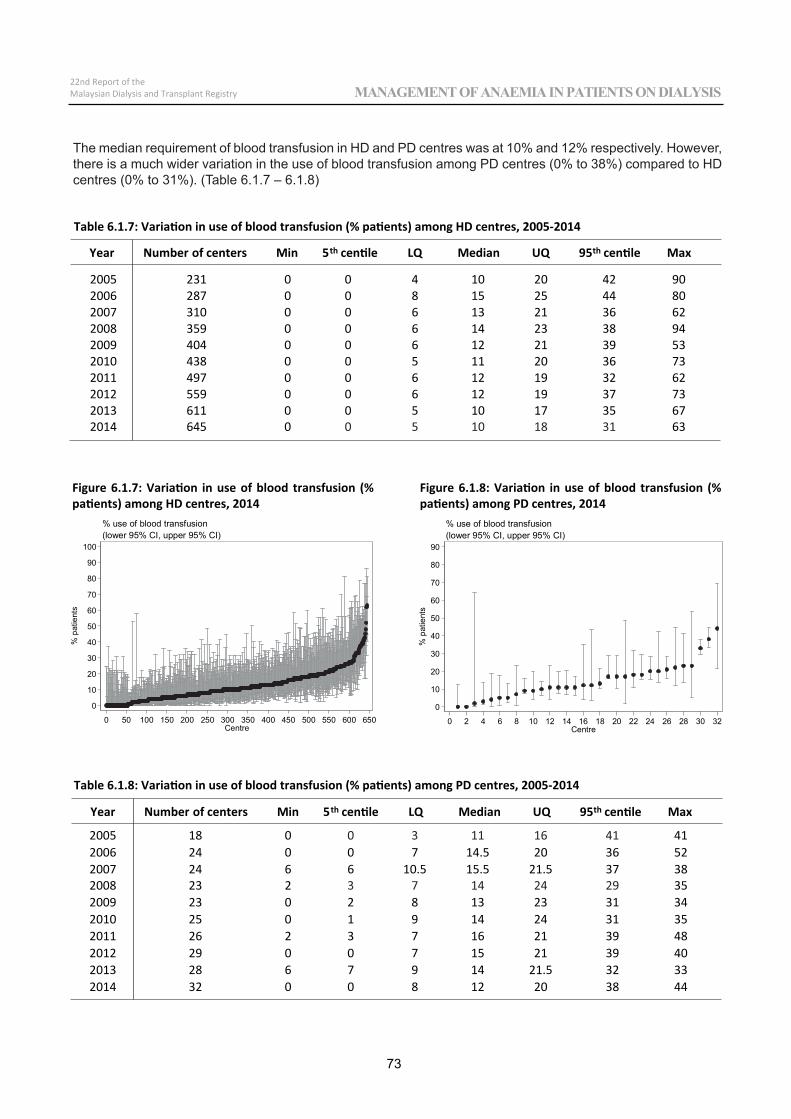
Table 6.1.7: Variation in use of blood transfusion (% patients) among HD centres, 2005-2014
Table 6.1.8: Variation in use of blood transfusion (% patients) among PD centres, 2005-2014
2005 231 0 0 4 10 20 42 902006 287 0 0 8 15 25 44 802007 310 0 0 6 13 21 36 622008 359 0 0 6 14 23 38 942009 404 0 0 6 12 21 39 532010 438 0 0 5 11 20 36 732011 497 0 0 6 12 19 32 622012 559 0 0 6 12 19 37 732013 611 0 0 5 10 17 35 672014 645 0 63
0
10
20
30
40
50
60
70
80
90
100
% p
atie
nts
0 50 100 150 200 250 300 350 400 450 500 550 600 650Centre
(lower 95% CI, upper 95% CI)% use of blood transfusion
0
10
20
30
40
50
60
70
80
90
% p
atie
nts
0 2 4 6 8 10 12 14 16 18 20 22 24 26 28 30 32Centre
(lower 95% CI, upper 95% CI)% use of blood transfusion
2005 18 0 412006 24 0 0 7 14.5 20 36 522007 24 6 6 10.5 15.5 21.5 37 382008 23 2 352009 23 0 2 8 13 23 31 342010 25 0 1 9 14 24 31 352011 26 2 3 7 16 21 39 482012 29 0 0 7 15 21 39 402013 28 6 7 9 14 21.5 32 332014 32 0 0 8 12 20 38 44
Year Number of centers Min 5th centile LQ Median UQ 95th centile Max
Figure 6.1.7: Variation in use of blood transfusion (% patients) among HD centres, 2014
Figure 6.1.8: Variation in use of blood transfusion (% patients) among PD centres, 2014
Year Number of centers Min 5th centile LQ Median UQ 95th centile Max
The median requirement of blood transfusion in HD and PD centres was at 10% and 12% respectively. However, there is a much wider variation in the use of blood transfusion among PD centres (0% to 38%) compared to HD centres (0% to 31%). (Table 6.1.7 – 6.1.8)
73
22nd Report of theMalaysian Dialysis and Transplant Registry MANAGEMENT OF ANAEMIA IN PATIENTS ON DIALYSIS
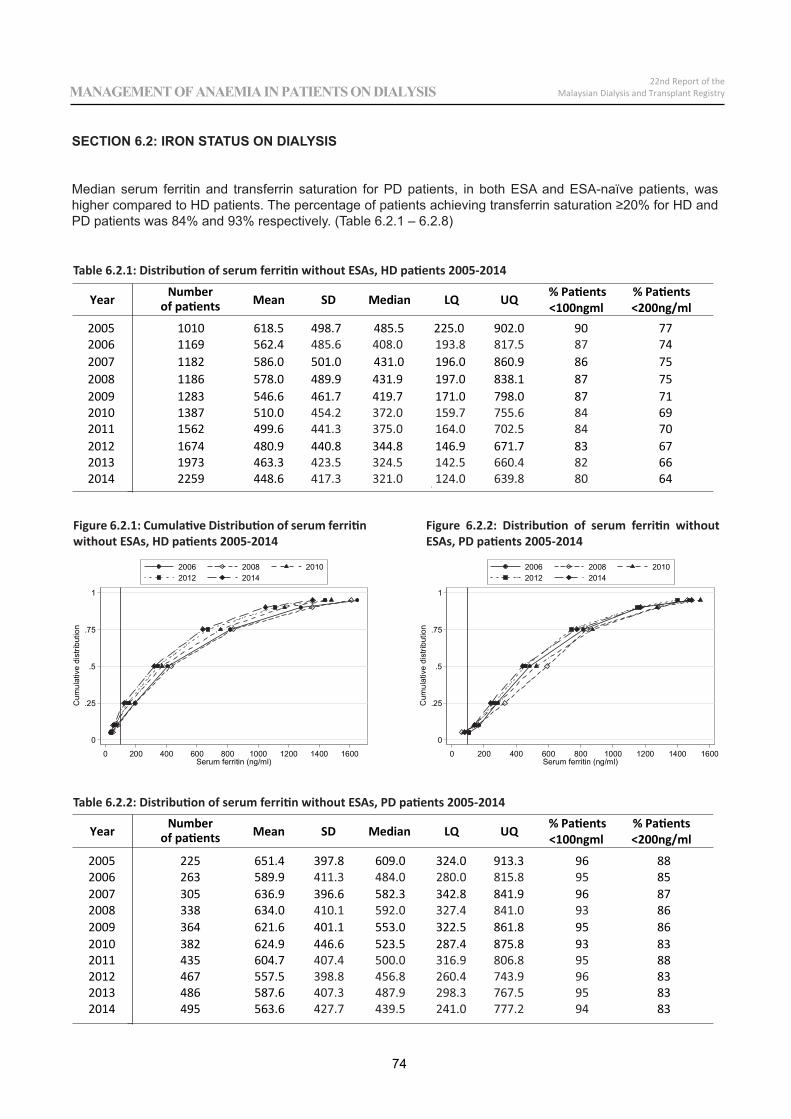
0
.25
.5
.75
1
Cum
ulat
ive
dist
ribut
ion
0 200 400 600 800 1000 1200 1400 1600Serum ferritin (ng/ml)
2006 2008 20102012 2014
0
.25
.5
.75
1
Cum
ulat
ive
dist
ribut
ion
0 200 400 600 800 1000 1200 1400 1600Serum ferritin (ng/ml)
2006 2008 20102012 2014
SECTION 6.2: IRON STATUS ON DIALYSIS
Median serum ferritin and transferrin saturation for PD patients, in both ESA and ESA-naïve patients, was higher compared to HD patients. The percentage of patients achieving transferrin saturation ≥20% for HD and PD patients was 84% and 93% respectively. (Table 6.2.1 – 6.2.8)
Table 6.2.1: Distribution of serum ferritin without ESAs, HD patients 2005-2014
Table 6.2.2: Distribution of serum ferritin without ESAs, PD patients 2005-2014
Figure 6.2.1: Cumulative Distribution of serum ferritin without ESAs, HD patients 2005-2014
Figure 6.2.2: Distribution of serum ferritin without ESAs, PD patients 2005-2014
Year Numberof patients Mean SD Median LQ UQ % Patients
<100ngml% Patients<200ng/ml
2005 1010 618.5 498.7 485.5 225.0 902.0 90 772006 1169 562.4 742007 1182 586.0 501.0 431.0 196.0 860.9 86 752008 1186 578.0 489.9 431.9 197.0 838.1 87 752009 1283 546.6 461.7 419.7 171.0 798.0 87 712010 1387 510.0 692011 1562 499.6 702012 1674 480.9 440.8 344.8 146.9 671.7 83 672013 1973 463.3 662014 2259 448.6 64
2005 225 651.4 397.8 609.0 324.0 913.3 96 882006 263 589.9 852007 305 636.9 396.6 582.3 342.8 841.9 96 872008 338 634.0 862009 364 621.6 401.1 553.0 322.5 861.8 95 862010 382 624.9 446.6 523.5 287.4 875.8 93 832011 435 604.7 882012 467 557.5 832013 486 587.6 832014 495 563.6 83
Year Numberof patients Mean SD Median LQ UQ % Patients
<100ngml% Patients<200ng/ml
74
22nd Report of theMalaysian Dialysis and Transplant RegistryMANAGEMENT OF ANAEMIA IN PATIENTS ON DIALYSIS
2005 5116 682.7 471.0 599.5 315.3 971.5 93 852006 6764 640.3 459.0 543.1 291.1 881.1 93 842007 8032 658.8 452.2 564.4 315.5 914.0 94 862008 9937 703.6 469.2 611.1 337.5 979.5 95 872009 12241 679.3 459.6 596.0 319.3 941.9 94 862010 13597 679.4 470.0 581.8 312.0 958.0 94 852011 15871 653.5 461.1 551.5 297.0 913.3 93 842012 18135 627.6 450.0 527.8 280.0 879.3 93 832013 20908 605.8 448.0 500.3 262.8 837.5 92 822014 24170 612.4 448.0 508.1 269.0 853.0 92 82
0
.25
.5
.75
1
Cum
ulat
ive
dist
ribut
ion
0 200 400 600 800 1000 1200 1400 1600Serum ferritin (ng/ml)
2006 2008 20102012 2014
0
.25
.5
.75
1
Cum
ulat
ive
dist
ribut
ion
0 200 400 600 800 1000 1200 1400 1600Serum ferritin (ng/ml)
2006 2008 20102012 2014
2005 767.0 732.9 433.6 659.0 403.6 997.5 97 922006 888.0 729.9 435.6 638.4 399.5 986.2 98 942007 1091.0 741.3 426.1 652.0 423.8 1015.0 98 942008 1310.0 758.4 445.4 668.6 422.4 1030.3 98 932009 1390.0 759.5 438.7 689.0 421.1 1017.5 98 932010 1554.0 753.3 438.0 677.1 426.3 1005.5 97 932011 1631.0 726.4 436.4 644.7 403.3 993.7 97 912012 1899.0 707.4 440.2 640.8 375.6 951.5 96 902013 2139.0 705.1 448.9 611.5 362.7 966.3 97 892014 2533.0 704.9 450.7 614.8 364.7 968.6 96 89
Year Numberof patients Mean SD Median LQ UQ % Patients
<100ngml% Patients<200ng/ml
Table 6.2.3: Distribution of serum ferritin on ESAs, HD patients 2005-2014
Table 6.2.4: Distribution of serum ferritin on ESAs, PD patients 2005-2014
Figure 6.2.3: Cumulative distribution of serum ferritin on ESAs, HD patients 2005-2014
Figure 6.2.4: Cumulative distribution of serum ferritin on ESAs, PD patients 2005-2014
Year Numberof patients Mean SD Median LQ UQ % Patients
<100ngml% Patients<200ng/ml
75
22nd Report of theMalaysian Dialysis and Transplant Registry MANAGEMENT OF ANAEMIA IN PATIENTS ON DIALYSIS
2005 1106 37.7 17.8 34.4 25.6 46.2 872006 1149 36.2 16.9 32.9 24.7 44.2 872007 1206 36.1 16.5 32.5 25.0 43.7 872008 1211 34.3 15.5 31.8 23.7 41.4 852009 1283 34.3 15.9 31.3 24.0 40.8 852010 1442 33.5 15.6 30.4 22.7 40.5 832011 1567 32.4 14.7 29.8 22.9 38.4 852012 1859 32.4 14.5 29.9 22.8 38.7 832013 2118 31.2 14.0 28.9 22.0 37.3 812014 2390 31.1 13.4 28.9 22.4 37.5 82
0
.25
.5
.75
1
Cum
ulat
ive
dist
ribut
ion
10 20 30 40 50 60 70 80Serum transferrin saturation (%)
2006 2008 20102012 2014
0
.25
.5
.75
1
Cum
ulat
ive
dist
ribut
ion
10 20 30 40 50 60 70 80 90Serum transferrin saturation (%)
2006 2008 20102012 2014
2005 287 40.6 16.2 37.8 29.4 48.2 952006 299 40.5 17.4 37.9 27.3 47.3 952007 348 40.3 17.9 36.6 27.5 48.2 922008 349 38.2 17.8 34.3 26.2 44.4 912009 439 38.4 18.2 36.1 26.4 45.7 872010 441 38.3 17.8 35.1 25.9 45.3 892011 424 36.8 15.8 33.2 26.5 45.5 902012 498 35.6 15.7 33.8 24.9 43.9 852013 462 37.3 15.7 33.9 26.1 44.4 912014 542 36.3 16.0 34.5 24.5 43.9 87
Table 6.2.6: Distribution of transferrin saturation without ESAs, PD patients, 2005-2014
Table 6.2.5: Distribution of transferrin saturation without ESAs, HD patients, 2005-2014
Year Numberof patients Mean SD Median LQ UQ % Patients
20
Figure 6.2.5: Cumulative distribution of transferrin saturation without ESAs, HD patients 2005-2014
Figure 6.2.6: Cumulative distribution of transferrin saturation without ESAs, PD patients 2005-2014
Year Numberof patients Mean SD Median LQ UQ % Patients
20
76
22nd Report of theMalaysian Dialysis and Transplant RegistryMANAGEMENT OF ANAEMIA IN PATIENTS ON DIALYSIS
2005 4808 36.6 872006 6384 35.1 872007 7604 34.7 882008 9537 34.7 872009 11854 34.0 862010 13761 34.0 872011 16214 32.6 14.3 29.7 23.1 38.7 852012 18972 31.7 13.5 29.2 22.9 37.5 852013 21988 31.0 842014 24964 31.2 12.9 28.9 22.7 36.9 84
0
.25
.5
.75
1
Cum
ulat
ive
dist
ribut
ion
10 20 30 40 50 60 70 80Serum transferrin saturation (%)
2006 2008 20102012 2014
0
.25
.5
.75
1
Cum
ulat
ive
dist
ribut
ion
10 20 30 40 50 60 70 80 90Serum transferrin saturation (%)
2006 2008 20102012 2014
2005 820 43.5 19.3 39.1 29.4 53.7 952006 916 41.6 952007 1080 39.3 922008 1265 38.6 17.9 34.4 26.2 47.1 912009 1550 39.1 922010 1628 38.9 17.5 35.5 26.7 47.3 912011 1673 36.5 882012 1932 36.2 902013 1995 37.4 932014 2483 36.5 93
Table 6.2.7: Distribution of transferrin saturation on ESAs, HD patients, 2005-2014
Table 6.2.8: Distribution of transferrin saturation on ESAs, PD patients, 2005-2014
Figure 6.2.7: Cumulative distribution of transferrin saturation on ESAs, HD patients 2005-2014
Figure 6.2.8: Cumulative distribution of transferrin saturation on ESAs, PD patients 2005-2014
Year Numberof patients Mean SD Median LQ UQ % Patients
20 %
Year Numberof patients Mean SD Median LQ UQ % Patients
20 %
There was a wide variation in ferritin levels ranging from 200 to 900 ng/ml, between HD centres in 2014. A similar trend was seen in the PD centres. Median ferritin for both HD and PD patients was ~ 500ng/ml. This may explain the relatively lower usage of parenteral iron among dialysis patients. The median proportion of patients on ESA with transferrin saturation of at least 20% among HD and PD centres was 86% and 94% respectively. (Table 6.2.9-10)
77
22nd Report of theMalaysian Dialysis and Transplant Registry MANAGEMENT OF ANAEMIA IN PATIENTS ON DIALYSIS
2005 160 1.6 239.2 453.0 612.5 726.5 998.0 2000.02006 207 1.5 224.5 416.0 548.0 672.6 904.5 2000.02007 237 78.3 236.0 428.5 560.7 682.0 881.0 1457.02008 274 82.4 277.0 481.4 592.8 719.5 934.7 2000.02009 331 113.1 283.6 444.0 592.0 714.0 894.0 1530.52010 365 35.5 248.0 435.3 558.0 733.8 981.8 1177.42011 427 25.0 251.6 409.5 539.0 683.0 915.0 1210.52012 488 10.1 246.7 383.0 512.2 663.7 869.5 1365.52013 530 107.9 1240.82014 587 30.0 231.4 366.5 497.8 647.5 928.4 1265.5
0
200
400
600
800
1000
1200
1400
1600
1800
2000
Seru
m F
errit
in, n
g/m
l
0 50 100 150 200 250 300 350 400 450 500 550Centre
(lower quartile, upper quartile)Median serum ferritin
0
10
20
30
40
50
60
70
80
90
100
% p
atie
nts
0 50 100 150 200 250 300 350 400 450 500 550 600Centre
(lower 95% CI, upper 95% CI)% with serum ferritin>=100ng/ml
2005 160 3 78 89 95 100 100 1002006 207 0 73 91 95 100 100 1002007 237 41 78 92 96 100 100 1002008 274 36 82 92 96 100 100 1002009 331 53 81 90 95 100 100 1002010 365 0 79 90 96 100 100 1002011 427 0 77 89 95 100 100 1002012 488 10 76 88 95 100 100 1002013 530 63 1002014 587 45 100
Table 6.2.9(a): Variation in median serum ferritin among patients on ESAs, HD centres, 2005-2014
Figure 6.2.9(a): Variation in median serum ferritin among patients on ESAs, HD centres 2014
Figure 6.2.9(b): Variation in proportion of patients on ESAs with serum ferritin ≥100 ng/ml, HD centres 2014
Year Number of centers Min 5th centile LQ Median UQ 95th centile Max
Table 6.2.9(b): Proportion of patients on ESAs with serum ferritin ≥100 ng/ml, HD centres
Year Number of centers Min 5th centile LQ Median UQ 95th centile Max
78
22nd Report of theMalaysian Dialysis and Transplant RegistryMANAGEMENT OF ANAEMIA IN PATIENTS ON DIALYSIS
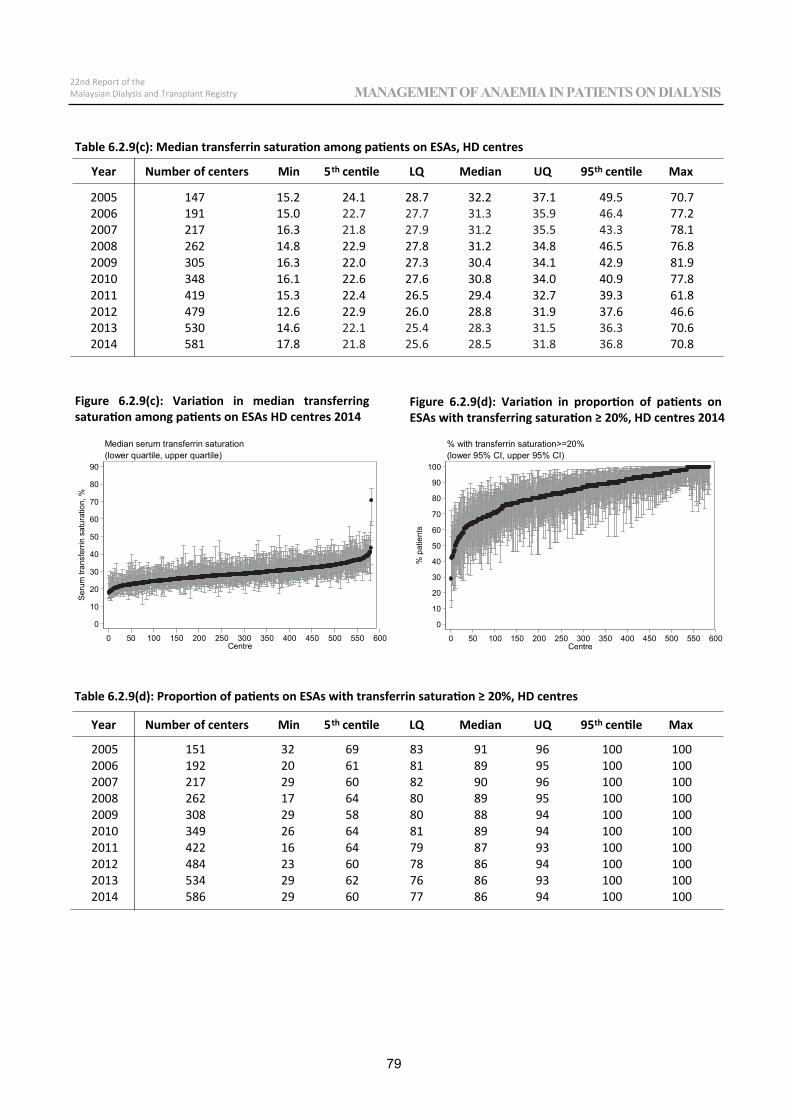
2005 147 15.2 24.1 28.7 32.2 37.1 49.5 70.72006 191 15.0 77.22007 217 16.3 78.12008 262 14.8 22.9 27.8 31.2 34.8 46.5 76.82009 305 16.3 22.0 27.3 30.4 34.1 42.9 81.92010 348 16.1 22.6 27.6 30.8 34.0 40.9 77.82011 419 15.3 22.4 26.5 29.4 32.7 39.3 61.82012 479 12.6 22.9 26.0 28.8 31.9 37.6 46.62013 530 14.6 70.62014 581 17.8 70.8
0
10
20
30
40
50
60
70
80
90
Seru
m tr
ansf
errin
sat
urat
ion,
%
0 50 100 150 200 250 300 350 400 450 500 550 600Centre
(lower quartile, upper quartile)Median serum transferrin saturation
0
10
20
30
40
50
60
70
80
90
100
% p
atie
nts
0 50 100 150 200 250 300 350 400 450 500 550 600Centre
(lower 95% CI, upper 95% CI)% with transferrin saturation>=20%
2005 151 32 69 83 91 96 100 1002006 192 20 61 81 89 95 100 1002007 217 29 60 82 90 96 100 1002008 262 17 64 80 89 95 100 1002009 308 29 58 80 88 94 100 1002010 349 26 64 81 89 94 100 1002011 422 16 64 79 87 93 100 1002012 484 23 60 78 86 94 100 1002013 534 29 62 76 86 93 100 1002014 586 29 60 77 86 94 100 100
Figure 6.2.9(c): Variation in median transferring saturation among patients on ESAs HD centres 2014
Table 6.2.9(d): Proportion of patients on ESAs with transferrin saturation ≥ 20%, HD centres
Table 6.2.9(c): Median transferrin saturation among patients on ESAs, HD centres
Year Number of centers Min 5th centile LQ Median UQ 95th centile Max
Figure 6.2.9(d): Variation in proportion of patients on ESAs with transferring saturation ≥ 20%, HD centres 2014
Year Number of centers Min 5th centile LQ Median UQ 95th centile Max
L
22nd Report of theMalaysian Dialysis and Transplant RegistryMANAGEMENT OF ANAEMIA IN PATIENTS ON DIALYSIS
79
22nd Report of theMalaysian Dialysis and Transplant Registry MANAGEMENT OF ANAEMIA IN PATIENTS ON DIALYSIS
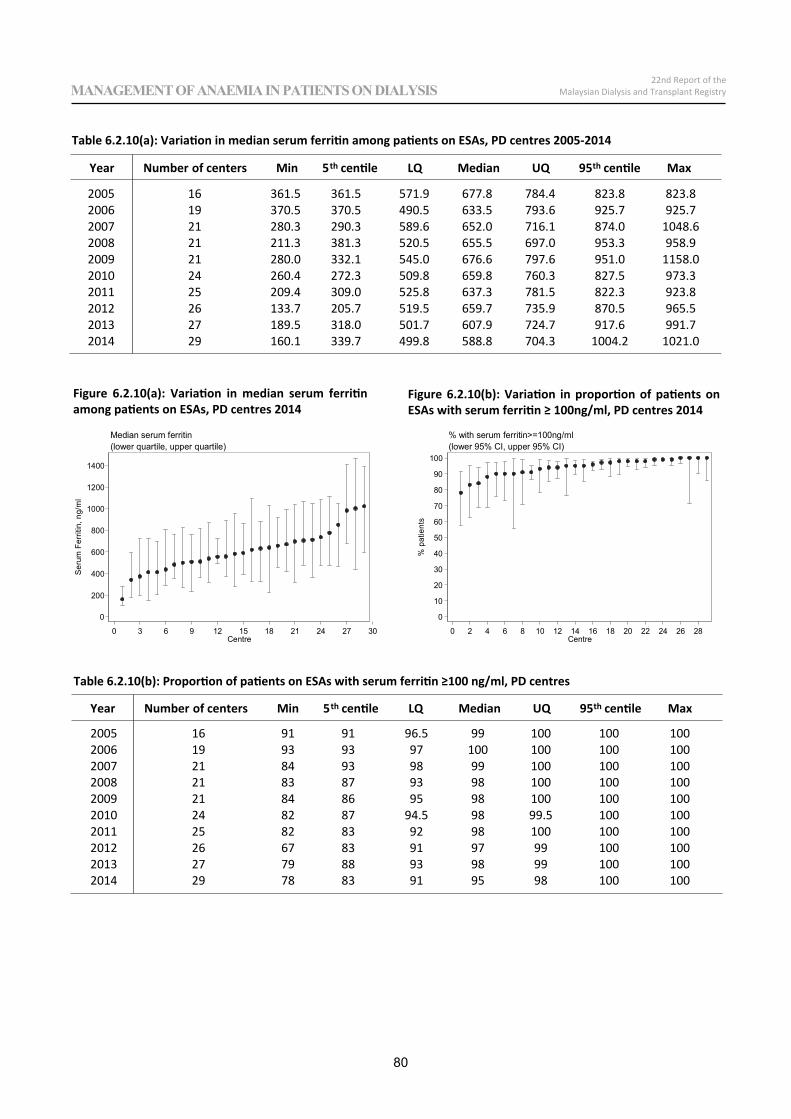
2005 16 361.5 361.5 571.9 677.8 784.4 823.8 823.82006 19 370.5 370.5 490.5 633.5 793.6 925.7 925.72007 21 280.3 290.3 589.6 652.0 716.1 874.0 1048.62008 21 211.3 381.3 520.5 655.5 697.0 953.3 958.92009 21 280.0 332.1 545.0 676.6 797.6 951.0 1158.02010 24 260.4 272.3 509.8 659.8 760.3 827.5 973.32011 25 209.4 309.0 525.8 637.3 781.5 822.3 923.82012 26 133.7 205.7 519.5 659.7 735.9 870.5 965.52013 27 189.5 318.0 501.7 607.9 724.7 917.6 991.72014 29 160.1 339.7 499.8 588.8 704.3 1004.2 1021.0
0
200
400
600
800
1000
1200
1400
Ser
um F
errit
in, n
g/m
l
0 3 6 9 12 15 18 21 24 27 30Centre
(lower quartile, upper quartile)Median serum ferritin
0
10
20
30
40
50
60
70
80
90
100
% p
atie
nts
0 2 4 6 8 10 12 14 16 18 20 22 24 26 28Centre
(lower 95% CI, upper 95% CI)% with serum ferritin>=100ng/ml
2005 16 91 91 96.5 99 100 100 1002006 19 93 93 97 100 100 100 1002007 21 84 93 98 99 100 100 1002008 21 83 87 93 98 100 100 1002009 21 84 86 95 98 100 100 1002010 24 82 87 94.5 98 99.5 100 1002011 25 82 83 92 98 100 100 1002012 26 67 83 91 97 99 100 1002013 27 79 88 93 98 99 100 1002014 29 78 83 91 95 98 100 100
Figure 6.2.10(a): Variation in median serum ferritin among patients on ESAs, PD centres 2014
Table 6.2.10(b): Proportion of patients on ESAs with serum ferritin ≥100 ng/ml, PD centres
Table 6.2.10(a): Variation in median serum ferritin among patients on ESAs, PD centres 2005-2014
Year Number of centers Min 5th centile LQ Median UQ 95th centile Max
Figure 6.2.10(b): Variation in proportion of patients on ESAs with serum ferritin ≥ 100ng/ml, PD centres 2014
Year Number of centers Min 5th centile LQ Median UQ 95th centile Max
80
22nd Report of theMalaysian Dialysis and Transplant RegistryMANAGEMENT OF ANAEMIA IN PATIENTS ON DIALYSIS
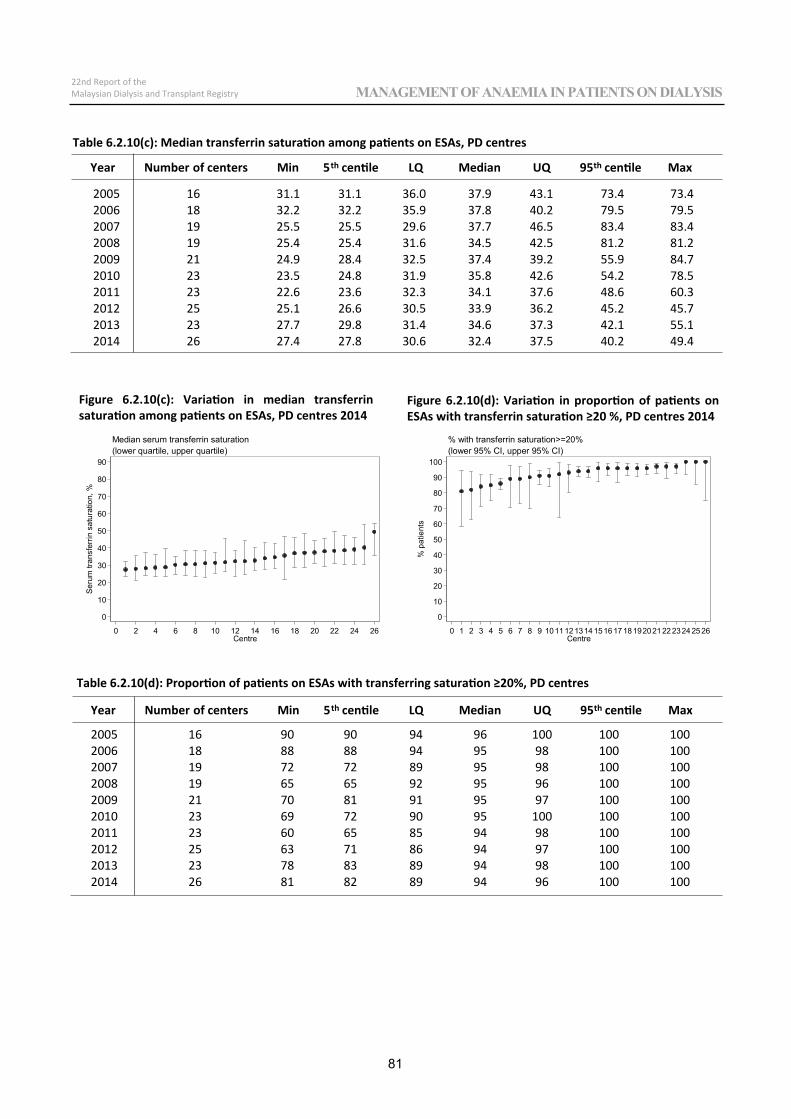
2005 16 31.1 31.1 36.0 37.9 43.1 73.4 73.42006 18 32.2 32.2 35.9 37.8 40.2 79.5 79.52007 19 25.5 25.5 29.6 37.7 46.5 83.4 83.42008 19 25.4 25.4 31.6 34.5 42.5 81.2 81.22009 21 24.9 28.4 32.5 37.4 39.2 55.9 84.72010 23 23.5 24.8 31.9 35.8 42.6 54.2 78.52011 23 22.6 23.6 32.3 34.1 37.6 48.6 60.32012 25 25.1 26.6 30.5 33.9 36.2 45.2 45.72013 23 27.7 29.8 31.4 34.6 37.3 42.1 55.12014 26 27.4 27.8 30.6 32.4 37.5 40.2 49.4
0
10
20
30
40
50
60
70
80
90
Ser
um tr
ansf
errin
sat
urat
ion,
%
0 2 4 6 8 10 12 14 16 18 20 22 24 26Centre
(lower quartile, upper quartile)Median serum transferrin saturation
0
10
20
30
40
50
60
70
80
90
100
% p
atie
nts
0 1 2 3 4 5 6 7 8 9 1011121314151617181920212223242526Centre
(lower 95% CI, upper 95% CI)% with transferrin saturation>=20%
2005 16 90 90 94 96 100 100 1002006 18 88 88 94 95 98 100 1002007 19 72 72 89 95 98 100 1002008 19 65 65 92 95 96 100 1002009 21 70 81 91 95 97 100 1002010 23 69 72 90 95 100 100 1002011 23 60 65 85 94 98 100 1002012 25 63 71 86 94 97 100 1002013 23 78 83 89 94 98 100 1002014 26 81 82 89 94 96 100 100
Figure 6.2.10(c): Variation in median transferrin saturation among patients on ESAs, PD centres 2014
Table 6.2.10(d): Proportion of patients on ESAs with transferring saturation ≥20%, PD centres
Table 6.2.10(c): Median transferrin saturation among patients on ESAs, PD centres
Year Number of centers Min 5th centile LQ Median UQ 95th centile Max
Figure 6.2.10(d): Variation in proportion of patients on ESAs with transferrin saturation ≥20 %, PD centres 2014
Year Number of centers Min 5th centile LQ Median UQ 95th centile Max
81
22nd Report of theMalaysian Dialysis and Transplant Registry MANAGEMENT OF ANAEMIA IN PATIENTS ON DIALYSIS
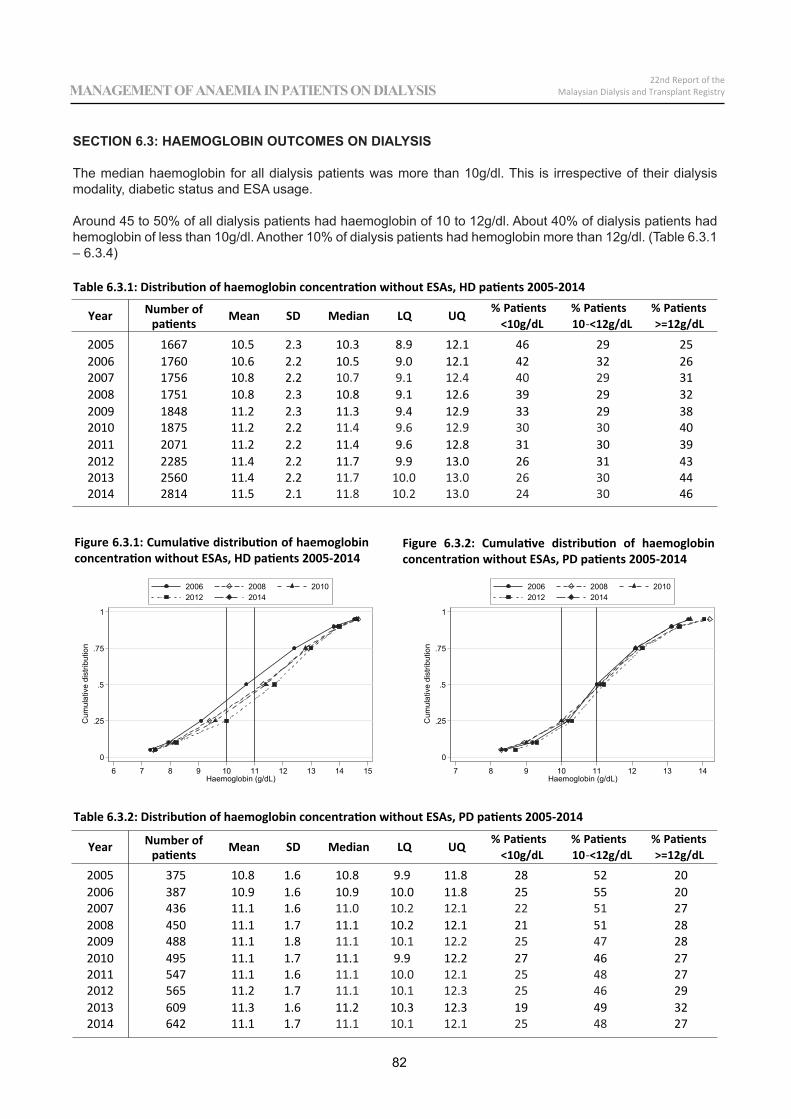
2005 1667 10.5 2.3 10.3 8.9 12.1 46 29 252006 1760 10.6 2.2 10.5 9.0 12.1 42 32 262007 1756 10.8 2.2 312008 1751 10.8 2.3 10.8 9.1 12.6 39 29 322009 1848 11.2 2.3 11.3 9.4 12.9 33 29 382010 1875 11.2 2.2 402011 2071 11.2 2.2 11.4 9.6 12.8 31 30 392012 2285 11.4 2.2 11.7 9.9 13.0 26 31 432013 2560 11.4 2.2 442014 2814 11.5 2.1 46
0
.25
.5
.75
1
Cum
ulat
ive
dist
ribut
ion
6 7 8 9 10 11 12 13 14 15Haemoglobin (g/dL)
2006 2008 20102012 2014
0
.25
.5
.75
1
Cum
ulat
ive
dist
ribut
ion
7 8 9 10 11 12 13 14Haemoglobin (g/dL)
2006 2008 20102012 2014
2005 375 10.8 1.6 10.8 9.9 11.8 28 52 202006 387 10.9 1.6 10.9 10.0 11.8 25 55 202007 436 11.1 1.6 272008 450 11.1 1.7 11.1 10.2 12.1 21 51 282009 488 11.1 1.8 282010 495 11.1 1.7 11.1 9.9 12.2 27 46 272011 547 11.1 1.6 272012 565 11.2 1.7 292013 609 11.3 1.6 11.2 10.3 12.3 19 49 322014 642 11.1 1.7 27
Figure 6.3.1: Cumulative distribution of haemoglobin concentration without ESAs, HD patients 2005-2014
Table 6.3.2: Distribution of haemoglobin concentration without ESAs, PD patients 2005-2014
Table 6.3.1: Distribution of haemoglobin concentration without ESAs, HD patients 2005-2014
Figure 6.3.2: Cumulative distribution of haemoglobin concentration without ESAs, PD patients 2005-2014
Year Number ofpatients Mean SD Median LQ UQ % Patients
<10g/dL% Patients10 <12g/dL
% Patients>=12g/dL
SECTION 6.3: HAEMOGLOBIN OUTCOMES ON DIALYSIS
The median haemoglobin for all dialysis patients was more than 10g/dl. This is irrespective of their dialysis modality, diabetic status and ESA usage.
Around 45 to 50% of all dialysis patients had haemoglobin of 10 to 12g/dl. About 40% of dialysis patients had hemoglobin of less than 10g/dl. Another 10% of dialysis patients had hemoglobin more than 12g/dl. (Table 6.3.1 – 6.3.4)
Year Number ofpatients Mean SD Median LQ UQ % Patients
<10g/dL% Patients10 <12g/dL
% Patients>=12g/dL
82
22nd Report of theMalaysian Dialysis and Transplant RegistryMANAGEMENT OF ANAEMIA IN PATIENTS ON DIALYSIS
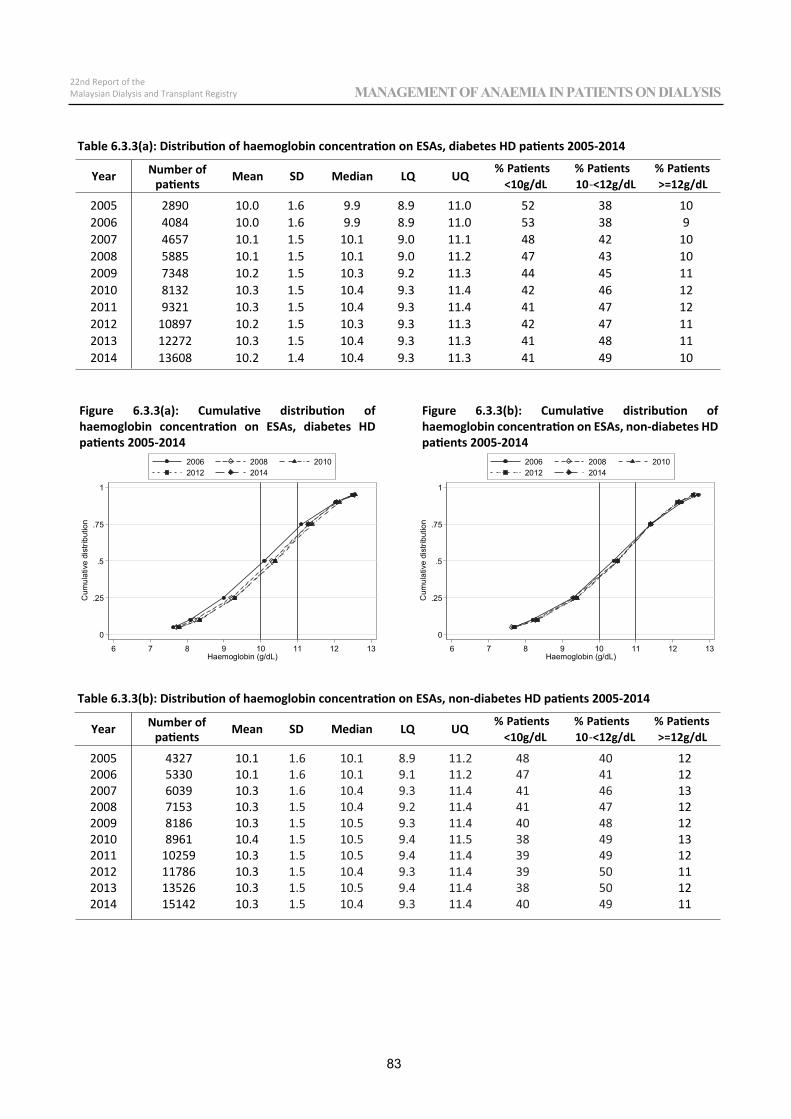
2005 2890 10.0 1.6 9.9 8.9 11.0 52 38 102006 4084 10.0 1.6 9.9 8.9 11.0 53 38 92007 4657 10.1 1.5 10.1 9.0 11.1 48 42 102008 5885 10.1 1.5 10.1 9.0 11.2 47 43 102009 7348 10.2 1.5 10.3 9.2 11.3 44 45 112010 8132 10.3 1.5 10.4 9.3 11.4 42 46 122011 9321 10.3 1.5 10.4 9.3 11.4 41 47 122012 10897 10.2 1.5 10.3 9.3 11.3 42 47 112013 12272 10.3 1.5 10.4 9.3 11.3 41 48 112014 13608 10.2 1.4 10.4 9.3 11.3 41 49 10
0
.25
.5
.75
1
Cum
ulat
ive
dist
ribut
ion
6 7 8 9 10 11 12 13Haemoglobin (g/dL)
2006 2008 20102012 2014
0
.25
.5
.75
1
Cum
ulat
ive
dist
ribut
ion
6 7 8 9 10 11 12 13Haemoglobin (g/dL)
2006 2008 20102012 2014
2005 4327 10.1 122006 5330 10.1 122007 6039 10.3 132008 7153 10.3 122009 8186 10.3 122010 8961 10.4 132011 10259 10.3 122012 11786 10.3 112013 13526 10.3 122014 15142 10.3 11
Table 6.3.3(b): Distribution of haemoglobin concentration on ESAs, non-diabetes HD patients 2005-2014
Table 6.3.3(a): Distribution of haemoglobin concentration on ESAs, diabetes HD patients 2005-2014
Year Number ofpatients Mean SD Median LQ UQ % Patients
<10g/dL% Patients10 <12g/dL
% Patients>=12g/dL
Year Number ofpatients Mean SD Median LQ UQ % Patients
<10g/dL% Patients10 <12g/dL
% Patients>=12g/dL
Figure 6.3.3(a): Cumulative distribution of haemoglobin concentration on ESAs, diabetes HD patients 2005-2014
Figure 6.3.3(b): Cumulative distribution of haemoglobin concentration on ESAs, non-diabetes HD patients 2005-2014
83
22nd Report of theMalaysian Dialysis and Transplant Registry MANAGEMENT OF ANAEMIA IN PATIENTS ON DIALYSIS
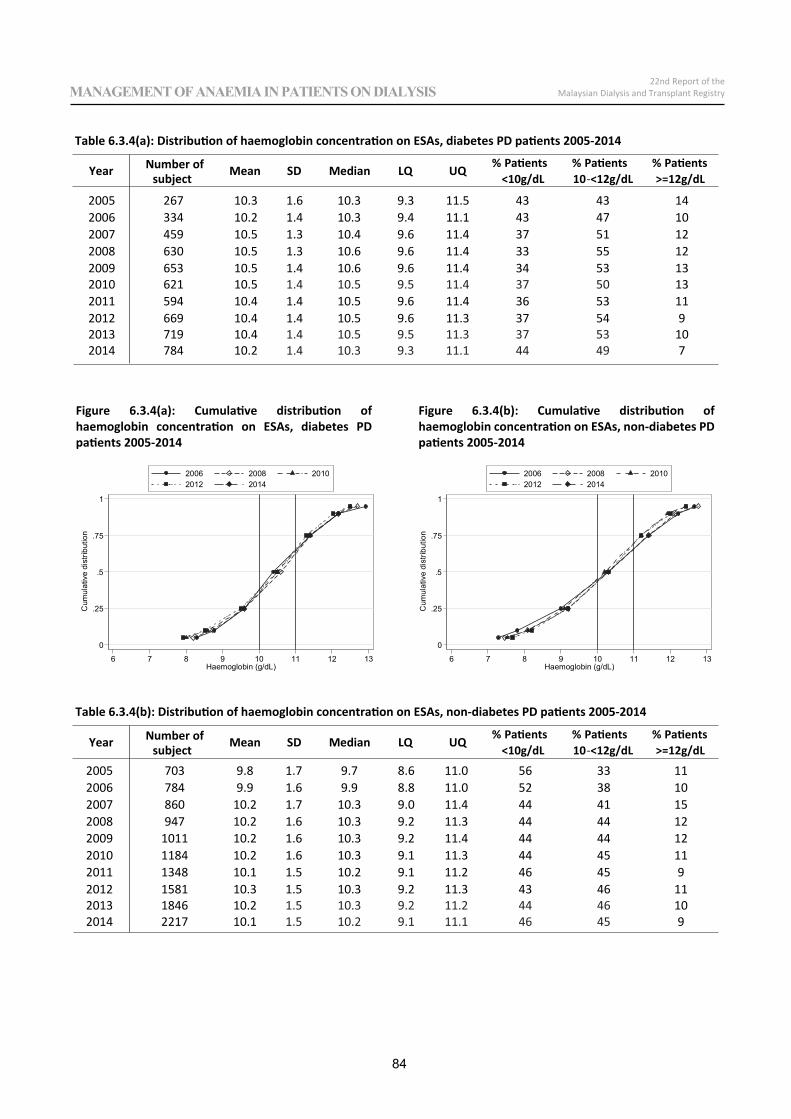
2005 267 10.3 1.6 10.3 9.3 11.5 43 43 142006 334 10.2 1.4 10.3 9.4 11.1 43 47 102007 459 10.5 1.3 10.4 9.6 11.4 37 51 122008 630 10.5 1.3 10.6 9.6 11.4 33 55 122009 653 10.5 1.4 10.6 9.6 11.4 34 53 132010 621 10.5 132011 594 10.4 1.4 10.5 9.6 11.4 36 53 112012 669 10.4 1.4 10.5 9.6 11.3 37 54 92013 719 10.4 102014 784 10.2 7
0
.25
.5
.75
1
Cum
ulat
ive
dist
ribut
ion
6 7 8 9 10 11 12 13Haemoglobin (g/dL)
2006 2008 20102012 2014
0
.25
.5
.75
1
Cum
ulat
ive
dist
ribut
ion
6 7 8 9 10 11 12 13Haemoglobin (g/dL)
2006 2008 20102012 2014
2005 703 9.8 1.7 9.7 8.6 11.0 56 33 112006 784 9.9 1.6 9.9 8.8 11.0 52 38 102007 860 10.2 1.7 10.3 9.0 11.4 44 41 152008 947 10.2 1.6 10.3 9.2 11.3 44 44 122009 1011 10.2 1.6 10.3 9.2 11.4 44 44 122010 1184 10.2 1.6 10.3 9.1 11.3 44 45 112011 1348 10.1 1.5 10.2 9.1 11.2 46 45 92012 1581 10.3 1.5 10.3 9.2 11.3 43 46 112013 1846 10.2 102014 2217 10.1 9
Table 6.3.4(b): Distribution of haemoglobin concentration on ESAs, non-diabetes PD patients 2005-2014
Table 6.3.4(a): Distribution of haemoglobin concentration on ESAs, diabetes PD patients 2005-2014
Year Number ofsubject Mean SD Median LQ UQ % Patients
<10g/dL% Patients10 <12g/dL
% Patients>=12g/dL
Year Number ofsubject Mean SD Median LQ UQ % Patients
<10g/dL% Patients10 <12g/dL
% Patients>=12g/dL
Figure 6.3.4(a): Cumulative distribution of haemoglobin concentration on ESAs, diabetes PD patients 2005-2014
Figure 6.3.4(b): Cumulative distribution of haemoglobin concentration on ESAs, non-diabetes PD patients 2005-2014
84
22nd Report of theMalaysian Dialysis and Transplant RegistryMANAGEMENT OF ANAEMIA IN PATIENTS ON DIALYSIS
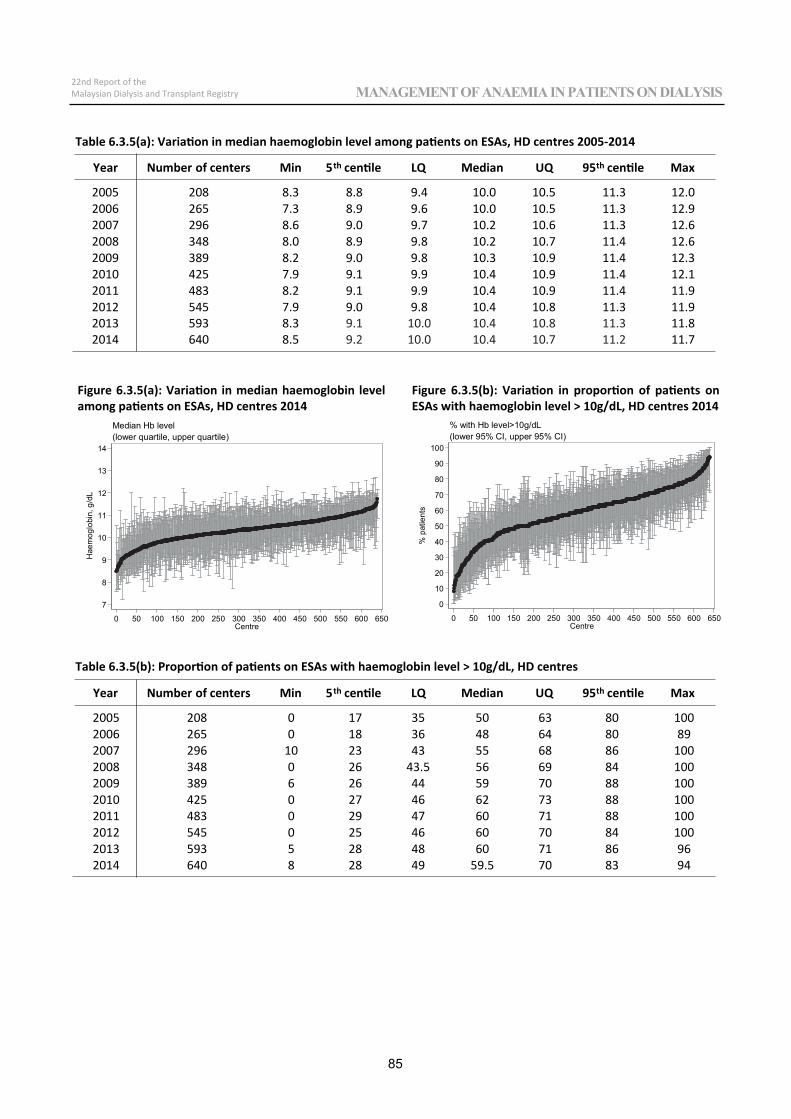
2005 208 8.3 8.8 9.4 10.0 10.5 11.3 12.02006 265 7.3 8.9 9.6 10.0 10.5 11.3 12.92007 296 8.6 9.0 9.7 10.2 10.6 11.3 12.62008 348 8.0 8.9 9.8 10.2 10.7 11.4 12.62009 389 8.2 9.0 9.8 10.3 10.9 11.4 12.32010 425 7.9 9.1 9.9 10.4 10.9 11.4 12.12011 483 8.2 9.1 9.9 10.4 10.9 11.4 11.92012 545 7.9 9.0 9.8 10.4 10.8 11.3 11.92013 593 8.3 11.82014 640 8.5 11.7
7
8
9
10
11
12
13
14
Hae
mog
lobi
n, g
/dL
0 50 100 150 200 250 300 350 400 450 500 550 600 650Centre
(lower quartile, upper quartile)Median Hb level
0
10
20
30
40
50
60
70
80
90
100
% p
atie
nts
0 50 100 150 200 250 300 350 400 450 500 550 600 650Centre
(lower 95% CI, upper 95% CI)% with Hb level>10g/dL
2005 208 0 17 35 50 63 80 1002006 265 0 18 36 48 64 80 892007 296 10 23 43 55 68 86 1002008 348 0 26 43.5 56 69 84 1002009 389 6 26 44 59 70 88 1002010 425 0 27 46 62 73 88 1002011 483 0 29 47 60 71 88 1002012 545 0 25 46 60 70 84 1002013 593 5 28 48 60 71 86 962014 640 8 28 49 59.5 70 83 94
Table 6.3.5(a): Variation in median haemoglobin level among patients on ESAs, HD centres 2005-2014
2011 483
Table 6.3.5(b): Proportion of patients on ESAs with haemoglobin level > 10g/dL, HD centres
Year Number of centers Min 5th centile LQ Median UQ 95th centile Max
Figure 6.3.5(a): Variation in median haemoglobin level among patients on ESAs, HD centres 2014
Figure 6.3.5(b): Variation in proportion of patients on ESAs with haemoglobin level > 10g/dL, HD centres 2014
Year Number of centers Min 5th centile LQ Median UQ 95th centile Max
85
22nd Report of theMalaysian Dialysis and Transplant Registry MANAGEMENT OF ANAEMIA IN PATIENTS ON DIALYSIS
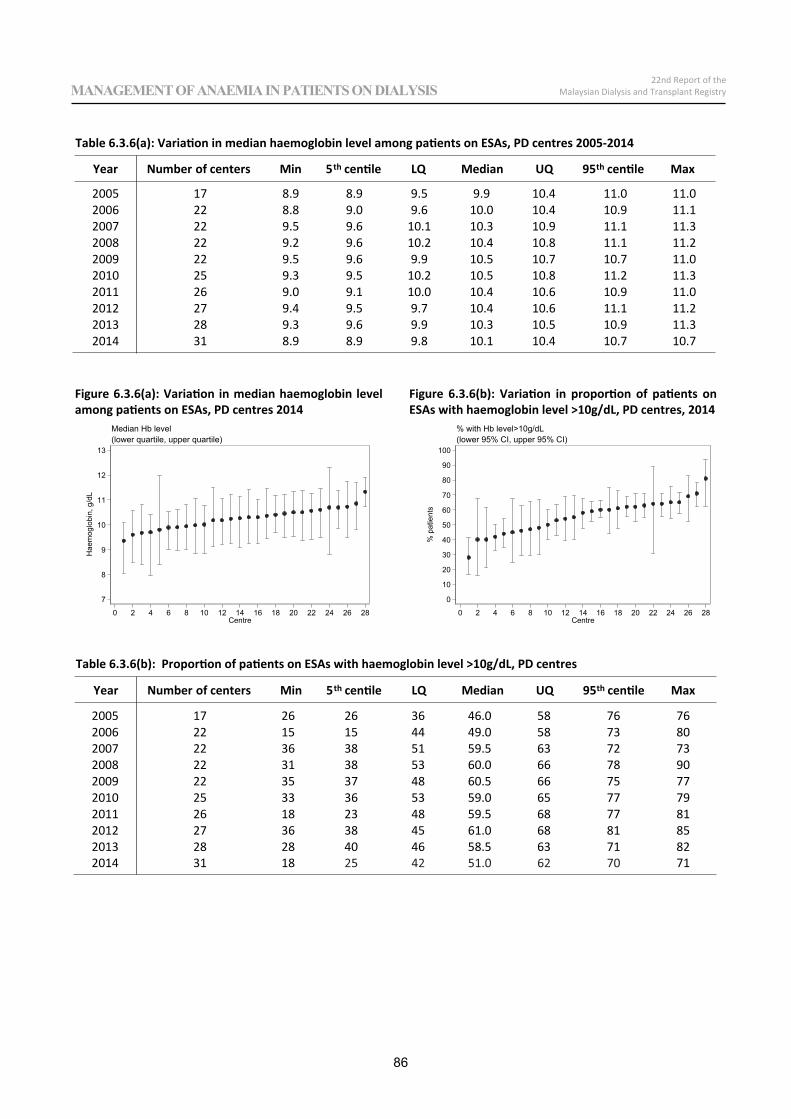
2005 17 8.9 8.9 9.5 9.9 10.4 11.0 11.02006 22 8.8 9.0 9.6 10.0 10.4 10.9 11.12007 22 9.5 9.6 10.1 10.3 10.9 11.1 11.32008 22 9.2 9.6 10.2 10.4 10.8 11.1 11.22009 22 9.5 9.6 9.9 10.5 10.7 10.7 11.02010 25 9.3 9.5 10.2 10.5 10.8 11.2 11.32011 26 9.0 9.1 10.0 10.4 10.6 10.9 11.02012 27 9.4 9.5 9.7 10.4 10.6 11.1 11.22013 28 9.3 9.6 9.9 10.3 10.5 10.9 11.32014 31 8.9 8.9 9.8 10.1 10.4 10.7 10.7
7
8
9
10
11
12
13
Hae
mog
lobi
n, g
/dL
0 2 4 6 8 10 12 14 16 18 20 22 24 26 28Centre
(lower quartile, upper quartile)Median Hb level
0
10
20
30
40
50
60
70
80
90
100
% p
atie
nts
0 2 4 6 8 10 12 14 16 18 20 22 24 26 28Centre
(lower 95% CI, upper 95% CI)% with Hb level>10g/dL
2005 17 26 26 36 46.0 58 76 762006 22 15 15 44 49.0 58 73 802007 22 36 38 51 59.5 63 72 732008 22 31 38 53 60.0 66 78 902009 22 35 37 48 60.5 66 75 772010 25 33 36 53 59.0 65 77 792011 26 18 23 48 59.5 68 77 812012 27 36 38 45 61.0 68 81 852013 28 28 40 46 58.5 63 71 822014 31 18 71
Table 6.3.6(a): Variation in median haemoglobin level among patients on ESAs, PD centres 2005-2014
Table 6.3.6(b): Proportion of patients on ESAs with haemoglobin level >10g/dL, PD centres
Year Number of centers Min 5th centile LQ Median UQ 95th centile Max
Figure 6.3.6(a): Variation in median haemoglobin level among patients on ESAs, PD centres 2014
Figure 6.3.6(b): Variation in proportion of patients on ESAs with haemoglobin level >10g/dL, PD centres, 2014
Year Number of centers Min 5th centile LQ Median UQ 95th centile Max
86
22nd Report of theMalaysian Dialysis and Transplant RegistryMANAGEMENT OF ANAEMIA IN PATIENTS ON DIALYSIS
23rd Report of theMalaysian Dialysis and Transplant RegistryNUTRITIONAL STATUS ON DIALYSIS
Chapter 7
NUTRITIONAL STATUS ON DIALYSIS
Abdul Halim bin Abdul GaforKoh Keng Hee
Tilakavati KarupaiahWinnie Chee Siew Swee
Table 7.1.1: Distributionof serum albumin, HD patients, 2005 2014
Year Number ofpatients Mean SD Median LQ UQ % patients
<30g/L% patients30 <35g/L
% patients35 <40g/L
% patients40g/L
2005 8705 40.0 5.2 40.3 37.5 42.8 3 9 33 562006 10927 39.8 5.4 40.3 37.3 42.8 3 10 33 542007 12315 39.7 5.3 40.0 37.0 42.5 3 10 35 522008 14551 39.4 5.1 40.0 37.0 42.3 3 10 36 502009 16948 39.4 5.1 40.0 37.0 42.3 3 11 35 512010 18757 38.9 4.9 39.3 36.3 41.8 4 13 40 442011 21360 38.8 4.9 39.3 36.5 41.5 4 12 41 432012 24531 38.8 5.0 39.3 36.3 41.5 4 13 41 432013 27818 38.6 4.9 39.0 36.0 41.5 4 13 42 412014 31287 38.5 4.9 39.0 36.0 41.5 4 15 41 41
Figure 7.1.1: Cumulativedistributionof serum albumin,HD patients 2005 2014
0
.25
.5
.75
1
Cum
ulat
ive
Dis
tribu
tion
25 30 35 40 45 50Serum albumin (g/L)
2006 2008 20102012 2014
Figure 7.1.2: Cumulative distributionof serum albumin,PD patients2005 2014
0
.25
.5
.75
1
Cum
ulat
ive
Dis
tribu
tion
20 25 30 35 40 45 50Serum albumin (g/L)
2006 2008 20102012 2014
Table 7.1.2: Distributionof serum albumin, PD patients, 2005 2014
Year Number of patients Mean SD Median LQ UQ% patients
<30g/L% patients30 <35g/L
% patients35 <40g/L
% patients40g/L
2005 1346 33.2 6.4 33.3 29.5 37.0 27 33 30 102006 1498 33.5 6.1 122007 1753 33.6 6.2 34.0 30.0 37.8 25 31 30 142008 2021 33.1 6.4 33.3 29.3 37.3 28 32 27 132009 2138 32.7 6.4 33.0 29.0 36.8 30 34 25 11
88
22nd Report of theMalaysian Dialysis and Transplant RegistryNUTRITIONAL STATUS ON DIALYSIS
SECTION 7.1: SERUM ALBUMIN LEVELS ON DIALYSIS
The mean serum albumin level in HD patients in the year 2014 was 38.5 g/L. The percentage of patients with low serum albumin of <30g/L has remained the same but the percentage of patients with desirable serum albumin of ≥40 g/L had reduced gradually over 10 years since 2005, with the proportion showing a decreasing trend from 56 to 41% from the year 2005 to 2014 (Table 7.1.1). The cumulative distribution trends of serum albumin for HD patients from 2005 to 2014 supported this observation (Figure 7.1.1).
The same trend was observed in PD patients since 2005. The percentage of patients with unsatisfactory serum albumin (<30g/L) increased from 27% to 30% in 2014 while the percentage of patients with desirable serum albumin levels of ≥40g/L remained about 10-11%. Cumulative distribution trends of serum albumin for PD patients from 2005 to 2014 supported this observation (Figure 7.1.2).
2010 2305 32.1 6.2 82011 2465 31.9 6.0 32.0 28.3 36.0 35 34 23 82012 2801 32.6 6.5 102013 3172 33.0 6.6 122014 3619 32.6 6.8 33.0 28.8 36.8 30 32 26 11
33.8 30.0 37.0 25 33 30
Table 7.1.3: Variationin proportionof patients with serum albumin 40g/L among HD centres 2005 2014Year Numberof centers Min 5th centile LQ Median UQ 95th centile Max
2005 217 3 8 41 58 71 90 1002006 274 0 6 36 55 73 89 1002007 300 0 9.5 36 53 70 88.5 1002008 346 0 6 33 50 67 84 1002009 389 0 4 38 52 65 85 1002010 430 0 4 26 44 60 80 1002011 488 0 6 27 44 58 76 1002012 546 0 3 26 42.5 58 76 962013 600 0 6 24 41 57.5 72 1002014 642 0 3 23 42 57 75 91
Figure 7.1.3: Variationin proportionof patients withserum albumin 40g/L, HD centres 2014
0
20
40
60
80
100
% P
atie
nts
0 50 100 150 200 250 300 350 400 450 500 550 600 650Centre
(lower 95% CI, upper 95% CI)% with serum albumin >=40g/L
Figure 7.1.4: Variationin proportionof patients withserum albumin 40g/L, PD centres 2014
0
20
40
60
80
100
% P
atie
nts
0 2 4 6 8 10 12 14 16 18 20 22 24 26 28 30 32Centre
(lower 95% CI, upper 95% CI)% with serum albumin >=40g/L
Table 7.1.4: Variationin proportionof patients with serum albumin 40g/L among PD centres 2005 2014Year Number of centers Min 5th centile LQ Median UQ 95th centile Max2005 18 0 0 6 13 23 29 292006 24 0 0 5 13 21 33 762007 23 0 0 4 15 23 35 642008 23 0 0 2 15 25 43 562009 23 0 0 5 14 24 36 372010 25 0 0 2 9 17 29 32
89
22nd Report of theMalaysian Dialysis and Transplant Registry NUTRITIONAL STATUS ON DIALYSIS
A wide variation in serum albumin among the 32 PD centres in 2014 is also evident (Figure 7.1.4).Half of the PD centres achieved 12 % of their PD patients with albumin level ≥40g/L (Table 7.1.4).
As in previous reports, there was a wide variation in serum albumin among the 642 HD centres in 2014 (Table 7.1.3). Half of the HD centres achieved 42% of their HD patients with albumin level ≥40g/L. The median percentage of HD patients with albumin level ≥40 g/L had significantly deteriorated from 58% in 2005 to 42% in 2014 (Figure 7.1.3).
2011 26 0 0 1 5.5 21 29 382012 28 0 0 3 10 20.5 33 372013 28 0 0 2 8 23.5 31 402014 32 0 0 3.5 12 20 50 67
0
.25
.5
.75
1
Cum
ulat
ive
Dis
tribu
tion
14 16 18 20 22 24 26 28 30 32BMI (kg/m2)
2006 2008 20102012 2014
Table 7.2.1: Distributionof BMI, HD patients, 2005 2014
Year Number of patients Mean SD Median LQ UQ % patients<18.5
% patients18.5 25
% patients>=25
2005 7827 23.1 5.6 22.5 19.8 25.6 14 57 292006 9783 23.1 5.2 22.6 19.9 25.7 14 56 292007 10507 23.2 5.4 22.7 19.9 25.8 14 56 302008 12229 23.3 5.1 22.8 20.1 26.0 14 55 312009 13747 23.5 5.2 23.0 20.1 26.2 13 54 332010 14720 23.7 5.3 23.2 20.3 26.4 12 53 352011 16479 23.8 5.7 23.2 20.4 26.5 12 53 352012 18355 24.0 5.4 23.4 20.5 26.7 11 52 372013 20325 24.1 5.6 23.5 20.6 26.9 11 51 382014 22046 24.3 5.9 23.7 20.7 27.0 10 51 39
Figure 7.2.1: Cumulativedistributionof BMI, HDpatients 2005 2014
0
.25
.5
.75
1
Cum
ulat
ive
Dis
tribu
tion
16 18 20 22 24 26 28 30 32BMI (kg/m2)
2006 2008 20102012 2014
Figure 7.2.2: Cumulativedistributionof BMI, PDpatients 2005 2014
Table 7.2.2: Distributionof BMI, PD patients 2005 2014
Year Number of patients Mean SD Median LQ UQ % patients<18.5
% patients18.5 25
% patients>=25
2005 1223 23.0 7.2 22.5 19.3 25.8 20 50 302006 1420 23.3 8.3 22.6 19.6 26.1 16 50 332007 1617 23.4 5.9 22.9 19.9 26.3 15 51 342008 1875 23.7 5.9 23.2 20.2 26.6 14 50 36
90
22nd Report of theMalaysian Dialysis and Transplant RegistryNUTRITIONAL STATUS ON DIALYSIS
00
SECTION 7.2: BODY MASS INDEX (BMI) ON DIALYSIS The mean BMI for HD patients in 2014 was 24.3 kg/m2. An increasing trend of BMI was observed for HD patients, with the percentage of HD patients with BMI ≥ 25 kg/m2 increasing from 29% in 2005 to 39% in 2014. As expected, the percentage of patients with BMI <18.5 reduced from 14% in 2004 to 10% in 2014 (Table 7.2.1)
The mean BMI for PD patients in 2014 was 24.2 kg/m2. The percentage of PD patients with BMI ≥ 25 kg/m2 increased from 30% in 2005 to 39% in 2014, whilst the percentage of patients with BMI <18.5 kg/m2 reduced significantly from 20% in 2005 to 12% in 2014 (Table 7.2.2). As in previous years, the shifting of the cumulative distribution curve for 2014 was to the right (Figure 7.2.2).
2009 1947 24.0 7.1 23.4 20.4 26.8 13 50 372010 2052 24.4 8.8 23.5 20.5 27.1 13 49 392011 2179 24.1 7.8 23.6 20.3 27.0 13 49 382012 2213 24.1 6.8 23.5 20.5 26.9 13 49 382013 2025 24.2 7.2 23.6 20.4 27.0 14 47 392014 2428 24.2 6.5 23.6 20.7 26.9 12 49 39
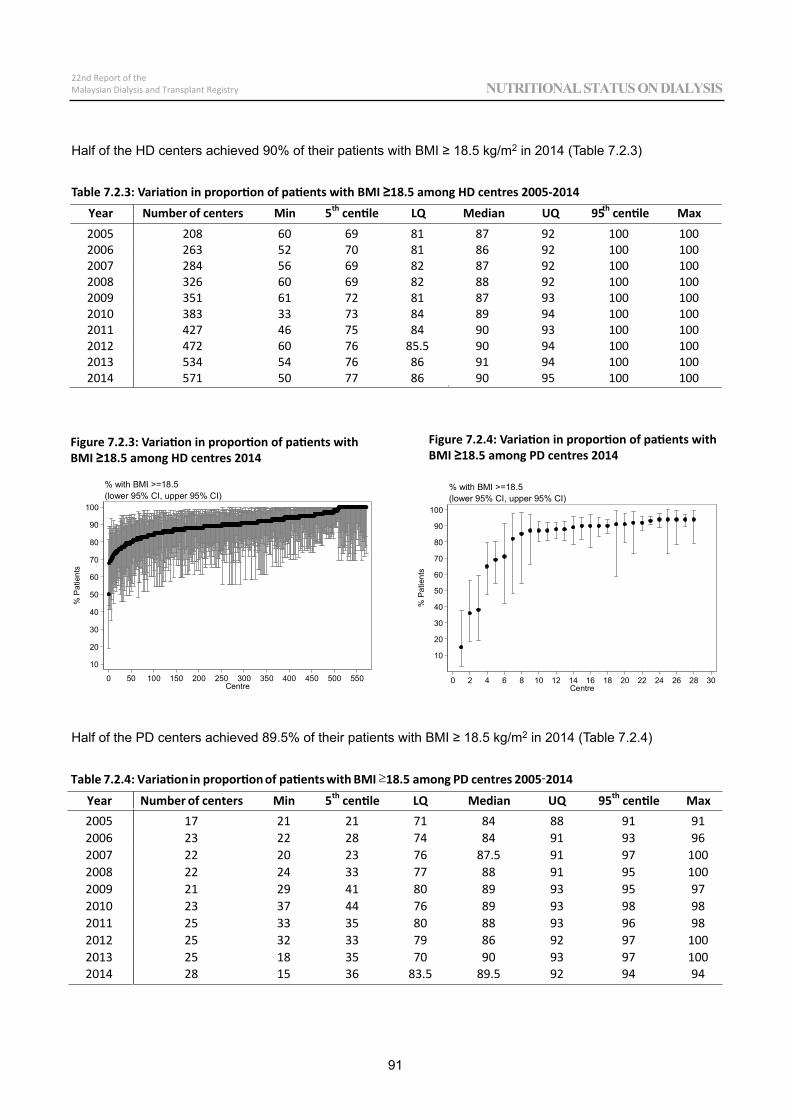
10
20
30
40
50
60
70
80
90
100
% P
atie
nts
0 2 4 6 8 10 12 14 16 18 20 22 24 26 28 30Centre
(lower 95% CI, upper 95% CI)% with BMI >=18.5
Year Number of centers Min 5th centile LQ Median UQ 95th centile Max2005 208 60 69 81 87 92 100 1002006 263 52 70 81 86 92 100 1002007 284 56 69 82 87 92 100 1002008 326 60 69 82 88 92 100 1002009 351 61 72 81 87 93 100 1002010 383 33 73 84 89 94 100 1002011 427 46 75 84 90 93 100 1002012 472 60 76 85.5 90 94 100 1002013 534 54 76 86 91 94 100 1002014 571 50 77 86 90 95 100 100
10
20
30
40
50
60
70
80
90
100
% P
atie
nts
0 50 100 150 200 250 300 350 400 450 500 550Centre
(lower 95% CI, upper 95% CI)% with BMI >=18.5
Table 7.2.4: Variation in proportion of patients with BMI 18.5 among PD centres 2005 2014
Year Number of centers Min 5th centile LQ Median UQ 95th centile Max2005 17 21 21 71 84 88 91 912006 23 22 28 74 84 91 93 962007 22 20 23 76 87.5 91 97 1002008 22 24 33 77 88 91 95 1002009 21 29 41 80 89 93 95 972010 23 37 44 76 89 93 98 982011 25 33 35 80 88 93 96 982012 25 32 33 79 86 92 97 1002013 25 18 35 70 90 93 97 1002014 28 15 36 83.5 89.5 92 94 94
00
91
22nd Report of theMalaysian Dialysis and Transplant Registry NUTRITIONAL STATUS ON DIALYSIS
Half of the PD centers achieved 89.5% of their patients with BMI ≥ 18.5 kg/m2 in 2014 (Table 7.2.4)
Table 7.2.3: Variation in proportion of patients with BMI ≥18.5 among HD centres 2005-2014
Half of the HD centers achieved 90% of their patients with BMI ≥ 18.5 kg/m2 in 2014 (Table 7.2.3)
Figure 7.2.3: Variation in proportion of patients with BMI ≥18.5 among HD centres 2014
Figure 7.2.4: Variation in proportion of patients with BMI ≥18.5 among PD centres 2014
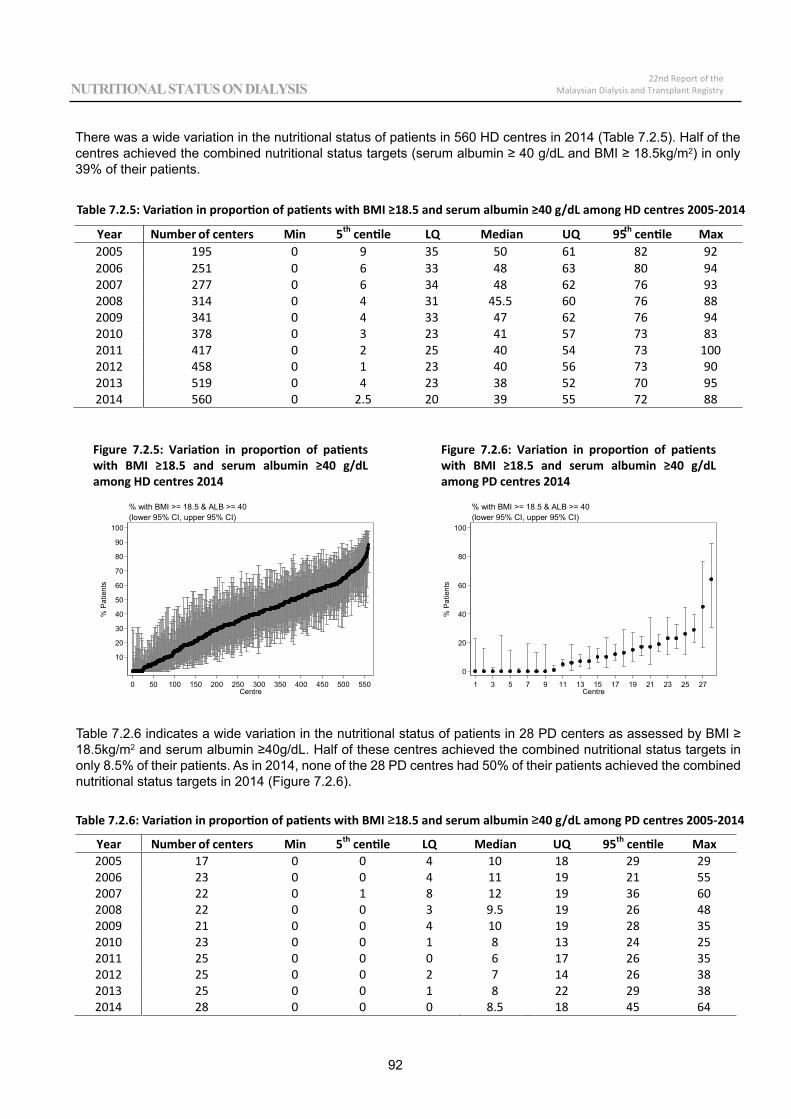
Year Number of centers Min 5th centile LQ Median UQ 95th centile Max2005 195 0 9 35 50 61 82 922006 251 0 6 33 48 63 80 942007 277 0 6 34 48 62 76 932008 314 0 4 31 45.5 60 76 882009 341 0 4 33 47 62 76 942010 378 0 3 23 41 57 73 832011 417 0 2 25 40 54 73 1002012 458 0 1 23 40 56 73 902013 519 0 4 23 38 52 70 952014 560 0 2.5 20 39 55 72 88
10
20
30
40
50
60
70
80
90
100
% P
atie
nts
0 50 100 150 200 250 300 350 400 450 500 550Centre
(lower 95% CI, upper 95% CI)% with BMI >= 18.5 & ALB >= 40
0
20
40
60
80
100
% P
atie
nts
1 3 5 7 9 11 13 15 17 19 21 23 25 27Centre
(lower 95% CI, upper 95% CI)% with BMI >= 18.5 & ALB >= 40
Year Number of centers Min 5th centile LQ Median UQ 95th centile Max2005 17 0 0 4 10 18 29 292006 23 0 0 4 11 19 21 552007 22 0 1 8 12 19 36 602008 22 0 0 3 9.5 19 26 482009 21 0 0 4 10 19 28 352010 23 0 0 1 8 13 24 252011 25 0 0 0 6 17 26 352012 25 0 0 2 7 14 26 382013 25 0 0 1 8 22 29 382014 28 0 0 0 8.5 18 45 64
92
22nd Report of theMalaysian Dialysis and Transplant RegistryNUTRITIONAL STATUS ON DIALYSIS
00
There was a wide variation in the nutritional status of patients in 560 HD centres in 2014 (Table 7.2.5). Half of the centres achieved the combined nutritional status targets (serum albumin ≥ 40 g/dL and BMI ≥ 18.5kg/m2) in only 39% of their patients.
Table 7.2.5: Variation in proportion of patients with BMI ≥18.5 and serum albumin ≥40 g/dL among HD centres 2005-2014
Table 7.2.6 indicates a wide variation in the nutritional status of patients in 28 PD centers as assessed by BMI ≥18.5kg/m2 and serum albumin ≥40g/dL. Half of these centres achieved the combined nutritional status targets in only 8.5% of their patients. As in 2014, none of the 28 PD centres had 50% of their patients achieved the combined nutritional status targets in 2014 (Figure 7.2.6).
Table 7.2.6: Variation in proportion of patients with BMI ≥18.5 and serum albumin ≥40 g/dL among PD centres 2005-2014
Figure 7.2.5: Variation in proportion of patients with BMI ≥18.5 and serum albumin ≥40 g/dL among HD centres 2014
Figure 7.2.6: Variation in proportion of patients with BMI ≥18.5 and serum albumin ≥40 g/dL among PD centres 2014
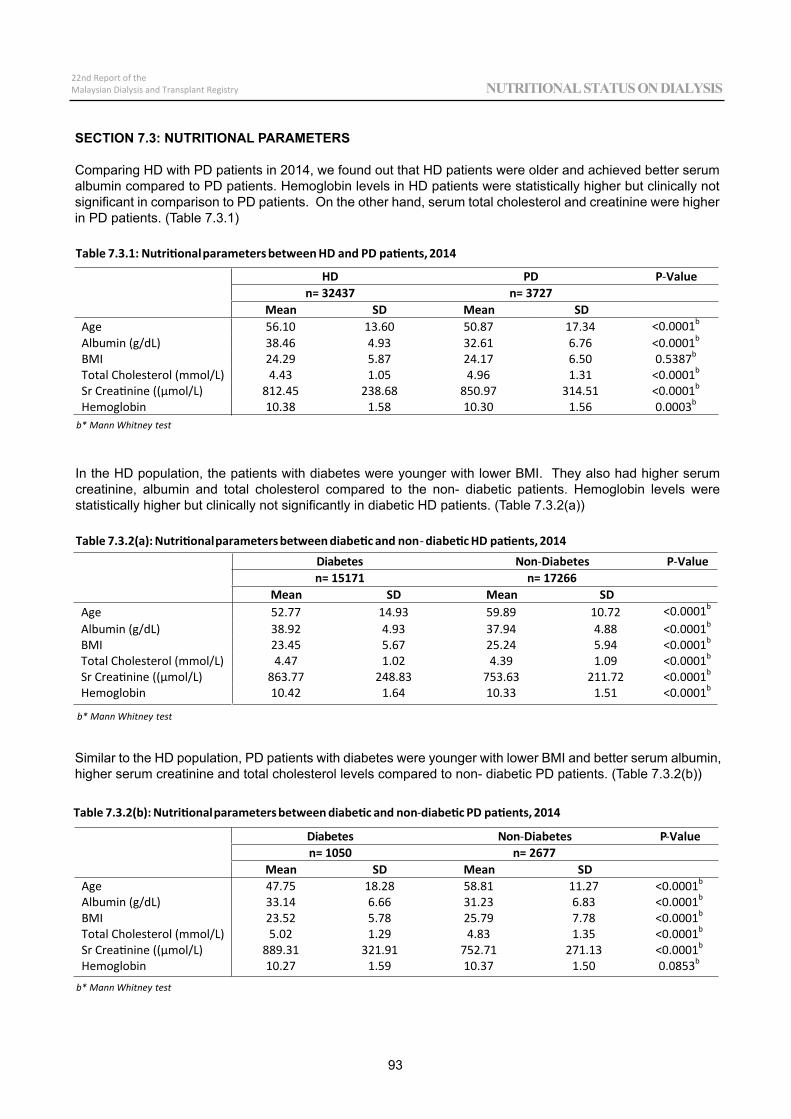
Table 7.3.1: Nutritionalparameters between HD and PD patients, 2014
PDPDH Valuen= =n73423 3727
Mean SD Mean SDAge 56.10 13.60 50.87 17.34 <0.0001b
Albumin (g/dL) 38.46 4.93 32.61 6.76 <0.0001b
BMI 24.29 5.87 24.17 6.50 0.5387b
Total Cholesterol (mmol/L) 4.43 1.05 4.96 1.31 <0.0001b
Sr Creatinine (( mol/L) 812.45 238.68 850.97 314.51 <0.0001b
Hemoglobin 10.38 1.58 10.30 1.56 0.0003b
b* Mann Whitney test
Table 7.3.2(a):Nutritionalparameters betweendiabeticand non diabeticHD patients, 2014noNsetebaiD Diabetes P Value
n= =n17151 17266Mean SD Mean SD
Age 52.77 14.93 59.89 10.72 <0.0001b
Albumin (g/dL) 38.92 4.93 37.94 4.88 <0.0001b
BMI 23.45 5.67 25.24 5.94 <0.0001b
Total Cholesterol (mmol/L) 4.47 1.02 4.39 1.09 <0.0001b
Sr Creatinine (( mol/L) 863.77 248.83 753.63 211.72 <0.0001b
Hemoglobin 10.42 1.64 10.33 1.51 <0.0001b
b* Mann Whitney test
Table 7.3.2(b): Nutritionalparameters between diabetic and non diabeticPD patients, 2014
noNsetebaiD Diabetes P Valuen= =n0501 2677
Mean SD Mean SDAge 47.75 18.28 58.81 11.27 <0.0001b
Albumin (g/dL) 33.14 6.66 31.23 6.83 <0.0001b
BMI 23.52 5.78 25.79 7.78 <0.0001b
Total Cholesterol (mmol/L) 5.02 1.29 4.83 1.35 <0.0001b
Sr Creatinine (( mol/L) 889.31 321.91 752.71 271.13 <0.0001b
Hemoglobin 10.27 1.59 10.37 1.50 0.0853b
b* Mann Whitney test
00
93
22nd Report of theMalaysian Dialysis and Transplant Registry NUTRITIONAL STATUS ON DIALYSIS
SECTION 7.3: NUTRITIONAL PARAMETERS
Comparing HD with PD patients in 2014, we found out that HD patients were older and achieved better serum albumin compared to PD patients. Hemoglobin levels in HD patients were statistically higher but clinically not significant in comparison to PD patients. On the other hand, serum total cholesterol and creatinine were higher in PD patients. (Table 7.3.1)
In the HD population, the patients with diabetes were younger with lower BMI. They also had higher serum creatinine, albumin and total cholesterol compared to the non- diabetic patients. Hemoglobin levels were statistically higher but clinically not significantly in diabetic HD patients. (Table 7.3.2(a))
Similar to the HD population, PD patients with diabetes were younger with lower BMI and better serum albumin, higher serum creatinine and total cholesterol levels compared to non- diabetic PD patients. (Table 7.3.2(b))
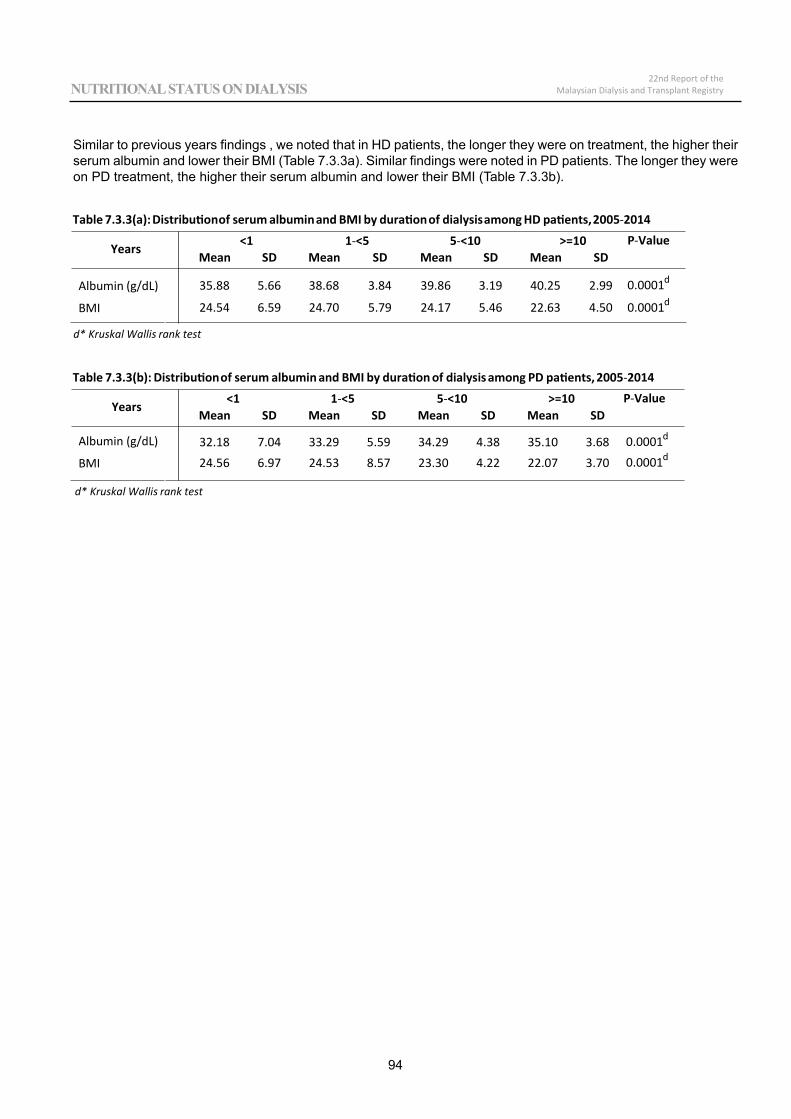
Table 7.3.3(a):Distributionof serum albuminand BMI by durationof dialysisamong HD patients,2005 2014
Years <1 1 <5 5 <10 >=10 P ValueMean SD Mean SD Mean SD Mean SD
Albumin (g/dL) 35.88 5.66 38.68 3.84 39.86 3.19 40.25 2.99 0.0001d
BMI 24.54 6.59 24.70 5.79 24.17 5.46 22.63 4.50 0.0001d
d* Kruskal Wallis rank test
Table 7.3.3(b):Distributionof serum albumin and BMI by duration of dialysis among PD patients,2005 2014
Years <1 1 <5 5 <10 >=10 P ValueMean SD Mean SD Mean SD Mean SD
Albumin (g/dL) 32.18 7.04 33.29 5.59 34.29 4.38 35.10 3.68 0.0001d
BMI 24.56 6.97 24.53 8.57 23.30 4.22 22.07 3.70 0.0001d
d* Kruskal Wallis rank test
94
22nd Report of theMalaysian Dialysis and Transplant RegistryNUTRITIONAL STATUS ON DIALYSIS
00
Similar to previous years findings , we noted that in HD patients, the longer they were on treatment, the higher their serum albumin and lower their BMI (Table 7.3.3a). Similar findings were noted in PD patients. The longer they were on PD treatment, the higher their serum albumin and lower their BMI (Table 7.3.3b).
23rd Report of theMalaysian Dialysis and Transplant Registry
BLOOD PRESSURE CONTROL ANDDYSLIPIDAEMIA IN PATIENTS ON DIALYSIS
Chapter 8
BLOOD PRESSURE CONTROL ANDDYSLIPIDAEMIA IN PATIENTS ON DIALYSIS
Lee Wan TinHooi Lai SeongNg Eng Khim
S. Prasad MenonSunita Bavanandan
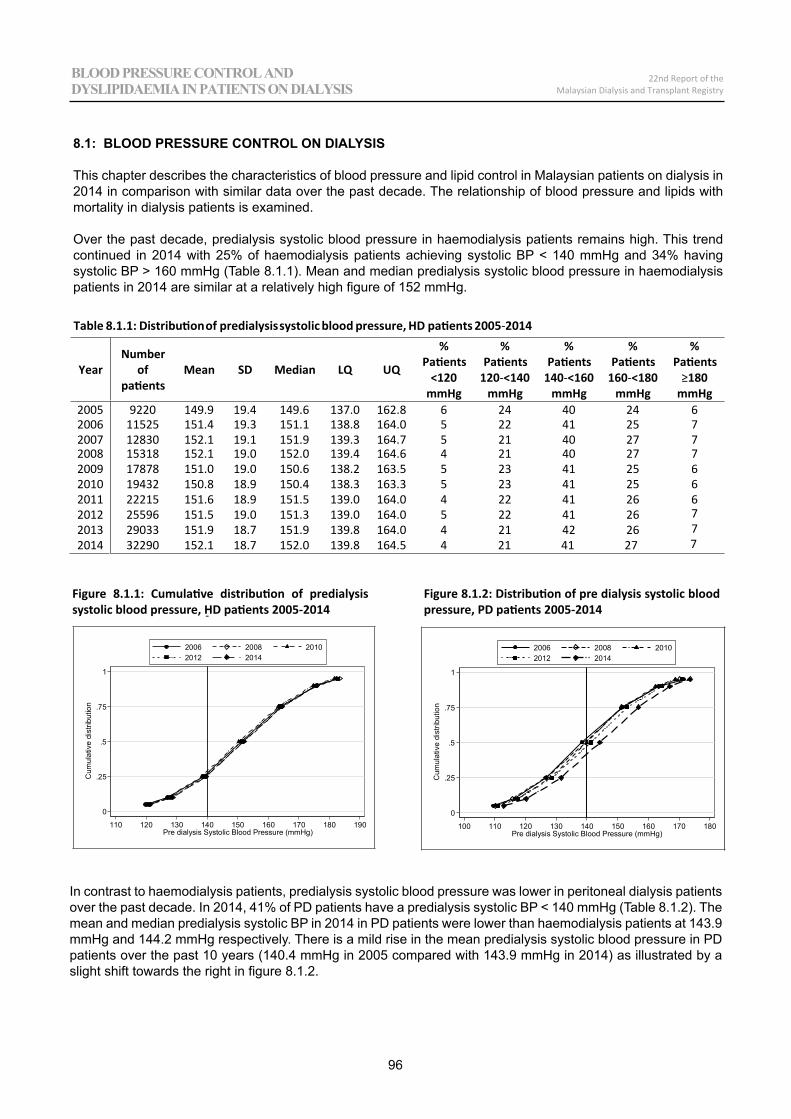
Table 8.1.1: Distributionof predialysissystolic blood pressure, HD patients 2005 2014
YearNumber
ofpatients
Mean SD Median LQ UQ
%Patients
<120mmHg
%Patients
120 <140mmHg
%Patients
140 <160mmHg
%Patients
160 <180mmHg
%Patients
180mmHg
2005 9220 149.9 19.4 149.6 137.0 162.8 6 24 40 24 62006 11525 151.4 19.3 151.1 138.8 164.0 5 22 41 25 72007 12830 152.1 19.1 151.9 139.3 164.7 5 21 40 27 72008 15318 152.1 19.0 152.0 139.4 164.6 4 21 40 27 72009 17878 151.0 19.0 150.6 138.2 163.5 5 23 41 25 62010 19432 150.8 18.9 150.4 138.3 163.3 5 23 41 25 62011 22215 151.6 18.9 151.5 139.0 164.0 4 22 41 26 62012 25596 151.5 19.0 151.3 139.0 164.0 5 22 41 26 72013 29033 151.9 18.7 151.9 139.8 164.0 4 21 42 26 72014 32290 152.1 18.7 152.0 139.8 164.5 4 21 41 27 7
0
.25
.5
.75
1
Cum
ulat
ive
dist
ribut
ion
110 120 130 140 150 160 170 180 190Pre dialysis Systolic Blood Pressure (mmHg)
2006 2008 20102012 2014
96
00
22nd Report of theMalaysian Dialysis and Transplant Registry
BLOOD PRESSURE CONTROL AND DYSLIPIDAEMIA IN PATIENTS ON DIALYSIS
BLOOD PRESSURE CONTROL AND DYSLIPIDAEMIA IN PATIENTS ON DIALYSIS
8.1: BLOOD PRESSURE CONTROL ON DIALYSIS
This chapter describes the characteristics of blood pressure and lipid control in Malaysian patients on dialysis in 2014 in comparison with similar data over the past decade. The relationship of blood pressure and lipids with mortality in dialysis patients is examined.
Over the past decade, predialysis systolic blood pressure in haemodialysis patients remains high. This trend continued in 2014 with 25% of haemodialysis patients achieving systolic BP < 140 mmHg and 34% having systolic BP > 160 mmHg (Table 8.1.1). Mean and median predialysis systolic blood pressure in haemodialysis patients in 2014 are similar at a relatively high figure of 152 mmHg.
In contrast to haemodialysis patients, predialysis systolic blood pressure was lower in peritoneal dialysis patients over the past decade. In 2014, 41% of PD patients have a predialysis systolic BP < 140 mmHg (Table 8.1.2). The mean and median predialysis systolic BP in 2014 in PD patients were lower than haemodialysis patients at 143.9 mmHg and 144.2 mmHg respectively. There is a mild rise in the mean predialysis systolic blood pressure in PD patients over the past 10 years (140.4 mmHg in 2005 compared with 143.9 mmHg in 2014) as illustrated by a slight shift towards the right in figure 8.1.2.
0
.25
.5
.75
1
Cum
ulat
ive
dist
ribut
ion
100 110 120 130 140 150 160 170 180Pre dialysis Systolic Blood Pressure (mmHg)
2006 2008 20102012 2014
Figure 8.1.1: Cumulative distribution of predialysis systolic blood pressure, HD patients 2005-2014
Figure 8.1.2: Distribution of pre dialysis systolic blood pressure, PD patients 2005-2014
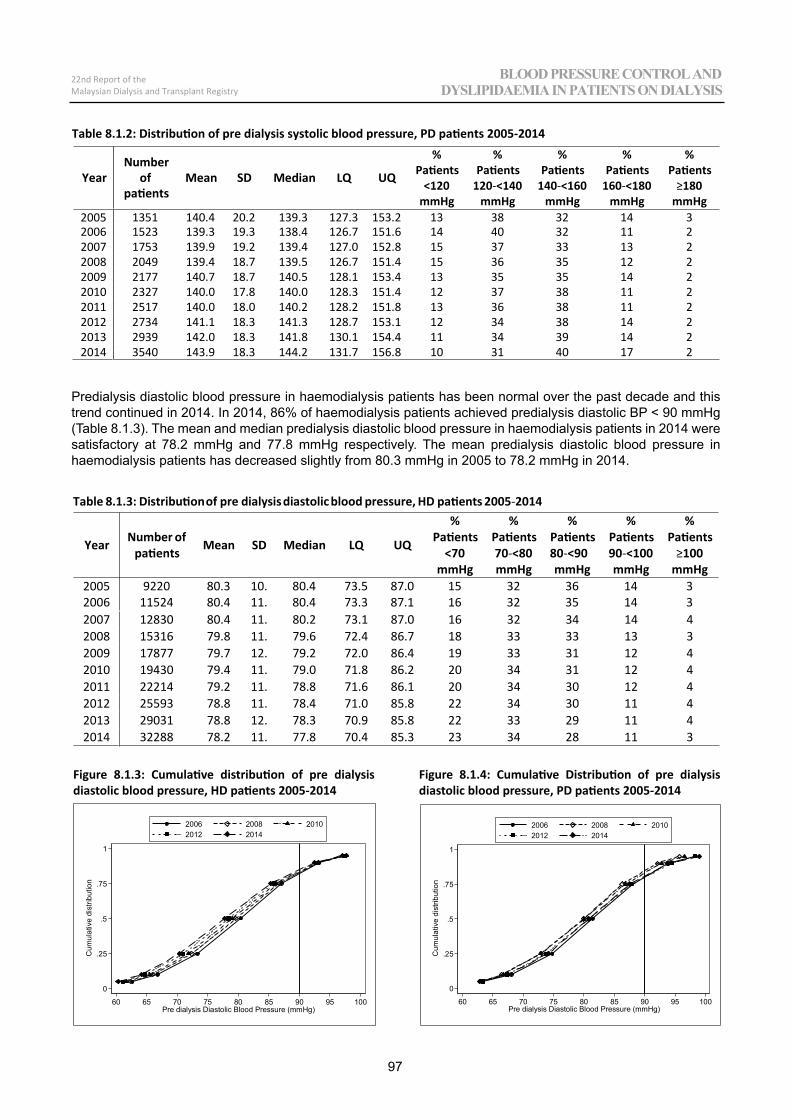
Table 8.1.2: Distribution of pre dialysis systolic blood pressure, PD patients 2005-2014
YearNumber
ofpatients
Mean SD Median LQ UQ
%Patients
<120mmHg
%Patients
120 <140mmHg
%Patients
140 <160mmHg
%Patients
160 <180mmHg
%Patients
180mmHg
2005 1351 140.4 20.2 139.3 127.3 153.2 13 38 32 14 32006 1523 139.3 19.3 138.4 126.7 151.6 14 40 32 11 22007 1753 139.9 19.2 139.4 127.0 152.8 15 37 33 13 22008 2049 139.4 18.7 139.5 126.7 151.4 15 36 35 12 22009 2177 140.7 18.7 140.5 128.1 153.4 13 35 35 14 22010 2327 140.0 17.8 140.0 128.3 151.4 12 37 38 11 22011 2517 140.0 18.0 140.2 128.2 151.8 13 36 38 11 22012 2734 141.1 18.3 141.3 128.7 153.1 12 34 38 14 22013 2939 142.0 18.3 141.8 130.1 154.4 11 34 39 14 22014 3540 143.9 18.3 144.2 131.7 156.8 10 31 40 17 2
Table 8.1.3: Distributionof pre dialysisdiastolic blood pressure, HD patients 2005 2014
Year Number ofpatients Mean SD Median LQ UQ
%Patients
<70mmHg
%Patients70 <80mmHg
%Patients80 <90mmHg
%Patients90 <100mmHg
%Patients
100mmHg
2005 9220 80.3 10. 80.4 73.5 87.0 15 32 36 14 32006 11524 80.4 11. 80.4 73.3 87.1 16 32 35 14 3
00
97
22nd Report of theMalaysian Dialysis and Transplant Registry
BLOOD PRESSURE CONTROL AND DYSLIPIDAEMIA IN PATIENTS ON DIALYSIS
Predialysis diastolic blood pressure in haemodialysis patients has been normal over the past decade and this trend continued in 2014. In 2014, 86% of haemodialysis patients achieved predialysis diastolic BP < 90 mmHg (Table 8.1.3). The mean and median predialysis diastolic blood pressure in haemodialysis patients in 2014 were satisfactory at 78.2 mmHg and 77.8 mmHg respectively. The mean predialysis diastolic blood pressure in haemodialysis patients has decreased slightly from 80.3 mmHg in 2005 to 78.2 mmHg in 2014.
2007 12830 80.4 11. 80.2 73.1 87.0 16 32 34 14 42008 15316 79.8 11. 79.6 72.4 86.7 18 33 33 13 32009 17877 79.7 12. 79.2 72.0 86.4 19 33 31 12 42010 19430 79.4 11. 79.0 71.8 86.2 20 34 31 12 42011 22214 79.2 11. 78.8 71.6 86.1 20 34 30 12 42012 25593 78.8 11. 78.4 71.0 85.8 22 34 30 11 42013 29031 78.8 12. 78.3 70.9 85.8 22 33 29 11 42014 32288 78.2 11. 77.8 70.4 85.3 23 34 28 11 3
43444443
0
.25
.5
.75
1
Cum
ulat
ive
dist
ribut
ion
60 65 70 75 80 85 90 95 100Pre dialysis Diastolic Blood Pressure (mmHg)
2006 2008 20102012 2014
Figure 8.1.3: Cumulative distribution of pre dialysis diastolic blood pressure, HD patients 2005-2014
Figure 8.1.4: Cumulative Distribution of pre dialysis diastolic blood pressure, PD patients 2005-2014
0
.25
.5
.75
1
Cum
ulat
ive
dist
ribut
ion
60 65 70 75 80 85 90 95 100Pre dialysis Diastolic Blood Pressure (mmHg)
2006 2008 20102012 2014
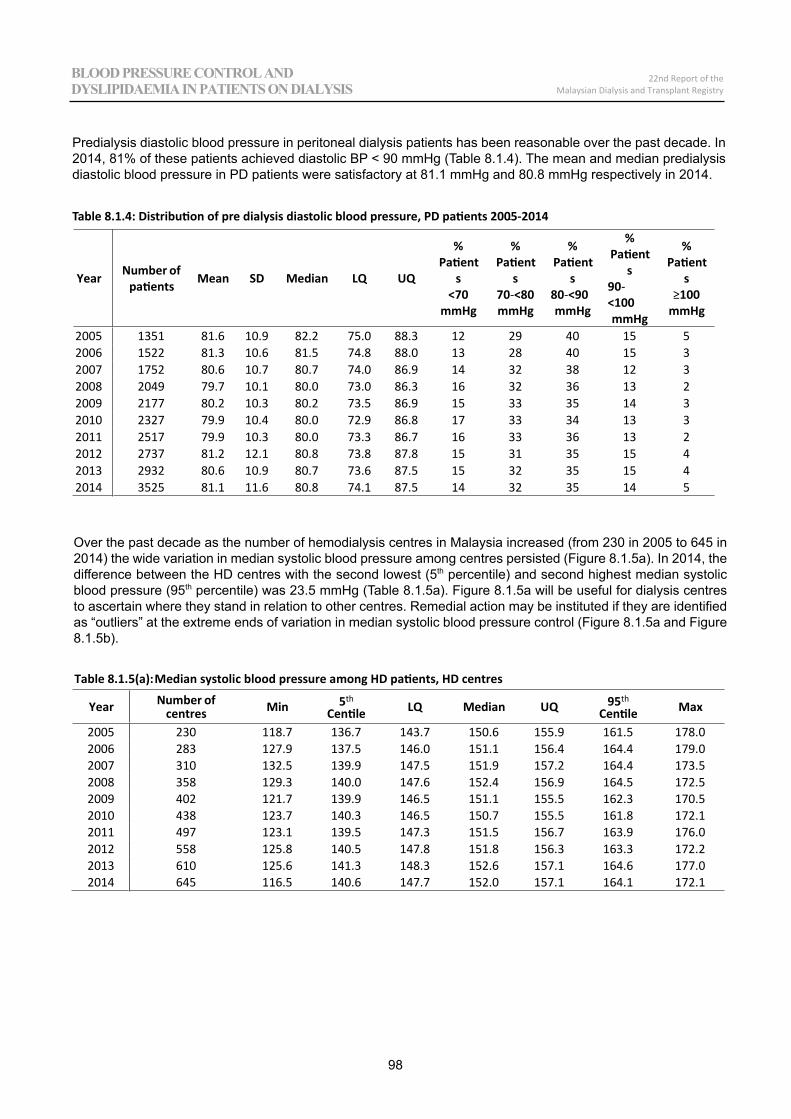
Year Number ofpatients Mean SD Median LQ UQ
%Patient
s<70
mmHg
%Patient
s70 <80mmHg
%Patient
s80 <90mmHg
%Patient
s90<100mmHg
%Patient
s100
mmHg
2005 1351 81.6 10.9 82.2 75.0 88.3 12 29 40 15 52006 1522 81.3 10.6 81.5 74.8 88.0 13 28 40 15 32007 1752 80.6 10.7 80.7 74.0 86.9 14 32 38 12 32008 2049 79.7 10.1 80.0 73.0 86.3 16 32 36 13 22009 2177 80.2 10.3 80.2 73.5 86.9 15 33 35 14 32010 2327 79.9 10.4 80.0 72.9 86.8 17 33 34 13 32011 2517 79.9 10.3 80.0 73.3 86.7 16 33 36 13 22012 2737 81.2 12.1 80.8 73.8 87.8 15 31 35 15 42013 2932 80.6 10.9 80.7 73.6 87.5 15 32 35 15 42014 3525 81.1 11.6 80.8 74.1 87.5 14 32 35 14 5
98
00
22nd Report of theMalaysian Dialysis and Transplant Registry
BLOOD PRESSURE CONTROL AND DYSLIPIDAEMIA IN PATIENTS ON DIALYSIS
BLOOD PRESSURE CONTROL AND DYSLIPIDAEMIA IN PATIENTS ON DIALYSIS
Predialysis diastolic blood pressure in peritoneal dialysis patients has been reasonable over the past decade. In 2014, 81% of these patients achieved diastolic BP < 90 mmHg (Table 8.1.4). The mean and median predialysis diastolic blood pressure in PD patients were satisfactory at 81.1 mmHg and 80.8 mmHg respectively in 2014.
Table 8.1.4: Distribution of pre dialysis diastolic blood pressure, PD patients 2005-2014
Year Number ofcentres Min 5th
Centile LQ Median UQ 95th
Centile Max
2005 230 118.7 136.7 143.7 150.6 155.9 161.5 178.02006 283 127.9 137.5 146.0 151.1 156.4 164.4 179.02007 310 132.5 139.9 147.5 151.9 157.2 164.4 173.52008 358 129.3 140.0 147.6 152.4 156.9 164.5 172.52009 402 121.7 139.9 146.5 151.1 155.5 162.3 170.52010 438 123.7 140.3 146.5 150.7 155.5 161.8 172.12011 497 123.1 139.5 147.3 151.5 156.7 163.9 176.02012 558 125.8 140.5 147.8 151.8 156.3 163.3 172.22013 610 125.6 141.3 148.3 152.6 157.1 164.6 177.02014 645 116.5 140.6 147.7 152.0 157.1 164.1 172.1
Over the past decade as the number of hemodialysis centres in Malaysia increased (from 230 in 2005 to 645 in 2014) the wide variation in median systolic blood pressure among centres persisted (Figure 8.1.5a). In 2014, the difference between the HD centres with the second lowest (5th percentile) and second highest median systolic blood pressure (95th percentile) was 23.5 mmHg (Table 8.1.5a). Figure 8.1.5a will be useful for dialysis centres to ascertain where they stand in relation to other centres. Remedial action may be instituted if they are identified as “outliers” at the extreme ends of variation in median systolic blood pressure control (Figure 8.1.5a and Figure 8.1.5b).
Table 8.1.5(a): Median systolic blood pressure among HD patients, HD centres
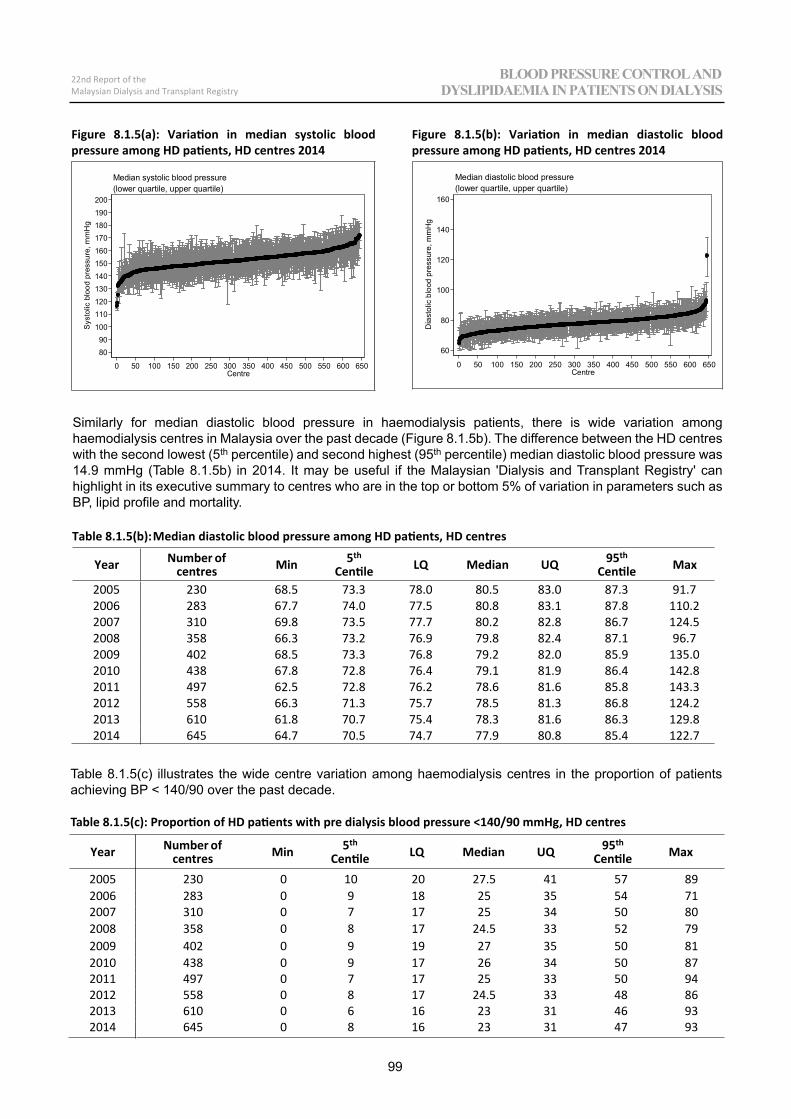
00
99
22nd Report of theMalaysian Dialysis and Transplant Registry
BLOOD PRESSURE CONTROL AND DYSLIPIDAEMIA IN PATIENTS ON DIALYSIS
8090
100110120130140150160170180190200
Sys
tolic
blo
od p
ress
ure,
mm
Hg
0 50 100 150 200 250 300 350 400 450 500 550 600 650Centre
(lower quartile, upper quartile)Median systolic blood pressure
Year Number ofcentres Min 5th
Centile LQ Median UQ 95th
Centile Max
2005 230 68.5 73.3 78.0 80.5 83.0 87.3 91.72006 283 67.7 74.0 77.5 80.8 83.1 87.8 110.22007 310 69.8 73.5 77.7 80.2 82.8 86.7 124.52008 358 66.3 73.2 76.9 79.8 82.4 87.1 96.72009 402 68.5 73.3 76.8 79.2 82.0 85.9 135.02010 438 67.8 72.8 76.4 79.1 81.9 86.4 142.82011 497 62.5 72.8 76.2 78.6 81.6 85.8 143.32012 558 66.3 71.3 75.7 78.5 81.3 86.8 124.22013 610 61.8 70.7 75.4 78.3 81.6 86.3 129.82014 645 64.7 70.5 74.7 77.9 80.8 85.4 122.7
Similarly for median diastolic blood pressure in haemodialysis patients, there is wide variation among haemodialysis centres in Malaysia over the past decade (Figure 8.1.5b). The difference between the HD centres with the second lowest (5th percentile) and second highest (95th percentile) median diastolic blood pressure was 14.9 mmHg (Table 8.1.5b) in 2014. It may be useful if the Malaysian 'Dialysis and Transplant Registry' can highlight in its executive summary to centres who are in the top or bottom 5% of variation in parameters such as BP, lipid profile and mortality.
Table 8.1.5(b): Median diastolic blood pressure among HD patients, HD centres
Figure 8.1.5(a): Variation in median systolic blood pressure among HD patients, HD centres 2014
Figure 8.1.5(b): Variation in median diastolic blood pressure among HD patients, HD centres 2014
60
80
100
120
140
160
Dia
stol
ic b
lood
pre
ssur
e, m
mH
g
0 50 100 150 200 250 300 350 400 450 500 550 600 650Centre
(lower quartile, upper quartile)Median diastolic blood pressure
2005 230 0 10 20 27.5 41 57 892006 283 0 9 18 25 35 54 712007 310 0 7 17 25 34 50 802008 358 0 8 17 24.5 33 52 792009 402 0 9 19 27 35 50 812010 438 0 9 17 26 34 50 872011 497 0 7 17 25 33 50 942012 558 0 8 17 24.5 33 48 862013 610 0 6 16 23 31 46 932014 645 0 8 16 23 31 47 93
Table 8.1.5(c) illustrates the wide centre variation among haemodialysis centres in the proportion of patients achieving BP < 140/90 over the past decade.
Table 8.1.5(c): Proportion of HD patients with pre dialysis blood pressure <140/90 mmHg, HD centres
Year Number ofcentres Min 5th
Centile LQ Median UQ 95th
Centile Max
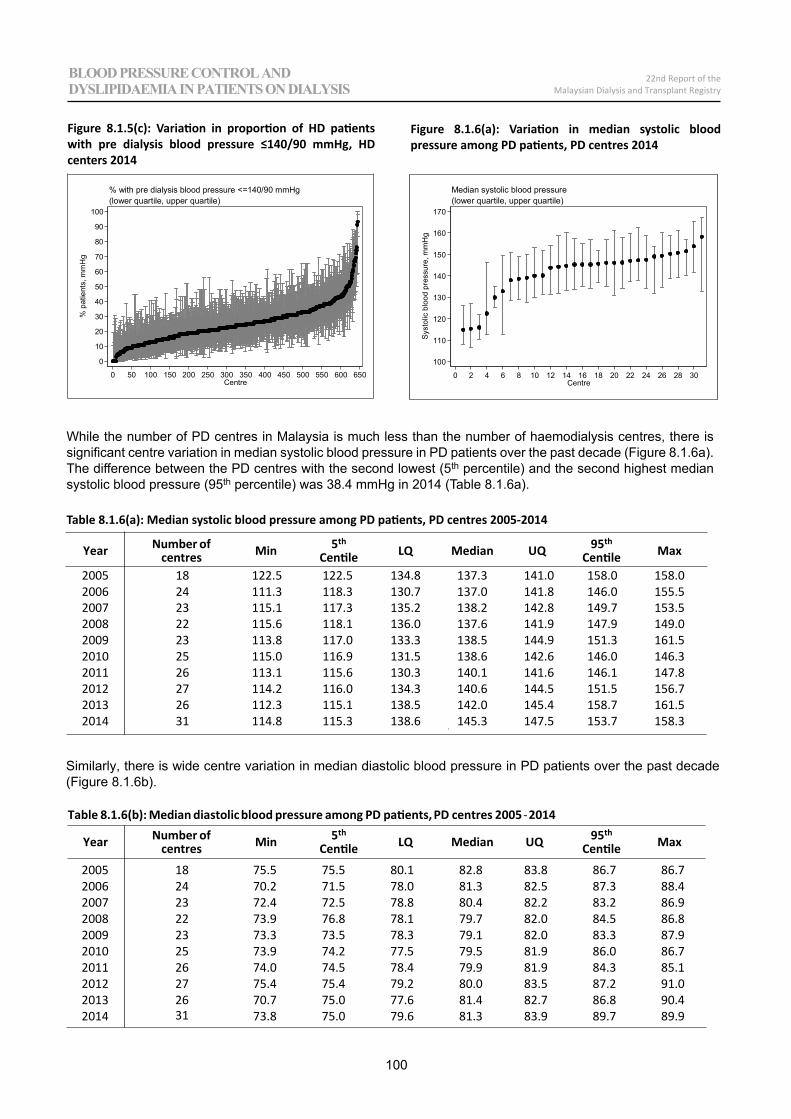
100
00
22nd Report of theMalaysian Dialysis and Transplant Registry
BLOOD PRESSURE CONTROL AND DYSLIPIDAEMIA IN PATIENTS ON DIALYSIS
0
10
20
30
40
50
60
70
80
90
100
% p
atie
nts,
mm
Hg
0 50 100 150 200 250 300 350 400 450 500 550 600 650Centre
(lower quartile, upper quartile)% with pre dialysis blood pressure <=140/90 mmHg
Figure 8.1.5(c): Variation in proportion of HD patients with pre dialysis blood pressure ≤140/90 mmHg, HD centers 2014
100
110
120
130
140
150
160
170
Sys
tolic
blo
od p
ress
ure,
mm
Hg
0 2 4 6 8 10 12 14 16 18 20 22 24 26 28 30Centre
(lower quartile, upper quartile)Median systolic blood pressure
Figure 8.1.6(a): Variation in median systolic blood pressure among PD patients, PD centres 2014
2005 18 122.5 122.5 134.8 137.3 141.0 158.0 158.02006 24 111.3 118.3 130.7 137.0 141.8 146.0 155.52007 23 115.1 117.3 135.2 138.2 142.8 149.7 153.52008 22 115.6 118.1 136.0 137.6 141.9 147.9 149.02009 23 113.8 117.0 133.3 138.5 144.9 151.3 161.52010 25 115.0 116.9 131.5 138.6 142.6 146.0 146.32011 26 113.1 115.6 130.3 140.1 141.6 146.1 147.82012 27 114.2 116.0 134.3 140.6 144.5 151.5 156.72013 26 112.3 115.1 138.5 142.0 145.4 158.7 161.52014 31 114.8 115.3 138.6 145.3 147.5 153.7 158.3
While the number of PD centres in Malaysia is much less than the number of haemodialysis centres, there is significant centre variation in median systolic blood pressure in PD patients over the past decade (Figure 8.1.6a). The difference between the PD centres with the second lowest (5th percentile) and the second highest median systolic blood pressure (95th percentile) was 38.4 mmHg in 2014 (Table 8.1.6a).
Table 8.1.6(a): Median systolic blood pressure among PD patients, PD centres 2005-2014
Table 8.1.6(b): Median diastolic blood pressure among PD patients, PD centres 2005 2014
2005 18 75.5 75.5 80.1 82.8 83.8 86.7 86.72006 24 70.2 71.5 78.0 81.3 82.5 87.3 88.42007 23 72.4 72.5 78.8 80.4 82.2 83.2 86.92008 22 73.9 76.8 78.1 79.7 82.0 84.5 86.82009 23 73.3 73.5 78.3 79.1 82.0 83.3 87.92010 25 73.9 74.2 77.5 79.5 81.9 86.0 86.72011 26 74.0 74.5 78.4 79.9 81.9 84.3 85.12012 27 75.4 75.4 79.2 80.0 83.5 87.2 91.02013 26
3170.7 75.0 77.6 81.4 82.7 86.8 90.4
2014 73.8 75.0 79.6 81.3 83.9 89.7 89.9
Similarly, there is wide centre variation in median diastolic blood pressure in PD patients over the past decade (Figure 8.1.6b).
Year Number ofcentres Min 5th
Centile LQ Median UQ 95th
Centile Max
Year Number ofcentres Min 5th
Centile LQ Median UQ 95th
Centile Max
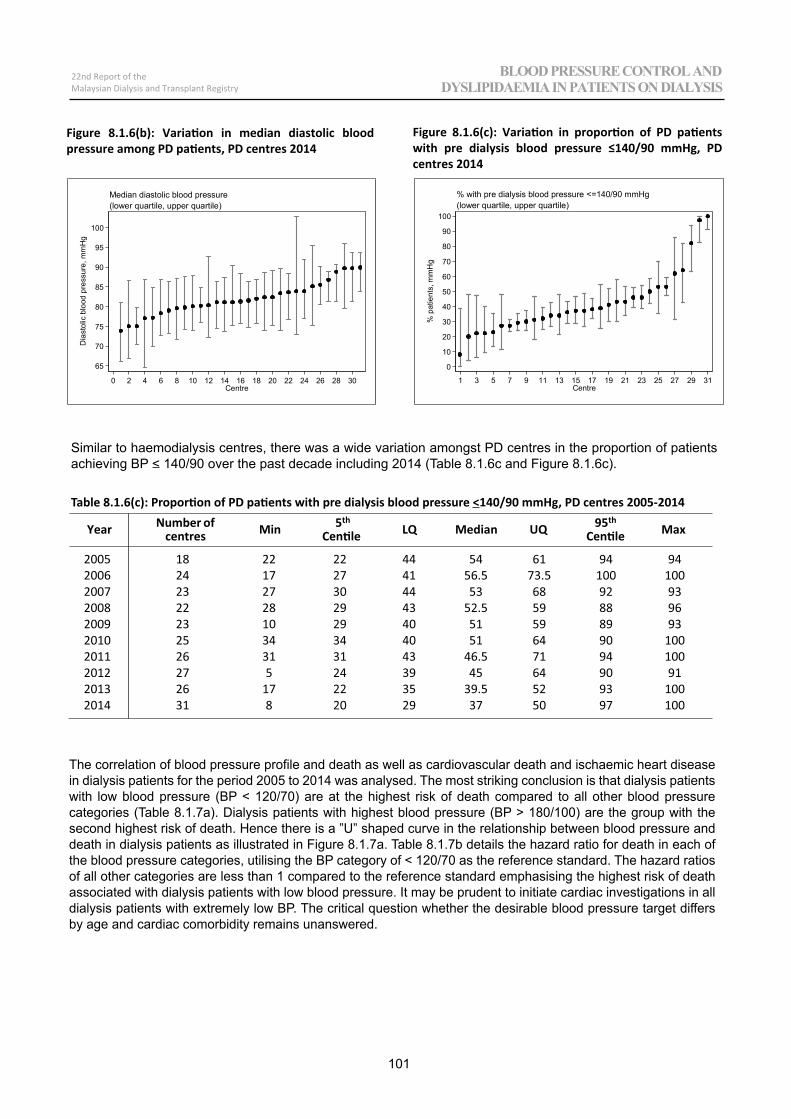
00
101
22nd Report of theMalaysian Dialysis and Transplant Registry
BLOOD PRESSURE CONTROL AND DYSLIPIDAEMIA IN PATIENTS ON DIALYSIS
65
70
75
80
85
90
95
100
Dia
stol
ic b
lood
pre
ssur
e, m
mH
g
0 2 4 6 8 10 12 14 16 18 20 22 24 26 28 30Centre
(lower quartile, upper quartile)Median diastolic blood pressure
2005 18 22 942006 24 17 1002007 23 27 932008 22 28 962009 23 10 932010 25 34 1002011 26 31 1002012 27 5 912013 26 17 1002014 31 8 100
Similar to haemodialysis centres, there was a wide variation amongst PD centres in the proportion of patients achieving BP < 140/90 over the past decade including 2014 (Table 8.1.6c and Figure 8.1.6c).
Table 8.1.6(c): Proportion of PD patients with pre dialysis blood pressure <140/90 mmHg, PD centres 2005-2014
Figure 8.1.6(b): Variation in median diastolic blood pressure among PD patients, PD centres 2014
0
10
20
30
40
50
60
70
80
90
100
% p
atie
nts,
mm
Hg
1 3 5 7 9 11 13 15 17 19 21 23 25 27 29 31Centre
(lower quartile, upper quartile)% with pre dialysis blood pressure <=140/90 mmHg
Figure 8.1.6(c): Variation in proportion of PD patients with pre dialysis blood pressure ≤140/90 mmHg, PD centres 2014
The correlation of blood pressure profile and death as well as cardiovascular death and ischaemic heart disease in dialysis patients for the period 2005 to 2014 was analysed. The most striking conclusion is that dialysis patients with low blood pressure (BP < 120/70) are at the highest risk of death compared to all other blood pressure categories (Table 8.1.7a). Dialysis patients with highest blood pressure (BP > 180/100) are the group with the second highest risk of death. Hence there is a ”U” shaped curve in the relationship between blood pressure and death in dialysis patients as illustrated in Figure 8.1.7a. Table 8.1.7b details the hazard ratio for death in each of the blood pressure categories, utilising the BP category of < 120/70 as the reference standard. The hazard ratios of all other categories are less than 1 compared to the reference standard emphasising the highest risk of death associated with dialysis patients with low blood pressure. It may be prudent to initiate cardiac investigations in all dialysis patients with extremely low BP. The critical question whether the desirable blood pressure target differs by age and cardiac comorbidity remains unanswered.
Year Number ofcentres Min 5th
Centile LQ Median UQ 95th
Centile Max
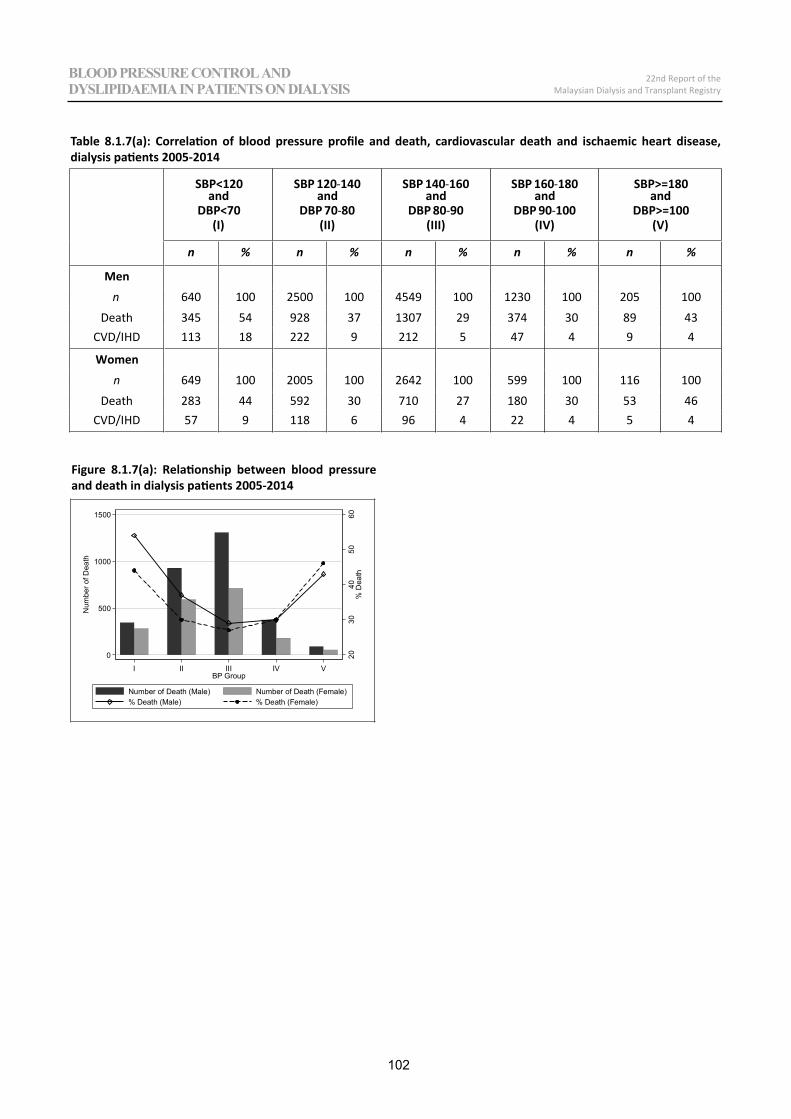
22nd Report of theMalaysian Dialysis and Transplant Registry
BLOOD PRESSURE CONTROL AND DYSLIPIDAEMIA IN PATIENTS ON DIALYSIS
BLOOD PRESSURE CONTROL AND DYSLIPIDAEMIA IN PATIENTS ON DIALYSIS
SBP<120and
DBP<70(I)
SBP 120 140and
DBP 70 80(II)
SBP 140 160and
DBP 80 90(III)
SBP 160 180and
DBP 90 100(IV)
SBP>=180and
DBP>=100(V)
n % n % n % n % n %
Menn 640 100 2500 100 4549 100 1230 100 205 100
Death 345 54 928 37 1307 29 374 30 89 43CVD/IHD 113 18 222 9 212 5 47 4 9 4
Womenn 649 100 2005 100 2642 100 599 100 116 100
Death 283 44 592 30 710 27 180 30 53 46CVD/IHD 57 9 118 6 96 4 22 4 5 4
2030
4050
60%
Dea
th
0
500
1000
1500
Num
ber o
f Dea
th
I II III IV VBP Group
Number of Death (Male) Number of Death (Female)% Death (Male) % Death (Female)
Table 8.1.7(a): Correlation of blood pressure profile and death, cardiovascular death and ischaemic heart disease, dialysis patients 2005-2014
Figure 8.1.7(a): Relationship between blood pressure and death in dialysis patients 2005-2014
102
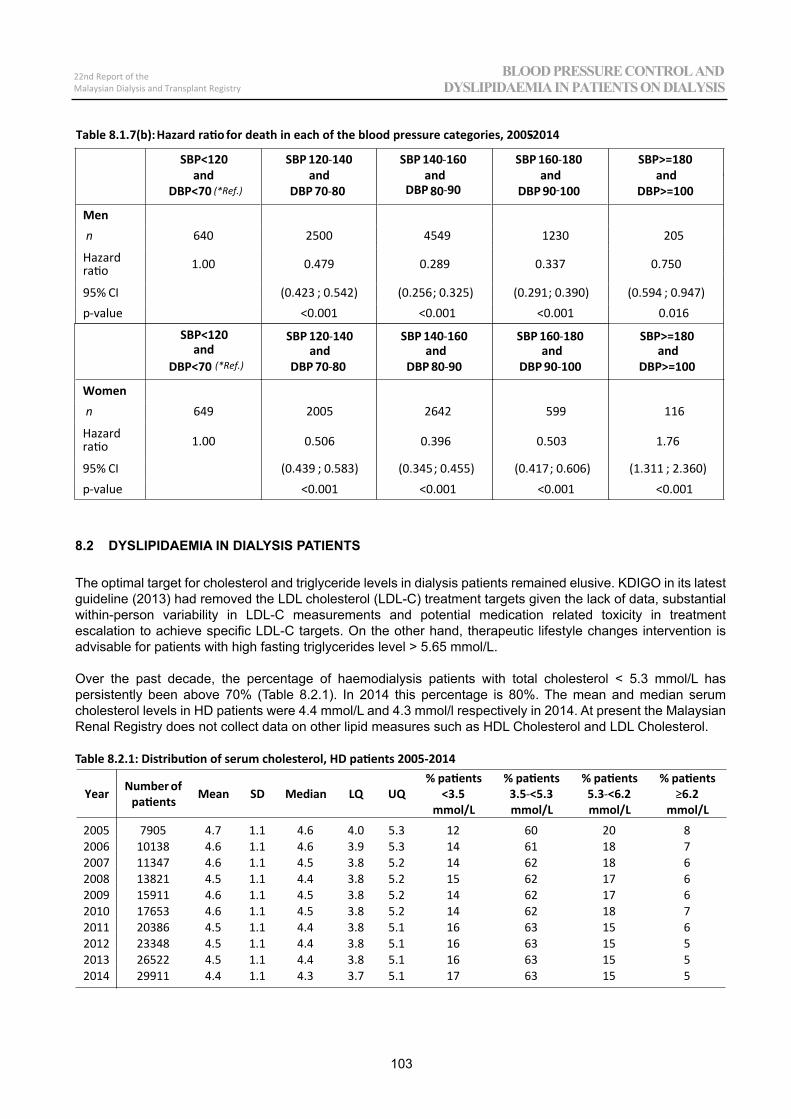
00
103
22nd Report of theMalaysian Dialysis and Transplant Registry
BLOOD PRESSURE CONTROL AND DYSLIPIDAEMIA IN PATIENTS ON DIALYSIS
Table 8.1.7(b): Hazard ratio for death in each of the blood pressure categories, 2005-2014
SBP<120and
DBP<70 (*Ref.)
(*Ref.)
SBP 120 140and
DBP 70 80
SBP 140 160and
DBP 80 90
SBP 160 180and
DBP 90 100
SBP>=180and
DBP>=100
Menn 640 2500 4549 1230 205
Hazardratio 1.00 0.479 0.289 0.337 0.750
95% CI (0.423 ; 0.542) (0.256; 0.325) (0.291; 0.390) (0.594 ; 0.947)p value <0.001 <0.001 <0.001 0.016
SBP<120and
DBP<70
SBP 120 140and
DBP 70 80
SBP 140 160and
DBP 80 90
SBP 160 180and
DBP 90 100
SBP>=180and
DBP>=100
Womenn 649 2005 2642 599 116
Hazardratio 1.00 0.506 0.396 0.503 1.76
95% CI (0.439 ; 0.583) (0.345; 0.455) (0.417; 0.606) (1.311 ; 2.360)p value <0.001 <0.001 <0.001 <0.001
Year Number ofpatients Mean SD Median LQ UQ
% patients<3.5
mmol/L
% patients3.5 <5.3mmol/L
% patients5.3 <6.2mmol/L
% patients6.2
mmol/L
2005 7905 4.7 1.1 4.6 4.0 5.3 12 60 20 82006 10138 4.6 1.1 4.6 3.9 5.3 14 61 18 72007 11347 4.6 1.1 4.5 3.8 5.2 14 62 18 62008 13821 4.5 1.1 4.4 3.8 5.2 15 62 17 62009 15911 4.6 1.1 4.5 3.8 5.2 14 62 17 62010 17653 4.6 1.1 4.5 3.8 5.2 14 62 18 72011 20386 4.5 1.1 4.4 3.8 5.1 16 63 15 62012 23348 4.5 1.1 4.4 3.8 5.1 16 63 15 52013 26522 4.5 1.1 4.4 3.8 5.1 16 63 15 52014 29911 4.4 1.1 4.3 3.7 5.1 17 63 15 5
8.2 DYSLIPIDAEMIA IN DIALYSIS PATIENTS
The optimal target for cholesterol and triglyceride levels in dialysis patients remained elusive. KDIGO in its latest guideline (2013) had removed the LDL cholesterol (LDL-C) treatment targets given the lack of data, substantial within-person variability in LDL-C measurements and potential medication related toxicity in treatment escalation to achieve specific LDL-C targets. On the other hand, therapeutic lifestyle changes intervention is advisable for patients with high fasting triglycerides level > 5.65 mmol/L.
Over the past decade, the percentage of haemodialysis patients with total cholesterol < 5.3 mmol/L has persistently been above 70% (Table 8.2.1). In 2014 this percentage is 80%. The mean and median serum cholesterol levels in HD patients were 4.4 mmol/L and 4.3 mmol/l respectively in 2014. At present the Malaysian Renal Registry does not collect data on other lipid measures such as HDL Cholesterol and LDL Cholesterol.
Table 8.2.1: Distribution of serum cholesterol, HD patients 2005-2014
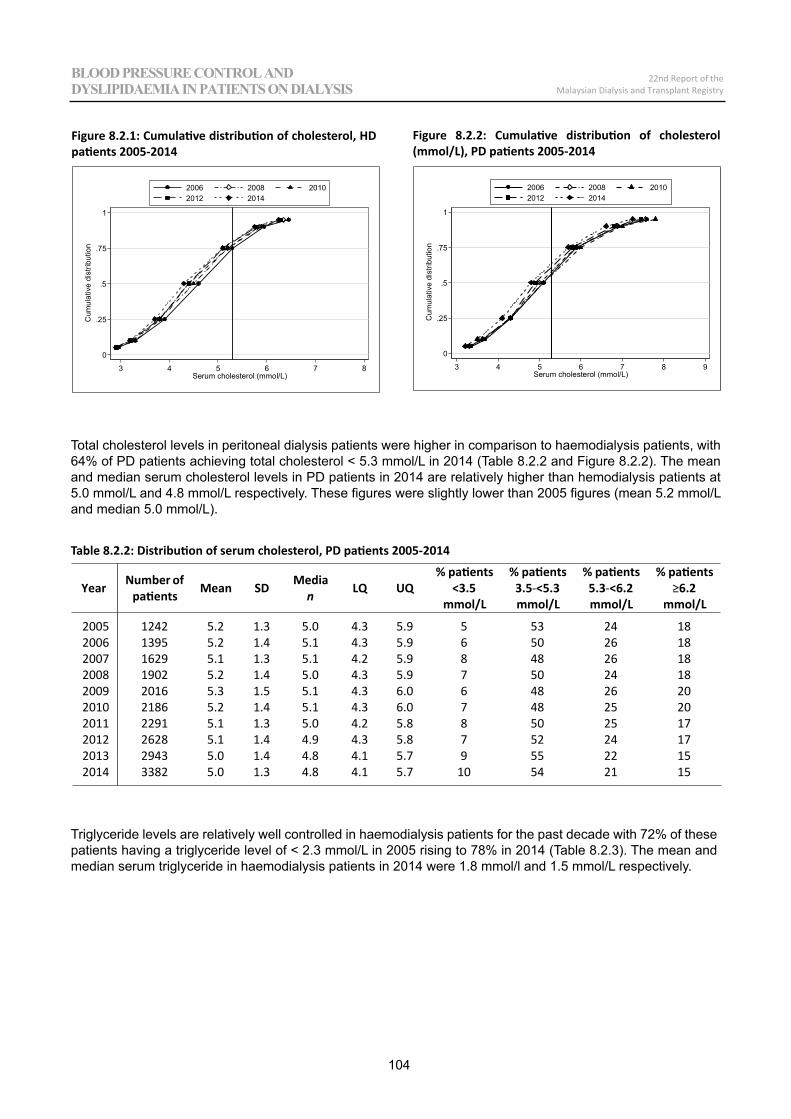
104
00
22nd Report of theMalaysian Dialysis and Transplant Registry
BLOOD PRESSURE CONTROL AND DYSLIPIDAEMIA IN PATIENTS ON DIALYSIS
0
.25
.5
.75
1
Cum
ulat
ive
dist
ribut
ion
3 4 5 6 7 8Serum cholesterol (mmol/L)
2006 2008 20102012 2014
Year Number ofpatients Mean SD Media
n LQ UQ% patients
<3.5mmol/L
% patients3.5 <5.3mmol/L
% patients5.3 <6.2mmol/L
% patients6.2
mmol/L
2005 1242 5.2 1.3 5.0 4.3 5.9 5 53 24 182006 1395 5.2 1.4 5.1 4.3 5.9 6 50 26 182007 1629 5.1 1.3 5.1 4.2 5.9 8 48 26 182008 1902 5.2 1.4 5.0 4.3 5.9 7 50 24 182009 2016 5.3 1.5 5.1 4.3 6.0 6 48 26 202010 2186 5.2 1.4 5.1 4.3 6.0 7 48 25 202011 2291 5.1 1.3 5.0 4.2 5.8 8 50 25 172012 2628 5.1 1.4 4.9 4.3 5.8 7 52 24 172013 2943 5.0 1.4 4.8 4.1 5.7 9 55 22 152014 3382 5.0 1.3 4.8 4.1 5.7 10 54 21 15
Total cholesterol levels in peritoneal dialysis patients were higher in comparison to haemodialysis patients, with 64% of PD patients achieving total cholesterol < 5.3 mmol/L in 2014 (Table 8.2.2 and Figure 8.2.2). The mean and median serum cholesterol levels in PD patients in 2014 are relatively higher than hemodialysis patients at 5.0 mmol/L and 4.8 mmol/L respectively. These figures were slightly lower than 2005 figures (mean 5.2 mmol/L and median 5.0 mmol/L).
Table 8.2.2: Distribution of serum cholesterol, PD patients 2005-2014
Figure 8.2.1: Cumulative distribution of cholesterol, HD patients 2005-2014
BLOOD PRESSURE CONTROL AND DYSLIPIDAEMIA IN PATIENTS ON DIALYSIS
0
.25
.5
.75
1
Cum
ulat
ive
dist
ribut
ion
3 4 5 6 7 8 9Serum cholesterol (mmol/L)
2006 2008 20102012 2014
Figure 8.2.2: Cumulative distribution of cholesterol (mmol/L), PD patients 2005-2014
Triglyceride levels are relatively well controlled in haemodialysis patients for the past decade with 72% of these patients having a triglyceride level of < 2.3 mmol/L in 2005 rising to 78% in 2014 (Table 8.2.3). The mean and median serum triglyceride in haemodialysis patients in 2014 were 1.8 mmol/l and 1.5 mmol/L respectively.
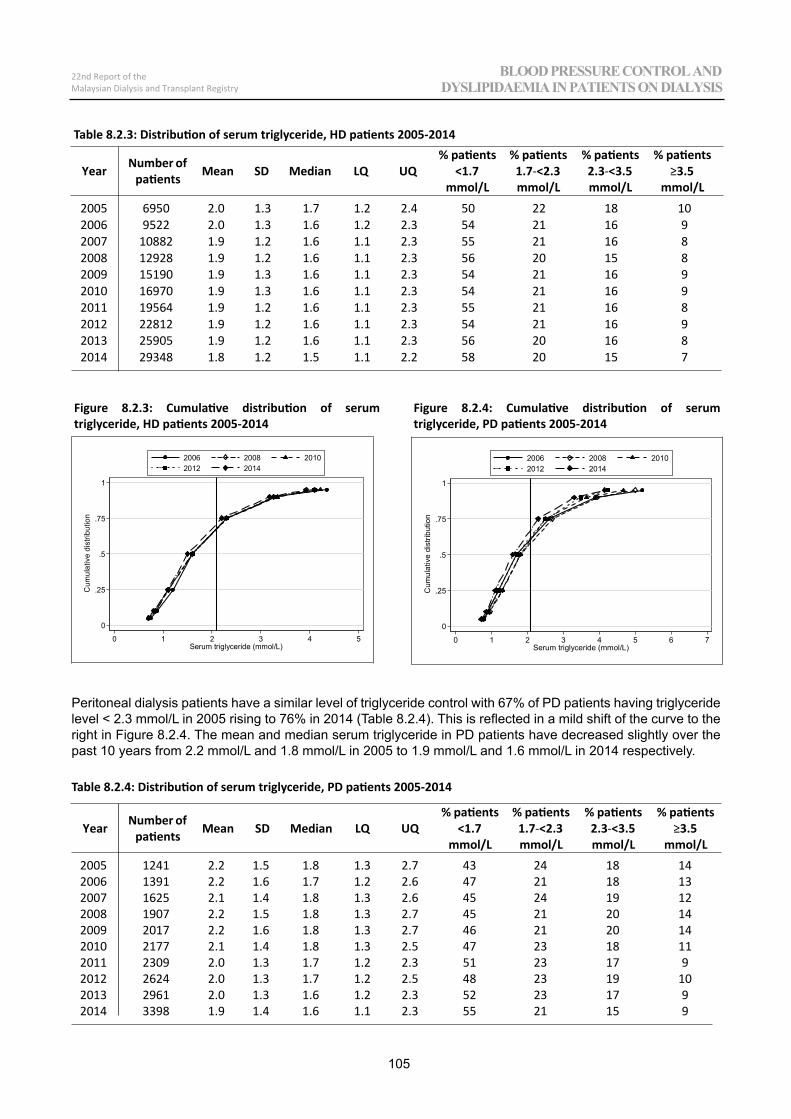
00
105
22nd Report of theMalaysian Dialysis and Transplant Registry
BLOOD PRESSURE CONTROL AND DYSLIPIDAEMIA IN PATIENTS ON DIALYSIS
Year Number ofpatients Mean SD Median LQ UQ
% patients<1.7
mmol/L
% patients1.7 <2.3mmol/L
% patients2.3 <3.5mmol/L
% patients3.5
mmol/L2005 6950 2.0 1.3 1.7 1.2 2.4 50 22 18 102006 9522 2.0 1.3 1.6 1.2 2.3 54 21 16 92007 10882 1.9 1.2 1.6 1.1 2.3 55 21 16 82008 12928 1.9 1.2 1.6 1.1 2.3 56 20 15 82009 15190 1.9 1.3 1.6 1.1 2.3 54 21 16 92010 16970 1.9 1.3 1.6 1.1 2.3 54 21 16 92011 19564 1.9 1.2 1.6 1.1 2.3 55 21 16 82012 22812 1.9 1.2 1.6 1.1 2.3 54 21 16 92013 25905 1.9 1.2 1.6 1.1 2.3 56 20 16 82014 29348 1.8 1.2 1.5 1.1 2.2 58 20 15 7
Table 8.2.3: Distribution of serum triglyceride, HD patients 2005-2014
0
.25
.5
.75
1
Cum
ulat
ive
dist
ribut
ion
0 1 2 3 4 5Serum triglyceride (mmol/L)
2006 2008 20102012 2014
Year Number ofpatients Mean SD Median LQ UQ
% patients<1.7
mmol/L
% patients1.7 <2.3mmol/L
% patients2.3 <3.5mmol/L
% patients3.5
mmol/L2005 1241 2.2 1.5 1.8 1.3 2.7 43 24 18 142006 1391 2.2 1.6 1.7 1.2 2.6 47 21 18 132007 1625 2.1 1.4 1.8 1.3 2.6 45 24 19 122008 1907 2.2 1.5 1.8 1.3 2.7 45 21 20 142009 2017 2.2 1.6 1.8 1.3 2.7 46 21 20 142010 2177 2.1 1.4 1.8 1.3 2.5 47 23 18 112011 2309 2.0 1.3 1.7 1.2 2.3 51 23 17 92012 2624 2.0 1.3 1.7 1.2 2.5 48 23 19 102013 2961 2.0 1.3 1.6 1.2 2.3 52 23 17 92014 3398 1.9 1.4 1.6 1.1 2.3 55 21 15 9
Peritoneal dialysis patients have a similar level of triglyceride control with 67% of PD patients having triglyceride level < 2.3 mmol/L in 2005 rising to 76% in 2014 (Table 8.2.4). This is reflected in a mild shift of the curve to the right in Figure 8.2.4. The mean and median serum triglyceride in PD patients have decreased slightly over the past 10 years from 2.2 mmol/L and 1.8 mmol/L in 2005 to 1.9 mmol/L and 1.6 mmol/L in 2014 respectively.
Table 8.2.4: Distribution of serum triglyceride, PD patients 2005-2014
Figure 8.2.3: Cumulative distribution of serum triglyceride, HD patients 2005-2014
0
.25
.5
.75
1
Cum
ulat
ive
dist
ribut
ion
0 1 2 3 4 5 6 7Serum triglyceride (mmol/L)
2006 2008 20102012 2014
Figure 8.2.4: Cumulative distribution of serum triglyceride, PD patients 2005-2014
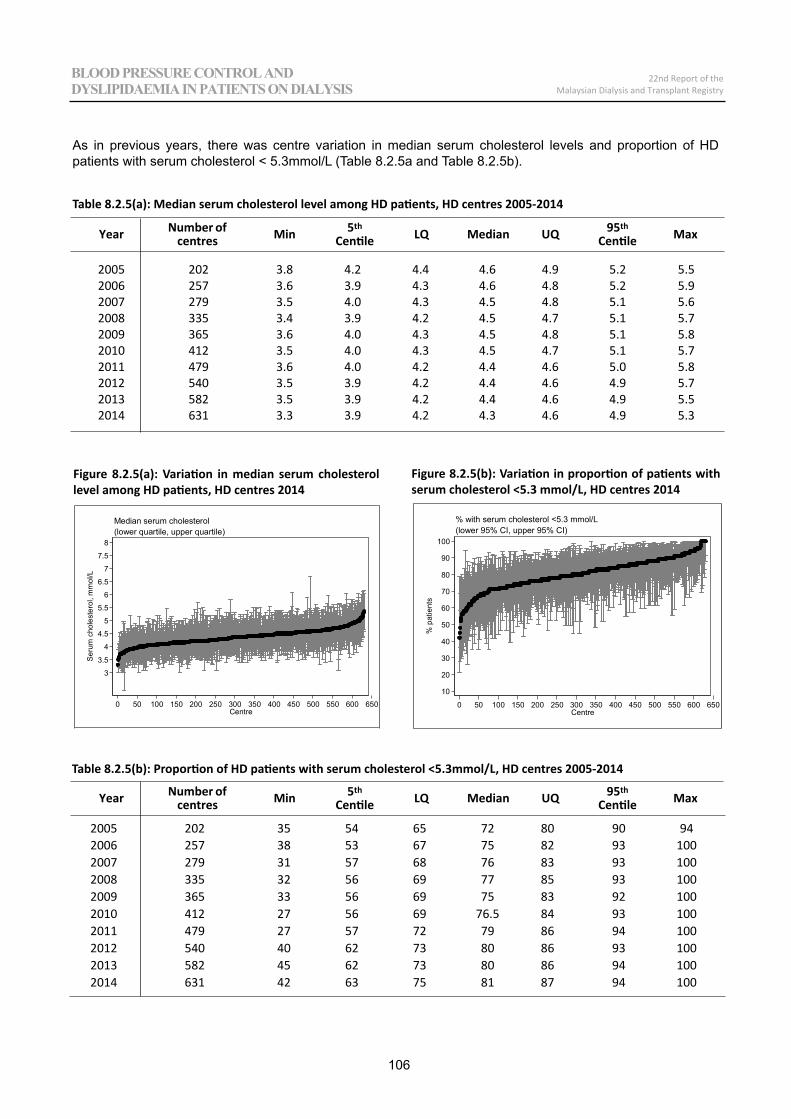
106
22nd Report of theMalaysian Dialysis and Transplant Registry
BLOOD PRESSURE CONTROL AND DYSLIPIDAEMIA IN PATIENTS ON DIALYSIS
2005 202 3.8 5.52006 257 3.6 5.92007 279 3.5 5.62008 335 3.4 5.72009 365 3.6 5.82010 412 3.5 5.72011 479 3.6 5.82012 540 3.5 5.72013 582 3.5 5.52014 631 3.3 5.3
As in previous years, there was centre variation in median serum cholesterol levels and proportion of HD patients with serum cholesterol < 5.3mmol/L (Table 8.2.5a and Table 8.2.5b).
Table 8.2.5(a): Median serum cholesterol level among HD patients, HD centres 2005-2014
3
3.5
4
4.5
5
5.5
6
6.5
7
7.5
8
Seru
m c
hole
ster
ol, m
mol
/L
0 50 100 150 200 250 300 350 400 450 500 550 600 650Centre
(lower quartile, upper quartile)Median serum cholesterol
2005 202 35 54 65 72 80 90 942006 257 38 53 67 75 82 93 1002007 279 31 57 68 76 83 93 1002008 335 32 56 69 77 85 93 1002009 365 33 56 69 75 83 92 1002010 412 27 56 69 76.5 84 93 1002011 479 27 57 72 79 86 94 1002012 540 40 62 73 80 86 93 1002013 582 45 62 73 80 86 94 1002014 631 42 63 75 81 87 94 100
Table 8.2.5(b): Proportion of HD patients with serum cholesterol <5.3mmol/L, HD centres 2005-2014
Figure 8.2.5(a): Variation in median serum cholesterol level among HD patients, HD centres 2014
Figure 8.2.5(b): Variation in proportion of patients with serum cholesterol <5.3 mmol/L, HD centres 2014
10
20
30
40
50
60
70
80
90
100
% p
atie
nts
0 50 100 150 200 250 300 350 400 450 500 550 600 650Centre
(lower 95% CI, upper 95% CI)% with serum cholesterol <5.3 mmol/L
Year Number ofcentres Min 5th
Centile LQ Median UQ 95th
Centile Max
Year Number ofcentres Min 5th
Centile LQ Median UQ 95th
Centile Max
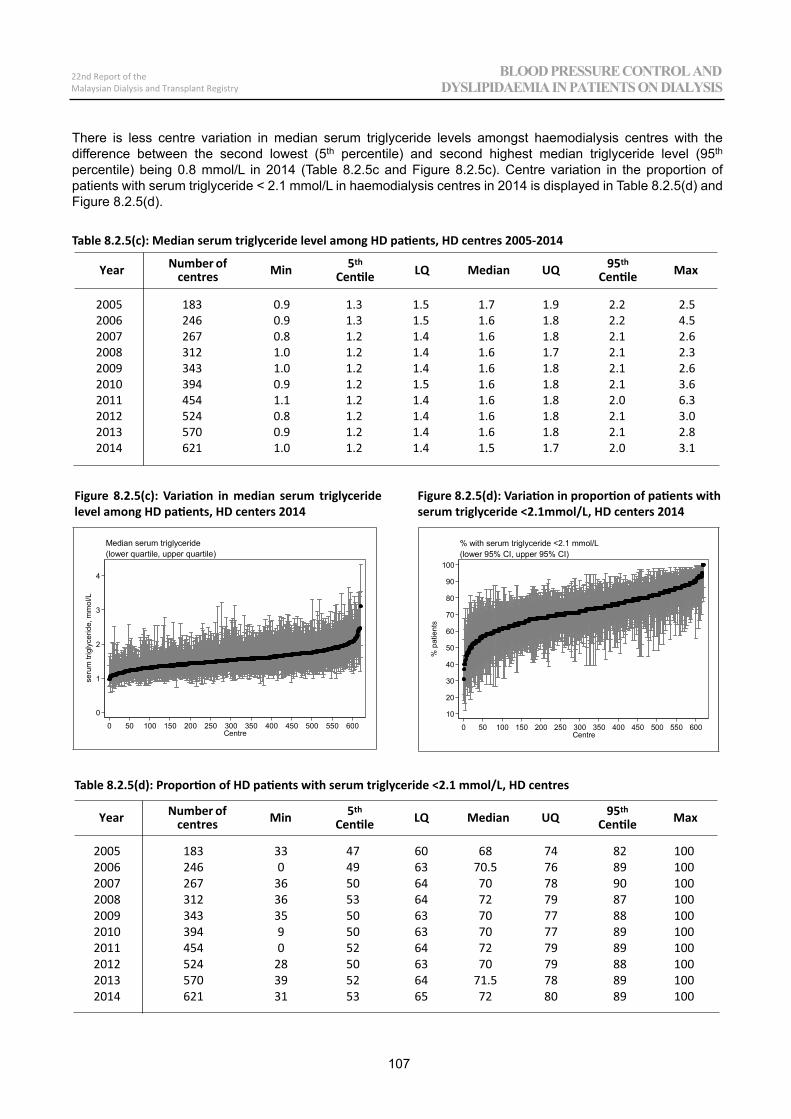
00
107
22nd Report of theMalaysian Dialysis and Transplant Registry
BLOOD PRESSURE CONTROL AND DYSLIPIDAEMIA IN PATIENTS ON DIALYSIS
2005 183 0.9 2.52006 246 0.9 4.52007 267 0.8 2.62008 312 1.0 2.32009 343 1.0 2.62010 394 0.9 3.62011 454 1.1 6.32012 524 0.8 3.02013 570 0.9 2.82014 621 1.0 3.1
There is less centre variation in median serum triglyceride levels amongst haemodialysis centres with the difference between the second lowest (5th percentile) and second highest median triglyceride level (95th percentile) being 0.8 mmol/L in 2014 (Table 8.2.5c and Figure 8.2.5c). Centre variation in the proportion of patients with serum triglyceride < 2.1 mmol/L in haemodialysis centres in 2014 is displayed in Table 8.2.5(d) and Figure 8.2.5(d).
Table 8.2.5(c): Median serum triglyceride level among HD patients, HD centres 2005-2014
0
1
2
3
4
seru
m tr
igly
cerid
e, m
mol
/L
0 50 100 150 200 250 300 350 400 450 500 550 600Centre
(lower quartile, upper quartile)Median serum triglyceride
2005 183 33 1002006 246 0 1002007 267 36 1002008 312 36 1002009 343 35 1002010 394 9 1002011 454 0 1002012 524 28 1002013 570 39 1002014 621 31 100
Table 8.2.5(d): Proportion of HD patients with serum triglyceride <2.1 mmol/L, HD centres
Figure 8.2.5(c): Variation in median serum triglyceride level among HD patients, HD centers 2014
10
20
30
40
50
60
70
80
90
100
% p
atie
nts
0 50 100 150 200 250 300 350 400 450 500 550 600Centre
(lower 95% CI, upper 95% CI)% with serum triglyceride <2.1 mmol/L
Figure 8.2.5(d): Variation in proportion of patients with serum triglyceride <2.1mmol/L, HD centers 2014
Year Number ofcentres Min 5th
Centile LQ Median UQ 95th
Centile Max
Year Number ofcentres Min 5th
Centile LQ Median UQ 95th
Centile Max
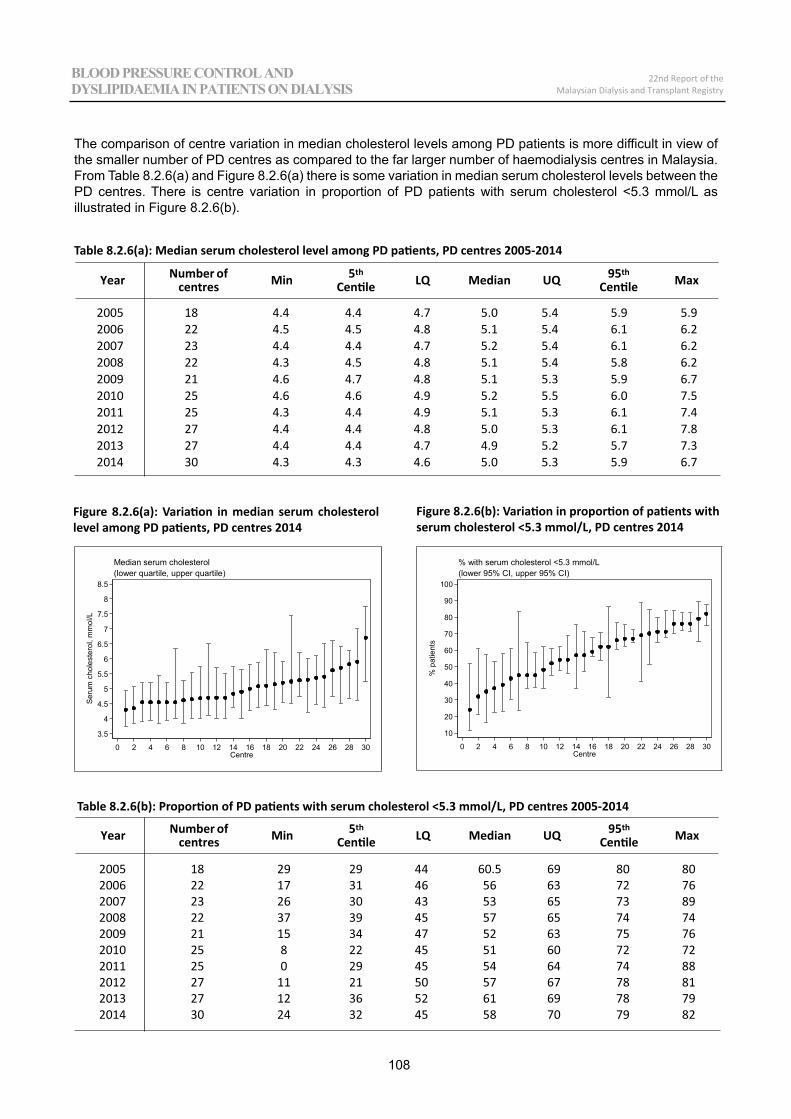
108
00
22nd Report of theMalaysian Dialysis and Transplant Registry
BLOOD PRESSURE CONTROL AND DYSLIPIDAEMIA IN PATIENTS ON DIALYSIS
BLOOD PRESSURE CONTROL AND DYSLIPIDAEMIA IN PATIENTS ON DIALYSIS
2005 18 4.4 4.4 4.7 5.0 5.4 5.9 5.92006 22 4.5 4.5 4.8 5.1 5.4 6.1 6.22007 23 4.4 4.4 4.7 5.2 5.4 6.1 6.22008 22 4.3 4.5 4.8 5.1 5.4 5.8 6.22009 21 4.6 4.7 4.8 5.1 5.3 5.9 6.72010 25 4.6 4.6 4.9 5.2 5.5 6.0 7.52011 25 4.3 4.4 4.9 5.1 5.3 6.1 7.42012 27 4.4 4.4 4.8 5.0 5.3 6.1 7.82013 27 4.4 4.4 4.7 4.9 5.2 5.7 7.32014 30 4.3 4.3 4.6 5.0 5.3 5.9 6.7
The comparison of centre variation in median cholesterol levels among PD patients is more difficult in view of the smaller number of PD centres as compared to the far larger number of haemodialysis centres in Malaysia. From Table 8.2.6(a) and Figure 8.2.6(a) there is some variation in median serum cholesterol levels between the PD centres. There is centre variation in proportion of PD patients with serum cholesterol <5.3 mmol/L as illustrated in Figure 8.2.6(b).
Table 8.2.6(a): Median serum cholesterol level among PD patients, PD centres 2005-2014
3.5
4
4.5
5
5.5
6
6.5
7
7.5
8
8.5
Ser
um c
hole
ster
ol, m
mol
/L
0 2 4 6 8 10 12 14 16 18 20 22 24 26 28 30Centre
(lower quartile, upper quartile)Median serum cholesterol
Figure 8.2.6(a): Variation in median serum cholesterol level among PD patients, PD centres 2014
2005 18 29 802006 22 17 762007 23 26 892008 22 37 742009 21 15 762010 25 8 722011 25 0 882012 27 11 812013 27 12 792014 30 24 82
Table 8.2.6(b): Proportion of PD patients with serum cholesterol <5.3 mmol/L, PD centres 2005-2014
10
20
30
40
50
60
70
80
90
100
% p
atie
nts
0 2 4 6 8 10 12 14 16 18 20 22 24 26 28 30Centre
(lower 95% CI, upper 95% CI)% with serum cholesterol <5.3 mmol/L
Figure 8.2.6(b): Variation in proportion of patients with serum cholesterol <5.3 mmol/L, PD centres 2014
Year Number ofcentres Min 5th
Centile LQ Median UQ 95th
Centile Max
Year Number ofcentres Min 5th
Centile LQ Median UQ 95th
Centile Max
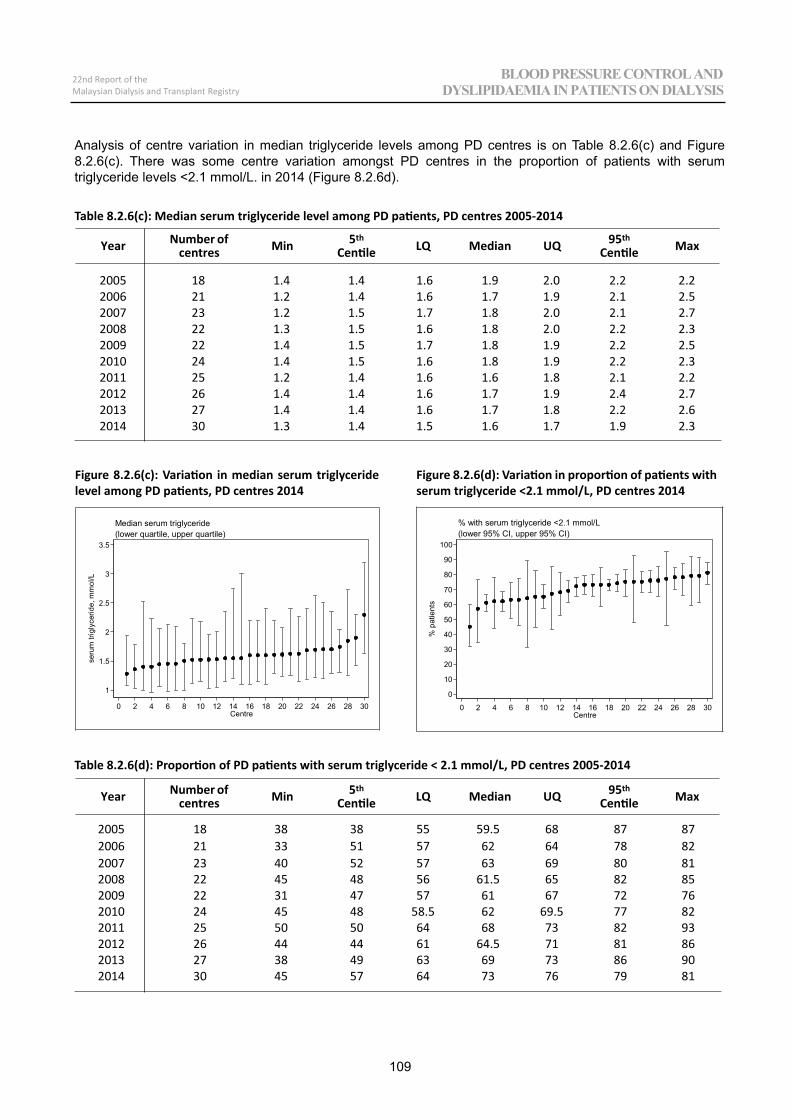
00
109
22nd Report of theMalaysian Dialysis and Transplant Registry
BLOOD PRESSURE CONTROL AND DYSLIPIDAEMIA IN PATIENTS ON DIALYSIS
2005 18 1.4 2.22006 21 1.2 2.52007 23 1.2 2.72008 22 1.3 2.32009 22 1.4 2.52010 24 1.4 2.32011 25 1.2 2.22012 26 1.4 2.72013 27 1.4 2.62014 30 1.3 2.3
Analysis of centre variation in median triglyceride levels among PD centres is on Table 8.2.6(c) and Figure 8.2.6(c). There was some centre variation amongst PD centres in the proportion of patients with serum triglyceride levels <2.1 mmol/L. in 2014 (Figure 8.2.6d).
Table 8.2.6(c): Median serum triglyceride level among PD patients, PD centres 2005-2014
1
1.5
2
2.5
3
3.5
seru
m tr
igly
cerid
e, m
mol
/L
0 2 4 6 8 10 12 14 16 18 20 22 24 26 28 30Centre
(lower quartile, upper quartile)Median serum triglyceride
2005 18 38 872006 21 33 822007 23 40 812008 22 45 852009 22 31 762010 24 45 822011 25 50 932012 26 44 862013 27 38 902014 30 45 81
Table 8.2.6(d): Proportion of PD patients with serum triglyceride < 2.1 mmol/L, PD centres 2005-2014
Figure 8.2.6(c): Variation in median serum triglyceride level among PD patients, PD centres 2014
0
10
20
30
40
50
60
70
80
90
100
% p
atie
nts
0 2 4 6 8 10 12 14 16 18 20 22 24 26 28 30Centre
(lower 95% CI, upper 95% CI)% with serum triglyceride <2.1 mmol/L
Figure 8.2.6(d): Variation in proportion of patients with serum triglyceride <2.1 mmol/L, PD centres 2014
Year Number ofcentres Min 5th
Centile LQ Median UQ 95th
Centile Max
Year Number ofcentres Min 5th
Centile LQ Median UQ 95th
Centile Max
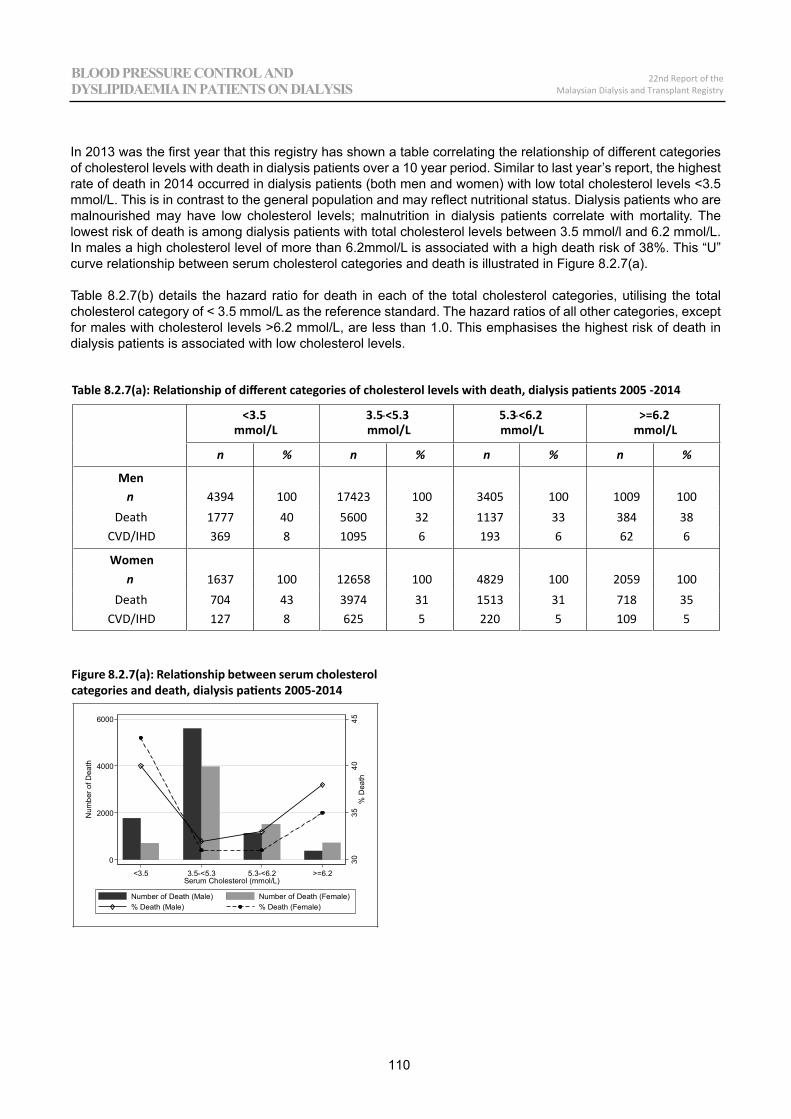
110
22nd Report of theMalaysian Dialysis and Transplant Registry
BLOOD PRESSURE CONTROL AND DYSLIPIDAEMIA IN PATIENTS ON DIALYSIS
In 2013 was the first year that this registry has shown a table correlating the relationship of different categories of cholesterol levels with death in dialysis patients over a 10 year period. Similar to last year’s report, the highest rate of death in 2014 occurred in dialysis patients (both men and women) with low total cholesterol levels <3.5 mmol/L. This is in contrast to the general population and may reflect nutritional status. Dialysis patients who are malnourished may have low cholesterol levels; malnutrition in dialysis patients correlate with mortality. The lowest risk of death is among dialysis patients with total cholesterol levels between 3.5 mmol/l and 6.2 mmol/L. In males a high cholesterol level of more than 6.2mmol/L is associated with a high death risk of 38%. This “U” curve relationship between serum cholesterol categories and death is illustrated in Figure 8.2.7(a).
Table 8.2.7(b) details the hazard ratio for death in each of the total cholesterol categories, utilising the total cholesterol category of < 3.5 mmol/L as the reference standard. The hazard ratios of all other categories, except for males with cholesterol levels >6.2 mmol/L, are less than 1.0. This emphasises the highest risk of death in dialysis patients is associated with low cholesterol levels.
3035
4045
% D
eath
0
2000
4000
6000
Num
ber o
f Dea
th
<3.5 3.5-<5.3 5.3-<6.2 >=6.2Serum Cholesterol (mmol/L)
Number of Death (Male) Number of Death (Female)% Death (Male) % Death (Female)
<3.5mmol/L
3.5 <5.3mmol/L
5.3 <6.2mmol/L
>=6.2mmol/L
n % n % n % n %
Menn 4394 100 17423 100 3405 100 1009 100
Death 1777 40 5600 32 1137 33 384 38CVD/IHD 369 8 1095 6 193 6 62 6
Womenn 1637 100 12658 100 4829 100 2059 100
Death 704 43 3974 31 1513 31 718 35CVD/IHD 127 8 625 5 220 5 109 5
Table 8.2.7(a): Relationship of different categories of cholesterol levels with death, dialysis patients 2005 -2014
Figure 8.2.7(a): Relationship between serum cholesterol categories and death, dialysis patients 2005-2014
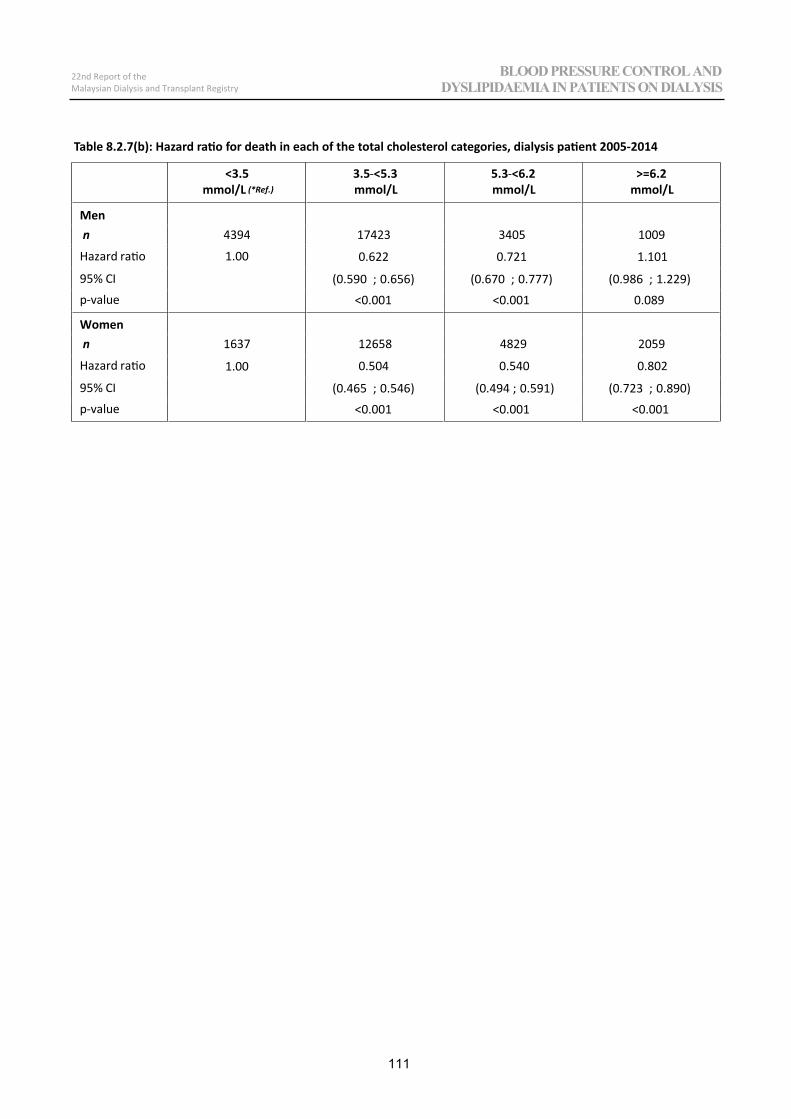
00
111
22nd Report of theMalaysian Dialysis and Transplant Registry
BLOOD PRESSURE CONTROL AND DYSLIPIDAEMIA IN PATIENTS ON DIALYSIS
<3.5mmol/L (*Ref.)
3.5 <5.3mmol/L
5.3 <6.2mmol/L
>=6.2mmol/L
Menn 4394
Hazard ratio 1.00 0.622 0.721 1.101
95% CI (0.590 ; 0.656) (0.670 ; 0.777) (0.986 ; 1.229)p value
Womenn 1637
Hazard ratio 1.00 0.504 0.540 0.802
95% CI (0.465 ; 0.546) (0.494 ; 0.591) (0.723 ; 0.890)p value
Table 8.2.7(b): Hazard ratio for death in each of the total cholesterol categories, dialysis patient 2005-2014

22nd Report of theMalaysian Dialysis and Transplant Registry ALL RENAL REPLACEMENT THERAPY IN MALAYSIA
Chapter 9
CHRONIC KIDNEY DISEASE - MINERAL AND BONE DISORDER
Goh Bak LeongChing Chen Hua
Kok Lai SunLiew Yew Fong
Yudisthra A/L M. Ganeshadeva
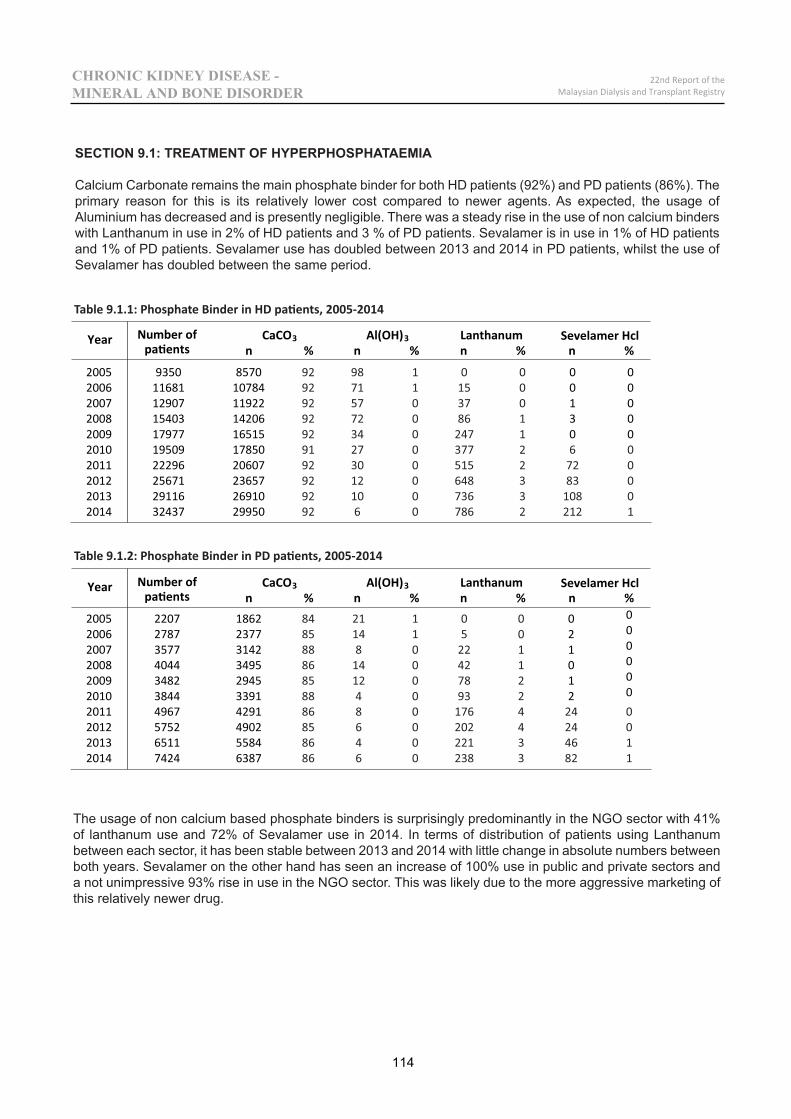
Year Number ofpatients
CaCO 3 Al(OH) 3 Lanthanum Sevelamer Hcln
2005 9350 8570 0 02006 11681 10784 0 02007 12907 11922 1 02008 15403 14206 3 02009 17977 16515 0 02010 19509 178502011 22296 206072012 25671 236572013 29116 269102014 32437 29950
2005 2207 1862 0 02006 2787 2377 2 02007 3577 3142 1 02008 4044 3495 0 02009 3482 2945 1 02010 3844 3391 2 02011 4967 42912012 5752 49022013 6511 55842014 7424 6387
114
22nd Report of theMalaysian Dialysis and Transplant Registry
CHRONIC KIDNEY DISEASE - MINERAL AND BONE DISORDER
SECTION 9.1: TREATMENT OF HYPERPHOSPHATAEMIA
Calcium Carbonate remains the main phosphate binder for both HD patients (92%) and PD patients (86%). The primary reason for this is its relatively lower cost compared to newer agents. As expected, the usage of Aluminium has decreased and is presently negligible. There was a steady rise in the use of non calcium binders with Lanthanum in use in 2% of HD patients and 3 % of PD patients. Sevalamer is in use in 1% of HD patients and 1% of PD patients. Sevalamer use has doubled between 2013 and 2014 in PD patients, whilst the use of Sevalamer has doubled between the same period.
Table 9.1.1: Phosphate Binder in HD patients, 2005-2014
Table 9.1.2: Phosphate Binder in PD patients, 2005-2014
The usage of non calcium based phosphate binders is surprisingly predominantly in the NGO sector with 41% of lanthanum use and 72% of Sevalamer use in 2014. In terms of distribution of patients using Lanthanum between each sector, it has been stable between 2013 and 2014 with little change in absolute numbers between both years. Sevalamer on the other hand has seen an increase of 100% use in public and private sectors and a not unimpressive 93% rise in use in the NGO sector. This was likely due to the more aggressive marketing of this relatively newer drug.
n % n % n %%
Year Number ofpatients
CaCO 3 Al(OH) 3 Lanthanum Sevelamer Hcln n % n % n %%
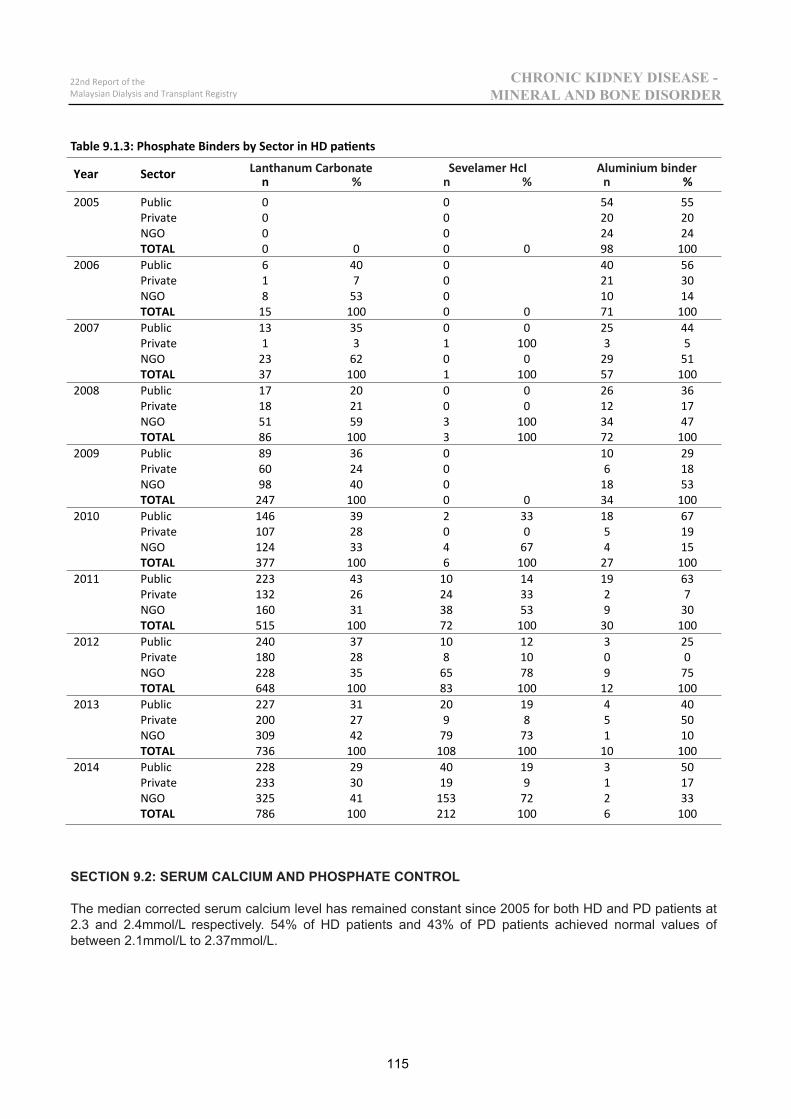
Year Sector n %2005 Public 0 450 55
Private 0 020 20NGO 0 420 24TOTAL 0 0 0 0 98 100
2006 Public 6 04004 56Private 1 1207 30NGO 8 53 0 10 14TOTAL 15 100 0 0 71 100
2007 Public 13 35 0 0 25 44Private 1 3 1 100 3 5NGO 23 62 0 0 29 51TOTAL 37 100 1 100 57 100
2008 Public 17 20 0 0 26 36Private 18 21 0 0 12 17NGO 51 59 3 100 34 47TOTAL 86 100 3 100 72 100
2009 Public 89 01063 29Private 60 6042 18NGO 98 81004 53TOTAL 247 100 0 0 34 100
2010 Public 146 39 2 33 18 67Private 107 28 0 0 5 19NGO 124 33 4 67 4 15TOTAL 377 100 6 100 27 100
2011 Public 223 43 10 14 19 63Private 132 26 24 33 2 7NGO 160 31 38 53 9 30TOTAL 515 100 72 100 30 100
2012 Public 240 37 10 12 3 25Private 180 28 8 10 0 0NGO 228 35 65 78 9 75TOTAL 648 100 83 100 12 100
2013 Public 227 31 20 19 4 40Private 200 27 9 8 5 50NGO 309 42 79 73 1 10TOTAL 736 100 108 100 10 100
2014 Public 228 29 40 19 3 50Private 233 30 19 9 1 17NGO 325 41 153 72 2 33TOTAL 786 100 212 100 6 100
115
22nd Report of theMalaysian Dialysis and Transplant Registry
CHRONIC KIDNEY DISEASE - MINERAL AND BONE DISORDER
Table 9.1.3: Phosphate Binders by Sector in HD patients
Lanthanum Carbonate Aluminium binderSevelamer HcI
SECTION 9.2: SERUM CALCIUM AND PHOSPHATE CONTROL
The median corrected serum calcium level has remained constant since 2005 for both HD and PD patients at 2.3 and 2.4mmol/L respectively. 54% of HD patients and 43% of PD patients achieved normal values of between 2.1mmol/L to 2.37mmol/L.
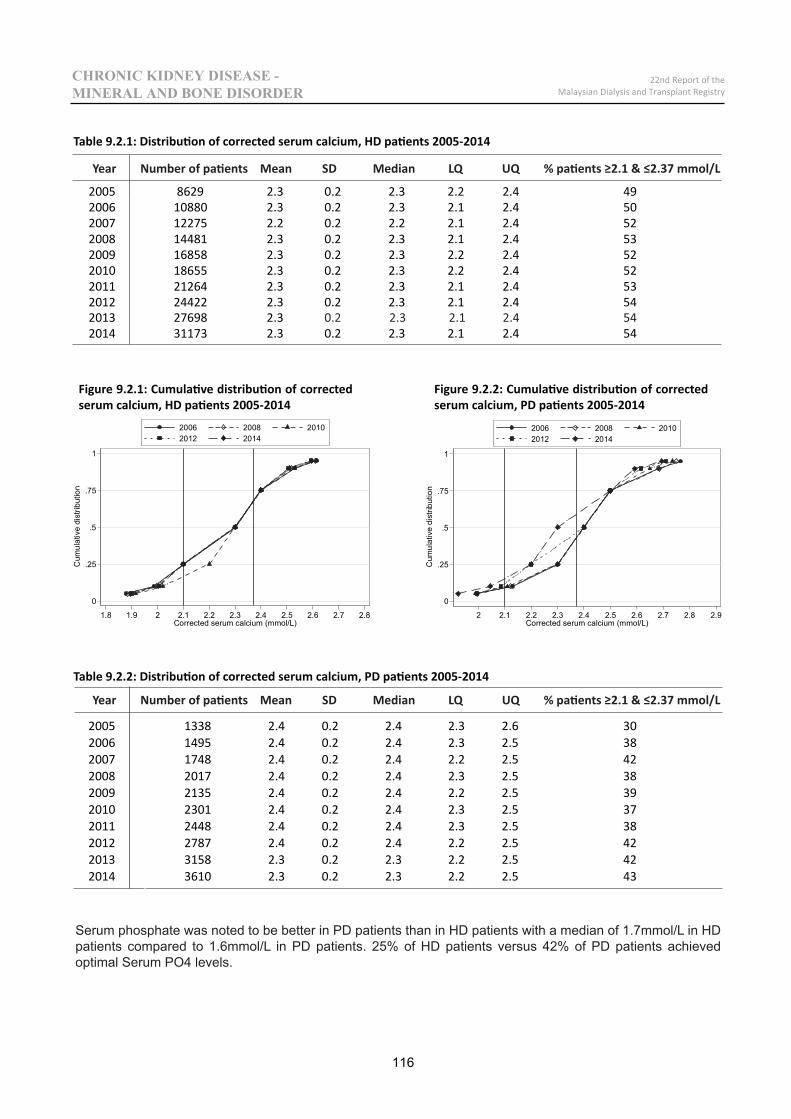
116
22nd Report of theMalaysian Dialysis and Transplant Registry
CHRONIC KIDNEY DISEASE - MINERAL AND BONE DISORDER
Table 9.2.1: Distribution of corrected serum calcium, HD patients 2005-2014
Table 9.2.2: Distribution of corrected serum calcium, PD patients 2005-2014
2005 8629 2.3 0.2 2.3 2.2 2.4 492006 10880 2.3 0.2 2.3 2.1 2.4 502007 12275 2.2 0.2 2.2 2.1 2.4 522008 14481 2.3 0.2 2.3 2.1 2.4 532009 16858 2.3 0.2 2.3 2.2 2.4 522010 18655 2.3 0.2 2.3 2.2 2.4 522011 21264 2.3 0.2 2.3 2.1 2.4 532012 24422 2.3 0.2 2.3 2.1 2.4 542013 27698 2.32014 31173 2.3 0.2 2.3 2.1 2.4 54
Year Number of patients Mean SD Median LQ UQ % patients ≥2.1 & ≤2.37 mmol/L
Year Number of patients Mean SD Median LQ UQ % patients ≥2.1 & ≤2.37 mmol/L
0
.25
.5
.75
1
Cum
ulat
ive
dist
ribut
ion
1.8 1.9 2 2.1 2.2 2.3 2.4 2.5 2.6 2.7 2.8Corrected serum calcium (mmol/L)
2006 2008 20102012 2014
0
.25
.5
.75
1
Cum
ulat
ive
dist
ribut
ion
2 2.1 2.2 2.3 2.4 2.5 2.6 2.7 2.8 2.9Corrected serum calcium (mmol/L)
2006 2008 20102012 2014
2005 1338 2.4 0.2 2.4 2.3 2.6 302006 1495 2.4 0.2 2.4 2.3 2.5 382007 1748 2.4 0.2 2.4 2.2 2.5 422008 2017 2.4 0.2 2.4 2.3 2.5 382009 2135 2.4 0.2 2.4 2.2 2.5 392010 2301 2.4 0.2 2.4 2.3 2.5 372011 2448 2.4 0.2 2.4 2.3 2.5 382012 2787 2.4 0.2 2.4 2.2 2.5 422013 3158 2.3 0.2 2.3 2.2 2.5 422014 3610 2.3 0.2 2.3 2.2 2.5 43
Figure 9.2.1: Cumulative distribution of corrected serum calcium, HD patients 2005-2014
Figure 9.2.2: Cumulative distribution of corrected serum calcium, PD patients 2005-2014
Serum phosphate was noted to be better in PD patients than in HD patients with a median of 1.7mmol/L in HD patients compared to 1.6mmol/L in PD patients. 25% of HD patients versus 42% of PD patients achieved optimal Serum PO4 levels.
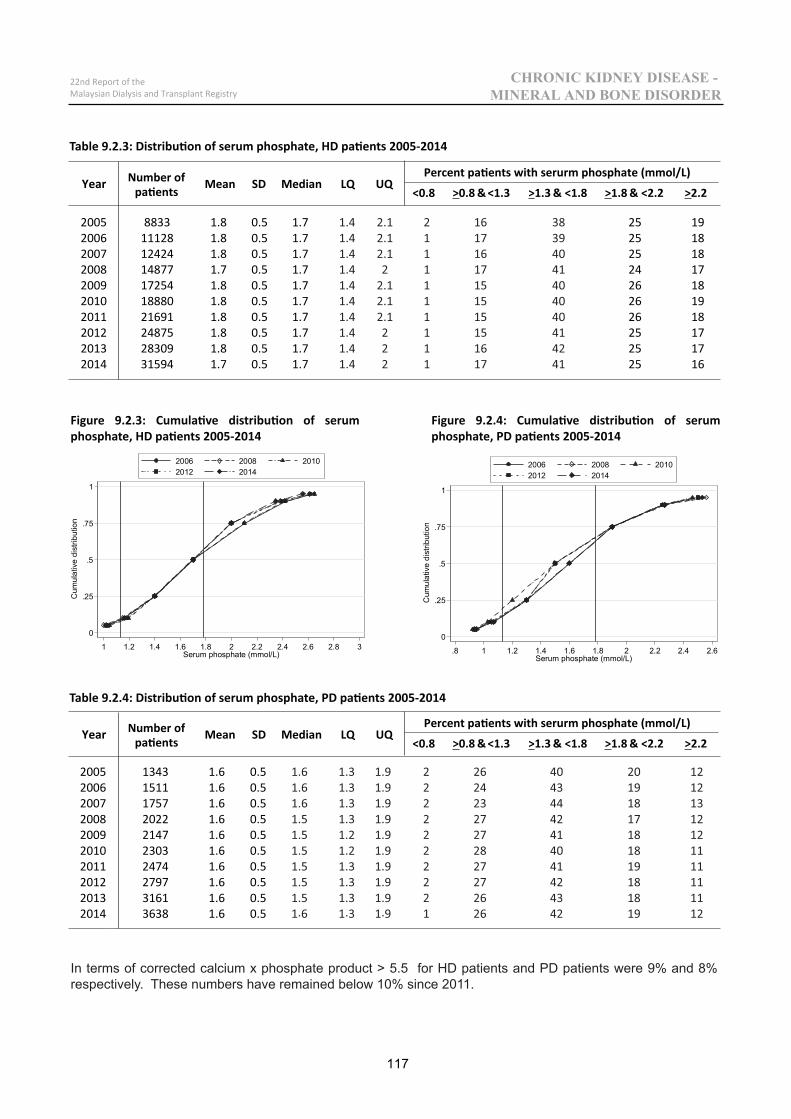
2005 8833 1.8 0.5 1.7 25 192006 11128 1.8 0.5 1.7 25 182007 12424 1.8 0.5 1.7 25 182008 14877 1.7 0.5 1.7 24 172009 17254 1.8 0.5 1.7 26 182010 18880 1.8 0.5 1.7 26 192011 21691 1.8 0.5 1.7 26 182012 24875 1.8 0.5 1.7 25 172013 28309 1.8 0.5 1.7 25 172014 31594 1.7 0.5 1.7 25 16
117
22nd Report of theMalaysian Dialysis and Transplant Registry
CHRONIC KIDNEY DISEASE - MINERAL AND BONE DISORDER
Table 9.2.3: Distribution of serum phosphate, HD patients 2005-2014
Table 9.2.4: Distribution of serum phosphate, PD patients 2005-2014
0
.25
.5
.75
1
Cum
ulat
ive
dist
ribut
ion
1 1.2 1.4 1.6 1.8 2 2.2 2.4 2.6 2.8 3Serum phosphate (mmol/L)
2006 2008 20102012 2014
0
.25
.5
.75
1
Cum
ulat
ive
dist
ribut
ion
.8 1 1.2 1.4 1.6 1.8 2 2.2 2.4 2.6Serum phosphate (mmol/L)
2006 2008 20102012 2014
2005 1343 1.6 0.52006 1511 1.6 0.52007 1757 1.6 0.52008 2022 1.6 0.52009 2147 1.6 0.52010 2303 1.6 0.52011 2474 1.6 0.52012 2797 1.6 0.52013 3161 1.6 0.52014 3638 1.6 0.5
Figure 9.2.3: Cumulative distribution of serum phosphate, HD patients 2005-2014
Figure 9.2.4: Cumulative distribution of serum phosphate, PD patients 2005-2014
In terms of corrected calcium x phosphate product > 5.5 for HD patients and PD patients were 9% and 8% respectively. These numbers have remained below 10% since 2011.
Year Number ofpatients Mean SD Median LQ UQ
Percent patients with serurm phosphate (mmol/L)
<0.8 >1.3 & <1.8 >1.8 & <2.2 >2.2>0.8 & <1.3
Year Number ofpatients Mean SD Median LQ UQ
Percent patients with serurm phosphate (mmol/L)
<0.8 >1.3 & <1.8 >1.8 & <2.2 >2.2>0.8 & <1.3
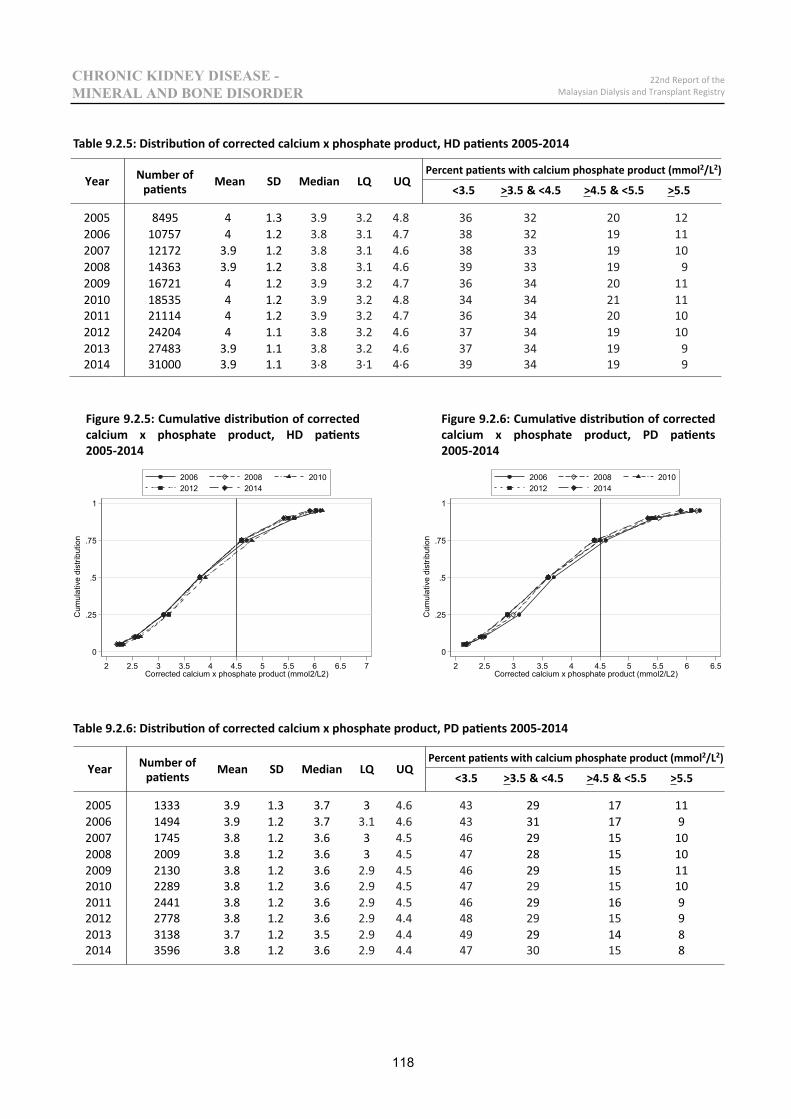
0
.25
.5
.75
1
Cum
ulat
ive
dist
ribut
ion
2 2.5 3 3.5 4 4.5 5 5.5 6 6.5 7Corrected calcium x phosphate product (mmol2/L2)
2006 2008 20102012 2014
0
.25
.5
.75
1
Cum
ulat
ive
dist
ribut
ion
2 2.5 3 3.5 4 4.5 5 5.5 6 6.5Corrected calcium x phosphate product (mmol2/L2)
2006 2008 20102012 2014
2005 1333 3.9 1.3 3.7 3 29 17 112006 1494 3.9 1.2 3.7 31 17 92007 1745 3.8 1.2 3.6 3 29 15 102008 2009 3.8 1.2 3.6 3 28 15 102009 2130 3.8 1.2 3.6 29 15 112010 2289 3.8 1.2 3.6 102011 2441 3.8 1.2 3.6 29 16 92012 2778 3.8 1.2 3.6 92013 3138 3.7 1.2 3.5 29 14 82014 3596 3.8 1.2 3.6 8
118
22nd Report of theMalaysian Dialysis and Transplant Registry
CHRONIC KIDNEY DISEASE - MINERAL AND BONE DISORDER
Figure 9.2.5: Cumulative distribution of corrected calcium x phosphate product, HD patients 2005-2014
Figure 9.2.6: Cumulative distribution of corrected calcium x phosphate product, PD patients 2005-2014
2007 12172 3.9 1.22008 14363 3.9 1.22009 16721 4 1.22010 18535 4 1.22011 21114 4 1.22012 24204 4 1.12013 27483 3.9 1.12014 31000 3.9 1.1
Year Number ofpatients Mean SD Median LQ UQ
Percent patients with calcium phosphate product (mmol2/L2)
<3.5 >3.5 & <4.5 >4.5 & <5.5 >5.5
2005 8495 4 1.32006 10757 4 1.2
Table 9.2.5: Distribution of corrected calcium x phosphate product, HD patients 2005-2014
Table 9.2.6: Distribution of corrected calcium x phosphate product, PD patients 2005-2014
Year Number ofpatients Mean SD Median LQ UQ
Percent patients with calcium phosphate product (mmol2/L2)
<3.5 >3.5 & <4.5 >4.5 & <5.5 >5.5
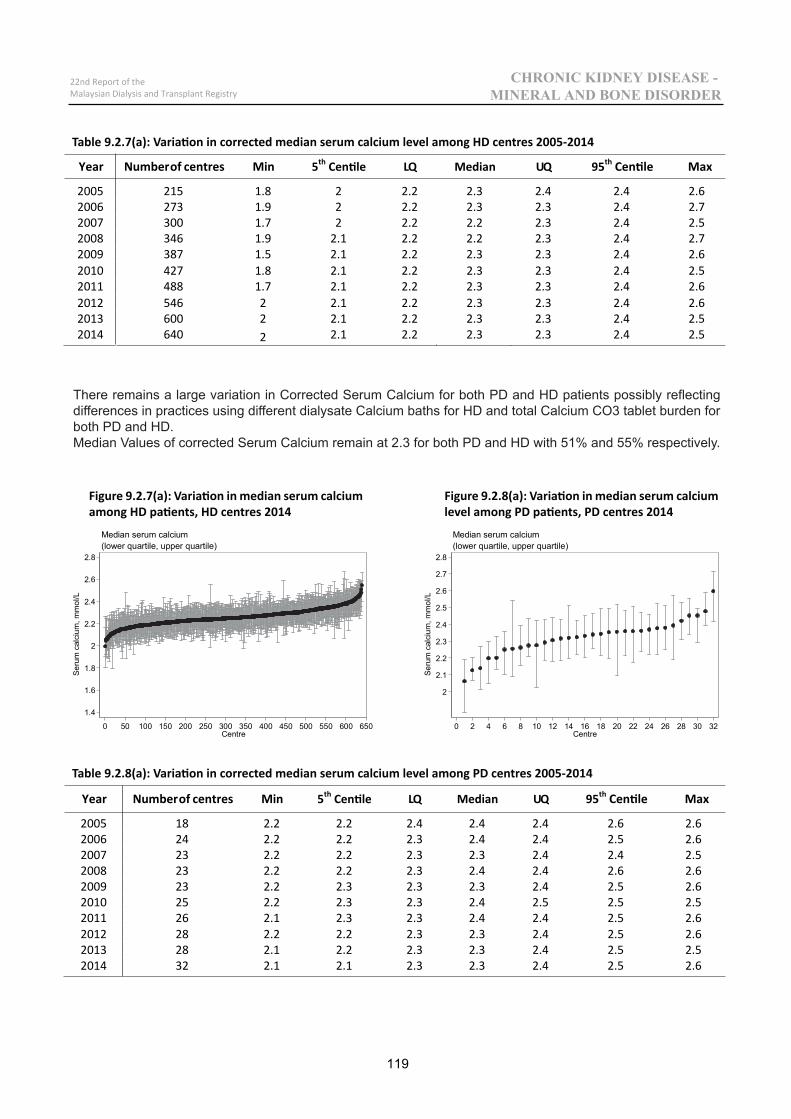
1.4
1.6
1.8
2
2.2
2.4
2.6
2.8
Seru
m c
alci
um, m
mol
/L
0 50 100 150 200 250 300 350 400 450 500 550 600 650Centre
(lower quartile, upper quartile)Median serum calcium
2
2.1
2.2
2.3
2.4
2.5
2.6
2.7
2.8
Seru
m c
alci
um, m
mol
/L
0 2 4 6 8 10 12 14 16 18 20 22 24 26 28 30 32Centre
(lower quartile, upper quartile)Median serum calcium
Year Numberof centres Min 5th Centile LQ Median UQ 95th Centile Max
2005 18 2.2 2.2 2.4 2.4 2.4 2.6 2.62006 24 2.2 2.2 2.3 2.4 2.4 2.5 2.62007 23 2.2 2.2 2.3 2.3 2.4 2.4 2.52008 23 2.2 2.2 2.3 2.4 2.4 2.6 2.62009 23 2.2 2.3 2.3 2.3 2.4 2.5 2.62010 25 2.2 2.3 2.3 2.4 2.5 2.5 2.52011 26 2.1 2.3 2.3 2.4 2.4 2.5 2.62012 28 2.2 2.2 2.3 2.3 2.4 2.5 2.62013 28 2.1 2.2 2.3 2.3 2.4 2.5 2.52014 32 2.1 2.1 2.3 2.3 2.4 2.5 2.6
Year Numberof centres Min 5th Centile LQ Median UQ 95th Centile Max
2005 215 1.8 2 2.2 2.3 2.4 2.4 2.62006 273 1.9 2 2.2 2.3 2.3 2.4 2.72007 300 1.7 2 2.2 2.2 2.3 2.4 2.52008 346 1.9 2.1 2.2 2.2 2.3 2.4 2.72009 387 1.5 2.1 2.2 2.3 2.3 2.4 2.62010 427 1.8 2.1 2.2 2.3 2.3 2.4 2.52011 488 1.7 2.1 2.2 2.3 2.3 2.4 2.62012 546 2 2.1 2.2 2.3 2.3 2.4 2.62013 600 2 2.1 2.2 2.3 2.3 2.4 2.52014 640 2 2.1 2.2 2.3 2.3 2.4 2.5
119
22nd Report of theMalaysian Dialysis and Transplant Registry
CHRONIC KIDNEY DISEASE - MINERAL AND BONE DISORDER
Figure 9.2.7(a): Variation in median serum calcium among HD patients, HD centres 2014
Figure 9.2.8(a): Variation in median serum calcium level among PD patients, PD centres 2014
Table 9.2.7(a): Variation in corrected median serum calcium level among HD centres 2005-2014
Table 9.2.8(a): Variation in corrected median serum calcium level among PD centres 2005-2014
There remains a large variation in Corrected Serum Calcium for both PD and HD patients possibly reflecting differences in practices using different dialysate Calcium baths for HD and total Calcium CO3 tablet burden for both PD and HD.Median Values of corrected Serum Calcium remain at 2.3 for both PD and HD with 51% and 55% respectively.
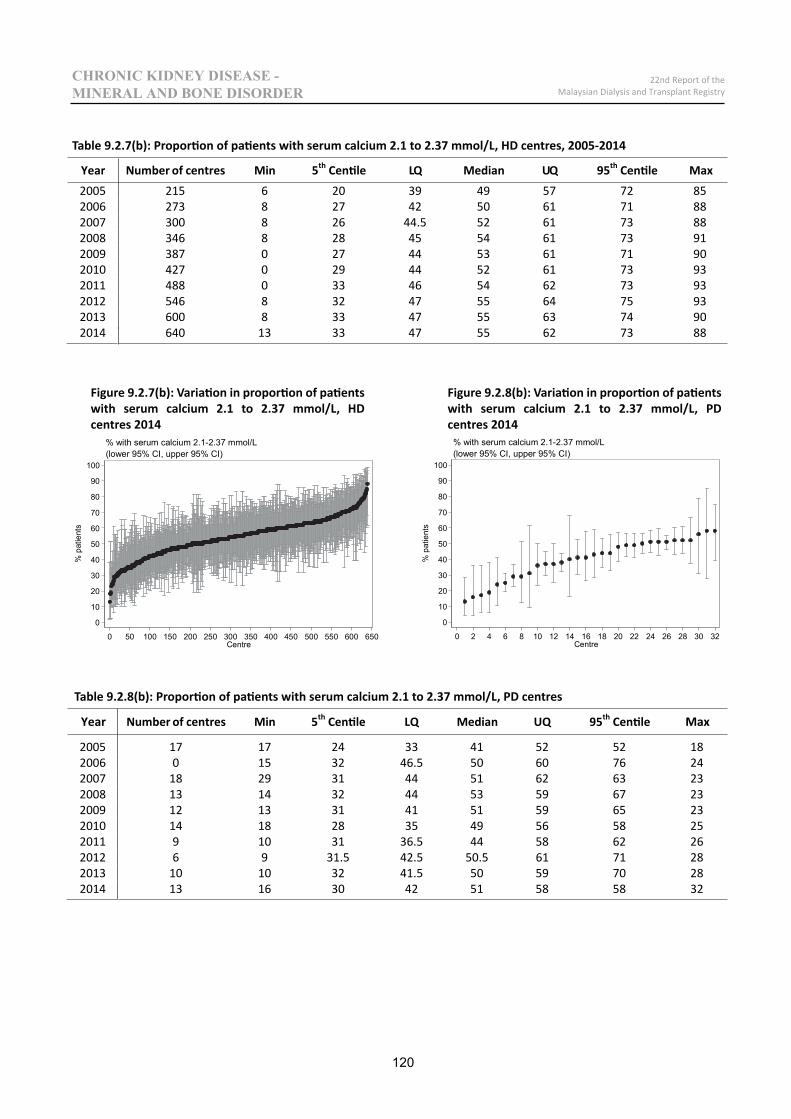
0
10
20
30
40
50
60
70
80
90
100
% p
atie
nts
0 50 100 150 200 250 300 350 400 450 500 550 600 650Centre
(lower 95% CI, upper 95% CI)% with serum calcium 2.1-2.37 mmol/L
0
10
20
30
40
50
60
70
80
90
100
% p
atie
nts
0 2 4 6 8 10 12 14 16 18 20 22 24 26 28 30 32Centre
(lower 95% CI, upper 95% CI)% with serum calcium 2.1-2.37 mmol/L
Year Number of centres Min 5th Centile LQ Median UQ 95th Centile Max
2005 17 17 24 33 41 52 52 182006 0 15 32 46.5 50 60 76 242007 18 29 31 44 51 62 63 232008 13 14 32 44 53 59 67 232009 12 13 31 41 51 59 65 232010 14 18 28 35 49 56 58 252011 9 10 31 36.5 44 58 62 262012 6 9 31.5 42.5 50.5 61 71 282013 10 10 32 41.5 50 59 70 282014 13 16 30 42 51 58 58 32
Year Number of centres Min 5th Centile LQ Median UQ 95th Centile Max2005 215 6 20 39 49 57 72 852006 273 8 27 42 50 61 71 882007 300 8 26 44.5 52 61 73 882008 346 8 28 45 54 61 73 912009 387 0 27 44 53 61 71 902010 427 0 29 44 52 61 73 932011 488 0 33 46 54 62 73 932012 546 8 32 47 55 64 75 932013 600 8 33 47 55 63 74 902014 640 13 33 47 55 62 73 88
Table 9.2.7(b): Proportion of patients with serum calcium 2.1 to 2.37 mmol/L, HD centres, 2005-2014
120
22nd Report of theMalaysian Dialysis and Transplant Registry
CHRONIC KIDNEY DISEASE - MINERAL AND BONE DISORDER
Figure 9.2.7(b): Variation in proportion of patients with serum calcium 2.1 to 2.37 mmol/L, HD centres 2014
Figure 9.2.8(b): Variation in proportion of patients with serum calcium 2.1 to 2.37 mmol/L, PD centres 2014
Table 9.2.8(b): Proportion of patients with serum calcium 2.1 to 2.37 mmol/L, PD centres
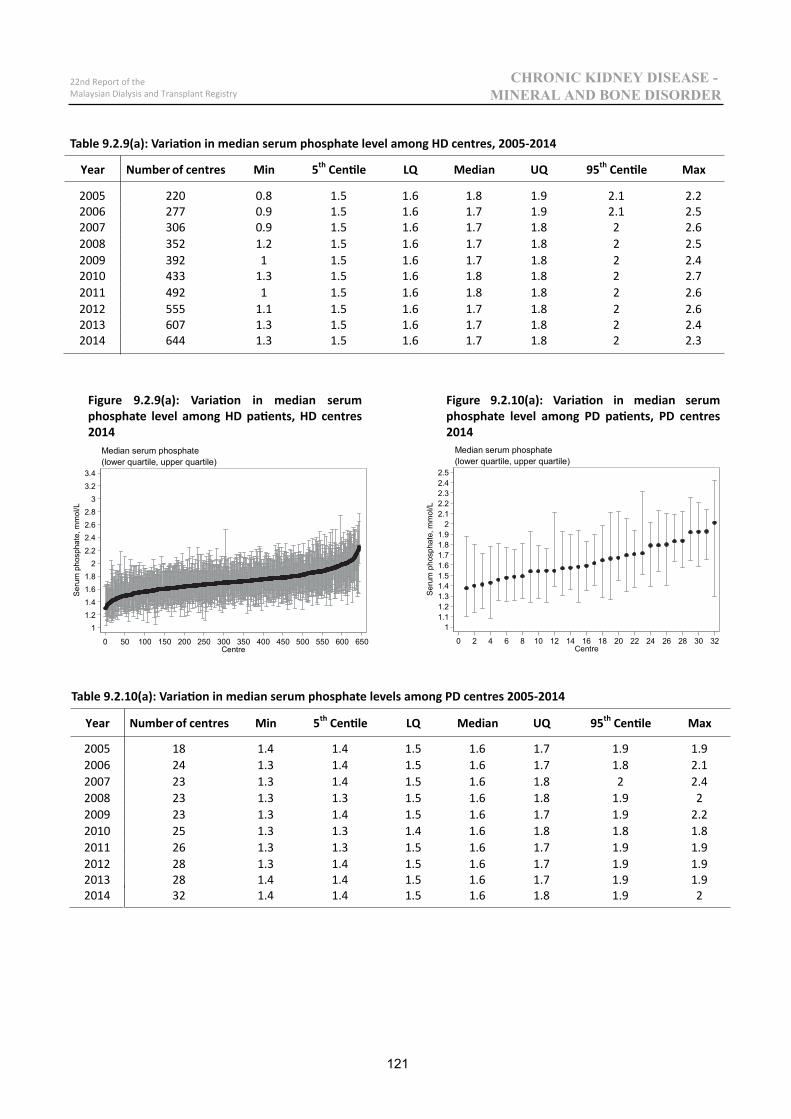
11.21.41.61.8
22.22.42.62.8
33.23.4
Ser
um p
hosp
hate
, mm
ol/L
0 50 100 150 200 250 300 350 400 450 500 550 600 650Centre
(lower quartile, upper quartile)Median serum phosphate
11.11.21.31.41.51.61.71.81.9
22.12.22.32.42.5
Ser
um p
hosp
hate
, mm
ol/L
0 2 4 6 8 10 12 14 16 18 20 22 24 26 28 30 32Centre
(lower quartile, upper quartile)Median serum phosphate
Year Number of centres Min 5th Centile LQ Median UQ 95th Centile Max
2005 18 1.4 1.4 1.5 1.6 1.7 1.9 1.92006 24 1.3 1.4 1.5 1.6 1.7 1.8 2.12007 23 1.3 1.4 1.5 1.6 1.8 2 2.42008 23 1.3 1.3 1.5 1.6 1.8 1.9 22009 23 1.3 1.4 1.5 1.6 1.7 1.9 2.22010 25 1.3 1.3 1.4 1.6 1.8 1.8 1.82011 26 1.3 1.3 1.5 1.6 1.7 1.9 1.92012 28 1.3 1.4 1.5 1.6 1.7 1.9 1.92013 28 1.4 1.4 1.5 1.6 1.7 1.9 1.92014 32 1.4 1.4 1.5 1.6 1.8 1.9 2
Year Number of centres Min 5th Centile LQ Median UQ 95th Centile Max
2005 220 0.8 1.5 1.6 1.8 1.9 2.1 2.22006 277 0.9 1.5 1.6 1.7 1.9 2.1 2.52007 306 0.9 1.5 1.6 1.7 1.8 2 2.62008 352 1.2 1.5 1.6 1.7 1.8 2 2.52009 392 1 1.5 1.6 1.7 1.8 2 2.42010 433 1.3 1.5 1.6 1.8 1.8 2 2.72011 492 1 1.5 1.6 1.8 1.8 2 2.62012 555 1.1 1.5 1.6 1.7 1.8 2 2.62013 607 1.3 1.5 1.6 1.7 1.8 2 2.42014 644 1.3 1.5 1.6 1.7 1.8 2 2.3
121
22nd Report of theMalaysian Dialysis and Transplant Registry
CHRONIC KIDNEY DISEASE - MINERAL AND BONE DISORDER
Figure 9.2.9(a): Variation in median serum phosphate level among HD patients, HD centres 2014
Figure 9.2.10(a): Variation in median serum phosphate level among PD patients, PD centres 2014
Table 9.2.9(a): Variation in median serum phosphate level among HD centres, 2005-2014
Table 9.2.10(a): Variation in median serum phosphate levels among PD centres 2005-2014
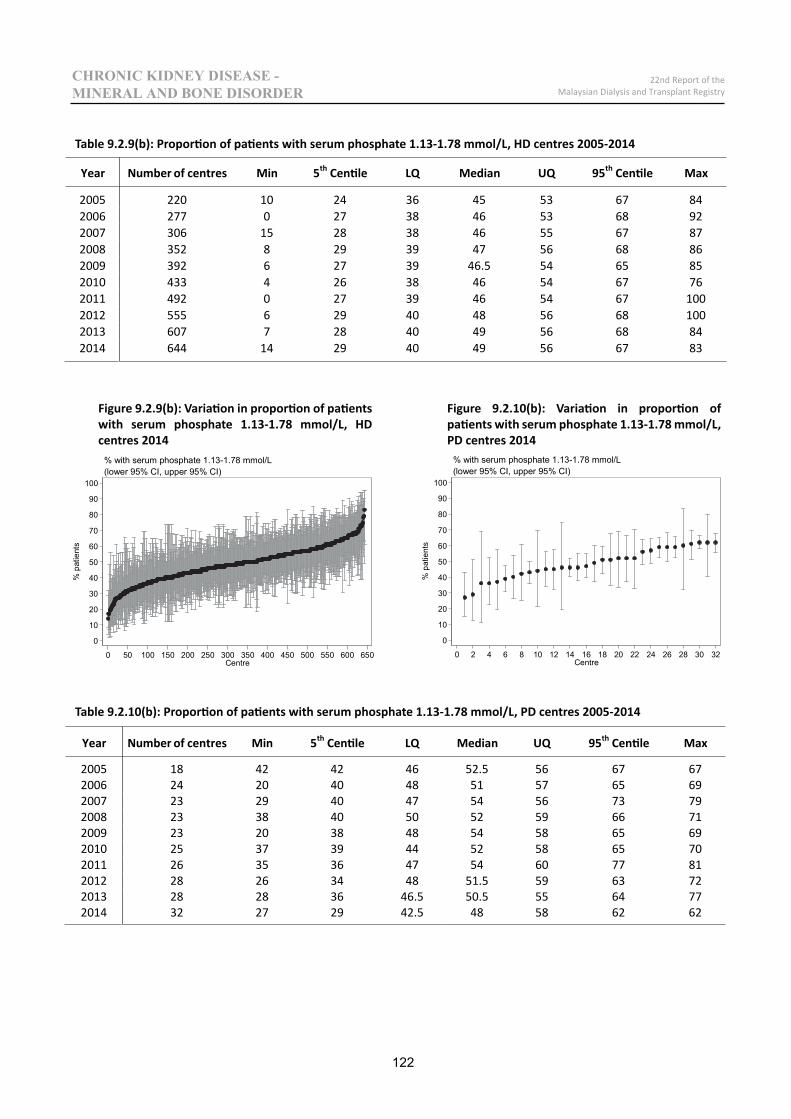
0
10
20
30
40
50
60
70
80
90
100
% p
atie
nts
0 50 100 150 200 250 300 350 400 450 500 550 600 650Centre
(lower 95% CI, upper 95% CI)% with serum phosphate 1.13-1.78 mmol/L
0
10
20
30
40
50
60
70
80
90
100
% p
atie
nts
0 2 4 6 8 10 12 14 16 18 20 22 24 26 28 30 32Centre
(lower 95% CI, upper 95% CI)% with serum phosphate 1.13-1.78 mmol/L
Year Number of centres Min 5th Centile LQ Median UQ 95th Centile Max
2005 18 42 42 46 52.5 56 67 672006 24 20 40 48 51 57 65 692007 23 29 40 47 54 56 73 792008 23 38 40 50 52 59 66 712009 23 20 38 48 54 58 65 692010 25 37 39 44 52 58 65 702011 26 35 36 47 54 60 77 812012 28 26 34 48 51.5 59 63 722013 28 28 36 46.5 50.5 55 64 772014 32 27 29 42.5 48 58 62 62
Year Number of centres Min 5th Centile LQ Median UQ 95th Centile Max
2005 220 10 24 36 45 53 67 842006 277 0 27 38 46 53 68 922007 306 15 28 38 46 55 67 872008 352 8 29 39 47 56 68 862009 392 6 27 39 46.5 54 65 852010 433 4 26 38 46 54 67 762011 492 0 27 39 46 54 67 1002012 555 6 29 40 48 56 68 1002013 607 7 28 40 49 56 68 842014 644 14 29 40 49 56 67 83
Table 9.2.9(b): Proportion of patients with serum phosphate 1.13-1.78 mmol/L, HD centres 2005-2014
Table 9.2.10(b): Proportion of patients with serum phosphate 1.13-1.78 mmol/L, PD centres 2005-2014
122
22nd Report of theMalaysian Dialysis and Transplant Registry
CHRONIC KIDNEY DISEASE - MINERAL AND BONE DISORDER
Figure 9.2.9(b): Variation in proportion of patients with serum phosphate 1.13-1.78 mmol/L, HD centres 2014
Figure 9.2.10(b): Variation in proportion of patients with serum phosphate 1.13-1.78 mmol/L, PD centres 2014
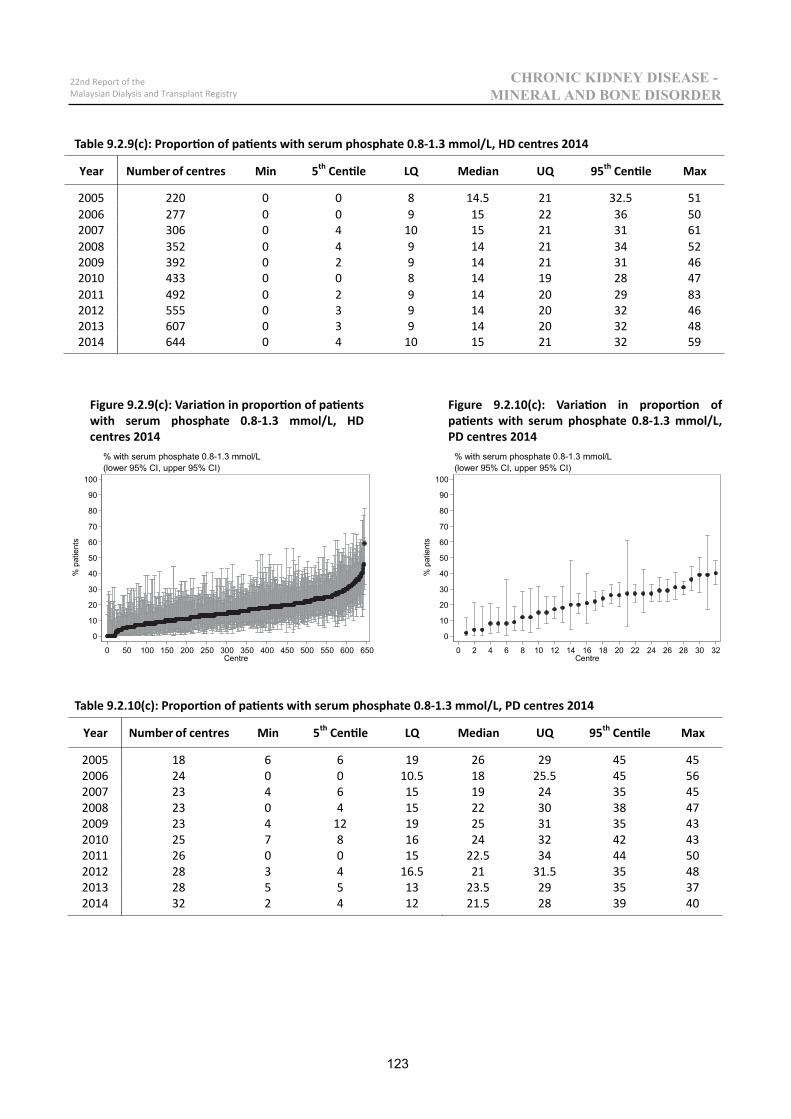
0
10
20
30
40
50
60
70
80
90
100
% p
atie
nts
0 50 100 150 200 250 300 350 400 450 500 550 600 650Centre
(lower 95% CI, upper 95% CI)% with serum phosphate 0.8-1.3 mmol/L
0
10
20
30
40
50
60
70
80
90
100
% p
atie
nts
0 2 4 6 8 10 12 14 16 18 20 22 24 26 28 30 32Centre
(lower 95% CI, upper 95% CI)% with serum phosphate 0.8-1.3 mmol/L
Year Number of centres Min 5th Centile LQ Median UQ 95th Centile Max
2005 18 6 6 19 26 29 45 452006 24 0 0 10.5 18 25.5 45 562007 23 4 6 15 19 24 35 452008 23 0 4 15 22 30 38 472009 23 4 12 19 25 31 35 432010 25 7 8 16 24 32 42 432011 26 0 0 15 22.5 34 44 502012 28 3 4 16.5 21 31.5 35 482013 28 5 5 13 23.5 29 35 372014 32 2 4 12 21.5 28 39 40
Year Number of centres Min 5th Centile LQ Median UQ 95th Centile Max
2005 220 0 0 8 14.5 21 32.5 512006 277 0 0 9 15 22 36 502007 306 0 4 10 15 21 31 612008 352 0 4 9 14 21 34 522009 392 0 2 9 14 21 31 462010 433 0 0 8 14 19 28 472011 492 0 2 9 14 20 29 832012 555 0 3 9 14 20 32 462013 607 0 3 9 14 20 32 482014 644 0 4 10 15 21 32 59
Table 9.2.9(c): Proportion of patients with serum phosphate 0.8-1.3 mmol/L, HD centres 2014
Table 9.2.10(c): Proportion of patients with serum phosphate 0.8-1.3 mmol/L, PD centres 2014
Figure 9.2.9(c): Variation in proportion of patients with serum phosphate 0.8-1.3 mmol/L, HD centres 2014
Figure 9.2.10(c): Variation in proportion of patients with serum phosphate 0.8-1.3 mmol/L, PD centres 2014
123
22nd Report of theMalaysian Dialysis and Transplant Registry
CHRONIC KIDNEY DISEASE - MINERAL AND BONE DISORDER
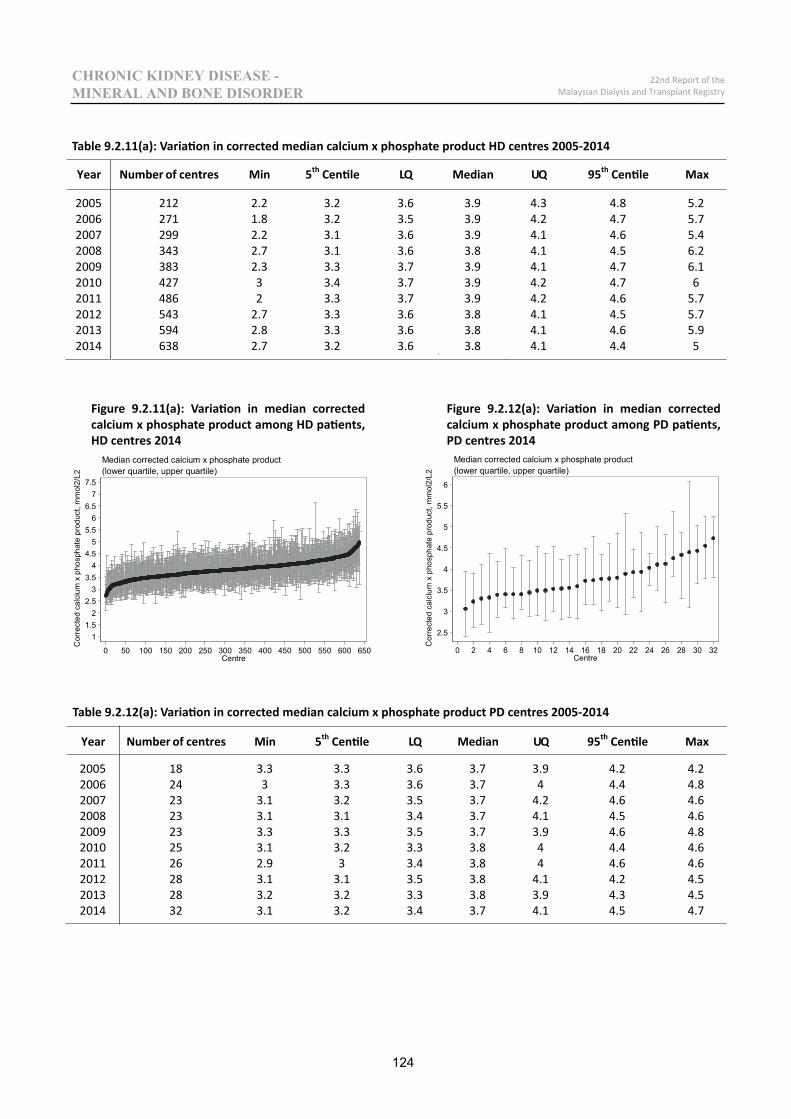
11.5
22.5
33.5
44.5
55.5
66.5
77.5
Cor
rect
ed c
alci
um x
pho
spha
te p
rodu
ct, m
mol
2/L2
0 50 100 150 200 250 300 350 400 450 500 550 600 650Centre
(lower quartile, upper quartile)Median corrected calcium x phosphate product
2.5
3
3.5
4
4.5
5
5.5
6
Cor
rect
ed c
alci
um x
pho
spha
te p
rodu
ct, m
mol
2/L2
0 2 4 6 8 10 12 14 16 18 20 22 24 26 28 30 32Centre
(lower quartile, upper quartile)Median corrected calcium x phosphate product
Year Number of centres Min 5th Centile LQ Median UQ 95th Centile Max
2005 18 3.3 3.3 3.6 3.7 3.9 4.2 4.22006 24 3 3.3 3.6 3.7 4 4.4 4.82007 23 3.1 3.2 3.5 3.7 4.2 4.6 4.62008 23 3.1 3.1 3.4 3.7 4.1 4.5 4.62009 23 3.3 3.3 3.5 3.7 3.9 4.6 4.82010 25 3.1 3.2 3.3 3.8 4 4.4 4.62011 26 2.9 3 3.4 3.8 4 4.6 4.62012 28 3.1 3.1 3.5 3.8 4.1 4.2 4.52013 28 3.2 3.2 3.3 3.8 3.9 4.3 4.52014 32 3.1 3.2 3.4 3.7 4.1 4.5 4.7
Year Number of centres Min 5th Centile LQ Median UQ 95th Centile Max
2005 212 2.2 3.2 3.6 3.9 4.3 4.8 5.22006 271 1.8 3.2 3.5 3.9 4.2 4.7 5.72007 299 2.2 3.1 3.6 3.9 4.1 4.6 5.42008 343 2.7 3.1 3.6 3.8 4.1 4.5 6.22009 383 2.3 3.3 3.7 3.9 4.1 4.7 6.12010 427 3 3.4 3.7 3.9 4.2 4.7 62011 486 2 3.3 3.7 3.9 4.2 4.6 5.72012 543 2.7 3.3 3.6 3.8 4.1 4.5 5.72013 594 2.8 3.3 3.6 3.8 4.1 4.6 5.92014 638 2.7 3.2 3.6 3.8 4.1 4.4 5
Table 9.2.11(a): Variation in corrected median calcium x phosphate product HD centres 2005-2014
124
22nd Report of theMalaysian Dialysis and Transplant Registry
CHRONIC KIDNEY DISEASE - MINERAL AND BONE DISORDER
Figure 9.2.11(a): Variation in median corrected calcium x phosphate product among HD patients, HD centres 2014
Figure 9.2.12(a): Variation in median corrected calcium x phosphate product among PD patients, PD centres 2014
Table 9.2.12(a): Variation in corrected median calcium x phosphate product PD centres 2005-2014
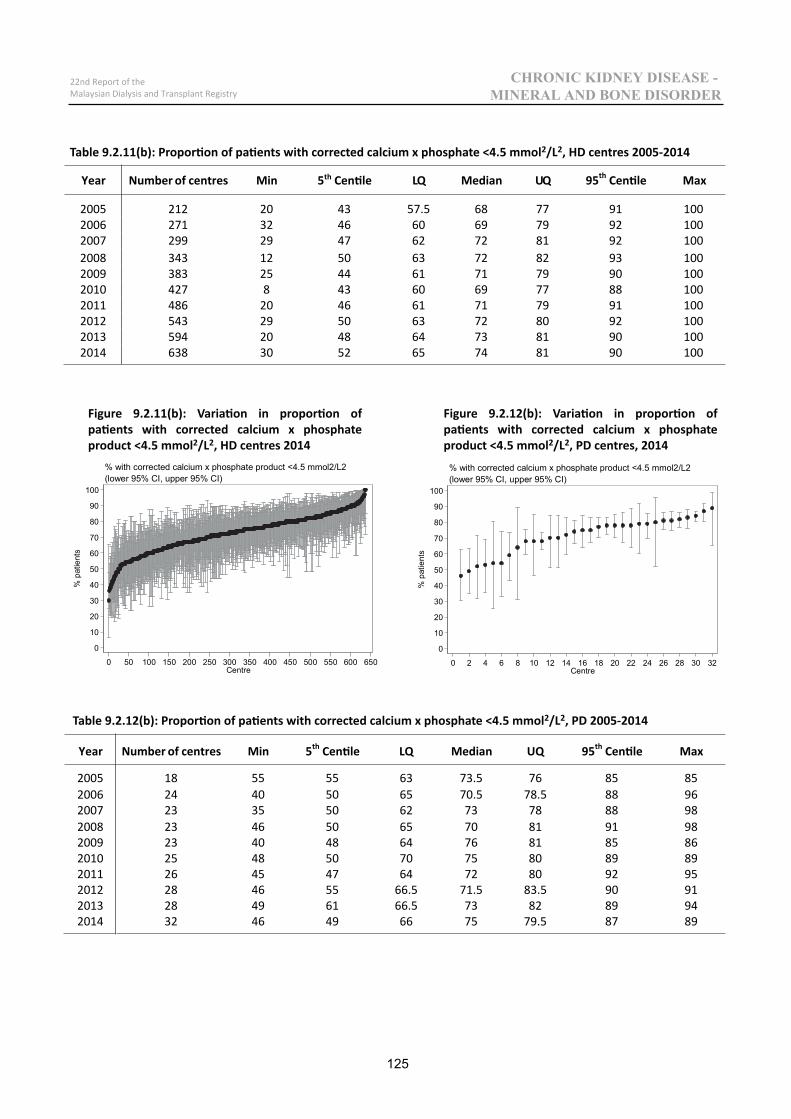
0
10
20
30
40
50
60
70
80
90
100
% p
atie
nts
0 50 100 150 200 250 300 350 400 450 500 550 600 650Centre
(lower 95% CI, upper 95% CI)% with corrected calcium x phosphate product <4.5 mmol2/L2
0
10
20
30
40
50
60
70
80
90
100
% p
atie
nts
0 2 4 6 8 10 12 14 16 18 20 22 24 26 28 30 32Centre
(lower 95% CI, upper 95% CI)% with corrected calcium x phosphate product <4.5 mmol2/L2
Year Number of centres Min 5th Centile LQ Median UQ 95th Centile Max
2005 18 55 55 63 73.5 76 85 852006 24 40 50 65 70.5 78.5 88 962007 23 35 50 62 73 78 88 982008 23 46 50 65 70 81 91 982009 23 40 48 64 76 81 85 862010 25 48 50 70 75 80 89 892011 26 45 47 64 72 80 92 952012 28 46 55 66.5 71.5 83.5 90 912013 28 49 61 66.5 73 82 89 942014 32 46 49 66 75 79.5 87 89
Year Number of centres Min 5th Centile LQ Median UQ 95th Centile Max
2005 212 20 43 57.5 68 77 91 1002006 271 32 46 60 69 79 92 1002007 299 29 47 62 72 81 92 1002008 343 12 50 63 72 82 93 1002009 383 25 44 61 71 79 90 1002010 427 8 43 60 69 77 88 1002011 486 20 46 61 71 79 91 1002012 543 29 50 63 72 80 92 1002013 594 20 48 64 73 81 90 1002014 638 30 52 65 74 81 90 100
Table 9.2.11(b): Proportion of patients with corrected calcium x phosphate <4.5 mmol2/L2, HD centres 2005-2014
125
22nd Report of theMalaysian Dialysis and Transplant Registry
CHRONIC KIDNEY DISEASE - MINERAL AND BONE DISORDER
Figure 9.2.11(b): Variation in proportion of patients with corrected calcium x phosphate product <4.5 mmol2/L2, HD centres 2014
Figure 9.2.12(b): Variation in proportion of patients with corrected calcium x phosphate product <4.5 mmol2/L2, PD centres, 2014
Table 9.2.12(b): Proportion of patients with corrected calcium x phosphate <4.5 mmol2/L2, PD 2005-2014
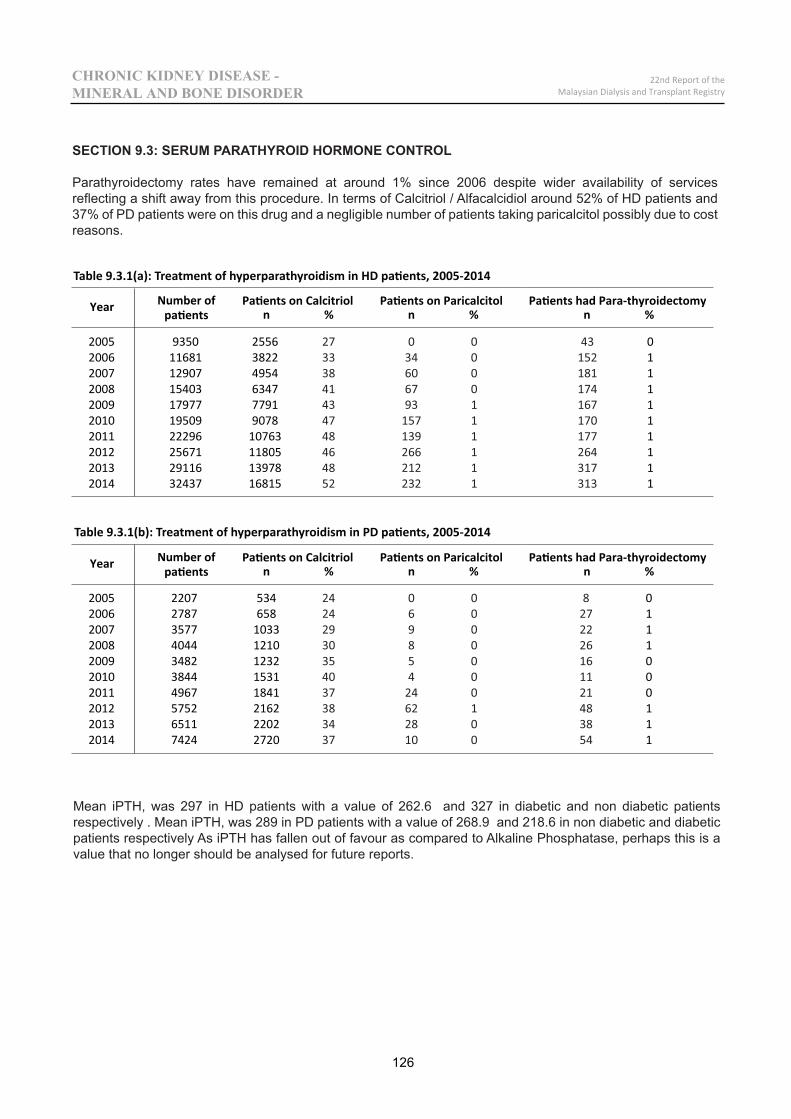
2005 9350 2556 02006 11681 3822 12007 12907 4954 12008 15403 6347 12009 17977 7791 12010 19509 9078 12011 22296 10763 12012 25671 11805 12013 29116 13978 12014 32437 16815 1
Year Number ofpatients n % n % n %
2005 2207 534 02006 2787 658 12007 3577 1033 12008 4044 1210 12009 3482 1232 02010 3844 1531 02011 4967 1841 02012 5752 2162 12013 6511 2202 12014 7424 2720 1
126
22nd Report of theMalaysian Dialysis and Transplant Registry
CHRONIC KIDNEY DISEASE - MINERAL AND BONE DISORDER
Table 9.3.1(a): Treatment of hyperparathyroidism in HD patients, 2005-2014
Table 9.3.1(b): Treatment of hyperparathyroidism in PD patients, 2005-2014
SECTION 9.3: SERUM PARATHYROID HORMONE CONTROL
Parathyroidectomy rates have remained at around 1% since 2006 despite wider availability of services reflecting a shift away from this procedure. In terms of Calcitriol / Alfacalcidiol around 52% of HD patients and 37% of PD patients were on this drug and a negligible number of patients taking paricalcitol possibly due to cost reasons.
Mean iPTH, was 297 in HD patients with a value of 262.6 and 327 in diabetic and non diabetic patients respectively . Mean iPTH, was 289 in PD patients with a value of 268.9 and 218.6 in non diabetic and diabetic patients respectively As iPTH has fallen out of favour as compared to Alkaline Phosphatase, perhaps this is a value that no longer should be analysed for future reports.
Patients on Calcitriol Patients on Paricalcitol Patients had Para-thyroidectomy
Year Number ofpatients n % n % n %
Patients on Calcitriol Patients on Paricalcitol Patients had Para-thyroidectomy
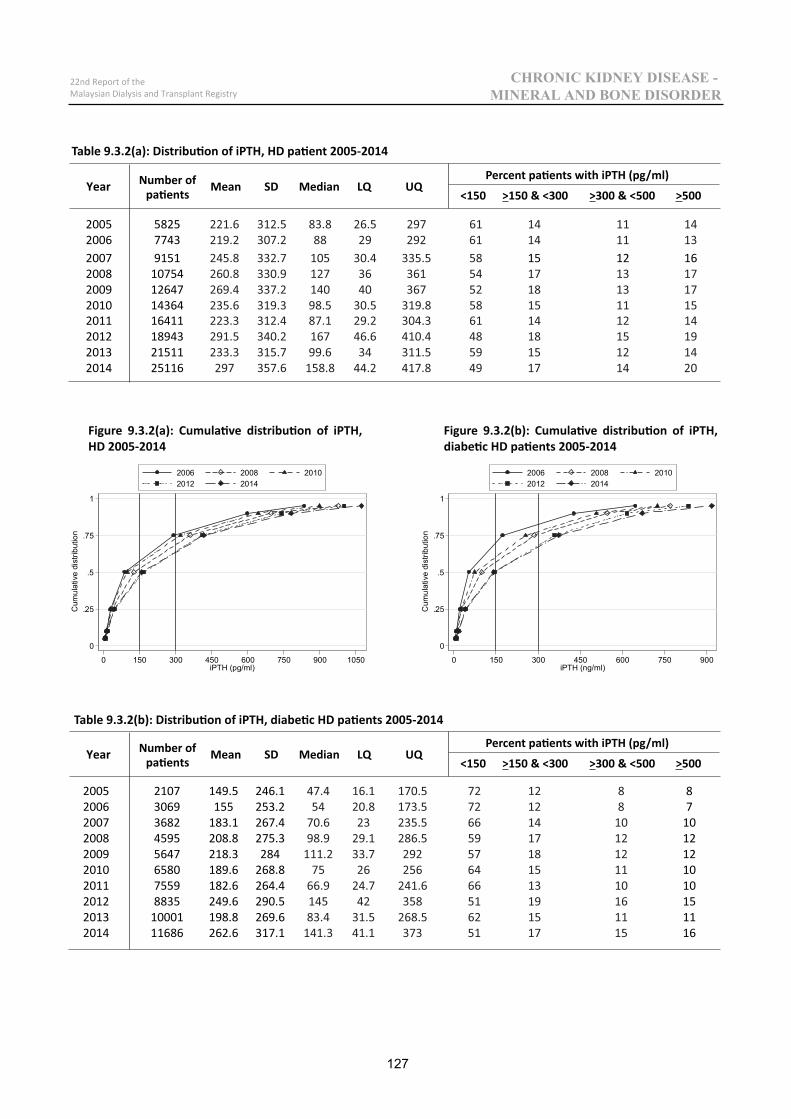
2011 164112012 189432013 215112014 25116
0
.25
.5
.75
1
Cum
ulat
ive
dist
ribut
ion
0 150 300 450 600 750 900 1050iPTH (pg/ml)
2006 2008 20102012 2014
0
.25
.5
.75
1
Cum
ulat
ive
dist
ribut
ion
0 150 300 450 600 750 900iPTH (ng/ml)
2006 2008 20102012 2014
2005 2107 149.5 246.1 82006 3069 155 253.2 72007 3682 183.1 267.4 102008 4595 208.8 275.3 122009 5647 218.3 284 122010 6580 189.6 268.8 102011 7559 182.6 264.4 102012 8835 249.6 290.5 152013 10001 198.8 269.6 112014 11686 262.6 317.1 16
2005 58252006 77432007 9151 15 12 162008 107542009 126472010 14364
Table 9.3.2(a): Distribution of iPTH, HD patient 2005-2014
127
22nd Report of theMalaysian Dialysis and Transplant Registry
CHRONIC KIDNEY DISEASE - MINERAL AND BONE DISORDER
Table 9.3.2(b): Distribution of iPTH, diabetic HD patients 2005-2014
Figure 9.3.2(a): Cumulative distribution of iPTH, HD 2005-2014
Figure 9.3.2(b): Cumulative distribution of iPTH, diabetic HD patients 2005-2014
Year Number ofpatients Mean SD Median LQ UQ
Percent patients with iPTH (pg/ml)
<150 >150 & <300 >300 & <500 >500
Year Number ofpatients Mean SD Median LQ UQ
Percent patients with iPTH (pg/ml)
<150 >150 & <300 >300 & <500 >500
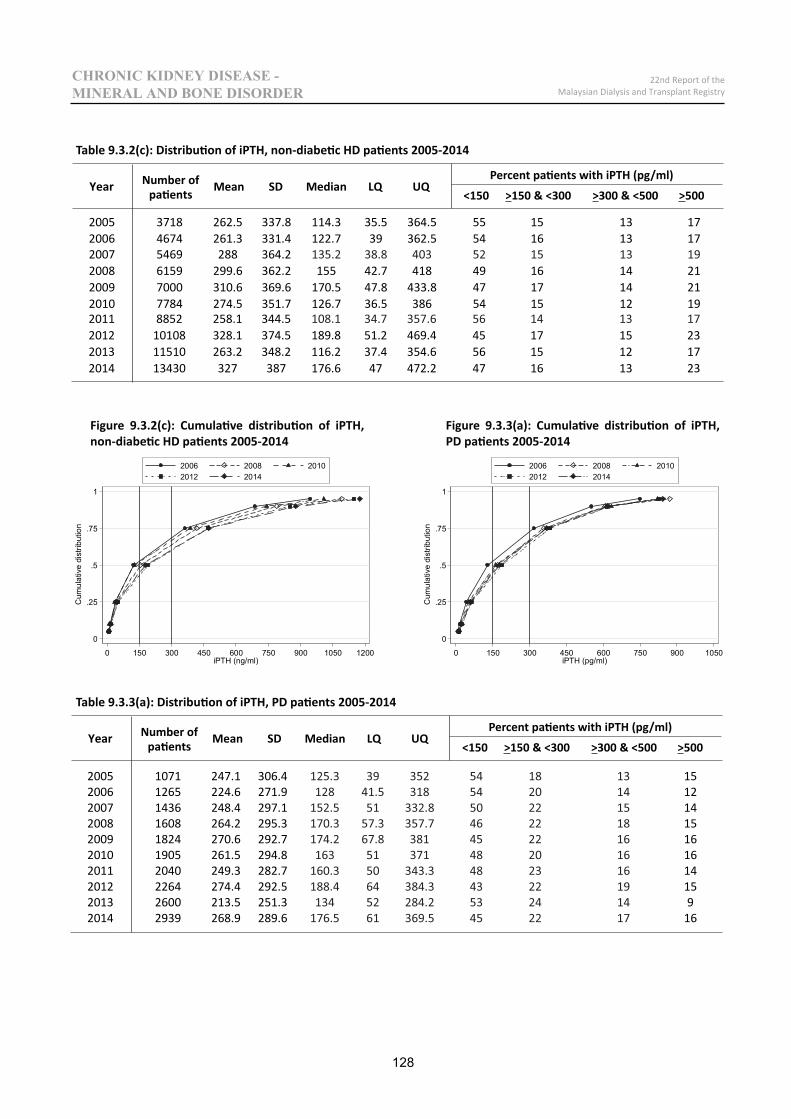
2011 8852 258.1 344.52012 10108 328.1 374.5 189.8 51.2 469.4 45 17 15 232013 11510 263.2 348.2 116.2 37.4 354.6 56 15 12 172014 13430 327 387 176.6 47 472.2 47 16 13 23
0
.25
.5
.75
1
Cum
ulat
ive
dist
ribut
ion
0 150 300 450 600 750 900 1050 1200iPTH (ng/ml)
2006 2008 20102012 2014
0
.25
.5
.75
1
Cum
ulat
ive
dist
ribut
ion
0 150 300 450 600 750 900 1050iPTH (pg/ml)
2006 2008 20102012 2014
2005 1071 247.1 306.4 152006 1265 224.6 271.9 122007 1436 248.4 297.1 142008 1608 264.2 295.3 152009 1824 270.6 292.7 162010 1905 261.5 294.8 162011 2040 249.3 282.7 142012 2264 274.4 292.5 152013 2600 213.5 251.3 92014 2939 268.9 289.6 16
2005 3718 262.5 337.8 114.3 35.5 364.5 55 15 13 172006 4674 261.3 331.4 122.7 39 362.5 54 16 13 172007 5469 288 364.22008 6159 299.6 362.2 155 42.7 418 49 16 14 212009 7000 310.6 369.6 170.5 47.8 433.8 47 17 14 212010 7784 274.5 351.7 126.7 36.5 386 54 15 12 19
Table 9.3.2(c): Distribution of iPTH, non-diabetic HD patients 2005-2014
128
22nd Report of theMalaysian Dialysis and Transplant Registry
CHRONIC KIDNEY DISEASE - MINERAL AND BONE DISORDER
Figure 9.3.2(c): Cumulative distribution of iPTH, non-diabetic HD patients 2005-2014
Figure 9.3.3(a): Cumulative distribution of iPTH, PD patients 2005-2014
Table 9.3.3(a): Distribution of iPTH, PD patients 2005-2014
Year Number ofpatients Mean SD Median LQ UQ
Percent patients with iPTH (pg/ml)
<150 >150 & <300 >300 & <500 >500
Year Number ofpatients Mean SD Median LQ UQ
Percent patients with iPTH (pg/ml)
<150 >150 & <300 >300 & <500 >500
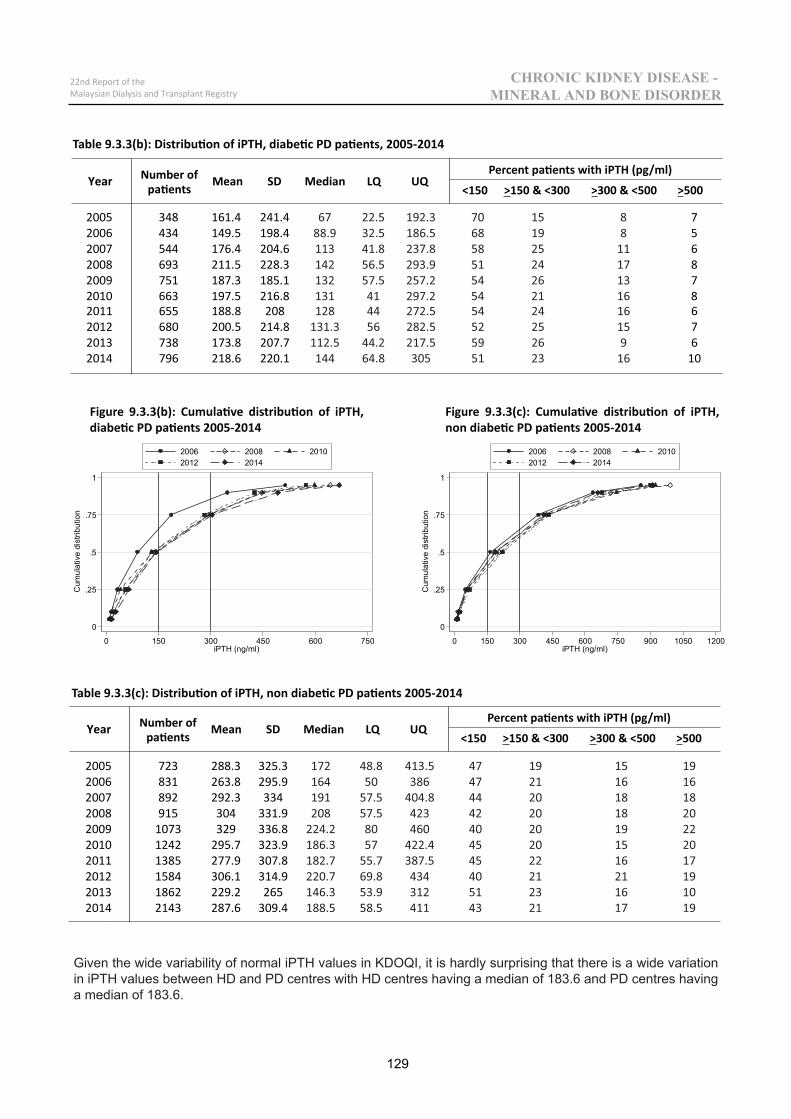
2011 655 188.8 208 62012 680 200.5 214.8 72013 738 173.8 207.7 62014 796 218.6 220.1 10
0
.25
.5
.75
1
Cum
ulat
ive
dist
ribut
ion
0 150 300 450 600 750iPTH (ng/ml)
2006 2008 20102012 2014
0
.25
.5
.75
1
Cum
ulat
ive
dist
ribut
ion
0 150 300 450 600 750 900 1050 1200iPTH (ng/ml)
2006 2008 20102012 2014
2005 723 288.3 325.32006 831 263.8 295.92007 892 292.3 3342008 915 304 331.92009 1073 329 336.82010 1242 295.7 323.92011 1385 277.9 307.82012 1584 306.1 314.92013 1862 229.2 2652014 2143 287.6 309.4
2005 348 161.4 241.4 72006 434 149.5 198.4 52007 544 176.4 204.6 62008 693 211.5 228.3 82009 751 187.3 185.1 72010 663 197.5 216.8 8
Table 9.3.3(b): Distribution of iPTH, diabetic PD patients, 2005-2014
129
22nd Report of theMalaysian Dialysis and Transplant Registry
CHRONIC KIDNEY DISEASE - MINERAL AND BONE DISORDER
Figure 9.3.3(b): Cumulative distribution of iPTH, diabetic PD patients 2005-2014
Figure 9.3.3(c): Cumulative distribution of iPTH, non diabetic PD patients 2005-2014
Table 9.3.3(c): Distribution of iPTH, non diabetic PD patients 2005-2014
Given the wide variability of normal iPTH values in KDOQI, it is hardly surprising that there is a wide variation in iPTH values between HD and PD centres with HD centres having a median of 183.6 and PD centres having a median of 183.6.
Year Number ofpatients Mean SD Median LQ UQ
Percent patients with iPTH (pg/ml)
<150 >150 & <300 >300 & <500 >500
Year Number ofpatients Mean SD Median LQ UQ
Percent patients with iPTH (pg/ml)
<150 >150 & <300 >300 & <500 >500
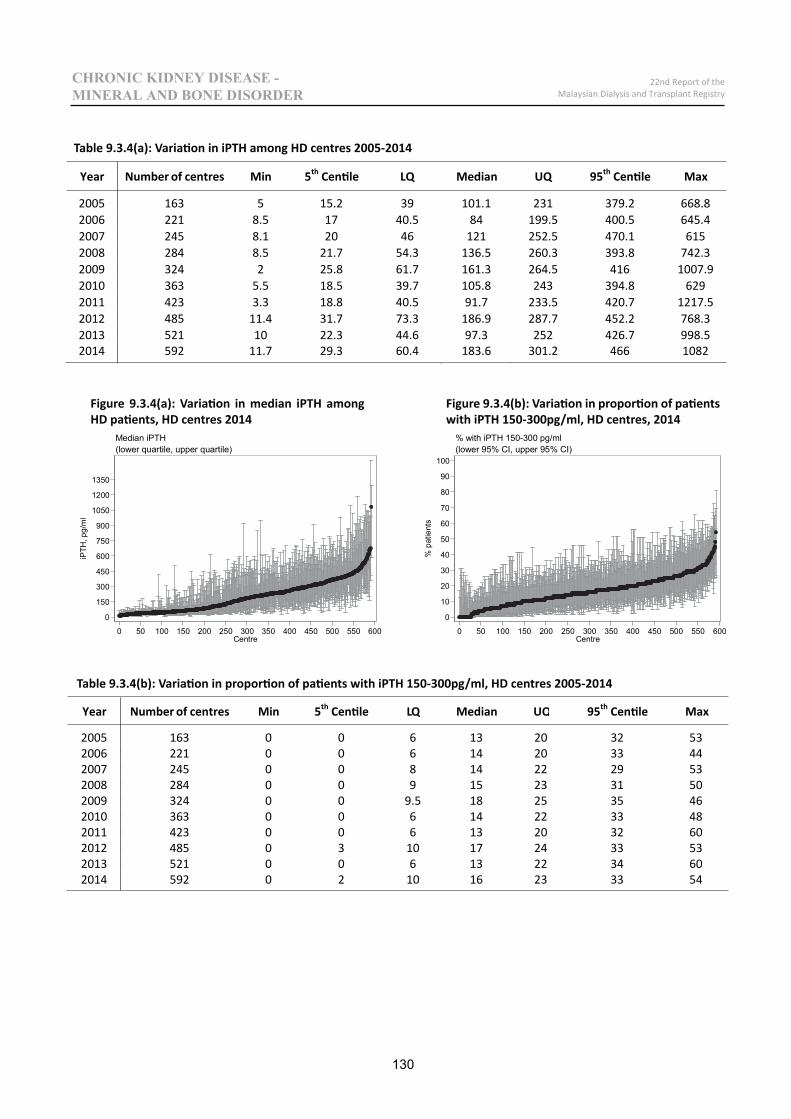
0
150
300
450
600
750
900
1050
1200
1350
iPTH
, pg/
ml
0 50 100 150 200 250 300 350 400 450 500 550 600Centre
(lower quartile, upper quartile)Median iPTH
0
10
20
30
40
50
60
70
80
90
100
% p
atie
nts
0 50 100 150 200 250 300 350 400 450 500 550 600Centre
(lower 95% CI, upper 95% CI)% with iPTH 150-300 pg/ml
Year Number of centres Min 5th Centile LQ Median UQ 95th Centile Max
2005 163 0 0 6 13 20 32 532006 221 0 0 6 14 20 33 442007 245 0 0 8 14 22 29 532008 284 0 0 9 15 23 31 502009 324 0 0 9.5 18 25 35 462010 363 0 0 6 14 22 33 482011 423 0 0 6 13 20 32 602012 485 0 3 10 17 24 33 532013 521 0 0 6 13 22 34 602014 592 0 2 10 16 23 33 54
2013 521 10 22.3 44.6 97.3 252 426.7 998.52014 592 11.7 29.3 60.4 183.6 301.2 466 1082
Year Number of centres Min 5th Centile LQ Median UQ 95th Centile Max
2005 163 5 15.2 39 101.1 231 379.2 668.82006 221 8.5 17 40.5 84 199.5 400.5 645.42007 245 8.1 20 46 121 252.5 470.1 6152008 284 8.5 21.7 54.3 136.5 260.3 393.8 742.32009 324 2 25.8 61.7 161.3 264.5 416 1007.92010 363 5.5 18.5 39.7 105.8 243 394.8 6292011 423 3.3 18.8 40.5 91.7 233.5 420.7 1217.52012 485 11.4 31.7 73.3 186.9 287.7 452.2 768.3
Table 9.3.4(a): Variation in iPTH among HD centres 2005-2014
130
22nd Report of theMalaysian Dialysis and Transplant Registry
CHRONIC KIDNEY DISEASE - MINERAL AND BONE DISORDER
Figure 9.3.4(a): Variation in median iPTH among HD patients, HD centres 2014
Figure 9.3.4(b): Variation in proportion of patients with iPTH 150-300pg/ml, HD centres, 2014
Table 9.3.4(b): Variation in proportion of patients with iPTH 150-300pg/ml, HD centres 2005-2014
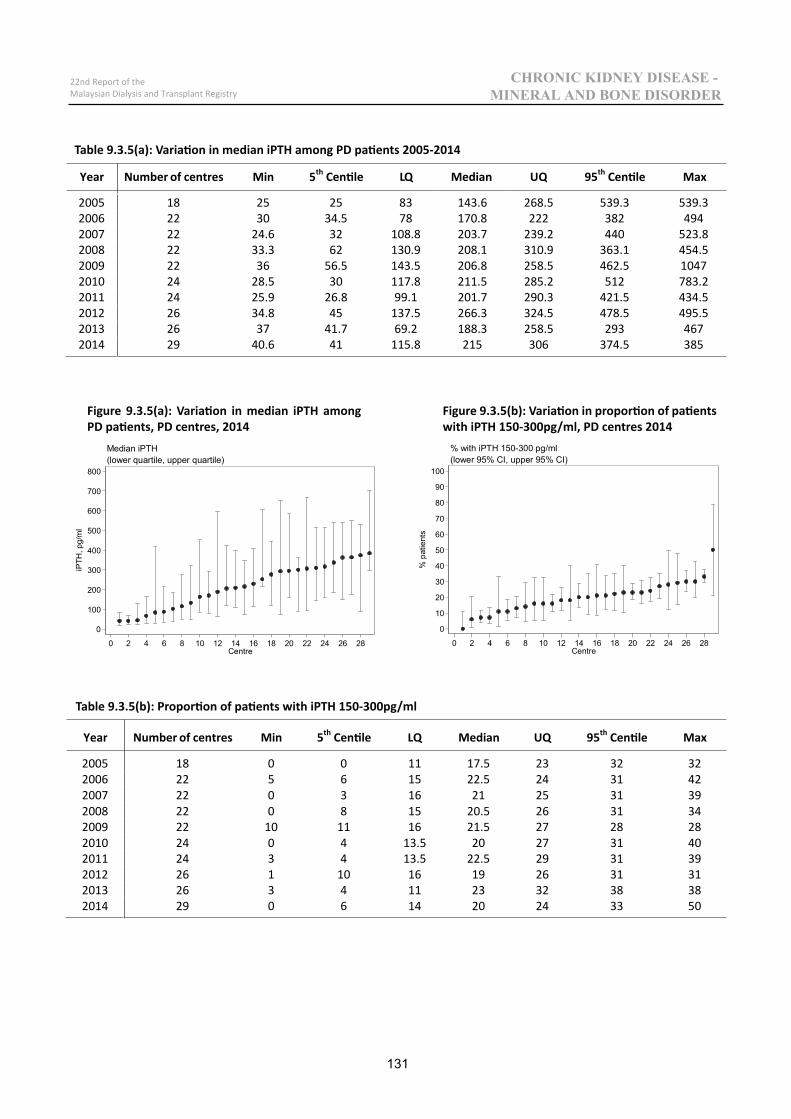
0
100
200
300
400
500
600
700
800
iPTH
, pg/
ml
0 2 4 6 8 10 12 14 16 18 20 22 24 26 28Centre
(lower quartile, upper quartile)Median iPTH
0
10
20
30
40
50
60
70
80
90
100
% p
atie
nts
0 2 4 6 8 10 12 14 16 18 20 22 24 26 28Centre
(lower 95% CI, upper 95% CI)% with iPTH 150-300 pg/ml
Year Number of centres Min 5th Centile LQ Median UQ 95th Centile Max
2005 18 0 0 11 17.5 23 32 322006 22 5 6 15 22.5 24 31 422007 22 0 3 16 21 25 31 392008 22 0 8 15 20.5 26 31 342009 22 10 11 16 21.5 27 28 282010 24 0 4 13.5 20 27 31 402011 24 3 4 13.5 22.5 29 31 392012 26 1 10 16 19 26 31 312013 26 3 4 11 23 32 38 382014 29 0 6 14 20 24 33 50
Year Number of centres Min 5th Centile LQ Median UQ 95th Centile Max
2005 18 25 25 83 143.6 268.5 539.3 539.32006 22 30 34.5 78 170.8 222 382 4942007 22 24.6 32 108.8 203.7 239.2 440 523.82008 22 33.3 62 130.9 208.1 310.9 363.1 454.52009 22 36 56.5 143.5 206.8 258.5 462.5 10472010 24 28.5 30 117.8 211.5 285.2 512 783.22011 24 25.9 26.8 99.1 201.7 290.3 421.5 434.52012 26 34.8 45 137.5 266.3 324.5 478.5 495.52013 26 37 41.7 69.2 188.3 258.5 293 4672014 29 40.6 41 115.8 215 306 374.5 385
Table 9.3.5(a): Variation in median iPTH among PD patients 2005-2014
131
22nd Report of theMalaysian Dialysis and Transplant Registry
CHRONIC KIDNEY DISEASE - MINERAL AND BONE DISORDER
Figure 9.3.5(a): Variation in median iPTH among PD patients, PD centres, 2014
Figure 9.3.5(b): Variation in proportion of patients with iPTH 150-300pg/ml, PD centres 2014
Table 9.3.5(b): Proportion of patients with iPTH 150-300pg/ml

22nd Report of theMalaysian Dialysis and Transplant Registry ALL RENAL REPLACEMENT THERAPY IN MALAYSIA
23rd Report of theMalaysian Dialysis and Transplant Registry HEPATITIS ON DIALYSIS
Chapter 10
Clare Tan Hui HongChow Yok Wai
Lawrence Hii Wei SoonLoh Chek Loong
Teo Sue Mei
HEPATITIS ON DIALYSIS
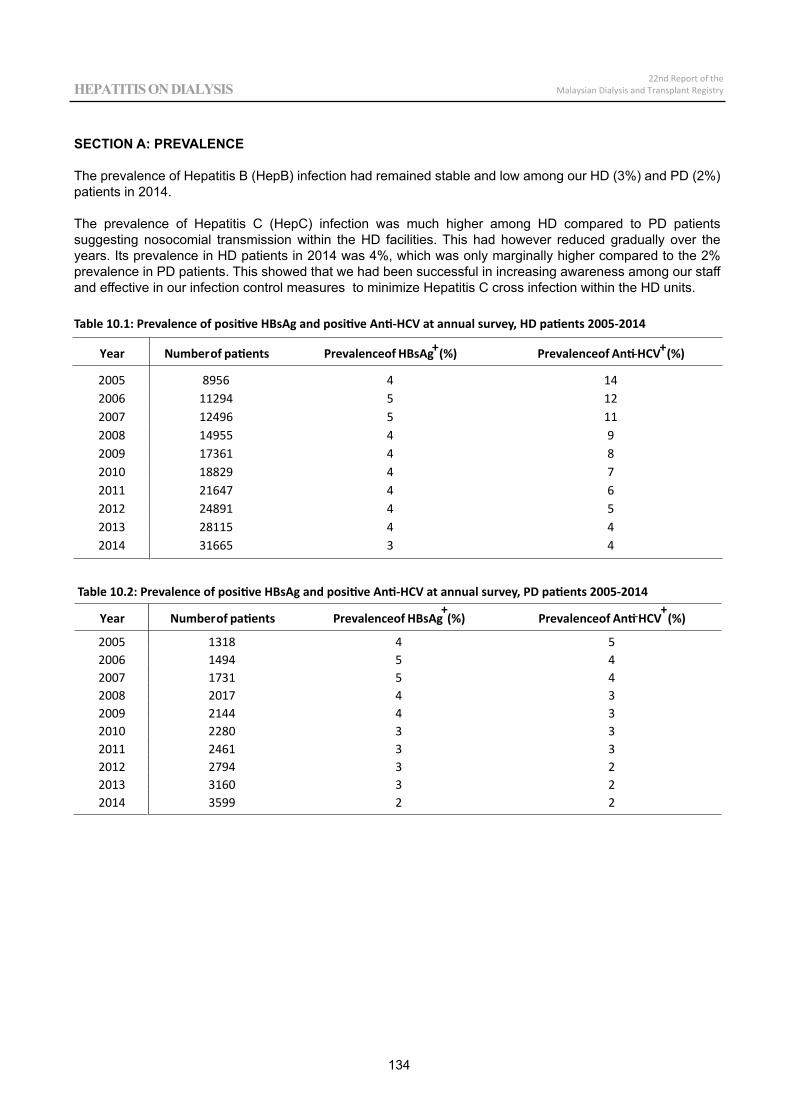
Year Numberof patients Prevalenceof HBsAg+(%) Prevalenceof Anti HCV+(%)
2005 8956 4 142006 11294 5 122007 12496 5 112008 14955 4 92009 17361 4 82010 18829 4 72011 21647 4 62012 24891 4 52013 28115 4 42014 31665 3 4
Year Numberof patients Prevalenceof HBsAg+
(%) Prevalenceof Anti HCV+
(%)
2005 1318 4 52006 1494 5 42007 1731 5 42008 2017 4 32009 2144 4 32010 2280 3 32011 2461 3 32012 2794 3 22013 3160 3 22014 3599 2 2
134
00
22nd Report of theMalaysian Dialysis and Transplant Registry HEPATITIS ON DIALYSIS
HEPATITIS ON DIALYSIS SECTION A: PREVALENCE
The prevalence of Hepatitis B (HepB) infection had remained stable and low among our HD (3%) and PD (2%) patients in 2014.
The prevalence of Hepatitis C (HepC) infection was much higher among HD compared to PD patients suggesting nosocomial transmission within the HD facilities. This had however reduced gradually over the years. Its prevalence in HD patients in 2014 was 4%, which was only marginally higher compared to the 2% prevalence in PD patients. This showed that we had been successful in increasing awareness among our staff and effective in our infection control measures to minimize Hepatitis C cross infection within the HD units.
Table 10.1: Prevalence of positive HBsAg and positive Anti-HCV at annual survey, HD patients 2005-2014
Table 10.2: Prevalence of positive HBsAg and positive Anti-HCV at annual survey, PD patients 2005-2014
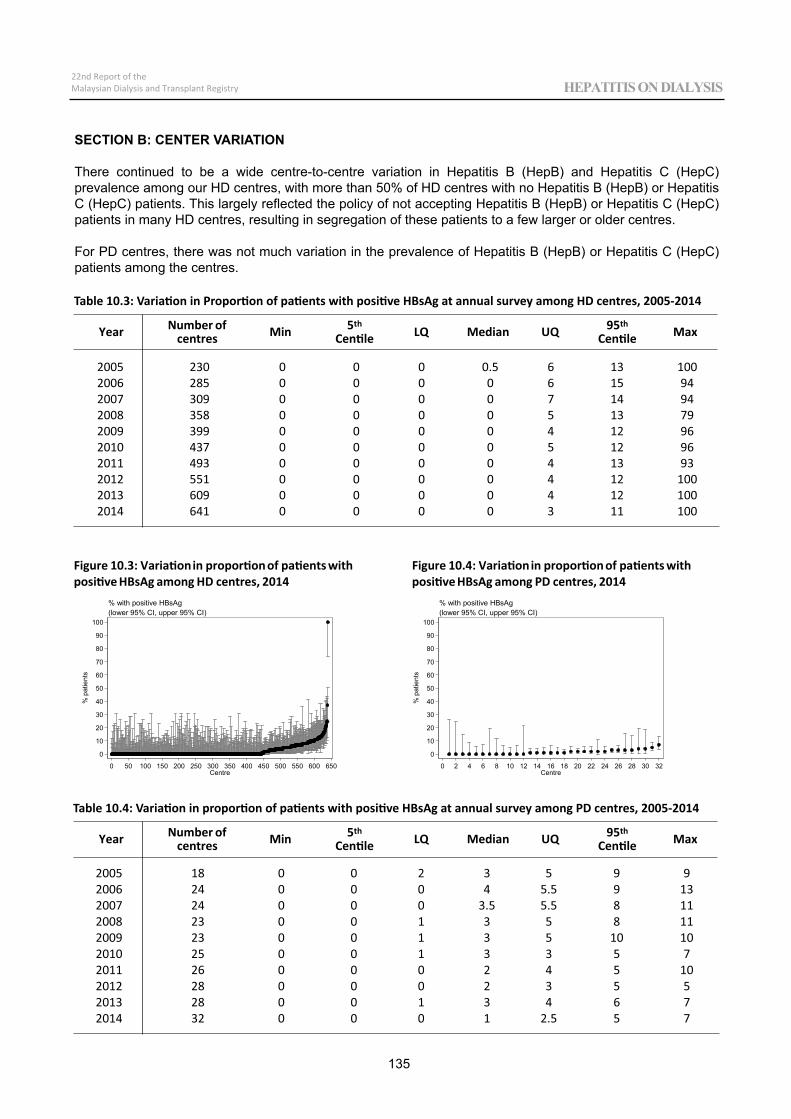
2005 230 0 1002006 285 0 942007 309 0 942008 358 0 792009 399 0 962010 437 0 962011 493 0 932012 551 0 1002013 609 0 1002014 641 0 100
Figure 10.3: Variationin proportion of patients withpositive HBsAg among HD centres, 2014
0
10
20
30
40
50
60
70
80
90
100
% p
atie
nts
0 50 100 150 200 250 300 350 400 450 500 550 600 650Centre
(lower 95% CI, upper 95% CI)% with positive HBsAg
Figure 10.4: Variationin proportion of patients withpositive HBsAg among PD centres, 2014
0
10
20
30
40
50
60
70
80
90
100
% p
atie
nts
0 2 4 6 8 10 12 14 16 18 20 22 24 26 28 30 32Centre
(lower 95% CI, upper 95% CI)% with positive HBsAg
2005 18 0 92006 24 0 132007 24 0 112008 23 0 112009 23 0 102010 25 0 72011 26 0 102012 28 0 52013 28 0 72014 32 0 7
00
135
22nd Report of theMalaysian Dialysis and Transplant Registry HEPATITIS ON DIALYSIS
Table 10.4: Variation in proportion of patients with positive HBsAg at annual survey among PD centres, 2005-2014
Year Number ofcentres Min 5th
Centile LQ Median UQ 95th
Centile Max
Year Number ofcentres Min 5th
Centile LQ Median UQ 95th
Centile Max
SECTION B: CENTER VARIATION
There continued to be a wide centre-to-centre variation in Hepatitis B (HepB) and Hepatitis C (HepC) prevalence among our HD centres, with more than 50% of HD centres with no Hepatitis B (HepB) or Hepatitis C (HepC) patients. This largely reflected the policy of not accepting Hepatitis B (HepB) or Hepatitis C (HepC) patients in many HD centres, resulting in segregation of these patients to a few larger or older centres.
For PD centres, there was not much variation in the prevalence of Hepatitis B (HepB) or Hepatitis C (HepC) patients among the centres.
Table 10.3: Variation in Proportion of patients with positive HBsAg at annual survey among HD centres, 2005-2014
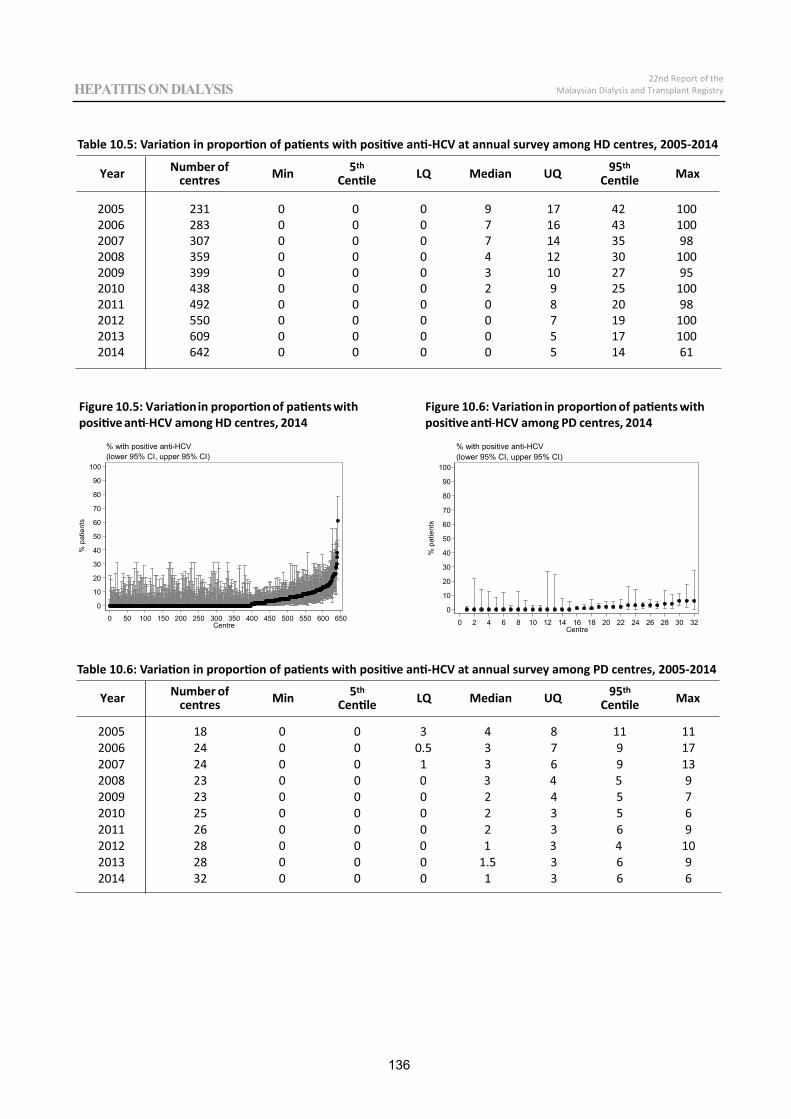
0
10
20
30
40
50
60
70
80
90
100
% p
atie
nts
0 2 4 6 8 10 12 14 16 18 20 22 24 26 28 30 32Centre
(lower 95% CI, upper 95% CI)% with positive anti-HCV
2005 231 0 1002006 283 0 1002007 307 0 982008 359 0 1002009 399 0 952010 438 0 1002011 492 0 982012 550 0 1002013 609 0 1002014 642 0 61
Figure 10.5: Variationin proportion of patients withpositive anti HCV among HD centres, 2014
0
10
20
30
40
50
60
70
80
90
100
% p
atie
nts
0 50 100 150 200 250 300 350 400 450 500 550 600 650Centre
(lower 95% CI, upper 95% CI)% with positive anti-HCV
Figure 10.6: Variationin proportion of patients withpositive anti HCV among PD centres, 2014
2005 18 0 112006 24 0 172007 24 0 132008 23 0 92009 23 0 72010 25 0 62011 26 0 92012 28 0 102013 28 0 92014 32 0 6
136
00
22nd Report of theMalaysian Dialysis and Transplant Registry HEPATITIS ON DIALYSIS
HEPATITIS ON DIALYSIS Table 10.5: Variation in proportion of patients with positive anti-HCV at annual survey among HD centres, 2005-2014
Table 10.6: Variation in proportion of patients with positive anti-HCV at annual survey among PD centres, 2005-2014
Year Number ofcentres Min 5th
Centile LQ Median UQ 95th
Centile Max
Year Number ofcentres Min 5th
Centile LQ Median UQ 95th
Centile Max
CONCLUSION
Hepatitis B prevalence had been low among our HD and PD patients over the years reflecting the effectiveness of Hepatitis B vaccination, isolation policy and infection control measures. The prevalence of Hepatitis C infection was much higher among HD patients compared to PD patients in the earlier years suggesting nosocomial transmission within the HD facilities. It is encouraging to note that its prevalence had reduced gradually over the years and is now comparable between HD and PD. However, we must continue to pay full attention, monitor and audit our infection control measures to ensure no nosocomial transmission occurs within the dialysis facilities, and the prevalence of Hepatitis B and Hepatitis C remains low.
22nd Report of theMalaysian Dialysis and Transplant Registry HEPATITIS ON DIALYSIS
137

22nd Report of theMalaysian Dialysis and Transplant Registry ALL RENAL REPLACEMENT THERAPY IN MALAYSIA
Chapter 11
HAEMODIALYSIS PRACTICES
Tan Chwee ChoonShahnaz Shah Firdaus KhanLeong Chong Men (Bryan)
Norleen Binti Zulkarnain SimAzreen Syazril Bin Adnan
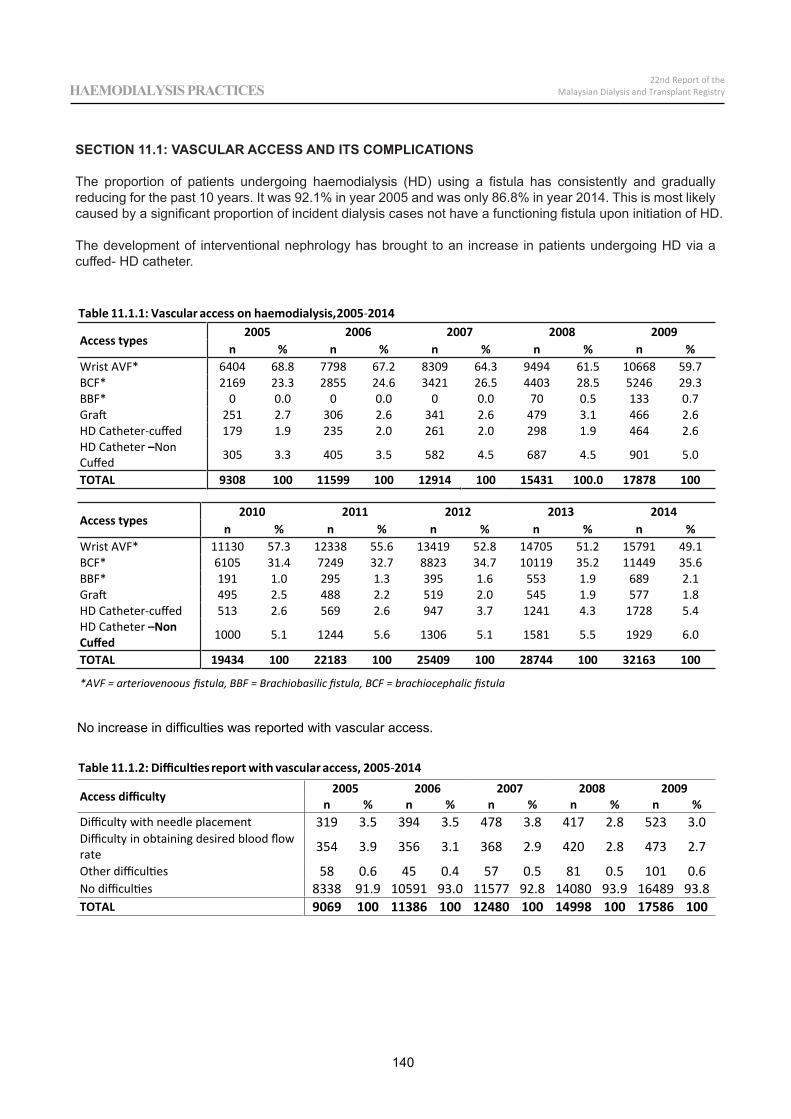
Table 11.1.1: Vascular access on haemodialysis,2005 2014
Access types2005 2006 2007 2008 2009
n % n % n % n % n %Wrist AVF* 6404 68.8 7798 67.2 8309 64.3 9494 61.5 10668 59.7BCF* 2169 23.3 2855 24.6 3421 26.5 4403 28.5 5246 29.3BBF* 0 0.0 0 0.0 0 0.0 70 0.5 133 0.7Graft 251 2.7 306 2.6 341 2.6 479 3.1 466 2.6HD Catheter cuffed 179 1.9 235 2.0 261 2.0 298 1.9 464 2.6HD Catheter –NonCuffed 305 3.3 405 3.5 582 4.5 687 4.5 901 5.0
TOTAL 9308 100 11599 100 12914 100 15431 100.0 17878 100
Access types2010 2011 2012 2013 2014
n % n % n % n % n %Wrist AVF* 11130 57.3 12338 55.6 13419 52.8 14705 51.2 15791 49.1BCF* 6105 31.4 7249 32.7 8823 34.7 10119 35.2 11449 35.6BBF* 191 1.0 295 1.3 395 1.6 553 1.9 689 2.1Graft 495 2.5 488 2.2 519 2.0 545 1.9 577 1.8HD Catheter cuffed 513 2.6 569 2.6 947 3.7 1241 4.3 1728 5.4HD Catheter –NonCuffed 1000 5.1 1244 5.6 1306 5.1 1581 5.5 1929 6.0
TOTAL 19434 100 22183 100 25409 100 28744 100 32163 100
*AVF = arteriovenoous fistula, BBF = Brachiobasilic fistula, BCF = brachiocephalic fistula
No increase in difficulties was reported with vascular access.
Table 11.1.2: Difficulties report with vascular access, 2005 2014
Access difficulty 2005 2006 2007 2008 2009n % n % n % n % n %
Difficulty with needle placement 319 3.5 394 3.5 478 3.8 417 2.8 523 3.0Difficulty in obtaining desired blood flowrate 354 3.9 356 3.1 368 2.9 420 2.8 473 2.7
Other difficulties 58 0.6 45 0.4 57 0.5 81 0.5 101 0.6No difficulties 8338 91.9 10591 93.0 11577 92.8 14080 93.9 16489 93.8TOTAL 9069 100 11386 100 12480 100 14998 100 17586 100
140
22nd Report of theMalaysian Dialysis and Transplant RegistryHAEMODIALYSIS PRACTICES
SECTION 11.1: VASCULAR ACCESS AND ITS COMPLICATIONS
The proportion of patients undergoing haemodialysis (HD) using a fistula has consistently and gradually reducing for the past 10 years. It was 92.1% in year 2005 and was only 86.8% in year 2014. This is most likely caused by a significant proportion of incident dialysis cases not have a functioning fistula upon initiation of HD.
The development of interventional nephrology has brought to an increase in patients undergoing HD via a cuffed- HD catheter.
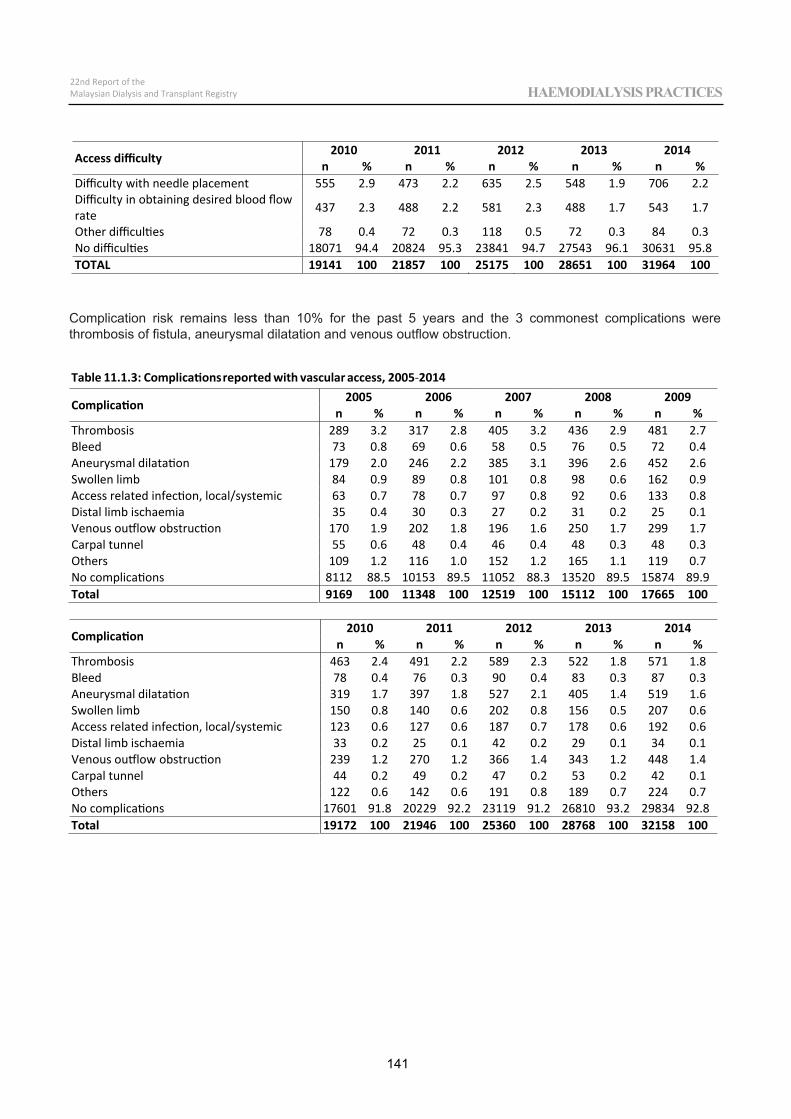
Access difficulty 2010 2011 2012 2013 2014n % n % n % n % n %
Difficulty with needle placement 555 2.9 473 2.2 635 2.5 548 1.9 706 2.2Difficulty in obtaining desired blood flowrate 437 2.3 488 2.2 581 2.3 488 1.7 543 1.7
Other difficulties 78 0.4 72 0.3 118 0.5 72 0.3 84 0.3No difficulties 18071 94.4 20824 95.3 23841 94.7 27543 96.1 30631 95.8TOTAL 19141 100 21857 100 25175 100 28651 100 31964 100
Table 11.1.3: Complicationsreported with vascular access, 2005 2014
Complication 2005 2006 2007 2008 2009n % n % n % n % n %
Thrombosis 289 3.2 317 2.8 405 3.2 436 2.9 481 2.7Bleed 73 0.8 69 0.6 58 0.5 76 0.5 72 0.4Aneurysmal dilatation 179 2.0 246 2.2 385 3.1 396 2.6 452 2.6Swollen limb 84 0.9 89 0.8 101 0.8 98 0.6 162 0.9Access related infection, local/systemic 63 0.7 78 0.7 97 0.8 92 0.6 133 0.8Distal limb ischaemia 35 0.4 30 0.3 27 0.2 31 0.2 25 0.1Venous outflow obstruction 170 1.9 202 1.8 196 1.6 250 1.7 299 1.7Carpal tunnel 55 0.6 48 0.4 46 0.4 48 0.3 48 0.3Others 109 1.2 116 1.0 152 1.2 165 1.1 119 0.7No complications 8112 88.5 10153 89.5 11052 88.3 13520 89.5 15874 89.9Total 9169 100 11348 100 12519 100 15112 100 17665 100
Complication 2010 2011 2012 2013 2014n % n % n % n % n %
Thrombosis 463 2.4 491 2.2 589 2.3 522 1.8 571 1.8Bleed 78 0.4 76 0.3 90 0.4 83 0.3 87 0.3Aneurysmal dilatation 319 1.7 397 1.8 527 2.1 405 1.4 519 1.6Swollen limb 150 0.8 140 0.6 202 0.8 156 0.5 207 0.6Access related infection, local/systemic 123 0.6 127 0.6 187 0.7 178 0.6 192 0.6Distal limb ischaemia 33 0.2 25 0.1 42 0.2 29 0.1 34 0.1Venous outflow obstruction 239 1.2 270 1.2 366 1.4 343 1.2 448 1.4Carpal tunnel 44 0.2 49 0.2 47 0.2 53 0.2 42 0.1Others 122 0.6 142 0.6 191 0.8 189 0.7 224 0.7No complications 17601 91.8 20229 92.2 23119 91.2 26810 93.2 29834 92.8Total 19172 100 21946 100 25360 100 28768 100 32158 100
141
22nd Report of theMalaysian Dialysis and Transplant Registry HAEMODIALYSIS PRACTICES
Complication risk remains less than 10% for the past 5 years and the 3 commonest complications were thrombosis of fistula, aneurysmal dilatation and venous outflow obstruction.
Table 11.2.1: Bloodflow rates in HD centers, 2005 2014
Blood flow rates(ml/min)
2005 2006 2007 2008 2009n % n % n % n % n %
<150 7 0.1 5 0.0 10 0.1 10 0.1 14 0.1150 199 94 1.0 103 0.9 87 0.7 120 0.8 126 0.7200 249 814 9.1 923 8.2 929 7.4 929 6.2 1178 6.8250 299 3523 39.2 3818 33.8 3821 30.5 4639 31.1 5050 28.9300 349 3225 35.9 4528 40.1 5214 41.7 6127 41.1 7097 40.7>=350 1328 14.8 1920 17.0 2451 19.6 3095 20.7 3981 22.8
Total 8991 100 11297 100 12512 100 14920 100 17446 100
Blood flow rates(ml/min)
2010 2011 2012 2013 2014n % n % n % n % n %
<150 16 0.1 13 0.1 15 0.1 21 0.1 24 0.1150 199 113 0.6 120 0.6 128 0.5 158 0.6 175 0.6200 249 1192 6.3 1112 5.1 1109 4.5 1245 4.4 1404 4.4250 299 5021 26.5 5341 24.7 5810 23.3 6301 22.3 7481 23.6300 349 7721 40.8 8871 41.0 10512 42.2 12324 43.5 13771 43.5>=350 4850 25.6 6167 28.5 7347 29.5 8259 29.2 8837 27.9
Total 18913 100 21624 100 24921 100 28308 100 31692 100
Figure 11.2.1: Bloodflow rates in HD centers, 2005 2014
0
10
20
30
40
%
2005 2006 2007 2008 2009 2010 2011 2012 2013 2014
Year
nim/lm 991-051nim/lm 051< 200-249 ml/min
250-299 ml/min 300-349 ml/min >=350 ml/min
142
22nd Report of theMalaysian Dialysis and Transplant RegistryHAEMODIALYSIS PRACTICES
R
22nd Report of theMalaysian Dialysis and Transplant Registry HAEMODIALYSIS PRACTICES
SECTION 11.2: HD PRESCRIPTION
More than 90% of the patients were undergoing HD with the blood flow rate of more than 250ml/min for the past 5 years. More than a quarter of them were dialyzing at the blood flow rate of more than 350ml/min.
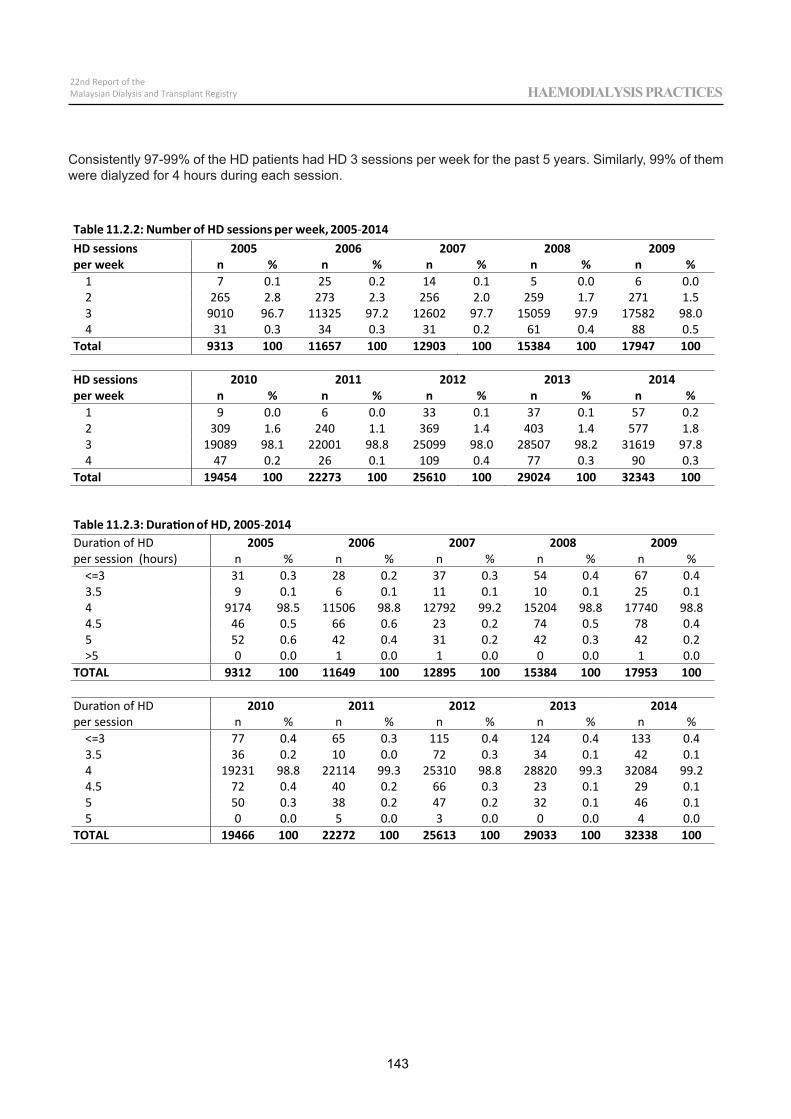
Table 11.2.2: Number of HD sessions per week, 2005 2014HD sessionsper week
2005 2006 2007 2008 2009n % n % n % n % n %
1 7 0.1 25 0.2 14 0.1 5 0.0 6 0.02 265 2.8 273 2.3 256 2.0 259 1.7 271 1.53 9010 96.7 11325 97.2 12602 97.7 15059 97.9 17582 98.04 31 0.3 34 0.3 31 0.2 61 0.4 88 0.5
Total 9313 100 11657 100 12903 100 15384 100 17947 100
HD sessionsper week
2010 2011 2012 2013 2014n % n % n % n % n %
1 9 0.0 6 0.0 33 0.1 37 0.1 57 0.22 309 1.6 240 1.1 369 1.4 403 1.4 577 1.83 19089 98.1 22001 98.8 25099 98.0 28507 98.2 31619 97.84 47 0.2 26 0.1 109 0.4 77 0.3 90 0.3
Total 19454 100 22273 100 25610 100 29024 100 32343 100
Table 11.2.3: Duration of HD, 2005 2014Duration of HDper session (hours)
2005 2006 2007 2008 2009n % n % n % n % n %
<=3 31 0.3 28 0.2 37 0.3 54 0.4 67 0.43.5 9 0.1 6 0.1 11 0.1 10 0.1 25 0.14 9174 98.5 11506 98.8 12792 99.2 15204 98.8 17740 98.84.5 46 0.5 66 0.6 23 0.2 74 0.5 78 0.45 52 0.6 42 0.4 31 0.2 42 0.3 42 0.2>5 0 0.0 1 0.0 1 0.0 0 0.0 1 0.0
TOTAL 9312 100 11649 100 12895 100 15384 100 17953 100
Duration of HDper session
2010 2011 2012 2013 2014n % n % n % n % n %
<=3 77 0.4 65 0.3 115 0.4 124 0.4 133 0.43.5 36 0.2 10 0.0 72 0.3 34 0.1 42 0.14 19231 98.8 22114 99.3 25310 98.8 28820 99.3 32084 99.24.5 72 0.4 40 0.2 66 0.3 23 0.1 29 0.15 50 0.3 38 0.2 47 0.2 32 0.1 46 0.15 0 0.0 5 0.0 3 0.0 0 0.0 4 0.0
TOTAL 19466 100 22272 100 25613 100 29033 100 32338 100
143
22nd Report of theMalaysian Dialysis and Transplant Registry HAEMODIALYSIS PRACTICES
Consistently 97-99% of the HD patients had HD 3 sessions per week for the past 5 years. Similarly, 99% of them were dialyzed for 4 hours during each session.
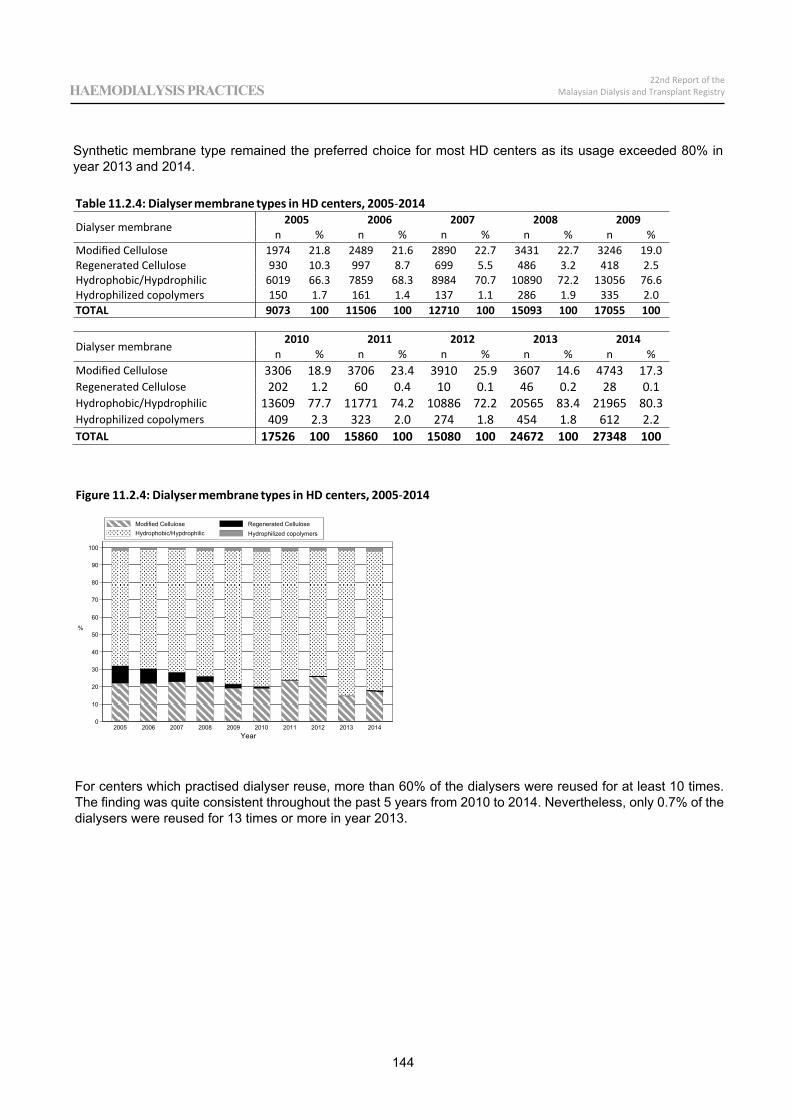
Table 11.2.4: Dialyser membrane types in HD centers, 2005 2014
Dialyser membrane 2005 2006 2007 2008 2009n % n % n % n % n %
Modified Cellulose 1974 21.8 2489 21.6 2890 22.7 3431 22.7 3246 19.0Regenerated Cellulose 930 10.3 997 8.7 699 5.5 486 3.2 418 2.5Hydrophobic/Hypdrophilic 6019 66.3 7859 68.3 8984 70.7 10890 72.2 13056 76.6Hydrophilized copolymers 150 1.7 161 1.4 137 1.1 286 1.9 335 2.0TOTAL 9073 100 11506 100 12710 100 15093 100 17055 100
Dialyser membrane 2010 2011 2012 2013 2014n % n % n % n % n %
Modified Cellulose 3306 18.9 3706 23.4 3910 25.9 3607 14.6 4743 17.3Regenerated Cellulose 202 1.2 60 0.4 10 0.1 46 0.2 28 0.1Hydrophobic/Hypdrophilic 13609 77.7 11771 74.2 10886 72.2 20565 83.4 21965 80.3Hydrophilized copolymers 409 2.3 323 2.0 274 1.8 454 1.8 612 2.2TOTAL 17526 100 15860 100 15080 100 24672 100 27348 100
Figure 11.2.4: Dialyser membrane types in HD centers, 2005 2014
0
10
20
30
40
50
60
70
80
90
100
%
2005 2006 2007 2008 2009 2010 2011 2012 2013 2014Year
esolulleC detarenegeResolulleC deifidoMHydrophobic/Hypdrophilic Hydrophilized copolymers
144
22nd Report of theMalaysian Dialysis and Transplant RegistryHAEMODIALYSIS PRACTICES
Synthetic membrane type remained the preferred choice for most HD centers as its usage exceeded 80% in year 2013 and 2014.
For centers which practised dialyser reuse, more than 60% of the dialysers were reused for at least 10 times. The finding was quite consistent throughout the past 5 years from 2010 to 2014. Nevertheless, only 0.7% of the dialysers were reused for 13 times or more in year 2013.
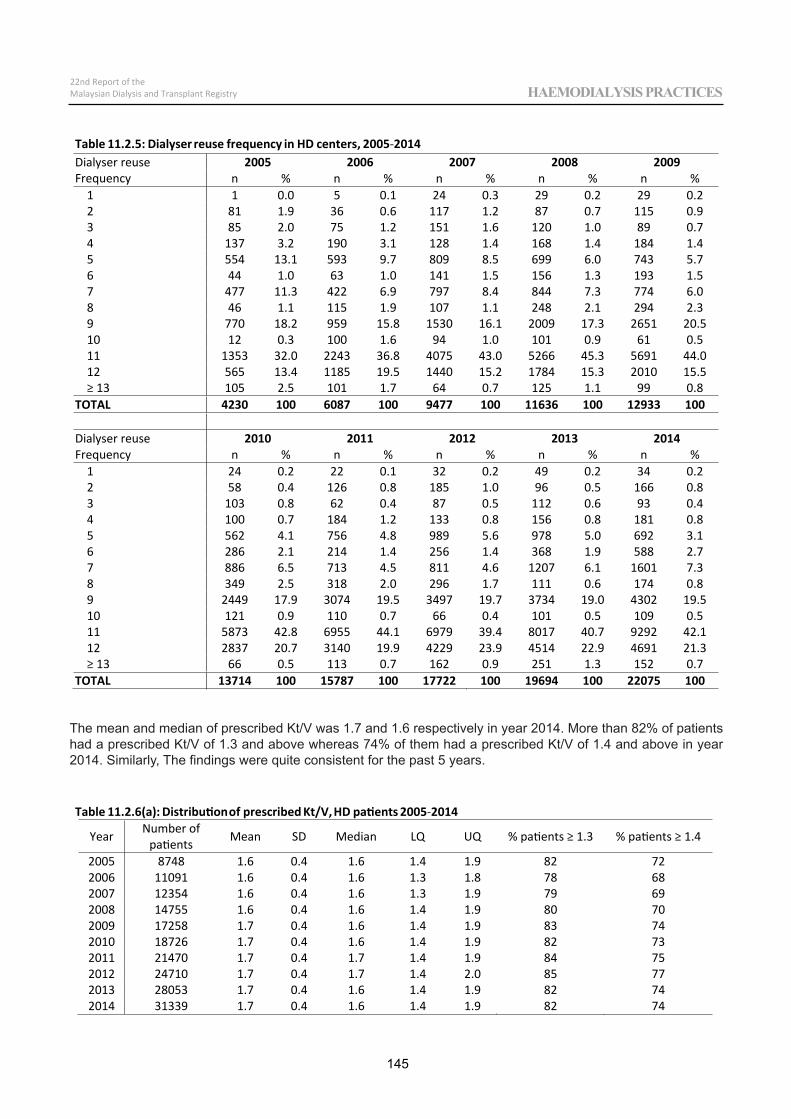
Table 11.2.5: Dialyser reuse frequency in HD centers, 2005 2014Dialyser reuseFrequency
2005 2006 2007 2008 2009n % n % n % n % n %
1 1 0.0 5 0.1 24 0.3 29 0.2 29 0.22 81 1.9 36 0.6 117 1.2 87 0.7 115 0.93 85 2.0 75 1.2 151 1.6 120 1.0 89 0.74 137 3.2 190 3.1 128 1.4 168 1.4 184 1.45 554 13.1 593 9.7 809 8.5 699 6.0 743 5.76 44 1.0 63 1.0 141 1.5 156 1.3 193 1.57 477 11.3 422 6.9 797 8.4 844 7.3 774 6.08 46 1.1 115 1.9 107 1.1 248 2.1 294 2.39 770 18.2 959 15.8 1530 16.1 2009 17.3 2651 20.510 12 0.3 100 1.6 94 1.0 101 0.9 61 0.511 1353 32.0 2243 36.8 4075 43.0 5266 45.3 5691 44.012 565 13.4 1185 19.5 1440 15.2 1784 15.3 2010 15.5
13 105 2.5 101 1.7 64 0.7 125 1.1 99 0.8TOTAL 4230 100 6087 100 9477 100 11636 100 12933 100
Dialyser reuseFrequency
2010 2011 2012 2013 2014n % n % n % n % n %
1 24 0.2 22 0.1 32 0.2 49 0.2 34 0.22 58 0.4 126 0.8 185 1.0 96 0.5 166 0.83 103 0.8 62 0.4 87 0.5 112 0.6 93 0.44 100 0.7 184 1.2 133 0.8 156 0.8 181 0.85 562 4.1 756 4.8 989 5.6 978 5.0 692 3.16 286 2.1 214 1.4 256 1.4 368 1.9 588 2.77 886 6.5 713 4.5 811 4.6 1207 6.1 1601 7.38 349 2.5 318 2.0 296 1.7 111 0.6 174 0.89 2449 17.9 3074 19.5 3497 19.7 3734 19.0 4302 19.510 121 0.9 110 0.7 66 0.4 101 0.5 109 0.511 5873 42.8 6955 44.1 6979 39.4 8017 40.7 9292 42.112 2837 20.7 3140 19.9 4229 23.9 4514 22.9 4691 21.3
13 66 0.5 113 0.7 162 0.9 251 1.3 152 0.7TOTAL 13714 100 15787 100 17722 100 19694 100 22075 100
Table 11.2.6(a):Distributionof prescribed Kt/V, HD patients 2005 2014
Year Number ofpatients Mean SD Median LQ UQ % patients 1.3 % patients 1.4
2005 8748 1.6 0.4 1.6 1.4 1.9 82 722006 11091 1.6 0.4 1.6 1.3 1.8 78 682007 12354 1.6 0.4 1.6 1.3 1.9 79 692008 14755 1.6 0.4 1.6 1.4 1.9 80 702009 17258 1.7 0.4 1.6 1.4 1.9 83 742010 18726 1.7 0.4 1.6 1.4 1.9 82 732011 21470 1.7 0.4 1.7 1.4 1.9 84 752012 24710 1.7 0.4 1.7 1.4 2.0 85 772013 28053 1.7 0.4 1.6 1.4 1.9 82 742014 31339 1.7 0.4 1.6 1.4 1.9 82 74
145
22nd Report of theMalaysian Dialysis and Transplant Registry HAEMODIALYSIS PRACTICES
The mean and median of prescribed Kt/V was 1.7 and 1.6 respectively in year 2014. More than 82% of patients had a prescribed Kt/V of 1.3 and above whereas 74% of them had a prescribed Kt/V of 1.4 and above in year 2014. Similarly, The findings were quite consistent for the past 5 years.
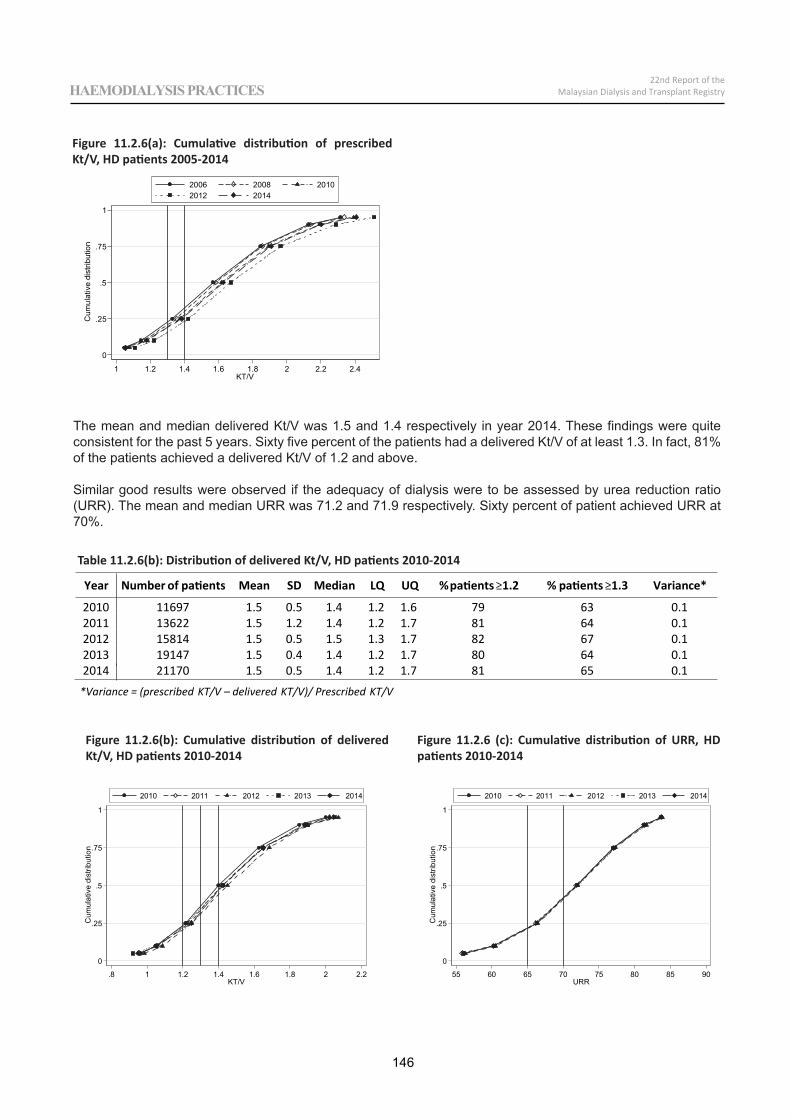
0
.25
.5
.75
1
Cum
ulat
ive
dist
ribut
ion
1 1.2 1.4 1.6 1.8 2 2.2 2.4KT/V
2006 2008 20102012 2014
Year Number of patients Mean SD Median LQ UQ %patients 1.2 % patients 1.3 Variance*
2010 11697 1.5 0.5 1.4 1.2 1.6 79 63 0.12011 13622 1.5 1.2 1.4 1.2 1.7 81 64 0.12012 15814 1.5 0.5 1.5 1.3 1.7 82 67 0.12013 19147 1.5 0.4 1.4 1.2 1.7 80 64 0.12014 21170 1.5 0.5 1.4 1.2 1.7 81 65 0.1
*Variance = (prescribed KT/V – delivered KT/V)/ Prescribed KT/V
0
.25
.5
.75
1
Cum
ulat
ive
dist
ribut
ion
.8 1 1.2 1.4 1.6 1.8 2 2.2KT/V
2010 2011 2012 2013 2014
0
.25
.5
.75
1
Cum
ulat
ive
dist
ribut
ion
55 60 65 70 75 80 85 90URR
2010 2011 2012 2013 2014
146
22nd Report of theMalaysian Dialysis and Transplant RegistryHAEMODIALYSIS PRACTICES
The mean and median delivered Kt/V was 1.5 and 1.4 respectively in year 2014. These findings were quite consistent for the past 5 years. Sixty five percent of the patients had a delivered Kt/V of at least 1.3. In fact, 81% of the patients achieved a delivered Kt/V of 1.2 and above.
Similar good results were observed if the adequacy of dialysis were to be assessed by urea reduction ratio (URR). The mean and median URR was 71.2 and 71.9 respectively. Sixty percent of patient achieved URR at 70%.
Figure 11.2.6(a): Cumulative distribution of prescribed Kt/V, HD patients 2005-2014
Figure 11.2.6(b): Cumulative distribution of delivered Kt/V, HD patients 2010-2014
Figure 11.2.6 (c): Cumulative distribution of URR, HD patients 2010-2014
Table 11.2.6(b): Distribution of delivered Kt/V, HD patients 2010-2014
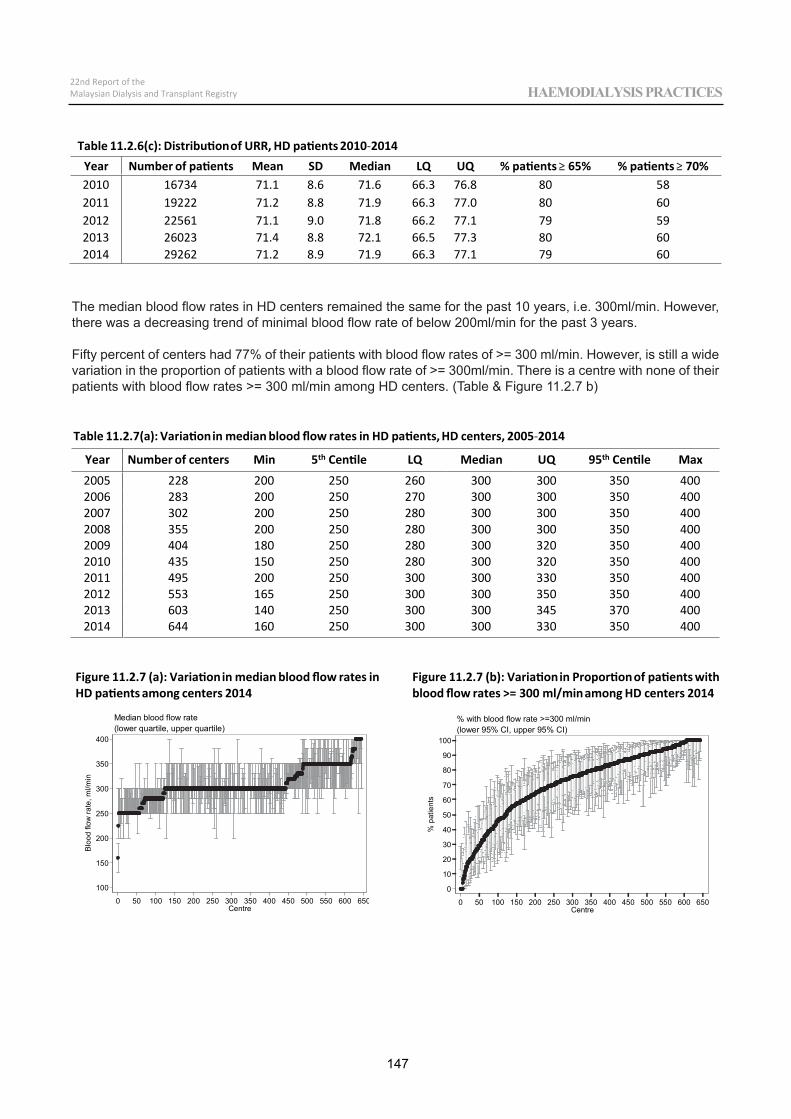
Table 11.2.6(c): Distributionof URR, HD patients2010 2014Year Number of patients Mean SD Median LQ UQ % patients 65% % patients 70%2010 16734 71.1 8.6 71.6 66.3 76.8 80 582011 19222 71.2 8.8 71.9 66.3 77.0 80 602012 22561 71.1 9.0 71.8 66.2 77.1 79 592013 26023 71.4 8.8 72.1 66.5 77.3 80 602014 29262 71.2 8.9 71.9 66.3 77.1 79 60
Table 11.2.7(a): Variation in median blood flow rates in HD patients, HD centers, 2005 2014
Year Number of centers Min 5th Centile LQ Median UQ 95th Centile Max
2005 228 200 250 260 300 300 350 4002006 283 200 250 270 300 300 350 4002007 302 200 250 280 300 300 350 4002008 355 200 250 280 300 300 350 4002009 404 180 250 280 300 320 350 4002010 435 150 250 280 300 320 350 4002011 495 200 250 300 300 330 350 4002012 553 165 250 300 300 350 350 4002013 603 140 250 300 300 345 370 4002014 644 160 250 300 300 330 350 400
Figure 11.2.7 (a): Variationin median bloodflow rates inHD patients among centers 2014
100
150
200
250
300
350
400
Blo
od fl
ow ra
te, m
l/min
0 50 100 150 200 250 300 350 400 450 500 550 600 650Centre
(lower quartile, upper quartile)Median blood flow rate
Figure 11.2.7 (b): Variationin Proportionof patients withbloodflow rates >= 300 ml/minamong HD centers 2014
0
10
20
30
40
50
60
70
80
90
100
% p
atie
nts
0 50 100 150 200 250 300 350 400 450 500 550 600 650Centre
(lower 95% CI, upper 95% CI)% with blood flow rate >=300 ml/min
147
22nd Report of theMalaysian Dialysis and Transplant Registry HAEMODIALYSIS PRACTICES
The median blood flow rates in HD centers remained the same for the past 10 years, i.e. 300ml/min. However, there was a decreasing trend of minimal blood flow rate of below 200ml/min for the past 3 years.
Fifty percent of centers had 77% of their patients with blood flow rates of >= 300 ml/min. However, is still a wide variation in the proportion of patients with a blood flow rate of >= 300ml/min. There is a centre with none of their patients with blood flow rates >= 300 ml/min among HD centers. (Table & Figure 11.2.7 b)
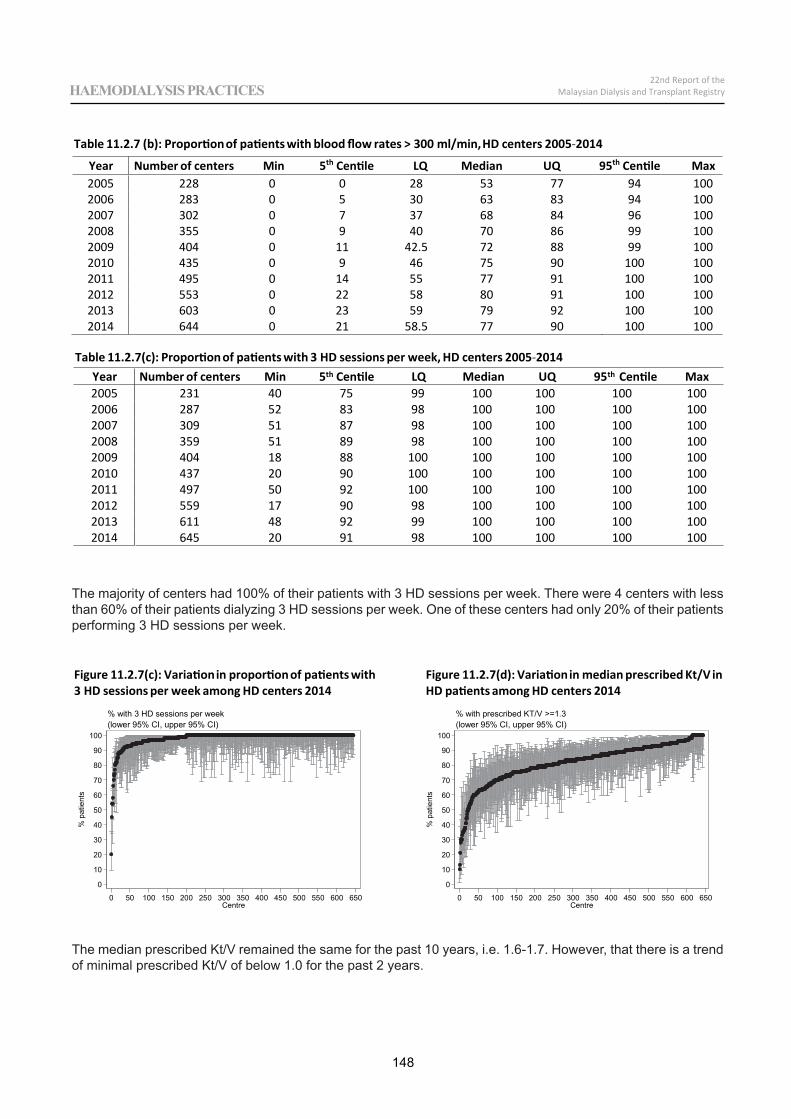
Table 11.2.7 (b): Proportionof patientswith bloodflow rates > 300 ml/min,HD centers 2005 2014
Year Number of centers Min 5th Centile LQ Median UQ 95th Centile Max2005 228 0 0 28 53 77 94 1002006 283 0 5 30 63 83 94 1002007 302 0 7 37 68 84 96 1002008 355 0 9 40 70 86 99 1002009 404 0 11 42.5 72 88 99 1002010 435 0 9 46 75 90 100 1002011 495 0 14 55 77 91 100 1002012 553 0 22 58 80 91 100 1002013 603 0 23 59 79 92 100 1002014 644 0 21 58.5 77 90 100 100
Table 11.2.7(c): Proportionof patientswith 3 HD sessionsper week, HD centers 2005 2014Year Number of centers Min 5th Centile LQ Median UQ 95th Centile Max2005 231 40 75 99 100 100 100 1002006 287 52 83 98 100 100 100 1002007 309 51 87 98 100 100 100 1002008 359 51 89 98 100 100 100 1002009 404 18 88 100 100 100 100 1002010 437 20 90 100 100 100 100 1002011 497 50 92 100 100 100 100 1002012 559 17 90 98 100 100 100 1002013 611 48 92 99 100 100 100 1002014 645 20 91 98 100 100 100 100
Figure 11.2.7(c):Variation in proportionof patientswith3 HD sessionsper week among HD centers 2014
0
10
20
30
40
50
60
70
80
90
100
% p
atie
nts
0 50 100 150 200 250 300 350 400 450 500 550 600 650Centre
(lower 95% CI, upper 95% CI)% with 3 HD sessions per week
Figure 11.2.7(d):Variationin medianprescribedKt/V inHD patients among HD centers 2014
0
10
20
30
40
50
60
70
80
90
100
% p
atie
nts
0 50 100 150 200 250 300 350 400 450 500 550 600 650Centre
(lower 95% CI, upper 95% CI)% with prescribed KT/V >=1.3
148
22nd Report of theMalaysian Dialysis and Transplant RegistryHAEMODIALYSIS PRACTICES
The majority of centers had 100% of their patients with 3 HD sessions per week. There were 4 centers with less than 60% of their patients dialyzing 3 HD sessions per week. One of these centers had only 20% of their patients performing 3 HD sessions per week.
The median prescribed Kt/V remained the same for the past 10 years, i.e. 1.6-1.7. However, that there is a trend of minimal prescribed Kt/V of below 1.0 for the past 2 years.
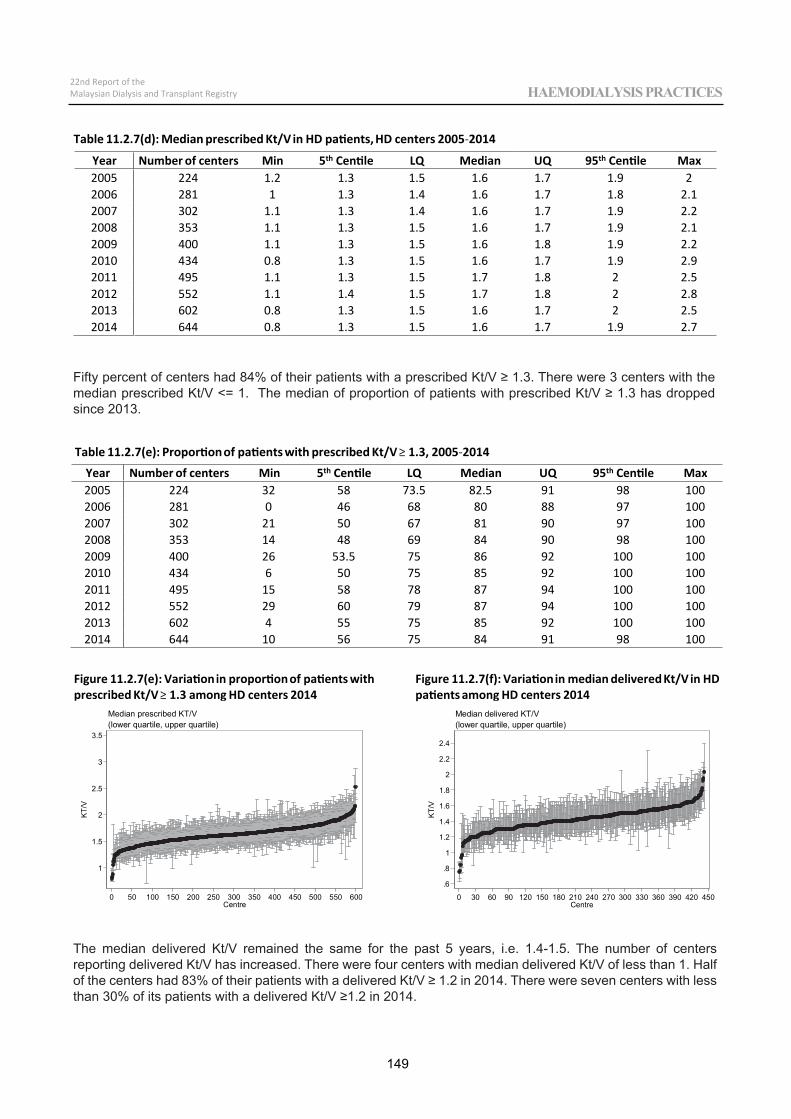
Table 11.2.7(d): Median prescribed Kt/V in HD patients, HD centers 2005 2014
Year Number of centers Min 5th Centile LQ Median UQ 95th Centile Max2005 224 1.2 1.3 1.5 1.6 1.7 1.9 22006 281 1 1.3 1.4 1.6 1.7 1.8 2.12007 302 1.1 1.3 1.4 1.6 1.7 1.9 2.22008 353 1.1 1.3 1.5 1.6 1.7 1.9 2.12009 400 1.1 1.3 1.5 1.6 1.8 1.9 2.22010 434 0.8 1.3 1.5 1.6 1.7 1.9 2.92011 495 1.1 1.3 1.5 1.7 1.8 2 2.52012 552 1.1 1.4 1.5 1.7 1.8 2 2.82013 602 0.8 1.3 1.5 1.6 1.7 2 2.52014 644 0.8 1.3 1.5 1.6 1.7 1.9 2.7
Table 11.2.7(e): Proportionof patients with prescribed Kt/V 1.3, 2005 2014Year Number of centers Min 5th Centile LQ Median UQ 95th Centile Max2005 224 32 58 73.5 82.5 91 98 1002006 281 0 46 68 80 88 97 1002007 302 21 50 67 81 90 97 1002008 353 14 48 69 84 90 98 1002009 400 26 53.5 75 86 92 100 1002010 434 6 50 75 85 92 100 1002011 495 15 58 78 87 94 100 1002012 552 29 60 79 87 94 100 1002013 602 4 55 75 85 92 100 1002014 644 10 56 75 84 91 98 100
Figure 11.2.7(e): Variationin proportion of patients withprescribed Kt/V 1.3 among HD centers 2014
1
1.5
2
2.5
3
3.5
KT/V
0 50 100 150 200 250 300 350 400 450 500 550 600Centre
(lower quartile, upper quartile)Median prescribed KT/V
Figure 11.2.7(f):Variationin median delivered Kt/V in HDpatients among HD centers 2014
.6
.8
1
1.2
1.4
1.6
1.8
2
2.2
2.4
KT/
V
0 30 60 90 120 150 180 210 240 270 300 330 360 390 420 450Centre
(lower quartile, upper quartile)Median delivered KT/V
149
22nd Report of theMalaysian Dialysis and Transplant Registry HAEMODIALYSIS PRACTICES
Fifty percent of centers had 84% of their patients with a prescribed Kt/V ≥ 1.3. There were 3 centers with the median prescribed Kt/V <= 1. The median of proportion of patients with prescribed Kt/V ≥ 1.3 has dropped since 2013.
The median delivered Kt/V remained the same for the past 5 years, i.e. 1.4-1.5. The number of centers reporting delivered Kt/V has increased. There were four centers with median delivered Kt/V of less than 1. Half of the centers had 83% of their patients with a delivered Kt/V ≥ 1.2 in 2014. There were seven centers with less than 30% of its patients with a delivered Kt/V ≥1.2 in 2014.
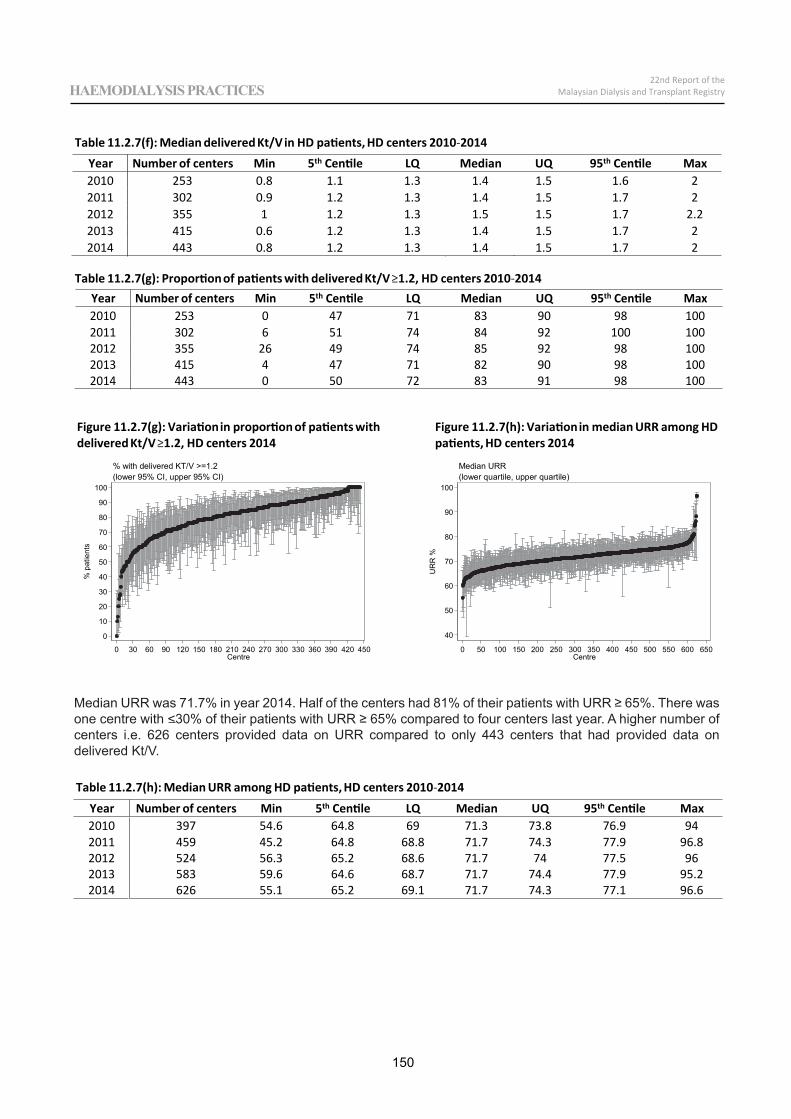
Table 11.2.7(f): Median delivered Kt/V in HD patients, HD centers 2010 2014Year Number of centers Min 5th Centile LQ Median UQ 95th Centile Max2010 253 0.8 1.1 1.3 1.4 1.5 1.6 22011 302 0.9 1.2 1.3 1.4 1.5 1.7 22012 355 1 1.2 1.3 1.5 1.5 1.7 2.22013 415 0.6 1.2 1.3 1.4 1.5 1.7 22014 443 0.8 1.2 1.3 1.4 1.5 1.7 2
Table 11.2.7(g): Proportionof patients with delivered Kt/V 1.2, HD centers 2010 2014Year Number of centers Min 5th Centile LQ Median UQ 95th Centile Max2010 253 0 47 71 83 90 98 1002011 302 6 51 74 84 92 100 1002012 355 26 49 74 85 92 98 1002013 415 4 47 71 82 90 98 1002014 443 0 50 72 83 91 98 100
Figure 11.2.7(g): Variation in proportion of patients withdelivered Kt/V 1.2, HD centers 2014
0
10
20
30
40
50
60
70
80
90
100
% p
atie
nts
0 30 60 90 120 150 180 210 240 270 300 330 360 390 420 450Centre
(lower 95% CI, upper 95% CI)% with delivered KT/V >=1.2
Figure 11.2.7(h):Variationin median URR among HDpatients, HD centers 2014
40
50
60
70
80
90
100
UR
R %
0 50 100 150 200 250 300 350 400 450 500 550 600 650Centre
(lower quartile, upper quartile)Median URR
Table 11.2.7(h): Median URR among HD patients, HD centers 2010 2014Year Number of centers Min 5th Centile LQ Median UQ 95th Centile Max2010 397 54.6 64.8 69 71.3 73.8 76.9 942011 459 45.2 64.8 68.8 71.7 74.3 77.9 96.82012 524 56.3 65.2 68.6 71.7 74 77.5 962013 583 59.6 64.6 68.7 71.7 74.4 77.9 95.22014 626 55.1 65.2 69.1 71.7 74.3 77.1 96.6
150
22nd Report of theMalaysian Dialysis and Transplant RegistryHAEMODIALYSIS PRACTICES
Median URR was 71.7% in year 2014. Half of the centers had 81% of their patients with URR ≥ 65%. There was one centre with <30% of their patients with URR ≥ 65% compared to four centers last year. A higher number of centers i.e. 626 centers provided data on URR compared to only 443 centers that had provided data on delivered Kt/V.
Table 11.2.7(i): Proportion of HD patients with URR 65%, HD centers 2010 2014
Year Number of centers Min 5th Centile LQ Median UQ 95th Centile Max2010 397 13 48 69 82 90 98 1002011 459 0 50 70 82 91 100 1002012 524 17 50 69 81 89 98 1002013 583 23 50 69 81 91 98 1002014 626 25 50 69 81 90 97 100
0
10
20
30
40
50
60
70
80
90
100
% p
atie
nts
0 50 100 150 200 250 300 350 400 450 500 550 600 650Centre
(lower 95% CI, upper 95% CI)% with URR >=65%
YearInterval(month)
2005 2006 2007 2008 2009
n %Survival SE n %
Survival SE n %Survival SE n %
Survival SE n %Survival SE
0 2959 100 3421 100 3691 100 4207 100 4573 1006 2730 93 0 3142 93 0 3464 94 0 3931 94 0 4275 94 012 2524 87 1 2918 87 1 3219 88 1 3674 88 1 3979 88 024 2188 76 1 2562 77 1 2828 78 1 3179 77 1 3443 76 136 1929 68 1 2252 68 1 2472 68 1 2794 68 1 3004 67 148 1676 59 1 2003 61 1 2151 60 1 2429 59 1 2640 59 160 1459 52 1 1756 53 1 1892 53 1 2097 51 1 2306 52 172 1290 46 1 1543 47 1 1646 46 1 1825 45 1 5684 1110 39 1 1320 40 1 1404 39 1 5596 957 34 1 1134 35 1 25108 840 30 1 24120 8
YearInterval(month)
2010 2011 2012 2013 2014
n %Survival SE n. %
Survival SE n. %Survival SE n %
Survival SE n %Survival SE
0 4960 100 5657 100 6109 100 6423 100 6353 1006 4510 91 0 5196 93 0 5633 93 0 5946 93 0 3281 93 012 4193 85 1 4820 86 0 5250 87 0 5547 87 0 27124 3633 74 1 4195 75 1 4560 76 1 15936 3179 65 1 3682 66 1 13748 2777 57 1 11560 48
151
22nd Report of theMalaysian Dialysis and Transplant Registry HAEMODIALYSIS PRACTICES
Figure 11.2.7(i): Variation in proportion of patients with URR ≥ 65% among HD centers 2014
SECTION 11.3: TECHNIQUE SURVIVAL ON DIALYSIS
Table 11.3.1(a): Unadjusted technique survival by year of entry, 2005-2014
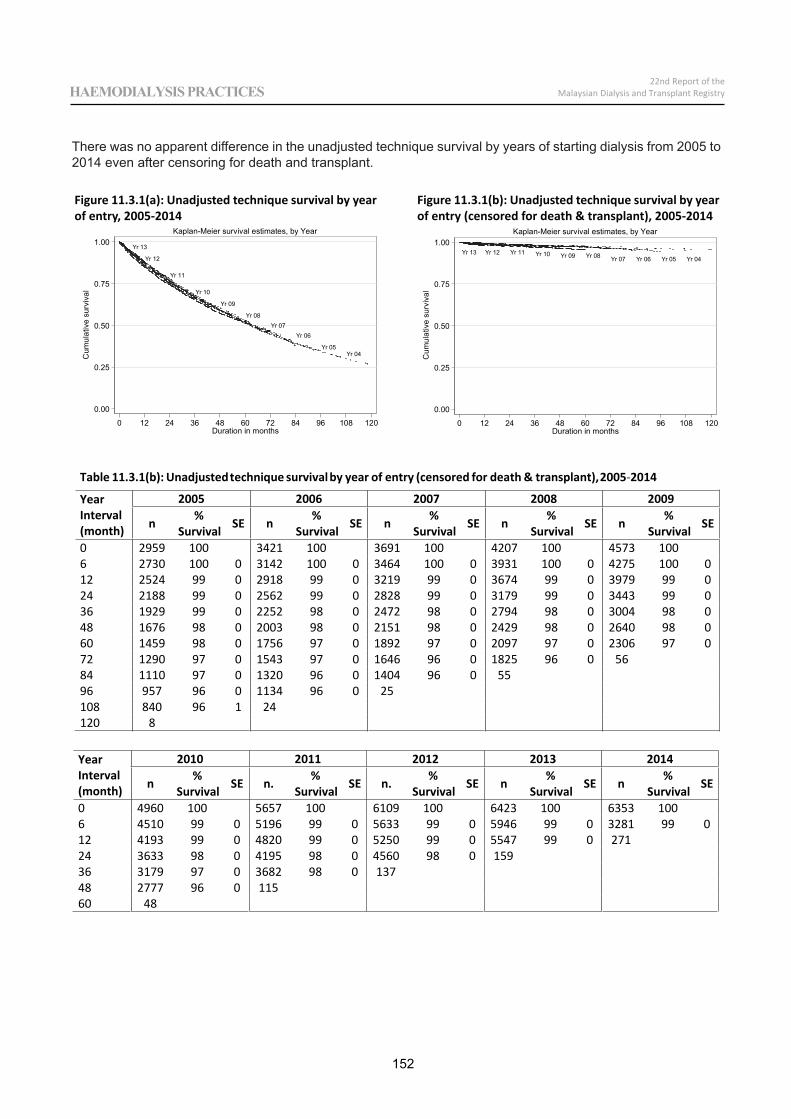
152
22nd Report of theMalaysian Dialysis and Transplant RegistryHAEMODIALYSIS PRACTICES
There was no apparent difference in the unadjusted technique survival by years of starting dialysis from 2005 to 2014 even after censoring for death and transplant.
Yr 13
Yr 12
Yr 11
Yr 10
Yr 09
Yr 08Yr 07
Yr 06
Yr 05Yr 04
0.00
0.25
0.50
0.75
1.00
Cum
ulat
ive
surv
ival
0 12 24 36 48 60 72 84 96 108 120Duration in months
Kaplan-Meier survival estimates, by Year
Yr 13 Yr 12 Yr 11 Yr 10 Yr 09 Yr 08 Yr 07 Yr 06 Yr 05 Yr 04
0.00
0.25
0.50
0.75
1.00
Cum
ulat
ive
surv
ival
0 12 24 36 48 60 72 84 96 108 120Duration in months
Kaplan-Meier survival estimates, by Year
Figure 11.3.1(a): Unadjusted technique survival by year of entry, 2005-2014
Figure 11.3.1(b): Unadjusted technique survival by year of entry (censored for death & transplant), 2005-2014
Table 11.3.1(b): Unadjustedtechnique survivalby year of entry (censored for death & transplant),2005 2014
YearInterval(month)
2005 2006 2007 2008 2009
n %Survival SE n %
Survival SE n %Survival SE n %
Survival SE n %Survival SE
0 2959 100 3421 100 3691 100 4207 100 4573 1006 2730 100 0 3142 100 0 3464 100 0 3931 100 0 4275 100 012 2524 99 0 2918 99 0 3219 99 0 3674 99 0 3979 99 024 2188 99 0 2562 99 0 2828 99 0 3179 99 0 3443 99 036 1929 99 0 2252 98 0 2472 98 0 2794 98 0 3004 98 048 1676 98 0 2003 98 0 2151 98 0 2429 98 0 2640 98 060 1459 98 0 1756 97 0 1892 97 0 2097 97 0 2306 97 072 1290 97 0 1543 97 0 1646 96 0 1825 96 0 5684 1110 97 0 1320 96 0 1404 96 0 5596 957 96 0 1134 96 0 25108 840 96 1 24120 8
YearInterval(month)
2010 2011 2012 2013 2014
n %Survival SE n. %
Survival SE n. %Survival SE n %
Survival SE n %Survival SE
0 4960 100 5657 100 6109 100 6423 100 6353 1006 4510 99 0 5196 99 0 5633 99 0 5946 99 0 3281 99 012 4193 99 0 4820 99 0 5250 99 0 5547 99 0 27124 3633 98 0 4195 98 0 4560 98 0 15936 3179 97 0 3682 98 0 13748 2777 96 0 11560 48
153
22nd Report of theMalaysian Dialysis and Transplant Registry HAEMODIALYSIS PRACTICES
Table 11.3.2(a): Unadjustedtechnique survivalby age, 2005 2014Age group (year)Interval(month)
14 15 24 25 34 35 44
n %Survival SE n %
Survival SE n %Survival SE n %
Survival SE
0 154 100 1279 100 2948 100 5143 1006 136 94 2 1156 96 1 2625 96 0 4554 95 012 118 90 3 1013 92 1 2346 93 0 4008 91 024 91 81 3 798 87 1 1847 88 1 3102 84 136 66 75 4 640 83 1 1467 84 1 2421 79 148 48 67 5 525 82 1 1118 80 1 1857 74 160 38 64 5 410 79 1 830 76 1 1389 70 172 27 57 6 300 77 2 597 72 1 1001 65 184 17 52 6 216 74 2 407 69 1 645 60 196 11 52 6 128 73 2 230 66 1 396 56 1108 4 37 10 58 68 3 106 63 2 163 52 1120 1 11 3
Age group (year)Interval(month)
45 54 55 64 65
n %Survival SE n %
Survival SE n %Survival SE
0 11812 100 14685 100 12332 1006 10462 94 0 12765 93 0 10404 90 012 9113 89 0 10939 87 0 8595 82 024 6921 80 0 7907 75 0 5916 67 036 5243 72 0 5646 65 0 3964 55 148 3793 65 1 3831 56 1 2534 44 160 2703 58 1 2561 48 1 1585 35 172 1884 52 1 1643 40 1 895 27 184 1163 45 1 970 33 1 469 20 196 633 39 1 503 27 1 209 15 1108 243 35 1 206 23 1 72 12 1120 1 12
The unadjusted technique survival was better in the younger age groups than the older age group. The 9-year unadjusted technique survival for the age groups of <14, 15-24, 25-34, 35-44, 45-54, 55-64 and >65 years old were 37%, 68%, 63%, 52%, 35%, 23% and 12% respectively. There was no apparent difference in the unadjusted technique survival by age once censored for death & transplant except for those less than 15 years old. Patients who were less than 14 years old had poorer technique survival for the first five years and subsequently maintained at 87%.
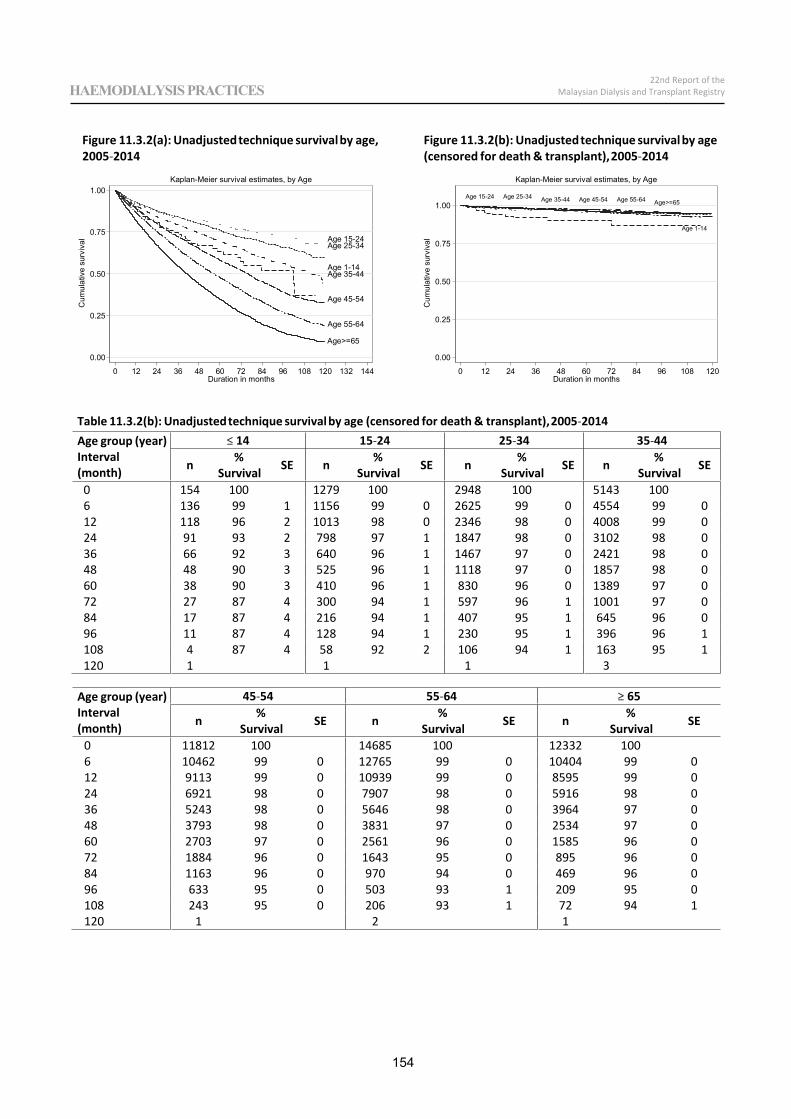
154
22nd Report of theMalaysian Dialysis and Transplant RegistryHAEMODIALYSIS PRACTICES
Figure 11.3.2(a): Unadjustedtechnique survivalby age,2005 2014
Age>=65
Age 55-64
Age 45-54
Age 35-44Age 1-14
Age 25-34Age 15-24
0.00
0.25
0.50
0.75
1.00
Cum
ulat
ive
surv
ival
0 12 24 36 48 60 72 84 96 108 120 132 144Duration in months
Kaplan-Meier survival estimates, by Age
Figure 11.3.2(b): Unadjustedtechnique survival by age(censored for death & transplant),2005 2014
Age>=65Age 55-64Age 45-54Age 35-44Age 25-34Age 15-24
Age 1-14
0.00
0.25
0.50
0.75
1.00
Cum
ulat
ive
surv
ival
0 12 24 36 48 60 72 84 96 108 120Duration in months
Kaplan-Meier survival estimates, by Age
Table 11.3.2(b): Unadjustedtechnique survivalby age (censored for death & transplant),2005 2014Age group (year)Interval(month)
14 15 24 25 34 35 44
n %Survival SE n %
Survival SE n %Survival SE n %
Survival SE
0 154 100 1279 100 2948 100 5143 1006 136 99 1 1156 99 0 2625 99 0 4554 99 012 118 96 2 1013 98 0 2346 98 0 4008 99 024 91 93 2 798 97 1 1847 98 0 3102 98 036 66 92 3 640 96 1 1467 97 0 2421 98 048 48 90 3 525 96 1 1118 97 0 1857 98 060 38 90 3 410 96 1 830 96 0 1389 97 072 27 87 4 300 94 1 597 96 1 1001 97 084 17 87 4 216 94 1 407 95 1 645 96 096 11 87 4 128 94 1 230 95 1 396 96 1108 4 87 4 58 92 2 106 94 1 163 95 1120 1 11 3
Age group (year)Interval(month)
45 54 55 64 65
n %Survival SE n %
Survival SE n %Survival SE
0 11812 100 14685 100 12332 1006 10462 99 0 12765 99 0 10404 99 012 9113 99 0 10939 99 0 8595 99 024 6921 98 0 7907 98 0 5916 98 036 5243 98 0 5646 98 0 3964 97 048 3793 98 0 3831 97 0 2534 97 060 2703 97 0 2561 96 0 1585 96 072 1884 96 0 1643 95 0 895 96 084 1163 96 0 970 94 0 469 96 096 633 95 0 503 93 1 209 95 0108 243 95 0 206 93 1 72 94 1120 1 12
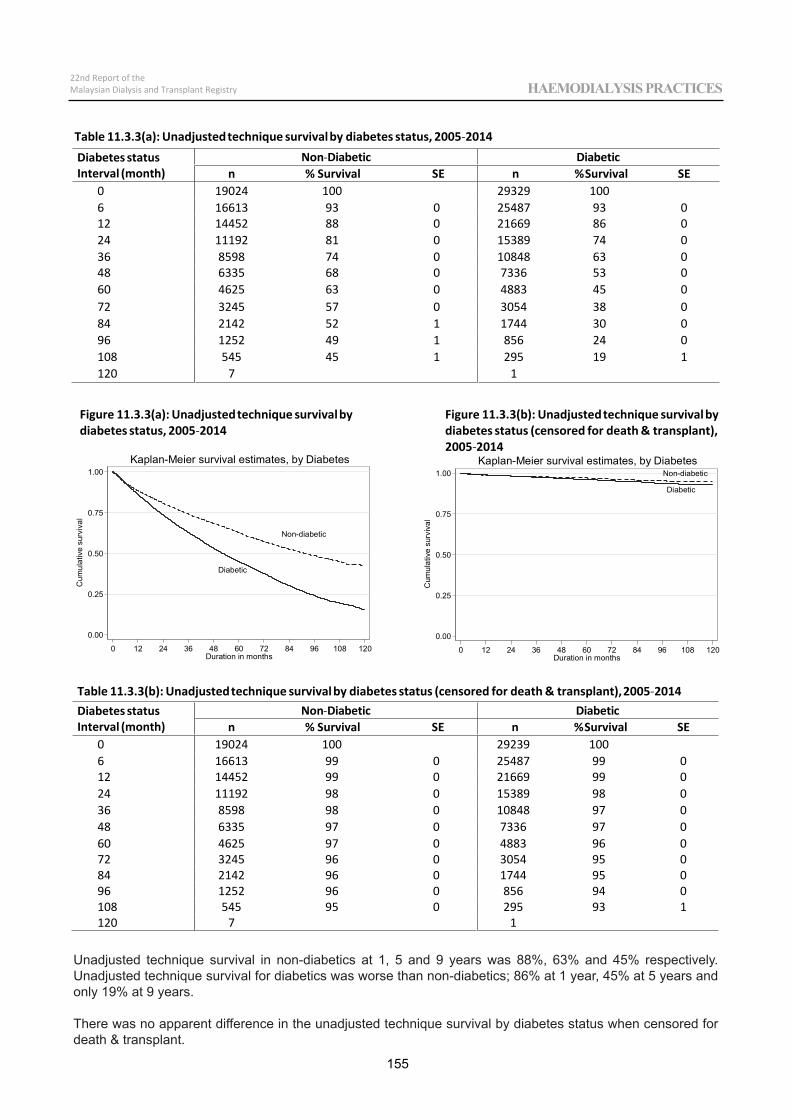
155
22nd Report of theMalaysian Dialysis and Transplant Registry HAEMODIALYSIS PRACTICES
Table 11.3.3(a): Unadjustedtechnique survivalby diabetes status, 2005 2014Diabetes statusInterval (month)
Non citebaiDcitebaiDn % Survival SE n %Survival SE
0 19024 100 29329 1006 16613 93 0 25487 93 012 14452 88 0 21669 86 024 11192 81 0 15389 74 036 8598 74 0 10848 63 048 6335 68 0 7336 53 060 4625 63 0 4883 45 072 3245 57 0 3054 38 084 2142 52 1 1744 30 096 1252 49 1 856 24 0108 545 45 1 295 19 1120 7 1
Figure 11.3.3(a): Unadjustedtechnique survivalbydiabetes status, 2005 2014
Diabetic
Non-diabetic
0.00
0.25
0.50
0.75
1.00
Cum
ulat
ive
surv
ival
0 12 24 36 48 60 72 84 96 108 120Duration in months
Kaplan-Meier survival estimates, by Diabetes
Diabetic
Non-diabetic
0.00
0.25
0.50
0.75
1.00
Cum
ulat
ive
surv
ival
0 12 24 36 48 60 72 84 96 108 120Duration in months
Kaplan-Meier survival estimates, by Diabetes
Table 11.3.3(b): Unadjustedtechnique survivalby diabetes status (censored for death & transplant),2005 2014Diabetes statusInterval (month)
Non citebaiDcitebaiDn % Survival SE n %Survival SE
0 19024 100 29239 1006 16613 99 0 25487 99 012 14452 99 0 21669 99 024 11192 98 0 15389 98 036 8598 98 0 10848 97 048 6335 97 0 7336 97 060 4625 97 0 4883 96 072 3245 96 0 3054 95 084 2142 96 0 1744 95 096 1252 96 0 856 94 0108 545 95 0 295 93 1120 7 1
Figure 11.3.3(b): Unadjustedtechnique survival bydiabetes status (censored for death & transplant),2005 2014
Unadjusted technique survival in non-diabetics at 1, 5 and 9 years was 88%, 63% and 45% respectively. Unadjusted technique survival for diabetics was worse than non-diabetics; 86% at 1 year, 45% at 5 years and only 19% at 9 years.
There was no apparent difference in the unadjusted technique survival by diabetes status when censored for death & transplant.

22nd Report of theMalaysian Dialysis and Transplant Registry ALL RENAL REPLACEMENT THERAPY IN MALAYSIA
Chapter 12
PERITONEAL DIALYSIS
B. Sunita A/P V. BavanandanAnita Bhajan Manocha
Lily Binti MushaharMohamad Zaimi Bin Abdul Wahab
Sudhaharan Sivathasan
Table12.1.1: Peritoneal dialysis regimes, 2005 2014
PD regime 2005 2006 2007 2008 2009n % n % n % N % n %
StandardCAPD 1303 93.2 1397 90 1547 85.7 1717 82.4 1847 83.5DAPD 45 3.2 67 4.3 115 6.4 121 5.8 119 5.4AutomatedPD/ CCPD 50 3.6 88 5.7 144 8 245 11.8 246 11.1TOTAL 1398 100 1552 100 1806 100 2083 100 2212 100
PD regime 2010 2011 2012 2013 2014n % n % n % N % n %
StandardCAPD 1973 83.6 2061 80.9 2309 81.1 2571 79.7 2965 81.3DAPD 91 3.9 117 4.6 140 4.9 183 5.7 194 5.3AutomatedPD/ CCPD 296 12.5 371 14.6 397 13.9 470 14.6 486 13.3TOTAL 2360 100 2549 100 2846 100 3224 100 3645 100
158
22nd Report of theMalaysian Dialysis and Transplant RegistryPERITONEAL DIALYSIS
SECTION 12.1: MODALITIES AND PRESCRIPTION OF PD (TABLES 12.1.1 -12.1.4)
The number of patients treated with Peritoneal Dialysis (PD) in Malaysia has grown by approximately 2.7 times over the last decade where the prevalence of PD patients as of 31st December has increased from 1174 in the year 2005 to 3149 patients for the year 2014. PD therapy overall comprises 9.4 % of the total number of dialysis patients (Table 12. 1.6(b)).
The bulk of PD therapy (81.3%) remains in the form of Continuous Ambulatory Peritoneal Dialysis (CAPD). Automated Peritoneal Dialysis (APD) utilization has increased from a mere 3.6% in 2005 to the present level of 13.3%. However, in the last five years the growth of APD has ceased (Table 12.1.1).
There has been an increased utilization of the Fresenius Medical Care (FMC) system, with the ratio of FMC to Baxter approaching 1:3 by 2014 (Table 12.1.2). The majority of patients on CAPD (91.5%) are using 4 exchanges per day, while 81.8% of those on APD are using total dwell volumes of 10L per day (Tables12.1.3a and Table 12.1.3b).
In CAPD, the majority of patients (65%) practice self care but in APD, the largest proportion (66%) are either completely or partially assisted. In terms of age distribution, it is clear PD is the preferred modality in the paediatric age groups where for ages 1-14 years, 78% of new patients start PD, for those aged 15 to 24 years it is approximately one-quarter and in the young working age group of 25-34 years, one-fifth choose PD (Tables12.1.5(a) and (b)). There are no significant gender differences in choice of PD therapy (Tables 12.1.6(a) and (b)).
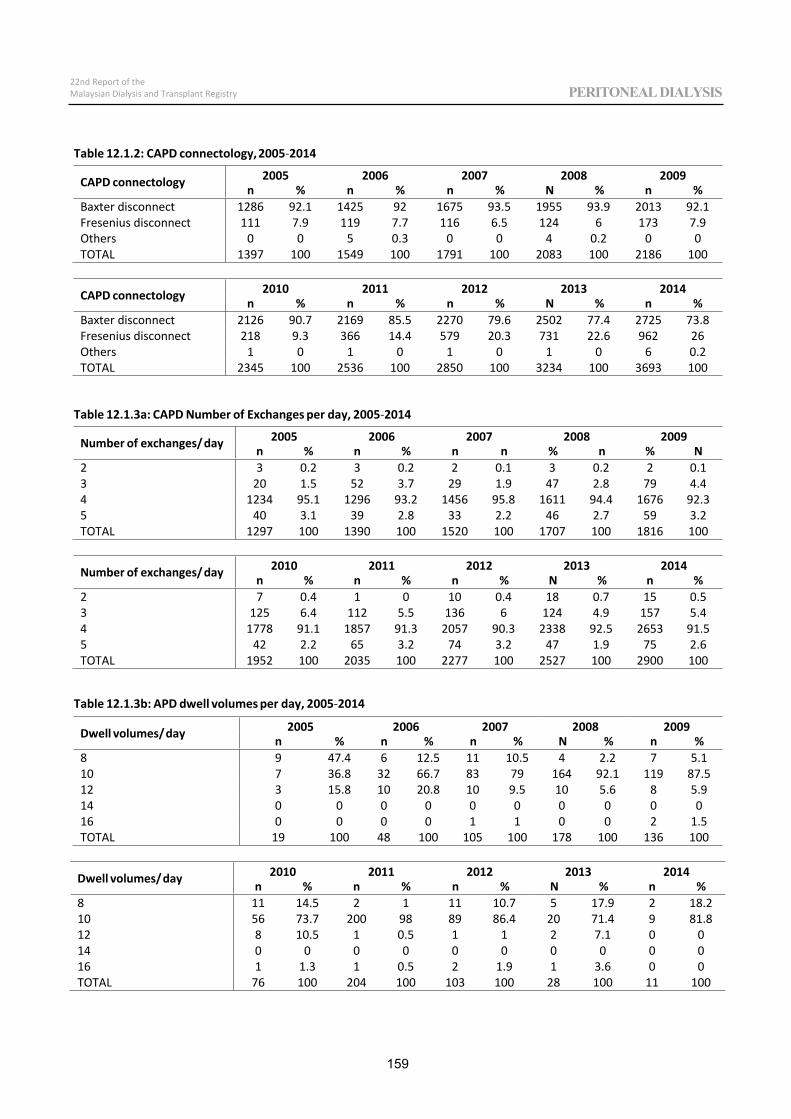
Table 12.1.2: CAPD connectology,2005 2014
CAPD connectology 2005 2006 2007 2008 2009n % n % n % N % n %
Baxter disconnect 1286 92.1 1425 92 1675 93.5 1955 93.9 2013 92.1Fresenius disconnect 111 7.9 119 7.7 116 6.5 124 6 173 7.9Others 0 0 5 0.3 0 0 4 0.2 0 0TOTAL 1397 100 1549 100 1791 100 2083 100 2186 100
CAPD connectology 2010 2011 2012 2013 2014n % n % n % N % n %
Baxter disconnect 2126 90.7 2169 85.5 2270 79.6 2502 77.4 2725 73.8Fresenius disconnect 218 9.3 366 14.4 579 20.3 731 22.6 962 26Others 1 0 1 0 1 0 1 0 6 0.2TOTAL 2345 100 2536 100 2850 100 3234 100 3693 100
Table 12.1.3a: CAPD Number of Exchanges per day, 2005 2014
Number of exchanges/day 2005 2006 2007 2008 2009n % n % n n % n % N
2 3 0.2 3 0.2 2 0.1 3 0.2 2 0.13 20 1.5 52 3.7 29 1.9 47 2.8 79 4.44 1234 95.1 1296 93.2 1456 95.8 1611 94.4 1676 92.35 40 3.1 39 2.8 33 2.2 46 2.7 59 3.2TOTAL 1297 100 1390 100 1520 100 1707 100 1816 100
Number of exchanges/day 2010 2011 2012 2013 2014n % n % n % N % n %
2 7 0.4 1 0 10 0.4 18 0.7 15 0.53 125 6.4 112 5.5 136 6 124 4.9 157 5.44 1778 91.1 1857 91.3 2057 90.3 2338 92.5 2653 91.55 42 2.2 65 3.2 74 3.2 47 1.9 75 2.6TOTAL 1952 100 2035 100 2277 100 2527 100 2900 100
Table 12.1.3b: APD dwell volumes per day, 2005 2014
Dwell volumes/day 2005 2006 2007 2008 2009n % n % n % N % n %
8 9 47.4 6 12.5 11 10.5 4 2.2 7 5.110 7 36.8 32 66.7 83 79 164 92.1 119 87.512 3 15.8 10 20.8 10 9.5 10 5.6 8 5.914 0 0 0 0 0 0 0 0 0 016 0 0 0 0 1 1 0 0 2 1.5TOTAL 19 100 48 100 105 100 178 100 136 100
Dwell volumes/day 2010 2011 2012 2013 2014n % n % n % N % n %
8 11 14.5 2 1 11 10.7 5 17.9 2 18.210 56 73.7 200 98 89 86.4 20 71.4 9 81.812 8 10.5 1 0.5 1 1 2 7.1 0 014 0 0 0 0 0 0 0 0 0 016 1 1.3 1 0.5 2 1.9 1 3.6 0 0TOTAL 76 100 204 100 103 100 28 100 11 100
159
22nd Report of theMalaysian Dialysis and Transplant Registry PERITONEAL DIALYSIS
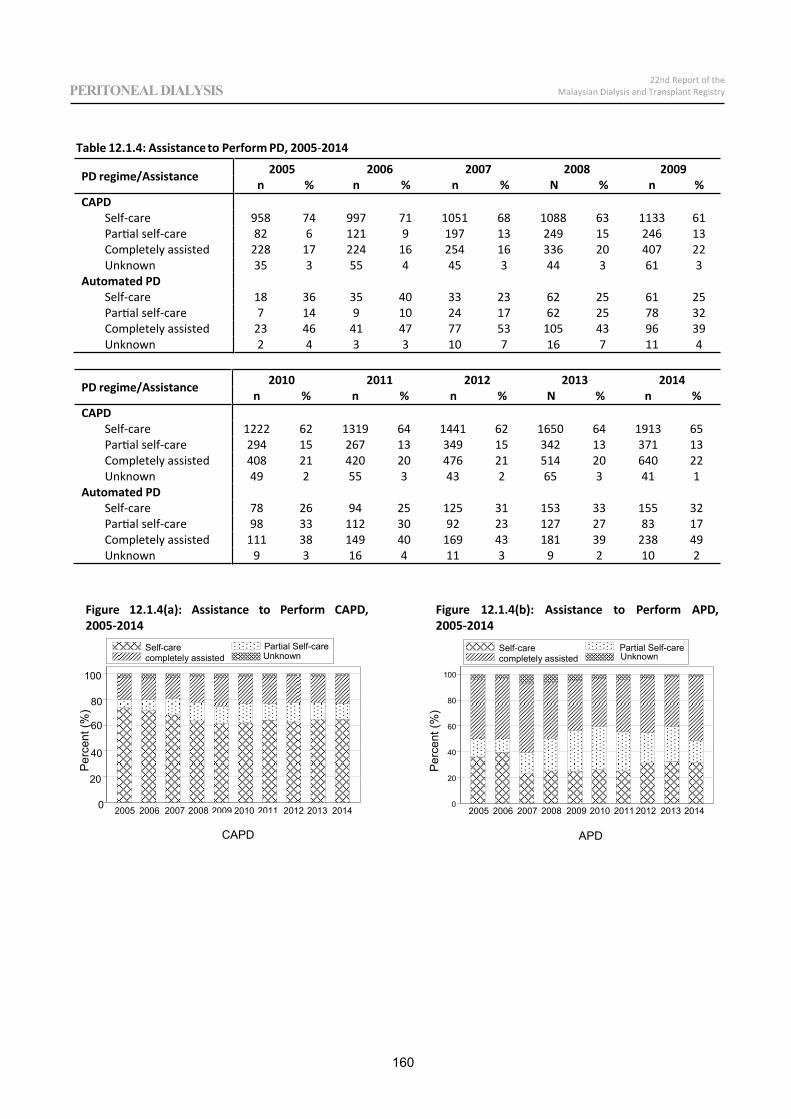
Table 12.1.4: Assistance to Perform PD, 2005 2014
PD regime/Assistance 2005 2006 2007 2008 2009n % n % n % N % n %
CAPDSelf care 958 74 997 71 1051 68 1088 63 1133 61Partial self care 82 6 121 9 197 13 249 15 246 13Completely assisted 228 17 224 16 254 16 336 20 407 22Unknown 35 3 55 4 45 3 44 3 61 3
Automated PD Self care 18 36 35 40 33 23 62 25 61 25Partial self care 7 14 9 10 24 17 62 25 78 32Completely assisted 23 46 41 47 77 53 105 43 96 39Unknown 2 4 3 3 10 7 16 7 11 4
PD regime/Assistance 2010 2011 2012 2013 2014n % n % n % N % n %
CAPDSelf care 1222 62 1319 64 1441 62 1650 64 1913 65Partial self care 294 15 267 13 349 15 342 13 371 13Completely assisted 408 21 420 20 476 21 514 20 640 22Unknown 49 2 55 3 43 2 65 3 41 1
Automated PD Self care 78 26 94 25 125 31 153 33 155 32Partial self care 98 33 112 30 92 23 127 27 83 17Completely assisted 111 38 149 40 169 43 181 39 238 49Unknown 9 3 16 4 11 3 9 2 10 2
0
20
40
60
80
100
Per
cent
(%)
CAPD
2005 2006 2007 2008 2009 2010 2011 2012 2013 2014
Self-care Partial Self-carecompletely assisted Unknown
0
20
40
60
80
100
Per
cent
(%)
APD
2005 2006 2007 2008 2009 2010 2011 2012 2013 2014
Self-care Partial Self-carecompletely assisted Unknown
160
22nd Report of theMalaysian Dialysis and Transplant RegistryPERITONEAL DIALYSIS
Figure 12.1.4(a): Assistance to Perform CAPD, 2005-2014
Figure 12.1.4(b): Assistance to Perform APD, 2005-2014
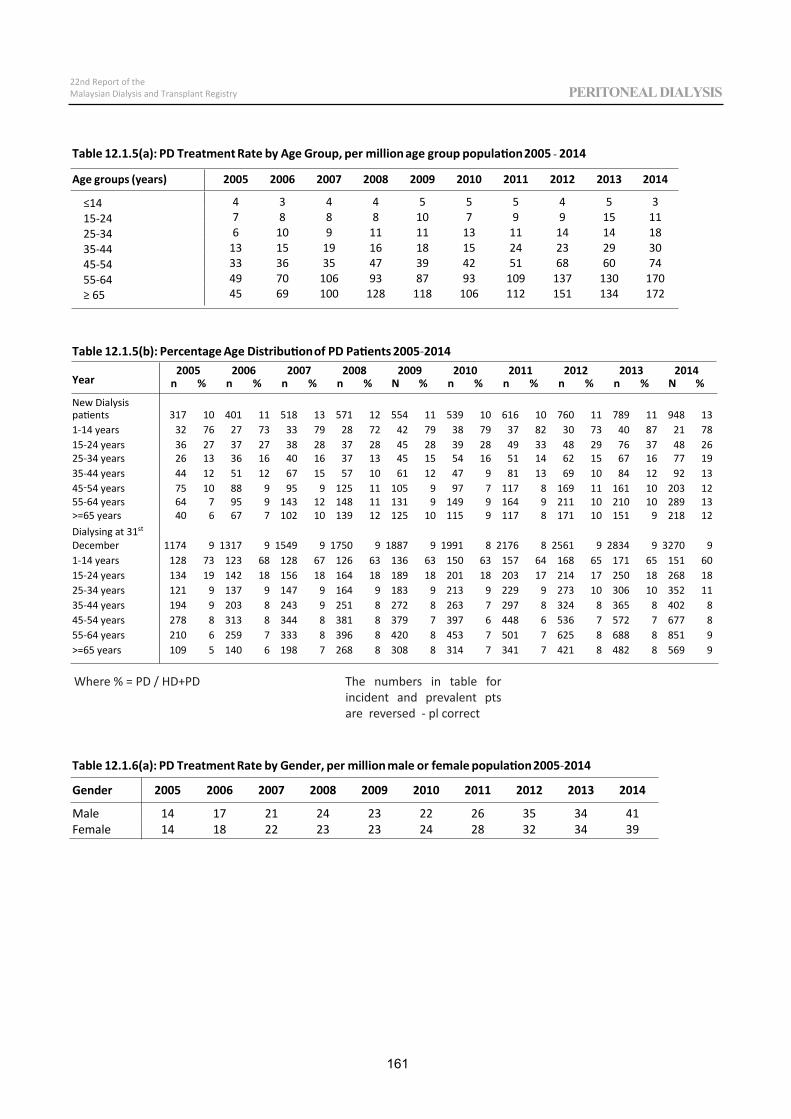
Table 12.1.5(a): PD Treatment Rate by Age Group, per million age group population2005 2014
Age groups (years) 2005 2006 2007 2008 2009 2010 2011 2012 2013 2014
14 4 3 4 4 5 5 5 4 5 315 24 7 8 8 8 10 7 9 9 15 1125 34 6 10 9 11 11 13 11 14 14 1835 44 13 15 19 16 18 15 24 23 29 3045 54 33 36 35 47 39 42 51 68 60 7455 64 49 70 106 93 87 93 109 137 130 170
65 45 69 100 128 118 106 112 151 134 172
Table 12.1.5(b): Percentage Age Distributionof PD Patients 2005 2014
Year2005 2006 2007 2008 2009 2010 2011 2012 2013 2014
n % n % n % n % N % n % n % n % n % N %
New Dialysispatients 317 10 401 11 518 13 571 12 554 11 539 10 616 10 760 11 789 11 948 131 14 years 32 76 27 73 33 79 28 72 42 79 38 79 37 82 30 73 40 87 21 7815 24 years 36 27 37 27 38 28 37 28 45 28 39 28 49 33 48 29 76 37 48 2625 34 years 26 13 36 16 40 16 37 13 45 15 54 16 51 14 62 15 67 16 77 1935 44 years 44 12 51 12 67 15 57 10 61 12 47 9 81 13 69 10 84 12 92 1345 54 years 75 10 88 9 95 9 125 11 105 9 97 7 117 8 169 11 161 10 203 1255 64 years 64 7 95 9 143 12 148 11 131 9 149 9 164 9 211 10 210 10 289 13>=65 years 40 6 67 7 102 10 139 12 125 10 115 9 117 8 171 10 151 9 218 12Dialysing at 31st
December 1174 9 1317 9 1549 9 1750 9 1887 9 1991 8 2176 8 2561 9 2834 9 3270 91 14 years 128 73 123 68 128 67 126 63 136 63 150 63 157 64 168 65 171 65 151 6015 24 years 134 19 142 18 156 18 164 18 189 18 201 18 203 17 214 17 250 18 268 1825 34 years 121 9 137 9 147 9 164 9 183 9 213 9 229 9 273 10 306 10 352 1135 44 years 194 9 203 8 243 9 251 8 272 8 263 7 297 8 324 8 365 8 402 845 54 years 278 8 313 8 344 8 381 8 379 7 397 6 448 6 536 7 572 7 677 855 64 years 210 6 259 7 333 8 396 8 420 8 453 7 501 7 625 8 688 8 851 9>=65 years 109 5 140 6 198 7 268 8 308 8 314 7 341 7 421 8 482 8 569 9
Table 12.1.6(a): PD Treatment Rate by Gender, per million male or female population2005 2014
Gender 2005 2006 2007 2008 2009 2010 2011 2012 2013 2014
Male 14 17 21 24 23 22 26 35 34 41Female 14 18 22 23 23 24 28 32 34 39
161
22nd Report of theMalaysian Dialysis and Transplant Registry PERITONEAL DIALYSIS
Where % = PD / HD+PD The numbers in table for incident and prevalent pts are reversed - pl correct
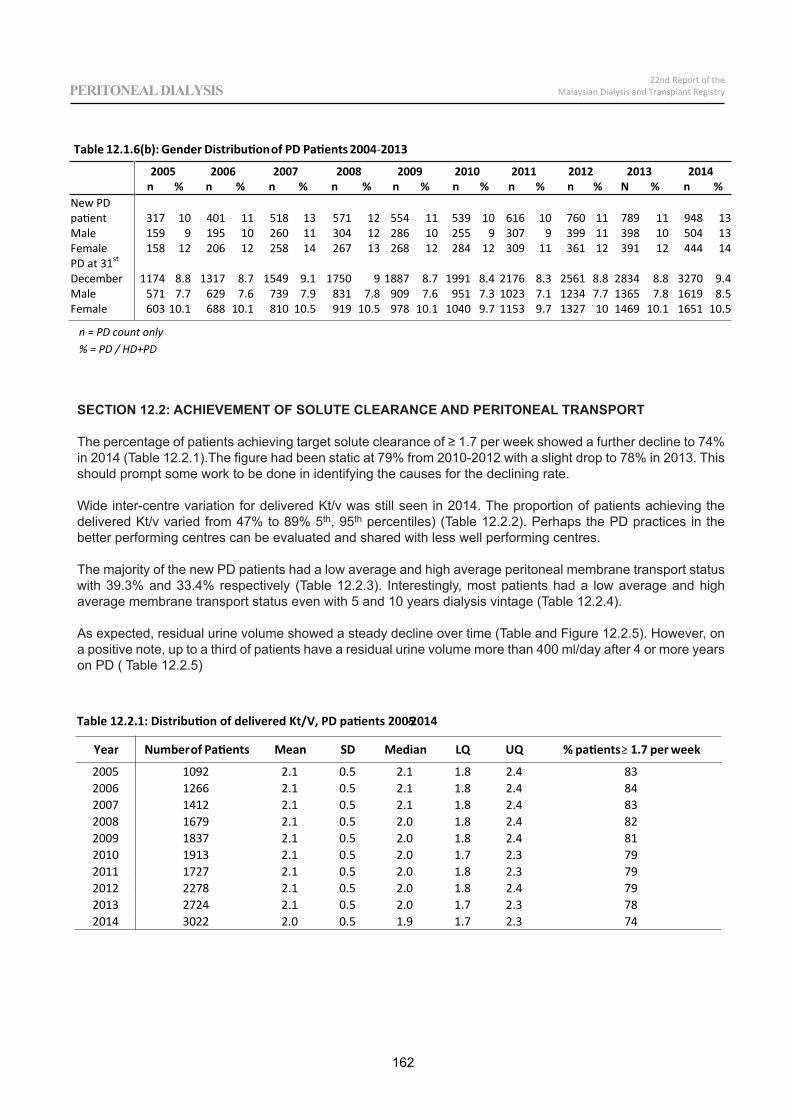
Year Numberof Patients Mean SD Median LQ UQ % patients 1.7 per week
2005 1092 2.1 0.5 2.1 1.8 2.4 832006 1266 2.1 0.5 2.1 1.8 2.4 842007 1412 2.1 0.5 2.1 1.8 2.4 832008 1679 2.1 0.5 2.0 1.8 2.4 822009 1837 2.1 0.5 2.0 1.8 2.4 812010 1913 2.1 0.5 2.0 1.7 2.3 792011 1727 2.1 0.5 2.0 1.8 2.3 792012 2278 2.1 0.5 2.0 1.8 2.4 792013 2724 2.1 0.5 2.0 1.7 2.3 782014 3022 2.0 0.5 1.9 1.7 2.3 74
162
22nd Report of theMalaysian Dialysis and Transplant RegistryPERITONEAL DIALYSIS
R
22nd Report of theMalaysian Dialysis and Transplant Registry PERITONEAL DIALYSIS
SECTION 12.2: ACHIEVEMENT OF SOLUTE CLEARANCE AND PERITONEAL TRANSPORT
The percentage of patients achieving target solute clearance of ≥ 1.7 per week showed a further decline to 74% in 2014 (Table 12.2.1).The figure had been static at 79% from 2010-2012 with a slight drop to 78% in 2013. This should prompt some work to be done in identifying the causes for the declining rate.
Wide inter-centre variation for delivered Kt/v was still seen in 2014. The proportion of patients achieving the delivered Kt/v varied from 47% to 89% 5th, 95th percentiles) (Table 12.2.2). Perhaps the PD practices in the better performing centres can be evaluated and shared with less well performing centres.
The majority of the new PD patients had a low average and high average peritoneal membrane transport status with 39.3% and 33.4% respectively (Table 12.2.3). Interestingly, most patients had a low average and high average membrane transport status even with 5 and 10 years dialysis vintage (Table 12.2.4).
As expected, residual urine volume showed a steady decline over time (Table and Figure 12.2.5). However, on a positive note, up to a third of patients have a residual urine volume more than 400 ml/day after 4 or more years on PD ( Table 12.2.5)
Table 12.2.1: Distribution of delivered Kt/V, PD patients 2005-2014
Table 12.1.6(b):Gender Distributionof PD Patients 2004 2013
2005 2006 2007 2008 2009 2010 2011 2012 2013 2014n % n % n % n % n % n % n % n % N % n %
New PDpatient 317 10 401 11 518 13 571 12 554 11 539 10 616 10 760 11 789 11 948 13Male 159 9 195 10 260 11 304 12 286 10 255 9 307 9 399 11 398 10 504 13Female 158 12 206 12 258 14 267 13 268 12 284 12 309 11 361 12 391 12 444 14PD at 31st
December 1174 8.8 1317 8.7 1549 9.1 1750 9 1887 8.7 1991 8.4 2176 8.3 2561 8.8 2834 8.8 3270 9.4Male 571 7.7 629 7.6 739 7.9 831 7.8 909 7.6 951 7.3 1023 7.1 1234 7.7 1365 7.8 1619 8.5Female 603 10.1 688 10.1 810 10.5 919 10.5 978 10.1 1040 9.7 1153 9.7 1327 10 1469 10.1 1651 10.5
n = PD count only % = PD / HD+PD
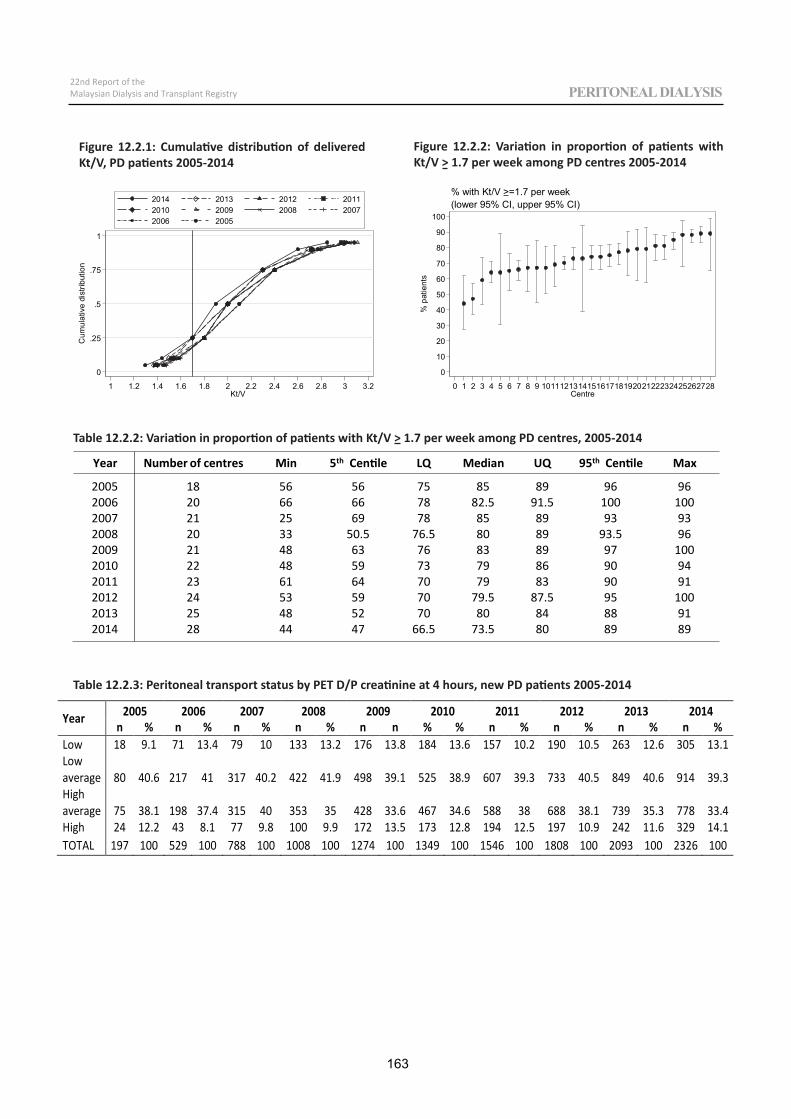
0
.25
.5
.75
1
Cum
ulat
ive
dist
ribut
ion
1 1.2 1.4 1.6 1.8 2 2.2 2.4 2.6 2.8 3 3.2Kt/V
2014 2013 2012 20112010 2009 2008 20072006 2005
0
10
20
30
40
50
60
70
80
90
100
% p
atie
nts
0 1 2 3 4 5 6 7 8 9 10111213141516171819202122232425262728Centre
(lower 95% CI, upper 95% CI)% with Kt/V >=1.7 per week
Year Number of centres Min 5th Centile LQ Median UQ 95th Centile Max
2005 18 56 56 75 85 89 96 962006 20 66 66 78 82.5 91.5 100 1002007 21 25 69 78 85 89 93 932008 20 33 50.5 76.5 80 89 93.5 962009 21 48 63 76 83 89 97 1002010 22 48 59 73 79 86 90 942011 23 61 64 70 79 83 90 912012 24 53 59 70 79.5 87.5 95 1002013 25 48 52 70 80 84 88 912014 28 44 47 66.5 73.5 80 89 89
163
22nd Report of theMalaysian Dialysis and Transplant Registry PERITONEAL DIALYSIS
Figure 12.2.1: Cumulative distribution of delivered Kt/V, PD patients 2005-2014
Table 12.2.2: Variation in proportion of patients with Kt/V > 1.7 per week among PD centres, 2005-2014
Table 12.2.3: Peritoneal transport status by PET D/P creatinine at 4 hours, new PD patients 2005-2014
Year 2005 2006 2007 2008 2009 2010 2011 2012 2013 2014 n % n % n % n % n n % % n % n % n % n %
Low 18 9.1 71 13.4 79 10 133 13.2 176 13.8 184 13.6 157 10.2 190 10.5 263 12.6 305 13.1 Low average 80 40.6 217 41 317 40.2 422 41.9 498 39.1 525 38.9 607 39.3 733 40.5 849 40.6 914 39.3 High average 75 38.1 198 37.4 315 40 353 35 428 33.6 467 34.6 588 38 688 38.1 739 35.3 778 33.4 High 24 12.2 43 8.1 77 9.8 100 9.9 172 13.5 173 12.8 194 12.5 197 10.9 242 11.6 329 14.1 TOTAL 197 100 529 100 788 100 1008 100 1274 100 1349 100 1546 100 1808 100 2093 100 2326 100
Figure 12.2.2: Variation in proportion of patients with Kt/V > 1.7 per week among PD centres 2005-2014
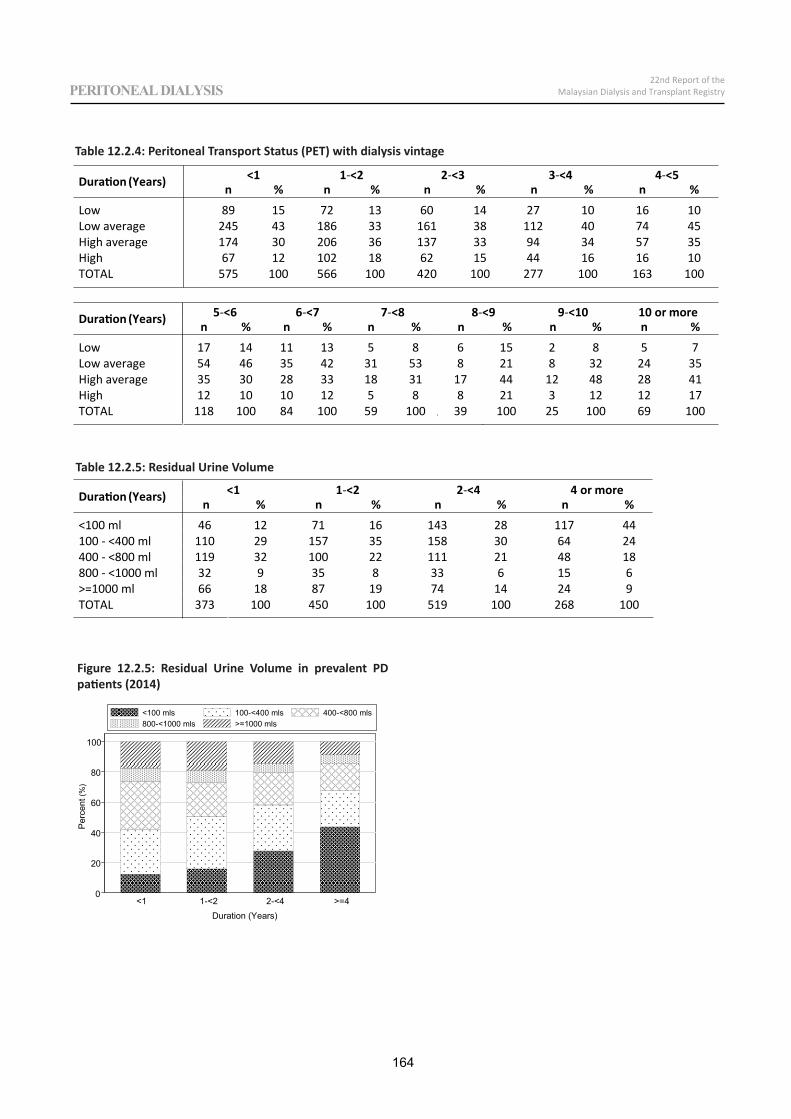
Duration (Years) <1 1 <2 2 <3 3 <4 4 <5n % n % n % n % n %
Low 89 15 72 13 60 14 27 10 16 10Low average 245 43 186 33 161 38 112 40 74 45High average 174 30 206 36 137 33 94 34 57 35High 67 12 102 18 62 15 44 16 16 10TOTAL 575 100 566 100 420 100 277 100 163 100
Duration (Years) 5 <6 6 <7 7 <8 8 <9 9 <10 10 or moren % n % n % n % n % n %
Low 17 14 11 13 5 8 6 15 2 8 5 7Low average 54 46 35 42 31 53 8 21 8 32 24 35High average 35 30 28 33 18 31 17 44 12 48 28 41High 12 10 10 12 5 8 8 21 3 12 12 17TOTAL 118 100 84 100 59 100 39 100 25 100 69 100
Duration (Years) <1 1 <2 2 <4 4 or moren % n % n % n %
<100 ml 46 12 71 16 143 28 117 44100 <400 ml 110 29 157 35 158 30 64 24400 <800 ml 119 32 100 22 111 21 48 18800 <1000 ml 32 9 35 8 33 6 15 6>=1000 ml 66 18 87 19 74 14 24 9TOTAL 373 100 450 100 519 100 268 100
0
20
40
60
80
100
Per
cent
(%)
<1 1-<2 2-<4 >=4Duration (Years)
<100 mls 100-<400 mls 400-<800 mls800-<1000 mls >=1000 mls
164
22nd Report of theMalaysian Dialysis and Transplant RegistryPERITONEAL DIALYSIS
Table 12.2.4: Peritoneal Transport Status (PET) with dialysis vintage
Table 12.2.5: Residual Urine Volume
Figure 12.2.5: Residual Urine Volume in prevalent PD patients (2014)
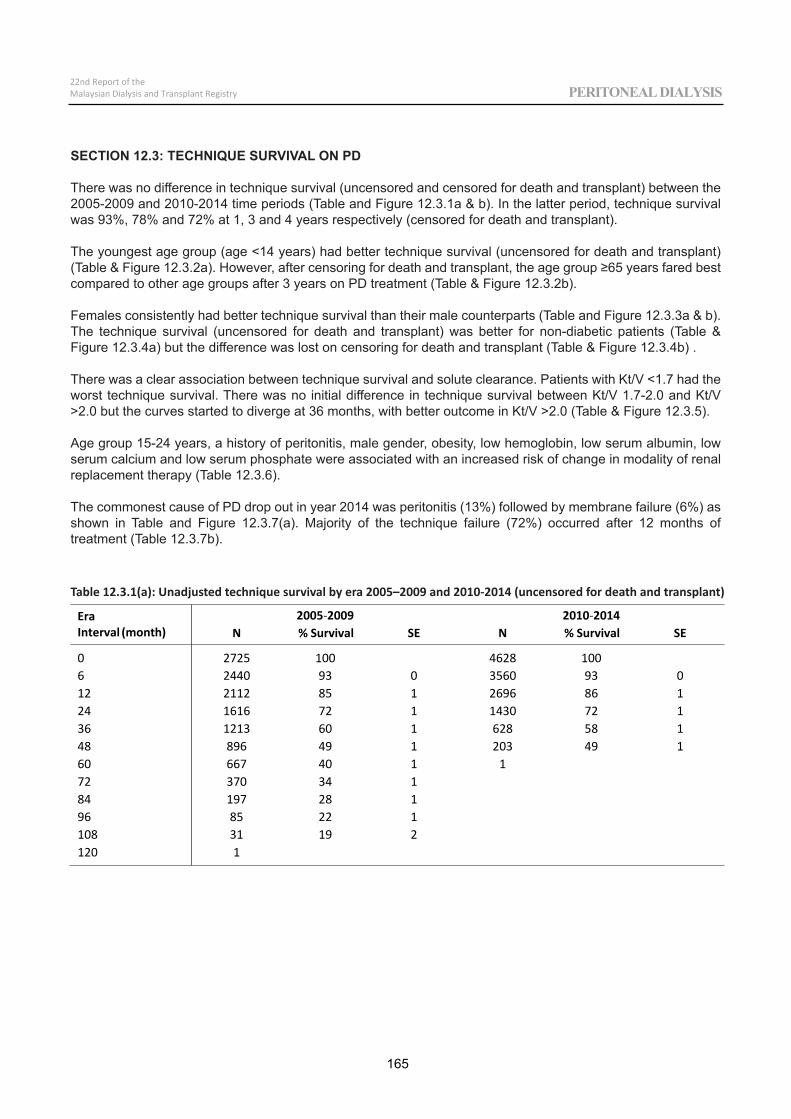
EraInterval (month)
2005 2009 2010 2014N % Survival SE N % Survival SE
0 2725 100 4628 1006 2440 93 0 3560 93 012 2112 85 1 2696 86 124 1616 72 1 1430 72 136 1213 60 1 628 58 148 896 49 1 203 49 160 667 40 1 172 370 34 184 197 28 196 85 22 1108 31 19 2120 1
165
22nd Report of theMalaysian Dialysis and Transplant Registry PERITONEAL DIALYSIS
SECTION 12.3: TECHNIQUE SURVIVAL ON PD
There was no difference in technique survival (uncensored and censored for death and transplant) between the 2005-2009 and 2010-2014 time periods (Table and Figure 12.3.1a & b). In the latter period, technique survival was 93%, 78% and 72% at 1, 3 and 4 years respectively (censored for death and transplant).
The youngest age group (age <14 years) had better technique survival (uncensored for death and transplant) (Table & Figure 12.3.2a). However, after censoring for death and transplant, the age group ≥65 years fared best compared to other age groups after 3 years on PD treatment (Table & Figure 12.3.2b).
Females consistently had better technique survival than their male counterparts (Table and Figure 12.3.3a & b). The technique survival (uncensored for death and transplant) was better for non-diabetic patients (Table & Figure 12.3.4a) but the difference was lost on censoring for death and transplant (Table & Figure 12.3.4b) .
There was a clear association between technique survival and solute clearance. Patients with Kt/V <1.7 had the worst technique survival. There was no initial difference in technique survival between Kt/V 1.7-2.0 and Kt/V >2.0 but the curves started to diverge at 36 months, with better outcome in Kt/V >2.0 (Table & Figure 12.3.5).
Age group 15-24 years, a history of peritonitis, male gender, obesity, low hemoglobin, low serum albumin, low serum calcium and low serum phosphate were associated with an increased risk of change in modality of renal replacement therapy (Table 12.3.6).
The commonest cause of PD drop out in year 2014 was peritonitis (13%) followed by membrane failure (6%) as shown in Table and Figure 12.3.7(a). Majority of the technique failure (72%) occurred after 12 months of treatment (Table 12.3.7b).
Table 12.3.1(a): Unadjusted technique survival by era 2005–2009 and 2010-2014 (uncensored for death and transplant)
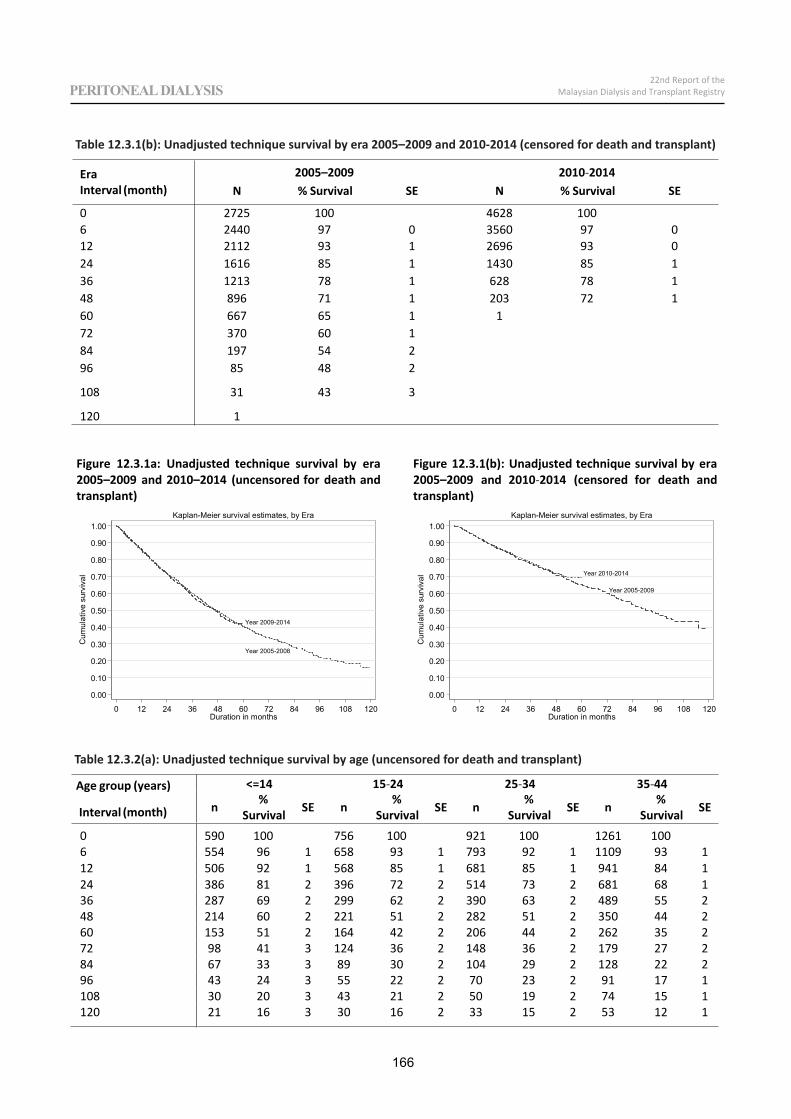
12 2112 93 1 2696 93 024 1616 85 1 1430 85 136 1213 78 1 628 78 148 896 71 1 203 72 160 667 65 1 172 370 60 184 197 54 296 85 48 2
108 31 43 3
120 1
Figure 12.3.1a: Unadjusted technique survival by era2005–2009 and 2010–2014 (uncensored for death andtransplant)
Year 2009-2014
Year 2005-2008
0.00
0.10
0.20
0.30
0.40
0.50
0.60
0.70
0.80
0.90
1.00
Cum
ulat
ive
surv
ival
0 12 24 36 48 60 72 84 96 108 120Duration in months
Kaplan-Meier survival estimates, by Era
Figure 12.3.1(b): Unadjusted technique survival by era2005–2009 and 2010 2014 (censored for death andtransplant)
Year 2010-2014
Year 2005-2009
0.00
0.10
0.20
0.30
0.40
0.50
0.60
0.70
0.80
0.90
1.00
Cum
ulat
ive
surv
ival
0 12 24 36 48 60 72 84 96 108 120Duration in months
Kaplan-Meier survival estimates, by Era
Age group (years)
Interval (month)
<=14 15 24 25 34 35 44
n %Survival SE n %
Survival SE n %Survival SE n %
Survival SE
0 590 100 756 100 921 100 1261 1006 554 96 1 658 93 1 793 92 1 1109 93 112 506 92 1 568 85 1 681 85 1 941 84 124 386 81 2 396 72 2 514 73 2 681 68 136 287 69 2 299 62 2 390 63 2 489 55 248 214 60 2 221 51 2 282 51 2 350 44 260 153 51 2 164 42 2 206 44 2 262 35 272 98 41 3 124 36 2 148 36 2 179 27 284 67 33 3 89 30 2 104 29 2 128 22 296 43 24 3 55 22 2 70 23 2 91 17 1108 30 20 3 43 21 2 50 19 2 74 15 1120 21 16 3 30 16 2 33 15 2 53 12 1
166
22nd Report of theMalaysian Dialysis and Transplant RegistryPERITONEAL DIALYSIS
EraInterval (month)
2005–2009 2010 2014N % Survival SE N % Survival SE
0 2725 00182640016 2440 97 0 3560 97 0
Table 12.3.1(b): Unadjusted technique survival by era 2005–2009 and 2010-2014 (censored for death and transplant)
Table 12.3.2(a): Unadjusted technique survival by age (uncensored for death and transplant)
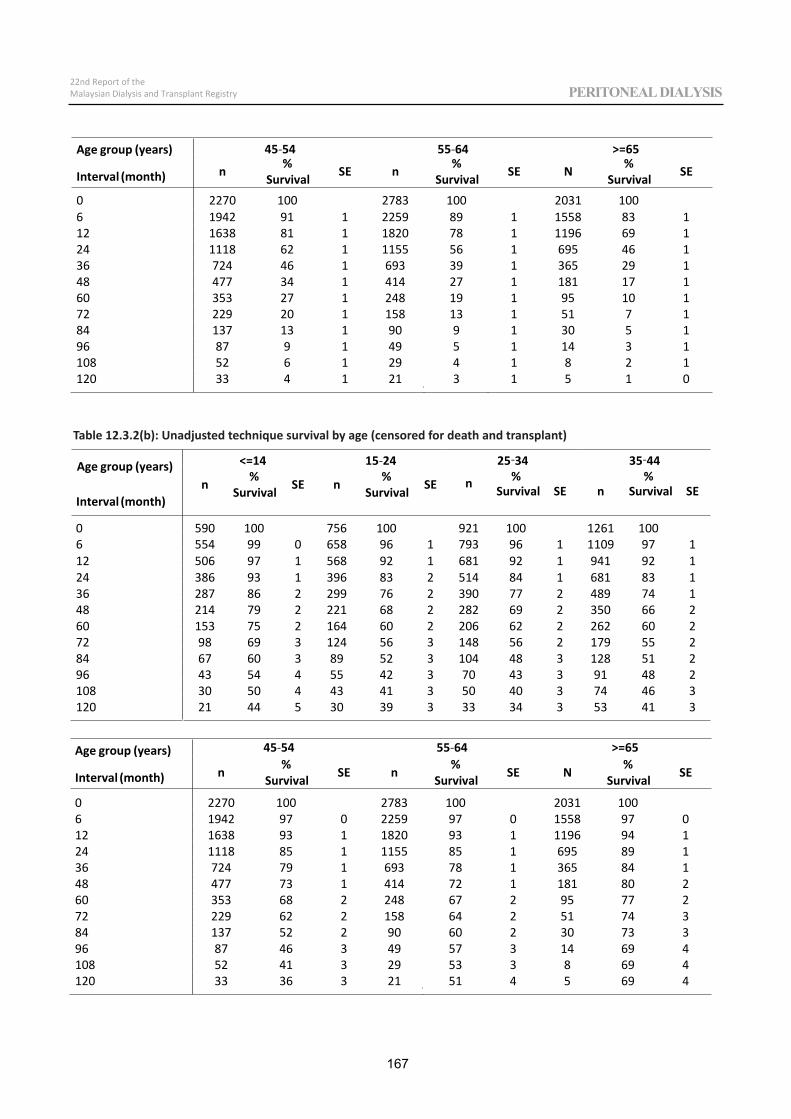
6 1942 91 1 2259 89 1 1558 83 112 1638 81 1 1820 78 1 1196 69 124 1118 62 1 1155 56 1 695 46 136 724 46 1 693 39 1 365 29 148 477 34 1 414 27 1 181 17 160 353 27 1 248 19 1 95 10 172 229 20 1 158 13 1 51 7 184 137 13 1 90 9 1 30 5 196 87 9 1 49 5 1 14 3 1108 52 6 1 29 4 1 8 2 1120 33 4 1 21 3 1 5 1 0
Age group (years)
Interval (month)
<=14 15 24 25 34 35 44
n %Survival SE n %
Survival SE n %Survival SE n
%Survival SE
0 590 100 756 100 921 100 1261 1006 554 99 0 658 96 1 793 96 1 1109 97 112 506 97 1 568 92 1 681 92 1 941 92 124 386 93 1 396 83 2 514 84 1 681 83 136 287 86 2 299 76 2 390 77 2 489 74 148 214 79 2 221 68 2 282 69 2 350 66 260 153 75 2 164 60 2 206 62 2 262 60 272 98 69 3 124 56 3 148 56 2 179 55 284 67 60 3 89 52 3 104 48 3 128 51 296 43 54 4 55 42 3 70 43 3 91 48 2108 30 50 4 43 41 3 50 40 3 74 46 3120 21 44 5 30 39 3 33 34 3 53 41 3
Age group (years)
Interval (month)
45 54 55 56=>46
n %Survival SE n %
Survival SE N %Survival SE
0 2270 100 2783 100 2031 1006 1942 97 0 2259 97 0 1558 97 012 1638 93 1 1820 93 1 1196 94 124 1118 85 1 1155 85 1 695 89 136 724 79 1 693 78 1 365 84 148 477 73 1 414 72 1 181 80 260 353 68 2 248 67 2 95 77 272 229 62 2 158 64 2 51 74 384 137 52 2 90 60 2 30 73 396 87 46 3 49 57 3 14 69 4108 52 41 3 29 53 3 8 69 4120 33 36 3 21 51 4 5 69 4
167
22nd Report of theMalaysian Dialysis and Transplant Registry PERITONEAL DIALYSIS
Age group (years)
Interval (month)
45 54 55 56=>46
n %Survival SE n %
Survival SE N %Survival SE
0 2270 100 2783 100 2031 100
Table 12.3.2(b): Unadjusted technique survival by age (censored for death and transplant)
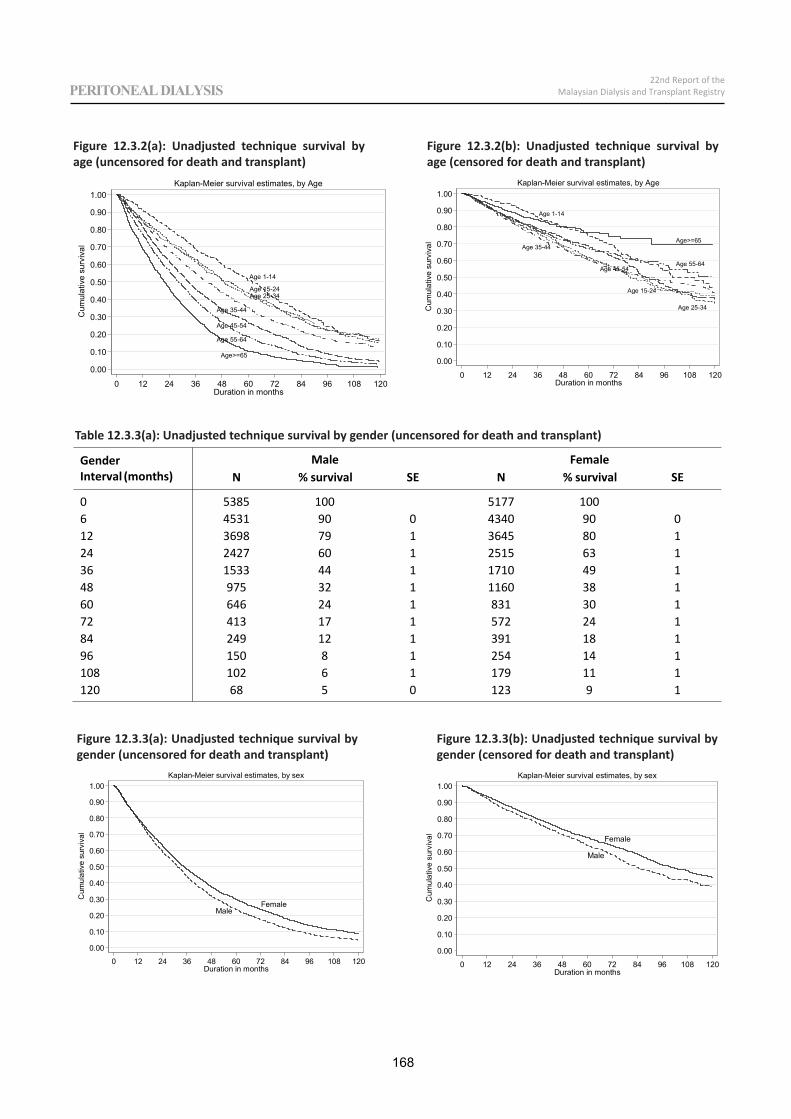
Age>=65
Age 55-64
Age 45-54
Age 35-44
Age 25-34Age 15-24
Age 1-14
0.00
0.10
0.20
0.30
0.40
0.50
0.60
0.70
0.80
0.90
1.00
Cum
ulat
ive
surv
ival
0 12 24 36 48 60 72 84 96 108 120Duration in months
Kaplan-Meier survival estimates, by Age
Age>=65
Age 55-64Age 45-54
Age 35-44
Age 25-34
Age 15-24
Age 1-14
0.00
0.10
0.20
0.30
0.40
0.50
0.60
0.70
0.80
0.90
1.00
Cum
ulat
ive
surv
ival
0 12 24 36 48 60 72 84 96 108 120Duration in months
Kaplan-Meier survival estimates, by Age
GenderInterval (months)
Male FemaleN % survival SE N % survival SE
0 5385 100 5177 1006 4531 90 0 4340 90 012 3698 79 1 3645 80 124 2427 60 1 2515 63 136 1533 44 1 1710 49 148 975 32 1 1160 38 160 646 24 1 831 30 172 413 17 1 572 24 184 249 12 1 391 18 196 150 8 1 254 14 1108 102 6 1 179 11 1120 68 5 0 123 9 1
168
22nd Report of theMalaysian Dialysis and Transplant RegistryPERITONEAL DIALYSIS
Figure 12.3.2(a): Unadjusted technique survival by age (uncensored for death and transplant)
Figure 12.3.2(b): Unadjusted technique survival by age (censored for death and transplant)
Table 12.3.3(a): Unadjusted technique survival by gender (uncensored for death and transplant)
MaleFemale
0.00
0.10
0.20
0.30
0.40
0.50
0.60
0.70
0.80
0.90
1.00
Cum
ulat
ive
surv
ival
0 12 24 36 48 60 72 84 96 108 120Duration in months
Kaplan-Meier survival estimates, by sex
Male
Female
0.00
0.10
0.20
0.30
0.40
0.50
0.60
0.70
0.80
0.90
1.00
Cum
ulat
ive
surv
ival
0 12 24 36 48 60 72 84 96 108 120Duration in months
Kaplan-Meier survival estimates, by sex
Figure 12.3.3(a): Unadjusted technique survival by gender (uncensored for death and transplant)
Figure 12.3.3(b): Unadjusted technique survival by gender (censored for death and transplant)
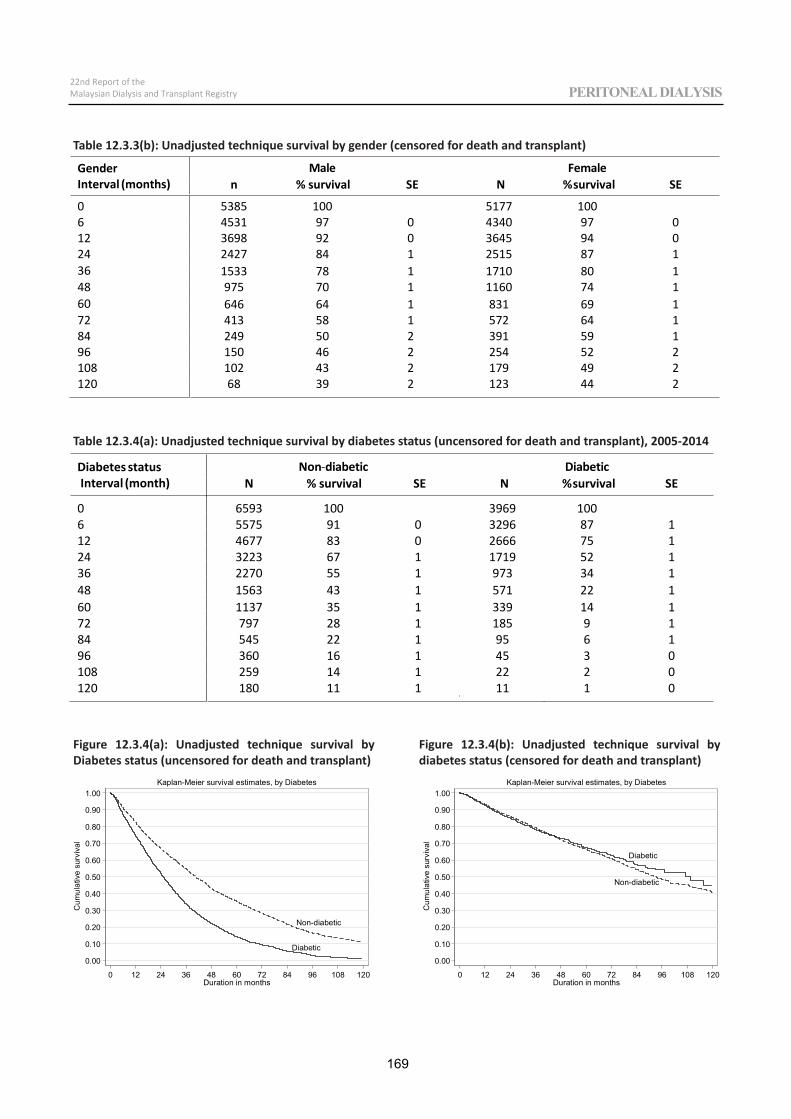
GenderInterval (months)
elameFelaMn % survival SE N %survival SE
0 5385 00177150016 4531 97 0 4340 97 012 3698 92 0 3645 94 024 2427 84 1 2515 87 136 1533 78 1 1710 80 148 975 70 1 1160 74 160 646 64 1 831 69 172 413 58 1 572 64 184 249 50 2 391 59 196 150 46 2 254 52 2108 102 43 2 179 49 2120 68 39 2 123 44 2
Diabetes statusInterval (month)
Non citebaiDcitebaidN % survival SE N %survival SE
0 6593 00196930016 5575 91 0 3296 87 112 4677 83 0 2666 75 124 3223 67 1 1719 52 136 2270 55 1 973 34 148 1563 43 1 571 22 160 1137 35 1 339 14 172 797 28 1 185 9 184 545 22 1 95 6 196 360 16 1 45 3 0108 259 14 1 22 2 0120 180 11 1 11 1 0
169
22nd Report of theMalaysian Dialysis and Transplant Registry PERITONEAL DIALYSIS
Table 12.3.3(b): Unadjusted technique survival by gender (censored for death and transplant)
Table 12.3.4(a): Unadjusted technique survival by diabetes status (uncensored for death and transplant), 2005-2014
Diabetic
Non-diabetic
0.00
0.10
0.20
0.30
0.40
0.50
0.60
0.70
0.80
0.90
1.00
Cum
ulat
ive
surv
ival
0 12 24 36 48 60 72 84 96 108 120Duration in months
Kaplan-Meier survival estimates, by Diabetes
Diabetic
Non-diabetic
0.00
0.10
0.20
0.30
0.40
0.50
0.60
0.70
0.80
0.90
1.00
Cum
ulat
ive
surv
ival
0 12 24 36 48 60 72 84 96 108 120Duration in months
Kaplan-Meier survival estimates, by Diabetes
Figure 12.3.4(a): Unadjusted technique survival by Diabetes status (uncensored for death and transplant)
Figure 12.3.4(b): Unadjusted technique survival by diabetes status (censored for death and transplant)
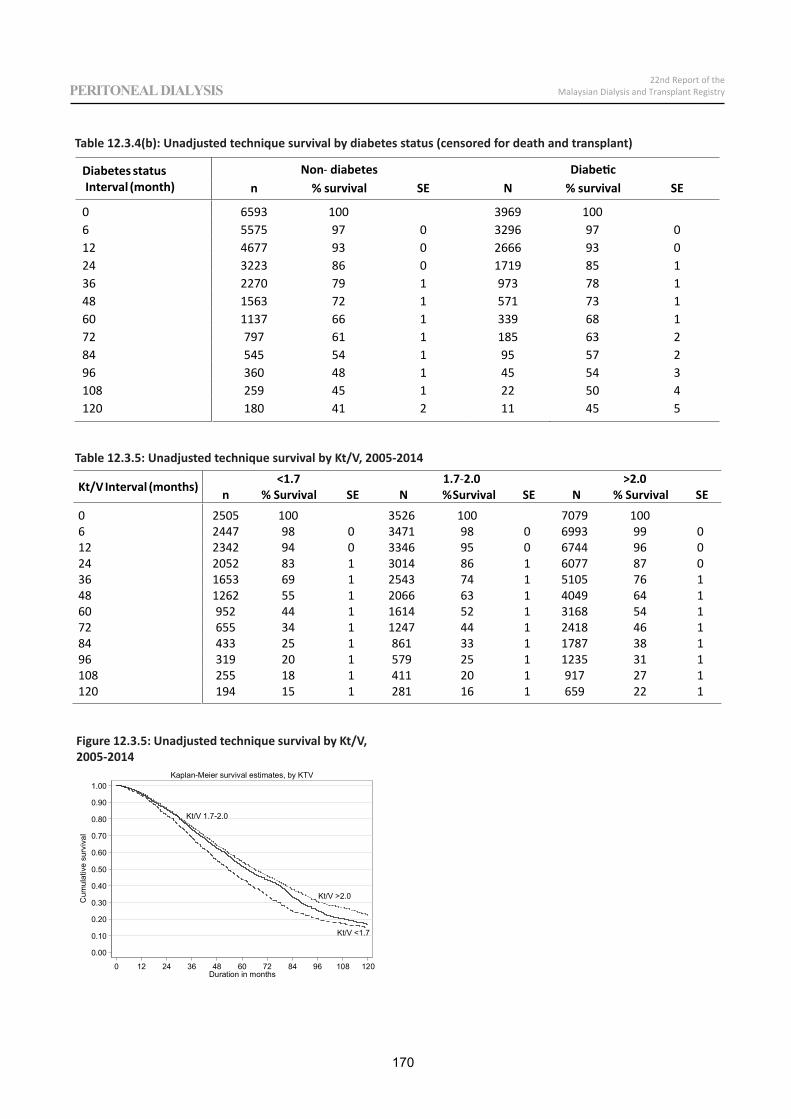
Diabetes statusInterval (month)
Non diabetes Diabeticn % survival SE N % survival SE
0 6593 100 3969 1006 5575 97 0 3296 97 012 4677 93 0 2666 93 024 3223 86 0 1719 85 136 2270 79 1 973 78 148 1563 72 1 571 73 160 1137 66 1 339 68 172 797 61 1 185 63 284 545 54 1 95 57 296 360 48 1 45 54 3108 259 45 1 22 50 4120 180 41 2 11 45 5
Kt/V Interval (months) <1.7 1.7 0.2>0.2n % Survival SE N %Survival SE N % Survival SE
0 2505 100 3526 100 7079 1006 2447 98 0 3471 98 0 6993 99 012 2342 94 0 3346 95 0 6744 96 024 2052 83 1 3014 86 1 6077 87 036 1653 69 1 2543 74 1 5105 76 148 1262 55 1 2066 63 1 4049 64 160 952 44 1 1614 52 1 3168 54 172 655 34 1 1247 44 1 2418 46 184 433 25 1 861 33 1 1787 38 196 319 20 1 579 25 1 1235 31 1108 255 18 1 411 20 1 917 27 1120 194 15 1 281 16 1 659 22 1
170
22nd Report of theMalaysian Dialysis and Transplant RegistryPERITONEAL DIALYSIS
Kt/V >2.0
Kt/V 1.7-2.0
Kt/V <1.7
0.00
0.10
0.20
0.30
0.40
0.50
0.60
0.70
0.80
0.90
1.00
Cum
ulat
ive
surv
ival
0 12 24 36 48 60 72 84 96 108 120Duration in months
Kaplan-Meier survival estimates, by KTV
Table 12.3.4(b): Unadjusted technique survival by diabetes status (censored for death and transplant)
Table 12.3.5: Unadjusted technique survival by Kt/V, 2005-2014
Figure 12.3.5: Unadjusted technique survival by Kt/V, 2005-2014
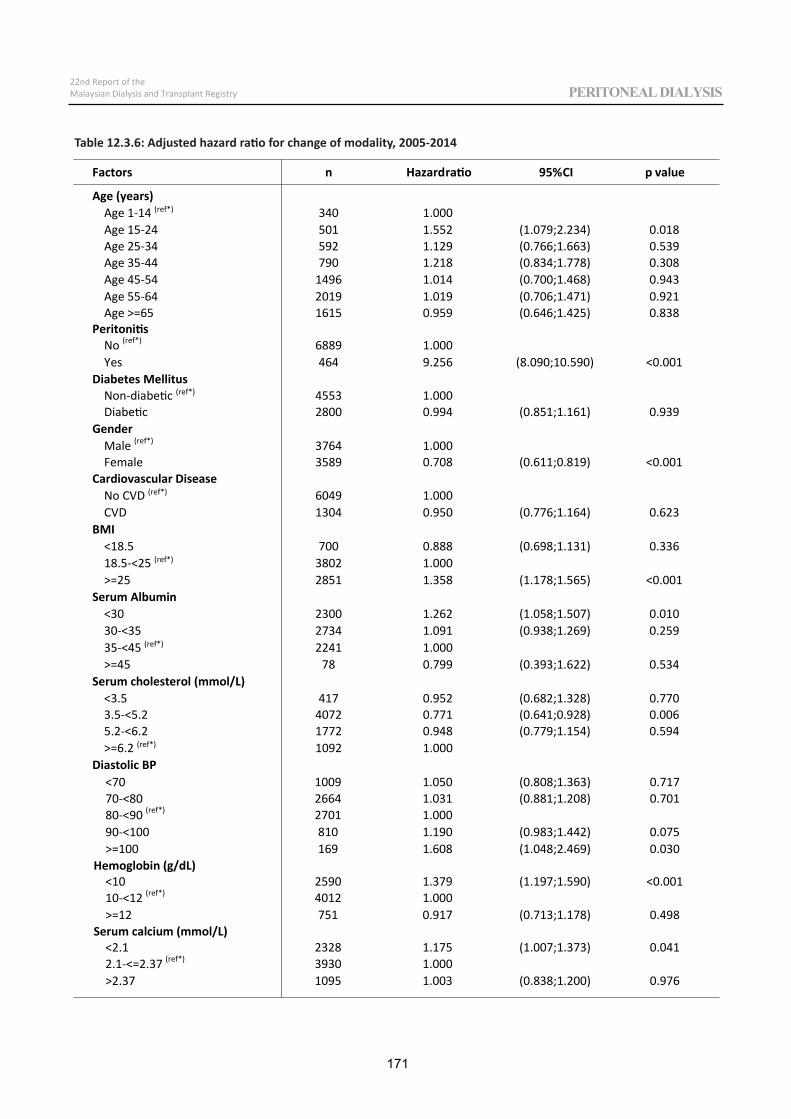
Factors n Hazardratio 95%CI p value
Age (years)Age 1 14 (ref*) 340 1.000Age 15 24 501 1.552 (1.079;2.234) 0.018Age 25 34 592 1.129 (0.766;1.663) 0.539Age 35 44 790 1.218 (0.834;1.778) 0.308Age 45 54 1496 1.014 (0.700;1.468) 0.943Age 55 64 2019 1.019 (0.706;1.471) 0.921Age >=65 1615 0.959 (0.646;1.425) 0.838
Peritonitis No (ref*) 6889 1.000Yes 464 9.256 (8.090;10.590) <0.001
Diabetes Mellitus Non diabetic (ref*) 4553 1.000Diabetic 2800 0.994 (0.851;1.161) 0.939
Gender Male (ref*) 3764 1.000Female 3589 0.708 (0.611;0.819) <0.001
Cardiovascular Disease No CVD (ref*) 6049 1.000CVD 1304 0.950 (0.776;1.164) 0.623
BMI <18.5 700 0.888 (0.698;1.131) 0.33618.5 <25 (ref*) 3802 1.000>=25 2851 1.358 (1.178;1.565) <0.001
Serum Albumin <30 2300 1.262 (1.058;1.507) 0.01030 <35 2734 1.091 (0.938;1.269) 0.25935 <45 (ref*) 2241 1.000>=45 78 0.799 (0.393;1.622) 0.534
Serum cholesterol (mmol/L) <3.5 417 0.952 (0.682;1.328) 0.7703.5 <5.2 4072 0.771 (0.641;0.928) 0.0065.2 <6.2 1772 0.948 (0.779;1.154) 0.594>=6.2 (ref*) 1092 1.000
Diastolic BP
171
22nd Report of theMalaysian Dialysis and Transplant Registry PERITONEAL DIALYSIS
Table 12.3.6: Adjusted hazard ratio for change of modality, 2005-2014
<7070 <8080 <90 (ref*)
90 <100>=100
Hemoglobin (g/dL)<1010 <12 (ref*)
>=12Serum calcium (mmol/L)
<2.12.1 <=2.37 (ref*)
>2.37
1009 1.050 (0.808;1.363) 0.7172664 1.031 (0.881;1.208) 0.7012701 1.000810 1.190 (0.983;1.442) 0.075169 1.608 (1.048;2.469) 0.030
2590 1.379 (1.197;1.590) <0.0014012 1.000751 0.917 (0.713;1.178) 0.498
2328 1.175 (1.007;1.373) 0.0413930 1.0001095 1.003 (0.838;1.200) 0.976
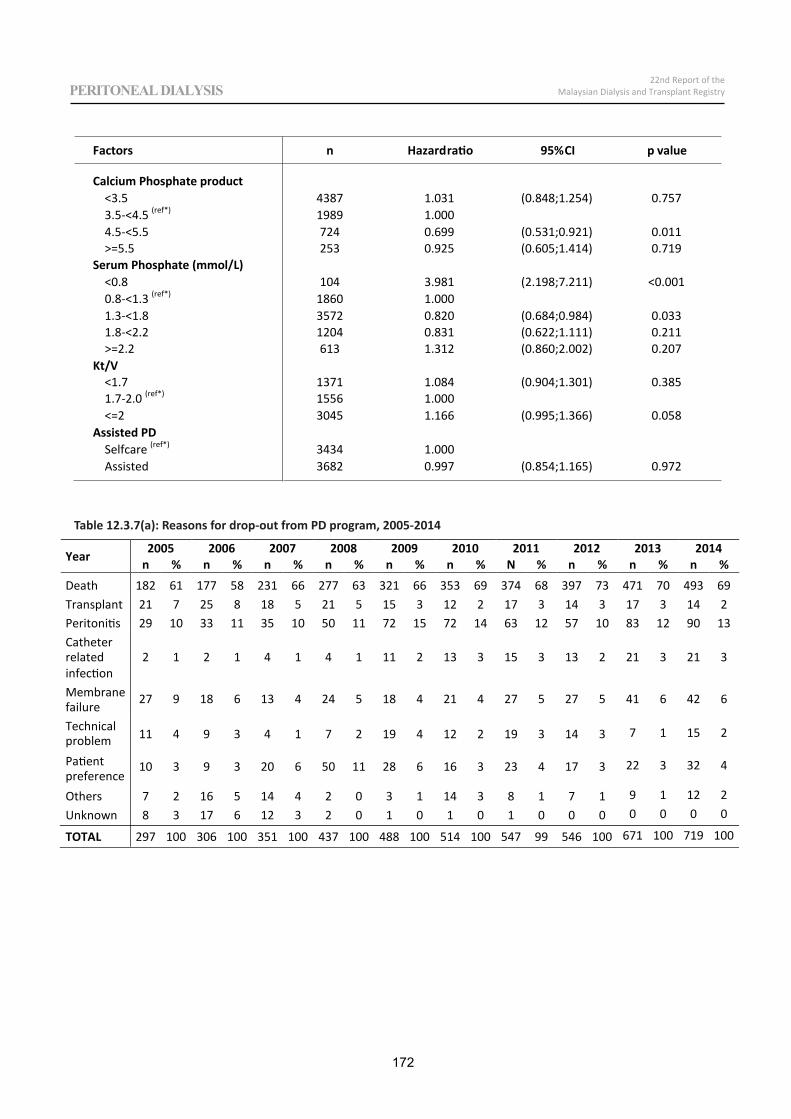
172
22nd Report of theMalaysian Dialysis and Transplant RegistryPERITONEAL DIALYSIS
Factors n Hazardratio 95%CI p value
Calcium Phosphate product<3.5 4387 1.031 (0.848;1.254) 0.7573.5 <4.5 (ref*) 1989 1.0004.5 <5.5 724 0.699 (0.531;0.921) 0.011>=5.5 253 0.925 (0.605;1.414) 0.719
Serum Phosphate (mmol/L) <0.8 104 3.981 (2.198;7.211) <0.0010.8 <1.3 (ref*) 1860 1.0001.3 <1.8 3572 0.820 (0.684;0.984) 0.0331.8 <2.2 1204 0.831 (0.622;1.111) 0.211>=2.2 613 1.312 (0.860;2.002) 0.207
Kt/V <1.7 1371 1.084 (0.904;1.301) 0.3851.7 2.0 (ref*) 1556 1.000<=2 3045 1.166 (0.995;1.366) 0.058
Assisted PD Selfcare (ref*) 3434 1.000Assisted 3682 0.997 (0.854;1.165) 0.972
Table 12.3.7(a): Reasons for drop-out from PD program, 2005-2014
Year 2005 2006 2007 2008 2009 2010 2011 2012 2013 2014 n % n % n % n % n % n % N % n % n % n %
Death 182 61 177 58 231 66 277 63 321 66 353 69 374 68 397 73 471 70 493 69 Transplant 21 7 25 8 18 5 21 5 15 3 12 2 17 3 14 3 17 3 14 2 Peritonitis 29 10 33 11 35 10 50 11 72 15 72 14 63 12 57 10 83 12 90 13 Catheter related infection
2 1 2 1 4 1 4 1 11 2 13 3 15 3 13 2 21 3 21 3
Membrane failure
27 9 18 6 13 4 24 5 18 4 21 4 27 5 27 5 41 6 42 6
Technical problem 11 4 9 3 4 1 7 2 19 4 12 2 19 3 14 3 7 1 15 2
Patient preference
10 3 9 3 20 6 50 11 28 6 16 3 23 4 17 3 22 3 32 4
Others 7 2 16 5 14 4 2 0 3 1 14 3 8 1 7 1 9 1 12 2 Unknown 8 3 17 6 12 3 2 0 1 0 1 0 1 0 0 0 0 0 0 0
TOTAL 297 100 306 100 351 100 437 100 488 100 514 100 547 99 546 100 671 100 719 100
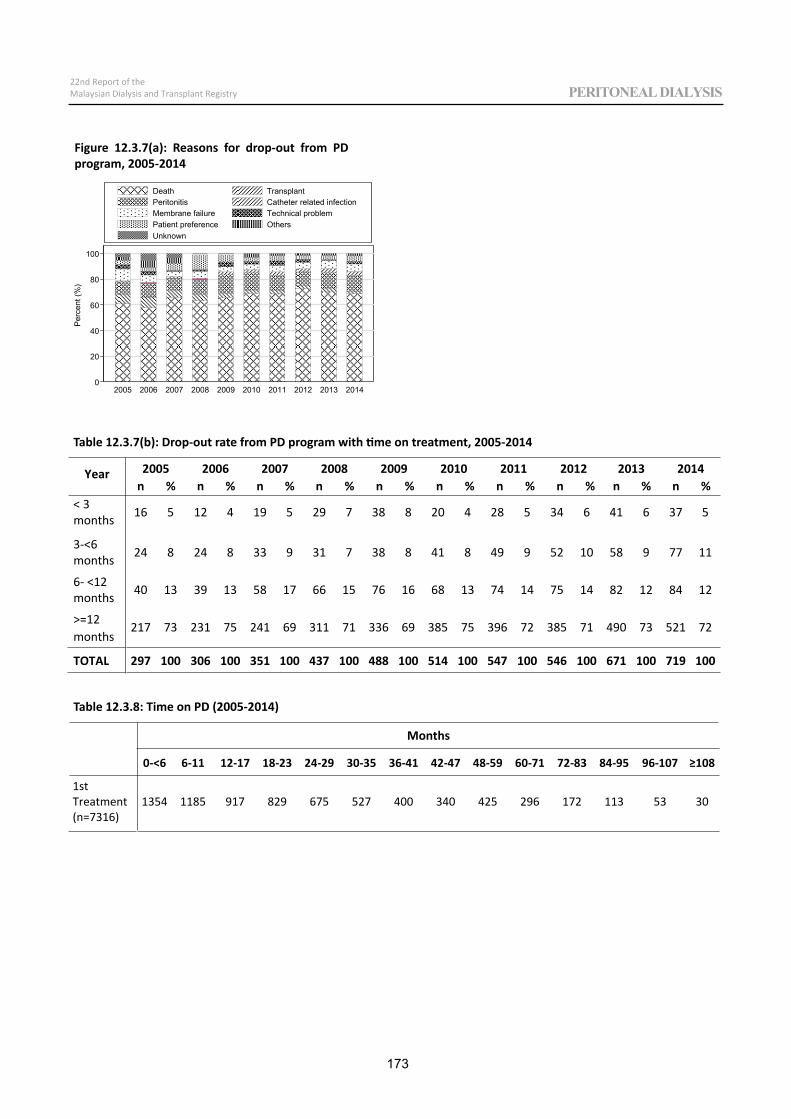
Year 2005 2006 2007 2008 2009 2010 2011 2012 2013 2014n % n % n % n % n % n % n % n % n % n %
< 3months 16 5 12 4 19 5 29 7 38 8 20 4 28 5 34 6 41 6 37 5
3 <6months 24 8 24 8 33 9 31 7 38 8 41 8 49 9 52 10 58 9 77 11
6 <12months 40 13 39 13 58 17 66 15 76 16 68 13 74 14 75 14 82 12 84 12
>=12months
217 73 231 75 241 69 311 71 336 69 385 75 396 72 385 71 490 73 521 72
TOTAL 297 100 306 100 351 100 437 100 488 100 514 100 547 100 546 100 671 100 719 100
Months
0 <6 6 11 12 17 18 23 24 29 30 35 36 41 42 47 48 59 60 71 72 83 84 95 96 107 108
1stTreatment(n=7316)
1354 1185 917 829 675 527 400 340 425 296 172 113 53 30
0
20
40
60
80
100
Per
cent
(%)
2005 2006 2007 2008 2009 2010 2011 2012 2013 2014
tnalpsnarThtaeDPeritonitis Catheter related infectionMembrane failure Technical problemPatient preference OthersUnknown
173
22nd Report of theMalaysian Dialysis and Transplant Registry PERITONEAL DIALYSIS
Figure 12.3.7(a): Reasons for drop-out from PD program, 2005-2014
Table 12.3.7(b): Drop-out rate from PD program with time on treatment, 2005-2014
Table 12.3.8: Time on PD (2005-2014)
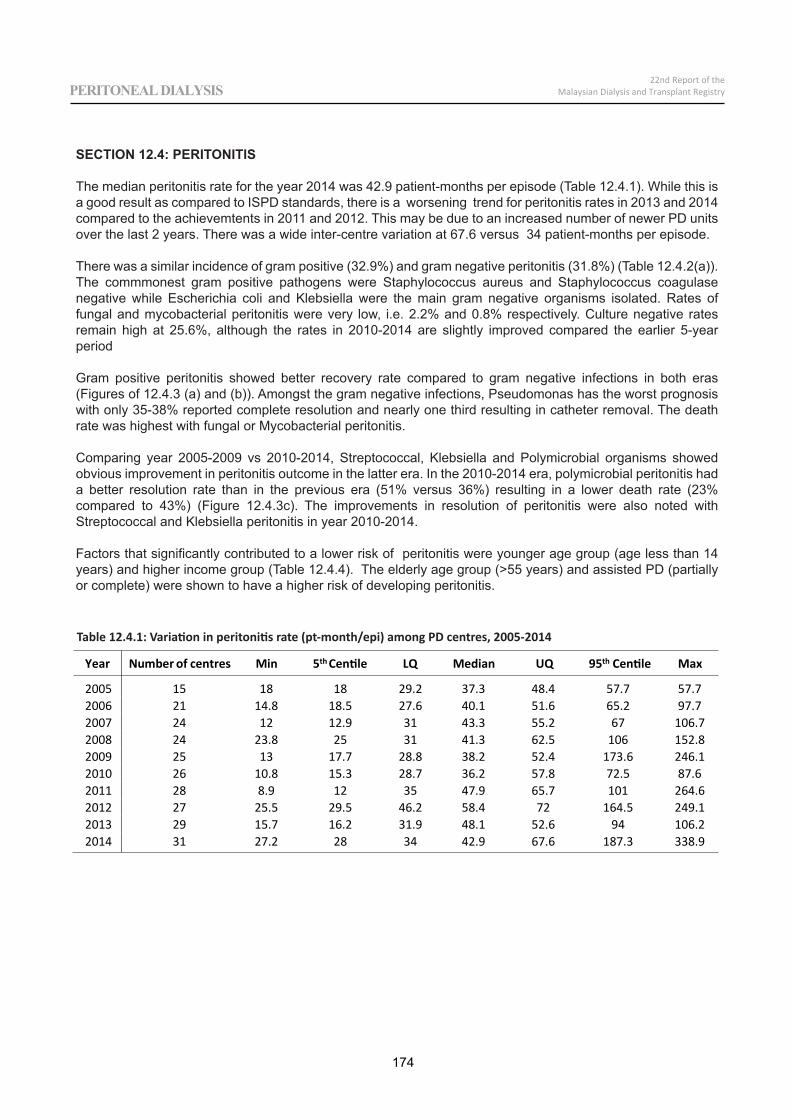
Year Number of centres Min 5th Centile LQ Median UQ 95th Centile Max
2005 15 18 18 29.2 37.3 48.4 57.7 57.72006 21 14.8 18.5 27.6 40.1 51.6 65.2 97.72007 24 12 12.9 31 43.3 55.2 67 106.72008 24 23.8 25 31 41.3 62.5 106 152.82009 25 13 17.7 28.8 38.2 52.4 173.6 246.12010 26 10.8 15.3 28.7 36.2 57.8 72.5 87.62011 28 8.9 12 35 47.9 65.7 101 264.62012 27 25.5 29.5 46.2 58.4 72 164.5 249.12013 29 15.7 16.2 31.9 48.1 52.6 94 106.22014 31 27.2 28 34 42.9 67.6 187.3 338.9
174
22nd Report of theMalaysian Dialysis and Transplant RegistryPERITONEAL DIALYSIS
SECTION 12.4: PERITONITIS
The median peritonitis rate for the year 2014 was 42.9 patient-months per episode (Table 12.4.1). While this is a good result as compared to ISPD standards, there is a worsening trend for peritonitis rates in 2013 and 2014 compared to the achievemtents in 2011 and 2012. This may be due to an increased number of newer PD units over the last 2 years. There was a wide inter-centre variation at 67.6 versus 34 patient-months per episode.
There was a similar incidence of gram positive (32.9%) and gram negative peritonitis (31.8%) (Table 12.4.2(a)). The commmonest gram positive pathogens were Staphylococcus aureus and Staphylococcus coagulase negative while Escherichia coli and Klebsiella were the main gram negative organisms isolated. Rates of fungal and mycobacterial peritonitis were very low, i.e. 2.2% and 0.8% respectively. Culture negative rates remain high at 25.6%, although the rates in 2010-2014 are slightly improved compared the earlier 5-year period
Gram positive peritonitis showed better recovery rate compared to gram negative infections in both eras (Figures of 12.4.3 (a) and (b)). Amongst the gram negative infections, Pseudomonas has the worst prognosis with only 35-38% reported complete resolution and nearly one third resulting in catheter removal. The death rate was highest with fungal or Mycobacterial peritonitis.
Comparing year 2005-2009 vs 2010-2014, Streptococcal, Klebsiella and Polymicrobial organisms showed obvious improvement in peritonitis outcome in the latter era. In the 2010-2014 era, polymicrobial peritonitis had a better resolution rate than in the previous era (51% versus 36%) resulting in a lower death rate (23% compared to 43%) (Figure 12.4.3c). The improvements in resolution of peritonitis were also noted with Streptococcal and Klebsiella peritonitis in year 2010-2014.
Factors that significantly contributed to a lower risk of peritonitis were younger age group (age less than 14 years) and higher income group (Table 12.4.4). The elderly age group (>55 years) and assisted PD (partially or complete) were shown to have a higher risk of developing peritonitis.
Table 12.4.1: Variation in peritonitis rate (pt-month/epi) among PD centres, 2005-2014
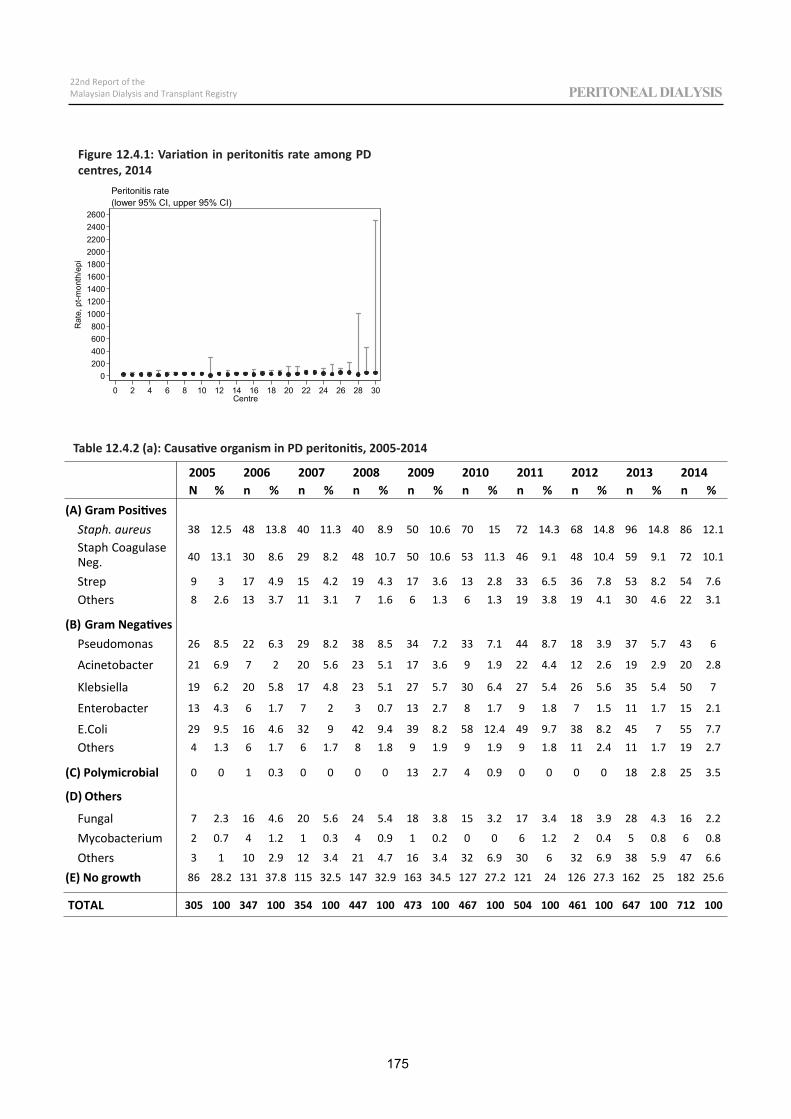
175
22nd Report of theMalaysian Dialysis and Transplant Registry PERITONEAL DIALYSIS
2005 2006 2007 2008 2009 2010 2011 2012 2013 2014N % n % n % n % n % n % n % n % n % n %
(A) Gram PositivesStaph. aureus 38 12.5 48 13.8 40 11.3 40 8.9 50 10.6 70 15 72 14.3 68 14.8 96 14.8 86 12.1Staph CoagulaseNeg. 40 13.1 30 8.6 29 8.2 48 10.7 50 10.6 53 11.3 46 9.1 48 10.4 59 9.1 72 10.1
Strep 9 3 17 4.9 15 4.2 19 4.3 17 3.6 13 2.8 33 6.5 36 7.8 53 8.2 54 7.6Others 8 2.6 13 3.7 11 3.1 7 1.6 6 1.3 6 1.3 19 3.8 19 4.1 30 4.6 22 3.1
(B) Gram Negatives Pseudomonas 26 8.5 22 6.3 29 8.2 38 8.5 34 7.2 33 7.1 44 8.7 18 3.9 37 5.7 43 6
Acinetobacter 21 6.9 7 2 20 5.6 23 5.1 17 3.6 9 1.9 22 4.4 12 2.6 19 2.9 20 2.8
Klebsiella 19 6.2 20 5.8 17 4.8 23 5.1 27 5.7 30 6.4 27 5.4 26 5.6 35 5.4 50 7
Enterobacter 13 4.3 6 1.7 7 2 3 0.7 13 2.7 8 1.7 9 1.8 7 1.5 11 1.7 15 2.1
E.Coli 29 9.5 16 4.6 32 9 42 9.4 39 8.2 58 12.4 49 9.7 38 8.2 45 7 55 7.7Others 4 1.3 6 1.7 6 1.7 8 1.8 9 1.9 9 1.9 9 1.8 11 2.4 11 1.7 19 2.7
(C) Polymicrobial 0 0 1 0.3 0 0 0 0 13 2.7 4 0.9 0 0 0 0 18 2.8 25 3.5
(D) Others
Fungal 7 2.3 16 4.6 20 5.6 24 5.4 18 3.8 15 3.2 17 3.4 18 3.9 28 4.3 16 2.2
Mycobacterium 2 0.7 4 1.2 1 0.3 4 0.9 1 0.2 0 0 6 1.2 2 0.4 5 0.8 6 0.8
Others 3 1 10 2.9 12 3.4 21 4.7 16 3.4 32 6.9 30 6 32 6.9 38 5.9 47 6.6
(E) No growth 86 28.2 131 37.8 115 32.5 147 32.9 163 34.5 127 27.2 121 24 126 27.3 162 25 182 25.6
TOTAL 305 100 347 100 354 100 447 100 473 100 467 100 504 100 461 100 647 100 712 100
0200400600800
100012001400160018002000220024002600
Rat
e, p
t-mon
th/e
pi
0 2 4 6 8 10 12 14 16 18 20 22 24 26 28 30Centre
(lower 95% CI, upper 95% CI)Peritonitis rate
Figure 12.4.1: Variation in peritonitis rate among PD centres, 2014
Table 12.4.2 (a): Causative organism in PD peritonitis, 2005-2014
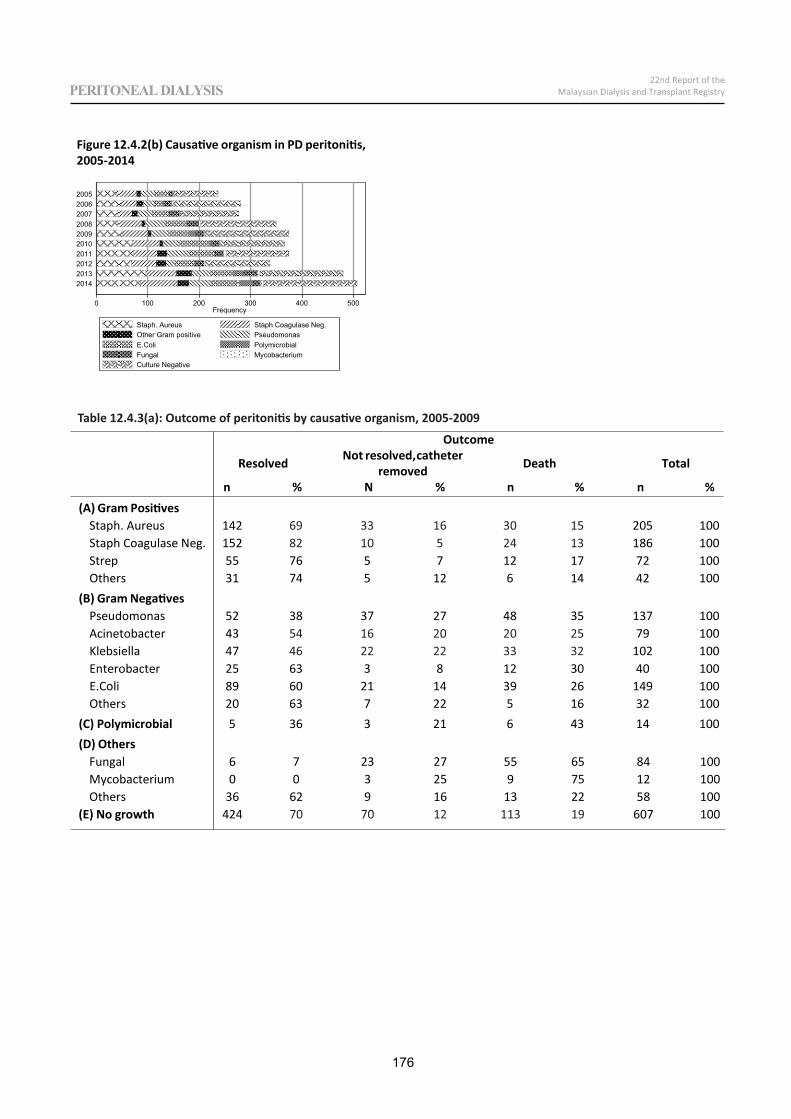
176
22nd Report of theMalaysian Dialysis and Transplant RegistryPERITONEAL DIALYSIS
Outcome
Resolved Not resolved,catheterremoved Death Total
n % N % n % n %(A) Gram Positives
Staph. Aureus 142 205 100Staph Coagulase Neg. 152 186 100Strep 55 76 5 7 12 17 72 100Others 31 74 5 12 6 14 42 100
(B) Gram NegativesPseudomonas 52 38 37 27 48 35 137 100Acinetobacter 43 79 100Klebsiella 47 102 100Enterobacter 25 63 3 8 12 30 40 100E.Coli 89 60 21 14 39 26 149 100Others 20 63 7 22 5 16 32 100
(C) Polymicrobial 5 36 3 21 6 43 14 100(D) Others
0 100 200 300 400 500Frequency
2014201320122011201020092008200720062005
.geN esalugaoC hpatSsueruA .hpatSOther Gram positive Pseudomonas
laiborcimyloPiloC.EmuiretcabocyMlagnuF
Culture Negative
Figure 12.4.2(b) Causative organism in PD peritonitis, 2005-2014
Table 12.4.3(a): Outcome of peritonitis by causative organism, 2005-2009
Fungal 6 7 23 27 55 65 84 100Mycobacterium 0 0 3 25 9 75 12 100Others 36 62 9 16 13 22 58 100
(E) No growth 424 607 100
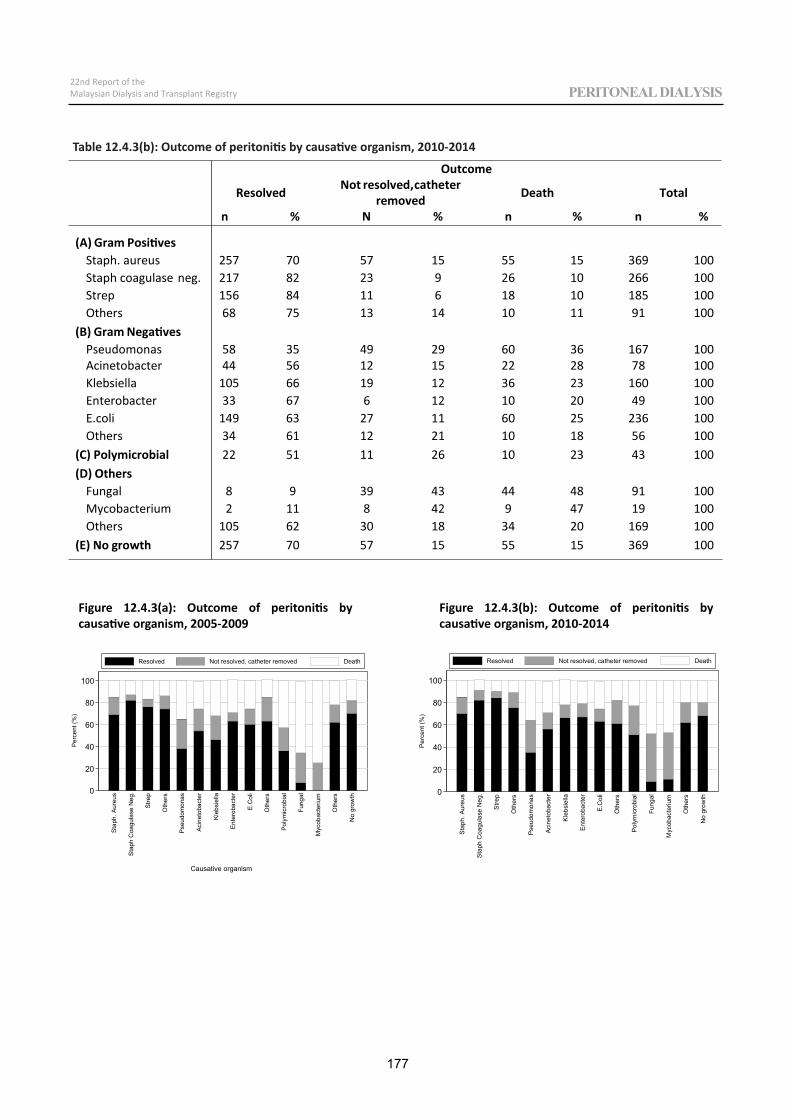
177
22nd Report of theMalaysian Dialysis and Transplant Registry PERITONEAL DIALYSIS
0
20
40
60
80
100
Perc
ent (
%)
Stap
h. A
ureu
s
Sta
ph C
oagu
lase
Neg
.
Stre
p
Oth
ers
Pseu
dom
onas
Acin
etob
acte
r
Kle
bsie
lla
Ente
roba
cter
E.C
oli
Oth
ers
Poly
mic
robi
al
Fung
al
Myc
obac
teriu
m
Oth
ers
No
grow
th
Resolved Not resolved, catheter removed Death
(A) Gram PositivesStaph. aureus 257 70 57 15 55 15 369 100Staph coagulase neg. 217 266 100Strep 156 185 100Others 68 75 13 14 10 11 91 100
(B) Gram NegativesPseudomonas 58 35 49 29 60 36 167 100Acinetobacter 44 56 12 15 22 28 78 100Klebsiella 105 160 100Enterobacter 33 49 100E.coli 149 63 27 11 60 25 236 100Others 34 61 12 21 10 18 56 100
(C) Polymicrobial 22 51 11 26 10 23 43 100(D) Others
Fungal 8 91 100Mycobacterium 2 19 100Others 105 62 30 18 34 20 169 100
(E) No growth 257 70 57 15 55 15 369 100
0
20
40
60
80
100
Perc
ent (
%)
Stap
h. A
ureu
s
Sta
ph C
oagu
lase
Neg
.
Stre
p
Oth
ers
Pseu
dom
onas
Acin
etob
acte
r
Kle
bsie
lla
Ente
roba
cter
E.C
oli
Oth
ers
Poly
mic
robi
al
Fung
al
Myc
obac
teriu
m
Oth
ers
No
grow
th
Resolved Not resolved, catheter removed Death
Causative organism
Outcome
Resolved Not resolved,catheterremoved Death Total
n % N % n % n %
Table 12.4.3(b): Outcome of peritonitis by causative organism, 2010-2014
Figure 12.4.3(a): Outcome of peritonitis by causative organism, 2005-2009
Figure 12.4.3(b): Outcome of peritonitis by causative organism, 2010-2014
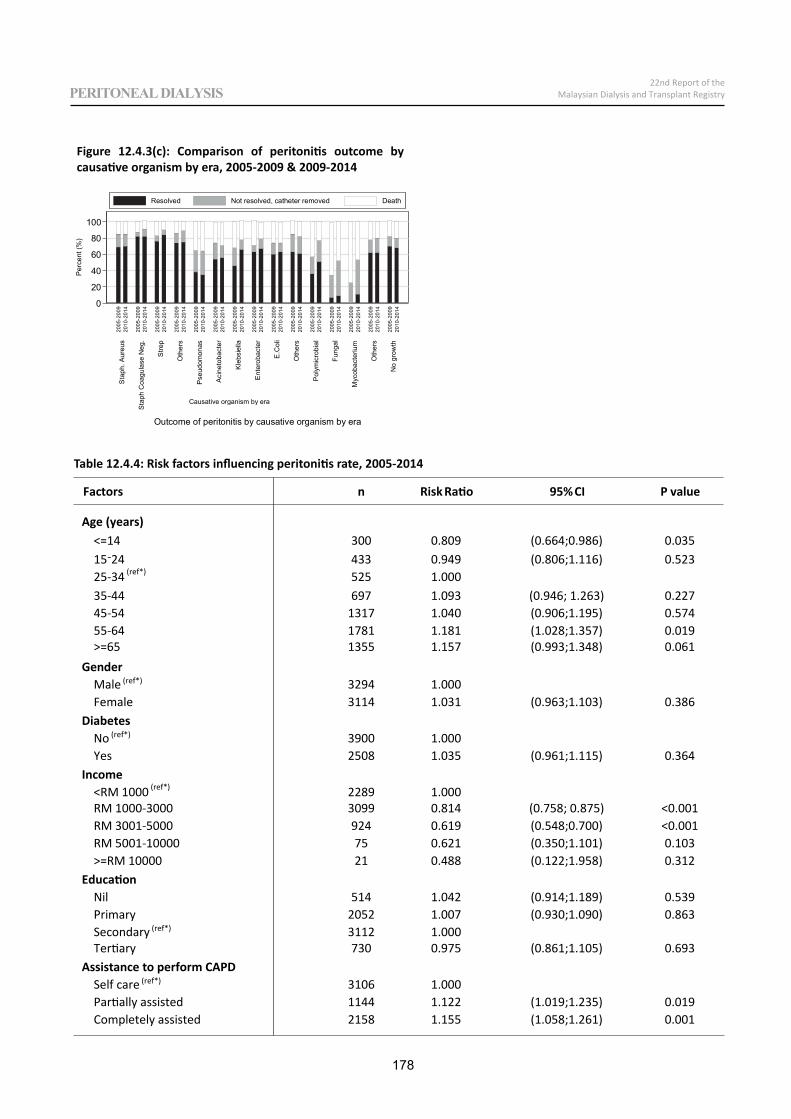
178
22nd Report of theMalaysian Dialysis and Transplant RegistryPERITONEAL DIALYSIS
0
20
40
60
80
100
Perc
ent (
%)
Sta
ph. A
ureu
s
Sta
ph C
oagu
lase
Neg
.
Stre
p
Oth
ers
Pse
udom
onas
Aci
neto
bact
er
Kle
bsie
lla
Ent
erob
acte
r
E.C
oli
Oth
ers
Pol
ymic
robi
al
Fung
al
Myc
obac
teriu
m
Oth
ers
No
grow
th
2005
-200
920
10-2
014
2005
-200
920
10-2
014
2005
-200
920
10-2
014
2005
-200
920
10-2
014
2005
-200
920
10-2
014
2005
-200
920
10-2
014
2005
-200
920
10-2
014
2005
-200
920
10-2
014
2005
-200
920
10-2
014
2005
-200
920
10-2
014
2005
-200
920
10-2
014
2005
-200
920
10-2
014
2005
-200
920
10-2
014
2005
-200
920
10-2
014
2005
-200
920
10-2
014
Outcome of peritonitis by causative organism by era
Resolved Not resolved, catheter removed Death
Causative organism by era
Factors n Risk Ratio 95% CI P value
Age (years)<=14 300 0.809 (0.664;0.986) 0.03515 24 433 0.949 (0.806;1.116) 0.52325 34 (ref*) 525 1.00035 44 697 1.093 (0.946; 1.263) 0.22745 54 1317 1.040 (0.906;1.195) 0.57455 64 1781 1.181 (1.028;1.357) 0.019>=65 1355 1.157 (0.993;1.348) 0.061
Gender Male (ref*) 3294 1.000Female 3114 1.031 (0.963;1.103) 0.386
Diabetes No (ref*) 3900 1.000Yes 2508 1.035 (0.961;1.115) 0.364
Income <RM 1000 (ref*) 2289 1.000RM 1000 3000 3099 0.814 (0.758; 0.875) <0.001RM 3001 5000 924 0.619 (0.548;0.700) <0.001RM 5001 10000 75 0.621 (0.350;1.101) 0.103>=RM 10000 21 0.488 (0.122;1.958) 0.312
Education Nil 514 1.042 (0.914;1.189) 0.539Primary 2052 1.007 (0.930;1.090) 0.863Secondary (ref*) 3112 1.000Tertiary 730 0.975 (0.861;1.105) 0.693
Assistance to perform CAPD Self care (ref*) 3106 1.000Partially assisted 1144 1.122 (1.019;1.235) 0.019Completely assisted 2158 1.155 (1.058;1.261) 0.001
Figure 12.4.3(c): Comparison of peritonitis outcome by causative organism by era, 2005-2009 & 2009-2014
Table 12.4.4: Risk factors influencing peritonitis rate, 2005-2014
Chapter 13
RENAL TRANSPLANTATION
Rosnawati YahyaHooi Lai SeongNg Kok Peng
Suryati Binti YakobWong Hin Seng
Table 13.1.1: Stock and flow of renal transplantation,2005 2014
Year 2005 2006 2007 2008 2009 2010 2011 2012 2013 2014
New transplant patients 172 151 112 131 141 128 127 107 98 81Died 49 58 47 59 49 48 55 64 55 52Graft failure 20 36 38 39 37 45 40 47 50 49Lost to Follow up 6 2 10 13 11 6 6 12 13 15Functioning graft at 31st December 1716 1771 1788 1808 1852 1881 1907 1891 1870 1844
Figure 13.1.1: Stock and flow of renal transplantation,2005 2014
0
200
400
600
800
1,000
1,200
1,400
1,600
1,800
2,000
No.
of p
atie
nts
2005 2006 2007 2008 2009 2010 2011 2012 2013 2014Year
New patients Functioning graft at 31st Dec
Table 13.1.2: New transplantrate per million population (pmp), 2005 2014
Year 2005 2006 2007 2008 2009 2010 2011 2012 2013 2014New transplant patients 172 151 112 131 141 128 127 107 98 81New transplant rate, pmp 6 6 4 5 5 4 4 4 3 3
Table 13.1.3: Transplantprevalence rate per millionpopulation(pmp), 2005 2014Year 2005 2006 2007 2008 2009 2010 2011 2012 2013 2014Functioning graft at 31st December 1716 1771 1788 1808 1852 1881 1907 1891 1870 1844Transplant prevalence rate, pmp 65 66 66 66 66 66 66 64 63 61
180
22nd Report of theMalaysian Dialysis and Transplant RegistryRENAL TRANSPLANTATION
SECTION 13.1: STOCK AND FLOW
The number of new transplant patients was 172 in 2005 and this decreased to 81 in 2014. The reduction in the number of new transplants was predominantly due to reduction in commercial transplantation performed overseas. The number of functioning renal transplants increased from 1716 in 2005 to 1907 in 2011 but declined to 1844 in 2014 (Table 13.1.1).
Despite advances in immunosuppression, the rate of allograft failure remained the same at 2-3% per year.
The incidence of renal transplantation is declining, from 6 per million population in 2005 and 2006 to 3 pmp in 2014 (Table & Figure 13.1.2). This is extremely low in comparison to Australia and New Zealand, which reported a rate of 38 per million population in 2013. The transplant prevalence rate remained static between 2005 and 2011 at 65 to 66 per million population then declined to 61 pmp in 2014 (Table & Figure 13.1.3). The dialysis prevalence rate in Malaysia in 2014 is 1155 pmp. The number of dialysis patients needing transplantation far outstrips the transplantation rate.
0
1
2
3
4
5
6
7
8
New
Tra
nspl
ant r
ate,
pm
p
2005 2006 2007 2008 2009 2010 2011 2012 2013 2014Year
Rate, pmp
Figure 13.1.2 (a): New transplantrate, 2005 2014
0
10
20
30
40
50
60
70
Tran
spla
nt P
reva
lenc
e ra
te, p
mp
2005 2006 2007 2008 2009 2010 2011 2012 2013 2014Year
Rate, pmp
181
22nd Report of theMalaysian Dialysis and Transplant Registry RENAL TRANSPLANTATION
Transplantation in local centres had increased from 48 in 2005 to 85 in 2011, dropping to 63 in 2014. This disturbing data underscores the failure to increase the rate of transplantation within the country. Hospital Kuala Lumpur, which is the main transplant centre in Malaysia contributed 36 (57%) followed by Hospital Selayang and UMMC with 13 each (20.6%).
The number of transplants performed overseas (especially China) continued to drop from 124 (72%) in 2005 to 18 (22%) in 2014 (Table 13.1.4 and Figure 13.1.4 a).
Figure 13.1.4(a): Places of transplantation,2005 2014
0
50
100
150
200
Number
2005 2006 2007 2008 2009 2010 2011 2012 2013 2014
nwonknUsaesrevo rehtOaidnIanihClacoL
0
10
20
30
40
2005 2006 2007 2008 2009 2010 2011 2012 2013 2014
HKL PPUKM Prince Court UMMC Selayang Hospital Other local
Table 13.1.4: Place of transplantation,2005 2014
Year2005 2006 2007 2008 2009
n % n % n % n % n %HKL 31 18.0 35 23.2 36 32.1 32 24.4 36 25.5PPUKM 2 1.2 1 0.7 2 1.8 5 3.8 3 2.1Prince Court Medical Centre 0 0.0 0 0.0 0 0.0 0 0.0 4 2.8UMMC 8 4.7 5 3.3 5 4.5 10 7.6 10 7.1Selayang Hospital 5 2.9 9 6.0 14 12.5 10 7.6 18 12.8Other local 2 1.2 1 0.7 2 1.8 3 2.3 3 2.1Subtotal – Local 48 28 51 33.9 59 52.7 60 45.7 74 52.4China 113 65.7 87 57.6 45 40.2 65 49.6 62 44.0India 7 4.1 7 4.6 3 2.7 3 2.3 2 1.4Other overseas 4 2.3 6 4.0 5 4.5 3 2.3 3 2.1Unknown 0 0.0 0 0.0 0 0.0 0 0.0 0 0.0Subtotal overseas 124 72.1 100 66.2 53 47.4 71 54.2 67 47.5Total 172 100.0 151 100.0 112 100.0 131 100.0 141 100.0
Figure 13.1.4(b): Place of transplantation within Malaysia
Figure 13.1.2 (b): Transplant prevalence rate, 2005 2014
Year2010 2011 2012 2013 2014
n % n % n % n % n %HKL 27 21.1 37 29.1 36 33.6 36 36.7 36 44.4PPUKM 2 1.6 1 0.8 3 2.8 0 0.0 0 0.0Prince Court Medical Centre 7 5.5 13 10.2 16 15.0 16 16.3 0 0.0UMMC 10 7.8 7 5.5 10 9.3 13 13.3 13 16.0Selayang Hospital 19 14.8 26 20.5 16 15.0 17 17.3 13 16.0Other local 0 0.0 1 0.8 1 0.9 0 0.0 1 1.2Subtotal 65 50.8 85 66.9 82 76.6 82 83.6 63 77.6China 52 40.6 40 31.5 22 20.6 10 10.2 12 14.8India 2 1.6 0 0.0 1 0.9 2 2.0 1 1.2Other overseas 8 6.3 2 1.6 2 1.9 4 4.1 5 6.2Unknown 1 0.8 0 0.0 0 0.0 0 0.0 0 0.0Subtotal overseas 63 49.3 42 33.1 25 23.4 16 16.3 18 22.2Total 128 100.0 127 100.0 107 100.0 98 100.0 81 100.0
182
22nd Report of theMalaysian Dialysis and Transplant RegistryRENAL TRANSPLANTATION
SECTION 13.2: RECIPIENTS’ CHARACTERISTICS
Over the last 10 years, the age of transplant recipients had remained unchanged, with a mean between 35 to 40 years old. Male patients continued to predominate with 57 to 70% of the recipients.
The proportion of diabetic patients undergoing renal transplantation decreased over the last 10 years from 22% in 2005 to 11% in 2014. This coincided with the drop in transplants from China where the majority of diabetic patients underwent their transplantation. The proportion of patients with hepatitis B and hepatitis C had remained the same over the past ten years, 3% HBsAg positive and 5% HCV positive in 2014.
In terms of underlying cause of end stage renal failure (Table 13.2.2), the commonest cause was glomerulonephritis (33%), followed by hypertension (27%) and diabetes (10%). The proportion recipients who had end stage renal disease due to unknown cause (23%) continue to decrease over the past ten years suggesting that more patients present early, allowing the physician time to make a diagnosis.
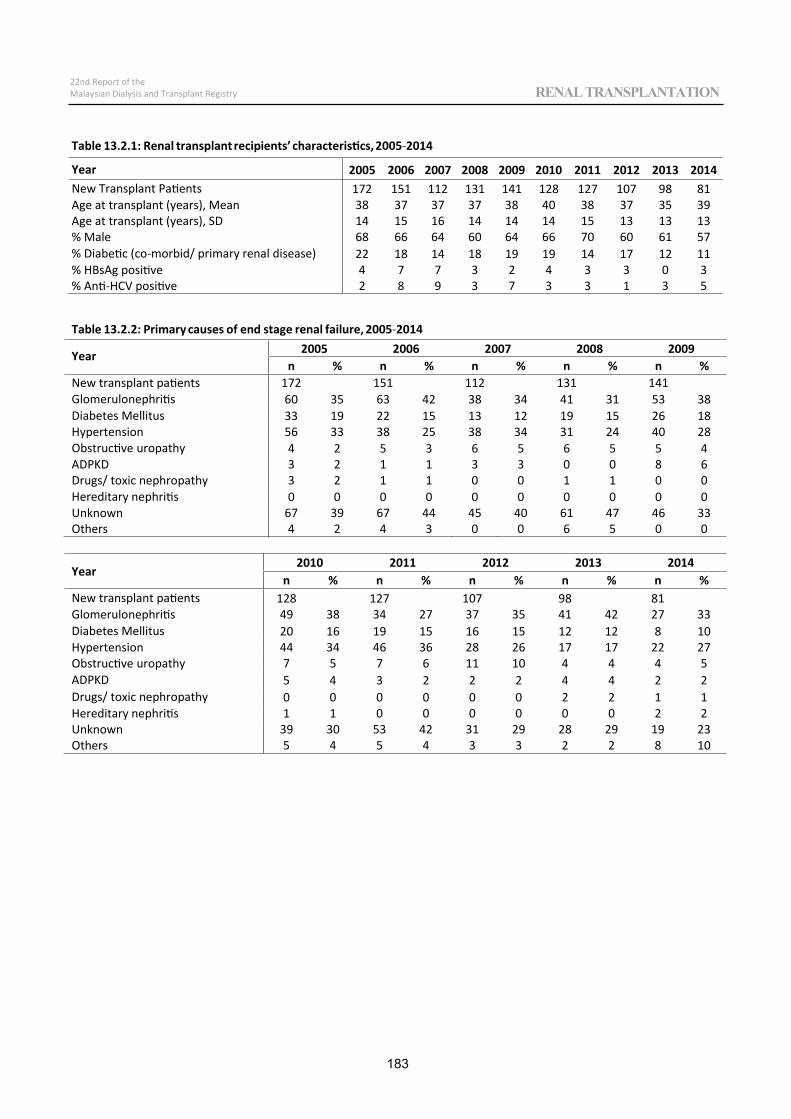
Table 13.2.1: Renal transplant recipients’ characteristics, 2005 2014
Year 2005 2006 2007 2008 2009 2010 2011 2012 2013 2014New Transplant Patients 172 151 112 131 141 128 127 107 98 81Age at transplant (years), Mean 38 37 37 37 38 40 38 37 35 39Age at transplant (years), SD 14 15 16 14 14 14 15 13 13 13% Male 68 66 64 60 64 66 70 60 61 57% Diabetic (co morbid/ primary renal disease) 22 18 14 18 19 19 14 17 12 11% HBsAg positive 4 7 7 3 2 4 3 3 0 3% Anti HCV positive 2 8 9 3 7 3 3 1 3 5
Table 13.2.2: Primary causes of end stage renal failure, 2005 2014
Year 2005 2006 2007 2008 2009n % n % n % n % n %
New transplant patients 172 151 112 131 141Glomerulonephritis 60 35 63 42 38 34 41 31 53 38Diabetes Mellitus 33 19 22 15 13 12 19 15 26 18Hypertension 56 33 38 25 38 34 31 24 40 28Obstructive uropathy 4 2 5 3 6 5 6 5 5 4ADPKD 3 2 1 1 3 3 0 0 8 6Drugs/ toxic nephropathy 3 2 1 1 0 0 1 1 0 0Hereditary nephritis 0 0 0 0 0 0 0 0 0 0Unknown 67 39 67 44 45 40 61 47 46 33Others 4 2 4 3 0 0 6 5 0 0
Year2010 2011 2012 2013 2014
n % n % n % n % n %New transplant patients 128 127 107 98 81Glomerulonephritis 49 38 34 27 37 35 41 42 27 33Diabetes Mellitus 20 16 19 15 16 15 12 12 8 10Hypertension 44 34 46 36 28 26 17 17 22 27Obstructive uropathy 7 5 7 6 11 10 4 4 4 5ADPKD 5 4 3 2 2 2 4 4 2 2Drugs/ toxic nephropathy 0 0 0 0 0 0 2 2 1 1Hereditary nephritis 1 1 0 0 0 0 0 0 2 2Unknown 39 30 53 42 31 29 28 29 19 23Others 5 4 5 4 3 3 2 2 8 10
183
22nd Report of theMalaysian Dialysis and Transplant Registry RENAL TRANSPLANTATION
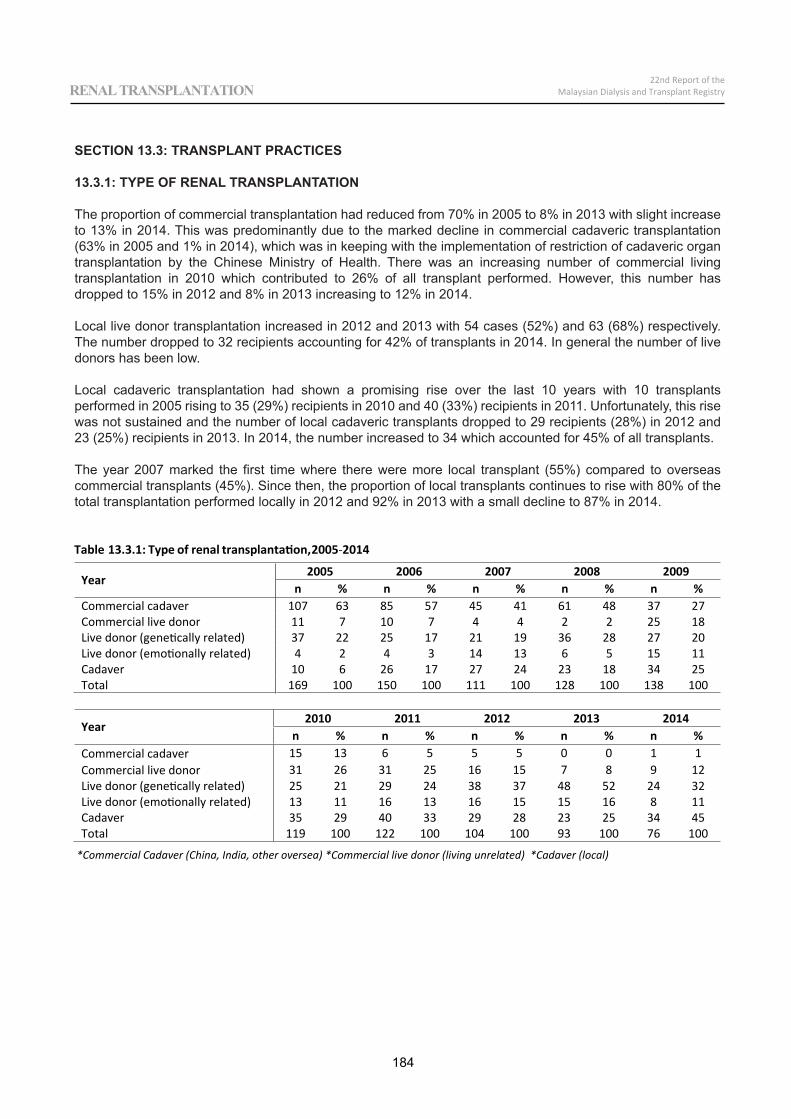
Table 13.3.1: Type of renal transplantation,2005 2014
Year2005 2006 2007 2008 2009
n % n % n % n % n %Commercial cadaver 107 63 85 57 45 41 61 48 37 27Commercial live donor 11 7 10 7 4 4 2 2 25 18Live donor (genetically related) 37 22 25 17 21 19 36 28 27 20Live donor (emotionally related) 4 2 4 3 14 13 6 5 15 11Cadaver 10 6 26 17 27 24 23 18 34 25Total 169 100 150 100 111 100 128 100 138 100
Year2010 2011 2012 2013 2014
n % n % n % n % n %Commercial cadaver 15 13 6 5 5 5 0 0 1 1Commercial live donor 31 26 31 25 16 15 7 8 9 12Live donor (genetically related) 25 21 29 24 38 37 48 52 24 32Live donor (emotionally related) 13 11 16 13 16 15 15 16 8 11Cadaver 35 29 40 33 29 28 23 25 34 45Total 119 100 122 100 104 100 93 100 76 100
*Commercial Cadaver (China, India, other oversea) *Commercial live donor (living unrelated) *Cadaver (local)
184
22nd Report of theMalaysian Dialysis and Transplant RegistryRENAL TRANSPLANTATION
SECTION 13.3: TRANSPLANT PRACTICES
13.3.1: TYPE OF RENAL TRANSPLANTATION
The proportion of commercial transplantation had reduced from 70% in 2005 to 8% in 2013 with slight increase to 13% in 2014. This was predominantly due to the marked decline in commercial cadaveric transplantation (63% in 2005 and 1% in 2014), which was in keeping with the implementation of restriction of cadaveric organ transplantation by the Chinese Ministry of Health. There was an increasing number of commercial living transplantation in 2010 which contributed to 26% of all transplant performed. However, this number has dropped to 15% in 2012 and 8% in 2013 increasing to 12% in 2014.
Local live donor transplantation increased in 2012 and 2013 with 54 cases (52%) and 63 (68%) respectively. The number dropped to 32 recipients accounting for 42% of transplants in 2014. In general the number of live donors has been low.
Local cadaveric transplantation had shown a promising rise over the last 10 years with 10 transplants performed in 2005 rising to 35 (29%) recipients in 2010 and 40 (33%) recipients in 2011. Unfortunately, this rise was not sustained and the number of local cadaveric transplants dropped to 29 recipients (28%) in 2012 and 23 (25%) recipients in 2013. In 2014, the number increased to 34 which accounted for 45% of all transplants.
The year 2007 marked the first time where there were more local transplant (55%) compared to overseas commercial transplants (45%). Since then, the proportion of local transplants continues to rise with 80% of the total transplantation performed locally in 2012 and 92% in 2013 with a small decline to 87% in 2014.
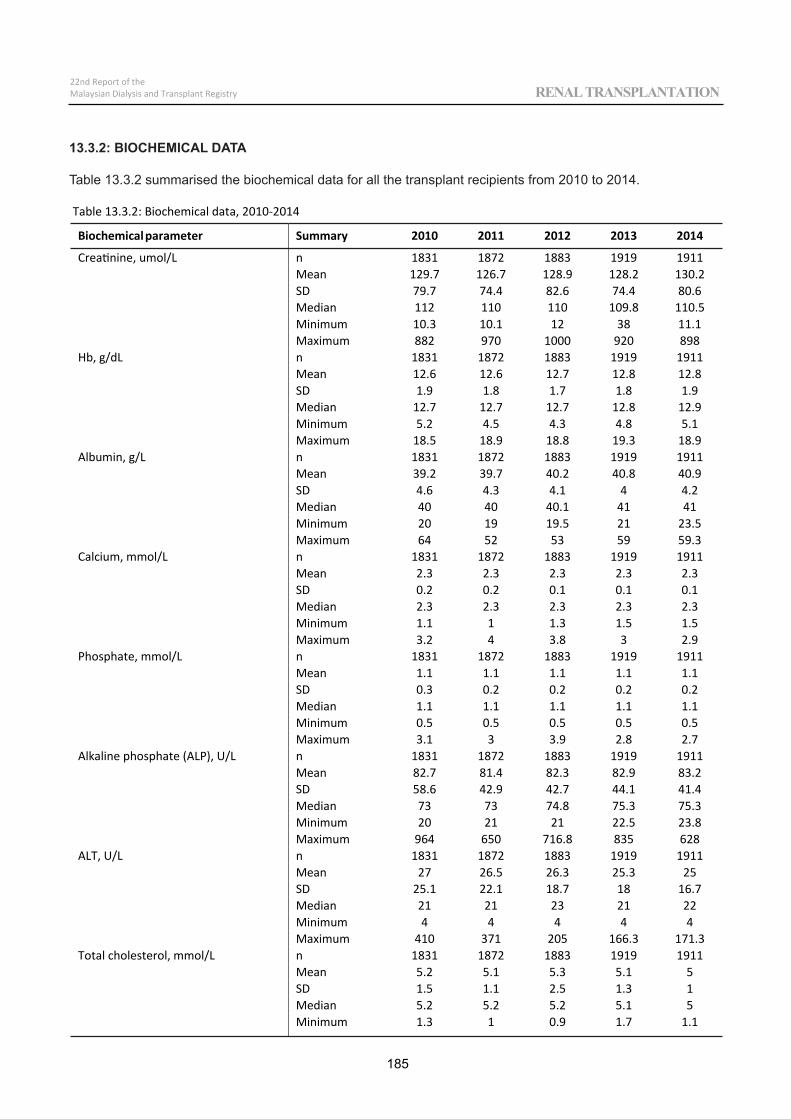
Table 13.3.2: Biochemical data, 2010 2014
Biochemicalparameter Summary 2010 2011 2012 2013 2014
Creatinine, umol/L n 1831 1872 1883 1919 1911Mean 129.7 126.7 128.9 128.2 130.2SD 79.7 74.4 82.6 74.4 80.6Median 112 110 110 109.8 110.5Minimum 10.3 10.1 12 38 11.1Maximum 882 970 1000 920 898
Hb, g/dL n 1831 1872 1883 1919 1911Mean 12.6 12.6 12.7 12.8 12.8SD 1.9 1.8 1.7 1.8 1.9Median 12.7 12.7 12.7 12.8 12.9Minimum 5.2 4.5 4.3 4.8 5.1Maximum 18.5 18.9 18.8 19.3 18.9
Albumin, g/L n 1831 1872 1883 1919 1911Mean 39.2 39.7 40.2 40.8 40.9SD 4.6 4.3 4.1 4 4.2Median 40 40 40.1 41 41Minimum 20 19 19.5 21 23.5Maximum 64 52 53 59 59.3
Calcium, mmol/L n 1831 1872 1883 1919 1911Mean 2.3 2.3 2.3 2.3 2.3SD 0.2 0.2 0.1 0.1 0.1Median 2.3 2.3 2.3 2.3 2.3Minimum 1.1 1 1.3 1.5 1.5Maximum 3.2 4 3.8 3 2.9
Phosphate, mmol/L n 1831 1872 1883 1919 1911Mean 1.1 1.1 1.1 1.1 1.1SD 0.3 0.2 0.2 0.2 0.2Median 1.1 1.1 1.1 1.1 1.1Minimum 0.5 0.5 0.5 0.5 0.5Maximum 3.1 3 3.9 2.8 2.7
Alkaline phosphate (ALP), U/L n 1831 1872 1883 1919 1911Mean 82.7 81.4 82.3 82.9 83.2SD 58.6 42.9 42.7 44.1 41.4Median 73 73 74.8 75.3 75.3Minimum 20 21 21 22.5 23.8Maximum 964 650 716.8 835 628
ALT, U/L n 1831 1872 1883 1919 1911Mean 27 26.5 26.3 25.3 25SD 25.1 22.1 18.7 18 16.7Median 21 21 23 21 22Minimum 4 4 4 4 4Maximum 410 371 205 166.3 171.3
Total cholesterol, mmol/L n 1831 1872 1883 1919 1911Mean 5.2 5.1 5.3 5.1 5SD 1.5 1.1 2.5 1.3 1Median 5.2 5.2 5.2 5.1 5Minimum 1.3 1 0.9 1.7 1.1
185
22nd Report of theMalaysian Dialysis and Transplant Registry RENAL TRANSPLANTATION
13.3.2: BIOCHEMICAL DATA
Table 13.3.2 summarised the biochemical data for all the transplant recipients from 2010 to 2014.
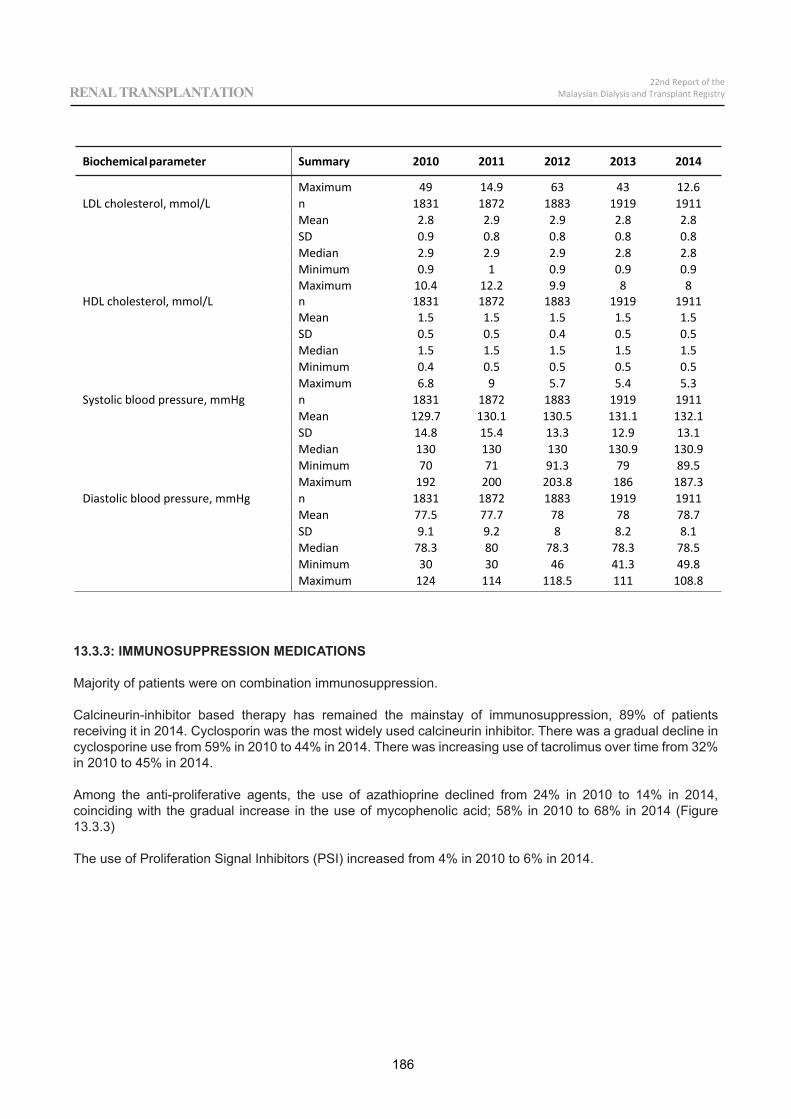
Biochemicalparameter Summary 2010 2011 2012 2013 2014
Maximum 49 14.9 63 43 12.6LDL cholesterol, mmol/L n 1831 1872 1883 1919 1911
Mean 2.8 2.9 2.9 2.8 2.8SD 0.9 0.8 0.8 0.8 0.8Median 2.9 2.9 2.9 2.8 2.8Minimum 0.9 1 0.9 0.9 0.9Maximum 10.4 12.2 9.9 8 8
HDL cholesterol, mmol/L n 1831 1872 1883 1919 1911Mean 1.5 1.5 1.5 1.5 1.5SD 0.5 0.5 0.4 0.5 0.5Median 1.5 1.5 1.5 1.5 1.5Minimum 0.4 0.5 0.5 0.5 0.5Maximum 6.8 9 5.7 5.4 5.3
Systolic blood pressure, mmHg n 1831 1872 1883 1919 1911Mean 129.7 130.1 130.5 131.1 132.1SD 14.8 15.4 13.3 12.9 13.1Median 130 130 130 130.9 130.9Minimum 70 71 91.3 79 89.5Maximum 192 200 203.8 186 187.3
Diastolic blood pressure, mmHg n 1831 1872 1883 1919 1911Mean 77.5 77.7 78 78 78.7SD 9.1 9.2 8 8.2 8.1Median 78.3 80 78.3 78.3 78.5Minimum 30 30 46 41.3 49.8Maximum 124 114 118.5 111 108.8
186
22nd Report of theMalaysian Dialysis and Transplant RegistryRENAL TRANSPLANTATION
13.3.3: IMMUNOSUPPRESSION MEDICATIONS
Majority of patients were on combination immunosuppression.
Calcineurin-inhibitor based therapy has remained the mainstay of immunosuppression, 89% of patients receiving it in 2014. Cyclosporin was the most widely used calcineurin inhibitor. There was a gradual decline in cyclosporine use from 59% in 2010 to 44% in 2014. There was increasing use of tacrolimus over time from 32% in 2010 to 45% in 2014.
Among the anti-proliferative agents, the use of azathioprine declined from 24% in 2010 to 14% in 2014, coinciding with the gradual increase in the use of mycophenolic acid; 58% in 2010 to 68% in 2014 (Figure 13.3.3)
The use of Proliferation Signal Inhibitors (PSI) increased from 4% in 2010 to 6% in 2014.
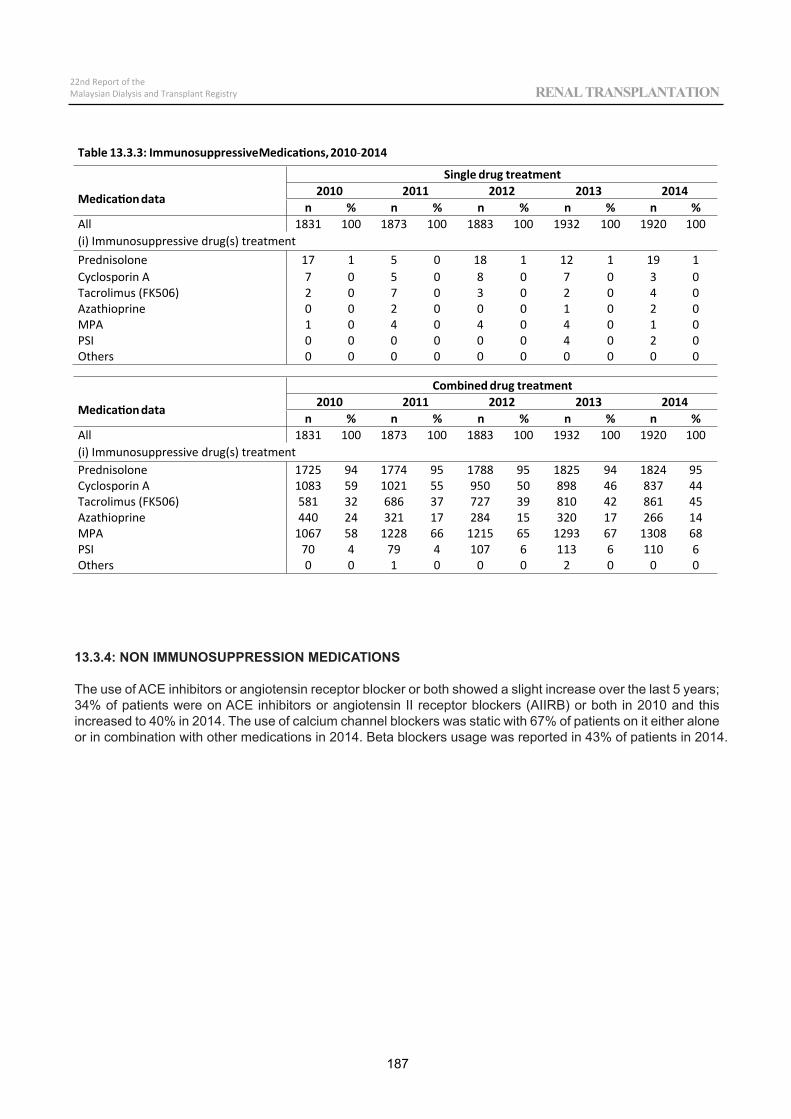
Table 13.3.3: ImmunosuppressiveMedications,2010 2014
Medication data
Single drug treatment2010 2011 2012 2013 2014
n % n % n % n % n %All 1831 100 1873 100 1883 100 1932 100 1920 100(i) Immunosuppressive drug(s) treatmentPrednisolone 17 1 5 0 18 1 12 1 19 1Cyclosporin A 7 0 5 0 8 0 7 0 3 0Tacrolimus (FK506) 2 0 7 0 3 0 2 0 4 0Azathioprine 0 0 2 0 0 0 1 0 2 0MPA 1 0 4 0 4 0 4 0 1 0PSI 0 0 0 0 0 0 4 0 2 0Others 0 0 0 0 0 0 0 0 0 0
Medication data
Combined drug treatment2010 2011 2012 2013 2014
n % n % n % n % n %All 1831 100 1873 100 1883 100 1932 100 1920 100(i) Immunosuppressive drug(s) treatmentPrednisolone 1725 94 1774 95 1788 95 1825 94 1824 95Cyclosporin A 1083 59 1021 55 950 50 898 46 837 44Tacrolimus (FK506) 581 32 686 37 727 39 810 42 861 45Azathioprine 440 24 321 17 284 15 320 17 266 14MPA 1067 58 1228 66 1215 65 1293 67 1308 68PSI 70 4 79 4 107 6 113 6 110 6Others 0 0 1 0 0 0 2 0 0 0
187
22nd Report of theMalaysian Dialysis and Transplant Registry RENAL TRANSPLANTATION
13.3.4: NON IMMUNOSUPPRESSION MEDICATIONS
The use of ACE inhibitors or angiotensin receptor blocker or both showed a slight increase over the last 5 years; 34% of patients were on ACE inhibitors or angiotensin II receptor blockers (AIIRB) or both in 2010 and this increased to 40% in 2014. The use of calcium channel blockers was static with 67% of patients on it either alone or in combination with other medications in 2014. Beta blockers usage was reported in 43% of patients in 2014.
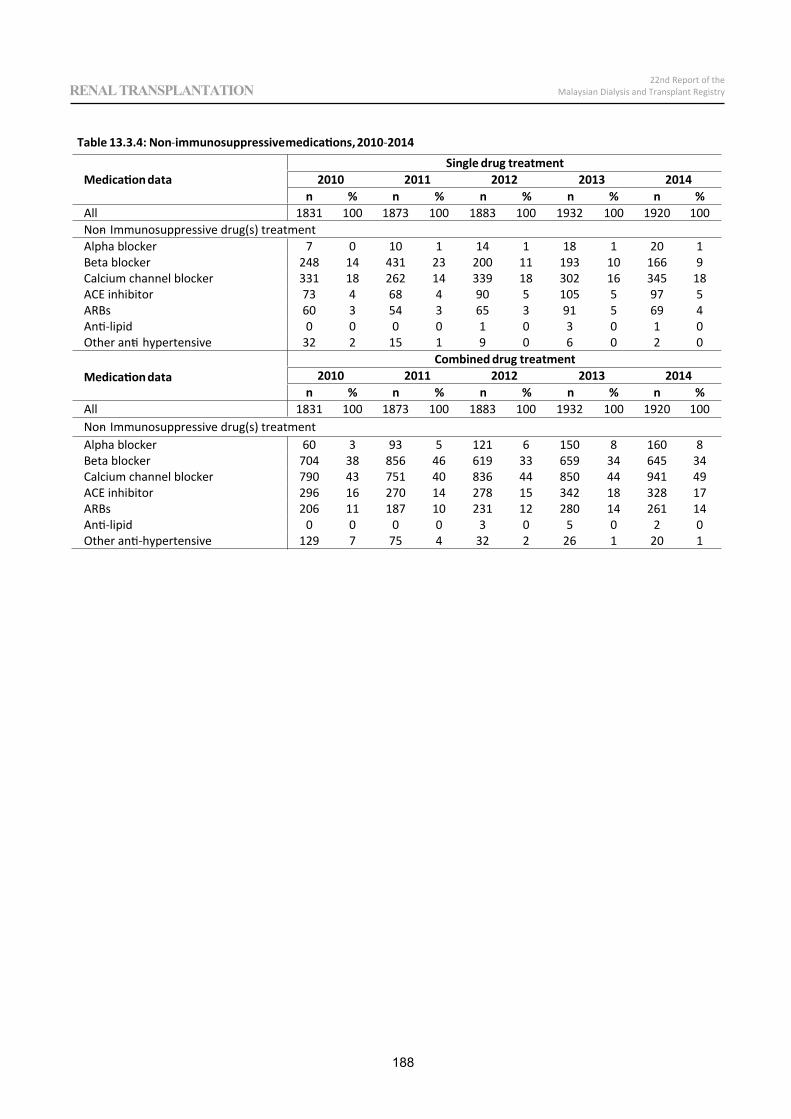
188
22nd Report of theMalaysian Dialysis and Transplant RegistryRENAL TRANSPLANTATION
Table 13.3.4: Non immunosuppressivemedications,2010 2014
Medication dataSingle drug treatment
2010 2011 2012 2013 2014n % n % n % n % n %
All 1831 100 1873 100 1883 100 1932 100 1920 100Non Immunosuppressive drug(s) treatmentAlpha blocker 7 0 10 1 14 1 18 1 20 1Beta blocker 248 14 431 23 200 11 193 10 166 9Calcium channel blocker 331 18 262 14 339 18 302 16 345 18ACE inhibitor 73 4 68 4 90 5 105 5 97 5ARBs 60 3 54 3 65 3 91 5 69 4Anti lipid 0 0 0 0 1 0 3 0 1 0Other anti hypertensive 32 2 15 1 9 0 6 0 2 0
Medication dataCombined drug treatment
2010 2011 2012 2013 2014n % n % n % n % n %
All 1831 100 1873 100 1883 100 1932 100 1920 100Non Immunosuppressive drug(s) treatmentAlpha blocker 60 3 93 5 121 6 150 8 160 8Beta blocker 704 38 856 46 619 33 659 34 645 34Calcium channel blocker 790 43 751 40 836 44 850 44 941 49ACE inhibitor 296 16 270 14 278 15 342 18 328 17ARBs 206 11 187 10 231 12 280 14 261 14Anti lipid 0 0 0 0 3 0 5 0 2 0Other anti hypertensive 129 7 75 4 32 2 26 1 20 1
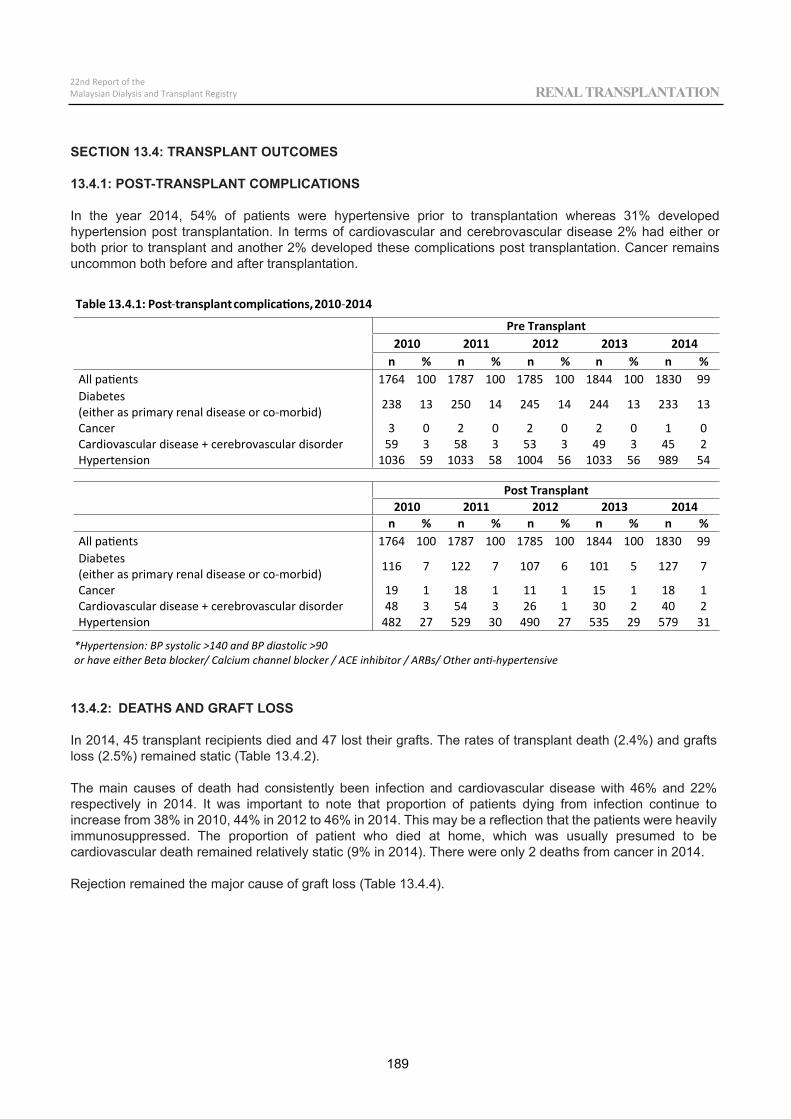
Table 13.4.1: Post transplantcomplications,2010 2014
Pre Transplant2010 2011 2012 2013 2014
n % n % n % n % n %All patients 1764 100 1787 100 1785 100 1844 100 1830 99Diabetes(either as primary renal disease or co morbid) 238 13 250 14 245 14 244 13 233 13
Cancer 3 0 2 0 2 0 2 0 1 0Cardiovascular disease + cerebrovascular disorder 59 3 58 3 53 3 49 3 45 2Hypertension 1036 59 1033 58 1004 56 1033 56 989 54
Post Transplant2010 2011 2012 2013 2014
n % n % n % n % n %All patients 1764 100 1787 100 1785 100 1844 100 1830 99Diabetes(either as primary renal disease or co morbid) 116 7 122 7 107 6 101 5 127 7
Cancer 19 1 18 1 11 1 15 1 18 1Cardiovascular disease + cerebrovascular disorder 48 3 54 3 26 1 30 2 40 2Hypertension 482 27 529 30 490 27 535 29 579 31
*Hypertension: BP systolic >140 and BP diastolic >90or have either Beta blocker/ Calcium channel blocker / ACE inhibitor / ARBs/ Other anti hypertensive
189
22nd Report of theMalaysian Dialysis and Transplant Registry RENAL TRANSPLANTATION
SECTION 13.4: TRANSPLANT OUTCOMES
13.4.1: POST-TRANSPLANT COMPLICATIONS
In the year 2014, 54% of patients were hypertensive prior to transplantation whereas 31% developed hypertension post transplantation. In terms of cardiovascular and cerebrovascular disease 2% had either or both prior to transplant and another 2% developed these complications post transplantation. Cancer remains uncommon both before and after transplantation.
13.4.2: DEATHS AND GRAFT LOSS
In 2014, 45 transplant recipients died and 47 lost their grafts. The rates of transplant death (2.4%) and grafts loss (2.5%) remained static (Table 13.4.2).
The main causes of death had consistently been infection and cardiovascular disease with 46% and 22% respectively in 2014. It was important to note that proportion of patients dying from infection continue to increase from 38% in 2010, 44% in 2012 to 46% in 2014. This may be a reflection that the patients were heavily immunosuppressed. The proportion of patient who died at home, which was usually presumed to be cardiovascular death remained relatively static (9% in 2014). There were only 2 deaths from cancer in 2014.
Rejection remained the major cause of graft loss (Table 13.4.4).
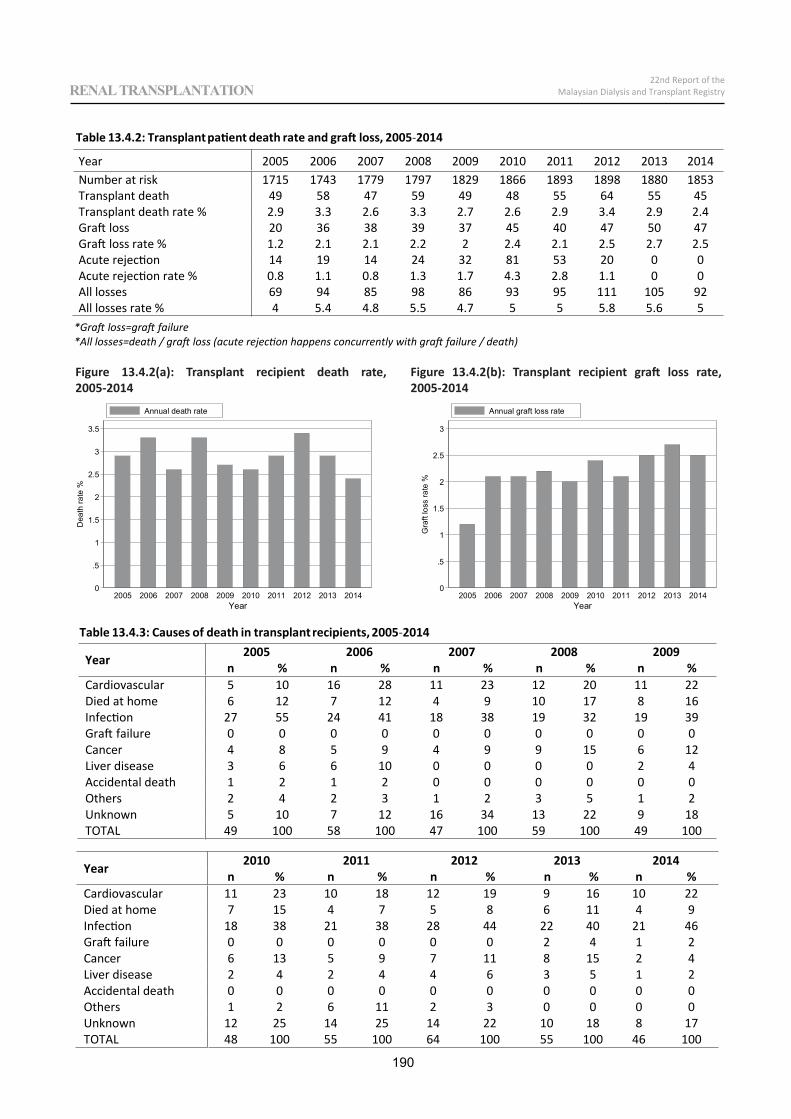
Table 13.4.2: Transplantpatient death rate and graft loss, 2005 2014
Year 2005 2006 2007 2008 2009 2010 2011 2012 2013 2014Number at risk 1715 1743 1779 1797 1829 1866 1893 1898 1880 1853Transplant death 49 58 47 59 49 48 55 64 55 45Transplant death rate % 2.9 3.3 2.6 3.3 2.7 2.6 2.9 3.4 2.9 2.4Graft loss 20 36 38 39 37 45 40 47 50 47Graft loss rate % 1.2 2.1 2.1 2.2 2 2.4 2.1 2.5 2.7 2.5Acute rejection 14 19 14 24 32 81 53 20 0 0Acute rejection rate % 0.8 1.1 0.8 1.3 1.7 4.3 2.8 1.1 0 0All losses 69 94 85 98 86 93 95 111 105 92All losses rate % 4 5.4 4.8 5.5 4.7 5 5 5.8 5.6 5
*Graft loss=graft failure*All losses=death / graft loss (acute rejection happens concurrently with graft failure / death)
0
.5
1
1.5
2
2.5
3
3.5
Dea
th ra
te %
2005 2006 2007 2008 2009 2010 2011 2012 2013 2014Year
Annual death rate
0
.5
1
1.5
2
2.5
3G
raft
loss
rate
%
2005 2006 2007 2008 2009 2010 2011 2012 2013 2014Year
Annual graft loss rate
Table 13.4.3: Causes of death in transplantrecipients, 2005 2014
Year 2005 2006 2007 2008 2009n % n % n % n % n %
Cardiovascular 5 10 16 28 11 23 12 20 11 22Died at home 6 12 7 12 4 9 10 17 8 16Infection 27 55 24 41 18 38 19 32 19 39Graft failure 0 0 0 0 0 0 0 0 0 0Cancer 4 8 5 9 4 9 9 15 6 12Liver disease 3 6 6 10 0 0 0 0 2 4Accidental death 1 2 1 2 0 0 0 0 0 0Others 2 4 2 3 1 2 3 5 1 2Unknown 5 10 7 12 16 34 13 22 9 18TOTAL 49 100 58 100 47 100 59 100 49 100
Year 2010 2011 2012 2013 2014n % n % n % n % n %
Cardiovascular 11 23 10 18 12 19 9 16 10 22Died at home 7 15 4 7 5 8 6 11 4 9Infection 18 38 21 38 28 44 22 40 21 46Graft failure 0 0 0 0 0 0 2 4 1 2Cancer 6 13 5 9 7 11 8 15 2 4Liver disease 2 4 2 4 4 6 3 5 1 2Accidental death 0 0 0 0 0 0 0 0 0 0Others 1 2 6 11 2 3 0 0 0 0Unknown 12 25 14 25 14 22 10 18 8 17TOTAL 48 100 55 100 64 100 55 100 46 100
190
22nd Report of theMalaysian Dialysis and Transplant RegistryRENAL TRANSPLANTATION
Figure 13.4.2(a): Transplant recipient death rate, 2005-2014
Figure 13.4.2(b): Transplant recipient graft loss rate, 2005-2014
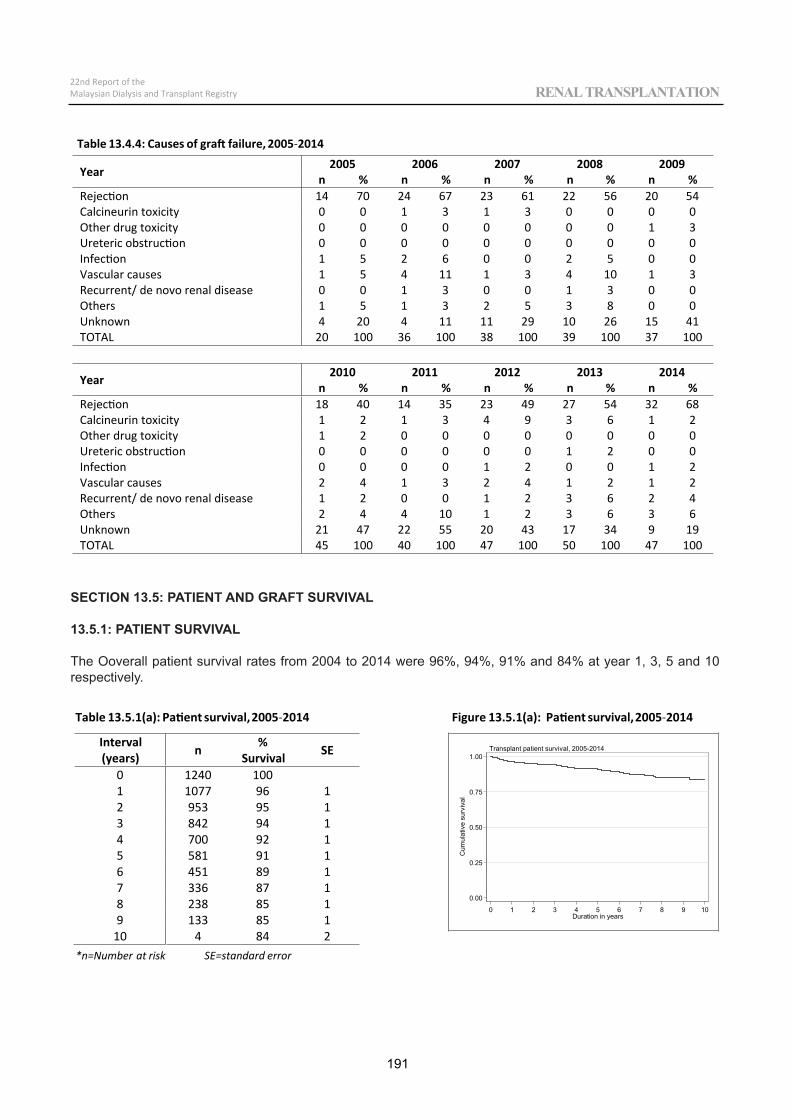
Table 13.4.4: Causes of graft failure, 2005 2014
Year 2005 2006 2007 2008 2009n % n % n % n % n %
Rejection 14 70 24 67 23 61 22 56 20 54Calcineurin toxicity 0 0 1 3 1 3 0 0 0 0Other drug toxicity 0 0 0 0 0 0 0 0 1 3Ureteric obstruction 0 0 0 0 0 0 0 0 0 0Infection 1 5 2 6 0 0 2 5 0 0Vascular causes 1 5 4 11 1 3 4 10 1 3Recurrent/ de novo renal disease 0 0 1 3 0 0 1 3 0 0Others 1 5 1 3 2 5 3 8 0 0Unknown 4 20 4 11 11 29 10 26 15 41TOTAL 20 100 36 100 38 100 39 100 37 100
Year 2010 2011 2012 2013 2014n % n % n % n % n %
Rejection 18 40 14 35 23 49 27 54 32 68Calcineurin toxicity 1 2 1 3 4 9 3 6 1 2Other drug toxicity 1 2 0 0 0 0 0 0 0 0Ureteric obstruction 0 0 0 0 0 0 1 2 0 0Infection 0 0 0 0 1 2 0 0 1 2Vascular causes 2 4 1 3 2 4 1 2 1 2Recurrent/ de novo renal disease 1 2 0 0 1 2 3 6 2 4Others 2 4 4 10 1 2 3 6 3 6Unknown 21 47 22 55 20 43 17 34 9 19TOTAL 45 100 40 100 47 100 50 100 47 100
191
22nd Report of theMalaysian Dialysis and Transplant Registry RENAL TRANSPLANTATION
Table 13.5.1(a):Patient survival,2005 2014
Interval(years) n %
Survival SE
0 1240 1001 1077 96 12 953 95 13 842 94 14 700 92 15 581 91 16 451 89 17 336 87 18 238 85 19 133 85 1
10 4 84 2*n=Number at risk SE=standard error
Figure 13.5.1(a): Patient survival,2005 2014
0.00
0.25
0.50
0.75
1.00
Cum
ulat
ive
surv
ival
0 1 2 3 4 5 6 7 8 9 10Duration in years
Transplant patient survival, 2005-2014
SECTION 13.5: PATIENT AND GRAFT SURVIVAL
13.5.1: PATIENT SURVIVAL
The Ooverall patient survival rates from 2004 to 2014 were 96%, 94%, 91% and 84% at year 1, 3, 5 and 10 respectively.
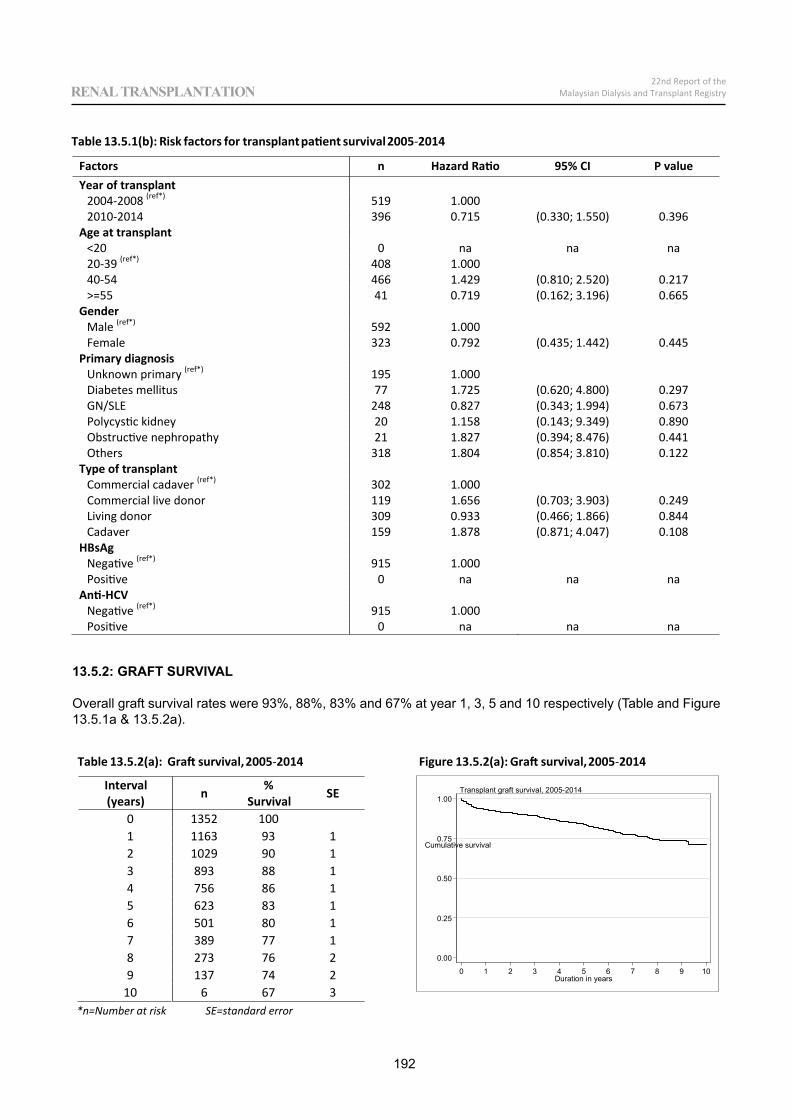
Table 13.5.1(b): Risk factors for transplantpatient survival2005 2014
Factors n Hazard Ratio 95% CI P valueYear of transplant
2004 2008 (ref*) 519 1.0002010 2014 396 0.715 (0.330; 1.550) 0.396
Age at transplant<20 0 na na na20 39 (ref*) 408 1.00040 54 466 1.429 (0.810; 2.520) 0.217>=55 41 0.719 (0.162; 3.196) 0.665
GenderMale (ref*) 592 1.000Female 323 0.792 (0.435; 1.442) 0.445
Primary diagnosisUnknown primary (ref*) 195 1.000Diabetes mellitus 77 1.725 (0.620; 4.800) 0.297GN/SLE 248 0.827 (0.343; 1.994) 0.673Polycystic kidney 20 1.158 (0.143; 9.349) 0.890Obstructive nephropathy 21 1.827 (0.394; 8.476) 0.441Others 318 1.804 (0.854; 3.810) 0.122
Type of transplantCommercial cadaver (ref*) 302 1.000Commercial live donor 119 1.656 (0.703; 3.903) 0.249Living donor 309 0.933 (0.466; 1.866) 0.844Cadaver 159 1.878 (0.871; 4.047) 0.108
HBsAgNegative (ref*) 915 1.000Positive 0 na na na
Anti HCVNegative (ref*) 915 1.000Positive 0 na na na
Table 13.5.2(a): Graft survival,2005 2014
Interval(years) n %
Survival SE
0 1352 1001 1163 93 12 1029 90 13 893 88 14 756 86 15 623 83 16 501 80 17 389 77 18 273 76 29 137 74 2
10 6 67 3*n=Number at risk SE=standard error
Figure 13.5.2(a): Graft survival,2005 2014
0.00
0.25
0.50
0.75
1.00
Cumulative survival
0 1 2 3 4 5 6 7 8 9 10Duration in years
Transplant graft survival, 2005-2014
13.5.2: GRAFT SURVIVAL
Overall graft survival rates were 93%, 88%, 83% and 67% at year 1, 3, 5 and 10 respectively (Table and Figure 13.5.1a & 13.5.2a).
192
22nd Report of theMalaysian Dialysis and Transplant RegistryRENAL TRANSPLANTATION
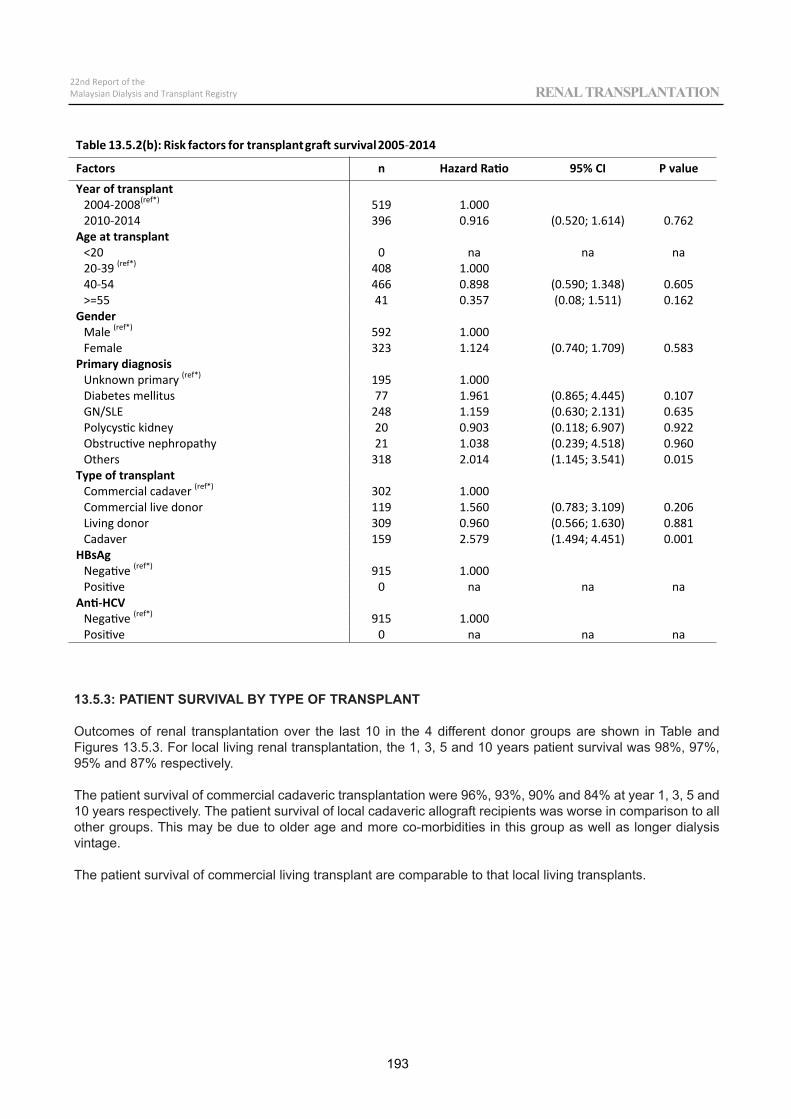
Table 13.5.2(b): Risk factors for transplantgraft survival2005 2014
Factors n Hazard Ratio 95% CI P valueYear of transplant
2004 2008(ref*) 519 1.0002010 2014 396 0.916 (0.520; 1.614) 0.762
Age at transplant<20 0 na na na20 39 (ref*) 408 1.00040 54 466 0.898 (0.590; 1.348) 0.605>=55 41 0.357 (0.08; 1.511) 0.162
GenderMale (ref*) 592 1.000Female 323 1.124 (0.740; 1.709) 0.583
Primary diagnosisUnknown primary (ref*) 195 1.000Diabetes mellitus 77 1.961 (0.865; 4.445) 0.107GN/SLE 248 1.159 (0.630; 2.131) 0.635Polycystic kidney 20 0.903 (0.118; 6.907) 0.922Obstructive nephropathy 21 1.038 (0.239; 4.518) 0.960Others 318 2.014 (1.145; 3.541) 0.015
Type of transplantCommercial cadaver (ref*) 302 1.000Commercial live donor 119 1.560 (0.783; 3.109) 0.206Living donor 309 0.960 (0.566; 1.630) 0.881Cadaver 159 2.579 (1.494; 4.451) 0.001
HBsAgNegative (ref*) 915 1.000Positive 0 na na na
Anti HCVNegative (ref*) 915 1.000Positive 0 na na na
13.5.3: PATIENT SURVIVAL BY TYPE OF TRANSPLANT
Outcomes of renal transplantation over the last 10 in the 4 different donor groups are shown in Table and Figures 13.5.3. For local living renal transplantation, the 1, 3, 5 and 10 years patient survival was 98%, 97%, 95% and 87% respectively.
The patient survival of commercial cadaveric transplantation were 96%, 93%, 90% and 84% at year 1, 3, 5 and 10 years respectively. The patient survival of local cadaveric allograft recipients was worse in comparison to all other groups. This may be due to older age and more co-morbidities in this group as well as longer dialysis vintage.
The patient survival of commercial living transplant are comparable to that local living transplants.
193
22nd Report of theMalaysian Dialysis and Transplant Registry RENAL TRANSPLANTATION
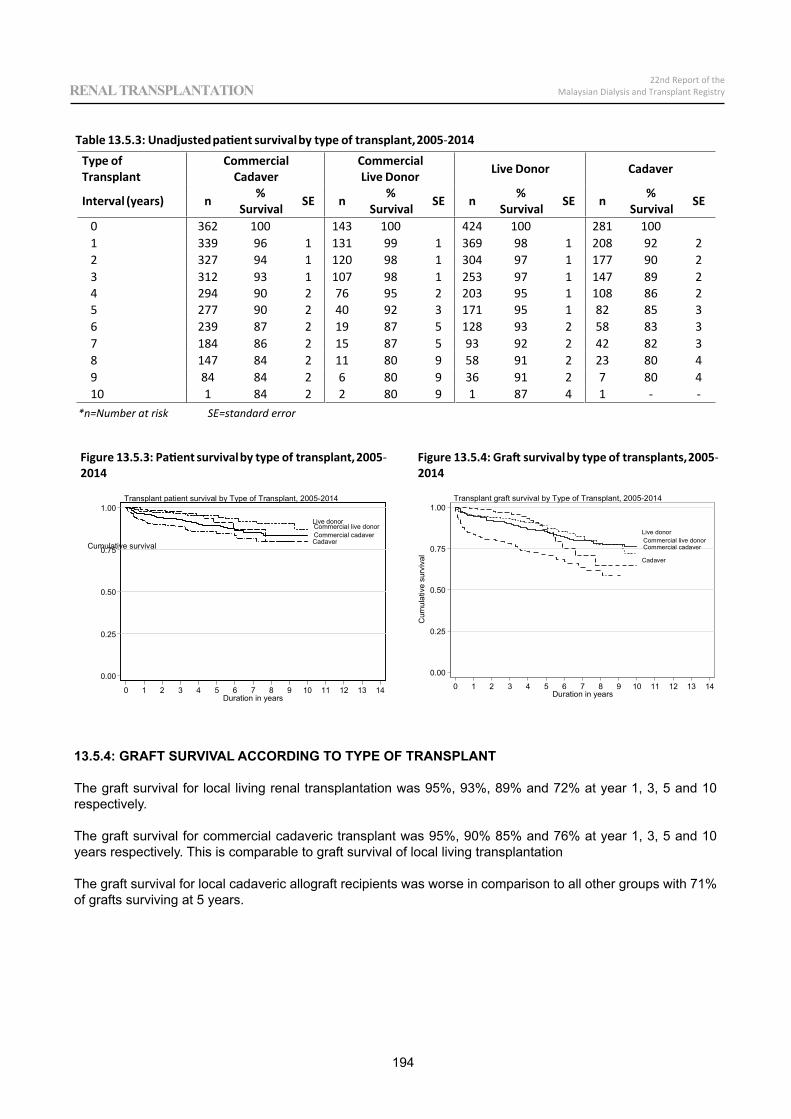
Table 13.5.3: Unadjustedpatient survivalby type of transplant,2005 2014Type ofTransplant
CommercialCadaver
CommercialLive Donor Live Donor Cadaver
Interval (years) n %Survival SE n %
Survival SE n %Survival SE n %
Survival SE
0 362 100 143 100 424 100 281 1001 339 96 1 131 99 1 369 98 1 208 92 22 327 94 1 120 98 1 304 97 1 177 90 23 312 93 1 107 98 1 253 97 1 147 89 24 294 90 2 76 95 2 203 95 1 108 86 25 277 90 2 40 92 3 171 95 1 82 85 36 239 87 2 19 87 5 128 93 2 58 83 37 184 86 2 15 87 5 93 92 2 42 82 38 147 84 2 11 80 9 58 91 2 23 80 49 84 84 2 6 80 9 36 91 2 7 80 410 1 84 2 2 80 9 1 87 4 1
*n=Number at risk SE=standard error
Figure 13.5.3: Patient survivalby type of transplant,20052014
Figure 13.5.4: Graft survivalby type of transplants,20052014
Commercial cadaverCommercial live donorLive donor
Cadaver
0.00
0.25
0.50
0.75
1.00
Cum
ulat
ive
surv
ival
0 1 2 3 4 5 6 7 8 9 10 11 12 13 14Duration in years
Transplant graft survival by Type of Transplant, 2005-2014
Commercial cadaverCommercial live donorLive donor
Cadaver
0.00
0.25
0.50
0.75
1.00
Cumulative survival
0 1 2 3 4 5 6 7 8 9 10 11 12 13 14Duration in years
Transplant patient survival by Type of Transplant, 2005-2014
13.5.4: GRAFT SURVIVAL ACCORDING TO TYPE OF TRANSPLANT
The graft survival for local living renal transplantation was 95%, 93%, 89% and 72% at year 1, 3, 5 and 10 respectively.
The graft survival for commercial cadaveric transplant was 95%, 90% 85% and 76% at year 1, 3, 5 and 10 years respectively. This is comparable to graft survival of local living transplantation
The graft survival for local cadaveric allograft recipients was worse in comparison to all other groups with 71% of grafts surviving at 5 years.
194
22nd Report of theMalaysian Dialysis and Transplant RegistryRENAL TRANSPLANTATION
R
22nd Report of theMalaysian Dialysis and Transplant Registry RENAL TRANSPLANTATION
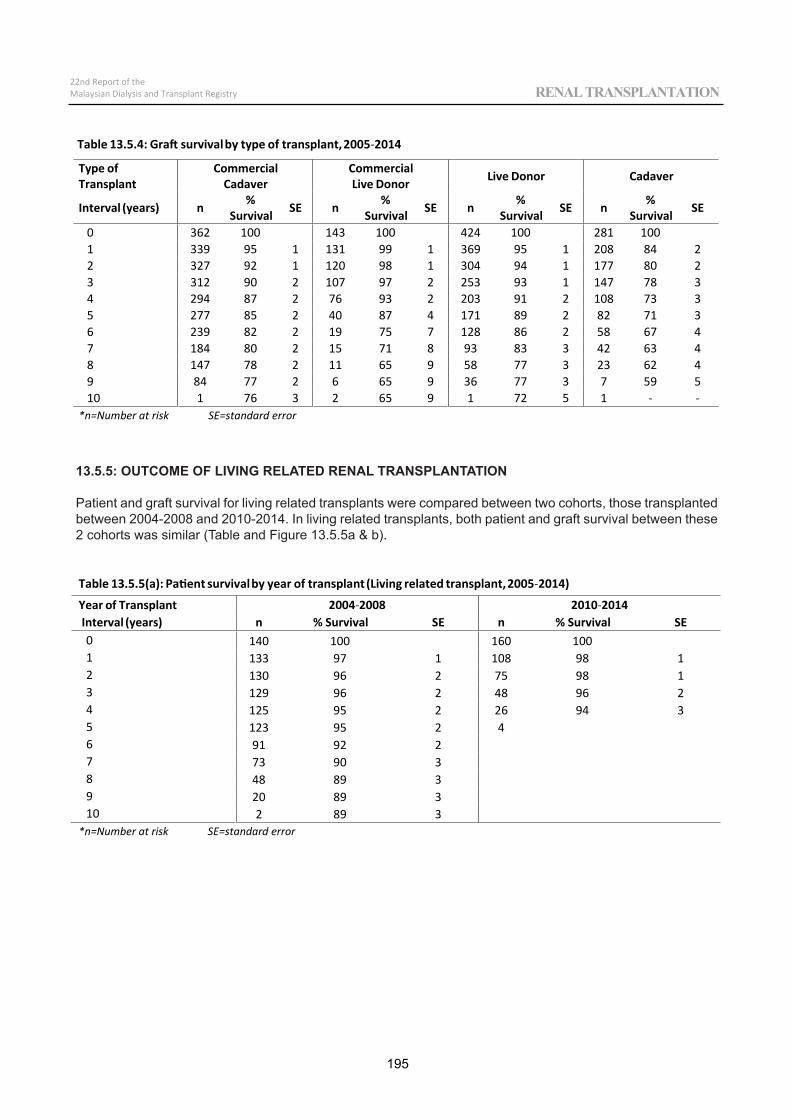
Table 13.5.4: Graft survivalby type of transplant,2005 2014
Type ofTransplant
CommercialCadaver
CommercialLive Donor Live Donor Cadaver
Interval (years) n %Survival SE n %
Survival SE n %Survival SE n %
Survival SE
0 362 100 143 100 424 100 281 1001 339 95 1 131 99 1 369 95 1 208 84 22 327 92 1 120 98 1 304 94 1 177 80 23 312 90 2 107 97 2 253 93 1 147 78 34 294 87 2 76 93 2 203 91 2 108 73 35 277 85 2 40 87 4 171 89 2 82 71 36 239 82 2 19 75 7 128 86 2 58 67 47 184 80 2 15 71 8 93 83 3 42 63 48 147 78 2 11 65 9 58 77 3 23 62 49 84 77 2 6 65 9 36 77 3 7 59 510 1 76 3 2 65 9 1 72 5 1
*n=Number at risk SE=standard error
Table 13.5.5(a):Patient survivalby year of transplant (Living related transplant,2005 2014)
Year of Transplant 2004 2008 2010 2014Interval (years) n % Survival SE n % Survival SE0 140 100 160 1001 133 97 1 108 98 12 130 96 2 75 98 13 129 96 2 48 96 24 125 95 2 26 94 35 123 95 2 46 91 92 27 73 90 38 48 89 39 20 89 310 2 89 3
*n=Number at risk SE=standard error
13.5.5: OUTCOME OF LIVING RELATED RENAL TRANSPLANTATION
Patient and graft survival for living related transplants were compared between two cohorts, those transplanted between 2004-2008 and 2010-2014. In living related transplants, both patient and graft survival between these 2 cohorts was similar (Table and Figure 13.5.5a & b).
195
22nd Report of theMalaysian Dialysis and Transplant Registry RENAL TRANSPLANTATION
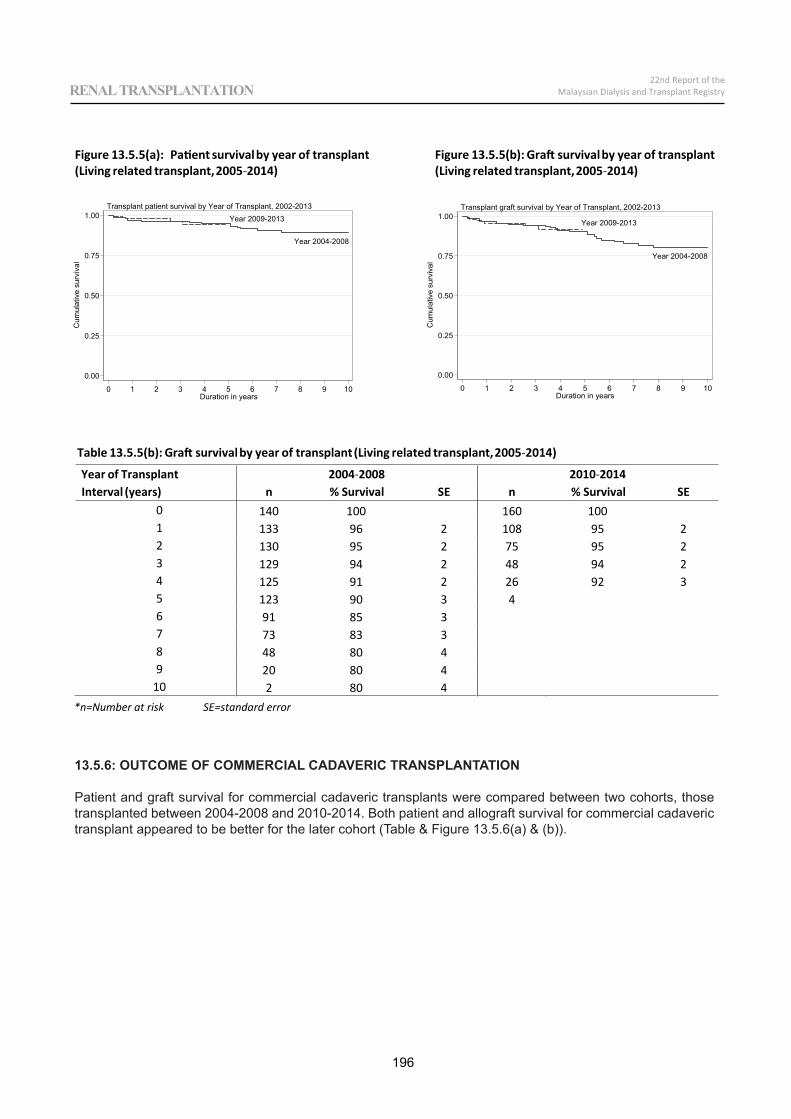
Figure 13.5.5(a): Patient survivalby year of transplant(Living related transplant,2005 2014)
Year 2009-2013
Year 2004-2008
0.00
0.25
0.50
0.75
1.00
Cum
ulat
ive
surv
ival
0 1 2 3 4 5 6 7 8 9 10Duration in years
Transplant patient survival by Year of Transplant, 2002-2013
Figure 13.5.5(b):Graft survivalby year of transplant(Living related transplant,2005 2014)
Year 2009-2013
Year 2004-2008
0.00
0.25
0.50
0.75
1.00
Cum
ulat
ive
surv
ival
0 1 2 3 4 5 6 7 8 9 10Duration in years
Transplant graft survival by Year of Transplant, 2002-2013
Table 13.5.5(b): Graft survivalby year of transplant(Living related transplant,2005 2014)
Year of Transplant 2004 2008 2010 2014Interval (years) n % Survival SE n % Survival SE
0 140 100 160 1001 133 96 2 108 95 22 130 95 2 75 95 23 129 94 2 48 94 24 125 91 2 26 92 35 123 90 3 46 91 85 37 73 83 38 48 80 49 20 80 4
10 2 80 4*n=Number at risk SE=standard error
13.5.6: OUTCOME OF COMMERCIAL CADAVERIC TRANSPLANTATION
Patient and graft survival for commercial cadaveric transplants were compared between two cohorts, those transplanted between 2004-2008 and 2010-2014. Both patient and allograft survival for commercial cadaveric transplant appeared to be better for the later cohort (Table & Figure 13.5.6(a) & (b)).
196
22nd Report of theMalaysian Dialysis and Transplant RegistryRENAL TRANSPLANTATION
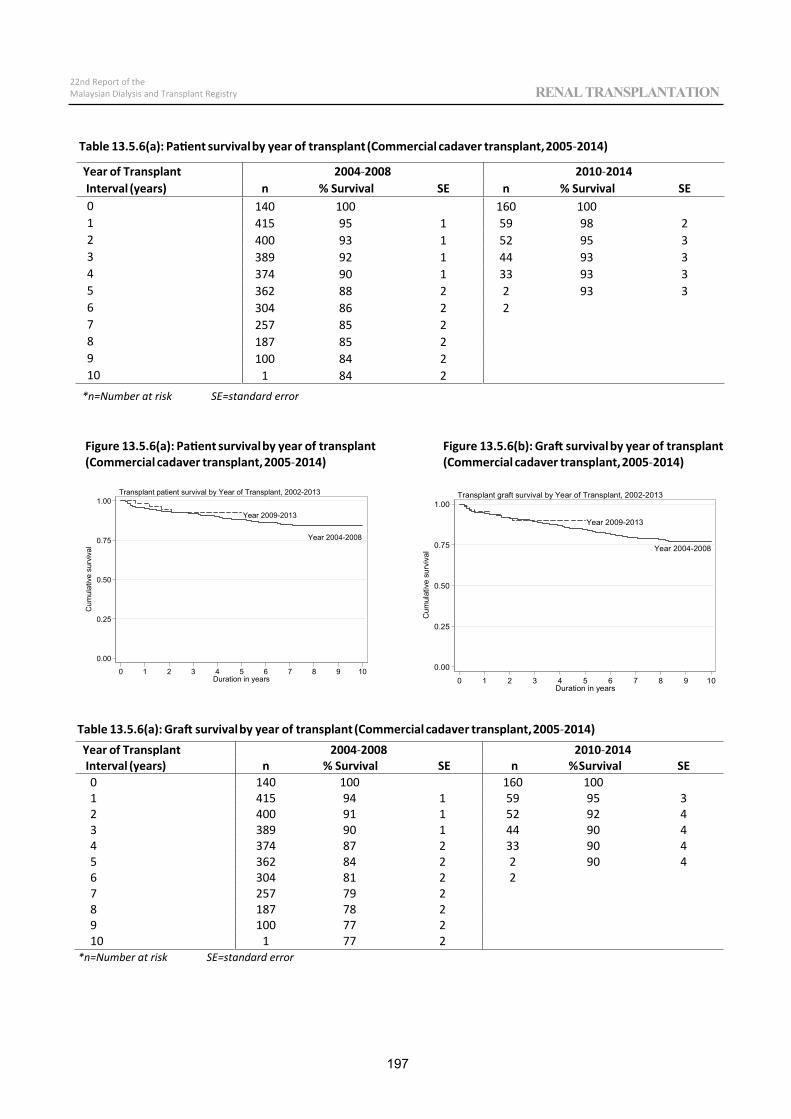
Table 13.5.6(a):Patient survivalby year of transplant (Commercial cadaver transplant,2005 2014)
Year of Transplant 2004 2008 2010 2014Interval (years) n % Survival SE n % Survival SE0 140 100 160 1001 415 95 1 59 98 22 400 93 1 52 95 33 389 92 1 44 93 34 374 90 1 33 93 35 362 88 2 2 93 36 304 86 2 27 257 85 28 187 85 29 100 84 210 1 84 2
*n=Number at risk SE=standard error
Figure 13.5.6(a):Patient survivalby year of transplant(Commercial cadaver transplant,2005 2014)
Year 2009-2013
Year 2004-2008
0.00
0.25
0.50
0.75
1.00
Cum
ulat
ive
surv
ival
0 1 2 3 4 5 6 7 8 9 10Duration in years
Transplant patient survival by Year of Transplant, 2002-2013
Figure 13.5.6(b):Graft survivalby year of transplant(Commercial cadaver transplant,2005 2014)
Year 2009-2013
Year 2004-2008
0.00
0.25
0.50
0.75
1.00
Cum
ulat
ive
surv
ival
0 1 2 3 4 5 6 7 8 9 10Duration in years
Transplant graft survival by Year of Transplant, 2002-2013
Table 13.5.6(a): Graft survivalby year of transplant (Commercial cadaver transplant,2005 2014)Year of Transplant 2004 01028002 2014Interval (years) n % Survival SE n %Survival SE0 140 0010610011 415 94 1 59 95 32 400 91 1 52 92 43 389 90 1 44 90 44 374 87 2 33 90 45 362 84 2 2 90 46 304 81 2 27 257 79 28 187 78 29 100 77 210 1 77 2
*n=Number at risk SE=standard error
197
22nd Report of theMalaysian Dialysis and Transplant Registry RENAL TRANSPLANTATION
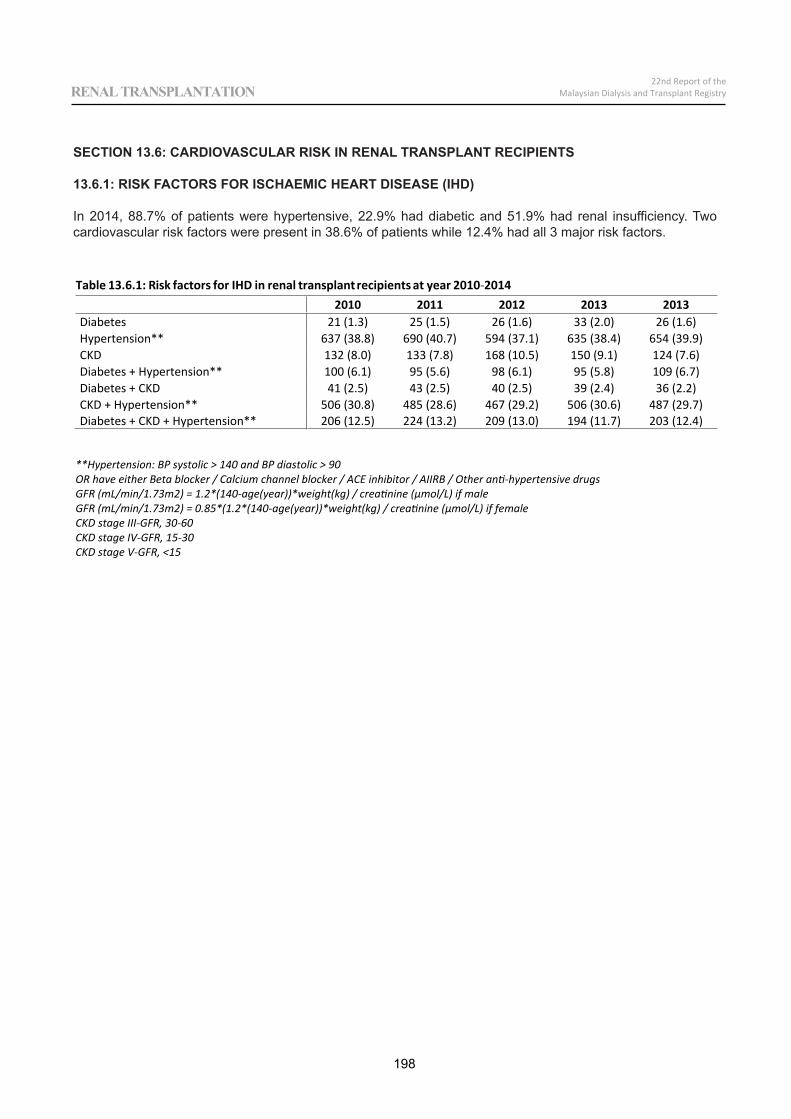
Table 13.6.1: Risk factors for IHD in renal transplantrecipients at year 2010 20142010 2011 2012 2013 2013
Diabetes 21 (1.3) 25 (1.5) 26 (1.6) 33 (2.0) 26 (1.6)Hypertension** 637 (38.8) 690 (40.7) 594 (37.1) 635 (38.4) 654 (39.9)CKD 132 (8.0) 133 (7.8) 168 (10.5) 150 (9.1) 124 (7.6)Diabetes + Hypertension** 100 (6.1) 95 (5.6) 98 (6.1) 95 (5.8) 109 (6.7)Diabetes + CKD 41 (2.5) 43 (2.5) 40 (2.5) 39 (2.4) 36 (2.2)CKD + Hypertension** 506 (30.8) 485 (28.6) 467 (29.2) 506 (30.6) 487 (29.7)Diabetes + CKD + Hypertension** 206 (12.5) 224 (13.2) 209 (13.0) 194 (11.7) 203 (12.4)
**Hypertension: BP systolic > 140 and BP diastolic > 90OR have either Beta blocker / Calcium channel blocker / ACE inhibitor / AIIRB / Other anti hypertensive drugsGFR (mL/min/1.73m2) = 1.2*(140 age(year))*weight(kg) / creatinine (µmol/L) if maleGFR (mL/min/1.73m2) = 0.85*(1.2*(140 age(year))*weight(kg) / creatinine (µmol/L) if femaleCKD stage III GFR, 30 60CKD stage IV GFR, 15 30CKD stage V GFR, <15
SECTION 13.6: CARDIOVASCULAR RISK IN RENAL TRANSPLANT RECIPIENTS 13.6.1: RISK FACTORS FOR ISCHAEMIC HEART DISEASE (IHD)
In 2014, 88.7% of patients were hypertensive, 22.9% had diabetic and 51.9% had renal insufficiency. Two cardiovascular risk factors were present in 38.6% of patients while 12.4% had all 3 major risk factors.
198
22nd Report of theMalaysian Dialysis and Transplant RegistryRENAL TRANSPLANTATION
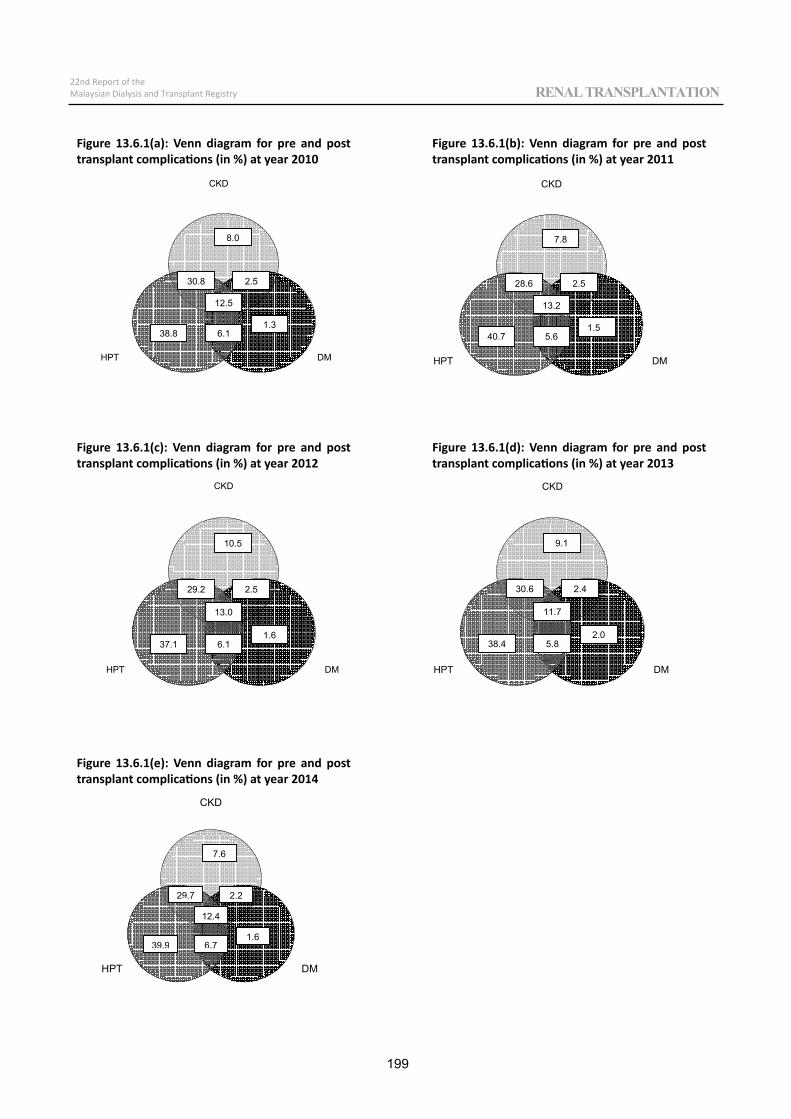
CKD
DMHPT
7.6
1.6 39.9
2.2 29.7
6.7
12.4
CKD
DMHPT
9.1
2.0 38.4
2.4 30.6
5.8
11.7
CKD
DM HPT
7.8
1.5 40.7
2.5 28.6
5.6
13.2
CKD
DMHPT
8.0
1.3 38.8
2.5 30.8
6.1
12.5
CKD
DMHPT
10.5
1.6 37.1
2.5 29.2
6.1
13.0
Figure 13.6.1(a): Venn diagram for pre and post transplant complications (in %) at year 2010
Figure 13.6.1(b): Venn diagram for pre and post transplant complications (in %) at year 2011
Figure 13.6.1(c): Venn diagram for pre and post transplant complications (in %) at year 2012
Figure 13.6.1(e): Venn diagram for pre and post transplant complications (in %) at year 2014
Figure 13.6.1(d): Venn diagram for pre and post transplant complications (in %) at year 2013
199
22nd Report of theMalaysian Dialysis and Transplant Registry RENAL TRANSPLANTATION
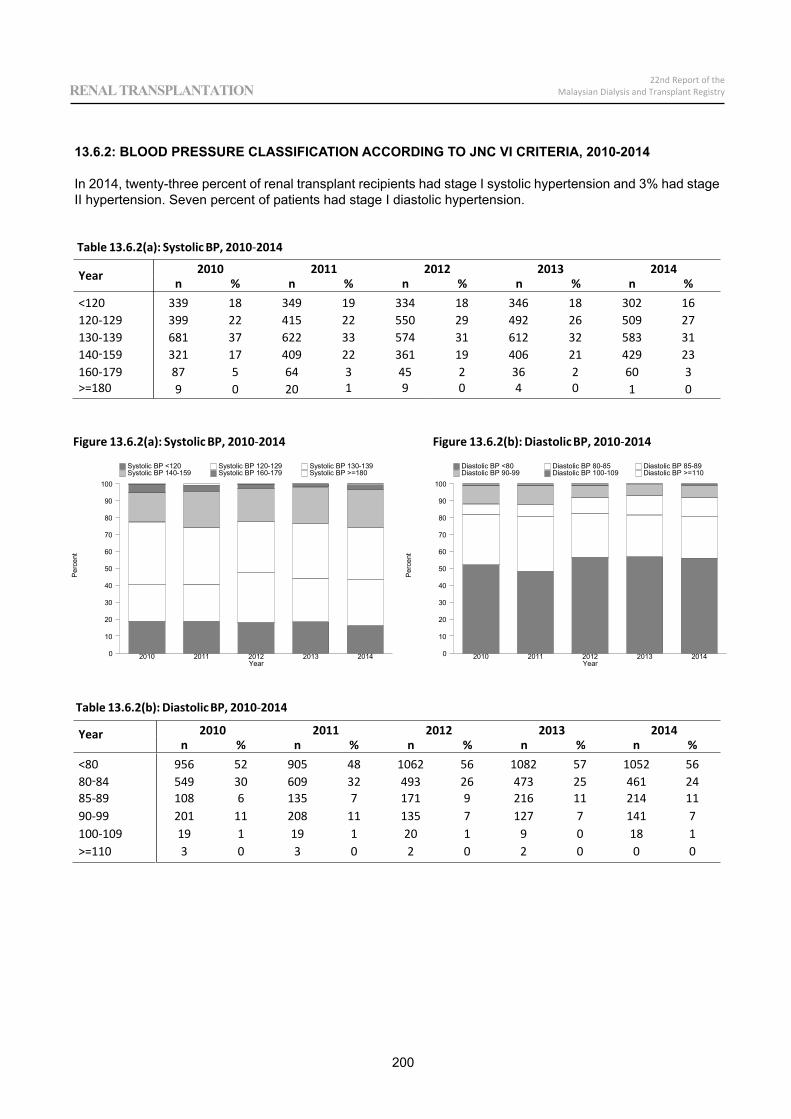
Table 13.6.2(a): Systolic BP, 2010 2014
Year 2010 2011 2012 2013 2014n % n % n % n % n %
<120 339 18 349 19 334 18 346 18 302 16120 129 399 22 415 22 550 29 492 26 509 27130 139 681 37 622 33 574 31 612 32 583 31140 159 321 17 409 22 361 19 406 21 429 23160 179 87 5 64 3 45 2 36 2 60 3>=180 9 0 20 1 9 0 4 0 1 0
Figure 13.6.2(a): Systolic BP, 2010 2014
Per
cent
Year0
10
20
30
40
50
60
70
80
90
100
Systolic BP <120 Systolic BP 120-129 Systolic BP 130-139 Systolic BP 140-159 Systolic BP 160-179 Systolic BP >=180
2010 2011 2012 2013 2014
Figure 13.6.2(b): Diastolic BP, 2010 2014
Per
cent
Year0
10
20
30
40
50
60
70
80
90
100
Diastolic BP <80 Diastolic BP 80-85 Diastolic BP 85-89 Diastolic BP 90-99 Diastolic BP 100-109 Diastolic BP >=110
2010 2011 2012 2013 2014
Table 13.6.2(b): Diastolic BP, 2010 2014
Year 2010 2011 2012 2013 2014n % n % n % n % n %
<80 956 52 905 48 1062 56 1082 57 1052 5680 84 549 30 609 32 493 26 473 25 461 2485 89 108 6 135 7 171 9 216 11 214 1190 99 201 11 208 11 135 7 127 7 141 7100 109 19 1 19 1 20 1 9 0 18 1>=110 3 0 3 0 2 0 2 0 0 0
13.6.2: BLOOD PRESSURE CLASSIFICATION ACCORDING TO JNC VI CRITERIA, 2010-2014
In 2014, twenty-three percent of renal transplant recipients had stage I systolic hypertension and 3% had stage II hypertension. Seven percent of patients had stage I diastolic hypertension.
200
22nd Report of theMalaysian Dialysis and Transplant RegistryRENAL TRANSPLANTATION
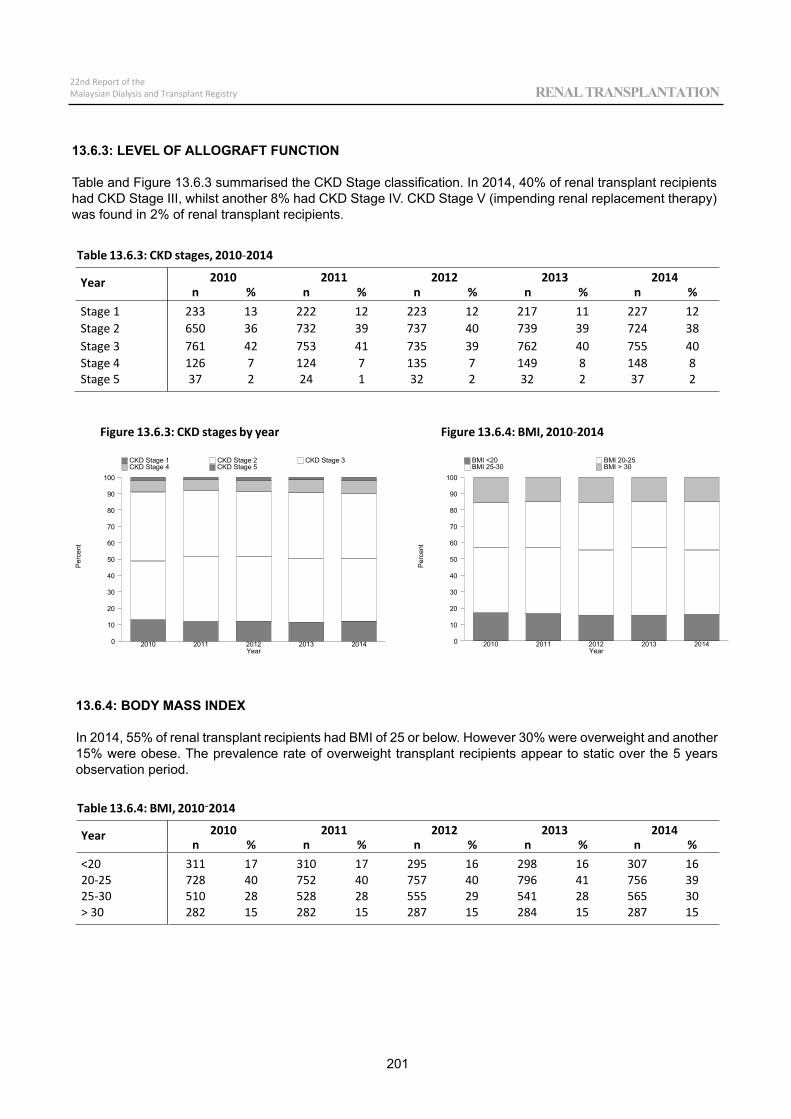
Table 13.6.3: CKD stages, 2010 2014
Year 2010 2011 2012 2013 2014n % n % n % n % n %
Stage 1 233 13 222 12 223 12 217 11 227 12Stage 2 650 36 732 39 737 40 739 39 724 38Stage 3 761 42 753 41 735 39 762 40 755 40Stage 4 126 7 124 7 135 7 149 8 148 8Stage 5 37 2 24 1 32 2 32 2 37 2
Figure 13.6.3: CKD stages by year
Per
cent
Year0
10
20
30
40
50
60
70
80
90
100
CKD Stage 1 CKD Stage 2 CKD Stage 3 CKD Stage 4 CKD Stage 5
2010 2011 2012 2013 2014
Figure 13.6.4: BMI, 2010 2014P
erce
nt
Year0
10
20
30
40
50
60
70
80
90
100
BMI <20 BMI 20-25 BMI 25-30 BMI > 30
2010 2011 2012 2013 2014
Table 13.6.4: BMI, 2010 2014
Year 2010 2011 2012 2013 2014n % n % n % n % n %
<20 311 17 310 17 295 16 298 16 307 1620 25 728 40 752 40 757 40 796 41 756 3925 30 510 28 528 28 555 29 541 28 565 30> 30 282 15 282 15 287 15 284 15 287 15
13.6.3: LEVEL OF ALLOGRAFT FUNCTION
Table and Figure 13.6.3 summarised the CKD Stage classification. In 2014, 40% of renal transplant recipients had CKD Stage III, whilst another 8% had CKD Stage IV. CKD Stage V (impending renal replacement therapy) was found in 2% of renal transplant recipients.
13.6.4: BODY MASS INDEX
In 2014, 55% of renal transplant recipients had BMI of 25 or below. However 30% were overweight and another 15% were obese. The prevalence rate of overweight transplant recipients appear to static over the 5 years observation period.
201
22nd Report of theMalaysian Dialysis and Transplant Registry RENAL TRANSPLANTATION
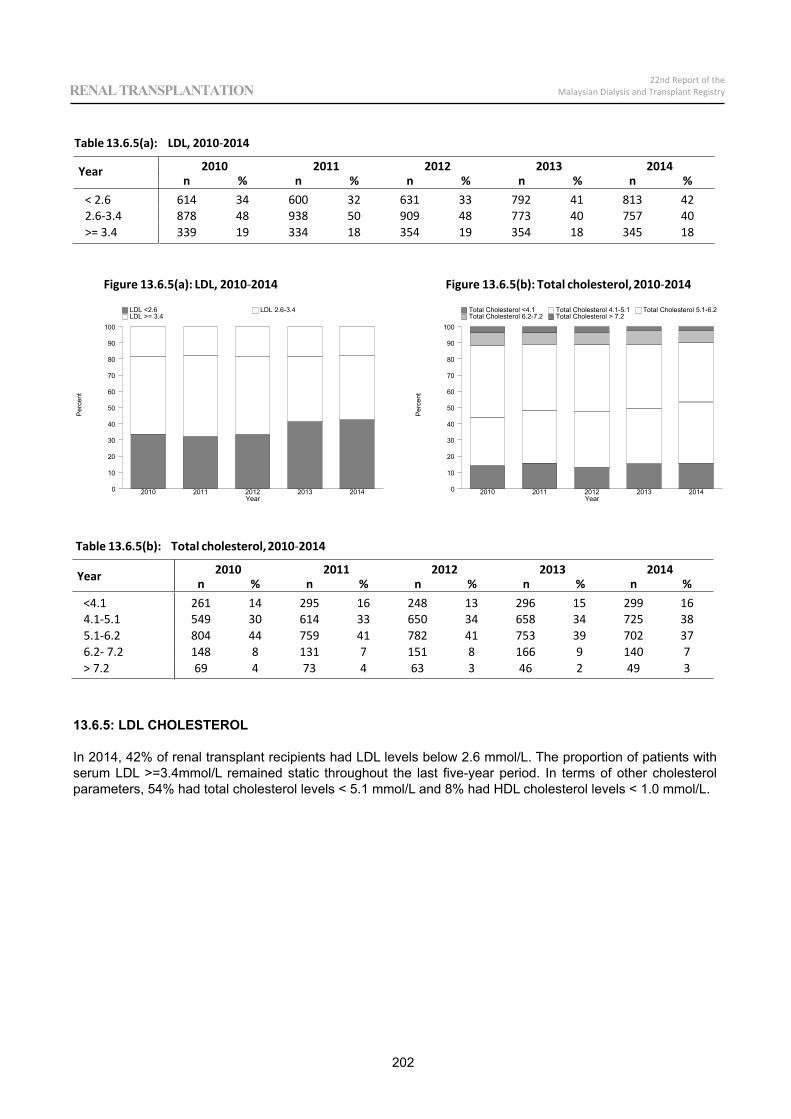
Table 13.6.5(a): LDL, 2010 2014
Year 2010 2011 2012 2013 2014n % n % n % n % n %
< 2.6 614 34 600 32 631 33 792 41 813 422.6 3.4 878 48 938 50 909 48 773 40 757 40>= 3.4 339 19 334 18 354 19 354 18 345 18
Figure 13.6.5(a): LDL, 2010 2014
Per
cent
Year0
10
20
30
40
50
60
70
80
90
100
LDL <2.6 LDL 2.6-3.4 LDL >= 3.4
2010 2011 2012 2013 2014
Figure 13.6.5(b): Total cholesterol, 2010 2014
Per
cent
Year0
10
20
30
40
50
60
70
80
90
100
Total Cholesterol <4.1 Total Cholesterol 4.1-5.1 Total Cholesterol 5.1-6.2 Total Cholesterol 6.2-7.2 Total Cholesterol > 7.2
2010 2011 2012 2013 2014
Table 13.6.5(b): Total cholesterol,2010 2014
Year 2010 2011 2012 2013 2014n % n % n % n % n %
<4.1 261 14 295 16 248 13 296 15 299 164.1 5.1 549 30 614 33 650 34 658 34 725 385.1 6.2 804 44 759 41 782 41 753 39 702 376.2 7.2 148 8 131 7 151 8 166 9 140 7> 7.2 69 4 73 4 63 3 46 2 49 3
13.6.5: LDL CHOLESTEROL
In 2014, 42% of renal transplant recipients had LDL levels below 2.6 mmol/L. The proportion of patients with serum LDL >=3.4mmol/L remained static throughout the last five-year period. In terms of other cholesterol parameters, 54% had total cholesterol levels < 5.1 mmol/L and 8% had HDL cholesterol levels < 1.0 mmol/L.
202
22nd Report of theMalaysian Dialysis and Transplant RegistryRENAL TRANSPLANTATION
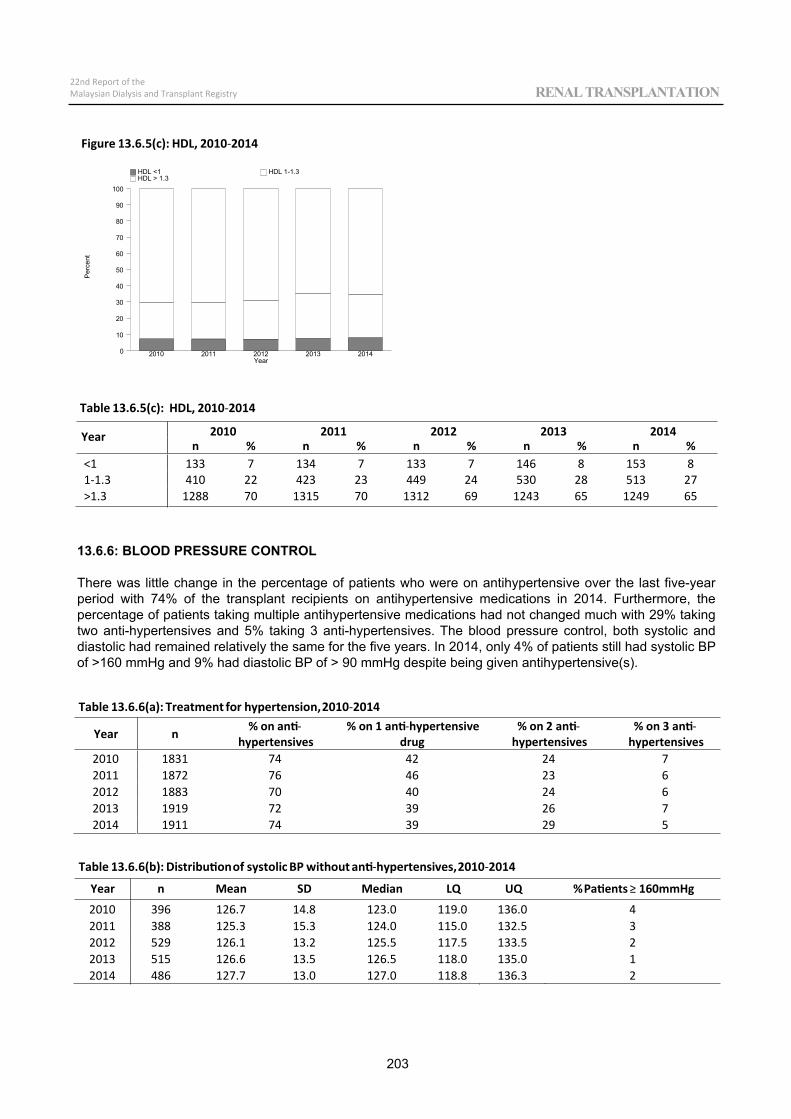
Figure 13.6.5(c): HDL, 2010 2014
Per
cent
Year0
10
20
30
40
50
60
70
80
90
100
HDL <1 HDL 1-1.3 HDL > 1.3
2010 2011 2012 2013 2014
Table 13.6.5(c): HDL, 2010 2014
Year 2010 2011 2012 2013 2014n % n % n % n % n %
<1 133 7 134 7 133 7 146 8 153 81 1.3 410 22 423 23 449 24 530 28 513 27>1.3 1288 70 1315 70 1312 69 1243 65 1249 65
Table 13.6.6(a): Treatment for hypertension,2010 2014
Year n % on antihypertensives
% on 1 anti hypertensivedrug
% on 2 antihypertensives
% on 3 antihypertensives
2010 1831 74 42 24 72011 1872 76 46 23 62012 1883 70 40 24 62013 1919 72 39 26 72014 1911 74 39 29 5
Table 13.6.6(b): Distributionof systolic BP without anti hypertensives,2010 2014
Year n Mean SD Median LQ UQ %Patients 160mmHg
2010 396 126.7 14.8 123.0 119.0 136.0 42011 388 125.3 15.3 124.0 115.0 132.5 32012 529 126.1 13.2 125.5 117.5 133.5 22013 515 126.6 13.5 126.5 118.0 135.0 12014 486 127.7 13.0 127.0 118.8 136.3 2
13.6.6: BLOOD PRESSURE CONTROL
There was little change in the percentage of patients who were on antihypertensive over the last five-year period with 74% of the transplant recipients on antihypertensive medications in 2014. Furthermore, the percentage of patients taking multiple antihypertensive medications had not changed much with 29% taking two anti-hypertensives and 5% taking 3 anti-hypertensives. The blood pressure control, both systolic and diastolic had remained relatively the same for the five years. In 2014, only 4% of patients still had systolic BP of >160 mmHg and 9% had diastolic BP of > 90 mmHg despite being given antihypertensive(s).
203
22nd Report of theMalaysian Dialysis and Transplant Registry RENAL TRANSPLANTATION
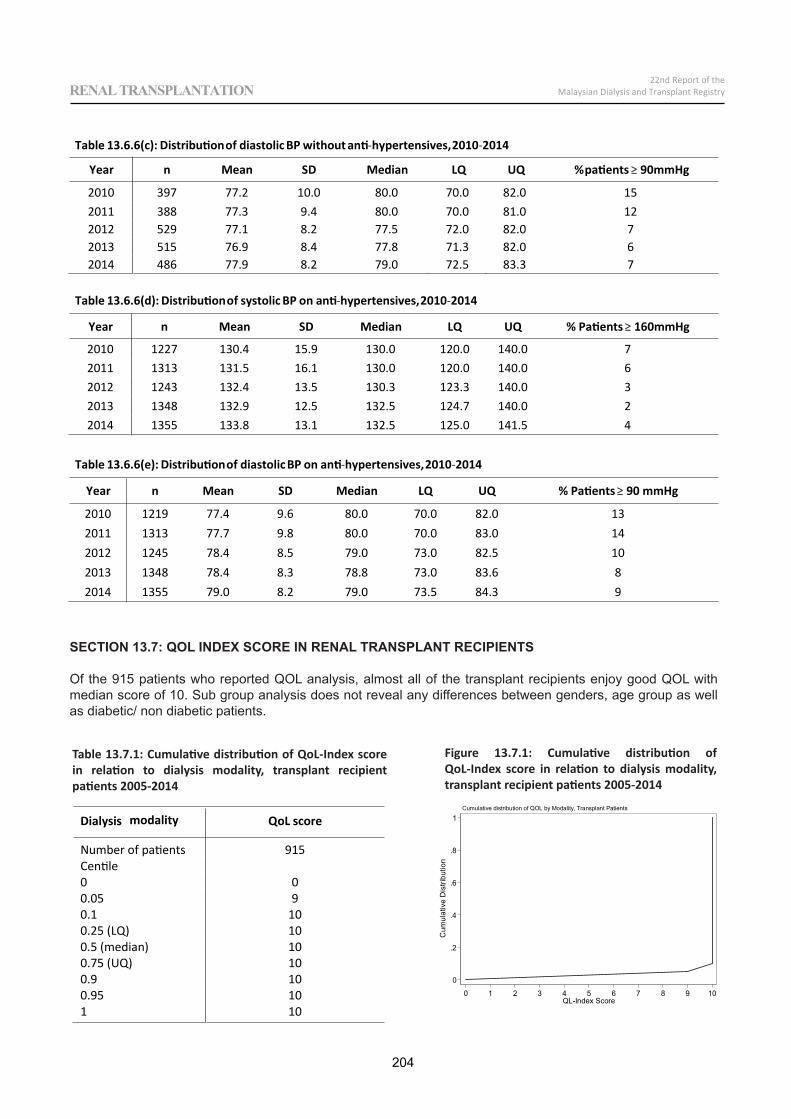
Table 13.6.6(c): Distributionof diastolic BP without anti hypertensives,2010 2014
Year n Mean SD Median LQ UQ %patients 90mmHg
2010 397 77.2 10.0 80.0 70.0 82.0 152011 388 77.3 9.4 80.0 70.0 81.0 122012 529 77.1 8.2 77.5 72.0 82.0 72013 515 76.9 8.4 77.8 71.3 82.0 62014 486 77.9 8.2 79.0 72.5 83.3 7
Table 13.6.6(d): Distributionof systolic BP on anti hypertensives,2010 2014
Year n Mean SD Median LQ UQ % Patients 160mmHg
2010 1227 130.4 15.9 130.0 120.0 140.0 72011 1313 131.5 16.1 130.0 120.0 140.0 62012 1243 132.4 13.5 130.3 123.3 140.0 32013 1348 132.9 12.5 132.5 124.7 140.0 22014 1355 133.8 13.1 132.5 125.0 141.5 4
Table 13.6.6(e): Distributionof diastolic BP on anti hypertensives,2010 2014
Year n Mean SD Median LQ UQ % Patients 90 mmHg
2010 1219 77.4 9.6 80.0 70.0 82.0 132011 1313 77.7 9.8 80.0 70.0 83.0 142012 1245 78.4 8.5 79.0 73.0 82.5 102013 1348 78.4 8.3 78.8 73.0 83.6 82014 1355 79.0 8.2 79.0 73.5 84.3 9
Dialysis modality QoL score
Number of patients 915Centile0 00.05 90.1 100.25 (LQ) 100.5 (median) 100.75 (UQ) 100.9 100.95 101 10
0
.2
.4
.6
.8
1
Cum
ulat
ive
Dis
tribu
tion
0 1 2 3 4 5 6 7 8 9 10QL-Index Score
Cumulative distribution of QOL by Modality, Transplant Patients
Figure 13.7.1: Cumulative distribution of QoL-Index score in relation to dialysis modality, transplant recipient patients 2005-2014
Table 13.7.1: Cumulative distribution of QoL-Index score in relation to dialysis modality, transplant recipient patients 2005-2014
SECTION 13.7: QOL INDEX SCORE IN RENAL TRANSPLANT RECIPIENTS
Of the 915 patients who reported QOL analysis, almost all of the transplant recipients enjoy good QOL with median score of 10. Sub group analysis does not reveal any differences between genders, age group as well as diabetic/ non diabetic patients.
204
22nd Report of theMalaysian Dialysis and Transplant RegistryRENAL TRANSPLANTATION
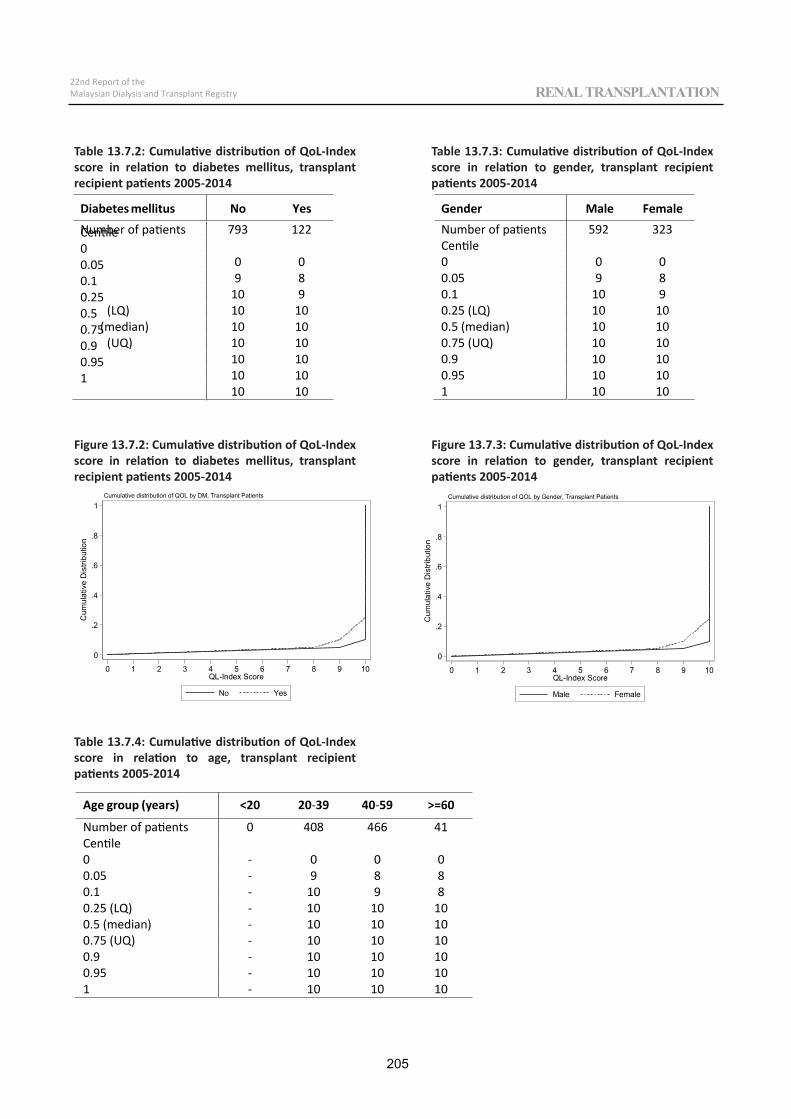
Diabetes mellitus No YesNumber of patients 793 122Centile0
0 00.059 80.1
10 90.25(LQ) 10 100.5
(median) 10 100.75(UQ) 10 100.9
10 100.9510 10110 10
0
.2
.4
.6
.8
1
Cum
ulat
ive
Dis
tribu
tion
0 1 2 3 4 5 6 7 8 9 10QL-Index Score
No Yes
Cumulative distribution of QOL by DM, Transplant Patients
Gender Male FemaleNumber of patients 592 323Centile
00 00.05 9 8
011.0 90.25 (LQ) 10 100.5 (median) 10 100.75 (UQ) 10 10
019.0 100.95 10 10
011 10
0
.2
.4
.6
.8
1
Cum
ulat
ive
Dis
tribu
tion
0 1 2 3 4 5 6 7 8 9 10QL-Index Score
Male Female
Cumulative distribution of QOL by Gender, Transplant Patients
Age group (years) <20 20 39 40 59 >=60
Number of patients 0 408 466 41Centile0 0 0 00.05 9 8 80.1 10 9 80.25 (LQ) 10 10 100.5 (median) 10 10 100.75 (UQ) 10 10 100.9 10 10 100.95 10 10 101 10 10 10
Table 13.7.2: Cumulative distribution of QoL-Index score in relation to diabetes mellitus, transplant recipient patients 2005-2014
Table 13.7.3: Cumulative distribution of QoL-Index score in relation to gender, transplant recipient patients 2005-2014
Figure 13.7.2: Cumulative distribution of QoL-Index score in relation to diabetes mellitus, transplant recipient patients 2005-2014
Table 13.7.4: Cumulative distribution of QoL-Index score in relation to age, transplant recipient patients 2005-2014
Figure 13.7.3: Cumulative distribution of QoL-Index score in relation to gender, transplant recipient patients 2005-2014
205
22nd Report of theMalaysian Dialysis and Transplant Registry RENAL TRANSPLANTATION
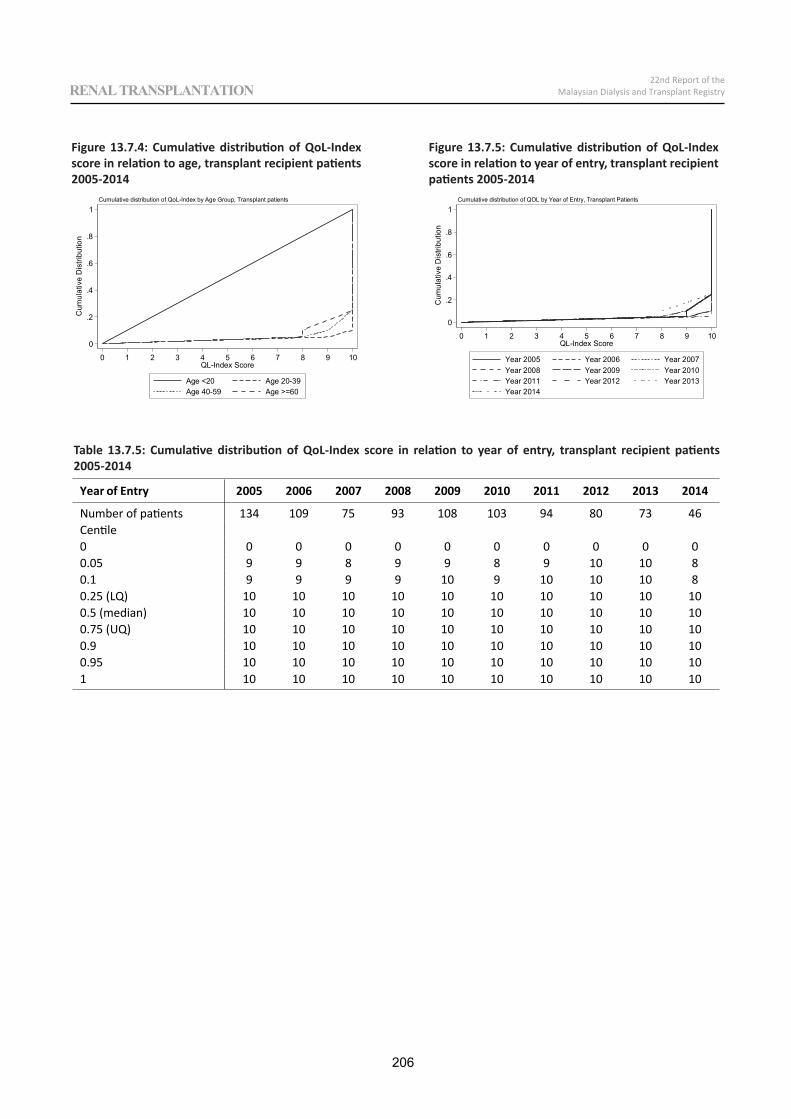
0
.2
.4
.6
.8
1
Cum
ulat
ive
Dis
tribu
tion
0 1 2 3 4 5 6 7 8 9 10QL-Index Score
Age <20 Age 20-39Age 40-59 Age >=60
Cumulative distribution of QoL-Index by Age Group, Transplant patients
0
.2
.4
.6
.8
1
Cum
ulat
ive
Dis
tribu
tion
0 1 2 3 4 5 6 7 8 9 10QL-Index Score
Year 2005 Year 2006 Year 2007Year 2008 Year 2009 Year 2010Year 2011 Year 2012 Year 2013Year 2014
Cumulative distribution of QOL by Year of Entry, Transplant Patients
Year of Entry 2005 2006 2007 2008 2009 2010 2011 2012 2013 2014
Number of patients 134 109 75 93 108 103 94 80 73 46Centile0 0 0 0 0 0 0 0 0 0 00.05 9 9 8 9 9 8 9 10 10 80.1 9 9 9 9 10 9 10 10 10 80.25 (LQ) 10 10 10 10 10 10 10 10 10 100.5 (median) 10 10 10 10 10 10 10 10 10 100.75 (UQ) 10 10 10 10 10 10 10 10 10 100.9 10 10 10 10 10 10 10 10 10 100.95 10 10 10 10 10 10 10 10 10 101 10 10 10 10 10 10 10 10 10 10
Figure 13.7.4: Cumulative distribution of QoL-Index score in relation to age, transplant recipient patients 2005-2014
Figure 13.7.5: Cumulative distribution of QoL-Index score in relation to year of entry, transplant recipient patients 2005-2014
Table 13.7.5: Cumulative distribution of QoL-Index score in relation to year of entry, transplant recipient patients 2005-2014
206
22nd Report of theMalaysian Dialysis and Transplant RegistryRENAL TRANSPLANTATION
Appendix I
DATA MANAGEMENT
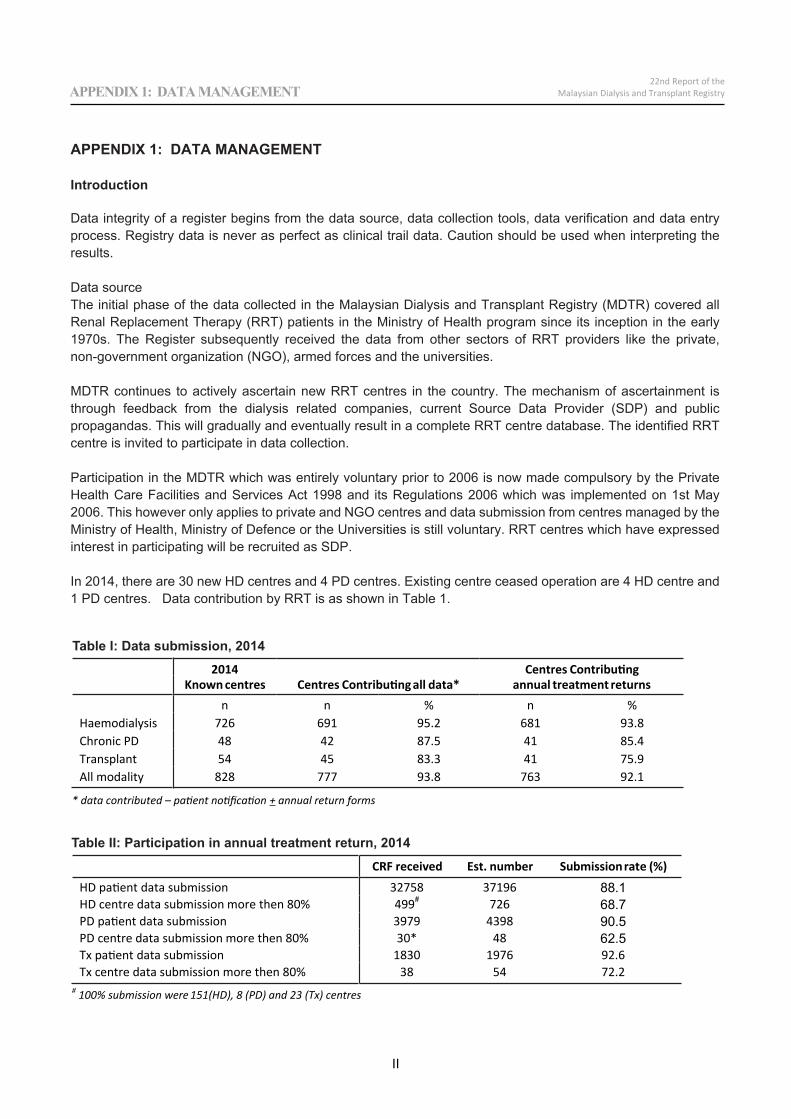
2014Centres Contributingall data*
Centres ContributingKnown centres annual treatment returns
n n % n %Haemodialysis 726 691 95.2 681 93.8Chronic PD 48 42 87.5 41 85.4Transplant 54 45 83.3 41 75.9All modality 828 777 93.8 763 92.1
* data contributed – patient notification + annual return forms
CRF received Est. number Submissionrate (%)
HD patient data submission 32758 37196 88.1 HD centre data submission more then 80% 499# 726 68.7 PD patient data submission 3979 4398 90.5 PD centre data submission more then 80% 30* 48 62.5 Tx patient data submission 1830 1976 92.6Tx centre data submission more then 80% 38 54 72.2
# 100% submission were 151(HD), 8 (PD) and 23 (Tx) centres
II
22nd Report of theMalaysian Dialysis and Transplant RegistryAPPENDIX 1: DATA MANAGEMENT
Table I: Data submission, 2014
Table II: Participation in annual treatment return, 2014
APPENDIX 1: DATA MANAGEMENT
Introduction
Data integrity of a register begins from the data source, data collection tools, data verification and data entry process. Registry data is never as perfect as clinical trail data. Caution should be used when interpreting the results.
Data sourceThe initial phase of the data collected in the Malaysian Dialysis and Transplant Registry (MDTR) covered all Renal Replacement Therapy (RRT) patients in the Ministry of Health program since its inception in the early 1970s. The Register subsequently received the data from other sectors of RRT providers like the private, non-government organization (NGO), armed forces and the universities.
MDTR continues to actively ascertain new RRT centres in the country. The mechanism of ascertainment is through feedback from the dialysis related companies, current Source Data Provider (SDP) and public propagandas. This will gradually and eventually result in a complete RRT centre database. The identified RRT centre is invited to participate in data collection.
Participation in the MDTR which was entirely voluntary prior to 2006 is now made compulsory by the Private Health Care Facilities and Services Act 1998 and its Regulations 2006 which was implemented on 1st May 2006. This however only applies to private and NGO centres and data submission from centres managed by the Ministry of Health, Ministry of Defence or the Universities is still voluntary. RRT centres which have expressed interest in participating will be recruited as SDP.
In 2014, there are 30 new HD centres and 4 PD centres. Existing centre ceased operation are 4 HD centre and 1 PD centres. Data contribution by RRT is as shown in Table 1.
III
22nd Report of theMalaysian Dialysis and Transplant Registry APPENDIX 1: DATA MANAGEMENT
Data collection
MDTR is a paper base data submission. The case reporting forms are designed to facilitate the data transcription and the information required are readily available in the patient’s case note. All the SDPs are provided with instructions on data collection and submission to the Register. The standard data collection forms are colour coded by modality and case report form (CRF) types. The notification forms are submitted periodically or whenever there is an incident. Annual return forms for the assessment year should reach the NRR coordinating office not later than January the following year. The CRFs are:
• Patient notification form • Outcome notification form • PD Infection • HD annual return form • PD annual return form • Transplant annual return form • Work related rehabilitation and quality of life assessment form – annual assessment
MDTR collects patients’ demographic details, clinical data, dialysis treatment data, transplant data, peritonitis data and outcome data. MDTR holds individual patient’s identifiable data that allow complete follow-up despite patient transfers from one centre to another or change of modality which are especially common among the RRT patients. These patients are monitored and tracked through from the time they were registered until their death. For those patients who were lost to follow-up, MDTR will verify their final outcome with the National Vital Registration System. Patient profiles are submitted to the Register throughout the year. The identity of patients in the database is not released publicly or in the registry reports.
Centre-specific reports are generated and forwarded to SDP on a quarterly basis. This has generated increased feedback from SDP and improved the patient ascertainment rate and the accuracy of the data transmittal in the registry.
MDTR also conducts an annual centre survey on the staffing and facility profile. The survey questionnaire provides summary information about the number of patients on various treatments. This acts as the basis to calculate the patient ascertainment rate.
Database SystemThe Register initial database was created in DBASE IV in a single computer environment. It was then upgraded to Microsoft Access as a client server application. Currently the NRR data system is a Pentium Xeon 2.33GHz with dual processors, with a total of 8GB RAM memory and 800GB of RAID-5 (Redundant Array of Independent Disks, level 5). In view of high volume of data accumulated throughout these years, capacity ability, performance and security issues of Microsoft Access, it was subsequently migrated to Microsoft SQL Server in the year 2004.
Data management personnelThe data management personnel in the Register office are trained base on the standard operating procedures (SOP). The data entry process is also designed to enhance data quality. Quality assurance procedures are in place at all stages to ensure the quality of data.
Visual review, Data entry and de-duplication verification, Data EditingOn receiving the case report form (CRF) submitted by SDP, visual review is performed to check for obvious error or missing data in the compulsory fields. Data entry will not be performed if a critical variable on the CRF is missing or ambiguous. The CRF is returned to the SDP for verification.
IV
22nd Report of theMalaysian Dialysis and Transplant RegistryAPPENDIX 1: DATA MANAGEMENT
After passing the duplicate check, the data is than entered and coded where required. Edit checks are performed against pre-specified validation rules to detect missing values, out of range values or inconsistent values. Any data discrepancy found is verified against the source CRF and resolved within the Register office where possible. Otherwise the specific data query report will be generated and forwarded to the SDP to clarify and resolve the data discrepancy.
Data coding, data cleaning / data analysisMost of the data fields have auto data coding. Those data in text fields will be manually coded by the Register manager. A final edit check run is performed to ensure that data is clean. All queries are resolved before dataset is locked and exported to the statistician for analysis
Limitation:NRR data submission is still paper base. The majority of the RRT centres do not have electronic patient information system. Computer literacy among staff is still low.
The data submission to the Register is still mainly on voluntary basis using the standard data collection forms. Some SDP choose not to participate in data collection on the patient treatment data for various reasons.
Data release and publication policyOne of the primary objectives of the Registry is to make data available to the renal community. There are published data in the registry’s annual report in the website: http://www.msn.org.my. This report is copyrighted. However it may be freely reproduced without the permission of the National Renal Registry. Acknowledgment would be appreciated. Suggested citation is BL Goh and LM Ong (Eds). Twenty second Report of the Malaysian Dialysis and Transplant Registry 2014, Kuala Lumpur 2016
A distinction is made between use of NRR results (as presented in NRR published report) and use of NRR data in a publication. The former is ordinary citation of published work. NRR, of course encourages such citation whether in the form of presentation or other write-ups. The latter constitutes original research publication. NRR position is as follows:The NRR does not envisage independent individual publication based entirely on NRR published results, without further analyses or additional data collection.
NRR however agrees that investigator shall have the right to publish any information or material arising in part out of NRR work. In other words, there must be additional original contribution by the investigator in the work intended for publication.
NRR encourages the use of its data for research purpose. Any proposed publication or presentation (e.g. manuscript, abstract or poster) for submission to journal or scientific meeting that is based in part or entirely on NRR data should be sent to the NRR prior to submission. NRR will undertake to comment on such documents within 4 weeks. Acknowledgement of the source of the data would also be appreciated.
Any formal publication of a research based in part or entirely on NRR data in which the input of NRR exceeded that of conventional data management and provision will be considered as a joint publication by investigator and the appropriate NRR personnel.
Any party who wish to request data for a specific purpose that requires computer-run should make such requests in writing (by e-mail, fax, or classic mail) accompanied by a Data Release Application Form and signed Data Release Agreement Form. Such request will require approval by the Advisory Board before the data can be released.
Appendix II
ANALYSIS SETS,STATISTICAL METHODS AND DEFINITIONS
VI
22nd Report of theMalaysian Dialysis and Transplant Registry
APPENDIX II: ANALYSIS SETS, STATISTICALMETHODS AND DEFINITIONS
APPENDIX II: ANALYSIS SETS, STATISTICAL METHODS AND DEFINITIONS
Analysis setsThis refers to the sets of cases whose data are to be included in the analysis.
Seven analysis sets were defined:
1. Dialysis patients notification between 2005 and 2014 This analysis set consists of patients commencing dialysis between 2005 and 2014. This analysis set was
used for the analysis in Chapter 1, 2 and 3.
Patients who were less than 20 years old at the start of dialysis between 2005 and 2014 were used for the analysis in Chapter 5.
Since 1993, the MDTR conducted an annual survey on all dialysis patients to collect data on dialysis and drug treatment, clinical and laboratory measurements. All available data were used to describe the trends in these characteristics. For this analysis in relation to these characteristics, only data from 2005 onwards were used. Remaining missing data in this analysis set was imputed using first available observation carried backward or last observation carried forward. This analysis set was used for the analysis in Chapters 6 to 12. However, the generated variable that has been imputed is prescribed Kt/V for HD patients. Prescribed Kt/V was generated using the formula below:
Kt/V = kdx x hd_time x 60/(0.58 x post weight x 1000) where kdx =[ 1 – exp(-ex)] x HD flow rate x 500/[500 – HD flow rate x exp(-ex)] and ex = (500 – HD flow rate) X ka/(500 x HD flow rate).
This variable is considered in Chapter 11.
2. New Dialysis Patients The number of new dialysis patients was based on the first dialysis treatment of the patients. Patients who
convert from one dialysis modality to another (from HD to PD or vice versa) are not counted as new patients. If transplant is the 1st modality and patient’s kidney transplant failed and he received dialysis, then for RRT count, the patients will be counted twice. However, if the patients receive transplant between the dialysis, then the dialysis after transplant will be counted if the transplant last for more than 90 days while if it is less than or equal to 90 days, then the dialysis after the transplant will not be counted. This analysis set definition was used in chapters 1, 2 and 5
3. Rehabilitation outcomes Analysis is confined to the living patients as at 31st December 2014. Hence we exclude the following
groups. Age less than or equal to 21 years Age more than or equal to 55 years Homemaker Full time student Retired This analysis set was used for the analysis in Chapter 4.
4. Centre Survey data Section 2.2 in the report was based on annual centre survey data between 2005 to 2014 rather than
individual patient data reported to the Registry.
VII
22nd Report of theMalaysian Dialysis and Transplant Registry
APPENDIX II: ANALYSIS SETS, STATISTICALMETHODS AND DEFINITIONS
5. Peritonitis data Analysis was confined to chronic PD patients who were on peritoneal dialysis from 2005 to 2014. This
analysis set was used for the analysis in Section 12.4.
6. Renal transplant data This analysis set was confined to patients who had undergone renal transplantation from 2005 to 2014.
This analysis set was used for the analysis in Chapter 13.
7. Sero-conversion patients The number of sero-conversion patients was based on the first dialysis treatment of patient with
sero-negative from 2005 to 2014. Patients with sero-positive at entry of dialysis treatment were excluded from analysis cohort. The analysis cohort also excluded patients who convert from one dialysis modality to another (from HD to PD or vice versa). Patients with sero-negative at the beginning and subsequently converted to positive will be considered as sero-converted patients and duration of conversion was calculated based on year of conversion minus year of entry. This analysis set was used in chapter 10.
8. Diabetes Mellitus Patients are considered to have diabetes mellitus (DM) as the cause of ESRD if the primary cause of
ESRD is notified as DM; or as unknown but the comorbid is DM. This is applicable to chapter 2, 3 and 13.
Statistical methods
1. Population treatment rates (new treatment or prevalence rates) Treatment rate is calculated by the ratio of the count of number of new patients or prevalent patients in a
given year to the mid-year population of Malaysia in that year, and expressed in per million-population. Results on distribution of treatment rates by state are also expressed in per million-population in the state since states obviously vary in their population sizes.
2. Adjusted Mortality of dialysis patients Cox proportional hazards model was considered for mortality of the patients adjusted with demographic
and laboratory variables. This analysis was used in Chapter 3 and 12.
3. Analysis of trend of intermediate results For summarizing intermediate results like continuous laboratory data, we have calculated summary
statistics like mean, standard deviation, median, lower quartile, upper quartile and the cumulative frequency distribution graph is plotted by year. Cumulative distribution plot shows a listing of the sample values of a variable on the X axis and the proportion of the observations less than or greater than each value on the Y axis. An accompanying table gives the Median (50% of values are above or below it), upper quartile (UQ, 25% of values above and 75% below it), lower quartile (LQ, 75% of values above and 25% below it). Other percentiles can be read directly off the cumulative distribution plot. The table also shows percent of observations above or below a target value, or with an interval of values; the target value or interval obviously vary with the type of laboratory data. For example, interval of values for prescribed Kt/V is >1.3 and that for haemoglobin is <10, 10-11 and >11 g/l. The choice of target value is guided by published clinical practice guidelines, for example, the DOQI guideline; or otherwise they represent consensus of the local dialysis community. This analysis was used in Chapter 4, 6, 7, 8, 9, 11 & 12.
VIII
22nd Report of theMalaysian Dialysis and Transplant Registry
APPENDIX II: ANALYSIS SETS, STATISTICALMETHODS AND DEFINITIONS
4. Centre survey data In contrast to other results reported in this report, Section 2.2 in chapter 2 was based on centre survey
data rather than individual patient data reported to the Registry. This is to provide up-to-date information on patient and centre census in the country and thus overcome the inevitable time lag between processing individual patient data and subsequent reporting of results. The survey was conducted in the month of December 2013. Centre response rate to survey was almost 100%. Standard error estimates are not reported because no sample was taken. Results on distribution by state are also expressed in per million state-population since states obviously vary in their population sizes. State population data are based on 2012 census projection. It is very difficult to estimate the amount of cross boundary patient flow; this source of error is therefore not accounted for in computing states estimates. However, we minimize the bias by combining states (eg Kedah and Perlis) based on geographical considerations. HD treatment capacity is derived by assuming on average patients underwent 3 HD sessions per week and a centre can maximally operate 2.5 shifts per day. A single HD machine can therefore support 5 patients’ treatment. Obviously HD treatment capacity is calculated only for centre HD. The ratio of the number of centre HD capacity to number of centre HD patient is a useful measure of utilization of available capacity.
5. Centre variation To compare the variation of the intermediate results between centres, graphs describing intermediate
results in each centre are presented. The 95% confidence intervals have been calculated using the normal approximation of the Poisson to show the variation of proportion in centres. Lower quartile and upper quartile are instead plotted in comparison of variation in median among centres. An accompanying table gives the summary statistics like minimum, 5th percentile, lower quartile, median, upper quartile, 95th percentile and maximum value among centres over year.
Centres with intermediate results for <10 patients were combined into one composite centre. This analytical method was used in Chapter 6, 7, 8, 9, 10 11 & 12.
Death rate calculationAnnual death rates were calculated by dividing the number of deaths in a year by the estimated mid-year patient population.
Incidence rate ratioThe incidence rate is determined by dividing the number of new cases of a disease or condition in a specific population over a given period of time by the total population. Therefore incidence rate ratio is the comparison of two groups in terms of incidence rate. Poisson regression model was considered to estimate the independent effect of each factor, expressed as incidence rate ratio. An incidence rate ratio of 3 means that group 2 have the rate 3 times higher than group 1 when group 1 is the reference group.
Odds ratio
The odds of an event is the probability of having the event divided by the probability of not having it. The odds ratio is used for comparing the odds of 2 groups. If the odds in group 1 is 1 and group 2 is 2, then odds ratio is 1/2. Thus the odds ratio expresses the relative probability that an event will occur when 2 groups are compared.
With multiple factors such as dialysis center, age, sex, modality, albumin, hemoglobin, calcium, cardiovascular and cholesterol, logistic regression model was used to estimate the independent effect of each factor, expressed as odds ratio, on the event of interest and the variation is odds ratio. This method was used in Chapter 3.
IX
22nd Report of theMalaysian Dialysis and Transplant Registry
APPENDIX II: ANALYSIS SETS, STATISTICALMETHODS AND DEFINITIONS
Standardized mortality rate The cohort considered for this analysis was patients who were on dialysis in 2013 and new patients in 2013 by modality.
SMR is a ratio between the observed number of death with the expected, based on the age group, diabetic, serum album group, diastolic blood pressure group and hemoglobin group rates in a standard population and the age group, diabetic, serum album group, diastolic blood pressure group and hemoglobin group distribution of the study population. If the ratio observed: expected death is greater the 1.0, we conclude that there is “excess death” in the study population. SMR was generated using the following formula:
SMR = observed death / expected death
Risk adjusted mortality rate (RAMR)When the mortality rates are risk adjusted, the information becomes more comparable among the hospitals because the data is adjusted to take into account variations in patients’ severity of renal disease and their risk of mortality. RAMR was generated using the following formula:
RAMR = SMR x AvMR where AvMR is the average of the overall observed mortality rate
Risk ratioRisk ratio is the relative measure of the difference in risk between the exposed and unexposed populations in a cohort study. The relative risk is defined as the rate of disease among the exposed divided by the rate of the disease among the unexposed. A relative risk of 2, means that the exposed group has twice the disease risk as the unexposed group.
Survival analysisThe unadjusted survival probabilities were calculated using the Kaplan-Meier method, in which the probability of surviving more than a given time can be estimated for members of a cohort of patients without accounting for the characteristics of the members of that cohort.
In order to estimate the difference in survival of different subgroups of patients within the cohort, a stratified proportional hazards model (Cox) was used where appropriate. The results from Cox model are interpreted using a hazard ratio. Adjusted survival probabilities are adjusted for age, gender, primary diagnosis and time on RRT. For diabetics compared with non-diabetics, for example, the hazard ratio is the ratio of the estimated hazards for diabetics relative to non-diabetics, where the hazard is the risk of dying at time t given that the individual has survived until this time. The underlying assumption of a proportional hazards model is that the ratio remains constant throughout the period under consideration.
Technique failure is defined as occurrence of death or transfer to another modality of dialysis. Similarly, graft failure is defined as occurrence of death or returned to dialysis.
Patient survival was considered in two ways:Survival censored for change of modality based on first modality. Duration survival for patients will be calculated from the date commencing the first modality till first modality outcome. Hence duration after the change modality or transplant will not be considered. Death occurring during the first modality will be considered in the analysis since patients will be censored for change of modality before death.
Survival not censored for change of modality based on first modality. Duration survival for patients will be calculated from the date commencing the first modality till 31 Dec 2013 for patients who were still on RRT. For patients who died, duration of survival will be calculated from date commencing the first modality till date of final outcome which is death. All death outcomes whether occurring during first modality or after change in modality will be considered for this analysis.
X
22nd Report of theMalaysian Dialysis and Transplant Registry
APPENDIX II: ANALYSIS SETS, STATISTICALMETHODS AND DEFINITIONS
Survival of incident patients by centre1-year survivalThe cohort considered for this analysis was considered from 2005 to 2013. Many patients commencing dialysis in 2013 would still not have completed one year.
5-year survivalThe cohort considered for this analysis was considered from 2005 to 2009. This is due to those commence from 2009 onwards still not able to have 5 year survivals analysis.
Funnel plotThis analysis was confined to new dialysis patients from year 2005 to 2013. The figure is included to assess whether survival probability adjusted to age and diabetes of each centre is likely to be different from the national average. This plot was used in Chapter 3.
Peritonitis rateThe occurrence of peritonitis is expressed as number of episode per patient-month of observation; peritonitis rate in short. Relapse peritonitis is defined as peritonitis caused by the same organism occurring within 6 weeks of diagnosis of previous peritonitis.
Cumulative RiskCumulative risk of sero-conversion is the cumulative incidence rate of patient being converted from sero-negative to sero-positive over a period of time. It was calculated by the number of cases during a period divided by number of subjects at risk i.e. sero-negative patients at the beginning of time. This analysis was used in chapter 10.