2016 ward profile: blythe - solihull council
TRANSCRIPT
Produced by Solihull Observatory |
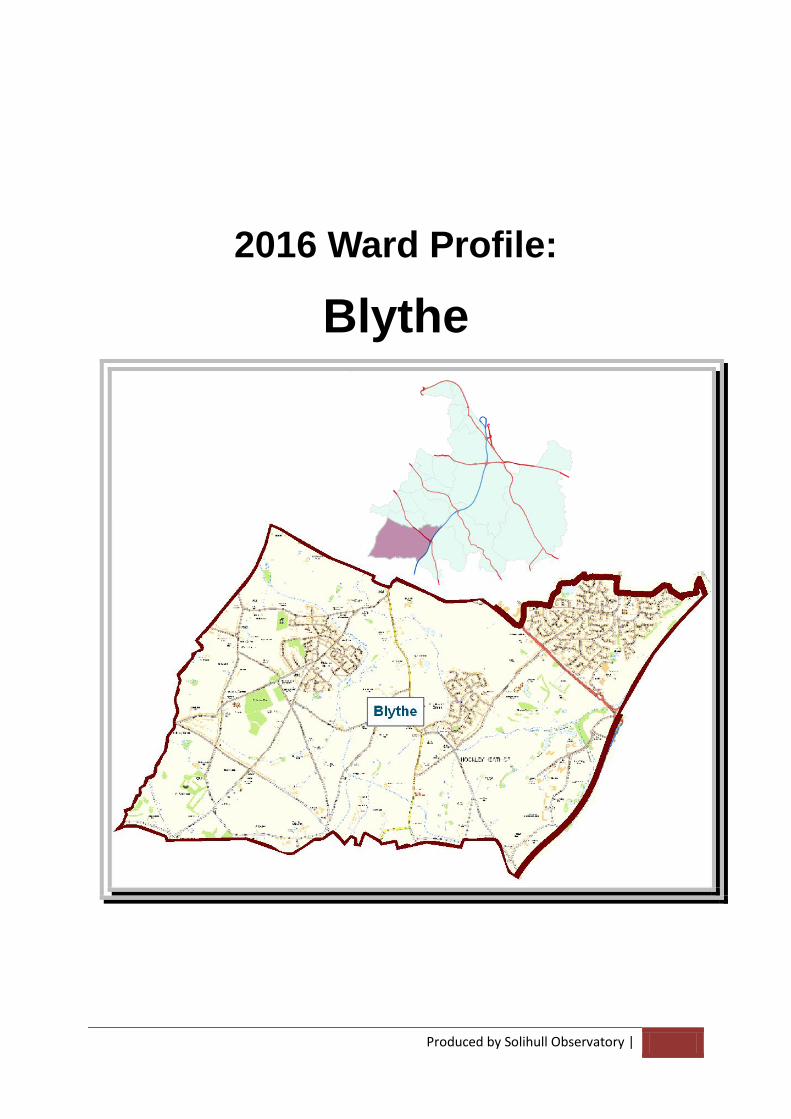
2016 Ward Profile:
Blythe
Winter 2016 BLYTHE WARD PROFILE 2016
Produced by Solihull Observatory |
CONTENTS page
number
WARD PROFILE FORWARD 1 WARD MAPS 2 CONTEXT 3 POPULATION AND DEMOGRAPHY 4 -11 Total Population and Households 4 Age Structure 4 Population Change 6 Ethnicity, Origin and Language 7 Household Composition 9 Deprivation 11 PROSPEROUS COMMUNITIES 12 – 23 Economic Activity and Employment 12 Adult Skills 13 Claimant Unemployment 14 Worklessness 16 Workforce Jobs and Businesses 17 Housing 19 Transport 21 A BRIGHTER FUTURE FOR CHILDREN AND YOUNG PEOPLE 23 – 28 Health 23 Education 25 Children in Poverty 28 STRONGER AND SAFER COMMUNITIES 28 – 34 Community Cohesion, Participation and Satisfaction 28 Crime 30 Anti-Social Behaviour 33 HEALTHIER COMMUNITIES 34 – 39 The Health of the Population and Carers 34 Life Expectancy and Mortality 36 Healthy Lifestyles 37 WARD CONTACTS AND KEY INFORMATION 40
Winter 2016 BLYTHE WARD PROFILE 2016
Produced by Solihull Observatory | 1
WARD PROFILE FORWARD
Ward Profiles provide a snapshot of a ward’s socio-economic circumstances and highlight specific issues and concerns at a local level.
This update still includes comprehensive coverage of the Census 2011 data first reported in the 2013 Ward Profile, as, in many instances, the Census remains the most detailed and accurate measure available at a ward level. The Census provides highly detailed information on the following themes:
Population and demography; Households, living arrangements & family structure; Ethnicity, religion, origin & language; Employment and qualifications; Health and care; Housing and housing condition.
This update also draws on the latest available version of following data sets:
Crime and anti-social behaviour rates (Crime Stats UK); Claimant unemployment (ONS/Nomis) and worklessness (DWP); Solihull Place Survey 2014 (SMBC); School attainment (Department for Education); Children in Poverty (DWP); Life expectancy and mortality rates (Public Health England); Index of Multiple Deprivation (ONS); Solihull Housing Register (SMBC).
Sub-borough data is available at a variety of levels. As well as the borough’s 17 electoral wards, the majority of data is based on the standard Census geographies:
Lower Super Output Areas (LSOAs) local neighbourhoods based on a minimum population of 1,000 and an average of 1,500 (134 in Solihull);
Middle Layer Super Output Areas (MSOAs) containing an average of 7,200 persons (29 in Solihull).
Technical advice and support is available from the Solihull Observatory.
Winter 2016 BLYTHE WARD PROFILE 2016
Produced by Solihull Observatory | 2
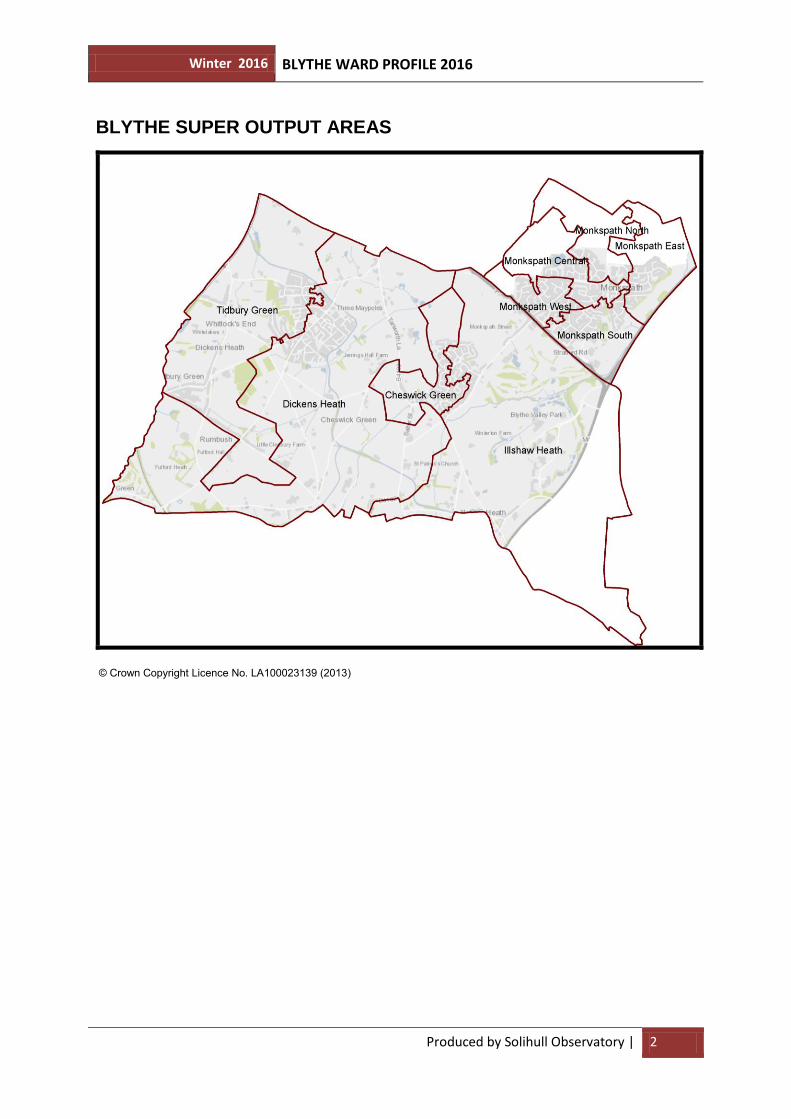
BLYTHE SUPER OUTPUT AREAS
© Crown Copyright Licence No. LA100023139 (2013)
Winter 2016 BLYTHE WARD PROFILE 2016
Produced by Solihull Observatory | 3
SOLIHULL CONTEXT
Solihull is a broadly affluent Borough in both the regional and national context, with generally above-average levels of school performance and low crime rates compared with the West Midlands key characteristics. Levels and extent of deprivation are limited with only 22 of the Borough’s 134 Lower Super Output Areas (LSOAs) in the most 20% deprived areas in the country.
Solihull as an authority is, however, challenged by a prosperity gap, with performance indicators in the regeneration zone to the north of Birmingham International Airport significantly lagging the rest of the Borough. Geographically Solihull can be split into the northern area (including the regeneration zone), the urban west (including Solihull town centre), the rural east and the semi-rural south.
BLYTHE SUMMARY
Blythe is located in south Solihull with significant Green Belt land, bordered by the M42 motorway and commercial hub of Blythe Valley Business Park to the east, Bromsgrove to the west and Stratford district to the south. Blythe has a number of very distinct but broadly affluent communities, from established villages such as Cheswick Green, to modern estates such as Monkspath and the rapidly expanding Dickens Heath. In addition to Dickens Heath, Blythe has a number of key strategic development sites and the ward is likely to remain the focus for much of Solihull’s additional new housing capacity.
The LSOA map on page 2 illustrates the individual localities within Blythe, based on the Office for National Statistics’ LSOAs. A number of LSOAs in Monkspath overlap the Blythe ward boundary as does Illshaw Heath. Three parishes (Cheswick Green, Dickens Heath and Tidbury Green) provide an alternative segmentation of Blythe, although while socially significant, these new parishes are available as statistical entities elsewhere and are not used as measures in this report.
Winter 2016 BLYTHE WARD PROFILE 2016
Produced by Solihull Observatory | 4
POPULATION AND DEMOGRAPHY
Total Population and Households
Blythe Solihull England
All usual residents 12,997 206,674 53,012,456 Household residents 12,938 205,087 52,059,931 Communal establishment residents 59 1,587 952,525 % of population in communal establishments 0.5% 0.8% 1.8% Area (hectares) 1,345 17,829 13,027,843 Population density 9.7 11.6 4.1 Households with at least one usual resident 5,353 86,056 22,063,368 Average household size 2.4 2.4 2.4 Source: ONS Census 2011
At the time of the 2011 Census the population of Blythe was 12,997 (6,449 males, 6,548 females). This equates to 9.7 residents per hectare, below the Solihull average of 11.6 and 5th lowest of the borough’s 17 wards.
Subsequent modelled estimates by the ONS record the Blythe population as 13,460 residents in mid-2014 (6,691 males, 6,769 females). However, as the Census provides the most accurate picture this is used as the source for the more detailed population breakdowns that follow.
Age Structure
Count % of Population
Blythe Blythe Solihull England
Pre-School Children (0-4 years) 779 6.0% 5.6% 6.3% School Age Children (5-15 Years) 1,679 12.9% 13.4% 12.6% All Children (0-15 years) 2,458 18.9% 19.0% 18.9% Young Adults (age 16-24 years) 1,270 9.8% 10.6% 11.9% Mature working Age (25-64 years) 7,544 58.0% 51.3% 52.9% Working Age Total (16-64) 8,814 67.8% 61.9% 64.8% Retirement Age (65 year+) 1,725 13.3% 19.2% 16.3% Older People (Age 85+) 166 1.3% 2.7% 2.2% Average Age (years) 38.8 41.3 39.3 Source: ONS Census 2011
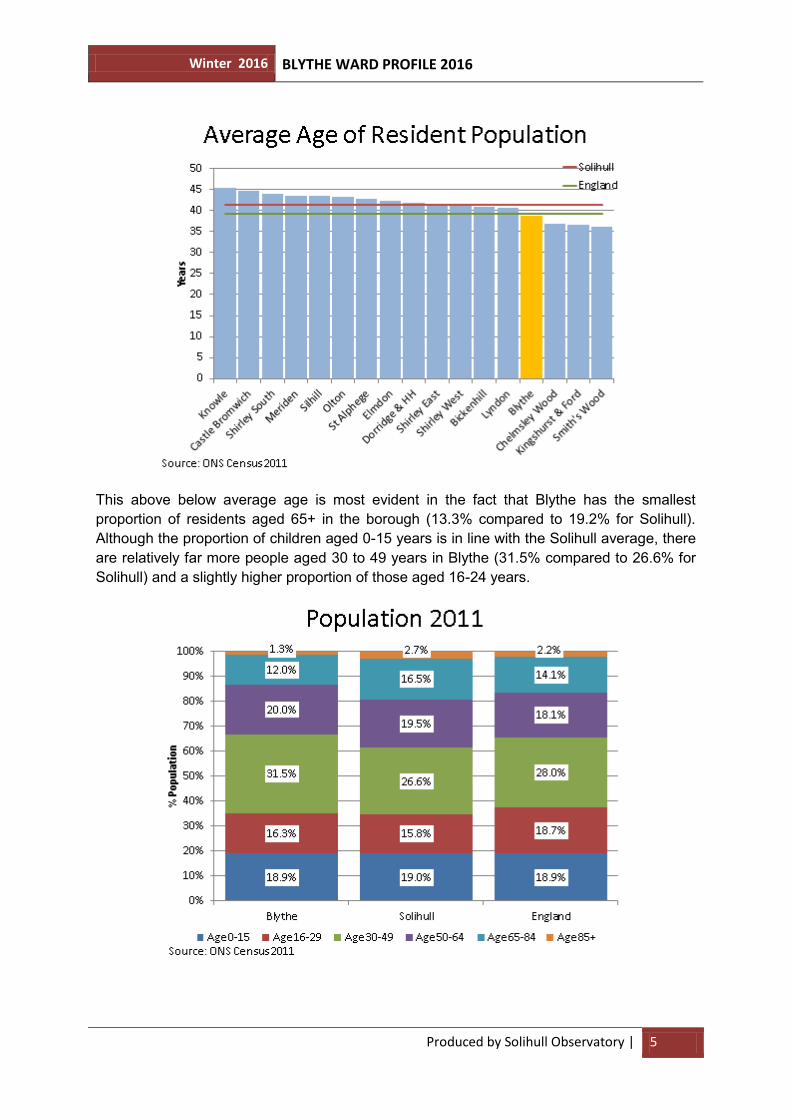
In 2011 the average age in Blythe was 38.8 years, substantially below that for Solihull as a whole (41.3 years) and 4th lowest in the borough.
Winter 2016 BLYTHE WARD PROFILE 2016
Produced by Solihull Observatory | 5
This above below average age is most evident in the fact that Blythe has the smallest proportion of residents aged 65+ in the borough (13.3% compared to 19.2% for Solihull). Although the proportion of children aged 0-15 years is in line with the Solihull average, there are relatively far more people aged 30 to 49 years in Blythe (31.5% compared to 26.6% for Solihull) and a slightly higher proportion of those aged 16-24 years.
Winter 2016 BLYTHE WARD PROFILE 2016
Produced by Solihull Observatory | 6
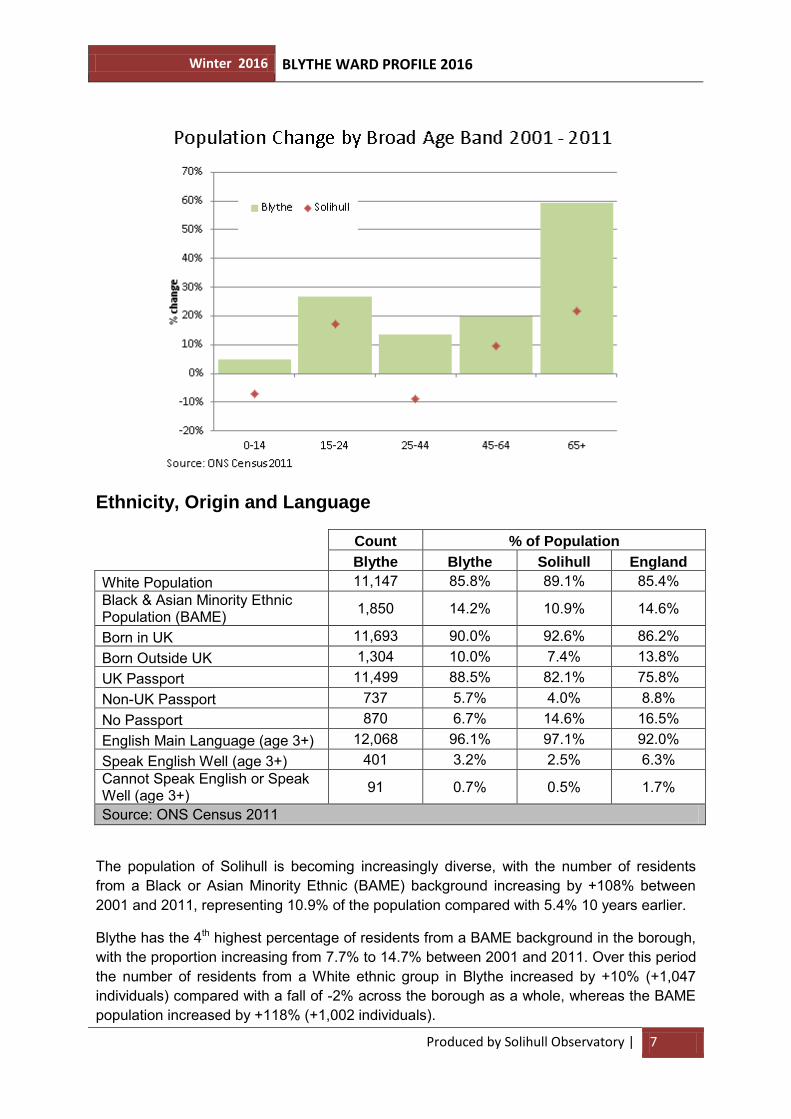
Population Change
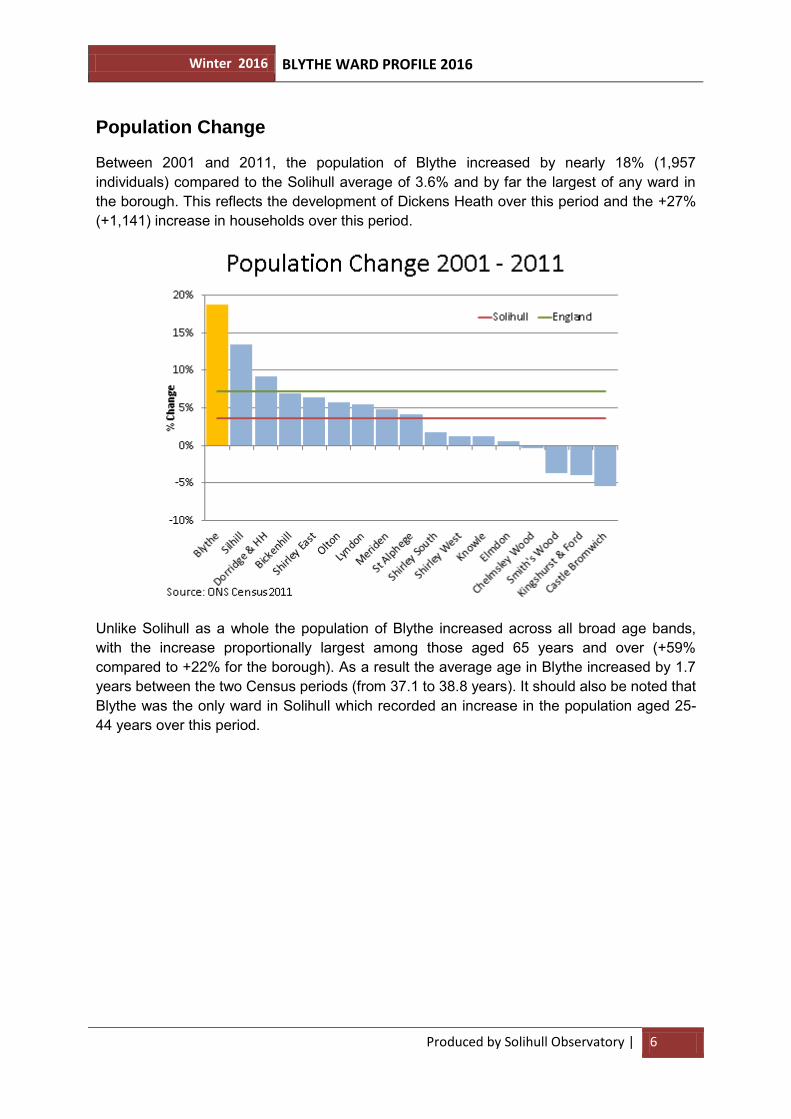
Between 2001 and 2011, the population of Blythe increased by nearly 18% (1,957 individuals) compared to the Solihull average of 3.6% and by far the largest of any ward in the borough. This reflects the development of Dickens Heath over this period and the +27% (+1,141) increase in households over this period.
Unlike Solihull as a whole the population of Blythe increased across all broad age bands, with the increase proportionally largest among those aged 65 years and over (+59% compared to +22% for the borough). As a result the average age in Blythe increased by 1.7 years between the two Census periods (from 37.1 to 38.8 years). It should also be noted that Blythe was the only ward in Solihull which recorded an increase in the population aged 25-44 years over this period.
Winter 2016 BLYTHE WARD PROFILE 2016
Produced by Solihull Observatory | 7
Ethnicity, Origin and Language
Count % of Population
Blythe Blythe Solihull England
White Population 11,147 85.8% 89.1% 85.4% Black & Asian Minority Ethnic Population (BAME) 1,850 14.2% 10.9% 14.6%
Born in UK 11,693 90.0% 92.6% 86.2% Born Outside UK 1,304 10.0% 7.4% 13.8% UK Passport 11,499 88.5% 82.1% 75.8% Non-UK Passport 737 5.7% 4.0% 8.8% No Passport 870 6.7% 14.6% 16.5% English Main Language (age 3+) 12,068 96.1% 97.1% 92.0% Speak English Well (age 3+) 401 3.2% 2.5% 6.3% Cannot Speak English or Speak Well (age 3+) 91 0.7% 0.5% 1.7%
Source: ONS Census 2011
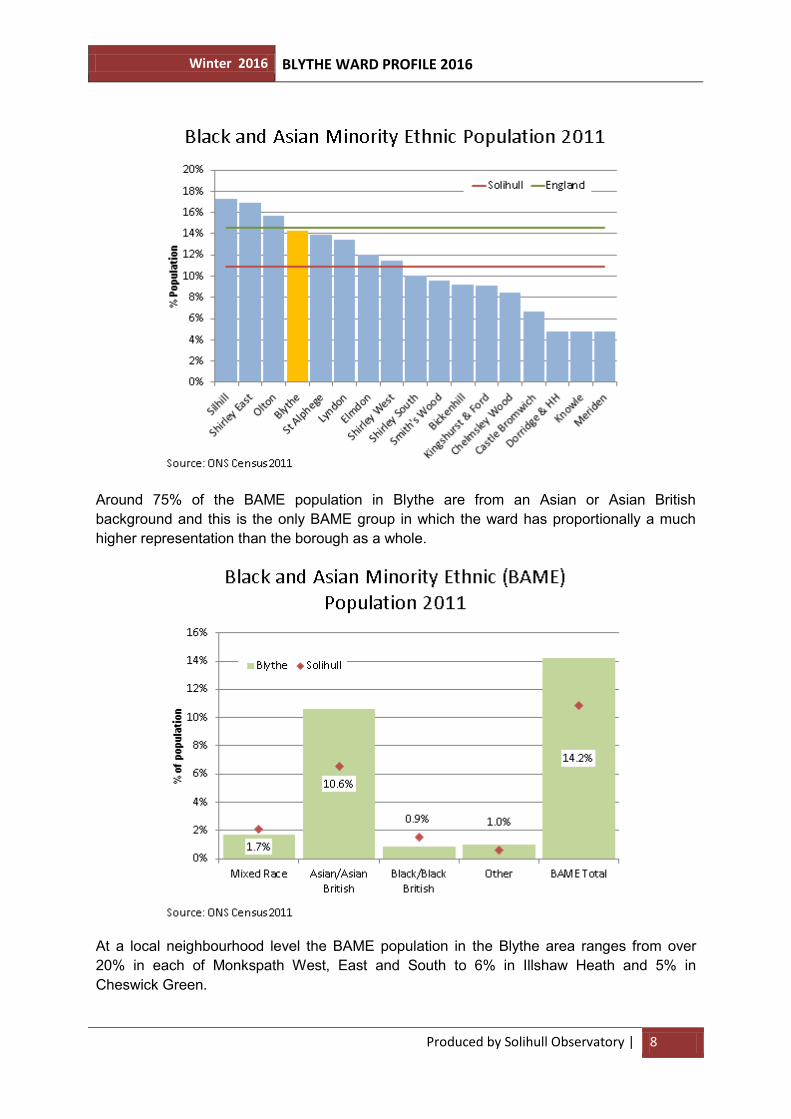
The population of Solihull is becoming increasingly diverse, with the number of residents from a Black or Asian Minority Ethnic (BAME) background increasing by +108% between 2001 and 2011, representing 10.9% of the population compared with 5.4% 10 years earlier.
Blythe has the 4th highest percentage of residents from a BAME background in the borough, with the proportion increasing from 7.7% to 14.7% between 2001 and 2011. Over this period the number of residents from a White ethnic group in Blythe increased by +10% (+1,047 individuals) compared with a fall of -2% across the borough as a whole, whereas the BAME population increased by +118% (+1,002 individuals).
Winter 2016 BLYTHE WARD PROFILE 2016
Produced by Solihull Observatory | 8
Around 75% of the BAME population in Blythe are from an Asian or Asian British background and this is the only BAME group in which the ward has proportionally a much higher representation than the borough as a whole.
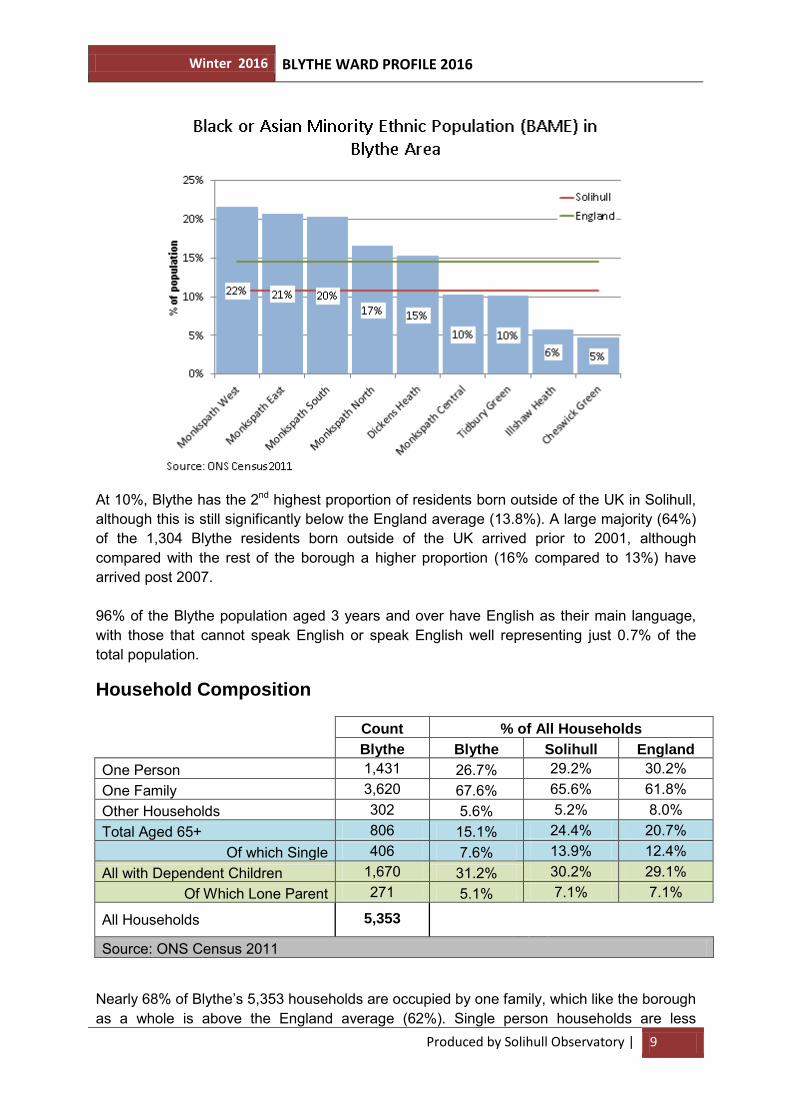
At a local neighbourhood level the BAME population in the Blythe area ranges from over 20% in each of Monkspath West, East and South to 6% in Illshaw Heath and 5% in Cheswick Green.
Winter 2016 BLYTHE WARD PROFILE 2016
Produced by Solihull Observatory | 9
At 10%, Blythe has the 2nd highest proportion of residents born outside of the UK in Solihull, although this is still significantly below the England average (13.8%). A large majority (64%) of the 1,304 Blythe residents born outside of the UK arrived prior to 2001, although compared with the rest of the borough a higher proportion (16% compared to 13%) have arrived post 2007. 96% of the Blythe population aged 3 years and over have English as their main language, with those that cannot speak English or speak English well representing just 0.7% of the total population.
Household Composition
Count % of All Households
Blythe Blythe Solihull England
One Person 1,431 26.7% 29.2% 30.2% One Family 3,620 67.6% 65.6% 61.8% Other Households 302 5.6% 5.2% 8.0% Total Aged 65+ 806 15.1% 24.4% 20.7%
Of which Single 406 7.6% 13.9% 12.4% All with Dependent Children 1,670 31.2% 30.2% 29.1%
Of Which Lone Parent 271 5.1% 7.1% 7.1%
All Households 5,353
Source: ONS Census 2011
Nearly 68% of Blythe’s 5,353 households are occupied by one family, which like the borough as a whole is above the England average (62%). Single person households are less
Winter 2016 BLYTHE WARD PROFILE 2016
Produced by Solihull Observatory | 10
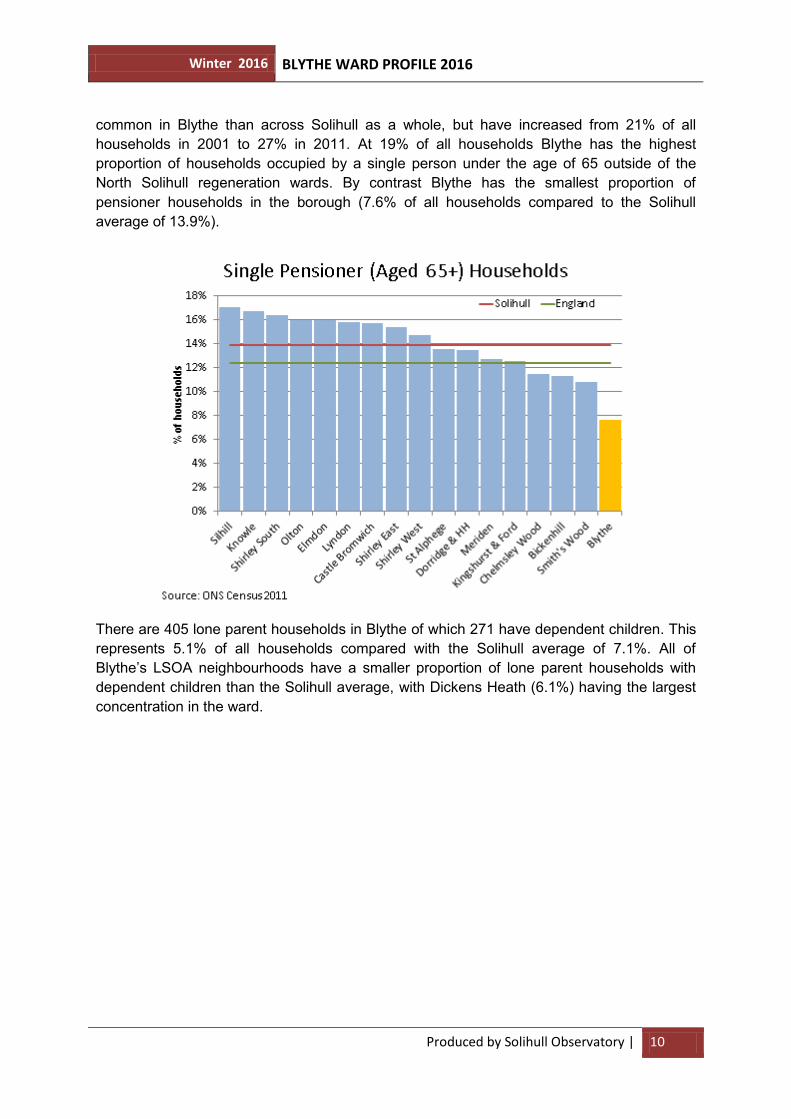
common in Blythe than across Solihull as a whole, but have increased from 21% of all households in 2001 to 27% in 2011. At 19% of all households Blythe has the highest proportion of households occupied by a single person under the age of 65 outside of the North Solihull regeneration wards. By contrast Blythe has the smallest proportion of pensioner households in the borough (7.6% of all households compared to the Solihull average of 13.9%).
There are 405 lone parent households in Blythe of which 271 have dependent children. This represents 5.1% of all households compared with the Solihull average of 7.1%. All of Blythe’s LSOA neighbourhoods have a smaller proportion of lone parent households with dependent children than the Solihull average, with Dickens Heath (6.1%) having the largest concentration in the ward.
Winter 2016 BLYTHE WARD PROFILE 2016
Produced by Solihull Observatory | 11
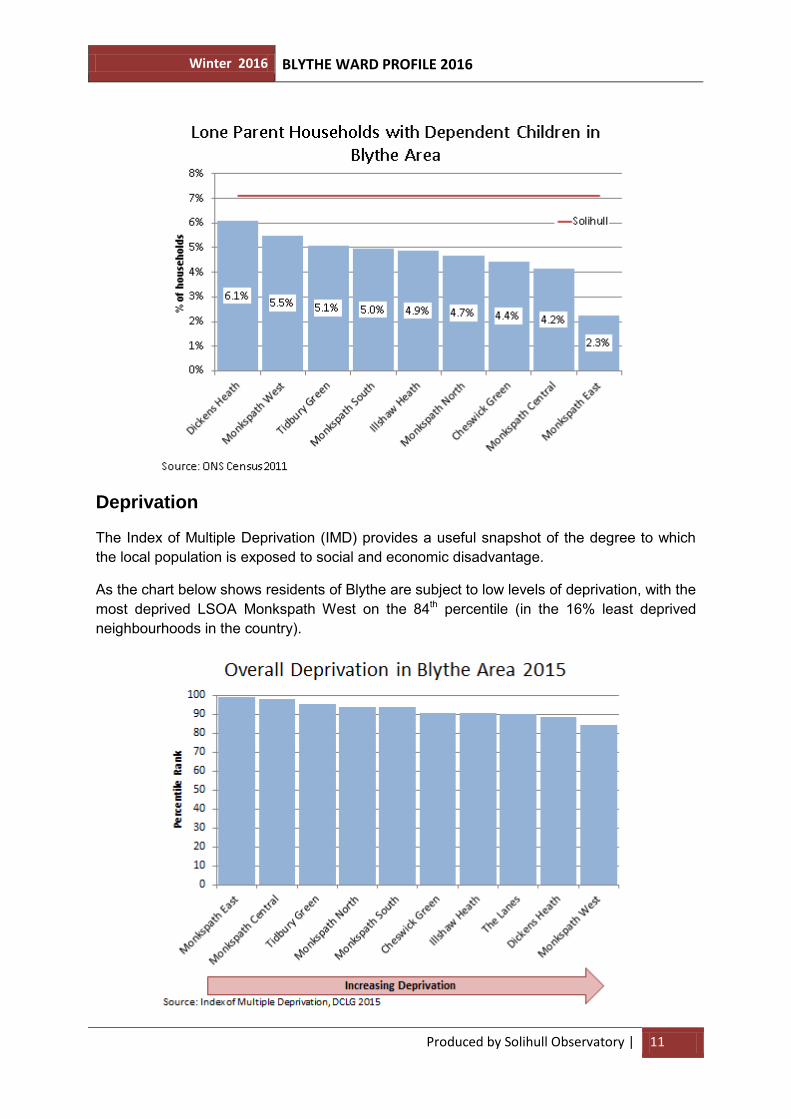
Deprivation
The Index of Multiple Deprivation (IMD) provides a useful snapshot of the degree to which the local population is exposed to social and economic disadvantage.
As the chart below shows residents of Blythe are subject to low levels of deprivation, with the most deprived LSOA Monkspath West on the 84th percentile (in the 16% least deprived neighbourhoods in the country).
Winter 2016 BLYTHE WARD PROFILE 2016
Produced by Solihull Observatory | 12
PROSPEROUS COMMUNITIES
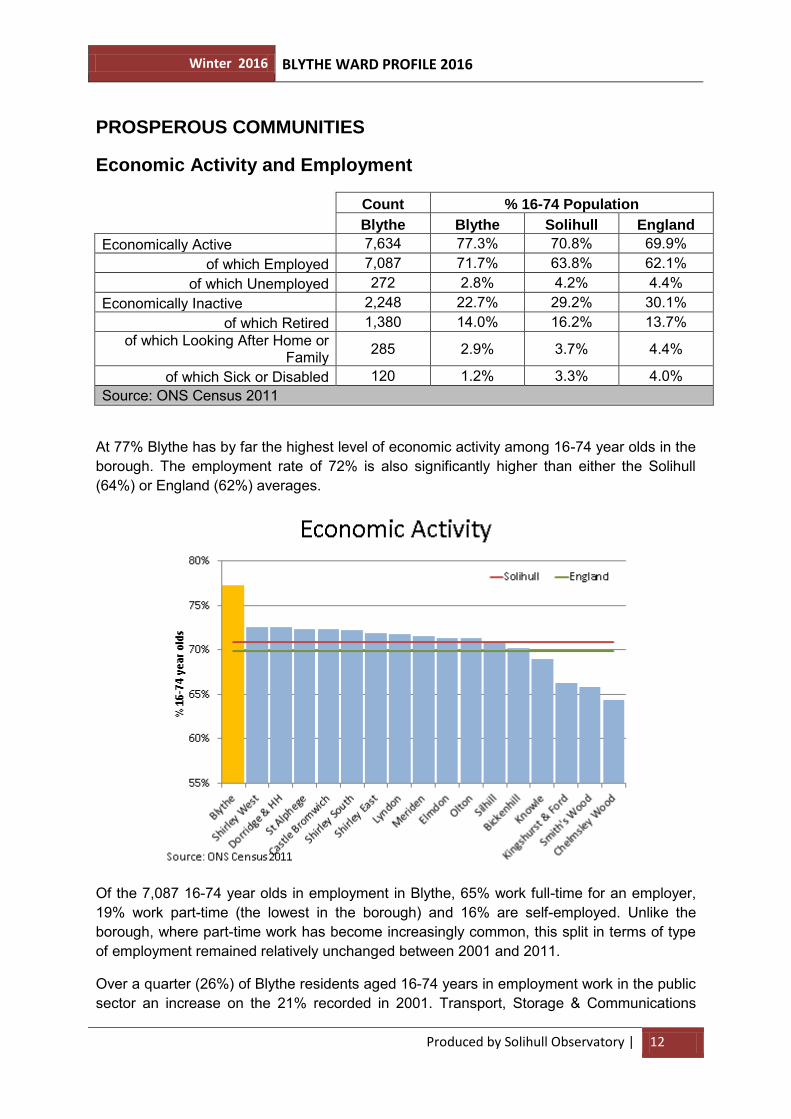
Economic Activity and Employment
Count % 16-74 Population
Blythe Blythe Solihull England
Economically Active 7,634 77.3% 70.8% 69.9% of which Employed 7,087 71.7% 63.8% 62.1%
of which Unemployed 272 2.8% 4.2% 4.4% Economically Inactive 2,248 22.7% 29.2% 30.1%
of which Retired 1,380 14.0% 16.2% 13.7% of which Looking After Home or
Family 285 2.9% 3.7% 4.4%
of which Sick or Disabled 120 1.2% 3.3% 4.0% Source: ONS Census 2011
At 77% Blythe has by far the highest level of economic activity among 16-74 year olds in the borough. The employment rate of 72% is also significantly higher than either the Solihull (64%) or England (62%) averages.
Of the 7,087 16-74 year olds in employment in Blythe, 65% work full-time for an employer, 19% work part-time (the lowest in the borough) and 16% are self-employed. Unlike the borough, where part-time work has become increasingly common, this split in terms of type of employment remained relatively unchanged between 2001 and 2011.
Over a quarter (26%) of Blythe residents aged 16-74 years in employment work in the public sector an increase on the 21% recorded in 2001. Transport, Storage & Communications
Winter 2016 BLYTHE WARD PROFILE 2016
Produced by Solihull Observatory | 13
(from 6% to 9% of the total) and construction (from 6% to 8%) have also become more important sources of employment for Blythe residents. By contrast the proportion of people employed in manufacturing has shrunk from 14% to 9%. However, both this and the greater role of the public sector are consistent with the pattern across Solihull.
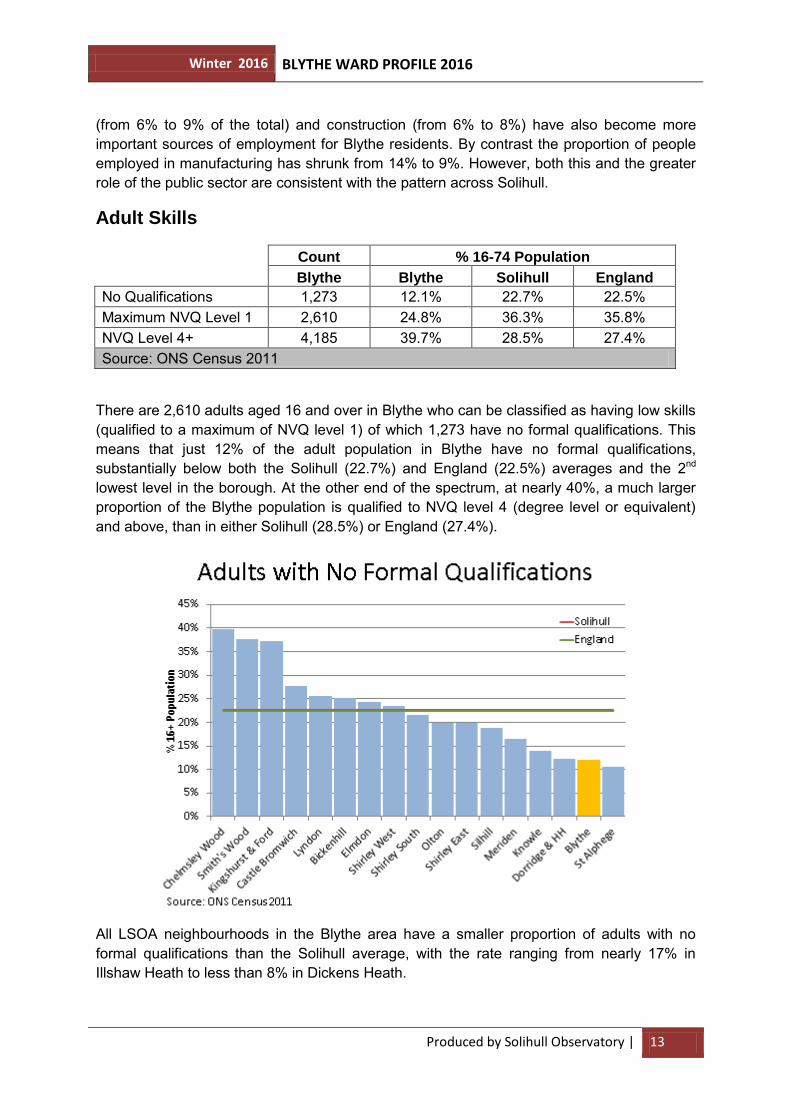
Adult Skills
Count % 16-74 Population
Blythe Blythe Solihull England
No Qualifications 1,273 12.1% 22.7% 22.5% Maximum NVQ Level 1 2,610 24.8% 36.3% 35.8% NVQ Level 4+ 4,185 39.7% 28.5% 27.4% Source: ONS Census 2011
There are 2,610 adults aged 16 and over in Blythe who can be classified as having low skills (qualified to a maximum of NVQ level 1) of which 1,273 have no formal qualifications. This means that just 12% of the adult population in Blythe have no formal qualifications, substantially below both the Solihull (22.7%) and England (22.5%) averages and the 2nd lowest level in the borough. At the other end of the spectrum, at nearly 40%, a much larger proportion of the Blythe population is qualified to NVQ level 4 (degree level or equivalent) and above, than in either Solihull (28.5%) or England (27.4%).
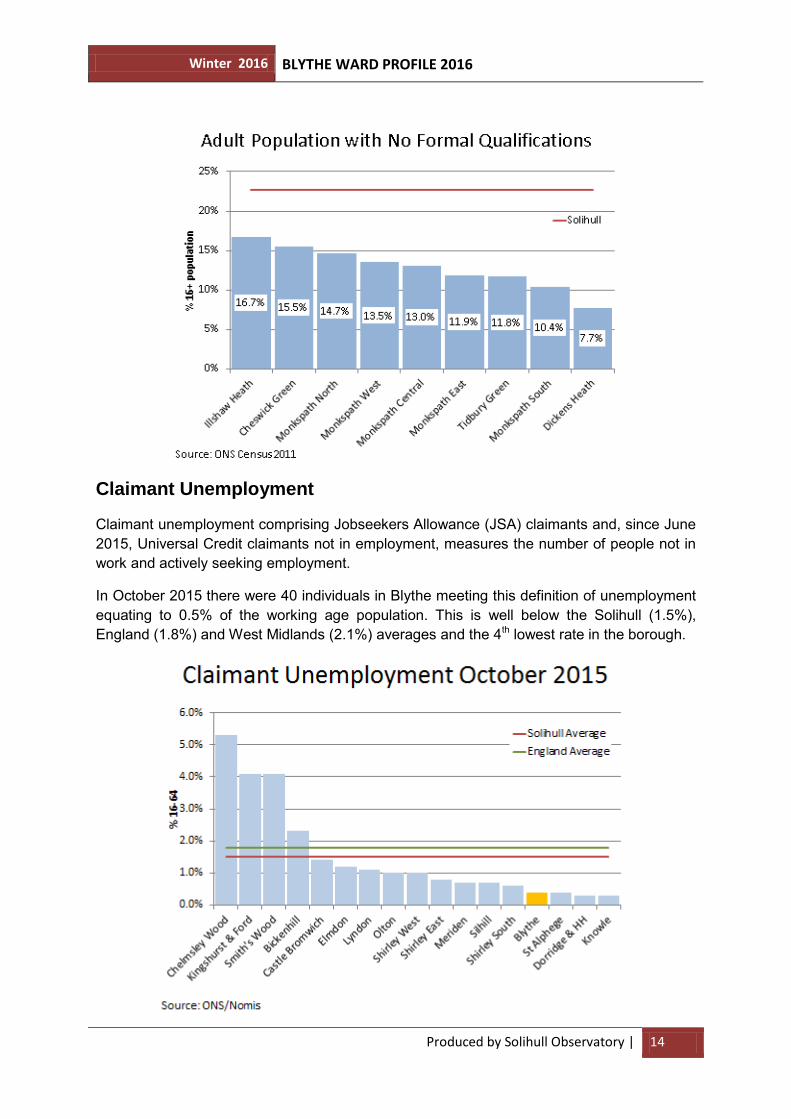
All LSOA neighbourhoods in the Blythe area have a smaller proportion of adults with no formal qualifications than the Solihull average, with the rate ranging from nearly 17% in Illshaw Heath to less than 8% in Dickens Heath.
Winter 2016 BLYTHE WARD PROFILE 2016
Produced by Solihull Observatory | 14
Claimant Unemployment
Claimant unemployment comprising Jobseekers Allowance (JSA) claimants and, since June 2015, Universal Credit claimants not in employment, measures the number of people not in work and actively seeking employment.
In October 2015 there were 40 individuals in Blythe meeting this definition of unemployment equating to 0.5% of the working age population. This is well below the Solihull (1.5%), England (1.8%) and West Midlands (2.1%) averages and the 4th lowest rate in the borough.
Winter 2016 BLYTHE WARD PROFILE 2016
Produced by Solihull Observatory | 15
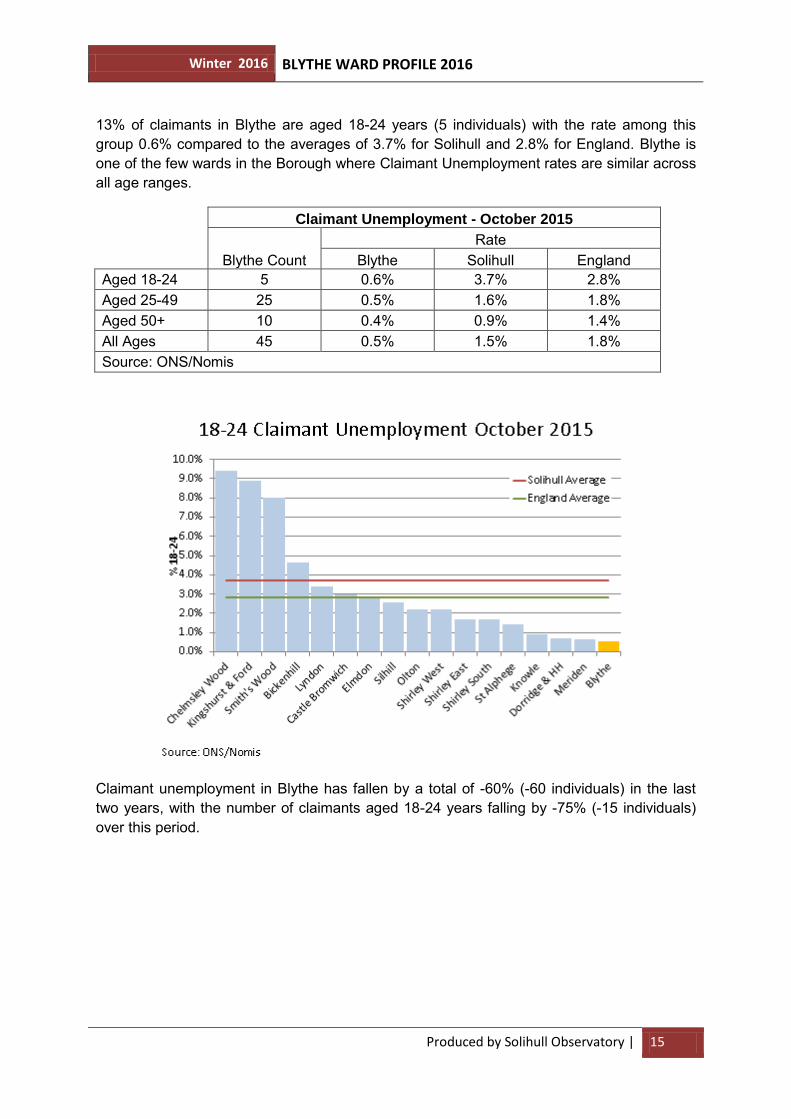
13% of claimants in Blythe are aged 18-24 years (5 individuals) with the rate among this group 0.6% compared to the averages of 3.7% for Solihull and 2.8% for England. Blythe is one of the few wards in the Borough where Claimant Unemployment rates are similar across all age ranges.
Claimant Unemployment - October 2015
Blythe Count Rate
Blythe Solihull England
Aged 18-24 5 0.6% 3.7% 2.8% Aged 25-49 25 0.5% 1.6% 1.8% Aged 50+ 10 0.4% 0.9% 1.4% All Ages 45 0.5% 1.5% 1.8% Source: ONS/Nomis
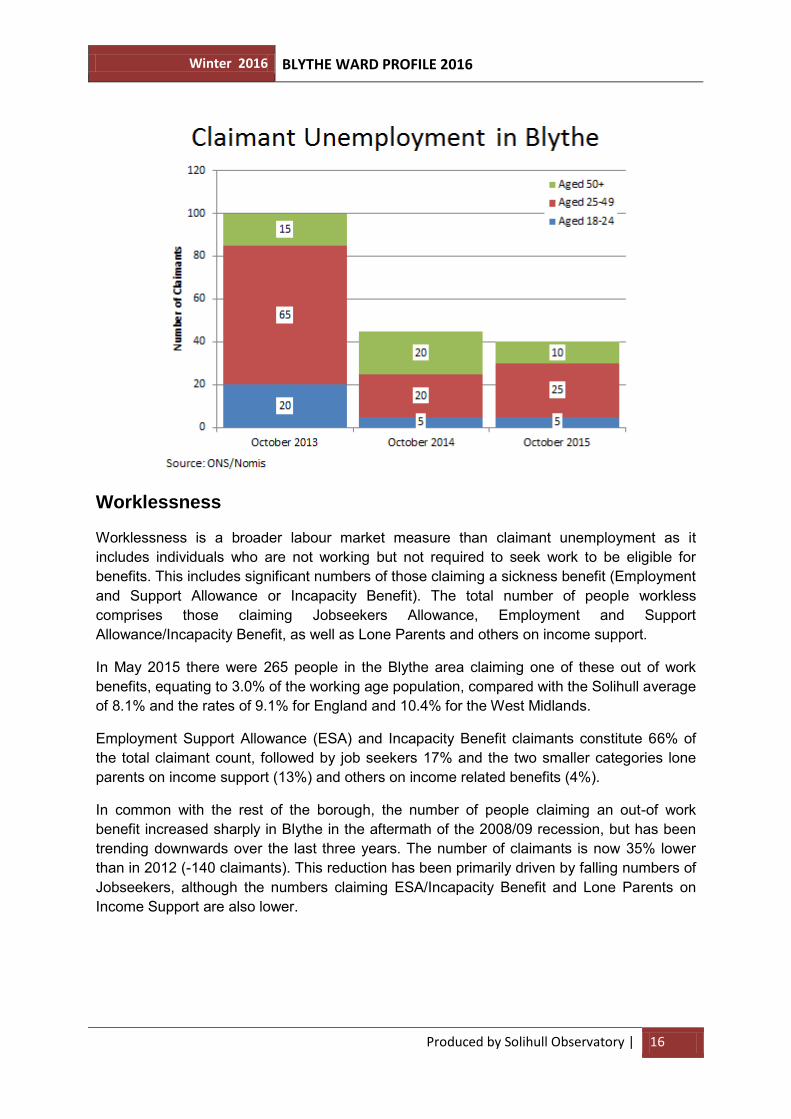
Claimant unemployment in Blythe has fallen by a total of -60% (-60 individuals) in the last two years, with the number of claimants aged 18-24 years falling by -75% (-15 individuals) over this period.
Winter 2016 BLYTHE WARD PROFILE 2016
Produced by Solihull Observatory | 16
Worklessness
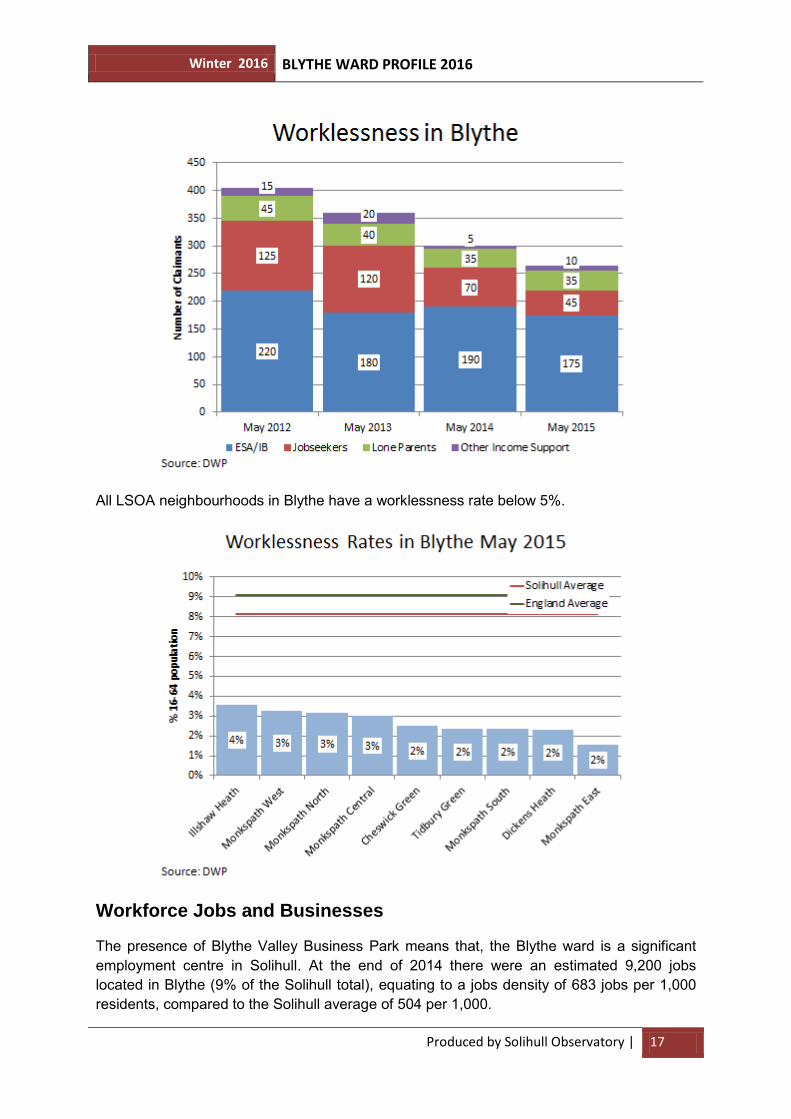
Worklessness is a broader labour market measure than claimant unemployment as it includes individuals who are not working but not required to seek work to be eligible for benefits. This includes significant numbers of those claiming a sickness benefit (Employment and Support Allowance or Incapacity Benefit). The total number of people workless comprises those claiming Jobseekers Allowance, Employment and Support Allowance/Incapacity Benefit, as well as Lone Parents and others on income support.
In May 2015 there were 265 people in the Blythe area claiming one of these out of work benefits, equating to 3.0% of the working age population, compared with the Solihull average of 8.1% and the rates of 9.1% for England and 10.4% for the West Midlands.
Employment Support Allowance (ESA) and Incapacity Benefit claimants constitute 66% of the total claimant count, followed by job seekers 17% and the two smaller categories lone parents on income support (13%) and others on income related benefits (4%).
In common with the rest of the borough, the number of people claiming an out-of work benefit increased sharply in Blythe in the aftermath of the 2008/09 recession, but has been trending downwards over the last three years. The number of claimants is now 35% lower than in 2012 (-140 claimants). This reduction has been primarily driven by falling numbers of Jobseekers, although the numbers claiming ESA/Incapacity Benefit and Lone Parents on Income Support are also lower.
Winter 2016 BLYTHE WARD PROFILE 2016
Produced by Solihull Observatory | 17
All LSOA neighbourhoods in Blythe have a worklessness rate below 5%.
Workforce Jobs and Businesses
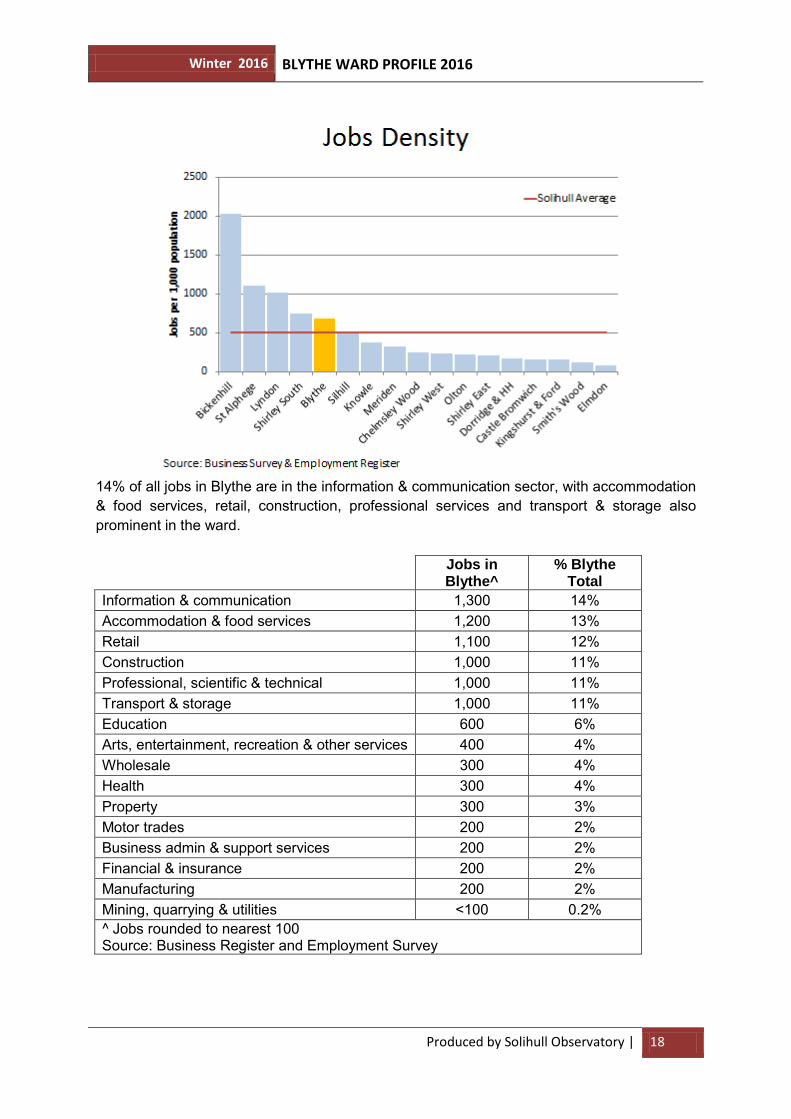
The presence of Blythe Valley Business Park means that, the Blythe ward is a significant employment centre in Solihull. At the end of 2014 there were an estimated 9,200 jobs located in Blythe (9% of the Solihull total), equating to a jobs density of 683 jobs per 1,000 residents, compared to the Solihull average of 504 per 1,000.
Winter 2016 BLYTHE WARD PROFILE 2016
Produced by Solihull Observatory | 18
14% of all jobs in Blythe are in the information & communication sector, with accommodation & food services, retail, construction, professional services and transport & storage also prominent in the ward.
Jobs in Blythe^
% Blythe Total
Information & communication 1,300 14% Accommodation & food services 1,200 13% Retail 1,100 12% Construction 1,000 11% Professional, scientific & technical 1,000 11% Transport & storage 1,000 11% Education 600 6% Arts, entertainment, recreation & other services 400 4% Wholesale 300 4% Health 300 4% Property 300 3% Motor trades 200 2% Business admin & support services 200 2% Financial & insurance 200 2% Manufacturing 200 2% Mining, quarrying & utilities <100 0.2% ^ Jobs rounded to nearest 100 Source: Business Register and Employment Survey
Winter 2016 BLYTHE WARD PROFILE 2016
Produced by Solihull Observatory | 19
The number of jobs in Blythe increased by around 25% (+1,800) between 2009 and 2014, a substantially higher rate of growth than either the Solihull (+12%) or England (+5%) averages.
Data on the number of business is available at Middle Super Output Area (MSOA) level. The majority of the Blythe ward falls within the Blythe Parishes MSOA. There were 620 businesses in this MSOA equating to 66 per 1,000 population, the 5th highest concentration of business in Solihull.
The number of business in the Blythe Parishes MSOA increased by 10% between 2010 and 2015, broadly in-line with the Solihull (+13%) and England (+14%) averages.
Business Base 2015 Change 2010-2015
Area Count % Solihull
Total Density (per
1,000) Number % Blythe Parishes 620 7% 66 +55 +10% Solihull 44 +13% England 47 +14% Source: ONS UK Business Counts
Housing
Count % of Households
Blythe Blythe Solihull England
Owner Occupied 4,309 80.5% 74.5% 64.1% Socially Rented 96 1.8% 14.9% 17.7% Privately Rented 908 17.0% 9.9% 16.8% Whole House or Bungalow 4,490 81.5% 81.6% 77.5% Flat, Maisonette or Apartment 1,009 18.3% 18.2% 22.1% No Central Heating 51 1.0% 1.8% 2.7% Overcrowding (bedrooms) 79 1.5% 2.7% 4.8% Overcrowding (all rooms) 298 5.6% 4.5% 8.7% Source: ONS Census 2011
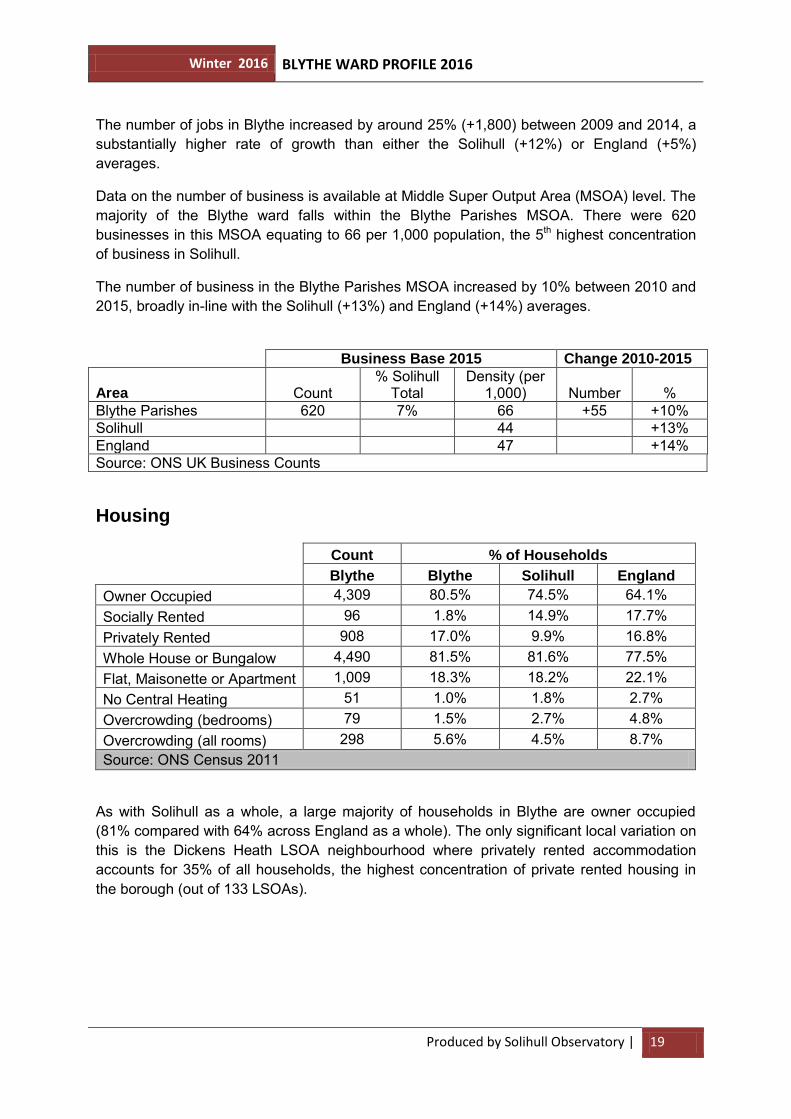
As with Solihull as a whole, a large majority of households in Blythe are owner occupied (81% compared with 64% across England as a whole). The only significant local variation on this is the Dickens Heath LSOA neighbourhood where privately rented accommodation accounts for 35% of all households, the highest concentration of private rented housing in the borough (out of 133 LSOAs).
Winter 2016 BLYTHE WARD PROFILE 2016
Produced by Solihull Observatory | 20
A significant feature in both the ward and the borough has been the substantial increase in the number of privately rented households between 2001 and 2011. There are 675 more private rented households in Blythe than in 2001, with the share of all households increasing from 6% to 18%. The number of owner occupied households increased by +398 over this period, but the share of the total shrank from 93% in 2001 to 80%.
In terms of housing condition just 1% of households in Blythe do not have central heating, below both the Solihull (1.8%) and England (2.7%) averages. Evidence from the Census also suggests that there are relatively few problems with overcrowding in Blythe. The Census provides an occupancy rating to assess the level of under-occupancy or over-crowding at a local level. For example, within this occupancy rating, a value of -1 implies that there is one room too few and that there is overcrowding in the household. It relates the actual number of rooms to the number of rooms ‘required’ by the members of the household (based on an assessment of the relationship between household members, their ages and gender). On average just 1.5% of households in Blythe have an occupancy rating of -1 in relation to the number of bedrooms compared with the Solihull average of 2.7% and the England average of 4.8%. However, when all rooms are taken into consideration the proportion of overcrowding in Blythe is above the Solihull average (5.6% compared to 4.5%). The majority (67%) of these households are in Dickens Heath, which suggests that this measure is linked to the design of new build apartments.
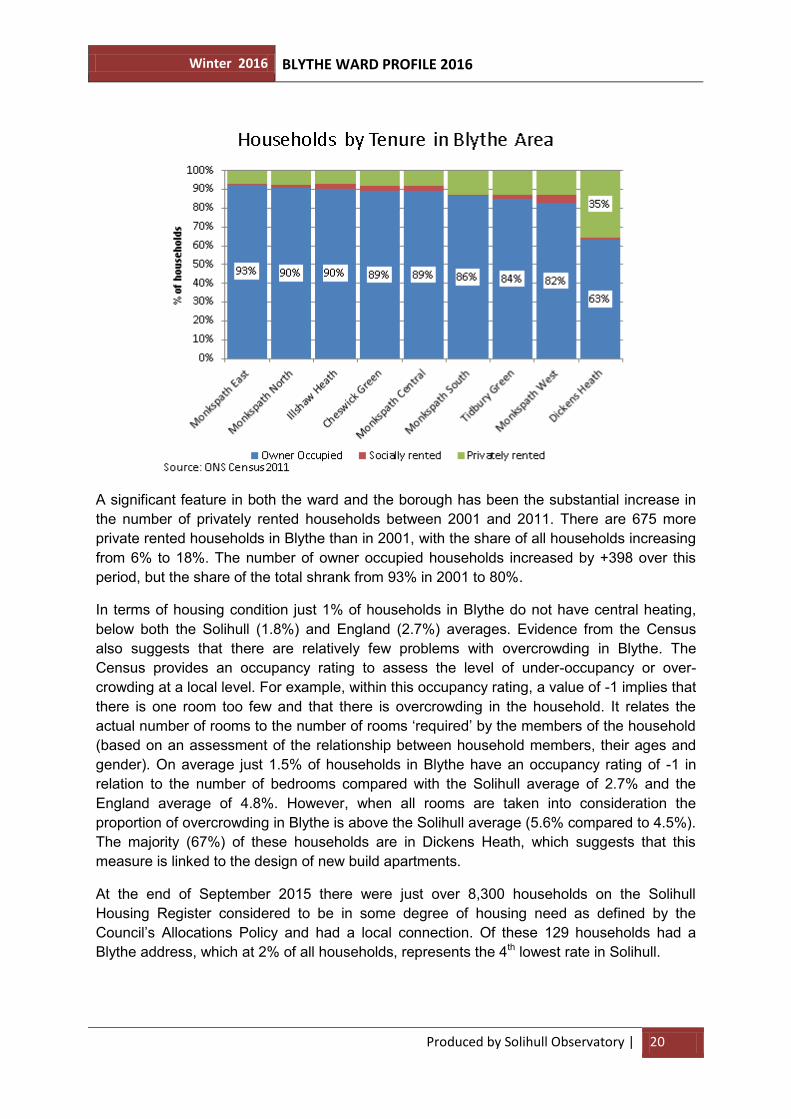
At the end of September 2015 there were just over 8,300 households on the Solihull Housing Register considered to be in some degree of housing need as defined by the Council’s Allocations Policy and had a local connection. Of these 129 households had a Blythe address, which at 2% of all households, represents the 4th lowest rate in Solihull.
Winter 2016 BLYTHE WARD PROFILE 2016
Produced by Solihull Observatory | 21
Transport
Count % of households
Blythe Blythe Solihull England
No Cars or Vans 317 5.9% 19.7% 25.8% 2 or More Cars or Vans 2,997 56.0% 40.8% 32.0% Average Cars or Vans per Household 1.68 1.34 1.16
Source: ONS Census 2011
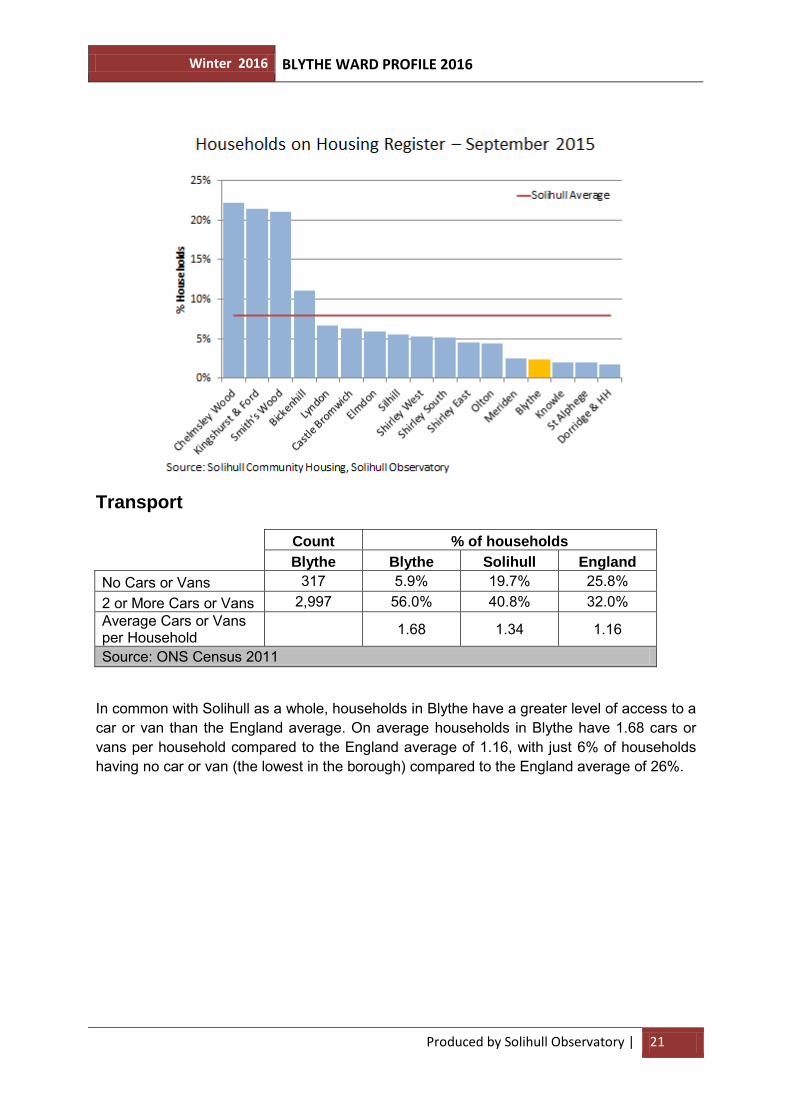
In common with Solihull as a whole, households in Blythe have a greater level of access to a car or van than the England average. On average households in Blythe have 1.68 cars or vans per household compared to the England average of 1.16, with just 6% of households having no car or van (the lowest in the borough) compared to the England average of 26%.
Winter 2016 BLYTHE WARD PROFILE 2016
Produced by Solihull Observatory | 22
Count
% 16-74 in Employment Work Who Travel to Work
Blythe Blythe Solihull England
Private Vehicle 5,863 85.4% 77.1% 67.0% Public Transport 642 9.3% 14.5% 17.9% Bicycle or Foot 321 4.7% 7.9% 14.5% Source: Census 2011
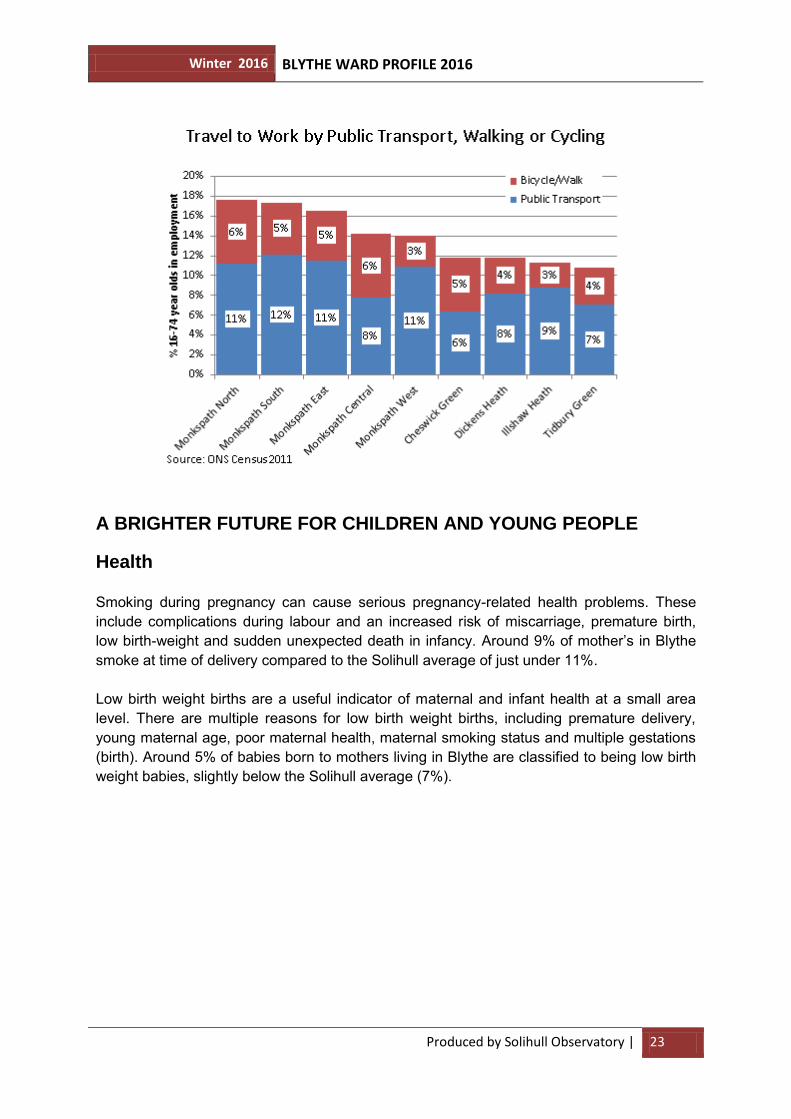
Along with location of work and availability of public transport, high levels of car ownership are a contributory factor in the way in which people travel to work. 85% of Blythe residents who travel to work do so in a private vehicle (e.g. car, van, motorcycle), above both the Solihull (77%) and England (67%) averages. Travel by public transport is the 2nd lowest in the borough (9% compared to the England average of 18%), while far fewer Blythe residents walk to work or cycle (5% compared to 15% for England). All LSOA neighbourhoods in Blythe have above England average levels of travel to work by private vehicle, although perhaps unsurprisingly use of public transport and walking or cycling are more common in the Monkspath area, which is closer to the town centre and better served by bus services, than in the more rural areas of the ward such as Tidbury Green and Illshaw Heath.
Winter 2016 BLYTHE WARD PROFILE 2016
Produced by Solihull Observatory | 23
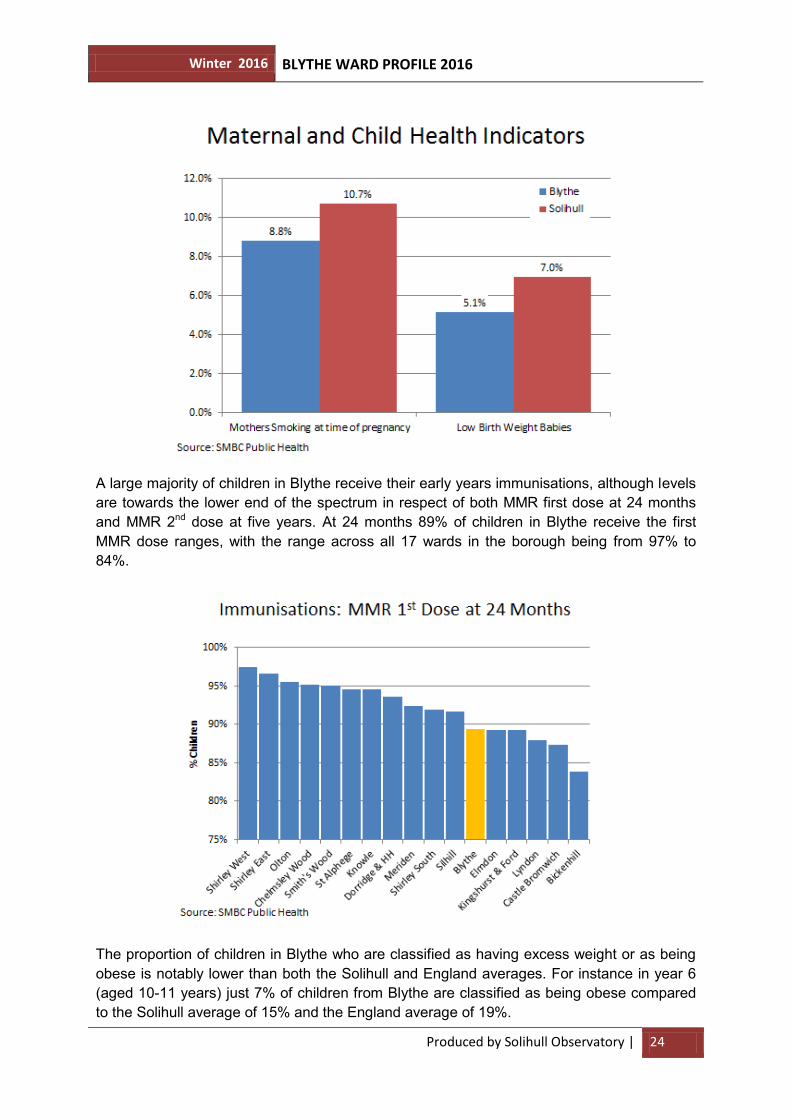
A BRIGHTER FUTURE FOR CHILDREN AND YOUNG PEOPLE Health Smoking during pregnancy can cause serious pregnancy-related health problems. These include complications during labour and an increased risk of miscarriage, premature birth, low birth-weight and sudden unexpected death in infancy. Around 9% of mother’s in Blythe smoke at time of delivery compared to the Solihull average of just under 11%. Low birth weight births are a useful indicator of maternal and infant health at a small area level. There are multiple reasons for low birth weight births, including premature delivery, young maternal age, poor maternal health, maternal smoking status and multiple gestations (birth). Around 5% of babies born to mothers living in Blythe are classified to being low birth weight babies, slightly below the Solihull average (7%).
Winter 2016 BLYTHE WARD PROFILE 2016
Produced by Solihull Observatory | 24
A large majority of children in Blythe receive their early years immunisations, although levels are towards the lower end of the spectrum in respect of both MMR first dose at 24 months and MMR 2nd dose at five years. At 24 months 89% of children in Blythe receive the first MMR dose ranges, with the range across all 17 wards in the borough being from 97% to 84%.
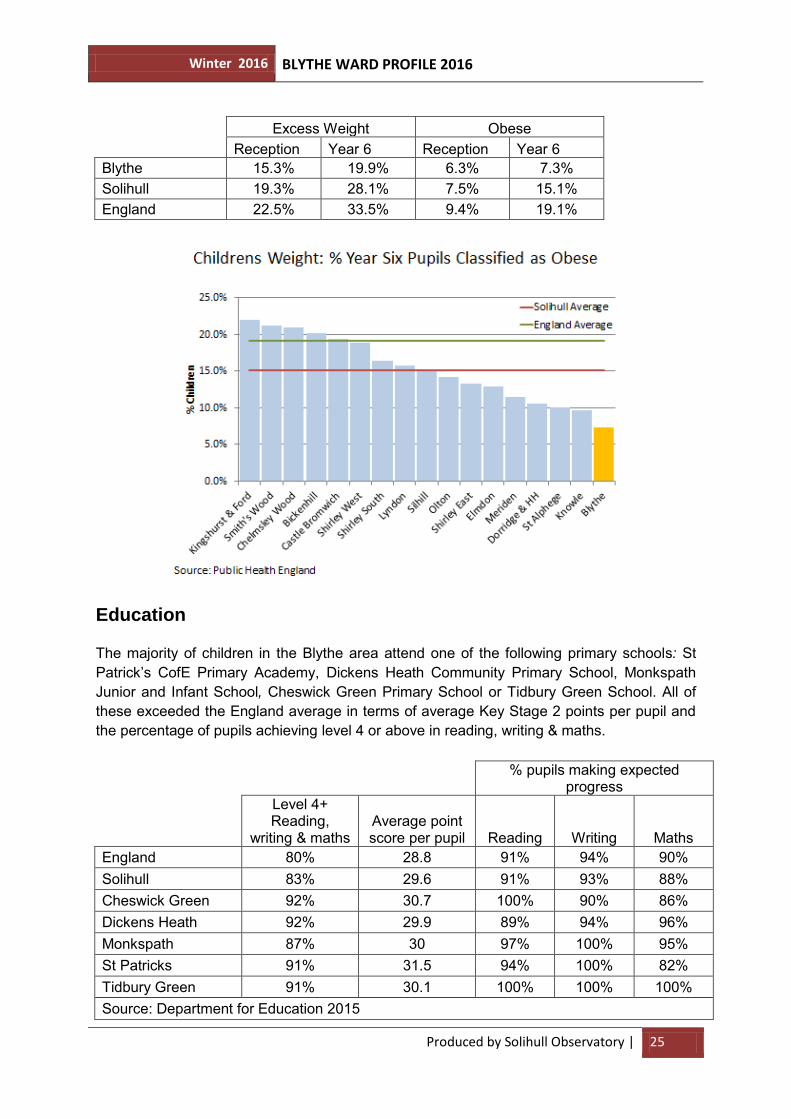
The proportion of children in Blythe who are classified as having excess weight or as being obese is notably lower than both the Solihull and England averages. For instance in year 6 (aged 10-11 years) just 7% of children from Blythe are classified as being obese compared to the Solihull average of 15% and the England average of 19%.
Winter 2016 BLYTHE WARD PROFILE 2016
Produced by Solihull Observatory | 25
Excess Weight Obese
Reception Year 6 Reception Year 6
Blythe 15.3% 19.9% 6.3% 7.3% Solihull 19.3% 28.1% 7.5% 15.1% England 22.5% 33.5% 9.4% 19.1%
Education The majority of children in the Blythe area attend one of the following primary schools: St Patrick’s CofE Primary Academy, Dickens Heath Community Primary School, Monkspath Junior and Infant School, Cheswick Green Primary School or Tidbury Green School. All of these exceeded the England average in terms of average Key Stage 2 points per pupil and the percentage of pupils achieving level 4 or above in reading, writing & maths.
% pupils making expected progress
Level 4+ Reading,
writing & maths Average point score per pupil Reading Writing Maths
England 80% 28.8 91% 94% 90% Solihull 83% 29.6 91% 93% 88% Cheswick Green 92% 30.7 100% 90% 86% Dickens Heath 92% 29.9 89% 94% 96% Monkspath 87% 30 97% 100% 95% St Patricks 91% 31.5 94% 100% 82% Tidbury Green 91% 30.1 100% 100% 100% Source: Department for Education 2015
Winter 2016 BLYTHE WARD PROFILE 2016
Produced by Solihull Observatory | 26
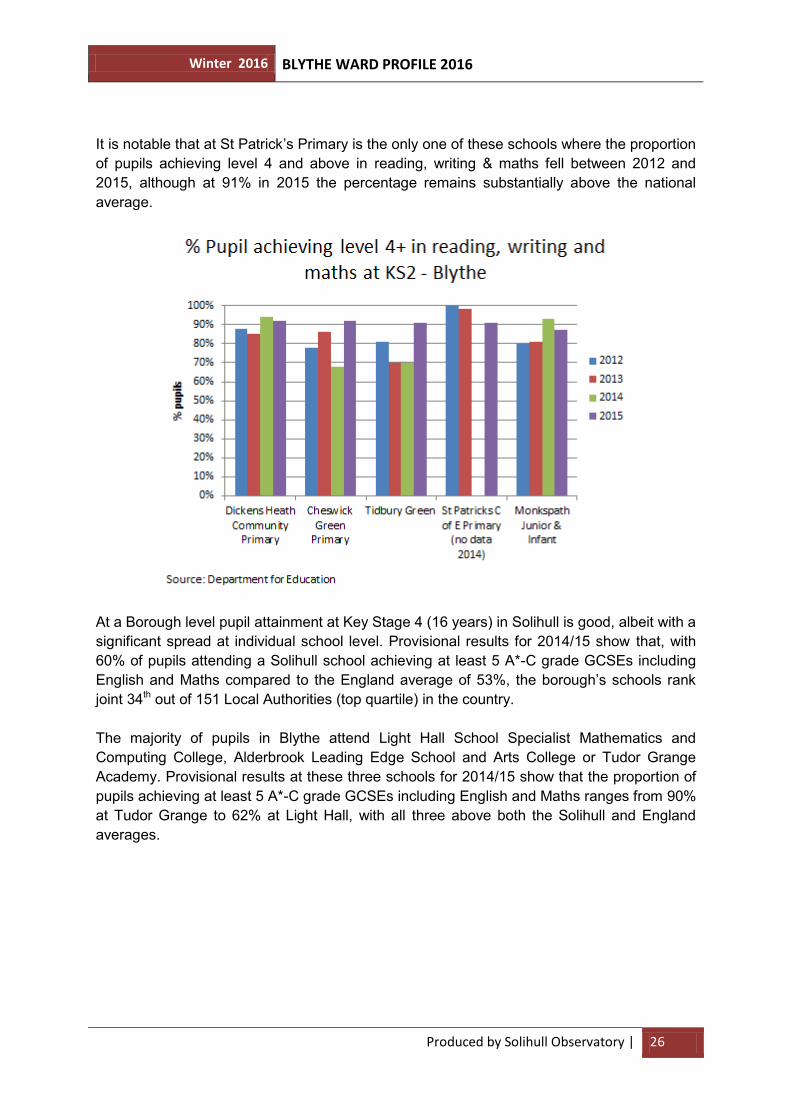
It is notable that at St Patrick’s Primary is the only one of these schools where the proportion of pupils achieving level 4 and above in reading, writing & maths fell between 2012 and 2015, although at 91% in 2015 the percentage remains substantially above the national average.
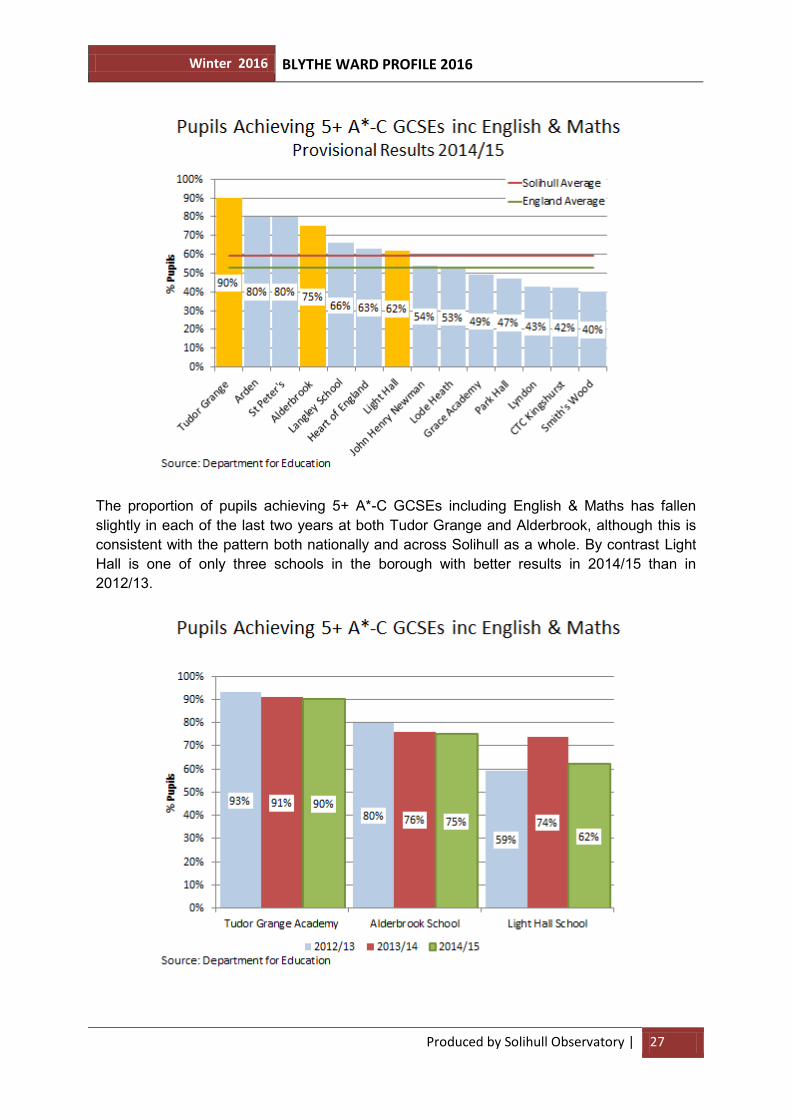
At a Borough level pupil attainment at Key Stage 4 (16 years) in Solihull is good, albeit with a significant spread at individual school level. Provisional results for 2014/15 show that, with 60% of pupils attending a Solihull school achieving at least 5 A*-C grade GCSEs including English and Maths compared to the England average of 53%, the borough’s schools rank joint 34th out of 151 Local Authorities (top quartile) in the country. The majority of pupils in Blythe attend Light Hall School Specialist Mathematics and Computing College, Alderbrook Leading Edge School and Arts College or Tudor Grange Academy. Provisional results at these three schools for 2014/15 show that the proportion of pupils achieving at least 5 A*-C grade GCSEs including English and Maths ranges from 90% at Tudor Grange to 62% at Light Hall, with all three above both the Solihull and England averages.
Winter 2016 BLYTHE WARD PROFILE 2016
Produced by Solihull Observatory | 27
The proportion of pupils achieving 5+ A*-C GCSEs including English & Maths has fallen slightly in each of the last two years at both Tudor Grange and Alderbrook, although this is consistent with the pattern both nationally and across Solihull as a whole. By contrast Light Hall is one of only three schools in the borough with better results in 2014/15 than in 2012/13.
Winter 2016 BLYTHE WARD PROFILE 2016
Produced by Solihull Observatory | 28
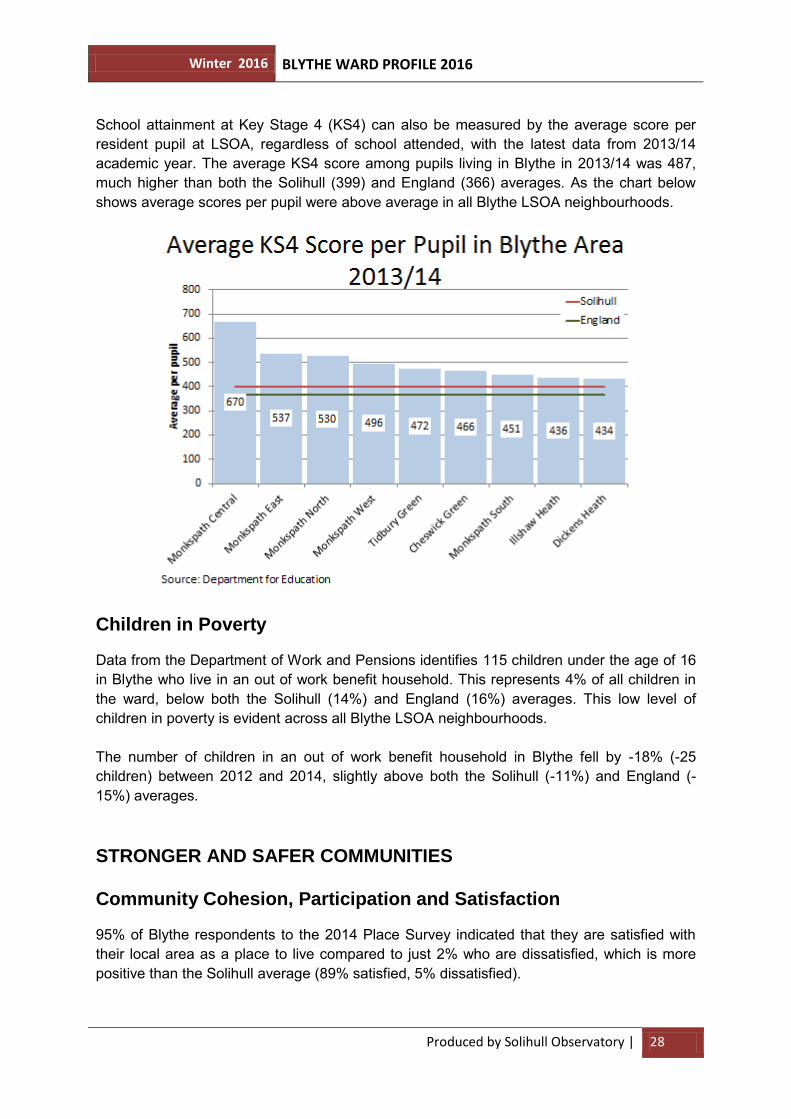
School attainment at Key Stage 4 (KS4) can also be measured by the average score per resident pupil at LSOA, regardless of school attended, with the latest data from 2013/14 academic year. The average KS4 score among pupils living in Blythe in 2013/14 was 487, much higher than both the Solihull (399) and England (366) averages. As the chart below shows average scores per pupil were above average in all Blythe LSOA neighbourhoods.
Children in Poverty Data from the Department of Work and Pensions identifies 115 children under the age of 16 in Blythe who live in an out of work benefit household. This represents 4% of all children in the ward, below both the Solihull (14%) and England (16%) averages. This low level of children in poverty is evident across all Blythe LSOA neighbourhoods. The number of children in an out of work benefit household in Blythe fell by -18% (-25 children) between 2012 and 2014, slightly above both the Solihull (-11%) and England (-15%) averages.
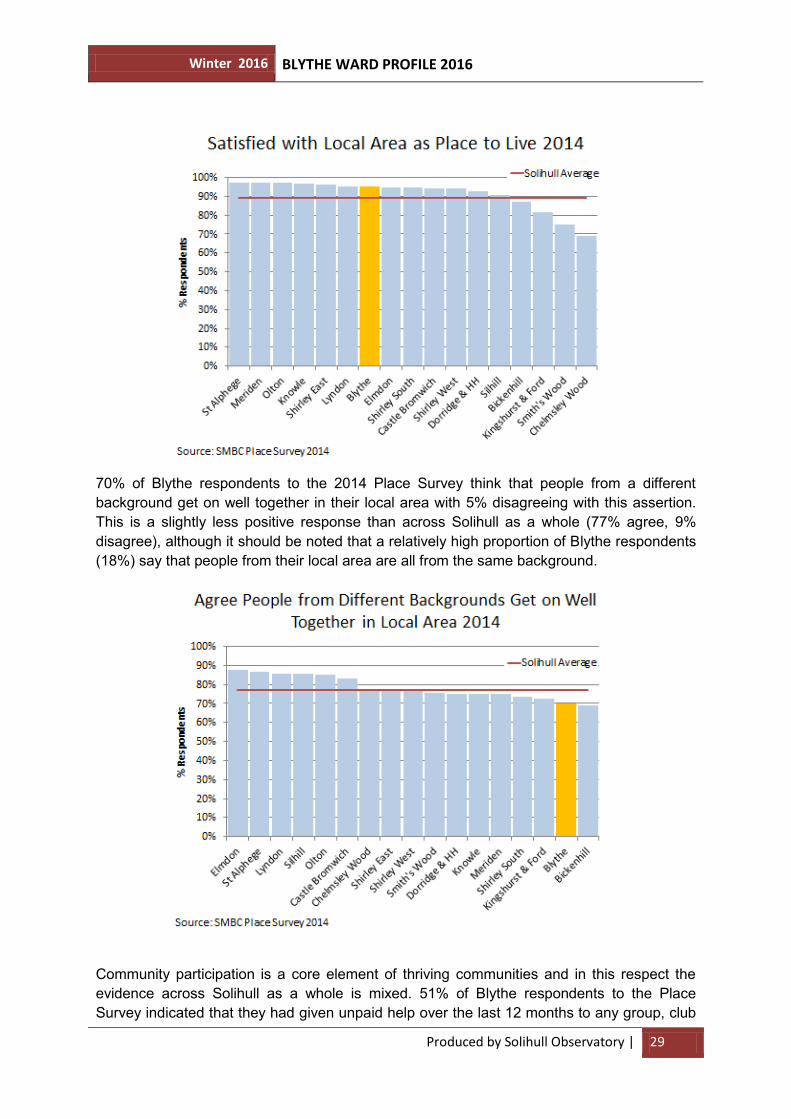
STRONGER AND SAFER COMMUNITIES Community Cohesion, Participation and Satisfaction 95% of Blythe respondents to the 2014 Place Survey indicated that they are satisfied with their local area as a place to live compared to just 2% who are dissatisfied, which is more positive than the Solihull average (89% satisfied, 5% dissatisfied).
Winter 2016 BLYTHE WARD PROFILE 2016
Produced by Solihull Observatory | 29
70% of Blythe respondents to the 2014 Place Survey think that people from a different background get on well together in their local area with 5% disagreeing with this assertion. This is a slightly less positive response than across Solihull as a whole (77% agree, 9% disagree), although it should be noted that a relatively high proportion of Blythe respondents (18%) say that people from their local area are all from the same background.
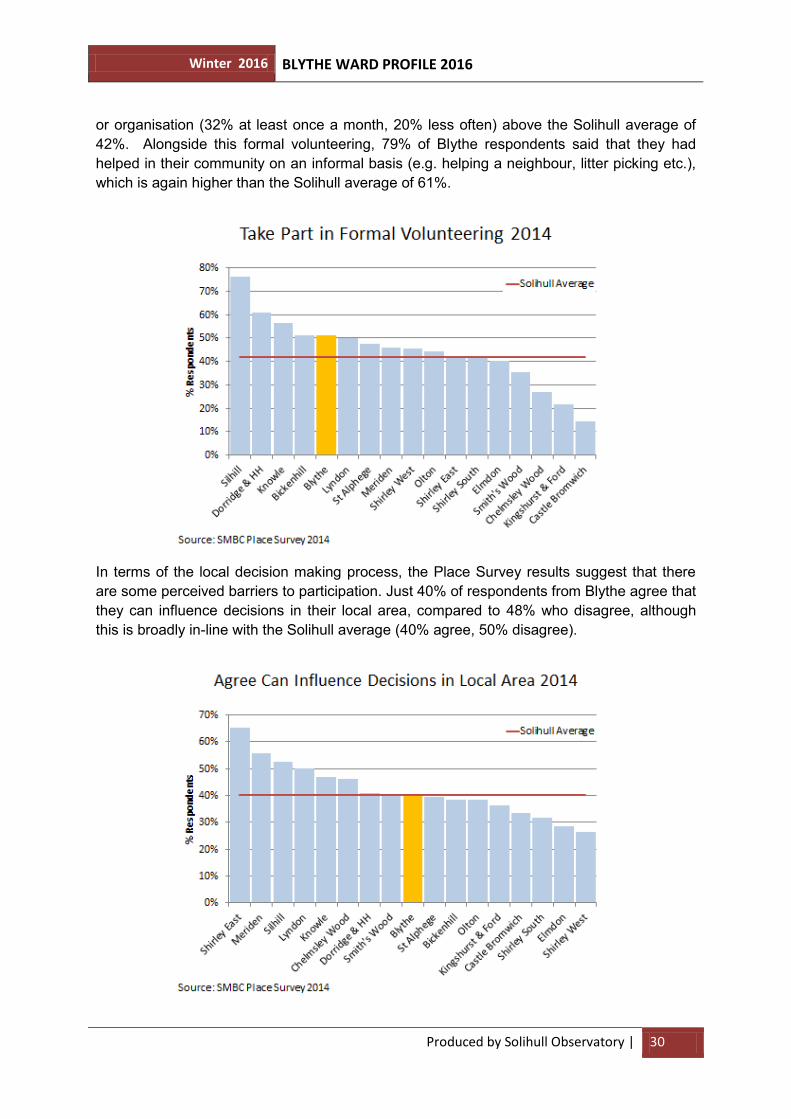
Community participation is a core element of thriving communities and in this respect the evidence across Solihull as a whole is mixed. 51% of Blythe respondents to the Place Survey indicated that they had given unpaid help over the last 12 months to any group, club
Winter 2016 BLYTHE WARD PROFILE 2016
Produced by Solihull Observatory | 30
or organisation (32% at least once a month, 20% less often) above the Solihull average of 42%. Alongside this formal volunteering, 79% of Blythe respondents said that they had helped in their community on an informal basis (e.g. helping a neighbour, litter picking etc.), which is again higher than the Solihull average of 61%.
In terms of the local decision making process, the Place Survey results suggest that there are some perceived barriers to participation. Just 40% of respondents from Blythe agree that they can influence decisions in their local area, compared to 48% who disagree, although this is broadly in-line with the Solihull average (40% agree, 50% disagree).
Winter 2016 BLYTHE WARD PROFILE 2016
Produced by Solihull Observatory | 31
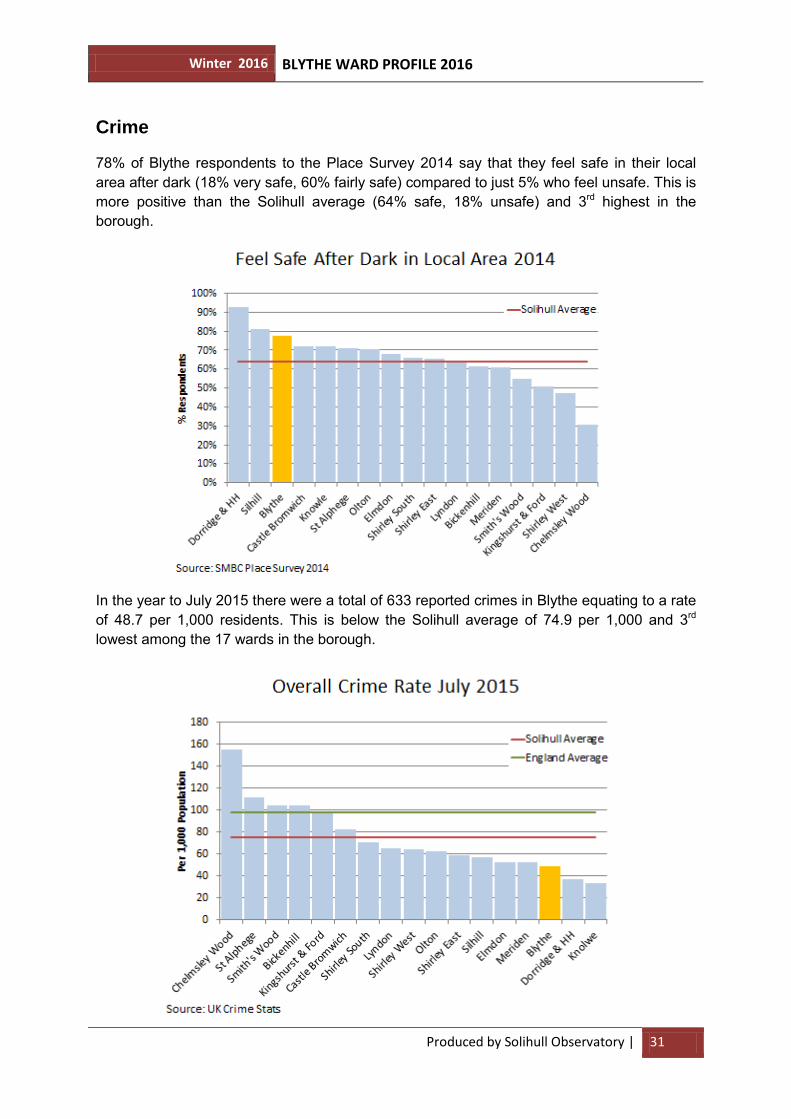
Crime 78% of Blythe respondents to the Place Survey 2014 say that they feel safe in their local area after dark (18% very safe, 60% fairly safe) compared to just 5% who feel unsafe. This is more positive than the Solihull average (64% safe, 18% unsafe) and 3rd highest in the borough.
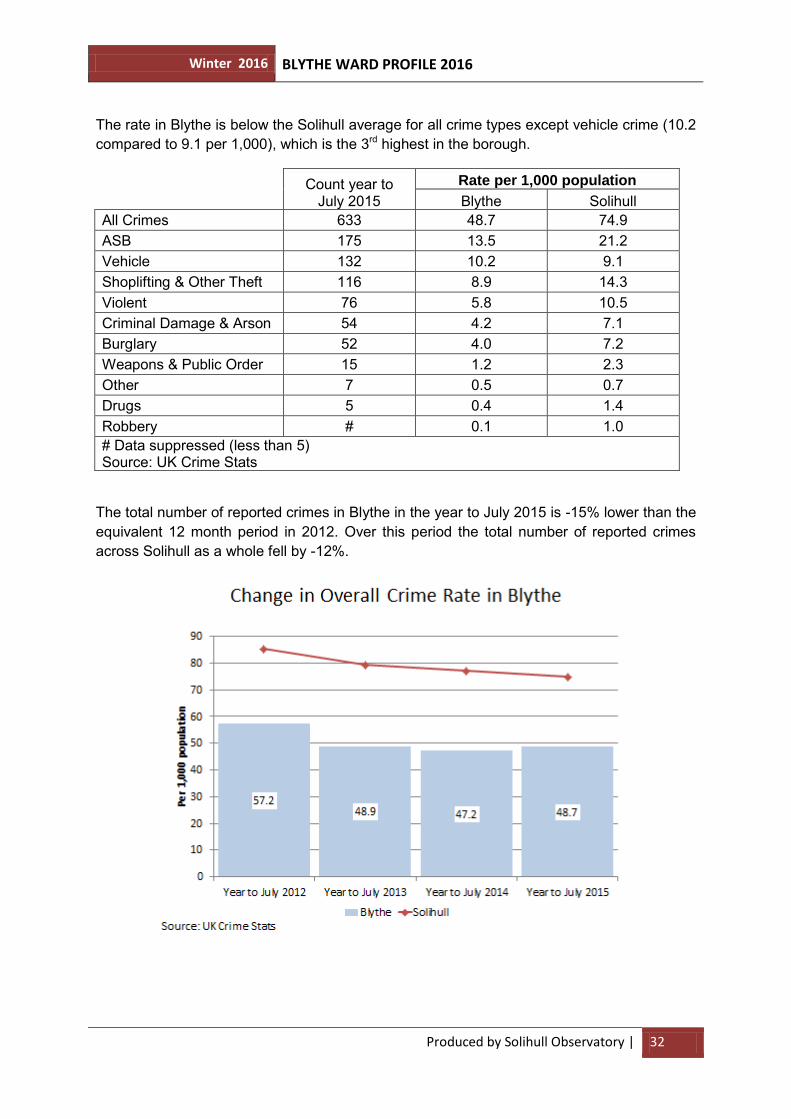
In the year to July 2015 there were a total of 633 reported crimes in Blythe equating to a rate of 48.7 per 1,000 residents. This is below the Solihull average of 74.9 per 1,000 and 3rd lowest among the 17 wards in the borough.
Winter 2016 BLYTHE WARD PROFILE 2016
Produced by Solihull Observatory | 32
The rate in Blythe is below the Solihull average for all crime types except vehicle crime (10.2 compared to 9.1 per 1,000), which is the 3rd highest in the borough.
Count year to
July 2015 Rate per 1,000 population
Blythe Solihull
All Crimes 633 48.7 74.9 ASB 175 13.5 21.2 Vehicle 132 10.2 9.1 Shoplifting & Other Theft 116 8.9 14.3 Violent 76 5.8 10.5 Criminal Damage & Arson 54 4.2 7.1 Burglary 52 4.0 7.2 Weapons & Public Order 15 1.2 2.3 Other 7 0.5 0.7 Drugs 5 0.4 1.4 Robbery # 0.1 1.0 # Data suppressed (less than 5) Source: UK Crime Stats
The total number of reported crimes in Blythe in the year to July 2015 is -15% lower than the equivalent 12 month period in 2012. Over this period the total number of reported crimes across Solihull as a whole fell by -12%.
Winter 2016 BLYTHE WARD PROFILE 2016
Produced by Solihull Observatory | 33
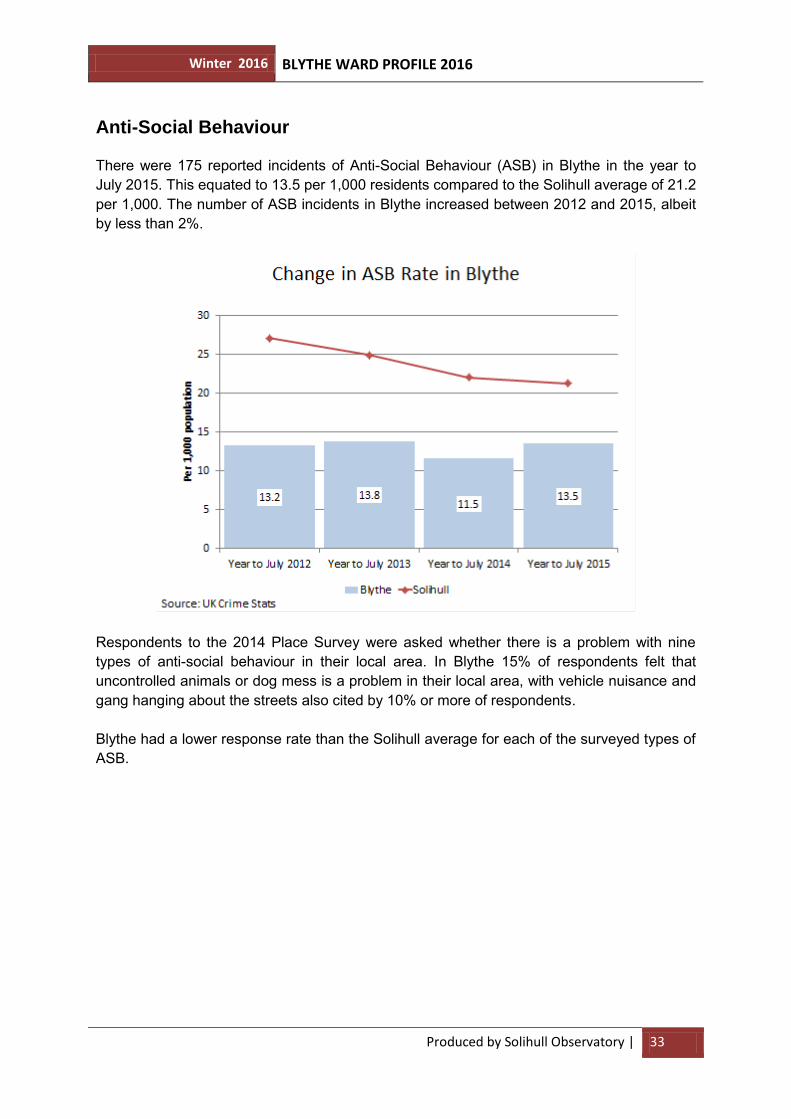
Anti-Social Behaviour There were 175 reported incidents of Anti-Social Behaviour (ASB) in Blythe in the year to July 2015. This equated to 13.5 per 1,000 residents compared to the Solihull average of 21.2 per 1,000. The number of ASB incidents in Blythe increased between 2012 and 2015, albeit by less than 2%.
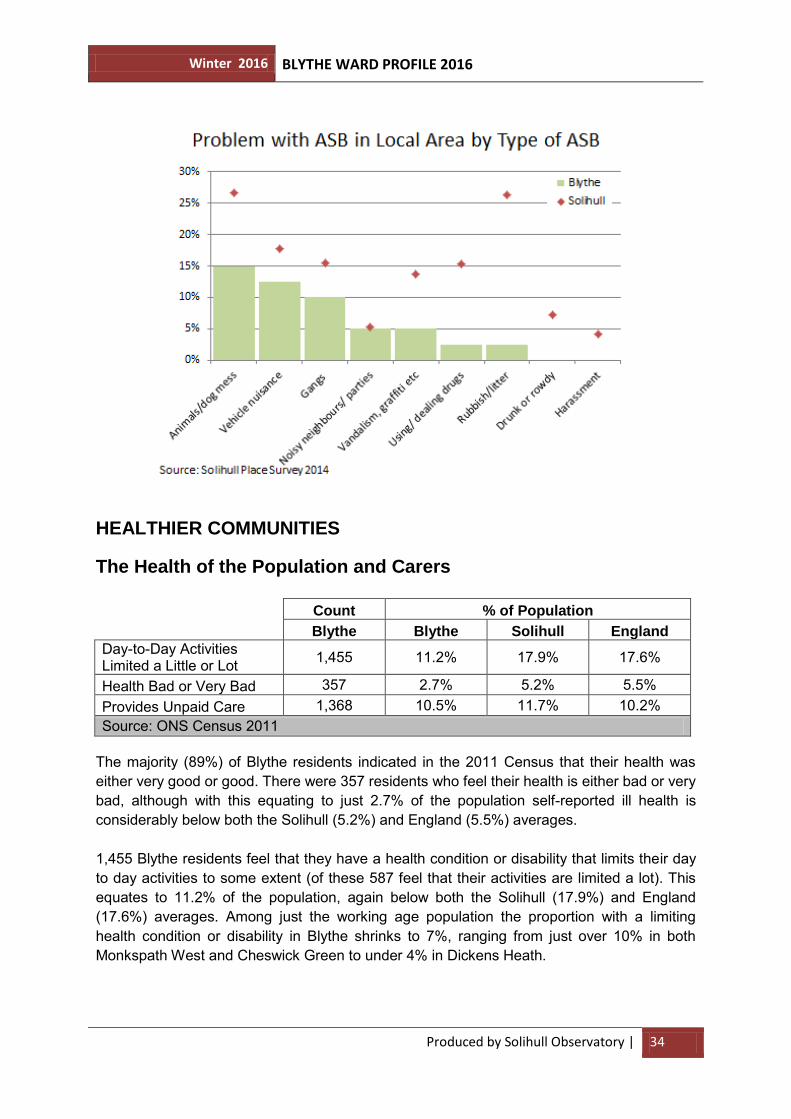
Respondents to the 2014 Place Survey were asked whether there is a problem with nine types of anti-social behaviour in their local area. In Blythe 15% of respondents felt that uncontrolled animals or dog mess is a problem in their local area, with vehicle nuisance and gang hanging about the streets also cited by 10% or more of respondents. Blythe had a lower response rate than the Solihull average for each of the surveyed types of ASB.
Winter 2016 BLYTHE WARD PROFILE 2016
Produced by Solihull Observatory | 34
HEALTHIER COMMUNITIES The Health of the Population and Carers
Count % of Population
Blythe Blythe Solihull England
Day-to-Day Activities Limited a Little or Lot 1,455 11.2% 17.9% 17.6%
Health Bad or Very Bad 357 2.7% 5.2% 5.5% Provides Unpaid Care 1,368 10.5% 11.7% 10.2% Source: ONS Census 2011
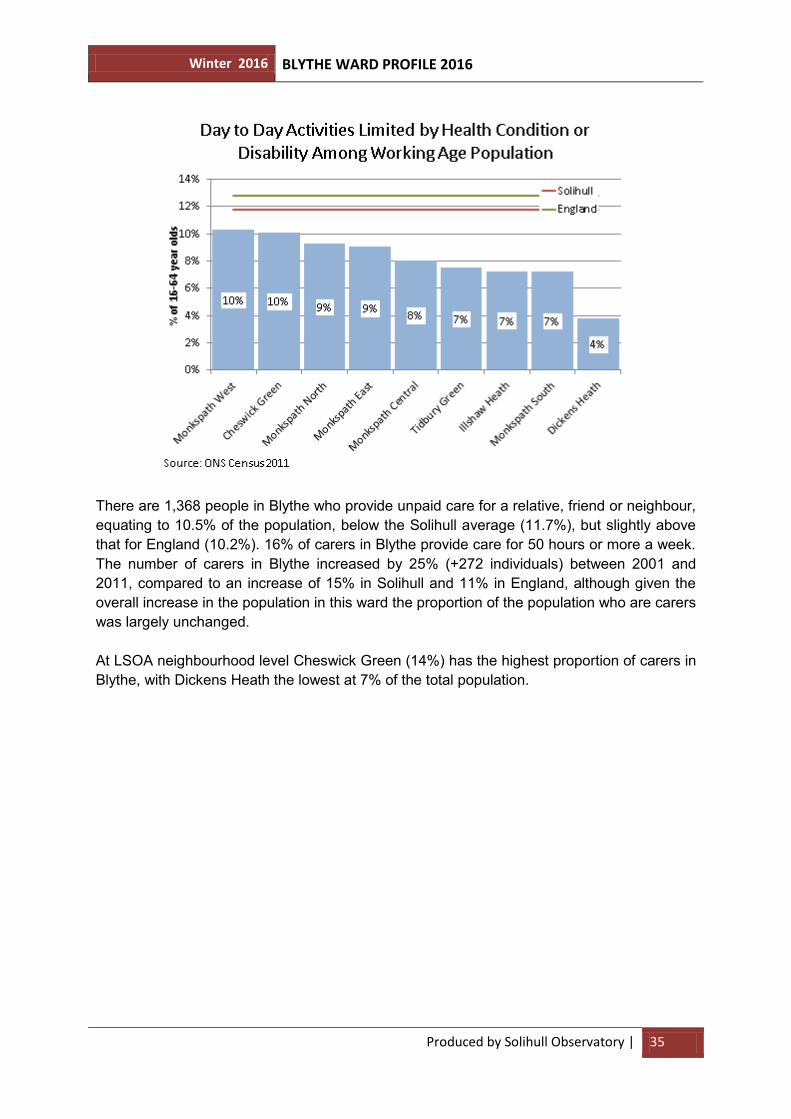
The majority (89%) of Blythe residents indicated in the 2011 Census that their health was either very good or good. There were 357 residents who feel their health is either bad or very bad, although with this equating to just 2.7% of the population self-reported ill health is considerably below both the Solihull (5.2%) and England (5.5%) averages. 1,455 Blythe residents feel that they have a health condition or disability that limits their day to day activities to some extent (of these 587 feel that their activities are limited a lot). This equates to 11.2% of the population, again below both the Solihull (17.9%) and England (17.6%) averages. Among just the working age population the proportion with a limiting health condition or disability in Blythe shrinks to 7%, ranging from just over 10% in both Monkspath West and Cheswick Green to under 4% in Dickens Heath.
Winter 2016 BLYTHE WARD PROFILE 2016
Produced by Solihull Observatory | 35
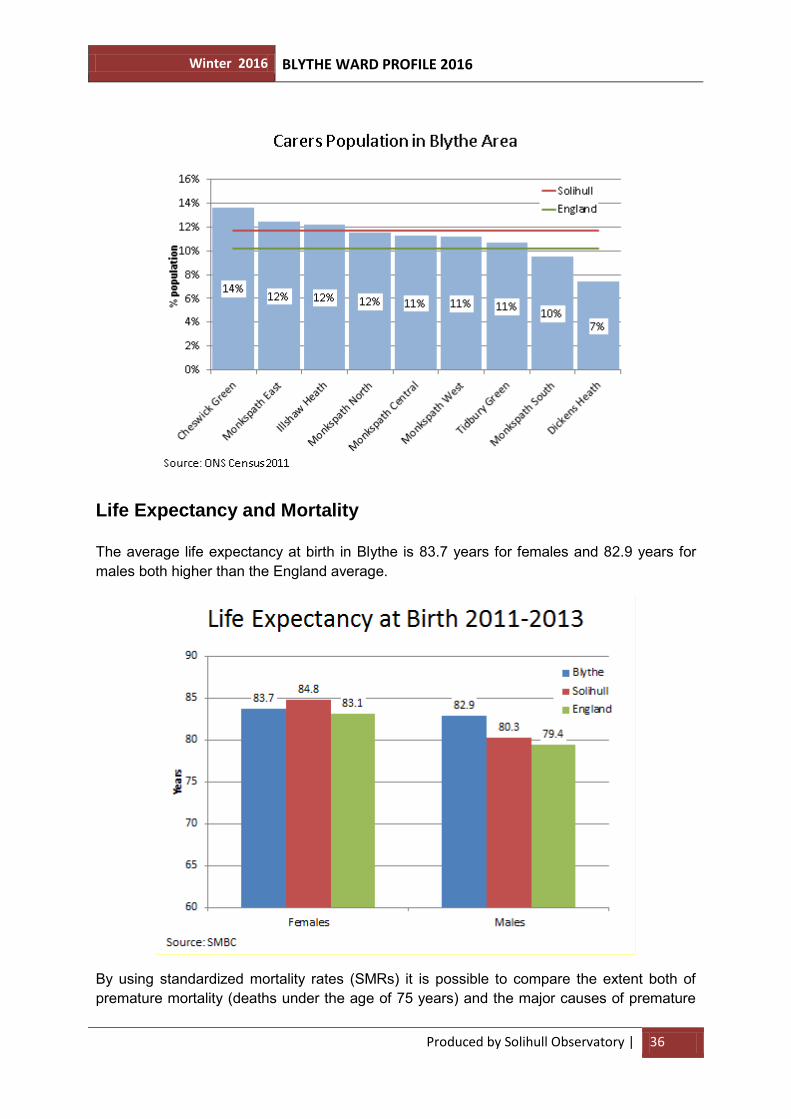
There are 1,368 people in Blythe who provide unpaid care for a relative, friend or neighbour, equating to 10.5% of the population, below the Solihull average (11.7%), but slightly above that for England (10.2%). 16% of carers in Blythe provide care for 50 hours or more a week. The number of carers in Blythe increased by 25% (+272 individuals) between 2001 and 2011, compared to an increase of 15% in Solihull and 11% in England, although given the overall increase in the population in this ward the proportion of the population who are carers was largely unchanged. At LSOA neighbourhood level Cheswick Green (14%) has the highest proportion of carers in Blythe, with Dickens Heath the lowest at 7% of the total population.
Winter 2016 BLYTHE WARD PROFILE 2016
Produced by Solihull Observatory | 36
Life Expectancy and Mortality The average life expectancy at birth in Blythe is 83.7 years for females and 82.9 years for males both higher than the England average.
By using standardized mortality rates (SMRs) it is possible to compare the extent both of premature mortality (deaths under the age of 75 years) and the major causes of premature
Winter 2016 BLYTHE WARD PROFILE 2016
Produced by Solihull Observatory | 37
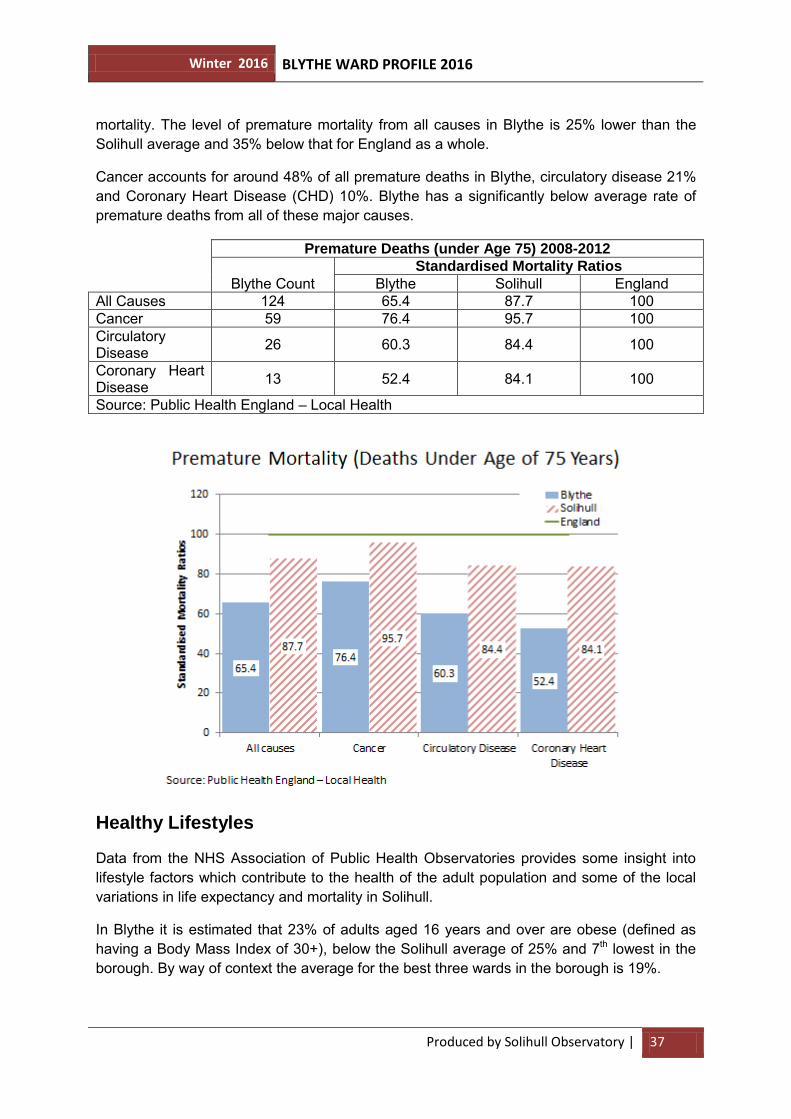
mortality. The level of premature mortality from all causes in Blythe is 25% lower than the Solihull average and 35% below that for England as a whole.
Cancer accounts for around 48% of all premature deaths in Blythe, circulatory disease 21% and Coronary Heart Disease (CHD) 10%. Blythe has a significantly below average rate of premature deaths from all of these major causes.
Premature Deaths (under Age 75) 2008-2012
Blythe Count
Standardised Mortality Ratios
Blythe Solihull England All Causes 124 65.4 87.7 100 Cancer 59 76.4 95.7 100 Circulatory Disease 26 60.3 84.4 100
Coronary Heart Disease 13 52.4 84.1 100
Source: Public Health England – Local Health
Healthy Lifestyles
Data from the NHS Association of Public Health Observatories provides some insight into lifestyle factors which contribute to the health of the adult population and some of the local variations in life expectancy and mortality in Solihull.
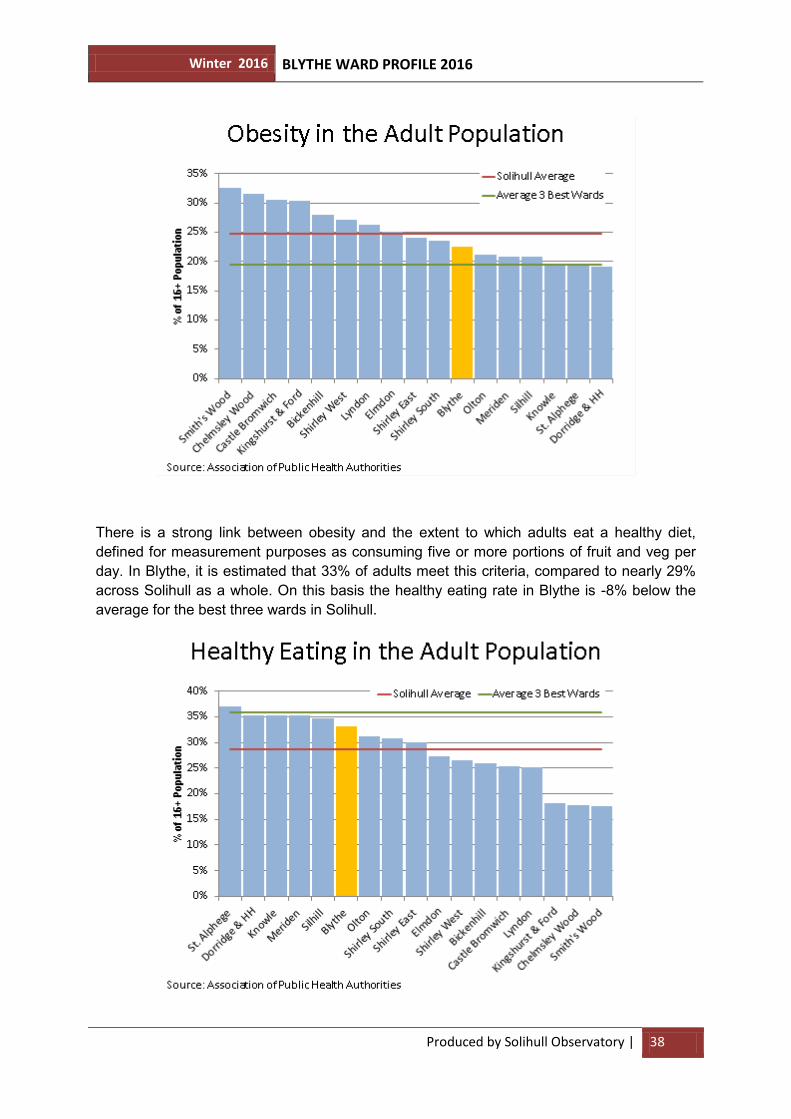
In Blythe it is estimated that 23% of adults aged 16 years and over are obese (defined as having a Body Mass Index of 30+), below the Solihull average of 25% and 7th lowest in the borough. By way of context the average for the best three wards in the borough is 19%.
Winter 2016 BLYTHE WARD PROFILE 2016
Produced by Solihull Observatory | 38
There is a strong link between obesity and the extent to which adults eat a healthy diet, defined for measurement purposes as consuming five or more portions of fruit and veg per day. In Blythe, it is estimated that 33% of adults meet this criteria, compared to nearly 29% across Solihull as a whole. On this basis the healthy eating rate in Blythe is -8% below the average for the best three wards in Solihull.
Winter 2016 BLYTHE WARD PROFILE 2016
Produced by Solihull Observatory | 39
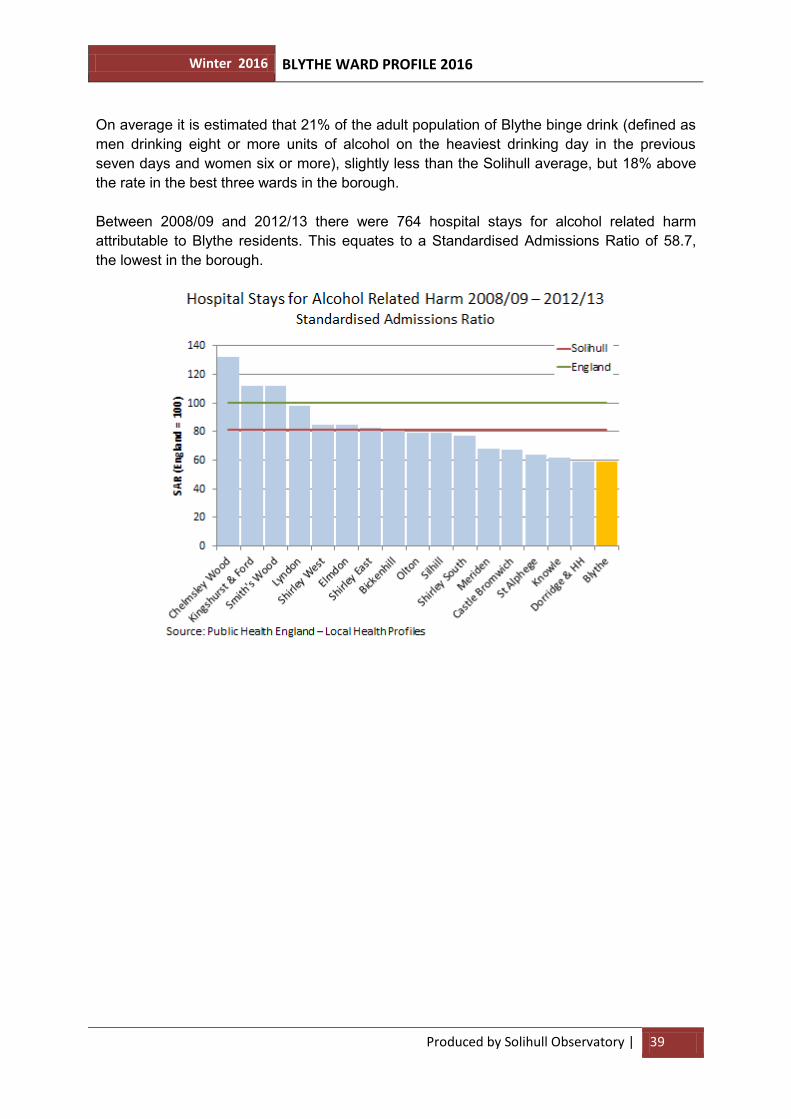
On average it is estimated that 21% of the adult population of Blythe binge drink (defined as men drinking eight or more units of alcohol on the heaviest drinking day in the previous seven days and women six or more), slightly less than the Solihull average, but 18% above the rate in the best three wards in the borough.
Between 2008/09 and 2012/13 there were 764 hospital stays for alcohol related harm attributable to Blythe residents. This equates to a Standardised Admissions Ratio of 58.7, the lowest in the borough.
Winter 2016 BLYTHE WARD PROFILE 2016
Produced by Solihull Observatory | 40
WARD CONTACTS AND KEY INFORMATION
Ward Members
Councillor Richard Holt (Con)
Councillor Ken Hawkins (Con)
Councillor James Butler (Conservative)
Solihull Observatory – Technical Support and Advice
Gary Baker – Senior Information Analyst
[email protected] 0121 704 8482 James Roberts – Information Analyst
[email protected] 0121 704 6884