2015 - development bank supervision report
TRANSCRIPT
Development Bank Supervision Report
2015
Nepal Rastra Bank
Baluwatar, Kathmandu, Nepal
July 2015
© 2015 by Nepal Rastra Bank
All rights reserved. No part of this work may be reproduced or copied in any form or by any
means – graphic, electronic, mechanical, including photocopying, recording, taping or
information and retrieval system without fully acknowledging Nepal Rasta Bank, Development
Bank Supervision Department as a source. All enquires and suggestions can be communicated to
the details mentioned below:
Development Bank Supervision Department
Nepal Rastra Bank,
Central Office,
Baluwatar, Kathmandu,
Nepal
P.O. Box No.73
E-mail: [email protected]
Table of Contents
I. AN OVERVIEW OF DEVELOPMENT BANKS IN NEPAL ..................................................... 1
Nepal Rastra Bank as a Regulator and Supervisor .................................................................................. 3
The Development Banks Presence ......................................................................................................... 4
Assets Share of Banks and Financial Institutions .................................................................................... 5
Existing Acts, By-laws and Guidelines ..................................................................................................... 6
II. DEVELOPMENT BANK SUPERVISION .................................................................................... 7
Supervision Function ............................................................................................................................... 7
Development Bank Supervision Department ......................................................................................... 7
Supervision Methodology ....................................................................................................................... 7
Organization of Development Bank Supervision Department ............................................................... 7
On-site Inspection ............................................................................................................................... 8
Off-site Supervision ........................................................................................................................... 10
Cash Reserve Ratio ............................................................................................................................ 12
Direct Lending ................................................................................................................................... 12
Statutory Liquidity Ratio ................................................................................................................... 12
Capital Adequacy Ratio ..................................................................................................................... 13
Policy, Planning and Analysis Unit .................................................................................................... 13
Internal Administration ..................................................................................................................... 13
III. OPERATIONAL PERFORMANCE OF DEVELOPMENT BANKS ................................... 14
Assets of the Development Banks ........................................................................................................ 14
Composition of Assets .......................................................................................................................... 14
Composition of Liabilities ...................................................................................................................... 15
Capital ................................................................................................................................................... 16
Deposits ................................................................................................................................................ 16
Loan and Advances ............................................................................................................................... 17
Sector-wise Loan and Advances ............................................................................................................ 18
Security-wise Loan and Advances ......................................................................................................... 18
Product-wise Loan and Advances ......................................................................................................... 19
Non- Performing Loans ......................................................................................................................... 20
Non-Banking Assets .............................................................................................................................. 20
Investment ............................................................................................................................................ 21
Earnings ................................................................................................................................................. 22
Liquidity ................................................................................................................................................. 22
Deprived Sector .................................................................................................................................... 23
Actions and Penalties ............................................................................................................................ 24
IV. NATIONAL INITIATIVES, ISSUES AND CHALLENGES IN SUPERVISION ................. 25
NATIONAL INITIATIVES AND DEVELOPMENTS ...................................................................................... 25
Special Inspection of Financial Institutions ....................................................................................... 25
Transition to NFRS ............................................................................................................................. 25
Financial Sector Assessment Program .............................................................................................. 25
Implementation of Supervisory Information System ....................................................................... 25
Business Continuity Plan in Banks and Financial Institutions ........................................................... 26
ISSUES AND CHALLENGES .......................................................................................................... 26
Urban concentration: ...................................................................................................................... 26
Enhancing Capability of Development Banks: ...................................................................................... 26
Strengthening Supervisory Capacity ..................................................................................................... 26
Financial inclusion and rural penetration ............................................................................................. 26
Corporate Governance .......................................................................................................................... 27
Operational Risks .................................................................................................................................. 27
Multiple Banking ................................................................................................................................... 27
Consolidation in banking industry .................................................................................................... 27
Proactive practices on AML/ CFT Guidelines .................................................................................... 27
Excess Liquidity ................................................................................................................................. 28
Shadow Banking ................................................................................................................................ 28
Adoption of NFRS .............................................................................................................................. 28
Development of Proactive Banking Industry .................................................................................... 28
Annexes .........................................................................................................................................................i
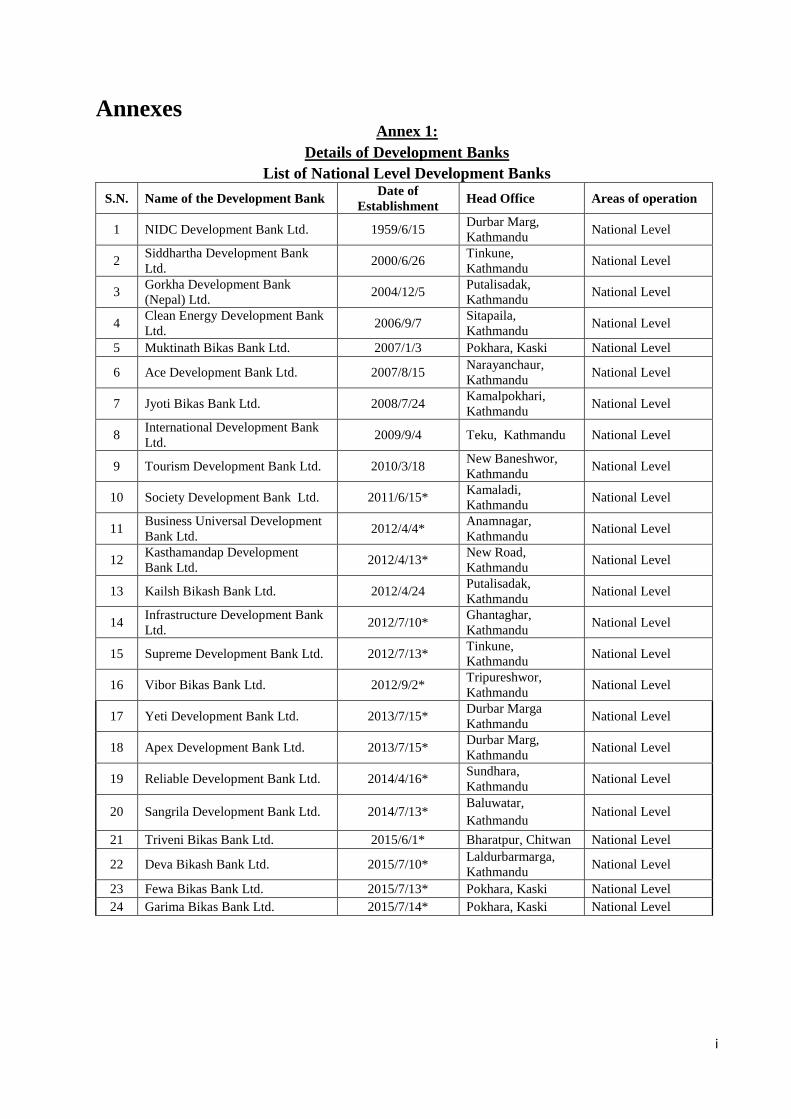
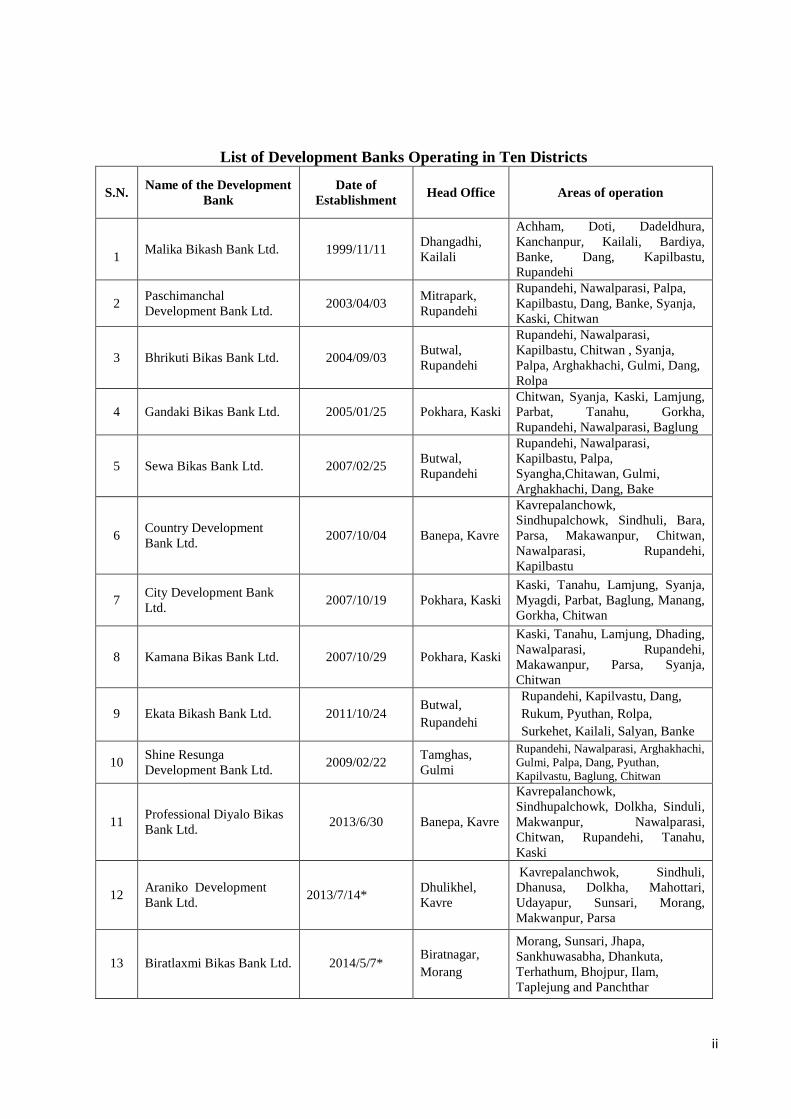
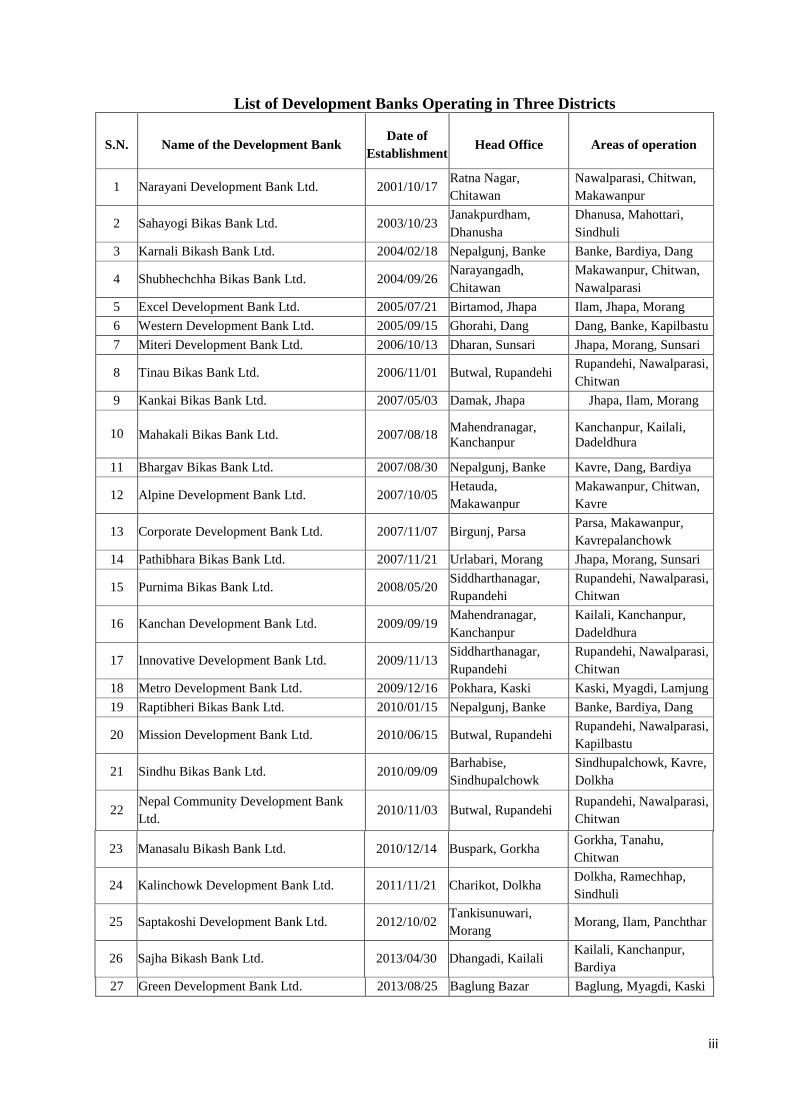
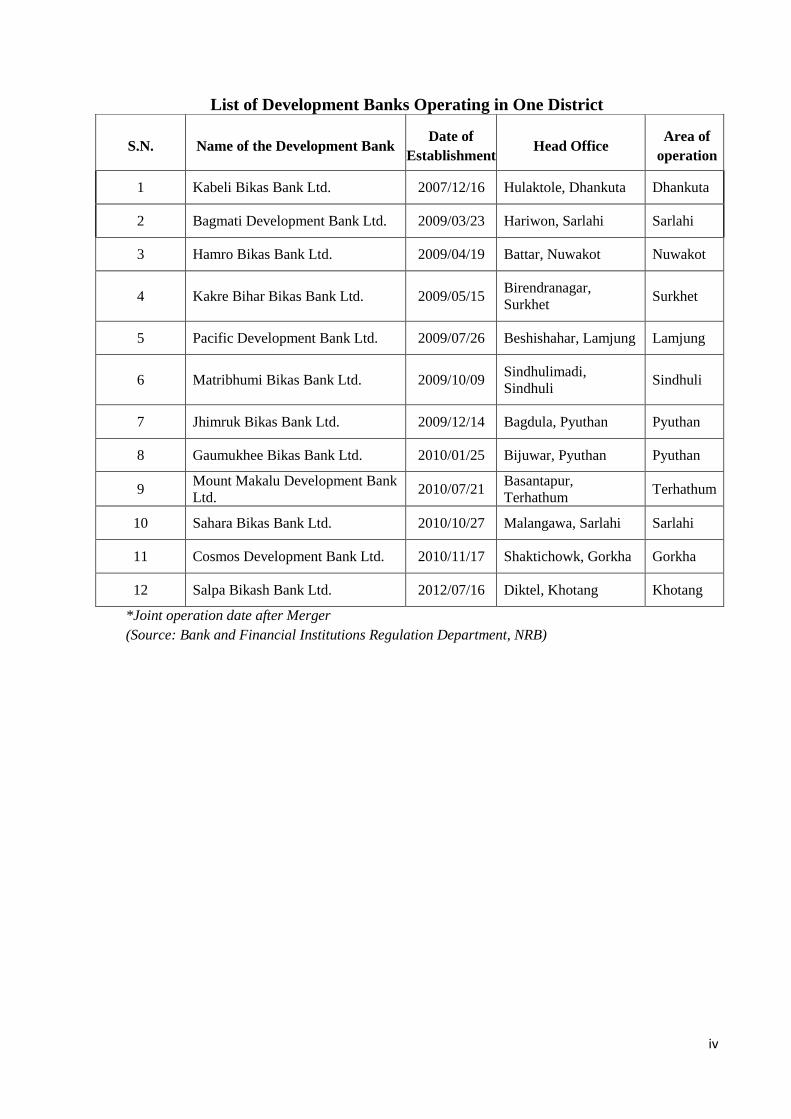
Annex 1: Details of Development Banks ...................................................................................................i
Annex 2: Inspection of Development Banks (FY 2014/15) ...................................................................... v
Annex 3: Targeted Inspection of Development Banks (FY 2014/15) ..................................................... vii
Annex 4: Special Inspection of Development Banks (FY 2014/15) ........................................................ vii
Annex 5: Follow up Inspection of Development Banks (FY 2014/15) .................................................... vii
Annex 6: International Training and Seminar Participation from DBSD (FY 2014/15) ......................... viii
Annex 7: Main Circulars issued to Bank and Financial Institutions (FY 2014/15) ................................... ix
Annex 8: Organization Chart of Development Bank Supervision Department ........................................ x
Annex 9: Industry Statistics ..................................................................................................................... xi
Annex 9.1: DB's Operations: (Mid July 2014) ...................................................................................... xi
Annex 9.2: Capital Fund ...................................................................................................................... xi
Annex 9.3: Deposit Mix ....................................................................................................................... xi
Annex 9.4: Non Performing Loan ........................................................................................................ xi
Annex 9.5: Non Banking Assets .......................................................................................................... xii
Annex 9.6: Investment ....................................................................................................................... xii
Annex 9.7: Liquid assets to Deposits & Liquid assets to total assets ................................................. xii
Annex 9.8: Operation efficiency of Development Banks ................................................................... xii
Annex 9.9: Consolidated financial figures of Development Banks ................................................... xiii
List of Figures
Figure 1.1: Growth of Development Banks ................................................................................... 2
Figure 1.2: District and Zonal presence of DB's (Mid July, 2015) .................................................. 4
Figure 1.3: Region wise distribution of Number of DB Branches (Mid July 2015) ........................ 5
Figure 3.1: Total Assets of Development Banks (Mid July 2015) ................................................. 14
Figure 3.2: Composition of Assets of Development Banks (Mid July 2015) ................................ 15
Figure 3.3: Composition of Liabilities of Development Banks (Mid July 2015) ........................... 15
Figure 3.4: Capital Funds of the Development Banks (Mid July) ................................................. 16
Figure 3.5: Deposit Mix of the Development Banks (Mid July) ................................................... 16
Figure 3.6: Deposit Mix of the Development Banks (Mid July 2015) .......................................... 17
Figure 3.7: Loan and Advances of the Development Banks (Mid July) ....................................... 17
Figure 3.8: Non-performing Loans of the Development Banks (Mid July) .................................. 20
Figure 3.9: Non-banking Assets of the Development Banks ...................................................... 21
Figure 3.10: Investment Portfolio of the Development Banks (Mid July 2015) .......................... 21
Figure 3.11: Operating Efficiency of the Development Banks (Mid July) .................................... 22
Figure 3.12: Liquidity Position of the Development Banks ......................................................... 23
List of Tables
Table 1.1: List of Merged Development Banks ............................................................................. 2
Table 1.2: Total Assets/Liabilities of Banks and Financial institutions .......................................... 5
Table 2.1: Important Directives regarding Capital, Credit and Liquidity (effective for 2014/15)11
Table 2.2: List of DB's Penalized for Not complying with CRR Requirement(FY 2014/15) ......... 12
Table 2.3: List of DB's penalized for Not complying to deprived Sector Lending (FY 2014/15) .. 12
Table 3.1: Sector-wise Loan and Advances of the Development Banks ...................................... 18
Table 3.2:Security Used to Secure Loan and Advances ............................................................... 19
Table 3.3: Product wise Loan and Advances................................................................................ 19
Table 3.4: List of Development Banks that Reported losses (FY 2013/14).................................. 22
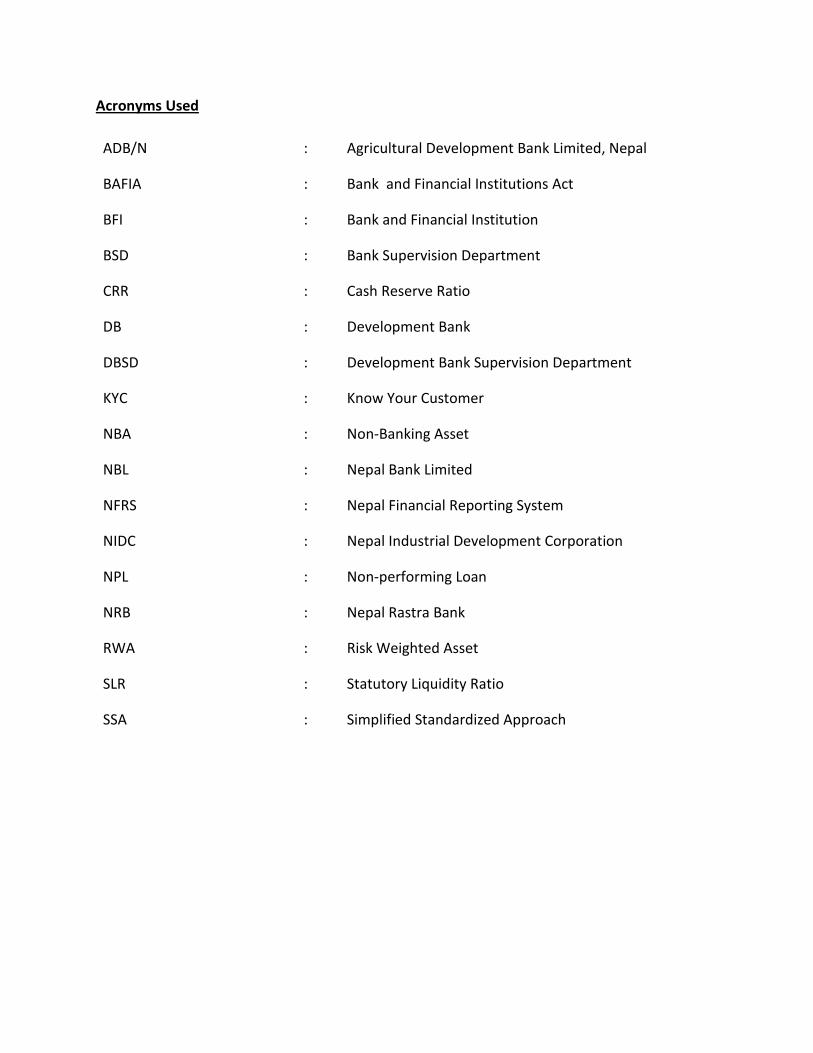
Acronyms Used
ADB/N : Agricultural Development Bank Limited, Nepal
BAFIA : Bank and Financial Institutions Act
BFI : Bank and Financial Institution
BSD : Bank Supervision Department
CRR : Cash Reserve Ratio
DB : Development Bank
DBSD : Development Bank Supervision Department
KYC : Know Your Customer
NBA : Non-Banking Asset
NBL : Nepal Bank Limited
NFRS : Nepal Financial Reporting System
NIDC : Nepal Industrial Development Corporation
NPL : Non-performing Loan
NRB : Nepal Rastra Bank
RWA : Risk Weighted Asset
SLR : Statutory Liquidity Ratio
SSA : Simplified Standardized Approach
1
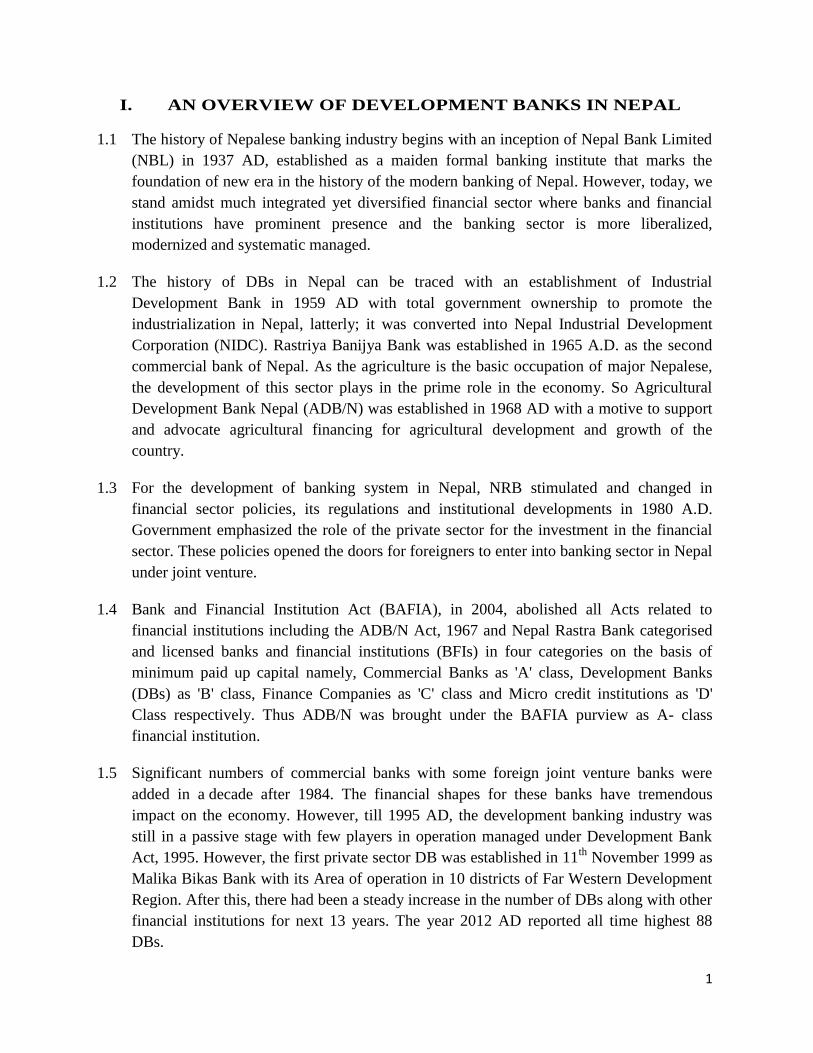
I. AN OVERVIEW OF DEVELOPMENT BANKS IN NEPAL
1.1 The history of Nepalese banking industry begins with an inception of Nepal Bank Limited
(NBL) in 1937 AD, established as a maiden formal banking institute that marks the
foundation of new era in the history of the modern banking of Nepal. However, today, we
stand amidst much integrated yet diversified financial sector where banks and financial
institutions have prominent presence and the banking sector is more liberalized,
modernized and systematic managed.
1.2 The history of DBs in Nepal can be traced with an establishment of Industrial
Development Bank in 1959 AD with total government ownership to promote the
industrialization in Nepal, latterly; it was converted into Nepal Industrial Development
Corporation (NIDC). Rastriya Banijya Bank was established in 1965 A.D. as the second
commercial bank of Nepal. As the agriculture is the basic occupation of major Nepalese,
the development of this sector plays in the prime role in the economy. So Agricultural
Development Bank Nepal (ADB/N) was established in 1968 AD with a motive to support
and advocate agricultural financing for agricultural development and growth of the
country.
1.3 For the development of banking system in Nepal, NRB stimulated and changed in
financial sector policies, its regulations and institutional developments in 1980 A.D.
Government emphasized the role of the private sector for the investment in the financial
sector. These policies opened the doors for foreigners to enter into banking sector in Nepal
under joint venture.
1.4 Bank and Financial Institution Act (BAFIA), in 2004, abolished all Acts related to
financial institutions including the ADB/N Act, 1967 and Nepal Rastra Bank categorised
and licensed banks and financial institutions (BFIs) in four categories on the basis of
minimum paid up capital namely, Commercial Banks as 'A' class, Development Banks
(DBs) as 'B' class, Finance Companies as 'C' class and Micro credit institutions as 'D'
Class respectively. Thus ADB/N was brought under the BAFIA purview as A- class
financial institution.
1.5 Significant numbers of commercial banks with some foreign joint venture banks were
added in a decade after 1984. The financial shapes for these banks have tremendous
impact on the economy. However, till 1995 AD, the development banking industry was
still in a passive stage with few players in operation managed under Development Bank
Act, 1995. However, the first private sector DB was established in 11th
November 1999 as
Malika Bikas Bank with its Area of operation in 10 districts of Far Western Development
Region. After this, there had been a steady increase in the number of DBs along with other
financial institutions for next 13 years. The year 2012 AD reported all time highest 88
DBs.
2
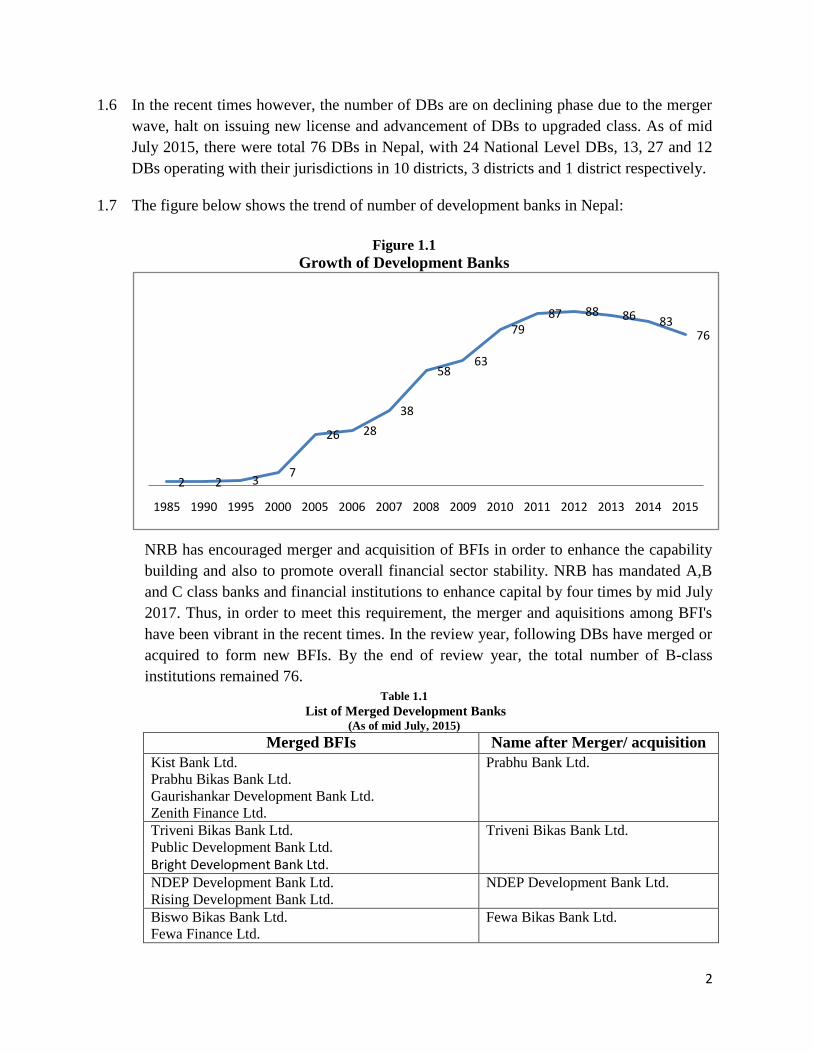
1.6 In the recent times however, the number of DBs are on declining phase due to the merger
wave, halt on issuing new license and advancement of DBs to upgraded class. As of mid
July 2015, there were total 76 DBs in Nepal, with 24 National Level DBs, 13, 27 and 12
DBs operating with their jurisdictions in 10 districts, 3 districts and 1 district respectively.
1.7 The figure below shows the trend of number of development banks in Nepal:
Figure 1.1
Growth of Development Banks
NRB has encouraged merger and acquisition of BFIs in order to enhance the capability
building and also to promote overall financial sector stability. NRB has mandated A,B
and C class banks and financial institutions to enhance capital by four times by mid July
2017. Thus, in order to meet this requirement, the merger and aquisitions among BFI's
have been vibrant in the recent times. In the review year, following DBs have merged or
acquired to form new BFIs. By the end of review year, the total number of B-class
institutions remained 76.
Table 1.1
List of Merged Development Banks (As of mid July, 2015)
Merged BFIs Name after Merger/ acquisition
Kist Bank Ltd.
Prabhu Bikas Bank Ltd.
Gaurishankar Development Bank Ltd.
Zenith Finance Ltd.
Prabhu Bank Ltd.
Triveni Bikas Bank Ltd.
Public Development Bank Ltd.
Bright Development Bank Ltd.
Triveni Bikas Bank Ltd.
NDEP Development Bank Ltd.
Rising Development Bank Ltd.
NDEP Development Bank Ltd.
Biswo Bikas Bank Ltd.
Fewa Finance Ltd.
Fewa Bikas Bank Ltd.
2 2 37
26 28
38
5863
7987 88 86 83
76
1985 1990 1995 2000 2005 2006 2007 2008 2009 2010 2011 2012 2013 2014 2015
3
Garima Bikas Bank Ltd.
Nilgiri Bikas Bank Ltd.
Garima Bikas Bank Ltd.
Muktinath Bikas Bank Ltd.
Civic Development Bank Ltd.
Muktinath Bikas Bank Ltd.
Nepal Rastra Bank as a Regulator and Supervisor
1.1 The Nepal Rastra Bank Act, 2002 supported by BAFIA, 2006 grants supervisory authority
to the NRB. NRB is responsible for supervision on all the four classes of BFIs mentioned
above. Nepal Rastra Bank Act, 2002, has made NRB an autonomous institution
empowered to regulate and supervise Nepalese banking industry. The preambles of NRB
act states:
Whereas, it is expedient to establish a NRB to function as the Central Bank to formulate
necessary monetary and foreign exchange policies, to maintain the stability of price, to
consolidate balance of payment for sustainable development of the economy of …. Nepal,
and to develop a secure, healthy and efficient system of payment; to appropriately
regulate, inspect and supervise in order to maintain the stability and healthy development
of banking and financial system; and for the enhancement of public credibility towards the
entire banking and financial system of the country.
1.2 Section 84, subsection (2), of the Nepal Rastra Bank Act, 2002 states that NRB may at
‘any time, inspect and supervise or cause to inspect and supervise any of the offices of
commercial banks or financial institutions.
1.3 Similarly the Bank and Financial Institution Act, 2006 empowers NRB to regulate and
supervise the BFIs. Section 49, subsection (1) of the Act states ‘The Nepal Rastra Bank
shall have full powers to regulate and systematize the functions and activities of licensed
institutions.’ Also section 52, subsection (1) of the act states ‘The Nepal Rastra Bank may
inspect and supervise, or cause to be inspected and supervised, any office of a licensed
institution at any time.
1.4 As a regulator and supervisor of BFIs, NRB has been continuously issuing various
policies, guidelines and directives to the licensed institutions, adopting international
practices and norms. A dedicated department – Bank and Financial Institutions Regulation
Department – is set in NRB's structure to issue regulating policies, directives and
guidelines.
1.5 As a supervisor, NRB supervises the activities of the banks and financial institutions based
on the existing legal framework, directives and guiding polices. To discharge the
responsibilities of supervisor, NRB has set four departments, as per the class of institution,
in its structure viz. Bank Supervision Department (BSD), Development Bank Supervision
4
Department (DBSD), Finance Company Supervision Department and Micro Finance
Promotion and Supervision Department.
1.6 Regulation and supervision of the financial system is a key tool for maintenance of
financial stability. Taking this into consideration, NRB continued to focus on proactive
regulation and supervision. The development banking sector presently remains adequately
capitalised based on the regulatory requirement. NRB aims to become more proactive with
regulatory and supervisory mechanisms that are forward looking and analytical.
The Development Banks Presence
1.7 As at mid July 2015, 24 National Level DBs, 13 DBs with 10 Districts as their area of
operation, 27 DBs with 3 Districts as their area of operation and 12 DBs were operating in
a single district jurisdiction. The details of all 76 DBs are highlighted in Annex 1.
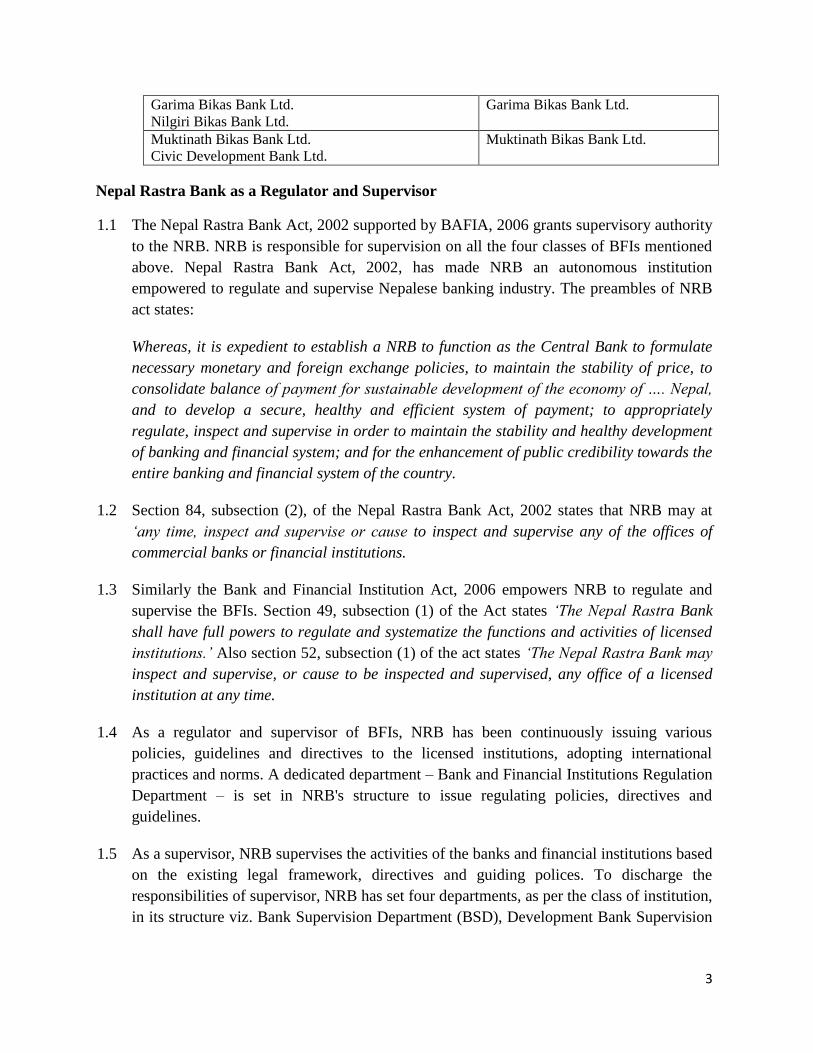
1.8 The total number of DBs branches stood 823 in mid-July 2015. NRB has been
encouraging BFIs to open branches to rural areas in order to increase the financial access.
While the numbers of DB branches are increasing each year, chunk of banking services is
still concentrated in urban areas. Bagmati Zone has largest number of DBs branches, 166,
followed by Lumbini, 149 and Gandaki 140, while Karnali does not have even a single
DBs Branch till the end of review period.
Figure 1.2
District and Zonal Presence of DBs
(As of Mid July, 2015)
*Number marked in each district symbolises total DB branch operating in that particular District.
5
1.9 Considering the district-wise operations, Kathmandu have highest number of branches
with 85, Rupandehi and Kaski together stand in the second position with 79 branches each
and Chitwan is in third position with 66 branches. On the contrary, 12 districts do not even
have a single DB branch and 10 districts have only a single DB branch. As depicted in the
picture above, the numbers of DB branches have a dominating presence in Terai districts
and clustered in central and western hills. While, mid western and far western regions
have a limited presence.
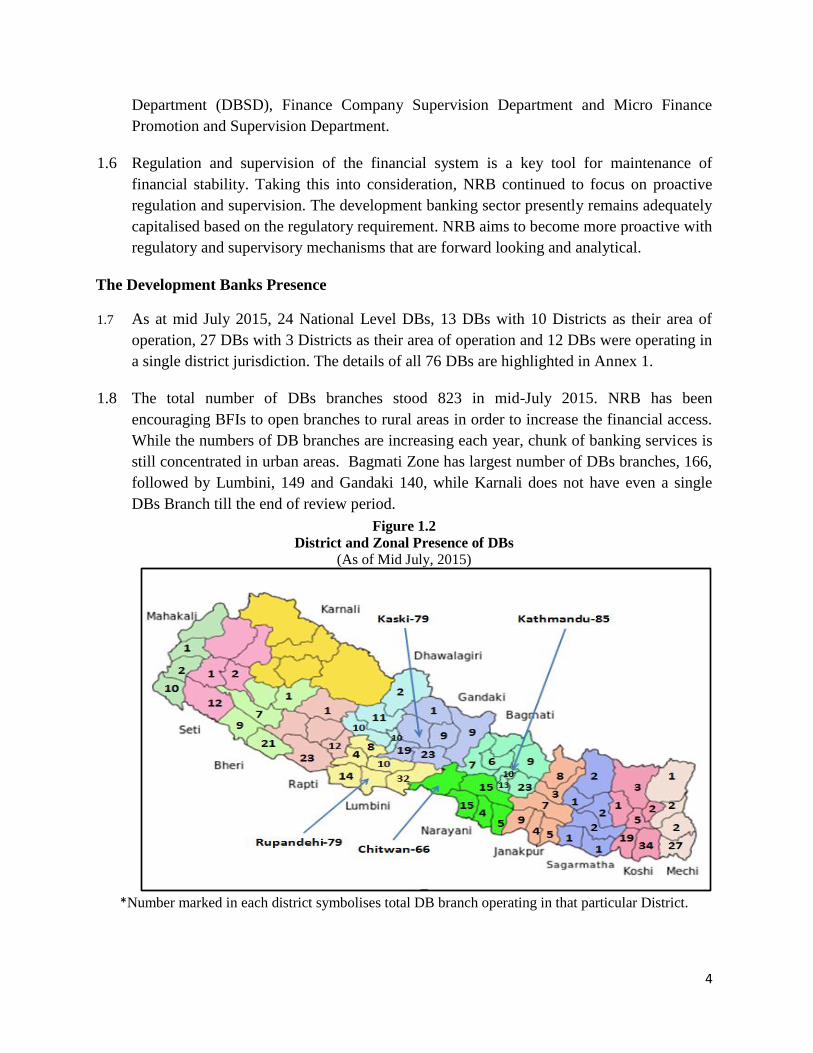
Figure 1.3
Region-wise Distribution of Number of DB Branches
(Mid July, 2015)
(Source: Bank and Financial Institutions Regulation Department, NRB)
Assets Share of Banks and Financial Institutions
1.10 The respective shares of BFIs (licensed by NRB) in the total assets of banking industry as
of Mid July for five consecutive years are depicted in the table 1.2.
Table 1.2
Total Assets/Liabilities of Banks and Financial Institutions
(Mid July 2015)
Banks and Financial Institutions Share Percentage
2010/11 2011/12 2012/13 2013/14 2014/15
Commercial Banks 75.3 77.3 78.2 77.9 78.73
Development Banks 12.0 12.4 13 13.7 13.34
Finance Companies 10.9 8.2 6.6 5.8 4.79
Micro Finance Development
Banks
1.8 2.2 2.2 2.6 3.14
Total 100 100 100 100 100
(Source: Bank and Financial Institutions Regulation Department, NRB)
107
304264
6524
764
109
316 290
7528
818
105
294 322
7428
823
Eastern Central Western Mid-western Far-western Total
2013 2014 2015
6
1.11 Table 1.2 shows the dominance of commercial banks, with the share of 78.73 percent of
total assets of Nepalese banking industry, while the DBs have 13.34 percent total assets in
mid July 2015. From 2010/11 to 2013/14, the total share of DBs increases by 3.1 percent
on point to point basis from 2013/14 to 2014/15 the same has decreased by 36 basis points
on point to point basis.
Existing Acts, By-laws and Guidelines
1.12 As a Central Bank of Nepal, NRB has a clear mandate to regulate and supervise banks and
financial institutions in Nepal. NRB continuously issues regulations, circulars and
guidelines and periodically amends its directives issued to the licensed BFIs. Likewise,
NRB continuously conducts onsite inspections and offsite supervisions both on a regular
and need-based ways to assess their compliance with the existing laws, regulations and
prudential norms.
1.13 The following are the key documents that guide the NRB’s regulatory and supervision
function:
Nepal Rastra Bank Act, 2002.
Bank and Financial Institutions Act, 2006.
Company Act, 2006.
Bank and Financial institution debt recovery Act, 2000.
Banking offense and punishment Act, 2007.
Asset (Money) Laundering Prevention Act, 2008.
Act Relating to Institutions Acting as Financial Intermediary, 1999 (Amended, 2002).
Nepal Rastra Bank, Inspection and Supervision By-laws, 2013.
Nepal Rastra Bank, Banks and Financial Institutions Prompt Corrective Action By-rule, 2007.
Unified Directives to licensed institutions
New Capital Adequacy Framework, 2007 (Updated, 2008).
Monetary Policy.
Banking Service Fee Guidelines.
Risk Management Guidelines, 2010.
Stress Testing Guidelines, 2012.
Internal Capital Adequacy Assessment Process - ICAAP Guidelines, 2012 (Updated
2013)
Information Technology Guidelines, 2012
Other circulars issued for the BFIs.
Apart from above, NRB regularly issues circulars to BFIs on a need basis. The details of
circulars issued during the review period are summarized in Annex 7.
7
II. DEVELOPMENT BANK SUPERVISION
Supervision Function
2.1 With the legal jurisdiction defined by Nepal Rastra Bank act, 2002 and the Bank and Financial
Institution Act, 2006, NRB regulates and supervises the Banks and Financial Institutions (BFIs).
Supervision is an important component of banking system as it promotes prudent banking system
by continuous feedback and monitoring of BFIs. This provides proactive measures to maintain
overall financial stability.
Development Bank Supervision Department
2.2 The DBSD is responsible for executing the supervisory policies and practices as per governing
laws, regulations and policies. The DBSD prepares an annual onsite supervision plan before the
new calendar year and supervises banks as per the plan approved by the Governor. The supervisory
process includes mainly full-fledged on-site examination, special inspection, targeted inspection
and follow up inspection if required. An onsite inspection is supported by an offsite supervision
function which is responsible for further enforcement and monitoring DBs on a continuous basis
based on the regular reporting submitted by DBs themselves. The DBSD is responsible for carrying
out inspection and supervision of all B-class institutions licensed by NRB. The work division and
staff composition is detailed in organization structure in Annex 8.
Supervision Methodology
2.3 The DBSD continues to adopt and implement the Core Principles framed by the Basel Committee.
The inspection is mainly compliance based for all DBs. Further, NRB has adopted the Simplified
Standardized Approach (SSA) based on BASEL II principles. However, SSA is on a parallel run
only for national level development banks. The regional level DBs still observe BASEL I core
principles. Though Supervision is compliance based, the different elements of CAMELS (Capital
Adequacy, Asset Quality, Management competence, Earning, Liquidity, and Sensitivity to Market
Risk) are closely observed to assess compliance, stability, sustainability, governance and overall
risk exposure of "B - class" institutions.
Organization of Development Bank Supervision Department
2.4 The DBSD comprises of on-site inspection, policy planning and analysis unit, internal
administration unit, off-site supervision unit and enforcement unit. Offsite and enforcement units
are sub-divided to regulate DBs based on area of operation. For example, there are different units
for the national level DBs, DBs operating in 10 districts, DBs operating in 3 districts and 1 district.
The same goes with enforcement unit. Further, the Department closely co-ordinates with BSD when
further complement is required from on a need based approach.
8
2.5 As per NRB inspection and supervision bylaw, 2013, DBSD is organized into following five units:
On-site Inspection
2.6 Onsite inspection of DBs is conducted as per the approved annual plan based on the Onsite
Inspection Manual.
2.7 The on-site examinations include:
Initial examination, generally conducted within six months of commencement of operation by a
new institution.
Routine full-fledged, corporate-level inspection, which is the regular examination, generally
carried out once in a year.
Targeted inspection, which addresses on specific areas of operation or transaction. The targeted
inspection undertaken by the department in the review year is summarized in Annex 3.
Special inspection, carried out based on offsite reports, press charges, legal charges or any
information obtained from external sources that come as a complaint against company's action,
undertaken against general welfare of public interest undertaken by the department in the review
year is summarized in Annex 4.
Follow-up inspection is carried out to examine on adherence on the enforcement instructions
given to institution in a previous inspection. The follow–up inspection undertaken by the
department in the review year is summarized in Annex 5.
2.8 The on-site examination unit takes feedback from the offsite unit, analyzes past inspection reports
and reviews current financial figures of DBs before commencement of onsite inspections. A typical
inspection team analyzes the compliance with the regulations and guidelines prescribed by NRB,
contemporary laws and approved act, guidelines and manuals of the same DB. The team also
identifies risk exposure on different areas such as credit, operations, management and overall
functions. Issues with corporate governance are scrutinized in a detailed manner as well. The
findings of the onsite inspection is communicated to respective DB institutions and directed to
address in the areas that requires further compliance and improvement. This is further
complemented by off-site supervision and enforcement unit to strengthen the capacity of an
organization. The on-site inspection undertaken in the review year is summarized in Annex 2.
2.9 The major shortcomings as well as non-compliance observed at the DBs during on-site
examinations in FY 2014/15 are summarized as follows:
9
2.9.1 Capital Adequacy:
Errors in calculation of Risk weighted Asset (RWA).
Insufficient capital due to low paid up capital.
High accumulated losses and provisioning resulting in inadequacy.
Operational risk omitted while RWA is calculated.
Mistakes on calculating irrevocable loan commitment while RWA is calculated.
Instances of DBs facing Prompt Corrective Action (PCA) imposed by NRB due to errors
occurred in calculating RWA.
2.9.2 Asset Quality:
Lack of adequate documents in credit files. (e.g. credit information report, tax clearance,
audited financial statements of the borrower, stock inspection report, valuation report,
inadequate insurance of collateral and assets, etc.)
Credit risk classification.
Insufficient analysis of customer background and need of credit.
Credit policy guidelines in contradiction to Nepal Rastra Bank directives.
Credit Management Practice is not robust enough to assess risk.
Instances of decisions against credit policy guidelines and manuals.
Non-compliance of the terms and conditions mentioned in the offer-letter.
Detail study of customer cash flow not undertaken leading to high default rate.
Wrong categorization while reporting loan loss provision.
Insufficient collateral and errors in calculating market price and government rate
composition.
Term loans issued without identifying the needs of customer.
Non-compliance of NRB Directives regarding blacklisting.
Lack of monitoring in case of deprived sector loan.
Delayed recovery process.
Know-your-customer (KYC) not observed as per NRB guidelines.
Non-compliance of loan classification and provisioning directives.
2.9.3 Management:
Lack of strategic plan, medium term business plans, risk management policies and
procedures, succession plans and other policies required for the effective management.
Weak and inadequate human resources management practices.
Lack of professionalism in terms of staff recruitment and selection.
Incompetent board members to take effective decisions.
Inadequate MIS, IT, Disaster Recovery, information security policy, weak data access
control.
Non-compliance of anti -money laundering directives.
10
Less effective internal audit and compliance department.
Non-compliance of direction given in the previous inspection report.
Inadequate efforts made to recover written off loans and black listing process not initiated
timely.
Discriminating decision made for waiving interest, penal interest and other fees.
2.9.4 Earning
Improper classification and provisioning.
Issues on income recognition.
Misuse of retained earnings by the Board of Directors and top level management for their
vested interest.
Non-compliance of service fees related guidelines.
Unplanned and irrational expenses.
Lack of proper liquidity management plan.
2.9.5 Liquidity:
Weaknesses in monitoring liquidity profile and gap analysis.
Heavy gap in short term asset and liabilities and no revival plan.
2.9.6 Sensitivity To Market:
Investment Policy not formulated/implemented.
Incompetency to analyse external market conditions.
Off-site Supervision
2.10 The offsite unit carries out off-site surveillance of the DBs. The core objective of this function is to
conduct periodic financial reviews of DBs in order to identify potential problems and to assess
whether an organization is in compliance to directives and laws.
2.11 The off-site unit is responsible for supervision of DBs operations on the basis of data submitted,
review data and address the deviations if any. The unit also monitors important ratios of each DBs
and submit the quarterly consolidated report desk wise for consolidated publication of the DB
industry. Another important function of an offsite unit is to study upon the dividend proposed and
bonus presented by DBs and issue clearance after a round of scrutiny. Apart from these, the unit
reviews compliance in terms of Cash Reserve Ratio (CRR), Statutory Liquidity Ratio (SLR) and
Deprived Sector Lending and penalize in case of non-compliance. Table 2.2 shows important
directives issued for compliance during the review year.
11
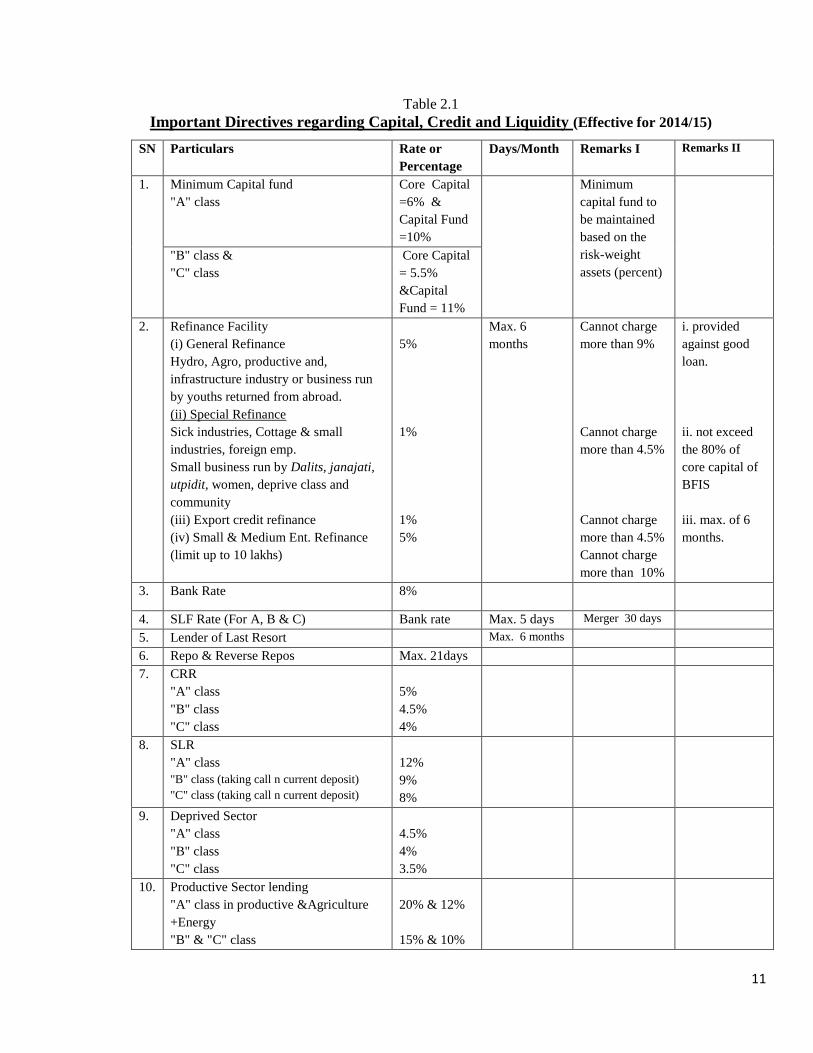
Table 2.1
Important Directives regarding Capital, Credit and Liquidity (Effective for 2014/15)
SN Particulars Rate or
Percentage
Days/Month Remarks I Remarks II
1. Minimum Capital fund
"A" class
Core Capital
=6% &
Capital Fund
=10%
Minimum
capital fund to
be maintained
based on the
risk-weight
assets (percent)
"B" class &
"C" class
Core Capital
= 5.5%
&Capital
Fund = 11%
2. Refinance Facility
(i) General Refinance
Hydro, Agro, productive and,
infrastructure industry or business run
by youths returned from abroad.
(ii) Special Refinance
Sick industries, Cottage & small
industries, foreign emp.
Small business run by Dalits, janajati,
utpidit, women, deprive class and
community
(iii) Export credit refinance
(iv) Small & Medium Ent. Refinance
(limit up to 10 lakhs)
5%
1%
1%
5%
Max. 6
months
Cannot charge
more than 9%
Cannot charge
more than 4.5%
Cannot charge
more than 4.5%
Cannot charge
more than 10%
i. provided
against good
loan.
ii. not exceed
the 80% of
core capital of
BFIS
iii. max. of 6
months.
3. Bank Rate 8%
4. SLF Rate (For A, B & C) Bank rate Max. 5 days Merger 30 days
5. Lender of Last Resort Max. 6 months
6. Repo & Reverse Repos Max. 21days
7. CRR
"A" class
"B" class
"C" class
5%
4.5%
4%
8. SLR
"A" class
"B" class (taking call n current deposit)
"C" class (taking call n current deposit)
12%
9%
8%
9. Deprived Sector
"A" class
"B" class
"C" class
4.5%
4%
3.5%
10. Productive Sector lending
"A" class in productive &Agriculture
+Energy
"B" & "C" class
20% & 12%
15% & 10%
12
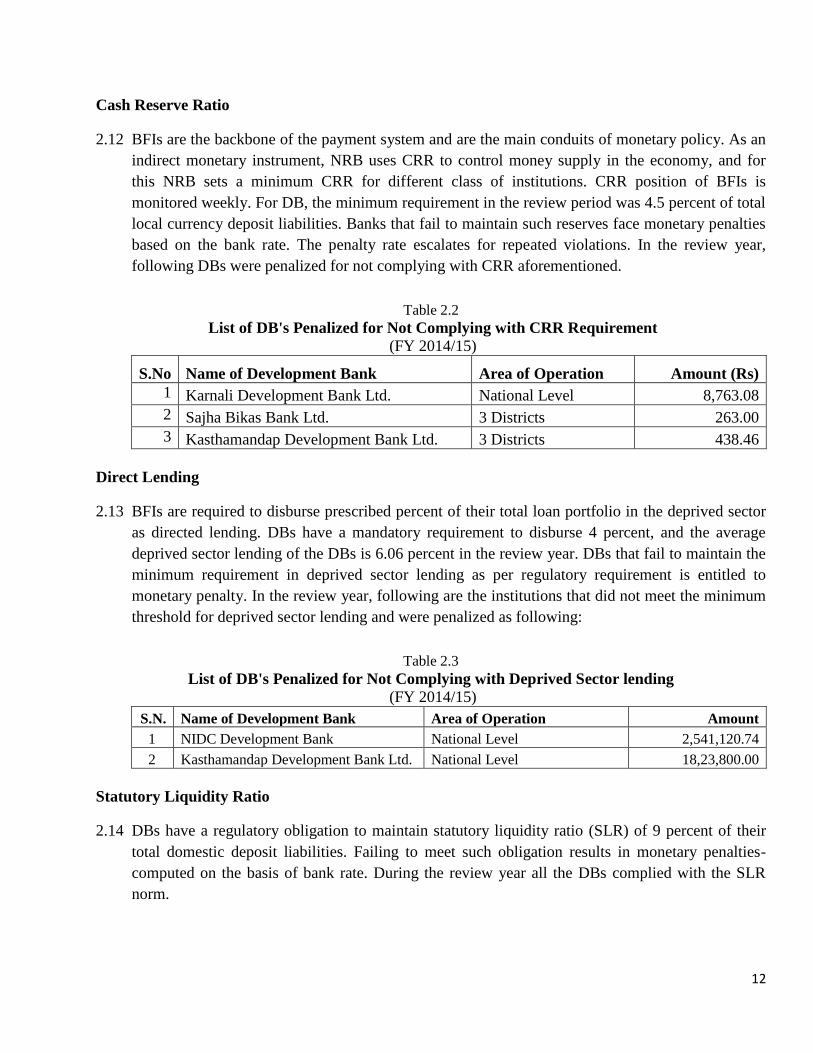
Cash Reserve Ratio
2.12 BFIs are the backbone of the payment system and are the main conduits of monetary policy. As an
indirect monetary instrument, NRB uses CRR to control money supply in the economy, and for
this NRB sets a minimum CRR for different class of institutions. CRR position of BFIs is
monitored weekly. For DB, the minimum requirement in the review period was 4.5 percent of total
local currency deposit liabilities. Banks that fail to maintain such reserves face monetary penalties
based on the bank rate. The penalty rate escalates for repeated violations. In the review year,
following DBs were penalized for not complying with CRR aforementioned.
Table 2.2
List of DB's Penalized for Not Complying with CRR Requirement
(FY 2014/15)
S.No Name of Development Bank Area of Operation Amount (Rs)
1 Karnali Development Bank Ltd. National Level 8,763.08
2 Sajha Bikas Bank Ltd. 3 Districts 263.00
3 Kasthamandap Development Bank Ltd. 3 Districts 438.46
Direct Lending
2.13 BFIs are required to disburse prescribed percent of their total loan portfolio in the deprived sector
as directed lending. DBs have a mandatory requirement to disburse 4 percent, and the average
deprived sector lending of the DBs is 6.06 percent in the review year. DBs that fail to maintain the
minimum requirement in deprived sector lending as per regulatory requirement is entitled to
monetary penalty. In the review year, following are the institutions that did not meet the minimum
threshold for deprived sector lending and were penalized as following:
Table 2.3
List of DB's Penalized for Not Complying with Deprived Sector lending
(FY 2014/15)
S.N. Name of Development Bank Area of Operation Amount
1 NIDC Development Bank National Level 2,541,120.74
2 Kasthamandap Development Bank Ltd. National Level 18,23,800.00
Statutory Liquidity Ratio
2.14 DBs have a regulatory obligation to maintain statutory liquidity ratio (SLR) of 9 percent of their
total domestic deposit liabilities. Failing to meet such obligation results in monetary penalties-
computed on the basis of bank rate. During the review year all the DBs complied with the SLR
norm.
13
Capital Adequacy Ratio
2.15 The Capital Adequacy Framework requires BFIs to maintain minimum capital requirements where
the DBs need to maintain at least 5.5 percent of core capital and 11 percent of Capital Fund. The
minimum capital adequacy requirements are based on Risk Weighted Assets (RWA) of the DBs.
The overall Capital Adequacy Ratio percentage of the DBs in the review year is 14.65 percent for
core capital and 15.40 percent for capital fund.
Policy, Planning and Analysis Unit
2.16 The Policy, Planning and Analysis Unit reviews and formulates the annual plans of DBSD in line
with NRB’s strategic plan. It also facilitates inter departmental communication and exchanges
information relating to the department. The Unit also reviews the progress of annual plan on a
quarterly basis, analyses the periodical data of the industry and explores the best practices and
emerging issues in a global supervision and regulation arena. Further, the Unit works closely with
Policy, planning and analysis unit of BSD unit in areas of new initiatives and global practices on
supervision. The Unit also prepares Annual Report for the department.
Internal Administration
2.17 The Internal Administration Unit performs the functions related to human resources and internal
administration within the DBSD. It includes internal placement, issuance of travel orders, and
maintaining leave records and also serving as the back office. This Unit also looks after
procurement for the DBSD such as supply of office logistics and stationery in coordination with
the General Services Department of NRB. This Unit also carries out coordination to assist other
units to carry out the functions more effectively.
14
III. OPERATIONAL PERFORMANCE OF DEVELOPMENT BANKS
Assets of the Development Banks
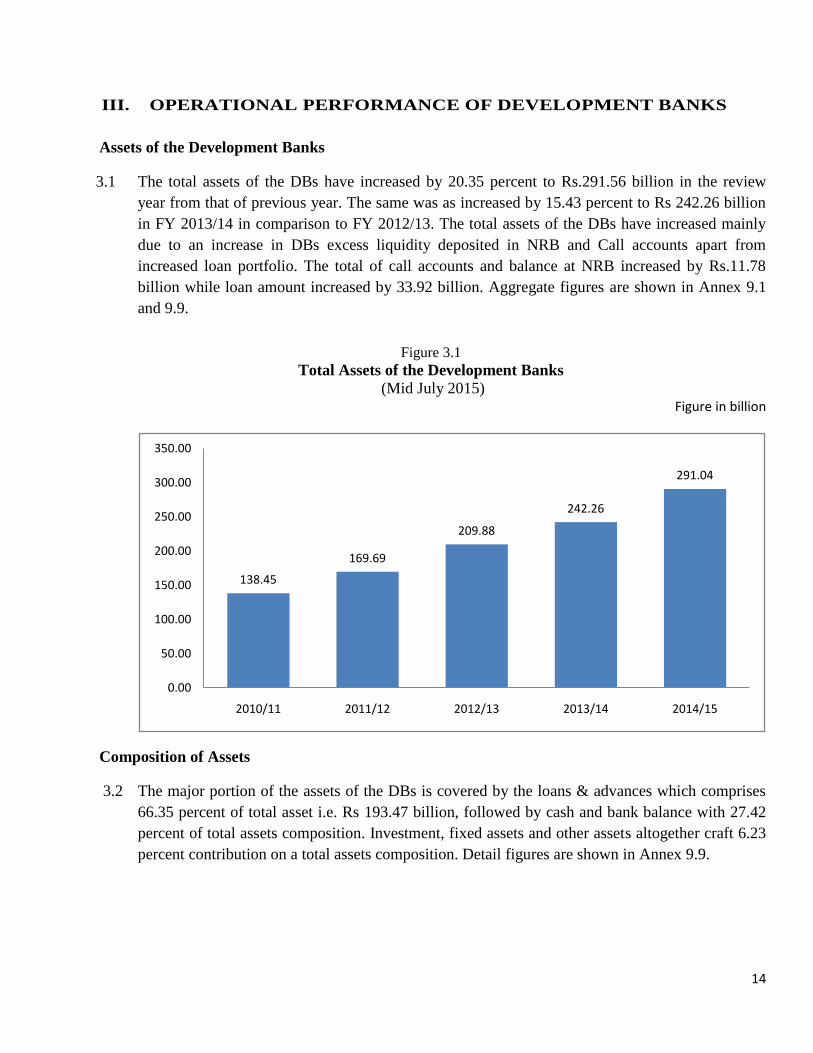
3.1 The total assets of the DBs have increased by 20.35 percent to Rs.291.56 billion in the review
year from that of previous year. The same was as increased by 15.43 percent to Rs 242.26 billion
in FY 2013/14 in comparison to FY 2012/13. The total assets of the DBs have increased mainly
due to an increase in DBs excess liquidity deposited in NRB and Call accounts apart from
increased loan portfolio. The total of call accounts and balance at NRB increased by Rs.11.78
billion while loan amount increased by 33.92 billion. Aggregate figures are shown in Annex 9.1
and 9.9.
Figure 3.1
Total Assets of the Development Banks
(Mid July 2015) Figure in billion
Composition of Assets
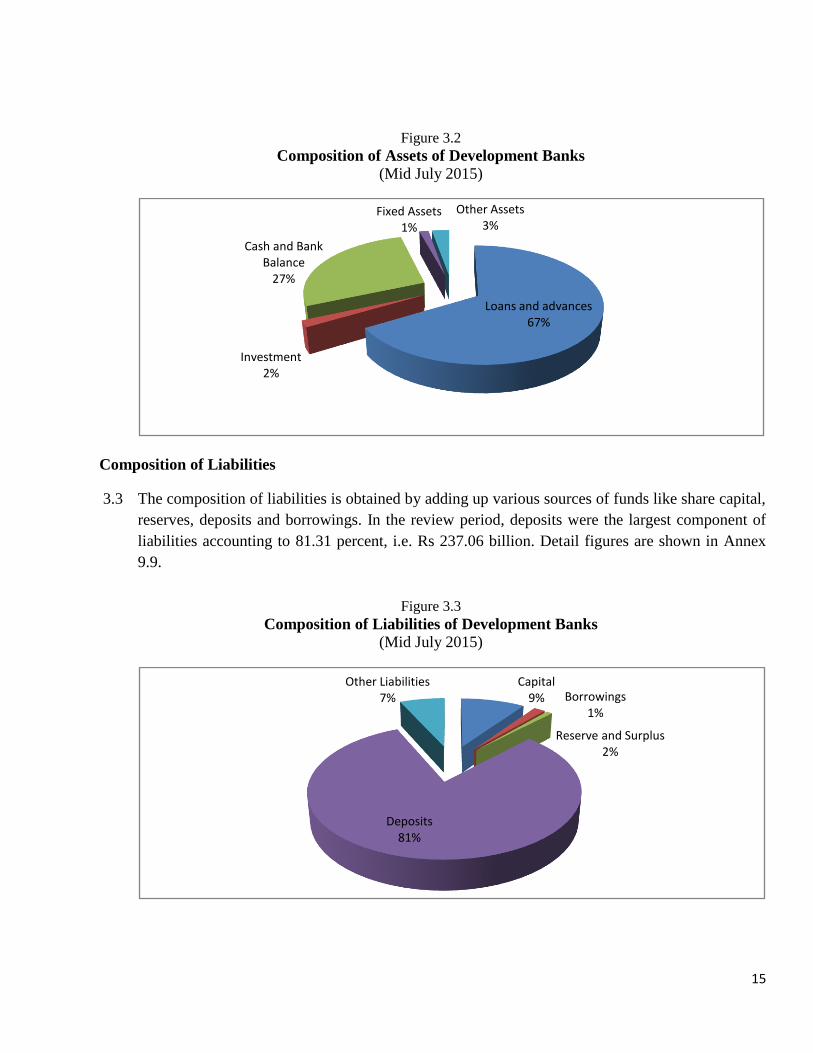
3.2 The major portion of the assets of the DBs is covered by the loans & advances which comprises
66.35 percent of total asset i.e. Rs 193.47 billion, followed by cash and bank balance with 27.42
percent of total assets composition. Investment, fixed assets and other assets altogether craft 6.23
percent contribution on a total assets composition. Detail figures are shown in Annex 9.9.
138.45
169.69
209.88
242.26
291.04
0.00
50.00
100.00
150.00
200.00
250.00
300.00
350.00
2010/11 2011/12 2012/13 2013/14 2014/15
15
Figure 3.2
Composition of Assets of Development Banks
(Mid July 2015)
Composition of Liabilities
3.3 The composition of liabilities is obtained by adding up various sources of funds like share capital,
reserves, deposits and borrowings. In the review period, deposits were the largest component of
liabilities accounting to 81.31 percent, i.e. Rs 237.06 billion. Detail figures are shown in Annex
9.9.
Figure 3.3
Composition of Liabilities of Development Banks
(Mid July 2015)
Loans and advances67%
Investment2%
Cash and Bank Balance
27%
Fixed Assets 1%
Other Assets3%
Capital9%
Reserve and Surplus2%
Borrowings1%
Deposits81%
Other Liabilities7%
16
Capital
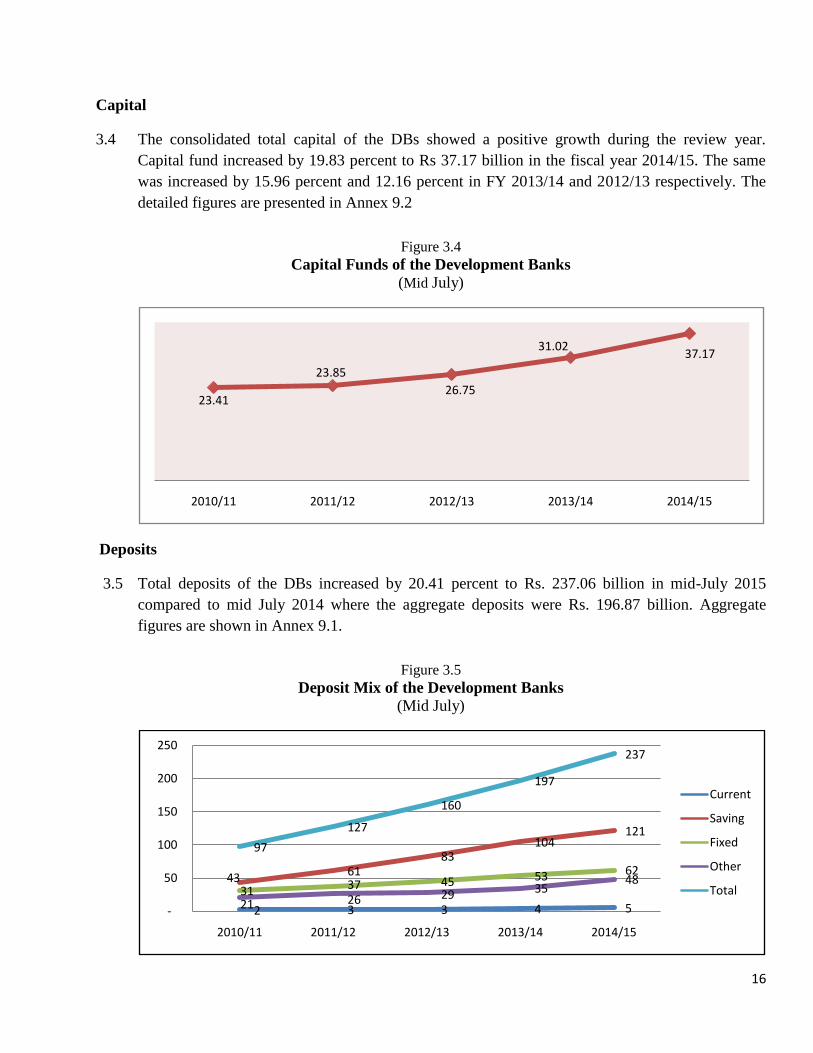
3.4 The consolidated total capital of the DBs showed a positive growth during the review year.
Capital fund increased by 19.83 percent to Rs 37.17 billion in the fiscal year 2014/15. The same
was increased by 15.96 percent and 12.16 percent in FY 2013/14 and 2012/13 respectively. The
detailed figures are presented in Annex 9.2
Figure 3.4
Capital Funds of the Development Banks
(Mid July)
Deposits
3.5 Total deposits of the DBs increased by 20.41 percent to Rs. 237.06 billion in mid-July 2015
compared to mid July 2014 where the aggregate deposits were Rs. 196.87 billion. Aggregate
figures are shown in Annex 9.1.
Figure 3.5
Deposit Mix of the Development Banks
(Mid July)
23.41
23.85
26.75
31.0237.17
2010/11 2011/12 2012/13 2013/14 2014/15
2 3 3 4 5
43 61 83
104 121
31 37 45 53 62
21 26 29 35 48
97
127
160
197
237
-
50
100
150
200
250
2010/11 2011/12 2012/13 2013/14 2014/15
Current
Saving
Fixed
Other
Total
17
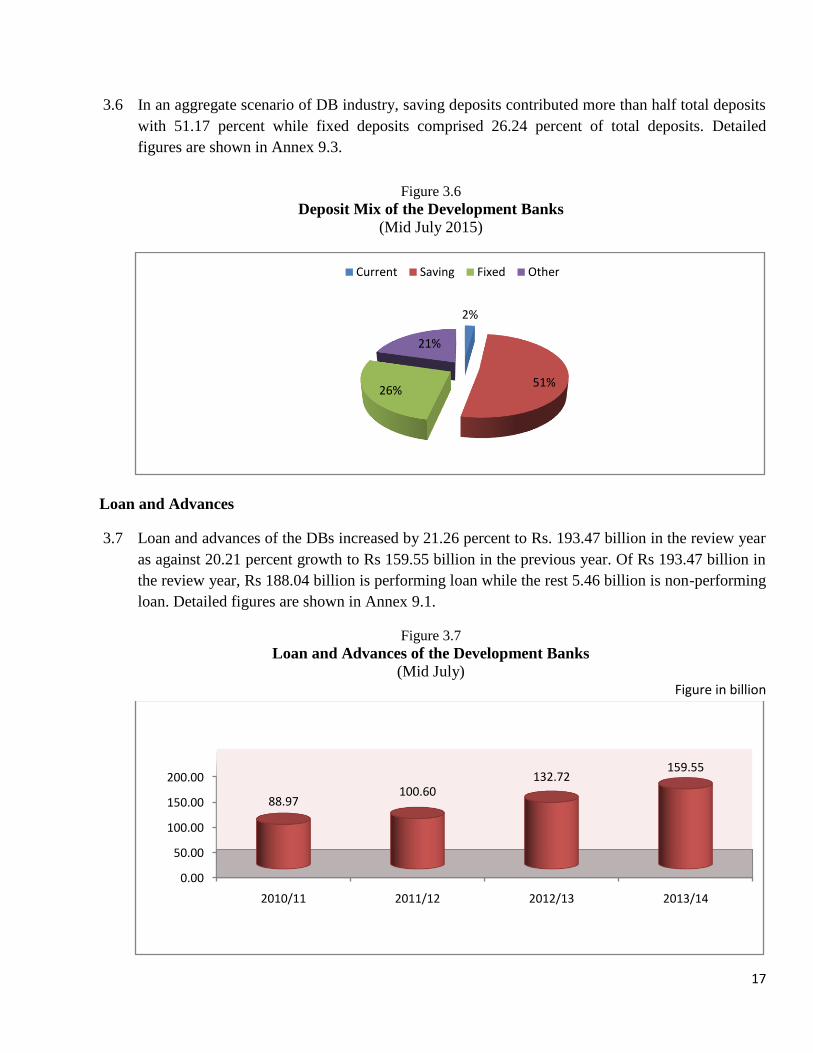
3.6 In an aggregate scenario of DB industry, saving deposits contributed more than half total deposits
with 51.17 percent while fixed deposits comprised 26.24 percent of total deposits. Detailed
figures are shown in Annex 9.3.
Figure 3.6
Deposit Mix of the Development Banks
(Mid July 2015)
Loan and Advances
3.7 Loan and advances of the DBs increased by 21.26 percent to Rs. 193.47 billion in the review year
as against 20.21 percent growth to Rs 159.55 billion in the previous year. Of Rs 193.47 billion in
the review year, Rs 188.04 billion is performing loan while the rest 5.46 billion is non-performing
loan. Detailed figures are shown in Annex 9.1.
Figure 3.7
Loan and Advances of the Development Banks
(Mid July) Figure in billion
2%
51%26%
21%
Current Saving Fixed Other
0.00
50.00
100.00
150.00
200.00
2010/11 2011/12 2012/13 2013/14
88.97100.60
132.72159.55
18
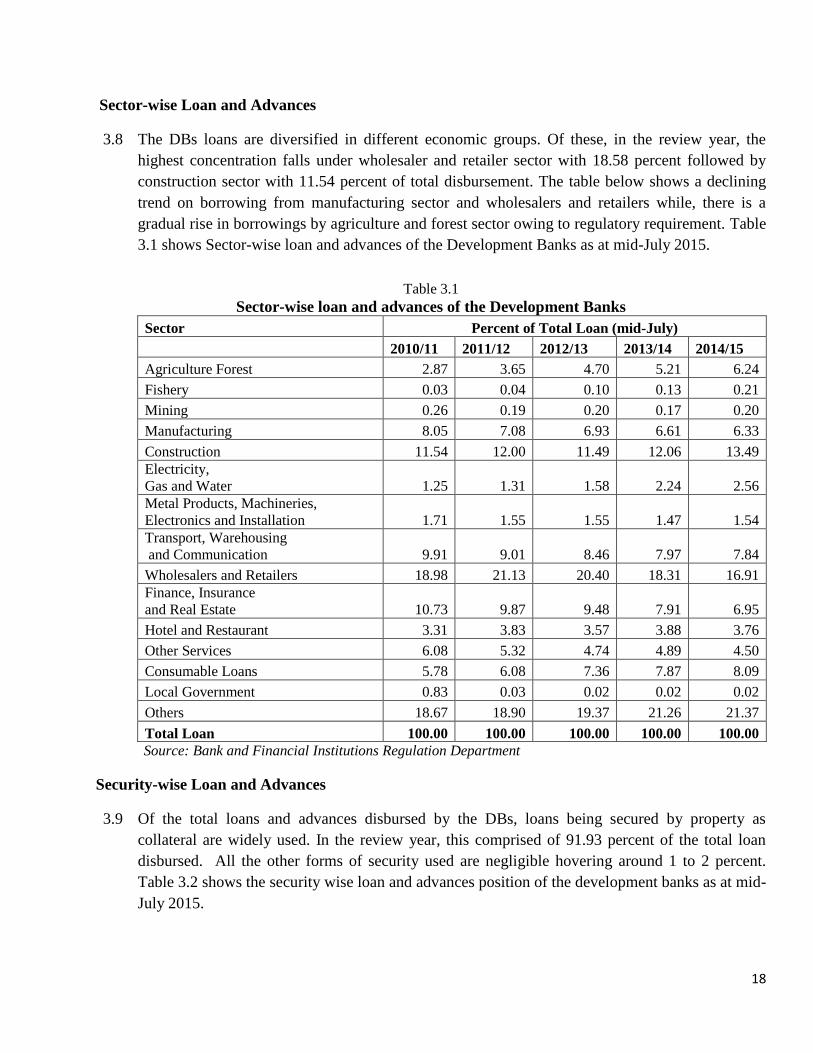
Sector-wise Loan and Advances
3.8 The DBs loans are diversified in different economic groups. Of these, in the review year, the
highest concentration falls under wholesaler and retailer sector with 18.58 percent followed by
construction sector with 11.54 percent of total disbursement. The table below shows a declining
trend on borrowing from manufacturing sector and wholesalers and retailers while, there is a
gradual rise in borrowings by agriculture and forest sector owing to regulatory requirement. Table
3.1 shows Sector-wise loan and advances of the Development Banks as at mid-July 2015.
Table 3.1
Sector-wise loan and advances of the Development Banks
Sector Percent of Total Loan (mid-July)
2010/11 2011/12 2012/13 2013/14 2014/15
Agriculture Forest 2.87 3.65 4.70 5.21 6.24
Fishery 0.03 0.04 0.10 0.13 0.21
Mining 0.26 0.19 0.20 0.17 0.20
Manufacturing 8.05 7.08 6.93 6.61 6.33
Construction 11.54 12.00 11.49 12.06 13.49
Electricity,
Gas and Water 1.25 1.31 1.58 2.24 2.56
Metal Products, Machineries,
Electronics and Installation 1.71 1.55 1.55 1.47 1.54
Transport, Warehousing
and Communication 9.91 9.01 8.46 7.97 7.84
Wholesalers and Retailers 18.98 21.13 20.40 18.31 16.91
Finance, Insurance
and Real Estate 10.73 9.87 9.48 7.91 6.95
Hotel and Restaurant 3.31 3.83 3.57 3.88 3.76
Other Services 6.08 5.32 4.74 4.89 4.50
Consumable Loans 5.78 6.08 7.36 7.87 8.09
Local Government 0.83 0.03 0.02 0.02 0.02
Others 18.67 18.90 19.37 21.26 21.37
Total Loan 100.00 100.00 100.00 100.00 100.00
Source: Bank and Financial Institutions Regulation Department
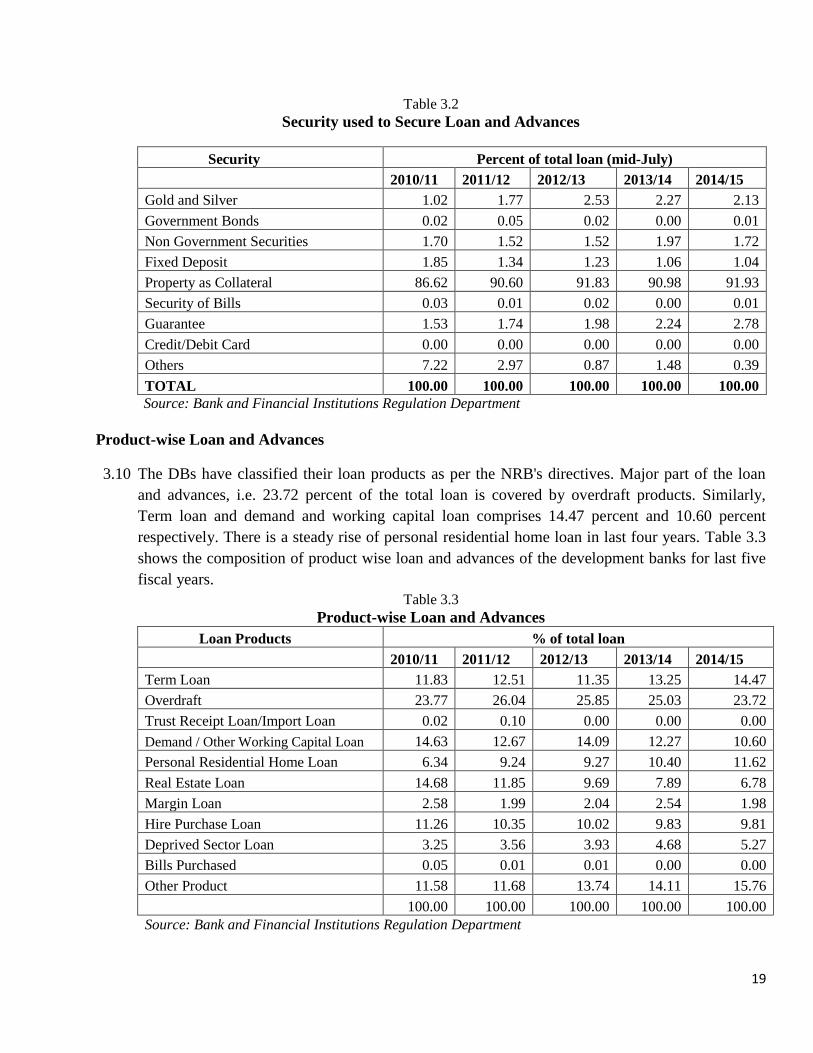
Security-wise Loan and Advances
3.9 Of the total loans and advances disbursed by the DBs, loans being secured by property as
collateral are widely used. In the review year, this comprised of 91.93 percent of the total loan
disbursed. All the other forms of security used are negligible hovering around 1 to 2 percent.
Table 3.2 shows the security wise loan and advances position of the development banks as at mid-
July 2015.
19
Table 3.2
Security used to Secure Loan and Advances
Security Percent of total loan (mid-July)
2010/11 2011/12 2012/13 2013/14 2014/15
Gold and Silver 1.02 1.77 2.53 2.27 2.13
Government Bonds 0.02 0.05 0.02 0.00 0.01
Non Government Securities 1.70 1.52 1.52 1.97 1.72
Fixed Deposit 1.85 1.34 1.23 1.06 1.04
Property as Collateral 86.62 90.60 91.83 90.98 91.93
Security of Bills 0.03 0.01 0.02 0.00 0.01
Guarantee 1.53 1.74 1.98 2.24 2.78
Credit/Debit Card 0.00 0.00 0.00 0.00 0.00
Others 7.22 2.97 0.87 1.48 0.39
TOTAL 100.00 100.00 100.00 100.00 100.00
Source: Bank and Financial Institutions Regulation Department
Product-wise Loan and Advances
3.10 The DBs have classified their loan products as per the NRB's directives. Major part of the loan
and advances, i.e. 23.72 percent of the total loan is covered by overdraft products. Similarly,
Term loan and demand and working capital loan comprises 14.47 percent and 10.60 percent
respectively. There is a steady rise of personal residential home loan in last four years. Table 3.3
shows the composition of product wise loan and advances of the development banks for last five
fiscal years.
Table 3.3
Product-wise Loan and Advances
Loan Products % of total loan
2010/11 2011/12 2012/13 2013/14 2014/15
Term Loan 11.83 12.51 11.35 13.25 14.47
Overdraft 23.77 26.04 25.85 25.03 23.72
Trust Receipt Loan/Import Loan 0.02 0.10 0.00 0.00 0.00
Demand / Other Working Capital Loan 14.63 12.67 14.09 12.27 10.60
Personal Residential Home Loan 6.34 9.24 9.27 10.40 11.62
Real Estate Loan 14.68 11.85 9.69 7.89 6.78
Margin Loan 2.58 1.99 2.04 2.54 1.98
Hire Purchase Loan 11.26 10.35 10.02 9.83 9.81
Deprived Sector Loan 3.25 3.56 3.93 4.68 5.27
Bills Purchased 0.05 0.01 0.01 0.00 0.00
Other Product 11.58 11.68 13.74 14.11 15.76
100.00 100.00 100.00 100.00 100.00
Source: Bank and Financial Institutions Regulation Department
20
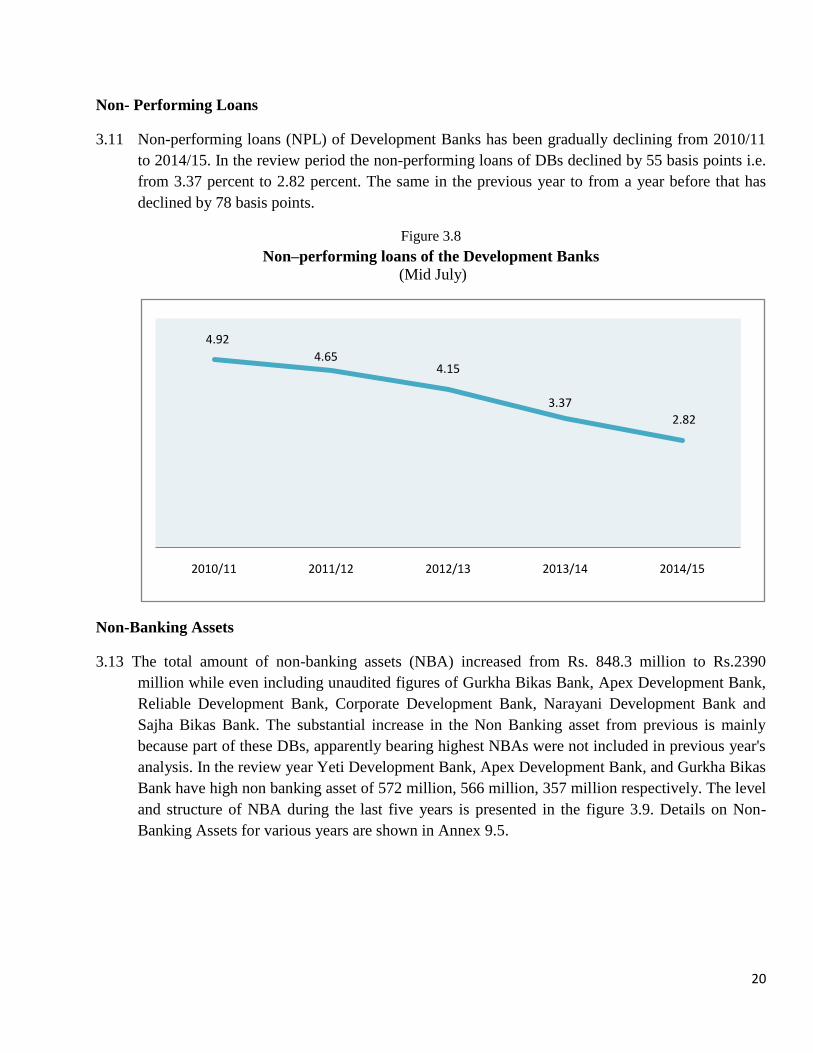
Non- Performing Loans
3.11 Non-performing loans (NPL) of Development Banks has been gradually declining from 2010/11
to 2014/15. In the review period the non-performing loans of DBs declined by 55 basis points i.e.
from 3.37 percent to 2.82 percent. The same in the previous year to from a year before that has
declined by 78 basis points.
Figure 3.8
Non–performing loans of the Development Banks
(Mid July)
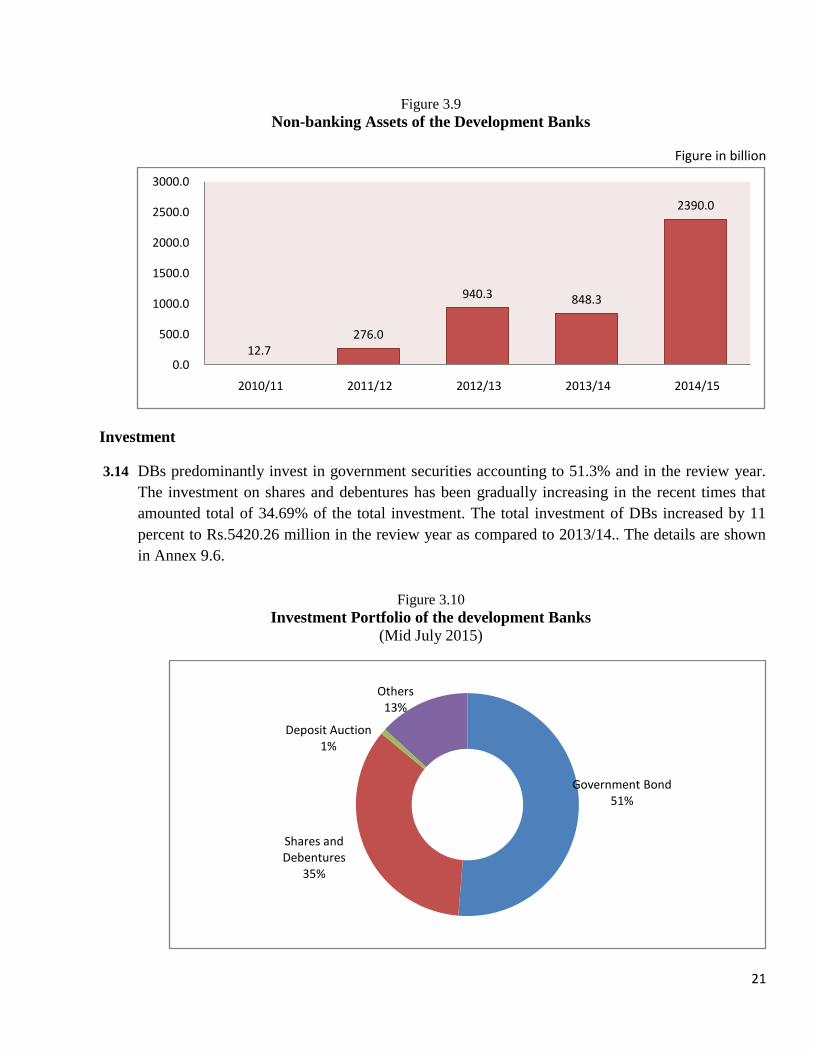
Non-Banking Assets
3.13 The total amount of non-banking assets (NBA) increased from Rs. 848.3 million to Rs.2390
million while even including unaudited figures of Gurkha Bikas Bank, Apex Development Bank,
Reliable Development Bank, Corporate Development Bank, Narayani Development Bank and
Sajha Bikas Bank. The substantial increase in the Non Banking asset from previous is mainly
because part of these DBs, apparently bearing highest NBAs were not included in previous year's
analysis. In the review year Yeti Development Bank, Apex Development Bank, and Gurkha Bikas
Bank have high non banking asset of 572 million, 566 million, 357 million respectively. The level
and structure of NBA during the last five years is presented in the figure 3.9. Details on Non-
Banking Assets for various years are shown in Annex 9.5.
4.92
4.654.15
3.37
2.82
2010/11 2011/12 2012/13 2013/14 2014/15
21
Figure 3.9
Non-banking Assets of the Development Banks
Figure in billion
Investment
3.14 DBs predominantly invest in government securities accounting to 51.3% and in the review year.
The investment on shares and debentures has been gradually increasing in the recent times that
amounted total of 34.69% of the total investment. The total investment of DBs increased by 11
percent to Rs.5420.26 million in the review year as compared to 2013/14.. The details are shown
in Annex 9.6.
Figure 3.10
Investment Portfolio of the development Banks
(Mid July 2015)
12.7 276.0
940.3 848.3
2390.0
0.0
500.0
1000.0
1500.0
2000.0
2500.0
3000.0
2010/11 2011/12 2012/13 2013/14 2014/15
Government Bond 51%
Shares and Debentures
35%
Deposit Auction1%
Others13%
22
Earnings
3.15 Earning is the backbone of organisation's sustainability. In the review period, out of 76
development banks following reported loss on their financial statements:
Table 3.4
List of Development Banks that Reported Losses
(FY 2014/15)
Rs. in thousand
Name of Institution Operation Area Net Loss
Apex Development Bank National Level 12,636
Green Development Bank 3 Districts 2,758
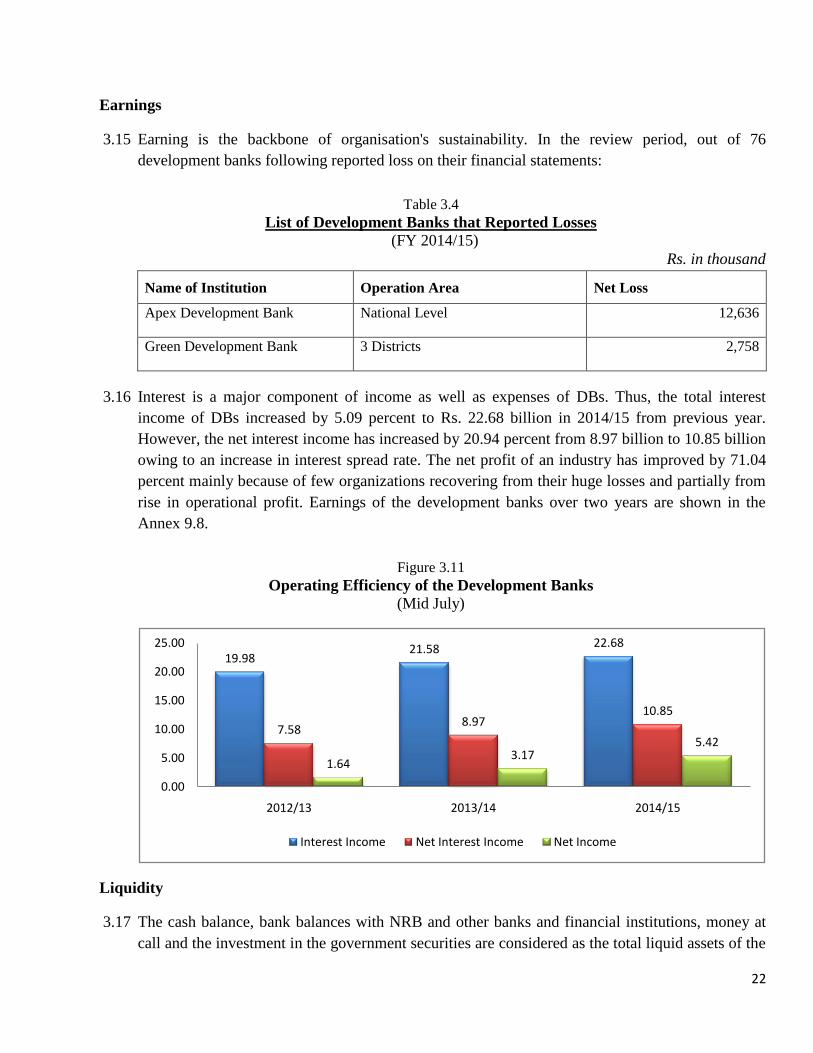
3.16 Interest is a major component of income as well as expenses of DBs. Thus, the total interest
income of DBs increased by 5.09 percent to Rs. 22.68 billion in 2014/15 from previous year.
However, the net interest income has increased by 20.94 percent from 8.97 billion to 10.85 billion
owing to an increase in interest spread rate. The net profit of an industry has improved by 71.04
percent mainly because of few organizations recovering from their huge losses and partially from
rise in operational profit. Earnings of the development banks over two years are shown in the
Annex 9.8.
Figure 3.11
Operating Efficiency of the Development Banks
(Mid July)
Liquidity
3.17 The cash balance, bank balances with NRB and other banks and financial institutions, money at
call and the investment in the government securities are considered as the total liquid assets of the
19.9821.58 22.68
7.588.97
10.85
1.643.17
5.42
0.00
5.00
10.00
15.00
20.00
25.00
2012/13 2013/14 2014/15
Interest Income Net Interest Income Net Income
23
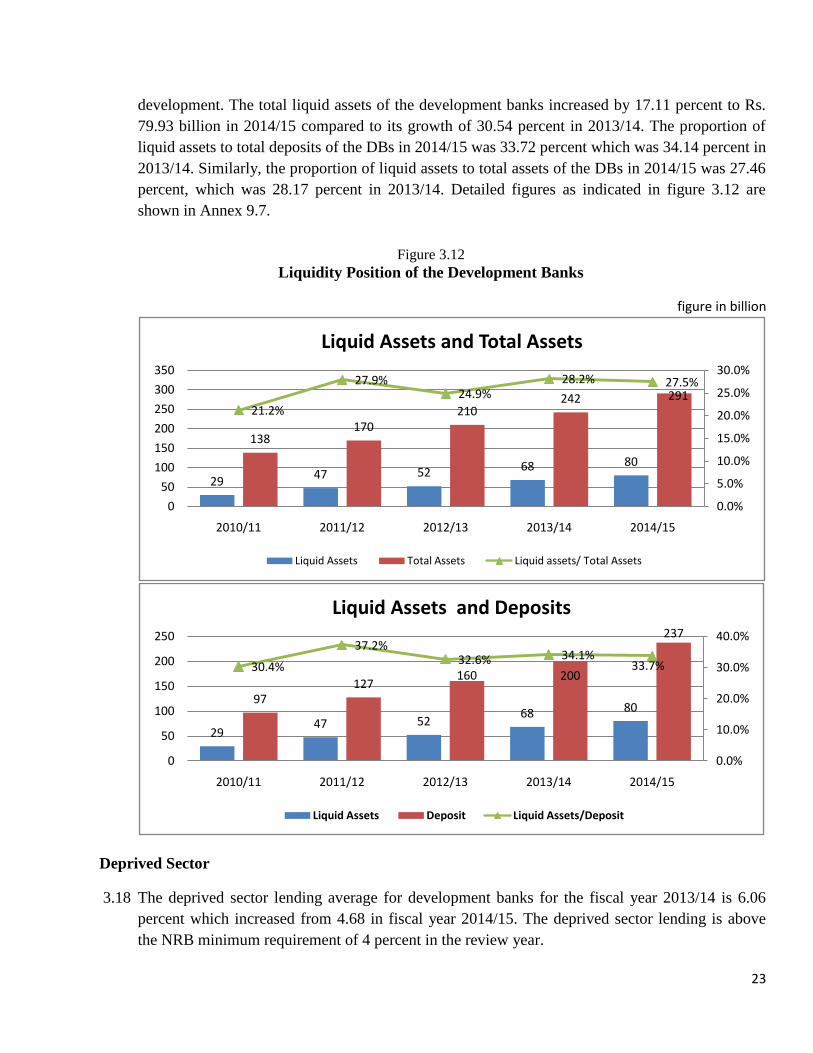
development. The total liquid assets of the development banks increased by 17.11 percent to Rs.
79.93 billion in 2014/15 compared to its growth of 30.54 percent in 2013/14. The proportion of
liquid assets to total deposits of the DBs in 2014/15 was 33.72 percent which was 34.14 percent in
2013/14. Similarly, the proportion of liquid assets to total assets of the DBs in 2014/15 was 27.46
percent, which was 28.17 percent in 2013/14. Detailed figures as indicated in figure 3.12 are
shown in Annex 9.7.
Figure 3.12
Liquidity Position of the Development Banks
figure in billion
Deprived Sector
3.18 The deprived sector lending average for development banks for the fiscal year 2013/14 is 6.06
percent which increased from 4.68 in fiscal year 2014/15. The deprived sector lending is above
the NRB minimum requirement of 4 percent in the review year.
2947 52 68 80
138170
210242 291
21.2%
27.9%24.9%
28.2% 27.5%
0.0%
5.0%
10.0%
15.0%
20.0%
25.0%
30.0%
0
50
100
150
200
250
300
350
2010/11 2011/12 2012/13 2013/14 2014/15
Liquid Assets and Total Assets
Liquid Assets Total Assets Liquid assets/ Total Assets
2947 52
68 8097
127160 200
237
30.4%
37.2%32.6% 34.1%
33.7%
0.0%
10.0%
20.0%
30.0%
40.0%
0
50
100
150
200
250
2010/11 2011/12 2012/13 2013/14 2014/15
Liquid Assets and Deposits
Liquid Assets Deposit Liquid Assets/Deposit
24
Actions and Penalties
3.19 Following actions are taken to DBs according to the Nepal Rastra Bank Act, 2002 in the review
year:
Then, NDEP Development Bank Limited was imposed PCA as per Prompt Corrective Action By
Law, 2007 sub rule 3 'Ka' for not maintaining capital adequacy ratio as per the regulatory
requirement.
Kasthamandap Development Bank Limited was imposed PCA as per Prompt Corrective Action
By Law, 2007 sub rule 3 'Ka' for not maintaining capital adequacy ratio as per the regulatory
requirement.
Karnali Development Bank Limited was imposed PCA as per Prompt Corrective Action By Law,
2007 sub rule 3 'Ka' for not maintaining capital adequacy ratio as per the regulatory requirement.
Corporate Development Bank Limited was declared problematic as per Prompt Corrective
Action By Law, 2007 sub rule 3 'Nga' and Nepal Rastra Bank Act, 2002 Section 86'kha'.
25
IV. NATIONAL INITIATIVES, ISSUES AND CHALLENGES IN
SUPERVISION
NATIONAL INITIATIVES AND DEVELOPMENTS
Special Inspection of Financial Institutions
4.1 The Special Inspection Program (SIP) has been undertaken as a part of Development Policy Credit
initiated by Government of Nepal. NRB, with an expertise of KPMG Portugal and with the joint
support from the World Bank, IMF and DFID, aims to conduct SIP on 54 BFIs culminating 22
Class A, 20 Class B, and 12 Class C institutions to have a comprehensive assessment of the
Nepalese Financial Sector. It is being carried out in 2 phases where second phase completed with
inspection of 27 BFIs including 10 development banks. Also, following the disastrous earthquake
on April 25, 2015, a fast diagnostic review was also conducted on the sampled BFIs to assess the
impact of physical damage loss on the collateral pledged with BFIs.
Transition to NFRS
4.2 In December 2014, NRB issued Nepal Financial Reporting Standard (NFRS) migration guideline
to Banks and Financial Institutions with aim to migrate to NFRS by 2017. The Special Inspection
of Financial Institutions being conducted by NRB also complements the transition to NFRS as the
inspection also aims to identify gaps in the existing Accounting Standards and NFRS and the
progress towards implementation of NFRS. For this, NRB has trained 76 officers (including 12
officers from DBSD) to develop their understanding regarding the statements prepared complying
NFRS, from regulators' perspectives.
Financial Sector Assessment Program
4.3 Following the Financial sector Assessment Program (FSAP) carried out jointly by the IMF and the
World Bank in February 2014, an action plan is being prepared for implementing the findings and
recommendations of the FSAP. The FSAP has assessed different areas of the financial sector
including banking, insurance, cooperatives and the capital market development in Nepal.
Implementation of Supervisory Information System
4.4 Nepal Rastra Bank has been working on implementation of supervisory information system in
order to empower the offsite supervision function under the technical and financial assistance of
the World Bank and DFID. The system is expected to be implemented within the fiscal year
2016/17.
26
Business Continuity Plan in Banks and Financial Institutions
4.5 The disastrous earthquake in April 2015, urged BFI's to implement the business continuity plans if
not implemented till then. To foster that, the regulatory guidelines have already been issued to
BFIs for the preparation of the same.
ISSUES AND CHALLENGES
Urban concentration:
4.6 Most of the development banks are concentrated in urban areas such as Kathmandu, Pokhara,
Chitwan and Butwal. The DBs are sharing a piece in a market which is penetrated by commercial
banks. For Financial inclusion and reach, development banks need to have their rural presence.
However, encouraging DBs to open a branch in rural areas has been a challenge mainly due to
sparse opportunities in urban and rural. Karnali, a zone with no branch even of a single
development bank stands as a testimony to this fact.
Enhancing Capability of Development Banks:
4.7 Another challenge that an NRB as a regulator faces is to increase the Management and control
capabilities of development banks. Till date, majority of DBs have promoters and directors who
lack leadership and vision to drive the organization with a public interest at large. A public
organization is still controlled by handful investors who drive organization towards vested interest.
Thus, enhancing capability more towards top management and the board of director's level remains
another challenge of NRB.
Strengthening Supervisory Capacity
4.8 The financial sector is rapidly changing and with the advent and application of new technologies in
banking, there have been lots of innovation in products and services offered by banks. In order to
strengthen the supervisory capacity, lot of efforts and resources are been channelled to the capacity
enhancement of supervisors through trainings, seminars, knowledge sharing and interaction
programs A list of various programs at international level for supervisors during the review period
has been listed in Annex 5.
Financial inclusion and rural penetration
4.9 Financial access has been increasing with the expansion of network of financial institutions
however; the urban concentration mentioned above remains one of the major challenges. In order
to increase financial access, BFI's with national presence must open at least 3 branches outside
Kathmandu valley such that one must be at least in a specified 14 districts, before they open a
27
branch in Kathmandu Valley. Further, NRB has a provision of interest free loan up to Rs. 5 million
and Rs. 10 million if any commercial or national level development bank wished to open a branch
in district head quarter and outside district headquarter of 14 remote districts. This is to encourage
financial inclusion and promote rural penetration.
Corporate Governance
4.10 The corporate governance has been considered as a vital factor to maintain institutional discipline
and compliance. The subprime crisis of 2009 is vivid example of market failure due to lack of
governance. In the DBs context, issues such as formulation and adoption of internal policies, lack
of strategic plan and a business plan, lack of independence of audit function, lack of board of
directors oversight banks operational activities, lack of successor plan, Inadequate MIS system and
unprofessional decisions of Board and Senior management, insider lending and ever greening of
loans remain the broad governance issues.
Operational Risks
4.11 The operational risks of DB's include extension of credit beyond approved limits, ever greening of
loans to related parties, poor implementation of internal policies and procedures, lack of qualified
employees and lack of proper security measures in adopted technology have increased exposure in
operational risks. The NRB recommends that banks should initiate processes to adopt the
international best practices in corporate governance, risk management, and adoption of self-
regulatory controls that go beyond the minimum standard set by NRB.
Multiple Banking
4.12 Multiple banking is prevalent and widespread in the industry. Borrowers enjoy different credit
facilities from multiple institutions. Intense competition for clients and the fear of losing market
share has motivated DBs to keep a blind eye to the issue of multiple banking. The central bank
faces challenges on establishing prudent banking practices and enforcing implementation of
directives from NRB.
Consolidation in banking industry
4.13 NRB has been encouraging consolidation in the industry, through merger and acquisition.
Industry has already observed the merger/acquisition of 12 development banks till the review
period. The enhanced capital requirement has infuriated the merger wave. It is expected that this
wave will remain vibrant for couple more years.
Proactive practices on AML/ CFT Guidelines
4.14 BFI's focusing on implementing Anti Money Laundering (AML) and Combat for Financing
Terrorism (CFT) remains another issue in banking industry. With national assessment due in
2019, it is challenge for a NRB to implement and direct BFI's towards adhering Assets (Money)
28
Laundering Prevention Act (ALPA) rules and international requirements as prescribed by IMF
and Financial Action Task Force (FATF).
Excess Liquidity
4.15 Liquidity in the banking sector has increased with the expansion of net foreign assets. Though
the banking sector has excessive liquidity, it has not been able to utilize it in the productive
sector. Thus, due attention is much needed for utilizing such liquidity in order to provide
positive impact to the economy through monetary transmission mechanism thereby improving
investment environment. In the review year, NRB moped up the liquidity of Rs. 155.00 billion
through deposit auction, Rs. 315.80 billion through reverse repo and Rs. 6.00 billion through
outright sale auction on cumulative basis.
Shadow Banking
4.16 Increasing trend of shadow banking practices by some of the larger cooperatives around the
urban areas has brought challenges to the financial system. This kind of activities conducted by
the cooperatives could also increase risk in the system as their deposit mobilization is rapidly
increasing. Lack of stringent regulatory and supervisory mechanism for various types of micro
finance institutions established and operated under different acts is also the matter of concerns.
Adoption of NFRS
4.17 Institute of Chartered Accountants of Nepal (ICAN) has announced a roadmap to gradually
adopt Nepal Financial Reporting Standard (NFRS). The Monetary Policy of F.Y. 2014/15 also
requires BFIs to adopt NFRS by 2017. For this NRB has already issued a migration guideline
for the BFIs. NRB has said that its prudential regulations will remain in force until further
notice and requires them to reconcile the differences in NFRS complied statements and
regulatory standards. Thus, industry is in the process of adopting the NFRS. Impairment of
assets and recognition of income are being taken as the main issue regarding the adoption of
NFRS.
Development of Proactive Banking Industry
4.18 Banking industry in Nepal is still focused on compliance of regulatory minimum standards.
They are emphasizing more on the compliance of the directives and circulars issued by Nepal
Rastra Bank and confining their prudent practices to those things only, being just reactive to
those norms. However, NRB expects them to adopt international best practices and take
proactive measures for the prudent banking. NRB has been endeavouring to make them
proactive by issuing different guidelines at different times. Additionally, many banks are
operating with their short term plans, mostly annual budgets, though few of them have
developed strategic plans.
i
Annexes Annex 1:
Details of Development Banks
List of National Level Development Banks
S.N. Name of the Development Bank Date of
Establishment Head Office Areas of operation
1 NIDC Development Bank Ltd. 1959/6/15 Durbar Marg,
Kathmandu National Level
2 Siddhartha Development Bank
Ltd. 2000/6/26
Tinkune,
Kathmandu National Level
3 Gorkha Development Bank
(Nepal) Ltd. 2004/12/5
Putalisadak,
Kathmandu National Level
4 Clean Energy Development Bank
Ltd. 2006/9/7
Sitapaila,
Kathmandu National Level
5 Muktinath Bikas Bank Ltd. 2007/1/3 Pokhara, Kaski National Level
6 Ace Development Bank Ltd. 2007/8/15 Narayanchaur,
Kathmandu National Level
7 Jyoti Bikas Bank Ltd. 2008/7/24 Kamalpokhari,
Kathmandu National Level
8 International Development Bank
Ltd. 2009/9/4 Teku, Kathmandu National Level
9 Tourism Development Bank Ltd. 2010/3/18 New Baneshwor,
Kathmandu National Level
10 Society Development Bank Ltd. 2011/6/15* Kamaladi,
Kathmandu National Level
11 Business Universal Development
Bank Ltd. 2012/4/4*
Anamnagar,
Kathmandu National Level
12 Kasthamandap Development
Bank Ltd. 2012/4/13*
New Road,
Kathmandu National Level
13 Kailsh Bikash Bank Ltd. 2012/4/24 Putalisadak,
Kathmandu National Level
14 Infrastructure Development Bank
Ltd. 2012/7/10*
Ghantaghar,
Kathmandu National Level
15 Supreme Development Bank Ltd. 2012/7/13* Tinkune,
Kathmandu National Level
16 Vibor Bikas Bank Ltd. 2012/9/2* Tripureshwor,
Kathmandu National Level
17 Yeti Development Bank Ltd. 2013/7/15* Durbar Marga
Kathmandu National Level
18 Apex Development Bank Ltd. 2013/7/15* Durbar Marg,
Kathmandu National Level
19 Reliable Development Bank Ltd. 2014/4/16* Sundhara,
Kathmandu National Level
20 Sangrila Development Bank Ltd. 2014/7/13* Baluwatar,
Kathmandu National Level
21 Triveni Bikas Bank Ltd. 2015/6/1* Bharatpur, Chitwan National Level
22 Deva Bikash Bank Ltd. 2015/7/10* Laldurbarmarga,
Kathmandu National Level
23 Fewa Bikas Bank Ltd. 2015/7/13* Pokhara, Kaski National Level
24 Garima Bikas Bank Ltd. 2015/7/14* Pokhara, Kaski National Level
ii
List of Development Banks Operating in Ten Districts
S.N. Name of the Development
Bank
Date of
Establishment Head Office Areas of operation
1 Malika Bikash Bank Ltd. 1999/11/11
Dhangadhi,
Kailali
Achham, Doti, Dadeldhura,
Kanchanpur, Kailali, Bardiya,
Banke, Dang, Kapilbastu,
Rupandehi
2 Paschimanchal
Development Bank Ltd. 2003/04/03
Mitrapark,
Rupandehi
Rupandehi, Nawalparasi, Palpa,
Kapilbastu, Dang, Banke, Syanja,
Kaski, Chitwan
3 Bhrikuti Bikas Bank Ltd. 2004/09/03 Butwal,
Rupandehi
Rupandehi, Nawalparasi,
Kapilbastu, Chitwan , Syanja,
Palpa, Arghakhachi, Gulmi, Dang,
Rolpa
4 Gandaki Bikas Bank Ltd. 2005/01/25 Pokhara, Kaski
Chitwan, Syanja, Kaski, Lamjung,
Parbat, Tanahu, Gorkha,
Rupandehi, Nawalparasi, Baglung
5 Sewa Bikas Bank Ltd. 2007/02/25 Butwal,
Rupandehi
Rupandehi, Nawalparasi,
Kapilbastu, Palpa,
Syangha,Chitawan, Gulmi,
Arghakhachi, Dang, Bake
6 Country Development
Bank Ltd. 2007/10/04 Banepa, Kavre
Kavrepalanchowk,
Sindhupalchowk, Sindhuli, Bara,
Parsa, Makawanpur, Chitwan,
Nawalparasi, Rupandehi,
Kapilbastu
7 City Development Bank
Ltd. 2007/10/19 Pokhara, Kaski
Kaski, Tanahu, Lamjung, Syanja,
Myagdi, Parbat, Baglung, Manang,
Gorkha, Chitwan
8 Kamana Bikas Bank Ltd. 2007/10/29 Pokhara, Kaski
Kaski, Tanahu, Lamjung, Dhading,
Nawalparasi, Rupandehi,
Makawanpur, Parsa, Syanja,
Chitwan
9 Ekata Bikash Bank Ltd. 2011/10/24 Butwal,
Rupandehi
Rupandehi, Kapilvastu, Dang,
Rukum, Pyuthan, Rolpa,
Surkehet, Kailali, Salyan, Banke
10 Shine Resunga
Development Bank Ltd. 2009/02/22
Tamghas,
Gulmi
Rupandehi, Nawalparasi, Arghakhachi,
Gulmi, Palpa, Dang, Pyuthan,
Kapilvastu, Baglung, Chitwan
11 Professional Diyalo Bikas
Bank Ltd. 2013/6/30 Banepa, Kavre
Kavrepalanchowk,
Sindhupalchowk, Dolkha, Sinduli,
Makwanpur, Nawalparasi,
Chitwan, Rupandehi, Tanahu,
Kaski
12 Araniko Development
Bank Ltd. 2013/7/14*
Dhulikhel,
Kavre
Kavrepalanchwok, Sindhuli,
Dhanusa, Dolkha, Mahottari,
Udayapur, Sunsari, Morang,
Makwanpur, Parsa
13 Biratlaxmi Bikas Bank Ltd. 2014/5/7* Biratnagar,
Morang
Morang, Sunsari, Jhapa,
Sankhuwasabha, Dhankuta,
Terhathum, Bhojpur, Ilam,
Taplejung and Panchthar
iii
List of Development Banks Operating in Three Districts
S.N. Name of the Development Bank Date of
Establishment Head Office Areas of operation
1 Narayani Development Bank Ltd. 2001/10/17 Ratna Nagar,
Chitawan
Nawalparasi, Chitwan,
Makawanpur
2 Sahayogi Bikas Bank Ltd. 2003/10/23 Janakpurdham,
Dhanusha
Dhanusa, Mahottari,
Sindhuli
3 Karnali Bikash Bank Ltd. 2004/02/18 Nepalgunj, Banke Banke, Bardiya, Dang
4 Shubhechchha Bikas Bank Ltd. 2004/09/26 Narayangadh,
Chitawan
Makawanpur, Chitwan,
Nawalparasi
5 Excel Development Bank Ltd. 2005/07/21 Birtamod, Jhapa Ilam, Jhapa, Morang
6 Western Development Bank Ltd. 2005/09/15 Ghorahi, Dang Dang, Banke, Kapilbastu
7 Miteri Development Bank Ltd. 2006/10/13 Dharan, Sunsari Jhapa, Morang, Sunsari
8 Tinau Bikas Bank Ltd. 2006/11/01 Butwal, Rupandehi Rupandehi, Nawalparasi,
Chitwan
9 Kankai Bikas Bank Ltd. 2007/05/03 Damak, Jhapa Jhapa, Ilam, Morang
10 Mahakali Bikas Bank Ltd. 2007/08/18 Mahendranagar,
Kanchanpur
Kanchanpur, Kailali,
Dadeldhura
11 Bhargav Bikas Bank Ltd. 2007/08/30 Nepalgunj, Banke Kavre, Dang, Bardiya
12 Alpine Development Bank Ltd. 2007/10/05 Hetauda,
Makawanpur
Makawanpur, Chitwan,
Kavre
13 Corporate Development Bank Ltd. 2007/11/07 Birgunj, Parsa Parsa, Makawanpur,
Kavrepalanchowk
14 Pathibhara Bikas Bank Ltd. 2007/11/21 Urlabari, Morang Jhapa, Morang, Sunsari
15 Purnima Bikas Bank Ltd. 2008/05/20 Siddharthanagar,
Rupandehi
Rupandehi, Nawalparasi,
Chitwan
16 Kanchan Development Bank Ltd. 2009/09/19 Mahendranagar,
Kanchanpur
Kailali, Kanchanpur,
Dadeldhura
17 Innovative Development Bank Ltd. 2009/11/13 Siddharthanagar,
Rupandehi
Rupandehi, Nawalparasi,
Chitwan
18 Metro Development Bank Ltd. 2009/12/16 Pokhara, Kaski Kaski, Myagdi, Lamjung
19 Raptibheri Bikas Bank Ltd. 2010/01/15 Nepalgunj, Banke Banke, Bardiya, Dang
20 Mission Development Bank Ltd. 2010/06/15 Butwal, Rupandehi Rupandehi, Nawalparasi,
Kapilbastu
21 Sindhu Bikas Bank Ltd. 2010/09/09 Barhabise,
Sindhupalchowk
Sindhupalchowk, Kavre,
Dolkha
22 Nepal Community Development Bank
Ltd. 2010/11/03 Butwal, Rupandehi
Rupandehi, Nawalparasi,
Chitwan
23 Manasalu Bikash Bank Ltd. 2010/12/14 Buspark, Gorkha Gorkha, Tanahu,
Chitwan
24 Kalinchowk Development Bank Ltd. 2011/11/21 Charikot, Dolkha Dolkha, Ramechhap,
Sindhuli
25 Saptakoshi Development Bank Ltd. 2012/10/02 Tankisunuwari,
Morang Morang, Ilam, Panchthar
26 Sajha Bikash Bank Ltd. 2013/04/30 Dhangadi, Kailali Kailali, Kanchanpur,
Bardiya
27 Green Development Bank Ltd. 2013/08/25 Baglung Bazar Baglung, Myagdi, Kaski
iv
List of Development Banks Operating in One District
S.N. Name of the Development Bank Date of
Establishment Head Office
Area of
operation
1 Kabeli Bikas Bank Ltd. 2007/12/16 Hulaktole, Dhankuta Dhankuta
2 Bagmati Development Bank Ltd. 2009/03/23 Hariwon, Sarlahi Sarlahi
3 Hamro Bikas Bank Ltd. 2009/04/19 Battar, Nuwakot Nuwakot
4 Kakre Bihar Bikas Bank Ltd. 2009/05/15 Birendranagar,
Surkhet Surkhet
5 Pacific Development Bank Ltd. 2009/07/26 Beshishahar, Lamjung Lamjung
6 Matribhumi Bikas Bank Ltd. 2009/10/09 Sindhulimadi,
Sindhuli Sindhuli
7 Jhimruk Bikas Bank Ltd. 2009/12/14 Bagdula, Pyuthan Pyuthan
8 Gaumukhee Bikas Bank Ltd. 2010/01/25 Bijuwar, Pyuthan Pyuthan
9 Mount Makalu Development Bank
Ltd. 2010/07/21
Basantapur,
Terhathum Terhathum
10 Sahara Bikas Bank Ltd. 2010/10/27 Malangawa, Sarlahi Sarlahi
11 Cosmos Development Bank Ltd. 2010/11/17 Shaktichowk, Gorkha Gorkha
12 Salpa Bikash Bank Ltd. 2012/07/16 Diktel, Khotang Khotang
*Joint operation date after Merger
(Source: Bank and Financial Institutions Regulation Department, NRB)
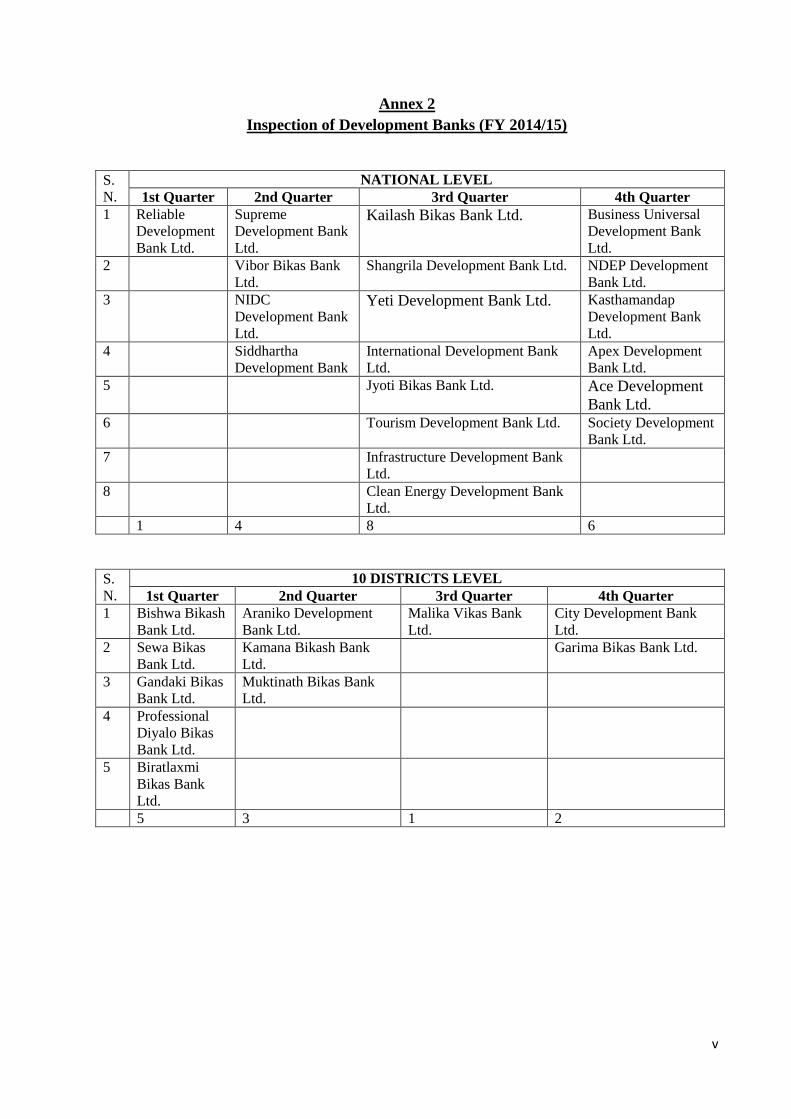
v
Annex 2
Inspection of Development Banks (FY 2014/15)
S.
N.
NATIONAL LEVEL
1st Quarter 2nd Quarter 3rd Quarter 4th Quarter
1 Reliable
Development
Bank Ltd.
Supreme
Development Bank
Ltd.
Kailash Bikas Bank Ltd. Business Universal
Development Bank
Ltd.
2 Vibor Bikas Bank
Ltd.
Shangrila Development Bank Ltd. NDEP Development
Bank Ltd.
3 NIDC
Development Bank
Ltd.
Yeti Development Bank Ltd. Kasthamandap
Development Bank
Ltd.
4 Siddhartha
Development Bank
International Development Bank
Ltd.
Apex Development
Bank Ltd.
5 Jyoti Bikas Bank Ltd. Ace Development
Bank Ltd. 6 Tourism Development Bank Ltd. Society Development
Bank Ltd.
7 Infrastructure Development Bank
Ltd.
8
Clean Energy Development Bank
Ltd.
1 4 8 6
S.
N.
10 DISTRICTS LEVEL
1st Quarter 2nd Quarter 3rd Quarter 4th Quarter
1 Bishwa Bikash
Bank Ltd.
Araniko Development
Bank Ltd.
Malika Vikas Bank
Ltd.
City Development Bank
Ltd.
2 Sewa Bikas
Bank Ltd.
Kamana Bikash Bank
Ltd.
Garima Bikas Bank Ltd.
3 Gandaki Bikas
Bank Ltd.
Muktinath Bikas Bank
Ltd.
4 Professional
Diyalo Bikas
Bank Ltd.
5 Biratlaxmi
Bikas Bank
Ltd.
5 3 1 2
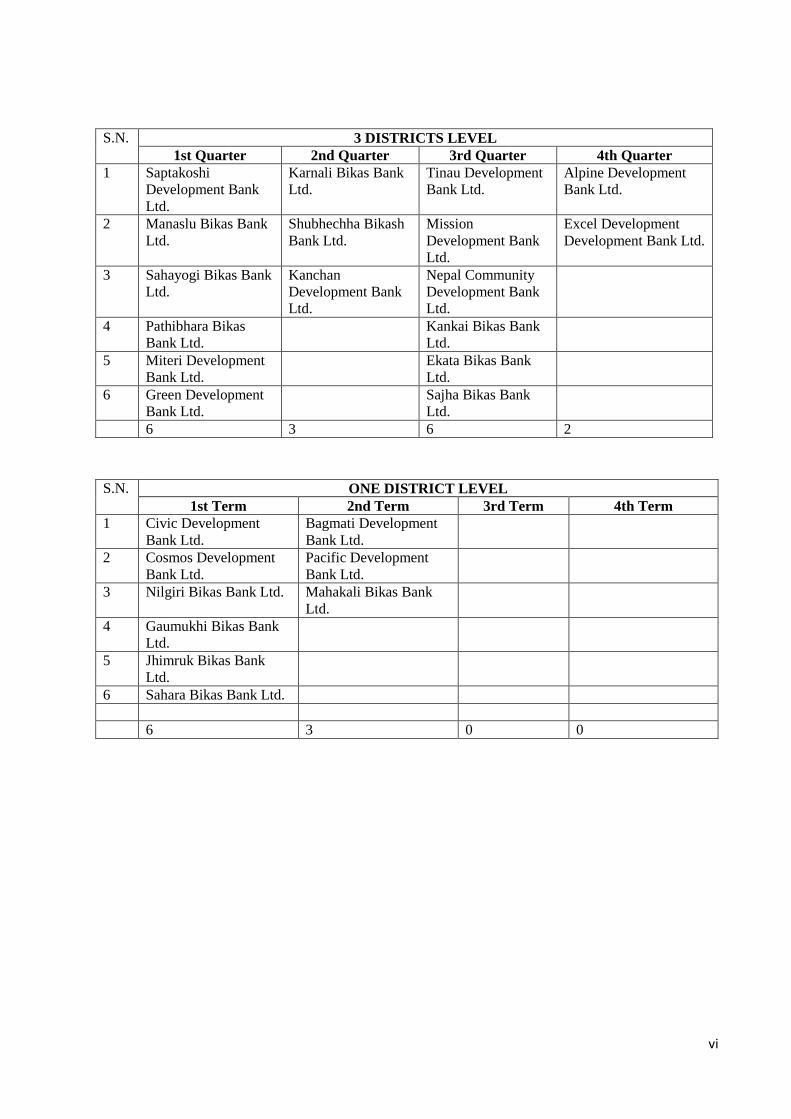
vi
S.N. 3 DISTRICTS LEVEL
1st Quarter 2nd Quarter 3rd Quarter 4th Quarter
1 Saptakoshi
Development Bank
Ltd.
Karnali Bikas Bank
Ltd.
Tinau Development
Bank Ltd.
Alpine Development
Bank Ltd.
2 Manaslu Bikas Bank
Ltd.
Shubhechha Bikash
Bank Ltd.
Mission
Development Bank
Ltd.
Excel Development
Development Bank Ltd.
3 Sahayogi Bikas Bank
Ltd.
Kanchan
Development Bank
Ltd.
Nepal Community
Development Bank
Ltd.
4 Pathibhara Bikas
Bank Ltd.
Kankai Bikas Bank
Ltd.
5 Miteri Development
Bank Ltd.
Ekata Bikas Bank
Ltd.
6 Green Development
Bank Ltd.
Sajha Bikas Bank
Ltd.
6 3 6 2
S.N. ONE DISTRICT LEVEL
1st Term 2nd Term 3rd Term 4th Term
1 Civic Development
Bank Ltd.
Bagmati Development
Bank Ltd.
2 Cosmos Development
Bank Ltd.
Pacific Development
Bank Ltd.
3 Nilgiri Bikas Bank Ltd. Mahakali Bikas Bank
Ltd.
4 Gaumukhi Bikas Bank
Ltd.
5 Jhimruk Bikas Bank
Ltd.
6 Sahara Bikas Bank Ltd.
6 3 0 0
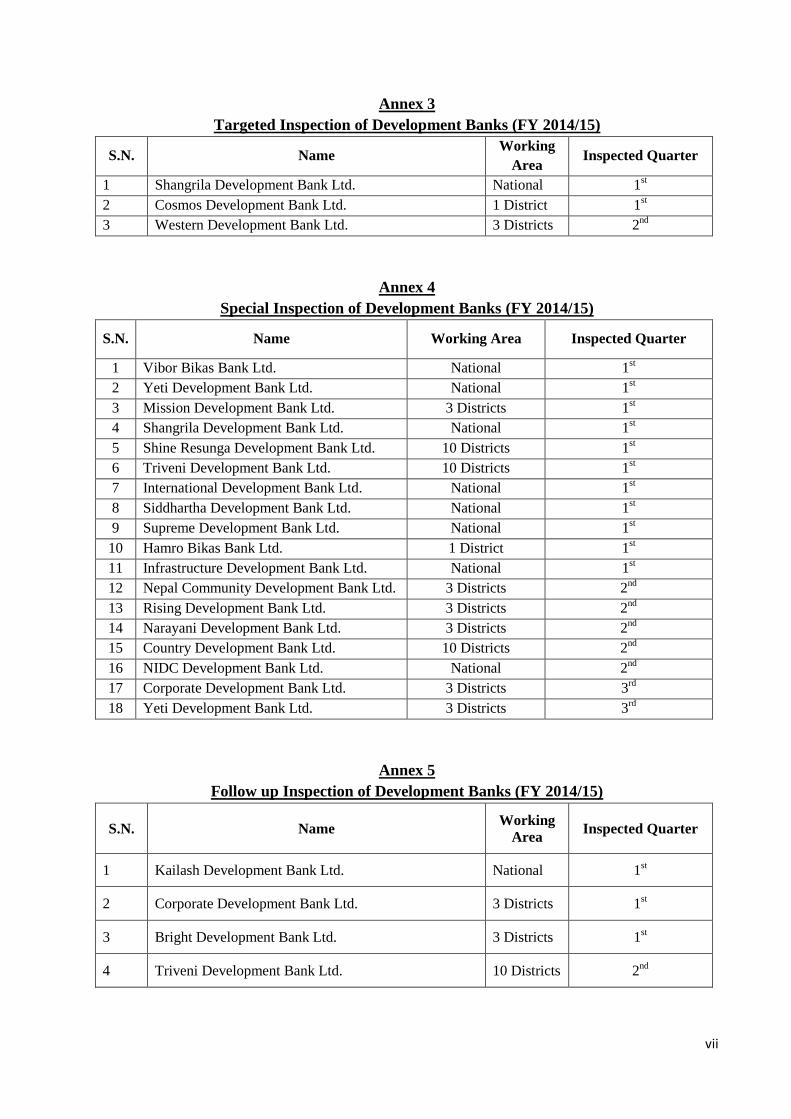
vii
Annex 3
Targeted Inspection of Development Banks (FY 2014/15)
S.N. Name Working
Area Inspected Quarter
1 Shangrila Development Bank Ltd. National 1st
2 Cosmos Development Bank Ltd. 1 District 1st
3 Western Development Bank Ltd. 3 Districts 2nd
Annex 4
Special Inspection of Development Banks (FY 2014/15)
S.N. Name Working Area Inspected Quarter
1 Vibor Bikas Bank Ltd. National 1st
2 Yeti Development Bank Ltd. National 1st
3 Mission Development Bank Ltd. 3 Districts 1st
4 Shangrila Development Bank Ltd. National 1st
5 Shine Resunga Development Bank Ltd. 10 Districts 1st
6 Triveni Development Bank Ltd. 10 Districts 1st
7 International Development Bank Ltd. National 1st
8 Siddhartha Development Bank Ltd. National 1st
9 Supreme Development Bank Ltd. National 1st
10 Hamro Bikas Bank Ltd. 1 District 1st
11 Infrastructure Development Bank Ltd. National 1st
12 Nepal Community Development Bank Ltd. 3 Districts 2nd
13 Rising Development Bank Ltd. 3 Districts 2nd
14 Narayani Development Bank Ltd. 3 Districts 2nd
15 Country Development Bank Ltd. 10 Districts 2nd
16 NIDC Development Bank Ltd. National 2nd
17 Corporate Development Bank Ltd. 3 Districts 3rd
18 Yeti Development Bank Ltd. 3 Districts 3rd
Annex 5
Follow up Inspection of Development Banks (FY 2014/15)
S.N. Name Working
Area Inspected Quarter
1 Kailash Development Bank Ltd. National 1st
2 Corporate Development Bank Ltd. 3 Districts 1st
3 Bright Development Bank Ltd. 3 Districts 1st
4 Triveni Development Bank Ltd. 10 Districts 2nd

viii
Annex 6
International Training and Seminar Participation from DBSD (FY 2014/15)
S.N Name of Subject Organizer Country Days Participants
1 SEACEN CGFS Workshop
SEACEN
Centre Singapore 7 1 2 Basel III FSI-BIS Switzerland 9 1
3
Financial Stability, Financial
Surveillance and Macro
Prudential Policy
Bank Nagara
Malaysia Malaysia 9 1
4
Risk Management Market,
Liquidity and Operational Risk
Financial
Stability
Institute Switzerland 8 1
5
Promoting Financial Stability
Through Enhanced Bank
Transparency
The SEACEN
Centre Malaysia 6 1
6 Capital Adequacy and Basel III
Bank of Int'l
Settlements Phillipines 8 1
7 Operation Risk Management etc.
Deutsche
Bundesbank Germany 8 1
8
Portfolio at Risk and Bank
Failures
Central Bank of
Sri Lanka Srilanka 7 2
9
MAS Banking Supervisors
Training Programme MAS Singapore 8 1
10
Regulation & Supervision of
Banks & Non Bank Financial
Institutions
Central Bank of
Sri Lanka Srilanka 9 5
11
International Central Banking
Course NIBAF Pakistan 30 1
12
Stress Testing in Supervision
and Management.
Bank for int'l
Settlements Thailand 7 1
13
Liquidity Risk Management and
Supervision.
Bank for int'l
Settlements China 7 2
14
Stress Testing: Supervision
Techniques and Bank Practices.
Bank for int'l
Settlements Hong Kong 7 1
15
Effective Credit Appraisal and
Credit Risk Management.
Central Bank of
Srilanka Srilanka 7 1
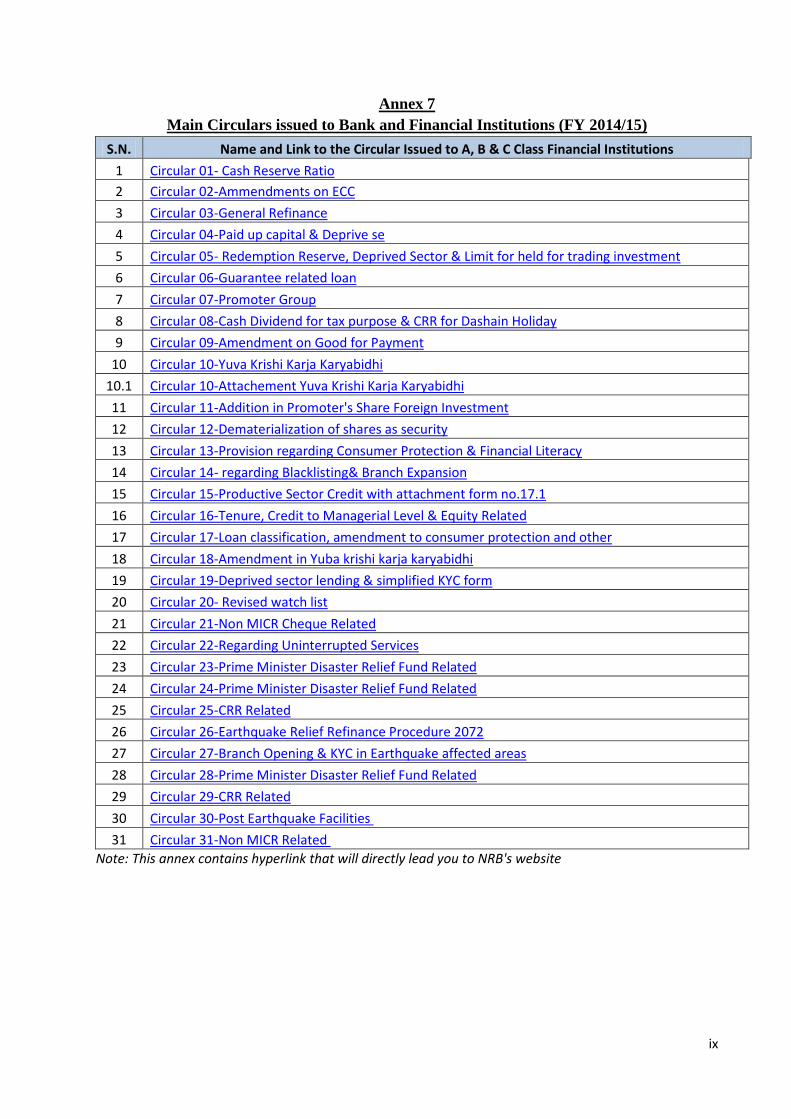
ix
Annex 7
Main Circulars issued to Bank and Financial Institutions (FY 2014/15)
S.N. Name and Link to the Circular Issued to A, B & C Class Financial Institutions
1 Circular 01- Cash Reserve Ratio
2 Circular 02-Ammendments on ECC
3 Circular 03-General Refinance
4 Circular 04-Paid up capital & Deprive se
5 Circular 05- Redemption Reserve, Deprived Sector & Limit for held for trading investment
6 Circular 06-Guarantee related loan
7 Circular 07-Promoter Group
8 Circular 08-Cash Dividend for tax purpose & CRR for Dashain Holiday
9 Circular 09-Amendment on Good for Payment
10 Circular 10-Yuva Krishi Karja Karyabidhi
10.1 Circular 10-Attachement Yuva Krishi Karja Karyabidhi
11 Circular 11-Addition in Promoter's Share Foreign Investment
12 Circular 12-Dematerialization of shares as security
13 Circular 13-Provision regarding Consumer Protection & Financial Literacy
14 Circular 14- regarding Blacklisting& Branch Expansion
15 Circular 15-Productive Sector Credit with attachment form no.17.1
16 Circular 16-Tenure, Credit to Managerial Level & Equity Related
17 Circular 17-Loan classification, amendment to consumer protection and other
18 Circular 18-Amendment in Yuba krishi karja karyabidhi
19 Circular 19-Deprived sector lending & simplified KYC form
20 Circular 20- Revised watch list
21 Circular 21-Non MICR Cheque Related
22 Circular 22-Regarding Uninterrupted Services
23 Circular 23-Prime Minister Disaster Relief Fund Related
24 Circular 24-Prime Minister Disaster Relief Fund Related
25 Circular 25-CRR Related
26 Circular 26-Earthquake Relief Refinance Procedure 2072
27 Circular 27-Branch Opening & KYC in Earthquake affected areas
28 Circular 28-Prime Minister Disaster Relief Fund Related
29 Circular 29-CRR Related
30 Circular 30-Post Earthquake Facilities
31 Circular 31-Non MICR Related
Note: This annex contains hyperlink that will directly lead you to NRB's website
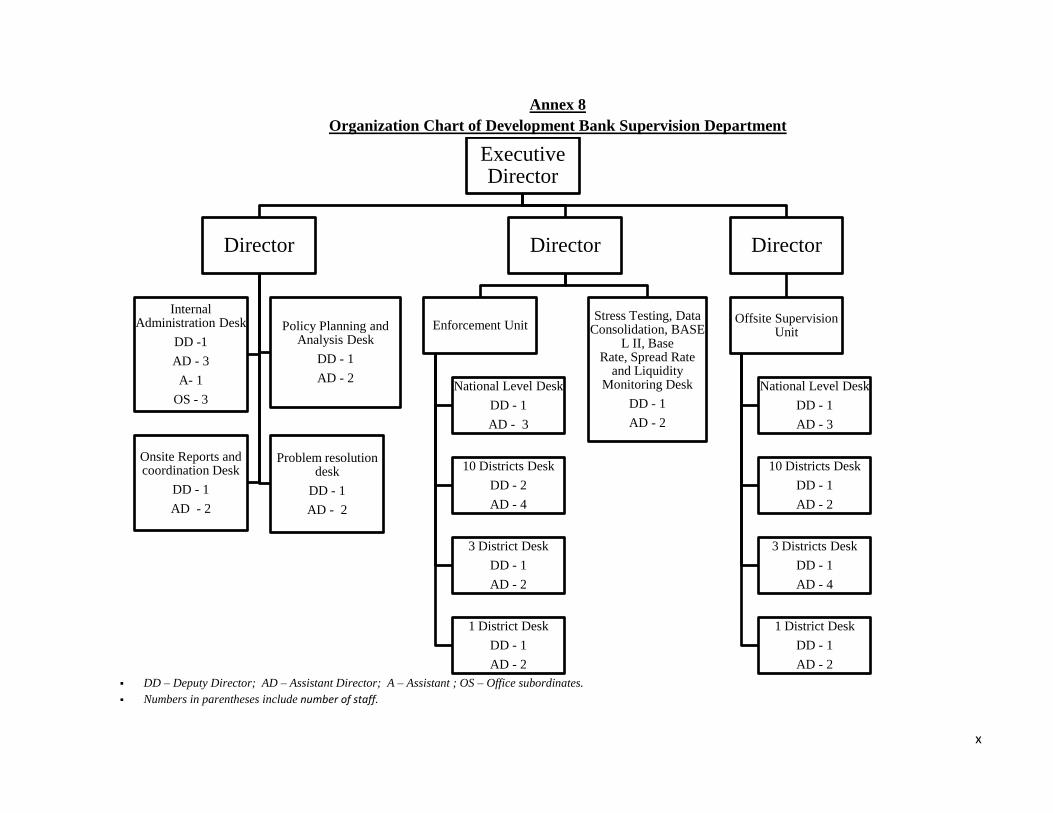
x
Annex 8
Organization Chart of Development Bank Supervision Department
DD – Deputy Director; AD – Assistant Director; A – Assistant ; OS – Office subordinates.
Numbers in parentheses include number of staff.
Executive Director
Director
Internal Administration Desk
DD -1
AD - 3
A- 1
OS - 3
Policy Planning and Analysis Desk
DD - 1
AD - 2
Onsite Reports and coordination Desk
DD - 1
AD - 2
Problem resolution desk
DD - 1
AD - 2
Director
Enforcement Unit
National Level Desk
DD - 1
AD - 3
10 Districts Desk
DD - 2
AD - 4
3 District Desk
DD - 1
AD - 2
1 District Desk
DD - 1
AD - 2
Stress Testing, Data Consolidation, BASE
L II, Base Rate, Spread Rate
and Liquidity Monitoring Desk
DD - 1
AD - 2
Director
Offsite Supervision Unit
National Level Desk
DD - 1
AD - 3
10 Districts Desk
DD - 1
AD - 2
3 Districts Desk
DD - 1
AD - 4
1 District Desk
DD - 1
AD - 2
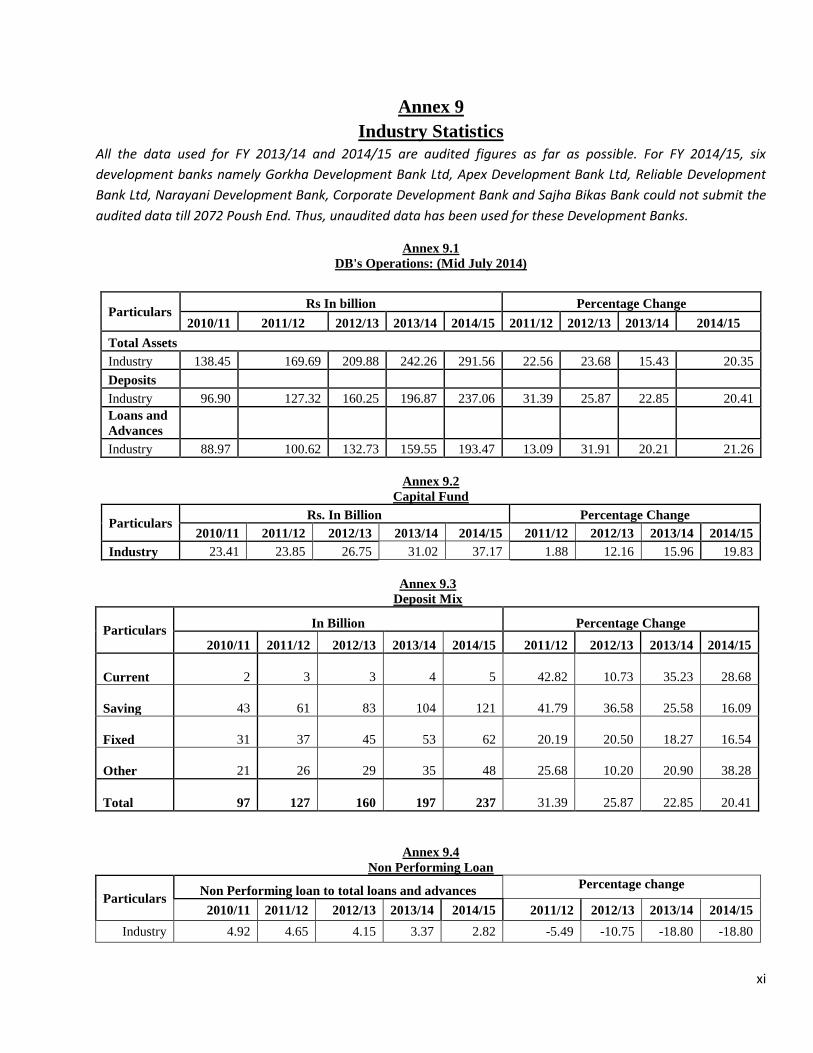
xi
Annex 9
Industry Statistics
All the data used for FY 2013/14 and 2014/15 are audited figures as far as possible. For FY 2014/15, six
development banks namely Gorkha Development Bank Ltd, Apex Development Bank Ltd, Reliable Development
Bank Ltd, Narayani Development Bank, Corporate Development Bank and Sajha Bikas Bank could not submit the
audited data till 2072 Poush End. Thus, unaudited data has been used for these Development Banks.
Annex 9.1
DB's Operations: (Mid July 2014)
Particulars Rs In billion Percentage Change
2010/11 2011/12 2012/13 2013/14 2014/15 2011/12 2012/13 2013/14 2014/15
Total Assets
Industry 138.45 169.69 209.88 242.26 291.56 22.56 23.68 15.43 20.35
Deposits
Industry 96.90 127.32 160.25 196.87 237.06 31.39 25.87 22.85 20.41
Loans and
Advances
Industry 88.97 100.62 132.73 159.55 193.47 13.09 31.91 20.21 21.26
Annex 9.2
Capital Fund
Particulars Rs. In Billion Percentage Change
2010/11 2011/12 2012/13 2013/14 2014/15 2011/12 2012/13 2013/14 2014/15
Industry 23.41 23.85 26.75 31.02 37.17 1.88 12.16 15.96 19.83
Annex 9.3
Deposit Mix
Particulars In Billion Percentage Change
2010/11 2011/12 2012/13 2013/14 2014/15 2011/12 2012/13 2013/14 2014/15
Current
2
3
3 4 5 42.82 10.73 35.23 28.68
Saving
43
61
83 104 121 41.79 36.58 25.58 16.09
Fixed
31
37
45 53 62 20.19 20.50 18.27 16.54
Other
21
26
29 35 48 25.68 10.20 20.90 38.28
Total
97
127
160 197 237 31.39 25.87 22.85 20.41
Annex 9.4
Non Performing Loan
Particulars Non Performing loan to total loans and advances
Percentage change
2010/11 2011/12 2012/13 2013/14 2014/15 2011/12 2012/13 2013/14 2014/15
Industry 4.92 4.65 4.15 3.37 2.82 -5.49 -10.75 -18.80 -18.80
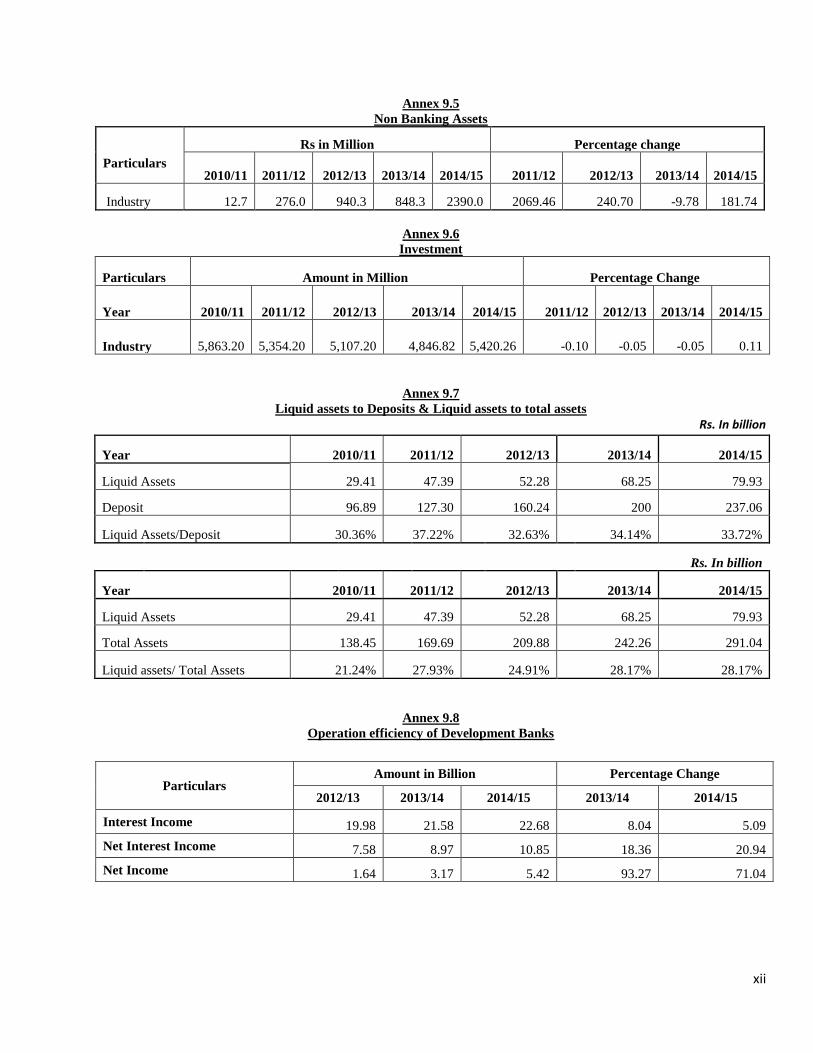
xii
Annex 9.5
Non Banking Assets
Particulars
Rs in Million Percentage change
2010/11
2011/12
2012/13
2013/14 2014/15 2011/12 2012/13 2013/14 2014/15
Industry 12.7 276.0 940.3 848.3 2390.0 2069.46 240.70 -9.78 181.74
Annex 9.6
Investment
Particulars Amount in Million Percentage Change
Year 2010/11 2011/12 2012/13 2013/14 2014/15 2011/12 2012/13 2013/14 2014/15
Industry 5,863.20 5,354.20 5,107.20 4,846.82 5,420.26 -0.10 -0.05 -0.05 0.11
Annex 9.7
Liquid assets to Deposits & Liquid assets to total assets
Rs. In billion
Year 2010/11 2011/12 2012/13 2013/14 2014/15
Liquid Assets 29.41 47.39 52.28 68.25 79.93
Deposit 96.89 127.30 160.24 200 237.06
Liquid Assets/Deposit 30.36% 37.22% 32.63% 34.14% 33.72%
Rs. In billion
Year 2010/11 2011/12 2012/13 2013/14 2014/15
Liquid Assets 29.41 47.39 52.28 68.25 79.93
Total Assets 138.45 169.69 209.88 242.26 291.04
Liquid assets/ Total Assets 21.24% 27.93% 24.91% 28.17% 28.17%
Annex 9.8
Operation efficiency of Development Banks
Particulars Amount in Billion Percentage Change
2012/13 2013/14 2014/15 2013/14 2014/15
Interest Income 19.98 21.58 22.68 8.04 5.09
Net Interest Income 7.58 8.97 10.85 18.36 20.94
Net Income 1.64 3.17 5.42 93.27 71.04
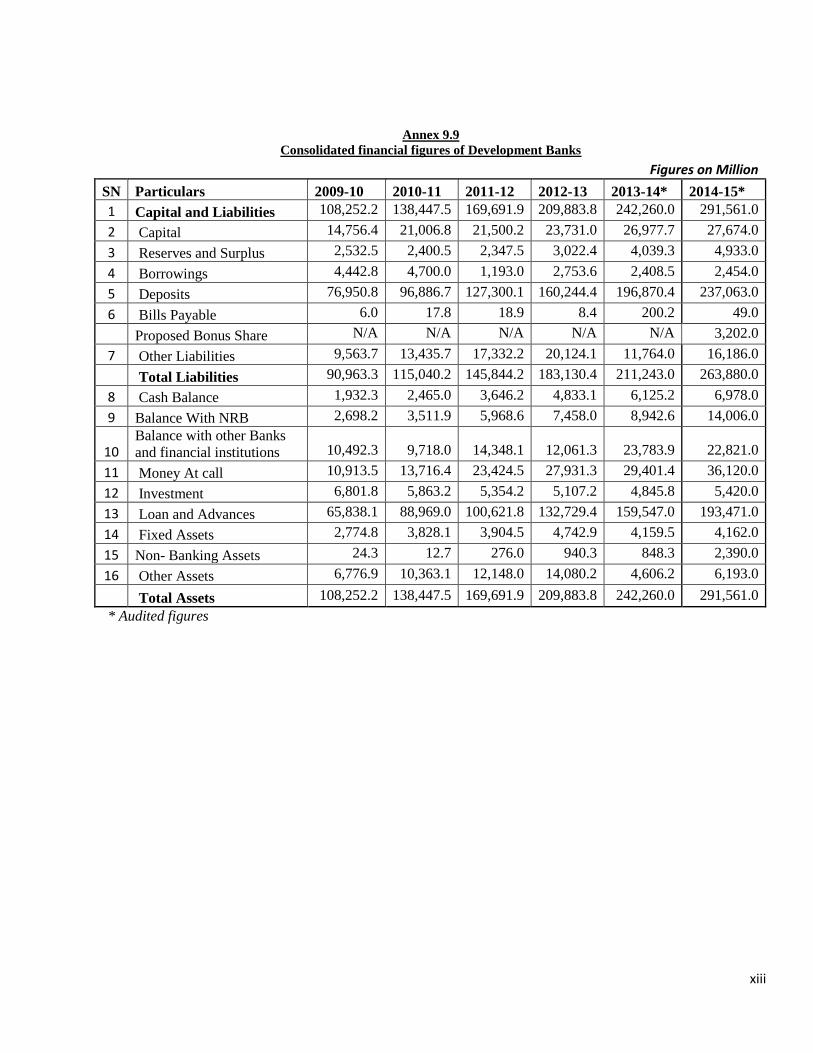
xiii
Annex 9.9
Consolidated financial figures of Development Banks
Figures on Million
SN Particulars 2009-10 2010-11 2011-12 2012-13 2013-14* 2014-15*
1 Capital and Liabilities 108,252.2 138,447.5 169,691.9 209,883.8 242,260.0 291,561.0
2 Capital 14,756.4 21,006.8 21,500.2 23,731.0 26,977.7 27,674.0
3 Reserves and Surplus 2,532.5 2,400.5 2,347.5 3,022.4 4,039.3 4,933.0
4 Borrowings 4,442.8 4,700.0 1,193.0 2,753.6 2,408.5 2,454.0
5 Deposits 76,950.8 96,886.7 127,300.1 160,244.4 196,870.4 237,063.0
6 Bills Payable 6.0 17.8 18.9 8.4 200.2 49.0
Proposed Bonus Share N/A N/A N/A N/A N/A 3,202.0
7 Other Liabilities 9,563.7 13,435.7 17,332.2 20,124.1 11,764.0 16,186.0
Total Liabilities 90,963.3 115,040.2 145,844.2 183,130.4 211,243.0 263,880.0
8 Cash Balance 1,932.3 2,465.0 3,646.2 4,833.1 6,125.2 6,978.0
9 Balance With NRB 2,698.2 3,511.9 5,968.6 7,458.0 8,942.6 14,006.0
10 Balance with other Banks
and financial institutions 10,492.3 9,718.0 14,348.1 12,061.3 23,783.9 22,821.0
11 Money At call 10,913.5 13,716.4 23,424.5 27,931.3 29,401.4 36,120.0
12 Investment 6,801.8 5,863.2 5,354.2 5,107.2 4,845.8 5,420.0
13 Loan and Advances 65,838.1 88,969.0 100,621.8 132,729.4 159,547.0 193,471.0
14 Fixed Assets 2,774.8 3,828.1 3,904.5 4,742.9 4,159.5 4,162.0
15 Non- Banking Assets 24.3 12.7 276.0 940.3 848.3 2,390.0
16 Other Assets 6,776.9 10,363.1 12,148.0 14,080.2 4,606.2 6,193.0
Total Assets 108,252.2 138,447.5 169,691.9 209,883.8 242,260.0 291,561.0
* Audited figures