(2014) is what we hear about migration really true? questioning eight stereotypes. stereotype 3:...
TRANSCRIPT
is what we hear about migration really true?questioning eight stereotypes
Edited by Philippe Fargues
The Migration Policy Centre receives financing from the European Commission. This publication reflects the views only of the author(s), and the Commission cannot be held responsible for any use which may be made of the information contained therein.
This Report has been published by the European University Institute, Robert Schuman Centre for Advanced Studies, Migration Policy Centre.
© European University Institute, 2014
The Migration Policy Centre at the European University Institute, Florence, conducts advanced research on global migration to serve migration governance needs at European level, from developing, implementing and monitoring migration-related policies to assessing their impact on the wider economy and society.
For queries regarding this publication, please contact the MPC at [email protected]
CONTACTSMigration Policy CentreRobert Schuman Centre for Advanced StudiesEuropean University InstituteVia delle Fontanelle 18I-50014 San Domenico di Fiesole (FI)Italy
Tel: (+39) 055 4685 817Fax: (+39) 055 4685 770Email: [email protected]: www.migrationpolicycentre.eu
Is what we hear about migration really true? - Questioning eight stereotypes
Migration Policy Centre (www.migrationpolicycentre.eu) i
Table of Contents
Authors and contributors ........................................................................................................................ iii
Foreword ................................................................................................................................................. v
Stereotype 1. “We do not need migrants” ............................................................................................... 1
Stereotype 2. “Migrants steal our jobs” ................................................................................................. 13
Stereotype 3. “We do not need low-skilled immigrants in the EU” ...................................................... 25
Stereotype 4. “Migrants undermine our welfare systems” .................................................................... 33
Stereotype 5. “Migration hampers our capacity to innovate” ............................................................... 43
Stereotype 6. “Our southern coastline is flooded with asylum seekers” ............................................... 51
Stereotype 7. “Economic migrants are trying to cheat our asylum system” ......................................... 61
Stereotype 8. “Our children suffer from having immigrants in class” .................................................. 71

Is what we hear about migration really true? - Questioning eight stereotypes
Migration Policy Centre (www.migrationpolicycentre.eu) iii
Authors and contributors
Sara Bonfanti, Migration Policy Centre, Robert Schuman Centre for Advanced Studies (RSCAS),
European University (EUI)
Anna Di Bartolomeo, Migration Policy Centre, RSCAS, EUI
Philippe Fargues, Migration Policy Centre, RSCAS, EUI
Pawel Kaczmarczyk, Warsaw University and formerly Migration Policy Centre, RSCAS, EUI
Sona Kalantaryan, Migration Policy Centre, RSCAS, EUI
Kathryn Lum, Migration Policy Centre, RSCAS, EUI
Iván Martín, Migration Policy Centre, RSCAS, EUI, and CIDOB, Barcelona Center for International
Affairs
Hillel Rapoport, Migration Policy Centre, RSCAS, EUI, and Paris School of Economics
Cameron Thibos, Migration Policy Centre, RSCAS, EUI
Alessandra Venturini, Migration Policy Centre, RSCAS, EUI, and University of Turin

Is what we hear about migration really true? - Questioning eight stereotypes
Migration Policy Centre (www.migrationpolicycentre.eu) v
Foreword
Philippe Fargues
For decades, the topic of immigration has been polarising European political arenas. The view that
immigration of non-EU nationals can be a positive contribution to Europe has had its defendants and
its opponents, and it has often been the matter of harsh debates. In recent years, however, the dispute
between the two groups often seems to have largely vanished. If not all politicians share the same
principles about migration and migrants, fewer and fewer dare to defend the view that migration is,
and will continue to be, needed. They follow the trends of public opinion, in which increasingly large
fractions see migrants as competitors in labour markets beset by unemployment, burdens on
endangered welfare systems, and a factor of social disruption.
This is in large part a result of the current crisis, which has exacerbated economic and social
tensions and given rise to the search for scapegoats. If the opinion that migration is a threat rather than
an asset prevails, there is a risk that European States will forego the positive benefits of immigration
and make decisions that undermine Europe’s recovery from the crisis and, ultimately, its leading
position in the world. The following stereotypes are successively examined.
Stereotype 1: “We do not need migrants”
The idea that Europe has a large enough population and would fare better with fewer immigrants is
typically a very short term vision. Europe’s population projections show a dramatic trend of decrease
and ageing that, in the absence of immigration, will translate into: an unprecedented reduction in
Europe’s demographic weight in the world; the unsustainability of its welfare systems; the ageing of
its skills.
Stereotype 2: “Migrants steal our jobs”
Contrary to this expectation, statistical analysis shows that unemployment and immigration vary more
often in opposite directions than in parallel. On one hand immigrants are attracted by employment
rather than unemployment, and on the other hand, successful labour markets create employment for
both migrants and natives, who, in many cases, are not in direct competition.
Stereotype 3: “We do not need low-skilled immigrants in the EU”
That migration policies must be selective does not mean that only highly-skilled migrants should be
selected. Low-skilled migrants have their place in Europe’s labour markets. They allow for the
employment of natives in highly-skilled occupations and compensate for shortages of low-skilled
workers in industries where they are needed.
Stereotype 4: “Migrants undermine our welfare systems”
With larger families and higher risks of job loss, immigrants would be a burden on the welfare system,
which would reduce natives’ trust in social solidarity. On the contrary, empirical evidence shows that:
given their age and occupational structure, migrants have on average a positive net fiscal contribution;
Is what we hear about migration really true? - Questioning eight stereotypes
vi Migration Policy Centre (www.migrationpolicycentre.eu)
immigration is accompanied by positive, more often than negative, attitudes towards social
redistribution of wealth.
Stereotype 5: “Migration hampers our capacity to innovate”
By bringing in labour, migration would reduce incentives for firms to invest in the capital-intensive
technologies where innovation takes place. On the contrary, empirical research shows that the
immigration of highly-skilled workers, together with the diversity of origins in the workplace, play in
favour of innovation.
Stereotype 6: “Our southern coastline is flooded with asylum seekers”
Europe and particularly its southern Member States are too exposed to waves of forced migrants. In
reality: the vast majority of recent refugees are not in Europe, but in countries neighbouring conflict
areas in the neighbourhood of Europe; most asylum seekers in Europe are not in Mediterranean
Member States, but in Western and Northern EU.
Stereotype 7: “Economic migrants are trying to cheat our asylum system”
Recurrent dramas in the Mediterranean have called for local responses ranging from better control of
emigration from North Africa to reduce the risk of dying at sea and to open new channels of legal
migration. However, data show that many clandestine migrants are genuine asylum seekers and the
roots of their drama is the lack of asylum channels in more distant regions, such as the Horn of Africa.
Stereotype 8: “Our children suffer from having immigrants in class”
Contrary to this received idea, PISA surveys on the educational achievement of students provide
evidence of a bonus, enjoyed by sons and daughters of mixed parentage, but no handicap of children
attending mixed schools when social factors are accounted for. Put in other terms, lower educational
performances are linked to social disadvantages rather than the presence of migrants.
This volume examines these eight stereotypes in the light of empirical evidence. Each chapter is based
on research findings established by the Migration Policy Centre. For the sake of readability,
methodological developments and sophisticated argumentation have been removed.
A booklet containing the core messages of each chapter accompanies this work, and may be
downloaded at: http://www.migrationpolicycentre.eu/migration-stereotypes.
Stereotype 1
“We do not need migrants”
Wrong: The economic downturn that generates unemployment will pass and
built-in demographic imbalances will resurface. Once the crisis is over
there will be two and only two options. Either European states close their
doors on migrants and accept the ineluctable corollary: a shrinking Europe
in a growing world; or they open themselves to immigration and citizenship
for immigrants and let Europe grow.
Text written by Philippe Fargues and Anna Di Bartolomeo drawing on previous works published
within the Migration Policy Centre by Philippe Fargues and Ashley McCormick (formerly Migration
Policy Centre, RSCAS, EUI)

Stereotype 1: “We do not need migrants”
Migration Policy Centre (www.migrationpolicycentre.eu) 3
There is the perception in EU societies that immigrants constitute too large a proportion of the
population. Almost one out of two Europeans would allow none or only few migrants of a different
race/ethnic group from the majority to enter and live in their country (European Social Survey 2010).
Many people perceive that immigration: has a negative effect on their countries in the long run
(41.1%); is generally negative for host countries’ economies (36.6%); makes their countries a worse
place to live (33.1%); or undermines their country’s cultural life (28.1%).
Demographic trends will challenge the EU in four respects, which call for strong and creative
policies.
The total population of the EU will decrease or stabilize depending upon migration
scenarios, while the world’s population will continue to steadily increase so that the relative
demographic weight of the EU will dwindle, challenging its role in world affairs.
The EU’s workforce will decline in absolute numbers, challenging the EU’s production and
wealth. If no immigration occurs between 2010 and 2030, the EU27 will lose 33 million
persons at working age (-11%).
The EU’s welfare systems and contract of the generations will become unsustainable due to
the old-age dependency ratio (65+ / 20-65) jumping from 28% in 2010 to 44% in 2030 in the
no-migration scenario.
A process of ageing of skills will result in a marked shift from young to old actives, i.e. a
continuous elevation of time elapsed since the termination of formal education. From 2010
to 2030 with no migration, the population aged 20-30 will decrease by 25% and the
population aged 60-70 will increase by 29%. Moreover, the ageing of skills will be amplified
by any postponement of the legal age of retirement adopted in response to rising old-age
dependency.
This paper shows how and to what extent international migration may positively affect European
population trends. It finds evidence that sensible international migration policies may represent a
complementary response to European strategies in addressing the consequences of European
population trends. As a general methodology, the role of international migration is here captured by
designing population scenarios, which in turn include and exclude international migration flows.
Long-term population decline and the relative weight of Europe in the world
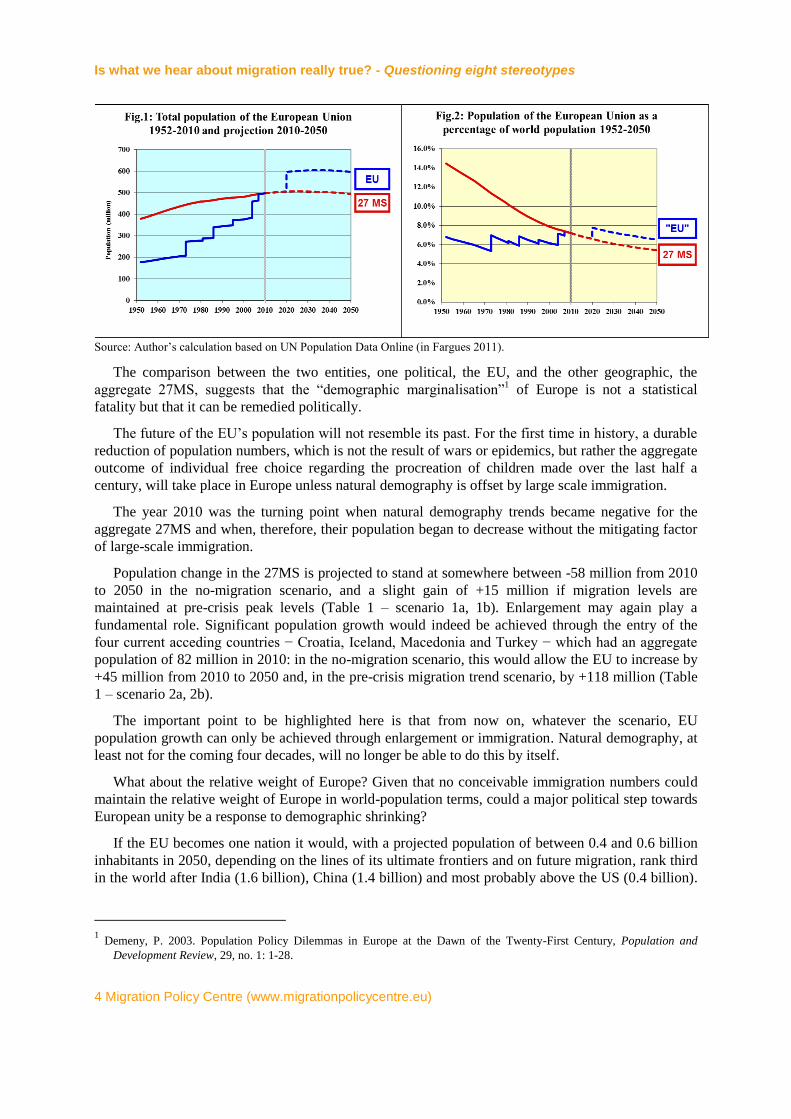
Since the beginning of the European Communities, the population of what would become the
European Union (hereafter “EU”, for successively the European Communities, then Union, from 1952
onwards) has continuously increased, not only in absolute numbers from less than 180 million in 1952
to 500 million in 2010, but also in relative terms, as a percentage of world population, from 6.8% in
1952 to 7.2% in 2010 (figures 1 & 2). This increase has been the result of both enlargement and
demographic growth. Six enlargements brought 248 million people into the EU, accounting for 70% of
its total growth. Demographic growth, which includes both natural population increase and
international migration, contributed 72 million or 30% of total growth.
If, instead of the expanding geography of the EU, the constant geography of the 27 member states
(hereafter 27MS) is considered, there is still growth, but slackening growth, in absolute terms and a
pronounced decrease in relative terms: the 27MS already had an aggregate population of 380 million
in 1952, then representing 14.5% of world population. They now have 500 million inhabitants, or a
mere 7% of the world population (figures 1 & 2).
Is what we hear about migration really true? - Questioning eight stereotypes
4 Migration Policy Centre (www.migrationpolicycentre.eu)
Source: Author’s calculation based on UN Population Data Online (in Fargues 2011).
The comparison between the two entities, one political, the EU, and the other geographic, the
aggregate 27MS, suggests that the “demographic marginalisation”1 of Europe is not a statistical
fatality but that it can be remedied politically.
The future of the EU’s population will not resemble its past. For the first time in history, a durable
reduction of population numbers, which is not the result of wars or epidemics, but rather the aggregate
outcome of individual free choice regarding the procreation of children made over the last half a
century, will take place in Europe unless natural demography is offset by large scale immigration.
The year 2010 was the turning point when natural demography trends became negative for the
aggregate 27MS and when, therefore, their population began to decrease without the mitigating factor
of large-scale immigration.
Population change in the 27MS is projected to stand at somewhere between -58 million from 2010
to 2050 in the no-migration scenario, and a slight gain of +15 million if migration levels are
maintained at pre-crisis peak levels (Table 1 – scenario 1a, 1b). Enlargement may again play a
fundamental role. Significant population growth would indeed be achieved through the entry of the
four current acceding countries − Croatia, Iceland, Macedonia and Turkey − which had an aggregate
population of 82 million in 2010: in the no-migration scenario, this would allow the EU to increase by
+45 million from 2010 to 2050 and, in the pre-crisis migration trend scenario, by +118 million (Table
1 – scenario 2a, 2b).
The important point to be highlighted here is that from now on, whatever the scenario, EU
population growth can only be achieved through enlargement or immigration. Natural demography, at
least not for the coming four decades, will no longer be able to do this by itself.
What about the relative weight of Europe? Given that no conceivable immigration numbers could
maintain the relative weight of Europe in world-population terms, could a major political step towards
European unity be a response to demographic shrinking?
If the EU becomes one nation it would, with a projected population of between 0.4 and 0.6 billion
inhabitants in 2050, depending on the lines of its ultimate frontiers and on future migration, rank third
in the world after India (1.6 billion), China (1.4 billion) and most probably above the US (0.4 billion).
1 Demeny, P. 2003. Population Policy Dilemmas in Europe at the Dawn of the Twenty-First Century, Population and
Development Review, 29, no. 1: 1-28.
Stereotype 1: “We do not need migrants”
Migration Policy Centre (www.migrationpolicycentre.eu) 5
This is, of course, assuming that the political geography in the rest of the world remains the same and
other groups of countries do not decide to unite into one nation.
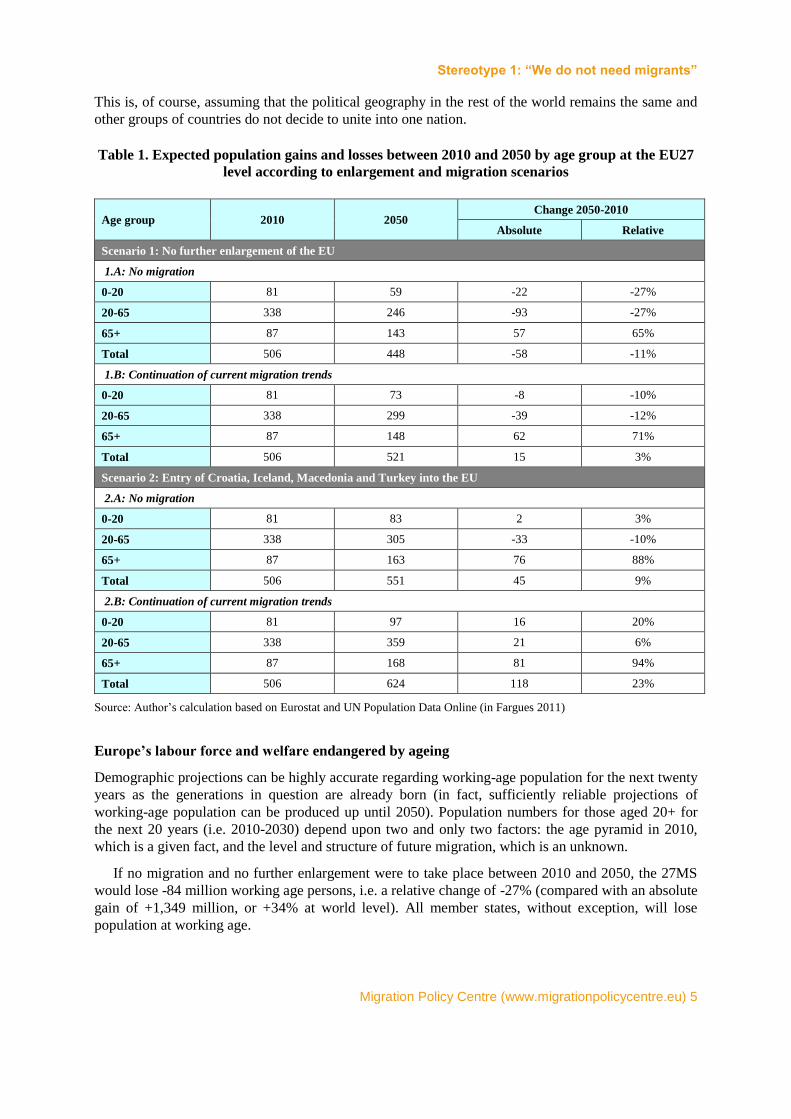
Table 1. Expected population gains and losses between 2010 and 2050 by age group at the EU27
level according to enlargement and migration scenarios
Age group 2010 2050 Change 2050-2010
Absolute Relative
Scenario 1: No further enlargement of the EU
1.A: No migration
0-20 81 59 -22 -27%
20-65 338 246 -93 -27%
65+ 87 143 57 65%
Total 506 448 -58 -11%
1.B: Continuation of current migration trends
0-20 81 73 -8 -10%
20-65 338 299 -39 -12%
65+ 87 148 62 71%
Total 506 521 15 3%
Scenario 2: Entry of Croatia, Iceland, Macedonia and Turkey into the EU
2.A: No migration
0-20 81 83 2 3%
20-65 338 305 -33 -10%
65+ 87 163 76 88%
Total 506 551 45 9%
2.B: Continuation of current migration trends
0-20 81 97 16 20%
20-65 338 359 21 6%
65+ 87 168 81 94%
Total 506 624 118 23%
Source: Author’s calculation based on Eurostat and UN Population Data Online (in Fargues 2011)
Europe’s labour force and welfare endangered by ageing
Demographic projections can be highly accurate regarding working-age population for the next twenty
years as the generations in question are already born (in fact, sufficiently reliable projections of
working-age population can be produced up until 2050). Population numbers for those aged 20+ for
the next 20 years (i.e. 2010-2030) depend upon two and only two factors: the age pyramid in 2010,
which is a given fact, and the level and structure of future migration, which is an unknown.
If no migration and no further enlargement were to take place between 2010 and 2050, the 27MS
would lose -84 million working age persons, i.e. a relative change of -27% (compared with an absolute
gain of +1,349 million, or +34% at world level). All member states, without exception, will lose
population at working age.
Is what we hear about migration really true? - Questioning eight stereotypes
6 Migration Policy Centre (www.migrationpolicycentre.eu)
A continuation of immigration trends at pre-crisis levels would not be sufficient to compensate for
declining trends in the natural demography of the 27MS. But it would reduce the loss to -37 million, or
-12% in relative numbers. Similarly, if Turkey, Croatia, Iceland and Macedonia were to be admitted to
the EU, population change at working ages would still be negative in the absence of immigration (-33
million, or -10% of its 2010 level).
It is only a combination of continuing immigration at pre-crisis levels and geographic enlargement
that would allow the EU to maintain its workforce through 2050 (with a small gain of +21 million, or
+6%).
In sharp contrast with the negative demographic trends at working age, populations aged 65 and
over will continuously grow in the coming four decades, whatever the scenario: the 27MS will gain
+57 million elderly persons between 2010 and 2050 (+65%) in the no-migration scenario, and +62
million (+71%) in the pre-crisis-migration scenario. The enlargement of the EU would bring even
more gains in terms of the elderly with no migration (+76 million, or +88%), and up to +81 million
(+94%) with migration. All European states will experience intense ageing.
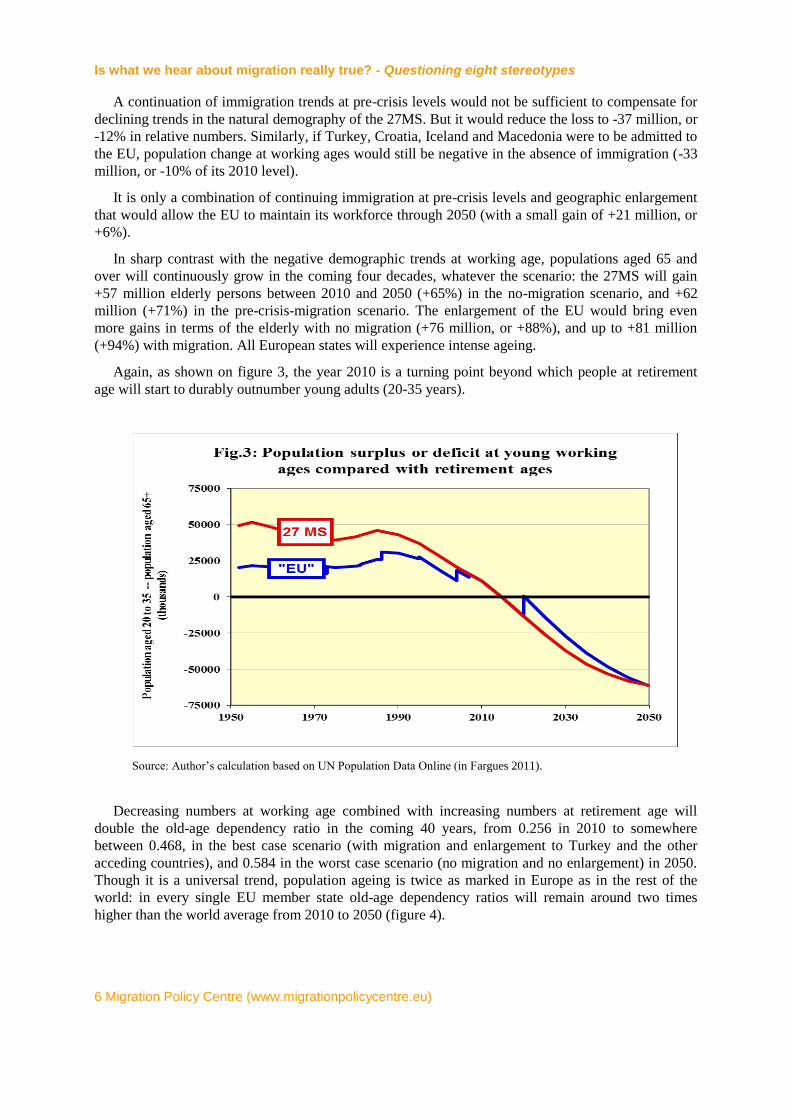
Again, as shown on figure 3, the year 2010 is a turning point beyond which people at retirement
age will start to durably outnumber young adults (20-35 years).
Source: Author’s calculation based on UN Population Data Online (in Fargues 2011).
Decreasing numbers at working age combined with increasing numbers at retirement age will
double the old-age dependency ratio in the coming 40 years, from 0.256 in 2010 to somewhere
between 0.468, in the best case scenario (with migration and enlargement to Turkey and the other
acceding countries), and 0.584 in the worst case scenario (no migration and no enlargement) in 2050.
Though it is a universal trend, population ageing is twice as marked in Europe as in the rest of the
world: in every single EU member state old-age dependency ratios will remain around two times
higher than the world average from 2010 to 2050 (figure 4).
Stereotype 1: “We do not need migrants”
Migration Policy Centre (www.migrationpolicycentre.eu) 7
Source: Author’s calculation based on UN Population Data Online (in Fargues 2011).
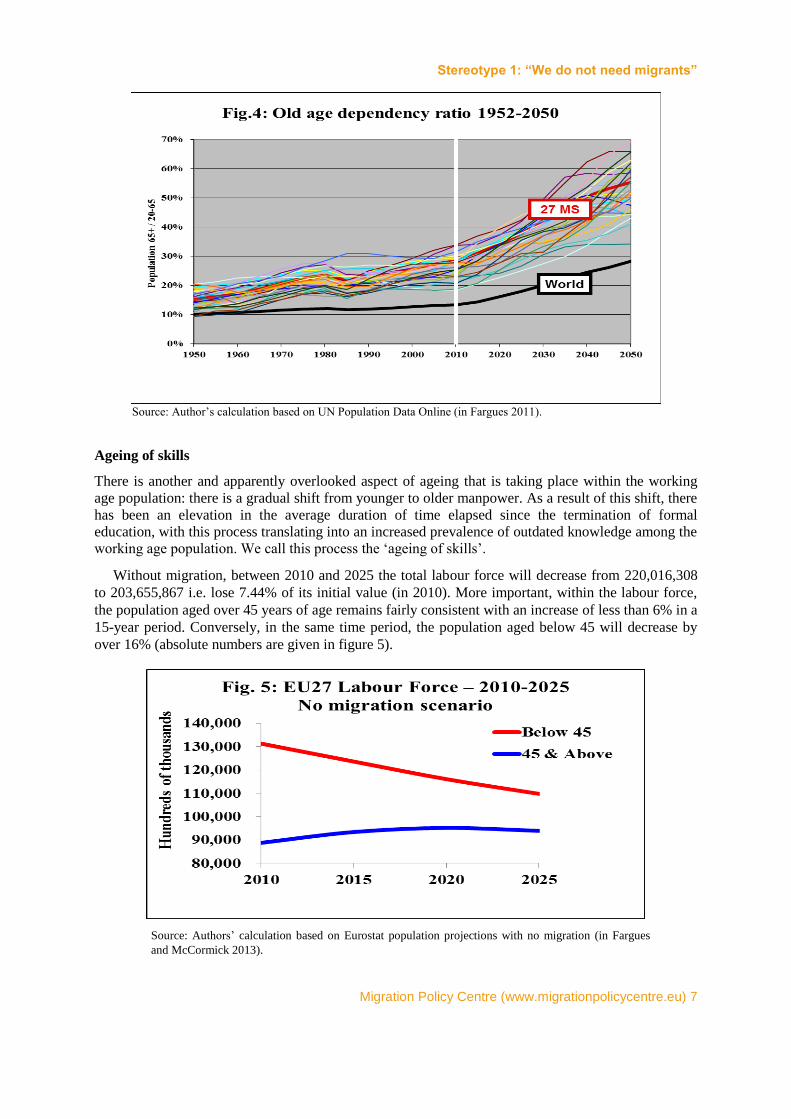
Ageing of skills
There is another and apparently overlooked aspect of ageing that is taking place within the working
age population: there is a gradual shift from younger to older manpower. As a result of this shift, there
has been an elevation in the average duration of time elapsed since the termination of formal
education, with this process translating into an increased prevalence of outdated knowledge among the
working age population. We call this process the ‘ageing of skills’.
Without migration, between 2010 and 2025 the total labour force will decrease from 220,016,308
to 203,655,867 i.e. lose 7.44% of its initial value (in 2010). More important, within the labour force,
the population aged over 45 years of age remains fairly consistent with an increase of less than 6% in a
15-year period. Conversely, in the same time period, the population aged below 45 will decrease by
over 16% (absolute numbers are given in figure 5).
Source: Authors’ calculation based on Eurostat population projections with no migration (in Fargues
and McCormick 2013).
Is what we hear about migration really true? - Questioning eight stereotypes
8 Migration Policy Centre (www.migrationpolicycentre.eu)
The overall reduction for the labour force aged below 45 will not affect all countries at the same
pace. The countries that are less affected by this trend are France and Cyprus, which manage to have a
relative reduction of less than 10%. Mediterranean countries (i.e. Italy and Spain) on the other hand
are likely to experience a nearly 30% reduction in the working age population aged below 45, in the
space of 15 years. These future patterns are likely to have a significant impact upon every economy in
the EU, as well as Europe as a whole.
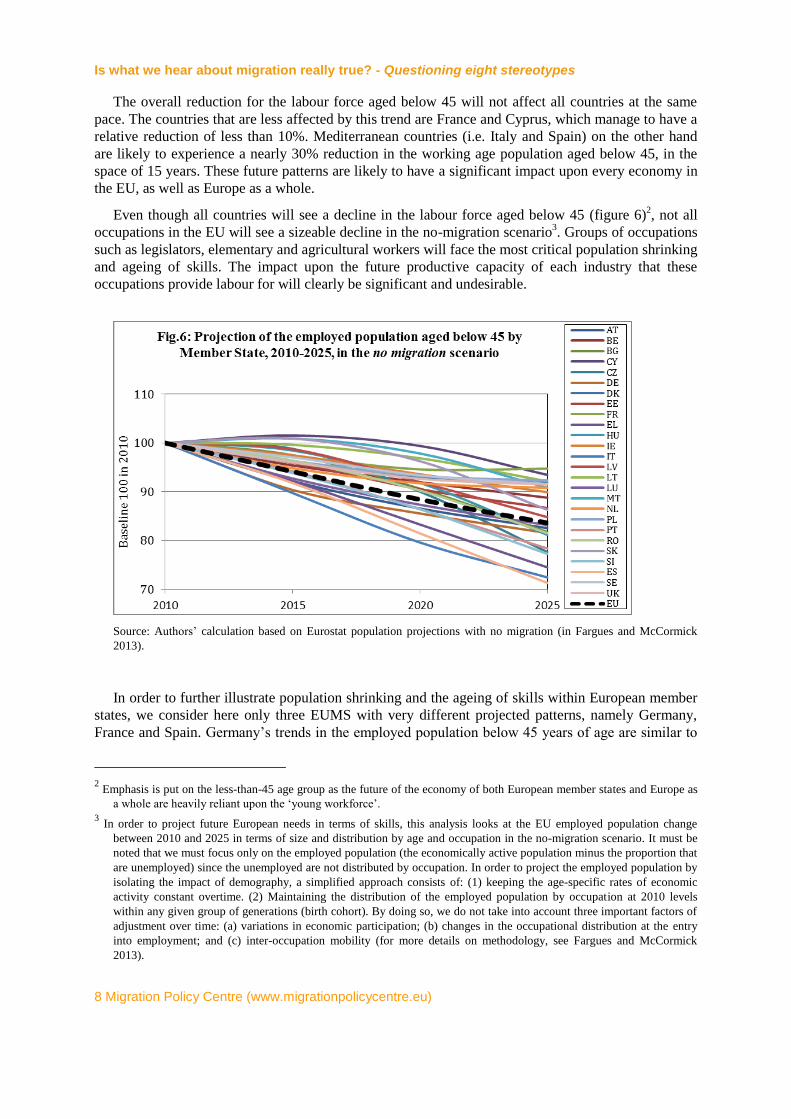
Even though all countries will see a decline in the labour force aged below 45 (figure 6)2, not all
occupations in the EU will see a sizeable decline in the no-migration scenario3. Groups of occupations
such as legislators, elementary and agricultural workers will face the most critical population shrinking
and ageing of skills. The impact upon the future productive capacity of each industry that these
occupations provide labour for will clearly be significant and undesirable.
Source: Authors’ calculation based on Eurostat population projections with no migration (in Fargues and McCormick
2013).
In order to further illustrate population shrinking and the ageing of skills within European member
states, we consider here only three EUMS with very different projected patterns, namely Germany,
France and Spain. Germany’s trends in the employed population below 45 years of age are similar to
2 Emphasis is put on the less-than-45 age group as the future of the economy of both European member states and Europe as
a whole are heavily reliant upon the ‘young workforce’. 3 In order to project future European needs in terms of skills, this analysis looks at the EU employed population change
between 2010 and 2025 in terms of size and distribution by age and occupation in the no-migration scenario. It must be
noted that we must focus only on the employed population (the economically active population minus the proportion that
are unemployed) since the unemployed are not distributed by occupation. In order to project the employed population by
isolating the impact of demography, a simplified approach consists of: (1) keeping the age-specific rates of economic
activity constant overtime. (2) Maintaining the distribution of the employed population by occupation at 2010 levels
within any given group of generations (birth cohort). By doing so, we do not take into account three important factors of
adjustment over time: (a) variations in economic participation; (b) changes in the occupational distribution at the entry
into employment; and (c) inter-occupation mobility (for more details on methodology, see Fargues and McCormick
2013).
Stereotype 1: “We do not need migrants”
Migration Policy Centre (www.migrationpolicycentre.eu) 9
the overall EU27 average. Conversely France and Spain have markedly contrasting trends to the EU27
average. While France will experience a 10% reduction in the employed population aged below 45
(lower than the EU27 average), Spain will have an almost 30% reduction in their labour force (higher
than the EU27 average).
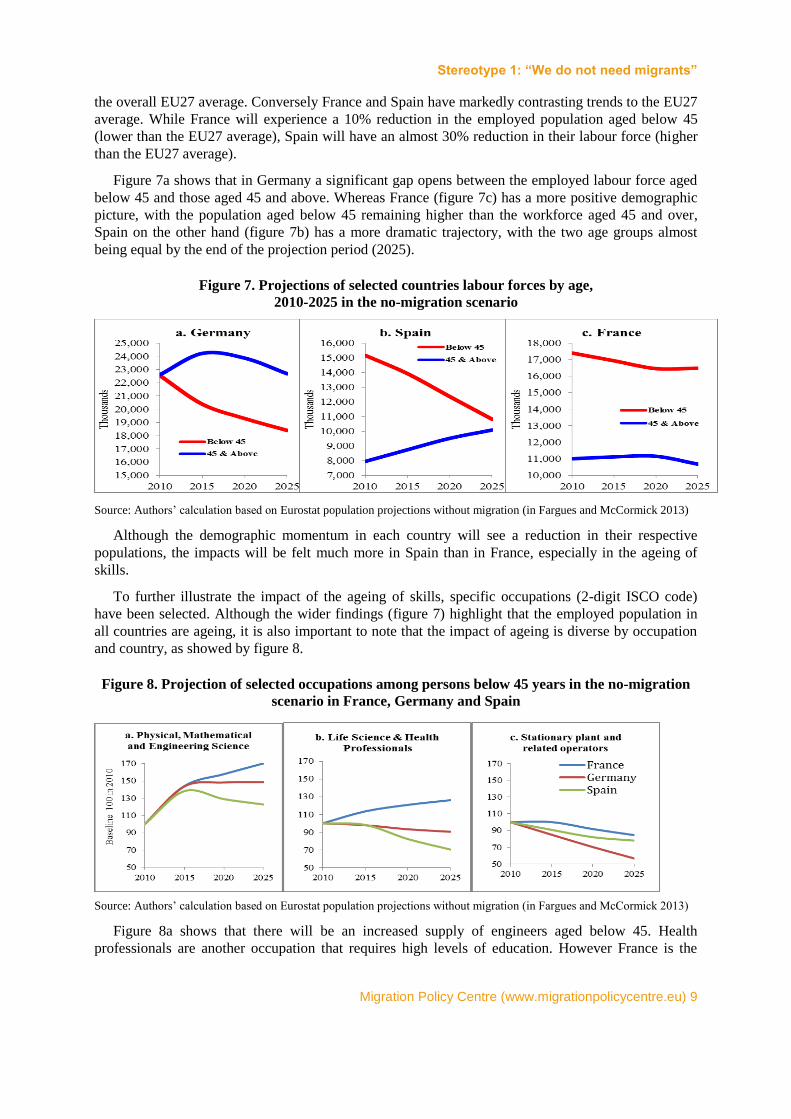
Figure 7a shows that in Germany a significant gap opens between the employed labour force aged
below 45 and those aged 45 and above. Whereas France (figure 7c) has a more positive demographic
picture, with the population aged below 45 remaining higher than the workforce aged 45 and over,
Spain on the other hand (figure 7b) has a more dramatic trajectory, with the two age groups almost
being equal by the end of the projection period (2025).
Figure 7. Projections of selected countries labour forces by age,
2010-2025 in the no-migration scenario
Source: Authors’ calculation based on Eurostat population projections without migration (in Fargues and McCormick 2013)
Although the demographic momentum in each country will see a reduction in their respective
populations, the impacts will be felt much more in Spain than in France, especially in the ageing of
skills.
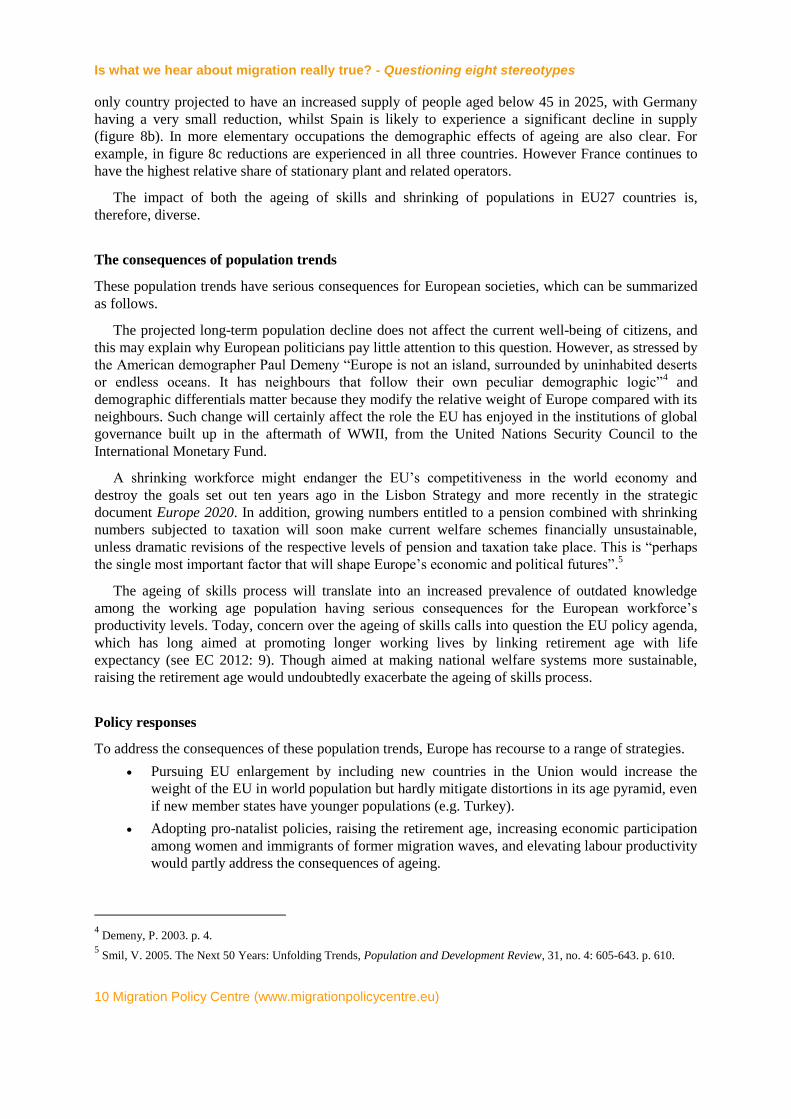
To further illustrate the impact of the ageing of skills, specific occupations (2-digit ISCO code)
have been selected. Although the wider findings (figure 7) highlight that the employed population in
all countries are ageing, it is also important to note that the impact of ageing is diverse by occupation
and country, as showed by figure 8.
Figure 8. Projection of selected occupations among persons below 45 years in the no-migration
scenario in France, Germany and Spain
Source: Authors’ calculation based on Eurostat population projections without migration (in Fargues and McCormick 2013)
Figure 8a shows that there will be an increased supply of engineers aged below 45. Health
professionals are another occupation that requires high levels of education. However France is the
Is what we hear about migration really true? - Questioning eight stereotypes
10 Migration Policy Centre (www.migrationpolicycentre.eu)
only country projected to have an increased supply of people aged below 45 in 2025, with Germany
having a very small reduction, whilst Spain is likely to experience a significant decline in supply
(figure 8b). In more elementary occupations the demographic effects of ageing are also clear. For
example, in figure 8c reductions are experienced in all three countries. However France continues to
have the highest relative share of stationary plant and related operators.
The impact of both the ageing of skills and shrinking of populations in EU27 countries is,
therefore, diverse.
The consequences of population trends
These population trends have serious consequences for European societies, which can be summarized
as follows.
The projected long-term population decline does not affect the current well-being of citizens, and
this may explain why European politicians pay little attention to this question. However, as stressed by
the American demographer Paul Demeny “Europe is not an island, surrounded by uninhabited deserts
or endless oceans. It has neighbours that follow their own peculiar demographic logic”4 and
demographic differentials matter because they modify the relative weight of Europe compared with its
neighbours. Such change will certainly affect the role the EU has enjoyed in the institutions of global
governance built up in the aftermath of WWII, from the United Nations Security Council to the
International Monetary Fund.
A shrinking workforce might endanger the EU’s competitiveness in the world economy and
destroy the goals set out ten years ago in the Lisbon Strategy and more recently in the strategic
document Europe 2020. In addition, growing numbers entitled to a pension combined with shrinking
numbers subjected to taxation will soon make current welfare schemes financially unsustainable,
unless dramatic revisions of the respective levels of pension and taxation take place. This is “perhaps
the single most important factor that will shape Europe’s economic and political futures”.5
The ageing of skills process will translate into an increased prevalence of outdated knowledge
among the working age population having serious consequences for the European workforce’s
productivity levels. Today, concern over the ageing of skills calls into question the EU policy agenda,
which has long aimed at promoting longer working lives by linking retirement age with life
expectancy (see EC 2012: 9). Though aimed at making national welfare systems more sustainable,
raising the retirement age would undoubtedly exacerbate the ageing of skills process.
Policy responses
To address the consequences of these population trends, Europe has recourse to a range of strategies.
Pursuing EU enlargement by including new countries in the Union would increase the
weight of the EU in world population but hardly mitigate distortions in its age pyramid, even
if new member states have younger populations (e.g. Turkey).
Adopting pro-natalist policies, raising the retirement age, increasing economic participation
among women and immigrants of former migration waves, and elevating labour productivity
would partly address the consequences of ageing.
4 Demeny, P. 2003. p. 4.
5 Smil, V. 2005. The Next 50 Years: Unfolding Trends, Population and Development Review, 31, no. 4: 605-643. p. 610.
Stereotype 1: “We do not need migrants”
Migration Policy Centre (www.migrationpolicycentre.eu) 11
Redesigning pro-immigration policies would be a complementary response. Immigration –
either temporary or permanent, depending upon whether the objective is to replace missing
workers or whether it is to increase citizenry – would affect both the size and the structure
(by age, but also by skills) of the population.
Permanent migration adds to manpower directly, because migrants are active at the time they
migrate, and indirectly, because permanent migrants found or bring a family to the host country,
thereby contributing to its demographic reproduction. But the population that permanent migration
adds is subject to the same process of ageing as natives and the more that migrants are called on to
compensate for retiring natives, the more new migrants will be needed to compensate for former
migrants retiring in their turn.
More precisely, this is what would happen if migrants had the same birth rates as non-migrants,
which was the central hypothesis of a study published in 2000 by the United Nations. Using
population projections to calculate “what level of migration from less developed countries would be
required to compensate for negative demographic trends in more developed countries”, the study
found that, in order to maintain what was called the “potential support ratio” (population aged 15-64 /
population aged 65+) over the period 2000-2050, 674 million immigrants would be needed in the
European Union (15 countries at that time), that is 14 million per year.6 The lack of realism in the
result − based on flawed reasoning, since not only the EU, but the entire world, is ageing, thus the
immigration of aliens from outer space would be required to neutralise global population ageing –
demonstrated, in a reductio ad absurdum, that migration cannot bring a durable solution to population
ageing, which is ineluctable.7
In many cases, however, migrants originating in developing countries have higher birth rates and,
once they enter the labour force, their sons and daughters slow down rising old-age dependency ratios.
That said, after only one generation a convergence of birth rates is expected, which means that in the
end permanent migration will have delayed, but not sustainably curbed, the rise of old-age
dependency.
Temporary migration, by contrast, brings to the host country workers who will return to their
country of origin before or at retirement. It adds to the host country’s manpower with no (or little)
impact on its demographic reproduction. It increases the size of the population at working age but not
(or only by a small margin) at young and old ages. In a number of European countries where
unemployment has recently been soaring among immigrants and their sons and daughters, and
integration policies are (rightly or wrongly) considered a failure, temporary, or circular, migration is
viewed as a solution for labour shortages which avoids social and cultural problems arising from
permanent migration. The European Commission advocates circular migration as a means to “help EU
Member States to address their labour needs while exploiting potential positive impacts of migration
on development and responding to the needs of countries of origin in terms of skill transfers and of
mitigating the impact of brain drain”.8
6 United Nations Secretariat, Population Division 2000, Replacement Migration: Is It a Solution to Declining and Ageing
Populations? ST/ESA/SER.A/206, New York. http://www.un.org/esa/population/publications/ReplMigED/migration.htm 7 See, inter alia, Alonso, F. G. 2007. Can the rising pension burden in Europe be mitigated by immigration? Modelling the
effects of selected demographic and socioeconomic factors on ageing in the European Union, 2008-2050, Vienna
Yearbook of Population Research 2009: 123-147; Bijak, J., Kupiszewska, D., Kupiszewski, M., Saczuk, K., and
Kicinger, A. 2007. Population and Labour Force Projections for 27 European Countries, 2002-2052, European Journal of
Population, 23, no. 1: 1-31. 8 European Commission 2007, Circular migration and mobility partnerships between the European Union and third
countries, COM(2007) 248 final.
Is what we hear about migration really true? - Questioning eight stereotypes
12 Migration Policy Centre (www.migrationpolicycentre.eu)
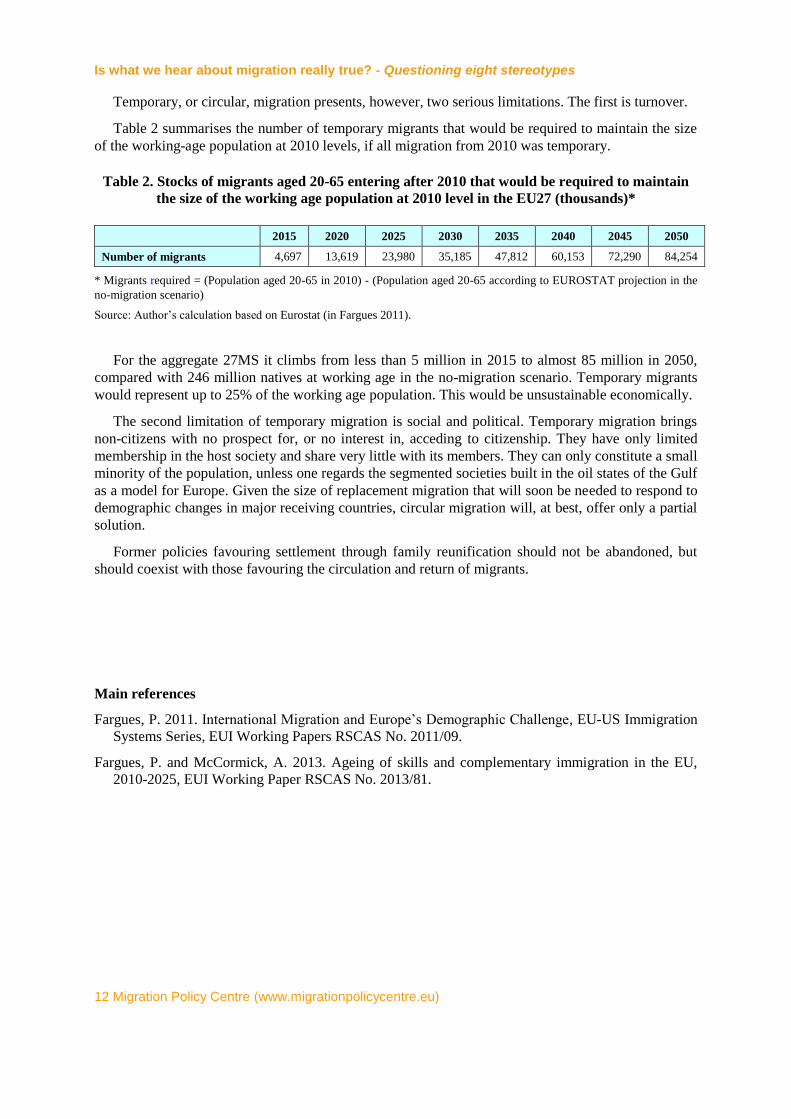
Temporary, or circular, migration presents, however, two serious limitations. The first is turnover.
Table 2 summarises the number of temporary migrants that would be required to maintain the size
of the working-age population at 2010 levels, if all migration from 2010 was temporary.
Table 2. Stocks of migrants aged 20-65 entering after 2010 that would be required to maintain
the size of the working age population at 2010 level in the EU27 (thousands)*
2015 2020 2025 2030 2035 2040 2045 2050
Number of migrants 4,697 13,619 23,980 35,185 47,812 60,153 72,290 84,254
* Migrants required = (Population aged 20-65 in 2010) - (Population aged 20-65 according to EUROSTAT projection in the
no-migration scenario)
Source: Author’s calculation based on Eurostat (in Fargues 2011).
For the aggregate 27MS it climbs from less than 5 million in 2015 to almost 85 million in 2050,
compared with 246 million natives at working age in the no-migration scenario. Temporary migrants
would represent up to 25% of the working age population. This would be unsustainable economically.
The second limitation of temporary migration is social and political. Temporary migration brings
non-citizens with no prospect for, or no interest in, acceding to citizenship. They have only limited
membership in the host society and share very little with its members. They can only constitute a small
minority of the population, unless one regards the segmented societies built in the oil states of the Gulf
as a model for Europe. Given the size of replacement migration that will soon be needed to respond to
demographic changes in major receiving countries, circular migration will, at best, offer only a partial
solution.
Former policies favouring settlement through family reunification should not be abandoned, but
should coexist with those favouring the circulation and return of migrants.
Main references
Fargues, P. 2011. International Migration and Europe’s Demographic Challenge, EU-US Immigration
Systems Series, EUI Working Papers RSCAS No. 2011/09.
Fargues, P. and McCormick, A. 2013. Ageing of skills and complementary immigration in the EU,
2010-2025, EUI Working Paper RSCAS No. 2013/81.
Stereotype 2
“Migrants steal our jobs”
Wrong: There is a negative correlation between unemployment and
immigration, both because unemployment deters potential migrants and
because immigration generates net employment.
Text written by Philippe Fargues and Sona Kalantaryan drawing on a publication by Ashley
McCormick (formerly Migration Policy Centre, RSCAS, EUI)

Stereotype 2: “Migrants steal our job”
MigrationPolicy Centre (www.migrationpolicycentre.eu) 15
There is a stereotype that immigrants have a negative impact on the employment opportunities of
natives. The public debate is further complicated by the ongoing crisis and the severe unemployment
that accompanies it. Immigration has, in fact, become a scapegoat, a way of explaining unemployment
in a number of European countries.
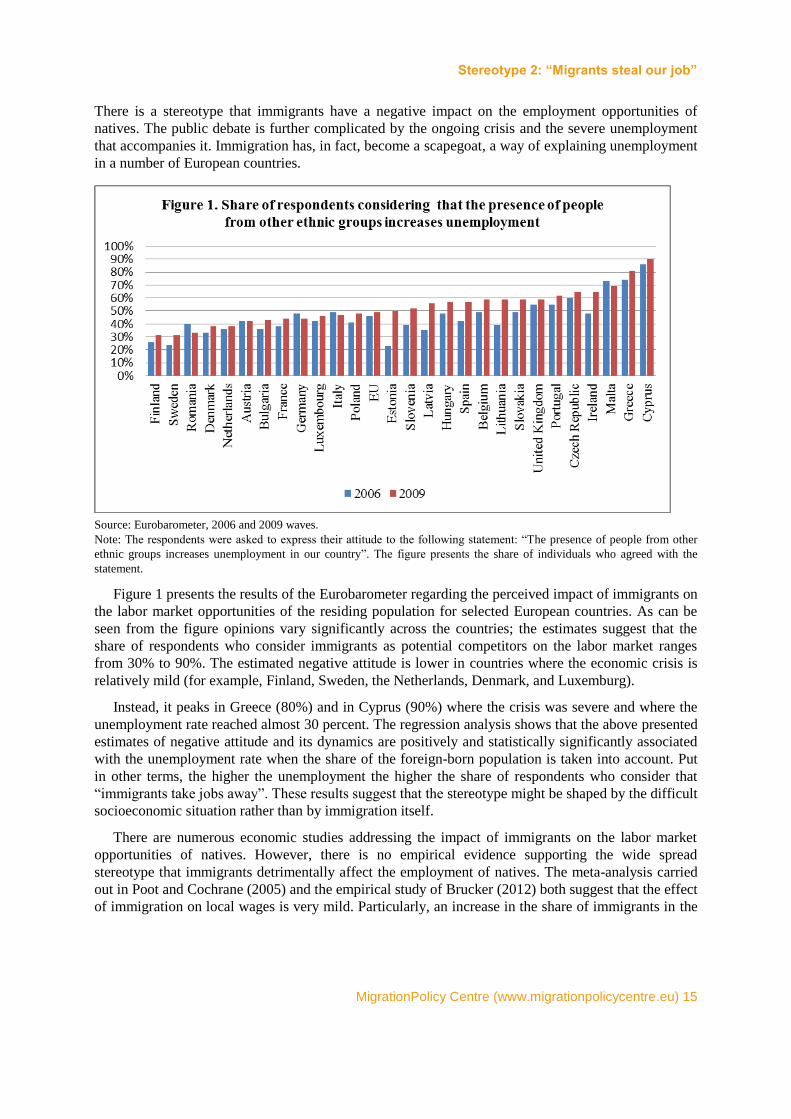
Source: Eurobarometer, 2006 and 2009 waves.
Note: The respondents were asked to express their attitude to the following statement: “The presence of people from other
ethnic groups increases unemployment in our country”. The figure presents the share of individuals who agreed with the
statement.
Figure 1 presents the results of the Eurobarometer regarding the perceived impact of immigrants on
the labor market opportunities of the residing population for selected European countries. As can be
seen from the figure opinions vary significantly across the countries; the estimates suggest that the
share of respondents who consider immigrants as potential competitors on the labor market ranges
from 30% to 90%. The estimated negative attitude is lower in countries where the economic crisis is
relatively mild (for example, Finland, Sweden, the Netherlands, Denmark, and Luxemburg).
Instead, it peaks in Greece (80%) and in Cyprus (90%) where the crisis was severe and where the
unemployment rate reached almost 30 percent. The regression analysis shows that the above presented
estimates of negative attitude and its dynamics are positively and statistically significantly associated
with the unemployment rate when the share of the foreign-born population is taken into account. Put
in other terms, the higher the unemployment the higher the share of respondents who consider that
“immigrants take jobs away”. These results suggest that the stereotype might be shaped by the difficult
socioeconomic situation rather than by immigration itself.
There are numerous economic studies addressing the impact of immigrants on the labor market
opportunities of natives. However, there is no empirical evidence supporting the wide spread
stereotype that immigrants detrimentally affect the employment of natives. The meta-analysis carried
out in Poot and Cochrane (2005) and the empirical study of Brucker (2012) both suggest that the effect
of immigration on local wages is very mild. Particularly, an increase in the share of immigrants in the
Is what we hear about migration really true? - Questioning eight stereotypes
16 Migration Policy Centre (www.migrationpolicycentre.eu)
local labour force by 1 percentage point leads to a reduction in wages of less than 0.1%.1 The
stereotype is not even supported by studies that focus on periods of economic downturn. Boubtane et
al. (2013) provides evidence of a positive relationship between immigration and host country GDP I,
and a negative relationship between immigration and the total host country unemployment rate. In
addition estimates indicate a positive impact of migration on the host country’s total employment rate,
suggesting that the negative impact of migration on the total unemployment rate is not because
migration discourages job seekers. Thus, that the main concern in host countries about the negative
impact of immigration on employment opportunities for native-born residents is not confirmed
(Boubtane et al. 2013). In addition, ongoing research suggests that migrants are affected more
adversely than equivalent natives (Green and Winters 2010). Natives tend to benefit (across all
education groups) from immigration, while immigrants lose substantially from further immigration
both in terms of lower wages and higher unemployment (Brucker 2011). Moreover Jeana and Jimenez
(2010), in their study of eighteen OECD countries over the timespan 1984–2003, did not find any
statistically significant impact on native unemployment in the long run. A temporary increase in
unemployment is subject to the policy framework (for example, stringent anticompetitive product
market regulation, or high replacement rates of unemployment benefits) and is not due to the presence
of immigrants. Cattaneo, Fiorio and Peri (2013) find that immigrants push native European workers
into a faster career track rather than reduce their employment opportunities, and that natives are more
likely to upgrade their occupation to one associated with higher skills and better pay when a larger
number of immigrants enter their the labour market. The authors find no evidence of an increased
likelihood to leave employment.
Assessment of the situation
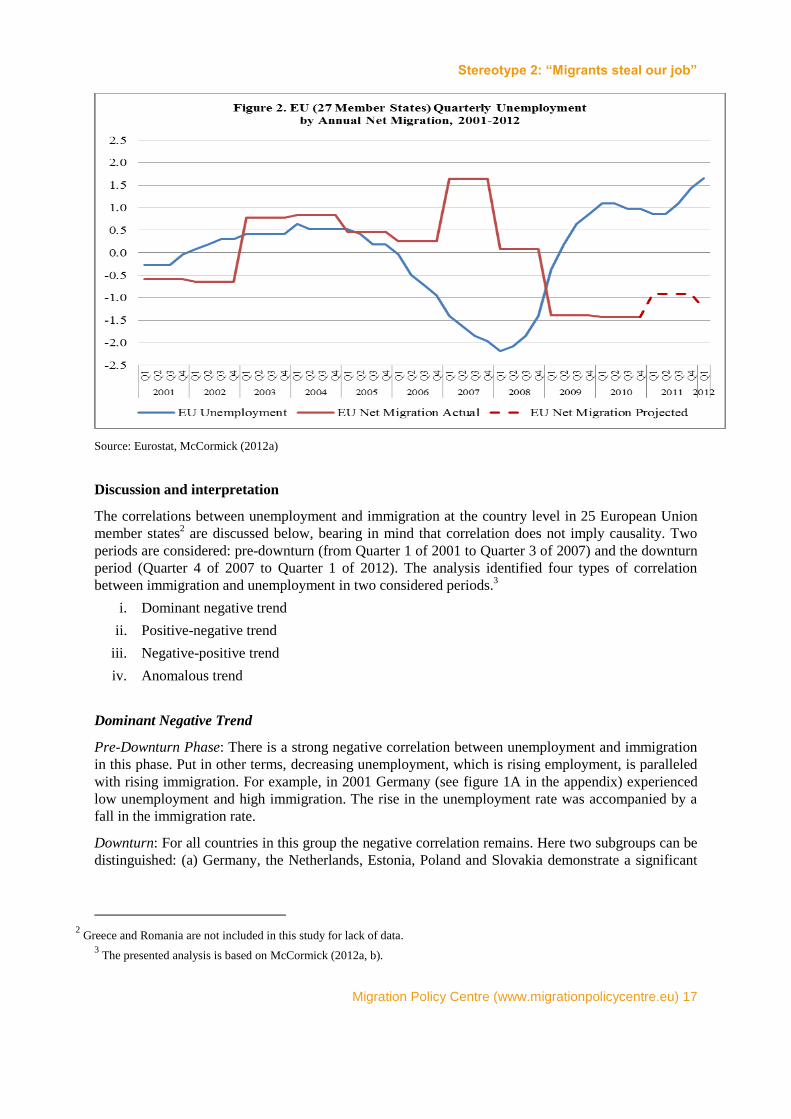
Figure 2 illustrates the quarterly evolution of the unemployment rate and net migration in the EU27
from 2001 to 2012. A visual inspection of the data shows that the two time series do not necessarily
move in the same direction. On the contrary, the increase in immigration between 2004 and 2007 has
been accompanied by a decrease in unemployment, while the rise in unemployment since 2008 has
been accompanied by a significant drop in net migration.
1 Poot, J. and Cochrane, W. 2005. Measuring the Economic Impact of Immigration: A Scoping Paper. Hamilton, New
Zealand: University of Waikato, Population Studies Centre, Discussion Paper No. 48.
Stereotype 2: “Migrants steal our job”
Migration Policy Centre (www.migrationpolicycentre.eu) 17
Source: Eurostat, McCormick (2012a)
Discussion and interpretation
The correlations between unemployment and immigration at the country level in 25 European Union
member states2 are discussed below, bearing in mind that correlation does not imply causality. Two
periods are considered: pre-downturn (from Quarter 1 of 2001 to Quarter 3 of 2007) and the downturn
period (Quarter 4 of 2007 to Quarter 1 of 2012). The analysis identified four types of correlation
between immigration and unemployment in two considered periods.3
i. Dominant negative trend
ii. Positive-negative trend
iii. Negative-positive trend
iv. Anomalous trend
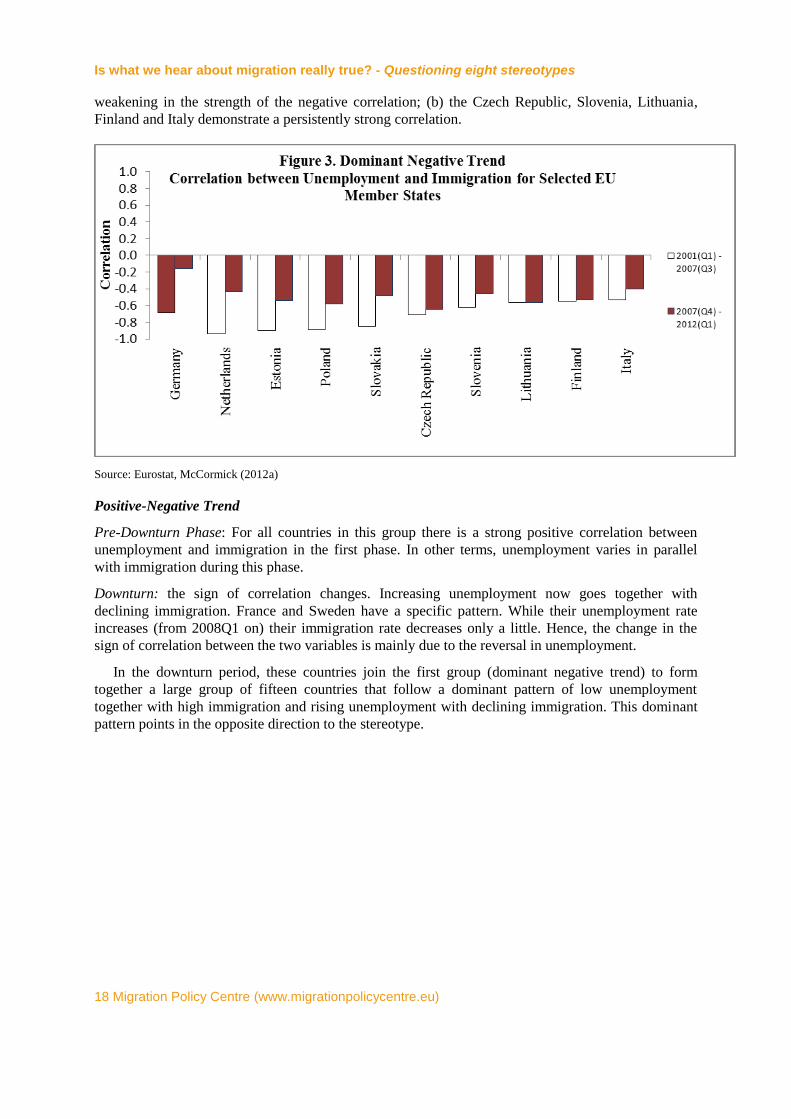
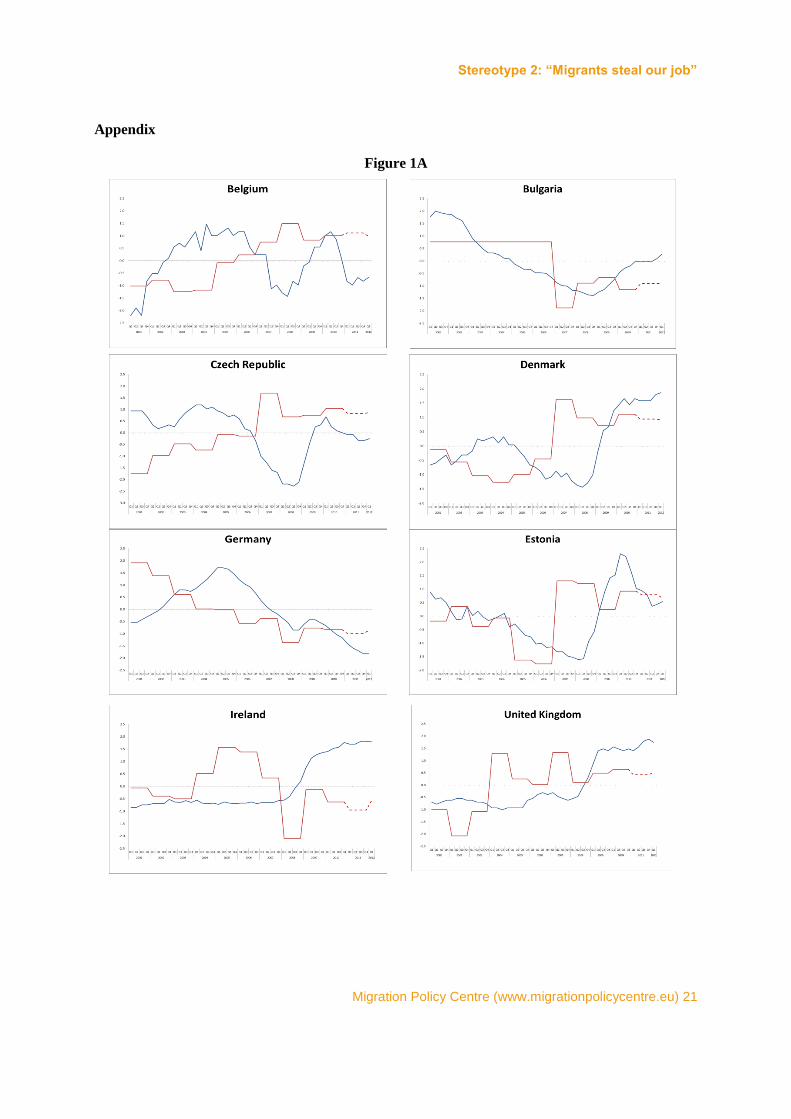
Dominant Negative Trend
Pre-Downturn Phase: There is a strong negative correlation between unemployment and immigration
in this phase. Put in other terms, decreasing unemployment, which is rising employment, is paralleled
with rising immigration. For example, in 2001 Germany (see figure 1A in the appendix) experienced
low unemployment and high immigration. The rise in the unemployment rate was accompanied by a
fall in the immigration rate.
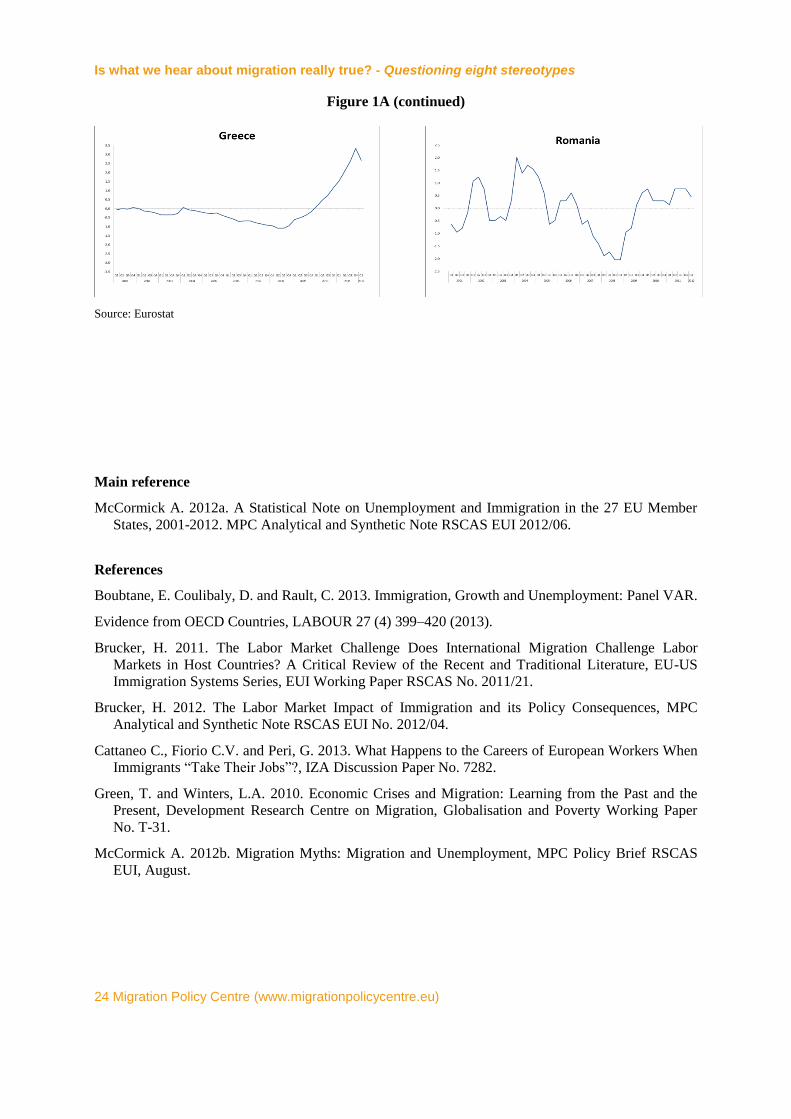
Downturn: For all countries in this group the negative correlation remains. Here two subgroups can be
distinguished: (a) Germany, the Netherlands, Estonia, Poland and Slovakia demonstrate a significant
2 Greece and Romania are not included in this study for lack of data.
3 The presented analysis is based on McCormick (2012a, b).
Is what we hear about migration really true? - Questioning eight stereotypes
18 Migration Policy Centre (www.migrationpolicycentre.eu)
weakening in the strength of the negative correlation; (b) the Czech Republic, Slovenia, Lithuania,
Finland and Italy demonstrate a persistently strong correlation.
Source: Eurostat, McCormick (2012a)
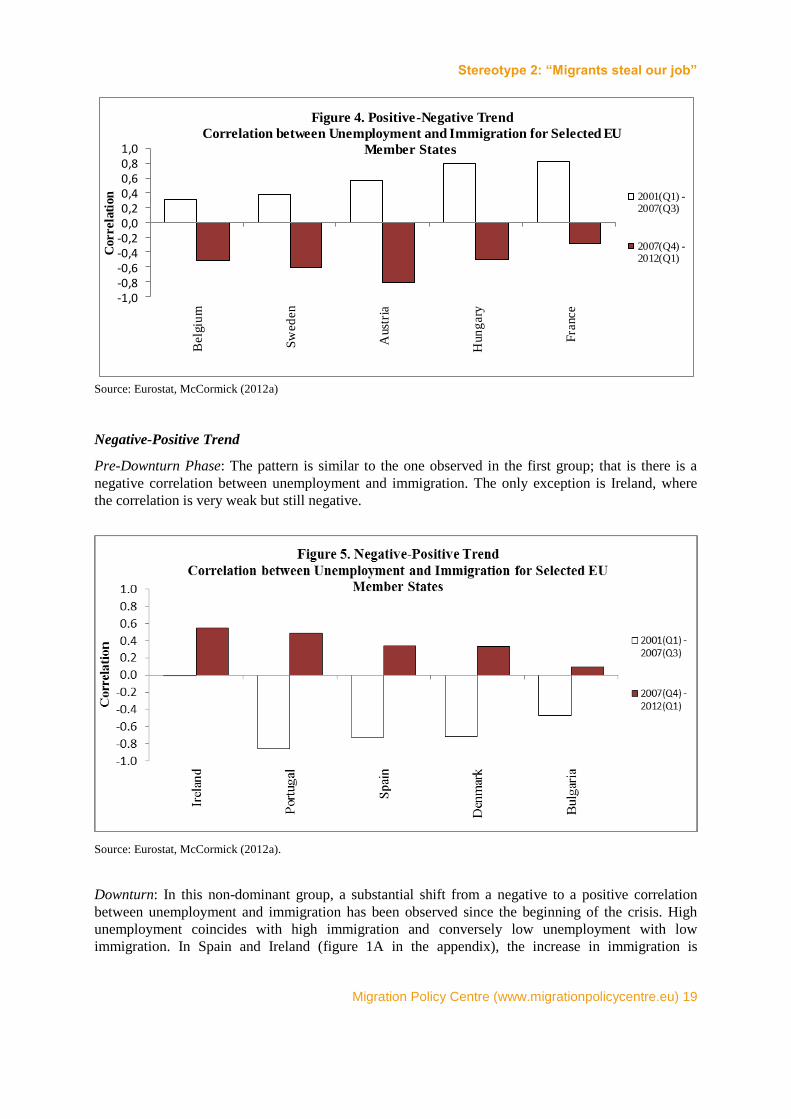
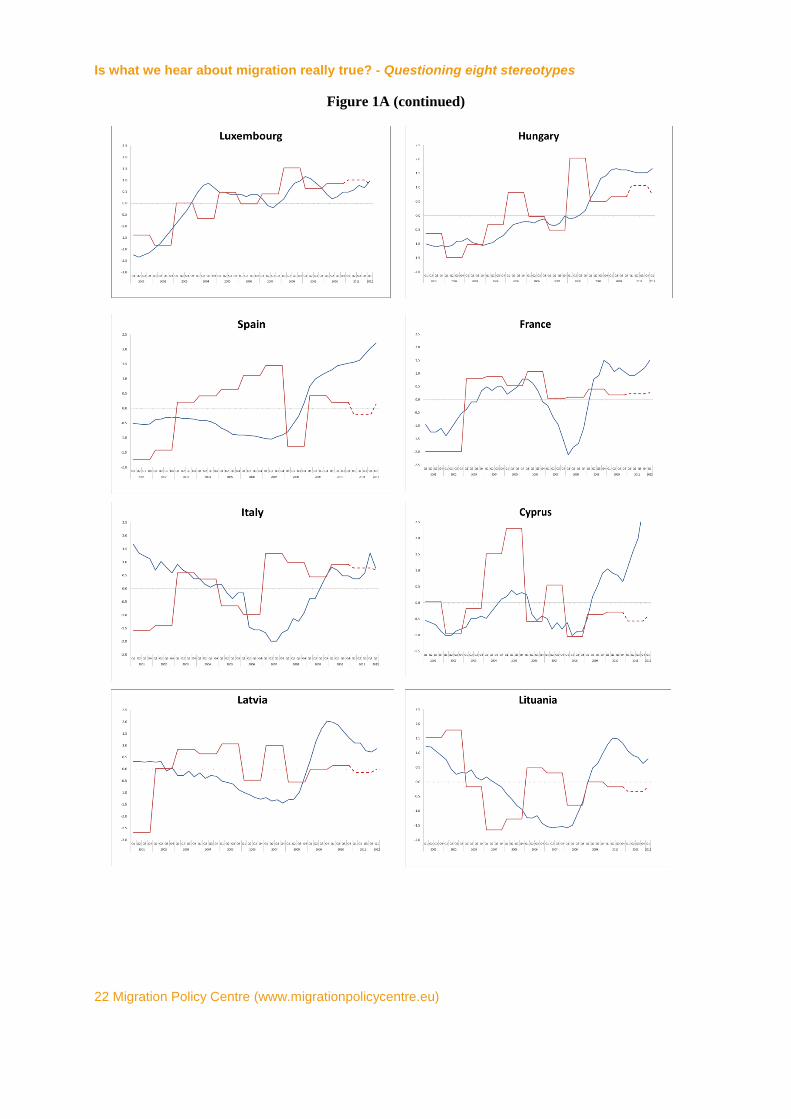
Positive-Negative Trend
Pre-Downturn Phase: For all countries in this group there is a strong positive correlation between
unemployment and immigration in the first phase. In other terms, unemployment varies in parallel
with immigration during this phase.
Downturn: the sign of correlation changes. Increasing unemployment now goes together with
declining immigration. France and Sweden have a specific pattern. While their unemployment rate
increases (from 2008Q1 on) their immigration rate decreases only a little. Hence, the change in the
sign of correlation between the two variables is mainly due to the reversal in unemployment.
In the downturn period, these countries join the first group (dominant negative trend) to form
together a large group of fifteen countries that follow a dominant pattern of low unemployment
together with high immigration and rising unemployment with declining immigration. This dominant
pattern points in the opposite direction to the stereotype.
Stereotype 2: “Migrants steal our job”
Migration Policy Centre (www.migrationpolicycentre.eu) 19
-1,0-0,8-0,6-0,4-0,20,00,20,40,60,81,0
Belg
ium
Sw
ed
en
Aust
ria
Hun
gary
Fra
nce
Correla
tion
Figure 4. Positive-Negative Trend
Correlation between Unemployment and Immigration for Selected EU
Member States
2001(Q1) -2007(Q3)
2007(Q4) -2012(Q1)
Source: Eurostat, McCormick (2012a)
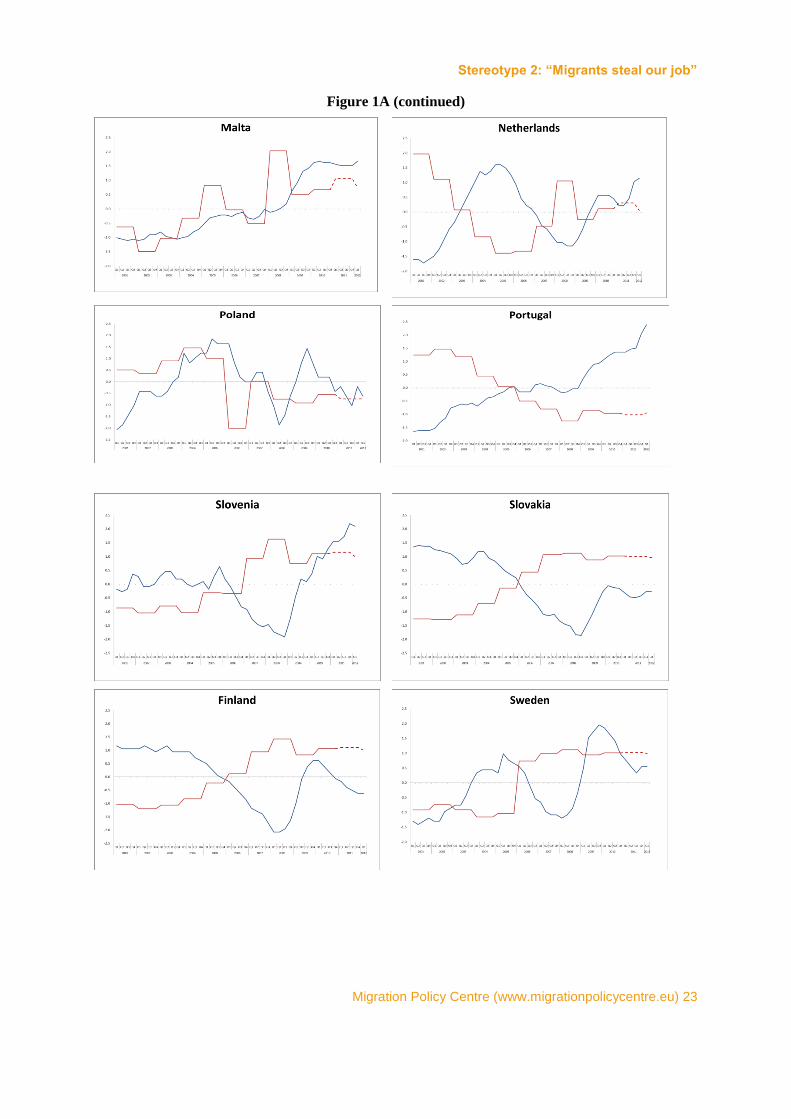
Negative-Positive Trend
Pre-Downturn Phase: The pattern is similar to the one observed in the first group; that is there is a
negative correlation between unemployment and immigration. The only exception is Ireland, where
the correlation is very weak but still negative.
Source: Eurostat, McCormick (2012a).
Downturn: In this non-dominant group, a substantial shift from a negative to a positive correlation
between unemployment and immigration has been observed since the beginning of the crisis. High
unemployment coincides with high immigration and conversely low unemployment with low
immigration. In Spain and Ireland (figure 1A in the appendix), the increase in immigration is
Is what we hear about migration really true? - Questioning eight stereotypes
20 Migration Policy Centre (www.migrationpolicycentre.eu)
accompanied by an increase in unemployment. The shift in trends has been strong in these two
countries as they have faced considerable economic challenges. One cannot say that immigration has
caused excess labour supply. Actually, the deterioration of the economic situation was rooted in
financial imbalances.
Both Spain and Ireland had real estate bubbles before the economic crisis, with excessive
construction leading to mounting private debt. The profitability of investments in real-estate
construction withdrew the resources from more productive sectors leading to housing bubble burst and
economic downturn as a result.
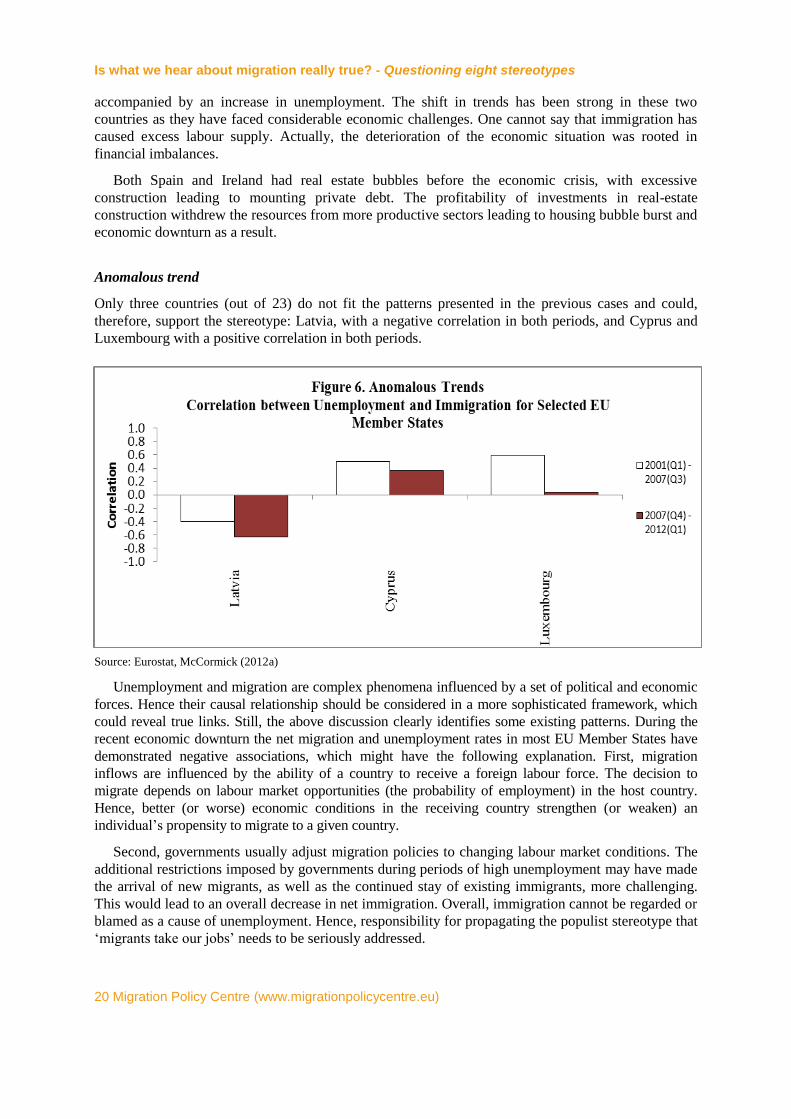
Anomalous trend
Only three countries (out of 23) do not fit the patterns presented in the previous cases and could,
therefore, support the stereotype: Latvia, with a negative correlation in both periods, and Cyprus and
Luxembourg with a positive correlation in both periods.
Source: Eurostat, McCormick (2012a)
Unemployment and migration are complex phenomena influenced by a set of political and economic
forces. Hence their causal relationship should be considered in a more sophisticated framework, which
could reveal true links. Still, the above discussion clearly identifies some existing patterns. During the
recent economic downturn the net migration and unemployment rates in most EU Member States have
demonstrated negative associations, which might have the following explanation. First, migration
inflows are influenced by the ability of a country to receive a foreign labour force. The decision to
migrate depends on labour market opportunities (the probability of employment) in the host country.
Hence, better (or worse) economic conditions in the receiving country strengthen (or weaken) an
individual’s propensity to migrate to a given country.
Second, governments usually adjust migration policies to changing labour market conditions. The
additional restrictions imposed by governments during periods of high unemployment may have made
the arrival of new migrants, as well as the continued stay of existing immigrants, more challenging.
This would lead to an overall decrease in net immigration. Overall, immigration cannot be regarded or
blamed as a cause of unemployment. Hence, responsibility for propagating the populist stereotype that
‘migrants take our jobs’ needs to be seriously addressed.
Stereotype 2: “Migrants steal our job”
Migration Policy Centre (www.migrationpolicycentre.eu) 21
Appendix
Figure 1A
Is what we hear about migration really true? - Questioning eight stereotypes
22 Migration Policy Centre (www.migrationpolicycentre.eu)
Figure 1A (continued)
Stereotype 2: “Migrants steal our job”
Migration Policy Centre (www.migrationpolicycentre.eu) 23
Figure 1A (continued)
Is what we hear about migration really true? - Questioning eight stereotypes
24 Migration Policy Centre (www.migrationpolicycentre.eu)
Figure 1A (continued)
Source: Eurostat
Main reference
McCormick A. 2012a. A Statistical Note on Unemployment and Immigration in the 27 EU Member
States, 2001-2012. MPC Analytical and Synthetic Note RSCAS EUI 2012/06.
References
Boubtane, E. Coulibaly, D. and Rault, C. 2013. Immigration, Growth and Unemployment: Panel VAR.
Evidence from OECD Countries, LABOUR 27 (4) 399–420 (2013).
Brucker, H. 2011. The Labor Market Challenge Does International Migration Challenge Labor
Markets in Host Countries? A Critical Review of the Recent and Traditional Literature, EU-US
Immigration Systems Series, EUI Working Paper RSCAS No. 2011/21.
Brucker, H. 2012. The Labor Market Impact of Immigration and its Policy Consequences, MPC
Analytical and Synthetic Note RSCAS EUI No. 2012/04.
Cattaneo C., Fiorio C.V. and Peri, G. 2013. What Happens to the Careers of European Workers When
Immigrants “Take Their Jobs”?, IZA Discussion Paper No. 7282.
Green, T. and Winters, L.A. 2010. Economic Crises and Migration: Learning from the Past and the
Present, Development Research Centre on Migration, Globalisation and Poverty Working Paper
No. T-31.
McCormick A. 2012b. Migration Myths: Migration and Unemployment, MPC Policy Brief RSCAS
EUI, August.
Stereotype 3
“We do not need low-skilled immigrants in the EU”
Wrong: Empirical studies show that low-skilled immigrants successfully
integrate into specific sectors of the economy without stealing jobs from
natives; on the contrary, low-skilled migration allows for the employment of
natives in occupations requiring higher skills. Moreover, immigrant workers
are necessary in saving certain national industries from collapse or
stagnation due to the acute shortage of native workers.
Text written by Sara Bonfanti, Kathryn Lum and Iván Martín

Stereotype 3: “We do not need low-skilled immigrants in the EU”
Migration Policy Centre (www.migrationpolicycentre.eu) 27
Over the years the increased flow of low-skilled workers to major EU labour-receiving countries, both
from within and outside the EU, has raised serious concerns. These include: their long-term
employability; their impact on the labour market; and issues with respect to the integration of
migrants, such as the fiscal burden related to education and labour market outcomes of their children
(OECD 2008).
Compared to lower-educated migrants, higher-educated migrants are more likely to have better
outcomes in the host country in terms of integration, including the performance of their children. Indeed,
although immigrants’ over-qualification – i.e. the situation where a worker has more qualifications than
required by his/her job – remains a common phenomenon in many EU countries,1 higher-skilled
immigrants have a good chance of gradually progressing out of low-skill jobs and seeing wage
convergence with natives. Furthermore, as shown by the OECD’s PISA results, the children of higher-
educated immigrants tend to have better educational outcomes than those of lesser-educated
immigrants.2
The distress caused by the immigration of low-skilled migrants has clearly emerged in the debate
around the efforts made at the EU level to build up a consensus on labour migration. After it proved
impossible to find an agreement about the formulation of a general directive on the management of
labour migration within the European Council in 2001, the EU re-launched the debate on the need to
have a common rule on labour migration in the ‘Green Paper on an EU Approach to Managing
Economic Migration’ presented in 2004. During the consultation that followed the release of this
document, member states expressed their support for a policy promoting the migration of highly-
skilled workers alone. The Commission’s ‘Policy Plan on Legal Migration’, which was produced as an
outcome of this discussion, generated some agreement on social and legal rights granted to economic
migrants in the EU.
The need for low-skilled migrants was partially recognized by including in the Policy Plan a
proposal for a directive on the conditions of entry and residence of seasonal workers aimed “ […]to
provide the necessary manpower in the Member States while at the same time granting a secure legal
status and a regular work prospective to the immigrants concerned, thereby protecting a particularly
weak category of workers and also contributing to the development of the countries of origin” (EC
2005b: 7). A directive on this topic was actually adopted by the European Parliament and the Council
in February 2014 (PE -CONS 113/13). However, no measure has been implemented so far to promote
long-term low-skilled migration. This, compounded by the global economic crisis with soaring
unemployment rates and labour market recession in many EU countries (ILO 2011), favoured the
perpetuation of the stereotype of the undesirability of low-skilled migration in a number of Member
States and, as highlighted by several studies (see, among others, Hollifield 2004; Joppke 1998; OECD
2008), the increase of irregular migration.
Projected demand for low-skilled labour in the EU
The available quantitative and qualitative evidence, which points to a rather stable and persistent
demand for low skilled labour (Sasikumar and Thimothy 2012), does not support a restrictive
approach to inflows of low-skilled migrants. The last decade in Europe has seen a continuous
occupational polarization. As CEDEFOP attests, in 1998-2008 demand grew at the upper and lower
ends of the occupational skill distribution. The number of workers in elementary occupations
1 OECD. 2007. Jobs for Immigrants – Volume 1: Labour Market Integration in Australia, Denmark, Germany and Sweden,
Paris: OECD Publishing. 2 OECD. 2007. PISA 2006: Science Competencies for Tomorrow’s World, Paris: OECD Publishing.
Is what we hear about migration really true? - Questioning eight stereotypes
28 Migration Policy Centre (www.migrationpolicycentre.eu)
contributed 20% to total employment growth in 2000-2008, with a 22% growth rate compared to an
average of 10%.3 The demand for lesser skilled occupations continued throughout the recession, and
increased in the first quarter of 2011 compared to the same period in the previous year. Less-skilled
occupations constitute the largest share of jobs in the European labour market (IOM 2012). In the UK,
where migration policy has been completely closed to low-skilled workers (including in the case of
temporary labour shortages), restaurant owners, especially from the ‘ethnic’ restaurant sector, have
raised concerns. They talk of the unfairness of a points-based immigration system, which only accepts
skilled workers who possess formal qualifications.4 Forecasts for selected EU countries reveal that in
the next decade, sectors requiring low-skilled workforce – e.g. food preparation and services, retail
sales and customer service, personal and home care aides, construction and transportation – will
continue to grow.5 For instance, in Italy business forecasts estimate that 40% of the demand for
workers is for persons with only minimum education, half of whom are not expected to have any prior
experience in terms of the jobs they will be taking on (OECD 2008).
The changing demographic profile of EU countries, the increasing ageing of the workforce and the
rapid growth of work in the care and personal service sector suggest that the demand for low-skilled
labour will continue over the medium/long–term. Indeed, several EU countries will face a decline or
stagnation in the working-age population over the next decade, unless immigration regains
momentum. In addition, increasing access to education and mandatory schooling in EU countries has
improved the educational level of the workforce. The European labour force aged 15+ with low-level
or no qualifications is expected to fall by around 15 million between 2010 and 2020 (CEDEFOP
2010).
The combined effect of increased attainment levels and shrinking cohorts is to effectively reduce
the supply of workers for less-skilled jobs. In particular, the rising educational level and participation
in the labour force of women is expected to lead to further demand for labour in the so-called
“household production substitution activities”, which includes cleaning, childcare, food preparation
and care for the elders (OECD 2008). The supply of workers for less-skilled jobs is further
undermined by the fact that native workers tend to avoid low-status, low-wage jobs, as well as jobs
that are located in remote areas. Indeed many native workers are unwilling to accept the so-called
three-D jobs (dirty, dangerous, and difficult), while others may not apply for a certain position because
of personal and social reasons such as low-status, lack of opportunities for promotion or personal
development and inconsistency with their own skills and experiences (IOM 2012).
All of these factors raise the question of how, and by whom, labour market demand for less-skilled
workers can be satisfied. For certain occupations the demand may be met by increased labour force
participation, especially by older people and by women, or by investment in capital equipment and
reorganisation of production. Nevertheless, system effects, which stem from the institutional structure,
the regulatory framework of the national labour market, and the wider welfare and public policies, do
not always make these choices possible (IOM 2012). Migration has been, and will continue to be, one
way to deal with this demand (OECD 2008). Thus, it is important to consider how best to support the
inclusion of migrants in labour markets. The immigration policy models adopted by most European
countries, which are built around a strict distinction between attracting highly-skilled workers for
eventually permanent settlement, and treating less-skilled immigration as a phenomenon to be
3 CEDEFOP. 2011. Labour-market polarisation and elementary occupations in Europe: Blip or Long-term Trend?,
Luxembourg: Publications Office of the European Union, Research Paper No. 9. 4 Grimwood, G. 2009. Immigration: Points-Based Immigration and the Restaurant Trade, London: House of Commons
Library. 5 CEDEFOP. 2008. Future Skill Needs in Europe: Medium-term Forecast, Luxembourg: Publications Office of the European
Union.
Stereotype 3: “We do not need low-skilled immigrants in the EU”
Migration Policy Centre (www.migrationpolicycentre.eu) 29
contained and acceptable only if kept temporary, seems to be unable to meet the needs of both of low-
skilled migrant workers (and their sending countries) and of EU economies (Sasikumar and Thimothy,
2012). Indeed temporary status discourages integration, both in terms of individual motivations and
eligibility for integration support, which often results in foreigners residing in the EU for several years
with limited integration progress (IOM 2012).6 Moreover, not all less-skilled jobs are temporary. As
we shall see in the case studies below, several low-skilled activities exist that not only require a
permanent workforce but are harmed by a high turnover of labour. While our case studies are based on
empirical research carried out in Italy and Spain, our findings apply to all MS. Indeed, the structural
need for low-skilled migration is witnessed, in greater or lesser degree, in the EU as a whole:
according to the skills supply and demand projections by countries (CEDEFOP 2010: 48, 67), the
predicted fall in the labour force with low qualification between 2010 and 2020 (-26% average fall for
the EU-27; among MS, only Romania, Denmark and Portugal have projected falls under 20%) will not
be matched by an equivalent fall in the demand for low qualified workers (-14% for the EU-27 as a
whole, with only the UK, Spain, Italy and Greece registering projected falls above 20%, and some
countries with predicted increases of low-qualified labour exceeding 10%, such as Austria, Denmark,
Germany, Czech Republic and Slovakia).
The example of the Italian dairy industry7
Italy is a key example of a county that has a consistent demand for low-skilled labour. The history of
migration policy in Italy has been conditioned by Italy’s historic status as an emigrant-sending
country. Italy has traditionally been more concerned with its large diaspora abroad, and with ensuring
that the Italian diaspora maintains citizenship and other ties with Italy, than with its growing non-
Italian immigrant population. A series of laws have made it increasingly easy for ethnic Italians living
abroad to obtain Italian citizenship, whereas non-EU nationals must have been resident for at least ten
years before they can apply for naturalization, and their children are not automatically eligible for
Italian nationality. The procedure for migrating legally to Italy as a non-EU national varies annually.
Since 1988, the Italian government has announced annual job quotas according to employment sector
and nationality for non-EU nationals; quotas that are judged by a number of experts to be too low,
since employer demand always greatly exceeds the annual limit. 8
In 2007 for example, in just 38
minutes the quota for homecarers for the elderly was exceeded on the online processing system, with
the Ministry of the Interior receiving 136,382 applications for 65,000 places.9 The tensions inherent in
catering to rising anti-immigrant sentiment while meeting the structural needs of the Italian economy
have resulted in five general amnesties designed to regularize the status of irregular migrants already
living and working for some time in Italy; the highest number of amnesties in Europe.
6 It is important to highlight that integration challenges concern not only potential new recruitment of low-skilled migrants but
also the residing population, with repercussions for the next generations. Actually, even countries that have sharply limited
the entry of low-educated migrants still have significant numbers of low-skilled migrants due to a number of interrelated
factors, which vary by country: a long tail effect of past guest-worker programmes, the impact of networks and the extent of
non-discretionary migration and of irregular migration (OECD 2008). The economic sectors that have already felt labour
shortages are currently relying on low-skilled migration. 7 This section is based on empirical research carried out by Kathryn Lum and published online at http://www.india-eu-
migration.eu/media/RR2012-2%20Lum.pdf 8 Finotelli, C. and Sciortino, G. 2008. New Trends in Italian Immigration Policies: ‘To change everything in order to keep
everything the same’, Madrid: Real Instituto Elcano. 9 Polchi, V. 2007. Flussi immigrati, secondo clic day i 65.000 posti esauriti in 38 minuti [online], la Repubblica.it, 18
December, available on http://www.repubblica.it/2007/11/sezioni/cronaca/flussi-decreto/clic-18dic/clic-18dic.html
[Accessed 29 May 2014].
Is what we hear about migration really true? - Questioning eight stereotypes
30 Migration Policy Centre (www.migrationpolicycentre.eu)
A case study of low-skilled employment in the Italian dairy industry reveals that immigrants from
the Punjab region of India have successfully inserted themselves into this sector of the Italian
economy, without ‘stealing’ jobs from native Italians. The dairy industry in Italy is the most important
sector of Italian agriculture, with an annual turnover of 15 billion Euros in 2011 (all dairy products),
including 2 billion Euros worth of cheese exports.10
In Italy, dairy consumption is ‘recession proof’,
with Italians continuing to consume dairy products, including high-quality DOP (Protected
Denomination of Origin) dairy products, despite the slowing of the Italian economy. Indeed, 87% of
Italians consider their national DOP cheeses to be the foundation of the ‘Made in Italy’ brand. Indians
have thus inserted themselves in a sector that is not only economically important, but also key to
Italian identity. Dairy work has since become a Punjabi niche market, with 90% of the workers in this
sector estimated to be Indian.11
According to 2008 data from Istat, (the Italian Institute of Statistics),
42.9% of Indians work in the agricultural sector in the Lombardy region, compared to only 2.8% of
the total foreign population, showing a marked tendency for Indians to concentrate in agriculture,
particularly in Northern Italy.
The socio-economic context leading to the Italian exodus from cow milking provides the
background necessary for understanding how a low-skilled immigrant group has been able to enter and
dominate a key domestic industry. A number of factors led to what is now the almost complete
absence of native Italians in the dairy sector. The mechanisation of the industry beginning in the 1950s
led to a sharp reduction in the number of jobs available, forcing Italian youth to look for work
elsewhere. Secondly, the economic boom that Italy experienced in the post-war period led to new
aspirations that working in the cascine (dairy farms) could not fulfill. In particular, the houses on the
cascine were increasingly abandoned in favor of more modern urban housing. Finally, the low social
status associated with cow milking was an additional incentive to look for other work, even when the
salary was raised and working conditions improved considerably with mechanisation. Male bergamini
(cow milkers) could not find local marriage partners and had to resort to finding spouses from other
Italian regions.12
Therefore, native workers have spurned this sector despite its relatively high salaries,
as well as other perks, such as free accommodation and ample opportunity to earn more via working
overtime. This native exodus from dairy milking led to demand for a reliable and steady source of
labour that could replace Italian workers. In the region of Lombardy, the agricultural sector is
distinguished, unlike in other parts of Italy, by the need for a specialised, stable and ‘regular’ (i.e.
legally documented) workforce that is highly available, in order to be able to adapt themselves to the
demanding rhythms of a dairy farm and avoid high turn-over, which would harm productivity.
Immigrant labour from India has met this demand for specialised labour that does not require a
high level of education. The need for a dependable, ‘regular’ workforce has meant that work in the
dairy industry has avoided the systematic abuses and severe exploitation characteristic of Italian
agriculture in other regions. Sources from the largest Italian union, the CGIL (Confederazione
Generale Italiana del Lavoro), have indicated that the vast majority of immigrant workers in this sector
possess legal contracts.
The Italian dairy industry is, therefore, a good example of the continuing need for low-skilled,
third-country labour in certain sectors of the European economy. Low-skilled does not mean ‘no skill’,
10
‘ASSOLATTE: il fatturato dei latticinio italiani ha raggiunto nel 2011 i 15 miliardi di euro’, Beverfood.com,
http://www.beverfood.com/v2/news+notizia.storyid+5341-assolatte-il-fatturato-dei-latticinio-italiani-ha-raggiunto-nel-2011-
i-15-miliardi-di-euro.htm. [Accessed 20 May 2014]. 11
‘Italy: Sikh Cheese Producers’, Deutsche Welle, 17 Sept. 2008, http://www.podcast.tv/video-episodes/italy-sikh-cheese-
producers-4887664.html. [Accessed 20 May 2014]. 12
Gardani, L. et al. 2002. Turbanti che non turbano: Ricerca sociologica sugli immigrati indiani nel cremonese, Provincia di
Cremona: Osservatorio provinciale sull’immigrazione, 1-71.
Stereotype 3: “We do not need low-skilled immigrants in the EU”
Migration Policy Centre (www.migrationpolicycentre.eu) 31
and can also be a pathway to other forms of employment, particularly entrepreneurship, in the future.
Indeed, an increasing number of Punjabis who initially worked in the dairy sector are now establishing
their own small businesses across Northern Italy.
The case of female, low-skilled immigrants and seasonal workers in Spain
Another revealing example comes from Spain. In the second half of the 1990s and the 2000s, the
arrival of, for the most part, unskilled immigrant women from Latin America, Romania and Morocco
made it possible to dramatically increase the activity rate of Spanish women by 12 percentage points
between 1996 and 2005, from slightly below 40% to more than 50%. According to estimations of the
Economic Office of the President of the Government in 2006 (Oficina Económica del Presidente del
Gobierno 2006), for each additional percentage point of the share of immigrants in the Spanish
population, the activity rate of working age women increased 0.6 percentage points, thus explaining
one third of the increase in female activity rates during that period. The domestic and care services
provided by immigrant workers for low salaries freed Spanish women, often qualified, to search for
full time jobs and earn a (better) salary.
But Spain also offers an extreme example showing that the same applies as well in times of crisis.
In 2012, the new Spanish government tried to cancel the quota for foreign temporary workers for the
farming season in the province of Huelva in the south of the country, which produces 30% of all
strawberries in the EU. In previous years predominantly Moroccan women had been selected by the
ANAPEC, the public employment service in Morocco, to come to Spain for three or four months a
year under regulated work conditions. The quota for Moroccan workers had peaked up in 2009 with
16,271 temporary migrant workers, which was reduced afterwards to 6,153 in 2010 and a similar
number in 2011. At the last moment, when the 2012 farming season was endangered by the lack of
labour, the government was forced to re-establish a last minute quota of 2,550 workers after verifying
that, for the 35€ a day paid to the strawberry pickers (above the Spanish minimum wage), it was not
possible to find enough workers ready to do the job among Spanish unemployed workers. For the
current 2013-2014 season, the number of Moroccans working temporarily in the Huelva strawberry
fields amounts to 2,270 workers. In comparison, according to the last Spanish Labour Force Survey, in
the third quarter of 2013 in Spain there was close to six million unemployed, one million of which are
foreign immigrant workers who have lost their job after 2009.
Conclusion: highly vs. low-skilled immigration, a wrong dichotomy
To conclude, although the EU debate in the recent years has mainly focused on the need to attract
more highly-skilled migrants from outside the European Union to boost competitiveness by increasing
the talent pool, the actual labour market demand points to the necessity of considering immigration at
all skill levels, temporary or permanent, to support economic recovery. From this perspective, the
current immigration provisions, policy discourse and overall systemic conditions in the national labour
markets, which often tend to further exacerbate these problems instead of providing solutions, not least
by devaluing the contribution of less-skilled migrants, needs to be revised. This would mean
recognizing that labour migration has a positive role in enhancing growth, competitiveness and
innovation in receiving countries, even when low and semi-skilled workers are considered.
Is what we hear about migration really true? - Questioning eight stereotypes
32 Migration Policy Centre (www.migrationpolicycentre.eu)
References
International Organization for Migration. 2012. Labour market inclusion of the less skilled migrants in
the European Union, Brussels: IOM.
Lum, K. 2012. Indian Diversities in Italy: A Case Study, CARIM-India Research Report 2012/02,
MPC RSCAS EUI.
Oficina Económica del Presidente del Gobierno. 2006. Inmigración y economía española: 1996-2006,
Madrid.
Organization for Economic Co-operation and Development. 2008. Managing Low Skilled Migration
International Migration Outlook 2008, Paris: OECD Publishing.
Sasikumar S.K. and R. Thimothy (2012) Migration of Low Skilled Workers from India to the
European Union, CARIM-India Research Report 2012/15, MPC RSCAS EUI.
Stereotype 4
“Migrants undermine our welfare systems”
Wrong: Most empirical studies show that migration generally has a positive
impact on the welfare system, as migrant workers also contribute to financing
the social security system. More often, migrants are of working age and do
not always have the same entitlement to benefits as natives, in particular
during the first years after having migrated. Also, the idea that more
immigration reduces support for redistribution schemes needs qualification in
the European context.
Text written by Pawel Kaczmarczyk and Hillel Rapoport

Stereotype 4: “Migrants undermine our welfare systems”
Migration Policy Centre (www.migrationpolicycentre.eu) 35
It is commonly argued that immigration undermines welfare systems. The stereotype has two
components: a purely economic component relating to immigrants’ allegedly negative net fiscal
contribution to the welfare system, which leads some to predict that more immigration will endanger
its financial sustainability; and a socio-political one, according to which immigration undermines
social trust and solidarity, translates into more negative attitudes among citizens with respect to
redistribution and social insurance and, as a result, weakens the political foundations of the European
Welfare State.
The economic component of the myth is relatively easy to dismiss: in nearly all European
countries, immigrants make a positive, not a negative net contribution to welfare systems. One may
then ask: how to explain the discrepancy between this demonstrable fact and public perceptions, which
portray immigrants as net beneficiaries? Most likely, the discrepancy comes from the fact that
immigrants are over-represented in the most “visible” dimensions of social insurance: unemployment
benefits, social housing, and children allowances. This is due to their lower education and labor
integration as well as to higher fertility. However, in spite of their lower average income potential,
immigrants are usually net contributors in terms of health and pension payments due to their younger
age structure and their lower reliance on formal health and pension systems. Given that health
insurance and pensions represent the bulk of welfare payments, immigrants’ net positive contributions
to these dimensions more than compensate for their over-representation as beneficiaries in other
dimensions – hence their net positive contribution.
The socio-political component is harder to dismiss. It is based on an intuition about what social
scientists have labeled the “group loyalty” effect. According to this view, increasing the diversity of a
group reduces the willingness of its members to redistribute (as people tend to trust one another less in
more diverse groups and to become less altruistic when the “other” is further away in cultural/ethnic
terms). This view had been put forward notably by Robert Putnam (1995) in his work on social capital
based on racial diversity and trust in the United States, and transposed to immigration in the European
context, most prominently by Paul Collier in his influential 2013 book, Exodus. However, recent
research on immigration and attitudes to redistribution in Europe shows that transposing the results on
racial diversity in a US context to immigration (or birthplace diversity) in a European context is
conceptually and empirically wrong and, therefore, misleading in terms of policy implications.
This note summarizes these two strands of recent literature first on immigrants’ fiscal contribution
and then on immigration and attitudes to redistribution.
Do immigrants pay their way in the welfare system? YES!
While assessing the impact of immigration on contemporary welfare states as a point of reference, we
will use a very broad and comprehensive analysis of the fiscal impact of migration presented recently
in the OECD (2013).
First, the net direct fiscal position of immigrants varies between OECD countries but in most cases
it is positive: this holds true not only for traditional immigration countries, but also for welfare states
like Iceland and Norway.1 This outcome is common for most of the general assessment of the welfare
impact of immigration: even if estimates for the fiscal position of immigrants can vary, these estimates
tend to be small in terms of GDP and the impact is rarely larger than 0.5 percent of GDP per year
(Brücker et al. 2002).
1 Note significant differences between immigrant and foreign households. OECD (2013) suggests country of birth rather than
citizenship: this is due to significant cross-country differences regarding citizenship legislation.
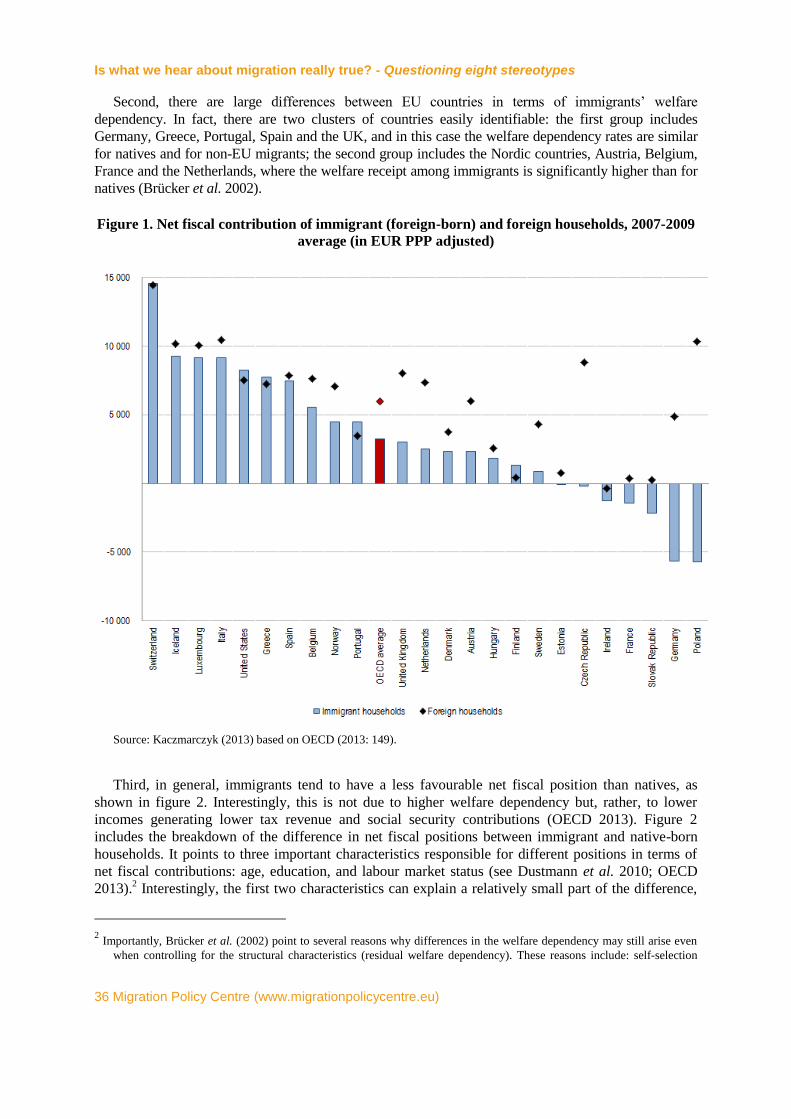
Is what we hear about migration really true? - Questioning eight stereotypes
36 Migration Policy Centre (www.migrationpolicycentre.eu)
Second, there are large differences between EU countries in terms of immigrants’ welfare
dependency. In fact, there are two clusters of countries easily identifiable: the first group includes
Germany, Greece, Portugal, Spain and the UK, and in this case the welfare dependency rates are similar
for natives and for non-EU migrants; the second group includes the Nordic countries, Austria, Belgium,
France and the Netherlands, where the welfare receipt among immigrants is significantly higher than for
natives (Brücker et al. 2002).
Figure 1. Net fiscal contribution of immigrant (foreign-born) and foreign households, 2007-2009
average (in EUR PPP adjusted)
Source: Kaczmarczyk (2013) based on OECD (2013: 149).
Third, in general, immigrants tend to have a less favourable net fiscal position than natives, as
shown in figure 2. Interestingly, this is not due to higher welfare dependency but, rather, to lower
incomes generating lower tax revenue and social security contributions (OECD 2013). Figure 2
includes the breakdown of the difference in net fiscal positions between immigrant and native-born
households. It points to three important characteristics responsible for different positions in terms of
net fiscal contributions: age, education, and labour market status (see Dustmann et al. 2010; OECD
2013).2 Interestingly, the first two characteristics can explain a relatively small part of the difference,
2 Importantly, Brücker et al. (2002) point to several reasons why differences in the welfare dependency may still arise even
when controlling for the structural characteristics (residual welfare dependency). These reasons include: self-selection
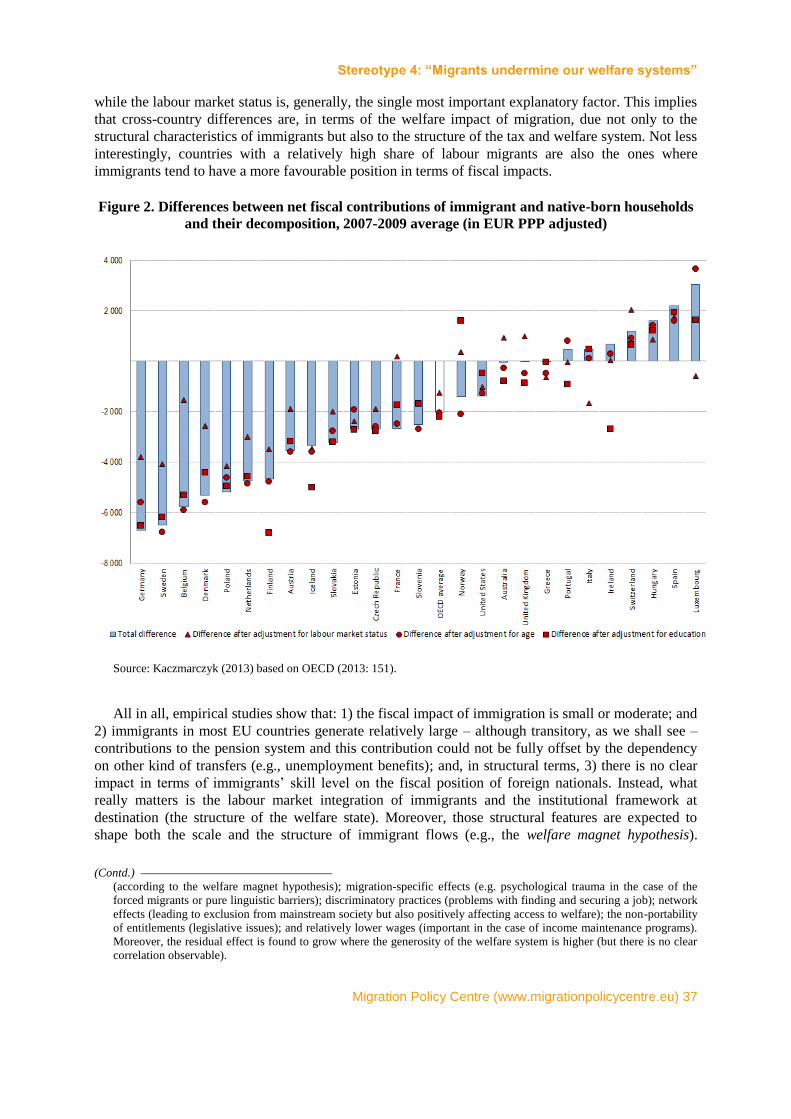
Stereotype 4: “Migrants undermine our welfare systems”
Migration Policy Centre (www.migrationpolicycentre.eu) 37
while the labour market status is, generally, the single most important explanatory factor. This implies
that cross-country differences are, in terms of the welfare impact of migration, due not only to the
structural characteristics of immigrants but also to the structure of the tax and welfare system. Not less
interestingly, countries with a relatively high share of labour migrants are also the ones where
immigrants tend to have a more favourable position in terms of fiscal impacts.
Figure 2. Differences between net fiscal contributions of immigrant and native-born households
and their decomposition, 2007-2009 average (in EUR PPP adjusted)
Source: Kaczmarczyk (2013) based on OECD (2013: 151).
All in all, empirical studies show that: 1) the fiscal impact of immigration is small or moderate; and
2) immigrants in most EU countries generate relatively large – although transitory, as we shall see –
contributions to the pension system and this contribution could not be fully offset by the dependency
on other kind of transfers (e.g., unemployment benefits); and, in structural terms, 3) there is no clear
impact in terms of immigrants’ skill level on the fiscal position of foreign nationals. Instead, what
really matters is the labour market integration of immigrants and the institutional framework at
destination (the structure of the welfare state). Moreover, those structural features are expected to
shape both the scale and the structure of immigrant flows (e.g., the welfare magnet hypothesis).
(Contd.)
(according to the welfare magnet hypothesis); migration-specific effects (e.g. psychological trauma in the case of the
forced migrants or pure linguistic barriers); discriminatory practices (problems with finding and securing a job); network
effects (leading to exclusion from mainstream society but also positively affecting access to welfare); the non-portability
of entitlements (legislative issues); and relatively lower wages (important in the case of income maintenance programs).
Moreover, the residual effect is found to grow where the generosity of the welfare system is higher (but there is no clear
correlation observable).
Is what we hear about migration really true? - Questioning eight stereotypes
38 Migration Policy Centre (www.migrationpolicycentre.eu)
Indeed, European studies on the fiscal position of immigrants prove that the fiscal impact of
immigration is strongly system dependent: in countries with more flexible labour markets and
relatively less generous welfare systems, immigration affects the welfare system in a positive way (but
the scale of its impact is small). Studies on the UK show that the net fiscal contribution of immigrants
is positive and potentially sizeable (Dustmann et al. 2010). Dustmann et al. (2010) present one of the
most interesting studies looking at the impact of the EU8 (A8 countries) immigration to the UK in a
fiscal context. In general terms, according to the study A8 immigrants made a positive fiscal
contribution to UK public finances for 2005-2009, irrespective of the way that the net fiscal
contribution or immigrants were defined. Indeed, it was possible due to immigrants’ very high
participation rates and employment rates, despite employment being mostly in low-skilled and low-
wage occupations, as well as to their relatively higher contribution via indirect taxes. Similar outcomes
have been noted for Ireland.3
On the other hand, outcomes for countries with generous welfare systems are rather negative. In
this case, however, one needs to consider both impact of the welfare system as well as the specific
structure of immigration (with a large share of refugees or dependents). Nannestad (2004) concludes
that according to the Danish experience unlimited (uncontrolled) immigration creates irresolvable
challenges for the Nordic type of redistributive welfare regime. The problem lies, however, not
necessarily in immigration but rather in the barriers to entry that immigrants face when attempting to
access the labour market. A similarly negative picture is presented for Sweden.4 Hansen and Lofstrom
(2009) analyzed the welfare position of immigrants and natives in the early 1990s and found that
immigrants use welfare more than natives. Additionally these differences cannot be explained by
observable characteristics only, and in the case of refugee immigrants a significant “welfare trap” was
found. Authors argue that immigrants, including refugee immigrants, are likely to assimilate out of
welfare but that it is a long process. Thus, the main factor responsible for increasing the welfare
utilization of immigrants is the change in structure of incoming migrants (with increasing number of
refugee immigrants as the main contributing factor).
Using this background as a point of comparison, outcomes for Germany are rather mixed. Riphan
et al. (2010) show that immigrants are more likely to receive welfare benefits than native Germans,
but higher welfare participation rates among immigrants are not related to immigrant status itself.
Rather they result from their structural characteristics (incomes and household structures). Riphan
(2004) finds that out of potential effects on the welfare dependence, the cohort effect was negligible
and the same holds true for the country of origin. On the contrary, the assimilation effect is significant
(and positive in terms of welfare dependency). It is, in fact, at the same level as the age effect (higher
age results in higher probability of welfare dependency). The most important explanatory factor
(except household size and city size) is the labour market status and age at immigration. Brücker et al.
(2002) show clearly that in the case of Germany most welfare dependency is attributable to the socio-
demographic characteristics of immigrants and not immigration per se.
Importantly, empirical studies assessing the net fiscal impact of immigration can be divided into two
broad categories: static studies and dynamic studies. The former approach refers to a given year (tax
year) and compares the contribution of immigrants to the public treasure in the form of direct and
indirect taxes: in practice, most studies are limited to the first case with the value of benefits and services
received. The latter attempts to compute the net present value of both contributions and benefits obtained
over the lifetime of migrants (and their children, if necessary). Dynamic modelling exercises reveal a
3 Barrett, A. and McCarthy, Y. 2008. Immigrant and Welfare Programmes: Exploring the Interactions between Immigrant
Characteristics, Immigrant Welfare and Welfare Policy, Oxford Review of Economic Policy, 24, no. 3: 543-560. 4 Andrén, D. and Andrén, T. 2012. Never give up? The persistence of welfare participation in Sweden, Discussion Papers, 5,
Central European Labour Studies Institute (CELSI).
Stereotype 4: “Migrants undermine our welfare systems”
Migration Policy Centre (www.migrationpolicycentre.eu) 39
quite different picture of the welfare impacts of immigration as compared to the static approaches.
Several studies suggest that the fiscal contribution of immigrants may be substantial in cases of countries
suffering (or expecting) rapid demographic decline (but mostly it is presented as a transitory effect only).
As shown by Bonin (2006) the size of future changes (higher taxes or lower transfers) depends on the
scale of immigration. Bonin (2006) applies the generational account to assess the overall fiscal impact of
immigrants coming to Germany and shows that in general terms, immigrants pay less to public coffers
but that their net position remains positive. The net fiscal position of foreign nationals residing in
Germany also remains positive when accounting for demographic ageing (in a dynamic perspective).
Additionally, the net effect of immigration can be even higher when assuming efficient selective
migration policies.
Results from studies looking at the net (static) contribution of immigrants to the welfare system in
France show that there is an overall gain of around 4 billion Euros yearly (very small but positive):
immigrants are net recipients for unemployment insurance, children allowances, and social housing
but net contributors on health insurance (due to their being on average younger and lacking
participation) and pensions. The dynamic extensions, using generational accounting techniques, show
the contribution of different immigration scenarios in lowering the rise in the dependency ratio and in
evaluating the contribution of immigration to the sustainability of the welfare system.5
Collado et al. (2004) refer to the extremely interesting case of Spain. Spain experienced the highest
immigration dynamics over the last decade. They analyse the impact of the inflow against the
background of an ageing Spanish society and ask the question whether such massive immigration can
improve the fiscal situation of the host country. Results presented show that the impact of immigration
on the welfare system is positive and significant, and that it is supposed to have a significant impact on
the state budget (the scale of this impact depends on the fiscal policy applied). OECD (2013) also
stresses the importance of the dynamic approach to the issue. The study shows clearly that in the case
of most OECD countries under analysis, the inclusion of the pension system contribution (i.e. a
dynamic accounting exercise) changes the assessment of the immigrants’ presence in well-developed
countries and does it in a very positive way. This point is particularly well made for those countries
that already suffer from population ageing and yet, at the same time, have immigrant populations that
are significantly younger than native populations (e.g. Southern European countries). Here,
immigration may be seen as a type of hedging mechanism. Even if this approach can be challenged
most dynamic studies emphasize the positive role of immigration in the sustainability of European
welfare systems.
Does immigration lead to lower support for redistribution in Europe? NO!
The second channel through which immigration affects the evolution of welfare systems is the
“political economy” channel. This includes the effect of immigration on attitudes to redistribution and
the resulting electoral outcomes in terms of votes supporting an increase/decrease in the extent of
social insurance and, more generally, redistribution (i.e. progressive taxation). Broadly speaking, two
lines of studies can be distinguished. A first strand of the literature focuses on immigration and voting
patterns assuming that electoral choices are solely determined by voters’ economic interests, that is, by
whether a given voter gains or loses from immigration. A second strand emphasizes that votes are
determined by attitudes, which are themselves determined not only by strictly economic
considerations but also (and maybe mostly) by other considerations such as social solidarity, group
loyalty and trust.
5 Chojnicki, X. (2014). The fiscal impact of immigration in France, World Economy, forthcoming.
Is what we hear about migration really true? - Questioning eight stereotypes
40 Migration Policy Centre (www.migrationpolicycentre.eu)
The study of attitudes to redistribution – like that of attitudes to immigration – starts with economic
models of individual utility maximization. A very intuitive central prediction of these models is that
individuals with higher current or prospective income tend to view redistribution less favourably than
others. These predictions, particularly those for expected future income, find ample empirical support.
People with past experience of upward income mobility are less in favour of income redistribution.6
Those with higher subjective and objective chances to move up the income ladder follow the same
pattern. Beliefs about the worthiness of the beneficiaries of redistribution also matter. People who
believe that the poor are poor through bad luck than rather than through a lack of effort tend to be
more generous.7
Generally, the literature suggests that one of the reasons why immigration policy is so heavily
debated and politically controversial is the fact that immigrants may obtain the right to vote and that
they might affect future policies, including redistributive policies.8 Against this background there are
several theoretical approaches to discussing the political economy of immigration policy, which show
the very tension between the working population (those who pay taxes) and welfare beneficiaries.
These studies emphasize that immigrants in liberal democracies become an important group player
and thus immigration policy is to be treated as a decision to admit particular agents into a political
community and impose their voting rights on future policies.9 Many authors challenge the
sustainability of the welfare state not only in purely economic, but also in political terms, where the
income and skill distribution of the electorate plays a critical role. They claim that, even if immigrants
tend to join the pro-transfer coalition, low-skill immigration will lead to a lower level of taxation and
redistribution. Further one could argue that considering potential coalitions among skilled and
unskilled voters or among unskilled and retired voters in any political equilibrium there will be a place
for policies favourable for unskilled voters.10
Empirical evidence for the link between immigration and attitudes to redistribution in Europe is
relatively sparse. As explained in the introduction, ethnic/racial diversity studies in the United States
concluded that diversity arising from ethnic and racial differences undermines social trust and
solidarity (Putnam 1995), and result in less public goods provision.11
As many studies for the U.S.
show, representatives of the (white) American majority are found to be much less supportive of
redistribution than members of minority groups.12
This is typically interpreted not only as
heterogeneity in cultural preferences, but as a sign of racial prejudices. Using individual data for the
US, Luttmer (2001) shows evidence for “group loyalty effects”, namely that support for redistribution
6 Piketty, T. 1995. Social Mobility and Redistributive Politics, Quarterly Journal of Economics, 110, no. 3: 551-584.
7 Alesina, A. and La Ferrara, E. 2005. Preferences for Redistribution in the Land of Opportunities, Journal of Public
Economics, 89, no. 5: 897-931. 8 Ortega, F. 2005. Immigration and the Survival of the Welfare State, Meeting Papers Series, Society for Economic
Dynamics 2005/71; Ortega, F. 2005. Immigration quotas and skill upgrading, Journal of Public Economics, 89, no. 9-10:
1841-1863. 9 Hansen, J. and Lofstrom, M. 2003. Immigrant Assimilation and Welfare Participation: Do Immigrants Assimilate Into or
Out of Welfare?, The Journal of Human Resources, 38, no. 1: 74-98. 10
Hassler, J., Rodríguez, M., José, V., Storesletten, K. and Zilibotti, F. 2003. The Survival of the Welfare State. The
American Economic Review, 93, no. 1: 87-112; Razin, A., Sadka, E. and Swagel, P. 2002. The Aging of the Population
and the Size of the Welfare State, IMF Working Paper 02/68; Razin, A., Sadka, E. and Suwankiri, B. 2011. Migration
and the welfare state. Political-economy policy formation, Cambridge, Massachusetts: MIT Press. 11
Alesina, A., Baqir, R. and Easterly, W. 1999. Public Goods and Ethnic Divisions, Quarterly Journal of Economics, 114,
no. 4: 1243-84. 12
Alesina, A. and La Ferrara, E. 2005.
Stereotype 4: “Migrants undermine our welfare systems”
Migration Policy Centre (www.migrationpolicycentre.eu) 41
increases if members of the respondent’s own ethnic group are over-represented among welfare
recipients.
Empirical evidence for the US shows that reduced support for redistribution due to racial
heterogeneity even extends to lower actual levels of redistribution.13
In addition, Alesina and Glaeser
(2004) show that the share of African-Americans in the population correlates very negatively with
maximum welfare allowances across US states. These studies for the US have a point in common:
they find racial, and not ethnic, linguistic or birthplace differences, to be the politically salient margin
with respect to attitudes and welfare spending.
Do these results extend to birthplace diversity (i.e. the diversity arising from immigration), as
claimed for example by Collier (2013)? Recent research on immigration and attitudes to redistribution
in Europe suggests a negative answer. More specifically, it suggests that the way immigration affects
natives’ attitudes to redistribution in Europe depends on the size, diversity and relative skill level of
immigrants to natives.
Alesina, Harnoss and Rapoport (2014) assess immigration and attitudes to redistribution and do
show an average negative effect, but one much lower in magnitude than what one would infer from
studies on racial diversity in the US. They find that a one percentage point increase in the share of
immigrants lowers support for redistribution by 0.2 percentage points, which is not much. In addition,
this average effect is supplemented and quite easily dominated by interesting, counter-acting (i.e.
positive) effects at the two extremes of the natives’ skill distribution.
Let us qualify the first result. The small magnitude of the average effect is in contrast with the
literature on US racial diversity, as already mentioned, and with other studies such as Dahlberg et al.
(2012), who find a strongly negative effect of (non-European) immigrant placement in Swedish
communities on attitudes to redistribution. They use a quasi-experiment for identification and claim
that non-experimental studies that do not account for the endogeneity of immigrants’ location (who
may go to more “friendly” places) tend to underestimate the real effect. They find quite a large effect,
about 10 times higher than ours). The reason for the difference is that they look at refugees from very
poor countries while we look at all immigrants, and all European countries, not just Sweden. Others,
mainly in the political science literature, find no real effect of immigration on attitudes, so are closer to
that but with much more advanced empirical analysis.
On the one hand, when immigration is more skilled and more diverse, highly-skilled natives
become more favourable to redistribution. This points to a change of preference channels, with more
positive views of immigration and a greater willingness to share more, even if the proceeds from
redistribution are shared with immigrants. At the other extreme, when immigration is less skilled, low-
skilled natives prefer more redistribution (as immigrants are closer substitutes to their own labour), i.e.
the insurance effect (demand for more protection) dominates the group loyalty effects. This is shown
using the well-known European Social Survey on attitudes and values and OECD migration data in 29
European countries. Alongside these non-standard effects, they also confirm more standard/expected
effects such as the presence of group loyalty effects (that are strong in the US along the racial
dimension) for the native/immigrant dimension in Europe – but at much lower magnitudes. Second,
they find evidence for a “labour market effect” on attitudes to redistribution: certain natives become
more supportive of redistributive policy in a way that is consistent with their narrowly-defined
economic interests, but one which includes the realization that immigrants, be they skilled or
unskilled, are essentially complementary to their own labour market skills.
13
Alesina, A., Baqir, R. and Easterly, W. 1999.
Is what we hear about migration really true? - Questioning eight stereotypes
42 Migration Policy Centre (www.migrationpolicycentre.eu)
Overall, Alesina, Harnoss and Rapoport (2014) conclude that birthplace diversity – not racial/ethnic
diversity – is the politically salient margin of diversity in Europe. The presence of two partly
compensating channels of effect further suggests that immigration to Europe will, at best, only
modestly decrease support for the welfare state in Europe. Therefore, the negative effects of
ethnic/racial diversity on trust and redistribution found in the US cannot be simply transposed to the
EU. Immigration and the diversity arising from it (i.e. birthplace diversity) do not translate, as
commonly assumed, into more negative attitudes towards redistribution; rather, they translate into
more positive attitudes.
References
Alesina, A. and Glaeser, E. 2004. Fighting Poverty in the U.S. and Europe: A World of Difference.
Oxford: Oxford University Press.
Alesina, A., Harnoss, J. and Rapoport, H. 2014. Immigration and attitudes to redistribution in Europe,
Mimeo., Paris School of Economics.
Bonin, H. 2006. Der Finanzierungsbeitrag der Auslaender zu den deutschen Staatsfinanzen: Eine
Bilanz für 2004. IZA Discussion Paper No. 2444, Institute for the Study of Labor (IZA).
Brücker, H., Epstein, G. S., McCormick, B., Saint-Paul, G., Venturini, A., and Zimmermann, K. 2002.
Managing Migration in the European Welfare State. In: Boeri, T., Hanson, G. and McCormick, B.
(eds.), Immigration Policy and the Welfare System, Oxford: Oxford University Press.
Collado, D., Iturbe-Ormaetxe, I., and Valera, G. 2004. Quantifying the Impact of Immigration on the
Spanish Welfare State, International Tax and Public Finance, 11: 335-353.
Collier, P. 2013. Exodus, Oxford: Oxford University Press.
Dahlberg, M., Edmark, K. and Lundqvist, H. 2012. Ethnic Diversity and Preferences for
Redistribution. Journal of Political Economy, 120, no. 1: 41-76.
Dustmann, C., Frattini, T. and Halls, C. 2010. Assessing the Fiscal Costs and Benefits of A8 Migration
to the UK. Fiscal Studies, 31, no. 1: 1-41.
Kaczmarczyk, P. 2013. Are immigrants a burden for the state budget? Review paper. RSCAS Working
Paper 2013/79.
Luttmer, E. 2001. Group Loyalty and the Taste for Redistribution. Journal of Political Economy, 109,
no. 3: 500-528.
Nannestad, P. 2004. Immigration as a challenge to the Danish welfare state?, European Journal of
Political Economy, 20: 755-767.
OECD. 2013. The fiscal impact of immigration in OECD countries. In: International Migration
Outlook. Paris: OECD.
Putnam, R. 1995. Bowling Alone: America’s Declining Social Capital. Journal of Democracy, 6, no.
1: 65-78.
Riphahn, R. 2004. Immigrant Participation in Social Assistance Programs: Evidence from German
Guestworkers. Applied Economics Quarterly, 50, no. 4: 329-362.
Riphahn, R., Sander, M. and Wunder, C. 2010. The Welfare Use of Immigrants and Natives in
Germany: The Case of Turkish Immigrants. LASER Discussion Papers 2010/44.
Stereotype 5
“Migration hampers our capacity to innovate”
Wrong: Actually, immigration boosts innovation. Recent research shows that
both highly diverse workplaces as well as inflows of highly educated migrants
boost a country’s innovative potential.
Text written by Sona Kalantaryan, Hillel Rapoport and Alessandra Venturini based on Rapoport
(2013) and Venturini (2013)

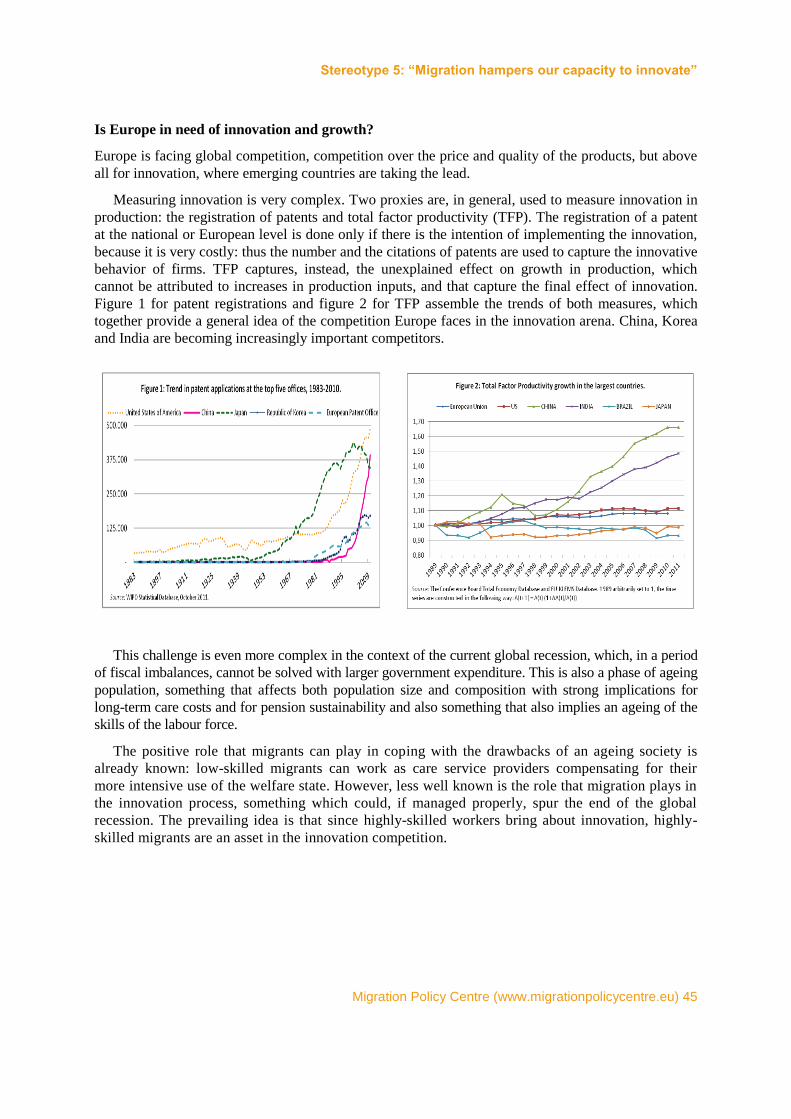
Stereotype 5: “Migration hampers our capacity to innovate”
Migration Policy Centre (www.migrationpolicycentre.eu) 45
Is Europe in need of innovation and growth?
Europe is facing global competition, competition over the price and quality of the products, but above
all for innovation, where emerging countries are taking the lead.
Measuring innovation is very complex. Two proxies are, in general, used to measure innovation in
production: the registration of patents and total factor productivity (TFP). The registration of a patent
at the national or European level is done only if there is the intention of implementing the innovation,
because it is very costly: thus the number and the citations of patents are used to capture the innovative
behavior of firms. TFP captures, instead, the unexplained effect on growth in production, which
cannot be attributed to increases in production inputs, and that capture the final effect of innovation.
Figure 1 for patent registrations and figure 2 for TFP assemble the trends of both measures, which
together provide a general idea of the competition Europe faces in the innovation arena. China, Korea
and India are becoming increasingly important competitors.
This challenge is even more complex in the context of the current global recession, which, in a period
of fiscal imbalances, cannot be solved with larger government expenditure. This is also a phase of ageing
population, something that affects both population size and composition with strong implications for
long-term care costs and for pension sustainability and also something that also implies an ageing of the
skills of the labour force.
The positive role that migrants can play in coping with the drawbacks of an ageing society is
already known: low-skilled migrants can work as care service providers compensating for their
more intensive use of the welfare state. However, less well known is the role that migration plays in
the innovation process, something which could, if managed properly, spur the end of the global
recession. The prevailing idea is that since highly-skilled workers bring about innovation, highly-
skilled migrants are an asset in the innovation competition.
Is what we hear about migration really true? - Questioning eight stereotypes
46 Migration Policy Centre (www.migrationpolicycentre.eu)
Why the stereotype?
It is commonly put forward that migration hampers innovation. The underlying rationale for such a
view is that immigration is the importation of cheap labour, and thus acts as a disincentive to invest in
R&D and in labour-saving techniques. In this way it reduces innovation and slows down the
modernisation of the industry.1
In fact, this overlooks a number of points that should be factored in when assessing the effect of
immigration on innovation.
First, the question as to whether immigration depresses wages is one of the most debated
issues in modern labor economics: while there is disagreement on the sign of the average
effect (i.e., for a typical worker), there is consensus that these effects (if they exist) are small,
with estimates within a range of just a few percentage points.
Second, innovation is not necessarily labor saving: technological progress can be capital
saving instead, or (Hicks-)neutral in terms of the capital to labor ratio. And indeed, recent
research, notably by California-based Italian economist Giovanni Peri (2013) has
demonstrated that immigration increases labor productivity in US states thanks to
immigration promoting, efficient task-specialization and thanks to the adoption of unskilled-
efficient (labor augmenting) technologies.
And third, by increasing the size of the population, immigration also increases the likelihood
of an invention. This is the well-known Simon-Kuznets’ “genius principle”, according to
which the higher the population, the more likely it is that another Mozart or Einstein will
come, raising the stock of ideas. Since ideas can be shared at zero cost, new ideas are used
more effectively in larger than in smaller populations.
In this note, however, we want to focus on two other aspects of the immigration and innovation
debate that seem most relevant for European immigration policy: the direct role of immigrants as
inventors, and their indirect role in terms of their effects on the innovation of others (i.e., the role of
foreign workers in the production of patents inside a team, a firm, a sector or a region). The first effect is
most directly captured using data on patent creation. The broader role of foreigners/immigrants can,
meanwhile, be tracked through patent data but also through more encompassing measures of innovation
and productivity such as TFP. In any event, there is ample empirical evidence that immigration is a
significant booster of innovation on both sides.
1 Venturini A. 2004. Postwar Migration in South Europe, 1950-2000: An Economic Analysis, Cambridge: Cambridge
University Press, 164-166.
Stereotype 5: “Migration hampers our capacity to innovate”
Migration Policy Centre (www.migrationpolicycentre.eu) 47
Immigrants as inventors
One strand of recent research has focused on the direct contribution of foreigners to innovation, using
changes in immigration policy for identification. For example, Kerr and Lincoln (2010) show that the
creation and expansion of the H-1B visa program, aimed at facilitating the entry of highly-skilled IT,
computer and engineering specialists to the US, translated into higher innovation and employment in
the fields of science and engineering. Such increases, they conclude, were mostly due to the direct
contribution of immigrants.2
An interesting study that bridges this and the next section is provided by Peri, Shih and Sparber
(2013). Much like Kerr and Lincoln (2010), they looked at the effect of the increase in the number of
science, technology, engineering and mathematics (STEM) workers at the city level in the United
States on the growth rates of wages and employment of college and non-college educated workers
from 1990 to 2010.3 They found that H-1B-driven increases in STEM workers in a city were
associated with significant increases in wages paid to both STEM and non-STEM college-educated
natives and with increased specialization in high human capital sectors, and a rise in the concentration
of natives in occupations requiring mostly cognitive (as opposed to manual and managerial) skills.
They conclude that the sheer magnitudes of their estimates imply that STEM workers contributed
significantly to total factor productivity growth in the US and across cities.
The conclusion is that the more open but specific the visa policy is on the highly skilled in science
and technology, the more patents will be registered by foreigners with possibly strong externalities for
the innovative capacity and productivity of others.
Their results, however, could be specific to the context of the United States. Indeed, the US is able
to attract highly-skilled workers in large numbers due to the high wage-premium offered, the high
probability of finding highly-skilled employment, the open nature of American society, as well as the
language, English (English reduces the initial cost of migration and constitutes a general human
capital, that is, a capital that can provide returns outside of the US). For these reasons, the results
related to the US should be transferred with caution to Europe because they were taken in a favorable
context where the internal mobility of firms is impressively large. In addition, these studies focus on a
very specific group of immigrants working in the STEM fields. We now turn to another strand of
recent research that emphasizes the benefits for innovation of skilled migration in general, and in
broader contexts.
2 In a similar spirit, Suen, Mobarak and Maskus (2012) use exogeneous variation in the supply of foreign Ph.D. students to
measure the contribution of foreign students to the scientific production and innovation performance of US academic
departments in science and technology. Identification relies on macro shocks in the students’ home countries having
differential effects on incentives to enroll in US institutions. The authors show that foreign students considerably boost
the production of knowledge and the general productivity of the receiving universities and laboratories. 3 In order to identify a supply-driven and heterogenous increase in STEM workers across US cities, they use the dependence
of each city on foreign-born STEM workers in 1980 and exploit the introduction and variation (over time and across
nationalities) of the H-1B visa program.
Is what we hear about migration really true? - Questioning eight stereotypes
48 Migration Policy Centre (www.migrationpolicycentre.eu)
Immigrants as contributors to innovation and productivity: share of migrants and the role of
diversity
A second and broader direction of recent economics research aims at capturing the effect of
immigration on native workers’ innovative performance and productivity at the firm, sector, regional
or national level. Interestingly, this second strand of research touches not just on the effect of having
more immigrants but also on the effect of having a range of immigrants from more diverse geographic
and cultural backgrounds.
The evidence here is broader and includes many European country case studies as well as cross-
country comparisons. We will focus on the European evidence.
The general idea behind these studies is that immigrants bring additional skills. But there is also the
point that these diverse skills (problem-solving procedures, specific knowledge, experiences and
ideas) can complement those of the native workers and, therefore, translate into beneficial production
function effects that can be tracked using measures of innovation and productivity. Of course,
diversity also has a negative side, which relates to the costs that arise from potential conflicts,
disagreements, and animosity between different groups.
European research is very interesting and complex:
At the regional level – be they regions within the EU or within a single member state – the
increase in migrant share and in the diversity of countries of origin have a positive effect on
productivity and the innovative capacity of the area (Alesina, Harnoss, and Rapoport 2014).
This result is not at all new in the innovation literature. Jacobs, already in 1961, discovered
the positive relations between diversity and innovation by studying the innovative dynamic
of New York City after the Second World War, where different foreign communities spread
across the city contributed to a rapid growth in innovative projects. In addition Alesina et al.
(2014) focus on the differential effects of various dimensions of diversity (comparing
“birthplace” – i.e., intra-population diversity coming from immigration and the resulting
diversity in people’s birthplaces) to ethnic, linguistic and genetic diversity. The find a
positive effect for the first (especially for diversity arising from high-skill immigration) on
long-run income and productivity. They also demonstrate that such effects are unlikely to be
due to extreme selection of skilled immigrants (e.g., cherry picking of the best and brightest
math and science students) or to reverse causality (that is, richer countries being more
diverse because they are richer rather than richer because they are more diverse). Lastly they
found that diversity among the highly skilled has a very strong effect but also that diversity
among the low skilled is positive.
At the sector level, the positive effect of the share of migrants remains positive and
important. In contrast, the positive effect of the diversity of the countries persists in low-
skilled sectors but disappears in highly-skilled sectors. This result does not contradict the
previous one, on the contrary it explains that the innovative process is passing through
complementary production sectors. Migrants favour innovative processes by penetrating
different sectors of production and by holding positions in strongly complementary sectors.4
A new strand of research, in fact, is showing how low-skilled women working in the family
services complement the highly-skilled women working in the highly skilled sector. This
4 Venturini, A., Montobbio, F., Fassio, C. 2012, Are migrants spurring innovation?, EUI Working Papers RSCAS No.
2012/11. See specifically Table 1B.
Stereotype 5: “Migration hampers our capacity to innovate”
Migration Policy Centre (www.migrationpolicycentre.eu) 49
result goes back to the flexibility provided by migrants, which is one of the more important
factors in favouring growth in the destination economies.5
At the level of firms the research results vary a great deal because the researchers use
different datasets in different countries with different specifications. However, in all the
papers there is evidence that either the share of migrants or the level of diversity by countries
of origin plays a positive role in spurring innovation and productivity.
The general conclusion is that inflows of highly-skilled migrants favour innovation. But, the
variety of origin of the migrants can also play a strong positive role. Thus a more open migration
policy for the highly skilled will boost innovation. In addition, diversity among the low skilled also
favour productivity and innovation providing complementary factors of production.
Conclusion
Research results do not want to propose a complete change in migration policy, which should now
look for diversity of countries of origin, instead of looking for the most appropriate and qualified
workers.
In Europe, for instance, “Indian engineers” are presently in great demand. Of course the market
demands them not because they are Indian or because (as such) they increase the diversity of the team,
but because, at the moment, they are the “best” engineers on the world labour maket.
The research results show that the “fact” that migrants slow down innovation and productivity is
wrong, and that any migration policy that favors more highly-skill immigration to Europe, and from
more diverse origins, would benefit innovation in Europe.
This is due not just to the innovative activity of immigrants in the fields most directly related to
innovation (STEM workers). It also relates to externalities brought by STEM as well as other types of
highly-skilled immigrants at different levels of economic and territorial aggregation.
In addition to this, it is important to stress that low skilled diversity has a positive effect on
innovation given the complementarity between factors of production.
5 Kahanec, M., Zimmerman, K., Kureková, L., Biavaschi, C. 2013. Labour Migration from EaP Countries to the EU –
Assessment of Costs and Benefits and Proposals for Better Labour Market Matching, IZA Research Report No. 56.
Is what we hear about migration really true? - Questioning eight stereotypes
50 Migration Policy Centre (www.migrationpolicycentre.eu)
Main references
Rapoport, H. 2013. Immigration, Diversity and Prosperity, MPC Policy Brief RSCAS EUI, June.
Venturini, A. 2013. Innovation and Human Capital: The Role of Migration, Migration Policy Center Policy Brief RSCAS EUI, October.
References
Alesina, A., Harnoss, J. and Rapoport H. 2014. Birthplace Diversity and Economic Prosperity, mimeo, Harvard University.
Jacobs J. 1961. The Death and Life of the Great American Cities, 1993 ed., New York: Random House.
Kerr, W.R. and Lincoln, W.F. 2010. The supply-side of Innovation: H-1B Visa Reforms and U.S. Ethnic Invention, Journal of Labor Economics, 28, no. 3: 473-508.
Suen, E., Mobarak, A.M. and Maskus, K. 2012. Skilled Immigration and Innovation: Evidence from Enrollment Fluctuations in US Doctoral Programs, The Economic Journal, 122, no. 565: 1143-76.
Peri, G., Shih, K. and Sparber, C. 2013. STEM workers, H1-B Visas and Productivity in US cities, mimeo, UC Davis.
Suen, E., Mobarak, A.M. and Maskus, K. 2012. Skilled Immigration and Innovation: Evidence from Enrollment Fluctuations in US Doctoral Programs, The Economic Journal, 122, no. 565: 1143-76.
Stereotype 6
“Our southern coastline is flooded with asylum seekers”
Wrong: Asylum seekers are people threatened with death or serious harm,
whose number rises when refugee crises break out and recedes when conflicts
are resolved. Europe has a duty to protect them under the Geneva Refugee
Convention. While the Dublin system foresees that the Member State
responsible for examining an asylum application is the EU Member State first
entered by the person, this system has not led to “front-line” states receiving
the most asylum seekers.
Text written by Sara Bonfanti and Philippe Fargues

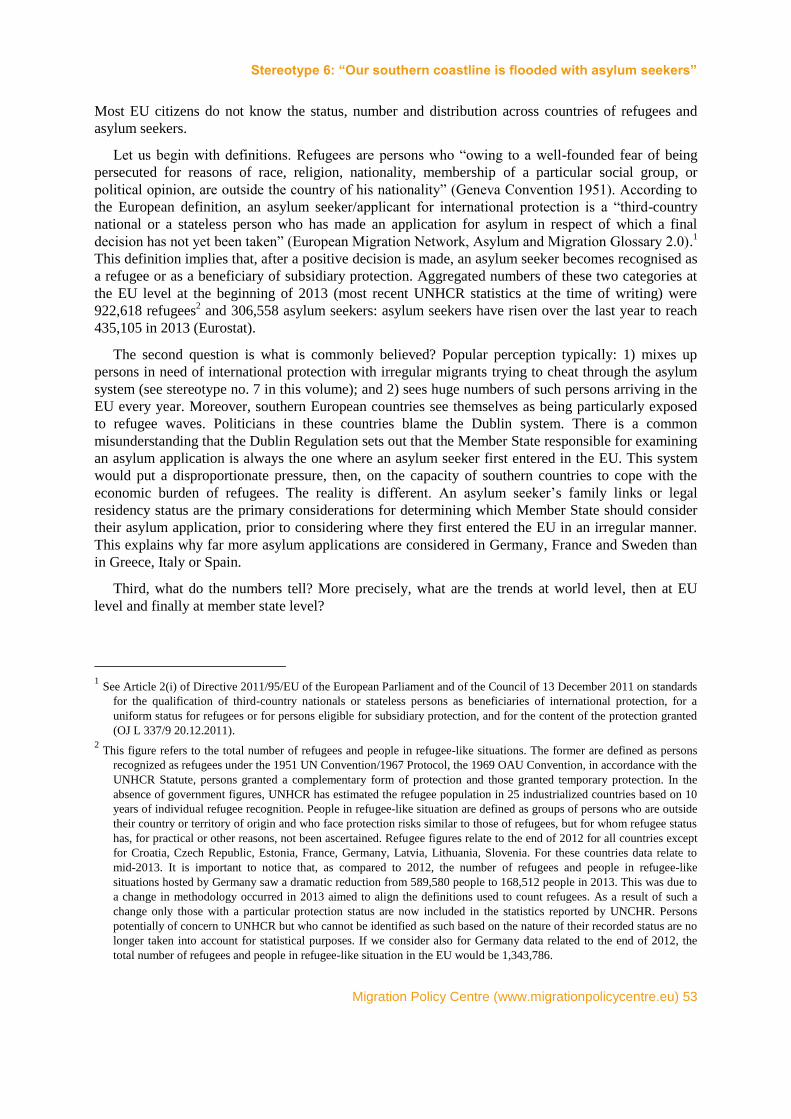
Stereotype 6: “Our southern coastline is flooded with asylum seekers”
Migration Policy Centre (www.migrationpolicycentre.eu) 53
Most EU citizens do not know the status, number and distribution across countries of refugees and
asylum seekers.
Let us begin with definitions. Refugees are persons who “owing to a well-founded fear of being
persecuted for reasons of race, religion, nationality, membership of a particular social group, or
political opinion, are outside the country of his nationality” (Geneva Convention 1951). According to
the European definition, an asylum seeker/applicant for international protection is a “third-country
national or a stateless person who has made an application for asylum in respect of which a final
decision has not yet been taken” (European Migration Network, Asylum and Migration Glossary 2.0).1
This definition implies that, after a positive decision is made, an asylum seeker becomes recognised as
a refugee or as a beneficiary of subsidiary protection. Aggregated numbers of these two categories at
the EU level at the beginning of 2013 (most recent UNHCR statistics at the time of writing) were
922,618 refugees2 and 306,558 asylum seekers: asylum seekers have risen over the last year to reach
435,105 in 2013 (Eurostat).
The second question is what is commonly believed? Popular perception typically: 1) mixes up
persons in need of international protection with irregular migrants trying to cheat through the asylum
system (see stereotype no. 7 in this volume); and 2) sees huge numbers of such persons arriving in the
EU every year. Moreover, southern European countries see themselves as being particularly exposed
to refugee waves. Politicians in these countries blame the Dublin system. There is a common
misunderstanding that the Dublin Regulation sets out that the Member State responsible for examining
an asylum application is always the one where an asylum seeker first entered in the EU. This system
would put a disproportionate pressure, then, on the capacity of southern countries to cope with the
economic burden of refugees. The reality is different. An asylum seeker’s family links or legal
residency status are the primary considerations for determining which Member State should consider
their asylum application, prior to considering where they first entered the EU in an irregular manner.
This explains why far more asylum applications are considered in Germany, France and Sweden than
in Greece, Italy or Spain.
Third, what do the numbers tell? More precisely, what are the trends at world level, then at EU
level and finally at member state level?
1 See Article 2(i) of Directive 2011/95/EU of the European Parliament and of the Council of 13 December 2011 on standards
for the qualification of third-country nationals or stateless persons as beneficiaries of international protection, for a
uniform status for refugees or for persons eligible for subsidiary protection, and for the content of the protection granted
(OJ L 337/9 20.12.2011). 2 This figure refers to the total number of refugees and people in refugee-like situations. The former are defined as persons
recognized as refugees under the 1951 UN Convention/1967 Protocol, the 1969 OAU Convention, in accordance with the
UNHCR Statute, persons granted a complementary form of protection and those granted temporary protection. In the
absence of government figures, UNHCR has estimated the refugee population in 25 industrialized countries based on 10
years of individual refugee recognition. People in refugee-like situation are defined as groups of persons who are outside
their country or territory of origin and who face protection risks similar to those of refugees, but for whom refugee status
has, for practical or other reasons, not been ascertained. Refugee figures relate to the end of 2012 for all countries except
for Croatia, Czech Republic, Estonia, France, Germany, Latvia, Lithuania, Slovenia. For these countries data relate to
mid-2013. It is important to notice that, as compared to 2012, the number of refugees and people in refugee-like
situations hosted by Germany saw a dramatic reduction from 589,580 people to 168,512 people in 2013. This was due to
a change in methodology occurred in 2013 aimed to align the definitions used to count refugees. As a result of such a
change only those with a particular protection status are now included in the statistics reported by UNCHR. Persons
potentially of concern to UNHCR but who cannot be identified as such based on the nature of their recorded status are no
longer taken into account for statistical purposes. If we consider also for Germany data related to the end of 2012, the
total number of refugees and people in refugee-like situation in the EU would be 1,343,786.
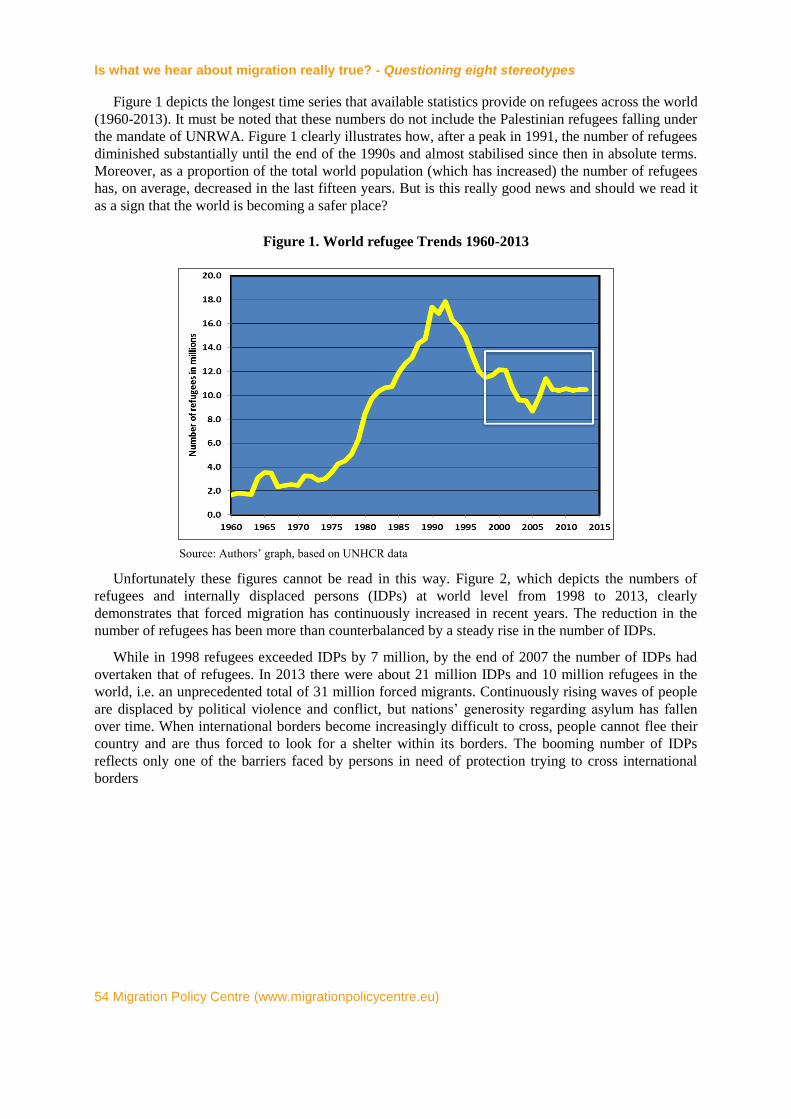
Is what we hear about migration really true? - Questioning eight stereotypes
54 Migration Policy Centre (www.migrationpolicycentre.eu)
Figure 1 depicts the longest time series that available statistics provide on refugees across the world
(1960-2013). It must be noted that these numbers do not include the Palestinian refugees falling under
the mandate of UNRWA. Figure 1 clearly illustrates how, after a peak in 1991, the number of refugees
diminished substantially until the end of the 1990s and almost stabilised since then in absolute terms.
Moreover, as a proportion of the total world population (which has increased) the number of refugees
has, on average, decreased in the last fifteen years. But is this really good news and should we read it
as a sign that the world is becoming a safer place?
Figure 1. World refugee Trends 1960-2013
Source: Authors’ graph, based on UNHCR data
Unfortunately these figures cannot be read in this way. Figure 2, which depicts the numbers of
refugees and internally displaced persons (IDPs) at world level from 1998 to 2013, clearly
demonstrates that forced migration has continuously increased in recent years. The reduction in the
number of refugees has been more than counterbalanced by a steady rise in the number of IDPs.
While in 1998 refugees exceeded IDPs by 7 million, by the end of 2007 the number of IDPs had
overtaken that of refugees. In 2013 there were about 21 million IDPs and 10 million refugees in the
world, i.e. an unprecedented total of 31 million forced migrants. Continuously rising waves of people
are displaced by political violence and conflict, but nations’ generosity regarding asylum has fallen
over time. When international borders become increasingly difficult to cross, people cannot flee their
country and are thus forced to look for a shelter within its borders. The booming number of IDPs
reflects only one of the barriers faced by persons in need of protection trying to cross international
borders
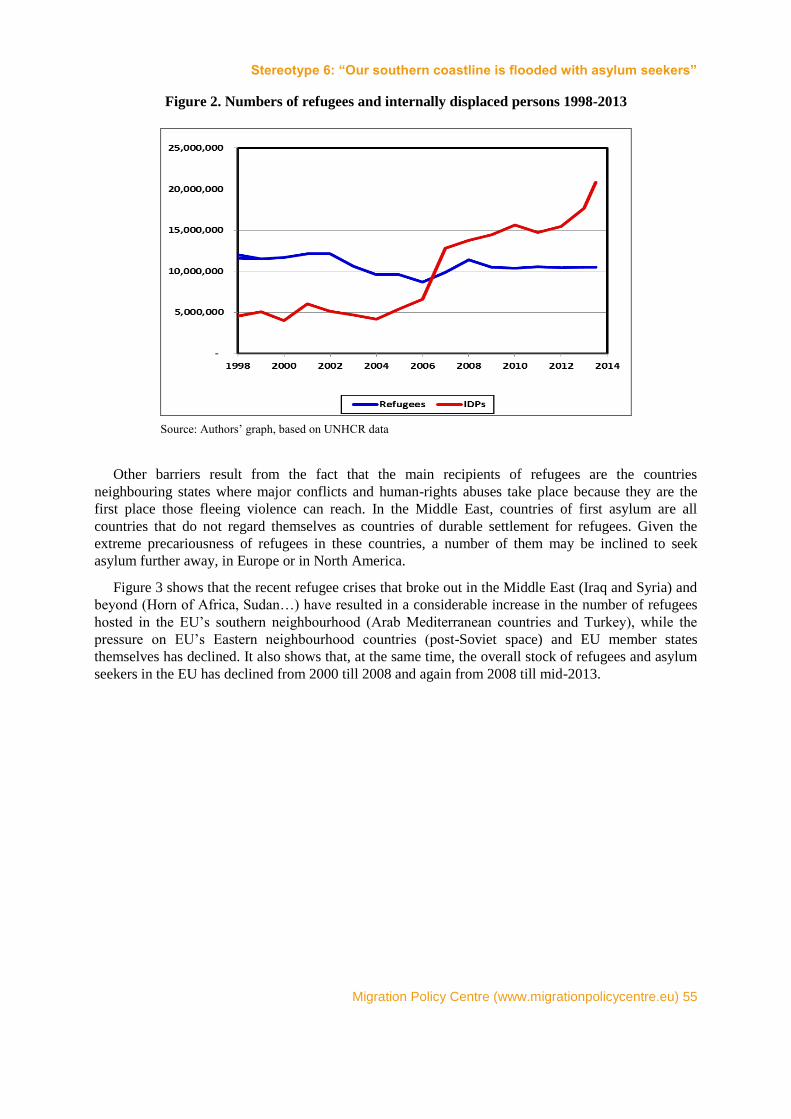
Stereotype 6: “Our southern coastline is flooded with asylum seekers”
Migration Policy Centre (www.migrationpolicycentre.eu) 55
Figure 2. Numbers of refugees and internally displaced persons 1998-2013
Source: Authors’ graph, based on UNHCR data
Other barriers result from the fact that the main recipients of refugees are the countries
neighbouring states where major conflicts and human-rights abuses take place because they are the
first place those fleeing violence can reach. In the Middle East, countries of first asylum are all
countries that do not regard themselves as countries of durable settlement for refugees. Given the
extreme precariousness of refugees in these countries, a number of them may be inclined to seek
asylum further away, in Europe or in North America.
Figure 3 shows that the recent refugee crises that broke out in the Middle East (Iraq and Syria) and
beyond (Horn of Africa, Sudan…) have resulted in a considerable increase in the number of refugees
hosted in the EU’s southern neighbourhood (Arab Mediterranean countries and Turkey), while the
pressure on EU’s Eastern neighbourhood countries (post-Soviet space) and EU member states
themselves has declined. It also shows that, at the same time, the overall stock of refugees and asylum
seekers in the EU has declined from 2000 till 2008 and again from 2008 till mid-2013.
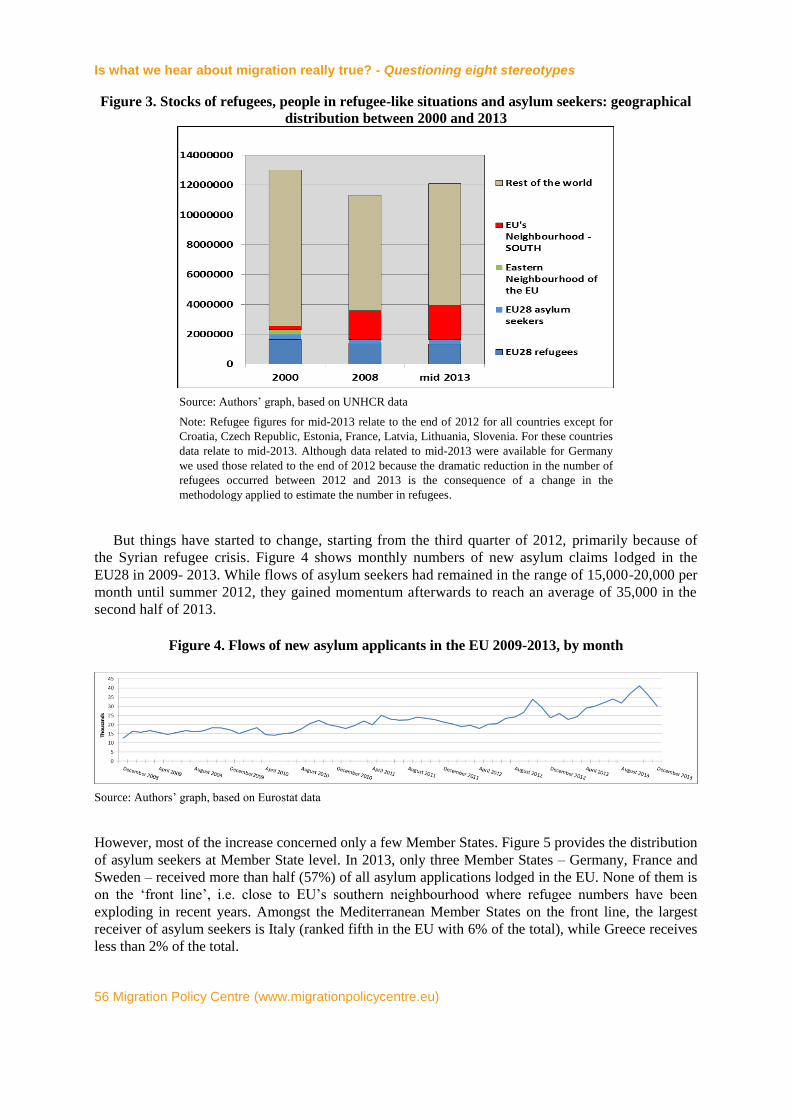
Is what we hear about migration really true? - Questioning eight stereotypes
56 Migration Policy Centre (www.migrationpolicycentre.eu)
Figure 3. Stocks of refugees, people in refugee-like situations and asylum seekers: geographical
distribution between 2000 and 2013
Source: Authors’ graph, based on UNHCR data
Note: Refugee figures for mid-2013 relate to the end of 2012 for all countries except for
Croatia, Czech Republic, Estonia, France, Latvia, Lithuania, Slovenia. For these countries
data relate to mid-2013. Although data related to mid-2013 were available for Germany
we used those related to the end of 2012 because the dramatic reduction in the number of
refugees occurred between 2012 and 2013 is the consequence of a change in the
methodology applied to estimate the number in refugees.
But things have started to change, starting from the third quarter of 2012, primarily because of
the Syrian refugee crisis. Figure 4 shows monthly numbers of new asylum claims lodged in the
EU28 in 2009- 2013. While flows of asylum seekers had remained in the range of 15,000-20,000 per
month until summer 2012, they gained momentum afterwards to reach an average of 35,000 in the
second half of 2013.
Figure 4. Flows of new asylum applicants in the EU 2009-2013, by month
Source: Authors’ graph, based on Eurostat data
However, most of the increase concerned only a few Member States. Figure 5 provides the distribution
of asylum seekers at Member State level. In 2013, only three Member States – Germany, France and
Sweden – received more than half (57%) of all asylum applications lodged in the EU. None of them is
on the ‘front line’, i.e. close to EU’s southern neighbourhood where refugee numbers have been
exploding in recent years. Amongst the Mediterranean Member States on the front line, the largest
receiver of asylum seekers is Italy (ranked fifth in the EU with 6% of the total), while Greece receives
less than 2% of the total.
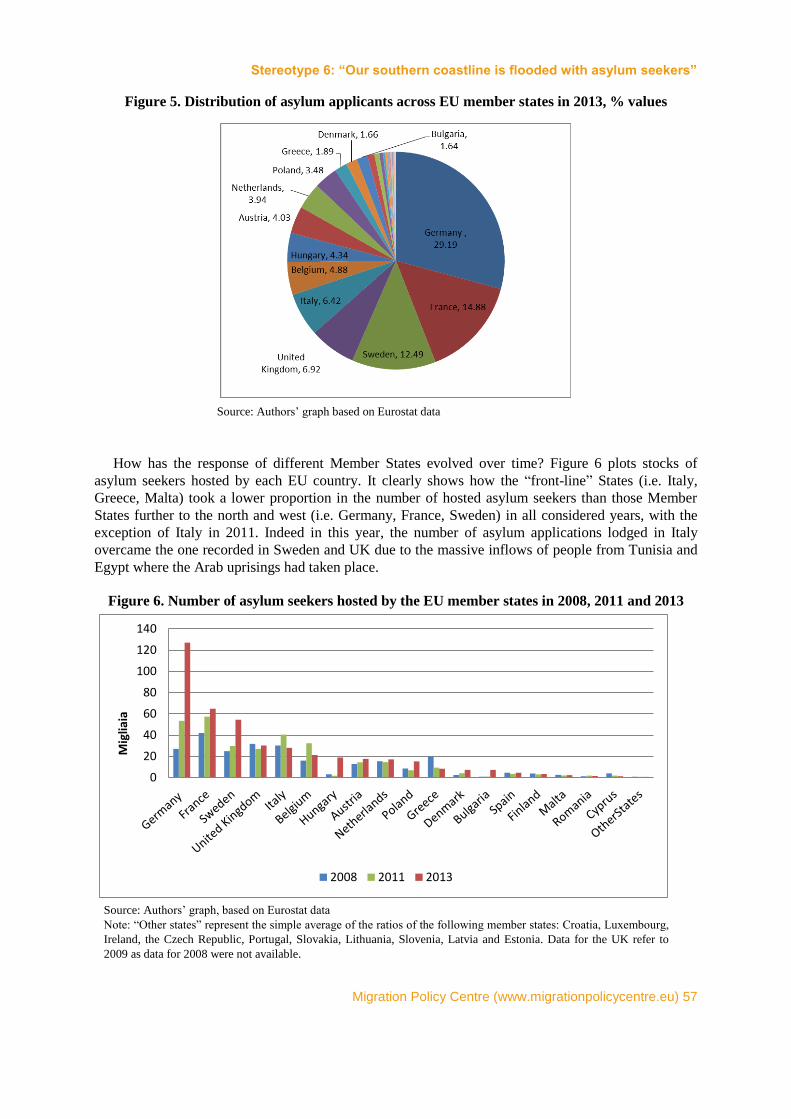
Stereotype 6: “Our southern coastline is flooded with asylum seekers”
Migration Policy Centre (www.migrationpolicycentre.eu) 57
Figure 5. Distribution of asylum applicants across EU member states in 2013, % values
Source: Authors’ graph based on Eurostat data
How has the response of different Member States evolved over time? Figure 6 plots stocks of
asylum seekers hosted by each EU country. It clearly shows how the “front-line” States (i.e. Italy,
Greece, Malta) took a lower proportion in the number of hosted asylum seekers than those Member
States further to the north and west (i.e. Germany, France, Sweden) in all considered years, with the
exception of Italy in 2011. Indeed in this year, the number of asylum applications lodged in Italy
overcame the one recorded in Sweden and UK due to the massive inflows of people from Tunisia and
Egypt where the Arab uprisings had taken place.
Figure 6. Number of asylum seekers hosted by the EU member states in 2008, 2011 and 2013
0
20
40
60
80
100
120
140
Migliaia
2008 2011 2013
Source: Authors’ graph, based on Eurostat data
Note: “Other states” represent the simple average of the ratios of the following member states: Croatia, Luxembourg,
Ireland, the Czech Republic, Portugal, Slovakia, Lithuania, Slovenia, Latvia and Estonia. Data for the UK refer to
2009 as data for 2008 were not available.
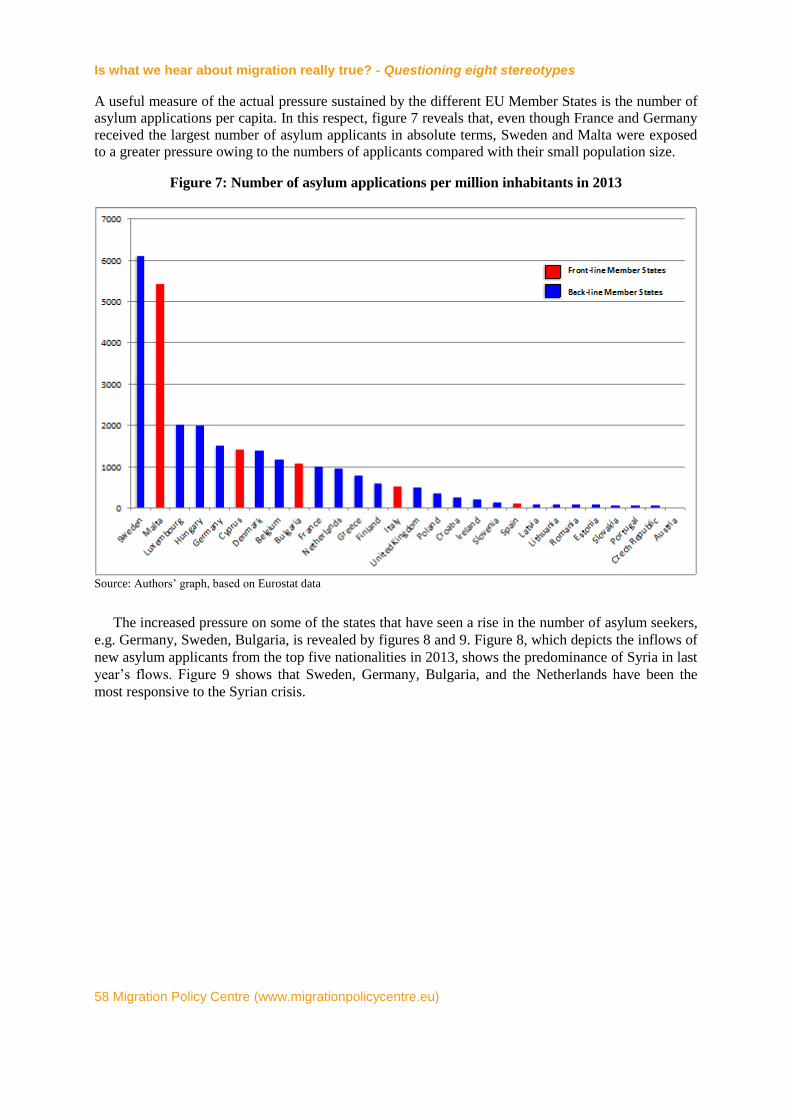
Is what we hear about migration really true? - Questioning eight stereotypes
58 Migration Policy Centre (www.migrationpolicycentre.eu)
A useful measure of the actual pressure sustained by the different EU Member States is the number of
asylum applications per capita. In this respect, figure 7 reveals that, even though France and Germany
received the largest number of asylum applicants in absolute terms, Sweden and Malta were exposed
to a greater pressure owing to the numbers of applicants compared with their small population size.
Figure 7: Number of asylum applications per million inhabitants in 2013
Source: Authors’ graph, based on Eurostat data
The increased pressure on some of the states that have seen a rise in the number of asylum seekers,
e.g. Germany, Sweden, Bulgaria, is revealed by figures 8 and 9. Figure 8, which depicts the inflows of
new asylum applicants from the top five nationalities in 2013, shows the predominance of Syria in last
year’s flows. Figure 9 shows that Sweden, Germany, Bulgaria, and the Netherlands have been the
most responsive to the Syrian crisis.
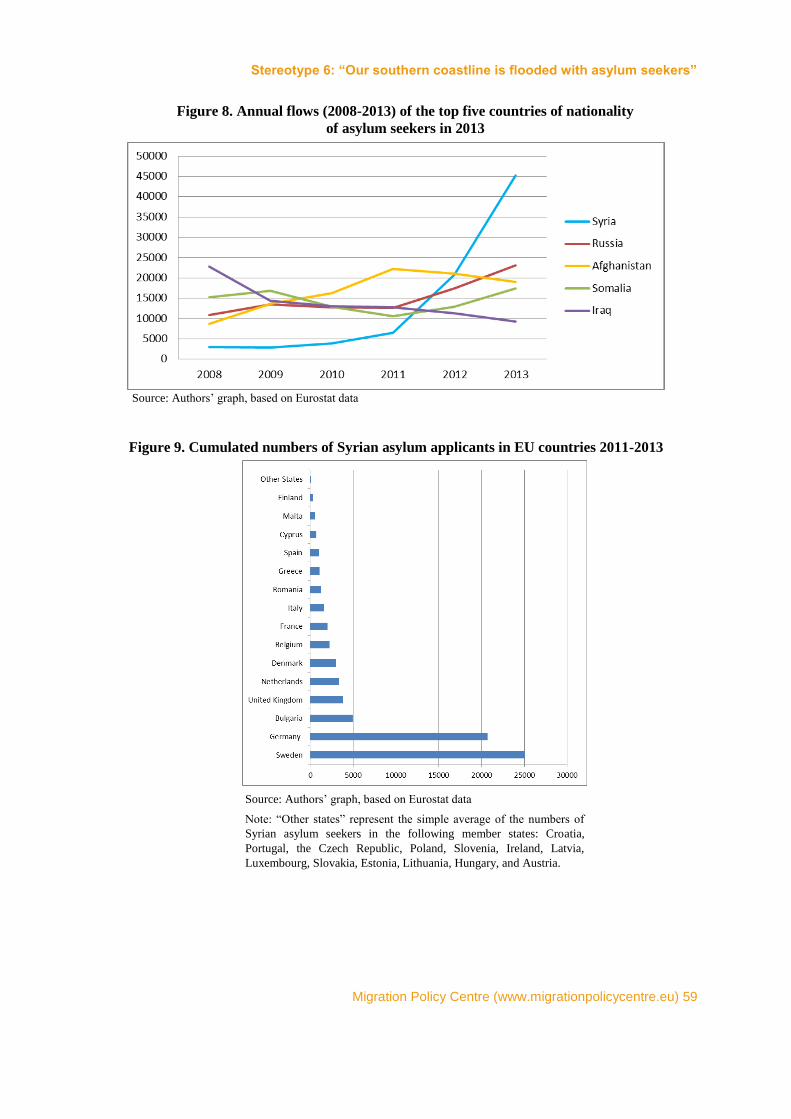
Stereotype 6: “Our southern coastline is flooded with asylum seekers”
Migration Policy Centre (www.migrationpolicycentre.eu) 59
Figure 8. Annual flows (2008-2013) of the top five countries of nationality
of asylum seekers in 2013
Source: Authors’ graph, based on Eurostat data
Figure 9. Cumulated numbers of Syrian asylum applicants in EU countries 2011-2013
Source: Authors’ graph, based on Eurostat data
Note: “Other states” represent the simple average of the numbers of
Syrian asylum seekers in the following member states: Croatia,
Portugal, the Czech Republic, Poland, Slovenia, Ireland, Latvia,
Luxembourg, Slovakia, Estonia, Lithuania, Hungary, and Austria.

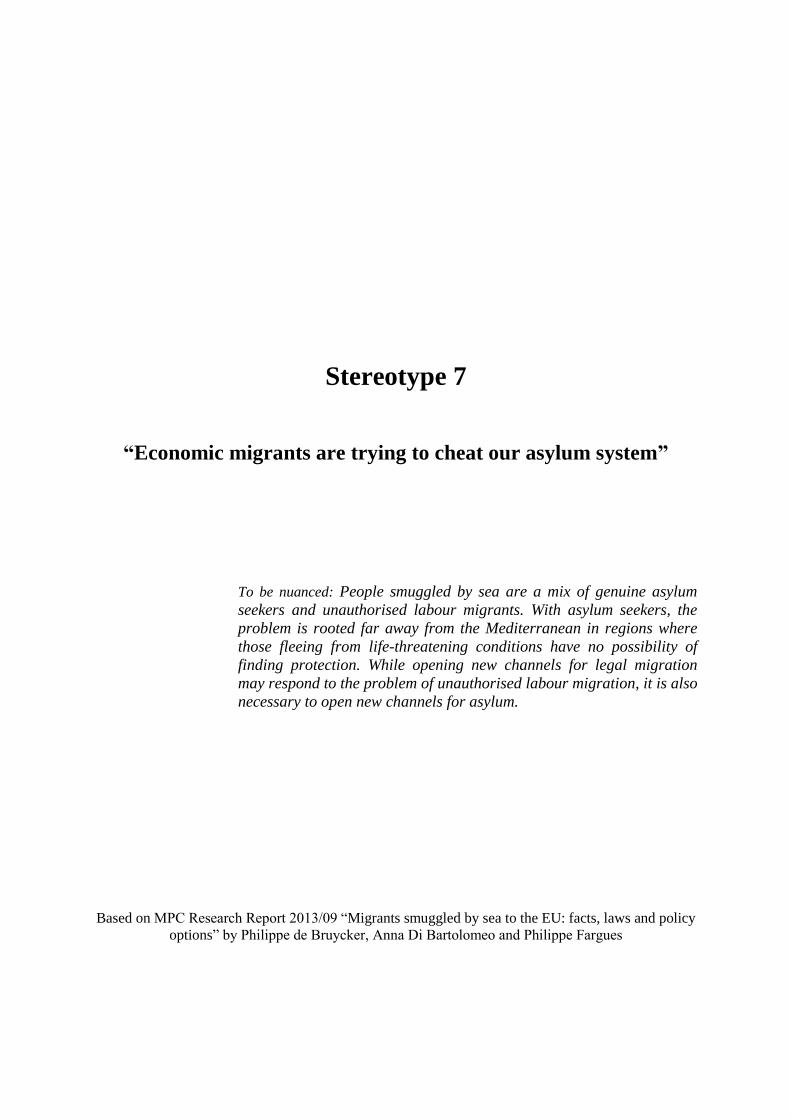
Stereotype 7
“Economic migrants are trying to cheat our asylum system”
To be nuanced: People smuggled by sea are a mix of genuine asylum
seekers and unauthorised labour migrants. With asylum seekers, the
problem is rooted far away from the Mediterranean in regions where
those fleeing from life-threatening conditions have no possibility of
finding protection. While opening new channels for legal migration
may respond to the problem of unauthorised labour migration, it is also
necessary to open new channels for asylum.
Based on MPC Research Report 2013/09 “Migrants smuggled by sea to the EU: facts, laws and policy
options” by Philippe de Bruycker, Anna Di Bartolomeo and Philippe Fargues

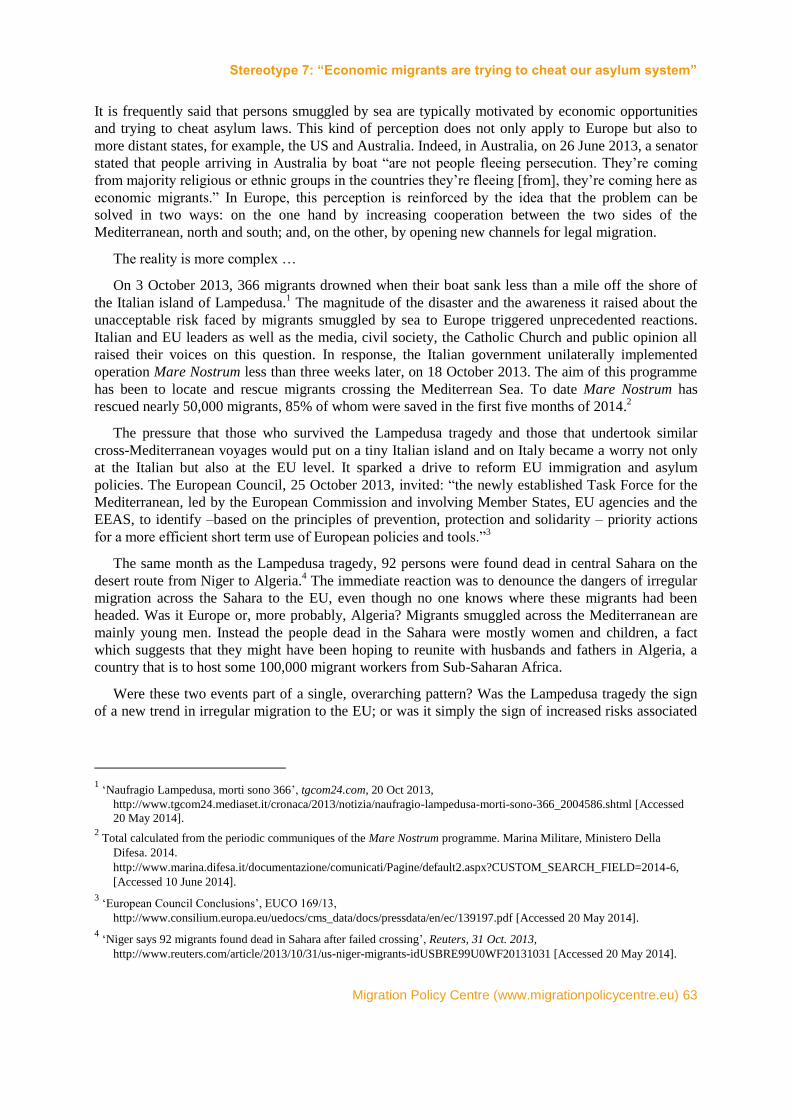
Stereotype 7: “Economic migrants are trying to cheat our asylum system”
Migration Policy Centre (www.migrationpolicycentre.eu) 63
It is frequently said that persons smuggled by sea are typically motivated by economic opportunities
and trying to cheat asylum laws. This kind of perception does not only apply to Europe but also to
more distant states, for example, the US and Australia. Indeed, in Australia, on 26 June 2013, a senator
stated that people arriving in Australia by boat “are not people fleeing persecution. They’re coming
from majority religious or ethnic groups in the countries they’re fleeing [from], they’re coming here as
economic migrants.” In Europe, this perception is reinforced by the idea that the problem can be
solved in two ways: on the one hand by increasing cooperation between the two sides of the
Mediterranean, north and south; and, on the other, by opening new channels for legal migration.
The reality is more complex …
On 3 October 2013, 366 migrants drowned when their boat sank less than a mile off the shore of
the Italian island of Lampedusa.1 The magnitude of the disaster and the awareness it raised about the
unacceptable risk faced by migrants smuggled by sea to Europe triggered unprecedented reactions.
Italian and EU leaders as well as the media, civil society, the Catholic Church and public opinion all
raised their voices on this question. In response, the Italian government unilaterally implemented
operation Mare Nostrum less than three weeks later, on 18 October 2013. The aim of this programme
has been to locate and rescue migrants crossing the Mediterrean Sea. To date Mare Nostrum has
rescued nearly 50,000 migrants, 85% of whom were saved in the first five months of 2014.2
The pressure that those who survived the Lampedusa tragedy and those that undertook similar
cross-Mediterranean voyages would put on a tiny Italian island and on Italy became a worry not only
at the Italian but also at the EU level. It sparked a drive to reform EU immigration and asylum
policies. The European Council, 25 October 2013, invited: “the newly established Task Force for the
Mediterranean, led by the European Commission and involving Member States, EU agencies and the
EEAS, to identify –based on the principles of prevention, protection and solidarity – priority actions
for a more efficient short term use of European policies and tools.”3
The same month as the Lampedusa tragedy, 92 persons were found dead in central Sahara on the
desert route from Niger to Algeria.4 The immediate reaction was to denounce the dangers of irregular
migration across the Sahara to the EU, even though no one knows where these migrants had been
headed. Was it Europe or, more probably, Algeria? Migrants smuggled across the Mediterranean are
mainly young men. Instead the people dead in the Sahara were mostly women and children, a fact
which suggests that they might have been hoping to reunite with husbands and fathers in Algeria, a
country that is to host some 100,000 migrant workers from Sub-Saharan Africa.
Were these two events part of a single, overarching pattern? Was the Lampedusa tragedy the sign
of a new trend in irregular migration to the EU; or was it simply the sign of increased risks associated
1 ‘Naufragio Lampedusa, morti sono 366’, tgcom24.com, 20 Oct 2013,
http://www.tgcom24.mediaset.it/cronaca/2013/notizia/naufragio-lampedusa-morti-sono-366_2004586.shtml [Accessed
20 May 2014]. 2 Total calculated from the periodic communiques of the Mare Nostrum programme. Marina Militare, Ministero Della
Difesa. 2014.
http://www.marina.difesa.it/documentazione/comunicati/Pagine/default2.aspx?CUSTOM_SEARCH_FIELD=2014-6,
[Accessed 10 June 2014].
3 ‘European Council Conclusions’, EUCO 169/13,
http://www.consilium.europa.eu/uedocs/cms_data/docs/pressdata/en/ec/139197.pdf [Accessed 20 May 2014].
4 ‘Niger says 92 migrants found dead in Sahara after failed crossing’, Reuters, 31 Oct. 2013,
http://www.reuters.com/article/2013/10/31/us-niger-migrants-idUSBRE99U0WF20131031 [Accessed 20 May 2014].
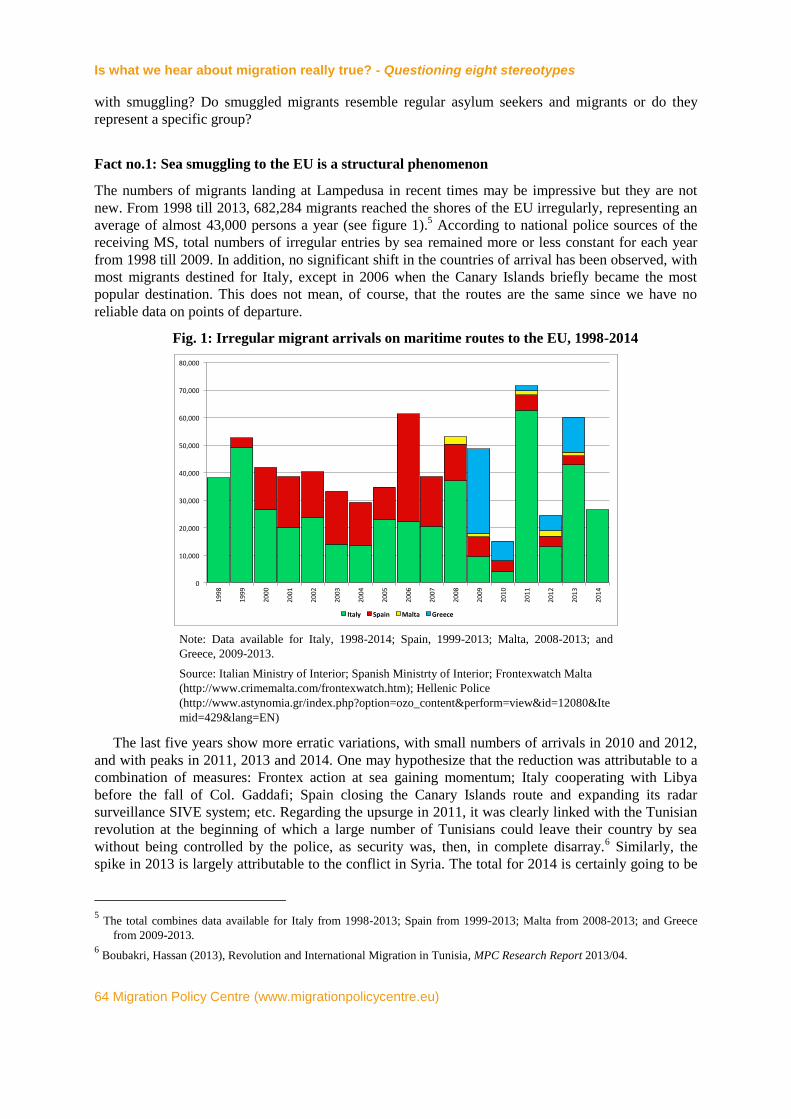
Is what we hear about migration really true? - Questioning eight stereotypes
64 Migration Policy Centre (www.migrationpolicycentre.eu)
with smuggling? Do smuggled migrants resemble regular asylum seekers and migrants or do they
represent a specific group?
Fact no.1: Sea smuggling to the EU is a structural phenomenon
The numbers of migrants landing at Lampedusa in recent times may be impressive but they are not
new. From 1998 till 2013, 682,284 migrants reached the shores of the EU irregularly, representing an
average of almost 43,000 persons a year (see figure 1).5 According to national police sources of the
receiving MS, total numbers of irregular entries by sea remained more or less constant for each year
from 1998 till 2009. In addition, no significant shift in the countries of arrival has been observed, with
most migrants destined for Italy, except in 2006 when the Canary Islands briefly became the most
popular destination. This does not mean, of course, that the routes are the same since we have no
reliable data on points of departure.
Fig. 1: Irregular migrant arrivals on maritime routes to the EU, 1998-2014
0
10,000
20,000
30,000
40,000
50,000
60,000
70,000
80,000
1998
1999
2000
2001
2002
2003
2004
2005
2006
2007
2008
2009
2010
2011
2012
2013
2014
Italy Spain Malta Greece
Note: Data available for Italy, 1998-2014; Spain, 1999-2013; Malta, 2008-2013; and
Greece, 2009-2013.
Source: Italian Ministry of Interior; Spanish Ministrty of Interior; Frontexwatch Malta
(http://www.crimemalta.com/frontexwatch.htm); Hellenic Police
(http://www.astynomia.gr/index.php?option=ozo_content&perform=view&id=12080&Ite
mid=429&lang=EN)
The last five years show more erratic variations, with small numbers of arrivals in 2010 and 2012,
and with peaks in 2011, 2013 and 2014. One may hypothesize that the reduction was attributable to a
combination of measures: Frontex action at sea gaining momentum; Italy cooperating with Libya
before the fall of Col. Gaddafi; Spain closing the Canary Islands route and expanding its radar
surveillance SIVE system; etc. Regarding the upsurge in 2011, it was clearly linked with the Tunisian
revolution at the beginning of which a large number of Tunisians could leave their country by sea
without being controlled by the police, as security was, then, in complete disarray.6 Similarly, the
spike in 2013 is largely attributable to the conflict in Syria. The total for 2014 is certainly going to be
5 The total combines data available for Italy from 1998-2013; Spain from 1999-2013; Malta from 2008-2013; and Greece
from 2009-2013. 6 Boubakri, Hassan (2013), Revolution and International Migration in Tunisia, MPC Research Report 2013/04.
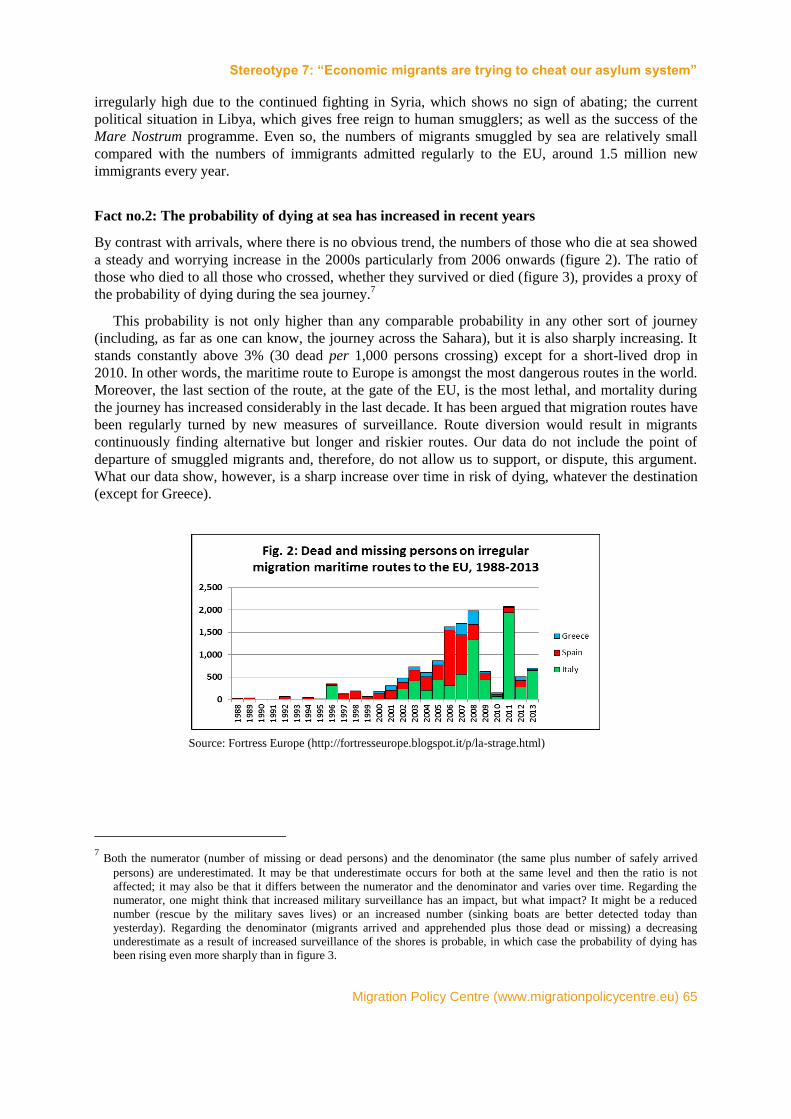
Stereotype 7: “Economic migrants are trying to cheat our asylum system”
Migration Policy Centre (www.migrationpolicycentre.eu) 65
irregularly high due to the continued fighting in Syria, which shows no sign of abating; the current
political situation in Libya, which gives free reign to human smugglers; as well as the success of the
Mare Nostrum programme. Even so, the numbers of migrants smuggled by sea are relatively small
compared with the numbers of immigrants admitted regularly to the EU, around 1.5 million new
immigrants every year.
Fact no.2: The probability of dying at sea has increased in recent years
By contrast with arrivals, where there is no obvious trend, the numbers of those who die at sea showed
a steady and worrying increase in the 2000s particularly from 2006 onwards (figure 2). The ratio of
those who died to all those who crossed, whether they survived or died (figure 3), provides a proxy of
the probability of dying during the sea journey.7
This probability is not only higher than any comparable probability in any other sort of journey
(including, as far as one can know, the journey across the Sahara), but it is also sharply increasing. It
stands constantly above 3% (30 dead per 1,000 persons crossing) except for a short-lived drop in
2010. In other words, the maritime route to Europe is amongst the most dangerous routes in the world.
Moreover, the last section of the route, at the gate of the EU, is the most lethal, and mortality during
the journey has increased considerably in the last decade. It has been argued that migration routes have
been regularly turned by new measures of surveillance. Route diversion would result in migrants
continuously finding alternative but longer and riskier routes. Our data do not include the point of
departure of smuggled migrants and, therefore, do not allow us to support, or dispute, this argument.
What our data show, however, is a sharp increase over time in risk of dying, whatever the destination
(except for Greece).
Source: Fortress Europe (http://fortresseurope.blogspot.it/p/la-strage.html)
7 Both the numerator (number of missing or dead persons) and the denominator (the same plus number of safely arrived
persons) are underestimated. It may be that underestimate occurs for both at the same level and then the ratio is not
affected; it may also be that it differs between the numerator and the denominator and varies over time. Regarding the
numerator, one might think that increased military surveillance has an impact, but what impact? It might be a reduced
number (rescue by the military saves lives) or an increased number (sinking boats are better detected today than
yesterday). Regarding the denominator (migrants arrived and apprehended plus those dead or missing) a decreasing
underestimate as a result of increased surveillance of the shores is probable, in which case the probability of dying has
been rising even more sharply than in figure 3.
Is what we hear about migration really true? - Questioning eight stereotypes
66 Migration Policy Centre (www.migrationpolicycentre.eu)
Source: Authors’ calculation based on Fortress Europe data.
Fact no.3: Persons smuggled by sea to the EU are NOT representative of registered asylum
seekers, regular immigrants or other irregular immigrants
Migrants smuggled by sea are often said to represent a “mixed” population comprising de facto
asylum seekers travelling alongside hidden economic migrants.8 Therefore, does their profile fall
somewhere between the two categories of asylum seekers and labour migrants? Available data on
migrants smuggled by sea are produced by EU ministries of the interior and they do not provide all the
information that would be necessary to draw their profile. The only available characteristic is, in the
case of Italy, the declared nationality of irregular migrants detained at arrival. The only question we
can, therefore, address is: do migrants smuggled by sea resemble – in terms of country of origin –
other asylum seekers, other labour migrants, and other irregular migrants?
In 2008-2012, migrants smuggled by sea to the EU were mainly nationals of Sub-Saharan countries
(32%), Tunisia (25%, most of them having arrived in the first half of 2011), Syria (7%) and
Afghanistan (4%). These nationalities were not the dominant ones amongst either registered asylum
seekers (figures 4 and 5), or regular immigrants (figure 6) or even immigrants found to be irregularly
present in the EU (figure 7).
Only four countries — Afghanistan, Nigeria, Somalia and Syria — are in the top 10 countries of
origin on both lists of asylum seekers in the EU and migrants smuggled by sea to Italy (figure 4). In
addition, for all countries of origin save two – Tunisia and “Central African Republic” – migrants
smuggled by sea are in smaller numbers than asylum seekers (figure 5). This may reflect the fact that
arrival by sea is not the most frequent way for asylum seekers to reach the EU. In the case of Central
Africa, however, a ratio of 459% suggests that many persons smuggled by sea to Europe from a French-
speaking African country may have falsified their true nationality and declared they were from Central
Africa in order to be eligible for refugee status. In the case of Tunisia, instead, a ratio of 336% reflects
the predominance of irregular labour migrants among persons arriving by sea and the rarity of eligible
refugees.
In the same vein, no country is both in the top 10 countries of origin of regular migrants to the EU
and migrants smuggled by sea to Italy (figure 6). Only four countries – Afghanistan, Nigeria, Pakistan
and Tunisia – are, meanwhile, in the top 10 countries of origin of irregular migrants in the EU and
migrants smuggled by sea to Italy (figure 7). This clearly demonstrates the specificity, in terms of
provenance, of migrants smuggled by sea to the EU.
8 ‘Refugee Protection and Mixed Migration’, UNHCR, http://www.unhcr.org/pages/4a16aac66.html [Accessed 20 May 2014]
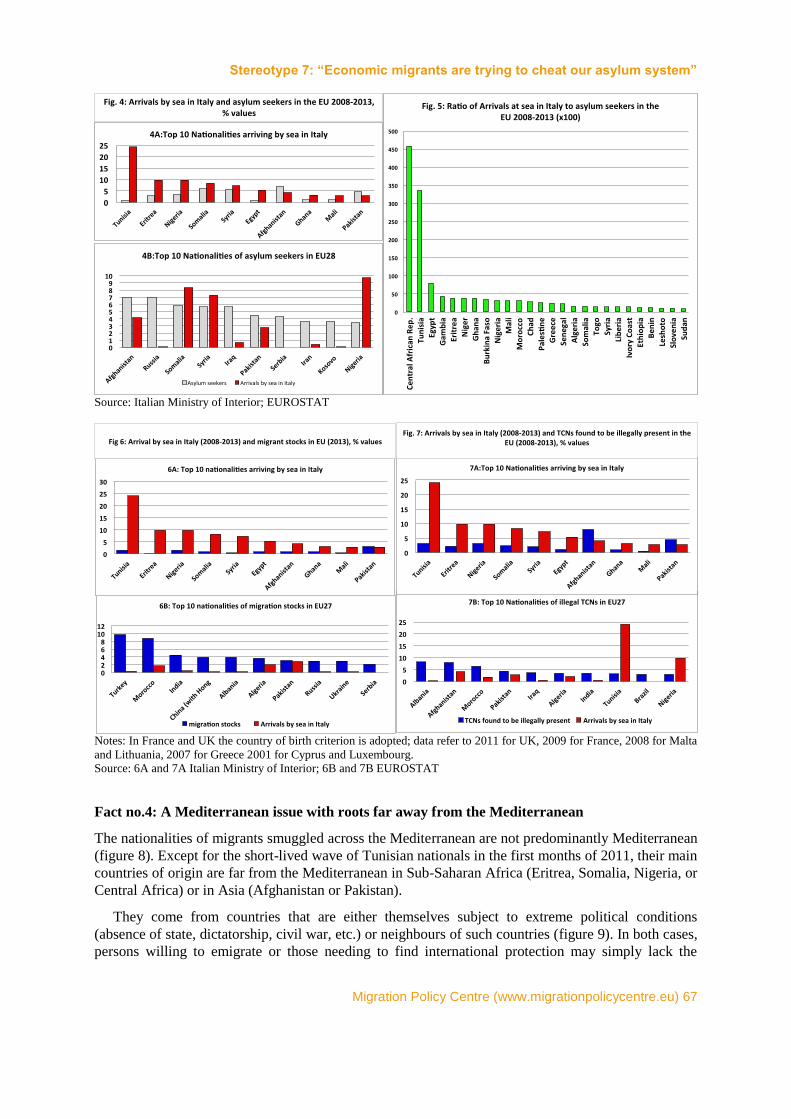
Stereotype 7: “Economic migrants are trying to cheat our asylum system”
Migration Policy Centre (www.migrationpolicycentre.eu) 67
Source: Italian Ministry of Interior; EUROSTAT
Notes: In France and UK the country of birth criterion is adopted; data refer to 2011 for UK, 2009 for France, 2008 for Malta
and Lithuania, 2007 for Greece 2001 for Cyprus and Luxembourg.
Source: 6A and 7A Italian Ministry of Interior; 6B and 7B EUROSTAT
Fact no.4: A Mediterranean issue with roots far away from the Mediterranean
The nationalities of migrants smuggled across the Mediterranean are not predominantly Mediterranean
(figure 8). Except for the short-lived wave of Tunisian nationals in the first months of 2011, their main
countries of origin are far from the Mediterranean in Sub-Saharan Africa (Eritrea, Somalia, Nigeria, or
Central Africa) or in Asia (Afghanistan or Pakistan).
They come from countries that are either themselves subject to extreme political conditions
(absence of state, dictatorship, civil war, etc.) or neighbours of such countries (figure 9). In both cases,
persons willing to emigrate or those needing to find international protection may simply lack the
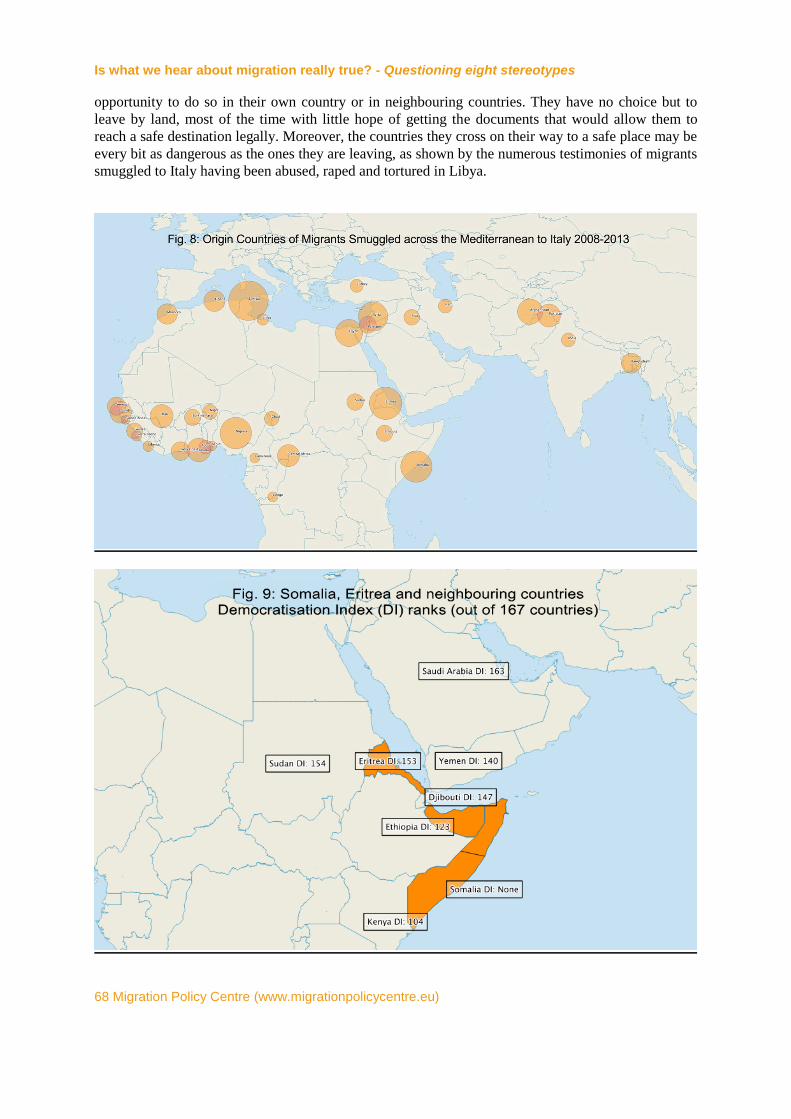
Is what we hear about migration really true? - Questioning eight stereotypes
68 Migration Policy Centre (www.migrationpolicycentre.eu)
opportunity to do so in their own country or in neighbouring countries. They have no choice but to
leave by land, most of the time with little hope of getting the documents that would allow them to
reach a safe destination legally. Moreover, the countries they cross on their way to a safe place may be
every bit as dangerous as the ones they are leaving, as shown by the numerous testimonies of migrants
smuggled to Italy having been abused, raped and tortured in Libya.
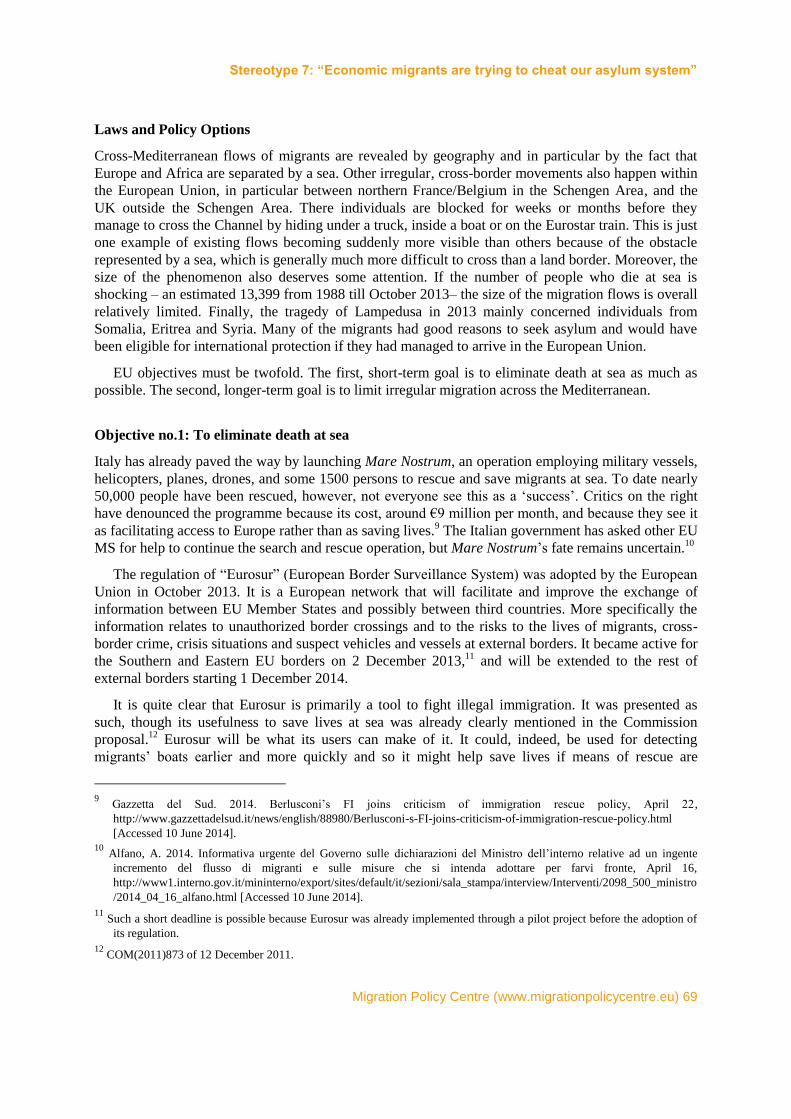
Stereotype 7: “Economic migrants are trying to cheat our asylum system”
Migration Policy Centre (www.migrationpolicycentre.eu) 69
Laws and Policy Options
Cross-Mediterranean flows of migrants are revealed by geography and in particular by the fact that
Europe and Africa are separated by a sea. Other irregular, cross-border movements also happen within
the European Union, in particular between northern France/Belgium in the Schengen Area, and the
UK outside the Schengen Area. There individuals are blocked for weeks or months before they
manage to cross the Channel by hiding under a truck, inside a boat or on the Eurostar train. This is just
one example of existing flows becoming suddenly more visible than others because of the obstacle
represented by a sea, which is generally much more difficult to cross than a land border. Moreover, the
size of the phenomenon also deserves some attention. If the number of people who die at sea is
shocking – an estimated 13,399 from 1988 till October 2013– the size of the migration flows is overall
relatively limited. Finally, the tragedy of Lampedusa in 2013 mainly concerned individuals from
Somalia, Eritrea and Syria. Many of the migrants had good reasons to seek asylum and would have
been eligible for international protection if they had managed to arrive in the European Union.
EU objectives must be twofold. The first, short-term goal is to eliminate death at sea as much as
possible. The second, longer-term goal is to limit irregular migration across the Mediterranean.
Objective no.1: To eliminate death at sea
Italy has already paved the way by launching Mare Nostrum, an operation employing military vessels,
helicopters, planes, drones, and some 1500 persons to rescue and save migrants at sea. To date nearly
50,000 people have been rescued, however, not everyone see this as a ‘success’. Critics on the right
have denounced the programme because its cost, around €9 million per month, and because they see it
as facilitating access to Europe rather than as saving lives.9 The Italian government has asked other EU
MS for help to continue the search and rescue operation, but Mare Nostrum’s fate remains uncertain.10
The regulation of “Eurosur” (European Border Surveillance System) was adopted by the European
Union in October 2013. It is a European network that will facilitate and improve the exchange of
information between EU Member States and possibly between third countries. More specifically the
information relates to unauthorized border crossings and to the risks to the lives of migrants, cross-
border crime, crisis situations and suspect vehicles and vessels at external borders. It became active for
the Southern and Eastern EU borders on 2 December 2013,11
and will be extended to the rest of
external borders starting 1 December 2014.
It is quite clear that Eurosur is primarily a tool to fight illegal immigration. It was presented as
such, though its usefulness to save lives at sea was already clearly mentioned in the Commission
proposal.12
Eurosur will be what its users can make of it. It could, indeed, be used for detecting
migrants’ boats earlier and more quickly and so it might help save lives if means of rescue are
9 Gazzetta del Sud. 2014. Berlusconi’s FI joins criticism of immigration rescue policy, April 22,
http://www.gazzettadelsud.it/news/english/88980/Berlusconi-s-FI-joins-criticism-of-immigration-rescue-policy.html
[Accessed 10 June 2014]. 10
Alfano, A. 2014. Informativa urgente del Governo sulle dichiarazioni del Ministro dell’interno relative ad un ingente
incremento del flusso di migranti e sulle misure che si intenda adottare per farvi fronte, April 16,
http://www1.interno.gov.it/mininterno/export/sites/default/it/sezioni/sala_stampa/interview/Interventi/2098_500_ministro
/2014_04_16_alfano.html [Accessed 10 June 2014].
11 Such a short deadline is possible because Eurosur was already implemented through a pilot project before the adoption of
its regulation.
12 COM(2011)873 of 12 December 2011.
Is what we hear about migration really true? - Questioning eight stereotypes
70 Migration Policy Centre (www.migrationpolicycentre.eu)
available. Eurosur raises then the questions of a) what to do with people that have been rescued and b)
how to determine where they should be disembarked.
Objective no.2: To limit irregular migration by sea
The recent tragedy at Lampedusa involved, for the most part, people coming from Somalia, Eritrea
and even Syria. Many from such countries have good reasons to seek asylum and would be eligible for
international protection if they managed to arrive in the European Union. Proposing to welcome them
through channels for legal migration is inappropriate. Most of these people are not ordinary migrants,
but genuine refugees. They should not have to ask to be admitted as a special favour: they have a right
to asylum, unless a safe third country can welcome them.
It is true that their hopes for applying for asylum in the European Union are rather limited.
European policies prioritising the fight against irregular migration and based on the requirement of
visas coupled with sanctions against carriers transporting persons without the required documents,
force most of them to use the routes used by irregular migrants. Europe should think of opening legal
channels for asylum that would be accessible to migrants faced with such obstacles. There is a real risk
that the Common European Asylum System that the EU is building will be unreachable for legitimate
asylum seekers from these countries, thereby preventing them from using legal channels to file their
claims. Several solutions can be envisaged.
The main one is resettlement of those persons from countries of first asylum where they have no
future or from transit countries where they cannot be protected as is the case, for instance, with Libya.
The European Union has started to experiment along these lines. Progress is nevertheless limited
because, as shown by a research project of the Migration Policy Centre,13
the number of EU resettling
Member States is rising, but the number of available places for resettlement is not increasing
proportionally. More can quite easily be done if the political will to do so really exists.
The second one is “Protected Entry procedures” (PEPs). This is the possibility of applying for a
special kind of visa that would better be named an “asylum visa”, rather than a humanitarian visa.
However, all previous attempts by EU Member States have been abandoned during the last decade.
Finally, one last solution is “Regional Protection Programmes” (RPPs). These are capacity building
programmes for third countries in order to enable these countries to welcome asylum seekers and to
provide them with asylum. They are sometimes considered as bad cases of burden shifting by the EU,
but there is nothing wrong in trying to increase the number of potential asylum countries in the world,
if the assistance provided is sufficient. Their main problem is that RPPs belong to the category of
long- rather than short-term solutions.
13
http://www.know-reset.eu/
Stereotype 8
“Our children suffer from having immigrants in class”
The reality is more complex: Performance levels depend more on the socio-
economic situation of the families than on the status of migrants as such.
While foreign-born children generally have lower performance levels than
natives, foreign-born parents catch up with their peers and perform at the
same level or even better, depending on the socioeconomic contexts and
countries of origin.
Text written by Sara Bonfanti and Anna Di Bartolomeo,
published as EUI/RSCAS Working Paper 2014/44

Stereotype 8: “Our children suffer from having immigrants in class”
Migration Policy Centre (www.migrationpolicycentre.eu) 73
In EU societies, the role that immigrants’ children play in the educational system is fiercely debated.
There exists a consensus that immigrants’ children show, on average, lower educational performances
than children of natives in all EU states, regardless of grade level, type of school, age, etc. This
awareness come out of scientific production over the last 20 years (see, for instance, Di Bartolomeo
2012; OECD 2006), which has been made possible thanks to the growing availability of quantitative
datasets that link migration background and educational performance.1
These findings have led to the perception that concentrations of immigrants’ children negatively
affect overall school educational performances. According to the European Social Survey, more than
three out of ten European citizens agree (or strongly agree) that immigrants “should be allowed to
educate their children in their own separate schools”. Above-average scores are found in Slovenia
(33.5%), Hungary (36.0%), France (37.7%) and the Czech Republic (41.7%), and even higher scores
in Ireland (47.0%), Portugal (54.5%) and Poland (70.0%).
These concerns have increasingly pushed natives to adopt a variety of measures to select more
homogeneous schools for their children in terms of the background of the student body. In France, a
study conducted in the city of Paris in 2003 found that 8% of parents – all belonging to middle/high
class – used a false address of residence, changed their residence, or enrolled in private schools to
escape the principe de sectorisation. This law was in force from 1963 to 2007. While it was initially
conceived as a planning instrument to manage educational resources in accordance with local
demographics, it led, ultimately, to an increase in local inequalities because of the overrepresentation
of immigrants in more deprived neighbourhoods and because of frequent attempts to get around the
system. Similar patterns have been observed in Germany and the UK. The highly differentiated
educational system of Germany tends to select students early on, on the basis of their curricula, age
and knowledge of the German language. Children are sent to different types of lower secondary
schools, all leading to different school-leaving qualifications: secondary modern schools
(Hauptschule); secondary schools leading to intermediate qualification (Realschule); grammar schools
(Gymnasium); or comprehensive schools (Gesamtschulen). Special schools (Förderschule or
Sonderschule), which address students with special learning needs, represent an additional option.
Language difficulties are the primary reason for which the children of immigrants are overrepresented
in Förderschule and Hauptschule schools and, thus, achieve lower qualifications. In the UK, 70% of
the people interviewed in a recent survey, which investigated the reasons why people chose to send
their children to private schools, declared that they did so because they wanted their children to attend
a school composed of pupils from a similar background and with similar aspirations. In securing for
their children a place in the “right” school, upper middle class parents increasingly cheat by feigning
religious observance, using a false address during the admission process or simply by moving home
(Becky and Hutchings 2013).
This note aims to disentangle the link between educational performance and migration background
and show how the reality is much more complex. Specifically, two questions are answered. First,
given that immigrants’ children represent a heterogeneous group in terms of parents’ origin, age at
arrival, etc., does a multicultural background bring any kind of advantage to school performance
compared with a “mono-cultural” one? Second, what is the effect of attending schools with a high
percentage of immigrants’ children in terms of average school performance, once controlled for school
socio-economic resources?
1 Some notable examples are: the Programme for International Student Assessment (PISA), developed by the Organisation
for Economic Co-operation and Development (OECD); the Trends in International Mathematics and Science Study
(TIMMS) and the Progress in International Reading Literacy Study (PIRLS), developed by the International Association
for the Evaluation of Educational Achievement (IEA).
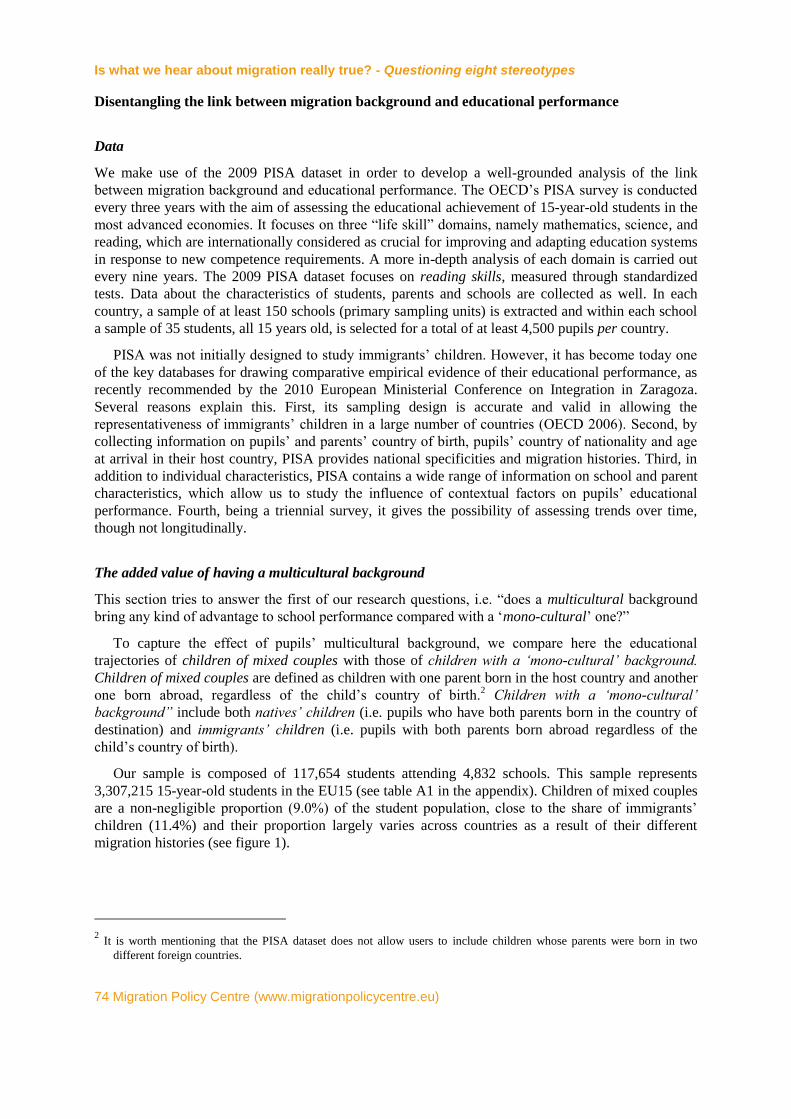
Is what we hear about migration really true? - Questioning eight stereotypes
74 Migration Policy Centre (www.migrationpolicycentre.eu)
Disentangling the link between migration background and educational performance
Data
We make use of the 2009 PISA dataset in order to develop a well-grounded analysis of the link
between migration background and educational performance. The OECD’s PISA survey is conducted
every three years with the aim of assessing the educational achievement of 15-year-old students in the
most advanced economies. It focuses on three “life skill” domains, namely mathematics, science, and
reading, which are internationally considered as crucial for improving and adapting education systems
in response to new competence requirements. A more in-depth analysis of each domain is carried out
every nine years. The 2009 PISA dataset focuses on reading skills, measured through standardized
tests. Data about the characteristics of students, parents and schools are collected as well. In each
country, a sample of at least 150 schools (primary sampling units) is extracted and within each school
a sample of 35 students, all 15 years old, is selected for a total of at least 4,500 pupils per country.
PISA was not initially designed to study immigrants’ children. However, it has become today one
of the key databases for drawing comparative empirical evidence of their educational performance, as
recently recommended by the 2010 European Ministerial Conference on Integration in Zaragoza.
Several reasons explain this. First, its sampling design is accurate and valid in allowing the
representativeness of immigrants’ children in a large number of countries (OECD 2006). Second, by
collecting information on pupils’ and parents’ country of birth, pupils’ country of nationality and age
at arrival in their host country, PISA provides national specificities and migration histories. Third, in
addition to individual characteristics, PISA contains a wide range of information on school and parent
characteristics, which allow us to study the influence of contextual factors on pupils’ educational
performance. Fourth, being a triennial survey, it gives the possibility of assessing trends over time,
though not longitudinally.
The added value of having a multicultural background
This section tries to answer the first of our research questions, i.e. “does a multicultural background
bring any kind of advantage to school performance compared with a ‘mono-cultural’ one?”
To capture the effect of pupils’ multicultural background, we compare here the educational
trajectories of children of mixed couples with those of children with a ‘mono-cultural’ background.
Children of mixed couples are defined as children with one parent born in the host country and another
one born abroad, regardless of the child’s country of birth.2 Children with a ‘mono-cultural’
background” include both natives’ children (i.e. pupils who have both parents born in the country of
destination) and immigrants’ children (i.e. pupils with both parents born abroad regardless of the
child’s country of birth).
Our sample is composed of 117,654 students attending 4,832 schools. This sample represents
3,307,215 15-year-old students in the EU15 (see table A1 in the appendix). Children of mixed couples
are a non-negligible proportion (9.0%) of the student population, close to the share of immigrants’
children (11.4%) and their proportion largely varies across countries as a result of their different
migration histories (see figure 1).
2 It is worth mentioning that the PISA dataset does not allow users to include children whose parents were born in two
different foreign countries.
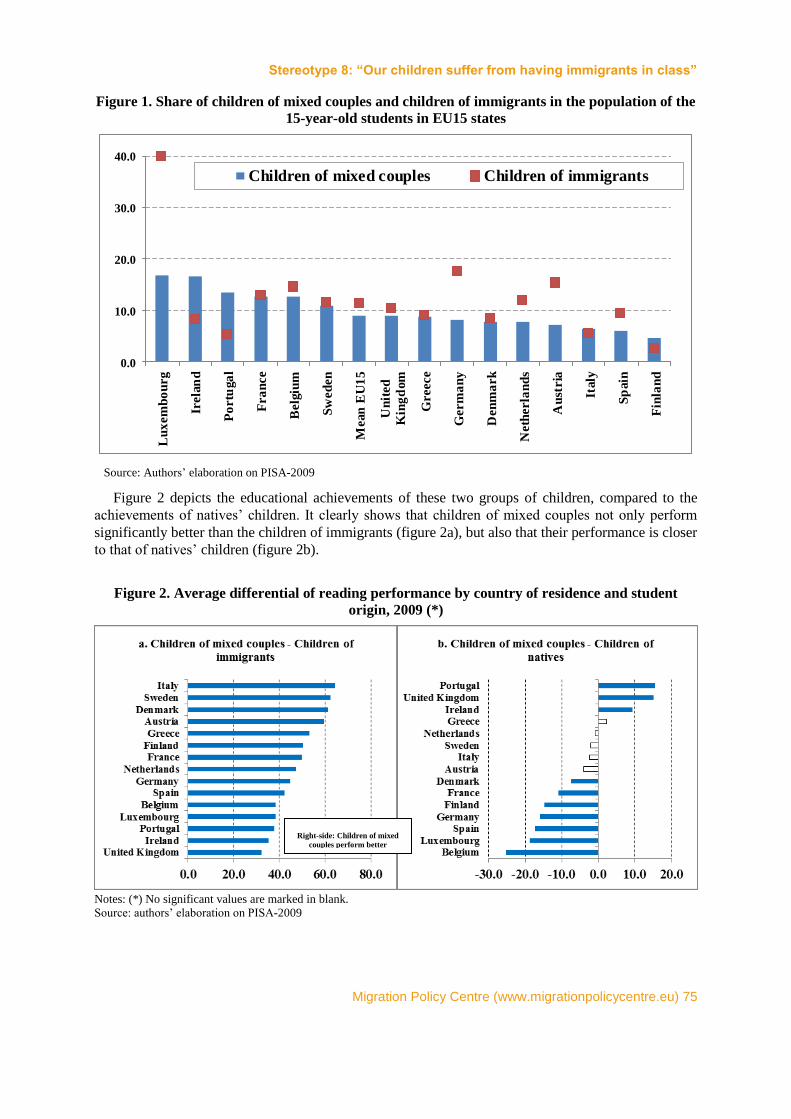
Stereotype 8: “Our children suffer from having immigrants in class”
Migration Policy Centre (www.migrationpolicycentre.eu) 75
Figure 1. Share of children of mixed couples and children of immigrants in the population of the
15-year-old students in EU15 states
Source: Authors’ elaboration on PISA-2009
Figure 2 depicts the educational achievements of these two groups of children, compared to the
achievements of natives’ children. It clearly shows that children of mixed couples not only perform
significantly better than the children of immigrants (figure 2a), but also that their performance is closer
to that of natives’ children (figure 2b).
Figure 2. Average differential of reading performance by country of residence and student
origin, 2009 (*)
Notes: (*) No significant values are marked in blank.
Source: authors’ elaboration on PISA-2009
Right-side: Children of mixed
couples perform better
0.0
10.0
20.0
30.0
40.0L
ux
em
bo
urg
Irela
nd
Po
rtu
ga
l
Fra
nce
Belg
ium
Sw
ed
en
Mean
EU
15
Un
ited
Kin
gd
om
Greece
Germ
an
y
Den
ma
rk
Neth
erla
nd
s
Au
stria
Italy
Sp
ain
Fin
lan
d
Children of mixed couples Children of immigrants
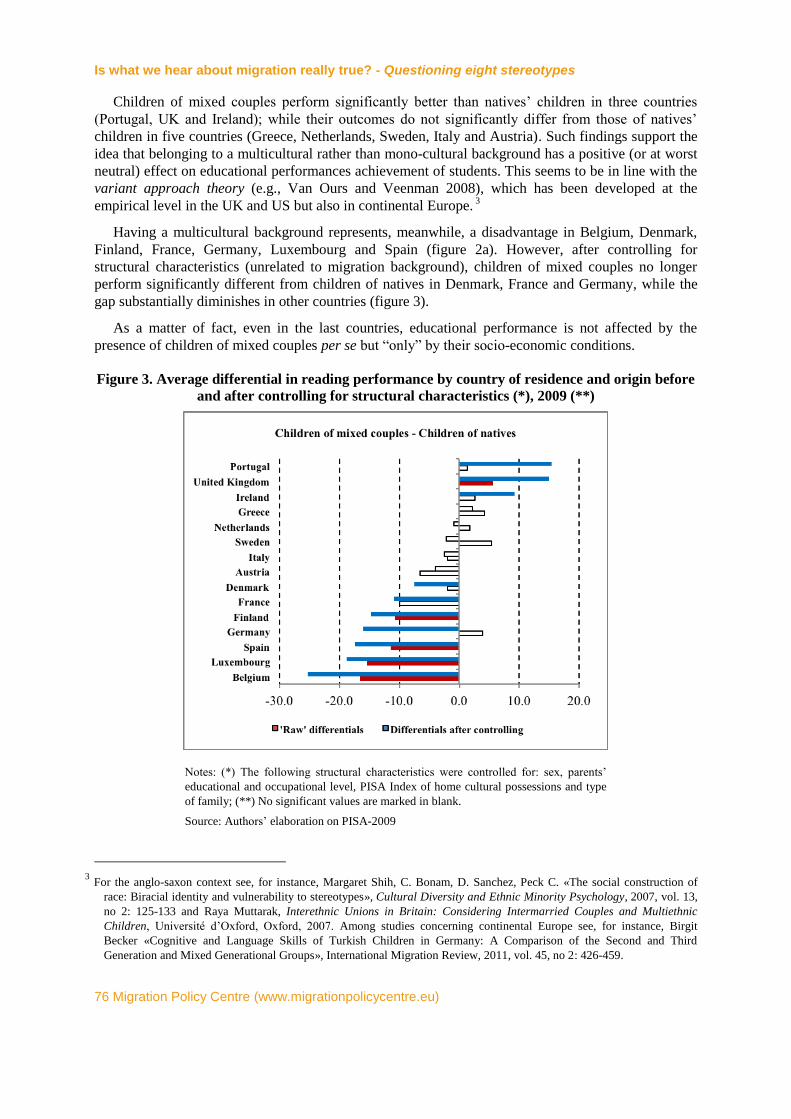
Is what we hear about migration really true? - Questioning eight stereotypes
76 Migration Policy Centre (www.migrationpolicycentre.eu)
Children of mixed couples perform significantly better than natives’ children in three countries
(Portugal, UK and Ireland); while their outcomes do not significantly differ from those of natives’
children in five countries (Greece, Netherlands, Sweden, Italy and Austria). Such findings support the
idea that belonging to a multicultural rather than mono-cultural background has a positive (or at worst
neutral) effect on educational performances achievement of students. This seems to be in line with the
variant approach theory (e.g., Van Ours and Veenman 2008), which has been developed at the
empirical level in the UK and US but also in continental Europe. 3
Having a multicultural background represents, meanwhile, a disadvantage in Belgium, Denmark,
Finland, France, Germany, Luxembourg and Spain (figure 2a). However, after controlling for
structural characteristics (unrelated to migration background), children of mixed couples no longer
perform significantly different from children of natives in Denmark, France and Germany, while the
gap substantially diminishes in other countries (figure 3).
As a matter of fact, even in the last countries, educational performance is not affected by the
presence of children of mixed couples per se but “only” by their socio-economic conditions.
Figure 3. Average differential in reading performance by country of residence and origin before
and after controlling for structural characteristics (*), 2009 (**)
Notes: (*) The following structural characteristics were controlled for: sex, parents’
educational and occupational level, PISA Index of home cultural possessions and type
of family; (**) No significant values are marked in blank.
Source: Authors’ elaboration on PISA-2009
3 For the anglo-saxon context see, for instance, Margaret Shih, C. Bonam, D. Sanchez, Peck C. «The social construction of
race: Biracial identity and vulnerability to stereotypes», Cultural Diversity and Ethnic Minority Psychology, 2007, vol. 13,
no 2: 125-133 and Raya Muttarak, Interethnic Unions in Britain: Considering Intermarried Couples and Multiethnic
Children, Université d’Oxford, Oxford, 2007. Among studies concerning continental Europe see, for instance, Birgit
Becker «Cognitive and Language Skills of Turkish Children in Germany: A Comparison of the Second and Third
Generation and Mixed Generational Groups», International Migration Review, 2011, vol. 45, no 2: 426-459.
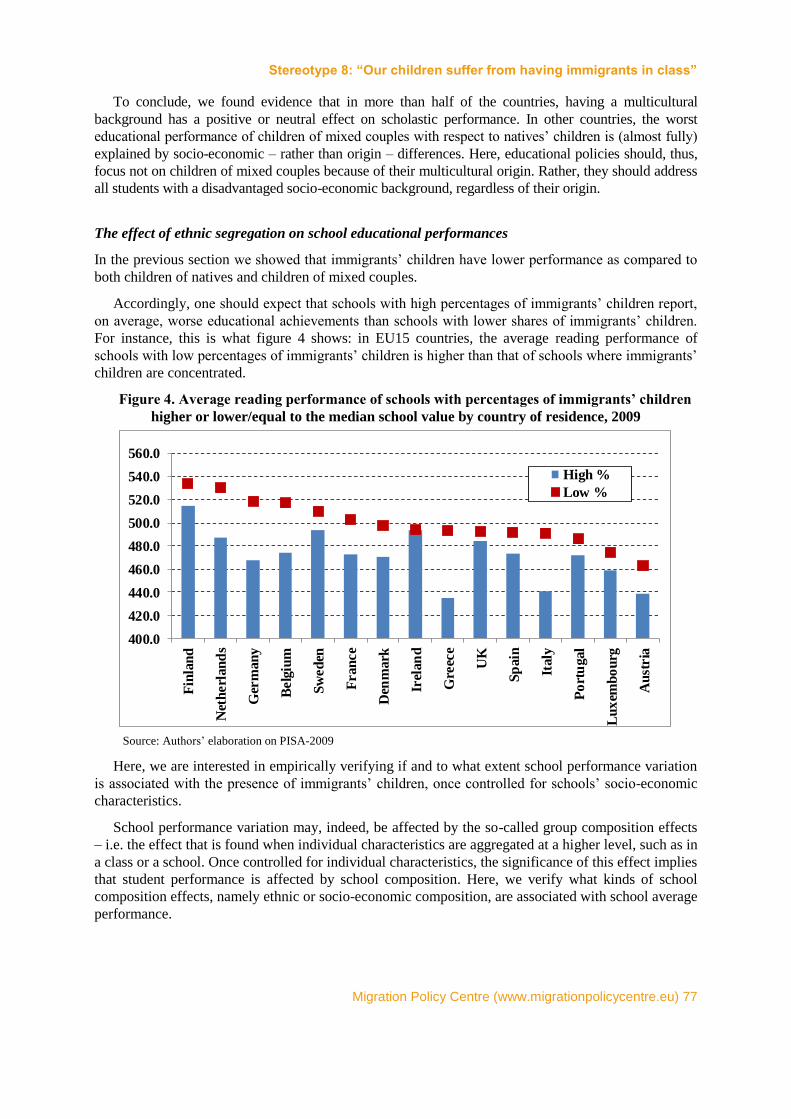
Stereotype 8: “Our children suffer from having immigrants in class”
Migration Policy Centre (www.migrationpolicycentre.eu) 77
To conclude, we found evidence that in more than half of the countries, having a multicultural
background has a positive or neutral effect on scholastic performance. In other countries, the worst
educational performance of children of mixed couples with respect to natives’ children is (almost fully)
explained by socio-economic – rather than origin – differences. Here, educational policies should, thus,
focus not on children of mixed couples because of their multicultural origin. Rather, they should address
all students with a disadvantaged socio-economic background, regardless of their origin.
The effect of ethnic segregation on school educational performances
In the previous section we showed that immigrants’ children have lower performance as compared to
both children of natives and children of mixed couples.
Accordingly, one should expect that schools with high percentages of immigrants’ children report,
on average, worse educational achievements than schools with lower shares of immigrants’ children.
For instance, this is what figure 4 shows: in EU15 countries, the average reading performance of
schools with low percentages of immigrants’ children is higher than that of schools where immigrants’
children are concentrated.
Figure 4. Average reading performance of schools with percentages of immigrants’ children
higher or lower/equal to the median school value by country of residence, 2009
400.0
420.0
440.0
460.0
480.0
500.0
520.0
540.0
560.0
Fin
lan
d
Net
herl
an
ds
Ger
man
y
Belg
ium
Sw
ed
en
Fran
ce
Den
mark
Irel
an
d
Gre
ece
UK
Sp
ain
Italy
Po
rtu
gal
Lu
xem
bo
urg
Au
stria
High %
Low %
Source: Authors’ elaboration on PISA-2009
Here, we are interested in empirically verifying if and to what extent school performance variation
is associated with the presence of immigrants’ children, once controlled for schools’ socio-economic
characteristics.
School performance variation may, indeed, be affected by the so-called group composition effects
– i.e. the effect that is found when individual characteristics are aggregated at a higher level, such as in
a class or a school. Once controlled for individual characteristics, the significance of this effect implies
that student performance is affected by school composition. Here, we verify what kinds of school
composition effects, namely ethnic or socio-economic composition, are associated with school average
performance.
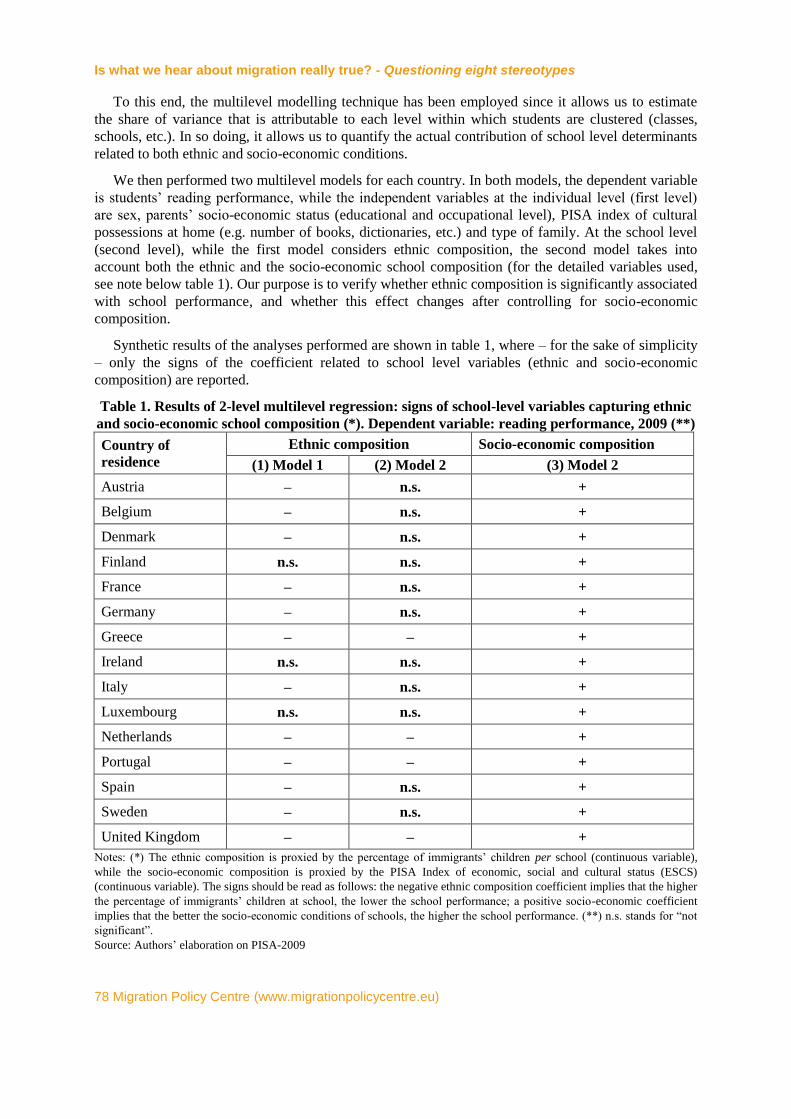
Is what we hear about migration really true? - Questioning eight stereotypes
78 Migration Policy Centre (www.migrationpolicycentre.eu)
To this end, the multilevel modelling technique has been employed since it allows us to estimate
the share of variance that is attributable to each level within which students are clustered (classes,
schools, etc.). In so doing, it allows us to quantify the actual contribution of school level determinants
related to both ethnic and socio-economic conditions.
We then performed two multilevel models for each country. In both models, the dependent variable
is students’ reading performance, while the independent variables at the individual level (first level)
are sex, parents’ socio-economic status (educational and occupational level), PISA index of cultural
possessions at home (e.g. number of books, dictionaries, etc.) and type of family. At the school level
(second level), while the first model considers ethnic composition, the second model takes into
account both the ethnic and the socio-economic school composition (for the detailed variables used,
see note below table 1). Our purpose is to verify whether ethnic composition is significantly associated
with school performance, and whether this effect changes after controlling for socio-economic
composition.
Synthetic results of the analyses performed are shown in table 1, where – for the sake of simplicity
– only the signs of the coefficient related to school level variables (ethnic and socio-economic
composition) are reported.
Table 1. Results of 2-level multilevel regression: signs of school-level variables capturing ethnic
and socio-economic school composition (*). Dependent variable: reading performance, 2009 (**)
Country of
residence
Ethnic composition Socio-economic composition
(1) Model 1 (2) Model 2 (3) Model 2
Austria – n.s. +
Belgium – n.s. +
Denmark – n.s. +
Finland n.s. n.s. +
France – n.s. +
Germany – n.s. +
Greece – – +
Ireland n.s. n.s. +
Italy – n.s. +
Luxembourg n.s. n.s. +
Netherlands – – +
Portugal – – +
Spain – n.s. +
Sweden – n.s. +
United Kingdom – – +
Notes: (*) The ethnic composition is proxied by the percentage of immigrants’ children per school (continuous variable),
while the socio-economic composition is proxied by the PISA Index of economic, social and cultural status (ESCS)
(continuous variable). The signs should be read as follows: the negative ethnic composition coefficient implies that the higher
the percentage of immigrants’ children at school, the lower the school performance; a positive socio-economic coefficient
implies that the better the socio-economic conditions of schools, the higher the school performance. (**) n.s. stands for “not
significant”.
Source: Authors’ elaboration on PISA-2009
Stereotype 8: “Our children suffer from having immigrants in class”
Migration Policy Centre (www.migrationpolicycentre.eu) 79
The group composition effect related to students’ ethnic background is significantly negative in the
vast majority of cases (column 1 – table 1), thus confirming that a concentration of pupils from a
migrant background is associated with lower scores in schools’ reading skills. However, once
controlled for schools’ socio-economic composition, the effect of the ethnic background becomes non-
significant for almost all countries (column 2 – table 1), while the socio-economic composition is
significantly correlated with reading performances everywhere (column 3 – table 1). This suggests that
the better the school socio-economic conditions, the higher the school performance in all countries.
Our results are in line with other studies performed at a national level with different datasets: see e.g.
Fekjaer and Birkelund (2007) on Norwegian upper secondary education; and Cebolla-Boado and
Medina (2011) on Spanish primary education. 4 Our analysis contributes to the previous literature as it
shows the effect of ethnic composition over countries when the same dataset and methodology is
applied to all countries.
Our findings, then, strongly suggest that a concentration of immigrants’ children in schools should
not be an issue of concern. Certainly, there is no evidence for a detrimental effect on student learning
in most OECD countries. What needs to be addressed by national policy-makers is the problem of a
deprived socio-economic background. It is this that seems to characterize most schools attended by
students from a migrant background.
4 Other studies have been conducted on French lower secondary school by Héctor Cebolla-Boado «Immigrant Concentration in
Schools: Peer Pressures in Place?» European Sociological Review, 2007, vol. 23, no. 3: 341-356 and on Swedish upper
secondary education by Lars Brannstrom «Making Their Mark: The Effects of Neighborhood and Upper Secondary School
on Educational Achievement», European Sociological Review, 2008, vol. 24, no. 4: 463-478.
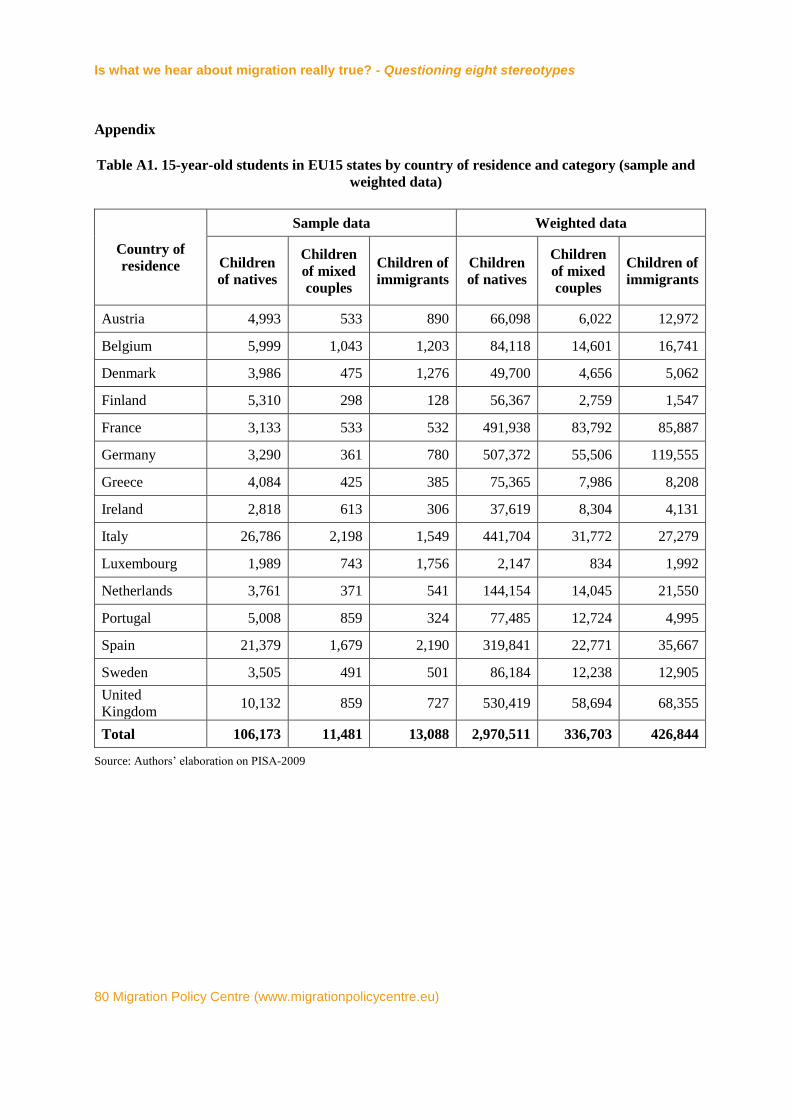
Is what we hear about migration really true? - Questioning eight stereotypes
80 Migration Policy Centre (www.migrationpolicycentre.eu)
Appendix
Table A1. 15-year-old students in EU15 states by country of residence and category (sample and
weighted data)
Country of
residence
Sample data Weighted data
Children
of natives
Children
of mixed
couples
Children of
immigrants
Children
of natives
Children
of mixed
couples
Children of
immigrants
Austria 4,993 533 890 66,098 6,022 12,972
Belgium 5,999 1,043 1,203 84,118 14,601 16,741
Denmark 3,986 475 1,276 49,700 4,656 5,062
Finland 5,310 298 128 56,367 2,759 1,547
France 3,133 533 532 491,938 83,792 85,887
Germany 3,290 361 780 507,372 55,506 119,555
Greece 4,084 425 385 75,365 7,986 8,208
Ireland 2,818 613 306 37,619 8,304 4,131
Italy 26,786 2,198 1,549 441,704 31,772 27,279
Luxembourg 1,989 743 1,756 2,147 834 1,992
Netherlands 3,761 371 541 144,154 14,045 21,550
Portugal 5,008 859 324 77,485 12,724 4,995
Spain 21,379 1,679 2,190 319,841 22,771 35,667
Sweden 3,505 491 501 86,184 12,238 12,905
United
Kingdom 10,132 859 727 530,419 58,694 68,355
Total 106,173 11,481 13,088 2,970,511 336,703 426,844
Source: Authors’ elaboration on PISA-2009
Stereotype 8: “Our children suffer from having immigrants in class”
Migration Policy Centre (www.migrationpolicycentre.eu) 81
References
Becky F., Hutchings M. (2013), Parent Power? Using money and information to boost children’s
chances of educational success, The Sutton Trust
Cebolla-Boado H., Garrido Medina L. (2011) The Impact of Immigrant Concentration in Spanish
Schools: School, Class, and Composition Effects, European Sociological Review, vol. 27, no. 5,
606 623
Di Bartolomeo A. (2012), The Educational Achievement of Immigrant Children: an International
Comparison, PhD Thesis in Demography, University of Rome Sapienza.
Fekjaer S.N., Birkelund G.E. (2007) Does the Ethnic Composition of Upper Secondary Schools
Influence Educational Achievement and Attainment? A Multilevel Analysis of the Norwegian
Case, European Sociological Review, vol. 23, no. 3, 309-323
OECD. (2006). Where immigrants succeed – A comparative review of performance and engagement
in PISA 2003, OECD-Paris.
Van Ours J.C., Veenman J. (2008). How interethnic marriages affect the educational attainment of
children: Evidence from a natural experiment, IZA DP No. 3308.


DOI 10.2870/11242
ISBN 978-92-9084-213-2
QM
-04-14-406-EN-N