2011 thompson henshilwood blombos taphonomy jhe
TRANSCRIPT

lable at ScienceDirect
Journal of Human Evolution 60 (2011) 746e767
Contents lists avai
Journal of Human Evolution
journal homepage: www.elsevier .com/locate/ jhevol
Taphonomic analysis of the Middle Stone Age larger mammal faunal assemblagefrom Blombos Cave, southern Cape, South Africa
Jessica C. Thompson a,*, Christopher S. Henshilwood b,c
a School of Social Science, Archaeology Program, The University of Queensland, Brisbane QLD 4072, Australiab Institute for Archaeology, History, Culture and Religion, University of Bergen, Norwayc Institute for Human Evolution, University of the Witwatersrand, Johannesburg, South Africa
a r t i c l e i n f o
Article history:Received 15 October 2009Accepted 13 January 2011
Keywords:ZooarchaeologyFaunal analysisBehavioural complexityWestern Cape
* Corresponding author.E-mail addresses: [email protected] (
[email protected] (C.S. Henshilwood).
0047-2484/$ e see front matter � 2011 Elsevier Ltd.doi:10.1016/j.jhevol.2011.01.013
a b s t r a c t
A detailed taphonomic analysis is reported for a sample of the larger mammalian faunal assemblage(>4.5 kg live body weight) from Blombos Cave. The analysis provides an assessment of humaninvolvement in the accumulation and modification of the faunal assemblage, and precedes equallydetailed analyses and separate reports of Middle Stone Age (MSA) butchery, transport, and huntingbehaviour. At Blombos, there are clear differences in the relative abundances of ungulate body sizeclasses, with the lower MSA phases (upper/lower M2 and M3) showing a high representation of size 1ungulates relative to the most recent MSA phase (M1). The bones from the earliest MSA phase (M3) havenot undergone much post-depositional fragmentation, in contrast to fragments from more recent phases(M1 and upper M2). Much of this variability can be attributed to more burning activity and tramplingduring M1 and upper M2, which could indicate more intensive occupation. Bone surfaces are variablypreserved, with high levels of exfoliation in the most recent two phases. Surface modification analysesrevealed high proportions of human modification throughout the sequence, indicating that MSA humanswere responsible for accumulating most of the larger mammals. After discard, the bones were modifiedby scavenging carnivores, leading to a moderate amount of density-mediated destruction and tooth-marking. Carnivores independently accumulated some of the smaller ungulates, mainly in the form ofpartially-digested remains. Raptorial birds are not implicated as major faunal accumulators. The resultsfrom Blombos are directly comparable with analogous datasets from two other sites in the Western Cape(Pinnacle Point Cave 13B and Die Kelders Cave 1). Such comparisons demonstrate that MSA faunalassemblages from nearby coastal sites have complex and different taphonomic histories both within andbetween sites. Because the human occupants were a major part of these processes, MSA subsistencebehaviour and site use was also quite variable over time and space.
� 2011 Elsevier Ltd. All rights reserved.
Introduction
The Middle Stone Age (MSA) in Africa started at or before ca.250 ka and in some regions continued until 30 ka (Deacon andDeacon, 1999; Stringer, 2002; McBrearty and Tryon, 2005; Tryonand McBrearty, 2006). Blombos Cave (BBC e Western Cape) hasplayed an important role in studies of the emergence of modernhumans by yielding abundant evidence for behavioural complexityfor some periods within the MSA. This evidence includes marine
J.C. Thompson), christopher.
All rights reserved.
shell beads, large quantities of worked ochre, engraved ochre pla-ques, formal and informal bone tools, and finely-flaked bifacialstone tools typical of the Still Bay industry (Henshilwood and Sealy,1997; d’Errico et al., 2001; Henshilwood et al., 2001a,b, 2002, 2004,2009; Henshilwood, 2009; Villa et al., 2009). Until the systematicexcavation and analyses of the MSA layers at Blombos commencedin 1992, (Henshilwood, 2008) such finds were rare in the MSA andpoorly-dated. New excavations at the South African site of Sibudu(KwaZulu-Natal) have produced bone tools, shell beads, andmarked artefacts in association with Still Bay points (Cain, 2004;Wadley, 2007; Backwell et al., 2008; d’Errico et al., 2008; Jacobset al., 2008). Also, a Still Bay component is present at DiepkloofRock Shelter on the Capewest coast (Rigaud et al., 2006), just belowyounger MSA layers bearing engraved ostrich eggshell (Texier et al.,
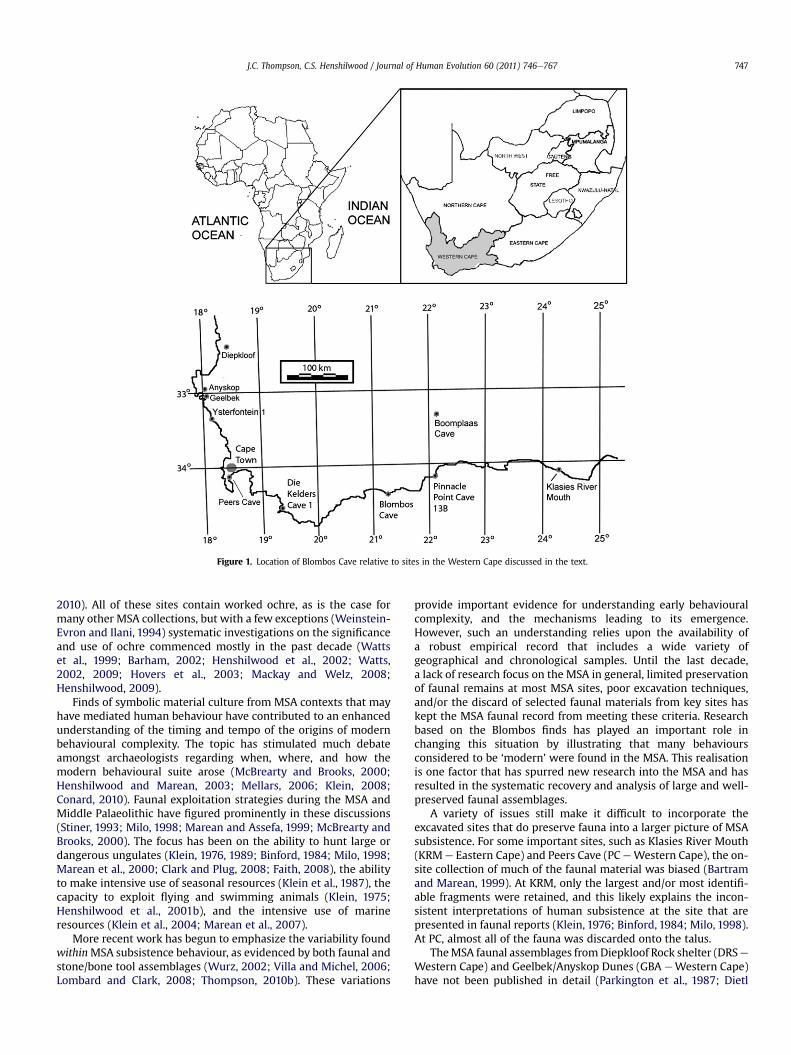
Figure 1. Location of Blombos Cave relative to sites in the Western Cape discussed in the text.
J.C. Thompson, C.S. Henshilwood / Journal of Human Evolution 60 (2011) 746e767 747
2010). All of these sites contain worked ochre, as is the case formany other MSA collections, but with a few exceptions (Weinstein-Evron and Ilani, 1994) systematic investigations on the significanceand use of ochre commenced mostly in the past decade (Wattset al., 1999; Barham, 2002; Henshilwood et al., 2002; Watts,2002, 2009; Hovers et al., 2003; Mackay and Welz, 2008;Henshilwood, 2009).
Finds of symbolic material culture from MSA contexts that mayhave mediated human behaviour have contributed to an enhancedunderstanding of the timing and tempo of the origins of modernbehavioural complexity. The topic has stimulated much debateamongst archaeologists regarding when, where, and how themodern behavioural suite arose (McBrearty and Brooks, 2000;Henshilwood and Marean, 2003; Mellars, 2006; Klein, 2008;Conard, 2010). Faunal exploitation strategies during the MSA andMiddle Palaeolithic have figured prominently in these discussions(Stiner, 1993; Milo, 1998; Marean and Assefa, 1999; McBrearty andBrooks, 2000). The focus has been on the ability to hunt large ordangerous ungulates (Klein, 1976, 1989; Binford, 1984; Milo, 1998;Marean et al., 2000; Clark and Plug, 2008; Faith, 2008), the abilityto make intensive use of seasonal resources (Klein et al., 1987), thecapacity to exploit flying and swimming animals (Klein, 1975;Henshilwood et al., 2001b), and the intensive use of marineresources (Klein et al., 2004; Marean et al., 2007).
More recent work has begun to emphasize the variability foundwithinMSA subsistence behaviour, as evidenced by both faunal andstone/bone tool assemblages (Wurz, 2002; Villa and Michel, 2006;Lombard and Clark, 2008; Thompson, 2010b). These variations
provide important evidence for understanding early behaviouralcomplexity, and the mechanisms leading to its emergence.However, such an understanding relies upon the availability ofa robust empirical record that includes a wide variety ofgeographical and chronological samples. Until the last decade,a lack of research focus on the MSA in general, limited preservationof faunal remains at most MSA sites, poor excavation techniques,and/or the discard of selected faunal materials from key sites haskept the MSA faunal record from meeting these criteria. Researchbased on the Blombos finds has played an important role inchanging this situation by illustrating that many behavioursconsidered to be ‘modern’ were found in the MSA. This realisationis one factor that has spurred new research into the MSA and hasresulted in the systematic recovery and analysis of large and well-preserved faunal assemblages.
A variety of issues still make it difficult to incorporate theexcavated sites that do preserve fauna into a larger picture of MSAsubsistence. For some important sites, such as Klasies River Mouth(KRM e Eastern Cape) and Peers Cave (PC eWestern Cape), the on-site collection of much of the faunal material was biased (Bartramand Marean, 1999). At KRM, only the largest and/or most identifi-able fragments were retained, and this likely explains the incon-sistent interpretations of human subsistence at the site that arepresented in faunal reports (Klein, 1976; Binford, 1984; Milo, 1998).At PC, almost all of the fauna was discarded onto the talus.
TheMSA faunal assemblages fromDiepkloof Rock shelter (DRSeWestern Cape) and Geelbek/Anyskop Dunes (GBA eWestern Cape)have not been published in detail (Parkington et al., 1987; Dietl
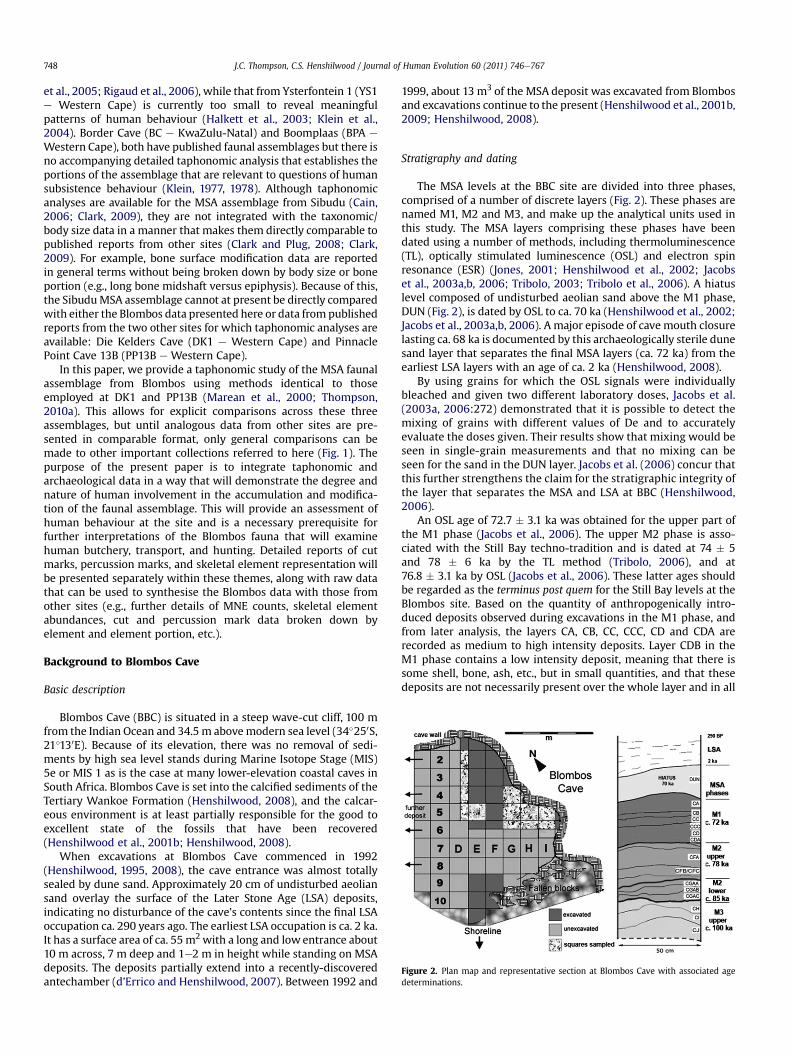
Figure 2. Plan map and representative section at Blombos Cave with associated agedeterminations.
J.C. Thompson, C.S. Henshilwood / Journal of Human Evolution 60 (2011) 746e767748
et al., 2005; Rigaud et al., 2006), while that from Ysterfontein 1 (YS1e Western Cape) is currently too small to reveal meaningfulpatterns of human behaviour (Halkett et al., 2003; Klein et al.,2004). Border Cave (BC e KwaZulu-Natal) and Boomplaas (BPA e
Western Cape), both have published faunal assemblages but there isno accompanying detailed taphonomic analysis that establishes theportions of the assemblage that are relevant to questions of humansubsistence behaviour (Klein, 1977, 1978). Although taphonomicanalyses are available for the MSA assemblage from Sibudu (Cain,2006; Clark, 2009), they are not integrated with the taxonomic/body size data in a manner that makes them directly comparable topublished reports from other sites (Clark and Plug, 2008; Clark,2009). For example, bone surface modification data are reportedin general terms without being broken down by body size or boneportion (e.g., long bone midshaft versus epiphysis). Because of this,the SibuduMSA assemblage cannot at present be directly comparedwith either the Blombos data presented here or data from publishedreports from the two other sites for which taphonomic analyses areavailable: Die Kelders Cave (DK1 e Western Cape) and PinnaclePoint Cave 13B (PP13B e Western Cape).
In this paper, we provide a taphonomic study of the MSA faunalassemblage from Blombos using methods identical to thoseemployed at DK1 and PP13B (Marean et al., 2000; Thompson,2010a). This allows for explicit comparisons across these threeassemblages, but until analogous data from other sites are pre-sented in comparable format, only general comparisons can bemade to other important collections referred to here (Fig. 1). Thepurpose of the present paper is to integrate taphonomic andarchaeological data in a way that will demonstrate the degree andnature of human involvement in the accumulation and modifica-tion of the faunal assemblage. This will provide an assessment ofhuman behaviour at the site and is a necessary prerequisite forfurther interpretations of the Blombos fauna that will examinehuman butchery, transport, and hunting. Detailed reports of cutmarks, percussion marks, and skeletal element representation willbe presented separately within these themes, along with raw datathat can be used to synthesise the Blombos data with those fromother sites (e.g., further details of MNE counts, skeletal elementabundances, cut and percussion mark data broken down byelement and element portion, etc.).
Background to Blombos Cave
Basic description
Blombos Cave (BBC) is situated in a steep wave-cut cliff, 100 mfrom the Indian Ocean and 34.5 m abovemodern sea level (34�250S,21�130E). Because of its elevation, there was no removal of sedi-ments by high sea level stands during Marine Isotope Stage (MIS)5e or MIS 1 as is the case at many lower-elevation coastal caves inSouth Africa. Blombos Cave is set into the calcified sediments of theTertiary Wankoe Formation (Henshilwood, 2008), and the calcar-eous environment is at least partially responsible for the good toexcellent state of the fossils that have been recovered(Henshilwood et al., 2001b; Henshilwood, 2008).
When excavations at Blombos Cave commenced in 1992(Henshilwood, 1995, 2008), the cave entrance was almost totallysealed by dune sand. Approximately 20 cm of undisturbed aeoliansand overlay the surface of the Later Stone Age (LSA) deposits,indicating no disturbance of the cave’s contents since the final LSAoccupation ca. 290 years ago. The earliest LSA occupation is ca. 2 ka.It has a surface area of ca. 55 m2with a long and low entrance about10 m across, 7 m deep and 1e2 m in height while standing on MSAdeposits. The deposits partially extend into a recently-discoveredantechamber (d’Errico and Henshilwood, 2007). Between 1992 and
1999, about 13 m3 of the MSA deposit was excavated from Blombosand excavations continue to the present (Henshilwood et al., 2001b,2009; Henshilwood, 2008).
Stratigraphy and dating
The MSA levels at the BBC site are divided into three phases,comprised of a number of discrete layers (Fig. 2). These phases arenamed M1, M2 and M3, and make up the analytical units used inthis study. The MSA layers comprising these phases have beendated using a number of methods, including thermoluminescence(TL), optically stimulated luminescence (OSL) and electron spinresonance (ESR) (Jones, 2001; Henshilwood et al., 2002; Jacobset al., 2003a,b, 2006; Tribolo, 2003; Tribolo et al., 2006). A hiatuslevel composed of undisturbed aeolian sand above the M1 phase,DUN (Fig. 2), is dated by OSL to ca. 70 ka (Henshilwood et al., 2002;Jacobs et al., 2003a,b, 2006). A major episode of cave mouth closurelasting ca. 68 ka is documented by this archaeologically sterile dunesand layer that separates the final MSA layers (ca. 72 ka) from theearliest LSA layers with an age of ca. 2 ka (Henshilwood, 2008).
By using grains for which the OSL signals were individuallybleached and given two different laboratory doses, Jacobs et al.(2003a, 2006:272) demonstrated that it is possible to detect themixing of grains with different values of De and to accuratelyevaluate the doses given. Their results show that mixing would beseen in single-grain measurements and that no mixing can beseen for the sand in the DUN layer. Jacobs et al. (2006) concur thatthis further strengthens the claim for the stratigraphic integrity ofthe layer that separates the MSA and LSA at BBC (Henshilwood,2006).
An OSL age of 72.7 � 3.1 ka was obtained for the upper part ofthe M1 phase (Jacobs et al., 2006). The upper M2 phase is asso-ciated with the Still Bay techno-tradition and is dated at 74 � 5and 78 � 6 ka by the TL method (Tribolo, 2006), and at76.8 � 3.1 ka by OSL (Jacobs et al., 2006). These latter ages shouldbe regarded as the terminus post quem for the Still Bay levels at theBlombos site. Based on the quantity of anthropogenically intro-duced deposits observed during excavations in the M1 phase, andfrom later analysis, the layers CA, CB, CC, CCC, CD and CDA arerecorded as medium to high intensity deposits. Layer CDB in theM1 phase contains a low intensity deposit, meaning that there issome shell, bone, ash, etc., but in small quantities, and that thesedeposits are not necessarily present over the whole layer and in all
J.C. Thompson, C.S. Henshilwood / Journal of Human Evolution 60 (2011) 746e767 749
quadrates. In the upper M2 phase (Still Bay), the intensity of theanthropogenic deposits in CFB/CFC and CFD are listed as mediumto high and CFA as a low intensity unit.
In the lower M2 phase layers, CGAA, CGAB, CGAB h1, CGAC arelisted as low intensity deposits. The lower M2 phase layers have anOSL age of 84.6� 5.8 ka (Jacobs et al., 2006). Only the upper level ofthe M3 phase has been dated and produced an OSL age of98.9 � 5.5 ka for the CH, CI and possibly CJ layers (Jacobs et al.,2006). Layer CH is a low intensity deposit, and CI and CJ are highintensity deposits. The ages of the lower layers within theM3 phaseare currently being determined.
Material culture: M1 and upper M2 phases
These phases at Blombos Cave contain high densities of bifacialpoints, the fossil directeur of the Still Bay techno-tradition. Most aremade on fine grained silcrete (Henshilwood et al., 2001b; Villaet al., 2009). A strong argument for early behavioural modernityin the MSA is the discovery of more than 65 shell beads in the M1phase, 41 of which have been described (Henshilwood et al., 2004;d’Errico et al., 2005). All of the beads are made from the shell of themarine gastropod, Nassarius kraussianus, carefully pierced usinga bone tool then strung, perhaps on cord or sinew, and worn asa personal ornament. More than 2000 pieces of ochre, manybearing signs of utilisation and including eight deliberatelyengraved pieces, have been recovered from the M1 and upper M2phases (Henshilwood et al., 2001b; Watts, 2009). The engravedpieces show that the designs result from deliberate intent andarguably are among the most complex and clearly-formed ofobjects claimed to be early abstract representations (Henshilwoodet al., 2002; d’Errico et al., 2003; Henshilwood, 2009; Texier et al.,2010).
More than forty formal bone artefacts have been recovered fromthe M1 and upper M2 phases, including awls and ‘points’(Henshilwood and Sealy, 1997; Henshilwood et al., 2001a; d’Erricoand Henshilwood, 2007). The majority are awls made on longbone shaft fragments, further manufactured by scraping and thenused to pierce soft material such as leather. At least some of the bonetools that were carefully polished after being shaped by scraping areprobably projectile points made for hafting. It is noteworthy that thepoints are treated differently from the awls. The high polish on thesepoints has no apparent functional reason that can be detected butseems rather a technique that gives a distinctive appearance e an
Table 1Minimum and maximum ages of sediments and NISP from analytical units used in the BBin Jacobs et al. (2003a,b, 2006).
MIS Min age(ka)
Max age(ka)
Large mammalNISP
Blombos phase orchronological event
1 0.3 2 N/A Later Stone Age Presen
4 70 72 N/A Sealing of MSA occupationlayers by dune e hiatus
N/A
5a/4 69.6 75.8 3879 M1 phase (Still Bay) e highdensity occupation
Abundmore
5a 73.7 78 2047 M2 (upper) phase (Still Bay) ehigh densityoccupation
Abundengra
5b 85a 85a 419 M2 (lower) phase e low densityoccupation
Presen
5c 100a 100a 1256 M3 phase e high densityoccupation
Very aengra
a OSL age is approximate (further OSL ages are expected).
“added value” e to these artefacts (d’Errico and Henshilwood,2007).
Material culture: lower M2 phase
Bone tools, bifacial points and shell beads are absent from thelower M2 phase. The intensity of the cultural deposits is low in thisphase but includes a few basin hearths, a very large hearth in layerCGAC, small quantities of blades, flakes and cores in silcrete, quartzand quartzite, and some small pieces of ochre. A detailed analysis ofthese artefacts is currently underway and the overall impression isthat human occupations in the M2 phase were of short durationand possibly that the size of the groups was also limited.
Material culture: M3 phase
In this lower phase, lithics are frequent and exotic fine grainedmaterials were commonly brought to the site for knapping. Retouchon the M3 lithics is mostly informal, and a higher incidence ofventral flaking and denticulate or notched edges distinguish theretouched lithics in M3 from those in the upper phases. Preliminaryfindings indicate that the lithics in M3 do not conform to the typicalMSA I or MSA II patterns observed at the Klasies River site (Soressi,pers. comm.).
Ochre is abundant in this phase and eight of these slabs aredeliberately engraved with either cross-hatched, Y-shaped orcrenulated designs (Henshilwood et al., 2001b, 2009; Watts, 2009).This indicates a tradition for the production of geometric engravedrepresentation in the MSA at Blombos with roots that go back intime to at least 100 ka, and which includes the production ofa number of different patterns. The findings support the view thatthe use of ochre during theMSA at Blombos was not only functionalbut that it also served, perhaps primarily, in a symbolic role(Henshilwood, 2009). The chronological and material cultureassociations of the phases at Blombos are summarised in Table 1.
General resource availability
Along the Southern Cape, coast fresh water springs arenumerous and emanate at the interface of the Table MountainGroup sandstones and the upper tidal reaches. These perennialsprings are fed by deep inland aquifers in the Bredasdorp Groupand provide, apart from occasional rivers, one of the few
C faunal analysis. Ages and stratigraphic assignments are summarised from OSL data
Cultural materials recovered
Ochre Bone tools Lithic tools Other
t Present Abundant OES beads, bonebeads, shellpendants, pottery
N/A N/A N/A
ant (relativelyengraved)
Relativelyabundant
Still Bay bifacialpoints, scrapers anddebris relatively abundant
Nassariuskraussianus shellbeads
ant (someved)
Relativelyabundant
Bifacial points,particularly near top ofphase
Few beads
t None Present None of note here
bundant (someved)
None Specialised MSA lithicassemblage with small blades
None of note here
J.C. Thompson, C.S. Henshilwood / Journal of Human Evolution 60 (2011) 746e767750
dependable sources of water on the coastal plain between the CapeFolded Belt mountains and the Indian Ocean (Henshilwood, 2008).Even during wet conditions, it is likely that these springs werea major attractant for MSA people and for animals.
The faunal collection from Blombos is varied, which suggeststhat MSA people may have practiced a subsistence strategy thatincluded a broad range of animals (Henshilwood et al., 2001b). Thismust be confirmed by taphonomic analyses of the small mammaland tortoise components of the assemblage that are currentlyunderway. Shellfish were collected and brought back to the caveduring all of the occupation phases, and the M3 phase is a partic-ularly rich shell midden. The shellfish species present in the MSAlevels are similar to those from the LSA. Fish bones have beenrecovered in all phases and are under study. It has been argued thatprior to ca. 50 ka, MSA people were unable to exploit coastalresources effectively (Klein et al., 2004) but this seems not to havebeen the case at Blombos.
Palaeoclimatic context: Southern Cape and Blombos Cave
Overview
A bimodal or year-round rainfall system in the Quaternarysuggests that the southern Cape region was wetter than the morewestern areas (Barrable et al., 2002), but was sensitive to changes inthe convergence of the Agulhas and Benguela currents from theIndian and Atlantic Oceans, respectively. Upwellings on the adja-cent shallow Agulhas plateau, sea level changes, and variability inwind directions are likely to have influencedmoisture supply to thecoastal areas of the southern Cape during the MSA (Bateman et al.,2004). This would have also affected the species of fish and shellfishthat are adapted to specific biomes. Climatic conditions during theearly and middle parts of MIS 5a (ca. 85e72 ka) (Butzer, 2004) insouthern Africa are likely to have beenmild and warmwith initiallywetter conditions before moving into the relatively cooler MIS 4(van Andel, 1989; Chase, 2010). MIS 5a broadly correlates with theM1 and upper M2 phase at Blombos, with the terminal Still Bay atthe top of M1 corresponding to the advent of MIS 4. The M3 phaseat Blombos corresponds with MIS 5c and marks a period of rela-tively warm conditions with sea levels possibly similar to those atpresent.
There is a higher density of known MSA archaeological siteswith long sequences that date to MIS 5 in the Southern Cape (e.g.,Klasies River, Boomplaas, Blombos Cave, Die Kelders, Pinnacle Point13B, and Nelson Bay) compared with the few sites in the south-western Cape (e.g., Peers Cave), which suggests that humans chosethe former area because it supported a higher biomass and offeredgreater subsistence opportunities (Deacon and Lancaster, 1988;Bateman et al., 2004; Butzer, 2004).
M1 phase (MIS 5a/4)
Cooler, perhaps drier conditions are indicated by an increase ingrazing animals at this time (Chase and Meadows, 2007). Grazerssuch as black wildebeest (Connochaetes gnou) and/or hartebeest(Alcelaphus buselaphus) are found in the M1 phase and suggest thatgrassy conditions had replaced the bushier elements that typifiedthe vegetation during the M2 phase (Henshilwood et al., 2001b).However, a recent palaeoclimatic synthesis by Chase (2010)suggests that the conditions at this time may have actually beenmore moist in southern Africa than has previously been inferredfrom extra-regional records. This highlights the conclusionsreached by Chase (2010) and Jacobs et al. (2008) that detailed localpalaeoclimatic records paired with more refined site chronologiesare still necessary to understand the complex relationships
between local and regional scale environmental change, and theimpacts of this change on human behaviour as reflected in thearchaeological record.
A relatively low shellfish density of 17.5 kg/m3 in the M1 phasesupports the contention of a retreating sea (Henshilwood et al.,2001b). The final stages of the M1 phase occupation fall withinthe MIS 5/4a boundary and are dated to ca. 72 ka years ago.Bateman et al. (2004) describes this as the start of the periodleading towards the Last Glacial Maximum with stadials ofincreasing intensity and brief interstadials. In this terminal phase,climatic conditions were likely also becoming colder and wetterregionally with fluctuating sea levels (Chase, 2010). From condi-tions that were relatively benign at ca. 76 ka years ago, it seems thatthe colder, perhaps locally drier conditions and falling sea levelswould have impacted on the hunter gatherer fishers that occupiedBlombos Cave in the terminal Still Bay. Deposition of the sterilehiatus dune directly above the final Still Bay, dated to ca. 70 ka,further supports the model for dune accretion suggested byBateman et al. (2004) and provides important data on the deteri-orating palaeoenvironment during the M1 final phase ofoccupation.
M2 phase (MIS 5b/a)
The early and middle parts of MIS 5b (ca. 95e85 ka) thatcoincide with the lower M2 phase at Blombos are characterisedby interstadial conditions with rising sea levels after ca. 86 kayears ago that persisted until ca. 74e70 ka years ago (Butzer,2004). A transgression of sea levels from �60 m in MIS 5bto �20 to �30 m in MIS 5a is reported globally (Lambeck et al.,2002). Near the modern village of Still Bay, the presence of ca.90 ka fossilized footprints of the elephant (Loxodonta africana)indicate higher precipitation levels than at present with wood-lands that may have extended close to this region during theearly stages of 5a (Roberts et al., 2008). The presence of thecommon duiker (Sylvicapra grimmia) in the upper M2 phase atBlombos supports a bushy environment. The water-dependentsouthern reedbuck (Redunca arundinum) provides a further indi-cator for relatively wet conditions during this M2 phase(Henshilwood et al., 2001b).
Shellfish data from the upper M2 phase support the contentionof a relatively higher sea level at this time. Shellfish collecting atBlombos was relatively intense in the upper M2 phase with 31.8 kgof marine shells being recovered from each cubic metre excavated(Henshilwood et al., 2001b). Low numbers of shellfish are presentin some layers in the lower M2 phase. Easy access to shellfish,a sessile protein, and fish during MIS 5 b/a could have served todraw hunter gatherer fishers to the Southern Cape coast.
M3 phase (MIS 5c)
This was a period of sea level fluctuation in the southern Cape(Carr et al., 2006) but between 109 and 98 ka, sea levels wererelatively high (Butzer, 2004) and possibly not less than 20m belowpresent (Lambeck et al., 2002). The possibility of a more than 4 msea level during MIS 5c in the southern Cape is also reported(Ramsay, 2002). Overall conditions were likely cool and dry but notcold until after 100 ka (Shackleton et al., 1984; van Andel,1989). Thehigh concentration of shellfish in the Blombos upper M3 phase(layers CH, CI), dated at ca. 100 ka, supports the proposition forrelatively higher sea levels and the shellfish species present in theselayers are indicative of warmer sea surface temperatures(Henshilwood et al., 2001b).
In summary, the excavated occupation horizons at Blombospost-date the severe climate and accentuated drop in sea levels
J.C. Thompson, C.S. Henshilwood / Journal of Human Evolution 60 (2011) 746e767 751
during MIS 6, and appear to be concentrated at times whenmarine resources were readily available (Henshilwood et al.,2001b; Jacobs et al., 2006; Henshilwood, 2008). The faunalassemblage from Blombos provides an opportunity for a detailedexamination of human subsistence strategies during the relativelywarmer periods of MIS 5c/b leading into the more severe MIS 5a/4.It also offers the chance to examine these strategies in tandemwith the substantial changes in technology and the materialexpression of symbolism that have been documented at the site,particularly between the oldest M3 phase and the overlying StillBay phases of M1 and upper M2.
Materials and methods
The faunal assemblage reported here consists of all of the largermammal postcranial fragments (>4.5 kg live weight) from the2000, 2002, and 2004 excavation seasons that exceed 2 mm in themaximum dimension. The sample includes all of the piece-plottedspecimens and specimens that have been recovered from thescreens, although unmodified faunal specimens were onlyroutinely piece-plotted in the 2002 and 2004 excavations. Thestudy does not include pieces of trabecular bone, bits of corticalbone with no evidence of having a medullary cavity or havingotherwise come from a long bone, or fragments of cortical bonewith no facets, diagnostic shape, or muscle markings that couldindicate even an approximate location in the skeleton. The analysedassemblage does include less identifiable fragments such as longbone shaft fragments and long bone flakes. All specimens meetingthe above criteria were cleaned with fresh water and given indi-vidual numbers for a total Number of Identified Specimens (NISP)of 3879 from the M1 phase, 2047 from the upper M2 phase, 419from the lower M2 phase, and 1256 from the M3 phase. Theseinclude fragments not identifiable to specific body size.
All data collection was conducted at Iziko: South AfricanMuseums of Cape Town. Each numbered specimen was entered asan individual record into a customized Microsoft Access database.Attributes such as element, side, taxon, and body size were enteredalong with macroscopically visible taphonomic attributes such asfragmentation (Villa and Mahieu, 1991) and burning (used here interms of present/absent and based on basic colour changes, such ascarbonization or calcination). Each specimen was then examinedunder a 10e40� binocular zoom light microscope for more subtletaphonomic indicators, such as weathering (Behrensmeyer, 1978),rodent gnawing, and post-depositional surface destruction(Thompson, 2005). Tooth, percussion, and cut marks were identi-fied using the criteria established from modern experimentalcollections (Blumenschine et al., 1996), and for which analystaccuracy has been verified by blind tests on specimens modified byknown agents. These data were collected during the publication ofarguments regarding how to distinguish between carnivore toothmarks, geochemical etching, and bioerosion (Dominguez-Rodrigoand Barba, 2006, 2007; Blumenschine et al., 2007). Althoughcertain kinds of bioerosion can mimic tooth marks (particularlyroot and fungus etchings), the Blombos assemblage only sufferedfrom one major morphological type of surface destruction (exfoli-ation). This, combined with the analyst’s experience in identifyinginstances of bioerosion on fossil assemblages (Thompson, 2005),and the fact that we only present high-confidence marks of anykind here, renders the chances of misidentification on the Blombosassemblage to be very low.
Each fragment that could be identified to element and confi-dently placed on a template of that element was drawn into a GISimage-analysis program developed by Marean et al. (2001), andlinked by specimen number to the external database. Where frag-ments could be identified to element and positioned on a template
but not sided (as was most often the case with metapodial frag-ments), specimens were drawn on alternate left and right sidetemplates (Thompson, 2008). The minimum number of elements(MNE) was estimated from these GIS images on the principle ofoverlaps: where two fragments overlap on a given element theycannot be from the same element (Marean et al., 2001). Thisprovides a way to rapidly and effectively estimate MNE values fromany given subset of data without manually revisiting the collection,but as with any method of estimating MNE values, it may miss anoverlap or indicate a very slight overlap (in terms of pixels) wherethere is not one (Lyman, 2008). However, these errors are small andunsystematic, and all of the images produced by the programweremanually inspected for areas where the MNE value may have beeninflated in this way. The smallest number of definite overlaps wasthe one recorded as the MNE.
More details on skeletal element abundances by both NISP andMNE will be presented separately, in a paper that deals specificallywith the issue of skeletal part transport. Here, all fragment countsand bone counts are reported in terms of NISP and theMNE data areused only for quantitative evaluation of density-mediated attrition.This was done by examining bone portion representation relative tofive long bone zones: two epiphyses, two near-epiphysis shafts(defined as a length of shaft with any trabecular bone on theinterior), and one midshaft (Abe et al., 2002). The area representedwithin each zone was calculated and multiplied by its MNE value,then added to obtain the total area count (in pixels) within thatzone (Thompson, 2008; Thompson and Marean, 2009). Theproportion of the total area that fell within the five zones was thenexpressed as a percentage and input as the y-axis into a regressionanalysis with density as the x-axis.
Density values were taken from computed tomography (CT)scans of a goat (Capra hircus) skeleton (Lam et al., 1998). Whendealing with an assemblage where nearly 98% of the fragmentsidentifiable to family or below are bovids (as at Blombos), andwhere therefore the majority of generic ungulate fragments alsolikely derive from bovids, the most accurate bovid values werepreferred. The sheep skeleton values are likely more accuratebecause the density values were obtained by scanning the speci-mens in water rather than an alternate method used for wildungulates (Lam et al., 1999), where bones were scanned while dryand then density values were calculated using a regression.Spearman’s Rho was then applied to the bone mineral densityvalues versus bone portion representation as calculated by theimage-analysis program. This nonparametric test is less susceptibleto small sample sizes and influence by outlying points, and the factthat the rank order of density values per scan site are tightlycorrelated even across a wide variety of taxa further ensures thatthe application of the sheep data to wild ungulates from Blombos isnot problematic (Lam et al., 1999; Carlson and Pickering, 2004).Finally, because this test is based on rank ordering, inequalities inthe distribution of pixels across the different long bone zones willhave less influence on the resultant correlations.
Four other statistical tests were employed in this analysis. A Chi-squared test was used to examine the likelihood of independencebetween two nominal or ordinal variables (e.g., body size andanalytical unit). Fisher’s Exact Test was used on two-way tables ofdata where small sample sizes made a chi-squared test inappro-priate. This provided a way to assess if a given proportion of data inone analytical unit was statistically different from the proportion ofdata in another analytical unit. The 95% confidence limits weredetermined usingWald’s adjustedmethod (Agresti and Coull,1998)for proportional data for which large numbers of analytical unitsrequired comparison (e.g., proportion of fracture angles that areright or proportion of shaft fragments bearing a percussion mark).Where these confidence intervals overlapped, two proportions
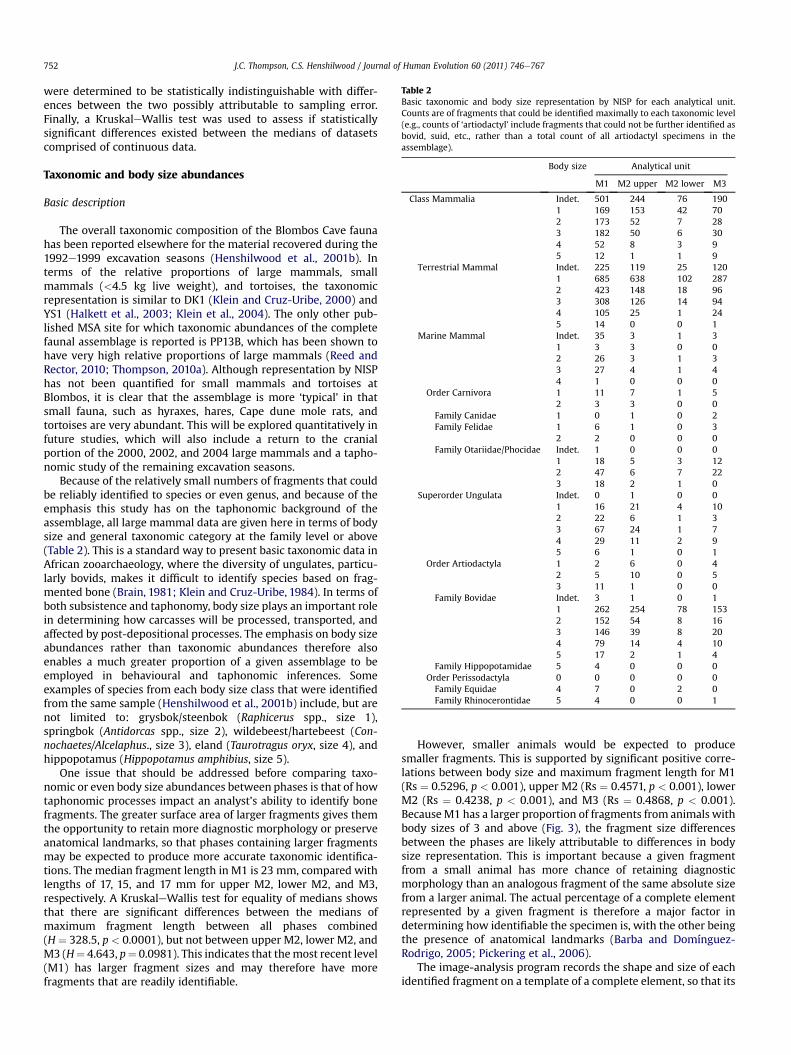
Table 2Basic taxonomic and body size representation by NISP for each analytical unit.Counts are of fragments that could be identified maximally to each taxonomic level(e.g., counts of ‘artiodactyl’ include fragments that could not be further identified asbovid, suid, etc., rather than a total count of all artiodactyl specimens in theassemblage).
Body size Analytical unit
M1 M2 upper M2 lower M3
Class Mammalia Indet. 501 244 76 1901 169 153 42 702 173 52 7 283 182 50 6 304 52 8 3 95 12 1 1 9
Terrestrial Mammal Indet. 225 119 25 1201 685 638 102 2872 423 148 18 963 308 126 14 944 105 25 1 245 14 0 0 1
Marine Mammal Indet. 35 3 1 31 3 3 0 02 26 3 1 33 27 4 1 44 1 0 0 0
Order Carnivora 1 11 7 1 52 3 3 0 0
Family Canidae 1 0 1 0 2Family Felidae 1 6 1 0 3
2 2 0 0 0Family Otariidae/Phocidae Indet. 1 0 0 0
1 18 5 3 122 47 6 7 223 18 2 1 0
Superorder Ungulata Indet. 0 1 0 01 16 21 4 102 22 6 1 33 67 24 1 74 29 11 2 95 6 1 0 1
Order Artiodactyla 1 2 6 0 42 5 10 0 53 11 1 0 0
Family Bovidae Indet. 3 1 0 11 262 254 78 1532 152 54 8 163 146 39 8 204 79 14 4 105 17 2 1 4
Family Hippopotamidae 5 4 0 0 0Order Perissodactyla 0 0 0 0 0Family Equidae 4 7 0 2 0Family Rhinocerontidae 5 4 0 0 1
J.C. Thompson, C.S. Henshilwood / Journal of Human Evolution 60 (2011) 746e767752
were determined to be statistically indistinguishable with differ-ences between the two possibly attributable to sampling error.Finally, a KruskaleWallis test was used to assess if statisticallysignificant differences existed between the medians of datasetscomprised of continuous data.
Taxonomic and body size abundances
Basic description
The overall taxonomic composition of the Blombos Cave faunahas been reported elsewhere for the material recovered during the1992e1999 excavation seasons (Henshilwood et al., 2001b). Interms of the relative proportions of large mammals, smallmammals (<4.5 kg live weight), and tortoises, the taxonomicrepresentation is similar to DK1 (Klein and Cruz-Uribe, 2000) andYS1 (Halkett et al., 2003; Klein et al., 2004). The only other pub-lished MSA site for which taxonomic abundances of the completefaunal assemblage is reported is PP13B, which has been shown tohave very high relative proportions of large mammals (Reed andRector, 2010; Thompson, 2010a). Although representation by NISPhas not been quantified for small mammals and tortoises atBlombos, it is clear that the assemblage is more ‘typical’ in thatsmall fauna, such as hyraxes, hares, Cape dune mole rats, andtortoises are very abundant. This will be explored quantitatively infuture studies, which will also include a return to the cranialportion of the 2000, 2002, and 2004 large mammals and a tapho-nomic study of the remaining excavation seasons.
Because of the relatively small numbers of fragments that couldbe reliably identified to species or even genus, and because of theemphasis this study has on the taphonomic background of theassemblage, all large mammal data are given here in terms of bodysize and general taxonomic category at the family level or above(Table 2). This is a standard way to present basic taxonomic data inAfrican zooarchaeology, where the diversity of ungulates, particu-larly bovids, makes it difficult to identify species based on frag-mented bone (Brain, 1981; Klein and Cruz-Uribe, 1984). In terms ofboth subsistence and taphonomy, body size plays an important rolein determining how carcasses will be processed, transported, andaffected by post-depositional processes. The emphasis on body sizeabundances rather than taxonomic abundances therefore alsoenables a much greater proportion of a given assemblage to beemployed in behavioural and taphonomic inferences. Someexamples of species from each body size class that were identifiedfrom the same sample (Henshilwood et al., 2001b) include, but arenot limited to: grysbok/steenbok (Raphicerus spp., size 1),springbok (Antidorcas spp., size 2), wildebeest/hartebeest (Con-nochaetes/Alcelaphus., size 3), eland (Taurotragus oryx, size 4), andhippopotamus (Hippopotamus amphibius, size 5).
One issue that should be addressed before comparing taxo-nomic or even body size abundances between phases is that of howtaphonomic processes impact an analyst’s ability to identify bonefragments. The greater surface area of larger fragments gives themthe opportunity to retain more diagnostic morphology or preserveanatomical landmarks, so that phases containing larger fragmentsmay be expected to produce more accurate taxonomic identifica-tions. The median fragment length in M1 is 23 mm, compared withlengths of 17, 15, and 17 mm for upper M2, lower M2, and M3,respectively. A KruskaleWallis test for equality of medians showsthat there are significant differences between the medians ofmaximum fragment length between all phases combined(H ¼ 328.5, p < 0.0001), but not between upper M2, lower M2, andM3 (H¼ 4.643, p¼ 0.0981). This indicates that themost recent level(M1) has larger fragment sizes and may therefore have morefragments that are readily identifiable.
However, smaller animals would be expected to producesmaller fragments. This is supported by significant positive corre-lations between body size and maximum fragment length for M1(Rs ¼ 0.5296, p < 0.001), upper M2 (Rs ¼ 0.4571, p < 0.001), lowerM2 (Rs ¼ 0.4238, p < 0.001), and M3 (Rs ¼ 0.4868, p < 0.001).BecauseM1 has a larger proportion of fragments from animals withbody sizes of 3 and above (Fig. 3), the fragment size differencesbetween the phases are likely attributable to differences in bodysize representation. This is important because a given fragmentfrom a small animal has more chance of retaining diagnosticmorphology than an analogous fragment of the same absolute sizefrom a larger animal. The actual percentage of a complete elementrepresented by a given fragment is therefore a major factor indetermining how identifiable the specimen is, with the other beingthe presence of anatomical landmarks (Barba and Domínguez-Rodrigo, 2005; Pickering et al., 2006).
The image-analysis program records the shape and size of eachidentified fragment on a template of a complete element, so that its
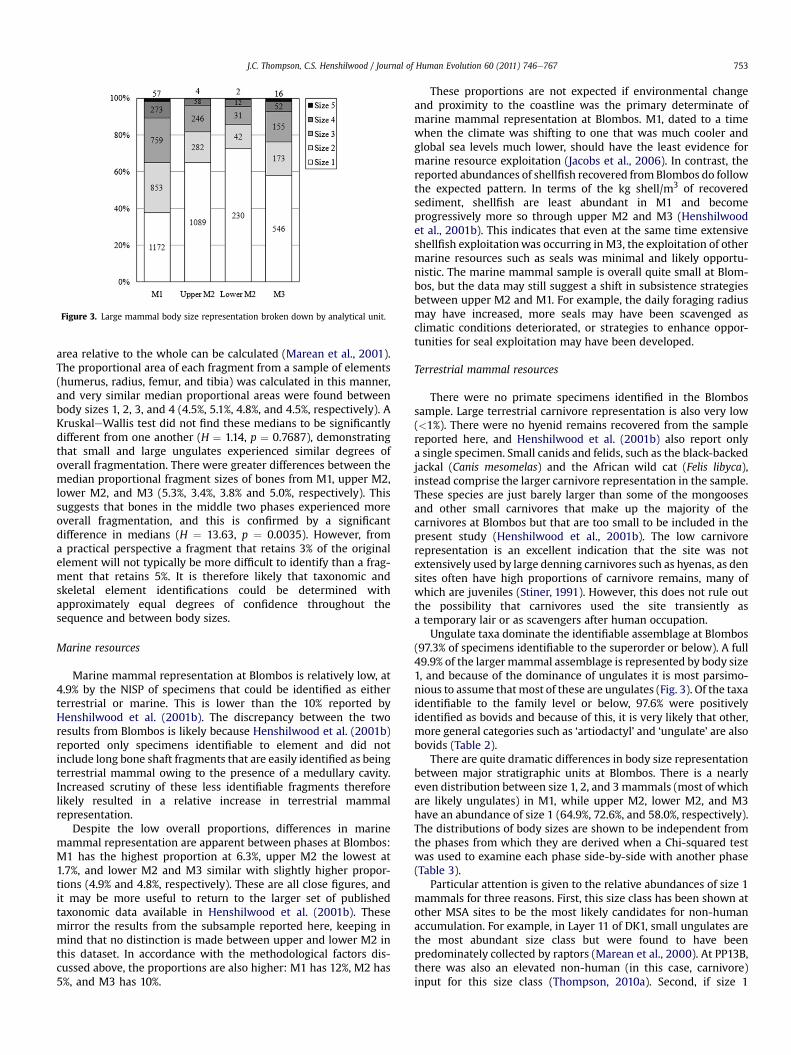
Figure 3. Large mammal body size representation broken down by analytical unit.
J.C. Thompson, C.S. Henshilwood / Journal of Human Evolution 60 (2011) 746e767 753
area relative to the whole can be calculated (Marean et al., 2001).The proportional area of each fragment from a sample of elements(humerus, radius, femur, and tibia) was calculated in this manner,and very similar median proportional areas were found betweenbody sizes 1, 2, 3, and 4 (4.5%, 5.1%, 4.8%, and 4.5%, respectively). AKruskaleWallis test did not find these medians to be significantlydifferent from one another (H ¼ 1.14, p ¼ 0.7687), demonstratingthat small and large ungulates experienced similar degrees ofoverall fragmentation. There were greater differences between themedian proportional fragment sizes of bones from M1, upper M2,lower M2, and M3 (5.3%, 3.4%, 3.8% and 5.0%, respectively). Thissuggests that bones in the middle two phases experienced moreoverall fragmentation, and this is confirmed by a significantdifference in medians (H ¼ 13.63, p ¼ 0.0035). However, froma practical perspective a fragment that retains 3% of the originalelement will not typically be more difficult to identify than a frag-ment that retains 5%. It is therefore likely that taxonomic andskeletal element identifications could be determined withapproximately equal degrees of confidence throughout thesequence and between body sizes.
Marine resources
Marine mammal representation at Blombos is relatively low, at4.9% by the NISP of specimens that could be identified as eitherterrestrial or marine. This is lower than the 10% reported byHenshilwood et al. (2001b). The discrepancy between the tworesults from Blombos is likely because Henshilwood et al. (2001b)reported only specimens identifiable to element and did notinclude long bone shaft fragments that are easily identified as beingterrestrial mammal owing to the presence of a medullary cavity.Increased scrutiny of these less identifiable fragments thereforelikely resulted in a relative increase in terrestrial mammalrepresentation.
Despite the low overall proportions, differences in marinemammal representation are apparent between phases at Blombos:M1 has the highest proportion at 6.3%, upper M2 the lowest at1.7%, and lower M2 and M3 similar with slightly higher propor-tions (4.9% and 4.8%, respectively). These are all close figures, andit may be more useful to return to the larger set of publishedtaxonomic data available in Henshilwood et al. (2001b). Thesemirror the results from the subsample reported here, keeping inmind that no distinction is made between upper and lower M2 inthis dataset. In accordance with the methodological factors dis-cussed above, the proportions are also higher: M1 has 12%, M2 has5%, and M3 has 10%.
These proportions are not expected if environmental changeand proximity to the coastline was the primary determinate ofmarine mammal representation at Blombos. M1, dated to a timewhen the climate was shifting to one that was much cooler andglobal sea levels much lower, should have the least evidence formarine resource exploitation (Jacobs et al., 2006). In contrast, thereported abundances of shellfish recovered from Blombos do followthe expected pattern. In terms of the kg shell/m3 of recoveredsediment, shellfish are least abundant in M1 and becomeprogressively more so through upper M2 and M3 (Henshilwoodet al., 2001b). This indicates that even at the same time extensiveshellfish exploitationwas occurring in M3, the exploitation of othermarine resources such as seals was minimal and likely opportu-nistic. The marine mammal sample is overall quite small at Blom-bos, but the data may still suggest a shift in subsistence strategiesbetween upper M2 and M1. For example, the daily foraging radiusmay have increased, more seals may have been scavenged asclimatic conditions deteriorated, or strategies to enhance oppor-tunities for seal exploitation may have been developed.
Terrestrial mammal resources
There were no primate specimens identified in the Blombossample. Large terrestrial carnivore representation is also very low(<1%). There were no hyenid remains recovered from the samplereported here, and Henshilwood et al. (2001b) also report onlya single specimen. Small canids and felids, such as the black-backedjackal (Canis mesomelas) and the African wild cat (Felis libyca),instead comprise the larger carnivore representation in the sample.These species are just barely larger than some of the mongoosesand other small carnivores that make up the majority of thecarnivores at Blombos but that are too small to be included in thepresent study (Henshilwood et al., 2001b). The low carnivorerepresentation is an excellent indication that the site was notextensively used by large denning carnivores such as hyenas, as densites often have high proportions of carnivore remains, many ofwhich are juveniles (Stiner, 1991). However, this does not rule outthe possibility that carnivores used the site transiently asa temporary lair or as scavengers after human occupation.
Ungulate taxa dominate the identifiable assemblage at Blombos(97.3% of specimens identifiable to the superorder or below). A full49.9% of the larger mammal assemblage is represented by body size1, and because of the dominance of ungulates it is most parsimo-nious to assume thatmost of these are ungulates (Fig. 3). Of the taxaidentifiable to the family level or below, 97.6% were positivelyidentified as bovids and because of this, it is very likely that other,more general categories such as ‘artiodactyl’ and ‘ungulate’ are alsobovids (Table 2).
There are quite dramatic differences in body size representationbetween major stratigraphic units at Blombos. There is a nearlyeven distribution between size 1, 2, and 3 mammals (most of whichare likely ungulates) in M1, while upper M2, lower M2, and M3have an abundance of size 1 (64.9%, 72.6%, and 58.0%, respectively).The distributions of body sizes are shown to be independent fromthe phases from which they are derived when a Chi-squared testwas used to examine each phase side-by-side with another phase(Table 3).
Particular attention is given to the relative abundances of size 1mammals for three reasons. First, this size class has been shown atother MSA sites to be the most likely candidates for non-humanaccumulation. For example, in Layer 11 of DK1, small ungulates arethe most abundant size class but were found to have beenpredominately collected by raptors (Marean et al., 2000). At PP13B,there was also an elevated non-human (in this case, carnivore)input for this size class (Thompson, 2010a). Second, if size 1
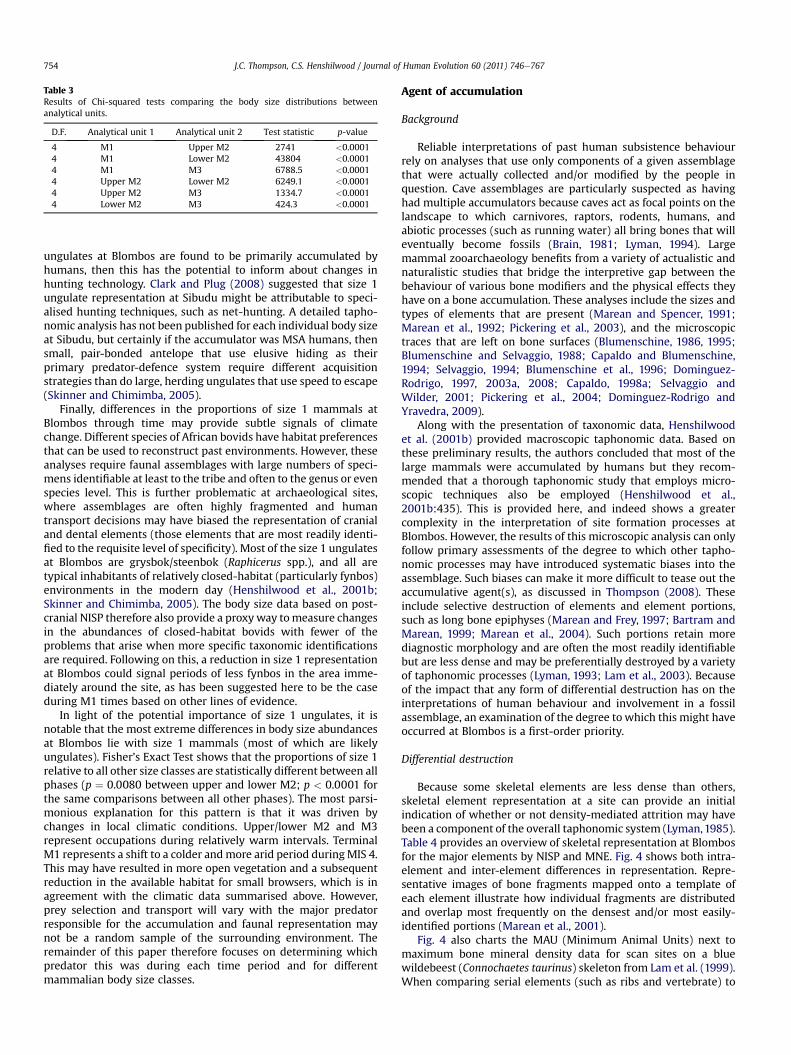
Table 3Results of Chi-squared tests comparing the body size distributions betweenanalytical units.
D.F. Analytical unit 1 Analytical unit 2 Test statistic p-value
4 M1 Upper M2 2741 <0.00014 M1 Lower M2 43804 <0.00014 M1 M3 6788.5 <0.00014 Upper M2 Lower M2 6249.1 <0.00014 Upper M2 M3 1334.7 <0.00014 Lower M2 M3 424.3 <0.0001
J.C. Thompson, C.S. Henshilwood / Journal of Human Evolution 60 (2011) 746e767754
ungulates at Blombos are found to be primarily accumulated byhumans, then this has the potential to inform about changes inhunting technology. Clark and Plug (2008) suggested that size 1ungulate representation at Sibudu might be attributable to speci-alised hunting techniques, such as net-hunting. A detailed tapho-nomic analysis has not been published for each individual body sizeat Sibudu, but certainly if the accumulator was MSA humans, thensmall, pair-bonded antelope that use elusive hiding as theirprimary predator-defence system require different acquisitionstrategies than do large, herding ungulates that use speed to escape(Skinner and Chimimba, 2005).
Finally, differences in the proportions of size 1 mammals atBlombos through time may provide subtle signals of climatechange. Different species of African bovids have habitat preferencesthat can be used to reconstruct past environments. However, theseanalyses require faunal assemblages with large numbers of speci-mens identifiable at least to the tribe and often to the genus or evenspecies level. This is further problematic at archaeological sites,where assemblages are often highly fragmented and humantransport decisions may have biased the representation of cranialand dental elements (those elements that are most readily identi-fied to the requisite level of specificity). Most of the size 1 ungulatesat Blombos are grysbok/steenbok (Raphicerus spp.), and all aretypical inhabitants of relatively closed-habitat (particularly fynbos)environments in the modern day (Henshilwood et al., 2001b;Skinner and Chimimba, 2005). The body size data based on post-cranial NISP therefore also provide a proxy way tomeasure changesin the abundances of closed-habitat bovids with fewer of theproblems that arise when more specific taxonomic identificationsare required. Following on this, a reduction in size 1 representationat Blombos could signal periods of less fynbos in the area imme-diately around the site, as has been suggested here to be the caseduring M1 times based on other lines of evidence.
In light of the potential importance of size 1 ungulates, it isnotable that the most extreme differences in body size abundancesat Blombos lie with size 1 mammals (most of which are likelyungulates). Fisher’s Exact Test shows that the proportions of size 1relative to all other size classes are statistically different between allphases (p ¼ 0.0080 between upper and lower M2; p < 0.0001 forthe same comparisons between all other phases). The most parsi-monious explanation for this pattern is that it was driven bychanges in local climatic conditions. Upper/lower M2 and M3represent occupations during relatively warm intervals. TerminalM1 represents a shift to a colder andmore arid period duringMIS 4.This may have resulted in more open vegetation and a subsequentreduction in the available habitat for small browsers, which is inagreement with the climatic data summarised above. However,prey selection and transport will vary with the major predatorresponsible for the accumulation and faunal representation maynot be a random sample of the surrounding environment. Theremainder of this paper therefore focuses on determining whichpredator this was during each time period and for differentmammalian body size classes.
Agent of accumulation
Background
Reliable interpretations of past human subsistence behaviourrely on analyses that use only components of a given assemblagethat were actually collected and/or modified by the people inquestion. Cave assemblages are particularly suspected as havinghad multiple accumulators because caves act as focal points on thelandscape to which carnivores, raptors, rodents, humans, andabiotic processes (such as running water) all bring bones that willeventually become fossils (Brain, 1981; Lyman, 1994). Largemammal zooarchaeology benefits from a variety of actualistic andnaturalistic studies that bridge the interpretive gap between thebehaviour of various bone modifiers and the physical effects theyhave on a bone accumulation. These analyses include the sizes andtypes of elements that are present (Marean and Spencer, 1991;Marean et al., 1992; Pickering et al., 2003), and the microscopictraces that are left on bone surfaces (Blumenschine, 1986, 1995;Blumenschine and Selvaggio, 1988; Capaldo and Blumenschine,1994; Selvaggio, 1994; Blumenschine et al., 1996; Dominguez-Rodrigo, 1997, 2003a, 2008; Capaldo, 1998a; Selvaggio andWilder, 2001; Pickering et al., 2004; Dominguez-Rodrigo andYravedra, 2009).
Along with the presentation of taxonomic data, Henshilwoodet al. (2001b) provided macroscopic taphonomic data. Based onthese preliminary results, the authors concluded that most of thelarge mammals were accumulated by humans but they recom-mended that a thorough taphonomic study that employs micro-scopic techniques also be employed (Henshilwood et al.,2001b:435). This is provided here, and indeed shows a greatercomplexity in the interpretation of site formation processes atBlombos. However, the results of this microscopic analysis can onlyfollow primary assessments of the degree to which other tapho-nomic processes may have introduced systematic biases into theassemblage. Such biases can make it more difficult to tease out theaccumulative agent(s), as discussed in Thompson (2008). Theseinclude selective destruction of elements and element portions,such as long bone epiphyses (Marean and Frey, 1997; Bartram andMarean, 1999; Marean et al., 2004). Such portions retain morediagnostic morphology and are often the most readily identifiablebut are less dense and may be preferentially destroyed by a varietyof taphonomic processes (Lyman, 1993; Lam et al., 2003). Becauseof the impact that any form of differential destruction has on theinterpretations of human behaviour and involvement in a fossilassemblage, an examination of the degree to which this might haveoccurred at Blombos is a first-order priority.
Differential destruction
Because some skeletal elements are less dense than others,skeletal element representation at a site can provide an initialindication of whether or not density-mediated attrition may havebeen a component of the overall taphonomic system (Lyman,1985).Table 4 provides an overview of skeletal representation at Blombosfor the major elements by NISP and MNE. Fig. 4 shows both intra-element and inter-element differences in representation. Repre-sentative images of bone fragments mapped onto a template ofeach element illustrate how individual fragments are distributedand overlap most frequently on the densest and/or most easily-identified portions (Marean et al., 2001).
Fig. 4 also charts the MAU (Minimum Animal Units) next tomaximum bone mineral density data for scan sites on a bluewildebeest (Connochaetes taurinus) skeleton from Lam et al. (1999).When comparing serial elements (such as ribs and vertebrate) to
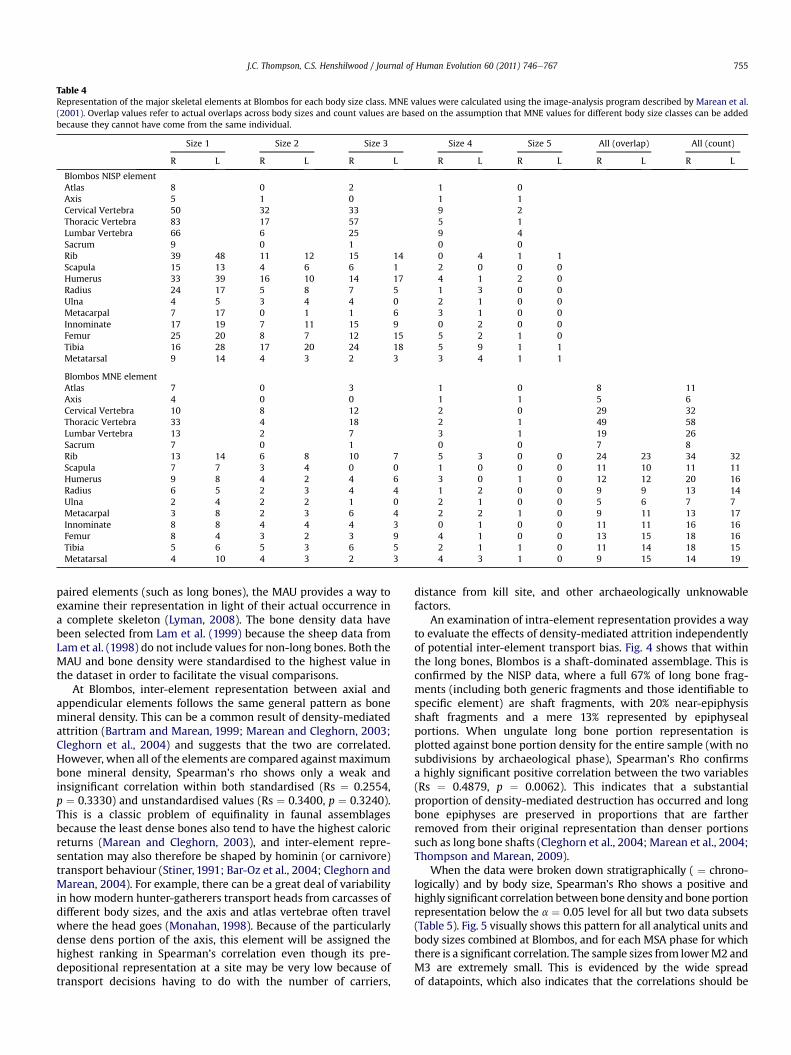
Table 4Representation of the major skeletal elements at Blombos for each body size class. MNE values were calculated using the image-analysis program described by Marean et al.(2001). Overlap values refer to actual overlaps across body sizes and count values are based on the assumption that MNE values for different body size classes can be addedbecause they cannot have come from the same individual.
Size 1 Size 2 Size 3 Size 4 Size 5 All (overlap) All (count)
R L R L R L R L R L R L R L
Blombos NISP elementAtlas 8 0 2 1 0Axis 5 1 0 1 1Cervical Vertebra 50 32 33 9 2Thoracic Vertebra 83 17 57 5 1Lumbar Vertebra 66 6 25 9 4Sacrum 9 0 1 0 0Rib 39 48 11 12 15 14 0 4 1 1Scapula 15 13 4 6 6 1 2 0 0 0Humerus 33 39 16 10 14 17 4 1 2 0Radius 24 17 5 8 7 5 1 3 0 0Ulna 4 5 3 4 4 0 2 1 0 0Metacarpal 7 17 0 1 1 6 3 1 0 0Innominate 17 19 7 11 15 9 0 2 0 0Femur 25 20 8 7 12 15 5 2 1 0Tibia 16 28 17 20 24 18 5 9 1 1Metatarsal 9 14 4 3 2 3 3 4 1 1
Blombos MNE elementAtlas 7 0 3 1 0 8 11Axis 4 0 0 1 1 5 6Cervical Vertebra 10 8 12 2 0 29 32Thoracic Vertebra 33 4 18 2 1 49 58Lumbar Vertebra 13 2 7 3 1 19 26Sacrum 7 0 1 0 0 7 8Rib 13 14 6 8 10 7 5 3 0 0 24 23 34 32Scapula 7 7 3 4 0 0 1 0 0 0 11 10 11 11Humerus 9 8 4 2 4 6 3 0 1 0 12 12 20 16Radius 6 5 2 3 4 4 1 2 0 0 9 9 13 14Ulna 2 4 2 2 1 0 2 1 0 0 5 6 7 7Metacarpal 3 8 2 3 6 4 2 2 1 0 9 11 13 17Innominate 8 8 4 4 4 3 0 1 0 0 11 11 16 16Femur 8 4 3 2 3 9 4 1 0 0 13 15 18 16Tibia 5 6 5 3 6 5 2 1 1 0 11 14 18 15Metatarsal 4 10 4 3 2 3 4 3 1 0 9 15 14 19
J.C. Thompson, C.S. Henshilwood / Journal of Human Evolution 60 (2011) 746e767 755
paired elements (such as long bones), the MAU provides a way toexamine their representation in light of their actual occurrence ina complete skeleton (Lyman, 2008). The bone density data havebeen selected from Lam et al. (1999) because the sheep data fromLam et al. (1998) do not include values for non-long bones. Both theMAU and bone density were standardised to the highest value inthe dataset in order to facilitate the visual comparisons.
At Blombos, inter-element representation between axial andappendicular elements follows the same general pattern as bonemineral density. This can be a common result of density-mediatedattrition (Bartram and Marean, 1999; Marean and Cleghorn, 2003;Cleghorn et al., 2004) and suggests that the two are correlated.However, when all of the elements are compared against maximumbone mineral density, Spearman’s rho shows only a weak andinsignificant correlation within both standardised (Rs ¼ 0.2554,p ¼ 0.3330) and unstandardised values (Rs ¼ 0.3400, p ¼ 0.3240).This is a classic problem of equifinality in faunal assemblagesbecause the least dense bones also tend to have the highest caloricreturns (Marean and Cleghorn, 2003), and inter-element repre-sentation may also therefore be shaped by hominin (or carnivore)transport behaviour (Stiner, 1991; Bar-Oz et al., 2004; Cleghorn andMarean, 2004). For example, there can be a great deal of variabilityin howmodern hunter-gatherers transport heads from carcasses ofdifferent body sizes, and the axis and atlas vertebrae often travelwhere the head goes (Monahan, 1998). Because of the particularlydense dens portion of the axis, this element will be assigned thehighest ranking in Spearman’s correlation even though its pre-depositional representation at a site may be very low because oftransport decisions having to do with the number of carriers,
distance from kill site, and other archaeologically unknowablefactors.
An examination of intra-element representation provides a wayto evaluate the effects of density-mediated attrition independentlyof potential inter-element transport bias. Fig. 4 shows that withinthe long bones, Blombos is a shaft-dominated assemblage. This isconfirmed by the NISP data, where a full 67% of long bone frag-ments (including both generic fragments and those identifiable tospecific element) are shaft fragments, with 20% near-epiphysisshaft fragments and a mere 13% represented by epiphysealportions. When ungulate long bone portion representation isplotted against bone portion density for the entire sample (with nosubdivisions by archaeological phase), Spearman’s Rho confirmsa highly significant positive correlation between the two variables(Rs ¼ 0.4879, p ¼ 0.0062). This indicates that a substantialproportion of density-mediated destruction has occurred and longbone epiphyses are preserved in proportions that are fartherremoved from their original representation than denser portionssuch as long bone shafts (Cleghorn et al., 2004; Marean et al., 2004;Thompson and Marean, 2009).
When the data were broken down stratigraphically ( ¼ chrono-logically) and by body size, Spearman’s Rho shows a positive andhighly significant correlation between bone density and bone portionrepresentation below the a ¼ 0.05 level for all but two data subsets(Table 5). Fig. 5 visually shows this pattern for all analytical units andbody sizes combined at Blombos, and for each MSA phase for whichthere is a significant correlation. The sample sizes from lowerM2 andM3 are extremely small. This is evidenced by the wide spreadof datapoints, which also indicates that the correlations should be
Figure 4. Standardised MAU values for the major skeletal elements at Blombos derived from the “Overlap” column in Table 5 (black bars) compared with a grey line showingstandardised bone mineral density maximum values of a Connochaetes taurinus skeleton from Lam et al. (1999). Representative bone maps were generated using the image-analysisprogram described by Marean et al. (2001), and darker areas represent areas where more fragment portions overlap. All paired elements are from the left posterior view, except formetapodials (left anterior view).
J.C. Thompson, C.S. Henshilwood / Journal of Human Evolution 60 (2011) 746e767756
interpreted cautiously. Within the large samples fromM1 and upperM2, the residuals for epiphyses almost always fall on or below thelinear regression line. This indicates that these less dense portions areactually less well-represented than predicted by their density. Incontrast, the residuals for near-epiphysis shafts are nearly alwayspositive. The graphs also illustrate that both bone density and ananalyst's ability to identify bone fragments likely impact how boneportion representation is reported from an assemblage. This isparticularly the case for highly fragmented assemblages derived fromanimals of a larger body size. Near-epiphysis shafts may be over-represented because they possess both a densemidshaft portion that
Table 5Spearman’s Rho correlations, the N of fragments placed on the GIS templates toderive the MNE values, and p-values for bone portion representation versus bonedensity for small (size 1 and 2) and large (size 3 and 4) ungulates during M1, upperM2, and M3.
Ungulate size Dataset N Fragments Spearman’s Rho p-value
Small M1 160 0.5131 0.0037Large 138 0.4899 0.0060
Small M2 upper 130 0.3277 0.0771Large 39 0.3763 0.0404
Small M2 lower 23 0.0121 0.9494Large 6 0.7885 < 0.0001
Small M3 40 0.3905 0.0329Large 19 0.4692 0.0089
Note that exact values for Rs differ slightly from those reported in Thompson andMarean (2009) because %Area was rounded to only two decimal places in thisanalysis. Sample sizes were quite small for M3.
is likely to survive, as well as a less dense but generally more easily-identified near-epiphysis portion (Thompson andMarean, 2009).
All correlations at Blombos are lower than were observed forlarge ungulates at other sites, such as PP13B and DK1 (note thatvalues for Blombos given here differ slightly from Thompson andMarean [2009] because the current regressions were run afterrounding both input values to two decimal places). However, thereis sufficient evidence of selective depletion of less dense portions towarrant careful consideration of which fragment types should beincluded in analyses used to determine the accumulator. This isbecause experimental and ethnoarchaeological studies have shownthat carnivore ravaging of a bone assemblage results in sucha pattern of density-mediated destruction, and that ravaging is anextremely common process even at sites where humans havenearly depleted all of the nutrients from bones through marrowand/or grease extraction (Marean and Spencer, 1991; Marean et al.,1992; Bartram, 1993; Lyman, 1993, 1994; Lupo, 1995; Lam et al.,1998, 2003; Bartram and Marean, 1999; Pickering et al., 2003;Cleghorn et al., 2004; Thompson and Lee-Gorishti, 2007).
The density-mediated destruction documented at Blombosshows some suggestive patterns that should be explored in moredetail. In particular, the small ungulates at Blombos appear to haveundergone less density-mediated attrition than have large ungu-lates e although they are nearly equal in the M1 phase. This isimportant because it could indicate differences in the accumulatoror the proportion of contribution from different accumulators.Raptors, large carnivores, small carnivores, carnivores withdifferent bone-crunching apparatus (e.g., canids versus felids), andhumanswill destroy less dense portions of bone to varying degrees.This is also the case for humans using grease extraction methods
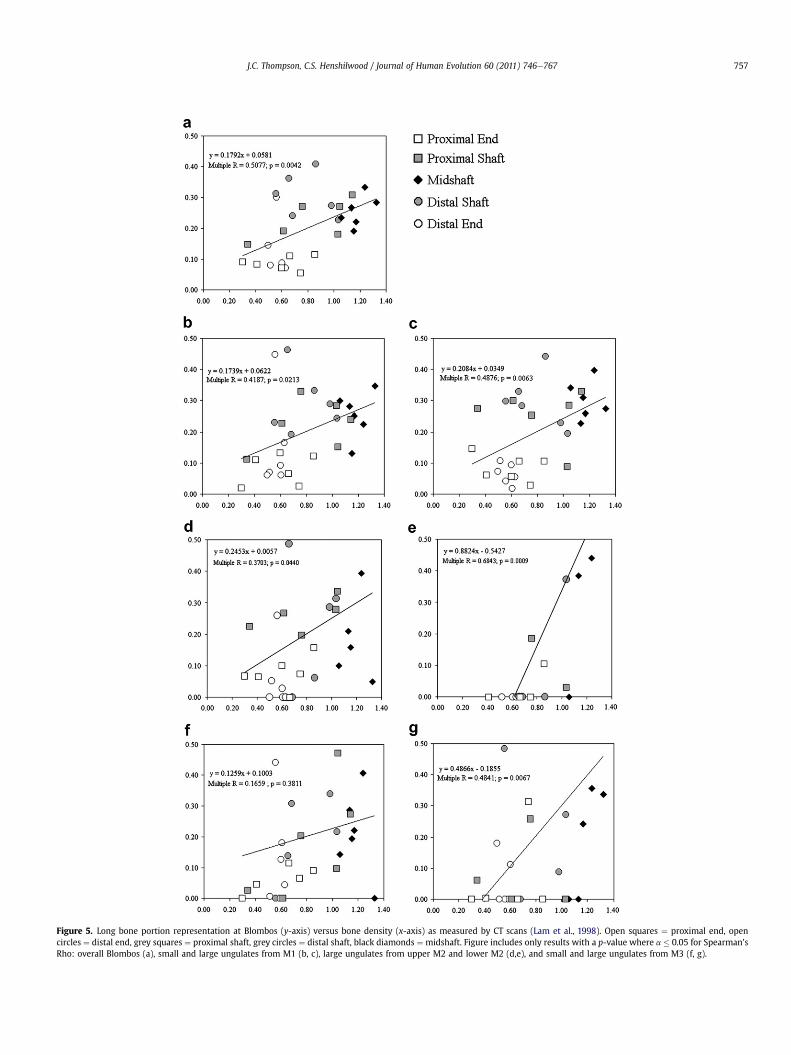
Figure 5. Long bone portion representation at Blombos (y-axis) versus bone density (x-axis) as measured by CT scans (Lam et al., 1998). Open squares ¼ proximal end, opencircles ¼ distal end, grey squares ¼ proximal shaft, grey circles ¼ distal shaft, black diamonds ¼ midshaft. Figure includes only results with a p-value where a � 0.05 for Spearman’sRho: overall Blombos (a), small and large ungulates from M1 (b, c), large ungulates from upper M2 and lower M2 (d,e), and small and large ungulates from M3 (f, g).
J.C. Thompson, C.S. Henshilwood / Journal of Human Evolution 60 (2011) 746e767 757
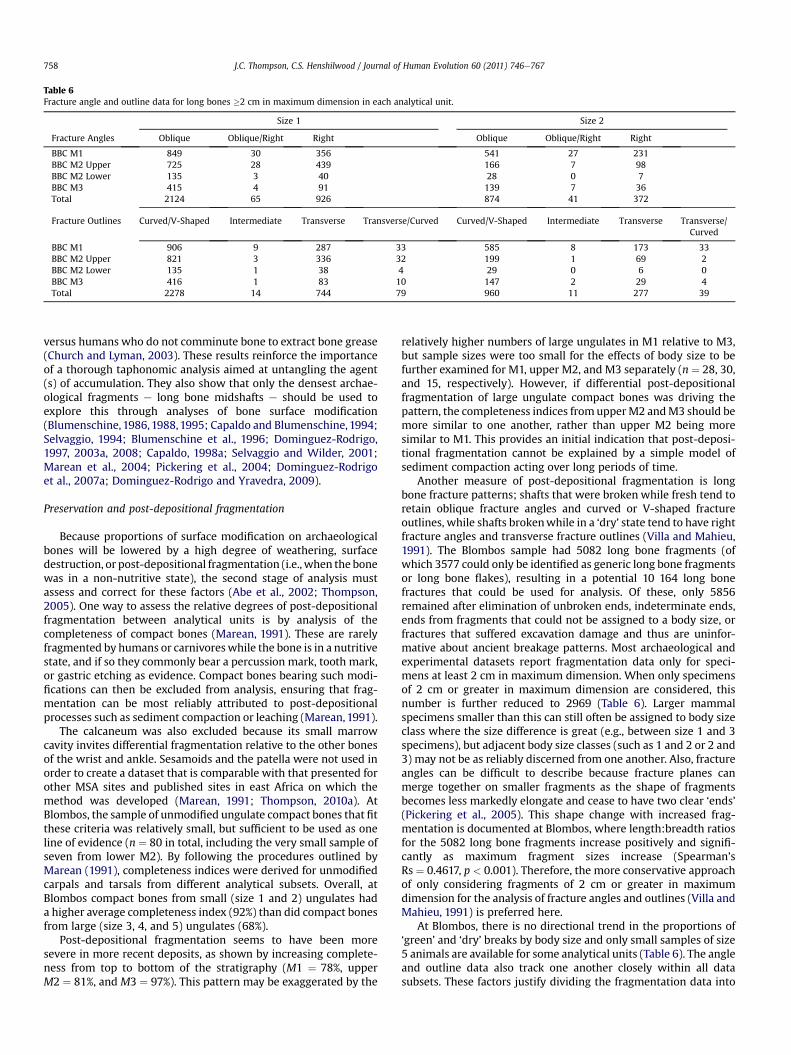
Table 6Fracture angle and outline data for long bones �2 cm in maximum dimension in each analytical unit.
Size 1 Size 2
Fracture Angles Oblique Oblique/Right Right Oblique Oblique/Right Right
BBC M1 849 30 356 541 27 231BBC M2 Upper 725 28 439 166 7 98BBC M2 Lower 135 3 40 28 0 7BBC M3 415 4 91 139 7 36Total 2124 65 926 874 41 372
Fracture Outlines Curved/V-Shaped Intermediate Transverse Transverse/Curved Curved/V-Shaped Intermediate Transverse Transverse/Curved
BBC M1 906 9 287 33 585 8 173 33BBC M2 Upper 821 3 336 32 199 1 69 2BBC M2 Lower 135 1 38 4 29 0 6 0BBC M3 416 1 83 10 147 2 29 4Total 2278 14 744 79 960 11 277 39
J.C. Thompson, C.S. Henshilwood / Journal of Human Evolution 60 (2011) 746e767758
versus humans who do not comminute bone to extract bone grease(Church and Lyman, 2003). These results reinforce the importanceof a thorough taphonomic analysis aimed at untangling the agent(s) of accumulation. They also show that only the densest archae-ological fragments e long bone midshafts e should be used toexplore this through analyses of bone surface modification(Blumenschine,1986,1988,1995; Capaldo and Blumenschine,1994;Selvaggio, 1994; Blumenschine et al., 1996; Dominguez-Rodrigo,1997, 2003a, 2008; Capaldo, 1998a; Selvaggio and Wilder, 2001;Marean et al., 2004; Pickering et al., 2004; Dominguez-Rodrigoet al., 2007a; Dominguez-Rodrigo and Yravedra, 2009).
Preservation and post-depositional fragmentation
Because proportions of surface modification on archaeologicalbones will be lowered by a high degree of weathering, surfacedestruction, or post-depositional fragmentation (i.e.,when the bonewas in a non-nutritive state), the second stage of analysis mustassess and correct for these factors (Abe et al., 2002; Thompson,2005). One way to assess the relative degrees of post-depositionalfragmentation between analytical units is by analysis of thecompleteness of compact bones (Marean, 1991). These are rarelyfragmented by humans or carnivoreswhile the bone is in a nutritivestate, and if so they commonly bear a percussion mark, tooth mark,or gastric etching as evidence. Compact bones bearing such modi-fications can then be excluded from analysis, ensuring that frag-mentation can be most reliably attributed to post-depositionalprocesses such as sediment compaction or leaching (Marean, 1991).
The calcaneum was also excluded because its small marrowcavity invites differential fragmentation relative to the other bonesof the wrist and ankle. Sesamoids and the patella were not used inorder to create a dataset that is comparable with that presented forother MSA sites and published sites in east Africa on which themethod was developed (Marean, 1991; Thompson, 2010a). AtBlombos, the sample of unmodified ungulate compact bones that fitthese criteria was relatively small, but sufficient to be used as oneline of evidence (n ¼ 80 in total, including the very small sample ofseven from lower M2). By following the procedures outlined byMarean (1991), completeness indices were derived for unmodifiedcarpals and tarsals from different analytical subsets. Overall, atBlombos compact bones from small (size 1 and 2) ungulates hada higher average completeness index (92%) than did compact bonesfrom large (size 3, 4, and 5) ungulates (68%).
Post-depositional fragmentation seems to have been moresevere in more recent deposits, as shown by increasing complete-ness from top to bottom of the stratigraphy (M1 ¼ 78%, upperM2 ¼ 81%, and M3 ¼ 97%). This pattern may be exaggerated by the
relatively higher numbers of large ungulates in M1 relative to M3,but sample sizes were too small for the effects of body size to befurther examined for M1, upper M2, and M3 separately (n ¼ 28, 30,and 15, respectively). However, if differential post-depositionalfragmentation of large ungulate compact bones was driving thepattern, the completeness indices fromupperM2 andM3 should bemore similar to one another, rather than upper M2 being moresimilar to M1. This provides an initial indication that post-deposi-tional fragmentation cannot be explained by a simple model ofsediment compaction acting over long periods of time.
Another measure of post-depositional fragmentation is longbone fracture patterns; shafts that were broken while fresh tend toretain oblique fracture angles and curved or V-shaped fractureoutlines, while shafts brokenwhile in a ‘dry’ state tend to have rightfracture angles and transverse fracture outlines (Villa and Mahieu,1991). The Blombos sample had 5082 long bone fragments (ofwhich 3577 could only be identified as generic long bone fragmentsor long bone flakes), resulting in a potential 10 164 long bonefractures that could be used for analysis. Of these, only 5856remained after elimination of unbroken ends, indeterminate ends,ends from fragments that could not be assigned to a body size, orfractures that suffered excavation damage and thus are uninfor-mative about ancient breakage patterns. Most archaeological andexperimental datasets report fragmentation data only for speci-mens at least 2 cm in maximum dimension. When only specimensof 2 cm or greater in maximum dimension are considered, thisnumber is further reduced to 2969 (Table 6). Larger mammalspecimens smaller than this can still often be assigned to body sizeclass where the size difference is great (e.g., between size 1 and 3specimens), but adjacent body size classes (such as 1 and 2 or 2 and3) may not be as reliably discerned from one another. Also, fractureangles can be difficult to describe because fracture planes canmerge together on smaller fragments as the shape of fragmentsbecomes less markedly elongate and cease to have two clear ‘ends’(Pickering et al., 2005). This shape change with increased frag-mentation is documented at Blombos, where length:breadth ratiosfor the 5082 long bone fragments increase positively and signifi-cantly as maximum fragment sizes increase (Spearman’sRs ¼ 0.4617, p < 0.001). Therefore, the more conservative approachof only considering fragments of 2 cm or greater in maximumdimension for the analysis of fracture angles and outlines (Villa andMahieu, 1991) is preferred here.
At Blombos, there is no directional trend in the proportions of‘green’ and ‘dry’ breaks by body size and only small samples of size5 animals are available for some analytical units (Table 6). The angleand outline data also track one another closely within all datasubsets. These factors justify dividing the fragmentation data into
Size 3 Size 4 Size 5
Oblique Oblique/Right
Right Oblique Oblique/Right
Right Oblique Oblique/Right
Right
438 28 132 154 19 54 13 2 9194 16 56 33 3 17 1 0 016 0 12 9 0 2 1 0 0162 3 25 37 2 9 5 0 2810 47 225 233 24 82 20 2 11
Curved/V-Shaped
Intermediate Transverse Transverse/Curved
Curved/V-Shaped
Intermediate Transverse Transverse/Curved
Curved/V-Shaped
Intermediate Transverse Transverse/Curved
449 9 118 22 162 1 54 10 14 1 8 1202 1 54 9 36 1 13 3 1 0 0 020 0 7 1 8 0 3 0 1 0 0 0158 0 26 6 35 1 10 2 7 0 0 0829 10 205 38 241 3 80 15 23 1 8 1
J.C. Thompson, C.S. Henshilwood / Journal of Human Evolution 60 (2011) 746e767 759
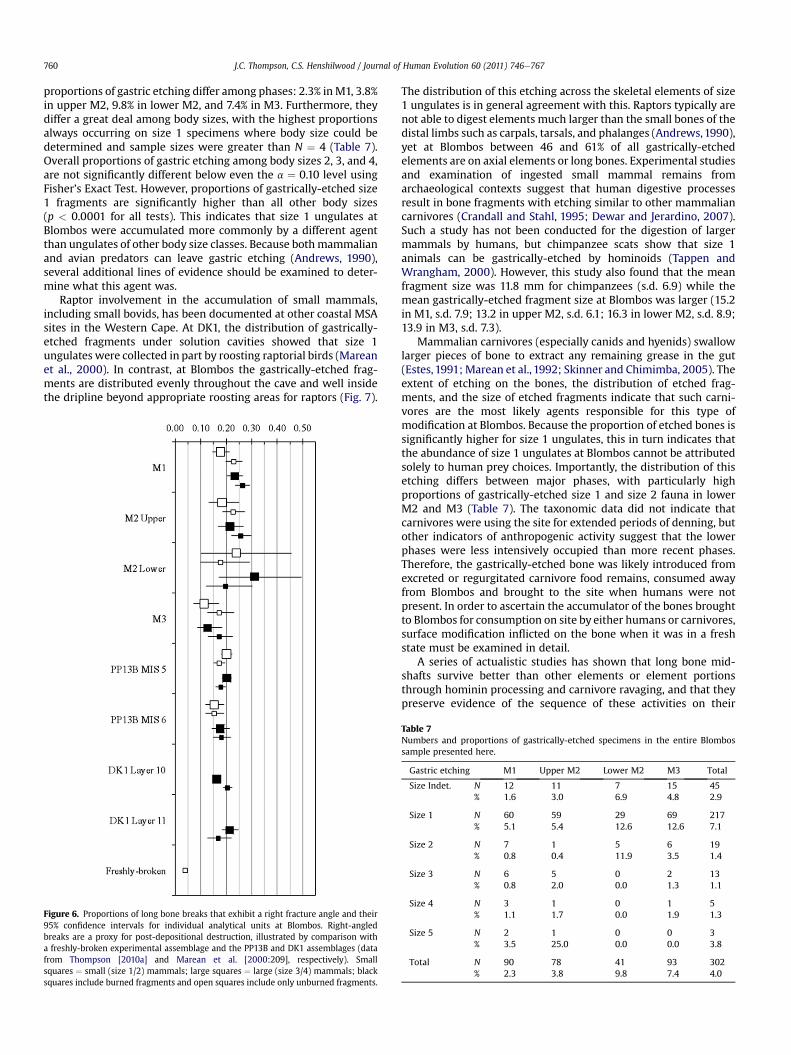
groupings of size 1/2 and size 3/4 for analytical purposes, and usingproportions of right-angled breaks as an overall proxy for thedegree of post-depositional long bone fragmentation (Fig. 6). Withthe exception of the very small sample from lowerM2, large (size 3/4) ungulates consistently have lower proportions of right-angledbreaks than do small (size 1/2) ungulates from the same analyticalunit. Although the 95% confidence intervals all overlap, thisconsistency in the data may suggest that larger ungulates under-went slightly less post-depositional breakage than did smallerungulates. This is not a consistent pattern across all sites of similarage. Layer 11 at DK1 shows the opposite pattern (Fig. 6), andYeshurun et al. (2007) found that at Levantine Palaeolithic sites,larger ungulates seem to have been subjected to a greater degree ofabiotic post-depositional fragmentation.
Furthermore, the compact bone and long bone data do not showthe same pattern for large versus small ungulates. This suggeststhat these two element types are differentially susceptible to post-depositional fragmentation at least partially in accordance withbody size. However, at Blombos all fragmentation data clearlydemonstrate that the oldest deposits (M3) were subjected to theleast amount of post-depositional fragmentation. Because simplesediment compaction over time cannot be invoked to explain thisphenomenon, it suggests that cave roof-fall, increased trampling, orsome other agent had a greater impact inmore recent deposits. Oneof these processes could be increased sub-aerial weathering and/orburning, which can weaken the bone and lead to greater suscep-tibility to breakage by other means (Marean et al., 2000).
At Blombos, only one fragment was weathered beyondBehrensmeyer’s (1978) stage 1, and thus weathering cannot accountfordifferences inpost-depositional fragmentation.However, 27.4%ofthe assemblage shows some evidence of colouration changes owingto having been burned. The lowest proportion of burned fragmentsoccurs in M3 at the base of the sequence (15.2%). This increases inlowerM2 (22.4%), thehighest proportionoccurs inupperM2 (35.9%),and there is an intermediate proportion at the top in M1 (27.4%).Eliminating burned long bone fragments results in a decrease in therelative proportions of ‘dry’ breaks and a corresponding increase inthe proportions of ‘green’ breaks for all phases (Fig. 6). However,when only unburned fragments are considered, the M3 fragmentsstill appear to have been subjected to less post-depositional frag-mentation and theupperendof theM3confidence intervals still onlybarely overlap with the lower ends of the M1 and M2 confidenceintervals. This suggests that increasedburning inM1andupperM2 isnot the primary cause of additional post-depositional breakage inyounger sediments at Blombos. Other potential causes may beincreased intensity of occupation and/or trampling and surfaceactivity per unit of time.
Importantly, all archaeological data exhibit a degree of post-depositional fragmentation that exceeds the 95% confidence limitsreported for three modern known-agent experimental assem-blages (Marean et al., 2000). This indicates that the proportions ofsurface modification, such as cut, percussion, and tooth markshave been depressed from their original values at the time ofdiscard. Fragments exhibiting evidence of post-depositionalbreakage should therefore be eliminated from long bone surfacemodification analyses (Abe et al., 2002). This is the most conser-vative approach, and it will make the Blombos data comparablewith those reported from other MSA sites in the Western Cape,such as PP13B (Thompson, 2010b) and DK1 (Marean et al., 2000).
It is also necessary to eliminate fragments with poorly-preserved surfaces. Overall, less than 1% of the assemblageshows extensive dendritic etching, pocking, sheen, or smoothing(Thompson, 2005). These types of post-depositional surfacemodification were spread evenly throughout the three majorphases, suggesting that the factors that created these modificationswere basically the same over time. In the case of dendritic etching,root activity was almost certainly the culprit, as evidenced by thepreservation of small clusters of tubular plant cells that occasion-ally still follow these etchings. These clusters may representmodern rootlet invasion or theymay be the calcined ash remnant ofa plant that etched the surface of the bone long ago and wassubsequently burned (Karkanas et al., 2007).
Exfoliation at Blombos was by far the most common form ofbone surface destruction, and occurred on 14.7% of specimens(Thompson, 2005). Fragments with severely exfoliated surfaces orwith more than 70% of their surface covered in matrix are thereforenot included in the surface modification analysis. Unlike the othertypes of surface destruction, exfoliation was not evenly distributedthroughout the phases, but instead is highest at the top in M1(31.2% of bones affected to some degree), similar in upper M2 andM3 (both 11.5%), and intermediate in lower M2 (16.2%). The agentbehind such exfoliation is unknown, but it appears to proceed viathe crystallization of minerals in miniscule fissures in the bonesurfaces such that layers of bone peel away. Ironically, fossils fromthe oldest sediments (M3) are the best-preserved in all senses ofthe word. In contrast, the fauna from M1 has suffered the mostdensity-mediated destruction, one of the highest degrees of post-depositional fragmentation, and the most destruction of bonesurfaces through exfoliation.
Surface modification
Gastric etching and rodent gnawing are rare at Blombos at 4.0%and <0.6% for all phases and body sizes, respectively. The
J.C. Thompson, C.S. Henshilwood / Journal of Human Evolution 60 (2011) 746e767760
proportions of gastric etching differ among phases: 2.3% inM1, 3.8%in upper M2, 9.8% in lower M2, and 7.4% in M3. Furthermore, theydiffer a great deal among body sizes, with the highest proportionsalways occurring on size 1 specimens where body size could bedetermined and sample sizes were greater than N ¼ 4 (Table 7).Overall proportions of gastric etching among body sizes 2, 3, and 4,are not significantly different below even the a ¼ 0.10 level usingFisher’s Exact Test. However, proportions of gastrically-etched size1 fragments are significantly higher than all other body sizes(p < 0.0001 for all tests). This indicates that size 1 ungulates atBlombos were accumulated more commonly by a different agentthan ungulates of other body size classes. Because bothmammalianand avian predators can leave gastric etching (Andrews, 1990),several additional lines of evidence should be examined to deter-mine what this agent was.
Raptor involvement in the accumulation of small mammals,including small bovids, has been documented at other coastal MSAsites in the Western Cape. At DK1, the distribution of gastrically-etched fragments under solution cavities showed that size 1ungulates were collected in part by roosting raptorial birds (Mareanet al., 2000). In contrast, at Blombos the gastrically-etched frag-ments are distributed evenly throughout the cave and well insidethe dripline beyond appropriate roosting areas for raptors (Fig. 7).
Figure 6. Proportions of long bone breaks that exhibit a right fracture angle and their95% confidence intervals for individual analytical units at Blombos. Right-angledbreaks are a proxy for post-depositional destruction, illustrated by comparison witha freshly-broken experimental assemblage and the PP13B and DK1 assemblages (datafrom Thompson [2010a] and Marean et al. [2000:209], respectively). Smallsquares ¼ small (size 1/2) mammals; large squares ¼ large (size 3/4) mammals; blacksquares include burned fragments and open squares include only unburned fragments.
The distribution of this etching across the skeletal elements of size1 ungulates is in general agreement with this. Raptors typically arenot able to digest elements much larger than the small bones of thedistal limbs such as carpals, tarsals, and phalanges (Andrews,1990),yet at Blombos between 46 and 61% of all gastrically-etchedelements are on axial elements or long bones. Experimental studiesand examination of ingested small mammal remains fromarchaeological contexts suggest that human digestive processesresult in bone fragments with etching similar to other mammaliancarnivores (Crandall and Stahl, 1995; Dewar and Jerardino, 2007).Such a study has not been conducted for the digestion of largermammals by humans, but chimpanzee scats show that size 1animals can be gastrically-etched by hominoids (Tappen andWrangham, 2000). However, this study also found that the meanfragment size was 11.8 mm for chimpanzees (s.d. 6.9) while themean gastrically-etched fragment size at Blombos was larger (15.2in M1, s.d. 7.9; 13.2 in upper M2, s.d. 6.1; 16.3 in lower M2, s.d. 8.9;13.9 in M3, s.d. 7.3).
Mammalian carnivores (especially canids and hyenids) swallowlarger pieces of bone to extract any remaining grease in the gut(Estes, 1991; Marean et al., 1992; Skinner and Chimimba, 2005). Theextent of etching on the bones, the distribution of etched frag-ments, and the size of etched fragments indicate that such carni-vores are the most likely agents responsible for this type ofmodification at Blombos. Because the proportion of etched bones issignificantly higher for size 1 ungulates, this in turn indicates thatthe abundance of size 1 ungulates at Blombos cannot be attributedsolely to human prey choices. Importantly, the distribution of thisetching differs between major phases, with particularly highproportions of gastrically-etched size 1 and size 2 fauna in lowerM2 and M3 (Table 7). The taxonomic data did not indicate thatcarnivores were using the site for extended periods of denning, butother indicators of anthropogenic activity suggest that the lowerphases were less intensively occupied than more recent phases.Therefore, the gastrically-etched bone was likely introduced fromexcreted or regurgitated carnivore food remains, consumed awayfrom Blombos and brought to the site when humans were notpresent. In order to ascertain the accumulator of the bones broughtto Blombos for consumption on site by either humans or carnivores,surface modification inflicted on the bone when it was in a freshstate must be examined in detail.
A series of actualistic studies has shown that long bone mid-shafts survive better than other elements or element portionsthrough hominin processing and carnivore ravaging, and that theypreserve evidence of the sequence of these activities on their
Table 7Numbers and proportions of gastrically-etched specimens in the entire Blombossample presented here.
Gastric etching M1 Upper M2 Lower M2 M3 Total
Size Indet. N 12 11 7 15 45% 1.6 3.0 6.9 4.8 2.9
Size 1 N 60 59 29 69 217% 5.1 5.4 12.6 12.6 7.1
Size 2 N 7 1 5 6 19% 0.8 0.4 11.9 3.5 1.4
Size 3 N 6 5 0 2 13% 0.8 2.0 0.0 1.3 1.1
Size 4 N 3 1 0 1 5% 1.1 1.7 0.0 1.9 1.3
Size 5 N 2 1 0 0 3% 3.5 25.0 0.0 0.0 3.8
Total N 90 78 41 93 302% 2.3 3.8 9.8 7.4 4.0

Figure 7. Map of the site showing the incidence of gastric etching in the sampledsquares with progressive grey shading with higher proportions. Numbers on top areproportions and N for each proportion is given in brackets. Data for square H4 are25.0% and N ¼ 1.
J.C. Thompson, C.S. Henshilwood / Journal of Human Evolution 60 (2011) 746e767 761
surfaces in the form of percussion, cut, and tooth marks(Blumenschine, 1988; Blumenschine and Selvaggio, 1988; Mareanet al., 1992; Selvaggio, 1994; Blumenschine et al., 1996;Dominguez-Rodrigo, 1997; Capaldo, 1998b; Domínguez-Rodrigoet al., 2007a). Models of carnivore and hominin interaction withan assemblage have been developed from these data and used toinfer past carcass access scenarios at archaeological sites based onthe frequencies of marked midshaft fragments (Blumenschine,1995; Capaldo, 1995, 1998a; Dominguez-Rodrigo, 1997; Mareanand Kim, 1998; Selvaggio, 1998a,b; Marean et al., 2000; Selvaggioand Wilder, 2001; Pickering, 2002; Dominguez-Rodrigo andBarba, 2006). Examples of these marks from Blombos are given inSupplementary Online Materials (SOM) Fig. 1.
These experimental studies provide a guide for the interpreta-tion of the frequencies of marked shafts in an assemblage, but thereis a wide array of variables that can influence how many marks areinflicted and on how many fragments. For example, percussionmarks provide an excellent indication of a specific activity per-formed by tool-using hominins (marrow and/or grease extraction),but their numbers vary according to the shapes and types of stoneused to break the bones, and by the body size of the animal fromwhich the bone is derived (Pickering and Egeland, 2006; Galánet al., 2009). Cut marks are also clear indicators of humanactivity, but there has been much debate over the utility of using
Table 8Numbers of percussion-marked, tooth-marked, and cut-marked midshaft fragments andbreaks, well-preserved and visible surfaces, and are �2 cm in maximum length.
Size Indet. Size 1 Size 2
PM TM CM PM TM CM PM TM CM
N marked shafts in sampleM1 7 2 4 33 16 20 25 6 17M2 Upper 2 1 0 35 15 25 8 4 4M2 Lower 0 0 0 9 6 6 0 2 1M3 5 0 1 20 6 9 11 6 4
Proportion of marked shafts in each sampleM1 0.44 0.13 0.25 0.53 0.26 0.32 0.56 0.13 0.M2 Upper 0.40 0.20 0.00 0.51 0.22 0.37 0.40 0.20 0.M2 Lower 0.00 0.00 0.00 0.56 0.38 0.38 0.00 0.67 0.M3 0.56 0.00 0.11 0.56 0.17 0.25 0.79 0.43 0.
proportions of cut-marked bone to directly address the accumu-lator of an assemblage. This is because the frequencies with whichcut marks are produced can vary dramatically depending on factorssuch as butcher skill, amount of flesh remaining on the bone,butchering strategy, taxon, body size, and the material thatcomprises the cutting tool (Dominguez-Rodrigo, 1997, 2003b,2008; Nilssen, 2000; O’Connell et al., 2003; O’Connell and Lupo,2003; Dominguez-Rodrigo and Yravedra, 2009).
Tooth marks can also be problematic because they are lessactivity-specific and can be left during both within-bone andoutside-bone nutrient extractions. Based on morphology alone,a single mark cannot be diagnosed as being left by a felid, canid,hyenid, or other carnivore (Dominguez-Rodrigo and Piqueras,2003), although modification by multiple carnivore taxa can beinferred from the shapes and sizes of the marks (Selvaggio andWilder, 2001). Even suids, humans, and crocodiles leave toothmarks that cannot always be differentiated from other bonemodifiers (Njau and Blumenschine, 2006; Landt, 2007;Domínguez-Solera and Domínguez-Rodrigo, 2008). This is impor-tant because proportions of tooth-marked midshafts can deviatefrom experimental models of carcass access if the numbers andspecies of carnivores accessing a carcass vary. For example, felidsleave substantially fewer tooth marks when they have primaryaccess and some carnivores leave extensive tooth-marking evenwhen scavenging the remains of human kills (Dominguez-Rodrigoet al., 2007a,b). Given these variables, the relative proportions oftooth-marked and percussion-marked midshafts in an assemblagehave been shown to be more informative than the absoluteproportion regarding the sequence of carcass access for carnivoresand humans (Blumenschine and Marean, 1993; Capaldo,1995,1998a; Blumenschine, 1988; Marean and Kim, 1998;Selvaggio, 1998a). Cut-marked midshafts can then also provide anadditional line of evidence.
There were 3419 long bone midshaft fragments from theBlombos sample, but only 1255 fit the rigorous criteria demandedby the results of the preceding taphonomic analysis (no dry breaks,recent breaks, poorly-preserved surfaces, or heavily-obscuredsurfaces). Because most actualistic data have been reported only forspecimens 2 cm or larger in their maximum dimension, this samplehad to be further reduced to 502 in order to be comparable withexperimental studies in which the agents of bone modification areknown (Capaldo, 1995; Dominguez-Rodrigo, 1997; Blumenschine,1988; Selvaggio, 1998b; Marean et al., 2000). Unfortunately, thisreduced sample hinders statistically robust comparisons betweeneach body size in each analytical unit at Blombos, particularly forthe small sample from the lower M2 phase (Table 8). Because thegastric etching data indicated an increased carnivore input for size1 ungulates, and because this body size comprises a relatively largeproportion of the sample, mammals of this size range are examined
proportions of these in each analytical unit. Fragments have no post-depositional
Size 3 Size 4 Size 5
PM TM CM PM TM CM PM TM CM
35 9 20 29 9 15 0 1 024 12 11 4 0 2 0 0 02 0 1 3 0 2 0 0 0
21 3 9 9 5 3 2 0 2
38 0.58 0.15 0.33 0.73 0.23 0.38 0.00 0.33 0.0020 0.53 0.27 0.24 0.80 0.00 0.40 0.00 0.00 0.0033 0.67 0.00 0.33 1.00 0.00 0.67 0.00 0.00 0.0029 0.64 0.09 0.27 0.75 0.42 0.25 1.00 0.00 1.00
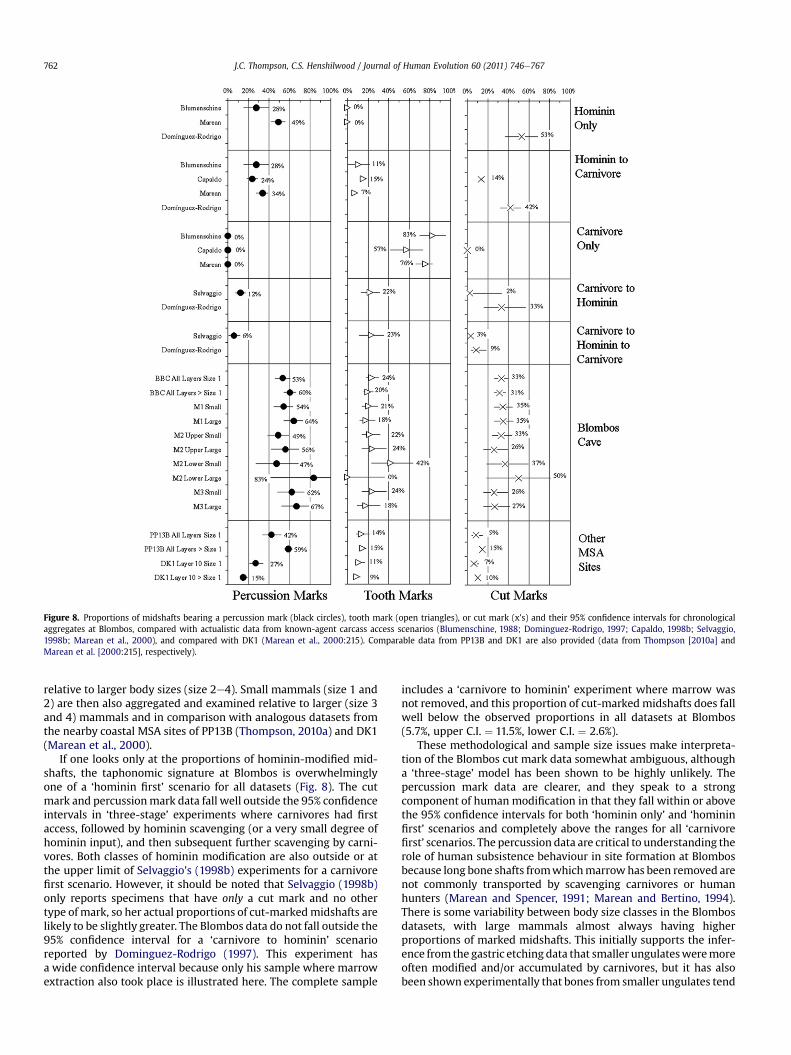
Figure 8. Proportions of midshafts bearing a percussion mark (black circles), tooth mark (open triangles), or cut mark (x’s) and their 95% confidence intervals for chronologicalaggregates at Blombos, compared with actualistic data from known-agent carcass access scenarios (Blumenschine, 1988; Dominguez-Rodrigo, 1997; Capaldo, 1998b; Selvaggio,1998b; Marean et al., 2000), and compared with DK1 (Marean et al., 2000:215). Comparable data from PP13B and DK1 are also provided (data from Thompson [2010a] andMarean et al. [2000:215], respectively).
J.C. Thompson, C.S. Henshilwood / Journal of Human Evolution 60 (2011) 746e767762
relative to larger body sizes (size 2e4). Small mammals (size 1 and2) are then also aggregated and examined relative to larger (size 3and 4) mammals and in comparison with analogous datasets fromthe nearby coastal MSA sites of PP13B (Thompson, 2010a) and DK1(Marean et al., 2000).
If one looks only at the proportions of hominin-modified mid-shafts, the taphonomic signature at Blombos is overwhelminglyone of a ‘hominin first’ scenario for all datasets (Fig. 8). The cutmark and percussionmark data fall well outside the 95% confidenceintervals in ‘three-stage’ experiments where carnivores had firstaccess, followed by hominin scavenging (or a very small degree ofhominin input), and then subsequent further scavenging by carni-vores. Both classes of hominin modification are also outside or atthe upper limit of Selvaggio’s (1998b) experiments for a carnivorefirst scenario. However, it should be noted that Selvaggio (1998b)only reports specimens that have only a cut mark and no othertype of mark, so her actual proportions of cut-markedmidshafts arelikely to be slightly greater. The Blombos data do not fall outside the95% confidence interval for a ‘carnivore to hominin’ scenarioreported by Dominguez-Rodrigo (1997). This experiment hasa wide confidence interval because only his sample where marrowextraction also took place is illustrated here. The complete sample
includes a ‘carnivore to hominin’ experiment where marrow wasnot removed, and this proportion of cut-marked midshafts does fallwell below the observed proportions in all datasets at Blombos(5.7%, upper C.I. ¼ 11.5%, lower C.I. ¼ 2.6%).
These methodological and sample size issues make interpreta-tion of the Blombos cut mark data somewhat ambiguous, althougha ‘three-stage’ model has been shown to be highly unlikely. Thepercussion mark data are clearer, and they speak to a strongcomponent of human modification in that they fall within or abovethe 95% confidence intervals for both ‘hominin only’ and ‘homininfirst’ scenarios and completely above the ranges for all ‘carnivorefirst’ scenarios. The percussion data are critical to understanding therole of human subsistence behaviour in site formation at Blombosbecause long bone shafts fromwhichmarrowhas been removed arenot commonly transported by scavenging carnivores or humanhunters (Marean and Spencer, 1991; Marean and Bertino, 1994).There is some variability between body size classes in the Blombosdatasets, with large mammals almost always having higherproportions of marked midshafts. This initially supports the infer-ence from the gastric etching data that smaller ungulatesweremoreoften modified and/or accumulated by carnivores, but it has alsobeen shown experimentally that bones from smaller ungulates tend
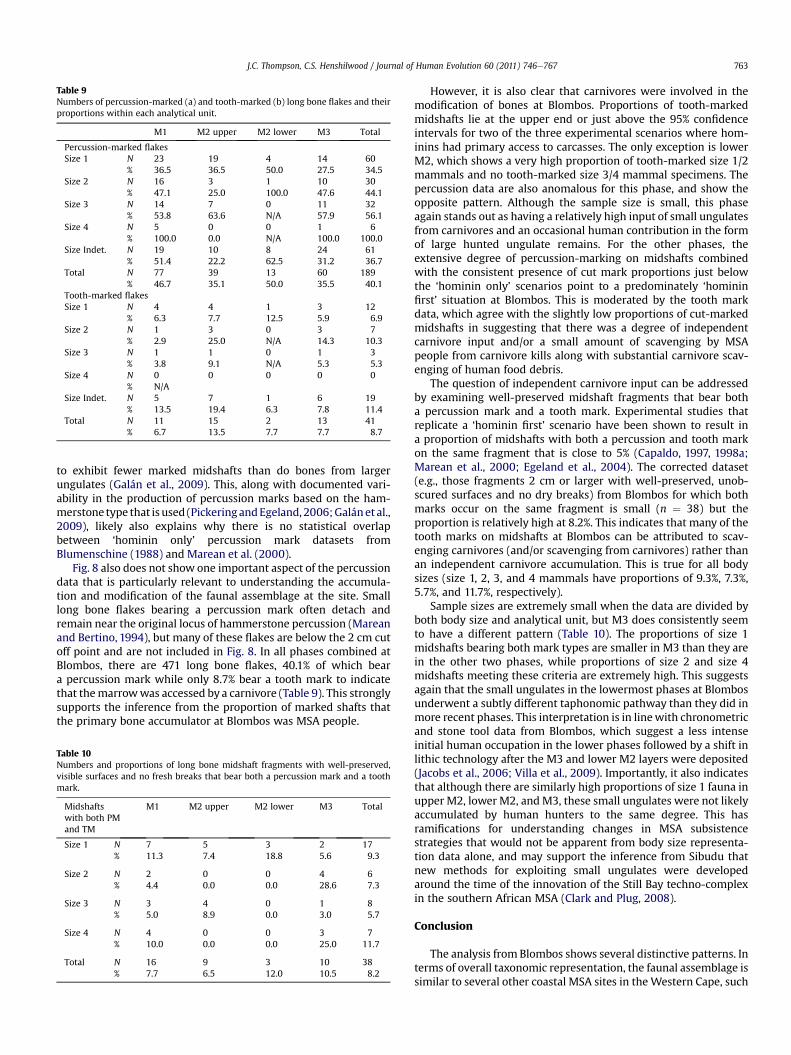
Table 9Numbers of percussion-marked (a) and tooth-marked (b) long bone flakes and theirproportions within each analytical unit.
M1 M2 upper M2 lower M3 Total
Percussion-marked flakesSize 1 N 23 19 4 14 60
% 36.5 36.5 50.0 27.5 34.5Size 2 N 16 3 1 10 30
% 47.1 25.0 100.0 47.6 44.1Size 3 N 14 7 0 11 32
% 53.8 63.6 N/A 57.9 56.1Size 4 N 5 0 0 1 6
% 100.0 0.0 N/A 100.0 100.0Size Indet. N 19 10 8 24 61
% 51.4 22.2 62.5 31.2 36.7Total N 77 39 13 60 189
% 46.7 35.1 50.0 35.5 40.1Tooth-marked flakesSize 1 N 4 4 1 3 12
% 6.3 7.7 12.5 5.9 6.9Size 2 N 1 3 0 3 7
% 2.9 25.0 N/A 14.3 10.3Size 3 N 1 1 0 1 3
% 3.8 9.1 N/A 5.3 5.3Size 4 N 0 0 0 0 0
% N/ASize Indet. N 5 7 1 6 19
% 13.5 19.4 6.3 7.8 11.4Total N 11 15 2 13 41
% 6.7 13.5 7.7 7.7 8.7
J.C. Thompson, C.S. Henshilwood / Journal of Human Evolution 60 (2011) 746e767 763
to exhibit fewer marked midshafts than do bones from largerungulates (Galán et al., 2009). This, along with documented vari-ability in the production of percussion marks based on the ham-merstone type that is used (PickeringandEgeland, 2006;Galánet al.,2009), likely also explains why there is no statistical overlapbetween ‘hominin only’ percussion mark datasets fromBlumenschine (1988) and Marean et al. (2000).
Fig. 8 also does not show one important aspect of the percussiondata that is particularly relevant to understanding the accumula-tion and modification of the faunal assemblage at the site. Smalllong bone flakes bearing a percussion mark often detach andremain near the original locus of hammerstone percussion (Mareanand Bertino, 1994), but many of these flakes are below the 2 cm cutoff point and are not included in Fig. 8. In all phases combined atBlombos, there are 471 long bone flakes, 40.1% of which beara percussion mark while only 8.7% bear a tooth mark to indicatethat themarrowwas accessed by a carnivore (Table 9). This stronglysupports the inference from the proportion of marked shafts thatthe primary bone accumulator at Blombos was MSA people.
Table 10Numbers and proportions of long bone midshaft fragments with well-preserved,visible surfaces and no fresh breaks that bear both a percussion mark and a toothmark.
Midshaftswith both PMand TM
M1 M2 upper M2 lower M3 Total
Size 1 N 7 5 3 2 17% 11.3 7.4 18.8 5.6 9.3
Size 2 N 2 0 0 4 6% 4.4 0.0 0.0 28.6 7.3
Size 3 N 3 4 0 1 8% 5.0 8.9 0.0 3.0 5.7
Size 4 N 4 0 0 3 7% 10.0 0.0 0.0 25.0 11.7
Total N 16 9 3 10 38% 7.7 6.5 12.0 10.5 8.2
However, it is also clear that carnivores were involved in themodification of bones at Blombos. Proportions of tooth-markedmidshafts lie at the upper end or just above the 95% confidenceintervals for two of the three experimental scenarios where hom-inins had primary access to carcasses. The only exception is lowerM2, which shows a very high proportion of tooth-marked size 1/2mammals and no tooth-marked size 3/4 mammal specimens. Thepercussion data are also anomalous for this phase, and show theopposite pattern. Although the sample size is small, this phaseagain stands out as having a relatively high input of small ungulatesfrom carnivores and an occasional human contribution in the formof large hunted ungulate remains. For the other phases, theextensive degree of percussion-marking on midshafts combinedwith the consistent presence of cut mark proportions just belowthe ‘hominin only’ scenarios point to a predominately ‘homininfirst’ situation at Blombos. This is moderated by the tooth markdata, which agree with the slightly low proportions of cut-markedmidshafts in suggesting that there was a degree of independentcarnivore input and/or a small amount of scavenging by MSApeople from carnivore kills along with substantial carnivore scav-enging of human food debris.
The question of independent carnivore input can be addressedby examining well-preserved midshaft fragments that bear botha percussion mark and a tooth mark. Experimental studies thatreplicate a ‘hominin first’ scenario have been shown to result ina proportion of midshafts with both a percussion and tooth markon the same fragment that is close to 5% (Capaldo, 1997, 1998a;Marean et al., 2000; Egeland et al., 2004). The corrected dataset(e.g., those fragments 2 cm or larger with well-preserved, unob-scured surfaces and no dry breaks) from Blombos for which bothmarks occur on the same fragment is small (n ¼ 38) but theproportion is relatively high at 8.2%. This indicates that many of thetooth marks on midshafts at Blombos can be attributed to scav-enging carnivores (and/or scavenging from carnivores) rather thanan independent carnivore accumulation. This is true for all bodysizes (size 1, 2, 3, and 4 mammals have proportions of 9.3%, 7.3%,5.7%, and 11.7%, respectively).
Sample sizes are extremely small when the data are divided byboth body size and analytical unit, but M3 does consistently seemto have a different pattern (Table 10). The proportions of size 1midshafts bearing both mark types are smaller in M3 than they arein the other two phases, while proportions of size 2 and size 4midshafts meeting these criteria are extremely high. This suggestsagain that the small ungulates in the lowermost phases at Blombosunderwent a subtly different taphonomic pathway than they did inmore recent phases. This interpretation is in linewith chronometricand stone tool data from Blombos, which suggest a less intenseinitial human occupation in the lower phases followed by a shift inlithic technology after the M3 and lower M2 layers were deposited(Jacobs et al., 2006; Villa et al., 2009). Importantly, it also indicatesthat although there are similarly high proportions of size 1 fauna inupper M2, lower M2, andM3, these small ungulates were not likelyaccumulated by human hunters to the same degree. This hasramifications for understanding changes in MSA subsistencestrategies that would not be apparent from body size representa-tion data alone, and may support the inference from Sibudu thatnew methods for exploiting small ungulates were developedaround the time of the innovation of the Still Bay techno-complexin the southern African MSA (Clark and Plug, 2008).
Conclusion
The analysis from Blombos shows several distinctive patterns. Interms of overall taxonomic representation, the faunal assemblage issimilar to several other coastal MSA sites in theWestern Cape, such
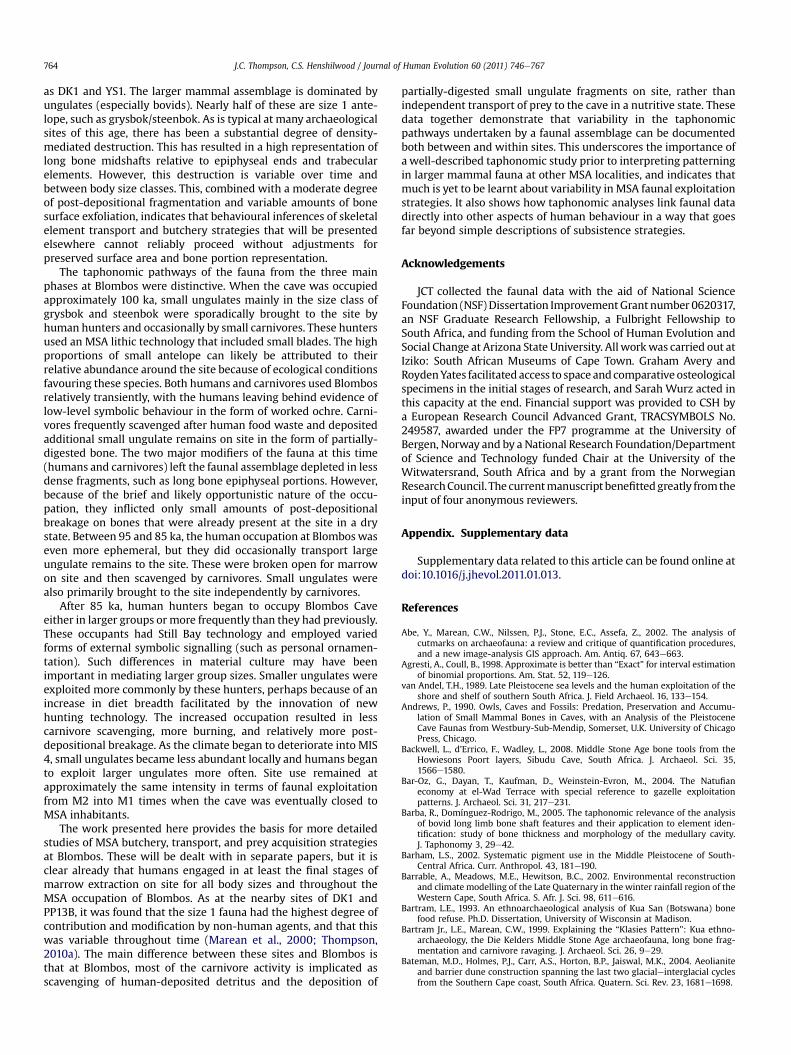
J.C. Thompson, C.S. Henshilwood / Journal of Human Evolution 60 (2011) 746e767764
as DK1 and YS1. The larger mammal assemblage is dominated byungulates (especially bovids). Nearly half of these are size 1 ante-lope, such as grysbok/steenbok. As is typical at many archaeologicalsites of this age, there has been a substantial degree of density-mediated destruction. This has resulted in a high representation oflong bone midshafts relative to epiphyseal ends and trabecularelements. However, this destruction is variable over time andbetween body size classes. This, combined with a moderate degreeof post-depositional fragmentation and variable amounts of bonesurface exfoliation, indicates that behavioural inferences of skeletalelement transport and butchery strategies that will be presentedelsewhere cannot reliably proceed without adjustments forpreserved surface area and bone portion representation.
The taphonomic pathways of the fauna from the three mainphases at Blombos were distinctive. When the cave was occupiedapproximately 100 ka, small ungulates mainly in the size class ofgrysbok and steenbok were sporadically brought to the site byhuman hunters and occasionally by small carnivores. These huntersused an MSA lithic technology that included small blades. The highproportions of small antelope can likely be attributed to theirrelative abundance around the site because of ecological conditionsfavouring these species. Both humans and carnivores used Blombosrelatively transiently, with the humans leaving behind evidence oflow-level symbolic behaviour in the form of worked ochre. Carni-vores frequently scavenged after human food waste and depositedadditional small ungulate remains on site in the form of partially-digested bone. The two major modifiers of the fauna at this time(humans and carnivores) left the faunal assemblage depleted in lessdense fragments, such as long bone epiphyseal portions. However,because of the brief and likely opportunistic nature of the occu-pation, they inflicted only small amounts of post-depositionalbreakage on bones that were already present at the site in a drystate. Between 95 and 85 ka, the human occupation at Blomboswaseven more ephemeral, but they did occasionally transport largeungulate remains to the site. These were broken open for marrowon site and then scavenged by carnivores. Small ungulates werealso primarily brought to the site independently by carnivores.
After 85 ka, human hunters began to occupy Blombos Caveeither in larger groups or more frequently than they had previously.These occupants had Still Bay technology and employed variedforms of external symbolic signalling (such as personal ornamen-tation). Such differences in material culture may have beenimportant in mediating larger group sizes. Smaller ungulates wereexploited more commonly by these hunters, perhaps because of anincrease in diet breadth facilitated by the innovation of newhunting technology. The increased occupation resulted in lesscarnivore scavenging, more burning, and relatively more post-depositional breakage. As the climate began to deteriorate into MIS4, small ungulates became less abundant locally and humans beganto exploit larger ungulates more often. Site use remained atapproximately the same intensity in terms of faunal exploitationfrom M2 into M1 times when the cave was eventually closed toMSA inhabitants.
The work presented here provides the basis for more detailedstudies of MSA butchery, transport, and prey acquisition strategiesat Blombos. These will be dealt with in separate papers, but it isclear already that humans engaged in at least the final stages ofmarrow extraction on site for all body sizes and throughout theMSA occupation of Blombos. As at the nearby sites of DK1 andPP13B, it was found that the size 1 fauna had the highest degree ofcontribution and modification by non-human agents, and that thiswas variable throughout time (Marean et al., 2000; Thompson,2010a). The main difference between these sites and Blombos isthat at Blombos, most of the carnivore activity is implicated asscavenging of human-deposited detritus and the deposition of
partially-digested small ungulate fragments on site, rather thanindependent transport of prey to the cave in a nutritive state. Thesedata together demonstrate that variability in the taphonomicpathways undertaken by a faunal assemblage can be documentedboth between and within sites. This underscores the importance ofa well-described taphonomic study prior to interpreting patterningin larger mammal fauna at other MSA localities, and indicates thatmuch is yet to be learnt about variability in MSA faunal exploitationstrategies. It also shows how taphonomic analyses link faunal datadirectly into other aspects of human behaviour in a way that goesfar beyond simple descriptions of subsistence strategies.
Acknowledgements
JCT collected the faunal data with the aid of National ScienceFoundation (NSF)Dissertation ImprovementGrant number 0620317,an NSF Graduate Research Fellowship, a Fulbright Fellowship toSouth Africa, and funding from the School of Human Evolution andSocial Change at Arizona State University. Allworkwas carried out atIziko: South African Museums of Cape Town. Graham Avery andRoydenYates facilitated access to space andcomparative osteologicalspecimens in the initial stages of research, and Sarah Wurz acted inthis capacity at the end. Financial support was provided to CSH bya European Research Council Advanced Grant, TRACSYMBOLS No.249587, awarded under the FP7 programme at the University ofBergen, Norway and by a National Research Foundation/Departmentof Science and Technology funded Chair at the University of theWitwatersrand, South Africa and by a grant from the NorwegianResearchCouncil. The currentmanuscript benefittedgreatly fromtheinput of four anonymous reviewers.
Appendix. Supplementary data
Supplementary data related to this article can be found online atdoi:10.1016/j.jhevol.2011.01.013.
References
Abe, Y., Marean, C.W., Nilssen, P.J., Stone, E.C., Assefa, Z., 2002. The analysis ofcutmarks on archaeofauna: a review and critique of quantification procedures,and a new image-analysis GIS approach. Am. Antiq. 67, 643e663.
Agresti, A., Coull, B., 1998. Approximate is better than “Exact” for interval estimationof binomial proportions. Am. Stat. 52, 119e126.
van Andel, T.H., 1989. Late Pleistocene sea levels and the human exploitation of theshore and shelf of southern South Africa. J. Field Archaeol. 16, 133e154.
Andrews, P., 1990. Owls, Caves and Fossils: Predation, Preservation and Accumu-lation of Small Mammal Bones in Caves, with an Analysis of the PleistoceneCave Faunas from Westbury-Sub-Mendip, Somerset, U.K. University of ChicagoPress, Chicago.
Backwell, L., d’Errico, F., Wadley, L., 2008. Middle Stone Age bone tools from theHowiesons Poort layers, Sibudu Cave, South Africa. J. Archaeol. Sci. 35,1566e1580.
Bar-Oz, G., Dayan, T., Kaufman, D., Weinstein-Evron, M., 2004. The Natufianeconomy at el-Wad Terrace with special reference to gazelle exploitationpatterns. J. Archaeol. Sci. 31, 217e231.
Barba, R., Domínguez-Rodrigo, M., 2005. The taphonomic relevance of the analysisof bovid long limb bone shaft features and their application to element iden-tification: study of bone thickness and morphology of the medullary cavity.J. Taphonomy 3, 29e42.
Barham, L.S., 2002. Systematic pigment use in the Middle Pleistocene of South-Central Africa. Curr. Anthropol. 43, 181e190.
Barrable, A., Meadows, M.E., Hewitson, B.C., 2002. Environmental reconstructionand climate modelling of the Late Quaternary in the winter rainfall region of theWestern Cape, South Africa. S. Afr. J. Sci. 98, 611e616.
Bartram, L.E., 1993. An ethnoarchaeological analysis of Kua San (Botswana) bonefood refuse. Ph.D. Dissertation, University of Wisconsin at Madison.
Bartram Jr., L.E., Marean, C.W., 1999. Explaining the “Klasies Pattern”: Kua ethno-archaeology, the Die Kelders Middle Stone Age archaeofauna, long bone frag-mentation and carnivore ravaging. J. Archaeol. Sci. 26, 9e29.
Bateman, M.D., Holmes, P.J., Carr, A.S., Horton, B.P., Jaiswal, M.K., 2004. Aeolianiteand barrier dune construction spanning the last two glacialeinterglacial cyclesfrom the Southern Cape coast, South Africa. Quatern. Sci. Rev. 23, 1681e1698.
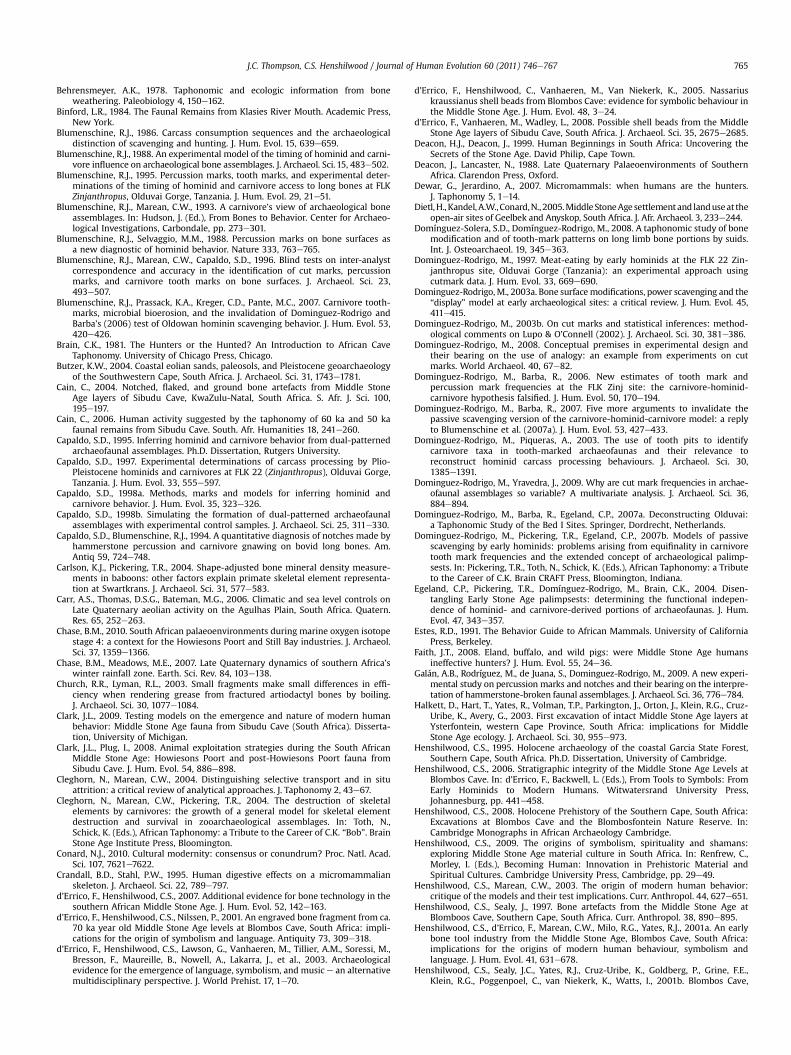
J.C. Thompson, C.S. Henshilwood / Journal of Human Evolution 60 (2011) 746e767 765
Behrensmeyer, A.K., 1978. Taphonomic and ecologic information from boneweathering. Paleobiology 4, 150e162.
Binford, L.R., 1984. The Faunal Remains from Klasies River Mouth. Academic Press,New York.
Blumenschine, R.J., 1986. Carcass consumption sequences and the archaeologicaldistinction of scavenging and hunting. J. Hum. Evol. 15, 639e659.
Blumenschine, R.J., 1988. An experimental model of the timing of hominid and carni-vore influence on archaeological bone assemblages. J. Archaeol. Sci. 15, 483e502.
Blumenschine, R.J., 1995. Percussion marks, tooth marks, and experimental deter-minations of the timing of hominid and carnivore access to long bones at FLKZinjanthropus, Olduvai Gorge, Tanzania. J. Hum. Evol. 29, 21e51.
Blumenschine, R.J., Marean, C.W., 1993. A carnivore’s view of archaeological boneassemblages. In: Hudson, J. (Ed.), From Bones to Behavior. Center for Archaeo-logical Investigations, Carbondale, pp. 273e301.
Blumenschine, R.J., Selvaggio, M.M., 1988. Percussion marks on bone surfaces asa new diagnostic of hominid behavior. Nature 333, 763e765.
Blumenschine, R.J., Marean, C.W., Capaldo, S.D., 1996. Blind tests on inter-analystcorrespondence and accuracy in the identification of cut marks, percussionmarks, and carnivore tooth marks on bone surfaces. J. Archaeol. Sci. 23,493e507.
Blumenschine, R.J., Prassack, K.A., Kreger, C.D., Pante, M.C., 2007. Carnivore tooth-marks, microbial bioerosion, and the invalidation of Dominguez-Rodrigo andBarba’s (2006) test of Oldowan hominin scavenging behavior. J. Hum. Evol. 53,420e426.
Brain, C.K., 1981. The Hunters or the Hunted? An Introduction to African CaveTaphonomy. University of Chicago Press, Chicago.
Butzer, K.W., 2004. Coastal eolian sands, paleosols, and Pleistocene geoarchaeologyof the Southwestern Cape, South Africa. J. Archaeol. Sci. 31, 1743e1781.
Cain, C., 2004. Notched, flaked, and ground bone artefacts from Middle StoneAge layers of Sibudu Cave, KwaZulu-Natal, South Africa. S. Afr. J. Sci. 100,195e197.
Cain, C., 2006. Human activity suggested by the taphonomy of 60 ka and 50 kafaunal remains from Sibudu Cave. South. Afr. Humanities 18, 241e260.
Capaldo, S.D., 1995. Inferring hominid and carnivore behavior from dual-patternedarchaeofaunal assemblages. Ph.D. Dissertation, Rutgers University.
Capaldo, S.D., 1997. Experimental determinations of carcass processing by Plio-Pleistocene hominids and carnivores at FLK 22 (Zinjanthropus), Olduvai Gorge,Tanzania. J. Hum. Evol. 33, 555e597.
Capaldo, S.D., 1998a. Methods, marks and models for inferring hominid andcarnivore behavior. J. Hum. Evol. 35, 323e326.
Capaldo, S.D., 1998b. Simulating the formation of dual-patterned archaeofaunalassemblages with experimental control samples. J. Archaeol. Sci. 25, 311e330.
Capaldo, S.D., Blumenschine, R.J., 1994. A quantitative diagnosis of notches made byhammerstone percussion and carnivore gnawing on bovid long bones. Am.Antiq 59, 724e748.
Carlson, K.J., Pickering, T.R., 2004. Shape-adjusted bone mineral density measure-ments in baboons: other factors explain primate skeletal element representa-tion at Swartkrans. J. Archaeol. Sci. 31, 577e583.
Carr, A.S., Thomas, D.S.G., Bateman, M.G., 2006. Climatic and sea level controls onLate Quaternary aeolian activity on the Agulhas Plain, South Africa. Quatern.Res. 65, 252e263.
Chase, B.M., 2010. South African palaeoenvironments during marine oxygen isotopestage 4: a context for the Howiesons Poort and Still Bay industries. J. Archaeol.Sci. 37, 1359e1366.
Chase, B.M., Meadows, M.E., 2007. Late Quaternary dynamics of southern Africa’swinter rainfall zone. Earth. Sci. Rev. 84, 103e138.
Church, R.R., Lyman, R.L., 2003. Small fragments make small differences in effi-ciency when rendering grease from fractured artiodactyl bones by boiling.J. Archaeol. Sci. 30, 1077e1084.
Clark, J.L., 2009. Testing models on the emergence and nature of modern humanbehavior: Middle Stone Age fauna from Sibudu Cave (South Africa). Disserta-tion, University of Michigan.
Clark, J.L., Plug, I., 2008. Animal exploitation strategies during the South AfricanMiddle Stone Age: Howiesons Poort and post-Howiesons Poort fauna fromSibudu Cave. J. Hum. Evol. 54, 886e898.
Cleghorn, N., Marean, C.W., 2004. Distinguishing selective transport and in situattrition: a critical review of analytical approaches. J. Taphonomy 2, 43e67.
Cleghorn, N., Marean, C.W., Pickering, T.R., 2004. The destruction of skeletalelements by carnivores: the growth of a general model for skeletal elementdestruction and survival in zooarchaeological assemblages. In: Toth, N.,Schick, K. (Eds.), African Taphonomy: a Tribute to the Career of C.K. “Bob”. BrainStone Age Institute Press, Bloomington.
Conard, N.J., 2010. Cultural modernity: consensus or conundrum? Proc. Natl. Acad.Sci. 107, 7621e7622.
Crandall, B.D., Stahl, P.W., 1995. Human digestive effects on a micromammalianskeleton. J. Archaeol. Sci. 22, 789e797.
d’Errico, F., Henshilwood, C.S., 2007. Additional evidence for bone technology in thesouthern African Middle Stone Age. J. Hum. Evol. 52, 142e163.
d’Errico, F., Henshilwood, C.S., Nilssen, P., 2001. An engraved bone fragment from ca.70 ka year old Middle Stone Age levels at Blombos Cave, South Africa: impli-cations for the origin of symbolism and language. Antiquity 73, 309e318.
d’Errico, F., Henshilwood, C.S., Lawson, G., Vanhaeren, M., Tillier, A.M., Soressi, M.,Bresson, F., Maureille, B., Nowell, A., Lakarra, J., et al., 2003. Archaeologicalevidence for the emergence of language, symbolism, and music e an alternativemultidisciplinary perspective. J. World Prehist. 17, 1e70.
d’Errico, F., Henshilwood, C., Vanhaeren, M., Van Niekerk, K., 2005. Nassariuskraussianus shell beads from Blombos Cave: evidence for symbolic behaviour inthe Middle Stone Age. J. Hum. Evol. 48, 3e24.
d’Errico, F., Vanhaeren, M., Wadley, L., 2008. Possible shell beads from the MiddleStone Age layers of Sibudu Cave, South Africa. J. Archaeol. Sci. 35, 2675e2685.
Deacon, H.J., Deacon, J., 1999. Human Beginnings in South Africa: Uncovering theSecrets of the Stone Age. David Philip, Cape Town.
Deacon, J., Lancaster, N., 1988. Late Quaternary Palaeoenvironments of SouthernAfrica. Clarendon Press, Oxford.
Dewar, G., Jerardino, A., 2007. Micromammals: when humans are the hunters.J. Taphonomy 5, 1e14.
Dietl,H., Kandel, A.W.,Conard,N.,2005.MiddleStoneAgesettlement and landuseat theopen-air sites of Geelbek and Anyskop, South Africa. J. Afr. Archaeol. 3, 233e244.
Domínguez-Solera, S.D., Domínguez-Rodrigo, M., 2008. A taphonomic study of bonemodification and of tooth-mark patterns on long limb bone portions by suids.Int. J. Osteoarchaeol. 19, 345e363.
Dominguez-Rodrigo, M., 1997. Meat-eating by early hominids at the FLK 22 Zin-janthropus site, Olduvai Gorge (Tanzania): an experimental approach usingcutmark data. J. Hum. Evol. 33, 669e690.
Dominguez-Rodrigo,M., 2003a. Bone surfacemodifications, power scavenging and the“display” model at early archaeological sites: a critical review. J. Hum. Evol. 45,411e415.
Dominguez-Rodrigo, M., 2003b. On cut marks and statistical inferences: method-ological comments on Lupo & O’Connell (2002). J. Archaeol. Sci. 30, 381e386.
Dominguez-Rodrigo, M., 2008. Conceptual premises in experimental design andtheir bearing on the use of analogy: an example from experiments on cutmarks. World Archaeol. 40, 67e82.
Dominguez-Rodrigo, M., Barba, R., 2006. New estimates of tooth mark andpercussion mark frequencies at the FLK Zinj site: the carnivore-hominid-carnivore hypothesis falsified. J. Hum. Evol. 50, 170e194.
Dominguez-Rodrigo, M., Barba, R., 2007. Five more arguments to invalidate thepassive scavenging version of the carnivore-hominid-carnivore model: a replyto Blumenschine et al. (2007a). J. Hum. Evol. 53, 427e433.
Dominguez-Rodrigo, M., Piqueras, A., 2003. The use of tooth pits to identifycarnivore taxa in tooth-marked archaeofaunas and their relevance toreconstruct hominid carcass processing behaviours. J. Archaeol. Sci. 30,1385e1391.
Dominguez-Rodrigo, M., Yravedra, J., 2009. Why are cut mark frequencies in archae-ofaunal assemblages so variable? A multivariate analysis. J. Archaeol. Sci. 36,884e894.
Dominguez-Rodrigo, M., Barba, R., Egeland, C.P., 2007a. Deconstructing Olduvai:a Taphonomic Study of the Bed I Sites. Springer, Dordrecht, Netherlands.
Dominguez-Rodrigo, M., Pickering, T.R., Egeland, C.P., 2007b. Models of passivescavenging by early hominids: problems arising from equifinality in carnivoretooth mark frequencies and the extended concept of archaeological palimp-sests. In: Pickering, T.R., Toth, N., Schick, K. (Eds.), African Taphonomy: a Tributeto the Career of C.K. Brain CRAFT Press, Bloomington, Indiana.
Egeland, C.P., Pickering, T.R., Domínguez-Rodrigo, M., Brain, C.K., 2004. Disen-tangling Early Stone Age palimpsests: determining the functional indepen-dence of hominid- and carnivore-derived portions of archaeofaunas. J. Hum.Evol. 47, 343e357.
Estes, R.D., 1991. The Behavior Guide to African Mammals. University of CaliforniaPress, Berkeley.
Faith, J.T., 2008. Eland, buffalo, and wild pigs: were Middle Stone Age humansineffective hunters? J. Hum. Evol. 55, 24e36.
Galán, A.B., Rodríguez, M., de Juana, S., Dominguez-Rodrigo, M., 2009. A new experi-mental study on percussion marks and notches and their bearing on the interpre-tation of hammerstone-broken faunal assemblages. J. Archaeol. Sci. 36, 776e784.
Halkett, D., Hart, T., Yates, R., Volman, T.P., Parkington, J., Orton, J., Klein, R.G., Cruz-Uribe, K., Avery, G., 2003. First excavation of intact Middle Stone Age layers atYsterfontein, western Cape Province, South Africa: implications for MiddleStone Age ecology. J. Archaeol. Sci. 30, 955e973.
Henshilwood, C.S., 1995. Holocene archaeology of the coastal Garcia State Forest,Southern Cape, South Africa. Ph.D. Dissertation, University of Cambridge.
Henshilwood, C.S., 2006. Stratigraphic integrity of the Middle Stone Age Levels atBlombos Cave. In: d’Errico, F., Backwell, L. (Eds.), From Tools to Symbols: FromEarly Hominids to Modern Humans. Witwatersrand University Press,Johannesburg, pp. 441e458.
Henshilwood, C.S., 2008. Holocene Prehistory of the Southern Cape, South Africa:Excavations at Blombos Cave and the Blombosfontein Nature Reserve. In:Cambridge Monographs in African Archaeology Cambridge.
Henshilwood, C.S., 2009. The origins of symbolism, spirituality and shamans:exploring Middle Stone Age material culture in South Africa. In: Renfrew, C.,Morley, I. (Eds.), Becoming Human: Innovation in Prehistoric Material andSpiritual Cultures. Cambridge University Press, Cambridge, pp. 29e49.
Henshilwood, C.S., Marean, C.W., 2003. The origin of modern human behavior:critique of the models and their test implications. Curr. Anthropol. 44, 627e651.
Henshilwood, C.S., Sealy, J., 1997. Bone artefacts from the Middle Stone Age atBlomboos Cave, Southern Cape, South Africa. Curr. Anthropol. 38, 890e895.
Henshilwood, C.S., d’Errico, F., Marean, C.W., Milo, R.G., Yates, R.J., 2001a. An earlybone tool industry from the Middle Stone Age, Blombos Cave, South Africa:implications for the origins of modern human behaviour, symbolism andlanguage. J. Hum. Evol. 41, 631e678.
Henshilwood, C.S., Sealy, J.C., Yates, R.J., Cruz-Uribe, K., Goldberg, P., Grine, F.E.,Klein, R.G., Poggenpoel, C., van Niekerk, K., Watts, I., 2001b. Blombos Cave,
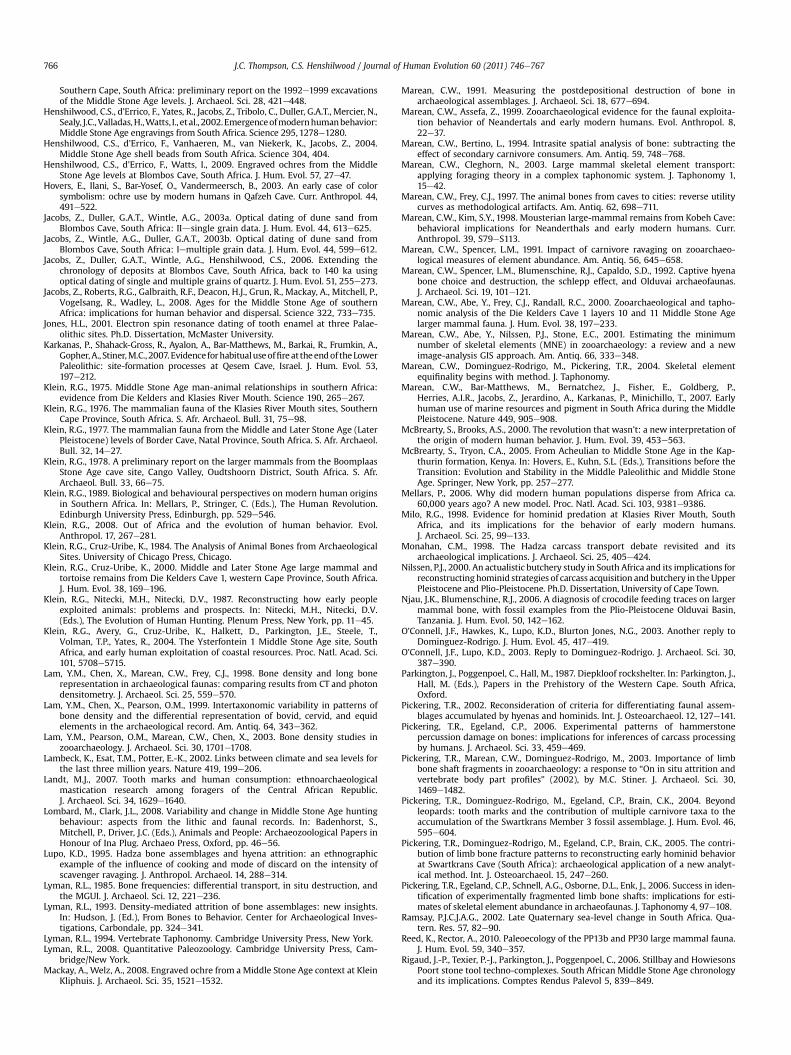
J.C. Thompson, C.S. Henshilwood / Journal of Human Evolution 60 (2011) 746e767766
Southern Cape, South Africa: preliminary report on the 1992e1999 excavationsof the Middle Stone Age levels. J. Archaeol. Sci. 28, 421e448.
Henshilwood, C.S., d’Errico, F., Yates, R., Jacobs, Z., Tribolo, C., Duller, G.A.T., Mercier, N.,Sealy, J.C.,Valladas,H.,Watts, I., et al., 2002.Emergenceofmodernhumanbehavior:Middle Stone Age engravings from South Africa. Science 295, 1278e1280.
Henshilwood, C.S., d’Errico, F., Vanhaeren, M., van Niekerk, K., Jacobs, Z., 2004.Middle Stone Age shell beads from South Africa. Science 304, 404.
Henshilwood, C.S., d’Errico, F., Watts, I., 2009. Engraved ochres from the MiddleStone Age levels at Blombos Cave, South Africa. J. Hum. Evol. 57, 27e47.
Hovers, E., Ilani, S., Bar-Yosef, O., Vandermeersch, B., 2003. An early case of colorsymbolism: ochre use by modern humans in Qafzeh Cave. Curr. Anthropol. 44,491e522.
Jacobs, Z., Duller, G.A.T., Wintle, A.G., 2003a. Optical dating of dune sand fromBlombos Cave, South Africa: IIdsingle grain data. J. Hum. Evol. 44, 613e625.
Jacobs, Z., Wintle, A.G., Duller, G.A.T., 2003b. Optical dating of dune sand fromBlombos Cave, South Africa: Iemultiple grain data. J. Hum. Evol. 44, 599e612.
Jacobs, Z., Duller, G.A.T., Wintle, A.G., Henshilwood, C.S., 2006. Extending thechronology of deposits at Blombos Cave, South Africa, back to 140 ka usingoptical dating of single and multiple grains of quartz. J. Hum. Evol. 51, 255e273.
Jacobs, Z., Roberts, R.G., Galbraith, R.F., Deacon, H.J., Grun, R., Mackay, A., Mitchell, P.,Vogelsang, R., Wadley, L., 2008. Ages for the Middle Stone Age of southernAfrica: implications for human behavior and dispersal. Science 322, 733e735.
Jones, H.L., 2001. Electron spin resonance dating of tooth enamel at three Palae-olithic sites. Ph.D. Dissertation, McMaster University.
Karkanas, P., Shahack-Gross, R., Ayalon, A., Bar-Matthews, M., Barkai, R., Frumkin, A.,Gopher,A., Stiner,M.C., 2007. Evidence forhabitualuseoffire at theendof theLowerPaleolithic: site-formation processes at Qesem Cave, Israel. J. Hum. Evol. 53,197e212.
Klein, R.G., 1975. Middle Stone Age man-animal relationships in southern Africa:evidence from Die Kelders and Klasies River Mouth. Science 190, 265e267.
Klein, R.G., 1976. The mammalian fauna of the Klasies River Mouth sites, SouthernCape Province, South Africa. S. Afr. Archaeol. Bull. 31, 75e98.
Klein, R.G., 1977. The mammalian fauna from the Middle and Later Stone Age (LaterPleistocene) levels of Border Cave, Natal Province, South Africa. S. Afr. Archaeol.Bull. 32, 14e27.
Klein, R.G., 1978. A preliminary report on the larger mammals from the BoomplaasStone Age cave site, Cango Valley, Oudtshoorn District, South Africa. S. Afr.Archaeol. Bull. 33, 66e75.
Klein, R.G., 1989. Biological and behavioural perspectives on modern human originsin Southern Africa. In: Mellars, P., Stringer, C. (Eds.), The Human Revolution.Edinburgh University Press, Edinburgh, pp. 529e546.
Klein, R.G., 2008. Out of Africa and the evolution of human behavior. Evol.Anthropol. 17, 267e281.
Klein, R.G., Cruz-Uribe, K., 1984. The Analysis of Animal Bones from ArchaeologicalSites. University of Chicago Press, Chicago.
Klein, R.G., Cruz-Uribe, K., 2000. Middle and Later Stone Age large mammal andtortoise remains from Die Kelders Cave 1, western Cape Province, South Africa.J. Hum. Evol. 38, 169e196.
Klein, R.G., Nitecki, M.H., Nitecki, D.V., 1987. Reconstructing how early peopleexploited animals: problems and prospects. In: Nitecki, M.H., Nitecki, D.V.(Eds.), The Evolution of Human Hunting. Plenum Press, New York, pp. 11e45.
Klein, R.G., Avery, G., Cruz-Uribe, K., Halkett, D., Parkington, J.E., Steele, T.,Volman, T.P., Yates, R., 2004. The Ysterfontein 1 Middle Stone Age site, SouthAfrica, and early human exploitation of coastal resources. Proc. Natl. Acad. Sci.101, 5708e5715.
Lam, Y.M., Chen, X., Marean, C.W., Frey, C.J., 1998. Bone density and long bonerepresentation in archaeological faunas: comparing results from CT and photondensitometry. J. Archaeol. Sci. 25, 559e570.
Lam, Y.M., Chen, X., Pearson, O.M., 1999. Intertaxonomic variability in patterns ofbone density and the differential representation of bovid, cervid, and equidelements in the archaeological record. Am. Antiq. 64, 343e362.
Lam, Y.M., Pearson, O.M., Marean, C.W., Chen, X., 2003. Bone density studies inzooarchaeology. J. Archaeol. Sci. 30, 1701e1708.
Lambeck, K., Esat, T.M., Potter, E.-K., 2002. Links between climate and sea levels forthe last three million years. Nature 419, 199e206.
Landt, M.J., 2007. Tooth marks and human consumption: ethnoarchaeologicalmastication research among foragers of the Central African Republic.J. Archaeol. Sci. 34, 1629e1640.
Lombard, M., Clark, J.L., 2008. Variability and change in Middle Stone Age huntingbehaviour: aspects from the lithic and faunal records. In: Badenhorst, S.,Mitchell, P., Driver, J.C. (Eds.), Animals and People: Archaeozoological Papers inHonour of Ina Plug. Archaeo Press, Oxford, pp. 46e56.
Lupo, K.D., 1995. Hadza bone assemblages and hyena attrition: an ethnographicexample of the influence of cooking and mode of discard on the intensity ofscavenger ravaging. J. Anthropol. Archaeol. 14, 288e314.
Lyman, R.L., 1985. Bone frequencies: differential transport, in situ destruction, andthe MGUI. J. Archaeol. Sci. 12, 221e236.
Lyman, R.L., 1993. Density-mediated attrition of bone assemblages: new insights.In: Hudson, J. (Ed.), From Bones to Behavior. Center for Archaeological Inves-tigations, Carbondale, pp. 324e341.
Lyman, R.L., 1994. Vertebrate Taphonomy. Cambridge University Press, New York.Lyman, R.L., 2008. Quantitative Paleozoology. Cambridge University Press, Cam-
bridge/New York.Mackay, A., Welz, A., 2008. Engraved ochre from a Middle Stone Age context at Klein
Kliphuis. J. Archaeol. Sci. 35, 1521e1532.
Marean, C.W., 1991. Measuring the postdepositional destruction of bone inarchaeological assemblages. J. Archaeol. Sci. 18, 677e694.
Marean, C.W., Assefa, Z., 1999. Zooarchaeological evidence for the faunal exploita-tion behavior of Neandertals and early modern humans. Evol. Anthropol. 8,22e37.
Marean, C.W., Bertino, L., 1994. Intrasite spatial analysis of bone: subtracting theeffect of secondary carnivore consumers. Am. Antiq. 59, 748e768.
Marean, C.W., Cleghorn, N., 2003. Large mammal skeletal element transport:applying foraging theory in a complex taphonomic system. J. Taphonomy 1,15e42.
Marean, C.W., Frey, C.J., 1997. The animal bones from caves to cities: reverse utilitycurves as methodological artifacts. Am. Antiq. 62, 698e711.
Marean, C.W., Kim, S.Y., 1998. Mousterian large-mammal remains from Kobeh Cave:behavioral implications for Neanderthals and early modern humans. Curr.Anthropol. 39, S79eS113.
Marean, C.W., Spencer, L.M., 1991. Impact of carnivore ravaging on zooarchaeo-logical measures of element abundance. Am. Antiq. 56, 645e658.
Marean, C.W., Spencer, L.M., Blumenschine, R.J., Capaldo, S.D., 1992. Captive hyenabone choice and destruction, the schlepp effect, and Olduvai archaeofaunas.J. Archaeol. Sci. 19, 101e121.
Marean, C.W., Abe, Y., Frey, C.J., Randall, R.C., 2000. Zooarchaeological and tapho-nomic analysis of the Die Kelders Cave 1 layers 10 and 11 Middle Stone Agelarger mammal fauna. J. Hum. Evol. 38, 197e233.
Marean, C.W., Abe, Y., Nilssen, P.J., Stone, E.C., 2001. Estimating the minimumnumber of skeletal elements (MNE) in zooarchaeology: a review and a newimage-analysis GIS approach. Am. Antiq. 66, 333e348.
Marean, C.W., Dominguez-Rodrigo, M., Pickering, T.R., 2004. Skeletal elementequifinality begins with method. J. Taphonomy.
Marean, C.W., Bar-Matthews, M., Bernatchez, J., Fisher, E., Goldberg, P.,Herries, A.I.R., Jacobs, Z., Jerardino, A., Karkanas, P., Minichillo, T., 2007. Earlyhuman use of marine resources and pigment in South Africa during the MiddlePleistocene. Nature 449, 905e908.
McBrearty, S., Brooks, A.S., 2000. The revolution that wasn’t: a new interpretation ofthe origin of modern human behavior. J. Hum. Evol. 39, 453e563.
McBrearty, S., Tryon, C.A., 2005. From Acheulian to Middle Stone Age in the Kap-thurin formation, Kenya. In: Hovers, E., Kuhn, S.L. (Eds.), Transitions before theTransition: Evolution and Stability in the Middle Paleolithic and Middle StoneAge. Springer, New York, pp. 257e277.
Mellars, P., 2006. Why did modern human populations disperse from Africa ca.60,000 years ago? A new model. Proc. Natl. Acad. Sci. 103, 9381e9386.
Milo, R.G., 1998. Evidence for hominid predation at Klasies River Mouth, SouthAfrica, and its implications for the behavior of early modern humans.J. Archaeol. Sci. 25, 99e133.
Monahan, C.M., 1998. The Hadza carcass transport debate revisited and itsarchaeological implications. J. Archaeol. Sci. 25, 405e424.
Nilssen, P.J., 2000. An actualistic butchery study in South Africa and its implications forreconstructinghominid strategies of carcass acquisition and butchery in theUpperPleistocene and Plio-Pleistocene. Ph.D. Dissertation, University of Cape Town.
Njau, J.K., Blumenschine, R.J., 2006. A diagnosis of crocodile feeding traces on largermammal bone, with fossil examples from the Plio-Pleistocene Olduvai Basin,Tanzania. J. Hum. Evol. 50, 142e162.
O’Connell, J.F., Hawkes, K., Lupo, K.D., Blurton Jones, N.G., 2003. Another reply toDominguez-Rodrigo. J. Hum. Evol. 45, 417e419.
O’Connell, J.F., Lupo, K.D., 2003. Reply to Dominguez-Rodrigo. J. Archaeol. Sci. 30,387e390.
Parkington, J., Poggenpoel, C., Hall, M., 1987. Diepkloof rockshelter. In: Parkington, J.,Hall, M. (Eds.), Papers in the Prehistory of the Western Cape. South Africa,Oxford.
Pickering, T.R., 2002. Reconsideration of criteria for differentiating faunal assem-blages accumulated by hyenas and hominids. Int. J. Osteoarchaeol. 12, 127e141.
Pickering, T.R., Egeland, C.P., 2006. Experimental patterns of hammerstonepercussion damage on bones: implications for inferences of carcass processingby humans. J. Archaeol. Sci. 33, 459e469.
Pickering, T.R., Marean, C.W., Dominguez-Rodrigo, M., 2003. Importance of limbbone shaft fragments in zooarchaeology: a response to “On in situ attrition andvertebrate body part profiles” (2002), by M.C. Stiner. J. Archaeol. Sci. 30,1469e1482.
Pickering, T.R., Dominguez-Rodrigo, M., Egeland, C.P., Brain, C.K., 2004. Beyondleopards: tooth marks and the contribution of multiple carnivore taxa to theaccumulation of the Swartkrans Member 3 fossil assemblage. J. Hum. Evol. 46,595e604.
Pickering, T.R., Dominguez-Rodrigo, M., Egeland, C.P., Brain, C.K., 2005. The contri-bution of limb bone fracture patterns to reconstructing early hominid behaviorat Swartkrans Cave (South Africa): archaeological application of a new analyt-ical method. Int. J. Osteoarchaeol. 15, 247e260.
Pickering, T.R., Egeland, C.P., Schnell, A.G., Osborne, D.L., Enk, J., 2006. Success in iden-tification of experimentally fragmented limb bone shafts: implications for esti-mates of skeletal element abundance in archaeofaunas. J. Taphonomy 4, 97e108.
Ramsay, P.J.C.J.A.G., 2002. Late Quaternary sea-level change in South Africa. Qua-tern. Res. 57, 82e90.
Reed, K., Rector, A., 2010. Paleoecology of the PP13b and PP30 large mammal fauna.J. Hum. Evol. 59, 340e357.
Rigaud, J.-P., Texier, P.-J., Parkington, J., Poggenpoel, C., 2006. Stillbay and HowiesonsPoort stone tool techno-complexes. South African Middle Stone Age chronologyand its implications. Comptes Rendus Palevol 5, 839e849.
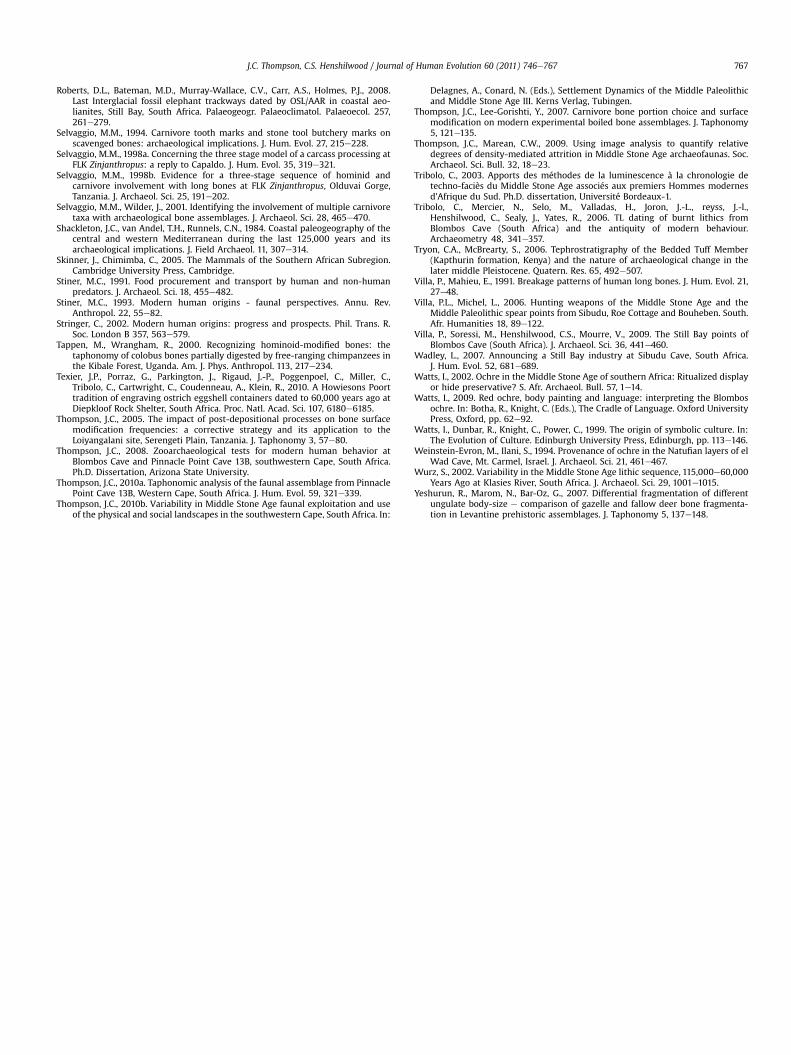
J.C. Thompson, C.S. Henshilwood / Journal of Human Evolution 60 (2011) 746e767 767
Roberts, D.L., Bateman, M.D., Murray-Wallace, C.V., Carr, A.S., Holmes, P.J., 2008.Last Interglacial fossil elephant trackways dated by OSL/AAR in coastal aeo-lianites, Still Bay, South Africa. Palaeogeogr. Palaeoclimatol. Palaeoecol. 257,261e279.
Selvaggio, M.M., 1994. Carnivore tooth marks and stone tool butchery marks onscavenged bones: archaeological implications. J. Hum. Evol. 27, 215e228.
Selvaggio, M.M., 1998a. Concerning the three stage model of a carcass processing atFLK Zinjanthropus: a reply to Capaldo. J. Hum. Evol. 35, 319e321.
Selvaggio, M.M., 1998b. Evidence for a three-stage sequence of hominid andcarnivore involvement with long bones at FLK Zinjanthropus, Olduvai Gorge,Tanzania. J. Archaeol. Sci. 25, 191e202.
Selvaggio, M.M., Wilder, J., 2001. Identifying the involvement of multiple carnivoretaxa with archaeological bone assemblages. J. Archaeol. Sci. 28, 465e470.
Shackleton, J.C., van Andel, T.H., Runnels, C.N., 1984. Coastal paleogeography of thecentral and western Mediterranean during the last 125,000 years and itsarchaeological implications. J. Field Archaeol. 11, 307e314.
Skinner, J., Chimimba, C., 2005. The Mammals of the Southern African Subregion.Cambridge University Press, Cambridge.
Stiner, M.C., 1991. Food procurement and transport by human and non-humanpredators. J. Archaeol. Sci. 18, 455e482.
Stiner, M.C., 1993. Modern human origins - faunal perspectives. Annu. Rev.Anthropol. 22, 55e82.
Stringer, C., 2002. Modern human origins: progress and prospects. Phil. Trans. R.Soc. London B 357, 563e579.
Tappen, M., Wrangham, R., 2000. Recognizing hominoid-modified bones: thetaphonomy of colobus bones partially digested by free-ranging chimpanzees inthe Kibale Forest, Uganda. Am. J. Phys. Anthropol. 113, 217e234.
Texier, J.P., Porraz, G., Parkington, J., Rigaud, J.-P., Poggenpoel, C., Miller, C.,Tribolo, C., Cartwright, C., Coudenneau, A., Klein, R., 2010. A Howiesons Poorttradition of engraving ostrich eggshell containers dated to 60,000 years ago atDiepkloof Rock Shelter, South Africa. Proc. Natl. Acad. Sci. 107, 6180e6185.
Thompson, J.C., 2005. The impact of post-depositional processes on bone surfacemodification frequencies: a corrective strategy and its application to theLoiyangalani site, Serengeti Plain, Tanzania. J. Taphonomy 3, 57e80.
Thompson, J.C., 2008. Zooarchaeological tests for modern human behavior atBlombos Cave and Pinnacle Point Cave 13B, southwestern Cape, South Africa.Ph.D. Dissertation, Arizona State University.
Thompson, J.C., 2010a. Taphonomic analysis of the faunal assemblage from PinnaclePoint Cave 13B, Western Cape, South Africa. J. Hum. Evol. 59, 321e339.
Thompson, J.C., 2010b. Variability in Middle Stone Age faunal exploitation and useof the physical and social landscapes in the southwestern Cape, South Africa. In:
Delagnes, A., Conard, N. (Eds.), Settlement Dynamics of the Middle Paleolithicand Middle Stone Age III. Kerns Verlag, Tubingen.
Thompson, J.C., Lee-Gorishti, Y., 2007. Carnivore bone portion choice and surfacemodification on modern experimental boiled bone assemblages. J. Taphonomy5, 121e135.
Thompson, J.C., Marean, C.W., 2009. Using image analysis to quantify relativedegrees of density-mediated attrition in Middle Stone Age archaeofaunas. Soc.Archaeol. Sci. Bull. 32, 18e23.
Tribolo, C., 2003. Apports des méthodes de la luminescence à la chronologie detechno-faciès du Middle Stone Age associés aux premiers Hommes modernesd’Afrique du Sud. Ph.D. dissertation, Université Bordeaux-1.
Tribolo, C., Mercier, N., Selo, M., Valladas, H., Joron, J.-L., reyss, J.-l.,Henshilwood, C., Sealy, J., Yates, R., 2006. TL dating of burnt lithics fromBlombos Cave (South Africa) and the antiquity of modern behaviour.Archaeometry 48, 341e357.
Tryon, C.A., McBrearty, S., 2006. Tephrostratigraphy of the Bedded Tuff Member(Kapthurin formation, Kenya) and the nature of archaeological change in thelater middle Pleistocene. Quatern. Res. 65, 492e507.
Villa, P., Mahieu, E., 1991. Breakage patterns of human long bones. J. Hum. Evol. 21,27e48.
Villa, P.L., Michel, L., 2006. Hunting weapons of the Middle Stone Age and theMiddle Paleolithic spear points from Sibudu, Roe Cottage and Bouheben. South.Afr. Humanities 18, 89e122.
Villa, P., Soressi, M., Henshilwood, C.S., Mourre, V., 2009. The Still Bay points ofBlombos Cave (South Africa). J. Archaeol. Sci. 36, 441e460.
Wadley, L., 2007. Announcing a Still Bay industry at Sibudu Cave, South Africa.J. Hum. Evol. 52, 681e689.
Watts, I., 2002. Ochre in the Middle Stone Age of southern Africa: Ritualized displayor hide preservative? S. Afr. Archaeol. Bull. 57, 1e14.
Watts, I., 2009. Red ochre, body painting and language: interpreting the Blombosochre. In: Botha, R., Knight, C. (Eds.), The Cradle of Language. Oxford UniversityPress, Oxford, pp. 62e92.
Watts, I., Dunbar, R., Knight, C., Power, C., 1999. The origin of symbolic culture. In:The Evolution of Culture. Edinburgh University Press, Edinburgh, pp. 113e146.
Weinstein-Evron, M., Ilani, S., 1994. Provenance of ochre in the Natufian layers of elWad Cave, Mt. Carmel, Israel. J. Archaeol. Sci. 21, 461e467.
Wurz, S., 2002. Variability in the Middle Stone Age lithic sequence, 115,000e60,000Years Ago at Klasies River, South Africa. J. Archaeol. Sci. 29, 1001e1015.
Yeshurun, R., Marom, N., Bar-Oz, G., 2007. Differential fragmentation of differentungulate body-size e comparison of gazelle and fallow deer bone fragmenta-tion in Levantine prehistoric assemblages. J. Taphonomy 5, 137e148.