2008-09 approved budget introduction - city of boulder
TRANSCRIPT
2008-09 BUDGET City of Boulder, Colorado
Volume I
2008-2009 BUDGET DOCUMENT
OVERVIEW AND OPERATING BUDGET City of Boulder
Mayor ........................................................Mark Ruzzin (term ended November 20, 2007)
Deputy Mayor ...................................................................................... Suzy Ageton
Council Members .................................................................... Matthew Appelbaum (term began November 20, 2007) Robin Bohannan (term ended November 20, 2007) Macon Cowles (term began November 20, 2007) Angelique Espinoza (term began November 20, 2007) Crystal Gray – Incoming Deputy Mayor Shaun McGrath – Incoming Mayor Lisa Morzel (term began November 20, 2007) Susan Osborne (term began November 20, 2007) Richard Polk (term ended November 20, 2007) Andy Schultheiss (resigned as of August, 2007) Jack Stoakes (term ended November 20, 2007) Ken Wilson City Manager...................................................................................Frank W. Bruno
CITY OF BOULDER STAFF
City Manager .........................................................................................................................................Frank W. Bruno
Deputy City Manager ....................................................................................................................... Stephanie Grainger
Deputy City Manager ................................................................................................................................. Kevin Burke
Acting City Attorney ..................................................................................................................................Jerry Gordon
Municipal Judge ..................................................................................................................................... Linda P. Cooke
Director of Finance ...................................................................................................................................... Bob Eichem
Co Directors of Housing and Human Services .................................................................. John Pollak and Karen Rahn
Director of Human Resources................................................................................................................... Eileen Gomez
Acting Director of Information Technology ..............................................................................................Francis Duffy
Library/Arts Director ............................................................................................................................Elizabeth Abbott
Director of Open Space/Mountain Parks .................................................................................................Michael Patton
Director of Parks and Recreation................................................................................................................Janice Geden
Acting Director of Planning....................................................................................................................Ruth McHeyser
Director of Public Works for Development & Support Services ...........................................................Maureen F. Rait
Director of Public Works for Transportation ............................................................................................Tracy Winfree
Director of Public Works for Utilities .......................................................................................................Ned Williams
Fire Chief................................................................................................................................................... Larry Donner
Police Chief ......................................................................................................................................... Mark R. Beckner
Director of Downtown University Hill Management Division/Parking Services ...................................... Molly Winter
Director of Support Services/City Clerk..................................................................................................Alisa D. Lewis
Budget Office Staff
Budget Officer ........................................................................................................................................Kathy McGuire
Budget Analysis Manager.............................................................................................................................. Jim Reasor
Budget Analyst ........................................................................................................................................... Cindy Miller
2008-09 BUDGET DOCUMENT
OVERVIEW AND OPERATING BUDGET TABLE OF CONTENTS Page OPERATING BUDGET INTRODUCTION
History of Boulder ............................................................................................................................................1
Organizational Chart .........................................................................................................................................5
Budget Philosophy & Process...........................................................................................................................7
CITY MANAGER’S BUDGET MESSAGE
2008-09 Budget Message................................................................................................................................15
City Council Direction on the Recommended Budget ....................................................................................43
CITY COUNCIL GOALS
City Council Goals..........................................................................................................................................49
BUDGET POLICIES
Citywide Financial and Management Policies ................................................................................................51
City of Boulder Reserve Policies ....................................................................................................................59
CITYWIDE SUMMARIES
Graphic of 2008 Budget..................................................................................................................................65
Budget Summary.............................................................................................................................................67
Summary of Sources of Funds ........................................................................................................................73
Summary of Uses of Funds .............................................................................................................................81
Summary of Interfund Transfers .....................................................................................................................89
2008 Fund Activity Summary – Original Budget ...........................................................................................93
Changes in Fund Balance................................................................................................................................95
Summary of Standard FTEs ............................................................................................................................96
Debt Policy and Administration......................................................................................................................97
Debt Service ...................................................................................................................................................98
Legal Debt Margins ...................................................................................................................................... 115
DEPARTMENT OVERVIEWS
City Council ................................................................................................................................................. 117
City Attorney ................................................................................................................................................ 121
Municipal Court ............................................................................................................................................ 127
Page
Administrative Services
City Manager...................................................................................................................................... 133
City Manager’s Office ............................................................................................................. 134
Manager’s Contingency........................................................................................................... 143
Non-Departmental Contracts and Citywide Programs............................................................. 144
Finance ............................................................................................................................................... 145
Human Resources............................................................................................................................... 151
Information Technology..................................................................................................................... 159
Economic Vitality
DUHMD/Parking Services................................................................................................................. 165
Economic Vitality & Urban Redevelopment...................................................................................... 171
Operations
Housing and Human Services ............................................................................................................ 173
Library/Arts........................................................................................................................................ 183
Office of Environmental Affairs......................................................................................................... 195
Open Space and Mountain Parks........................................................................................................ 201
Parks and Recreation.......................................................................................................................... 209
Planning ............................................................................................................................................. 219
Public Works ..................................................................................................................................... 223
Development and Support Services ......................................................................................... 227
Transportation ......................................................................................................................... 235
Utilities .................................................................................................................................... 247
Planning & Development Services..................................................................................................... 255
Public Safety
Fire ................................................................................................................................................. 267
Police ................................................................................................................................................. 273
FUND FINANCIALS General Fund................................................................................................................................................. 281
CHAP Fund ................................................................................................................................................. 285
Capital Development Fund ........................................................................................................................... 286
Lottery Fund ................................................................................................................................................. 287
Planning & Development Services Fund ...................................................................................................... 288
.25 Cent Sales Tax Fund ............................................................................................................................... 289
Affordable Housing Fund ............................................................................................................................. 290
Library Fund ................................................................................................................................................. 292
Recreation Activity Fund .............................................................................................................................. 293
Page
Climate Action Plan Fund............................................................................................................................. 294
Open Space Fund .......................................................................................................................................... 295
Airport Fund ................................................................................................................................................. 296
Transportation Fund...................................................................................................................................... 298
Transportation Development Fund................................................................................................................ 300
Transit Pass General Improvement District – Forest Glen Fund................................................................... 301
Community Development Block Grant (CDBG) Fund ................................................................................ 302
HOME Fund ................................................................................................................................................. 303
Water Utility Fund ........................................................................................................................................ 304
Wastewater Utility Fund ............................................................................................................................... 306
Stormwater/Flood Management Utility Fund ............................................................................................... 308
Downtown Commercial District Fund .......................................................................................................... 310
University Hill Commercial District Fund .................................................................................................... 312
Permanent Parks & Recreation Fund ............................................................................................................ 314
Telecommunications Fund ............................................................................................................................ 315
Property & Casualty Insurance Fund ............................................................................................................ 316
Workers’ Compensation Fund ...................................................................................................................... 317
Compensated Absences Fund ....................................................................................................................... 318
Fleet Operations Fund................................................................................................................................... 319
Fleet Replacement Fund................................................................................................................................ 320
Computer Replacement Fund........................................................................................................................ 321
Equipment Replacement Fund ...................................................................................................................... 322
Facility Renovation & Replacement Fund .................................................................................................... 323
UTILITY RATES Utility Rates ................................................................................................................................................. 325
APPROPRIATION ORDINANCE Appropriation Ordinance .............................................................................................................................. 329
APPENDIX Appendix A: Summary of Standard FTEs by Department and Program...................................................... 337

Introduction
CITY OF BOULDER 2008-09 BUDGET
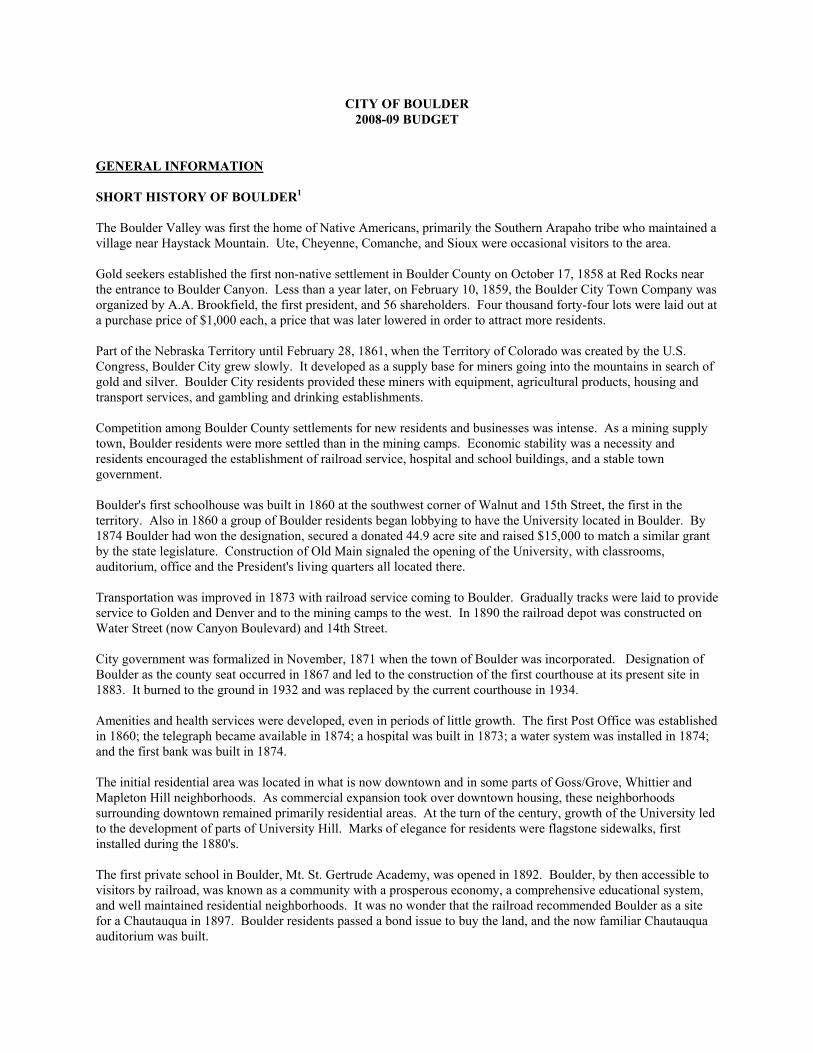
GENERAL INFORMATION SHORT HISTORY OF BOULDER1 The Boulder Valley was first the home of Native Americans, primarily the Southern Arapaho tribe who maintained a village near Haystack Mountain. Ute, Cheyenne, Comanche, and Sioux were occasional visitors to the area.
Gold seekers established the first non-native settlement in Boulder County on October 17, 1858 at Red Rocks near the entrance to Boulder Canyon. Less than a year later, on February 10, 1859, the Boulder City Town Company was organized by A.A. Brookfield, the first president, and 56 shareholders. Four thousand forty-four lots were laid out at a purchase price of $1,000 each, a price that was later lowered in order to attract more residents.
Part of the Nebraska Territory until February 28, 1861, when the Territory of Colorado was created by the U.S. Congress, Boulder City grew slowly. It developed as a supply base for miners going into the mountains in search of gold and silver. Boulder City residents provided these miners with equipment, agricultural products, housing and transport services, and gambling and drinking establishments. Competition among Boulder County settlements for new residents and businesses was intense. As a mining supply town, Boulder residents were more settled than in the mining camps. Economic stability was a necessity and residents encouraged the establishment of railroad service, hospital and school buildings, and a stable town government. Boulder's first schoolhouse was built in 1860 at the southwest corner of Walnut and 15th Street, the first in the territory. Also in 1860 a group of Boulder residents began lobbying to have the University located in Boulder. By 1874 Boulder had won the designation, secured a donated 44.9 acre site and raised $15,000 to match a similar grant by the state legislature. Construction of Old Main signaled the opening of the University, with classrooms, auditorium, office and the President's living quarters all located there. Transportation was improved in 1873 with railroad service coming to Boulder. Gradually tracks were laid to provide service to Golden and Denver and to the mining camps to the west. In 1890 the railroad depot was constructed on Water Street (now Canyon Boulevard) and 14th Street. City government was formalized in November, 1871 when the town of Boulder was incorporated. Designation of Boulder as the county seat occurred in 1867 and led to the construction of the first courthouse at its present site in 1883. It burned to the ground in 1932 and was replaced by the current courthouse in 1934. Amenities and health services were developed, even in periods of little growth. The first Post Office was established in 1860; the telegraph became available in 1874; a hospital was built in 1873; a water system was installed in 1874; and the first bank was built in 1874. The initial residential area was located in what is now downtown and in some parts of Goss/Grove, Whittier and Mapleton Hill neighborhoods. As commercial expansion took over downtown housing, these neighborhoods surrounding downtown remained primarily residential areas. At the turn of the century, growth of the University led to the development of parts of University Hill. Marks of elegance for residents were flagstone sidewalks, first installed during the 1880's.
The first private school in Boulder, Mt. St. Gertrude Academy, was opened in 1892. Boulder, by then accessible to visitors by railroad, was known as a community with a prosperous economy, a comprehensive educational system, and well maintained residential neighborhoods. It was no wonder that the railroad recommended Boulder as a site for a Chautauqua in 1897. Boulder residents passed a bond issue to buy the land, and the now familiar Chautauqua auditorium was built.
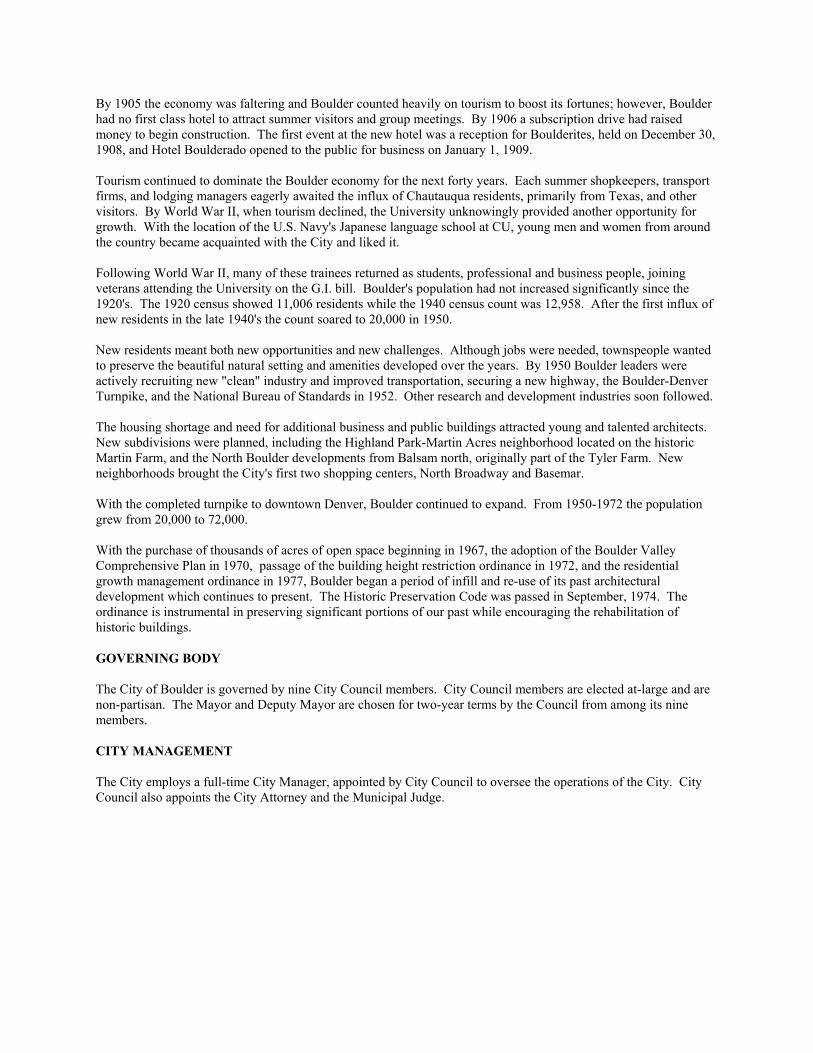
By 1905 the economy was faltering and Boulder counted heavily on tourism to boost its fortunes; however, Boulder had no first class hotel to attract summer visitors and group meetings. By 1906 a subscription drive had raised money to begin construction. The first event at the new hotel was a reception for Boulderites, held on December 30, 1908, and Hotel Boulderado opened to the public for business on January 1, 1909. Tourism continued to dominate the Boulder economy for the next forty years. Each summer shopkeepers, transport firms, and lodging managers eagerly awaited the influx of Chautauqua residents, primarily from Texas, and other visitors. By World War II, when tourism declined, the University unknowingly provided another opportunity for growth. With the location of the U.S. Navy's Japanese language school at CU, young men and women from around the country became acquainted with the City and liked it. Following World War II, many of these trainees returned as students, professional and business people, joining veterans attending the University on the G.I. bill. Boulder's population had not increased significantly since the 1920's. The 1920 census showed 11,006 residents while the 1940 census count was 12,958. After the first influx of new residents in the late 1940's the count soared to 20,000 in 1950. New residents meant both new opportunities and new challenges. Although jobs were needed, townspeople wanted to preserve the beautiful natural setting and amenities developed over the years. By 1950 Boulder leaders were actively recruiting new "clean" industry and improved transportation, securing a new highway, the Boulder-Denver Turnpike, and the National Bureau of Standards in 1952. Other research and development industries soon followed. The housing shortage and need for additional business and public buildings attracted young and talented architects. New subdivisions were planned, including the Highland Park-Martin Acres neighborhood located on the historic Martin Farm, and the North Boulder developments from Balsam north, originally part of the Tyler Farm. New neighborhoods brought the City's first two shopping centers, North Broadway and Basemar. With the completed turnpike to downtown Denver, Boulder continued to expand. From 1950-1972 the population grew from 20,000 to 72,000. With the purchase of thousands of acres of open space beginning in 1967, the adoption of the Boulder Valley Comprehensive Plan in 1970, passage of the building height restriction ordinance in 1972, and the residential growth management ordinance in 1977, Boulder began a period of infill and re-use of its past architectural development which continues to present. The Historic Preservation Code was passed in September, 1974. The ordinance is instrumental in preserving significant portions of our past while encouraging the rehabilitation of historic buildings. GOVERNING BODY The City of Boulder is governed by nine City Council members. City Council members are elected at-large and are non-partisan. The Mayor and Deputy Mayor are chosen for two-year terms by the Council from among its nine members. CITY MANAGEMENT The City employs a full-time City Manager, appointed by City Council to oversee the operations of the City. City Council also appoints the City Attorney and the Municipal Judge.
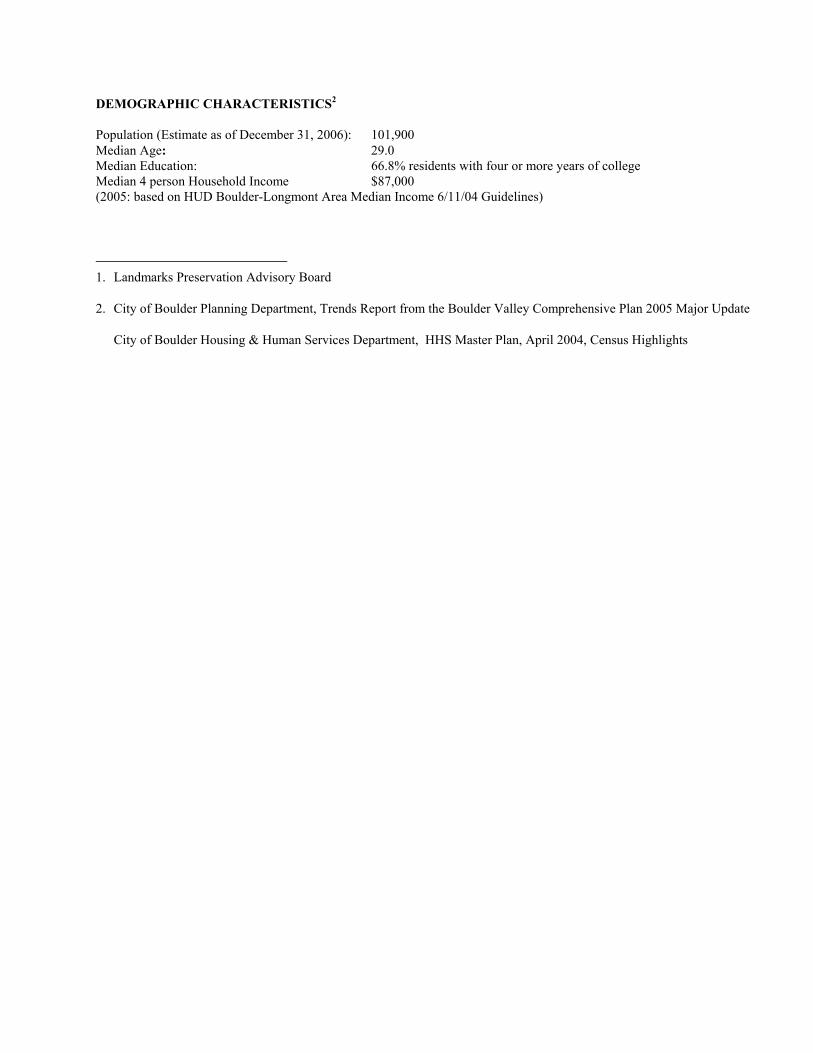
DEMOGRAPHIC CHARACTERISTICS2 Population (Estimate as of December 31, 2006): 101,900 Median Age: 29.0 Median Education: 66.8% residents with four or more years of college Median 4 person Household Income $87,000 (2005: based on HUD Boulder-Longmont Area Median Income 6/11/04 Guidelines) 1. Landmarks Preservation Advisory Board
2. City of Boulder Planning Department, Trends Report from the Boulder Valley Comprehensive Plan 2005 Major Update
City of Boulder Housing & Human Services Department, HHS Master Plan, April 2004, Census Highlights
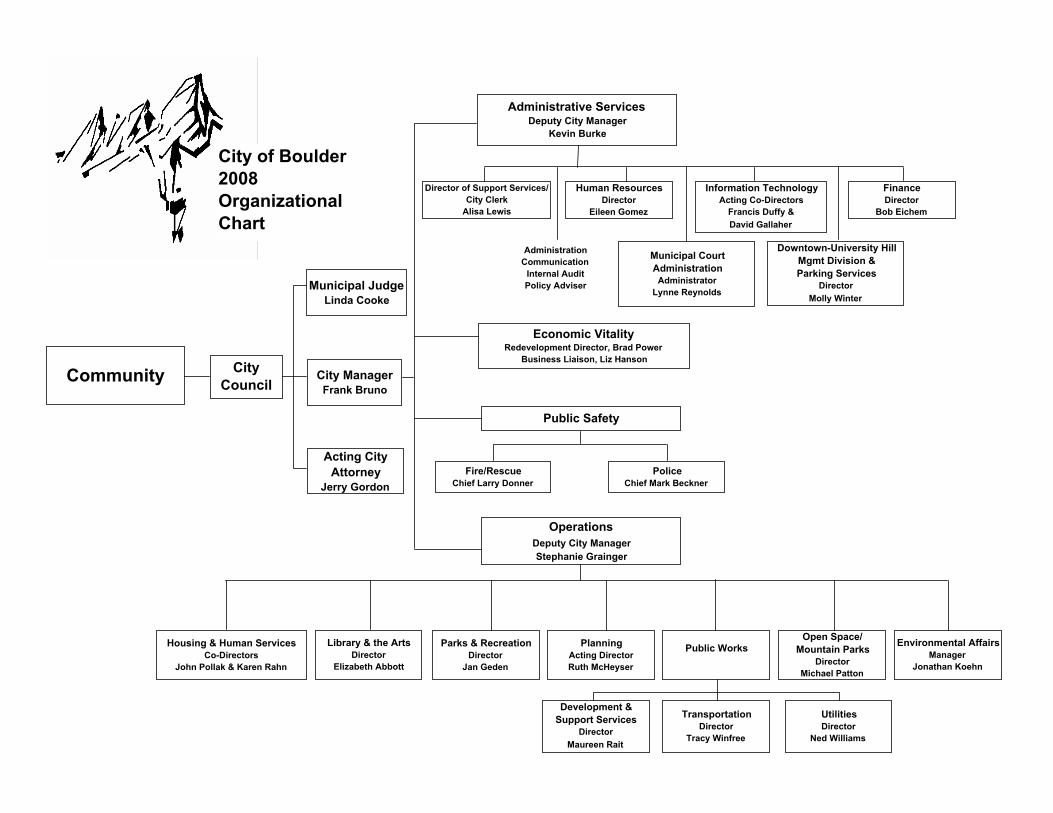
City of Boulder2008Organizational Chart
Community City Council
Municipal JudgeLinda Cooke
City ManagerFrank Bruno
Acting City Attorney
Jerry Gordon
Administrative ServicesDeputy City Manager
Kevin Burke
Director of Support Services/ City Clerk
Alisa Lewis
AdministrationCommunication
Internal AuditPolicy Adviser
Human ResourcesDirector
Eileen Gomez
Information TechnologyActing Co-Directors
Francis Duffy &David Gallaher
FinanceDirector
Bob Eichem
Economic VitalityRedevelopment Director, Brad Power
Business Liaison, Liz Hanson
Public Safety
OperationsDeputy City ManagerStephanie Grainger
Library & the ArtsDirector
Elizabeth Abbott
Parks & RecreationDirector
Jan Geden
Open Space/Mountain Parks
DirectorMichael Patton
Public WorksPlanningActing DirectorRuth McHeyser
Environmental AffairsManager
Jonathan Koehn
Housing & Human ServicesCo-Directors
John Pollak & Karen Rahn
Fire/RescueChief Larry Donner
PoliceChief Mark Beckner
Downtown-University Hill Mgmt Division & Parking Services
DirectorMolly Winter
Municipal Court Administration
AdministratorLynne Reynolds
Development & Support Services
DirectorMaureen Rait
TransportationDirector
Tracy Winfree
UtilitiesDirector
Ned Williams
BUDGET PHILOSOPHY AND PROCESS Budget Philosophy Serving the public trust requires that the annual budget provide the best possible balance of allocation to meet the varied needs of the community. The budget is a principal management tool for the City administration, and in allocating the City's resources, it both reflects and defines the annual work program. In this context, the budget provides a framework for us to accomplish our mission, which is "to create, enhance, and preserve a human, natural, physical, and economic environment which fosters our community's unique quality of life". The budget should also reflect our core City organization values of integrity, teamwork, service excellence, personal growth, and innovation. In addition to balancing allocations to meet community needs, and incorporating our mission and core values, a successful annual budget preparation process requires excellent communications, community outreach, and a commitment to excellence. To this end, the process must be a cooperative effort of the entire City organization. Boulder prides itself on being a progressive community, willing to challenge the status quo and being on the "cutting edge". City staff has accepted this challenge by developing the budget within the context of a search for creative solutions for the delivery of City services. The budget will emphasize measures to improve the productivity and effectiveness of service delivery to residents. Teamwork and efficiency enhancements will limit the amount of bureaucratic "red tape" required, both between functional areas within the City, and between City staff and the community. The overriding goals must be to support the high standards set by the community, and to provide long-term value at reasonable cost. The budget will be based upon timely, consistent and clearly articulated policies. It will be realistic and will include adequate resources to meet assigned work programs. Once adopted, within the parameters of policy guidelines, departments will be given full spending authority for their budget(s). Budget Process The fiscal year of the City is the calendar year. The City has implemented a two-year budget process and adopts a biennial budget by December 1st of the year prior to the two-year budget period. Even though the budget is adopted for a two-year term, the State and City Charter require that prior to each fiscal year, an appropriation ordinance must be adopted to authorize budgeted expenditures for the coming fiscal year. The City of Boulder Charter establishes the time limits pertaining to the adoption of the budget. The budget process and schedule of development is designed to fit within the Charter mandate and to allow for active and early participation by the City Council, with an emphasis on public input. The City's budget is developed over a ten month period, beginning in February and ending in October/November. In February, staff begins the development of five year revenue projections along with preliminary cost projections. In April/May, Council is updated on the proposed budget. At this time, policy issues are presented and Council has the opportunity to provide direction for consideration by the City Manager in the development of the proposed budget. Then staff compiles all the necessary information in the budget guideline manual that provides the basis for the development of each department's budget. Departments begin developing their detailed budgets in May/June with review by boards and/or commissions where appropriate. The City Manager reviews departmental budgets in June/July and meets with the Directors Group as needed to discuss the proposals submitted by departments.
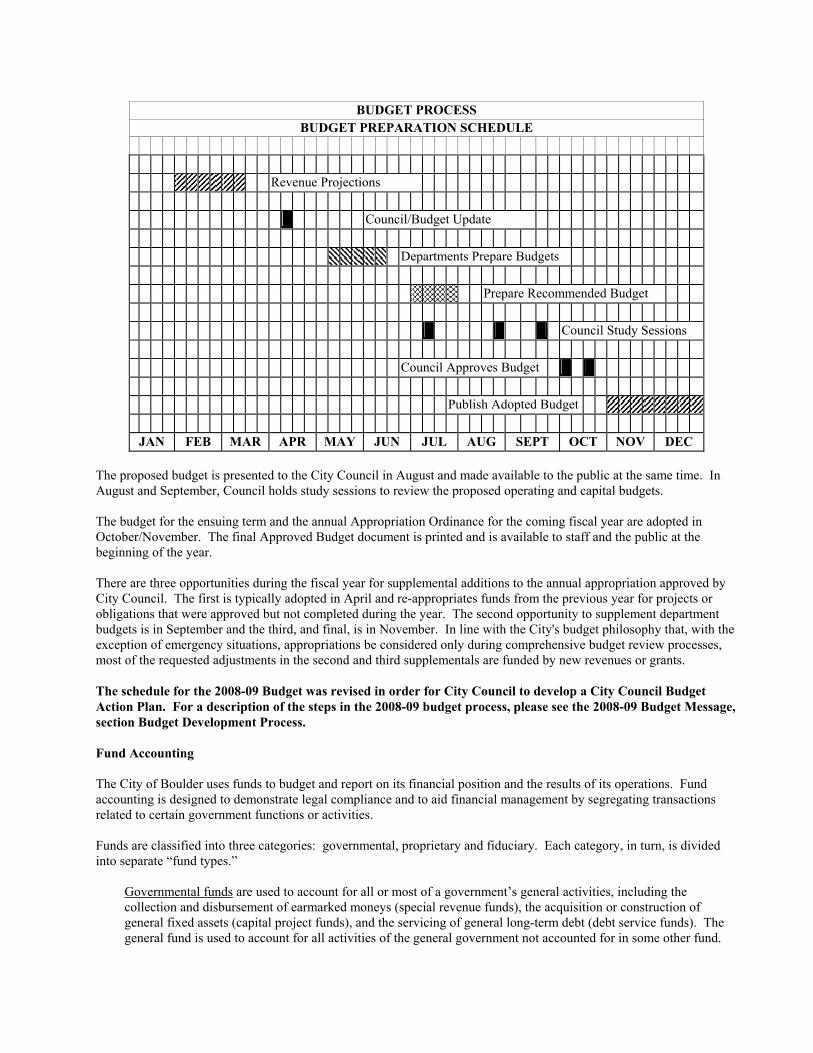
BUDGET PROCESS
BUDGET PREPARATION SCHEDULE Revenue Projections Council/Budget Update Departments Prepare Budgets Prepare Recommended Budget Council Study Sessions Council Approves Budget Publish Adopted Budget JAN FEB MAR APR MAY JUN JUL AUG SEPT OCT NOV DEC
The proposed budget is presented to the City Council in August and made available to the public at the same time. In August and September, Council holds study sessions to review the proposed operating and capital budgets. The budget for the ensuing term and the annual Appropriation Ordinance for the coming fiscal year are adopted in October/November. The final Approved Budget document is printed and is available to staff and the public at the beginning of the year. There are three opportunities during the fiscal year for supplemental additions to the annual appropriation approved by City Council. The first is typically adopted in April and re-appropriates funds from the previous year for projects or obligations that were approved but not completed during the year. The second opportunity to supplement department budgets is in September and the third, and final, is in November. In line with the City's budget philosophy that, with the exception of emergency situations, appropriations be considered only during comprehensive budget review processes, most of the requested adjustments in the second and third supplementals are funded by new revenues or grants. The schedule for the 2008-09 Budget was revised in order for City Council to develop a City Council Budget Action Plan. For a description of the steps in the 2008-09 budget process, please see the 2008-09 Budget Message, section Budget Development Process. Fund Accounting The City of Boulder uses funds to budget and report on its financial position and the results of its operations. Fund accounting is designed to demonstrate legal compliance and to aid financial management by segregating transactions related to certain government functions or activities. Funds are classified into three categories: governmental, proprietary and fiduciary. Each category, in turn, is divided into separate “fund types.”
Governmental funds are used to account for all or most of a government’s general activities, including the collection and disbursement of earmarked moneys (special revenue funds), the acquisition or construction of general fixed assets (capital project funds), and the servicing of general long-term debt (debt service funds). The general fund is used to account for all activities of the general government not accounted for in some other fund.
Proprietary funds are used to account for activities similar to those found in the private sector, and where the determination of net income is necessary or useful to sound financial administration. Goods or services from such activities can be provided either to outside parties (enterprise funds) or to other departments or agencies primarily within the government (internal service funds). The City applies all applicable FASB pronouncements issued prior to November 30, 1989, and GASB statements since that date in accounting and reporting for its proprietary operations.
Fiduciary funds are used to account for assets held on behalf of outside parties, including other governments, or on behalf of other funds within the government. When these assets are held under the terms of a formal trust agreement, a pension trust fund must be used. Agency funds generally are used to account for assets that the government holds on behalf of others as their agent.
Fund Definitions General Fund The General Fund is established to account for the revenues and expenditures necessary to carry out basic governmental activities of the City such as public safety, human services, legal services, administrative services, etc, which are not required to be accounted for in another fund. Special Revenue Funds Special Revenue Funds are established to account for the proceeds of specific revenue sources (other than special assessments, pension trusts, proprietary fund operations and revenues received for major capital projects) that are legally restricted for specific purposes. The City of Boulder has the following special revenue funds.
Capital Development Fund - to account for development fee proceeds to be utilized for the acquisition, construction and improvement of facilities necessary to maintain the current level of public amenities such as police, fire, library, human services, municipal offices, streets, and parks and recreation.
Lottery Fund - to account for State Conservation Trust Fund proceeds to be utilized for the refurbishment, capital improvement and debt service on park acquisitions.
Planning & Development Services Fund - to account for revenues and expenditures related to development and building services functions.
Affordable Housing Fund - to account for cash in lieu financial contributions from developers and General Fund contributions which are to be used to construct, purchase and maintain permanently affordable housing units in Boulder.
Community Housing Assistance Program (CHAP) Fund - to account for property tax, a housing excise tax and fees to be used to increase the supply of affordable housing in Boulder.
.15 Cent Sales Tax Fund - to account for earmarked sales tax authorized by the voters in 1992 for parks and recreation and general municipal purposes.
.25 Cent Sales Tax Fund - to account for earmarked sales tax authorized by the voters in 1995 for parks and recreation operating and capital needs.
Library Fund - to account for the operations of the City-owned library and branches. Financing is provided by general property taxes and General Fund contributions.
Recreation Activity Fund - to account for revenues and expenditures related to the provision of recreation, reservoir and golf course services/programs.
Climate Action Plan Fund - to account for revenues and expenditures related to programs implemented to increase energy efficiency, increase renewable energy use, reduce emissions from motor vehicles and take other steps toward the goal of meeting the Kyoto Protocol. Open Space Fund - to account for the acquisition and maintenance of greenbelt land. Financing is provided by sales taxes and the issuance of long-term bonds and notes payable.
Airport Fund - to account for the operations of the City-owned municipal airport. Financing is provided by grants, rents and leases.
Transportation Fund - to account for construction, operation and maintenance of all major thoroughfares, local streets, bikeways, walkways and City-owned parking. Financing is provided by sales taxes, the City's share of the County Road and Bridge tax, State Highway Users' tax and State Auto Registration fees. Transportation Development Fund - to account for development fees to be utilized for the construction of transportation capital improvements related to new development and growth.
Community Development Block Grant Fund - to account for the funds granted by the Community Development Block Grant program administered by the Department of Housing and Urban Development.
HOME Fund - to account for funds granted by the HOME program administered by the Department of Housing and Urban Development.
Capital Project Funds The Capital Project Funds are established to account for financial resources to be utilized for acquisition, construction and improvement of general fixed assets (other than those financed by Proprietary Funds). The City of Boulder has the following Capital Project Funds:
.25 Cent Sales Tax Bond Proceeds Fund Permanent Parks and Recreation Fund Boulder Municipal Property Authority Bond Fund
Debt Service Fund The Debt Service Funds are established to accumulate moneys for payment of general long-term debt principal and interest.
General Obligation Debt Service Fund - Financing is provided by investments accumulated for the retirement of specific notes payable.
.15 Cent Sales Tax Debt Service Fund - Financing is provided by earmarked sales tax.
Boulder Municipal Property Authority Debt Service Fund - Financing is provided by base rentals from the General Fund, Lottery Fund, Open Space Fund and the Permanent Parks and Recreation Fund.
Enterprise Funds Enterprise Funds are established to finance and account for the acquisition, operation and maintenance of governmental facilities and services which are entirely or predominantly self-supporting by user charges. All activities necessary to provide such services are accounted for in these funds, including, but not limited to, administration, operations, maintenance, financing and related debt service, and billing collections.
The City of Boulder has the following Enterprise Funds:
Water Utility Fund Wastewater Utility Fund Stormwater/Flood Management Utility Fund Downtown Commercial District University Hill Commercial District
Internal Service Funds The Internal Service Funds are established to finance and account for services and/or commodities required by other funds. The City of Boulder has the following Internal Service Funds:
Telecommunications Fund - to account for the costs of operating, acquiring and maintaining telecommunications equipment used by all City departments. Property & Casualty Insurance Fund - to account for and facilitate the monitoring of the City's self-insured property & casualty insurance plan. Workers Compensation Insurance Fund - to account for and facilitate the monitoring of the City's self-insured workers compensation plan.
Compensated Absences - to account for payments of compensated absences to employees of the General and Library Funds. Funding is received primarily from the General Fund.
Fleet Fund - to account for the costs of operating, acquiring and maintaining automotive equipment used by other City departments. Such costs are billed to the other departments.
Computer Replacement Fund - to account for the costs of acquiring and maintaining computer equipment used by other City departments. Such costs are billed to the other departments.
Equipment Replacement Fund - to account for the costs of acquiring equipment used by other City departments. Such costs are billed to the other departments.
Facility Renovation & Replacement Fund - to account for the costs of maintaining and replacing facilities within the City of Boulder.
Budget Basis Budgets are prepared on a modified accrual basis, except for outstanding encumbrances which are budgeted as expenditures. Briefly, this means that obligations of the City are budgeted as expenditures, but revenues are recognized only when they are measurable and available. "Measurable" means the amount of the transaction can be determined and "available" means collectible within the current period or soon enough thereafter to be used to pay liabilities of the current period. Expenditures generally are recorded when a liability is incurred. The Comprehensive Annual Financial Report (CAFR) shows the status of the City’s finances on the basis of generally accepted accounting principles (GAAP). In most cases, this conforms to the way the City prepares the budget. One exception is compensated absences (accrued but unused vacation or sick leave) which are treated slightly differently in the budget and in the CAFR. Budget Terms Accrual Basis - The basis of accounting under which revenues and expenses are recognized when they occur, rather than when collected or paid. Ad Valorem Tax - Tax based on the Assessed Valuation of property.
Appropriation - Legal authorization granted by City Council to make expenditures and incur obligations up to a specific dollar amount. Appropriation Ordinance - An ordinance by means of which appropriations are given legal effect. It is the method by which the expenditure side of the annual budget is enacted into law by the City Council. Assessed Valuation - Basis for determining property taxes. The assessor determines the assessed valuation of residential real property. For 2003-2004, property was appraised at the 2002 actual value. The residential rate was 7.96% of its actual 2002 value and all other property was assessed at 29%. Bond - Written promise to pay a specified sum of money, called the face value or principal, at a specified date or dates in the future, called the maturity date(s), together with periodic interest at a specified rate. Budget - Plan of financial operation, embodying an estimate of proposed expenditures for a given period and the proposed revenue estimates of financing them. Upon approval by City Council, the budget appropriation ordinance is the legal basis for expenditures in the budget year. Capital Assets - Assets of significant value and having a useful life of several years. Capital assets are also referred to as fixed assets. Capital Improvement Program - An annual, updated plan of capital expenditures for public facilities and infrastructure (buildings, streets, etc.) with estimated costs, sources of funding and timing of work over a five year period. Capital Project - Projects involving the purchase or construction of capital assets. Often a capital project encompasses the purchase of land and the construction of a building or facility, or major street construction or reconstruction. Design, engineering or architectural fees are often a part of a capital project. Capital Purchases - Those items which a department purchases that have a value of over $5,000 and a life of longer than one year, with the exception of computing equipment and copy machines which have a limit of $1,000. Debt Service - Payment of principal and interest related to long-term debt. Department - An organizational unit of the city which provides one or more services. Depreciation - Expiration in the service life of fixed assets, attributable to wear and tear, deterioration, action of the physical elements, inadequacy and obsolescence. Designated Fund Balance - That portion of the fund balance that has been set aside for a specific purpose by the City Council. Division - A group of related tasks to provide a specific benefit to either the general public or the city organization. A division is a sub-organizational unit of the department. Encumbrance - Appropriations committed by contract for goods or services, which will not be paid for until the next fiscal year. Fiscal Year - A 12-month period to which the annual operating budget applies and at the end of which a government determines its financial position and the results of its operations. The City of Boulder's fiscal year is January 1 through December 31. Fund Balance - The balance remaining in a fund after costs have been subtracted from revenues. General Obligation Bonds - Bonds which the full faith and credit of the issuing government are pledged for payment. Grants - Contributions or gifts of cash or other assets from another organization to be used or expended for a specified purpose or activity.
Home Rule - Statutory and constitutional provisions, which allow municipalities to exercise powers of local self-government such as the administration and collection of local taxes. The City of Boulder is a home rule municipality. Infrastructure - Facilities on which the continuance and growth of a community depend, such as streets, waterlines, etc. Interdepartmental Charges - Charges for services provided by the Interdepartmental Service Funds. An example of these charges is vehicle charges. These charges are reflected as expenditures in the department budgets and as revenues in the Intradepartmental Service Funds. Internal Transfers - Legally authorized intra-city transfers from a fund receiving revenue to another fund where it is to be expended. Revenue and expenditures are accounted for in both funds. Lease-Purchase Agreements - Contractual agreements which are termed "leases", but which in substance amount to purchase contracts, for equipment and machinery. Long-term Debt - Debt with a maturity of more than one year after the date of issuance. Maturity - The date on which the principal or stated value of investments or debt obligations are due and may be reclaimed. Mill Levy - Rate applied to Assessed Valuation of property to determine property taxes. A mill is 1/10th of a penny, or $1.00 of tax for each $1,000 of assessed valuation. The city's maximum mill levy, excluding debt service, is thirteen mills per City Charter. Modified Accrual Basis - Revenues are recorded as the amount becomes measurable and available. Expenditures are recorded when the liability is incurred. Operating Budget - Represents the amount of money necessary to provide for the day to day functions of city government. It does not include internal transfers between funds, nor does it include expenditures for debt service and capital projects. Operating Expenses - Those items that a department will utilize in its daily operations. Examples of these items would be copying, office supplies, postage, work supplies, and chemicals. In addition, any item that a department receives from outside agencies such as telephone services, gas and electric charges, equipment rentals, rent, advertising, and contractual arrangements are also included in operating expenses. Personnel Services - This category includes salary and benefits for standard and temporary employees. It also includes budgeted overtime. Plant Investment Fees - Charges to new developers for connecting to the city's water or sewer system to compensate the city for additional facilities needed to serve the development. Program - A specific activity within a department. A grouping of programs typically defines a division within a department. Projected - Estimation of revenues and expenditures based on past trends, current economic conditions and future financial forecasts. Reserves - Funds which are planned to not be spent in the current budget year, and whose level is established by a specific policy decision. Please refer to specific reserve policies in this document. Revised Budget - Most recent estimate of revenue and expenditures including additional appropriations made throughout the year and encumbrances carried over. Special Assessment - A levy made against certain properties to defray part or all of the cost of a specific improvement or service deemed to primarily benefit those properties. Supplemental Requests - Programs and services which departments would like to have added to their budget. Typically,

supplemental requests are covered by additional revenue, as is the case with new grants. Unallocated Fund Balances - Unspent funds whose levels at any point in time are the difference between expected revenues plus any unspent funds from prior years, and budgeted expenditures. The primary conceptual difference between unallocated fund balances and reserves is that reserves are earmarked by conscious policy decisions, and unallocated fund balances are funds which remain above the reserve. User Fees - The payment of a fee for direct receipt of a public service by the party benefiting from the service.

CITY MANAGER'S BUDGET MESSAGE
City Of Boulder Office of the City Manager DATE: August 14, 2007
TO: Mayor, City Council and the Residents of Boulder
FROM: Frank W. Bruno, City Manager SUBJECT: 2008-09 Budget Message
________________________________________________________________________
INTRODUCTION The budget message is my transmittal memorandum and my opportunity to share with City Council and the community the overall philosophy for my budget recommendations. The 2008-09 Recommended Budget is a reflection of the economic challenges we face in providing a complex set of public services to the Boulder community. In addition, it mirrors the findings of the Blue Ribbon Commission which indicate that current revenues are not keeping pace with the growth in expenses (both in the short-term as well as the long-term). Indications are that this trend, which is impacting many other local governments, will persist and the cost of providing services will continue to outpace the resources available to fund them. Combining this ongoing economic reality with the continued expectation for providing a high quality, diverse set of services represents both a challenge as well as an opportunity for the municipal corporation. As part of the development of this recommended budget, I am pleased to say that we were able to begin addressing the priorities identified through the City Council Budget Action Plan while continuing to work toward stabilizing basic services through the use of the Business Plan. Although we weren’t able to make as much progress as we would like, or the community deserves, we were generally able to allocate the available funding in a way that is consistent with the Business Plan philosophy and with the city’s community sustainability goals of social, environmental and economic sustainability. I believe that the core values of this community are represented through the recommendations in the 2008-09 budget.
The Challenges
Revenue Instability As the local economy began to improve slightly in late 2004, it became evident that the volatility of sales/use tax (the primary source of funding for city services) combined with the sharp escalation in the cost of providing services was creating further instability in the city’s funding streams. This factor was masked to a degree by the failure and eventual closure of the Crossroads Mall. In response, City Council appointed a Blue Ribbon
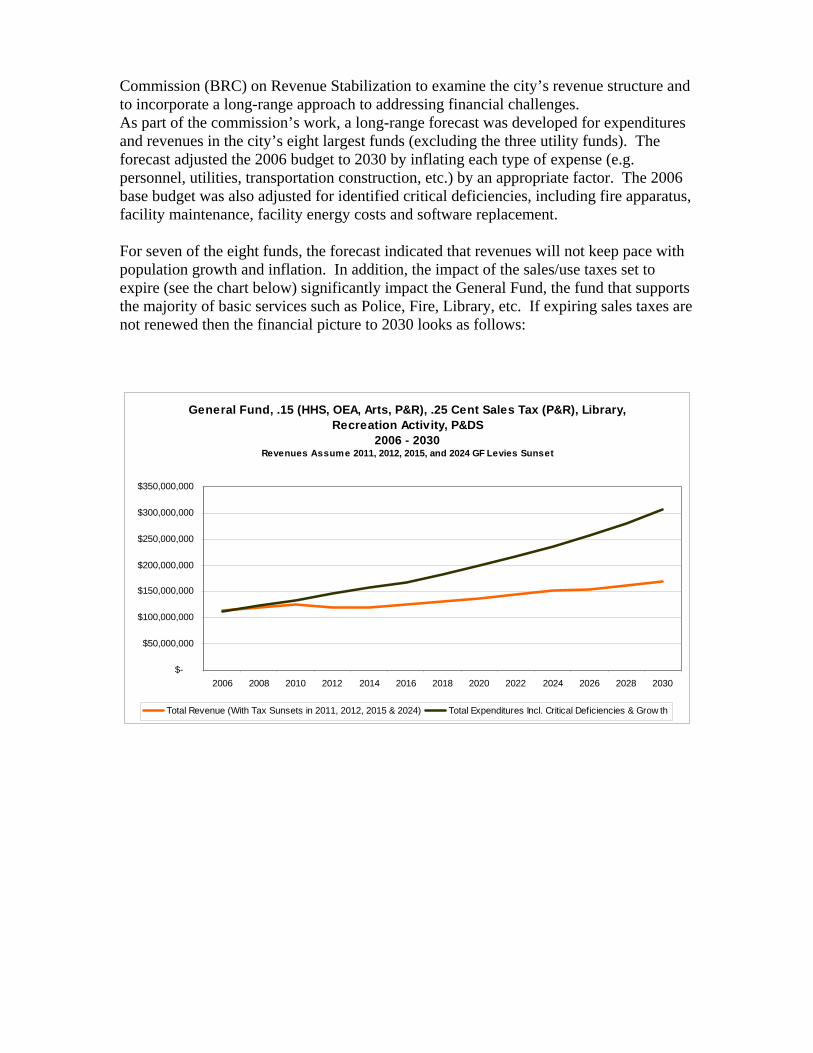
Commission (BRC) on Revenue Stabilization to examine the city’s revenue structure and to incorporate a long-range approach to addressing financial challenges. As part of the commission’s work, a long-range forecast was developed for expenditures and revenues in the city’s eight largest funds (excluding the three utility funds). The forecast adjusted the 2006 budget to 2030 by inflating each type of expense (e.g. personnel, utilities, transportation construction, etc.) by an appropriate factor. The 2006 base budget was also adjusted for identified critical deficiencies, including fire apparatus, facility maintenance, facility energy costs and software replacement. For seven of the eight funds, the forecast indicated that revenues will not keep pace with population growth and inflation. In addition, the impact of the sales/use taxes set to expire (see the chart below) significantly impact the General Fund, the fund that supports the majority of basic services such as Police, Fire, Library, etc. If expiring sales taxes are not renewed then the financial picture to 2030 looks as follows:
General Fund, .15 (HHS, OEA, Arts, P&R), .25 Cent Sales Tax (P&R), Library, Recreation Activity, P&DS
2006 - 2030 Revenues Assume 2011, 2012, 2015, and 2024 GF Levies Sunset
$-
$50,000,000
$100,000,000
$150,000,000
$200,000,000
$250,000,000
$300,000,000
$350,000,000
2006 2008 2010 2012 2014 2016 2018 2020 2022 2024 2026 2028 2030
Total Revenue (With Tax Sunsets in 2011, 2012, 2015 & 2024) Total Expenditures Incl. Critical Deficiencies & Grow th
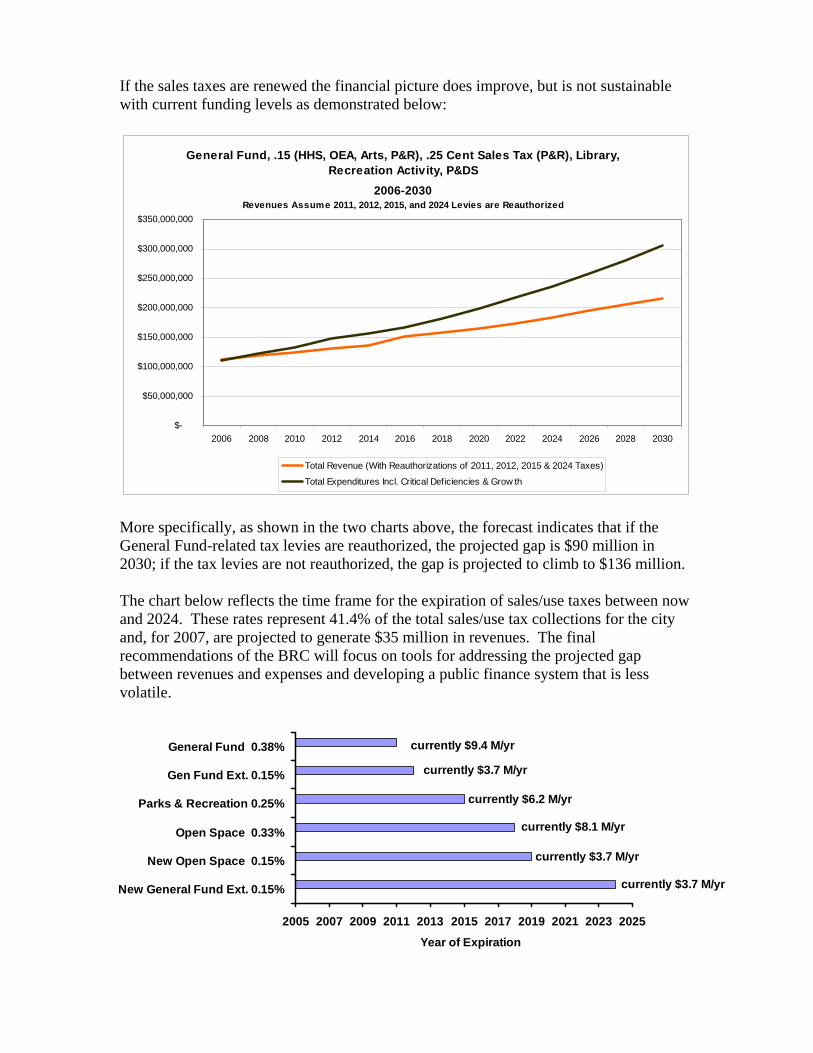
If the sales taxes are renewed the financial picture does improve, but is not sustainable with current funding levels as demonstrated below:
General Fund, .15 (HHS, OEA, Arts, P&R), .25 Cent Sales Tax (P&R), Library, Recreation Activity, P&DS
2006-2030Revenues Assume 2011, 2012, 2015, and 2024 Levies are Reauthorized
$-
$50,000,000
$100,000,000
$150,000,000
$200,000,000
$250,000,000
$300,000,000
$350,000,000
2006 2008 2010 2012 2014 2016 2018 2020 2022 2024 2026 2028 2030
Total Revenue (With Reauthorizations of 2011, 2012, 2015 & 2024 Taxes)
Total Expenditures Incl. Critical Deficiencies & Grow th
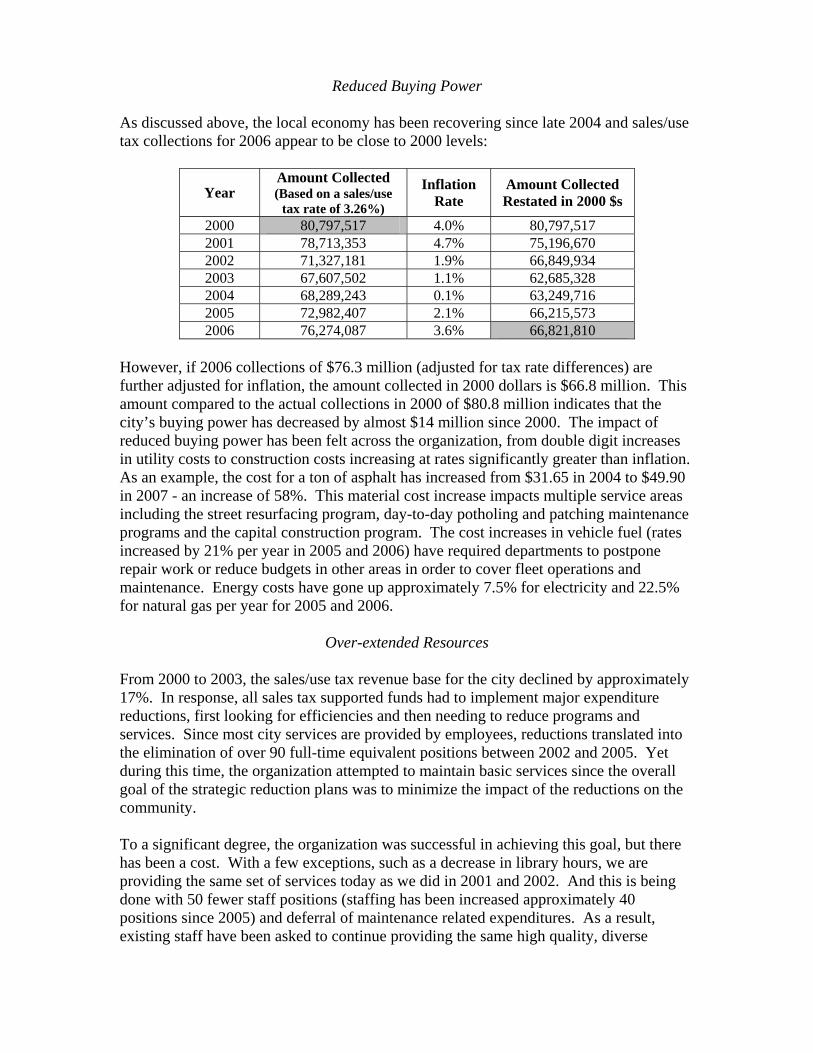
More specifically, as shown in the two charts above, the forecast indicates that if the General Fund-related tax levies are reauthorized, the projected gap is $90 million in 2030; if the tax levies are not reauthorized, the gap is projected to climb to $136 million. The chart below reflects the time frame for the expiration of sales/use taxes between now and 2024. These rates represent 41.4% of the total sales/use tax collections for the city and, for 2007, are projected to generate $35 million in revenues. The final recommendations of the BRC will focus on tools for addressing the projected gap between revenues and expenses and developing a public finance system that is less volatile.
Year of Expiration
currently $9.4 M/yr
currently $3.7 M/yr
currently $6.2 M/yr
currently $8.1 M/yr
currently $3.7 M/yr
currently $3.7 M/yr
2005 2007 2009 2011 2013 2015 2017 2019 2021 2023 2025
New General Fund Ext. 0.15%
New Open Space 0.15%
Open Space 0.33%
Parks & Recreation 0.25%
Gen Fund Ext. 0.15%
General Fund 0.38%
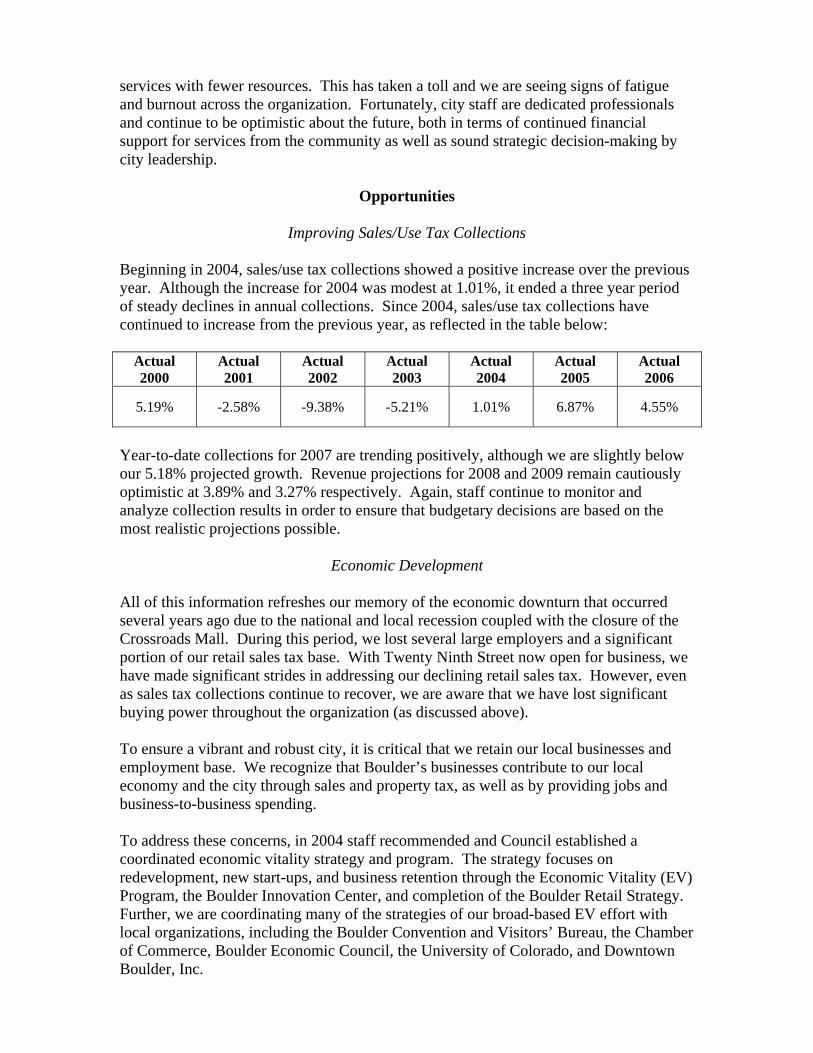
Reduced Buying Power As discussed above, the local economy has been recovering since late 2004 and sales/use tax collections for 2006 appear to be close to 2000 levels:
Year Amount Collected (Based on a sales/use
tax rate of 3.26%)
Inflation Rate
Amount Collected Restated in 2000 $s
2000 80,797,517 4.0% 80,797,517 2001 78,713,353 4.7% 75,196,670 2002 71,327,181 1.9% 66,849,934 2003 67,607,502 1.1% 62,685,328 2004 68,289,243 0.1% 63,249,716 2005 72,982,407 2.1% 66,215,573 2006 76,274,087 3.6% 66,821,810
However, if 2006 collections of $76.3 million (adjusted for tax rate differences) are further adjusted for inflation, the amount collected in 2000 dollars is $66.8 million. This amount compared to the actual collections in 2000 of $80.8 million indicates that the city’s buying power has decreased by almost $14 million since 2000. The impact of reduced buying power has been felt across the organization, from double digit increases in utility costs to construction costs increasing at rates significantly greater than inflation. As an example, the cost for a ton of asphalt has increased from $31.65 in 2004 to $49.90 in 2007 - an increase of 58%. This material cost increase impacts multiple service areas including the street resurfacing program, day-to-day potholing and patching maintenance programs and the capital construction program. The cost increases in vehicle fuel (rates increased by 21% per year in 2005 and 2006) have required departments to postpone repair work or reduce budgets in other areas in order to cover fleet operations and maintenance. Energy costs have gone up approximately 7.5% for electricity and 22.5% for natural gas per year for 2005 and 2006.
Over-extended Resources From 2000 to 2003, the sales/use tax revenue base for the city declined by approximately 17%. In response, all sales tax supported funds had to implement major expenditure reductions, first looking for efficiencies and then needing to reduce programs and services. Since most city services are provided by employees, reductions translated into the elimination of over 90 full-time equivalent positions between 2002 and 2005. Yet during this time, the organization attempted to maintain basic services since the overall goal of the strategic reduction plans was to minimize the impact of the reductions on the community. To a significant degree, the organization was successful in achieving this goal, but there has been a cost. With a few exceptions, such as a decrease in library hours, we are providing the same set of services today as we did in 2001 and 2002. And this is being done with 50 fewer staff positions (staffing has been increased approximately 40 positions since 2005) and deferral of maintenance related expenditures. As a result, existing staff have been asked to continue providing the same high quality, diverse
services with fewer resources. This has taken a toll and we are seeing signs of fatigue and burnout across the organization. Fortunately, city staff are dedicated professionals and continue to be optimistic about the future, both in terms of continued financial support for services from the community as well as sound strategic decision-making by city leadership.
Opportunities
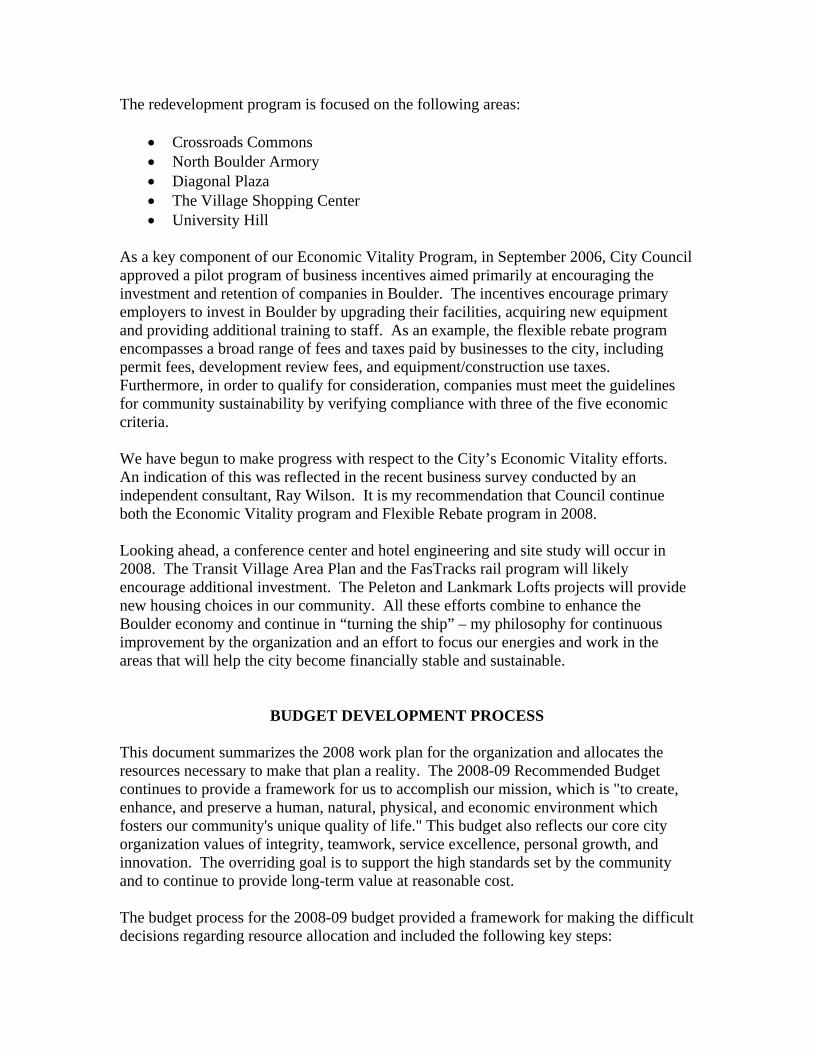
Improving Sales/Use Tax Collections Beginning in 2004, sales/use tax collections showed a positive increase over the previous year. Although the increase for 2004 was modest at 1.01%, it ended a three year period of steady declines in annual collections. Since 2004, sales/use tax collections have continued to increase from the previous year, as reflected in the table below:
Actual 2000
Actual 2001
Actual 2002
Actual 2003
Actual 2004
Actual 2005
Actual 2006
5.19% -2.58% -9.38% -5.21% 1.01% 6.87% 4.55%
Year-to-date collections for 2007 are trending positively, although we are slightly below our 5.18% projected growth. Revenue projections for 2008 and 2009 remain cautiously optimistic at 3.89% and 3.27% respectively. Again, staff continue to monitor and analyze collection results in order to ensure that budgetary decisions are based on the most realistic projections possible.
Economic Development All of this information refreshes our memory of the economic downturn that occurred several years ago due to the national and local recession coupled with the closure of the Crossroads Mall. During this period, we lost several large employers and a significant portion of our retail sales tax base. With Twenty Ninth Street now open for business, we have made significant strides in addressing our declining retail sales tax. However, even as sales tax collections continue to recover, we are aware that we have lost significant buying power throughout the organization (as discussed above). To ensure a vibrant and robust city, it is critical that we retain our local businesses and employment base. We recognize that Boulder’s businesses contribute to our local economy and the city through sales and property tax, as well as by providing jobs and business-to-business spending. To address these concerns, in 2004 staff recommended and Council established a coordinated economic vitality strategy and program. The strategy focuses on redevelopment, new start-ups, and business retention through the Economic Vitality (EV) Program, the Boulder Innovation Center, and completion of the Boulder Retail Strategy. Further, we are coordinating many of the strategies of our broad-based EV effort with local organizations, including the Boulder Convention and Visitors’ Bureau, the Chamber of Commerce, Boulder Economic Council, the University of Colorado, and Downtown Boulder, Inc.
The redevelopment program is focused on the following areas:
• Crossroads Commons • North Boulder Armory • Diagonal Plaza • The Village Shopping Center • University Hill
As a key component of our Economic Vitality Program, in September 2006, City Council approved a pilot program of business incentives aimed primarily at encouraging the investment and retention of companies in Boulder. The incentives encourage primary employers to invest in Boulder by upgrading their facilities, acquiring new equipment and providing additional training to staff. As an example, the flexible rebate program encompasses a broad range of fees and taxes paid by businesses to the city, including permit fees, development review fees, and equipment/construction use taxes. Furthermore, in order to qualify for consideration, companies must meet the guidelines for community sustainability by verifying compliance with three of the five economic criteria. We have begun to make progress with respect to the City’s Economic Vitality efforts. An indication of this was reflected in the recent business survey conducted by an independent consultant, Ray Wilson. It is my recommendation that Council continue both the Economic Vitality program and Flexible Rebate program in 2008. Looking ahead, a conference center and hotel engineering and site study will occur in 2008. The Transit Village Area Plan and the FasTracks rail program will likely encourage additional investment. The Peleton and Lankmark Lofts projects will provide new housing choices in our community. All these efforts combine to enhance the Boulder economy and continue in “turning the ship” – my philosophy for continuous improvement by the organization and an effort to focus our energies and work in the areas that will help the city become financially stable and sustainable.
BUDGET DEVELOPMENT PROCESS This document summarizes the 2008 work plan for the organization and allocates the resources necessary to make that plan a reality. The 2008-09 Recommended Budget continues to provide a framework for us to accomplish our mission, which is "to create, enhance, and preserve a human, natural, physical, and economic environment which fosters our community's unique quality of life." This budget also reflects our core city organization values of integrity, teamwork, service excellence, personal growth, and innovation. The overriding goal is to support the high standards set by the community and to continue to provide long-term value at reasonable cost. The budget process for the 2008-09 budget provided a framework for making the difficult decisions regarding resource allocation and included the following key steps:
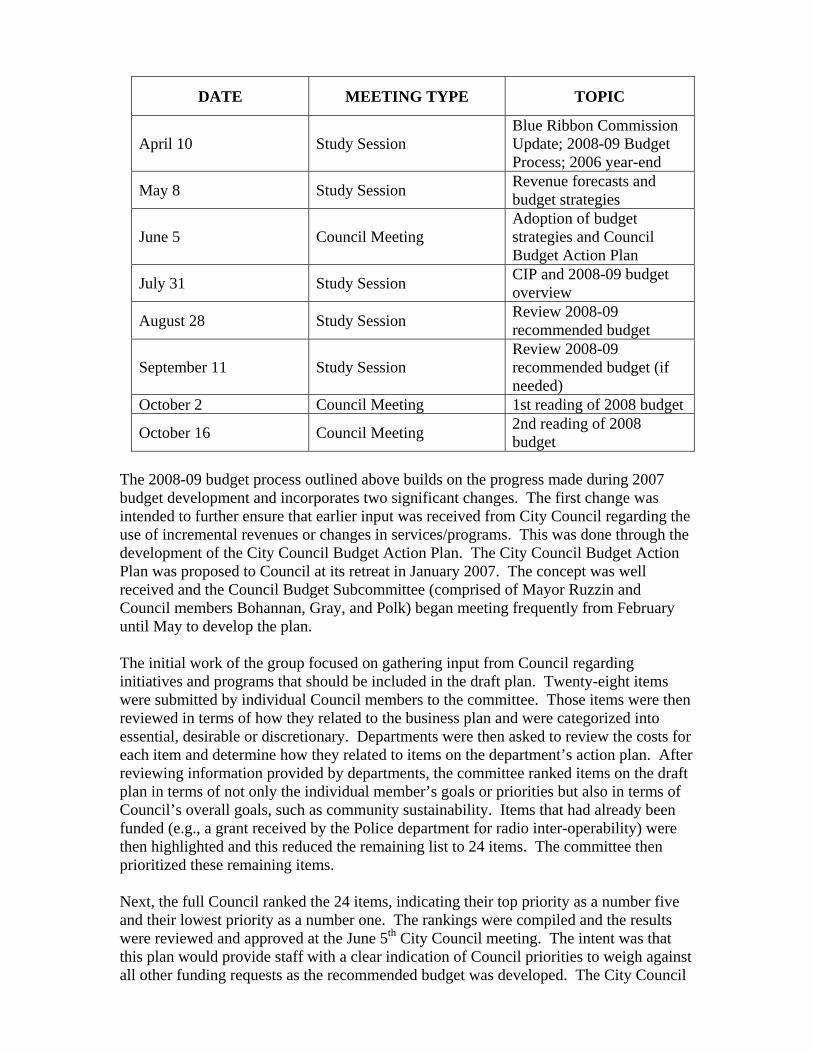
DATE MEETING TYPE TOPIC
April 10 Study Session Blue Ribbon Commission Update; 2008-09 Budget Process; 2006 year-end
May 8 Study Session Revenue forecasts and budget strategies
June 5 Council Meeting Adoption of budget strategies and Council Budget Action Plan
July 31 Study Session CIP and 2008-09 budget overview
August 28 Study Session Review 2008-09 recommended budget
September 11 Study Session Review 2008-09 recommended budget (if needed)
October 2 Council Meeting 1st reading of 2008 budget
October 16 Council Meeting 2nd reading of 2008 budget
The 2008-09 budget process outlined above builds on the progress made during 2007 budget development and incorporates two significant changes. The first change was intended to further ensure that earlier input was received from City Council regarding the use of incremental revenues or changes in services/programs. This was done through the development of the City Council Budget Action Plan. The City Council Budget Action Plan was proposed to Council at its retreat in January 2007. The concept was well received and the Council Budget Subcommittee (comprised of Mayor Ruzzin and Council members Bohannan, Gray, and Polk) began meeting frequently from February until May to develop the plan. The initial work of the group focused on gathering input from Council regarding initiatives and programs that should be included in the draft plan. Twenty-eight items were submitted by individual Council members to the committee. Those items were then reviewed in terms of how they related to the business plan and were categorized into essential, desirable or discretionary. Departments were then asked to review the costs for each item and determine how they related to items on the department’s action plan. After reviewing information provided by departments, the committee ranked items on the draft plan in terms of not only the individual member’s goals or priorities but also in terms of Council’s overall goals, such as community sustainability. Items that had already been funded (e.g., a grant received by the Police department for radio inter-operability) were then highlighted and this reduced the remaining list to 24 items. The committee then prioritized these remaining items. Next, the full Council ranked the 24 items, indicating their top priority as a number five and their lowest priority as a number one. The rankings were compiled and the results were reviewed and approved at the June 5th City Council meeting. The intent was that this plan would provide staff with a clear indication of Council priorities to weigh against all other funding requests as the recommended budget was developed. The City Council
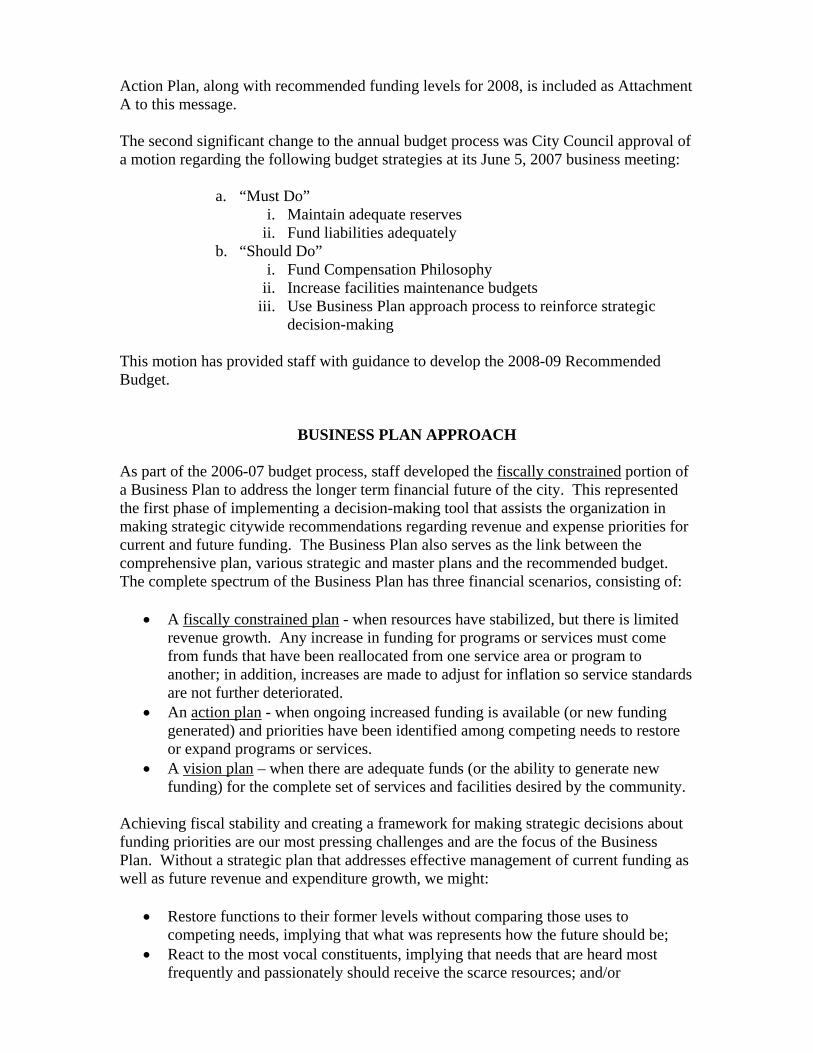
Action Plan, along with recommended funding levels for 2008, is included as Attachment A to this message. The second significant change to the annual budget process was City Council approval of a motion regarding the following budget strategies at its June 5, 2007 business meeting:
a. “Must Do” i. Maintain adequate reserves
ii. Fund liabilities adequately b. “Should Do”
i. Fund Compensation Philosophy ii. Increase facilities maintenance budgets
iii. Use Business Plan approach process to reinforce strategic decision-making
This motion has provided staff with guidance to develop the 2008-09 Recommended Budget.
BUSINESS PLAN APPROACH As part of the 2006-07 budget process, staff developed the fiscally constrained portion of a Business Plan to address the longer term financial future of the city. This represented the first phase of implementing a decision-making tool that assists the organization in making strategic citywide recommendations regarding revenue and expense priorities for current and future funding. The Business Plan also serves as the link between the comprehensive plan, various strategic and master plans and the recommended budget. The complete spectrum of the Business Plan has three financial scenarios, consisting of:
• A fiscally constrained plan - when resources have stabilized, but there is limited revenue growth. Any increase in funding for programs or services must come from funds that have been reallocated from one service area or program to another; in addition, increases are made to adjust for inflation so service standards are not further deteriorated.
• An action plan - when ongoing increased funding is available (or new funding generated) and priorities have been identified among competing needs to restore or expand programs or services.
• A vision plan – when there are adequate funds (or the ability to generate new funding) for the complete set of services and facilities desired by the community.
Achieving fiscal stability and creating a framework for making strategic decisions about funding priorities are our most pressing challenges and are the focus of the Business Plan. Without a strategic plan that addresses effective management of current funding as well as future revenue and expenditure growth, we might:
• Restore functions to their former levels without comparing those uses to competing needs, implying that what was represents how the future should be;
• React to the most vocal constituents, implying that needs that are heard most frequently and passionately should receive the scarce resources; and/or
• Fund the first few excellent ideas or master plan proposals implying that whatever comes up first should grow.
As mentioned above, the fiscally constrained budget was developed based on a Business Plan for the city and was considered Phase I of plan development. The Business Plan addresses effective management of current funding as well as any future revenue and expenditure growth. During this initial process of plan development, departments were asked to develop the fiscally constrained portion of the Business Plan (see description above). In addition, departments were asked to focus their efforts on determining where reallocations within their existing fiscally constrained plan were possible in order to continue meeting current service priorities without additional funding. Although the Business Plan addresses effective management of current resources, it is also the tool to address future revenue and expenditure growth and new services/programs. In Phase II of Business Plan development, departments continued the work done in developing their fiscally constrained plans - identifying areas where resources should be reallocated to address essential services that are currently being provided below an acceptable standard – and developing action and vision plans (through strategic and master plans currently adopted or underway) to guide the allocation of available resources. Although departments and their advisory boards take the lead in preparing their fiscally constrained and action plans, all plans were compared and considered by the City Manager from a citywide perspective. For example, should an expenditure of funds for a Recreation program occur before basic Fire Safety services are provided? “Trade-off” conversations helped in identifying the costs and the benefits of giving or taking from one area or department. The funding pyramid below depicts how the limited additional funding was allocated as the 2008-09 recommended budget was developed. As revenues start to increase, we are starting to move slowly up the pyramid, from the fiscally constrained base to the action plan level. Some funds, such as the Open Space Fund (that has a new dedicated .15% sales tax approved by voters in 2003), are able to fund some of their action and vision plan level services/programs while most funds remain fiscally constrained. As a result, most available funding is going to support the continuance of services/programs provided as part of the fiscally constrained budget. The goal with this approach is to maintain the current service standards being provided as part of the fiscally constrained plan (including essential, desired, and discretionary services). Fiscally constrained budgets also focus on reallocating desired and discretionary services in order to fund an acceptable service standard for essential services. Maintaining fiscally constrained budgets has gotten harder, and in many cases is not sustainable, as the organization’s purchasing power continues to erode.
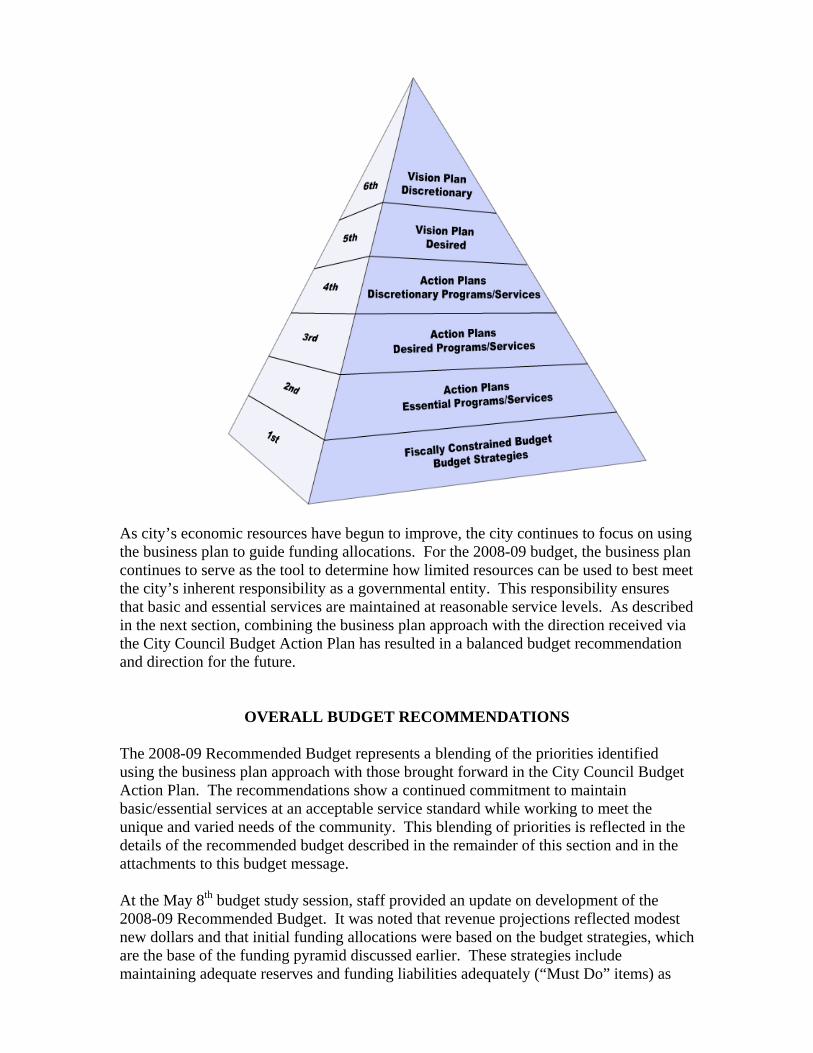
As city’s economic resources have begun to improve, the city continues to focus on using the business plan to guide funding allocations. For the 2008-09 budget, the business plan continues to serve as the tool to determine how limited resources can be used to best meet the city’s inherent responsibility as a governmental entity. This responsibility ensures that basic and essential services are maintained at reasonable service levels. As described in the next section, combining the business plan approach with the direction received via the City Council Budget Action Plan has resulted in a balanced budget recommendation and direction for the future.
OVERALL BUDGET RECOMMENDATIONS
The 2008-09 Recommended Budget represents a blending of the priorities identified using the business plan approach with those brought forward in the City Council Budget Action Plan. The recommendations show a continued commitment to maintain basic/essential services at an acceptable service standard while working to meet the unique and varied needs of the community. This blending of priorities is reflected in the details of the recommended budget described in the remainder of this section and in the attachments to this budget message. At the May 8th budget study session, staff provided an update on development of the 2008-09 Recommended Budget. It was noted that revenue projections reflected modest new dollars and that initial funding allocations were based on the budget strategies, which are the base of the funding pyramid discussed earlier. These strategies include maintaining adequate reserves and funding liabilities adequately (“Must Do” items) as
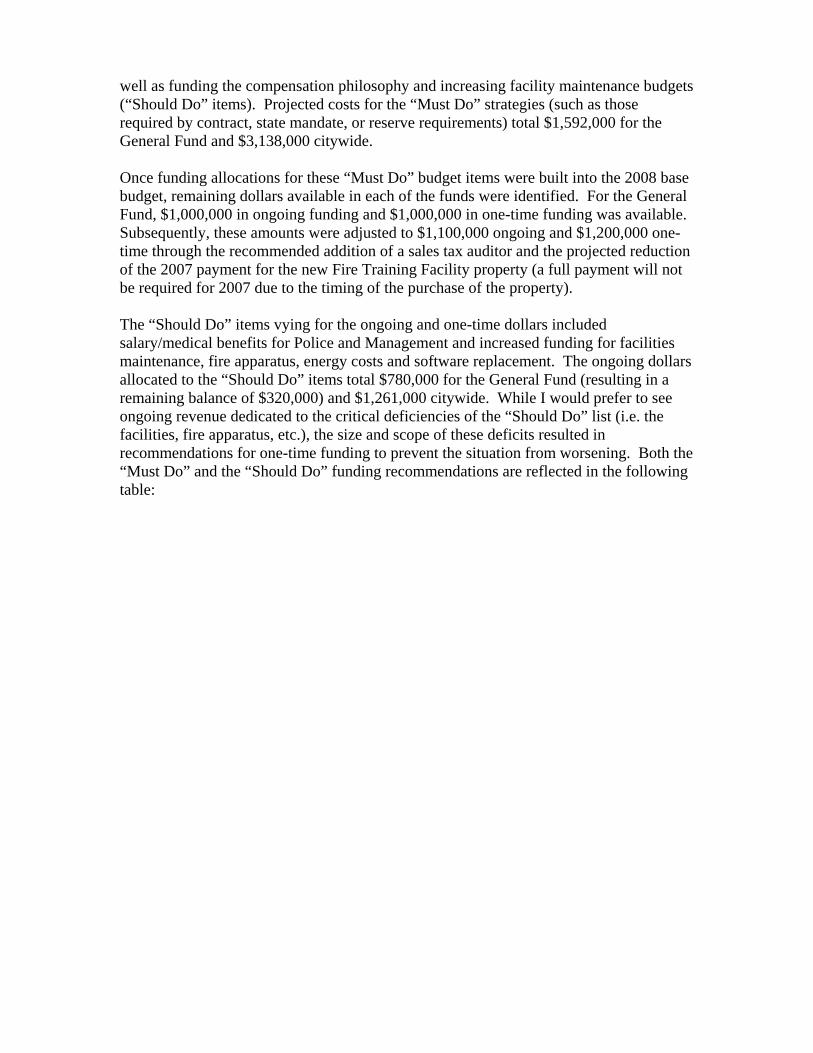
well as funding the compensation philosophy and increasing facility maintenance budgets (“Should Do” items). Projected costs for the “Must Do” strategies (such as those required by contract, state mandate, or reserve requirements) total $1,592,000 for the General Fund and $3,138,000 citywide. Once funding allocations for these “Must Do” budget items were built into the 2008 base budget, remaining dollars available in each of the funds were identified. For the General Fund, $1,000,000 in ongoing funding and $1,000,000 in one-time funding was available. Subsequently, these amounts were adjusted to $1,100,000 ongoing and $1,200,000 one-time through the recommended addition of a sales tax auditor and the projected reduction of the 2007 payment for the new Fire Training Facility property (a full payment will not be required for 2007 due to the timing of the purchase of the property). The “Should Do” items vying for the ongoing and one-time dollars included salary/medical benefits for Police and Management and increased funding for facilities maintenance, fire apparatus, energy costs and software replacement. The ongoing dollars allocated to the “Should Do” items total $780,000 for the General Fund (resulting in a remaining balance of $320,000) and $1,261,000 citywide. While I would prefer to see ongoing revenue dedicated to the critical deficiencies of the “Should Do” list (i.e. the facilities, fire apparatus, etc.), the size and scope of these deficits resulted in recommendations for one-time funding to prevent the situation from worsening. Both the “Must Do” and the “Should Do” funding recommendations are reflected in the following table:
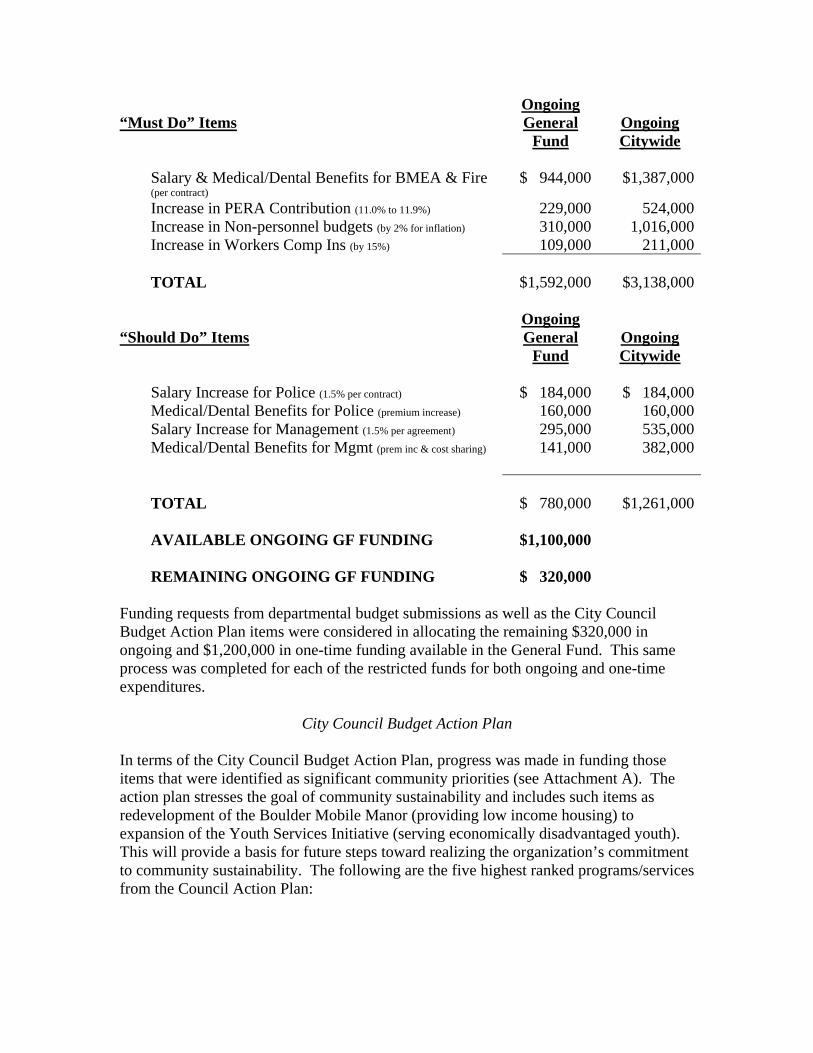
“Must Do” Items
Ongoing General
Fund
Ongoing Citywide
Salary & Medical/Dental Benefits for BMEA & Fire (per contract)
$ 944,000 $1,387,000
Increase in PERA Contribution (11.0% to 11.9%) 229,000 524,000 Increase in Non-personnel budgets (by 2% for inflation) 310,000 1,016,000 Increase in Workers Comp Ins (by 15%) 109,000 211,000 TOTAL $1,592,000 $3,138,000 “Should Do” Items
Ongoing General
Fund
Ongoing Citywide
Salary Increase for Police (1.5% per contract) $ 184,000 $ 184,000 Medical/Dental Benefits for Police (premium increase) 160,000 160,000 Salary Increase for Management (1.5% per agreement) 295,000 535,000 Medical/Dental Benefits for Mgmt (prem inc & cost sharing) 141,000 382,000 TOTAL $ 780,000
$1,261,000
AVAILABLE ONGOING GF FUNDING $1,100,000
REMAINING ONGOING GF FUNDING
$ 320,000 Funding requests from departmental budget submissions as well as the City Council Budget Action Plan items were considered in allocating the remaining $320,000 in ongoing and $1,200,000 in one-time funding available in the General Fund. This same process was completed for each of the restricted funds for both ongoing and one-time expenditures.
City Council Budget Action Plan In terms of the City Council Budget Action Plan, progress was made in funding those items that were identified as significant community priorities (see Attachment A). The action plan stresses the goal of community sustainability and includes such items as redevelopment of the Boulder Mobile Manor (providing low income housing) to expansion of the Youth Services Initiative (serving economically disadvantaged youth). This will provide a basis for future steps toward realizing the organization’s commitment to community sustainability. The following are the five highest ranked programs/services from the Council Action Plan:
- Boulder Mobile Manor Redevelopment - Youth Services Initiative (YSI) Expansion - Study of Pop-Tops and Scrapes - Boulder TV Ongoing Operations - Fire Apparatus Replacement Funding
Highlights of Action Plans
My recommended Action Plan items for each fund are included as Attachment B to this budget message. Although available new funding is limited, I believe that the funding recommendations in the budget align well with the Business Plan and the Community Sustainability filters. A brief overview of key funding recommendations in the 2008-09 budget include:
• The Youth Services Initiative (YSI) program - $50,000 ongoing funding to provide additional services at two existing sites and increasing the Getting Fit program (which focuses on fitness, recreation and community projects) to two days per week.
• Facilities and Asset Management (FAM) - $200,000 one-time allocation for
facility maintenance needs.
• Fire Apparatus Replacement and Operations - $100,000 one-time allocation to pay down the $2.9 million fire apparatus lease; $40,000 ongoing allocation to offset rising fuel costs.
• Boulder Television (BTV) - $150,000 one-time allocation to fund station
operations in 2008 while a permanent solution is developed.
• Floor Area Ratio (FAR) aka “Pops and Scrapes” Study - $40,000 one-time allocation.
• Development Excise Study (DET) - $100,000 one-time allocation from excise tax
funds (e.g. Transportation, Permanent Parks and Recreation, Capital Development and Affordable Housing, specifically CHAP).
• Planning and Development Services – Investments focus on managing the
customer “queue” and include the fixed-term positions for a land use review planner, landscape review and inspection, building permit administrative support, and modifications to the Service Center to expedite over-the-counter customer service.
• The Transportation budget includes a $513,000 ongoing allocation for operations
and maintenance to address escalating construction costs.
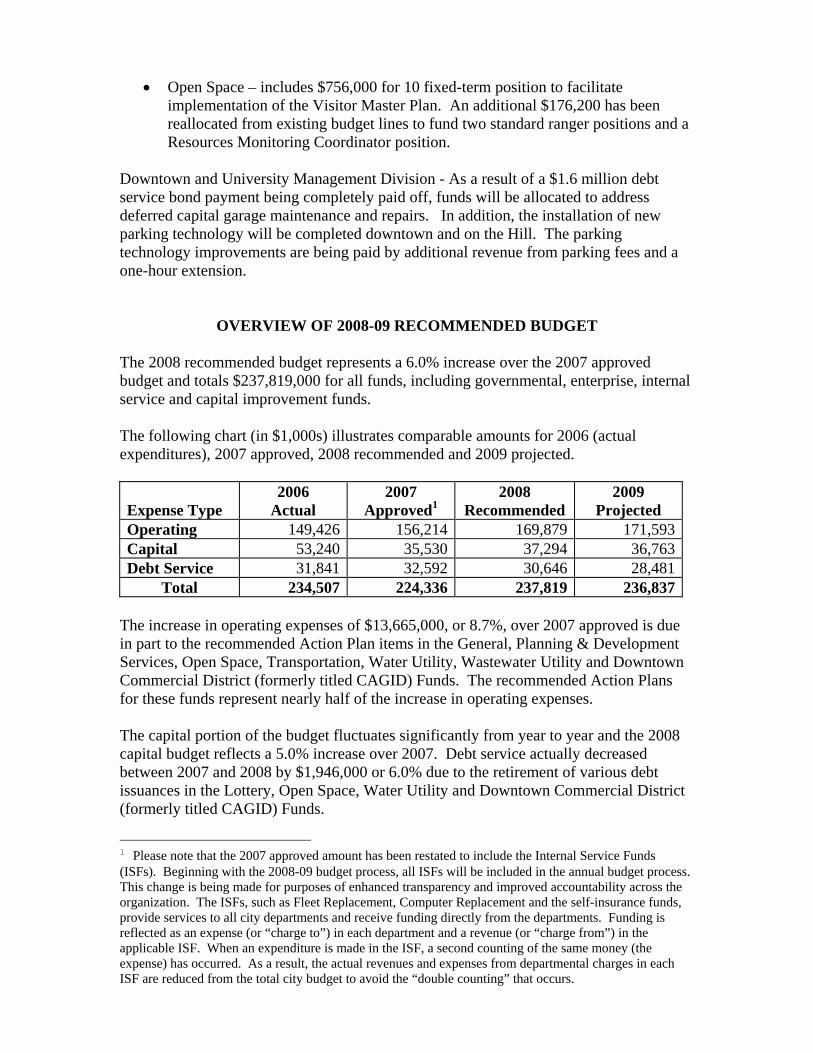
• Open Space – includes $756,000 for 10 fixed-term position to facilitate implementation of the Visitor Master Plan. An additional $176,200 has been reallocated from existing budget lines to fund two standard ranger positions and a Resources Monitoring Coordinator position.
Downtown and University Management Division - As a result of a $1.6 million debt service bond payment being completely paid off, funds will be allocated to address deferred capital garage maintenance and repairs. In addition, the installation of new parking technology will be completed downtown and on the Hill. The parking technology improvements are being paid by additional revenue from parking fees and a one-hour extension.
OVERVIEW OF 2008-09 RECOMMENDED BUDGET
The 2008 recommended budget represents a 6.0% increase over the 2007 approved budget and totals $237,819,000 for all funds, including governmental, enterprise, internal service and capital improvement funds. The following chart (in $1,000s) illustrates comparable amounts for 2006 (actual expenditures), 2007 approved, 2008 recommended and 2009 projected. Expense Type
2006 Actual
2007 Approved1
2008 Recommended
2009 Projected
Operating 149,426 156,214 169,879 171,593Capital 53,240 35,530 37,294 36,763Debt Service 31,841 32,592 30,646 28,481
Total 234,507 224,336 237,819 236,837 The increase in operating expenses of $13,665,000, or 8.7%, over 2007 approved is due in part to the recommended Action Plan items in the General, Planning & Development Services, Open Space, Transportation, Water Utility, Wastewater Utility and Downtown Commercial District (formerly titled CAGID) Funds. The recommended Action Plans for these funds represent nearly half of the increase in operating expenses. The capital portion of the budget fluctuates significantly from year to year and the 2008 capital budget reflects a 5.0% increase over 2007. Debt service actually decreased between 2007 and 2008 by $1,946,000 or 6.0% due to the retirement of various debt issuances in the Lottery, Open Space, Water Utility and Downtown Commercial District (formerly titled CAGID) Funds.
1 Please note that the 2007 approved amount has been restated to include the Internal Service Funds (ISFs). Beginning with the 2008-09 budget process, all ISFs will be included in the annual budget process. This change is being made for purposes of enhanced transparency and improved accountability across the organization. The ISFs, such as Fleet Replacement, Computer Replacement and the self-insurance funds, provide services to all city departments and receive funding directly from the departments. Funding is reflected as an expense (or “charge to”) in each department and a revenue (or “charge from”) in the applicable ISF. When an expenditure is made in the ISF, a second counting of the same money (the expense) has occurred. As a result, the actual revenues and expenses from departmental charges in each ISF are reduced from the total city budget to avoid the “double counting” that occurs.
REVENUE HIGHLIGHTS
The majority of user fees are increased according to the established pricing policy guidelines and, correspondingly, most are increased annually by approximately the rate of inflation. Please refer to the “Utility Rate” section of this document for detailed information. POLICY & REVENUE ISSUES REQUIRING CITY COUNCIL DIRECTION The following policy issues require additional discussion and direction from City Council and will be highlighted at the August 28, 2007 budget study session. 1.) Funding Options for Boulder Mobile Manor The redevelopment of Boulder Mobile Manor (BMM) is currently in the concept planning phase and firm redevelopment budget numbers are not yet finalized. Preliminary numbers suggest that the project would have a budget in the range of $14 million. The current concept plan indicates that BMM could increase from 66 up to 81 permanently affordable housing units and the redevelopment would result in a greatly improved, energy efficient infrastructure and community. Typically for a project with this level of affordable housing and community benefit, including the potential addition of 15 permanently affordable units, it would be reasonable to expect a subsidy of approximately $1 million from the city’s affordable housing funds which include: Community Housing Assistance Program (CHAP), Affordable Housing Fund (AHF), Community Development Block Grant (CDBG) and Home Investment Partnership Grant (HOME). Decisions regarding the use of affordable housing funds are based on staff analysis and input from the community’s resident advisory committee (the Technical Review Group). Given City Council’s desire to achieve a model redevelopment, including green building standards and high level energy efficiency, it is expected that the subsidy needed would be in the range of $2 million, approximately 14% of the project cost.
Options: There are several funding options to be considered and each has trade-offs that will need to be considered in order to fund this project:
a.) Use affordable housing funds: Staff expects between $2 million to $4 million to be available for the 2008 housing fund round, depending on the timing of cash-in-lieu payments. If the $2 million subsidy, potentially needed for this project, were provided entirely out of affordable housing funds, it would greatly limit the 2008 opportunities for development and acquisition of other affordable housing.
The trade-off for using a higher than normal affordable housing fund subsidy toward BMM as a demonstration project with enhanced quality and energy efficient redevelopment is that the city would reduce its progress towards the 10% permanently affordable housing goal by between 20-35 units or would reduce the
potential for other rehab and/or land acquisition in 2008/2009. This high level of subsidy, focused on fewer units, could be a precedent that would lead to significantly reduced progress towards the affordable housing goal in the future.
b.) Use one-time 2008 General Funds: For 2008, $1.2M is available in one-time general funds and this funding or a portion of the funding could be used for this project. However, this would put the city’s funding focus on just one project for 2008. As has been outlined in my recommended budget (action plan) I have distributed this one-time funding across many critical need services and “Should Do” items including fire apparatus, facilities maintenance, software maintenance, and other not service-critical, but needed services including park maintenance, liquor licensing staff, emergency management, etc.
One-time General Fund funding could be combined with the affordable housing fund in various combinations (for example, $1.5 million housing/$500,000 General Fund).
Whether funded through the General Fund or through the affordable housing funds, the impact could be spread out by distributing the subsidy over two years. However, as this City Council cannot bind a future City Council for 2009 one-time funds, staff believes if an allocation from the one-time General Fund is desired Council should allocate those funds in the 2008 budget process.
c.) Reduce the Scale of the Project: Although the city desires a model “green” redevelopment at BMM, it could consider reducing the total anticipated city support to the $1 million dollar level, provided from the affordable housing funds. The trade-offs to this option, is that if the city is not able to provide a strong level of subsidy for BMM, it is unlikely that the ambitious goals that were established by City Council for the redevelopment can be achieved.
d.) Identify Environmental Grant or Other Sources for “Green” Funding: There is the potential for this project to receive grant and incentive funding from federal, state, and/or private agencies. There is also the potential for Council to consider using Climate Action Plan (CAP) funds set aside for affordable housing energy-related improvements each year to fund the higher level of “green” development at this site. The trade-off of using CAP funds is that all the focus on affordable housing improvements would occur at this site alone and limit improvements at other affordable housing facilities. In 2008, $90,000 has been set aside in CAP funds for affordable housing energy improvements. If dedicated for two-years, CAP funding of $180,000 could be made available with the same trade-offs discussed above.
2.) Boulder Community Media (dba Boulder Television) During the 2007 budget deliberations, City Council indicated significant support for the idea of converting funding for BTV to ongoing rather then one-time. There was, however, some debate and desire to consider the trade-offs associated with various funding scenarios. When we use the business plan strategies and the community sustainability filters to assess the priority of BTV for ongoing funding, it is not as high a
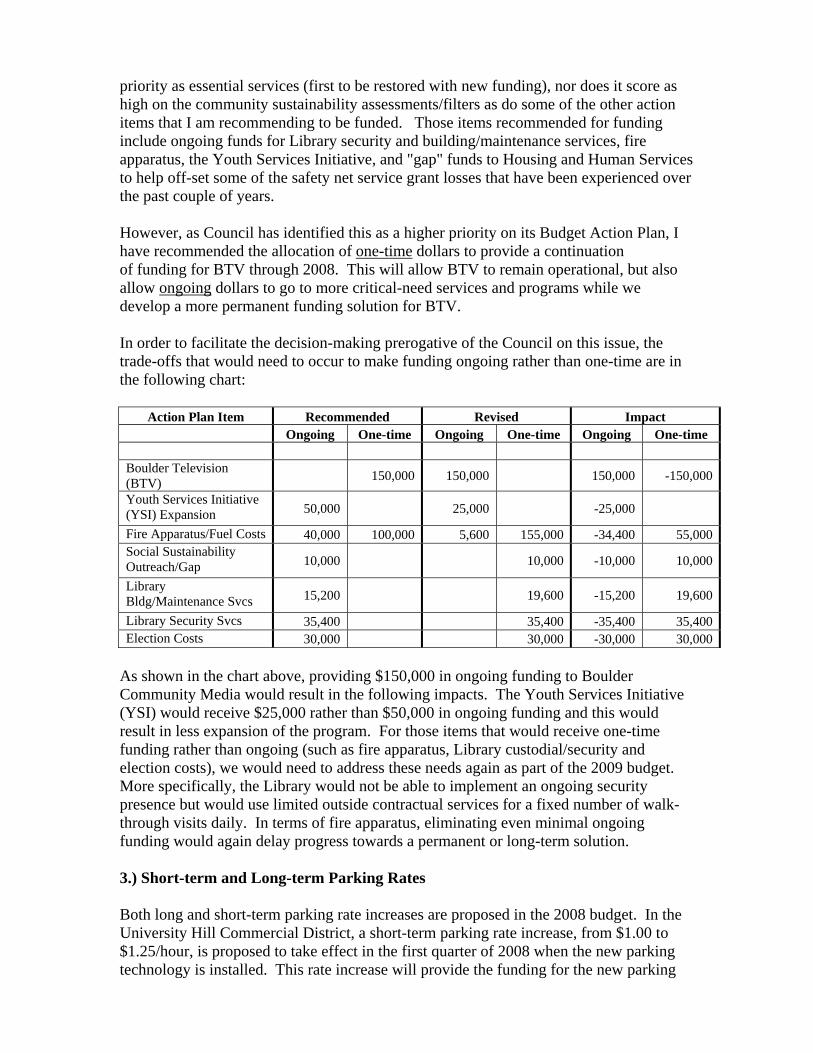
priority as essential services (first to be restored with new funding), nor does it score as high on the community sustainability assessments/filters as do some of the other action items that I am recommending to be funded. Those items recommended for funding include ongoing funds for Library security and building/maintenance services, fire apparatus, the Youth Services Initiative, and "gap" funds to Housing and Human Services to help off-set some of the safety net service grant losses that have been experienced over the past couple of years. However, as Council has identified this as a higher priority on its Budget Action Plan, I have recommended the allocation of one-time dollars to provide a continuation of funding for BTV through 2008. This will allow BTV to remain operational, but also allow ongoing dollars to go to more critical-need services and programs while we develop a more permanent funding solution for BTV. In order to facilitate the decision-making prerogative of the Council on this issue, the trade-offs that would need to occur to make funding ongoing rather than one-time are in the following chart:
Action Plan Item Recommended Revised Impact Ongoing One-time Ongoing One-time Ongoing One-time
Boulder Television (BTV) 150,000 150,000 150,000 -150,000
Youth Services Initiative (YSI) Expansion 50,000 25,000 -25,000
Fire Apparatus/Fuel Costs 40,000 100,000 5,600 155,000 -34,400 55,000Social Sustainability Outreach/Gap 10,000 10,000 -10,000 10,000
Library Bldg/Maintenance Svcs 15,200 19,600 -15,200 19,600
Library Security Svcs 35,400 35,400 -35,400 35,400Election Costs 30,000 30,000 -30,000 30,000
As shown in the chart above, providing $150,000 in ongoing funding to Boulder Community Media would result in the following impacts. The Youth Services Initiative (YSI) would receive $25,000 rather than $50,000 in ongoing funding and this would result in less expansion of the program. For those items that would receive one-time funding rather than ongoing (such as fire apparatus, Library custodial/security and election costs), we would need to address these needs again as part of the 2009 budget. More specifically, the Library would not be able to implement an ongoing security presence but would use limited outside contractual services for a fixed number of walk-through visits daily. In terms of fire apparatus, eliminating even minimal ongoing funding would again delay progress towards a permanent or long-term solution.
3.) Short-term and Long-term Parking Rates Both long and short-term parking rate increases are proposed in the 2008 budget. In the University Hill Commercial District, a short-term parking rate increase, from $1.00 to $1.25/hour, is proposed to take effect in the first quarter of 2008 when the new parking technology is installed. This rate increase will provide the funding for the new parking
pay stations which will be installed within the first quarter of 2008. Short-term parking rate increases are scheduled for every five years and the last rate increase on the Hill was in 2003. In addition, in order to cover costs for new parking technology and increase customer access to on-street parking spaces, the hours charged for parking are proposed to change from 6pm to 7pm. The proposed increase will make the parking rates and hours on the Hill consistent with the Downtown where short-term parking rates were increased in August 2007 in conjunction with the installation of the new parking technology. Parking is enforced on the Hill and Downtown Monday through Saturday beginning at 9am. As a point of reference, the University of Colorado charges $1.25 at its on-street meters and enforces between 7:30 a.m. and 5 p.m., 7 days a week. Long-term or permit parking rates are proposed to increase in both the Downtown and the Hill area. Historically, long-term permit rates are increased 5% every two years. A market analysis was done to evaluate utilization rates and evaluate competitive prices for both districts. For 2008, long-term rates in the University Hill Commercial District surface lots are proposed to increase 5% to $148 per quarter. In the Downtown Commercial District, rates are proposed to increase 10% to $155 per quarter for surface lots and $255 per quarter for parking garages. Market research in private lots and garages in the downtown and hill areas indicate the new rates are competitive, but below current market rates. These proposed rate increases will be presented for public hearing and input at both the Downtown Management Commission and the University Hill General Improvement District Advisory Committees this fall before implementation. 4.) Economic Vitality As discussed at the August 14th study session regarding the city’s Economic Vitality (EV) program, we are requesting that Council reauthorize the program for 2008. There is a sufficient balance in the BURA reserve (the current source of funding for the program) to cover the two fixed-term positions (Business Liaison and Redevelopment Director), to pay for the partnership programs and to fund a much scaled back Flexible Rebate Incentive program through 2008. In terms of the Flexible Rebate Incentive program, staff anticipates that roughly $200,000 of remaining BURA reserves will be available to devote to this important element of the EV program. As Council may recall, $500,000 was appropriated in 2006 from the reserve account to fund a pilot program. While this is a significant amount given the needs across the municipal corporation, it is a very small investment given the potential for retention and capital business expansion. As we face an increasingly constrained revenue stream, investing in our business community will become even more critical. I further believe that not continuing the incentive program would be very negative and would create the perception that the city is not serious about economic vitality and retaining businesses in Boulder. Funding beyond 2008 is a challenge and we will be exploring options that provide an ongoing funding source for the EV program as part of the 2009 budget. During the upcoming study sessions on the recommended budget, staff will provide an overview of some of the funding options being considered, including a proposed trigger concept based on actual business use tax collections exceeding 2007 projections. In addition, the options considered for 2009 will include converting the two fixed-term positions to standard ongoing FTEs.
ORGANIZATIONAL UPDATES
Urban Wildlife Coordinator Pilot Program I have established a new fixed-term Urban Wildlife Coordinator (UWC) position as part of a pilot program through 2008 to plan, coordinate, and implement the city-wide activities of the Urban Wildlife Management program and the city’s wildlife ordinance. The management of urban wildlife affects many departments and projects/programs of the city. The adoption of a wildlife ordinance established permitting requirements and the need for staff to oversee and implement this program. The approval of the Urban Wildlife Management Plan set into motion a need for work programs and tasks to address management of urban wildlife in the city. I believe it is important that the city have a consistent understanding of, and approach to, wildlife management to ensure that all of our codes and policies are being complied with and to ensure the same is occurring in the private sector. This position, working with the existing inter-departmental staff team for wildlife management, will help to achieve this goal. Funds are not being requested in the 2008 budget. The position will be funded through 2008 by the various departments who currently have urban wildlife management needs or staff working on urban wildlife. The position and the success of the program will be monitored over the next year and continuation of the program and funding requests will be considered as part of the 2009 budget process. An item with more information on the pilot program was provided in the August 16, 2007 Weekly Information Packet. At the July 31 budget study session, a Council member raised questions about the funding and need for the Parks and Recreation “conservation team.” At one of the upcoming budget study sessions, Parks and Recreation staff will be prepared to provide Council with information and costs (personnel and non-personnel) on how it handles urban wildlife management and how its current program will be impacted by the UWC position.
Community Sustainability Coordinator and Work Program
As Council is aware during its January 2006 and 2007 retreats, I was asked to consider establishing an Office of Sustainability. Council members also reaffirmed this interest through their 2008 Council Budget Action Plan submittals for consideration as part of my 2008 Recommended Budget. I believe City Council has shown great leadership in advancing the philosophy of community sustainability. In May 2007, I established a .50 FTE fixed-term Community Sustainability Coordinator position through 2008. I am using the resources of the municipal corporation to advance this important goal and to ensure that community sustainability is integrated throughout the entire organization and that it becomes part of our daily organizational lives. The position through 2007 will cost approximately $20,000 and for 2008, $40,000. Funding for the position is coming from my “extraordinary personnel” contingency fund. This is an annual contingency that provides funds for unanticipated personnel costs – such as Fire overtime costs – and also used to allow flexibility for fixed-term personnel
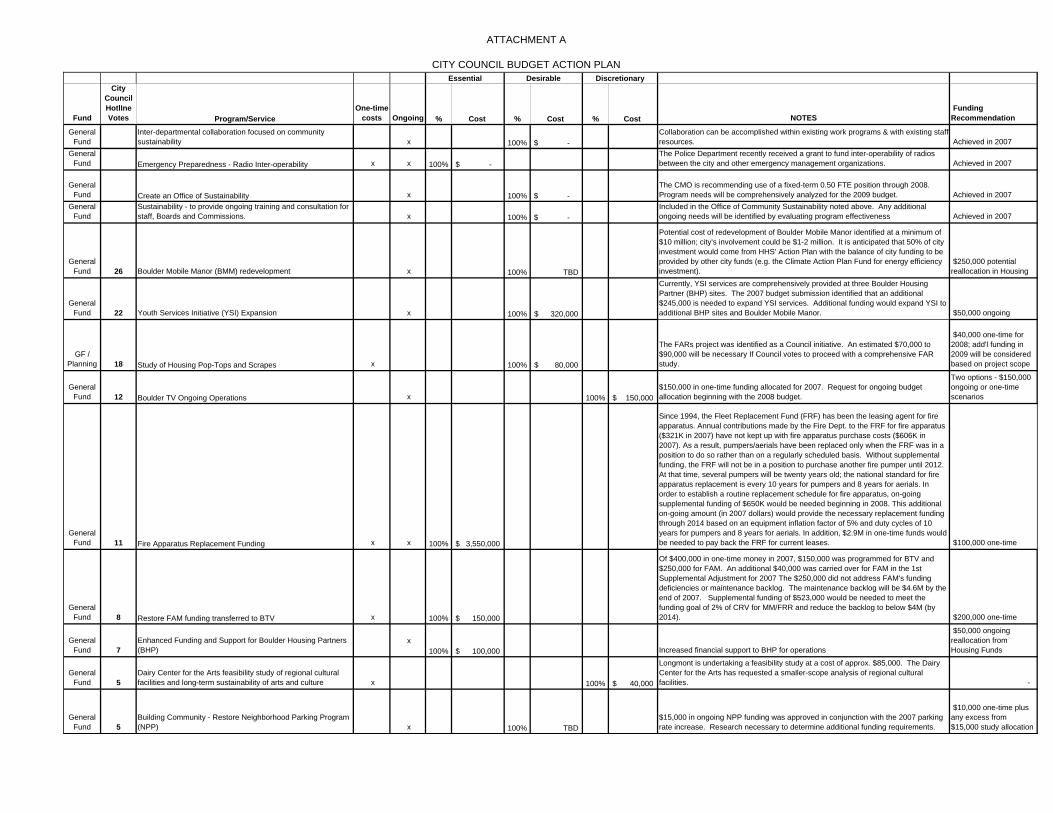
ATTACHMENT A
CITY COUNCIL BUDGET ACTION PLAN
Fund
City Council HotlIne Votes Program/Service
One-time costs Ongoing % Cost % Cost % Cost NOTES
Funding Recommendation
General Fund
Inter-departmental collaboration focused on community sustainability x 100% -$
Collaboration can be accomplished within existing work programs & with existing staff resources. Achieved in 2007
General Fund Emergency Preparedness - Radio Inter-operability x x 100% -$
The Police Department recently received a grant to fund inter-operability of radios between the city and other emergency management organizations. Achieved in 2007
General Fund Create an Office of Sustainability x 100% -$
The CMO is recommending use of a fixed-term 0.50 FTE position through 2008. Program needs will be comprehensively analyzed for the 2009 budget. Achieved in 2007
General Fund
Sustainability - to provide ongoing training and consultation for staff, Boards and Commissions. x 100% -$
Included in the Office of Community Sustainability noted above. Any additional ongoing needs will be identified by evaluating program effectiveness Achieved in 2007
General Fund 26 Boulder Mobile Manor (BMM) redevelopment x 100% TBD
Potential cost of redevelopment of Boulder Mobile Manor identified at a minimum of $10 million; city's involvement could be $1-2 million. It is anticipated that 50% of city investment would come from HHS' Action Plan with the balance of city funding to be provided by other city funds (e.g. the Climate Action Plan Fund for energy efficiency investment).
$250,000 potential reallocation in Housing
General Fund 22 Youth Services Initiative (YSI) Expansion x 100% 320,000$
Currently, YSI services are comprehensively provided at three Boulder Housing Partner (BHP) sites. The 2007 budget submission identified that an additional $245,000 is needed to expand YSI services. Additional funding would expand YSI to additional BHP sites and Boulder Mobile Manor. $50,000 ongoing
GF / Planning 18 Study of Housing Pop-Tops and Scrapes x 100% 80,000$
The FARs project was identified as a Council initiative. An estimated $70,000 to $90,000 will be necessary If Council votes to proceed with a comprehensive FAR study.
$40,000 one-time for 2008; add'l funding in 2009 will be considered based on project scope
General Fund 12 Boulder TV Ongoing Operations x 100% 150,000$
$150,000 in one-time funding allocated for 2007. Request for ongoing budget allocation beginning with the 2008 budget.
Two options - $150,000 ongoing or one-time scenarios
General Fund 11 Fire Apparatus Replacement Funding x x 100% 3,550,000$
Since 1994, the Fleet Replacement Fund (FRF) has been the leasing agent for fire apparatus. Annual contributions made by the Fire Dept. to the FRF for fire apparatus ($321K in 2007) have not kept up with fire apparatus purchase costs ($606K in 2007). As a result, pumpers/aerials have been replaced only when the FRF was in a position to do so rather than on a regularly scheduled basis. Without supplemental funding, the FRF will not be in a position to purchase another fire pumper until 2012. At that time, several pumpers will be twenty years old; the national standard for fire apparatus replacement is every 10 years for pumpers and 8 years for aerials. In order to establish a routine replacement schedule for fire apparatus, on-going supplemental funding of $650K would be needed beginning in 2008. This additional on-going amount (in 2007 dollars) would provide the necessary replacement funding through 2014 based on an equipment inflation factor of 5% and duty cycles of 10 years for pumpers and 8 years for aerials. In addition, $2.9M in one-time funds would be needed to pay back the FRF for current leases. $100,000 one-time
General Fund 8 Restore FAM funding transferred to BTV x 100% 150,000$
Of $400,000 in one-time money in 2007, $150,000 was programmed for BTV and $250,000 for FAM. An additional $40,000 was carried over for FAM in the 1st Supplemental Adjustment for 2007 The $250,000 did not address FAM's funding deficiencies or maintenance backlog. The maintenance backlog will be $4.6M by the end of 2007. Supplemental funding of $523,000 would be needed to meet the funding goal of 2% of CRV for MM/FRR and reduce the backlog to below $4M (by 2014). $200,000 one-time
General Fund 7
Enhanced Funding and Support for Boulder Housing Partners (BHP)
x 100% 100,000$ Increased financial support to BHP for operations
$50,000 ongoing reallocation from Housing Funds
General Fund 5
Dairy Center for the Arts feasibility study of regional cultural facilities and long-term sustainability of arts and culture x 100% 40,000$
Longmont is undertaking a feasibility study at a cost of approx. $85,000. The Dairy Center for the Arts has requested a smaller-scope analysis of regional cultural facilities. -
General Fund 5
Building Community - Restore Neighborhood Parking Program (NPP) x 100% TBD
$15,000 in ongoing NPP funding was approved in conjunction with the 2007 parking rate increase. Research necessary to determine additional funding requirements.
$10,000 one-time plus any excess from $15,000 study allocation
Essential Desirable Discretionary
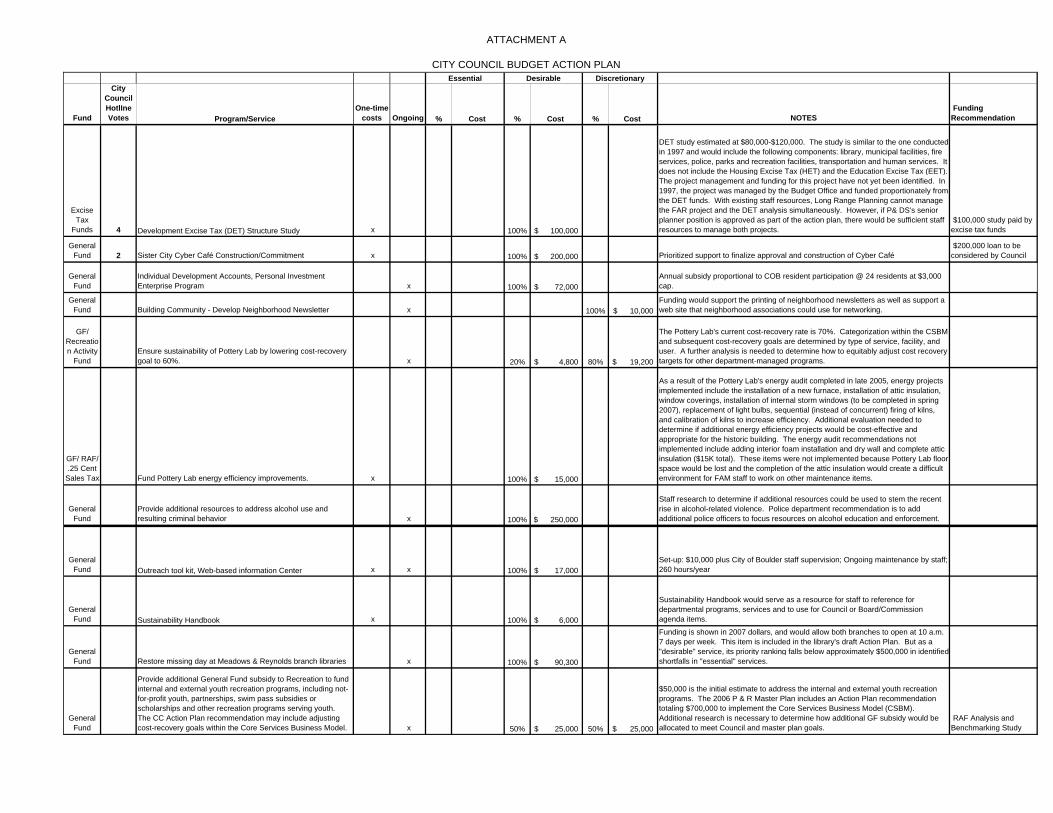
ATTACHMENT A
CITY COUNCIL BUDGET ACTION PLAN
Fund
City Council HotlIne Votes Program/Service
One-time costs Ongoing % Cost % Cost % Cost NOTES
Funding Recommendation
Essential Desirable Discretionary
Excise Tax
Funds 4 Development Excise Tax (DET) Structure Study x 100% 100,000$
DET study estimated at $80,000-$120,000. The study is similar to the one conducted in 1997 and would include the following components: library, municipal facilities, fire services, police, parks and recreation facilities, transportation and human services. It does not include the Housing Excise Tax (HET) and the Education Excise Tax (EET). The project management and funding for this project have not yet been identified. In 1997, the project was managed by the Budget Office and funded proportionately from the DET funds. With existing staff resources, Long Range Planning cannot manage the FAR project and the DET analysis simultaneously. However, if P& DS's senior planner position is approved as part of the action plan, there would be sufficient staff resources to manage both projects.
$100,000 study paid by excise tax funds
General Fund 2 Sister City Cyber Café Construction/Commitment x 100% 200,000$ Prioritized support to finalize approval and construction of Cyber Café
$200,000 loan to be considered by Council
General Fund
Individual Development Accounts, Personal Investment Enterprise Program x 100% 72,000$
Annual subsidy proportional to COB resident participation @ 24 residents at $3,000 cap.
General Fund Building Community - Develop Neighborhood Newsletter x 100% 10,000$
Funding would support the printing of neighborhood newsletters as well as support a web site that neighborhood associations could use for networking.
GF/ Recreation Activity
FundEnsure sustainability of Pottery Lab by lowering cost-recovery goal to 60%. x 20% 4,800$ 80% 19,200$
The Pottery Lab's current cost-recovery rate is 70%. Categorization within the CSBM and subsequent cost-recovery goals are determined by type of service, facility, and user. A further analysis is needed to determine how to equitably adjust cost recovery targets for other department-managed programs.
GF/ RAF/ .25 Cent
Sales Tax Fund Pottery Lab energy efficiency improvements. x 100% 15,000$
As a result of the Pottery Lab's energy audit completed in late 2005, energy projects implemented include the installation of a new furnace, installation of attic insulation, window coverings, installation of internal storm windows (to be completed in spring 2007), replacement of light bulbs, sequential (instead of concurrent) firing of kilns, and calibration of kilns to increase efficiency. Additional evaluation needed to determine if additional energy efficiency projects would be cost-effective and appropriate for the historic building. The energy audit recommendations not implemented include adding interior foam installation and dry wall and complete attic insulation ($15K total). These items were not implemented because Pottery Lab floor space would be lost and the completion of the attic insulation would create a difficult environment for FAM staff to work on other maintenance items.
General Fund
Provide additional resources to address alcohol use and resulting criminal behavior x 100% 250,000$
Staff research to determine if additional resources could be used to stem the recent rise in alcohol-related violence. Police department recommendation is to add additional police officers to focus resources on alcohol education and enforcement.
x
General Fund Outreach tool kit, Web-based information Center x x 100% 17,000$
Set-up: $10,000 plus City of Boulder staff supervision; Ongoing maintenance by staff; 260 hours/year
General Fund Sustainability Handbook x 100% 6,000$
Sustainability Handbook would serve as a resource for staff to reference for departmental programs, services and to use for Council or Board/Commission agenda items.
General Fund Restore missing day at Meadows & Reynolds branch libraries x 100% 90,300$
Funding is shown in 2007 dollars, and would allow both branches to open at 10 a.m. 7 days per week. This item is included in the library's draft Action Plan. But as a "desirable" service, its priority ranking falls below approximately $500,000 in identified shortfalls in "essential" services.
General Fund
Provide additional General Fund subsidy to Recreation to fund internal and external youth recreation programs, including not-for-profit youth, partnerships, swim pass subsidies or scholarships and other recreation programs serving youth. The CC Action Plan recommendation may include adjusting cost-recovery goals within the Core Services Business Model. x 50% 25,000$ 50% 25,000$
$50,000 is the initial estimate to address the internal and external youth recreation programs. The 2006 P & R Master Plan includes an Action Plan recommendation totaling $700,000 to implement the Core Services Business Model (CSBM). Additional research is necessary to determine how additional GF subsidy would be allocated to meet Council and master plan goals.
RAF Analysis and Benchmarking Study
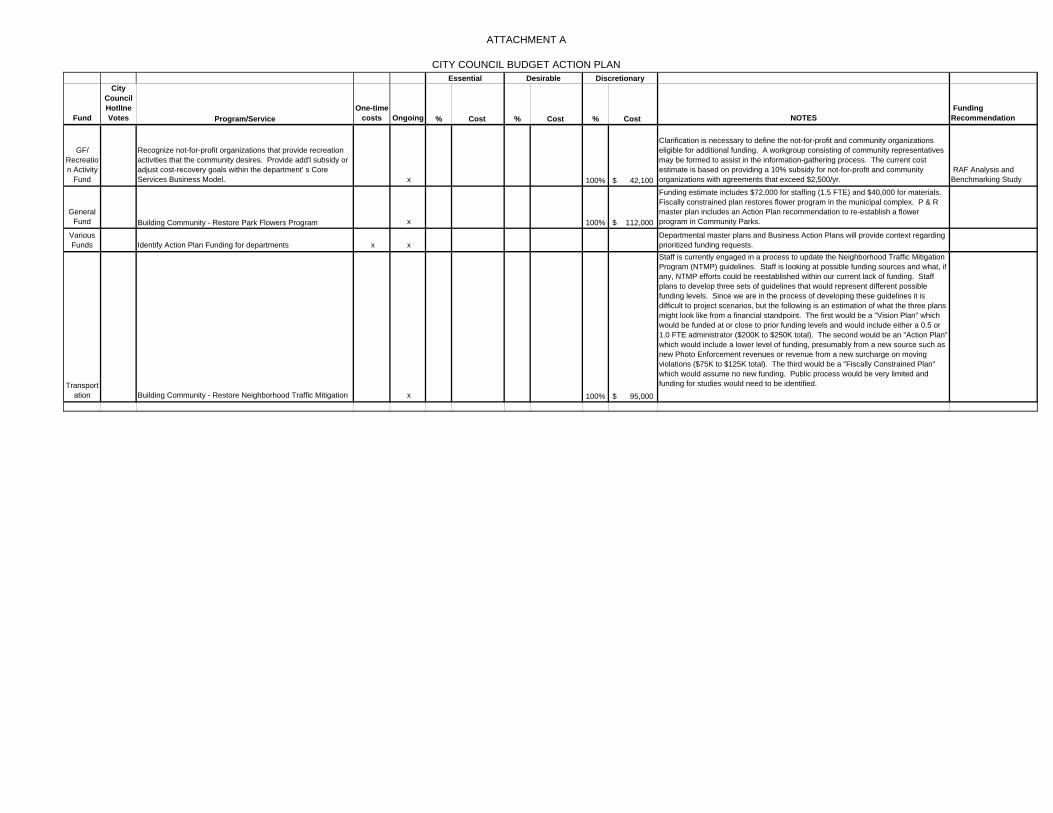
ATTACHMENT A
CITY COUNCIL BUDGET ACTION PLAN
Fund
City Council HotlIne Votes Program/Service
One-time costs Ongoing % Cost % Cost % Cost NOTES
Funding Recommendation
Essential Desirable Discretionary
GF/ Recreation Activity
Fund
Recognize not-for-profit organizations that provide recreation activities that the community desires. Provide add'l subsidy or adjust cost-recovery goals within the department' s Core Services Business Model. x 100% 42,100$
Clarification is necessary to define the not-for-profit and community organizations eligible for additional funding. A workgroup consisting of community representatives may be formed to assist in the information-gathering process. The current cost estimate is based on providing a 10% subsidy for not-for-profit and community organizations with agreements that exceed $2,500/yr.
RAF Analysis and Benchmarking Study
General Fund Building Community - Restore Park Flowers Program x 100% 112,000$
Funding estimate includes $72,000 for staffing (1.5 FTE) and $40,000 for materials. Fiscally constrained plan restores flower program in the municipal complex. P & R master plan includes an Action Plan recommendation to re-establish a flower program in Community Parks.
Various Funds Identify Action Plan Funding for departments x x
Departmental master plans and Business Action Plans will provide context regarding prioritized funding requests.
Transportation Building Community - Restore Neighborhood Traffic Mitigation x 100% 95,000$
Staff is currently engaged in a process to update the Neighborhood Traffic Mitigation Program (NTMP) guidelines. Staff is looking at possible funding sources and what, if any, NTMP efforts could be reestablished within our current lack of funding. Staff plans to develop three sets of guidelines that would represent different possible funding levels. Since we are in the process of developing these guidelines it is difficult to project scenarios, but the following is an estimation of what the three plans might look like from a financial standpoint. The first would be a "Vision Plan" which would be funded at or close to prior funding levels and would include either a 0.5 or 1.0 FTE administrator ($200K to $250K total). The second would be an "Action Plan" which would include a lower level of funding, presumably from a new source such as new Photo Enforcement revenues or revenue from a new surcharge on moving violations ($75K to $125K total). The third would be a "Fiscally Constrained Plan" which would assume no new funding. Public process would be very limited and funding for studies would need to be identified.
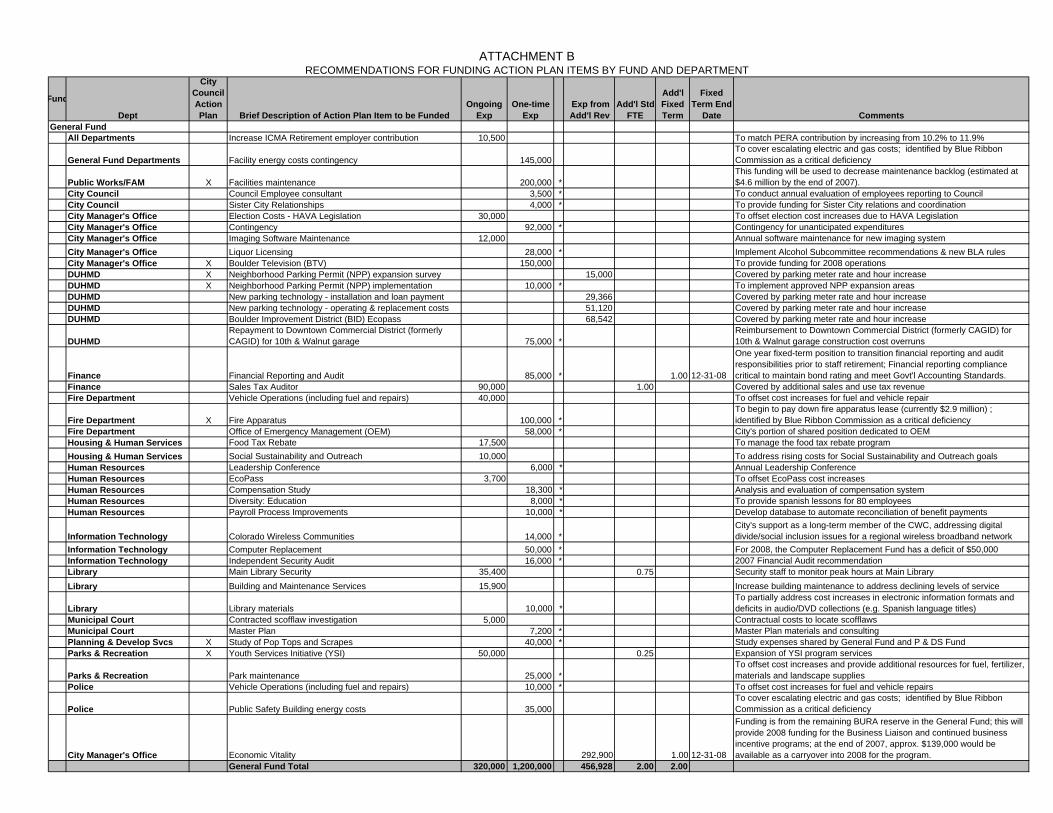
ATTACHMENT BRECOMMENDATIONS FOR FUNDING ACTION PLAN ITEMS BY FUND AND DEPARTMENT
Add'l Fixed Term
Fixed Term End
Date
All Departments Increase ICMA Retirement employer contribution 10,500 To match PERA contribution by increasing from 10.2% to 11.9%
General Fund Departments Facility energy costs contingency 145,000To cover escalating electric and gas costs; identified by Blue Ribbon Commission as a critical deficiency
Public Works/FAM X Facilities maintenance 200,000 *This funding will be used to decrease maintenance backlog (estimated at $4.6 million by the end of 2007).
City Council Council Employee consultant 3,500 * To conduct annual evaluation of employees reporting to Council City Council Sister City Relationships 4,000 * To provide funding for Sister City relations and coordinationCity Manager's Office Election Costs - HAVA Legislation 30,000 To offset election cost increases due to HAVA Legislation City Manager's Office Contingency 92,000 * Contingency for unanticipated expendituresCity Manager's Office Imaging Software Maintenance 12,000 Annual software maintenance for new imaging systemCity Manager's Office Liquor Licensing 28,000 * Implement Alcohol Subcommittee recommendations & new BLA rulesCity Manager's Office X Boulder Television (BTV) 150,000 To provide funding for 2008 operationsDUHMD X Neighborhood Parking Permit (NPP) expansion survey 15,000 Covered by parking meter rate and hour increaseDUHMD X Neighborhood Parking Permit (NPP) implementation 10,000 * To implement approved NPP expansion areasDUHMD New parking technology - installation and loan payment 29,366 Covered by parking meter rate and hour increaseDUHMD New parking technology - operating & replacement costs 51,120 Covered by parking meter rate and hour increaseDUHMD Boulder Improvement District (BID) Ecopass 68,542 Covered by parking meter rate and hour increase
DUHMDRepayment to Downtown Commercial District (formerly CAGID) for 10th & Walnut garage 75,000 *
Reimbursement to Downtown Commercial District (formerly CAGID) for 10th & Walnut garage construction cost overruns
Finance Financial Reporting and Audit 85,000 * 1.00 12-31-08
One year fixed-term position to transition financial reporting and audit responsibilities prior to staff retirement; Financial reporting compliance critical to maintain bond rating and meet Govt'l Accounting Standards.
Finance Sales Tax Auditor 90,000 1.00 Covered by additional sales and use tax revenueFire Department Vehicle Operations (including fuel and repairs) 40,000 To offset cost increases for fuel and vehicle repair
Fire Department X Fire Apparatus 100,000 *To begin to pay down fire apparatus lease (currently $2.9 million) ; identified by Blue Ribbon Commission as a critical deficiency
Fire Department Office of Emergency Management (OEM) 58,000 * City's portion of shared position dedicated to OEMHousing & Human Services Food Tax Rebate 17,500 To manage the food tax rebate programHousing & Human Services Social Sustainability and Outreach 10,000 To address rising costs for Social Sustainability and Outreach goalsHuman Resources Leadership Conference 6,000 * Annual Leadership ConferenceHuman Resources EcoPass 3,700 To offset EcoPass cost increasesHuman Resources Compensation Study 18,300 * Analysis and evaluation of compensation system Human Resources Diversity: Education 8,000 * To provide spanish lessons for 80 employeesHuman Resources Payroll Process Improvements 10,000 * Develop database to automate reconciliation of benefit payments
Information Technology Colorado Wireless Communities 14,000 *City's support as a long-term member of the CWC, addressing digital divide/social inclusion issues for a regional wireless broadband network
Information Technology Computer Replacement 50,000 * For 2008, the Computer Replacement Fund has a deficit of $50,000 Information Technology Independent Security Audit 16,000 * 2007 Financial Audit recommendationLibrary Main Library Security 35,400 0.75 Security staff to monitor peak hours at Main LibraryLibrary Building and Maintenance Services 15,900 Increase building maintenance to address declining levels of service
Library Library materials 10,000 *To partially address cost increases in electronic information formats and deficits in audio/DVD collections (e.g. Spanish language titles)
Municipal Court Contracted scofflaw investigation 5,000 Contractual costs to locate scofflaws Municipal Court Master Plan 7,200 * Master Plan materials and consultingPlanning & Develop Svcs X Study of Pop Tops and Scrapes 40,000 * Study expenses shared by General Fund and P & DS Fund Parks & Recreation X Youth Services Initiative (YSI) 50,000 0.25 Expansion of YSI program services
Parks & Recreation Park maintenance 25,000 *To offset cost increases and provide additional resources for fuel, fertilizer, materials and landscape supplies
Police Vehicle Operations (including fuel and repairs) 10,000 * To offset cost increases for fuel and vehicle repairs
Police Public Safety Building energy costs 35,000To cover escalating electric and gas costs; identified by Blue Ribbon Commission as a critical deficiency
City Manager's Office Economic Vitality 292,900 1.00 12-31-08
Funding is from the remaining BURA reserve in the General Fund; this will provide 2008 funding for the Business Liaison and continued business incentive programs; at the end of 2007, approx. $139,000 would be available as a carryover into 2008 for the program.
General Fund Total 320,000 1,200,000 456,928 2.00 2.00
General Fund
One-time Exp
Exp from Add'l Rev
Add'l Std FTE Comments
Fund
Dept Brief Description of Action Plan Item to be FundedOngoing
Exp
City Council Action Plan
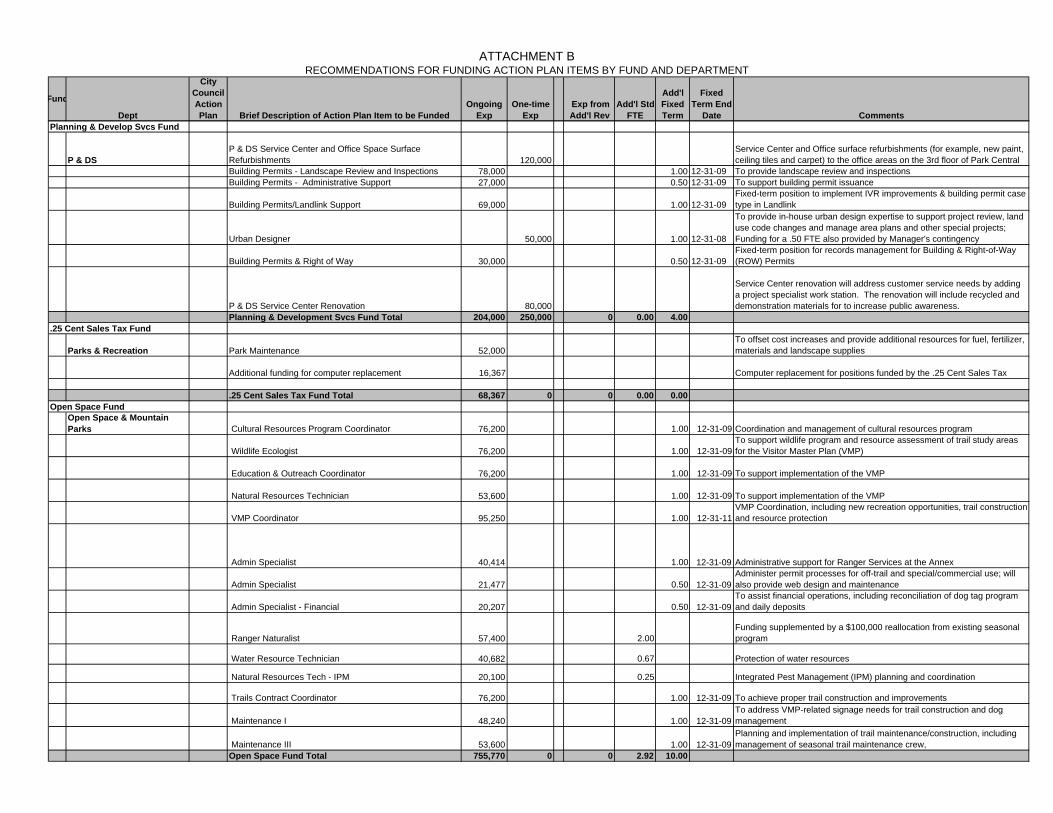
ATTACHMENT BRECOMMENDATIONS FOR FUNDING ACTION PLAN ITEMS BY FUND AND DEPARTMENT
Add'l Fixed Term
Fixed Term End
DateOne-time
Exp Exp from Add'l Rev
Add'l Std FTE Comments
Fund
Dept Brief Description of Action Plan Item to be FundedOngoing
Exp
City Council Action Plan
P & DSP & DS Service Center and Office Space Surface Refurbishments 120,000
Service Center and Office surface refurbishments (for example, new paint, ceiling tiles and carpet) to the office areas on the 3rd floor of Park Central
Building Permits - Landscape Review and Inspections 78,000 1.00 12-31-09 To provide landscape review and inspectionsBuilding Permits - Administrative Support 27,000 0.50 12-31-09 To support building permit issuance
Building Permits/Landlink Support 69,000 1.00 12-31-09Fixed-term position to implement IVR improvements & building permit case type in Landlink
Urban Designer 50,000 1.00 12-31-08
To provide in-house urban design expertise to support project review, land use code changes and manage area plans and other special projects; Funding for a .50 FTE also provided by Manager's contingency
Building Permits & Right of Way 30,000 0.50 12-31-09Fixed-term position for records management for Building & Right-of-Way (ROW) Permits
P & DS Service Center Renovation 80,000
Service Center renovation will address customer service needs by adding a project specialist work station. The renovation will include recycled and demonstration materials for to increase public awareness.
Planning & Development Svcs Fund Total 204,000 250,000 0 0.00 4.00.25 Cent Sales Tax Fund
Parks & Recreation Park Maintenance 52,000To offset cost increases and provide additional resources for fuel, fertilizer, materials and landscape supplies
Additional funding for computer replacement 16,367 Computer replacement for positions funded by the .25 Cent Sales Tax
.25 Cent Sales Tax Fund Total 68,367 0 0 0.00 0.00Open Space Fund
Open Space & Mountain Parks Cultural Resources Program Coordinator 76,200 1.00 12-31-09 Coordination and management of cultural resources program
Wildlife Ecologist 76,200 1.00 12-31-09To support wildlife program and resource assessment of trail study areas for the Visitor Master Plan (VMP)
Education & Outreach Coordinator 76,200 1.00 12-31-09 To support implementation of the VMP
Natural Resources Technician 53,600 1.00 12-31-09 To support implementation of the VMP
VMP Coordinator 95,250 1.00 12-31-11VMP Coordination, including new recreation opportunities, trail construction and resource protection
Admin Specialist 40,414 1.00 12-31-09 Administrative support for Ranger Services at the Annex
Admin Specialist 21,477 0.50 12-31-09Administer permit processes for off-trail and special/commercial use; will also provide web design and maintenance
Admin Specialist - Financial 20,207 0.50 12-31-09To assist financial operations, including reconciliation of dog tag program and daily deposits
Ranger Naturalist 57,400 2.00Funding supplemented by a $100,000 reallocation from existing seasonal program
Water Resource Technician 40,682 0.67 Protection of water resources
Natural Resources Tech - IPM 20,100 0.25 Integrated Pest Management (IPM) planning and coordination
Trails Contract Coordinator 76,200 1.00 12-31-09 To achieve proper trail construction and improvements
Maintenance I 48,240 1.00 12-31-09To address VMP-related signage needs for trail construction and dog management
Maintenance III 53,600 1.00 12-31-09Planning and implementation of trail maintenance/construction, including management of seasonal trail maintenance crew,
Open Space Fund Total 755,770 0 0 2.92 10.00
Planning & Develop Svcs Fund
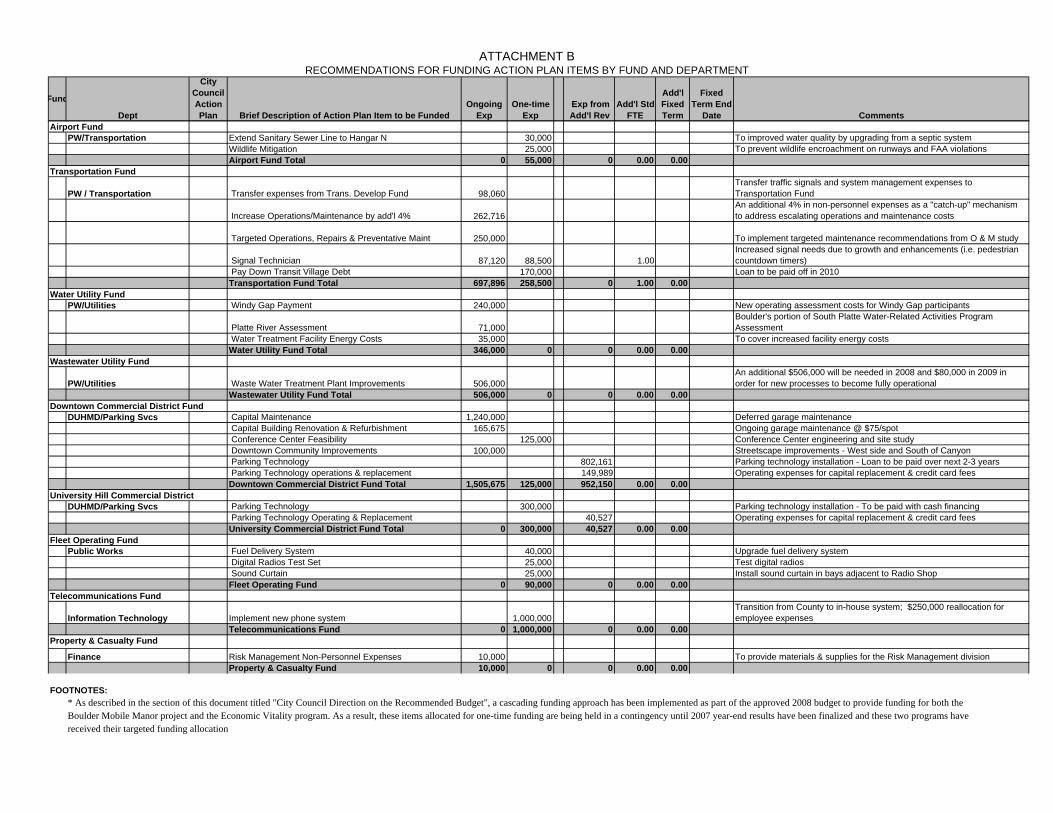
ATTACHMENT BRECOMMENDATIONS FOR FUNDING ACTION PLAN ITEMS BY FUND AND DEPARTMENT
Add'l Fixed Term
Fixed Term End
DateOne-time
Exp Exp from Add'l Rev
Add'l Std FTE Comments
Fund
Dept Brief Description of Action Plan Item to be FundedOngoing
Exp
City Council Action Plan
Airport FundPW/Transportation Extend Sanitary Sewer Line to Hangar N 30,000 To improved water quality by upgrading from a septic system
Wildlife Mitigation 25,000 To prevent wildlife encroachment on runways and FAA violations Airport Fund Total 0 55,000 0 0.00 0.00
Transportation Fund
PW / Transportation Transfer expenses from Trans. Develop Fund 98,060Transfer traffic signals and system management expenses to Transportation Fund
Increase Operations/Maintenance by add'l 4% 262,716An additional 4% in non-personnel expenses as a "catch-up" mechanism to address escalating operations and maintenance costs
Targeted Operations, Repairs & Preventative Maint 250,000 To implement targeted maintenance recommendations from O & M study
Signal Technician 87,120 88,500 1.00Increased signal needs due to growth and enhancements (i.e. pedestrian countdown timers)
Pay Down Transit Village Debt 170,000 Loan to be paid off in 2010Transportation Fund Total 697,896 258,500 0 1.00 0.00
Water Utility FundPW/Utilities Windy Gap Payment 240,000 New operating assessment costs for Windy Gap participants
Platte River Assessment 71,000Boulder's portion of South Platte Water-Related Activities Program Assessment
Water Treatment Facility Energy Costs 35,000 To cover increased facility energy costsWater Utility Fund Total 346,000 0 0 0.00 0.00
Wastewater Utility Fund
PW/Utilities Waste Water Treatment Plant Improvements 506,000An additional $506,000 will be needed in 2008 and $80,000 in 2009 in order for new processes to become fully operational
Wastewater Utility Fund Total 506,000 0 0 0.00 0.00Downtown Commercial District Fund
DUHMD/Parking Svcs Capital Maintenance 1,240,000 Deferred garage maintenance Capital Building Renovation & Refurbishment 165,675 Ongoing garage maintenance @ $75/spot Conference Center Feasibility 125,000 Conference Center engineering and site study Downtown Community Improvements 100,000 Streetscape improvements - West side and South of Canyon Parking Technology 802,161 Parking technology installation - Loan to be paid over next 2-3 years Parking Technology operations & replacement 149,989 Operating expenses for capital replacement & credit card feesDowntown Commercial District Fund Total 1,505,675 125,000 952,150 0.00 0.00
University Hill Commercial DistrictDUHMD/Parking Svcs Parking Technology 300,000 Parking technology installation - To be paid with cash financing
Parking Technology Operating & Replacement 40,527 Operating expenses for capital replacement & credit card feesUniversity Commercial District Fund Total 0 300,000 40,527 0.00 0.00
Fleet Operating FundPublic Works Fuel Delivery System 40,000 Upgrade fuel delivery system
Digital Radios Test Set 25,000 Test digital radios Sound Curtain 25,000 Install sound curtain in bays adjacent to Radio ShopFleet Operating Fund 0 90,000 0 0.00 0.00
Telecommunications Fund
Information Technology Implement new phone system 1,000,000Transition from County to in-house system; $250,000 reallocation for employee expenses
Telecommunications Fund 0 1,000,000 0 0.00 0.00Property & Casualty Fund
Finance Risk Management Non-Personnel Expenses 10,000 To provide materials & supplies for the Risk Management divisionProperty & Casualty Fund 10,000 0 0 0.00 0.00
FOOTNOTES:* As described in the section of this document titled "City Council Direction on the Recommended Budget", a cascading funding approach has been implemented as part of the approved 2008 budget to provide funding for both theBoulder Mobile Manor project and the Economic Vitality program. As a result, these items allocated for one-time funding are being held in a contingency until 2007 year-end results have been finalized and these two programs havereceived their targeted funding allocation
CITY COUNCIL DIRECTION ON THE RECOMMENDED BUDGET
The City Manager’s 2008-09 Recommended Budget was presented to City Council for first reading on October 2nd, second reading on October 16th and third reading/adoption on November 13th. The following changes were made to the recommended budget based on feedback received from City Council at the August 28th and the September 11th study sessions and at second reading of the budget on October 16th. Boulder Mobile Manor Development Project and the Economic Vitality Program Prior to first reading, the City Manager’s recommended budget was changed based on feedback from City Council at both the August 28th and the September 11th study sessions. At the August study session, Council clarified that not all funding for the Manor project should come from affordable housing funds since this project is broader than just affordable housing and really reflects Council’s broader goal of community sustainability. Council also expressed a concern about the limited 2008 funding for Economic Vitality, specifically for the Business Incentive Rebate Program. Based on this feedback, staff proposed a “cascading” approach to provide additional 2008 funding for both these items.
As part of the approach, target funding in the amount of $800,000 from the General Fund for the Manor project was proposed for 2008. This is based on funding in previous years totaling $600,000 already allocated to the project as well as the likelihood that $1 million would be recommended for funding from the available 2008 affordable housing funds. Based on this, the additional $800,000 from the General Fund in 2008 would bring the total city funding for the project to $2.4 million and would allow for a significant achievement of community sustainability goals including:
- targets of 30%, 40% & 50% average median income (AMI) - greater livability (design, green space, playground) - a higher level of energy efficiency and green building
The additional 2008 funding from the General Fund for the Economic Vitality program was targeted at $123,000. The goal of this target was to provide additional funding for the program with the understanding that it comes at the cost of other needed items in the city. However, every additional dollar improves the health of the city’s overall economic vitality program and, as a result, a target of an additional $123,000 in 2008 funding was recommended. The following describes each of the steps in the “cascading” funding approach: Step 1: As discussed above, the additional funding targets for both the Major and the Economic Vitality projects were set at $800,000 and $123,000, respectively. Approximately, $90,000 of the Manor project will be covered by 2008 funding from the Climate Action Plan Fund. These dollars are budgeted for energy efficiency programs
for low income households. Based on the $90,000 provided by the Climate Action Plan Fund, the remaining target for the Manor project is $710,000 ($800,000 less $90,000). Step 2: The second step includes the deferment of the proposed increase in Worker Compensation Insurance rates for 2008 until 2009. This will generate about $110,000 in General Fund savings that will be appropriated for the Manor project. Although the 2008 targeted fund balance for Worker Compensation may fall short, staff feels it is an acceptable level of risk to defer the rate increase until 2009. After step 2, the remaining target for the Manor project is $600,000 ($710,000 less $110,000) and $123,000 for Economic Vitality. At this point, staff would proceed to step 3. Step 3: This step relies on allocating any excess collections from construction and business use tax as follows for the two projects:
- Any increase over the current 2007 General Fund projection for construction use tax would first be used to fill the funding target for the Manor - Any increase over the current 2007 General Fund projection for business use tax would first be used to fill the funding target for Economic Vitality
If step 3 does not meet the remaining target for both projects, then staff would automatically move to step 4. Step 4: After all accounts payable are booked for 2007, available year-end savings in the General Fund would be used to reach the remaining targets for the two projects. First, dollars would go to the Manor project until that target it met, then to the Economic Vitality program.
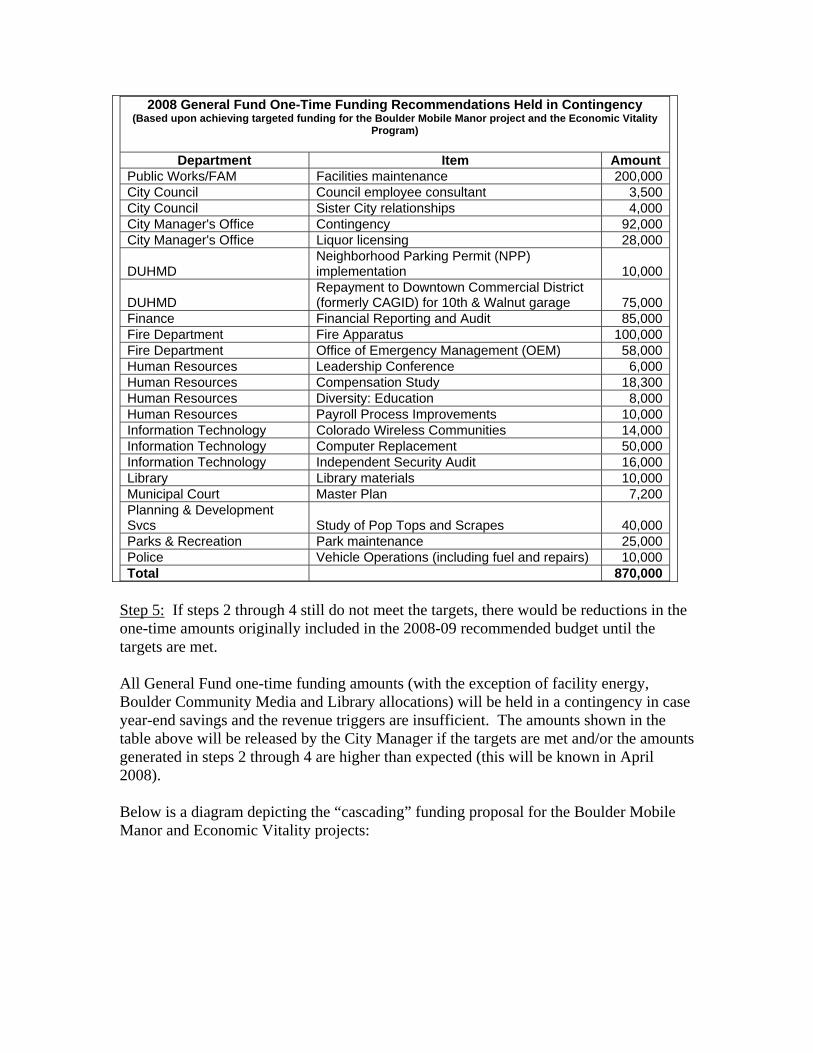
2008 General Fund One-Time Funding Recommendations Held in Contingency (Based upon achieving targeted funding for the Boulder Mobile Manor project and the Economic Vitality
Program)
Department Item Amount Public Works/FAM Facilities maintenance 200,000City Council Council employee consultant 3,500City Council Sister City relationships 4,000City Manager's Office Contingency 92,000City Manager's Office Liquor licensing 28,000
DUHMD Neighborhood Parking Permit (NPP) implementation 10,000
DUHMD Repayment to Downtown Commercial District (formerly CAGID) for 10th & Walnut garage 75,000
Finance Financial Reporting and Audit 85,000Fire Department Fire Apparatus 100,000Fire Department Office of Emergency Management (OEM) 58,000Human Resources Leadership Conference 6,000Human Resources Compensation Study 18,300Human Resources Diversity: Education 8,000Human Resources Payroll Process Improvements 10,000Information Technology Colorado Wireless Communities 14,000Information Technology Computer Replacement 50,000Information Technology Independent Security Audit 16,000Library Library materials 10,000Municipal Court Master Plan 7,200Planning & Development Svcs Study of Pop Tops and Scrapes 40,000Parks & Recreation Park maintenance 25,000Police Vehicle Operations (including fuel and repairs) 10,000Total 870,000
Step 5: If steps 2 through 4 still do not meet the targets, there would be reductions in the one-time amounts originally included in the 2008-09 recommended budget until the targets are met. All General Fund one-time funding amounts (with the exception of facility energy, Boulder Community Media and Library allocations) will be held in a contingency in case year-end savings and the revenue triggers are insufficient. The amounts shown in the table above will be released by the City Manager if the targets are met and/or the amounts generated in steps 2 through 4 are higher than expected (this will be known in April 2008). Below is a diagram depicting the “cascading” funding proposal for the Boulder Mobile Manor and Economic Vitality projects:
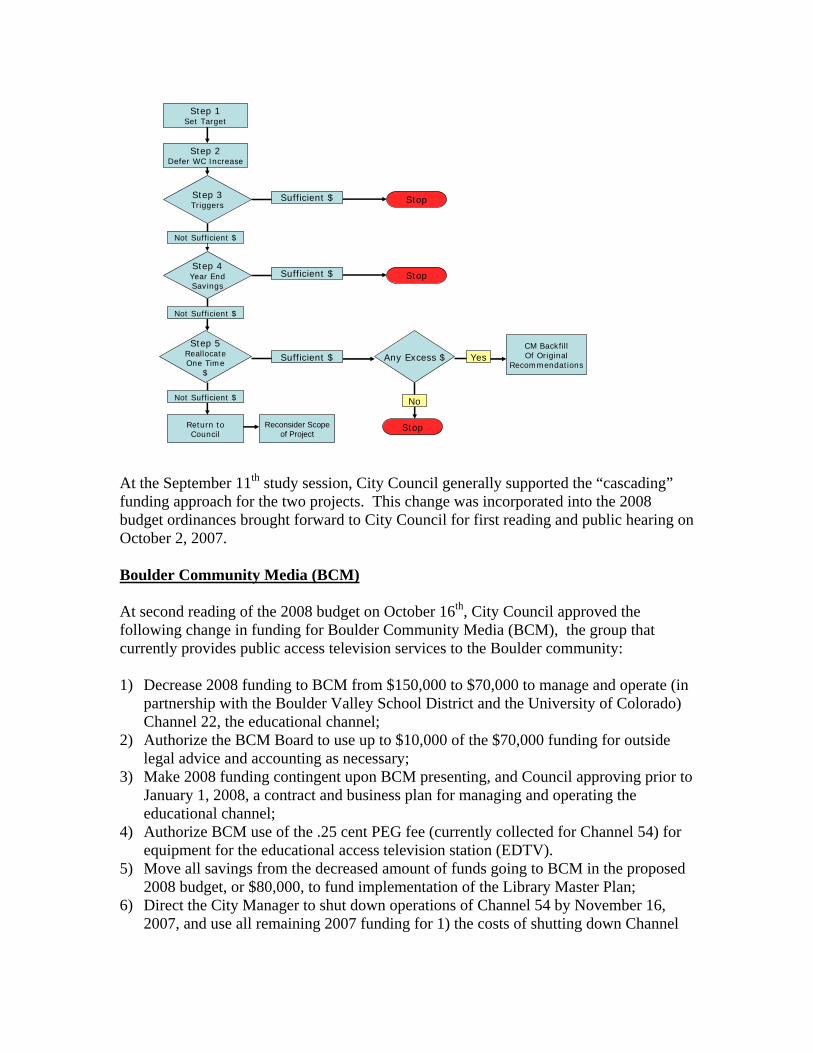
Step 1Set Target
Step 3Triggers
Not Sufficient $
Step 4Year EndSavings
Step 5ReallocateOne Time
$
Sufficient $
Sufficient $
Any Excess $Sufficient $
Stop
Yes
No
Step 2Defer WC Increase
Not Sufficient $
Return toCouncil
Reconsider Scopeof Project
CM BackfillOf Original
Recommendations
Stop
Stop
Not Sufficient $
At the September 11th study session, City Council generally supported the “cascading” funding approach for the two projects. This change was incorporated into the 2008 budget ordinances brought forward to City Council for first reading and public hearing on October 2, 2007. Boulder Community Media (BCM) At second reading of the 2008 budget on October 16th, City Council approved the following change in funding for Boulder Community Media (BCM), the group that currently provides public access television services to the Boulder community: 1) Decrease 2008 funding to BCM from $150,000 to $70,000 to manage and operate (in
partnership with the Boulder Valley School District and the University of Colorado) Channel 22, the educational channel;
2) Authorize the BCM Board to use up to $10,000 of the $70,000 funding for outside legal advice and accounting as necessary;
3) Make 2008 funding contingent upon BCM presenting, and Council approving prior to January 1, 2008, a contract and business plan for managing and operating the educational channel;
4) Authorize BCM use of the .25 cent PEG fee (currently collected for Channel 54) for equipment for the educational access television station (EDTV).
5) Move all savings from the decreased amount of funds going to BCM in the proposed 2008 budget, or $80,000, to fund implementation of the Library Master Plan;
6) Direct the City Manager to shut down operations of Channel 54 by November 16, 2007, and use all remaining 2007 funding for 1) the costs of shutting down Channel

54 and BTV; and 2) to operate and manage Channel 22, EDTV through fiscal year 2008.
Staff is currently developing a plan for utilizing the $80,000 in one-time funding for the Library based on the Library Master Plan. The approach will be provided to City Council via a Weekly Information Packet (WIP) in early 2008 before the funds are actually expended.

CITY COUNCIL GOALS
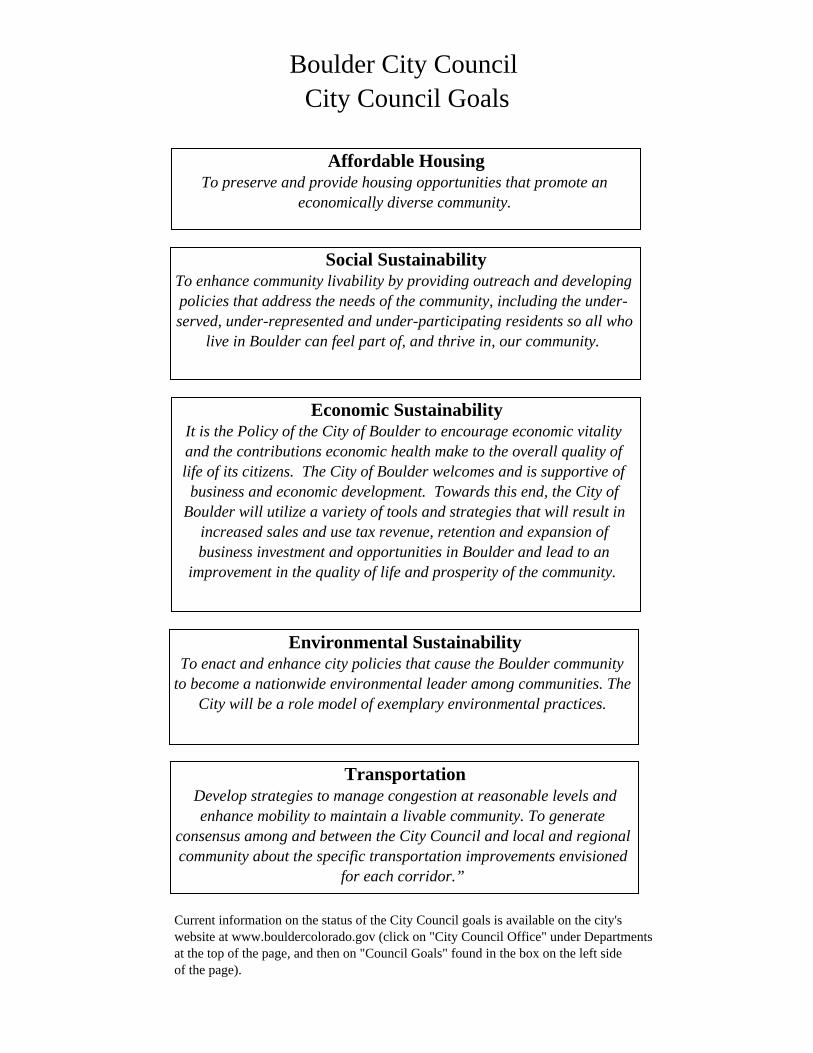
Boulder City Council City Council Goals
Current information on the status of the City Council goals is available on the city'swebsite at www.bouldercolorado.gov (click on "City Council Office" under Departments at the top of the page, and then on "Council Goals" found in the box on the left side of the page).
Affordable HousingTo preserve and provide housing opportunities that promote an
economically diverse community.
Environmental SustainabilityTo enact and enhance city policies that cause the Boulder community
to become a nationwide environmental leader among communities. The City will be a role model of exemplary environmental practices.
Economic SustainabilityIt is the Policy of the City of Boulder to encourage economic vitality and the contributions economic health make to the overall quality of life of its citizens. The City of Boulder welcomes and is supportive of business and economic development. Towards this end, the City of
Boulder will utilize a variety of tools and strategies that will result in increased sales and use tax revenue, retention and expansion of business investment and opportunities in Boulder and lead to an
improvement in the quality of life and prosperity of the community.
Social SustainabilityTo enhance community livability by providing outreach and developing policies that address the needs of the community, including the under-served, under-represented and under-participating residents so all who
live in Boulder can feel part of, and thrive in, our community.
Transportation Develop strategies to manage congestion at reasonable levels and
enhance mobility to maintain a livable community. To generate consensus among and between the City Council and local and regional community about the specific transportation improvements envisioned
for each corridor.”

BUDGET POLICIES
CITYWIDE FINANCIAL AND MANAGEMENT POLICIES
SECTION 1 - GENERAL INFORMATION
1.1 Annual Budget Submittal - Biennial budgets shall be balanced. Budgeted expenditures and transfers-out will not exceed reasonable projection of the sum of current year revenues, transfers-in, and available fund balances. Debt shall not be utilized for operating expenses.1
1.2 Budget Process - A Biennial budget shall be adopted every two years by December 1st of the year prior
to the two-year budget period. Adjustments for changing circumstances for the second year of the two-year budget cycle shall be adopted by December 1st of the first year of the biennial period. 2
1.3 Budget Preparation - While the Charter establishes time limits and the essential content of the City
Manager's proposed budget, the budget preparation process is not prescribed. The preparation process is developed by the City Manager with input from the City Council.
1.4 Changes to Adopted Budget - Normally, initial appropriations (excluding carryovers and encumbrances)
will be made only in the context of the annual budget process when all City needs can be reviewed and prioritized in a comprehensive manner. The biennial budget process will also include a projection of the multi-year impact of decisions.3
SECTION 2 - REVENUE POLICIES
2.1 Property Tax - Mill levies shall be certified at the 1992 mill levy rate. A temporary mill levy credit shall also be certified whenever the calculated revenue forecast exceeds the calculated revenue limitation by more than 1/10th of a mill. 4
2.2 Revenue Review and Projection - The City reviews estimated revenue and fee schedules as part of the
budget process. Estimated revenue is projected in a "most likely" scenario for five years and updated annually. Proposed rate increases are based upon Citywide Pricing Policy Guidelines that were adopted by Council in 1994. User fees shall be aligned with these guidelines over a five-year period.
2.3 User Fee Guidelines - The general guidelines of the City of Boulder regarding user fees are based upon
the following considerations:
A. Full Cost Recovery
1. The individual or group using the service is the primary beneficiary. 2. The level of service use attributed to a user is known. 3. Administrative cost of imposing and collecting the fee is not excessive. 4. Imposing a full cost fee would not place the City at a competitive disadvantage. 5. The service is usually provided by the private sector, but may also be provided by the public
sector.
B. Partial Cost Recovery
1. Services benefit those who participate but the community at large also benefits. 2. The level of service use attributed to a user is known. 3. Administrative costs of imposing and collecting the fee is not excessive. 4. Imposing a full cost fee would place the City at a competitive disadvantage. 5. The service is usually provided by the public sector, but may also be provided by the private
sector.
C. No-cost Recovery: (a service does not have to meet every criterion)
1. The service is equally available to everyone in the community and should benefit everyone. 2. Because the service is basic, it is difficult to determine benefits received by one user. 3. The level of service attributable to a user is not known. 4. Administrative costs of imposing and collecting a fee exceed revenue expected from the fee. 5. Imposing the fee would place the City at a serious competitive disadvantage. 6. The service is primarily provided by the public sector. 7. Charging a fee would result in undesirable behavior.
D. "Enterprise or Profit" Center
(a service does not have to meet every criterion)
1. Individuals or groups benefit from the service and there is little community benefit. 2. The level of service use attributable to a user is known. 3. There is excess demand for the service; therefore, allocation of limited services is required. 4. Administrative cost of imposing and collecting the fee is not excessive. 5. The service is provided at market price by the private sector.
E. Other Considerations
1. Nonresidents do not pay the full level of City taxes. Therefore, nonresidents will usually pay a premium of 25% above the standard fee for the service.
2. The City currently defines "Direct Costs" as costs that are all the specific, identifiable expenses associated with the actual provision of a service.
3. "Indirect Costs" can include departmental overhead costs such as administrative costs and operating reserve account as well as city overhead costs. City overhead costs include the costs of all the City's general support services.
4. Departments when establishing fees should identify whether a fee recovers the full cost, (sum of direct and indirect costs), partial cost or is a market rate fee.
2.3a User Fee Subsidies - After a fee has been set at a either a full, partial or market level, any subsidy or
reduced rate user fee offered by the City of Boulder will be based primarily on economic or financial need. The basis for determining financial need will be 50% of the average median income (AMI) for Boulder County. In addition, programs that include a subsidy or reduced rate component are available to City of Boulder residents only.
Recreation services in Parks and Recreation offer reduced rate user fees based on age only rather than on
economic or financial need. As part of its 5-year User Fee Alignment Plan, this department is moving away from age-based discounting, but has not yet determined if it should be completely eliminated.
2.4 Asset Forfeiture Revenue - To create a long-term funding source from limited and uncertain revenue,
asset forfeiture/seizure revenue resulting from crime prevention/apprehension activities by the Police Department shall be conceptually considered as "endowment" funds and the principal shall be held in reserve. With the exception of occasional exceptional unanticipated unfunded needs, only interest earnings on the principal shall be allocated for expenditures.
2.5 Accrued Interest -Earmarked Funds - The determination of whether earmarked funds shall accrue interest income is whether the General Fund costs required to collect and administer such funds are allocated to the subject funds. Interest income shall not be distributed to funds unless they are bearing their appropriate allocation of administrative costs.
2.6 Unspent Revenues - On an annual basis, any unspent revenues subject to and in compliance with the
associated limitations of Amendment #1 revenue and spending constraints shall be "reserved" and therefore will be considered "spending" in the current fiscal year.
2.7 Excise Taxes - In November 1998, the electorate approved a ballot issue that increased the current excise
tax rates by an inflationary factor. The rate will be adjusted annually by an inflation factor until the maximum amount included in the ballot issue is reached. 5
2.7 a Education Excise Tax- In June 2003, City Council approved the following policy guidelines pertaining
to Education Excise Tax: Education Excise Tax revenues shall be used for capital expenditures only, and not for operational
expenditures. Education Excise Tax revenues may be used to: • Help fund facilities needed to serve new growth • Improve or renovate existing facilities • Enhance the viability of existing facilities , including recreational facilities • Fund tax refunds or set-offs relating to education purposes • Purchase properties to preserve them for future educational purposes.
Education Excise Tax revenues shall be expended in a manner that supports both Boulder Valley School District and city of Boulder needs and objectives. Education Excise Tax revenues shall be programmed for expenditure as part of the city’s Capital Improvement Programming process. The intent is that funds will be used for large capital expenditures that exceed $1,000,000 and will be programmed for expenditure on an infrequent basis.
2.8 Utility Charges - The City reviews estimated revenues and fee schedules as part of the budget process. Estimated revenue and expenditures are projected for five years and updated annually. Proposed rate increases to monthly user fees are developed using a cost-of-service methodology which includes the following:
• Determination of the Utility's revenue requirements for operations, maintenance, and capital
construction; • Ability of the Utility to maintain adequate reserves and meet debt service coverage requirements; • Analysis of customer demands and usage characteristics; • Allocation of revenue requirements to customer service characteristics; • Development and design of rates schedules.
Other charges for specific services are designed to recover costs and follow the guidelines of the Citywide Pricing Policy adopted by Council in 1994.
Plant Investment Fees are one-time charges to customers connecting to the utility system are based on the replacement value of the utility assets and are reviewed every 3-5 years.
SECTION 3 - FINANCIAL ADMINISTRATION
3.1 General Information - The city's fiscal year shall be the calendar year. The Department of Finance and Record shall collect taxes and maintain financial records.6
3.2 Administrative Charges - The City shall employ a cost allocation system to identify the full cost of providing services to the public and recover certain costs incurred by various funds in providing support services to other City departments. The system shall accomplish the following objectives:
a. Complete recovery of costs incurred with the exception of the costs of "general governance". b. Equitable allocation of costs to users. c. Provision of incentives for service providers to deliver products and services efficiently and
effectively. d. Provision of a stable cost allocation system to facilitate the organization's budgeting for charges and
revenues. e. Promotion of customer confidence in and acceptance of the accuracy, reasonableness, and fairness
of the charges they incur.
Charges for "general governance" (City Council, City Manager's Office, City Clerk Council support and elections, etc.) shall not be cost allocated to restricted funds but instead shall be totally funded out of the General Fund. The "general governance" category shall not include election costs for ballot issues related to funds with earmarked revenue sources. Costs for non-General Fund ballot issues shall be charged to the appropriate fund.
The Housing Authority shall not be charged for services provided by General Fund Departments. Such costs will be born by the General Fund.
3.3 Building Maintenance/Renovation - To protect City investment in facilities, funds shall be budgeted
annually for maintenance of such facilities. To extend the life of these assets, the goal shall be to increase the funds budgeted annually for maintenance of facilities to approximately 2 percent of the replacement cost (with the exception of debt financed facilities). These funds may be utilized for facility maintenance, reserved for facility replacement, or utilized for debt service payments for facility related projects pursuant to a long term plan based upon the condition of each facility. If the 2 percent funding goal cannot be reached in any given year due to funding constraints, the expected result will be an increase in the maintenance backlog equal to the funding shortfall. The Facilities and Asset Manager will prioritize maintenance/renovation needs to ensure that critical systems are properly maintained so that facility safety and operations continue without interruption. Lower priority work will be postponed until funding is available to complete these tasks. The Facilities & Asset Manager will report the amount of maintenance backlog and any impacts on facility safety and operations annually during the budget process. If/when the revenue base permits, facility maintenance funding shall be given a high priority before consideration of other service restorations or additions.
3.4 Building Replacement Costs - Where debt payments are being made for city buildings, if the revenue
source(s) do not sunset when the debt is retired, the on-going revenue will be allocated to a building replacement fund. If the funding source does sunset, replacement resources for the building shall usually come from new or extended revenue leveraged by bonding.
3.5 Equipment Replacement Costs - Funds shall be reserved annually for replacement of City equipment
and these costs will be reflected in the operating expenditures of the activity using the equipment, to facilitate accurate costing of service delivery.
3.6 Vehicle Replacement Costs - Vehicles shall normally be purchased rather than leased and a vehicle
replacement fund shall be maintained for replacement of vehicles at the end of their useful life. In the limited situations where vehicles may be leased (temporary vehicles, fire apparatus, etc.) specific approval by the City Manager is required.
3.6a Vehicle Changes - It is the expectation of the City Manager's Office that all departments will meet the
objectives of the Fleet Evaluation Study. These objectives are: no increase in miles driven in the conduct of City business, and no net increase in the number of fleet units.
3.7 Computer Replacement Costs - Computer replacement funds shall be created to level out spending for
microcomputer and network related hardware and software and ensure that adequate replacement funds are available when equipment reaches the end of its useful life. This fund is expected to cover 80% of the General Fund replacement costs. The remaining 20% costs will be covered in individual departmental budgets. Restricted funds are expected to reserve funds necessary to cover 100% of their microcomputer and network related hardware and software.
3.8 Technology Improvements - Recognizing the contribution of technology in efficient and effective
service provision, improvements in technology shall be important considerations in resource allocations.
3.9 General Fund Annual Savings - The General Fund emergency/stabilization reserve shall be maintained at a 10% minimum and a 15% maximum, as conditions allow.
3.10 Grant Expenditures - Expenditures related to grants shall continue only during the period of time they
are funded by the grant. Any grant employees will be considered fixed-term. The City Manager shall review applications for new grants before they are submitted to the granting agency.
3.11 Property & Casualty and Workers Compensation Funds - Both Property and Casualty and Workers
Compensation liability will be self-insured. The goal of the Property & Casualty Fund is to fully fund an actuarially calculated liability as of the end of the prior year at the 50% certainty level plus $500,000 for current and future claims. The Workers Comp Fund's goal is to fully fund case loss reserves at the 50% confidence level and rate stabilization reserves at the industry standard reserve/retention of eight-to-one. At least every five years, an analysis comparing the cost and effectiveness of self insurance compared to purchase outside insurance will be conducted to determine whether self-insurance in one or both of these liability categories continues to be the best alternative.
3.12 Accumulated Sick, Vacation Time, & Appreciation Bonus - To facilitate the long-term financial
sustainability of the city, liabilities associated with accumulated sick time, vacation time, appreciation bonuses, and/or any other employee benefits that would result in liability upon termination or retirement shall be fully funded based on TABOR requirements. This may be accomplished, subject to Council review and approval, by a combination of modifying benefits and/or setting aside reserves.
3.13 Compensation Policy - The City of Boulder is committed to recruiting and retaining highly productive
employees through a competitive total compensation package, which strives to: • Provide favorable salary relationships when compared to appropriate labor markets, while
recognizing the City's ability to pay; • Maintain internal job relationships according to the responsibilities and customer service
requirements found in all jobs; • Recognize and reward employees for their efforts as demonstrated through specific performance
achievements; and • Acknowledge the unique contributions and potential sacrifices of our Police and Fire Protective
Services by continuing to offer enriched benefit programs for them.
SECTION 4 - CAPITAL IMPROVEMENT PLANS
4.1 Capital Improvement Plan Submission - While the Charter establishes time limits and the essential content of the City Manager's proposed CIP budget, the budget preparation process is not prescribed. The preparation process is developed by the City Manager with input from the City Council.7
4.2 Inclusion of Operating Costs - Prior to approval of capital projects, associated operating costs must be
included in balanced multi-year operating budgets.
4.3 Capital Improvement Project Contingency Funds - Capital Improvement Project contingency funds may be expended by the Project Manager, with Director approval, for unanticipated needs or changes that are within the original scope of the project. The "scope of the project" is defined as the description of the project presented with the CIP that clearly defines the parameters, objectives, and budget of the project. Requested modifications exceeding the original scope of the project shall be presented to Council for approval.
4.4 CIP Arts Funding - Where feasible, Project Managers, when designing capital projects should
incorporate public art into the design. SECTION 5 - RESERVE POLICIES
5.1 Please refer to separate section defining individual reserve goals by fund.
5.2 In the case of a declared emergency within the City, applicable insurance coverage (subject to the related deductibles) would be the first funding source utilized. Reserve funds established for other purposes may also be utilized for needs related to emergency situations. The following reserve categories could be utilized if required (as prioritized based upon the importance of the needs related to the emergency versus the negative impact of the steps necessary to replenish reserves in the future).
General Fund (no legal restrictions):
Emergency/stabilization reserve Computer replacement reserve Facility renovation and replacement reserve Workers compensation reserve (would have to "book" any unfunded liability) Property & casualty self-ins reserve (would have to "book" any unfunded liability) Insurance stabilization reserve
Restricted funds (only for emergency purposes within the function of each fund)
Emergency/stabilization reserves Various replacement reserves
SECTION 6 - PENSION PLAN POLICIES
6.1 Authorization to Expend Funds for Administrative Costs - If budgetary conditions permit, the City may authorize defined contribution (money purchase) pension plans to expend certain forfeiture funds for administrative costs. The plan board(s) may submit a request annually to the City Manager to be considered in the context of the City's annual budget process.
6.2 Increase for “Old Hire” Police and Fire Pension Plans - “Ad hoc”/cost of living increases for retirees of
the Old Hire Police and Old Hire Fire Pension Plans will be funded only if adequate funds are available, on an actuarially sound basis, from existing plan assets.
SECTION 7 - DEBT POLICIES
7.1 Policy Statement - Debt shall be considered only for capital purchases/projects and the term of the debt
shall not exceed the useful life of the financed asset. Municipal bonds, Interfund loans, equipment leases (with the exception of vehicles) and sale/leaseback agreements are approved methods for financing capital projects.
END NOTES 1. Charter Requirements Sec 93. Not later than three months before the end of each fiscal year, the city manager shall prepare and submit to the council an annual budget for the ensuing fiscal year, based upon detailed estimates furnished by the several departments and other divisions of the city government, according to a classification as nearly uniform as possible. The budget shall present the following information: (A) An itemized statement of the appropriations recommended by the city manager for estimated expenses and for permanent improvements for each department and each division thereof for the ensuing fiscal year, with comparative statements in parallel columns of the appropriations and the expenditures for the current and last preceding fiscal year and the increases or decreases in the appropriations recommended; (B) An itemized statement of the taxes required and of the estimated revenues of the city from all other sources for the ensuing fiscal year with comparative statements in parallel columns of the taxes and other revenues for the current and last preceding fiscal year and of the increases or decrease estimated or proposed; (C) A statement of the financial condition of the city; and (D) Such other information as may be required by the council.
2. Charter Requirement Sec. 95. Upon the basis of the budget as adopted and filed, and including the levies required to be made by the charter, the several sums shall forthwith be appropriated by ordinance to the several purposes therein named for the ensuing fiscal year. Said ordinance shall be adopted not later than the first day of December in each year and shall be entitled "The Annual Appropriation Ordinance."
3. Charter Requirement Sec. 102. At any time after the passage of the annual appropriation ordinance and after at least one week's public notice, the council may transfer unused balances appropriated for one purpose to another purpose and may by ordinance appropriate available revenues not included in the annual budget. This provision shall not apply to the water, park and library funds.
4. Charter Requirements. Sec 94. Upon said estimate the council shall forthwith proceed to make by ordinance the proper levy in mills upon each dollar of the assessed valuation of all taxable property within the city,… The levy shall never exceed thirteen mills on the dollar for all general city purposes upon the total assessed valuation of said taxable property with the city. The foregoing limitation of thirteen mills shall not apply to taxes levied by the council for the payment of any interest, sinking fund, or principals of any bonded indebtedness of the city now existing or hereafter created nor to special assessments for local improvements. Sec. 135. The city council shall make an annual appropriation, which shall amount to not less than the return of one-third of a mill tax levied upon each dollar of assessed valuation of all taxable property in the City of Boulder. Sec. 161. There shall be a permanent park and recreation fund. This fund shall consist of the following:
(a) An annual levy of nine-tenths of one mill on each dollar of assessed valuation of all taxable within the city.
5. Code Requirement. Sec. 3-8-1. Development Excise Tax; Sec. 3-9-1, Housing Excise Tax; Sec. 8-3-18, and Park Land Acquisition and Development Fees, B.R.C. 1981.
6. Charter Requirements Sec. 88. The fiscal year of the city shall commence on the first day of January and end on the last day of December of each year. Sec. 89. Collection and custody of public moneys. The Director of Finance and Record shall have charge of the revenues and records of the city except as otherwise provided by this charter or by ordinance. All taxes, special assessments, and license fees accruing to the city shall be received or collected by officers of the department of finance and record. All moneys received by any officer or employee of the city or in connection with the business of the city shall be paid promptly into the city treasury.
The council shall by ordinance provide a system for prompt collection and regular payment, custody, and deposit of all city moneys; shall require surety bonds of all depositors of city moneys. Deposits shall be made daily and in the name of the city. Sec. 90. System of accounting The council shall by ordinance provide a system of accounting for the city, not inconsistent with the provisions of this charter, which may be recommended by the city manager, to conform as nearly as possible with the uniform system of municipal accounting.
7. Charter Requirements. Sec 78. The Planning Department shall..... (C)Submit annually to the city manager, not less than sixty days prior to the date for submission of the city manager's proposed budget to the city council, a list of recommended capital improvements to be undertaken during the forthcoming six-year period; The list shall be arranged in order of preference, with recommendations as to which projects shall be completed each year. Each list of capital improvements shall be accompanied by a six-year capital budget indicating estimated costs and methods of financing all improvements.
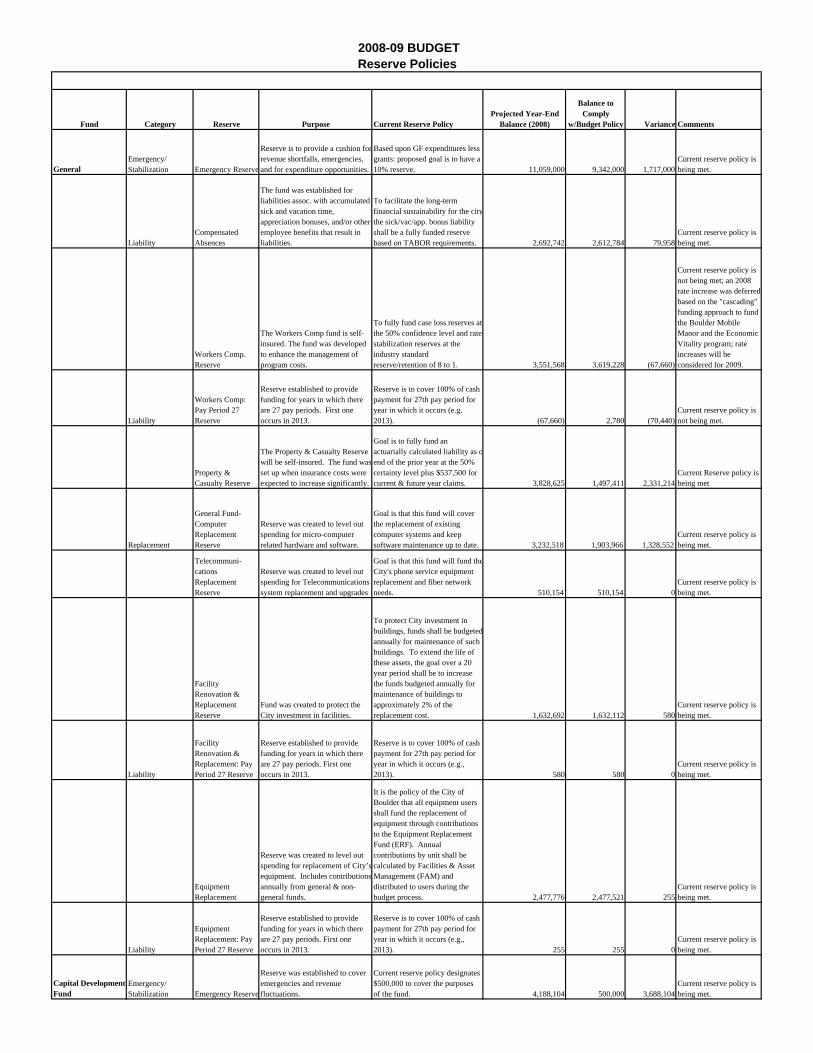
2008-09 BUDGETReserve Policies
Fund Category Reserve Purpose Current Reserve PolicyProjected Year-End
Balance (2008)
Balance to Comply
w/Budget Policy Variance Comments
GeneralEmergency/ Stabilization Emergency Reserve
Reserve is to provide a cushion forrevenue shortfalls, emergencies, and for expenditure opportunities.
Based upon GF expenditures less grants: proposed goal is to have a 10% reserve. 11,059,000 9,342,000 1,717,000
Current reserve policy is being met.
LiabilityCompensated Absences
The fund was established for liabilities assoc. with accumulated sick and vacation time, appreciation bonuses, and/or other employee benefits that result in liabilities.
To facilitate the long-term financial sustainability for the citythe sick/vac/app. bonus liability shall be a fully funded reserve based on TABOR requirements. 2,692,742 2,612,784 79,958
Current reserve policy is being met.
Workers Comp. Reserve
The Workers Comp fund is self-insured. The fund was developed to enhance the management of program costs.
To fully fund case loss reserves at the 50% confidence level and rate stabilization reserves at the industry standard reserve/retention of 8 to 1. 3,551,568 3,619,228 (67,660)
Current reserve policy is not being met; an 2008 rate increase was deferred based on the "cascading" funding approach to fund the Boulder Mobile Manor and the Economic Vitality program; rate increases will be considered for 2009.
Liability
Workers Comp: Pay Period 27 Reserve
Reserve established to provide funding for years in which there are 27 pay periods. First one occurs in 2013.
Reserve is to cover 100% of cash payment for 27th pay period for year in which it occurs (e.g. 2013). (67,660) 2,780 (70,440)
Current reserve policy is not being met.
Property & Casualty Reserve
The Property & Casualty Reserve will be self-insured. The fund was set up when insurance costs were expected to increase significantly.
Goal is to fully fund an actuarially calculated liability as oend of the prior year at the 50% certainty level plus $537,500 for current & future year claims. 3,828,625 1,497,411 2,331,214
Current Reserve policy is being met
Replacement
General Fund-Computer Replacement Reserve
Reserve was created to level out spending for micro-computer related hardware and software.
Goal is that this fund will cover the replacement of existing computer systems and keep software maintenance up to date. 3,232,518 1,903,966 1,328,552
Current reserve policy is being met.
Telecommuni-cations Replacement Reserve
Reserve was created to level out spending for Telecommunications system replacement and upgrades
Goal is that this fund will fund theCity's phone service equipment replacement and fiber network needs. 510,154 510,154 0
Current reserve policy is being met.
Facility Renovation & Replacement Reserve
Fund was created to protect the City investment in facilities.
To protect City investment in buildings, funds shall be budgeted annually for maintenance of such buildings. To extend the life of these assets, the goal over a 20 year period shall be to increase the funds budgeted annually for maintenance of buildings to approximately 2% of the replacement cost. 1,632,692 1,632,112 580
Current reserve policy is being met.
Liability
Facility Renovation & Replacement: Pay Period 27 Reserve
Reserve established to provide funding for years in which there are 27 pay periods. First one occurs in 2013.
Reserve is to cover 100% of cash payment for 27th pay period for year in which it occurs (e.g., 2013). 580 580 0
Current reserve policy is being met.
Equipment Replacement
Reserve was created to level out spending for replacement of City’sequipment. Includes contributionsannually from general & non-general funds.
It is the policy of the City of Boulder that all equipment users shall fund the replacement of equipment through contributions to the Equipment Replacement Fund (ERF). Annual contributions by unit shall be calculated by Facilities & Asset Management (FAM) and distributed to users during the budget process. 2,477,776 2,477,521 255
Current reserve policy is being met.
Liability
Equipment Replacement: Pay Period 27 Reserve
Reserve established to provide funding for years in which there are 27 pay periods. First one occurs in 2013.
Reserve is to cover 100% of cash payment for 27th pay period for year in which it occurs (e.g., 2013). 255 255 0
Current reserve policy is being met.
Capital Development Fund
Emergency/ Stabilization Emergency Reserve
Reserve was established to cover emergencies and revenue fluctuations.
Current reserve policy designates $500,000 to cover the purposes of the fund. 4,188,104 500,000 3,688,104
Current reserve policy is being met.
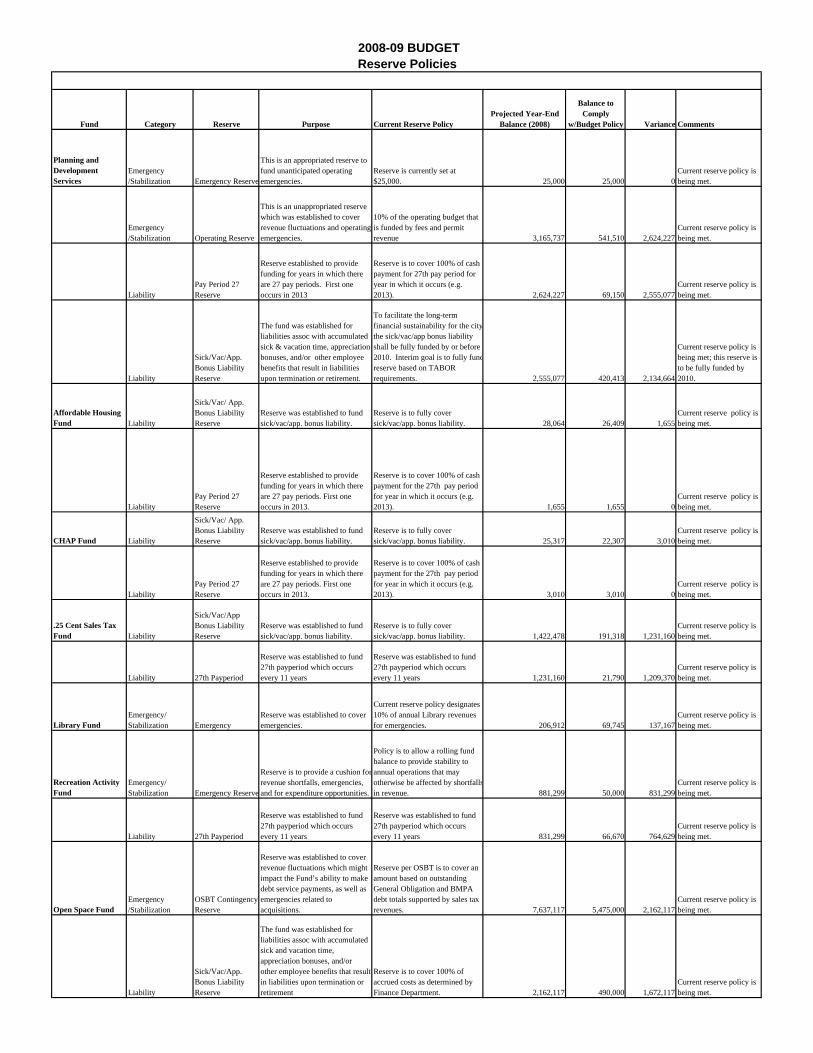
2008-09 BUDGETReserve Policies
Fund Category Reserve Purpose Current Reserve PolicyProjected Year-End
Balance (2008)
Balance to Comply
w/Budget Policy Variance Comments
Planning and Development Services
Emergency /Stabilization Emergency Reserve
This is an appropriated reserve to fund unanticipated operating emergencies.
Reserve is currently set at $25,000. 25,000 25,000 0
Current reserve policy is being met.
Emergency /Stabilization Operating Reserve
This is an unappropriated reserve which was established to cover revenue fluctuations and operating emergencies.
10% of the operating budget that is funded by fees and permit revenue 3,165,737 541,510 2,624,227
Current reserve policy is being met.
LiabilityPay Period 27 Reserve
Reserve established to provide funding for years in which there are 27 pay periods. First one occurs in 2013
Reserve is to cover 100% of cash payment for 27th pay period for year in which it occurs (e.g. 2013). 2,624,227 69,150 2,555,077
Current reserve policy is being met.
Liability
Sick/Vac/App. Bonus Liability Reserve
The fund was established for liabilities assoc with accumulated sick & vacation time, appreciation bonuses, and/or other employee benefits that result in liabilities upon termination or retirement.
To facilitate the long-term financial sustainability for the citythe sick/vac/app bonus liability shall be fully funded by or before 2010. Interim goal is to fully fundreserve based on TABOR requirements. 2,555,077 420,413 2,134,664
Current reserve policy is being met; this reserve is to be fully funded by 2010.
Affordable Housing Fund Liability
Sick/Vac/ App. Bonus Liability Reserve
Reserve was established to fund sick/vac/app. bonus liability.
Reserve is to fully cover sick/vac/app. bonus liability. 28,064 26,409 1,655
Current reserve policy is being met.
LiabilityPay Period 27 Reserve
Reserve established to provide funding for years in which there are 27 pay periods. First one occurs in 2013.
Reserve is to cover 100% of cash payment for the 27th pay period for year in which it occurs (e.g. 2013). 1,655 1,655 0
Current reserve policy is being met.
CHAP Fund Liability
Sick/Vac/ App. Bonus Liability Reserve
Reserve was established to fund sick/vac/app. bonus liability.
Reserve is to fully cover sick/vac/app. bonus liability. 25,317 22,307 3,010
Current reserve policy is being met.
LiabilityPay Period 27 Reserve
Reserve established to provide funding for years in which there are 27 pay periods. First one occurs in 2013.
Reserve is to cover 100% of cash payment for the 27th pay period for year in which it occurs (e.g. 2013). 3,010 3,010 0
Current reserve policy is being met.
.25 Cent Sales Tax Fund Liability
Sick/Vac/App Bonus Liability Reserve
Reserve was established to fund sick/vac/app. bonus liability.
Reserve is to fully cover sick/vac/app. bonus liability. 1,422,478 191,318 1,231,160
Current reserve policy is being met.
Liability 27th Payperiod
Reserve was established to fund 27th payperiod which occurs every 11 years
Reserve was established to fund 27th payperiod which occurs every 11 years 1,231,160 21,790 1,209,370
Current reserve policy is being met.
Library FundEmergency/ Stabilization Emergency
Reserve was established to cover emergencies.
Current reserve policy designates 10% of annual Library revenues for emergencies. 206,912 69,745 137,167
Current reserve policy is being met.
Recreation Activity Fund
Emergency/ Stabilization Emergency Reserve
Reserve is to provide a cushion forrevenue shortfalls, emergencies, and for expenditure opportunities.
Policy is to allow a rolling fund balance to provide stability to annual operations that may otherwise be affected by shortfallsin revenue. 881,299 50,000 831,299
Current reserve policy is being met.
Liability 27th Payperiod
Reserve was established to fund 27th payperiod which occurs every 11 years
Reserve was established to fund 27th payperiod which occurs every 11 years 831,299 66,670 764,629
Current reserve policy is being met.
Open Space FundEmergency /Stabilization
OSBT Contingency Reserve
Reserve was established to cover revenue fluctuations which might impact the Fund’s ability to make debt service payments, as well as emergencies related to acquisitions.
Reserve per OSBT is to cover an amount based on outstanding General Obligation and BMPA debt totals supported by sales tax revenues. 7,637,117 5,475,000 2,162,117
Current reserve policy is being met.
Liability
Sick/Vac/App. Bonus Liability Reserve
The fund was established for liabilities assoc with accumulated sick and vacation time, appreciation bonuses, and/or other employee benefits that result in liabilities upon termination or retirement
Reserve is to cover 100% of accrued costs as determined by Finance Department. 2,162,117 490,000 1,672,117
Current reserve policy is being met.
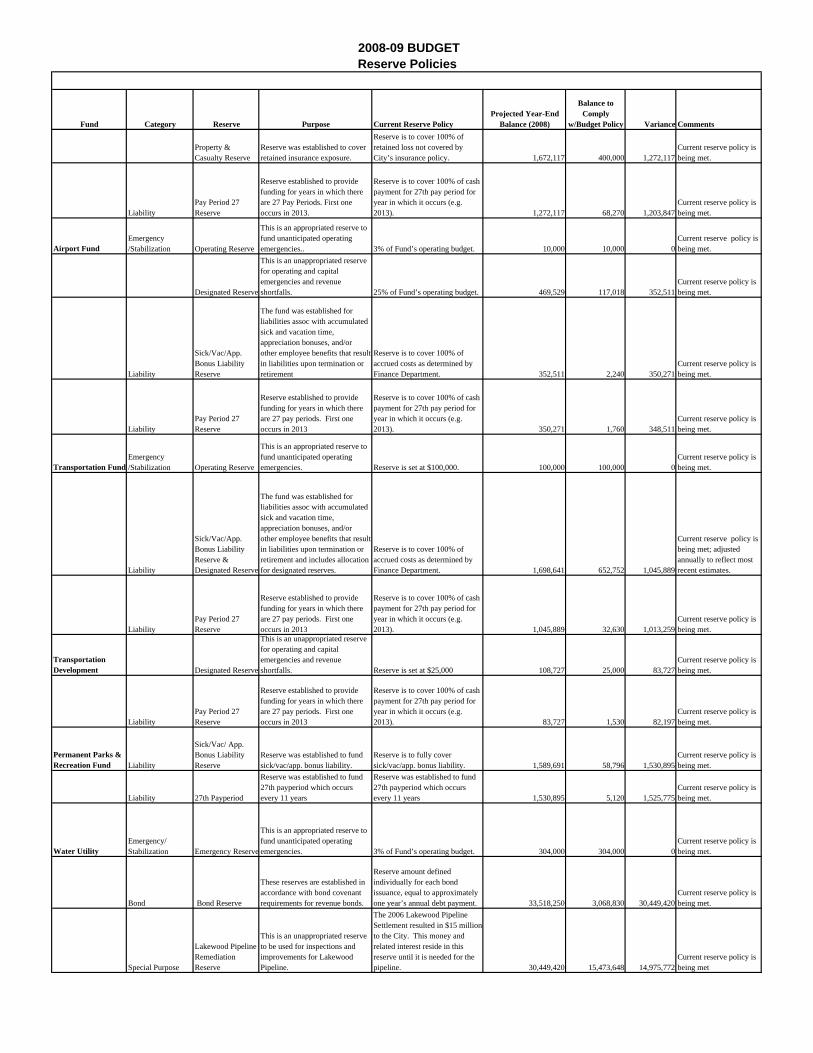
2008-09 BUDGETReserve Policies
Fund Category Reserve Purpose Current Reserve PolicyProjected Year-End
Balance (2008)
Balance to Comply
w/Budget Policy Variance Comments
Property & Casualty Reserve
Reserve was established to cover retained insurance exposure.
Reserve is to cover 100% of retained loss not covered by City’s insurance policy. 1,672,117 400,000 1,272,117
Current reserve policy is being met.
LiabilityPay Period 27 Reserve
Reserve established to provide funding for years in which there are 27 Pay Periods. First one occurs in 2013.
Reserve is to cover 100% of cash payment for 27th pay period for year in which it occurs (e.g. 2013). 1,272,117 68,270 1,203,847
Current reserve policy is being met.
Airport FundEmergency /Stabilization Operating Reserve
This is an appropriated reserve to fund unanticipated operating emergencies.. 3% of Fund’s operating budget. 10,000 10,000 0
Current reserve policy is being met.
Designated Reserve
This is an unappropriated reserve for operating and capital emergencies and revenue shortfalls. 25% of Fund’s operating budget. 469,529 117,018 352,511
Current reserve policy is being met.
Liability
Sick/Vac/App. Bonus Liability Reserve
The fund was established for liabilities assoc with accumulated sick and vacation time, appreciation bonuses, and/or other employee benefits that result in liabilities upon termination or retirement
Reserve is to cover 100% of accrued costs as determined by Finance Department. 352,511 2,240 350,271
Current reserve policy is being met.
LiabilityPay Period 27 Reserve
Reserve established to provide funding for years in which there are 27 pay periods. First one occurs in 2013
Reserve is to cover 100% of cash payment for 27th pay period for year in which it occurs (e.g. 2013). 350,271 1,760 348,511
Current reserve policy is being met.
Transportation FundEmergency /Stabilization Operating Reserve
This is an appropriated reserve to fund unanticipated operating emergencies. Reserve is set at $100,000. 100,000 100,000 0
Current reserve policy is being met.
Liability
Sick/Vac/App. Bonus Liability Reserve & Designated Reserve
The fund was established for liabilities assoc with accumulated sick and vacation time, appreciation bonuses, and/or other employee benefits that result in liabilities upon termination or retirement and includes allocation for designated reserves.
Reserve is to cover 100% of accrued costs as determined by Finance Department. 1,698,641 652,752 1,045,889
Current reserve policy is being met; adjusted annually to reflect most recent estimates.
LiabilityPay Period 27 Reserve
Reserve established to provide funding for years in which there are 27 pay periods. First one occurs in 2013
Reserve is to cover 100% of cash payment for 27th pay period for year in which it occurs (e.g. 2013). 1,045,889 32,630 1,013,259
Current reserve policy is being met.
Transportation Development Designated Reserve
This is an unappropriated reserve for operating and capital emergencies and revenue shortfalls. Reserve is set at $25,000 108,727 25,000 83,727
Current reserve policy is being met.
LiabilityPay Period 27 Reserve
Reserve established to provide funding for years in which there are 27 pay periods. First one occurs in 2013
Reserve is to cover 100% of cash payment for 27th pay period for year in which it occurs (e.g. 2013). 83,727 1,530 82,197
Current reserve policy is being met.
Permanent Parks & Recreation Fund Liability
Sick/Vac/ App. Bonus Liability Reserve
Reserve was established to fund sick/vac/app. bonus liability.
Reserve is to fully cover sick/vac/app. bonus liability. 1,589,691 58,796 1,530,895
Current reserve policy is being met.
Liability 27th Payperiod
Reserve was established to fund 27th payperiod which occurs every 11 years
Reserve was established to fund 27th payperiod which occurs every 11 years 1,530,895 5,120 1,525,775
Current reserve policy is being met.
Water UtilityEmergency/ Stabilization Emergency Reserve
This is an appropriated reserve to fund unanticipated operating emergencies. 3% of Fund’s operating budget. 304,000 304,000 0
Current reserve policy is being met.
Bond Bond Reserve
These reserves are established in accordance with bond covenant requirements for revenue bonds.
Reserve amount defined individually for each bond issuance, equal to approximately one year’s annual debt payment. 33,518,250 3,068,830 30,449,420
Current reserve policy is being met.
Special Purpose
Lakewood Pipeline Remediation Reserve
This is an unappropriated reserve to be used for inspections and improvements for Lakewood Pipeline.
The 2006 Lakewood Pipeline Settlement resulted in $15 million to the City. This money and related interest reside in this reserve until it is needed for the pipeline. 30,449,420 15,473,648 14,975,772
Current reserve policy is being met
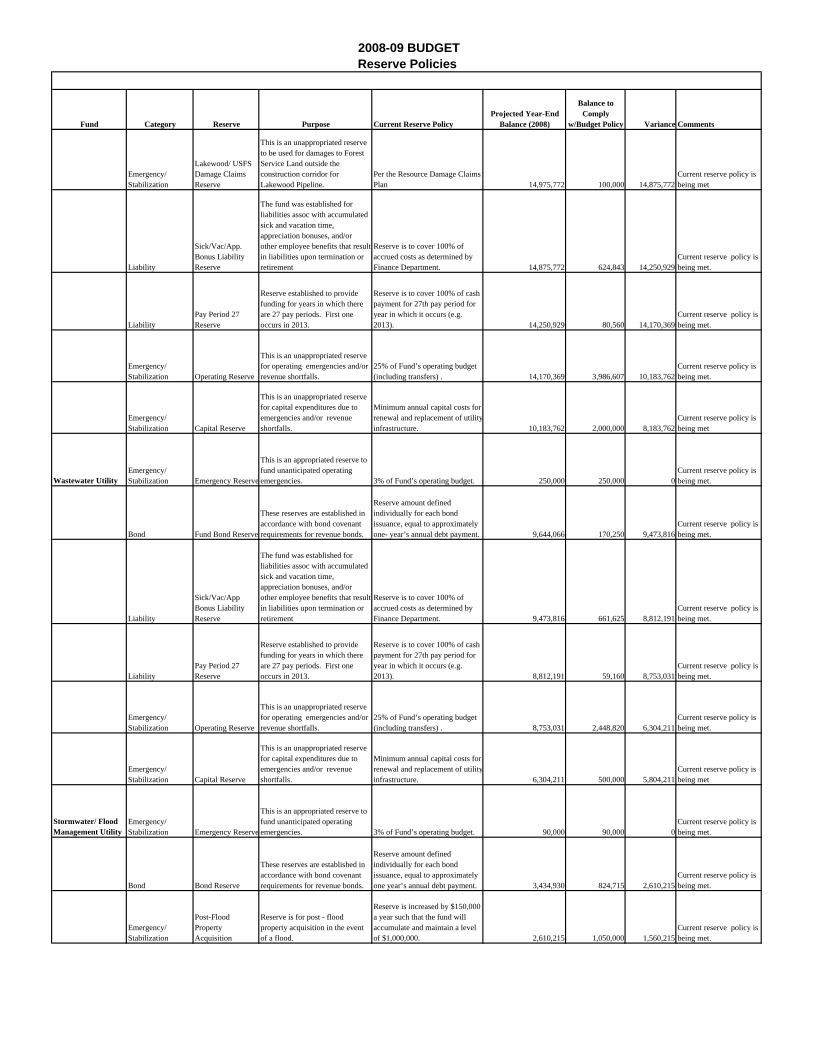
2008-09 BUDGETReserve Policies
Fund Category Reserve Purpose Current Reserve PolicyProjected Year-End
Balance (2008)
Balance to Comply
w/Budget Policy Variance Comments
Emergency/ Stabilization
Lakewood/ USFS Damage Claims Reserve
This is an unappropriated reserve to be used for damages to Forest Service Land outside the construction corridor for Lakewood Pipeline.
Per the Resource Damage Claims Plan 14,975,772 100,000 14,875,772
Current reserve policy is being met
Liability
Sick/Vac/App. Bonus Liability Reserve
The fund was established for liabilities assoc with accumulated sick and vacation time, appreciation bonuses, and/or other employee benefits that result in liabilities upon termination or retirement
Reserve is to cover 100% of accrued costs as determined by Finance Department. 14,875,772 624,843 14,250,929
Current reserve policy is being met.
LiabilityPay Period 27 Reserve
Reserve established to provide funding for years in which there are 27 pay periods. First one occurs in 2013.
Reserve is to cover 100% of cash payment for 27th pay period for year in which it occurs (e.g. 2013). 14,250,929 80,560 14,170,369
Current reserve policy is being met.
Emergency/ Stabilization Operating Reserve
This is an unappropriated reserve for operating emergencies and/or revenue shortfalls.
25% of Fund’s operating budget (including transfers) . 14,170,369 3,986,607 10,183,762
Current reserve policy is being met.
Emergency/ Stabilization Capital Reserve
This is an unappropriated reserve for capital expenditures due to emergencies and/or revenue shortfalls.
Minimum annual capital costs for renewal and replacement of utilityinfrastructure. 10,183,762 2,000,000 8,183,762
Current reserve policy is being met
Wastewater UtilityEmergency/ Stabilization Emergency Reserve
This is an appropriated reserve to fund unanticipated operating emergencies. 3% of Fund’s operating budget. 250,000 250,000 0
Current reserve policy is being met.
Bond Fund Bond Reserve
These reserves are established in accordance with bond covenant requirements for revenue bonds.
Reserve amount defined individually for each bond issuance, equal to approximately one- year’s annual debt payment. 9,644,066 170,250 9,473,816
Current reserve policy is being met.
Liability
Sick/Vac/App Bonus Liability Reserve
The fund was established for liabilities assoc with accumulated sick and vacation time, appreciation bonuses, and/or other employee benefits that result in liabilities upon termination or retirement
Reserve is to cover 100% of accrued costs as determined by Finance Department. 9,473,816 661,625 8,812,191
Current reserve policy is being met.
LiabilityPay Period 27 Reserve
Reserve established to provide funding for years in which there are 27 pay periods. First one occurs in 2013.
Reserve is to cover 100% of cash payment for 27th pay period for year in which it occurs (e.g. 2013). 8,812,191 59,160 8,753,031
Current reserve policy is being met.
Emergency/ Stabilization Operating Reserve
This is an unappropriated reserve for operating emergencies and/or revenue shortfalls.
25% of Fund’s operating budget (including transfers) . 8,753,031 2,448,820 6,304,211
Current reserve policy is being met.
Emergency/ Stabilization Capital Reserve
This is an unappropriated reserve for capital expenditures due to emergencies and/or revenue shortfalls.
Minimum annual capital costs for renewal and replacement of utilityinfrastructure. 6,304,211 500,000 5,804,211
Current reserve policy is being met
Stormwater/ Flood Management Utility
Emergency/ Stabilization Emergency Reserve
This is an appropriated reserve to fund unanticipated operating emergencies. 3% of Fund’s operating budget. 90,000 90,000 0
Current reserve policy is being met.
Bond Bond Reserve
These reserves are established in accordance with bond covenant requirements for revenue bonds.
Reserve amount defined individually for each bond issuance, equal to approximately one year’s annual debt payment. 3,434,930 824,715 2,610,215
Current reserve policy is being met.
Emergency/ Stabilization
Post-Flood Property Acquisition
Reserve is for post - flood property acquisition in the event of a flood.
Reserve is increased by $150,000 a year such that the fund will accumulate and maintain a level of $1,000,000. 2,610,215 1,050,000 1,560,215
Current reserve policy is being met.
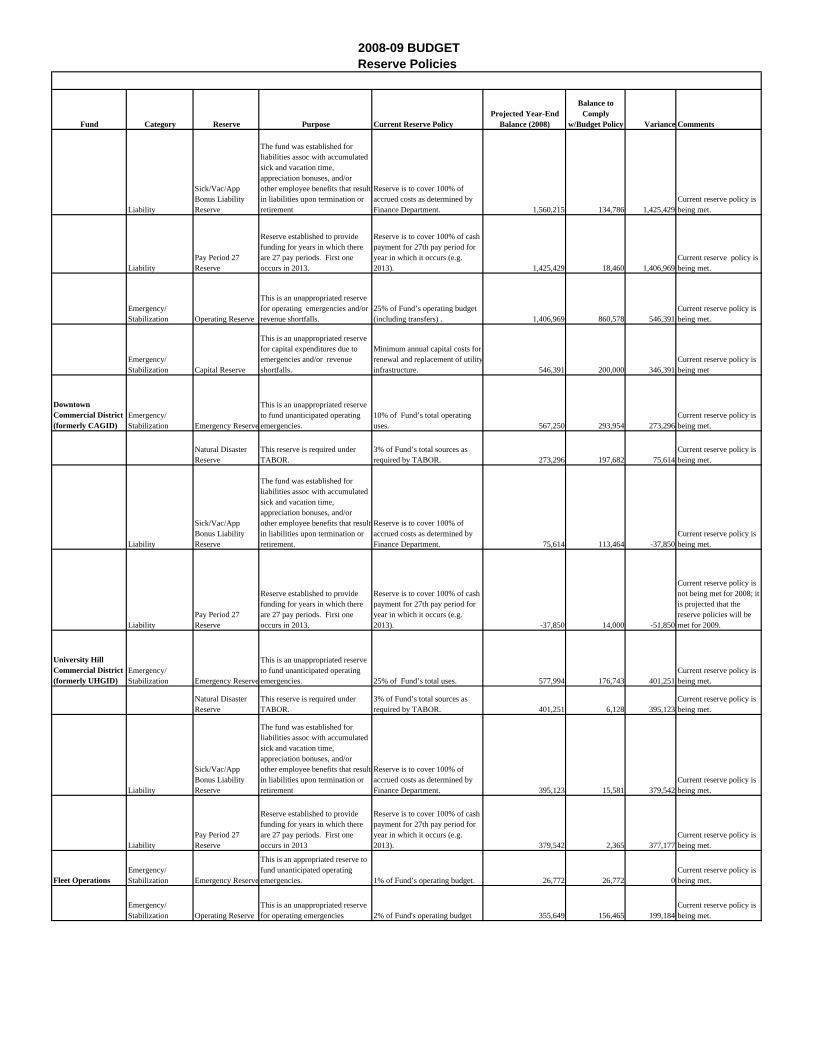
2008-09 BUDGETReserve Policies
Fund Category Reserve Purpose Current Reserve PolicyProjected Year-End
Balance (2008)
Balance to Comply
w/Budget Policy Variance Comments
Liability
Sick/Vac/App Bonus Liability Reserve
The fund was established for liabilities assoc with accumulated sick and vacation time, appreciation bonuses, and/or other employee benefits that result in liabilities upon termination or retirement
Reserve is to cover 100% of accrued costs as determined by Finance Department. 1,560,215 134,786 1,425,429
Current reserve policy is being met.
LiabilityPay Period 27 Reserve
Reserve established to provide funding for years in which there are 27 pay periods. First one occurs in 2013.
Reserve is to cover 100% of cash payment for 27th pay period for year in which it occurs (e.g. 2013). 1,425,429 18,460 1,406,969
Current reserve policy is being met.
Emergency/ Stabilization Operating Reserve
This is an unappropriated reserve for operating emergencies and/or revenue shortfalls.
25% of Fund’s operating budget (including transfers) . 1,406,969 860,578 546,391
Current reserve policy is being met.
Emergency/ Stabilization Capital Reserve
This is an unappropriated reserve for capital expenditures due to emergencies and/or revenue shortfalls.
Minimum annual capital costs for renewal and replacement of utilityinfrastructure. 546,391 200,000 346,391
Current reserve policy is being met
Downtown Commercial District (formerly CAGID)
Emergency/ Stabilization Emergency Reserve
This is an unappropriated reserve to fund unanticipated operating emergencies.
10% of Fund’s total operating uses. 567,250 293,954 273,296
Current reserve policy is being met.
Natural Disaster Reserve
This reserve is required under TABOR.
3% of Fund’s total sources as required by TABOR. 273,296 197,682 75,614
Current reserve policy is being met.
Liability
Sick/Vac/App Bonus Liability Reserve
The fund was established for liabilities assoc with accumulated sick and vacation time, appreciation bonuses, and/or other employee benefits that result in liabilities upon termination or retirement.
Reserve is to cover 100% of accrued costs as determined by Finance Department. 75,614 113,464 -37,850
Current reserve policy is being met.
LiabilityPay Period 27 Reserve
Reserve established to provide funding for years in which there are 27 pay periods. First one occurs in 2013.
Reserve is to cover 100% of cash payment for 27th pay period for year in which it occurs (e.g. 2013). -37,850 14,000 -51,850
Current reserve policy is not being met for 2008; it is projected that the reserve policies will be met for 2009.
University Hill Commercial District (formerly UHGID)
Emergency/ Stabilization Emergency Reserve
This is an unappropriated reserve to fund unanticipated operating emergencies. 25% of Fund’s total uses. 577,994 176,743 401,251
Current reserve policy is being met.
Natural Disaster Reserve
This reserve is required under TABOR.
3% of Fund’s total sources as required by TABOR. 401,251 6,128 395,123
Current reserve policy is being met.
Liability
Sick/Vac/App Bonus Liability Reserve
The fund was established for liabilities assoc with accumulated sick and vacation time, appreciation bonuses, and/or other employee benefits that result in liabilities upon termination or retirement
Reserve is to cover 100% of accrued costs as determined by Finance Department. 395,123 15,581 379,542
Current reserve policy is being met.
LiabilityPay Period 27 Reserve
Reserve established to provide funding for years in which there are 27 pay periods. First one occurs in 2013
Reserve is to cover 100% of cash payment for 27th pay period for year in which it occurs (e.g. 2013). 379,542 2,365 377,177
Current reserve policy is being met.
Fleet OperationsEmergency/ Stabilization Emergency Reserve
This is an appropriated reserve to fund unanticipated operating emergencies. 1% of Fund’s operating budget. 26,772 26,772 0
Current reserve policy is being met.
Emergency/ Stabilization Operating Reserve
This is an unappropriated reserve for operating emergencies 2% of Fund's operating budget 355,649 156,465 199,184
Current reserve policy is being met.
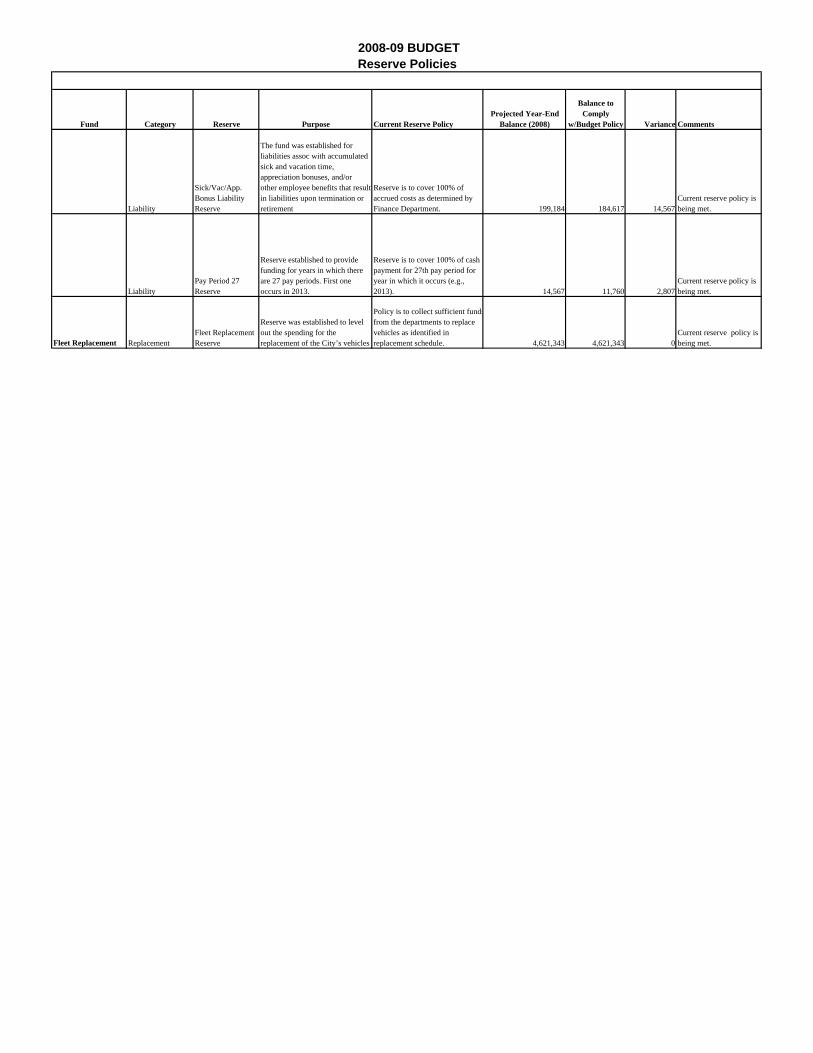
2008-09 BUDGETReserve Policies
Fund Category Reserve Purpose Current Reserve PolicyProjected Year-End
Balance (2008)
Balance to Comply
w/Budget Policy Variance Comments
Liability
Sick/Vac/App. Bonus Liability Reserve
The fund was established for liabilities assoc with accumulated sick and vacation time, appreciation bonuses, and/or other employee benefits that result in liabilities upon termination or retirement
Reserve is to cover 100% of accrued costs as determined by Finance Department. 199,184 184,617 14,567
Current reserve policy is being met.
LiabilityPay Period 27 Reserve
Reserve established to provide funding for years in which there are 27 pay periods. First one occurs in 2013.
Reserve is to cover 100% of cash payment for 27th pay period for year in which it occurs (e.g., 2013). 14,567 11,760 2,807
Current reserve policy is being met.
Fleet Replacement ReplacementFleet Replacement Reserve
Reserve was established to level out the spending for the replacement of the City’s vehicles
Policy is to collect sufficient fundsfrom the departments to replace vehicles as identified in replacement schedule. 4,621,343 4,621,343 0
Current reserve policy is being met.

CITYWIDE SUMMARIES
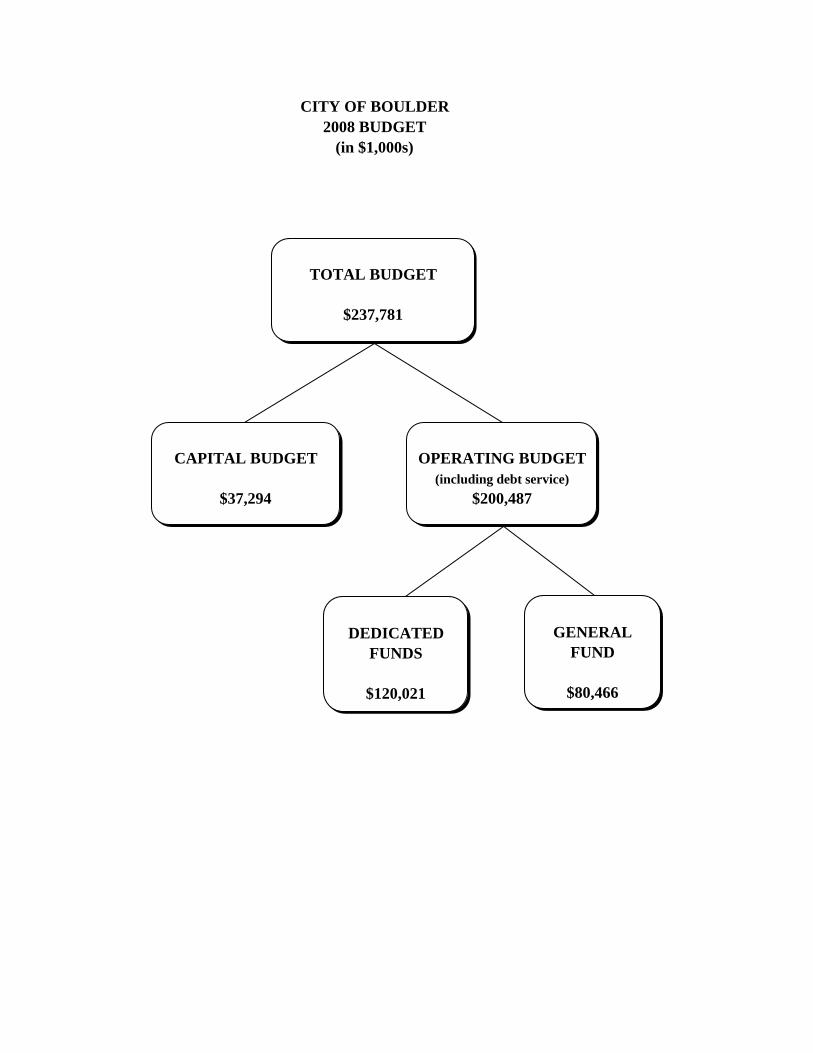
CITY OF BOULDER2008 BUDGET
(in $1,000s)
TOTAL BUDGET
$237,781
CAPITAL BUDGET
$37,294
OPERATING BUDGET(including debt service)
$200,487
DEDICATEDFUNDS
$120,021
GENERALFUND
$80,466
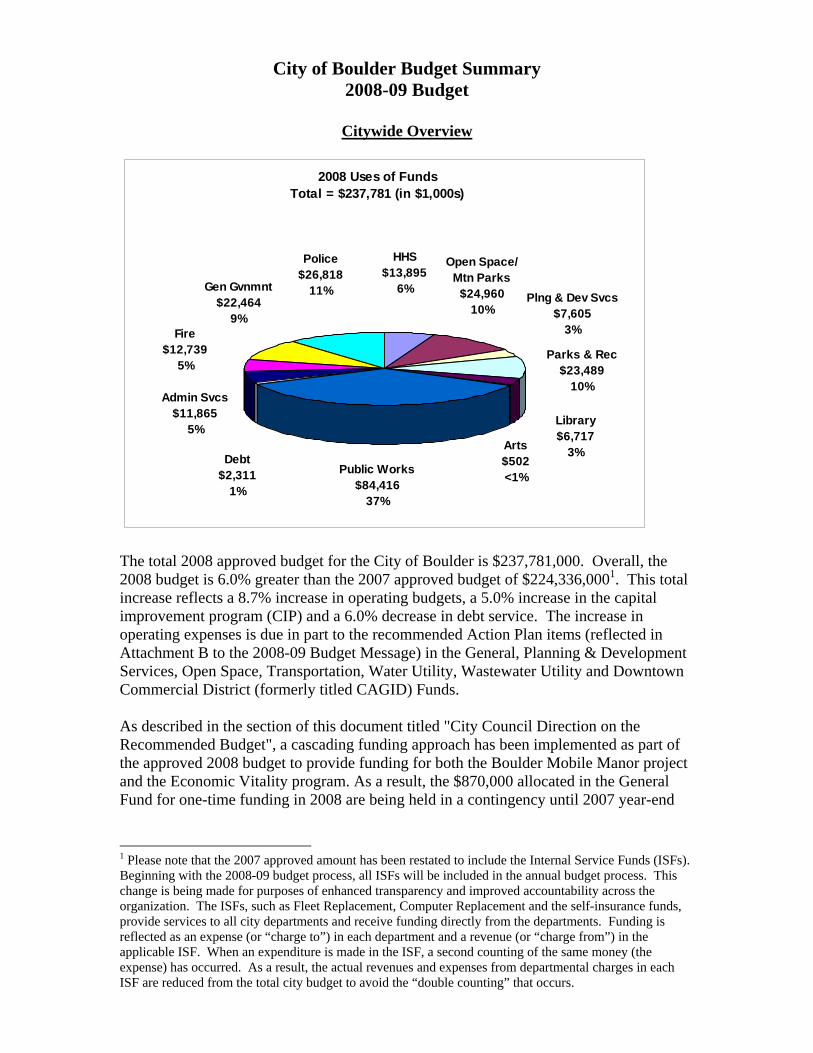
City of Boulder Budget Summary 2008-09 Budget
Citywide Overview
Gen Gvnmnt$22,464
9%Fire
$12,7395%
Admin Svcs$11,865
5%
Debt$2,311
1%
Public Works$84,416
37%
Plng & Dev Svcs$7,605
3%
Open Space/Mtn Parks
$24,96010%
Parks & Rec$23,489
10%
Library$6,717
3%Arts$502<1%
HHS$13,895
6%
Police$26,818
11%
2008 Uses of FundsTotal = $237,781 (in $1,000s)
The total 2008 approved budget for the City of Boulder is $237,781,000. Overall, the 2008 budget is 6.0% greater than the 2007 approved budget of $224,336,0001. This total increase reflects a 8.7% increase in operating budgets, a 5.0% increase in the capital improvement program (CIP) and a 6.0% decrease in debt service. The increase in operating expenses is due in part to the recommended Action Plan items (reflected in Attachment B to the 2008-09 Budget Message) in the General, Planning & Development Services, Open Space, Transportation, Water Utility, Wastewater Utility and Downtown Commercial District (formerly titled CAGID) Funds.
As described in the section of this document titled "City Council Direction on the Recommended Budget", a cascading funding approach has been implemented as part of the approved 2008 budget to provide funding for both the Boulder Mobile Manor project and the Economic Vitality program. As a result, the $870,000 allocated in the General Fund for one-time funding in 2008 are being held in a contingency until 2007 year-end
1 Please note that the 2007 approved amount has been restated to include the Internal Service Funds (ISFs). Beginning with the 2008-09 budget process, all ISFs will be included in the annual budget process. This change is being made for purposes of enhanced transparency and improved accountability across the organization. The ISFs, such as Fleet Replacement, Computer Replacement and the self-insurance funds, provide services to all city departments and receive funding directly from the departments. Funding is reflected as an expense (or “charge to”) in each department and a revenue (or “charge from”) in the applicable ISF. When an expenditure is made in the ISF, a second counting of the same money (the expense) has occurred. As a result, the actual revenues and expenses from departmental charges in each ISF are reduced from the total city budget to avoid the “double counting” that occurs.
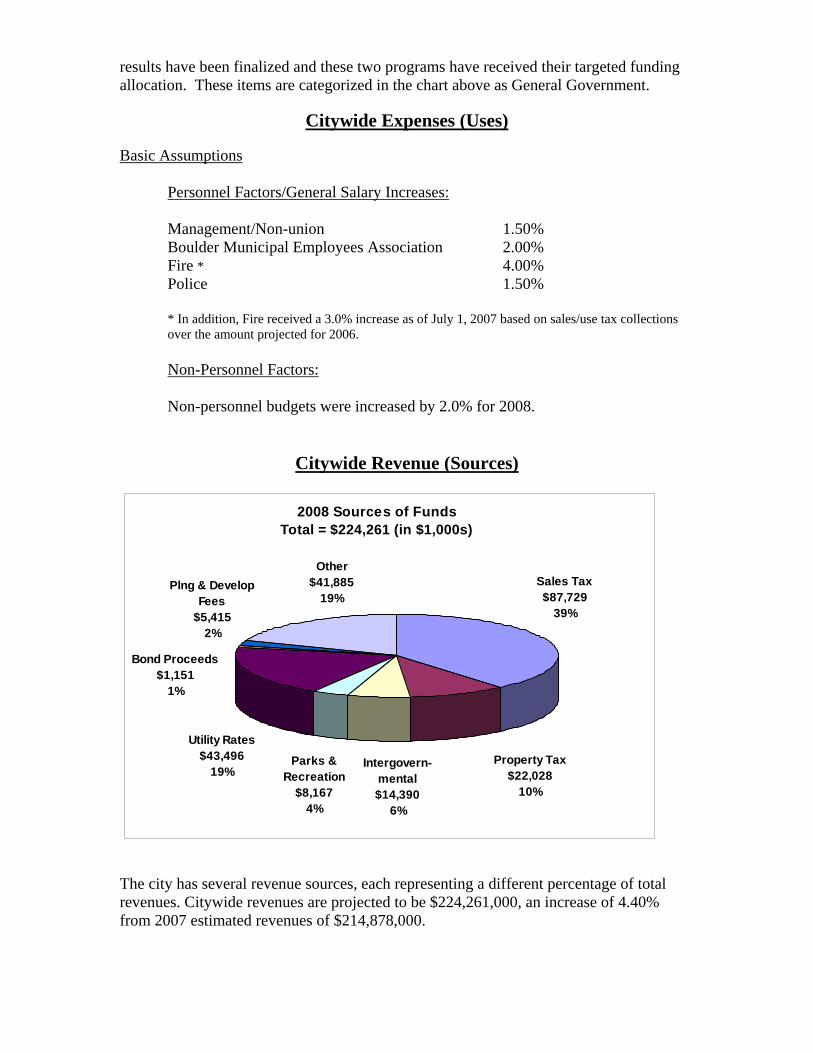
results have been finalized and these two programs have received their targeted funding allocation. These items are categorized in the chart above as General Government.
Citywide Expenses (Uses) Basic Assumptions Personnel Factors/General Salary Increases:
Management/Non-union 1.50% Boulder Municipal Employees Association 2.00% Fire * 4.00%
Police 1.50%
* In addition, Fire received a 3.0% increase as of July 1, 2007 based on sales/use tax collections over the amount projected for 2006.
Non-Personnel Factors: Non-personnel budgets were increased by 2.0% for 2008.
Citywide Revenue (Sources)
Sales Tax$87,729
39%
Property Tax$22,028
10%
Other $41,885
19%
Intergovern-mental$14,390
6%
Parks & Recreation
$8,1674%
Utility Rates $43,496
19%
Bond Proceeds$1,151
1%
Plng & Develop Fees
$5,4152%
2008 Sources of FundsTotal = $224,261 (in $1,000s)
The city has several revenue sources, each representing a different percentage of total revenues. Citywide revenues are projected to be $224,261,000, an increase of 4.40% from 2007 estimated revenues of $214,878,000.
Sales Tax Sales Tax represents 39% of the city’s total revenue. Sales tax is a transaction tax levied upon all sales, purchases, and leases of tangible personal property and taxable services sold or leased by persons engaged in business in the city and is collected by the vendor or lessor and remitted to the city. The 2008 sales and use tax rate consists of several components. The following is a list of the specific funds that have sales tax as a component of their revenue. Fund Rate Start Date Expiration Date General 1.00% 1/1/1964 None General 0.38% 1/1/1988 12/31/2011 General (designated) 0.15% 1/1/1993 12/31/2012 General (formerly designated for 0.15% 1/1/2005 12/31/2024 public safety purposes) Open Space 0.40% 1/1/1967 None Open Space 0.33% 1/1/1990 12/31/2018 Open Space 0.15% 1/1/2004 12/31/2019 Transportation 0.60% 1/1/1967 None Parks 0.25% 1/1/1996 12/31/2015
Total for 2008 3.41% Basic Assumptions:
Inflation – Projected CPI for the Denver-Boulder-Greeley area is 2.6% for 2008. This information based on projections from the Colorado Office of State Planning and Budgeting (OSPB). Overall Sales Tax Growth – The overall growth in sales & use tax for the city is expected to be 3.9% in 2008.
Property Tax Property Tax represents 10% of the city’s total revenue. Property tax revenue is based on the city’s mill levy to the current assessed value. All property tax revenue growth (except the 2 mil for public safety services) is restricted under the Taxpayer Bill of Rights Amendment to the Colorado Constitution (TABOR) to the Denver-Boulder Consumer Price Index (CPI) and a local growth factor. The following rates were approved as part of the 2008 budget:
Property Tax Rate from 2007 Approved Budget: General City Operations 8.748 Permanent Parks Fund (Charter Sec. 161) 0.900 Library Fund (Charter Sec. 165) 0.333 TOTAL 9.981 Less Mill Levy Credit 2.780 TOTAL (Mills subject to Article X, Section 20 Of the Colorado Constitution 7.201 General City Operations (Public Safety) 2.000 NET MILL LEVY 9.201
City of Boulder - Net Mill Levy
Revenue Year
2002 2003 2004 2005 2006 2007 2008
Mill Levy 9.301 9.640 9.860 10.005 9.643 9.889 9.201
Impact on Fund Balance For the 2008 budget year, there is $13,520,000 being used from fund balance to fund anticipated expenses. The use of fund balance is typically for one-time only expenses or for capital projects. Most funds that are using fund balance have built up reserves especially for the purpose of funding capital projects; for example, the Open Space, Transportation and Utility Funds. For a complete look at the five year position of the city’s funds, please refer to the “Fund Financial” section of the budget document. In addition, each fund’s reserve policies are summarized in the “Budget Policies” section of the document and their current status relative to those policies.
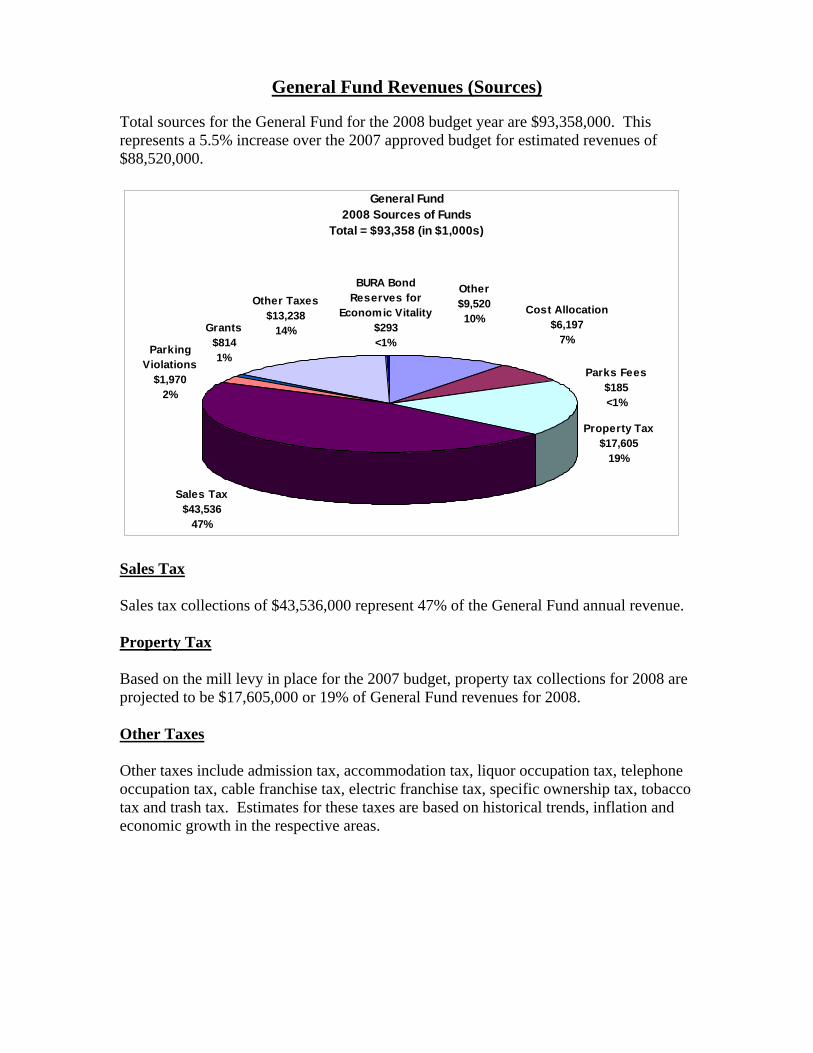
General Fund Revenues (Sources)
Total sources for the General Fund for the 2008 budget year are $93,358,000. This represents a 5.5% increase over the 2007 approved budget for estimated revenues of $88,520,000.
Other Taxes$13,238
14%Grants$8141%
ParkingViolations
$1,9702%
Sales Tax$43,536
47%
Property Tax$17,605
19%
Parks Fees$185<1%
Cost Allocation$6,197
7%
Other$9,52010%
BURA Bond Reserves for
Economic Vitality$293<1%
General Fund2008 Sources of Funds
Total = $93,358 (in $1,000s)
Sales Tax Sales tax collections of $43,536,000 represent 47% of the General Fund annual revenue. Property Tax Based on the mill levy in place for the 2007 budget, property tax collections for 2008 are projected to be $17,605,000 or 19% of General Fund revenues for 2008. Other Taxes Other taxes include admission tax, accommodation tax, liquor occupation tax, telephone occupation tax, cable franchise tax, electric franchise tax, specific ownership tax, tobacco tax and trash tax. Estimates for these taxes are based on historical trends, inflation and economic growth in the respective areas.
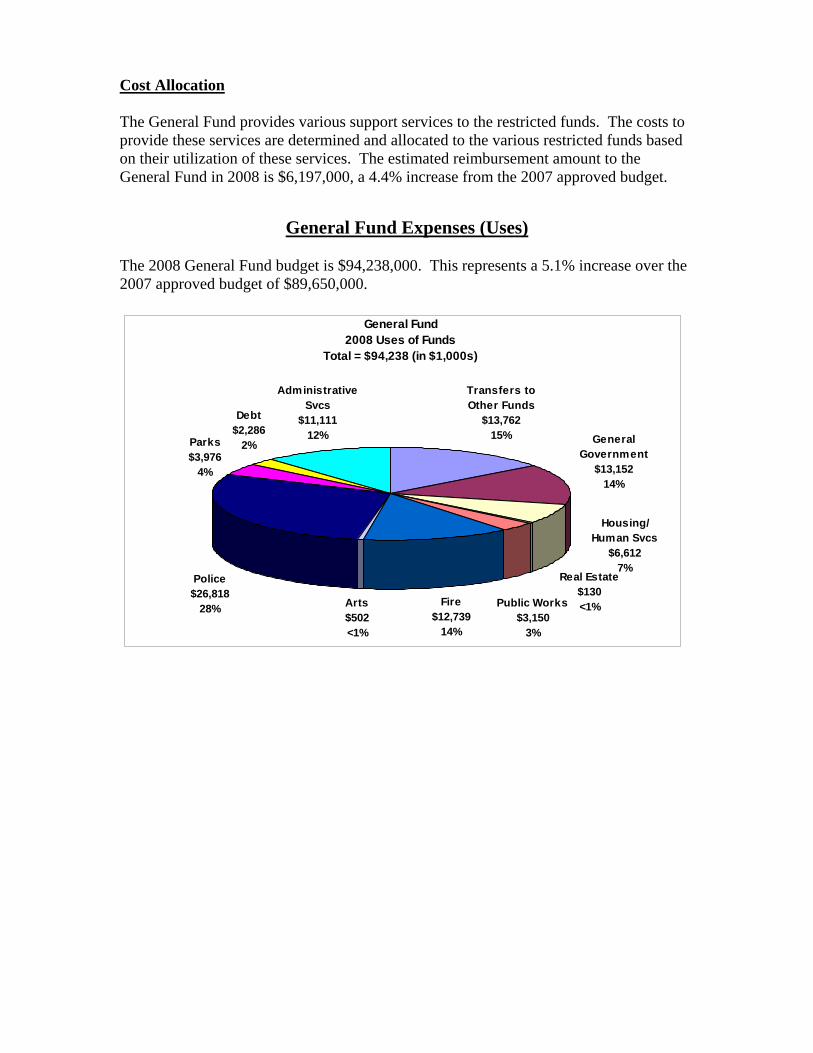
Cost Allocation The General Fund provides various support services to the restricted funds. The costs to provide these services are determined and allocated to the various restricted funds based on their utilization of these services. The estimated reimbursement amount to the General Fund in 2008 is $6,197,000, a 4.4% increase from the 2007 approved budget.
General Fund Expenses (Uses) The 2008 General Fund budget is $94,238,000. This represents a 5.1% increase over the 2007 approved budget of $89,650,000.
Transfers toOther Funds
$13,76215% General
Government$13,152
14%
Real Estate$130<1%Fire
$12,73914%
Arts$502<1%
Police$26,818
28%
Parks $3,976
4%
Debt$2,286
2%
Administrative Svcs
$11,11112%
Public Works$3,150
3%
Housing/Human Svcs
$6,6127%
General Fund2008 Uses of Funds
Total = $94,238 (in $1,000s)
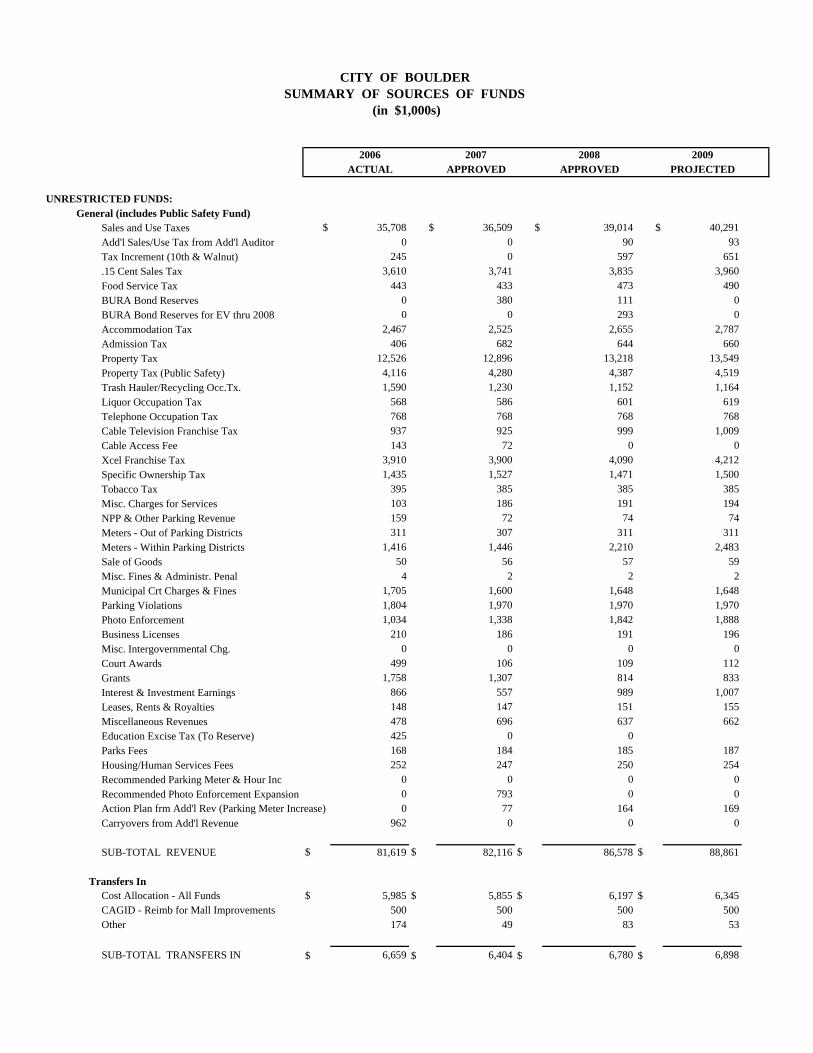
2006 2007 2008 2009ACTUAL APPROVED APPROVED PROJECTED
UNRESTRICTED FUNDS:General (includes Public Safety Fund)
Sales and Use Taxes $ 35,708 $ 36,509 $ 39,014 $ 40,291Add'l Sales/Use Tax from Add'l Auditor 0 0 90 93Tax Increment (10th & Walnut) 245 0 597 651.15 Cent Sales Tax 3,610 3,741 3,835 3,960Food Service Tax 443 433 473 490BURA Bond Reserves 0 380 111 0BURA Bond Reserves for EV thru 2008 0 0 293 0Accommodation Tax 2,467 2,525 2,655 2,787Admission Tax 406 682 644 660Property Tax 12,526 12,896 13,218 13,549Property Tax (Public Safety) 4,116 4,280 4,387 4,519Trash Hauler/Recycling Occ.Tx. 1,590 1,230 1,152 1,164Liquor Occupation Tax 568 586 601 619Telephone Occupation Tax 768 768 768 768Cable Television Franchise Tax 937 925 999 1,009Cable Access Fee 143 72 0 0Xcel Franchise Tax 3,910 3,900 4,090 4,212Specific Ownership Tax 1,435 1,527 1,471 1,500Tobacco Tax 395 385 385 385Misc. Charges for Services 103 186 191 194NPP & Other Parking Revenue 159 72 74 74Meters - Out of Parking Districts 311 307 311 311Meters - Within Parking Districts 1,416 1,446 2,210 2,483Sale of Goods 50 56 57 59Misc. Fines & Administr. Penal 4 2 2 2Municipal Crt Charges & Fines 1,705 1,600 1,648 1,648Parking Violations 1,804 1,970 1,970 1,970Photo Enforcement 1,034 1,338 1,842 1,888Business Licenses 210 186 191 196Misc. Intergovernmental Chg. 0 0 0 0Court Awards 499 106 109 112Grants 1,758 1,307 814 833Interest & Investment Earnings 866 557 989 1,007Leases, Rents & Royalties 148 147 151 155Miscellaneous Revenues 478 696 637 662Education Excise Tax (To Reserve) 425 0 0Parks Fees 168 184 185 187Housing/Human Services Fees 252 247 250 254Recommended Parking Meter & Hour Inc 0 0 0 0Recommended Photo Enforcement Expansion 0 793 0 0Action Plan frm Add'l Rev (Parking Meter Increase) 0 77 164 169Carryovers from Add'l Revenue 962 0 0 0
SUB-TOTAL REVENUE $ 81,619 $ 82,116 $ 86,578 $ 88,861
Transfers InCost Allocation - All Funds $ 5,985 $ 5,855 $ 6,197 $ 6,345CAGID - Reimb for Mall Improvements 500 500 500 500Other 174 49 83 53
SUB-TOTAL TRANSFERS IN $ 6,659 $ 6,404 $ 6,780 $ 6,898
CITY OF BOULDER SUMMARY OF SOURCES OF FUNDS
(in $1,000s)
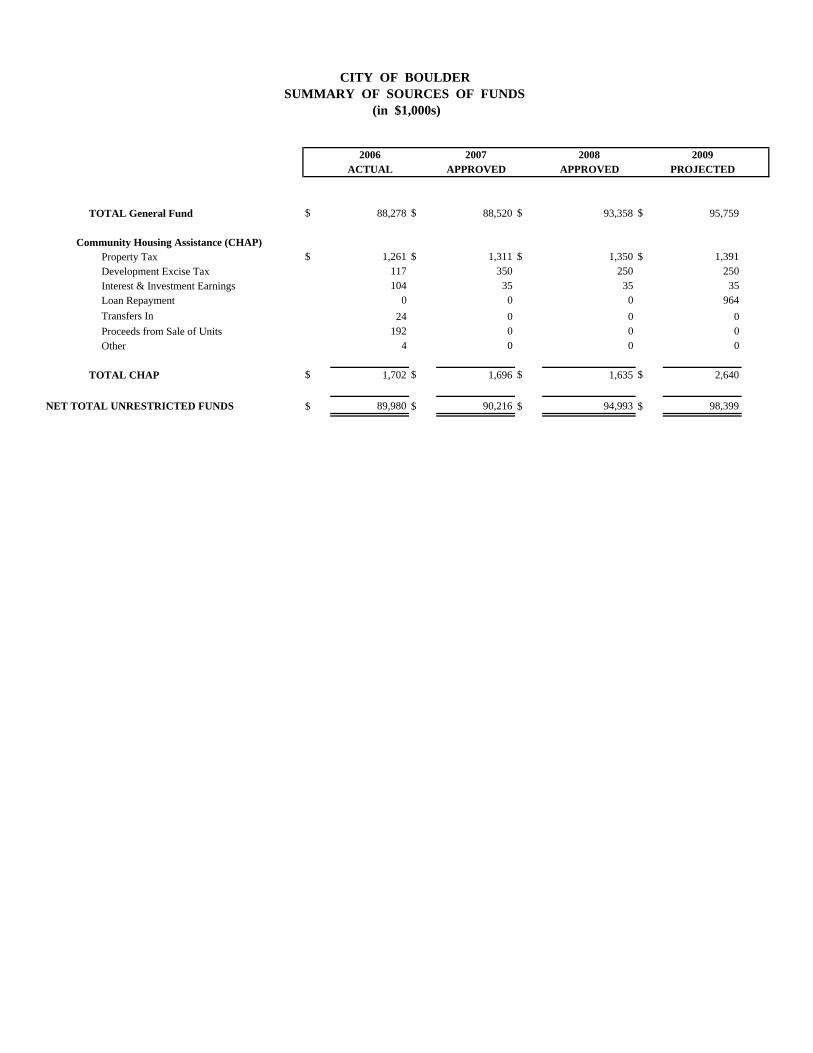
2006 2007 2008 2009ACTUAL APPROVED APPROVED PROJECTED
CITY OF BOULDER SUMMARY OF SOURCES OF FUNDS
(in $1,000s)
TOTAL General Fund $ 88,278 $ 88,520 $ 93,358 $ 95,759
Community Housing Assistance (CHAP)Property Tax $ 1,261 $ 1,311 $ 1,350 $ 1,391Development Excise Tax 117 350 250 250Interest & Investment Earnings 104 35 35 35Loan Repayment 0 0 0 964Transfers In 24 0 0 0Proceeds from Sale of Units 192 0 0 0Other 4 0 0 0
TOTAL CHAP $ 1,702 $ 1,696 $ 1,635 $ 2,640
NET TOTAL UNRESTRICTED FUNDS $ 89,980 $ 90,216 $ 94,993 $ 98,399
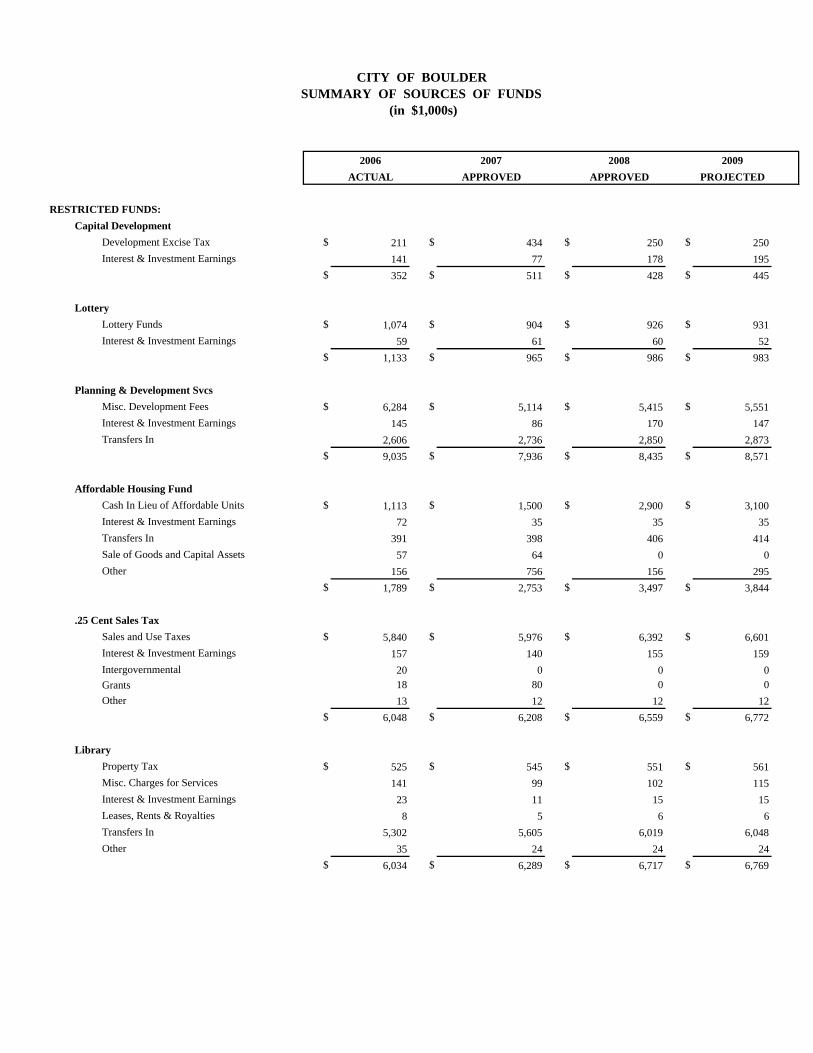
2006 2007 2008 2009ACTUAL APPROVED APPROVED PROJECTED
RESTRICTED FUNDS:Capital Development
Development Excise Tax $ 211 $ 434 $ 250 $ 250Interest & Investment Earnings 141 77 178 195
$ 352 $ 511 $ 428 $ 445
LotteryLottery Funds $ 1,074 $ 904 $ 926 $ 931Interest & Investment Earnings 59 61 60 52
$ 1,133 $ 965 $ 986 $ 983
Planning & Development SvcsMisc. Development Fees $ 6,284 $ 5,114 $ 5,415 $ 5,551Interest & Investment Earnings 145 86 170 147Transfers In 2,606 2,736 2,850 2,873
$ 9,035 $ 7,936 $ 8,435 $ 8,571
Affordable Housing FundCash In Lieu of Affordable Units $ 1,113 $ 1,500 $ 2,900 $ 3,100Interest & Investment Earnings 72 35 35 35Transfers In 391 398 406 414Sale of Goods and Capital Assets 57 64 0 0Other 156 756 156 295
$ 1,789 $ 2,753 $ 3,497 $ 3,844
.25 Cent Sales TaxSales and Use Taxes $ 5,840 $ 5,976 $ 6,392 $ 6,601Interest & Investment Earnings 157 140 155 159Intergovernmental 20 0 0 0Grants 18 80 0 0Other 13 12 12 12
$ 6,048 $ 6,208 $ 6,559 $ 6,772
LibraryProperty Tax $ 525 $ 545 $ 551 $ 561Misc. Charges for Services 141 99 102 115Interest & Investment Earnings 23 11 15 15Leases, Rents & Royalties 8 5 6 6Transfers In 5,302 5,605 6,019 6,048Other 35 24 24 24
$ 6,034 $ 6,289 $ 6,717 $ 6,769
CITY OF BOULDER SUMMARY OF SOURCES OF FUNDS
(in $1,000s)
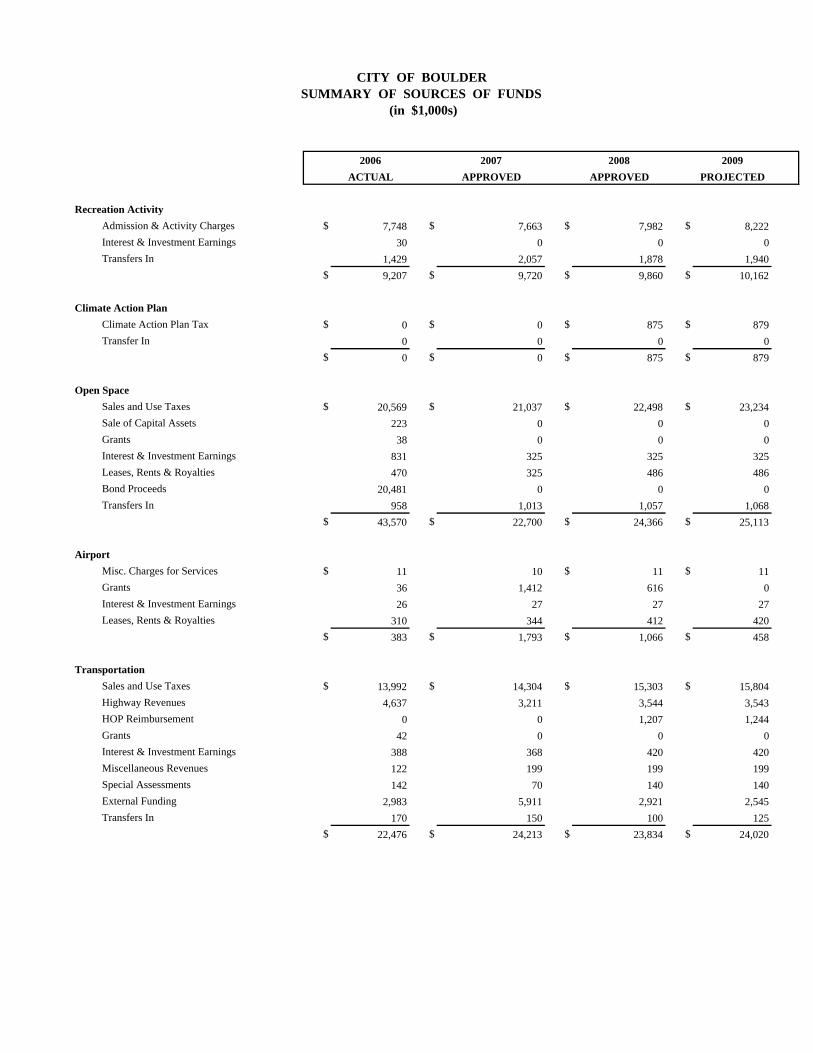
2006 2007 2008 2009ACTUAL APPROVED APPROVED PROJECTED
CITY OF BOULDER SUMMARY OF SOURCES OF FUNDS
(in $1,000s)
Recreation Activity Admission & Activity Charges $ 7,748 $ 7,663 $ 7,982 $ 8,222Interest & Investment Earnings 30 0 0 0Transfers In 1,429 2,057 1,878 1,940
$ 9,207 $ 9,720 $ 9,860 $ 10,162
Climate Action PlanClimate Action Plan Tax $ 0 $ 0 $ 875 $ 879Transfer In 0 0 0 0
$ 0 $ 0 $ 875 $ 879
Open SpaceSales and Use Taxes $ 20,569 $ 21,037 $ 22,498 $ 23,234Sale of Capital Assets 223 0 0 0Grants 38 0 0 0Interest & Investment Earnings 831 325 325 325Leases, Rents & Royalties 470 325 486 486Bond Proceeds 20,481 0 0 0Transfers In 958 1,013 1,057 1,068
$ 43,570 $ 22,700 $ 24,366 $ 25,113
AirportMisc. Charges for Services $ 11 10 $ 11 $ 11Grants 36 1,412 616 0Interest & Investment Earnings 26 27 27 27Leases, Rents & Royalties 310 344 412 420
$ 383 $ 1,793 $ 1,066 $ 458
TransportationSales and Use Taxes $ 13,992 $ 14,304 $ 15,303 $ 15,804Highway Revenues 4,637 3,211 3,544 3,543HOP Reimbursement 0 0 1,207 1,244Grants 42 0 0 0Interest & Investment Earnings 388 368 420 420Miscellaneous Revenues 122 199 199 199Special Assessments 142 70 140 140External Funding 2,983 5,911 2,921 2,545Transfers In 170 150 100 125
$ 22,476 $ 24,213 $ 23,834 $ 24,020
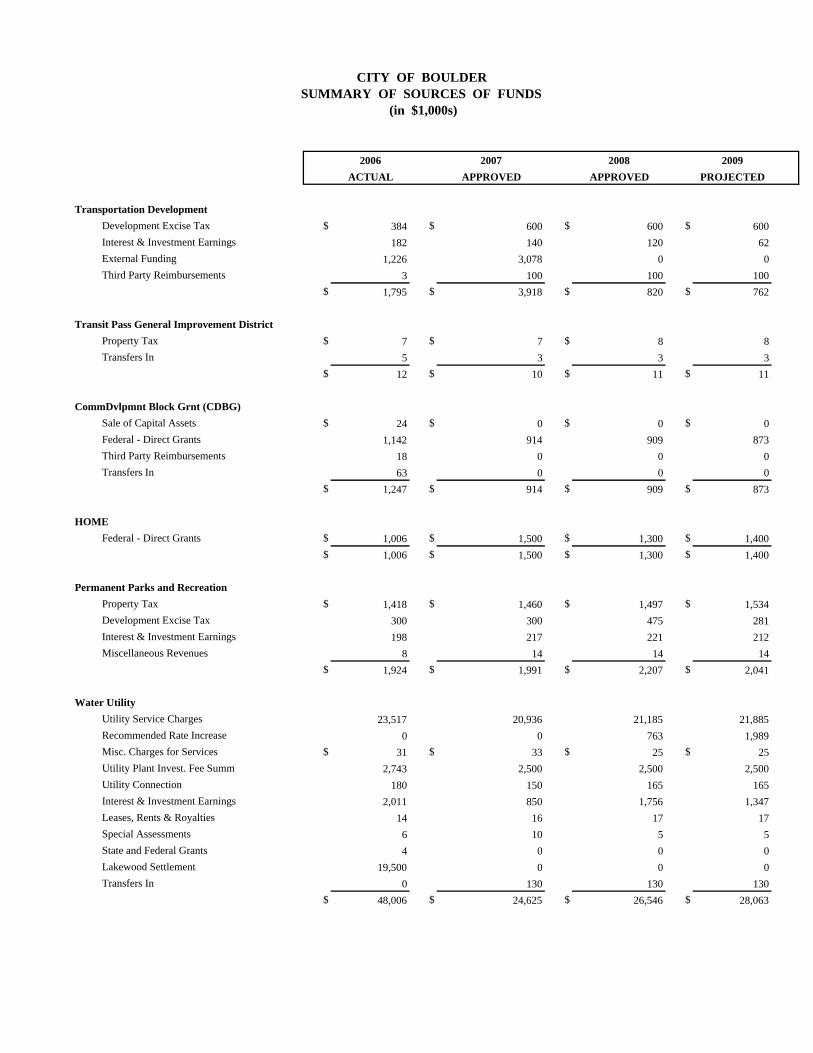
2006 2007 2008 2009ACTUAL APPROVED APPROVED PROJECTED
CITY OF BOULDER SUMMARY OF SOURCES OF FUNDS
(in $1,000s)
Transportation DevelopmentDevelopment Excise Tax $ 384 $ 600 $ 600 $ 600Interest & Investment Earnings 182 140 120 62External Funding 1,226 3,078 0 0Third Party Reimbursements 3 100 100 100
$ 1,795 $ 3,918 $ 820 $ 762
Transit Pass General Improvement DistrictProperty Tax $ 7 $ 7 $ 8 8Transfers In 5 3 3 3
$ 12 $ 10 $ 11 $ 11
CommDvlpmnt Block Grnt (CDBG)Sale of Capital Assets $ 24 $ 0 $ 0 $ 0Federal - Direct Grants 1,142 914 909 873Third Party Reimbursements 18 0 0 0Transfers In 63 0 0 0
$ 1,247 $ 914 $ 909 $ 873
HOMEFederal - Direct Grants $ 1,006 $ 1,500 $ 1,300 $ 1,400
$ 1,006 $ 1,500 $ 1,300 $ 1,400
Permanent Parks and RecreationProperty Tax $ 1,418 $ 1,460 $ 1,497 $ 1,534Development Excise Tax 300 300 475 281Interest & Investment Earnings 198 217 221 212Miscellaneous Revenues 8 14 14 14
$ 1,924 $ 1,991 $ 2,207 $ 2,041
Water UtilityUtility Service Charges 23,517 20,936 21,185 21,885Recommended Rate Increase 0 0 763 1,989Misc. Charges for Services $ 31 $ 33 $ 25 $ 25Utility Plant Invest. Fee Summ 2,743 2,500 2,500 2,500Utility Connection 180 150 165 165Interest & Investment Earnings 2,011 850 1,756 1,347Leases, Rents & Royalties 14 16 17 17Special Assessments 6 10 5 5State and Federal Grants 4 0 0 0Lakewood Settlement 19,500 0 0 0Transfers In 0 130 130 130
$ 48,006 $ 24,625 $ 26,546 $ 28,063
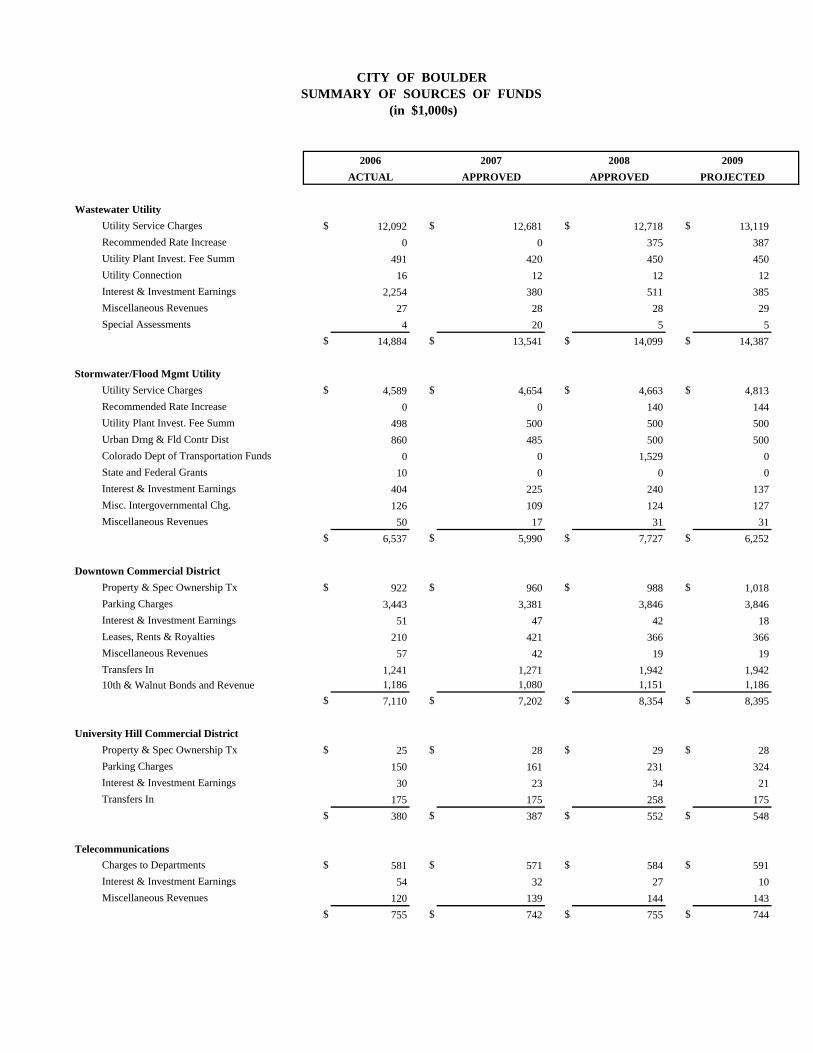
2006 2007 2008 2009ACTUAL APPROVED APPROVED PROJECTED
CITY OF BOULDER SUMMARY OF SOURCES OF FUNDS
(in $1,000s)
Wastewater UtilityUtility Service Charges $ 12,092 $ 12,681 $ 12,718 $ 13,119Recommended Rate Increase 0 0 375 387Utility Plant Invest. Fee Summ 491 420 450 450Utility Connection 16 12 12 12Interest & Investment Earnings 2,254 380 511 385Miscellaneous Revenues 27 28 28 29Special Assessments 4 20 5 5
$ 14,884 $ 13,541 $ 14,099 $ 14,387
Stormwater/Flood Mgmt UtilityUtility Service Charges $ 4,589 $ 4,654 $ 4,663 $ 4,813Recommended Rate Increase 0 0 140 144Utility Plant Invest. Fee Summ 498 500 500 500Urban Drng & Fld Contr Dist 860 485 500 500Colorado Dept of Transportation Funds 0 0 1,529 0State and Federal Grants 10 0 0 0Interest & Investment Earnings 404 225 240 137Misc. Intergovernmental Chg. 126 109 124 127Miscellaneous Revenues 50 17 31 31
$ 6,537 $ 5,990 $ 7,727 $ 6,252
Downtown Commercial DistrictProperty & Spec Ownership Tx $ 922 $ 960 $ 988 $ 1,018Parking Charges 3,443 3,381 3,846 3,846Interest & Investment Earnings 51 47 42 18Leases, Rents & Royalties 210 421 366 366Miscellaneous Revenues 57 42 19 19Transfers In 1,241 1,271 1,942 1,94210th & Walnut Bonds and Revenue 1,186 1,080 1,151 1,186
$ 7,110 $ 7,202 $ 8,354 $ 8,395
University Hill Commercial DistrictProperty & Spec Ownership Tx $ 25 $ 28 $ 29 $ 28Parking Charges 150 161 231 324Interest & Investment Earnings 30 23 34 21Transfers In 175 175 258 175
$ 380 $ 387 $ 552 $ 548
Telecommunications Charges to Departments $ 581 $ 571 $ 584 $ 591Interest & Investment Earnings 54 32 27 10Miscellaneous Revenues 120 139 144 143
$ 755 $ 742 $ 755 $ 744
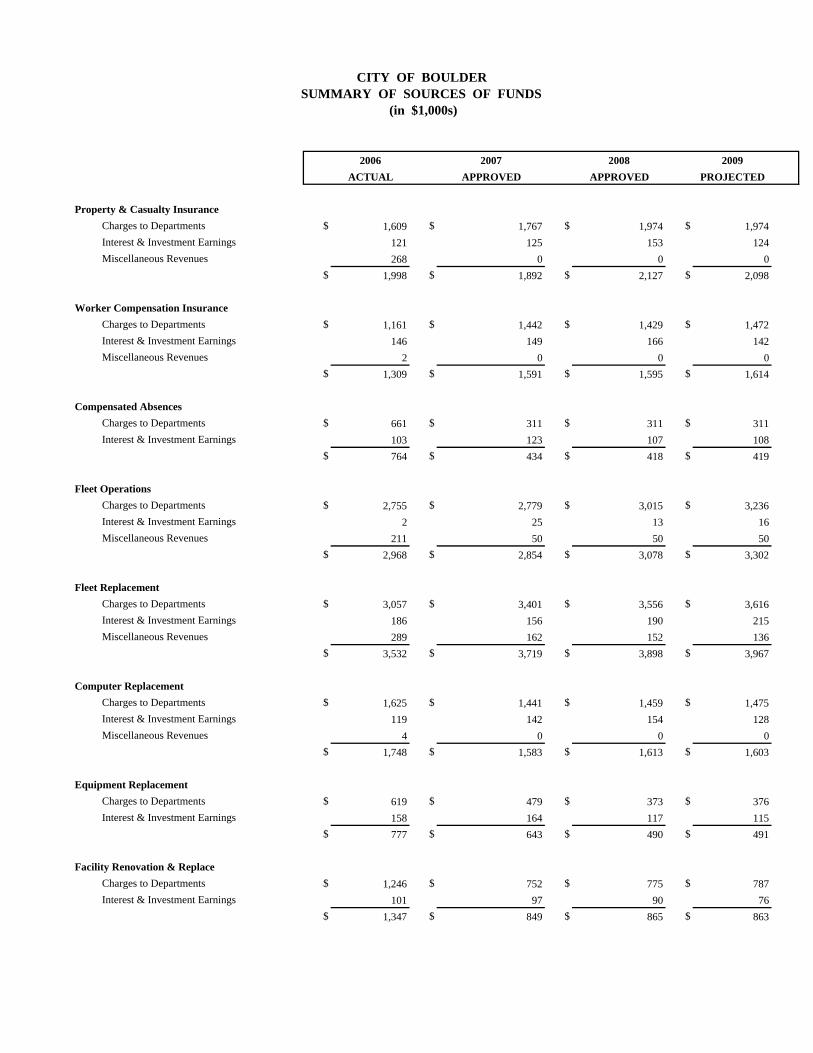
2006 2007 2008 2009ACTUAL APPROVED APPROVED PROJECTED
CITY OF BOULDER SUMMARY OF SOURCES OF FUNDS
(in $1,000s)
Property & Casualty InsuranceCharges to Departments $ 1,609 $ 1,767 $ 1,974 $ 1,974Interest & Investment Earnings 121 125 153 124Miscellaneous Revenues 268 0 0 0
$ 1,998 $ 1,892 $ 2,127 $ 2,098
Worker Compensation InsuranceCharges to Departments $ 1,161 $ 1,442 $ 1,429 $ 1,472Interest & Investment Earnings 146 149 166 142Miscellaneous Revenues 2 0 0 0
$ 1,309 $ 1,591 $ 1,595 $ 1,614
Compensated AbsencesCharges to Departments $ 661 $ 311 $ 311 $ 311Interest & Investment Earnings 103 123 107 108
$ 764 $ 434 $ 418 $ 419
Fleet OperationsCharges to Departments $ 2,755 $ 2,779 $ 3,015 $ 3,236Interest & Investment Earnings 2 25 13 16Miscellaneous Revenues 211 50 50 50
$ 2,968 $ 2,854 $ 3,078 $ 3,302
Fleet ReplacementCharges to Departments $ 3,057 $ 3,401 $ 3,556 $ 3,616Interest & Investment Earnings 186 156 190 215Miscellaneous Revenues 289 162 152 136
$ 3,532 $ 3,719 $ 3,898 $ 3,967
Computer ReplacementCharges to Departments $ 1,625 $ 1,441 $ 1,459 $ 1,475Interest & Investment Earnings 119 142 154 128Miscellaneous Revenues 4 0 0 0
$ 1,748 $ 1,583 $ 1,613 $ 1,603
Equipment ReplacementCharges to Departments $ 619 $ 479 $ 373 $ 376Interest & Investment Earnings 158 164 117 115
$ 777 $ 643 $ 490 $ 491
Facility Renovation & ReplaceCharges to Departments $ 1,246 $ 752 $ 775 $ 787Interest & Investment Earnings 101 97 90 76
$ 1,347 $ 849 $ 865 $ 863
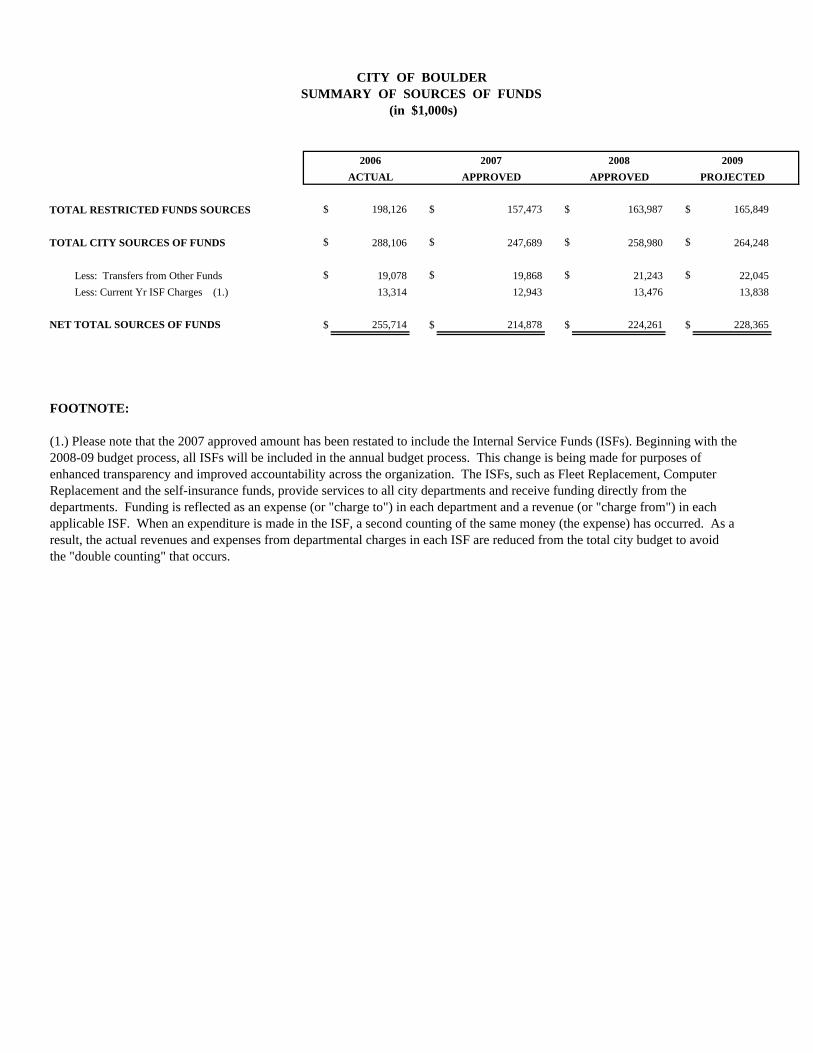
2006 2007 2008 2009ACTUAL APPROVED APPROVED PROJECTED
CITY OF BOULDER SUMMARY OF SOURCES OF FUNDS
(in $1,000s)
TOTAL RESTRICTED FUNDS SOURCES $ 198,126 $ 157,473 $ 163,987 $ 165,849
TOTAL CITY SOURCES OF FUNDS $ 288,106 $ 247,689 $ 258,980 $ 264,248
Less: Transfers from Other Funds $ 19,078 $ 19,868 $ 21,243 $ 22,045Less: Current Yr ISF Charges (1.) 13,314 12,943 13,476 13,838
NET TOTAL SOURCES OF FUNDS $ 255,714 $ 214,878 $ 224,261 $ 228,365
FOOTNOTE:
(1.) Please note that the 2007 approved amount has been restated to include the Internal Service Funds (ISFs). Beginning with the2008-09 budget process, all ISFs will be included in the annual budget process. This change is being made for purposes ofenhanced transparency and improved accountability across the organization. The ISFs, such as Fleet Replacement, ComputerReplacement and the self-insurance funds, provide services to all city departments and receive funding directly from thedepartments. Funding is reflected as an expense (or "charge to") in each department and a revenue (or "charge from") in eachapplicable ISF. When an expenditure is made in the ISF, a second counting of the same money (the expense) has occurred. As aresult, the actual revenues and expenses from departmental charges in each ISF are reduced from the total city budget to avoidthe "double counting" that occurs.
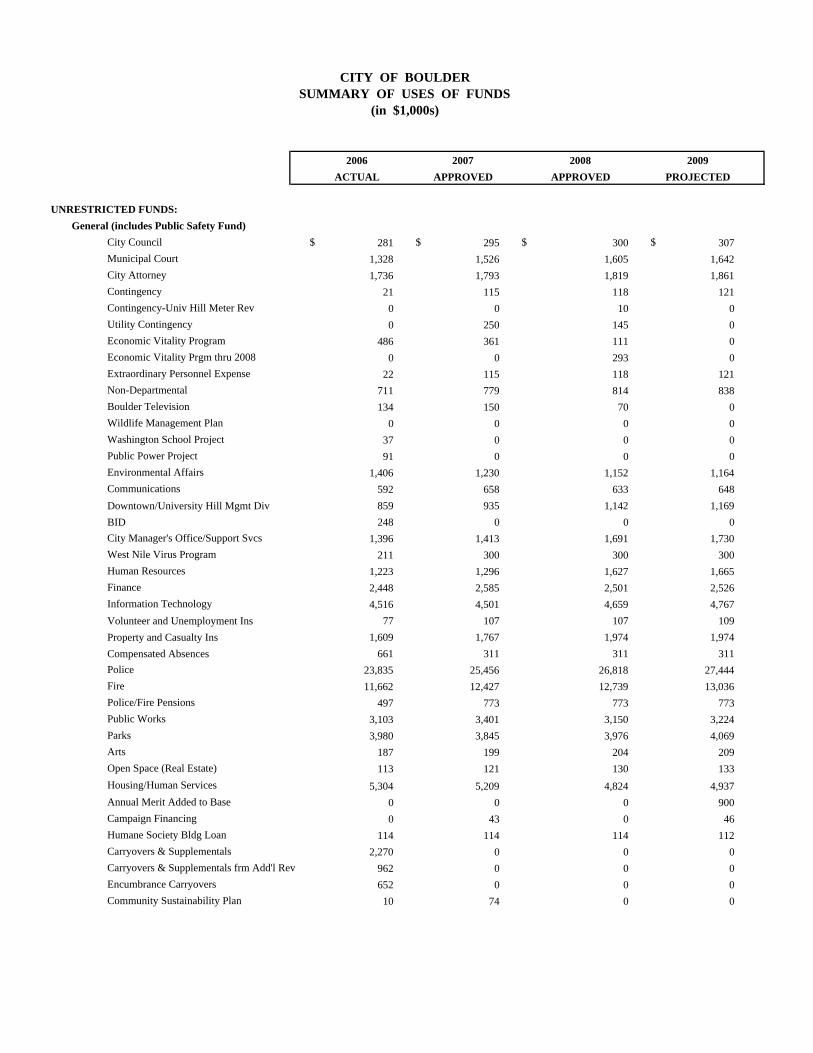
2006 2007 2008 2009ACTUAL APPROVED APPROVED PROJECTED
UNRESTRICTED FUNDS:General (includes Public Safety Fund)
City Council $ 281 $ 295 $ 300 $ 307Municipal Court 1,328 1,526 1,605 1,642City Attorney 1,736 1,793 1,819 1,861Contingency 21 115 118 121Contingency-Univ Hill Meter Rev 0 0 10 0Utility Contingency 0 250 145 0Economic Vitality Program 486 361 111 0Economic Vitality Prgm thru 2008 0 0 293 0Extraordinary Personnel Expense 22 115 118 121Non-Departmental 711 779 814 838Boulder Television 134 150 70 0Wildlife Management Plan 0 0 0 0Washington School Project 37 0 0 0Public Power Project 91 0 0 0Environmental Affairs 1,406 1,230 1,152 1,164Communications 592 658 633 648Downtown/University Hill Mgmt Div 859 935 1,142 1,169BID 248 0 0 0City Manager's Office/Support Svcs 1,396 1,413 1,691 1,730West Nile Virus Program 211 300 300 300Human Resources 1,223 1,296 1,627 1,665Finance 2,448 2,585 2,501 2,526Information Technology 4,516 4,501 4,659 4,767Volunteer and Unemployment Ins 77 107 107 109Property and Casualty Ins 1,609 1,767 1,974 1,974Compensated Absences 661 311 311 311Police 23,835 25,456 26,818 27,444Fire 11,662 12,427 12,739 13,036Police/Fire Pensions 497 773 773 773Public Works 3,103 3,401 3,150 3,224Parks 3,980 3,845 3,976 4,069Arts 187 199 204 209Open Space (Real Estate) 113 121 130 133Housing/Human Services 5,304 5,209 4,824 4,937Annual Merit Added to Base 0 0 0 900Campaign Financing 0 43 0 46Humane Society Bldg Loan 114 114 114 112Carryovers & Supplementals 2,270 0 0 0Carryovers & Supplementals frm Add'l Rev 962 0 0 0Encumbrance Carryovers 652 0 0 0Community Sustainability Plan 10 74 0 0
CITY OF BOULDER SUMMARY OF USES OF FUNDS
(in $1,000s)
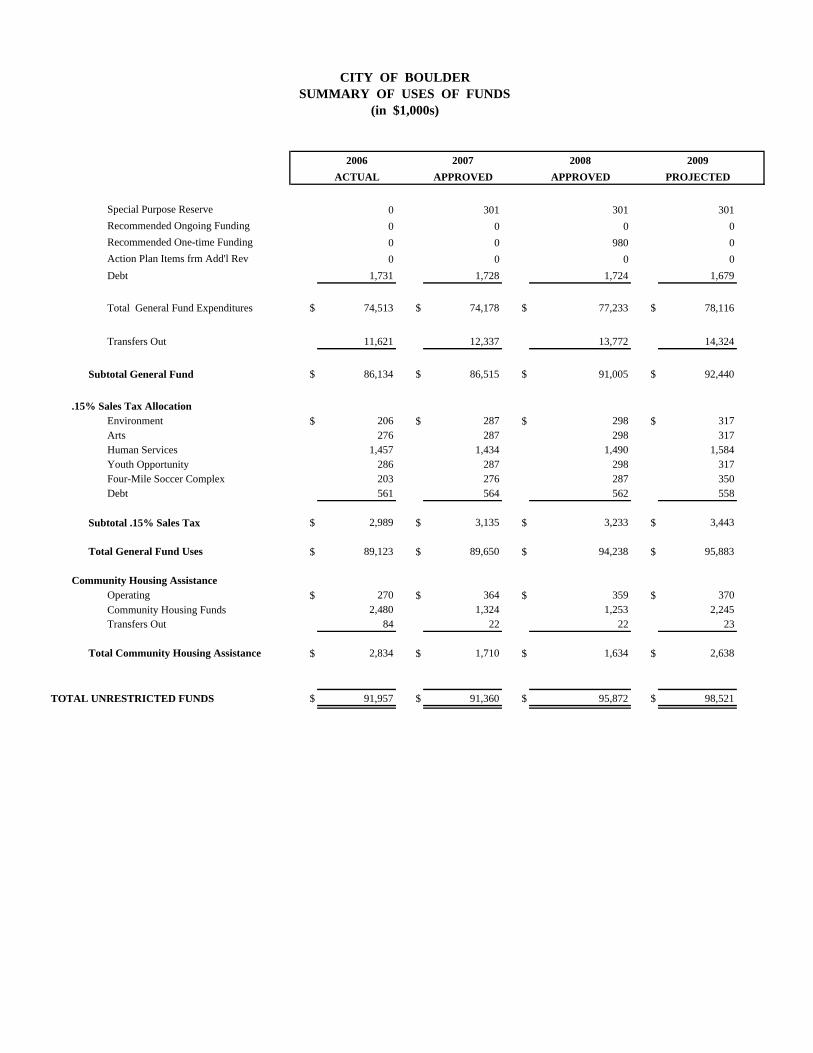
2006 2007 2008 2009ACTUAL APPROVED APPROVED PROJECTED
CITY OF BOULDER SUMMARY OF USES OF FUNDS
(in $1,000s)
Special Purpose Reserve 0 301 301 301Recommended Ongoing Funding 0 0 0 0Recommended One-time Funding 0 0 980 0Action Plan Items frm Add'l Rev 0 0 0 0Debt 1,731 1,728 1,724 1,679
Total General Fund Expenditures $ 74,513 $ 74,178 $ 77,233 $ 78,116
Transfers Out 11,621 12,337 13,772 14,324
Subtotal General Fund $ 86,134 $ 86,515 $ 91,005 $ 92,440
.15% Sales Tax AllocationEnvironment $ 206 $ 287 $ 298 $ 317Arts 276 287 298 317Human Services 1,457 1,434 1,490 1,584Youth Opportunity 286 287 298 317Four-Mile Soccer Complex 203 276 287 350Debt 561 564 562 558
Subtotal .15% Sales Tax $ 2,989 $ 3,135 $ 3,233 $ 3,443
Total General Fund Uses $ 89,123 $ 89,650 $ 94,238 $ 95,883
Community Housing AssistanceOperating $ 270 $ 364 $ 359 $ 370Community Housing Funds 2,480 1,324 1,253 2,245Transfers Out 84 22 22 23
Total Community Housing Assistance $ 2,834 $ 1,710 $ 1,634 $ 2,638
TOTAL UNRESTRICTED FUNDS $ 91,957 $ 91,360 $ 95,872 $ 98,521
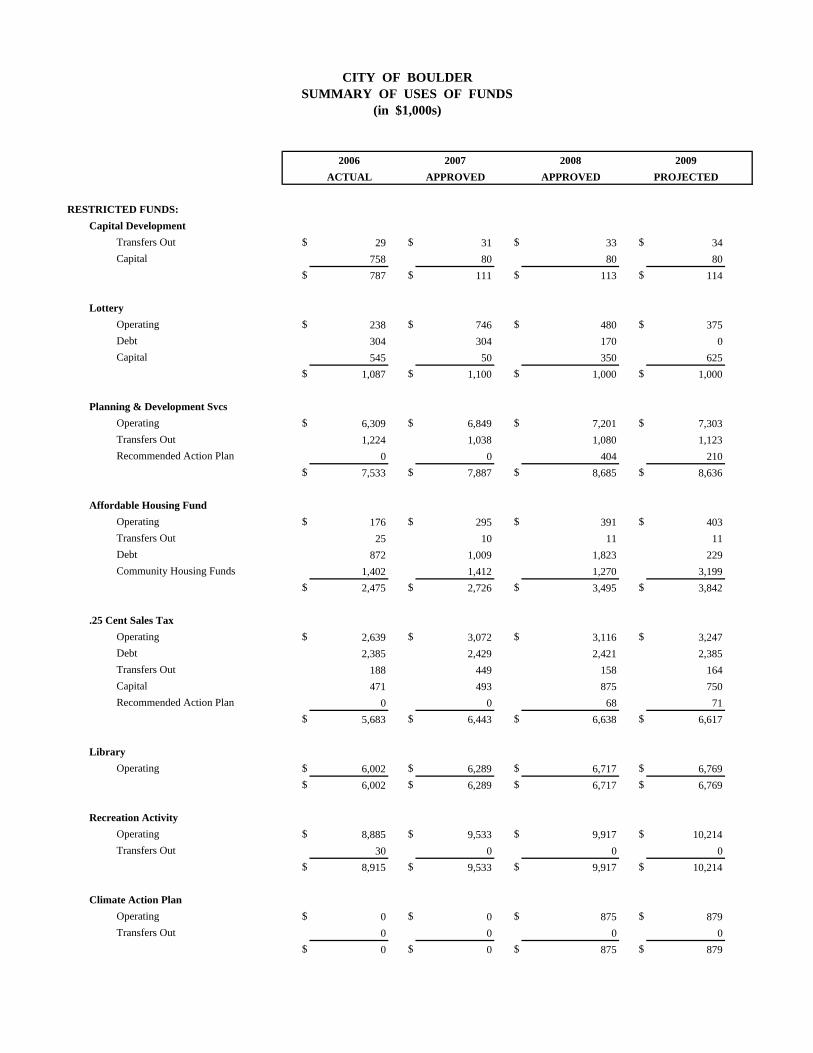
2006 2007 2008 2009ACTUAL APPROVED APPROVED PROJECTED
RESTRICTED FUNDS:Capital Development
Transfers Out $ 29 $ 31 $ 33 $ 34Capital 758 80 80 80
$ 787 $ 111 $ 113 $ 114
LotteryOperating $ 238 $ 746 $ 480 $ 375Debt 304 304 170 0Capital 545 50 350 625
$ 1,087 $ 1,100 $ 1,000 $ 1,000
Planning & Development SvcsOperating $ 6,309 $ 6,849 $ 7,201 $ 7,303Transfers Out 1,224 1,038 1,080 1,123Recommended Action Plan 0 0 404 210
$ 7,533 $ 7,887 $ 8,685 $ 8,636
Affordable Housing FundOperating $ 176 $ 295 $ 391 $ 403Transfers Out 25 10 11 11Debt 872 1,009 1,823 229Community Housing Funds 1,402 1,412 1,270 3,199
$ 2,475 $ 2,726 $ 3,495 $ 3,842
.25 Cent Sales TaxOperating $ 2,639 $ 3,072 $ 3,116 $ 3,247Debt 2,385 2,429 2,421 2,385Transfers Out 188 449 158 164Capital 471 493 875 750Recommended Action Plan 0 0 68 71
$ 5,683 $ 6,443 $ 6,638 $ 6,617
LibraryOperating $ 6,002 $ 6,289 $ 6,717 $ 6,769
$ 6,002 $ 6,289 $ 6,717 $ 6,769
Recreation ActivityOperating $ 8,885 $ 9,533 $ 9,917 $ 10,214Transfers Out 30 0 0 0
$ 8,915 $ 9,533 $ 9,917 $ 10,214
Climate Action PlanOperating $ 0 $ 0 $ 875 $ 879Transfers Out 0 0 0 0
$ 0 $ 0 $ 875 $ 879
CITY OF BOULDER SUMMARY OF USES OF FUNDS
(in $1,000s)
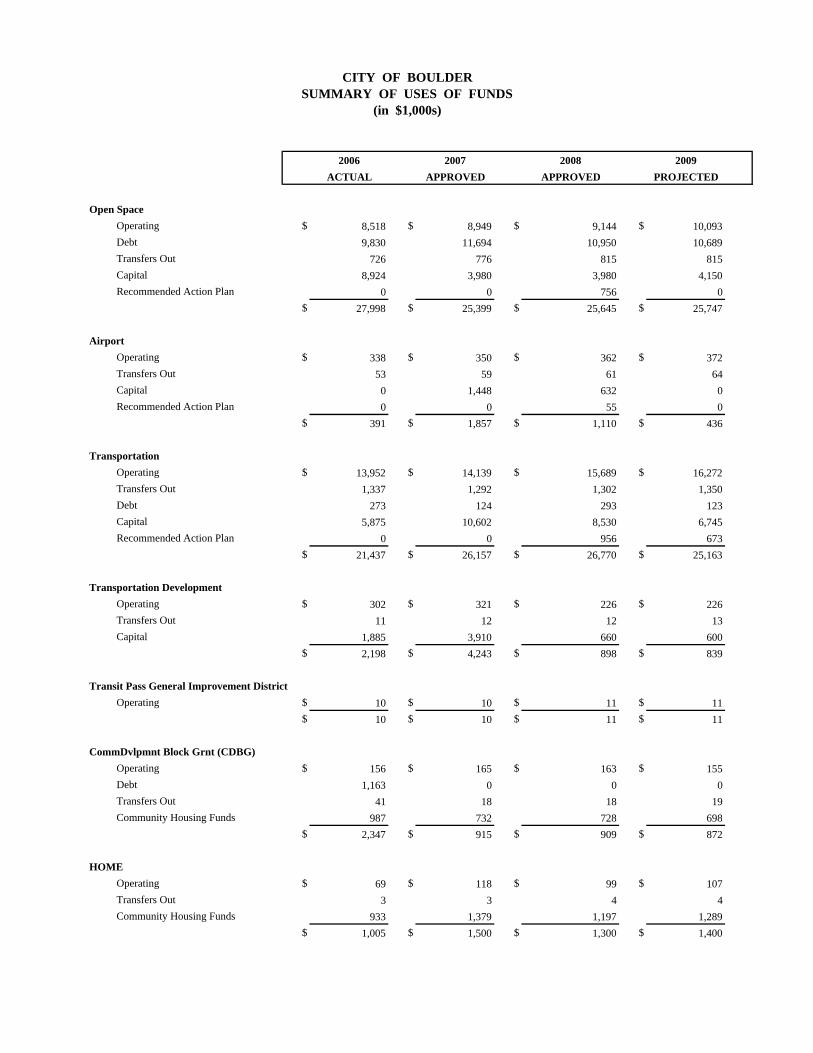
2006 2007 2008 2009ACTUAL APPROVED APPROVED PROJECTED
CITY OF BOULDER SUMMARY OF USES OF FUNDS
(in $1,000s)
Open SpaceOperating $ 8,518 $ 8,949 $ 9,144 $ 10,093Debt 9,830 11,694 10,950 10,689Transfers Out 726 776 815 815Capital 8,924 3,980 3,980 4,150Recommended Action Plan 0 0 756 0
$ 27,998 $ 25,399 $ 25,645 $ 25,747
AirportOperating $ 338 $ 350 $ 362 $ 372Transfers Out 53 59 61 64Capital 0 1,448 632 0Recommended Action Plan 0 0 55 0
$ 391 $ 1,857 $ 1,110 $ 436
TransportationOperating $ 13,952 $ 14,139 $ 15,689 $ 16,272Transfers Out 1,337 1,292 1,302 1,350Debt 273 124 293 123Capital 5,875 10,602 8,530 6,745Recommended Action Plan 0 0 956 673
$ 21,437 $ 26,157 $ 26,770 $ 25,163
Transportation DevelopmentOperating $ 302 $ 321 $ 226 $ 226Transfers Out 11 12 12 13Capital 1,885 3,910 660 600
$ 2,198 $ 4,243 $ 898 $ 839
Transit Pass General Improvement DistrictOperating $ 10 $ 10 $ 11 $ 11
$ 10 $ 10 $ 11 $ 11
CommDvlpmnt Block Grnt (CDBG)Operating $ 156 $ 165 $ 163 $ 155Debt 1,163 0 0 0Transfers Out 41 18 18 19Community Housing Funds 987 732 728 698
$ 2,347 $ 915 $ 909 $ 872
HOMEOperating $ 69 $ 118 $ 99 $ 107Transfers Out 3 3 4 4Community Housing Funds 933 1,379 1,197 1,289
$ 1,005 $ 1,500 $ 1,300 $ 1,400
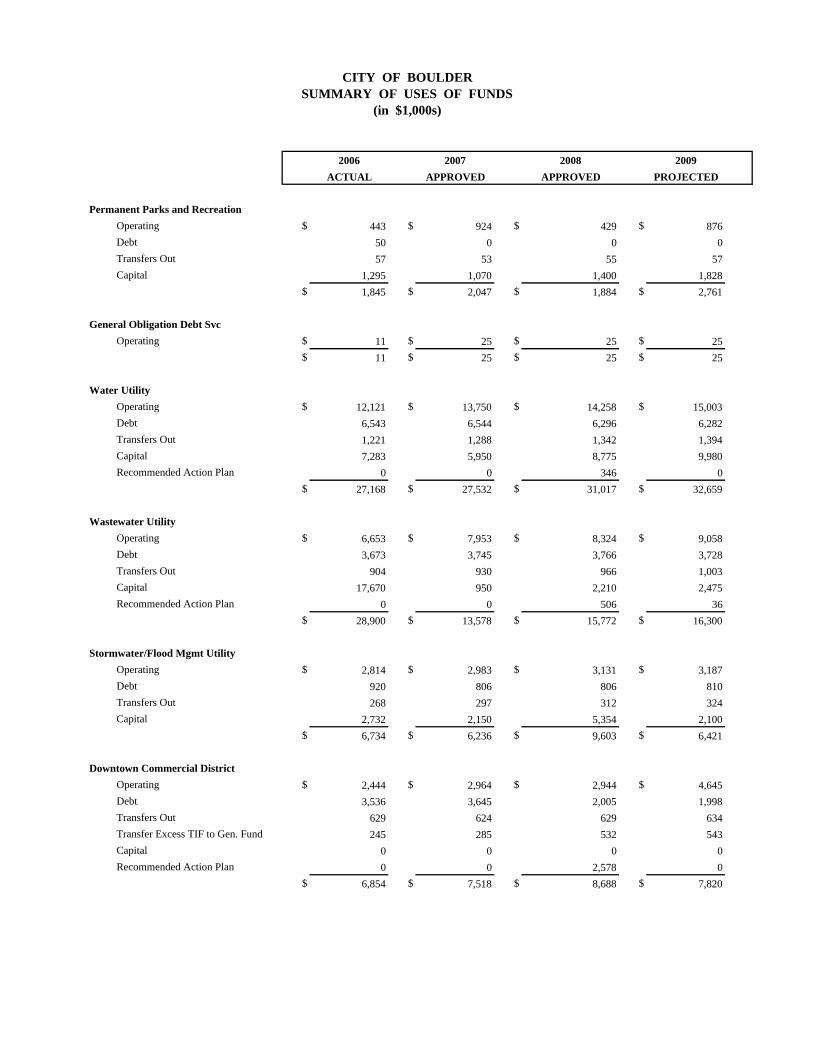
2006 2007 2008 2009ACTUAL APPROVED APPROVED PROJECTED
CITY OF BOULDER SUMMARY OF USES OF FUNDS
(in $1,000s)
Permanent Parks and RecreationOperating $ 443 $ 924 $ 429 $ 876Debt 50 0 0 0Transfers Out 57 53 55 57Capital 1,295 1,070 1,400 1,828
$ 1,845 $ 2,047 $ 1,884 $ 2,761
General Obligation Debt SvcOperating $ 11 $ 25 $ 25 $ 25
$ 11 $ 25 $ 25 $ 25
Water UtilityOperating $ 12,121 $ 13,750 $ 14,258 $ 15,003Debt 6,543 6,544 6,296 6,282Transfers Out 1,221 1,288 1,342 1,394Capital 7,283 5,950 8,775 9,980Recommended Action Plan 0 0 346 0
$ 27,168 $ 27,532 $ 31,017 $ 32,659
Wastewater UtilityOperating $ 6,653 $ 7,953 $ 8,324 $ 9,058Debt 3,673 3,745 3,766 3,728Transfers Out 904 930 966 1,003Capital 17,670 950 2,210 2,475Recommended Action Plan 0 0 506 36
$ 28,900 $ 13,578 $ 15,772 $ 16,300
Stormwater/Flood Mgmt UtilityOperating $ 2,814 $ 2,983 $ 3,131 $ 3,187Debt 920 806 806 810Transfers Out 268 297 312 324Capital 2,732 2,150 5,354 2,100
$ 6,734 $ 6,236 $ 9,603 $ 6,421
Downtown Commercial DistrictOperating $ 2,444 $ 2,964 $ 2,944 $ 4,645Debt 3,536 3,645 2,005 1,998Transfers Out 629 624 629 634Transfer Excess TIF to Gen. Fund 245 285 532 543Capital 0 0 0 0Recommended Action Plan 0 0 2,578 0
$ 6,854 $ 7,518 $ 8,688 $ 7,820
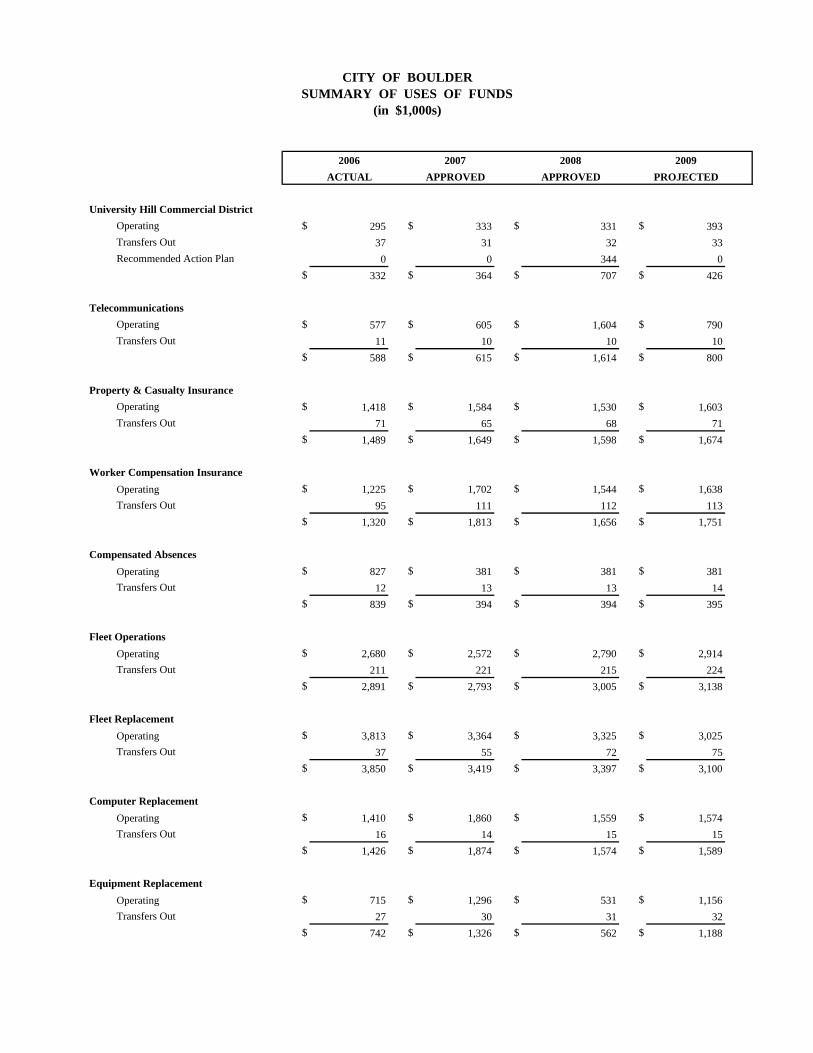
2006 2007 2008 2009ACTUAL APPROVED APPROVED PROJECTED
CITY OF BOULDER SUMMARY OF USES OF FUNDS
(in $1,000s)
University Hill Commercial DistrictOperating $ 295 $ 333 $ 331 $ 393Transfers Out 37 31 32 33Recommended Action Plan 0 0 344 0
$ 332 $ 364 $ 707 $ 426
TelecommunicationsOperating $ 577 $ 605 $ 1,604 $ 790Transfers Out 11 10 10 10
$ 588 $ 615 $ 1,614 $ 800
Property & Casualty InsuranceOperating $ 1,418 $ 1,584 $ 1,530 $ 1,603Transfers Out 71 65 68 71
$ 1,489 $ 1,649 $ 1,598 $ 1,674
Worker Compensation InsuranceOperating $ 1,225 $ 1,702 $ 1,544 $ 1,638Transfers Out 95 111 112 113
$ 1,320 $ 1,813 $ 1,656 $ 1,751
Compensated AbsencesOperating $ 827 $ 381 $ 381 $ 381Transfers Out 12 13 13 14
$ 839 $ 394 $ 394 $ 395
Fleet OperationsOperating $ 2,680 $ 2,572 $ 2,790 $ 2,914Transfers Out 211 221 215 224
$ 2,891 $ 2,793 $ 3,005 $ 3,138
Fleet ReplacementOperating $ 3,813 $ 3,364 $ 3,325 $ 3,025Transfers Out 37 55 72 75
$ 3,850 $ 3,419 $ 3,397 $ 3,100
Computer ReplacementOperating $ 1,410 $ 1,860 $ 1,559 $ 1,574Transfers Out 16 14 15 15
$ 1,426 $ 1,874 $ 1,574 $ 1,589
Equipment ReplacementOperating $ 715 $ 1,296 $ 531 $ 1,156Transfers Out 27 30 31 32
$ 742 $ 1,326 $ 562 $ 1,188
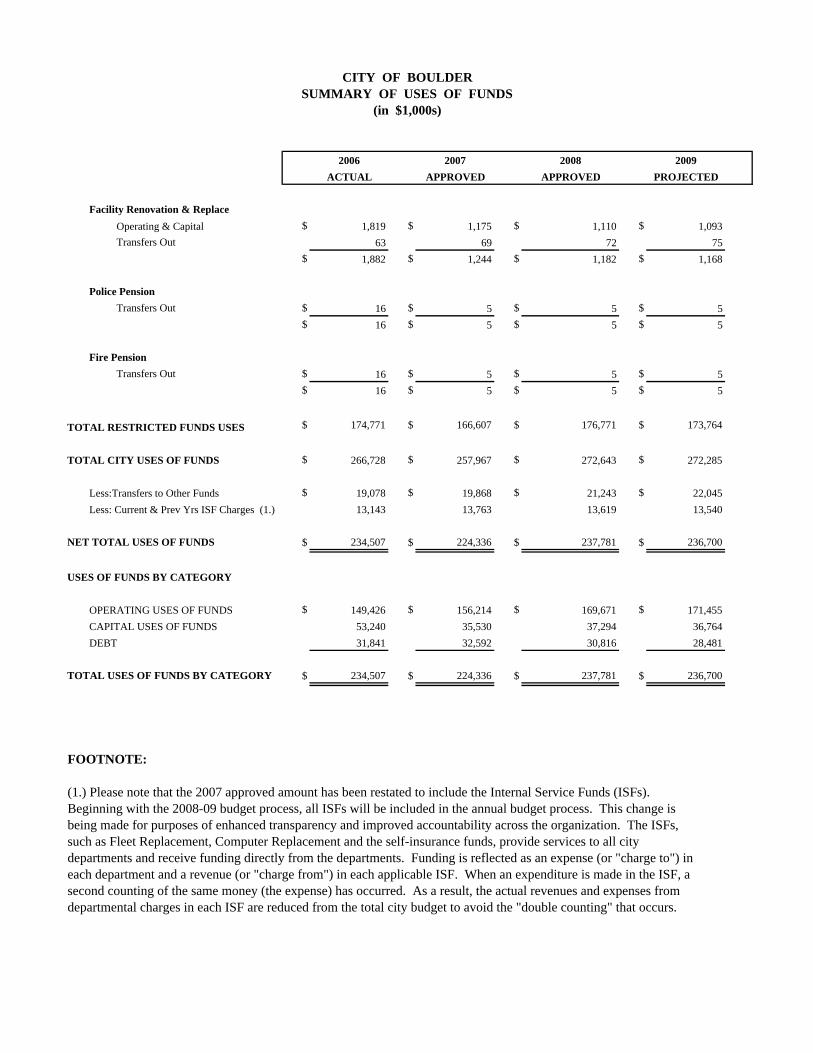
2006 2007 2008 2009ACTUAL APPROVED APPROVED PROJECTED
CITY OF BOULDER SUMMARY OF USES OF FUNDS
(in $1,000s)
Facility Renovation & ReplaceOperating & Capital $ 1,819 $ 1,175 $ 1,110 $ 1,093Transfers Out 63 69 72 75
$ 1,882 $ 1,244 $ 1,182 $ 1,168
Police PensionTransfers Out $ 16 $ 5 $ 5 $ 5
$ 16 $ 5 $ 5 $ 5
Fire PensionTransfers Out $ 16 $ 5 $ 5 $ 5
$ 16 $ 5 $ 5 $ 5
TOTAL RESTRICTED FUNDS USES $ 174,771 $ 166,607 $ 176,771 $ 173,764
TOTAL CITY USES OF FUNDS $ 266,728 $ 257,967 $ 272,643 $ 272,285
Less:Transfers to Other Funds $ 19,078 $ 19,868 $ 21,243 $ 22,045Less: Current & Prev Yrs ISF Charges (1.) 13,143 13,763 13,619 13,540
NET TOTAL USES OF FUNDS $ 234,507 $ 224,336 $ 237,781 $ 236,700
USES OF FUNDS BY CATEGORY
OPERATING USES OF FUNDS $ 149,426 $ 156,214 $ 169,671 $ 171,455CAPITAL USES OF FUNDS 53,240 35,530 37,294 36,764DEBT 31,841 32,592 30,816 28,481
TOTAL USES OF FUNDS BY CATEGORY $ 234,507 $ 224,336 $ 237,781 $ 236,700
FOOTNOTE:
(1.) Please note that the 2007 approved amount has been restated to include the Internal Service Funds (ISFs). Beginning with the 2008-09 budget process, all ISFs will be included in the annual budget process. This change isbeing made for purposes of enhanced transparency and improved accountability across the organization. The ISFs,such as Fleet Replacement, Computer Replacement and the self-insurance funds, provide services to all citydepartments and receive funding directly from the departments. Funding is reflected as an expense (or "charge to") ineach department and a revenue (or "charge from") in each applicable ISF. When an expenditure is made in the ISF, asecond counting of the same money (the expense) has occurred. As a result, the actual revenues and expenses fromdepartmental charges in each ISF are reduced from the total city budget to avoid the "double counting" that occurs.
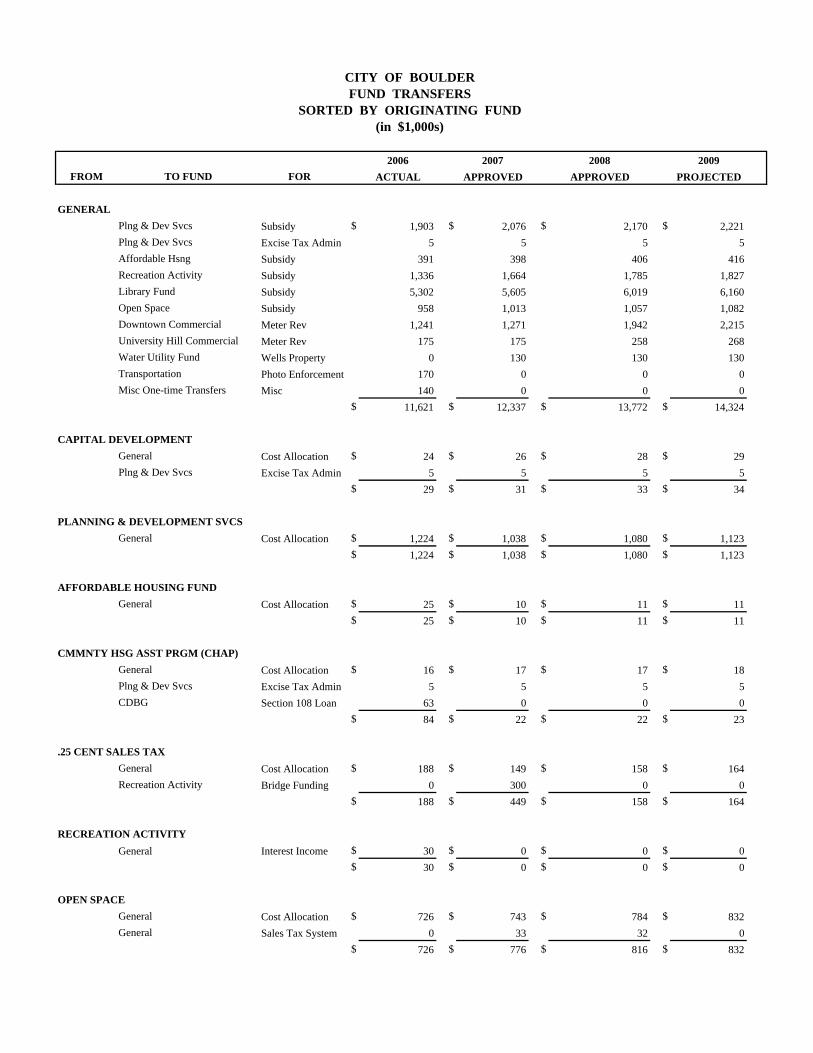
2006 2007 2008 2009FROM TO FUND FOR ACTUAL APPROVED APPROVED PROJECTED
GENERALPlng & Dev Svcs Subsidy $ 1,903 $ 2,076 $ 2,170 $ 2,221Plng & Dev Svcs Excise Tax Admin 5 5 5 5Affordable Hsng Subsidy 391 398 406 416Recreation Activity Subsidy 1,336 1,664 1,785 1,827Library Fund Subsidy 5,302 5,605 6,019 6,160Open Space Subsidy 958 1,013 1,057 1,082Downtown Commercial Meter Rev 1,241 1,271 1,942 2,215University Hill Commercial Meter Rev 175 175 258 268Water Utility Fund Wells Property 0 130 130 130Transportation Photo Enforcement 170 0 0 0Misc One-time Transfers Misc 140 0 0 0
$ 11,621 $ 12,337 $ 13,772 $ 14,324
CAPITAL DEVELOPMENTGeneral Cost Allocation $ 24 $ 26 $ 28 $ 29Plng & Dev Svcs Excise Tax Admin 5 5 5 5
$ 29 $ 31 $ 33 $ 34
PLANNING & DEVELOPMENT SVCSGeneral Cost Allocation $ 1,224 $ 1,038 $ 1,080 $ 1,123
$ 1,224 $ 1,038 $ 1,080 $ 1,123
AFFORDABLE HOUSING FUNDGeneral Cost Allocation $ 25 $ 10 $ 11 $ 11
$ 25 $ 10 $ 11 $ 11
CMMNTY HSG ASST PRGM (CHAP)General Cost Allocation $ 16 $ 17 $ 17 $ 18Plng & Dev Svcs Excise Tax Admin 5 5 5 5CDBG Section 108 Loan 63 0 0 0
$ 84 $ 22 $ 22 $ 23
.25 CENT SALES TAXGeneral Cost Allocation $ 188 $ 149 $ 158 $ 164Recreation Activity Bridge Funding 0 300 0 0
$ 188 $ 449 $ 158 $ 164
RECREATION ACTIVITYGeneral Interest Income $ 30 $ 0 $ 0 $ 0
$ 30 $ 0 $ 0 $ 0
OPEN SPACEGeneral Cost Allocation $ 726 $ 743 $ 784 $ 832General Sales Tax System 0 33 32 0
$ 726 $ 776 $ 816 $ 832
CITY OF BOULDER FUND TRANSFERS
SORTED BY ORIGINATING FUND (in $1,000s)
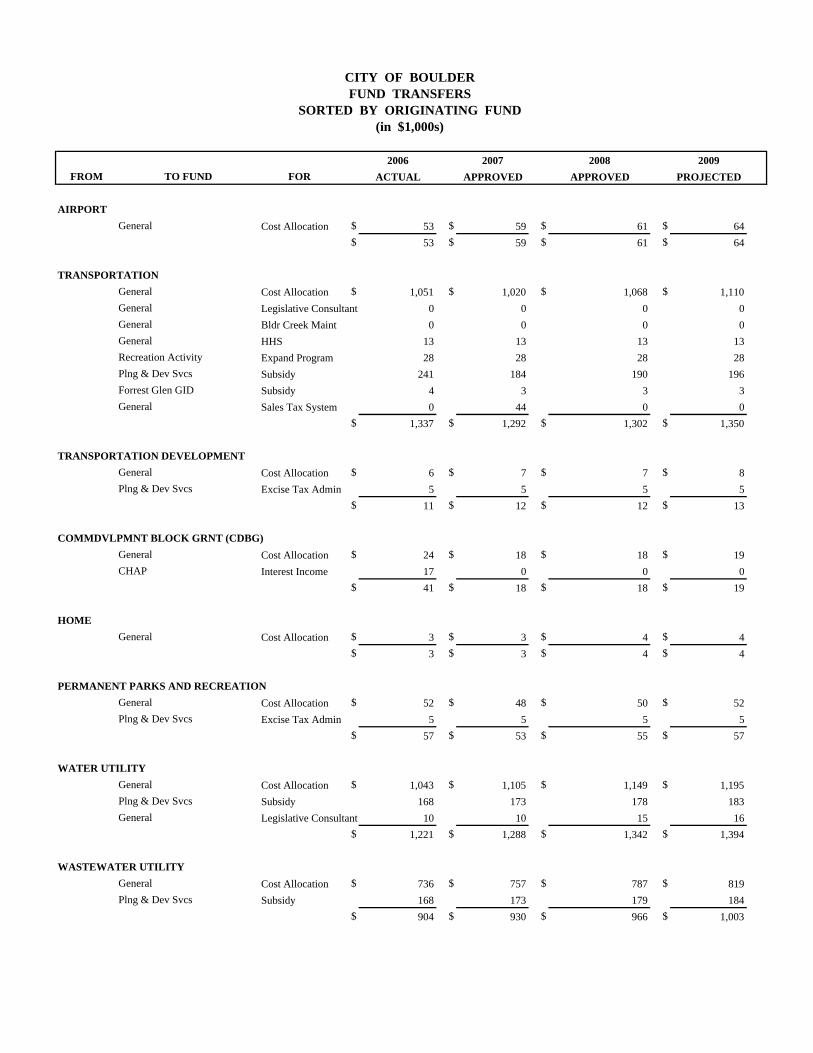
2006 2007 2008 2009FROM TO FUND FOR ACTUAL APPROVED APPROVED PROJECTED
CITY OF BOULDER FUND TRANSFERS
SORTED BY ORIGINATING FUND (in $1,000s)
AIRPORTGeneral Cost Allocation $ 53 $ 59 $ 61 $ 64
$ 53 $ 59 $ 61 $ 64
TRANSPORTATIONGeneral Cost Allocation $ 1,051 $ 1,020 $ 1,068 $ 1,110General Legislative Consultant 0 0 0 0General Bldr Creek Maint 0 0 0 0General HHS 13 13 13 13Recreation Activity Expand Program 28 28 28 28Plng & Dev Svcs Subsidy 241 184 190 196Forrest Glen GID Subsidy 4 3 3 3General Sales Tax System 0 44 0 0
$ 1,337 $ 1,292 $ 1,302 $ 1,350
TRANSPORTATION DEVELOPMENTGeneral Cost Allocation $ 6 $ 7 $ 7 $ 8Plng & Dev Svcs Excise Tax Admin 5 5 5 5
$ 11 $ 12 $ 12 $ 13
COMMDVLPMNT BLOCK GRNT (CDBG)General Cost Allocation $ 24 $ 18 $ 18 $ 19CHAP Interest Income 17 0 0 0
$ 41 $ 18 $ 18 $ 19
HOMEGeneral Cost Allocation $ 3 $ 3 $ 4 $ 4
$ 3 $ 3 $ 4 $ 4
PERMANENT PARKS AND RECREATIONGeneral Cost Allocation $ 52 $ 48 $ 50 $ 52Plng & Dev Svcs Excise Tax Admin 5 5 5 5
$ 57 $ 53 $ 55 $ 57
WATER UTILITYGeneral Cost Allocation $ 1,043 $ 1,105 $ 1,149 $ 1,195Plng & Dev Svcs Subsidy 168 173 178 183General Legislative Consultant 10 10 15 16
$ 1,221 $ 1,288 $ 1,342 $ 1,394
WASTEWATER UTILITYGeneral Cost Allocation $ 736 $ 757 $ 787 $ 819Plng & Dev Svcs Subsidy 168 173 179 184
$ 904 $ 930 $ 966 $ 1,003
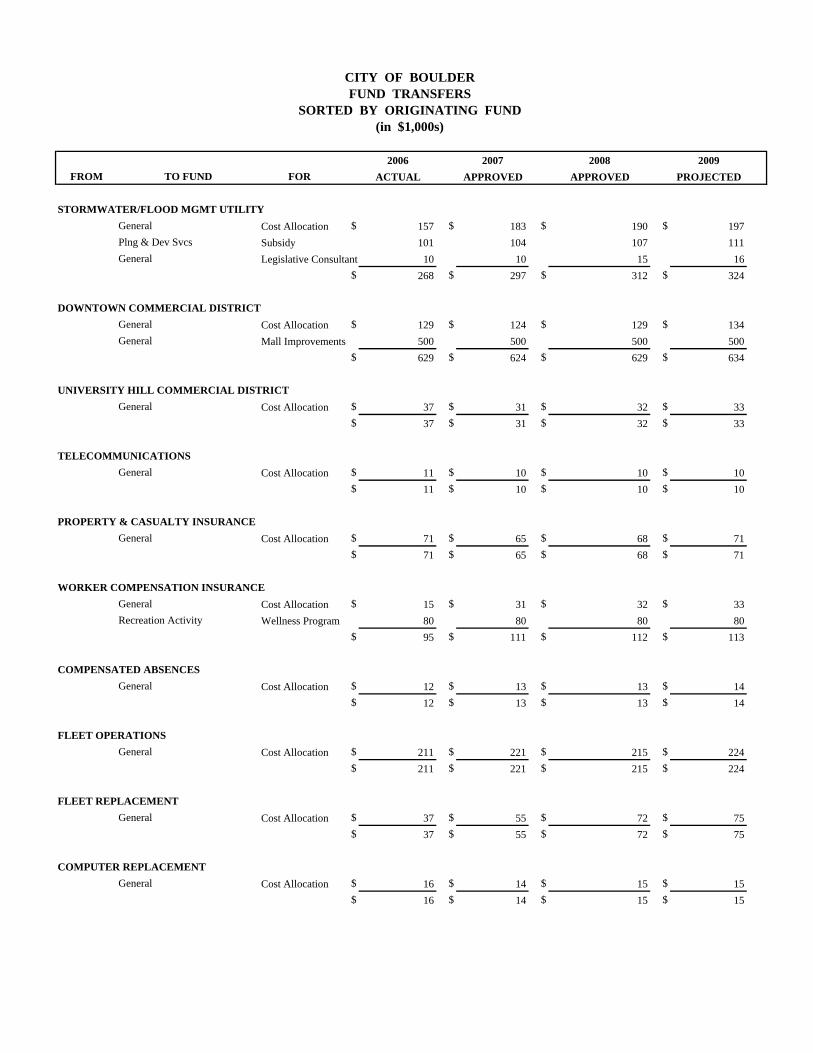
2006 2007 2008 2009FROM TO FUND FOR ACTUAL APPROVED APPROVED PROJECTED
CITY OF BOULDER FUND TRANSFERS
SORTED BY ORIGINATING FUND (in $1,000s)
STORMWATER/FLOOD MGMT UTILITYGeneral Cost Allocation $ 157 $ 183 $ 190 $ 197Plng & Dev Svcs Subsidy 101 104 107 111General Legislative Consultant 10 10 15 16
$ 268 $ 297 $ 312 $ 324
DOWNTOWN COMMERCIAL DISTRICTGeneral Cost Allocation $ 129 $ 124 $ 129 $ 134General Mall Improvements 500 500 500 500
$ 629 $ 624 $ 629 $ 634
UNIVERSITY HILL COMMERCIAL DISTRICTGeneral Cost Allocation $ 37 $ 31 $ 32 $ 33
$ 37 $ 31 $ 32 $ 33
TELECOMMUNICATIONSGeneral Cost Allocation $ 11 $ 10 $ 10 $ 10
$ 11 $ 10 $ 10 $ 10
PROPERTY & CASUALTY INSURANCEGeneral Cost Allocation $ 71 $ 65 $ 68 $ 71
$ 71 $ 65 $ 68 $ 71
WORKER COMPENSATION INSURANCEGeneral Cost Allocation $ 15 $ 31 $ 32 $ 33Recreation Activity Wellness Program 80 80 80 80
$ 95 $ 111 $ 112 $ 113
COMPENSATED ABSENCES General Cost Allocation $ 12 $ 13 $ 13 $ 14
$ 12 $ 13 $ 13 $ 14
FLEET OPERATIONSGeneral Cost Allocation $ 211 $ 221 $ 215 $ 224
$ 211 $ 221 $ 215 $ 224
FLEET REPLACEMENTGeneral Cost Allocation $ 37 $ 55 $ 72 $ 75
$ 37 $ 55 $ 72 $ 75
COMPUTER REPLACEMENTGeneral Cost Allocation $ 16 $ 14 $ 15 $ 15
$ 16 $ 14 $ 15 $ 15
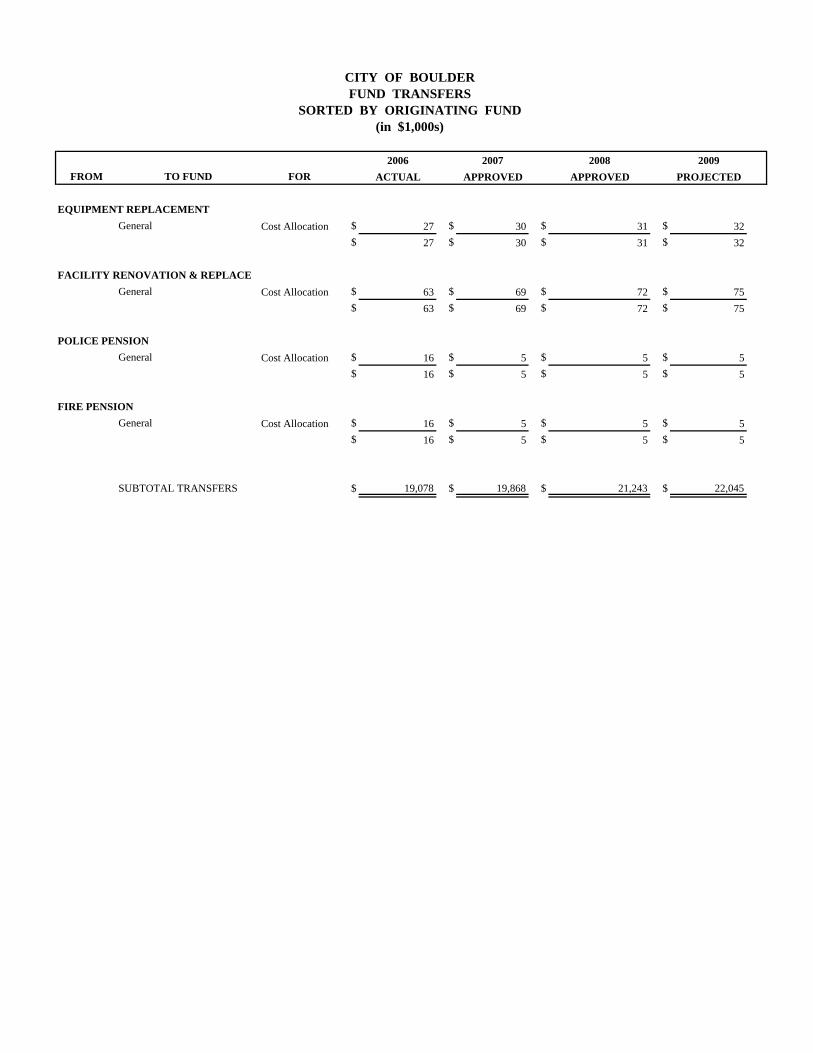
2006 2007 2008 2009FROM TO FUND FOR ACTUAL APPROVED APPROVED PROJECTED
CITY OF BOULDER FUND TRANSFERS
SORTED BY ORIGINATING FUND (in $1,000s)
EQUIPMENT REPLACEMENTGeneral Cost Allocation $ 27 $ 30 $ 31 $ 32
$ 27 $ 30 $ 31 $ 32
FACILITY RENOVATION & REPLACEGeneral Cost Allocation $ 63 $ 69 $ 72 $ 75
$ 63 $ 69 $ 72 $ 75
POLICE PENSIONGeneral Cost Allocation $ 16 $ 5 $ 5 $ 5
$ 16 $ 5 $ 5 $ 5
FIRE PENSIONGeneral Cost Allocation $ 16 $ 5 $ 5 $ 5
$ 16 $ 5 $ 5 $ 5
SUBTOTAL TRANSFERS $ 19,078 $ 19,868 $ 21,243 $ 22,045
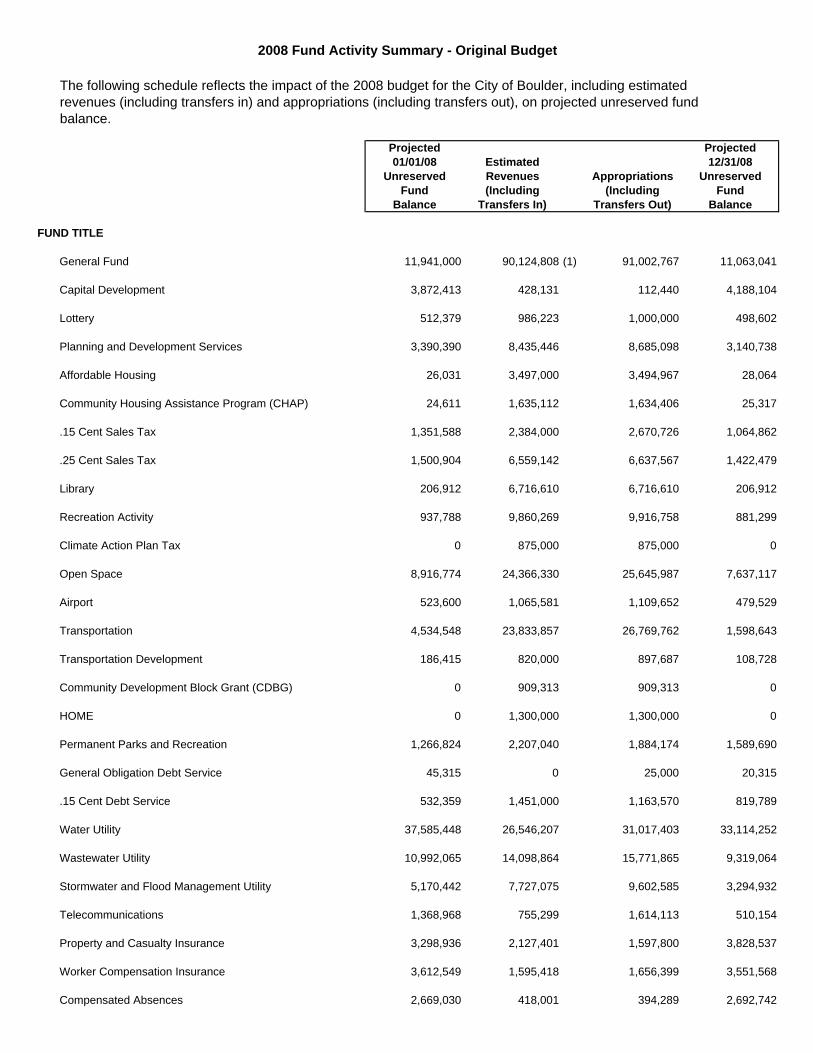
The following schedule reflects the impact of the 2008 budget for the City of Boulder, including estimatedrevenues (including transfers in) and appropriations (including transfers out), on projected unreserved fundbalance.
Projected Projected01/01/08 Estimated 12/31/08
Unreserved Revenues Appropriations UnreservedFund (Including (Including Fund
Balance Transfers In) Transfers Out) Balance
FUND TITLE
General Fund 11,941,000 90,124,808 (1) 91,002,767 11,063,041
Capital Development 3,872,413 428,131 112,440 4,188,104
Lottery 512,379 986,223 1,000,000 498,602
Planning and Development Services 3,390,390 8,435,446 8,685,098 3,140,738
Affordable Housing 26,031 3,497,000 3,494,967 28,064
Community Housing Assistance Program (CHAP) 24,611 1,635,112 1,634,406 25,317
.15 Cent Sales Tax 1,351,588 2,384,000 2,670,726 1,064,862
.25 Cent Sales Tax 1,500,904 6,559,142 6,637,567 1,422,479
Library 206,912 6,716,610 6,716,610 206,912
Recreation Activity 937,788 9,860,269 9,916,758 881,299
Climate Action Plan Tax 0 875,000 875,000 0
Open Space 8,916,774 24,366,330 25,645,987 7,637,117
Airport 523,600 1,065,581 1,109,652 479,529
Transportation 4,534,548 23,833,857 26,769,762 1,598,643
Transportation Development 186,415 820,000 897,687 108,728
Community Development Block Grant (CDBG) 0 909,313 909,313 0
HOME 0 1,300,000 1,300,000 0
Permanent Parks and Recreation 1,266,824 2,207,040 1,884,174 1,589,690
General Obligation Debt Service 45,315 0 25,000 20,315
.15 Cent Debt Service 532,359 1,451,000 1,163,570 819,789
Water Utility 37,585,448 26,546,207 31,017,403 33,114,252
Wastewater Utility 10,992,065 14,098,864 15,771,865 9,319,064
Stormwater and Flood Management Utility 5,170,442 7,727,075 9,602,585 3,294,932
Telecommunications 1,368,968 755,299 1,614,113 510,154
Property and Casualty Insurance 3,298,936 2,127,401 1,597,800 3,828,537
Worker Compensation Insurance 3,612,549 1,595,418 1,656,399 3,551,568
Compensated Absences 2,669,030 418,001 394,289 2,692,742
2008 Fund Activity Summary - Original Budget
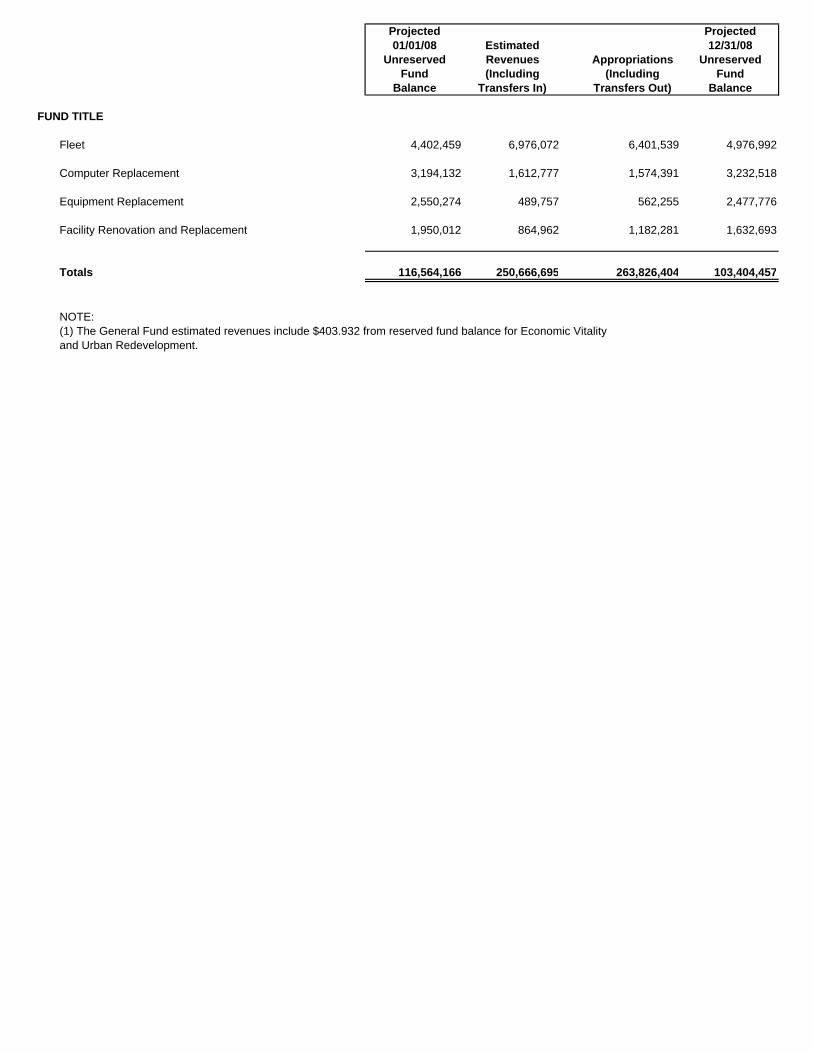
Projected Projected01/01/08 Estimated 12/31/08
Unreserved Revenues Appropriations UnreservedFund (Including (Including Fund
Balance Transfers In) Transfers Out) Balance
FUND TITLE
Fleet 4,402,459 6,976,072 6,401,539 4,976,992
Computer Replacement 3,194,132 1,612,777 1,574,391 3,232,518
Equipment Replacement 2,550,274 489,757 562,255 2,477,776
Facility Renovation and Replacement 1,950,012 864,962 1,182,281 1,632,693
Totals 116,564,166 250,666,695 263,826,404 103,404,457
NOTE:(1) The General Fund estimated revenues include $403.932 from reserved fund balance for Economic Vitalityand Urban Redevelopment.
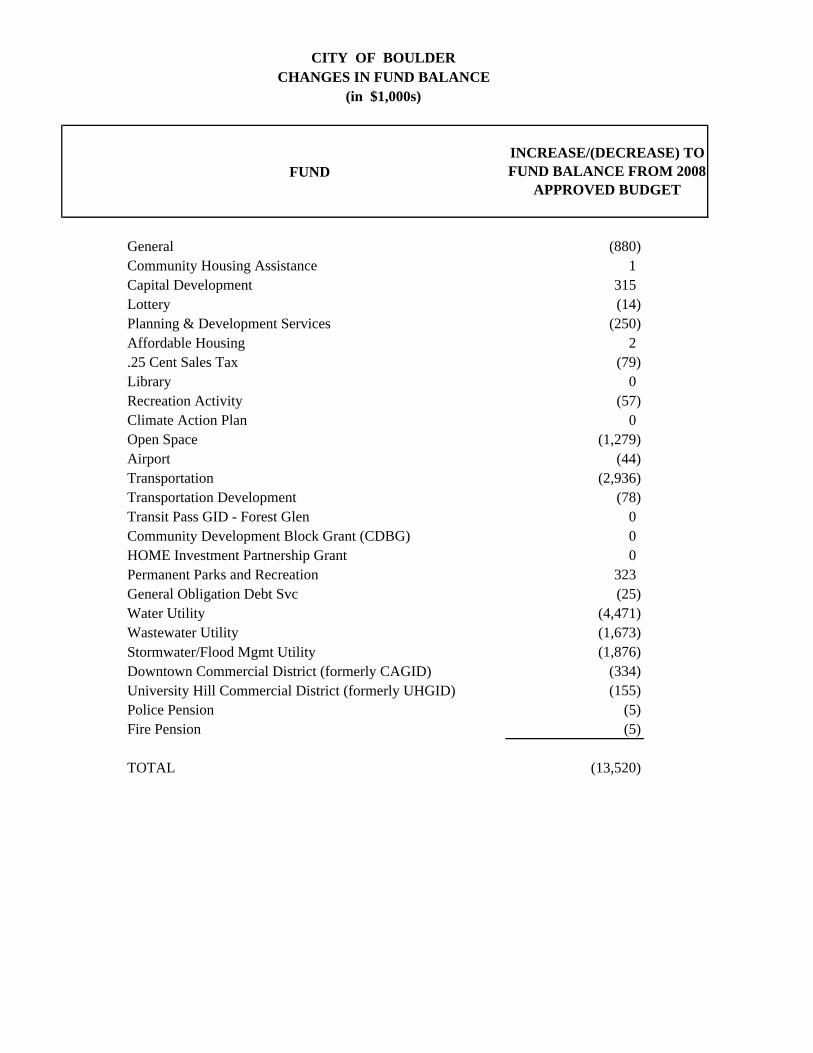
FUND
General (880)Community Housing Assistance 1Capital Development 315Lottery (14)Planning & Development Services (250)Affordable Housing 2.25 Cent Sales Tax (79)Library 0Recreation Activity (57)Climate Action Plan 0Open Space (1,279)Airport (44)Transportation (2,936)Transportation Development (78)Transit Pass GID - Forest Glen 0Community Development Block Grant (CDBG) 0HOME Investment Partnership Grant 0Permanent Parks and Recreation 323General Obligation Debt Svc (25)Water Utility (4,471)Wastewater Utility (1,673)Stormwater/Flood Mgmt Utility (1,876)Downtown Commercial District (formerly CAGID) (334)University Hill Commercial District (formerly UHGID) (155)Police Pension (5)Fire Pension (5)
TOTAL (13,520)
INCREASE/(DECREASE) TO FUND BALANCE FROM 2008
APPROVED BUDGET
CITY OF BOULDER CHANGES IN FUND BALANCE
(in $1,000s)
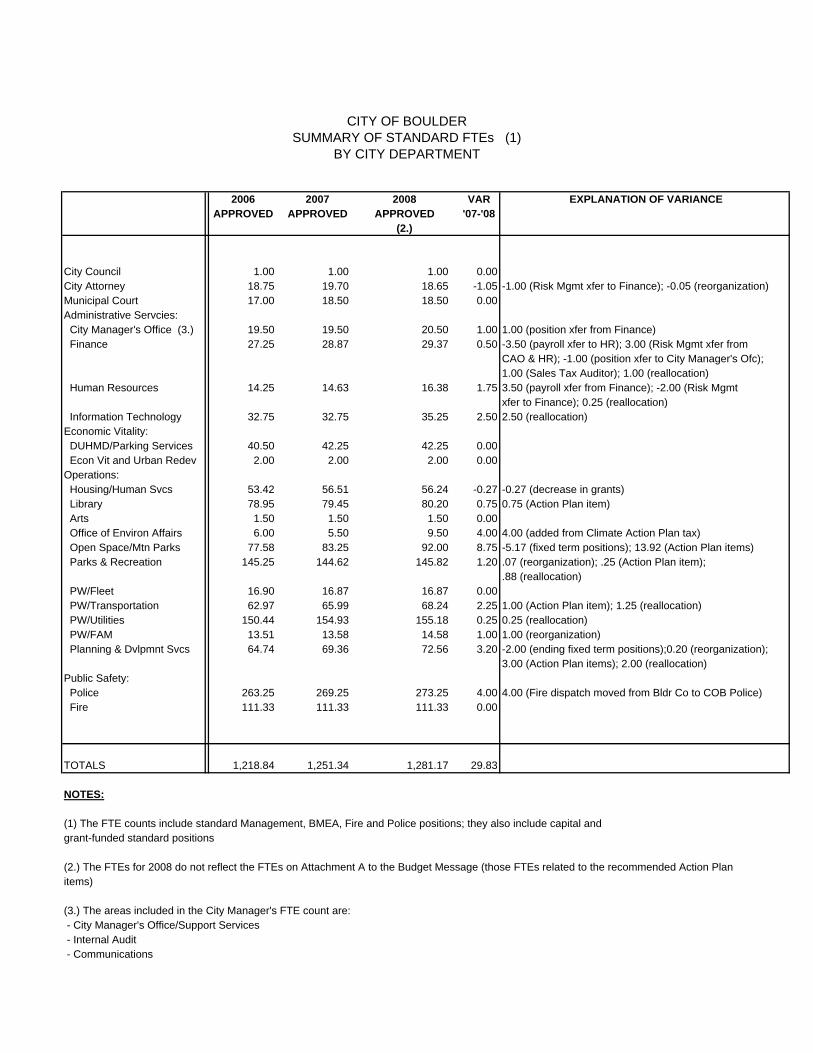
CITY OF BOULDERSUMMARY OF STANDARD FTEs (1)
BY CITY DEPARTMENT
2006 2007 2008 VAR EXPLANATION OF VARIANCEAPPROVED APPROVED APPROVED '07-'08
(2.)
City Council 1.00 1.00 1.00 0.00City Attorney 18.75 19.70 18.65 -1.05 -1.00 (Risk Mgmt xfer to Finance); -0.05 (reorganization)Municipal Court 17.00 18.50 18.50 0.00Administrative Servcies: City Manager's Office (3.) 19.50 19.50 20.50 1.00 1.00 (position xfer from Finance) Finance 27.25 28.87 29.37 0.50 -3.50 (payroll xfer to HR); 3.00 (Risk Mgmt xfer from
CAO & HR); -1.00 (position xfer to City Manager's Ofc);1.00 (Sales Tax Auditor); 1.00 (reallocation)
Human Resources 14.25 14.63 16.38 1.75 3.50 (payroll xfer from Finance); -2.00 (Risk Mgmtxfer to Finance); 0.25 (reallocation)
Information Technology 32.75 32.75 35.25 2.50 2.50 (reallocation)Economic Vitality: DUHMD/Parking Services 40.50 42.25 42.25 0.00 Econ Vit and Urban Redev 2.00 2.00 2.00 0.00Operations: Housing/Human Svcs 53.42 56.51 56.24 -0.27 -0.27 (decrease in grants) Library 78.95 79.45 80.20 0.75 0.75 (Action Plan item) Arts 1.50 1.50 1.50 0.00 Office of Environ Affairs 6.00 5.50 9.50 4.00 4.00 (added from Climate Action Plan tax) Open Space/Mtn Parks 77.58 83.25 92.00 8.75 -5.17 (fixed term positions); 13.92 (Action Plan items) Parks & Recreation 145.25 144.62 145.82 1.20 .07 (reorganization); .25 (Action Plan item);
.88 (reallocation) PW/Fleet 16.90 16.87 16.87 0.00 PW/Transportation 62.97 65.99 68.24 2.25 1.00 (Action Plan item); 1.25 (reallocation) PW/Utilities 150.44 154.93 155.18 0.25 0.25 (reallocation) PW/FAM 13.51 13.58 14.58 1.00 1.00 (reorganization) Planning & Dvlpmnt Svcs 64.74 69.36 72.56 3.20 -2.00 (ending fixed term positions);0.20 (reorganization);
3.00 (Action Plan items); 2.00 (reallocation)Public Safety: Police 263.25 269.25 273.25 4.00 4.00 (Fire dispatch moved from Bldr Co to COB Police) Fire 111.33 111.33 111.33 0.00
TOTALS 1,218.84 1,251.34 1,281.17 29.83
NOTES:
(1) The FTE counts include standard Management, BMEA, Fire and Police positions; they also include capital andgrant-funded standard positions
(2.) The FTEs for 2008 do not reflect the FTEs on Attachment A to the Budget Message (those FTEs related to the recommended Action Planitems)
(3.) The areas included in the City Manager's FTE count are: - City Manager's Office/Support Services - Internal Audit - Communications
DEBT POLICY AND ADMINISTRATION Debt Policy As stated in Section 7 of the Citywide Financial and Management Policies, debt shall be considered only for capital purchases/projects and the term of the debt shall not exceed the useful life of the financed asset. Municipal bonds, Interfund loans, equipment leases (with the exception of vehicles) and sale/leaseback agreements are approved methods for financing capital projects. Debt Administration At December 31, 2007, the City had a number of debt issues outstanding made up of (amounts in 000's):
$ 88,185 General Obligation Bonds Payable (Includes $20,431 of General Improvement District Bonds which are a debt of the Central Area General Improvement District)
110,603 Revenue Bonds Payable 2,065 Certificates of Participation (which are a debt of the Boulder Municipal Property
Authority)
In addition, there were $16,878,000 of Lease Purchase Revenue Notes Payable and $1,560,000 payable under a Revolving Credit Facility Agreement outstanding at December 31, 2007. The Combined Schedule of Long-Term Debt Payable and the current debt schedules by fund for 2008-2013 present more detailed information about the debt position of the city. The city's general obligation credit rating has been established as Aa1 by Moody's Investors Service and AA+ by Standard & Poor's. The city’s revenue bond credit rating has been established as Aa2 by Moody’s Investors Service and AA+ by Standard and Poors. The primary reasons for these high rating levels are the general strength and diversity of the Boulder economy anchored by a major university; above average income indicators; strong financial performance and reserve policies; and affordable debt levels. Under the City Charter, the city's general obligation bonded debt issuances are subject to a legal limitation based on 3% of total assessed value of real and personal property. None of the city's outstanding debt is supported by property taxes. As a result, all bonded debt is considered to be self-supporting and the ratio of net bonded debt to assessed valuation is zero. The actual calculation of the debt margin is presented in the Computation of Legal Debt Margin schedule. As of November 30, 2007, the City does not anticipate issuing additional debt in 2008.
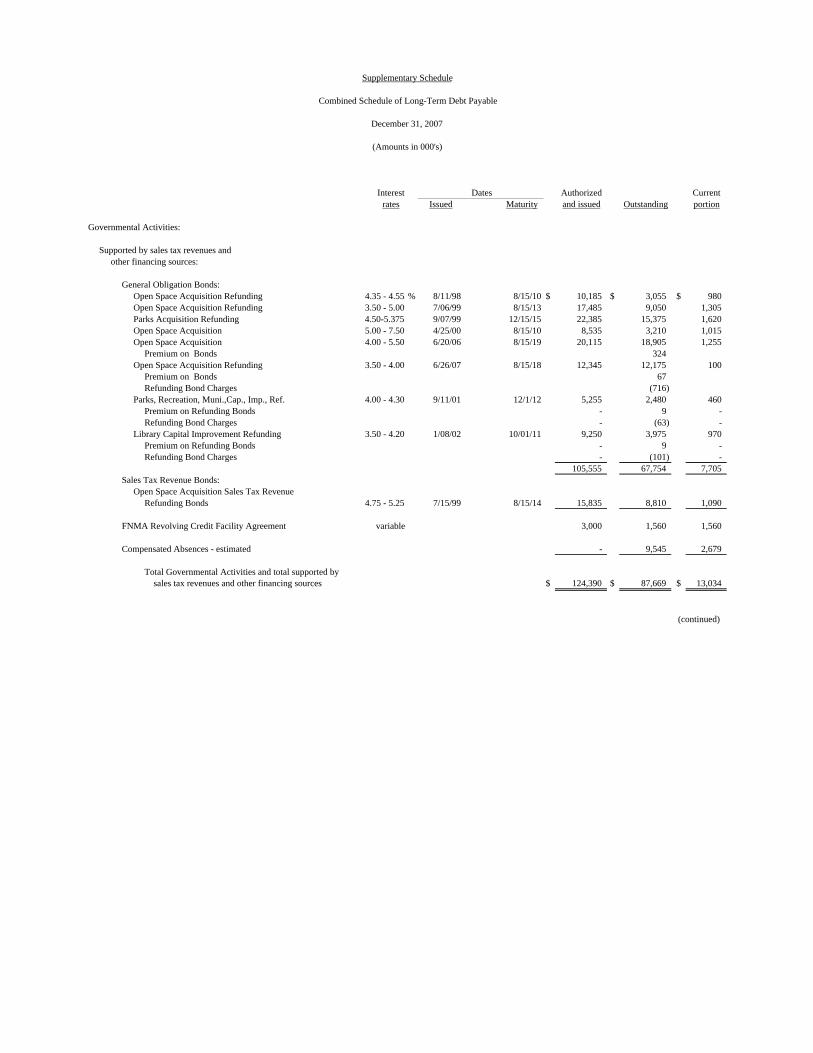
Supplementary Schedule
Combined Schedule of Long-Term Debt Payable
December 31, 2007
(Amounts in 000's)
Interest Dates Authorized Currentrates Issued Maturity and issued Outstanding portion
Governmental Activities:
Supported by sales tax revenues andother financing sources:
General Obligation Bonds:Open Space Acquisition Refunding 4.35 - 4.55 % 8/11/98 8/15/10 $ 10,185 $ 3,055 $ 980 Open Space Acquisition Refunding 3.50 - 5.00 7/06/99 8/15/13 17,485 9,050 1,305 Parks Acquisition Refunding 4.50-5.375 9/07/99 12/15/15 22,385 15,375 1,620 Open Space Acquisition 5.00 - 7.50 4/25/00 8/15/10 8,535 3,210 1,015 Open Space Acquisition 4.00 - 5.50 6/20/06 8/15/19 20,115 18,905 1,255
Premium on Bonds 324 Open Space Acquisition Refunding 3.50 - 4.00 6/26/07 8/15/18 12,345 12,175 100
Premium on Bonds 67 Refunding Bond Charges (716)
Parks, Recreation, Muni.,Cap., Imp., Ref. 4.00 - 4.30 9/11/01 12/1/12 5,255 2,480 460 Premium on Refunding Bonds - 9 - Refunding Bond Charges - (63) -
Library Capital Improvement Refunding 3.50 - 4.20 1/08/02 10/01/11 9,250 3,975 970 Premium on Refunding Bonds - 9 - Refunding Bond Charges - (101) -
105,555 67,754 7,705 Sales Tax Revenue Bonds:
Open Space Acquisition Sales Tax RevenueRefunding Bonds 4.75 - 5.25 7/15/99 8/15/14 15,835 8,810 1,090
FNMA Revolving Credit Facility Agreement variable 3,000 1,560 1,560
Compensated Absences - estimated - 9,545 2,679
Total Governmental Activities and total supported by sales tax revenues and other financing sources $ 124,390 $ 87,669 $ 13,034
(continued)
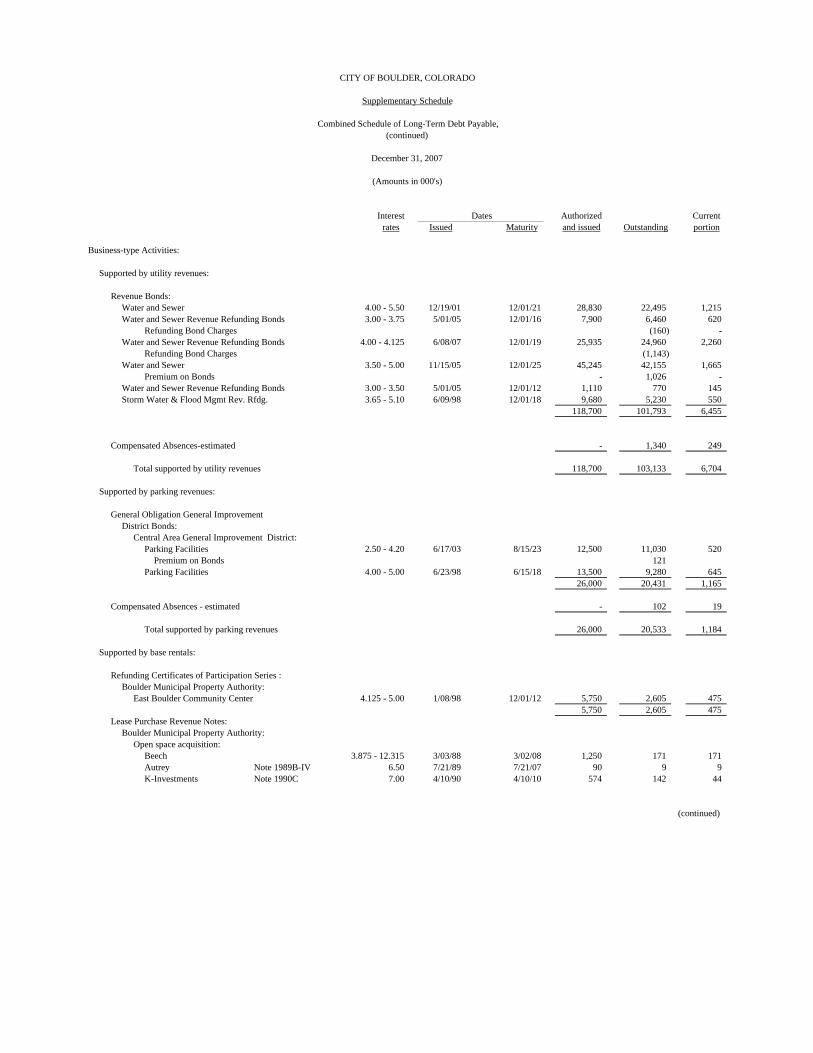
CITY OF BOULDER, COLORADO
Supplementary Schedule
Combined Schedule of Long-Term Debt Payable,(continued)
December 31, 2007
(Amounts in 000's)
Interest Dates Authorized Currentrates Issued Maturity and issued Outstanding portion
Business-type Activities:
Supported by utility revenues:
Revenue Bonds:Water and Sewer 4.00 - 5.50 12/19/01 12/01/21 28,830 22,495 1,215 Water and Sewer Revenue Refunding Bonds 3.00 - 3.75 5/01/05 12/01/16 7,900 6,460 620
Refunding Bond Charges (160) - Water and Sewer Revenue Refunding Bonds 4.00 - 4.125 6/08/07 12/01/19 25,935 24,960 2,260
Refunding Bond Charges (1,143) Water and Sewer 3.50 - 5.00 11/15/05 12/01/25 45,245 42,155 1,665
Premium on Bonds - 1,026 - Water and Sewer Revenue Refunding Bonds 3.00 - 3.50 5/01/05 12/01/12 1,110 770 145 Storm Water & Flood Mgmt Rev. Rfdg. 3.65 - 5.10 6/09/98 12/01/18 9,680 5,230 550
118,700 101,793 6,455
Compensated Absences-estimated - 1,340 249
Total supported by utility revenues 118,700 103,133 6,704
Supported by parking revenues:
General Obligation General ImprovementDistrict Bonds:
Central Area General Improvement District:Parking Facilities 2.50 - 4.20 6/17/03 8/15/23 12,500 11,030 520
Premium on Bonds 121 Parking Facilities 4.00 - 5.00 6/23/98 6/15/18 13,500 9,280 645
26,000 20,431 1,165
Compensated Absences - estimated - 102 19
Total supported by parking revenues 26,000 20,533 1,184
Supported by base rentals:
Refunding Certificates of Participation Series :Boulder Municipal Property Authority:
East Boulder Community Center 4.125 - 5.00 1/08/98 12/01/12 5,750 2,605 475 5,750 2,605 475
Lease Purchase Revenue Notes:Boulder Municipal Property Authority:
Open space acquisition:Beech 3.875 - 12.315 3/03/88 3/02/08 1,250 171 171 Autrey Note 1989B-IV 6.50 7/21/89 7/21/07 90 9 9 K-Investments Note 1990C 7.00 4/10/90 4/10/10 574 142 44
(continued)
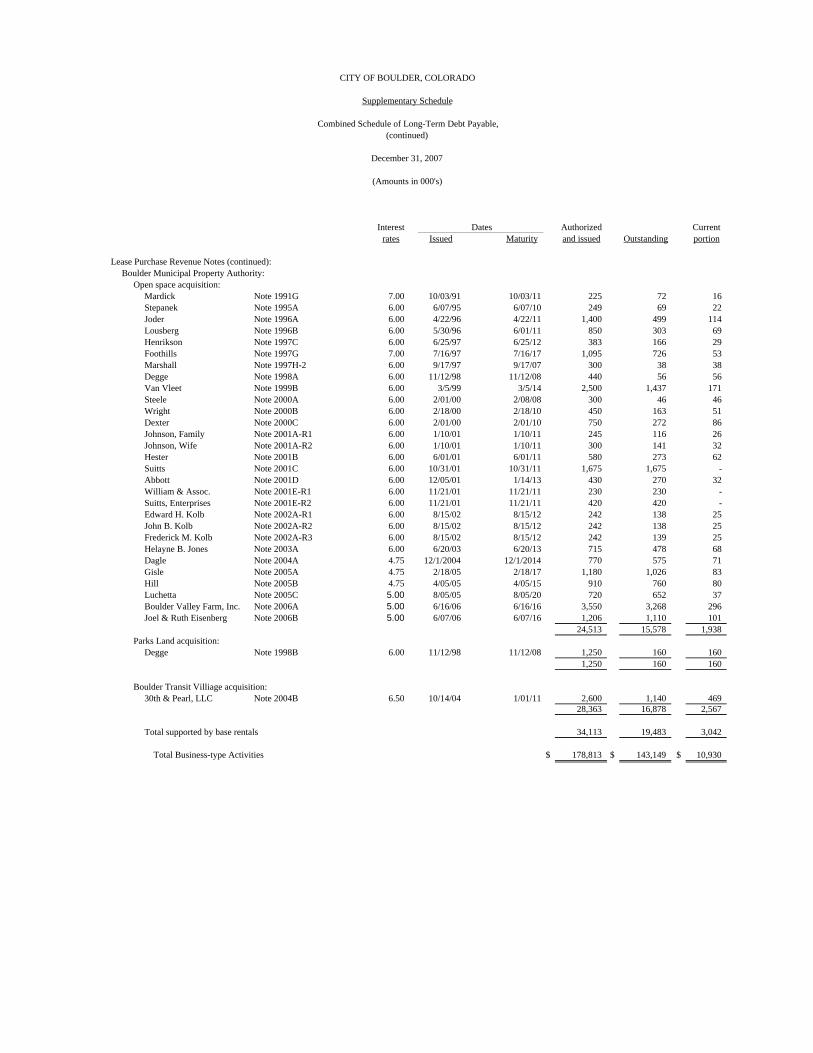
CITY OF BOULDER, COLORADO
Supplementary Schedule
Combined Schedule of Long-Term Debt Payable,(continued)
December 31, 2007
(Amounts in 000's)
Interest Dates Authorized Currentrates Issued Maturity and issued Outstanding portion
Lease Purchase Revenue Notes (continued):Boulder Municipal Property Authority:
Open space acquisition:Mardick Note 1991G 7.00 10/03/91 10/03/11 225 72 16 Stepanek Note 1995A 6.00 6/07/95 6/07/10 249 69 22 Joder Note 1996A 6.00 4/22/96 4/22/11 1,400 499 114 Lousberg Note 1996B 6.00 5/30/96 6/01/11 850 303 69 Henrikson Note 1997C 6.00 6/25/97 6/25/12 383 166 29 Foothills Note 1997G 7.00 7/16/97 7/16/17 1,095 726 53 Marshall Note 1997H-2 6.00 9/17/97 9/17/07 300 38 38 Degge Note 1998A 6.00 11/12/98 11/12/08 440 56 56 Van Vleet Note 1999B 6.00 3/5/99 3/5/14 2,500 1,437 171 Steele Note 2000A 6.00 2/01/00 2/08/08 300 46 46 Wright Note 2000B 6.00 2/18/00 2/18/10 450 163 51 Dexter Note 2000C 6.00 2/01/00 2/01/10 750 272 86 Johnson, Family Note 2001A-R1 6.00 1/10/01 1/10/11 245 116 26 Johnson, Wife Note 2001A-R2 6.00 1/10/01 1/10/11 300 141 32 Hester Note 2001B 6.00 6/01/01 6/01/11 580 273 62 Suitts Note 2001C 6.00 10/31/01 10/31/11 1,675 1,675 - Abbott Note 2001D 6.00 12/05/01 1/14/13 430 270 32 William & Assoc. Note 2001E-R1 6.00 11/21/01 11/21/11 230 230 - Suitts, Enterprises Note 2001E-R2 6.00 11/21/01 11/21/11 420 420 - Edward H. Kolb Note 2002A-R1 6.00 8/15/02 8/15/12 242 138 25 John B. Kolb Note 2002A-R2 6.00 8/15/02 8/15/12 242 138 25 Frederick M. Kolb Note 2002A-R3 6.00 8/15/02 8/15/12 242 139 25 Helayne B. Jones Note 2003A 6.00 6/20/03 6/20/13 715 478 68 Dagle Note 2004A 4.75 12/1/2004 12/1/2014 770 575 71 Gisle Note 2005A 4.75 2/18/05 2/18/17 1,180 1,026 83 Hill Note 2005B 4.75 4/05/05 4/05/15 910 760 80 Luchetta Note 2005C 5.00 8/05/05 8/05/20 720 652 37 Boulder Valley Farm, Inc. Note 2006A 5.00 6/16/06 6/16/16 3,550 3,268 296 Joel & Ruth Eisenberg Note 2006B 5.00 6/07/06 6/07/16 1,206 1,110 101
24,513 15,578 1,938 Parks Land acquisition:
Degge Note 1998B 6.00 11/12/98 11/12/08 1,250 160 160 1,250 160 160
Boulder Transit Villiage acquisition:30th & Pearl, LLC Note 2004B 6.50 10/14/04 1/01/11 2,600 1,140 469
28,363 16,878 2,567
Total supported by base rentals 34,113 19,483 3,042
Total Business-type Activities $ 178,813 $ 143,149 $ 10,930
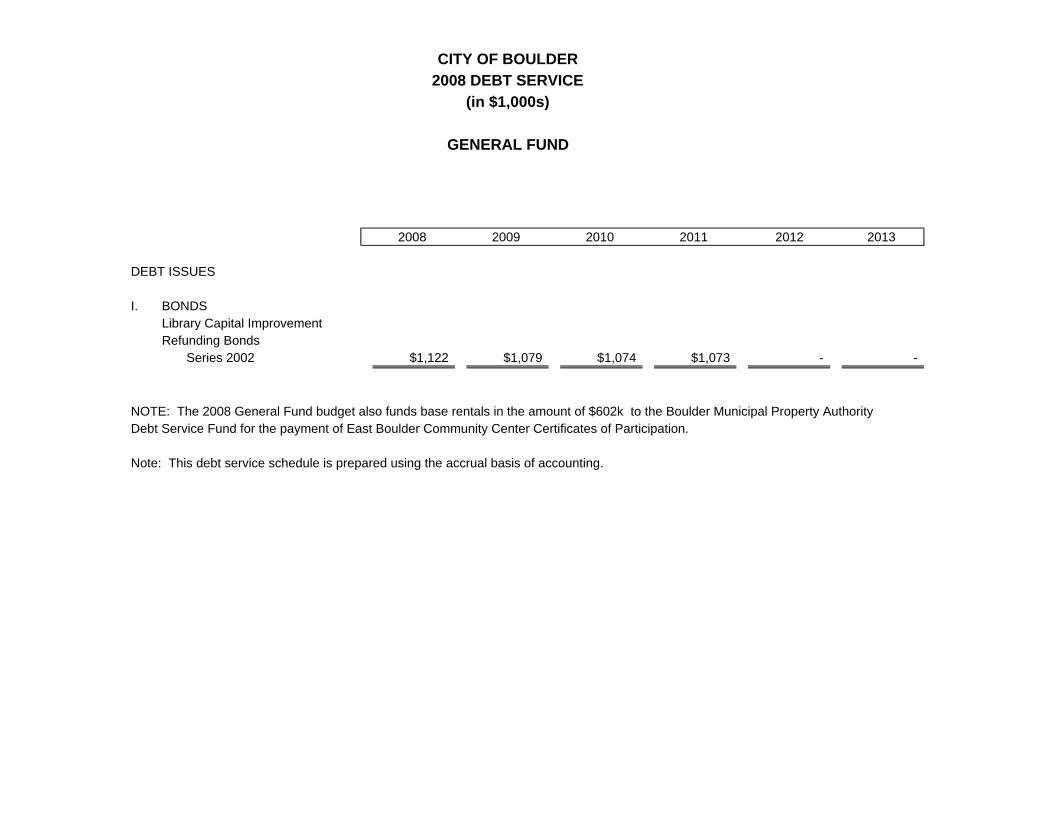
CITY OF BOULDER2008 DEBT SERVICE
(in $1,000s)
GENERAL FUND
2008 2009 2010 2011 2012 2013
DEBT ISSUES
I. BONDSLibrary Capital ImprovementRefunding Bonds
Series 2002 $1,122 $1,079 $1,074 $1,073 - -
NOTE: The 2008 General Fund budget also funds base rentals in the amount of $602k to the Boulder Municipal Property AuthorityDebt Service Fund for the payment of East Boulder Community Center Certificates of Participation.
Note: This debt service schedule is prepared using the accrual basis of accounting.
CITY OF BOULDER2008 DEBT SERVICE
(in $1,000s)
LOTTERY FUND
NOTE: The 2008 Lottery Fund budget funds base rentals in the amount of $170k to the Boulder MunicipalProperty Authority Debt Service Fund for the final Degge property payment.
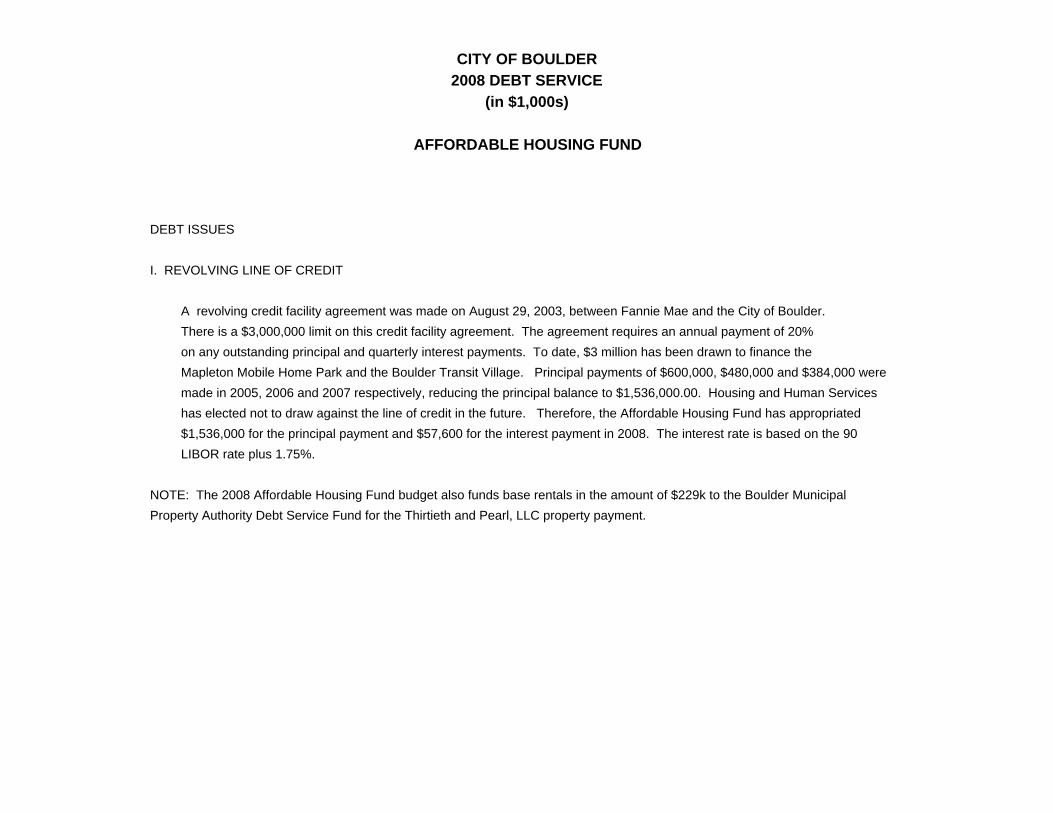
CITY OF BOULDER2008 DEBT SERVICE
(in $1,000s)
AFFORDABLE HOUSING FUND
DEBT ISSUES
I. REVOLVING LINE OF CREDIT
A revolving credit facility agreement was made on August 29, 2003, between Fannie Mae and the City of Boulder.There is a $3,000,000 limit on this credit facility agreement. The agreement requires an annual payment of 20%on any outstanding principal and quarterly interest payments. To date, $3 million has been drawn to finance theMapleton Mobile Home Park and the Boulder Transit Village. Principal payments of $600,000, $480,000 and $384,000 weremade in 2005, 2006 and 2007 respectively, reducing the principal balance to $1,536,000.00. Housing and Human Serviceshas elected not to draw against the line of credit in the future. Therefore, the Affordable Housing Fund has appropriated $1,536,000 for the principal payment and $57,600 for the interest payment in 2008. The interest rate is based on the 90LIBOR rate plus 1.75%.
NOTE: The 2008 Affordable Housing Fund budget also funds base rentals in the amount of $229k to the Boulder Municipal Property Authority Debt Service Fund for the Thirtieth and Pearl, LLC property payment.
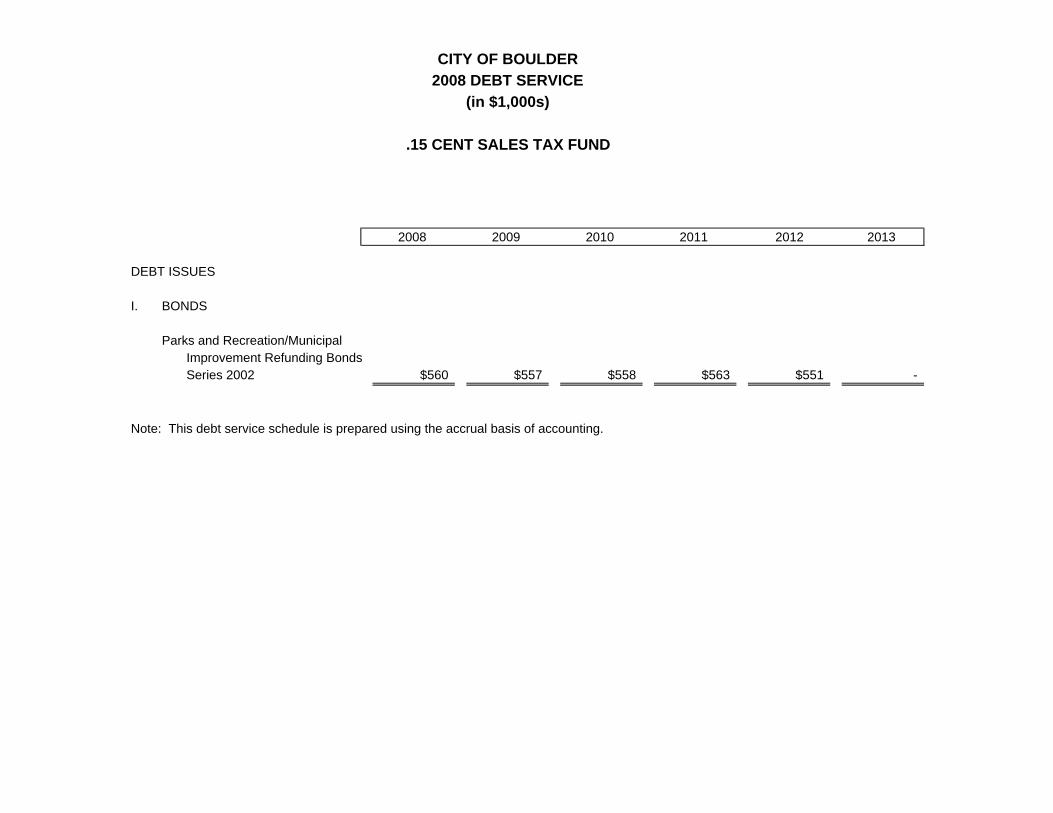
CITY OF BOULDER2008 DEBT SERVICE
(in $1,000s)
.15 CENT SALES TAX FUND
2008 2009 2010 2011 2012 2013
DEBT ISSUES
I. BONDS
Parks and Recreation/MunicipalImprovement Refunding BondsSeries 2002 $560 $557 $558 $563 $551 -
Note: This debt service schedule is prepared using the accrual basis of accounting.
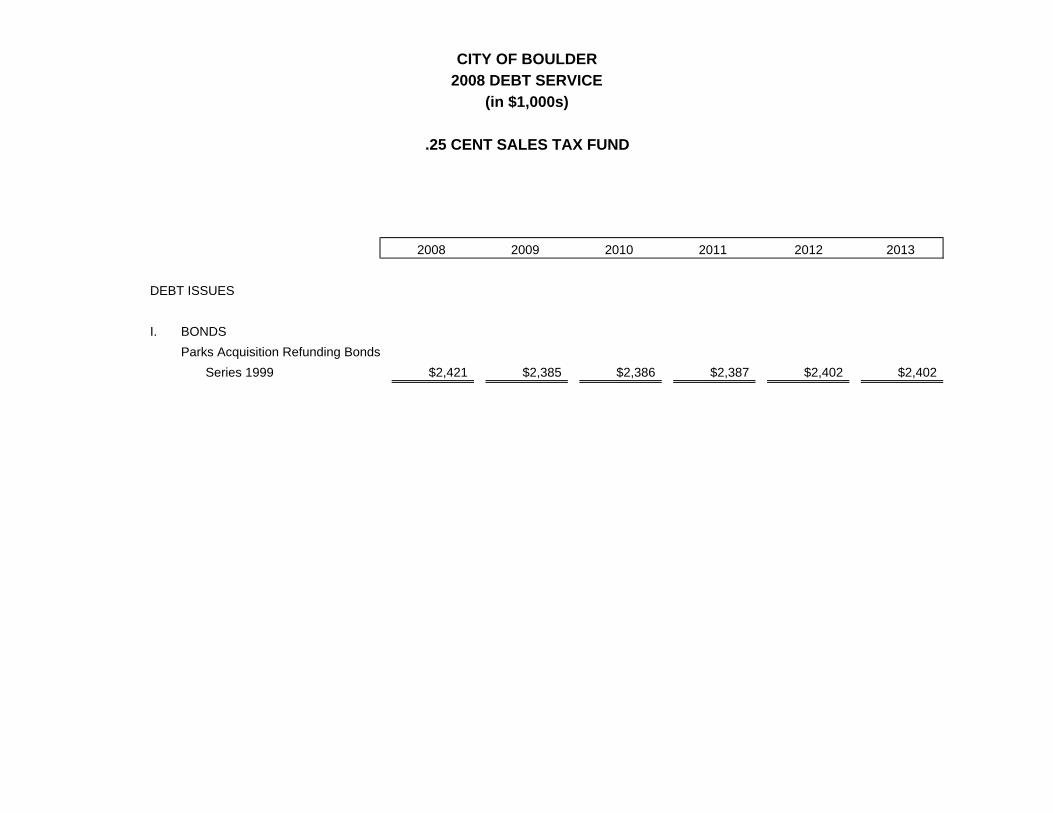
CITY OF BOULDER2008 DEBT SERVICE
(in $1,000s)
.25 CENT SALES TAX FUND
2008 2009 2010 2011 2012 2013
DEBT ISSUES
I. BONDSParks Acquisition Refunding Bonds
Series 1999 $2,421 $2,385 $2,386 $2,387 $2,402 $2,402
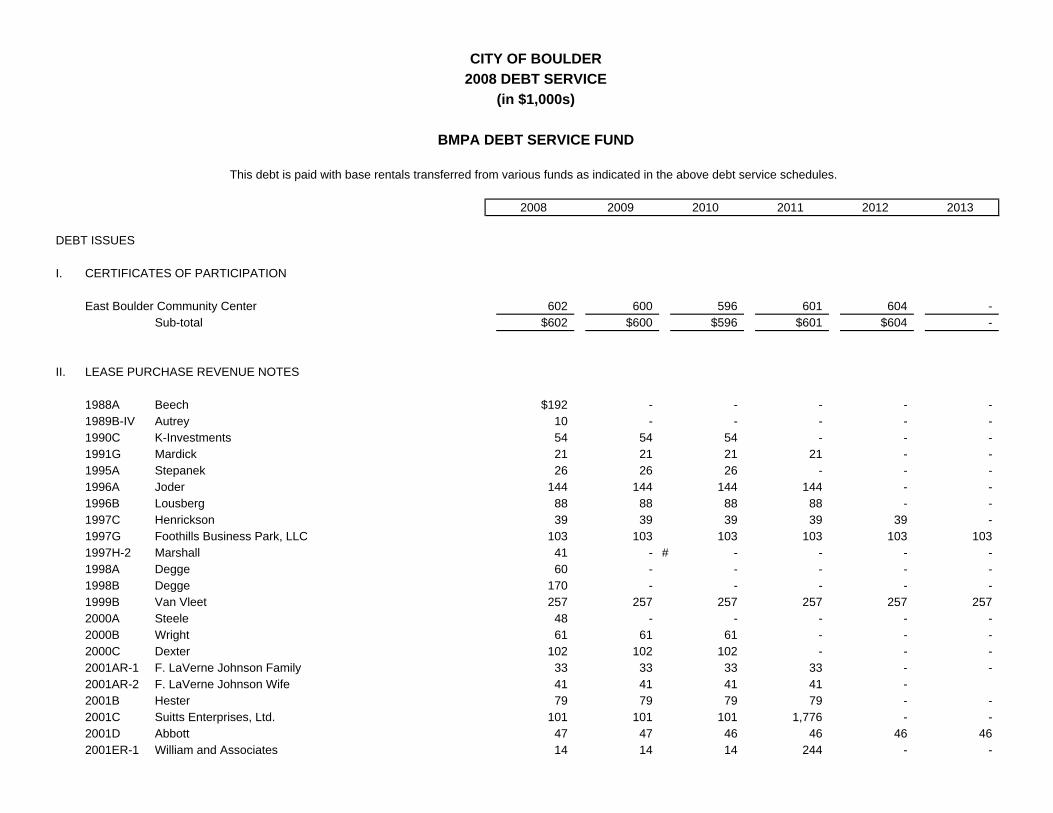
CITY OF BOULDER2008 DEBT SERVICE
(in $1,000s)
BMPA DEBT SERVICE FUND
This debt is paid with base rentals transferred from various funds as indicated in the above debt service schedules.
2008 2009 2010 2011 2012 2013
DEBT ISSUES
I. CERTIFICATES OF PARTICIPATION
East Boulder Community Center 602 600 596 601 604 - Sub-total $602 $600 $596 $601 $604 -
II. LEASE PURCHASE REVENUE NOTES
1988A Beech $192 - - - - - 1989B-IV Autrey 10 - - - - - 1990C K-Investments 54 54 54 - - - 1991G Mardick 21 21 21 21 - - 1995A Stepanek 26 26 26 - - - 1996A Joder 144 144 144 144 - - 1996B Lousberg 88 88 88 88 - - 1997C Henrickson 39 39 39 39 39 - 1997G Foothills Business Park, LLC 103 103 103 103 103 1031997H-2 Marshall 41 - # - - - - 1998A Degge 60 - - - - - 1998B Degge 170 - - - - - 1999B Van Vleet 257 257 257 257 257 2572000A Steele 48 - - - - - 2000B Wright 61 61 61 - - - 2000C Dexter 102 102 102 - - - 2001AR-1 F. LaVerne Johnson Family 33 33 33 33 - - 2001AR-2 F. LaVerne Johnson Wife 41 41 41 41 - 2001B Hester 79 79 79 79 - - 2001C Suitts Enterprises, Ltd. 101 101 101 1,776 - - 2001D Abbott 47 47 46 46 46 462001ER-1 William and Associates 14 14 14 244 - -
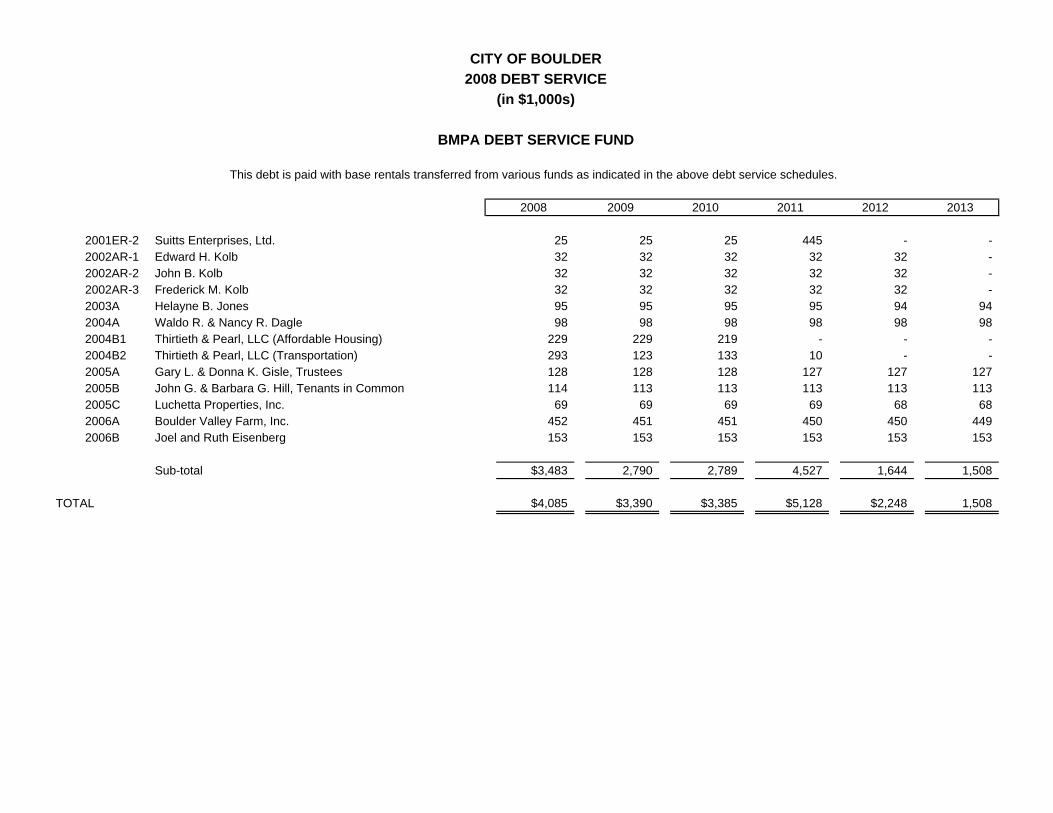
CITY OF BOULDER2008 DEBT SERVICE
(in $1,000s)
BMPA DEBT SERVICE FUND
This debt is paid with base rentals transferred from various funds as indicated in the above debt service schedules.
2008 2009 2010 2011 2012 2013
2001ER-2 Suitts Enterprises, Ltd. 25 25 25 445 - - 2002AR-1 Edward H. Kolb 32 32 32 32 32 - 2002AR-2 John B. Kolb 32 32 32 32 32 - 2002AR-3 Frederick M. Kolb 32 32 32 32 32 - 2003A Helayne B. Jones 95 95 95 95 94 942004A Waldo R. & Nancy R. Dagle 98 98 98 98 98 982004B1 Thirtieth & Pearl, LLC (Affordable Housing) 229 229 219 - - - 2004B2 Thirtieth & Pearl, LLC (Transportation) 293 123 133 10 - - 2005A Gary L. & Donna K. Gisle, Trustees 128 128 128 127 127 1272005B John G. & Barbara G. Hill, Tenants in Common 114 113 113 113 113 1132005C Luchetta Properties, Inc. 69 69 69 69 68 682006A Boulder Valley Farm, Inc. 452 451 451 450 450 4492006B Joel and Ruth Eisenberg 153 153 153 153 153 153
Sub-total $3,483 2,790 2,789 4,527 1,644 1,508
TOTAL $4,085 $3,390 $3,385 $5,128 $2,248 1,508
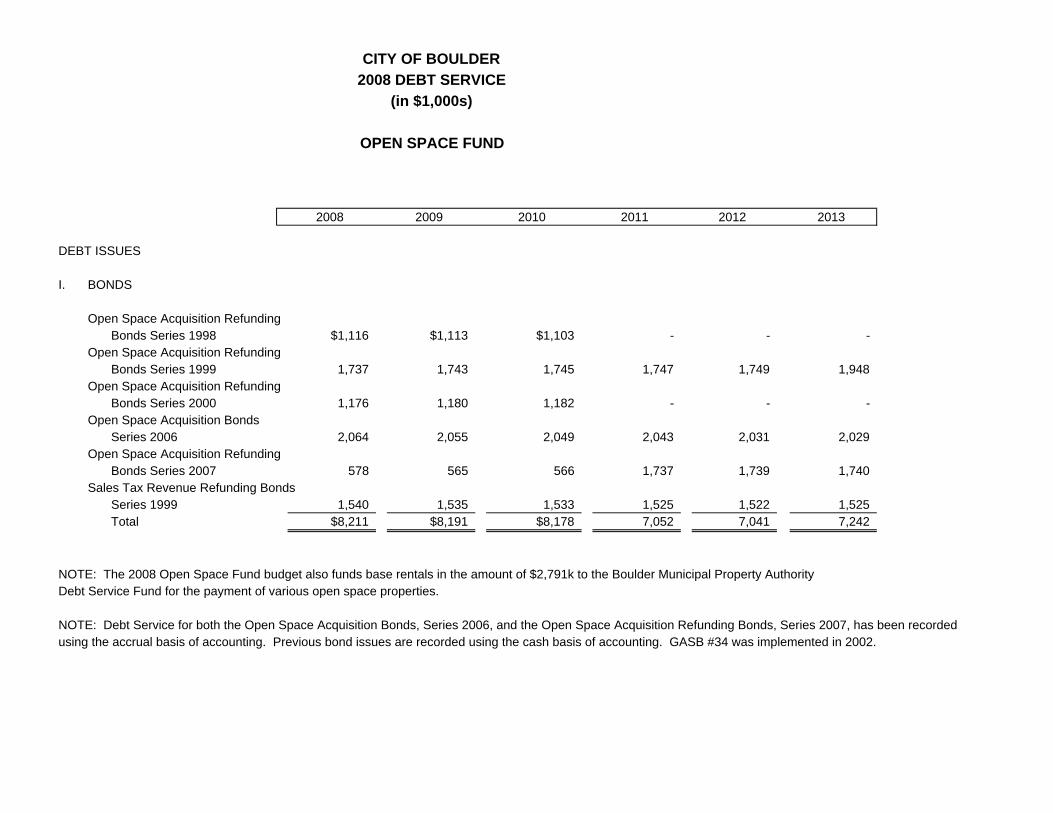
CITY OF BOULDER2008 DEBT SERVICE
(in $1,000s)
OPEN SPACE FUND
2008 2009 2010 2011 2012 2013
DEBT ISSUES
I. BONDS
Open Space Acquisition RefundingBonds Series 1998 $1,116 $1,113 $1,103 - - -
Open Space Acquisition RefundingBonds Series 1999 1,737 1,743 1,745 1,747 1,749 1,948
Open Space Acquisition RefundingBonds Series 2000 1,176 1,180 1,182 - - -
Open Space Acquisition BondsSeries 2006 2,064 2,055 2,049 2,043 2,031 2,029
Open Space Acquisition RefundingBonds Series 2007 578 565 566 1,737 1,739 1,740
Sales Tax Revenue Refunding BondsSeries 1999 1,540 1,535 1,533 1,525 1,522 1,525Total $8,211 $8,191 $8,178 7,052 7,041 7,242
NOTE: The 2008 Open Space Fund budget also funds base rentals in the amount of $2,791k to the Boulder Municipal Property AuthorityDebt Service Fund for the payment of various open space properties.
NOTE: Debt Service for both the Open Space Acquisition Bonds, Series 2006, and the Open Space Acquisition Refunding Bonds, Series 2007, has been recordedusing the accrual basis of accounting. Previous bond issues are recorded using the cash basis of accounting. GASB #34 was implemented in 2002.
CITY OF BOULDER2008 DEBT SERVICE
(in $1,000s)
TRANSPORTATION FUND
NOTE: The 2008 Transportation Fund budget funds base rentals in the amount of $293k to the Boulder MunicipalProperty Authority Debt Service Fund for the Thirtieth & Pearl, LLC property payment.
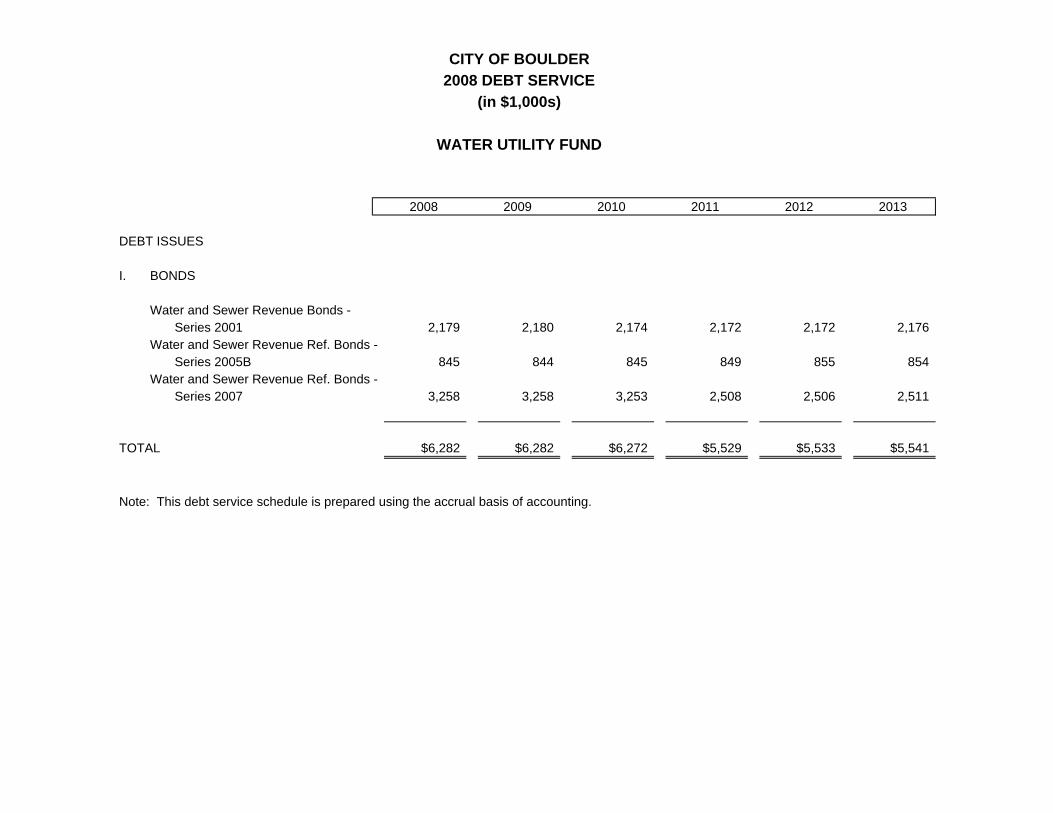
CITY OF BOULDER2008 DEBT SERVICE
(in $1,000s)
WATER UTILITY FUND
2008 2009 2010 2011 2012 2013
DEBT ISSUES
I. BONDS
Water and Sewer Revenue Bonds -Series 2001 2,179 2,180 2,174 2,172 2,172 2,176
Water and Sewer Revenue Ref. Bonds -Series 2005B 845 844 845 849 855 854
Water and Sewer Revenue Ref. Bonds -Series 2007 3,258 3,258 3,253 2,508 2,506 2,511
TOTAL $6,282 $6,282 $6,272 $5,529 $5,533 $5,541
Note: This debt service schedule is prepared using the accrual basis of accounting.
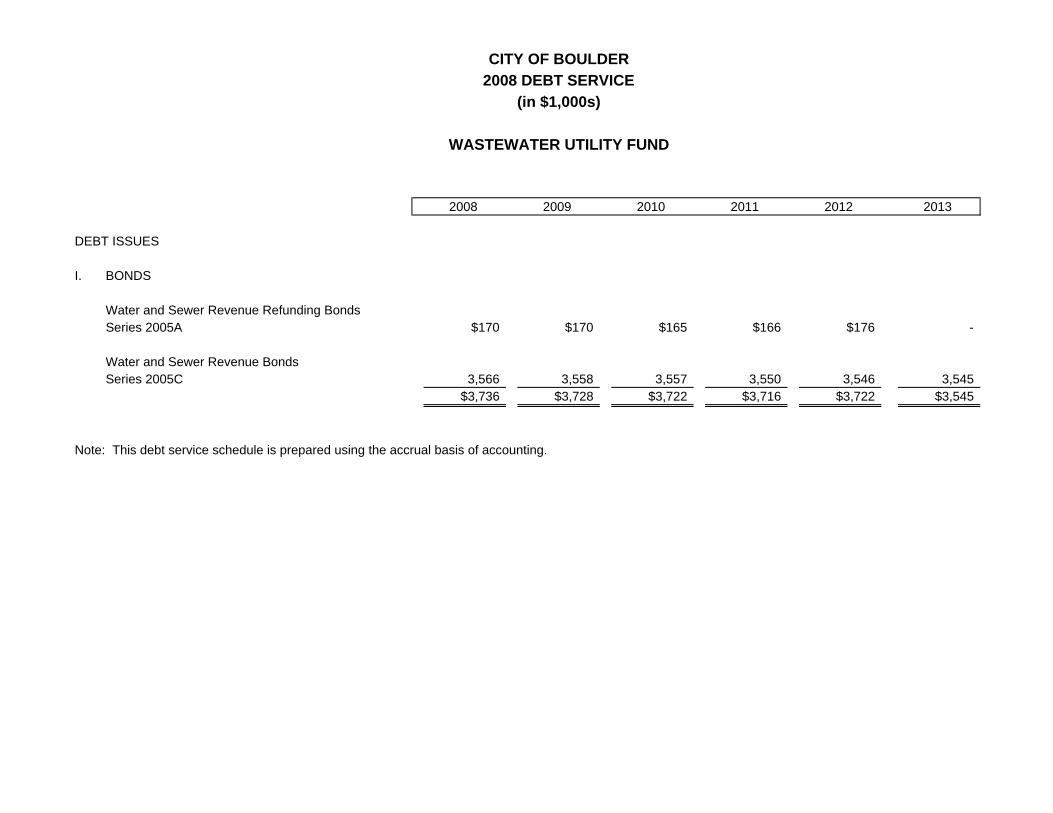
CITY OF BOULDER2008 DEBT SERVICE
(in $1,000s)
WASTEWATER UTILITY FUND
2008 2009 2010 2011 2012 2013
DEBT ISSUES
I. BONDS
Water and Sewer Revenue Refunding BondsSeries 2005A $170 $170 $165 $166 $176 -
Water and Sewer Revenue BondsSeries 2005C 3,566 3,558 3,557 3,550 3,546 3,545
$3,736 $3,728 $3,722 $3,716 $3,722 $3,545
Note: This debt service schedule is prepared using the accrual basis of accounting.
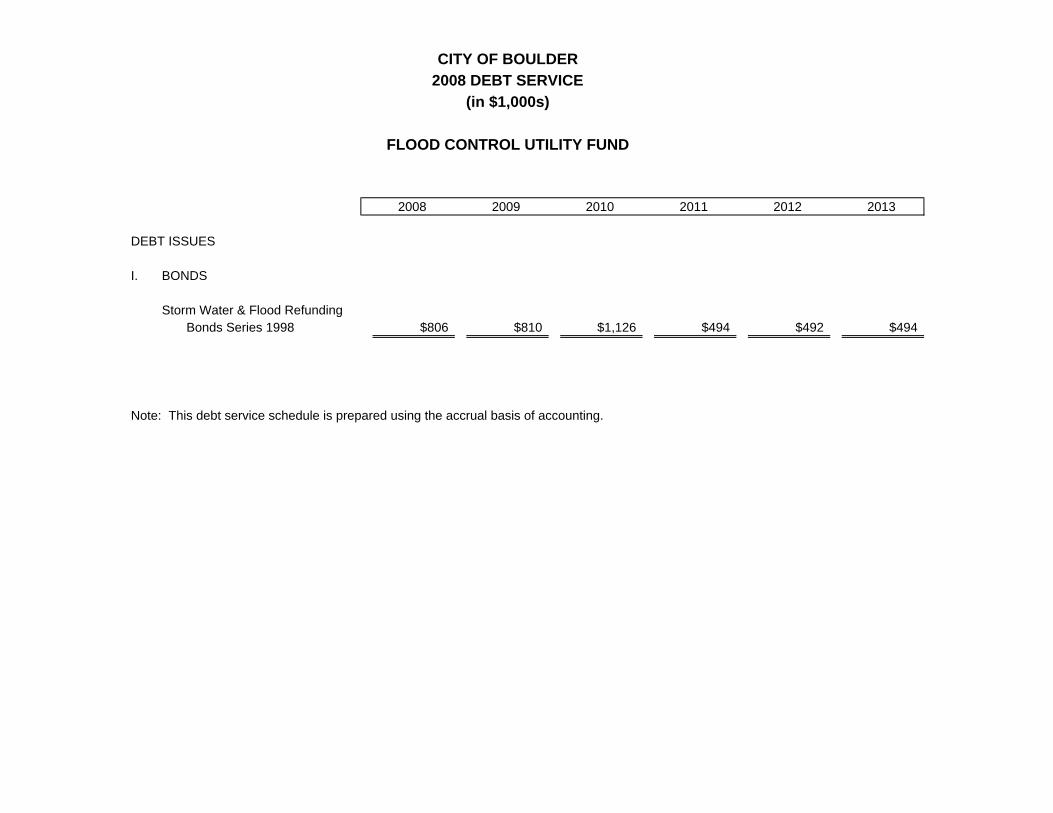
CITY OF BOULDER2008 DEBT SERVICE
(in $1,000s)
FLOOD CONTROL UTILITY FUND
2008 2009 2010 2011 2012 2013
DEBT ISSUES
I. BONDS
Storm Water & Flood RefundingBonds Series 1998 $806 $810 $1,126 $494 $492 $494
Note: This debt service schedule is prepared using the accrual basis of accounting.
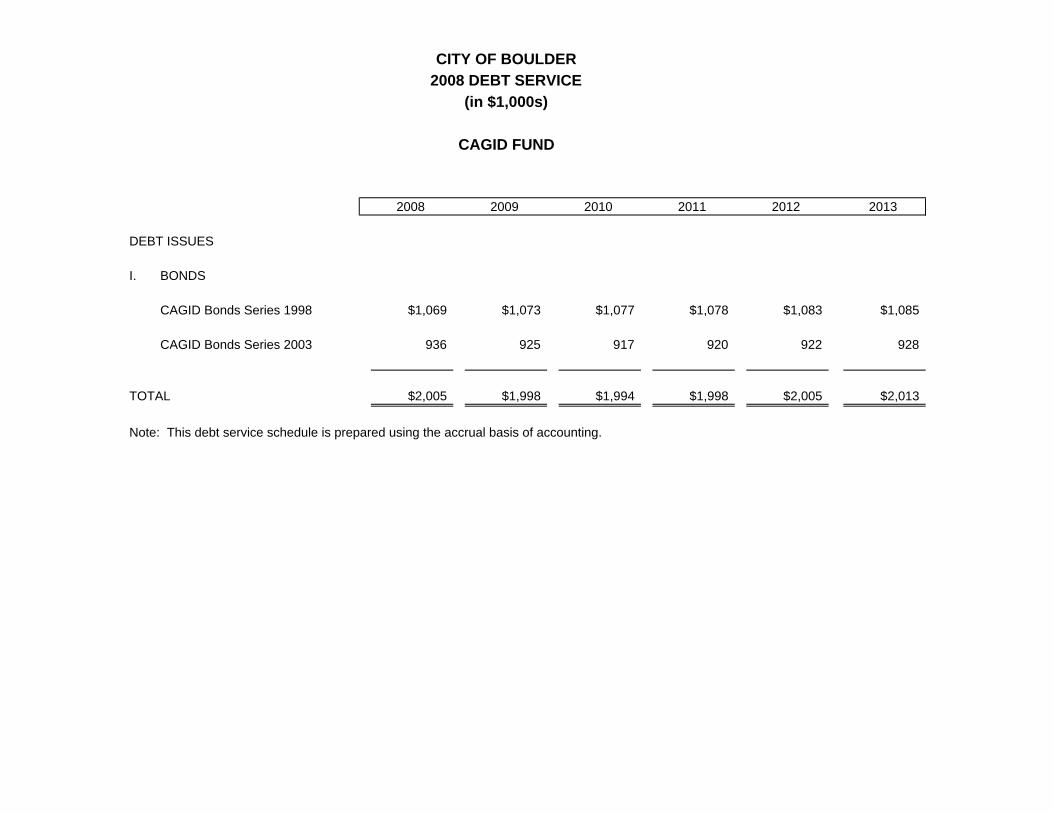
CITY OF BOULDER2008 DEBT SERVICE
(in $1,000s)
CAGID FUND
2008 2009 2010 2011 2012 2013
DEBT ISSUES
I. BONDS
CAGID Bonds Series 1998 $1,069 $1,073 $1,077 $1,078 $1,083 $1,085
CAGID Bonds Series 2003 936 925 917 920 922 928
TOTAL $2,005 $1,998 $1,994 $1,998 $2,005 $2,013
Note: This debt service schedule is prepared using the accrual basis of accounting.
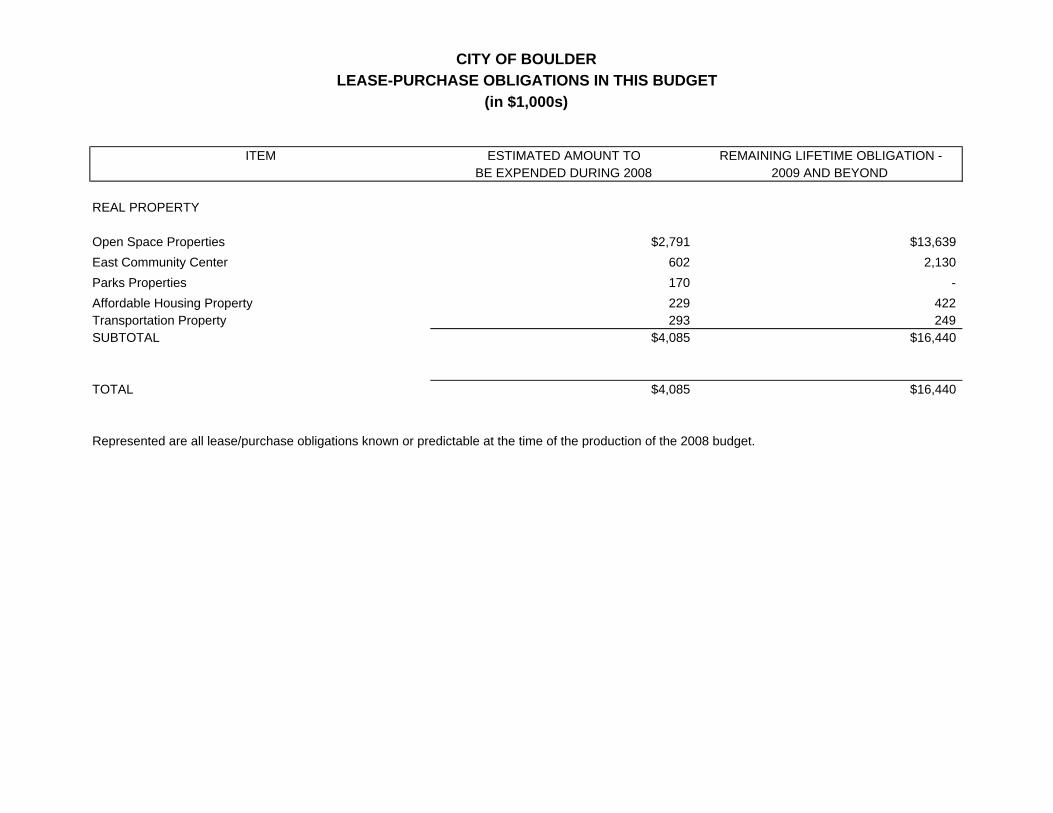
CITY OF BOULDERLEASE-PURCHASE OBLIGATIONS IN THIS BUDGET
(in $1,000s)
ITEM ESTIMATED AMOUNT TO REMAINING LIFETIME OBLIGATION -BE EXPENDED DURING 2008 2009 AND BEYOND
REAL PROPERTY
Open Space Properties $2,791 $13,639East Community Center 602 2,130Parks Properties 170 - Affordable Housing Property 229 422Transportation Property 293 249SUBTOTAL $4,085 $16,440
TOTAL $4,085 $16,440
Represented are all lease/purchase obligations known or predictable at the time of the production of the 2008 budget.
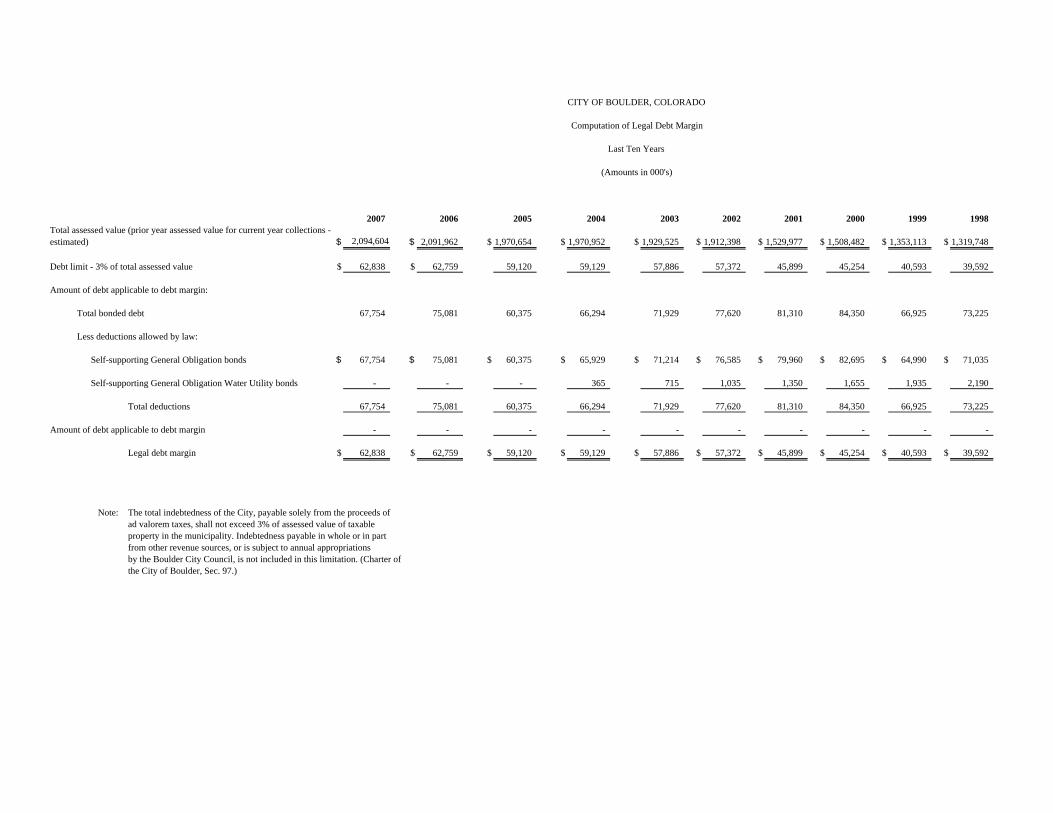
CITY OF BOULDER, COLORADO
Computation of Legal Debt Margin
Last Ten Years
(Amounts in 000's)
2007 2006 2005 2004 2003 2002 2001 2000 1999 1998
$ 2,094,604 $ 2,091,962 $ 1,970,654 $ 1,970,952 $ 1,929,525 $ 1,912,398 $ 1,529,977 $ 1,508,482 $ 1,353,113 $ 1,319,748
Debt limit - 3% of total assessed value $ 62,838 $ 62,759 59,120 59,129 57,886 57,372 45,899 45,254 40,593 39,592
Amount of debt applicable to debt margin:
Total bonded debt 67,754 75,081 60,375 66,294 71,929 77,620 81,310 84,350 66,925 73,225
Less deductions allowed by law:
Self-supporting General Obligation bonds $ 67,754 $ 75,081 $ 60,375 $ 65,929 $ 71,214 $ 76,585 $ 79,960 $ 82,695 $ 64,990 $ 71,035
Self-supporting General Obligation Water Utility bonds - - - 365 715 1,035 1,350 1,655 1,935 2,190
Total deductions 67,754 75,081 60,375 66,294 71,929 77,620 81,310 84,350 66,925 73,225
Amount of debt applicable to debt margin - - - - - - - - - -
Legal debt margin $ 62,838 $ 62,759 $ 59,120 $ 59,129 $ 57,886 $ 57,372 $ 45,899 $ 45,254 $ 40,593 $ 39,592
Note: The total indebtedness of the City, payable solely from the proceeds ofad valorem taxes, shall not exceed 3% of assessed value of taxableproperty in the municipality. Indebtedness payable in whole or in partfrom other revenue sources, or is subject to annual appropriationsby the Boulder City Council, is not included in this limitation. (Charter ofthe City of Boulder, Sec. 97.)
Total assessed value (prior year assessed value for current year collections - estimated)
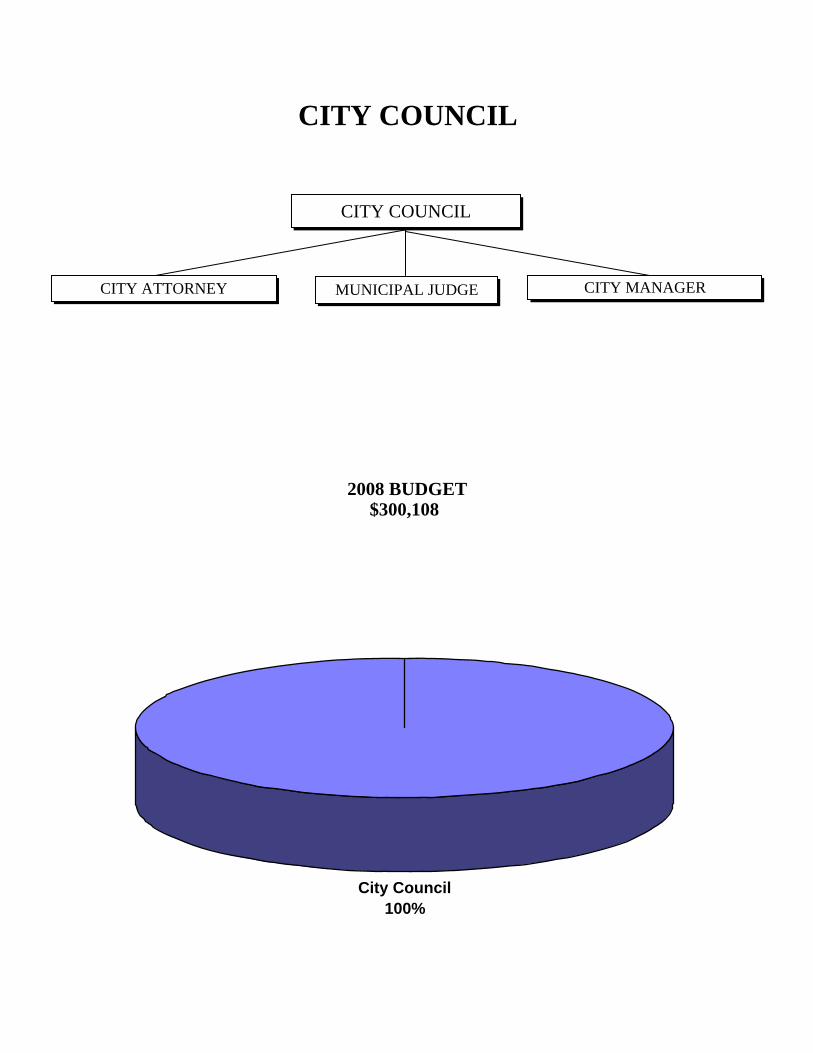
CITY COUNCIL
2008 BUDGET$300,108
CITY COUNCIL
CITY ATTORNEY MUNICIPAL JUDGE CITY MANAGER
City Council100%
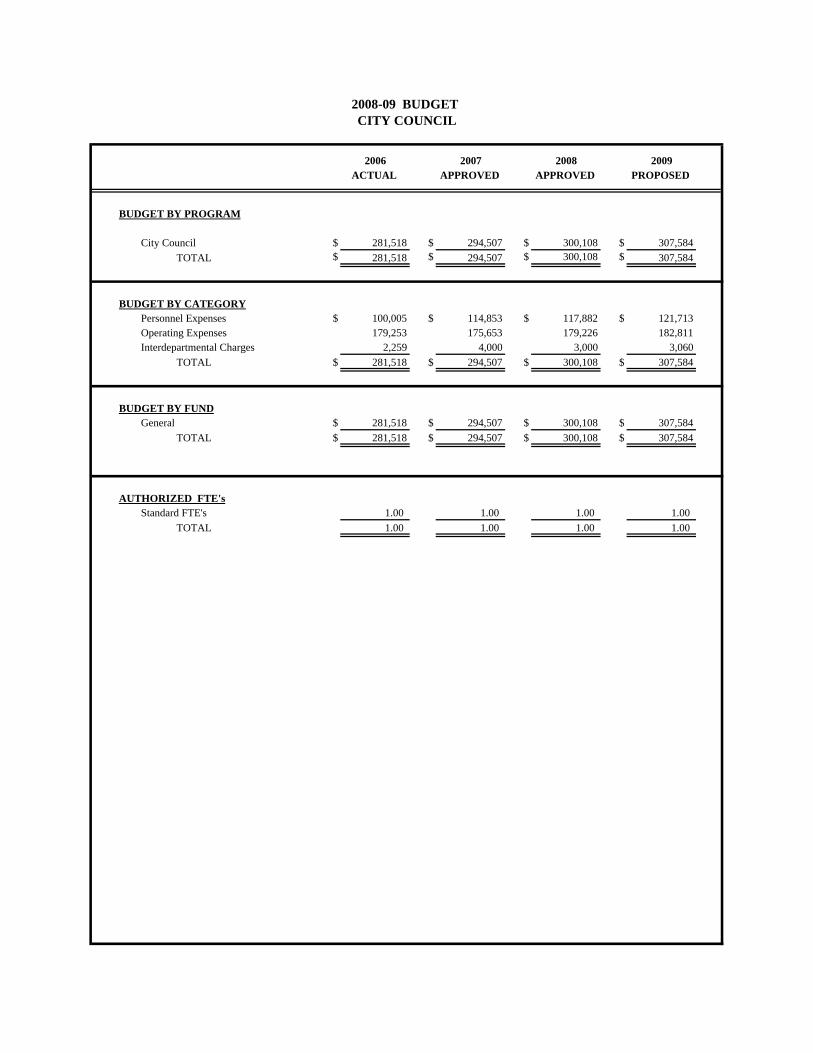
2006 2007 2008 2009ACTUAL APPROVED APPROVED PROPOSED
BUDGET BY PROGRAM
City Council $ 281,518 $ 294,507 $ 300,108 $ 307,584TOTAL $ 281,518 $ 294,507 $ 300,108 $ 307,584
BUDGET BY CATEGORYPersonnel Expenses $ 100,005 $ 114,853 $ 117,882 $ 121,713Operating Expenses 179,253 175,653 179,226 182,811Interdepartmental Charges 2,259 4,000 3,000 3,060
TOTAL $ 281,518 $ 294,507 $ 300,108 $ 307,584
BUDGET BY FUNDGeneral $ 281,518 $ 294,507 $ 300,108 $ 307,584
TOTAL $ 281,518 $ 294,507 $ 300,108 $ 307,584
AUTHORIZED FTE'sStandard FTE's 1.00 1.00 1.00 1.00
TOTAL 1.00 1.00 1.00 1.00
2008-09 BUDGET CITY COUNCIL
2008-09 BUDGET CITY COUNCIL
MISSION STATEMENT To serve as the governing body for the City of Boulder, providing policy direction and leadership to the city organization. BUSINESS PLAN NARRATIVE Through the establishment of Council Goals, the Boulder City Council sets policy and direction. During the January 2006 City Council Retreat, the Council restructured its committees and approach around the community sustainability concept. This resulted in three Council Committees with corresponding impact tools: 1) Social; 2) Environmental; and 3) Economic. An outcome of the 2007 City Council Mid-Term Retreat was to meet as a Committee of the Whole each month to review Council initiatives using these tools. The following are the definitions for providing that information: Economic: Overall economic impacts on the business community which could impact city revenues; promotes a diverse and sustainable economy that supports needs of all segments of the community; may also include intergovernmental relations or issues. Environmental: Overall impacts based on environmental concerns such as transportation, climate, energy, greenhouse gas emission, recycling; considers balance of renewable and non-renewable resources; may also include intergovernmental relations or issues. Social: Overall impacts on the needs of diverse communities, e.g. different ethnicities and cultures, abilities, age, income, family demographics, under-represented residents; engages broad segments of community for input; may also include intergovernmental relations or issues. The current initiatives that council has identified:
1. Bicycle Summit 2. Executive Sessions 3. Upgrading Green Points Program 4. Increase City Purchasing of Renewable Energy (Purchase improved pricing
through partnerships) 5. Small Car Initiative 6. Sister City project for Cyber Café in Dushanbe 7. Redevelop the Boulder Mobile Manor (BPH project) 8. Re-evaluate Floor Area Ratios decision (FAR’s) 9. Complementary Currency Consideration 10. CAP Symposium for press and delegates at 2008 Democratic Convention
11. Baseline Reservoir- work on IGA with Lafayette to improve recreational opportunities
GUIDING PRINCIPLES OR INVESTMENT STRATEGY
1.) Essential Services include: Council salary, a portion of administrative support tied to primary Council functions including agenda preparation, costs associated with legal notifications and boards and commissions. All of the above are mandated by Charter or are essential to conduct the business of Council.
2.) Desirable Services include: Administration and Intergovernmental
Memberships, includes Council administrative support not directly linked to mandated responsibilities, and membership in the following intergovernmental organizations: DRCOG $31,000, CML $69,426 and Metro Mayor’s Caucus $7,120.
3.) Discretionary Services include: Council meals and travel.
OVERVIEW OF ACTION PLAN Please refer to Attachment B of the 2008-09 Budget Message for a listing of those Action Plan Items that were recommended for funding. The listing is presented in order by fund and department. Please see the section titled “City Council Direction on the Recommended Budget” for any changes from Attachment B. OVERVIEW OF VISION PLAN To lead a progressive community that fosters quality of life, is a world leader on environmental issues, is economically sustainable, provides equitable housing and is at the forefront of transportation issues while being inclusive of all. PERFORMANCE MEASURES
Actual 2006
Target 2007
Target 2008
Target 2009
Number of days to respond to public correspondence when additional response is directed by CAC
95%
1,891 items of correspondence were received this year.
Within 10 days after
CAC
Within 10 days after
CAC
Within 10 days after
CAC
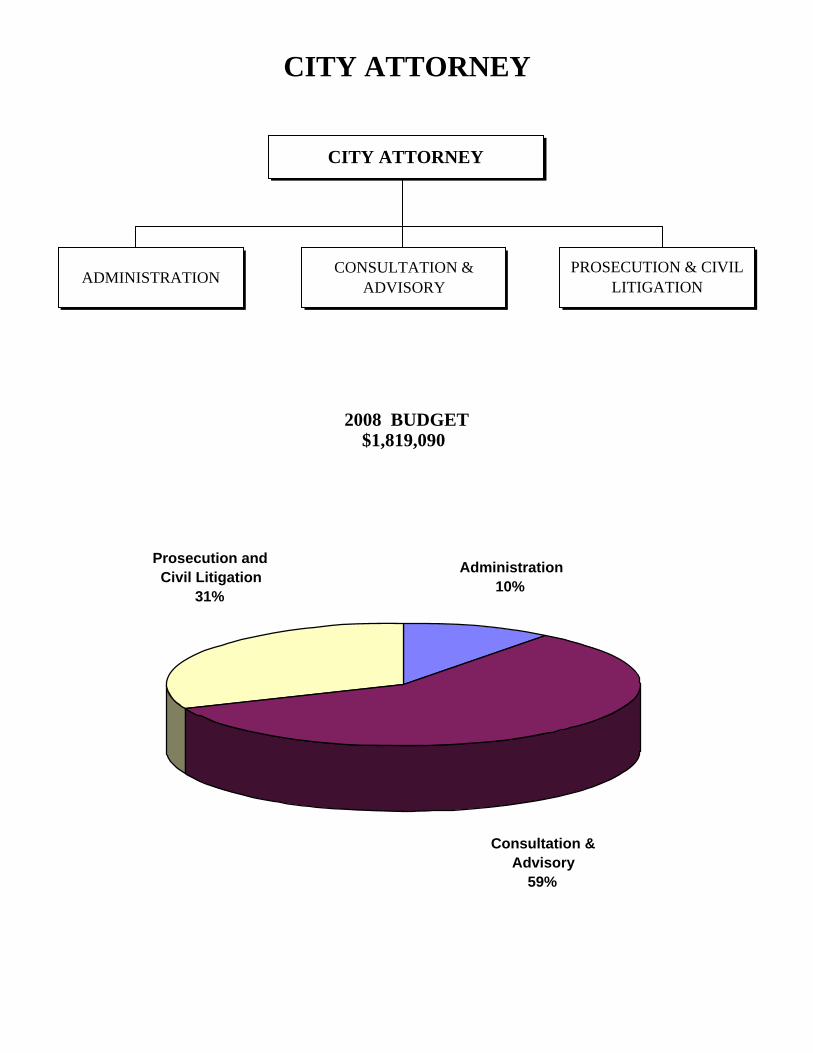
CITY ATTORNEY
2008 BUDGET$1,819,090
CITY ATTORNEY
ADMINISTRATIONPROSECUTION & CIVIL
LITIGATIONCONSULTATION &
ADVISORY
Prosecution and Civil Litigation
31%
Consultation & Advisory
59%
Administration10%
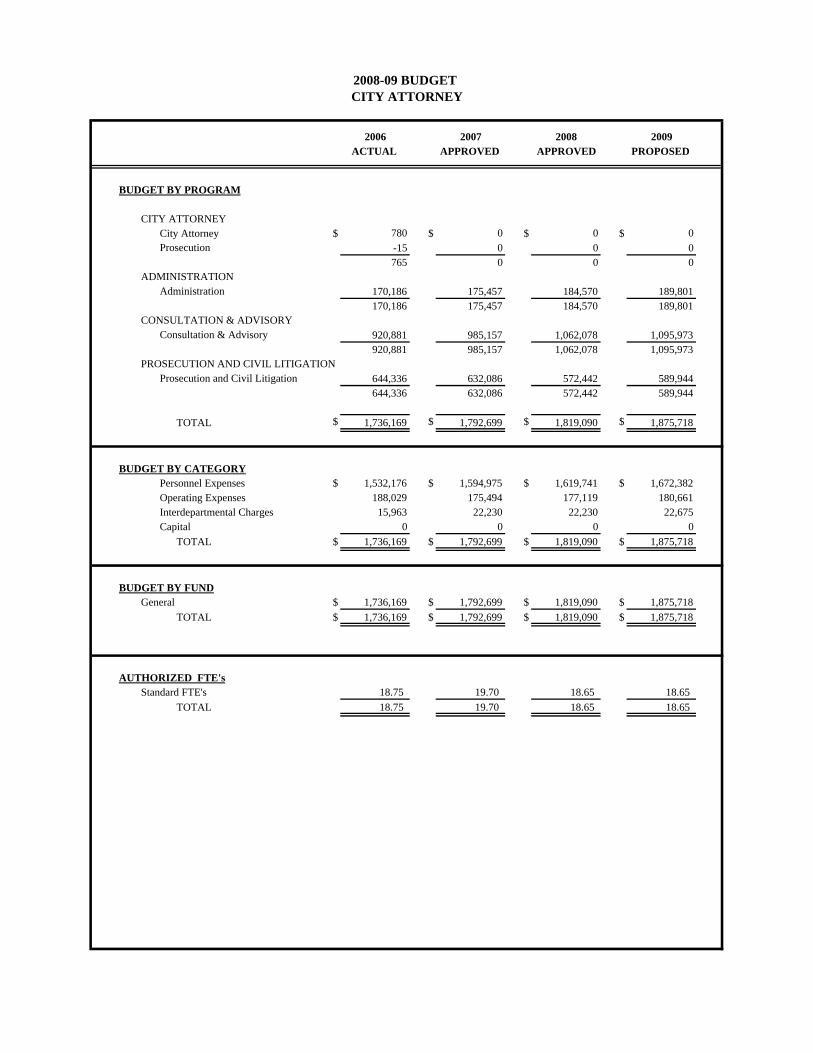
2006 2007 2008 2009ACTUAL APPROVED APPROVED PROPOSED
BUDGET BY PROGRAM
CITY ATTORNEYCity Attorney $ 780 $ 0 $ 0 $ 0Prosecution -15 0 0 0
765 0 0 0ADMINISTRATION
Administration 170,186 175,457 184,570 189,801170,186 175,457 184,570 189,801
CONSULTATION & ADVISORYConsultation & Advisory 920,881 985,157 1,062,078 1,095,973
920,881 985,157 1,062,078 1,095,973PROSECUTION AND CIVIL LITIGATION
Prosecution and Civil Litigation 644,336 632,086 572,442 589,944644,336 632,086 572,442 589,944
TOTAL $ 1,736,169 $ 1,792,699 $ 1,819,090 $ 1,875,718
BUDGET BY CATEGORYPersonnel Expenses $ 1,532,176 $ 1,594,975 $ 1,619,741 $ 1,672,382Operating Expenses 188,029 175,494 177,119 180,661Interdepartmental Charges 15,963 22,230 22,230 22,675Capital 0 0 0 0
TOTAL $ 1,736,169 $ 1,792,699 $ 1,819,090 $ 1,875,718
BUDGET BY FUNDGeneral $ 1,736,169 $ 1,792,699 $ 1,819,090 $ 1,875,718
TOTAL $ 1,736,169 $ 1,792,699 $ 1,819,090 $ 1,875,718
AUTHORIZED FTE'sStandard FTE's 18.75 19.70 18.65 18.65
TOTAL 18.75 19.70 18.65 18.65
2008-09 BUDGET CITY ATTORNEY
2008-09 BUDGET OFFICE OF THE CITY ATTORNEY
MISSION STATEMENT We work for Boulder to deliver the highest quality municipal legal service. We achieve this by providing responsive, creative, and timely advice. We back our advice with cost-effective litigation services when necessary. BUSINESS PLAN NARRATIVE The City Attorney’s Office has completed many of the reorganization and adaptation measures identified in the January 2005 “Organizational Review and Management Analysis of the City Attorney’s Office.” Some of the highlights include:
Implementing a practice management system. This system increases productivity by reducing the time spent on routine tasks such as document production, time keeping and project tracking;
Dedicating substantially greater staff resources to the Human Resources Department; Introducing a customer service feedback program for our public interactions on claims
against the city; Emphasizing recovery of compensation for damage to city property (usually as the result
of car accidents); Continued development of our in-house litigation group.
Training, teaching and staff development continue to be emphasis areas for the office. The CAO’s management philosophy is built around the use of life long learning techniques, such as internal teaching and training opportunities, to inspire, retain and develop city attorneys. GUIDING PRINCIPLES OR INVESTMENT STRATEGY 1) Essential Services A. Administration: Supporting legally-required continuing legal education for staff attorneys is
essential. File maintenance, timekeeping and reporting, and updating the municipal code is also essential.
B. Advisory Services: Support for the City Council and the City’s advisory boards and commissions is
essential, as is compliance with the Colorado Open Records Act, elections law, Council agenda support, bond finance and tax matters, water rights defense, and providing conflict of interest advice. In addition, support for operating
departments is essential when that support is part of their efforts to meet their own essential functions or the City Council’s goals.
C. Litigation Services: The CAO is legally obligated to defend the City in civil litigation and to prosecute
criminal matters within the Boulder Municipal Court’s jurisdiction. 2) Desirable Services A. Administration: Providing intra-departmental coordination and training is desirable. B. Advisory Services: Support for operating departments is desirable when that support is part of their
efforts to provide desirable services. Other desirable services include legal maintenance of the City’s extensive real estate and affordable housing portfolio, providing responsive support to public inquiries, and supporting the City’s legislative agenda.
C. Litigation Services: Providing proactive litigation services to challenge the actions of other persons
and entities when those actions are contrary to the City’s interests is desirable. Pre-prosecution counseling and informal dispute resolution is also desirable. Work done on behalf of the Office of Environmental Affairs is desirable and includes the city’s leadership in the key “global warming” lawsuit, Friends of the Earth v. Peter Watson (in the United States District Court for the District of Northern California, Docket No. C 02-4106 JSW, see http://www.climatelawsuit.org), litigation on implementation of Amendment 37 (renewable energy portfolio requirements), and Xcel Energy cases pending before the Colorado Public Utilities Commission.
3) Discretionary Services A. Administration:
Administrative time reporting to operating departments is discretionary. B. Advisory Services: All other advisory services are discretionary. C. Litigation Services:
All other litigation is discretionary, such as Amicus Curiae (friend of the court) participation in significant cases.
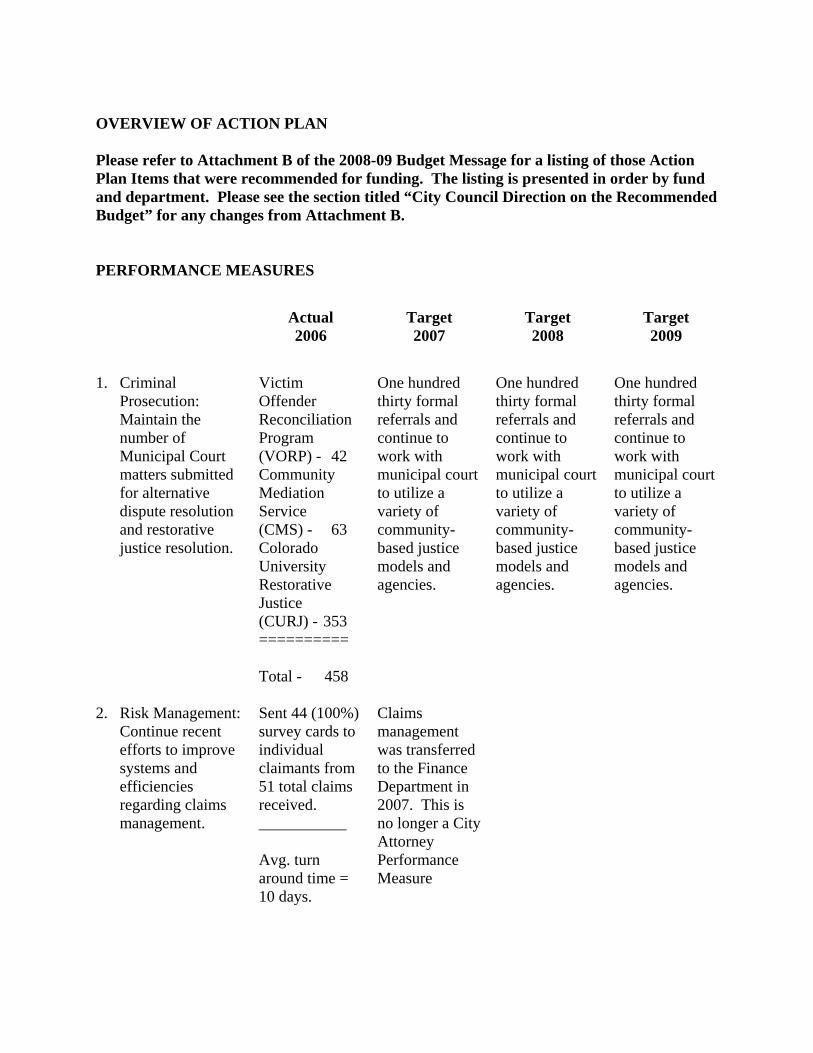
OVERVIEW OF ACTION PLAN Please refer to Attachment B of the 2008-09 Budget Message for a listing of those Action Plan Items that were recommended for funding. The listing is presented in order by fund and department. Please see the section titled “City Council Direction on the Recommended Budget” for any changes from Attachment B. PERFORMANCE MEASURES
Actual 2006
Target 2007
Target 2008
Target 2009
1. Criminal
Prosecution: Maintain the number of Municipal Court matters submitted for alternative dispute resolution and restorative justice resolution.
Victim Offender Reconciliation Program (VORP) - 42 Community Mediation Service (CMS) - 63 Colorado University Restorative Justice (CURJ) - 353 ========== Total - 458
One hundred thirty formal referrals and continue to work with municipal court to utilize a variety of community-based justice models and agencies.
One hundred thirty formal referrals and continue to work with municipal court to utilize a variety of community-based justice models and agencies.
One hundred thirty formal referrals and continue to work with municipal court to utilize a variety of community-based justice models and agencies.
2. Risk Management:
Continue recent efforts to improve systems and efficiencies regarding claims management.
Sent 44 (100%) survey cards to individual claimants from 51 total claims received. ___________ Avg. turn around time = 10 days.
Claims management was transferred to the Finance Department in 2007. This is no longer a City Attorney Performance Measure
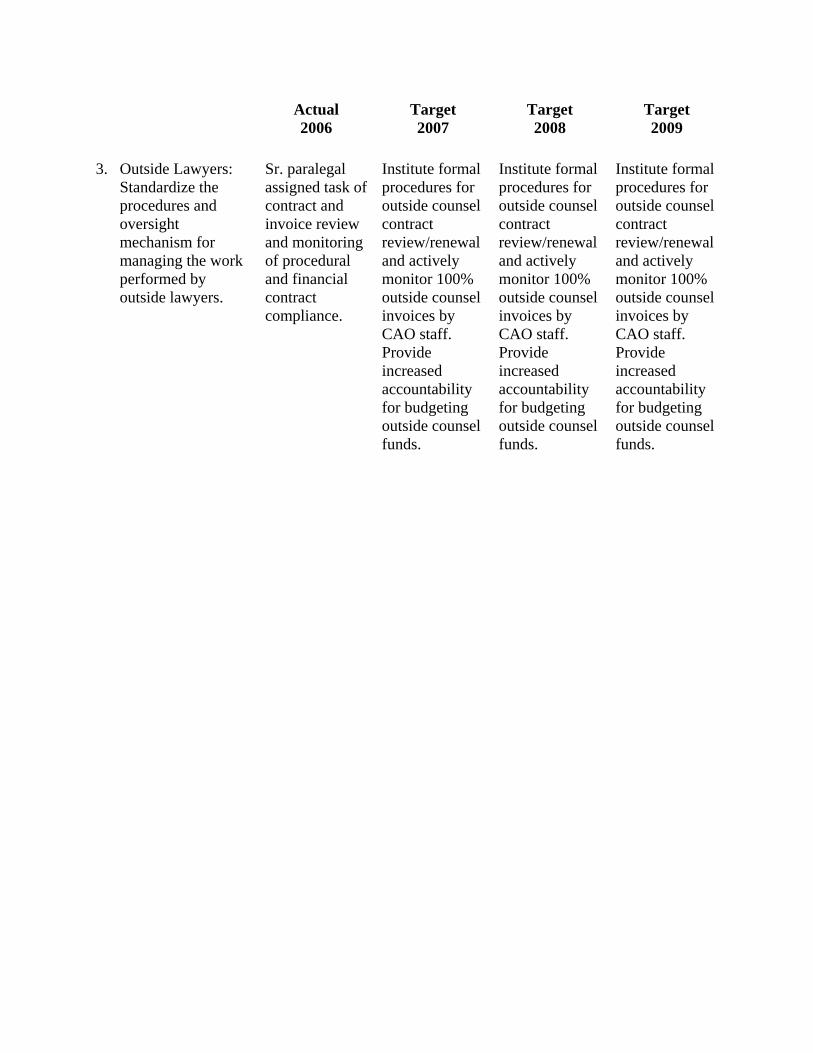
Actual 2006
Target 2007
Target 2008
Target 2009
3. Outside Lawyers:
Standardize the procedures and oversight mechanism for managing the work performed by outside lawyers.
Sr. paralegal assigned task of contract and invoice review and monitoring of procedural and financial contract compliance.
Institute formal procedures for outside counsel contract review/renewal and actively monitor 100% outside counsel invoices by CAO staff. Provide increased accountability for budgeting outside counsel funds.
Institute formal procedures for outside counsel contract review/renewal and actively monitor 100% outside counsel invoices by CAO staff. Provide increased accountability for budgeting outside counsel funds.
Institute formal procedures for outside counsel contract review/renewal and actively monitor 100% outside counsel invoices by CAO staff. Provide increased accountability for budgeting outside counsel funds.
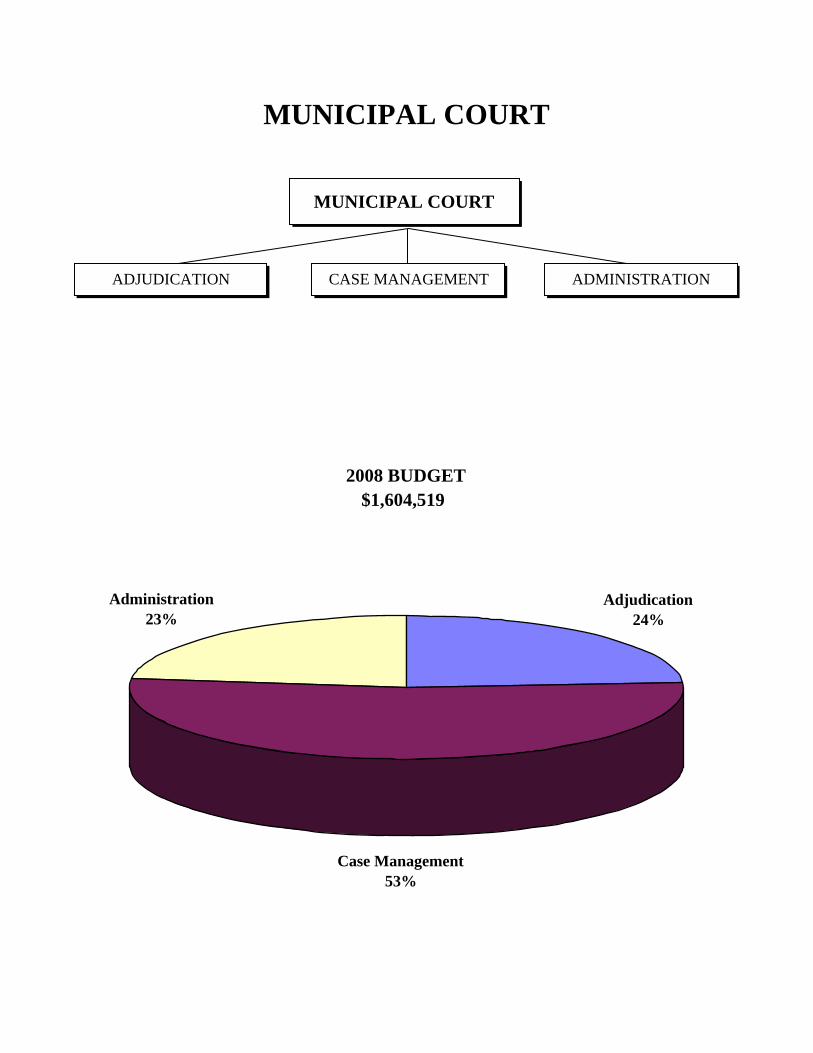
MUNICIPAL COURT
2008 BUDGET$1,604,519
MUNICIPAL COURT
ADJUDICATION
Adjudication24%
Administration23%
Case Management53%
CASE MANAGEMENT ADMINISTRATION
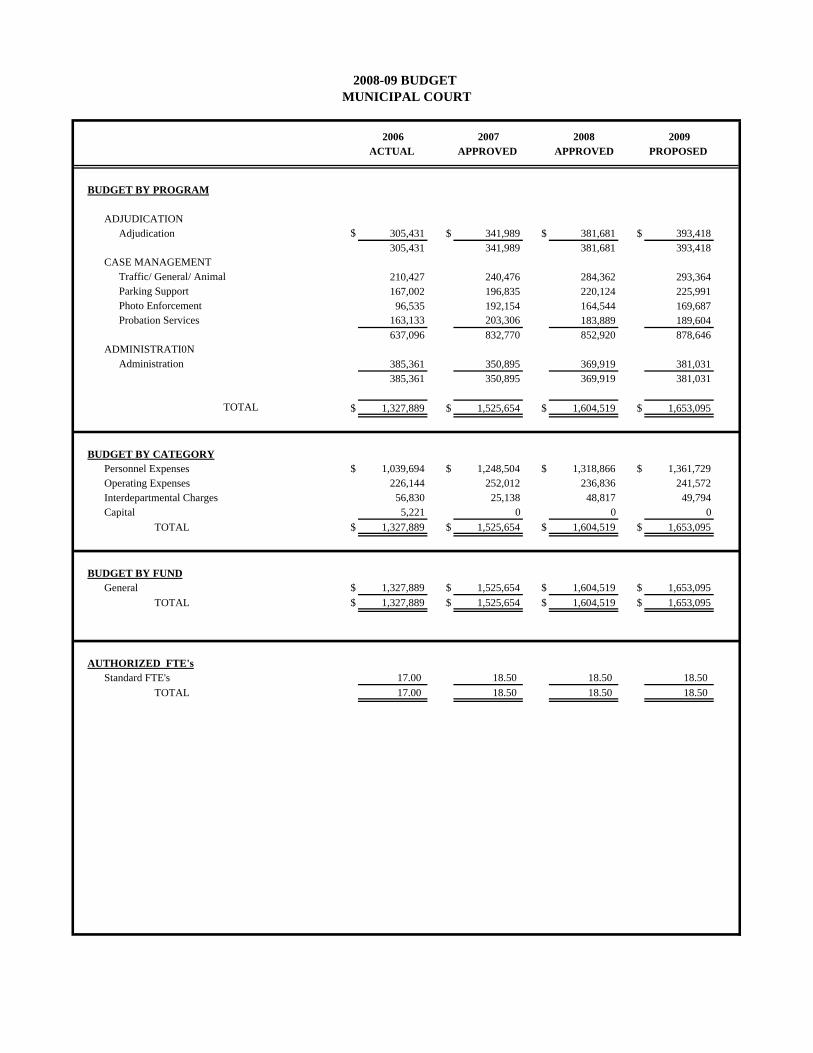
2006 2007 2008 2009ACTUAL APPROVED APPROVED PROPOSED
BUDGET BY PROGRAM
ADJUDICATIONAdjudication $ 305,431 $ 341,989 $ 381,681 $ 393,418
305,431 341,989 381,681 393,418CASE MANAGEMENT
Traffic/ General/ Animal 210,427 240,476 284,362 293,364Parking Support 167,002 196,835 220,124 225,991Photo Enforcement 96,535 192,154 164,544 169,687Probation Services 163,133 203,306 183,889 189,604
637,096 832,770 852,920 878,646ADMINISTRATI0N
Administration 385,361 350,895 369,919 381,031385,361 350,895 369,919 381,031
TOTAL $ 1,327,889 $ 1,525,654 $ 1,604,519 $ 1,653,095
BUDGET BY CATEGORYPersonnel Expenses $ 1,039,694 $ 1,248,504 $ 1,318,866 $ 1,361,729Operating Expenses 226,144 252,012 236,836 241,572Interdepartmental Charges 56,830 25,138 48,817 49,794Capital 5,221 0 0 0
TOTAL $ 1,327,889 $ 1,525,654 $ 1,604,519 $ 1,653,095
BUDGET BY FUNDGeneral $ 1,327,889 $ 1,525,654 $ 1,604,519 $ 1,653,095
TOTAL $ 1,327,889 $ 1,525,654 $ 1,604,519 $ 1,653,095
AUTHORIZED FTE'sStandard FTE's 17.00 18.50 18.50 18.50
TOTAL 17.00 18.50 18.50 18.50
2008-09 BUDGET MUNICIPAL COURT
2008-09 BUDGET MUNICIPAL COURT
MISSION STATEMENT The mission of the Boulder Municipal Court is:
• To provide an accessible, efficient, and impartial forum for all participants in cases involving municipal ordinance violations;
• To adjudicate cases consistent with the law, the needs of the individual, and the community’s values; and
• To promote public trust in both the justice system and local government. BUSINESS PLAN NARRATIVE The Court has continued to manage service demands through significant changes in operations. Cross-training as well as workload assessments remain key activities used to address delivery of services. Responding to routine procedures by capitalizing on technology is also one of the Court’s major objectives. Initial Strategic Planning efforts clearly identified management of parking violations as the most seriously deficient service standard in the department. Much of the focus of the past three years has involved replacing a twenty-four year old parking system with a state-of-the-art, web-based, industry leading software solution. Completed project phases include the ability to make payments and file appeals on-line through e-commerce. The Court has improved this deficient service area and parking activities now meet minimal acceptable service standards. While the Court has worked very hard to preserve service standards of core functions; resource reductions inevitably have had a negative impact on some aspects of service delivery. The Court has experienced a lower performance in several service areas including accuracy of data entry, and financial/budgetary reporting and analysis. These service standard reductions have been largely invisible to the public. Over the past four years the Court has been operating at the absolute minimum staffing and funding level necessary to maintain current functions. Court staff is very challenged by the demands inherent in the performance of their increased level of duties. Administrative personnel are also challenged by the increased oversight and audit trails necessary to manage new technologies used to gather revenue such as e-payment and expanded collection interfaces. Department leaders have taken on additional responsibilities with increased workload in an effort to meet the short-term budget limitations. At current staffing levels, there is no room to further increase the obligations of staff or the department’s leadership to manage the Court’s workload. The result is that administration service standards have decreased and options are being explored internally to attempt to improve the service delivery without adding additional staff.
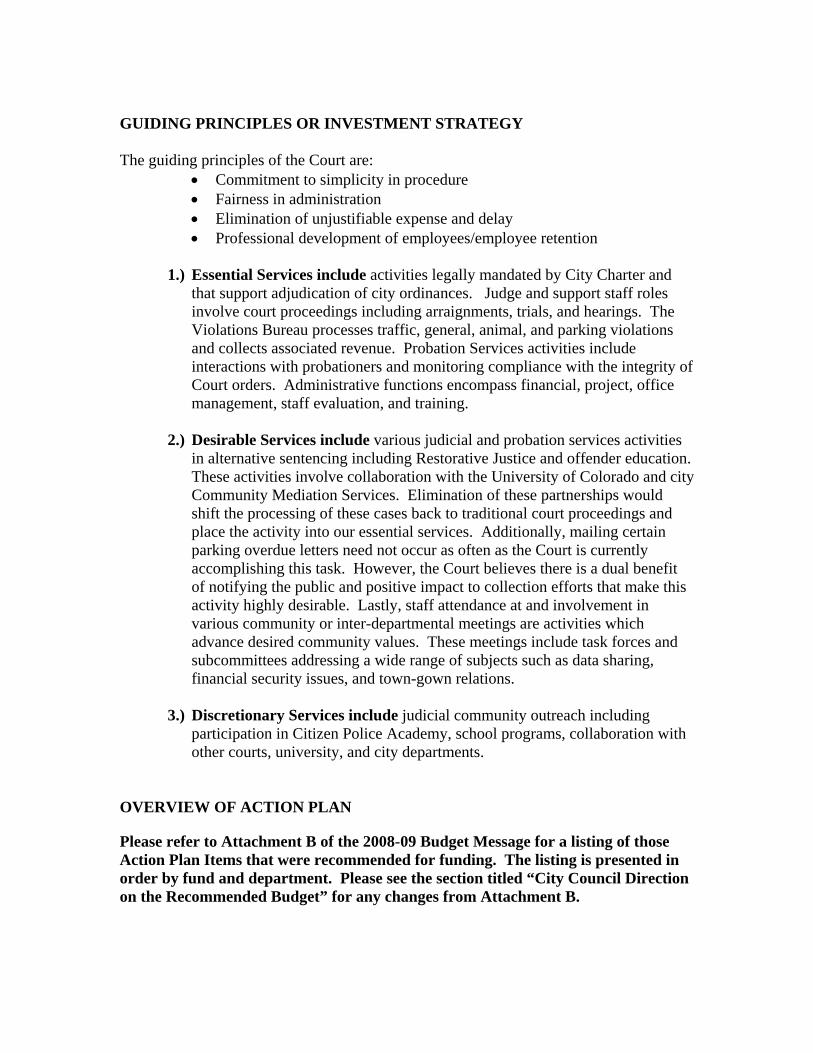
GUIDING PRINCIPLES OR INVESTMENT STRATEGY The guiding principles of the Court are:
• Commitment to simplicity in procedure • Fairness in administration • Elimination of unjustifiable expense and delay • Professional development of employees/employee retention
1.) Essential Services include activities legally mandated by City Charter and
that support adjudication of city ordinances. Judge and support staff roles involve court proceedings including arraignments, trials, and hearings. The Violations Bureau processes traffic, general, animal, and parking violations and collects associated revenue. Probation Services activities include interactions with probationers and monitoring compliance with the integrity of Court orders. Administrative functions encompass financial, project, office management, staff evaluation, and training.
2.) Desirable Services include various judicial and probation services activities
in alternative sentencing including Restorative Justice and offender education. These activities involve collaboration with the University of Colorado and city Community Mediation Services. Elimination of these partnerships would shift the processing of these cases back to traditional court proceedings and place the activity into our essential services. Additionally, mailing certain parking overdue letters need not occur as often as the Court is currently accomplishing this task. However, the Court believes there is a dual benefit of notifying the public and positive impact to collection efforts that make this activity highly desirable. Lastly, staff attendance at and involvement in various community or inter-departmental meetings are activities which advance desired community values. These meetings include task forces and subcommittees addressing a wide range of subjects such as data sharing, financial security issues, and town-gown relations.
3.) Discretionary Services include judicial community outreach including
participation in Citizen Police Academy, school programs, collaboration with other courts, university, and city departments.
OVERVIEW OF ACTION PLAN Please refer to Attachment B of the 2008-09 Budget Message for a listing of those Action Plan Items that were recommended for funding. The listing is presented in order by fund and department. Please see the section titled “City Council Direction on the Recommended Budget” for any changes from Attachment B.
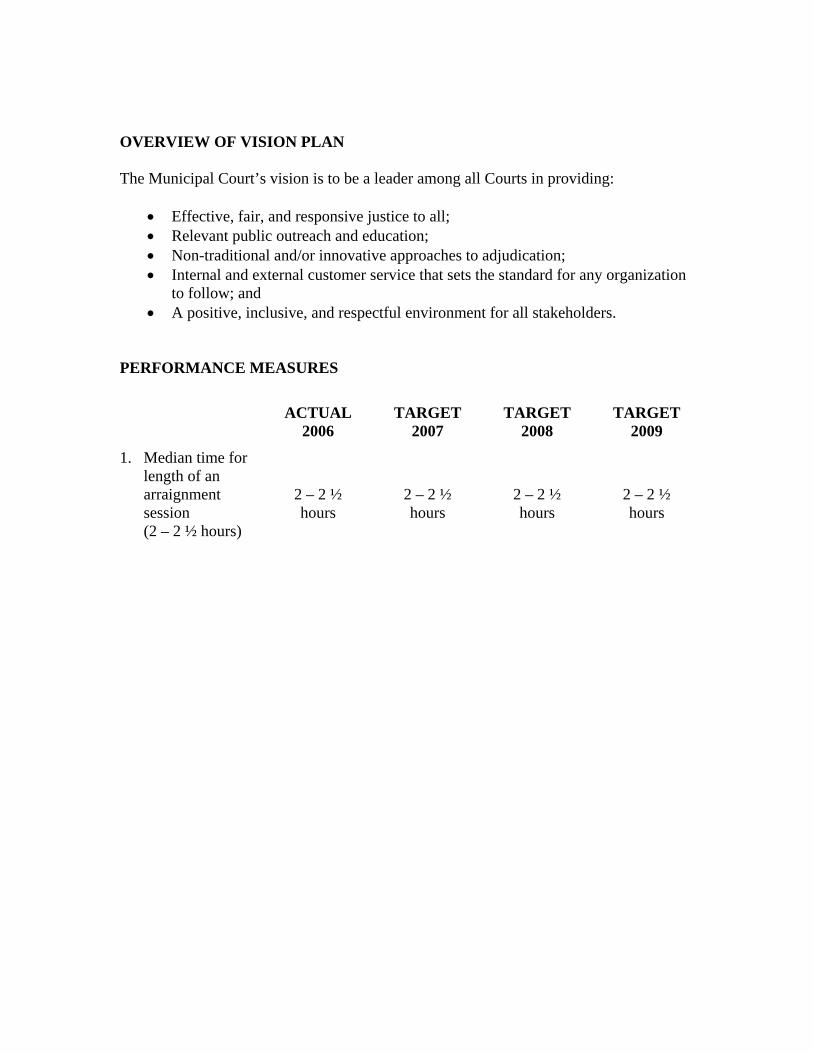
OVERVIEW OF VISION PLAN The Municipal Court’s vision is to be a leader among all Courts in providing:
• Effective, fair, and responsive justice to all; • Relevant public outreach and education; • Non-traditional and/or innovative approaches to adjudication; • Internal and external customer service that sets the standard for any organization
to follow; and • A positive, inclusive, and respectful environment for all stakeholders.
PERFORMANCE MEASURES ACTUAL
2006 TARGET
2007 TARGET
2008 TARGET
2009
1. Median time for length of an arraignment session (2 – 2 ½ hours)
2 – 2 ½ hours
2 – 2 ½ hours
2 – 2 ½ hours
2 – 2 ½ hours
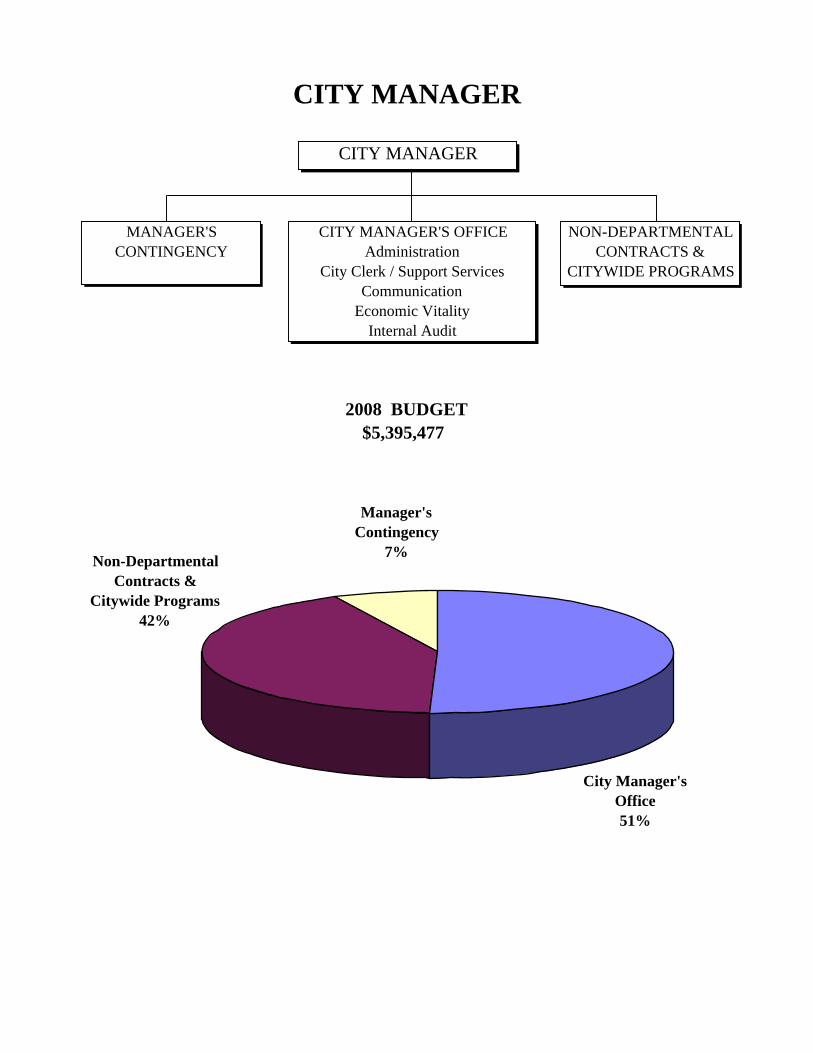
CITY MANAGER
2008 BUDGET$5,395,477
CITY MANAGER
NON-DEPARTMENTAL CONTRACTS &
CITYWIDE PROGRAMS
CITY MANAGER'S OFFICEAdministration
City Clerk / Support ServicesCommunication
Economic VitalityInternal Audit
MANAGER'S CONTINGENCY
Non-Departmental Contracts &
Citywide Programs42%
Manager's Contingency
7%
City Manager's Office51%
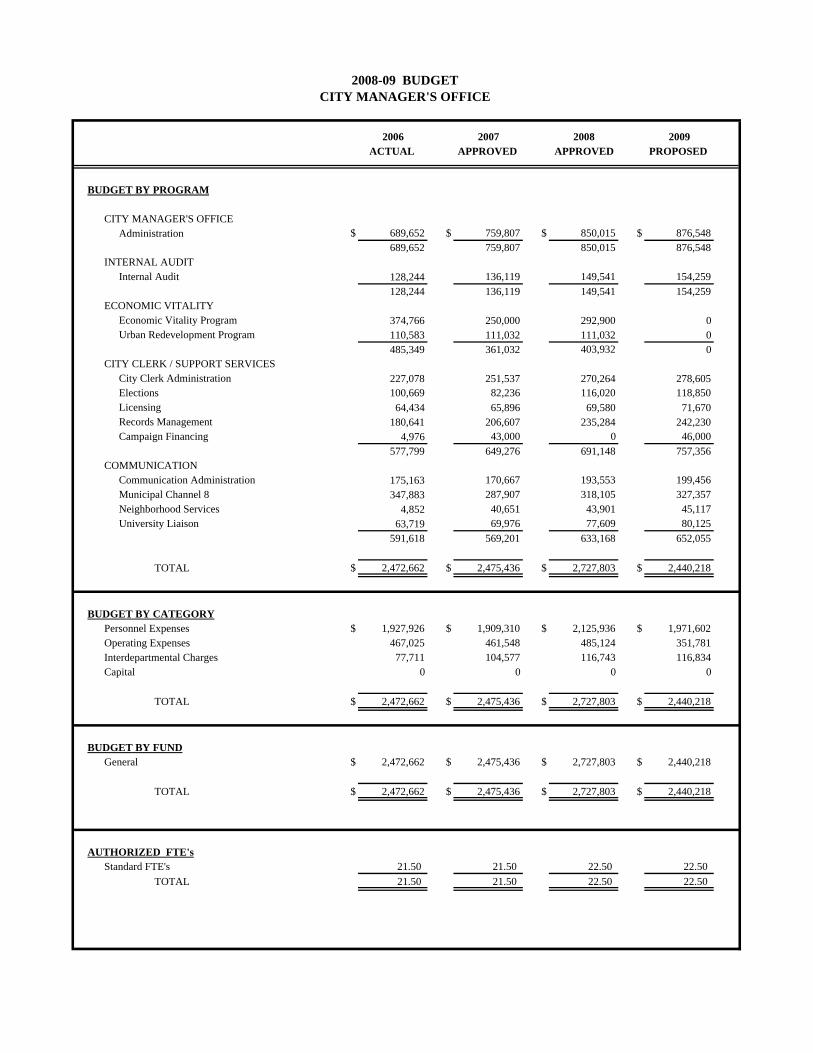
2006 2007 2008 2009ACTUAL APPROVED APPROVED PROPOSED
BUDGET BY PROGRAM
CITY MANAGER'S OFFICEAdministration $ 689,652 $ 759,807 $ 850,015 $ 876,548
689,652 759,807 850,015 876,548INTERNAL AUDIT
Internal Audit 128,244 136,119 149,541 154,259128,244 136,119 149,541 154,259
ECONOMIC VITALITYEconomic Vitality Program 374,766 250,000 292,900 0Urban Redevelopment Program 110,583 111,032 111,032 0
485,349 361,032 403,932 0CITY CLERK / SUPPORT SERVICES
City Clerk Administration 227,078 251,537 270,264 278,605Elections 100,669 82,236 116,020 118,850Licensing 64,434 65,896 69,580 71,670Records Management 180,641 206,607 235,284 242,230Campaign Financing 4,976 43,000 0 46,000
577,799 649,276 691,148 757,356COMMUNICATION
Communication Administration 175,163 170,667 193,553 199,456Municipal Channel 8 347,883 287,907 318,105 327,357Neighborhood Services 4,852 40,651 43,901 45,117University Liaison 63,719 69,976 77,609 80,125
591,618 569,201 633,168 652,055
TOTAL $ 2,472,662 $ 2,475,436 $ 2,727,803 $ 2,440,218
BUDGET BY CATEGORYPersonnel Expenses $ 1,927,926 $ 1,909,310 $ 2,125,936 $ 1,971,602Operating Expenses 467,025 461,548 485,124 351,781Interdepartmental Charges 77,711 104,577 116,743 116,834Capital 0 0 0 0
TOTAL $ 2,472,662 $ 2,475,436 $ 2,727,803 $ 2,440,218
BUDGET BY FUNDGeneral $ 2,472,662 $ 2,475,436 $ 2,727,803 $ 2,440,218
TOTAL $ 2,472,662 $ 2,475,436 $ 2,727,803 $ 2,440,218
AUTHORIZED FTE'sStandard FTE's 21.50 21.50 22.50 22.50
TOTAL 21.50 21.50 22.50 22.50
2008-09 BUDGET CITY MANAGER'S OFFICE
2008-09 BUDGET CITY MANAGER’S OFFICE
MISSION STATEMENT We provide timely, accurate, accessible information and the administration and execution of policies, representing the City of Boulder with integrity, professionalism and progressive leadership.
• The mission of the City Manager’s Office is to provide professional leadership in the administration and execution of policies and objectives formulated by City Council, the development and recommendation of alternative solutions to community problems for Council consideration, the planning and development of new programs to meet future needs of the city, and government through excellent customer service.
• The Policy Advisor’s Office provides staff representation and communication on
intergovernmental matters, and guidance on cross-departmental city policies, on behalf of the City Council and all city departments, in order to further city goals and advance understandings and mutually beneficial alliances with other governmental organizations.
• Internal Audit provides audit and consulting information and analysis for city of
Boulder management to promote effective and efficient operations of city departments and programs, to promote effective management controls, to protect the assets of the city of Boulder, and to ensure the integrity of administration and execution of policies.
• Communication provides information, education and resources to the Boulder
community, its stakeholders and city staff and policymakers in an effort to support an open government, build a healthy and informed community, and ensure excellent customer service.
• Boulder Channel 8 provides current and accessible community and government
information to viewers so they may participate more fully and effectively in the creation and preservation of Boulder's unique quality of life.
• Support Services/City Clerk’s Office provides program administration, excellent customer service, guidance and access to information and resources, and various levels of support for our diverse customers to foster informed, open and participatory government while meeting legal requirements.
• Economic Vitality supports an economic environment of partnership, collaboration, innovation and opportunity with the private sector to achieve a vibrant and healthy economy.
BUSINESS PLAN NARRATIVE City Manager’s Office The City Manager’s Office (CMO) provides an array of services and programs to the organization and the community. The ongoing challenge is to maintain quality customer service as we recover from prior year reductions and the ambitious work plan driven by Council goals and complex initiatives. As part of recovering and working with the business plan to evaluate services in our fiscally constrained budget, the City Clerk/Support Service Division is undertaking an effort to review its services and explore re-structuring/re-organizing where opportunities to maximize effectiveness present themselves. This effort should be complete by October of 2007. A direct outcome of utilizing the business plan and prioritizing services has led to reallocation of resources and the ability to restore the Assistant to the City Manager position. The Assistant to the City Manager performs a variety of complex assignments including: policy analysis and recommendations, report preparation and drafting correspondence, project research and coordination, management of Hotline and Council Correspondence. This was a transfer of 1 FTE from Finance in 2007. The City Manager’s Office continues to utilize interns for Economic Vitality, Communication, University Liaison and has extended the program to Channel 8. The internship program continues to be invaluable in that we are able to attract talented resources that address issues/work that we would have otherwise had to discontinue. Internal Audit An RFP for Fraud Hotline services has been issued and responded to by five vendors. The Fraud Hotline implementation schedule will depend on a vendor selected, contract completion process, and the availability of personnel to implement the hotline. Once implemented an evaluation will be conducted and any on-going issues will be brought forward in the 2009 budget. Policy Advisor Having completed the Washington Elementary School project in 2006, the Policy Advisor's Office was able to increase its service level on intergovernmental policy matters. Beyond providing the usual support for effective city participation with its regional partners, this also included specific intergovernmental policy efforts relating to the proposed multi-modal improvements to the US 36 corridor, exploration of regional revenue sharing possibilities, and analyzing and facilitating consideration of requests made of the city's education excise tax fund. While the Policy Advisor's federal legislative lobbying efforts continue at an appropriate service level standard, insufficient resources dedicated toward lobbying at the state legislature continue to account for below service level standards of representation for the city on state legislative matters. This resource deficiency is significantly less problematic during the eight-month
period when the state legislature is not in session and when only limited demands are placed on the Policy Advisor by interim committee work and proactive planning for the next session. Economic Vitality The city of Boulder established its Economic Vitality Program in 2003 to reinforce the importance of economic health to our overall quality of life and to demonstrate the city’s support of business and economic development. Funding was approved for five years from the Boulder Urban Renewal Authority (BURA) Bond reserves and a base budget of $250,000 per year for five years was established (with carry over of unused funds each year) continuing until the end of 2007. In 2005, the City of Boulder teamed with the Boulder Economic Council and brought forth the Economic Vitality work plan. In 2006 a Business Liaison intern were hired, and a Business Incentive pilot program was implemented. Over the past few years, the Economic Vitality program has evolved from an account with funds for economic development related needs to an active and visible city program with staff providing customized services to Boulder businesses, ranging from small businesses, to local start ups, to larger companies. Proactive city efforts include a business retention and expansion program, community outreach, and “troubleshooting” assistance with city-related issues. All efforts have received positive feedback from the business community indicating that this is a useful and needed program that is essential to the city’s sustainability. Economic Vitality staff is scheduled to update Council at its August 14, 2007 study session on the status of the Economic Vitality Work Program and the business incentives pilot program. Just as the Economic Vitality Program begins to take shape and gain momentum, the original funding is expiring. On-going funding for this effort is critical in order to grow revenues essential to funding basic and enhanced city services. It is projected that there will be a fund balance of $542,478 at the end of 2007. This fund balance, if authorized by Council, will extend the program through 2008. Ongoing economic vitality funding past 2008 would require City Council approval of a general fund source in the 2009 budget. Communication The Communication division has absorbed the reduction of a Director of Communication, a .5 FTE administrative assistant and three FTE’s at Channel 8. In light of this, the Communication team seeks to provide openness, accuracy, consistency and accessibility of local government information, resources and relationships. Key projects this group has been involved with in the last year include: South Platte wells, community dialogue, alcohol issues, diversity issues, CMO internship program, emergency preparedness, crisis communication, prairie dog issues, economic vitality, public meeting notification, West Nile Virus, and ongoing efforts to provide neighborhood services, media relations, communication resources, Channel 8 programming and university relations. The continually growing list of high profile city issues, such as the ones listed
above requiring strategic and coordinated communication to the public, presents an ever growing challenge to an understaffed Communication division. With limited resources and an ever-changing media landscape, the CMO communication team has used creativity and ingenuity to increase opportunities for getting out the city's messages. By using existing formats and re-engineering current tools using the city's Web site, Municipal Channel 8 and the local media, city departments have been able to send their messages about their programs consistently, frequently and effectively. Examples of this include upgrading Channel 8's Update Boulder program to include interviews with City Council; using the city's weekly News Briefs to create Channel 8's What's Happening Boulder program and to enhance the city's electronic bulletin board on Channel 8; hiring non-paid interns to track media coverage, work on special research projects (including researching community newsletters across the Front Range), and assist in producing some of the Channel 8 programs as listed above; and working more closely with local reporters (through twice-monthly Manager Media Meetings) and public information staff (through monthly or quarterly meetings between PIOs) across the organization to create communication plans and strategies in a more proactive, less reactive way. The ability to provide more direct city-to-resident communication through webstreaming, podcasting, print and television will be limited by the corresponding staff increase necessary to accomplish this. Licensing The Licensing Clerk, in addition to day-to-day operations, continues to work with the various committees on the on-going effort to support Council Resolution No. 960. With one full year of the implementation of the new Beverages Licensing Authority (BLA) rules and the information sharing effort between departments, the work of the liquor licensing office increased approximately 18 percent with no additional funding or increase in FTE. The increase is directly related to an increase in the number of applications and the changes brought forward by the new BLA rules. Overall, the rules call for a higher level of investigation and information sharing when preparing New, Transfer, Change-Alter-Modification and Renewals for approval. Following are examples of volume and time demand to administer liquor licensing: In 2000 there were 8 new licenses, in 2006 that number increased to 20. In 2000, the estimated time to handle a new application over a three month timeline was 20 hours. In 2006, this increased to 27 hours due to the additional investigation detail that is now presented to the BLA to consider when approving or denying a license. In 2000, the licensing office handled a total of 31 applications; 19 Show Cause Hearings and 0 Renewal Hearings. In 2006, this increased to 32 applications, 25 Show Cause Hearings and 11 Renewal Hearings or a 26% increase in volume. In 2000, this office handled 33 Special Event Liquor licenses; this increased to 51 in 2006 and continues to grow in 2007.
Elections The cost of elections continues to grow as a direct outcome of the requirements outlined in the Help America Vote Act (HAVA). Our election costs have doubled in the last year as HAVA requires additional levels of outreach to voters and improved security provisions. Even with the progress we have made there are still areas that continue to be impacted by the reductions from previous years. The organization has managed to address as much as it can by strategic planning, leveraging technology and reallocating resources in the context of the business of the day with marginal decrease in service standards. At this time any additional funding in operating goes to the growing cost to provide service at the current level vs. being able to apply it to improving service standards. GUIDING PRINCIPLES OR INVESTMENT STRATEGY In support of our community, open government and the city of Boulder municipal organization with progressive leadership. The City Manager’s Prioritization is as follows:
1.) City Administration (Essential): Management and administration to the municipal organization and support to City Council, as well as items mandated by local charter or state and federal law. These include the City Manager, Primary City Clerk responsibilities, Elections, Records Management, and Liquor and miscellaneous licensing.
2.) Administration & Programs (Desirable): Whereas these services are not
essential to the safety, health and welfare of the city, they are highly desirable in the underlying value that they bring to the community, indirect cost savings to the organization and effectiveness of the City Manager. These include Deputy City Managers, City Manager Support, Policy Advisor, Communication, Municipal Channel 8, Internal Audit and Economic Vitality.
3.) Additional Administration (Discretionary): This area includes additional administration that is not tied to charter or local and state law. This area of the budget has sustained a 100 percent reduction.
OVERVIEW OF ACTION PLAN Please refer to Attachment B of the 2008-09 Budget Message for a listing of those Action Plan Items that were recommended for funding. The listing is presented in order by fund and department. Please see the section titled “City Council Direction on the Recommended Budget” for any changes from Attachment B.
OVERVIEW OF VISION PLAN Policy Advisor: The Policy Advisor is the city’s primary staff resource for outstanding representation and communication on intergovernmental matters, and guidance on cross-departmental polices. The action steps necessary in order to achieve this vision are as follows:
• Identifying options for regular administrative support for correspondence, meeting planning, Website updates, editing and document production. Formalize roles and expectations.
• Restructuring federal lobbying contracts to increase departmental commitments and intergovernmental partnerships, thus potentially lowering contract costs to the city and increasing overall financial return to the city.
• Increasing resources devoted to state lobbying efforts as deemed necessary. Options to consider include contracting with full-time lobbyist and/or hiring an intern to assist with the legislative monitoring and reporting during the legislative session.
Internal Audit: Provide world-class internal audit and consulting services to city of Boulder management in support of achieving City Council Goals. This is accomplished by implementing best practices appropriate for small audit shops (one to three auditors) described in the most recent National Association of Local Government Auditors Benchmarking and Best Practices Survey. These Best Practices include:
• Audit Committee reviews audit work plan, and strongly supports early involvement of the audit department.
• Audit department has developed a marketing product (in our case Audit Report Summary), which encourages management to see audit as an advisor/consultant and supports the audit mission.
• Audit asks customers to value audit after engagement completed. • Audit response action items date logged and tracked and non-compliance reported
to Audit Committee. • Audit Committee / Senior Management actively supports the audit resolution
process and takes corrective action in a reasonable period of time. • Audits focus on business process (economy and efficiency and effectiveness) in
addition to management controls. • Audit Department educates/facilitates/equips operating department for self-
assessment of organizational risks. • Use computer-assisted audit techniques and tools to assist in audit analysis and
testing.
• Provide a hotline for employees to report suspected fraud, waste and abuse for independent analysis by Internal Audit.
Communication: The city’s Communication team seeks to provide openness, accuracy and accessibility to local government information, resources and relationships by employing skilled and experienced professionals; fostering a work environment of empowerment, authority and balance; and encouraging personal and professional growth, collaborative approaches to projects, and clear, concise and truthful communication with each other and the public. To provide this, the city’s Communication team needs to be fully-staffed, fully-funded and fully-supported. This could be best accomplished by:
• The transfer of Neighborhood services to the city’s community sustainability effort
• Shifting in resources to provide outreach to underserved, under participating groups in the community
• Increasing staffing to provide additional outreach, communications tools and programming
• Funding for Channel 8 operating so efforts can return inward to provide unfiltered government message.
Boulder Municipal Channel 8: The Boulder Channel 8 vision provides world-class, timely information with a unified voice of the city organization to the people of Boulder, city of Boulder employees and to anyone in the world with an interest in Boulder. This information will accurately portray and reflect city goals such as affordable housing, community sustainability, and retention and expansion of business investment and opportunities in Boulder. This could be best accomplished by:
• Incorporating evolving broadcasting technologies such as wireless technology. • Staffing and funding to meet current and expanding programming requests. • Capability to broadcast from the Emergency Operations Center.
Support Services/City Clerk’s Office: The city of Boulder Support Services/City Clerk’s Office is a national model of municipal government that encourages active public involvement and is responsive to the needs of its diverse citizens. The actions to achieve this vision are as follows:
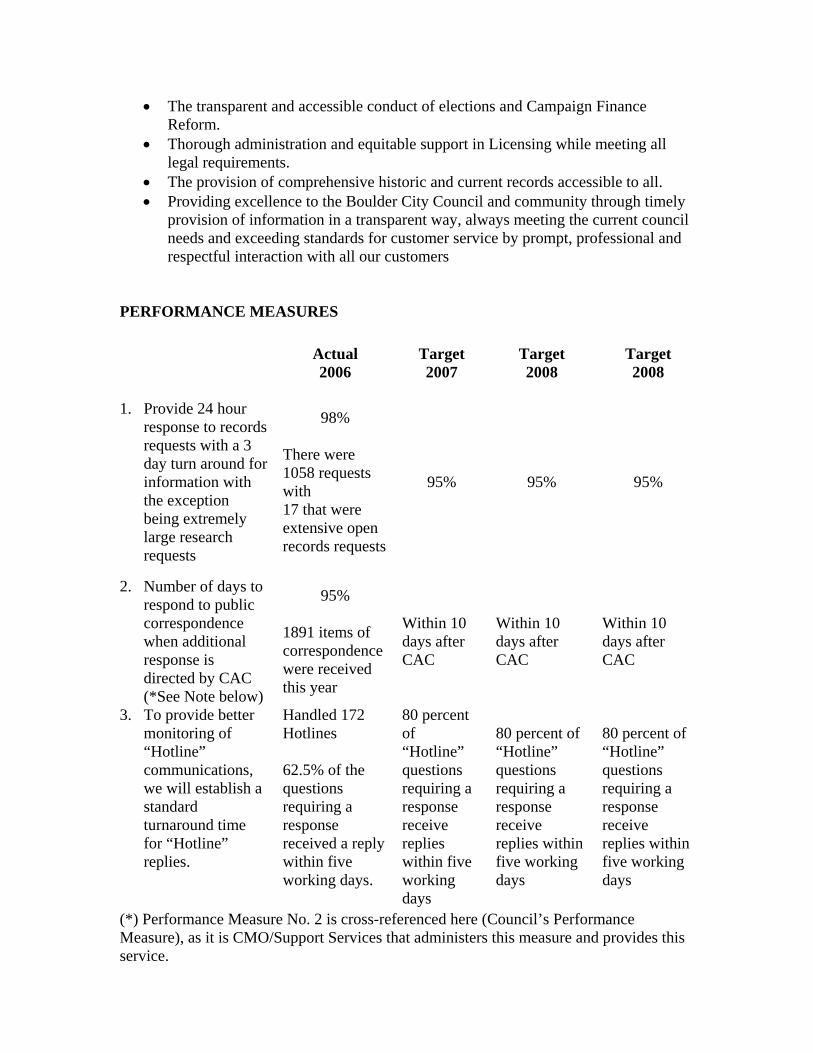
• The transparent and accessible conduct of elections and Campaign Finance Reform.
• Thorough administration and equitable support in Licensing while meeting all legal requirements.
• The provision of comprehensive historic and current records accessible to all. • Providing excellence to the Boulder City Council and community through timely
provision of information in a transparent way, always meeting the current council needs and exceeding standards for customer service by prompt, professional and respectful interaction with all our customers
PERFORMANCE MEASURES
Actual 2006
Target 2007
Target 2008
Target 2008
1. Provide 24 hour response to records requests with a 3 day turn around for information with the exception being extremely large research requests
98% There were 1058 requests with 17 that were extensive open records requests
95% 95% 95%
2. Number of days to respond to public correspondence when additional response is directed by CAC
(*See Note below)
95% 1891 items of correspondence were received this year
Within 10 days after CAC
Within 10 days after CAC
Within 10 days after CAC
3. To provide better monitoring of “Hotline” communications, we will establish a standard turnaround time for “Hotline” replies.
Handled 172 Hotlines 62.5% of the questions requiring a response received a reply within five working days.
80 percent of “Hotline” questions requiring a response receive replies within five working days
80 percent of “Hotline” questions requiring a response receive replies within five working days
80 percent of “Hotline” questions requiring a response receive replies within five working days
(*) Performance Measure No. 2 is cross-referenced here (Council’s Performance Measure), as it is CMO/Support Services that administers this measure and provides this service.
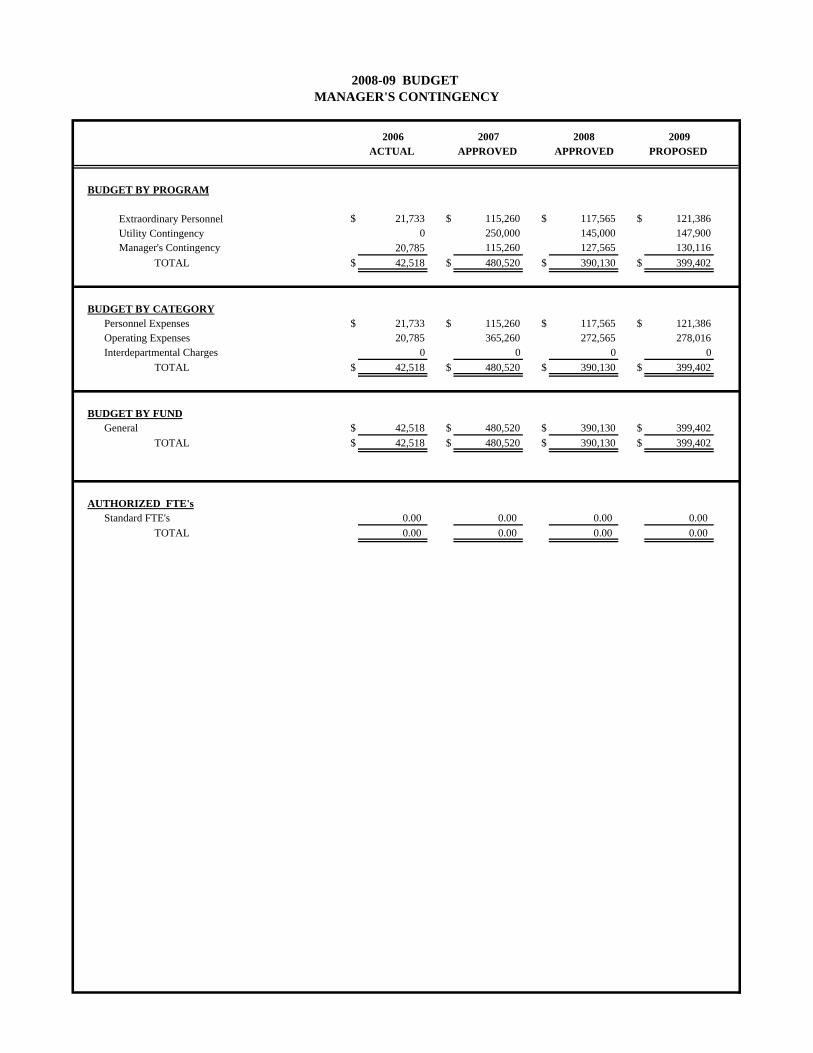
2006 2007 2008 2009ACTUAL APPROVED APPROVED PROPOSED
BUDGET BY PROGRAM
Extraordinary Personnel $ 21,733 $ 115,260 $ 117,565 $ 121,386Utility Contingency 0 250,000 145,000 147,900Manager's Contingency 20,785 115,260 127,565 130,116
TOTAL $ 42,518 $ 480,520 $ 390,130 $ 399,402
BUDGET BY CATEGORYPersonnel Expenses $ 21,733 $ 115,260 $ 117,565 $ 121,386Operating Expenses 20,785 365,260 272,565 278,016Interdepartmental Charges 0 0 0 0
TOTAL $ 42,518 $ 480,520 $ 390,130 $ 399,402
BUDGET BY FUNDGeneral $ 42,518 $ 480,520 $ 390,130 $ 399,402
TOTAL $ 42,518 $ 480,520 $ 390,130 $ 399,402
AUTHORIZED FTE'sStandard FTE's 0.00 0.00 0.00 0.00
TOTAL 0.00 0.00 0.00 0.00
2008-09 BUDGET MANAGER'S CONTINGENCY
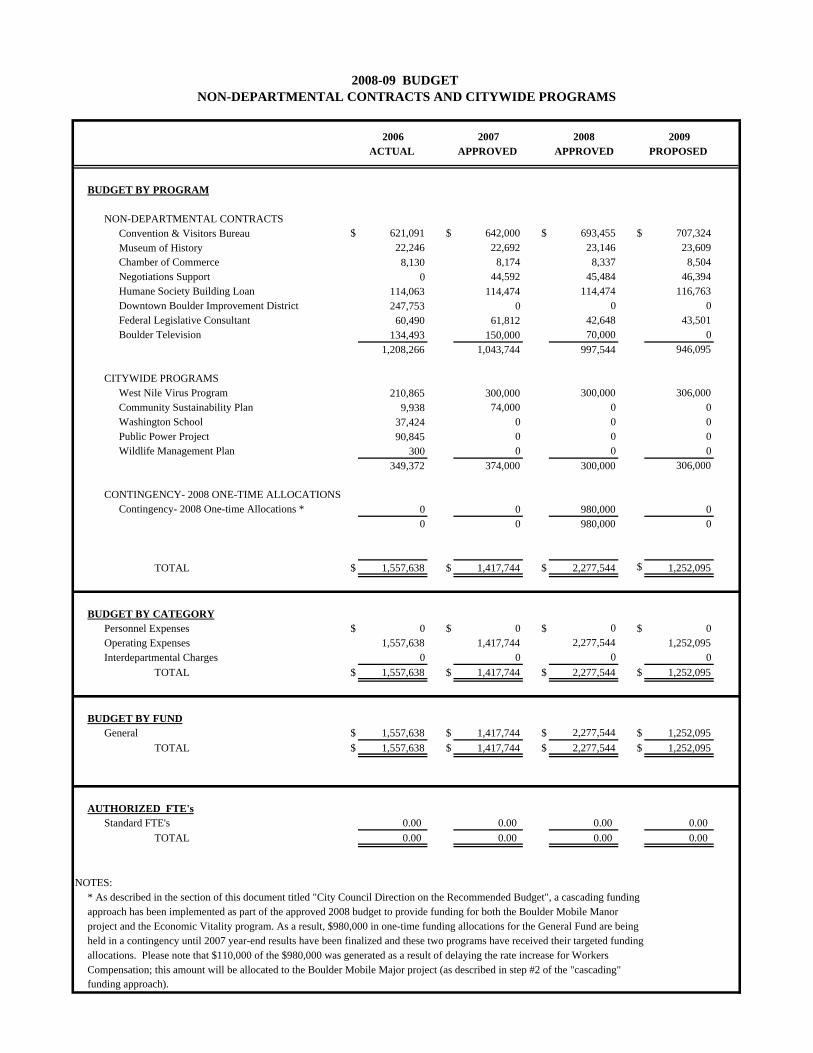
2006 2007 2008 2009ACTUAL APPROVED APPROVED PROPOSED
BUDGET BY PROGRAM
NON-DEPARTMENTAL CONTRACTSConvention & Visitors Bureau $ 621,091 $ 642,000 $ 693,455 $ 707,324Museum of History 22,246 22,692 23,146 23,609Chamber of Commerce 8,130 8,174 8,337 8,504Negotiations Support 0 44,592 45,484 46,394Humane Society Building Loan 114,063 114,474 114,474 116,763Downtown Boulder Improvement District 247,753 0 0 0Federal Legislative Consultant 60,490 61,812 42,648 43,501Boulder Television 134,493 150,000 70,000 0
1,208,266 1,043,744 997,544 946,095
CITYWIDE PROGRAMSWest Nile Virus Program 210,865 300,000 300,000 306,000Community Sustainability Plan 9,938 74,000 0 0Washington School 37,424 0 0 0Public Power Project 90,845 0 0 0Wildlife Management Plan 300 0 0 0
349,372 374,000 300,000 306,000
CONTINGENCY- 2008 ONE-TIME ALLOCATIONSContingency- 2008 One-time Allocations * 0 0 980,000 0
0 0 980,000 0
TOTAL $ 1,557,638 $ 1,417,744 $ 2,277,544 $ 1,252,095
BUDGET BY CATEGORYPersonnel Expenses $ 0 $ 0 $ 0 $ 0Operating Expenses 1,557,638 1,417,744 2,277,544 1,252,095Interdepartmental Charges 0 0 0 0
TOTAL $ 1,557,638 $ 1,417,744 $ 2,277,544 $ 1,252,095
BUDGET BY FUNDGeneral $ 1,557,638 $ 1,417,744 $ 2,277,544 $ 1,252,095
TOTAL $ 1,557,638 $ 1,417,744 $ 2,277,544 $ 1,252,095
AUTHORIZED FTE'sStandard FTE's 0.00 0.00 0.00 0.00
TOTAL 0.00 0.00 0.00 0.00
NOTES:* As described in the section of this document titled "City Council Direction on the Recommended Budget", a cascading fundingapproach has been implemented as part of the approved 2008 budget to provide funding for both the Boulder Mobile Manorproject and the Economic Vitality program. As a result, $980,000 in one-time funding allocations for the General Fund are beingheld in a contingency until 2007 year-end results have been finalized and these two programs have received their targeted fundingallocations. Please note that $110,000 of the $980,000 was generated as a result of delaying the rate increase for WorkersCompensation; this amount will be allocated to the Boulder Mobile Major project (as described in step #2 of the "cascading"funding approach).
2008-09 BUDGET NON-DEPARTMENTAL CONTRACTS AND CITYWIDE PROGRAMS
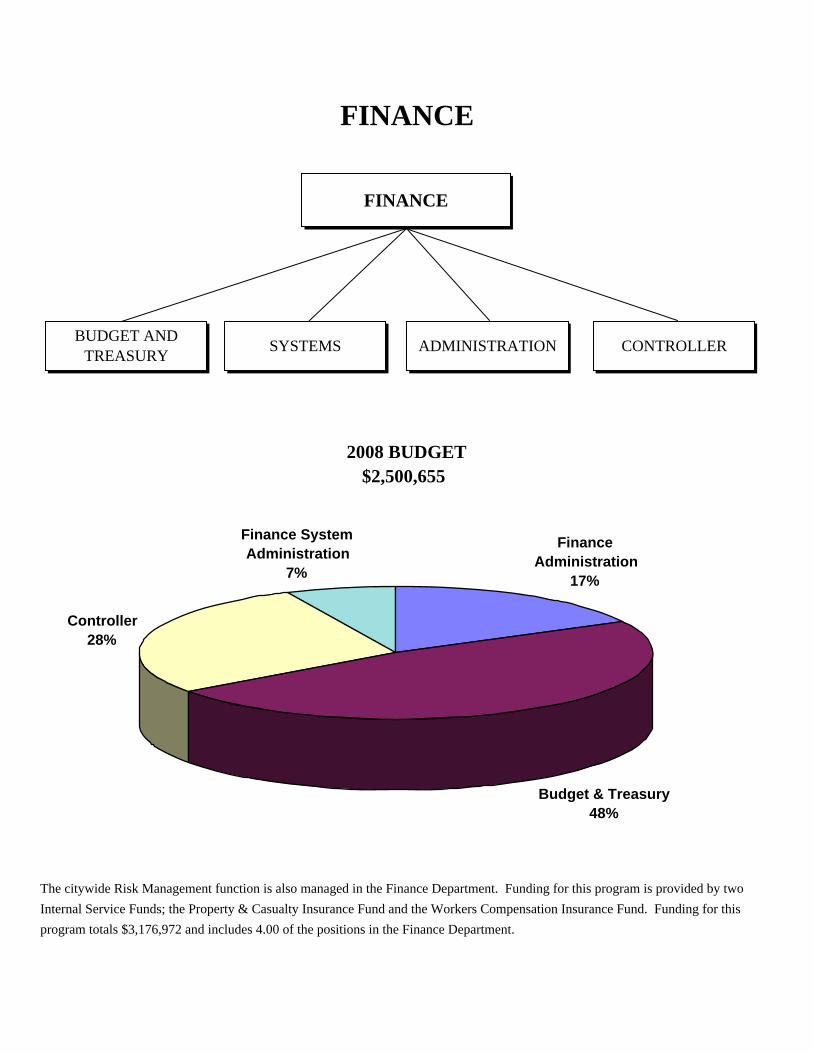
FINANCE
2008 BUDGET$2,500,655
The citywide Risk Management function is also managed in the Finance Department. Funding for this program is provided by twoInternal Service Funds; the Property & Casualty Insurance Fund and the Workers Compensation Insurance Fund. Funding for thisprogram totals $3,176,972 and includes 4.00 of the positions in the Finance Department.
FINANCE
CONTROLLERSYSTEMSBUDGET AND TREASURY
Controller28%
Finance System Administration
7%
Finance Administration
17%
Budget & Treasury48%
ADMINISTRATION
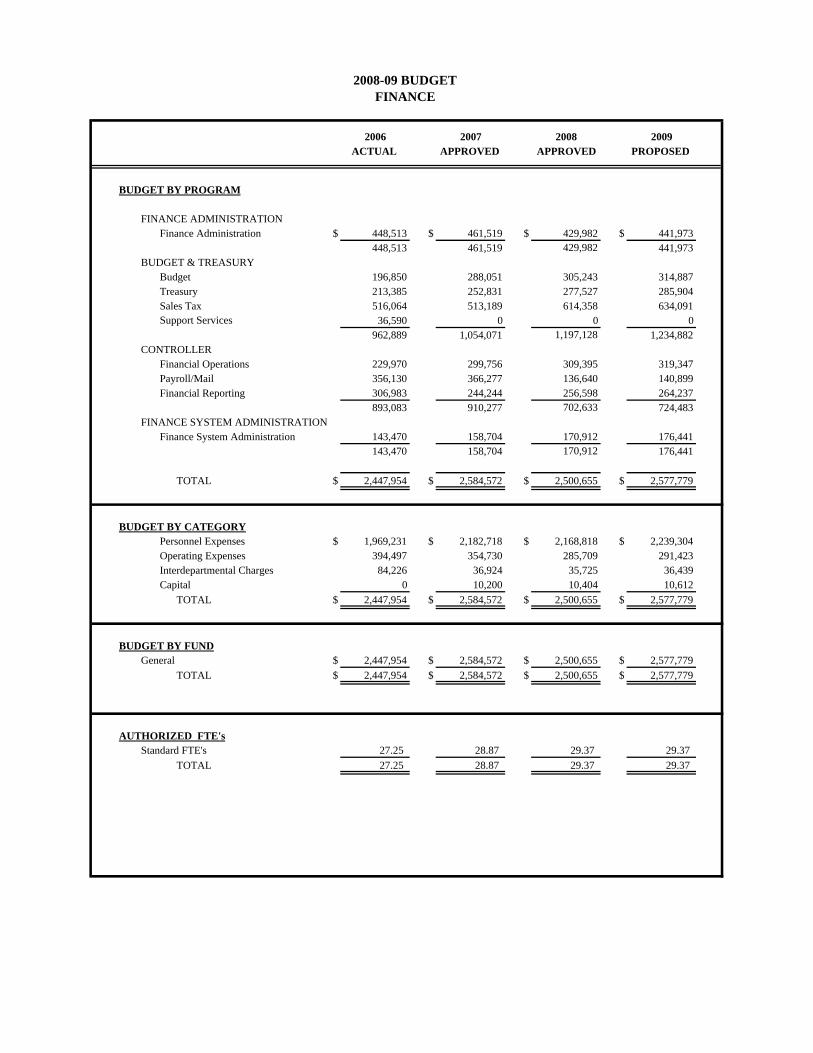
2006 2007 2008 2009ACTUAL APPROVED APPROVED PROPOSED
BUDGET BY PROGRAM
FINANCE ADMINISTRATIONFinance Administration $ 448,513 $ 461,519 $ 429,982 $ 441,973
448,513 461,519 429,982 441,973BUDGET & TREASURY
Budget 196,850 288,051 305,243 314,887Treasury 213,385 252,831 277,527 285,904Sales Tax 516,064 513,189 614,358 634,091Support Services 36,590 0 0 0
962,889 1,054,071 1,197,128 1,234,882CONTROLLER
Financial Operations 229,970 299,756 309,395 319,347Payroll/Mail 356,130 366,277 136,640 140,899Financial Reporting 306,983 244,244 256,598 264,237
893,083 910,277 702,633 724,483FINANCE SYSTEM ADMINISTRATION
Finance System Administration 143,470 158,704 170,912 176,441143,470 158,704 170,912 176,441
TOTAL $ 2,447,954 $ 2,584,572 $ 2,500,655 $ 2,577,779
BUDGET BY CATEGORYPersonnel Expenses $ 1,969,231 $ 2,182,718 $ 2,168,818 $ 2,239,304Operating Expenses 394,497 354,730 285,709 291,423Interdepartmental Charges 84,226 36,924 35,725 36,439Capital 0 10,200 10,404 10,612
TOTAL $ 2,447,954 $ 2,584,572 $ 2,500,655 $ 2,577,779
BUDGET BY FUNDGeneral $ 2,447,954 $ 2,584,572 $ 2,500,655 $ 2,577,779
TOTAL $ 2,447,954 $ 2,584,572 $ 2,500,655 $ 2,577,779
AUTHORIZED FTE'sStandard FTE's 27.25 28.87 29.37 29.37
TOTAL 27.25 28.87 29.37 29.37
2008-09 BUDGET FINANCE
2008-09 BUDGET FINANCE DEPARTMENT
MISSION STATEMENT The mission of the Finance Department is to provide responsive, professional and ethical administrative and fiscal services to meet the needs of the public, the city council, and all departments of the city. We value and maintain business practices that further the City’s goals for sustainability. Specific services provided by the Finance Department include: long-range financial planning and budgeting, accounting/auditing, financial reporting, risk management, accounts payable, accounts receivable, investment and cash management, debt issuance and management, purchasing, assessments, revenue collection, tax enforcement, and financial analyses. BUSINESS PLAN NARRATIVE The Finance Department provides central financial services necessary for the financial operations of the city of Boulder. We provide these services for all departments in the city while also carrying out specific responsibilities assigned in the City Charter and state or federal laws. The Finance Department has a history of minimizing discretionary costs while meeting legal requirements. Over the years, processes have been modified and new computer systems implemented to add efficiency both within the Finance Department and for users in the other city departments. Beginning with the 2006 budget, the business plan was used to categorize and prioritize services. As a result, it became apparent that some of the essential and all of the desirable services in the department were bordering on inadequate. To address this, it was determined that all remaining discretionary services should be eliminated and the resources should be reallocated to essential and desirable services. As a result, essential and desirable services now meet standards. For example, resources in Finance were reallocated to provide support for the old hire fire and police pension programs, the debt management programs, staffing of the governmental accounting functions, staffing of long-range financial planning, additional quantitative and qualitative analysis, and improving the operations area of the department. During 2007, an organizational evaluation resulted in a restructuring of the citywide payroll and risk management functions. The payroll function was transferred to the Human Resources Department from Finance in order to provide a better alignment of all employment services. All aspects of the citywide Risk Management function were consolidated in the Finance Department to provide a more comprehensive and coordinated approach. This included reclassifying a vacant position to hire the city’s first Risk Manager who is responsible for coordinating a variety of programs for all city departments including insurance administration, liability and risk mitigation, workers’ compensation, property and casualty administration, safety training, Americans with
Disabilities Act (ADA), loss prevention programs and the employee wellness program. The risk management division also has responsibility for the day to day management of both the property and casualty and worker’s compensation funds. GUIDING PRINCIPLES AND/OR INVESTMENT STRATEGY
1.) Essential Services include those financial/budgetary functions that are legally mandated by federal or state law, City Charter or generally accepted accounting requirements for governmental agencies. Specifically, this service category reflects those processes which ensure the sound fiscal management of the municipal organization, such as strategic planning and budgeting, debt issuance and management, financial reporting and accounting, purchasing, assessments, treasury management, and collections. These programs represent 92% of the appropriation and 87% of the staffing in the general fund portion of Finance.
2.) Desirable Services reflect services that provide positive interaction with the
public, efficient and effective business practices, provide financial information so departments can make sound fiscal decisions, enhance internal customer service, increase citywide efficiency and effectiveness, or generate cost savings due to centralization. Services in this category include Property and Casualty Insurance Fund Management, financial inquiry and query reporting, the information center in the municipal building, and central mail services. This category currently represents 8% of the appropriations and 13% of the staff in general fund portion of Finance.
3.) Discretionary Services on an ongoing basis have been eliminated in Finance.
Resources were consolidated and transferred to meet acceptable service levels in the essential and desirable programs of the department. Project work that is requested that falls into this category is accomplished by either assigning finance staff members on an ad hoc basis or asking the requesting department to outsource the project.
OVERVIEW OF ACTION PLAN The Finance Department is in the process of developing a Strategic Plan which is projected to be completed by the end of 2007 or early in 2008. In the interim, the Action Plan includes those immediate needs that are above the personnel and nonpersonnel expense (NPE) increase for the 2007-2012 budget planning period. This includes one-time expenses to overfill for the Accounting Manager’s position since she will be retiring at the end of 2008. This is a crucial position and will allow time for adequate training and succession planning. The Finance Department has recommended that an additional sales/use tax auditor be hired in 2008 in order to meet standard practices for a municipality the same size as the City of Boulder.
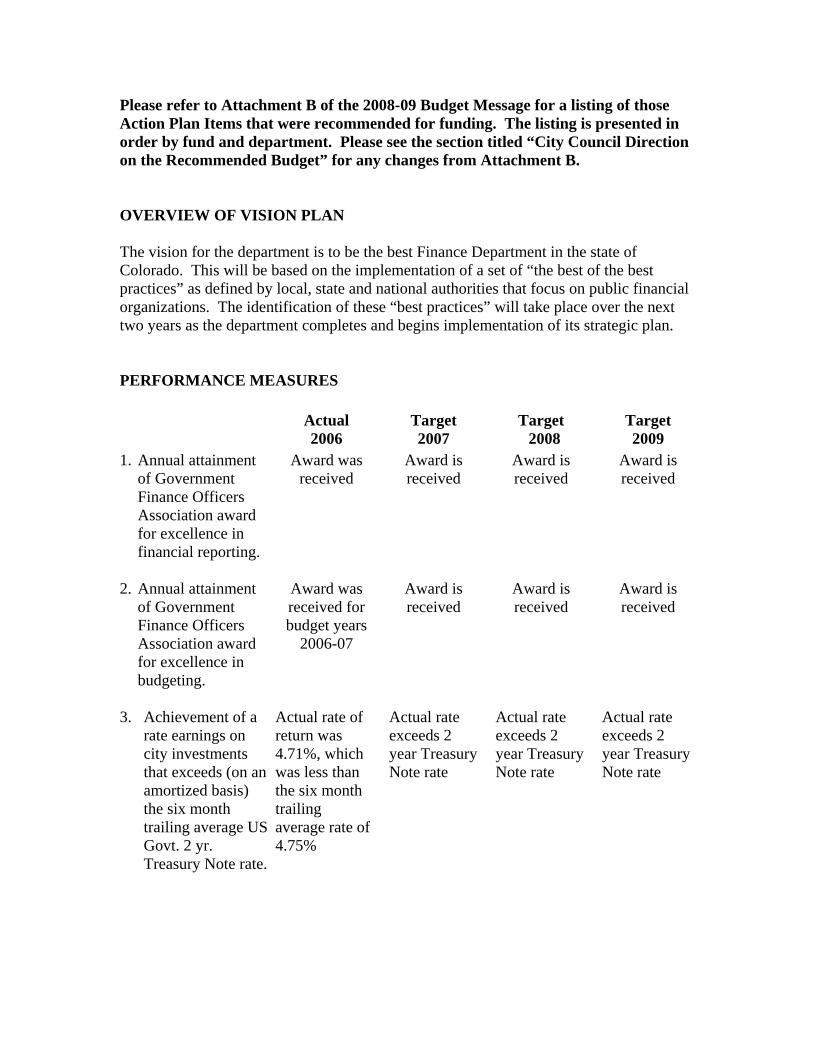
Please refer to Attachment B of the 2008-09 Budget Message for a listing of those Action Plan Items that were recommended for funding. The listing is presented in order by fund and department. Please see the section titled “City Council Direction on the Recommended Budget” for any changes from Attachment B. OVERVIEW OF VISION PLAN The vision for the department is to be the best Finance Department in the state of Colorado. This will be based on the implementation of a set of “the best of the best practices” as defined by local, state and national authorities that focus on public financial organizations. The identification of these “best practices” will take place over the next two years as the department completes and begins implementation of its strategic plan. PERFORMANCE MEASURES
Actual 2006
Target 2007
Target 2008
Target 2009
1. Annual attainment of Government Finance Officers Association award for excellence in financial reporting.
Award was received
Award is received
Award is received
Award is received
2. Annual attainment of Government Finance Officers Association award for excellence in budgeting.
Award was received for budget years
2006-07
Award is received
Award is received
Award is received
3. Achievement of a rate earnings on city investments that exceeds (on an amortized basis) the six month trailing average US Govt. 2 yr. Treasury Note rate.
Actual rate of return was 4.71%, which was less than the six month trailing average rate of 4.75%
Actual rate exceeds 2 year Treasury Note rate
Actual rate exceeds 2 year Treasury Note rate
Actual rate exceeds 2 year Treasury Note rate
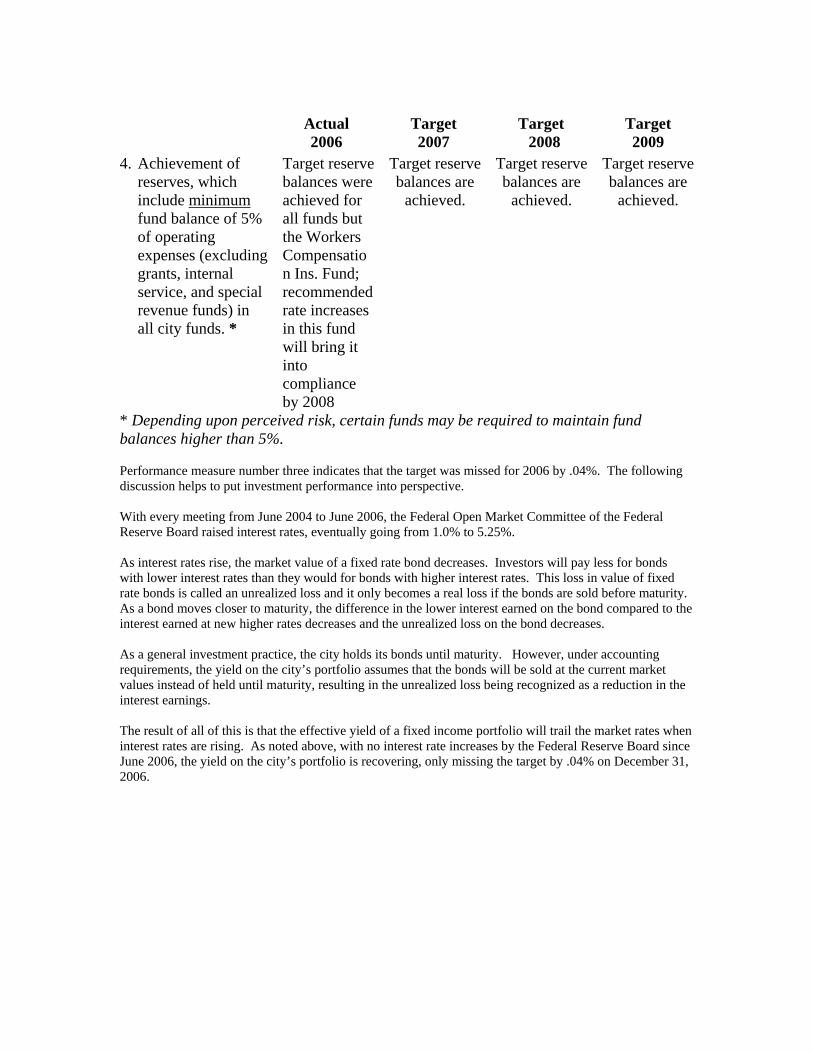
Actual 2006
Target 2007
Target 2008
Target 2009
4. Achievement of reserves, which include minimum fund balance of 5% of operating expenses (excluding grants, internal service, and special revenue funds) in all city funds. *
Target reserve balances were achieved for all funds but the Workers Compensation Ins. Fund; recommended rate increases in this fund will bring it into compliance by 2008
Target reserve balances are
achieved.
Target reserve balances are
achieved.
Target reserve balances are
achieved.
* Depending upon perceived risk, certain funds may be required to maintain fund balances higher than 5%. Performance measure number three indicates that the target was missed for 2006 by .04%. The following discussion helps to put investment performance into perspective. With every meeting from June 2004 to June 2006, the Federal Open Market Committee of the Federal Reserve Board raised interest rates, eventually going from 1.0% to 5.25%. As interest rates rise, the market value of a fixed rate bond decreases. Investors will pay less for bonds with lower interest rates than they would for bonds with higher interest rates. This loss in value of fixed rate bonds is called an unrealized loss and it only becomes a real loss if the bonds are sold before maturity. As a bond moves closer to maturity, the difference in the lower interest earned on the bond compared to the interest earned at new higher rates decreases and the unrealized loss on the bond decreases. As a general investment practice, the city holds its bonds until maturity. However, under accounting requirements, the yield on the city’s portfolio assumes that the bonds will be sold at the current market values instead of held until maturity, resulting in the unrealized loss being recognized as a reduction in the interest earnings. The result of all of this is that the effective yield of a fixed income portfolio will trail the market rates when interest rates are rising. As noted above, with no interest rate increases by the Federal Reserve Board since June 2006, the yield on the city’s portfolio is recovering, only missing the target by .04% on December 31, 2006.
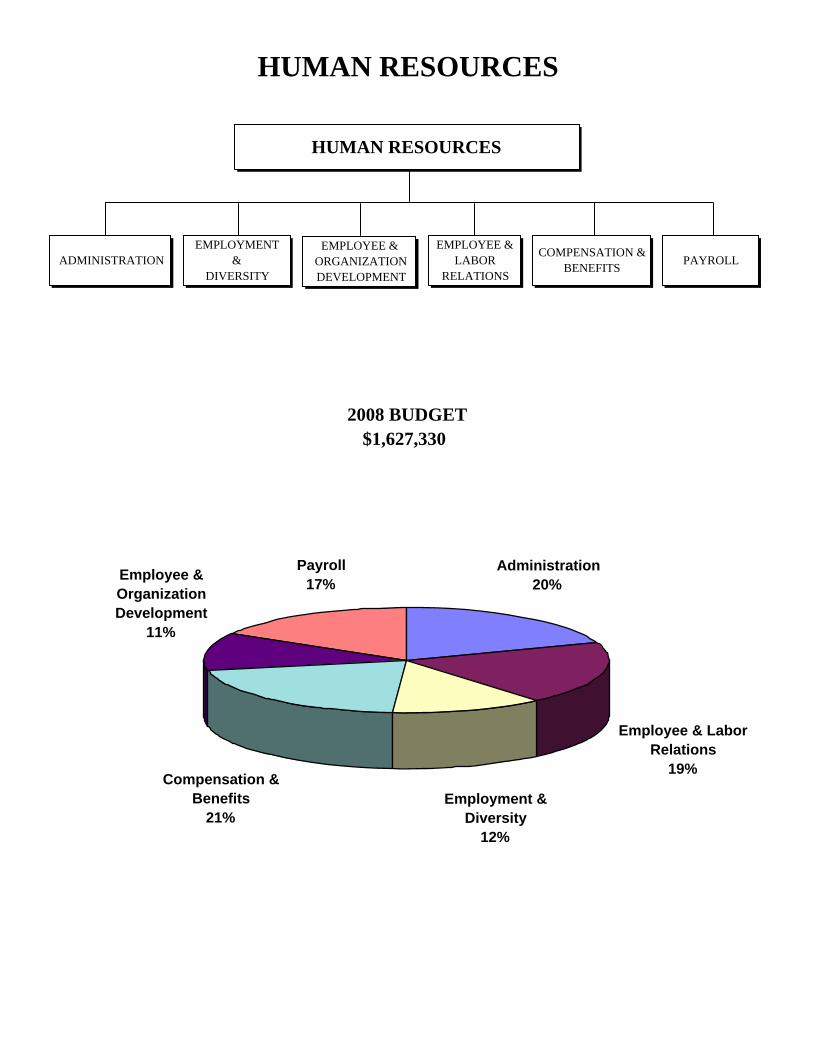
HUMAN RESOURCES
2008 BUDGET$1,627,330
HUMAN RESOURCES
ADMINISTRATIONEMPLOYMENT
&DIVERSITY
EMPLOYEE & ORGANIZATION DEVELOPMENT
EMPLOYEE &LABOR
RELATIONS
COMPENSATION & BENEFITS
Administration20%
Payroll17%Employee &
Organization Development
11%
Compensation & Benefits
21%Employment &
Diversity12%
Employee & Labor Relations
19%
PAYROLL
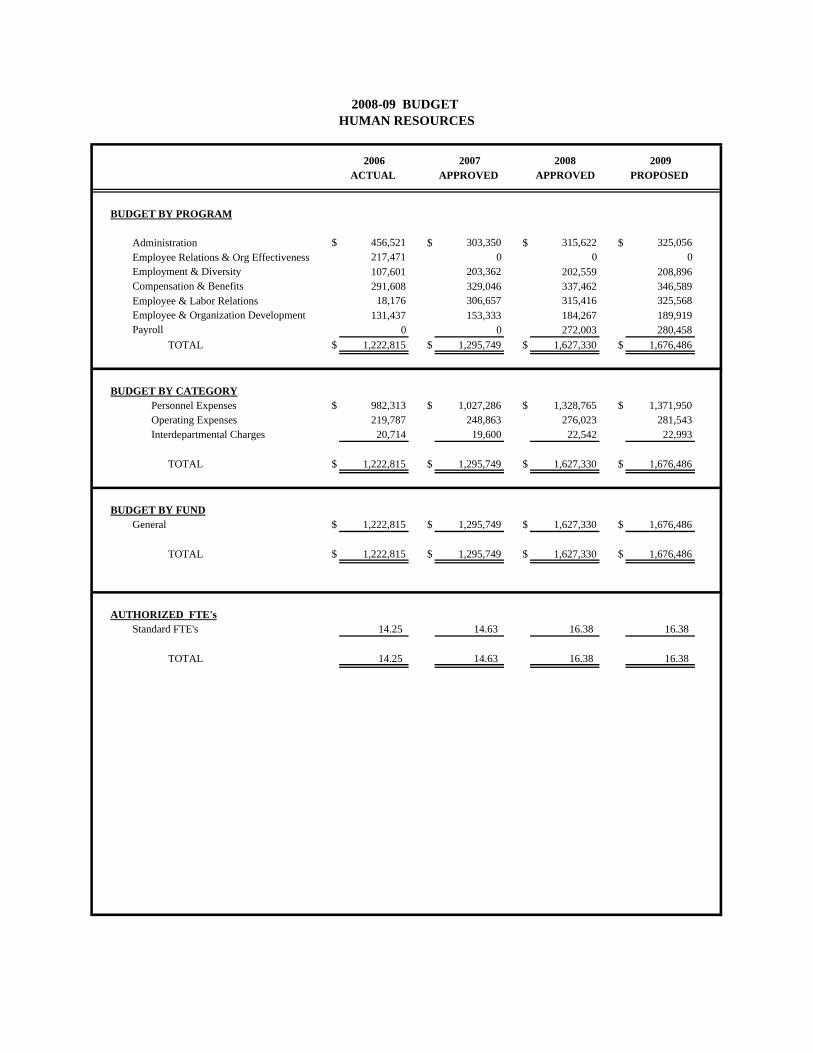
2006 2007 2008 2009ACTUAL APPROVED APPROVED PROPOSED
BUDGET BY PROGRAM
Administration $ 456,521 $ 303,350 $ 315,622 $ 325,056Employee Relations & Org Effectiveness 217,471 0 0 0Employment & Diversity 107,601 203,362 202,559 208,896Compensation & Benefits 291,608 329,046 337,462 346,589Employee & Labor Relations 18,176 306,657 315,416 325,568Employee & Organization Development 131,437 153,333 184,267 189,919Payroll 0 0 272,003 280,458
TOTAL $ 1,222,815 $ 1,295,749 $ 1,627,330 $ 1,676,486
BUDGET BY CATEGORYPersonnel Expenses $ 982,313 $ 1,027,286 $ 1,328,765 $ 1,371,950Operating Expenses 219,787 248,863 276,023 281,543Interdepartmental Charges 20,714 19,600 22,542 22,993
TOTAL $ 1,222,815 $ 1,295,749 $ 1,627,330 $ 1,676,486
BUDGET BY FUNDGeneral $ 1,222,815 $ 1,295,749 $ 1,627,330 $ 1,676,486
TOTAL $ 1,222,815 $ 1,295,749 $ 1,627,330 $ 1,676,486
AUTHORIZED FTE'sStandard FTE's 14.25 14.63 16.38 16.38
TOTAL 14.25 14.63 16.38 16.38
2008-09 BUDGET HUMAN RESOURCES
2008-09 BUDGET HUMAN RESOURCES DEPARTMENT
MISSION STATEMENT Our mission simply put is “Caring Accountability”. Human Resources traditional mission is to recruit and retain talent for the organization. Our purpose is two-fold:
• As enforcers, we provide a safe working environment for employees and protect the City from liability.
• As coaches and trainers, we provide tools to the workforce for accomplishing their goals. BUSINESS PLAN NARRATIVE Since the inception of the business plan, our focus has been on rebuilding the department, which has included assessing customer needs, improving efficiencies and ensuring the department has employees who are aligned with department values and trained to deliver needed services. For example, in 2006 work re-design resulted in service level improvements in the areas of compliance and our compensation philosophy. In 2007 we experienced a lot of change through turnover and the movement of Workers’ Compensation to the Finance department and the shift of Payroll from Finance to Human Resources. We took advantage of these changes and saw them as an opportunity to do some internal work re-design and training. Once the department is fully staffed and experiences a full year with the job re-design, we anticipate service levels to increase in additional areas. Diversity became a Council and City Manager focus in 2007 with a commitment to begin diversity training for all employees. As a result, a city-wide employee Diversity Planning Group was created and a Leadership Conference for all managers was held. In coordination with these efforts and supporting the City Manager’s commitment to diversity, we have added an area to the Business Plan on diversity training and oversight to the city-wide diversity plan. As we updated our Action Plan, we referred to our guiding principles to determine priorities among the programs and services. Our top 1% priorities, both essential services, are based on retaining and developing operational knowledge. GUIDING PRINCIPLES OR INVESTMENT STRATEGY
1.) Essential Services include those that are required by law as well as those services relative to compensation and benefits that help us maintain our competitive place in the market as an employer. Examples include:
a. Complying with the Family & Medical Leave Act of 1993, which includes
notifying employees of their rights to take leave as well as administering the leave.
b. Developing policies that help provide a safe working environment for employees and protect the City from liability.
2.) Desirable Services include those that improve our competitive place in the market
and those that help us to be more efficient. Examples include:
a. Ecopasses for employees are a competitive benefit that provides a more economic means of commuting, fits in with the Boulder mission and also prevents congestion and additional construction for parking.
b. A training program helps us work and manage more efficiently. Sharing policies, standards and templates, not only results in consistency, but also time savings.
3.) Discretionary Services include those that help us to be a “best practices” employer.
Examples include: a. Having a leadership course that brings public sector and private sector
employers together to solve regional issues. b. Creatively designing incentive pay as a way to continue to show employees’
value while controlling costs. OVERVIEW OF ACTION PLAN Please refer to Attachment B of the 2008-09 Budget Message for a listing of those Action Plan Items that were recommended for funding. The listing is presented in order by fund and department. Please see the section titled “City Council Direction on the Recommended Budget” for any changes from Attachment B. OVERVIEW OF VISION PLAN The HR Department’s vision is to be a World Class HR Department. We are in the process of continuing development of a Strategic Plan. The types of services, programs, benefits and pay we provide to employees is indicative of the type of culture we have. As we strive to maintain Boulder’s status as one of the great cities, the employee characteristics of the culture that will support this goal include high performing, service-oriented, partnership, proactive, forward and big-picture thinking. We want to model and support that culture in our behavior and the types of service we provide. A World Class HR department consists of valued strategic partners who:
• have simplified and standardized processes, • are innovators in the field, • provide just-in-time high quality service and • meet cost/effectiveness metrics
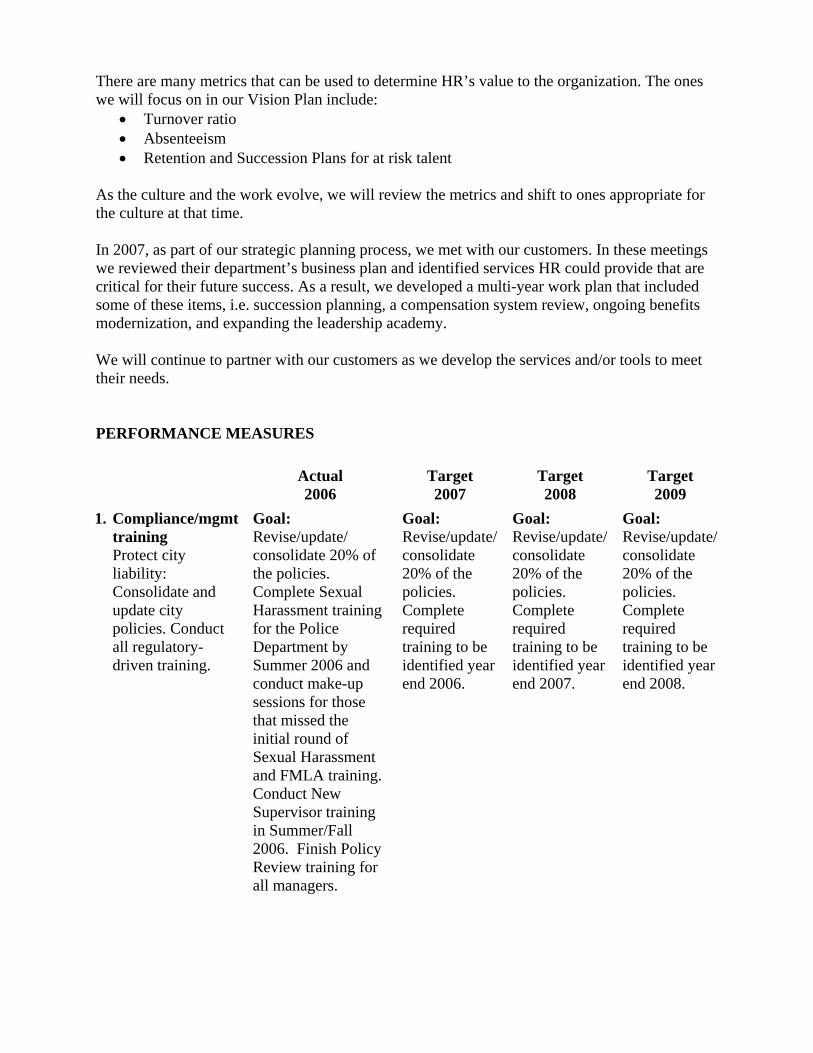
There are many metrics that can be used to determine HR’s value to the organization. The ones we will focus on in our Vision Plan include:
• Turnover ratio • Absenteeism • Retention and Succession Plans for at risk talent
As the culture and the work evolve, we will review the metrics and shift to ones appropriate for the culture at that time. In 2007, as part of our strategic planning process, we met with our customers. In these meetings we reviewed their department’s business plan and identified services HR could provide that are critical for their future success. As a result, we developed a multi-year work plan that included some of these items, i.e. succession planning, a compensation system review, ongoing benefits modernization, and expanding the leadership academy. We will continue to partner with our customers as we develop the services and/or tools to meet their needs. PERFORMANCE MEASURES Actual
2006 Target 2007
Target 2008
Target 2009
1. Compliance/mgmt training Protect city liability: Consolidate and update city policies. Conduct all regulatory-driven training.
Goal: Revise/update/ consolidate 20% of the policies. Complete Sexual Harassment training for the Police Department by Summer 2006 and conduct make-up sessions for those that missed the initial round of Sexual Harassment and FMLA training. Conduct New Supervisor training in Summer/Fall 2006. Finish Policy Review training for all managers.
Goal: Revise/update/ consolidate 20% of the policies. Complete required training to be identified year end 2006.
Goal: Revise/update/ consolidate 20% of the policies. Complete required training to be identified year end 2007.
Goal: Revise/update/ consolidate 20% of the policies. Complete required training to be identified year end 2008.
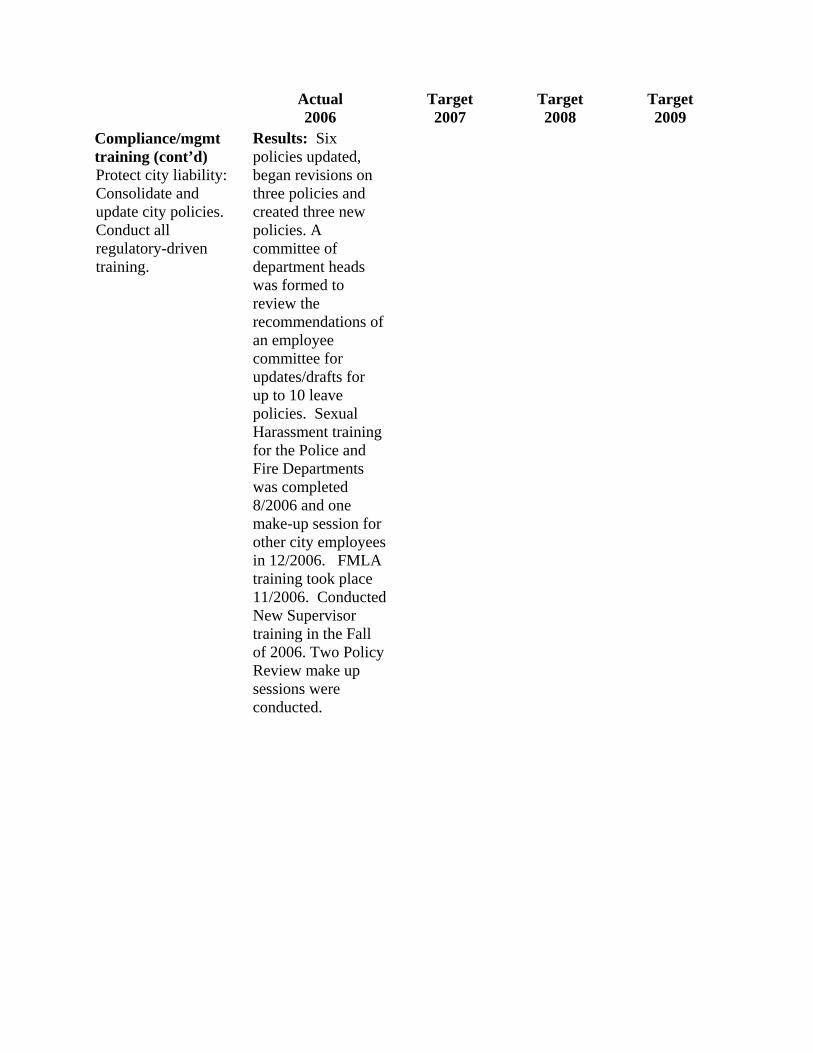
Actual
2006 Target 2007
Target 2008
Target 2009
Compliance/mgmt training (cont’d) Protect city liability: Consolidate and update city policies. Conduct all regulatory-driven training.
Results: Six policies updated, began revisions on three policies and created three new policies. A committee of department heads was formed to review the recommendations of an employee committee for updates/drafts for up to 10 leave policies. Sexual Harassment training for the Police and Fire Departments was completed 8/2006 and one make-up session for other city employees in 12/2006. FMLA training took place 11/2006. Conducted New Supervisor training in the Fall of 2006. Two Policy Review make up sessions were conducted.
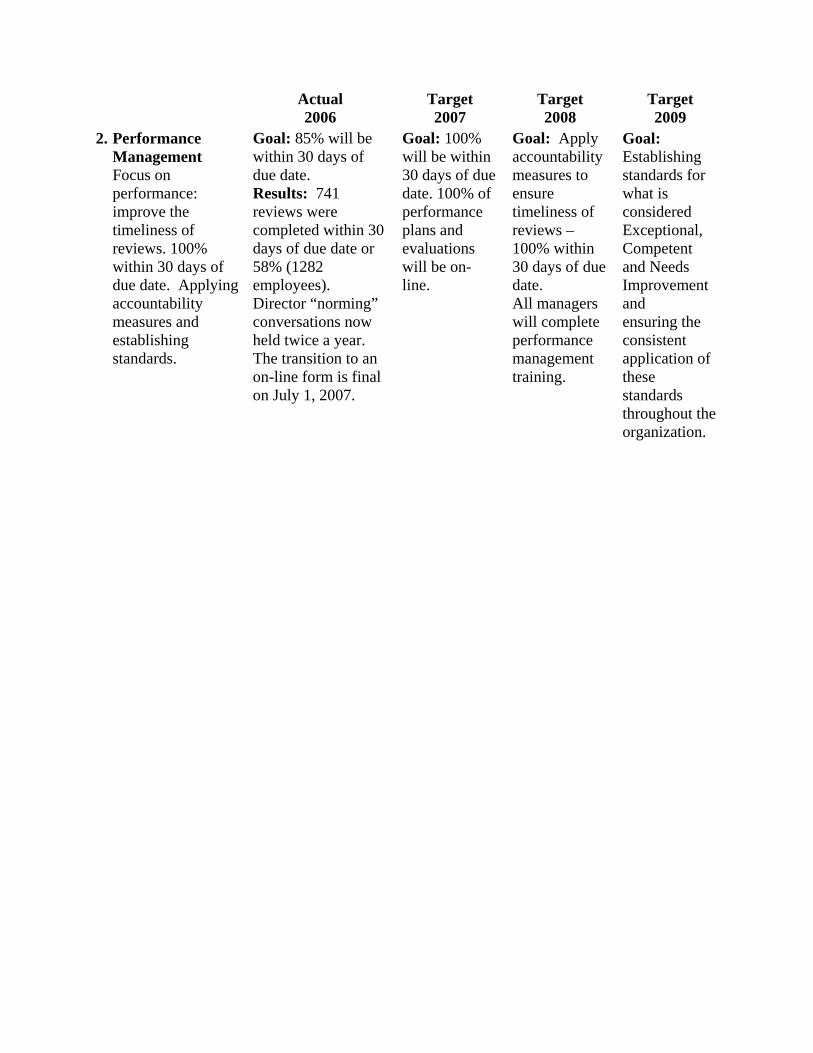
Actual
2006 Target 2007
Target 2008
Target 2009
2. Performance Management Focus on performance: improve the timeliness of reviews. 100% within 30 days of due date. Applying accountability measures and establishing standards.
Goal: 85% will be within 30 days of due date. Results: 741 reviews were completed within 30 days of due date or 58% (1282 employees). Director “norming” conversations now held twice a year. The transition to an on-line form is final on July 1, 2007.
Goal: 100% will be within 30 days of due date. 100% of performance plans and evaluations will be on-line.
Goal: Apply accountability measures to ensure timeliness of reviews – 100% within 30 days of due date. All managers will complete performance management training.
Goal: Establishing standards for what is considered Exceptional, Competent and Needs Improvement and ensuring the consistent application of these standards throughout the organization.
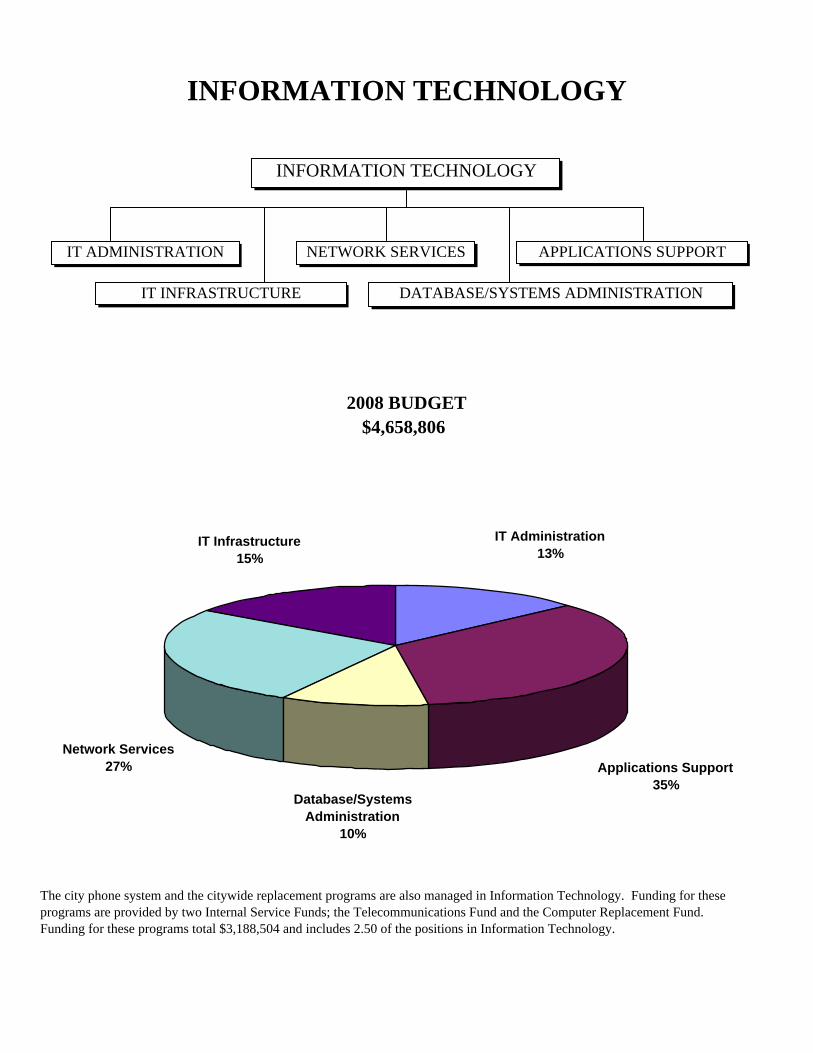
INFORMATION TECHNOLOGY
$4,658,806
The city phone system and the citywide replacement programs are also managed in Information Technology. Funding for theseprograms are provided by two Internal Service Funds; the Telecommunications Fund and the Computer Replacement Fund. Funding for these programs total $3,188,504 and includes 2.50 of the positions in Information Technology.
2008 BUDGET
INFORMATION TECHNOLOGY
NETWORK SERVICES
IT INFRASTRUCTURE
APPLICATIONS SUPPORT
DATABASE/SYSTEMS ADMINISTRATION
IT ADMINISTRATION
IT Administration13%
IT Infrastructure15%
Database/Systems Administration
10%
Network Services27% Applications Support
35%
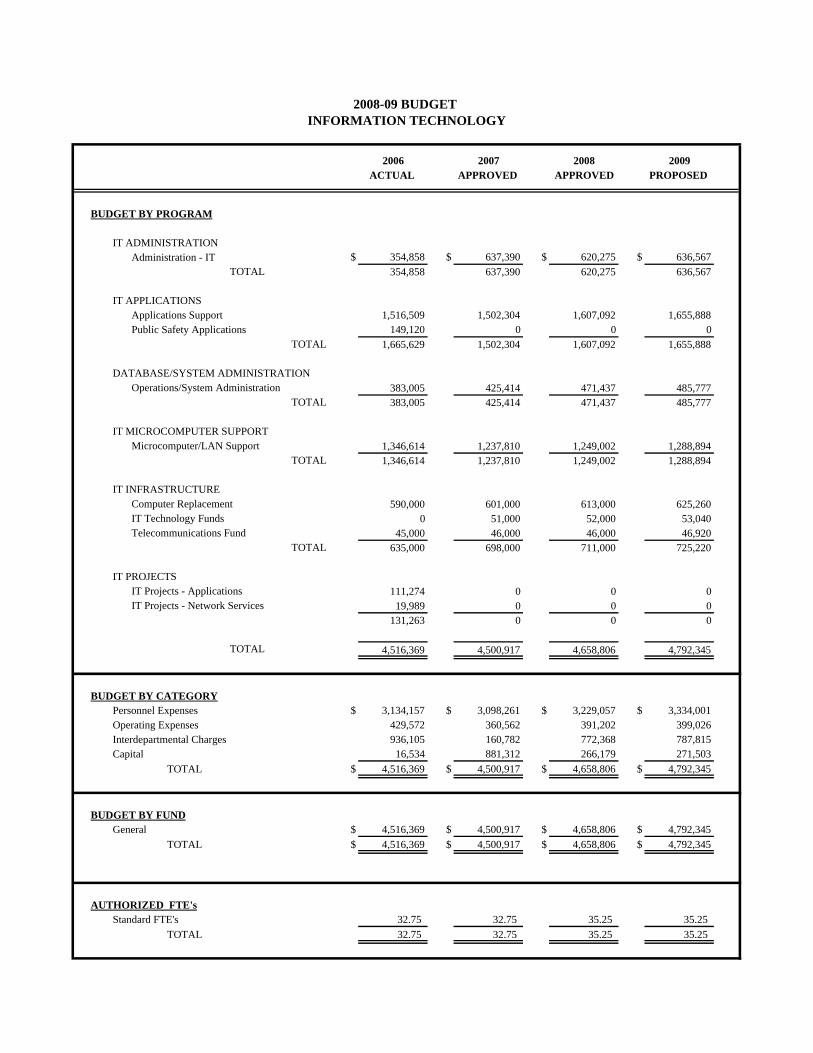
2006 2007 2008 2009ACTUAL APPROVED APPROVED PROPOSED
BUDGET BY PROGRAM
IT ADMINISTRATIONAdministration - IT $ 354,858 $ 637,390 $ 620,275 $ 636,567
TOTAL 354,858 637,390 620,275 636,567
IT APPLICATIONSApplications Support 1,516,509 1,502,304 1,607,092 1,655,888Public Safety Applications 149,120 0 0 0
TOTAL 1,665,629 1,502,304 1,607,092 1,655,888
DATABASE/SYSTEM ADMINISTRATIONOperations/System Administration 383,005 425,414 471,437 485,777
TOTAL 383,005 425,414 471,437 485,777
IT MICROCOMPUTER SUPPORTMicrocomputer/LAN Support 1,346,614 1,237,810 1,249,002 1,288,894
TOTAL 1,346,614 1,237,810 1,249,002 1,288,894
IT INFRASTRUCTUREComputer Replacement 590,000 601,000 613,000 625,260IT Technology Funds 0 51,000 52,000 53,040Telecommunications Fund 45,000 46,000 46,000 46,920
TOTAL 635,000 698,000 711,000 725,220
IT PROJECTSIT Projects - Applications 111,274 0 0 0IT Projects - Network Services 19,989 0 0 0
131,263 0 0 0
TOTAL 4,516,369 4,500,917 4,658,806 4,792,345
BUDGET BY CATEGORYPersonnel Expenses $ 3,134,157 $ 3,098,261 $ 3,229,057 $ 3,334,001Operating Expenses 429,572 360,562 391,202 399,026Interdepartmental Charges 936,105 160,782 772,368 787,815Capital 16,534 881,312 266,179 271,503
TOTAL $ 4,516,369 $ 4,500,917 $ 4,658,806 $ 4,792,345
BUDGET BY FUNDGeneral $ 4,516,369 $ 4,500,917 $ 4,658,806 $ 4,792,345
TOTAL $ 4,516,369 $ 4,500,917 $ 4,658,806 $ 4,792,345
AUTHORIZED FTE'sStandard FTE's 32.75 32.75 35.25 35.25
TOTAL 32.75 32.75 35.25 35.25
2008-09 BUDGET INFORMATION TECHNOLOGY
2008-09 BUDGET INFORMATION TECHNOLOGY DEPARTMENT
MISSION STATEMENT We leverage technology to improve city services. BUSINESS PLAN NARRATIVE The IT Department’s budget for 2008 continues to focus on accomplishing our mission in a fiscally constrained environment, which means meeting the demand for more sophisticated services and providing quality secure infrastructure services, with only minor compromises to long term technical strategies and goals. Throughout the past few years, the IT Department has continued to benefit and grow from an increasing citywide demand for technology services. This is mostly a result of executive management understanding the value and benefits of technology as a strategy to offset citywide budget and staffing reductions. With this understanding comes the demand for more sophisticated services, an increasing number of secure “self service” web-based systems, as well as more rapid software development cycles. An ongoing tightly constrained IT budget without new citywide investment in IT will continue to limit our ability to meet the appetite for new services while also maintaining the reliability and performance of existing system. However, the demand on IT for new and increasingly sophisticated services is only part of our responsibility. We must continue to be proactive in implementing industry standard “best practices” that are necessary, yet not requested from the enterprise. Examples are security improvements, project management and improved repeatability of processes and procedures. With this, IT Management must also manage one of the most challenging aspects of technology… constant change within a fiscally constrained environment. A continued limit in new technology investments, offset with a never-ending appetite for new technology services continues to force IT to look inward for creative funding and management approaches. We have had success with this in past budget years as an attempt to balance increasing demand without new organizational investment. Open source software development, server virtualizations, aggressive contract renegotiations, increased investment in IT staff training, and technology standards are a few examples of our ongoing internal IT investments. However, the opportunities for new and significant cost and staff savings within IT are becoming scarce. IT must have additional investment from the organization to continue its current pace of new development and maintenance responsibilities.
GUIDING PRINCIPLES AND/OR INVESTMENT STRATEGY The following points embrace the long term strategic direction of the IT Department, support our mission and follow IT industry best practices:
• Align IT services with the current and future needs of the city organization and its customers,
• Improve the quality and delivery of IT services to the organization, and • Reduce the long term costs of IT services
Based on this, the following guiding principles have been used to prioritize the IT Department 2008 budget: 1. Maintenance and support of existing systems (essential): These are highly critical
services that ensure existing systems function and perform as designed. This includes maintenance of the network and server infrastructure, software applications, databases, and workstations; Help Desk services for customer support; data backup and recovery; business continuity planning and disaster recovery; and security. Essential services also include technology asset management, centralized purchasing, planning, quality control, IT/client relationships, and staff training and development. A portion of our essential work includes application modifications in order to meet changing requirements, such as changes in the law, city charter or codes. As software reaches the end of its life cycle, it is essential that systems be replaced. Examples of software that lived beyond its useful life includes utility billing system, the police records management system, and the sales tax application. We also consider the ongoing work to update our software standards and web services development as essential.
2. Improvements of Systems (desirable): These services are performed if any
improvements to existing software applications are needed based on changing business needs. If an existing application no longer meets the business needs of the city or its departments, the application must be changed or replaced. These services ensure that the city stays current in its use of technology, therefore avoiding costly major replacements of out dated technology. Some examples of major upgrades to existing systems include the transition from mainframe to client-server, which has now shifted to web services technology used today.
3. Implement New Systems (discretionary): These are a portion of the projects that
have been requested by or are specifically designed for City departments. These services or elements do not exist in the current environment. These projects are new investments in technology to improve services, reduce overhead, and save staff time. Expected financial returns are documented and approved prior to implementing the project. Even still, a portion of these projects can be postponed in the short term without significant impact. As the city’s economy recovers and discretionary projects are identified, these project investments must occur to continue to advance the city’s use of technology.
OVERVIEW OF ACTION PLAN The Information Technology Department is in the process of revising the city’s Strategic Technology Plan (STP). This document will outline business valued strategies for 2008 – 2010, in part, for our ongoing advancement of enhancing the city’s business processes through open source technologies, web services, and mobile government services. In the interim, the Action Plan includes those immediate needs that are above the personnel and non-personnel expense (NPE) increase for the 2008 – 2012 budget planning period. This includes expenses associated with the following:
1. maintaining Help Desk and PC/End user support 2. citywide wireless network contract funding 3. increasing the general fund subsidy to the CRF (one time) 4. improving business continuity planning and disaster recovery preparedness
(mostly one time cost) 5. establishing an enterprise Software Replacement Fund 6. implementing application development QA/QC testing 7. pursuing “yellow list” master plan projects 8. performing annual security audits and mitigation 9. acquiring consulting services for negotiating the citywide wireless network
contract (one time cost) 10. establishing a citywide Business Intelligence system 11. restoring the IT training program. 12. funding for the upgrade of the city’s phone system
During the year 2008 the city’s telephone system will be converted from a PBX system to VoIP technology. This project is being funded from the city’s telecommunications fund and has been planned for several years. Please refer to Attachment B of the 2008-09 Budget Message for a listing of those Action Plan Items that were recommended for funding. The listing is presented in order by fund and department. Please see the section titled “City Council Direction on the Recommended Budget” for any changes from Attachment B. OVERVIEW OF VISION PLAN The City of Boulder's vision is to use information technology to increase the capacity of the organization by improving Service Delivery, supporting Policy Development, and enabling Information Access.
Improving Service Delivery - The City organization is about delivering quality services to the public. We must use information technologies to improve how efficiently and conveniently those services are delivered.
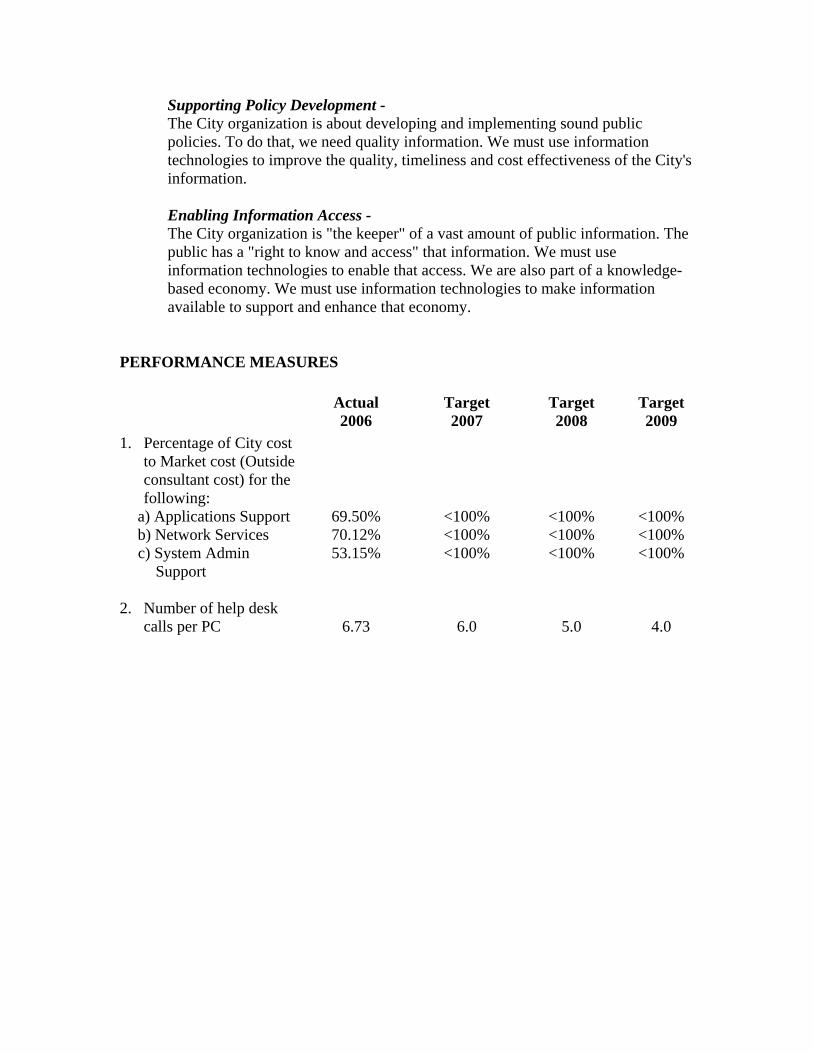
Supporting Policy Development - The City organization is about developing and implementing sound public policies. To do that, we need quality information. We must use information technologies to improve the quality, timeliness and cost effectiveness of the City's information. Enabling Information Access - The City organization is "the keeper" of a vast amount of public information. The public has a "right to know and access" that information. We must use information technologies to enable that access. We are also part of a knowledge-based economy. We must use information technologies to make information available to support and enhance that economy.
PERFORMANCE MEASURES
Actual 2006
Target 2007
Target 2008
Target 2009
1. Percentage of City cost to Market cost (Outside consultant cost) for the following:
a) Applications Support b) Network Services
c) System Admin Support
69.50% 70.12% 53.15%
<100% <100% <100%
<100% <100% <100%
<100% <100% <100%
2. Number of help desk calls per PC 6.73 6.0 5.0 4.0
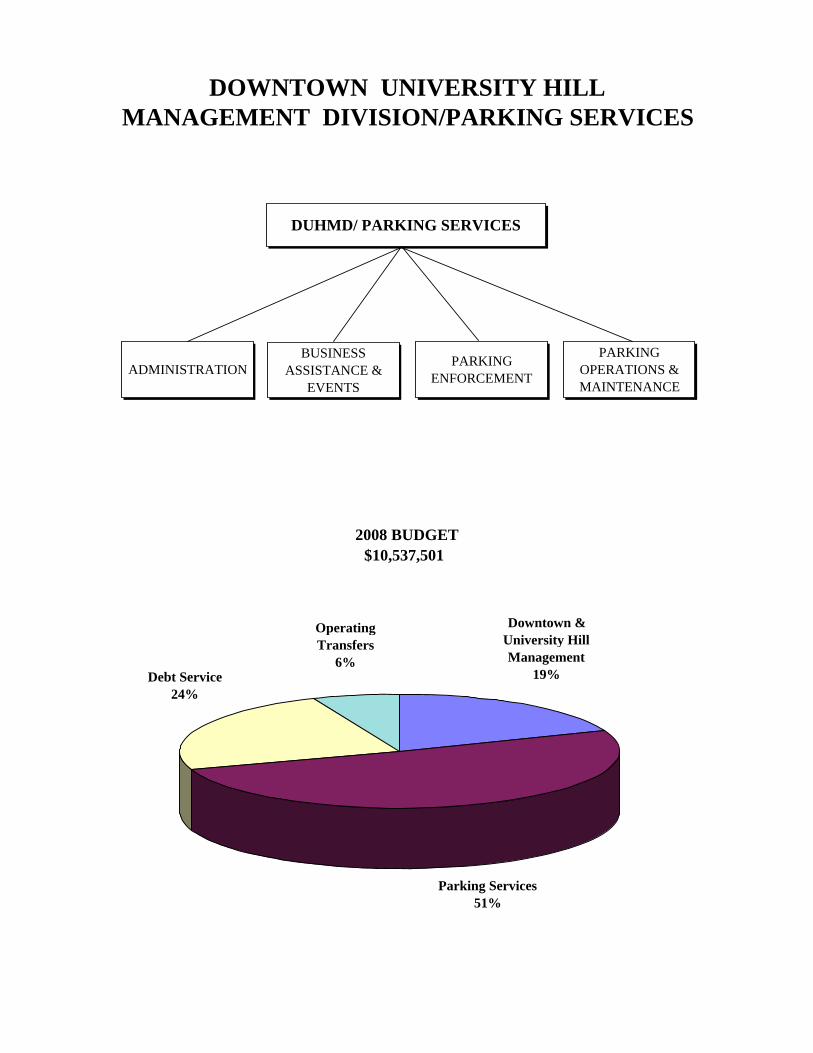
DOWNTOWN UNIVERSITY HILLMANAGEMENT DIVISION/PARKING SERVICES
2008 BUDGET$10,537,501
DUHMD/ PARKING SERVICES
ADMINISTRATION BUSINESS
ASSISTANCE & EVENTS
PARKING ENFORCEMENT
PARKING OPERATIONS & MAINTENANCE
Debt Service24%
Parking Services51%
Downtown & University Hill Management
19%
Operating Transfers
6%
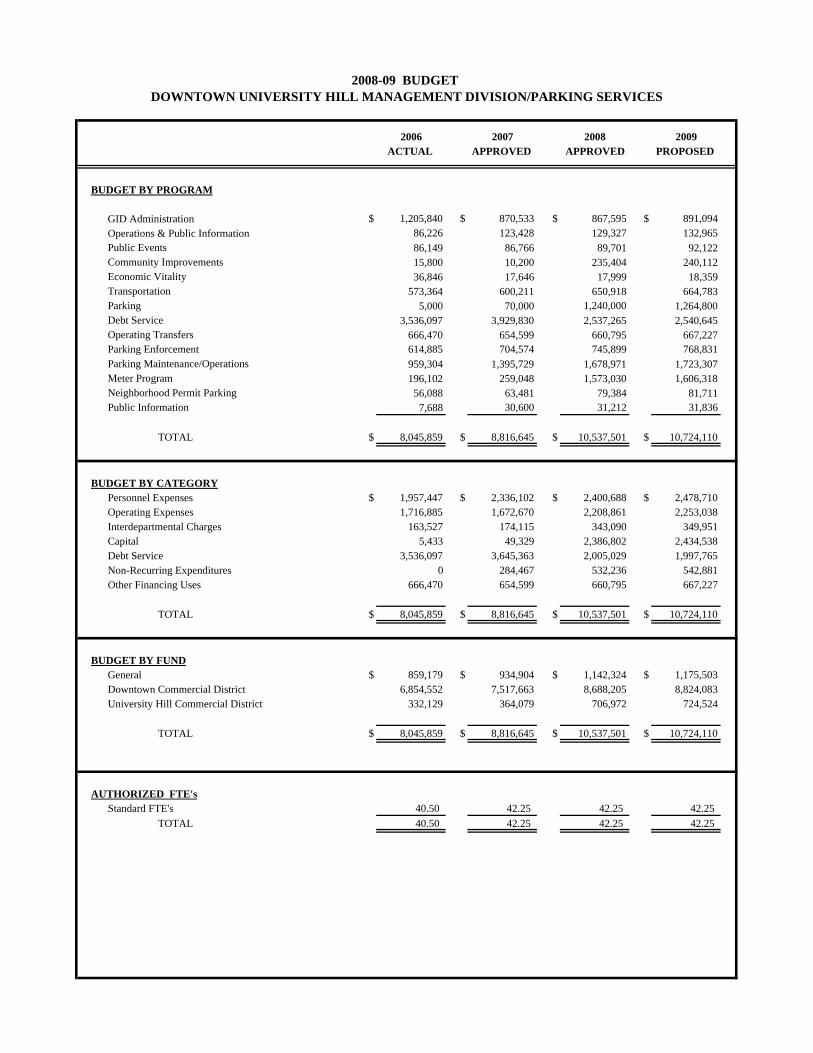
2006 2007 2008 2009ACTUAL APPROVED APPROVED PROPOSED
BUDGET BY PROGRAM
GID Administration $ 1,205,840 $ 870,533 $ 867,595 $ 891,094Operations & Public Information 86,226 123,428 129,327 132,965Public Events 86,149 86,766 89,701 92,122Community Improvements 15,800 10,200 235,404 240,112Economic Vitality 36,846 17,646 17,999 18,359Transportation 573,364 600,211 650,918 664,783Parking 5,000 70,000 1,240,000 1,264,800Debt Service 3,536,097 3,929,830 2,537,265 2,540,645Operating Transfers 666,470 654,599 660,795 667,227Parking Enforcement 614,885 704,574 745,899 768,831Parking Maintenance/Operations 959,304 1,395,729 1,678,971 1,723,307Meter Program 196,102 259,048 1,573,030 1,606,318Neighborhood Permit Parking 56,088 63,481 79,384 81,711Public Information 7,688 30,600 31,212 31,836
TOTAL $ 8,045,859 $ 8,816,645 $ 10,537,501 $ 10,724,110
BUDGET BY CATEGORYPersonnel Expenses $ 1,957,447 $ 2,336,102 $ 2,400,688 $ 2,478,710Operating Expenses 1,716,885 1,672,670 2,208,861 2,253,038Interdepartmental Charges 163,527 174,115 343,090 349,951Capital 5,433 49,329 2,386,802 2,434,538Debt Service 3,536,097 3,645,363 2,005,029 1,997,765Non-Recurring Expenditures 0 284,467 532,236 542,881Other Financing Uses 666,470 654,599 660,795 667,227
TOTAL $ 8,045,859 $ 8,816,645 $ 10,537,501 $ 10,724,110
BUDGET BY FUNDGeneral $ 859,179 $ 934,904 $ 1,142,324 $ 1,175,503Downtown Commercial District 6,854,552 7,517,663 8,688,205 8,824,083University Hill Commercial District 332,129 364,079 706,972 724,524
TOTAL $ 8,045,859 $ 8,816,645 $ 10,537,501 $ 10,724,110
AUTHORIZED FTE'sStandard FTE's 40.50 42.25 42.25 42.25
TOTAL 40.50 42.25 42.25 42.25
2008-09 BUDGET DOWNTOWN UNIVERSITY HILL MANAGEMENT DIVISION/PARKING SERVICES
2008-09 BUDGET DOWNTOWN AND UNIVERSITY HILL MANAGEMENT DIVISION/
PARKING SERVICES
MISSION STATEMENT We serve the Downtown, University Hill and affected communities by providing quality programs, parking, enforcement, maintenance, and alternative modes services through the highest level of customer service, efficient management, and effective problem solving. BUSINESS PLAN NARRATIVE The Downtown and University Hill Management Division and Parking Services represents an unusual bundling of municipal services – downtown management, travel demand management, parking operations (on and off street and neighborhood permits), parking enforcement, citywide event permitting, and economic vitality initiatives. This integrated management strategy incorporating these diverse services enables a comprehensive approach to supporting Boulder’s historic commercial centers – downtown and the University Hill commercial areas. The funding mechanism for DUHMD/PS is almost exclusively parking revenues from the commercial districts which are reinvested back into the parking systems and commercial areas. Strong and thriving commercial areas generate sales tax for the city as well as drawing residents and visitors, increasing parking revenues. These revenues in turn are used to reinvest in programs and strategies that keep the downtown and the hill vital, competitive and appealing. It is this reinvestment strategy that is at the core of the business plan approach that benefits University Hill and downtown as well as the city as a whole – both in terms of assuring revenues for city services but also creating vibrant public spaces that are a source of community benefit and pride, and an asset for tourism. Downtown Commercial District Fund (formerly CAGID Fund) A key priority for the Downtown Commercial District Fund in 2008 is to reinvest in the long term economic sustainability of the downtown in several areas –
• Renovations and repairs in downtown parking garages • Long-term economic vitality of the downtown and the city as a whole through
further studies and refinement of a potential citywide conference/convention center
• Assessment and design of ongoing downtown public right of way streetscape improvements to maintain a vital and competitive commercial area.
University Hill Commercial District Fund (formerly UHGID Fund) A key priority for the University Hill Commercial District Fund in 2008 is to reinvest in the long-term economic sustainability of the University Hill commercial area by:
• Replacement of on-street parking with new customer friendly parking technology, • Support and potential partnerships for redevelopment on the hill.
General Fund In the DUHMD/PS’s General Fund services, priorities are:
• Support neighborhood livability through the reinstatement of the Neighborhood Parking Permit program
• Enhance the goals of the Transportation Master Plan by expanding the free, downtown Eco Pass program to include additional downtown employees who work in the Business Improvement District (BID) boundary but outside of CAGID.
GUIDING PRINCIPLES OR INVESTMENT STRATEGY
1.) Essential Services include: Services that ensure the basic qualities of a healthy, efficient, accessible, and economically viable downtown and University Hill commercial districts are essential to maintaining the commercial infrastructure and fiscally responsible funds. These include parking operations and maintenance, EcoPass program for downtown employees and parking enforcement.
2.) Desirable Services include: Services that enhance and promote the quality of
life of the commercial centers, bolster economic vitality efforts and encourage economic recovery, and contribute to neighborhood quality of life. These include mall permitting and operations, travel demand management programs other than the Eco Pass program, contract services with the Business Improvement District, parking marketing activities, the NPP program, and proactive measures to stimulate economic recovery and redevelopment such as the Hill Redevelopment workshops, Downtown Strategic Plan, and the conference/convention center.
3.) Discretionary Services include: Services that enhance the quality of life but
can be provided by other entities. This includes school crossings.
OVERVIEW OF ACTION PLAN Please refer to Attachment B of the 2008-09 Budget Message for a listing of those Action Plan Items that were recommended for funding. The listing is presented in order by fund and department. Please see the section titled “City Council Direction on the Recommended Budget” for any changes from Attachment B. OVERVIEW OF VISION PLAN DUHMD/PS does not yet have an overall departmental strategic plan and efforts are underway to develop one. A draft vision statement: “World class organization focusing on integrated transportation, economic development and public space management for urban areas through best practices analysis, progressive technology use, and robust partnerships and collaboration” will be reviewed and commented upon by internal staff and our customer stakeholder groups. However, area strategies and plans have been developed over the years for both the University Hill (the Hill Business Plan, the Hill Marketing Study and the council-approved Hill Sub Area Plan) and the downtown (the Downtown Alliance plan and regular development updates, the Downtown Economic Strategic Plan, Best Practices in Parking, and annual downtown user surveys). Strategies and polices for specific issues and projects, such as Eco Pass funding, major maintenance and improvements plan for CAGID parking garages, social issues on the mall and parking enforcement, are implemented on a case by case basis through special task forces and studies. All of these past efforts will be integrated into the development of the DUHMD/PS Strategic Plan. In the interim prior to the adoption of a strategic plan, DUHMD/PS has identified key programs and initiatives for initial funding under an Action Plan including activities rated below standard as well as initiatives to enhance the vitality of the commercial districts and meet Council goals.
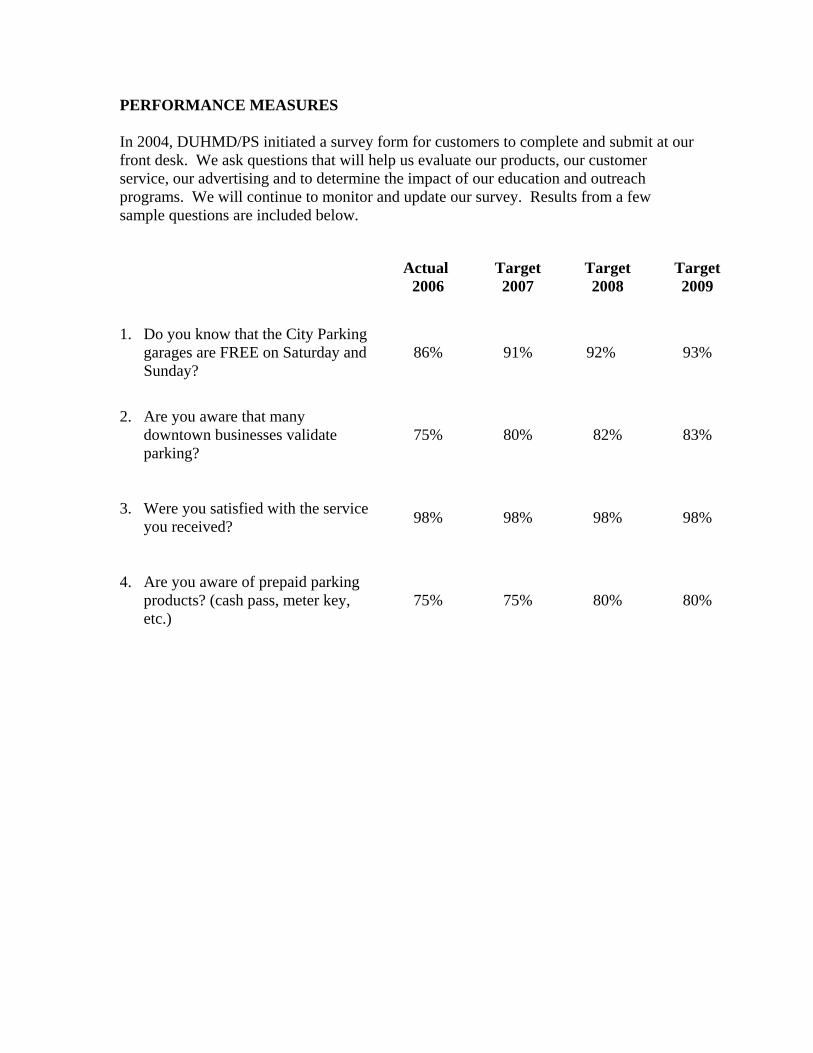
PERFORMANCE MEASURES In 2004, DUHMD/PS initiated a survey form for customers to complete and submit at our front desk. We ask questions that will help us evaluate our products, our customer service, our advertising and to determine the impact of our education and outreach programs. We will continue to monitor and update our survey. Results from a few sample questions are included below.
Actual
2006 Target 2007
Target 2008
Target 2009
1. Do you know that the City Parking garages are FREE on Saturday and Sunday?
86% 91% 92% 93%
2. Are you aware that many downtown businesses validate parking?
75% 80% 82% 83%
3. Were you satisfied with the service you received? 98% 98% 98% 98%
4. Are you aware of prepaid parking products? (cash pass, meter key, etc.)
75% 75% 80% 80%
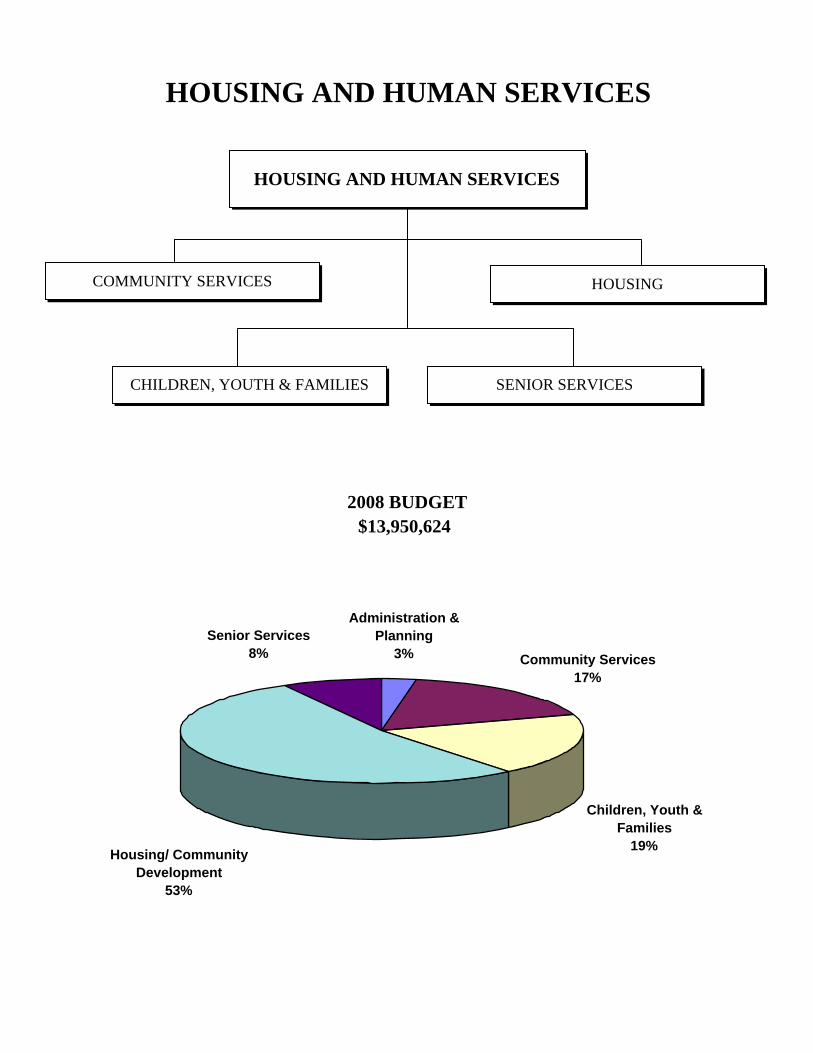
2008 BUDGET$13,950,624
HOUSING AND HUMAN SERVICES
HOUSING AND HUMAN SERVICES
CHILDREN, YOUTH & FAMILIES SENIOR SERVICES
Community Services17%
Housing/ Community Development
53%
Administration & Planning
3%
Children, Youth & Families
19%
Senior Services8%
COMMUNITY SERVICES HOUSING
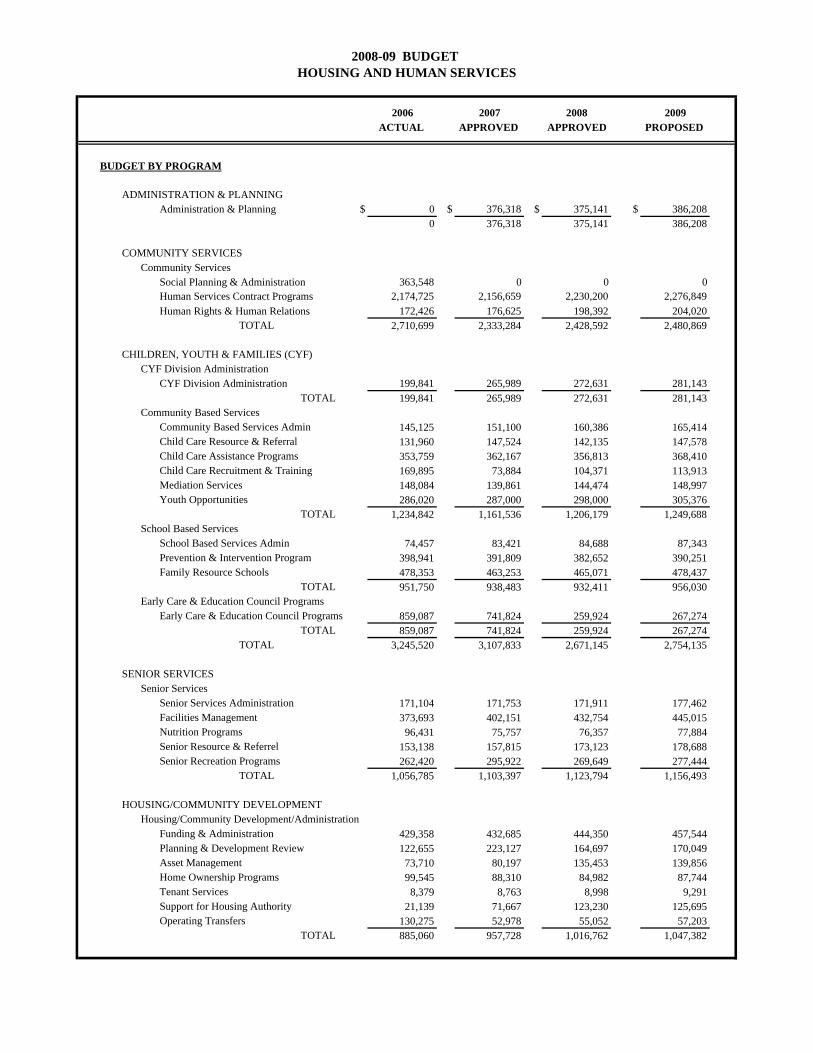
2006 2007 2008 2009ACTUAL APPROVED APPROVED PROPOSED
BUDGET BY PROGRAM
ADMINISTRATION & PLANNINGAdministration & Planning $ 0 $ 376,318 $ 375,141 $ 386,208
0 376,318 375,141 386,208
COMMUNITY SERVICESCommunity Services
Social Planning & Administration 363,548 0 0 0Human Services Contract Programs 2,174,725 2,156,659 2,230,200 2,276,849Human Rights & Human Relations 172,426 176,625 198,392 204,020
TOTAL 2,710,699 2,333,284 2,428,592 2,480,869
CHILDREN, YOUTH & FAMILIES (CYF)CYF Division Administration
CYF Division Administration 199,841 265,989 272,631 281,143TOTAL 199,841 265,989 272,631 281,143
Community Based ServicesCommunity Based Services Admin 145,125 151,100 160,386 165,414Child Care Resource & Referral 131,960 147,524 142,135 147,578Child Care Assistance Programs 353,759 362,167 356,813 368,410Child Care Recruitment & Training 169,895 73,884 104,371 113,913Mediation Services 148,084 139,861 144,474 148,997Youth Opportunities 286,020 287,000 298,000 305,376
TOTAL 1,234,842 1,161,536 1,206,179 1,249,688School Based Services
School Based Services Admin 74,457 83,421 84,688 87,343Prevention & Intervention Program 398,941 391,809 382,652 390,251Family Resource Schools 478,353 463,253 465,071 478,437
TOTAL 951,750 938,483 932,411 956,030Early Care & Education Council Programs
Early Care & Education Council Programs 859,087 741,824 259,924 267,274TOTAL 859,087 741,824 259,924 267,274
TOTAL 3,245,520 3,107,833 2,671,145 2,754,135
SENIOR SERVICESSenior Services
Senior Services Administration 171,104 171,753 171,911 177,462Facilities Management 373,693 402,151 432,754 445,015Nutrition Programs 96,431 75,757 76,357 77,884Senior Resource & Referrel 153,138 157,815 173,123 178,688Senior Recreation Programs 262,420 295,922 269,649 277,444
TOTAL 1,056,785 1,103,397 1,123,794 1,156,493
HOUSING/COMMUNITY DEVELOPMENTHousing/Community Development/Administration
Funding & Administration 429,358 432,685 444,350 457,544Planning & Development Review 122,655 223,127 164,697 170,049Asset Management 73,710 80,197 135,453 139,856Home Ownership Programs 99,545 88,310 84,982 87,744Tenant Services 8,379 8,763 8,998 9,291Support for Housing Authority 21,139 71,667 123,230 125,695Operating Transfers 130,275 52,978 55,052 57,203
TOTAL 885,060 957,728 1,016,762 1,047,382
2008-09 BUDGET HOUSING AND HUMAN SERVICES
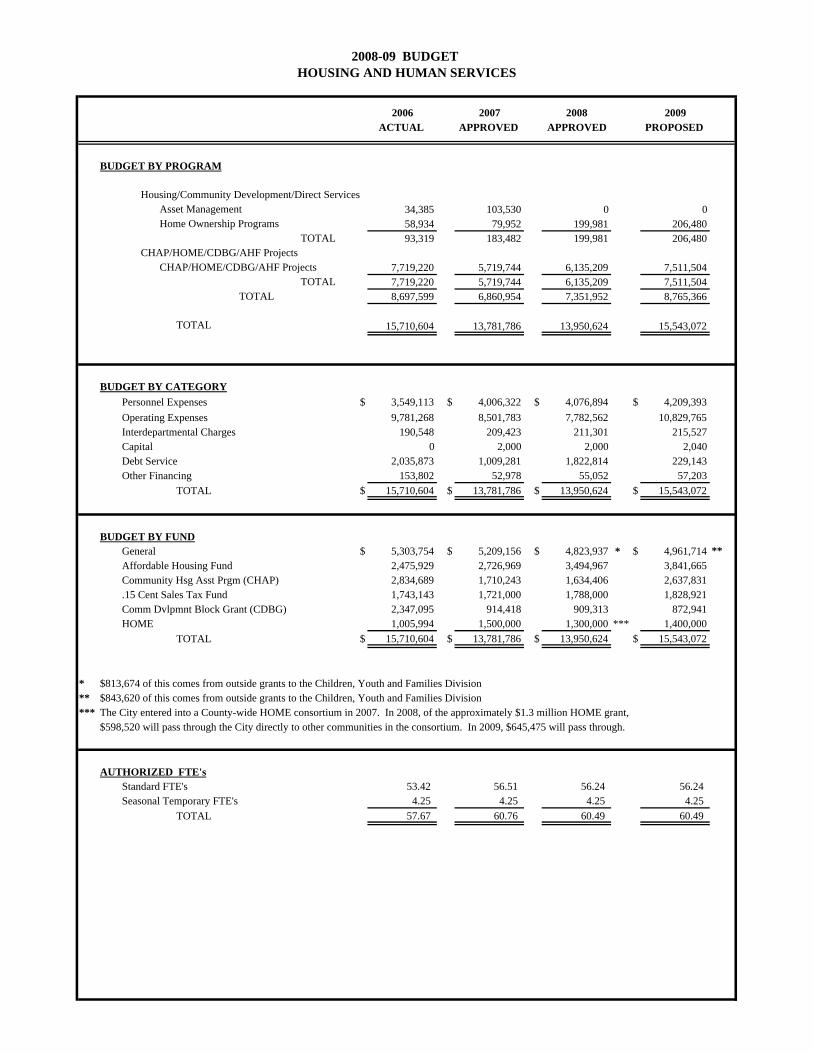
2006 2007 2008 2009ACTUAL APPROVED APPROVED PROPOSED
BUDGET BY PROGRAM
2008-09 BUDGET HOUSING AND HUMAN SERVICES
Housing/Community Development/Direct ServicesAsset Management 34,385 103,530 0 0Home Ownership Programs 58,934 79,952 199,981 206,480
TOTAL 93,319 183,482 199,981 206,480CHAP/HOME/CDBG/AHF Projects
CHAP/HOME/CDBG/AHF Projects 7,719,220 5,719,744 6,135,209 7,511,504TOTAL 7,719,220 5,719,744 6,135,209 7,511,504
TOTAL 8,697,599 6,860,954 7,351,952 8,765,366
TOTAL 15,710,604 13,781,786 13,950,624 15,543,072
BUDGET BY CATEGORYPersonnel Expenses $ 3,549,113 $ 4,006,322 $ 4,076,894 $ 4,209,393Operating Expenses 9,781,268 8,501,783 7,782,562 10,829,765Interdepartmental Charges 190,548 209,423 211,301 215,527Capital 0 2,000 2,000 2,040Debt Service 2,035,873 1,009,281 1,822,814 229,143Other Financing 153,802 52,978 55,052 57,203
TOTAL $ 15,710,604 $ 13,781,786 $ 13,950,624 $ 15,543,072
BUDGET BY FUNDGeneral $ 5,303,754 $ 5,209,156 $ 4,823,937 * $ 4,961,714 **Affordable Housing Fund 2,475,929 2,726,969 3,494,967 3,841,665Community Hsg Asst Prgm (CHAP) 2,834,689 1,710,243 1,634,406 2,637,831.15 Cent Sales Tax Fund 1,743,143 1,721,000 1,788,000 1,828,921Comm Dvlpmnt Block Grant (CDBG) 2,347,095 914,418 909,313 872,941HOME 1,005,994 1,500,000 1,300,000 *** 1,400,000
TOTAL $ 15,710,604 $ 13,781,786 $ 13,950,624 $ 15,543,072
* $813,674 of this comes from outside grants to the Children, Youth and Families Division** $843,620 of this comes from outside grants to the Children, Youth and Families Division*** The City entered into a County-wide HOME consortium in 2007. In 2008, of the approximately $1.3 million HOME grant,
$598,520 will pass through the City directly to other communities in the consortium. In 2009, $645,475 will pass through.
AUTHORIZED FTE'sStandard FTE's 53.42 56.51 56.24 56.24Seasonal Temporary FTE's 4.25 4.25 4.25 4.25
TOTAL 57.67 60.76 60.49 60.49
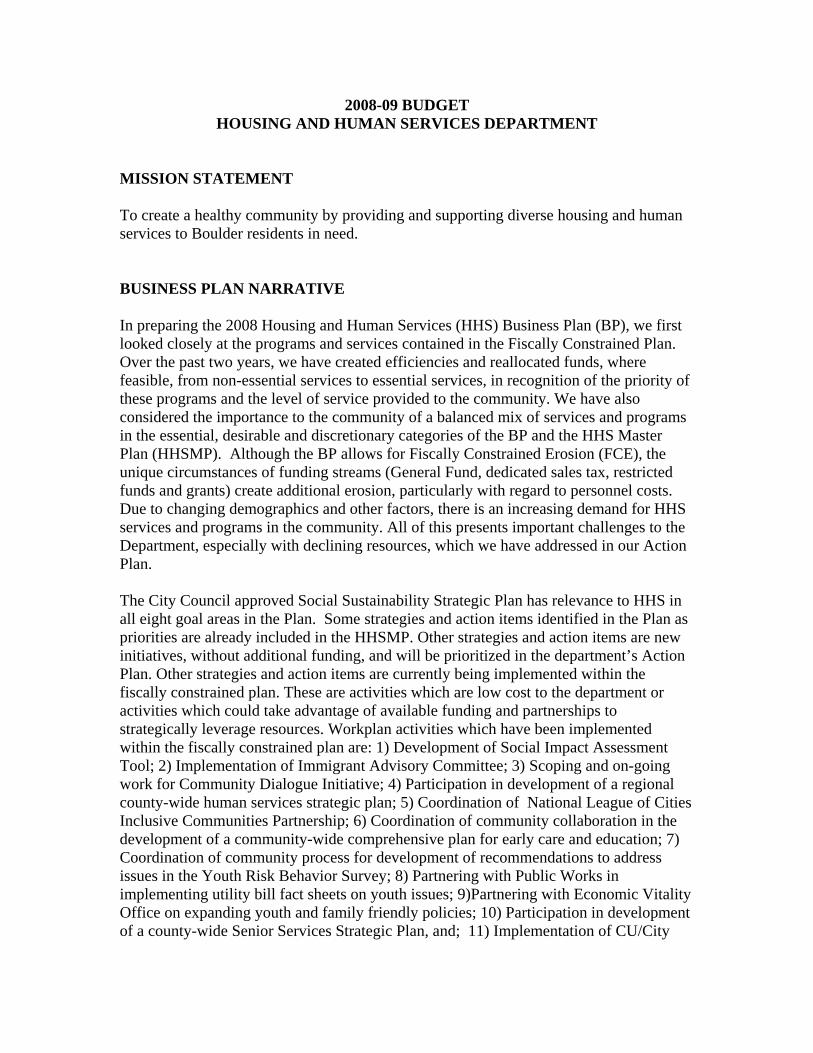
2008-09 BUDGET HOUSING AND HUMAN SERVICES DEPARTMENT
MISSION STATEMENT To create a healthy community by providing and supporting diverse housing and human services to Boulder residents in need. BUSINESS PLAN NARRATIVE In preparing the 2008 Housing and Human Services (HHS) Business Plan (BP), we first looked closely at the programs and services contained in the Fiscally Constrained Plan. Over the past two years, we have created efficiencies and reallocated funds, where feasible, from non-essential services to essential services, in recognition of the priority of these programs and the level of service provided to the community. We have also considered the importance to the community of a balanced mix of services and programs in the essential, desirable and discretionary categories of the BP and the HHS Master Plan (HHSMP). Although the BP allows for Fiscally Constrained Erosion (FCE), the unique circumstances of funding streams (General Fund, dedicated sales tax, restricted funds and grants) create additional erosion, particularly with regard to personnel costs. Due to changing demographics and other factors, there is an increasing demand for HHS services and programs in the community. All of this presents important challenges to the Department, especially with declining resources, which we have addressed in our Action Plan. The City Council approved Social Sustainability Strategic Plan has relevance to HHS in all eight goal areas in the Plan. Some strategies and action items identified in the Plan as priorities are already included in the HHSMP. Other strategies and action items are new initiatives, without additional funding, and will be prioritized in the department’s Action Plan. Other strategies and action items are currently being implemented within the fiscally constrained plan. These are activities which are low cost to the department or activities which could take advantage of available funding and partnerships to strategically leverage resources. Workplan activities which have been implemented within the fiscally constrained plan are: 1) Development of Social Impact Assessment Tool; 2) Implementation of Immigrant Advisory Committee; 3) Scoping and on-going work for Community Dialogue Initiative; 4) Participation in development of a regional county-wide human services strategic plan; 5) Coordination of National League of Cities Inclusive Communities Partnership; 6) Coordination of community collaboration in the development of a community-wide comprehensive plan for early care and education; 7) Coordination of community process for development of recommendations to address issues in the Youth Risk Behavior Survey; 8) Partnering with Public Works in implementing utility bill fact sheets on youth issues; 9)Partnering with Economic Vitality Office on expanding youth and family friendly policies; 10) Participation in development of a county-wide Senior Services Strategic Plan, and; 11) Implementation of CU/City
Oversight Group Sub-Committee on Inclusiveness and Diversity. This has increased the workload of the department and reduced the ability of the department to minimize erosion in programs and services in the fiscally constrained plan. The City Council Action Plan Budget identifies two housing items that inter-face with the HHS budget: 1) subsidy to Boulder Housing Partners (BHP) toward capital investment in the redevelopment of Boulder Mobile Manor (BMM) and 2) operating subsidy to support BHP efforts to provide rental assistance to vulnerable residents. As of July 2007, the city has expended and/or obligated approximately $410,000 of subsidy to BHP for BMM. This includes $307,000 in 1996 toward the acquisition of the property. Given the type of redevelopment that has been proposed, it is reasonable to expect that additional funding in the range of $500,000 - $1,000,000 could be provided through allocation of existing Housing Funds. This funding would be subject to review and analysis by HHS staff and the community's Technical Review Group (TRG) and to approval of this expenditure by the City Manager. In addition, one-time funding of approximately $500,000 could provide substantive support for some of the goals for the property that have been identified by City Council. Regarding on-going BHP operating subsidy, HHS proposes a reallocation of up to $50,000 toward this initiative out of the Affordable Housing Fund. It should be recognized that shifting funds to operations will diminish progress on increasing the community's affordable housing inventory. To the extent that General Fund is used to match this reallocation, additional support could be provided to this initiative. As of mid-2007, the city had secured approximately 2,800 permanently affordable housing units. Currently the city is on track to reach the goal of 4,500 units by 2019, in the Fiscally Constrained Plan. The Action Plan shortens the time to achieve the goal to 2015 and the Vision Plan to 2013. A combination of factors, such as reduced funding and shifting funding from acquisition to redevelopment, could push the date of achieving the goal out beyond 2019. GUIDING PRINCIPLES AND/OR INVESTMENT STRATEGY Guiding Principles:
• Maintain the integrity of the City’s Human Services infrastructure by providing
and/or supporting programs and services which meet community needs in the following areas:
⇒ Safety net – health and safety ⇒ Prevention and intervention ⇒ Social equity, diversity and human rights ⇒ Services and programs that promote self-sufficiency ⇒ Quality of life enhancement
• Seek out efficiency improvements
• Capitalize on leverage opportunities • Fulfill current financial obligations
Investment Strategy: The ten-year update to the HHSMP was completed and accepted in 2005 and is being implemented. It provides direction regarding investment strategies for the department and is the basis for the Department’s Business Plan, including the 2008 Action Plan. This includes operational and organizational strategies that may impact investment. The strategies are consistent with the city-wide business plan. In addition to the HHSMP, the approved Social Sustainability Strategic Plan provides further direction regarding investment priorities. Only 29% of the HHS budget comes from the General Fund. The remaining 71% comes from restricted or dedicated funds, including Federal, State, other local government and private grants. Some of these funds are received in support of specific programs and cannot be used for any other purpose. HHS strives to maximize leveraged funding, as a way to increase the community benefit of COB dollars. HHS serves primarily vulnerable (at risk and/or low income) populations through all of its services and programs, including those that have been listed as desirable or discretionary. HHS also recognizes, as per direction from Council and in support of community values, the importance of having a range and mix of services that contribute to a balanced and diverse community. HHS Categorization is based on the following: Essential
⇒ Safety net services and programs - meeting basic needs of mental and physical health, food and shelter, crisis intervention and containment - With a priority focus of residents at 40% AMI or less, residents at 200% national poverty level or less, disabled residents, at risk residents (e.g. of domestic violence, suicide, teen pregnancy, social isolation), etc.
⇒ Financial obligations ⇒ Barebones maintenance of existing, essential facilities ⇒ Core services not provided by any other entity
Desirable ⇒ Prevention and intervention services and programs that avoid future social
and economic cost to the City and the community – counseling, outreach, education, training, family support - With a priority focus of meeting the needs of residents up to 70% AMI
⇒ Services and programs reflecting community values and supported by ballot initiatives or legislative action of City Council
⇒ Services and programs that advance and/or support Council goals and/or Council directed initiatives
Discretionary ⇒ Services and programs that enhance quality of life – social, cultural and
recreational support that improves the social fabric of the community ⇒ Services available through other means ⇒ Other community desired programs and services not specifically supported
through legislative action or election HHS Prioritization is based on the following criteria: Safety net services Services not available elsewhere Services available elsewhere but not affordable Support of legislative action and/or code Support of Council goals Council directed initiatives Consistency with Boulder Valley Comprehensive Plan Support of regional initiatives or goals Cost per client served and/or cost/benefit Efficiency of providing service or program Available funding and/or leveraged funding Breadth of community population served Community capacity building Court-ordered or referred services Geographic population served OVERVIEW OF ACTION PLAN Please refer to Attachment B of the 2008-09 Budget Message for a listing of those Action Plan Items that were recommended for funding. The listing is presented in order by fund and department. Please see the section titled “City Council Direction on the Recommended Budget” for any changes from Attachment B. OVERVIEW OF VISION PLAN The HHS Vision Plan, as detailed in the HHS Master Plan, is a vision of the future, based on what is desirable for the community and could be accomplished if sufficient funds were available. Through the Vision Plan, the basic needs of residents are more fully met and programs are supported to ensure families and individuals at all stages of life have the tools necessary to reduce dependencies and be successful, contributing members of the community.
Services contained in the Vision Plan are designed to address changing demographics, needs and service trends and enhance Boulder’s position as a leader in the housing and human services fields. When compared with the Action Plan, these services are viewed as longer-term, visionary needs within the 10-year planning period. The Vision plan proposes additional areas of emphasis including: 10% affordable housing goal by 2013; senior services analysis and plan for future services; increase nutritional, dental and hearing aid needs for seniors; expand human services fund to better meet community health needs; increase community engagement efforts; expand mediation services; expand services related to early care and education for children; and address needs of middle and high school youth. BUDGET POLICY ISSUES The Food Tax Rebate Program was transferred to HHS from the City Clerk’s Office in 2004 without funds to administer the program. The Food Tax Rebate Program is administratively costly and burdensome for applicants due to the eligibility and certification criteria. The Program has been streamlined and changed to be as efficient and effective as possible, within the constraints of the ordinance. This is still currently an unfunded program with funds diverted from other programs to support the Food Tax Rebate Program. We are requesting that funding the Food Tax Rebate Program be considered during the 2008 budget process. REVENUE ISSUES -none PERFORMANCE MEASURES
Actual 2006
Target 2007
Target 2008
Target 2009
1. The number of permanently affordable housing units added to the City of Boulder’s housing stock on an annual basis ¹
117 120 125 125
2. The average percentage of goal attainment on performance objectives set for agencies & projects funded by the HSF & YOP ²
91% 85% 85% 85%
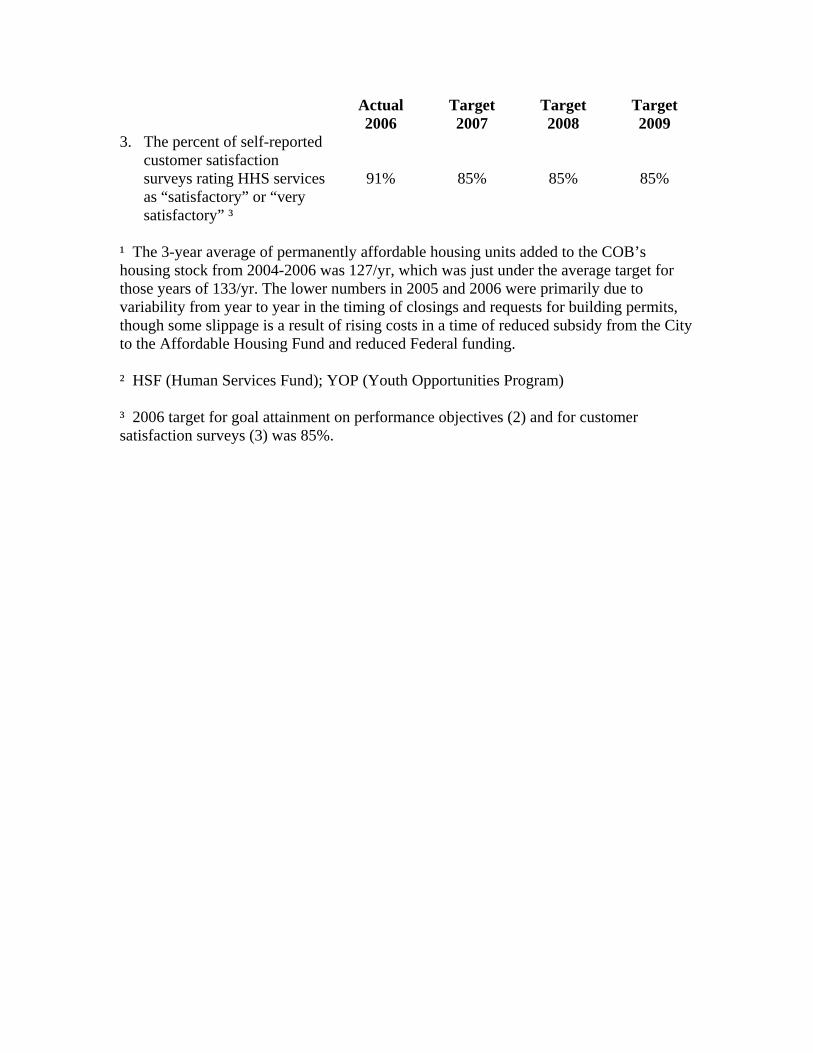
Actual 2006
Target 2007
Target 2008
Target 2009
3. The percent of self-reported customer satisfaction surveys rating HHS services as “satisfactory” or “very satisfactory” ³
91% 85% 85% 85%
¹ The 3-year average of permanently affordable housing units added to the COB’s housing stock from 2004-2006 was 127/yr, which was just under the average target for those years of 133/yr. The lower numbers in 2005 and 2006 were primarily due to variability from year to year in the timing of closings and requests for building permits, though some slippage is a result of rising costs in a time of reduced subsidy from the City to the Affordable Housing Fund and reduced Federal funding. ² HSF (Human Services Fund); YOP (Youth Opportunities Program) ³ 2006 target for goal attainment on performance objectives (2) and for customer satisfaction surveys (3) was 85%.
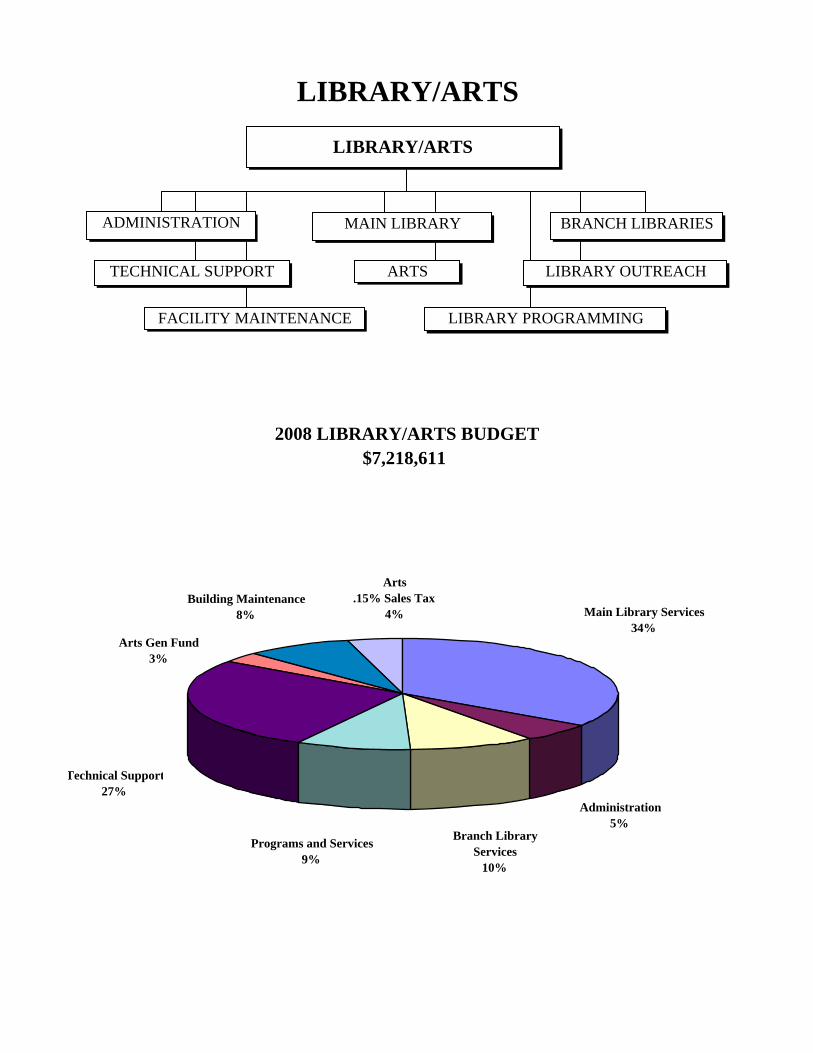
LIBRARY/ARTS
2008 LIBRARY/ARTS BUDGET$7,218,611
LIBRARY/ARTS
FACILITY MAINTENANCE
LIBRARY OUTREACH
LIBRARY PROGRAMMING
TECHNICAL SUPPORT ARTS
BRANCH LIBRARIESMAIN LIBRARYADMINISTRATION
Administration5%
Main Library Services34%
Arts.15% Sales Tax
4%Building Maintenance
8%
Arts Gen Fund3%
Technical Support27%
Programs and Services9%
Branch Library Services
10%
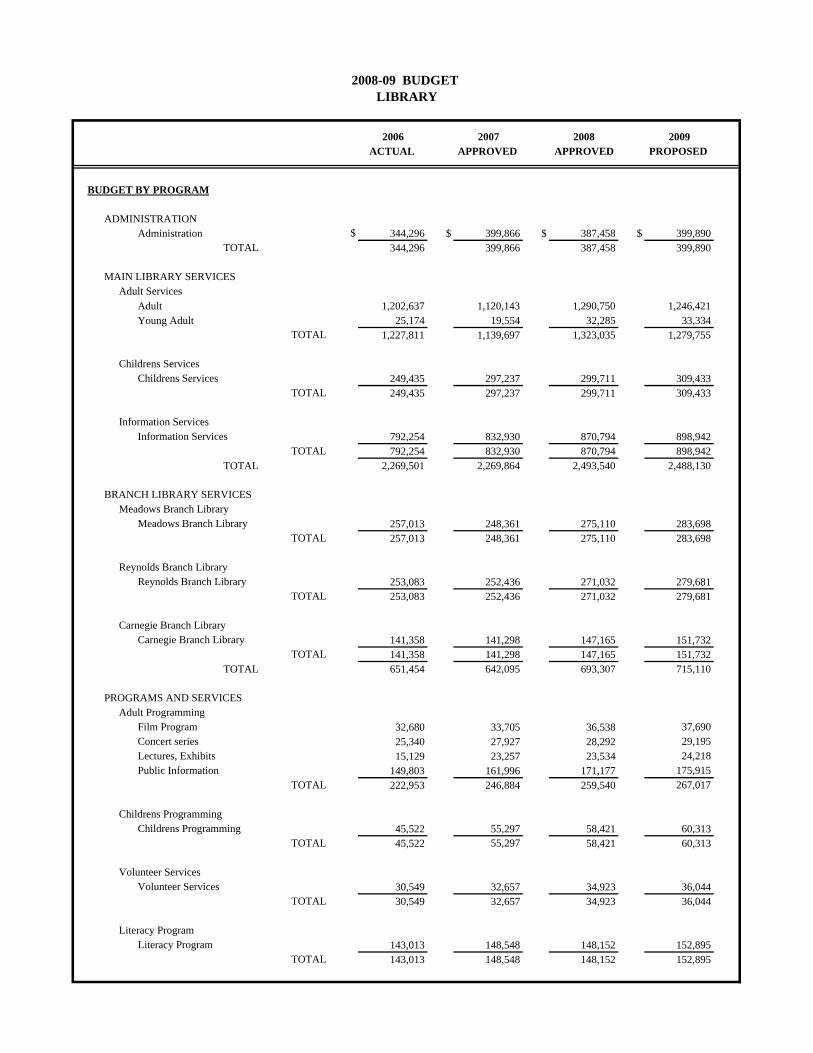
2006 2007 2008 2009ACTUAL APPROVED APPROVED PROPOSED
BUDGET BY PROGRAM
ADMINISTRATIONAdministration $ 344,296 $ 399,866 $ 387,458 $ 399,890
TOTAL 344,296 399,866 387,458 399,890
MAIN LIBRARY SERVICESAdult Services
Adult 1,202,637 1,120,143 1,290,750 1,246,421Young Adult 25,174 19,554 32,285 33,334
TOTAL 1,227,811 1,139,697 1,323,035 1,279,755
Childrens ServicesChildrens Services 249,435 297,237 299,711 309,433
TOTAL 249,435 297,237 299,711 309,433
Information ServicesInformation Services 792,254 832,930 870,794 898,942
TOTAL 792,254 832,930 870,794 898,942TOTAL 2,269,501 2,269,864 2,493,540 2,488,130
BRANCH LIBRARY SERVICESMeadows Branch Library
Meadows Branch Library 257,013 248,361 275,110 283,698TOTAL 257,013 248,361 275,110 283,698
Reynolds Branch LibraryReynolds Branch Library 253,083 252,436 271,032 279,681
TOTAL 253,083 252,436 271,032 279,681
Carnegie Branch LibraryCarnegie Branch Library 141,358 141,298 147,165 151,732
TOTAL 141,358 141,298 147,165 151,732TOTAL 651,454 642,095 693,307 715,110
PROGRAMS AND SERVICESAdult Programming
Film Program 32,680 33,705 36,538 37,690Concert series 25,340 27,927 28,292 29,195Lectures, Exhibits 15,129 23,257 23,534 24,218Public Information 149,803 161,996 171,177 175,915
TOTAL 222,953 246,884 259,540 267,017
Childrens ProgrammingChildrens Programming 45,522 55,297 58,421 60,313
TOTAL 45,522 55,297 58,421 60,313
Volunteer ServicesVolunteer Services 30,549 32,657 34,923 36,044
TOTAL 30,549 32,657 34,923 36,044
Literacy ProgramLiteracy Program 143,013 148,548 148,152 152,895
TOTAL 143,013 148,548 148,152 152,895
2008-09 BUDGET LIBRARY
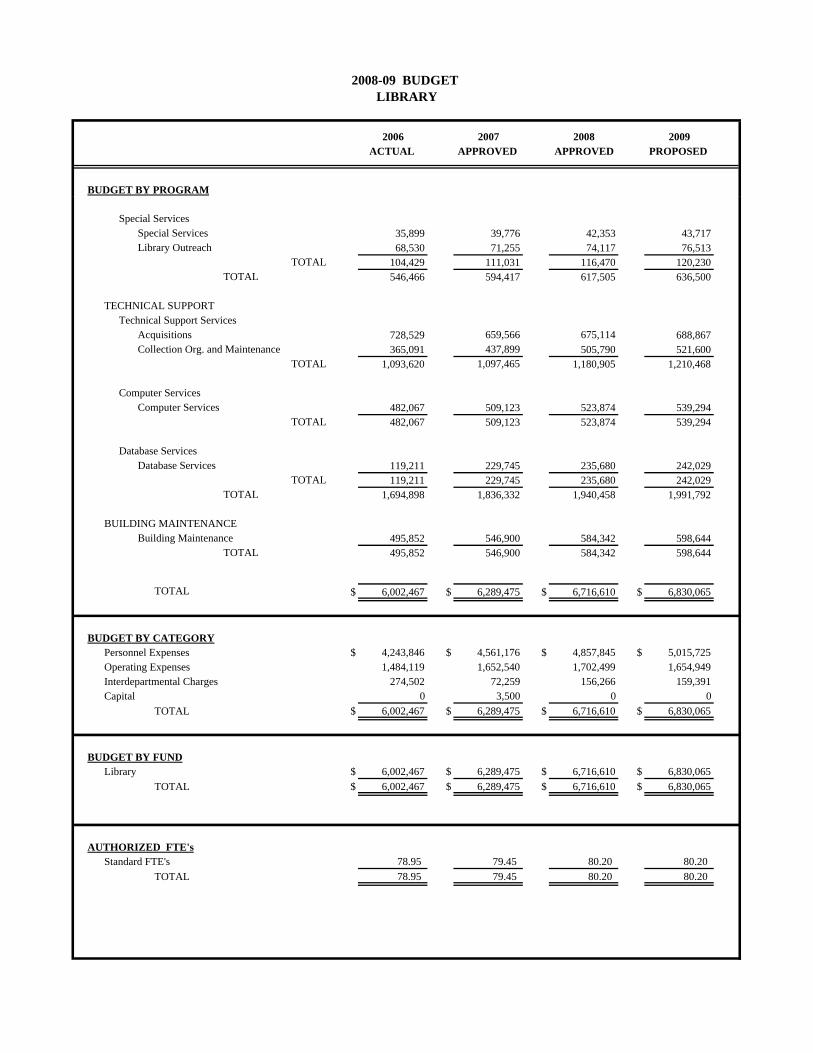
2006 2007 2008 2009ACTUAL APPROVED APPROVED PROPOSED
BUDGET BY PROGRAM
2008-09 BUDGET LIBRARY
Special ServicesSpecial Services 35,899 39,776 42,353 43,717Library Outreach 68,530 71,255 74,117 76,513
TOTAL 104,429 111,031 116,470 120,230TOTAL 546,466 594,417 617,505 636,500
TECHNICAL SUPPORTTechnical Support Services
Acquisitions 728,529 659,566 675,114 688,867Collection Org. and Maintenance 365,091 437,899 505,790 521,600
TOTAL 1,093,620 1,097,465 1,180,905 1,210,468
Computer ServicesComputer Services 482,067 509,123 523,874 539,294
TOTAL 482,067 509,123 523,874 539,294
Database ServicesDatabase Services 119,211 229,745 235,680 242,029
TOTAL 119,211 229,745 235,680 242,029TOTAL 1,694,898 1,836,332 1,940,458 1,991,792
BUILDING MAINTENANCEBuilding Maintenance 495,852 546,900 584,342 598,644
TOTAL 495,852 546,900 584,342 598,644
TOTAL $ 6,002,467 $ 6,289,475 $ 6,716,610 $ 6,830,065
BUDGET BY CATEGORYPersonnel Expenses $ 4,243,846 $ 4,561,176 $ 4,857,845 $ 5,015,725Operating Expenses 1,484,119 1,652,540 1,702,499 1,654,949Interdepartmental Charges 274,502 72,259 156,266 159,391Capital 0 3,500 0 0
TOTAL $ 6,002,467 $ 6,289,475 $ 6,716,610 $ 6,830,065
BUDGET BY FUNDLibrary $ 6,002,467 $ 6,289,475 $ 6,716,610 $ 6,830,065
TOTAL $ 6,002,467 $ 6,289,475 $ 6,716,610 $ 6,830,065
AUTHORIZED FTE'sStandard FTE's 78.95 79.45 80.20 80.20
TOTAL 78.95 79.45 80.20 80.20
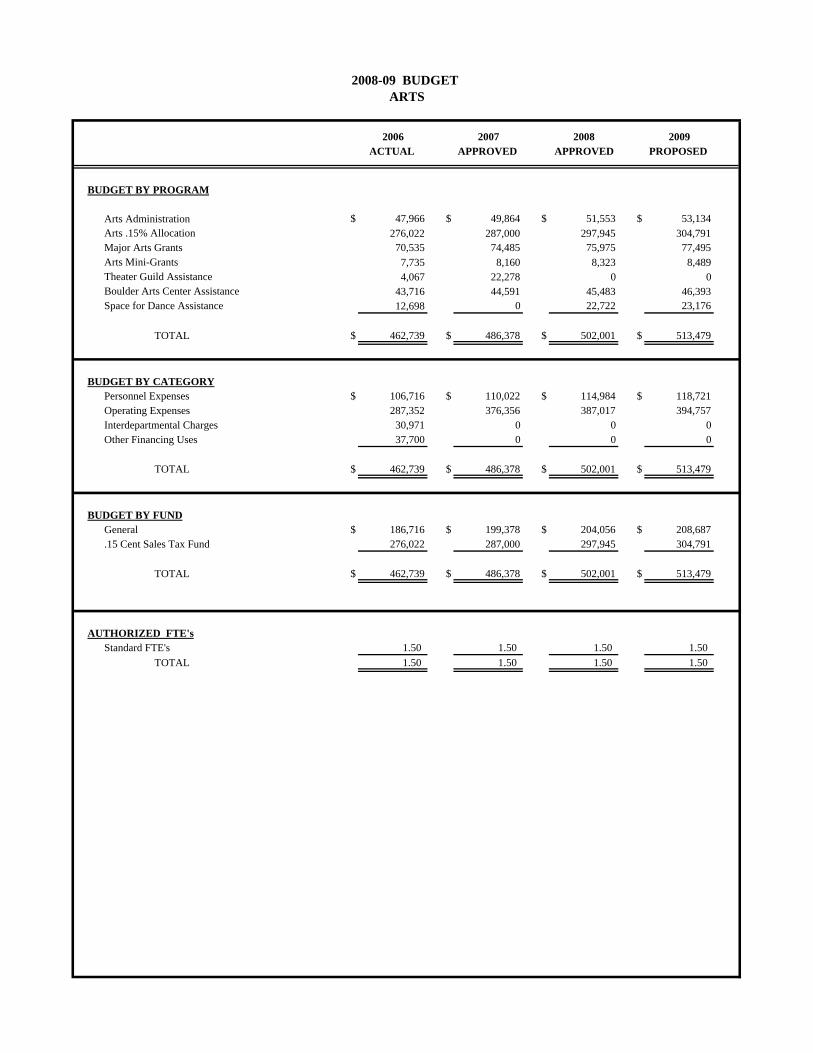
2006 2007 2008 2009ACTUAL APPROVED APPROVED PROPOSED
BUDGET BY PROGRAM
Arts Administration $ 47,966 $ 49,864 $ 51,553 $ 53,134Arts .15% Allocation 276,022 287,000 297,945 304,791Major Arts Grants 70,535 74,485 75,975 77,495Arts Mini-Grants 7,735 8,160 8,323 8,489Theater Guild Assistance 4,067 22,278 0 0Boulder Arts Center Assistance 43,716 44,591 45,483 46,393Space for Dance Assistance 12,698 0 22,722 23,176
TOTAL $ 462,739 $ 486,378 $ 502,001 $ 513,479
BUDGET BY CATEGORYPersonnel Expenses $ 106,716 $ 110,022 $ 114,984 $ 118,721Operating Expenses 287,352 376,356 387,017 394,757Interdepartmental Charges 30,971 0 0 0Other Financing Uses 37,700 0 0 0
TOTAL $ 462,739 $ 486,378 $ 502,001 $ 513,479
BUDGET BY FUNDGeneral $ 186,716 $ 199,378 $ 204,056 $ 208,687.15 Cent Sales Tax Fund 276,022 287,000 297,945 304,791
TOTAL $ 462,739 $ 486,378 $ 502,001 $ 513,479
AUTHORIZED FTE'sStandard FTE's 1.50 1.50 1.50 1.50
TOTAL 1.50 1.50 1.50 1.50
2008-09 BUDGET ARTS
2008-09 BUDGET LIBRARY DEPARTMENT
MISSION STATEMENT The mission of the Boulder Public Library is to enhance the personal and professional growth of Boulder residents and contribute to the development and sustainability of an engaged community through free access to ideas, information, cultural experiences and educational opportunities. BUSINESS PLAN NARRATIVE The business plan model continues to provide a framework for library budget development and has been integral to the development of the 2007 Library Master Plan recommendations. Like many city departments, the library has been challenged to rethink how it can best offer services of sustainable quality in an environment of limited resources. The business plan offers a clearly defined system of priorities to guide these decisions. The 2008 library business plan has evolved from the 2006 and 2007 business plans, to include fully developed fiscally constrained, action and vision plans. The 2008 Fiscally Constrained Plan presents a number of challenges, as analysis of the library’s financial position and services show that the quality of several core services cannot be sustained at current levels without new funding or reallocations that would result in service reductions. Even with an ongoing, dedicated focus on efficiencies and cost savings, the General Fund reductions sustained during the 2003-2005 budget retrenchment are proving to have a long-term impact on service quality. The areas most affected by this service quality erosion include building maintenance and security, energy costs, the library collection, children’s services, technology equipment and services, materials handling and shelving, and replacement funding for critical library equipment. GUIDING PRINCIPLES AND/OR INVESTMENT STRATEGY The business plan categorizes services as follows:
1.) Essential Services include basic adult and children information services found in all public libraries, and a central main library facility to house these services. Included are children's and adult fiction and non-fiction materials, reference materials and reference assistance, and basic children's literacy programming such as story time. Support services for these direct public services are also categorized as essential. Examples include the technology and staffing to select, purchase, catalog,
process, and shelve materials, technology and staffing to allow the public to use and check out materials, and resources to clean and maintain the facility.
2.) Desirable Services are enhancements to essential services and provide additional service points and facilities to accommodate population growth and/or convenience, outreach programs to ensure equal information access by all community members, and programs that enable the library to offer access to information in alternative forms and contribute to the community’s economic vitality by functioning as an important local arts venue.
3.) Discretionary Services enhance desirable library services. Currently funded discretionary services include Books-by-Mail and branch library cultural programming.
Funding recommendations are guided by the library’s business plan, with essential services being given priority over desired or discretionary services. In addition to the business plan framework, the library’s investment strategy is based on the following guiding principles:
• The library’s mission and vision statements guide program and policy decisions. • Priority consideration is given to programs and services that:
- serve significant numbers of people, - help BPL keep pace with advancements in the delivery of library services, - reach groups that cannot easily access library services or are under-served in
the community, - generate or leverage additional funding, and/or - foster community involvement through volunteerism.
• Facilities must be safe, clean and well maintained.
OVERVIEW OF ACTION PLAN The 2008 Action Plan identifies two types of improvements. Highest priority funding needs are focused on essential services which at present are inadequately funded to provide sustainable service quality in the Fiscally Constrained Plan, as described above. Lower priorities are assigned to other strategies identified in the Action Plan, but remain important if the library is to provide quality services that stay current with the changes occurring in the world of information services, and also address the needs of changing community demographics. Included among these is the change most frequently requested by library patrons - restoring hours that were reduced in 2004 and 2005. The Action Plan also proposes relatively modest improvements to meeting areas, and reconfiguration of library space to better meet the needs of library users. In the technology area, the plan addresses the growing demand for online information services
by recommending additional resources to develop information portals, expansion of remotely accessed services and simplified access to content available on the BPL Web site. In the area of outreach and services to diverse populations, the plan addresses the needs of Boulder’s growing Latino population by proposing expansion of the Spanish language collection and translation of portions of the Web site. Finally, the Action Plan recommends that library furnishings and fixtures be replaced on a 25-year cycle, and that a program plan be developed to address the long-term needs and services of the Carnegie branch facility. Please refer to Attachment B of the 2008-09 Budget Message for a listing of those Action Plan Items that were recommended for funding. The listing is presented in order by fund and department. Please see the section titled “City Council Direction on the Recommended Budget” for any changes from Attachment B. OVERVIEW OF VISION PLAN The Boulder Public Library vision of excellence is intended to create physical and virtual crossroads to connect patrons to past and present information and provide them with the tools and facilities to create new knowledge, to interact with others, to read and reflect on their own, and to enjoy and be inspired by the arts. Much of the vision plan is dependent upon a comprehensive study of current functions and uses of space within the library system. In order to achieve the objectives of becoming a leading edge center for access to information technology and to provide flexible, state-of-the-art multimedia meeting and community spaces, the library staff will engage the services of a qualified consultant to evaluate the current use of space and propose recommendations for future uses. The space study will also be used to evaluate the necessity for an expanded main library facility, as well as additional branch and/or mobile facilities to serve other needs of the community, including robust collaboration with area educational, business and non-profit institutions, and a world-class technology/homework center for teens and children. Finally, the vision plan will provide the citizens of Boulder with the materials collection befitting a progressive, highly educated community, by developing and implementing a sustainable financial method to endow such a collection.
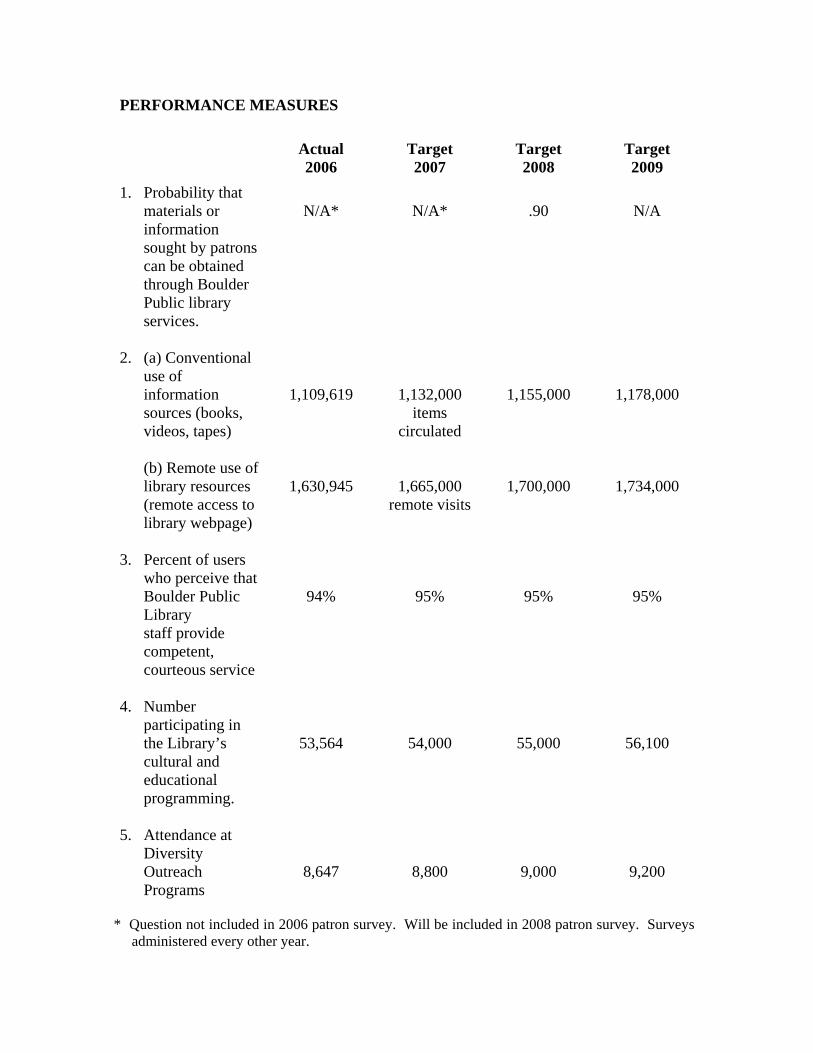
PERFORMANCE MEASURES Actual
2006 Target 2007
Target 2008
Target 2009
1. Probability that materials or information sought by patrons can be obtained through Boulder Public library services.
N/A*
N/A*
.90
N/A
2. (a) Conventional use of information sources (books, videos, tapes)
(b) Remote use of
library resources (remote access to library webpage)
1,109,619
1,630,945
1,132,000 items
circulated
1,665,000 remote visits
1,155,000
1,700,000
1,178,000
1,734,000
3. Percent of users who perceive that Boulder Public Library staff provide competent, courteous service
94%
95%
95%
95%
4. Number participating in the Library’s cultural and educational programming.
53,564
54,000
55,000
56,100
5. Attendance at Diversity Outreach Programs
8,647
8,800
9,000
9,200
* Question not included in 2006 patron survey. Will be included in 2008 patron survey. Surveys
administered every other year.
2008-09 BUDGET ARTS DEPARTMENT
MISSION STATEMENT The mission of the Boulder Arts Commission is to further the development of a dynamic arts community through encouraging artistic innovation, collaboration, public art and organizational stability; to increase awareness of, participation in, and access to the arts as a community-wide resource; to promote multicultural expression and participation in the arts through support of diverse ethnic cultures and artistic aesthetics; to create opportunities for Boulder artists and arts organizations to participate successfully in their communities; to act as an advocate on behalf of the arts in the public and private sectors; and to foster a creative cultural climate in the community. BUSINESS PLAN NARRATIVE The quality of life implications of a thriving arts community are apparent, but the financial reasons for supporting the arts are less obvious. The latest Arts Commission/Americans for the Arts economic study completed in May 2007 show the arts generated $27.58 million in local economic activity. This results from arts audiences’ event-related expenditures in local restaurants, hotels, retail stores and services and artist/organizational expenditures to produce events. The arts are a clean industry that attracts audiences, spurs business development, supports jobs and generates revenue for government services. Recognizing the arts’ role in economic vitality, the Arts Commission continues to focus grant funding on efforts which will position Boulder as a major center known for quality arts offerings. In addition to supporting diverse and professional arts performances, exhibits and works, funding has also included organizational training and resource development for arts groups to enhance business and management skills, with a strong focus on mentorship. Local and regional partnerships with the business community and other arts organizations have been focused on marketing, promotion and coordinated support of the arts. Implementation of the Cultural Master Plan, a joint effort of the Boulder Arts Commission, community arts organizations and artists is complete and community arts objectives have been initiated. GUIDING PRINCIPLES OR INVESTMENT STRATEGY The arts program seeks to strategically support and promote the development of Boulder’s fine and performing arts in alignment with the Arts Department mission.
Current arts services and programs are categorized using the following investment strategy model: 1. Essential Services: There are no arts services meeting the essential services definition as presented in the City Business Plan. 2. Desirable Services: Desirable arts services and programs contribute to the local economic vitality, help shape the identity of the community, attract creative talent and enhance the community’s quality of life. 3. Discretionary Services: Discretionary arts services and programs enhance or expand desirable arts programs or are programs that benefit a limited population or group. OVERVIEW OF ACTION PLAN Please refer to Attachment B of the 2008-09 Budget Message for a listing of those Action Plan Items that were recommended for funding. The listing is presented in order by fund and department. Please see the section titled “City Council Direction on the Recommended Budget” for any changes from Attachment B. OVERVIEW OF VISION PLAN With the completion of the Cultural Master Plan, the Boulder Arts Commission is committed to position Boulder as an important and thriving year-round center for the arts. The BAC’s role in implementing the Cultural Master Plan includes strategic funding to support the following goals:
• Positioning, Marketing and Promoting: Raise the profile of the arts through more aggressive marketing and education. The BAC will support these efforts through innovative grant making, facilitating the sharing of resources, pursuing publicity and public relations and bringing arts leaders together to keep the arts community focused on the plan’s goals and objectives.
• Community and Arts Partnerships: Develop greater resources within public and
private sectors to support the arts. Create partnerships with the business community that yield returns for both entities.
• Organizational Development: Coordinate the cultural development efforts of arts
organizations and individual artists. Sponsor professional workshops to develop skills and provide networking opportunities for the arts.
• Increase public awareness of the value of arts and culture: Create opportunities
for joint programming and marketing among cultural organizations. Advance arts promotion strategies designed to education and inform the community.
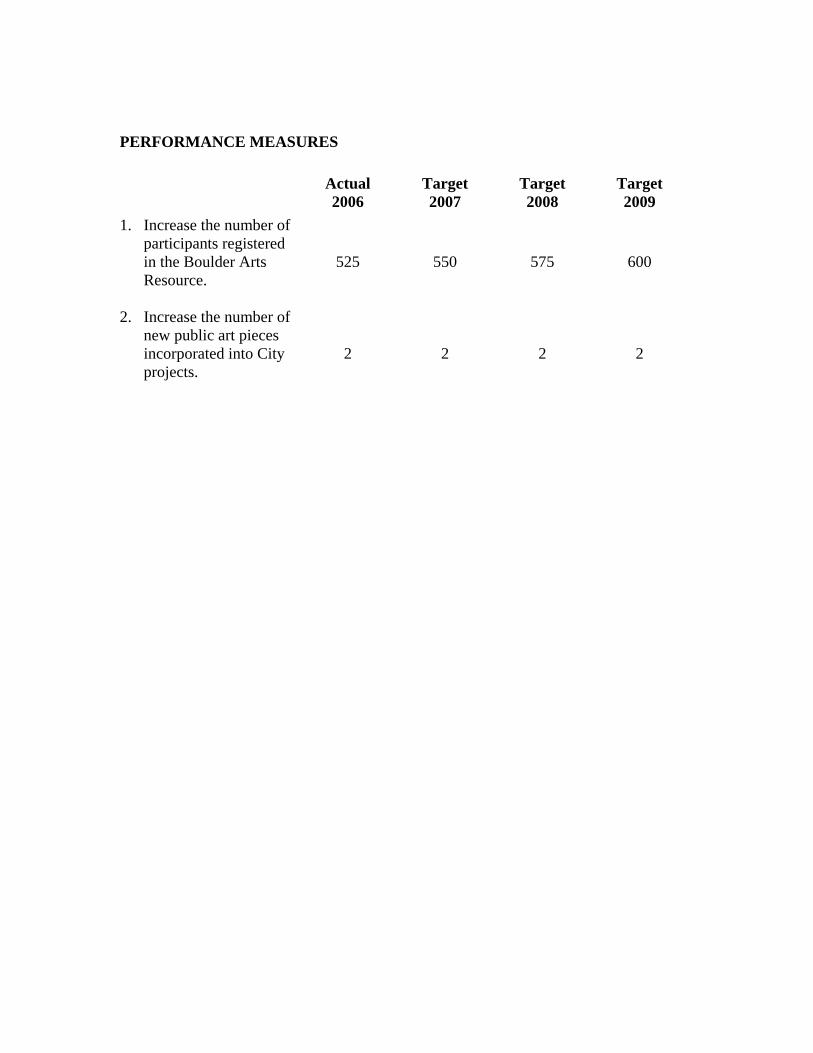
PERFORMANCE MEASURES
Actual 2006
Target 2007
Target 2008
Target 2009
1. Increase the number of participants registered in the Boulder Arts Resource.
525 550 575 600
2. Increase the number of new public art pieces incorporated into City projects.
2 2 2 2
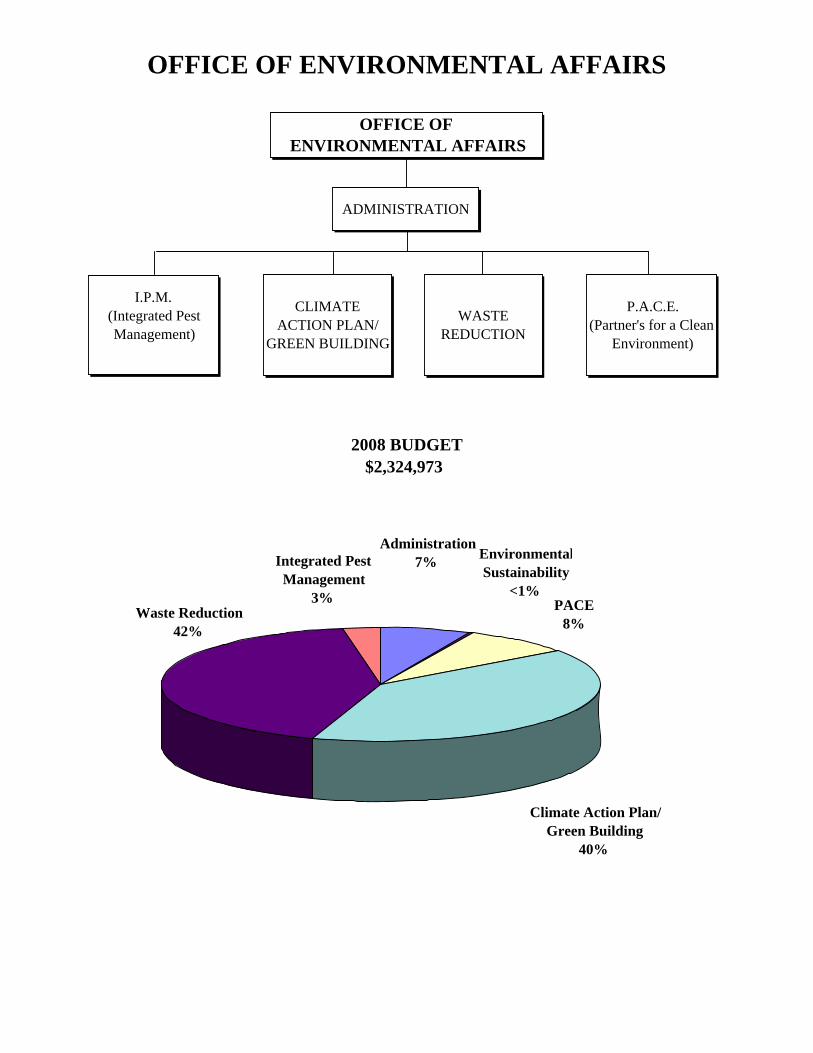
OFFICE OF ENVIRONMENTAL AFFAIRS
2008 BUDGET$2,324,973
OFFICE OF ENVIRONMENTAL AFFAIRS
ADMINISTRATION
P.A.C.E.(Partner's for a Clean
Environment)
CLIMATE ACTION PLAN/
GREEN BUILDING
WASTE REDUCTION
I.P.M.(Integrated Pest Management)
Waste Reduction42%
PACE8%
EnvironmentalSustainability
<1%
Integrated PestManagement
3%
Administration7%
Climate Action Plan/Green Building
40%
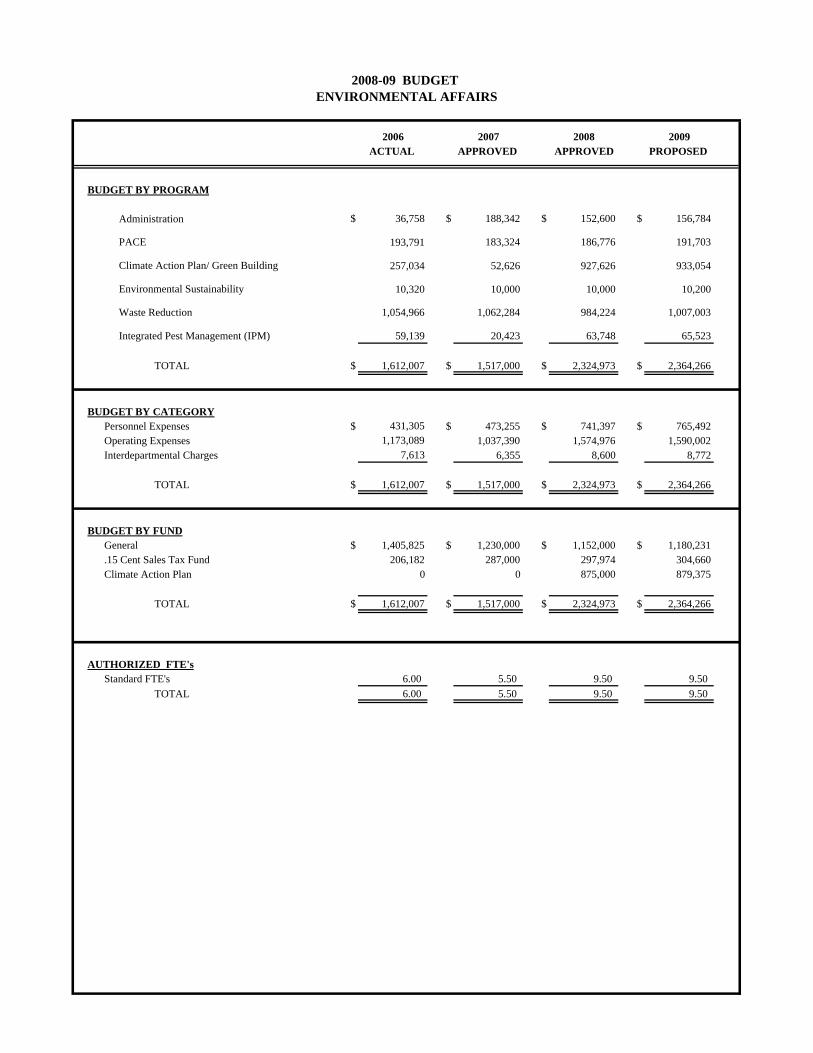
2006 2007 2008 2009ACTUAL APPROVED APPROVED PROPOSED
BUDGET BY PROGRAM
Administration $ 36,758 $ 188,342 $ 152,600 $ 156,784
PACE 193,791 183,324 186,776 191,703
Climate Action Plan/ Green Building 257,034 52,626 927,626 933,054
Environmental Sustainability 10,320 10,000 10,000 10,200
Waste Reduction 1,054,966 1,062,284 984,224 1,007,003
Integrated Pest Management (IPM) 59,139 20,423 63,748 65,523
TOTAL $ 1,612,007 $ 1,517,000 $ 2,324,973 $ 2,364,266
BUDGET BY CATEGORYPersonnel Expenses $ 431,305 $ 473,255 $ 741,397 $ 765,492Operating Expenses 1,173,089 1,037,390 1,574,976 1,590,002Interdepartmental Charges 7,613 6,355 8,600 8,772
TOTAL $ 1,612,007 $ 1,517,000 $ 2,324,973 $ 2,364,266
BUDGET BY FUNDGeneral $ 1,405,825 $ 1,230,000 $ 1,152,000 $ 1,180,231.15 Cent Sales Tax Fund 206,182 287,000 297,974 304,660Climate Action Plan 0 0 875,000 879,375
TOTAL $ 1,612,007 $ 1,517,000 $ 2,324,973 $ 2,364,266
AUTHORIZED FTE'sStandard FTE's 6.00 5.50 9.50 9.50
TOTAL 6.00 5.50 9.50 9.50
2008-09 BUDGET ENVIRONMENTAL AFFAIRS
2008-09 BUDGET CITY MANAGER’S OFFICE
OFFICE OF ENVIRONMENTAL AFFAIRS
MISSION STATEMENT To guide the community and city organization in protecting the quality of our environment by reducing pollution, curbing resource consumption and promoting sustainable practices. BUSINESS PLAN NARRATIVE The 2008 budget for the Office of Environmental Affairs is comprised of $1,152,000 from the General Fund - Trash Haulers’ Occupation Tax revenues, $298,000 from a portion of the 0.15% Sales Tax - Dedicated Environment Fund and $875,000 from the Climate Action Plan tax. Budget History As part of the 2005 budget, City Council approved increasing the Trash Tax by $468,000. A portion of this, $258,000 had been dedicated to greenhouse gas emissions reduction programs, but expired at the end of 2006. The remaining $210,000 Trash Tax increase does not expire and is dedicated to carrying out the fiscally constrained portion of the city’s Master Plan for Waste Reduction (MPWR). OEA’s 2007 budget target included no funding for greenhouse gas emissions reduction programs, except personnel costs associated with 1.0 FTE still funded by the base Trash Tax. At this level, the fiscally constrained portion of the city’s Climate Action Plan was under-funded. Implementation of the Climate Action Plan (CAP) began in January 2007. Because Xcel Energy began collecting the CAP tax on April 1, 2007, tax revenue is not projected to provide the City Council approved budget of $860,265. Staff estimated that $700,000 in CAP tax revenue would be generated in 2007. Of the $860,265 appropriated in 2007, $160,265 was carried over from unspent climate & energy program budgets and excess trash tax revenues collected in 2006. If received, excess CAP tax revenues will be used to reimburse the trash tax. If tax revenues are short, programmatic expenses will be reduced. Full scale implementation of the Climate Action Plan will be phased in during 2007 and 2008. The CAP assumed that programs, strategies and funding levels would be adjusted over time to ensure the emissions reduction goal is met and to respond to actual program results, changes in utility program offerings and other factors. Staff is evaluating the emissions reduction potential associated with existing programs, as well as other more aggressive measures outlined in the CAP. Staff will review their analysis and options with the CAP Advisory Group and City Council during July and August and request
input on options for 2008. Potential changes include increasing the annual budget to expand or add programs, as well as regulatory options that reduce energy use in homes and commercial buildings. OVERVIEW OF ACTION PLAN In April 2006, City Council adopted the Master Plan for Waste Reduction (MPWR), which includes a Fiscally Constrained current plan, an Action Plan and a Vision Plan and outlines a roadmap to achieve 85 percent waste reduction by 2017. Funding for the action or vision plans of the MPWR would likely come from future increases to the city Trash Tax.
The MPWR and the Climate Action Plan will be merged into a larger Strategic Plan for the Office of Environmental Affairs, expected by the early part of 2008. In the interim, the Action Plan includes those immediate needs that are above the personnel and non-personnel expense (NPE) increase for the 2007-2012 budget planning period. This includes expenses associated with residential and commercial green building programs. Please refer to Attachment B of the 2008-09 Budget Message for a listing of those Action Plan Items that were recommended for funding. The listing is presented in order by fund and department. Please see the section titled “City Council Direction on the Recommended Budget” for any changes from Attachment B. OVERVIEW OF VISION PLAN OEA’s work program currently encompasses six different focus areas. City Council has accepted master plans for two of these focus areas: waste reduction and greenhouse gas emissions reduction. The MPWR outlines a vision of 85 percent waste diversion by 2017. The Climate Action Plan lays out the plan to get the city to the Kyoto Protocol goal. City Council could set a greenhouse gas emissions reduction goal higher than the Kyoto Protocol target as a Climate Vision Plan. For the four other program areas: integrated pest management (including West Nile Virus), urban wildlife management, green building and pollution prevention (PACE), no master plans currently exist. The vision for city of Boulder green building programs includes implementation of a comprehensive residential Green Points program, adding green multifamily and affordable housing programs as well. All green building programs will be integrated into Planning and Development Services business processes, and is updated every three years to keep pace with industry norms, technological advances and the standard code adoption process. In addition, a green building vision includes a city of Boulder commercial green building code that results in all new and remodeled commercial construction being designed and built to a LEED (Leadership in Energy & Environmental Design) standard or a predetermined performance measure. The vision
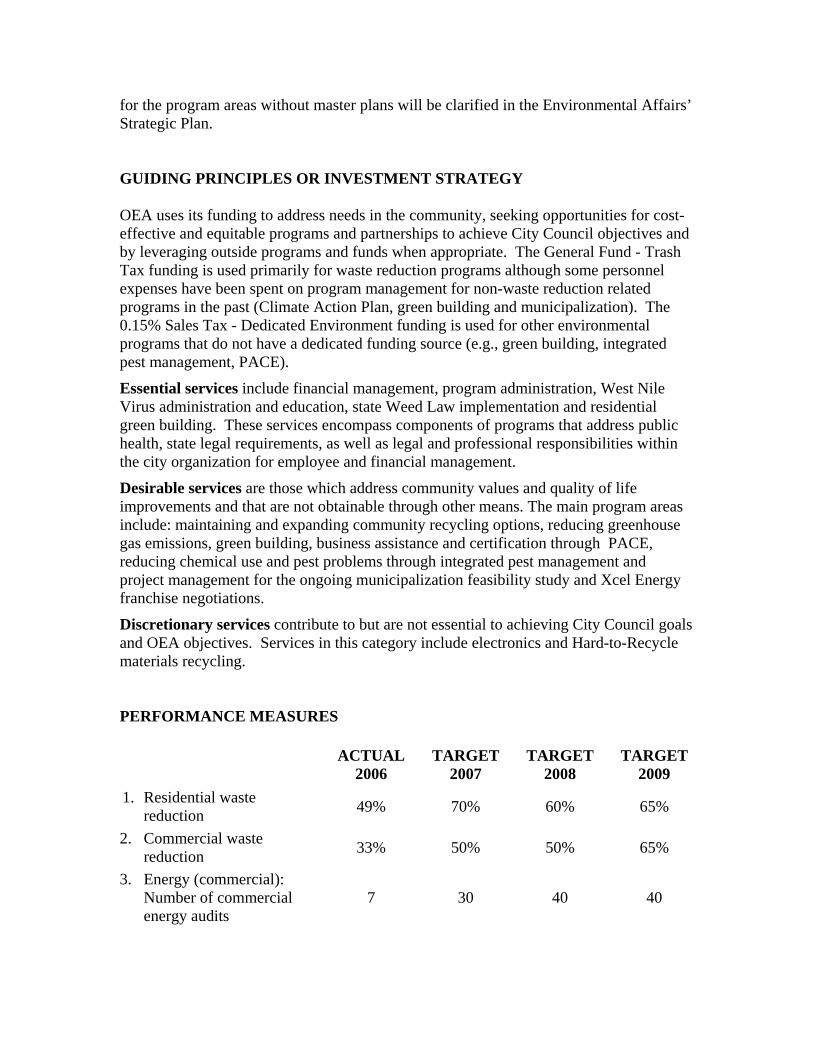
for the program areas without master plans will be clarified in the Environmental Affairs’ Strategic Plan. GUIDING PRINCIPLES OR INVESTMENT STRATEGY OEA uses its funding to address needs in the community, seeking opportunities for cost-effective and equitable programs and partnerships to achieve City Council objectives and by leveraging outside programs and funds when appropriate. The General Fund - Trash Tax funding is used primarily for waste reduction programs although some personnel expenses have been spent on program management for non-waste reduction related programs in the past (Climate Action Plan, green building and municipalization). The 0.15% Sales Tax - Dedicated Environment funding is used for other environmental programs that do not have a dedicated funding source (e.g., green building, integrated pest management, PACE).
Essential services include financial management, program administration, West Nile Virus administration and education, state Weed Law implementation and residential green building. These services encompass components of programs that address public health, state legal requirements, as well as legal and professional responsibilities within the city organization for employee and financial management.
Desirable services are those which address community values and quality of life improvements and that are not obtainable through other means. The main program areas include: maintaining and expanding community recycling options, reducing greenhouse gas emissions, green building, business assistance and certification through PACE, reducing chemical use and pest problems through integrated pest management and project management for the ongoing municipalization feasibility study and Xcel Energy franchise negotiations.
Discretionary services contribute to but are not essential to achieving City Council goals and OEA objectives. Services in this category include electronics and Hard-to-Recycle materials recycling. PERFORMANCE MEASURES
ACTUAL 2006
TARGET 2007
TARGET 2008
TARGET 2009
1. Residential waste reduction 49% 70% 60% 65%
2. Commercial waste reduction 33% 50% 50% 65%
3. Energy (commercial): Number of commercial energy audits
7 30 40 40

ACTUAL 2006
TARGET 2007
TARGET 2008
TARGET 2009
4. Energy (residential): Number of residential energy audits Number of weatherization projects
10
10
280
10
350
25
500
30
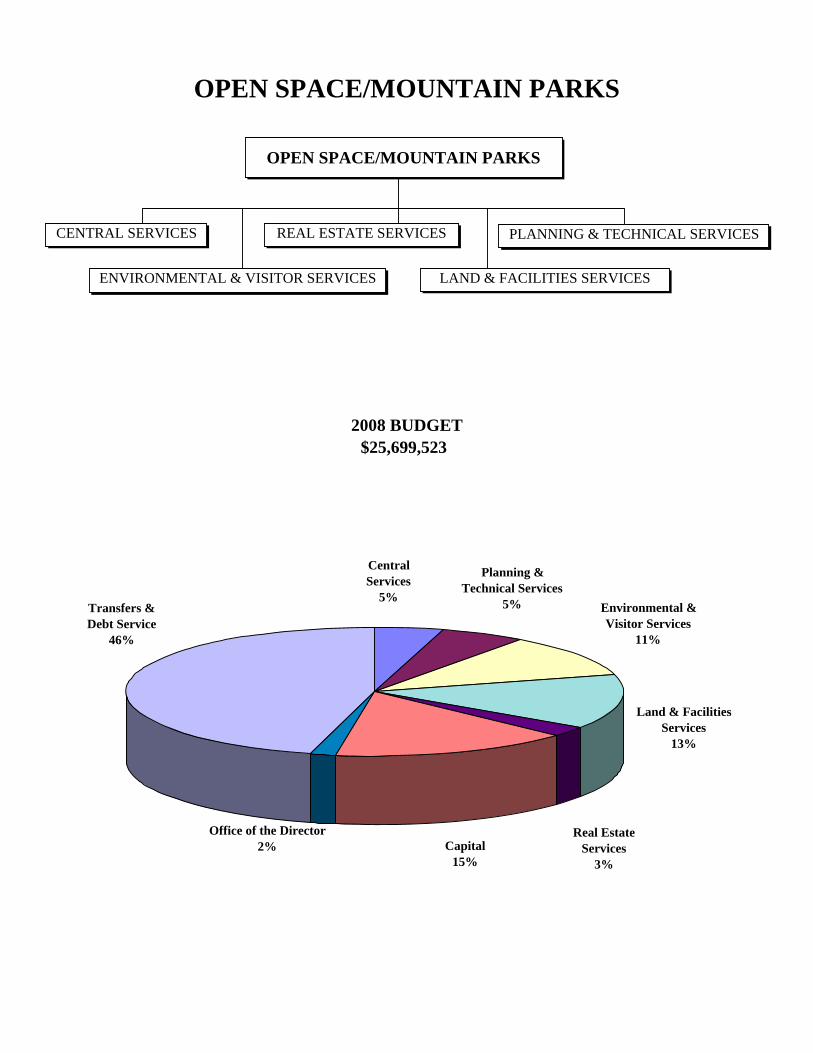
OPEN SPACE/MOUNTAIN PARKS
2008 BUDGET$25,699,523
OPEN SPACE/MOUNTAIN PARKS
CENTRAL SERVICES REAL ESTATE SERVICES PLANNING & TECHNICAL SERVICES
ENVIRONMENTAL & VISITOR SERVICES LAND & FACILITIES SERVICES
Environmental &Visitor Services
11%
Planning &Technical Services
5%
Land & Facilities Services
13%
Real EstateServices
3%Capital
15%
CentralServices
5%
Office of the Director2%
Transfers &Debt Service
46%
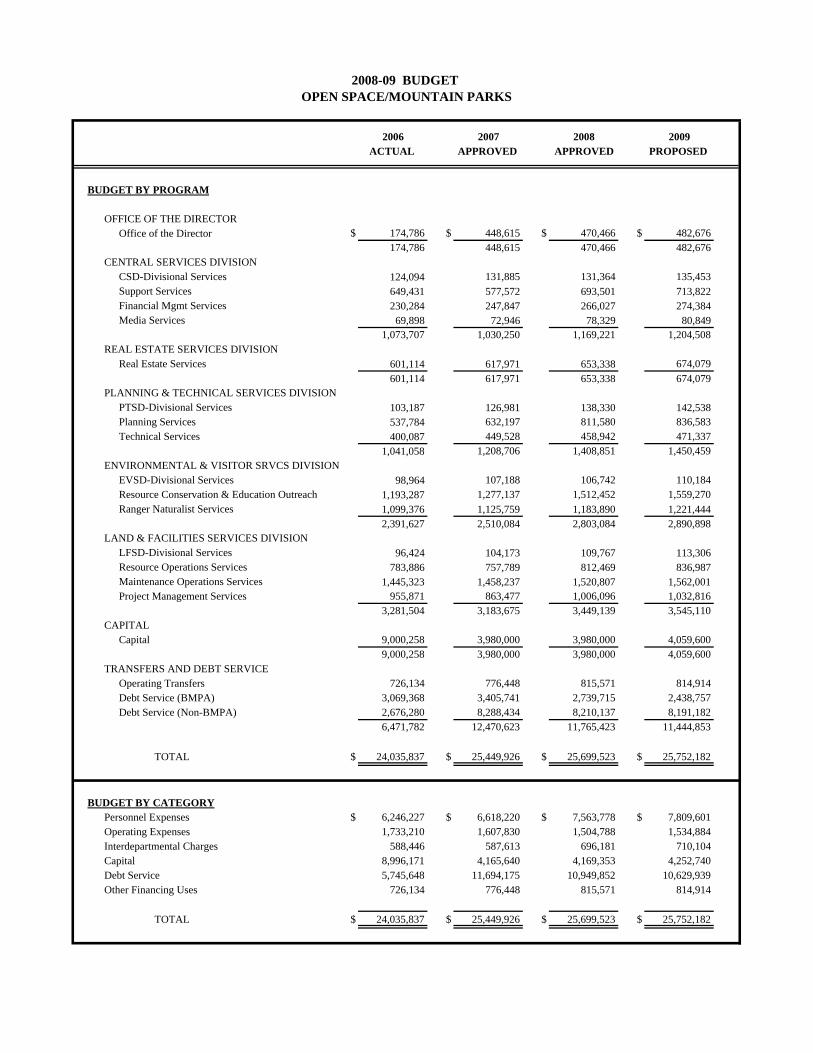
2006 2007 2008 2009ACTUAL APPROVED APPROVED PROPOSED
BUDGET BY PROGRAM
OFFICE OF THE DIRECTOR Office of the Director $ 174,786 $ 448,615 $ 470,466 $ 482,676
174,786 448,615 470,466 482,676CENTRAL SERVICES DIVISION
CSD-Divisional Services 124,094 131,885 131,364 135,453Support Services 649,431 577,572 693,501 713,822Financial Mgmt Services 230,284 247,847 266,027 274,384Media Services 69,898 72,946 78,329 80,849
1,073,707 1,030,250 1,169,221 1,204,508REAL ESTATE SERVICES DIVISION
Real Estate Services 601,114 617,971 653,338 674,079601,114 617,971 653,338 674,079
PLANNING & TECHNICAL SERVICES DIVISIONPTSD-Divisional Services 103,187 126,981 138,330 142,538Planning Services 537,784 632,197 811,580 836,583Technical Services 400,087 449,528 458,942 471,337
1,041,058 1,208,706 1,408,851 1,450,459ENVIRONMENTAL & VISITOR SRVCS DIVISION
EVSD-Divisional Services 98,964 107,188 106,742 110,184Resource Conservation & Education Outreach 1,193,287 1,277,137 1,512,452 1,559,270Ranger Naturalist Services 1,099,376 1,125,759 1,183,890 1,221,444
2,391,627 2,510,084 2,803,084 2,890,898LAND & FACILITIES SERVICES DIVISION
LFSD-Divisional Services 96,424 104,173 109,767 113,306Resource Operations Services 783,886 757,789 812,469 836,987Maintenance Operations Services 1,445,323 1,458,237 1,520,807 1,562,001Project Management Services 955,871 863,477 1,006,096 1,032,816
3,281,504 3,183,675 3,449,139 3,545,110CAPITAL
Capital 9,000,258 3,980,000 3,980,000 4,059,6009,000,258 3,980,000 3,980,000 4,059,600
TRANSFERS AND DEBT SERVICEOperating Transfers 726,134 776,448 815,571 814,914Debt Service (BMPA) 3,069,368 3,405,741 2,739,715 2,438,757Debt Service (Non-BMPA) 2,676,280 8,288,434 8,210,137 8,191,182
6,471,782 12,470,623 11,765,423 11,444,853
TOTAL $ 24,035,837 $ 25,449,926 $ 25,699,523 $ 25,752,182
BUDGET BY CATEGORYPersonnel Expenses $ 6,246,227 $ 6,618,220 $ 7,563,778 $ 7,809,601Operating Expenses 1,733,210 1,607,830 1,504,788 1,534,884Interdepartmental Charges 588,446 587,613 696,181 710,104Capital 8,996,171 4,165,640 4,169,353 4,252,740Debt Service 5,745,648 11,694,175 10,949,852 10,629,939Other Financing Uses 726,134 776,448 815,571 814,914
TOTAL $ 24,035,837 $ 25,449,926 $ 25,699,523 $ 25,752,182
2008-09 BUDGET OPEN SPACE/MOUNTAIN PARKS
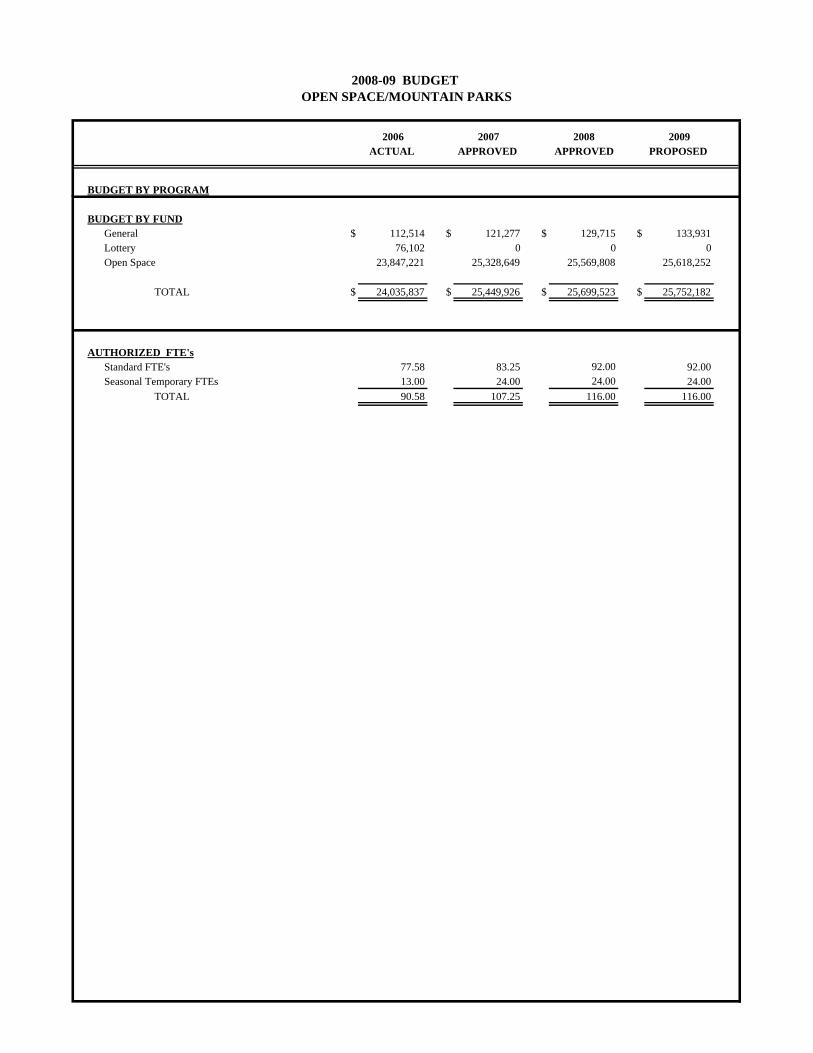
2006 2007 2008 2009ACTUAL APPROVED APPROVED PROPOSED
BUDGET BY PROGRAM
2008-09 BUDGET OPEN SPACE/MOUNTAIN PARKS
BUDGET BY FUNDGeneral $ 112,514 $ 121,277 $ 129,715 $ 133,931Lottery 76,102 0 0 0Open Space 23,847,221 25,328,649 25,569,808 25,618,252
TOTAL $ 24,035,837 $ 25,449,926 $ 25,699,523 $ 25,752,182
AUTHORIZED FTE'sStandard FTE's 77.58 83.25 92.00 92.00Seasonal Temporary FTEs 13.00 24.00 24.00 24.00
TOTAL 90.58 107.25 116.00 116.00
2008-09 BUDGET OPEN SPACE AND MOUNTAIN PARKS DEPARTMENT
MISSION STATEMENT The Open Space and Mountain Parks Department preserves and protects the natural environment and land resources that characterize Boulder. The Department fosters appreciation and use that sustain the natural values of the land for current and future generations. BUSINESS PLAN NARRATIVE Council established and clarified two major priorities in 2005 with approval of the Visitor Master Plan and extension of the Acquisitions and Management Plan from 2006 through 2011. The Acquisitions and Management Plan 2000-2006 was first approved by council in 1999 and expanded in 2001. It set the framework for completion of the Open Space acquisitions program, entering its 40th year in 2007, at approximately 51,000 acres extending from Coal Creek Canyon in the south to Table Mountain and the Saint Vrain Creek Drainage to the north. Approximately 6,700 acres remain for acquisition including full fee purchases, purchased and donated conservation easements and Intergovernmental Agreements (IGAs). The staff feels it is on target to complete the plan using the tools available including partnerships with other entities and IGAs, and utilizing the remaining bonding authorities from previous elections, the Boulder Municipal Property Authority (BMPA) notes and annual CIP appropriations from the Open Space Fund fund balance. The Visitor Master Plan (VMP) will enter its third full year of implementation in 2008. Major capital projects envisioned in the plan were scheduled within a 6 year CIP horizon through 2010 but the plan also acknowledges that it would “require a longer time period to complete all identified capital and non-capital projects”. The Fiscally Constrained Budget (Current Funding Scenario) relied on a combination of Open Space capital funds and Lottery funds. OSMP has nearly doubled its contribution for Visitor Infrastructure to $450,000 per year and raised the potential for capital implementation toward the Vision Plan (Identified Need) Level when combined with the Lottery Funds. However, the reallocation of the Lottery funds to Parks and Recreation for 2 years, in 2007 and 2008, has put implementation below the Action Plan (Accelerated Funding) level for that time period. A particularly dynamic aspect of the VMP is the Trails Study Area (TSA) concept. The VMP identified 9 TSAs within the system for further study in order to produce, including extensive public process, a comprehensive and detailed set of recommendations for each area including actions for existing trails, undesignated trails and new trails. Completion of the first two TSAs in the Marshall Mesa/Southern Grasslands and Eldorado Mountain/Doudy Draw areas has resulted in visitor infrastructure plans that are more detailed than the broad brush of the Management Area Designations found in the VMP.
This in turn has driven the need for staffing to implement these plans including construction and maintenance, and education and enforcement as well as monitoring. In 2006, the staff condensed the initial 9 TSAs into 4 TSAs, determined so as to complete a system plan that will address and link together resource management needs not addressed in the VMP or other approved area and resource management plans. In 2006, council also directed staff to complete a Grasslands Plan for its consideration by first quarter of 2008. Voter approval in 2003 of an additional 0.15 cent sales and use tax for Open Space purposes from 2004 through 2019 made it possible for the department to begin restoration of programs and services starting in 2004. This increase of revenues is the reason that the department has been able to re-program itself to meet the needs of the VMP as aggressively as it has and to continue with the vision of the Acquisitions and Management Plan. Staff’s strategy for accomplishing the goals and strategies of these plans has been to start out with fixed term positions and then evaluate their long term effectiveness and fiscal sustainability. In this way staff is taking gradual steps to achieve the goals of the plans and maintain a balance with all departmental commitments to programs and funding, including maintenance and acquisitions, in the context of actual and projected revenues and expenditures. The business plan indicates deficiencies in several areas linked to implementation of the VMP including administrative support for all functions, ranger services, education, resource conservation, planning and technical services, trails and related facilities, as well as key operational functions. Fixed term professional staff (10.92 FTEs) and seasonals (2 FTEs) now fill many of these positions. Because the positions now providing services to the community expire at the end of 2007, a number of programs and services would fall well below acceptable service standards without the Action Plan funding requested for 2008. In 2008, the department proposes a combination of fixed term and ongoing positions across major service areas of the organization to address some of these needs. These include administrative support for new programs, rangers, education, resource conservation, monitoring and coordination of VMP, construction and maintenance of trails and related facilities, including signs, and resource operations, as well as a currently unfunded cultural resources program. Approximately 18% of the funding would come directly from reallocations. Additionally, existing fleet will be more actively pooled, and staff will continue to explore cost savings that might be realized by using smaller vehicles, extending replacement cycles and sharing equipment.
GUIDING PRINCIPLES AND/OR INVESTMENT STRATEGY
1.) Essential Services include the Charter goals of land acquisition for open space and mountain parks; preservation and restoration of open space and mountain parks land to protect unusual, spectacular, historically important and valuable terrain, geologic formations, flora and fauna. Other Charter goals include preservation of water resources by purchase of water rights; shaping the development of the City; limiting urban sprawl through land acquisitions; and preserving land for its aesthetic or passive recreational value and its contribution to the quality of life of the community. In addition to attaining Charter goals, the Department must comply with local, state and federal laws and regulations; for example, state weed laws and dam safety regulations.
2.) Desirable Services include enforcement of City code requirements including
dog management, parking on Flagstaff Mountain and trailhead curfews. In April 2005, the City Council approved the Visitor Master Plan establishing long-term policies and practices designed to improve the visitor experience on OSMP land. Additionally, OSMP is guided by the adopted Boulder Valley Comprehensive Plan, the Open Space Long Range Management Policies and resource management plans including Forest Ecosystem Management Plan and the Grasslands/Black-tailed Prairie Dog Plan. All of the plans require that the Department take specific actions for implementation and management.
3.) Discretionary Services include certain aspects of facility maintenance,
education and enforcement, volunteer management, and monitoring and planning that are important to members of the community as well as management of third tier prairie dog issues which include relocation of prairie dogs from private property in the City to other sites. This relocation is no longer being performed as it is no longer feasible.
OVERVIEW OF ACTION PLAN Please refer to Attachment B of the 2008-09 Budget Message for a listing of those Action Plan Items that were recommended for funding. The listing is presented in order by fund and department. Please see the section titled “City Council Direction on the Recommended Budget” for any changes from Attachment B. OVERVIEW OF VISION PLAN The Open Space and Mountain Parks Vision Plan would include full implementation of the Visitor Master Plan approved by Council in April 2005, including outcomes of the Trails Study Area (TSA) public processes now in development together with the goals of the Acquisition and Management Plan 2005-2011 extended by Council in October 2005.
The Open Space and Mountain Parks’ Visitor Master Plan outlines a Fiscally Constrained Plan, an Action Plan and a Vision Plan (identified as Current Funding Investment, Accelerated Funding Investment and Identified Need Investment Programs respectively in the Visitor Master Plan). The Action Plan is the next set of strategic steps that will provide additional resources across the Department including trails construction and maintenance, education and outreach, cultural and recreational resource programs and administrative support. Staffing needs have grown with the commitments from the VMP, a growing trails system, increasing acreage and heightened community expectations for the OSMP program. It is unrealistic for the department to expect to accomplish the aggressive level of VMP implementation it has undertaken without gradually increasing staffing levels. Increased and sustained funding for operations staff starting in 2008 will move the department further toward attainment of these goals. PERFORMANCE MEASURES
Actual 2006
Target 2007
Target 2008
Target 2009
1. Total acres under Management and Stewardship of Department
43,797 44,800 45,800 46,800
2. Number of adopted Trail Study Area Plans 1 2 3 4
Actual acres acquired through 2006 total 43,797.
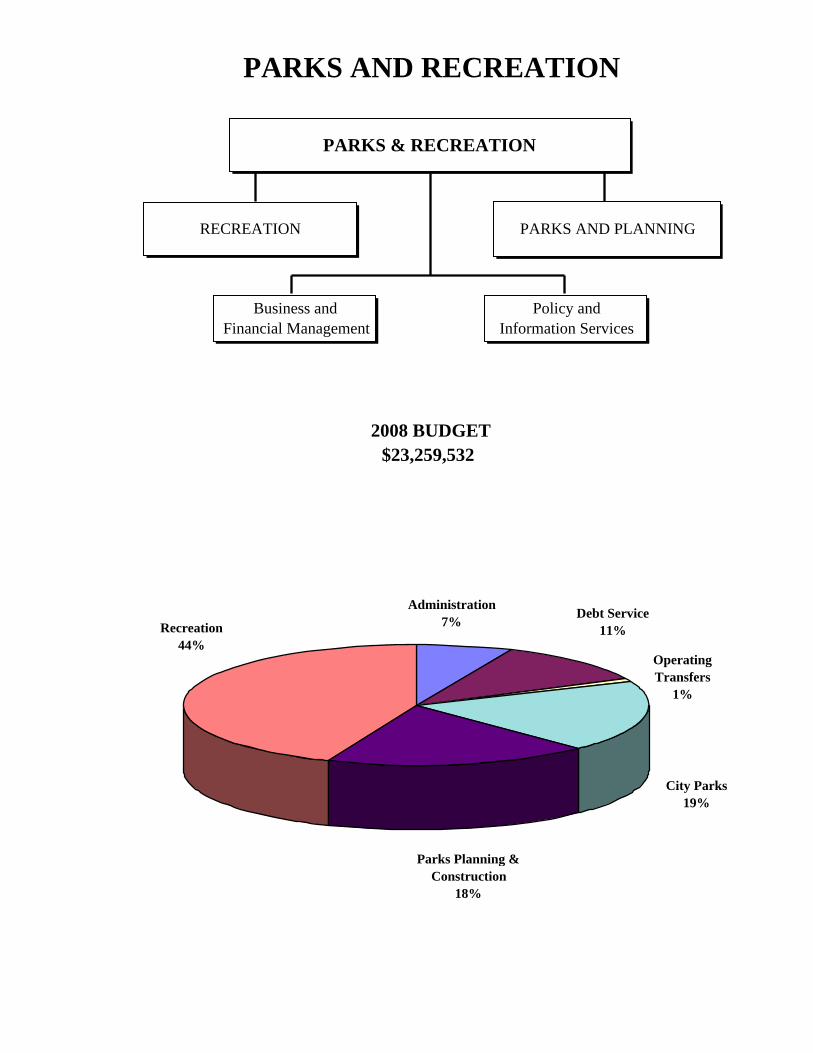
PARKS AND RECREATION
2008 BUDGET$23,259,532
PARKS & RECREATION
Recreation44%
Administration7% Debt Service
11%
City Parks19%
OperatingTransfers
1%
Parks Planning & Construction
18%
PARKS AND PLANNINGRECREATION
Business and Financial Management
Policy and Information Services
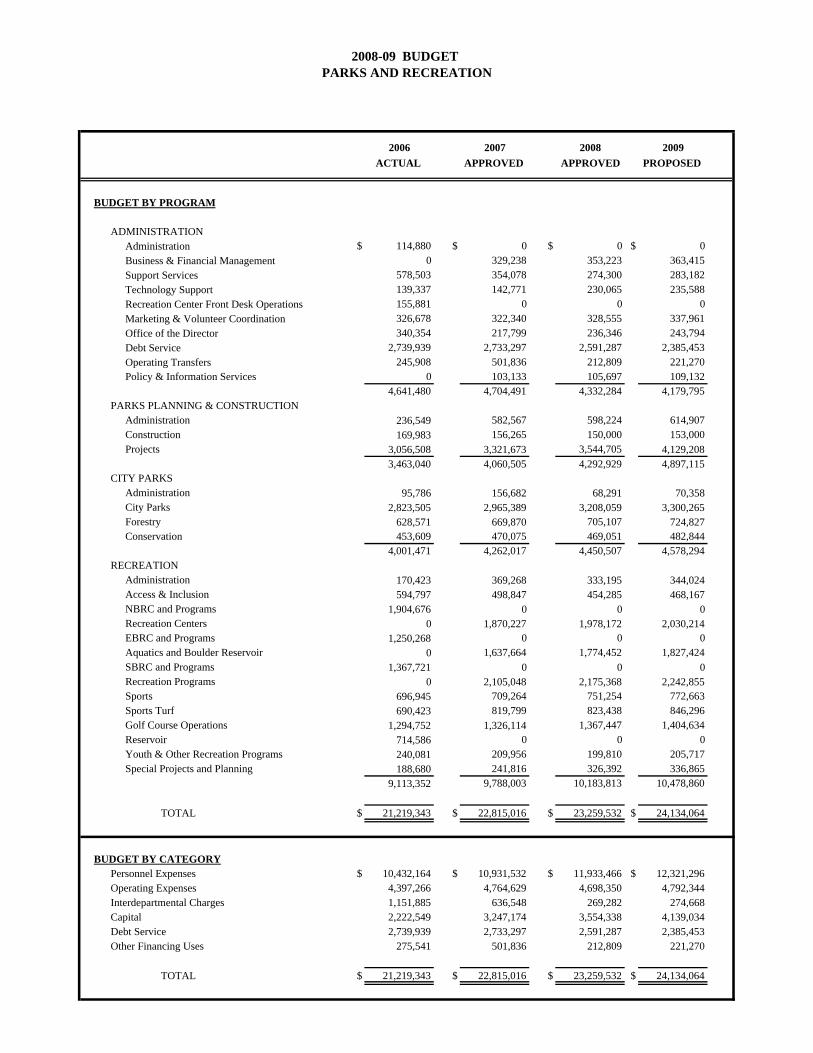
2006 2007 2008 2009ACTUAL APPROVED APPROVED PROPOSED
BUDGET BY PROGRAM
ADMINISTRATIONAdministration $ 114,880 $ 0 $ 0 $ 0Business & Financial Management 0 329,238 353,223 363,415Support Services 578,503 354,078 274,300 283,182Technology Support 139,337 142,771 230,065 235,588Recreation Center Front Desk Operations 155,881 0 0 0Marketing & Volunteer Coordination 326,678 322,340 328,555 337,961Office of the Director 340,354 217,799 236,346 243,794Debt Service 2,739,939 2,733,297 2,591,287 2,385,453Operating Transfers 245,908 501,836 212,809 221,270Policy & Information Services 0 103,133 105,697 109,132
4,641,480 4,704,491 4,332,284 4,179,795PARKS PLANNING & CONSTRUCTION
Administration 236,549 582,567 598,224 614,907Construction 169,983 156,265 150,000 153,000Projects 3,056,508 3,321,673 3,544,705 4,129,208
3,463,040 4,060,505 4,292,929 4,897,115CITY PARKS
Administration 95,786 156,682 68,291 70,358City Parks 2,823,505 2,965,389 3,208,059 3,300,265Forestry 628,571 669,870 705,107 724,827Conservation 453,609 470,075 469,051 482,844
4,001,471 4,262,017 4,450,507 4,578,294RECREATION
Administration 170,423 369,268 333,195 344,024Access & Inclusion 594,797 498,847 454,285 468,167NBRC and Programs 1,904,676 0 0 0Recreation Centers 0 1,870,227 1,978,172 2,030,214EBRC and Programs 1,250,268 0 0 0Aquatics and Boulder Reservoir 0 1,637,664 1,774,452 1,827,424SBRC and Programs 1,367,721 0 0 0Recreation Programs 0 2,105,048 2,175,368 2,242,855Sports 696,945 709,264 751,254 772,663Sports Turf 690,423 819,799 823,438 846,296Golf Course Operations 1,294,752 1,326,114 1,367,447 1,404,634Reservoir 714,586 0 0 0Youth & Other Recreation Programs 240,081 209,956 199,810 205,717Special Projects and Planning 188,680 241,816 326,392 336,865
9,113,352 9,788,003 10,183,813 10,478,860
TOTAL $ 21,219,343 $ 22,815,016 $ 23,259,532 $ 24,134,064
BUDGET BY CATEGORYPersonnel Expenses $ 10,432,164 $ 10,931,532 $ 11,933,466 $ 12,321,296Operating Expenses 4,397,266 4,764,629 4,698,350 4,792,344Interdepartmental Charges 1,151,885 636,548 269,282 274,668Capital 2,222,549 3,247,174 3,554,338 4,139,034Debt Service 2,739,939 2,733,297 2,591,287 2,385,453Other Financing Uses 275,541 501,836 212,809 221,270
TOTAL $ 21,219,343 $ 22,815,016 $ 23,259,532 $ 24,134,064
2008-09 BUDGET PARKS AND RECREATION
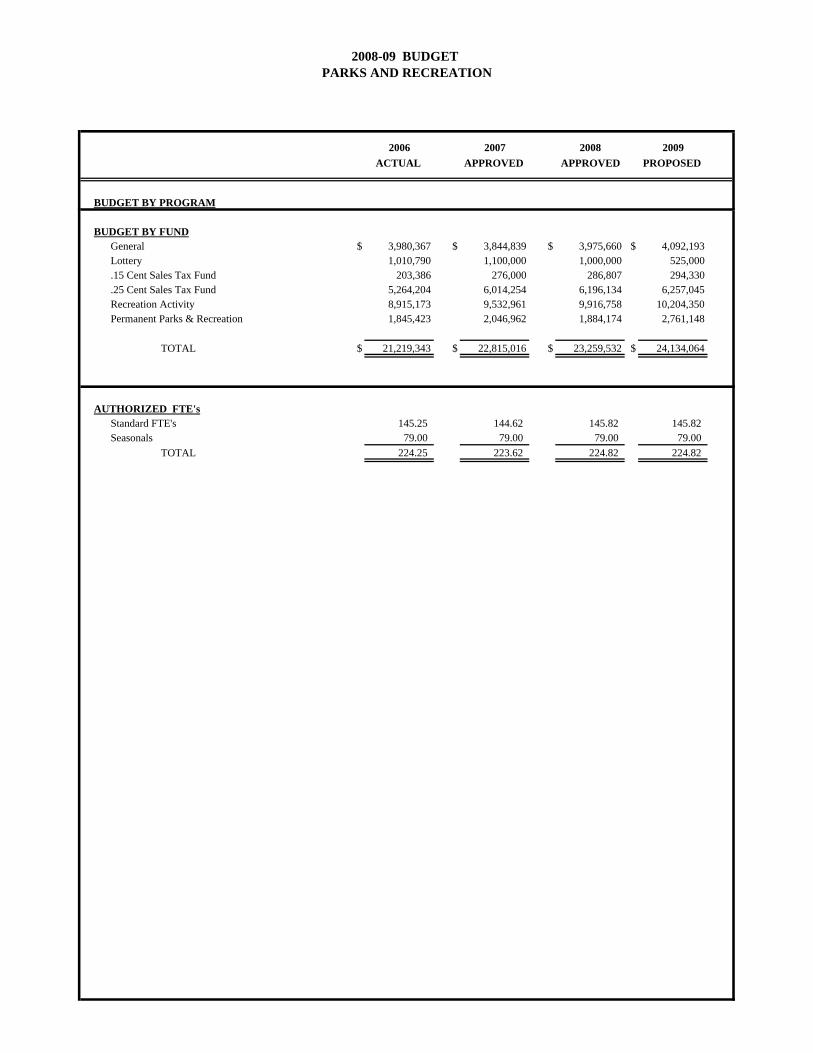
2006 2007 2008 2009ACTUAL APPROVED APPROVED PROPOSED
BUDGET BY PROGRAM
2008-09 BUDGET PARKS AND RECREATION
BUDGET BY FUNDGeneral $ 3,980,367 $ 3,844,839 $ 3,975,660 $ 4,092,193Lottery 1,010,790 1,100,000 1,000,000 525,000.15 Cent Sales Tax Fund 203,386 276,000 286,807 294,330.25 Cent Sales Tax Fund 5,264,204 6,014,254 6,196,134 6,257,045Recreation Activity 8,915,173 9,532,961 9,916,758 10,204,350Permanent Parks & Recreation 1,845,423 2,046,962 1,884,174 2,761,148
TOTAL $ 21,219,343 $ 22,815,016 $ 23,259,532 $ 24,134,064
AUTHORIZED FTE'sStandard FTE's 145.25 144.62 145.82 145.82Seasonals 79.00 79.00 79.00 79.00
TOTAL 224.25 223.62 224.82 224.82
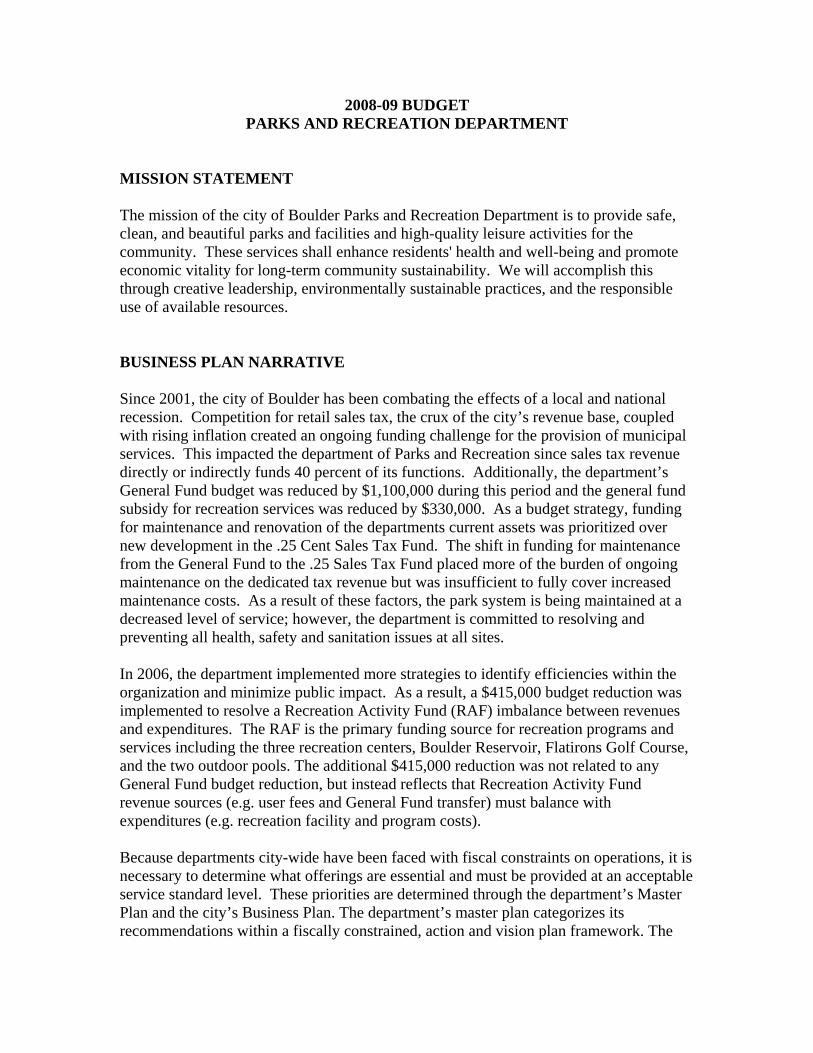
2008-09 BUDGET PARKS AND RECREATION DEPARTMENT
MISSION STATEMENT The mission of the city of Boulder Parks and Recreation Department is to provide safe, clean, and beautiful parks and facilities and high-quality leisure activities for the community. These services shall enhance residents' health and well-being and promote economic vitality for long-term community sustainability. We will accomplish this through creative leadership, environmentally sustainable practices, and the responsible use of available resources. BUSINESS PLAN NARRATIVE Since 2001, the city of Boulder has been combating the effects of a local and national recession. Competition for retail sales tax, the crux of the city’s revenue base, coupled with rising inflation created an ongoing funding challenge for the provision of municipal services. This impacted the department of Parks and Recreation since sales tax revenue directly or indirectly funds 40 percent of its functions. Additionally, the department’s General Fund budget was reduced by $1,100,000 during this period and the general fund subsidy for recreation services was reduced by $330,000. As a budget strategy, funding for maintenance and renovation of the departments current assets was prioritized over new development in the .25 Cent Sales Tax Fund. The shift in funding for maintenance from the General Fund to the .25 Sales Tax Fund placed more of the burden of ongoing maintenance on the dedicated tax revenue but was insufficient to fully cover increased maintenance costs. As a result of these factors, the park system is being maintained at a decreased level of service; however, the department is committed to resolving and preventing all health, safety and sanitation issues at all sites. In 2006, the department implemented more strategies to identify efficiencies within the organization and minimize public impact. As a result, a $415,000 budget reduction was implemented to resolve a Recreation Activity Fund (RAF) imbalance between revenues and expenditures. The RAF is the primary funding source for recreation programs and services including the three recreation centers, Boulder Reservoir, Flatirons Golf Course, and the two outdoor pools. The additional $415,000 reduction was not related to any General Fund budget reduction, but instead reflects that Recreation Activity Fund revenue sources (e.g. user fees and General Fund transfer) must balance with expenditures (e.g. recreation facility and program costs). Because departments city-wide have been faced with fiscal constraints on operations, it is necessary to determine what offerings are essential and must be provided at an acceptable service standard level. These priorities are determined through the department’s Master Plan and the city’s Business Plan. The department’s master plan categorizes its recommendations within a fiscally constrained, action and vision plan framework. The
city’s Business Plan categorizes all city programs and services into essential, desirable and discretionary categories and determines what will be funded within fiscally constrained, action and vision plans. A key objective for the department in both the business plan and master plan is to take care of existing assets. Necessary services include: snow removal, sidewalk, parking lot, playground, walkway and path maintenance, basic turf maintenance, trash removal, security lighting, protective fencing, bridge repair, maintenance of retaining walls, precautionary signage; hazardous tree removal, noxious weed mitigation, protective wildlife management (e.g. bear encroachment); general health and safety maintenance and repairs to recreation facilities, restrooms and shelters; ADA requirements (accessibility and inclusion). The department’s Fiscally Constrained Plan reflects how the department manages these functional areas. The department is striving to best serve the community with its available resources. Reallocations in the 2007 budget provided increased ongoing funding for parks maintenance and capital renovations of approximately $170,000. Beginning in 2006, the department’s Capital Improvement Program (CIP) has been increased to reflect stabilizing and improved sales tax collections in the .25 Cent Sales Tax Fund. The Parks and Planning Division is phasing in an organizational restructure to position itself to better allocate current resources and create a more sustainable system. The department’s Action Plan submission includes unfunded priorities necessary to restore and expand programs and services. For 2008, key requests include: increased park maintenance staffing to meet an acceptable service standard level, expansion of the Youth Services Initiative (YSI) to provide comprehensive services at additional sites city-wide, implementation of a framework to align programs and services with cost-recovery goals/levels. All efforts are currently not viable unless additional funding is provided or new revenues are produced. The department’s long-term outlook for financial sustainability emerged as one of the most critical issues of the master plan. Two expiring sales taxes, the .15 cent and the .25 cent, volatile user fee revenues and increasing costs contribute to an unstable long term financial picture. The department’s ability to generate additional revenue through the provision of recreation programs and services is challenged by competition from private providers and local competition. In recent years, many neighboring communities have built new recreation centers and increased the number of programs offered to their residents. Market comparisons indicate that recreation center fees are higher in Boulder than in neighboring communities. To ensure the solvency of the Recreation Activity Fund (RAF), revenue generation must grow at the same rate as expenditures. RAF expenses are projected to increase in 2007 and beyond based on higher costs related to day-to-day business, including increased staffing, utilities and other operational requirements. Staff assumes personnel expenses will continue to grow annually at approximately 4 percent. Additional seasonal staff will be required to support the department’s more popular seasonal program and service
offerings requiring a higher staff-to-participant ratio. Staff also assumes the majority of non-personnel expenditures will generally rise at the rate of the Denver/Boulder Consumer Price Index (CPI) of approximately 3 percent. However, utilities and fuel expenses are projected to remain volatile and it is anticipated that they will continue to rise at a rate higher than the CPI. As a result, the gap between revenues and expenditures will continue to grow. Similar to the General Fund’s reserve policy, the department strives to maintain a 10 percent fund balance reserve in the RAF. This balance would be available to assist in sustaining programs and services in the event of decreased financial performance due to weather-related incidence and/or program and facility attendance. Even though the Recreation Division continues to be challenged by financial conditions, the department has initiated strategies that have increased revenue production in the RAF. New practices have been adopted including: implementation of a pricing methodology for programs, activities and services; implementation of the annual pass monthly payment option intended to give payment flexibility to users and to make purchasing an annual pass more affordable; implementation of a discount program for the purchase of annual passes aimed at employees of businesses that belong to the Boulder Chamber of Commerce; implementation of special promotional programs that target existing and potential customers; and hiring a Marketing Manager to centralize and evaluate marketing efforts with an interest in effectiveness and increased return on investment. As a result of the new practices, the Recreation Division has experienced increases in attendance, sales volume, and revenues. Although revenues have increased for the past three years, rising costs coupled with the need to maintain adequate reserves will result in a $675,000 fund balance in 2013. GUIDING PRINCIPLES AND INVESTMENT STRATEGY City Council approved the department’s master plan in December 2006. The master plan incorporated public feedback from Town Hall Meetings, focus groups, survey data and the recommendations of the Parks and Recreation Advisory Board and city Planning Board. The master plan discussions with the community clearly indicated that Boulder residents place a high value on Parks and Recreation services and programs. Although budgetary conditions remain fiscally constrained, the department is committed to developing long-term sustainability and providing great parks and recreation experiences to the public. The recently-adopted master plan is being utilized to provide the framework, recommendations and guidance necessary to help the department achieve goals that align with the city’s business plan goals. In an effort to integrate the principles of economic, social, and environmental sustainability into operational decision making, the department’s goals are as follows:
• Maintain and protect our parks and recreation facilities and programs. • Become economically sustainable.
• Fill in the gaps in our parks and recreation system. • Engage a broader range of the community, especially underrepresented
populations. • Be a communitywide leader in environmental sustainability. • Enhance our quality of life.
The department’s investment strategy also aligns with the city's business plan, which all city departments utilize to create funding priorities and recommendations. Services are categorized as essential, desirable, and discretionary.
1.) Essential services include programs and services that are equally available to all residents for no additional charge and support the operations and maintenance of the existing system for health and safety purposes. These include: snow removal, sidewalk, parking lot, playground, walkway and path maintenance, basic turf maintenance, trash removal, security lighting, protective fencing, bridge repair, maintenance of retaining walls, precautionary signage; hazardous tree removal, noxious weed mitigation, protective wildlife management (e.g. bear encroachment); general health and safety maintenance and repairs to recreation facilities, restrooms and shelters; ADA requirements (accessibility and inclusion); strategic management (financial/budget, crisis communication).
2.) Desirable services include programs and services that benefit a large portion of
the community, are provided to residents at no cost or for an appropriate user fee, and sustain a system derived from significant public investment at parks and recreation industry standards These include: expansion of the system to meet ballot measure commitments (planning, design, construction); parks and facilities routine and preventative maintenance; capital improvements, replacement and modification to achieve or maintain industry standards; safety net programming (EXPAND, Youth Services Initiative; learn to swim and public open swim programs); societal benefit through recreation, programs for people with financial barriers; administrative services to sustain operations.
3.) Discretionary services include programs and services that benefit a wide range of
targeted interest groups, age groups or ability levels by developing or enhancing the system beyond industry standards and providing programs and services some of which have high cost recovery rates that subsidize desirable programs and services. The benefits associated with discretionary programs typically benefit the individual participant more directly than the community. These include: land acquisition beyond current service level standards; development of currently owned undeveloped land; aesthetic enhancements to land and facilities (flower beds, turf edging); enhanced park maintenance; golf course and reservoir operations; maintenance outside of health and safety reasons; habitat restoration; public youth and adult programs with high cost recovery capability; public education programs.
Additionally, the department is considerate of the community’s future needs and prioritizes its efforts and operating funding accordingly. The department’s investment priorities are as follows: Priority 1: Take care of existing assets. Priority 2: Develop the highest priority park sites. Priority 3: Invest in revenue-producing facilities. Priority 4: Increase maintenance funding. Priority 5: Broaden access to programs and services to meet changing demographics. Priority 6: Complete the remaining gaps in the park system. Priority 7: Adapt to changing needs. Priority 8: Implement vision plans and enhance the system. OVERVIEW OF ACTION PLAN Please refer to Attachment B of the 2008-09 Budget Message for a listing of those Action Plan Items that were recommended for funding. The listing is presented in order by fund and department. Please see the section titled “City Council Direction on the Recommended Budget” for any changes from Attachment B. OVERVIEW OF VISION PLAN Vision Statement The vision of the department is to strive for excellence in our parks and recreation system to reflect and serve the unique values and qualities of our community. Vision Narrative Our vision is to create a world-class parks and recreation system to match Boulder’s commitment to fitness, health and recreations. We want to become the destination of choice for parks and recreation facilities in the region. Our vision calls for transforming our parks and recreation facilities into exceptional public gathering places that are attractive, safe and reflect the community’s unique character and natural beauty. We will connect people and places throughout the city with physical links between parks and recreation facilities and other destinations. Our vision revitalizes parks and recreation facilities near 29th Street and the Transit Village, and connects them to new places for people to live, work, shop, eat and play. We will complete our park system, including Valmont City Park and community, neighborhood and pocket parks. We intend to pursue opportunities, partnerships and new
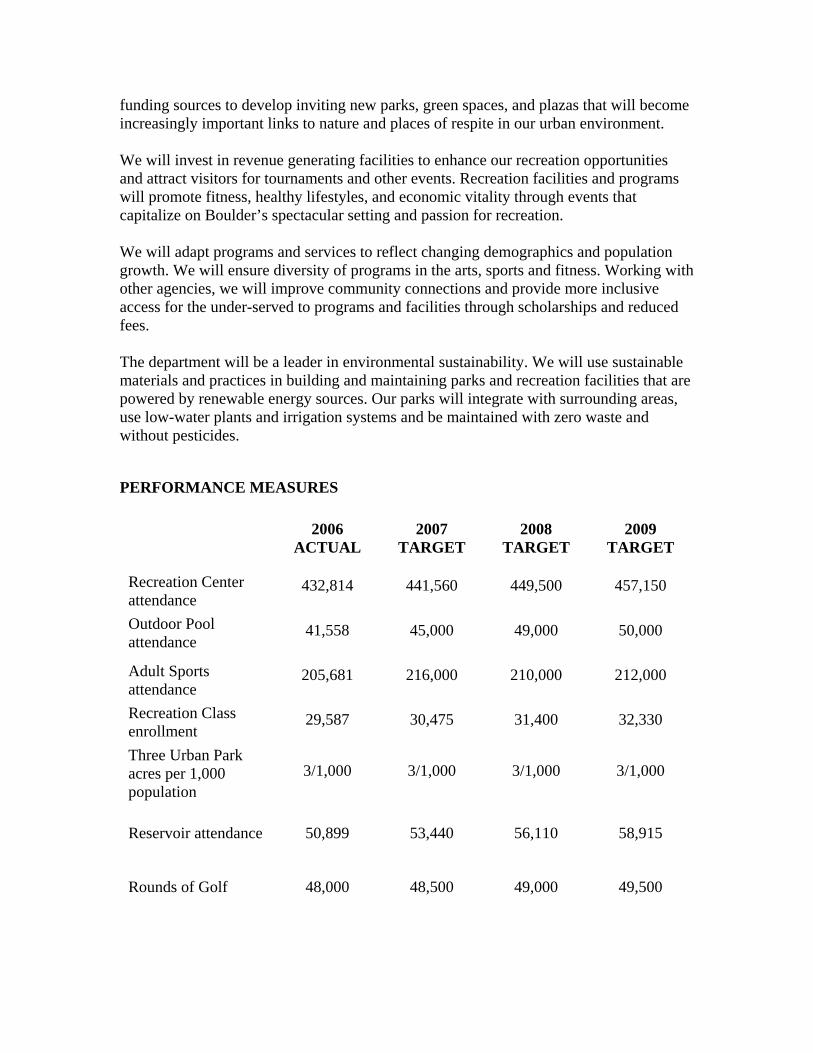
funding sources to develop inviting new parks, green spaces, and plazas that will become increasingly important links to nature and places of respite in our urban environment. We will invest in revenue generating facilities to enhance our recreation opportunities and attract visitors for tournaments and other events. Recreation facilities and programs will promote fitness, healthy lifestyles, and economic vitality through events that capitalize on Boulder’s spectacular setting and passion for recreation. We will adapt programs and services to reflect changing demographics and population growth. We will ensure diversity of programs in the arts, sports and fitness. Working with other agencies, we will improve community connections and provide more inclusive access for the under-served to programs and facilities through scholarships and reduced fees. The department will be a leader in environmental sustainability. We will use sustainable materials and practices in building and maintaining parks and recreation facilities that are powered by renewable energy sources. Our parks will integrate with surrounding areas, use low-water plants and irrigation systems and be maintained with zero waste and without pesticides. PERFORMANCE MEASURES
2006 ACTUAL
2007 TARGET
2008 TARGET
2009 TARGET
Recreation Center attendance
432,814 441,560 449,500 457,150
Outdoor Pool attendance
41,558 45,000 49,000 50,000
Adult Sports attendance
205,681 216,000 210,000 212,000
Recreation Class enrollment
29,587 30,475 31,400 32,330
Three Urban Park acres per 1,000 population
3/1,000 3/1,000 3/1,000 3/1,000
Reservoir attendance 50,899 53,440 56,110 58,915
Rounds of Golf 48,000 48,500 49,000 49,500
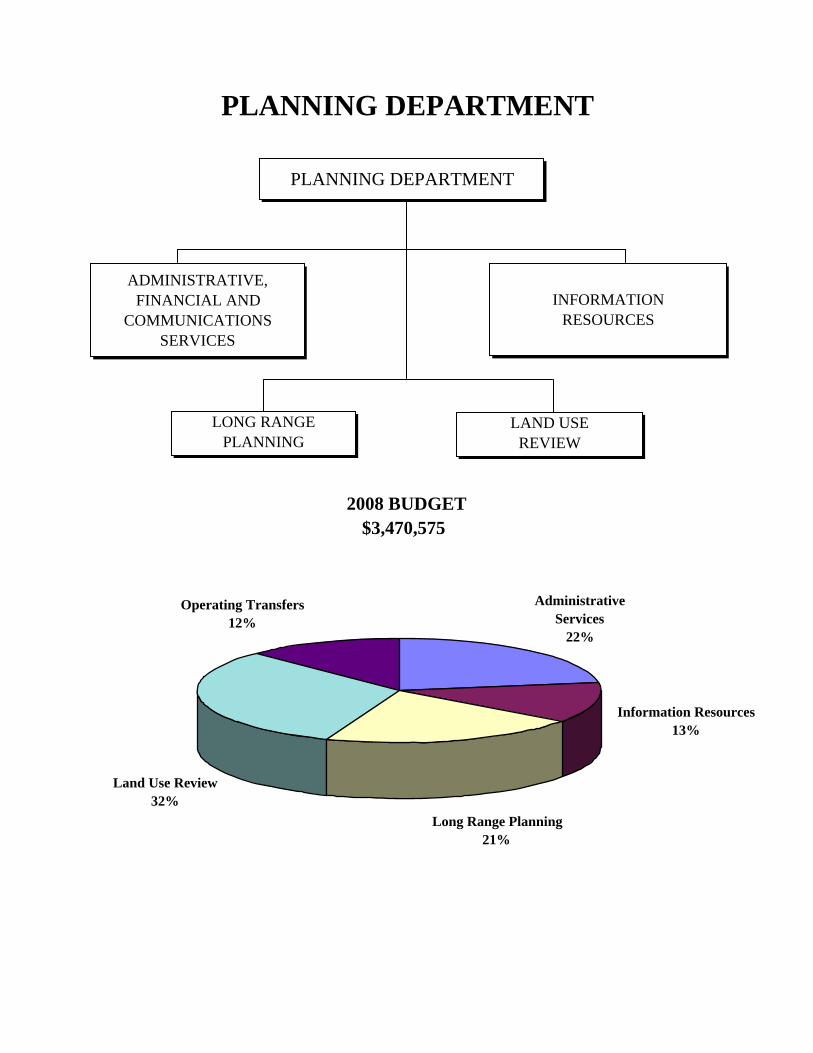
PLANNING DEPARTMENT
2008 BUDGET$3,470,575
PLANNING DEPARTMENT
ADMINISTRATIVE, FINANCIAL AND
COMMUNICATIONS SERVICES
INFORMATIONRESOURCES
LONG RANGEPLANNING
LAND USE REVIEW
Administrative Services
22%
Operating Transfers12%
Land Use Review32%
Long Range Planning21%
Information Resources13%
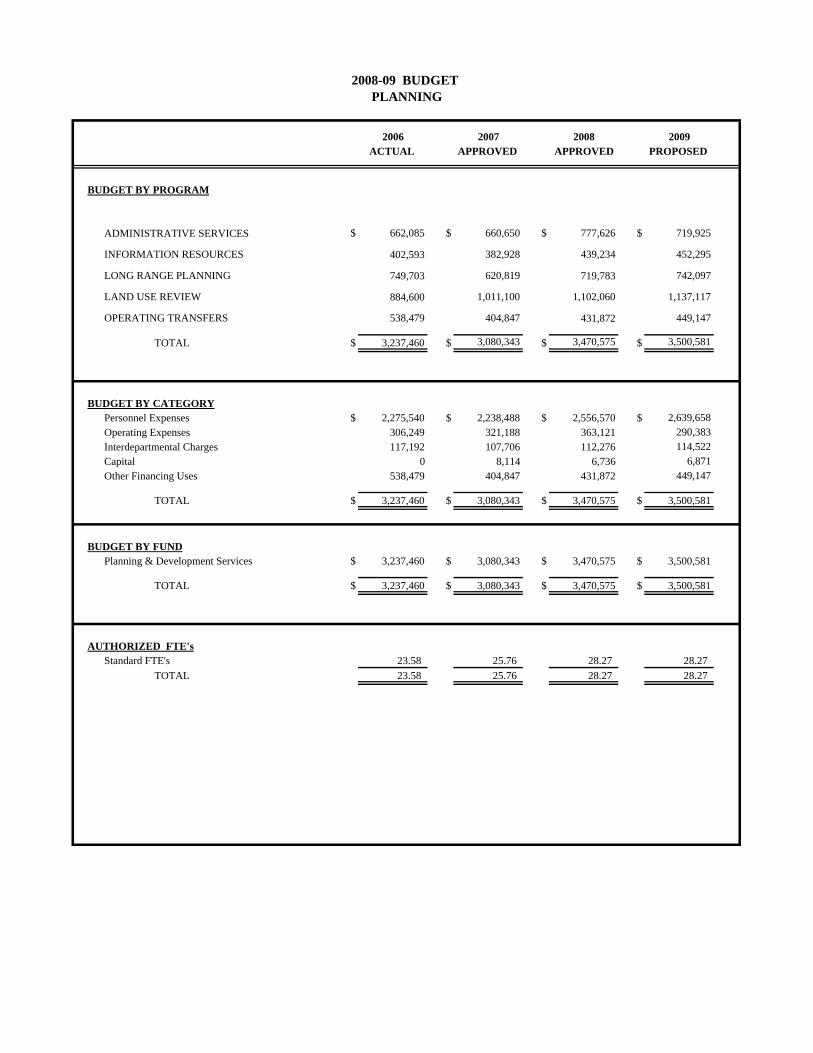
2006 2007 2008 2009ACTUAL APPROVED APPROVED PROPOSED
BUDGET BY PROGRAM
ADMINISTRATIVE SERVICES $ 662,085 $ 660,650 $ 777,626 $ 719,925
INFORMATION RESOURCES 402,593 382,928 439,234 452,295
LONG RANGE PLANNING 749,703 620,819 719,783 742,097
LAND USE REVIEW 884,600 1,011,100 1,102,060 1,137,117
OPERATING TRANSFERS 538,479 404,847 431,872 449,147
TOTAL $ 3,237,460 $ 3,080,343 $ 3,470,575 $ 3,500,581
BUDGET BY CATEGORYPersonnel Expenses $ 2,275,540 $ 2,238,488 $ 2,556,570 $ 2,639,658Operating Expenses 306,249 321,188 363,121 290,383Interdepartmental Charges 117,192 107,706 112,276 114,522Capital 0 8,114 6,736 6,871Other Financing Uses 538,479 404,847 431,872 449,147
TOTAL $ 3,237,460 $ 3,080,343 $ 3,470,575 $ 3,500,581
BUDGET BY FUNDPlanning & Development Services $ 3,237,460 $ 3,080,343 $ 3,470,575 $ 3,500,581
TOTAL $ 3,237,460 $ 3,080,343 $ 3,470,575 $ 3,500,581
AUTHORIZED FTE'sStandard FTE's 23.58 25.76 28.27 28.27
TOTAL 23.58 25.76 28.27 28.27
2008-09 BUDGET PLANNING
2008-09 BUDGET PLANNING DEPARTMENT
MISSION STATEMENT The mission of the Planning Department is to help create, enhance and preserve a natural, physical and economic environment that fosters a unique quality of life in the City of Boulder. BUSINESS PLAN NARRATIVE The business plan narrative can be found in the Planning and Development Services page. GUIDING PRINCIPLES AND/OR INVESTMENT STRATEGY The guiding principles and/or investment strategy can be found in the Planning and Development Services page. OVERVIEW OF ACTION PLAN The overview of the action plan can be found in the Planning and Development Services page. OVERVIEW OF VISION PLAN The overview of the vision plan can be found in the Planning and Development Services page. PERFORMANCE MEASURES Performance measures are reported in the Planning & Development Services page.
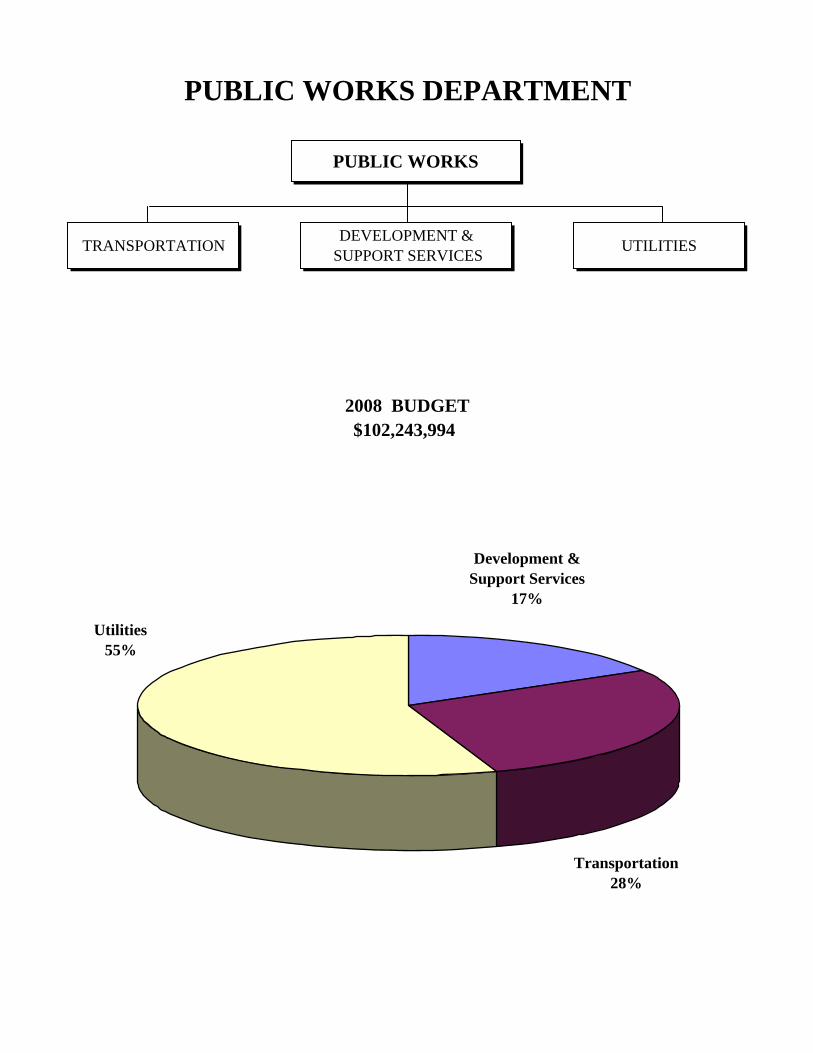
PUBLIC WORKS DEPARTMENT
$102,243,9942008 BUDGET
PUBLIC WORKS
DEVELOPMENT & SUPPORT SERVICESTRANSPORTATION UTILITIES
Development & Support Services
17%
Transportation28%
Utilities55%
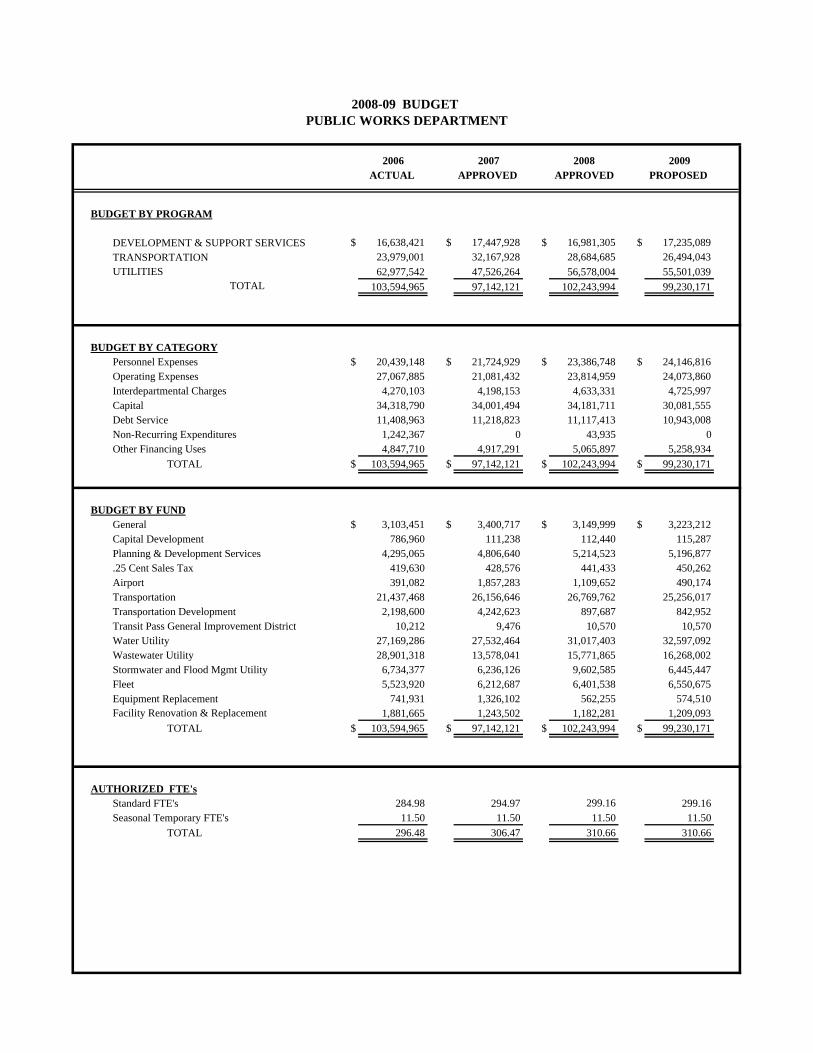
2006 2007 2008 2009ACTUAL APPROVED APPROVED PROPOSED
BUDGET BY PROGRAM
DEVELOPMENT & SUPPORT SERVICES $ 16,638,421 $ 17,447,928 $ 16,981,305 $ 17,235,089TRANSPORTATION 23,979,001 32,167,928 28,684,685 26,494,043UTILITIES 62,977,542 47,526,264 56,578,004 55,501,039
TOTAL 103,594,965 97,142,121 102,243,994 99,230,171
BUDGET BY CATEGORYPersonnel Expenses $ 20,439,148 $ 21,724,929 $ 23,386,748 $ 24,146,816Operating Expenses 27,067,885 21,081,432 23,814,959 24,073,860Interdepartmental Charges 4,270,103 4,198,153 4,633,331 4,725,997Capital 34,318,790 34,001,494 34,181,711 30,081,555Debt Service 11,408,963 11,218,823 11,117,413 10,943,008Non-Recurring Expenditures 1,242,367 0 43,935 0Other Financing Uses 4,847,710 4,917,291 5,065,897 5,258,934
TOTAL $ 103,594,965 $ 97,142,121 $ 102,243,994 $ 99,230,171
BUDGET BY FUNDGeneral $ 3,103,451 $ 3,400,717 $ 3,149,999 $ 3,223,212Capital Development 786,960 111,238 112,440 115,287Planning & Development Services 4,295,065 4,806,640 5,214,523 5,196,877.25 Cent Sales Tax 419,630 428,576 441,433 450,262Airport 391,082 1,857,283 1,109,652 490,174Transportation 21,437,468 26,156,646 26,769,762 25,256,017Transportation Development 2,198,600 4,242,623 897,687 842,952Transit Pass General Improvement District 10,212 9,476 10,570 10,570Water Utility 27,169,286 27,532,464 31,017,403 32,597,092Wastewater Utility 28,901,318 13,578,041 15,771,865 16,268,002Stormwater and Flood Mgmt Utility 6,734,377 6,236,126 9,602,585 6,445,447Fleet 5,523,920 6,212,687 6,401,538 6,550,675Equipment Replacement 741,931 1,326,102 562,255 574,510Facility Renovation & Replacement 1,881,665 1,243,502 1,182,281 1,209,093
TOTAL $ 103,594,965 $ 97,142,121 $ 102,243,994 $ 99,230,171
AUTHORIZED FTE'sStandard FTE's 284.98 294.97 299.16 299.16Seasonal Temporary FTE's 11.50 11.50 11.50 11.50
TOTAL 296.48 306.47 310.66 310.66
2008-09 BUDGET PUBLIC WORKS DEPARTMENT
2008-09 BUDGET PUBLIC WORKS DEPARTMENT
DEPARTMENT OVERVIEW The Public Works Department continues to work toward building a “sustainable organization” by focusing on operational efficiencies and improvements. These efforts are consistent with ongoing budget themes supported by council for the 2008-09 budget process. These themes are exemplified by the department’s commitment to reevaluate systems and business processes through costing of service analysis, implementing and monitoring performance measures, and analyzing privatization options. Public Works is committed to fiscal sustainability by maintaining reserve goals in each of its special revenue and enterprise funds. These are analyzed and adjusted accordingly based on operational and fund balance goals. BUSINESS PLAN Please see the individual Public Works Division sections for a complete discussion of the business plan. PERFORMANCE MEASURES Performance measures are reported within the separate Public Works Divisions.
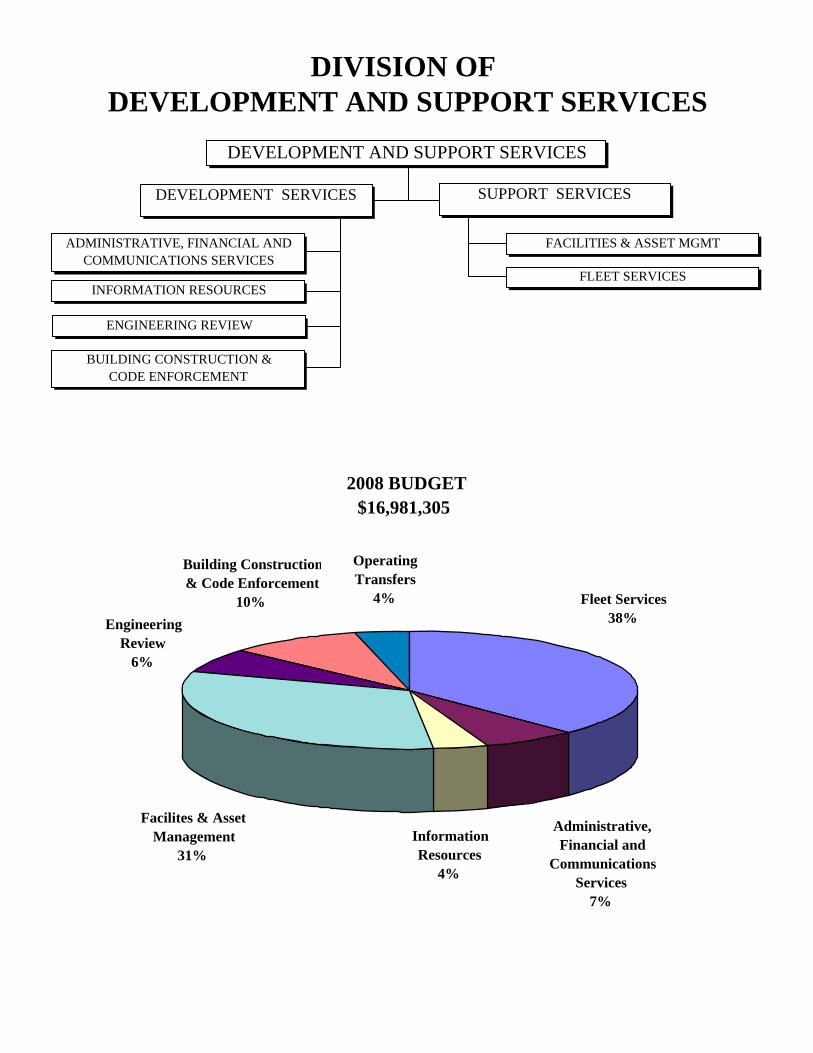
DIVISION OF DEVELOPMENT AND SUPPORT SERVICES
$16,981,3052008 BUDGET
DEVELOPMENT AND SUPPORT SERVICES
DEVELOPMENT SERVICES SUPPORT SERVICES
ADMINISTRATIVE, FINANCIAL AND COMMUNICATIONS SERVICES
INFORMATION RESOURCES
ENGINEERING REVIEW
BUILDING CONSTRUCTION & CODE ENFORCEMENT
FACILITIES & ASSET MGMT
FLEET SERVICES
InformationResources
4%
EngineeringReview
6%
OperatingTransfers
4%
Building Construction& Code Enforcement
10%
Facilites & Asset Management
31%
Administrative, Financial and
CommunicationsServices
7%
Fleet Services38%
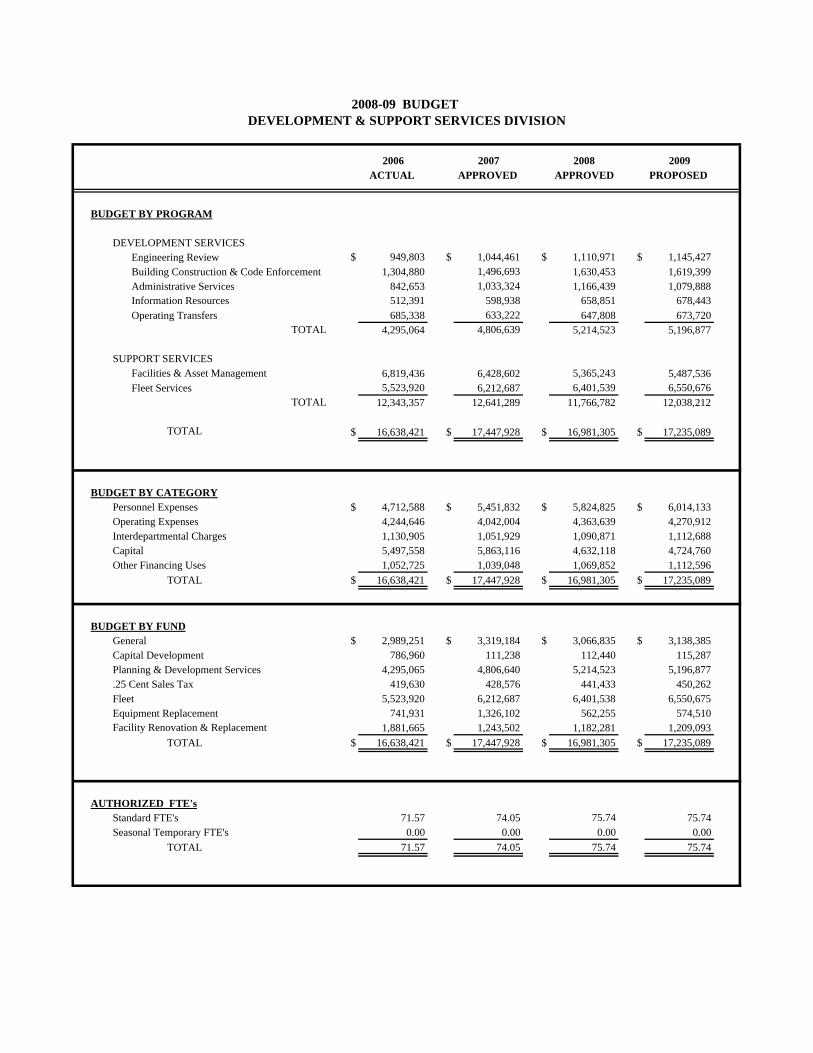
2006 2007 2008 2009ACTUAL APPROVED APPROVED PROPOSED
BUDGET BY PROGRAM
DEVELOPMENT SERVICESEngineering Review $ 949,803 $ 1,044,461 $ 1,110,971 $ 1,145,427Building Construction & Code Enforcement 1,304,880 1,496,693 1,630,453 1,619,399Administrative Services 842,653 1,033,324 1,166,439 1,079,888Information Resources 512,391 598,938 658,851 678,443Operating Transfers 685,338 633,222 647,808 673,720
TOTAL 4,295,064 4,806,639 5,214,523 5,196,877
SUPPORT SERVICESFacilities & Asset Management 6,819,436 6,428,602 5,365,243 5,487,536Fleet Services 5,523,920 6,212,687 6,401,539 6,550,676
TOTAL 12,343,357 12,641,289 11,766,782 12,038,212
TOTAL $ 16,638,421 $ 17,447,928 $ 16,981,305 $ 17,235,089
BUDGET BY CATEGORYPersonnel Expenses $ 4,712,588 $ 5,451,832 $ 5,824,825 $ 6,014,133Operating Expenses 4,244,646 4,042,004 4,363,639 4,270,912Interdepartmental Charges 1,130,905 1,051,929 1,090,871 1,112,688Capital 5,497,558 5,863,116 4,632,118 4,724,760Other Financing Uses 1,052,725 1,039,048 1,069,852 1,112,596
TOTAL $ 16,638,421 $ 17,447,928 $ 16,981,305 $ 17,235,089
BUDGET BY FUNDGeneral $ 2,989,251 $ 3,319,184 $ 3,066,835 $ 3,138,385Capital Development 786,960 111,238 112,440 115,287Planning & Development Services 4,295,065 4,806,640 5,214,523 5,196,877.25 Cent Sales Tax 419,630 428,576 441,433 450,262Fleet 5,523,920 6,212,687 6,401,538 6,550,675Equipment Replacement 741,931 1,326,102 562,255 574,510Facility Renovation & Replacement 1,881,665 1,243,502 1,182,281 1,209,093
TOTAL $ 16,638,421 $ 17,447,928 $ 16,981,305 $ 17,235,089
AUTHORIZED FTE'sStandard FTE's 71.57 74.05 75.74 75.74Seasonal Temporary FTE's 0.00 0.00 0.00 0.00
TOTAL 71.57 74.05 75.74 75.74
2008-09 BUDGET DEVELOPMENT & SUPPORT SERVICES DIVISION
2008-09 BUDGET PUBLIC WORKS DEPARTMENT
DEVELOPMENT AND SUPPORT SERVICES DIVISION
MISSION STATEMENT The mission of Development and Support Services is
- to effectively assist customers in a regulatory environment while preserving public health, safety and environmental quality for our community overall, through the efficient administration of codes and standards,
- to provide quality facilities and asset management (FAM) services to City departments for the design, construction and maintenance of facilities,
- to effectively maintain the City’s fleet while balancing customer and community values.
BUSINESS PLAN NARRATIVE Since 2004, FAM has reduced its operating budget by $695,000 and has eliminated three standard positions. FAM continues to focus its resources on preserving programs and activities central to its mission. Reductions have been in non-essential maintenance, outsourcing custodial services, and postponing non-essential projects. Operations and Maintenance (O&M) funding levels for General Fund facilities are projected to be 2.13 percent of the Current Replacement Value (CRV) by the end of 2007. The recommended service standard is 2.5 percent of the CRV. O&M needs will continue to be prioritized based upon the most essential needs. Under the Current Funding Program, all preventative and corrective maintenance will be performed on essential systems in all FAM maintained buildings. However, maintenance on non-essential systems will be done in the 26 essential buildings only. These essential buildings provide core community services such as Police, Fire, and Public Works. Major Maintenance/Facility Renovation and Replacement (MM/FR&R) funding levels are projected to be 1.62 percent CRV by the end of 2007. This percentage would have been even lower except in 2006 FAM reallocated $107,165 from desirable and discretionary services in operating accounts to essential projects in MM/FR&R and in 2007, FAM received one-time funding of $290,000. The recommended service standard is 2.0 percent CRV. Without additional funding in MM/FR&R, the maintenance backlog1 is projected to increase from approximately $4.6 million in 2007 to $5.2 million by the
1 Backlog is an industry standard term used to define the accumulation of uncorrected or deferred deficiencies that represent a liability (in both physical and financial terms) for a facility. These items include maintenance deficiencies, equipment or systems overdue for replacement, etc. Future maintenance items, planned replacements and efficiency improvements are not part of the backlog.
end of 2008; $4 million is the point at which the overall condition rating for General Fund facilities changes from “good” to “fair” and is the maximum desired maintenance backlog amount. The focus of Fleet Services’ fiscally constrained plan is to continue to effectively maintain the city’s fleet while balancing customer and community values. Fleet Services is in the process of finalizing its strategic plan with a completion date in 2007. In 2006, Fleet Services retained the services of a consulting firm, Mercury Associates Inc., to assist in the development of the strategic plan. Mercury Associates reviewed the methodology used by Fleet Services to establish chargeback costs to customers for the purpose of recovering the operating and maintenance (O&M) cost of Fleet Services. As a result of Mercury Associates’ analysis of fleet operating costs and input received from fleet customers, a new rate structure was implemented in 2007. OVERVIEW OF ACTION PLAN The FAM Master Plan Update was accepted by City Council on July 19, 2005. The plan recommends industry standard levels of service at all General Fund facilities. The plan also recognizes the city’s current economic climate and the need to prioritize services such that the 26 essential facilities will receive industry standard levels of service and the remaining facilities will receive services commensurate with available funding. The plan also presents an Action Plan that identifies additional funding so that the recommended service standard goal of 2.5 percent CRV for O&M and the recommended service standard goal of 2.0 percent CRV for MM/FR&R are realized by 2014. In May 2006, the Action Plan was updated in order to reflect additions to FAM’s maintenance backlog. In 2007, the total additional amount needed to meet industry service standards is $684,115 per year; $225,862 for O&M and $458,253 for MM/FR&R. In addition, FAM’s 2008 Action Plan includes requests to return the reallocation of $107,165 to major maintenance, return the reallocation of $156,049 to Facility Maintenance (352235) “desirable” services which includes 0.5 FTE (Building Maintenance Person II), return the reallocation of $83,794 to P & R: O & M (352237) “desirable” services which includes 0.5 FTE (Building Maintenance Person II). The Action Plan also includes a request for $186,513 which is the “fiscally constrained erosion” amount related to construction and contractual; these costs have been rising at a rate of 5 percent per year. These funding increases would:
o Restore surface refurbishments from minimal standards (greater than ten years) to a ten year schedule,
o Allow implementation of energy improvements with a longer payback period -all projects with less than a five year payback; the Fiscally Constrained Plan includes all projects with less than a three year payback, and
o Maintain the maintenance backlog below $4 million.
Business Plan implementation, including the development and updating of associated departmental Master Plans, continues to inform investment priorities for capital expenditures and the FAM action plan. As an example, the Library Master Plan effort has illustrated that with over 800,000 customer visits per year, the HVAC system at the Main library has been challenged to perform adequately for a building of its size and design. Patrons are increasingly concerned about the heat, humidity and lack of air flow in this essential facility. As a result, FAM is currently working with the Library Department to evaluate possible improvements to the existing evaporative cooling system installed at the Main Library in 1992. Short-term actions include:
• Conducting an Indoor Air Quality sample at key areas of the building to determine actual temperature, humidity, carbon monoxide and carbon dioxide levels over a period of several days.
• Contracting with an engineering firm to re-commission the heating, ventilating, and air conditioning (HVAC) systems to determine if improvements to the existing system are possible.
These assessment steps will help determine the longer-term needs. Should replacement of the air conditioning system be warranted, a system that is designed to meet current needs at the Main Library would cost approximately $1 million. The Fleet Services Action Plan will include purchasing hybrid and alternative fuel vehicles (HAFV) 75 percent of the time they are offered by manufacturers. The current goal of 65 percent was set by the (staff) Fleet Policy Advisory Board. The city Fleet’s Green House Targets (GHG) for the implementation of the Kyoto Protocol has been met; the city’s fleet produces a total of seven percent less emissions than in 1990. As funds become available, high priority operational and facility needs for Fleet Services will be completed such as upgrading the fuel delivery system, purchasing a test set for digital radios, and installing a sound-dampening system for the Radio Shop in order to help to reduce noise levels caused by being located next to the heavy equipment maintenance area at Fleet Services. The need to replace the fleet facilities roof has been identified and is scheduled to be replaced in 2009 as part of the Facilities Renovation and Replacement Fund (fund 650) CIP program. Please refer to the Planning and Development Services’ Business Plan Narrative. Please refer to Attachment B of the 2008-09 Budget Message for a listing of those Action Plan Items that were recommended for funding. The listing is presented in order by fund and department. Please see the section titled “City Council Direction on the Recommended Budget” for any changes from Attachment B.
GUIDING PRINCIPLES OR INVESTMENT STRATEGY 1). Maintenance of City Assets (Essential): FAM: Provides industry standard levels of O&M for 26 essential buildings assigned
to the General Fund (GF). Essential services also include providing preventive and corrective maintenance on only essential building systems in the remaining GF facilities assigned to FAM, security and access control systems, energy payments and essential MM/FR&R projects. Implements energy-saving projects with a payback of three years or less.
Fleet Services: Includes all vehicle and equipment maintenance and acquisition services directly related to vehicle safety. Also includes the Fleet Replacement Fund (FRF) which replaces existing vehicles classified as “emergency” such as police patrol cars and heavy trucks used for snow and ice control. Provides preventive and corrective maintenance on all mobile and stationary communications equipment.
2.) Maintenance of City Assets (Desirable):
FAM: Provides O&M service levels in ”Non-Essential Buildings” to industry
standards for all buildings assigned to FAM, periodic surface finish replacements on a ten year cycle, administrative services, staff training and includes the Equipment Replacement Fund (ERP) payments for capital equipment assigned to FAM. Implements energy-saving projects with a payback of five years or less.
Fleet Services: Includes all non-essential customer requested services such as providing a self-service car wash facility, increased implementation of HAFV technologies, and includes the Fleet Replacement Fund (FRF) which replaces existing vehicles classified as “non-emergency” such as non-patrol sedans and pickup trucks.
3.) Maintenance of City Assets (Discretionary): FAM: Includes funding for furnishing GF common areas such as conference areas and
outdoor furniture and administrative services associated with investigating renewable energy technologies such as solar and wind, where cost effective. Implements energy-saving projects with a payback of ten years or less.
Fleet Services: Includes a one percent Emergency Reserve and a two percent
Operating Reserve which are annually appropriated to fund unanticipated emergency and operating needs. Also includes funding for lower priority facility needs and construction of a separate Radio Shop facility.
Please refer to Planning and Development Services’ Guiding Principles or Investment Strategy.
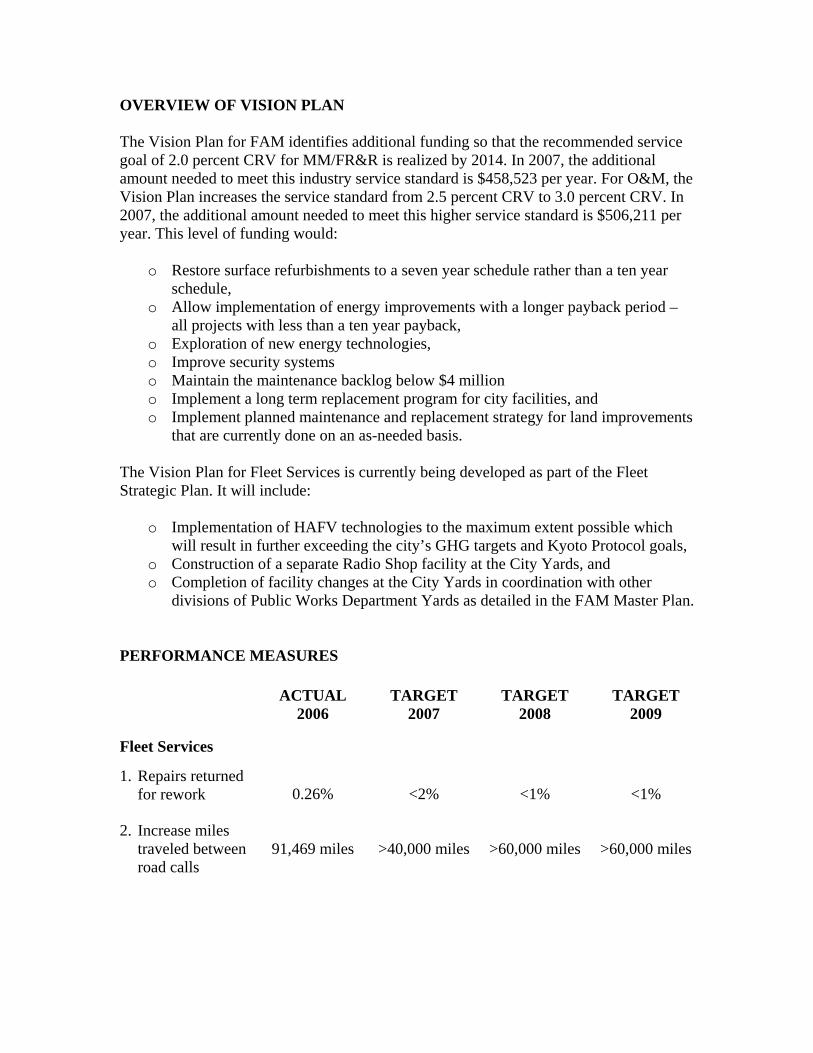
OVERVIEW OF VISION PLAN The Vision Plan for FAM identifies additional funding so that the recommended service goal of 2.0 percent CRV for MM/FR&R is realized by 2014. In 2007, the additional amount needed to meet this industry service standard is $458,523 per year. For O&M, the Vision Plan increases the service standard from 2.5 percent CRV to 3.0 percent CRV. In 2007, the additional amount needed to meet this higher service standard is $506,211 per year. This level of funding would:
o Restore surface refurbishments to a seven year schedule rather than a ten year schedule,
o Allow implementation of energy improvements with a longer payback period – all projects with less than a ten year payback,
o Exploration of new energy technologies, o Improve security systems o Maintain the maintenance backlog below $4 million o Implement a long term replacement program for city facilities, and o Implement planned maintenance and replacement strategy for land improvements
that are currently done on an as-needed basis. The Vision Plan for Fleet Services is currently being developed as part of the Fleet Strategic Plan. It will include:
o Implementation of HAFV technologies to the maximum extent possible which will result in further exceeding the city’s GHG targets and Kyoto Protocol goals,
o Construction of a separate Radio Shop facility at the City Yards, and o Completion of facility changes at the City Yards in coordination with other
divisions of Public Works Department Yards as detailed in the FAM Master Plan.
PERFORMANCE MEASURES ACTUAL
2006 TARGET
2007 TARGET
2008 TARGET
2009
Fleet Services
1. Repairs returned for rework 0.26% <2% <1% <1%
2. Increase miles traveled between road calls
91,469 miles >40,000 miles >60,000 miles >60,000 miles
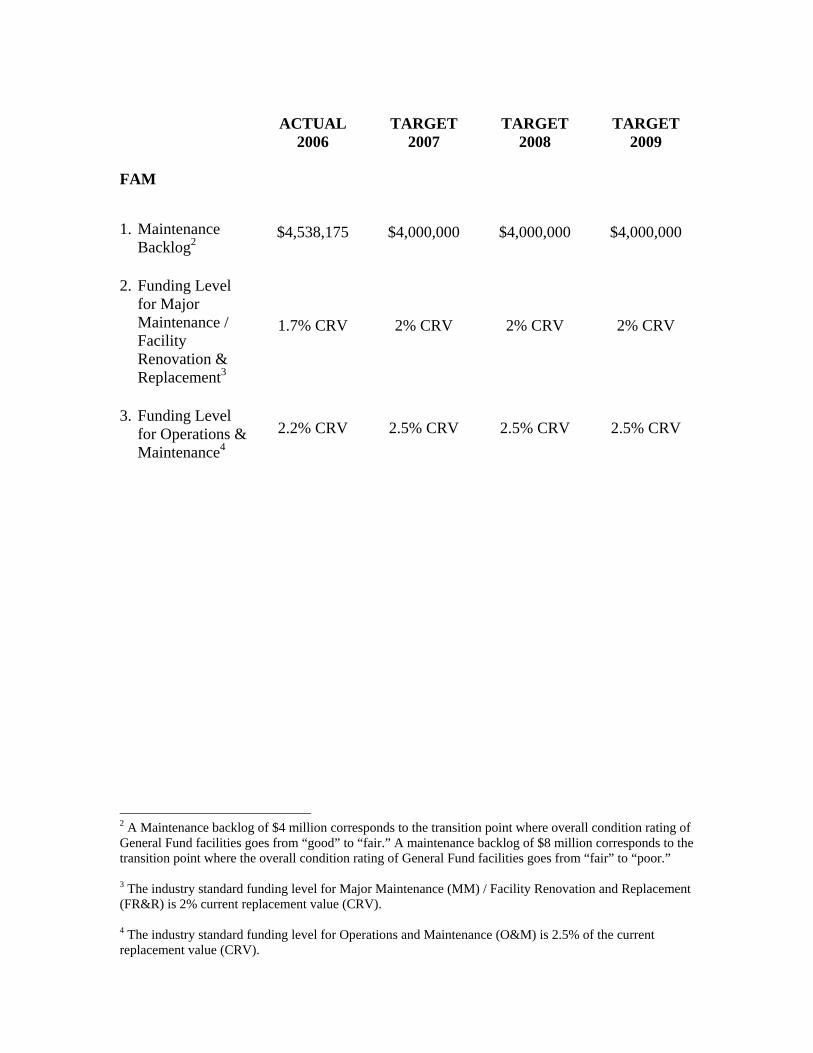
ACTUAL
2006 TARGET
2007 TARGET
2008 TARGET
2009
FAM
1. Maintenance Backlog2
$4,538,175 $4,000,000 $4,000,000 $4,000,000
2. Funding Level for Major Maintenance / Facility Renovation & Replacement3
1.7% CRV 2% CRV 2% CRV 2% CRV
3. Funding Level for Operations & Maintenance4
2.2% CRV 2.5% CRV 2.5% CRV 2.5% CRV
2 A Maintenance backlog of $4 million corresponds to the transition point where overall condition rating of General Fund facilities goes from “good” to “fair.” A maintenance backlog of $8 million corresponds to the transition point where the overall condition rating of General Fund facilities goes from “fair” to “poor.” 3 The industry standard funding level for Major Maintenance (MM) / Facility Renovation and Replacement (FR&R) is 2% current replacement value (CRV). 4 The industry standard funding level for Operations and Maintenance (O&M) is 2.5% of the current replacement value (CRV).
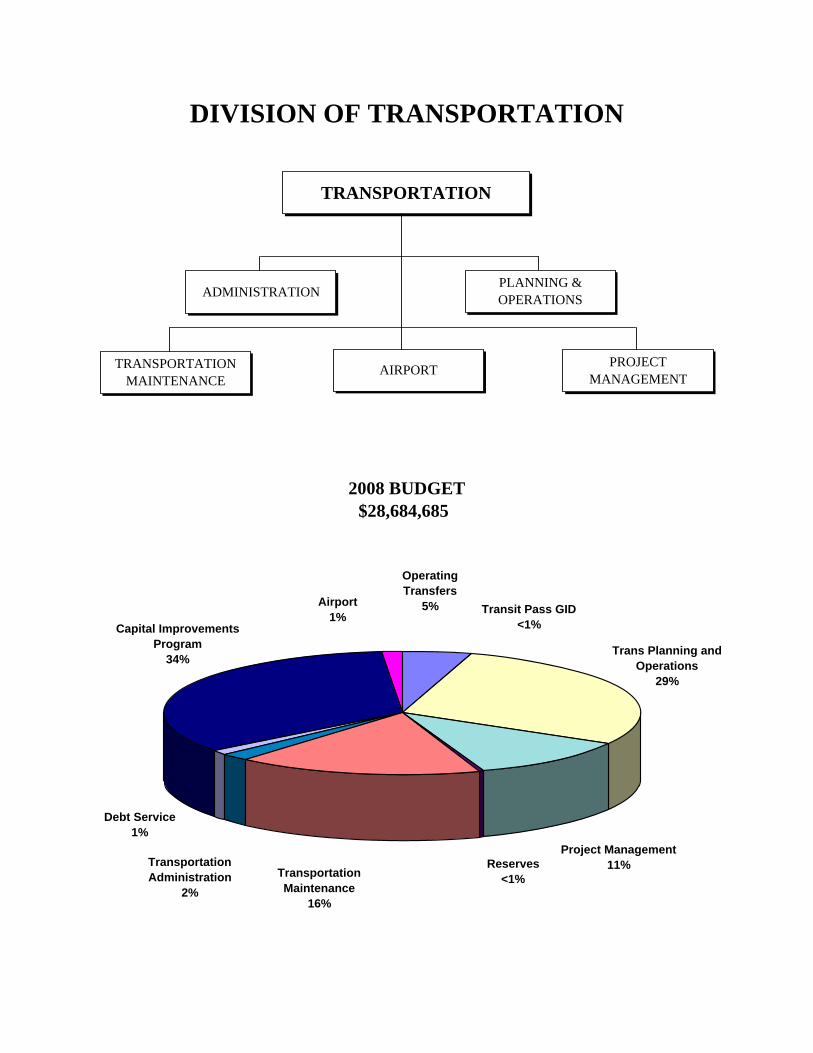
DIVISION OF TRANSPORTATION
2008 BUDGET$28,684,685
TRANSPORTATION
TRANSPORTATIONMAINTENANCE
AIRPORT PROJECT MANAGEMENT
ADMINISTRATIONPLANNING & OPERATIONS
Capital Improvements Program
34%
Transportation Maintenance
16%
Project Management11%Reserves
<1%
Trans Planning and Operations
29%
Transit Pass GID<1%
OperatingTransfers
5%Airport1%
Transportation Administration
2%
Debt Service1%
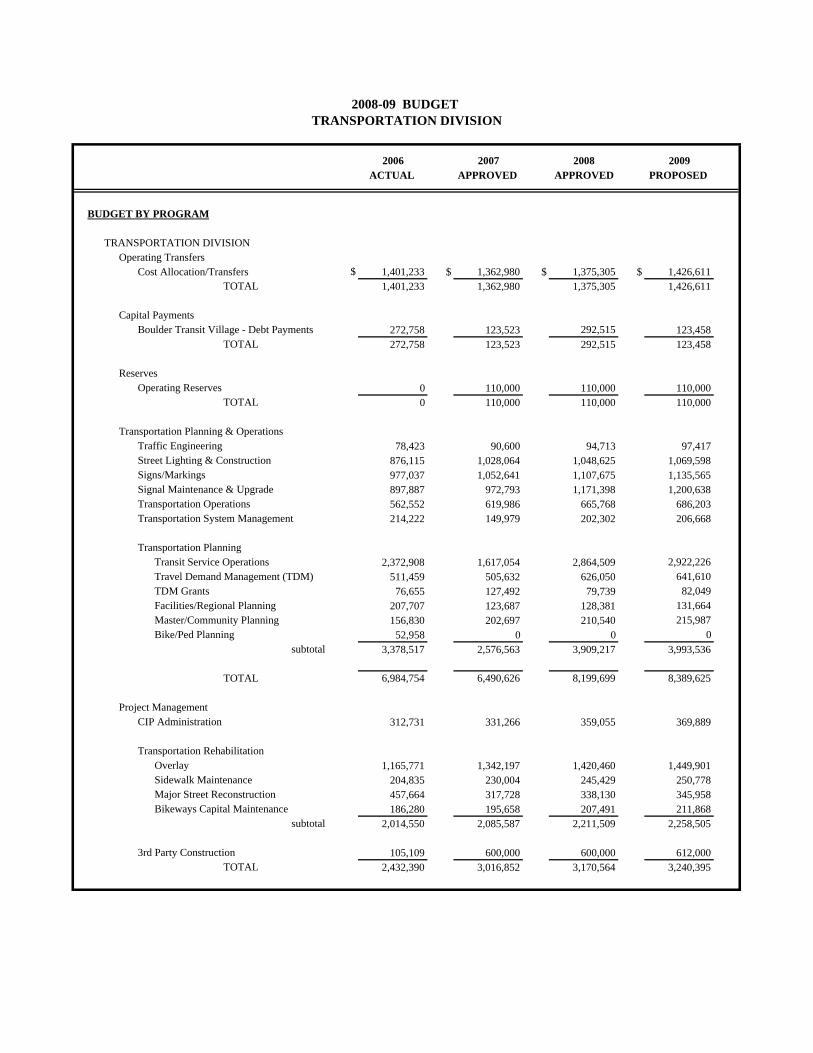
2006 2007 2008 2009ACTUAL APPROVED APPROVED PROPOSED
BUDGET BY PROGRAM
TRANSPORTATION DIVISIONOperating Transfers
Cost Allocation/Transfers $ 1,401,233 $ 1,362,980 $ 1,375,305 $ 1,426,611TOTAL 1,401,233 1,362,980 1,375,305 1,426,611
Capital PaymentsBoulder Transit Village - Debt Payments 272,758 123,523 292,515 123,458
TOTAL 272,758 123,523 292,515 123,458
ReservesOperating Reserves 0 110,000 110,000 110,000
TOTAL 0 110,000 110,000 110,000
Transportation Planning & OperationsTraffic Engineering 78,423 90,600 94,713 97,417Street Lighting & Construction 876,115 1,028,064 1,048,625 1,069,598Signs/Markings 977,037 1,052,641 1,107,675 1,135,565Signal Maintenance & Upgrade 897,887 972,793 1,171,398 1,200,638Transportation Operations 562,552 619,986 665,768 686,203Transportation System Management 214,222 149,979 202,302 206,668
Transportation PlanningTransit Service Operations 2,372,908 1,617,054 2,864,509 2,922,226Travel Demand Management (TDM) 511,459 505,632 626,050 641,610TDM Grants 76,655 127,492 79,739 82,049Facilities/Regional Planning 207,707 123,687 128,381 131,664Master/Community Planning 156,830 202,697 210,540 215,987Bike/Ped Planning 52,958 0 0 0
subtotal 3,378,517 2,576,563 3,909,217 3,993,536
TOTAL 6,984,754 6,490,626 8,199,699 8,389,625
Project ManagementCIP Administration 312,731 331,266 359,055 369,889
Transportation RehabilitationOverlay 1,165,771 1,342,197 1,420,460 1,449,901Sidewalk Maintenance 204,835 230,004 245,429 250,778Major Street Reconstruction 457,664 317,728 338,130 345,958Bikeways Capital Maintenance 186,280 195,658 207,491 211,868
subtotal 2,014,550 2,085,587 2,211,509 2,258,505
3rd Party Construction 105,109 600,000 600,000 612,000TOTAL 2,432,390 3,016,852 3,170,564 3,240,395
2008-09 BUDGET TRANSPORTATION DIVISION
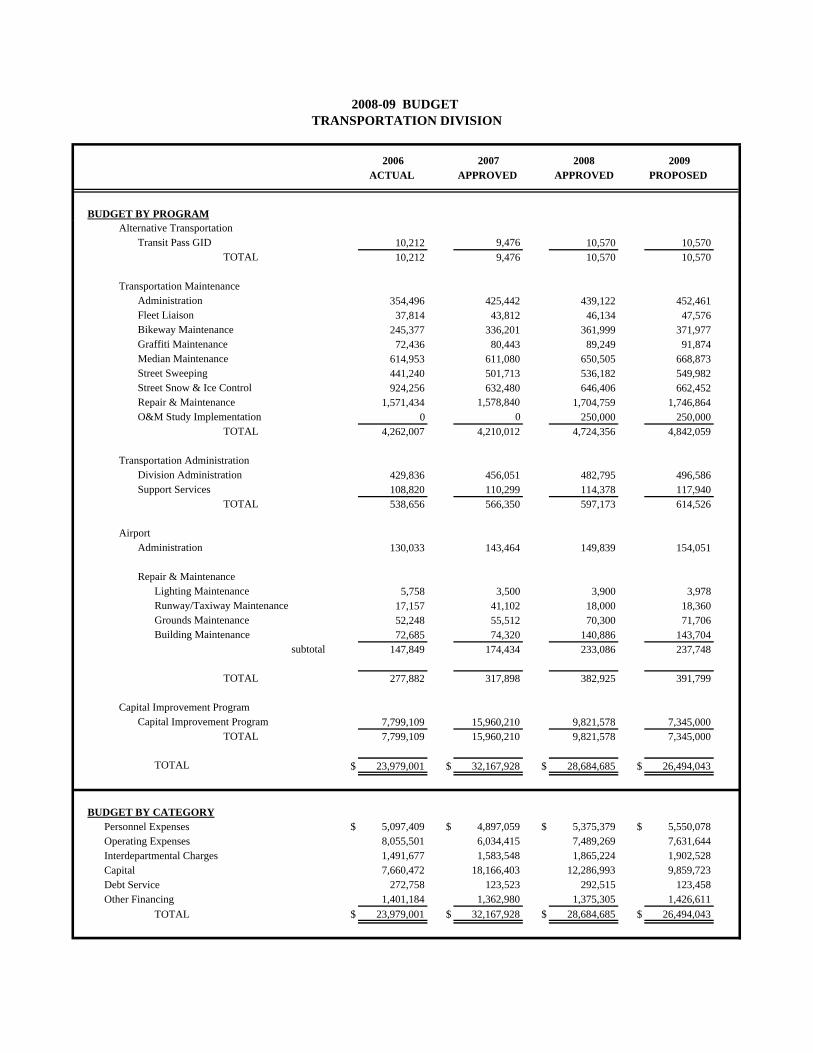
2006 2007 2008 2009ACTUAL APPROVED APPROVED PROPOSED
BUDGET BY PROGRAM
2008-09 BUDGET TRANSPORTATION DIVISION
Alternative TransportationTransit Pass GID 10,212 9,476 10,570 10,570
TOTAL 10,212 9,476 10,570 10,570
Transportation MaintenanceAdministration 354,496 425,442 439,122 452,461Fleet Liaison 37,814 43,812 46,134 47,576Bikeway Maintenance 245,377 336,201 361,999 371,977Graffiti Maintenance 72,436 80,443 89,249 91,874Median Maintenance 614,953 611,080 650,505 668,873Street Sweeping 441,240 501,713 536,182 549,982Street Snow & Ice Control 924,256 632,480 646,406 662,452Repair & Maintenance 1,571,434 1,578,840 1,704,759 1,746,864O&M Study Implementation 0 0 250,000 250,000
TOTAL 4,262,007 4,210,012 4,724,356 4,842,059
Transportation AdministrationDivision Administration 429,836 456,051 482,795 496,586Support Services 108,820 110,299 114,378 117,940
TOTAL 538,656 566,350 597,173 614,526
AirportAdministration 130,033 143,464 149,839 154,051
Repair & MaintenanceLighting Maintenance 5,758 3,500 3,900 3,978Runway/Taxiway Maintenance 17,157 41,102 18,000 18,360Grounds Maintenance 52,248 55,512 70,300 71,706Building Maintenance 72,685 74,320 140,886 143,704
subtotal 147,849 174,434 233,086 237,748
TOTAL 277,882 317,898 382,925 391,799
Capital Improvement ProgramCapital Improvement Program 7,799,109 15,960,210 9,821,578 7,345,000
TOTAL 7,799,109 15,960,210 9,821,578 7,345,000
TOTAL $ 23,979,001 $ 32,167,928 $ 28,684,685 $ 26,494,043
BUDGET BY CATEGORYPersonnel Expenses $ 5,097,409 $ 4,897,059 $ 5,375,379 $ 5,550,078Operating Expenses 8,055,501 6,034,415 7,489,269 7,631,644Interdepartmental Charges 1,491,677 1,583,548 1,865,224 1,902,528Capital 7,660,472 18,166,403 12,286,993 9,859,723Debt Service 272,758 123,523 292,515 123,458Other Financing 1,401,184 1,362,980 1,375,305 1,426,611
TOTAL $ 23,979,001 $ 32,167,928 $ 28,684,685 $ 26,494,043
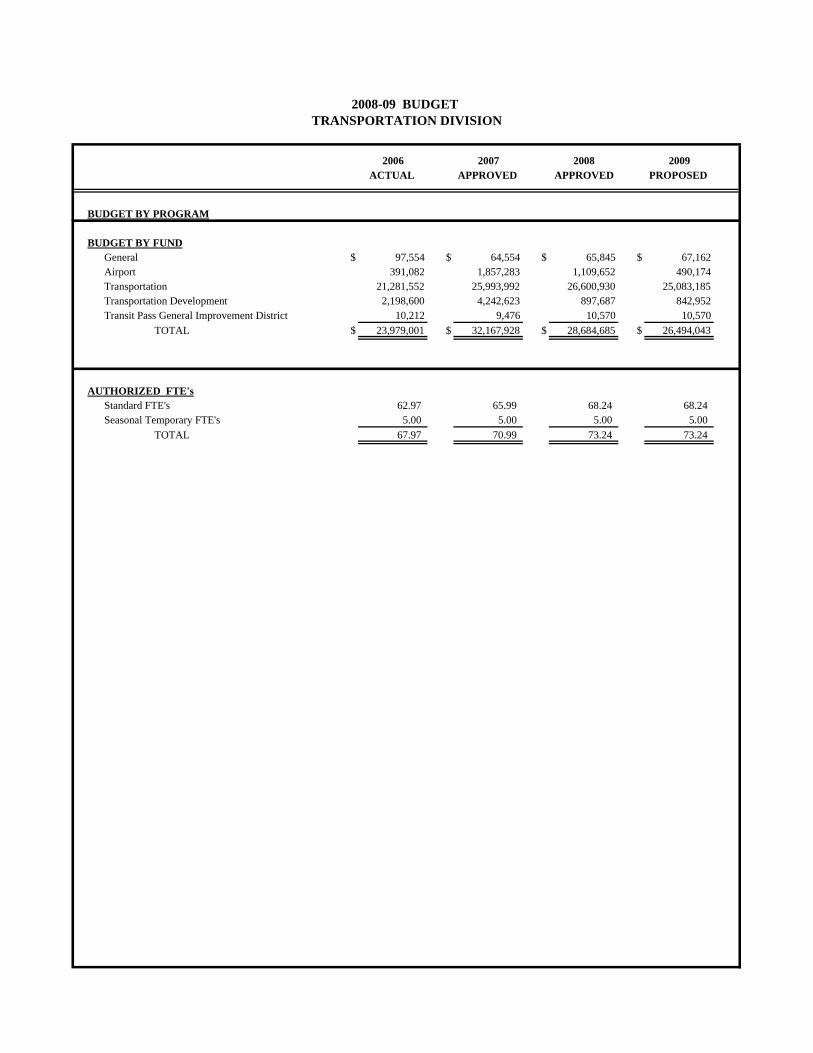
2006 2007 2008 2009ACTUAL APPROVED APPROVED PROPOSED
BUDGET BY PROGRAM
2008-09 BUDGET TRANSPORTATION DIVISION
BUDGET BY FUNDGeneral $ 97,554 $ 64,554 $ 65,845 $ 67,162Airport 391,082 1,857,283 1,109,652 490,174Transportation 21,281,552 25,993,992 26,600,930 25,083,185Transportation Development 2,198,600 4,242,623 897,687 842,952Transit Pass General Improvement District 10,212 9,476 10,570 10,570
TOTAL $ 23,979,001 $ 32,167,928 $ 28,684,685 $ 26,494,043
AUTHORIZED FTE'sStandard FTE's 62.97 65.99 68.24 68.24Seasonal Temporary FTE's 5.00 5.00 5.00 5.00
TOTAL 67.97 70.99 73.24 73.24
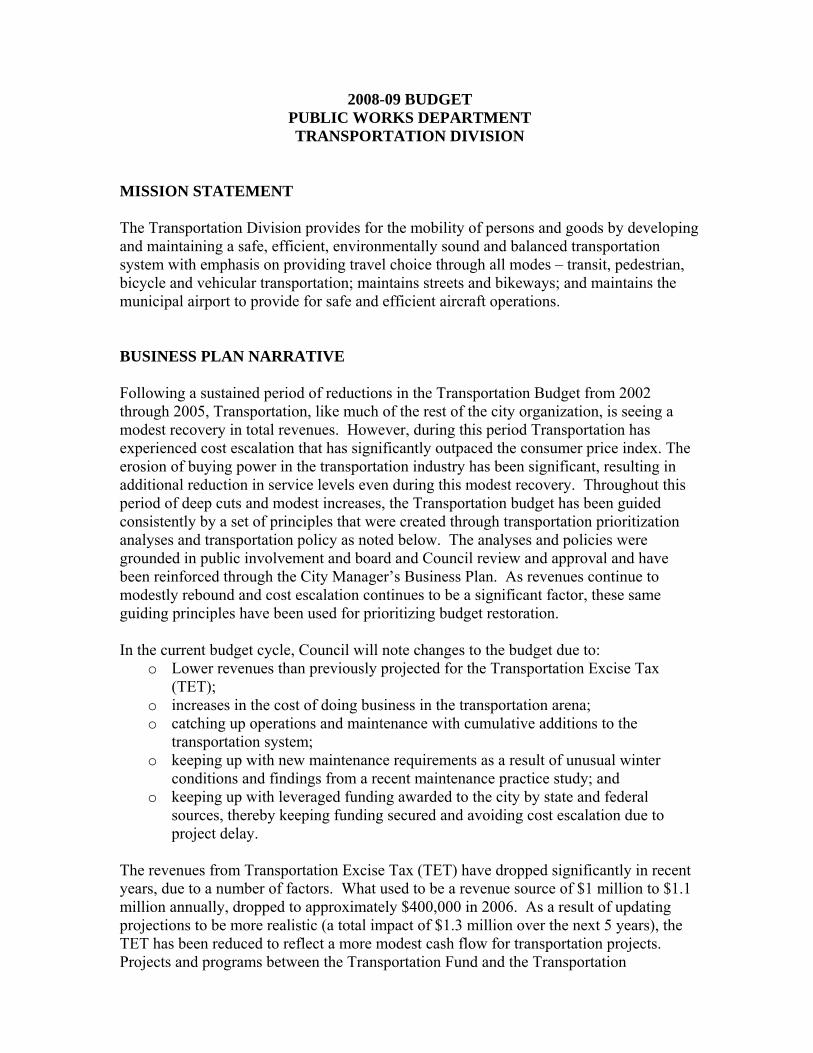
2008-09 BUDGET PUBLIC WORKS DEPARTMENT TRANSPORTATION DIVISION
MISSION STATEMENT The Transportation Division provides for the mobility of persons and goods by developing and maintaining a safe, efficient, environmentally sound and balanced transportation system with emphasis on providing travel choice through all modes – transit, pedestrian, bicycle and vehicular transportation; maintains streets and bikeways; and maintains the municipal airport to provide for safe and efficient aircraft operations. BUSINESS PLAN NARRATIVE Following a sustained period of reductions in the Transportation Budget from 2002 through 2005, Transportation, like much of the rest of the city organization, is seeing a modest recovery in total revenues. However, during this period Transportation has experienced cost escalation that has significantly outpaced the consumer price index. The erosion of buying power in the transportation industry has been significant, resulting in additional reduction in service levels even during this modest recovery. Throughout this period of deep cuts and modest increases, the Transportation budget has been guided consistently by a set of principles that were created through transportation prioritization analyses and transportation policy as noted below. The analyses and policies were grounded in public involvement and board and Council review and approval and have been reinforced through the City Manager’s Business Plan. As revenues continue to modestly rebound and cost escalation continues to be a significant factor, these same guiding principles have been used for prioritizing budget restoration. In the current budget cycle, Council will note changes to the budget due to:
o Lower revenues than previously projected for the Transportation Excise Tax (TET);
o increases in the cost of doing business in the transportation arena; o catching up operations and maintenance with cumulative additions to the
transportation system; o keeping up with new maintenance requirements as a result of unusual winter
conditions and findings from a recent maintenance practice study; and o keeping up with leveraged funding awarded to the city by state and federal
sources, thereby keeping funding secured and avoiding cost escalation due to project delay.
The revenues from Transportation Excise Tax (TET) have dropped significantly in recent years, due to a number of factors. What used to be a revenue source of $1 million to $1.1 million annually, dropped to approximately $400,000 in 2006. As a result of updating projections to be more realistic (a total impact of $1.3 million over the next 5 years), the TET has been reduced to reflect a more modest cash flow for transportation projects. Projects and programs between the Transportation Fund and the Transportation
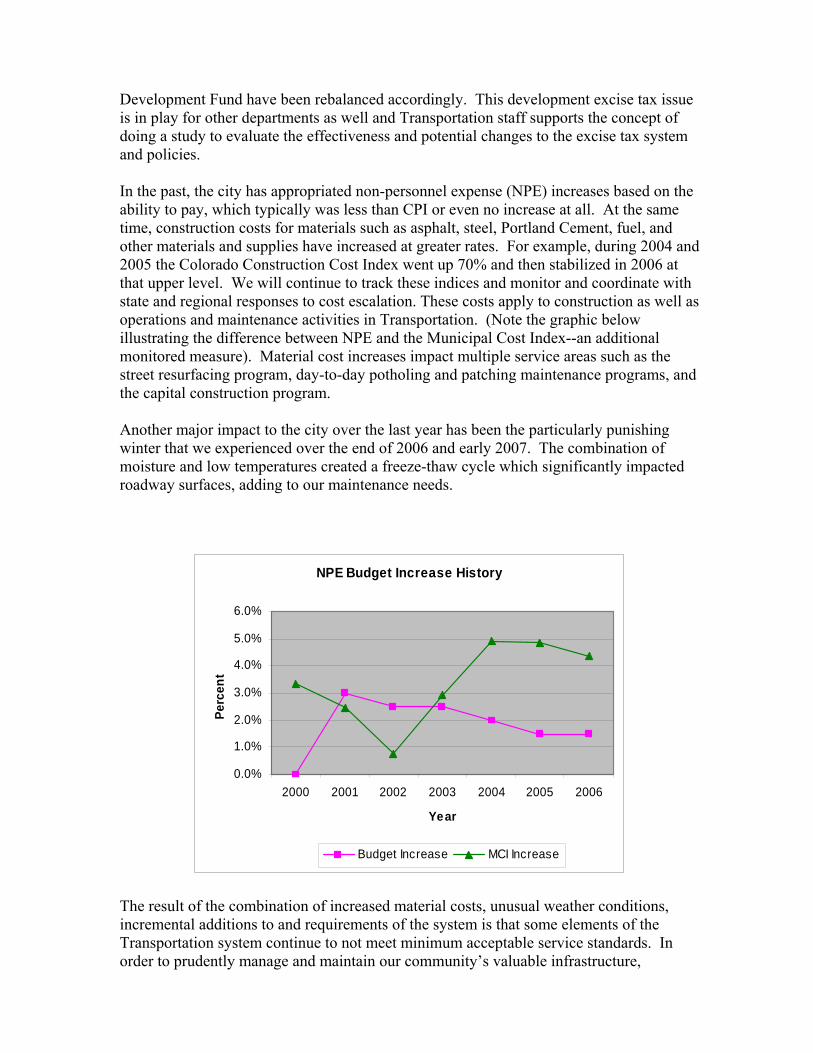
Development Fund have been rebalanced accordingly. This development excise tax issue is in play for other departments as well and Transportation staff supports the concept of doing a study to evaluate the effectiveness and potential changes to the excise tax system and policies. In the past, the city has appropriated non-personnel expense (NPE) increases based on the ability to pay, which typically was less than CPI or even no increase at all. At the same time, construction costs for materials such as asphalt, steel, Portland Cement, fuel, and other materials and supplies have increased at greater rates. For example, during 2004 and 2005 the Colorado Construction Cost Index went up 70% and then stabilized in 2006 at that upper level. We will continue to track these indices and monitor and coordinate with state and regional responses to cost escalation. These costs apply to construction as well as operations and maintenance activities in Transportation. (Note the graphic below illustrating the difference between NPE and the Municipal Cost Index--an additional monitored measure). Material cost increases impact multiple service areas such as the street resurfacing program, day-to-day potholing and patching maintenance programs, and the capital construction program. Another major impact to the city over the last year has been the particularly punishing winter that we experienced over the end of 2006 and early 2007. The combination of moisture and low temperatures created a freeze-thaw cycle which significantly impacted roadway surfaces, adding to our maintenance needs.
NPE Budget Increase History
0.0%
1.0%
2.0%
3.0%
4.0%
5.0%
6.0%
2000 2001 2002 2003 2004 2005 2006
Year
Perc
ent
Budget Increase MCI Increase
The result of the combination of increased material costs, unusual weather conditions, incremental additions to and requirements of the system is that some elements of the Transportation system continue to not meet minimum acceptable service standards. In order to prudently manage and maintain our community’s valuable infrastructure,
Transportation proposes focusing fiscally constrained revenue increases on catching up with the cost of doing business through NPE increases (additional 4% in areas most affected by cost/weather impacts) and catching up operations and maintenance activities. Finally, Transportation has initial results from an Operations and Maintenance Study which identifies the need to improve data collection and data management for tracking and programming preventative maintenance activities for the transportation system. Two specific activities include finalizing the implementation of an industry-standard pavement management system and updating the rating of the condition of the street/transportation system. This data update and data management system will then allow us to improve our strategic planning and implementation to right-size efforts such as resurfacing, patching, chip and seal, crack sealing and other maintenance practices. Therefore, a line item is proposed to finalize pavement management, contract services to rate the system’s condition, and include some flexibility to respond to immediate preventative maintenance efforts. In the past, Transportation has been successful at seeking leveraged funding opportunities. On a positive note, if Transportation had not been successful at winning “reconstruction” dollars, our need for additional maintenance funding would be even greater than it is now. Also, most projects that have added travel choices, system improvements and safety enhancements have included leveraged funding. For example, Boulder was recently awarded federal funding for transportation connections in the Boulder Transit Village vicinity, stretching our local resources to address a community goal. However, one challenge that staff faces is that the Denver Regional Council of Governments (DRCOG), Colorado Department of Transportation and Federal Government have been simultaneously creating penalties, as severe as losing funding, for delaying project construction and creating more requirements to achieve project approval. Add the city’s ethic of thorough and comprehensive public involvement and we face the challenge of implementing the approved CIP in a timely fashion without losing valuable federal and state funding. Also, each year a project is delayed, the more it is impacted by escalating material costs. Overall, it is important to advance the CIP in a timely manner in order to keep valuable leveraged funds. Historically, Transportation has averaged $2 million annually in leveraged investments in our transportation infrastructure. As a result of public and private development of the transportation system over time, there have been traffic signals added to the system. The number of signals increased from 122 in 1993 to 144 in 2005. We have reached the threshold of adding enough signals to the system that we are not meeting acceptable service levels for Operations & Maintenance (O & M) of the system with current staffing levels. A guideline in the signal industry is a ratio of 1 technician per 30 or 40 signals. Along with the increase of signals, there are also more other kinds of electronic signs. From 2000 to 2005, the number of flashing pedestrian crossing treatments went from 1 to 11, and the number of radar speed display signs increased from 3 to 23. With these additions to the system and in order to catch up with minimum acceptable service standards, Transportation is proposing one additional FTE for O & M of the signal system. This FTE is consistent with the Budget Guiding Principles since it focuses on day-to-day maintenance and operations of the existing system.
Similar to the previous budget cycle, in out years of the Transportation Fund of the capital program, we are attempting to allow continued flexibility to provide local match for federal funding and/or local implementation to optimize FasTracks and other community objectives. Please note that, while we have had great success in past years in leveraging federal funds, it may be more difficult in the future as federal funds are diminishing. Recent estimates indicate that on its current course, the Highway Users Trust Fund (HUTF) would no longer have funds available to distribute as soon as 2009. Staff also will be monitoring changes at the federal level which would impact funding of DRCOG’s Transportation Improvement Program, our primary source of federal funds. Another item reflected beginning with a supplemental in the 2007 budget and continued with the 2008 budget is a contractual change for the HOP service. The contract change reflects the RTD contribution to the HOP in addition to the City of Boulder’s contribution. The HOP service contract change makes it clear that Special Transit is providing the HOP service on behalf of municipal government, which allows Special Transit to pay lower fuel taxes. Since the full amount of this budget increase is reimbursed from RTD, there is no real difference in what the city invests in the HOP, but this administrative and budget tracking change keeps money invested in local transportation. GUIDING PRINCIPLES AND/OR INVESTMENT STRATEGIES Aligning with the policies of the Transportation Master Plan is an important aspect of the Transportation Budget’s guiding principles. As previously outlined in Council/Board budget processes, the following priorities and strategies have been used to develop the Transportation budget:
► Maintain Integrity of Transportation Prioritization, in order: – Maintenance and Operations (Essential) – Multimodal System Expansion (Desirable) – Enhancements without system performance benefit (Discretionary)
► Achieve Sustainable Budget Over Time ► Continue Efficiency Improvements ► Maintain Leveraged Funded Projects ► Reduce Boulder Transit Village (BTV) debt through annual operating savings if
available The essential, desirable, discretionary categories of funding are derived similarly and are described below with examples:
1.) Essential Services include Operation and Maintenance of Existing System to Maintain Public Safety. Examples include pothole repair, street resurfacing, taking care of signs and signals, addressing safety issues and basic levels of existing direct service for all modes, etc. This area has sustained reductions, but to a much lesser extent than other areas at about 18% reductions on average across Operations and Maintenance. Quality of life is addressed in this area though air quality, quality of experience in travel (e.g.
addressing failing streets, potholes, sidewalk hazards, etc.), and maintaining a reliable system (e.g. traffic signals functioning and in good condition).
2.) Desirable Services include Expansion of Multimodal System - All modal
system expansion has been slowed. The expansion of the multimodal system includes roadway, bicycle, pedestrian, transit and travel demand management projects, programs and services. Examples include new sections of path, sidewalk, improved roadway segments and intersections, expanded transit service and increases to Eco Pass enrollment. This area has received cuts over the past several years in excess of 50%. At this point, if a citizen sees a project it is highly likely that it either has leveraged funds, is associated with a capital maintenance project, or both. The quality of life enhancement consists of improving system performance, providing more travel choices, connecting citizens to basic needs and activities, improved air quality, and increasing mobility. Also, a capital improvements program helps support the community’s economic vitality efforts.
3.) Discretionary Services include Mitigation Projects – Examples include
things like noise walls and Neighborhood Traffic Mitigation such as traffic circles, bulb outs, speed bumps, etc. This area of the budget does not improve system performance or preserve the quality or integrity of the infrastructure and/or system. This area of the budget has sustained a 100% reduction. Until the economy recovers sufficiently, we will not be considering any new mitigation projects.
OVERVIEW OF ACTION PLAN The Transportation Master Plan outlines a Current Plan (Fiscally Constrained), an Action Plan and a Vision Plan. The Action Plan is the next set of strategic steps that will provide a prioritized increment of multimodal connections, subsequent O & M investments, travel demand management expansion, transit service enhancements, and progress with regional coalitions toward expanding regional travel choices. The Action Plan’s estimated cost is $5.5 million annually. The Action Plan’s funding would be dependent upon new revenues above and beyond current funding sources. However, since the TMP was adopted, FasTracks was created by RTD and approved by the voters. The Transportation Advisory Board (TAB) and staff have been working with a steering committee to better understand how FasTracks will serve our community and which projects and programs the city needs to advance to maximize the benefit of FasTracks. Also, the city needs to adjust costs to reflect a new fiscal reality as a result of cost escalation in the transportation industry. At a May 29, 2007 study session, Council’s guidance to staff and TAB included returning to Council with updated project lists for the Fiscally Constrained Plan and Action Plan of the TMP. Staff and TAB are refining those lists and will return to Council for final action. Also, staff and TAB will be coordinating with Blue Ribbon Commission work and outcomes to develop new revenue sources for transportation which Council would consider to advance the Action Plan project list of the TMP.
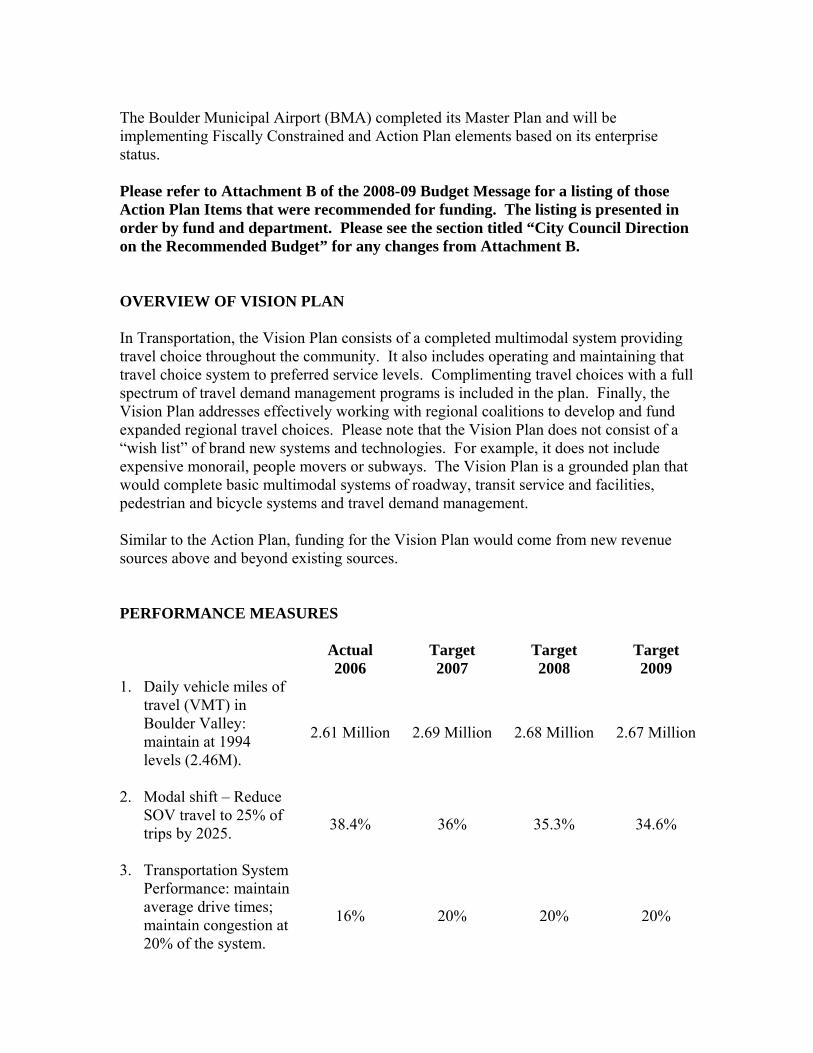
The Boulder Municipal Airport (BMA) completed its Master Plan and will be implementing Fiscally Constrained and Action Plan elements based on its enterprise status. Please refer to Attachment B of the 2008-09 Budget Message for a listing of those Action Plan Items that were recommended for funding. The listing is presented in order by fund and department. Please see the section titled “City Council Direction on the Recommended Budget” for any changes from Attachment B. OVERVIEW OF VISION PLAN In Transportation, the Vision Plan consists of a completed multimodal system providing travel choice throughout the community. It also includes operating and maintaining that travel choice system to preferred service levels. Complimenting travel choices with a full spectrum of travel demand management programs is included in the plan. Finally, the Vision Plan addresses effectively working with regional coalitions to develop and fund expanded regional travel choices. Please note that the Vision Plan does not consist of a “wish list” of brand new systems and technologies. For example, it does not include expensive monorail, people movers or subways. The Vision Plan is a grounded plan that would complete basic multimodal systems of roadway, transit service and facilities, pedestrian and bicycle systems and travel demand management. Similar to the Action Plan, funding for the Vision Plan would come from new revenue sources above and beyond existing sources. PERFORMANCE MEASURES
Actual 2006
Target 2007
Target 2008
Target 2009
1. Daily vehicle miles of travel (VMT) in Boulder Valley: maintain at 1994 levels (2.46M).
2.61 Million 2.69 Million 2.68 Million 2.67 Million
2. Modal shift – Reduce SOV travel to 25% of trips by 2025.
38.4% 36% 35.3% 34.6%
3. Transportation System Performance: maintain average drive times; maintain congestion at 20% of the system.
16% 20% 20% 20%
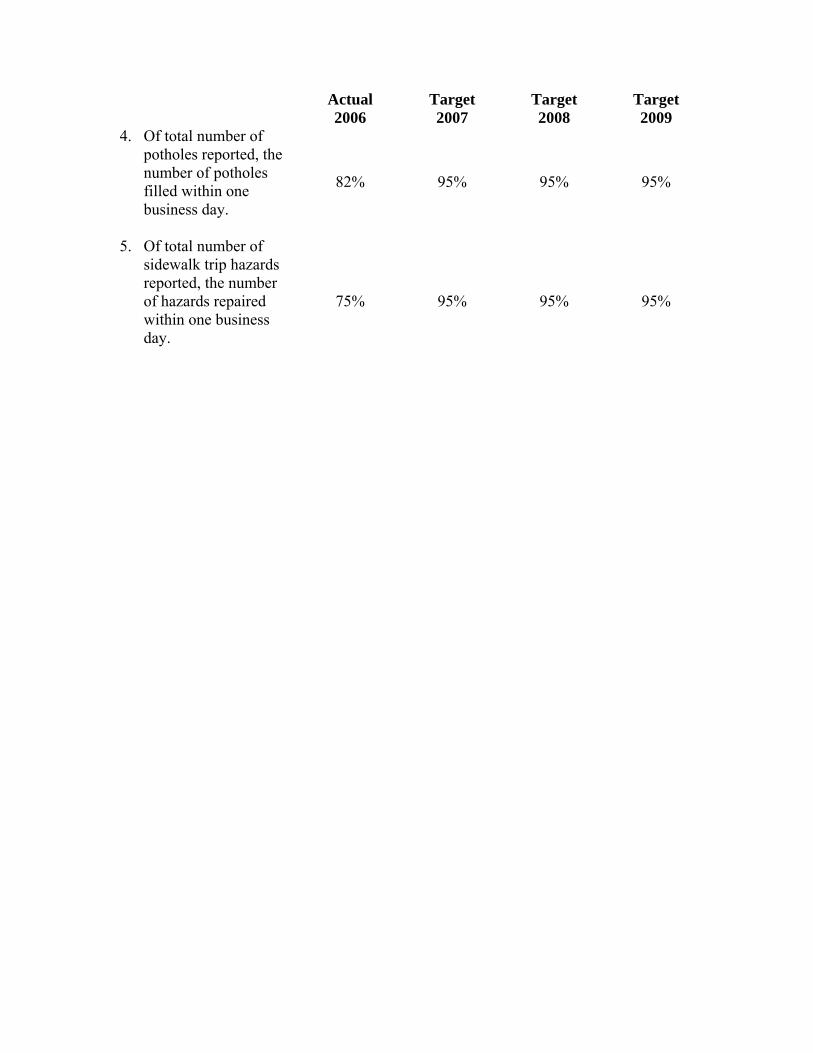
Actual 2006
Target 2007
Target 2008
Target 2009
4. Of total number of potholes reported, the number of potholes filled within one business day.
82% 95% 95% 95%
5. Of total number of sidewalk trip hazards reported, the number of hazards repaired within one business day.
75% 95% 95% 95%
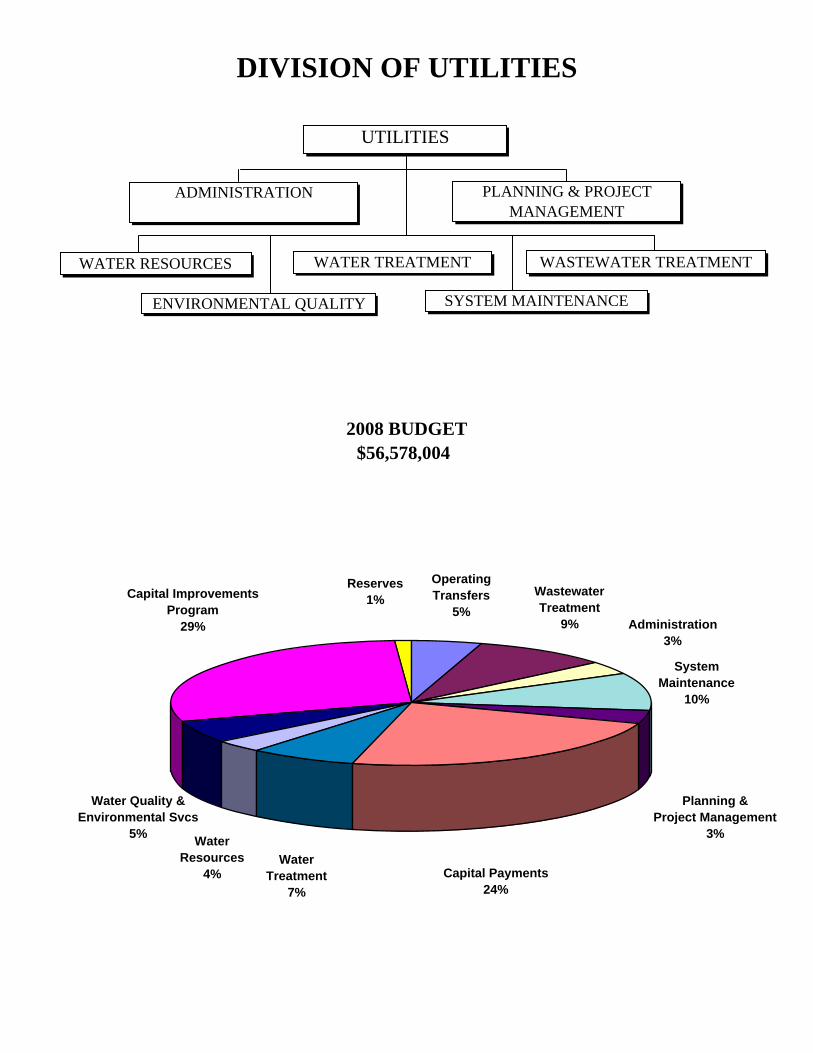
DIVISION OF UTILITIES
2008 BUDGET$56,578,004
UTILITIES
ENVIRONMENTAL QUALITY
WATER RESOURCES
PLANNING & PROJECT MANAGEMENT
SYSTEM MAINTENANCE
WATER TREATMENT WASTEWATER TREATMENT
ADMINISTRATION
Capital Improvements Program
29% Administration3%
WastewaterTreatment
9%
OperatingTransfers
5%
Reserves1%
SystemMaintenance
10%
Planning & Project Management
3%
Capital Payments24%
Water Quality & Environmental Svcs
5% WaterResources
4%Water
Treatment7%
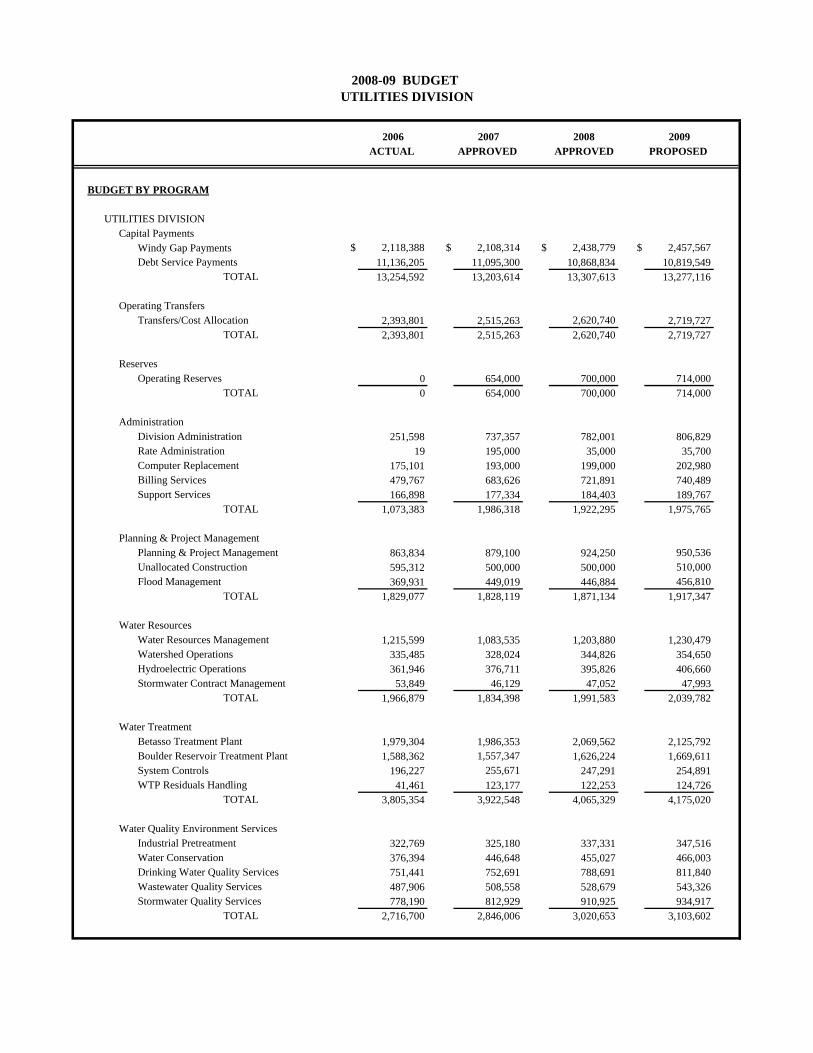
2006 2007 2008 2009ACTUAL APPROVED APPROVED PROPOSED
BUDGET BY PROGRAM
UTILITIES DIVISIONCapital Payments
Windy Gap Payments $ 2,118,388 $ 2,108,314 $ 2,438,779 $ 2,457,567Debt Service Payments 11,136,205 11,095,300 10,868,834 10,819,549
TOTAL 13,254,592 13,203,614 13,307,613 13,277,116
Operating TransfersTransfers/Cost Allocation 2,393,801 2,515,263 2,620,740 2,719,727
TOTAL 2,393,801 2,515,263 2,620,740 2,719,727
ReservesOperating Reserves 0 654,000 700,000 714,000
TOTAL 0 654,000 700,000 714,000
AdministrationDivision Administration 251,598 737,357 782,001 806,829Rate Administration 19 195,000 35,000 35,700Computer Replacement 175,101 193,000 199,000 202,980Billing Services 479,767 683,626 721,891 740,489Support Services 166,898 177,334 184,403 189,767
TOTAL 1,073,383 1,986,318 1,922,295 1,975,765
Planning & Project ManagementPlanning & Project Management 863,834 879,100 924,250 950,536Unallocated Construction 595,312 500,000 500,000 510,000Flood Management 369,931 449,019 446,884 456,810
TOTAL 1,829,077 1,828,119 1,871,134 1,917,347
Water ResourcesWater Resources Management 1,215,599 1,083,535 1,203,880 1,230,479Watershed Operations 335,485 328,024 344,826 354,650Hydroelectric Operations 361,946 376,711 395,826 406,660Stormwater Contract Management 53,849 46,129 47,052 47,993
TOTAL 1,966,879 1,834,398 1,991,583 2,039,782
Water TreatmentBetasso Treatment Plant 1,979,304 1,986,353 2,069,562 2,125,792Boulder Reservoir Treatment Plant 1,588,362 1,557,347 1,626,224 1,669,611System Controls 196,227 255,671 247,291 254,891WTP Residuals Handling 41,461 123,177 122,253 124,726
TOTAL 3,805,354 3,922,548 4,065,329 4,175,020
Water Quality Environment ServicesIndustrial Pretreatment 322,769 325,180 337,331 347,516Water Conservation 376,394 446,648 455,027 466,003Drinking Water Quality Services 751,441 752,691 788,691 811,840Wastewater Quality Services 487,906 508,558 528,679 543,326Stormwater Quality Services 778,190 812,929 910,925 934,917
TOTAL 2,716,700 2,846,006 3,020,653 3,103,602
2008-09 BUDGET UTILITIES DIVISION
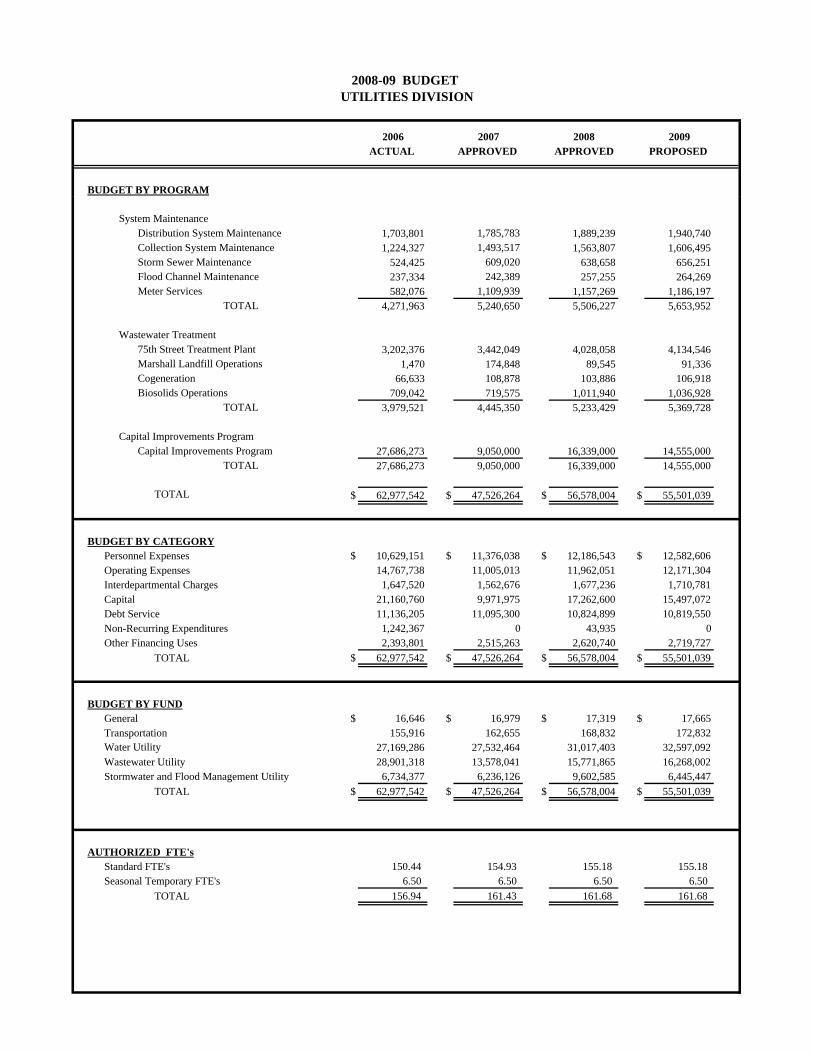
2006 2007 2008 2009ACTUAL APPROVED APPROVED PROPOSED
BUDGET BY PROGRAM
2008-09 BUDGET UTILITIES DIVISION
System MaintenanceDistribution System Maintenance 1,703,801 1,785,783 1,889,239 1,940,740Collection System Maintenance 1,224,327 1,493,517 1,563,807 1,606,495Storm Sewer Maintenance 524,425 609,020 638,658 656,251Flood Channel Maintenance 237,334 242,389 257,255 264,269Meter Services 582,076 1,109,939 1,157,269 1,186,197
TOTAL 4,271,963 5,240,650 5,506,227 5,653,952
Wastewater Treatment75th Street Treatment Plant 3,202,376 3,442,049 4,028,058 4,134,546Marshall Landfill Operations 1,470 174,848 89,545 91,336Cogeneration 66,633 108,878 103,886 106,918Biosolids Operations 709,042 719,575 1,011,940 1,036,928
TOTAL 3,979,521 4,445,350 5,233,429 5,369,728
Capital Improvements ProgramCapital Improvements Program 27,686,273 9,050,000 16,339,000 14,555,000
TOTAL 27,686,273 9,050,000 16,339,000 14,555,000
TOTAL $ 62,977,542 $ 47,526,264 $ 56,578,004 $ 55,501,039
BUDGET BY CATEGORYPersonnel Expenses $ 10,629,151 $ 11,376,038 $ 12,186,543 $ 12,582,606Operating Expenses 14,767,738 11,005,013 11,962,051 12,171,304Interdepartmental Charges 1,647,520 1,562,676 1,677,236 1,710,781Capital 21,160,760 9,971,975 17,262,600 15,497,072Debt Service 11,136,205 11,095,300 10,824,899 10,819,550Non-Recurring Expenditures 1,242,367 0 43,935 0Other Financing Uses 2,393,801 2,515,263 2,620,740 2,719,727
TOTAL $ 62,977,542 $ 47,526,264 $ 56,578,004 $ 55,501,039
BUDGET BY FUNDGeneral $ 16,646 $ 16,979 $ 17,319 $ 17,665Transportation 155,916 162,655 168,832 172,832Water Utility 27,169,286 27,532,464 31,017,403 32,597,092Wastewater Utility 28,901,318 13,578,041 15,771,865 16,268,002Stormwater and Flood Management Utility 6,734,377 6,236,126 9,602,585 6,445,447
TOTAL $ 62,977,542 $ 47,526,264 $ 56,578,004 $ 55,501,039
AUTHORIZED FTE'sStandard FTE's 150.44 154.93 155.18 155.18Seasonal Temporary FTE's 6.50 6.50 6.50 6.50
TOTAL 156.94 161.43 161.68 161.68
2008-09 BUDGET PUBLIC WORKS DEPARTMENT
UTILITIES DIVISION
MISSION STATEMENT The Utilities Division’s mission is to provide quality water services, as desired by the community, in a manner which protects human and environmental health and emphasizes efficient management of fiscal and natural resources. Our services include:
Potable Water Treatment and Distribution Water Resources and Hydroelectric Management Wastewater Collection and Treatment Stormwater Collection and Conveyance Water Quality Protection and Enhancement Infrastructure Planning, Construction and Maintenance Administration and Emergency Planning/Response
BUSINESS PLAN NARRATIVE Each of the city’s three utilities (Water, Wastewater and Stormwater/Flood Management) is a separate enterprise fund established to finance and account for the acquisition, administration, operation and maintenance of each utility’s facilities and services. The utility funds receive a majority of their revenues from monthly user charges and utility system development fees. The implementation of the new water budget rate structure in January 2007 provides a bit of uncertainty as to water revenue projections for the next several years. It was anticipated that the new water budget rate structure overall would be revenue neutral for the water utility although some customers may pay more and some less. Revenue forecasts have been made with the best available information and staff will monitor and evaluate actual revenues on a monthly basis. Late in 2006, the city had contracted with Red Oak Consulting to conduct a review of the various financial reserves and reserve levels for each of the city’s three utilities. This included a survey of the reserve policies of ten other utilities in the Front Range and Southwestern United States. The findings of the study were presented to the Water Resources Advisory Board (WRAB) in January 2007. Based on the study findings, consultant’s recommendation and the WRAB’s input, staff is proposing to modify the reserve policies of each utility. It is recommended that each utility shows a 25% operating reserve (changed from a range of 20%-25%) and a separate capital reserve. The amount of the capital reserve is based on the minimum annual renewal and replacement costs for capital. Having both an operating and capital reserve will provide the utility with greater financial stability and flexibility should emergencies or revenue
shortfalls occur and will function indirectly as a rate stabilization fund. These changes to the reserves are reflected in both the Reserve Policies and in each utility fund financial. The fiscally constrained plan for the 2008 budget reflects the administration, operation and maintenance of each utility’s facilities and services that can be funded with an annual 2% increase in revenue, beginning in 2008. Since the 2008 Budget Guidelines provide for a 2% nonpersonnel expense (NPE) increase in General Fund activities, the Utilities’ Funds have also used this amount as its fiscally constrained base. Programs and projects which exceed this minimum funding level comprise the Utilities’ action plan. All of the Utilities’ services and programs meet or exceed the minimum acceptable service standard levels except for maintenance activities for the water distribution system. Prior to 2007, this activity operated at an acceptable standard level, but in reviewing the business plan for 2007, it was revised to below standard. Increases in the costs of materials and fuels in excess of historical nonpersonnel increases have impacted the service level in this area. This situation falls into the “fiscally constrained erosion” category and a reallocation of funds is being proposed for 2008 that would bring this program back to an acceptable service standard level. Energy costs for the water treatment facilities have also increased beyond historical nonpersonnel increases. Even though to date these increases have not negatively impacted the service levels in this area, funds have been diverted from other areas in water treatment to offset the energy costs. This is also an area where fiscal erosion has occurred and is identified in the action plan. In addition to reallocating dollars to address increased fuel costs in utility maintenance, Utilities is also recommending the following budget reallocations for 2008: reallocating nonpersonnel dollars to fund a 0.50 FTE communications support specialist for 2008 ($12,500), reallocating funds from Marshall Landfill Operations to offset some of the additional ongoing operating costs related to the recent Wastewater Treatment Plant Improvements ($150,000) and reallocating dollars from Rate Administration, Stormwater Quality Improvements, and the Capital Improvements Program to fund a one-time data collection effort on Boulder Creek for the Environmental Protection Agency ($55,000). GUIDING PRINCIPLES OR INVESTMENT STRATEGY
1.) Essential Services include those that ensure highly reliable treatment and delivery systems and those that meet federal and state regulatory criteria. These services and programs include treatment operations, maintenance of existing facilities, watershed protection of raw water quality, pretreatment program, financial management, utility billing operations, planning and analysis, raw water supply management and emergency response programs.
2.) Desirable Services include expansion of treatment and delivery systems. This
includes services and programs that are desired to respond to impacts of future growth, meet federal or state goals, or which support city goals. These services
and programs include conservation and public education programs, hydroelectric operations and household hazardous waste program.
3.) Discretionary Services include enhancement of treatment and delivery
systems. This includes services and programs that enhance the existing systems or to help others (but not required) perform their basic business service. These services and programs include the acquisition of new water supplies beyond that needed for build-out projections, treatment optimization programs and some facility maintenance projects.
OVERVIEW OF ACTION PLAN Please refer to Attachment B of the 2008-09 Budget Message for a listing of those Action Plan Items that were recommended for funding. The listing is presented in order by fund and department. Please see the section titled “City Council Direction on the Recommended Budget” for any changes from Attachment B. OVERVIEW OF VISION PLAN The vision plan for each utility reflects services, programs and projects which will complete and sustain the high quality water services, as desired by the community, in a manner which protects human and environmental health and emphasizes efficient management of fiscal and natural resources. This will require, in some cases, going beyond the minimum requirements established by federal and state regulatory agencies. For example, during the term of the Capital Improvement Program (2008-2013), the Northern Colorado Water Conservancy District Pipeline (Carter Lake to Boulder Reservoir) is a vision plan project which is not required, but which is desirable and would protect Boulder’s water supply from future contamination and pollution, thereby securing Boulder’s water supply for future generations. This project is anticipated to begin construction in 2009. At the July 31st Study Session, City Council expressed concerns about funding this project in 2008 and 2009 and asked for additional information about the project and the potential for federal funding before proceeding with and approving funding for this project. City Council did approve one million dollars in the 2008 Budget for activities related to environmental analysis, design, permitting and property acquisition, but has not approved or committed to construction funds. The Utilities Division will consolidate its multiple master plans and strategic plans consistent with the city’s Business Plan over the next several years. The Business Plan calls for a separate master plan for each of the Utilities Division three restricted funds. It is anticipated the current Wastewater Treatment Master Plan and Wastewater Collection System Master Plan will be merged as the Wastewater Utility Master Plan and work on this will begin in 2007. The Water Utility Master Plan and Stormwater and Flood Management Utility Master Plan will follow in future years.
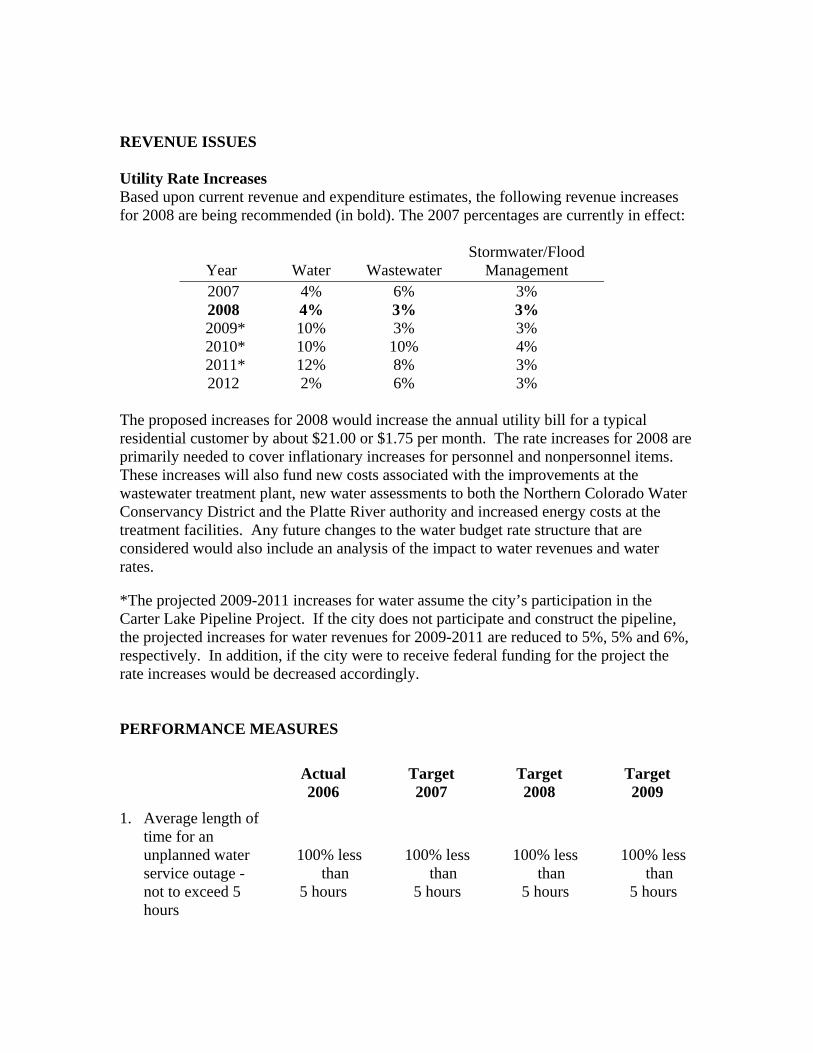
REVENUE ISSUES Utility Rate Increases Based upon current revenue and expenditure estimates, the following revenue increases for 2008 are being recommended (in bold). The 2007 percentages are currently in effect:
Year
Water
Wastewater
Stormwater/Flood Management
2007 4% 6% 3% 2008 4% 3% 3% 2009* 10% 3% 3% 2010* 10% 10% 4% 2011* 12% 8% 3% 2012 2% 6% 3%
The proposed increases for 2008 would increase the annual utility bill for a typical residential customer by about $21.00 or $1.75 per month. The rate increases for 2008 are primarily needed to cover inflationary increases for personnel and nonpersonnel items. These increases will also fund new costs associated with the improvements at the wastewater treatment plant, new water assessments to both the Northern Colorado Water Conservancy District and the Platte River authority and increased energy costs at the treatment facilities. Any future changes to the water budget rate structure that are considered would also include an analysis of the impact to water revenues and water rates. *The projected 2009-2011 increases for water assume the city’s participation in the Carter Lake Pipeline Project. If the city does not participate and construct the pipeline, the projected increases for water revenues for 2009-2011 are reduced to 5%, 5% and 6%, respectively. In addition, if the city were to receive federal funding for the project the rate increases would be decreased accordingly. PERFORMANCE MEASURES
Actual 2006
Target 2007
Target 2008
Target 2009
1. Average length of time for an unplanned water service outage - not to exceed 5 hours
100% less than
5 hours
100% less than
5 hours
100% less than
5 hours
100% less than
5 hours
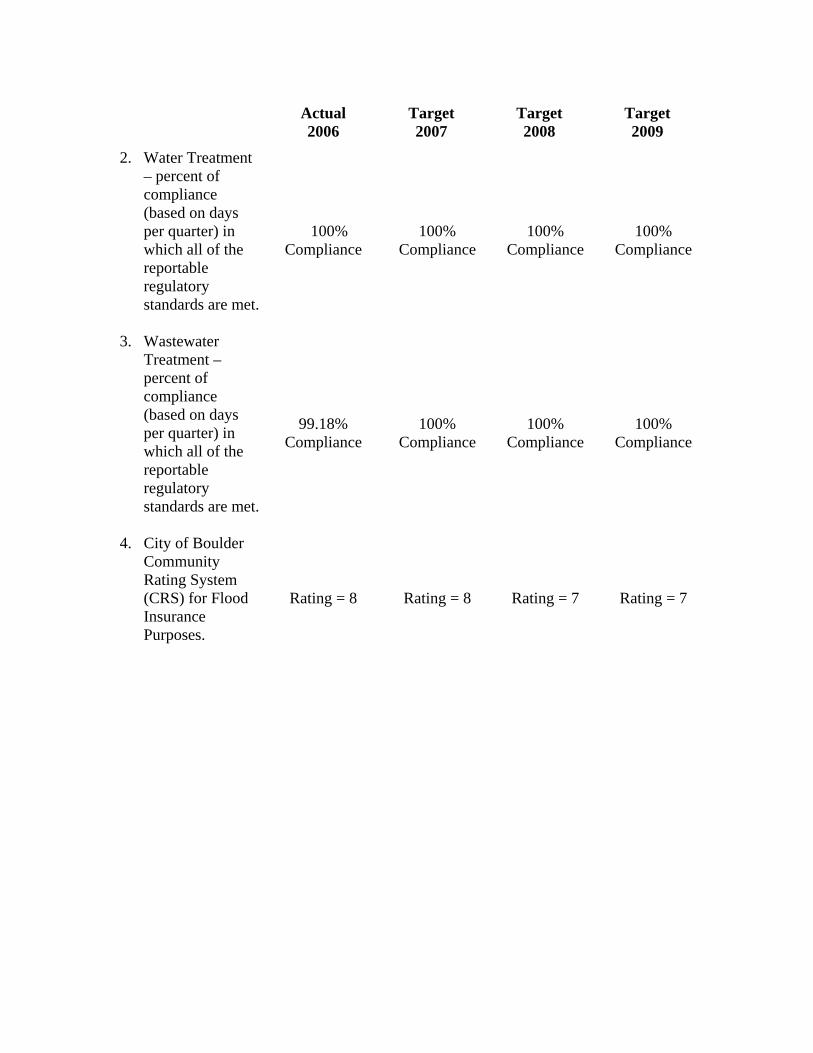
Actual 2006
Target 2007
Target 2008
Target 2009
2. Water Treatment – percent of compliance (based on days per quarter) in which all of the reportable regulatory standards are met.
100% Compliance
100% Compliance
100% Compliance
100% Compliance
3. Wastewater Treatment – percent of compliance (based on days per quarter) in which all of the reportable regulatory standards are met.
99.18% Compliance
100% Compliance
100% Compliance
100% Compliance
4. City of Boulder Community Rating System (CRS) for Flood Insurance Purposes.
Rating = 8 Rating = 8 Rating = 7 Rating = 7
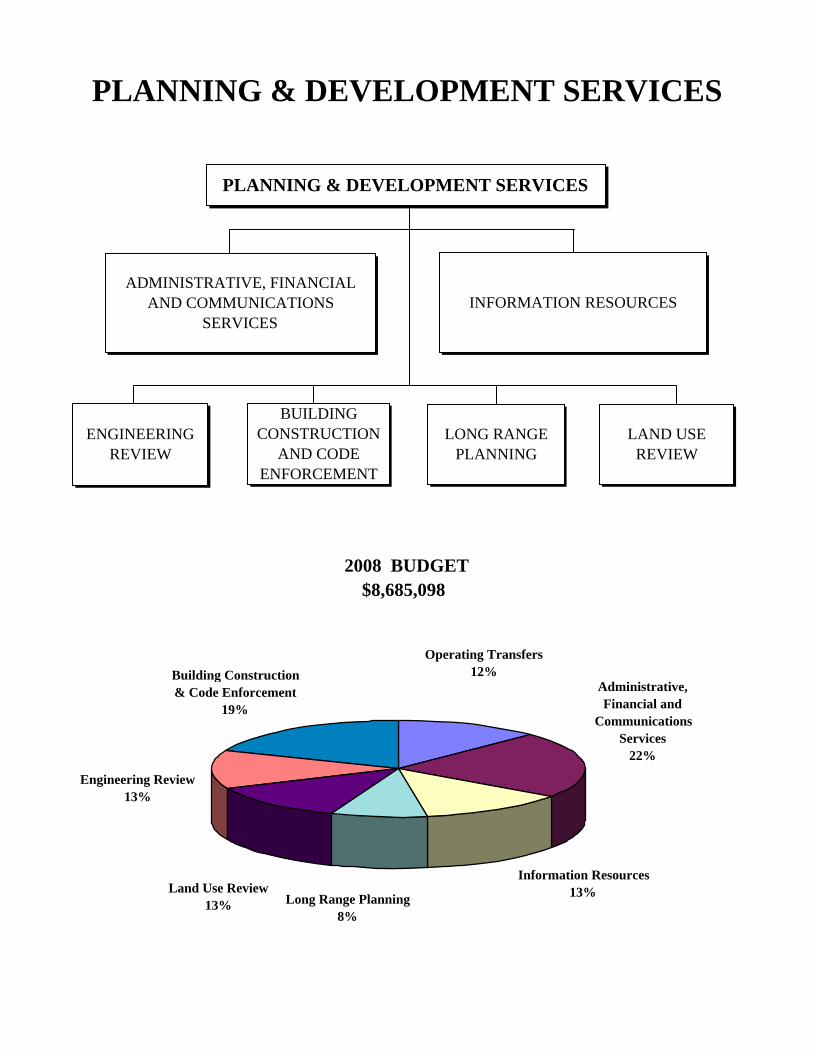
$8,685,0982008 BUDGET
PLANNING & DEVELOPMENT SERVICES
PLANNING & DEVELOPMENT SERVICES
ADMINISTRATIVE, FINANCIAL AND COMMUNICATIONS
SERVICESINFORMATION RESOURCES
LONG RANGE PLANNING
LAND USE REVIEW
ENGINEERINGREVIEW
BUILDING CONSTRUCTION
AND CODE ENFORCEMENT
Operating Transfers12%
Administrative, Financial and
Communications Services
22%
Engineering Review13%
Land Use Review13% Long Range Planning
8%
Information Resources13%
Building Construction & Code Enforcement
19%
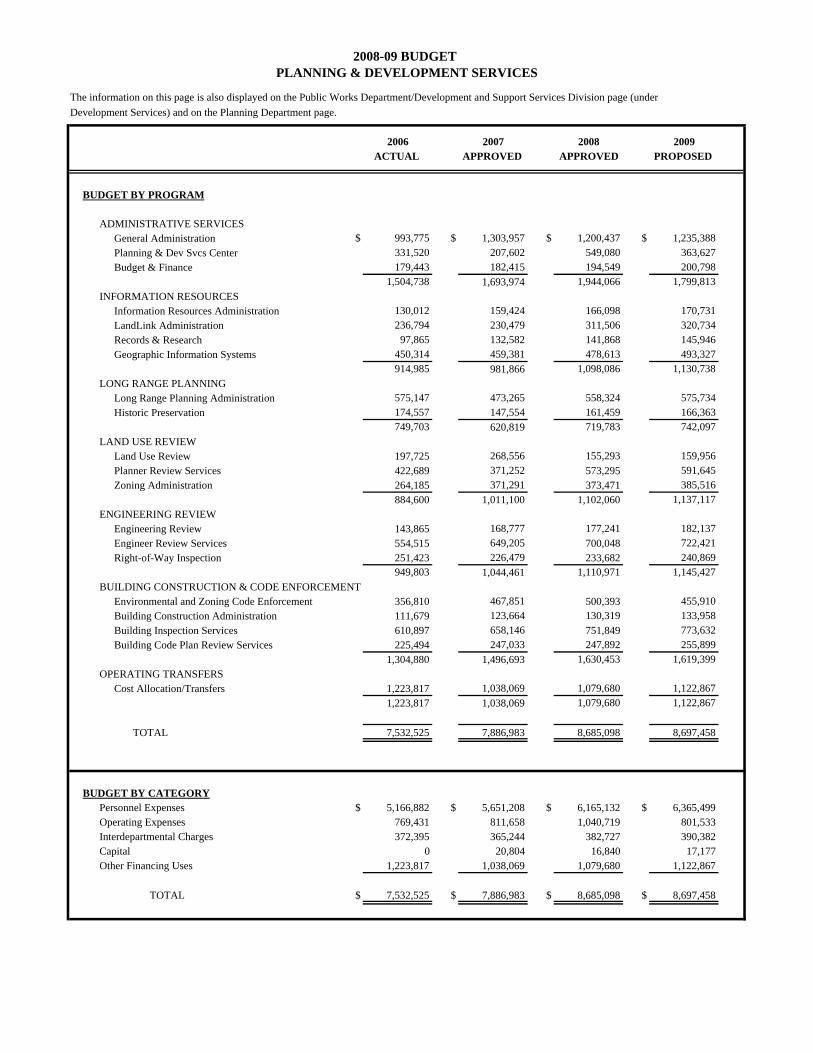
The information on this page is also displayed on the Public Works Department/Development and Support Services Division page (underDevelopment Services) and on the Planning Department page.
2006 2007 2008 2009ACTUAL APPROVED APPROVED PROPOSED
BUDGET BY PROGRAM
ADMINISTRATIVE SERVICESGeneral Administration $ 993,775 $ 1,303,957 $ 1,200,437 $ 1,235,388Planning & Dev Svcs Center 331,520 207,602 549,080 363,627Budget & Finance 179,443 182,415 194,549 200,798
1,504,738 1,693,974 1,944,066 1,799,813INFORMATION RESOURCES
Information Resources Administration 130,012 159,424 166,098 170,731LandLink Administration 236,794 230,479 311,506 320,734Records & Research 97,865 132,582 141,868 145,946Geographic Information Systems 450,314 459,381 478,613 493,327
914,985 981,866 1,098,086 1,130,738LONG RANGE PLANNING
Long Range Planning Administration 575,147 473,265 558,324 575,734Historic Preservation 174,557 147,554 161,459 166,363
749,703 620,819 719,783 742,097LAND USE REVIEW
Land Use Review 197,725 268,556 155,293 159,956Planner Review Services 422,689 371,252 573,295 591,645Zoning Administration 264,185 371,291 373,471 385,516
884,600 1,011,100 1,102,060 1,137,117ENGINEERING REVIEW
Engineering Review 143,865 168,777 177,241 182,137Engineer Review Services 554,515 649,205 700,048 722,421Right-of-Way Inspection 251,423 226,479 233,682 240,869
949,803 1,044,461 1,110,971 1,145,427BUILDING CONSTRUCTION & CODE ENFORCEMENT
Environmental and Zoning Code Enforcement 356,810 467,851 500,393 455,910Building Construction Administration 111,679 123,664 130,319 133,958Building Inspection Services 610,897 658,146 751,849 773,632Building Code Plan Review Services 225,494 247,033 247,892 255,899
1,304,880 1,496,693 1,630,453 1,619,399OPERATING TRANSFERS
Cost Allocation/Transfers 1,223,817 1,038,069 1,079,680 1,122,8671,223,817 1,038,069 1,079,680 1,122,867
TOTAL 7,532,525 7,886,983 8,685,098 8,697,458
BUDGET BY CATEGORYPersonnel Expenses $ 5,166,882 $ 5,651,208 $ 6,165,132 $ 6,365,499Operating Expenses 769,431 811,658 1,040,719 801,533Interdepartmental Charges 372,395 365,244 382,727 390,382Capital 0 20,804 16,840 17,177Other Financing Uses 1,223,817 1,038,069 1,079,680 1,122,867
TOTAL $ 7,532,525 $ 7,886,983 $ 8,685,098 $ 8,697,458
2008-09 BUDGET PLANNING & DEVELOPMENT SERVICES
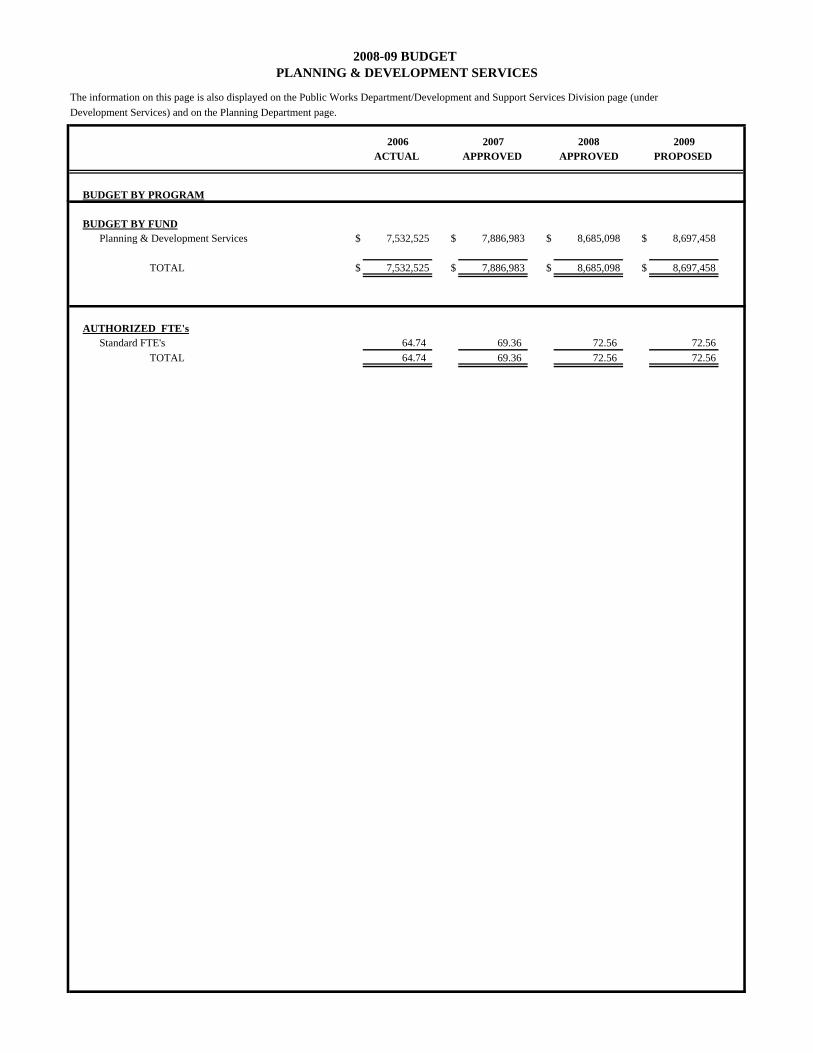
The information on this page is also displayed on the Public Works Department/Development and Support Services Division page (underDevelopment Services) and on the Planning Department page.
2006 2007 2008 2009ACTUAL APPROVED APPROVED PROPOSED
BUDGET BY PROGRAM
2008-09 BUDGET PLANNING & DEVELOPMENT SERVICES
BUDGET BY FUNDPlanning & Development Services $ 7,532,525 $ 7,886,983 $ 8,685,098 $ 8,697,458
TOTAL $ 7,532,525 $ 7,886,983 $ 8,685,098 $ 8,697,458
AUTHORIZED FTE'sStandard FTE's 64.74 69.36 72.56 72.56
TOTAL 64.74 69.36 72.56 72.56
2008-09 BUDGET PLANNING AND DEVELOPMENT SERVICES
MISSION STATEMENT Planning and Development Services (P&DS) strives to develop and implement the desired long-term future of the natural and built environment in the city of Boulder by: • Supporting a community vision and plan that preserves Boulder’s high quality of life, • Protecting the public health and safety, • Promoting economic, environmental, and social sustainability, and • Supporting others in carrying out their mission. BUSINESS PLAN NARRATIVE P&DS is funded from three primary sources: General Fund transfer, fees, and restricted fund transfers. The approximately $8.2 million annual operating budget is appropriated across seven different work functions and funds 49 services. Since 2003, P&DS has reduced its operating budget by $995,000 and has eliminated 9 standard and 7 temporary positions. The reductions have been in areas where resources provided were in excess of the current demand and in activities which may enhance the efficiency and effectiveness of P&DS but were not absolutely essential to its central mission. All but one of our discretionary services have been eliminated through budget reductions or reallocation. P&DS has been focused on minimizing impacts to services central to the mission, as well as improving the service standards where possible. Of the 49 services provided, 63% of our operating budget is spent on essential services. In 2007, P&DS focused on improving essential services identified as below standard in the Development Review, Building Permit, and Environmental and Zoning Enforcement areas. To improve these services, $149,500 was added and $120,500 was reallocated in the 2007 operating budget. Of the total, an on-going amount of $25,500 and $60,000 for a fixed-term FTE through 2008 was funded by the General Fund. The remaining $185,500 was funded by revenue. The emphasis of the 2008 Fiscally Constrained Plan has been on the reallocation of resources to improve service standards in essential areas. For example, in order to address the below service level standard in the Development Review area, non-personnel dollars are recommended to be shifted to personnel dollars in order to add a fixed-term position to manage development review cases.
GUIDING PRINCIPLES OR INVESTMENT STRATEGY
Essential Services The essential services category is described as programs, services or facilities essential to ensuring the health and safety of the people and property in the community and municipal corporation, as well as programs or expenses that are legally mandated by federal or state law or City Charter.
Essential services provided by P&DS include health and safety related code compliance such as the review and inspections associated with building, floodplain, right of way and utility permits and the land use and engineering review associated with annexations, rezoning and subdivisions. City Charter mandated services include the coordination of the comprehensive plan, capital improvement program, and department master plans.
Desirable Services The desirable services category is described as programs that further community goals by protecting cultural and natural resources and by enhancing the quality of the built environment. Desirable services provided by P&DS include area planning, discretionary review processes, code amendments, and other programs such as historic preservation. Area planning enhances the built environment by bridging the gap between the broad policies of the comprehensive plan and site-specific project review. Discretionary review includes land use review processes that define community standards for development while allowing flexibility in project design which is an example of how the community can enhance the quality of the built environment. Code amendments include changes to the land use regulations to implement Council policy direction, special projects, area plans, and other refinements to update the regulations as needed. The historic preservation program is an example of protecting the cultural resources in the community. The wetland permitting program and environmental planning are examples of activities that protect natural resources. In addition, environmental and zoning enforcement and the rental licensing program enhance the quality of life. Discretionary Services The discretionary services category is described as programs and services that further enhance Boulder’s quality of life or that provide a special convenience to the customer.
The only discretionary service provided by P&DS is the residential permit allocation system as it serves to enhance Boulder’s quality of life. All other discretionary services have been eliminated through either budget reductions or reallocations.
OVERVIEW OF ACTION PLAN The P&DS Action Plan represents the next step to achieve the service level or restoration that should occur when funding is available within current revenue sources or new approved sources. The 2008 P&DS Action Plan identifies additional resources necessary to improve the service level for essential and desirable services that are currently below the service standard. The Action Plan includes expenses associated with improving or restoring service levels for the following services: building permit and inspection services, development review, comprehensive planning, historic preservation, environmental planning, mapping data maintenance, floodplain permits, right-of-way permit review and inspection, equipment replacement and Service Center. The total P&DS Action Plan for all services is estimated at $1,122,000 ($922,000 annually and $200,000 one-time) and represents an additional 10.5 FTE. Of the total, $444,750 including 3.75 FTE is necessary to improve the service level for General Fund services and $477,250 including 6.75 FTE and $200,000 one-time is necessary to improve the service level for Revenue services. Each resource identified as necessary to improve the service level has been prioritized based on a critical need due to increased activity level. For 2008-2009, in the General Fund, P&DS recommends a total resource increase of approximately $205,000 in on-going funding including a 1.0 FTE to address service level deficiencies and to implement City Council initiated projects that further community sustainability goals. Of the $205,000, $75,000 represents our 1% highest priority that focuses on improving service levels as described below and the remaining $130,000 is to restore consulting services to support Council initiated projects such as the Pops and Scrapes/FAR project. In the Revenue area, P&DS recommends a total resource increase of $404,000 ($204,000 on-going and $200,000 one-time) including 3.0 FTE to address service level deficiencies as described below. Please refer to Attachment B of the 2008-09 Budget Message for a listing of those Action Plan Items that were recommended for funding. The listing is presented in order by fund and department. Please see the section titled “City Council Direction on the Recommended Budget” for any changes from Attachment B. OVERVIEW OF VISION PLAN The vision for Planning and Development Services is to provide a full range of planning and development services from proactive long range planning to code enforcement in order to protect and enhance Boulder’s quality of life, built environment, environmental quality, and health and safety including:
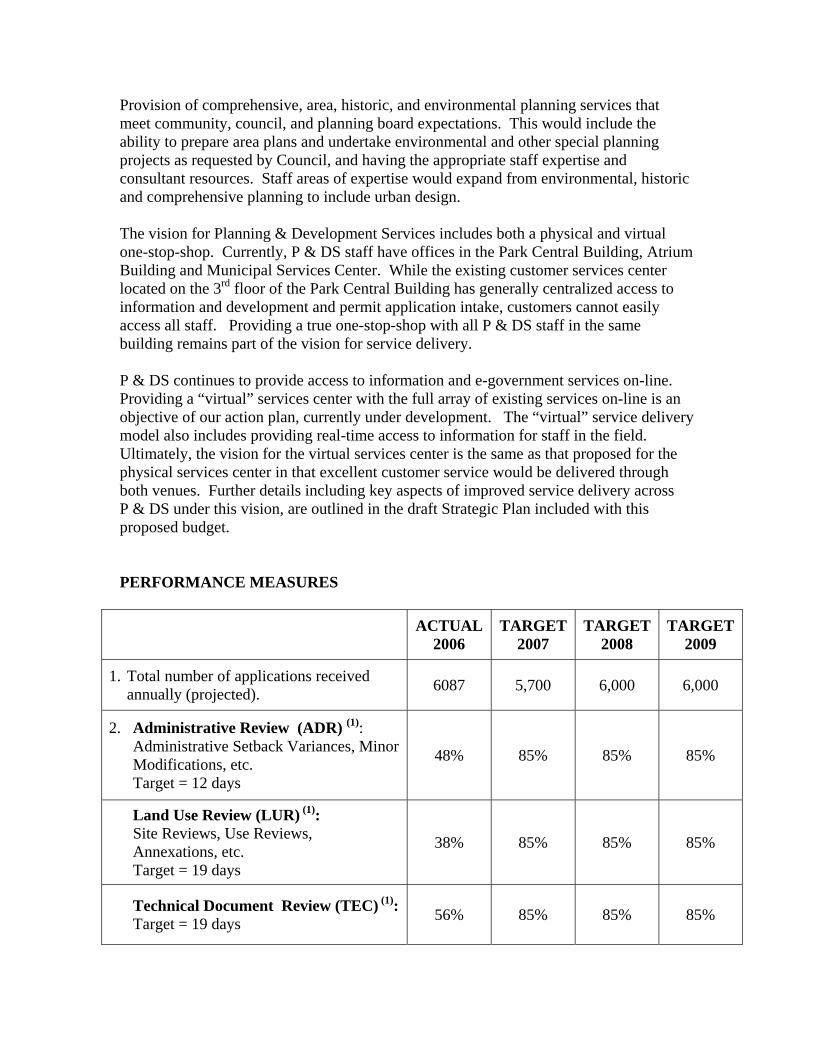
Provision of comprehensive, area, historic, and environmental planning services that meet community, council, and planning board expectations. This would include the ability to prepare area plans and undertake environmental and other special planning projects as requested by Council, and having the appropriate staff expertise and consultant resources. Staff areas of expertise would expand from environmental, historic and comprehensive planning to include urban design. The vision for Planning & Development Services includes both a physical and virtual one-stop-shop. Currently, P & DS staff have offices in the Park Central Building, Atrium Building and Municipal Services Center. While the existing customer services center located on the 3rd floor of the Park Central Building has generally centralized access to information and development and permit application intake, customers cannot easily access all staff. Providing a true one-stop-shop with all P & DS staff in the same building remains part of the vision for service delivery. P & DS continues to provide access to information and e-government services on-line. Providing a “virtual” services center with the full array of existing services on-line is an objective of our action plan, currently under development. The “virtual” service delivery model also includes providing real-time access to information for staff in the field. Ultimately, the vision for the virtual services center is the same as that proposed for the physical services center in that excellent customer service would be delivered through both venues. Further details including key aspects of improved service delivery across P & DS under this vision, are outlined in the draft Strategic Plan included with this proposed budget. PERFORMANCE MEASURES
ACTUAL2006
TARGET2007
TARGET 2008
TARGET2009
1. Total number of applications received annually (projected). 6087 5,700 6,000 6,000
2. Administrative Review (ADR) (1): Administrative Setback Variances, Minor
Modifications, etc. Target = 12 days
48% 85% 85% 85%
Land Use Review (LUR) (1): Site Reviews, Use Reviews,
Annexations, etc. Target = 19 days
38% 85% 85% 85%
Technical Document Review (TEC) (1): Target = 19 days 56% 85% 85% 85%
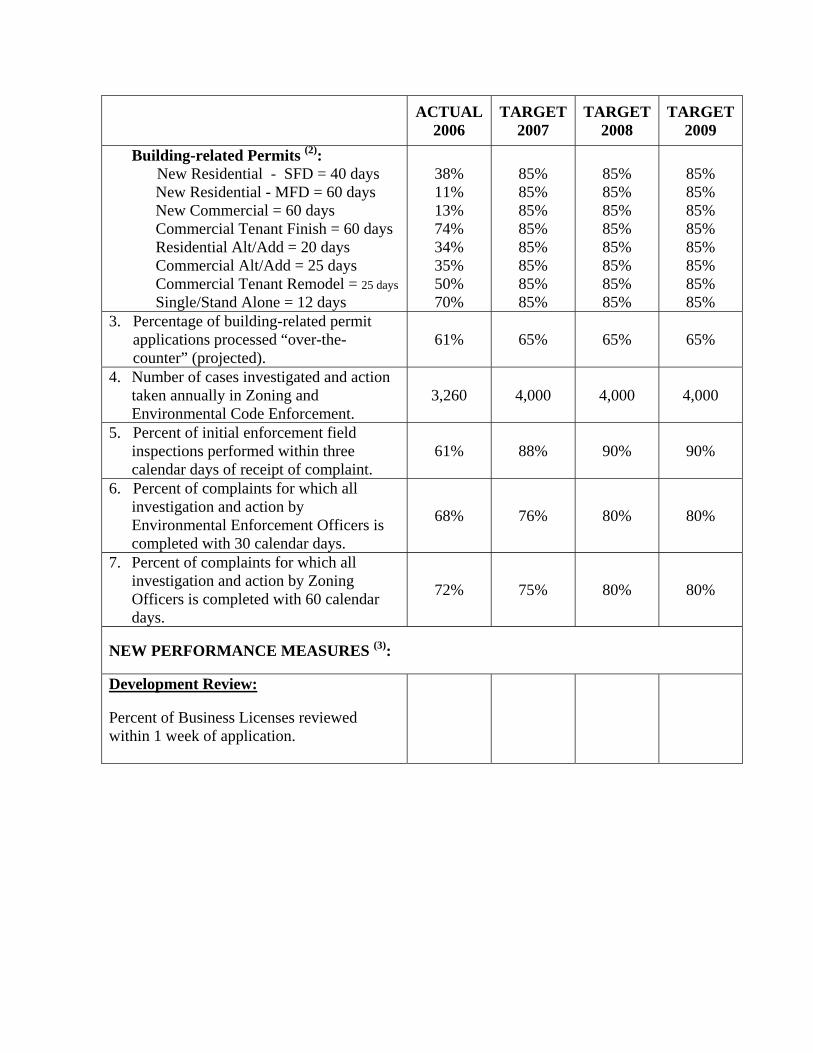
ACTUAL2006
TARGET2007
TARGET 2008
TARGET2009
Building-related Permits (2): New Residential - SFD = 40 days
New Residential - MFD = 60 days New Commercial = 60 days Commercial Tenant Finish = 60 days Residential Alt/Add = 20 days Commercial Alt/Add = 25 days Commercial Tenant Remodel = 25 days Single/Stand Alone = 12 days
38% 11% 13% 74% 34% 35% 50% 70%
85% 85% 85% 85% 85% 85% 85% 85%
85% 85% 85% 85% 85% 85% 85% 85%
85% 85% 85% 85% 85% 85% 85% 85%
3. Percentage of building-related permit applications processed “over-the-counter” (projected).
61% 65% 65% 65%
4. Number of cases investigated and action taken annually in Zoning and Environmental Code Enforcement.
3,260 4,000 4,000 4,000
5. Percent of initial enforcement field inspections performed within three calendar days of receipt of complaint.
61% 88% 90% 90%
6. Percent of complaints for which all investigation and action by Environmental Enforcement Officers is completed with 30 calendar days.
68% 76% 80% 80%
7. Percent of complaints for which all investigation and action by Zoning Officers is completed with 60 calendar days.
72% 75% 80% 80%
NEW PERFORMANCE MEASURES (3):
Development Review: Percent of Business Licenses reviewed within 1 week of application.
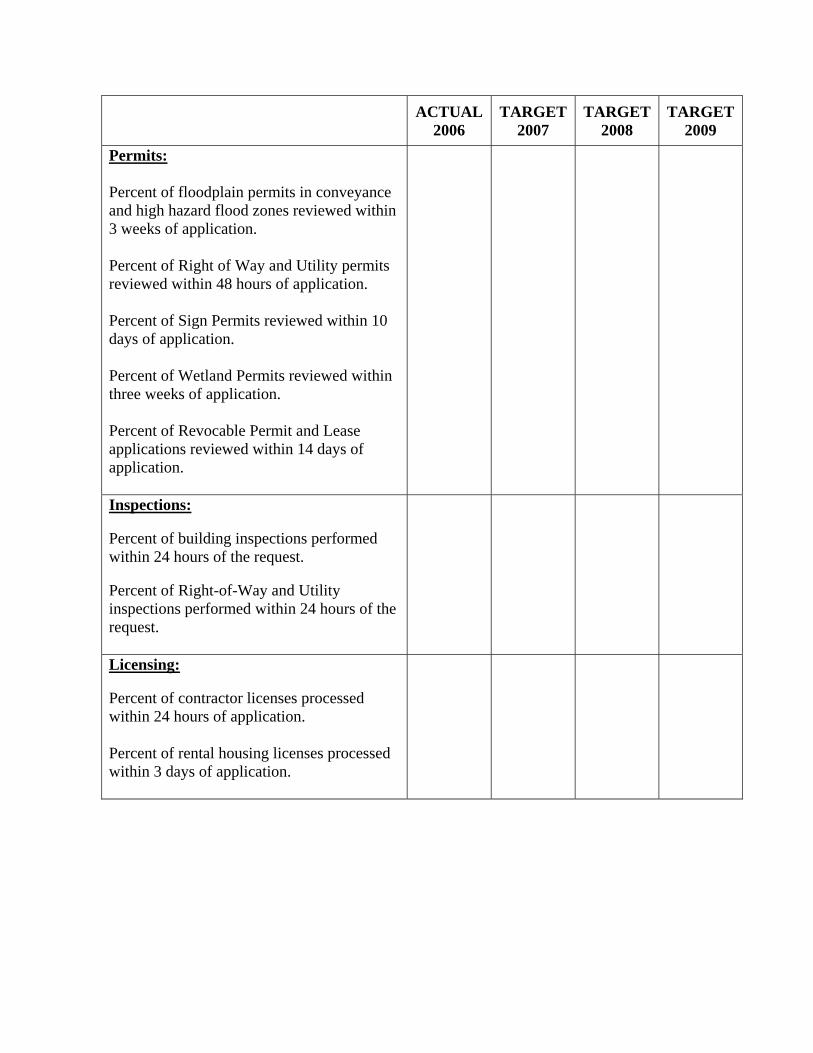
ACTUAL2006
TARGET2007
TARGET 2008
TARGET2009
Permits: Percent of floodplain permits in conveyance and high hazard flood zones reviewed within 3 weeks of application. Percent of Right of Way and Utility permits reviewed within 48 hours of application. Percent of Sign Permits reviewed within 10 days of application.
Percent of Wetland Permits reviewed within three weeks of application. Percent of Revocable Permit and Lease applications reviewed within 14 days of application.
Inspections: Percent of building inspections performed within 24 hours of the request. Percent of Right-of-Way and Utility inspections performed within 24 hours of the request.
Licensing: Percent of contractor licenses processed within 24 hours of application. Percent of rental housing licenses processed within 3 days of application.
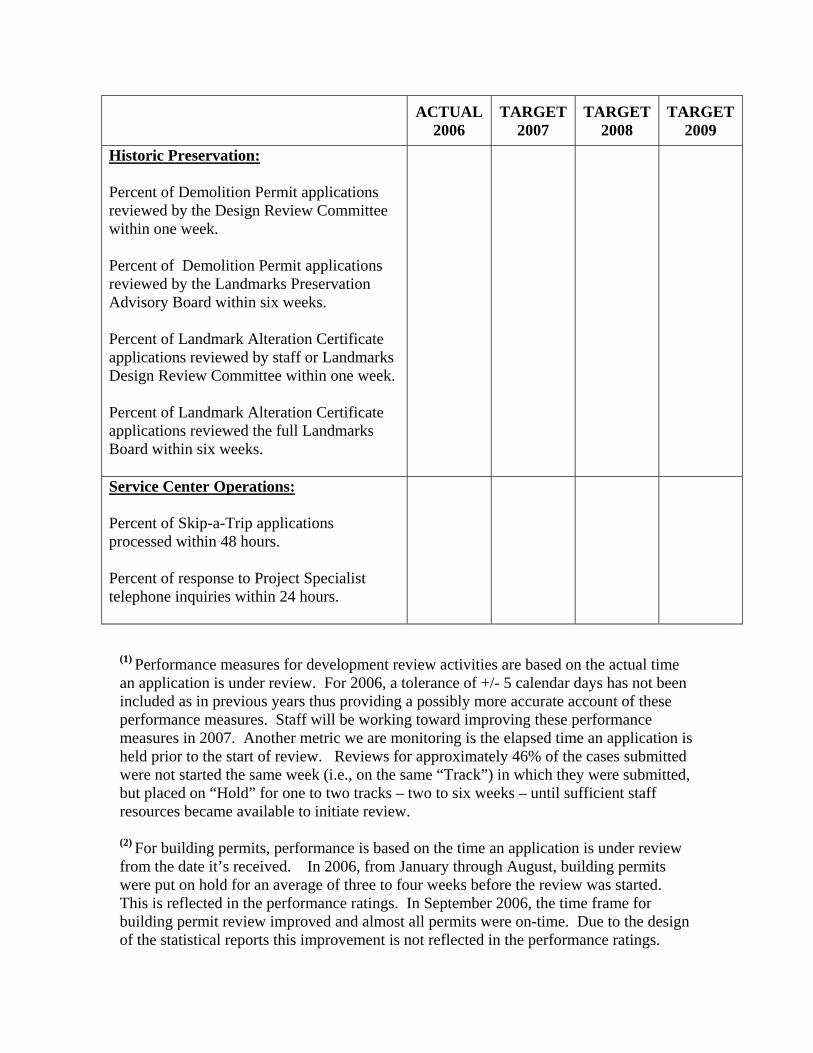
ACTUAL2006
TARGET2007
TARGET 2008
TARGET2009
Historic Preservation: Percent of Demolition Permit applications reviewed by the Design Review Committee within one week. Percent of Demolition Permit applications reviewed by the Landmarks Preservation Advisory Board within six weeks. Percent of Landmark Alteration Certificate applications reviewed by staff or Landmarks Design Review Committee within one week. Percent of Landmark Alteration Certificate applications reviewed the full Landmarks Board within six weeks.
Service Center Operations: Percent of Skip-a-Trip applications processed within 48 hours. Percent of response to Project Specialist telephone inquiries within 24 hours.
(1) Performance measures for development review activities are based on the actual time an application is under review. For 2006, a tolerance of +/- 5 calendar days has not been included as in previous years thus providing a possibly more accurate account of these performance measures. Staff will be working toward improving these performance measures in 2007. Another metric we are monitoring is the elapsed time an application is held prior to the start of review. Reviews for approximately 46% of the cases submitted were not started the same week (i.e., on the same “Track”) in which they were submitted, but placed on “Hold” for one to two tracks – two to six weeks – until sufficient staff resources became available to initiate review. (2) For building permits, performance is based on the time an application is under review from the date it’s received. In 2006, from January through August, building permits were put on hold for an average of three to four weeks before the review was started. This is reflected in the performance ratings. In September 2006, the time frame for building permit review improved and almost all permits were on-time. Due to the design of the statistical reports this improvement is not reflected in the performance ratings.

(3) As part of the Draft P&DS Strategic Plan, sixteen new performance measures have been added. The 2008 and 2009 target information for these performance measures will be included following the compilation of data from peer city surveys anticipated to be completed by the end of 2007.
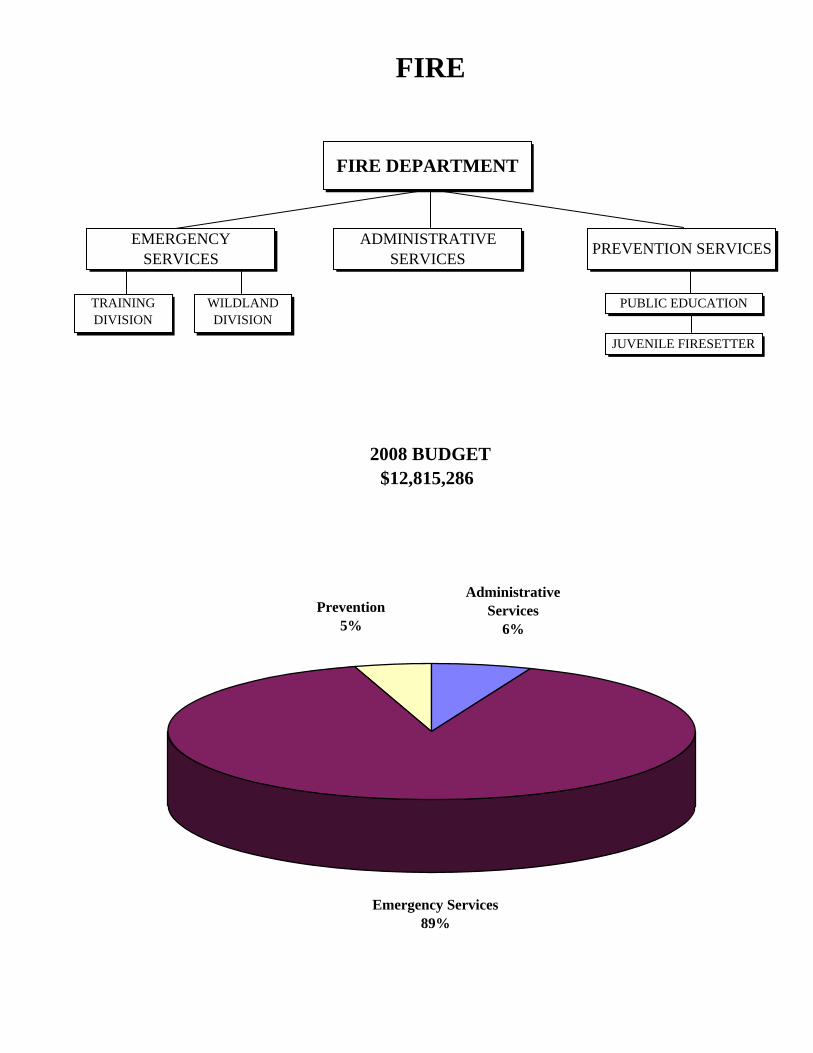
FIRE
2008 BUDGET$12,815,286
FIRE DEPARTMENT
ADMINISTRATIVE SERVICES
TRAININGDIVISION
PUBLIC EDUCATION
Prevention5%
Administrative Services
6%
Emergency Services89%
EMERGENCYSERVICES PREVENTION SERVICES
WILDLANDDIVISION
JUVENILE FIRESETTER
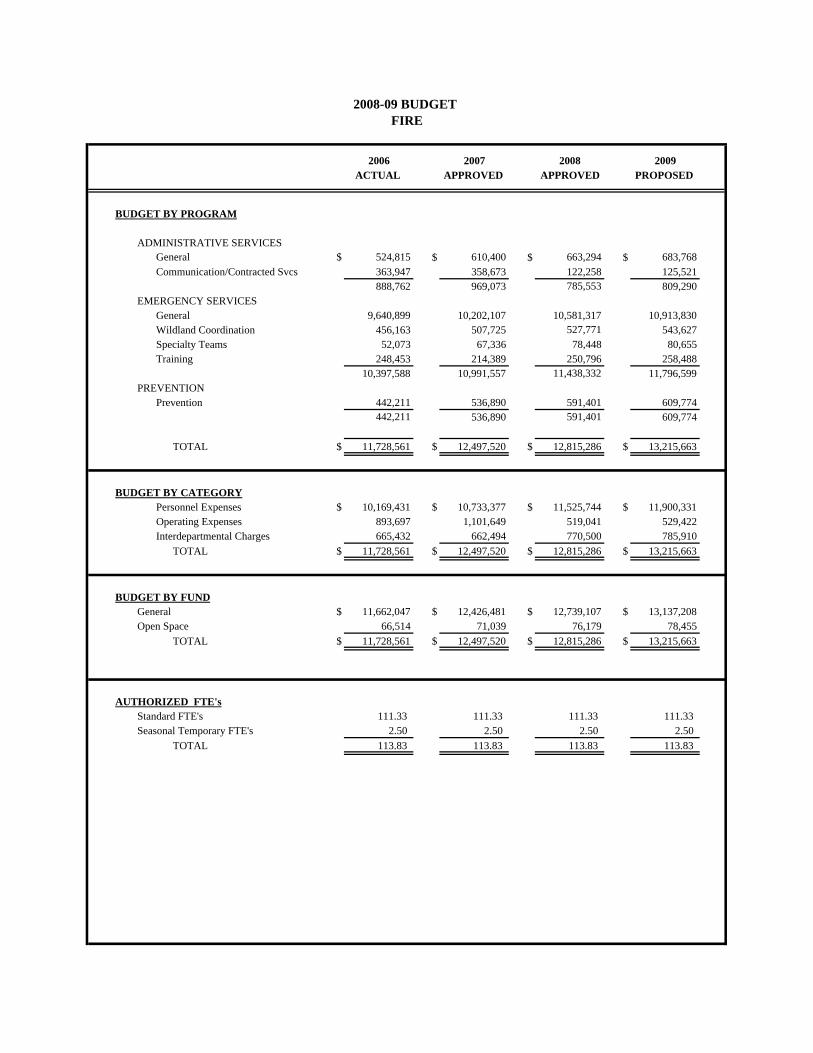
2006 2007 2008 2009ACTUAL APPROVED APPROVED PROPOSED
BUDGET BY PROGRAM
ADMINISTRATIVE SERVICESGeneral $ 524,815 $ 610,400 $ 663,294 $ 683,768Communication/Contracted Svcs 363,947 358,673 122,258 125,521
888,762 969,073 785,553 809,290EMERGENCY SERVICES
General 9,640,899 10,202,107 10,581,317 10,913,830Wildland Coordination 456,163 507,725 527,771 543,627Specialty Teams 52,073 67,336 78,448 80,655Training 248,453 214,389 250,796 258,488
10,397,588 10,991,557 11,438,332 11,796,599PREVENTION
Prevention 442,211 536,890 591,401 609,774442,211 536,890 591,401 609,774
TOTAL $ 11,728,561 $ 12,497,520 $ 12,815,286 $ 13,215,663
BUDGET BY CATEGORYPersonnel Expenses $ 10,169,431 $ 10,733,377 $ 11,525,744 $ 11,900,331Operating Expenses 893,697 1,101,649 519,041 529,422Interdepartmental Charges 665,432 662,494 770,500 785,910
TOTAL $ 11,728,561 $ 12,497,520 $ 12,815,286 $ 13,215,663
BUDGET BY FUNDGeneral $ 11,662,047 $ 12,426,481 $ 12,739,107 $ 13,137,208Open Space 66,514 71,039 76,179 78,455
TOTAL $ 11,728,561 $ 12,497,520 $ 12,815,286 $ 13,215,663
AUTHORIZED FTE'sStandard FTE's 111.33 111.33 111.33 111.33Seasonal Temporary FTE's 2.50 2.50 2.50 2.50
TOTAL 113.83 113.83 113.83 113.83
2008-09 BUDGET FIRE
2008-09 BUDGET FIRE DEPARTMENT
MISSION STATEMENT The Boulder Fire Department strives to make Boulder a safe place to live, work and play. We reduce the human suffering caused by fires, accidents, sudden illness, hazardous material releases, or other disasters. BUSINESS PLAN NARRATIVE The Fire Department Business Plan supports the goals, objectives and service standards outlined in the Boulder Valley Comprehensive Plan (BVCP). It identifies areas where the Fire Department does not currently meet goals outlined in the BVCP. It also addresses the needs of the Boulder Fire Department in order to met national standards and recognized fire industry good practices. The overall goals outlined in the BVCP call for well trained, well equipped fire fighters strategically located throughout the City who can arrive at emergencies within six minutes. Actual and anticipated growth and redevelopment coupled with the City economic environment have impacted the Fire Department’s ability to meet the BVCP goals. Higher density and more congestion increase calls for service and increased traffic slows emergency response. Relocation of fire stations built decades ago will be necessary. The addition of more fire trucks in existing fire stations and more fire fighters on those fire engines will help meet the BVCP goals and move the Fire Department towards compliance with national standards resulting in a higher level of safety for the community and the fire fighters. Budget constraints over the past five years have caused the Fire Department to reduce or postpone support activities like outside training and equipment replacement in order to redirect those funds to maintain emergency response services at a consistent level in the community. The Fire Department Master Plan will be finished in early 2008. This Business Plan is consistent with the draft master plan. It will provide the basis for the Action and Vision Plan for this crucial city service.
GUIDING PRINCIPLES OR INVESTMENT STRATEGY
1.) Essential Services include those that directly provide for the health and safety of the people and property in the community. These services are not provided by another entity. These include response to emergencies within and around the City, and the support activities necessary to safely and efficiently mitigate those emergencies. Examples include; fire and emergency medical response, automobile, technical and water rescues, fire fighter training and fire safety inspections to comply with City and State regulations and ordinances. Replacement of aging fire vehicles is essential.
2.) Desirable Services include those that enhance essential services or improve
quality of life in the Boulder community. Examples include wildland fire mitigation and public safety education designed to reduce the demand for emergency responses.
3.) Discretionary Services include those that serve limited special interest.
Examples are funding of a regular fire apparatus replacement program and our smoke detector give away program funded through donations.
OVERVIEW OF ACTION PLAN Please refer to Attachment B of the 2008-09 Budget Message for a listing of those Action Plan Items that were recommended for funding. The listing is presented in order by fund and department. Please see the section titled “City Council Direction on the Recommended Budget” for any changes from Attachment B. OVERVIEW OF VISION PLAN The Vision Plan allows the Boulder Fire Department meet accepted national standards for fire fighting and hazardous materials response. Meeting national standards greatly improves firefighter safety and has the potential to reduce fire insurance rates in Boulder. The Vision Plan continues replacement of outdated facilities and increases the capability of the seasonal wildland mitigation efforts improving community safety in the wildland interface area of the City.
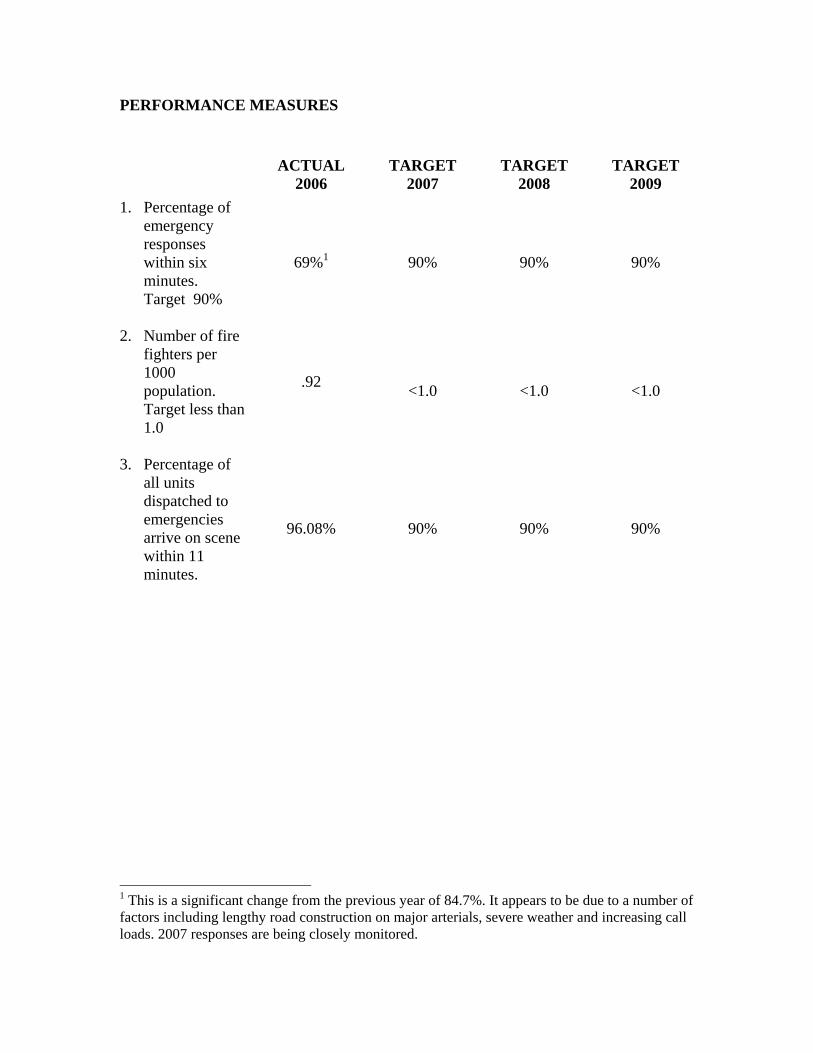
PERFORMANCE MEASURES ACTUAL
2006 TARGET
2007 TARGET
2008 TARGET
2009 1. Percentage of
emergency responses within six minutes.
Target 90%
69%1 90% 90% 90%
2. Number of fire fighters per 1000 population. Target less than 1.0
.92 <1.0 <1.0 <1.0
3. Percentage of all units dispatched to emergencies arrive on scene within 11 minutes.
96.08% 90% 90% 90%
1 This is a significant change from the previous year of 84.7%. It appears to be due to a number of factors including lengthy road construction on major arterials, severe weather and increasing call loads. 2007 responses are being closely monitored.
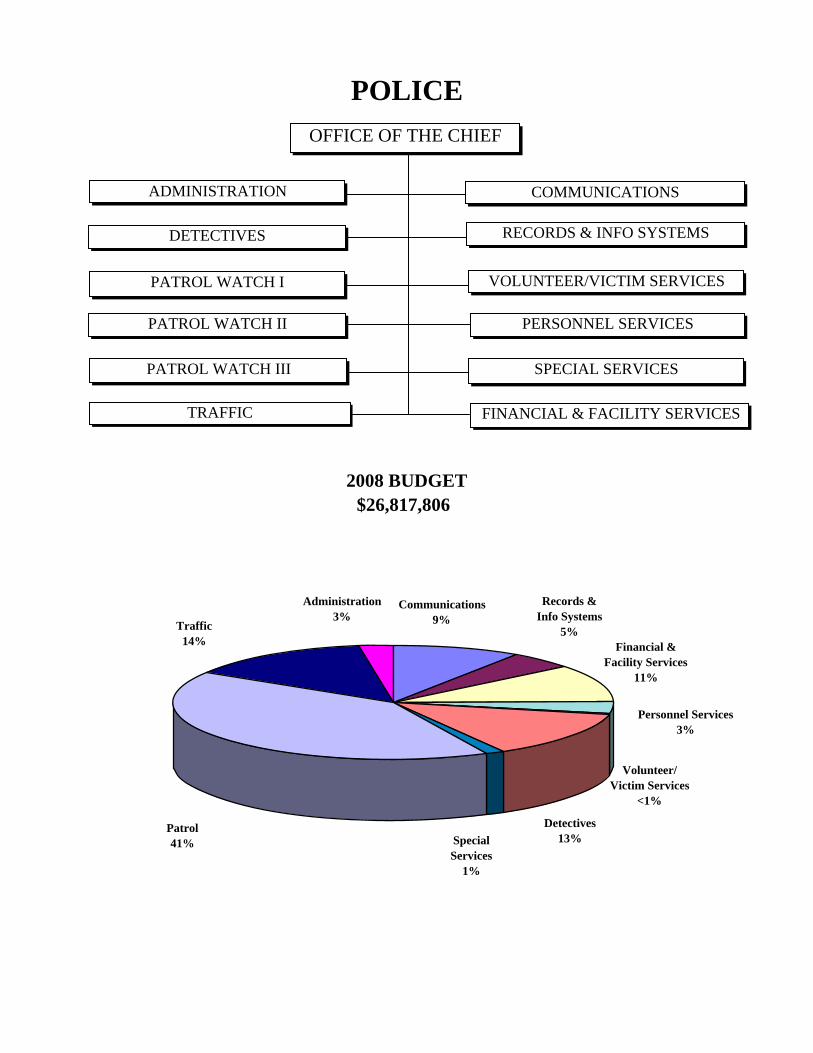
POLICE
$26,817,8062008 BUDGET
OFFICE OF THE CHIEF
ADMINISTRATION
PATROL WATCH I
COMMUNICATIONS
PATROL WATCH II PERSONNEL SERVICES
TRAFFIC
PATROL WATCH III SPECIAL SERVICES
RECORDS & INFO SYSTEMSDETECTIVES
FINANCIAL & FACILITY SERVICES
VOLUNTEER/VICTIM SERVICES
Patrol 41% Special
Services1%
Detectives13%
Volunteer/Victim Services
<1%
Administration3%
Communications9%
Records &Info Systems
5%
Personnel Services3%
Financial &Facility Services
11%
Traffic14%
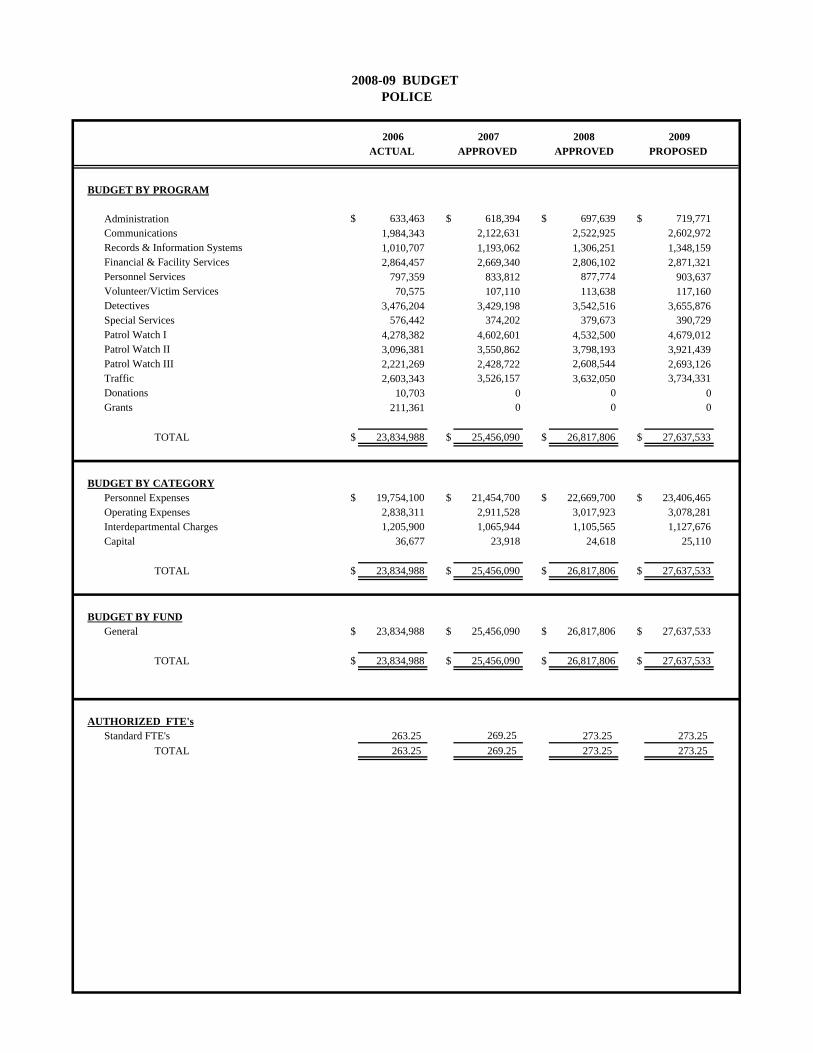
2006 2007 2008 2009ACTUAL APPROVED APPROVED PROPOSED
BUDGET BY PROGRAM
Administration $ 633,463 $ 618,394 $ 697,639 $ 719,771Communications 1,984,343 2,122,631 2,522,925 2,602,972Records & Information Systems 1,010,707 1,193,062 1,306,251 1,348,159Financial & Facility Services 2,864,457 2,669,340 2,806,102 2,871,321Personnel Services 797,359 833,812 877,774 903,637Volunteer/Victim Services 70,575 107,110 113,638 117,160Detectives 3,476,204 3,429,198 3,542,516 3,655,876Special Services 576,442 374,202 379,673 390,729Patrol Watch I 4,278,382 4,602,601 4,532,500 4,679,012Patrol Watch II 3,096,381 3,550,862 3,798,193 3,921,439Patrol Watch III 2,221,269 2,428,722 2,608,544 2,693,126Traffic 2,603,343 3,526,157 3,632,050 3,734,331Donations 10,703 0 0 0Grants 211,361 0 0 0
TOTAL $ 23,834,988 $ 25,456,090 $ 26,817,806 $ 27,637,533
BUDGET BY CATEGORYPersonnel Expenses $ 19,754,100 $ 21,454,700 $ 22,669,700 $ 23,406,465Operating Expenses 2,838,311 2,911,528 3,017,923 3,078,281Interdepartmental Charges 1,205,900 1,065,944 1,105,565 1,127,676Capital 36,677 23,918 24,618 25,110
TOTAL $ 23,834,988 $ 25,456,090 $ 26,817,806 $ 27,637,533
BUDGET BY FUNDGeneral $ 23,834,988 $ 25,456,090 $ 26,817,806 $ 27,637,533
TOTAL $ 23,834,988 $ 25,456,090 $ 26,817,806 $ 27,637,533
AUTHORIZED FTE'sStandard FTE's 263.25 269.25 273.25 273.25
TOTAL 263.25 269.25 273.25 273.25
2008-09 BUDGET POLICE
2008-09 BUDGET POLICE DEPARTMENT
MISSION STATEMENT The mission statement of the Boulder Police Department is very simple: Working with the community to provide service and safety. BUSINESS PLAN NARRATIVE From 2001 to 2005 the department experienced a 7.5% budget reduction for a cumulative total of $1,643,718.00. In the midst of these cuts, the Police Department has been committed to absorbing these reductions without compromising the efficiency of core public safety services to the citizens of Boulder. The Department has been successful at protecting the quality of core services, but the reductions inevitably had to impact some services and efficiencies. We have taken across the board reductions from non-personnel accounts in an attempt to meet unfunded liabilities. We have reduced our staffing by 19.25 FTE’s. We have also taken steps to increase efficiencies by streamlining our arrest and report writing procedures, and reducing our paperwork for officers. We have also made one time adjustments to our vehicle replacement fund. The loss of an annex reduced the Department’s efforts to develop partnerships within the community which were beneficial in utilizing both the resources of the Department and the community to maintain a safe environment. It is a loss of decentralization of police services and loss of improved access/convenience for residents which would have provided a neighborhood approach to service delivery. Another service affected by budget cuts was the reduction of services in the Records Section. The Police Records Specialists provide direct service to the community at the front desk as well as to department staff. They maintain police records, and are responsible for data entry of reports in the Police Information Network (PIN). These services are still available, but operating hours had to be reduced by eliminating the graveyard shift and closing the section on week-ends. This impacts citizens as well as officers and detectives who need to access information. The Detectives Division was also affected when reduced staffing forced them to decrease the types of cases for follow-up. Detectives are unable to follow-up on forgeries or check frauds under $1,500. These are now referred to the District Attorney for alternative disposition. The functions performed by a reduced Police Sergeant position, namely responsibility for Special Events and Emergency Preparedness, were assigned to a Patrol Division Commander in addition to regular duties. The canine unit, consisting of two officers and two dogs, was disbanded completely and the funding reallocated to fund core services. The canine unit was a great asset in
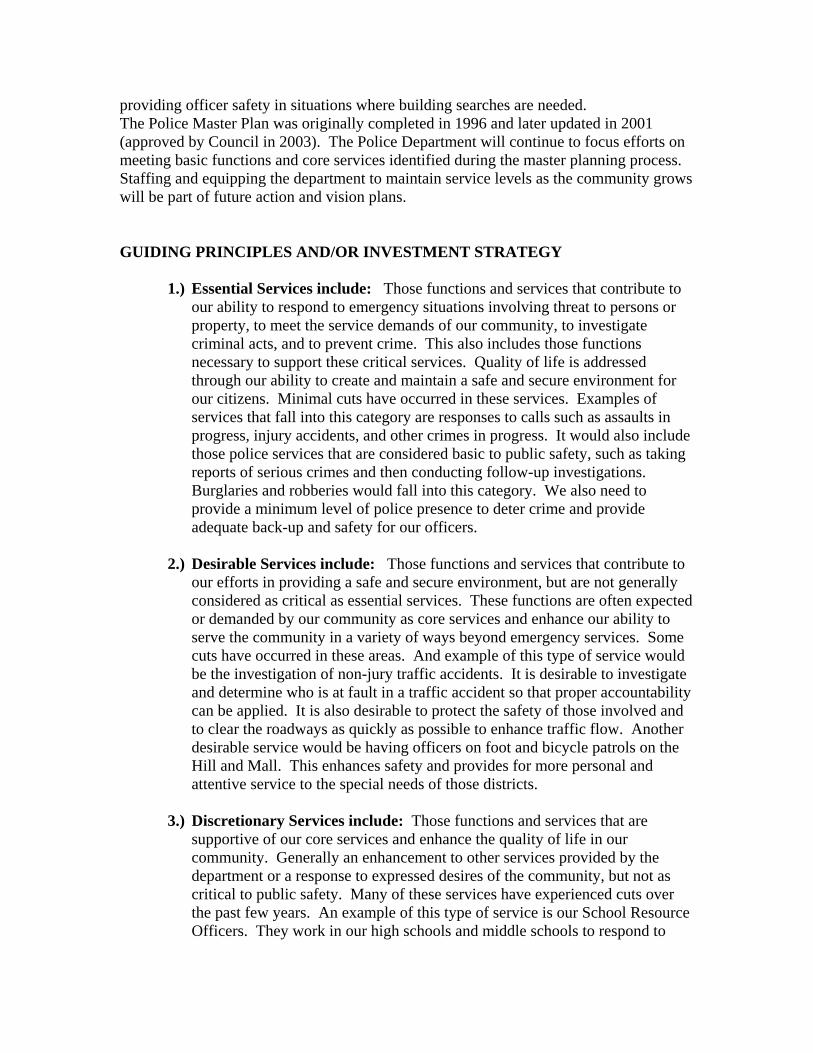
providing officer safety in situations where building searches are needed. The Police Master Plan was originally completed in 1996 and later updated in 2001 (approved by Council in 2003). The Police Department will continue to focus efforts on meeting basic functions and core services identified during the master planning process. Staffing and equipping the department to maintain service levels as the community grows will be part of future action and vision plans. GUIDING PRINCIPLES AND/OR INVESTMENT STRATEGY
1.) Essential Services include: Those functions and services that contribute to our ability to respond to emergency situations involving threat to persons or property, to meet the service demands of our community, to investigate criminal acts, and to prevent crime. This also includes those functions necessary to support these critical services. Quality of life is addressed through our ability to create and maintain a safe and secure environment for our citizens. Minimal cuts have occurred in these services. Examples of services that fall into this category are responses to calls such as assaults in progress, injury accidents, and other crimes in progress. It would also include those police services that are considered basic to public safety, such as taking reports of serious crimes and then conducting follow-up investigations. Burglaries and robberies would fall into this category. We also need to provide a minimum level of police presence to deter crime and provide adequate back-up and safety for our officers.
2.) Desirable Services include: Those functions and services that contribute to
our efforts in providing a safe and secure environment, but are not generally considered as critical as essential services. These functions are often expected or demanded by our community as core services and enhance our ability to serve the community in a variety of ways beyond emergency services. Some cuts have occurred in these areas. And example of this type of service would be the investigation of non-jury traffic accidents. It is desirable to investigate and determine who is at fault in a traffic accident so that proper accountability can be applied. It is also desirable to protect the safety of those involved and to clear the roadways as quickly as possible to enhance traffic flow. Another desirable service would be having officers on foot and bicycle patrols on the Hill and Mall. This enhances safety and provides for more personal and attentive service to the special needs of those districts.
3.) Discretionary Services include: Those functions and services that are
supportive of our core services and enhance the quality of life in our community. Generally an enhancement to other services provided by the department or a response to expressed desires of the community, but not as critical to public safety. Many of these services have experienced cuts over the past few years. An example of this type of service is our School Resource Officers. They work in our high schools and middle schools to respond to
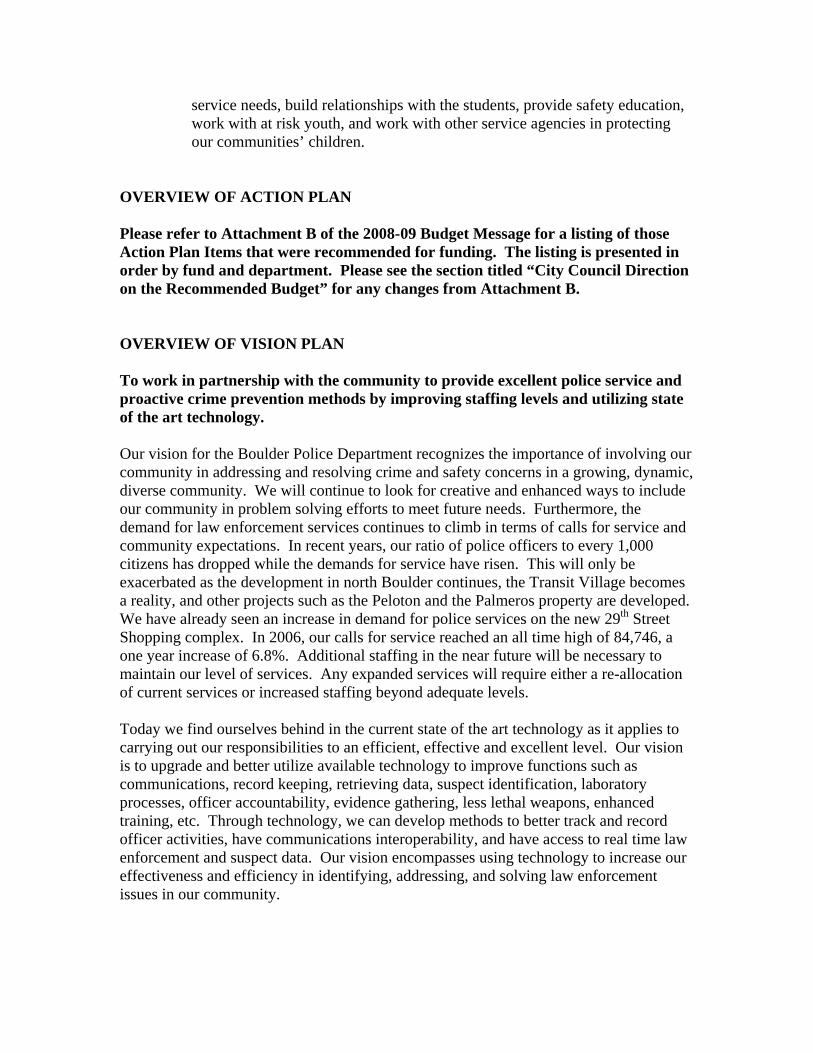
service needs, build relationships with the students, provide safety education, work with at risk youth, and work with other service agencies in protecting our communities’ children.
OVERVIEW OF ACTION PLAN Please refer to Attachment B of the 2008-09 Budget Message for a listing of those Action Plan Items that were recommended for funding. The listing is presented in order by fund and department. Please see the section titled “City Council Direction on the Recommended Budget” for any changes from Attachment B. OVERVIEW OF VISION PLAN To work in partnership with the community to provide excellent police service and proactive crime prevention methods by improving staffing levels and utilizing state of the art technology. Our vision for the Boulder Police Department recognizes the importance of involving our community in addressing and resolving crime and safety concerns in a growing, dynamic, diverse community. We will continue to look for creative and enhanced ways to include our community in problem solving efforts to meet future needs. Furthermore, the demand for law enforcement services continues to climb in terms of calls for service and community expectations. In recent years, our ratio of police officers to every 1,000 citizens has dropped while the demands for service have risen. This will only be exacerbated as the development in north Boulder continues, the Transit Village becomes a reality, and other projects such as the Peloton and the Palmeros property are developed. We have already seen an increase in demand for police services on the new 29th Street Shopping complex. In 2006, our calls for service reached an all time high of 84,746, a one year increase of 6.8%. Additional staffing in the near future will be necessary to maintain our level of services. Any expanded services will require either a re-allocation of current services or increased staffing beyond adequate levels. Today we find ourselves behind in the current state of the art technology as it applies to carrying out our responsibilities to an efficient, effective and excellent level. Our vision is to upgrade and better utilize available technology to improve functions such as communications, record keeping, retrieving data, suspect identification, laboratory processes, officer accountability, evidence gathering, less lethal weapons, enhanced training, etc. Through technology, we can develop methods to better track and record officer activities, have communications interoperability, and have access to real time law enforcement and suspect data. Our vision encompasses using technology to increase our effectiveness and efficiency in identifying, addressing, and solving law enforcement issues in our community.
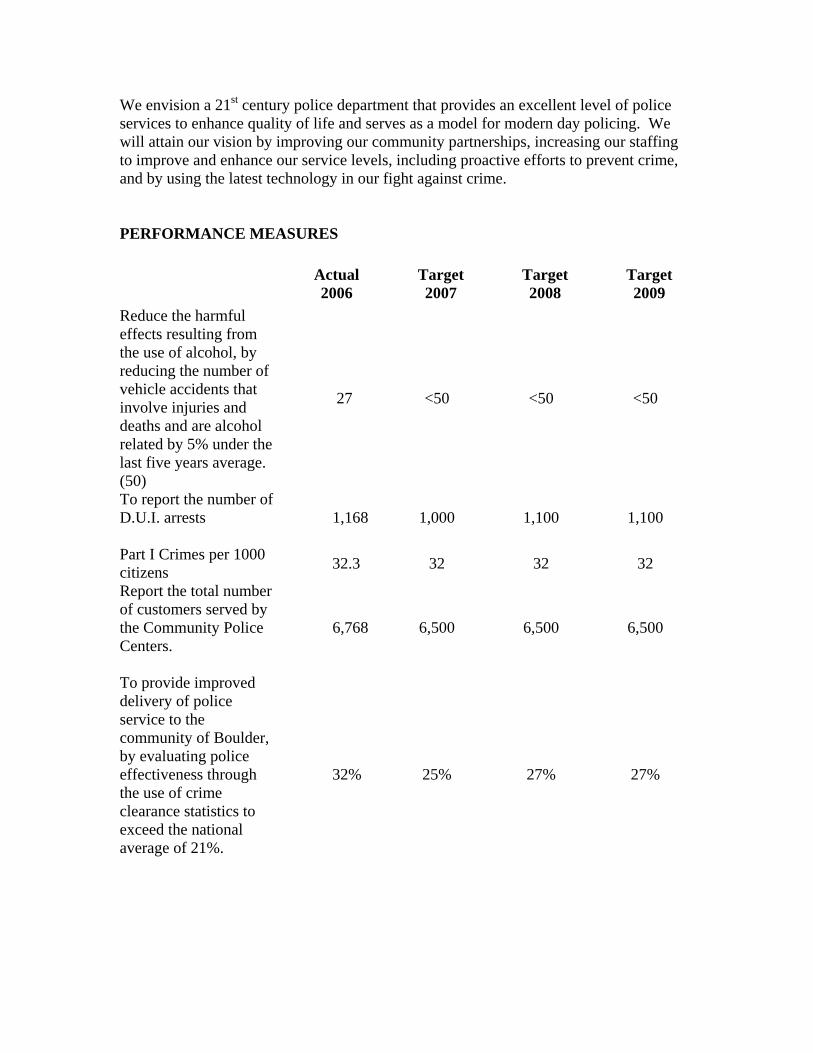
We envision a 21st century police department that provides an excellent level of police services to enhance quality of life and serves as a model for modern day policing. We will attain our vision by improving our community partnerships, increasing our staffing to improve and enhance our service levels, including proactive efforts to prevent crime, and by using the latest technology in our fight against crime. PERFORMANCE MEASURES
Actual 2006
Target 2007
Target 2008
Target 2009
Reduce the harmful effects resulting from the use of alcohol, by reducing the number of vehicle accidents that involve injuries and deaths and are alcohol related by 5% under the last five years average. (50)
27 <50 <50 <50
To report the number of D.U.I. arrests
1,168 1,000 1,100 1,100
Part I Crimes per 1000 citizens 32.3 32 32 32
Report the total number of customers served by the Community Police Centers.
6,768 6,500 6,500 6,500
To provide improved delivery of police service to the community of Boulder, by evaluating police effectiveness through the use of crime clearance statistics to exceed the national average of 21%.
32% 25% 27% 27%
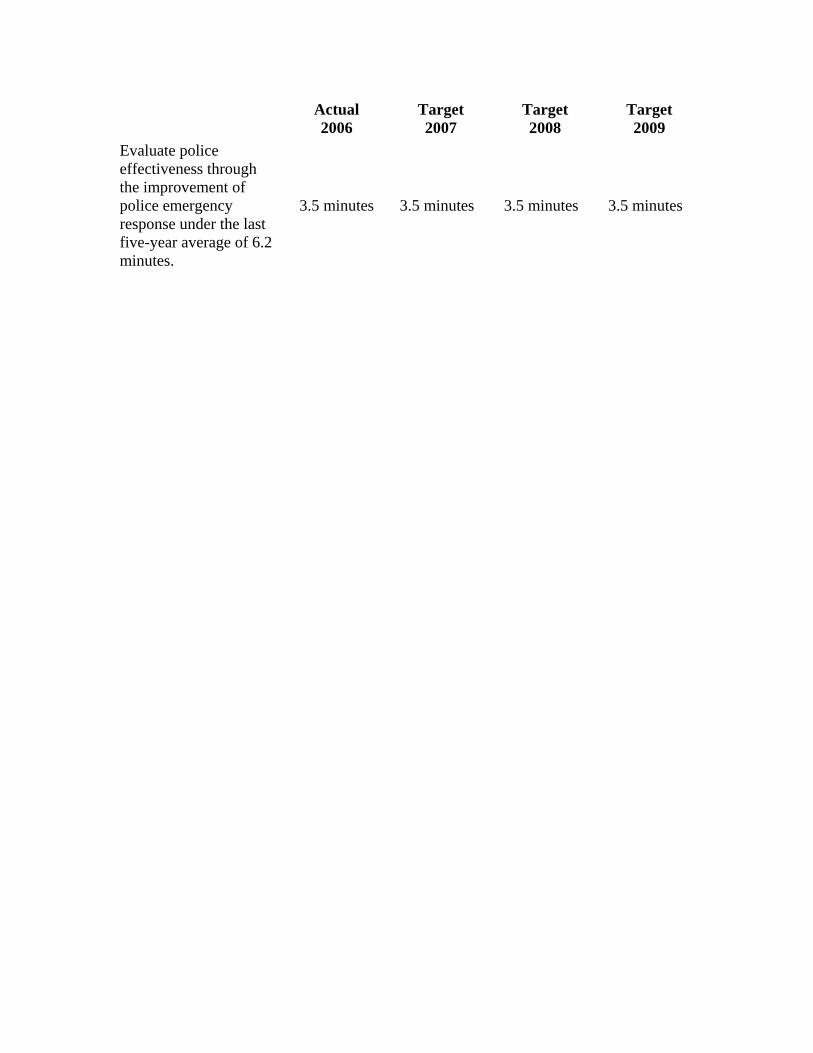
Actual 2006
Target 2007
Target 2008
Target 2009
Evaluate police effectiveness through the improvement of police emergency response under the last five-year average of 6.2 minutes.
3.5 minutes 3.5 minutes 3.5 minutes 3.5 minutes

FUND FINANCIALS
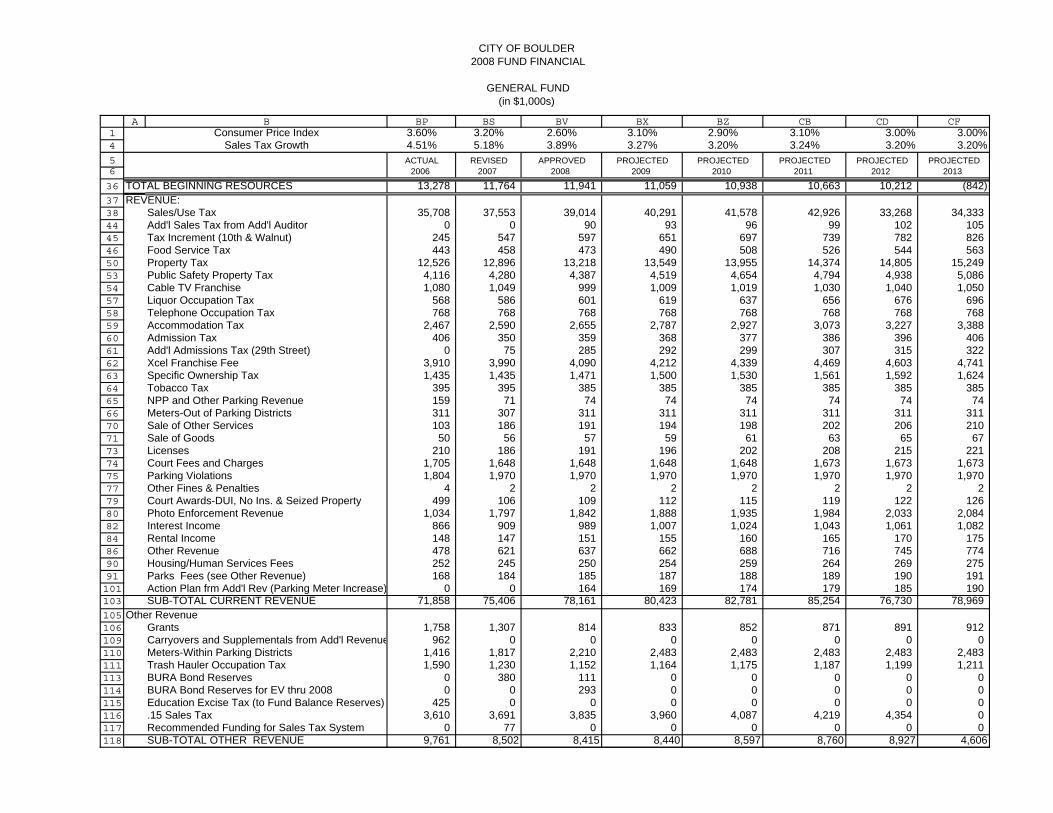
CITY OF BOULDER 2008 FUND FINANCIAL
GENERAL FUND(in $1,000s)
14
56
A B BP BS BV BX BZ CB CD CFConsumer Price Index 3.60% 3.20% 2.60% 3.10% 2.90% 3.10% 3.00% 3.00%
Sales Tax Growth 4.51% 5.18% 3.89% 3.27% 3.20% 3.24% 3.20% 3.20%ACTUAL REVISED APPROVED PROJECTED PROJECTED PROJECTED PROJECTED PROJECTED
2006 2007 2008 2009 2010 2011 2012 2013
36
37384445465053545758596061626364656670717374757779808284869091101103
105106109110111113114115116117118
TOTAL BEGINNING RESOURCES 13,278 11,764 11,941 11,059 10,938 10,663 10,212 (842)REVENUE:
Sales/Use Tax 35,708 37,553 39,014 40,291 41,578 42,926 33,268 34,333Add'l Sales Tax from Add'l Auditor 0 0 90 93 96 99 102 105Tax Increment (10th & Walnut) 245 547 597 651 697 739 782 826Food Service Tax 443 458 473 490 508 526 544 563Property Tax 12,526 12,896 13,218 13,549 13,955 14,374 14,805 15,249Public Safety Property Tax 4,116 4,280 4,387 4,519 4,654 4,794 4,938 5,086Cable TV Franchise 1,080 1,049 999 1,009 1,019 1,030 1,040 1,050Liquor Occupation Tax 568 586 601 619 637 656 676 696Telephone Occupation Tax 768 768 768 768 768 768 768 768Accommodation Tax 2,467 2,590 2,655 2,787 2,927 3,073 3,227 3,388Admission Tax 406 350 359 368 377 386 396 406Add'l Admissions Tax (29th Street) 0 75 285 292 299 307 315 322Xcel Franchise Fee 3,910 3,990 4,090 4,212 4,339 4,469 4,603 4,741Specific Ownership Tax 1,435 1,435 1,471 1,500 1,530 1,561 1,592 1,624Tobacco Tax 395 395 385 385 385 385 385 385NPP and Other Parking Revenue 159 71 74 74 74 74 74 74Meters-Out of Parking Districts 311 307 311 311 311 311 311 311Sale of Other Services 103 186 191 194 198 202 206 210Sale of Goods 50 56 57 59 61 63 65 67Licenses 210 186 191 196 202 208 215 221Court Fees and Charges 1,705 1,648 1,648 1,648 1,648 1,673 1,673 1,673Parking Violations 1,804 1,970 1,970 1,970 1,970 1,970 1,970 1,970Other Fines & Penalties 4 2 2 2 2 2 2 2Court Awards-DUI, No Ins. & Seized Property 499 106 109 112 115 119 122 126Photo Enforcement Revenue 1,034 1,797 1,842 1,888 1,935 1,984 2,033 2,084Interest Income 866 909 989 1,007 1,024 1,043 1,061 1,082Rental Income 148 147 151 155 160 165 170 175Other Revenue 478 621 637 662 688 716 745 774Housing/Human Services Fees 252 245 250 254 259 264 269 275Parks Fees (see Other Revenue) 168 184 185 187 188 189 190 191Action Plan frm Add'l Rev (Parking Meter Increase) 0 0 164 169 174 179 185 190SUB-TOTAL CURRENT REVENUE 71,858 75,406 78,161 80,423 82,781 85,254 76,730 78,969
Other RevenueGrants 1,758 1,307 814 833 852 871 891 912Carryovers and Supplementals from Add'l Revenue 962 0 0 0 0 0 0 0Meters-Within Parking Districts 1,416 1,817 2,210 2,483 2,483 2,483 2,483 2,483Trash Hauler Occupation Tax 1,590 1,230 1,152 1,164 1,175 1,187 1,199 1,211BURA Bond Reserves 0 380 111 0 0 0 0 0BURA Bond Reserves for EV thru 2008 0 0 293 0 0 0 0 0Education Excise Tax (to Fund Balance Reserves) 425 0 0 0 0 0 0 0.15 Sales Tax 3,610 3,691 3,835 3,960 4,087 4,219 4,354 0Recommended Funding for Sales Tax System 0 77 0 0 0 0 0 0SUB-TOTAL OTHER REVENUE 9,761 8,502 8,415 8,440 8,597 8,760 8,927 4,606

CITY OF BOULDER 2008 FUND FINANCIAL
GENERAL FUND(in $1,000s)
14
56
A B BP BS BV BX BZ CB CD CFConsumer Price Index 3.60% 3.20% 2.60% 3.10% 2.90% 3.10% 3.00% 3.00%
Sales Tax Growth 4.51% 5.18% 3.89% 3.27% 3.20% 3.24% 3.20% 3.20%ACTUAL REVISED APPROVED PROJECTED PROJECTED PROJECTED PROJECTED PROJECTED
2006 2007 2008 2009 2010 2011 2012 2013
120128129130145148
149150151152153155158159160161163164165166167168171172173174175177178180181182186187188189191192193194196199200202204
TRANSFERS IN:Cost Allocation - Current Opr Costs-All Funds 5,985 5,855 6,110 6,294 6,482 6,677 6,877 7,083Add'l Cost Allocation for Auditor & Fin Rprting Mgr 0 0 87 52 53 55 56 58Other Transfers 174 49 83 53 55 56 58 60Mall Reimbursement from CAGID (see Revenue) 500 500 500 500 500 500 44 44SUB-TOTAL TRANSFERS IN 6,659 6,404 6,781 6,898 7,090 7,288 7,035 7,245
ANNUAL SOURCES (EXCLUDING FUND BALANCE) 88,278 90,312 93,357 95,761 98,468 101,303 92,693 90,820TOTAL SOURCES OF FUNDS 101,556 102,076 105,298 106,820 109,406 111,965 102,904 89,978USES OF FUNDS
City Council 281 295 300 307 314 321 328 336Municipal Court 1,328 1,526 1,605 1,642 1,680 1,718 1,757 1,797City Attorney 1,736 1,793 1,819 1,861 1,904 1,947 1,992 2,037City Manager (including Internal Audit) 1,396 1,413 1,691 1,730 1,770 1,810 1,851 1,894West Nile Virus Program 211 300 300 300 300 300 300 300Economic Vitality Program 486 361 111 0 0 0 0 0Economic Vitality thru 2008 0 0 293 0 0 0 0 0Washington School Project 37 0 0 0 0 0 0 0Public Power Project 91 0 0 0 0 0 0 0Conference and Visitors Bureau 621 642 694 715 744 774 806 838Non-departmental 90 137 120 123 126 128 131 134Boulder Television 134 150 70 0 0 0 0 0Contingency 21 115 118 121 123 126 129 132Contingency for Parking Meter Rev for Univ Hill 0 0 10 0 0 0 0 0Extraordinary Personnel Expense 22 115 118 121 123 126 129 132Utility Contingency 0 250 145 0 0 0 0 0Environmental Affairs 1,406 1,230 1,152 1,164 1,175 1,187 1,199 1,211DUHMD/Parking Svcs 859 935 1,142 1,169 1,195 1,223 1,250 1,279Downtown BID 248 0 0 0 0 0 0 0Communications 592 658 633 648 662 678 693 709Unemployment & Volunteer Ins 77 108 107 109 112 115 117 120Property & Casualty Ins. 1,609 1,767 1,974 1,974 1,974 1,974 1,974 1,974Compensated Absences 661 311 311 311 311 311 311 311Information Technology 4,516 3,803 3,948 4,040 4,132 4,226 4,323 4,421IT/Computer Replacement Funding 0 602 613 627 641 656 671 686IT/Technology Funding 0 51 52 53 54 56 57 58IT/Telecommunications Funding 0 46 46 47 49 50 51 52Human Resources 1,223 1,296 1,627 1,665 1,703 1,742 1,781 1,822Finance 2,448 2,585 2,501 2,526 2,583 2,642 2,702 2,764Campaign Financing 0 43 0 46 0 0 0 0Police 23,835 25,456 26,818 27,444 28,065 28,709 29,362 30,031Fire 11,662 12,427 12,739 13,036 13,331 13,637 13,948 14,265Public Works 3,103 1,960 1,681 1,720 1,759 1,800 1,840 1,882Municipal Facilities Fund 0 827 842 862 882 902 922 943Equipment Replacement 0 25 25 26 26 27 28 28Facilities Renovation & Replacement 0 591 602 616 630 644 659 674
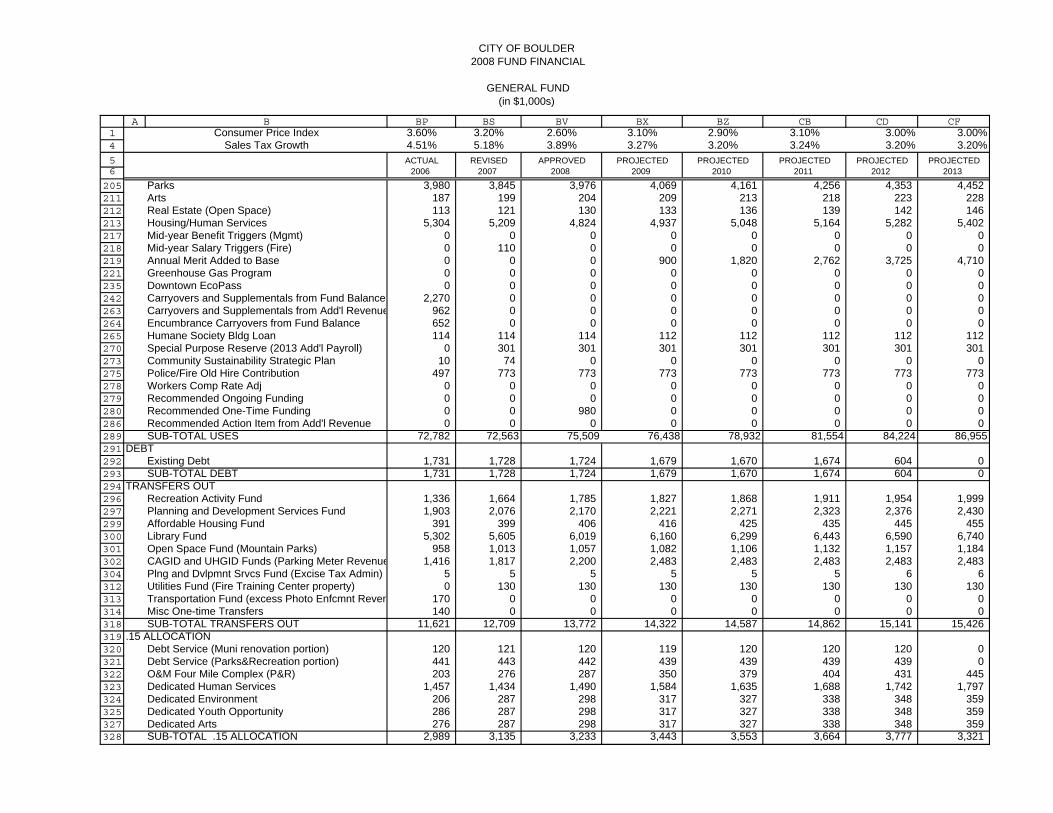
CITY OF BOULDER 2008 FUND FINANCIAL
GENERAL FUND(in $1,000s)
14
56
A B BP BS BV BX BZ CB CD CFConsumer Price Index 3.60% 3.20% 2.60% 3.10% 2.90% 3.10% 3.00% 3.00%
Sales Tax Growth 4.51% 5.18% 3.89% 3.27% 3.20% 3.24% 3.20% 3.20%ACTUAL REVISED APPROVED PROJECTED PROJECTED PROJECTED PROJECTED PROJECTED
2006 2007 2008 2009 2010 2011 2012 2013
205211212213217218219221235242263264265270273275278279280286289291292293294296297299300301302304312313314318319320321322323324325327328
Parks 3,980 3,845 3,976 4,069 4,161 4,256 4,353 4,452Arts 187 199 204 209 213 218 223 228Real Estate (Open Space) 113 121 130 133 136 139 142 146Housing/Human Services 5,304 5,209 4,824 4,937 5,048 5,164 5,282 5,402Mid-year Benefit Triggers (Mgmt) 0 0 0 0 0 0 0 0Mid-year Salary Triggers (Fire) 0 110 0 0 0 0 0 0Annual Merit Added to Base 0 0 0 900 1,820 2,762 3,725 4,710Greenhouse Gas Program 0 0 0 0 0 0 0 0Downtown EcoPass 0 0 0 0 0 0 0 0Carryovers and Supplementals from Fund Balance 2,270 0 0 0 0 0 0 0Carryovers and Supplementals from Add'l Revenue 962 0 0 0 0 0 0 0Encumbrance Carryovers from Fund Balance 652 0 0 0 0 0 0 0Humane Society Bldg Loan 114 114 114 112 112 112 112 112Special Purpose Reserve (2013 Add'l Payroll) 0 301 301 301 301 301 301 301Community Sustainability Strategic Plan 10 74 0 0 0 0 0 0Police/Fire Old Hire Contribution 497 773 773 773 773 773 773 773Workers Comp Rate Adj 0 0 0 0 0 0 0 0Recommended Ongoing Funding 0 0 0 0 0 0 0 0Recommended One-Time Funding 0 0 980 0 0 0 0 0Recommended Action Item from Add'l Revenue 0 0 0 0 0 0 0 0SUB-TOTAL USES 72,782 72,563 75,509 76,438 78,932 81,554 84,224 86,955
DEBTExisting Debt 1,731 1,728 1,724 1,679 1,670 1,674 604 0SUB-TOTAL DEBT 1,731 1,728 1,724 1,679 1,670 1,674 604 0
TRANSFERS OUTRecreation Activity Fund 1,336 1,664 1,785 1,827 1,868 1,911 1,954 1,999Planning and Development Services Fund 1,903 2,076 2,170 2,221 2,271 2,323 2,376 2,430Affordable Housing Fund 391 399 406 416 425 435 445 455Library Fund 5,302 5,605 6,019 6,160 6,299 6,443 6,590 6,740Open Space Fund (Mountain Parks) 958 1,013 1,057 1,082 1,106 1,132 1,157 1,184CAGID and UHGID Funds (Parking Meter Revenue 1,416 1,817 2,200 2,483 2,483 2,483 2,483 2,483Plng and Dvlpmnt Srvcs Fund (Excise Tax Admin) 5 5 5 5 5 5 6 6Utilities Fund (Fire Training Center property) 0 130 130 130 130 130 130 130Transportation Fund (excess Photo Enfcmnt Reven 170 0 0 0 0 0 0 0Misc One-time Transfers 140 0 0 0 0 0 0 0SUB-TOTAL TRANSFERS OUT 11,621 12,709 13,772 14,322 14,587 14,862 15,141 15,426
.15 ALLOCATIONDebt Service (Muni renovation portion) 120 121 120 119 120 120 120 0Debt Service (Parks&Recreation portion) 441 443 442 439 439 439 439 0O&M Four Mile Complex (P&R) 203 276 287 350 379 404 431 445Dedicated Human Services 1,457 1,434 1,490 1,584 1,635 1,688 1,742 1,797Dedicated Environment 206 287 298 317 327 338 348 359Dedicated Youth Opportunity 286 287 298 317 327 338 348 359Dedicated Arts 276 287 298 317 327 338 348 359SUB-TOTAL .15 ALLOCATION 2,989 3,135 3,233 3,443 3,553 3,664 3,777 3,321
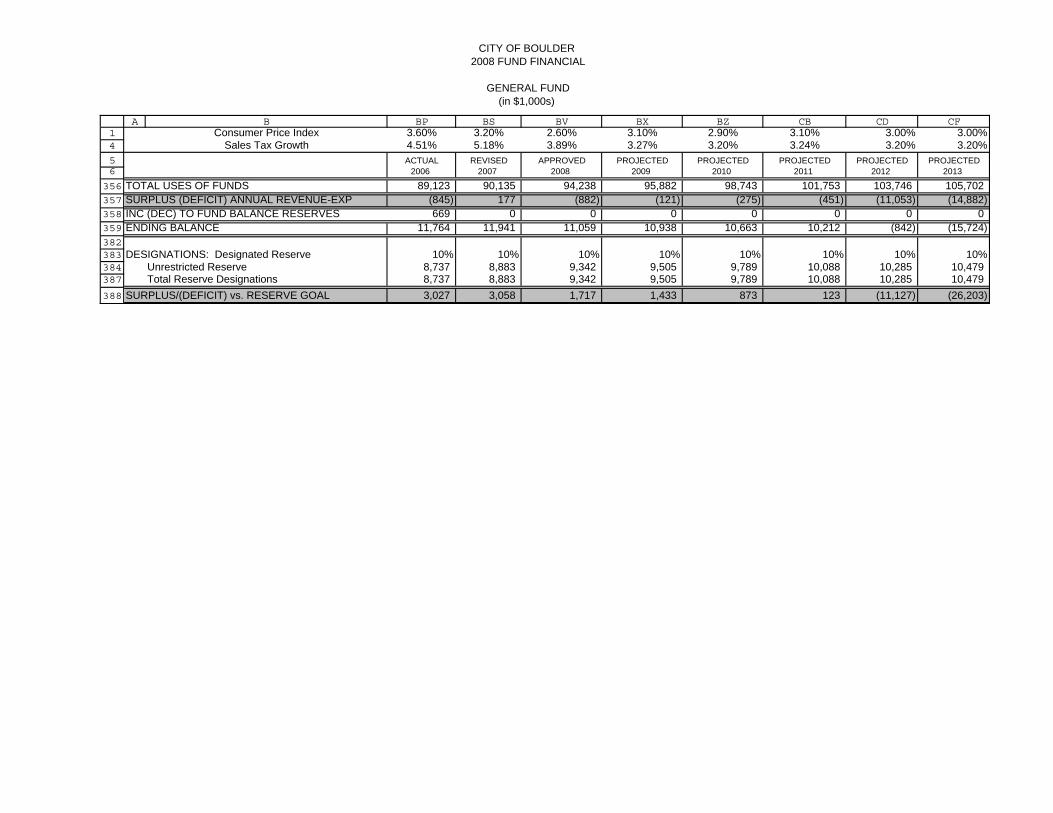
CITY OF BOULDER 2008 FUND FINANCIAL
GENERAL FUND(in $1,000s)
14
56
A B BP BS BV BX BZ CB CD CFConsumer Price Index 3.60% 3.20% 2.60% 3.10% 2.90% 3.10% 3.00% 3.00%
Sales Tax Growth 4.51% 5.18% 3.89% 3.27% 3.20% 3.24% 3.20% 3.20%ACTUAL REVISED APPROVED PROJECTED PROJECTED PROJECTED PROJECTED PROJECTED
2006 2007 2008 2009 2010 2011 2012 2013
356357358359
382383384387
388
TOTAL USES OF FUNDS 89,123 90,135 94,238 95,882 98,743 101,753 103,746 105,702SURPLUS (DEFICIT) ANNUAL REVENUE-EXP (845) 177 (882) (121) (275) (451) (11,053) (14,882)INC (DEC) TO FUND BALANCE RESERVES 669 0 0 0 0 0 0 0ENDING BALANCE 11,764 11,941 11,059 10,938 10,663 10,212 (842) (15,724)
DESIGNATIONS: Designated Reserve 10% 10% 10% 10% 10% 10% 10% 10%Unrestricted Reserve 8,737 8,883 9,342 9,505 9,789 10,088 10,285 10,479Total Reserve Designations 8,737 8,883 9,342 9,505 9,789 10,088 10,285 10,479
SURPLUS/(DEFICIT) vs. RESERVE GOAL 3,027 3,058 1,717 1,433 873 123 (11,127) (26,203)
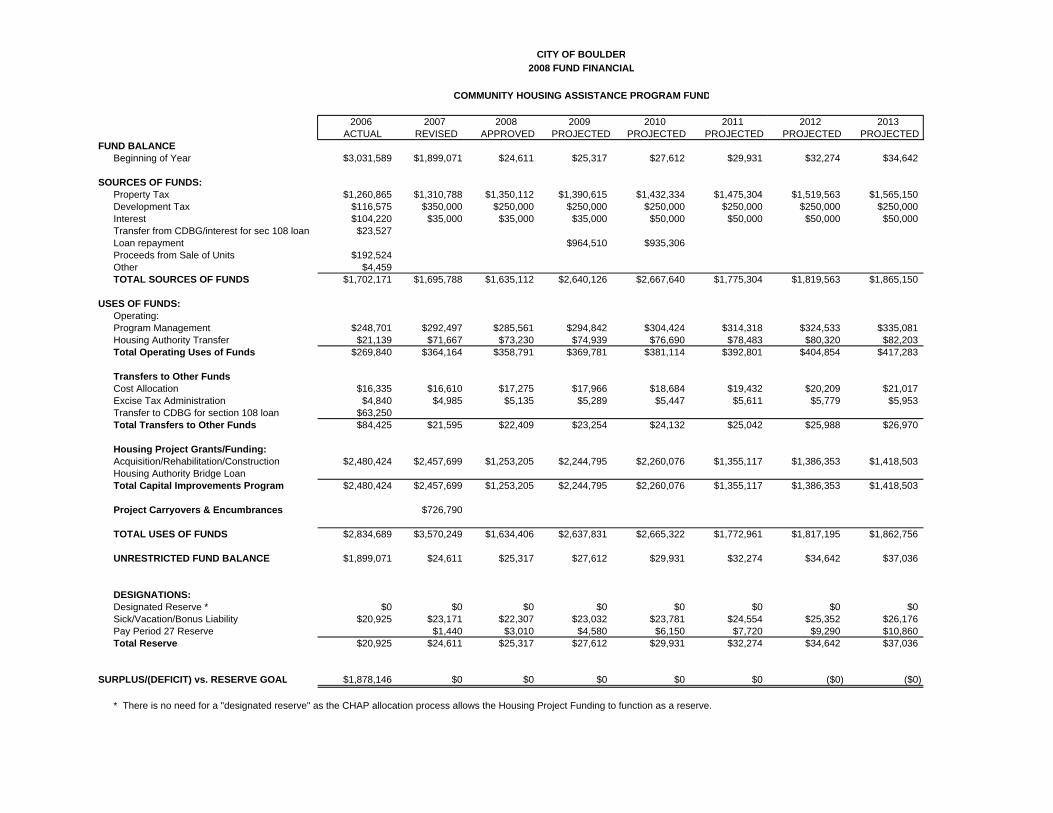
CITY OF BOULDER2008 FUND FINANCIAL
COMMUNITY HOUSING ASSISTANCE PROGRAM FUND
2006 2007 2008 2009 2010 2011 2012 2013ACTUAL REVISED APPROVED PROJECTED PROJECTED PROJECTED PROJECTED PROJECTED
FUND BALANCEBeginning of Year $3,031,589 $1,899,071 $24,611 $25,317 $27,612 $29,931 $32,274 $34,642
SOURCES OF FUNDS:Property Tax $1,260,865 $1,310,788 $1,350,112 $1,390,615 $1,432,334 $1,475,304 $1,519,563 $1,565,150Development Tax $116,575 $350,000 $250,000 $250,000 $250,000 $250,000 $250,000 $250,000Interest $104,220 $35,000 $35,000 $35,000 $50,000 $50,000 $50,000 $50,000Transfer from CDBG/interest for sec 108 loan $23,527Loan repayment $964,510 $935,306Proceeds from Sale of Units $192,524Other $4,459TOTAL SOURCES OF FUNDS $1,702,171 $1,695,788 $1,635,112 $2,640,126 $2,667,640 $1,775,304 $1,819,563 $1,865,150
USES OF FUNDS:Operating:Program Management $248,701 $292,497 $285,561 $294,842 $304,424 $314,318 $324,533 $335,081Housing Authority Transfer $21,139 $71,667 $73,230 $74,939 $76,690 $78,483 $80,320 $82,203Total Operating Uses of Funds $269,840 $364,164 $358,791 $369,781 $381,114 $392,801 $404,854 $417,283
Transfers to Other FundsCost Allocation $16,335 $16,610 $17,275 $17,966 $18,684 $19,432 $20,209 $21,017Excise Tax Administration $4,840 $4,985 $5,135 $5,289 $5,447 $5,611 $5,779 $5,953Transfer to CDBG for section 108 loan $63,250Total Transfers to Other Funds $84,425 $21,595 $22,409 $23,254 $24,132 $25,042 $25,988 $26,970
Housing Project Grants/Funding:Acquisition/Rehabilitation/Construction $2,480,424 $2,457,699 $1,253,205 $2,244,795 $2,260,076 $1,355,117 $1,386,353 $1,418,503Housing Authority Bridge LoanTotal Capital Improvements Program $2,480,424 $2,457,699 $1,253,205 $2,244,795 $2,260,076 $1,355,117 $1,386,353 $1,418,503
Project Carryovers & Encumbrances $726,790
TOTAL USES OF FUNDS $2,834,689 $3,570,249 $1,634,406 $2,637,831 $2,665,322 $1,772,961 $1,817,195 $1,862,756
UNRESTRICTED FUND BALANCE $1,899,071 $24,611 $25,317 $27,612 $29,931 $32,274 $34,642 $37,036
DESIGNATIONS:Designated Reserve * $0 $0 $0 $0 $0 $0 $0 $0Sick/Vacation/Bonus Liability $20,925 $23,171 $22,307 $23,032 $23,781 $24,554 $25,352 $26,176Pay Period 27 Reserve $1,440 $3,010 $4,580 $6,150 $7,720 $9,290 $10,860Total Reserve $20,925 $24,611 $25,317 $27,612 $29,931 $32,274 $34,642 $37,036
SURPLUS/(DEFICIT) vs. RESERVE GOAL $1,878,146 $0 $0 $0 $0 $0 ($0) ($0)
* There is no need for a "designated reserve" as the CHAP allocation process allows the Housing Project Funding to function as a reserve.
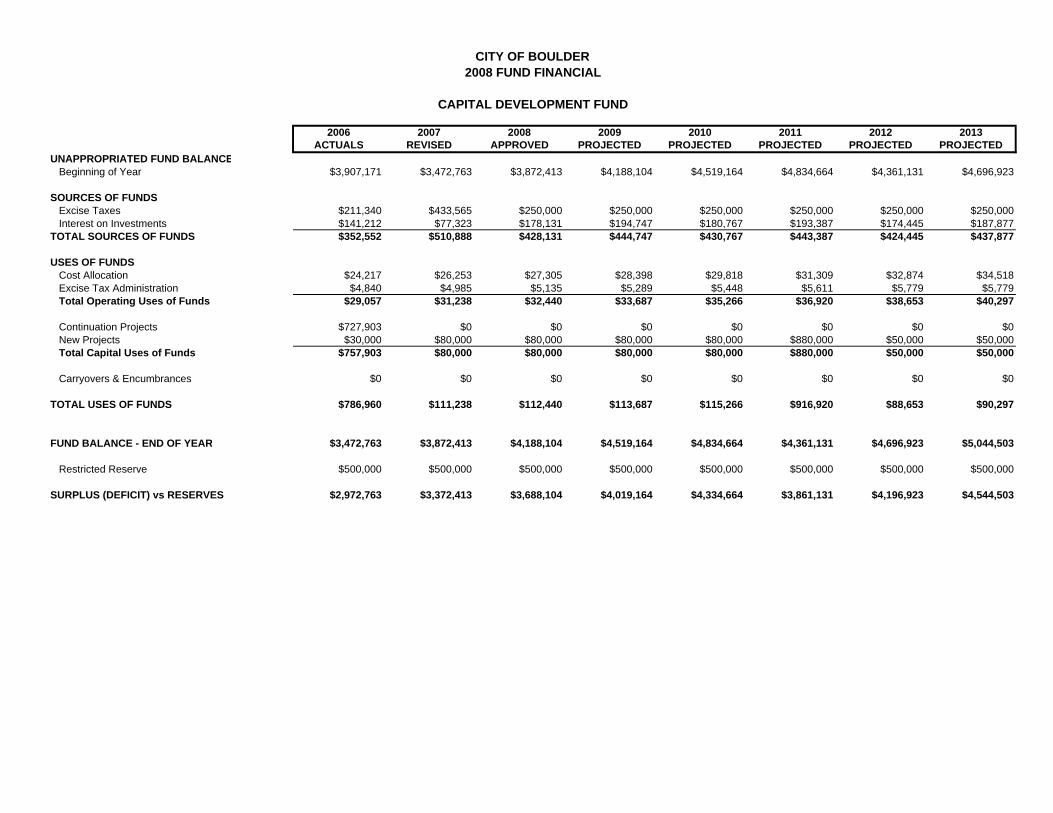
2006 2007 2008 2009 2010 2011 2012 2013ACTUALS REVISED APPROVED PROJECTED PROJECTED PROJECTED PROJECTED PROJECTED
UNAPPROPRIATED FUND BALANCE Beginning of Year $3,907,171 $3,472,763 $3,872,413 $4,188,104 $4,519,164 $4,834,664 $4,361,131 $4,696,923
SOURCES OF FUNDSExcise Taxes $211,340 $433,565 $250,000 $250,000 $250,000 $250,000 $250,000 $250,000Interest on Investments $141,212 $77,323 $178,131 $194,747 $180,767 $193,387 $174,445 $187,877
TOTAL SOURCES OF FUNDS $352,552 $510,888 $428,131 $444,747 $430,767 $443,387 $424,445 $437,877
USES OF FUNDSCost Allocation $24,217 $26,253 $27,305 $28,398 $29,818 $31,309 $32,874 $34,518Excise Tax Administration $4,840 $4,985 $5,135 $5,289 $5,448 $5,611 $5,779 $5,779Total Operating Uses of Funds $29,057 $31,238 $32,440 $33,687 $35,266 $36,920 $38,653 $40,297
Continuation Projects $727,903 $0 $0 $0 $0 $0 $0 $0New Projects $30,000 $80,000 $80,000 $80,000 $80,000 $880,000 $50,000 $50,000
Total Capital Uses of Funds $757,903 $80,000 $80,000 $80,000 $80,000 $880,000 $50,000 $50,000
Carryovers & Encumbrances $0 $0 $0 $0 $0 $0 $0 $0
TOTAL USES OF FUNDS $786,960 $111,238 $112,440 $113,687 $115,266 $916,920 $88,653 $90,297
FUND BALANCE - END OF YEAR $3,472,763 $3,872,413 $4,188,104 $4,519,164 $4,834,664 $4,361,131 $4,696,923 $5,044,503
Restricted Reserve $500,000 $500,000 $500,000 $500,000 $500,000 $500,000 $500,000 $500,000
SURPLUS (DEFICIT) vs RESERVES $2,972,763 $3,372,413 $3,688,104 $4,019,164 $4,334,664 $3,861,131 $4,196,923 $4,544,503
CITY OF BOULDER2008 FUND FINANCIAL
CAPITAL DEVELOPMENT FUND
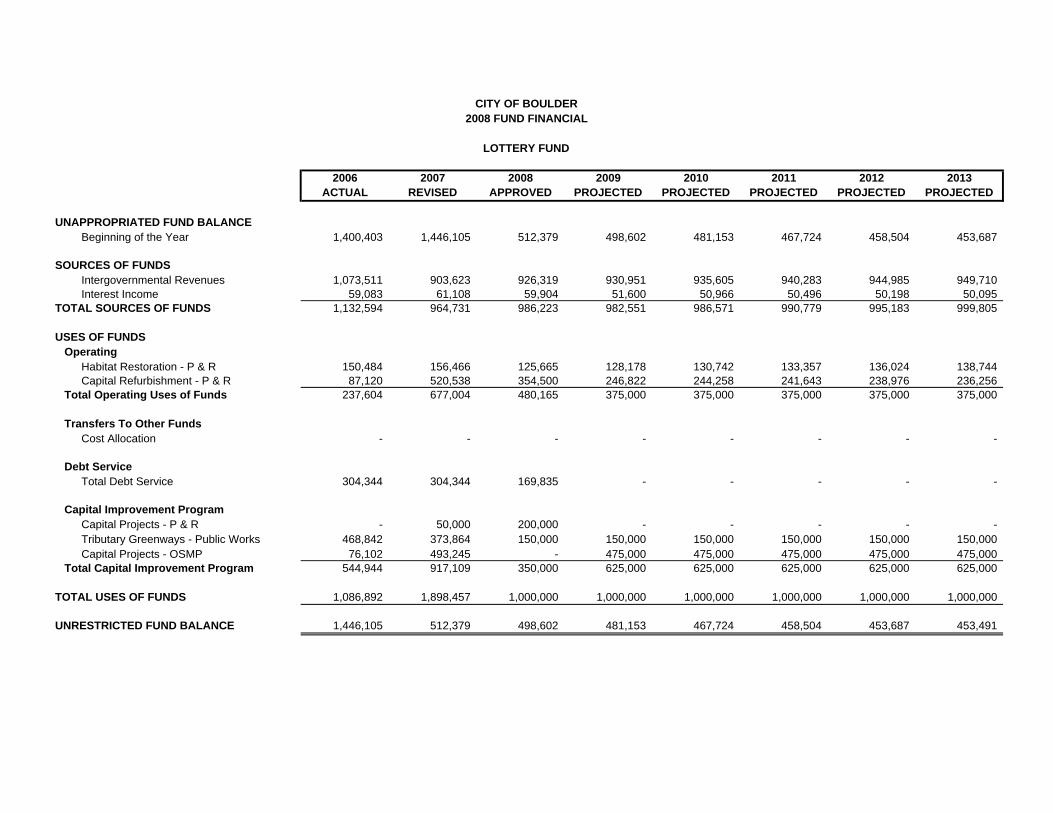
2006 2007 2008 2009 2010 2011 2012 2013ACTUAL REVISED APPROVED PROJECTED PROJECTED PROJECTED PROJECTED PROJECTED
UNAPPROPRIATED FUND BALANCEBeginning of the Year 1,400,403 1,446,105 512,379 498,602 481,153 467,724 458,504 453,687
SOURCES OF FUNDSIntergovernmental Revenues 1,073,511 903,623 926,319 930,951 935,605 940,283 944,985 949,710 Interest Income 59,083 61,108 59,904 51,600 50,966 50,496 50,198 50,095
TOTAL SOURCES OF FUNDS 1,132,594 964,731 986,223 982,551 986,571 990,779 995,183 999,805
USES OF FUNDS Operating
Habitat Restoration - P & R 150,484 156,466 125,665 128,178 130,742 133,357 136,024 138,744 Capital Refurbishment - P & R 87,120 520,538 354,500 246,822 244,258 241,643 238,976 236,256
Total Operating Uses of Funds 237,604 677,004 480,165 375,000 375,000 375,000 375,000 375,000
Transfers To Other Funds Cost Allocation - - - - - - - -
Debt ServiceTotal Debt Service 304,344 304,344 169,835 - - - - -
Capital Improvement ProgramCapital Projects - P & R - 50,000 200,000 - - - - - Tributary Greenways - Public Works 468,842 373,864 150,000 150,000 150,000 150,000 150,000 150,000 Capital Projects - OSMP 76,102 493,245 - 475,000 475,000 475,000 475,000 475,000
Total Capital Improvement Program 544,944 917,109 350,000 625,000 625,000 625,000 625,000 625,000
TOTAL USES OF FUNDS 1,086,892 1,898,457 1,000,000 1,000,000 1,000,000 1,000,000 1,000,000 1,000,000
UNRESTRICTED FUND BALANCE 1,446,105 512,379 498,602 481,153 467,724 458,504 453,687 453,491
CITY OF BOULDER2008 FUND FINANCIAL
LOTTERY FUND
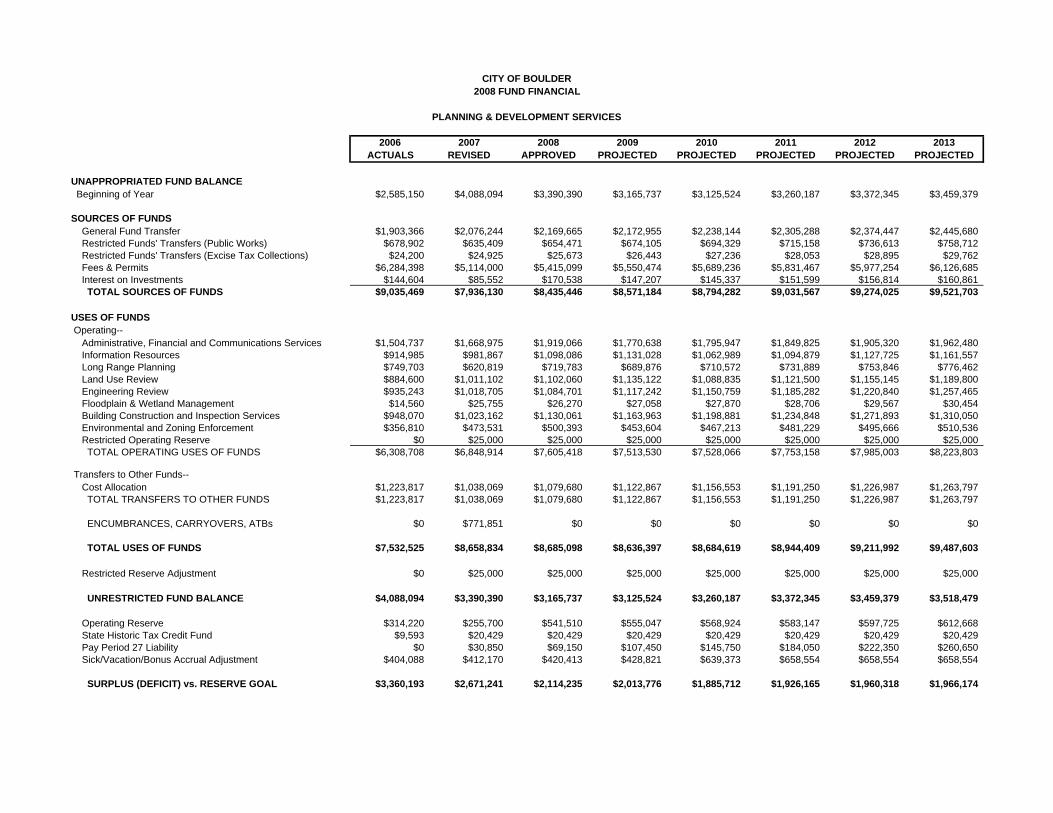
2006 2007 2008 2009 2010 2011 2012 2013ACTUALS REVISED APPROVED PROJECTED PROJECTED PROJECTED PROJECTED PROJECTED
UNAPPROPRIATED FUND BALANCE Beginning of Year $2,585,150 $4,088,094 $3,390,390 $3,165,737 $3,125,524 $3,260,187 $3,372,345 $3,459,379
SOURCES OF FUNDS General Fund Transfer $1,903,366 $2,076,244 $2,169,665 $2,172,955 $2,238,144 $2,305,288 $2,374,447 $2,445,680 Restricted Funds' Transfers (Public Works) $678,902 $635,409 $654,471 $674,105 $694,329 $715,158 $736,613 $758,712 Restricted Funds' Transfers (Excise Tax Collections) $24,200 $24,925 $25,673 $26,443 $27,236 $28,053 $28,895 $29,762 Fees & Permits $6,284,398 $5,114,000 $5,415,099 $5,550,474 $5,689,236 $5,831,467 $5,977,254 $6,126,685 Interest on Investments $144,604 $85,552 $170,538 $147,207 $145,337 $151,599 $156,814 $160,861 TOTAL SOURCES OF FUNDS $9,035,469 $7,936,130 $8,435,446 $8,571,184 $8,794,282 $9,031,567 $9,274,025 $9,521,703
USES OF FUNDS Operating-- Administrative, Financial and Communications Services $1,504,737 $1,668,975 $1,919,066 $1,770,638 $1,795,947 $1,849,825 $1,905,320 $1,962,480 Information Resources $914,985 $981,867 $1,098,086 $1,131,028 $1,062,989 $1,094,879 $1,127,725 $1,161,557 Long Range Planning $749,703 $620,819 $719,783 $689,876 $710,572 $731,889 $753,846 $776,462 Land Use Review $884,600 $1,011,102 $1,102,060 $1,135,122 $1,088,835 $1,121,500 $1,155,145 $1,189,800 Engineering Review $935,243 $1,018,705 $1,084,701 $1,117,242 $1,150,759 $1,185,282 $1,220,840 $1,257,465 Floodplain & Wetland Management $14,560 $25,755 $26,270 $27,058 $27,870 $28,706 $29,567 $30,454 Building Construction and Inspection Services $948,070 $1,023,162 $1,130,061 $1,163,963 $1,198,881 $1,234,848 $1,271,893 $1,310,050 Environmental and Zoning Enforcement $356,810 $473,531 $500,393 $453,604 $467,213 $481,229 $495,666 $510,536 Restricted Operating Reserve $0 $25,000 $25,000 $25,000 $25,000 $25,000 $25,000 $25,000 TOTAL OPERATING USES OF FUNDS $6,308,708 $6,848,914 $7,605,418 $7,513,530 $7,528,066 $7,753,158 $7,985,003 $8,223,803
Transfers to Other Funds-- Cost Allocation $1,223,817 $1,038,069 $1,079,680 $1,122,867 $1,156,553 $1,191,250 $1,226,987 $1,263,797 TOTAL TRANSFERS TO OTHER FUNDS $1,223,817 $1,038,069 $1,079,680 $1,122,867 $1,156,553 $1,191,250 $1,226,987 $1,263,797
ENCUMBRANCES, CARRYOVERS, ATBs $0 $771,851 $0 $0 $0 $0 $0 $0
TOTAL USES OF FUNDS $7,532,525 $8,658,834 $8,685,098 $8,636,397 $8,684,619 $8,944,409 $9,211,992 $9,487,603
Restricted Reserve Adjustment $0 $25,000 $25,000 $25,000 $25,000 $25,000 $25,000 $25,000
UNRESTRICTED FUND BALANCE $4,088,094 $3,390,390 $3,165,737 $3,125,524 $3,260,187 $3,372,345 $3,459,379 $3,518,479
Operating Reserve $314,220 $255,700 $541,510 $555,047 $568,924 $583,147 $597,725 $612,668 State Historic Tax Credit Fund $9,593 $20,429 $20,429 $20,429 $20,429 $20,429 $20,429 $20,429 Pay Period 27 Liability $0 $30,850 $69,150 $107,450 $145,750 $184,050 $222,350 $260,650 Sick/Vacation/Bonus Accrual Adjustment $404,088 $412,170 $420,413 $428,821 $639,373 $658,554 $658,554 $658,554
SURPLUS (DEFICIT) vs. RESERVE GOAL $3,360,193 $2,671,241 $2,114,235 $2,013,776 $1,885,712 $1,926,165 $1,960,318 $1,966,174
CITY OF BOULDER2008 FUND FINANCIAL
PLANNING & DEVELOPMENT SERVICES
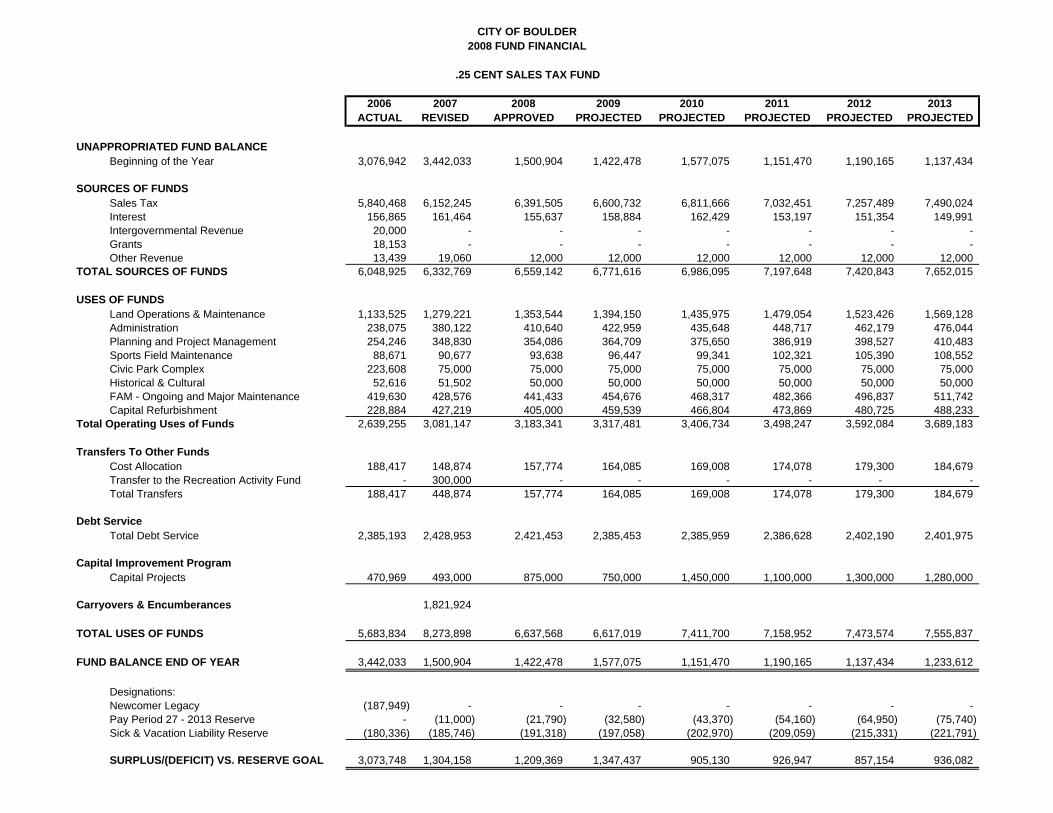
2006 2007 2008 2009 2010 2011 2012 2013ACTUAL REVISED APPROVED PROJECTED PROJECTED PROJECTED PROJECTED PROJECTED
UNAPPROPRIATED FUND BALANCEBeginning of the Year 3,076,942 3,442,033 1,500,904 1,422,478 1,577,075 1,151,470 1,190,165 1,137,434
SOURCES OF FUNDSSales Tax 5,840,468 6,152,245 6,391,505 6,600,732 6,811,666 7,032,451 7,257,489 7,490,024 Interest 156,865 161,464 155,637 158,884 162,429 153,197 151,354 149,991 Intergovernmental Revenue 20,000 - - - - - - - Grants 18,153 - - - - - - - Other Revenue 13,439 19,060 12,000 12,000 12,000 12,000 12,000 12,000
TOTAL SOURCES OF FUNDS 6,048,925 6,332,769 6,559,142 6,771,616 6,986,095 7,197,648 7,420,843 7,652,015
USES OF FUNDSLand Operations & Maintenance 1,133,525 1,279,221 1,353,544 1,394,150 1,435,975 1,479,054 1,523,426 1,569,128 Administration 238,075 380,122 410,640 422,959 435,648 448,717 462,179 476,044 Planning and Project Management 254,246 348,830 354,086 364,709 375,650 386,919 398,527 410,483 Sports Field Maintenance 88,671 90,677 93,638 96,447 99,341 102,321 105,390 108,552 Civic Park Complex 223,608 75,000 75,000 75,000 75,000 75,000 75,000 75,000 Historical & Cultural 52,616 51,502 50,000 50,000 50,000 50,000 50,000 50,000 FAM - Ongoing and Major Maintenance 419,630 428,576 441,433 454,676 468,317 482,366 496,837 511,742 Capital Refurbishment 228,884 427,219 405,000 459,539 466,804 473,869 480,725 488,233
Total Operating Uses of Funds 2,639,255 3,081,147 3,183,341 3,317,481 3,406,734 3,498,247 3,592,084 3,689,183
Transfers To Other Funds Cost Allocation 188,417 148,874 157,774 164,085 169,008 174,078 179,300 184,679 Transfer to the Recreation Activity Fund - 300,000 - - - - - - Total Transfers 188,417 448,874 157,774 164,085 169,008 174,078 179,300 184,679
Debt ServiceTotal Debt Service 2,385,193 2,428,953 2,421,453 2,385,453 2,385,959 2,386,628 2,402,190 2,401,975
Capital Improvement ProgramCapital Projects 470,969 493,000 875,000 750,000 1,450,000 1,100,000 1,300,000 1,280,000
Carryovers & Encumberances 1,821,924
TOTAL USES OF FUNDS 5,683,834 8,273,898 6,637,568 6,617,019 7,411,700 7,158,952 7,473,574 7,555,837
FUND BALANCE END OF YEAR 3,442,033 1,500,904 1,422,478 1,577,075 1,151,470 1,190,165 1,137,434 1,233,612
Designations:Newcomer Legacy (187,949) - - - - - - - Pay Period 27 - 2013 Reserve - (11,000) (21,790) (32,580) (43,370) (54,160) (64,950) (75,740) Sick & Vacation Liability Reserve (180,336) (185,746) (191,318) (197,058) (202,970) (209,059) (215,331) (221,791)
SURPLUS/(DEFICIT) VS. RESERVE GOAL 3,073,748 1,304,158 1,209,369 1,347,437 905,130 926,947 857,154 936,082
.25 CENT SALES TAX FUND
CITY OF BOULDER2008 FUND FINANCIAL
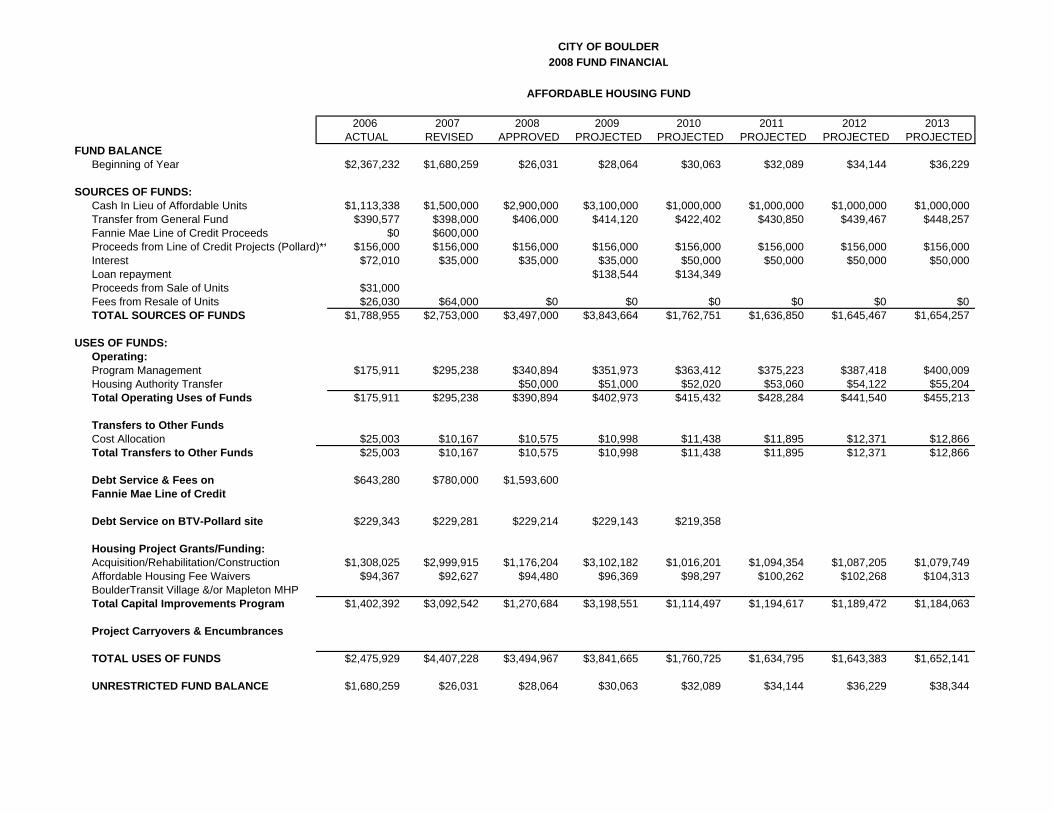
CITY OF BOULDER2008 FUND FINANCIAL
AFFORDABLE HOUSING FUND
2006 2007 2008 2009 2010 2011 2012 2013ACTUAL REVISED APPROVED PROJECTED PROJECTED PROJECTED PROJECTED PROJECTED
FUND BALANCEBeginning of Year $2,367,232 $1,680,259 $26,031 $28,064 $30,063 $32,089 $34,144 $36,229
SOURCES OF FUNDS:Cash In Lieu of Affordable Units $1,113,338 $1,500,000 $2,900,000 $3,100,000 $1,000,000 $1,000,000 $1,000,000 $1,000,000Transfer from General Fund $390,577 $398,000 $406,000 $414,120 $422,402 $430,850 $439,467 $448,257Fannie Mae Line of Credit Proceeds $0 $600,000Proceeds from Line of Credit Projects (Pollard)** $156,000 $156,000 $156,000 $156,000 $156,000 $156,000 $156,000 $156,000Interest $72,010 $35,000 $35,000 $35,000 $50,000 $50,000 $50,000 $50,000Loan repayment $138,544 $134,349Proceeds from Sale of Units $31,000Fees from Resale of Units $26,030 $64,000 $0 $0 $0 $0 $0 $0TOTAL SOURCES OF FUNDS $1,788,955 $2,753,000 $3,497,000 $3,843,664 $1,762,751 $1,636,850 $1,645,467 $1,654,257
USES OF FUNDS:Operating:Program Management $175,911 $295,238 $340,894 $351,973 $363,412 $375,223 $387,418 $400,009Housing Authority Transfer $50,000 $51,000 $52,020 $53,060 $54,122 $55,204Total Operating Uses of Funds $175,911 $295,238 $390,894 $402,973 $415,432 $428,284 $441,540 $455,213
Transfers to Other FundsCost Allocation $25,003 $10,167 $10,575 $10,998 $11,438 $11,895 $12,371 $12,866Total Transfers to Other Funds $25,003 $10,167 $10,575 $10,998 $11,438 $11,895 $12,371 $12,866
Debt Service & Fees on $643,280 $780,000 $1,593,600Fannie Mae Line of Credit
Debt Service on BTV-Pollard site $229,343 $229,281 $229,214 $229,143 $219,358
Housing Project Grants/Funding:Acquisition/Rehabilitation/Construction $1,308,025 $2,999,915 $1,176,204 $3,102,182 $1,016,201 $1,094,354 $1,087,205 $1,079,749Affordable Housing Fee Waivers $94,367 $92,627 $94,480 $96,369 $98,297 $100,262 $102,268 $104,313BoulderTransit Village &/or Mapleton MHPTotal Capital Improvements Program $1,402,392 $3,092,542 $1,270,684 $3,198,551 $1,114,497 $1,194,617 $1,189,472 $1,184,063
Project Carryovers & Encumbrances
TOTAL USES OF FUNDS $2,475,929 $4,407,228 $3,494,967 $3,841,665 $1,760,725 $1,634,795 $1,643,383 $1,652,141
UNRESTRICTED FUND BALANCE $1,680,259 $26,031 $28,064 $30,063 $32,089 $34,144 $36,229 $38,344
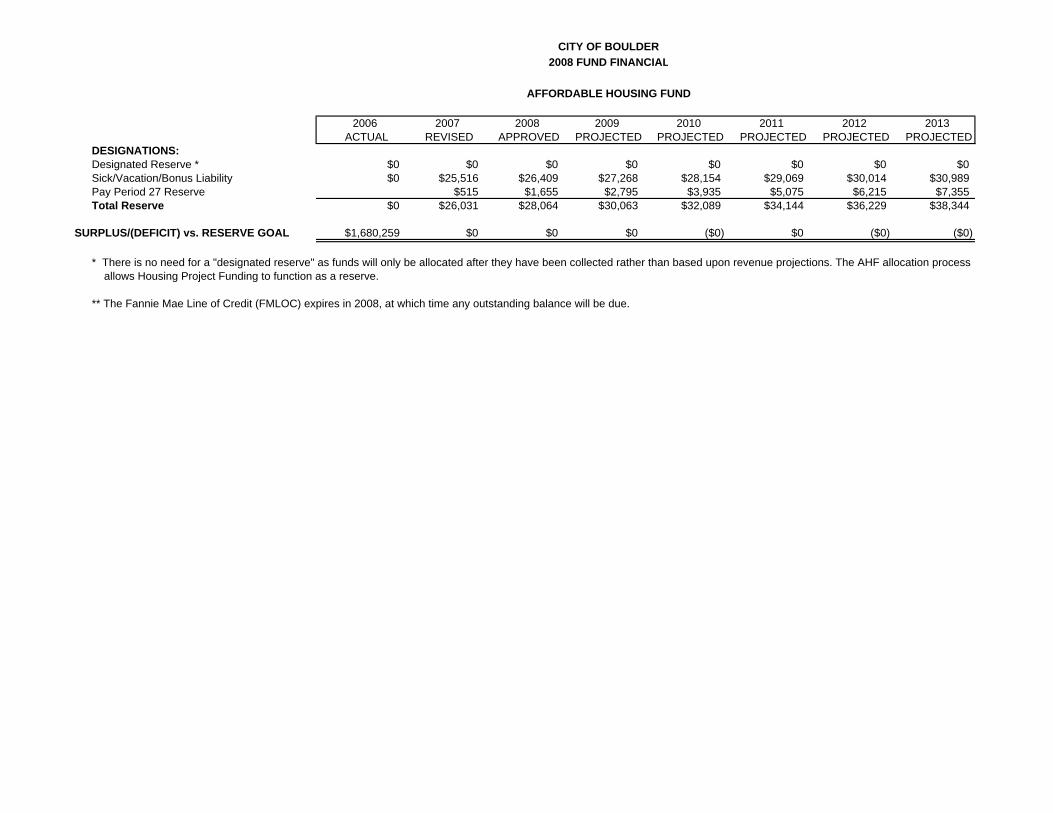
CITY OF BOULDER2008 FUND FINANCIAL
AFFORDABLE HOUSING FUND
2006 2007 2008 2009 2010 2011 2012 2013ACTUAL REVISED APPROVED PROJECTED PROJECTED PROJECTED PROJECTED PROJECTED
DESIGNATIONS:Designated Reserve * $0 $0 $0 $0 $0 $0 $0 $0Sick/Vacation/Bonus Liability $0 $25,516 $26,409 $27,268 $28,154 $29,069 $30,014 $30,989Pay Period 27 Reserve $515 $1,655 $2,795 $3,935 $5,075 $6,215 $7,355Total Reserve $0 $26,031 $28,064 $30,063 $32,089 $34,144 $36,229 $38,344
SURPLUS/(DEFICIT) vs. RESERVE GOAL $1,680,259 $0 $0 $0 ($0) $0 ($0) ($0)
* There is no need for a "designated reserve" as funds will only be allocated after they have been collected rather than based upon revenue projections. The AHF allocation process allows Housing Project Funding to function as a reserve.
** The Fannie Mae Line of Credit (FMLOC) expires in 2008, at which time any outstanding balance will be due.
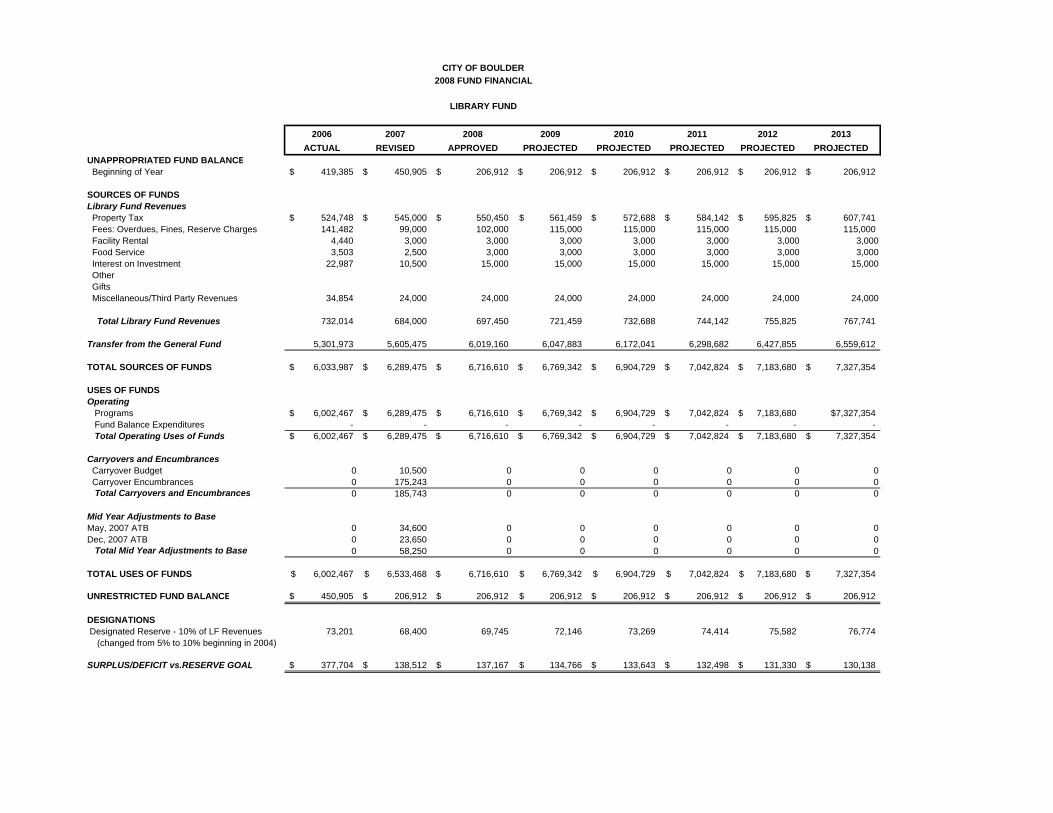
2006 2007 2008 2009 2010 2011 2012 2013ACTUAL REVISED APPROVED PROJECTED PROJECTED PROJECTED PROJECTED PROJECTED
UNAPPROPRIATED FUND BALANCE Beginning of Year 419,385$ 450,905$ 206,912$ 206,912$ 206,912$ 206,912$ 206,912$ 206,912$
SOURCES OF FUNDSLibrary Fund Revenues Property Tax 524,748$ 545,000$ 550,450$ 561,459$ 572,688$ 584,142$ 595,825$ 607,741$ Fees: Overdues, Fines, Reserve Charges 141,482 99,000 102,000 115,000 115,000 115,000 115,000 115,000 Facility Rental 4,440 3,000 3,000 3,000 3,000 3,000 3,000 3,000 Food Service 3,503 2,500 3,000 3,000 3,000 3,000 3,000 3,000 Interest on Investment 22,987 10,500 15,000 15,000 15,000 15,000 15,000 15,000 Other Gifts Miscellaneous/Third Party Revenues 34,854 24,000 24,000 24,000 24,000 24,000 24,000 24,000
Total Library Fund Revenues 732,014 684,000 697,450 721,459 732,688 744,142 755,825 767,741
Transfer from the General Fund 5,301,973 5,605,475 6,019,160 6,047,883 6,172,041 6,298,682 6,427,855 6,559,612
TOTAL SOURCES OF FUNDS 6,033,987$ 6,289,475$ 6,716,610$ 6,769,342$ 6,904,729$ 7,042,824$ 7,183,680$ 7,327,354$
USES OF FUNDSOperating Programs 6,002,467$ 6,289,475$ 6,716,610$ 6,769,342$ 6,904,729$ 7,042,824$ 7,183,680$ $7,327,354 Fund Balance Expenditures - - - - - - - - Total Operating Uses of Funds 6,002,467$ 6,289,475$ 6,716,610$ 6,769,342$ 6,904,729$ 7,042,824$ 7,183,680$ 7,327,354$
Carryovers and Encumbrances Carryover Budget 0 10,500 0 0 0 0 0 0 Carryover Encumbrances 0 175,243 0 0 0 0 0 0 Total Carryovers and Encumbrances 0 185,743 0 0 0 0 0 0
Mid Year Adjustments to BaseMay, 2007 ATB 0 34,600 0 0 0 0 0 0Dec, 2007 ATB 0 23,650 0 0 0 0 0 0 Total Mid Year Adjustments to Base 0 58,250 0 0 0 0 0 0
TOTAL USES OF FUNDS 6,002,467$ 6,533,468$ 6,716,610$ 6,769,342$ 6,904,729$ 7,042,824$ 7,183,680$ 7,327,354$
UNRESTRICTED FUND BALANCE 450,905$ 206,912$ 206,912$ 206,912$ 206,912$ 206,912$ 206,912$ 206,912$
DESIGNATIONS Designated Reserve - 10% of LF Revenues 73,201 68,400 69,745 72,146 73,269 74,414 75,582 76,774 (changed from 5% to 10% beginning in 2004)
SURPLUS/DEFICIT vs.RESERVE GOAL 377,704$ 138,512$ 137,167$ 134,766$ 133,643$ 132,498$ 131,330$ 130,138$
CITY OF BOULDER2008 FUND FINANCIAL
LIBRARY FUND
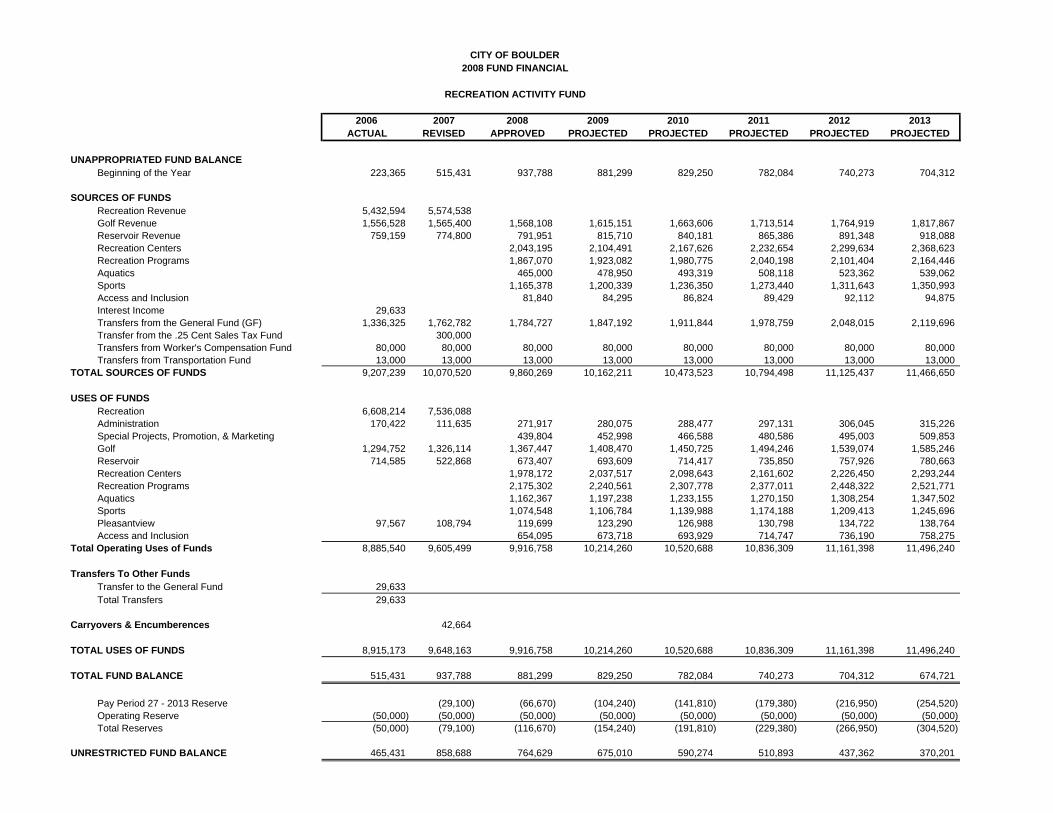
2006 2007 2008 2009 2010 2011 2012 2013
ACTUAL REVISED APPROVED PROJECTED PROJECTED PROJECTED PROJECTED PROJECTED
UNAPPROPRIATED FUND BALANCEBeginning of the Year 223,365 515,431 937,788 881,299 829,250 782,084 740,273 704,312
SOURCES OF FUNDSRecreation Revenue 5,432,594 5,574,538 Golf Revenue 1,556,528 1,565,400 1,568,108 1,615,151 1,663,606 1,713,514 1,764,919 1,817,867 Reservoir Revenue 759,159 774,800 791,951 815,710 840,181 865,386 891,348 918,088 Recreation Centers 2,043,195 2,104,491 2,167,626 2,232,654 2,299,634 2,368,623 Recreation Programs 1,867,070 1,923,082 1,980,775 2,040,198 2,101,404 2,164,446 Aquatics 465,000 478,950 493,319 508,118 523,362 539,062 Sports 1,165,378 1,200,339 1,236,350 1,273,440 1,311,643 1,350,993 Access and Inclusion 81,840 84,295 86,824 89,429 92,112 94,875 Interest Income 29,633 Transfers from the General Fund (GF) 1,336,325 1,762,782 1,784,727 1,847,192 1,911,844 1,978,759 2,048,015 2,119,696 Transfer from the .25 Cent Sales Tax Fund 300,000 Transfers from Worker's Compensation Fund 80,000 80,000 80,000 80,000 80,000 80,000 80,000 80,000 Transfers from Transportation Fund 13,000 13,000 13,000 13,000 13,000 13,000 13,000 13,000
TOTAL SOURCES OF FUNDS 9,207,239 10,070,520 9,860,269 10,162,211 10,473,523 10,794,498 11,125,437 11,466,650
USES OF FUNDSRecreation 6,608,214 7,536,088 Administration 170,422 111,635 271,917 280,075 288,477 297,131 306,045 315,226 Special Projects, Promotion, & Marketing 439,804 452,998 466,588 480,586 495,003 509,853 Golf 1,294,752 1,326,114 1,367,447 1,408,470 1,450,725 1,494,246 1,539,074 1,585,246 Reservoir 714,585 522,868 673,407 693,609 714,417 735,850 757,926 780,663 Recreation Centers 1,978,172 2,037,517 2,098,643 2,161,602 2,226,450 2,293,244 Recreation Programs 2,175,302 2,240,561 2,307,778 2,377,011 2,448,322 2,521,771 Aquatics 1,162,367 1,197,238 1,233,155 1,270,150 1,308,254 1,347,502 Sports 1,074,548 1,106,784 1,139,988 1,174,188 1,209,413 1,245,696 Pleasantview 97,567 108,794 119,699 123,290 126,988 130,798 134,722 138,764 Access and Inclusion 654,095 673,718 693,929 714,747 736,190 758,275
Total Operating Uses of Funds 8,885,540 9,605,499 9,916,758 10,214,260 10,520,688 10,836,309 11,161,398 11,496,240
Transfers To Other Funds Transfer to the General Fund 29,633 Total Transfers 29,633
Carryovers & Encumberences 42,664
TOTAL USES OF FUNDS 8,915,173 9,648,163 9,916,758 10,214,260 10,520,688 10,836,309 11,161,398 11,496,240
TOTAL FUND BALANCE 515,431 937,788 881,299 829,250 782,084 740,273 704,312 674,721
Pay Period 27 - 2013 Reserve (29,100) (66,670) (104,240) (141,810) (179,380) (216,950) (254,520) Operating Reserve (50,000) (50,000) (50,000) (50,000) (50,000) (50,000) (50,000) (50,000) Total Reserves (50,000) (79,100) (116,670) (154,240) (191,810) (229,380) (266,950) (304,520)
UNRESTRICTED FUND BALANCE 465,431 858,688 764,629 675,010 590,274 510,893 437,362 370,201
CITY OF BOULDER2008 FUND FINANCIAL
RECREATION ACTIVITY FUND
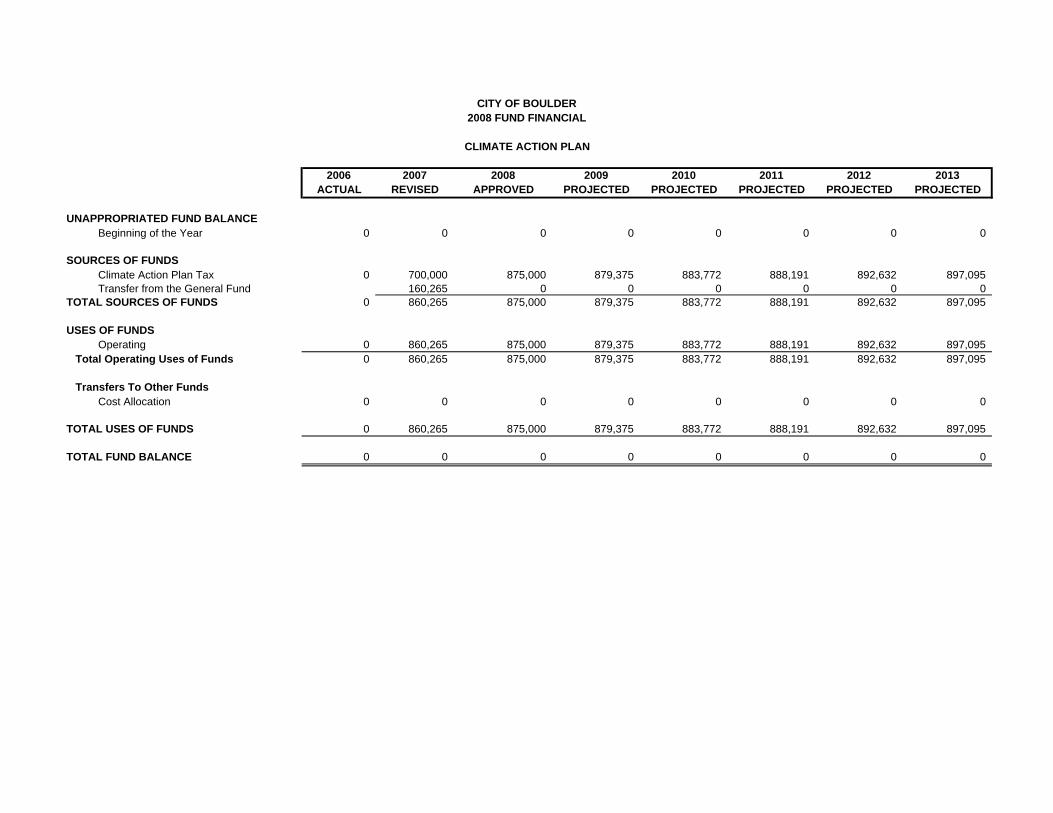
2006 2007 2008 2009 2010 2011 2012 2013ACTUAL REVISED APPROVED PROJECTED PROJECTED PROJECTED PROJECTED PROJECTED
UNAPPROPRIATED FUND BALANCEBeginning of the Year 0 0 0 0 0 0 0 0
SOURCES OF FUNDSClimate Action Plan Tax 0 700,000 875,000 879,375 883,772 888,191 892,632 897,095Transfer from the General Fund 160,265 0 0 0 0 0 0
TOTAL SOURCES OF FUNDS 0 860,265 875,000 879,375 883,772 888,191 892,632 897,095
USES OF FUNDSOperating 0 860,265 875,000 879,375 883,772 888,191 892,632 897,095
Total Operating Uses of Funds 0 860,265 875,000 879,375 883,772 888,191 892,632 897,095
Transfers To Other Funds Cost Allocation 0 0 0 0 0 0 0 0
TOTAL USES OF FUNDS 0 860,265 875,000 879,375 883,772 888,191 892,632 897,095
TOTAL FUND BALANCE 0 0 0 0 0 0 0 0
CITY OF BOULDER2008 FUND FINANCIAL
CLIMATE ACTION PLAN
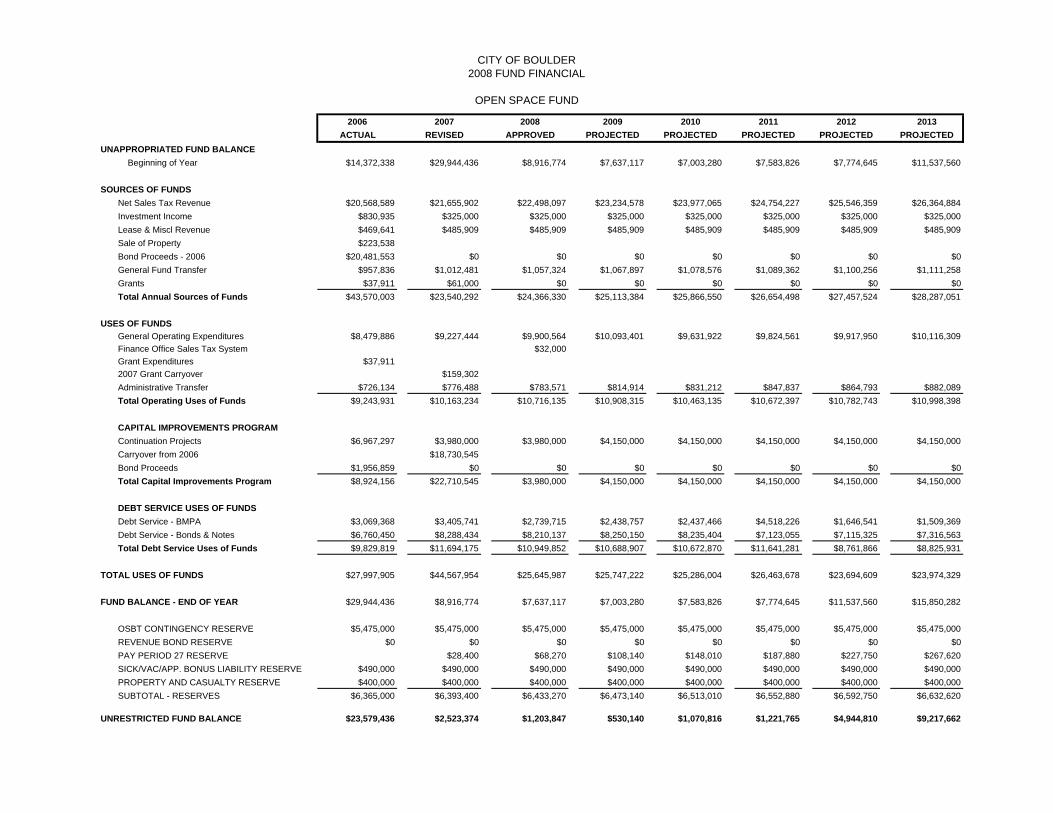
CITY OF BOULDER2008 FUND FINANCIAL
OPEN SPACE FUND
UNAPPROPRIATED FUND BALANCE Beginning of Year
SOURCES OF FUNDSNet Sales Tax RevenueInvestment IncomeLease & Miscl RevenueSale of PropertyBond Proceeds - 2006General Fund TransferGrants
Total Annual Sources of Funds
USES OF FUNDSGeneral Operating ExpendituresFinance Office Sales Tax SystemGrant Expenditures2007 Grant CarryoverAdministrative TransferTotal Operating Uses of Funds
CAPITAL IMPROVEMENTS PROGRAMContinuation ProjectsCarryover from 2006Bond ProceedsTotal Capital Improvements Program
DEBT SERVICE USES OF FUNDSDebt Service - BMPADebt Service - Bonds & NotesTotal Debt Service Uses of Funds
TOTAL USES OF FUNDS
FUND BALANCE - END OF YEAR
OSBT CONTINGENCY RESERVEREVENUE BOND RESERVEPAY PERIOD 27 RESERVESICK/VAC/APP. BONUS LIABILITY RESERVEPROPERTY AND CASUALTY RESERVESUBTOTAL - RESERVES
UNRESTRICTED FUND BALANCE
2006 2007 2008 2009 2010 2011 2012 2013ACTUAL REVISED APPROVED PROJECTED PROJECTED PROJECTED PROJECTED PROJECTED
$14,372,338 $29,944,436 $8,916,774 $7,637,117 $7,003,280 $7,583,826 $7,774,645 $11,537,560
$20,568,589 $21,655,902 $22,498,097 $23,234,578 $23,977,065 $24,754,227 $25,546,359 $26,364,884$830,935 $325,000 $325,000 $325,000 $325,000 $325,000 $325,000 $325,000$469,641 $485,909 $485,909 $485,909 $485,909 $485,909 $485,909 $485,909$223,538
$20,481,553 $0 $0 $0 $0 $0 $0 $0$957,836 $1,012,481 $1,057,324 $1,067,897 $1,078,576 $1,089,362 $1,100,256 $1,111,258
$37,911 $61,000 $0 $0 $0 $0 $0 $0$43,570,003 $23,540,292 $24,366,330 $25,113,384 $25,866,550 $26,654,498 $27,457,524 $28,287,051
$8,479,886 $9,227,444 $9,900,564 $10,093,401 $9,631,922 $9,824,561 $9,917,950 $10,116,309$32,000
$37,911$159,302
$726,134 $776,488 $783,571 $814,914 $831,212 $847,837 $864,793 $882,089$9,243,931 $10,163,234 $10,716,135 $10,908,315 $10,463,135 $10,672,397 $10,782,743 $10,998,398
$6,967,297 $3,980,000 $3,980,000 $4,150,000 $4,150,000 $4,150,000 $4,150,000 $4,150,000$18,730,545
$1,956,859 $0 $0 $0 $0 $0 $0 $0$8,924,156 $22,710,545 $3,980,000 $4,150,000 $4,150,000 $4,150,000 $4,150,000 $4,150,000
$3,069,368 $3,405,741 $2,739,715 $2,438,757 $2,437,466 $4,518,226 $1,646,541 $1,509,369$6,760,450 $8,288,434 $8,210,137 $8,250,150 $8,235,404 $7,123,055 $7,115,325 $7,316,563$9,829,819 $11,694,175 $10,949,852 $10,688,907 $10,672,870 $11,641,281 $8,761,866 $8,825,931
$27,997,905 $44,567,954 $25,645,987 $25,747,222 $25,286,004 $26,463,678 $23,694,609 $23,974,329
$29,944,436 $8,916,774 $7,637,117 $7,003,280 $7,583,826 $7,774,645 $11,537,560 $15,850,282
$5,475,000 $5,475,000 $5,475,000 $5,475,000 $5,475,000 $5,475,000 $5,475,000 $5,475,000$0 $0 $0 $0 $0 $0 $0 $0
$28,400 $68,270 $108,140 $148,010 $187,880 $227,750 $267,620$490,000 $490,000 $490,000 $490,000 $490,000 $490,000 $490,000 $490,000$400,000 $400,000 $400,000 $400,000 $400,000 $400,000 $400,000 $400,000
$6,365,000 $6,393,400 $6,433,270 $6,473,140 $6,513,010 $6,552,880 $6,592,750 $6,632,620
$23,579,436 $2,523,374 $1,203,847 $530,140 $1,070,816 $1,221,765 $4,944,810 $9,217,662
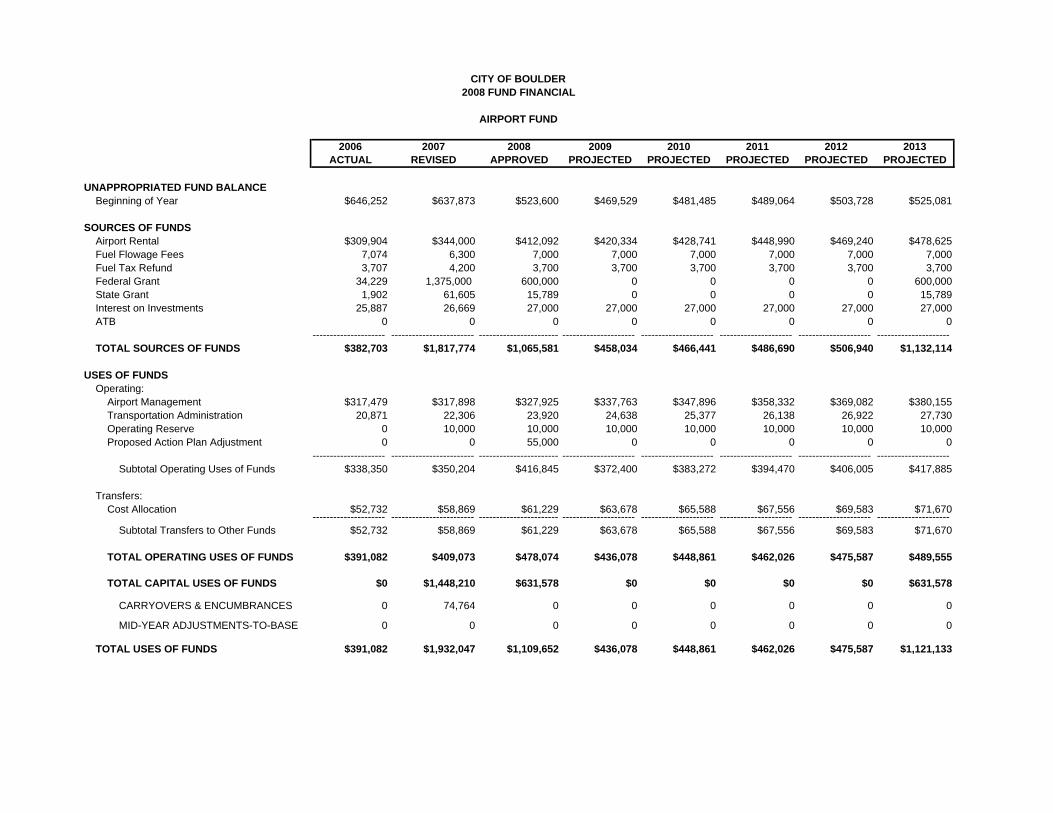
2006 2007 2008 2009 2010 2011 2012 2013ACTUAL REVISED APPROVED PROJECTED PROJECTED PROJECTED PROJECTED PROJECTED
UNAPPROPRIATED FUND BALANCEBeginning of Year $646,252 $637,873 $523,600 $469,529 $481,485 $489,064 $503,728 $525,081
SOURCES OF FUNDSAirport Rental $309,904 $344,000 $412,092 $420,334 $428,741 $448,990 $469,240 $478,625Fuel Flowage Fees 7,074 6,300 7,000 7,000 7,000 7,000 7,000 7,000Fuel Tax Refund 3,707 4,200 3,700 3,700 3,700 3,700 3,700 3,700Federal Grant 34,229 1,375,000 600,000 0 0 0 0 600,000State Grant 1,902 61,605 15,789 0 0 0 0 15,789Interest on Investments 25,887 26,669 27,000 27,000 27,000 27,000 27,000 27,000ATB 0 0 0 0 0 0 0 0
--------------------- ------------------------ ----------------------- --------------------- --------------------- --------------------- --------------------- ---------------------TOTAL SOURCES OF FUNDS $382,703 $1,817,774 $1,065,581 $458,034 $466,441 $486,690 $506,940 $1,132,114
USES OF FUNDSOperating:
Airport Management $317,479 $317,898 $327,925 $337,763 $347,896 $358,332 $369,082 $380,155Transportation Administration 20,871 22,306 23,920 24,638 25,377 26,138 26,922 27,730Operating Reserve 0 10,000 10,000 10,000 10,000 10,000 10,000 10,000Proposed Action Plan Adjustment 0 0 55,000 0 0 0 0 0
--------------------- ------------------------ ----------------------- --------------------- --------------------- --------------------- --------------------- ---------------------Subtotal Operating Uses of Funds $338,350 $350,204 $416,845 $372,400 $383,272 $394,470 $406,005 $417,885
Transfers:Cost Allocation $52,732 $58,869 $61,229 $63,678 $65,588 $67,556 $69,583 $71,670
--------------------- ------------------------ ----------------------- --------------------- --------------------- --------------------- --------------------- ---------------------Subtotal Transfers to Other Funds $52,732 $58,869 $61,229 $63,678 $65,588 $67,556 $69,583 $71,670
TOTAL OPERATING USES OF FUNDS $391,082 $409,073 $478,074 $436,078 $448,861 $462,026 $475,587 $489,555
TOTAL CAPITAL USES OF FUNDS $0 $1,448,210 $631,578 $0 $0 $0 $0 $631,578
CARRYOVERS & ENCUMBRANCES 0 74,764 0 0 0 0 0 0
MID-YEAR ADJUSTMENTS-TO-BASE 0 0 0 0 0 0 0 0
TOTAL USES OF FUNDS $391,082 $1,932,047 $1,109,652 $436,078 $448,861 $462,026 $475,587 $1,121,133
AIRPORT FUND
CITY OF BOULDER2008 FUND FINANCIAL
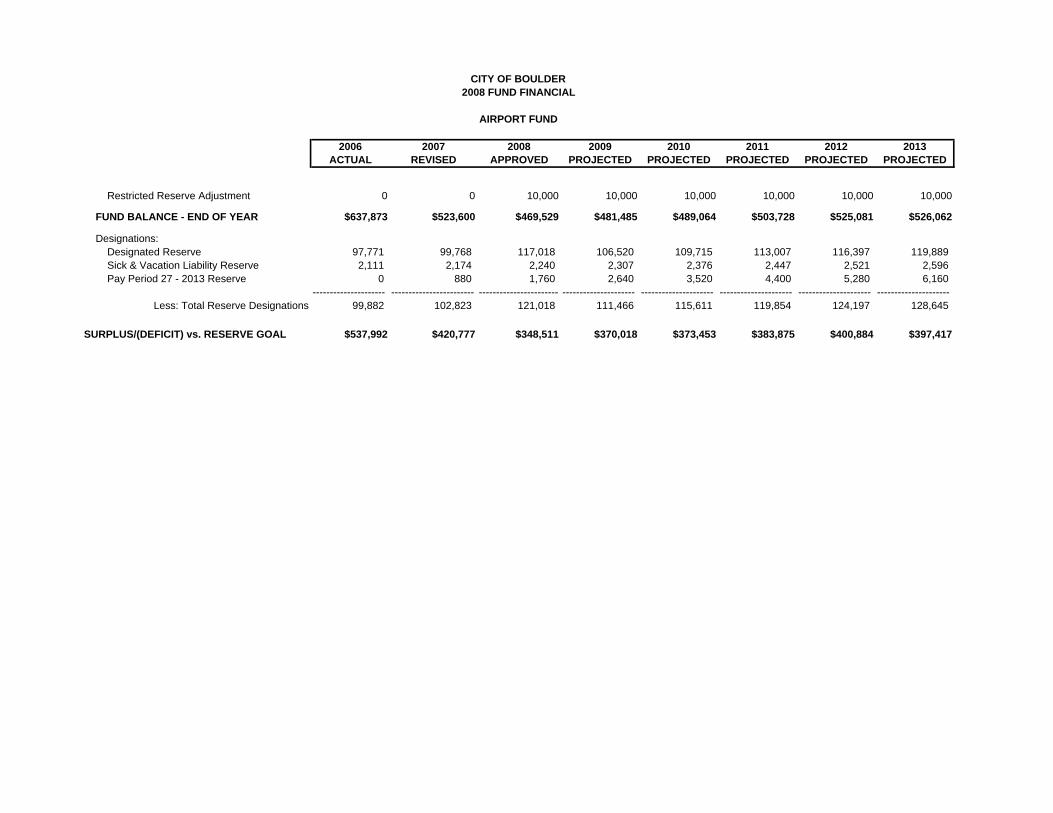
2006 2007 2008 2009 2010 2011 2012 2013ACTUAL REVISED APPROVED PROJECTED PROJECTED PROJECTED PROJECTED PROJECTED
AIRPORT FUND
CITY OF BOULDER2008 FUND FINANCIAL
Restricted Reserve Adjustment 0 0 10,000 10,000 10,000 10,000 10,000 10,000
FUND BALANCE - END OF YEAR $637,873 $523,600 $469,529 $481,485 $489,064 $503,728 $525,081 $526,062
Designations:Designated Reserve 97,771 99,768 117,018 106,520 109,715 113,007 116,397 119,889Sick & Vacation Liability Reserve 2,111 2,174 2,240 2,307 2,376 2,447 2,521 2,596Pay Period 27 - 2013 Reserve 0 880 1,760 2,640 3,520 4,400 5,280 6,160
--------------------- ------------------------ ----------------------- --------------------- --------------------- --------------------- --------------------- ---------------------Less: Total Reserve Designations 99,882 102,823 121,018 111,466 115,611 119,854 124,197 128,645
SURPLUS/(DEFICIT) vs. RESERVE GOAL $537,992 $420,777 $348,511 $370,018 $373,453 $383,875 $400,884 $397,417
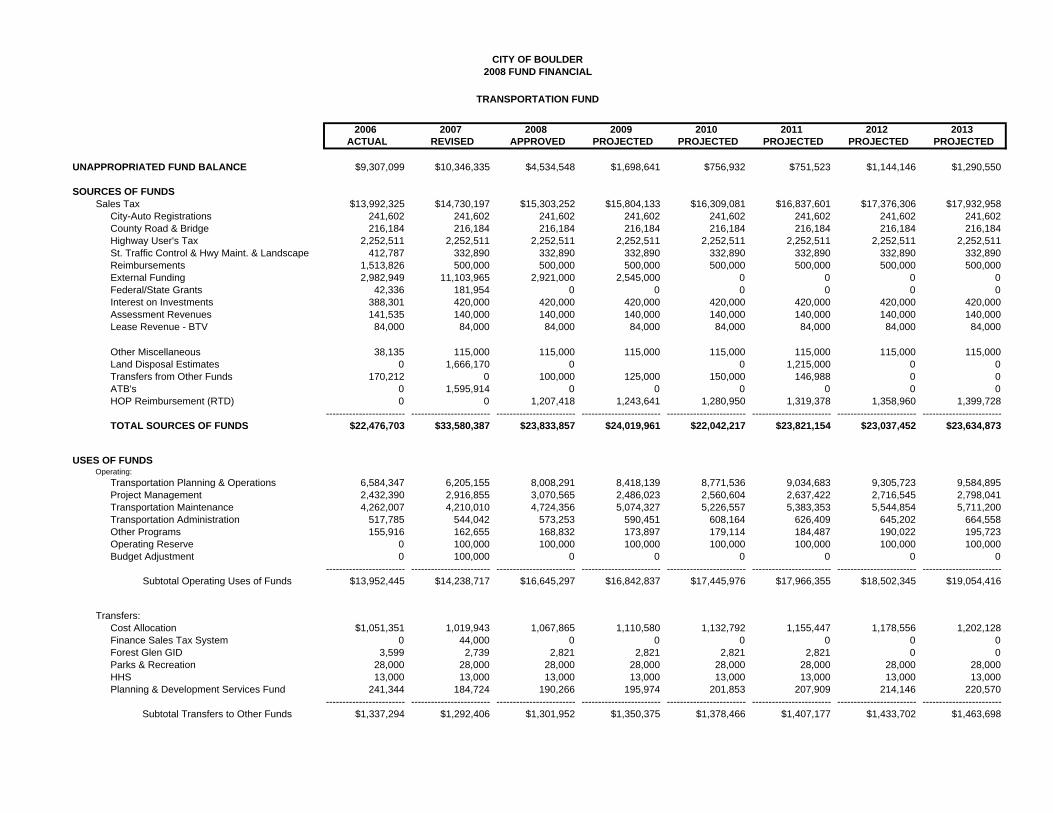
CITY OF BOULDER2008 FUND FINANCIAL
TRANSPORTATION FUND
2006 2007 2008 2009 2010 2011 2012 2013ACTUAL REVISED APPROVED PROJECTED PROJECTED PROJECTED PROJECTED PROJECTED
UNAPPROPRIATED FUND BALANCE $9,307,099 $10,346,335 $4,534,548 $1,698,641 $756,932 $751,523 $1,144,146 $1,290,550
SOURCES OF FUNDSSales Tax $13,992,325 $14,730,197 $15,303,252 $15,804,133 $16,309,081 $16,837,601 $17,376,306 $17,932,958
City-Auto Registrations 241,602 241,602 241,602 241,602 241,602 241,602 241,602 241,602County Road & Bridge 216,184 216,184 216,184 216,184 216,184 216,184 216,184 216,184Highway User's Tax 2,252,511 2,252,511 2,252,511 2,252,511 2,252,511 2,252,511 2,252,511 2,252,511St. Traffic Control & Hwy Maint. & Landscape 412,787 332,890 332,890 332,890 332,890 332,890 332,890 332,890Reimbursements 1,513,826 500,000 500,000 500,000 500,000 500,000 500,000 500,000External Funding 2,982,949 11,103,965 2,921,000 2,545,000 0 0 0 0Federal/State Grants 42,336 181,954 0 0 0 0 0 0Interest on Investments 388,301 420,000 420,000 420,000 420,000 420,000 420,000 420,000Assessment Revenues 141,535 140,000 140,000 140,000 140,000 140,000 140,000 140,000Lease Revenue - BTV 84,000 84,000 84,000 84,000 84,000 84,000 84,000 84,000
Other Miscellaneous 38,135 115,000 115,000 115,000 115,000 115,000 115,000 115,000Land Disposal Estimates 0 1,666,170 0 0 1,215,000 0 0Transfers from Other Funds 170,212 0 100,000 125,000 150,000 146,988 0 0ATB's 0 1,595,914 0 0 0 0 0 0HOP Reimbursement (RTD) 0 0 1,207,418 1,243,641 1,280,950 1,319,378 1,358,960 1,399,728
------------------------ ------------------------ ------------------------ ------------------------ ------------------------ ------------------------ ------------------------ ------------------------TOTAL SOURCES OF FUNDS $22,476,703 $33,580,387 $23,833,857 $24,019,961 $22,042,217 $23,821,154 $23,037,452 $23,634,873
USES OF FUNDSOperating:
Transportation Planning & Operations 6,584,347 6,205,155 8,008,291 8,418,139 8,771,536 9,034,683 9,305,723 9,584,895Project Management 2,432,390 2,916,855 3,070,565 2,486,023 2,560,604 2,637,422 2,716,545 2,798,041Transportation Maintenance 4,262,007 4,210,010 4,724,356 5,074,327 5,226,557 5,383,353 5,544,854 5,711,200Transportation Administration 517,785 544,042 573,253 590,451 608,164 626,409 645,202 664,558Other Programs 155,916 162,655 168,832 173,897 179,114 184,487 190,022 195,723Operating Reserve 0 100,000 100,000 100,000 100,000 100,000 100,000 100,000Budget Adjustment 0 100,000 0 0 0 0 0 0
------------------------ ------------------------ ------------------------ ------------------------ ------------------------ ------------------------ ------------------------ ------------------------Subtotal Operating Uses of Funds $13,952,445 $14,238,717 $16,645,297 $16,842,837 $17,445,976 $17,966,355 $18,502,345 $19,054,416
Transfers:Cost Allocation $1,051,351 1,019,943 1,067,865 1,110,580 1,132,792 1,155,447 1,178,556 1,202,128Finance Sales Tax System 0 44,000 0 0 0 0 0 0Forest Glen GID 3,599 2,739 2,821 2,821 2,821 2,821 0 0Parks & Recreation 28,000 28,000 28,000 28,000 28,000 28,000 28,000 28,000HHS 13,000 13,000 13,000 13,000 13,000 13,000 13,000 13,000Planning & Development Services Fund 241,344 184,724 190,266 195,974 201,853 207,909 214,146 220,570
------------------------ ------------------------ ------------------------ ------------------------ ------------------------ ------------------------ ------------------------ ------------------------Subtotal Transfers to Other Funds $1,337,294 $1,292,406 $1,301,952 $1,350,375 $1,378,466 $1,407,177 $1,433,702 $1,463,698
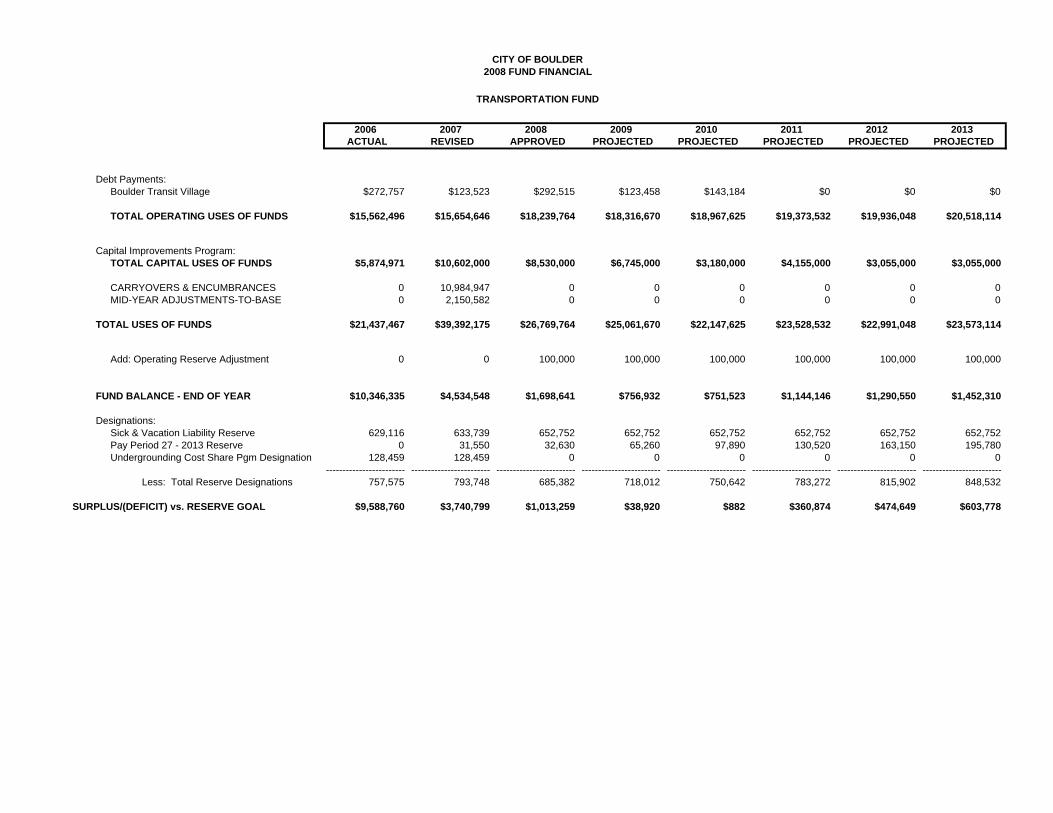
CITY OF BOULDER2008 FUND FINANCIAL
TRANSPORTATION FUND
2006 2007 2008 2009 2010 2011 2012 2013ACTUAL REVISED APPROVED PROJECTED PROJECTED PROJECTED PROJECTED PROJECTED
Debt Payments: Boulder Transit Village $272,757 $123,523 $292,515 $123,458 $143,184 $0 $0 $0
TOTAL OPERATING USES OF FUNDS $15,562,496 $15,654,646 $18,239,764 $18,316,670 $18,967,625 $19,373,532 $19,936,048 $20,518,114
Capital Improvements Program:TOTAL CAPITAL USES OF FUNDS $5,874,971 $10,602,000 $8,530,000 $6,745,000 $3,180,000 $4,155,000 $3,055,000 $3,055,000
CARRYOVERS & ENCUMBRANCES 0 10,984,947 0 0 0 0 0 0MID-YEAR ADJUSTMENTS-TO-BASE 0 2,150,582 0 0 0 0 0 0
TOTAL USES OF FUNDS $21,437,467 $39,392,175 $26,769,764 $25,061,670 $22,147,625 $23,528,532 $22,991,048 $23,573,114
Add: Operating Reserve Adjustment 0 0 100,000 100,000 100,000 100,000 100,000 100,000
FUND BALANCE - END OF YEAR $10,346,335 $4,534,548 $1,698,641 $756,932 $751,523 $1,144,146 $1,290,550 $1,452,310
Designations:Sick & Vacation Liability Reserve 629,116 633,739 652,752 652,752 652,752 652,752 652,752 652,752Pay Period 27 - 2013 Reserve 0 31,550 32,630 65,260 97,890 130,520 163,150 195,780Undergrounding Cost Share Pgm Designation 128,459 128,459 0 0 0 0 0 0
------------------------ ------------------------ ------------------------ ------------------------ ------------------------ ------------------------ ------------------------ ------------------------Less: Total Reserve Designations 757,575 793,748 685,382 718,012 750,642 783,272 815,902 848,532
SURPLUS/(DEFICIT) vs. RESERVE GOAL $9,588,760 $3,740,799 $1,013,259 $38,920 $882 $360,874 $474,649 $603,778
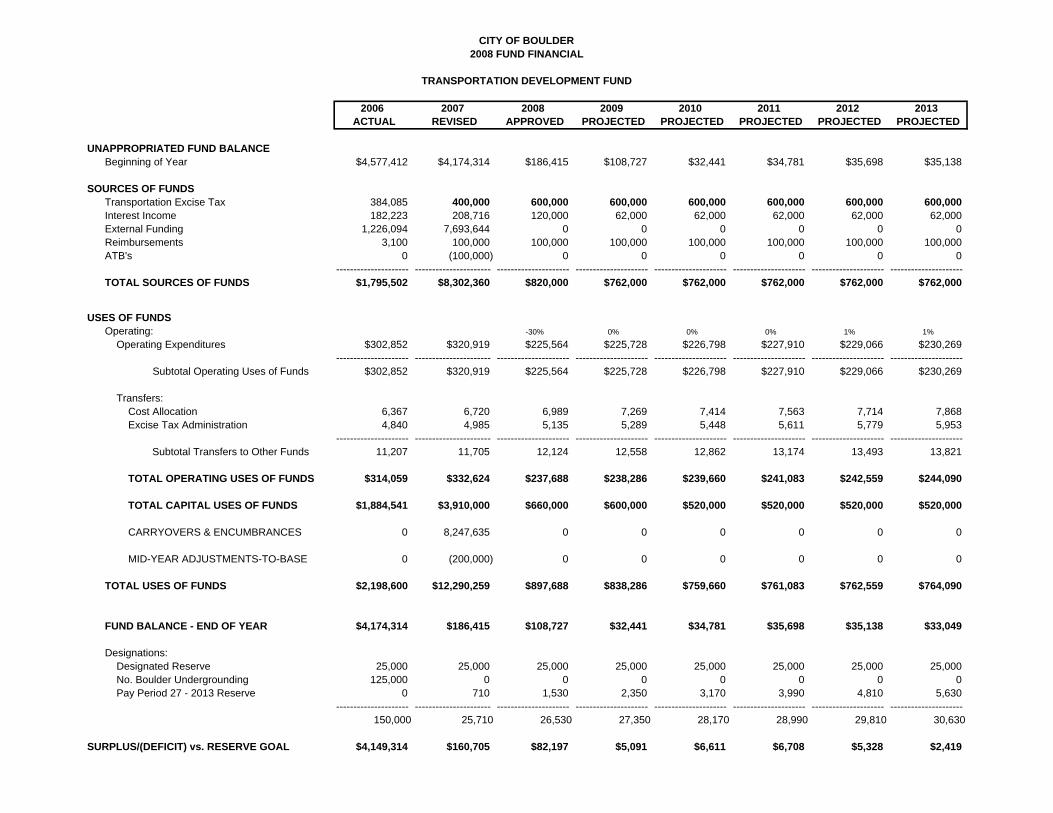
2006 2007 2008 2009 2010 2011 2012 2013ACTUAL REVISED APPROVED PROJECTED PROJECTED PROJECTED PROJECTED PROJECTED
UNAPPROPRIATED FUND BALANCEBeginning of Year $4,577,412 $4,174,314 $186,415 $108,727 $32,441 $34,781 $35,698 $35,138
SOURCES OF FUNDSTransportation Excise Tax 384,085 400,000 600,000 600,000 600,000 600,000 600,000 600,000Interest Income 182,223 208,716 120,000 62,000 62,000 62,000 62,000 62,000External Funding 1,226,094 7,693,644 0 0 0 0 0 0Reimbursements 3,100 100,000 100,000 100,000 100,000 100,000 100,000 100,000ATB's 0 (100,000) 0 0 0 0 0 0
--------------------- ---------------------- --------------------- --------------------- --------------------- --------------------- --------------------- ---------------------TOTAL SOURCES OF FUNDS $1,795,502 $8,302,360 $820,000 $762,000 $762,000 $762,000 $762,000 $762,000
USES OF FUNDSOperating: -30% 0% 0% 0% 1% 1%
Operating Expenditures $302,852 $320,919 $225,564 $225,728 $226,798 $227,910 $229,066 $230,269--------------------- ---------------------- --------------------- --------------------- --------------------- --------------------- --------------------- ---------------------
Subtotal Operating Uses of Funds $302,852 $320,919 $225,564 $225,728 $226,798 $227,910 $229,066 $230,269
Transfers:Cost Allocation 6,367 6,720 6,989 7,269 7,414 7,563 7,714 7,868Excise Tax Administration 4,840 4,985 5,135 5,289 5,448 5,611 5,779 5,953
--------------------- ---------------------- --------------------- --------------------- --------------------- --------------------- --------------------- ---------------------Subtotal Transfers to Other Funds 11,207 11,705 12,124 12,558 12,862 13,174 13,493 13,821
TOTAL OPERATING USES OF FUNDS $314,059 $332,624 $237,688 $238,286 $239,660 $241,083 $242,559 $244,090
TOTAL CAPITAL USES OF FUNDS $1,884,541 $3,910,000 $660,000 $600,000 $520,000 $520,000 $520,000 $520,000
CARRYOVERS & ENCUMBRANCES 0 8,247,635 0 0 0 0 0 0
MID-YEAR ADJUSTMENTS-TO-BASE 0 (200,000) 0 0 0 0 0 0
TOTAL USES OF FUNDS $2,198,600 $12,290,259 $897,688 $838,286 $759,660 $761,083 $762,559 $764,090
FUND BALANCE - END OF YEAR $4,174,314 $186,415 $108,727 $32,441 $34,781 $35,698 $35,138 $33,049
Designations:Designated Reserve 25,000 25,000 25,000 25,000 25,000 25,000 25,000 25,000No. Boulder Undergrounding 125,000 0 0 0 0 0 0 0Pay Period 27 - 2013 Reserve 0 710 1,530 2,350 3,170 3,990 4,810 5,630
--------------------- ---------------------- --------------------- --------------------- --------------------- --------------------- --------------------- ---------------------150,000 25,710 26,530 27,350 28,170 28,990 29,810 30,630
SURPLUS/(DEFICIT) vs. RESERVE GOAL $4,149,314 $160,705 $82,197 $5,091 $6,611 $6,708 $5,328 $2,419
CITY OF BOULDER2008 FUND FINANCIAL
TRANSPORTATION DEVELOPMENT FUND
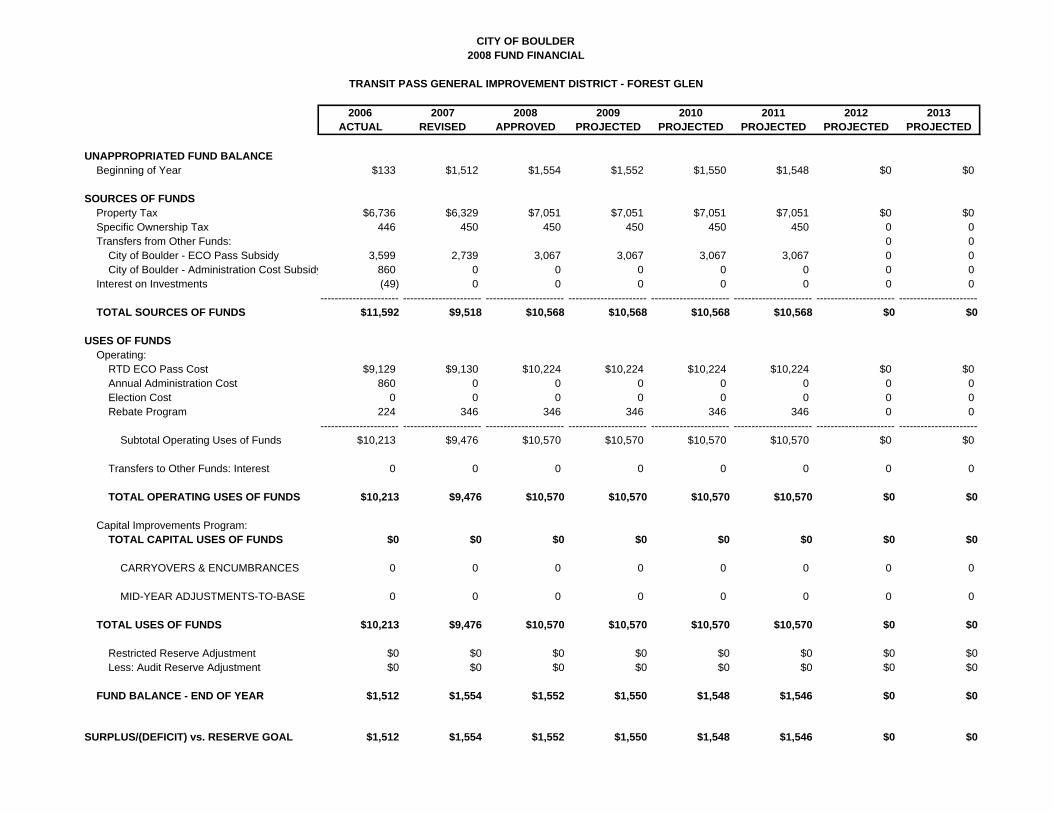
CITY OF BOULDER2008 FUND FINANCIAL
TRANSIT PASS GENERAL IMPROVEMENT DISTRICT - FOREST GLEN
2006 2007 2008 2009 2010 2011 2012 2013ACTUAL REVISED APPROVED PROJECTED PROJECTED PROJECTED PROJECTED PROJECTED
UNAPPROPRIATED FUND BALANCEBeginning of Year $133 $1,512 $1,554 $1,552 $1,550 $1,548 $0 $0
SOURCES OF FUNDSProperty Tax $6,736 $6,329 $7,051 $7,051 $7,051 $7,051 $0 $0Specific Ownership Tax 446 450 450 450 450 450 0 0Transfers from Other Funds: 0 0
City of Boulder - ECO Pass Subsidy 3,599 2,739 3,067 3,067 3,067 3,067 0 0City of Boulder - Administration Cost Subsidy 860 0 0 0 0 0 0 0
Interest on Investments (49) 0 0 0 0 0 0 0---------------------- ---------------------- ---------------------- ---------------------- ---------------------- ---------------------- ---------------------- ----------------------
TOTAL SOURCES OF FUNDS $11,592 $9,518 $10,568 $10,568 $10,568 $10,568 $0 $0
USES OF FUNDSOperating:
RTD ECO Pass Cost $9,129 $9,130 $10,224 $10,224 $10,224 $10,224 $0 $0Annual Administration Cost 860 0 0 0 0 0 0 0Election Cost 0 0 0 0 0 0 0 0Rebate Program 224 346 346 346 346 346 0 0
---------------------- ---------------------- ---------------------- ---------------------- ---------------------- ---------------------- ---------------------- ----------------------Subtotal Operating Uses of Funds $10,213 $9,476 $10,570 $10,570 $10,570 $10,570 $0 $0
Transfers to Other Funds: Interest 0 0 0 0 0 0 0 0
TOTAL OPERATING USES OF FUNDS $10,213 $9,476 $10,570 $10,570 $10,570 $10,570 $0 $0
Capital Improvements Program:TOTAL CAPITAL USES OF FUNDS $0 $0 $0 $0 $0 $0 $0 $0
CARRYOVERS & ENCUMBRANCES 0 0 0 0 0 0 0 0
MID-YEAR ADJUSTMENTS-TO-BASE 0 0 0 0 0 0 0 0
TOTAL USES OF FUNDS $10,213 $9,476 $10,570 $10,570 $10,570 $10,570 $0 $0
Restricted Reserve Adjustment $0 $0 $0 $0 $0 $0 $0 $0Less: Audit Reserve Adjustment $0 $0 $0 $0 $0 $0 $0 $0
FUND BALANCE - END OF YEAR $1,512 $1,554 $1,552 $1,550 $1,548 $1,546 $0 $0
SURPLUS/(DEFICIT) vs. RESERVE GOAL $1,512 $1,554 $1,552 $1,550 $1,548 $1,546 $0 $0
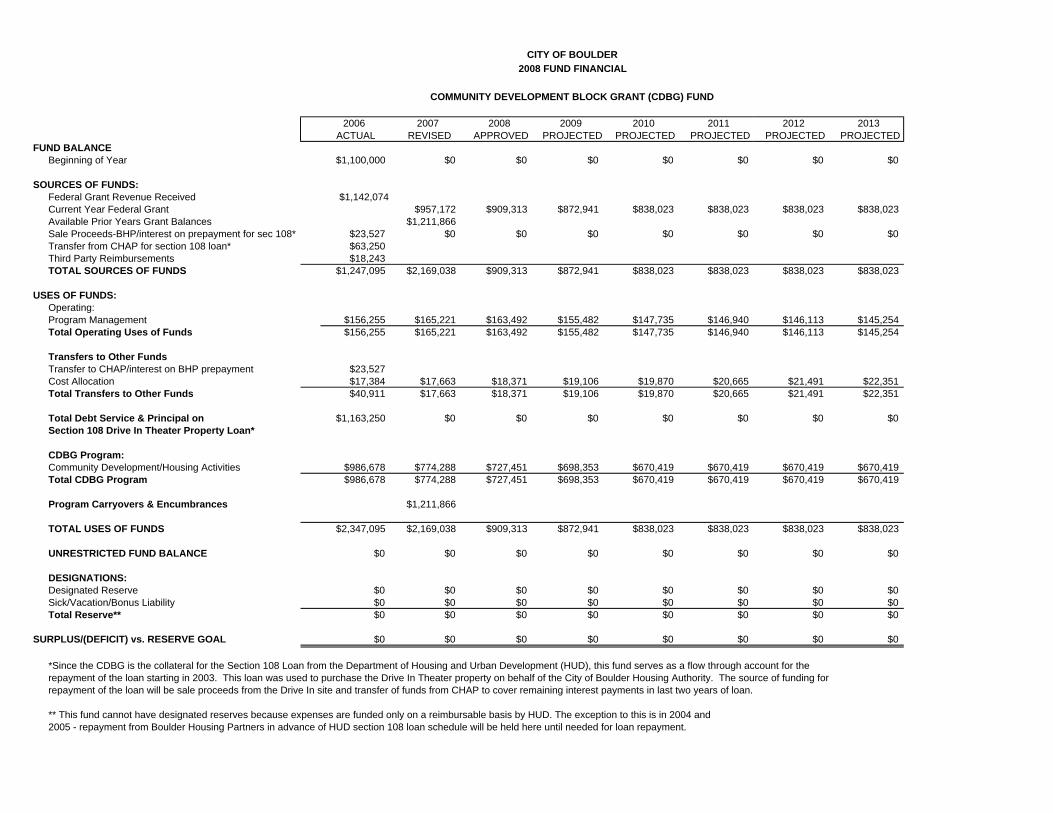
CITY OF BOULDER2008 FUND FINANCIAL
COMMUNITY DEVELOPMENT BLOCK GRANT (CDBG) FUND
2006 2007 2008 2009 2010 2011 2012 2013ACTUAL REVISED APPROVED PROJECTED PROJECTED PROJECTED PROJECTED PROJECTED
FUND BALANCEBeginning of Year $1,100,000 $0 $0 $0 $0 $0 $0 $0
SOURCES OF FUNDS:Federal Grant Revenue Received $1,142,074Current Year Federal Grant $957,172 $909,313 $872,941 $838,023 $838,023 $838,023 $838,023Available Prior Years Grant Balances $1,211,866Sale Proceeds-BHP/interest on prepayment for sec 108* $23,527 $0 $0 $0 $0 $0 $0 $0Transfer from CHAP for section 108 loan* $63,250Third Party Reimbursements $18,243TOTAL SOURCES OF FUNDS $1,247,095 $2,169,038 $909,313 $872,941 $838,023 $838,023 $838,023 $838,023
USES OF FUNDS:Operating:Program Management $156,255 $165,221 $163,492 $155,482 $147,735 $146,940 $146,113 $145,254Total Operating Uses of Funds $156,255 $165,221 $163,492 $155,482 $147,735 $146,940 $146,113 $145,254
Transfers to Other FundsTransfer to CHAP/interest on BHP prepayment $23,527Cost Allocation $17,384 $17,663 $18,371 $19,106 $19,870 $20,665 $21,491 $22,351Total Transfers to Other Funds $40,911 $17,663 $18,371 $19,106 $19,870 $20,665 $21,491 $22,351
Total Debt Service & Principal on $1,163,250 $0 $0 $0 $0 $0 $0 $0 Section 108 Drive In Theater Property Loan*
CDBG Program:Community Development/Housing Activities $986,678 $774,288 $727,451 $698,353 $670,419 $670,419 $670,419 $670,419Total CDBG Program $986,678 $774,288 $727,451 $698,353 $670,419 $670,419 $670,419 $670,419
Program Carryovers & Encumbrances $1,211,866
TOTAL USES OF FUNDS $2,347,095 $2,169,038 $909,313 $872,941 $838,023 $838,023 $838,023 $838,023
UNRESTRICTED FUND BALANCE $0 $0 $0 $0 $0 $0 $0 $0
DESIGNATIONS:Designated Reserve $0 $0 $0 $0 $0 $0 $0 $0Sick/Vacation/Bonus Liability $0 $0 $0 $0 $0 $0 $0 $0Total Reserve** $0 $0 $0 $0 $0 $0 $0 $0
SURPLUS/(DEFICIT) vs. RESERVE GOAL $0 $0 $0 $0 $0 $0 $0 $0
*Since the CDBG is the collateral for the Section 108 Loan from the Department of Housing and Urban Development (HUD), this fund serves as a flow through account for therepayment of the loan starting in 2003. This loan was used to purchase the Drive In Theater property on behalf of the City of Boulder Housing Authority. The source of funding forrepayment of the loan will be sale proceeds from the Drive In site and transfer of funds from CHAP to cover remaining interest payments in last two years of loan.
** This fund cannot have designated reserves because expenses are funded only on a reimbursable basis by HUD. The exception to this is in 2004 and2005 - repayment from Boulder Housing Partners in advance of HUD section 108 loan schedule will be held here until needed for loan repayment.
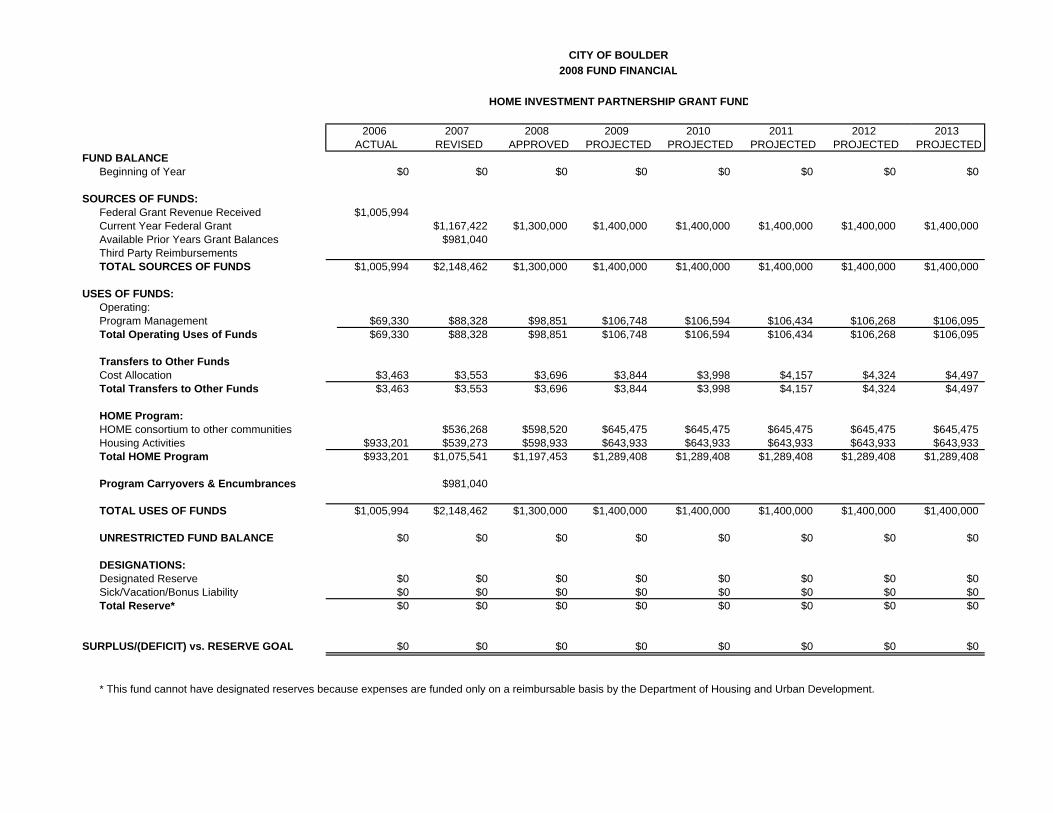
CITY OF BOULDER2008 FUND FINANCIAL
HOME INVESTMENT PARTNERSHIP GRANT FUND
2006 2007 2008 2009 2010 2011 2012 2013ACTUAL REVISED APPROVED PROJECTED PROJECTED PROJECTED PROJECTED PROJECTED
FUND BALANCEBeginning of Year $0 $0 $0 $0 $0 $0 $0 $0
SOURCES OF FUNDS:Federal Grant Revenue Received $1,005,994Current Year Federal Grant $1,167,422 $1,300,000 $1,400,000 $1,400,000 $1,400,000 $1,400,000 $1,400,000Available Prior Years Grant Balances $981,040Third Party ReimbursementsTOTAL SOURCES OF FUNDS $1,005,994 $2,148,462 $1,300,000 $1,400,000 $1,400,000 $1,400,000 $1,400,000 $1,400,000
USES OF FUNDS:Operating:Program Management $69,330 $88,328 $98,851 $106,748 $106,594 $106,434 $106,268 $106,095Total Operating Uses of Funds $69,330 $88,328 $98,851 $106,748 $106,594 $106,434 $106,268 $106,095
Transfers to Other FundsCost Allocation $3,463 $3,553 $3,696 $3,844 $3,998 $4,157 $4,324 $4,497Total Transfers to Other Funds $3,463 $3,553 $3,696 $3,844 $3,998 $4,157 $4,324 $4,497
HOME Program:HOME consortium to other communities $536,268 $598,520 $645,475 $645,475 $645,475 $645,475 $645,475Housing Activities $933,201 $539,273 $598,933 $643,933 $643,933 $643,933 $643,933 $643,933Total HOME Program $933,201 $1,075,541 $1,197,453 $1,289,408 $1,289,408 $1,289,408 $1,289,408 $1,289,408
Program Carryovers & Encumbrances $981,040
TOTAL USES OF FUNDS $1,005,994 $2,148,462 $1,300,000 $1,400,000 $1,400,000 $1,400,000 $1,400,000 $1,400,000
UNRESTRICTED FUND BALANCE $0 $0 $0 $0 $0 $0 $0 $0
DESIGNATIONS:Designated Reserve $0 $0 $0 $0 $0 $0 $0 $0Sick/Vacation/Bonus Liability $0 $0 $0 $0 $0 $0 $0 $0Total Reserve* $0 $0 $0 $0 $0 $0 $0 $0
SURPLUS/(DEFICIT) vs. RESERVE GOAL $0 $0 $0 $0 $0 $0 $0 $0
* This fund cannot have designated reserves because expenses are funded only on a reimbursable basis by the Department of Housing and Urban Development.
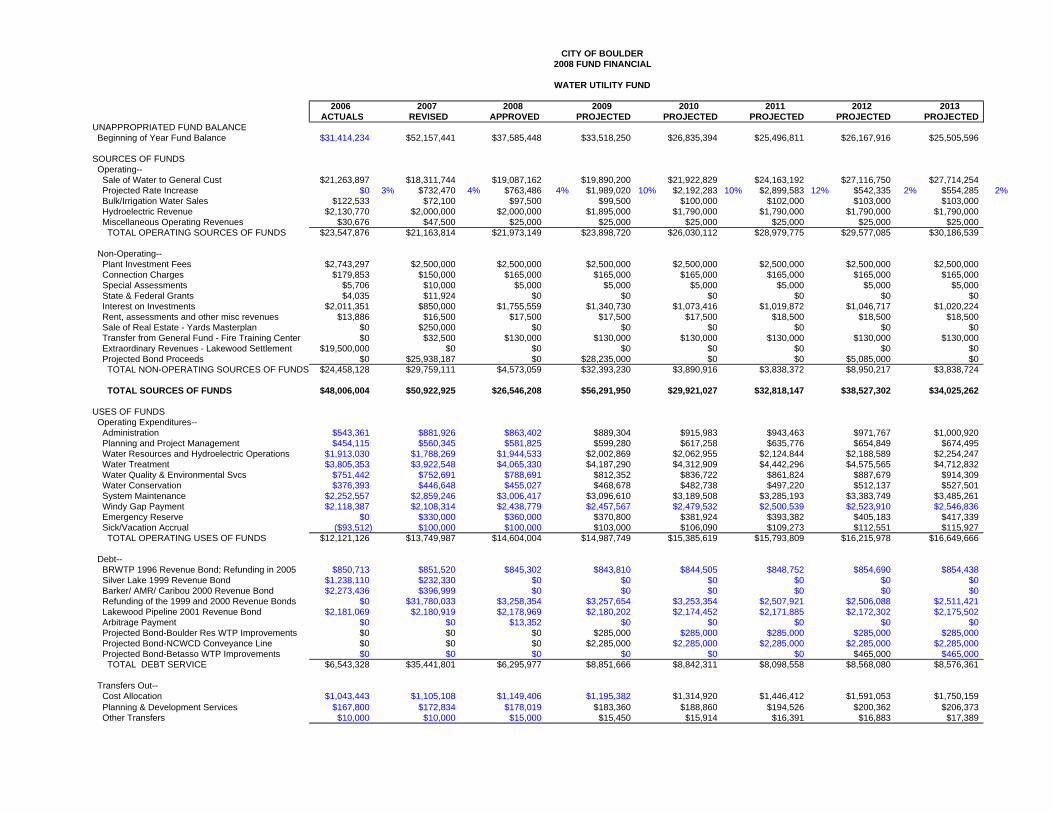
CITY OF BOULDER2008 FUND FINANCIAL
WATER UTILITY FUND
2006 2007 2008 2009 2010 2011 2012 2013ACTUALS REVISED APPROVED PROJECTED PROJECTED PROJECTED PROJECTED PROJECTED
UNAPPROPRIATED FUND BALANCE Beginning of Year Fund Balance $31,414,234 $52,157,441 $37,585,448 $33,518,250 $26,835,394 $25,496,811 $26,167,916 $25,505,596
SOURCES OF FUNDS Operating-- Sale of Water to General Cust $21,263,897 $18,311,744 $19,087,162 $19,890,200 $21,922,829 $24,163,192 $27,116,750 $27,714,254 Projected Rate Increase $0 3% $732,470 4% $763,486 4% $1,989,020 10% $2,192,283 10% $2,899,583 12% $542,335 2% $554,285 2% Bulk/Irrigation Water Sales $122,533 $72,100 $97,500 $99,500 $100,000 $102,000 $103,000 $103,000 Hydroelectric Revenue $2,130,770 $2,000,000 $2,000,000 $1,895,000 $1,790,000 $1,790,000 $1,790,000 $1,790,000 Miscellaneous Operating Revenues $30,676 $47,500 $25,000 $25,000 $25,000 $25,000 $25,000 $25,000 TOTAL OPERATING SOURCES OF FUNDS $23,547,876 $21,163,814 $21,973,149 $23,898,720 $26,030,112 $28,979,775 $29,577,085 $30,186,539
Non-Operating-- Plant Investment Fees $2,743,297 $2,500,000 $2,500,000 $2,500,000 $2,500,000 $2,500,000 $2,500,000 $2,500,000 Connection Charges $179,853 $150,000 $165,000 $165,000 $165,000 $165,000 $165,000 $165,000 Special Assessments $5,706 $10,000 $5,000 $5,000 $5,000 $5,000 $5,000 $5,000 State & Federal Grants $4,035 $11,924 $0 $0 $0 $0 $0 $0 Interest on Investments $2,011,351 $850,000 $1,755,559 $1,340,730 $1,073,416 $1,019,872 $1,046,717 $1,020,224 Rent, assessments and other misc revenues $13,886 $16,500 $17,500 $17,500 $17,500 $18,500 $18,500 $18,500 Sale of Real Estate - Yards Masterplan $0 $250,000 $0 $0 $0 $0 $0 $0 Transfer from General Fund - Fire Training Center $0 $32,500 $130,000 $130,000 $130,000 $130,000 $130,000 $130,000 Extraordinary Revenues - Lakewood Settlement $19,500,000 $0 $0 $0 $0 $0 $0 $0 Projected Bond Proceeds $0 $25,938,187 $0 $28,235,000 $0 $0 $5,085,000 $0 TOTAL NON-OPERATING SOURCES OF FUNDS $24,458,128 $29,759,111 $4,573,059 $32,393,230 $3,890,916 $3,838,372 $8,950,217 $3,838,724
TOTAL SOURCES OF FUNDS $48,006,004 $50,922,925 $26,546,208 $56,291,950 $29,921,027 $32,818,147 $38,527,302 $34,025,262
USES OF FUNDS Operating Expenditures-- Administration $543,361 $881,926 $863,402 $889,304 $915,983 $943,463 $971,767 $1,000,920 Planning and Project Management $454,115 $560,345 $581,825 $599,280 $617,258 $635,776 $654,849 $674,495 Water Resources and Hydroelectric Operations $1,913,030 $1,788,269 $1,944,533 $2,002,869 $2,062,955 $2,124,844 $2,188,589 $2,254,247 Water Treatment $3,805,353 $3,922,548 $4,065,330 $4,187,290 $4,312,909 $4,442,296 $4,575,565 $4,712,832 Water Quality & Environmental Svcs $751,442 $752,691 $788,691 $812,352 $836,722 $861,824 $887,679 $914,309 Water Conservation $376,393 $446,648 $455,027 $468,678 $482,738 $497,220 $512,137 $527,501 System Maintenance $2,252,557 $2,859,246 $3,006,417 $3,096,610 $3,189,508 $3,285,193 $3,383,749 $3,485,261 Windy Gap Payment $2,118,387 $2,108,314 $2,438,779 $2,457,567 $2,479,532 $2,500,539 $2,523,910 $2,546,836 Emergency Reserve $0 $330,000 $360,000 $370,800 $381,924 $393,382 $405,183 $417,339 Sick/Vacation Accrual ($93,512) $100,000 $100,000 $103,000 $106,090 $109,273 $112,551 $115,927 TOTAL OPERATING USES OF FUNDS $12,121,126 $13,749,987 $14,604,004 $14,987,749 $15,385,619 $15,793,809 $16,215,978 $16,649,666
Debt-- BRWTP 1996 Revenue Bond; Refunding in 2005 $850,713 $851,520 $845,302 $843,810 $844,505 $848,752 $854,690 $854,438 Silver Lake 1999 Revenue Bond $1,238,110 $232,330 $0 $0 $0 $0 $0 $0 Barker/ AMR/ Caribou 2000 Revenue Bond $2,273,436 $396,999 $0 $0 $0 $0 $0 $0 Refunding of the 1999 and 2000 Revenue Bonds $0 $31,780,033 $3,258,354 $3,257,654 $3,253,354 $2,507,921 $2,506,088 $2,511,421 Lakewood Pipeline 2001 Revenue Bond $2,181,069 $2,180,919 $2,178,969 $2,180,202 $2,174,452 $2,171,885 $2,172,302 $2,175,502 Arbitrage Payment $0 $0 $13,352 $0 $0 $0 $0 $0 Projected Bond-Boulder Res WTP Improvements $0 $0 $0 $285,000 $285,000 $285,000 $285,000 $285,000 Projected Bond-NCWCD Conveyance Line $0 $0 $0 $2,285,000 $2,285,000 $2,285,000 $2,285,000 $2,285,000 Projected Bond-Betasso WTP Improvements $0 $0 $0 $0 $0 $0 $465,000 $465,000 TOTAL DEBT SERVICE $6,543,328 $35,441,801 $6,295,977 $8,851,666 $8,842,311 $8,098,558 $8,568,080 $8,576,361
Transfers Out-- Cost Allocation $1,043,443 $1,105,108 $1,149,406 $1,195,382 $1,314,920 $1,446,412 $1,591,053 $1,750,159 Planning & Development Services $167,800 $172,834 $178,019 $183,360 $188,860 $194,526 $200,362 $206,373 Other Transfers $10,000 $10,000 $15,000 $15,450 $15,914 $16,391 $16,883 $17,389
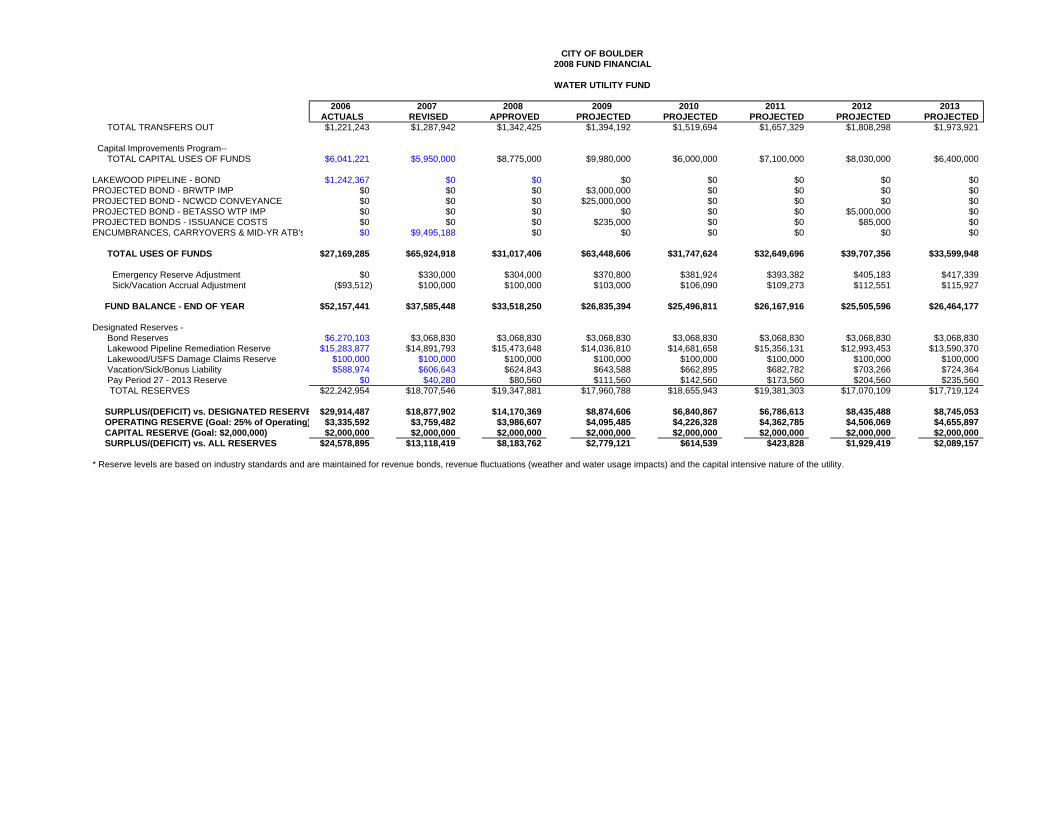
CITY OF BOULDER2008 FUND FINANCIAL
WATER UTILITY FUND
2006 2007 2008 2009 2010 2011 2012 2013ACTUALS REVISED APPROVED PROJECTED PROJECTED PROJECTED PROJECTED PROJECTED
TOTAL TRANSFERS OUT $1,221,243 $1,287,942 $1,342,425 $1,394,192 $1,519,694 $1,657,329 $1,808,298 $1,973,921
Capital Improvements Program-- TOTAL CAPITAL USES OF FUNDS $6,041,221 $5,950,000 $8,775,000 $9,980,000 $6,000,000 $7,100,000 $8,030,000 $6,400,000
LAKEWOOD PIPELINE - BOND $1,242,367 $0 $0 $0 $0 $0 $0 $0PROJECTED BOND - BRWTP IMP $0 $0 $0 $3,000,000 $0 $0 $0 $0PROJECTED BOND - NCWCD CONVEYANCE $0 $0 $0 $25,000,000 $0 $0 $0 $0PROJECTED BOND - BETASSO WTP IMP $0 $0 $0 $0 $0 $0 $5,000,000 $0PROJECTED BONDS - ISSUANCE COSTS $0 $0 $0 $235,000 $0 $0 $85,000 $0ENCUMBRANCES, CARRYOVERS & MID-YR ATB's $0 $9,495,188 $0 $0 $0 $0 $0 $0
TOTAL USES OF FUNDS $27,169,285 $65,924,918 $31,017,406 $63,448,606 $31,747,624 $32,649,696 $39,707,356 $33,599,948
Emergency Reserve Adjustment $0 $330,000 $304,000 $370,800 $381,924 $393,382 $405,183 $417,339 Sick/Vacation Accrual Adjustment ($93,512) $100,000 $100,000 $103,000 $106,090 $109,273 $112,551 $115,927
FUND BALANCE - END OF YEAR $52,157,441 $37,585,448 $33,518,250 $26,835,394 $25,496,811 $26,167,916 $25,505,596 $26,464,177
Designated Reserves - Bond Reserves $6,270,103 $3,068,830 $3,068,830 $3,068,830 $3,068,830 $3,068,830 $3,068,830 $3,068,830 Lakewood Pipeline Remediation Reserve $15,283,877 $14,891,793 $15,473,648 $14,036,810 $14,681,658 $15,356,131 $12,993,453 $13,590,370 Lakewood/USFS Damage Claims Reserve $100,000 $100,000 $100,000 $100,000 $100,000 $100,000 $100,000 $100,000 Vacation/Sick/Bonus Liability $588,974 $606,643 $624,843 $643,588 $662,895 $682,782 $703,266 $724,364 Pay Period 27 - 2013 Reserve $0 $40,280 $80,560 $111,560 $142,560 $173,560 $204,560 $235,560 TOTAL RESERVES $22,242,954 $18,707,546 $19,347,881 $17,960,788 $18,655,943 $19,381,303 $17,070,109 $17,719,124
SURPLUS/(DEFICIT) vs. DESIGNATED RESERVE $29,914,487 $18,877,902 $14,170,369 $8,874,606 $6,840,867 $6,786,613 $8,435,488 $8,745,053 OPERATING RESERVE (Goal: 25% of Operating) $3,335,592 $3,759,482 $3,986,607 $4,095,485 $4,226,328 $4,362,785 $4,506,069 $4,655,897 CAPITAL RESERVE (Goal: $2,000,000) $2,000,000 $2,000,000 $2,000,000 $2,000,000 $2,000,000 $2,000,000 $2,000,000 $2,000,000 SURPLUS/(DEFICIT) vs. ALL RESERVES $24,578,895 $13,118,419 $8,183,762 $2,779,121 $614,539 $423,828 $1,929,419 $2,089,157
* Reserve levels are based on industry standards and are maintained for revenue bonds, revenue fluctuations (weather and water usage impacts) and the capital intensive nature of the utility.
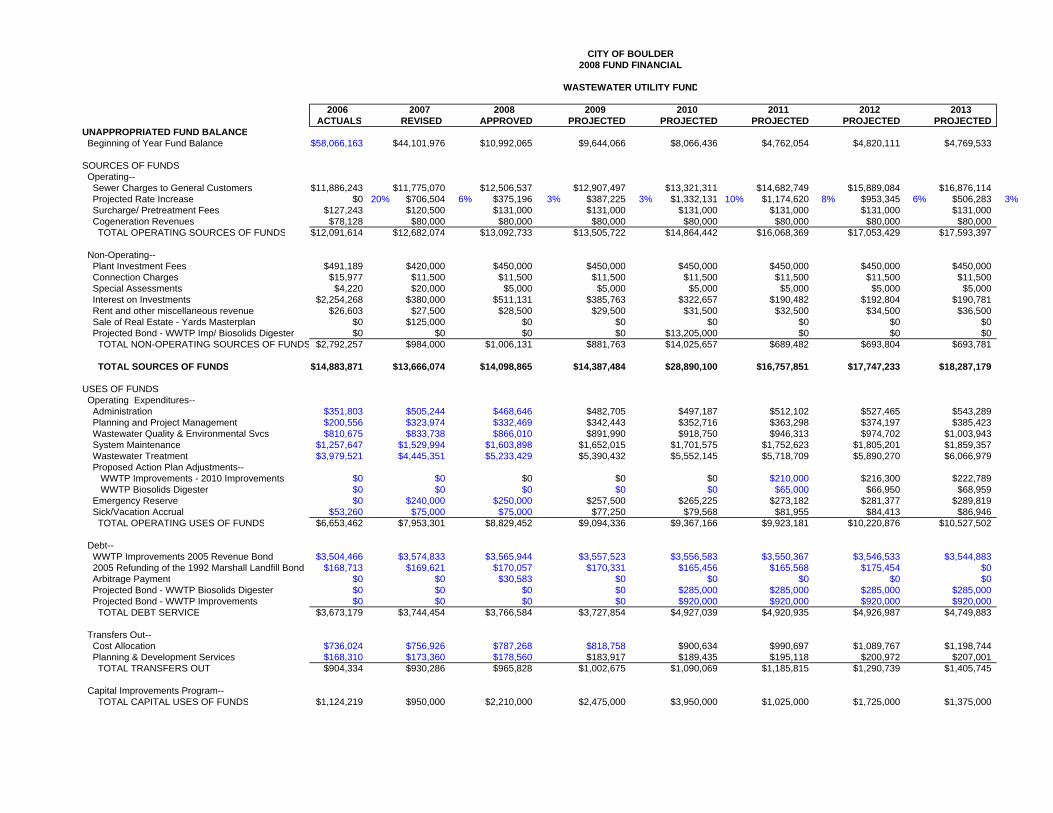
CITY OF BOULDER2008 FUND FINANCIAL
WASTEWATER UTILITY FUND
2006 2007 2008 2009 2010 2011 2012 2013ACTUALS REVISED APPROVED PROJECTED PROJECTED PROJECTED PROJECTED PROJECTED
UNAPPROPRIATED FUND BALANCE Beginning of Year Fund Balance $58,066,163 $44,101,976 $10,992,065 $9,644,066 $8,066,436 $4,762,054 $4,820,111 $4,769,533
SOURCES OF FUNDS Operating-- Sewer Charges to General Customers $11,886,243 $11,775,070 $12,506,537 $12,907,497 $13,321,311 $14,682,749 $15,889,084 $16,876,114 Projected Rate Increase $0 20% $706,504 6% $375,196 3% $387,225 3% $1,332,131 10% $1,174,620 8% $953,345 6% $506,283 3% Surcharge/ Pretreatment Fees $127,243 $120,500 $131,000 $131,000 $131,000 $131,000 $131,000 $131,000 Cogeneration Revenues $78,128 $80,000 $80,000 $80,000 $80,000 $80,000 $80,000 $80,000 TOTAL OPERATING SOURCES OF FUNDS $12,091,614 $12,682,074 $13,092,733 $13,505,722 $14,864,442 $16,068,369 $17,053,429 $17,593,397
Non-Operating-- Plant Investment Fees $491,189 $420,000 $450,000 $450,000 $450,000 $450,000 $450,000 $450,000 Connection Charges $15,977 $11,500 $11,500 $11,500 $11,500 $11,500 $11,500 $11,500 Special Assessments $4,220 $20,000 $5,000 $5,000 $5,000 $5,000 $5,000 $5,000 Interest on Investments $2,254,268 $380,000 $511,131 $385,763 $322,657 $190,482 $192,804 $190,781 Rent and other miscellaneous revenue $26,603 $27,500 $28,500 $29,500 $31,500 $32,500 $34,500 $36,500 Sale of Real Estate - Yards Masterplan $0 $125,000 $0 $0 $0 $0 $0 $0 Projected Bond - WWTP Imp/ Biosolids Digester $0 $0 $0 $0 $13,205,000 $0 $0 $0 TOTAL NON-OPERATING SOURCES OF FUNDS $2,792,257 $984,000 $1,006,131 $881,763 $14,025,657 $689,482 $693,804 $693,781
TOTAL SOURCES OF FUNDS $14,883,871 $13,666,074 $14,098,865 $14,387,484 $28,890,100 $16,757,851 $17,747,233 $18,287,179
USES OF FUNDS Operating Expenditures-- Administration $351,803 $505,244 $468,646 $482,705 $497,187 $512,102 $527,465 $543,289 Planning and Project Management $200,556 $323,974 $332,469 $342,443 $352,716 $363,298 $374,197 $385,423 Wastewater Quality & Environmental Svcs $810,675 $833,738 $866,010 $891,990 $918,750 $946,313 $974,702 $1,003,943 System Maintenance $1,257,647 $1,529,994 $1,603,898 $1,652,015 $1,701,575 $1,752,623 $1,805,201 $1,859,357 Wastewater Treatment $3,979,521 $4,445,351 $5,233,429 $5,390,432 $5,552,145 $5,718,709 $5,890,270 $6,066,979 Proposed Action Plan Adjustments-- WWTP Improvements - 2010 Improvements $0 $0 $0 $0 $0 $210,000 $216,300 $222,789 WWTP Biosolids Digester $0 $0 $0 $0 $0 $65,000 $66,950 $68,959 Emergency Reserve $0 $240,000 $250,000 $257,500 $265,225 $273,182 $281,377 $289,819 Sick/Vacation Accrual $53,260 $75,000 $75,000 $77,250 $79,568 $81,955 $84,413 $86,946 TOTAL OPERATING USES OF FUNDS $6,653,462 $7,953,301 $8,829,452 $9,094,336 $9,367,166 $9,923,181 $10,220,876 $10,527,502
Debt-- WWTP Improvements 2005 Revenue Bond $3,504,466 $3,574,833 $3,565,944 $3,557,523 $3,556,583 $3,550,367 $3,546,533 $3,544,883 2005 Refunding of the 1992 Marshall Landfill Bond $168,713 $169,621 $170,057 $170,331 $165,456 $165,568 $175,454 $0 Arbitrage Payment $0 $0 $30,583 $0 $0 $0 $0 $0 Projected Bond - WWTP Biosolids Digester $0 $0 $0 $0 $285,000 $285,000 $285,000 $285,000 Projected Bond - WWTP Improvements $0 $0 $0 $0 $920,000 $920,000 $920,000 $920,000 TOTAL DEBT SERVICE $3,673,179 $3,744,454 $3,766,584 $3,727,854 $4,927,039 $4,920,935 $4,926,987 $4,749,883
Transfers Out-- Cost Allocation $736,024 $756,926 $787,268 $818,758 $900,634 $990,697 $1,089,767 $1,198,744 Planning & Development Services $168,310 $173,360 $178,560 $183,917 $189,435 $195,118 $200,972 $207,001 TOTAL TRANSFERS OUT $904,334 $930,286 $965,828 $1,002,675 $1,090,069 $1,185,815 $1,290,739 $1,405,745
Capital Improvements Program-- TOTAL CAPITAL USES OF FUNDS $1,124,219 $950,000 $2,210,000 $2,475,000 $3,950,000 $1,025,000 $1,725,000 $1,375,000
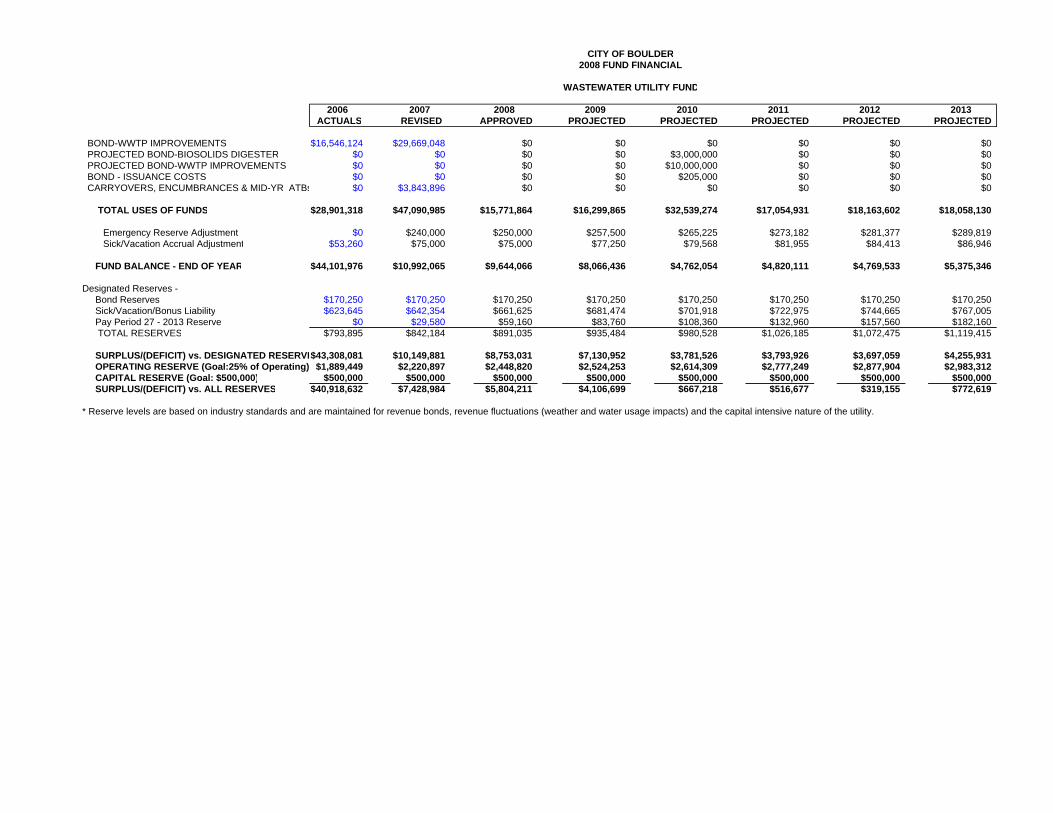
CITY OF BOULDER2008 FUND FINANCIAL
WASTEWATER UTILITY FUND
2006 2007 2008 2009 2010 2011 2012 2013ACTUALS REVISED APPROVED PROJECTED PROJECTED PROJECTED PROJECTED PROJECTED
BOND-WWTP IMPROVEMENTS $16,546,124 $29,669,048 $0 $0 $0 $0 $0 $0 PROJECTED BOND-BIOSOLIDS DIGESTER $0 $0 $0 $0 $3,000,000 $0 $0 $0 PROJECTED BOND-WWTP IMPROVEMENTS $0 $0 $0 $0 $10,000,000 $0 $0 $0 BOND - ISSUANCE COSTS $0 $0 $0 $0 $205,000 $0 $0 $0 CARRYOVERS, ENCUMBRANCES & MID-YR ATBs $0 $3,843,896 $0 $0 $0 $0 $0 $0
TOTAL USES OF FUNDS $28,901,318 $47,090,985 $15,771,864 $16,299,865 $32,539,274 $17,054,931 $18,163,602 $18,058,130
Emergency Reserve Adjustment $0 $240,000 $250,000 $257,500 $265,225 $273,182 $281,377 $289,819 Sick/Vacation Accrual Adjustment $53,260 $75,000 $75,000 $77,250 $79,568 $81,955 $84,413 $86,946
FUND BALANCE - END OF YEAR $44,101,976 $10,992,065 $9,644,066 $8,066,436 $4,762,054 $4,820,111 $4,769,533 $5,375,346
Designated Reserves - Bond Reserves $170,250 $170,250 $170,250 $170,250 $170,250 $170,250 $170,250 $170,250 Sick/Vacation/Bonus Liability $623,645 $642,354 $661,625 $681,474 $701,918 $722,975 $744,665 $767,005 Pay Period 27 - 2013 Reserve $0 $29,580 $59,160 $83,760 $108,360 $132,960 $157,560 $182,160 TOTAL RESERVES $793,895 $842,184 $891,035 $935,484 $980,528 $1,026,185 $1,072,475 $1,119,415
SURPLUS/(DEFICIT) vs. DESIGNATED RESERVE$43,308,081 $10,149,881 $8,753,031 $7,130,952 $3,781,526 $3,793,926 $3,697,059 $4,255,931 OPERATING RESERVE (Goal:25% of Operating) $1,889,449 $2,220,897 $2,448,820 $2,524,253 $2,614,309 $2,777,249 $2,877,904 $2,983,312 CAPITAL RESERVE (Goal: $500,000) $500,000 $500,000 $500,000 $500,000 $500,000 $500,000 $500,000 $500,000 SURPLUS/(DEFICIT) vs. ALL RESERVES $40,918,632 $7,428,984 $5,804,211 $4,106,699 $667,218 $516,677 $319,155 $772,619
* Reserve levels are based on industry standards and are maintained for revenue bonds, revenue fluctuations (weather and water usage impacts) and the capital intensive nature of the utility.
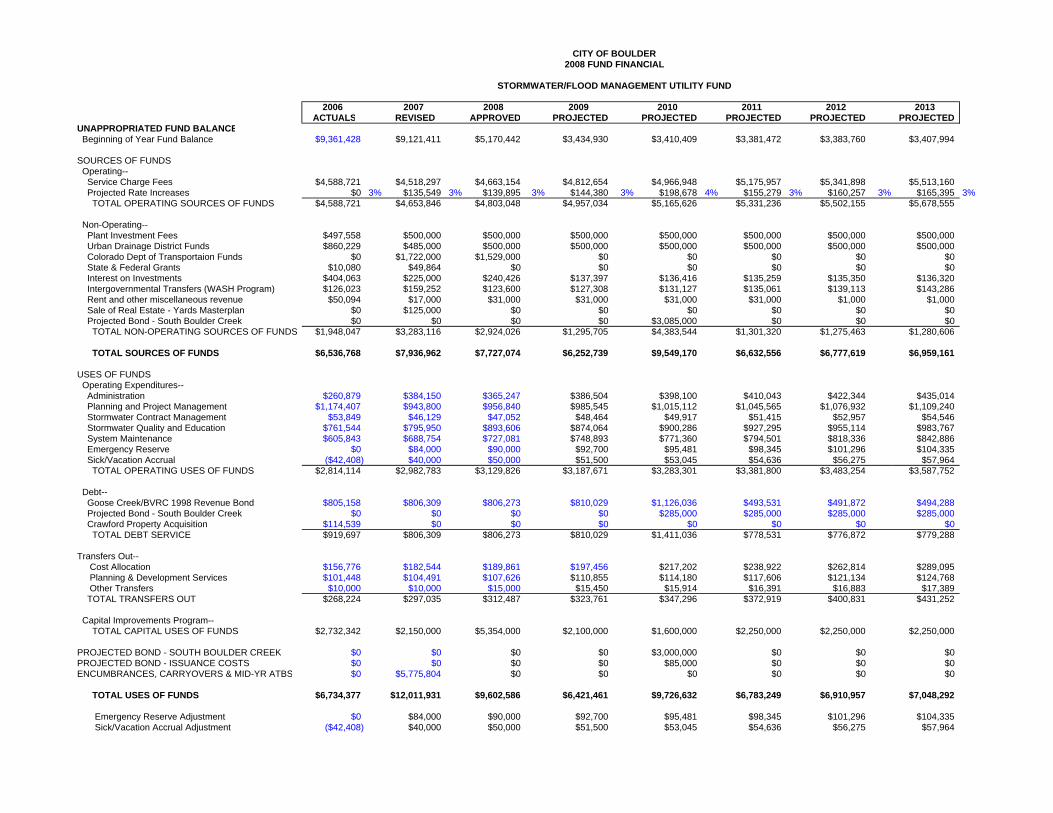
CITY OF BOULDER2008 FUND FINANCIAL
STORMWATER/FLOOD MANAGEMENT UTILITY FUND
2006 2007 2008 2009 2010 2011 2012 2013ACTUALS REVISED APPROVED PROJECTED PROJECTED PROJECTED PROJECTED PROJECTED
UNAPPROPRIATED FUND BALANCE Beginning of Year Fund Balance $9,361,428 $9,121,411 $5,170,442 $3,434,930 $3,410,409 $3,381,472 $3,383,760 $3,407,994
SOURCES OF FUNDS Operating-- Service Charge Fees $4,588,721 $4,518,297 $4,663,154 $4,812,654 $4,966,948 $5,175,957 $5,341,898 $5,513,160 Projected Rate Increases $0 3% $135,549 3% $139,895 3% $144,380 3% $198,678 4% $155,279 3% $160,257 3% $165,395 3% TOTAL OPERATING SOURCES OF FUNDS $4,588,721 $4,653,846 $4,803,048 $4,957,034 $5,165,626 $5,331,236 $5,502,155 $5,678,555
Non-Operating-- Plant Investment Fees $497,558 $500,000 $500,000 $500,000 $500,000 $500,000 $500,000 $500,000 Urban Drainage District Funds $860,229 $485,000 $500,000 $500,000 $500,000 $500,000 $500,000 $500,000 Colorado Dept of Transportaion Funds $0 $1,722,000 $1,529,000 $0 $0 $0 $0 $0 State & Federal Grants $10,080 $49,864 $0 $0 $0 $0 $0 $0 Interest on Investments $404,063 $225,000 $240,426 $137,397 $136,416 $135,259 $135,350 $136,320 Intergovernmental Transfers (WASH Program) $126,023 $159,252 $123,600 $127,308 $131,127 $135,061 $139,113 $143,286 Rent and other miscellaneous revenue $50,094 $17,000 $31,000 $31,000 $31,000 $31,000 $1,000 $1,000 Sale of Real Estate - Yards Masterplan $0 $125,000 $0 $0 $0 $0 $0 $0 Projected Bond - South Boulder Creek $0 $0 $0 $0 $3,085,000 $0 $0 $0 TOTAL NON-OPERATING SOURCES OF FUNDS $1,948,047 $3,283,116 $2,924,026 $1,295,705 $4,383,544 $1,301,320 $1,275,463 $1,280,606
TOTAL SOURCES OF FUNDS $6,536,768 $7,936,962 $7,727,074 $6,252,739 $9,549,170 $6,632,556 $6,777,619 $6,959,161
USES OF FUNDS Operating Expenditures-- Administration $260,879 $384,150 $365,247 $386,504 $398,100 $410,043 $422,344 $435,014 Planning and Project Management $1,174,407 $943,800 $956,840 $985,545 $1,015,112 $1,045,565 $1,076,932 $1,109,240 Stormwater Contract Management $53,849 $46,129 $47,052 $48,464 $49,917 $51,415 $52,957 $54,546 Stormwater Quality and Education $761,544 $795,950 $893,606 $874,064 $900,286 $927,295 $955,114 $983,767 System Maintenance $605,843 $688,754 $727,081 $748,893 $771,360 $794,501 $818,336 $842,886 Emergency Reserve $0 $84,000 $90,000 $92,700 $95,481 $98,345 $101,296 $104,335 Sick/Vacation Accrual ($42,408) $40,000 $50,000 $51,500 $53,045 $54,636 $56,275 $57,964 TOTAL OPERATING USES OF FUNDS $2,814,114 $2,982,783 $3,129,826 $3,187,671 $3,283,301 $3,381,800 $3,483,254 $3,587,752
Debt-- Goose Creek/BVRC 1998 Revenue Bond $805,158 $806,309 $806,273 $810,029 $1,126,036 $493,531 $491,872 $494,288 Projected Bond - South Boulder Creek $0 $0 $0 $0 $285,000 $285,000 $285,000 $285,000 Crawford Property Acquisition $114,539 $0 $0 $0 $0 $0 $0 $0 TOTAL DEBT SERVICE $919,697 $806,309 $806,273 $810,029 $1,411,036 $778,531 $776,872 $779,288
Transfers Out-- Cost Allocation $156,776 $182,544 $189,861 $197,456 $217,202 $238,922 $262,814 $289,095 Planning & Development Services $101,448 $104,491 $107,626 $110,855 $114,180 $117,606 $121,134 $124,768 Other Transfers $10,000 $10,000 $15,000 $15,450 $15,914 $16,391 $16,883 $17,389 TOTAL TRANSFERS OUT $268,224 $297,035 $312,487 $323,761 $347,296 $372,919 $400,831 $431,252
Capital Improvements Program-- TOTAL CAPITAL USES OF FUNDS $2,732,342 $2,150,000 $5,354,000 $2,100,000 $1,600,000 $2,250,000 $2,250,000 $2,250,000
PROJECTED BOND - SOUTH BOULDER CREEK $0 $0 $0 $0 $3,000,000 $0 $0 $0PROJECTED BOND - ISSUANCE COSTS $0 $0 $0 $0 $85,000 $0 $0 $0ENCUMBRANCES, CARRYOVERS & MID-YR ATBS $0 $5,775,804 $0 $0 $0 $0 $0 $0
TOTAL USES OF FUNDS $6,734,377 $12,011,931 $9,602,586 $6,421,461 $9,726,632 $6,783,249 $6,910,957 $7,048,292
Emergency Reserve Adjustment $0 $84,000 $90,000 $92,700 $95,481 $98,345 $101,296 $104,335 Sick/Vacation Accrual Adjustment ($42,408) $40,000 $50,000 $51,500 $53,045 $54,636 $56,275 $57,964
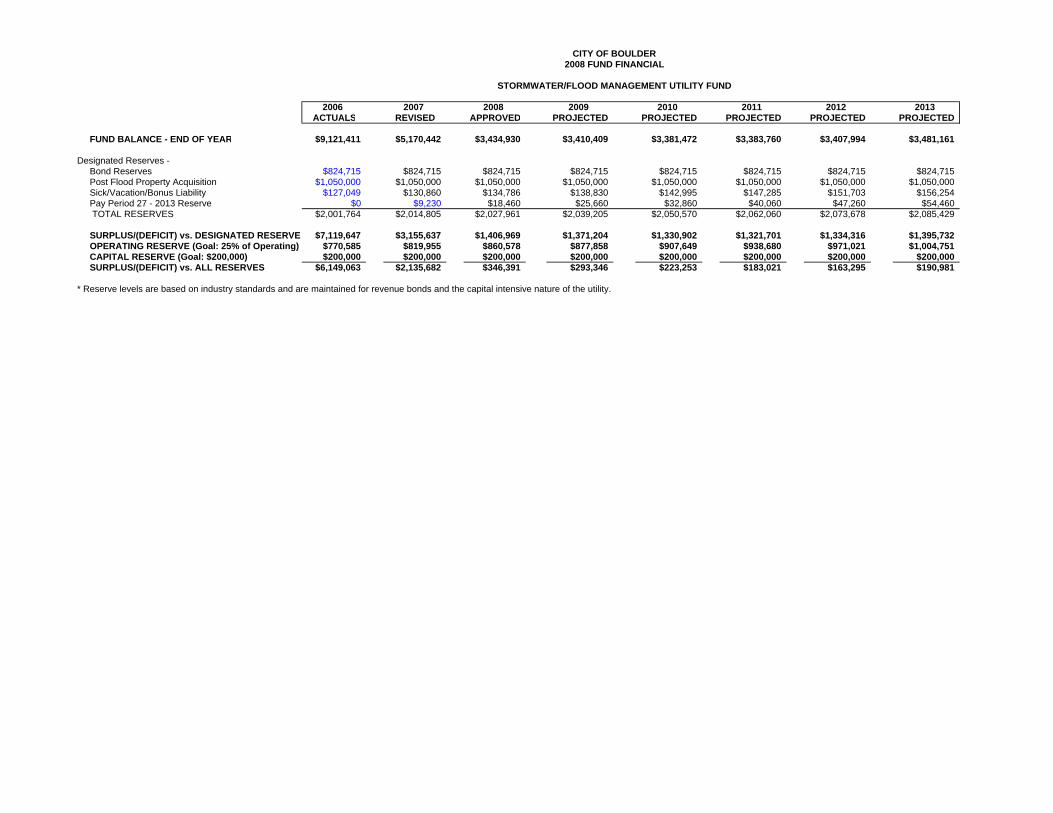
CITY OF BOULDER2008 FUND FINANCIAL
STORMWATER/FLOOD MANAGEMENT UTILITY FUND
2006 2007 2008 2009 2010 2011 2012 2013ACTUALS REVISED APPROVED PROJECTED PROJECTED PROJECTED PROJECTED PROJECTED
FUND BALANCE - END OF YEAR $9,121,411 $5,170,442 $3,434,930 $3,410,409 $3,381,472 $3,383,760 $3,407,994 $3,481,161
Designated Reserves - Bond Reserves $824,715 $824,715 $824,715 $824,715 $824,715 $824,715 $824,715 $824,715 Post Flood Property Acquisition $1,050,000 $1,050,000 $1,050,000 $1,050,000 $1,050,000 $1,050,000 $1,050,000 $1,050,000 Sick/Vacation/Bonus Liability $127,049 $130,860 $134,786 $138,830 $142,995 $147,285 $151,703 $156,254 Pay Period 27 - 2013 Reserve $0 $9,230 $18,460 $25,660 $32,860 $40,060 $47,260 $54,460 TOTAL RESERVES $2,001,764 $2,014,805 $2,027,961 $2,039,205 $2,050,570 $2,062,060 $2,073,678 $2,085,429
SURPLUS/(DEFICIT) vs. DESIGNATED RESERVES $7,119,647 $3,155,637 $1,406,969 $1,371,204 $1,330,902 $1,321,701 $1,334,316 $1,395,732 OPERATING RESERVE (Goal: 25% of Operating) $770,585 $819,955 $860,578 $877,858 $907,649 $938,680 $971,021 $1,004,751 CAPITAL RESERVE (Goal: $200,000) $200,000 $200,000 $200,000 $200,000 $200,000 $200,000 $200,000 $200,000 SURPLUS/(DEFICIT) vs. ALL RESERVES $6,149,063 $2,135,682 $346,391 $293,346 $223,253 $183,021 $163,295 $190,981
* Reserve levels are based on industry standards and are maintained for revenue bonds and the capital intensive nature of the utility.
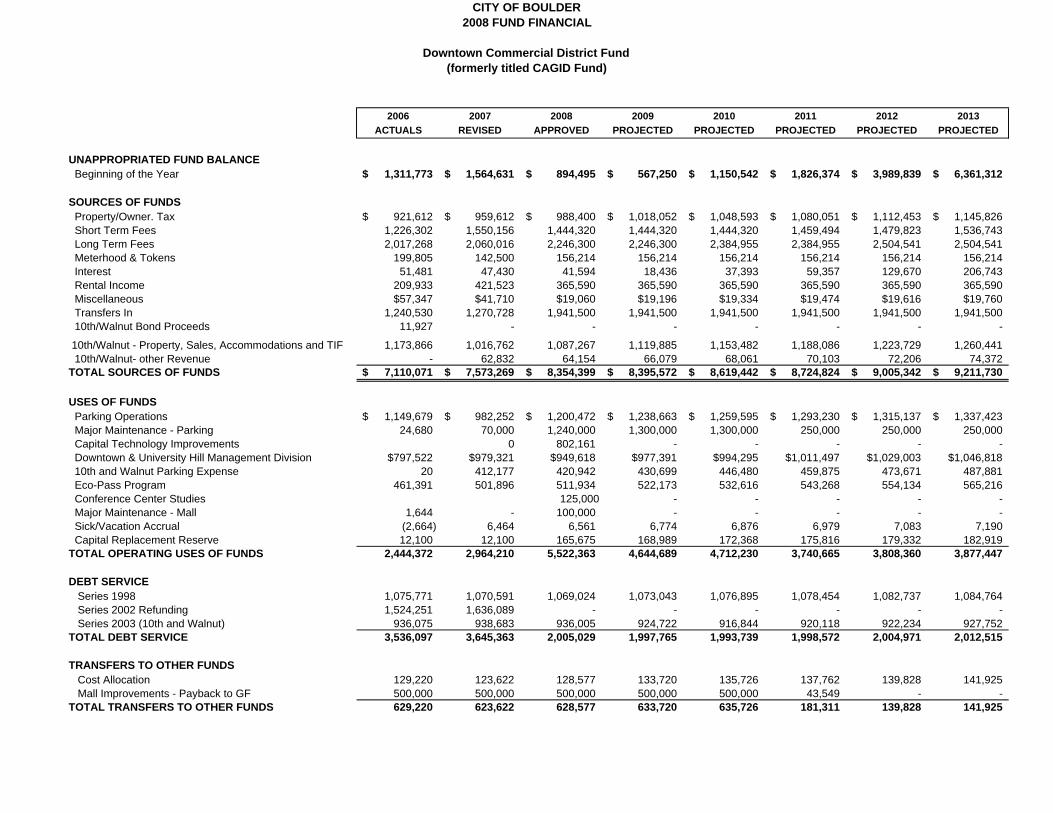
CITY OF BOULDER2008 FUND FINANCIAL
Downtown Commercial District Fund(formerly titled CAGID Fund)
2006 2007 2008 2009 2010 2011 2012 2013ACTUALS REVISED APPROVED PROJECTED PROJECTED PROJECTED PROJECTED PROJECTED
UNAPPROPRIATED FUND BALANCE Beginning of the Year 1,311,773$ 1,564,631$ 894,495$ 567,250$ 1,150,542$ 1,826,374$ 3,989,839$ 6,361,312$
SOURCES OF FUNDS Property/Owner. Tax 921,612$ 959,612$ 988,400$ 1,018,052$ 1,048,593$ 1,080,051$ 1,112,453$ 1,145,826$ Short Term Fees 1,226,302 1,550,156 1,444,320 1,444,320 1,444,320 1,459,494 1,479,823 1,536,743 Long Term Fees 2,017,268 2,060,016 2,246,300 2,246,300 2,384,955 2,384,955 2,504,541 2,504,541 Meterhood & Tokens 199,805 142,500 156,214 156,214 156,214 156,214 156,214 156,214 Interest 51,481 47,430 41,594 18,436 37,393 59,357 129,670 206,743 Rental Income 209,933 421,523 365,590 365,590 365,590 365,590 365,590 365,590 Miscellaneous $57,347 $41,710 $19,060 $19,196 $19,334 $19,474 $19,616 $19,760 Transfers In 1,240,530 1,270,728 1,941,500 1,941,500 1,941,500 1,941,500 1,941,500 1,941,500 10th/Walnut Bond Proceeds 11,927 - - - - - - -
10th/Walnut - Property, Sales, Accommodations and TIF 1,173,866 1,016,762 1,087,267 1,119,885 1,153,482 1,188,086 1,223,729 1,260,441 10th/Walnut- other Revenue - 62,832 64,154 66,079 68,061 70,103 72,206 74,372 TOTAL SOURCES OF FUNDS 7,110,071$ 7,573,269$ 8,354,399$ 8,395,572$ 8,619,442$ 8,724,824$ 9,005,342$ 9,211,730$
USES OF FUNDS Parking Operations 1,149,679$ 982,252$ 1,200,472$ 1,238,663$ 1,259,595$ 1,293,230$ 1,315,137$ 1,337,423$ Major Maintenance - Parking 24,680 70,000 1,240,000 1,300,000 1,300,000 250,000 250,000 250,000 Capital Technology Improvements 0 802,161 - - - - - Downtown & University Hill Management Division $797,522 $979,321 $949,618 $977,391 $994,295 $1,011,497 $1,029,003 $1,046,818 10th and Walnut Parking Expense 20 412,177 420,942 430,699 446,480 459,875 473,671 487,881 Eco-Pass Program 461,391 501,896 511,934 522,173 532,616 543,268 554,134 565,216 Conference Center Studies 125,000 - - - - - Major Maintenance - Mall 1,644 - 100,000 - - - - - Sick/Vacation Accrual (2,664) 6,464 6,561 6,774 6,876 6,979 7,083 7,190 Capital Replacement Reserve 12,100 12,100 165,675 168,989 172,368 175,816 179,332 182,919 TOTAL OPERATING USES OF FUNDS 2,444,372 2,964,210 5,522,363 4,644,689 4,712,230 3,740,665 3,808,360 3,877,447
DEBT SERVICE Series 1998 1,075,771 1,070,591 1,069,024 1,073,043 1,076,895 1,078,454 1,082,737 1,084,764 Series 2002 Refunding 1,524,251 1,636,089 - - - - - - Series 2003 (10th and Walnut) 936,075 938,683 936,005 924,722 916,844 920,118 922,234 927,752 TOTAL DEBT SERVICE 3,536,097 3,645,363 2,005,029 1,997,765 1,993,739 1,998,572 2,004,971 2,012,515
TRANSFERS TO OTHER FUNDS Cost Allocation 129,220 123,622 128,577 133,720 135,726 137,762 139,828 141,925 Mall Improvements - Payback to GF 500,000 500,000 500,000 500,000 500,000 43,549 - - TOTAL TRANSFERS TO OTHER FUNDS 629,220 623,622 628,577 633,720 635,726 181,311 139,828 141,925
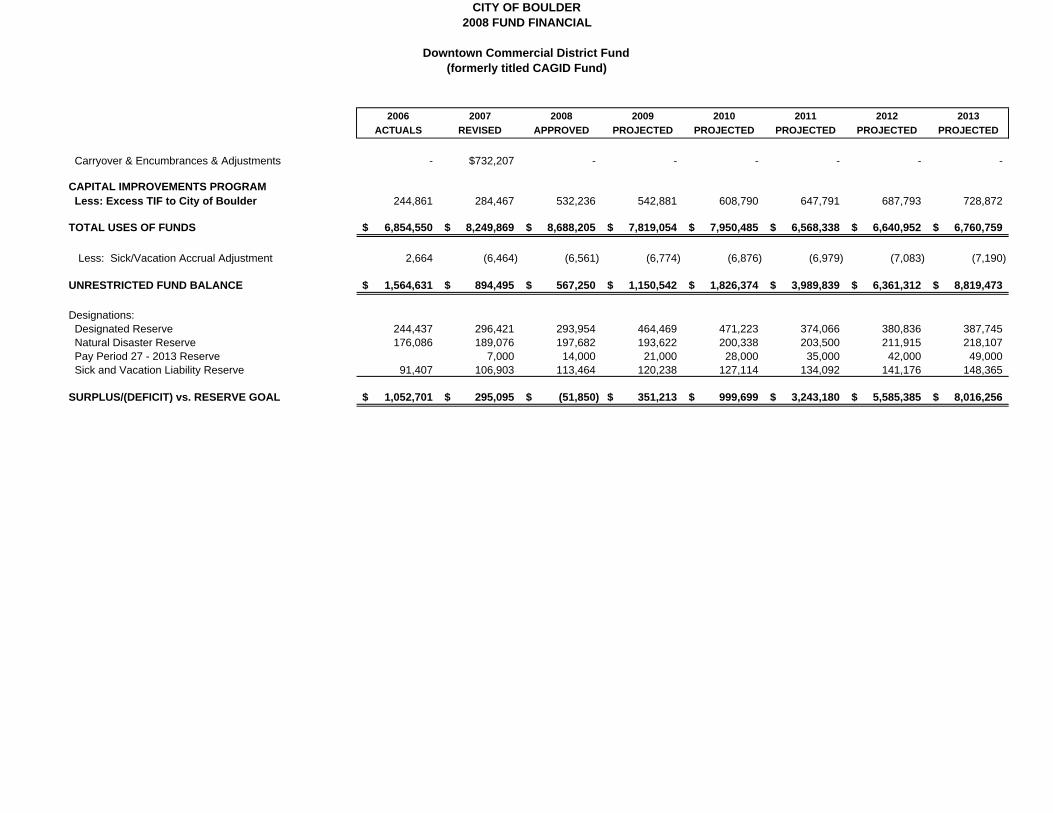
CITY OF BOULDER2008 FUND FINANCIAL
Downtown Commercial District Fund(formerly titled CAGID Fund)
2006 2007 2008 2009 2010 2011 2012 2013ACTUALS REVISED APPROVED PROJECTED PROJECTED PROJECTED PROJECTED PROJECTED
Carryover & Encumbrances & Adjustments - $732,207 - - - - - -
CAPITAL IMPROVEMENTS PROGRAM Less: Excess TIF to City of Boulder 244,861 284,467 532,236 542,881 608,790 647,791 687,793 728,872
TOTAL USES OF FUNDS 6,854,550$ 8,249,869$ 8,688,205$ 7,819,054$ 7,950,485$ 6,568,338$ 6,640,952$ 6,760,759$
Less: Sick/Vacation Accrual Adjustment 2,664 (6,464) (6,561) (6,774) (6,876) (6,979) (7,083) (7,190)
UNRESTRICTED FUND BALANCE 1,564,631$ 894,495$ 567,250$ 1,150,542$ 1,826,374$ 3,989,839$ 6,361,312$ 8,819,473$
Designations: Designated Reserve 244,437 296,421 293,954 464,469 471,223 374,066 380,836 387,745 Natural Disaster Reserve 176,086 189,076 197,682 193,622 200,338 203,500 211,915 218,107 Pay Period 27 - 2013 Reserve 7,000 14,000 21,000 28,000 35,000 42,000 49,000 Sick and Vacation Liability Reserve 91,407 106,903 113,464 120,238 127,114 134,092 141,176 148,365
SURPLUS/(DEFICIT) vs. RESERVE GOAL 1,052,701$ 295,095$ (51,850)$ 351,213$ 999,699$ 3,243,180$ 5,585,385$ 8,016,256$
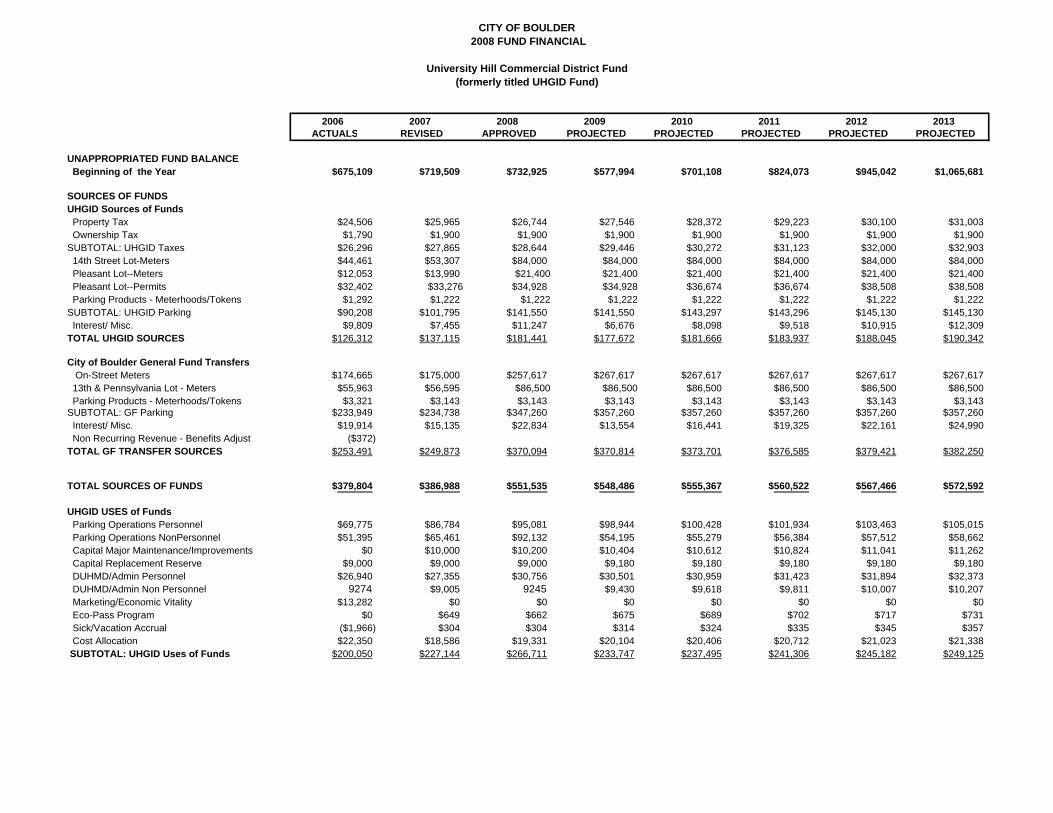
CITY OF BOULDER 2008 FUND FINANCIAL
University Hill Commercial District Fund(formerly titled UHGID Fund)
2006 2007 2008 2009 2010 2011 2012 2013ACTUALS REVISED APPROVED PROJECTED PROJECTED PROJECTED PROJECTED PROJECTED
UNAPPROPRIATED FUND BALANCE Beginning of the Year $675,109 $719,509 $732,925 $577,994 $701,108 $824,073 $945,042 $1,065,681
SOURCES OF FUNDSUHGID Sources of Funds Property Tax $24,506 $25,965 $26,744 $27,546 $28,372 $29,223 $30,100 $31,003 Ownership Tax $1,790 $1,900 $1,900 $1,900 $1,900 $1,900 $1,900 $1,900SUBTOTAL: UHGID Taxes $26,296 $27,865 $28,644 $29,446 $30,272 $31,123 $32,000 $32,903 14th Street Lot-Meters $44,461 $53,307 $84,000 $84,000 $84,000 $84,000 $84,000 $84,000 Pleasant Lot--Meters $12,053 $13,990 $21,400 $21,400 $21,400 $21,400 $21,400 $21,400 Pleasant Lot--Permits $32,402 $33,276 $34,928 $34,928 $36,674 $36,674 $38,508 $38,508 Parking Products - Meterhoods/Tokens $1,292 $1,222 $1,222 $1,222 $1,222 $1,222 $1,222 $1,222SUBTOTAL: UHGID Parking $90,208 $101,795 $141,550 $141,550 $143,297 $143,296 $145,130 $145,130 Interest/ Misc. $9,809 $7,455 $11,247 $6,676 $8,098 $9,518 $10,915 $12,309TOTAL UHGID SOURCES $126,312 $137,115 $181,441 $177,672 $181,666 $183,937 $188,045 $190,342
City of Boulder General Fund Transfers On-Street Meters $174,665 $175,000 $257,617 $267,617 $267,617 $267,617 $267,617 $267,617 13th & Pennsylvania Lot - Meters $55,963 $56,595 $86,500 $86,500 $86,500 $86,500 $86,500 $86,500 Parking Products - Meterhoods/Tokens $3,321 $3,143 $3,143 $3,143 $3,143 $3,143 $3,143 $3,143SUBTOTAL: GF Parking $233,949 $234,738 $347,260 $357,260 $357,260 $357,260 $357,260 $357,260 Interest/ Misc. $19,914 $15,135 $22,834 $13,554 $16,441 $19,325 $22,161 $24,990 Non Recurring Revenue - Benefits Adjust ($372)TOTAL GF TRANSFER SOURCES $253,491 $249,873 $370,094 $370,814 $373,701 $376,585 $379,421 $382,250
TOTAL SOURCES OF FUNDS $379,804 $386,988 $551,535 $548,486 $555,367 $560,522 $567,466 $572,592
UHGID USES of Funds Parking Operations Personnel $69,775 $86,784 $95,081 $98,944 $100,428 $101,934 $103,463 $105,015 Parking Operations NonPersonnel $51,395 $65,461 $92,132 $54,195 $55,279 $56,384 $57,512 $58,662 Capital Major Maintenance/Improvements $0 $10,000 $10,200 $10,404 $10,612 $10,824 $11,041 $11,262 Capital Replacement Reserve $9,000 $9,000 $9,000 $9,180 $9,180 $9,180 $9,180 $9,180 DUHMD/Admin Personnel $26,940 $27,355 $30,756 $30,501 $30,959 $31,423 $31,894 $32,373 DUHMD/Admin Non Personnel 9274 $9,005 9245 $9,430 $9,618 $9,811 $10,007 $10,207 Marketing/Economic Vitality $13,282 $0 $0 $0 $0 $0 $0 $0 Eco-Pass Program $0 $649 $662 $675 $689 $702 $717 $731 Sick/Vacation Accrual ($1,966) $304 $304 $314 $324 $335 $345 $357 Cost Allocation $22,350 $18,586 $19,331 $20,104 $20,406 $20,712 $21,023 $21,338 SUBTOTAL: UHGID Uses of Funds $200,050 $227,144 $266,711 $233,747 $237,495 $241,306 $245,182 $249,125
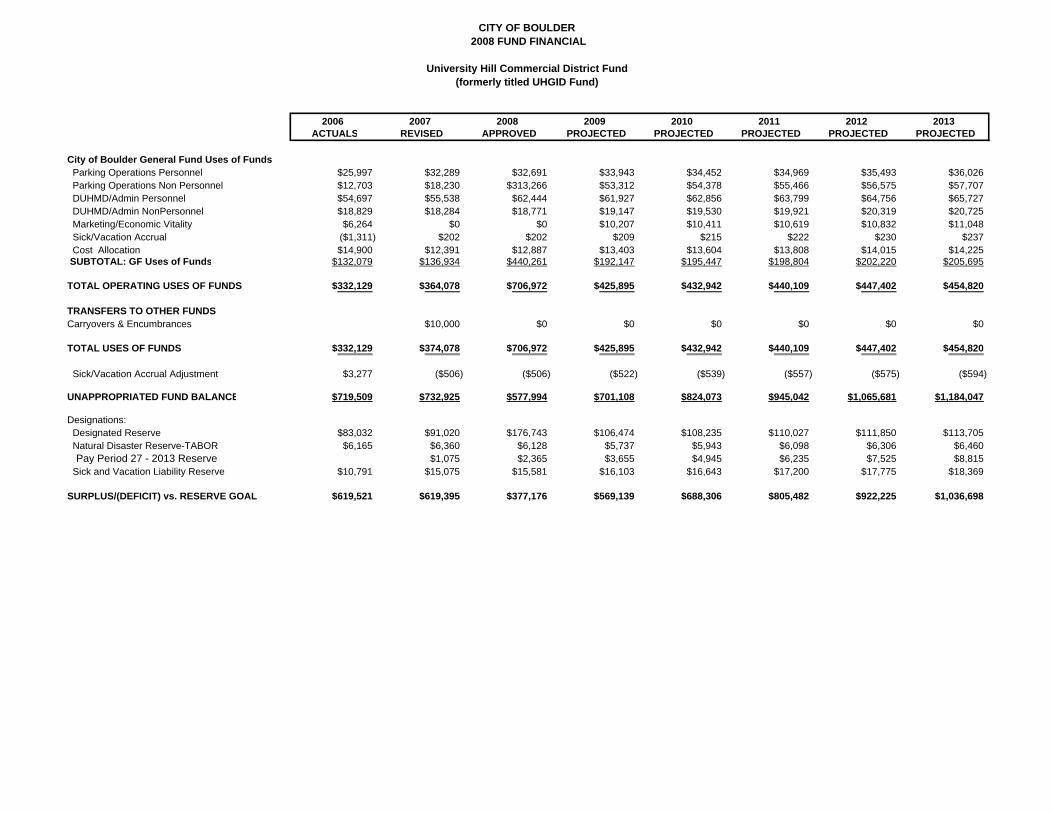
CITY OF BOULDER 2008 FUND FINANCIAL
University Hill Commercial District Fund(formerly titled UHGID Fund)
2006 2007 2008 2009 2010 2011 2012 2013ACTUALS REVISED APPROVED PROJECTED PROJECTED PROJECTED PROJECTED PROJECTED
City of Boulder General Fund Uses of Funds Parking Operations Personnel $25,997 $32,289 $32,691 $33,943 $34,452 $34,969 $35,493 $36,026 Parking Operations Non Personnel $12,703 $18,230 $313,266 $53,312 $54,378 $55,466 $56,575 $57,707 DUHMD/Admin Personnel $54,697 $55,538 $62,444 $61,927 $62,856 $63,799 $64,756 $65,727 DUHMD/Admin NonPersonnel $18,829 $18,284 $18,771 $19,147 $19,530 $19,921 $20,319 $20,725 Marketing/Economic Vitality $6,264 $0 $0 $10,207 $10,411 $10,619 $10,832 $11,048 Sick/Vacation Accrual ($1,311) $202 $202 $209 $215 $222 $230 $237 Cost Allocation $14,900 $12,391 $12,887 $13,403 $13,604 $13,808 $14,015 $14,225 SUBTOTAL: GF Uses of Funds $132,079 $136,934 $440,261 $192,147 $195,447 $198,804 $202,220 $205,695
TOTAL OPERATING USES OF FUNDS $332,129 $364,078 $706,972 $425,895 $432,942 $440,109 $447,402 $454,820
TRANSFERS TO OTHER FUNDSCarryovers & Encumbrances $10,000 $0 $0 $0 $0 $0 $0
TOTAL USES OF FUNDS $332,129 $374,078 $706,972 $425,895 $432,942 $440,109 $447,402 $454,820
Sick/Vacation Accrual Adjustment $3,277 ($506) ($506) ($522) ($539) ($557) ($575) ($594)
UNAPPROPRIATED FUND BALANCE $719,509 $732,925 $577,994 $701,108 $824,073 $945,042 $1,065,681 $1,184,047
Designations: Designated Reserve $83,032 $91,020 $176,743 $106,474 $108,235 $110,027 $111,850 $113,705 Natural Disaster Reserve-TABOR $6,165 $6,360 $6,128 $5,737 $5,943 $6,098 $6,306 $6,460 Pay Period 27 - 2013 Reserve $1,075 $2,365 $3,655 $4,945 $6,235 $7,525 $8,815 Sick and Vacation Liability Reserve $10,791 $15,075 $15,581 $16,103 $16,643 $17,200 $17,775 $18,369
SURPLUS/(DEFICIT) vs. RESERVE GOAL $619,521 $619,395 $377,176 $569,139 $688,306 $805,482 $922,225 $1,036,698
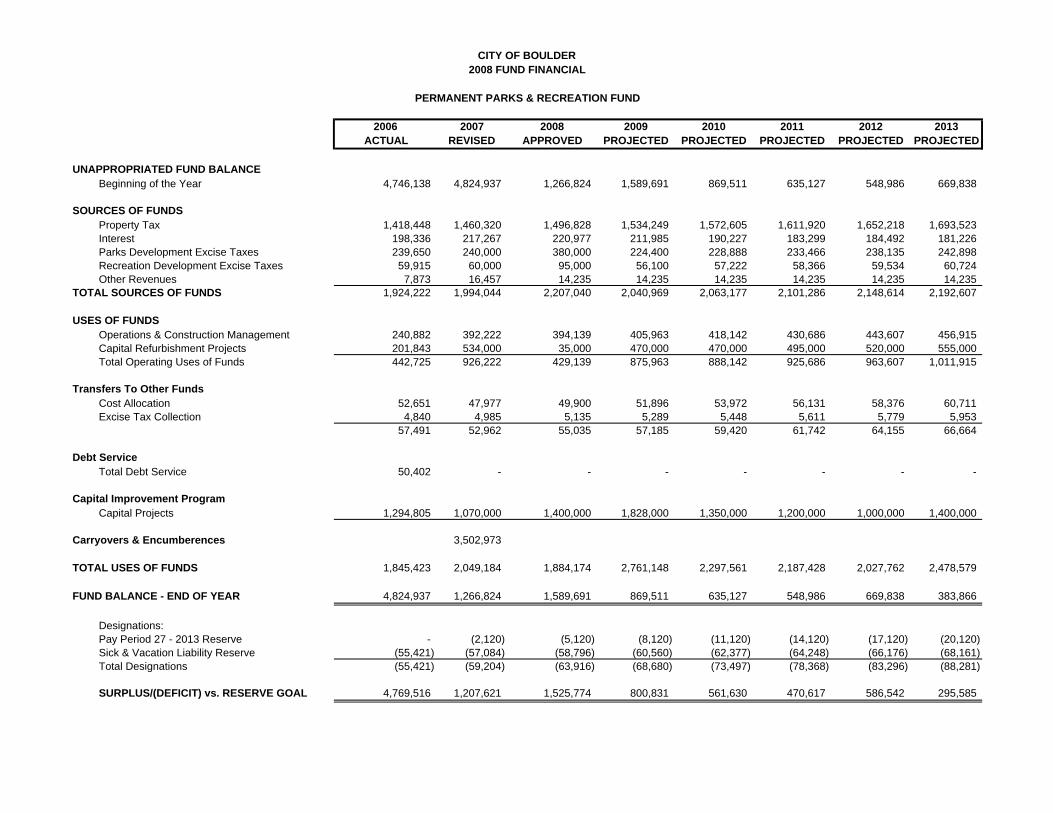
2006 2007 2008 2009 2010 2011 2012 2013ACTUAL REVISED APPROVED PROJECTED PROJECTED PROJECTED PROJECTED PROJECTED
UNAPPROPRIATED FUND BALANCEBeginning of the Year 4,746,138 4,824,937 1,266,824 1,589,691 869,511 635,127 548,986 669,838
SOURCES OF FUNDSProperty Tax 1,418,448 1,460,320 1,496,828 1,534,249 1,572,605 1,611,920 1,652,218 1,693,523 Interest 198,336 217,267 220,977 211,985 190,227 183,299 184,492 181,226 Parks Development Excise Taxes 239,650 240,000 380,000 224,400 228,888 233,466 238,135 242,898 Recreation Development Excise Taxes 59,915 60,000 95,000 56,100 57,222 58,366 59,534 60,724 Other Revenues 7,873 16,457 14,235 14,235 14,235 14,235 14,235 14,235
TOTAL SOURCES OF FUNDS 1,924,222 1,994,044 2,207,040 2,040,969 2,063,177 2,101,286 2,148,614 2,192,607
USES OF FUNDSOperations & Construction Management 240,882 392,222 394,139 405,963 418,142 430,686 443,607 456,915 Capital Refurbishment Projects 201,843 534,000 35,000 470,000 470,000 495,000 520,000 555,000 Total Operating Uses of Funds 442,725 926,222 429,139 875,963 888,142 925,686 963,607 1,011,915
Transfers To Other Funds Cost Allocation 52,651 47,977 49,900 51,896 53,972 56,131 58,376 60,711 Excise Tax Collection 4,840 4,985 5,135 5,289 5,448 5,611 5,779 5,953
57,491 52,962 55,035 57,185 59,420 61,742 64,155 66,664
Debt ServiceTotal Debt Service 50,402 - - - - - - -
Capital Improvement ProgramCapital Projects 1,294,805 1,070,000 1,400,000 1,828,000 1,350,000 1,200,000 1,000,000 1,400,000
Carryovers & Encumberences 3,502,973
TOTAL USES OF FUNDS 1,845,423 2,049,184 1,884,174 2,761,148 2,297,561 2,187,428 2,027,762 2,478,579
FUND BALANCE - END OF YEAR 4,824,937 1,266,824 1,589,691 869,511 635,127 548,986 669,838 383,866
Designations:Pay Period 27 - 2013 Reserve - (2,120) (5,120) (8,120) (11,120) (14,120) (17,120) (20,120) Sick & Vacation Liability Reserve (55,421) (57,084) (58,796) (60,560) (62,377) (64,248) (66,176) (68,161) Total Designations (55,421) (59,204) (63,916) (68,680) (73,497) (78,368) (83,296) (88,281)
SURPLUS/(DEFICIT) vs. RESERVE GOAL 4,769,516 1,207,621 1,525,774 800,831 561,630 470,617 586,542 295,585
PERMANENT PARKS & RECREATION FUND
CITY OF BOULDER2008 FUND FINANCIAL
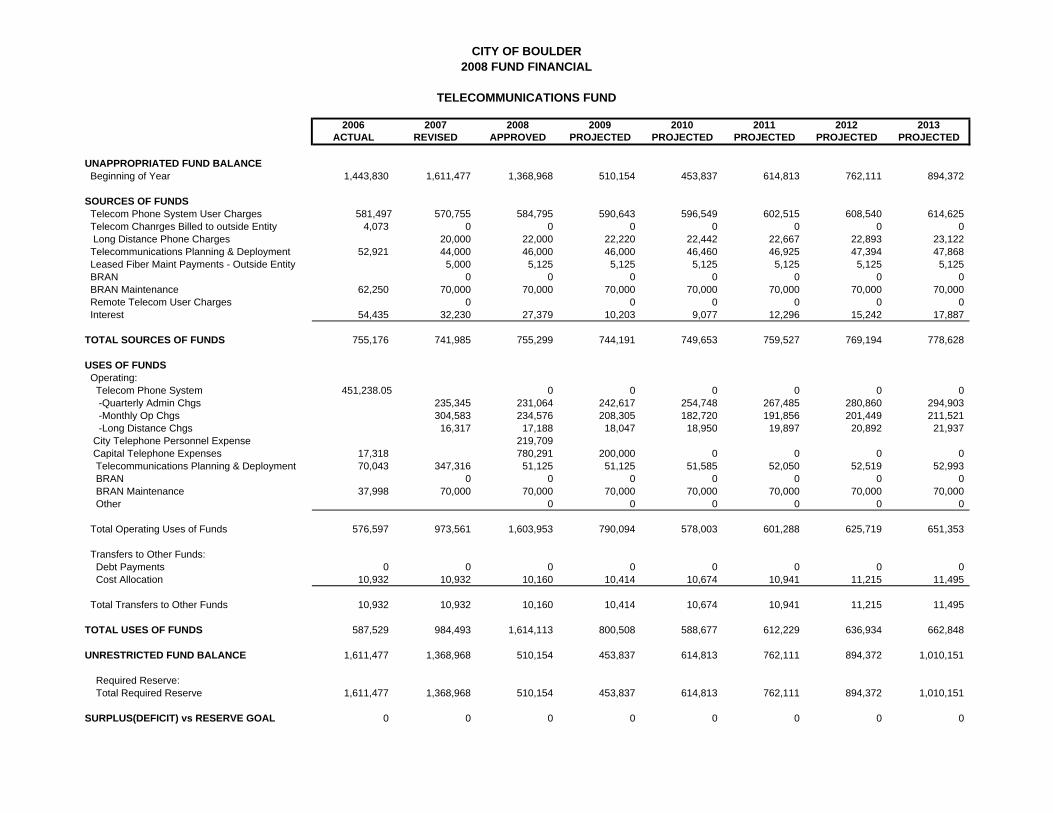
2008 FUND FINANCIAL
TELECOMMUNICATIONS FUND
2006 2007 2008 2009 2010 2011 2012 2013ACTUAL REVISED APPROVED PROJECTED PROJECTED PROJECTED PROJECTED PROJECTED
UNAPPROPRIATED FUND BALANCE Beginning of Year 1,443,830 1,611,477 1,368,968 510,154 453,837 614,813 762,111 894,372
SOURCES OF FUNDS Telecom Phone System User Charges 581,497 570,755 584,795 590,643 596,549 602,515 608,540 614,625 Telecom Chanrges Billed to outside Entity 4,073 0 0 0 0 0 0 0 Long Distance Phone Charges 20,000 22,000 22,220 22,442 22,667 22,893 23,122 Telecommunications Planning & Deployment 52,921 44,000 46,000 46,000 46,460 46,925 47,394 47,868 Leased Fiber Maint Payments - Outside Entity 5,000 5,125 5,125 5,125 5,125 5,125 5,125 BRAN 0 0 0 0 0 0 0 BRAN Maintenance 62,250 70,000 70,000 70,000 70,000 70,000 70,000 70,000 Remote Telecom User Charges 0 0 0 0 0 0 Interest 54,435 32,230 27,379 10,203 9,077 12,296 15,242 17,887
TOTAL SOURCES OF FUNDS 755,176 741,985 755,299 744,191 749,653 759,527 769,194 778,628
USES OF FUNDS Operating: Telecom Phone System 451,238.05 0 0 0 0 0 0 -Quarterly Admin Chgs 235,345 231,064 242,617 254,748 267,485 280,860 294,903 -Monthly Op Chgs 304,583 234,576 208,305 182,720 191,856 201,449 211,521 -Long Distance Chgs 16,317 17,188 18,047 18,950 19,897 20,892 21,937 City Telephone Personnel Expense 219,709 Capital Telephone Expenses 17,318 780,291 200,000 0 0 0 0 Telecommunications Planning & Deployment 70,043 347,316 51,125 51,125 51,585 52,050 52,519 52,993 BRAN 0 0 0 0 0 0 0 BRAN Maintenance 37,998 70,000 70,000 70,000 70,000 70,000 70,000 70,000 Other 0 0 0 0 0 0
Total Operating Uses of Funds 576,597 973,561 1,603,953 790,094 578,003 601,288 625,719 651,353
Transfers to Other Funds: Debt Payments 0 0 0 0 0 0 0 0 Cost Allocation 10,932 10,932 10,160 10,414 10,674 10,941 11,215 11,495
Total Transfers to Other Funds 10,932 10,932 10,160 10,414 10,674 10,941 11,215 11,495
TOTAL USES OF FUNDS 587,529 984,493 1,614,113 800,508 588,677 612,229 636,934 662,848
UNRESTRICTED FUND BALANCE 1,611,477 1,368,968 510,154 453,837 614,813 762,111 894,372 1,010,151
Required Reserve: Total Required Reserve 1,611,477 1,368,968 510,154 453,837 614,813 762,111 894,372 1,010,151
SURPLUS(DEFICIT) vs RESERVE GOAL 0 0 0 0 0 0 0 0
CITY OF BOULDER
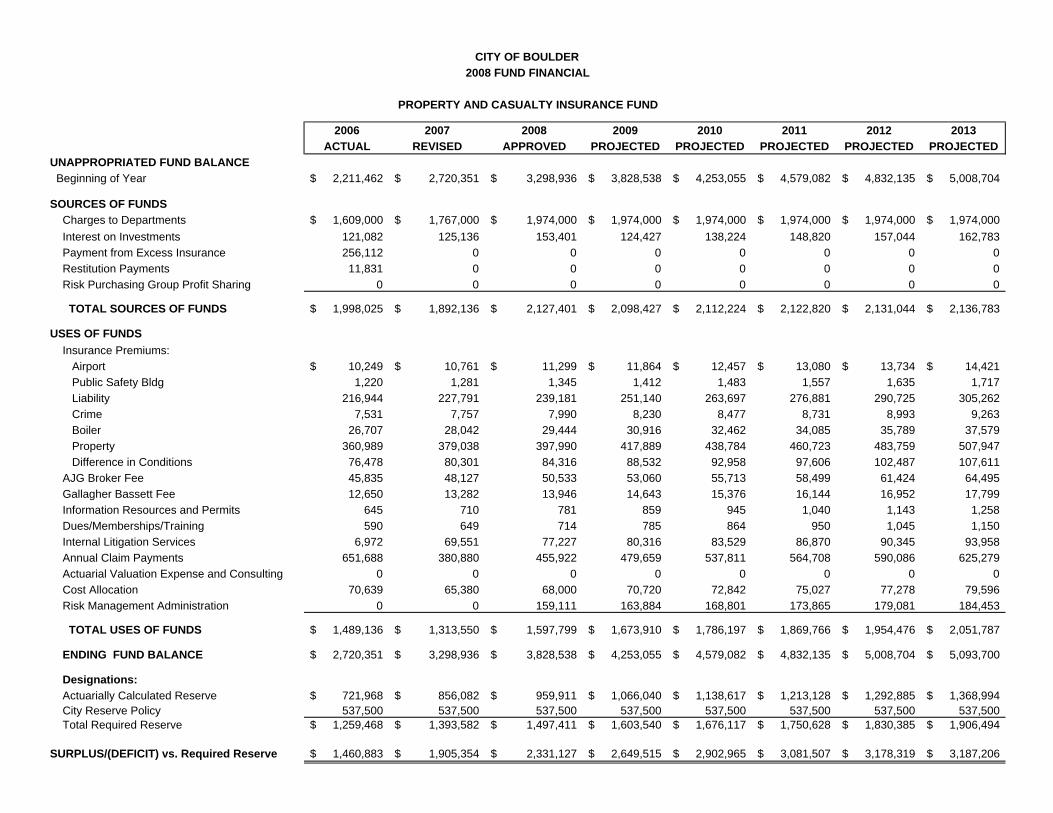
2006 2007 2008 2009 2010 2011 2012 2013ACTUAL REVISED APPROVED PROJECTED PROJECTED PROJECTED PROJECTED PROJECTED
UNAPPROPRIATED FUND BALANCE Beginning of Year 2,211,462$ 2,720,351$ 3,298,936$ 3,828,538$ 4,253,055$ 4,579,082$ 4,832,135$ 5,008,704$
SOURCES OF FUNDS Charges to Departments 1,609,000$ 1,767,000$ 1,974,000$ 1,974,000$ 1,974,000$ 1,974,000$ 1,974,000$ 1,974,000$ Interest on Investments 121,082 125,136 153,401 124,427 138,224 148,820 157,044 162,783 Payment from Excess Insurance 256,112 0 0 0 0 0 0 0 Restitution Payments 11,831 0 0 0 0 0 0 0 Risk Purchasing Group Profit Sharing 0 0 0 0 0 0 0 0
TOTAL SOURCES OF FUNDS 1,998,025$ 1,892,136$ 2,127,401$ 2,098,427$ 2,112,224$ 2,122,820$ 2,131,044$ 2,136,783$
USES OF FUNDS Insurance Premiums: Airport 10,249$ 10,761$ 11,299$ 11,864$ 12,457$ 13,080$ 13,734$ 14,421$ Public Safety Bldg 1,220 1,281 1,345 1,412 1,483 1,557 1,635 1,717 Liability 216,944 227,791 239,181 251,140 263,697 276,881 290,725 305,262 Crime 7,531 7,757 7,990 8,230 8,477 8,731 8,993 9,263 Boiler 26,707 28,042 29,444 30,916 32,462 34,085 35,789 37,579 Property 360,989 379,038 397,990 417,889 438,784 460,723 483,759 507,947 Difference in Conditions 76,478 80,301 84,316 88,532 92,958 97,606 102,487 107,611 AJG Broker Fee 45,835 48,127 50,533 53,060 55,713 58,499 61,424 64,495 Gallagher Bassett Fee 12,650 13,282 13,946 14,643 15,376 16,144 16,952 17,799 Information Resources and Permits 645 710 781 859 945 1,040 1,143 1,258 Dues/Memberships/Training 590 649 714 785 864 950 1,045 1,150 Internal Litigation Services 6,972 69,551 77,227 80,316 83,529 86,870 90,345 93,958 Annual Claim Payments 651,688 380,880 455,922 479,659 537,811 564,708 590,086 625,279 Actuarial Valuation Expense and Consulting 0 0 0 0 0 0 0 0 Cost Allocation 70,639 65,380 68,000 70,720 72,842 75,027 77,278 79,596 Risk Management Administration 0 0 159,111 163,884 168,801 173,865 179,081 184,453
TOTAL USES OF FUNDS 1,489,136$ 1,313,550$ 1,597,799$ 1,673,910$ 1,786,197$ 1,869,766$ 1,954,476$ 2,051,787$
ENDING FUND BALANCE 2,720,351$ 3,298,936$ 3,828,538$ 4,253,055$ 4,579,082$ 4,832,135$ 5,008,704$ 5,093,700$
Designations: Actuarially Calculated Reserve 721,968$ 856,082$ 959,911$ 1,066,040$ 1,138,617$ 1,213,128$ 1,292,885$ 1,368,994$ City Reserve Policy 537,500 537,500 537,500 537,500 537,500 537,500 537,500 537,500 Total Required Reserve 1,259,468$ 1,393,582$ 1,497,411$ 1,603,540$ 1,676,117$ 1,750,628$ 1,830,385$ 1,906,494$
SURPLUS/(DEFICIT) vs. Required Reserve 1,460,883$ 1,905,354$ 2,331,127$ 2,649,515$ 2,902,965$ 3,081,507$ 3,178,319$ 3,187,206$
CITY OF BOULDER2008 FUND FINANCIAL
PROPERTY AND CASUALTY INSURANCE FUND
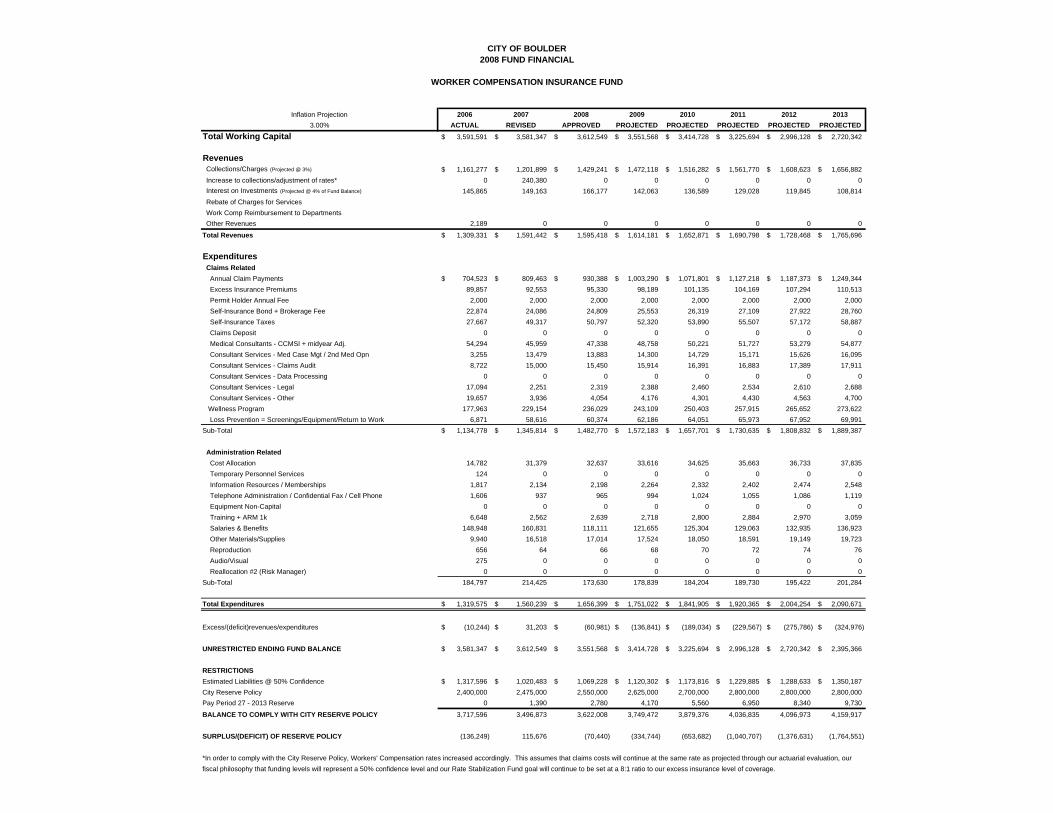
CITY OF BOULDER2008 FUND FINANCIAL
WORKER COMPENSATION INSURANCE FUND
Inflation Projection 2006 2007 2008 2009 2010 2011 2012 20133.00% ACTUAL REVISED APPROVED PROJECTED PROJECTED PROJECTED PROJECTED PROJECTED
Total Working Capital 3,591,591$ 3,581,347$ 3,612,549$ 3,551,568$ 3,414,728$ 3,225,694$ 2,996,128$ 2,720,342$
Revenues Collections/Charges (Projected @ 3%) 1,161,277$ 1,201,899$ 1,429,241$ 1,472,118$ 1,516,282$ 1,561,770$ 1,608,623$ 1,656,882$ Increase to collections/adjustment of rates* 0 240,380 0 0 0 0 0 0 Interest on Investments (Projected @ 4% of Fund Balance) 145,865 149,163 166,177 142,063 136,589 129,028 119,845 108,814 Rebate of Charges for Services Work Comp Reimbursement to Departments Other Revenues 2,189 0 0 0 0 0 0 0
Total Revenues 1,309,331$ 1,591,442$ 1,595,418$ 1,614,181$ 1,652,871$ 1,690,798$ 1,728,468$ 1,765,696$
Expenditures Claims Related Annual Claim Payments 704,523$ 809,463$ 930,388$ 1,003,290$ 1,071,801$ 1,127,218$ 1,187,373$ 1,249,344$ Excess Insurance Premiums 89,857 92,553 95,330 98,189 101,135 104,169 107,294 110,513 Permit Holder Annual Fee 2,000 2,000 2,000 2,000 2,000 2,000 2,000 2,000 Self-Insurance Bond + Brokerage Fee 22,874 24,086 24,809 25,553 26,319 27,109 27,922 28,760 Self-Insurance Taxes 27,667 49,317 50,797 52,320 53,890 55,507 57,172 58,887 Claims Deposit 0 0 0 0 0 0 0 0 Medical Consultants - CCMSI + midyear Adj. 54,294 45,959 47,338 48,758 50,221 51,727 53,279 54,877 Consultant Services - Med Case Mgt / 2nd Med Opn 3,255 13,479 13,883 14,300 14,729 15,171 15,626 16,095 Consultant Services - Claims Audit 8,722 15,000 15,450 15,914 16,391 16,883 17,389 17,911 Consultant Services - Data Processing 0 0 0 0 0 0 0 0 Consultant Services - Legal 17,094 2,251 2,319 2,388 2,460 2,534 2,610 2,688 Consultant Services - Other 19,657 3,936 4,054 4,176 4,301 4,430 4,563 4,700 Wellness Program 177,963 229,154 236,029 243,109 250,403 257,915 265,652 273,622 Loss Prevention = Screenings/Equipment/Return to Work 6,871 58,616 60,374 62,186 64,051 65,973 67,952 69,991Sub-Total 1,134,778$ 1,345,814$ 1,482,770$ 1,572,183$ 1,657,701$ 1,730,635$ 1,808,832$ 1,889,387$
Administration Related Cost Allocation 14,782 31,379 32,637 33,616 34,625 35,663 36,733 37,835 Temporary Personnel Services 124 0 0 0 0 0 0 0 Information Resources / Memberships 1,817 2,134 2,198 2,264 2,332 2,402 2,474 2,548 Telephone Administration / Confidential Fax / Cell Phone 1,606 937 965 994 1,024 1,055 1,086 1,119 Equipment Non-Capital 0 0 0 0 0 0 0 0 Training + ARM 1k 6,648 2,562 2,639 2,718 2,800 2,884 2,970 3,059 Salaries & Benefits 148,948 160,831 118,111 121,655 125,304 129,063 132,935 136,923 Other Materials/Supplies 9,940 16,518 17,014 17,524 18,050 18,591 19,149 19,723 Reproduction 656 64 66 68 70 72 74 76 Audio/Visual 275 0 0 0 0 0 0 0 Reallocation #2 (Risk Manager) 0 0 0 0 0 0 0 0Sub-Total 184,797 214,425 173,630 178,839 184,204 189,730 195,422 201,284
Total Expenditures 1,319,575$ 1,560,239$ 1,656,399$ 1,751,022$ 1,841,905$ 1,920,365$ 2,004,254$ 2,090,671$
Excess/(deficit)revenues/expenditures (10,244)$ 31,203$ (60,981)$ (136,841)$ (189,034)$ (229,567)$ (275,786)$ (324,976)$
UNRESTRICTED ENDING FUND BALANCE 3,581,347$ 3,612,549$ 3,551,568$ 3,414,728$ 3,225,694$ 2,996,128$ 2,720,342$ 2,395,366$
RESTRICTIONSEstimated Liabilities @ 50% Confidence 1,317,596$ 1,020,483$ 1,069,228$ 1,120,302$ 1,173,816$ 1,229,885$ 1,288,633$ 1,350,187$ City Reserve Policy 2,400,000 2,475,000 2,550,000 2,625,000 2,700,000 2,800,000 2,800,000 2,800,000Pay Period 27 - 2013 Reserve 0 1,390 2,780 4,170 5,560 6,950 8,340 9,730
BALANCE TO COMPLY WITH CITY RESERVE POLICY 3,717,596 3,496,873 3,622,008 3,749,472 3,879,376 4,036,835 4,096,973 4,159,917
SURPLUS/(DEFICIT) OF RESERVE POLICY (136,249) 115,676 (70,440) (334,744) (653,682) (1,040,707) (1,376,631) (1,764,551)
*In order to comply with the City Reserve Policy, Workers' Compensation rates increased accordingly. This assumes that claims costs will continue at the same rate as projected through our actuarial evaluation, our fiscal philosophy that funding levels will represent a 50% confidence level and our Rate Stabilization Fund goal will continue to be set at a 8:1 ratio to our excess insurance level of coverage.
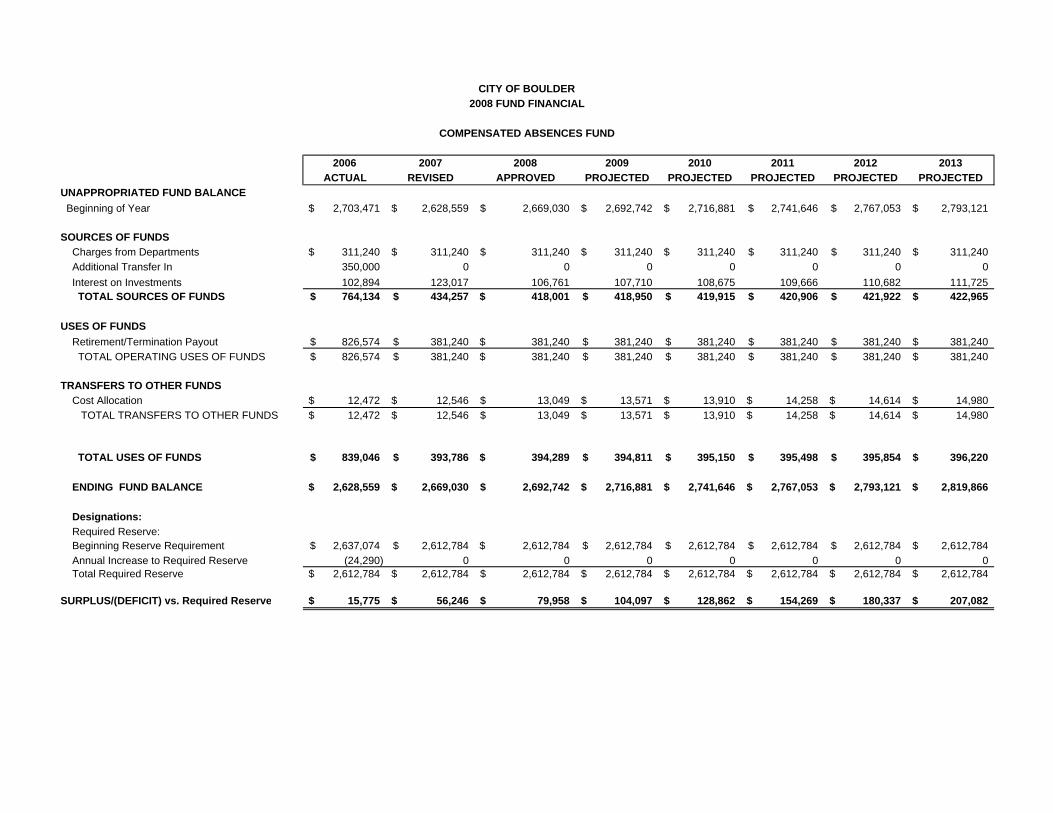
2006 2007 2008 2009 2010 2011 2012 2013ACTUAL REVISED APPROVED PROJECTED PROJECTED PROJECTED PROJECTED PROJECTED
UNAPPROPRIATED FUND BALANCE Beginning of Year 2,703,471$ 2,628,559$ 2,669,030$ 2,692,742$ 2,716,881$ 2,741,646$ 2,767,053$ 2,793,121$
SOURCES OF FUNDS Charges from Departments 311,240$ 311,240$ 311,240$ 311,240$ 311,240$ 311,240$ 311,240$ 311,240$ Additional Transfer In 350,000 0 0 0 0 0 0 0 Interest on Investments 102,894 123,017 106,761 107,710 108,675 109,666 110,682 111,725 TOTAL SOURCES OF FUNDS 764,134$ 434,257$ 418,001$ 418,950$ 419,915$ 420,906$ 421,922$ 422,965$
USES OF FUNDS Retirement/Termination Payout 826,574$ 381,240$ 381,240$ 381,240$ 381,240$ 381,240$ 381,240$ 381,240$ TOTAL OPERATING USES OF FUNDS 826,574$ 381,240$ 381,240$ 381,240$ 381,240$ 381,240$ 381,240$ 381,240$
TRANSFERS TO OTHER FUNDS Cost Allocation 12,472$ 12,546$ 13,049$ 13,571$ 13,910$ 14,258$ 14,614$ 14,980$ TOTAL TRANSFERS TO OTHER FUNDS 12,472$ 12,546$ 13,049$ 13,571$ 13,910$ 14,258$ 14,614$ 14,980$
TOTAL USES OF FUNDS 839,046$ 393,786$ 394,289$ 394,811$ 395,150$ 395,498$ 395,854$ 396,220$
ENDING FUND BALANCE 2,628,559$ 2,669,030$ 2,692,742$ 2,716,881$ 2,741,646$ 2,767,053$ 2,793,121$ 2,819,866$
Designations: Required Reserve: Beginning Reserve Requirement 2,637,074$ 2,612,784$ 2,612,784$ 2,612,784$ 2,612,784$ 2,612,784$ 2,612,784$ 2,612,784$ Annual Increase to Required Reserve (24,290) 0 0 0 0 0 0 0 Total Required Reserve 2,612,784$ 2,612,784$ 2,612,784$ 2,612,784$ 2,612,784$ 2,612,784$ 2,612,784$ 2,612,784$
SURPLUS/(DEFICIT) vs. Required Reserve 15,775$ 56,246$ 79,958$ 104,097$ 128,862$ 154,269$ 180,337$ 207,082$
CITY OF BOULDER2008 FUND FINANCIAL
COMPENSATED ABSENCES FUND
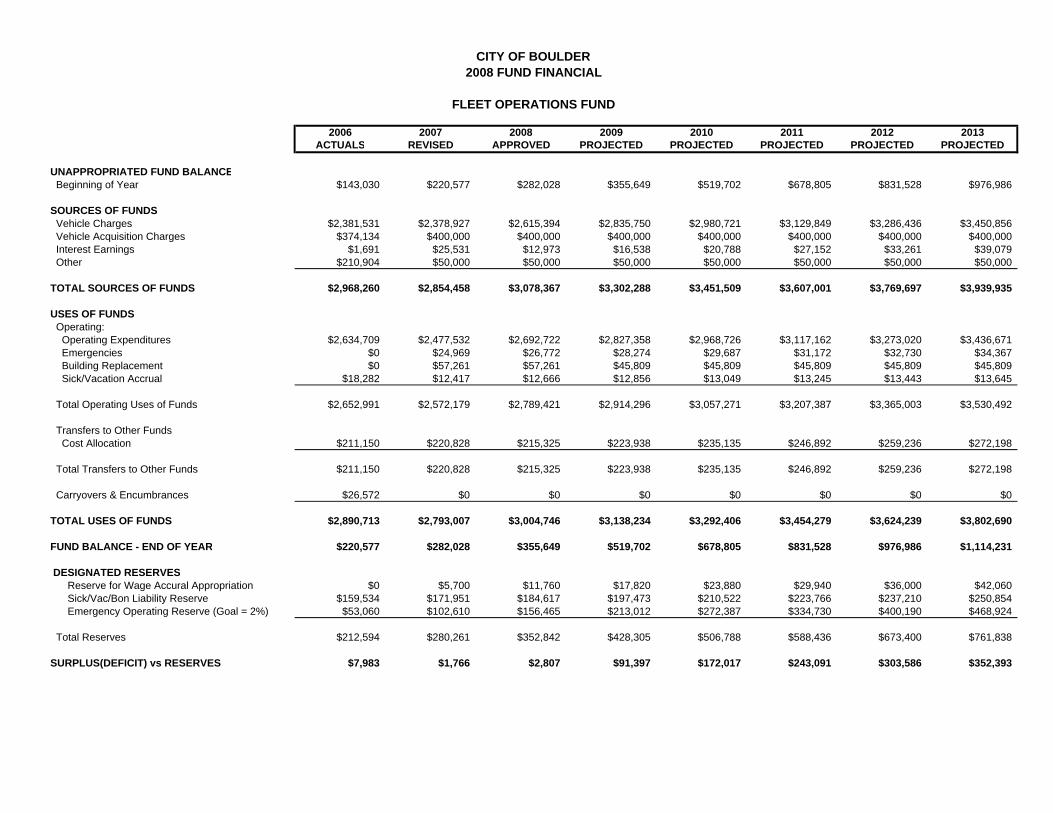
2006 2007 2008 2009 2010 2011 2012 2013ACTUALS REVISED APPROVED PROJECTED PROJECTED PROJECTED PROJECTED PROJECTED
UNAPPROPRIATED FUND BALANCE Beginning of Year $143,030 $220,577 $282,028 $355,649 $519,702 $678,805 $831,528 $976,986
SOURCES OF FUNDS Vehicle Charges $2,381,531 $2,378,927 $2,615,394 $2,835,750 $2,980,721 $3,129,849 $3,286,436 $3,450,856 Vehicle Acquisition Charges $374,134 $400,000 $400,000 $400,000 $400,000 $400,000 $400,000 $400,000 Interest Earnings $1,691 $25,531 $12,973 $16,538 $20,788 $27,152 $33,261 $39,079 Other $210,904 $50,000 $50,000 $50,000 $50,000 $50,000 $50,000 $50,000
TOTAL SOURCES OF FUNDS $2,968,260 $2,854,458 $3,078,367 $3,302,288 $3,451,509 $3,607,001 $3,769,697 $3,939,935
USES OF FUNDS Operating: Operating Expenditures $2,634,709 $2,477,532 $2,692,722 $2,827,358 $2,968,726 $3,117,162 $3,273,020 $3,436,671 Emergencies $0 $24,969 $26,772 $28,274 $29,687 $31,172 $32,730 $34,367 Building Replacement $0 $57,261 $57,261 $45,809 $45,809 $45,809 $45,809 $45,809 Sick/Vacation Accrual $18,282 $12,417 $12,666 $12,856 $13,049 $13,245 $13,443 $13,645
Total Operating Uses of Funds $2,652,991 $2,572,179 $2,789,421 $2,914,296 $3,057,271 $3,207,387 $3,365,003 $3,530,492
Transfers to Other Funds Cost Allocation $211,150 $220,828 $215,325 $223,938 $235,135 $246,892 $259,236 $272,198
Total Transfers to Other Funds $211,150 $220,828 $215,325 $223,938 $235,135 $246,892 $259,236 $272,198
Carryovers & Encumbrances $26,572 $0 $0 $0 $0 $0 $0 $0
TOTAL USES OF FUNDS $2,890,713 $2,793,007 $3,004,746 $3,138,234 $3,292,406 $3,454,279 $3,624,239 $3,802,690
FUND BALANCE - END OF YEAR $220,577 $282,028 $355,649 $519,702 $678,805 $831,528 $976,986 $1,114,231
DESIGNATED RESERVES Reserve for Wage Accural Appropriation $0 $5,700 $11,760 $17,820 $23,880 $29,940 $36,000 $42,060 Sick/Vac/Bon Liability Reserve $159,534 $171,951 $184,617 $197,473 $210,522 $223,766 $237,210 $250,854 Emergency Operating Reserve (Goal = 2%) $53,060 $102,610 $156,465 $213,012 $272,387 $334,730 $400,190 $468,924
Total Reserves $212,594 $280,261 $352,842 $428,305 $506,788 $588,436 $673,400 $761,838
SURPLUS(DEFICIT) vs RESERVES $7,983 $1,766 $2,807 $91,397 $172,017 $243,091 $303,586 $352,393
CITY OF BOULDER2008 FUND FINANCIAL
FLEET OPERATIONS FUND
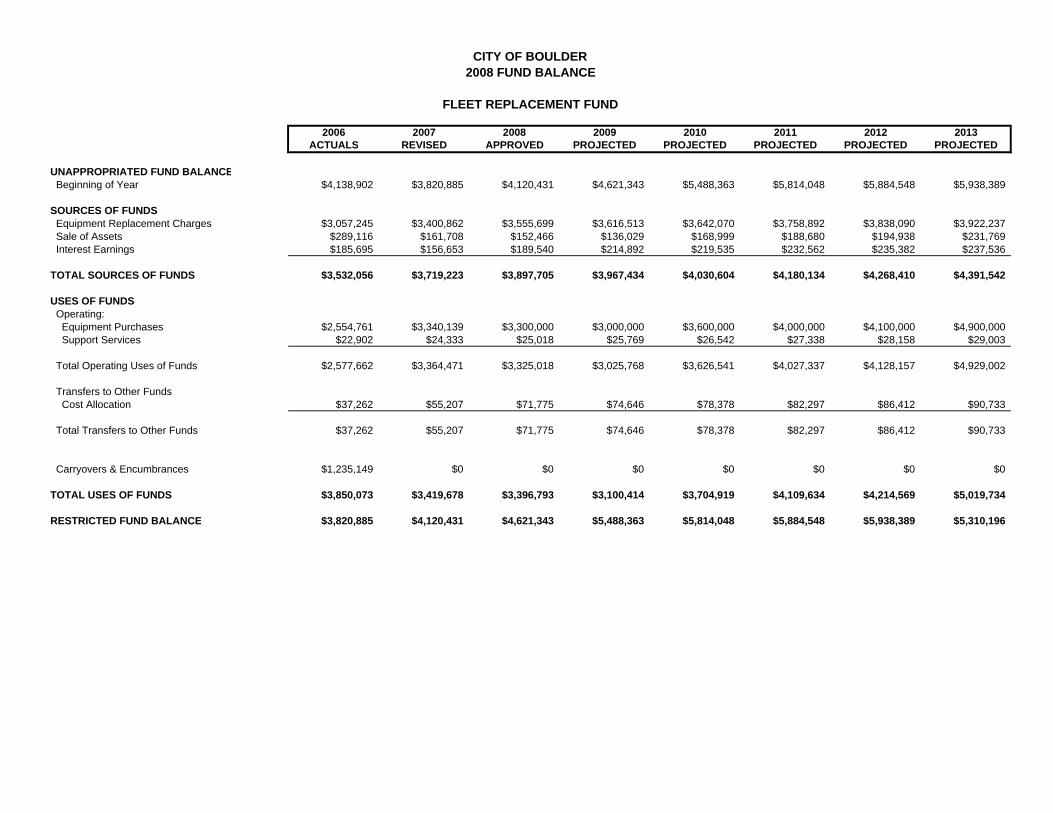
2006 2007 2008 2009 2010 2011 2012 2013ACTUALS REVISED APPROVED PROJECTED PROJECTED PROJECTED PROJECTED PROJECTED
UNAPPROPRIATED FUND BALANCE Beginning of Year $4,138,902 $3,820,885 $4,120,431 $4,621,343 $5,488,363 $5,814,048 $5,884,548 $5,938,389
SOURCES OF FUNDS Equipment Replacement Charges $3,057,245 $3,400,862 $3,555,699 $3,616,513 $3,642,070 $3,758,892 $3,838,090 $3,922,237 Sale of Assets $289,116 $161,708 $152,466 $136,029 $168,999 $188,680 $194,938 $231,769 Interest Earnings $185,695 $156,653 $189,540 $214,892 $219,535 $232,562 $235,382 $237,536
TOTAL SOURCES OF FUNDS $3,532,056 $3,719,223 $3,897,705 $3,967,434 $4,030,604 $4,180,134 $4,268,410 $4,391,542
USES OF FUNDS Operating: Equipment Purchases $2,554,761 $3,340,139 $3,300,000 $3,000,000 $3,600,000 $4,000,000 $4,100,000 $4,900,000 Support Services $22,902 $24,333 $25,018 $25,769 $26,542 $27,338 $28,158 $29,003
Total Operating Uses of Funds $2,577,662 $3,364,471 $3,325,018 $3,025,768 $3,626,541 $4,027,337 $4,128,157 $4,929,002
Transfers to Other Funds Cost Allocation $37,262 $55,207 $71,775 $74,646 $78,378 $82,297 $86,412 $90,733
Total Transfers to Other Funds $37,262 $55,207 $71,775 $74,646 $78,378 $82,297 $86,412 $90,733
Carryovers & Encumbrances $1,235,149 $0 $0 $0 $0 $0 $0 $0
TOTAL USES OF FUNDS $3,850,073 $3,419,678 $3,396,793 $3,100,414 $3,704,919 $4,109,634 $4,214,569 $5,019,734
RESTRICTED FUND BALANCE $3,820,885 $4,120,431 $4,621,343 $5,488,363 $5,814,048 $5,884,548 $5,938,389 $5,310,196
CITY OF BOULDER2008 FUND BALANCE
FLEET REPLACEMENT FUND
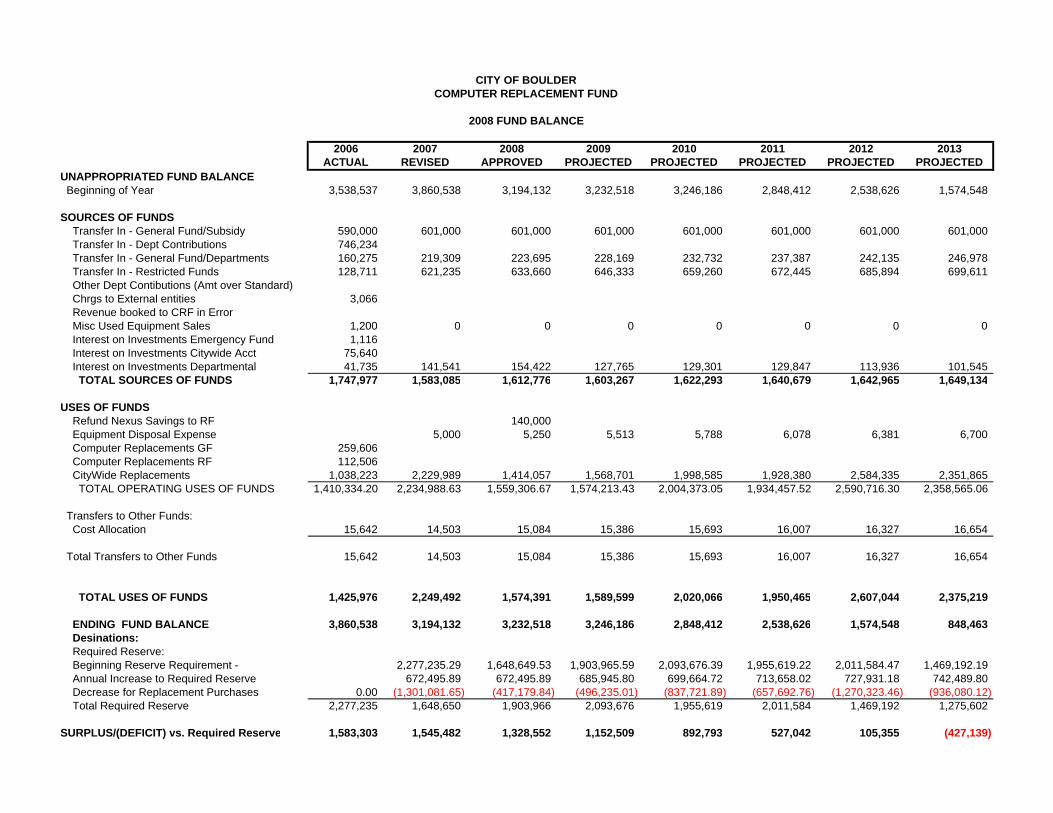
CITY OF BOULDERCOMPUTER REPLACEMENT FUND
2008 FUND BALANCE
2006 2007 2008 2009 2010 2011 2012 2013ACTUAL REVISED APPROVED PROJECTED PROJECTED PROJECTED PROJECTED PROJECTED
UNAPPROPRIATED FUND BALANCE Beginning of Year 3,538,537 3,860,538 3,194,132 3,232,518 3,246,186 2,848,412 2,538,626 1,574,548
SOURCES OF FUNDS Transfer In - General Fund/Subsidy 590,000 601,000 601,000 601,000 601,000 601,000 601,000 601,000 Transfer In - Dept Contributions 746,234 Transfer In - General Fund/Departments 160,275 219,309 223,695 228,169 232,732 237,387 242,135 246,978 Transfer In - Restricted Funds 128,711 621,235 633,660 646,333 659,260 672,445 685,894 699,611 Other Dept Contibutions (Amt over Standard) Chrgs to External entities 3,066 Revenue booked to CRF in Error Misc Used Equipment Sales 1,200 0 0 0 0 0 0 0 Interest on Investments Emergency Fund 1,116 Interest on Investments Citywide Acct 75,640 Interest on Investments Departmental 41,735 141,541 154,422 127,765 129,301 129,847 113,936 101,545 TOTAL SOURCES OF FUNDS 1,747,977 1,583,085 1,612,776 1,603,267 1,622,293 1,640,679 1,642,965 1,649,134
USES OF FUNDS Refund Nexus Savings to RF 140,000 Equipment Disposal Expense 5,000 5,250 5,513 5,788 6,078 6,381 6,700 Computer Replacements GF 259,606 Computer Replacements RF 112,506 CityWide Replacements 1,038,223 2,229,989 1,414,057 1,568,701 1,998,585 1,928,380 2,584,335 2,351,865 TOTAL OPERATING USES OF FUNDS 1,410,334.20 2,234,988.63 1,559,306.67 1,574,213.43 2,004,373.05 1,934,457.52 2,590,716.30 2,358,565.06
Transfers to Other Funds: Cost Allocation 15,642 14,503 15,084 15,386 15,693 16,007 16,327 16,654
Total Transfers to Other Funds 15,642 14,503 15,084 15,386 15,693 16,007 16,327 16,654
TOTAL USES OF FUNDS 1,425,976 2,249,492 1,574,391 1,589,599 2,020,066 1,950,465 2,607,044 2,375,219
ENDING FUND BALANCE 3,860,538 3,194,132 3,232,518 3,246,186 2,848,412 2,538,626 1,574,548 848,463 Desinations: Required Reserve: Beginning Reserve Requirement - 2,277,235.29 1,648,649.53 1,903,965.59 2,093,676.39 1,955,619.22 2,011,584.47 1,469,192.19 Annual Increase to Required Reserve 672,495.89 672,495.89 685,945.80 699,664.72 713,658.02 727,931.18 742,489.80 Decrease for Replacement Purchases 0.00 (1,301,081.65) (417,179.84) (496,235.01) (837,721.89) (657,692.76) (1,270,323.46) (936,080.12) Total Required Reserve 2,277,235 1,648,650 1,903,966 2,093,676 1,955,619 2,011,584 1,469,192 1,275,602
SURPLUS/(DEFICIT) vs. Required Reserve 1,583,303 1,545,482 1,328,552 1,152,509 892,793 527,042 105,355 (427,139)
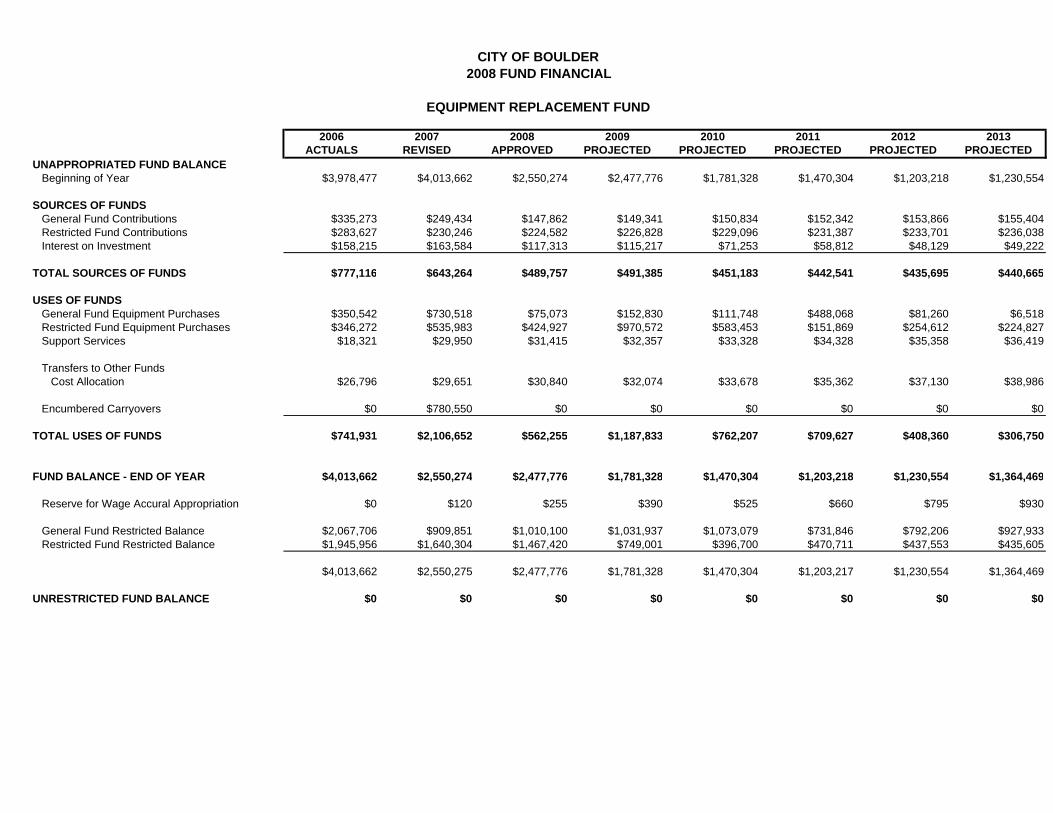
2006 2007 2008 2009 2010 2011 2012 2013ACTUALS REVISED APPROVED PROJECTED PROJECTED PROJECTED PROJECTED PROJECTED
UNAPPROPRIATED FUND BALANCE Beginning of Year $3,978,477 $4,013,662 $2,550,274 $2,477,776 $1,781,328 $1,470,304 $1,203,218 $1,230,554
SOURCES OF FUNDS General Fund Contributions $335,273 $249,434 $147,862 $149,341 $150,834 $152,342 $153,866 $155,404 Restricted Fund Contributions $283,627 $230,246 $224,582 $226,828 $229,096 $231,387 $233,701 $236,038 Interest on Investment $158,215 $163,584 $117,313 $115,217 $71,253 $58,812 $48,129 $49,222
TOTAL SOURCES OF FUNDS $777,116 $643,264 $489,757 $491,385 $451,183 $442,541 $435,695 $440,665
USES OF FUNDSGeneral Fund Equipment Purchases $350,542 $730,518 $75,073 $152,830 $111,748 $488,068 $81,260 $6,518Restricted Fund Equipment Purchases $346,272 $535,983 $424,927 $970,572 $583,453 $151,869 $254,612 $224,827Support Services $18,321 $29,950 $31,415 $32,357 $33,328 $34,328 $35,358 $36,419
Transfers to Other Funds Cost Allocation $26,796 $29,651 $30,840 $32,074 $33,678 $35,362 $37,130 $38,986
Encumbered Carryovers $0 $780,550 $0 $0 $0 $0 $0 $0
TOTAL USES OF FUNDS $741,931 $2,106,652 $562,255 $1,187,833 $762,207 $709,627 $408,360 $306,750
FUND BALANCE - END OF YEAR $4,013,662 $2,550,274 $2,477,776 $1,781,328 $1,470,304 $1,203,218 $1,230,554 $1,364,469
Reserve for Wage Accural Appropriation $0 $120 $255 $390 $525 $660 $795 $930
General Fund Restricted Balance $2,067,706 $909,851 $1,010,100 $1,031,937 $1,073,079 $731,846 $792,206 $927,933 Restricted Fund Restricted Balance $1,945,956 $1,640,304 $1,467,420 $749,001 $396,700 $470,711 $437,553 $435,605
$4,013,662 $2,550,275 $2,477,776 $1,781,328 $1,470,304 $1,203,217 $1,230,554 $1,364,469
UNRESTRICTED FUND BALANCE $0 $0 $0 $0 $0 $0 $0 $0
CITY OF BOULDER2008 FUND FINANCIAL
EQUIPMENT REPLACEMENT FUND
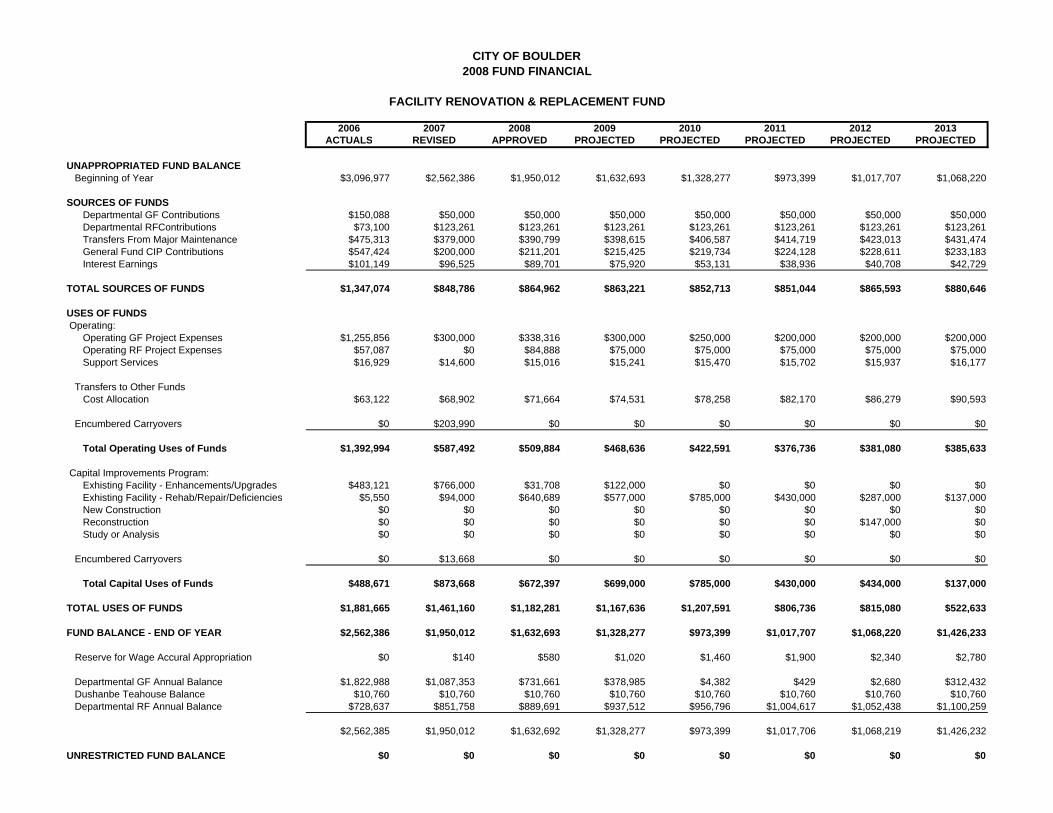
2006 2007 2008 2009 2010 2011 2012 2013ACTUALS REVISED APPROVED PROJECTED PROJECTED PROJECTED PROJECTED PROJECTED
UNAPPROPRIATED FUND BALANCEBeginning of Year $3,096,977 $2,562,386 $1,950,012 $1,632,693 $1,328,277 $973,399 $1,017,707 $1,068,220
SOURCES OF FUNDSDepartmental GF Contributions $150,088 $50,000 $50,000 $50,000 $50,000 $50,000 $50,000 $50,000Departmental RFContributions $73,100 $123,261 $123,261 $123,261 $123,261 $123,261 $123,261 $123,261Transfers From Major Maintenance $475,313 $379,000 $390,799 $398,615 $406,587 $414,719 $423,013 $431,474General Fund CIP Contributions $547,424 $200,000 $211,201 $215,425 $219,734 $224,128 $228,611 $233,183Interest Earnings $101,149 $96,525 $89,701 $75,920 $53,131 $38,936 $40,708 $42,729
TOTAL SOURCES OF FUNDS $1,347,074 $848,786 $864,962 $863,221 $852,713 $851,044 $865,593 $880,646
USES OF FUNDS Operating:
Operating GF Project Expenses $1,255,856 $300,000 $338,316 $300,000 $250,000 $200,000 $200,000 $200,000Operating RF Project Expenses $57,087 $0 $84,888 $75,000 $75,000 $75,000 $75,000 $75,000Support Services $16,929 $14,600 $15,016 $15,241 $15,470 $15,702 $15,937 $16,177
Transfers to Other Funds Cost Allocation $63,122 $68,902 $71,664 $74,531 $78,258 $82,170 $86,279 $90,593
Encumbered Carryovers $0 $203,990 $0 $0 $0 $0 $0 $0
Total Operating Uses of Funds $1,392,994 $587,492 $509,884 $468,636 $422,591 $376,736 $381,080 $385,633
Capital Improvements Program:Exhisting Facility - Enhancements/Upgrades $483,121 $766,000 $31,708 $122,000 $0 $0 $0 $0Exhisting Facility - Rehab/Repair/Deficiencies $5,550 $94,000 $640,689 $577,000 $785,000 $430,000 $287,000 $137,000New Construction $0 $0 $0 $0 $0 $0 $0 $0Reconstruction $0 $0 $0 $0 $0 $0 $147,000 $0Study or Analysis $0 $0 $0 $0 $0 $0 $0 $0
Encumbered Carryovers $0 $13,668 $0 $0 $0 $0 $0 $0
Total Capital Uses of Funds $488,671 $873,668 $672,397 $699,000 $785,000 $430,000 $434,000 $137,000
TOTAL USES OF FUNDS $1,881,665 $1,461,160 $1,182,281 $1,167,636 $1,207,591 $806,736 $815,080 $522,633
FUND BALANCE - END OF YEAR $2,562,386 $1,950,012 $1,632,693 $1,328,277 $973,399 $1,017,707 $1,068,220 $1,426,233
Reserve for Wage Accural Appropriation $0 $140 $580 $1,020 $1,460 $1,900 $2,340 $2,780
Departmental GF Annual Balance $1,822,988 $1,087,353 $731,661 $378,985 $4,382 $429 $2,680 $312,432Dushanbe Teahouse Balance $10,760 $10,760 $10,760 $10,760 $10,760 $10,760 $10,760 $10,760Departmental RF Annual Balance $728,637 $851,758 $889,691 $937,512 $956,796 $1,004,617 $1,052,438 $1,100,259
$2,562,385 $1,950,012 $1,632,692 $1,328,277 $973,399 $1,017,706 $1,068,219 $1,426,232
UNRESTRICTED FUND BALANCE $0 $0 $0 $0 $0 $0 $0 $0
CITY OF BOULDER2008 FUND FINANCIAL
FACILITY RENOVATION & REPLACEMENT FUND

UTILITY RATES
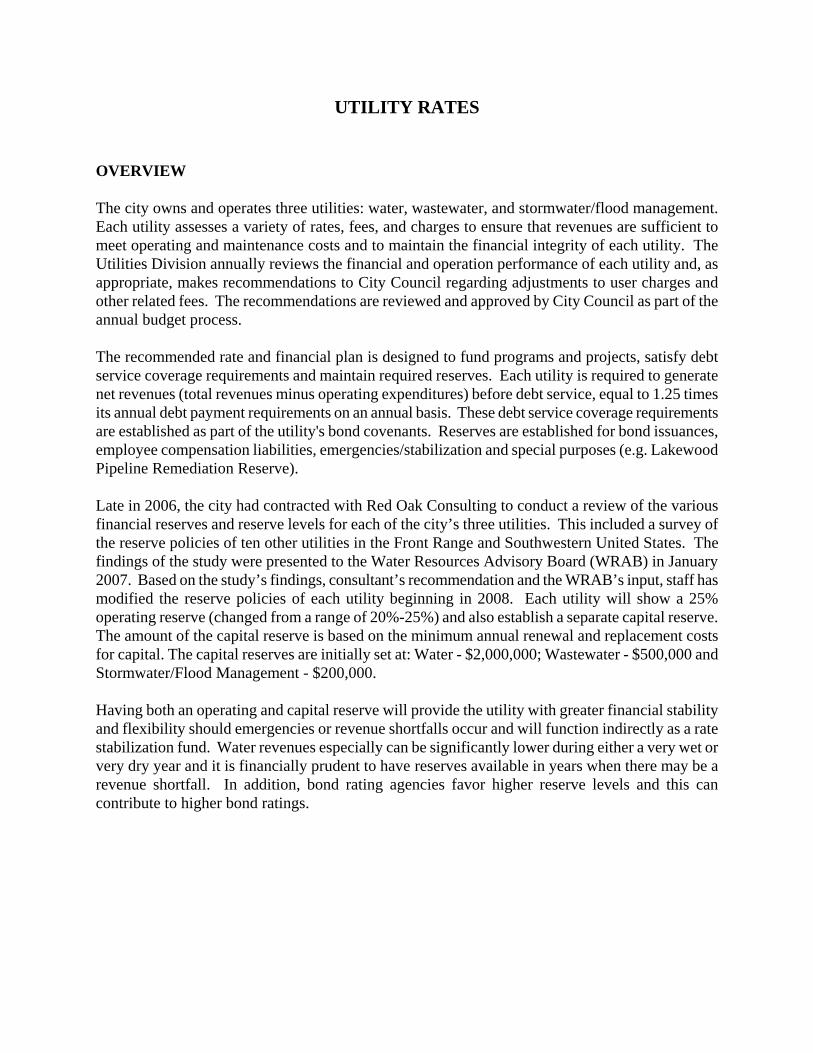
UTILITY RATES OVERVIEW The city owns and operates three utilities: water, wastewater, and stormwater/flood management. Each utility assesses a variety of rates, fees, and charges to ensure that revenues are sufficient to meet operating and maintenance costs and to maintain the financial integrity of each utility. The Utilities Division annually reviews the financial and operation performance of each utility and, as appropriate, makes recommendations to City Council regarding adjustments to user charges and other related fees. The recommendations are reviewed and approved by City Council as part of the annual budget process. The recommended rate and financial plan is designed to fund programs and projects, satisfy debt service coverage requirements and maintain required reserves. Each utility is required to generate net revenues (total revenues minus operating expenditures) before debt service, equal to 1.25 times its annual debt payment requirements on an annual basis. These debt service coverage requirements are established as part of the utility's bond covenants. Reserves are established for bond issuances, employee compensation liabilities, emergencies/stabilization and special purposes (e.g. Lakewood Pipeline Remediation Reserve). Late in 2006, the city had contracted with Red Oak Consulting to conduct a review of the various financial reserves and reserve levels for each of the city’s three utilities. This included a survey of the reserve policies of ten other utilities in the Front Range and Southwestern United States. The findings of the study were presented to the Water Resources Advisory Board (WRAB) in January 2007. Based on the study’s findings, consultant’s recommendation and the WRAB’s input, staff has modified the reserve policies of each utility beginning in 2008. Each utility will show a 25% operating reserve (changed from a range of 20%-25%) and also establish a separate capital reserve. The amount of the capital reserve is based on the minimum annual renewal and replacement costs for capital. The capital reserves are initially set at: Water - $2,000,000; Wastewater - $500,000 and Stormwater/Flood Management - $200,000. Having both an operating and capital reserve will provide the utility with greater financial stability and flexibility should emergencies or revenue shortfalls occur and will function indirectly as a rate stabilization fund. Water revenues especially can be significantly lower during either a very wet or very dry year and it is financially prudent to have reserves available in years when there may be a revenue shortfall. In addition, bond rating agencies favor higher reserve levels and this can contribute to higher bond ratings.
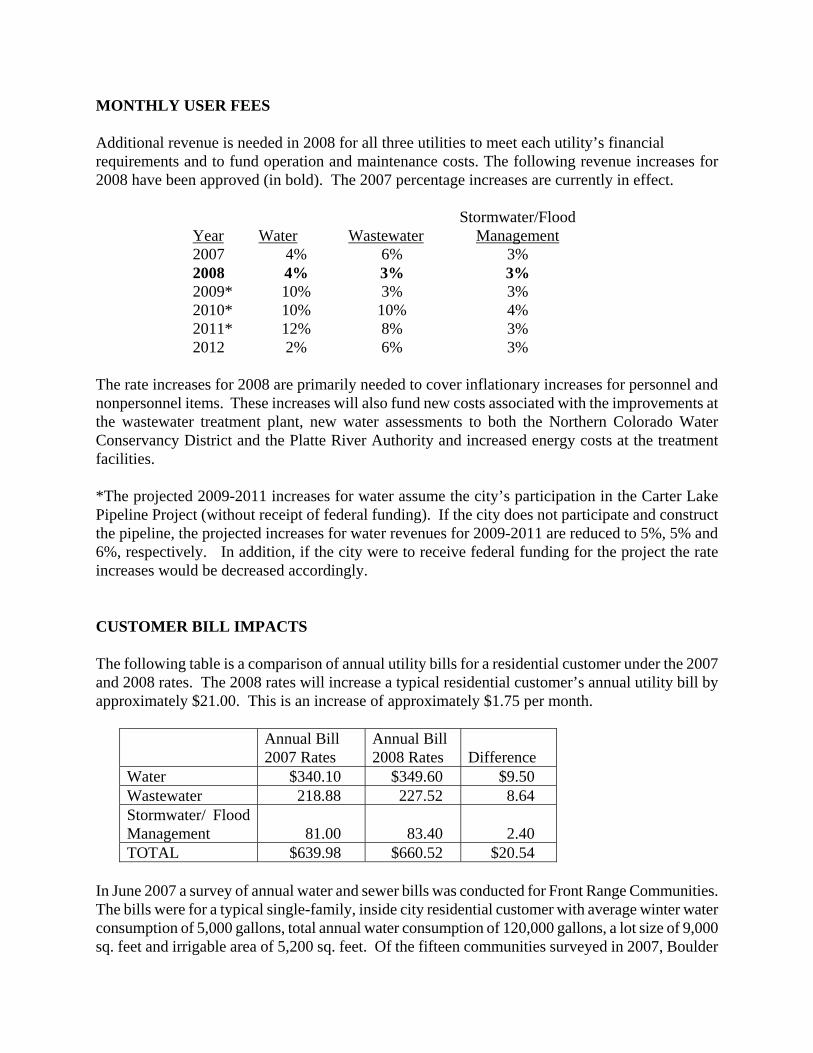
MONTHLY USER FEES Additional revenue is needed in 2008 for all three utilities to meet each utility’s financial requirements and to fund operation and maintenance costs. The following revenue increases for 2008 have been approved (in bold). The 2007 percentage increases are currently in effect.
Year
Water
Wastewater
Stormwater/Flood Management
2007 4% 6% 3% 2008 4% 3% 3% 2009* 10% 3% 3% 2010* 10% 10% 4% 2011* 12% 8% 3% 2012 2% 6% 3%
The rate increases for 2008 are primarily needed to cover inflationary increases for personnel and nonpersonnel items. These increases will also fund new costs associated with the improvements at the wastewater treatment plant, new water assessments to both the Northern Colorado Water Conservancy District and the Platte River Authority and increased energy costs at the treatment facilities. *The projected 2009-2011 increases for water assume the city’s participation in the Carter Lake Pipeline Project (without receipt of federal funding). If the city does not participate and construct the pipeline, the projected increases for water revenues for 2009-2011 are reduced to 5%, 5% and 6%, respectively. In addition, if the city were to receive federal funding for the project the rate increases would be decreased accordingly. CUSTOMER BILL IMPACTS The following table is a comparison of annual utility bills for a residential customer under the 2007 and 2008 rates. The 2008 rates will increase a typical residential customer’s annual utility bill by approximately $21.00. This is an increase of approximately $1.75 per month.
Annual Bill 2007 Rates
Annual Bill 2008 Rates
Difference
Water $340.10 $349.60 $9.50 Wastewater 218.88 227.52 8.64 Stormwater/ Flood Management
81.00
83.40
2.40
TOTAL $639.98 $660.52 $20.54 In June 2007 a survey of annual water and sewer bills was conducted for Front Range Communities. The bills were for a typical single-family, inside city residential customer with average winter water consumption of 5,000 gallons, total annual water consumption of 120,000 gallons, a lot size of 9,000 sq. feet and irrigable area of 5,200 sq. feet. Of the fifteen communities surveyed in 2007, Boulder
has the third lowest annual water-only bill; the fourth highest annual sewer-only bill and was in the middle (seventh lowest) for the combined water and sewer bills. PROGRAMS AND PROJECTS WITH A POTENTIAL RATE IMPACT In January 2007 a new water rate structure that uses water budgets was implemented. Changing to a new rate methodology will provide a bit of uncertainty to revenue projections for the next several years. Revenue forecasts have been made with the best available information and staff will monitor and evaluate actual revenues on a monthly basis in order to make adjustments, if needed. In addition any future changes to the water budget rate structure that are considered would also include an analysis of the impact to water revenues and water rates. In addition, the Utilities’ 2008-2013 fund financials reflect several bond issuances, and the associated rate increases, to fund the following capital projects: Water Utility
- Boulder Reservoir Water Treatment Plant Improvements ($3.0 million included in the 2009 CIP) - Northern Colorado Water Conservancy District Conveyance - Carter Lake Pipeline ($25.0 million included in the 2009 CIP) - Betasso Water Treatment Plant Improvements ($5.0 million included in the 2012 CIP)
Wastewater Utility - Biosolids Digester ($3.0 million included in 2010 CIP, plus increase in operating budget;
total project cost is $6.0 million with $3.0 million being cash financed) - Wastewater Treatment Plant Improvements ($10.0 million included in the 2010 CIP) This
project is for possible additional improvements to the plant, depending upon effective regulatory limits for the 2008 discharge permit.
Stormwater/ Flood Management Utility - Initial improvements related to South Boulder Creek ($3.0 million included in 2010 CIP) Cost estimates for these capital projects will likely be refined as the construction date approaches which could result in changes to projected rate increases. PLANT INVESTMENT FEES Utility Plant Investment Fees (PIFs) will increase by an inflationary amount (2.9%) for 2008. This amount is based on the percent change in the construction cost index for the Denver area. PIFs are a one-time fee collected when a property is annexed, developed, or redeveloped and requires access (capacity) into the existing water, wastewater and/or stormwater/ flood management systems. PIFs were recalculated, based on the replacement value of the utility assets, as part of the 2001 Utility Rate and Plant Investment Fee Review conducted by Integrated Utilities Group, Inc. and became effective January 2002. Beginning in 2003, PIFs are increased annually by a small percentage
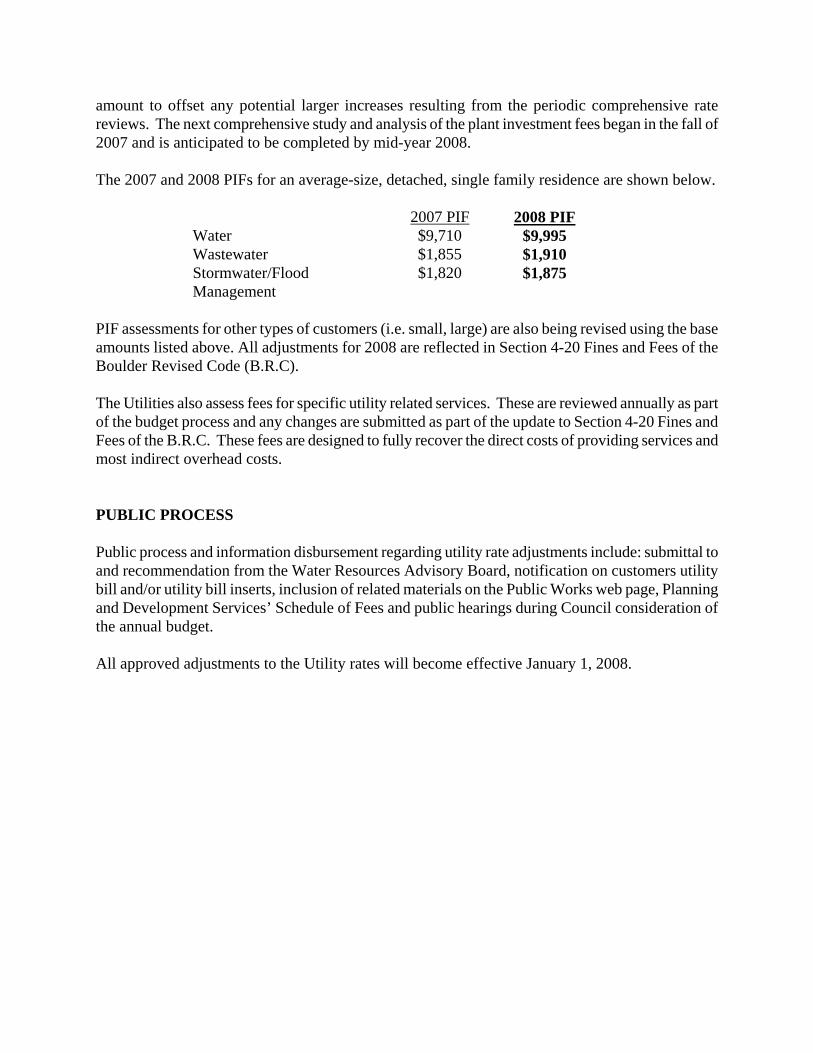
amount to offset any potential larger increases resulting from the periodic comprehensive rate reviews. The next comprehensive study and analysis of the plant investment fees began in the fall of 2007 and is anticipated to be completed by mid-year 2008. The 2007 and 2008 PIFs for an average-size, detached, single family residence are shown below.
2007 PIF 2008 PIF Water $9,710 $9,995 Wastewater $1,855 $1,910 Stormwater/Flood Management
$1,820
$1,875
PIF assessments for other types of customers (i.e. small, large) are also being revised using the base amounts listed above. All adjustments for 2008 are reflected in Section 4-20 Fines and Fees of the Boulder Revised Code (B.R.C). The Utilities also assess fees for specific utility related services. These are reviewed annually as part of the budget process and any changes are submitted as part of the update to Section 4-20 Fines and Fees of the B.R.C. These fees are designed to fully recover the direct costs of providing services and most indirect overhead costs. PUBLIC PROCESS Public process and information disbursement regarding utility rate adjustments include: submittal to and recommendation from the Water Resources Advisory Board, notification on customers utility bill and/or utility bill inserts, inclusion of related materials on the Public Works web page, Planning and Development Services’ Schedule of Fees and public hearings during Council consideration of the annual budget. All approved adjustments to the Utility rates will become effective January 1, 2008.

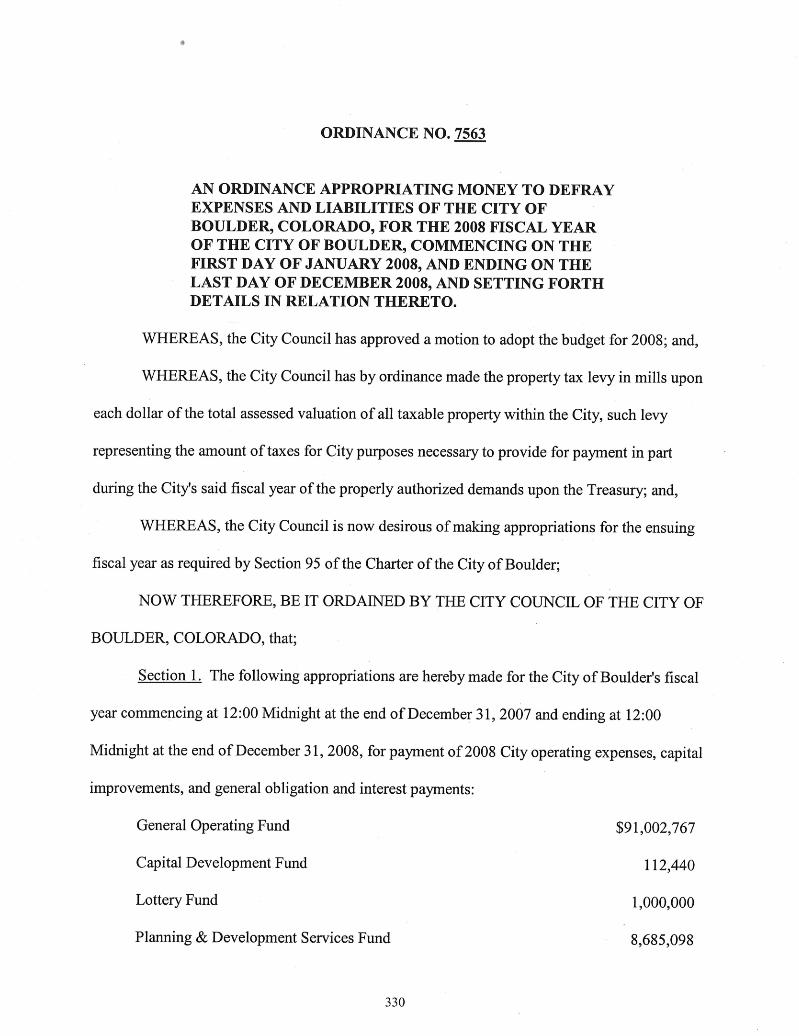
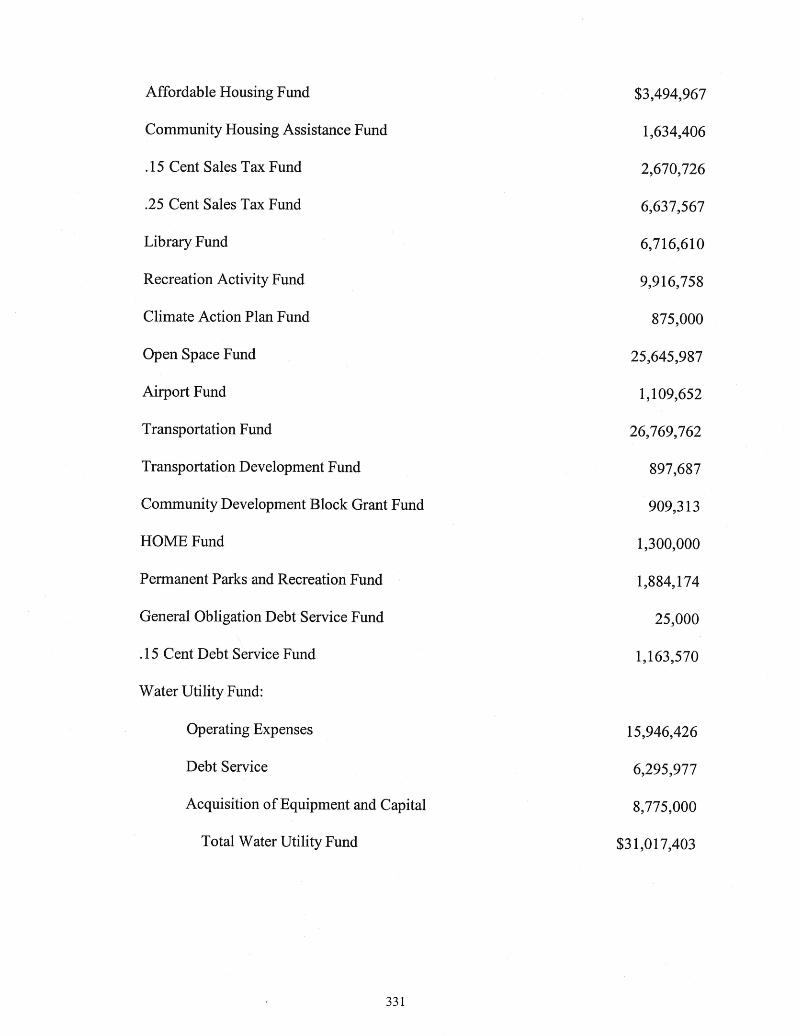
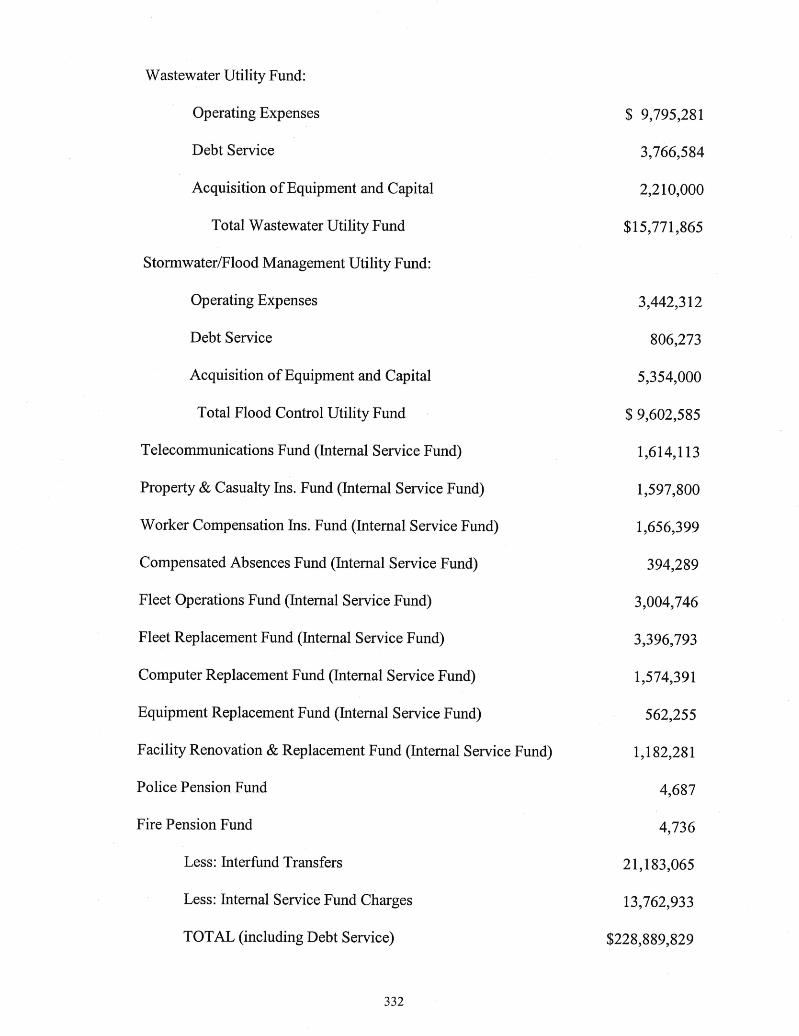
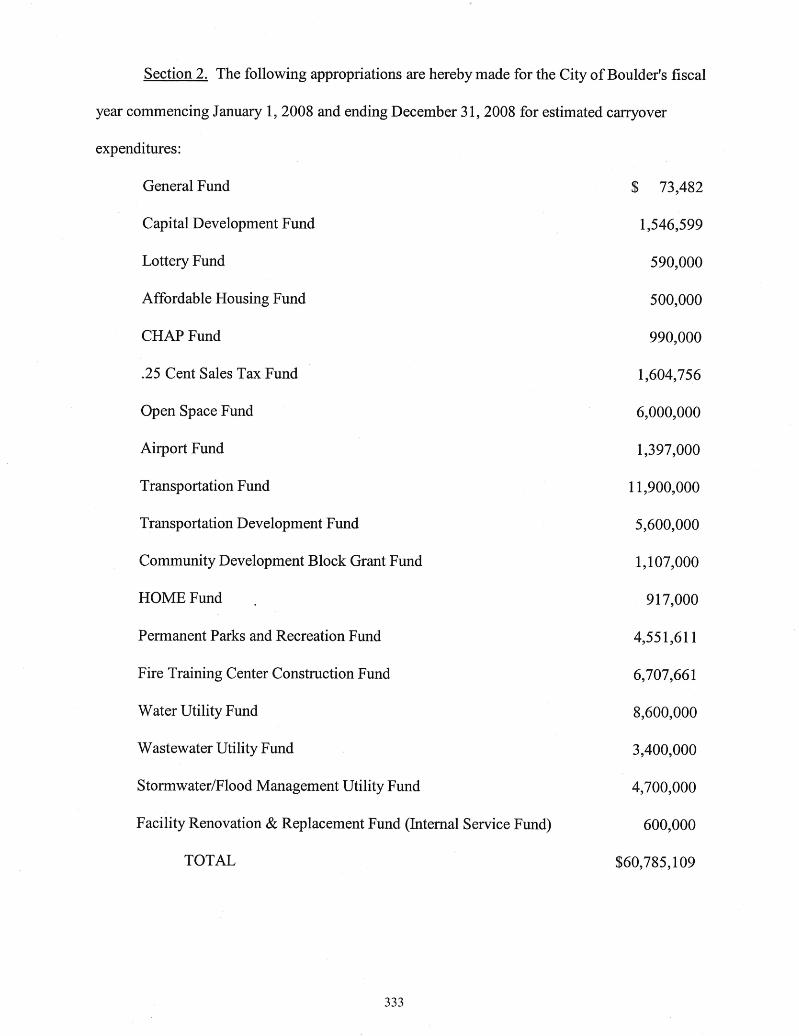
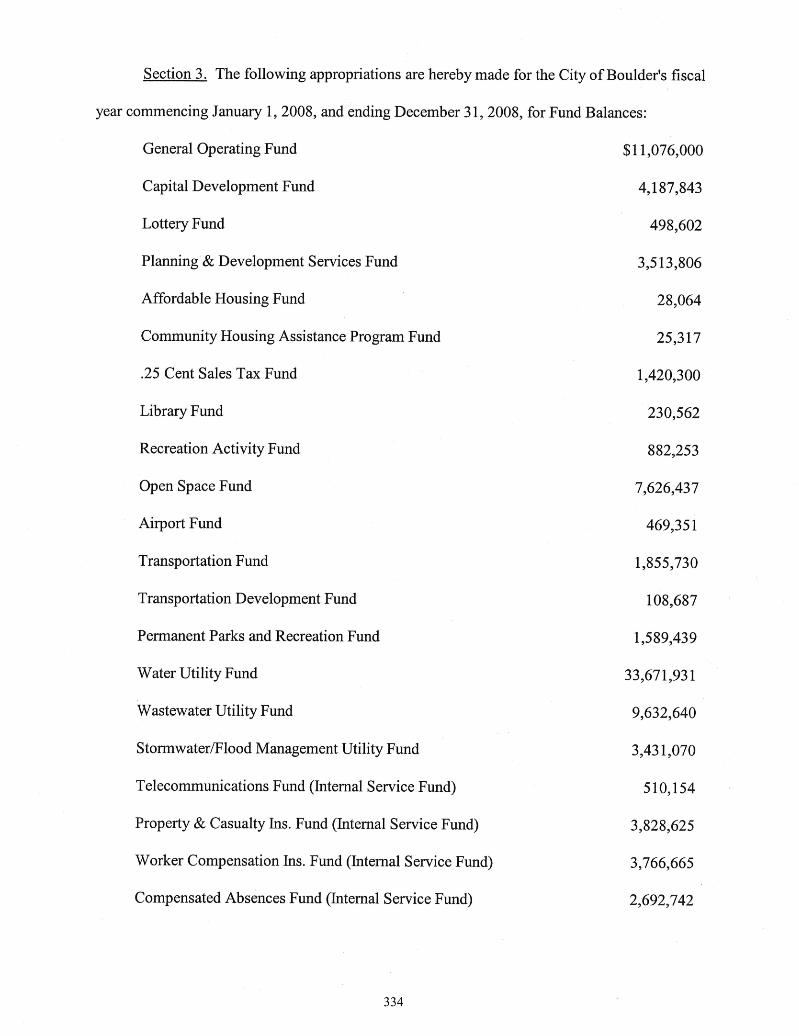
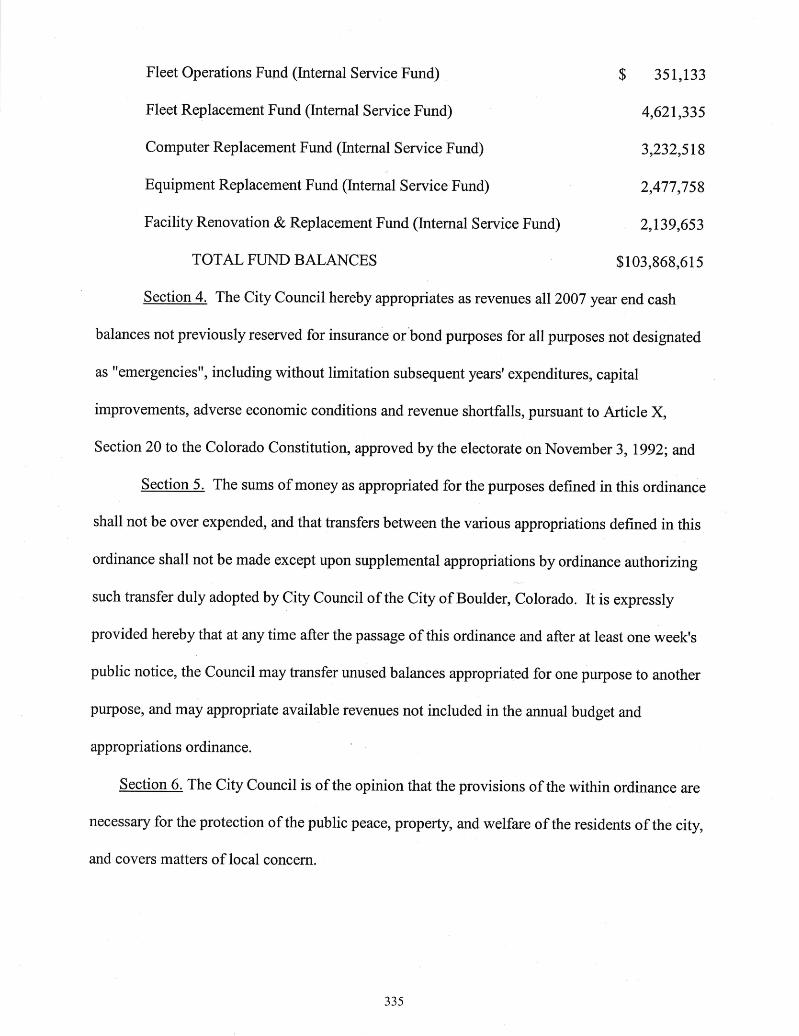
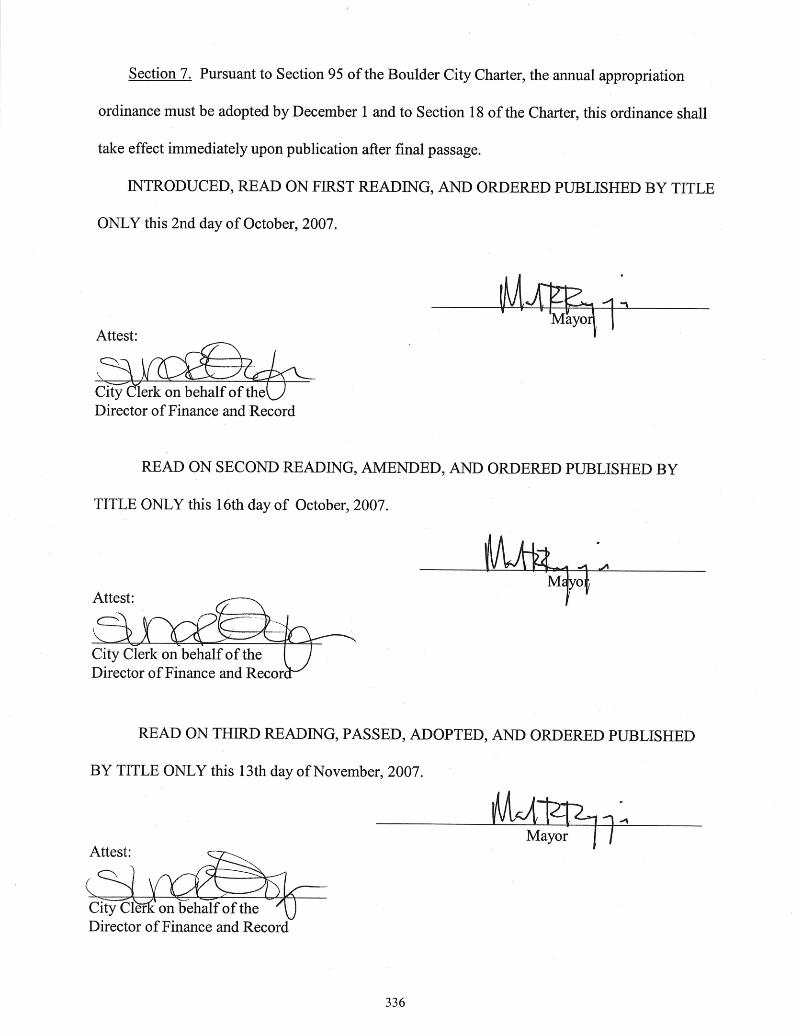

APPENDIX
APPENDIX A
The information included in Appendix A provides the number of standard full time equivalents (or FTEs) by department and program. The FTE numbers include standard Management/Non-Union, Boulder Municipal Employees’ Association (BMEA), Fire and Police positions; they also include capital and grant funded positions. The do not, however, include any temporary or standard positions.
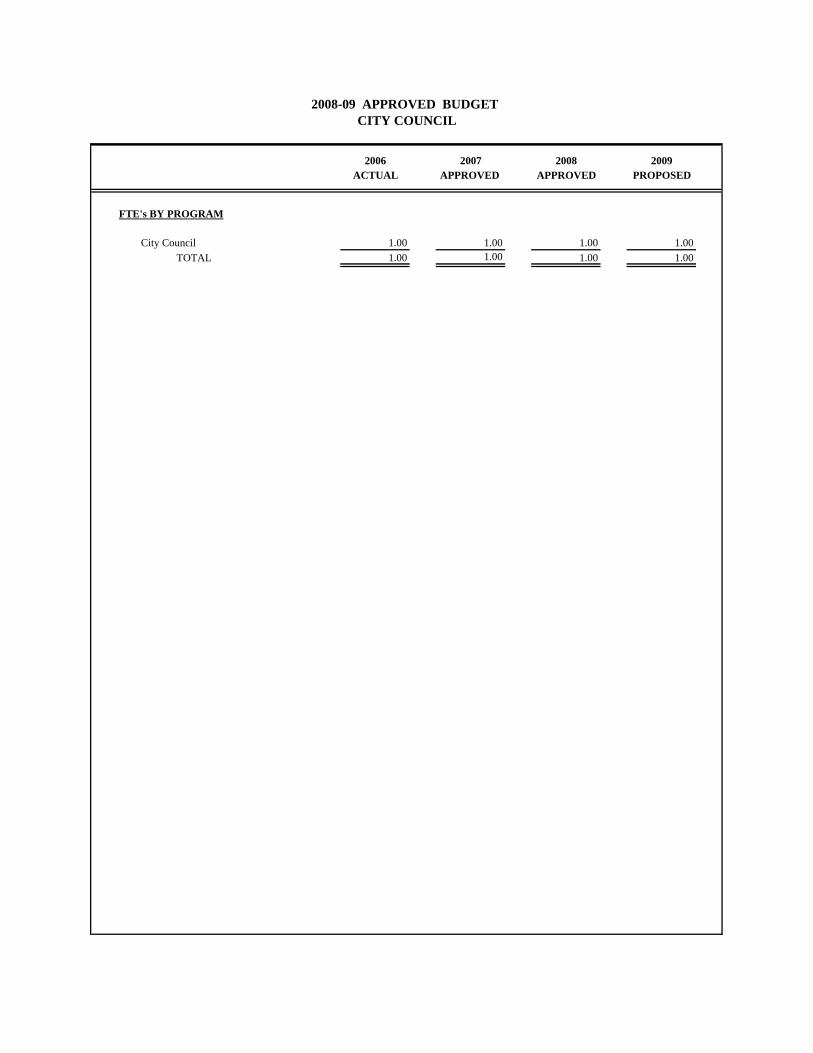
2006 2007 2008 2009ACTUAL APPROVED APPROVED PROPOSED
FTE's BY PROGRAM
City Council 1.00 1.00 1.00 1.00TOTAL 1.00 1.00 1.00 1.00
2008-09 APPROVED BUDGET CITY COUNCIL
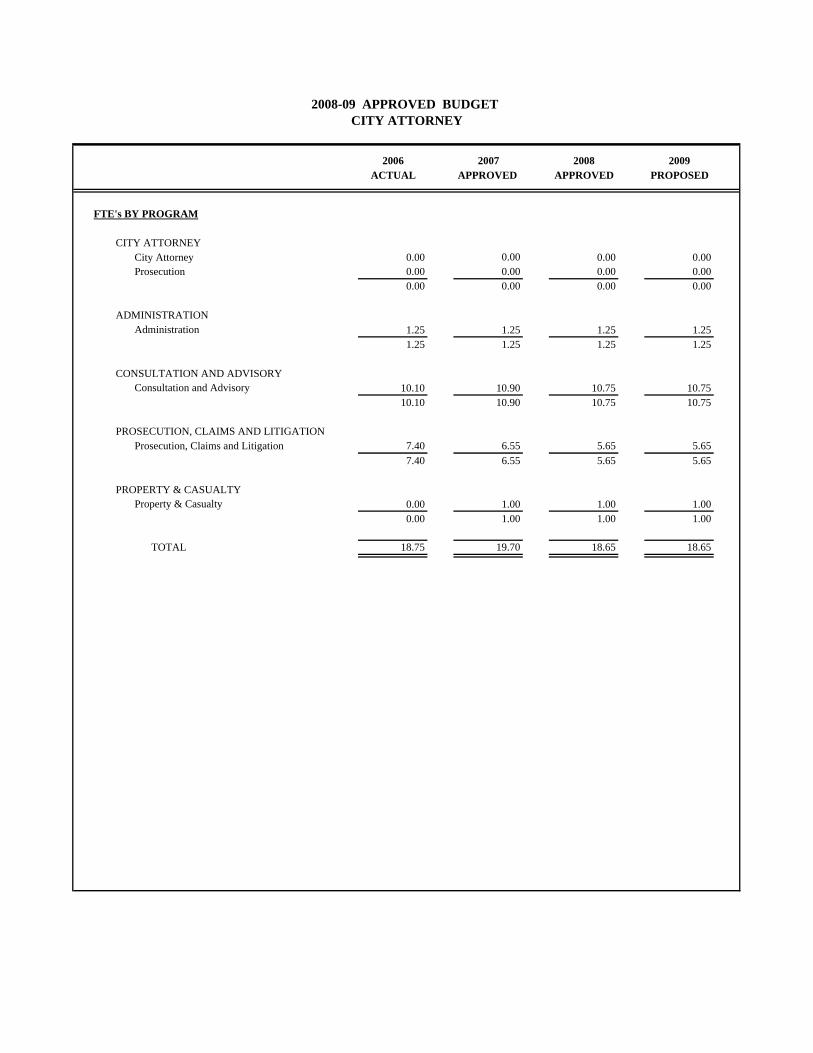
2006 2007 2008 2009ACTUAL APPROVED APPROVED PROPOSED
FTE's BY PROGRAM
CITY ATTORNEYCity Attorney 0.00 0.00 0.00 0.00Prosecution 0.00 0.00 0.00 0.00
0.00 0.00 0.00 0.00
ADMINISTRATIONAdministration 1.25 1.25 1.25 1.25
1.25 1.25 1.25 1.25
CONSULTATION AND ADVISORYConsultation and Advisory 10.10 10.90 10.75 10.75
10.10 10.90 10.75 10.75
PROSECUTION, CLAIMS AND LITIGATIONProsecution, Claims and Litigation 7.40 6.55 5.65 5.65
7.40 6.55 5.65 5.65
PROPERTY & CASUALTYProperty & Casualty 0.00 1.00 1.00 1.00
0.00 1.00 1.00 1.00
TOTAL 18.75 19.70 18.65 18.65
2008-09 APPROVED BUDGET CITY ATTORNEY
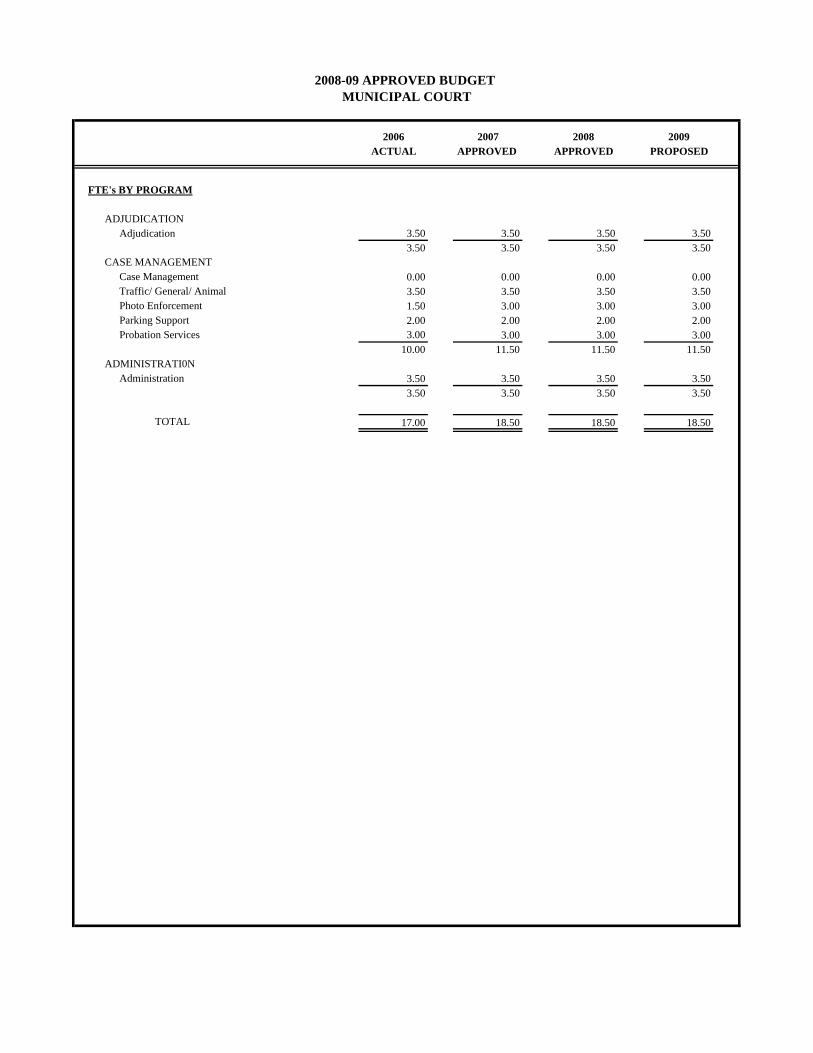
2006 2007 2008 2009ACTUAL APPROVED APPROVED PROPOSED
FTE's BY PROGRAM
ADJUDICATIONAdjudication 3.50 3.50 3.50 3.50
3.50 3.50 3.50 3.50CASE MANAGEMENT
Case Management 0.00 0.00 0.00 0.00Traffic/ General/ Animal 3.50 3.50 3.50 3.50Photo Enforcement 1.50 3.00 3.00 3.00Parking Support 2.00 2.00 2.00 2.00Probation Services 3.00 3.00 3.00 3.00
10.00 11.50 11.50 11.50ADMINISTRATI0N
Administration 3.50 3.50 3.50 3.503.50 3.50 3.50 3.50
TOTAL 17.00 18.50 18.50 18.50
2008-09 APPROVED BUDGET MUNICIPAL COURT
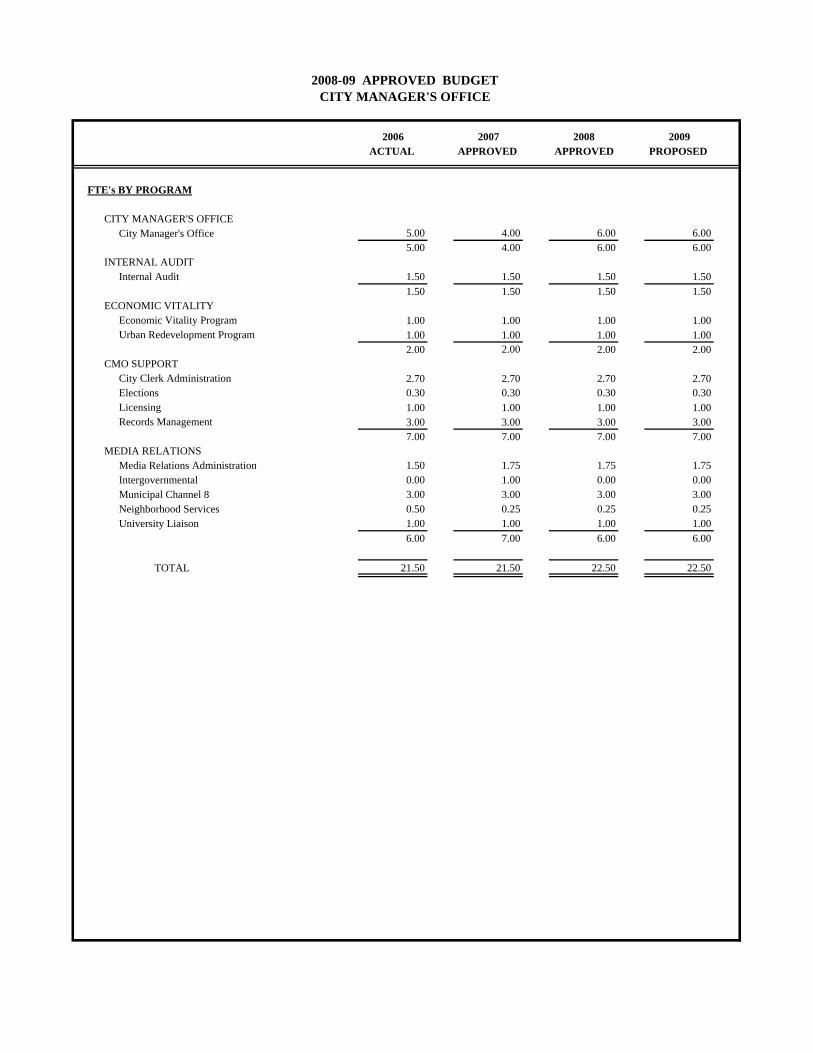
2006 2007 2008 2009ACTUAL APPROVED APPROVED PROPOSED
FTE's BY PROGRAM
CITY MANAGER'S OFFICECity Manager's Office 5.00 4.00 6.00 6.00
5.00 4.00 6.00 6.00INTERNAL AUDIT
Internal Audit 1.50 1.50 1.50 1.501.50 1.50 1.50 1.50
ECONOMIC VITALITYEconomic Vitality Program 1.00 1.00 1.00 1.00Urban Redevelopment Program 1.00 1.00 1.00 1.00
2.00 2.00 2.00 2.00CMO SUPPORT
City Clerk Administration 2.70 2.70 2.70 2.70Elections 0.30 0.30 0.30 0.30Licensing 1.00 1.00 1.00 1.00Records Management 3.00 3.00 3.00 3.00
7.00 7.00 7.00 7.00MEDIA RELATIONS
Media Relations Administration 1.50 1.75 1.75 1.75Intergovernmental 0.00 1.00 0.00 0.00Municipal Channel 8 3.00 3.00 3.00 3.00Neighborhood Services 0.50 0.25 0.25 0.25University Liaison 1.00 1.00 1.00 1.00
6.00 7.00 6.00 6.00
TOTAL 21.50 21.50 22.50 22.50
2008-09 APPROVED BUDGET CITY MANAGER'S OFFICE
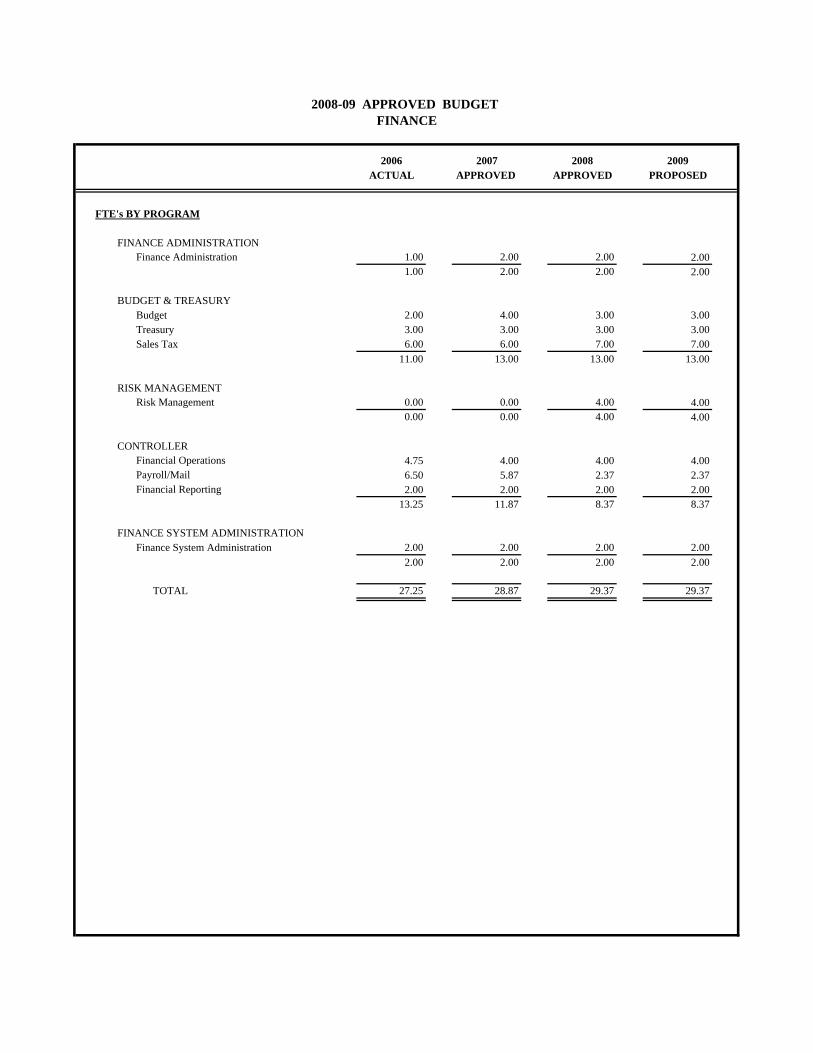
2006 2007 2008 2009ACTUAL APPROVED APPROVED PROPOSED
FTE's BY PROGRAM
FINANCE ADMINISTRATIONFinance Administration 1.00 2.00 2.00 2.00
1.00 2.00 2.00 2.00
BUDGET & TREASURYBudget 2.00 4.00 3.00 3.00Treasury 3.00 3.00 3.00 3.00Sales Tax 6.00 6.00 7.00 7.00
11.00 13.00 13.00 13.00
RISK MANAGEMENTRisk Management 0.00 0.00 4.00 4.00
0.00 0.00 4.00 4.00
CONTROLLERFinancial Operations 4.75 4.00 4.00 4.00Payroll/Mail 6.50 5.87 2.37 2.37Financial Reporting 2.00 2.00 2.00 2.00
13.25 11.87 8.37 8.37
FINANCE SYSTEM ADMINISTRATIONFinance System Administration 2.00 2.00 2.00 2.00
2.00 2.00 2.00 2.00
TOTAL 27.25 28.87 29.37 29.37
2008-09 APPROVED BUDGET FINANCE
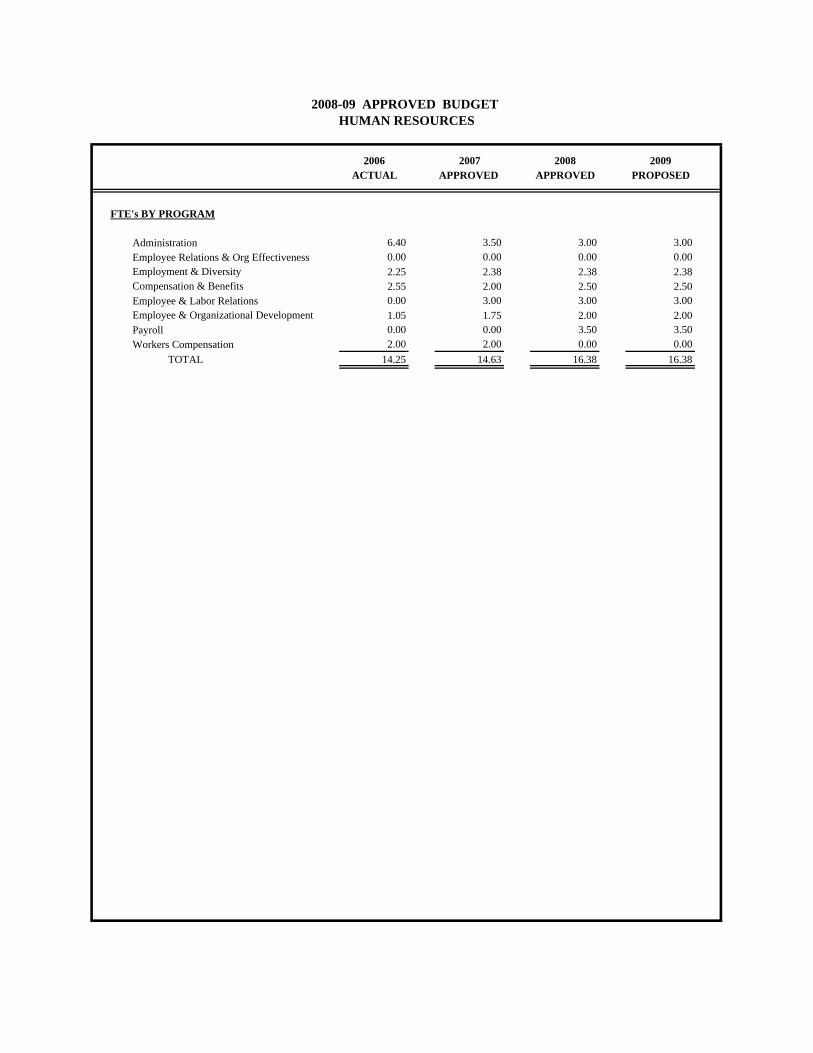
2006 2007 2008 2009ACTUAL APPROVED APPROVED PROPOSED
FTE's BY PROGRAM
Administration 6.40 3.50 3.00 3.00Employee Relations & Org Effectiveness 0.00 0.00 0.00 0.00Employment & Diversity 2.25 2.38 2.38 2.38Compensation & Benefits 2.55 2.00 2.50 2.50Employee & Labor Relations 0.00 3.00 3.00 3.00Employee & Organizational Development 1.05 1.75 2.00 2.00Payroll 0.00 0.00 3.50 3.50Workers Compensation 2.00 2.00 0.00 0.00
TOTAL 14.25 14.63 16.38 16.38
HUMAN RESOURCES2008-09 APPROVED BUDGET
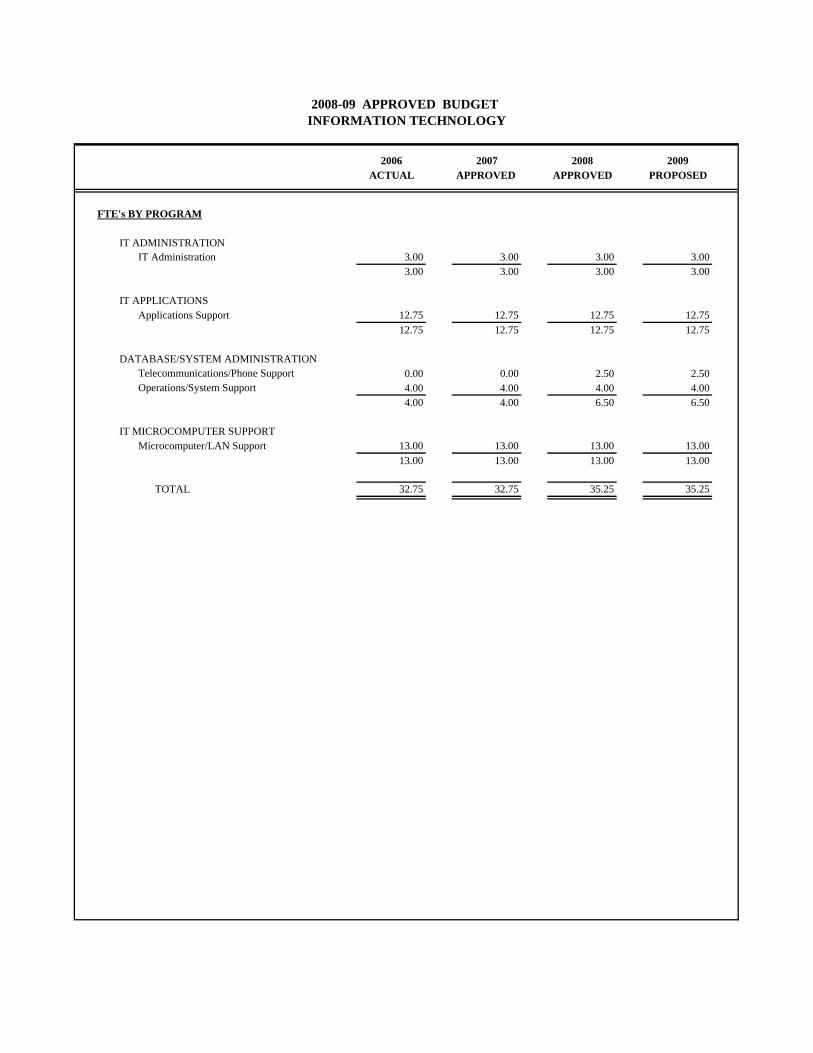
2006 2007 2008 2009ACTUAL APPROVED APPROVED PROPOSED
FTE's BY PROGRAM
IT ADMINISTRATIONIT Administration 3.00 3.00 3.00 3.00
3.00 3.00 3.00 3.00
IT APPLICATIONSApplications Support 12.75 12.75 12.75 12.75
12.75 12.75 12.75 12.75
DATABASE/SYSTEM ADMINISTRATIONTelecommunications/Phone Support 0.00 0.00 2.50 2.50Operations/System Support 4.00 4.00 4.00 4.00
4.00 4.00 6.50 6.50
IT MICROCOMPUTER SUPPORTMicrocomputer/LAN Support 13.00 13.00 13.00 13.00
13.00 13.00 13.00 13.00
TOTAL 32.75 32.75 35.25 35.25
2008-09 APPROVED BUDGET INFORMATION TECHNOLOGY
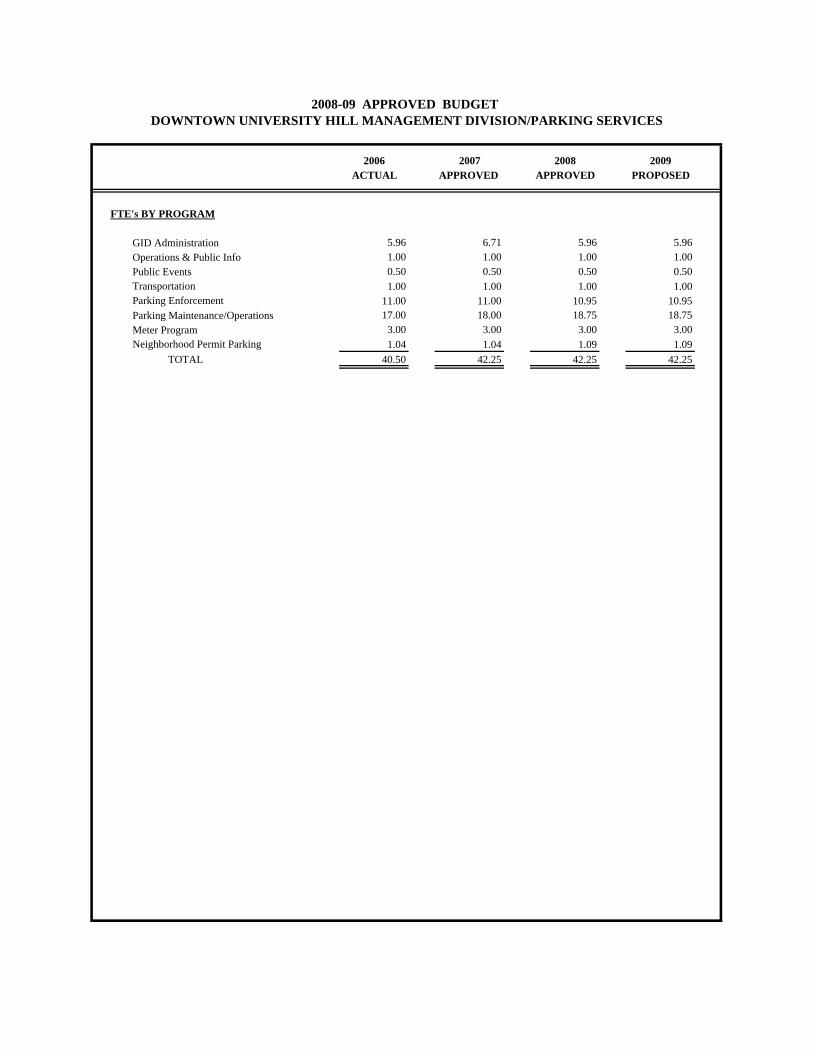
2006 2007 2008 2009ACTUAL APPROVED APPROVED PROPOSED
FTE's BY PROGRAM
GID Administration 5.96 6.71 5.96 5.96Operations & Public Info 1.00 1.00 1.00 1.00Public Events 0.50 0.50 0.50 0.50Transportation 1.00 1.00 1.00 1.00Parking Enforcement 11.00 11.00 10.95 10.95Parking Maintenance/Operations 17.00 18.00 18.75 18.75Meter Program 3.00 3.00 3.00 3.00Neighborhood Permit Parking 1.04 1.04 1.09 1.09
TOTAL 40.50 42.25 42.25 42.25
DOWNTOWN UNIVERSITY HILL MANAGEMENT DIVISION/PARKING SERVICES2008-09 APPROVED BUDGET
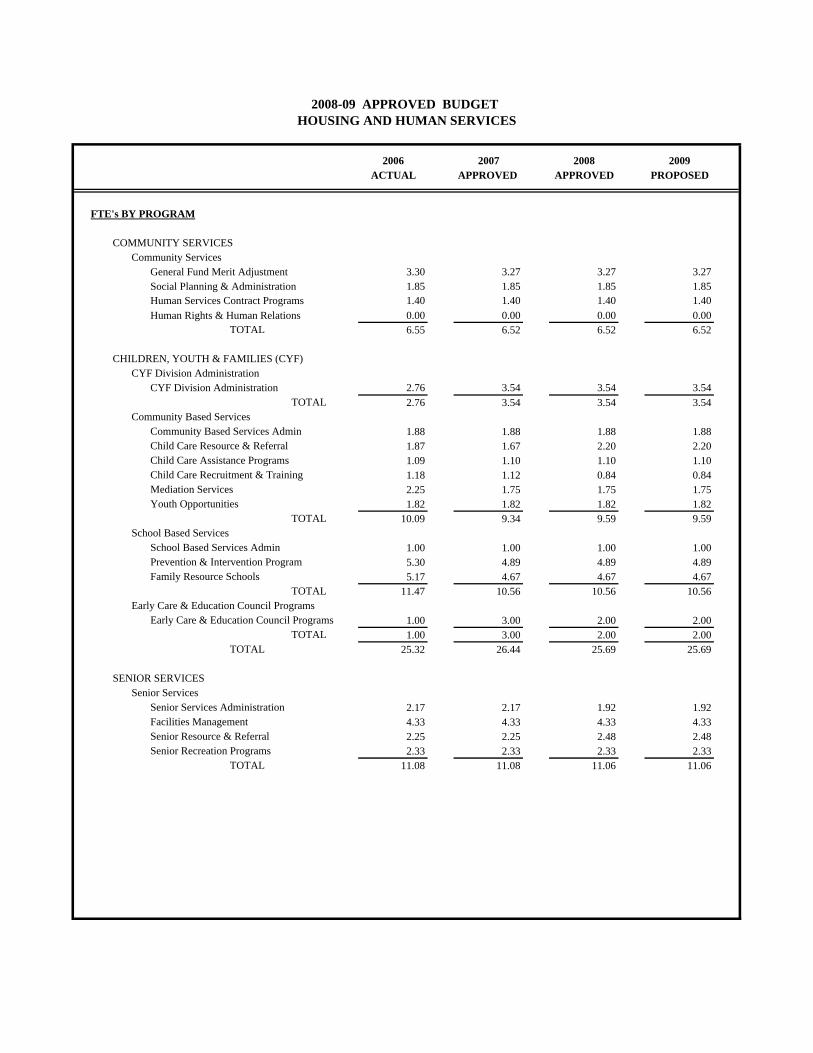
2006 2007 2008 2009ACTUAL APPROVED APPROVED PROPOSED
FTE's BY PROGRAM
COMMUNITY SERVICESCommunity Services
General Fund Merit Adjustment 3.30 3.27 3.27 3.27Social Planning & Administration 1.85 1.85 1.85 1.85Human Services Contract Programs 1.40 1.40 1.40 1.40Human Rights & Human Relations 0.00 0.00 0.00 0.00
TOTAL 6.55 6.52 6.52 6.52
CHILDREN, YOUTH & FAMILIES (CYF)CYF Division Administration
CYF Division Administration 2.76 3.54 3.54 3.54TOTAL 2.76 3.54 3.54 3.54
Community Based ServicesCommunity Based Services Admin 1.88 1.88 1.88 1.88Child Care Resource & Referral 1.87 1.67 2.20 2.20Child Care Assistance Programs 1.09 1.10 1.10 1.10Child Care Recruitment & Training 1.18 1.12 0.84 0.84Mediation Services 2.25 1.75 1.75 1.75Youth Opportunities 1.82 1.82 1.82 1.82
TOTAL 10.09 9.34 9.59 9.59School Based Services
School Based Services Admin 1.00 1.00 1.00 1.00Prevention & Intervention Program 5.30 4.89 4.89 4.89Family Resource Schools 5.17 4.67 4.67 4.67
TOTAL 11.47 10.56 10.56 10.56Early Care & Education Council Programs
Early Care & Education Council Programs 1.00 3.00 2.00 2.00TOTAL 1.00 3.00 2.00 2.00
TOTAL 25.32 26.44 25.69 25.69
SENIOR SERVICESSenior Services
Senior Services Administration 2.17 2.17 1.92 1.92Facilities Management 4.33 4.33 4.33 4.33Senior Resource & Referral 2.25 2.25 2.48 2.48Senior Recreation Programs 2.33 2.33 2.33 2.33
TOTAL 11.08 11.08 11.06 11.06
HOUSING AND HUMAN SERVICES2008-09 APPROVED BUDGET
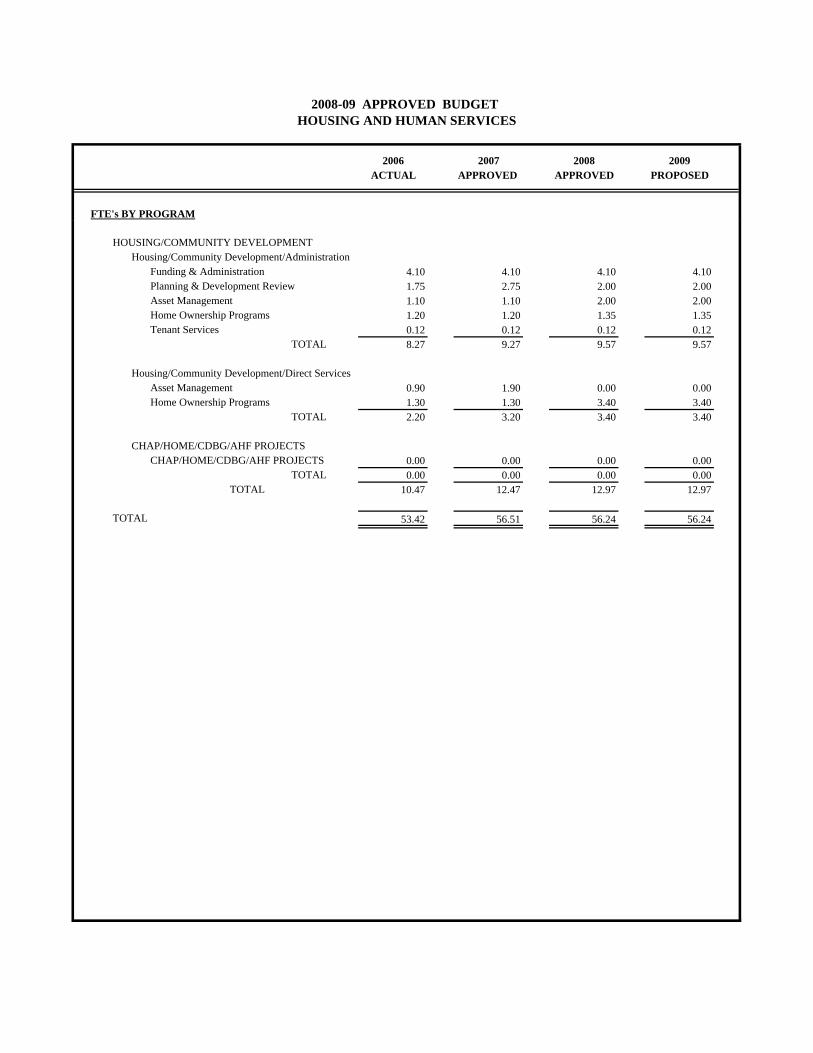
2006 2007 2008 2009ACTUAL APPROVED APPROVED PROPOSED
FTE's BY PROGRAM
HOUSING AND HUMAN SERVICES2008-09 APPROVED BUDGET
HOUSING/COMMUNITY DEVELOPMENTHousing/Community Development/Administration
Funding & Administration 4.10 4.10 4.10 4.10Planning & Development Review 1.75 2.75 2.00 2.00Asset Management 1.10 1.10 2.00 2.00Home Ownership Programs 1.20 1.20 1.35 1.35Tenant Services 0.12 0.12 0.12 0.12
TOTAL 8.27 9.27 9.57 9.57
Housing/Community Development/Direct ServicesAsset Management 0.90 1.90 0.00 0.00Home Ownership Programs 1.30 1.30 3.40 3.40
TOTAL 2.20 3.20 3.40 3.40
CHAP/HOME/CDBG/AHF PROJECTSCHAP/HOME/CDBG/AHF PROJECTS 0.00 0.00 0.00 0.00
TOTAL 0.00 0.00 0.00 0.00TOTAL 10.47 12.47 12.97 12.97
TOTAL 53.42 56.51 56.24 56.24
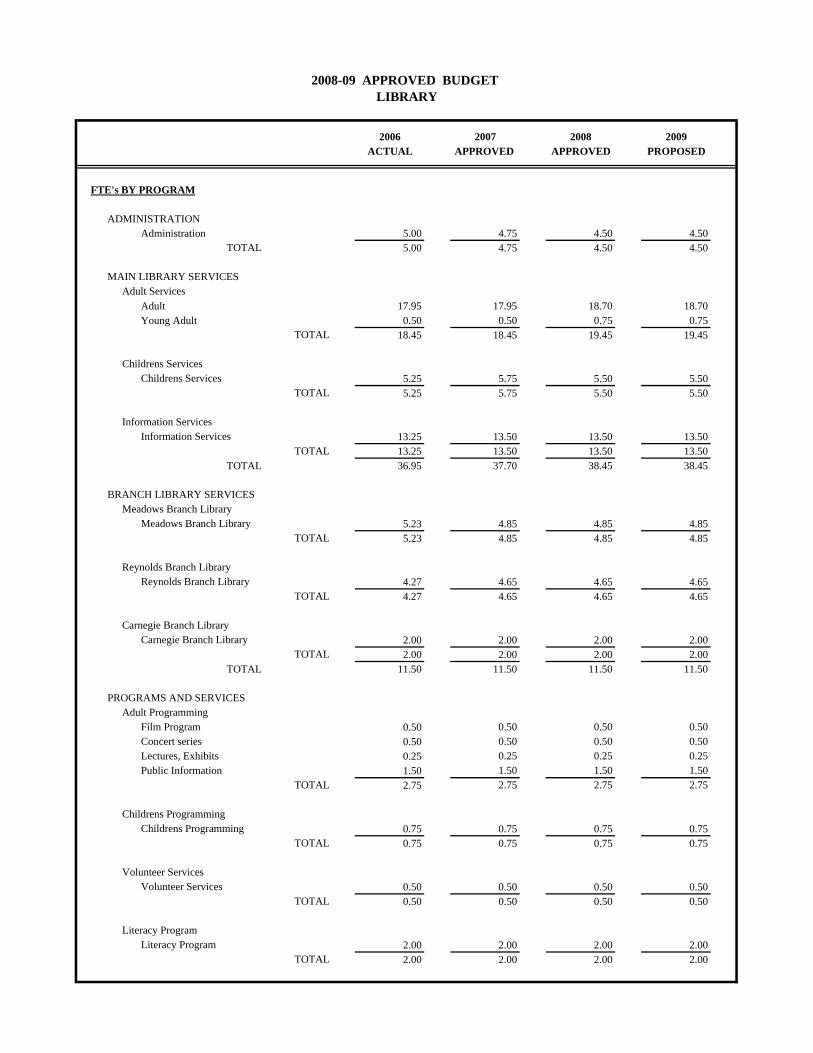
2006 2007 2008 2009ACTUAL APPROVED APPROVED PROPOSED
FTE's BY PROGRAM
ADMINISTRATIONAdministration 5.00 4.75 4.50 4.50
TOTAL 5.00 4.75 4.50 4.50
MAIN LIBRARY SERVICESAdult Services
Adult 17.95 17.95 18.70 18.70Young Adult 0.50 0.50 0.75 0.75
TOTAL 18.45 18.45 19.45 19.45
Childrens ServicesChildrens Services 5.25 5.75 5.50 5.50
TOTAL 5.25 5.75 5.50 5.50
Information ServicesInformation Services 13.25 13.50 13.50 13.50
TOTAL 13.25 13.50 13.50 13.50TOTAL 36.95 37.70 38.45 38.45
BRANCH LIBRARY SERVICESMeadows Branch Library
Meadows Branch Library 5.23 4.85 4.85 4.85TOTAL 5.23 4.85 4.85 4.85
Reynolds Branch LibraryReynolds Branch Library 4.27 4.65 4.65 4.65
TOTAL 4.27 4.65 4.65 4.65
Carnegie Branch LibraryCarnegie Branch Library 2.00 2.00 2.00 2.00
TOTAL 2.00 2.00 2.00 2.00TOTAL 11.50 11.50 11.50 11.50
PROGRAMS AND SERVICESAdult Programming
Film Program 0.50 0.50 0.50 0.50Concert series 0.50 0.50 0.50 0.50Lectures, Exhibits 0.25 0.25 0.25 0.25Public Information 1.50 1.50 1.50 1.50
TOTAL 2.75 2.75 2.75 2.75
Childrens ProgrammingChildrens Programming 0.75 0.75 0.75 0.75
TOTAL 0.75 0.75 0.75 0.75
Volunteer ServicesVolunteer Services 0.50 0.50 0.50 0.50
TOTAL 0.50 0.50 0.50 0.50
Literacy ProgramLiteracy Program 2.00 2.00 2.00 2.00
TOTAL 2.00 2.00 2.00 2.00
LIBRARY2008-09 APPROVED BUDGET
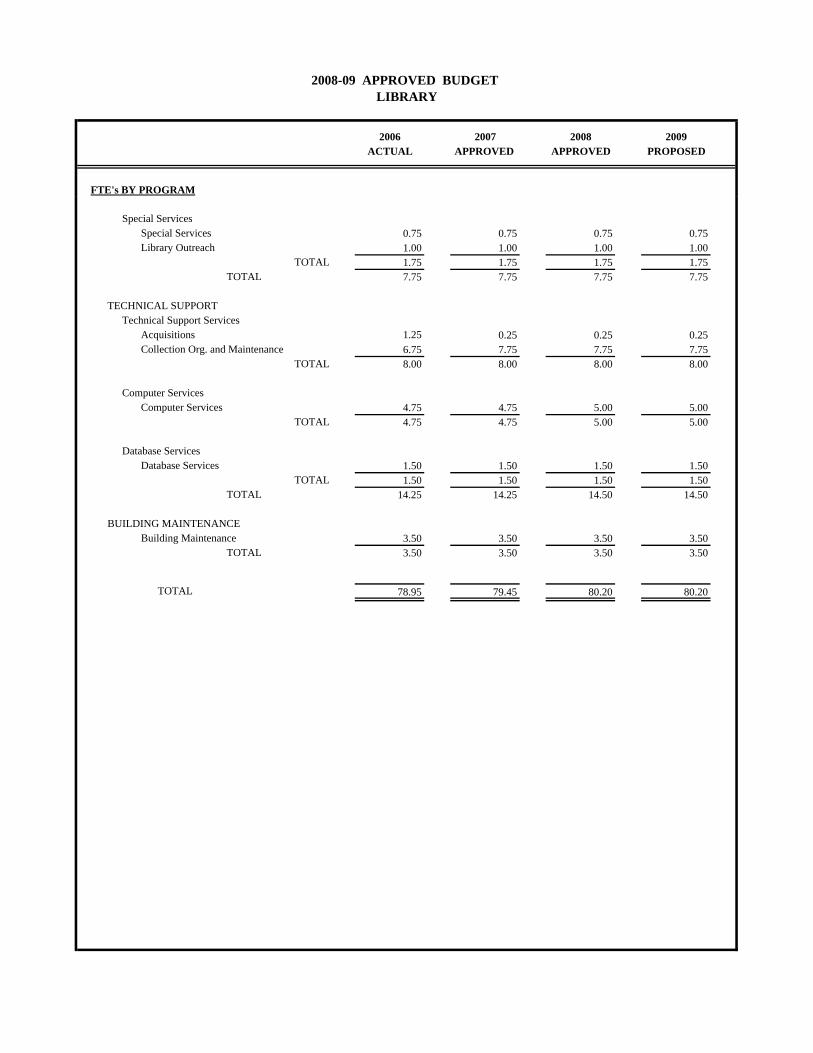
2006 2007 2008 2009ACTUAL APPROVED APPROVED PROPOSED
FTE's BY PROGRAM
LIBRARY2008-09 APPROVED BUDGET
Special ServicesSpecial Services 0.75 0.75 0.75 0.75Library Outreach 1.00 1.00 1.00 1.00
TOTAL 1.75 1.75 1.75 1.75TOTAL 7.75 7.75 7.75 7.75
TECHNICAL SUPPORTTechnical Support Services
Acquisitions 1.25 0.25 0.25 0.25Collection Org. and Maintenance 6.75 7.75 7.75 7.75
TOTAL 8.00 8.00 8.00 8.00
Computer ServicesComputer Services 4.75 4.75 5.00 5.00
TOTAL 4.75 4.75 5.00 5.00
Database ServicesDatabase Services 1.50 1.50 1.50 1.50
TOTAL 1.50 1.50 1.50 1.50TOTAL 14.25 14.25 14.50 14.50
BUILDING MAINTENANCEBuilding Maintenance 3.50 3.50 3.50 3.50
TOTAL 3.50 3.50 3.50 3.50
TOTAL 78.95 79.45 80.20 80.20
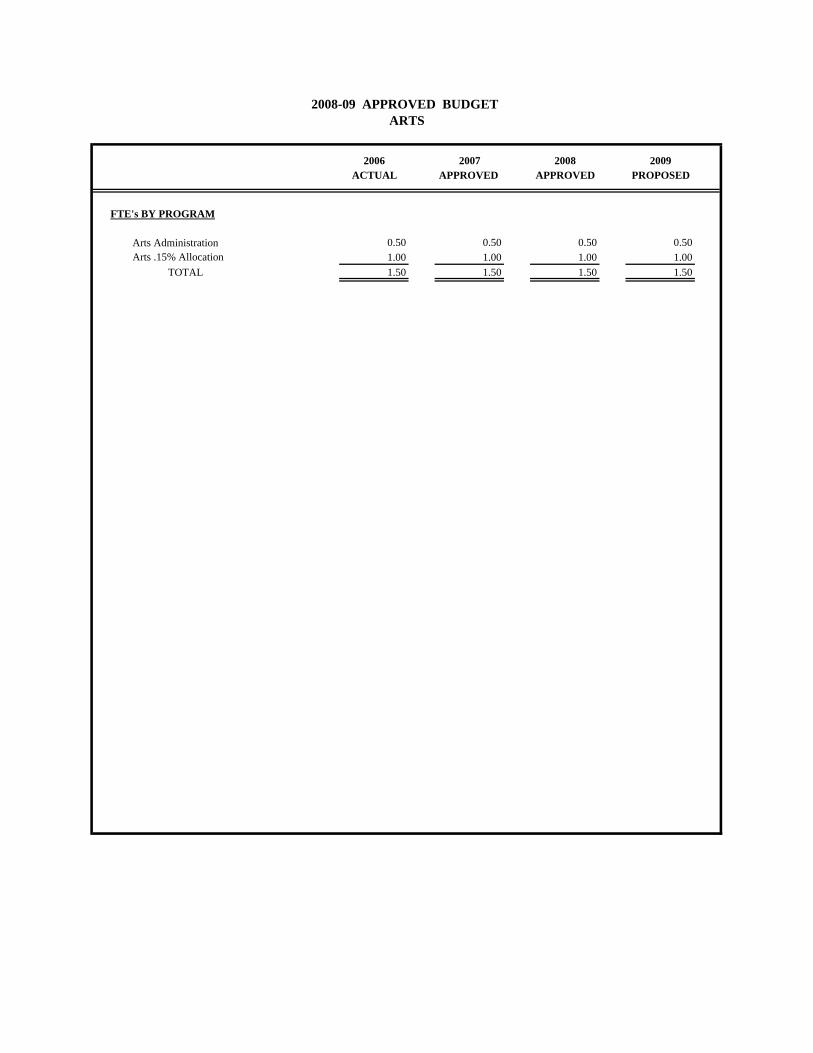
2006 2007 2008 2009ACTUAL APPROVED APPROVED PROPOSED
FTE's BY PROGRAM
Arts Administration 0.50 0.50 0.50 0.50Arts .15% Allocation 1.00 1.00 1.00 1.00
TOTAL 1.50 1.50 1.50 1.50
2008-09 APPROVED BUDGET ARTS
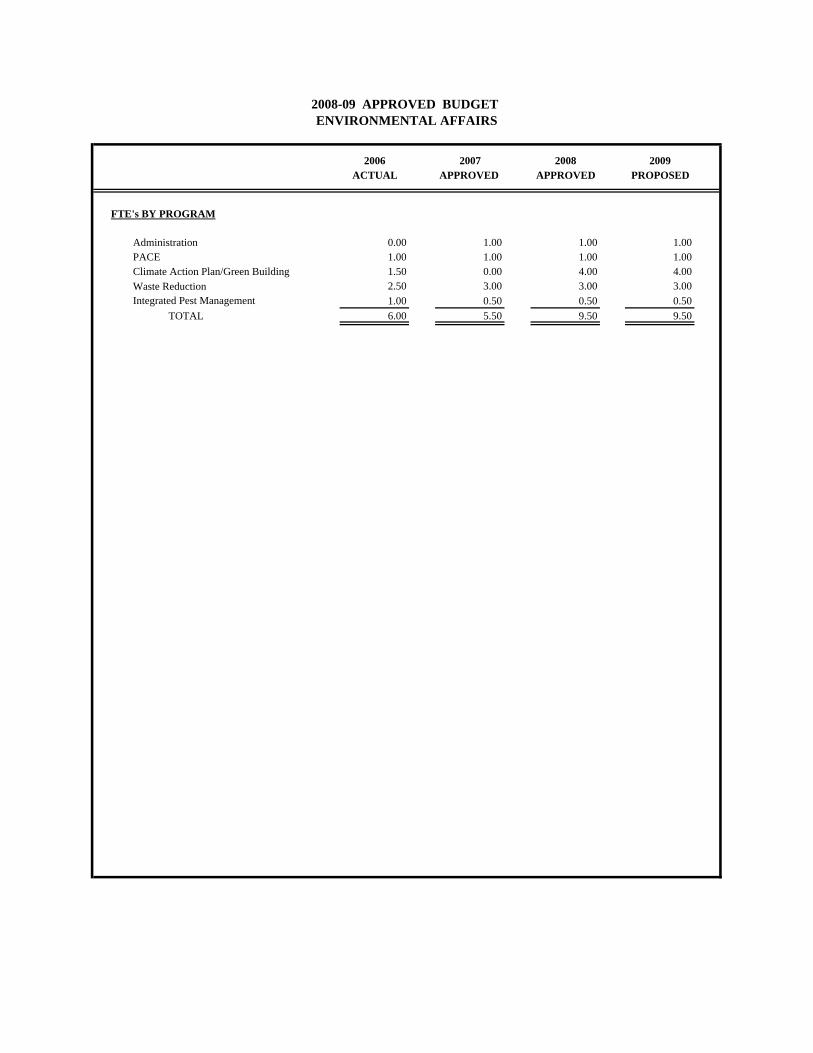
2006 2007 2008 2009ACTUAL APPROVED APPROVED PROPOSED
FTE's BY PROGRAM
Administration 0.00 1.00 1.00 1.00PACE 1.00 1.00 1.00 1.00Climate Action Plan/Green Building 1.50 0.00 4.00 4.00Waste Reduction 2.50 3.00 3.00 3.00Integrated Pest Management 1.00 0.50 0.50 0.50
TOTAL 6.00 5.50 9.50 9.50
ENVIRONMENTAL AFFAIRS2008-09 APPROVED BUDGET
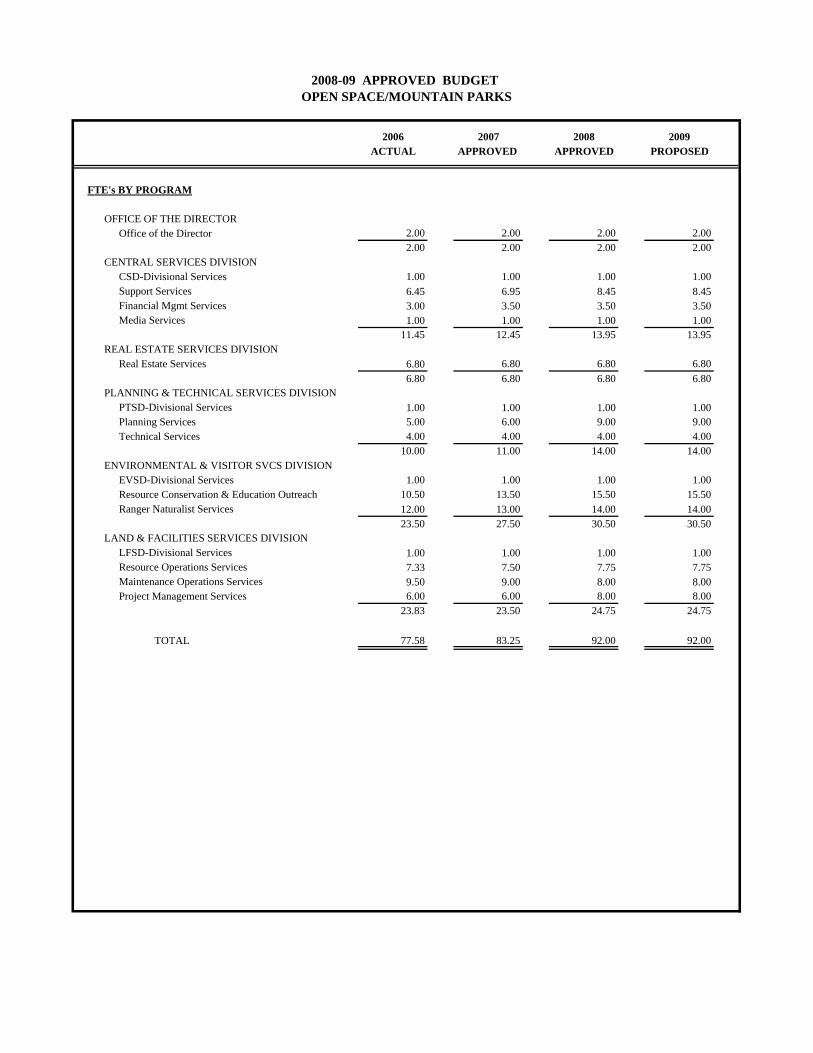
2006 2007 2008 2009ACTUAL APPROVED APPROVED PROPOSED
FTE's BY PROGRAM
OFFICE OF THE DIRECTOR Office of the Director 2.00 2.00 2.00 2.00
2.00 2.00 2.00 2.00CENTRAL SERVICES DIVISION
CSD-Divisional Services 1.00 1.00 1.00 1.00Support Services 6.45 6.95 8.45 8.45Financial Mgmt Services 3.00 3.50 3.50 3.50Media Services 1.00 1.00 1.00 1.00
11.45 12.45 13.95 13.95REAL ESTATE SERVICES DIVISION
Real Estate Services 6.80 6.80 6.80 6.806.80 6.80 6.80 6.80
PLANNING & TECHNICAL SERVICES DIVISIONPTSD-Divisional Services 1.00 1.00 1.00 1.00Planning Services 5.00 6.00 9.00 9.00Technical Services 4.00 4.00 4.00 4.00
10.00 11.00 14.00 14.00ENVIRONMENTAL & VISITOR SVCS DIVISION
EVSD-Divisional Services 1.00 1.00 1.00 1.00Resource Conservation & Education Outreach 10.50 13.50 15.50 15.50Ranger Naturalist Services 12.00 13.00 14.00 14.00
23.50 27.50 30.50 30.50LAND & FACILITIES SERVICES DIVISION
LFSD-Divisional Services 1.00 1.00 1.00 1.00Resource Operations Services 7.33 7.50 7.75 7.75Maintenance Operations Services 9.50 9.00 8.00 8.00Project Management Services 6.00 6.00 8.00 8.00
23.83 23.50 24.75 24.75
TOTAL 77.58 83.25 92.00 92.00
OPEN SPACE/MOUNTAIN PARKS2008-09 APPROVED BUDGET

2006 2007 2008 2009ACTUAL APPROVED APPROVED PROPOSED
FTE's BY PROGRAM
ADMINISTRATIONBusiness and Financial Management 1.25 3.25 3.45 3.45Technological Support 0.00 1.00 1.00 1.00Support Services 9.25 4.75 4.00 4.00Seasonal Hiring Coordination 0.00 0.37 0.37 0.37Office of the Director 3.00 2.00 2.00 2.00Policy and Information Services 0.00 1.00 1.00 1.00Marketing and Volunteer Coordination 0.00 3.50 3.50 3.50Registration 3.00 0.00 0.00 0.00Community Relations 3.50 0.00 0.00 0.00
20.00 15.87 15.32 15.32PLANNING
Administration 3.10 5.50 5.50 4.50Projects and Construction 9.90 7.00 6.00 7.00
13.00 12.50 11.50 11.50CITY PARKS
Administration 1.00 1.50 0.50 0.50City Parks 32.25 31.25 33.25 33.25Forestry 5.00 5.00 5.00 5.00Environmental Resources 3.00 3.00 3.00 3.00Reservoir 2.12 0.00 0.00 0.00Golf Course Operations 3.00 0.00 0.00 0.00
46.37 40.75 41.75 41.75RECREATION
Administration 1.00 4.00 4.00 4.00Access and Inclusion 0.00 5.00 5.00 5.00Youth Programs 5.00 3.00 3.25 3.25Sports 0.00 4.00 4.00 4.00Sports Turf 7.00 7.20 7.20 7.20Recreation Centers 0.00 17.25 17.25 17.25Recreation Programs 0.00 18.13 18.38 18.38Flatirons Golf Course 0.00 7.80 7.80 7.80Aquatics and Boulder Reservoir 0.00 6.12 6.37 6.37Special Projects and Planning 0.00 3.00 4.00 4.00Therapeutics 6.00 0.00 0.00 0.00Athletics 7.00 0.00 0.00 0.00NBRC and Programs 17.25 0.00 0.00 0.00EBRC and Programs 11.13 0.00 0.00 0.00SBRC and Programs 11.50 0.00 0.00 0.00
65.88 75.50 77.25 77.25
TOTAL 145.25 144.62 145.82 145.82
PARKS AND RECREATION2008-09 APPROVED BUDGET
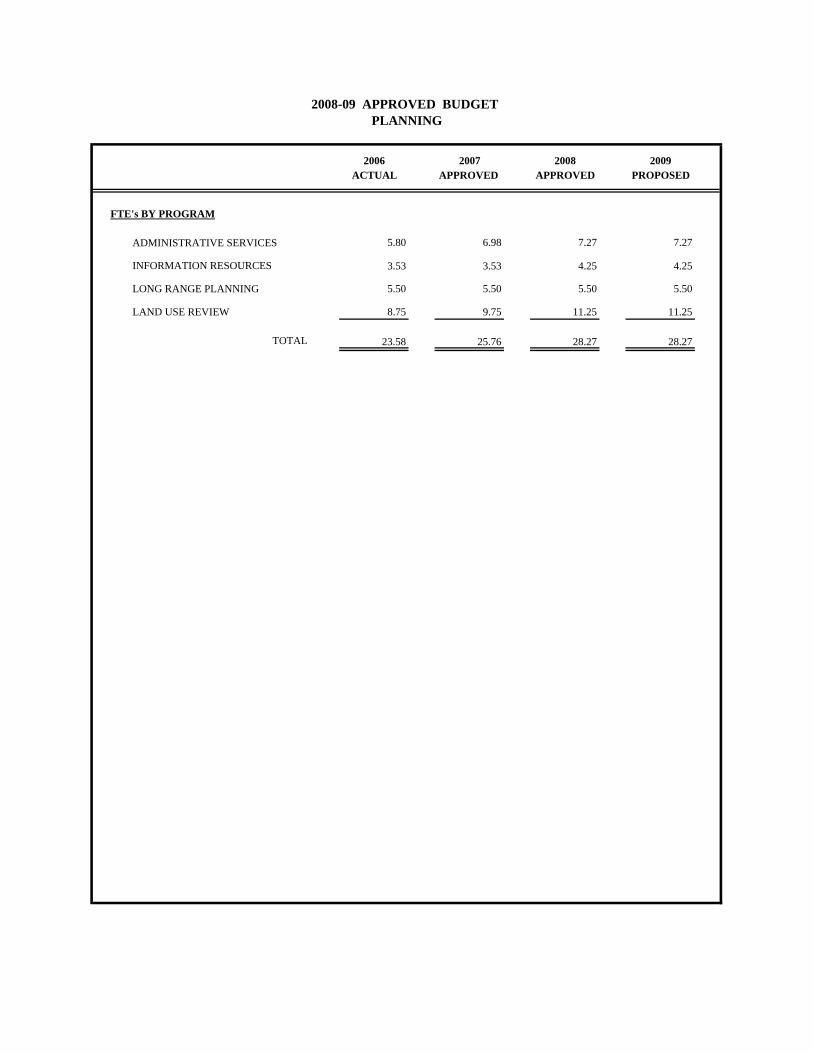
2006 2007 2008 2009ACTUAL APPROVED APPROVED PROPOSED
FTE's BY PROGRAM
ADMINISTRATIVE SERVICES 5.80 6.98 7.27 7.27
INFORMATION RESOURCES 3.53 3.53 4.25 4.25
LONG RANGE PLANNING 5.50 5.50 5.50 5.50
LAND USE REVIEW 8.75 9.75 11.25 11.25
TOTAL 23.58 25.76 28.27 28.27
2008-09 APPROVED BUDGET PLANNING
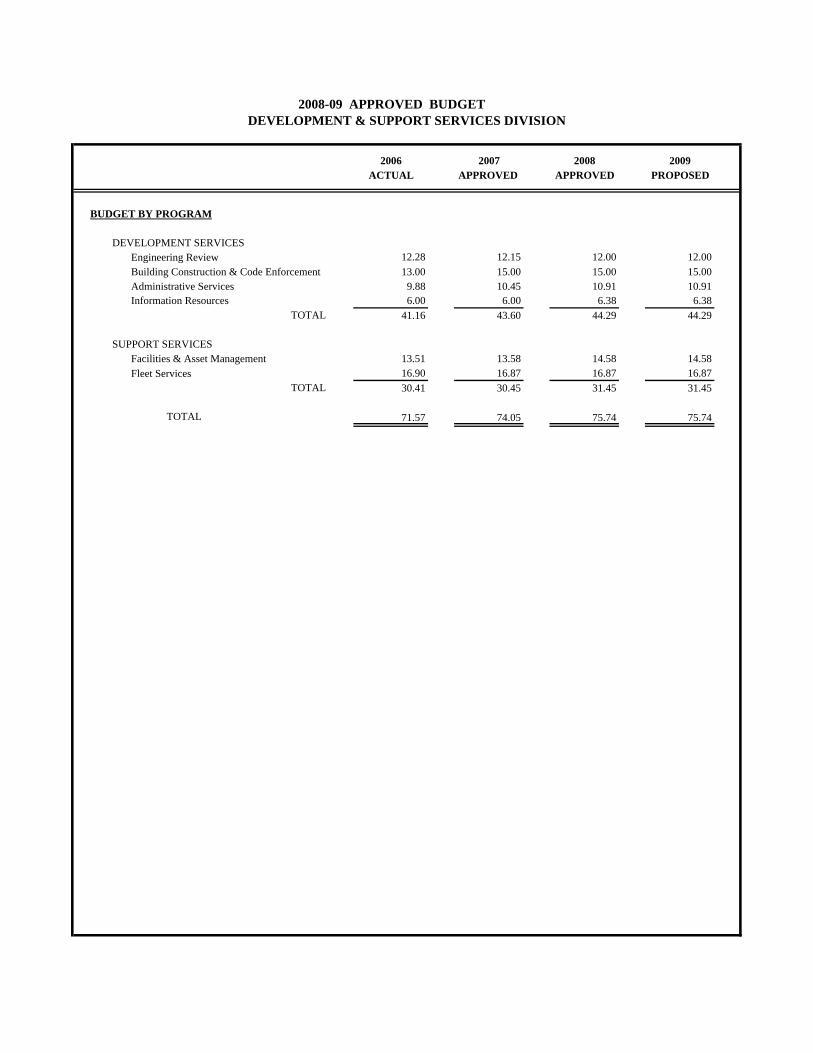
2006 2007 2008 2009ACTUAL APPROVED APPROVED PROPOSED
BUDGET BY PROGRAM
DEVELOPMENT SERVICESEngineering Review 12.28 12.15 12.00 12.00Building Construction & Code Enforcement 13.00 15.00 15.00 15.00Administrative Services 9.88 10.45 10.91 10.91Information Resources 6.00 6.00 6.38 6.38
TOTAL 41.16 43.60 44.29 44.29
SUPPORT SERVICESFacilities & Asset Management 13.51 13.58 14.58 14.58Fleet Services 16.90 16.87 16.87 16.87
TOTAL 30.41 30.45 31.45 31.45
TOTAL 71.57 74.05 75.74 75.74
DEVELOPMENT & SUPPORT SERVICES DIVISION2008-09 APPROVED BUDGET
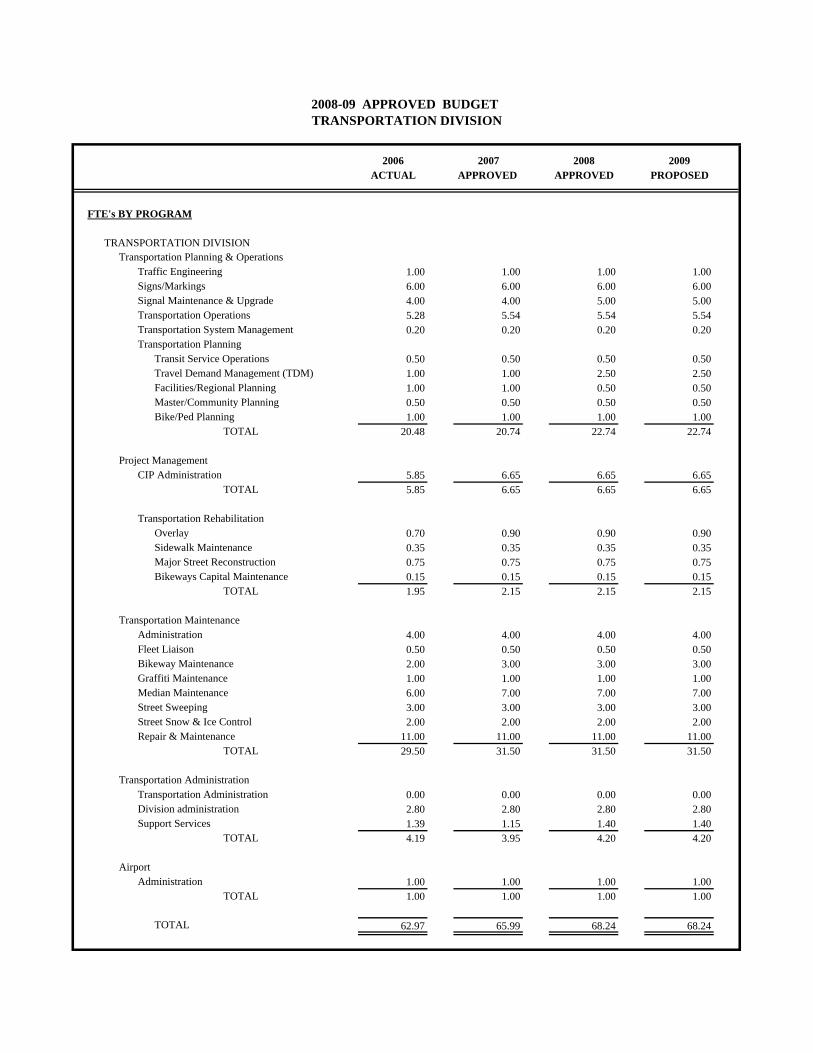
2006 2007 2008 2009ACTUAL APPROVED APPROVED PROPOSED
FTE's BY PROGRAM
TRANSPORTATION DIVISIONTransportation Planning & Operations
Traffic Engineering 1.00 1.00 1.00 1.00Signs/Markings 6.00 6.00 6.00 6.00Signal Maintenance & Upgrade 4.00 4.00 5.00 5.00Transportation Operations 5.28 5.54 5.54 5.54Transportation System Management 0.20 0.20 0.20 0.20Transportation Planning
Transit Service Operations 0.50 0.50 0.50 0.50Travel Demand Management (TDM) 1.00 1.00 2.50 2.50Facilities/Regional Planning 1.00 1.00 0.50 0.50Master/Community Planning 0.50 0.50 0.50 0.50Bike/Ped Planning 1.00 1.00 1.00 1.00
TOTAL 20.48 20.74 22.74 22.74
Project ManagementCIP Administration 5.85 6.65 6.65 6.65
TOTAL 5.85 6.65 6.65 6.65
Transportation RehabilitationOverlay 0.70 0.90 0.90 0.90Sidewalk Maintenance 0.35 0.35 0.35 0.35Major Street Reconstruction 0.75 0.75 0.75 0.75Bikeways Capital Maintenance 0.15 0.15 0.15 0.15
TOTAL 1.95 2.15 2.15 2.15
Transportation MaintenanceAdministration 4.00 4.00 4.00 4.00Fleet Liaison 0.50 0.50 0.50 0.50Bikeway Maintenance 2.00 3.00 3.00 3.00Graffiti Maintenance 1.00 1.00 1.00 1.00Median Maintenance 6.00 7.00 7.00 7.00Street Sweeping 3.00 3.00 3.00 3.00Street Snow & Ice Control 2.00 2.00 2.00 2.00Repair & Maintenance 11.00 11.00 11.00 11.00
TOTAL 29.50 31.50 31.50 31.50
Transportation AdministrationTransportation Administration 0.00 0.00 0.00 0.00Division administration 2.80 2.80 2.80 2.80Support Services 1.39 1.15 1.40 1.40
TOTAL 4.19 3.95 4.20 4.20
AirportAdministration 1.00 1.00 1.00 1.00
TOTAL 1.00 1.00 1.00 1.00
TOTAL 62.97 65.99 68.24 68.24
2008-09 APPROVED BUDGET TRANSPORTATION DIVISION
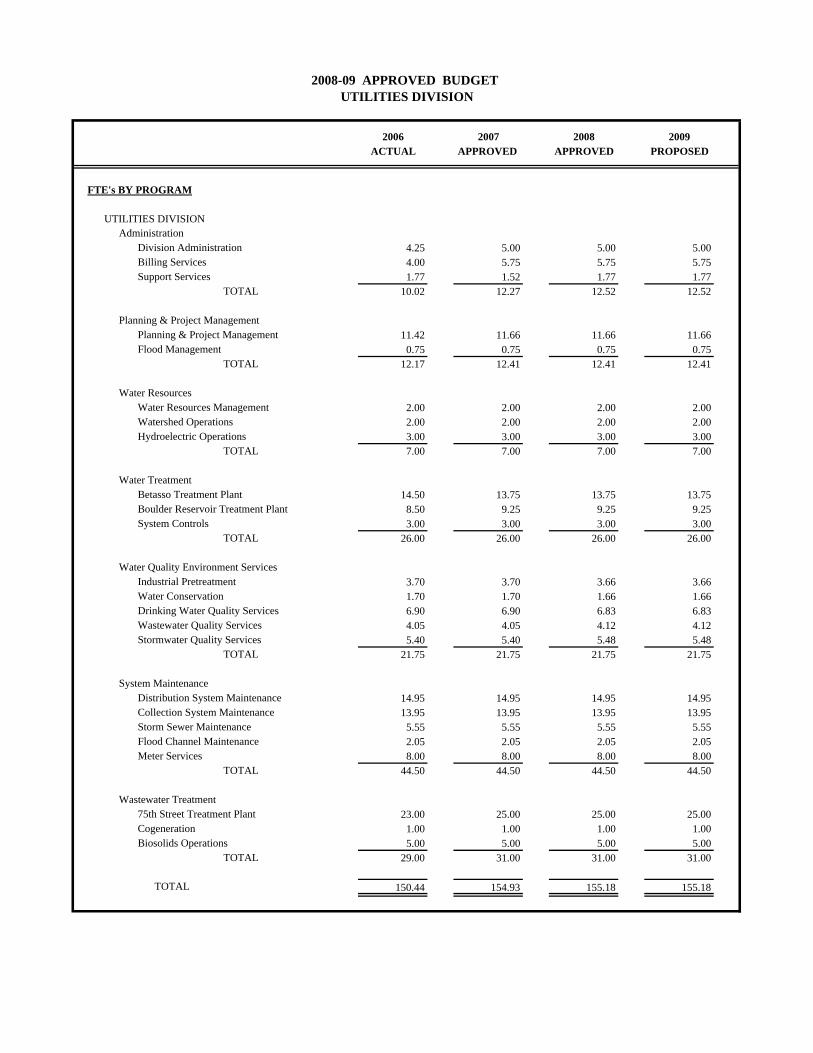
2006 2007 2008 2009ACTUAL APPROVED APPROVED PROPOSED
FTE's BY PROGRAM
UTILITIES DIVISIONAdministration
Division Administration 4.25 5.00 5.00 5.00Billing Services 4.00 5.75 5.75 5.75Support Services 1.77 1.52 1.77 1.77
TOTAL 10.02 12.27 12.52 12.52
Planning & Project ManagementPlanning & Project Management 11.42 11.66 11.66 11.66Flood Management 0.75 0.75 0.75 0.75
TOTAL 12.17 12.41 12.41 12.41
Water ResourcesWater Resources Management 2.00 2.00 2.00 2.00Watershed Operations 2.00 2.00 2.00 2.00Hydroelectric Operations 3.00 3.00 3.00 3.00
TOTAL 7.00 7.00 7.00 7.00
Water TreatmentBetasso Treatment Plant 14.50 13.75 13.75 13.75Boulder Reservoir Treatment Plant 8.50 9.25 9.25 9.25System Controls 3.00 3.00 3.00 3.00
TOTAL 26.00 26.00 26.00 26.00
Water Quality Environment ServicesIndustrial Pretreatment 3.70 3.70 3.66 3.66Water Conservation 1.70 1.70 1.66 1.66Drinking Water Quality Services 6.90 6.90 6.83 6.83Wastewater Quality Services 4.05 4.05 4.12 4.12Stormwater Quality Services 5.40 5.40 5.48 5.48
TOTAL 21.75 21.75 21.75 21.75
System MaintenanceDistribution System Maintenance 14.95 14.95 14.95 14.95Collection System Maintenance 13.95 13.95 13.95 13.95Storm Sewer Maintenance 5.55 5.55 5.55 5.55Flood Channel Maintenance 2.05 2.05 2.05 2.05Meter Services 8.00 8.00 8.00 8.00
TOTAL 44.50 44.50 44.50 44.50
Wastewater Treatment75th Street Treatment Plant 23.00 25.00 25.00 25.00Cogeneration 1.00 1.00 1.00 1.00Biosolids Operations 5.00 5.00 5.00 5.00
TOTAL 29.00 31.00 31.00 31.00
TOTAL 150.44 154.93 155.18 155.18
2008-09 APPROVED BUDGET UTILITIES DIVISION
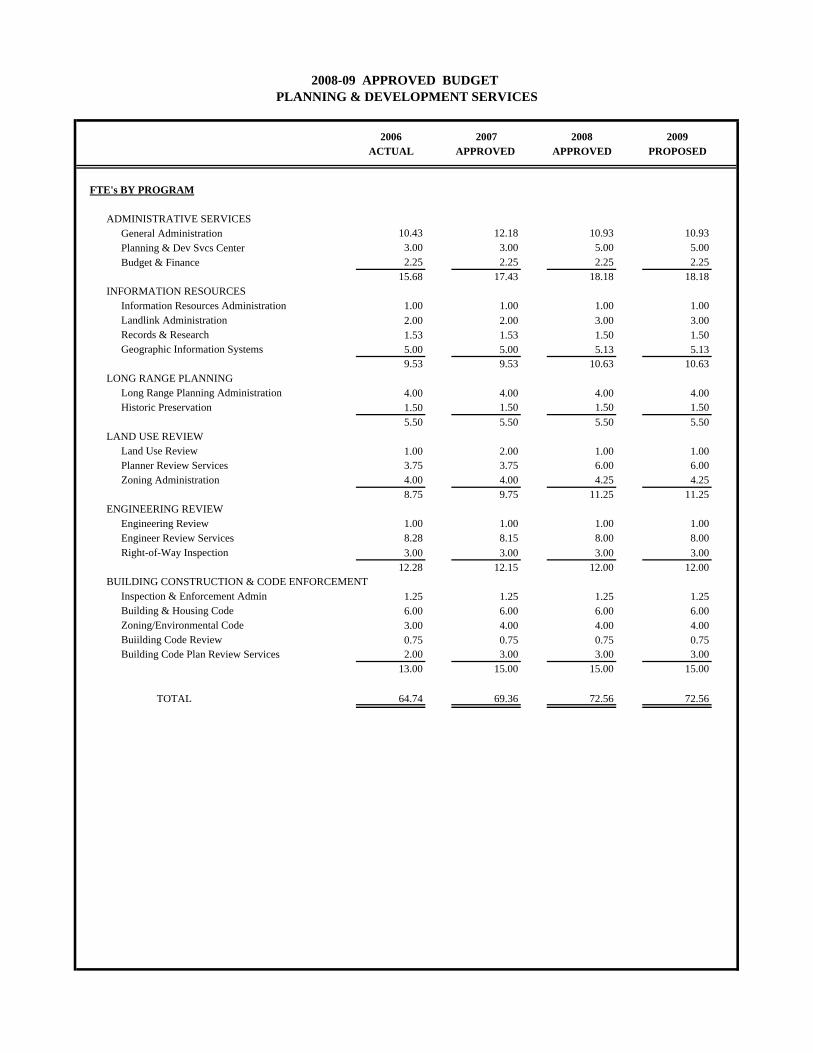
2006 2007 2008 2009ACTUAL APPROVED APPROVED PROPOSED
FTE's BY PROGRAM
ADMINISTRATIVE SERVICESGeneral Administration 10.43 12.18 10.93 10.93Planning & Dev Svcs Center 3.00 3.00 5.00 5.00Budget & Finance 2.25 2.25 2.25 2.25
15.68 17.43 18.18 18.18INFORMATION RESOURCES
Information Resources Administration 1.00 1.00 1.00 1.00Landlink Administration 2.00 2.00 3.00 3.00Records & Research 1.53 1.53 1.50 1.50Geographic Information Systems 5.00 5.00 5.13 5.13
9.53 9.53 10.63 10.63LONG RANGE PLANNING
Long Range Planning Administration 4.00 4.00 4.00 4.00Historic Preservation 1.50 1.50 1.50 1.50
5.50 5.50 5.50 5.50LAND USE REVIEW
Land Use Review 1.00 2.00 1.00 1.00Planner Review Services 3.75 3.75 6.00 6.00Zoning Administration 4.00 4.00 4.25 4.25
8.75 9.75 11.25 11.25ENGINEERING REVIEW
Engineering Review 1.00 1.00 1.00 1.00Engineer Review Services 8.28 8.15 8.00 8.00Right-of-Way Inspection 3.00 3.00 3.00 3.00
12.28 12.15 12.00 12.00BUILDING CONSTRUCTION & CODE ENFORCEMENT
Inspection & Enforcement Admin 1.25 1.25 1.25 1.25Building & Housing Code 6.00 6.00 6.00 6.00Zoning/Environmental Code 3.00 4.00 4.00 4.00Buiilding Code Review 0.75 0.75 0.75 0.75Building Code Plan Review Services 2.00 3.00 3.00 3.00
13.00 15.00 15.00 15.00
TOTAL 64.74 69.36 72.56 72.56
2008-09 APPROVED BUDGET PLANNING & DEVELOPMENT SERVICES
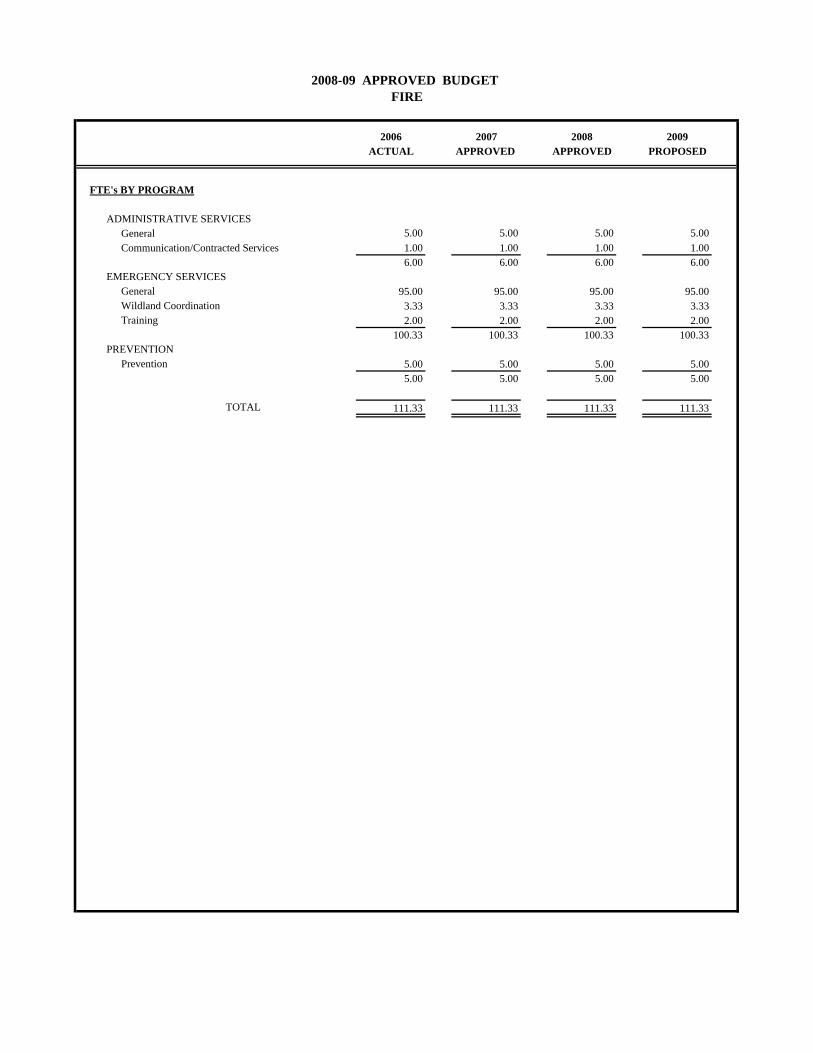
2006 2007 2008 2009ACTUAL APPROVED APPROVED PROPOSED
FTE's BY PROGRAM
ADMINISTRATIVE SERVICESGeneral 5.00 5.00 5.00 5.00Communication/Contracted Services 1.00 1.00 1.00 1.00
6.00 6.00 6.00 6.00EMERGENCY SERVICES
General 95.00 95.00 95.00 95.00Wildland Coordination 3.33 3.33 3.33 3.33Training 2.00 2.00 2.00 2.00
100.33 100.33 100.33 100.33PREVENTION
Prevention 5.00 5.00 5.00 5.005.00 5.00 5.00 5.00
TOTAL 111.33 111.33 111.33 111.33
2008-09 APPROVED BUDGET FIRE
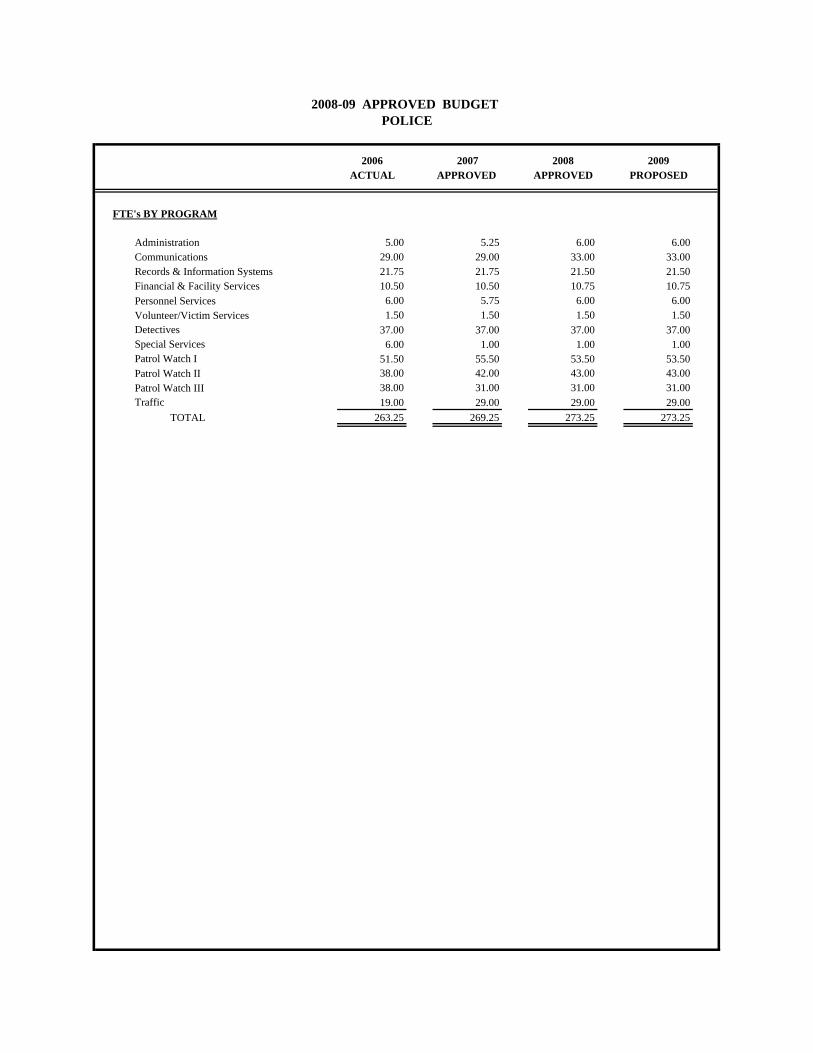
2006 2007 2008 2009ACTUAL APPROVED APPROVED PROPOSED
FTE's BY PROGRAM
Administration 5.00 5.25 6.00 6.00Communications 29.00 29.00 33.00 33.00Records & Information Systems 21.75 21.75 21.50 21.50Financial & Facility Services 10.50 10.50 10.75 10.75Personnel Services 6.00 5.75 6.00 6.00Volunteer/Victim Services 1.50 1.50 1.50 1.50Detectives 37.00 37.00 37.00 37.00Special Services 6.00 1.00 1.00 1.00Patrol Watch I 51.50 55.50 53.50 53.50Patrol Watch II 38.00 42.00 43.00 43.00Patrol Watch III 38.00 31.00 31.00 31.00Traffic 19.00 29.00 29.00 29.00
TOTAL 263.25 269.25 273.25 273.25
2008-09 APPROVED BUDGET POLICE