20 inventory management, just-in-time, and simplified
TRANSCRIPT
Suppose you could receive a large quantity discount fora product that you regularly use, but the discountrequires you to buy a year’s supply and necessitates alarge up-front expenditure.Would you take the quantity discount? Companies face similardecisions because firms pay a price for tying up money in inventorysitting on their shelves or elsewhere. Money tied up in inventory is aparticularly serious problem when times are tough. When faced withthese circumstances, companies like Costco work very hard tobetter manage their inventories.
Costco Aggressively Manages Inventory toThrive in Tough Times1
When consumers reduced their spending in 2008, traditional stalwarts
like Circuit City and Linens ‘n Things wilted under the weight of their
own massive inventories. They could not turn their inventories quickly
enough to pay suppliers and were forced to close their doors when
cash ran out.
At the same time, Costco continued to thrive! How? By
intentionally stocking fewer items than its competitors—and employing
inventory management practices that successfully reduced costs
throughout its operations. While the average grocery store carries
around 40,000 items, Costco limits its offerings to about
4,000 products, or 90% less! Limiting the number of products on its
shelves reduces Costco’s costs of carrying inventory.
Costco also employs a just-in-time inventory management system,
which includes sharing data directly with many of its largest suppliers.
Companies like Kimberly-Clark calculate re-order points in real time
and send new inventory, as needed, to replenish store shelves.
Costco also works to redesign product packaging to squeeze more
bulky goods onto trucks and shelves, reducing the number of orders
Costco needs to place with suppliers.
Occasionally, the company leverages its 75 million square feet of
warehouse space to reduce purchasing costs. For example, when
Procter & Gamble recently announced a 6% price increase for its
paper goods, Costco bought 258 truckloads of paper towels at the old
rate and stored them using available capacity in its distribution centers
and warehouses.
Learning Objectives
1. Identify six categories of costsassociated with goods for sale
2. Balance ordering costs with carry-ing costs using the economic-order-quantity (EOQ) decision model
3. Identify the effect of errors that canarise when using the EOQ decisionmodel and ways to reduce conflictsbetween the EOQ model and mod-els used for performance evaluation
4. Describe why companies are usingjust-in-time purchasing
5. Distinguish materials require-ments planning (MRP) systemsfrom just-in-time (JIT) systems formanufacturing
6. Identify the features and benefitsof a just-in-time production system
7. Describe different ways backflushcosting can simplify traditionalinventory-costing systems
8. Understand the principles of leanaccounting
�
702
20 Inventory Management, Just-in-Time,and Simplified Costing Methods
1 Source: McGregor, Jena. 2008. Costco’s artful discounts. BusinessWeek, October 20.
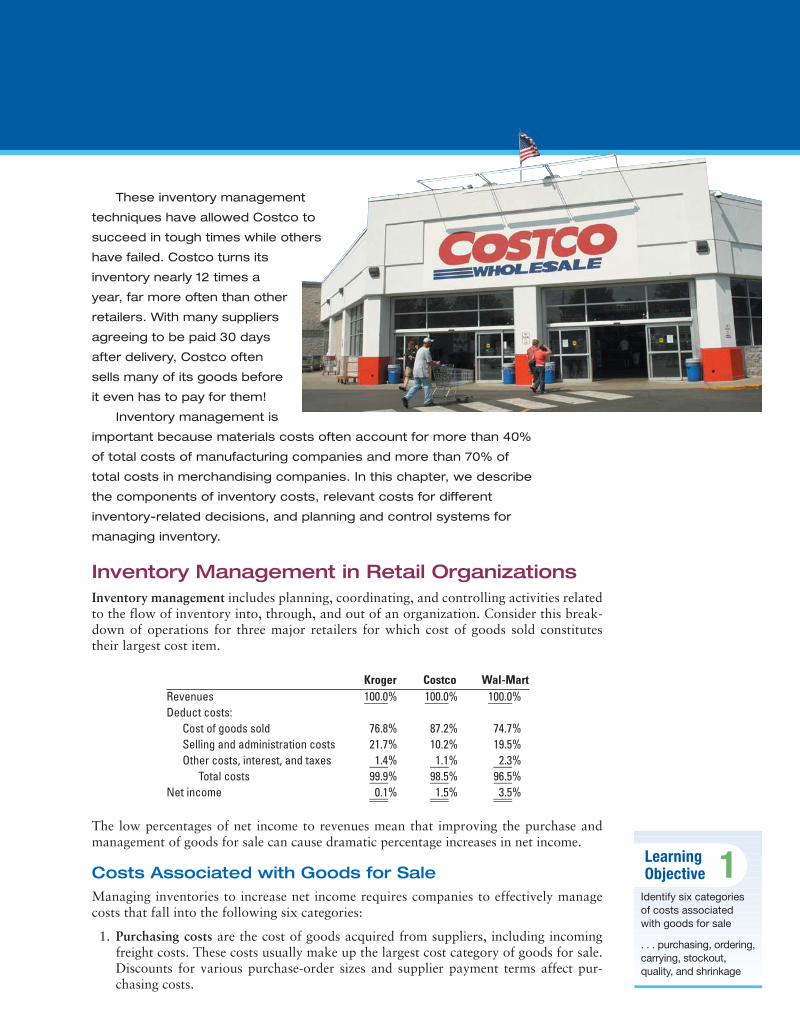
These inventory management
techniques have allowed Costco to
succeed in tough times while others
have failed. Costco turns its
inventory nearly 12 times a
year, far more often than other
retailers. With many suppliers
agreeing to be paid 30 days
after delivery, Costco often
sells many of its goods before
it even has to pay for them!
Inventory management is
important because materials costs often account for more than 40%
of total costs of manufacturing companies and more than 70% of
total costs in merchandising companies. In this chapter, we describe
the components of inventory costs, relevant costs for different
inventory-related decisions, and planning and control systems for
managing inventory.
Inventory Management in Retail OrganizationsInventory management includes planning, coordinating, and controlling activities relatedto the flow of inventory into, through, and out of an organization. Consider this break-down of operations for three major retailers for which cost of goods sold constitutestheir largest cost item.
Kroger Costco Wal-MartRevenues 100.0% 100.0% 100.0%Deduct costs:
Cost of goods sold 76.8% 87.2% 74.7%Selling and administration costs 21.7% 10.2% 19.5%Other costs, interest, and taxes ƒ1.4% ƒ1.1% ƒ2.3%
Total costs 99.9% 98.5% 96.5%Net income ƒ0.1% ƒ1.5% ƒ3.5%
The low percentages of net income to revenues mean that improving the purchase andmanagement of goods for sale can cause dramatic percentage increases in net income.
Costs Associated with Goods for SaleManaging inventories to increase net income requires companies to effectively managecosts that fall into the following six categories:
1. Purchasing costs are the cost of goods acquired from suppliers, including incomingfreight costs. These costs usually make up the largest cost category of goods for sale.Discounts for various purchase-order sizes and supplier payment terms affect pur-chasing costs.
LearningObjective 1
Identify six categoriesof costs associatedwith goods for sale
. . . purchasing, ordering,carrying, stockout,quality, and shrinkage
704 � CHAPTER 20 INVENTORY MANAGEMENT, JUST-IN-TIME, AND SIMPLIFIED COSTING METHODS
2. Ordering costs arise in preparing and issuing purchase orders, receiving and inspect-ing the items included in the orders, and matching invoices received, purchase orders,and delivery records to make payments. Ordering costs include the cost of obtainingpurchase approvals, as well as other special processing costs.
3. Carrying costs arise while holding an inventory of goods for sale. Carrying costsinclude the opportunity cost of the investment tied up in inventory (see Chapter 11,pp. 403–405) and the costs associated with storage, such as space rental, insurance,obsolescence, and spoilage.
4. Stockout costs arise when a company runs out of a particular item for which there iscustomer demand, a stockout. The company must act quickly to replenish inventoryto meet that demand or suffer the costs of not meeting it. A company may respond toa stockout by expediting an order from a supplier, which can be expensive because ofadditional ordering costs plus any associated transportation costs. Or the companymay lose sales due to the stockout. In this case, the opportunity cost of the stockoutincludes lost contribution margin on the sale not made plus any contribution marginlost on future sales due to customer ill will.
5. Costs of quality result when features and characteristics of a product or service arenot in conformance with customer specifications. There are four categories of qualitycosts (prevention costs, appraisal costs, internal failure costs, and external failurecosts), as described in Chapter 19.
6. Shrinkage costs result from theft by outsiders, embezzlement by employees, mis-classifications, and clerical errors. Shrinkage is measured by the differencebetween (a) the cost of the inventory recorded on the books in the absence of theftand other incidents just mentioned, and (b) the cost of inventory when physicallycounted. Shrinkage can often be an important measure of management perform-ance. Consider, for example, the grocery business, where operating income per-centages hover around 2%. With such small margins, it is easy to see why one ofa store manager’s prime responsibilities is controlling inventory shrinkage. A$1,000 increase in shrinkage will erase the operating income from sales of$50,000 (2% $50,000 $1,000).
Note that not all inventory costs are available in financial accounting systems. For exam-ple, opportunity costs are not recorded in these systems and are a significant componentin several of these cost categories.
Information-gathering technology increases the reliability and timeliness of inventoryinformation and reduces costs in the six cost categories. For example, barcoding technol-ogy allows a scanner to record purchases and sales of individual units. As soon as a unitis scanned, an instantaneous record of inventory movements is created that helps in themanagement of purchasing, carrying, and stockout costs. In the next several sections, weconsider how relevant costs are computed for different inventory-related decisions in mer-chandising companies.
Economic-Order-Quantity Decision ModelThe first decision in managing goods for sale is how much to order of a given product.The economic order quantity (EOQ) is a decision model that, under a given set ofassumptions, calculates the optimal quantity of inventory to order.
� The simplest version of an EOQ model assumes there are only ordering and carry-ing costs.
� The same quantity is ordered at each reorder point.� Demand, ordering costs, and carrying costs are known with certainty. The
purchase-order lead time, the time between placing an order and its delivery, isalso known with certainty.
� Purchasing cost per unit is unaffected by the order quantity. This assumption makespurchasing costs irrelevant to determining EOQ, because the purchase price is thesame, whatever the order size.
=*
LearningObjective 2
Balance ordering costswith carrying costsusing the economic-order-quantity (EOQ)decision model
. . . choose the inventoryquantity per order tominimize these costs
DecisionPoint
What are the sixcategories of costs
associated withgoods for sale?
INVENTORY MANAGEMENT IN RETAIL ORGANIZATIONS � 705
� No stockouts occur. The basis for this assumption is that the costs of stockouts are sohigh that managers maintain adequate inventory to prevent them.
� In deciding on the size of a purchase order, managers consider costs of quality andshrinkage costs only to the extent that these costs affect ordering or carrying costs.
Given these assumptions, EOQ analysis ignores purchasing costs, stockout costs, costs ofquality, and shrinkage costs. EOQ is the order quantity that minimizes the relevant order-ing and carrying costs (that is, the ordering and carrying costs affected by the quantity ofinventory ordered):
We use the following notations:
Average inventory in units = , because each time the inventory goes down to 0, an orderQ
2
Number of purchase orders per period (one year) = Demand in units for a period (one year)
Size of each order (order quantity)=
DQ
Q = Size of each order (order quantity)
D = Demand in units for a specified period (one year in this example)
Relevant total costs = Relevant ordering costs + Relevant carrying costs
for Q units is received. The inventory varies from Q to 0 so the average inventory is .
For any order quantity, Q,
The order quantity that minimizes annual relevant total costs is
The EOQ model is solved using calculus but the key intuition is that relevant total costsare minimized when relevant ordering costs equal relevant carrying costs. If carrying costsare less (greater) than ordering costs, total costs can be reduced by increasing (decreasing)the order quantity. To solve for EOQ, we set
Multiplying both sides by , we get
The formula indicates that EOQ increases with higher demand and/or higher orderingcosts and decreases with higher carrying costs.
Let’s consider an example to see how EOQ analysis works. CD World is an independ-ent electronics store that sells blank compact disks. CD World purchases the CDs from
Q = A2DPC
Q 2 =2DP
C2QC
aQ2
* Cb = aDQ
* Pb
EOQ = A2DPC
Annual relevant total costs =Annual
relevant ordering +costs
Annualrelevant carrying
costs= aD
Q* Pb + aQ
2* Cb
Annual relevant carrying costs = PAverage inventoryin units
*Annual
relevant carryingcost per unit
Q = aQ2
* Cb
Annual relevant ordering costs = PNumber of
purchase ordersper year
*Relevant ordering
cost perpurchase order
Q = aDQ
* Pb
C = Relevant carrying cost of one unit in stock for the time period used for D (one year)
P = Relevant ordering cost per purchase order
0 + Q
2
Sontek at $14 a package (each package contains 20 disks). Sontek pays for all incomingfreight. No inspection is necessary at CD World because Sontek supplies quality merchan-dise. CD World’s annual demand is 13,000 packages, at a rate of 250 packages per week.CD World requires a 15% annual rate of return on investment. The purchase-order leadtime is two weeks. Relevant ordering cost per purchase order is $200.
Relevant carrying cost per package per year is as follows:
706 � CHAPTER 20 INVENTORY MANAGEMENT, JUST-IN-TIME, AND SIMPLIFIED COSTING METHODS
What is the EOQ of packages of disks?Substituting D = 13,000 packages per year, P = $200 per order, and C = $5.20 per
package per year, in the EOQ formula, we get,
Purchasing 1,000 packages per order minimizes total relevant ordering and carrying costs.Therefore, the number of deliveries each period (one year in this example) is as follows:
Recall the annual relevant total costs (RTC)For Q 1,000 units,
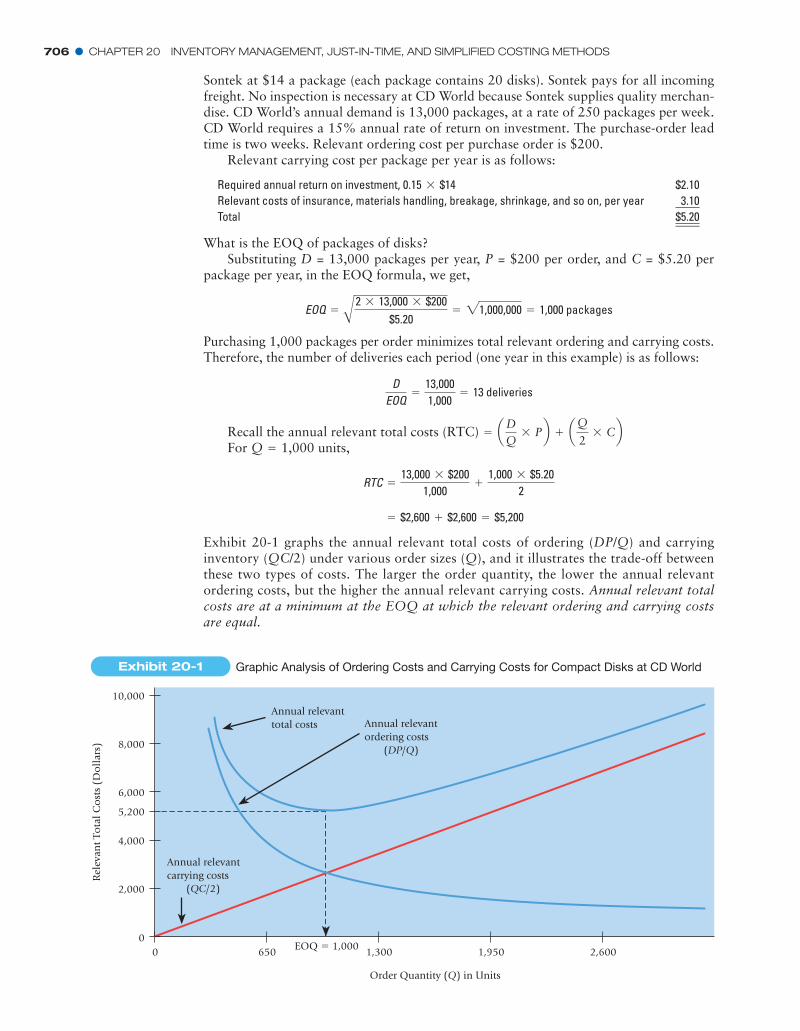
Exhibit 20-1 graphs the annual relevant total costs of ordering (DP/Q) and carryinginventory (QC/2) under various order sizes (Q), and it illustrates the trade-off betweenthese two types of costs. The larger the order quantity, the lower the annual relevantordering costs, but the higher the annual relevant carrying costs. Annual relevant totalcosts are at a minimum at the EOQ at which the relevant ordering and carrying costsare equal.
= $2,600 + $2,600 = $5,200
RTC =13,000 * $200
1,000+
1,000 * $5.202
== aD
Q* Pb + aQ
2* Cb
DEOQ
=13,0001,000
= 13 deliveries
EOQ = A2 * 13,000 * $200$5.20
= 21,000,000 = 1,000 packages
Required annual return on investment, 0.15 $14* $2.10Relevant costs of insurance, materials handling, breakage, shrinkage, and so on, per year ƒ3.10Total $5.20
10,000Annual relevanttotal costs
Annual relevantcarrying costs (QC/2)
Annual relevantordering costs (DP/Q)8,000
6,000
5,200
4,000
2,000
Rel
evan
t To
tal C
ost
s (D
oll
ars)
00
Order Quantity (Q) in Units
2,6001,9501,300EOQ � 1,000650
Exhibit 20-1 Graphic Analysis of Ordering Costs and Carrying Costs for Compact Disks at CD World
INVENTORY MANAGEMENT IN RETAIL ORGANIZATIONS � 707
When to Order, Assuming CertaintyThe second decision in managing goods for sale is when to order a given product. Thereorder point is the quantity level of inventory on hand that triggers a new purchaseorder. The reorder point is simplest to compute when both demand and purchase-orderlead time are known with certainty:
In our CD World example, we choose one week as the time period in the reorder-pointformula:
Reorder point =Number of units sold
per time period*
Purchase-orderlead time
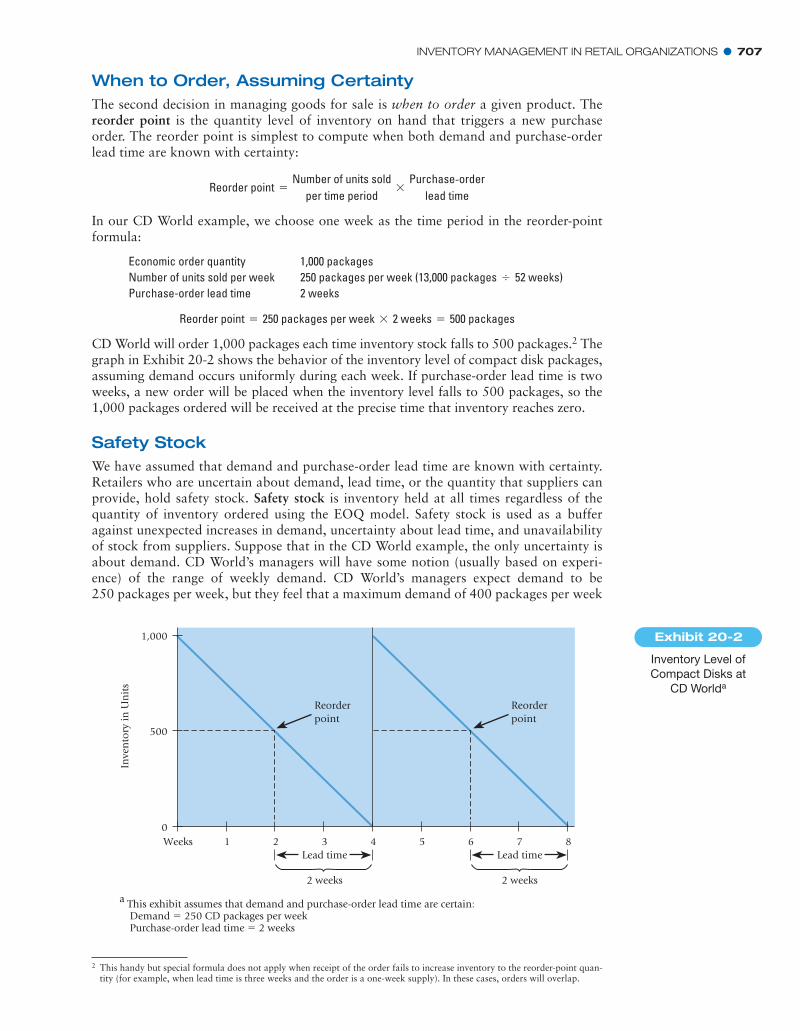
CD World will order 1,000 packages each time inventory stock falls to 500 packages.2 Thegraph in Exhibit 20-2 shows the behavior of the inventory level of compact disk packages,assuming demand occurs uniformly during each week. If purchase-order lead time is twoweeks, a new order will be placed when the inventory level falls to 500 packages, so the1,000 packages ordered will be received at the precise time that inventory reaches zero.
Safety StockWe have assumed that demand and purchase-order lead time are known with certainty.Retailers who are uncertain about demand, lead time, or the quantity that suppliers canprovide, hold safety stock. Safety stock is inventory held at all times regardless of thequantity of inventory ordered using the EOQ model. Safety stock is used as a bufferagainst unexpected increases in demand, uncertainty about lead time, and unavailabilityof stock from suppliers. Suppose that in the CD World example, the only uncertainty isabout demand. CD World’s managers will have some notion (usually based on experi-ence) of the range of weekly demand. CD World’s managers expect demand to be250 packages per week, but they feel that a maximum demand of 400 packages per week
Reorder point = 250 packages per week * 2 weeks = 500 packages
2 This handy but special formula does not apply when receipt of the order fails to increase inventory to the reorder-point quan-tity (for example, when lead time is three weeks and the order is a one-week supply). In these cases, orders will overlap.
Economic order quantity 1,000 packagesNumber of units sold per week 250 packages per week (13,000 packages 52 weeks),Purchase-order lead time 2 weeks
1,000
500
Inve
nto
ry in
Un
its
0Weeks
Reorderpoint
87Lead time
6543Lead time
2 weeks2 weeks
21
Reorderpoint
a This exhibit assumes that demand and purchase-order lead time are certain: Demand � 250 CD packages per week Purchase-order lead time � 2 weeks
Inventory Level ofCompact Disks at
CD Worlda
Exhibit 20-2
708 � CHAPTER 20 INVENTORY MANAGEMENT, JUST-IN-TIME, AND SIMPLIFIED COSTING METHODS
may occur. If stockout costs are very high, CD World will hold a safety stock of300 packages and incur higher carrying costs. The 300 packages equal the maximumexcess demand of 150 (400 250) packages per week times the two weeks of purchase-order lead time. If stockout costs are minimal, CD World will hold no safety stocks andavoid incurring the additional carrying costs.
A frequency distribution based on prior daily or weekly levels of demand forms thebasis for computing safety-stock levels. Assume that one of the following levels of demandwill occur over the two-week purchase-order lead time at CD World.
-
We see that 500 units is the most likely level of demand for two weeks because it has thehighest probability of occurrence. We see also a 0.35 probability that demand will be 600,700, or 800 packages (0.20 0.09 0.06 0.35).
If a customer wants to buy compact disks and the store has none in stock, CD Worldcan “rush” them to the customer at an additional cost to CD World of $4 per package.The relevant stockout costs in this case are $4 per package. The optimal safety-stock levelis the quantity of safety stock that minimizes the sum of annual relevant stockout and car-rying costs. Note that CD World will place 13 orders per year and will incur the sameordering costs whatever level of safety stock it chooses. Therefore, ordering costs are irrel-evant for the safety-stock decision. Recall that the relevant carrying cost for CD World is$5.20 per package per year.
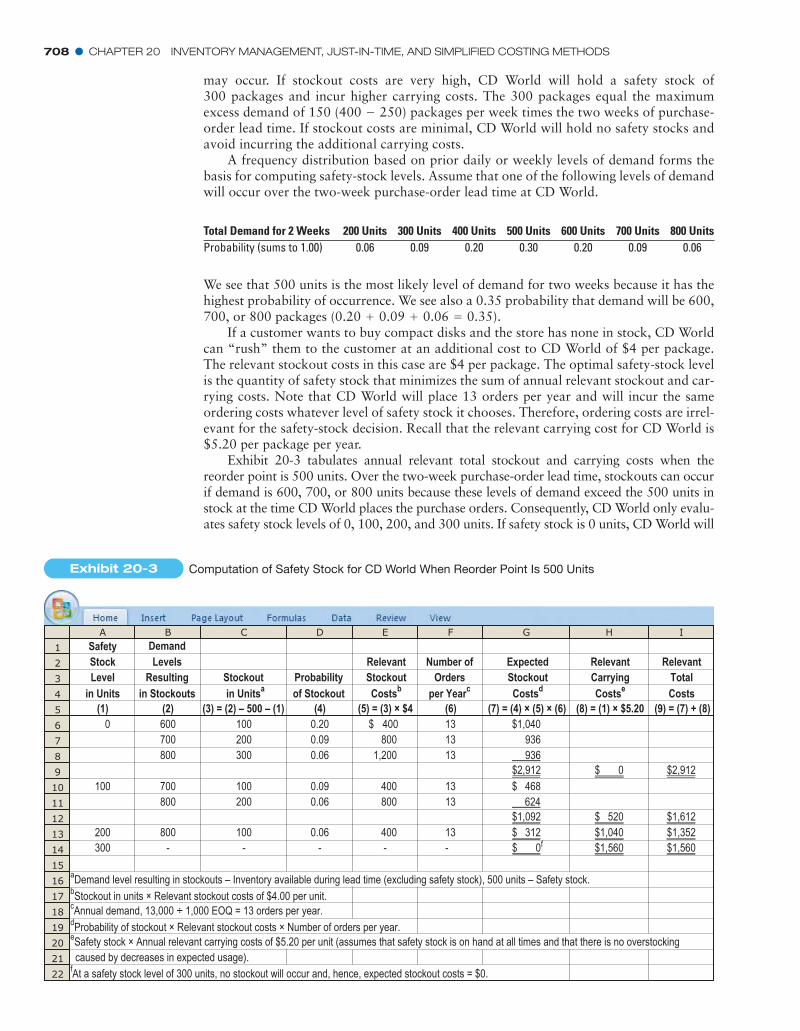
Exhibit 20-3 tabulates annual relevant total stockout and carrying costs when thereorder point is 500 units. Over the two-week purchase-order lead time, stockouts can occurif demand is 600, 700, or 800 units because these levels of demand exceed the 500 units instock at the time CD World places the purchase orders. Consequently, CD World only evalu-ates safety stock levels of 0, 100, 200, and 300 units. If safety stock is 0 units, CD World will
=++
Total Demand for 2 Weeks 200 Units 300 Units 400 Units 500 Units 600 Units 700 Units 800 UnitsProbability (sums to 1.00) 0.06 0.09 0.20 0.30 0.20 0.09 0.06
1
2
3
4
5
6
7
8
9
10
11
12
13
14
15
16
17
18
19
20
21
22
A B C D E F G H I
Safety ExpectedNumber ofRelevantLevelsStock
Levelin Units
(1) (2) (3) = (2) – 500 – (1) (4) (5) = (3) × $4 (6) (7) = (4) × (5) × (6) (8) = (1) × $5.20 (9) = (7) + (8)600 100 0.20 400 13 $1,040700 200 0.09 800 13 936800 300 0.06 1,200 13 936
$2,912 $ 0 $2,912
100 700 100 0.09 400 13 $ 468800 200 0.06 800 13 624
$1,092 $ 520 $1,612200 800 100 0.06 400 13 $ 312 $1,040 $1,352300 - - - - - $ 0f $1,560 $1,560
aDemand level resulting in stockouts – Inventory available during lead time (excluding safety stock), 500 units – Safety stock.bStockout in units × Relevant stockout costs of $4.00 per unit.cAnnual demand, 13,000 ÷ 1,000 EOQ = 13 orders per year.dProbability of stockout × Relevant stockout costs × Number of orders per year.eSafety stock × Annual relevant carrying costs of $5.20 per unit (assumes that safety stock is on hand at all times and that there is no overstockingcaused by decreases in expected usage).
fAt a safety stock level of 300 units, no stockout will occur and, hence, expected stockout costs = $0.
RelevantTotalCosts
RelevantCarryingCostse
StockoutCostsd
Ordersper Yearc
StockoutCostsb
Probabilityof Stockout
Stockoutin Unitsain Stockouts
Resulting
Demand
$ 0
Exhibit 20-3 Computation of Safety Stock for CD World When Reorder Point Is 500 Units
ESTIMATING INVENTORY-RELATED RELEVANT COSTS AND THEIR EFFECTS � 709
incur stockout costs if demand is 600, 700, or 800 units but will have no additional carryingcosts. At the other extreme, if safety stock is 300 units, CD World will never incur stockoutcosts but will have higher carrying costs. As Exhibit 20-3 shows, annual relevant total stock-out and carrying costs would be the lowest ($1,352) when a safety stock of 200 packages ismaintained. Therefore, 200 units is the optimal safety-stock level. Consider the 200 units ofsafety stock as extra stock that CD World maintains. For example, CD World’s total inven-tory of compact disks at the time of reordering its EOQ of 1,000 units would be 700 units(the reorder point of 500 units plus safety stock of 200 units).
Estimating Inventory-Related Relevant Costsand Their EffectsJust as we did in earlier chapters, we need to determine which costs are relevant whenmaking and evaluating inventory management decisions. We next describe the estimatesthat need to be made to calculate the annual relevant carrying costs of inventory, stock-out costs, and ordering costs.
Considerations in Obtaining Estimates of Relevant CostsRelevant inventory carrying costs consist of the relevant incremental costs plus therelevant opportunity cost of capital.
What are the relevant incremental costs of carrying inventory? Only those costs of thepurchasing company, such as warehouse rent, warehouse workers’ salaries, costs of obso-lescence, costs of shrinkage, and costs of breakage, that change with the quantity ofinventory held. Salaries paid to clerks, stock keepers, and materials handlers are irrelevantif they are unaffected by changes in inventory levels. Suppose, however, that as inventoriesincrease (decrease), total salary costs increase (decrease) as clerks, stock keepers, andmaterials handlers are added (transferred to other activities or laid off). In this case,salaries paid are relevant costs of carrying inventory. Similarly, costs of storage spaceowned that cannot be used for other profitable purposes when inventories decrease areirrelevant. But if the space has other profitable uses, or if total rental cost is tied to theamount of space occupied, storage costs are relevant costs of carrying inventory.
What is the relevant opportunity cost of capital? It is the return forgone by investingcapital in inventory rather than elsewhere. It is calculated as the required rate of returnmultiplied by the per-unit costs such as the purchase price of units, incoming freight, andincoming inspection. Opportunity costs are not computed on investments (say, in build-ings) if these investments are unaffected by changes in inventory levels.
In the case of stockouts, the relevant incremental cost is the cost of expediting anorder from a supplier. The relevant opportunity cost is (1) the lost contribution margin onsales forgone because of the stockout and (2) lost contribution margin on future sales for-gone as a result of customer ill will.
Relevant ordering costs are only those ordering costs that change with the number oforders placed (for example, costs of preparing and issuing purchase orders and receivingand inspecting materials).
Cost of a Prediction ErrorPredicting relevant costs is difficult and seldom flawless, which raises the question,“What is the cost when actual relevant costs differ from the estimated relevant costs usedfor decision making?”
Let’s revisit the CD World example. Suppose relevant ordering costs per purchaseorder are $100, while the manager predicts them to be $200 at the time of calculatingthe order quantity. We can calculate the cost of this “prediction” error using a three-step approach.
Step 1: Compute the Monetary Outcome from the Best Action That Could Be Taken,Given the Actual Amount of the Cost Input (Cost per Purchase Order). This is the bench-mark, the decision the manager would have made if the manager had known the correct
DecisionPoint
What does the EOQdecision model helpmanagers do andhow do managersdecide on the levelof safety stocks?
LearningObjective 3
Identify the effect oferrors that can arisewhen using the EOQdecision model
. . . errors in predictingparameters have asmall effect on costs
and ways to reduceconflicts between theEOQ model and modelsused for performanceevaluation
. . . by making the twomodels congruent
710 � CHAPTER 20 INVENTORY MANAGEMENT, JUST-IN-TIME, AND SIMPLIFIED COSTING METHODS
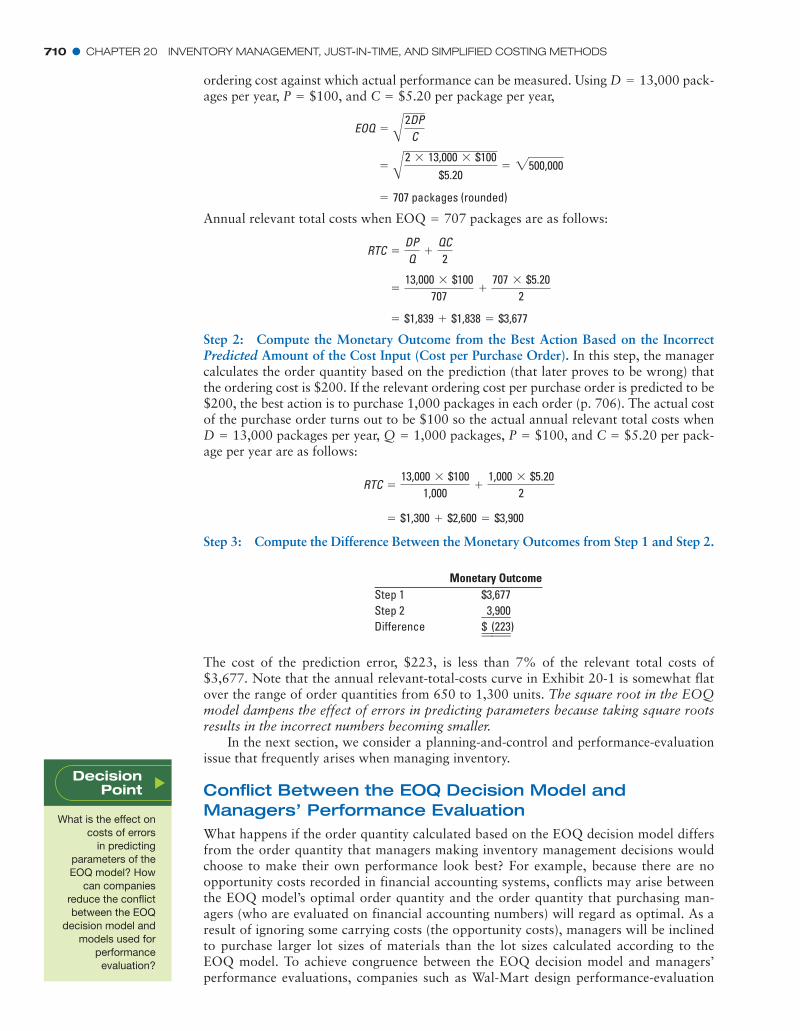
ordering cost against which actual performance can be measured. Using D 13,000 pack-ages per year, P $100, and C $5.20 per package per year,
Annual relevant total costs when EOQ 707 packages are as follows:
Step 2: Compute the Monetary Outcome from the Best Action Based on the IncorrectPredicted Amount of the Cost Input (Cost per Purchase Order). In this step, the managercalculates the order quantity based on the prediction (that later proves to be wrong) thatthe ordering cost is $200. If the relevant ordering cost per purchase order is predicted to be$200, the best action is to purchase 1,000 packages in each order (p. 706). The actual costof the purchase order turns out to be $100 so the actual annual relevant total costs whenD 13,000 packages per year, Q 1,000 packages, P $100, and C $5.20 per pack-age per year are as follows:
Step 3: Compute the Difference Between the Monetary Outcomes from Step 1 and Step 2.
= $1,300 + $2,600 = $3,900
RTC =13,000 * $100
1,000+
1,000 * $5.202
====
= $1,839 + $1,838 = $3,677
=13,000 * $100
707+
707 * $5.202
RTC =DPQ
+QC2
=
= 707 packages (rounded)
= A2 * 13,000 * $100$5.20
= 2500,000
EOQ = A2DPC
===
Monetary OutcomeStep 1 $3,677Step 2 ƒ3,900Difference $ƒ(223)
The cost of the prediction error, $223, is less than 7% of the relevant total costs of$3,677. Note that the annual relevant-total-costs curve in Exhibit 20-1 is somewhat flatover the range of order quantities from 650 to 1,300 units. The square root in the EOQmodel dampens the effect of errors in predicting parameters because taking square rootsresults in the incorrect numbers becoming smaller.
In the next section, we consider a planning-and-control and performance-evaluationissue that frequently arises when managing inventory.
Conflict Between the EOQ Decision Model andManagers’ Performance EvaluationWhat happens if the order quantity calculated based on the EOQ decision model differsfrom the order quantity that managers making inventory management decisions wouldchoose to make their own performance look best? For example, because there are noopportunity costs recorded in financial accounting systems, conflicts may arise betweenthe EOQ model’s optimal order quantity and the order quantity that purchasing man-agers (who are evaluated on financial accounting numbers) will regard as optimal. As aresult of ignoring some carrying costs (the opportunity costs), managers will be inclinedto purchase larger lot sizes of materials than the lot sizes calculated according to theEOQ model. To achieve congruence between the EOQ decision model and managers’performance evaluations, companies such as Wal-Mart design performance-evaluation
DecisionPoint
What is the effect oncosts of errors
in predictingparameters of theEOQ model? How
can companiesreduce the conflictbetween the EOQ
decision model andmodels used for
performanceevaluation?
JUST-IN-TIME PURCHASING � 711
models that charge managers responsible for managing inventory levels with carryingcosts that include a required return on investment.
Just-in-Time PurchasingJust-in-time (JIT) purchasing is the purchase of materials (or goods) so that they aredelivered just as needed for production (or sales). Consider JIT purchasing for Hewlett-Packard’s (HP’s) manufacture of computer printers. HP has long-term agreements withsuppliers for the major components of its printers. Each supplier is required to make fre-quent deliveries of small orders directly to the production floor, based on the productionschedule that HP gives its suppliers. Suppliers work hard to keep their commitmentsbecause failure to deliver components on time, or to meet agreed-upon quality standards,can cause an HP assembly plant not to meet its own scheduled deliveries for printers.
JIT Purchasing and EOQ Model ParametersCompanies moving toward JIT purchasing to reduce their costs of carrying inventories(parameter C in the EOQ model) say that, in the past, carrying costs have actually beenmuch greater than estimated because costs of warehousing, handling, shrinkage, andinvestment have not been fully identified. At the same time, the cost of placing a pur-chase order (parameter P in the EOQ model) is decreasing because of the following:
� Companies are establishing long-term purchasing agreements that define price andquality terms over an extended period. Individual purchase orders covered by thoseagreements require no additional negotiation regarding price or quality.
� Companies are using electronic links to place purchase orders at a cost that is esti-mated to be a small fraction of the cost of placing orders by telephone or by mail.
� Companies are using purchase-order cards (similar to consumer credit cards such asVISA and MasterCard). As long as purchasing personnel stay within preset total andindividual-transaction dollar limits, traditional labor-intensive procurement-approvalprocedures are not required.
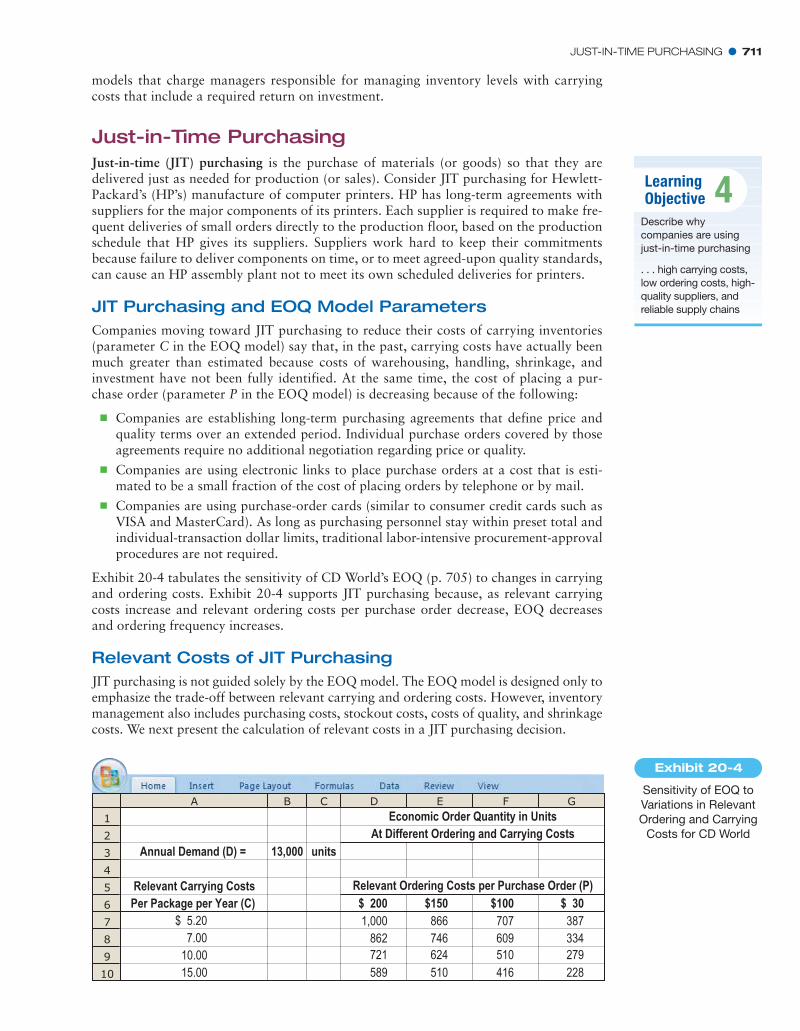
Exhibit 20-4 tabulates the sensitivity of CD World’s EOQ (p. 705) to changes in carryingand ordering costs. Exhibit 20-4 supports JIT purchasing because, as relevant carryingcosts increase and relevant ordering costs per purchase order decrease, EOQ decreasesand ordering frequency increases.
Relevant Costs of JIT PurchasingJIT purchasing is not guided solely by the EOQ model. The EOQ model is designed only toemphasize the trade-off between relevant carrying and ordering costs. However, inventorymanagement also includes purchasing costs, stockout costs, costs of quality, and shrinkagecosts. We next present the calculation of relevant costs in a JIT purchasing decision.
LearningObjective 4
Describe whycompanies are usingjust-in-time purchasing
. . . high carrying costs,low ordering costs, high-quality suppliers, andreliable supply chains
1
2
3
4
5
6
7
8
9
10
A B C D E F G
Annual Demand (D) = 13,000 units
Relevant Carrying CostsPer Package per Year (C)
$ 5.20 7.0010.0015.00
Economic Order Quantity in UnitsAt Different Ordering and Carrying Costs
Relevant Ordering Costs per Purchase Order (P)
228589 510 416
$ 30$ 200 $150 $100
721 624 510862 746 609
1,000 866 707
279334387
Sensitivity of EOQ toVariations in RelevantOrdering and Carrying
Costs for CD World
Exhibit 20-4
712 � CHAPTER 20 INVENTORY MANAGEMENT, JUST-IN-TIME, AND SIMPLIFIED COSTING METHODS
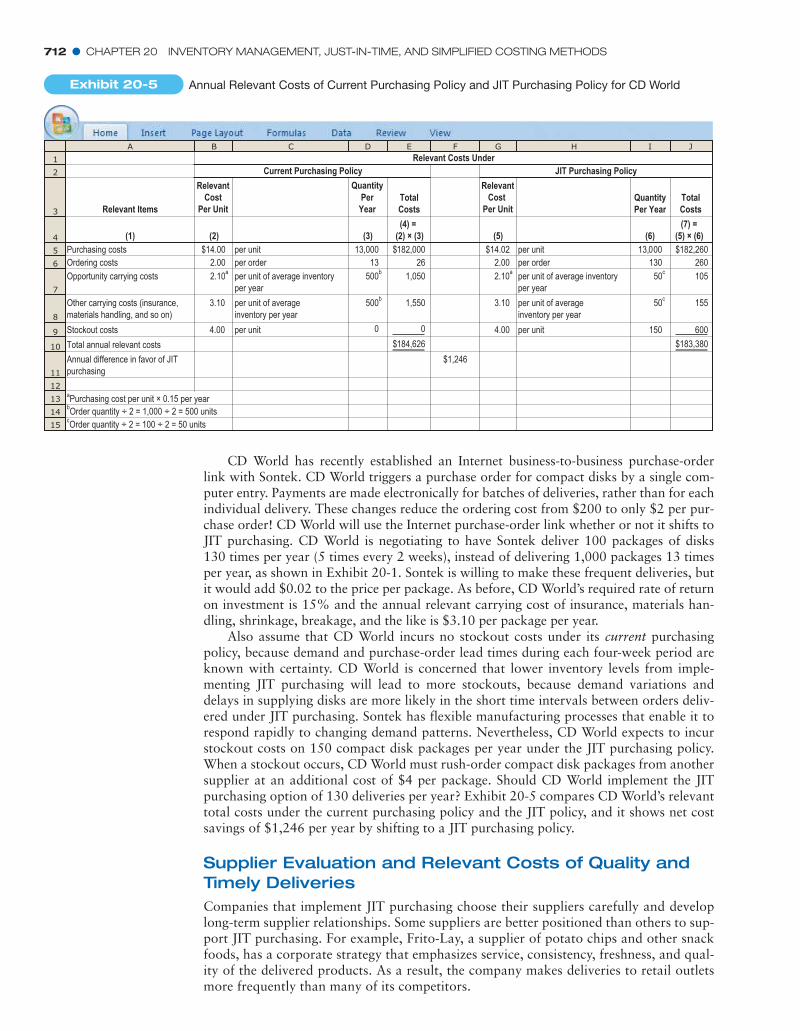
CD World has recently established an Internet business-to-business purchase-orderlink with Sontek. CD World triggers a purchase order for compact disks by a single com-puter entry. Payments are made electronically for batches of deliveries, rather than for eachindividual delivery. These changes reduce the ordering cost from $200 to only $2 per pur-chase order! CD World will use the Internet purchase-order link whether or not it shifts toJIT purchasing. CD World is negotiating to have Sontek deliver 100 packages of disks130 times per year (5 times every 2 weeks), instead of delivering 1,000 packages 13 timesper year, as shown in Exhibit 20-1. Sontek is willing to make these frequent deliveries, butit would add $0.02 to the price per package. As before, CD World’s required rate of returnon investment is 15% and the annual relevant carrying cost of insurance, materials han-dling, shrinkage, breakage, and the like is $3.10 per package per year.
Also assume that CD World incurs no stockout costs under its current purchasingpolicy, because demand and purchase-order lead times during each four-week period areknown with certainty. CD World is concerned that lower inventory levels from imple-menting JIT purchasing will lead to more stockouts, because demand variations anddelays in supplying disks are more likely in the short time intervals between orders deliv-ered under JIT purchasing. Sontek has flexible manufacturing processes that enable it torespond rapidly to changing demand patterns. Nevertheless, CD World expects to incurstockout costs on 150 compact disk packages per year under the JIT purchasing policy.When a stockout occurs, CD World must rush-order compact disk packages from anothersupplier at an additional cost of $4 per package. Should CD World implement the JITpurchasing option of 130 deliveries per year? Exhibit 20-5 compares CD World’s relevanttotal costs under the current purchasing policy and the JIT policy, and it shows net costsavings of $1,246 per year by shifting to a JIT purchasing policy.
Supplier Evaluation and Relevant Costs of Quality andTimely DeliveriesCompanies that implement JIT purchasing choose their suppliers carefully and developlong-term supplier relationships. Some suppliers are better positioned than others to sup-port JIT purchasing. For example, Frito-Lay, a supplier of potato chips and other snackfoods, has a corporate strategy that emphasizes service, consistency, freshness, and qual-ity of the delivered products. As a result, the company makes deliveries to retail outletsmore frequently than many of its competitors.
1
2
3
4
5
6
7
8
9
10
11
12
13
14
15
A B C D E F G H I J
Relevant Items
RelevantCost
Per Unit
QuantityPer Total
Costs
RelevantCost
Per UnitQuantityPer Year
TotalCosts
)3()2()1((4) =
(2) × (3) )6()5((7) =
(5) × (6)Purchasing costs 000,31tinu rep
tinu rep
$14.00 182,000 $14.02 000,31tinu rep 182,260$Ordering costs 31redro rep 26 2.00 031 260
105
155
600
redro rep
Opportunity carrying costs 2.10a per unit of average inventory per year
500b 1,050 2.10a per unit of average inventory per year
50c
Other carrying costs (insurance, materials handling, and so on)
3.10
4.00
per unit of average inventory per year
500b 1,550 3.10 per unit of average inventory per year
50c
Stockout costs 00 4.00 051tinu rep
Total annual relevant costs 184,626$
$
183,380$
Annual difference in favor of JIT purchasing
$1,246
bOrder quantity ÷ 2 = 1,000 ÷ 2 = 500 unitscOrder quantity ÷ 2 = 100 ÷ 2 = 50 units
Current Purchasing PolicyRelevant Costs Under
JIT Purchasing Policy
aPurchasing cost per unit × 0.15 per year
Year
2.00
Exhibit 20-5 Annual Relevant Costs of Current Purchasing Policy and JIT Purchasing Policy for CD World
JUST-IN-TIME PURCHASING � 713
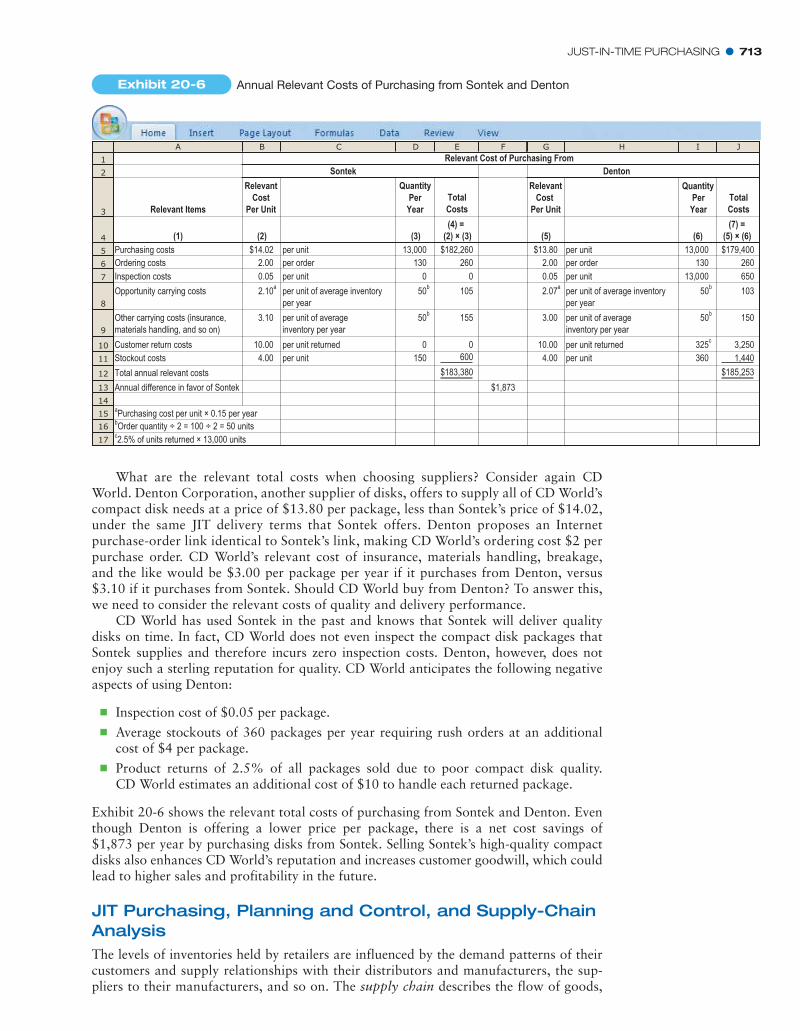
What are the relevant total costs when choosing suppliers? Consider again CDWorld. Denton Corporation, another supplier of disks, offers to supply all of CD World’scompact disk needs at a price of $13.80 per package, less than Sontek’s price of $14.02,under the same JIT delivery terms that Sontek offers. Denton proposes an Internetpurchase-order link identical to Sontek’s link, making CD World’s ordering cost $2 perpurchase order. CD World’s relevant cost of insurance, materials handling, breakage,and the like would be $3.00 per package per year if it purchases from Denton, versus$3.10 if it purchases from Sontek. Should CD World buy from Denton? To answer this,we need to consider the relevant costs of quality and delivery performance.
CD World has used Sontek in the past and knows that Sontek will deliver qualitydisks on time. In fact, CD World does not even inspect the compact disk packages thatSontek supplies and therefore incurs zero inspection costs. Denton, however, does notenjoy such a sterling reputation for quality. CD World anticipates the following negativeaspects of using Denton:
� Inspection cost of $0.05 per package.� Average stockouts of 360 packages per year requiring rush orders at an additional
cost of $4 per package.� Product returns of 2.5% of all packages sold due to poor compact disk quality.
CD World estimates an additional cost of $10 to handle each returned package.
Exhibit 20-6 shows the relevant total costs of purchasing from Sontek and Denton. Eventhough Denton is offering a lower price per package, there is a net cost savings of$1,873 per year by purchasing disks from Sontek. Selling Sontek’s high-quality compactdisks also enhances CD World’s reputation and increases customer goodwill, which couldlead to higher sales and profitability in the future.
JIT Purchasing, Planning and Control, and Supply-ChainAnalysisThe levels of inventories held by retailers are influenced by the demand patterns of theircustomers and supply relationships with their distributors and manufacturers, the sup-pliers to their manufacturers, and so on. The supply chain describes the flow of goods,
1
2
3
4
5
6
7
8
9
10
11
12
13
14
15
16
17
A B C D E F G H I J
Relevant Items
RelevantCost
Per Unit
QuantityPer Total
Costs
RelevantCost
Per Unit
QuantityTotalCosts
)3()2()1((4) =
(2) × (3) )6()5((7) =
(5) × (6)
Inspection costs
000,31tinu
u
rep $14.02Purchasing costs
0 0
0 0
tin rep0.05
182,260 13.80 000,31
000,31
tinu rep
tinu rep
$$ 179,400$Ordering costs 130redro rep 260 2.00 031 260
650
103
150
3,2501,440
redro rep
Opportunity carrying costs 2.10a per unit of average inventory per year
50b 105
155
2.07a per unit of average inventory per year
50b
Other carrying costs (insurance, materials handling, and so on)
3.10 per unit of average inventory per year
per unit
50b
150
per unit of average inventory per year
50b
Stockout costs 600 4.00 360325c
tinu rep
Total annual relevant costs 183,380$ 185,253$
Annual difference in favor of Sontek $1,873
bOrder quantity ÷ 2 = 100 ÷ 2 = 50 unitsc2.5% of units returned × 13,000 units
SontekRelevant Cost of Purchasing From
Denton
aPurchasing cost per unit × 0.15 per year
YearPerYear
3.00
10.00
0.05
2.00
4.00per unit returned per unit returnedCustomer return costs 10.00
Exhibit 20-6 Annual Relevant Costs of Purchasing from Sontek and Denton
714 � CHAPTER 20 INVENTORY MANAGEMENT, JUST-IN-TIME, AND SIMPLIFIED COSTING METHODS
services, and information from the initial sources of materials and services to the deliveryof products to consumers, regardless of whether those activities occur in the same com-pany or in other companies. Retailers can purchase inventories on a JIT basis only if activ-ities throughout the supply chain are properly planned, coordinated, and controlled.
Procter and Gamble’s (P&G’s) experience with its Pampers product illustrates thegains from supply-chain coordination. Retailers selling Pampers encountered variabil-ity in weekly demand because families purchased disposable diapers randomly.Anticipating even more demand variability and lacking information about availableinventory with P&G, retailers’ orders to P&G became more variable that, in turn,increased variability of orders at P&G’s suppliers, resulting in high levels of inventoryat all stages in the supply chain.
How did P&G respond to these problems? By sharing information and planning andcoordinating activities throughout the supply chain among retailers, P&G, and P&G’ssuppliers. Sharing sales information reduced the level of uncertainty that P&G and itssuppliers had about retail demand for Pampers and led to (1) fewer stockouts at the retaillevel, (2) reduced manufacture of Pampers not immediately needed by retailers, (3) fewermanufacturing orders that had to be “rushed” or “expedited,” and (4) lower inventoriesheld by each company in the supply chain. The benefits of supply chain coordination atP&G have been so great that retailers such as Wal-Mart have contracted with P&G tomanage Wal-Mart’s retail inventories on a just-in-time basis. This practice is calledsupplier- or vendor-managed inventory. Supply-chain management, however, has chal-lenges in sharing accurate, timely, and relevant information about sales, inventory, andsales forecasts caused by problems of communication, trust, incompatible informationsystems, and limited people and financial resources.
Inventory Management, MRP and JIT ProductionWe now turn our attention away from purchasing to managing production inventories inmanufacturing companies. Managers at manufacturing companies have developednumerous systems to plan and implement inventory activities within their plants. Weconsider two widely used types of systems: materials requirements planning (MRP) andjust-in-time (JIT) production.
Materials Requirements PlanningMaterials requirements planning (MRP) is a “push-through” system that manufacturesfinished goods for inventory on the basis of demand forecasts. To determine outputs ateach stage of production, MRP uses (1) demand forecasts for final products; (2) a bill ofmaterials detailing the materials, components, and subassemblies for each final product;and (3) available inventories of materials, components, and products. Taking intoaccount the lead time required to purchase materials and to manufacture componentsand finished products, a master production schedule specifies the quantity and timing ofeach item to be produced. Once production starts as scheduled, the output of eachdepartment is pushed through the production line. This “push through” can sometimesresult in an accumulation of inventory when workstations receive work they are not yetready to process.
Maintaining accurate inventory records and costs is critical in an MRP system. Forexample, after becoming aware of the full costs of carrying finished goods inventory in itsMRP system, National Semiconductor contracted with Federal Express to airfreight itsmicrochips from a central location in Singapore to customer sites worldwide, instead ofstoring products at geographically dispersed warehouses. This change enabled Nationalto move products from plant to customer in 4 days rather than 45 days and to reduce dis-tribution costs from 2.6% to 1.9% of revenues. These benefits subsequently led Nationalto outsource all its shipping activities to Federal Express.
MRP is a push-through approach. We now consider JIT production, a “demand-pull”approach, which is used by companies such as Toyota in the automobile industry, Dell inthe computer industry, and Braun in the appliance industry.
DecisionPoint
Why are companiesusing just-in-time
purchasing?
LearningObjective 5
Distinguish materialsrequirements planning(MRP) systems
. . . manufacturingproducts based ondemand forecasts
from just-in-time (JIT)systems formanufacturing
. . . manufacturingproducts onlyupon receivingcustomer orders
INVENTORY MANAGEMENT, MRP AND JIT PRODUCTION � 715
JIT ProductionJust-in-time (JIT) production, which is also called lean production, is a “demand-pull”manufacturing system that manufactures each component in a production line as soonas, and only when, needed by the next step in the production line. In a JIT productionline, manufacturing activity at any particular workstation is prompted by the need forthat workstation’s output at the following workstation. Demand triggers each step of theproduction process, starting with customer demand for a finished product at the end ofthe process and working all the way back to the demand for direct materials at the begin-ning of the process. In this way, demand pulls an order through the production line. Thedemand-pull feature of JIT production systems achieves close coordination among work-stations. It smooths the flow of goods, despite low quantities of inventory. JIT produc-tion systems aim to simultaneously (1) meet customer demand in a timely manner(2) with high-quality products and (3) at the lowest possible total cost.
Features of JIT Production SystemsA JIT production system has these features:
� Production is organized in manufacturing cells, groupings of all the different types ofequipment used to make a given product. Materials move from one machine to another,and various operations are performed in sequence, minimizing materials-handling costs.
� Workers are hired and trained to be multiskilled and capable of performing a varietyof operations and tasks, including minor repairs and routine equipment maintenance.
� Defects are aggressively eliminated. Because of the tight links between workstationsin the production line and the minimal inventories at each workstation, defects aris-ing at one workstation quickly affect other workstations in the line. JIT creates anurgency for solving problems immediately and eliminating the root causes of defectsas quickly as possible. Low levels of inventories allow workers to trace problems toand solve problems at earlier workstations in the production process, where the prob-lems likely originated.
� Setup time, the time required to get equipment, tools, and materials ready to start theproduction of a component or product, and manufacturing cycle time, the time fromwhen an order is received by manufacturing until it becomes a finished good, arereduced. Setup costs correspond to the ordering costs P in the EOQ model. Reducingsetup time and costs makes production in smaller batches economical, which in turnreduces inventory levels. Reducing manufacturing cycle time enables a company torespond faster to changes in customer demand (see also Concepts in Action, p. 717).
� Suppliers are selected on the basis of their ability to deliver quality materials in atimely manner. Most companies implementing JIT production also implement JITpurchasing. JIT plants expect JIT suppliers to make timely deliveries of high-qualitygoods directly to the production floor.
We next present a relevant-cost analysis for deciding whether to implement a JIT produc-tion system.
Financial Benefits of JIT and Relevant CostsEarly advocates saw the benefit of JIT production as lower carrying costs of inventory.But there are other benefits of lower inventories: heightened emphasis on improvingquality by eliminating the specific causes of rework, scrap, and waste, and lower manu-facturing cycle times. In computing the relevant benefits and costs of reducing invento-ries in JIT production systems, the cost analyst should take into account all benefits andall costs.
Consider Hudson Corporation, a manufacturer of brass fittings. Hudson is consideringimplementing a JIT production system. To implement JIT production, Hudson must incur$100,000 in annual tooling costs to reduce setup times. Hudson expects that JIT will reduceaverage inventory by $500,000 and that relevant costs of insurance, storage, materials han-dling, and setup will decline by $30,000 per year. The company’s required rate of return on
DecisionPoint
How do materialsrequirementsplanning (MRP)systems differ fromjust-in-time (JIT)production systems?
LearningObjective 6
Identify the features andbenefits of a just-in-timeproduction system
. . . for example,organizing work inmanufacturing cells,improving quality, andreducing manufacturinglead time to reducecosts and earn highermargins
716 � CHAPTER 20 INVENTORY MANAGEMENT, JUST-IN-TIME, AND SIMPLIFIED COSTING METHODS
inventory investments is 10% per year. Should Hudson implement a JIT production system?On the basis of the information provided, we would be tempted to say “no,” becauseannual relevant total cost savings amount to $80,000 [(10% of $500,000) $30,000)],which is less than the additional annual tooling costs of $100,000.
Our analysis, however, is incomplete. We have not considered the other benefits oflower inventories in JIT production. Hudson estimates that implementing JIT willimprove quality and reduce rework on 500 units each year, resulting in savings of $50 perunit. Also, better quality and faster delivery will allow Hudson to charge $2 more per uniton the 20,000 units that it sells each year.
The annual relevant benefits and costs from implementing JIT equal the following:
+
3 Charles Atkinson, “McDonald’s, A Guide to the Benefits of JIT,” Inventory Management Review,www.inventorymanagementreview.org/2005/11/mcdonalds_a_gui.html (accessed May 2, 2007).
4 For an excellent discussion, see T. H. Davenport, “Putting the Enterprise into the Enterprise System,” Harvard BusinessReview, (July–August 1998); also see A. Cagilo, “Enterprise Resource Planning Systems and Accountants: TowardsHybridization?” European Accounting Review, (May 2003).
Incremental savings in insurance, storage, materials handling, and set up $ 30,000Incremental savings in inventory carrying costs (10% $500,000)* 50,000Incremental savings from reduced rework ($50 per unit 500 units)* 25,000Additional contribution margin from better quality and faster delivery
($2 per unit 20,000 units)* 40,000Incremental annual tooling costs (100,000)Net incremental benefit $ƒƒ45,000
Therefore, Hudson should implement a JIT production system.
JIT in Service IndustriesJIT purchasing and production methods can be applied in service industries as well. Forexample, inventories and supplies, and the associated labor costs to manage them, repre-sent more than a third of the costs in most hospitals. By implementing a JIT purchasingand distribution system, Eisenhower Memorial Hospital in Palm Springs, California,reduced its inventories and supplies by 90% in 18 months. McDonald’s has adapted JITproduction practices to making hamburgers.3 Before, McDonald’s precooked a batch ofhamburgers that were placed under heat lamps to stay warm until ordered. If the ham-burgers didn’t sell within a specified period of time, they were discarded resulting in highinventory holding costs and spoilage costs. Moreover, the quality of hamburgers deterio-rated the longer they sat under the heat lamps. Finally, customers placing a special orderfor a hamburger (such as a hamburger with no cheese) had to wait for the hamburger tobe cooked. Today, the use of new technology (including an innovative bun toaster) andJIT production practices allow McDonald’s to cook hamburgers only when they areordered, significantly reducing inventory holding and spoilage costs. More importantly,JIT has improved customer satisfaction by increasing the quality of hamburgers andreducing the time needed for special orders.
We next turn our attention to planning and control in JIT production systems.
Enterprise Resource Planning (ERP) Systems4
The success of a JIT production system hinges on the speed of information flows fromcustomers to manufacturers to suppliers. Information flows are a problem for largecompanies that have fragmented information systems spread over dozens of unlinkedcomputer systems. Enterprise Resource Planning (ERP) systems improve these informa-tion flows. An ERP system is an integrated set of software modules covering account-ing, distribution, manufacturing, purchasing, human resources, and other functions.ERP uses a single database to collect and feed data into all software applications, allow-ing integrated, real-time information sharing and providing visibility to the company’sbusiness processes as a whole. For example, using an ERP system, a salesperson can
INVENTORY MANAGEMENT, MRP AND JIT PRODUCTION � 717
generate a contract for a customer in Germany, verify the customer’s credit limits, andplace a production order. The system then uses this same information to schedule man-ufacturing in, say, Brazil, requisition materials from inventory, order components fromsuppliers, and schedule shipments. At the same time, it credits sales commissions to thesalesperson and records all the costing and financial accounting information.
ERP systems give lower-level managers, workers, customers, and suppliers access todetailed and timely operating information. This benefit, coupled with tight coordinationacross business functions of the value chain, enables ERP systems to shift manufacturingand distribution plans rapidly in response to changes in supply and demand. Companiesbelieve that an ERP system is essential to support JIT initiatives because of the effect it hason lead times. Using an ERP system, Autodesk, a maker of computer-aided design soft-ware, reduced order lead time from two weeks to one day; and Fujitsu reduced lead timefrom 18 days to 1.5 days.
ERP systems are large and unwieldy. Because of its complexity, suppliers of ERP sys-tems such as SAP and Oracle provide software packages that are standard but that can becustomized, although at considerable cost. Without some customization, unique and dis-tinctive features that confer strategic advantage will not be available. The challenge whenimplementing ERP systems is to strike the proper balance between the lower cost of stan-dardized systems and the strategic benefits that accrue from customization.
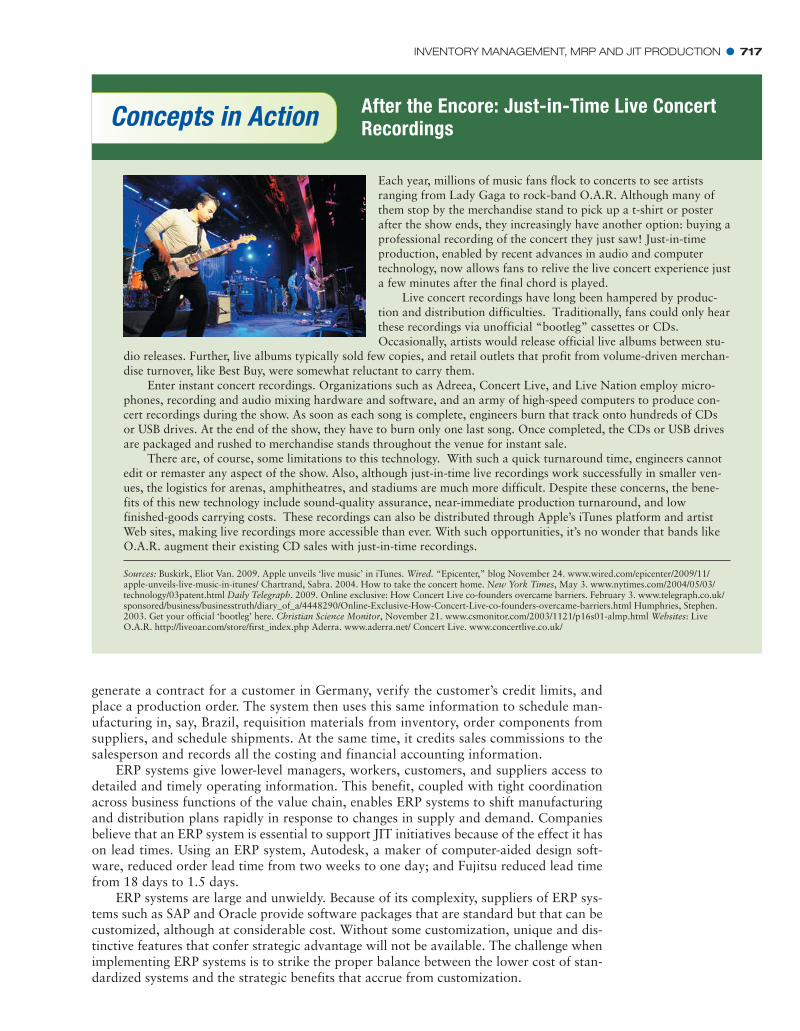
Concepts in Action After the Encore: Just-in-Time Live ConcertRecordings
Each year, millions of music fans flock to concerts to see artistsranging from Lady Gaga to rock-band O.A.R. Although many ofthem stop by the merchandise stand to pick up a t-shirt or posterafter the show ends, they increasingly have another option: buying aprofessional recording of the concert they just saw! Just-in-timeproduction, enabled by recent advances in audio and computertechnology, now allows fans to relive the live concert experience justa few minutes after the final chord is played.
Live concert recordings have long been hampered by produc-tion and distribution difficulties. Traditionally, fans could only hearthese recordings via unofficial “bootleg” cassettes or CDs.Occasionally, artists would release official live albums between stu-
dio releases. Further, live albums typically sold few copies, and retail outlets that profit from volume-driven merchan-dise turnover, like Best Buy, were somewhat reluctant to carry them.
Enter instant concert recordings. Organizations such as Adreea, Concert Live, and Live Nation employ micro-phones, recording and audio mixing hardware and software, and an army of high-speed computers to produce con-cert recordings during the show. As soon as each song is complete, engineers burn that track onto hundreds of CDsor USB drives. At the end of the show, they have to burn only one last song. Once completed, the CDs or USB drivesare packaged and rushed to merchandise stands throughout the venue for instant sale.
There are, of course, some limitations to this technology. With such a quick turnaround time, engineers cannotedit or remaster any aspect of the show. Also, although just-in-time live recordings work successfully in smaller ven-ues, the logistics for arenas, amphitheatres, and stadiums are much more difficult. Despite these concerns, the bene-fits of this new technology include sound-quality assurance, near-immediate production turnaround, and lowfinished-goods carrying costs. These recordings can also be distributed through Apple’s iTunes platform and artistWeb sites, making live recordings more accessible than ever. With such opportunities, it’s no wonder that bands likeO.A.R. augment their existing CD sales with just-in-time recordings.
Sources: Buskirk, Eliot Van. 2009. Apple unveils ‘live music’ in iTunes. Wired. “Epicenter,” blog November 24. www.wired.com/epicenter/2009/11/apple-unveils-live-music-in-itunes/ Chartrand, Sabra. 2004. How to take the concert home. New York Times, May 3. www.nytimes.com/2004/05/03/technology/03patent.html Daily Telegraph. 2009. Online exclusive: How Concert Live co-founders overcame barriers. February 3. www.telegraph.co.uk/sponsored/business/businesstruth/diary_of_a/4448290/Online-Exclusive-How-Concert-Live-co-founders-overcame-barriers.html Humphries, Stephen.2003. Get your official ‘bootleg’ here. Christian Science Monitor, November 21. www.csmonitor.com/2003/1121/p16s01-almp.html Websites: LiveO.A.R. http://liveoar.com/store/first_index.php Aderra. www.aderra.net/ Concert Live. www.concertlive.co.uk/
718 � CHAPTER 20 INVENTORY MANAGEMENT, JUST-IN-TIME, AND SIMPLIFIED COSTING METHODS
Performance Measures and Control in JIT ProductionIn addition to personal observation, managers use financial and nonfinancial measuresto evaluate and control JIT production. We describe these measures and indicate theeffect that JIT systems are expected to have on these measures.
1. Financial performance measures, such as inventory turnover ratio (Cost of goodssold Average inventory), which is expected to increase
2. Nonfinancial performance measures of inventory, quality, and time such as the following:� Number of days of inventory on hand, expected to decrease� Units produced per hour, expected to increase
�
� Manufacturing cycle time, expected to decrease
�
Personal observation and nonfinancial performance measures provide the most timely,intuitive, and easy to understand measures of manufacturing performance. Rapid, mean-ingful feedback is critical because the lack of inventories in a demand-pull system makesit urgent to detect and solve problems quickly. JIT measures can also be incorporated intothe four perspectives of the balanced scorecard (financial, customer, internal businessprocess, and learning and growth). The logic is as follows: Multiskilled, and well-trainedemployees (learning and growth measures) improve internal business processes measuredby the preceding inventory, quality, and time measures. As operational performanceimproves, customer satisfaction also increases because of greater flexibility, responsive-ness, and quality resulting in better financial performance from lower purchasing, inven-tory holding, and quality costs, and higher revenues.
Effect of JIT Systems on Product CostingBy reducing materials handling, warehousing, and inspection, JIT systems reduce over-head costs. JIT systems also aid in direct tracing of some costs usually classified as indi-rect. For example, the use of manufacturing cells makes it cost-effective to trace materialshandling and machine operating costs to specific products or product families made inthese cells. These costs then become direct costs of those products. Also, the use of multi-skilled workers in these cells allows the costs of setup, maintenance, and quality inspec-tion to be traced as direct costs. These changes have prompted some companies using JITto adopt simplified product costing methods that dovetail with JIT production and thatare less costly to operate than the traditional costing systems described in Chapters 4, 7,8, and 17. We examine two of these methods next: backflush costing and lean accounting.
Backflush CostingOrganizing manufacturing in cells, reducing defects and manufacturing cycle time, andensuring timely delivery of materials enables purchasing, production, and sales to occur inquick succession with minimal inventories. The absence of inventories makes choices aboutcost-flow assumptions (such as weighted average or first-in, first-out) or inventory-costingmethods (such as absorption or variable costing) unimportant: All manufacturing costs ofthe accounting period flow directly into cost of goods sold. The rapid conversion of directmaterials into finished goods that are immediately sold greatly simplifies the costing system.
Simplified Normal or Standard Costing SystemsTraditional normal or standard-costing systems (Chapters 4, 7, 8, and 17) use sequentialtracking, which is a costing system in which recording of the journal entries occurs in thesame order as actual purchases and progress in production. Costs are tracked sequen-tially as products pass through each of the following four stages:
Total setup time for machinesTotal manufacturing time
, expected to decrease
Number of units scrapped or requiring reworkTotal number of units started and completed
, expected to decrease
,
LearningObjective 7
Describe different waysbackflush costing cansimplify traditionalinventory-costingsystems
. . . for example, by notrecording journalentries for work inprocess, purchase ofmaterials, or productionof finished goods
DecisionPoint
What are thefeatures and
benefits of a JITproduction system?
BACKFLUSH COSTING � 719
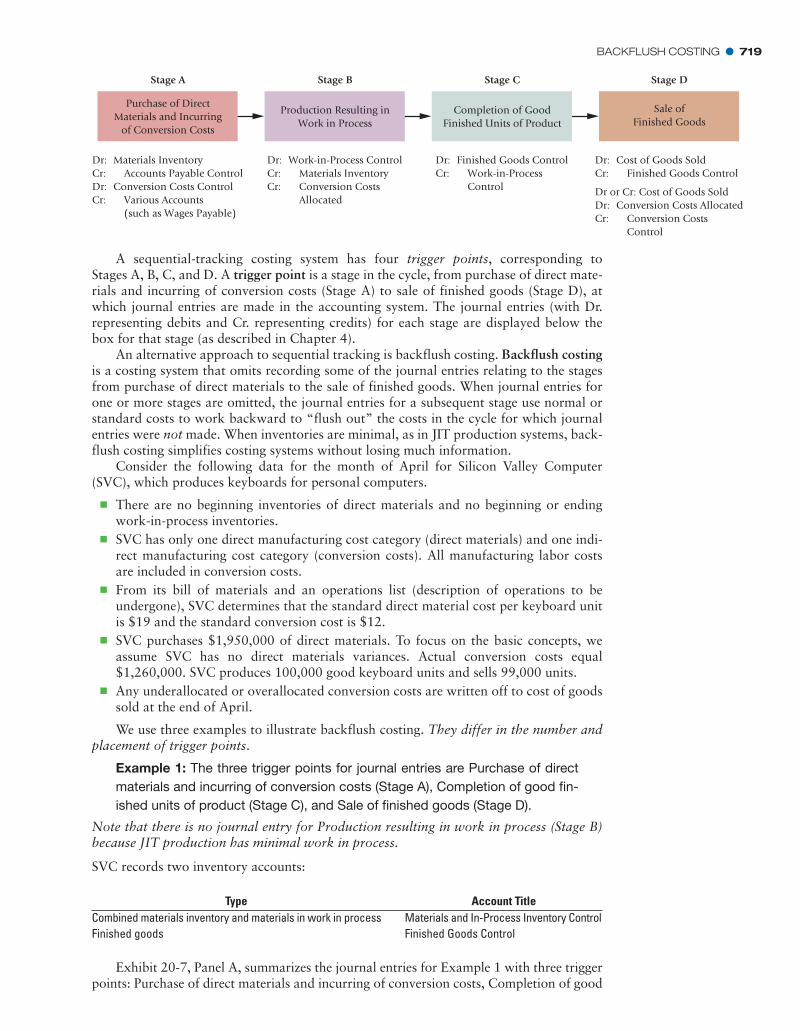
A sequential-tracking costing system has four trigger points, corresponding toStages A, B, C, and D. A trigger point is a stage in the cycle, from purchase of direct mate-rials and incurring of conversion costs (Stage A) to sale of finished goods (Stage D), atwhich journal entries are made in the accounting system. The journal entries (with Dr.representing debits and Cr. representing credits) for each stage are displayed below thebox for that stage (as described in Chapter 4).
An alternative approach to sequential tracking is backflush costing. Backflush costingis a costing system that omits recording some of the journal entries relating to the stagesfrom purchase of direct materials to the sale of finished goods. When journal entries forone or more stages are omitted, the journal entries for a subsequent stage use normal orstandard costs to work backward to “flush out” the costs in the cycle for which journalentries were not made. When inventories are minimal, as in JIT production systems, back-flush costing simplifies costing systems without losing much information.
Consider the following data for the month of April for Silicon Valley Computer(SVC), which produces keyboards for personal computers.
� There are no beginning inventories of direct materials and no beginning or endingwork-in-process inventories.
� SVC has only one direct manufacturing cost category (direct materials) and one indi-rect manufacturing cost category (conversion costs). All manufacturing labor costsare included in conversion costs.
� From its bill of materials and an operations list (description of operations to beundergone), SVC determines that the standard direct material cost per keyboard unitis $19 and the standard conversion cost is $12.
� SVC purchases $1,950,000 of direct materials. To focus on the basic concepts, weassume SVC has no direct materials variances. Actual conversion costs equal$1,260,000. SVC produces 100,000 good keyboard units and sells 99,000 units.
� Any underallocated or overallocated conversion costs are written off to cost of goodssold at the end of April.
We use three examples to illustrate backflush costing. They differ in the number andplacement of trigger points.
Example 1: The three trigger points for journal entries are Purchase of directmaterials and incurring of conversion costs (Stage A), Completion of good fin-ished units of product (Stage C), and Sale of finished goods (Stage D).
Note that there is no journal entry for Production resulting in work in process (Stage B)because JIT production has minimal work in process.
SVC records two inventory accounts:
Purchase of DirectMaterials and Incurring
of Conversion Costs
Stage A
Production Resulting inWork in Process
Completion of GoodFinished Units of Product
Sale ofFinished Goods
Dr: Materials InventoryCr: Accounts Payable ControlDr: Conversion Costs ControlCr: Various Accounts (such as Wages Payable)
Dr: Work-in-Process ControlCr: Materials InventoryCr: Conversion Costs Allocated
Dr: Finished Goods ControlCr: Work-in-Process Control
Stage B Stage C Stage D
Dr: Cost of Goods SoldCr: Finished Goods Control
Dr or Cr: Cost of Goods SoldDr: Conversion Costs AllocatedCr: Conversion Costs Control
Type Account TitleCombined materials inventory and materials in work in process Materials and In-Process Inventory ControlFinished goods Finished Goods Control
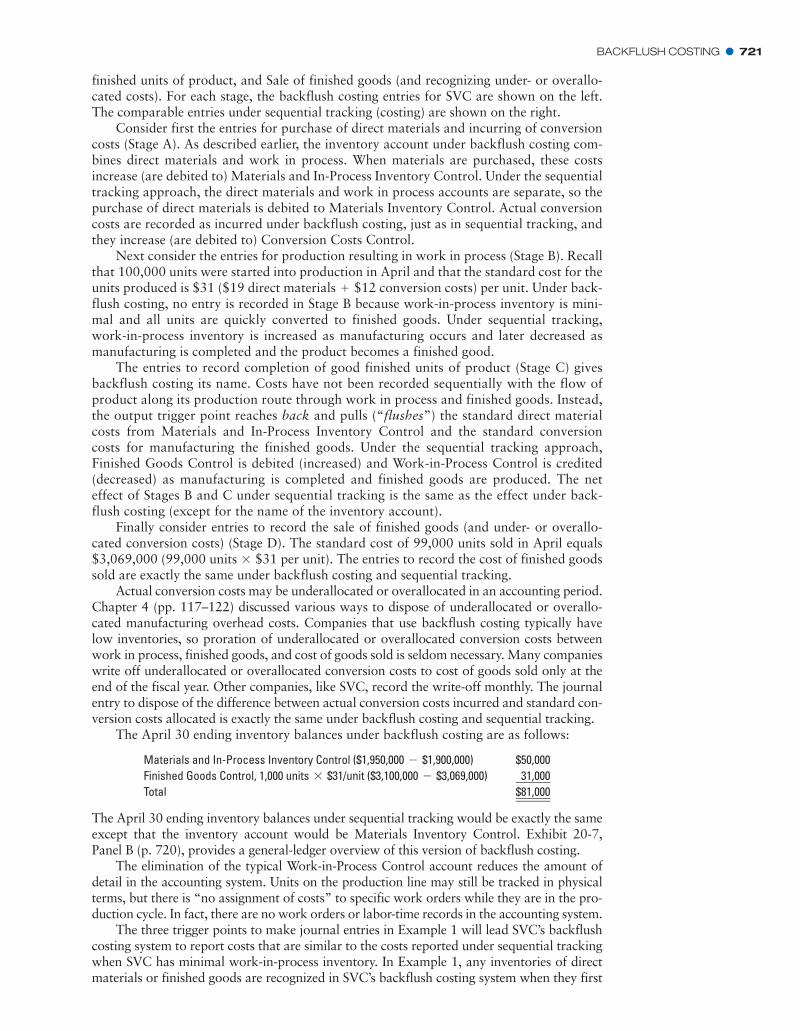
Exhibit 20-7, Panel A, summarizes the journal entries for Example 1 with three triggerpoints: Purchase of direct materials and incurring of conversion costs, Completion of good
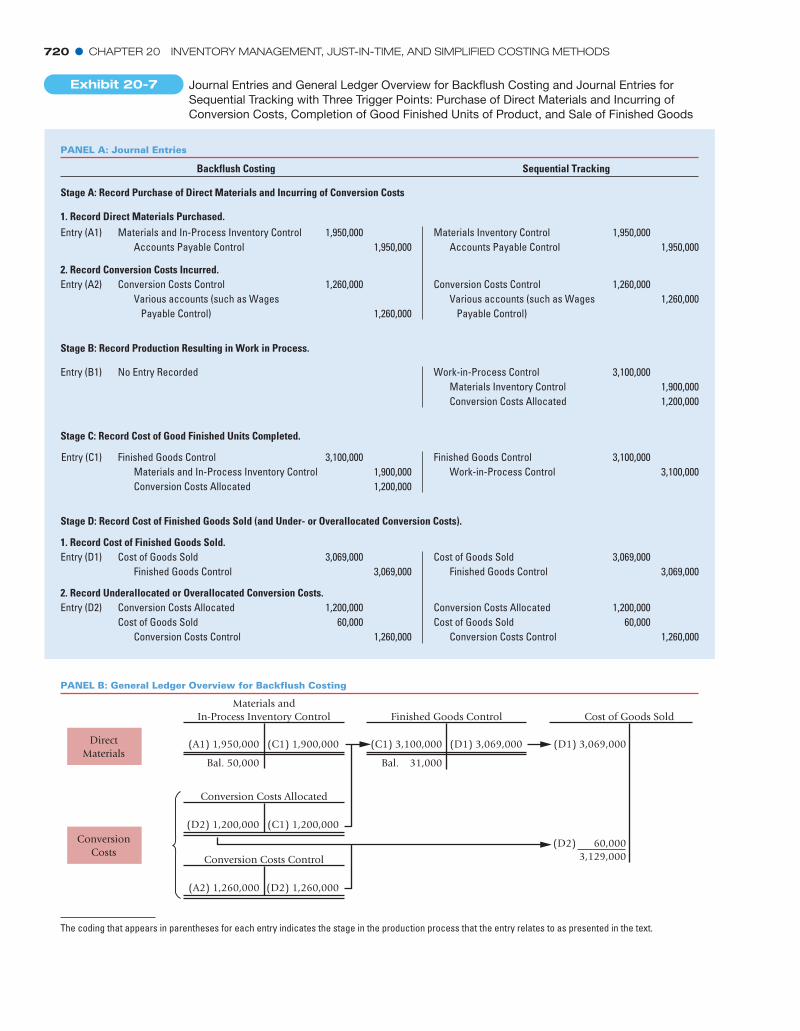
720 � CHAPTER 20 INVENTORY MANAGEMENT, JUST-IN-TIME, AND SIMPLIFIED COSTING METHODS
PANEL B: General Ledger Overview for Backflush Costing
(C1) 1,900,000
Finished Goods Control
Bal. 31,000
(D1) 3,069,000
Cost of Goods Sold
(D1) 3,069,000
(D2) 60,0003,129,000
(D2) 1,200,000 (C1) 1,200,000
Materials andIn-Process Inventory Control
Conversion Costs Allocated
(A2) 1,260,000 (D2) 1,260,000
Conversion Costs Control
DirectMaterials
ConversionCosts
(A1) 1,950,000
Bal. 50,000
(C1) 3,100,000
Conversion Costs Control Various accounts (such as Wages Payable Control)
Entry (A2) Conversion Costs Control Various accounts (such as Wages Payable Control)
1,260,0001,260,000
1,260,000
1,260,000
Work-in-Process Control Materials Inventory Control Conversion Costs Allocated
3,100,0001,900,0001,200,000
No Entry RecordedEntry (B1)
Finished Goods Control Work-in-Process Control
3,100,0003,100,000
3,100,0001,900,0001,200,000
Finished Goods Control Materials and In-Process Inventory Control Conversion Costs Allocated
Entry (C1)
Cost of Goods Sold Finished Goods Control
3,069,0003,069,000
3,069,0003,069,000
Cost of Goods Sold Finished Goods Control
Entry (D1)
Conversion Costs AllocatedCost of Goods Sold Conversion Costs Control
1,200,00060,000
1,260,000
1,200,00060,000
1,260,000
Conversion Costs AllocatedCost of Goods Sold Conversion Costs Control
Entry (D2)
Materials Inventory Control Accounts Payable Control
1,950,0001,950,000
1,950,0001,950,000
Materials and In-Process Inventory Control Accounts Payable Control
Entry (A1)
PANEL A: Journal Entries
Stage A: Record Purchase of Direct Materials and Incurring of Conversion Costs
1. Record Direct Materials Purchased.
2. Record Conversion Costs Incurred.
Stage B: Record Production Resulting in Work in Process.
Stage C: Record Cost of Good Finished Units Completed.
Stage D: Record Cost of Finished Goods Sold (and Under- or Overallocated Conversion Costs).
1. Record Cost of Finished Goods Sold.
2. Record Underallocated or Overallocated Conversion Costs.
The coding that appears in parentheses for each entry indicates the stage in the production process that the entry relates to as presented in the text.
Sequential TrackingBackflush Costing
Exhibit 20-7 Journal Entries and General Ledger Overview for Backflush Costing and Journal Entries forSequential Tracking with Three Trigger Points: Purchase of Direct Materials and Incurring ofConversion Costs, Completion of Good Finished Units of Product, and Sale of Finished Goods
BACKFLUSH COSTING � 721
finished units of product, and Sale of finished goods (and recognizing under- or overallo-cated costs). For each stage, the backflush costing entries for SVC are shown on the left.The comparable entries under sequential tracking (costing) are shown on the right.
Consider first the entries for purchase of direct materials and incurring of conversioncosts (Stage A). As described earlier, the inventory account under backflush costing com-bines direct materials and work in process. When materials are purchased, these costsincrease (are debited to) Materials and In-Process Inventory Control. Under the sequentialtracking approach, the direct materials and work in process accounts are separate, so thepurchase of direct materials is debited to Materials Inventory Control. Actual conversioncosts are recorded as incurred under backflush costing, just as in sequential tracking, andthey increase (are debited to) Conversion Costs Control.
Next consider the entries for production resulting in work in process (Stage B). Recallthat 100,000 units were started into production in April and that the standard cost for theunits produced is $31 ($19 direct materials $12 conversion costs) per unit. Under back-flush costing, no entry is recorded in Stage B because work-in-process inventory is mini-mal and all units are quickly converted to finished goods. Under sequential tracking,work-in-process inventory is increased as manufacturing occurs and later decreased asmanufacturing is completed and the product becomes a finished good.
The entries to record completion of good finished units of product (Stage C) givesbackflush costing its name. Costs have not been recorded sequentially with the flow ofproduct along its production route through work in process and finished goods. Instead,the output trigger point reaches back and pulls (“flushes”) the standard direct materialcosts from Materials and In-Process Inventory Control and the standard conversioncosts for manufacturing the finished goods. Under the sequential tracking approach,Finished Goods Control is debited (increased) and Work-in-Process Control is credited(decreased) as manufacturing is completed and finished goods are produced. The neteffect of Stages B and C under sequential tracking is the same as the effect under back-flush costing (except for the name of the inventory account).
Finally consider entries to record the sale of finished goods (and under- or overallo-cated conversion costs) (Stage D). The standard cost of 99,000 units sold in April equals$3,069,000 (99,000 units $31 per unit). The entries to record the cost of finished goodssold are exactly the same under backflush costing and sequential tracking.
Actual conversion costs may be underallocated or overallocated in an accounting period.Chapter 4 (pp. 117–122) discussed various ways to dispose of underallocated or overallo-cated manufacturing overhead costs. Companies that use backflush costing typically havelow inventories, so proration of underallocated or overallocated conversion costs betweenwork in process, finished goods, and cost of goods sold is seldom necessary. Many companieswrite off underallocated or overallocated conversion costs to cost of goods sold only at theend of the fiscal year. Other companies, like SVC, record the write-off monthly. The journalentry to dispose of the difference between actual conversion costs incurred and standard con-version costs allocated is exactly the same under backflush costing and sequential tracking.
The April 30 ending inventory balances under backflush costing are as follows:
*
+
Materials and In-Process Inventory Control ($1,950,000 $1,900,000)- $50,000Finished Goods Control, 1,000 units $31/unit ($3,100,000 $3,069,000)-* ƒ31,000Total $81,000
The April 30 ending inventory balances under sequential tracking would be exactly the sameexcept that the inventory account would be Materials Inventory Control. Exhibit 20-7,Panel B (p. 720), provides a general-ledger overview of this version of backflush costing.
The elimination of the typical Work-in-Process Control account reduces the amount ofdetail in the accounting system. Units on the production line may still be tracked in physicalterms, but there is “no assignment of costs” to specific work orders while they are in the pro-duction cycle. In fact, there are no work orders or labor-time records in the accounting system.
The three trigger points to make journal entries in Example 1 will lead SVC’s backflushcosting system to report costs that are similar to the costs reported under sequential trackingwhen SVC has minimal work-in-process inventory. In Example 1, any inventories of directmaterials or finished goods are recognized in SVC’s backflush costing system when they first
722 � CHAPTER 20 INVENTORY MANAGEMENT, JUST-IN-TIME, AND SIMPLIFIED COSTING METHODS
appear (as would be done in a costing system using sequential tracking). International PaperCompany uses a method similar to Example 1 in its specialty papers plant.
Accounting for Variances Accounting for variances between actual and standard costs isbasically the same under all standard-costing systems. The procedures are described inChapters 7 and 8. Suppose that in Example 1, SVC had an unfavorable direct materialsprice variance of $42,000. Then the journal entry would be as follows:
Direct material costs are often a large proportion of total manufacturing costs, sometimeswell over 60%. Consequently, many companies will at least measure the direct materialsefficiency variance in total by physically comparing what remains in direct materialsinventory against what should remain based on the output of finished goods for theaccounting period. In our example, suppose that such a comparison showed an unfavor-able materials efficiency variance of $30,000. The journal entry would be as follows:
Materials and In-Process Inventory Control 1,950,000Direct Materials Price Variance 42,000
Accounts Payable Control 1,992,000
Direct Materials Efficiency Variance 30,000Materials and In-Process Inventory Control 30,000
The underallocated or overallocated conversion costs are split into various overhead vari-ances (spending variance, efficiency variance, and production-volume variance), as explainedin Chapter 8. Each variance is closed to cost of goods sold, if it is immaterial in amount.
Example 2: The two trigger points are Purchase of direct materials and incur-ring of conversion costs (Stage A) and Sale of finished goods (Stage D).
This example uses the SVC data to illustrate a backflush costing that differs more fromsequential tracking than the backflush costing in Example 1. This example and Example 1have the same first trigger point, purchase of direct materials and incurring of conversioncosts. But the second trigger point in Example 2 is the sale, not the completion, of finishedgoods. Note that in this example, there is no journal entry for Production resulting inwork in progress (Stage B) and Completion of good finished units of product (Stage C)because there are minimal work in process and finished goods inventories.
In this example, there is only one inventory account: direct materials, whether they are instorerooms, in process, or in finished goods.
Type Account TitleCombines direct materials inventory and any direct materials
in work-in-process and finished goods inventoriesInventory Control
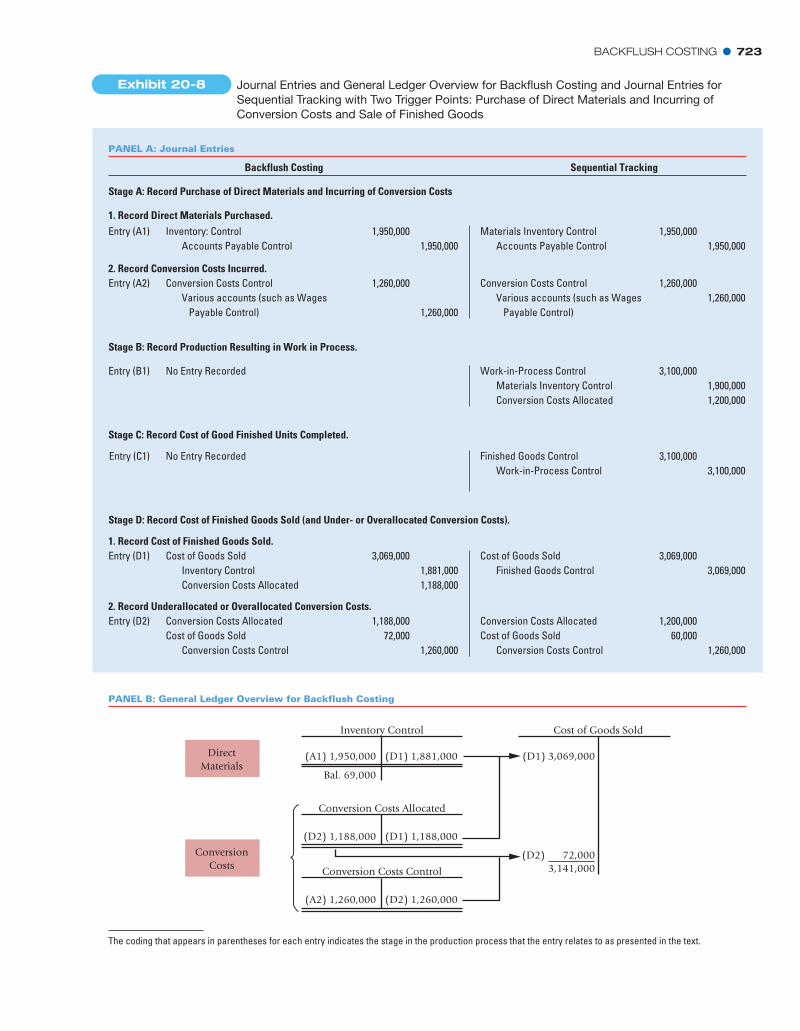
Exhibit 20-8, Panel A, summarizes the journal entries for Example 2 with two triggerpoints: Purchase of direct materials and incurring of conversion costs, and Sale of finishedgoods (and recognizing under- or overallocated costs). As in Example 1, for each stage,the backflush costing entries for SVC are shown on the left. The comparable entries undersequential tracking are shown on the right.
The entries for direct materials purchased and conversion costs incurred (Stage A) arethe same as in Example 1, except that the inventory account is called Inventory Control.As in Example 1, no entry is made to record production of work-in-process inventory(Stage B) because work-in-process inventory is minimal. When finished goods are com-pleted (Stage C), no entry is recorded because the completed units are expected to be soldquickly and finished goods inventory is expected to be minimal. As finished goods aresold (Stage D), the cost of goods sold is calculated as 99,000 units sold $31 per unit $3,069,000, which is composed of direct material costs (99,000 units $19 per unit $1,881,000) and conversion costs allocated (99,000 units $12 per unit $1,188,000).This is the same Cost of Goods Sold calculated under sequential tracking as described inExample 1.
=*=*=*
BACKFLUSH COSTING � 723
Conversion Costs Control Various accounts (such as Wages Payable Control)
Entry (A2) Conversion Costs Control Various accounts (such as Wages Payable Control)
1,260,0001,260,000
1,260,000
1,260,000
Work-in-Process Control Materials Inventory Control Conversion Costs Allocated
3,100,0001,900,0001,200,000
No Entry RecordedEntry (B1)
Finished Goods Control Work-in-Process Control
3,100,0003,100,000
No Entry RecordedEntry (C1)
Cost of Goods Sold Finished Goods Control
3,069,0003,069,000
3,069,0001,881,0001,188,000
Cost of Goods Sold Inventory Control Conversion Costs Allocated
Entry (D1)
Conversion Costs AllocatedCost of Goods Sold Conversion Costs Control
1,200,00060,000
1,260,000
1,188,00072,000
1,260,000
Conversion Costs AllocatedCost of Goods Sold Conversion Costs Control
Entry (D2)
Materials Inventory Control Accounts Payable Control
1,950,0001,950,000
1,950,0001,950,000
Inventory: Control Accounts Payable Control
Entry (A1)
Stage A: Record Purchase of Direct Materials and Incurring of Conversion Costs
1. Record Direct Materials Purchased.
2. Record Conversion Costs Incurred.
Stage B: Record Production Resulting in Work in Process.
Stage C: Record Cost of Good Finished Units Completed.
Stage D: Record Cost of Finished Goods Sold (and Under- or Overallocated Conversion Costs).
1. Record Cost of Finished Goods Sold.
2. Record Underallocated or Overallocated Conversion Costs.
The coding that appears in parentheses for each entry indicates the stage in the production process that the entry relates to as presented in the text.
PANEL B: General Ledger Overview for Backflush Costing
Inventory Control
(A1) 1,950,000
Bal. 69,000
(D1) 1,881,000
Cost of Goods Sold
(D1) 3,069,000
(D2) 72,0003,141,000
(D2) 1,188,000 (D1) 1,188,000
Conversion Costs Control
(A2) 1,260,000 (D2) 1,260,000
Conversion Costs Allocated
DirectMaterials
ConversionCosts
PANEL A: Journal Entries
Sequential TrackingBackflush Costing
Exhibit 20-8 Journal Entries and General Ledger Overview for Backflush Costing and Journal Entries forSequential Tracking with Two Trigger Points: Purchase of Direct Materials and Incurring ofConversion Costs and Sale of Finished Goods
724 � CHAPTER 20 INVENTORY MANAGEMENT, JUST-IN-TIME, AND SIMPLIFIED COSTING METHODS
Under this method of backflush costing, conversion costs are not inventoried becauseno entries are recorded when finished goods are produced in Stage C. That is, comparedwith sequential tracking, Example 2 does not assign $12,000 ($12 per unit 1,000 units)of conversion costs to finished goods inventory produced but not sold. Of the $1,260,000in conversion costs, $1,188,000 is allocated at standard cost to the units sold. Theremaining $72,000 ($1,260,000 $1,188,000) of conversion costs is underallocated.Entry (D2) presents the journal entry if SVC, like many companies, writes off these under-allocated costs monthly as additions to cost of goods sold.
The April 30 ending balance of Inventory Control is $69,000 ($1,950,000 $1,881,000). This balance represents the $50,000 direct materials still on hand $19,000 direct materials embodied in the 1,000 good finished units manufactured but notsold during the period. Exhibit 20-8, Panel B, provides a general-ledger overview ofExample 2. The approach described in Example 2 closely approximates the costs com-puted using sequential tracking when a company holds minimal work-in-process and fin-ished goods inventories.
Toyota’s cost accounting system at its Kentucky plant is similar to this example. Twoadvantages of this system are (1) it removes the incentive for managers to produce forinventory because conversion costs are recorded as period costs instead of inventoriablecosts and (2) it focuses managers on sales.
Example 3: The two trigger points are Completion of good finished units ofproduct (Stage C) and Sale of finished goods (Stage D).
This example has two trigger points. In contrast to Example 2, the first trigger point inExample 3 is delayed until Stage C, SVC’s completion of good finished units of product. Notethat in this example, there are no journal entries for Purchase of direct materials and incurringof conversion costs (Stage A) and Production resulting in work in process (Stage B) becausethere are minimal direct materials and work-in-process inventories.
Exhibit 20-9, Panel A, summarizes the journal entries for Example 3 with two triggerpoints: Completion of good finished units of product and Sale of finished goods (and rec-ognizing under- or overallocated costs). As in Examples 1 and 2, for each stage, the back-flush costing entries for SVC are shown on the left. The comparable entries undersequential tracking are shown on the right.
No entry is made for direct materials purchases of $1,950,000 (Stage A) because theacquisition of direct materials is not a trigger point in this form of backflush costing. As inExamples 1 and 2, actual conversion costs are recorded as incurred and no entry is madeto record production resulting in work-in-process inventory (Stage B). The cost of 100,000good finished units completed (Stage C) is recorded at standard cost of $31 ($19 directmaterials $12 conversion costs) per unit as in Example 1 except that Accounts PayableControl is credited (instead of Materials and In-Process Inventory Control) because noentry had been made when direct materials were purchased in Stage A. Note that at the endof April, $50,000 of direct materials purchased have not yet been placed into production($1,950,000 $1,900,000 $50,000), nor have the cost of those direct materials beenentered into the inventory-costing system. The Example 3 version of backflush costing issuitable for a JIT production system in which both direct materials inventory and work-in-process inventory are minimal. As finished goods are sold (Stage D), the cost of goods soldis calculated as 99,000 units sold $31 per unit $3,069,000. This is the same Cost ofGoods sold calculated under sequential tracking. Finished Goods Control has a balance of$31,000 under both this form of backflush costing and sequential tracking. The journalentry to dispose of the difference between actual conversion costs incurred and standardconversion costs allocated is the same under backflush costing and sequential tracking. Theonly difference between this form of backflush costing and sequential tracking is that directmaterials inventory of $50,000 (and the corresponding Accounts Payable Control) is notrecorded, which is no problem if direct materials inventories are minimal. Exhibit 20-9,Panel B, provides a general-ledger overview of Example 3.
=*
=-
+
+-
-
*
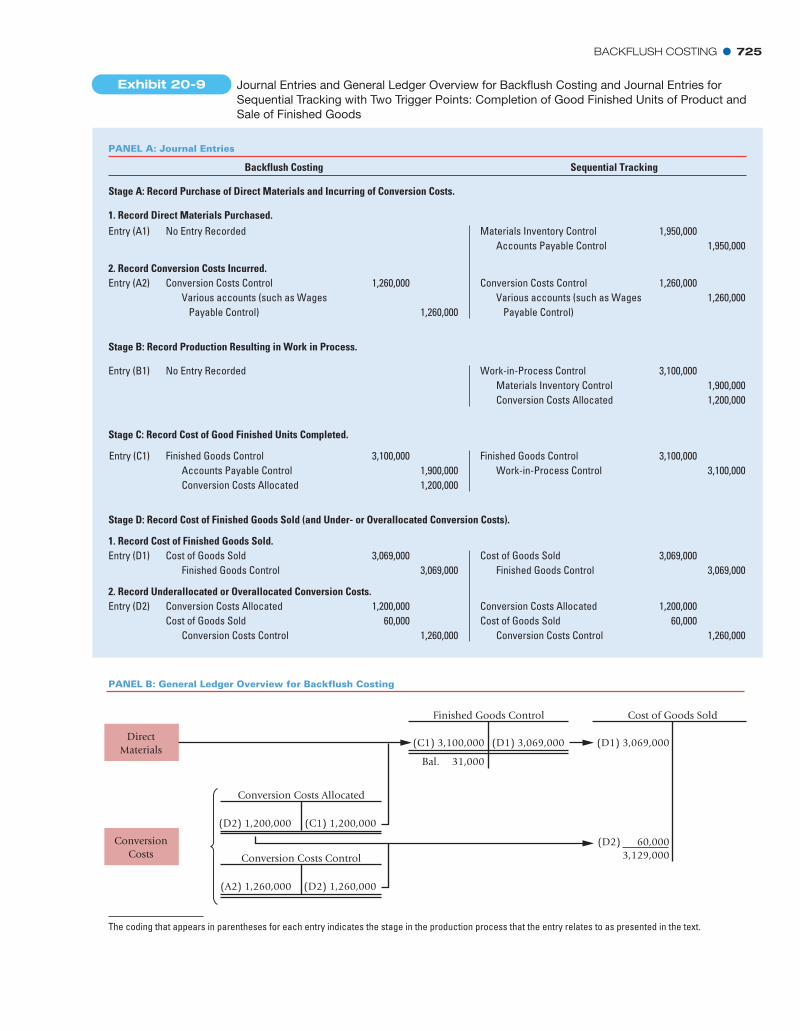
BACKFLUSH COSTING � 725
Conversion Costs Control Various accounts (such as Wages Payable Control)
Entry (A2) Conversion Costs Control Various accounts (such as Wages Payable Control)
1,260,0001,260,000
1,260,000
1,260,000
Work-in-Process Control Materials Inventory Control Conversion Costs Allocated
3,100,0001,900,0001,200,000
No Entry RecordedEntry (B1)
Finished Goods Control Work-in-Process Control
3,100,0003,100,000
3,100,0001,900,0001,200,000
Finished Goods Control Accounts Payable Control Conversion Costs Allocated
Entry (C1)
Cost of Goods Sold Finished Goods Control
3,069,0003,069,000
3,069,0003,069,000
Cost of Goods Sold Finished Goods Control
Entry (D1)
Conversion Costs AllocatedCost of Goods Sold Conversion Costs Control
1,200,00060,000
1,260,000
1,200,00060,000
1,260,000
Conversion Costs AllocatedCost of Goods Sold Conversion Costs Control
Entry (D2)
Materials Inventory Control Accounts Payable Control
1,950,0001,950,000
No Entry RecordedEntry (A1)
Stage A: Record Purchase of Direct Materials and Incurring of Conversion Costs.
1. Record Direct Materials Purchased.
2. Record Conversion Costs Incurred.
Stage B: Record Production Resulting in Work in Process.
Stage C: Record Cost of Good Finished Units Completed.
Stage D: Record Cost of Finished Goods Sold (and Under- or Overallocated Conversion Costs).
1. Record Cost of Finished Goods Sold.
2. Record Underallocated or Overallocated Conversion Costs.
PANEL B: General Ledger Overview for Backflush Costing
Finished Goods Control
(C1) 3,100,000
Bal. 31,000
(D1) 3,069,000
Cost of Goods Sold
(D1) 3,069,000
(D2) 60,0003,129,000
Conversion Costs Allocated
(D2) 1,200,000 (C1) 1,200,000
Conversion Costs Control
(A2) 1,260,000 (D2) 1,260,000
DirectMaterials
ConversionCosts
PANEL A: Journal Entries
The coding that appears in parentheses for each entry indicates the stage in the production process that the entry relates to as presented in the text.
Sequential TrackingBackflush Costing
Exhibit 20-9 Journal Entries and General Ledger Overview for Backflush Costing and Journal Entries forSequential Tracking with Two Trigger Points: Completion of Good Finished Units of Product andSale of Finished Goods
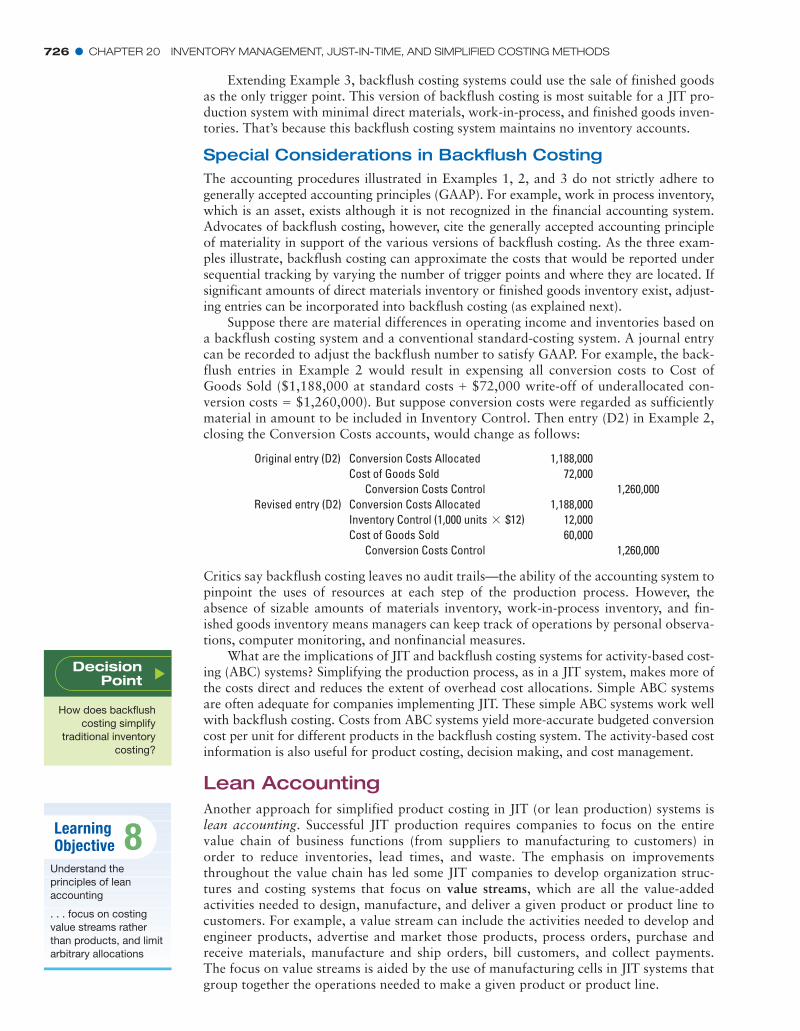
726 � CHAPTER 20 INVENTORY MANAGEMENT, JUST-IN-TIME, AND SIMPLIFIED COSTING METHODS
Extending Example 3, backflush costing systems could use the sale of finished goodsas the only trigger point. This version of backflush costing is most suitable for a JIT pro-duction system with minimal direct materials, work-in-process, and finished goods inven-tories. That’s because this backflush costing system maintains no inventory accounts.
Special Considerations in Backflush CostingThe accounting procedures illustrated in Examples 1, 2, and 3 do not strictly adhere togenerally accepted accounting principles (GAAP). For example, work in process inventory,which is an asset, exists although it is not recognized in the financial accounting system.Advocates of backflush costing, however, cite the generally accepted accounting principleof materiality in support of the various versions of backflush costing. As the three exam-ples illustrate, backflush costing can approximate the costs that would be reported undersequential tracking by varying the number of trigger points and where they are located. Ifsignificant amounts of direct materials inventory or finished goods inventory exist, adjust-ing entries can be incorporated into backflush costing (as explained next).
Suppose there are material differences in operating income and inventories based ona backflush costing system and a conventional standard-costing system. A journal entrycan be recorded to adjust the backflush number to satisfy GAAP. For example, the back-flush entries in Example 2 would result in expensing all conversion costs to Cost ofGoods Sold ($1,188,000 at standard costs $72,000 write-off of underallocated con-version costs $1,260,000). But suppose conversion costs were regarded as sufficientlymaterial in amount to be included in Inventory Control. Then entry (D2) in Example 2,closing the Conversion Costs accounts, would change as follows:
=+
Critics say backflush costing leaves no audit trails—the ability of the accounting system topinpoint the uses of resources at each step of the production process. However, theabsence of sizable amounts of materials inventory, work-in-process inventory, and fin-ished goods inventory means managers can keep track of operations by personal observa-tions, computer monitoring, and nonfinancial measures.
What are the implications of JIT and backflush costing systems for activity-based cost-ing (ABC) systems? Simplifying the production process, as in a JIT system, makes more ofthe costs direct and reduces the extent of overhead cost allocations. Simple ABC systemsare often adequate for companies implementing JIT. These simple ABC systems work wellwith backflush costing. Costs from ABC systems yield more-accurate budgeted conversioncost per unit for different products in the backflush costing system. The activity-based costinformation is also useful for product costing, decision making, and cost management.
Lean AccountingAnother approach for simplified product costing in JIT (or lean production) systems islean accounting. Successful JIT production requires companies to focus on the entirevalue chain of business functions (from suppliers to manufacturing to customers) inorder to reduce inventories, lead times, and waste. The emphasis on improvementsthroughout the value chain has led some JIT companies to develop organization struc-tures and costing systems that focus on value streams, which are all the value-addedactivities needed to design, manufacture, and deliver a given product or product line tocustomers. For example, a value stream can include the activities needed to develop andengineer products, advertise and market those products, process orders, purchase andreceive materials, manufacture and ship orders, bill customers, and collect payments.The focus on value streams is aided by the use of manufacturing cells in JIT systems thatgroup together the operations needed to make a given product or product line.
Original entry (D2) Conversion Costs Allocated 1,188,000Cost of Goods Sold 72,000
Conversion Costs Control 1,260,000Revised entry (D2) Conversion Costs Allocated 1,188,000
Inventory Control (1,000 units $12)* 12,000Cost of Goods Sold 60,000
Conversion Costs Control 1,260,000
DecisionPoint
How does backflushcosting simplify
traditional inventorycosting?
LearningObjective 8
Understand theprinciples of leanaccounting
. . . focus on costingvalue streams ratherthan products, and limitarbitrary allocations
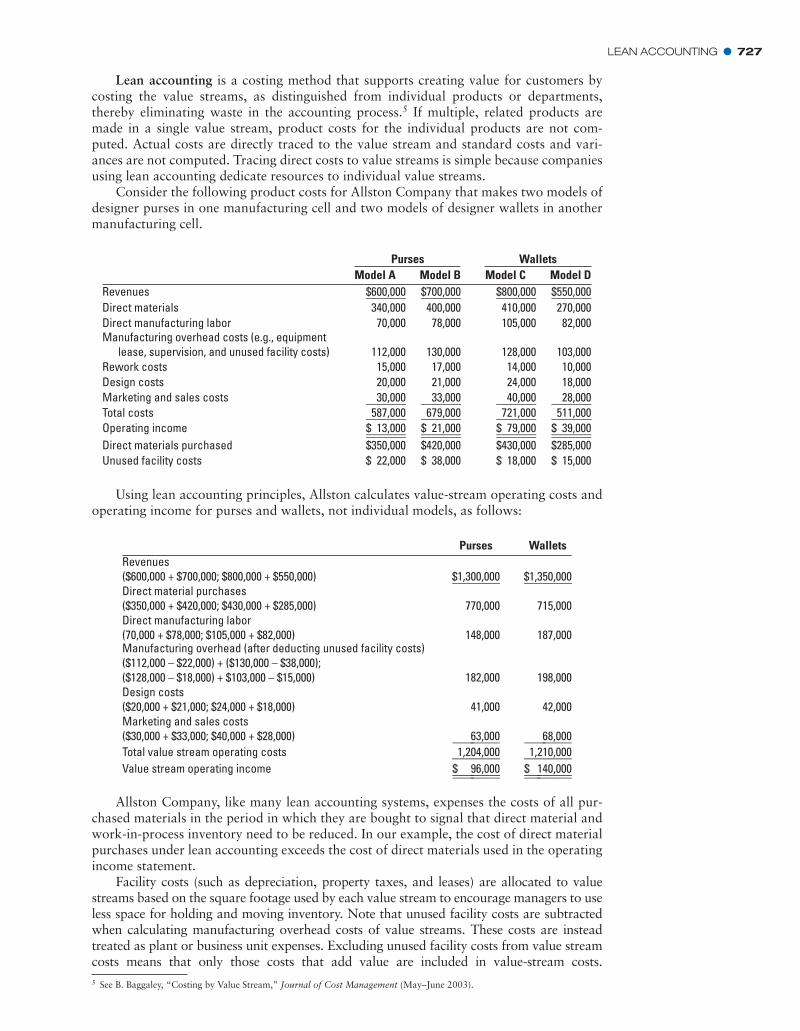
LEAN ACCOUNTING � 727
5 See B. Baggaley, “Costing by Value Stream,” Journal of Cost Management (May–June 2003).
Lean accounting is a costing method that supports creating value for customers bycosting the value streams, as distinguished from individual products or departments,thereby eliminating waste in the accounting process.5 If multiple, related products aremade in a single value stream, product costs for the individual products are not com-puted. Actual costs are directly traced to the value stream and standard costs and vari-ances are not computed. Tracing direct costs to value streams is simple because companiesusing lean accounting dedicate resources to individual value streams.
Consider the following product costs for Allston Company that makes two models ofdesigner purses in one manufacturing cell and two models of designer wallets in anothermanufacturing cell.
Using lean accounting principles, Allston calculates value-stream operating costs andoperating income for purses and wallets, not individual models, as follows:
Purses WalletsModel A Model B Model C Model D
Revenues $600,000 $700,000 $800,000 $550,000Direct materials 340,000 400,000 410,000 270,000Direct manufacturing labor 70,000 78,000 105,000 82,000Manufacturing overhead costs (e.g., equipment
lease, supervision, and unused facility costs) 112,000 130,000 128,000 103,000Rework costs 15,000 17,000 14,000 10,000Design costs 20,000 21,000 24,000 18,000Marketing and sales costs ƒƒ30,000 ƒƒ33,000 ƒƒ40,000 ƒƒ28,000Total costs ƒ587,000 ƒ679,000 ƒ721,000 ƒ511,000Operating income $ƒ13,000 $ƒ21,000 $ƒ79,000 $ƒ39,000Direct materials purchased $350,000 $420,000 $430,000 $285,000Unused facility costs $ 22,000 $ 38,000 $ 18,000 $ 15,000
Purses WalletsRevenues($600,000 + $700,000; $800,000 + $550,000) $1,300,000 $1,350,000Direct material purchases($350,000 + $420,000; $430,000 + $285,000) 770,000 715,000Direct manufacturing labor(70,000 + $78,000; $105,000 + $82,000) 148,000 187,000Manufacturing overhead (after deducting unused facility costs)($112,000 – $22,000) + ($130,000 – $38,000); ($128,000 – $18,000) + $103,000 – $15,000) 182,000 198,000Design costs($20,000 + $21,000; $24,000 + $18,000) 41,000 42,000Marketing and sales costs($30,000 + $33,000; $40,000 + $28,000) ƒƒƒƒ63,000 ƒƒƒƒ68,000Total value stream operating costs ƒ1,204,000 ƒ1,210,000Value stream operating income $ƒƒƒ96,000 $ƒƒ140,000
Allston Company, like many lean accounting systems, expenses the costs of all pur-chased materials in the period in which they are bought to signal that direct material andwork-in-process inventory need to be reduced. In our example, the cost of direct materialpurchases under lean accounting exceeds the cost of direct materials used in the operatingincome statement.
Facility costs (such as depreciation, property taxes, and leases) are allocated to valuestreams based on the square footage used by each value stream to encourage managers to useless space for holding and moving inventory. Note that unused facility costs are subtractedwhen calculating manufacturing overhead costs of value streams. These costs are insteadtreated as plant or business unit expenses. Excluding unused facility costs from value streamcosts means that only those costs that add value are included in value-stream costs.
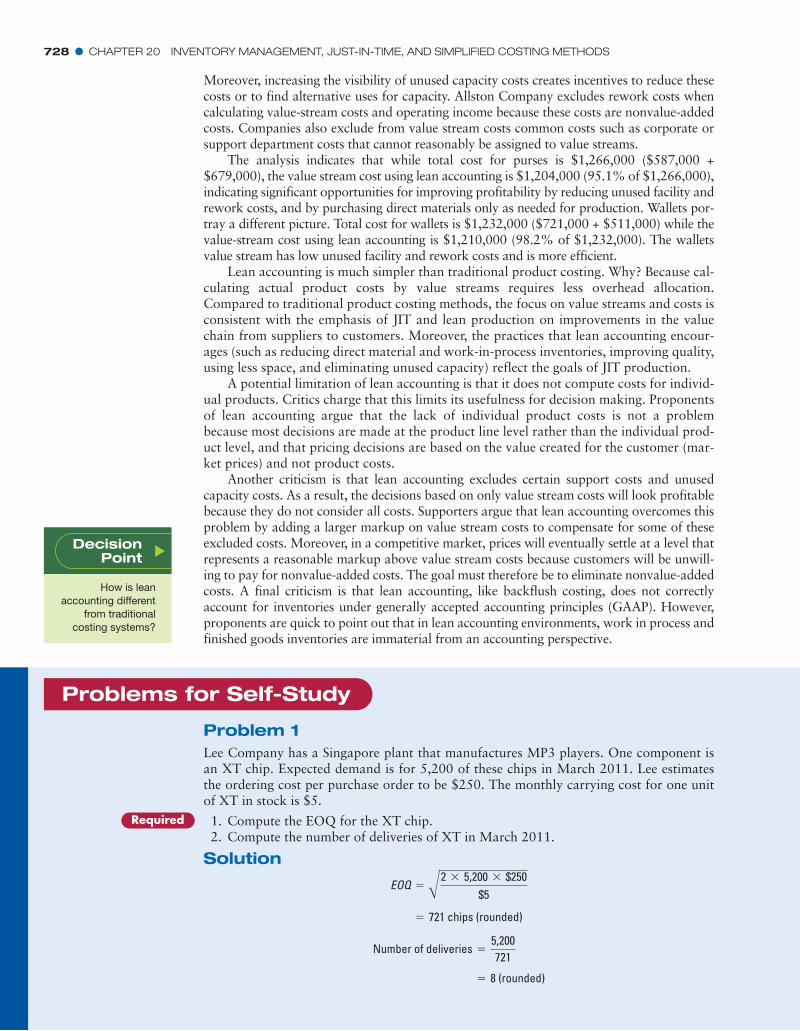
728 � CHAPTER 20 INVENTORY MANAGEMENT, JUST-IN-TIME, AND SIMPLIFIED COSTING METHODS
Moreover, increasing the visibility of unused capacity costs creates incentives to reduce thesecosts or to find alternative uses for capacity. Allston Company excludes rework costs whencalculating value-stream costs and operating income because these costs are nonvalue-addedcosts. Companies also exclude from value stream costs common costs such as corporate orsupport department costs that cannot reasonably be assigned to value streams.
The analysis indicates that while total cost for purses is $1,266,000 ($587,000 +$679,000), the value stream cost using lean accounting is $1,204,000 (95.1% of $1,266,000),indicating significant opportunities for improving profitability by reducing unused facility andrework costs, and by purchasing direct materials only as needed for production. Wallets por-tray a different picture. Total cost for wallets is $1,232,000 ($721,000 + $511,000) while thevalue-stream cost using lean accounting is $1,210,000 (98.2% of $1,232,000). The walletsvalue stream has low unused facility and rework costs and is more efficient.
Lean accounting is much simpler than traditional product costing. Why? Because cal-culating actual product costs by value streams requires less overhead allocation.Compared to traditional product costing methods, the focus on value streams and costs isconsistent with the emphasis of JIT and lean production on improvements in the valuechain from suppliers to customers. Moreover, the practices that lean accounting encour-ages (such as reducing direct material and work-in-process inventories, improving quality,using less space, and eliminating unused capacity) reflect the goals of JIT production.
A potential limitation of lean accounting is that it does not compute costs for individ-ual products. Critics charge that this limits its usefulness for decision making. Proponentsof lean accounting argue that the lack of individual product costs is not a problembecause most decisions are made at the product line level rather than the individual prod-uct level, and that pricing decisions are based on the value created for the customer (mar-ket prices) and not product costs.
Another criticism is that lean accounting excludes certain support costs and unusedcapacity costs. As a result, the decisions based on only value stream costs will look profitablebecause they do not consider all costs. Supporters argue that lean accounting overcomes thisproblem by adding a larger markup on value stream costs to compensate for some of theseexcluded costs. Moreover, in a competitive market, prices will eventually settle at a level thatrepresents a reasonable markup above value stream costs because customers will be unwill-ing to pay for nonvalue-added costs. The goal must therefore be to eliminate nonvalue-addedcosts. A final criticism is that lean accounting, like backflush costing, does not correctlyaccount for inventories under generally accepted accounting principles (GAAP). However,proponents are quick to point out that in lean accounting environments, work in process andfinished goods inventories are immaterial from an accounting perspective.
Problem 1Lee Company has a Singapore plant that manufactures MP3 players. One component isan XT chip. Expected demand is for 5,200 of these chips in March 2011. Lee estimatesthe ordering cost per purchase order to be $250. The monthly carrying cost for one unitof XT in stock is $5.
Problems for Self-Study
Required 1. Compute the EOQ for the XT chip.2. Compute the number of deliveries of XT in March 2011.
Solution
= 8 (rounded)
Number of deliveries =5,200721
= 721 chips (rounded)
EOQ = A2 * 5,200 * $250$5
DecisionPoint
How is leanaccounting different
from traditionalcosting systems?
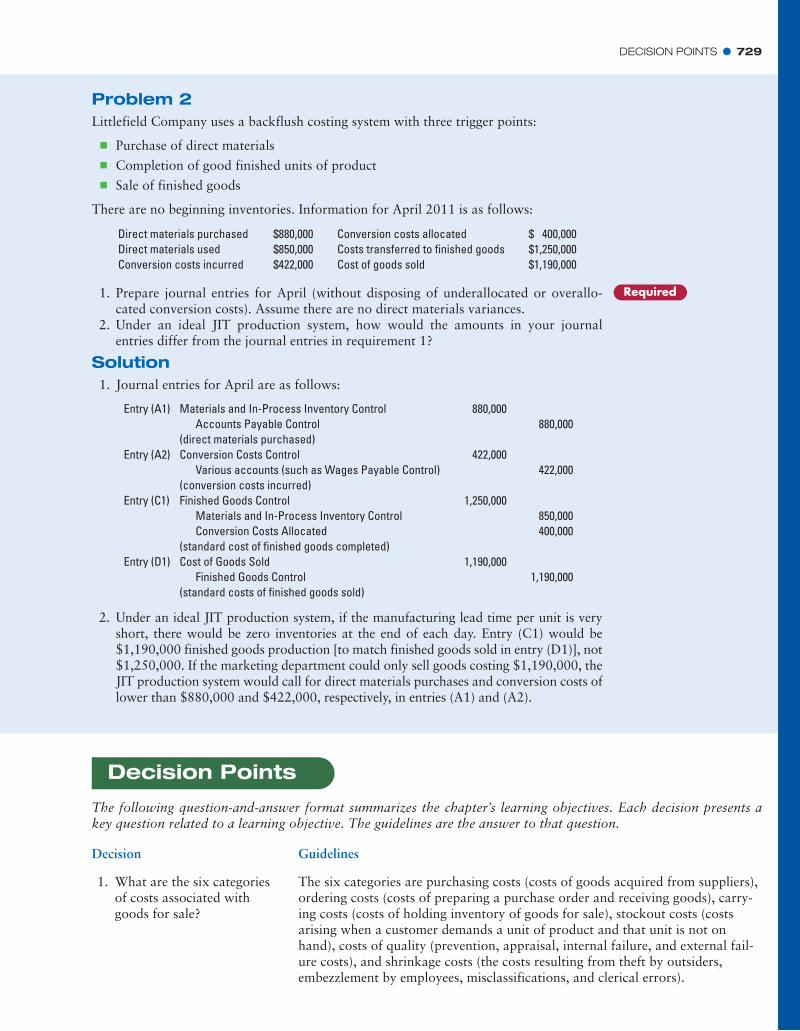
DECISION POINTS � 729
Problem 2Littlefield Company uses a backflush costing system with three trigger points:
� Purchase of direct materials� Completion of good finished units of product� Sale of finished goods
There are no beginning inventories. Information for April 2011 is as follows:
Direct materials purchased $880,000 Conversion costs allocated $ 400,000Direct materials used $850,000 Costs transferred to finished goods $1,250,000Conversion costs incurred $422,000 Cost of goods sold $1,190,000
Entry (A1) Materials and In-Process Inventory Control 880,000Accounts Payable Control 880,000
(direct materials purchased)Entry (A2) Conversion Costs Control 422,000
Various accounts (such as Wages Payable Control) 422,000(conversion costs incurred)
Entry (C1) Finished Goods Control 1,250,000Materials and In-Process Inventory Control 850,000Conversion Costs Allocated 400,000
(standard cost of finished goods completed)Entry (D1) Cost of Goods Sold 1,190,000
Finished Goods Control 1,190,000(standard costs of finished goods sold)
Required1. Prepare journal entries for April (without disposing of underallocated or overallo-cated conversion costs). Assume there are no direct materials variances.
2. Under an ideal JIT production system, how would the amounts in your journalentries differ from the journal entries in requirement 1?
Solution1. Journal entries for April are as follows:
2. Under an ideal JIT production system, if the manufacturing lead time per unit is veryshort, there would be zero inventories at the end of each day. Entry (C1) would be$1,190,000 finished goods production [to match finished goods sold in entry (D1)], not$1,250,000. If the marketing department could only sell goods costing $1,190,000, theJIT production system would call for direct materials purchases and conversion costs oflower than $880,000 and $422,000, respectively, in entries (A1) and (A2).
Decision Points
The following question-and-answer format summarizes the chapter’s learning objectives. Each decision presents akey question related to a learning objective. The guidelines are the answer to that question.
Decision Guidelines
1. What are the six categoriesof costs associated withgoods for sale?
The six categories are purchasing costs (costs of goods acquired from suppliers),ordering costs (costs of preparing a purchase order and receiving goods), carry-ing costs (costs of holding inventory of goods for sale), stockout costs (costsarising when a customer demands a unit of product and that unit is not onhand), costs of quality (prevention, appraisal, internal failure, and external fail-ure costs), and shrinkage costs (the costs resulting from theft by outsiders,embezzlement by employees, misclassifications, and clerical errors).
730 � CHAPTER 20 INVENTORY MANAGEMENT, JUST-IN-TIME, AND SIMPLIFIED COSTING METHODS
2. What does the EOQ decisionmodel help managers do andhow do managers decide onthe level of safety stocks?
The economic-order-quantity (EOQ) decision model helps managers to calculatethe optimal quantity of inventory to order by balancing ordering costs and car-rying costs. The larger the order quantity, the higher the annual carrying costsand the lower the annual ordering costs. The EOQ model includes costsrecorded in the financial accounting system as well as opportunity costs notrecorded in the financial accounting system. Managers choose a level of safetystocks to minimize stock out costs and carrying costs of holding more inventory.
3. What is the effect on costs oferrors in predicting parametersof the EOQ model? How cancompanies reduce the conflictbetween the EOQ decisionmodel and models used forperformance evaluation?
The cost of prediction errors when using the EOQ model is small. To reduce theconflict between the EOQ decision model and the performance evaluationmodel, companies should include the opportunity cost of investment when eval-uating managers. The opportunity cost of investment tied up in inventory is akey input in the EOQ decision model that is often ignored in the performance-evaluation model.
4. Why are companies usingjust-in-time purchasing?
Just-in-time (JIT) purchasing is making purchases in small order quantities justas needed for production (or sales). JIT purchasing is a response to high carryingcosts and low ordering costs. JIT purchasing increases the focus of companiesand suppliers on quality and timely deliveries. Companies coordinate their activ-ities and reduce inventories throughout the supply chain, from the initial sourcesof materials and services to the delivery of products to consumers.
5. How do materials require-ments planning (MRP) sys-tems differ from just-in-time(JIT) production systems?
Materials requirements planning (MRP) systems use a “push-through”approach that manufactures finished goods for inventory on the basis ofdemand forecasts. Just-in-time (JIT) production systems use a “demand-pull”approach in which goods are manufactured only to satisfy customer orders.
6. What are the features andbenefits of a JIT productionsystem?
JIT production systems (a) organize production in manufacturing cells, (b) hireand train multiskilled workers, (c) emphasize total quality management,(d) reduce manufacturing lead time and setup time, and (e) build strong supplierrelationships. The benefits of JIT production include lower costs and highermargins from better flow of information, higher quality, and faster delivery.
7. How does backflush costingsimplify traditional inven-tory costing?
Traditional inventory-costing systems use sequential tracking, in which record-ing of the journal entries occurs in the same order as actual purchases andprogress in production. Most backflush costing systems do not record journalentries for the work-in-process stage of production. Some backflush costing sys-tems also do not record entries for either the purchase of direct materials or thecompletion of finished goods.
8. How is lean accounting dif-ferent from traditional cost-ing systems?
Lean accounting costs value streams rather than products. Nonvalue-addedcosts, unused capacity costs and costs that cannot be easily traced to valuestreams are not allocated but instead expensed.
Terms to Learn
This chapter and the Glossary at the end of the book contain definitions of the following important terms:
backflush costing (p. 719)carrying costs (p. 704)economic order quantity (EOQ) (p. 704)inventory management (p. 703)just-in-time (JIT) production (p. 715)just-in-time (JIT) purchasing (p. 711)lean accounting (p. 727)
lean production (p. 715)manufacturing cells (p. 715)materials requirements planning
(MRP) (p. 714)ordering costs (p. 704)purchase-order lead time (p. 704)purchasing costs (p. 703)
reorder point (p. 707)safety stock (p. 707)sequential tracking (p. 718)shrinkage costs (p. 704)stockout costs (p. 704)trigger point (p. 719)value streams (p. 726)
ASSIGNMENT MATERIAL � 731
Each jersey costs FB $40 and sells for $80. The $7 carrying cost per jersey per year comprises the requiredreturn on investment of $4.80 (12% $40 purchase price) plus $2.20 in relevant insurance, handling, andtheft-related costs. The purchasing lead time is 7 days. FB is open 365 days a year.
*
Expected annual demand for Galaxy jerseys 10,000Ordering cost per purchase order $200Carrying cost per year $7 per jersey
Annual demand for denim cloth 26,400 yardsOrdering cost per purchase order $165Carrying cost per year 20% of purchase costsSafety-stock requirements NoneCost of denim cloth $9 per yard
Assignment Material
Questions
20-1 Why do better decisions regarding the purchasing and managing of goods for sale frequentlycause dramatic percentage increases in net income?
20-2 Name six cost categories that are important in managing goods for sale in a retail company.20-3 What assumptions are made when using the simplest version of the economic-order-quantity
(EOQ) decision model?20-4 Give examples of costs included in annual carrying costs of inventory when using the EOQ deci-
sion model.20-5 Give three examples of opportunity costs that typically are not recorded in accounting systems,
although they are relevant when using the EOQ model in the presence of demand uncertainty.20-6 What are the steps in computing the cost of a prediction error when using the EOQ decision model?20-7 Why might goal-congruence issues arise when an EOQ model is used to guide decisions on how
much to order?20-8 Describe JIT purchasing and its benefits.20-9 What are three factors causing reductions in the cost to place purchase orders for materials?
20-10 “You should always choose the supplier who offers the lowest price per unit.” Do you agree? Explain.20-11 What is supply-chain analysis, and how can it benefit manufacturers and retailers?20-12 What are the main features of JIT production?20-13 Distinguish inventory-costing systems using sequential tracking from those using backflush costing.20-14 Describe three different versions of backflush costing.20-15 Discuss the differences between lean accounting and traditional cost accounting.
Exercises
20-16 Economic order quantity for retailer. Fan Base (FB) operates a megastore featuring sports merchan-dise. It uses an EOQ decision model to make inventory decisions. It is now considering inventory decisions forits Los Angeles Galaxy soccer jerseys product line. This is a highly popular item. Data for 2011 are as follows:
Required1. Calculate the EOQ.2. Calculate the number of orders that will be placed each year.3. Calculate the reorder point.
20-17 Economic order quantity, effect of parameter changes (continuation of 20-16). Athletic Textiles(AT) manufactures the Galaxy jerseys that Fan Base (FB) sells to its customers. AT has recently installedcomputer software that enables its customers to conduct “one-stop” purchasing using state-of-the-artWeb site technology. FB’s ordering cost per purchase order will be $30 using this new technology.
Required1. Calculate the EOQ for the Galaxy jerseys using the revised ordering cost of $30 per purchase order.Assume all other data from Exercise 20-16 are the same. Comment on the result.
2. Suppose AT proposes to “assist” FB. AT will allow FB customers to order directly from the AT Web site.AT would ship directly to these customers. AT would pay $10 to FB for every Galaxy jersey purchasedby one of FB’s customers. Comment qualitatively on how this offer would affect inventory managementat FB. What factors should FB consider in deciding whether to accept AT’s proposal?
20-18 EOQ for a retailer. The Denim World sells fabrics to a wide range of industrial and consumer users.One of the products it carries is denim cloth, used in the manufacture of jeans and carrying bags. The sup-plier for the denim cloth pays all incoming freight. No incoming inspection of the denim is necessarybecause the supplier has a track record of delivering high-quality merchandise. The purchasing officer ofthe Denim World has collected the following information:
732 � CHAPTER 20 INVENTORY MANAGEMENT, JUST-IN-TIME, AND SIMPLIFIED COSTING METHODS
The purchasing lead time is 2 weeks. The Denim World is open 250 days a year (50 weeks for 5 days a week).
Relevant Carrying Cost per Unit per Year Relevant Ordering Cost per Purchase Order$10 $400$20 $200$40 $100
Required 1. Calculate the EOQ for denim cloth.2. Calculate the number of orders that will be placed each year.3. Calculate the reorder point for denim cloth.
20-19 EOQ for manufacturer. Lakeland Company produces lawn mowers and purchases 18,000 units of arotor blade part each year at a cost of $60 per unit. Lakeland requires a 15% annual rate of return on invest-ment. In addition, the relevant carrying cost (for insurance, materials handling, breakage, and so on) is$6 per unit per year. The relevant ordering cost per purchase order is $150.
Required 1. Calculate Lakeland’s EOQ for the rotor blade part.2. Calculate Lakeland’s annual relevant ordering costs for the EOQ calculated in requirement 1.3. Calculate Lakeland’s annual relevant carrying costs for the EOQ calculated in requirement 1.4. Assume that demand is uniform throughout the year and known with certainty so that there is no need
for safety stocks. The purchase-order lead time is half a month. Calculate Lakeland’s reorder point forthe rotor blade part.
20-20 Sensitivity of EOQ to changes in relevant ordering and carrying costs, cost of prediction error.Alpha Company’s annual demand for its only product, XT-590, is 10,000 units. Alpha is currently analyzingpossible combinations of relevant carrying cost per unit per year and relevant ordering cost per purchaseorder, depending on the company’s choice of supplier and average levels of inventory. This table presentsthree possible combinations of carrying and ordering costs.
Required 1. For each of the relevant ordering and carrying-cost alternatives, determine (a) EOQ and (b) annual rel-evant total costs.
2. How does your answer to requirement 1 give insight into the impact of changes in relevant orderingand carrying costs on EOQ and annual relevant total costs? Explain briefly.
3. Suppose the relevant carrying cost per unit per year was $20 and the relevant ordering cost per pur-chase order was $200. Suppose further that Alpha calculates EOQ after incorrectly estimating relevantcarrying cost per unit per year to be $10 and relevant ordering cost per purchase order to be $400.Calculate the actual annual relevant total costs of Alpha’s EOQ decision. Compare this cost to the annualrelevant total costs that Alpha would have incurred if it had correctly estimated the relevant carryingcost per unit per year of $20 and the relevant ordering cost per purchase order of $200 that you havealready calculated in requirement 1. Calculate and comment on the cost of the prediction error.
20-21 Inventory management and the balanced scorecard. Devin Sports Cars (DSC) has implemented abalanced scorecard to measure and support its just-in-time production system. In the learning and growthcategory, DSC measures the percentage of employees who are cross-trained to perform a wide variety ofproduction tasks. Internal business process measures are inventory turns and on-time delivery. The cus-tomer perspective is measured using a customer satisfaction measure and financial performance usingoperating income. DSC estimates that if it can increase the percentage of cross-trained employees by 5%,the resulting increase in labor productivity will reduce inventory-related costs by $100,000 per year andshorten delivery times by 10%. The 10% reduction in delivery times, in turn, is expected to increase cus-tomer satisfaction by 5%, and each 1% increase in customer satisfaction is expected to increase revenuesby 2% due to higher prices.
Required 1. Assume that budgeted revenues in the coming year are $5,000,000. Ignoring the costs of training, whatis the expected increase in operating income in the coming year if the number of cross-trained employ-ees is increased by 5%?
2. What is the most DSC would be willing to pay to increase the percentage of cross-trained employees ifit is only interested in maximizing operating income in the coming year?
3. What factors other than short-term profits should DSC consider when assessing the benefits fromemployee cross-training?
20-22 JIT production, relevant benefits, relevant costs. The Champion Hardware Company manufac-tures specialty brass door handles at its Lynchburg plant. Champion is considering implementing a JIT pro-duction system. The following are the estimated costs and benefits of JIT production:
a. Annual additional tooling costs would be $100,000.b. Average inventory would decline by 80% from the current level of $1,000,000.
ASSIGNMENT MATERIAL � 733
c. Insurance, space, materials-handling, and setup costs, which currently total $300,000 annually, woulddecline by 25%.
d. The emphasis on quality inherent in JIT production would reduce rework costs by 30%. Champion cur-rently incurs $200,000 in annual rework costs.
e. Improved product quality under JIT production would enable Champion to raise the price of its productby $4 per unit. Champion sells 40,000 units each year.
Champion’s required rate of return on inventory investment is 15% per year.
Road Warrior records direct materials purchased and conversion costs incurred at actual costs. It has nodirect materials variances. When finished goods are sold, the backflush costing system “pulls through”standard direct material cost ($102 per unit) and standard conversion cost ($28 per unit). Road Warrior pro-duced 26,800 finished units in August 2011 and sold 26,400 units. The actual direct material cost per unit inAugust 2011 was $102, and the actual conversion cost per unit was $27.
Direct materials purchased $2,754,000 Conversion costs incurred $723,600Direct materials used $2,733,600 Conversion costs allocated $750,400
Required1. Calculate the net benefit or cost to Champion if it adopts JIT production at the Lynchburg plant.2. What nonfinancial and qualitative factors should Champion consider when making the decision to
adopt JIT production?3. Suppose Champion implements JIT production at its Lynchburg plant. Give examples of performance
measures Champion could use to evaluate and control JIT production. What would be the benefit ofChampion implementing an enterprise resource planning (ERP) system?
20-23 Backflush costing and JIT production. Road Warrior Corporation assembles handheld comput-ers that have scaled-down capabilities of laptop computers. Each handheld computer takes six hoursto assemble. Road Warrior uses a JIT production system and a backflush costing system with threetrigger points:
� Purchase of direct materials and incurring of conversion costs� Completion of good finished units of product� Sale of finished goods
There are no beginning inventories of materials or finished goods and no beginning or ending work-in-process inventories. The following data are for August 2011:
Required1. Prepare summary journal entries for August 2011 (without disposing of under- or overallocated conver-sion costs).
2. Post the entries in requirement 1 to T-accounts for applicable Materials and In-Process InventoryControl, Finished Goods Control, Conversion Costs Control, Conversion Costs Allocated, and Cost ofGoods Sold.
3. Under an ideal JIT production system, how would the amounts in your journal entries differ from thosein requirement 1?
20-24 Backflush costing, two trigger points, materials purchase and sale (continuation of 20-23).Assume the same facts as in Exercise 20-23, except that Road Warrior now uses a backflush costing systemwith the following two trigger points:
� Purchase of direct materials and incurring of conversion costs� Sale of finished goods
The Inventory Control account will include direct materials purchased but not yet in production, materials inwork in process, and materials in finished goods but not sold. No conversion costs are inventoried. Anyunder- or overallocated conversion costs are written off monthly to Cost of Goods Sold.
Required1. Prepare summary journal entries for August, including the disposition of under- or overallocated con-version costs.
2. Post the entries in requirement 1 to T-accounts for Inventory Control, Conversion Costs Control,Conversion Costs Allocated, and Cost of Goods Sold.
20-25 Backflush costing, two trigger points, completion of production and sale (continuation of 20-23).Assume the same facts as in Exercise 20-23, except now Road Warrior uses only two trigger points,Completion of good finished units of product and Sale of finished goods. Any under- or overallocated con-version costs are written off monthly to Cost of Goods Sold.
Required1. Prepare summary journal entries for August, including the disposition of under- or overallocated con-version costs.
2. Post the entries in requirement 1 to T-accounts for Finished Goods Control, Conversion Costs Control,Conversion Costs Allocated, and Cost of Goods Sold.
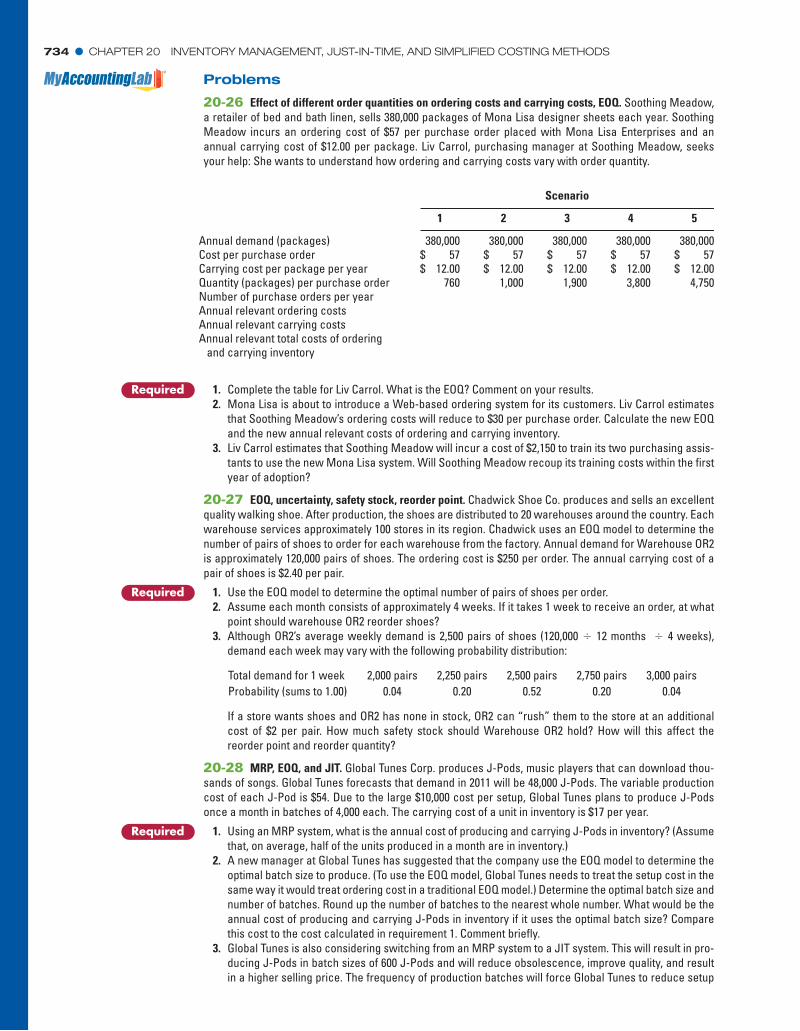
734 � CHAPTER 20 INVENTORY MANAGEMENT, JUST-IN-TIME, AND SIMPLIFIED COSTING METHODS
Problems
20-26 Effect of different order quantities on ordering costs and carrying costs, EOQ. Soothing Meadow,a retailer of bed and bath linen, sells 380,000 packages of Mona Lisa designer sheets each year. SoothingMeadow incurs an ordering cost of $57 per purchase order placed with Mona Lisa Enterprises and anannual carrying cost of $12.00 per package. Liv Carrol, purchasing manager at Soothing Meadow, seeksyour help: She wants to understand how ordering and carrying costs vary with order quantity.
Annual demand (packages)Cost per purchase orderCarrying cost per package per yearQuantity (packages) per purchase orderNumber of purchase orders per yearAnnual relevant ordering costsAnnual relevant carrying costsAnnual relevant total costs of ordering and carrying inventory
380,000$ 57$ 12.00
760
1
380,000$ 57$ 12.00
1,000
2
Scenario
380,000$ 57$ 12.00
1,900
3
380,000$ 57$ 12.00
3,800
4
380,000$ 57$ 12.00
4,750
5
Total demand for 1 week 2,000 pairs 2,250 pairs 2,500 pairs 2,750 pairs 3,000 pairsProbability (sums to 1.00) 0.04 0.20 0.52 0.20 0.04
Required 1. Complete the table for Liv Carrol. What is the EOQ? Comment on your results.2. Mona Lisa is about to introduce a Web-based ordering system for its customers. Liv Carrol estimates
that Soothing Meadow’s ordering costs will reduce to $30 per purchase order. Calculate the new EOQand the new annual relevant costs of ordering and carrying inventory.
3. Liv Carrol estimates that Soothing Meadow will incur a cost of $2,150 to train its two purchasing assis-tants to use the new Mona Lisa system. Will Soothing Meadow recoup its training costs within the firstyear of adoption?
20-27 EOQ, uncertainty, safety stock, reorder point. Chadwick Shoe Co. produces and sells an excellentquality walking shoe. After production, the shoes are distributed to 20 warehouses around the country. Eachwarehouse services approximately 100 stores in its region. Chadwick uses an EOQ model to determine thenumber of pairs of shoes to order for each warehouse from the factory. Annual demand for Warehouse OR2is approximately 120,000 pairs of shoes. The ordering cost is $250 per order. The annual carrying cost of apair of shoes is $2.40 per pair.
Required 1. Use the EOQ model to determine the optimal number of pairs of shoes per order.2. Assume each month consists of approximately 4 weeks. If it takes 1 week to receive an order, at what
point should warehouse OR2 reorder shoes?3. Although OR2’s average weekly demand is 2,500 pairs of shoes (120,000 12 months 4 weeks),
demand each week may vary with the following probability distribution:,,
If a store wants shoes and OR2 has none in stock, OR2 can “rush” them to the store at an additionalcost of $2 per pair. How much safety stock should Warehouse OR2 hold? How will this affect thereorder point and reorder quantity?
20-28 MRP, EOQ, and JIT. Global Tunes Corp. produces J-Pods, music players that can download thou-sands of songs. Global Tunes forecasts that demand in 2011 will be 48,000 J-Pods. The variable productioncost of each J-Pod is $54. Due to the large $10,000 cost per setup, Global Tunes plans to produce J-Podsonce a month in batches of 4,000 each. The carrying cost of a unit in inventory is $17 per year.
Required 1. Using an MRP system, what is the annual cost of producing and carrying J-Pods in inventory? (Assumethat, on average, half of the units produced in a month are in inventory.)
2. A new manager at Global Tunes has suggested that the company use the EOQ model to determine theoptimal batch size to produce. (To use the EOQ model, Global Tunes needs to treat the setup cost in thesame way it would treat ordering cost in a traditional EOQ model.) Determine the optimal batch size andnumber of batches. Round up the number of batches to the nearest whole number. What would be theannual cost of producing and carrying J-Pods in inventory if it uses the optimal batch size? Comparethis cost to the cost calculated in requirement 1. Comment briefly.
3. Global Tunes is also considering switching from an MRP system to a JIT system. This will result in pro-ducing J-Pods in batch sizes of 600 J-Pods and will reduce obsolescence, improve quality, and resultin a higher selling price. The frequency of production batches will force Global Tunes to reduce setup
ASSIGNMENT MATERIAL � 735
time and will result in a reduction in setup cost. The new setup cost will be $500 per setup. What is theannual cost of producing and carrying J-Pods in inventory under the JIT system?
4. Compare the models analyzed in the previous parts of the problem. What are the advantages and dis-advantages of each?
20-29 Effect of management evaluation criteria on EOQ model. Computers 4 U purchases one model ofcomputer at a wholesale cost of $200 per unit and resells it to end consumers. The annual demand for thecompany’s product is 500,000 units. Ordering costs are $800 per order and carrying costs are $50 per com-puter, including $20 in the opportunity cost of holding inventory.
Required1. Compute the optimal order quantity using the EOQ model.2. Compute a) the number of orders per year and b) the annual relevant total cost of ordering and carry-
ing inventory.3. Assume that when evaluating the manager, the company excludes the opportunity cost of carrying
inventory. If the manager makes the EOQ decision excluding the opportunity cost of carrying inventory,the relevant carrying cost would be $30 not $50. How would this affect the EOQ amount and the actualannual relevant cost of ordering and carrying inventory?
4. What is the cost impact on the company of excluding the opportunity cost of carrying inventory whenmaking EOQ decisions? Why do you think the company currently excludes the opportunity costs of car-rying inventory when evaluating the manager’s performance? What could the company do to encour-age the manager to make decisions more congruent with the goal of reducing total inventory costs?
20-30 JIT purchasing, relevant benefits, relevant costs. (CMA, adapted) The Margro Corporation is anautomotive supplier that uses automatic turning machines to manufacture precision parts from steel bars.Margro’s inventory of raw steel averages $600,000. John Oates, president of Margro, and Helen Gorman,Margro’s controller, are concerned about the costs of carrying inventory. The steel supplier is willing to sup-ply steel in smaller lots at no additional charge. Gorman identifies the following effects of adopting a JITinventory program to virtually eliminate steel inventory:
� Without scheduling any overtime, lost sales due to stockouts would increase by 35,000 units per year.However, by incurring overtime premiums of $40,000 per year, the increase in lost sales could bereduced to 20,000 units per year. This would be the maximum amount of overtime that would be feasi-ble for Margro.
� Two warehouses currently used for steel bar storage would no longer be needed. Margro rents onewarehouse from another company under a cancelable leasing arrangement at an annual cost of$60,000. The other warehouse is owned by Margro and contains 12,000 square feet. Three-fourths ofthe space in the owned warehouse could be rented for $1.50 per square foot per year. Insurance andproperty tax costs totaling $14,000 per year would be eliminated.
Margro’s required rate of return on investment is 20% per year. Margro’s budgeted income statement for theyear ending December 31, 2011 (in thousands) is as follows:
Required1. Calculate the estimated dollar savings (loss) for the Margro Corporation that would result in 2011 fromthe adoption of JIT purchasing.
2. Identify and explain other factors that Margro should consider before deciding whether to adoptJIT purchasing.
20-31 Supply chain effects on total relevant inventory cost. Cow Spot Computer Co. outsources the pro-duction of motherboards for its computers. It is currently deciding which of two suppliers to use: Maji orInduk. Due to differences in the product failure rates across the two companies, 5% of motherboards pur-chased from Maji will be inspected and 25% of motherboards purchased from Induk will be inspected. Thefollowing data refers to costs associated with Maji and Induk.
Revenues (900,000 units) $10,800Cost of goods sold
Variable costs $4,050Fixed costs ƒ1,450
Total costs of goods sold ƒƒ5,500Gross margin 5,300Marketing and distribution costs
Variable costs $ 900Fixed costs ƒ1,500
Total marketing and distribution costs ƒƒ2,400Operating income $ƒ2,900
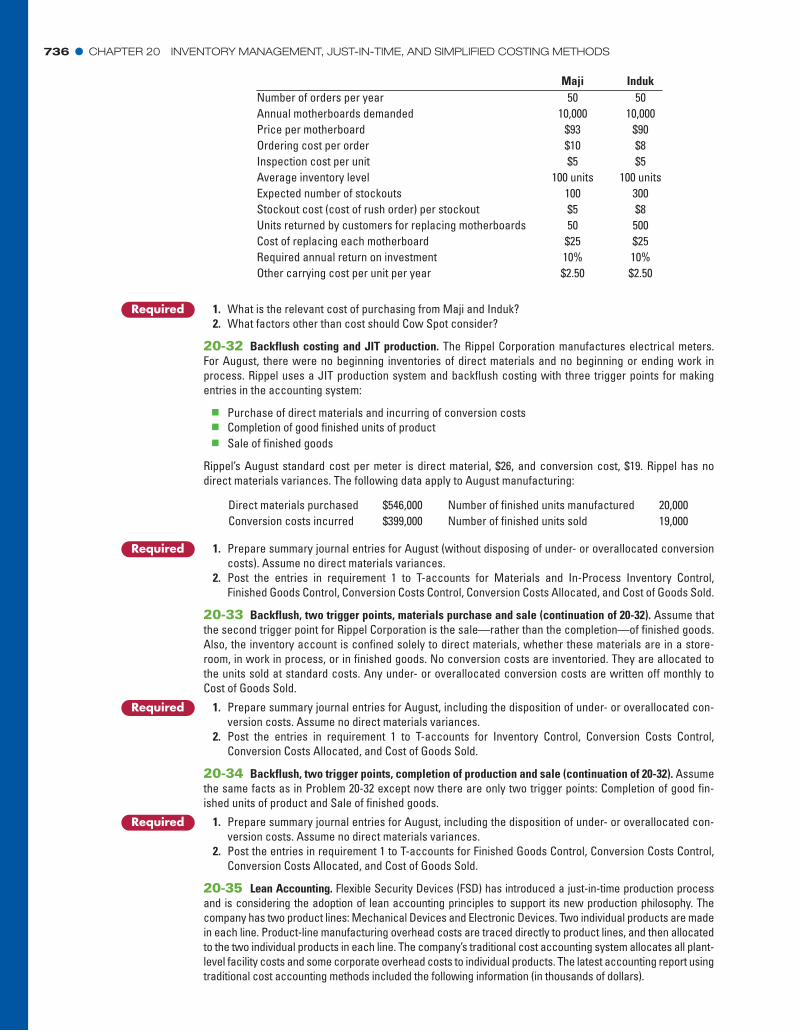
736 � CHAPTER 20 INVENTORY MANAGEMENT, JUST-IN-TIME, AND SIMPLIFIED COSTING METHODS
Maji IndukNumber of orders per year 50 50Annual motherboards demanded 10,000 10,000Price per motherboard $93 $90Ordering cost per order $10 $8Inspection cost per unit $5 $5Average inventory level 100 units 100 unitsExpected number of stockouts 100 300Stockout cost (cost of rush order) per stockout $5 $8Units returned by customers for replacing motherboards 50 500Cost of replacing each motherboard $25 $25Required annual return on investment 10% 10%Other carrying cost per unit per year $2.50 $2.50
Direct materials purchased $546,000 Number of finished units manufactured 20,000Conversion costs incurred $399,000 Number of finished units sold 19,000
Required 1. What is the relevant cost of purchasing from Maji and Induk?2. What factors other than cost should Cow Spot consider?
20-32 Backflush costing and JIT production. The Rippel Corporation manufactures electrical meters.For August, there were no beginning inventories of direct materials and no beginning or ending work inprocess. Rippel uses a JIT production system and backflush costing with three trigger points for makingentries in the accounting system:
� Purchase of direct materials and incurring of conversion costs� Completion of good finished units of product� Sale of finished goods
Rippel’s August standard cost per meter is direct material, $26, and conversion cost, $19. Rippel has nodirect materials variances. The following data apply to August manufacturing:
Required 1. Prepare summary journal entries for August (without disposing of under- or overallocated conversioncosts). Assume no direct materials variances.
2. Post the entries in requirement 1 to T-accounts for Materials and In-Process Inventory Control,Finished Goods Control, Conversion Costs Control, Conversion Costs Allocated, and Cost of Goods Sold.
20-33 Backflush, two trigger points, materials purchase and sale (continuation of 20-32). Assume thatthe second trigger point for Rippel Corporation is the sale—rather than the completion—of finished goods.Also, the inventory account is confined solely to direct materials, whether these materials are in a store-room, in work in process, or in finished goods. No conversion costs are inventoried. They are allocated tothe units sold at standard costs. Any under- or overallocated conversion costs are written off monthly toCost of Goods Sold.
Required 1. Prepare summary journal entries for August, including the disposition of under- or overallocated con-version costs. Assume no direct materials variances.
2. Post the entries in requirement 1 to T-accounts for Inventory Control, Conversion Costs Control,Conversion Costs Allocated, and Cost of Goods Sold.
20-34 Backflush, two trigger points, completion of production and sale (continuation of 20-32). Assumethe same facts as in Problem 20-32 except now there are only two trigger points: Completion of good fin-ished units of product and Sale of finished goods.
Required 1. Prepare summary journal entries for August, including the disposition of under- or overallocated con-version costs. Assume no direct materials variances.
2. Post the entries in requirement 1 to T-accounts for Finished Goods Control, Conversion Costs Control,Conversion Costs Allocated, and Cost of Goods Sold.
20-35 Lean Accounting. Flexible Security Devices (FSD) has introduced a just-in-time production processand is considering the adoption of lean accounting principles to support its new production philosophy. Thecompany has two product lines: Mechanical Devices and Electronic Devices. Two individual products are madein each line. Product-line manufacturing overhead costs are traced directly to product lines, and then allocatedto the two individual products in each line. The company’s traditional cost accounting system allocates all plant-level facility costs and some corporate overhead costs to individual products. The latest accounting report usingtraditional cost accounting methods included the following information (in thousands of dollars).
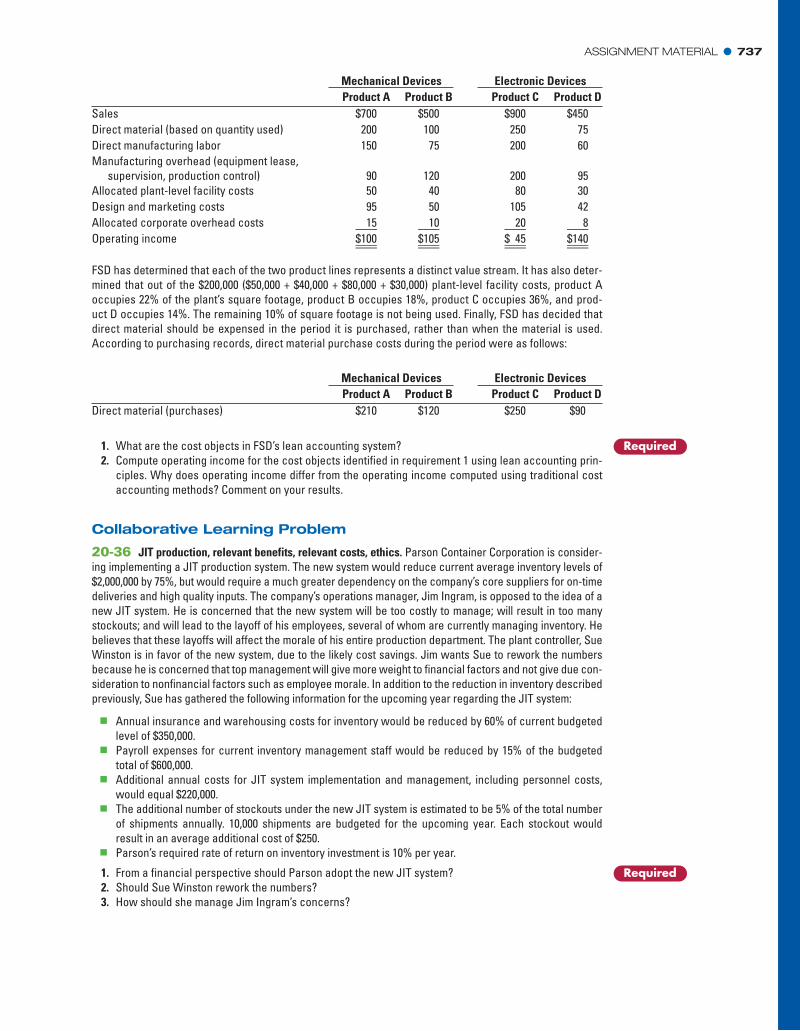
ASSIGNMENT MATERIAL � 737
Mechanical Devices Electronic DevicesProduct A Product B Product C Product D
Sales $700 $500 $900 $450Direct material (based on quantity used) 200 100 250 75Direct manufacturing labor 150 75 200 60Manufacturing overhead (equipment lease,
supervision, production control) 90 120 200 95Allocated plant-level facility costs 50 40 80 30Design and marketing costs 95 50 105 42Allocated corporate overhead costs ƒƒ15 ƒƒ10 ƒƒ20 ƒƒƒ8Operating income $100 $105 $ƒ45 $140
Mechanical Devices Electronic DevicesProduct A Product B Product C Product D
Direct material (purchases) $210 $120 $250 $90
FSD has determined that each of the two product lines represents a distinct value stream. It has also deter-mined that out of the $200,000 ($50,000 + $40,000 + $80,000 + $30,000) plant-level facility costs, product Aoccupies 22% of the plant’s square footage, product B occupies 18%, product C occupies 36%, and prod-uct D occupies 14%. The remaining 10% of square footage is not being used. Finally, FSD has decided thatdirect material should be expensed in the period it is purchased, rather than when the material is used.According to purchasing records, direct material purchase costs during the period were as follows:
Required1. What are the cost objects in FSD’s lean accounting system?2. Compute operating income for the cost objects identified in requirement 1 using lean accounting prin-
ciples. Why does operating income differ from the operating income computed using traditional costaccounting methods? Comment on your results.
Collaborative Learning Problem
20-36 JIT production, relevant benefits, relevant costs, ethics. Parson Container Corporation is consider-ing implementing a JIT production system. The new system would reduce current average inventory levels of$2,000,000 by 75%, but would require a much greater dependency on the company’s core suppliers for on-timedeliveries and high quality inputs. The company’s operations manager, Jim Ingram, is opposed to the idea of anew JIT system. He is concerned that the new system will be too costly to manage; will result in too manystockouts; and will lead to the layoff of his employees, several of whom are currently managing inventory. Hebelieves that these layoffs will affect the morale of his entire production department. The plant controller, SueWinston is in favor of the new system, due to the likely cost savings. Jim wants Sue to rework the numbersbecause he is concerned that top management will give more weight to financial factors and not give due con-sideration to nonfinancial factors such as employee morale. In addition to the reduction in inventory describedpreviously, Sue has gathered the following information for the upcoming year regarding the JIT system:
� Annual insurance and warehousing costs for inventory would be reduced by 60% of current budgetedlevel of $350,000.
� Payroll expenses for current inventory management staff would be reduced by 15% of the budgetedtotal of $600,000.
� Additional annual costs for JIT system implementation and management, including personnel costs,would equal $220,000.
� The additional number of stockouts under the new JIT system is estimated to be 5% of the total numberof shipments annually. 10,000 shipments are budgeted for the upcoming year. Each stockout wouldresult in an average additional cost of $250.
� Parson’s required rate of return on inventory investment is 10% per year.
Required1. From a financial perspective should Parson adopt the new JIT system?2. Should Sue Winston rework the numbers?3. How should she manage Jim Ingram’s concerns?