2. performance audits relating to government companies - cag
TRANSCRIPT
CHAPTER-II
2. Performance Audits relating to Government Companies
2.1 Functioning of Sanjay Gandhi Thermal Power Station, Birsinghpur
Executive summary
Introduction The Madhya Pradesh Power Generating Company Limited (Company) has four thermal power stations and eight hydel power stations with an installed capacity of 4320 MW and 915 MW respectively as on 31 March 2015. Sanjay Gandhi Thermal Power Station (SGTPS) is the major thermal power station with generating capacity of 1340 MW spread across three Power Houses (PH I consisting of two units of 210 MW each, PH II consisting of two units of 210 MW each and PH III consisting of one unit of 500 MW). A review of operation and maintenance of the plant, contract management and environmental compliance by SGTPS revealed the following.
Power House I
• Power House I did not meet the generation target during 2010-11 to 2014-15 and the shortage ranged from 7.15 per cent to 34.24 per cent. The performance of the PH was not satisfactory as it did not meet the targets set by MPERC in respect of Station Heat Rate, fuel oil consumption, auxiliary power consumption and Plant availability factor (PAF). It was mainly due to deviation in key operational parameters like high main steam temperature, vibrations in super heater and re-heater areas of boiler, furnace instability caused by poor quality of coal, improper functioning of important boiler equipment due to delay in carrying out the annual maintenance and non-taking up of the capital intensive renovation and modernisation works to improve the performance of the power house.
This resulted in excess consumption of coal by 10.42 lakh MT worth ` 376.04 crore, excess fuel oil consumption by 9573.490 kilo litre (KL) worth ` 41.63 crore, excess auxiliary power consumption of 212.784 MU worth ` 63.51 crore and under recovery of MPERC approved fixed cost by ` 379.20 crore during 2010-11 to 2014-15.
(Paragraphs 2.1.9, 2.1.10, 2.1.11, 2.1.12 and 2.1.13)
• There was excess presence of un-burnt coal ranging from 1.15 per cent to 14.80 per cent in bottom ash and from 0.35 per cent to 2.37 per cent in fly ash during 2010-11 to 2014-15. This was due to improper combustion in boiler furnace as required equipment to monitor the coal fineness and air-fuel ratio in the boiler furnace were not installed. This led to loss of coal measuring 79648.529 MT worth ` 27.67 crore.
(Paragraph 2.1.14)
• The re-heater tubes in boiler were not replaced despite rendering the service life of 20 years resulting in their frequent failures causing generation loss of 85.05 MU worth ` 30.45 crore.
(Paragraph 2.1.17)
Report on Public Sector Undertakings for the year ended 31March 2015
________________________________________________________________________18
• The coal mills in PH I and II were not provided with gravimetric coal feeders to measure the accurate quantity of coal to be fed into the boiler. This led to excess coal consumption of 1.31 lakh MT worth ` 21.20 crore per annum.
(Paragraph 2.1.18)
Power House II
• Power House II did not meet the generation target during 2010-11 to 2014-15 and the shortage ranged from 13.98 per cent to 39.63 per cent. The performance of the PH was not satisfactory as it did not meet the targets set by MPERC in respect of Station Heat Rate, fuel oil consumption, auxiliary power consumption and Plant availability factor (PAF). It was mainly due to deviation in key operational parameters like high main steam temperature, vibrations in super heater and re-heater areas of boiler, furnace instability caused by poor quality of coal, improper functioning of important boiler equipment due to delay in carrying out the annual maintenance and non-taking up of the capital intensive renovation and modernisation works to improve the performance of the power house.
This led to excess consumption of coal by 7.57 lakh MT worth ` 276.36 crore, excess fuel oil consumption by 8270.370 KL worth ` 39.48 crore and excess auxiliary power consumption of 254.446 MU worth ` 80.91 crore during 2010-11 to 2014-15.
(Paragraphs 2.1.22, 2.1.23, 2.1.24 and 2.1.25)
• There was excess presence of un-burnt coal in bottom and fly ash due to non installation of equipment to monitor the coal fineness and combustion in the boiler. This led to loss of coal in the form of un-burnt coal of 32404.596 MT worth ` 12.38 crore.
(Paragraph 2.1.26)
• There was frequent outage of coal mills in PH II during 2010-11 to 2014-15 despite having preventive and regular maintenance contracts. It was due to premature failure of coal grinding elements caused by the passage of foreign materials into coal mills in the absence of proper maintenance of sieves at the entry point of coal. This resulted in shutdowns and running of the plant on partial load resulting in generation loss of 816.184 MU worth ` 265.42 crore.
(Paragraph 2.1.28)
Power House III
• PH III did not meet the generation target during the years 2010-11 to 2014-15 and the shortage ranged from 0.76 per cent to 7.56 per cent. Further, it did not meet the target set by MPERC with regard to Station Heat Rate leading to excess consumption of coal by 5.92 lakh MT valuing ` 200.25 crore. This was caused by poor quality of coal and improper maintenance of boiler equipment from time to time.
(Paragraphs 2.1.32 and 2.1.33)
• Deferment of annual overhaul (AOH) of power house from scheduled dates resulted in excessive wear and tear in turbine leading to prolonging of AOH period by 14 days. This resulted in generation loss of 168 MU worth ` 63.67 crore.
(Paragraph 2.1.37)
Chapter -II- Performance Audit relating to Government Companies
________________________________________________________________________19
• Improper maintenance of the tilting tangential type firing system adopted in boiler of PH-III resulted in avoidable leakages in water wall tubes and re-heater tubes. As a result there was forced shut down causing generation loss of 220.948 MU worth ` 75.20 crore.
(Paragraphs 2.1.39 and 2.1.40)
• SGTPS did not realise the claims of ` 3.80 crore lodged against M/s South Eastern Collieries Limited towards oversized stones received along with coal. Further, interest of ` 80 lakh on pending claims for the delayed period was not levied though provided in Fuel Supply Agreement.
(Paragraph 2.1.44)
• The liaising contract awarded by SGTPS for coordinating with collieries and railways was deficient as it did not have effective clauses for holding the contractor responsible for his failure. Due to failure of contractor to ensure quality coal, SGTPS suffered generation loss of 1153.540 MU worth ` 351.97 crore.
(Paragraph 2.1.45)
Environmental Compliance by SGTPS
• SGTPS did not meet the 100 per cent ash utilisation target set under notification (November 2009) of GoI. The actual utilisaiton of ash ranged from 57.73 per cent and 79.89 per cent during 2010-11 to 2014-15 due to poor response from the parties to lift the ash. Further as against the limit of 10 kilo liter (KL) for storing the hazardous waste provided under Hazardous Waste (Management & Handling) Rules, SGTPS was storing hazardous waste of 30 KL resins and 16 KL of lube oil as of 31 March 2015 due to non-disposal of the same.
(Paragraphs 2.1.48 and 2.1.49)
Introduction
2.1.1 The function of power generation in Madhya Pradesh is vested with Madhya Pradesh Power Generating Company Limited (Company). The Company has four thermal power generating stations with an installed capacity of 4320 MW and eight hydel power generating stations with an installed capacity of 915 MW as on 31 March 2015. During the years 2010-11 to 2014-15 the Company generated revenue of ` 25815.56 crore, incurred total cost of ` 27560.77 crore and suffered loss of ` 1745.21 crore. The details of installed capacity (both thermal and hydel) and the financial performance of the Company are given in Annexure 2.1.1.
Sanjay Gandhi Thermal Power Station (SGTPS), Birsinghpur consists of three Power Houses (PHs) with an installed capacity of 1340 MW. These are PH I consisting of two units of 210 MW each commissioned during 1993-94, PH II consisting of two units of 210 MW each commissioned during 1998-99 and PH III consisting of one unit of 500 MW commissioned during August 2008. The power generated by SGTPS during the period 2010-11 to 2014-15 was ranging between 40.35 per cent and 52.26 per cent of total power generated by the Company.
Contract Management in SGTPS

Report on Public Sector Undertakings for the year ended 31March 2015
________________________________________________________________________20
Organisational Setup
2.1.2 The management of the company is vested in Chairman and the Board of Directors which consists of eight directors including the Managing Director as on 31 March 2015. The operational activities of SGTPS are supervised by the Chief General Manager (CGM) who is assisted by five Deputy Chief General Managers (Dy CGM) and twenty General Managers (GM) to supervise the day to day operation and maintenance activities of the generating station. The organisation structure is given in Annexure 2.1.2.
Audit objectives
2.1.3 The Performance Audit was conducted with a view to assess whether:
• The action plans were prepared and implemented to optimize the existing plant capacity and the running of plant was meeting the operational parameters fixed by MPERC,
• Timely preventive and breakdown maintenance of plant was carried out to minimize outages and maximize plant utilization
• Contracts entered into for procurement and liaising were managed efficiently and effectively
• The plant was complying with the environmental statutes and regulations.
Audit Criteria
2.1.4 The audit criteria for the Performance Audit were drawn from the following sources.
• Regulations/guidelines issued by Central Electricity Authority (CEA)/State Government/ Electricity Regulatory Commission (Central and State) with regard to operation and maintenance of generating stations.
• Parameters fixed by Madhya Pradesh Electricity Regulatory Commission (MPERC) for various operational parameters for power generation.
• Statutes, Rules and regulations relating to protection of environment.
• Standard procedures for tendering and awarding contracts as per the procurement policy of the company and their execution.
Scope and methodology of Audit
2.1.5 The Performance Audit was conducted covering the functional performance of SGTPS for the period 2010-11 to 2014-15. Entry conference with the Principal Secretary (Energy) was held on 6 April 2015 where in the audit objectives and scope of audit were discussed. During the course of audit, Board Agenda items and minutes of the meetings were reviewed. The operational performance of SGTPS with regard to the parameters set by MPERC was examined. The maintenance plans prepared and implemented and the environmental compliance were studied. Exit conference was held with Principal Secretary (Energy) on 16 October 2015. The replies furnished by Government and views of Government in exit conference have been suitably included in the report.
Chapter -II- Performance Audit relating to Government Companies
________________________________________________________________________21
Audit Findings
2.1.6 SGTPS was given a generation target of 44083 MU by MPERC during the years 2010-11 to 2014-15. However it could generate only 39390.010 MU falling short by 4692.990 MU (10.64 per cent) as detailed in Annexure 2.1.3. This was mainly due to shortcomings on the part of SGTPS to frame and implement action plans to optimise the utilisation of resources for achieving operational parameters, maintain the equipments to run at rated capacity and other reasons as discussed in the succeeding paragraphs.
Ineffective functioning of Planning and Management Cell 2.1.7 A dedicated Planning and Management Cell (PMC) was established in the generating station, to prepare plans for improving the functional performance and achieve overall efficiency and economy. However, during the period under audit, no major plans were prepared and implemented by this Cell. Consequently, the generating station continued to face operational problems and the targets set by MPERC with regard to various operational parameters were not achieved. Government while accepting the audit observation stated (September 2015) that as against the sanctioned strength of 21 persons, the cell was functioning with six persons. Hence there were certain shortcomings in the functioning of the cell.
Recommendation Management should initiate steps to strengthen the planning cell to frame and implement the action plans for improved performance of SGTPS.
Operational performance and maintenance activities
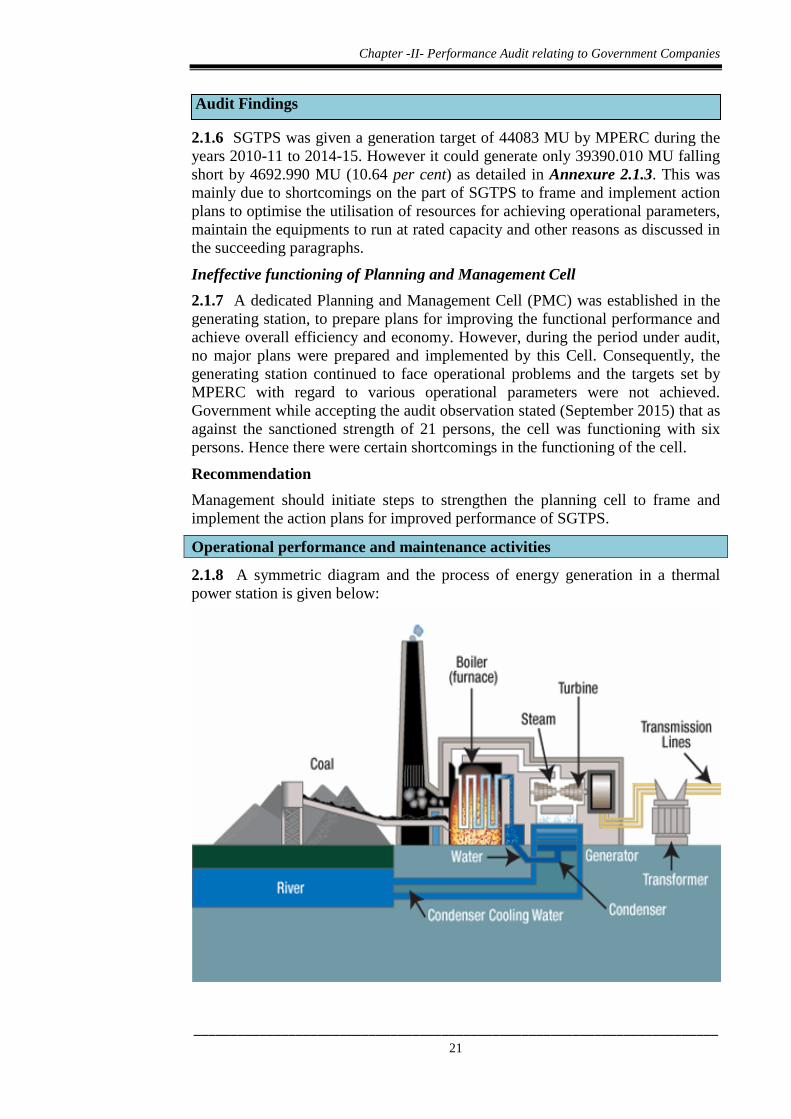
2.1.8 A symmetric diagram and the process of energy generation in a thermal power station is given below:
Report on Public Sector Undertakings for the year ended 31March 2015
________________________________________________________________________22
A review of the operational performance and maintenance activities of PH-I, PH-II and PH-III of SGTPS during 2010-11 to 2014-15 revealed the following shortcomings.
Power House -I
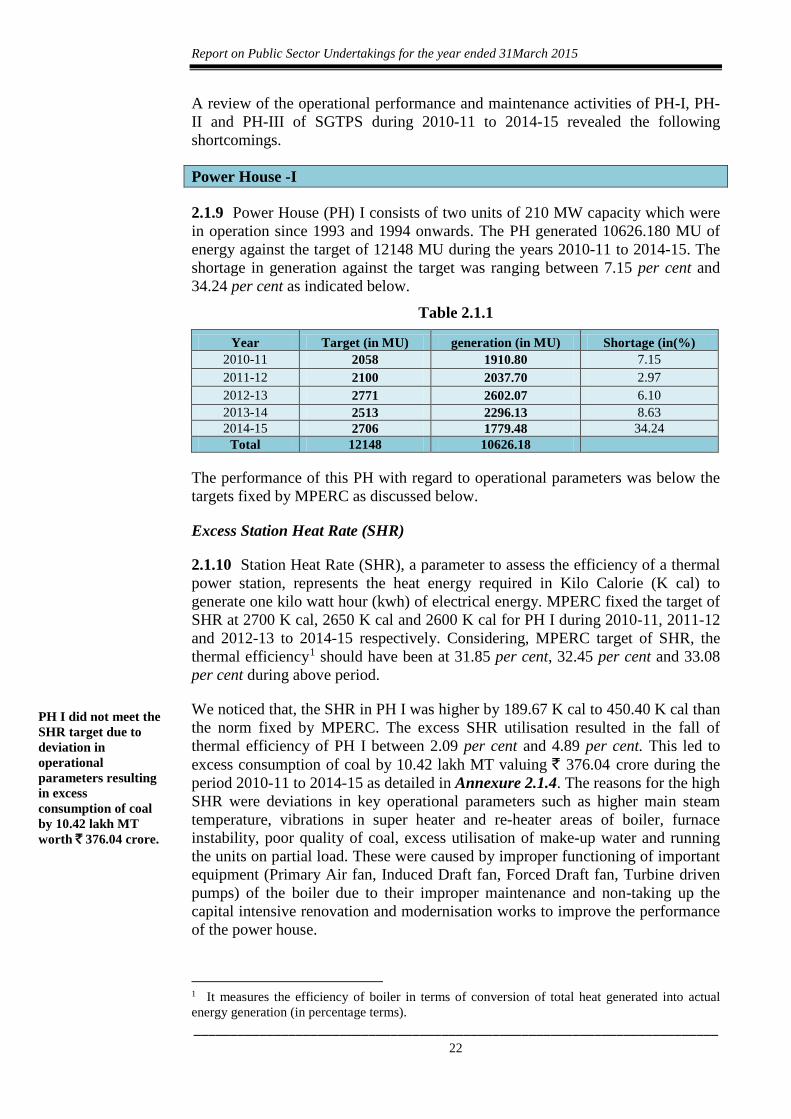
2.1.9 Power House (PH) I consists of two units of 210 MW capacity which were in operation since 1993 and 1994 onwards. The PH generated 10626.180 MU of energy against the target of 12148 MU during the years 2010-11 to 2014-15. The shortage in generation against the target was ranging between 7.15 per cent and 34.24 per cent as indicated below.
Table 2.1.1
Year Target (in MU) generation (in MU) Shortage (in(%) 2010-11 2058 1910.80 7.15 2011-12 2100 2037.70 2.97 2012-13 2771 2602.07 6.10 2013-14 2513 2296.13 8.63 2014-15 2706 1779.48 34.24
Total 12148 10626.18
The performance of this PH with regard to operational parameters was below the targets fixed by MPERC as discussed below.
Excess Station Heat Rate (SHR)
2.1.10 Station Heat Rate (SHR), a parameter to assess the efficiency of a thermal power station, represents the heat energy required in Kilo Calorie (K cal) to generate one kilo watt hour (kwh) of electrical energy. MPERC fixed the target of SHR at 2700 K cal, 2650 K cal and 2600 K cal for PH I during 2010-11, 2011-12 and 2012-13 to 2014-15 respectively. Considering, MPERC target of SHR, the thermal efficiency1 should have been at 31.85 per cent, 32.45 per cent and 33.08 per cent during above period.
We noticed that, the SHR in PH I was higher by 189.67 K cal to 450.40 K cal than the norm fixed by MPERC. The excess SHR utilisation resulted in the fall of thermal efficiency of PH I between 2.09 per cent and 4.89 per cent. This led to excess consumption of coal by 10.42 lakh MT valuing ` 376.04 crore during the period 2010-11 to 2014-15 as detailed in Annexure 2.1.4. The reasons for the high SHR were deviations in key operational parameters such as higher main steam temperature, vibrations in super heater and re-heater areas of boiler, furnace instability, poor quality of coal, excess utilisation of make-up water and running the units on partial load. These were caused by improper functioning of important equipment (Primary Air fan, Induced Draft fan, Forced Draft fan, Turbine driven pumps) of the boiler due to their improper maintenance and non-taking up the capital intensive renovation and modernisation works to improve the performance of the power house.
1 It measures the efficiency of boiler in terms of conversion of total heat generated into actual energy generation (in percentage terms).
PH I did not meet the SHR target due to deviation in operational parameters resulting in excess consumption of coal by 10.42 lakh MT worth ` 376.04 crore.
Chapter -II- Performance Audit relating to Government Companies
________________________________________________________________________23
We further noticed that the Company circulated an operational guideline in April 2014 for reducing the SHR of PHs and to improve the operational efficiency of thermal power stations. The generating station however continued to record excess SHR in the year 2014-15 indicating ineffective implementation of the guidelines.
Government while accepting the audit observation stated (September 2015) that the units of PH I were very old and due to shortage of funds adequate expenditure on repair and maintenance/capital investment could not be done. Hence the SHR remain beyond MPERC prescribed limits.
The fact remains that, MPERC while fixing the operational targets considers the working condition of the units. Hence the prescribed target should have been achieved.
Recommendation: Management should prepare and implement action plans for addressing the deficiencies resulting in non-achievement of MPERC prescribed SHR target.
Excess fuel oil consumption
2.1.11 Thermal generating stations use fuel oil (Heavy Fuel Oil and Light Diesel Oil) as secondary fuel to give support for starting the unit and to attain furnace/flame stability. MPERC had fixed norms of consumption of fuel oil of 1.15 mili letre per kwh for PH I for the period 2010-11 to 2014-15.
We noticed that the units in PH I were consuming excess fuel oil than the limit prescribed by MPERC ranging between 494.050 KL and 3512.580 KL during 2010-11 to 2014-15. The total excess fuel oil consumed during this period was 9573.49 KL worth ` 41.63 crore as detailed in Annexure 2.1.5. It was mainly was due to factors such as operational problems in coal mills, poor bunker feeding, furnace instability, frequent forced outages, frequent hot starts etc. These were caused by not getting the supply of quality coal from mines despite having a separate liaising contract for coordinating with collieries, problems in coal handling plant, and not taking up of capital intensive renovation and maintenance work in the power house.
Government while accepting the audit observation (September 2015) stated that the units in PH I were of old age and due to financial crunch the adequate funds were not provided for capital intensive works and repair/maintenance works hence the targets set by MPERC were not met.
The fact remains that MPERC while fixing the operational norms considers the working condition of the units. Hence the prescribed target should have been achieved.
Excess Auxiliary Consumption
2.1.12 Auxiliary consumption represents the power used internally by generating station for running the equipment/common services. Based on the plant design,
There was excess consumption of fuel oil by 9573.49 KL worth ` 41.63 crore due to furnace instability, frequent forced outages etc.
Report on Public Sector Undertakings for the year ended 31March 2015
________________________________________________________________________24
specifications and working conditions, MPERC specifies norm for auxiliary power consumption.
We noticed that PH I registered excess auxiliary power consumption ranging between 1.11 per cent and 3.20 per cent as compared to MPERC prescribed norm during the period 2010-11 to 2014-15. As a result excess auxiliary power of 212.784 MU valuing ` 63.51 crore was consumed as detailed in Annexure 2.1.6.
As per the Energy Audit Report (February 2011) conducted by M/s. Electrical Research and Development Association (ERDA) during the year 2006-07, many of the auxiliaries were operating below their rated capacities leading to excess auxiliary consumption. We noticed that measures suggested by ERDA for reducing the auxiliary consumption were only partially implemented as of June 2015. As a result there was no marked improvement and the auxiliary consumption still remain high as compared to the MPERC norm.
Government while accepting the audit observation stated (September 2015) that due to old age the efficiency of electrical equipment had reduced and power consumption increased. Further, due to financial crunch the adequate funds were not provided for capital intensive works, repair and maintenance works hence the targets set by MPERC were not met.
The fact remains that MPERC while fixing the operational norms considers the working condition of the units. Hence the prescribed target should have been achieved.
Plant Availability Factor (PAF)
2.1.13 Plant Availability Factor (PAF) represents the availability of a generating unit to produce electricity in a given period. The MPERC has fixed PAF target of 80 per cent for PH I and PH II together during the years 2010-11 to 2014-15.
The generation cost incurred by a PH includes both variable cost and fixed cost. MPERC, after analysis of the elements of the fixed cost submitted by the management, approves the fixed cost that could be recovered in a year through generation tariff. If the actual PAF achieved by a PH was lesser than targeted PAF then the actual recovery of fixed cost would be reduced proportionately for that year.
The details of PAF target fixed by MPERC, actual PAF certified by State Load Dispatch Center (SLDC)2, fixed cost approved by MPERC and actual fixed cost recovered during the period 2010-11 to 2014-15 are as below.
2 SLDC is responsible for maintaining the optimum scheduling and despatch of electricity within
the state and it certifies the actual PAF achieved by each PH. In Madhya Pradesh it is operated by the Transmission Company.
Non achievement of PAF target resulted in under recovery of MPERC approved fixed cost by ` 379.20 crore.
Chapter -II- Performance Audit relating to Government Companies
________________________________________________________________________25
Table 2.1.2
Year
Power House (I &II) PAF (%) Fixed Charges (` in crore)
MPERC Target
PAF certified by SLDC
Fixed Cost Allowed by MPERC
Recovered by company
Under recovery
2010-11 80 53.96 411.87 277.78 134.09 2011-12 80 64.17 378.64 320.28 58.36 2012-13 80 72.24 429.60 387.91 41.69 2013-14 80 74.86 467.94 437.90 30.04 2014-15 80 58.34 424.82 309.80 115.02
Total 2112.87 1733.67 379.20
Source: Information furnished by the company.
It can be seen from the table that the PAF achieved by PH I and II together was ranging between 53.96 per cent and 74.86 per cent only of the targeted PAF. This resulted in under recovery of the fixed cost to the extent of ` 379.20 crore during 2010-11 to 2014-15 in respect of PH I and II. The main reason for non-achieving the targeted PAF by PH I and PH II was excessive forced outages. PH I and II had lost 7875 hours in 231 forced outages and 7807 hours in 247 forced outages respectively during above period. This was caused by improper functioning of various important equipment of the boiler and tube leakages in boiler due to delay in carrying out the annual maintenance of power house and uneven supply of coal during the years etc,
Government while accepting the audit observation stated (September 2015) that apart from forced shut downs the short receipt of coal was also one of the factors for under achievement of PAF.
The reply is not convincing as SGTPS had in place a liaising contract for ensuring the supply of requisite quantity of coal and that PAF target was fixed by MPERC considering the working condition of the plant.
Excess un-burnt coal in bottom and fly ash
2.1.14 In thermal power stations, the coal gets pulverized into fine particles in coal mills and fed through coal pipes into the boiler furnace with the help of primary air. The coal particles fineness and air-fuel ratio in the furnace have impact on the combustion3 of coal and the performance of boiler. Therefore, required coal fineness and air-fuel ratio is to be maintained for achieving the optimum efficiency of boiler. Non-maintenance of required coal fineness and air-fuel ratio results in improper combustion which causes excess release of un-burnt coal particles in the bottom and fly ash. As per the design parameters of boiler in PH I, prescribed limits of un-burnt coal particles in bottom and fly ash were four per cent and less than one per cent respectively.
We noticed from the chemical reports of SGTPS that in PH I there was excess presence of un-burnt coal ranging from 1.15 per cent to 14.80 per cent in bottom ash and from 0.35 per cent to 2.37 per cent in fly ash respectively during the years 2010-11 to 2014-15. This indicates that the combustion in the boilers was not
3 Combustion refers to the rapid oxidation of fuel. Complete combustion of any fuel is possible only in the presence of adequate supply of oxygen.
Report on Public Sector Undertakings for the year ended 31March 2015
________________________________________________________________________26
proper. The main reasons for the improper combustion were time consuming manual system of analyzing the size of coal particles drawn from the coal pipes leading to belated setting of coal mills and improper functioning of the oxygen analysers meant for monitoring the proportion of oxygen in flue gases emitting from the boiler.
To overcome the problem of improper combustion a trial run of laser based online coal sizer to measure the coal fineness was conducted (December 2008) in SGTPS and the results were found satisfactory. However, this equipment was not procured and installed at SGTPS up to 2014-15, the reasons for which were not found on record. This resulted in avoidable loss of 79648.529 MT coal worth ` 27.67 crore as detailed in Annexure 2.1.7.
Government while accepting the audit observation stated (September 2015) that the online coal sizer required to arrest this problem were not installed at SGTPS since in no other power station in the country these were installed in the past.
The reply is not acceptable since, the company itself worked out (March to November 2013) the savings of ` 6.23 crore per annum in coal by installing these required equipments. Further, the trial run (December 2008) of the equipment was found successful by SGTPS itself.
Recommendation: Management should immediately install required equipment to reduce the un-burnt coal in ash and to ensure the optimum utilisation of coal.
Delay in carrying out overhaul and resultant loss of generation
2.1.15 We noticed that despite the units in PH I were very old and have already rendered 20 years life, there was inordinate delay of 10 months in each unit in carrying out the annual overhaul (AOH) (October 2013 to July 2014 for unit-1 and October 2012 to July 2013 for unit-2). This resulted in tripping of unit-1 on 23 occasions causing generation loss of 108.986 MUs worth ` 35.53 crore and tripping of unit-2 on 11 occasions causing generation loss of 47.210 MUs worth ` 16.62 crore.
Government replied (September 2015) that, AOH of the units was planned considering factors like performance of the units, technical requirement and availability of generating capacity to meet the target.
The reply is not convincing as considering the old age and incidence of frequent trippings of the units, the overhaul should be carried as per the schedule. In exit conference (October 2015) Principal Secretary (Energy), directed the Company to adhere to the AOH schedule in order to ensure improved performance of units.
Recommendation: Management should adhere to the scheduled time period for carrying out AOH considering the age of the plant and frequent tripping.
Lack of proper equipment to monitor coal fineness led to improper combustion in boiler and excess un-burnt coal particles in bottom and fly ash resulting in loss of 79648.529 MT coal worth ` 27.67 crore.
Delay in carrying out the annual overhaul resulted in generation loss of 156.196 MU worth ` 52.15 crore.
Chapter -II- Performance Audit relating to Government Companies
________________________________________________________________________27
Frequent failure of coal mills resulting in avoidable generation loss
2.1.16 PH I was provided with 12 coal mills for continuous supply of pulverised coal with requisite fineness into boiler furnace. Of this two coal mills remain standby.
We noticed that coal mills in PH I were out of order for 1008 hours during 2010-11 to 2014-15 and thereby suffered generation loss of 658.976 MU worth ` 204.48 crore. Further, PH I consumed fuel oil of 3094.90 KL worth ` 12.99 crore during the above period to overcome furnace instability caused by frequent outage of coal mills as detailed in Annexure 2.1.8. This poor performance was witnessed in PH I despite having preventive maintenance contracts worth ` 3.09 crore and regular maintenance contracts worth ` 1.82 crore to cater the coal mills.
We further noticed that as against the expected life of 8000 hours, the grinding elements in coal mills had rendered life between 2884 hours and 6464 hours. The main reasons for premature failure of grinding elements and frequent outage of coal mills were flow of foreign materials such as stones, iron particles, nuts and bolts, big hammers along with coal into the coal mills. We also noticed during physical verification of coal mills that the sieve grills provided at the delivery point of coal were in damaged condition allowing easy entry of foreign materials into coal feeders.
Government while accepting the audit observation replied (September 2015) that, the coal mills in PH I were in continuous operation since their installation and no major modification was carried out. It was further stated that, considering the lesser number of hours rendered by grinding mills the metallurgy of the same was being upgraded.
Recommendation: Management should strengthen system of receipt and feeding of coal to avoid entry of foreign materials into coal mills for their improved performance.
Non-replacement of re-heater tubes resulting in generation loss
2.1.17 The re-heater tubes constitute an important component of boiler pressure part. The re-heater tubes in unit-1 of PH I were in operation since commissioning (1993) and rendered their service life of about 20 years. We noticed that leakages in re-heater tubes caused forced shut down of unit-1 during 2010-11 to 2014-15.
We further noticed that in the residual life assessment (RLA) study of unit-2 the consultant recommended (2007-08) for replacement of re-heater tubes once in five years. Though this recommendation was implemented in unit-2, it was not implemented in unit-1 (as of June 2015) despite deteriorating condition of re-heater tubes. The main reason for delay in replacement of re-heater tubes was defective procurement procedure adopted by SGTPS by obtaining offer from one party instead of calling for tenders in the first instance (September 2013) as per the procurement manual (2012-13) of the Company.
Non replacement of re-heater tubes in boiler resulted in forced shut down causing generation loss worth ` 30.45 crore.
Report on Public Sector Undertakings for the year ended 31March 2015
________________________________________________________________________28
During this delayed period, SGTPS incurred avoidable expenditure of ` 3.21 crore on fixed cost and suffered the generation loss of 85.05 MU worth ` 30.45 crore on account of re-heater tube leakages causing forced shut downs.
Government while accepting the audit observation stated (September 2015) that the proposal for replacement of re-heater tubes was under consideration and same would be replaced in the year 2016-17.
Non-installation of gravimetric coal feeders
2.1.18 In order to ensure optimum efficiency of thermal power generating station, right quantities of coal are required to be measured before feeding into boiler furnace. To measure the quantity of coal to be fed into the boiler, PH I and PH II had the system of volumetric coal feeders which was not an accurate method to measure the quantity of coal required for consumption in boiler furnace. On the directive (April 2010) of the Secretary (Energy), GoMP, the BoD of the Company approved (September 2010) proposal for the installation of microprocessor controller (MPC) type gravimetric coal feeders in PH I and II of SGTPS.
The cost of equipment having expected life of 15 years was estimated at ` 30 crore with a payback period of 18 months. The Company estimated three per cent savings (130683 MT per annum) worth ` 21.20 crore4 in coal consumption by installing this equipment. The Company had, however, not placed order for installation of gravimetric coal feeders in PH I and PH II so far (June 2015). This resulted in loss of savings in coal consumption worth ` 63.60 crore5.
Government stated (September 2015) that action had been initiated to install these equipments at SGTPS. The fact remains that Company had failed to install the equipment despite lapse of five years period since the approval of BoD.
Recommendation: Management should install the gravimetric coal feeders immediately considering significant saving of coal and payback period of just 18 months.
Non-installation of bus bar protection system
2.1.19 The electricity generated by PH I and PH II is evacuated through 220 KV bus bar6 and that of PH III it is evacuated through 400 KV bus bar. These two bus bars were interconnected through an inter-connecting transformer (ICT) to transfer the power generated as per grid requirement from time to time. To restrict damage caused by faults in any part of the bus bar, a bus bar protection system was required to be installed to save the remaining parts of the bus bar by way of auto tripping. This protection system was available in 400 kV bus bar but the same was not installed in 220 kV bus bar.
4 ` 21.20 crore (savings in coal consumption 130683 Mt * cost of coal ` 1662 per MT) 5 Savings of ` 21.20 crore * 3 years (from 2012 to 2015) after excluding the work completion period of 18 months 6 Functions of a bus bar mentioned in this report is as per the literature ‘Network Protection & Automation Guide available on website.
Non installation of gravimetric coal feeders in PH I and PH II resulted in excess consumption of coal worth ` 63.60 crore
Chapter -II- Performance Audit relating to Government Companies
________________________________________________________________________29
We noticed that Western Region Load Dispatch Centre (WRLDC) was insisting (since October 2013) for implementation of bus bar protection system in 220 kV bus bar, but SGTPS did not install the system in 220 kV bus bar so far (June 2015).
We further noticed that while igniting the unit-2 of PH I, an accident occurred (13 November 2014) in 220 kV bus bar and in the absence of bus bar protection system all feeders connected to 220 kV bus bar got tripped. This led to the shutdown of units-2 for 99 hours causing generation loss of 10.43 MU worth ` 3.95 crore.
Government stated (September 2015) that the process for installation of bus bar protection system has been initiated and would be installed by the end of this year.
Non up-keeping of plant & machinery resulting in partial generation loss
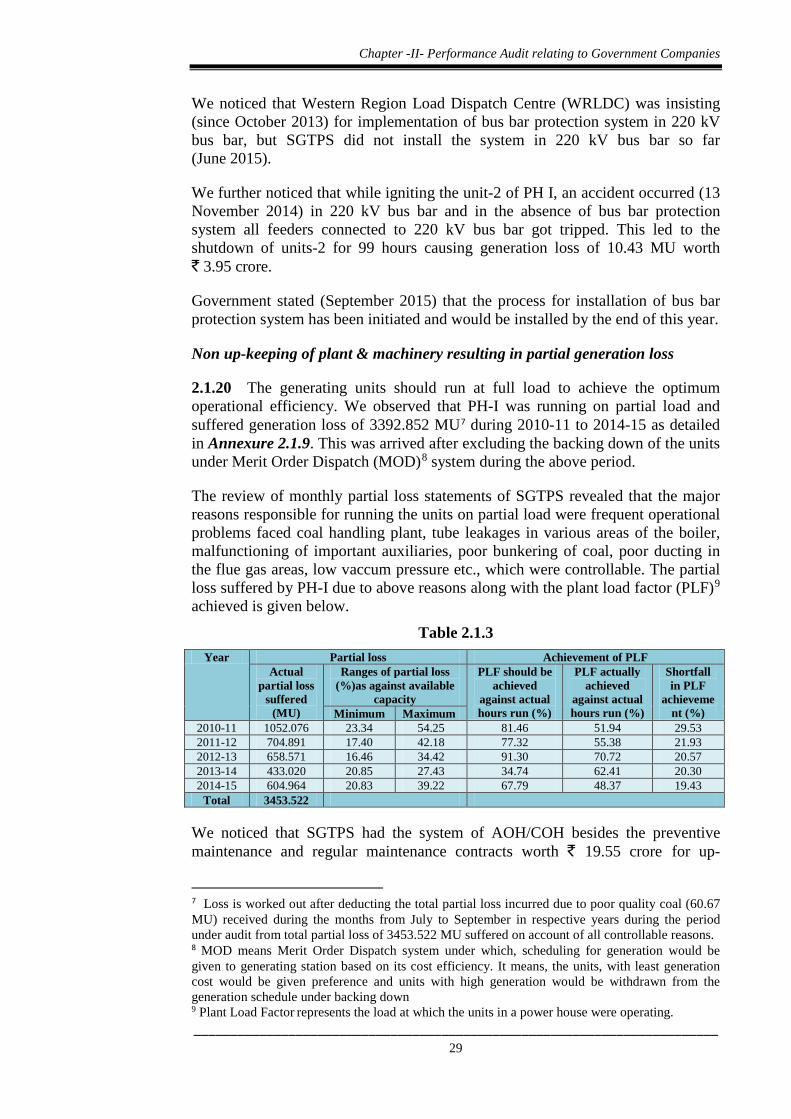
2.1.20 The generating units should run at full load to achieve the optimum operational efficiency. We observed that PH-I was running on partial load and suffered generation loss of 3392.852 MU7 during 2010-11 to 2014-15 as detailed in Annexure 2.1.9. This was arrived after excluding the backing down of the units under Merit Order Dispatch (MOD)8 system during the above period.
The review of monthly partial loss statements of SGTPS revealed that the major reasons responsible for running the units on partial load were frequent operational problems faced coal handling plant, tube leakages in various areas of the boiler, malfunctioning of important auxiliaries, poor bunkering of coal, poor ducting in the flue gas areas, low vaccum pressure etc., which were controllable. The partial loss suffered by PH-I due to above reasons along with the plant load factor (PLF)9 achieved is given below.
Table 2.1.3 Year Partial loss Achievement of PLF
Actual partial loss
suffered (MU)
Ranges of partial loss (%)as against available
capacity
PLF should be achieved
against actual hours run (%)
PLF actually achieved
against actual hours run (%)
Shortfall in PLF
achievement (%) Minimum Maximum
2010-11 1052.076 23.34 54.25 81.46 51.94 29.53 2011-12 704.891 17.40 42.18 77.32 55.38 21.93 2012-13 658.571 16.46 34.42 91.30 70.72 20.57 2013-14 433.020 20.85 27.43 34.74 62.41 20.30 2014-15 604.964 20.83 39.22 67.79 48.37 19.43
Total 3453.522
We noticed that SGTPS had the system of AOH/COH besides the preventive maintenance and regular maintenance contracts worth ` 19.55 crore for up-
7 Loss is worked out after deducting the total partial loss incurred due to poor quality coal (60.67 MU) received during the months from July to September in respective years during the period under audit from total partial loss of 3453.522 MU suffered on account of all controllable reasons. 8 MOD means Merit Order Dispatch system under which, scheduling for generation would be given to generating station based on its cost efficiency. It means, the units, with least generation cost would be given preference and units with high generation would be withdrawn from the generation schedule under backing down 9 Plant Load Factor represents the load at which the units in a power house were operating.
Report on Public Sector Undertakings for the year ended 31March 2015
________________________________________________________________________30
keeping the various equipments of the plant and machinery. Despite having this maintenance mechanism in place, there were frequent problems in various equipments compelling to run the units on partial load resulting in partial generation loss of 3392.582 MU.
Government while accepting the audit observation replied (September 2015) that the efforts were put in place to minimise the partial loss caused by controllable reasons.
Recommendation: The Company should address the factors responsible for running the units on partial load in order to improve their performance.
Overall performance of Power House I:
2.1.21 The above audit findings indicate that Power House I could not meet the generation target during the years 2010-11 to 2014-15 and shortage was ranging from 7.15 per cent to 34.24 per cent. The performance of this PH was not satisfactory as it did not meet the operational parameters set by MPERC and incurred excess expenditure by registering high SHR, fuel oil consumption, auxiliary power consumption and low PAF during the above period. It was caused due to deficient planning to optimise the utilisation of available resources, poor quality of coal, improper maintenance of plant and machinery, non-installation of equipment required to measure accurate quantity of coal and non-taking up of capital intensive renovation and modernisation works in timely manner.
Power House II
2.1.22 Power House II consists of two units of 210 MW capacity each and these units were in operation since 1998 and 1999 onwards. PH II generated 11016.610 MU of energy against the target of 13652 MU during the years 2010-11 to 2014-15. The shortage in production against the target was ranging between 13.98 per cent and 39.63 per cent as indicated below.
Table 2.1.4
Year Target (in MU) Generation (in MU) Shortage (in %) 2010-11 3553 2144.93 39.63 2011-12 2325 2499.00 No shortfall 2012-13 2944 2532.46 13.98 2013-14 2566 2012.73 21.25 2014-15 2274 1827.49 19.64
Total 13652 11016.61
The performance of this PH with regard to operational parameters was below the targets fixed by MPERC as discussed below.
Excess Station Heat Rate (SHR)
2.1.23 Similar to as discussed in paragraph 2.1.10, MPERC fixed the target of SHR for PH II at 2700 K cal, 2650 K cal and 2600 K cal during 2010-11, 2011-12 and 2012-13 to 2014-15 respectively. Considering, MPERC target of SHR, the
Chapter -II- Performance Audit relating to Government Companies
________________________________________________________________________31
thermal efficiency of the PH II should have been at 31.85 per cent, 32.45 per cent and 33.08 per cent during above period.
We noticed that, the SHR was higher than the norm fixed by MPERC. The excess SHR utilisation was ranging between 44.18 K cal and 747.61 K cal during 2010-11 to 2014-15 leading to fall in thermal efficiency ranging between 0.47 per cent and 7.39 per cent. This resulted in excess consumption of coal by 7.57 lakh MT valuing ` 276.36 crore as detailed in Annexure 2.1.10. It was mainly due to deviation in key operational parameters as discussed in paragraph 2.1.10. These were caused by improper functioning of important equipment of the boiler due to delay in carrying out the annual maintenance and non-taking up the capital intensive renovation and modernisation works in timely manner to improve the performance of the power house.
Government while accepting the audit observation stated (September 2015) that the units in PH II were of old age; hence the SHR target was not met.
The fact remains that, MPERC while fixing the operational norms considers the working condition of the units. Hence the prescribed target should have been achieved.
Excess fuel oil consumption
2.1.24 Similar to as discussed in paragraph 2.1.11, MPERC fixed norm for consumption of fuel oil of one ml per kwh for PH II during 2010-11 to 2014-15.
We noticed that the units in PH II registered excess fuel oil consumption ranging between 712.011 KL and 2549.519 KL than the limit prescribed by MPERC during 2010-11 to 2014-15. The total excess fuel oil consumed was 8270.37 KL worth ` 39.48 crore as detailed in Annexure 2.1.11. The reasons responsible for excess consumption of fuel oil in PH II were similar to as discussed in paragraph 2.1.11. These were caused by not getting the supply of quality coal from mines, problems in coal handling plant and non-taking up of capital intensive renovation and maintenance work in the power house.
Government while accepting the audit observation stated (September 2015) that the units in PH II were of old age; hence the excess fuel oil was consumed. The fact remains that, MPERC while fixing the operational norms considers the working condition of the units. Hence the prescribed target should have been achieved.
Excess Auxiliary Consumption
2.1.25 Similar to as discussed in paragraph 2.1.12, based on the plant working conditions, MPERC specified the auxiliary consumption norm at 8.25 per cent, 8 per cent and 9 per cent for PH II, in the years 2010-11, 2011-12 to 2012-13 and 2013-14 to 2014-15 respectively.
We noticed that PH II was registering excess auxiliary power consumption ranging between 1.95 per cent and 2.76 per cent during 2010-11 to 2014-15 resulting in excess auxiliary power consumption by 254.446 MU worth ` 80.91
PH II did not meet MPREC target with regard to auxiliary power consumption and consumed excess power of 254.446 MU worth ` 80.91 crore

Report on Public Sector Undertakings for the year ended 31March 2015
________________________________________________________________________32
crore during this period as detailed in Annexure 2.1.12. The reasons responsible for excess auxiliary power consumption in PH II were similar to as discussed in paragraph 2.1.12.
Government while accepting the audit observation stated (September 2015) that the units in PH II were of old age; hence the auxiliary power consumption target was not met.
The fact remains that, MPERC fixes the operational norms considering the working condition of the units. Hence the prescribed target should have been achieved.
Excess un-burnt coal in bottom and fly ash
2.1.26 Similar to as discussed in paragraph 2.1.14, we noticed from the analysis of chemical reports of the SGTPS that in PH II there was presence of un-burnt coal particles ranging between 3.30 per cent and 12.22 per cent in bottom ash and between 0.7 per cent and 2.15 per cent in fly ash during the years 2010-11 to 2014-15 as against the permissible limit of four per cent in bottom ash and less than one per cent in fly ash. The reasons for excess presence of un-burnt coal particles in bottom and fly ash were similar to those discussed in paragraph 2.1.14.
The required equipment for overcoming this problem were not installed in PH II. The excess presence of unburnt coal in ash resulted in avoidable loss of 32404.596 MT coal worth ` 12.38 crore as detailed in Annexure 2.1.13.
Government while accepting the audit observation stated (September 2015) that the online coal sizer required to arrest this problem was not installed at SGTPS since in no other power station in the country these were installed in the past.
The reply is not acceptable since, as per the Company’s own assessment, there could be huge savings in coal by installing the equipment in PH II.
Delay in carrying out AOH/COH and resultant loss of generation
2.1.27 Similar to as discussed in paragraph 2.1.15, in PH II we noticed that despite old age of units and their being in continuous operation, there was inordinate delay in carrying out AOH/ COH from the scheduled dates. There was a delay of 18 months (from September 2012 to June 2013 and from September 2014 to March 2015) in carrying out AOH of unit-3, leading to tripping of unit on 25 occasions resulting in generation loss of 231.321 MUs worth ` 84.85 crore. Similarly, there was delay of 20 months (from November 2011 to June 2012 and from August 2013 to July 2014) in respect of unit-4 leading to its tripping on 16 occasions resulting in generation loss of 126.824 MUs worth ` 42.56 crore. Government replied (September 2015) that AOH schedule is prepared considering the generating capacity of the Company and demand in the state etc.
The reply is not acceptable as considering the old age and frequent trippings AOH/COH should be carried out as per schedule. Further in exit conference (October 2015), Principal Secretary (Energy) directed the Company to follow the schedule considering the age of plants.
Chapter -II- Performance Audit relating to Government Companies
________________________________________________________________________33
Frequent failure of coal mills resulting in avoidable generation loss
2.1.28 Similar to as discussed in paragraph 2.1.16, PH II (consisting of two units) was provided with 14 coal mills for continuous supply of pulverised coal with requisite fineness into boiler furnace. Of this four coal mills remain standby.
We noticed that coal mills in PH II were out of order for 1032 hours during 2010-11 to 2014-15 and thereby suffered 816.184 MU worth ` 265.42 crore. Further, PH II consumed fuel oil of 2540 KL worth ` 12.84 crore to overcome furnace instability caused by frequent outage of coal mills during this period as detailed in Annexure 2.1.14. The poor performance of coal meals was witnessed in PH II despite having preventive maintenance contracts worth ` 2.09 crore and regular maintenance contracts worth ` 3.25 crore to cater the coal mills.
We further noticed that, as against the expected life of 8000 hours, the grinding elements in coal mills had rendered life between 3259 hours and 7636 hours. The reasons responsible for poor performance of coal mills were similar to those discussed in paragraph 2.1.16.
Government while accepting the audit observation replied (September 2015) that steps would be initiated to improve the performance of coal mills.
Non-installation of bus bar protection system
2.1.29 Similar to as discussed in paragraph 2.1.19, due to non-availability of bus bar protection system in 220kV bus bar, meant for evacuating the power generated by PH-I and II, the impact of accident occurred in November 2014 in the 220 kV bus spread in the entire bus bar and unit-3 and 4 of PH-II tripped for 06 hours, 12 hours respectively causing generation loss of 1.775 MU worth ` 0.67 crore.
Government while accepting the audit observation stated (September 2015) that the bus bar protection system would be installed by the end of the year.
Non up-keeping of plant & machinery resulting in partial generation loss
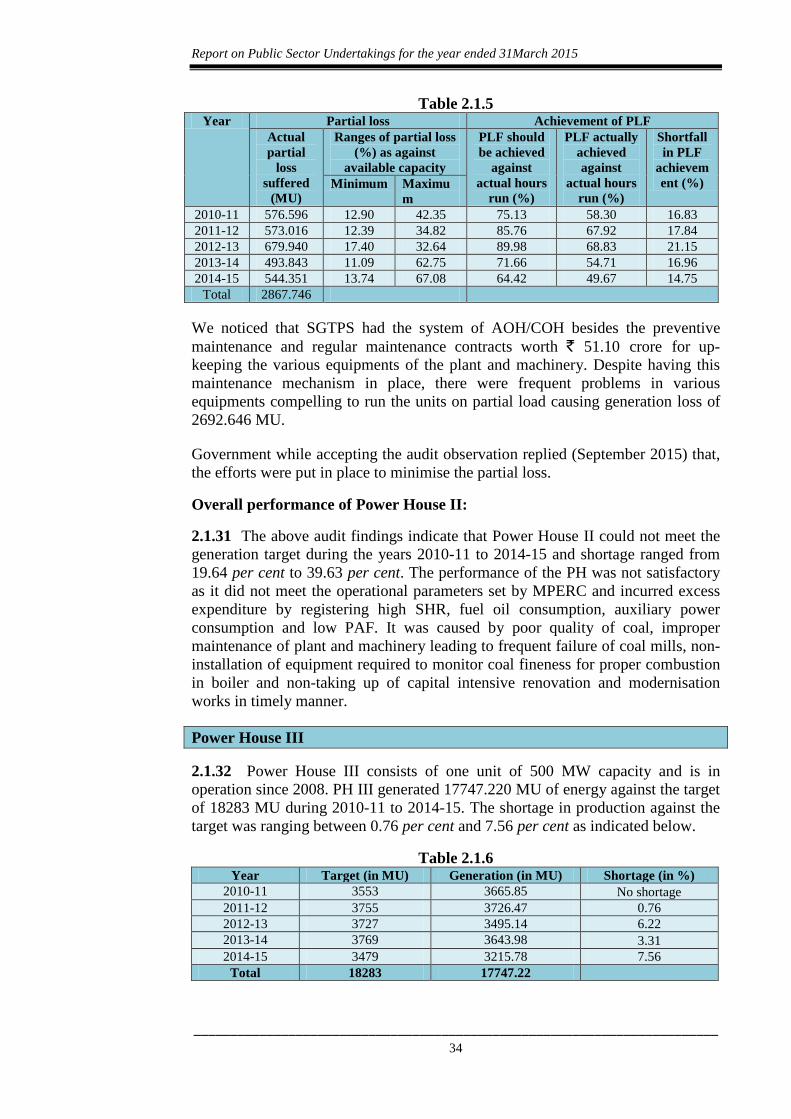
2.1.30 Similar to as discussed in paragraph 2.1.20, we observed that, PH-II was running on partial load resulting in generation loss of 2692.646 MU10 during 2010-11 to 2014-15 as detailed in Annexure 2.1.9. This was arrived after excluding the backing down of the units under Merit Order Dispatch (MOD) system during the above period. The reasons responsible for running the units on partial load were similar to those discussed under paragraph 2.1.20. The partial loss suffered by PH-II along with the plant load factor (PLF) achieved is given below.
10 Loss is worked out after deducting the total partial loss incurred due to poor quality coal (175.10 MU) received during the months from July to September in respective years during the period under audit from total partial loss of 2867.746 MU suffered on account of all controllable reasons.
The frequent failure of coal mills despite having maintenance contracts caused generation loss of 816.184 MU worth ` 265.42 crore.
The operation of plant on partial load caused generation loss of 2692.646 MU during 201-11 to 2014-15.
Report on Public Sector Undertakings for the year ended 31March 2015
________________________________________________________________________34
Table 2.1.5 Year Partial loss Achievement of PLF
Actual partial
loss suffered
(MU)
Ranges of partial loss (%) as against
available capacity
PLF should be achieved
against actual hours
run (%)
PLF actually achieved against
actual hours run (%)
Shortfall in PLF
achievement (%) Minimum Maximu
m 2010-11 576.596 12.90 42.35 75.13 58.30 16.83 2011-12 573.016 12.39 34.82 85.76 67.92 17.84 2012-13 679.940 17.40 32.64 89.98 68.83 21.15 2013-14 493.843 11.09 62.75 71.66 54.71 16.96 2014-15 544.351 13.74 67.08 64.42 49.67 14.75
Total 2867.746
We noticed that SGTPS had the system of AOH/COH besides the preventive maintenance and regular maintenance contracts worth ` 51.10 crore for up-keeping the various equipments of the plant and machinery. Despite having this maintenance mechanism in place, there were frequent problems in various equipments compelling to run the units on partial load causing generation loss of 2692.646 MU.
Government while accepting the audit observation replied (September 2015) that, the efforts were put in place to minimise the partial loss.
Overall performance of Power House II:
2.1.31 The above audit findings indicate that Power House II could not meet the generation target during the years 2010-11 to 2014-15 and shortage ranged from 19.64 per cent to 39.63 per cent. The performance of the PH was not satisfactory as it did not meet the operational parameters set by MPERC and incurred excess expenditure by registering high SHR, fuel oil consumption, auxiliary power consumption and low PAF. It was caused by poor quality of coal, improper maintenance of plant and machinery leading to frequent failure of coal mills, non-installation of equipment required to monitor coal fineness for proper combustion in boiler and non-taking up of capital intensive renovation and modernisation works in timely manner.
Power House III
2.1.32 Power House III consists of one unit of 500 MW capacity and is in operation since 2008. PH III generated 17747.220 MU of energy against the target of 18283 MU during 2010-11 to 2014-15. The shortage in production against the target was ranging between 0.76 per cent and 7.56 per cent as indicated below.
Table 2.1.6 Year Target (in MU) Generation (in MU) Shortage (in %)
2010-11 3553 3665.85 No shortage 2011-12 3755 3726.47 0.76 2012-13 3727 3495.14 6.22 2013-14 3769 3643.98 3.31 2014-15 3479 3215.78 7.56
Total 18283 17747.22
Chapter -II- Performance Audit relating to Government Companies
________________________________________________________________________35
The performance of this PH with regard to operational parameters was below the targets fixed by MPERC as discussed below.
Excess Station Heat Rate (SHR)
2.1.33 Similar to as discussed in paragraph 2.1.10, MPERC fixed the target of SHR for PH III at 2425 K cal per Kwh during the years 2010-11 to 2014-15. Considering, MPERC target of SHR, the thermal efficiency of PH III should have been at 35.46 per cent during this period.
We noticed that, the SHR in PH III was above the norm fixed by MPERC. The excess SHR utilisation ranged between 31 K cal and 227 K cal during 2010-11 to 2014-15 leading to fall in thermal efficiency ranging between 0.44 per cent and 3.03 per cent. This resulted in excess consumption of coal by 5.92 lakh MT valuing ` 200.25 crore as detailed in Annexure 2.1.15. The reasons for excess SHR in PH III were similar as discussed in paragraph 2.1.10. These were caused by improper functioning of important equipment of boiler due to delay in carrying out annual maintenance.
Government while accepting the audit observation stated (September 2015) that there was marginal increase in SHR due to running the unit on partial load.
The fact remain that, PH III did not achieve the MPERC target of SHR that was fixed considering the working condition of the plant.
Plant Availability Factor (PAF) 2.1.34 Similar to as discussed in paragraph 2.1.13, MPERC fixed the PAF target at 85 per cent for PH III during the years 2010-11 to 2014-15. The recovery of fixed cost allowed by MPERC depends on the actual achievement of PAF. The PAF actually achieved by PH III and the fixed cost recovered during above period is indicated below.
Table 2.1.7
Year
Power House III PAF (%) Fixed Charges (` in crore)
MPERC Target
PAF certified by SLDC
Fixed Cost Allowed by MPERC
Recovered by company
Under recovery
2010-11 85 86.46 414.31 417.87 0.00 2011-12 85 93.53 431.91 435.08 0.00 2012-13 85 84.81 379.82 360.43 19.39 2013-14 85 97.76 429.64 461.88 0.00 2014-15 85 80.64 423.82 412.96 10.86
Total 2079.50 2088.22 30.25 Source: Information furnished by the company.
As evident from the table, PH III had not achieved the targeted PAF during the years 2012-13 and 2014-15 resulting in under recovery of MPERC approved fixed cost by ` 30.25 crore. It was mainly due to the loss of 1744 hours in 68 forced outages occurred during the above period. This was caused by improper functioning of various important equipment of the boiler and tube leakages in boiler due to delay in carrying out the annual maintenance of power house and uneven supply of coal during the years etc.
Report on Public Sector Undertakings for the year ended 31March 2015
________________________________________________________________________36
Government replied (September 2015) that, during 2012-13 and 2014-15, the forced outages occurred due to emptying of bunkers and due to poor quality of coal received at SGTPS.
The fact remains that SGTPS had in place the liaising contract to ensure the supply of allocated quantity of proper quality coal during this period. Thus adequate quantity and quality of coal should have been received.
Excess un-burnt coal in bottom and fly ash
2.1.35 Similar to as discussed in paragraph 2.1.14, we noticed from the analysis of chemical reports of SGTPS that in PH III there was presence of un-burnt coal particles ranging between 1.5 per cent and 4.35 per cent in bottom ash and between 0.4 per cent and 1.2 per cent in fly ash during the years 2010-11 to 2014-15 as against the permissible limit of 1.5 per cent in bottom ash and less than one per cent in fly ash. The reasons for the excess presence of un-burnt coal particles in bottom and fly ash were similar to those discussed in paragraph 2.1.14.
The required equipment for overcoming this problem were not installed in PH III. The excess presence of unburnt coal in ash resulted in avoidable loss of 17704.360 MT worth ` 6.06 crore as detailed in Annexure 2.1.16.
Government while accepting the audit observation stated (September 2015) that the online coal sizer required to arrest this problem was not installed at SGTPS since in no other power station in the country these were installed in the past.
The reply is not acceptable since, as per Company’s own assessment, there could be huge savings in coal by installing the equipment.
Improper power scheduling resulting in avoidable payment
2.1.36 As per clause 5 read with clause 6 (2) of Central Electricity Regulatory Commission Regulations, 2009, the unscheduled interchange (UI) charges were payable by the power generator for under-injection of energy within the permissible grid frequency11. Under the said regulations the generator was also allowed to revise the committed energy to be injected into grid up to two hours before the scheduled period.
We noticed (June 2015) that the PH-III of SGTPS injected less energy than the Declared Capacity (DC) into the grid due to less generation of energy during the declared period. Further the PH had not revised the committed energy within the allowed time period. This resulted in paying the avoidable UI charges of ` 15.29 crore during 2012-13 to 2-14-15 as detailed in Annexure 2.1.17.
Government replied (September 2015) that SGTPS had not suffered any loss by not injecting committed quantum of energy into the grid since it had not generated the power and saved the fuel cost.
11 Permissible grid frequency is between 50.3 Hz and 49.2 Hz
PH III failed to inject the energy into the grid as per commitment given and thereby paid avoidable UI charges of ` 15.29 crore.
Chapter -II- Performance Audit relating to Government Companies
________________________________________________________________________37
The reply is not acceptable since the non-generation of energy as per commitment given resulted in loss of potential revenue from the sale of energy to that extent apart from payment of UI charges.
Recommendation:
SGTPS should make efforts to inject energy into grid as per the commitment given from time to time.
Generation loss due to prolonged period of annual overhaul
2.1.37 Similar to as discussed in paragraph 2.1.15, in PH-III, AOH was carried out in August 2012 and next AOH was planned in August 2014. However, the AOH was delayed by six months and was planned to be carried out in February 2015 for 34 days (from 23 February 2015 to 28 March 2015).
We noticed that, due to continuous running of the unit during the delayed AOH period (from August 2014 to February 2015), it suffered severe damage in various parts of boiler and turbine leading to prolonging the AOH period by 14 days which was actually completed on 11 April 2015 as against the scheduled completion date of 28 March 2015. This resulted in the loss of generation of 168 MU12 worth ` 63.67 crore that could have otherwise been avoided.
Government while accepting the audit observation stated (September 2015) that due to excess wear and tear in turbine and due to non availability of spares, the AOH period was prolonged. The fact remains that, the deferment of AOH led to avoidable loss of generation.
Malfunctioning of bus bar protection system
2.1.38 Similar to as discussed in paragraph 2.1.19, though the bus bar protection system was available in 400 kV bus bar meant for evacuation of energy generated by PH III, but due to malfunction of the inter-connecting transformer (ICT) the impact of accident occurred (November 2014) in 220 kV bus bar, spread into 400kV bus bar. The malfunction of ICT led to its belated tripping by 1 minute and 41 seconds after the accident.
As a result, the 400 kV bus bar and all elements connected to 400 kV bus got tripped. This led to the shutdown of PH-III for 24 hours causing generation loss of 5.895 MU worth ` 2.23 crore.
Government while accepting the audit observation stated (September 2015) that steps have been initiated to avoid the recurrence of such incidences in future.
Avoidable tube leakages in the boiler causing generation loss
2.1.39 In PH III, the wind boxes meant for supply of air and pulverised coal into boiler furnace were located very close to the water wall tubes. The proper maintenance of the wind boxes was essential to avoid any possible damage to
12 14 days * 24 days * 0.50 MU per hour = 168 MU
Report on Public Sector Undertakings for the year ended 31March 2015
________________________________________________________________________38
water wall tubes by coming in contact with coal particles released by damaged wind boxes.
We noticed that the wind boxes in PH III were severely damaged due to improper maintenance leading to release of irregular/uneven supply of coal into boiler furnace and this resulted in four water wall tube leakages causing generation loss of 117.43 MU worth ` 39.52 crore.
Government while accepting the audit observation stated (September 2015) that steps were taken and water wall tube leakages have been reduced to minimum level.
2.1.40 PH III was provided with tilting tangential type firing system in boiler and proper maintenance of this advanced system was essential to control the fire ball formation location (in the centre portion of boiler furnace) and to achieve optimum efficiency of the boiler.
We noticed that, six re-heater tube leakages occurred in the right side of the boiler during January 2012 to July 2013 due to overheating of tubes as per the trippings reports of mechanical maintenance (MM) division. This indicates the formation of fire ball at improper location in boiler furnace. Further, as per reports of MM division, the thermocouple probes installed inside boiler to monitor the temperature of flue gases were not functioning during this period hence the overheating in boiler could not be monitored. This resulted in tube leakages which caused forced shut downs leading to generation loss of 103.518 MU worth ` 35.68 crore.
The Central Power Research Institute (CPRI)13 also found (October 2013) that the leakages in tubes were due to high temperature, pressure and due to internal corrosion. This confirms that boiler equipment were not properly maintained which led to tube leakages causing generation loss.
Government while accepting the audit observation stated (September 2015) that steps were taken for proper maintenance of boiler equipments to avoid leakages.
Non up-keeping of plant & machinery resulting in partial generation loss
2.1.41 Similar to as discussed in paragraph 2.1.20, we observed that PH-III was running on partial load resulting in generation loss of 733.689 MU14 during 2010-11 to 2014-15 as detailed in Annexure 2.1.9. This was arrived after excluding the backing down of the units under Merit Order Dispatch (MOD) system during the above period.
13 CPRI is an autonomous body set up in 1960 and working under Ministry of Power, GoI to undertake applied research in electrical power engineering, product development and quality assurance etc. 14 Loss is worked out after deducting the total partial loss incurred due to poor quality coal (62.42 MU) received during the months from July to September in respective years during the period under audit from total partial loss of 796.109 MU suffered on account of all controllable reasons.
The improper maintenance of firing system in the boiler of PH III resulted in frequent trippings and generation loss of 220.948 MU worth ` 75.20 crore.
Chapter -II- Performance Audit relating to Government Companies
________________________________________________________________________39
The reasons responsible for running the units on partial load were similar to those discussed under paragraph 2.1.20. The partial loss suffered by PH-III along with the plant load factor (PLF) achieved is given below.
Table 2.1.8 Year Partial loss Achievement of PLF
Actual partial loss
suffered (MU)
Ranges of partial loss (%)as against available
capacity
PLF should be achieved
against actual hours run (%)
PLF actually achieved
against actual hours run (%)
Shortfall in PLF
achievement (%) Minimum Maximum
2010-11 186.279 0.75 15.06 44.79 41.85 2.94 2011-12 245.441 2.79 18.50 46.07 42.54 3.53 2012-13 67.130 2.43 14.77 41.38 39.90 1.48 2013-14 26.538 3.95 22.99 48.28 41.60 6.68 2014-15 270.721 9.94 19.16 43.40 36.71 6.69
Total 796.109
We noticed that SGTPS had the system of AOH/COH besides the preventive maintenance and regular maintenance contracts worth ` 23.15 crore for up-keeping the various equipments of the plant and machinery. Despite having this maintenance mechanism in place, there were frequent problems in various equipments compelling to run the PH on partial load resulting in generation loss of 733.689 MU.
Government while accepting the audit observation replied (September 2015) that, the efforts were put in place to minimise the partial loss.
Overall performance of Power House III:
2.1.42 The above audit findings indicate that Power House III could not meet the generation target during the years 2010-11 to 2014-15 and shortage ranged from 0.76 per cent to 7.56 per cent. The performance of this PH was satisfactory with regard to targets set by MPERC for fuel oil consumption and auxiliary power consumption, however the PH did not meet the targets of Station Heat Rate and Plant Availability Factor. It was caused due poor quality of coal and improper maintenance of coal firing system in the boiler.
Contract Management in SGTPS
2.1.43 The generating station entered into Fuel Supply Agreement (FSA) (August 2009) with South Eastern Collieries Limited (SECL) for supply of coal to meet its coal requirement and liaising contract (November 2009) for ensuring the smooth supply of quality coal. A review of these contracts revealed the following shortcomings.
Non-realisation of pending claims for oversized stones received along with coal
2.1.44 Under new coal distribution policy (NCDP) notified by the GoI (October 2007) the Company signed (August 2009) Fuel Supply Agreement (FSA) with South Eastern Collieries Limited (SECL) for supply of 64 lakh MT of coal per annum to SGTPS for twenty years.
Report on Public Sector Undertakings for the year ended 31March 2015
________________________________________________________________________40
As per clause 4.6.3 of the FSA, if stones of greater than 250 mm size were received at the generating station, the same shall be segregated and thereafter joint assessment shall be done by the representative of SGTPS and SECL for adjusting the value of oversized stones. Clause 9.1 further specified that the seller shall issue credit notes to the purchaser covering 100 per cent value of stones and other charges such as surface transportation charges, crushing charges, rapid loading charges and railway freight for the quantity of oversized stones received at unloading station. Clause 12 provided for levy of interest for delays in clearing the payments by either party.
We noticed that the claims of ` 3.80 crore lodged against SECL (excluding rail freight of ` 1.27 crore paid) towards oversized stones supplied during the period 2009-10 to 2014-15 were pending. We further noticed that SGTPS was not raising claims of interest for the belated settlement of claims by SECL as provided in the FSA leading loss of interest income by ` 86.88 lakh for that period.
Government replied (September 2015) that, FSA did not provide for refund of railway freight. It was further stated that, for levy of interest on the pending claims a mechanism would be developed.
The reply is not acceptable since clause 9.1 of FSA specifically provided for the inclusion of railway freight while lodging claims against stones supplied by SECL.
Poor performance of liaising contractor resulted in generation loss.
2.1.45 The Company had been awarding liaising contract to coordinate with SECL and Railway to ensure the smooth supply of coal to SGTPS. The scope of work also included ensuring loading of proper quality and allotted quantity of coal at loading points ensuring availability of required number of rakes at mines and monitoring the movement of coal rakes. Subsequent to the introduction of FSA regime (August 2009), the role of a liaising contractor was reduced considerably as the quantity to be supplied was fixed in the FSA.
A review of the terms and conditions of the liaising contract and its implementation by the management revealed the following shortcomings.
• SGTPS was getting coal with foreign material such as mud, soil and big stones/shales etc, indicating inadequate supervision of liaising contractor at loading points. The excess presence of foreign material in coal delayed the unloading of coal rakes at SGTPS ranging between eight hours and 137 hours. This resulted in avoidable payment of heavy demurrages of ` 2.62 crore15 (based on test check of 300 rakes) during 2010-11 to 2014-15.
Government while accepting the audit observation stated (September 2015) that contract did not provide for passing of demurrages incurred to the contractor. The
15 Demurrage charges were calculated after excluding 5 1/2 hours in respect of NTH and WT and 9 hours in respect of OTH. Further the gross demurrage charges were considered without excluding the waival if any, was granted by railways due to non availability of information.
The deficient clauses in the liaising contract and the poor performance of the contractor resulted in receipt of poor quality coal.
Chapter -II- Performance Audit relating to Government Companies
________________________________________________________________________41
fact remains that the contract did not have effective clauses for making the contractor accountable for this issue.
• Clause 4.1.15 of the contract provided for the assessment of impact of poor quality of coal on coal mills and boiler equipment. However, the assessment was not carried out and passed on to the contractor by SGTPS despite poor quality coal received. Instead nominal penalty of ` 2.82 crore alone was imposed.
Government replied (September 2015) that the assessment of damage caused to equipment by poor quality coal was not done as it depends on various other factors. The reply is not acceptable since contract provided for assessment of damage.
• The contract (clause 1.0.3) provided for the payment of materialisation incentive to the contractor for delivering the coal over and above monthly contracted quantity. However, while making payment to the contractor, the quantity of foreign material supplied along with coal was not reduced from the total quantity of coal resulting in undue payment of ` 20.8016 lakh.
Government replied (September 2015) that the contract did not provide for such clause, hence, no deduction was made in this regard. The fact remains that the contract was deficient in this regard thereby granting undue benefit to the contractor.
• Clause 1.0.3 of contract provided for the payment of shortage minimisation charges at the rate of ` 471 per MT to the contractor to the extent coal transit losses were kept below 0.8 per cent. We noticed that the limit of 0.8 per cent for coal loss prescribed by MPERC includes provision for stacking/handling losses also. Hence, the limit for the shortage minimisation charges should have been fixed below 0.8 per cent to take care of stacking/handling loss. As a result of not considering stacking/handling losses the contractor was paid undue amount of ` 1.36 crore17.
Government replied (September 2015) that the transit loss norm fixed by MPERC was not realistic; hence review petition was filed. The reply is not acceptable as MPERC fixed norm considering all the factors.
The above shortcomings indicate poor performance of the contractor and also that the liaising contract was deficient so far as it did not provide for holding the contractor responsible for his failure in discharging the contractual obligations. This resulted in SGTPS facing the problems of receiving poor quality coal, coal with high gross calorific value (GCV) than required, non-placement of adequate number of rakes at mines, high demurrage charges and generation loss of 1153.540 MU worth ` 351.97 crore due to poor quality of coal during 2010-11 to 2014-15 (Annexure 2.1.18).
16 69360 Mt stones received * ` 30 per Mt incentive considering the lowest rate 17 50 per cent of total shortage minimisation charges paid, considering remaining 50 per cent towards stacking/handling losses by allowing 0.8 per cent which cover all other losses.
Report on Public Sector Undertakings for the year ended 31March 2015
________________________________________________________________________42
Thus the objective of engaging liaising contractor at a cost of ` 29.56 crore remained largely unfulfilled as it did not fully serve the intended purpose.
Recommendation: The Company should remove the deficiencies in contract and safeguard its interest by making liaising contractor liable for avoidable expenditure caused due to his failure.
Abnormal coal loss in transit, handling and stacking
2.1.46 It is inherent nature of coal to suffer certain percentage of losses during transit and while in storage/stacking and handling. These losses include both normal and abnormal losses. MPERC has prescribed the limit of 0.8 per cent for coal loss which covers transit loss and other losses incurred in handling and stacking of coal during 2010-11 to 2014-15.
We noticed that the excess loss of coal beyond the normal limit ranged from 0.43 per cent to 2.38 per cent. Stacking/ handling loss alone exceeded the limit of 0.8 per cent specified by MPERC. The excess loss include loss in unloading operation, loss while moving coal from coal handling plant (CHP) to coal mills and from coal mill to boiler furnace and loss due to local burning/fire accidents etc.
We further noticed from write off proposals moved by SGTPS that no specific reasons were given for the abnormal loss of coal and BoD approved the same. Due to the high incidence of abnormal coal losses SGTPS had lost 361086 MT of coal worth ` 112.20 crore as detailed below.
Table 2.1.9
Year
Total qty of coal recd (MT)
Total coal loss incurred (MT)
MPERC limit of coal loss 0.8 % (MT)
Excess coal loss incurred
Average cost of coal per MT
Avoidable loss (`)
1 2 3 4 5 (3-4) 6 7 (5*6) 2010-11 5918499 188416 47348.00 141068.00 2015.86 284373338 2011-12 6219068 116783 49752.54 67030.46 3648.50 244560633 2012-13 6475190 120443 51801.52 68641.48 4009.15 275193989 2013-14 5923193 109336 47385.54 61950.46 3670.95 227417041 2014-15 5227592 64176 41821.00 22355.00 4048.00 90493040 Total 361265 1122038041
Government while accepting the audit observation stated (September 2015) that the coal losses were caused during rainy season and due to stacking of coal in the open yard in the rest of the period.
The reply is not acceptable as the abnormal losses occurred in seasons other than rainy season also and the limit of total loss fixed by MPERC evidently took into account all factors causing loss of coal including stacking loss.
SGTPS lost 3.61 lakh MT coal worth ` 112.20 crore due to excessive handing stacking losses beyond the norm prescribed by MPERC.
Chapter -II- Performance Audit relating to Government Companies
________________________________________________________________________43
Environment compliance by SGTPS
2.1.47 SGTPS, being under the category of major polluting industry was under statutory obligation to comply with norms/provisions of various Acts pertaining to environment compliance.
SGTPS had received two environmental compliance awards i.e. Annual Environment Award for the year 2013-14 from GoMP and One Green Leaf rating award from Centre for Science and Environment, GoI, for the year 2014-15 for its compliance with environmental norms. However from review of records we noticed the following shortcomings.
Non-achieving the ash utilisation targets
2.1.48 Ministry of Environment and Forests (MoE&F) issued revised notification (November 2009) specifying that each thermal power generating station should achieve 100 per cent utilisation of total ash generated by the end of five years (November 2014).
We noticed that SGTPS had not achieved the ash utilisation target by November 2014 and the actual utilisation of total ash was ranging between 57.73 per cent and 79.89 per cent during 2010-11 to 2014-15. This was due to poor response from the prospective user of the ash.
We further noticed that as per amended notification (2009) the whole proceeds of ash sale should be utilised for creating better facilities to improve the ash utilisation. SGTPS realised ` 56.85 crore by sale of ash during the years 2010-11 to 2014-15 but utilized ` 22.83 lakh only for creation of better facilities to improve the ash utilization up to March 2015 which was only 0.40 per cent of sale proceeds. Thus SGTPS, failed to utilise the funds from sale of ash as per MOEF directions.
Government while accepting the audit observation stated (September 2015) that all possible efforts were made to improve the ash utilization; however, the same had not yielded the expected results in achieving the targets. The reply was silent on non-utilisation of ash sale proceeds.
Accumulation of hazardous waste beyond prescribed limits
2.1.49 As per Hazardous Waste (Management & Handling) Rules 2007 hazardous waste material generated could be stored for a maximum period of 90 days and up to a maximum quantity of 10 Metric Tonne (MT) or 10 kilo litre (KL).
We observed that SGTPS had accumulated stock of hazardous waste consisting of 30 KL resins and 16.46 KL lub oil at the end of 2014-15 which was beyond the limit prescribed under the above rules.
Further as per amendment (24 September 2008) of Hazardous Waste (Management and Handling) Rules utilisation of hazardous waste was allowed as supplementary fuel along with coal for energy generation. SGTPS applied for permission (July 2010) from central pollution control board (CPCB) for using the resins in the boilers by mixing with coal at prescribed proportion for heat generation process. However CPCB permission was awaited as of July 2015 and SGTPS continued to store the hazardous materials beyond the limits prescribed.
SGTPS did not meet the ash utilization target during the years 2010-11 to 2014-15.
Report on Public Sector Undertakings for the year ended 31March 2015
________________________________________________________________________44
Government, while accepting the audit observation, stated (September 2015) that it would utilise these materials in the boilers on obtaining the approval from CPCB.
Recommendation: The Company should initiate effective steps to comply with environment norms as per statutes.
Conclusion and Recommendations
Operation and Maintenance of Power Houses
Power House I
• PH I did not meet the generation target during the years 2010-11 to 2014-15 and shortage ranged from 7.15 per cent to 34.24 per cent. The performance of PH was not satisfactory as it did not meet the targets set by MPERC with regard to Station Heat Rate, fuel oil consumption, auxiliary power consumption and Plant Availability Factor. It was caused by improper functioning of important equipment of boiler due to delayed maintenance and non-taking up the capital intensive renovation and modernisation works to improve the performance of PH.
This led to excess consumption of coal by 10.42 lakh MT worth ` 376.04 crore, excess fuel oil by 9573.490 KL worth ` 41.63 crore, excess auxiliary power by 212.784 MU worth ` 63.51 crore and under recovery of MPERC approved fixed cost by ` 379.20 crore. Management should identify and address the operational problems resulting in non-achievement of operational parameters set for PH I by MPERC.
• The coal mills in PH I and II were not provided with gravimetric coal feeders to measure the accurate quantity of coal to be fed into the boilers. The inaccurate measurement of coal fed into boilers resulted in excess coal consumption of 1.31 lakh MT worth ` 21.20 crore per annum. Gravimetric coal feeders should be installed in PH I and II for accurate measurement of coal feeding and to ensure optimisation in coal consumption.
Power House II
• PH II did not meet the generation target during the years 2010-11 to 2014-15 and shortage ranged from 13.98 per cent to 39.63 per cent. The performance of PH was not satisfactory as it did not meet the targets set by MPERC with regard to Station Heat Rate, fuel oil consumption, auxiliary power consumption and Plant Availability Factor. It was caused by improper functioning of important equipment of boiler due to delayed maintenance and non-taking up the capital intensive renovation and modernisation works to improve the performance of PH.
This resulted in excess consumption of coal by 7.57 lakh MT worth ` 276.36 crore, excess fuel oil by 8270.370 KL worth ` 39.48 crore and excess auxiliary power by 254.446 MU worth ` 80.91 crore Management should identify and address the operational problems resulting in non-achievement of operational parameters set for PH II by MPERC.
Chapter -II- Performance Audit relating to Government Companies
________________________________________________________________________45
• The coal mills in PH II were out of order for 1032 hours during the years 2010-11 to 2014-15 despite having preventive and regular maintenance contracts. It was due to premature failure of coal grinding elements as a result of passage of foreign materials into coal mills. This led to generation loss of 816.184 MU worth ` 265.42 crore. Management should take steps to improve the performance of coal mills and avoid their frequent failure causing generation loss.
Power House III
• PH III did not meet the generation target during the years 2010-11 to 2014-15 and shortage ranged from 0.76 per cent to 7.56 per cent. The PH did not meet the target of Station Heat Rate and PAF. It was caused due poor quality of coal and improper maintenance of coal firing system in the boiler.
This resulted in excess consumption of coal by 5.92 lakh MT worth ` 200.25 crore and under recovery of MPERC approved fixed cost by ` 30.25 crore. Management should identify and address the operational problems resulting in non-achievement of operational parameters set for PH III by MPERC.
• Non up-keeping of plant and machinery and various auxiliaries in PH III led to running the plant on partial load. This resulted in generation loss of 733.689 MU. Management should properly upkeep the plant and machinery to avoid running the plant on partial load so as to achieve optimum energy generation.
Contract Management in SGTPS
• The liaising contract awarded by SGTPS for coordinating with collieries and railways was deficient as it did not have effective clauses for holding the contractor responsible for his poor performance. This caused generation loss of 1153.540 MU worth ` 351.97 crore due to receipt of poor quality coal during 2010-11 to 2014-15. The Company should remove the deficiencies in the liaising contract in order to safeguard its interest.
Environmental Compliance by SGTPS
• SGTPS did not meet the 100 per cent ash utilisation target set under notification (November 2009) of GoI as there was poor response from the parties to lift the ash. Further, there was accumulation of hazardous waste material (30 Kilo litre resins and 16 Kilo litre lube oil) beyond the limit (10 Kilo litre) prescribed under the Rules due to non-disposal of the same. Management should ensure adherence to environmental norms prescribed under relevant statutes.
Report on Public Sector Undertakings for the year ended 31March 2015
46
2.2 Working of Madhya Pradesh State Agro Industries Development Corporation Limited
Executive Summary
Introduction Madhya Pradesh State Agro Industries Development Corporation Limited, Bhopal (Company) was incorporated in March 1969 as a Joint Venture Company of Government of Madhya Pradesh (GoMP) and Government of India (GoI) for the promotion of agriculture and agro industries in the State. During the period from 2010-11 to 2013-14 the sales/turnover of the Company ranged from ` 940.02 crore to ` 1293.77 crore and net profit ranged from ` 15.16 crore to ` 51.20 crore. A Performance Audit was conducted to assess the performance of the Company during 2010-15 covering various aspects such as financial management, trading and production activities, performance of Mechanised Agriculture Farm (MAF) and effectiveness of monitoring and internal control mechanism. Following are the main audit findings.
Financial Management
• Due to non development of common codes of account heads, the Company was unable to consolidate accounts of its District Offices in a timely manner. This has resulted in delayed finalisation of annual accounts. As of 31 October 2015 annual accounts for the year 2013-14 and 2014-15 were in arrears.
(Paragraph 2.2.7)
• As on 31 March 2015 trade receivables of ` 231.44 crore were outstanding, out of which receivables of ` 8.65 crore were pertaining to more than three years. Further the adverse (credit) balances in trade receivables were not reconciled, which increased from ` 10.09 crore in 2010-11 to ` 22.37 crore in 2013-14.
(Paragraph 2.2.9) Planning
• The Company had not prepared any perspective and strategic plan for driving its activities for attainment of objectives. The annual Memorandum of Understandings (MoUs) with GoMP containing financial/commercial targets for the years 2010-11 to 2013-14 were finalised belatedly. Further, MoU for the year 2014-15 was not finalised. Thus, the purpose of entering into MoU with the GoMP to optimally drive the operations of the Company was defeated.
(Paragraphs 2.2.12 and 2.2.13) Operational Activities
• The Company carried out expansion of Ready to Eat production unit and also procured plant for production of khichadi during 2009-11. However, due to non-construction of additional storage space along-with the expansion, the Company failed to operationalise Khichadi production plant even after lapse of four years from its procurement and incurred avoidable expenditure of ` 20.96 lakh on transportation of raw material from alternate location due to lack of sufficient storage space at RTE unit.
(Paragraph 2.2.17)
Chapter -II- Performance Audit relating to Government Companies
47
• The capacity utilisation of Bio-fertilizers plant of the Company declined from 62 per cent in 2010-11 to 35 per cent in 2014-15 due to failure of the Company to develop a marketing strategy to promote the sale of Bio-fertilizers and dependence on Government agencies for sale of Bio-fertilizers.
(Paragraph 2.2.19)
• MAF was engaged in traditional farming activities and did not undertake the activities as per its objectives i.e. production of seeds, demonstration of cultivation methods and training to farmers. Further, the utilisation of agricultural land ranged between 22.27 per cent to 48.41 per cent in Kharif season and 41.42 per cent to 51.85 per cent in Rabi season during 2010-11 to 2014-15 due to non provision of irrigation facility. Due to under-utilisation of the allotted land by MAF, GoMP transferred 679.89 hectares land to Commerce, Industries and Employment Department in October 2012.
(Paragraphs 2.2.20 and 2.2.22) Monitoring and Internal Control
• The internal control mechanism was deficient as there was no system for watching the timely utilisation of grants/subsidy and timely disposal of non-moving stores and unserviceable assets. Due to non-holding of regular meetings of Board of Directors of the Company, the timely decision making and monitoring process was hampered.
(Paragraphs 2.2.25 and 2.2.26)
Introduction
2.2.1 Madhya Pradesh State Agro Industries Development Corporation Limited, (Company) Bhopal was incorporated in March 1969 as a Joint Venture Company of Government of Madhya Pradesh (GoMP) and Government of India (GoI) for the promotion of agriculture and agro industries in the State. The Company is under administrative control of Department of Horticulture and Food Processing, GoMP.
The main objectives of the Company are to accelerate and increase agriculture production, contribute to the production of principal and supplementary food and contribute to the agro-industrial development of Madhya Pradesh.
The Company is engaged in production and trading of Ready to Eat (RTE) products (Gehu-Soya Barfi, Aata-Besan Laddu, Halwa, Bal-Aahar and Khichadi), trading of various agricultural implements and inputs, cultivation of various crops/horticulture/ nursery items at Mechanised Agricultural Farm and production and sales of bio-fertilizers. Activity-wise sales/turnover of the Company is given in Table 2.2.1.
Report on Public Sector Undertakings for the year ended 31March 2015
48
Table 2.2.1 (` in crore) Particulars 2010-11 2011-12 2012-13 2013-141
Turnover % Turnover % Turnover % Turnover %
Ready to Eat Products 485.11 51.60 635.43 50.83 655.99 53.49 671.68 51.92 Agricultural Implements and Inputs 451.18 48.00 609.69 48.77 564.17 46.00 616.17 47.63
Crops/Horticulture/ Nursery Items 0.93 0.10 1.25 0.10 2.73 0.23 1.91 0.15
Bio-fertilizers 2.80 0.30 3.76 0.30 3.48 0.28 4.01 0.31
TOTAL 940.02 100 1250.13 100 1226.37 100 1293.77 100
During the four years from 2010-11 to 2013-14 the sales/turnover of the Company ranged from ` 940.02 crore to ` 1293.77 crore and net profit ranged from ` 15.16 crore to ` 51.20 crore.
Organisational setup
2.2.2 The management of the Company is vested in the Board of Directors (BoD). As on 31 March 2015, there were seven directors, of whom six including Chairman and Managing Director were nominated by GoMP and one director by the GoI.
The Managing Director is chief executive of the Company who is assisted by two General Managers, four Deputy General Managers and seven Regional Mangers. The Company has a Head Office at Bhopal, seven Regional Offices2 (ROs) and 50 District Offices (DOs). The Company owns a Mechanised Agricultural Farm (MAF) at Babai, an RTE production unit at Badi and Bio-fertilizer Plant (BFP) and Workshop both at Bhopal which are headed by respective in-charge. The organization chart of the Company is given in Annexure-2.2.1.
Besides this, the Company is holding 30 per cent shares in three Joint Venture (JV) Companies with private parties (M.P. Agro Nutri Foods Limited, Indore; Madhya Pradesh Agro Food Industries Limited, Mandideep and M.P. Agrotonics Limited, Mandideep) to meet the demand of RTE products from Woman and Child Development Department (WCDD).
Audit Objectives
2.2.3 The Performance Audit was undertaken to assess whether;
• Sound financial management system was in place;
• Plans were prepared and implemented for driving the activities of the Company in consonance with its objectives;
• Operations of the Company including farming, production, rendering of products and services were carried out efficiently and economically; and
• Internal control and monitoring mechanism was adequate and commensurate with the size and nature of the organisation.
1 Annual accounts of the year 2013-14 is provisional accounts as furnished by the Company. 2 Bhopal, Indore, Ujjain, Gwalior, Jabalpur, Sagar and Satna
Chapter -II- Performance Audit relating to Government Companies
49
Audit Criteria
2.2.4 The audit criteria for the performance audit was drawn from the following sources:
• Policies, guidelines & directions framed or issued from time to time by GoMP and GoI viz. Food Processing Policies;
• Various schemes objectives and targets/Memorandum of Understandings (MoUs) for the supply of RTE products;
• Memorandum of Association, Articles of Association of the Company; and
• Agenda and minutes of the board meetings.
Scope and methodologies of Audit
2.2.5 The present Performance Audit was conducted during April to June 2015 to assess the performance of the Company during 2010-11 to 2014-15 covering Head Office (HO), all the seven ROs, 17 DOs (i.e. 34 per cent of the total 50 DOs based on geographical distribution in the State), MAF, RTE production unit and BFP of the Company. We also reviewed the action taken by the management on the recommendations of COPU on the previous Performance Audit on the working of the Company for the period from 2004-05 to 2008-09 included in the Report of the Comptroller and Auditor General of India (Commercial) for the year ended 31 March 2009, GoMP and observations in this regard have been included in the present report.
We explained the audit objectives, audit criteria, scope and methodologies of audit to the Government/Company during entry conference held on 8 April 2015. Audit findings were reported to the Company and Government in August 2015. Replies of the Government and Company were received in October 2015. Audit findings were discussed with Principal Secretary and Managing Director of the Company in exit conference held on 14 October 2015. Views and replies of the Company and Government have been suitably incorporated in the Report.
Audit Findings Audit findings are discussed in the succeeding paragraphs.
Financial Management
Financial position and working results
2.2.6 The Company had finalised (October 2015) its accounts up to 2012-13 and provisional accounts for the year 2013-14. The financial position and working results of the Company for the years 2010-11 to 2013-14 are given in Annexure-2.2.2 and Annexure-2.2.3.
A review of financial position and working results of the Company for the years 2010-11 to 2013-14 revealed that the turnover of the Company increased from ` 940.02 crore in 2010-11 to ` 1293.77 crore in 2013-14. Similarly net profit of the Company increased from ` 15.16 crore in 2010-11 to ` 51.20 crore in 2013-14.
Report on Public Sector Undertakings for the year ended 31March 2015
50
The turnover mainly includes value of supply of RTE products (ranging from 50.83 per cent to 53.49 per cent) on demand of the Government and sale of agricultural implements (ranging from 46.00 per cent to 48.77 per cent) to farmers mostly on subsidy by the Government as detailed in Table 2.2.1. The sale prices include profit margin of 10 per cent in case of own production of RTE products, 2.5 per cent in case of supply of RTE products through JVs and varying per cent on agriculture implements. Thus, the Company had assured profit on its operations.
However, the return on capital employed drastically decreased from 98.65 per cent in 2010-11 to 38.93 per cent in 2012-13 and marginally increased to 46 per cent in 2013-143, indicating fall in performance of the Company. Government stated (October 2015) that the return on capital employed decreased due to increase in the shareholders fund. The fact remains that there was no proportionate increase in return on capital employed along with increase in capital employed.
Delay in finalisation of Annual Accounts
2.2.7 As per Section 210 of the Companies Act 1956 and Section 129(2) of the Companies Act 2013 (applicable from April 2014), every Company has to finalise and place in the Annual General Meetings its Annual Financial Statements within six month of the end of the financial year.
The Company has not finalised its accounts for the years 2013-14 and 2014-15 so far (October 2015). We observed that accounting of District Offices (DOs) of the Company was being done using an accounting software i.e. Tally.ERP 9. However, the compilation/consolidation of the accounts of these DOs in HO of the Company was being done on manual basis, though the accounting software provided facility of integration of accounts as common codes for account heads were not developed. This was causing delay in finalisation of accounts.
Government stated (October 2015) that the accounts for the year 2013-14 is under finalisation and services of professionals are being taken for removal of difficulties in consolidation through accounting software.
Recommendation: The Company should develop common codes of account heads to timely finalise its annual accounts
Deficient management of surplus funds
2.2.8 The Company had cash and cash equivalents amounting to ` 182.07 crore, ` 183.22 crore, ` 251.44 crore, ` 281.12 crore and ` 248.11 crore as at the end of the last five years from 2010-11 to 2014-15 respectively. Company invests its surplus funds in short term deposits.
We noticed that the Company does not have mechanism for periodically identifying surplus funds by preparing cash budget/forecast for investment in long term deposits for earning better returns. The funds amounting to ` 134.03 crore,
3 Based on provisional accounts for the year 2013-14.
The Company invested surplus funds in short term deposits without inviting competitive offers.
Due to non-development of common codes of account heads there was delay in consolidation and finalisation of accounts.
Chapter -II- Performance Audit relating to Government Companies
51
` 171.86 crore, ` 228.29 crore, ` 305.35 crore4 and ` 291.31 crore5 available at the end of last five years from 2010-11 to 2014-15 respectively were invested mainly in short term fixed deposits without inviting competitive offers. Thus, the Company did not ensure optimum returns on investment of surplus funds.
Government accepted the audit observation and stated (October 2015) that detailed instructions have been issued to DOs for the transfer of surplus funds to HO and Fixed Deposits would be made after inviting the competitive rates at HO level.
Recommendation: The Company should prepare cash budget regularly to find out cash surplus for investment in fixed deposits on long term basis to optimize the returns.
Deficiencies in management of trade receivables
2.2.9 The Company procures agricultural implements from various producers/ agencies after entering into rate contracts and supplies these implements to farmers/departments of GoMP through its DOs. The amount outstanding against the purchasing departments is reflected in accounts as trade receivables. The trade receivables of the Company stood at ` 231.44 crore at the end 2014-15 as per provisional figures.
From the review of the trade receivables we observed that:
• Out of the total outstanding trade receivables of ` 231.44 crore as on 31 March 2015, ` 8.65 crore was outstanding for more than three years and ` 15.99 crore was outstanding for more than one year and less than three years. The trade receivables includes amount of ` 68.73 crore (29.69 per cent) from Agriculture department. The receivables could not be recovered mainly due to inadequate records in respect of trade receivables.
• There were adverse (credit) balances in the accounts under the head trade receivables of ` 10.09 crore, ` 16.58 crore, ` 20.88 crore and ` 22.37 crore at the end of 2010-11, 2011-12, 2012-13 and 2013-14, respectively, which were not reconciled. Therefore, trade receivables balances shown in the accounts were not reliable. Thus, there are risks of long overdue receivables turning bad besides the probability of fraudulent transactions due to non-reconciliation or confirmation of balances from receivables.
In the exit conference (October 2015) Managing Director stated that the steps would be taken for recovery/adjustment of trade receivables during finalisation of accounts for the year 2014-15.
4 There was negative balance in current account under ‘cash and bank balance head; hence FDs were more than the net cash and bank balance. 5 This is as per the information provided by the management.
Adverse balances under the head trade receivables were not reconciled.
Report on Public Sector Undertakings for the year ended 31March 2015
52
Recommendation: The Company should prepare an action plan for reconciliation of trade receivable to identify actual amount of trade receivable and to ensure their timely realisation.
Unutilised balance of subsidies and advances
2.2.10 The Company is engaged in trading of agricultural implements, fertilizers, pesticides, installation of bio-gas plants and implementation of schemes for food processing, horticulture and agriculture development, for which it receives subsidies/advances from the Government for direct disbursement to beneficiaries or for subsidising products etc.
We observed that subsidies and advances amounting to ` 34.92 crore (Annexure-2.2.4) were remaining unutilised as at the end of March 2014. Out of this, ` 3.64 crore (Annexure-2.2.5) was pending for utilisation/disbursement since 2007-08. The Company had not reconciled subsidy received and passed on to beneficiaries. In absence of reconciliation, amount of subsidies/advances remaining unutilised were not ascertained for utilisation or surrender to the Government.
Government accepted the audit observation and stated (October 2015) that efforts would be made to settle pending entries with respective credits and the unutilised amount would be returned to concerned department.
Recommendation: The Company should reconcile and identify actual amount of subsidies and advances remaining unutilised and to take action for its utilisation or surrender to the Government.
Avoidable payment of Entry Tax
2.2.11 The Company is engaged in trading of water tankers which are subject to levy of Entry Tax by GoMP. The approved purchase price (as fixed by MARKFED) of water tankers was inclusive of Entry Tax at the rate of one per cent of the cost.
We observed that during 2010-11 to 2013-14, eleven suppliers of water tankers have collected Entry Tax of ` 1.16 crore from the Company on purchase of water tankers, which was not further paid to the Commercial Tax Department by the suppliers.
Government stated (October 2015) that the Company withheld the amount of ` 1.16 crore from suppliers’ bills and instructions for not allowing Entry Tax in future at DO level have been issued. Fact remains that the final adjustment of amount withheld from suppliers was pending in the books of accounts.
Subsidies/advances amounting to ` 3.64 crore were pending for settlement since 2007-08.
Chapter -II- Performance Audit relating to Government Companies
53
Planning
Absence of Long Term and Strategic Planning
2.2.12 The Company is engaged in trading activities of agriculture implements and inputs. With a view to maintain and expand its market share in the changing business environment, it needs a long term to medium term perspective and strategic plan in respect of these activities to compete with the private players as well as the other government agencies. We, however, observed that the Company has not prepared any perspective and strategic plan. The Company prepared only the projection of business and budget estimates for the ensuing years on annual basis. Besides, targets are set in the MoUs with GoMP on annual basis.
Deficiencies relating to Memorandum of Understanding with GoMP
2.2.13 Every Public Sector Undertaking in the State is required to enter into MoU with GoMP every year, detailing the activities proposed to be undertaken in the ensuing year. The MoUs entered in to by the Company with GoMP mainly include financial/commercial targets and further, evaluation of the achievements against previous year targets. In this regard following deficiencies were noticed:
(a) Delay in entering MOUs:
MoU is required to be signed by the Public Sector Undertakings before the commencement of the relevant year. However, we observed that MoUs with GoMP for the years 2010-11, 2011-12, 2012-13 and 2013-14 were signed belatedly in the month of February 2011, February 2012, January 2013 and October 2013 i.e. at the fag end of the relevant financial year. MoU for the year 2014-15 was not finalised even though the financial year is long over. Thus, the purpose of entering MoU with the GoMP to optimally drive the operations of the Company was entirely defeated.
Government replied (October 2015) that the MoU is finalised by a taskforce established by the GoMP and the Company follows the same MoU. Fact remains that long delays in finalisation of MoUs defeated vary purpose of entering into MoUs.
(b) Non-fixation of activity-wise physical targets:
The targets fixed in the MoUs were not in physical terms of the different activities being undertaken by the Company. The financial targets in terms of overall business and achievements there against for the period 2010-11 to 2013-14 are given in Table 2.2.2.
Table 2.2.2 (` in lakh) Particulars 2010-11 2011-12 2012-13 2013-14 Targets 78000 110000 142000 142400 Achievements (as per MOU) 101700 134806 133208 139852 Achievement (%) 130 123 94 98
As already pointed out above, the entire target fixation process was rendered meaningless because the targets were fixed belatedly, generally in the last quarter
There was inordinate delay in finalisation of MoUs with GoMP for setting financial/ commercial targets.
Report on Public Sector Undertakings for the year ended 31March 2015
54
of the relevant year. Despite this, as seen from the table above, the Company failed to fully achieve the targets during the years 2012-13 and 2013-14. Further, it was also observed that achievements mentioned in MOUs differ with the certified/provisional annual accounts.
Further, we observed that following significant targets in MOUs were also not achieved: • As planned in the MoU (2013-14), the Company could not expand its business in the open market and it was largely dependent on the sale of RTE products to WCDD which alone constituted 52 per cent of Company’s turnover during 2013-14.
• In the MoUs for the years 2010-11 to 2013-14, the Company planned for better utilisation of non-performing assets. The COPU suggested (March 2012) for establishment of a new plant on the land available after disposal of existing non-functional Organic Manure Plant at Gwalior. However, we noticed that the plant could not be disposed of even after lapse of 15 years since it became non-functional. Consequently the land available at plant site could not be used for setting up a new plant or any other purpose. During the exit conference the GoMP while accepting audit observation stated (October 2015) that it has been decided to auction the material at plant and to handover the plant site to Municipal Corporation, Gwalior.
• The Company had targeted in the MoUs for years 2011-12 to 2013-14 for commercial utilisation of vacant land of Putali-ghar and Indrapuri, Bhopal to generate income from these assets. We noticed that no action was taken in this regard.
• In the MoU for the year 2010-11, the Company planned for disposal of hazardous waste lying at its pesticides formulation plant, Bina since 1991-92. The COPU also recommended (March 2012) for disposal of hazardous waste. However, hazardous waste had not been disposed off so far (October 2015).
Government stated (October 2015) that the efforts are going on for proper disposal of hazardous waste. Fact remains that even after recommendation of COPU, Company failed to dispose off the hazardous waste.
Evidently, the planning process in the Company was flawed as no long term strategic planning system was in place and MoUs with GoMP for steering its continuing activities of trading in agricultural implements, farming, RTE products and production of bio-fertilizers were finalised belatedly at the fag end of the respective years. Therefore the Company was operating on ad-hoc basis.
Government stated (October 2015) that as per the availability of resources, requirement of Government schemes and demand raised by the Departments, the Company prepares its operational plans as well as production plan for BFP and MAF.
Reply is not acceptable as for the effective conduct of activities of the Company on continuing basis, long term planning was required. In absence of planning capacity of bio-fertilizers plant was not utilised to the full extent and total land
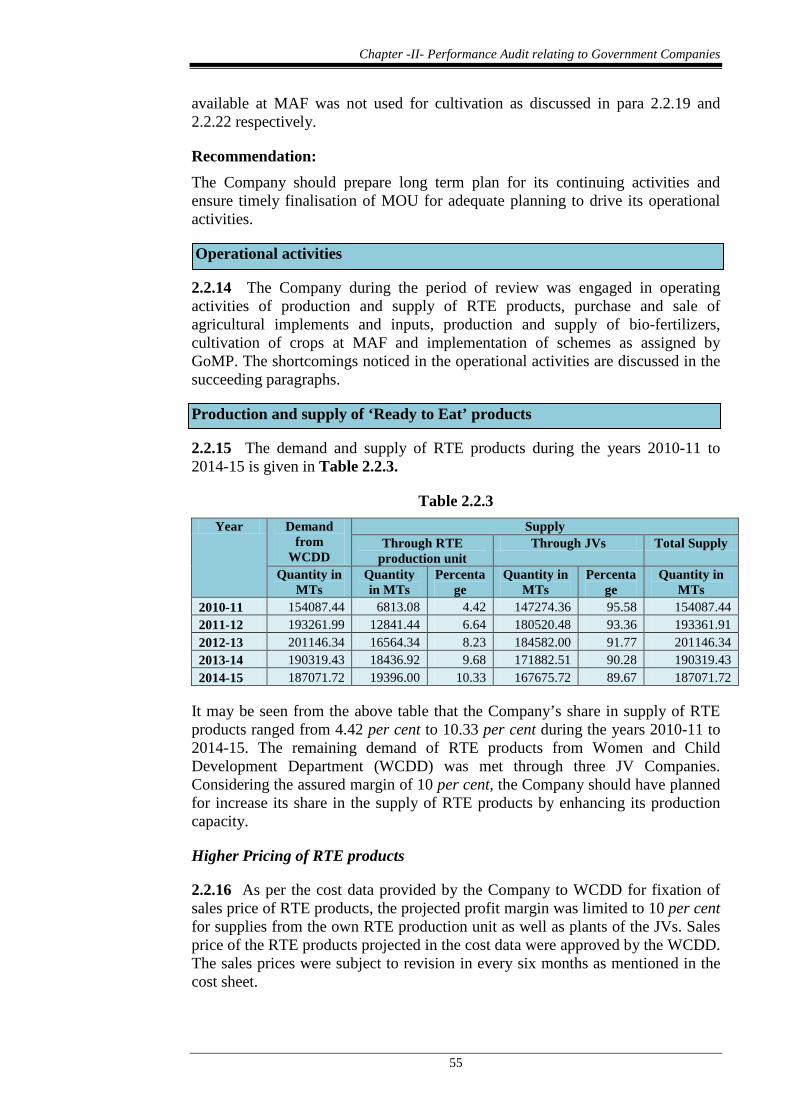
Chapter -II- Performance Audit relating to Government Companies
55
available at MAF was not used for cultivation as discussed in para 2.2.19 and 2.2.22 respectively.
Recommendation: The Company should prepare long term plan for its continuing activities and ensure timely finalisation of MOU for adequate planning to drive its operational activities.
Operational activities
2.2.14 The Company during the period of review was engaged in operating activities of production and supply of RTE products, purchase and sale of agricultural implements and inputs, production and supply of bio-fertilizers, cultivation of crops at MAF and implementation of schemes as assigned by GoMP. The shortcomings noticed in the operational activities are discussed in the succeeding paragraphs.
Production and supply of ‘Ready to Eat’ products
2.2.15 The demand and supply of RTE products during the years 2010-11 to 2014-15 is given in Table 2.2.3.
Table 2.2.3 Year Demand
from WCDD
Supply Through RTE
production unit Through JVs Total Supply
Quantity in MTs
Quantity in MTs
Percentage
Quantity in MTs
Percentage
Quantity in MTs
2010-11 154087.44 6813.08 4.42 147274.36 95.58 154087.44 2011-12 193261.99 12841.44 6.64 180520.48 93.36 193361.91 2012-13 201146.34 16564.34 8.23 184582.00 91.77 201146.34 2013-14 190319.43 18436.92 9.68 171882.51 90.28 190319.43 2014-15 187071.72 19396.00 10.33 167675.72 89.67 187071.72
It may be seen from the above table that the Company’s share in supply of RTE products ranged from 4.42 per cent to 10.33 per cent during the years 2010-11 to 2014-15. The remaining demand of RTE products from Women and Child Development Department (WCDD) was met through three JV Companies. Considering the assured margin of 10 per cent, the Company should have planned for increase its share in the supply of RTE products by enhancing its production capacity.
Higher Pricing of RTE products
2.2.16 As per the cost data provided by the Company to WCDD for fixation of sales price of RTE products, the projected profit margin was limited to 10 per cent for supplies from the own RTE production unit as well as plants of the JVs. Sales price of the RTE products projected in the cost data were approved by the WCDD. The sales prices were subject to revision in every six months as mentioned in the cost sheet.
Report on Public Sector Undertakings for the year ended 31March 2015
56
We observed that the sale price for RTE products were fixed in May 2009 which was revised only once in August 2013 during 2010-11 to 2014-15 instead of revision in every six months period. We further observed from the cost data provided by the production unit, that actual profit margin earned by the own RTE production unit of the Company ranged from 23.44 per cent to 29.35 per cent (except 6.41 per cent during the year 2012-13) which was significantly higher than the approved margin of 10 per cent during 2010-11 to 2013-14.
We further analysed that while fixing sale price, non-consideration of sale value of gunny bags of the raw material, inclusion of non-applicable taxes, excess distance was considered for transportation cost of raw material and cost for fuel was taken on higher side resulting in fixation of higher sale price of RTE products. The higher profit margin on these elements earned by the Company worked out to ` 16.94 crore during the years 2010-11 to 2013-14. Consequently Government exchequer was overburdened to that extent.
Since the sales price fixed was also applicable on the supplies made by JVs, hence the higher profit margin was earned by them also. As the cost data of JVs was not available, the higher profit margin earned by them could not be ascertained in audit.
Government stated (October 2015) that it is true that the profit of RTE production unit is more than 10 per cent but the profit of JVs was ranging from 4.5 per cent to 7 per cent during the years 2009-10 to 2014-15. Further, it was also stated that audit suggestion would be taken care of at the time of preparation of cost sheet in future. Reply is not acceptable as the Company quoted the profit of JVs from their profit and loss accounts. Above percentage of profit margin pertains to overall business of the JVs which includes sales of other items also. Further, the Company has also not obtained cost data from the JVs and cost sheet has not been revised after every six months as per the actual cost incurred by the RTE products unit, Badi and JVs.
Recommendation: The Company should revise cost data for fixation of sale price of RTE products on six monthly basis based on the recent input cost to ensure that sale prices are not unduly inflated at the cost of Government exchequer.
Delay in creation of storage capacity and non-operationalisation of Khichadi Plant 2.2.17 The RTE production unit was setup (1995-96) with initial annual capacity of 4800 MT per year for production and supply RTE products to the WCDD. Later, the Company carried out modernization (2009-10) of RTE production unit, enhanced capacity upto 12000 MT per year and further procured plant (2010-11) for production of Khichadi with capacity of 15 MT per day at the cost of ` 14.52 lakh.
We observed that the Company had not started (October 2015) production of Khichadi at RTE production unit even after the lapse of four years from the procurement of Khichadi production plant due to availability of limited space in
Actual profit margin earned by the RTE production unit of the Company was significantly higher than the approved profit margin.
Chapter -II- Performance Audit relating to Government Companies
57
the RTE production unit. As a result, the Company is not supplying Khichadi to WCDD and fully dependent on its JVs’ plants for this purpose.
The Company belatedly decided (February 2012) to construct godown/silo of 2000 MT to meet the increased requirement of storage capacity due to expansion of the production capacity and procurement of Khichadi plant. However, the construction of godown/silo has not been taken up so far (October 2015), the reasons for which were not on record.
We further observed that resultantly due to lack of sufficient storage facility at RTE production unit the Company had to make alternate arrangement for storage of raw material at its JVs plants situated at Mandideep and lift back the same as per availability of storage space at RTE production unit. The JVs’ plants at Mandideep are situated at a distance of about 78 km from the RTE production unit at Badi. Therefore, the Company had to incur avoidable expenditure of ` 20.96 lakh on transportation of raw material between JVs’ plants and RTE production unit during 2012-13 to 2014-15.
Thus, absence of a plan for construction of additional storage capacity along with capacity expansion of the RTE production unit and subsequent inaction for construction of godown/silo had resulted in avoidable expenditure of ` 20.96 lakh on transportation of raw material.
Government stated (October 2015) that items purchased for the plant (except elevator and hoper amounting to ` 1.57 lakh) are being used in RTE production unit as an alternate arrangement. Further, in the exit conference (October 2015) while accepting the audit observation Company stated that they are trying to relocate the RTE production unit from Badi to Bhopal, hence the Company was not going forward on the RTE production unit Badi. Fact remains that even after the procurement of the plant, the Company could not start the production of Khichadi due to non-availability of storage space and the Company is fully dependent on JVs for supply of Khichadi.
Recommendation: The construction of storage facility and operationalisation of khichadi plant at RTE production unit should be completed in a time bound manner.
Performance of Bio-fertilizer plant
2.2.18 The Bio-fertilizer plant (BFP) having annual production capacity of 1000 MT per annum was established in 1986. The Bio-fertilizers were being produced at BFP according to season wise (Rabi and Kharif) demand in the State. The useful life of Bio-fertilizers is about one season of six months and it requires sale within the stipulated period.
The Ministry of Agriculture, GoI issued (January 2007) Fertilizer Control Order for promotion of Bio-fertilizers and advised the State Governments to educate farmers about the importance of Bio-fertilizers for increasing agricultural yields. The COPU in respect of previous Performance Audit on the workings of the Company had also recommended (2012) for making efforts for enhancing sales of
Due to non-construction of additional storage space along with capacity expansion, the Company failed to operationalise the khichadi production plant and incurred avoidable expenditure of ` 20.96 lakh on transportation of raw material.
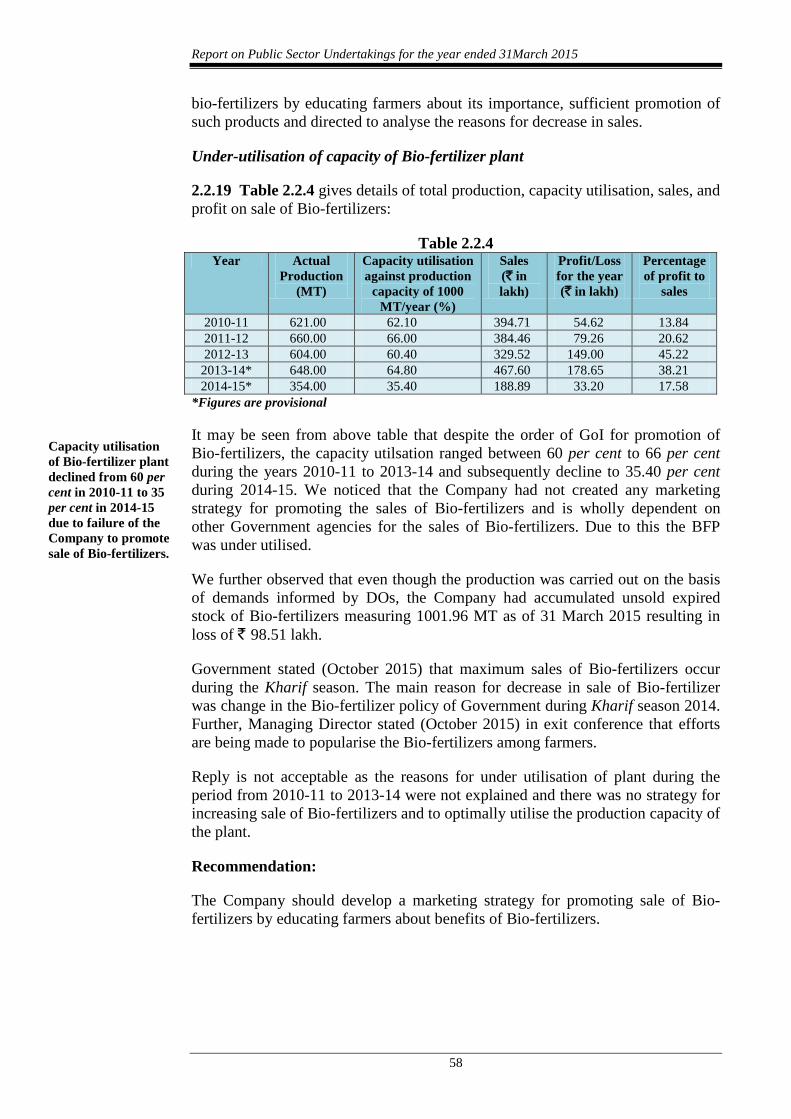
Report on Public Sector Undertakings for the year ended 31March 2015
58
bio-fertilizers by educating farmers about its importance, sufficient promotion of such products and directed to analyse the reasons for decrease in sales.
Under-utilisation of capacity of Bio-fertilizer plant
2.2.19 Table 2.2.4 gives details of total production, capacity utilisation, sales, and profit on sale of Bio-fertilizers:
Table 2.2.4 Year Actual
Production (MT)
Capacity utilisation against production
capacity of 1000 MT/year (%)
Sales (` in lakh)
Profit/Loss for the year (` in lakh)
Percentage of profit to
sales
2010-11 621.00 62.10 394.71 54.62 13.84 2011-12 660.00 66.00 384.46 79.26 20.62 2012-13 604.00 60.40 329.52 149.00 45.22
2013-14* 648.00 64.80 467.60 178.65 38.21 2014-15* 354.00 35.40 188.89 33.20 17.58
*Figures are provisional
It may be seen from above table that despite the order of GoI for promotion of Bio-fertilizers, the capacity utilsation ranged between 60 per cent to 66 per cent during the years 2010-11 to 2013-14 and subsequently decline to 35.40 per cent during 2014-15. We noticed that the Company had not created any marketing strategy for promoting the sales of Bio-fertilizers and is wholly dependent on other Government agencies for the sales of Bio-fertilizers. Due to this the BFP was under utilised.
We further observed that even though the production was carried out on the basis of demands informed by DOs, the Company had accumulated unsold expired stock of Bio-fertilizers measuring 1001.96 MT as of 31 March 2015 resulting in loss of ` 98.51 lakh.
Government stated (October 2015) that maximum sales of Bio-fertilizers occur during the Kharif season. The main reason for decrease in sale of Bio-fertilizer was change in the Bio-fertilizer policy of Government during Kharif season 2014. Further, Managing Director stated (October 2015) in exit conference that efforts are being made to popularise the Bio-fertilizers among farmers.
Reply is not acceptable as the reasons for under utilisation of plant during the period from 2010-11 to 2013-14 were not explained and there was no strategy for increasing sale of Bio-fertilizers and to optimally utilise the production capacity of the plant.
Recommendation:
The Company should develop a marketing strategy for promoting sale of Bio-fertilizers by educating farmers about benefits of Bio-fertilizers.
Capacity utilisation of Bio-fertilizer plant declined from 60 per cent in 2010-11 to 35 per cent in 2014-15 due to failure of the Company to promote sale of Bio-fertilizers.
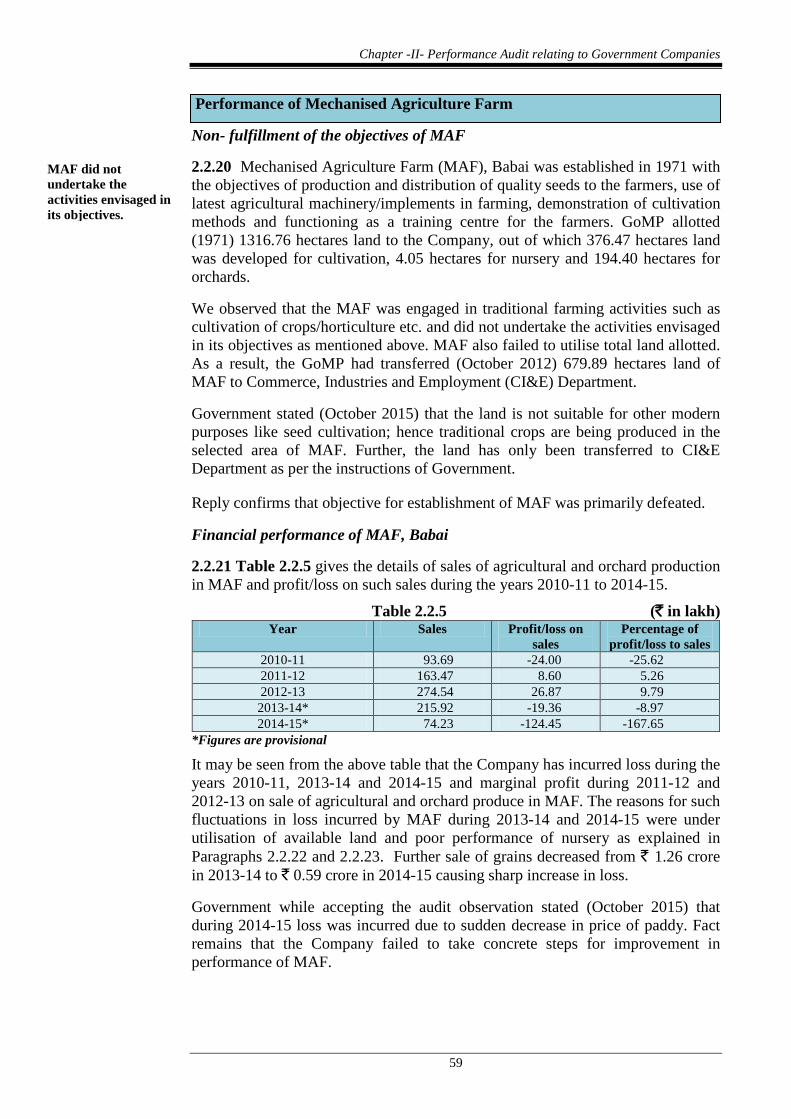
Chapter -II- Performance Audit relating to Government Companies
59
Performance of Mechanised Agriculture Farm
Non- fulfillment of the objectives of MAF
2.2.20 Mechanised Agriculture Farm (MAF), Babai was established in 1971 with the objectives of production and distribution of quality seeds to the farmers, use of latest agricultural machinery/implements in farming, demonstration of cultivation methods and functioning as a training centre for the farmers. GoMP allotted (1971) 1316.76 hectares land to the Company, out of which 376.47 hectares land was developed for cultivation, 4.05 hectares for nursery and 194.40 hectares for orchards.
We observed that the MAF was engaged in traditional farming activities such as cultivation of crops/horticulture etc. and did not undertake the activities envisaged in its objectives as mentioned above. MAF also failed to utilise total land allotted. As a result, the GoMP had transferred (October 2012) 679.89 hectares land of MAF to Commerce, Industries and Employment (CI&E) Department.
Government stated (October 2015) that the land is not suitable for other modern purposes like seed cultivation; hence traditional crops are being produced in the selected area of MAF. Further, the land has only been transferred to CI&E Department as per the instructions of Government.
Reply confirms that objective for establishment of MAF was primarily defeated.
Financial performance of MAF, Babai
2.2.21 Table 2.2.5 gives the details of sales of agricultural and orchard production in MAF and profit/loss on such sales during the years 2010-11 to 2014-15.
Table 2.2.5 (` in lakh) Year Sales Profit/loss on
sales Percentage of
profit/loss to sales 2010-11 93.69 -24.00 -25.62 2011-12 163.47 8.60 5.26 2012-13 274.54 26.87 9.79 2013-14* 215.92 -19.36 -8.97 2014-15* 74.23 -124.45 -167.65
*Figures are provisional
It may be seen from the above table that the Company has incurred loss during the years 2010-11, 2013-14 and 2014-15 and marginal profit during 2011-12 and 2012-13 on sale of agricultural and orchard produce in MAF. The reasons for such fluctuations in loss incurred by MAF during 2013-14 and 2014-15 were under utilisation of available land and poor performance of nursery as explained in Paragraphs 2.2.22 and 2.2.23. Further sale of grains decreased from ` 1.26 crore in 2013-14 to ` 0.59 crore in 2014-15 causing sharp increase in loss.
Government while accepting the audit observation stated (October 2015) that during 2014-15 loss was incurred due to sudden decrease in price of paddy. Fact remains that the Company failed to take concrete steps for improvement in performance of MAF.
MAF did not undertake the activities envisaged in its objectives.
Report on Public Sector Undertakings for the year ended 31March 2015
60
Poor Utilisation of available land for cultivation of crops in MAF
2.2.22 After transfer of 679.89 hectares land to CI&E Department in October 2012, the MAF had land measuring 376.47 hectares for cultivation.
The utilisation of available land for cultivation ranged from 22.27 per cent to 48.41 per cent in Kharif season for cultivation of paddy and 41.42 per cent to 51.85 per cent in Rabi season for cultivation of wheat during 2010-11 to 2014-15 as detailed in Annexure-2.2.6. Thus, the Company did not plan for optimum utilisation of available land for agriculture.
Government stated (October 2015) that utilisation of land has been done as per availability of irrigation capacity and staff. Fact remains that the Company has not taken steps for optimum utilisation of land available including provision for irrigation facility.
Recommendation: The Company should plan for utilisation of the unutilised land in the farm to increase its turnover and profit margin.
Decline in performance of nursery at MAF
2.2.23 A nursery was being maintained at MAF, Babai which was developed during the year 1971-72. The total area of nursery is 4.05 hectares. We noticed that sales of the plants reduced from 45687 numbers in the year 2010-11 to 6777 numbers in 2014-15. We did not find that management has done any analysis for ascertaining reasons for declining sale of plants and prepared any plan for increasing the sale of plants from nursery.
Government stated (October 2015) that Company is dependent on Department of Horticulture and Food Processing for the demand of nursery plants and due to less demand in the year 2014-15 the sale of plants from the nursery had reduced.
The fact remains that Company has not made efforts to explore new areas of demand instead of dependency on Government.
Irregularities in auction/tendering of trees and orchards
2.2.24 The Company had developed orchards of fruits, vegetables and trees on 194.40 hectares of land available at MAF. The produce of these orchards are sold by inviting offers though tenders. Company made sales of ` 1.62 crore from these orchard during the period 2010-11 to 2014-15 through tendering.
Review of records pertaining to sale of orchards and trees at MAF, Babai revealed the following shortcoming; i) Base/upset price fixation/valuation of saleable items were not being done by the Company to ensure reasonableness of price bids. ii) The amount of EMD being demanded from the bidders was not according to the number of trees in the orchard and estimated/actual bid value as detailed in Annexure-2.2.7.
Utilisation of land for cultivating at MAF ranged from 22.27 per cent to 51.85 per cent during 2010-15.
Chapter -II- Performance Audit relating to Government Companies
61
Government stated (October 2015) that the Company has followed its standard practice for auction of orchards/trees and the Company also involved specialists in finalisation of sale rates. Fact remains that the Company has not fixed the upset price and the EMD had not been fixed rationally.
Internal Control and Monitoring Mechanism
2.2.25 Internal control and Monitoring are essential parts of the management activity. An efficient and effective system helps the management in achieving its’ laid down objectives, compliance to procedures and financial discipline.
The Internal control and monitoring mechanism prevalent in the Company was deficient as there was no effective control/monitoring for timely finalisation of accounts (Para 2.2.7), timely recovery and reconciliation of very old Trade receivables (Para 2.2.9) and timely utilisation of subsidies and advances (Para 2.2.10). Further, system for timely disposal of non-moving damaged and surplus inventory accumulated in the branches was not in place as discussed in Para 2.2.27.
Absence of regular meetings of Board of Directors
2.2.26 As per Section 285 of the Companies Act, 1956 and Section 173 (1) of the Companies Act, 2013 (applicable from April 2014), at least four meetings of the BoD of the Company shall be held every year.
We observed that during the years 2010-11 to 2014-15 only 12 meetings were held against the required 20 meetings. We further observed that significant matters of (i) Commercial utilisation of pesticide plant at Bina (ii) Development of MAF as model farm on Public Private Partnership basis (iii) Creating additional storage capacity of 2000 MT at RTE production unit, and (iv) Change in the structure of the Company with a view to change in the needs of farmers and business competition, were submitted to and deliberated in the BoD meetings held during 2010-11 to 2013-14, however further progress in these matters was not submitted to the BoD leading to their non-monitoring at higher level.
Thus, non-holding of requisite meetings at the apex level has evidently impacted the timely decision making and monitoring process in the Company.
Management assured (October 2015) that the Company would hold BoD meetings as per the Companies Act in future. Further, the action would be taken to resolve the issues raised by the audit.
Non-disposal of unserviceable assets/non-moving items
2.2.27 The Company has been doing physical verification of stores/stock annually for identifying shortage/surplus therein.
We noticed from the scrutiny of store records and physical verification reports of DOs and production units that stock valuing ` 1.14 crore (Annexure-2.2.8) was lying idle in the stores as non-moving and unserviceable assets/store items. The
Stock and stores of ` 1.14 crore were lying idle and shortage of ` 11.30 lakh was also noticed.
Report on Public Sector Undertakings for the year ended 31March 2015
62
Company has, however, not prepared age-wise breakup of these items. We further observed that at nine DOs/production units there were shortage/missing goods/stocks valuing ` 11.30 lakh (Annexure-2.2.9). Management has not taken any action for disposal of the non-moving/defective stock/stores and has not fixed responsibility any of the officials for the shortage/missing items.
Management stated (October 2015) that the instructions to DOs for disposal of unservicable goods have been issued. Fact remains that Company had not disposed the unservisible goods in timely manner.
Recommendation: The Company should hold required number of meetings of Board of Directors for timely decision making and effective monitoring. The Company should also prepare a system for timely disposal of unserviceable assets and non- moving store.
Conclusion and Recommendations
• Due to non development of common codes of account heads, the Company was unable to consolidate accounts of its District Offices within time. This has resulted in delayed finalisation of annual accounts. As of 31 October 2015 annual accounts for the year 2013-14 and 2014-15 were in arrears. The Company should develop common codes of account heads and ensure timely finalisation of its annual accounts
• The Company had not prepared any perspective and strategic plan for driving its activities for attainment of objectives. The annual Memorandum of Understandings (MoUs) with GoMP containing financial/commercial targets for the years 2010-11 to 2013-14 were finalised belatedly. Further, MoU for the year 2014-15 was not finalised. Thus, due to delayed/non-finalisation of MoUs, their purpose to optimally drive the operations of the Company was defeated. The Company should prepare long term plan for its continuing activities and ensure timely finalisation of MOU for adequate planning to drive its operational activities
• Due to non-revision of sale price of RTE products after every six months as stipulated in approved cost sheet, the sale price for supply to Women and Child Development Department were fixed on higher side. Consequently, the Company earned higher profit of ` 16.94 crore overburdening the Government exchequer to that extent. The Company should review fixation of sale prices of RTE products on prescribed six monthly basis to ensure that the sale prices are not unduly inflated at the cost of Government exchequer.
• Due to non- construction of storage space along with the expansion of RTE production unit at Badi, the Company failed to operationalise Khichadi production plant even after lapse of four years from its procurement and also incurred avoidable expenditure of ` 20.96 lakh on transportation of raw material from alternate location. The construction of storage facility and operationalisation of khichadi plant at RTE production unit should be completed in a time bound manner.
Chapter -II- Performance Audit relating to Government Companies
63
• There was low utilisation of available land at Mechanised Agricultural Farm (MAF), Babai which ranged from 22.27 per cent to 48.41 per cent in Kharif season and 41.42 per cent to 51.85 per cent in Rabi season during 2010-11 to 2014-15. The Company should put in place a plan for better utilisation of available land at MAF, Babai to increase its turnover and profitability.
• The internal control mechanism was deficient as there was no system for watching the timely utilisation of grants/subsidy and timely disposal of non-moving stores and unserviceable assets. Due to non-holding of regular meetings of Board of Directors of the Company, the timely decision making and monitoring process was hampered. The Company should hold required number of meetings of Board of Directors for timely decision making and effective monitoring. The Company should also prepare a system for timely disposal of unserviceable assets and non- moving store.
Report on Public Sector Undertakings for the year ended 31March 2015
__________________________________________________________________64
Executive Summary
Introduction
For the promotion of renewable energy (RE) resources of the State, Madhya Pradesh Urja Vikas Nigam Limited (Company) was incorporated on 25 August 1982. The RE activities in the State are classified into “Grid connected” and “Off-grid” projects. For implementation of the Grid connected projects, Office of Commissioner, New and Renewable Energy (Department) was setup (April 2010), whereas the Company undertakes the activities related to implementation of Off-grid projects. The Performance Audit was conducted to assess the performance of the Department and the Company relating to development of Grid connected and Off-grid renewal energy in the State during 2010-11 to 2014-15. Following are the main findings of the Performance Audit.
Grid Connected Renewal Energy Projects The installed capacity of RE in the State was only 1243 MW against the estimated potential of 39095 MW. The RE policies for Solar, Wind, Small Hydel and Biomass based energy projects formulated during October 2011 to July 2012 by Government of Madhya Pradesh were not based on the assessment of RE potential in the State, which was assessed belatedly in October 2014. Further, no specific targets for capacity addition were set and no long term/short term plans were prepared by the Department for development of RE. As a result, the potential of RE in the State could not be harnessed in a planned manner.
(Paragraphs 2.3.2 and 2.3.8) • As of 31 March 2015, the projects of 453.22 MW in Solar (45 per cent), 665.30 MW (nine per cent) in Wind and 55.40 MW in Biomass (12 per cent) could only be commissioned against registered projects of 1007.50 MW, 7196.55 MW and 471.20 MW capacity respectively. Also no Small Hydel project was commissioned by the Department. Further, the projects of 247 MW in Solar (25 per cent), 833.35 MW (12 per cent) in Wind, 44.80 MW in Small Hydel (14 per cent) and 194 MW in Biomass (41 per cent) were deregistered by the Department.
The reasons for low percentage of commissioning and high deregistration were non-allotment of land to projects, disinterest shown by the developers, non-availability of the raw materials, insufficient tariffs for energy and long gestation period of the projects etc. As a result, the basic objective of RE policies to encourage participation of private developers to setup RE power projects had not been fulfilled.
(Paragraphs 2.3.9, 2.3.13 and 2.3.14)
• Undue benefit of ` 1.02 crore was extended to seven developers of Grid connected Wind and Biomass energy projects due to non-collection of performance guarantee for ensuring timely completion of projects on Government land.
(Paragraphs 2.3.12 and 2.3.15)
2.3 Development of New and Renewable Energy in Madhya Pradesh
Chapter -II- Performance Audit relating to Government Companies
__________________________________________________________________65
Off-grid Renewal Energy Projects
• GoMP has not framed any specific policy and annual targets for installation of the Off-grid RE systems. In the absence of specific targets, the Off-grid installations were being done on the basis of adhoc demands received from beneficiaries. As a result, the full potential for Off-grid RE in the State could not be harnessed.
(Paragraph 2.3.17)
• During 2010-15, Company could commission only 3061 kWp capacity (45 per cent) of Solar Photovoltaic Power Plants (SPVPP) against the MNRE sanction of 6725 kWp capacity due to non-completion of the work by the suppliers and frequent cancellation of the work orders. Failure of the Company to analyse the reasons for non-completion of work by the suppliers and to take corrective action resulted in deprival of RE benefits to the beneficiaries though the beneficiary share of ` 34.08 crore was lying unutilised with the Company as on 31 March 2015.
(Paragraph 2.3.18)
• During 2010-15, the Company installed only 18.66 lakh litre per day (22.84 per cent) capacity of Solar water heater systems against 81.70 litre per day of capacity sanctioned by MNRE due to delay in retendering of the cancelled work orders. As a result the beneficiary share of ` 4.54 crore was lying idle with the Company as on 31 March 2015.
(Paragraph 2.3.19)
• In the Joint physical verification by audit team along with Company officials of 38 installed Solar photovoltaic power plant systems, only 26 systems (68 per cent) were found working, four systems (11 per cent) were not working and 8 systems (21 per cent) though working but were facing problems in spares/ batteries etc. due to lack of maintenance by the suppliers in the absence of proper monitoring by the Company. Thus the Company failed to ensure long term sustainability and proper functioning of the installed systems resulting in deprival of intended benefits to the beneficiaries.
(Paragraph 2.3.20) • Due to insufficient generation of RE in the State during the years 2010-15, the Power Distribution Companies could not meet the Renewable Purchase Obligation (RPO) targets fixed by the Madhya Pradesh Electricity Regulatory Commission which resulted in RPO shortfall aggregating to 6316.91 MU. Further, the Power Distribution Companies did not purchase the Renewable Energy Certificates of ` 3013.20 crore for the shortfall in RPO in contravention of the regulations.
(Paragraph 2.3.22)
2.3.1 For the promotion of renewable energy (RE) resources of the State, Madhya Pradesh Urja Vikas Nigam Ltd, (Company) was incorporated on 25 August 1982. The Company receives fund from the Ministry of New and Renewable Energy
Introduction
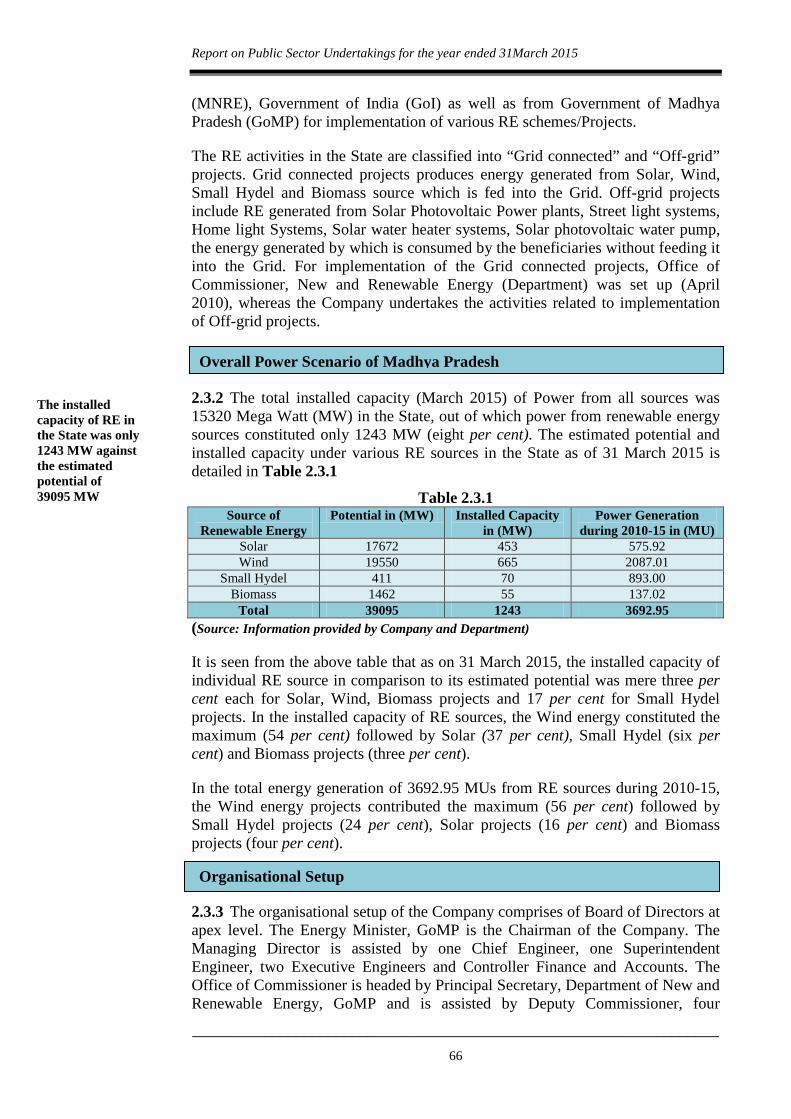
Report on Public Sector Undertakings for the year ended 31March 2015
__________________________________________________________________66
(MNRE), Government of India (GoI) as well as from Government of Madhya Pradesh (GoMP) for implementation of various RE schemes/Projects.
The RE activities in the State are classified into “Grid connected” and “Off-grid” projects. Grid connected projects produces energy generated from Solar, Wind, Small Hydel and Biomass source which is fed into the Grid. Off-grid projects include RE generated from Solar Photovoltaic Power plants, Street light systems, Home light Systems, Solar water heater systems, Solar photovoltaic water pump, the energy generated by which is consumed by the beneficiaries without feeding it into the Grid. For implementation of the Grid connected projects, Office of Commissioner, New and Renewable Energy (Department) was set up (April 2010), whereas the Company undertakes the activities related to implementation of Off-grid projects.
2.3.2 The total installed capacity (March 2015) of Power from all sources was 15320 Mega Watt (MW) in the State, out of which power from renewable energy sources constituted only 1243 MW (eight per cent). The estimated potential and installed capacity under various RE sources in the State as of 31 March 2015 is detailed in Table 2.3.1
Table 2.3.1 Source of
Renewable Energy Potential in (MW) Installed Capacity
in (MW) Power Generation
during 2010-15 in (MU) Solar 17672 453 575.92 Wind 19550 665 2087.01
Small Hydel 411 70 893.00 Biomass 1462 55 137.02
Total 39095 1243 3692.95 (Source: Information provided by Company and Department)
It is seen from the above table that as on 31 March 2015, the installed capacity of individual RE source in comparison to its estimated potential was mere three per cent each for Solar, Wind, Biomass projects and 17 per cent for Small Hydel projects. In the installed capacity of RE sources, the Wind energy constituted the maximum (54 per cent) followed by Solar (37 per cent), Small Hydel (six per cent) and Biomass projects (three per cent).
In the total energy generation of 3692.95 MUs from RE sources during 2010-15, the Wind energy projects contributed the maximum (56 per cent) followed by Small Hydel projects (24 per cent), Solar projects (16 per cent) and Biomass projects (four per cent).
2.3.3 The organisational setup of the Company comprises of Board of Directors at apex level. The Energy Minister, GoMP is the Chairman of the Company. The Managing Director is assisted by one Chief Engineer, one Superintendent Engineer, two Executive Engineers and Controller Finance and Accounts. The Office of Commissioner is headed by Principal Secretary, Department of New and Renewable Energy, GoMP and is assisted by Deputy Commissioner, four
Organisational Setup
Overall Power Scenario of Madhya Pradesh
The installed capacity of RE in the State was only 1243 MW against the estimated potential of 39095 MW
Chapter -II- Performance Audit relating to Government Companies
__________________________________________________________________67
Executive Engineers and an Accounts Officer. The organisational structure of the Company and the Department is given in Annexure 2.3.1.
2.3.4 The objectives of the Performance Audit were to assess whether:-
• Sound financial management mechanism was in place in the Company and the Department for economic and effective utilisation of the funds.
• The Company/Department prepared plans to increase contribution of renewable energy in the energy mix of the state in line with the renewable energy potential of each source as per policy of MNRE/GoI/GoMP.
• Implementation of the schemes/programmes was as per the plans framed and monitoring of schemes/programmes was adequate and effective.
2.3.5 The audit criteria for the Performance Audit were drawn from following sources:
• Guidelines of Ministry of New and Renewable Energy (MNRE) for implementation of New and Renewal Energy programmes
• GoMP policies and instructions/guidelines for the promotion of renewable sources of energy;
• Relevant Financial Rules/Regulations of GoMP and MPERC regulations 2008 on Cogeneration and generation of electricity from renewable source of energy.
2.3.6 The Performance Audit was conducted during April to June 2015 covering the activities of the Department and the Company in respect of Grid connected and Off-grid projects respectively for the period 2010-11 to 2014-15. We test checked records of 152 out of 357 Grid connected projects (including 38 out of 94 commissioned projects and 21 out of 69 deregistered projects).
Further, the Head Office of the Company was selected along with four1 District Renewable Energy Office (DREO) out of 37 DREOs across the State. In the selected four DREOs, 38 out of the 61 Solar Photovoltaic Power Plant (SPVPP) systems were selected for joint physical verification by the audit team along with Company officials.
The entry conference with the Principal Secretary, NRE Department, GoMP was held on 30 April 2015, wherein the audit objectives, methodology and coverage were discussed. The findings of audit were brought out to the notice of Department and the Company on 4 August 2015. The reply of the Government
1Chhindwara, Shivpuri, Bhopal, Raisen
Audit Objectives
Scope and Methodology of Audit
Audit Criteria
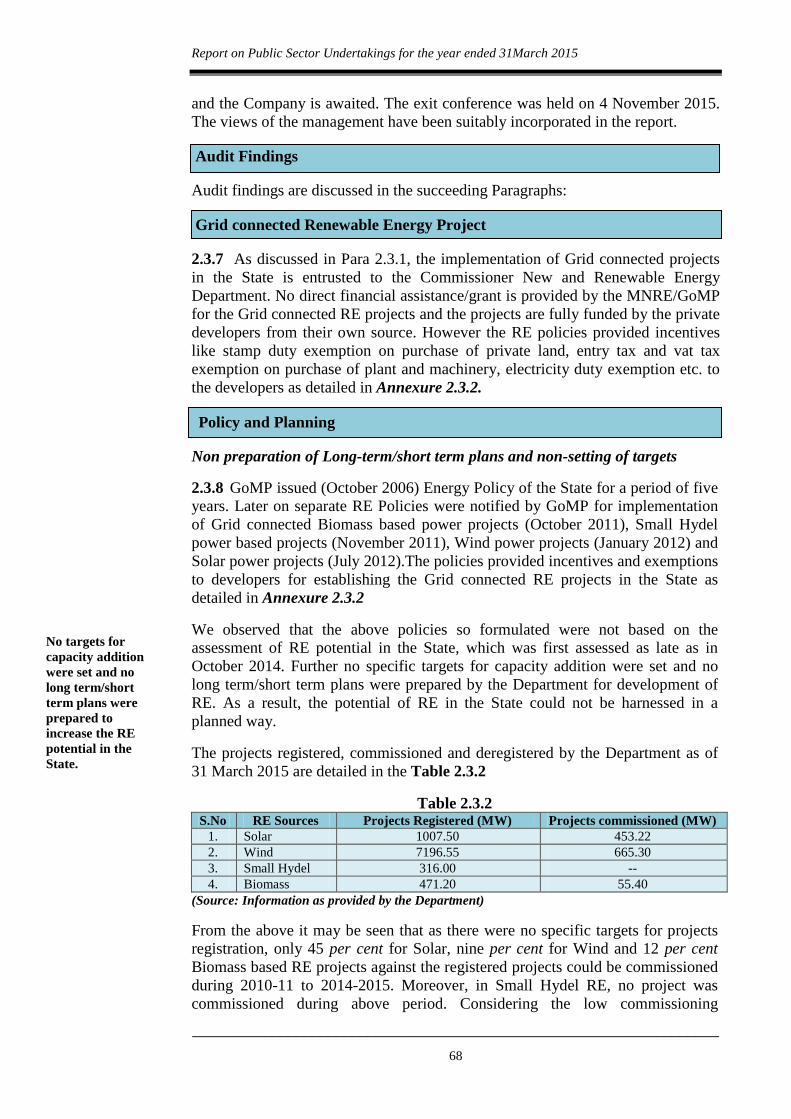
Report on Public Sector Undertakings for the year ended 31March 2015
__________________________________________________________________68
and the Company is awaited. The exit conference was held on 4 November 2015. The views of the management have been suitably incorporated in the report.
Audit Findings
Audit findings are discussed in the succeeding Paragraphs:
Grid connected Renewable Energy Project
2.3.7 As discussed in Para 2.3.1, the implementation of Grid connected projects in the State is entrusted to the Commissioner New and Renewable Energy Department. No direct financial assistance/grant is provided by the MNRE/GoMP for the Grid connected RE projects and the projects are fully funded by the private developers from their own source. However the RE policies provided incentives like stamp duty exemption on purchase of private land, entry tax and vat tax exemption on purchase of plant and machinery, electricity duty exemption etc. to the developers as detailed in Annexure 2.3.2.
Non preparation of Long-term/short term plans and non-setting of targets
2.3.8 GoMP issued (October 2006) Energy Policy of the State for a period of five years. Later on separate RE Policies were notified by GoMP for implementation of Grid connected Biomass based power projects (October 2011), Small Hydel power based projects (November 2011), Wind power projects (January 2012) and Solar power projects (July 2012).The policies provided incentives and exemptions to developers for establishing the Grid connected RE projects in the State as detailed in Annexure 2.3.2
We observed that the above policies so formulated were not based on the assessment of RE potential in the State, which was first assessed as late as in October 2014. Further no specific targets for capacity addition were set and no long term/short term plans were prepared by the Department for development of RE. As a result, the potential of RE in the State could not be harnessed in a planned way.
The projects registered, commissioned and deregistered by the Department as of 31 March 2015 are detailed in the Table 2.3.2
Table 2.3.2 S.No RE Sources Projects Registered (MW) Projects commissioned (MW)
1. Solar 1007.50 453.22 2. Wind 7196.55 665.30 3. Small Hydel 316.00 -- 4. Biomass 471.20 55.40
(Source: Information as provided by the Department)
From the above it may be seen that as there were no specific targets for projects registration, only 45 per cent for Solar, nine per cent for Wind and 12 per cent Biomass based RE projects against the registered projects could be commissioned during 2010-11 to 2014-2015. Moreover, in Small Hydel RE, no project was commissioned during above period. Considering the low commissioning
Policy and Planning
No targets for capacity addition were set and no long term/short term plans were prepared to increase the RE potential in the State.
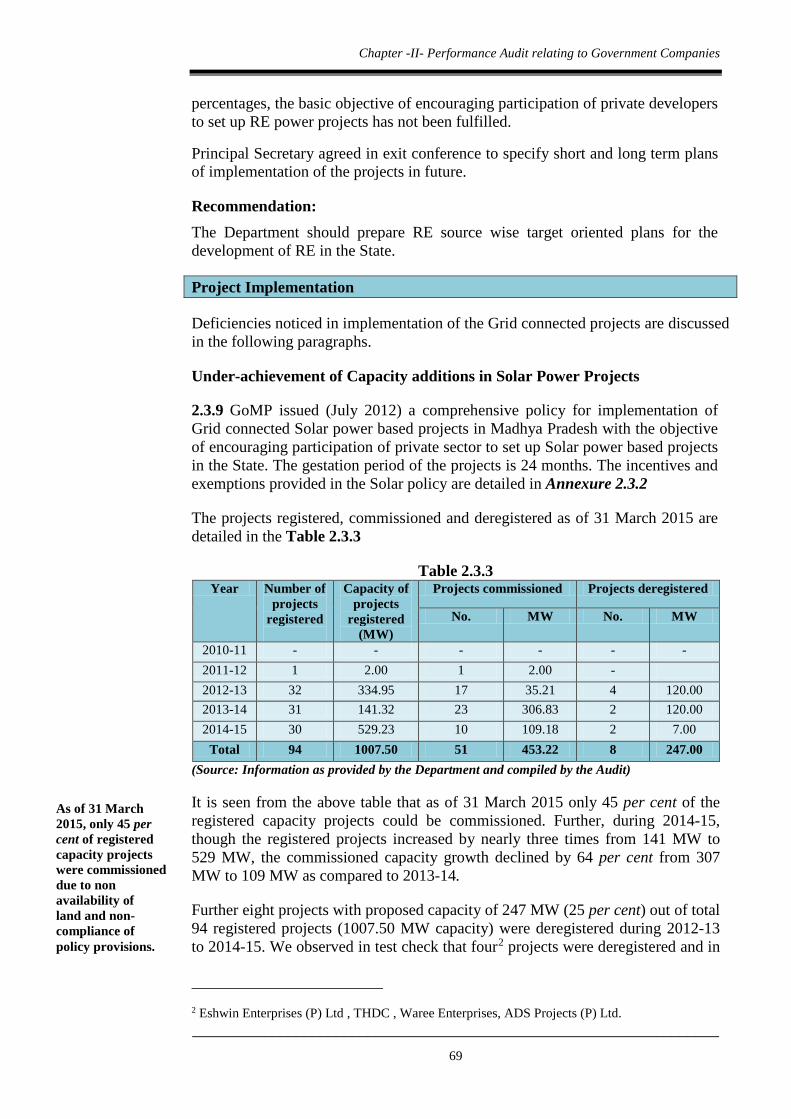
Chapter -II- Performance Audit relating to Government Companies
__________________________________________________________________69
percentages, the basic objective of encouraging participation of private developers to set up RE power projects has not been fulfilled.
Principal Secretary agreed in exit conference to specify short and long term plans of implementation of the projects in future.
Recommendation: The Department should prepare RE source wise target oriented plans for the development of RE in the State.
Project Implementation
Deficiencies noticed in implementation of the Grid connected projects are discussed in the following paragraphs.
Under-achievement of Capacity additions in Solar Power Projects
2.3.9 GoMP issued (July 2012) a comprehensive policy for implementation of Grid connected Solar power based projects in Madhya Pradesh with the objective of encouraging participation of private sector to set up Solar power based projects in the State. The gestation period of the projects is 24 months. The incentives and exemptions provided in the Solar policy are detailed in Annexure 2.3.2
The projects registered, commissioned and deregistered as of 31 March 2015 are detailed in the Table 2.3.3
Table 2.3.3
(Source: Information as provided by the Department and compiled by the Audit)
It is seen from the above table that as of 31 March 2015 only 45 per cent of the registered capacity projects could be commissioned. Further, during 2014-15, though the registered projects increased by nearly three times from 141 MW to 529 MW, the commissioned capacity growth declined by 64 per cent from 307 MW to 109 MW as compared to 2013-14.
Further eight projects with proposed capacity of 247 MW (25 per cent) out of total 94 registered projects (1007.50 MW capacity) were deregistered during 2012-13 to 2014-15. We observed in test check that four2 projects were deregistered and in
2 Eshwin Enterprises (P) Ltd , THDC , Waree Enterprises, ADS Projects (P) Ltd.
Year Number of projects
registered
Capacity of projects
registered (MW)
Projects commissioned Projects deregistered
No. MW No. MW
2010-11 - - - - - - 2011-12 1 2.00 1 2.00 - 2012-13 32 334.95 17 35.21 4 120.00 2013-14 31 141.32 23 306.83 2 120.00 2014-15 30 529.23 10 109.18 2 7.00
Total 94 1007.50 51 453.22 8 247.00
As of 31 March 2015, only 45 per cent of registered capacity projects were commissioned due to non availability of land and non-compliance of policy provisions.
Report on Public Sector Undertakings for the year ended 31March 2015
__________________________________________________________________70
another 173 projects no progress was achieved due to non-availability of land. The Department failed to coordinate with other departments for facilitating the allotment of land to the developers. This was the main reason for the delay in commissioning and deregistration of the projects.
The Department (July 2015) accepted the audit observations stating that non availability of land and non compliance of the policy provisions by the developers are the main reason for the slow progress.
Though the reasons for delay in project implementation and deregistration are known to the Department, it did nothing to remove the bottlenecks. Thus despite a whopping RE potential of Solar energy available in the State as pointed out in Table 2.3.1, a meager 3 per cent is tapped at present.
Other irregularities
2.3.10 Other shortcomings observed in the implementation process of the solar power projects are as under:
(a) Non convening of Project Clearance and Implementation Board Meetings
As per Clause 7 Part B of Solar policy, for removal of difficulties in implementation of the projects and Inter Departmental coordination, were to be referred to the Project Clearance and Implementation Board (PCIB) constituted under the chairmanship of Chief Secretary, GoMP. However in four test checked deregistered projects we observed that applications were cancelled due to non-availability of land. Further, in 17 test checked projects, we observed that these could not be commissioned due to non-availability of land as discussed in Paragraph 2.3.9. Despite this, no PCIB meetings were convened by the Department to overcome the difficulties in land allotment for the projects during 2010-11 to 2014-15.
Principal Secretary in exit conference accepted the audit observation and assured that necessary compliance as mentioned in the policy provisions regarding convening of PCIB meeting in future would be made.
(b) Lack of monitoring due to non maintenance of electricity generation data
As per Clause 5 (c), 5 (d) Part B of the Solar energy policy, the developers were required to submit the monthly and annual generation data to the Department and a data bank of the same was required to be maintained by the Department. We observed that the Department did not maintain the generation data of any projects commissioned. This exhibits that monitoring of the projects commissioned was not done by the Department as per the policy.
3 Swan Power P Ltd (2), M&B Switch Gear, Staple Energy P Ltd, Ujas Energy (3), Kailash Dev build, Management Multi Trade, Waree, Welspun, Avanti Power P Ltd, Sai Prakash Power India Ltd, Saranga Renewable Energy, Barod Renewable Energy, Shriji Polymers, Eastman International
Department did not convene any PCIB meetings to overcome the difficulties in land allotment process.
Department did not maintain the generation data of commissioned solar power projects indicating weak monitoring.
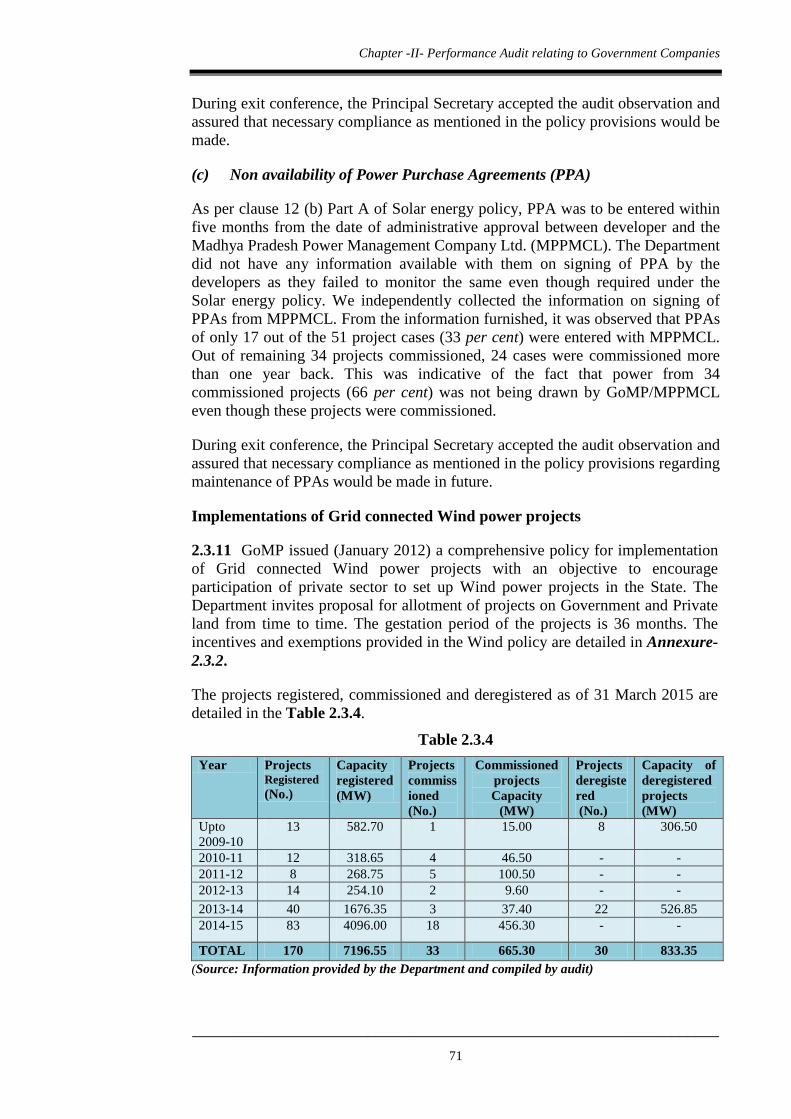
Chapter -II- Performance Audit relating to Government Companies
__________________________________________________________________71
During exit conference, the Principal Secretary accepted the audit observation and assured that necessary compliance as mentioned in the policy provisions would be made.
(c) Non availability of Power Purchase Agreements (PPA)
As per clause 12 (b) Part A of Solar energy policy, PPA was to be entered within five months from the date of administrative approval between developer and the Madhya Pradesh Power Management Company Ltd. (MPPMCL). The Department did not have any information available with them on signing of PPA by the developers as they failed to monitor the same even though required under the Solar energy policy. We independently collected the information on signing of PPAs from MPPMCL. From the information furnished, it was observed that PPAs of only 17 out of the 51 project cases (33 per cent) were entered with MPPMCL. Out of remaining 34 projects commissioned, 24 cases were commissioned more than one year back. This was indicative of the fact that power from 34 commissioned projects (66 per cent) was not being drawn by GoMP/MPPMCL even though these projects were commissioned.
During exit conference, the Principal Secretary accepted the audit observation and assured that necessary compliance as mentioned in the policy provisions regarding maintenance of PPAs would be made in future.
Implementations of Grid connected Wind power projects
2.3.11 GoMP issued (January 2012) a comprehensive policy for implementation of Grid connected Wind power projects with an objective to encourage participation of private sector to set up Wind power projects in the State. The Department invites proposal for allotment of projects on Government and Private land from time to time. The gestation period of the projects is 36 months. The incentives and exemptions provided in the Wind policy are detailed in Annexure-2.3.2.
The projects registered, commissioned and deregistered as of 31 March 2015 are detailed in the Table 2.3.4.
Table 2.3.4 Year Projects
Registered (No.)
Capacity registered (MW)
Projects commissioned (No.)
Commissioned projects Capacity
(MW)
Projects deregistered (No.)
Capacity of deregistered projects (MW)
Upto 2009-10
13 582.70 1 15.00 8 306.50
2010-11 12 318.65 4 46.50 - - 2011-12 8 268.75 5 100.50 - - 2012-13 14 254.10 2 9.60 - - 2013-14 40 1676.35 3 37.40 22 526.85 2014-15 83 4096.00 18 456.30 - -
TOTAL 170 7196.55 33 665.30 30 833.35 (Source: Information provided by the Department and compiled by audit)
Report on Public Sector Undertakings for the year ended 31March 2015
__________________________________________________________________72
It is seen from the above table that, the number of projects registered and commissioned has substantially picked up in the last two years. However, as of 31 March 2015, 665.30 MW capacity projects (nine per cent) out of 7196.55 MW capacity registered projects could only be commissioned mainly due to the long gestation period of the projects.
Further, 30 projects with capacity of 833.35 MW (12 per cent of total registered projects) were deregistered during 2010-15 due to non-submission of performance guarantee. Thus the mortality rate of the projects was high.
The Principal Secretary stated during exit conference that major registration in the wind projects had been done during the last two years and implementation period of the projects is about three years, hence in the next couple of years the commissioning would take place. It was also stated that Government was expecting an implementation rate of around 60 to 70 per cent in the coming years.
Other irregularities
2.3.12 Other shortcomings observed in the implementation process of Wind power projects are as under:
(a) Lack of monitoring due to non-maintenance of electricity generation data and commissioning reports
Clause 6.3 Part B of the Wind policy requires that after commissioning of the project, every developer was required to essentially submit the monthly data of energy generated from the projects to the Department. We observed that the Department had neither maintained the data, nor made any effort to obtain the generation data in any of the projects so commissioned. Further in four4 projects out of 115 commissioned test checked projects, even the commissioning reports of the projects were also not maintained by the Department. This exhibits that monitoring of the projects was not conducted by the Department as per the policy.
(b) Undue favour to the Developer
As per clause 3.1.3 of the Wind policy, the developer has to deposit performance guarantee to ensure timely completion of the project on Government land at the rate of ` One lakh per MW. We observed that in the case of one project of 30 MW capacity under implementation, the performance guarantee of ` 30 lakh was not obtained from the developer.
During the exit conference, the Principal Secretary assured that the matter would be reviewed and factual position would be intimated.
4 Renewable Energy Generation P Ltd, Gamesa Wind Turbine Ltd, Siddhant Wind Energy Ltd, , Enercon India Ltd 5 Betul Wind Farm Ltd, Renewable Energy Generation P Ltd, Gamesa Wind Turbine Ltd, Siddhant Wind Energy Ltd, Southern Wind Farm Ltd, Enercon India Ltd, Chouksey Energy Infra Power Ltd, Wind world India Ltd, Suzlon Ltd (3 cases)
Department did not maintain the generation data of commissioned projects in violation of the policy provisions.
As of 31 March 2015, only nine per cent of registered capacity projects were commissioned due to long gestation period of the Projects.
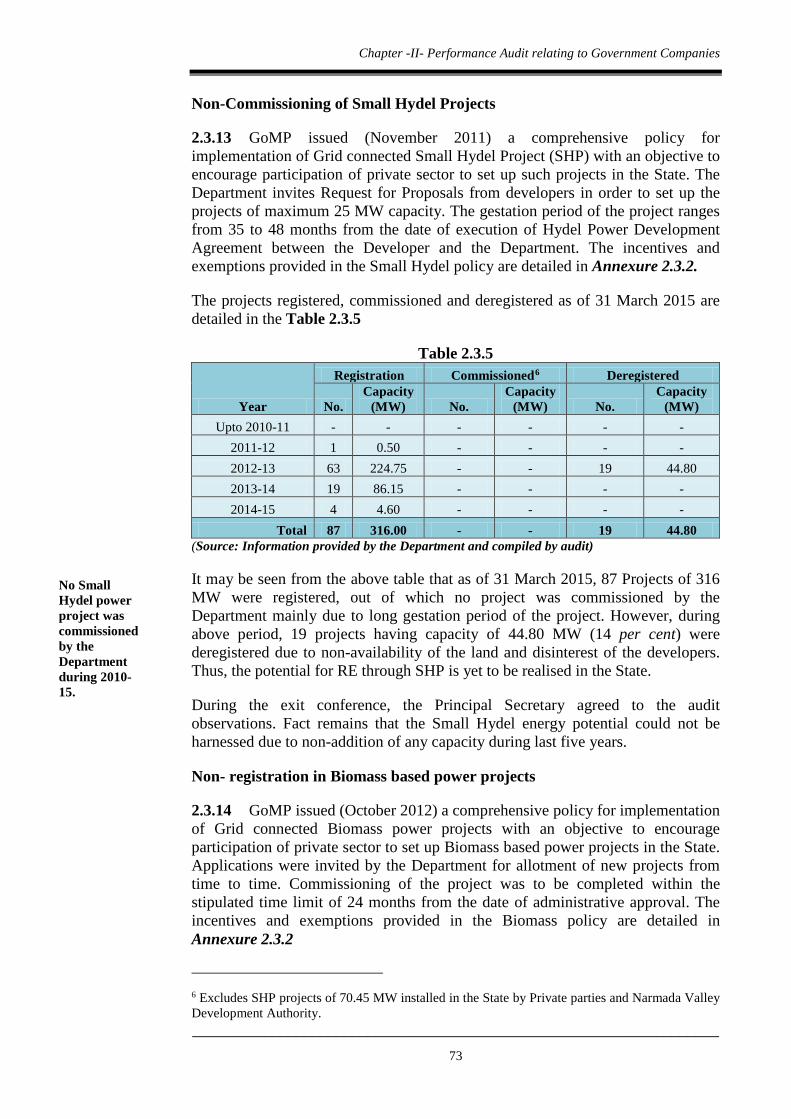
Chapter -II- Performance Audit relating to Government Companies
__________________________________________________________________73
Non-Commissioning of Small Hydel Projects
2.3.13 GoMP issued (November 2011) a comprehensive policy for implementation of Grid connected Small Hydel Project (SHP) with an objective to encourage participation of private sector to set up such projects in the State. The Department invites Request for Proposals from developers in order to set up the projects of maximum 25 MW capacity. The gestation period of the project ranges from 35 to 48 months from the date of execution of Hydel Power Development Agreement between the Developer and the Department. The incentives and exemptions provided in the Small Hydel policy are detailed in Annexure 2.3.2.
The projects registered, commissioned and deregistered as of 31 March 2015 are detailed in the Table 2.3.5
Table 2.3.5
Year
Registration Commissioned6 Deregistered
No. Capacity
(MW) No. Capacity
(MW) No. Capacity
(MW) Upto 2010-11 - - - - - -
2011-12 1 0.50 - - - - 2012-13 63 224.75 - - 19 44.80 2013-14 19 86.15 - - - - 2014-15 4 4.60 - - - -
Total 87 316.00 - - 19 44.80 (Source: Information provided by the Department and compiled by audit)
It may be seen from the above table that as of 31 March 2015, 87 Projects of 316 MW were registered, out of which no project was commissioned by the Department mainly due to long gestation period of the project. However, during above period, 19 projects having capacity of 44.80 MW (14 per cent) were deregistered due to non-availability of the land and disinterest of the developers. Thus, the potential for RE through SHP is yet to be realised in the State.
During the exit conference, the Principal Secretary agreed to the audit observations. Fact remains that the Small Hydel energy potential could not be harnessed due to non-addition of any capacity during last five years.
Non- registration in Biomass based power projects
2.3.14 GoMP issued (October 2012) a comprehensive policy for implementation of Grid connected Biomass power projects with an objective to encourage participation of private sector to set up Biomass based power projects in the State. Applications were invited by the Department for allotment of new projects from time to time. Commissioning of the project was to be completed within the stipulated time limit of 24 months from the date of administrative approval. The incentives and exemptions provided in the Biomass policy are detailed in Annexure 2.3.2
6 Excludes SHP projects of 70.45 MW installed in the State by Private parties and Narmada Valley Development Authority.
No Small Hydel power project was commissioned by the Department during 2010-15.
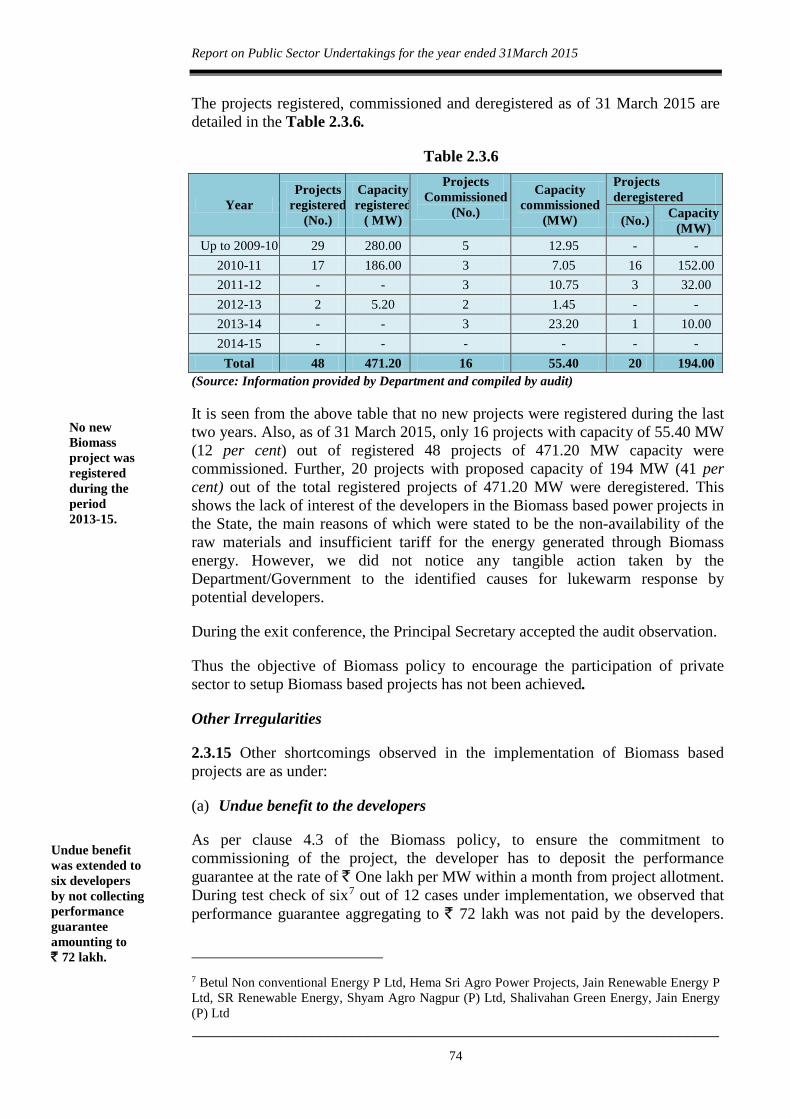
Report on Public Sector Undertakings for the year ended 31March 2015
__________________________________________________________________74
The projects registered, commissioned and deregistered as of 31 March 2015 are detailed in the Table 2.3.6.
Table 2.3.6
Year Projects
registered (No.)
Capacity registered
( MW)
Projects Commissioned
(No.)
Capacity commissioned
(MW)
Projects deregistered
(No.) Capacity (MW)
Up to 2009-10 29 280.00 5 12.95 - - 2010-11 17 186.00 3 7.05 16 152.00 2011-12 - - 3 10.75 3 32.00 2012-13 2 5.20 2 1.45 - - 2013-14 - - 3 23.20 1 10.00 2014-15 - - - - - -
Total 48 471.20 16 55.40 20 194.00 (Source: Information provided by Department and compiled by audit)
It is seen from the above table that no new projects were registered during the last two years. Also, as of 31 March 2015, only 16 projects with capacity of 55.40 MW (12 per cent) out of registered 48 projects of 471.20 MW capacity were commissioned. Further, 20 projects with proposed capacity of 194 MW (41 per cent) out of the total registered projects of 471.20 MW were deregistered. This shows the lack of interest of the developers in the Biomass based power projects in the State, the main reasons of which were stated to be the non-availability of the raw materials and insufficient tariff for the energy generated through Biomass energy. However, we did not notice any tangible action taken by the Department/Government to the identified causes for lukewarm response by potential developers.
During the exit conference, the Principal Secretary accepted the audit observation.
Thus the objective of Biomass policy to encourage the participation of private sector to setup Biomass based projects has not been achieved.
Other Irregularities
2.3.15 Other shortcomings observed in the implementation of Biomass based projects are as under:
(a) Undue benefit to the developers
As per clause 4.3 of the Biomass policy, to ensure the commitment to commissioning of the project, the developer has to deposit the performance guarantee at the rate of ` One lakh per MW within a month from project allotment. During test check of six7 out of 12 cases under implementation, we observed that performance guarantee aggregating to ` 72 lakh was not paid by the developers.
7 Betul Non conventional Energy P Ltd, Hema Sri Agro Power Projects, Jain Renewable Energy P Ltd, SR Renewable Energy, Shyam Agro Nagpur (P) Ltd, Shalivahan Green Energy, Jain Energy (P) Ltd
Undue benefit was extended to six developers by not collecting performance guarantee amounting to ` 72 lakh.
No new Biomass project was registered during the period 2013-15.
Chapter -II- Performance Audit relating to Government Companies
__________________________________________________________________75
However the Department did not take any action for collection of the said performance guarantee, resulting in extension of undue benefit to the developers.
During the exit conference, while accepting the audit observation, the Principal Secretary assured to review the reasons thereof.
(b) Lack of monitoring due to non maintenance of Generation data:
As per clause 12.2 A of the Biomass policy, monthly data of the electricity generated certified by the Distribution/Transmission Company, was to be submitted by the developers to the Department. However, in test checked five8 commissioned projects we observed that generation data was not maintained by the Department. This exhibits that monitoring of the projects commissioned was not conducted by the Department as per the policy.
During exit conference, the Principal Secretary accepted the audit observation and assured that necessary compliance as mentioned in the policy provisions regarding maintenance of electricity generation in future would be made.
Recommendation:
The Company should evaluate the policy framework for renewable energy and its implementation to fine tune the provisions in accordance with constraints observed.
Off-grid based Renewable Energy Projects
The Company undertakes the implementation of Off-grid based RE programmes which includes installation of Solar Photovoltaic Power plant (SPVPP), Street Light Systems (SLS), Home Light Systems (HLS), Solar Water Heating Systems (SWHS), Solar Water Pump and Remote village electrification Programme (RVE) in the State. In addition, the Biogass plants for domestic use is also one of the component of the Off-grid renewable energy. However the implementation of Biogass plant is not undertaken by the Company.
Financial Management
Under-utilisation of Funds from MNRE, GoMP and Beneficiaries
2.3.16 For the implementation of various Off-grid programmes, the funds are received from the MNRE as Central Financial Assistance (CFA), from the State Government and from the beneficiaries. During the period 2010-11 to 2014-15, the funds received from MNRE, GoMP and Beneficiaries are detailed in the Table 2.3.7.
8 Arya Energy Ltd, Orient Green Power, Anant Urja P Ltd, Lanxess P Ltd, Pragya Energy P Ltd.
Department neither maintained the generation data nor monitoring the functioning of the commissioned projects.

Report on Public Sector Undertakings for the year ended 31March 2015
__________________________________________________________________76
Table 2.3.7 (` in crore)
Year MNRE GoMP Beneficiary Fund recd Exp Fund recd Exp Fund recd Exp
2010-119 27.02 23.03 27.46 17.90 17.48 7.95 2011-12 21.84 8.55 6.36 4.95 49.92 5.50 2012-13 7.05 9.12 17.61 5.27 15.50 8.36 2013-14 2.16 19.27 35.82 18.46 78.28 33.46 2014-15 23.56 15.70 9.29 26.08 33.34 52.12
Total 81.63 75.67 96.54 72.66 194.52 107.39 (Source: Information furnished by Company and compiled by Audit)
It is seen from the above table that utilisation of available funds during 2010-11 to 2014-15 was 93 per cent in case of MNRE funds and 75 per cent in case of GoMP funds. However, the utilisation of the beneficiary fund was significantly low. Out of the available beneficiary funds of ` 194.52 crore during 2010-11 to 2014-15, the Company could utilize only ` 107.39 crore (55 per cent), leaving beneficiary funds of ` 87.13 crore unutilised as on 31 March 2015. The reasons for under utilisation of the funds are discussed in the Paragraph 2.3.18 and 2.3.19.
During the exit conference the Principal Secretary accepted the audit observation. The fact remains that the beneficiaries were deprived of RE benefits even after depositing fund with the Company.
Recommendation: The Company should expedite utilization of beneficiary funds.
2.3.17 GoMP issued (October 2006) Energy Policy of the State for a period of five years. On expiry of this policy, the GoMP has not framed any specific policy and annual targets for installation of Off-grid solar applications. Hence the Company followed the operational guidelines issued by MNRE for implementation of Off-grid programmes.
As no targets for Off-grid installations were fixed, the same were being installed on the basis of adhoc demands as received from beneficiaries. Hence, due to non-formulation of the State specific policy and non-fixation of the targets, the full potential for Off-grid installations in the State could not be harnessed.
During the exit conference, the Principal Secretary accepted the audit observation.
Project Implementation
The status of the various Off-grid RE systems sanctioned by MNRE and achievement there against during 2010-11 to 2014-15 are detailed in the Table 2.3.8.
9The fund received figure for the year 2010-11 includes opening balances of ` 6.28 crore, 6.18 crore, and ` 4.93 crore from MNRE, GoMP and Beneficiary respectively.
Beneficiary funds of ` 87.13 crore were lying unutilised with the Company as on 31 March 2015.
No specific policy or any targets were framed for Off-grid System Installations.
Policy and Planning
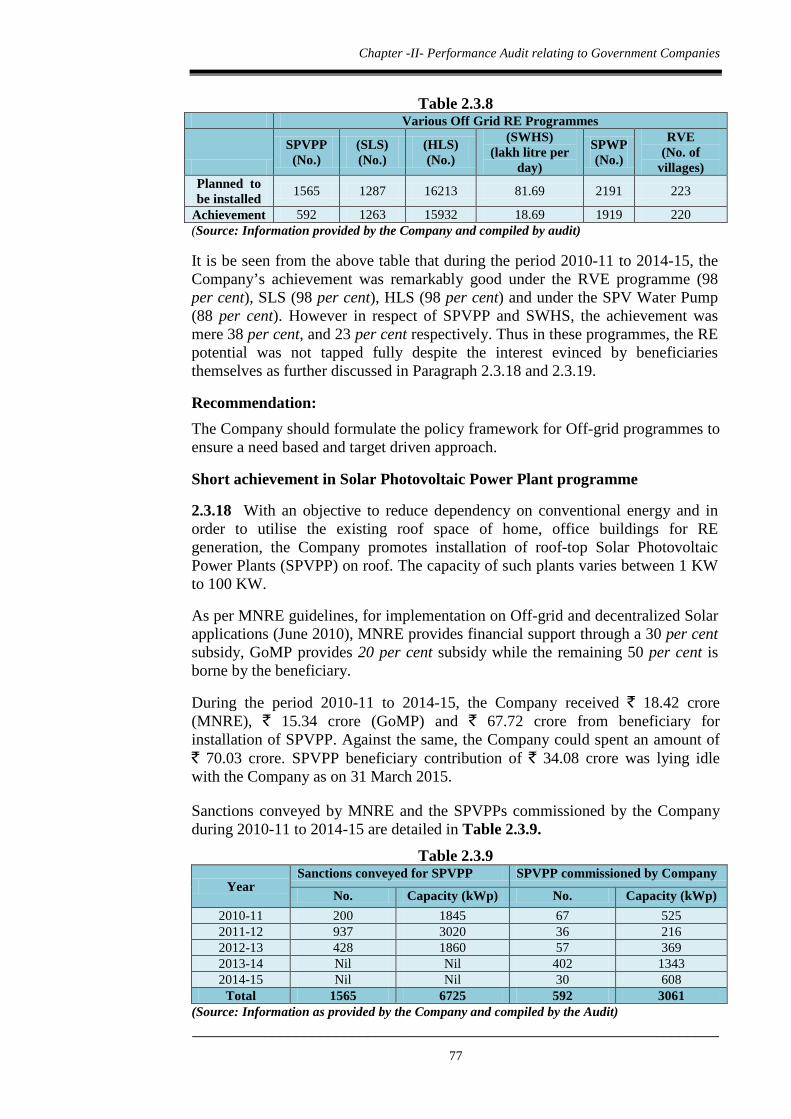
Chapter -II- Performance Audit relating to Government Companies
__________________________________________________________________77
Table 2.3.8 Various Off Grid RE Programmes
SPVPP (No.)
(SLS) (No.)
(HLS) (No.)
(SWHS) (lakh litre per
day)
SPWP (No.)
RVE (No. of
villages) Planned to be installed 1565 1287 16213 81.69 2191 223
Achievement 592 1263 15932 18.69 1919 220 (Source: Information provided by the Company and compiled by audit)
It is be seen from the above table that during the period 2010-11 to 2014-15, the Company’s achievement was remarkably good under the RVE programme (98 per cent), SLS (98 per cent), HLS (98 per cent) and under the SPV Water Pump (88 per cent). However in respect of SPVPP and SWHS, the achievement was mere 38 per cent, and 23 per cent respectively. Thus in these programmes, the RE potential was not tapped fully despite the interest evinced by beneficiaries themselves as further discussed in Paragraph 2.3.18 and 2.3.19.
Recommendation: The Company should formulate the policy framework for Off-grid programmes to ensure a need based and target driven approach.
Short achievement in Solar Photovoltaic Power Plant programme
2.3.18 With an objective to reduce dependency on conventional energy and in order to utilise the existing roof space of home, office buildings for RE generation, the Company promotes installation of roof-top Solar Photovoltaic Power Plants (SPVPP) on roof. The capacity of such plants varies between 1 KW to 100 KW.
As per MNRE guidelines, for implementation on Off-grid and decentralized Solar applications (June 2010), MNRE provides financial support through a 30 per cent subsidy, GoMP provides 20 per cent subsidy while the remaining 50 per cent is borne by the beneficiary.
During the period 2010-11 to 2014-15, the Company received ` 18.42 crore (MNRE), ` 15.34 crore (GoMP) and ` 67.72 crore from beneficiary for installation of SPVPP. Against the same, the Company could spent an amount of ` 70.03 crore. SPVPP beneficiary contribution of ` 34.08 crore was lying idle with the Company as on 31 March 2015.
Sanctions conveyed by MNRE and the SPVPPs commissioned by the Company during 2010-11 to 2014-15 are detailed in Table 2.3.9.
Table 2.3.9
Year Sanctions conveyed for SPVPP SPVPP commissioned by Company
No. Capacity (kWp) No. Capacity (kWp) 2010-11 200 1845 67 525 2011-12 937 3020 36 216 2012-13 428 1860 57 369 2013-14 Nil Nil 402 1343 2014-15 Nil Nil 30 608
Total 1565 6725 592 3061 (Source: Information as provided by the Company and compiled by the Audit)
Report on Public Sector Undertakings for the year ended 31March 2015
__________________________________________________________________78
It is evident from above table that during 2010-11 to 2014-15, the Company could commission mere 38 per cent of the SPVPPs in terms of the numbers sanctioned and 45 per cent in terms of sanctioned capacity by MNRE.
We observed that for the commissioning of sanctioned SPVPP’s, two firms to whom the initial work orders were issued (January 2013 to April 2013) did not take up the work, leading to cancellation of their work orders. The subsequent work orders (August 2013 to March 2014) were issued to another firm to carry out the left over work were also once again cancelled, as the new firm also left the work midway.
The Company failed to carry out any assessment of the reasons for the non-working on the part of suppliers and did not take any corrective action to ensure successful completion of works. As a result, 62 per cent of the SPVPPs in terms of the numbers sanctioned by MNRE during the period 2010-11 to 2014-15 could not be installed up to 31 March 2015.
The Company replied (June 2015) that funds could not be utilised due to delay in tendering process. The Principal Secretary during exit conference accepted the observation and assured to tackle the Contract management issues affecting the implementation of Off-grid Installation.
The fact remains that the beneficiaries remained deprived of RE benefit even after depositing money with the Company.
Recommendation: The Company should improve the Contract management and increase the vendor base for timely installation of the RE systems.
Non-installation of Solar Water Heater Systems
2.3.19 MNRE is implementing the scheme for installation of Solar water heater, through State Nodal Agencies, Government PSUs, Local Bodies and Private entities.
Under the scheme, MNRE provided CFA in the form of 30 per cent capital subsidy on the cost of the system while the remaining 70 per cent cost was to be borne by the beneficiary. However, disbursement of subsidy has been discontinued by MNRE w.e.f. October 2014. Hence as of now, implementation of Solar water heater is being done through 100 per cent beneficiary fund.
During the period 2010-11 to 2014-15, the Company received an amount of ` 7.61 crore from MNRE (` 2.88 crore) and beneficiaries (` 4.73 crore), out of which only ` 1.98 crore was spent, leaving an unspent balance of ` 5.63 crore (74 per cent) of MNRE (` 1.09 crore) and beneficiary (` 4.54 crore) share as of March 2015.
The details of sanctions received and installation of Solar water heating systems under the Solar water heater programme during 2010-11 to 2014-15 is depicted in Table 2.3.10.
Due to frequent cancellation of work orders, 62 per cent of MNRE sanctioned SPVPP systems could not be installed and beneficiary share of ` 34.08 crore remained unutilised.
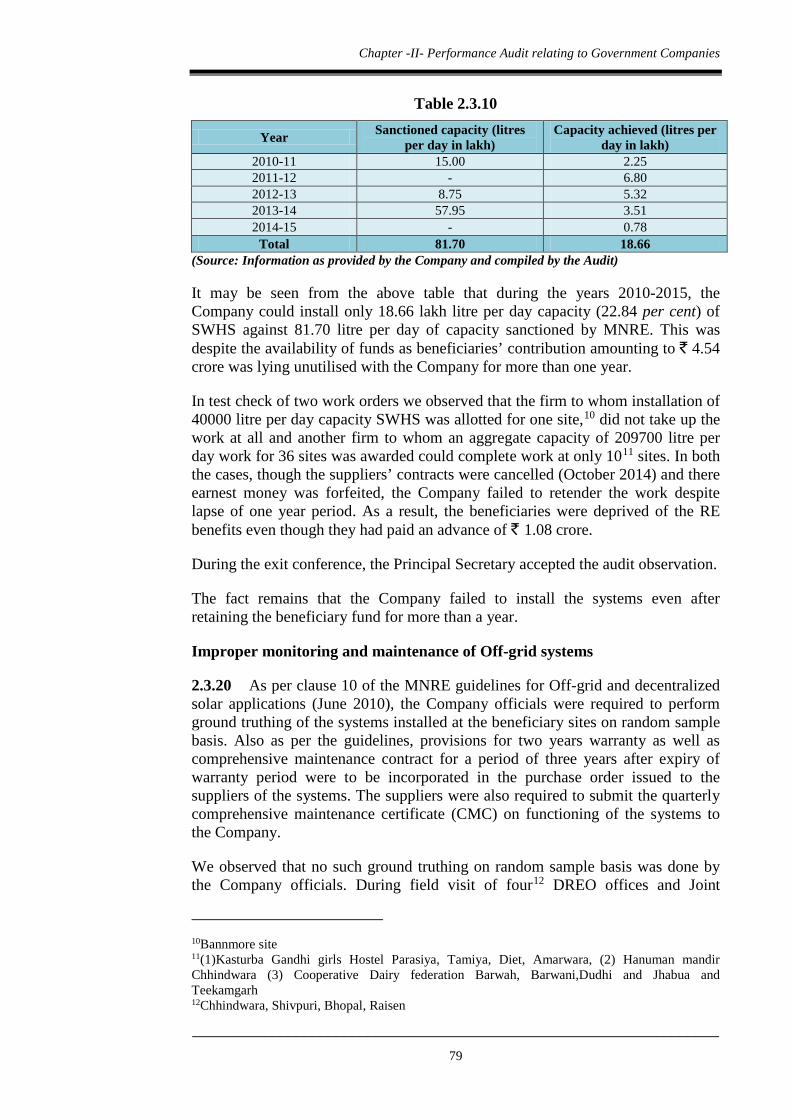
Chapter -II- Performance Audit relating to Government Companies
__________________________________________________________________79
Table 2.3.10
Year Sanctioned capacity (litres per day in lakh)
Capacity achieved (litres per day in lakh)
2010-11 15.00 2.25 2011-12 - 6.80 2012-13 8.75 5.32 2013-14 57.95 3.51 2014-15 - 0.78
Total 81.70 18.66 (Source: Information as provided by the Company and compiled by the Audit)
It may be seen from the above table that during the years 2010-2015, the Company could install only 18.66 lakh litre per day capacity (22.84 per cent) of SWHS against 81.70 litre per day of capacity sanctioned by MNRE. This was despite the availability of funds as beneficiaries’ contribution amounting to ` 4.54 crore was lying unutilised with the Company for more than one year.
In test check of two work orders we observed that the firm to whom installation of 40000 litre per day capacity SWHS was allotted for one site,10 did not take up the work at all and another firm to whom an aggregate capacity of 209700 litre per day work for 36 sites was awarded could complete work at only 1011 sites. In both the cases, though the suppliers’ contracts were cancelled (October 2014) and there earnest money was forfeited, the Company failed to retender the work despite lapse of one year period. As a result, the beneficiaries were deprived of the RE benefits even though they had paid an advance of ` 1.08 crore.
During the exit conference, the Principal Secretary accepted the audit observation.
The fact remains that the Company failed to install the systems even after retaining the beneficiary fund for more than a year.
Improper monitoring and maintenance of Off-grid systems
2.3.20 As per clause 10 of the MNRE guidelines for Off-grid and decentralized solar applications (June 2010), the Company officials were required to perform ground truthing of the systems installed at the beneficiary sites on random sample basis. Also as per the guidelines, provisions for two years warranty as well as comprehensive maintenance contract for a period of three years after expiry of warranty period were to be incorporated in the purchase order issued to the suppliers of the systems. The suppliers were also required to submit the quarterly comprehensive maintenance certificate (CMC) on functioning of the systems to the Company.
We observed that no such ground truthing on random sample basis was done by the Company officials. During field visit of four12 DREO offices and Joint
10Bannmore site 11(1)Kasturba Gandhi girls Hostel Parasiya, Tamiya, Diet, Amarwara, (2) Hanuman mandir Chhindwara (3) Cooperative Dairy federation Barwah, Barwani,Dudhi and Jhabua and Teekamgarh 12Chhindwara, Shivpuri, Bhopal, Raisen
Report on Public Sector Undertakings for the year ended 31March 2015
__________________________________________________________________80
physical verification by audit team along with Company officials of 38 out of 61 installed SPVPP systems, it was noticed that 26 systems (68 per cent) were working, four systems (11 per cent) were not working and 8 systems (21 per cent) though working but were facing problems in spares/batteries etc. which remained unattended by the suppliers as on the date of inspection. It was also observed that the suppliers were not regular in submitting the quarterly comprehensive maintenance certificate in any of the test checked DREO offices.
During the exit conference, the Principal Secretary accepted the audit observation.
Thus the Company failed to monitor the suppliers engaged for maintenance and also failed to ensure long term sustainability of the installed systems which resulted in poor survival/ functioning of installed systems and deprival of intended benefits of RE to the beneficiaries.
Recommendation: The Company should strengthen monitoring mechanism of the installed Off-grid systems for ensuring their proper maintenance and functioning.
2.3.21 GoI sanctioned (2005-06) the Programme for Electrification of remote unelectrified villages through non-conventional energy. The objective of the programme was electrification of unelectrified remote villages where grid connectivity is either not feasible or not cost effective, through non-conventional energy sources. The programme was to be implemented through State nodal agencies with active involvement of district-level bodies, panchayati raj institutions, village councils, etc.
Central financial assistance of upto 90 per cent of the approved project cost was to be provided by MNRE. The balance 10 per cent of projects can be financed through contribution from beneficiaries, State plans, or other sources/development schemes
During the period from 2010-11 to 2014-15, available funds of ` 28.11 crore under the programme were nearly fully spent. During the period 2010-11 to 2014-15, the Company had electrified 220 out of 223 villages (98 per cent) sanctioned, and had commissioned 1263 out of 1287 street lights (98 per cent) sanctioned, and 15932 out of 16213 home lights (98 per cent) sanctioned. Thus the target set under RVE programme were almost achieved.
Further, during the field visit by the audit team along with the Company officials of six remote villages13, it was observed that regular maintenance of the systems was being done by the suppliers. In two villages beneficiaries were satisfied with the systems however, in other villages, the beneficiaries’ complained about failure in batteries, dim light, and gradual decrease in efficiency of the systems over the years.
13 Satkunda, Gopisur , Panjeer, Jhirribhadea, Bhurakheda, Sirali
Remote Village Electrification Programme
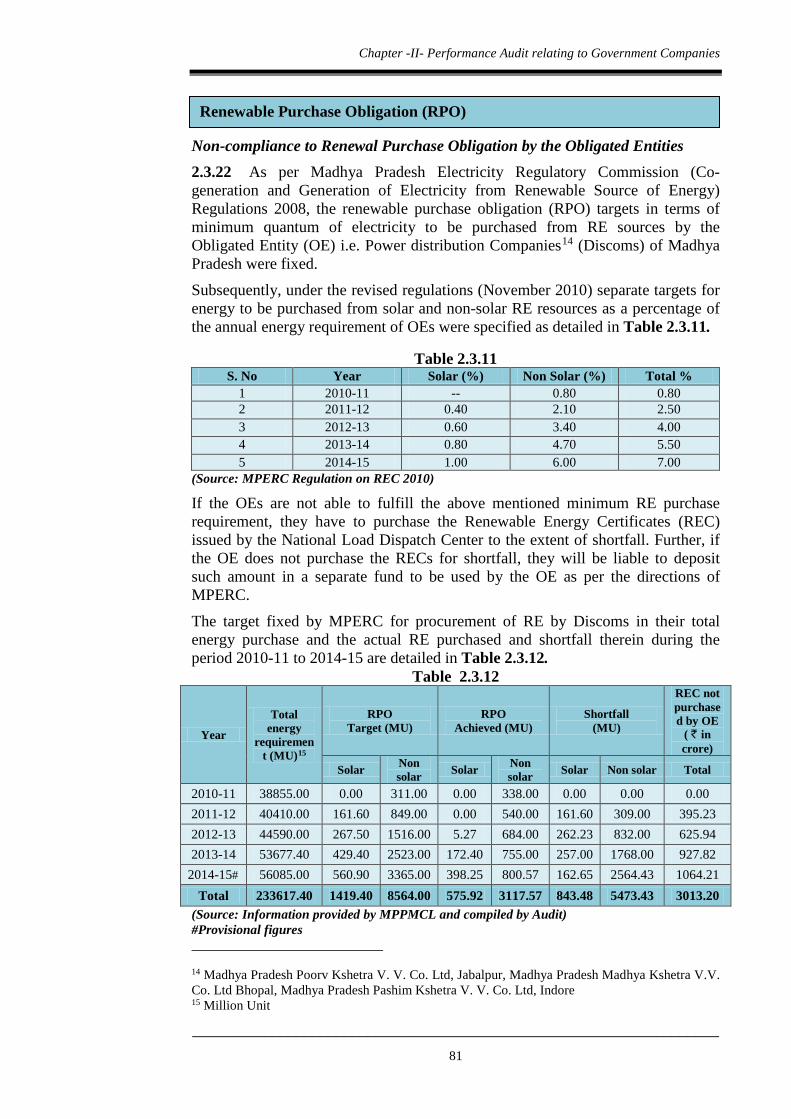
Chapter -II- Performance Audit relating to Government Companies
__________________________________________________________________81
Non-compliance to Renewal Purchase Obligation by the Obligated Entities 2.3.22 As per Madhya Pradesh Electricity Regulatory Commission (Co-generation and Generation of Electricity from Renewable Source of Energy) Regulations 2008, the renewable purchase obligation (RPO) targets in terms of minimum quantum of electricity to be purchased from RE sources by the Obligated Entity (OE) i.e. Power distribution Companies14 (Discoms) of Madhya Pradesh were fixed. Subsequently, under the revised regulations (November 2010) separate targets for energy to be purchased from solar and non-solar RE resources as a percentage of the annual energy requirement of OEs were specified as detailed in Table 2.3.11.
Table 2.3.11 S. No Year Solar (%) Non Solar (%) Total %
1 2010-11 -- 0.80 0.80 2 2011-12 0.40 2.10 2.50 3 2012-13 0.60 3.40 4.00 4 2013-14 0.80 4.70 5.50 5 2014-15 1.00 6.00 7.00
(Source: MPERC Regulation on REC 2010)
If the OEs are not able to fulfill the above mentioned minimum RE purchase requirement, they have to purchase the Renewable Energy Certificates (REC) issued by the National Load Dispatch Center to the extent of shortfall. Further, if the OE does not purchase the RECs for shortfall, they will be liable to deposit such amount in a separate fund to be used by the OE as per the directions of MPERC. The target fixed by MPERC for procurement of RE by Discoms in their total energy purchase and the actual RE purchased and shortfall therein during the period 2010-11 to 2014-15 are detailed in Table 2.3.12.
Table 2.3.12
Year
Total energy
requirement (MU)15
RPO Target (MU)
RPO Achieved (MU)
Shortfall (MU)
REC not purchased by OE
( ` in crore)
Solar Non solar Solar Non
solar Solar Non solar Total
2010-11 38855.00 0.00 311.00 0.00 338.00 0.00 0.00 0.00 2011-12 40410.00 161.60 849.00 0.00 540.00 161.60 309.00 395.23 2012-13 44590.00 267.50 1516.00 5.27 684.00 262.23 832.00 625.94 2013-14 53677.40 429.40 2523.00 172.40 755.00 257.00 1768.00 927.82
2014-15# 56085.00 560.90 3365.00 398.25 800.57 162.65 2564.43 1064.21 Total 233617.40 1419.40 8564.00 575.92 3117.57 843.48 5473.43 3013.20
(Source: Information provided by MPPMCL and compiled by Audit) #Provisional figures 14 Madhya Pradesh Poorv Kshetra V. V. Co. Ltd, Jabalpur, Madhya Pradesh Madhya Kshetra V.V. Co. Ltd Bhopal, Madhya Pradesh Pashim Kshetra V. V. Co. Ltd, Indore 15 Million Unit
Renewable Purchase Obligation (RPO)
Report on Public Sector Undertakings for the year ended 31March 2015
__________________________________________________________________82
It may be seen from the above table that during 2010-15, the RPO target for the OEs /Discoms was of 9983 MU from Solar (1419 MU) and Non solar (8564 MU) sources. However, as the generation of renewable energy in the state during this period was only 3693 MU, the OEs could achieve only 37 per cent of their RPO target resulting in shortfall of 6316.91 MU.
We observed that for the shortfall in achievement of RPO the OEs were required to purchase RECs aggregating to ` 3013.20 crore or deposit the amount in a separate fund as per MPERC regulations, however, neither any REC was purchased, nor was any amount deposited by the OEs in the separate fund.
The objective behind imposition of RPO was in greater public interest as this would have long impact on protection of environment and reducing the emission of greenhouse gases, which however, was not achieved.
Recommendation:
The Government should make efforts to increase the renewable energy generation in the State to meet the RPO requirement and Discoms should purchase the requisite RECs for the shortfall in RPO or maintain a separate fund as per MPERC regulations.
Grid connected Renewable Energy Projects
• During 2010-11 to 2014-15, no specific targets for capacity addition were set for any of the renewal energy (RE) source and no long term/short term plans were prepared by the Department for development of RE. As a result, the potential of RE in the State could not be harnessed in a planned manner. The Department should prepare RE source wise target oriented plans for the development of RE in the State. • As of 31 March 2015, the projects of 453.22 MW in Solar (45 per cent), 665.30 MW (nine per cent) in Wind and 55.40 MW in Biomass (12 per cent) could only be commissioned against registered projects of 1007.50 MW, 7196.55 MW and 471.20 MW capacity respectively. Also no Small Hydel project was commissioned by the Department. Further, the projects of 247 MW in Solar (25 per cent), 833.35 MW (12 per cent) in Wind, 44.80 MW in Small Hydel (14 per cent) and 194 MW in Biomass (41 per cent) were deregistered. The reasons for low commissioning and high deregistration were non-allotment of land, disinterest shown by the developers, non-availability of the raw materials, insufficient tariffs for energy and long gestation period of the projects etc. The Department should evaluate the policy framework for renewable energy and its implementation to fine tune the provisions in accordance with constraints observed.
• Undue benefit of ` 1.02 crore was extended to seven developers of Wind and Biomass energy projects due to non-collection of performance guarantee for ensuring timely completion of projects on Government land.
Conclusion and Recommendations
Discoms did not purchased the RECs aggregating to ` 3013.20 crore for shortfall in achieving RPO.
Chapter -II- Performance Audit relating to Government Companies
__________________________________________________________________83
Off-grid Projects
• Due to non-fixation of the targets, the Off-grid systems were being installed on the basis of adhoc demands received from beneficiaries. As a result, the full potential for Off-grid installations in the State could not be assessed and developed in a planned manner. The Company should formulate the policy framework for Off-grid programmes to ensure a need based and target driven approach.
• Due to failure to analyse the reasons for non-completion of work by the suppliers and to take corrective action, the Company could commission only 3061 kWp (45 per cent) out of the 6725 kWp capacity Solar Photovoltaic Power plants sanctioned by MNRE during 2010-15. As a result, the beneficiaries were deprived of renewable energy benefits though their share of ` 34.08 crore was lying unutilised with the Company. The Company should improve the Contract management and increase the vendor base for timely installation of the systems.
• In the Joint physical verification by audit team along with Company officials of 38 installed Solar photovoltaic power plant systems (SPVPP), four systems were found not working and eight were facing technical problems which were not attended promptly by the suppliers due to non-monitoring and non-emphasizing the submission of quarterly maintenance certificates of the systems by the Company as per terms of maintenance agreements. The Company should strengthen monitoring mechanism of the installed Off-grid systems for ensuring their proper maintenance and functioning.
• Due to insufficient generation of renewable energy in the State during 2010-15, there was a shortfall in meeting Renewable Purchase Obligation (RPO) target of 6316.91 MU. Also, the Power Distribution Companies did not purchase Renewable Energy Certificates (RECs) of ` 3013.20 crore for shortfall in RPO. The Government should make efforts to increase the renewable energy generation to meet the RPO requirement and Discoms should purchase the requisite RECs for the shortfall in RPO as per MPERC regulations.