13.ambati janardhana rao 500028066.pdf - upes
TRANSCRIPT
1
BENCHMARKING AND TRANSFORMATION OF MAJOR PORTS IN INDIA
By
AMBATI JANARDHANA RAO
SCHOOL OF BUSINESS
(DEPARTMENT OF TRANSPORTATION)
Submitted
IN PARTIAL FULFILLMENT OF THE REQUIREMENT OF THE DEGREE OF
DOCTOR OF PHILOSOPHY
TO
UNIVERSITY OF PETROLEUM AND ENERGY STUDIES
DEHRADUN
May, 2018
UNDER GUIDANCE OF
DR. T. BANGAR RAJU
(GUIDE)
PROFESSOR & HEAD
DEPARTMENT OF
TRANSPORTATION
SoB-UPES DEHRADUN
DR. HIRANMOY ROY
(CO-GUIDE)
ASSOCIATE PROFESSOR
DEPARTMENT OF
ECONOMICS & IB
SoB, UPES DEHRADUN
DR. L.R. THAPAR
(EXTERNAL GUIDE)
DIRECTOR
HIND TERMINALS
LIMITED
NEW DELHI
2
भारत के प्रमुख बंदरगाह ंमें बेंच मार्किं ग तथा पररवततन
द्वारा
ए जनार्धना राव
डॉक्टरऑफ फफलॉसफी की फडग्री कीआवश्यकता कीआंफिक पूफति के फलए
(पेट्र ोलियम और ऊर्ात लिक्षा र्वश्वर्वद्यालय) May 2018
के मार्धदिधन में
र्ाइड सह र्ाइड बाह्य र्ाइड
डॉ ट्ी बंर्ार राजू डॉ लहरनमॉय रॉय डॉ एि के थापर
प्रोफेसर और प्रमुख सहयोर्ी प्रोफेसर र्नदेशक
पररवहन प्रबंर् लवभार् अथधिास्त्र और आईबी लवभार् र्हंद ट्लमधनि लिलमटे्ड
एस. ओ. बी. - पेट्र ोलियम और एस. ओ. बी. - पेट्र ोलियम और नई लदल्ली
ऊर्ात लिक्षा र्वश्वर्वद्यालय ऊर्ात लिक्षा र्वश्वर्वद्यालय
देहरादून देहरादून
3
Acknowledgements
I would like to state that I worked upon this thesis solely based on my utmost fascination
to the Port Sector and my inner urge to contribute substantially towards indelible progress
of the Major Ports. This thesis has been kept on track and seen through to completion
with the support and encouragement of numerous people including my family, well-
wishers and various institutions. I would like to thank all those people who made this
thesis possible. It is a pleasant task to express my thanks to all those who contributed in
many ways to the success of this study and made it an unforgettable experience for me.
At this moment of accomplishment, first of all I pay special honor to my guide, Dr. T.
Bangar Raju- HOD & Professor, Department of Transportation, UPES and Co-Guide Dr.
Hiranmoy Roy – Associate Professor, Department of Economics & IB UPES. This work
would not have been possible without their guidance, support and encouragement. Under
their guidance I successfully overcame many difficulties and learned a lot. I am very
much thankful to them for considering me as their Research Scholar.
I would like to express my sincere gratitude to University of Petroleum & Energy Studies
(UPES) for allowing me to undertake this research. I am very grateful to Chancellor,
UPES & Vice-Chancellor, UPES for the motivation that they have given during this
journey of research.
My utmost respects go to Dr. L.R. Thapar for his constant support in shaping the research
output. My sincere regards to the members of SoB-UPES for their constant assistance and
help that they have extended to me.

4
My sincere thanks to the members of FRC, UPES for their constant and invaluable
suggestions that have helped in enhancing the quality of this research work. My sincere
thanks to the officials of Indian Ports Association (IPA), all Major Ports, Indian Ship
Owners Association (INSA) and various stakeholders in the port sector for providing
much required inputs and support that helped in carving this research work.
A special thanks to my family. Words cannot express how grateful I am to my family for
continuously motivating and encouraging me to continue this journey.
I would also like to acknowledge the immense contribution of my friends who supported
me in writing, and induced me to strive towards my goal. Last but not least, I would like
to express appreciation to my beloved wife who was always in my support during the
inevitable ups and downs of conducting my research, this helped me a lot to work for
hours together tirelessly.

Scanned with CamScanner
Scanned with CamScanner
7
TABLE OF CONTENT
EXECUTIVE SUMMARY ......................................................................................................................... 14
ABBREVIATIONS ..................................................................................................................................... 18
CHAPTER I - INTRODUCTION.............................................................................................................. 20
1.1 BACKGROUND .................................................................................................................................. 20 1.2 MAJOR PORTS IN INDIA - AN OVERVIEW: ............................................................................................... 21 1.3 MAJOR PORTS LOSING SHARE TO NON-MAJOR PORTS................................................................................ 24 1.4 HIGHER TURN ROUND TIME IN MAJOR PORTS OF INDIA ............................................................................. 24 1.5 SIZE OF COAL VESSELS VISITING MAJOR PORTS OF INDIA ............................................................................ 25 1.6 LOGISTICS SHARE IN INDIAN GDP ......................................................................................................... 25 1.7 CAPACITY AUGMENTATION .................................................................................................................. 27 1.8 QUANTITATIVE BENCHMARKING ........................................................................................................... 28
1.8.1 Benchmarking Theory: ......................................................................................................... 28 1.8.2 Techniques of Benchmarking/Classification: ....................................................................... 29 1.8.3 Selection of benchmark ports and data normalization ....................................................... 30
1.9 BUSINESS PROBLEM: .......................................................................................................................... 32 1.10 MOTIVATION FOR STUDY: ................................................................................................................... 32
CHAPTER II- LITERATURE REVIEW ................................................................................................. 34
2.1 MAJOR INFERENCES DERIVED FROM LITERATURE REVIEW: .......................................................................... 89 2.2 MAJOR GAPS DERIVED FROM LITERATURE REVIEW: ................................................................................. 89 2.3 THEME BASED INFERENCES AND GAPS: .................................................................................................. 90 2.4 BENCHMARKING STUDIES: .................................................................................................................. 94
CHAPTER III - RESEARCH METHODOLOGY .................................................................................. 95
3.1 RESEARCH PROBLEM .......................................................................................................................... 95 3.2 RESEARCH QUESTIONS:....................................................................................................................... 95 3.2 RESEARCH OBJECTIVES: ...................................................................................................................... 95 3.3 RESEARCH DESIGN ............................................................................................................................. 95 3.4 PROCESS DETAILS .............................................................................................................................. 96 3.5 RESEARCH METHODOLOGY FOR RESEARCH OBJECTIVE 1: ........................................................................ 101 3.6 RESEARCH METHODOLOGY FOR OBJECTIVE 2 ........................................................................................ 105 3.7 THEORETICAL UNDERPINNING: ........................................................................................................... 108 3.8 BENCHMARKING THEORY: ................................................................................................................. 108
CHAPTER IV- ANALYSIS (OBJECTIVE 1) ........................................................................................ 111
4.1 CONTAINER TERMINALS .................................................................................................................... 111 4.1.1 Underutilization of Container Capacity FY 2014-15 .......................................................... 112 4.1.2 Berth occupancy FY 2014-15 ............................................................................................. 113 4.1.3 Berth productivity FY 2014-15 .......................................................................................... 114 4.1.4 JNPT own terminal and V.O.C lagging behind peers in quay crane productivity lowering
their effective capacity ............................................................................................................... 115 4.1.5 Yard throughput levels ..................................................................................................... 116 4.1.6 Ground slot density FY 2014-15 ......................................................................................... 117 4.1.7 Yard space utilization FY 2014-15 ..................................................................................... 118 4.1.8 Number of cranes per meter quay FY 2014-15 .................................................................. 119 4.1.9 Number of RTGCs in line with benchmarks except for own terminal at JNPT ................... 120
8
4.1.10 RTGC productivity above international benchmark levels for most terminals except JNPT
own terminal .............................................................................................................................. 121 4.1.11 Number of terminal tractors FY 2014-15 ......................................................................... 122 4.1.12 TT productivity FY 2014-15 .............................................................................................. 123 4.1.13 Evacuation of containers FY 2014-15 .............................................................................. 124 4.1.14 Gate lane productivity FY 2014-15 .................................................................................. 125 4.1.15 Truck turnaround time FY 2014-15 .................................................................................. 126 4.1.16 Variation in rail line productivity between JNPT terminals FY 2014-15 ........................... 127 4.1.17 Rail turnaround time for container terminals in India ..................................................... 128
4.2 DRY BULK TERMINALS ............................................................................................................................. 129 4.2.1 Distribution of coal traffic handled by the major ports FY 2014-15 .................................. 130 4.2.2 Distribution of size of coal vessels calls across major ports FY 2014-15 ............................ 131 4.2.3 Benchmarking Procedures: ................................................................................................ 132 4.2.4 Occupancy levels for Mechanized and Conventional Berths ............................................ 133 4.2.5 Productivity across berths ................................................................................................. 134 4.2.6 Productivity of Panamax vessel ......................................................................................... 135 4.2.7 Potential improvements in case of adaptation of ‘best demonstrated performance’ ...... 136
4.3 FERTILIZER TERMINALS ............................................................................................................................ 137 4.3.1 Panamax class constitutes ~45% of all dry bulk fertilizer vessel calls ............................... 138 4.3.2 Berths handling for dry fertilizer running .......................................................................... 139 4.3.3 Productivity of Dry bulk fertilizer ....................................................................................... 140 4.3.4 Large scope for improvement as avg. BDP is 13000 MT/day ............................................ 141 4.3.5 Low capacity utilization for Dry Bulk Fertilizer Cargo ........................................................ 142
4.4 POL .................................................................................................................................................... 143 4.4.1 Distribution of Liquid cargo traffic across major ports FY 2014-15 ................................... 144 4.4.2 Handymax class constitutes ~50% of all liquid vessel calls ............................................... 145 4.4.3 Liquid berth occupancy ...................................................................................................... 146 4.4.4 Productivity of POL (Crude) at Major Ports FY 2014-15 .................................................... 147 4.4.5 Productivity of LPG across berths of Major Ports FY 2014-15 ........................................... 148 4.4.6 Productivity of POL (Product) across berths of Major Ports in 2014-15 ............................ 149 4.4.7 Productivity across berth significantly below benchmarks (IV) ......................................... 150 4.4.8 Potential to double volumes by replicating ‘best demonstrated performance’ consistently
.................................................................................................................................................... 151 4.5 BULK STORAGE AND EVACUATION ............................................................................................................. 152
4.5.1 Preliminary view of storage allocation by commodities across deep-dive ports ............... 153 4.5.2 Rake turn-around times higher than private ports ............................................................ 156
4.6 PORT COST BENCHMARK ......................................................................................................................... 157 4.6.1 Labour, operation & maintenance and dredging accounts for ~80% of the operating
expenditure across ports ............................................................................................................ 158 4.6.2 Labour cost is highest in legacy ports such as Mumbai, Kolkata and Goa ........................ 159 4.6.3 Number of cargo and non cargo handling employees per MT .......................................... 160 4.6.4 Maintenance & Operations cost per unit traffic ................................................................ 161 4.6.5 Port crane utilization high in Mormugao, J.N.P.T and Kandla........................................... 162
CHAPTER V – ANALYSIS (OBJECTIVE 2) ........................................................................................ 163
5.1 JAWAHARLAL NEHRU PORT TRUST ............................................................................................................ 163 5.1.1 Port performance dashboard – JNPT ................................................................................. 163 5.1.2 Summary of suggestions – JNPT ........................................................................................ 164 5.1.3 JNPT Reduce shift change losses to improve QC productivity ........................................... 165 5.1.4 JNPT Increase twin-lift ratio .............................................................................................. 166 5.1.5 JNPT Redesign operation incentive scheme ...................................................................... 167
9
5.1.6 JNPT Redesign operation incentive scheme ...................................................................... 168 5.1.7 JNPT Dynamic deployment of RTGCs based on actual demand ........................................ 169 5.1.8 JNPT Ensure 100% yard integrity through real-time update of container location by RTGC
operators .................................................................................................................................... 170 5.1.9 JNPT Acquire additional RTGCs ......................................................................................... 171
5.2 PARADIP PORT TRUST ............................................................................................................................. 172 5.2.1 Port performance dashboard – PPT .................................................................................. 172 5.2.2 Summary of suggestions – PPT .......................................................................................... 173 5.2.3 PPT Modification of existing berthing policy and setup of penal berth charges linked to
productivity norms ..................................................................................................................... 174 5.2.4 PPT Generate additional demand for thermal coal from existing and new customers ..... 175 5.2.5 PPT Use IHP for export coal cargo and handle Haldia top-up vessels and smaller players176 5.2.6 PPT Rationalisation of existing plots in MCHP and development of additional land ....... 177 5.2.7 PPT Improve RRS monitoring to reduce rake TRT .............................................................. 178 5.2.8 PPT Operate 8 HMCs across EQ 1-3, CQ 1-2 berths to upgrade productivity .................... 179 5.2.9 PPT Develop additional storage capacity and full rake sidings for conventional operations
.................................................................................................................................................... 180 5.3 COCHIN PORT TRUST .............................................................................................................................. 181
5.3.1 Port performance dashboard – CoPT ................................................................................ 181 5.3.2 Summary of suggestions – CoPT........................................................................................ 182 5.3.3 CoPT Pilot for improving rail connectivity from Coimbatore to ICTT ................................. 183 5.3.4 CoPT Requirements for easing the delays and costs for road transport to ICTT ............... 184 5.3.5 CoPT Proposal for extended cabotage relaxation for coastal cargo ................................. 185 5.3.6 CoPT Mechanization to attract FCI food-gain traffic from North India/ Andhra Pradesh . 186 5.3.7 CoPT Mechanized bagging plant to attract fertilizer imports ........................................... 187 5.3.8 CoPT Enable BPCL to set up POL quality testing facility within port premises .................. 188
5.4 CHENNAI PORT TRUST ............................................................................................................................ 189 5.4.1 Port performance dashboard – CHPT ................................................................................ 189 5.4.2 Summary of suggestions – CHPT ....................................................................................... 190 5.4.3 CHPT Monitor and incentivise yard productivity of private terminals ............................... 191 5.4.4 CHPT Provide additional yard space to DPW .................................................................... 192 5.4.5 CHPT Frontload pre-gate processing & entry of trailer details to CFS .............................. 193 5.4.6 CHPT Automate container verification by installing cameras ........................................... 194 5.4.7 CHPT Discount charges on rake operations for Bangalore ICD ......................................... 195 5.4.8 CHPT Facilitate construction of new POL-products pipeline .............................................. 196 5.4.9 CHPT Reduce the port charges at Chennai to match the prices at Krishnapatnam for edible
oil ................................................................................................................................................ 197 5.4.10 CHPT Start edible oil rakes between Chennai and Madurai ............................................ 198 5.4.11 CHPT Facilitate investment in mechanized fertilizer bagging plant ................................ 199
5.5 VISHAKHAPATNAM PORT TRUST ............................................................................................................... 200 5.5.1 Port performance dashboard – VPT .................................................................................. 200 5.5.2 Summary of suggestions – VPT ......................................................................................... 201 5.5.3 VPT Setup new Business Development team to convert customers ................................. 202 5.5.4 VPT Reconfigure cargo handling volumes of existing customers along S. Central Railway
from low to high productive berths ............................................................................................ 203 5.5.5 VPT Allocate additional land to high productive berths to drive higher productivity ........ 204 5.5.6 VPT Revisit storage cost in PPP BOT to make them competitive ....................................... 205 5.5.7 VPT Setup dashboard and regularize weekly meetings to track performance. Subsequently
use inputs to set productivity norms .......................................................................................... 206 5.6 MUMBAI PORT TRUST ............................................................................................................................ 207
5.6.1 Port performance dashboard – MbPT ............................................................................... 207
10
5.6.2 Summary of suggestions – MbPT ...................................................................................... 208 5.6.3 MbPT Install quick release systems on berths ................................................................... 209 5.6.4 MbPT Policy change to mandate usage of testing lab at JD ............................................. 210 5.6.5 MbPT Bring JD 5 plans of creating tank farms forward and implement low performance
penalties ..................................................................................................................................... 211 5.6.6 MbPT Installation of higher capacity shore crane will help increase productivity by ~20%
.................................................................................................................................................... 212 5.6.7 MbPT Use of 2nd OCT berth for steel handling to unlock additional capacity.................... 213
5.7 KANDLA PORT TRUST ............................................................................................................................. 214 5.7.1 Port performance dashboard – KPT .................................................................................. 214 5.7.2 Summary of suggestions in KPT I/II ................................................................................... 215 5.7.3 KPT Increasing crane throughput by optimizing grab sizes to commodities ..................... 217 5.7.4 KPT Bunching of TIL ELL cranes in fewer berths to increase crane density on the berths . 218 5.7.5 KPT Improving performance of own MHC by optimizing boom length and grab volume . 219 5.7.6 KPT Increase crane density by adding 4 100T MHCs ......................................................... 220 5.7.7 KPT Reduce tug fuel consumption ..................................................................................... 221 5.7.8 KPT Improve night navigation by using advanced navigational aids ................................ 222 5.7.9 KPT Reducing fertilizer rake loading time by adding automated bag loader .................... 223 5.7.10 KPT Increase overall dry bulk productivity by instituting berth productivity norms ........ 224 5.7.11 KPT Reduce non-working time by instituting hot seat changes ...................................... 225 5.7.12 KPT Reduce non working time by changing shift schedule ............................................. 226 5.7.13 KPT Increase overall liquid productivity by instituting berth productivity norms ............ 227
5.8 KOLKATA PORT TRUST ............................................................................................................................ 228 5.8.1 Port performance dashboard – KOPT ................................................................................ 228 5.8.2 Summary of suggestions in KoPT ...................................................................................... 229 5.8.3 KOPT HMC for berths 2,8; hardstand 56 sqm .................................................................... 231 5.8.4 KOPT HMC for berths 9, 13; hardstand 150 sqm ............................................................... 232 5.8.5 KOPT Reduce non-working time by reducing shift change time, marine wait time ......... 233 5.8.6 KOPT Increase capacity of mechanized coal export berth 4 .............................................. 234 5.8.7 KOPT Making transloading option attractive by reducing overall cost and creating a
combined package ..................................................................................................................... 235 5.8.8 KOPT Increase container handling capacity by adding HMC to berth 3 in KDC, NSD ........ 236 5.8.9 KOPT Reduce NWT by instituting hot seat changes and reducing marine wait time ........ 237 5.8.10 KOPT Improvement of truck traffic during night by facilitating night payment and
customs clearance ...................................................................................................................... 238 5.8.10 KOPT Reduce rake turnaround time at KDS by improving railway infrastructure ........... 239 5.8.11 KOPT Dredging cost reduction ......................................................................................... 240 5.8.12 KOPT Reduce loco hiring cost by relocating 2 good quality locos to from KDS to HDC ... 241 5.8.13 KOPT Reduce tug operation cost at HDC by scrapping own tugs and replacing them by
hired tugs.................................................................................................................................... 242 5.8.14 KOPT Reduce security cost at KDS by reducing security cover for areas with lower activity
.................................................................................................................................................... 243 5.9 VOC PORT TRUST ................................................................................................................................. 244
5.9.1 Port performance dashboard – VOCPT .............................................................................. 244 5.9.2 Summary of suggestions in VOCPT .................................................................................... 245 5.9.3 VOC Incorporate specific productivity norms in berthing policy ........................................ 246 5.9.4 VOC Installation of MHCs at berths III and IV .................................................................... 247 5.9.5 VOC Mechanization of evacuation at berth IX .................................................................. 248 5.9.6 VOC Consolidation and improvement of spare capacity on TNEB berths .......................... 249 5.9.7 VOC Short-term agreement with DBGT for us of berth VIII for copper concentrate vessels
.................................................................................................................................................... 250
11
5.10 MORMUGAO PORT TRUST ..................................................................................................................... 251 5.10.1 Port performance dashboard – MPT ............................................................................... 251 5.10.2 Summary of suggestions in MPT ..................................................................................... 252 5.10.3 MPT Implement hot seat shift change for HMC .............................................................. 253 5.10.4 MPT Improve HMC operator performance ...................................................................... 254 5.10.5 MPT Addition of HMC on general cargo berths ............................................................... 255 5.10.6 MPT Enhance draft for JSW coal berth to increase cargo handling capacity .................. 256 5.10.7 MPT Development of 10 MTPA new coal terminal .......................................................... 257 5.10.8 MPT Doubling of MPT railway line to Hospet .................................................................. 258 5.10.9 MPT SVRS announcement and redeployment of MOHP employees ............................... 259
5.11 NEW MANGALORE PORT TRUST ............................................................................................................. 260 5.11.1 Port performance dashboard – NMPT............................................................................. 260 5.11.2 Summary of suggestions - NMPT .................................................................................... 261 5.11.3 NMPT Increase container cargo by attracting customers from Mysore and adjoining
areas ........................................................................................................................................... 262 5.11.4 NMPT Improve service level for containers ..................................................................... 263 5.11.5 NMPT Setup a LNG terminal at NMPT ............................................................................. 264 5.11.6 NMPT Setup a mechanized berth for handling fertilizer ................................................. 265 5.11.7 NMPT Reduce overtime costs for marine equipment by migrating to three shift
deployment................................................................................................................................. 266 5.12 KAMARAJAR PORT TRUST...................................................................................................................... 267
5.12.1 Port performance dashboard – KPL ................................................................................. 267 5.12.2 Summary of suggestions - KPL ......................................................................................... 268 5.12.3 KPL Improve productivity at existing coal terminals to increase cargo handling capacity
and implement governance mechanism .................................................................................... 269 5.12.4 KPL Requirement of additional cargo to fill capacity at Chettinad terminal ................... 270 5.12.5 KPL Modification of existing empty Iron Ore berth to handle coal and serve hinterland
demand ...................................................................................................................................... 271 5.12.6 KPL Improve productivity at liquid terminal through reduction in pigging and sampling
time ............................................................................................................................................ 272
CHAPTER VI - SUGGESTIONS AND CONCLUSIONS .................................................................... 273
6.1 TECHNOLOGY UPGRADE ..................................................................................................................... 273 6.2 PROCESS OPTIMIZATION ..................................................................................................................... 274 6.3 PRICING & INCENTIVE ALIGNMENT ....................................................................................................... 275 6.4 EQUIPMENT UPGRADE ....................................................................................................................... 276 6.5 BARGE BASED DREDGING SUCCESSFULLY PILOTED IN KOLKATA ................................................................... 277 6.6 DUAL-LOADING OF SHIPS IMPLEMENTED AT PARADIP RESULTING IN ACHIEVEMENT OF 2X NORMAL BERTH
PRODUCTIVITY: ............................................................................................................................................ 279 6.7. LIQUID NORMS DESIGNED IN KANDLA TO ENCOURAGE CUSTOMERS TO SHIFT TO LARGER VESSELS ...................... 280 6.8. JNPT EVACUATION INITIATIVES SHOWING IMPROVEMENTS ....................................................................... 281 6.9 LIKELY REDUCTION TURNAROUND TIMES ACROSS PORTS .......................................................................... 283 6.10 >RS 3,500 CR VALUE CREATION .......................................................................................................... 287 6.12 FOCUS ON MECHANIZATION OF PORT BERTHS TO ENHANCE PORT CAPACITY ................................................... 288 6.13. WAY FORWARD: FEW IDEAS TO DRIVE FURTHER EFFICIENCY UNLOCK .......................................................... 290
APPENDIX - SURVEY OF MAJOR INDIAN PORTS ......................................................................... 291
REFERENCES .......................................................................................................................................... 300
12
List of Figures and Tables
FIGURE 1.1 INDIAN SEAPORTS AND CONTRIBUTION TO GDP THROUGH EXPORT-IMPORT TRADE ........................................ 20 FIGURE 1.2 CONTRIBUTION OF MARITIME TRADE TO TOTAL EXPORT-IMPORT TRADE VALUE IN INDIA .................................. 21 FIGURE. 1.3 THE LOCATION AND TRAFFIC OF ALL MAJOR PORTS IN THE COUNTRY. .......................................................... 22 TABLE 1. 1 TRAFFIC HANDLED BY THE MAJOR PORTS DURING 2016-17....................................................................... 22 FIGURE 1.4 (A) TURNAROUND TIME STATUS AT MAJOR PORTS OF INDIA. ....................................................................... 24 FIGURE 1.4 (B) VESSELS TRAFFIC (COAL), FY 2015 .................................................................................................. 25 FIGURE 1.5 (A): COMPARISON OF LOGISTICS SHARE TO GDP. ..................................................................................... 26 TABLE 1.4 IMPACT OF HIGH LOGISTIC COSTS OF SEAPORTS ......................................................................................... 26 FIGURE 1.6 (A): EXPECTED INVESTMENTS IN PORTS SECTOR IN THE YEARS TO COME. ...................................................... 27 TABLE 2.1: LIST OF JOURNALS & DATABASE EXPLORED FOR LITERATURE REVIEW ............................................................ 34 TABLE 2.2 THEMATIC SEGREGATION OF LITERATURE REVIEW DATA.............................................................................. 34 TABLE 2.3 AUTHOR-WISE LITERATURE REVIEW ....................................................................................................... 35 TABLE 3.5.1 BENCHMARKING PROCESS .................................................................................................................. 97 TABLE 3.5.2 DATA NORMALIZATION WAS UNDERTAKEN FOR ACCURATE BENCHMARKING ................................................. 97 TABLE 3.5.3 DATA COLLECTION ............................................................................................................................ 99 TABLE 3.5.4 METRIC USED FOR BENCHMARKING PROCESS ....................................................................................... 100 FIGURE 4.1: CONTAINER TRAFFIC, 2014-15 ......................................................................................................... 111 FIGURE 4.1.1: CAPACITY UTILIZATION AT NOMINAL PRODUCTIVITY ............................................................................ 112 FIGURE 4.1.2: BERTH OCCUPANCY ...................................................................................................................... 113 FIGURE 4.1.3: BERTH PRODUCTIVITY ................................................................................................................... 114 FIGURE 4.1.4: CRANE PRODUCTIVITY .................................................................................................................. 115 FIGURE 4.1.5: THROUGHPUT PER HECTARE ........................................................................................................... 116 FIGURE 4.1.6: GROUND SLOTS PER HA ................................................................................................................. 117 FIGURE 4.1.8: QUAY CRANES PER 100 METERS QUAY LENGTH .................................................................................. 119 FIGURE 4.1.9: RUBBER TIRE GANTRY CRANE PER QUAY CRANE .................................................................................. 120 FIGURE 4.1.10: RTGC PRODUCTIVITY ................................................................................................................. 121 FIGURE 4.1.11: TERMINAL FACTOR PER QUAY CRANE ............................................................................................. 122 FIGURE 4.1.12: TT PRODUCTIVITY ...................................................................................................................... 123 FIGURE 4.1.13: MODE OF EVACUATION .............................................................................................................. 124 FIGURE 4.1.14 THROUGHPUT PER LANE PER DAY .................................................................................................. 125 FIGURE 4.1.16: RAIL THROUGHPUT/DAY/RAIL LINE (TEUS) ..................................................................................... 127 FIGURE 4.1.17: RAIL TURNAROUND TIME ............................................................................................................ 128 FIGURE 4.2.1: DISTRIBUTION OF COAL TRAFFIC ...................................................................................................... 130 FIGURE 4.2.2: DISTRIBUTION OF SIZE OF COAL VESSELS CALLS ................................................................................... 131 TABLE 4.3.1: DATA CLEAN UP, RE-ANALYSIS AND NORMALIZATION DONE TO ENSURE ‘LIKE TO LIKE’ BENCHMARKING ........... 132 FIGURE 4.2.4 (A): OCCUPANCY LEVEL (MECHANIZED BERTH) ................................................................................... 133 FIGURE 4.2.5 (A): PRODUCTIVITY ACROSS BERTH (MECHANICAL) .............................................................................. 134 TABLE 4.2.7: BERTHS HANDLING >60% COAL TRAFFIC (2014-15) ............................................................................ 136 FIGURE 4.3.1: PERCENTAGE OF SPLIT TRAFFIC DRY BULK FERTILIZER VESSEL CALLS ........................................................ 138 FIGURE 4.3.2: BERTHS HANDLING MORE THAN 40% DRY BULK FERTILIZER CARGO FY 2014-15 .................................... 139 FIGURE 4.3.5: BERTHS HANDLING MORE THAN 40% DRY BULK FERTILIZER CARGO ...................................................... 142 FIGURE 4.4.1:MAJOR PORT DISTRIBUTION OF LIQUID CARGO ................................................................................... 144 FIGURE 4.4.2: PERCENTAGE OF SPLIT TRAFFIC........................................................................................................ 145 FIGURE 4.4.3: LIQUID BERTHS - OCCUPANCY......................................................................................................... 146 FIGURE 4.4.4 (A): CRUDE PRODUCTIVITY .............................................................................................................. 147 FIGURE 4.4.5: LPG PRODUCTIVITY...................................................................................................................... 148 FIGURE 4.4.6: POL PRODUCTIVITY & AVG FLOW RATE ........................................................................................... 149 FIGURE 4.4.7 PRODUCTIVITY & AVG FLOW RATE (OTHER LIQUIDS) ............................................................................ 150
13
FIGURE 4.5.1 (B): DRY BULK STORAGE ALLOCATION ACROSS DEEP-DIVE PORTS ............................................................ 154 FIGURE 4.5.1 (C): BREAK BULK STORAGE ALLOCATION ACROSS DEEP-DIVE PORTS .......................................................... 155 FIGURE 4.5.2 (A): TAT FOR RAKE LOADING ACROSS DEEP-DIVE PORTS - COAL .............................................................. 156 FIGURE 4.5.2 (B): TAT FOR RAKE LOADING ACROSS DEEP-DIVE PORTS - FERTILIZERS ..................................................... 156 FIGURE 4.6: TOTAL COST PER TON OF TOTAL TRAFFIC .............................................................................................. 157 FIGURE 4.6.1: PERCENT TO TOTAL EXPENSES ......................................................................................................... 158 FIGURE 4.6.2 (A): LABOUR COST PER TON OF TOTAL TRAFFIC .................................................................................... 159 FIGURE 4.6.3 (A): NO OF EMPLOYEES PER TON OF NON CONTAINER DRY CARGO ........................................................... 160 FIGURE 4.6.4: MAINTENANCE AND OPERATIONS COST PER TON OF TOTAL TRAFFIC ....................................................... 161 FIGURE 4.6.5: PERCENTAGE OF CRANE UTILIZATION ............................................................................................... 162 FIGURE 6.5 (A): BARGES DEPLOYED FOR CARRYING DREDGED SILT TO DUMPING SITE ..................................................... 278 FIGURE 6.6 (A):UTILIZATION OF SHIP LOADERS MAXIMIZED THROUGH DUAL LOADING ................................................... 279 FIGURE 6.7 (A):PARCEL SIZE BASED NORMS DRAFTED FOR KANDLA PORT .................................................................... 280 FIGURE 6.7 (C):>50% IMPROVEMENT DUE TO NORM ROLLOUT ................................................................................ 281 FIGURE 6.8 (C): 27% REDUCTION IN BORDER COMPLIANCE TIME ............................................................................... 283 FIGURE 6.9: LIKELY REDUCTION TURNAROUND TIMES ACROSS PORTS ........................................................................ 284 FIGURE 6.9 (C): SHARP JUMP IN PRODUCTIVITY ACROSS HIGH OCCUPANCY BERTHS ....................................................... 286 FIGURE 6.9 (D): SHARP JUMP IN PRODUCTIVITY ACROSS HIGH OCCUPANCY BERTHS ....................................................... 287 FIGURE 6.11: HIGH VALUE INITIATIVES NEED TO BE COMPLETED IN TIME ..................................................................... 288 FIGURE 6.13: WAY FORWARD : FEW IDEAS TO DRIVE FURTHER EFFICIENCY UNLOCK BEYOND CAPITAL PROJECTS ................. 290
14
EXECUTIVE SUMMARY
BENCHMARKING AND TRANSFORMATION OF MAJOR PORTS IN INDIA
Economic buoyancy coupled with progressive flow of foreign investments have fueled
growth in Indian foreign trade during the last three decades. Easing of quantitative
restrictions and tariff levels across product lines have resulted in growth of India’s
international business and trade. Consequently, both imports and exports have seen an
upward trend resulting in a spurt in demand for shipping of cargo across many nations
across the world. Recognising the need for existence of robust ports that act as key nodes
in the supply chain cycle, government of India has allowed private participation including
100% FDI investments in port sector. Ports in India, due to strategic reasons, were under
the control of both Federal and State governments in India. However, due to numerous
reasons, performance standards of these ports stagnated at low over a period of time and
they could not match-up to the growing needs of India’s foreign trade. Taking into
cognizance of the prevailing conditions at the publicly owned ports, government of India
allowed private investments at major ports of India that are aimed to make them
competitive vis-à-vis the private ports. Investments through PPP mode at various
processes of these ports are aimed at improving their operational efficiency and result in
financial gains.
It is interesting to note that ports in India have improved in their cargo handling
capacities with private ports taking a lead over their public counterparts. There has been a
significant growth in the cargo handled by these ports with major ports handling 64.83
MT during the year 2016-17 and with CAGR of over 4% from 2007 to 2017. The non-
15
major ports handled 48.52 MT during the year 2016-17 with a CAGR of over 10% from
2007-17. In spite of these growth trends, Indian ports have to go a long way to match
their performance standards at par with the counterparts of the world. Efficiency trends
displayed by some the world ports are resultant of meticulously designed performance
standards. Benchmarking standards has resulted in competitive spirit among the ports and
helped them to enhance their performance and efficiency. Lack to such benchmarks have
resulted in lopsided performance among the major ports. Performance declared by the
major ports merely show the actuals which, often times, cannot be compared to any
benchmarks due to numerous factors like infrastructure facilities at the ports, type of
cargo handled, clientele, etc. Considering the existence of a vacuum in efficiency
comparison mechanism, this research has framed its business problem.
Although privatization has resulted in efficiency improvements at
Major Ports of India, lack to efficiency benchmarks are hampering
the measurement of their absolute efficiency.
As an attempt to probe the implications of theory and practice of benchmarking, a search
of existing literature is made with key words including ‘performance’, ‘efficiency’,
‘benchmarking’, and ‘performance standards’. The search resulted in gathering of
research papers covering various sectors, apart from ports, including aviation, agriculture,
banking, airlines, power, automobiles, shipping etc. from across 200 research articles
covering 27 journals of international repute. The literature is segregated into broad
themes of ‘performance and efficiency – general’, ‘performance and efficiency – ports’,
‘benchmarking – general’, ‘benchmarking – ports’. A review of literature highlights the
fact that benchmarking is attempted in numerous sectors and is slowly gathering
momentum in port sector at some selected parts of the world. However, most of these
16
studies relied on publicly available data and used both parametric and non-parametric
tools for benchmarking. The studies have also proved that benchmarking has resulted in
significant improvement in efficiencies of these ports. However, gaps gathered from the
literature review prove need for more studies on benchmarking using newer techniques
that allow usage of data that can be gathered from personal interactions and observations
that are generally not in public domain. Literature on Indian ports reveal a greater need
and scope for benchmarking studies that can comprehend and suggest in proposing of
benchmarking standards for sustainable efficiency improvements.
These gaps have helped in devising the following research problem, research questions,
and research objectives:
Research Problem
Numerous studies have measured efficiency of Indian major ports. However,
these studies could not prescribe any effective and implementable standards for
improvement in efficiency parameters. This warrants a comprehensive research to
set performance benchmarks in comparison to the best-in-class ports and thereby
explore measures for improvement of overall efficiency resulting in optimisation
of capacity and financial gains.
Research Questions:
How to benchmark various Key Productivity Parameters in port operation for
Major Ports of India?
How port efficiency can be improved using benchmarks?
17
Research Objectives:
To determine & calculate benchmarks for Key Productivity Parameters in port
operation for Major Ports of India;
To explore the initiative required to improve efficiencies at major ports of
India and transform them into best- in- class ports.
To answer the first research question of determining ‘important KPIs’ and ‘calculate
benchmark’, major ports were clustered on the basis of cargo being handled following
which a comparison of selected performance indicators on basis of literature review in
relation to some of the best ports is done and finally a survey method is used to identify
reliable and pragmatic benchmarking standards. For the second research question,
‘efficiency improvements at major ports of India’, deep ‘Root Cause Analysis’ carried
through Fish-Bone diagram analysis, “5 Whys analysis” are captured in deep-dive
analysis chapter that form basis for suggestion of measures to improve efficiency
standards at these ports.
Overall, this research encompasses a unique exercise of exploring solutions after deep
dive analysis into the real productivity issues in Major Ports by taking into consideration
the aspirations of stakeholders and it is what distinguishes from other research studies.
These solutions are vividly described under various heads like Technology upgrade,
Process optimization, Pricing & incentive alignment and Value creation in the last
chapter.

18
ABBREVIATIONS
AHP - Analytic Hierarchy Process
BOT - Built Operate Transfer
CE - Chief Engineer
Chen. - Chennai
CHPT - Chennai Port Trust
CME - Chief Mechanical Engineer
Coch - Cochin
COL/CMB - Colombo
CoPT - Cochin Port Trust
DBGT - Dakshin Bharat Gateway Termial
DMU - Decision Making Units
DPR - Detail Project Report
DPW - DP world
EDP - Early Departure Procedure
EIR - Equipment Interchange Receipt
ELC - Electric Level Luffing Crane
EOI - Expression of Interest
GTI - Gateway terminal
HDC - Haldia Dock Complex
JEB/JAB - Jebal Ali
KoPT - Kolkata Port Trust
KPL (Ennore)- Kamarajar Port Limited
KPT - Kandla Port Trust
KRI - Krishnapatnam
KTPD - Killo Tons Per Day
MbPT - Mumbai Port Trust
MgPT - Mormugao Port Trust
MMC - Mobile Harbor Crane
MMT - Million Metric Ton
MOHP - Mechanical Ore Handling Plant
MPSS - Most Productive Scale Size
MT - Metric Ton
MTPA - Metric Ton Per Annum
MUN - Mundra
NMPT - New Mangalore Port Trust
NWT - Non-working time
OCR - Optical Character Recognition
OCT - Outer Container Terminal
OPEX - Operating Expenditure
POL - Petroleum Oil Lubricants
PPT - Paradip Port Trust
PSA - Port of Singapore
QC - Quay Crane
QRS - Quick Release System
RFQ - Request for Qualification
RTGC - Rubber Tyred Gantry Crane
19
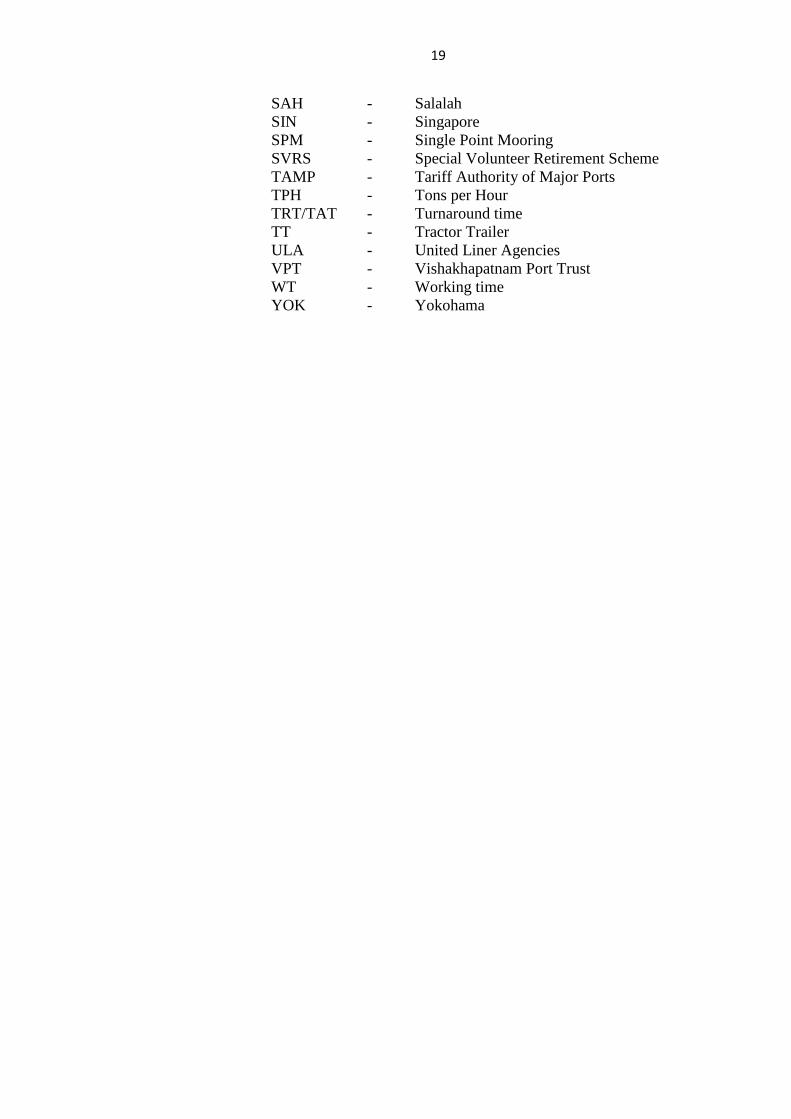
SAH - Salalah
SIN - Singapore
SPM - Single Point Mooring
SVRS - Special Volunteer Retirement Scheme
TAMP - Tariff Authority of Major Ports
TPH - Tons per Hour
TRT/TAT - Turnaround time
TT - Tractor Trailer
ULA - United Liner Agencies
VPT - Vishakhapatnam Port Trust
WT - Working time
YOK - Yokohama
20
CHAPTER I - INTRODUCTION
India, a major maritime nation, is bestowed with a vast coastline of 7517 Kms
including the two island territories, dotted with 12 major ports and 176 non-major
ports. Cargo Volumes handled in Indian Ports has seen a strong growth in the last
decade. Traffic has grown by around 10% CAGR during this period. Volumes are
expected to continue growing at this rate as India’s GDP growth rate accelerates back
to 7-8% YoY basis.
The demand for coal, petroleum, container and other commodities can further
accelerate if the plans for debottlenecking of logistic infrastructure are implemented
in time, and the ‘Make in India’ push drives greater industrial production and foreign
trade. Further, the Sagarmala initiative is expected to drive coastal movement of
cargo to further increase the volumes handled at the Indian Ports.
1.1 Background
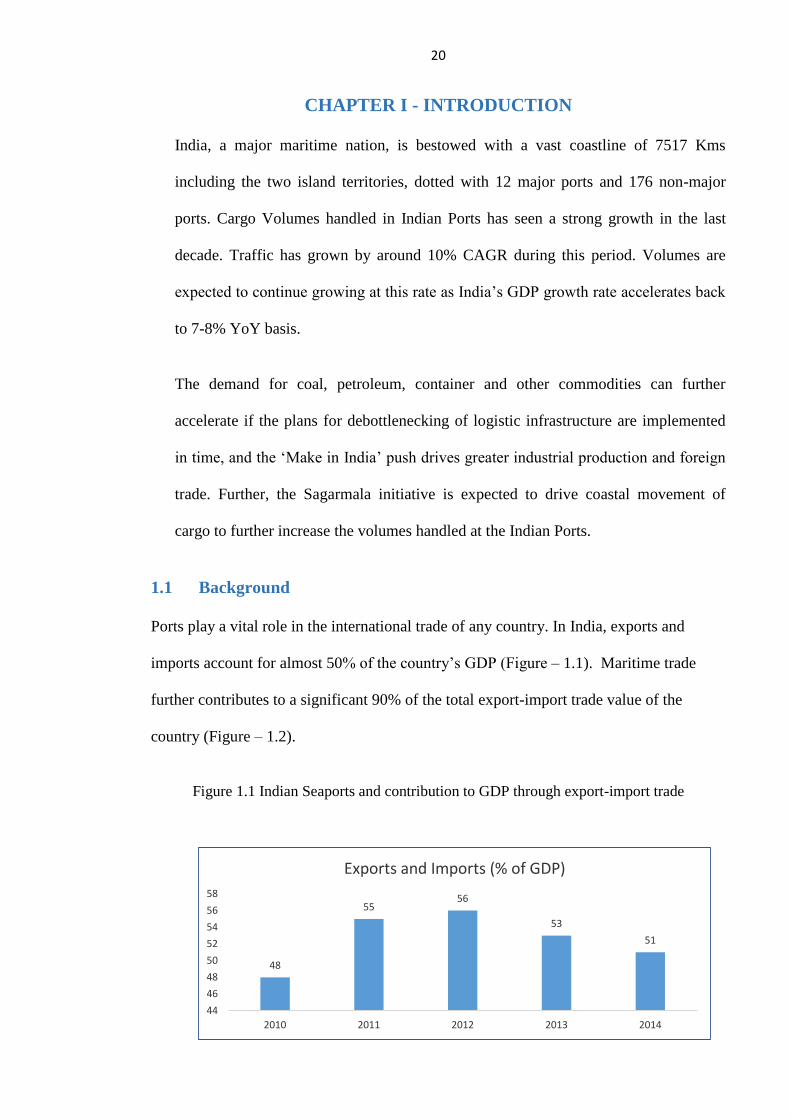
Ports play a vital role in the international trade of any country. In India, exports and
imports account for almost 50% of the country’s GDP (Figure – 1.1). Maritime trade
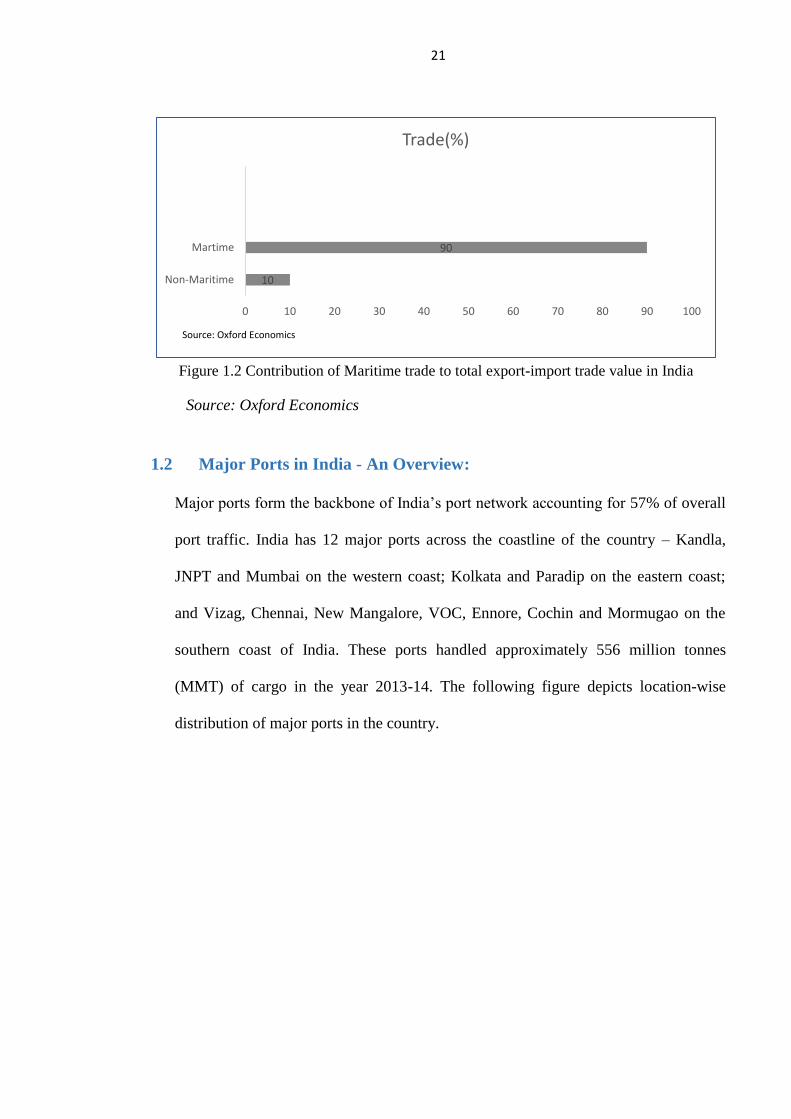
further contributes to a significant 90% of the total export-import trade value of the
country (Figure – 1.2).
Figure 1.1 Indian Seaports and contribution to GDP through export-import trade
48
5556
53
51
44
46
48
50
52
54
56
58
2010 2011 2012 2013 2014
Exports and Imports (% of GDP)
21
Figure 1.2 Contribution of Maritime trade to total export-import trade value in India
1.2 Major Ports in India - An Overview:
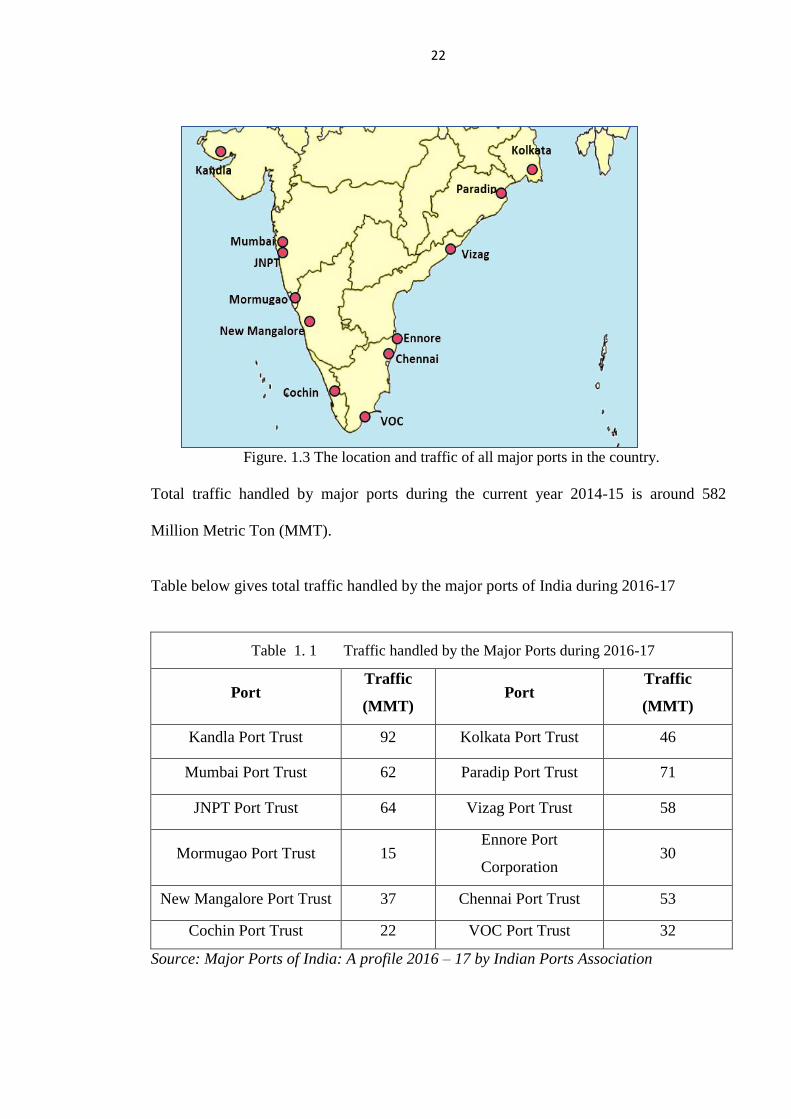
Major ports form the backbone of India’s port network accounting for 57% of overall
port traffic. India has 12 major ports across the coastline of the country – Kandla,
JNPT and Mumbai on the western coast; Kolkata and Paradip on the eastern coast;
and Vizag, Chennai, New Mangalore, VOC, Ennore, Cochin and Mormugao on the
southern coast of India. These ports handled approximately 556 million tonnes
(MMT) of cargo in the year 2013-14. The following figure depicts location-wise
distribution of major ports in the country.
10
90
0 10 20 30 40 50 60 70 80 90 100
Non-Maritime
Martime
Trade(%)
TradeSource: Oxford Economics
Source: Oxford Economics
22
Figure. 1.3 The location and traffic of all major ports in the country.
Total traffic handled by major ports during the current year 2014-15 is around 582
Million Metric Ton (MMT).
Table below gives total traffic handled by the major ports of India during 2016-17
Table 1. 1 Traffic handled by the Major Ports during 2016-17
Port Traffic
(MMT) Port
Traffic
(MMT)
Kandla Port Trust 92 Kolkata Port Trust 46
Mumbai Port Trust 62 Paradip Port Trust 71
JNPT Port Trust 64 Vizag Port Trust 58
Mormugao Port Trust 15 Ennore Port
Corporation 30
New Mangalore Port Trust 37 Chennai Port Trust 53
Cochin Port Trust 22 VOC Port Trust 32
Source: Major Ports of India: A profile 2016 – 17 by Indian Ports Association
23
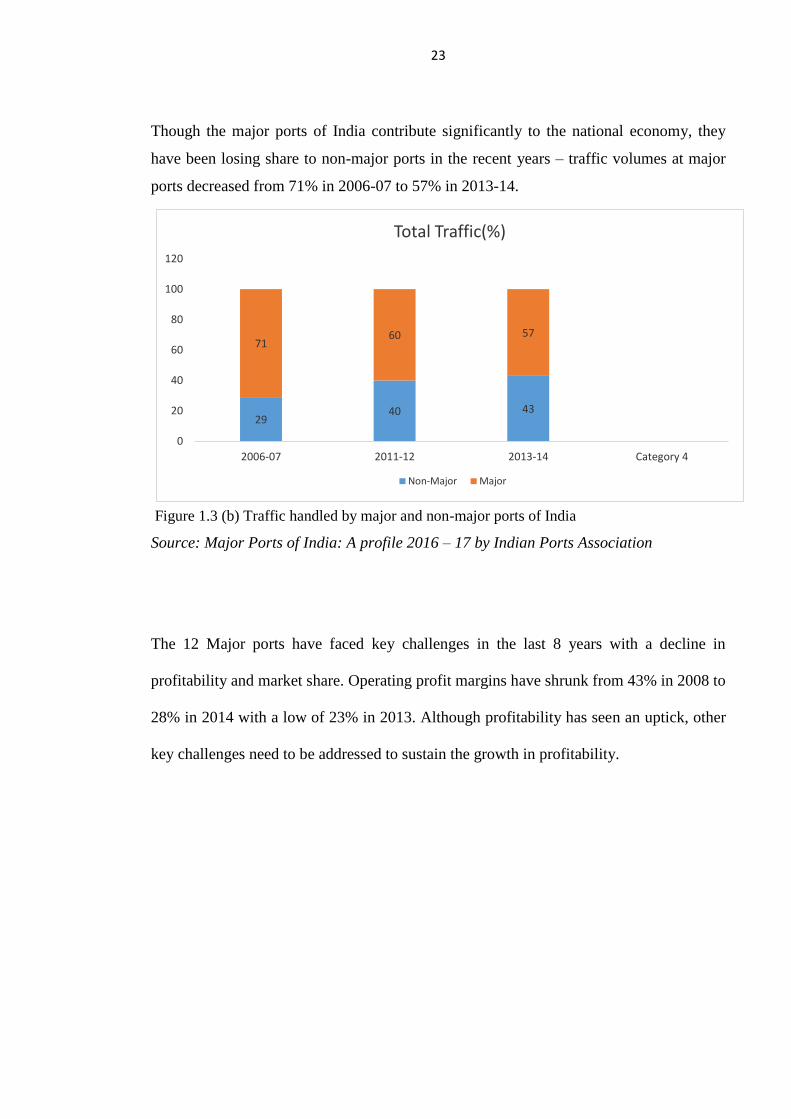
Though the major ports of India contribute significantly to the national economy, they
have been losing share to non-major ports in the recent years – traffic volumes at major
ports decreased from 71% in 2006-07 to 57% in 2013-14.
2940 43
7160 57
0
20
40
60
80
100
120
2006-07 2011-12 2013-14 Category 4
Total Traffic(%)
Non-Major Major
Figure 1.3 (b) Traffic handled by major and non-major ports of India
Source: Major Ports of India: A profile 2016 – 17 by Indian Ports Association
The 12 Major ports have faced key challenges in the last 8 years with a decline in
profitability and market share. Operating profit margins have shrunk from 43% in 2008 to
28% in 2014 with a low of 23% in 2013. Although profitability has seen an uptick, other
key challenges need to be addressed to sustain the growth in profitability.
24
1.3 Major ports losing share to non-major ports
Government policies to open-up port sector to private participation has seen a sharp rise
in the number of private ports and has led to a shrinkage in the cargo volumes handled by
major ports.
The loss of share by major ports is attributed to three key areas:
Low productivity levels and higher turn round time
Congestion issues in road evacuation
Insufficient draft to handle large vessels
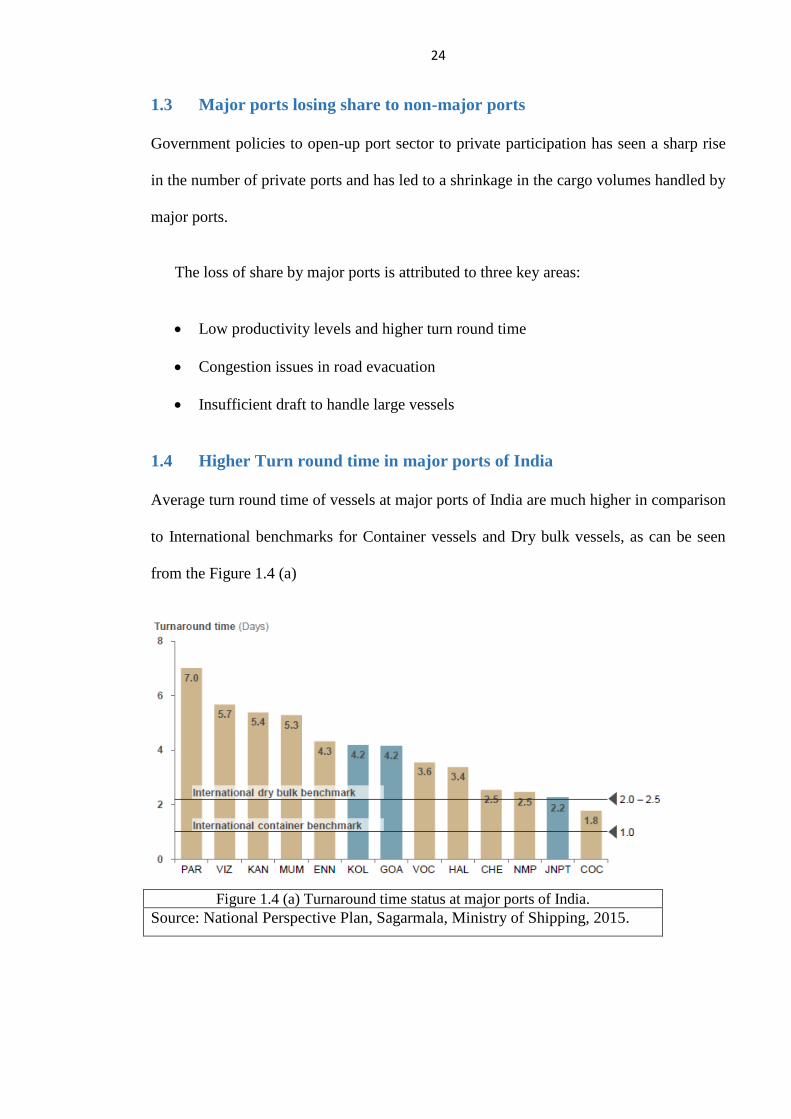
1.4 Higher Turn round time in major ports of India
Average turn round time of vessels at major ports of India are much higher in comparison
to International benchmarks for Container vessels and Dry bulk vessels, as can be seen
from the Figure 1.4 (a)
Figure 1.4 (a) Turnaround time status at major ports of India.
Source: National Perspective Plan, Sagarmala, Ministry of Shipping, 2015.
25
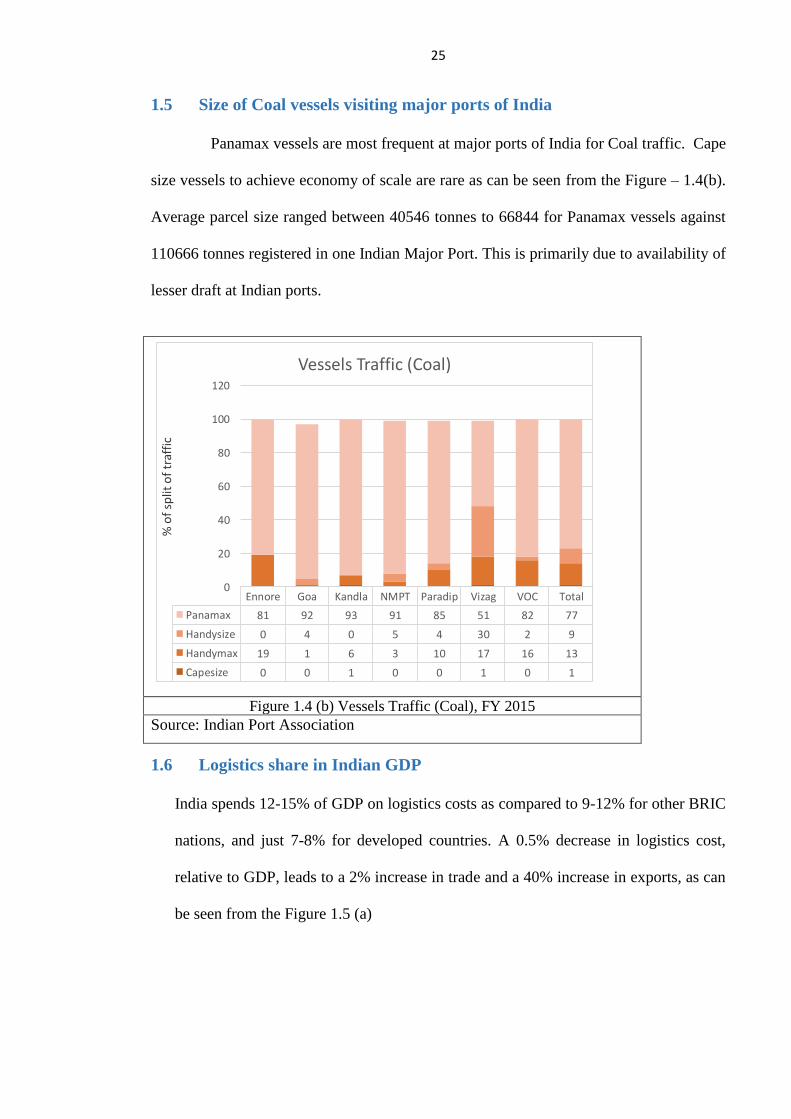
1.5 Size of Coal vessels visiting major ports of India
Panamax vessels are most frequent at major ports of India for Coal traffic. Cape
size vessels to achieve economy of scale are rare as can be seen from the Figure – 1.4(b).
Average parcel size ranged between 40546 tonnes to 66844 for Panamax vessels against
110666 tonnes registered in one Indian Major Port. This is primarily due to availability of
lesser draft at Indian ports.
Ennore Goa Kandla NMPT Paradip Vizag VOC Total
Panamax 81 92 93 91 85 51 82 77
Handysize 0 4 0 5 4 30 2 9
Handymax 19 1 6 3 10 17 16 13
Capesize 0 0 1 0 0 1 0 1
0
20
40
60
80
100
120
% o
f sp
lit o
f tr
affi
c
Vessels Traffic (Coal)
Figure 1.4 (b) Vessels Traffic (Coal), FY 2015
Source: Indian Port Association
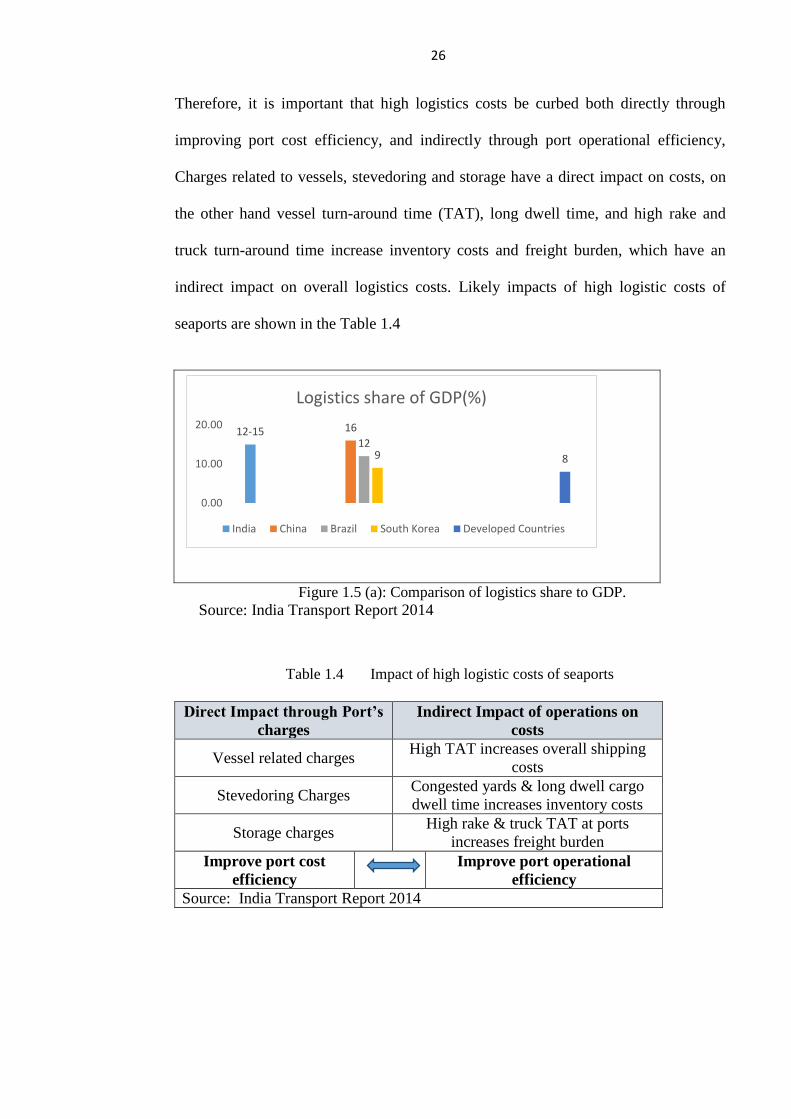
1.6 Logistics share in Indian GDP
India spends 12-15% of GDP on logistics costs as compared to 9-12% for other BRIC
nations, and just 7-8% for developed countries. A 0.5% decrease in logistics cost,
relative to GDP, leads to a 2% increase in trade and a 40% increase in exports, as can
be seen from the Figure 1.5 (a)
26
Therefore, it is important that high logistics costs be curbed both directly through
improving port cost efficiency, and indirectly through port operational efficiency,
Charges related to vessels, stevedoring and storage have a direct impact on costs, on
the other hand vessel turn-around time (TAT), long dwell time, and high rake and
truck turn-around time increase inventory costs and freight burden, which have an
indirect impact on overall logistics costs. Likely impacts of high logistic costs of
seaports are shown in the Table 1.4
12-15 16
129 8
0.00
10.00
20.00
Logistics share of GDP(%)
India China Brazil South Korea Developed Countries
Figure 1.5 (a): Comparison of logistics share to GDP.
Source: India Transport Report 2014
Table 1.4 Impact of high logistic costs of seaports
Direct Impact through Port’s
charges
Indirect Impact of operations on
costs
Vessel related charges High TAT increases overall shipping
costs
Stevedoring Charges Congested yards & long dwell cargo
dwell time increases inventory costs
Storage charges High rake & truck TAT at ports
increases freight burden
Improve port cost
efficiency
Improve port operational
efficiency
Source: India Transport Report 2014
27
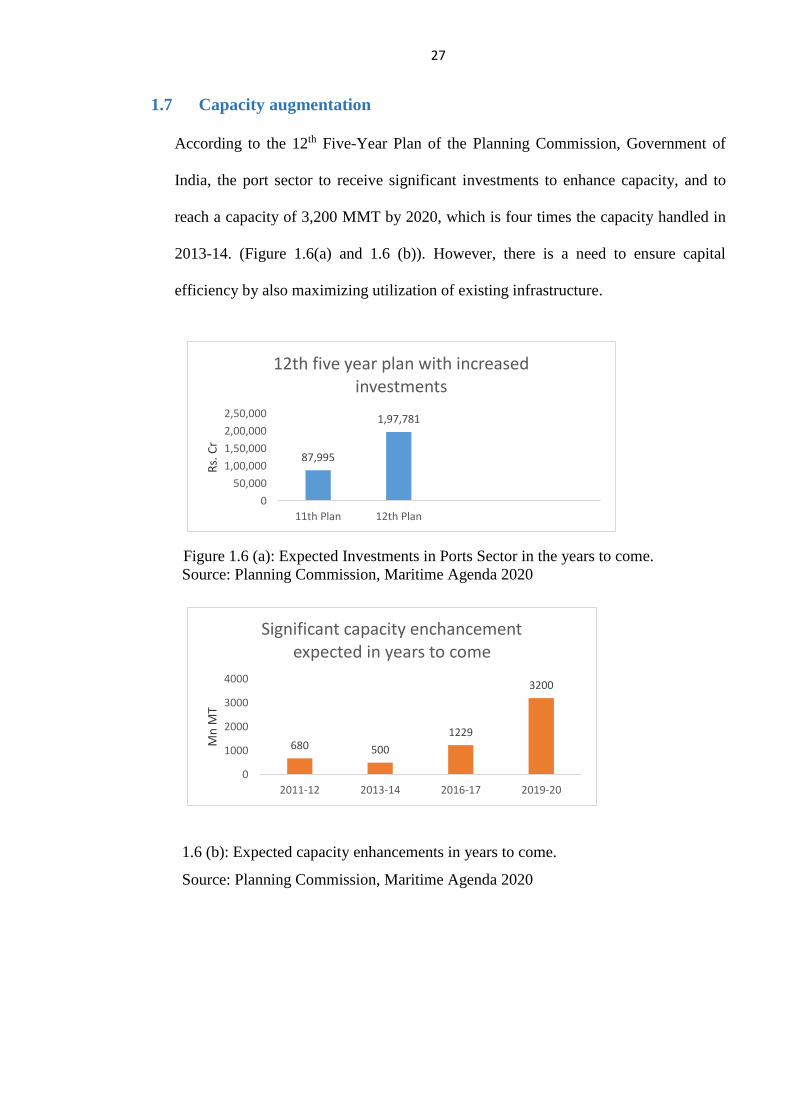
1.7 Capacity augmentation
According to the 12th Five-Year Plan of the Planning Commission, Government of
India, the port sector to receive significant investments to enhance capacity, and to
reach a capacity of 3,200 MMT by 2020, which is four times the capacity handled in
2013-14. (Figure 1.6(a) and 1.6 (b)). However, there is a need to ensure capital
efficiency by also maximizing utilization of existing infrastructure.
87,995
1,97,781
0
50,000
1,00,000
1,50,000
2,00,000
2,50,000
11th Plan 12th Plan
Rs.
Cr
12th five year plan with increased investments
Figure 1.6 (a): Expected Investments in Ports Sector in the years to come.
Source: Planning Commission, Maritime Agenda 2020
680 500
1229
3200
0
1000
2000
3000
4000
2011-12 2013-14 2016-17 2019-20
Mn
MT
Significant capacity enchancement expected in years to come
1.6 (b): Expected capacity enhancements in years to come.
Source: Planning Commission, Maritime Agenda 2020
28
Therefore, it is critical to achieve greater productivity and efficiencies to unlock
capacity, and ensure that we do not undermine our competitiveness and slow down
economic growth. Process delays and operational bottlenecks are the key reasons
behind under-utilization of capacity. Focused efforts are required to streamline these
operations and strengthen processes along the entire value chain.
1.8 Quantitative Benchmarking
1.8.1 Benchmarking Theory:
Formal definition of benchmarking used by Rank Xerox, 2013 ‘Continuous
systematic process of evaluating companies recognised as industry leaders, to
determine business and work processes that represent best practices and establish
rational performance goals.’ In operational terms it is frequency condensed to ‘the
search for industry best practices that lead to superior performance.’ ‘Best Practices’
refer to the methods used in work processes that best meet customer requirements.
Benchmarking is not ‘what we want to achieve’ but ‘how they are to be achieved’.
Types and ways of Benchmarking Theory:
1. Types of Benchmarking – Product and Process
2. Ways of process benchmarking/How benchmarking is done?
a. Benchmarking Internal Operations – to find the best-performing unit within
your own company;
b. Benchmark vis-à-vis competitor;
c. Best-in-class – Comparing your performance vis-à-vis the best in industry;
29
d. Strategic benchmarking – integrates strategic competitive analysis with best-
in-class benchmarking.
1.8.2 Techniques of Benchmarking/Classification:
i. Analytical Hierarchy Process (AHP) – (Saaty 1980; Partovi, 1994; Ragavan &
Punniyamoorthy, 2003; Punniyamoorthy & Murali, 2008.
ii. Data Envelopment Analysis (DEA) – (Banker et al, 1984, Wober, 2002)
iii. Principal Component Analysis (PCA) – De, 2001; Buyukzkan & Marie
iv. Confirmatory Factor Analysis (CFA) – Buyukozkan & Marie, 1998
v. Stochastic Frontier Analysis (SFA) approach - (Walters, 1963; Braeutigam, 1999)
vi. Partial Productivity Measures (PPM) approach - (Saari, 2006)
vii. Discriminant Analysis- (Itoh, Matsuoka and Okada 2005)
viii. Cluster Analysis - (Fengrong et al. 2014)
In view of various techniques of benchmarking with different sets of assumptions
and limitations studied in literature review, it is proposed to use the ‘best in class’
method using ‘Root Cause Analysis’ technique.
In this phase, it is proposed to collect data for 12 major ports as well as relevant
private Indian ports and international ports to benchmark performance on all three
key dimensions of
1) Financial,
2) Operational, and
3) Organizational capability
30
In each of these benchmarking focus areas/ dimensions, a set of targeted and specific
metrics was used for comparing performance. These metrics have been shortlisted
since they provide the most specific and insightful understanding of the relative
performance of the ports. The KPIs shortlisted under following heads are:
1. Demand and utilization
2. Marine services
3. Productivity
4. Equipment
5. Yard and gate productivity
6. Labor
7. Profile/cost metrics
In case of any specific situation /context for a port, other relevant metrics added as
required for building an in-depth and specific understanding of the port’s
performance.
1.8.3 Selection of benchmark ports and data normalization
The major ports have been clustered based on cargo categories (mechanized dry bulk,
conventional dry bulk, containers, and break bulk) for the purpose of benchmarking,
relevant and comparable private Indian Ports and international ports were selected to
ensure that these benchmark ports are comparable on the following parameters:
Size of port
Number of berths
Type of commodity
31
Degree of automation
During the benchmarking phase, it was proposed to conduct a ‘customer survey’. The
survey to be a combination of online and face-to-face discussions with key port
stakeholders. The objective of this survey was to provide an external perspective on
stakeholders’ views of the port, rank KPIs determined by literature review and
highlight the key concerns and issues being faced by them in conducting operations at
the port.
List of some of the stakeholders surveyed:
Container liners and bulk ship owners/operators
Terminal operators
Cargo handling /stevedore agents
Railways
Logistics and transport providers
Exporters/importers (end-customer)
As an outcome from the benchmarking phase, a list of priority focus areas was
identified for each of the 12 major ports across financial, operational and
organizational metrics.
32
1.9 Business Problem:
Although privatisation has resulted in efficiency improvements at Major Ports of
India, lack to efficiency benchmarks are hampering the measurement of their absolute
efficiency.
Ports, handle 80% of world trade by volume and over 70% by value. In 2000, 5.88
billion tons was moved through World’s ports. In India also, Ports play a vital role in
the overall economic development of the country. About 90% by volume and 70% by
value of the country’s international trade is carried on through maritime transport.
Hence, the significance of Ports in the overall economy of the country needs no
emphasise. Having recognized the immense importance of the role of Ports, Indian
Ports are still languishing at Turn Round time of 2.25 days and Average Pre-Berthing
Detention at 6.94 Hrs on Port Account. Ideally, there should not be any pre-berthing
detention (Zero Pre-berthing detention) and also Overall Turnaround time should not
exceed 1 day in any case. Ship-standing cost is in the level of US$ 9,000 per day
(Approximately 6, 12,000 Rs. Per day). If Vessels stay longer for various reasons,
Trade and the Nation lose economically. Similarly, Vessel related charges are
reportedly high in Indian ports and consequently entails high transactional cost. It is
required to study and do in-depth research to quantify the loss and measures to
mitigate/minimise the loss.
1.10 Motivation for Study:
Efficiency and productivity at ports across the world has been an area of interest for
researchers and policy makers from times immemorial. Numerous studies in the
western and eastern world have proved positive relationship between port
33
performance and development of an economy. Setting standards for performance of
ports, actually, help in enhancing of performance of ports and numerous initiatives in
this direction are already at implementation stage among countries competing for a
niche maritime sector. In the Indian context, significant number of researchers have
attempted to measure efficiency and productivity in hindsight. However, considering,
the buoyant aspirations of Government of India, existence of performance
benchmarks in the port sector can alone help in enhance absolute efficiency levels at
the Major Ports of India. The current research, therefore, is an attempt to set and
achieve performance benchmarks for the Major Ports of India.
34
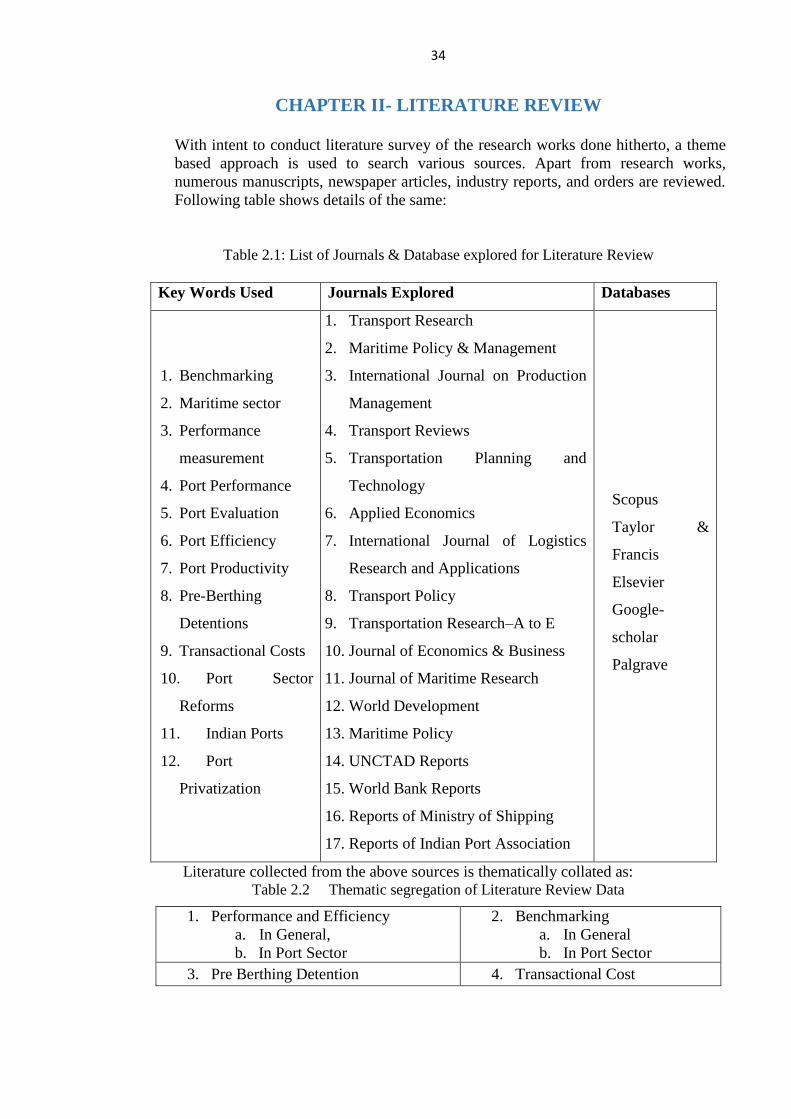
CHAPTER II- LITERATURE REVIEW
With intent to conduct literature survey of the research works done hitherto, a theme
based approach is used to search various sources. Apart from research works,
numerous manuscripts, newspaper articles, industry reports, and orders are reviewed.
Following table shows details of the same:
Table 2.1: List of Journals & Database explored for Literature Review
Key Words Used Journals Explored Databases
1. Benchmarking
2. Maritime sector
3. Performance
measurement
4. Port Performance
5. Port Evaluation
6. Port Efficiency
7. Port Productivity
8. Pre-Berthing
Detentions
9. Transactional Costs
10. Port Sector
Reforms
11. Indian Ports
12. Port
Privatization
1. Transport Research
2. Maritime Policy & Management
3. International Journal on Production
Management
4. Transport Reviews
5. Transportation Planning and
Technology
6. Applied Economics
7. International Journal of Logistics
Research and Applications
8. Transport Policy
9. Transportation Research–A to E
10. Journal of Economics & Business
11. Journal of Maritime Research
12. World Development
13. Maritime Policy
14. UNCTAD Reports
15. World Bank Reports
16. Reports of Ministry of Shipping
17. Reports of Indian Port Association
Scopus
Taylor &
Francis
Elsevier
Google-
scholar
Palgrave
Literature collected from the above sources is thematically collated as: Table 2.2 Thematic segregation of Literature Review Data
1. Performance and Efficiency
a. In General,
b. In Port Sector
2. Benchmarking
a. In General
b. In Port Sector
3. Pre Berthing Detention 4. Transactional Cost
35
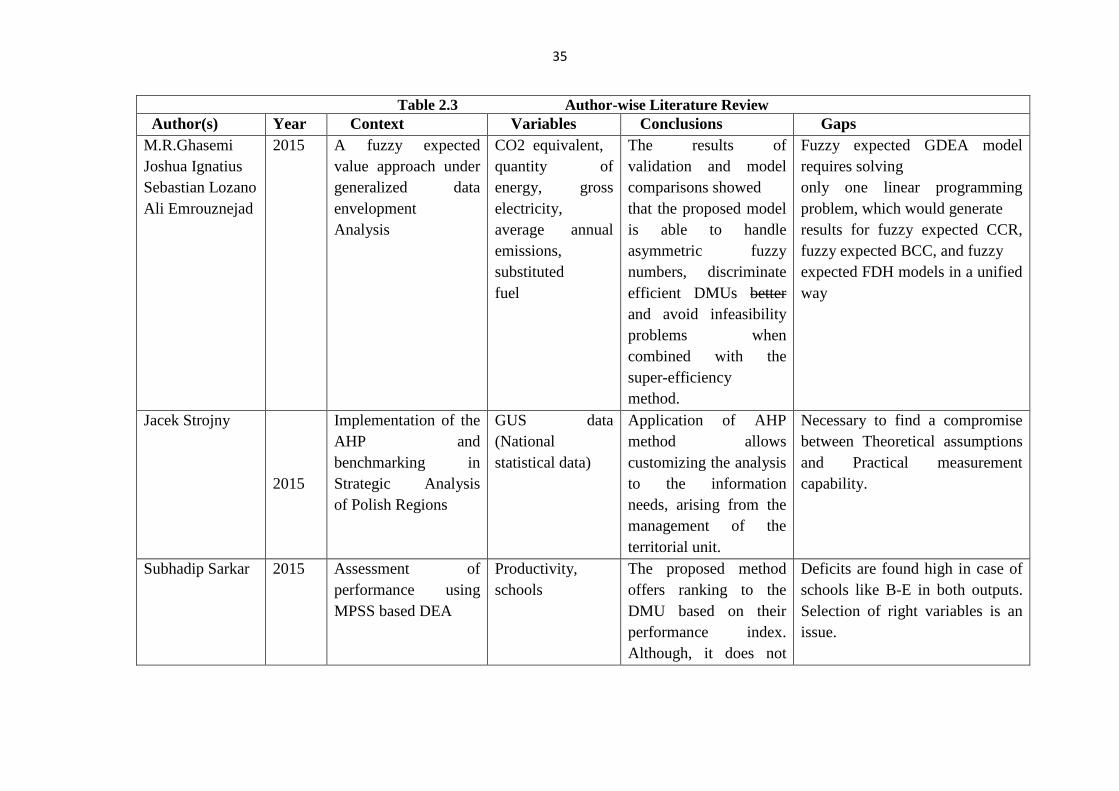
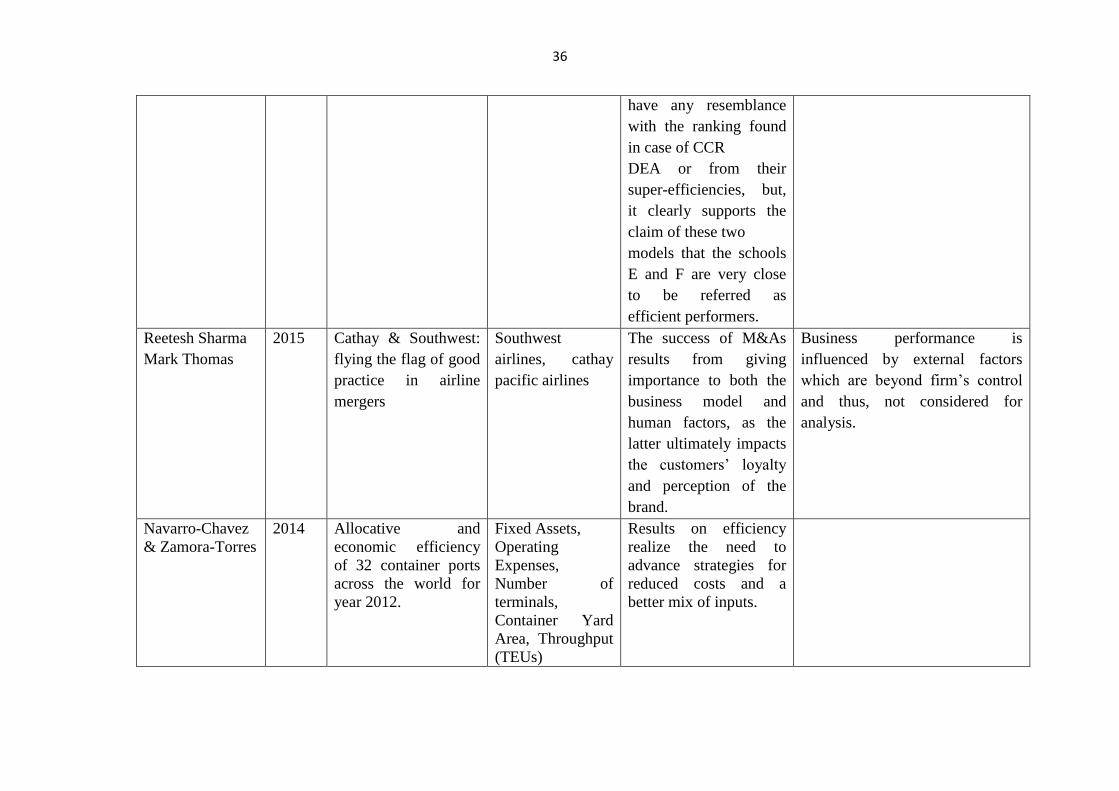
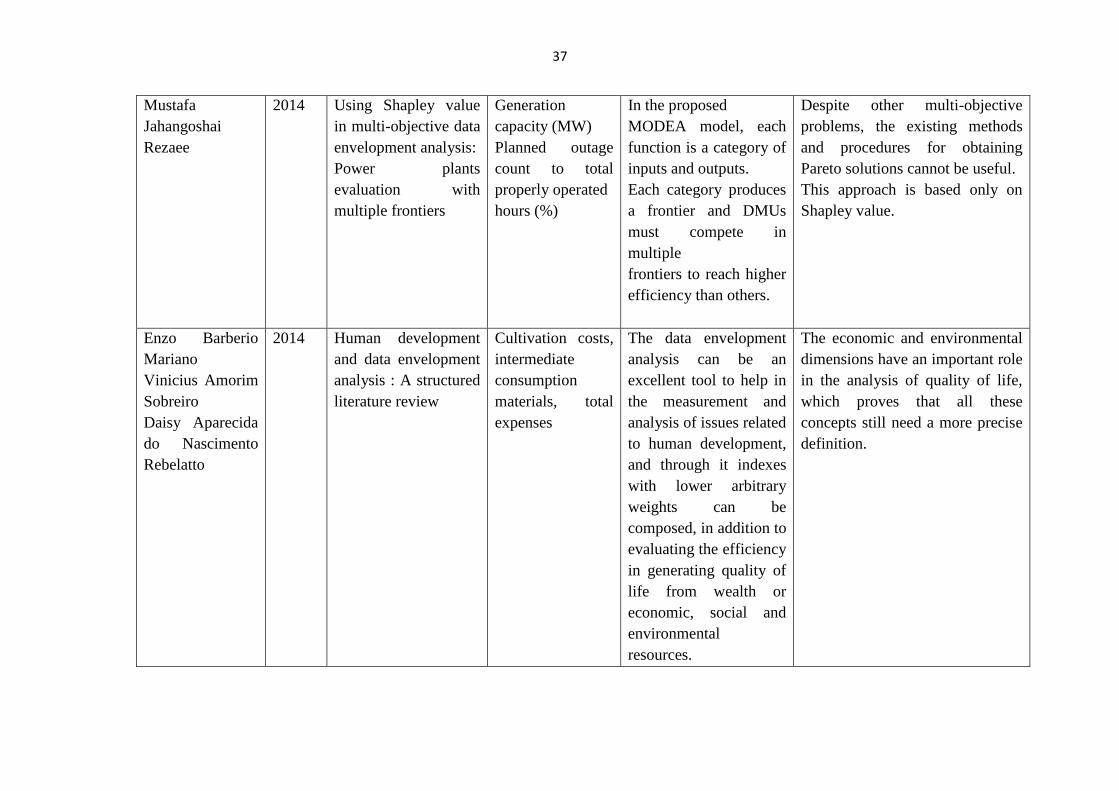
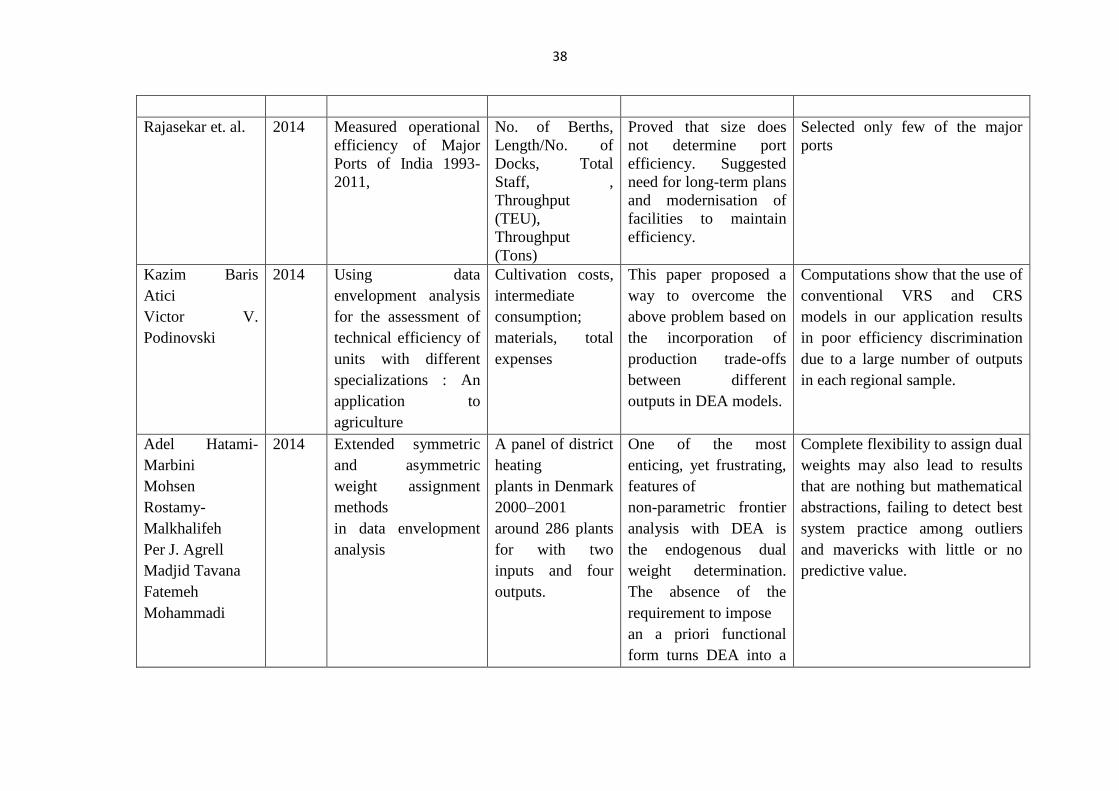
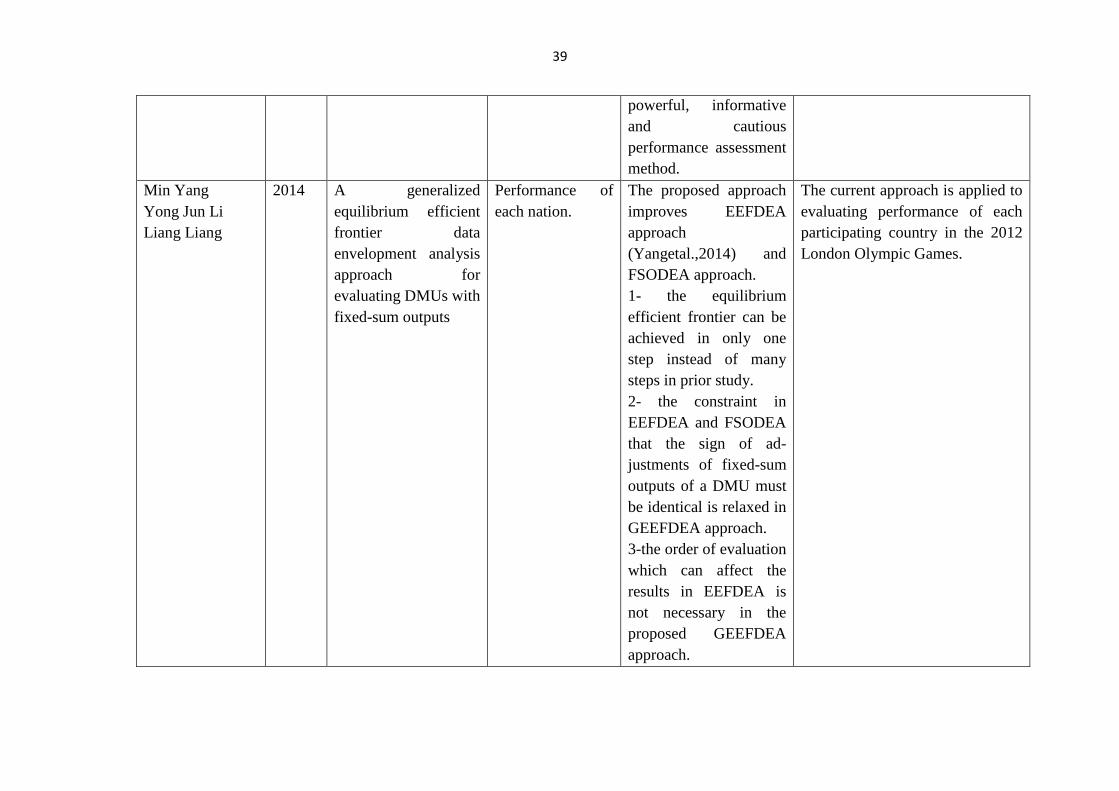
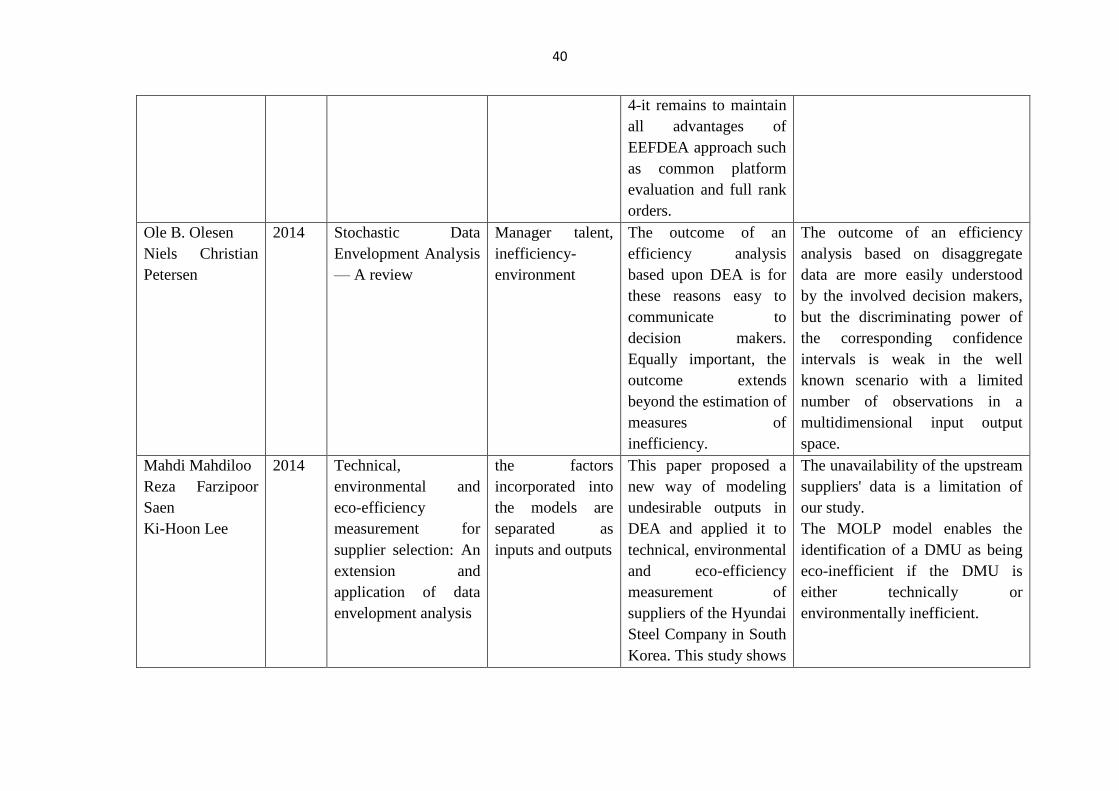
Table 2.3 Author-wise Literature Review
Author(s) Year Context Variables Conclusions Gaps
M.R.Ghasemi
Joshua Ignatius
Sebastian Lozano
Ali Emrouznejad
2015 A fuzzy expected
value approach under
generalized data
envelopment
Analysis
CO2 equivalent,
quantity of
energy, gross
electricity,
average annual
emissions,
substituted
fuel
The results of
validation and model
comparisons showed
that the proposed model
is able to handle
asymmetric fuzzy
numbers, discriminate
efficient DMUs better
and avoid infeasibility
problems when
combined with the
super-efficiency
method.
Fuzzy expected GDEA model
requires solving
only one linear programming
problem, which would generate
results for fuzzy expected CCR,
fuzzy expected BCC, and fuzzy
expected FDH models in a unified
way
Jacek Strojny
2015
Implementation of the
AHP and
benchmarking in
Strategic Analysis
of Polish Regions
GUS data
(National
statistical data)
Application of AHP
method allows
customizing the analysis
to the information
needs, arising from the
management of the
territorial unit.
Necessary to find a compromise
between Theoretical assumptions
and Practical measurement
capability.
Subhadip Sarkar 2015 Assessment of
performance using
MPSS based DEA
Productivity,
schools
The proposed method
offers ranking to the
DMU based on their
performance index.
Although, it does not
Deficits are found high in case of
schools like B-E in both outputs.
Selection of right variables is an
issue.
36
have any resemblance
with the ranking found
in case of CCR
DEA or from their
super-efficiencies, but,
it clearly supports the
claim of these two
models that the schools
E and F are very close
to be referred as
efficient performers.
Reetesh Sharma
Mark Thomas
2015 Cathay & Southwest:
flying the flag of good
practice in airline
mergers
Southwest
airlines, cathay
pacific airlines
The success of M&As
results from giving
importance to both the
business model and
human factors, as the
latter ultimately impacts
the customers’ loyalty
and perception of the
brand.
Business performance is
influenced by external factors
which are beyond firm’s control
and thus, not considered for
analysis.
Navarro-Chavez
& Zamora-Torres
2014 Allocative and
economic efficiency
of 32 container ports
across the world for
year 2012.
Fixed Assets,
Operating
Expenses,
Number of
terminals,
Container Yard
Area, Throughput
(TEUs)
Results on efficiency
realize the need to
advance strategies for
reduced costs and a
better mix of inputs.
37
Mustafa
Jahangoshai
Rezaee
2014 Using Shapley value
in multi-objective data
envelopment analysis:
Power plants
evaluation with
multiple frontiers
Generation
capacity (MW)
Planned outage
count to total
properly operated
hours (%)
In the proposed
MODEA model, each
function is a category of
inputs and outputs.
Each category produces
a frontier and DMUs
must compete in
multiple
frontiers to reach higher
efficiency than others.
Despite other multi-objective
problems, the existing methods
and procedures for obtaining
Pareto solutions cannot be useful.
This approach is based only on
Shapley value.
Enzo Barberio
Mariano
Vinicius Amorim
Sobreiro
Daisy Aparecida
do Nascimento
Rebelatto
2014 Human development
and data envelopment
analysis : A structured
literature review
Cultivation costs,
intermediate
consumption
materials, total
expenses
The data envelopment
analysis can be an
excellent tool to help in
the measurement and
analysis of issues related
to human development,
and through it indexes
with lower arbitrary
weights can be
composed, in addition to
evaluating the efficiency
in generating quality of
life from wealth or
economic, social and
environmental
resources.
The economic and environmental
dimensions have an important role
in the analysis of quality of life,
which proves that all these
concepts still need a more precise
definition.
38
Rajasekar et. al. 2014 Measured operational
efficiency of Major
Ports of India 1993-
2011,
No. of Berths,
Length/No. of
Docks, Total
Staff, ,
Throughput
(TEU),
Throughput
(Tons)
Proved that size does
not determine port
efficiency. Suggested
need for long-term plans
and modernisation of
facilities to maintain
efficiency.
Selected only few of the major
ports
Kazim Baris
Atici
Victor V.
Podinovski
2014 Using data
envelopment analysis
for the assessment of
technical efficiency of
units with different
specializations : An
application to
agriculture
Cultivation costs,
intermediate
consumption;
materials, total
expenses
This paper proposed a
way to overcome the
above problem based on
the incorporation of
production trade-offs
between different
outputs in DEA models.
Computations show that the use of
conventional VRS and CRS
models in our application results
in poor efficiency discrimination
due to a large number of outputs
in each regional sample.
Adel Hatami-
Marbini
Mohsen
Rostamy-
Malkhalifeh
Per J. Agrell
Madjid Tavana
Fatemeh
Mohammadi
2014 Extended symmetric
and asymmetric
weight assignment
methods
in data envelopment
analysis
A panel of district
heating
plants in Denmark
2000–2001
around 286 plants
for with two
inputs and four
outputs.
One of the most
enticing, yet frustrating,
features of
non-parametric frontier
analysis with DEA is
the endogenous dual
weight determination.
The absence of the
requirement to impose
an a priori functional
form turns DEA into a
Complete flexibility to assign dual
weights may also lead to results
that are nothing but mathematical
abstractions, failing to detect best
system practice among outliers
and mavericks with little or no
predictive value.
39
powerful, informative
and cautious
performance assessment
method.
Min Yang
Yong Jun Li
Liang Liang
2014 A generalized
equilibrium efficient
frontier data
envelopment analysis
approach for
evaluating DMUs with
fixed-sum outputs
Performance of
each nation.
The proposed approach
improves EEFDEA
approach
(Yangetal.,2014) and
FSODEA approach.
1- the equilibrium
efficient frontier can be
achieved in only one
step instead of many
steps in prior study.
2- the constraint in
EEFDEA and FSODEA
that the sign of ad-
justments of fixed-sum
outputs of a DMU must
be identical is relaxed in
GEEFDEA approach.
3-the order of evaluation
which can affect the
results in EEFDEA is
not necessary in the
proposed GEEFDEA
approach.
The current approach is applied to
evaluating performance of each
participating country in the 2012
London Olympic Games.
40
4-it remains to maintain
all advantages of
EEFDEA approach such
as common platform
evaluation and full rank
orders.
Ole B. Olesen
Niels Christian
Petersen
2014 Stochastic Data
Envelopment Analysis
— A review
Manager talent,
inefficiency-
environment
The outcome of an
efficiency analysis
based upon DEA is for
these reasons easy to
communicate to
decision makers.
Equally important, the
outcome extends
beyond the estimation of
measures of
inefficiency.
The outcome of an efficiency
analysis based on disaggregate
data are more easily understood
by the involved decision makers,
but the discriminating power of
the corresponding confidence
intervals is weak in the well
known scenario with a limited
number of observations in a
multidimensional input output
space.
Mahdi Mahdiloo
Reza Farzipoor
Saen
Ki-Hoon Lee
2014 Technical,
environmental and
eco-efficiency
measurement for
supplier selection: An
extension and
application of data
envelopment analysis
the factors
incorporated into
the models are
separated as
inputs and outputs
This paper proposed a
new way of modeling
undesirable outputs in
DEA and applied it to
technical, environmental
and eco-efficiency
measurement of
suppliers of the Hyundai
Steel Company in South
Korea. This study shows
The unavailability of the upstream
suppliers' data is a limitation of
our study.
The MOLP model enables the
identification of a DMU as being
eco-inefficient if the DMU is
either technically or
environmentally inefficient.
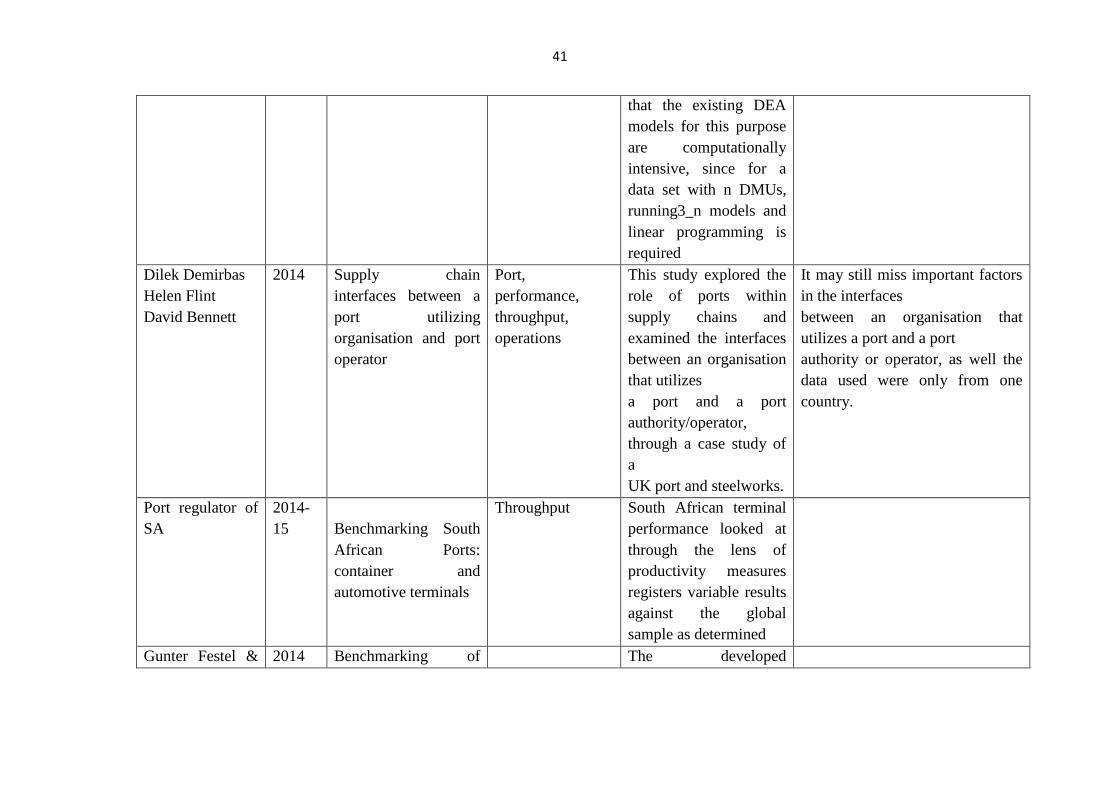
41
that the existing DEA
models for this purpose
are computationally
intensive, since for a
data set with n DMUs,
running3_n models and
linear programming is
required
Dilek Demirbas
Helen Flint
David Bennett
2014 Supply chain
interfaces between a
port utilizing
organisation and port
operator
Port,
performance,
throughput,
operations
This study explored the
role of ports within
supply chains and
examined the interfaces
between an organisation
that utilizes
a port and a port
authority/operator,
through a case study of
a
UK port and steelworks.
It may still miss important factors
in the interfaces
between an organisation that
utilizes a port and a port
authority or operator, as well the
data used were only from one
country.
Port regulator of
SA
2014-
15
Benchmarking South
African Ports:
container and
automotive terminals
Throughput
South African terminal
performance looked at
through the lens of
productivity measures
registers variable results
against the global
sample as determined
Gunter Festel & 2014 Benchmarking of The developed
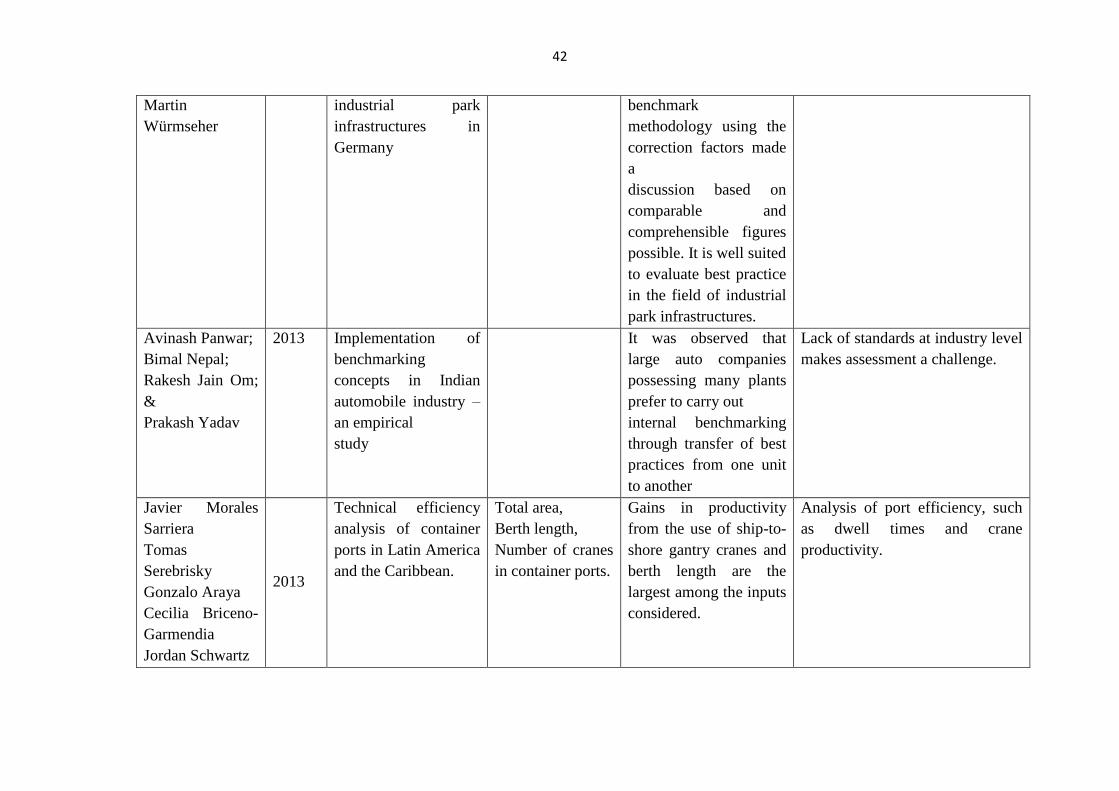
42
Martin
Würmseher
industrial park
infrastructures in
Germany
benchmark
methodology using the
correction factors made
a
discussion based on
comparable and
comprehensible figures
possible. It is well suited
to evaluate best practice
in the field of industrial
park infrastructures.
Avinash Panwar;
Bimal Nepal;
Rakesh Jain Om;
&
Prakash Yadav
2013 Implementation of
benchmarking
concepts in Indian
automobile industry –
an empirical
study
It was observed that
large auto companies
possessing many plants
prefer to carry out
internal benchmarking
through transfer of best
practices from one unit
to another
Lack of standards at industry level
makes assessment a challenge.
Javier Morales
Sarriera
Tomas
Serebrisky
Gonzalo Araya
Cecilia Briceno-
Garmendia
Jordan Schwartz
2013
Technical efficiency
analysis of container
ports in Latin America
and the Caribbean.
Total area,
Berth length,
Number of cranes
in container ports.
Gains in productivity
from the use of ship-to-
shore gantry cranes and
berth length are the
largest among the inputs
considered.
Analysis of port efficiency, such
as dwell times and crane
productivity.
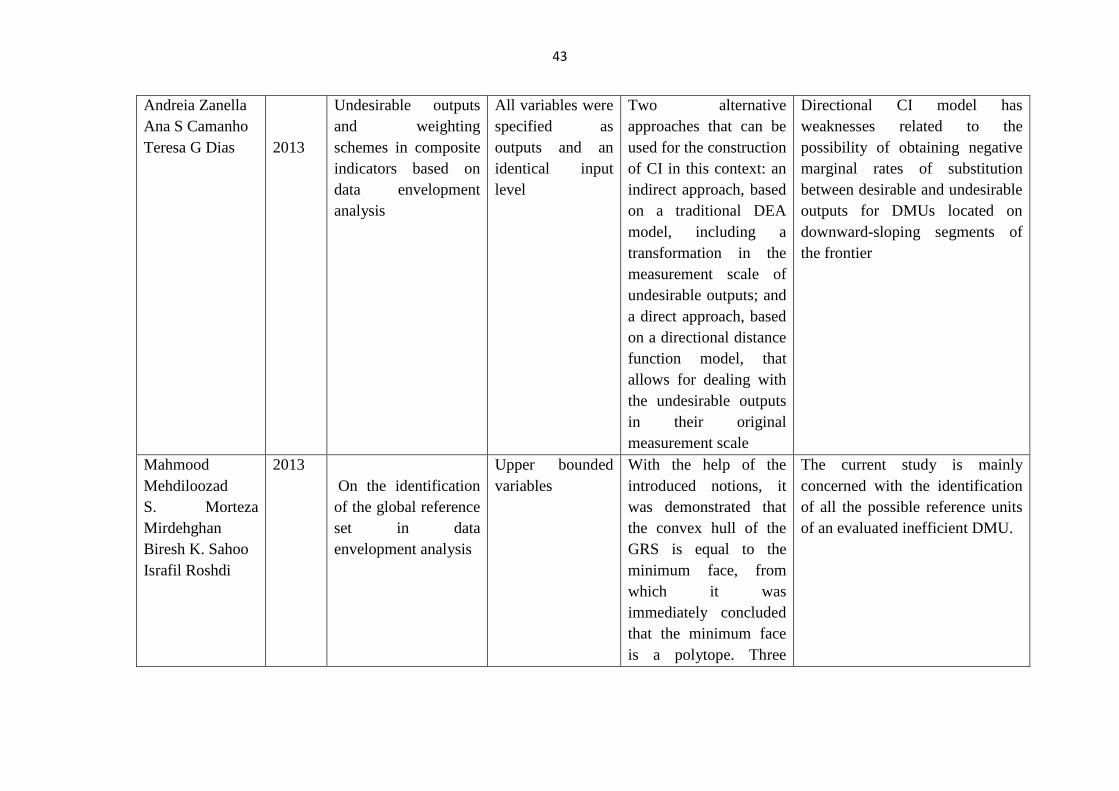
43
Andreia Zanella
Ana S Camanho
Teresa G Dias
2013
Undesirable outputs
and weighting
schemes in composite
indicators based on
data envelopment
analysis
All variables were
specified as
outputs and an
identical input
level
Two alternative
approaches that can be
used for the construction
of CI in this context: an
indirect approach, based
on a traditional DEA
model, including a
transformation in the
measurement scale of
undesirable outputs; and
a direct approach, based
on a directional distance
function model, that
allows for dealing with
the undesirable outputs
in their original
measurement scale
Directional CI model has
weaknesses related to the
possibility of obtaining negative
marginal rates of substitution
between desirable and undesirable
outputs for DMUs located on
downward-sloping segments of
the frontier
Mahmood
Mehdiloozad
S. Morteza
Mirdehghan
Biresh K. Sahoo
Israfil Roshdi
2013
On the identification
of the global reference
set in data
envelopment analysis
Upper bounded
variables
With the help of the
introduced notions, it
was demonstrated that
the convex hull of the
GRS is equal to the
minimum face, from
which it was
immediately concluded
that the minimum face
is a polytope. Three
The current study is mainly
concerned with the identification
of all the possible reference units
of an evaluated inefficient DMU.
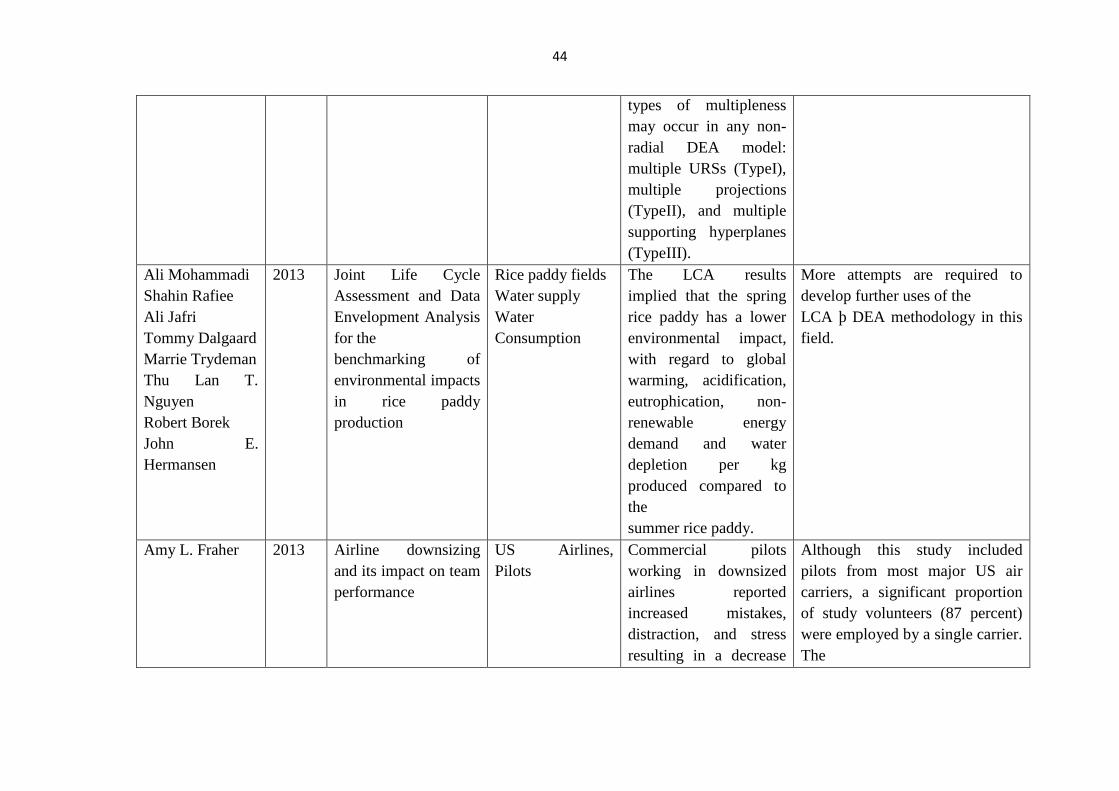
44
types of multipleness
may occur in any non-
radial DEA model:
multiple URSs (TypeI),
multiple projections
(TypeII), and multiple
supporting hyperplanes
(TypeIII).
Ali Mohammadi
Shahin Rafiee
Ali Jafri
Tommy Dalgaard
Marrie Trydeman
Thu Lan T.
Nguyen
Robert Borek
John E.
Hermansen
2013 Joint Life Cycle
Assessment and Data
Envelopment Analysis
for the
benchmarking of
environmental impacts
in rice paddy
production
Rice paddy fields
Water supply
Water
Consumption
The LCA results
implied that the spring
rice paddy has a lower
environmental impact,
with regard to global
warming, acidification,
eutrophication, non-
renewable energy
demand and water
depletion per kg
produced compared to
the
summer rice paddy.
More attempts are required to
develop further uses of the
LCA þ DEA methodology in this
field.
Amy L. Fraher 2013 Airline downsizing
and its impact on team
performance
US Airlines,
Pilots
Commercial pilots
working in downsized
airlines reported
increased mistakes,
distraction, and stress
resulting in a decrease
Although this study included
pilots from most major US air
carriers, a significant proportion
of study volunteers (87 percent)
were employed by a single carrier.
The
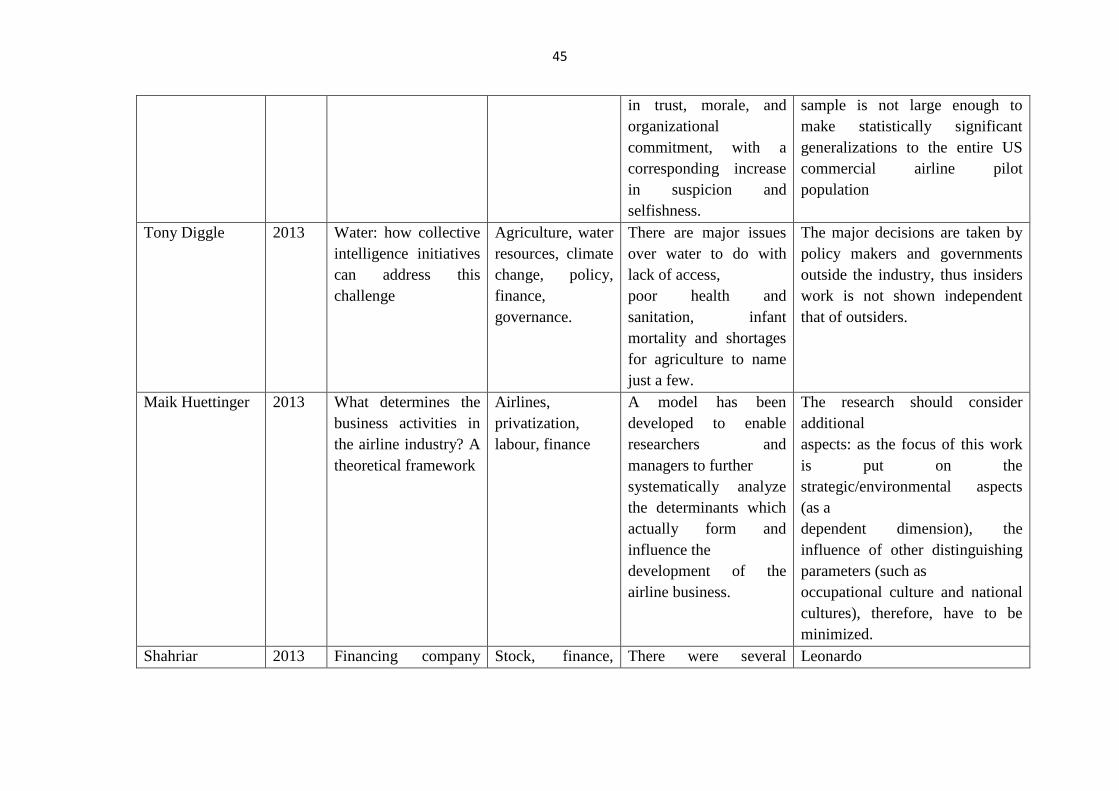
45
in trust, morale, and
organizational
commitment, with a
corresponding increase
in suspicion and
selfishness.
sample is not large enough to
make statistically significant
generalizations to the entire US
commercial airline pilot
population
Tony Diggle 2013 Water: how collective
intelligence initiatives
can address this
challenge
Agriculture, water
resources, climate
change, policy,
finance,
governance.
There are major issues
over water to do with
lack of access,
poor health and
sanitation, infant
mortality and shortages
for agriculture to name
just a few.
The major decisions are taken by
policy makers and governments
outside the industry, thus insiders
work is not shown independent
that of outsiders.
Maik Huettinger 2013 What determines the
business activities in
the airline industry? A
theoretical framework
Airlines,
privatization,
labour, finance
A model has been
developed to enable
researchers and
managers to further
systematically analyze
the determinants which
actually form and
influence the
development of the
airline business.
The research should consider
additional
aspects: as the focus of this work
is put on the
strategic/environmental aspects
(as a
dependent dimension), the
influence of other distinguishing
parameters (such as
occupational culture and national
cultures), therefore, have to be
minimized.
Shahriar 2013 Financing company Stock, finance, There were several Leonardo
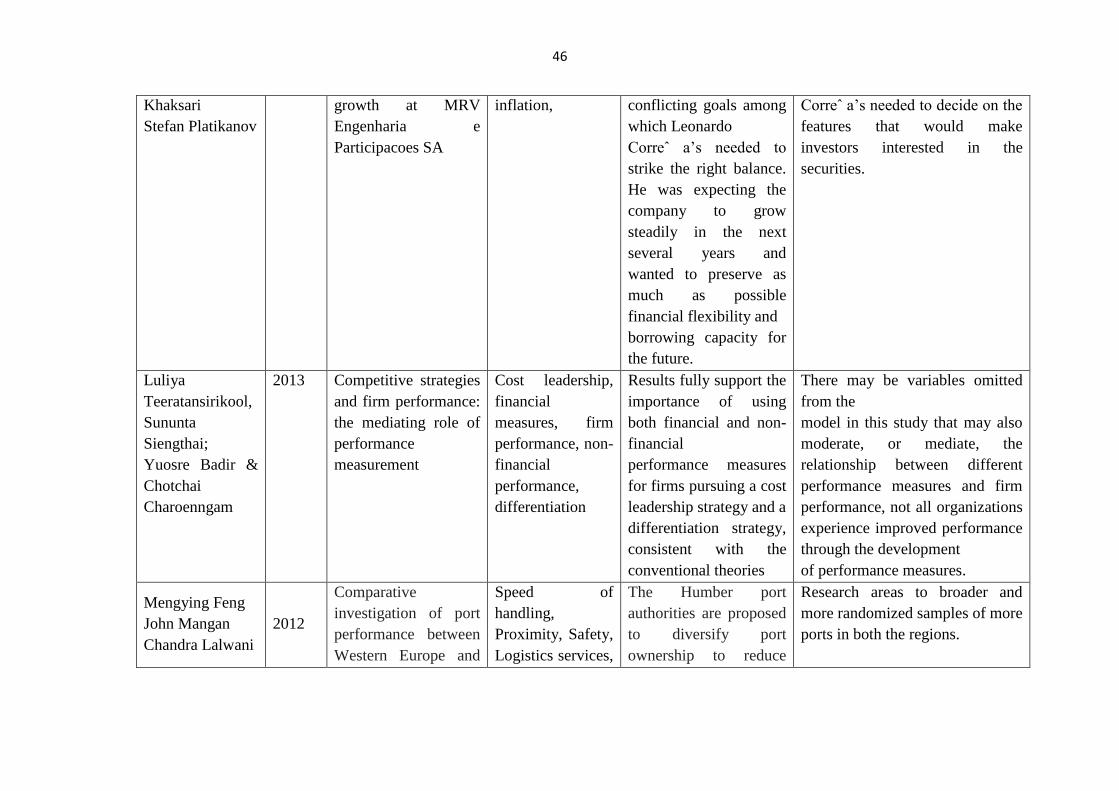
46
Khaksari
Stefan Platikanov
growth at MRV
Engenharia e
Participacoes SA
inflation, conflicting goals among
which Leonardo
Correˆ a’s needed to
strike the right balance.
He was expecting the
company to grow
steadily in the next
several years and
wanted to preserve as
much as possible
financial flexibility and
borrowing capacity for
the future.
Correˆ a’s needed to decide on the
features that would make
investors interested in the
securities.
Luliya
Teeratansirikool,
Sununta
Siengthai;
Yuosre Badir &
Chotchai
Charoenngam
2013 Competitive strategies
and firm performance:
the mediating role of
performance
measurement
Cost leadership,
financial
measures, firm
performance, non-
financial
performance,
differentiation
Results fully support the
importance of using
both financial and non-
financial
performance measures
for firms pursuing a cost
leadership strategy and a
differentiation strategy,
consistent with the
conventional theories
There may be variables omitted
from the
model in this study that may also
moderate, or mediate, the
relationship between different
performance measures and firm
performance, not all organizations
experience improved performance
through the development
of performance measures.
Mengying Feng
John Mangan
Chandra Lalwani
2012
Comparative
investigation of port
performance between
Western Europe and
Speed of
handling,
Proximity, Safety,
Logistics services,
The Humber port
authorities are proposed
to diversify port
ownership to reduce
Research areas to broader and
more randomized samples of more
ports in both the regions.
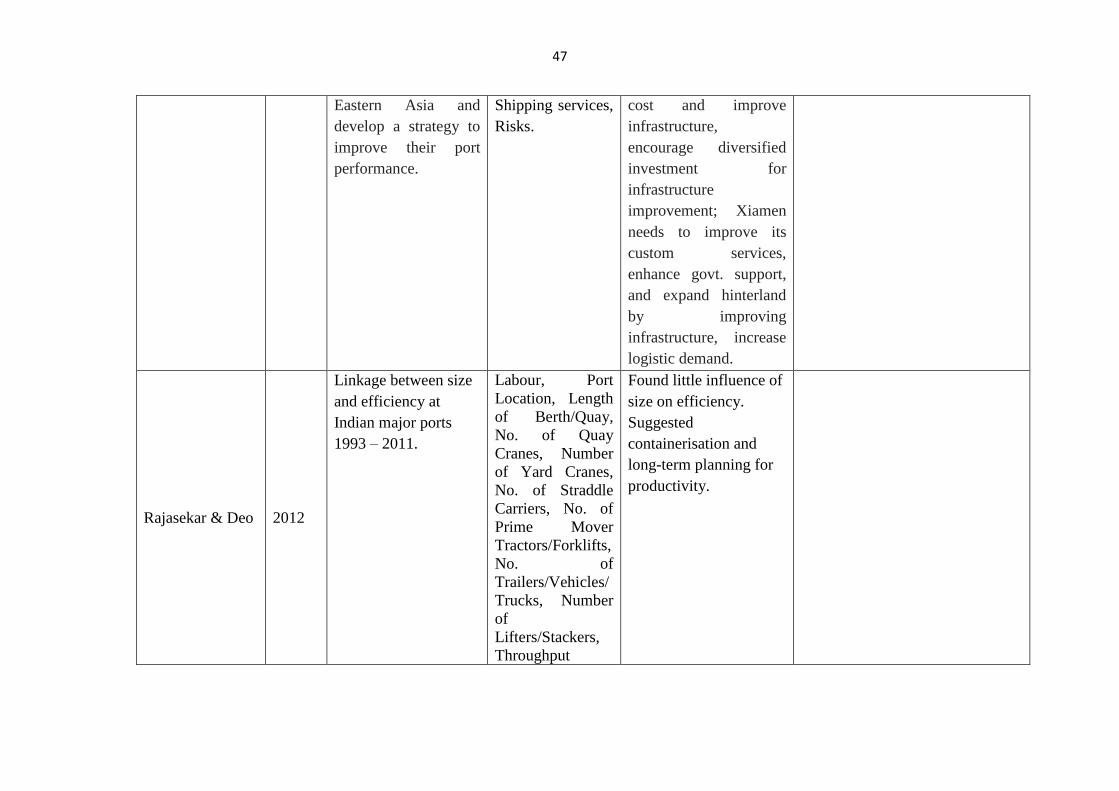
47
Eastern Asia and
develop a strategy to
improve their port
performance.
Shipping services,
Risks.
cost and improve
infrastructure,
encourage diversified
investment for
infrastructure
improvement; Xiamen
needs to improve its
custom services,
enhance govt. support,
and expand hinterland
by improving
infrastructure, increase
logistic demand.
Rajasekar & Deo 2012
Linkage between size
and efficiency at
Indian major ports
1993 – 2011.
Labour, Port
Location, Length
of Berth/Quay,
No. of Quay
Cranes, Number
of Yard Cranes,
No. of Straddle
Carriers, No. of
Prime Mover
Tractors/Forklifts,
No. of
Trailers/Vehicles/
Trucks, Number
of
Lifters/Stackers,
Throughput
Found little influence of
size on efficiency.
Suggested
containerisation and
long-term planning for
productivity.
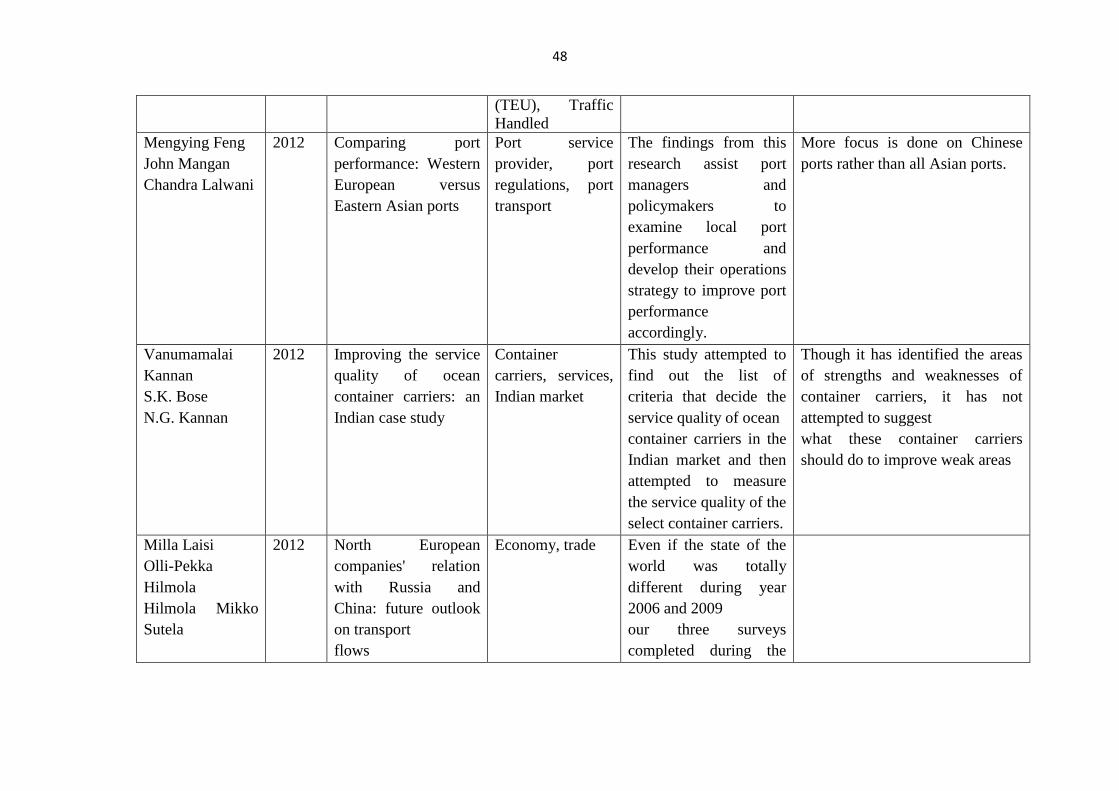
48
(TEU), Traffic
Handled
Mengying Feng
John Mangan
Chandra Lalwani
2012 Comparing port
performance: Western
European versus
Eastern Asian ports
Port service
provider, port
regulations, port
transport
The findings from this
research assist port
managers and
policymakers to
examine local port
performance and
develop their operations
strategy to improve port
performance
accordingly.
More focus is done on Chinese
ports rather than all Asian ports.
Vanumamalai
Kannan
S.K. Bose
N.G. Kannan
2012 Improving the service
quality of ocean
container carriers: an
Indian case study
Container
carriers, services,
Indian market
This study attempted to
find out the list of
criteria that decide the
service quality of ocean
container carriers in the
Indian market and then
attempted to measure
the service quality of the
select container carriers.
Though it has identified the areas
of strengths and weaknesses of
container carriers, it has not
attempted to suggest
what these container carriers
should do to improve weak areas
Milla Laisi
Olli-Pekka
Hilmola
Hilmola Mikko
Sutela
2012 North European
companies' relation
with Russia and
China: future outlook
on transport
flows
Economy, trade Even if the state of the
world was totally
different during year
2006 and 2009
our three surveys
completed during the
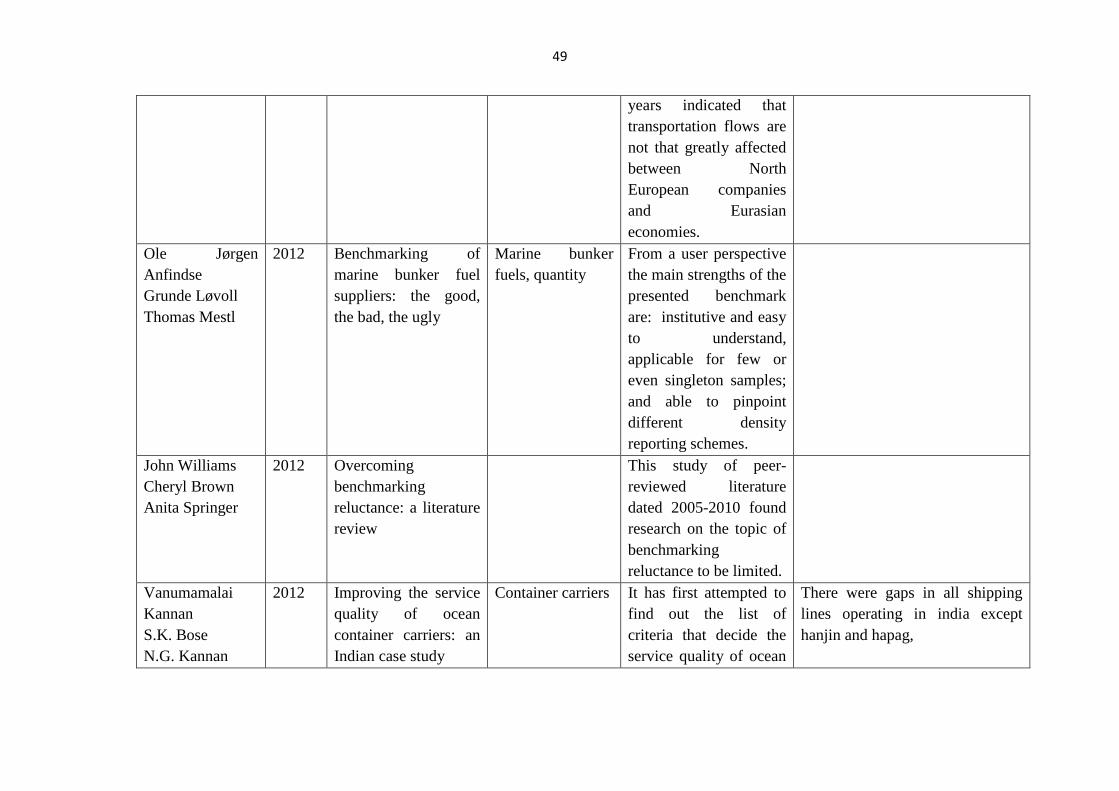
49
years indicated that
transportation flows are
not that greatly affected
between North
European companies
and Eurasian
economies.
Ole Jørgen
Anfindse
Grunde Løvoll
Thomas Mestl
2012 Benchmarking of
marine bunker fuel
suppliers: the good,
the bad, the ugly
Marine bunker
fuels, quantity
From a user perspective
the main strengths of the
presented benchmark
are: institutive and easy
to understand,
applicable for few or
even singleton samples;
and able to pinpoint
different density
reporting schemes.
John Williams
Cheryl Brown
Anita Springer
2012 Overcoming
benchmarking
reluctance: a literature
review
This study of peer-
reviewed literature
dated 2005-2010 found
research on the topic of
benchmarking
reluctance to be limited.
Vanumamalai
Kannan
S.K. Bose
N.G. Kannan
2012 Improving the service
quality of ocean
container carriers: an
Indian case study
Container carriers It has first attempted to
find out the list of
criteria that decide the
service quality of ocean
There were gaps in all shipping
lines operating in india except
hanjin and hapag,
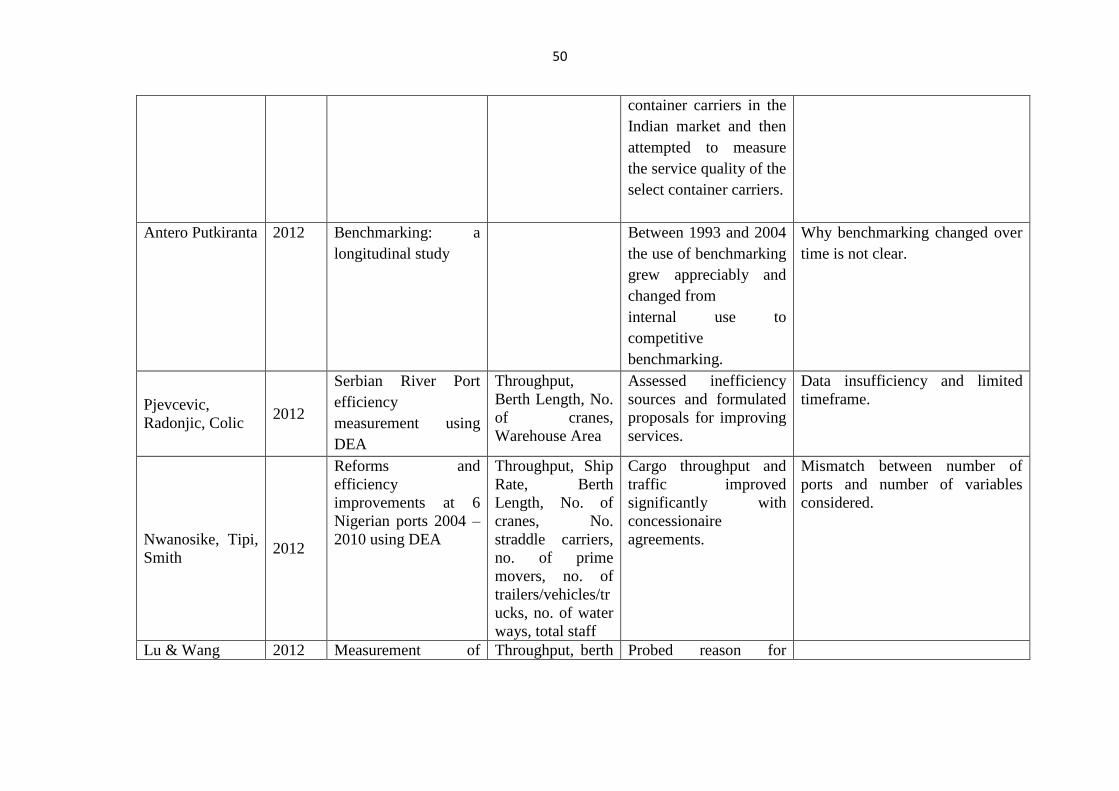
50
container carriers in the
Indian market and then
attempted to measure
the service quality of the
select container carriers.
Antero Putkiranta 2012 Benchmarking: a
longitudinal study
Between 1993 and 2004
the use of benchmarking
grew appreciably and
changed from
internal use to
competitive
benchmarking.
Why benchmarking changed over
time is not clear.
Pjevcevic,
Radonjic, Colic 2012
Serbian River Port
efficiency
measurement using
DEA
Throughput,
Berth Length, No.
of cranes,
Warehouse Area
Assessed inefficiency
sources and formulated
proposals for improving
services.
Data insufficiency and limited
timeframe.
Nwanosike, Tipi,
Smith 2012
Reforms and
efficiency
improvements at 6
Nigerian ports 2004 –
2010 using DEA
Throughput, Ship
Rate, Berth
Length, No. of
cranes, No.
straddle carriers,
no. of prime
movers, no. of
trailers/vehicles/tr
ucks, no. of water
ways, total staff
Cargo throughput and
traffic improved
significantly with
concessionaire
agreements.
Mismatch between number of
ports and number of variables
considered.
Lu & Wang 2012 Measurement of Throughput, berth Probed reason for
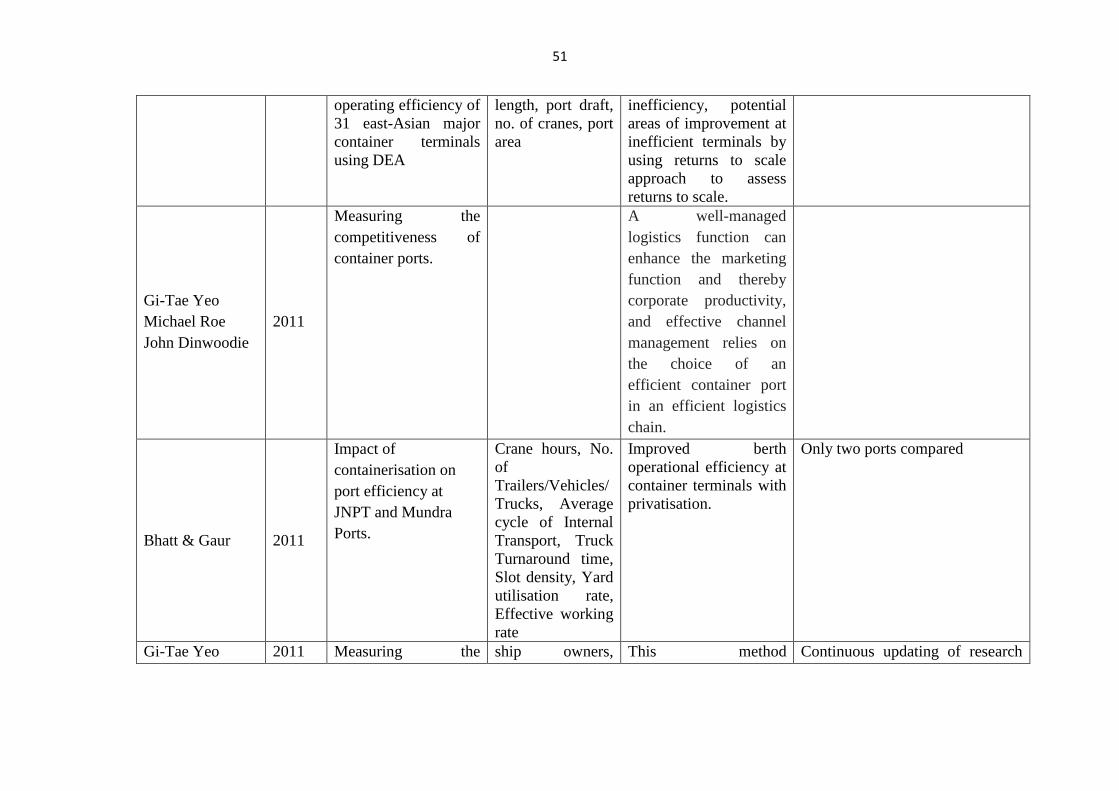
51
operating efficiency of
31 east-Asian major
container terminals
using DEA
length, port draft,
no. of cranes, port
area
inefficiency, potential
areas of improvement at
inefficient terminals by
using returns to scale
approach to assess
returns to scale.
Gi-Tae Yeo
Michael Roe
John Dinwoodie
2011
Measuring the
competitiveness of
container ports.
A well-managed
logistics function can
enhance the marketing
function and thereby
corporate productivity,
and effective channel
management relies on
the choice of an
efficient container port
in an efficient logistics
chain.
Bhatt & Gaur 2011
Impact of
containerisation on
port efficiency at
JNPT and Mundra
Ports.
Crane hours, No.
of
Trailers/Vehicles/
Trucks, Average
cycle of Internal
Transport, Truck
Turnaround time,
Slot density, Yard
utilisation rate,
Effective working
rate
Improved berth
operational efficiency at
container terminals with
privatisation.
Only two ports compared
Gi-Tae Yeo 2011 Measuring the ship owners, This method Continuous updating of research
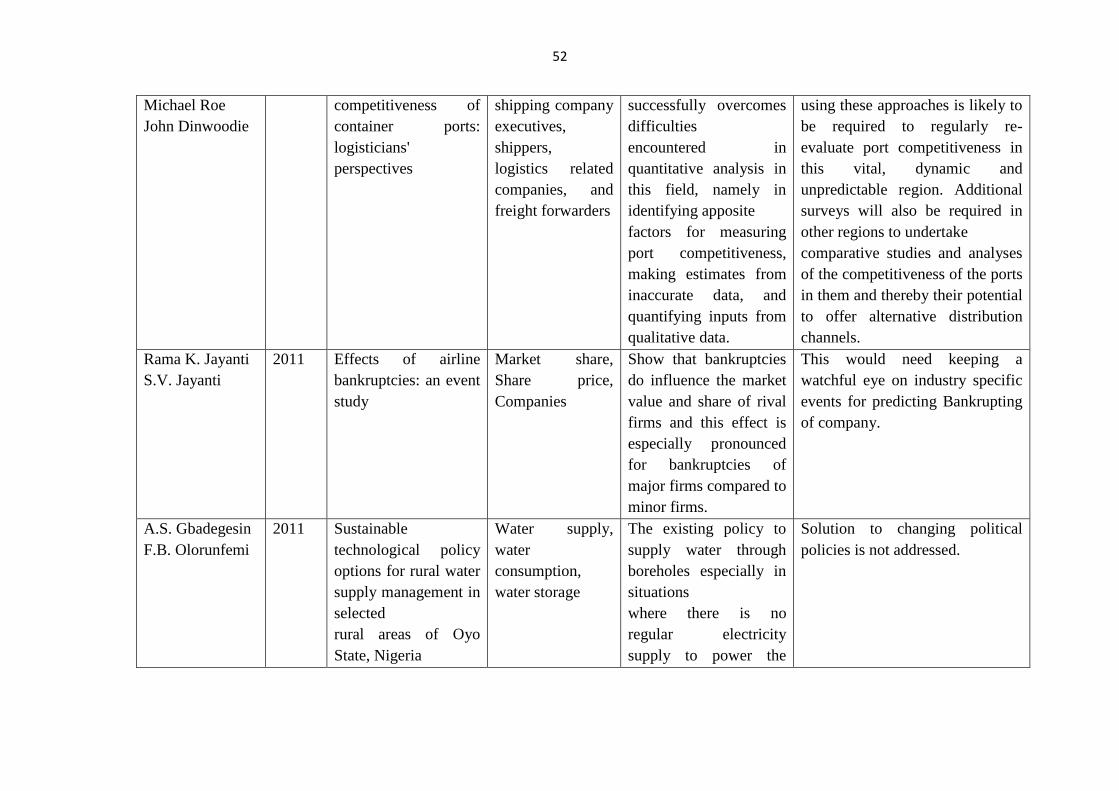
52
Michael Roe
John Dinwoodie
competitiveness of
container ports:
logisticians'
perspectives
shipping company
executives,
shippers,
logistics related
companies, and
freight forwarders
successfully overcomes
difficulties
encountered in
quantitative analysis in
this field, namely in
identifying apposite
factors for measuring
port competitiveness,
making estimates from
inaccurate data, and
quantifying inputs from
qualitative data.
using these approaches is likely to
be required to regularly re-
evaluate port competitiveness in
this vital, dynamic and
unpredictable region. Additional
surveys will also be required in
other regions to undertake
comparative studies and analyses
of the competitiveness of the ports
in them and thereby their potential
to offer alternative distribution
channels.
Rama K. Jayanti
S.V. Jayanti
2011 Effects of airline
bankruptcies: an event
study
Market share,
Share price,
Companies
Show that bankruptcies
do influence the market
value and share of rival
firms and this effect is
especially pronounced
for bankruptcies of
major firms compared to
minor firms.
This would need keeping a
watchful eye on industry specific
events for predicting Bankrupting
of company.
A.S. Gbadegesin
F.B. Olorunfemi
2011 Sustainable
technological policy
options for rural water
supply management in
selected
rural areas of Oyo
State, Nigeria
Water supply,
water
consumption,
water storage
The existing policy to
supply water through
boreholes especially in
situations
where there is no
regular electricity
supply to power the
Solution to changing political
policies is not addressed.
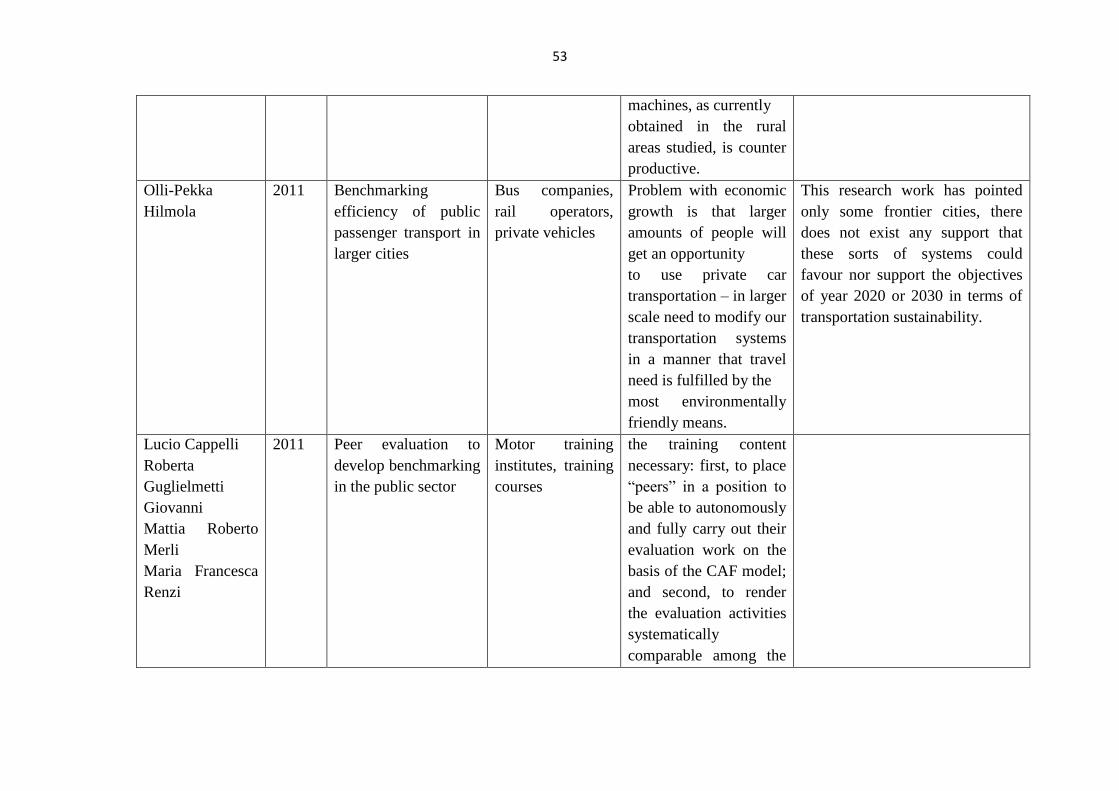
53
machines, as currently
obtained in the rural
areas studied, is counter
productive.
Olli-Pekka
Hilmola
2011 Benchmarking
efficiency of public
passenger transport in
larger cities
Bus companies,
rail operators,
private vehicles
Problem with economic
growth is that larger
amounts of people will
get an opportunity
to use private car
transportation – in larger
scale need to modify our
transportation systems
in a manner that travel
need is fulfilled by the
most environmentally
friendly means.
This research work has pointed
only some frontier cities, there
does not exist any support that
these sorts of systems could
favour nor support the objectives
of year 2020 or 2030 in terms of
transportation sustainability.
Lucio Cappelli
Roberta
Guglielmetti
Giovanni
Mattia Roberto
Merli
Maria Francesca
Renzi
2011 Peer evaluation to
develop benchmarking
in the public sector
Motor training
institutes, training
courses
the training content
necessary: first, to place
“peers” in a position to
be able to autonomously
and fully carry out their
evaluation work on the
basis of the CAF model;
and second, to render
the evaluation activities
systematically
comparable among the
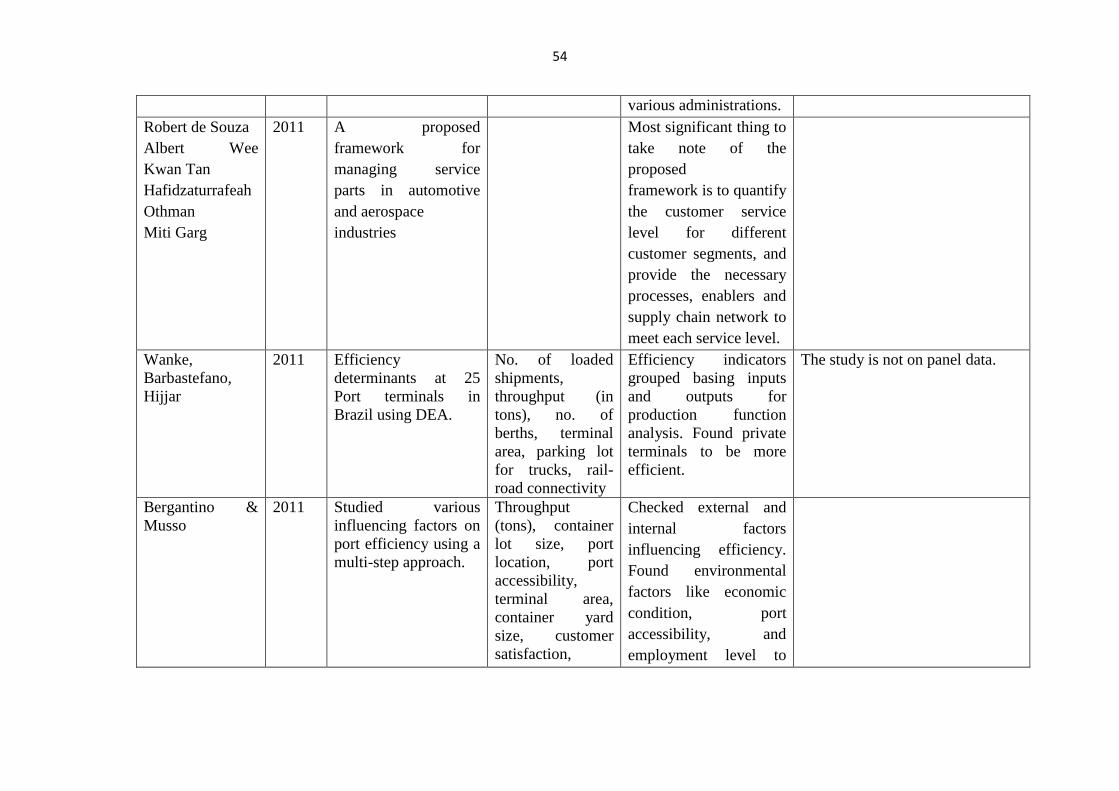
54
various administrations.
Robert de Souza
Albert Wee
Kwan Tan
Hafidzaturrafeah
Othman
Miti Garg
2011 A proposed
framework for
managing service
parts in automotive
and aerospace
industries
Most significant thing to
take note of the
proposed
framework is to quantify
the customer service
level for different
customer segments, and
provide the necessary
processes, enablers and
supply chain network to
meet each service level.
Wanke,
Barbastefano,
Hijjar
2011 Efficiency
determinants at 25
Port terminals in
Brazil using DEA.
No. of loaded
shipments,
throughput (in
tons), no. of
berths, terminal
area, parking lot
for trucks, rail-
road connectivity
Efficiency indicators
grouped basing inputs
and outputs for
production function
analysis. Found private
terminals to be more
efficient.
The study is not on panel data.
Bergantino &
Musso
2011 Studied various
influencing factors on
port efficiency using a
multi-step approach.
Throughput
(tons), container
lot size, port
location, port
accessibility,
terminal area,
container yard
size, customer
satisfaction,
Checked external and
internal factors
influencing efficiency.
Found environmental
factors like economic
condition, port
accessibility, and
employment level to
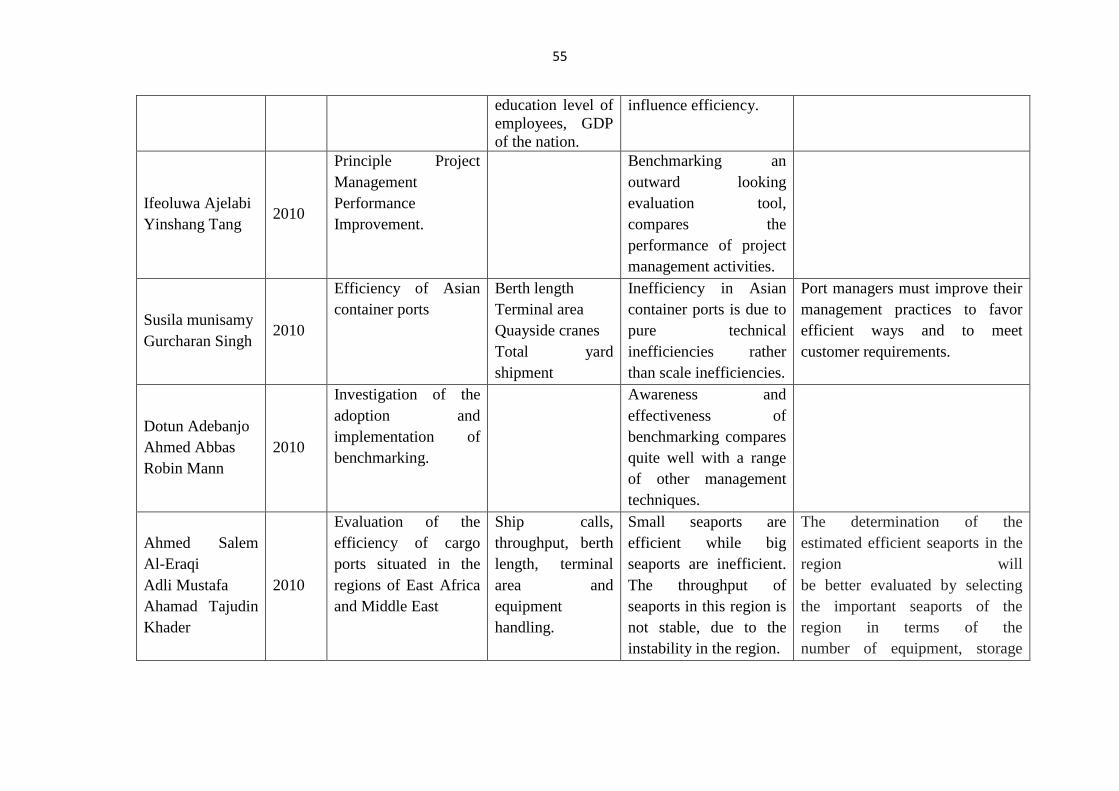
55
education level of
employees, GDP
of the nation.
influence efficiency.
Ifeoluwa Ajelabi
Yinshang Tang 2010
Principle Project
Management
Performance
Improvement.
Benchmarking an
outward looking
evaluation tool,
compares the
performance of project
management activities.
Susila munisamy
Gurcharan Singh 2010
Efficiency of Asian
container ports
Berth length
Terminal area
Quayside cranes
Total yard
shipment
Inefficiency in Asian
container ports is due to
pure technical
inefficiencies rather
than scale inefficiencies.
Port managers must improve their
management practices to favor
efficient ways and to meet
customer requirements.
Dotun Adebanjo
Ahmed Abbas
Robin Mann
2010
Investigation of the
adoption and
implementation of
benchmarking.
Awareness and
effectiveness of
benchmarking compares
quite well with a range
of other management
techniques.
Ahmed Salem
Al-Eraqi
Adli Mustafa
Ahamad Tajudin
Khader
2010
Evaluation of the
efficiency of cargo
ports situated in the
regions of East Africa
and Middle East
Ship calls,
throughput, berth
length, terminal
area and
equipment
handling.
Small seaports are
efficient while big
seaports are inefficient.
The throughput of
seaports in this region is
not stable, due to the
instability in the region.
The determination of the
estimated efficient seaports in the
region will
be better evaluated by selecting
the important seaports of the
region in terms of the
number of equipment, storage
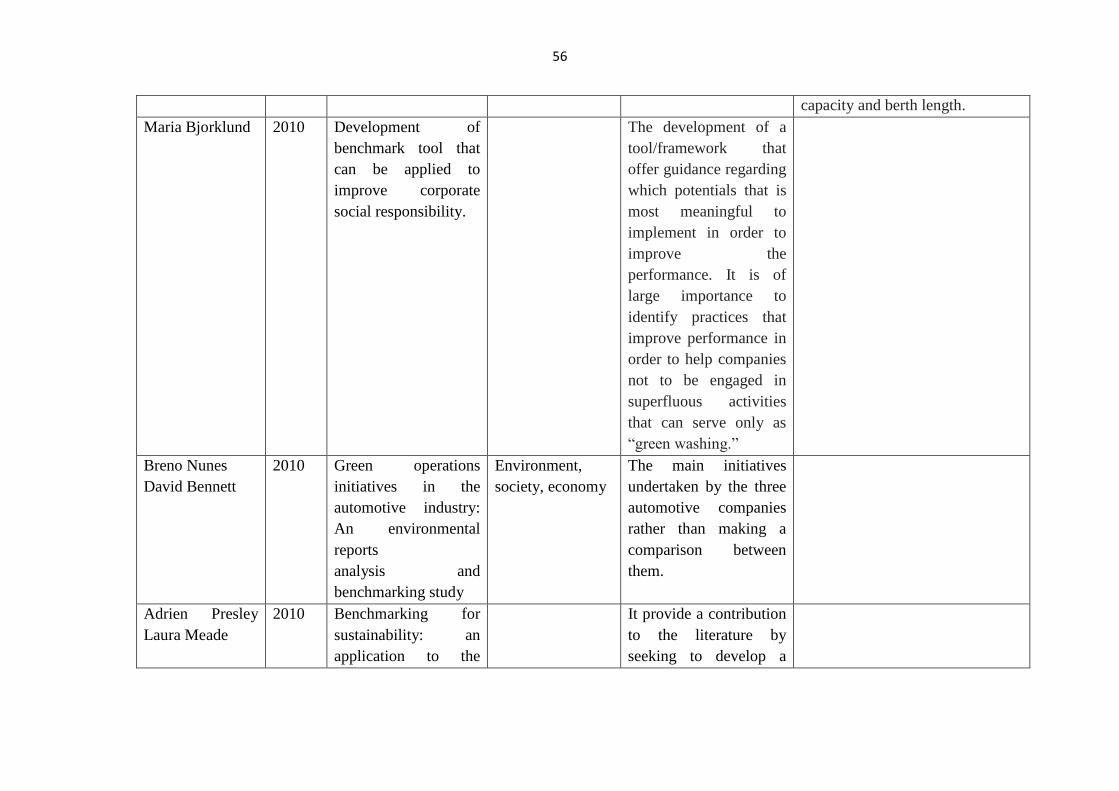
56
capacity and berth length.
Maria Bjorklund 2010 Development of
benchmark tool that
can be applied to
improve corporate
social responsibility.
The development of a
tool/framework that
offer guidance regarding
which potentials that is
most meaningful to
implement in order to
improve the
performance. It is of
large importance to
identify practices that
improve performance in
order to help companies
not to be engaged in
superfluous activities
that can serve only as
“green washing.”
Breno Nunes
David Bennett
2010 Green operations
initiatives in the
automotive industry:
An environmental
reports
analysis and
benchmarking study
Environment,
society, economy
The main initiatives
undertaken by the three
automotive companies
rather than making a
comparison between
them.
Adrien Presley
Laura Meade
2010 Benchmarking for
sustainability: an
application to the
It provide a contribution
to the literature by
seeking to develop a
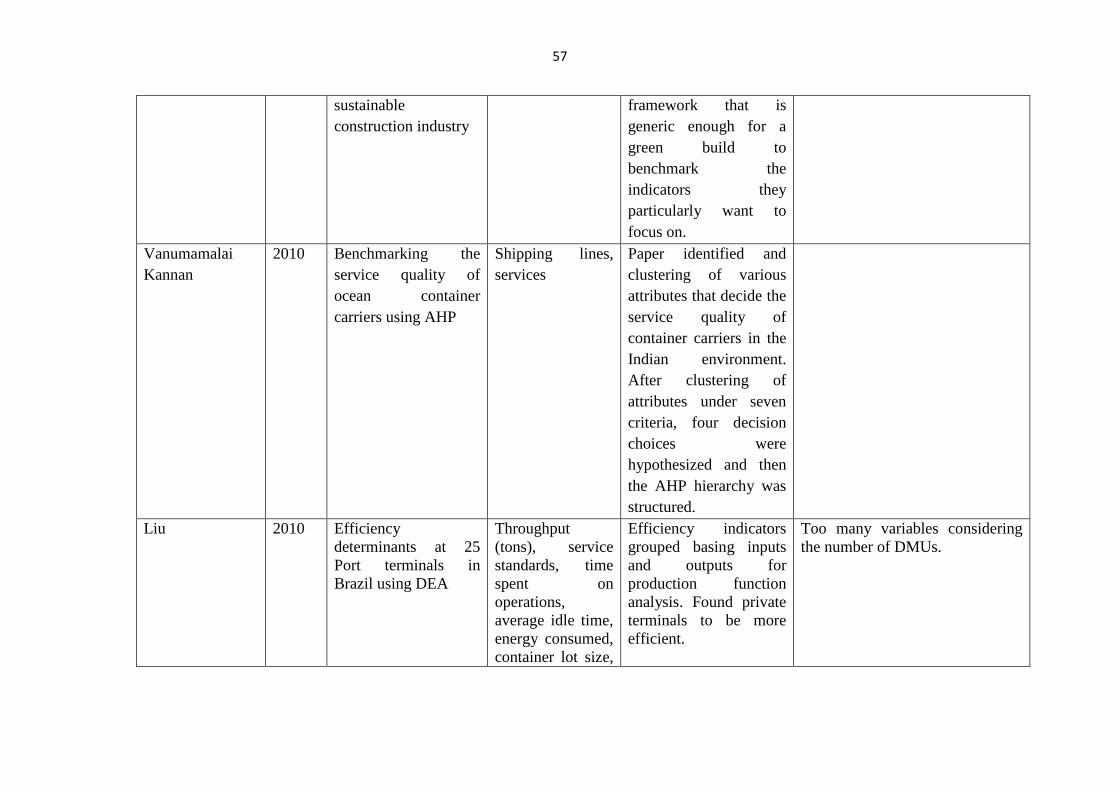
57
sustainable
construction industry
framework that is
generic enough for a
green build to
benchmark the
indicators they
particularly want to
focus on.
Vanumamalai
Kannan
2010 Benchmarking the
service quality of
ocean container
carriers using AHP
Shipping lines,
services
Paper identified and
clustering of various
attributes that decide the
service quality of
container carriers in the
Indian environment.
After clustering of
attributes under seven
criteria, four decision
choices were
hypothesized and then
the AHP hierarchy was
structured.
Liu 2010 Efficiency
determinants at 25
Port terminals in
Brazil using DEA
Throughput
(tons), service
standards, time
spent on
operations,
average idle time,
energy consumed,
container lot size,
Efficiency indicators
grouped basing inputs
and outputs for
production function
analysis. Found private
terminals to be more
efficient.
Too many variables considering
the number of DMUs.
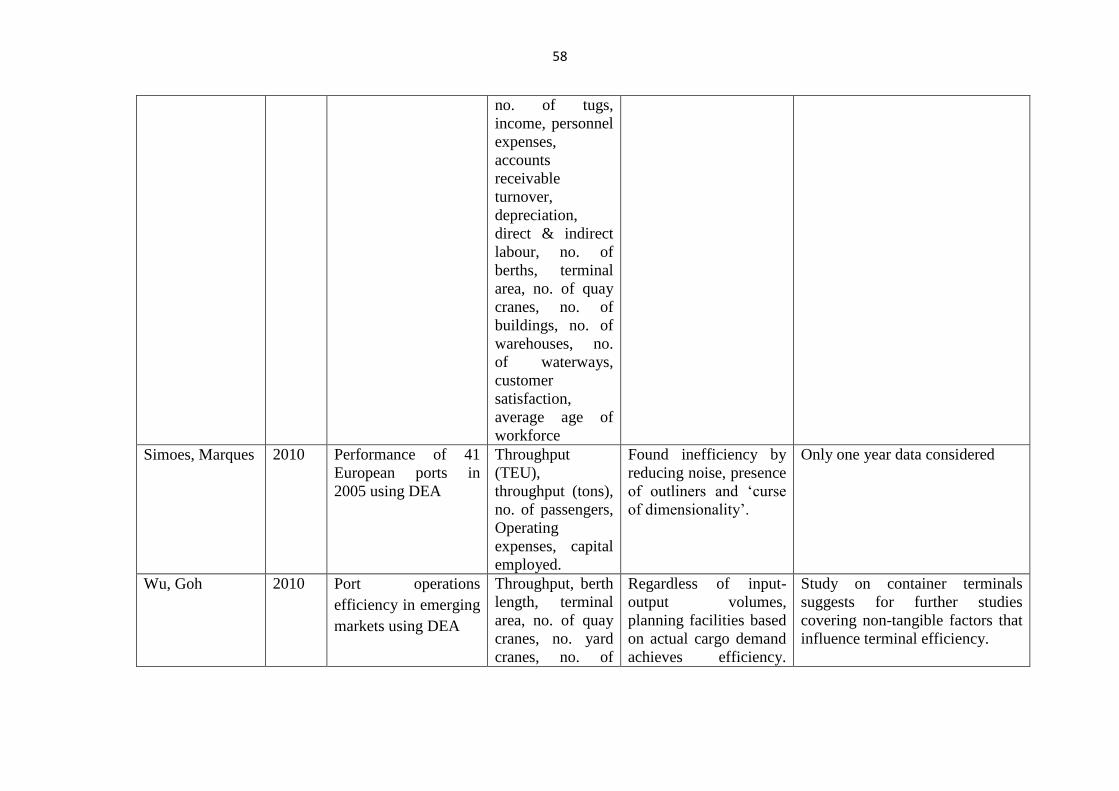
58
no. of tugs,
income, personnel
expenses,
accounts
receivable
turnover,
depreciation,
direct & indirect
labour, no. of
berths, terminal
area, no. of quay
cranes, no. of
buildings, no. of
warehouses, no.
of waterways,
customer
satisfaction,
average age of
workforce
Simoes, Marques
2010 Performance of 41
European ports in
2005 using DEA
Throughput
(TEU),
throughput (tons),
no. of passengers,
Operating
expenses, capital
employed.
Found inefficiency by
reducing noise, presence
of outliners and ‘curse
of dimensionality’.
Only one year data considered
Wu, Goh 2010 Port operations
efficiency in emerging
markets using DEA
Throughput, berth
length, terminal
area, no. of quay
cranes, no. yard
cranes, no. of
Regardless of input-
output volumes,
planning facilities based
on actual cargo demand
achieves efficiency.
Study on container terminals
suggests for further studies
covering non-tangible factors that
influence terminal efficiency.
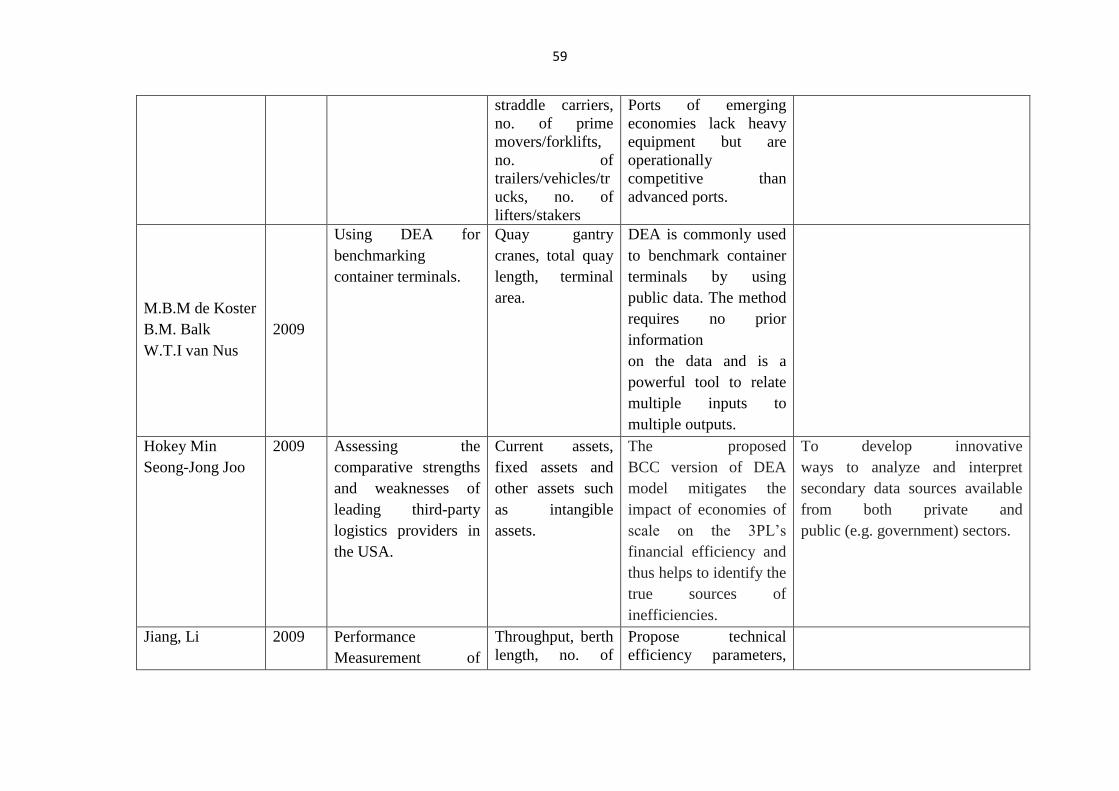
59
straddle carriers,
no. of prime
movers/forklifts,
no. of
trailers/vehicles/tr
ucks, no. of
lifters/stakers
Ports of emerging
economies lack heavy
equipment but are
operationally
competitive than
advanced ports.
M.B.M de Koster
B.M. Balk
W.T.I van Nus
2009
Using DEA for
benchmarking
container terminals.
Quay gantry
cranes, total quay
length, terminal
area.
DEA is commonly used
to benchmark container
terminals by using
public data. The method
requires no prior
information
on the data and is a
powerful tool to relate
multiple inputs to
multiple outputs.
Hokey Min
Seong-Jong Joo
2009 Assessing the
comparative strengths
and weaknesses of
leading third-party
logistics providers in
the USA.
Current assets,
fixed assets and
other assets such
as intangible
assets.
The proposed
BCC version of DEA
model mitigates the
impact of economies of
scale on the 3PL’s
financial efficiency and
thus helps to identify the
true sources of
inefficiencies.
To develop innovative
ways to analyze and interpret
secondary data sources available
from both private and
public (e.g. government) sectors.
Jiang, Li 2009 Performance
Measurement of
Throughput, berth
length, no. of
Propose technical
efficiency parameters,
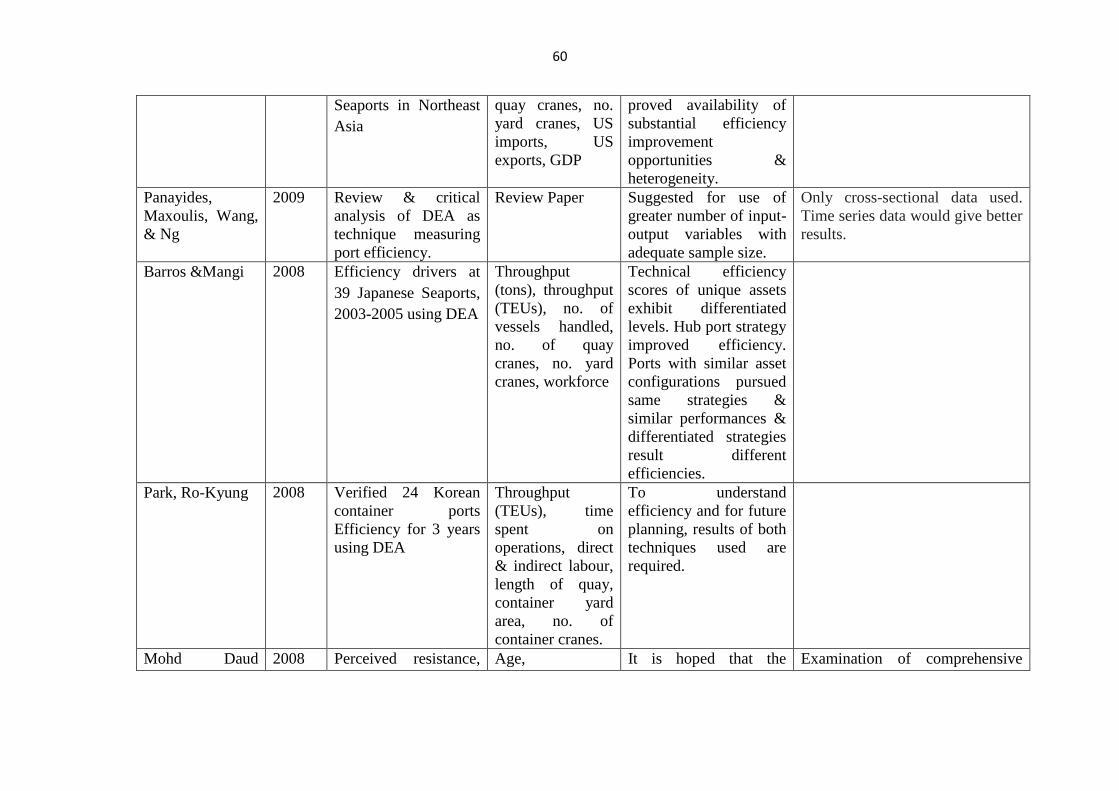
60
Seaports in Northeast
Asia
quay cranes, no.
yard cranes, US
imports, US
exports, GDP
proved availability of
substantial efficiency
improvement
opportunities &
heterogeneity.
Panayides,
Maxoulis, Wang,
& Ng
2009 Review & critical
analysis of DEA as
technique measuring
port efficiency.
Review Paper Suggested for use of
greater number of input-
output variables with
adequate sample size.
Only cross-sectional data used.
Time series data would give better
results.
Barros &Mangi 2008 Efficiency drivers at
39 Japanese Seaports,
2003-2005 using DEA
Throughput
(tons), throughput
(TEUs), no. of
vessels handled,
no. of quay
cranes, no. yard
cranes, workforce
Technical efficiency
scores of unique assets
exhibit differentiated
levels. Hub port strategy
improved efficiency.
Ports with similar asset
configurations pursued
same strategies &
similar performances &
differentiated strategies
result different
efficiencies.
Park, Ro-Kyung 2008 Verified 24 Korean
container ports
Efficiency for 3 years
using DEA
Throughput
(TEUs), time
spent on
operations, direct
& indirect labour,
length of quay,
container yard
area, no. of
container cranes.
To understand
efficiency and for future
planning, results of both
techniques used are
required.
Mohd Daud 2008 Perceived resistance, Age, It is hoped that the Examination of comprehensive
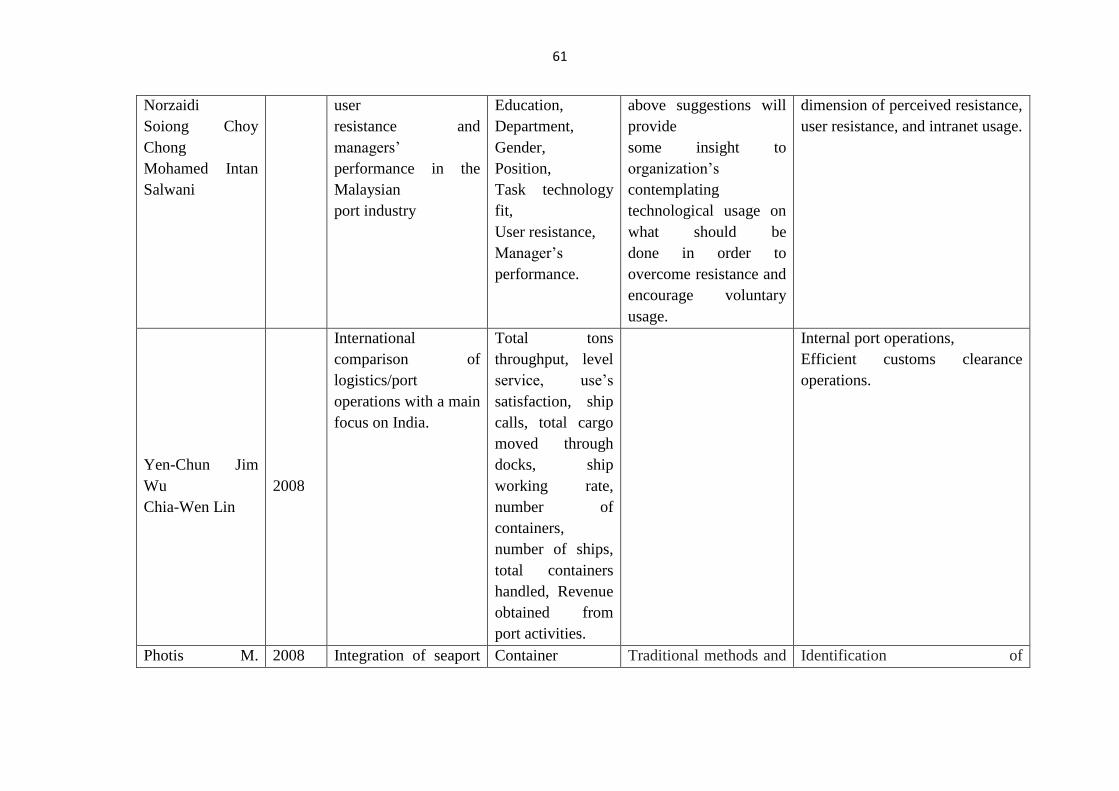
61
Norzaidi
Soiong Choy
Chong
Mohamed Intan
Salwani
user
resistance and
managers’
performance in the
Malaysian
port industry
Education,
Department,
Gender,
Position,
Task technology
fit,
User resistance,
Manager’s
performance.
above suggestions will
provide
some insight to
organization’s
contemplating
technological usage on
what should be
done in order to
overcome resistance and
encourage voluntary
usage.
dimension of perceived resistance,
user resistance, and intranet usage.
Yen-Chun Jim
Wu
Chia-Wen Lin
2008
International
comparison of
logistics/port
operations with a main
focus on India.
Total tons
throughput, level
service, use’s
satisfaction, ship
calls, total cargo
moved through
docks, ship
working rate,
number of
containers,
number of ships,
total containers
handled, Revenue
obtained from
port activities.
Internal port operations,
Efficient customs clearance
operations.
Photis M. 2008 Integration of seaport Container Traditional methods and Identification of
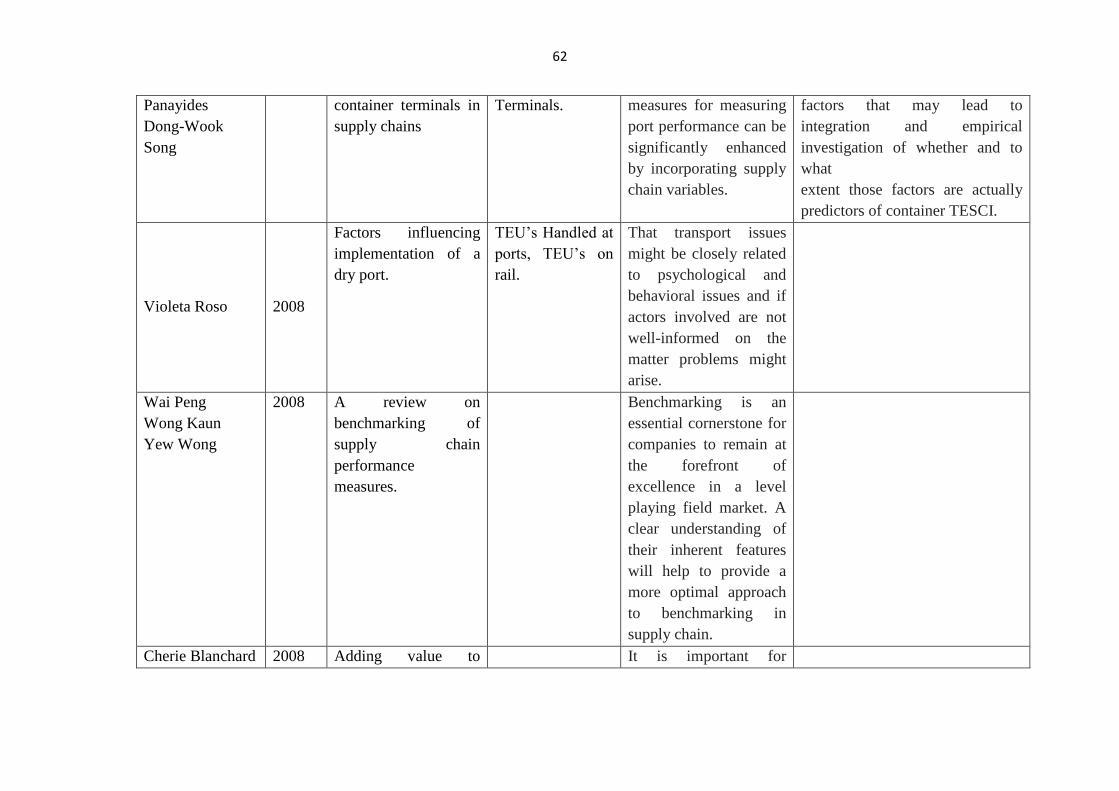
62
Panayides
Dong-Wook
Song
container terminals in
supply chains
Terminals. measures for measuring
port performance can be
significantly enhanced
by incorporating supply
chain variables.
factors that may lead to
integration and empirical
investigation of whether and to
what
extent those factors are actually
predictors of container TESCI.
Violeta Roso 2008
Factors influencing
implementation of a
dry port.
TEU’s Handled at
ports, TEU’s on
rail.
That transport issues
might be closely related
to psychological and
behavioral issues and if
actors involved are not
well-informed on the
matter problems might
arise.
Wai Peng
Wong Kaun
Yew Wong
2008 A review on
benchmarking of
supply chain
performance
measures.
Benchmarking is an
essential cornerstone for
companies to remain at
the forefront of
excellence in a level
playing field market. A
clear understanding of
their inherent features
will help to provide a
more optimal approach
to benchmarking in
supply chain.
Cherie Blanchard 2008 Adding value to It is important for
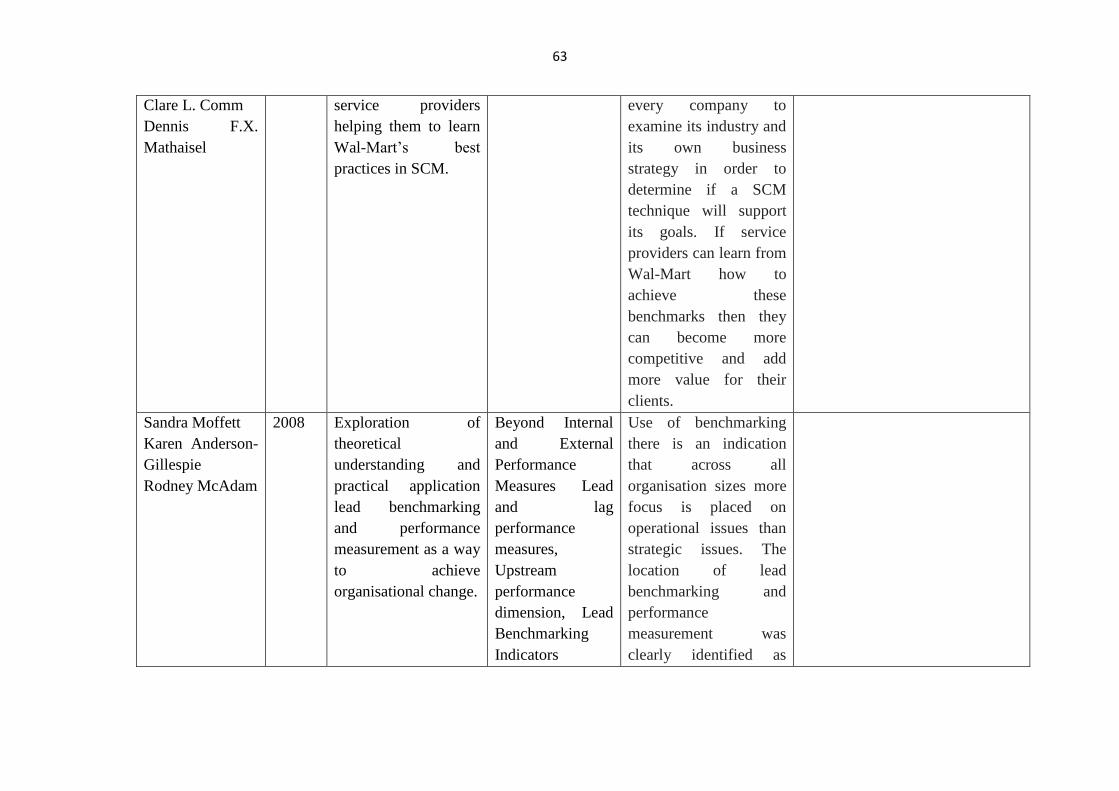
63
Clare L. Comm
Dennis F.X.
Mathaisel
service providers
helping them to learn
Wal-Mart’s best
practices in SCM.
every company to
examine its industry and
its own business
strategy in order to
determine if a SCM
technique will support
its goals. If service
providers can learn from
Wal-Mart how to
achieve these
benchmarks then they
can become more
competitive and add
more value for their
clients.
Sandra Moffett
Karen Anderson-
Gillespie
Rodney McAdam
2008 Exploration of
theoretical
understanding and
practical application
lead benchmarking
and performance
measurement as a way
to achieve
organisational change.
Beyond Internal
and External
Performance
Measures Lead
and lag
performance
measures,
Upstream
performance
dimension, Lead
Benchmarking
Indicators
Use of benchmarking
there is an indication
that across all
organisation sizes more
focus is placed on
operational issues than
strategic issues. The
location of lead
benchmarking and
performance
measurement was
clearly identified as
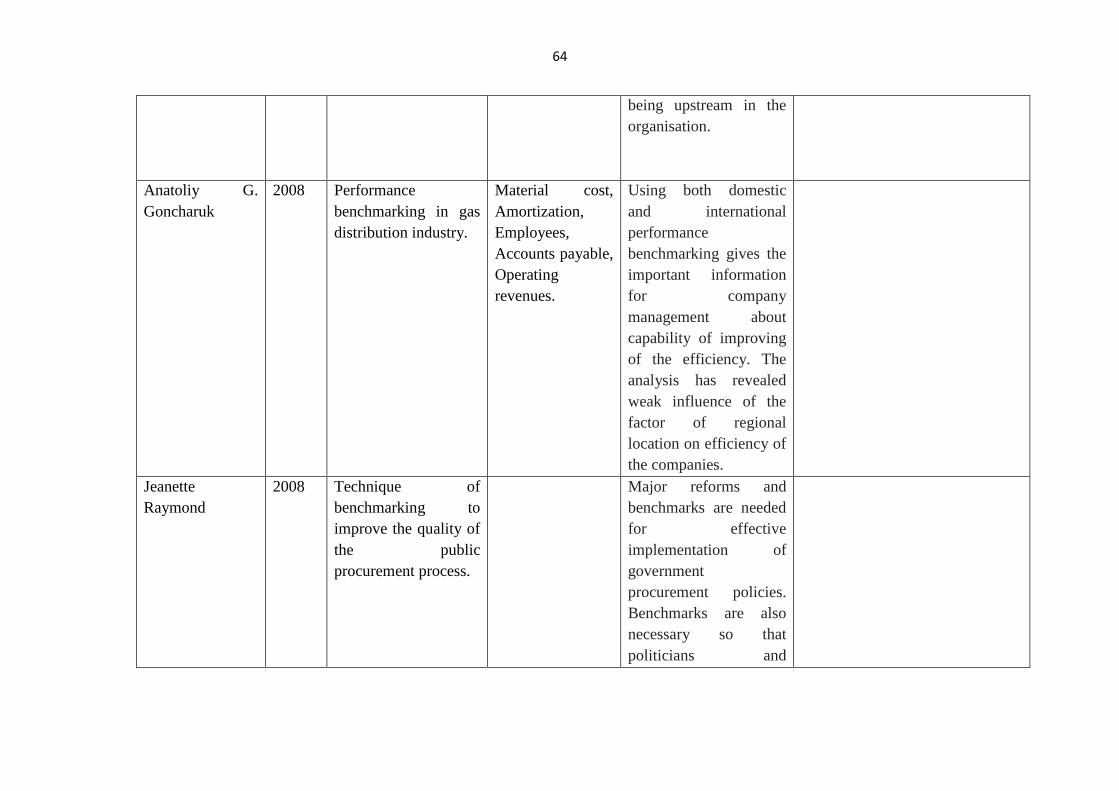
64
being upstream in the
organisation.
Anatoliy G.
Goncharuk
2008 Performance
benchmarking in gas
distribution industry.
Material cost,
Amortization,
Employees,
Accounts payable,
Operating
revenues.
Using both domestic
and international
performance
benchmarking gives the
important information
for company
management about
capability of improving
of the efficiency. The
analysis has revealed
weak influence of the
factor of regional
location on efficiency of
the companies.
Jeanette
Raymond
2008 Technique of
benchmarking to
improve the quality of
the public
procurement process.
Major reforms and
benchmarks are needed
for effective
implementation of
government
procurement policies.
Benchmarks are also
necessary so that
politicians and
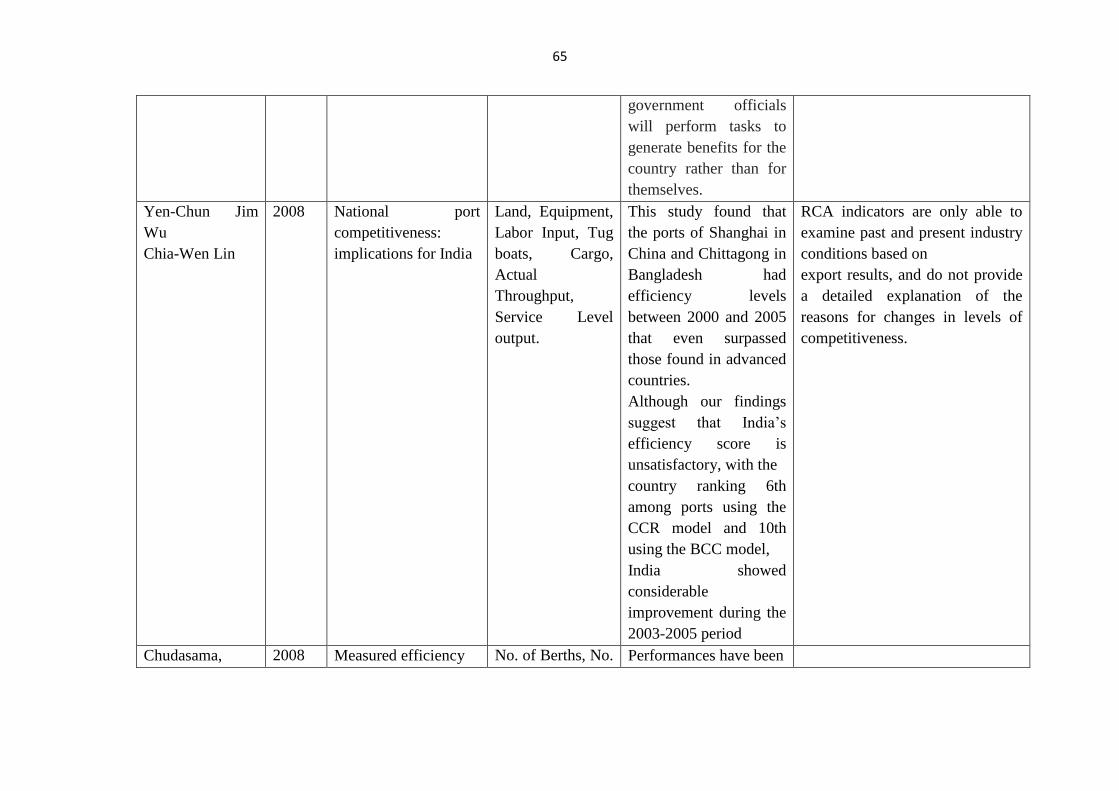
65
government officials
will perform tasks to
generate benefits for the
country rather than for
themselves.
Yen-Chun Jim
Wu
Chia-Wen Lin
2008 National port
competitiveness:
implications for India
Land, Equipment,
Labor Input, Tug
boats, Cargo,
Actual
Throughput,
Service Level
output.
This study found that
the ports of Shanghai in
China and Chittagong in
Bangladesh had
efficiency levels
between 2000 and 2005
that even surpassed
those found in advanced
countries.
Although our findings
suggest that India’s
efficiency score is
unsatisfactory, with the
country ranking 6th
among ports using the
CCR model and 10th
using the BCC model,
India showed
considerable
improvement during the
2003-2005 period
RCA indicators are only able to
examine past and present industry
conditions based on
export results, and do not provide
a detailed explanation of the
reasons for changes in levels of
competitiveness.
Chudasama, 2008 Measured efficiency No. of Berths, No. Performances have been
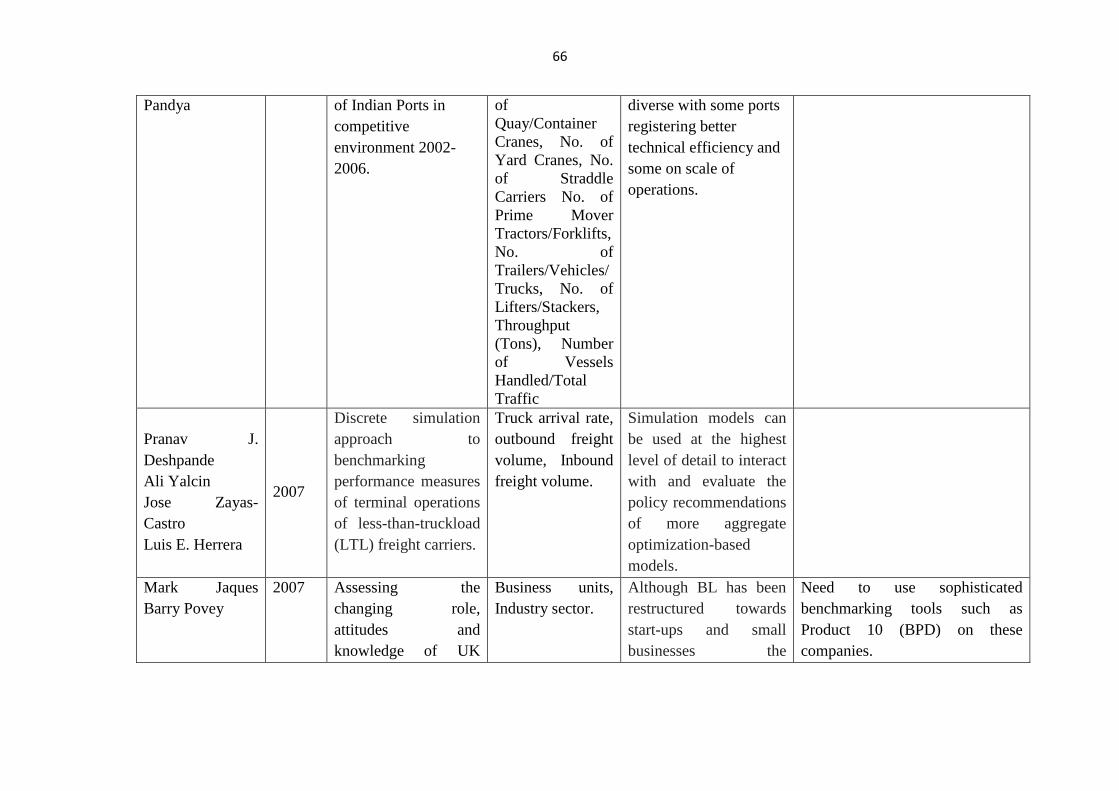
66
Pandya of Indian Ports in
competitive
environment 2002-
2006.
of
Quay/Container
Cranes, No. of
Yard Cranes, No.
of Straddle
Carriers No. of
Prime Mover
Tractors/Forklifts,
No. of
Trailers/Vehicles/
Trucks, No. of
Lifters/Stackers,
Throughput
(Tons), Number
of Vessels
Handled/Total
Traffic
diverse with some ports
registering better
technical efficiency and
some on scale of
operations.
Pranav J.
Deshpande
Ali Yalcin
Jose Zayas-
Castro
Luis E. Herrera
2007
Discrete simulation
approach to
benchmarking
performance measures
of terminal operations
of less-than-truckload
(LTL) freight carriers.
Truck arrival rate,
outbound freight
volume, Inbound
freight volume.
Simulation models can
be used at the highest
level of detail to interact
with and evaluate the
policy recommendations
of more aggregate
optimization-based
models.
Mark Jaques
Barry Povey
2007 Assessing the
changing role,
attitudes and
knowledge of UK
Business units,
Industry sector.
Although BL has been
restructured towards
start-ups and small
businesses the
Need to use sophisticated
benchmarking tools such as
Product 10 (BPD) on these
companies.
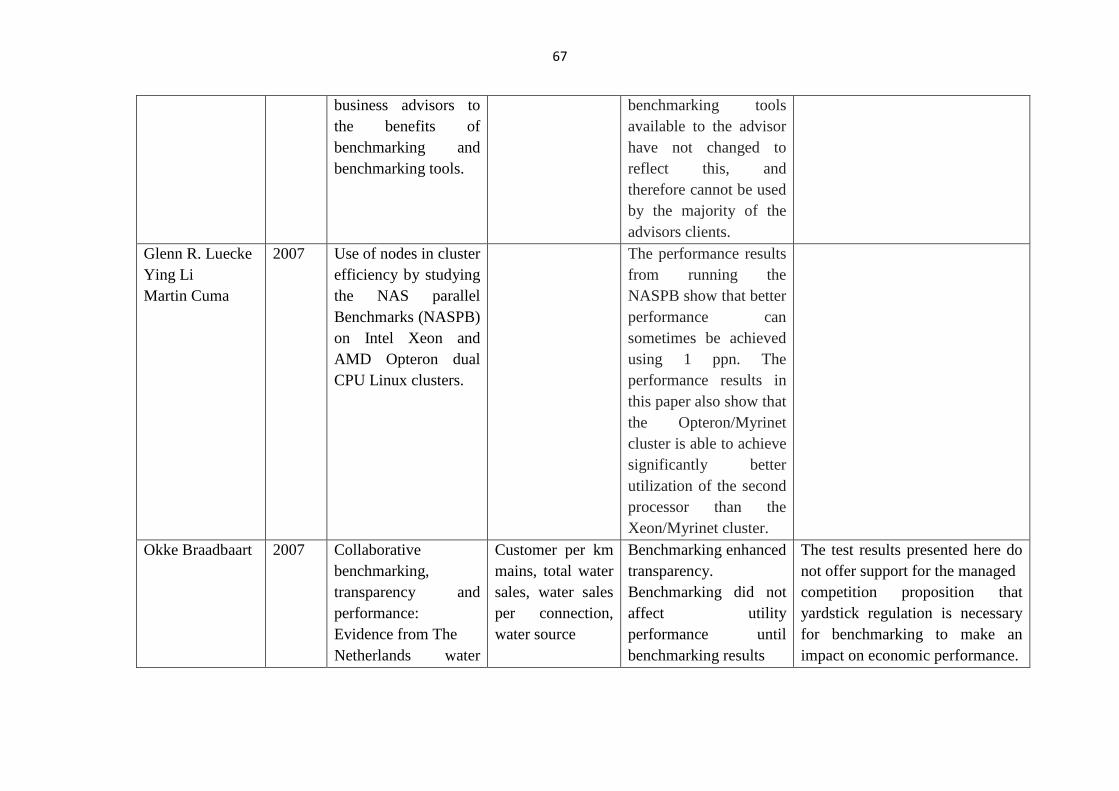
67
business advisors to
the benefits of
benchmarking and
benchmarking tools.
benchmarking tools
available to the advisor
have not changed to
reflect this, and
therefore cannot be used
by the majority of the
advisors clients.
Glenn R. Luecke
Ying Li
Martin Cuma
2007 Use of nodes in cluster
efficiency by studying
the NAS parallel
Benchmarks (NASPB)
on Intel Xeon and
AMD Opteron dual
CPU Linux clusters.
The performance results
from running the
NASPB show that better
performance can
sometimes be achieved
using 1 ppn. The
performance results in
this paper also show that
the Opteron/Myrinet
cluster is able to achieve
significantly better
utilization of the second
processor than the
Xeon/Myrinet cluster.
Okke Braadbaart 2007 Collaborative
benchmarking,
transparency and
performance:
Evidence from The
Netherlands water
Customer per km
mains, total water
sales, water sales
per connection,
water source
Benchmarking enhanced
transparency.
Benchmarking did not
affect utility
performance until
benchmarking results
The test results presented here do
not offer support for the managed
competition proposition that
yardstick regulation is necessary
for benchmarking to make an
impact on economic performance.
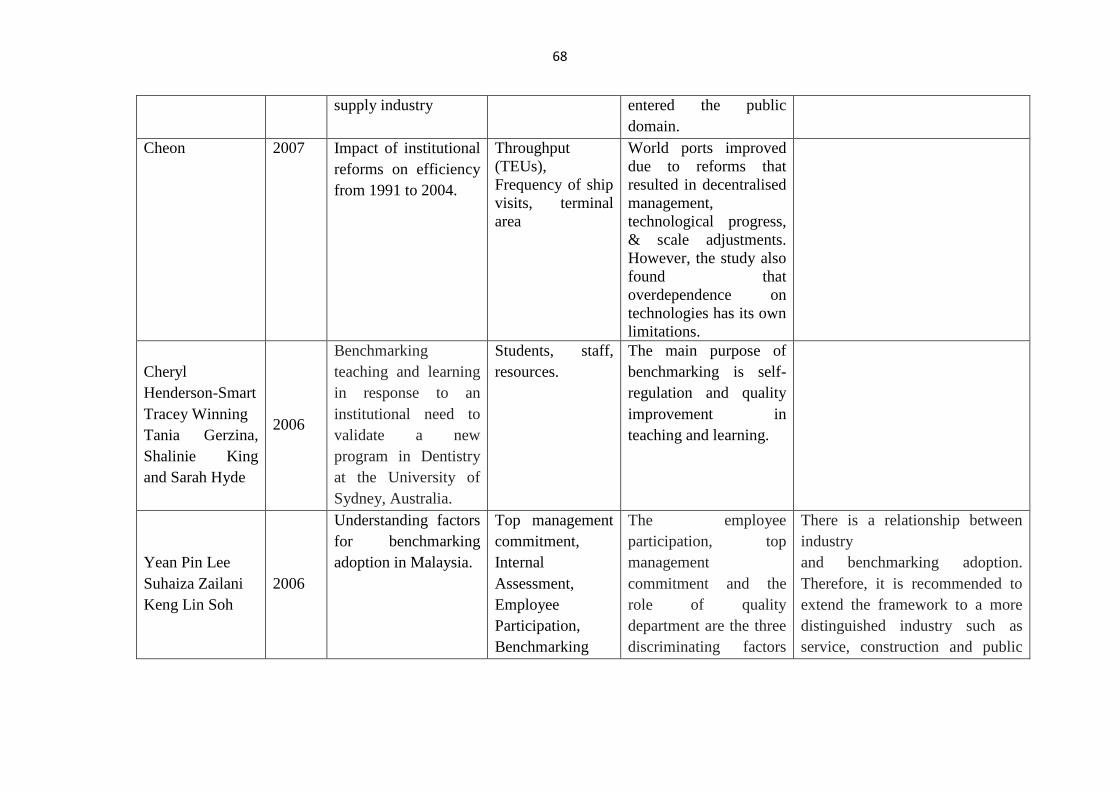
68
supply industry entered the public
domain.
Cheon 2007 Impact of institutional
reforms on efficiency
from 1991 to 2004.
Throughput
(TEUs),
Frequency of ship
visits, terminal
area
World ports improved
due to reforms that
resulted in decentralised
management,
technological progress,
& scale adjustments.
However, the study also
found that
overdependence on
technologies has its own
limitations.
Cheryl
Henderson-Smart
Tracey Winning
Tania Gerzina,
Shalinie King
and Sarah Hyde
2006
Benchmarking
teaching and learning
in response to an
institutional need to
validate a new
program in Dentistry
at the University of
Sydney, Australia.
Students, staff,
resources.
The main purpose of
benchmarking is self-
regulation and quality
improvement in
teaching and learning.
Yean Pin Lee
Suhaiza Zailani
Keng Lin Soh
2006
Understanding factors
for benchmarking
adoption in Malaysia.
Top management
commitment,
Internal
Assessment,
Employee
Participation,
Benchmarking
The employee
participation, top
management
commitment and the
role of quality
department are the three
discriminating factors
There is a relationship between
industry
and benchmarking adoption.
Therefore, it is recommended to
extend the framework to a more
distinguished industry such as
service, construction and public
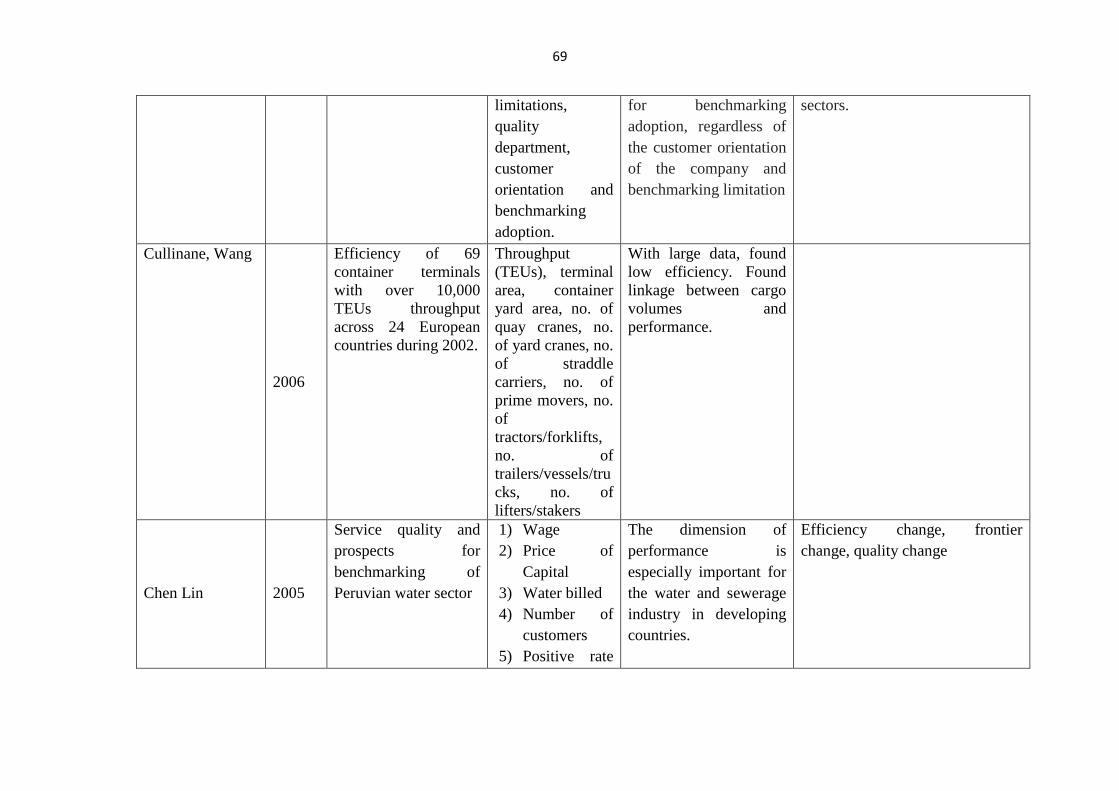
69
limitations,
quality
department,
customer
orientation and
benchmarking
adoption.
for benchmarking
adoption, regardless of
the customer orientation
of the company and
benchmarking limitation
sectors.
Cullinane, Wang
2006
Efficiency of 69
container terminals
with over 10,000
TEUs throughput
across 24 European
countries during 2002.
Throughput
(TEUs), terminal
area, container
yard area, no. of
quay cranes, no.
of yard cranes, no.
of straddle
carriers, no. of
prime movers, no.
of
tractors/forklifts,
no. of
trailers/vessels/tru
cks, no. of
lifters/stakers
With large data, found
low efficiency. Found
linkage between cargo
volumes and
performance.
Chen Lin 2005
Service quality and
prospects for
benchmarking of
Peruvian water sector
1) Wage
2) Price of
Capital
3) Water billed
4) Number of
customers
5) Positive rate
The dimension of
performance is
especially important for
the water and sewerage
industry in developing
countries.
Efficiency change, frontier
change, quality change
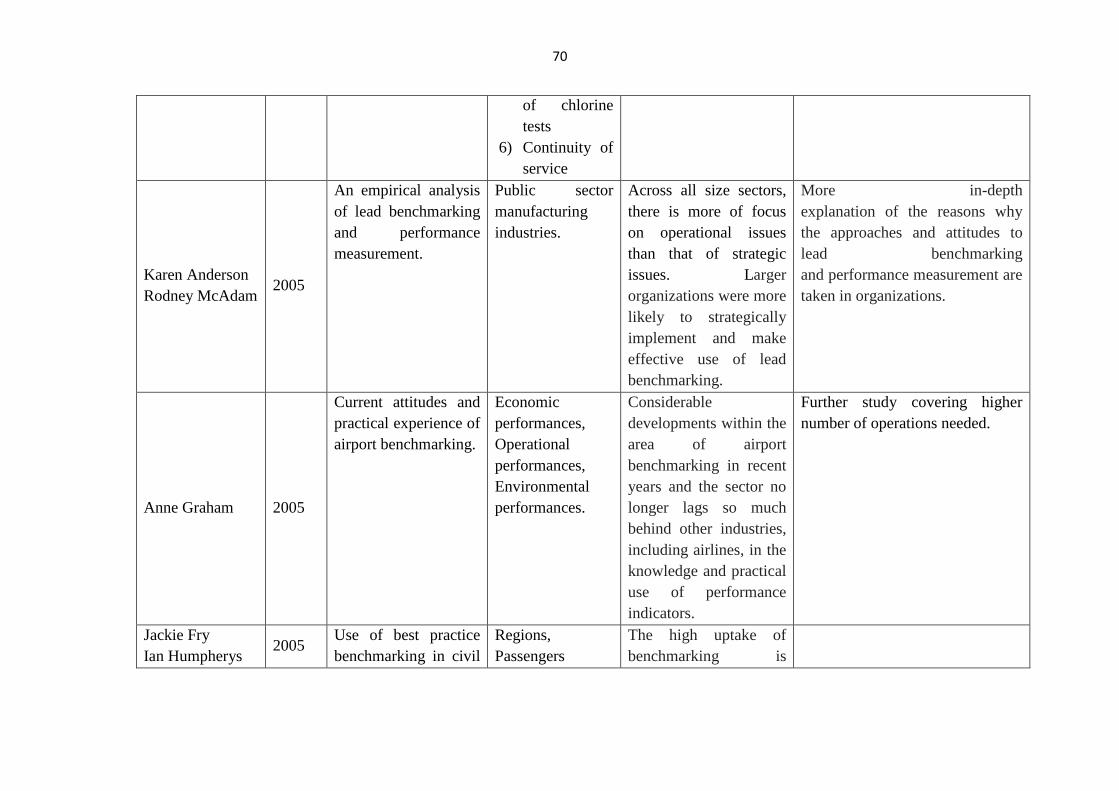
70
of chlorine
tests
6) Continuity of
service
Karen Anderson
Rodney McAdam 2005
An empirical analysis
of lead benchmarking
and performance
measurement.
Public sector
manufacturing
industries.
Across all size sectors,
there is more of focus
on operational issues
than that of strategic
issues. Larger
organizations were more
likely to strategically
implement and make
effective use of lead
benchmarking.
More in-depth
explanation of the reasons why
the approaches and attitudes to
lead benchmarking
and performance measurement are
taken in organizations.
Anne Graham 2005
Current attitudes and
practical experience of
airport benchmarking.
Economic
performances,
Operational
performances,
Environmental
performances.
Considerable
developments within the
area of airport
benchmarking in recent
years and the sector no
longer lags so much
behind other industries,
including airlines, in the
knowledge and practical
use of performance
indicators.
Further study covering higher
number of operations needed.
Jackie Fry
Ian Humpherys 2005
Use of best practice
benchmarking in civil
Regions,
Passengers
The high uptake of
benchmarking is
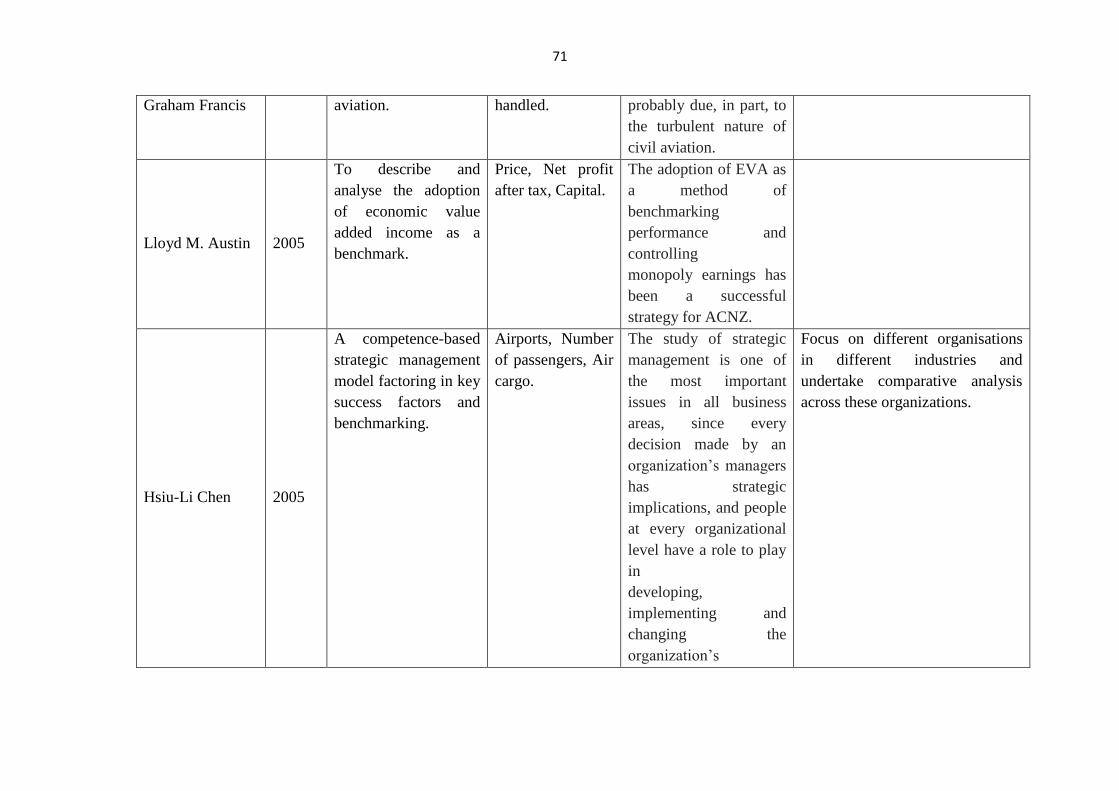
71
Graham Francis aviation. handled. probably due, in part, to
the turbulent nature of
civil aviation.
Lloyd M. Austin 2005
To describe and
analyse the adoption
of economic value
added income as a
benchmark.
Price, Net profit
after tax, Capital.
The adoption of EVA as
a method of
benchmarking
performance and
controlling
monopoly earnings has
been a successful
strategy for ACNZ.
Hsiu-Li Chen 2005
A competence-based
strategic management
model factoring in key
success factors and
benchmarking.
Airports, Number
of passengers, Air
cargo.
The study of strategic
management is one of
the most important
issues in all business
areas, since every
decision made by an
organization’s managers
has strategic
implications, and people
at every organizational
level have a role to play
in
developing,
implementing and
changing the
organization’s
Focus on different organisations
in different industries and
undertake comparative analysis
across these organizations.
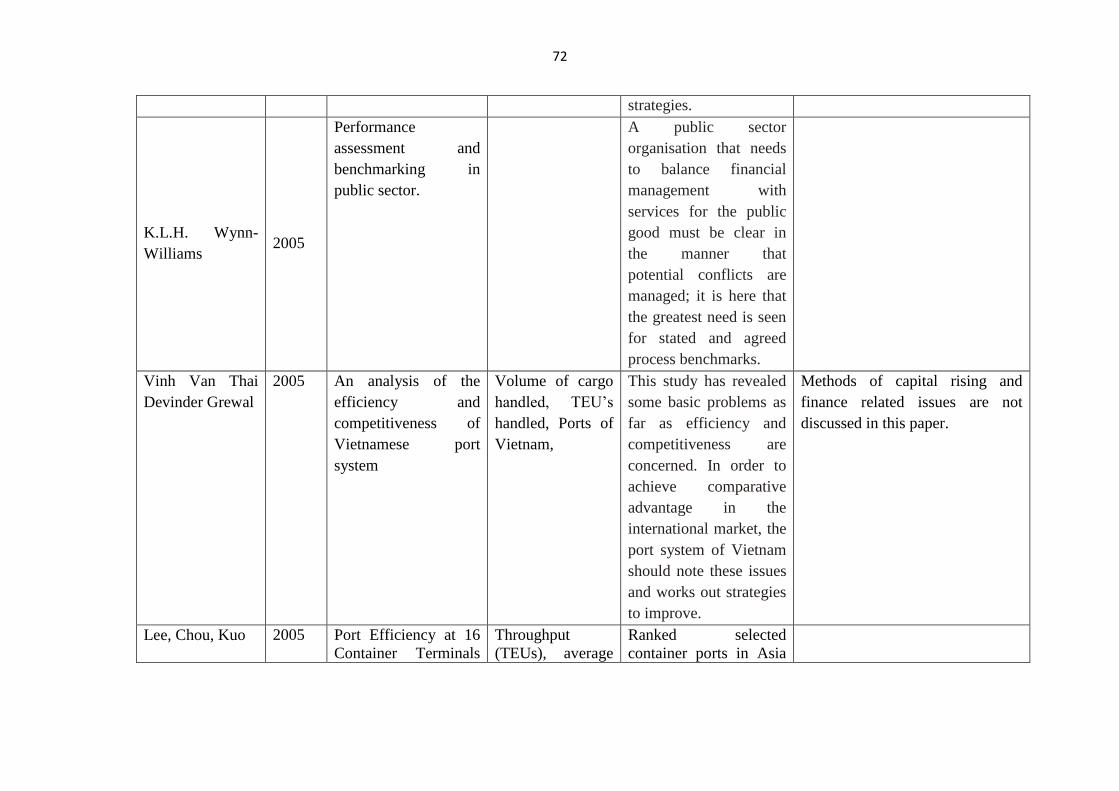
72
strategies.
K.L.H. Wynn-
Williams 2005
Performance
assessment and
benchmarking in
public sector.
A public sector
organisation that needs
to balance financial
management with
services for the public
good must be clear in
the manner that
potential conflicts are
managed; it is here that
the greatest need is seen
for stated and agreed
process benchmarks.
Vinh Van Thai
Devinder Grewal
2005 An analysis of the
efficiency and
competitiveness of
Vietnamese port
system
Volume of cargo
handled, TEU’s
handled, Ports of
Vietnam,
This study has revealed
some basic problems as
far as efficiency and
competitiveness are
concerned. In order to
achieve comparative
advantage in the
international market, the
port system of Vietnam
should note these issues
and works out strategies
to improve.
Methods of capital rising and
finance related issues are not
discussed in this paper.
Lee, Chou, Kuo 2005 Port Efficiency at 16
Container Terminals
Throughput
(TEUs), average
Ranked selected
container ports in Asia
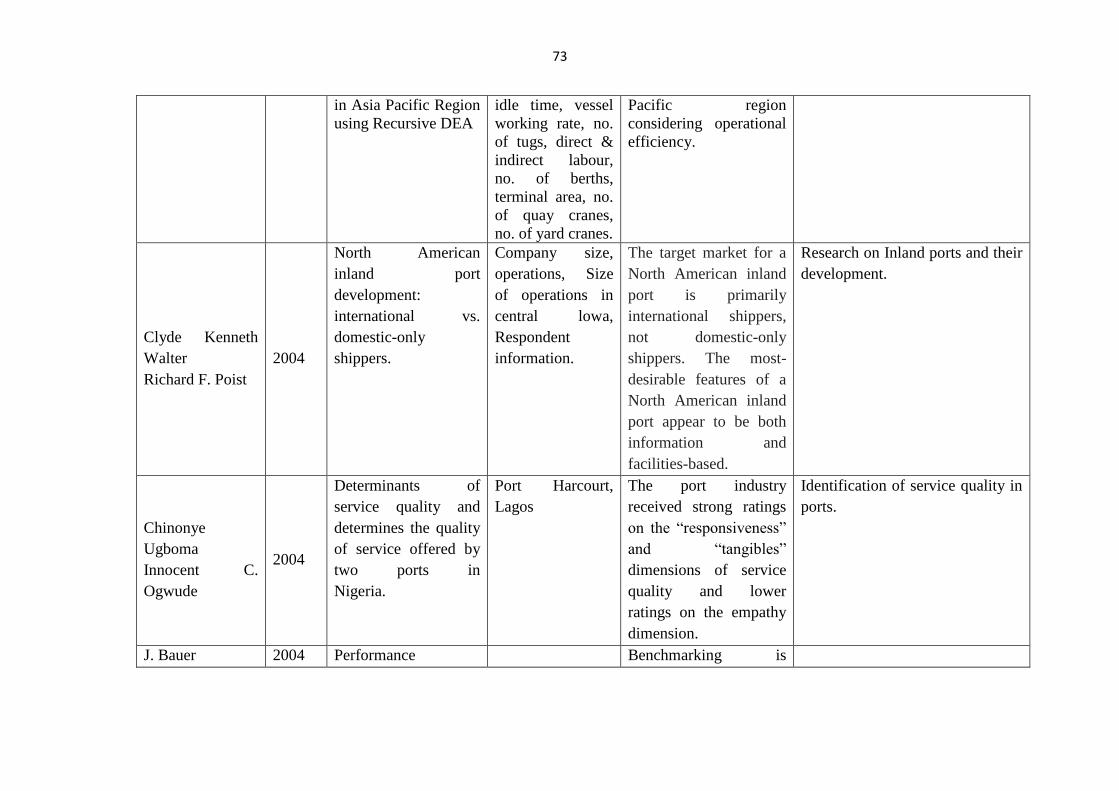
73
in Asia Pacific Region
using Recursive DEA
idle time, vessel
working rate, no.
of tugs, direct &
indirect labour,
no. of berths,
terminal area, no.
of quay cranes,
no. of yard cranes.
Pacific region
considering operational
efficiency.
Clyde Kenneth
Walter
Richard F. Poist
2004
North American
inland port
development:
international vs.
domestic-only
shippers.
Company size,
operations, Size
of operations in
central lowa,
Respondent
information.
The target market for a
North American inland
port is primarily
international shippers,
not domestic-only
shippers. The most-
desirable features of a
North American inland
port appear to be both
information and
facilities-based.
Research on Inland ports and their
development.
Chinonye
Ugboma
Innocent C.
Ogwude
2004
Determinants of
service quality and
determines the quality
of service offered by
two ports in
Nigeria.
Port Harcourt,
Lagos
The port industry
received strong ratings
on the “responsiveness”
and “tangibles”
dimensions of service
quality and lower
ratings on the empathy
dimension.
Identification of service quality in
ports.
J. Bauer 2004 Performance Benchmarking is
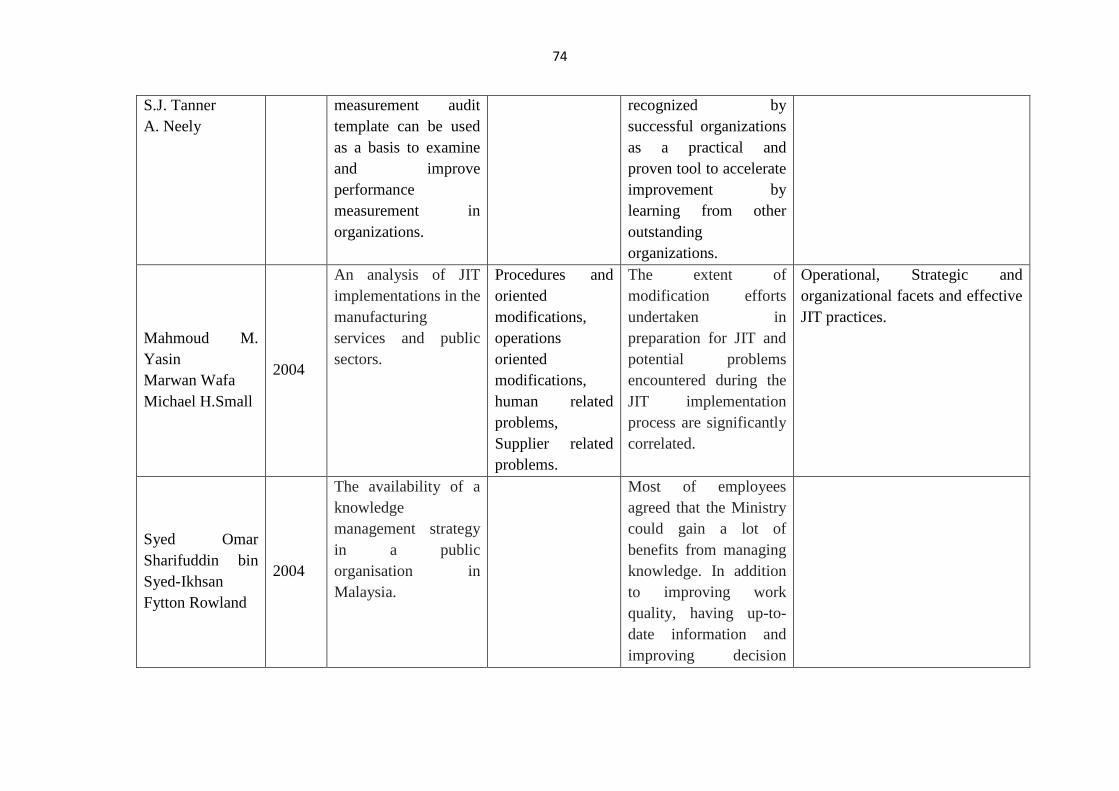
74
S.J. Tanner
A. Neely
measurement audit
template can be used
as a basis to examine
and improve
performance
measurement in
organizations.
recognized by
successful organizations
as a practical and
proven tool to accelerate
improvement by
learning from other
outstanding
organizations.
Mahmoud M.
Yasin
Marwan Wafa
Michael H.Small
2004
An analysis of JIT
implementations in the
manufacturing
services and public
sectors.
Procedures and
oriented
modifications,
operations
oriented
modifications,
human related
problems,
Supplier related
problems.
The extent of
modification efforts
undertaken in
preparation for JIT and
potential problems
encountered during the
JIT implementation
process are significantly
correlated.
Operational, Strategic and
organizational facets and effective
JIT practices.
Syed Omar
Sharifuddin bin
Syed-Ikhsan
Fytton Rowland
2004
The availability of a
knowledge
management strategy
in a public
organisation in
Malaysia.
Most of employees
agreed that the Ministry
could gain a lot of
benefits from managing
knowledge. In addition
to improving work
quality, having up-to-
date information and
improving decision
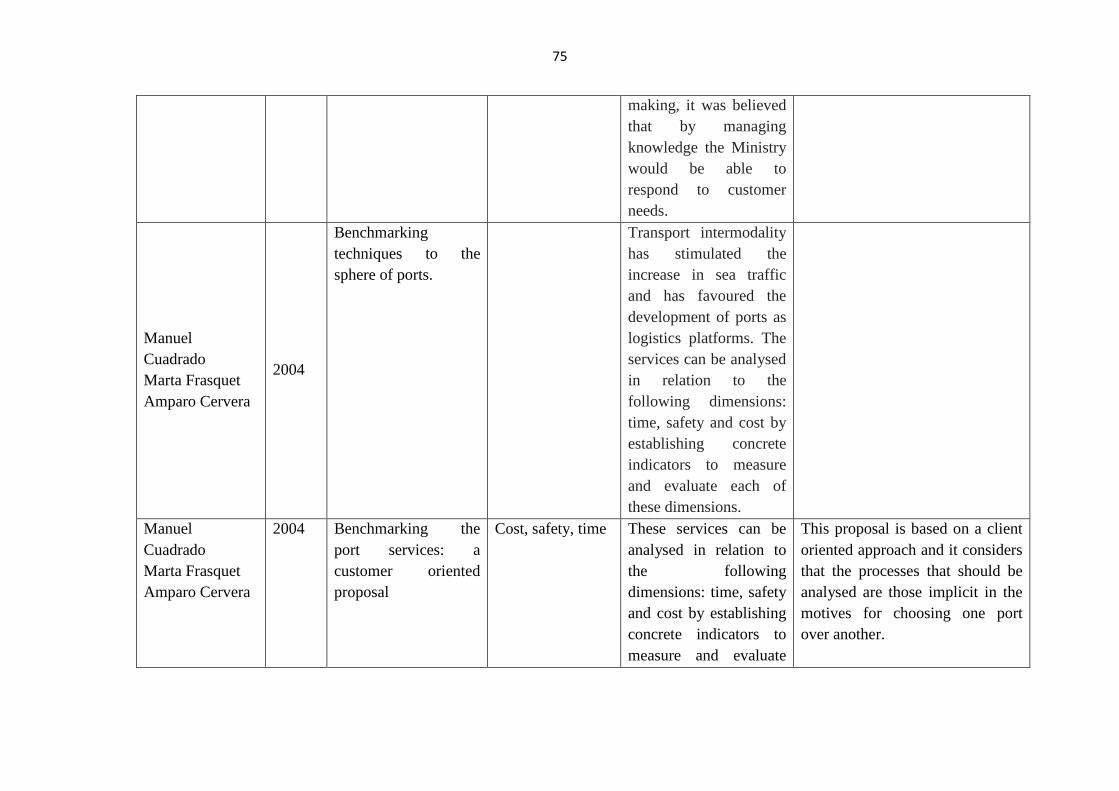
75
making, it was believed
that by managing
knowledge the Ministry
would be able to
respond to customer
needs.
Manuel
Cuadrado
Marta Frasquet
Amparo Cervera
2004
Benchmarking
techniques to the
sphere of ports.
Transport intermodality
has stimulated the
increase in sea traffic
and has favoured the
development of ports as
logistics platforms. The
services can be analysed
in relation to the
following dimensions:
time, safety and cost by
establishing concrete
indicators to measure
and evaluate each of
these dimensions.
Manuel
Cuadrado
Marta Frasquet
Amparo Cervera
2004 Benchmarking the
port services: a
customer oriented
proposal
Cost, safety, time These services can be
analysed in relation to
the following
dimensions: time, safety
and cost by establishing
concrete indicators to
measure and evaluate
This proposal is based on a client
oriented approach and it considers
that the processes that should be
analysed are those implicit in the
motives for choosing one port
over another.
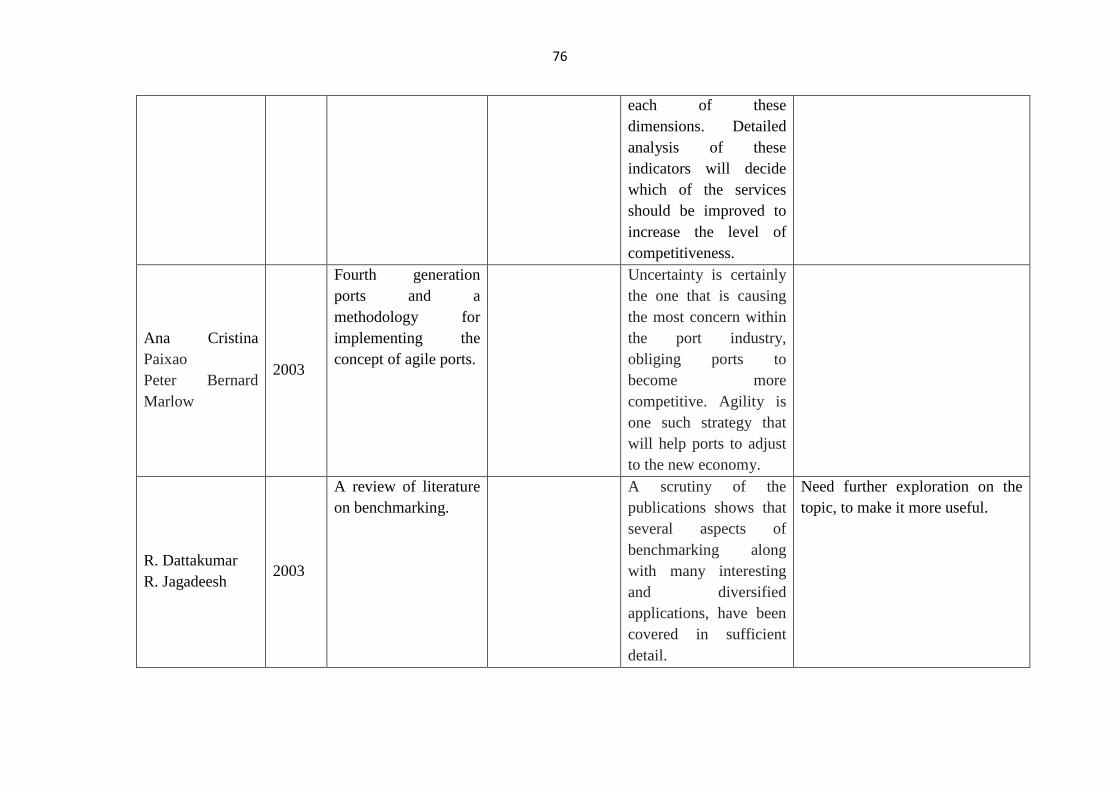
76
each of these
dimensions. Detailed
analysis of these
indicators will decide
which of the services
should be improved to
increase the level of
competitiveness.
Ana Cristina
Paixao
Peter Bernard
Marlow
2003
Fourth generation
ports and a
methodology for
implementing the
concept of agile ports.
Uncertainty is certainly
the one that is causing
the most concern within
the port industry,
obliging ports to
become more
competitive. Agility is
one such strategy that
will help ports to adjust
to the new economy.
R. Dattakumar
R. Jagadeesh 2003
A review of literature
on benchmarking.
A scrutiny of the
publications shows that
several aspects of
benchmarking along
with many interesting
and diversified
applications, have been
covered in sufficient
detail.
Need further exploration on the
topic, to make it more useful.

77
Paula Kyro 2003
Revising the concept
and classification for
both theoretical and
practical purposes of
benchmarking.
Performances,
Technology,
Process,
Competence and
strategy.
Benchmarking requires
some conceptual
rethinking. It was
argued that the need for
re-conceptualizing is
due both to the
appearance of three new
forms of benchmarking,
and new fields of
benchmarking.
Hesham Magd
Adrienne Curry 2003
In order for
benchmarking to be
successful in public
sector organisations, it
is important to have a
full commitment to
continuous
improvement.
It is vital for public-
sector organisations to
develop a desire to
change processes as
well as outputs and an
organisational
willingness to search for
ideas outside the
organisation in order to
achieve successful
benchmarking.
Louise boulter 2003
Legal issues in
Benchmarking.
The practice of
benchmarking creates a
new area of interest for
the law. Organisations
conducting
benchmarking studies
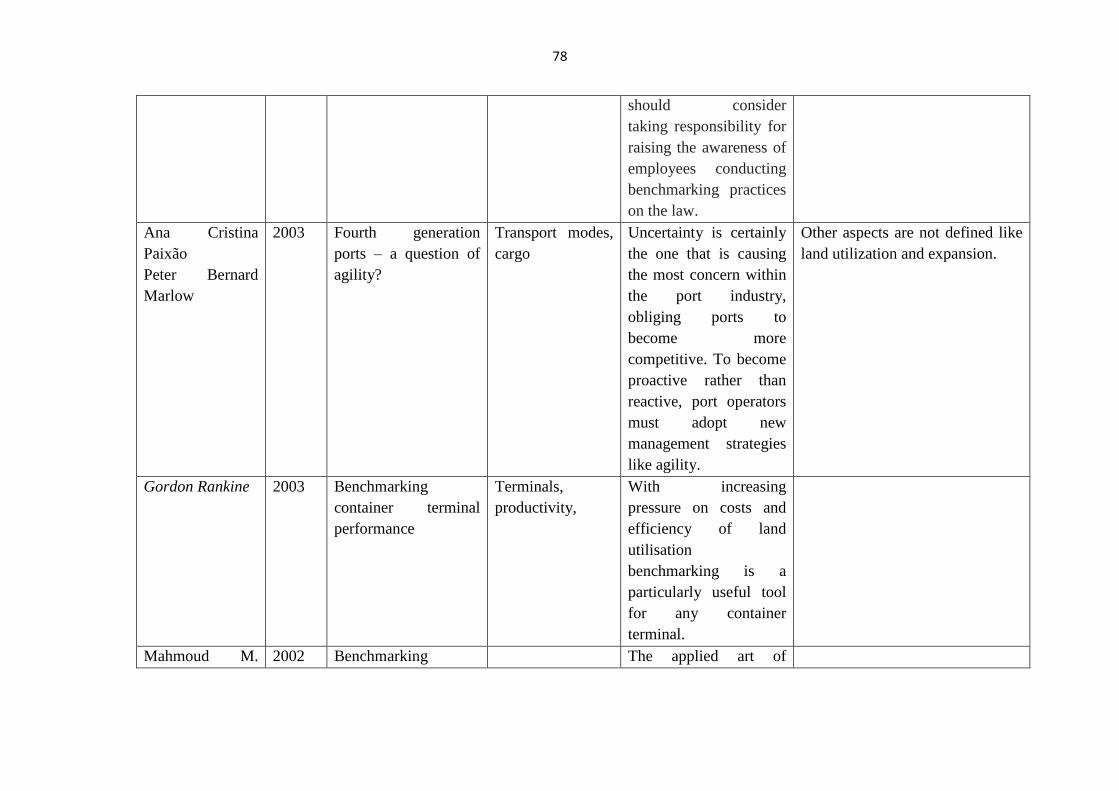
78
should consider
taking responsibility for
raising the awareness of
employees conducting
benchmarking practices
on the law.
Ana Cristina
Paixão
Peter Bernard
Marlow
2003 Fourth generation
ports – a question of
agility?
Transport modes,
cargo
Uncertainty is certainly
the one that is causing
the most concern within
the port industry,
obliging ports to
become more
competitive. To become
proactive rather than
reactive, port operators
must adopt new
management strategies
like agility.
Other aspects are not defined like
land utilization and expansion.
Gordon Rankine 2003 Benchmarking
container terminal
performance
Terminals,
productivity,
With increasing
pressure on costs and
efficiency of land
utilisation
benchmarking is a
particularly useful tool
for any container
terminal.
Mahmoud M. 2002 Benchmarking The applied art of
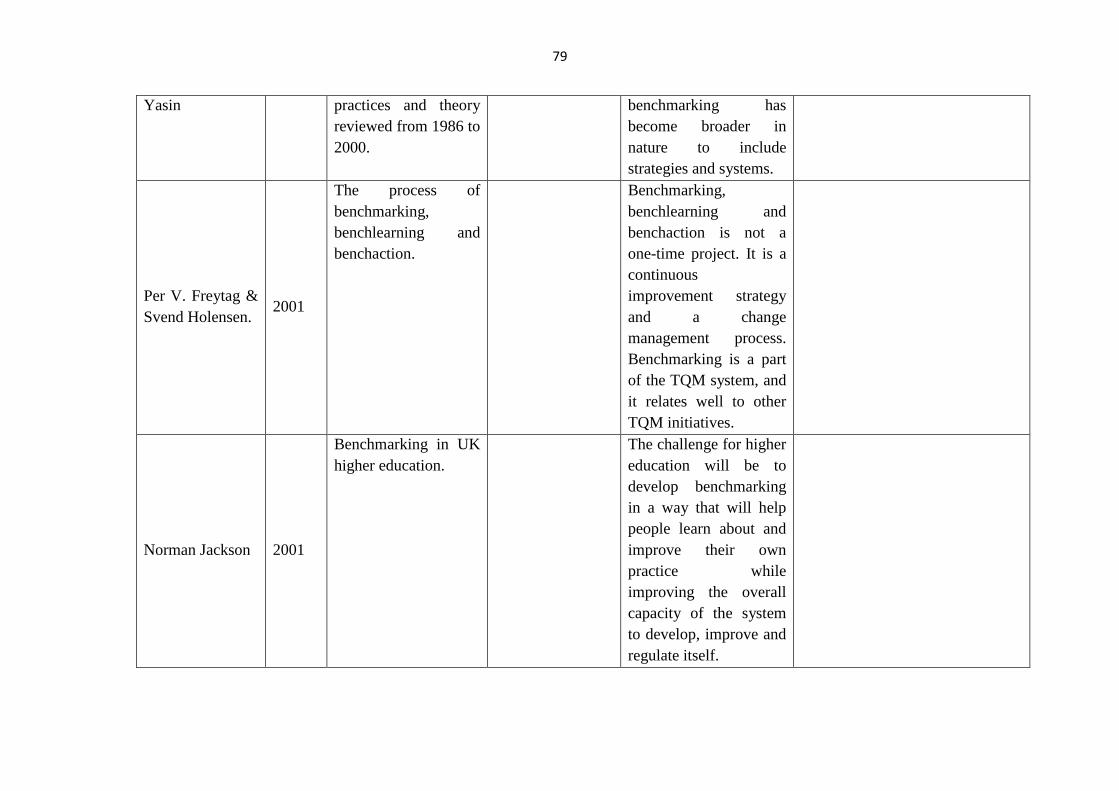
79
Yasin practices and theory
reviewed from 1986 to
2000.
benchmarking has
become broader in
nature to include
strategies and systems.
Per V. Freytag &
Svend Holensen. 2001
The process of
benchmarking,
benchlearning and
benchaction.
Benchmarking,
benchlearning and
benchaction is not a
one-time project. It is a
continuous
improvement strategy
and a change
management process.
Benchmarking is a part
of the TQM system, and
it relates well to other
TQM initiatives.
Norman Jackson 2001
Benchmarking in UK
higher education.
The challenge for higher
education will be to
develop benchmarking
in a way that will help
people learn about and
improve their own
practice while
improving the overall
capacity of the system
to develop, improve and
regulate itself.
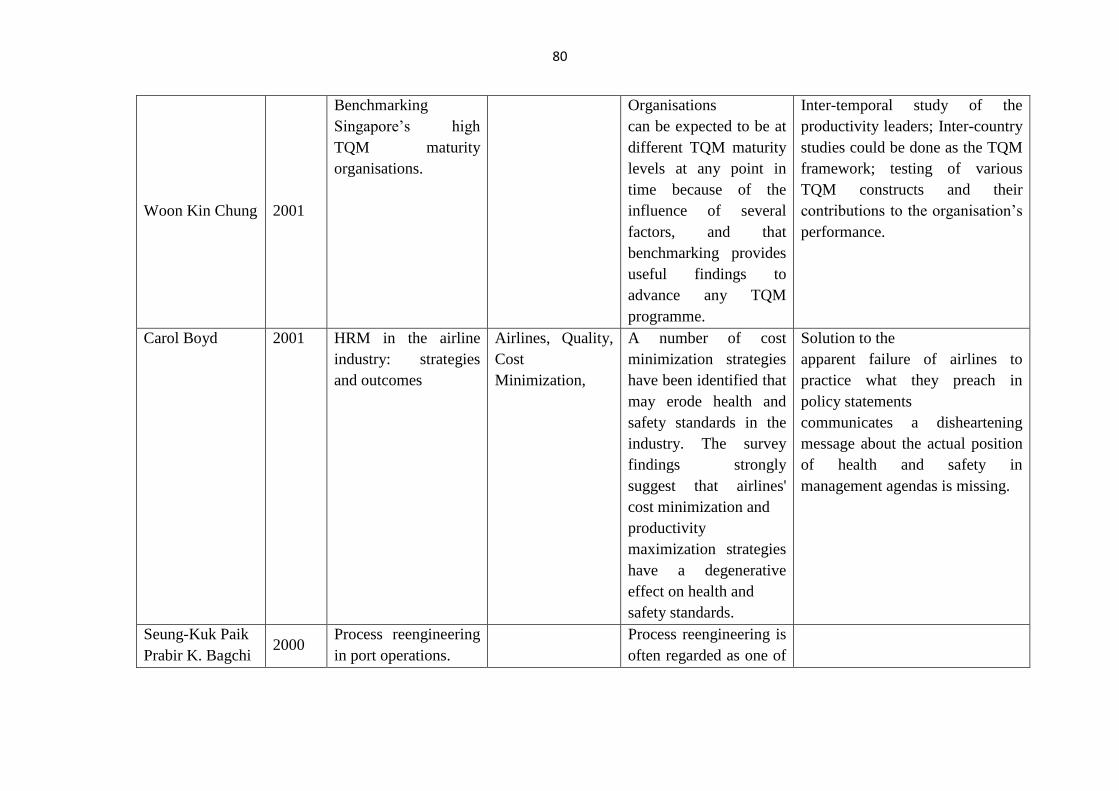
80
Woon Kin Chung 2001
Benchmarking
Singapore’s high
TQM maturity
organisations.
Organisations
can be expected to be at
different TQM maturity
levels at any point in
time because of the
influence of several
factors, and that
benchmarking provides
useful findings to
advance any TQM
programme.
Inter-temporal study of the
productivity leaders; Inter-country
studies could be done as the TQM
framework; testing of various
TQM constructs and their
contributions to the organisation’s
performance.
Carol Boyd 2001 HRM in the airline
industry: strategies
and outcomes
Airlines, Quality,
Cost
Minimization,
A number of cost
minimization strategies
have been identified that
may erode health and
safety standards in the
industry. The survey
findings strongly
suggest that airlines'
cost minimization and
productivity
maximization strategies
have a degenerative
effect on health and
safety standards.
Solution to the
apparent failure of airlines to
practice what they preach in
policy statements
communicates a disheartening
message about the actual position
of health and safety in
management agendas is missing.
Seung-Kuk Paik
Prabir K. Bagchi 2000
Process reengineering
in port operations.
Process reengineering is
often regarded as one of
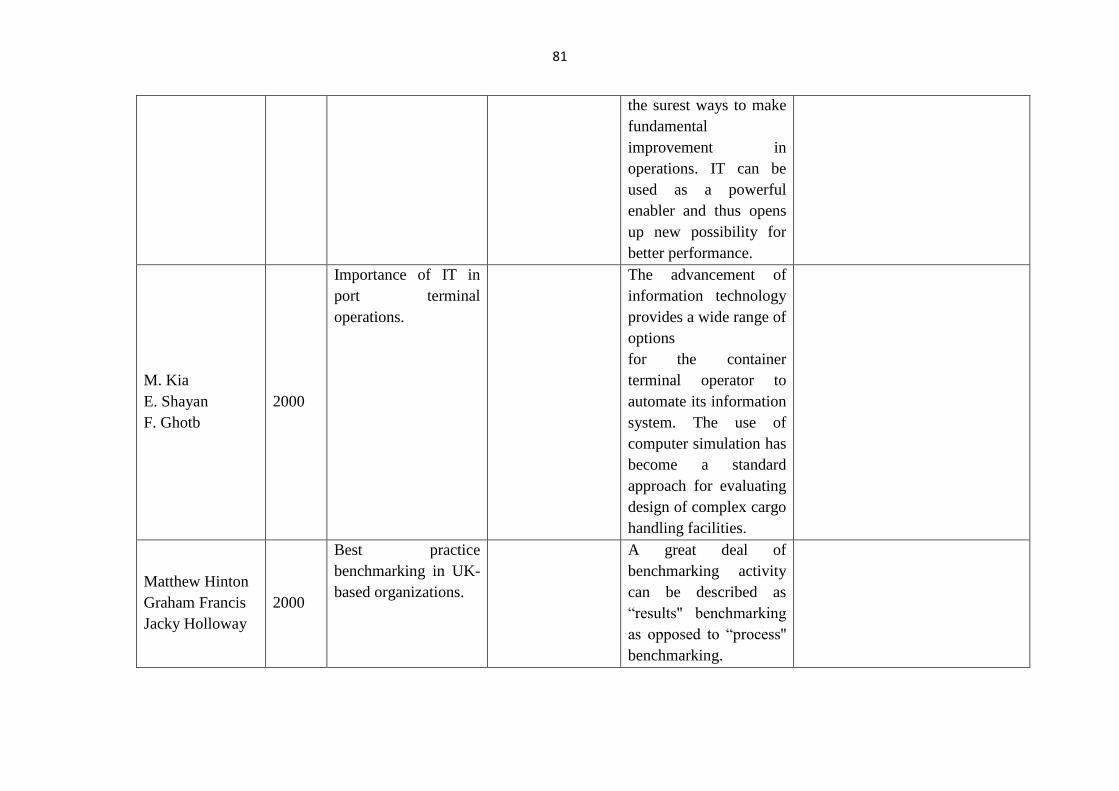
81
the surest ways to make
fundamental
improvement in
operations. IT can be
used as a powerful
enabler and thus opens
up new possibility for
better performance.
M. Kia
E. Shayan
F. Ghotb
2000
Importance of IT in
port terminal
operations.
The advancement of
information technology
provides a wide range of
options
for the container
terminal operator to
automate its information
system. The use of
computer simulation has
become a standard
approach for evaluating
design of complex cargo
handling facilities.
Matthew Hinton
Graham Francis
Jacky Holloway
2000
Best practice
benchmarking in UK-
based organizations.
A great deal of
benchmarking activity
can be described as
“results'' benchmarking
as opposed to “process''
benchmarking.
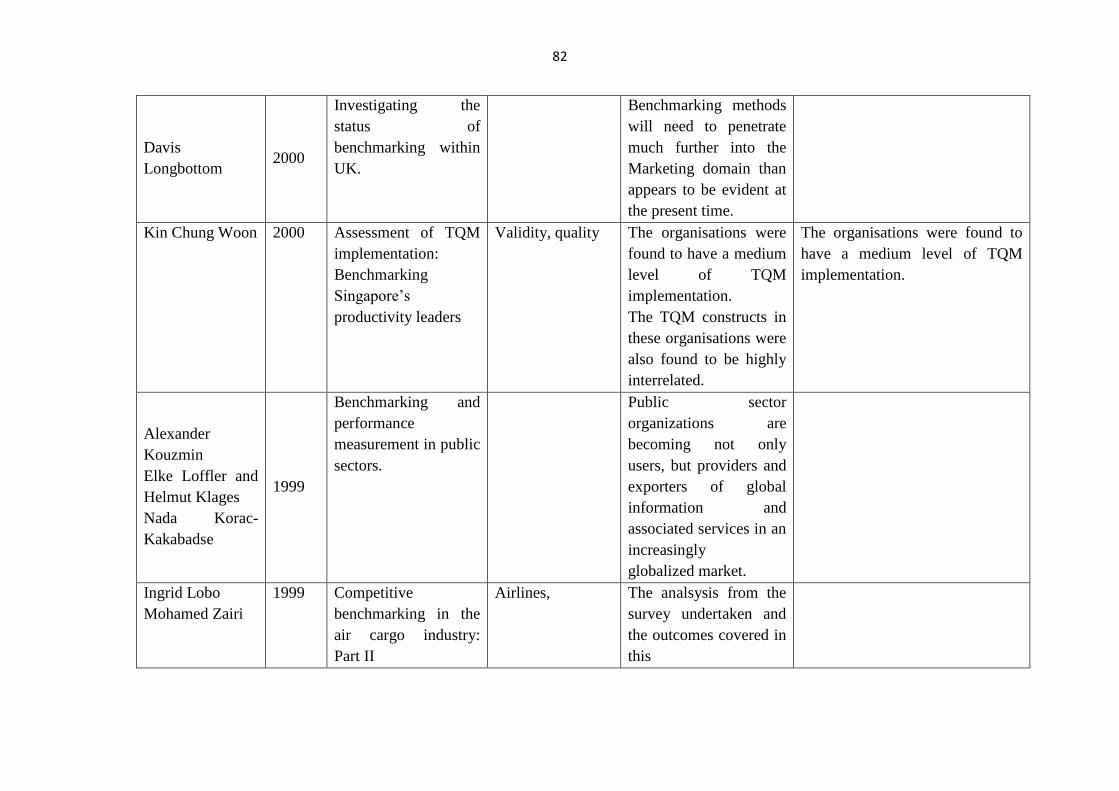
82
Davis
Longbottom 2000
Investigating the
status of
benchmarking within
UK.
Benchmarking methods
will need to penetrate
much further into the
Marketing domain than
appears to be evident at
the present time.
Kin Chung Woon 2000 Assessment of TQM
implementation:
Benchmarking
Singapore’s
productivity leaders
Validity, quality The organisations were
found to have a medium
level of TQM
implementation.
The TQM constructs in
these organisations were
also found to be highly
interrelated.
The organisations were found to
have a medium level of TQM
implementation.
Alexander
Kouzmin
Elke Loffler and
Helmut Klages
Nada Korac-
Kakabadse
1999
Benchmarking and
performance
measurement in public
sectors.
Public sector
organizations are
becoming not only
users, but providers and
exporters of global
information and
associated services in an
increasingly
globalized market.
Ingrid Lobo
Mohamed Zairi
1999 Competitive
benchmarking in the
air cargo industry:
Part II
Airlines, The analsysis from the
survey undertaken and
the outcomes covered in
this
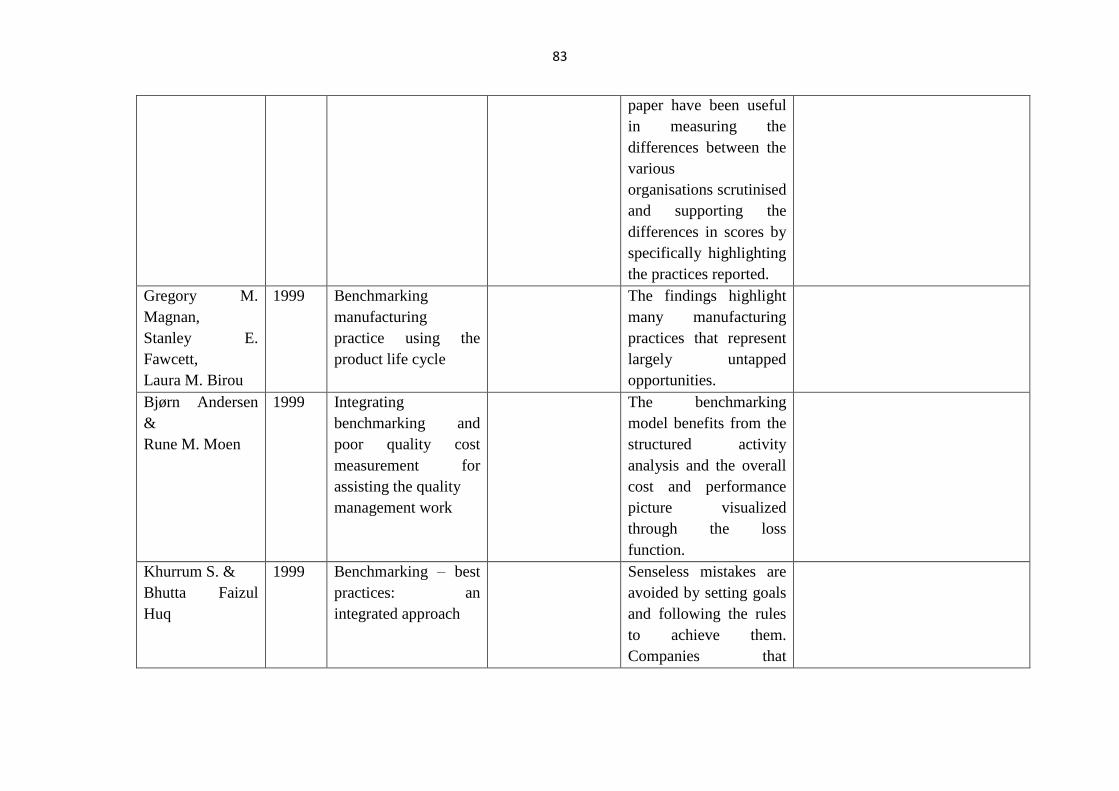
83
paper have been useful
in measuring the
differences between the
various
organisations scrutinised
and supporting the
differences in scores by
specifically highlighting
the practices reported.
Gregory M.
Magnan,
Stanley E.
Fawcett,
Laura M. Birou
1999 Benchmarking
manufacturing
practice using the
product life cycle
The findings highlight
many manufacturing
practices that represent
largely untapped
opportunities.
Bjørn Andersen
&
Rune M. Moen
1999 Integrating
benchmarking and
poor quality cost
measurement for
assisting the quality
management work
The benchmarking
model benefits from the
structured activity
analysis and the overall
cost and performance
picture visualized
through the loss
function.
Khurrum S. &
Bhutta Faizul
Huq
1999 Benchmarking – best
practices: an
integrated approach
Senseless mistakes are
avoided by setting goals
and following the rules
to achieve them.
Companies that
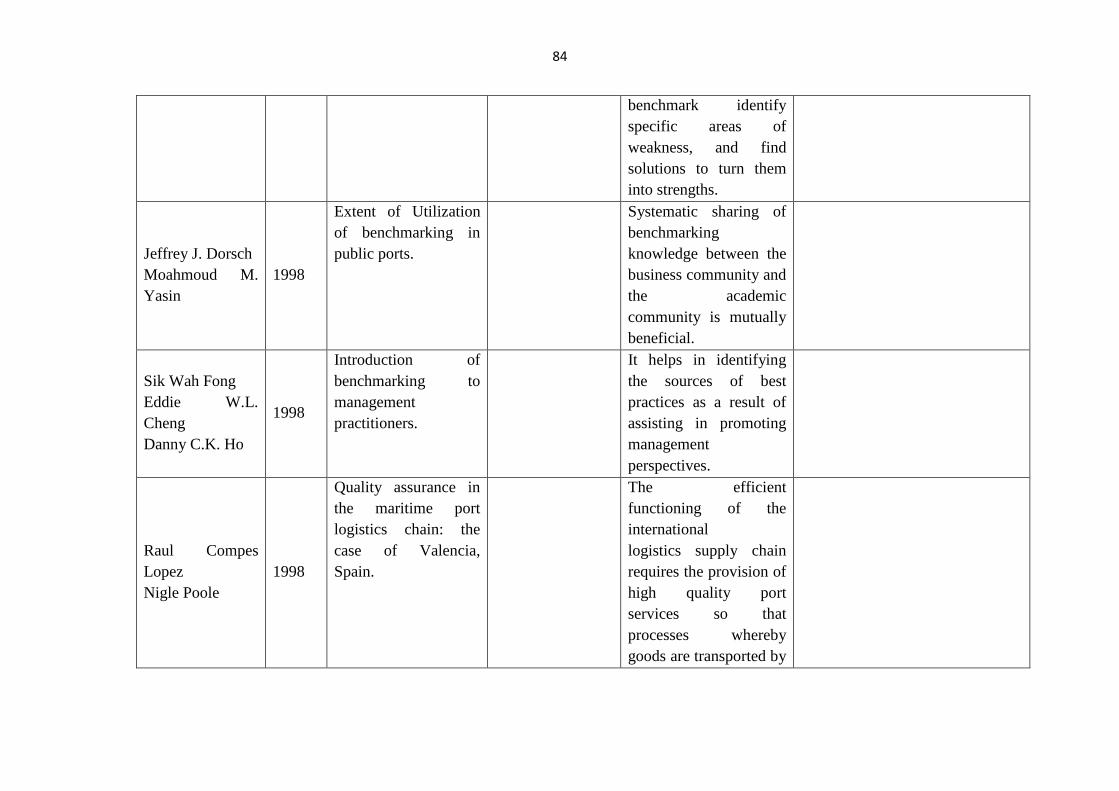
84
benchmark identify
specific areas of
weakness, and find
solutions to turn them
into strengths.
Jeffrey J. Dorsch
Moahmoud M.
Yasin
1998
Extent of Utilization
of benchmarking in
public ports.
Systematic sharing of
benchmarking
knowledge between the
business community and
the academic
community is mutually
beneficial.
Sik Wah Fong
Eddie W.L.
Cheng
Danny C.K. Ho
1998
Introduction of
benchmarking to
management
practitioners.
It helps in identifying
the sources of best
practices as a result of
assisting in promoting
management
perspectives.
Raul Compes
Lopez
Nigle Poole
1998
Quality assurance in
the maritime port
logistics chain: the
case of Valencia,
Spain.
The efficient
functioning of the
international
logistics supply chain
requires the provision of
high quality port
services so that
processes whereby
goods are transported by
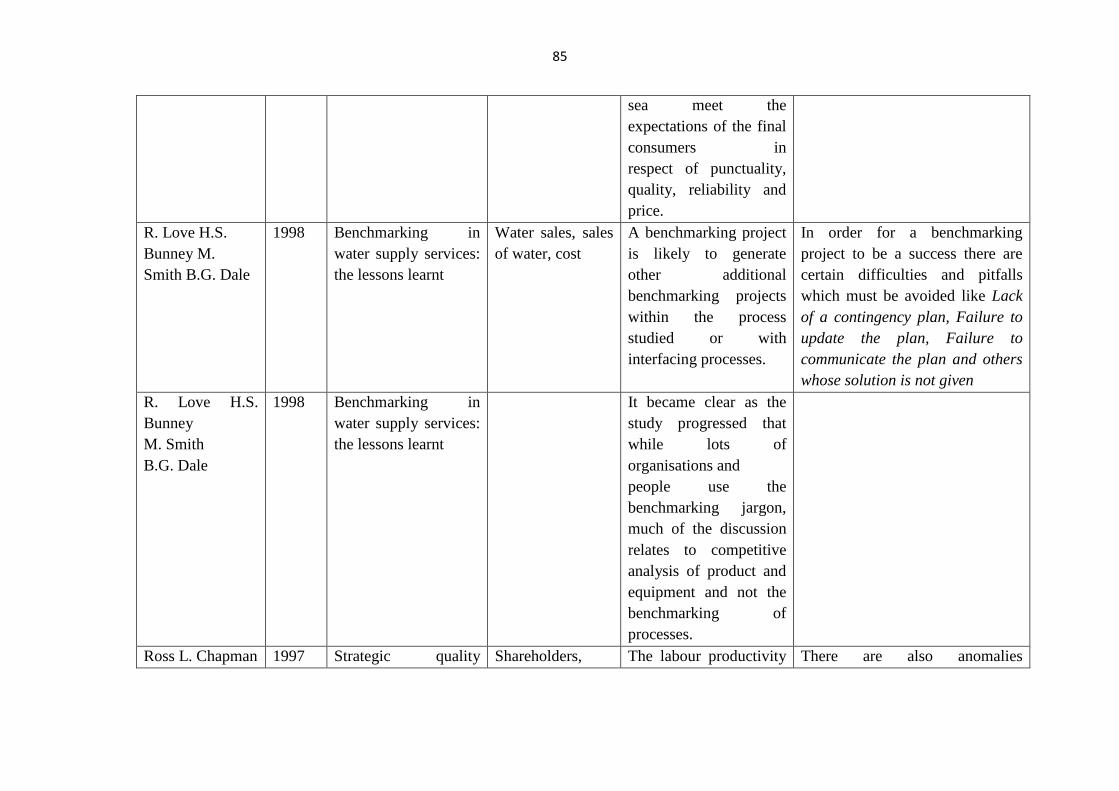
85
sea meet the
expectations of the final
consumers in
respect of punctuality,
quality, reliability and
price.
R. Love H.S.
Bunney M.
Smith B.G. Dale
1998 Benchmarking in
water supply services:
the lessons learnt
Water sales, sales
of water, cost
A benchmarking project
is likely to generate
other additional
benchmarking projects
within the process
studied or with
interfacing processes.
In order for a benchmarking
project to be a success there are
certain difficulties and pitfalls
which must be avoided like Lack
of a contingency plan, Failure to
update the plan, Failure to
communicate the plan and others
whose solution is not given
R. Love H.S.
Bunney
M. Smith
B.G. Dale
1998 Benchmarking in
water supply services:
the lessons learnt
It became clear as the
study progressed that
while lots of
organisations and
people use the
benchmarking jargon,
much of the discussion
relates to competitive
analysis of product and
equipment and not the
benchmarking of
processes.
Ross L. Chapman 1997 Strategic quality Shareholders, The labour productivity There are also anomalies
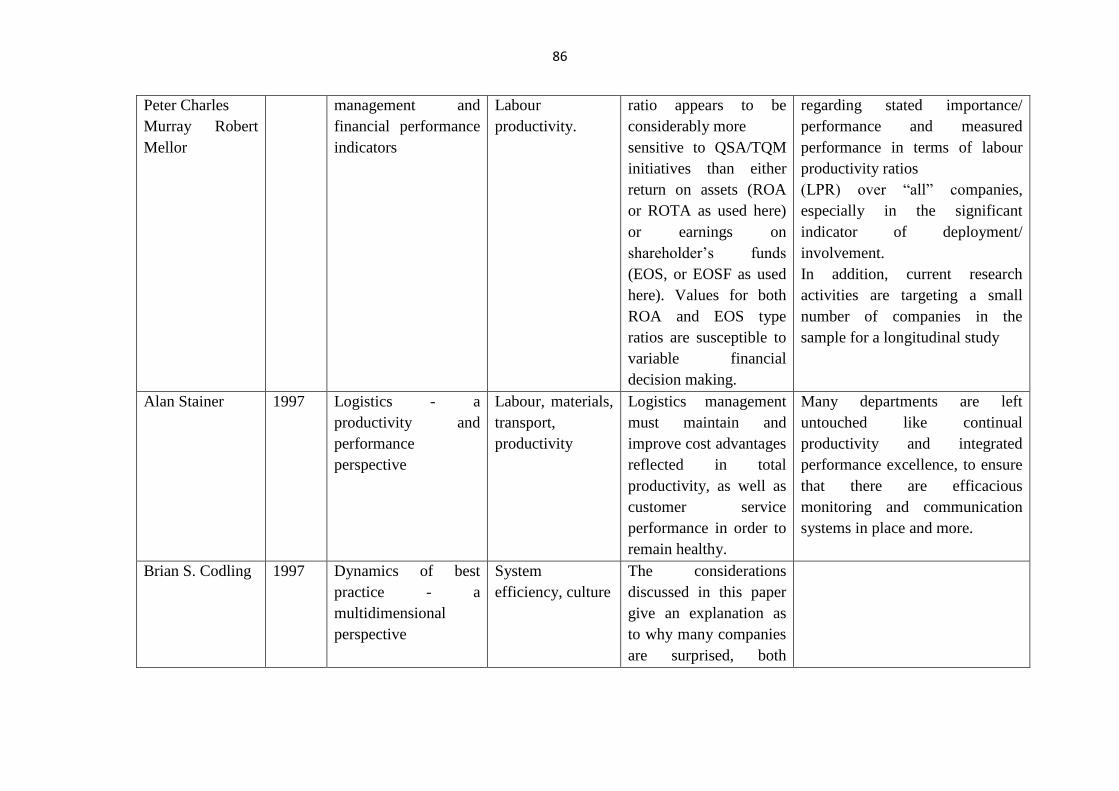
86
Peter Charles
Murray Robert
Mellor
management and
financial performance
indicators
Labour
productivity.
ratio appears to be
considerably more
sensitive to QSA/TQM
initiatives than either
return on assets (ROA
or ROTA as used here)
or earnings on
shareholder’s funds
(EOS, or EOSF as used
here). Values for both
ROA and EOS type
ratios are susceptible to
variable financial
decision making.
regarding stated importance/
performance and measured
performance in terms of labour
productivity ratios
(LPR) over “all” companies,
especially in the significant
indicator of deployment/
involvement.
In addition, current research
activities are targeting a small
number of companies in the
sample for a longitudinal study
Alan Stainer 1997 Logistics - a
productivity and
performance
perspective
Labour, materials,
transport,
productivity
Logistics management
must maintain and
improve cost advantages
reflected in total
productivity, as well as
customer service
performance in order to
remain healthy.
Many departments are left
untouched like continual
productivity and integrated
performance excellence, to ensure
that there are efficacious
monitoring and communication
systems in place and more.
Brian S. Codling 1997 Dynamics of best
practice - a
multidimensional
perspective
System
efficiency, culture
The considerations
discussed in this paper
give an explanation as
to why many companies
are surprised, both
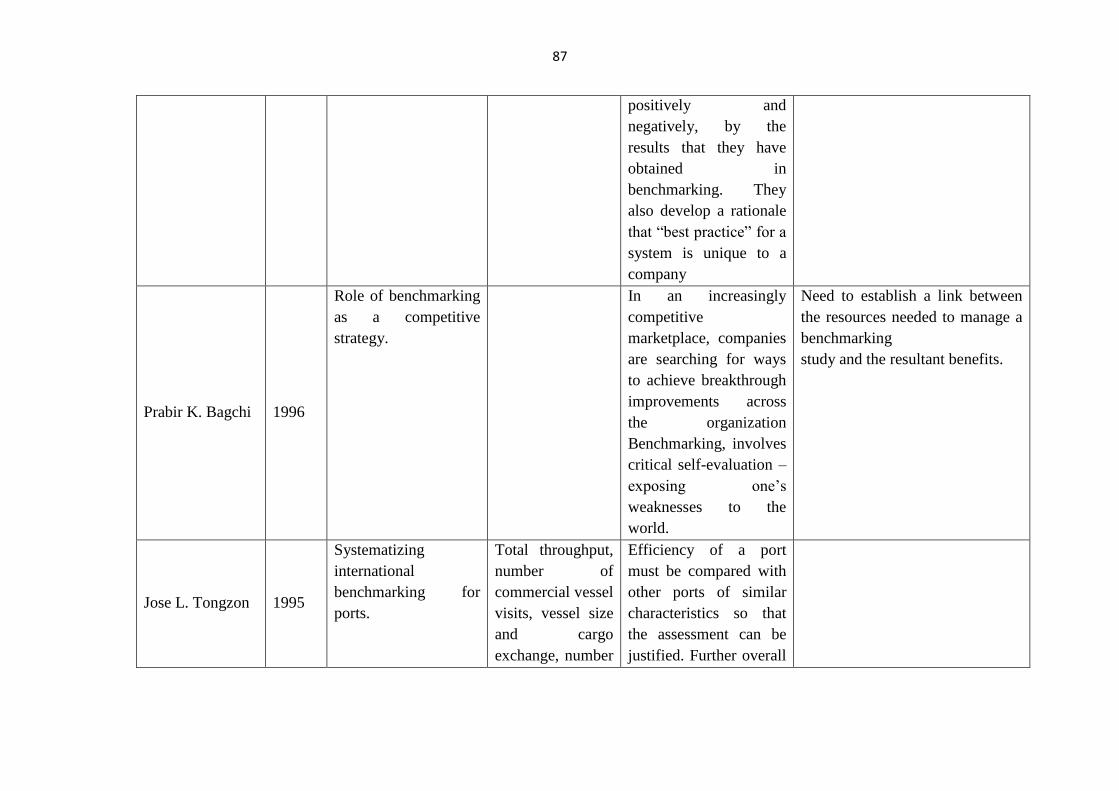
87
positively and
negatively, by the
results that they have
obtained in
benchmarking. They
also develop a rationale
that “best practice” for a
system is unique to a
company
Prabir K. Bagchi 1996
Role of benchmarking
as a competitive
strategy.
In an increasingly
competitive
marketplace, companies
are searching for ways
to achieve breakthrough
improvements across
the organization
Benchmarking, involves
critical self-evaluation –
exposing one’s
weaknesses to the
world.
Need to establish a link between
the resources needed to manage a
benchmarking
study and the resultant benefits.
Jose L. Tongzon 1995
Systematizing
international
benchmarking for
ports.
Total throughput,
number of
commercial vessel
visits, vessel size
and cargo
exchange, number
Efficiency of a port
must be compared with
other ports of similar
characteristics so that
the assessment can be
justified. Further overall
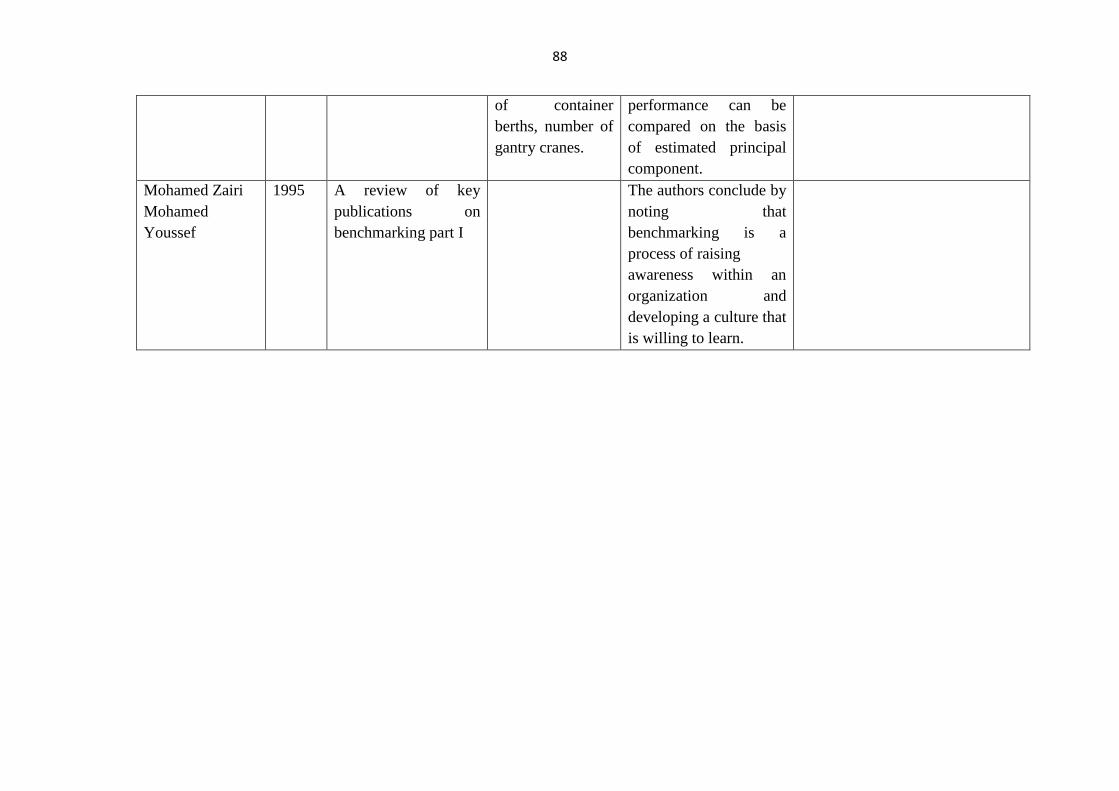
88
of container
berths, number of
gantry cranes.
performance can be
compared on the basis
of estimated principal
component.
Mohamed Zairi
Mohamed
Youssef
1995 A review of key
publications on
benchmarking part I
The authors conclude by
noting that
benchmarking is a
process of raising
awareness within an
organization and
developing a culture that
is willing to learn.
89
2.1 Major inferences derived from literature review:
1. Numerous studies exist on performance measurement at selected organisations in
various sectors and are based on limited data (but not on comprehensive data
across the industry).
2. Efficiency measurement at port sector is dominated with studies measuring relative
efficiency using various techniques including Data Envelopment Analysis (DEA)
in hindsight but do not propose any measures to improve efficiency.
3. Benchmarking studies in ports taken up at a few countries have contributed in
efficiency gains at those ports/terminals.
4. In Indian context, numerous studies exist on port performance but there exists no
study on setting benchmarks for performance improvement. This has led to an
ambiguity of benchmarking performance standards.
5. Establishment of benchmarks in port sector would help in monitoring and thus
enhancing the service quality levels at the major ports of India where by reducing
pre berthing detention time, and faster turnaround time of vessels and reduction in
the total transactional cost.
2.2 Major Gaps derived from Literature Review:
From the literature review, the following gaps were evident
a) Research papers on Indian ports hitherto focused on relative efficiency but not
absolute efficiency. This results in lack of scope for efficiency improvements.
b) No attempts were made to set benchmarks covering holistic efficiency of ports in
India such as Overall Port/Terminal Efficiency, Berth Efficiency, Yard
Throughput, and Evacuation Efficiency
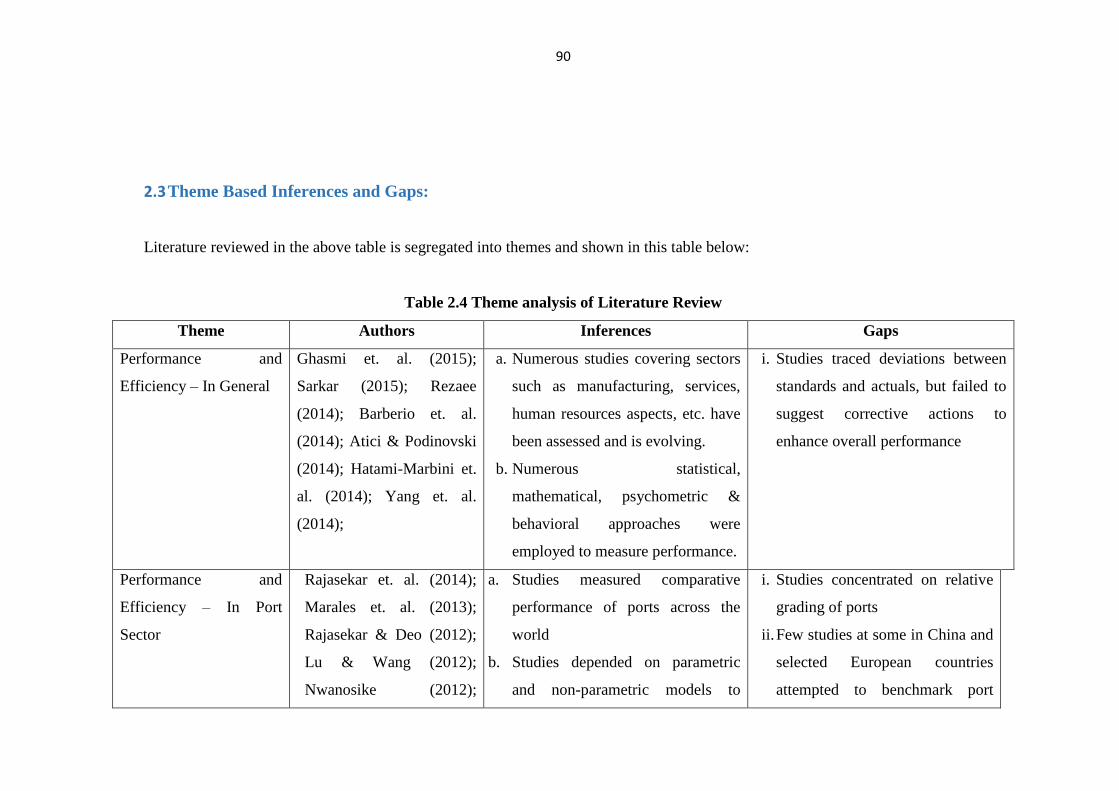
90
2.3 Theme Based Inferences and Gaps:
Literature reviewed in the above table is segregated into themes and shown in this table below:
Table 2.4 Theme analysis of Literature Review
Theme Authors Inferences Gaps
Performance and
Efficiency – In General
Ghasmi et. al. (2015);
Sarkar (2015); Rezaee
(2014); Barberio et. al.
(2014); Atici & Podinovski
(2014); Hatami-Marbini et.
al. (2014); Yang et. al.
(2014);
a. Numerous studies covering sectors
such as manufacturing, services,
human resources aspects, etc. have
been assessed and is evolving.
b. Numerous statistical,
mathematical, psychometric &
behavioral approaches were
employed to measure performance.
i. Studies traced deviations between
standards and actuals, but failed to
suggest corrective actions to
enhance overall performance
Performance and
Efficiency – In Port
Sector
Rajasekar et. al. (2014);
Marales et. al. (2013);
Rajasekar & Deo (2012);
Lu & Wang (2012);
Nwanosike (2012);
a. Studies measured comparative
performance of ports across the
world
b. Studies depended on parametric
and non-parametric models to
i. Studies concentrated on relative
grading of ports
ii. Few studies at some in China and
selected European countries
attempted to benchmark port
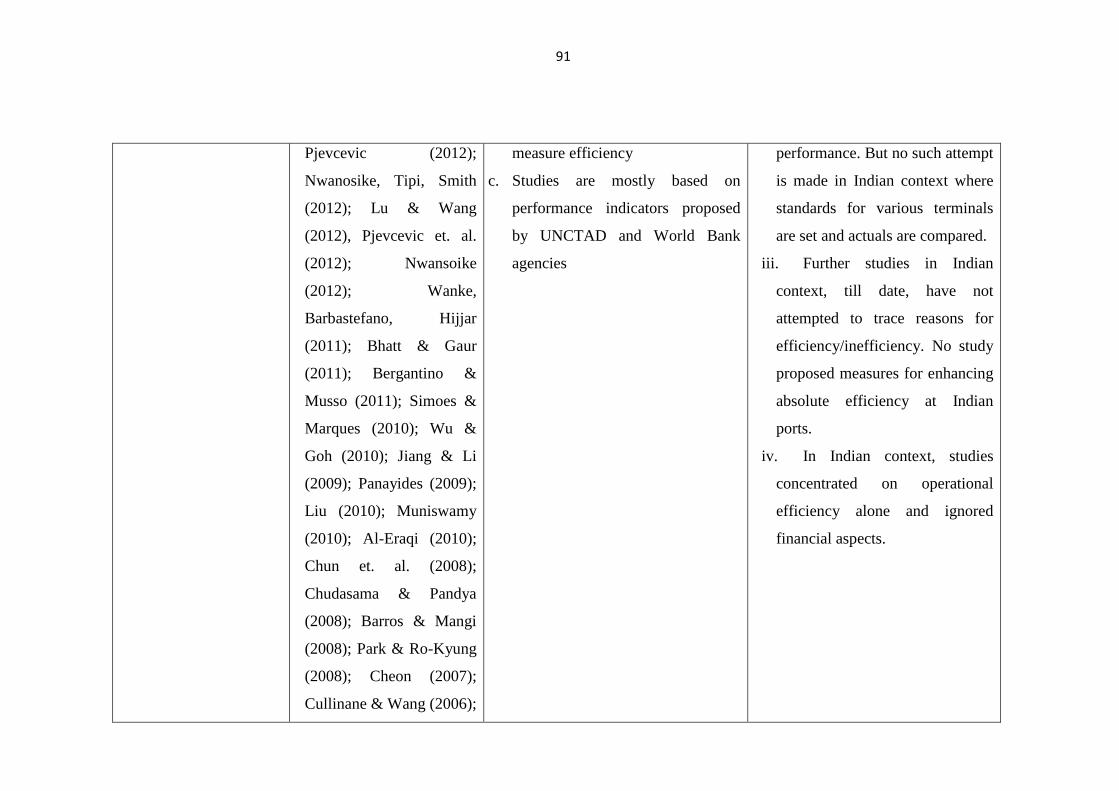
91
Pjevcevic (2012);
Nwanosike, Tipi, Smith
(2012); Lu & Wang
(2012), Pjevcevic et. al.
(2012); Nwansoike
(2012); Wanke,
Barbastefano, Hijjar
(2011); Bhatt & Gaur
(2011); Bergantino &
Musso (2011); Simoes &
Marques (2010); Wu &
Goh (2010); Jiang & Li
(2009); Panayides (2009);
Liu (2010); Muniswamy
(2010); Al-Eraqi (2010);
Chun et. al. (2008);
Chudasama & Pandya
(2008); Barros & Mangi
(2008); Park & Ro-Kyung
(2008); Cheon (2007);
Cullinane & Wang (2006);
measure efficiency
c. Studies are mostly based on
performance indicators proposed
by UNCTAD and World Bank
agencies
performance. But no such attempt
is made in Indian context where
standards for various terminals
are set and actuals are compared.
iii. Further studies in Indian
context, till date, have not
attempted to trace reasons for
efficiency/inefficiency. No study
proposed measures for enhancing
absolute efficiency at Indian
ports.
iv. In Indian context, studies
concentrated on operational
efficiency alone and ignored
financial aspects.
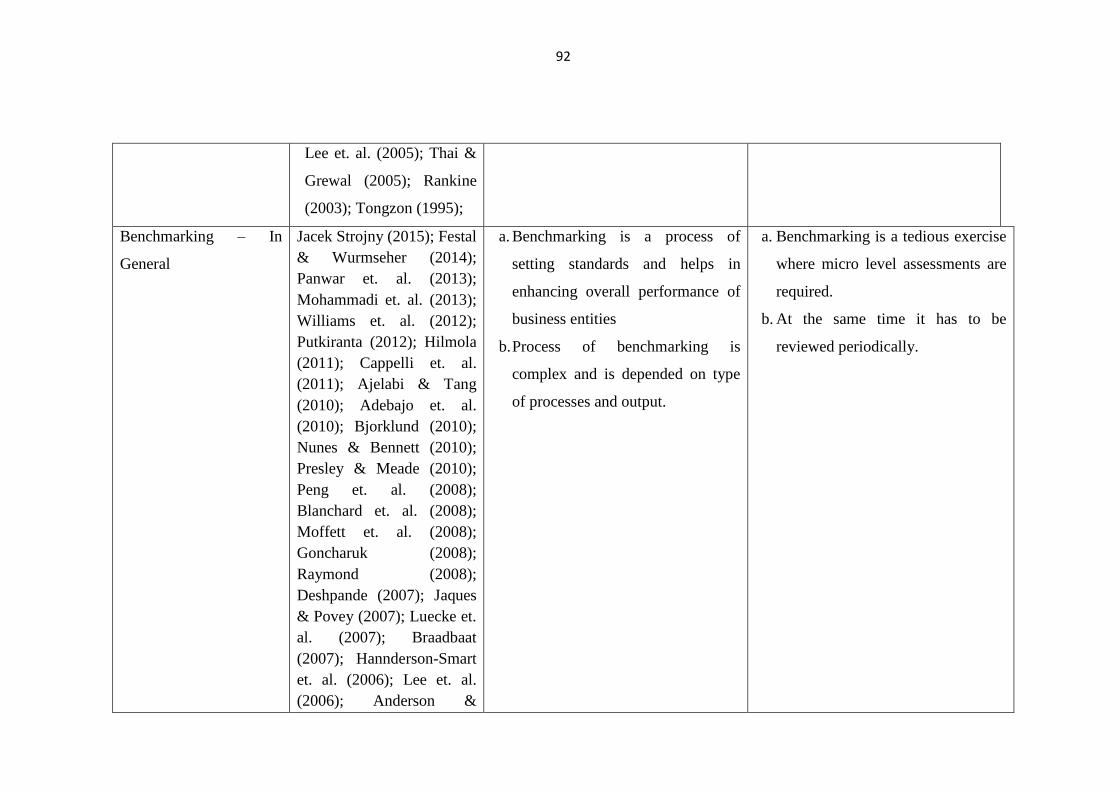
92
Lee et. al. (2005); Thai &
Grewal (2005); Rankine
(2003); Tongzon (1995);
Benchmarking – In
General
Jacek Strojny (2015); Festal
& Wurmseher (2014);
Panwar et. al. (2013);
Mohammadi et. al. (2013);
Williams et. al. (2012);
Putkiranta (2012); Hilmola
(2011); Cappelli et. al.
(2011); Ajelabi & Tang
(2010); Adebajo et. al.
(2010); Bjorklund (2010);
Nunes & Bennett (2010);
Presley & Meade (2010);
Peng et. al. (2008);
Blanchard et. al. (2008);
Moffett et. al. (2008);
Goncharuk (2008);
Raymond (2008);
Deshpande (2007); Jaques
& Povey (2007); Luecke et.
al. (2007); Braadbaat
(2007); Hannderson-Smart
et. al. (2006); Lee et. al.
(2006); Anderson &
a. Benchmarking is a process of
setting standards and helps in
enhancing overall performance of
business entities
b. Process of benchmarking is
complex and is depended on type
of processes and output.
a. Benchmarking is a tedious exercise
where micro level assessments are
required.
b. At the same time it has to be
reviewed periodically.
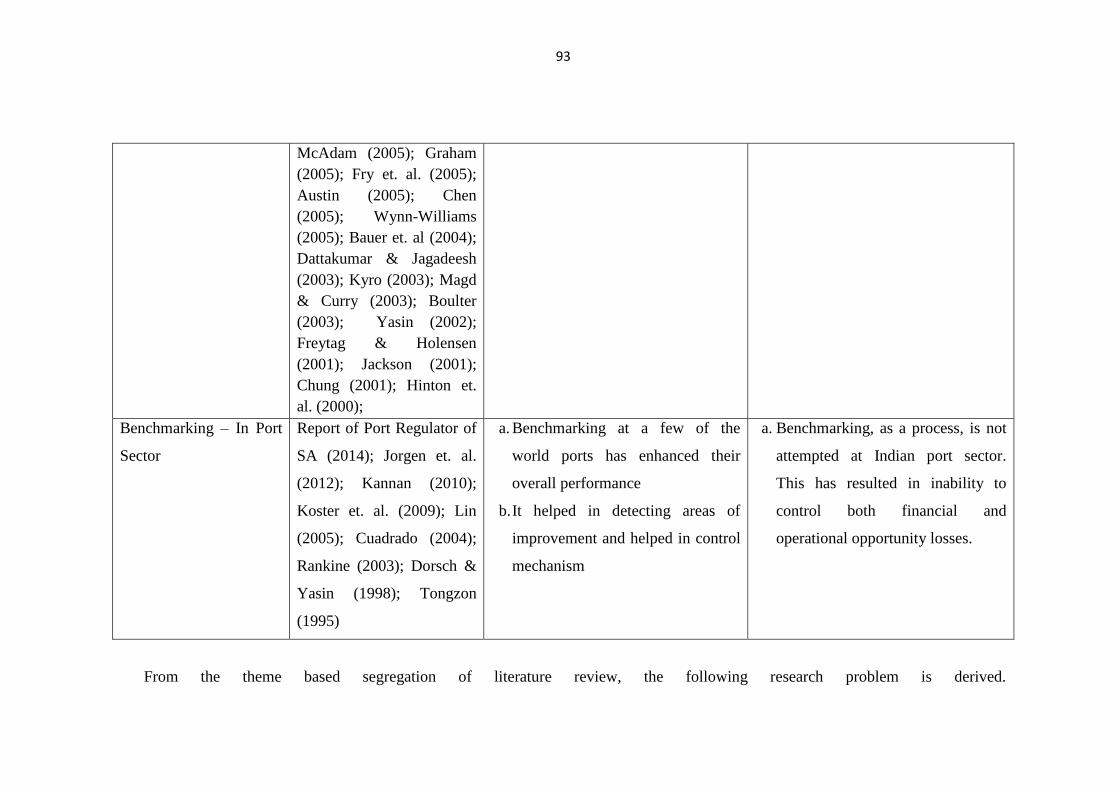
93
McAdam (2005); Graham
(2005); Fry et. al. (2005);
Austin (2005); Chen
(2005); Wynn-Williams
(2005); Bauer et. al (2004);
Dattakumar & Jagadeesh
(2003); Kyro (2003); Magd
& Curry (2003); Boulter
(2003); Yasin (2002);
Freytag & Holensen
(2001); Jackson (2001);
Chung (2001); Hinton et.
al. (2000);
Benchmarking – In Port
Sector
Report of Port Regulator of
SA (2014); Jorgen et. al.
(2012); Kannan (2010);
Koster et. al. (2009); Lin
(2005); Cuadrado (2004);
Rankine (2003); Dorsch &
Yasin (1998); Tongzon
(1995)
a. Benchmarking at a few of the
world ports has enhanced their
overall performance
b. It helped in detecting areas of
improvement and helped in control
mechanism
a. Benchmarking, as a process, is not
attempted at Indian port sector.
This has resulted in inability to
control both financial and
operational opportunity losses.
From the theme based segregation of literature review, the following research problem is derived.
94
2.4 Benchmarking Studies:
From the literature reviewed, it can be observed that numerous studies covering a wide
variety of sectors are available that have attempted to set benchmarks. Researchers
proposed benchmarks in industries such as automobile, airports, manufacturing, etc. to
enhance workforce performance. However, number of studies on ports sector are limited
and generally focused on operations of container terminals alone. Koster et. al.(2009) used
Data Envelopment Analysis (DEA) to set benchmarks at selected container terminals
across the world. The authors suggested DEA as a better tool for benchmarking only if
accurate and minute data variables, often times not in public domain are available.
Deshpande et. al. 2009 attempted performance benchmarking of terminal operators of less
than truck-load freight carriers. They used discrete simulation approach for benchmarking
and found the tool to be effective, especially, in live work environment.
Cuadrad & Cervera, 2004 proposed time, safety and cost as important dimensions for
benchmarking of selected container ports. They argued that these indicators can help in
identification of services for improvement in efficiency of ports. Tongzon, 1995 used
Principal Component Analysis to benchmark homogeneous ports and suggested measures
for efficiency measurement among them.
While the above studies have attempted to benchmark ports/terminals, their access is
limited to publicly available data. However, to derive reliable benchmark standards, a
study considering the real time data pertaining to various activities at ports (including
navigation side, berth side & yard side operations) is required. The current study aims to
set benchmarks at various terminals at the major ports of India with the help of narrowed
down real-time data. The results of this thesis would benefit all the major ports to look to
these benchmark standards and compare their performance. The study would also help
them to derive policies to improve their efficiencies and strive to achieve these standards.
95
Chapter III - Research Methodology
3.1 Research Problem
Numerous studies have measured efficiency of Indian major ports. However, these studies
could not prescribe any standards for improvement in efficiency parameters. This warrants
a comprehensive research to set performance benchmarks in comparison to the best-in-
class ports and thereby explore measures for improvement of overall efficiency resulting
in optimisation of capacity and financial gains.
3.2 Research Questions:
How to benchmark various Key Productivity Parameters in port operation for
Major Ports of India?
How port efficiency can be improved using benchmarks?
3.2 Research Objectives:
To determine & calculate benchmarks for Key Productivity Parameters in port
operation for Major Ports of India;
To explore the initiative required to improve efficiencies at major ports of India
and transform them into best- in- class ports.
3.3 Research Design
In pursuance of the first objective, of determining ‘important KPIs’ and ‘calculate
benchmark’, major ports were clustered on the basis of cargo being handled. KPIs was
determined through literature review and raked them by survey through Liker Scale
analysis, the operational and financial data for each of the 12 major Indian ports was
collected for benchmarking against relevant private Indian Private Ports as well as a group
of relevant International ports. The benchmarking exercise was done for all important
96
aspects of port operations, i.e, marine operations, berth operations, yard management,
storage and evacuation in terms of Key Performance Indicators by normalization of data
by taking the parameters: viz., Size of Port, Number of Berths, Type of commodity and
Degree of Automation. For the second research objective, ‘efficiency improvements at
major ports of India’, deep ‘Root Cause Analysis’ carried through Fish-Bone diagram
analysis, “5 Whys analysis” are captured in deep-dive analysis chapter that form basis for
suggestion of measures to improve efficiency standards at these ports.
3.4 Process details
Benchmarking Process, normalization, nature of data and metric used for
benchmarking process are shown in Table 3. 5.1, 3.5.2, 3.5.3 and 3.5.4 respectively.
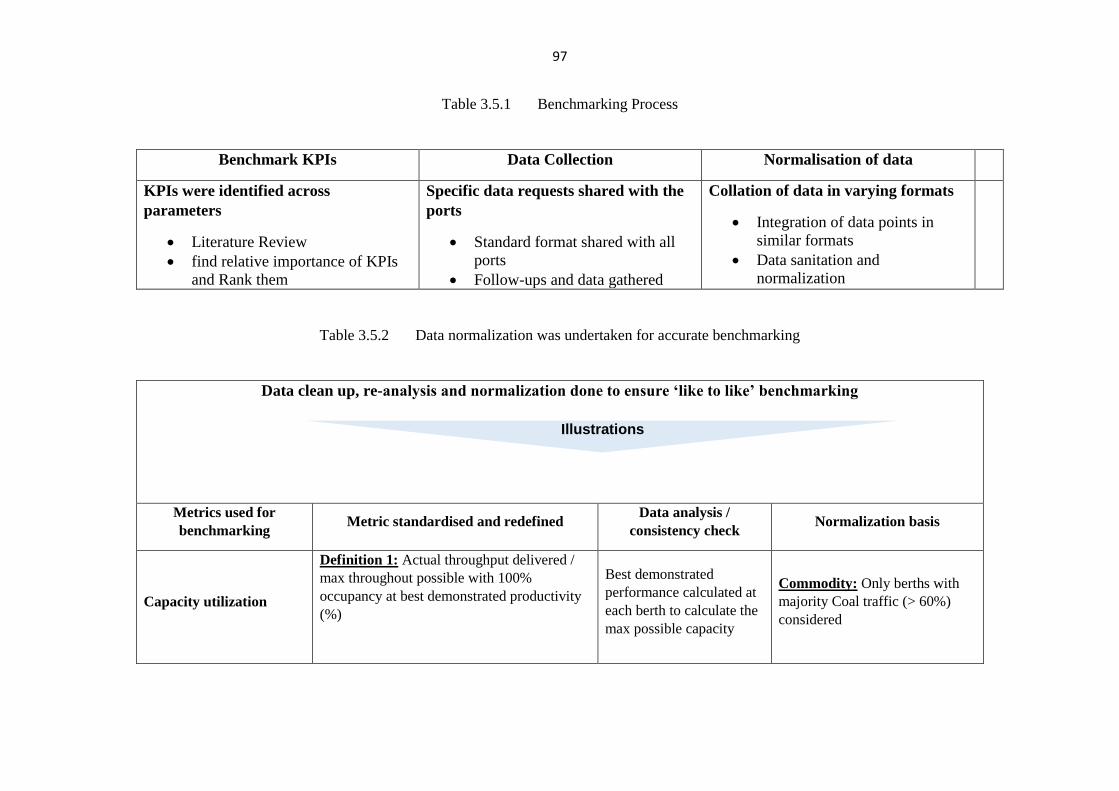
97
Table 3.5.1 Benchmarking Process
Benchmark KPIs Data Collection Normalisation of data
KPIs were identified across
parameters
Literature Review
find relative importance of KPIs
and Rank them
Specific data requests shared with the
ports
Standard format shared with all
ports
Follow-ups and data gathered
Collation of data in varying formats
Integration of data points in
similar formats
Data sanitation and
normalization
Table 3.5.2 Data normalization was undertaken for accurate benchmarking
Data clean up, re-analysis and normalization done to ensure ‘like to like’ benchmarking
Metrics used for
benchmarking Metric standardised and redefined
Data analysis /
consistency check Normalization basis
Capacity utilization
Definition 1: Actual throughput delivered /
max throughout possible with 100%
occupancy at best demonstrated productivity
(%)
Best demonstrated
performance calculated at
each berth to calculate the
max possible capacity
Commodity: Only berths with
majority Coal traffic (> 60%)
considered
Illustrations
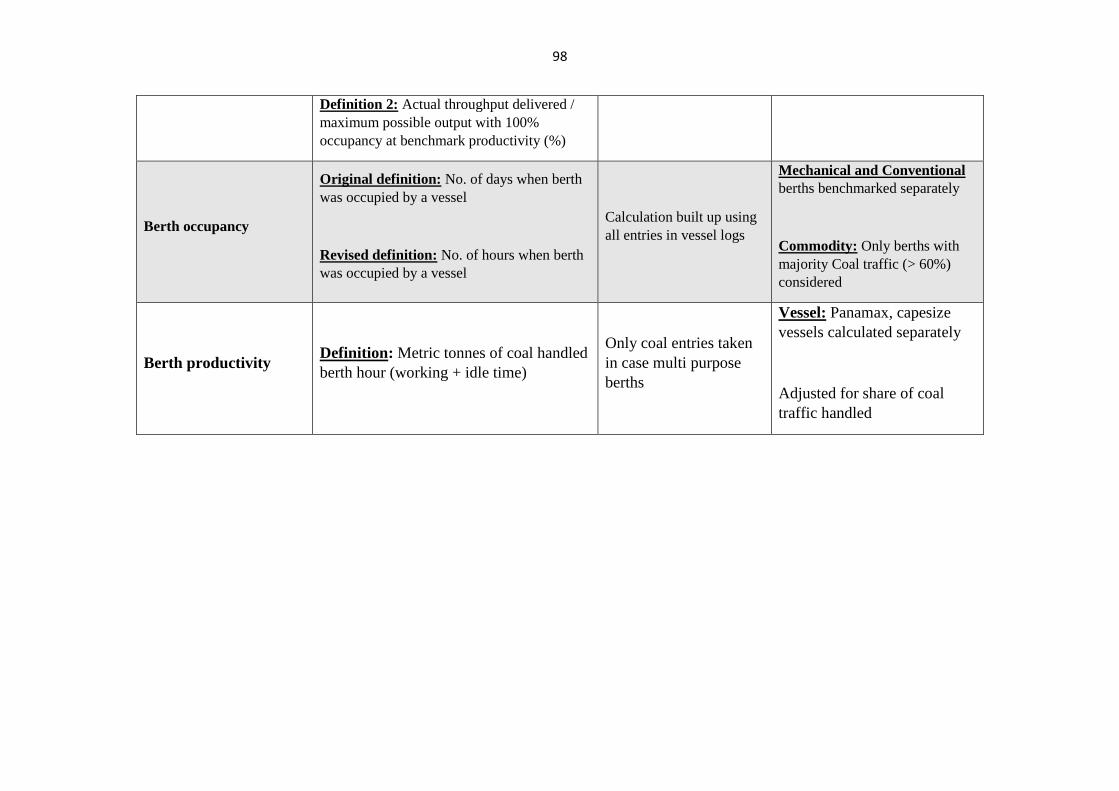
98
Definition 2: Actual throughput delivered /
maximum possible output with 100%
occupancy at benchmark productivity (%)
Berth occupancy
Original definition: No. of days when berth
was occupied by a vessel
Revised definition: No. of hours when berth
was occupied by a vessel
Calculation built up using
all entries in vessel logs
Mechanical and Conventional
berths benchmarked separately
Commodity: Only berths with
majority Coal traffic (> 60%)
considered
Berth productivity Definition: Metric tonnes of coal handled
berth hour (working + idle time)
Only coal entries taken
in case multi purpose
berths
Vessel: Panamax, capesize
vessels calculated separately
Adjusted for share of coal
traffic handled
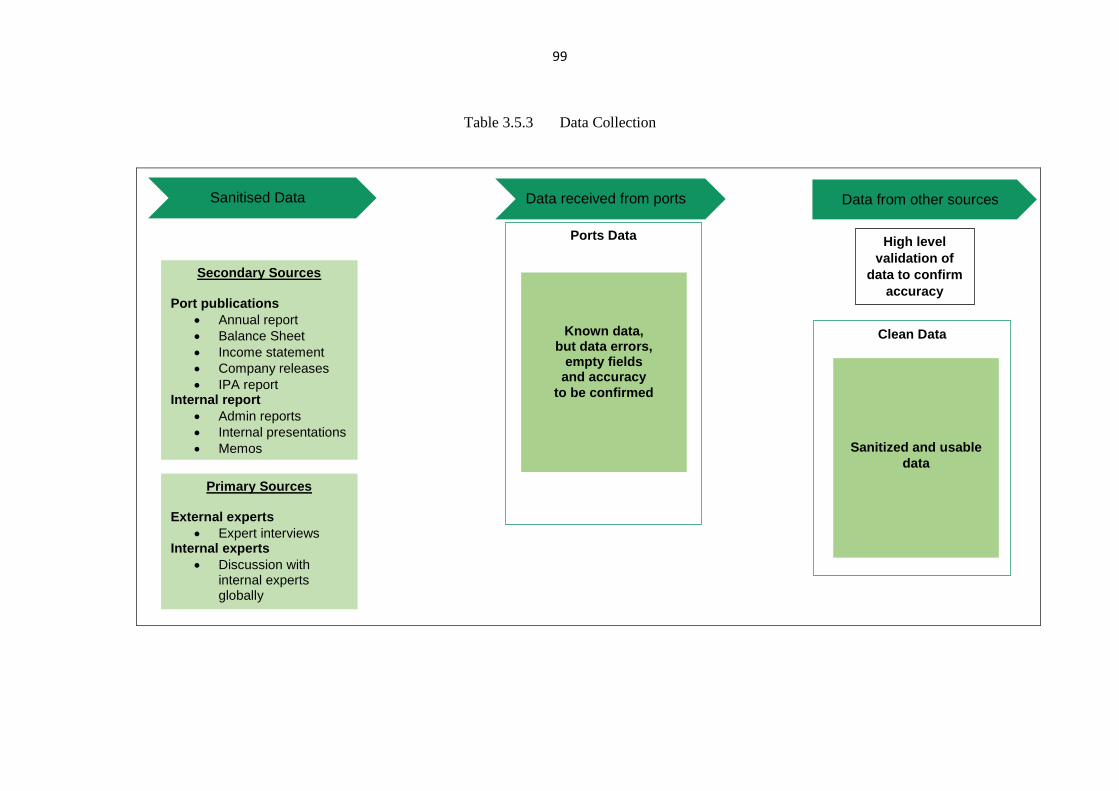
99
Table 3.5.3 Data Collection
Data from other sources Data received from ports Sanitised Data
Secondary Sources
Port publications
Annual report
Balance Sheet
Income statement
Company releases
IPA report Internal report
Admin reports
Internal presentations
Memos
Primary Sources
External experts
Expert interviews Internal experts
Discussion with internal experts globally
Ports Data
Known data, but data errors,
empty fields and accuracy
to be confirmed
Clean Data
Sanitized and usable
data
High level
validation of
data to confirm
accuracy
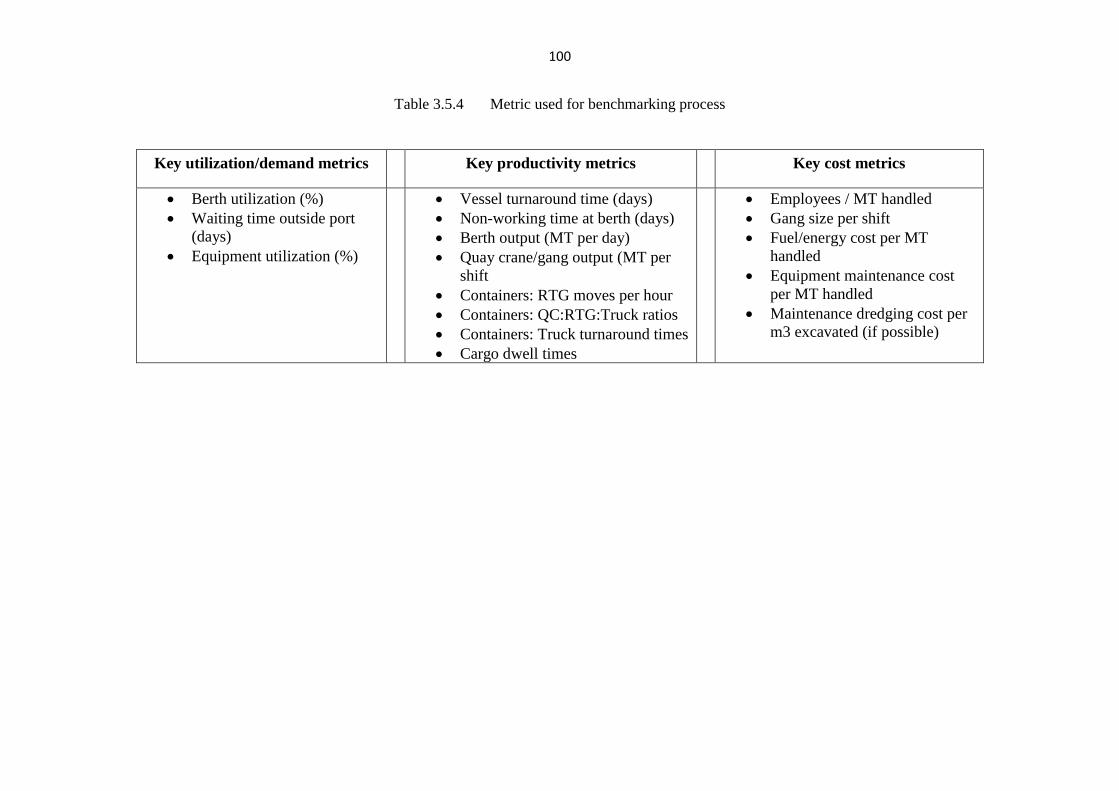
100
Table 3.5.4 Metric used for benchmarking process
Key utilization/demand metrics Key productivity metrics Key cost metrics
Berth utilization (%)
Waiting time outside port
(days)
Equipment utilization (%)
Vessel turnaround time (days)
Non-working time at berth (days)
Berth output (MT per day)
Quay crane/gang output (MT per
shift
Containers: RTG moves per hour
Containers: QC:RTG:Truck ratios
Containers: Truck turnaround times
Cargo dwell times
Employees / MT handled
Gang size per shift
Fuel/energy cost per MT
handled
Equipment maintenance cost
per MT handled
Maintenance dredging cost per
m3 excavated (if possible)
101
3.5 Research Methodology for Research Objective 1:
For the purpose of Benchmarking, the following steps are taken:
1. The Major Ports were clustered based on cargo categories (mechanised dry bulk,
conventional dry bulk, containers and break bulk)
2. Important aspects of port operations were identified through Literature review viz.,
marine operations, berth operations, yard management, storage and evacuation. A set of
targeted and specific metrics were used for comparing performance, they are:
Berth output
Vessel turnaround time
Quay crane/gang output
Containers: RTG moves/hr
Containers: QC:RTG Truck Ratio
Container: Truck turnaround times
Cargo dwell times
Waiting time outside port
Berth utilization
Equipment utilization
Non-working time at berth
Employees/MT handled
Fuel/energy cost per MT handled
Gang size per shift
Equipment maintenance cost per MT handled
Maintenance dredging cost per m3 excavated
102
3. To assess degree of importance of the identified KPIs, a survey was undertaken.
A Likert type questionnaire (at Appendix- Survey Questionnaire) was administered among
200 key port stakeholders to get an external perspective.
[About Likert scale: It is a measuring tool or scale used to measure attitudes, beliefs, opinions
behaviors and perceptions of individuals or consumers. It is a set question (called items) where each item
has a fixed number of response categories used to know the agreements of respondents on variety of items,
products and services]
The stakeholders were drawn from Senior Port Officers and experts, Customs Department,
CHAs, ICDs, Freight Forwarders, Container Shipping Lines, CFSs, Ship-owners, Importers,
Exporters, Railways.
The respondents were requested to indicate their perceptions about degree of
importance to each of the 16 identified KPI (arranged in random fashion) in a five-point
scale where 5 denotes maximum importance and 1 denotes minimum importance of a KPI.
However, complete responses covering all the KPIs were obtained only from 185
respondents. Analysis of data was carried out with the responses completed on all respects
from these 185 respondents. Distribution of scores for each KPI was found to be positively
skewed with large variance. This is primarily due to the fact that the stakeholders more or
less perceived each KPI as important. However, variance of each KPI was high, indicating
non-uniform perspectives of the respondents. Highest mean was 4.00 and the lowest mean
was 3.065. Descriptive statistics of the KPIs are depicted below. Cronbach alpha for the
questionnaire was found to be 0.692387 implying moderately high reliability of the
questionnaire.
[About Cronbach’s alpha: Reliability of Likert scale are usually found using Cronbach’s alpha which is a measure of
internal consistency of the scale or questionnaire and is a function of the number of items in a test, item variances and
the variance of the total score. Alpha is defined as:
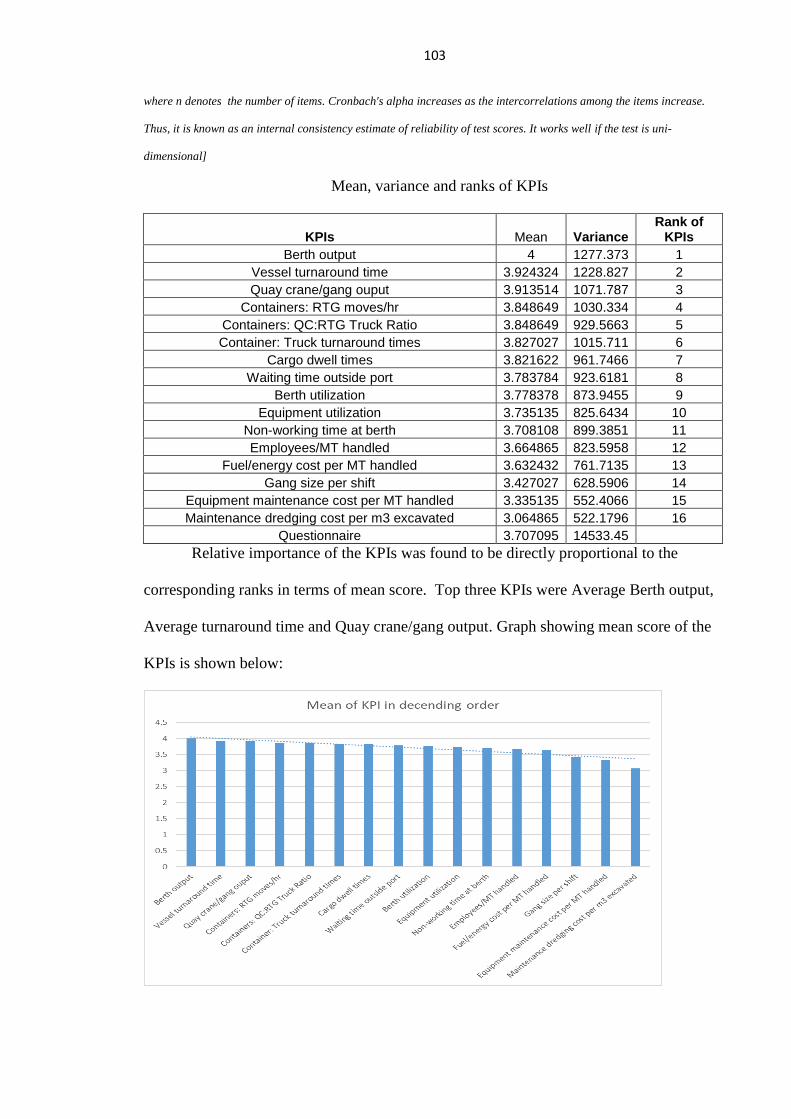
103
where n denotes the number of items. Cronbach's alpha increases as the intercorrelations among the items increase.
Thus, it is known as an internal consistency estimate of reliability of test scores. It works well if the test is uni-
dimensional]
Mean, variance and ranks of KPIs
KPIs Mean Variance Rank of
KPIs
Berth output 4 1277.373 1
Vessel turnaround time 3.924324 1228.827 2
Quay crane/gang ouput 3.913514 1071.787 3
Containers: RTG moves/hr 3.848649 1030.334 4
Containers: QC:RTG Truck Ratio 3.848649 929.5663 5
Container: Truck turnaround times 3.827027 1015.711 6
Cargo dwell times 3.821622 961.7466 7
Waiting time outside port 3.783784 923.6181 8
Berth utilization 3.778378 873.9455 9
Equipment utilization 3.735135 825.6434 10
Non-working time at berth 3.708108 899.3851 11
Employees/MT handled 3.664865 823.5958 12
Fuel/energy cost per MT handled 3.632432 761.7135 13
Gang size per shift 3.427027 628.5906 14
Equipment maintenance cost per MT handled 3.335135 552.4066 15
Maintenance dredging cost per m3 excavated 3.064865 522.1796 16
Questionnaire 3.707095 14533.45 Relative importance of the KPIs was found to be directly proportional to the
corresponding ranks in terms of mean score. Top three KPIs were Average Berth output,
Average turnaround time and Quay crane/gang output. Graph showing mean score of the
KPIs is shown below:
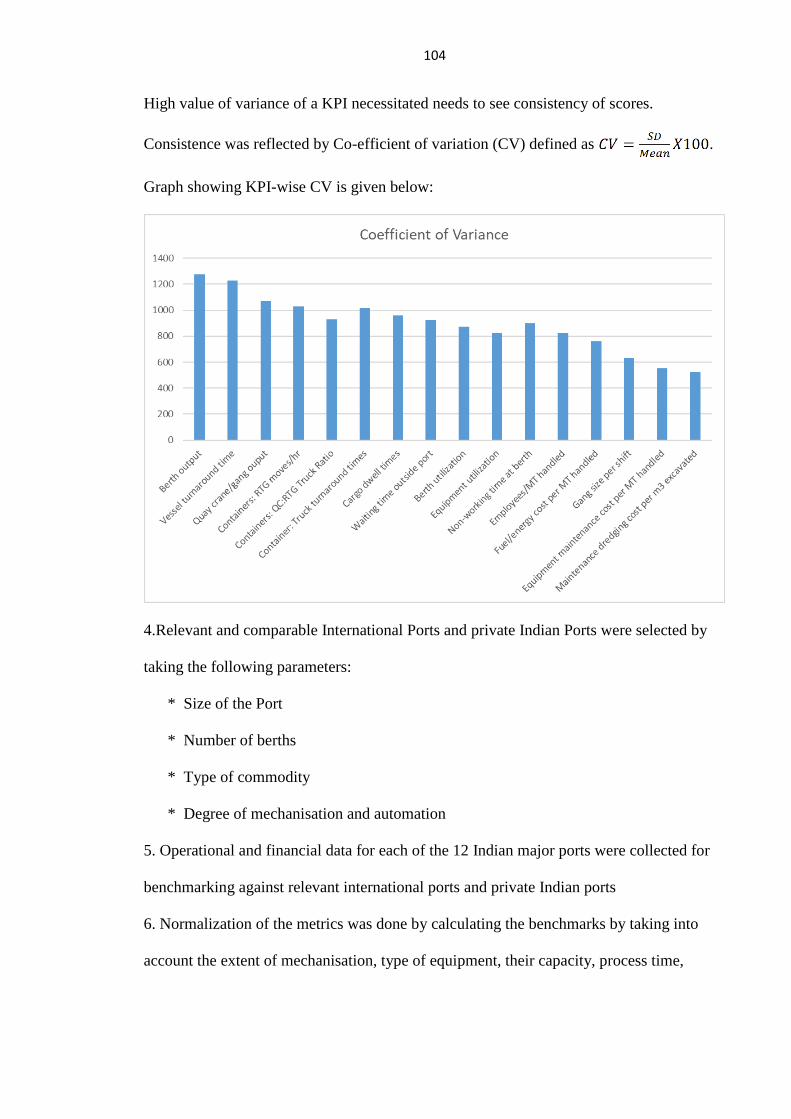
104
High value of variance of a KPI necessitated needs to see consistency of scores.
Consistence was reflected by Co-efficient of variation (CV) defined as .
Graph showing KPI-wise CV is given below:
4.Relevant and comparable International Ports and private Indian Ports were selected by
taking the following parameters:
* Size of the Port
* Number of berths
* Type of commodity
* Degree of mechanisation and automation
5. Operational and financial data for each of the 12 Indian major ports were collected for
benchmarking against relevant international ports and private Indian ports
6. Normalization of the metrics was done by calculating the benchmarks by taking into
account the extent of mechanisation, type of equipment, their capacity, process time,
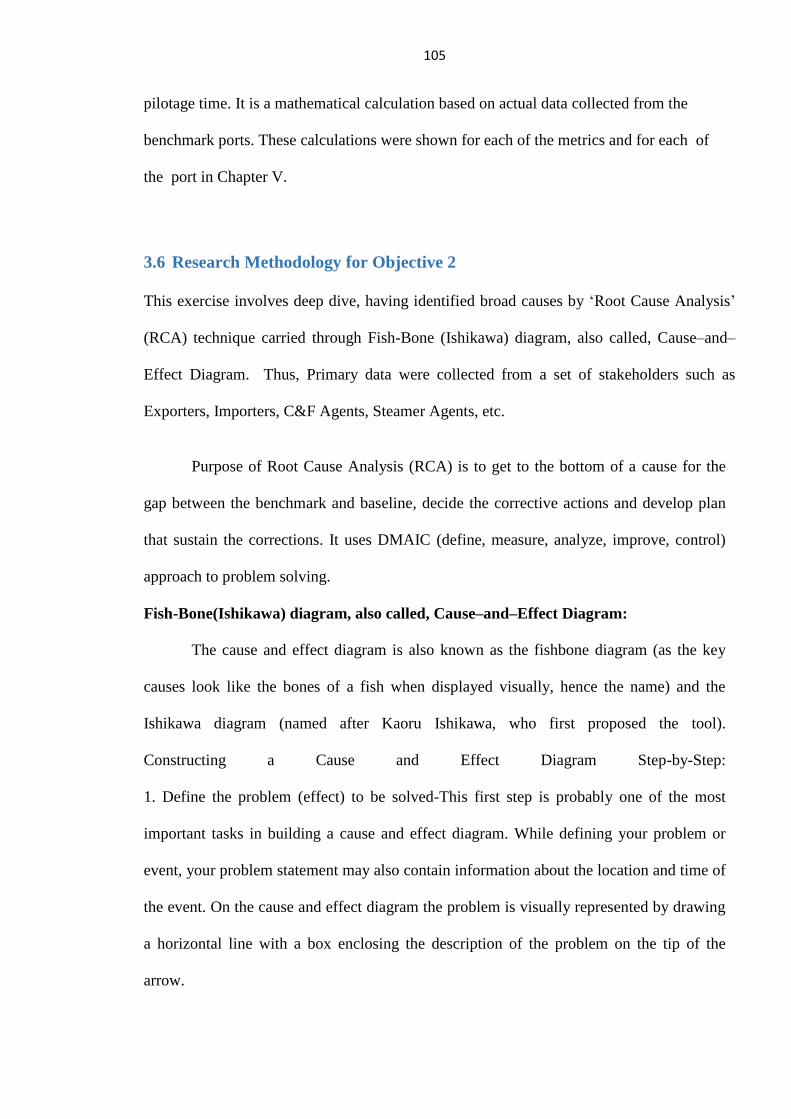
105
pilotage time. It is a mathematical calculation based on actual data collected from the
benchmark ports. These calculations were shown for each of the metrics and for each of
the port in Chapter V.
3.6 Research Methodology for Objective 2
This exercise involves deep dive, having identified broad causes by ‘Root Cause Analysis’
(RCA) technique carried through Fish-Bone (Ishikawa) diagram, also called, Cause–and–
Effect Diagram. Thus, Primary data were collected from a set of stakeholders such as
Exporters, Importers, C&F Agents, Steamer Agents, etc.
Purpose of Root Cause Analysis (RCA) is to get to the bottom of a cause for the
gap between the benchmark and baseline, decide the corrective actions and develop plan
that sustain the corrections. It uses DMAIC (define, measure, analyze, improve, control)
approach to problem solving.
Fish-Bone(Ishikawa) diagram, also called, Cause–and–Effect Diagram:
The cause and effect diagram is also known as the fishbone diagram (as the key
causes look like the bones of a fish when displayed visually, hence the name) and the
Ishikawa diagram (named after Kaoru Ishikawa, who first proposed the tool).
Constructing a Cause and Effect Diagram Step-by-Step:
1. Define the problem (effect) to be solved-This first step is probably one of the most
important tasks in building a cause and effect diagram. While defining your problem or
event, your problem statement may also contain information about the location and time of
the event. On the cause and effect diagram the problem is visually represented by drawing
a horizontal line with a box enclosing the description of the problem on the tip of the
arrow.
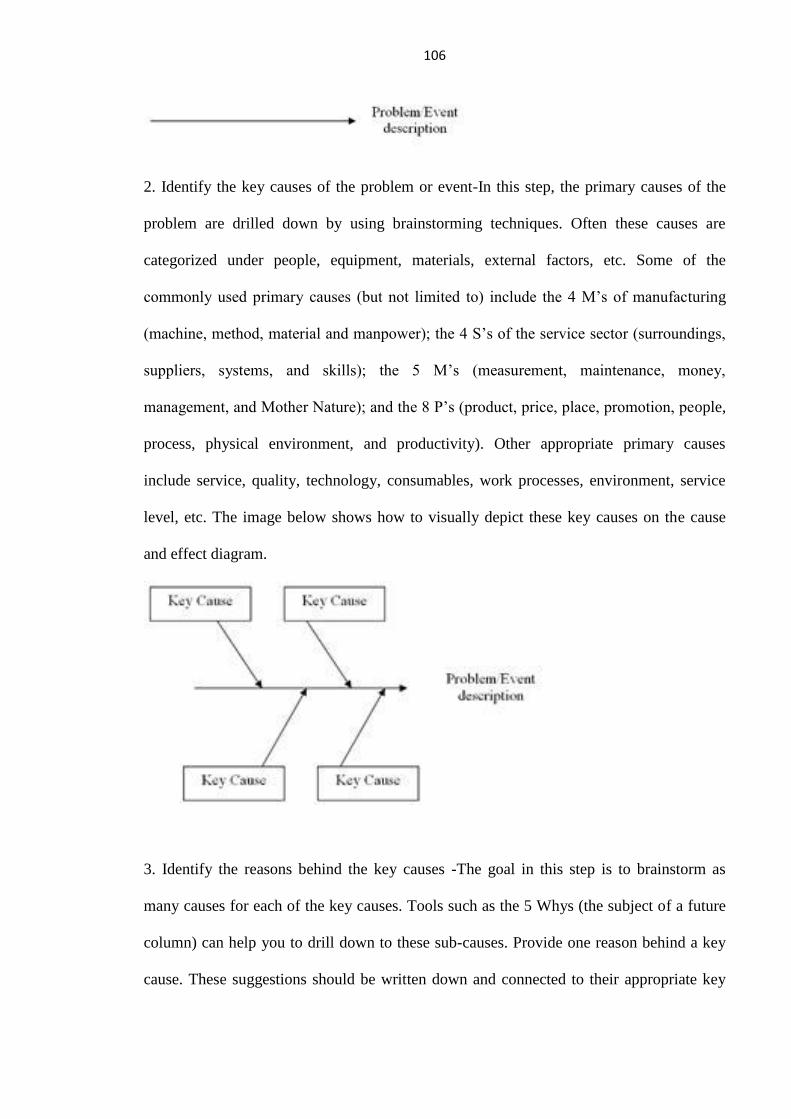
106
2. Identify the key causes of the problem or event-In this step, the primary causes of the
problem are drilled down by using brainstorming techniques. Often these causes are
categorized under people, equipment, materials, external factors, etc. Some of the
commonly used primary causes (but not limited to) include the 4 M’s of manufacturing
(machine, method, material and manpower); the 4 S’s of the service sector (surroundings,
suppliers, systems, and skills); the 5 M’s (measurement, maintenance, money,
management, and Mother Nature); and the 8 P’s (product, price, place, promotion, people,
process, physical environment, and productivity). Other appropriate primary causes
include service, quality, technology, consumables, work processes, environment, service
level, etc. The image below shows how to visually depict these key causes on the cause
and effect diagram.
3. Identify the reasons behind the key causes -The goal in this step is to brainstorm as
many causes for each of the key causes. Tools such as the 5 Whys (the subject of a future
column) can help you to drill down to these sub-causes. Provide one reason behind a key
cause. These suggestions should be written down and connected to their appropriate key
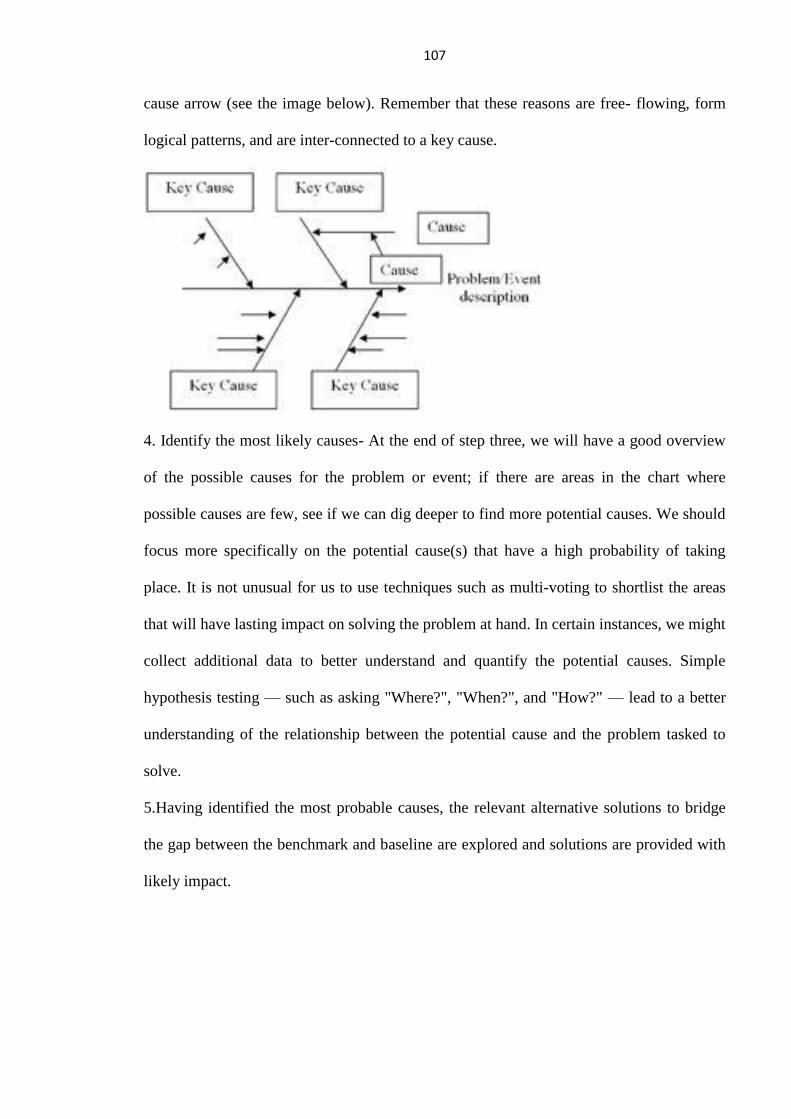
107
cause arrow (see the image below). Remember that these reasons are free- flowing, form
logical patterns, and are inter-connected to a key cause.
4. Identify the most likely causes- At the end of step three, we will have a good overview
of the possible causes for the problem or event; if there are areas in the chart where
possible causes are few, see if we can dig deeper to find more potential causes. We should
focus more specifically on the potential cause(s) that have a high probability of taking
place. It is not unusual for us to use techniques such as multi-voting to shortlist the areas
that will have lasting impact on solving the problem at hand. In certain instances, we might
collect additional data to better understand and quantify the potential causes. Simple
hypothesis testing — such as asking "Where?", "When?", and "How?" — lead to a better
understanding of the relationship between the potential cause and the problem tasked to
solve.
5.Having identified the most probable causes, the relevant alternative solutions to bridge
the gap between the benchmark and baseline are explored and solutions are provided with
likely impact.
108
3.7 Theoretical Underpinning:
This research is the first of its kind in Benchmarking theory whereby the combination of
normalization along with Best-in-class benchmarking and Root Cause Analysis was used
for solutioning exercise, this will perhaps add a new dimension in the benchmarking
exercise in port industry. This research contributes to the theory/literature of
benchmarking, especially, in the context of Indian ports whereby the future researchers
can get the benefit of standards for comparing operational performance of various ports in
India.
3.8 Benchmarking Theory:
Formal definition of benchmarking used by Rank Xerox ‘Continuous systematic process
of evaluating companies recognised as industry leaders, to determine business and work
processes that represent best practices and establish rational performance goals.’ In
operational terms it is frequency condensed to ‘the search for industry best practices that
lead to superior performance.’ ‘Best Practices’ refer to – methods used in work processes
that best meet customer requirements. Benchmarking is not ‘what we want to achieve’ but
‘how they are to be achieved’.
Types and ways of Benchmarking Theory:
o Types of Benchmarking – Product and Process
o Ways of process benchmarking/How benchmarking is done?
a. Benchmarking Internal Operations – to find the best-performing unit
within your own company;
b. Benchmark vis-à-vis competitor;
109
c. Best-in-class – Comparing your performance vis-à-vis the best in
industry;
d. Strategic benchmarking – integrates strategic competitive analysis
with best-in-class benchmarking.
What we propose to use the ‘best in class’ method using deep ‘Root Cause Analysis’
technique. It was proposed to collect data for 12 major ports as well as relevant private
Indian ports and international ports to benchmark performance on all three key dimensions
of
1) Financial,
2) Operational, and
3) Organizational capability
In each of these benchmarking focus areas, a set of targeted and specific metrics were
used for comparing performance. These metrics have been shortlisted through
Literature review and ranked using 5-point Likert Scale Analysis via Survey since they
provided the most specific and insightful understanding of the relative performance of
the ports. The KPIs shortlisted for benchmarking
Berth output
Vessel turnaround time
Quay crane/gang ouput
Containers: RTG moves/hr
Containers: QC:RTG Truck Ratio
Container: Truck turnaround times
Cargo dwell times
110
Waiting time outside port
Berth utilization
Equipment utilization
Non-working time at berth
Employees/MT handled
Fuel/energy cost per MT handled
Gang size per shift
Equipment maintenance cost per MT handled
Maintenance dredging cost per m3 excavated
In case of any specific situation /context for a port, other relevant metrics were added
as required for building an in-depth and specific understanding of the port’s
performance.
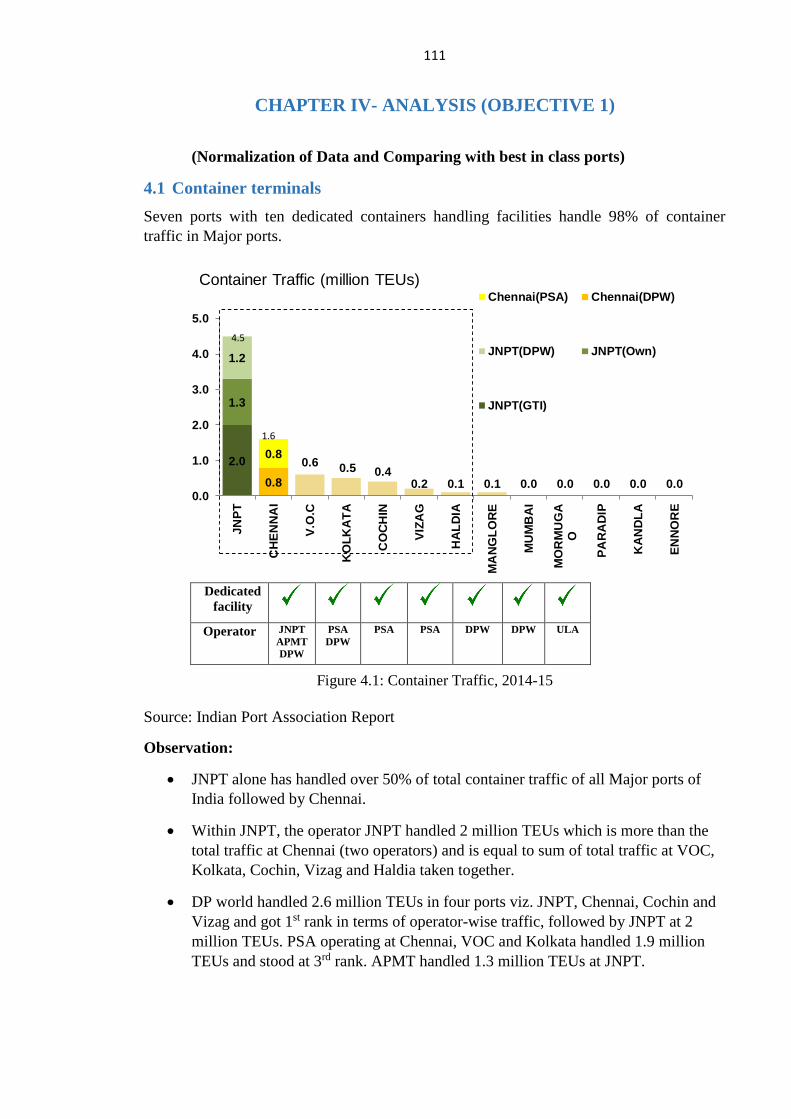
111
CHAPTER IV- ANALYSIS (OBJECTIVE 1)
(Normalization of Data and Comparing with best in class ports)
4.1 Container terminals
Seven ports with ten dedicated containers handling facilities handle 98% of container
traffic in Major ports.
2.0
1.3
1.2
0.8
0.80.6 0.5 0.4
0.2 0.1 0.1 0.0 0.0 0.0 0.0 0.00.0
1.0
2.0
3.0
4.0
5.0
JN
PT
CH
EN
NA
I
V.O
.C
KO
LK
AT
A
CO
CH
IN
VIZ
AG
HA
LD
IA
MA
NG
LO
RE
MU
MB
AI
MO
RM
UG
AO
PA
RA
DIP
KA
ND
LA
EN
NO
RE
Container Traffic (million TEUs)Chennai(PSA) Chennai(DPW)
JNPT(DPW) JNPT(Own)
JNPT(GTI)
4.5
1.6
Figure 4.1: Container Traffic, 2014-15
Source: Indian Port Association Report
Observation:
JNPT alone has handled over 50% of total container traffic of all Major ports of
India followed by Chennai.
Within JNPT, the operator JNPT handled 2 million TEUs which is more than the
total traffic at Chennai (two operators) and is equal to sum of total traffic at VOC,
Kolkata, Cochin, Vizag and Haldia taken together.
DP world handled 2.6 million TEUs in four ports viz. JNPT, Chennai, Cochin and
Vizag and got 1st rank in terms of operator-wise traffic, followed by JNPT at 2
million TEUs. PSA operating at Chennai, VOC and Kolkata handled 1.9 million
TEUs and stood at 3rd rank. APMT handled 1.3 million TEUs at JNPT.
Dedicated
facility
Operator JNPT
APMT
DPW
PSA
DPW
PSA PSA DPW DPW ULA
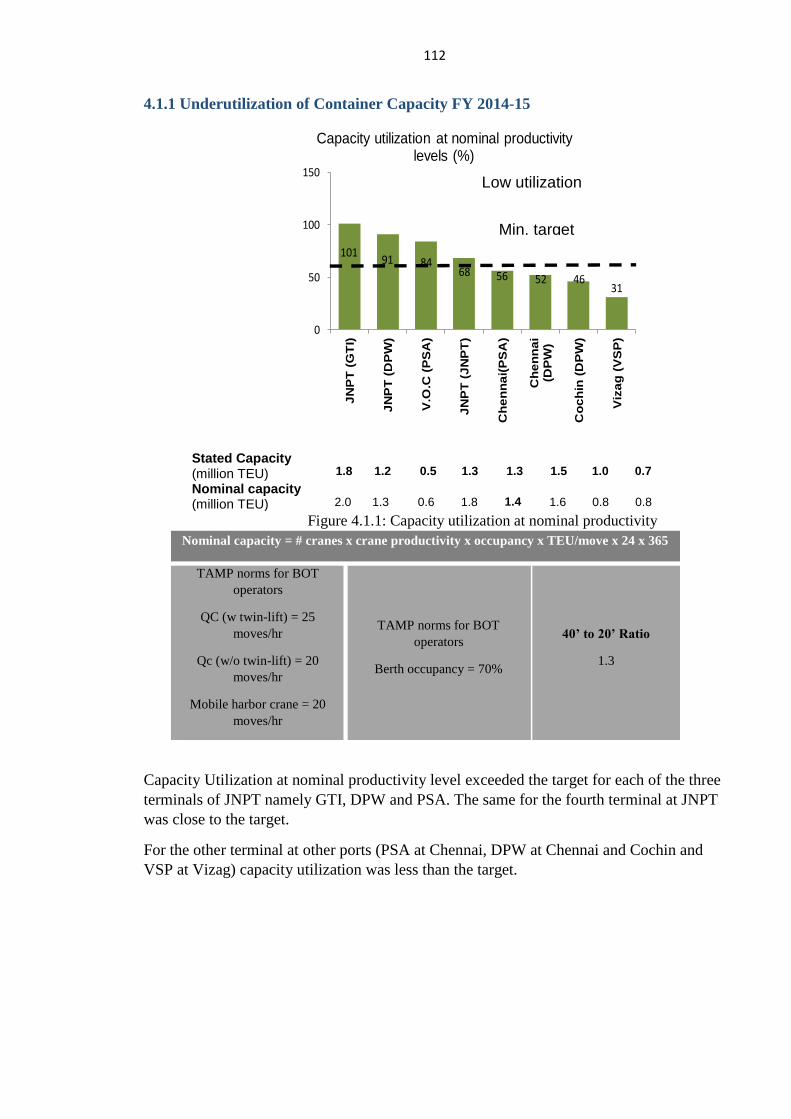
112
4.1.1 Underutilization of Container Capacity FY 2014-15
10191 84
68 56 52 4631
0
50
100
150
JN
PT
(G
TI)
JN
PT
(D
PW
)
V.O
.C (
PS
A)
JN
PT
(J
NP
T)
Ch
en
na
i(P
SA
)
Ch
en
na
i(D
PW
)
Co
ch
in (
DP
W)
Viz
ag
(V
SP
)
Capacity utilization at nominal productivity levels (%)
Stated Capacity (million TEU)
1.8
1.2
0.5
1.3
1.3
1.5
1.0
0.7
Nominal capacity (million TEU)
2.0
1.3
0.6
1.8
1.4
1.6
0.8
0.8
Figure 4.1.1: Capacity utilization at nominal productivity
Nominal capacity = # cranes x crane productivity x occupancy x TEU/move x 24 x 365
TAMP norms for BOT
operators
QC (w twin-lift) = 25
moves/hr
Qc (w/o twin-lift) = 20
moves/hr
Mobile harbor crane = 20
moves/hr
TAMP norms for BOT
operators
Berth occupancy = 70%
40’ to 20’ Ratio
1.3
Capacity Utilization at nominal productivity level exceeded the target for each of the three
terminals of JNPT namely GTI, DPW and PSA. The same for the fourth terminal at JNPT
was close to the target.
For the other terminal at other ports (PSA at Chennai, DPW at Chennai and Cochin and
VSP at Vizag) capacity utilization was less than the target.
Low utilization
Min. target
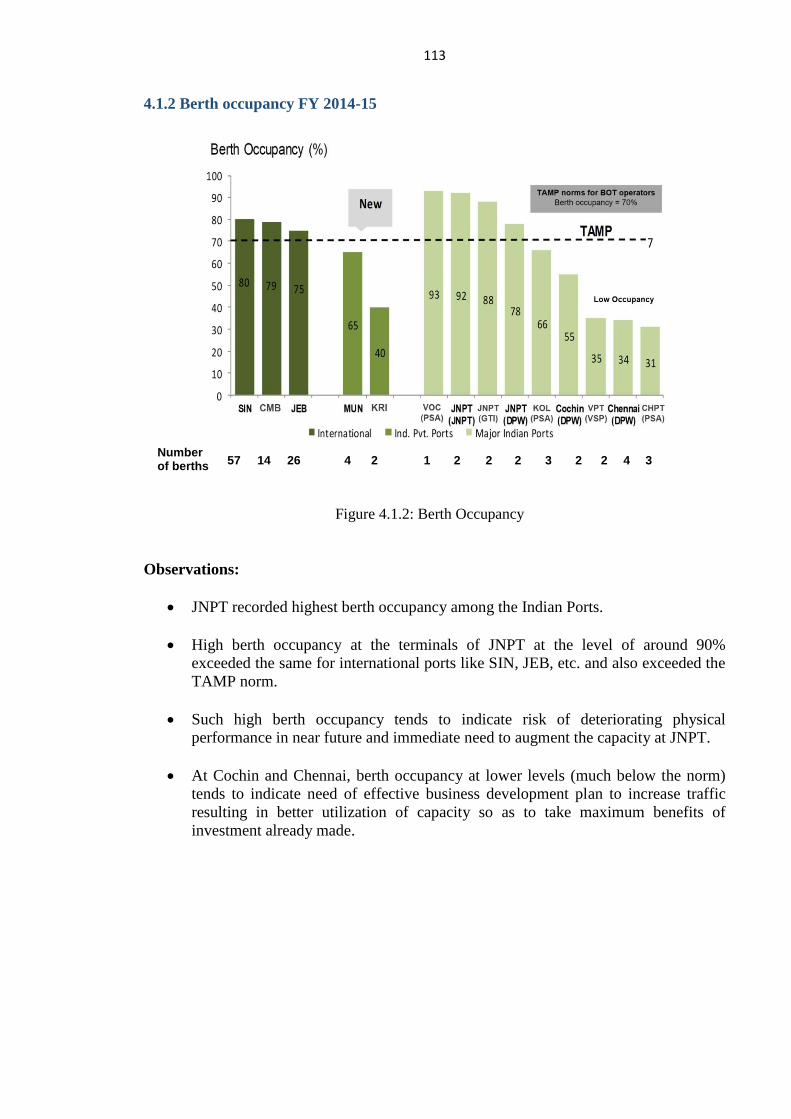
113
4.1.2 Berth occupancy FY 2014-15
Number of berths
57 14 26 4 2 1 2 2 2 3 2 2 4 3
Figure 4.1.2: Berth Occupancy
Observations:
JNPT recorded highest berth occupancy among the Indian Ports.
High berth occupancy at the terminals of JNPT at the level of around 90%
exceeded the same for international ports like SIN, JEB, etc. and also exceeded the
TAMP norm.
Such high berth occupancy tends to indicate risk of deteriorating physical
performance in near future and immediate need to augment the capacity at JNPT.
At Cochin and Chennai, berth occupancy at lower levels (much below the norm)
tends to indicate need of effective business development plan to increase traffic
resulting in better utilization of capacity so as to take maximum benefits of
investment already made.
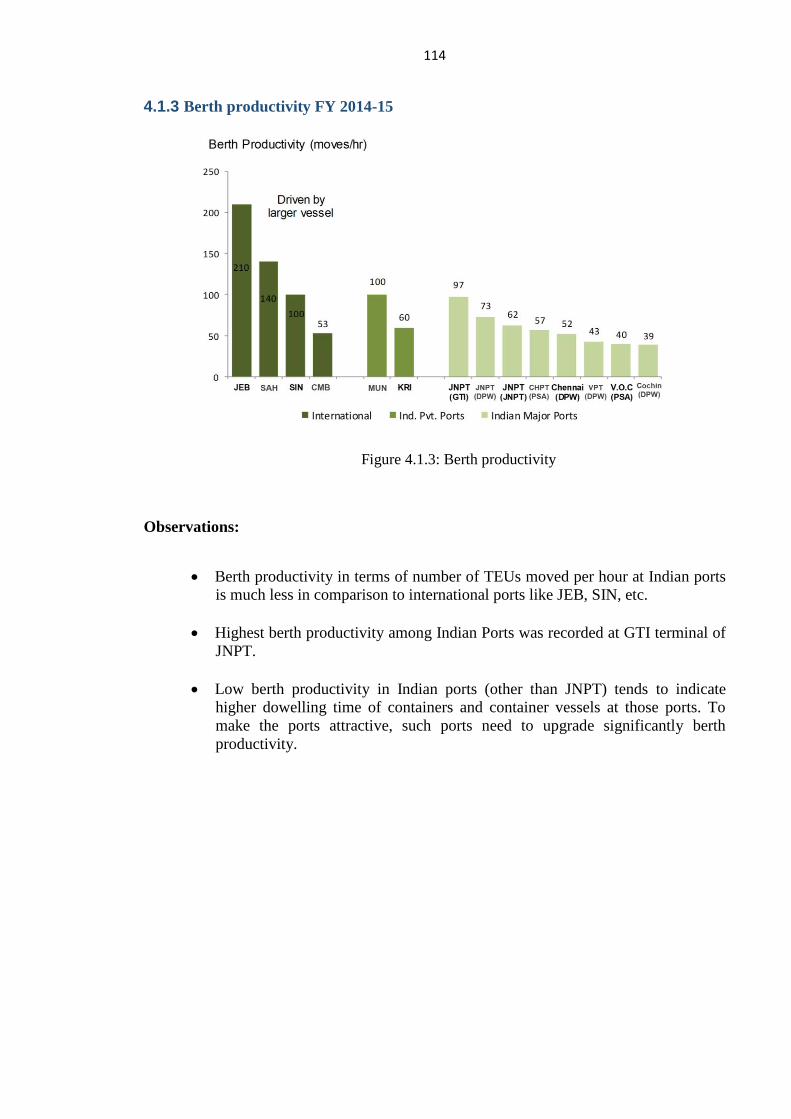
114
4.1.3 Berth productivity FY 2014-15
Figure 4.1.3: Berth productivity
Observations:
Berth productivity in terms of number of TEUs moved per hour at Indian ports
is much less in comparison to international ports like JEB, SIN, etc.
Highest berth productivity among Indian Ports was recorded at GTI terminal of
JNPT.
Low berth productivity in Indian ports (other than JNPT) tends to indicate
higher dowelling time of containers and container vessels at those ports. To
make the ports attractive, such ports need to upgrade significantly berth
productivity.
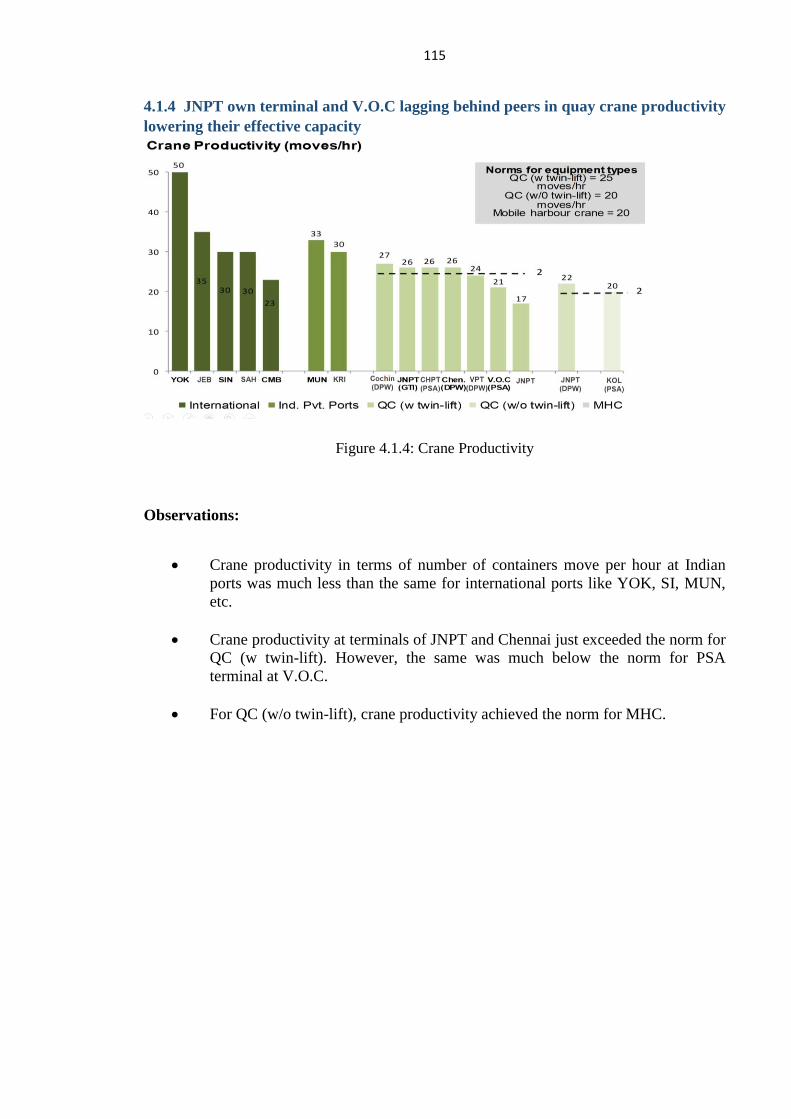
115
4.1.4 JNPT own terminal and V.O.C lagging behind peers in quay crane productivity
lowering their effective capacity
Figure 4.1.4: Crane Productivity
Observations:
Crane productivity in terms of number of containers move per hour at Indian
ports was much less than the same for international ports like YOK, SI, MUN,
etc.
Crane productivity at terminals of JNPT and Chennai just exceeded the norm for
QC (w twin-lift). However, the same was much below the norm for PSA
terminal at V.O.C.
For QC (w/o twin-lift), crane productivity achieved the norm for MHC.
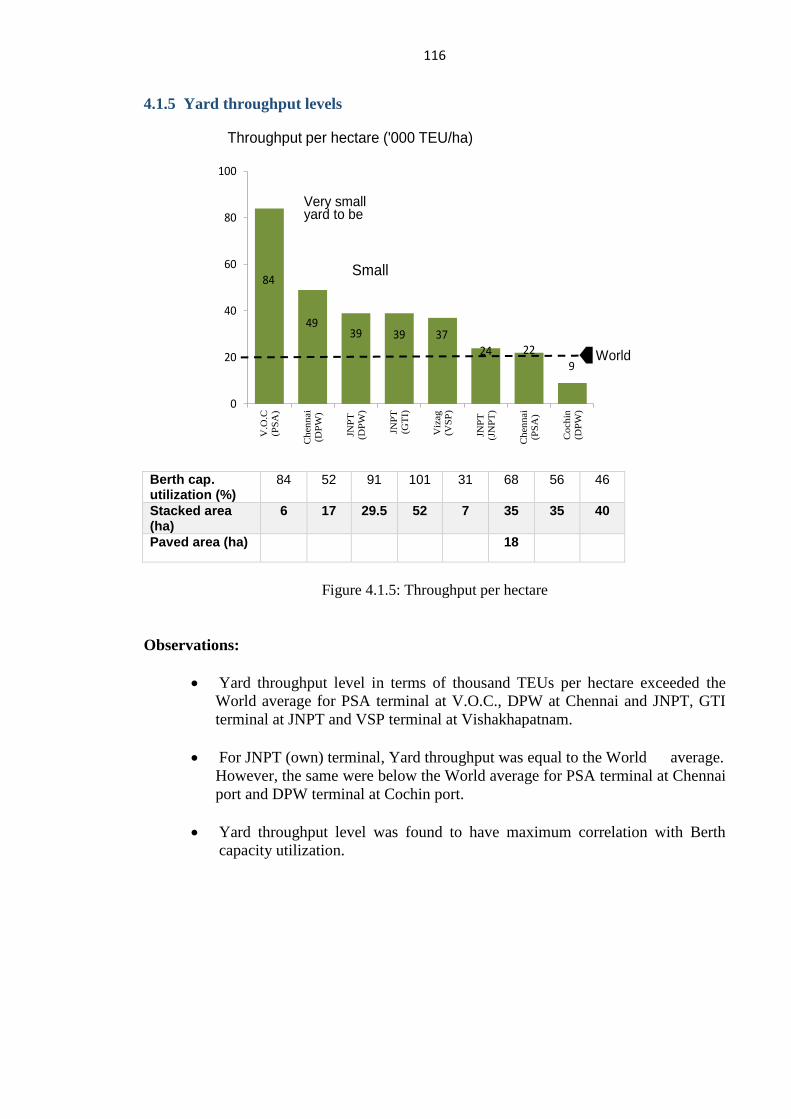
116
4.1.5 Yard throughput levels
84
4939 39 37
24 22
9
0
20
40
60
80
100
V.O
.C
(PS
A)
Ch
en
nai
(DP
W)
JNP
T
(DP
W)
JNP
T
(GT
I)
Viz
ag
(VS
P)
JNP
T
(JN
PT
)
Ch
en
nai
(PS
A)
Co
ch
in
(DP
W)
Throughput per hectare ('000 TEU/ha)
Very small yard to be
Small
World
Berth cap. utilization (%)
84 52 91 101 31 68 56 46
Stacked area (ha)
6 17 29.5 52 7 35 35 40
Paved area (ha) 18
Figure 4.1.5: Throughput per hectare
Observations:
Yard throughput level in terms of thousand TEUs per hectare exceeded the
World average for PSA terminal at V.O.C., DPW at Chennai and JNPT, GTI
terminal at JNPT and VSP terminal at Vishakhapatnam.
For JNPT (own) terminal, Yard throughput was equal to the World average.
However, the same were below the World average for PSA terminal at Chennai
port and DPW terminal at Cochin port.
Yard throughput level was found to have maximum correlation with Berth
capacity utilization.
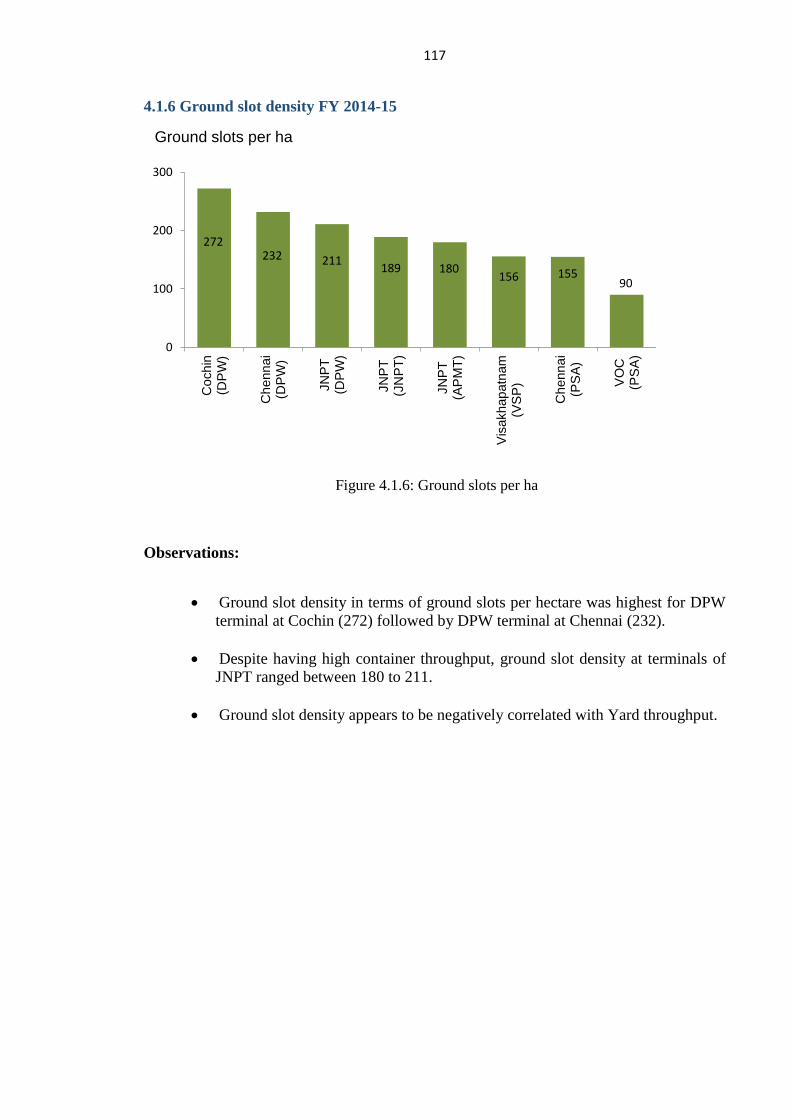
117
4.1.6 Ground slot density FY 2014-15
272232 211
189 180156 155
90
0
100
200
300
Co
ch
in(D
PW
)
Ch
enn
ai
(DP
W)
JN
PT
(DP
W)
JN
PT
(JN
PT
)
JN
PT
(AP
MT
)
Vis
akhap
atn
am
(VS
P)
Ch
enn
ai
(PS
A)
VO
C(P
SA
)
Ground slots per ha
Figure 4.1.6: Ground slots per ha
Observations:
Ground slot density in terms of ground slots per hectare was highest for DPW
terminal at Cochin (272) followed by DPW terminal at Chennai (232).
Despite having high container throughput, ground slot density at terminals of
JNPT ranged between 180 to 211.
Ground slot density appears to be negatively correlated with Yard throughput.
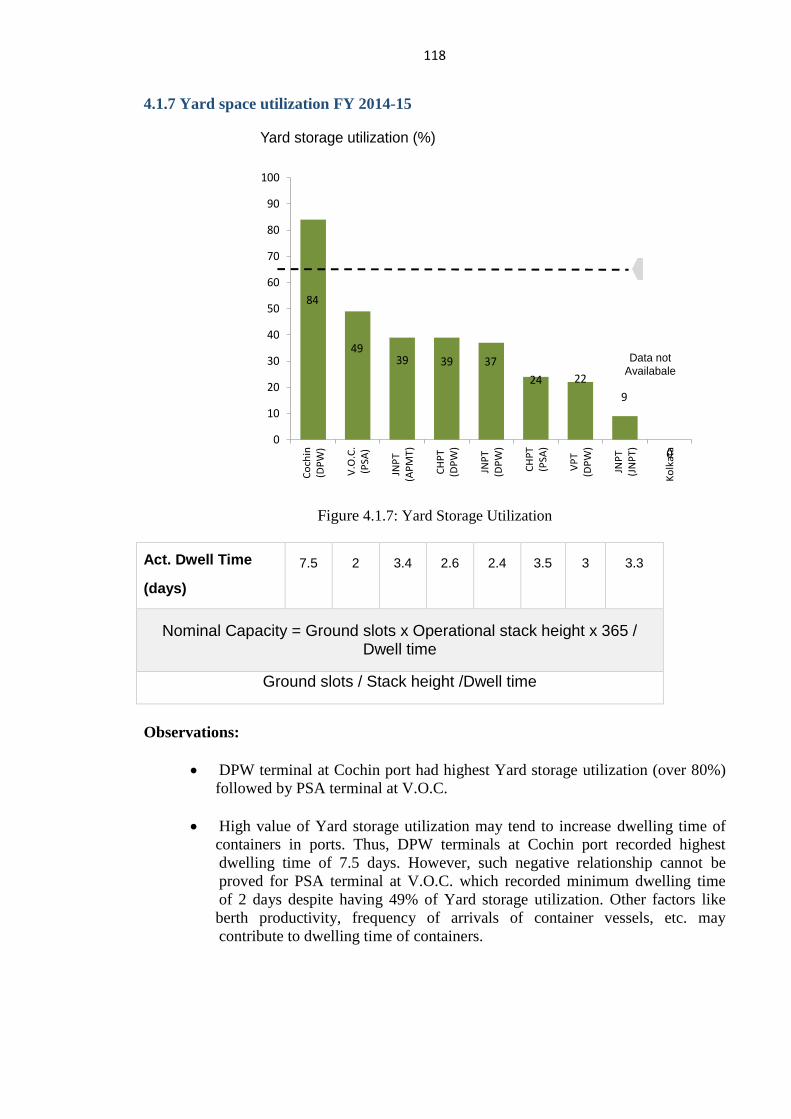
118
4.1.7 Yard space utilization FY 2014-15
84
4939 39 37
24 22
9
00
10
20
30
40
50
60
70
80
90
100
Co
chin
(DP
W)
V.O
.C.
(PSA
)
JNP
T(A
PM
T)
CH
PT
(DP
W)
JNP
T(D
PW
)
CH
PT
(PSA
)
VP
T(D
PW
)
JNP
T(J
NP
T)
Ko
lkat
a
Yard storage utilization (%)
Data not Availabale
Figure 4.1.7: Yard Storage Utilization
Act. Dwell Time
(days)
7.5 2 3.4 2.6 2.4 3.5 3 3.3
Nominal Capacity = Ground slots x Operational stack height x 365 / Dwell time
Ground slots / Stack height /Dwell time
Observations:
DPW terminal at Cochin port had highest Yard storage utilization (over 80%)
followed by PSA terminal at V.O.C.
High value of Yard storage utilization may tend to increase dwelling time of
containers in ports. Thus, DPW terminals at Cochin port recorded highest
dwelling time of 7.5 days. However, such negative relationship cannot be
proved for PSA terminal at V.O.C. which recorded minimum dwelling time
of 2 days despite having 49% of Yard storage utilization. Other factors like
berth productivity, frequency of arrivals of container vessels, etc. may
contribute to dwelling time of containers.
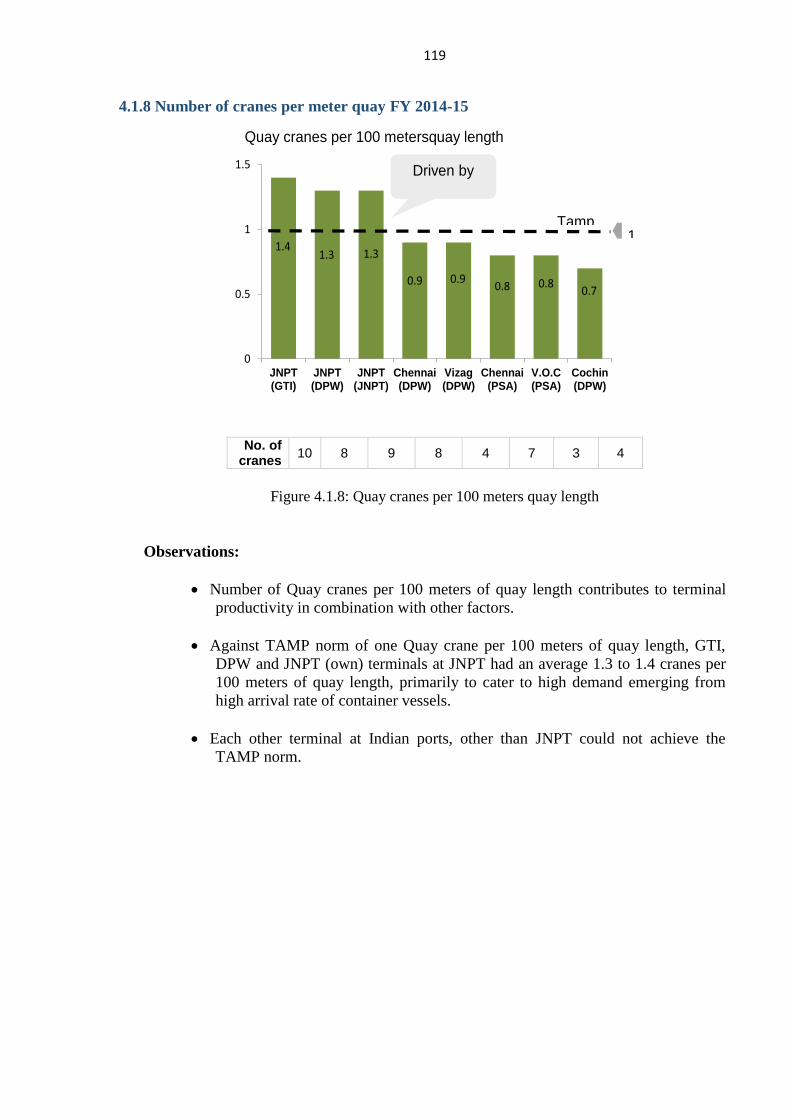
119
4.1.8 Number of cranes per meter quay FY 2014-15
1.41.3 1.3
0.9 0.90.8 0.8
0.7
0
0.5
1
1.5
JNPT(GTI)
JNPT(DPW)
JNPT(JNPT)
Chennai(DPW)
Vizag(DPW)
Chennai(PSA)
V.O.C(PSA)
Cochin(DPW)
Quay cranes per 100 metersquay length
Tamp
Driven by
1
No. of
cranes 10 8 9 8 4 7 3 4
Figure 4.1.8: Quay cranes per 100 meters quay length
Observations:
Number of Quay cranes per 100 meters of quay length contributes to terminal
productivity in combination with other factors.
Against TAMP norm of one Quay crane per 100 meters of quay length, GTI,
DPW and JNPT (own) terminals at JNPT had an average 1.3 to 1.4 cranes per
100 meters of quay length, primarily to cater to high demand emerging from
high arrival rate of container vessels.
Each other terminal at Indian ports, other than JNPT could not achieve the
TAMP norm.
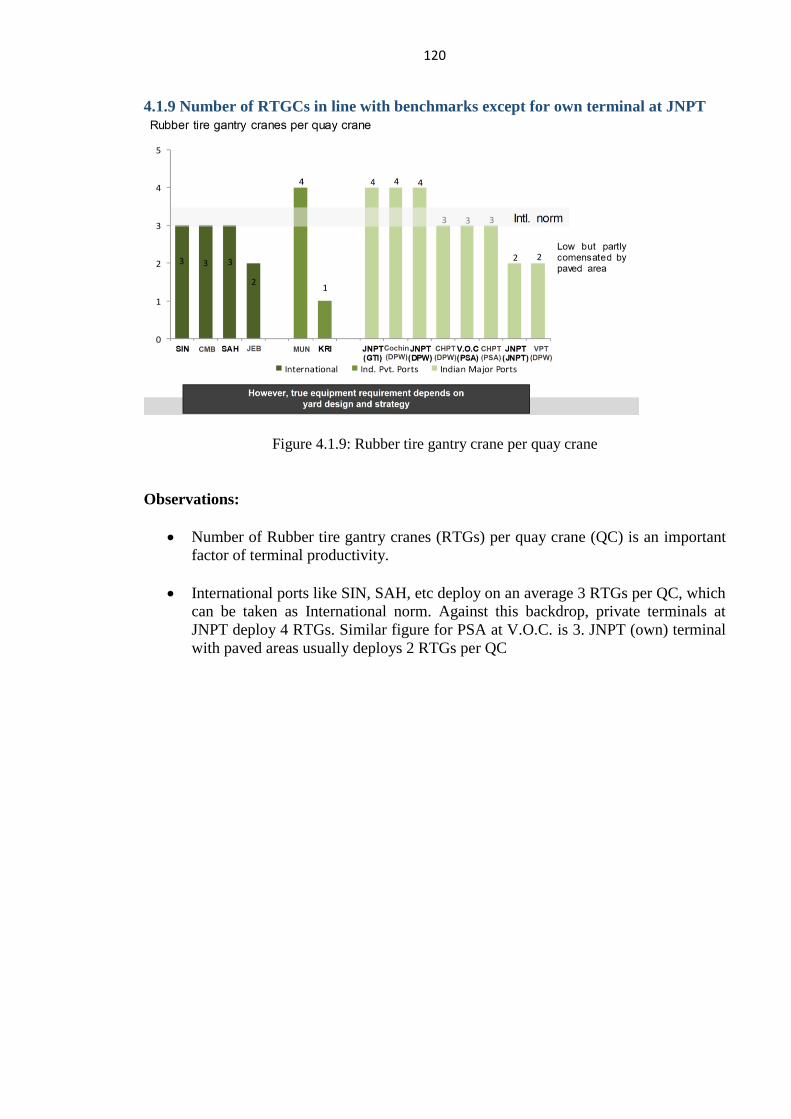
120
4.1.9 Number of RTGCs in line with benchmarks except for own terminal at JNPT
Figure 4.1.9: Rubber tire gantry crane per quay crane
Observations:
Number of Rubber tire gantry cranes (RTGs) per quay crane (QC) is an important
factor of terminal productivity.
International ports like SIN, SAH, etc deploy on an average 3 RTGs per QC, which
can be taken as International norm. Against this backdrop, private terminals at
JNPT deploy 4 RTGs. Similar figure for PSA at V.O.C. is 3. JNPT (own) terminal
with paved areas usually deploys 2 RTGs per QC
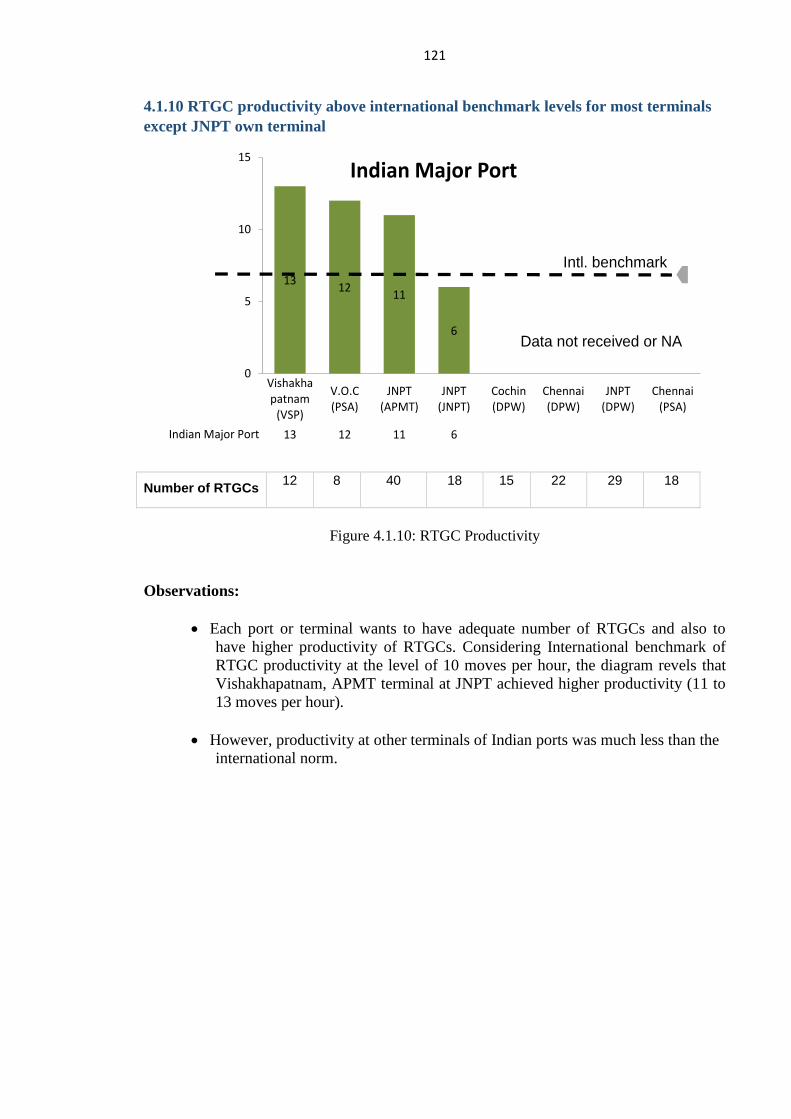
121
4.1.10 RTGC productivity above international benchmark levels for most terminals
except JNPT own terminal
1312
11
6
0
5
10
15
Vishakhapatnam
(VSP)
V.O.C(PSA)
JNPT(APMT)
JNPT(JNPT)
Cochin(DPW)
Chennai(DPW)
JNPT(DPW)
Chennai(PSA)
Indian Major Port 13 12 11 6
Indian Major Port
Intl. benchmark
Data not received or NA
Number of RTGCs 12 8 40 18 15 22 29 18
Figure 4.1.10: RTGC Productivity
Observations:
Each port or terminal wants to have adequate number of RTGCs and also to
have higher productivity of RTGCs. Considering International benchmark of
RTGC productivity at the level of 10 moves per hour, the diagram revels that
Vishakhapatnam, APMT terminal at JNPT achieved higher productivity (11 to
13 moves per hour).
However, productivity at other terminals of Indian ports was much less than the
international norm.
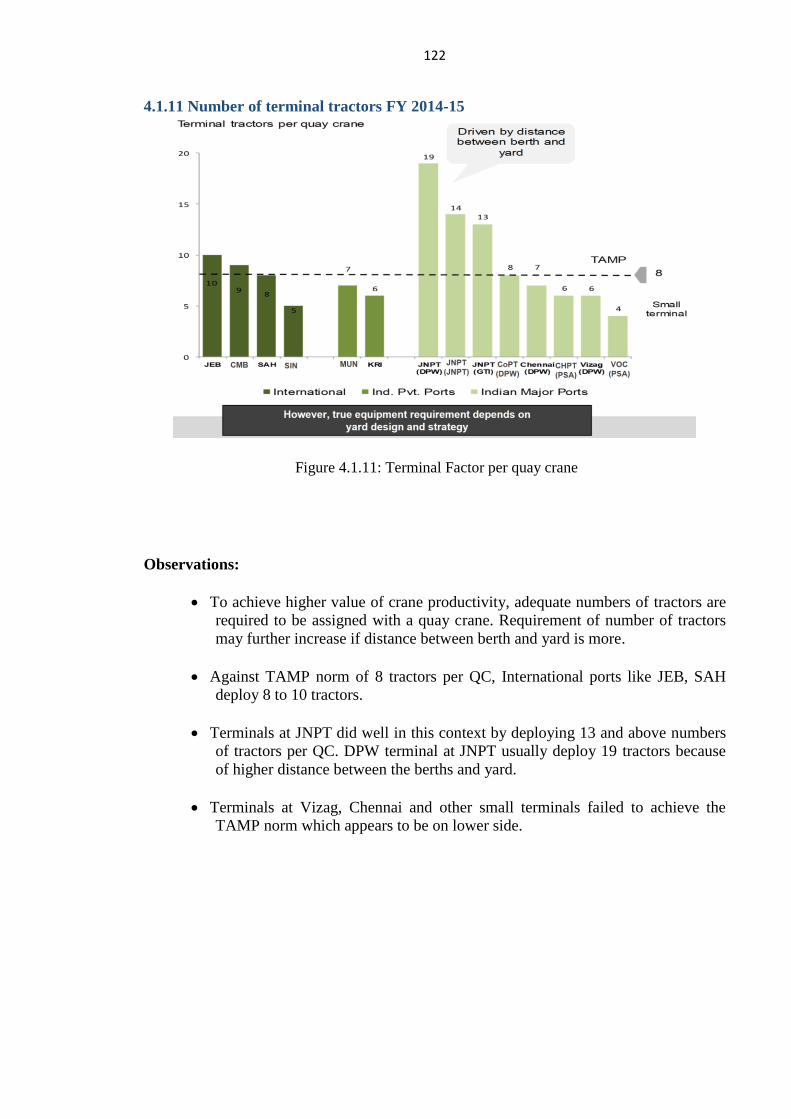
122
4.1.11 Number of terminal tractors FY 2014-15
Figure 4.1.11: Terminal Factor per quay crane
Observations:
To achieve higher value of crane productivity, adequate numbers of tractors are
required to be assigned with a quay crane. Requirement of number of tractors
may further increase if distance between berth and yard is more.
Against TAMP norm of 8 tractors per QC, International ports like JEB, SAH
deploy 8 to 10 tractors.
Terminals at JNPT did well in this context by deploying 13 and above numbers
of tractors per QC. DPW terminal at JNPT usually deploy 19 tractors because
of higher distance between the berths and yard.
Terminals at Vizag, Chennai and other small terminals failed to achieve the
TAMP norm which appears to be on lower side.
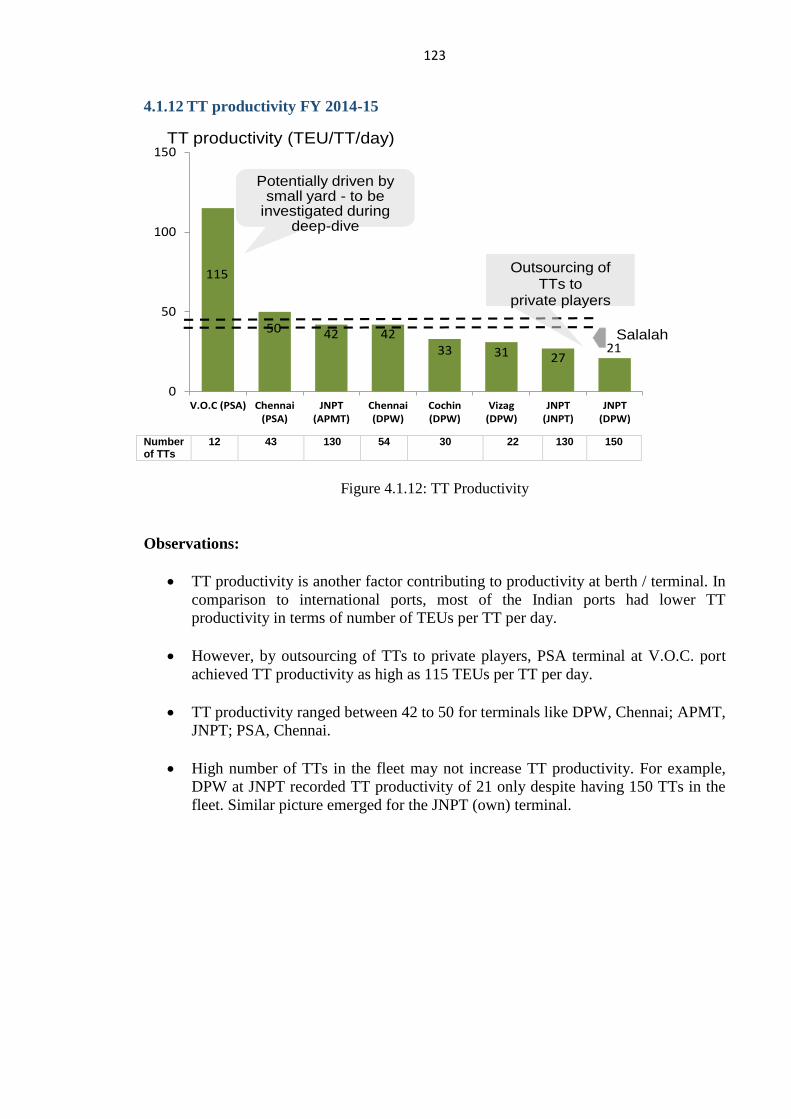
123
4.1.12 TT productivity FY 2014-15
115
50 42 4233 31 27
21
0
50
100
150
V.O.C (PSA) Chennai(PSA)
JNPT(APMT)
Chennai(DPW)
Cochin(DPW)
Vizag(DPW)
JNPT(JNPT)
JNPT(DPW)
TT productivity (TEU/TT/day)
Potentially driven by small yard - to be
investigated during deep-dive
Salalah
Outsourcing of TTs to
private players
Number of TTs
12 43 130 54 30 22 130 150
Figure 4.1.12: TT Productivity
Observations:
TT productivity is another factor contributing to productivity at berth / terminal. In
comparison to international ports, most of the Indian ports had lower TT
productivity in terms of number of TEUs per TT per day.
However, by outsourcing of TTs to private players, PSA terminal at V.O.C. port
achieved TT productivity as high as 115 TEUs per TT per day.
TT productivity ranged between 42 to 50 for terminals like DPW, Chennai; APMT,
JNPT; PSA, Chennai.
High number of TTs in the fleet may not increase TT productivity. For example,
DPW at JNPT recorded TT productivity of 21 only despite having 150 TTs in the
fleet. Similar picture emerged for the JNPT (own) terminal.
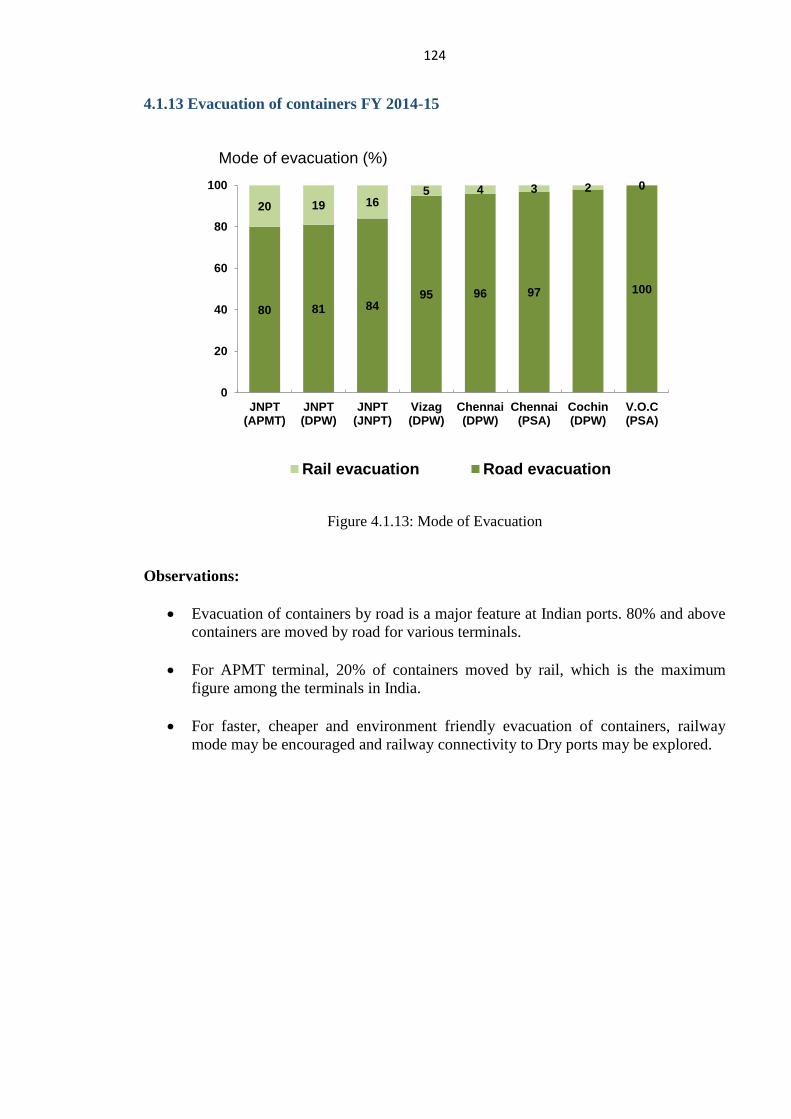
124
4.1.13 Evacuation of containers FY 2014-15
80 81 8495 96 97 100
20 19 165 4 3 2 0
0
20
40
60
80
100
JNPT(APMT)
JNPT(DPW)
JNPT(JNPT)
Vizag(DPW)
Chennai(DPW)
Chennai(PSA)
Cochin(DPW)
V.O.C(PSA)
Mode of evacuation (%)
Rail evacuation Road evacuation
Figure 4.1.13: Mode of Evacuation
Observations:
Evacuation of containers by road is a major feature at Indian ports. 80% and above
containers are moved by road for various terminals.
For APMT terminal, 20% of containers moved by rail, which is the maximum
figure among the terminals in India.
For faster, cheaper and environment friendly evacuation of containers, railway
mode may be encouraged and railway connectivity to Dry ports may be explored.
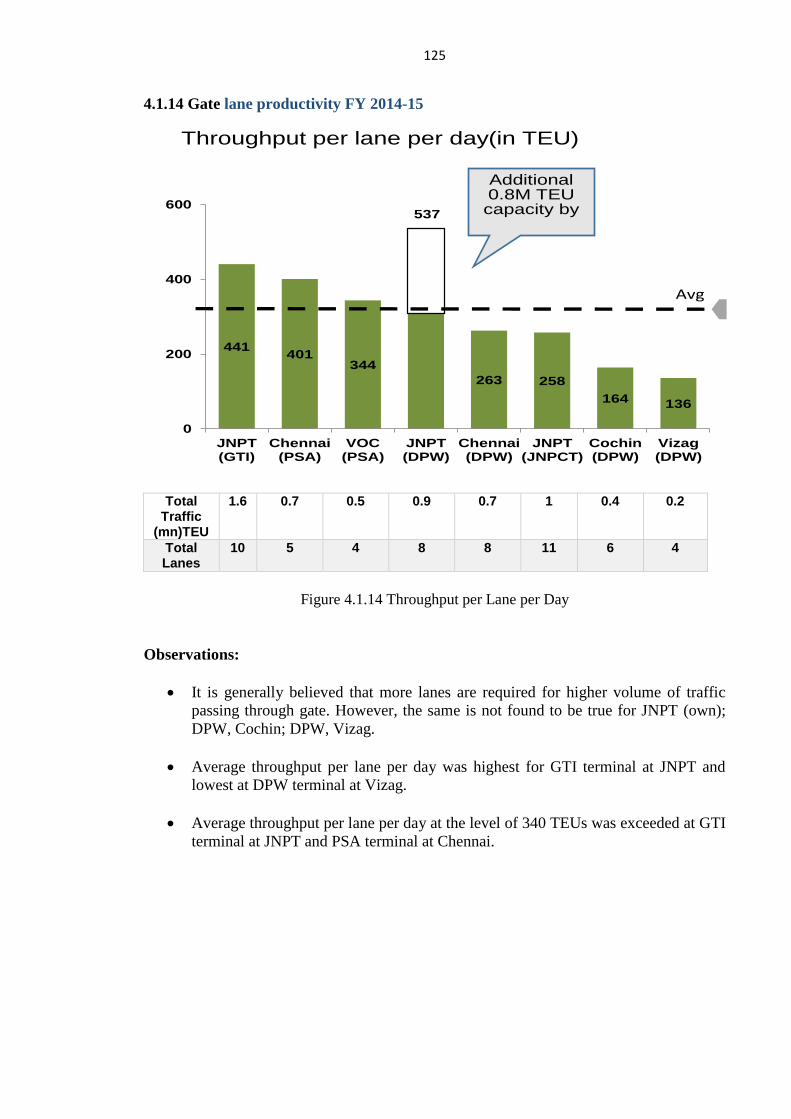
125
4.1.14 Gate lane productivity FY 2014-15
441401
344
263 258
164 136
537
0
200
400
600
JNPT(GTI)
Chennai(PSA)
VOC(PSA)
JNPT(DPW)
Chennai(DPW)
JNPT(JNPCT)
Cochin(DPW)
Vizag(DPW)
Throughput per lane per day(in TEU)
Avg
Additional0.8M TEU capacity by
Total
Traffic (mn)TEU
1.6 0.7 0.5 0.9 0.7 1 0.4 0.2
Total Lanes
10 5 4 8 8 11 6 4
Figure 4.1.14 Throughput per Lane per Day
Observations:
It is generally believed that more lanes are required for higher volume of traffic
passing through gate. However, the same is not found to be true for JNPT (own);
DPW, Cochin; DPW, Vizag.
Average throughput per lane per day was highest for GTI terminal at JNPT and
lowest at DPW terminal at Vizag.
Average throughput per lane per day at the level of 340 TEUs was exceeded at GTI
terminal at JNPT and PSA terminal at Chennai.
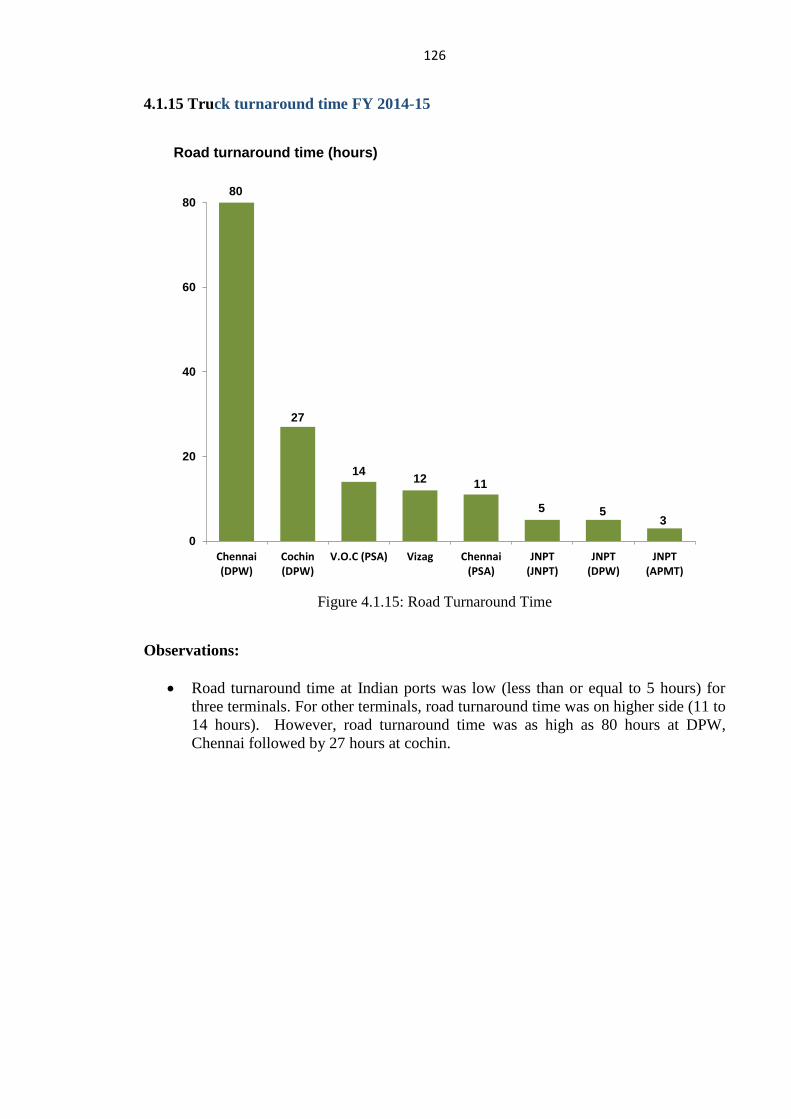
126
4.1.15 Truck turnaround time FY 2014-15
80
27
1412 11
5 53
0
20
40
60
80
Chennai(DPW)
Cochin(DPW)
V.O.C (PSA) Vizag Chennai(PSA)
JNPT(JNPT)
JNPT(DPW)
JNPT(APMT)
Road turnaround time (hours)
Figure 4.1.15: Road Turnaround Time
Observations:
Road turnaround time at Indian ports was low (less than or equal to 5 hours) for
three terminals. For other terminals, road turnaround time was on higher side (11 to
14 hours). However, road turnaround time was as high as 80 hours at DPW,
Chennai followed by 27 hours at cochin.
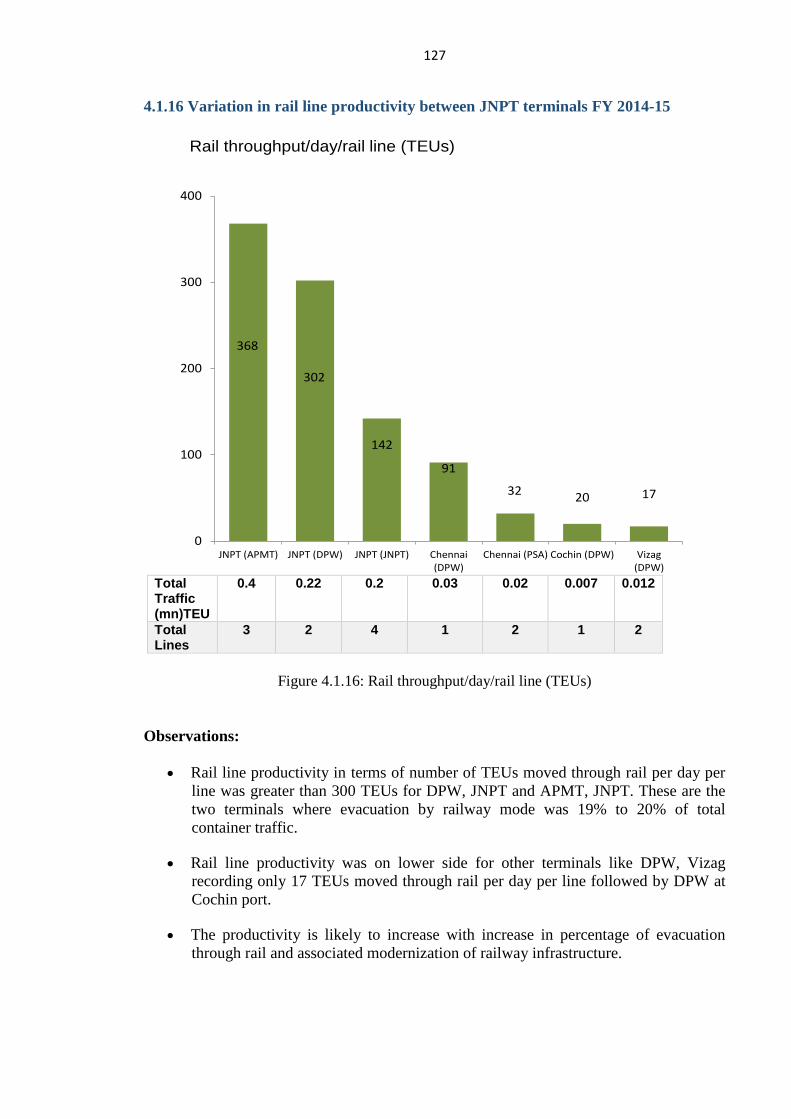
127
4.1.16 Variation in rail line productivity between JNPT terminals FY 2014-15
368
302
142
91
3220 17
0
100
200
300
400
JNPT (APMT) JNPT (DPW) JNPT (JNPT) Chennai(DPW)
Chennai (PSA) Cochin (DPW) Vizag(DPW)
Rail throughput/day/rail line (TEUs)
Total Traffic (mn)TEU
0.4 0.22 0.2 0.03 0.02 0.007 0.012
Total Lines
3 2 4 1 2 1 2
Figure 4.1.16: Rail throughput/day/rail line (TEUs)
Observations:
Rail line productivity in terms of number of TEUs moved through rail per day per
line was greater than 300 TEUs for DPW, JNPT and APMT, JNPT. These are the
two terminals where evacuation by railway mode was 19% to 20% of total
container traffic.
Rail line productivity was on lower side for other terminals like DPW, Vizag
recording only 17 TEUs moved through rail per day per line followed by DPW at
Cochin port.
The productivity is likely to increase with increase in percentage of evacuation
through rail and associated modernization of railway infrastructure.
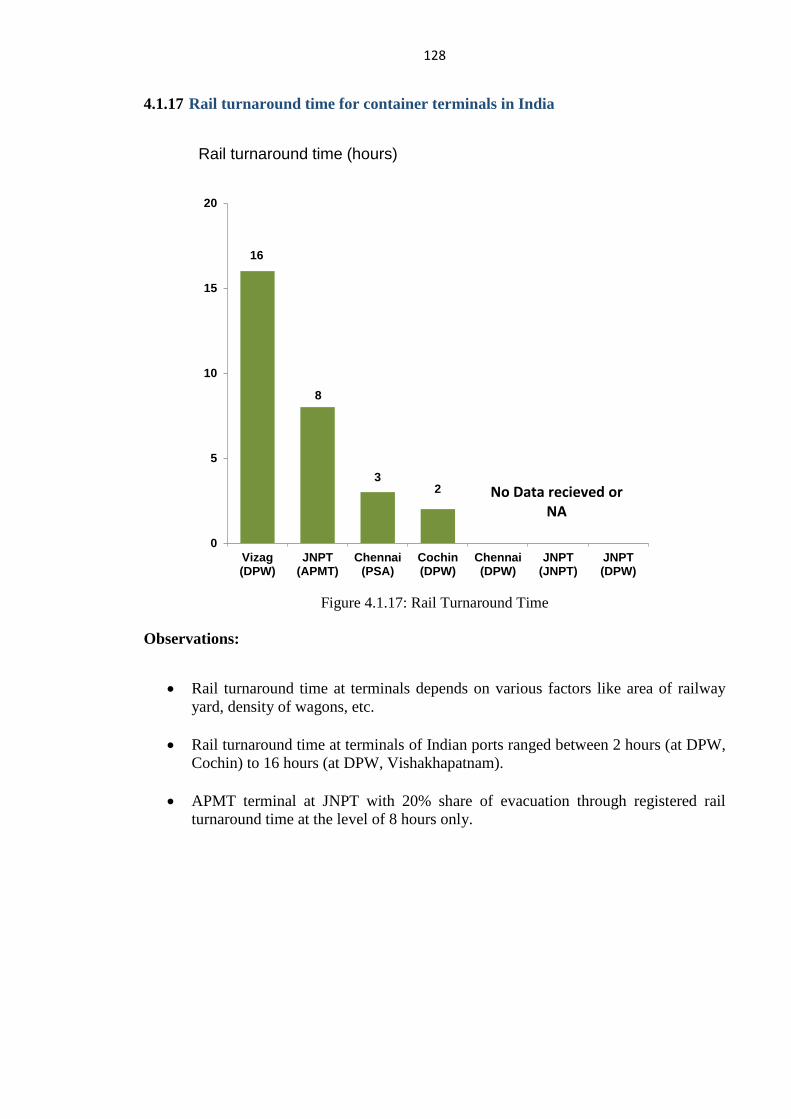
128
4.1.17 Rail turnaround time for container terminals in India
16
8
32
0
5
10
15
20
Vizag(DPW)
JNPT(APMT)
Chennai(PSA)
Cochin(DPW)
Chennai(DPW)
JNPT(JNPT)
JNPT(DPW)
Rail turnaround time (hours)
No Data recieved or NA
Figure 4.1.17: Rail Turnaround Time
Observations:
Rail turnaround time at terminals depends on various factors like area of railway
yard, density of wagons, etc.
Rail turnaround time at terminals of Indian ports ranged between 2 hours (at DPW,
Cochin) to 16 hours (at DPW, Vishakhapatnam).
APMT terminal at JNPT with 20% share of evacuation through registered rail
turnaround time at the level of 8 hours only.
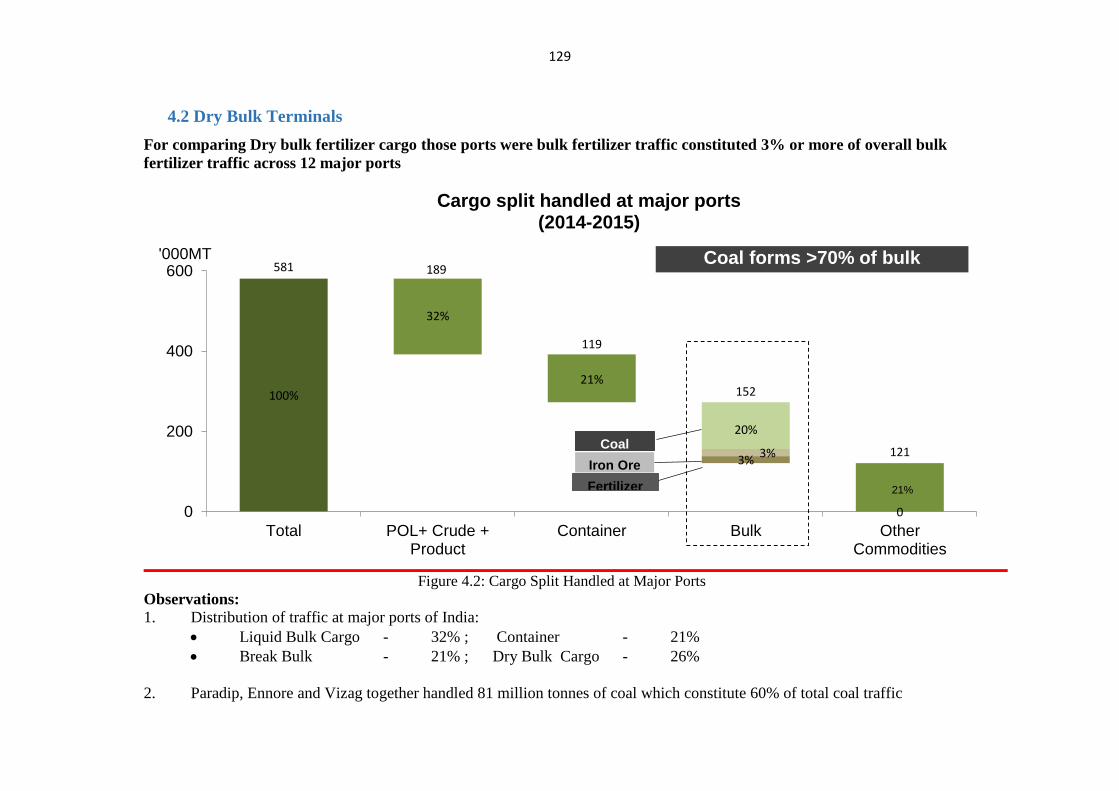
129
4.2 Dry Bulk Terminals
For comparing Dry bulk fertilizer cargo those ports were bulk fertilizer traffic constituted 3% or more of overall bulk
fertilizer traffic across 12 major ports
100%
0
581
32%
21%
20%
3%3%
152
189
119
121
0
200
400
600
Total POL+ Crude +Product
Container Bulk OtherCommodities
Cargo split handled at major ports(2014-2015)
21%
'000MT
Coal
Iron Ore
Fertilizer
Figure 4.2: Cargo Split Handled at Major Ports
Observations:
1. Distribution of traffic at major ports of India:
Liquid Bulk Cargo - 32% ; Container - 21%
Break Bulk - 21% ; Dry Bulk Cargo - 26%
2. Paradip, Ennore and Vizag together handled 81 million tonnes of coal which constitute 60% of total coal traffic
Coal forms >70% of bulk
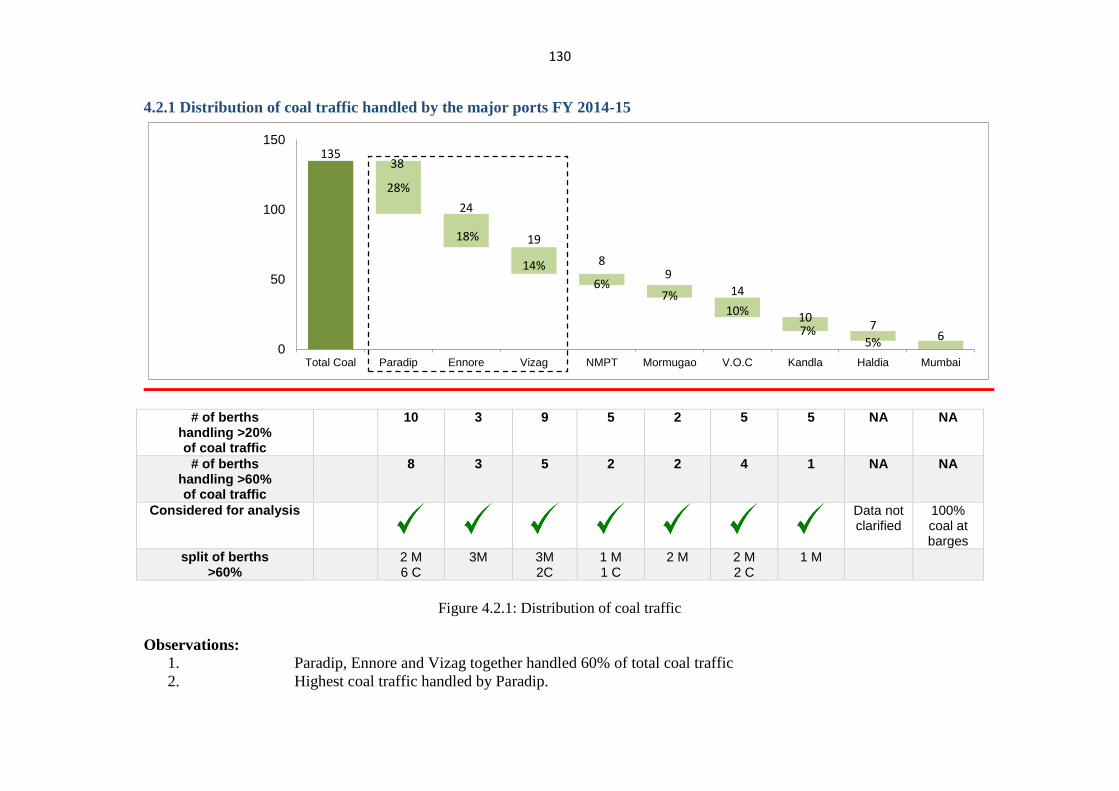
130
4.2.1 Distribution of coal traffic handled by the major ports FY 2014-15
13538
18%
14%
6%7%
10%
7%5%
28%
24
19
89
14
107
60
50
100
150
Total Coal Paradip Ennore Vizag NMPT Mormugao V.O.C Kandla Haldia Mumbai
# of berths
handling >20% of coal traffic
10 3 9 5 2 5 5 NA NA
# of berths handling >60% of coal traffic
8 3 5 2 2 4 1 NA NA
Considered for analysis
Data not clarified
100% coal at barges
split of berths >60%
2 M 6 C
3M 3M 2C
1 M 1 C
2 M 2 M 2 C
1 M
Figure 4.2.1: Distribution of coal traffic
Observations:
1. Paradip, Ennore and Vizag together handled 60% of total coal traffic
2. Highest coal traffic handled by Paradip.
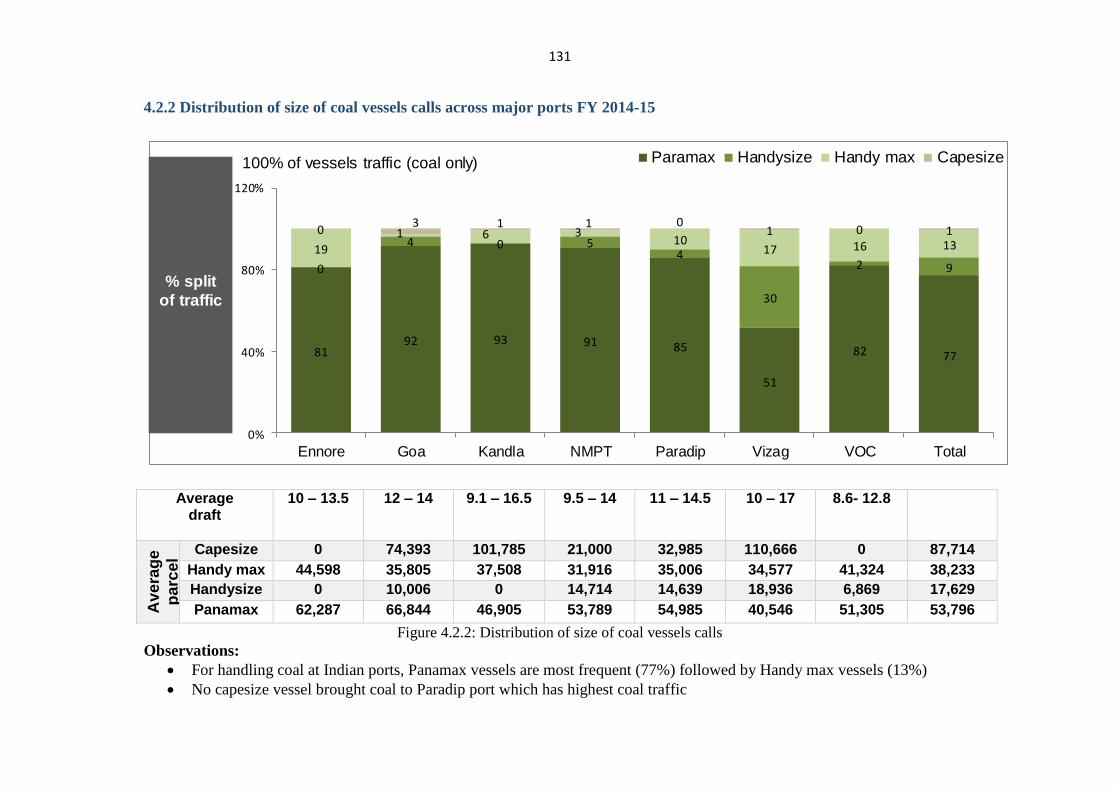
131
4.2.2 Distribution of size of coal vessels calls across major ports FY 2014-15
8192 93 91 85
51
82 77
0
4 0 54
30
2 9
191 6 3
1017 16 13
03 1 1 0
1 0 1
0%
40%
80%
120%
Ennore Goa Kandla NMPT Paradip Vizag VOC Total
100% of vessels traffic (coal only) Paramax Handysize Handy max Capesize
% split
of traffic
Average
draft
10 – 13.5 12 – 14 9.1 – 16.5 9.5 – 14 11 – 14.5 10 – 17 8.6- 12.8
Ave
rag
e
pa
rce
l
siz
e
Capesize 0 74,393 101,785 21,000 32,985 110,666 0 87,714
Handy max 44,598 35,805 37,508 31,916 35,006 34,577 41,324 38,233
Handysize 0 10,006 0 14,714 14,639 18,936 6,869 17,629
Panamax 62,287 66,844 46,905 53,789 54,985 40,546 51,305 53,796
Figure 4.2.2: Distribution of size of coal vessels calls
Observations:
For handling coal at Indian ports, Panamax vessels are most frequent (77%) followed by Handy max vessels (13%)
No capesize vessel brought coal to Paradip port which has highest coal traffic
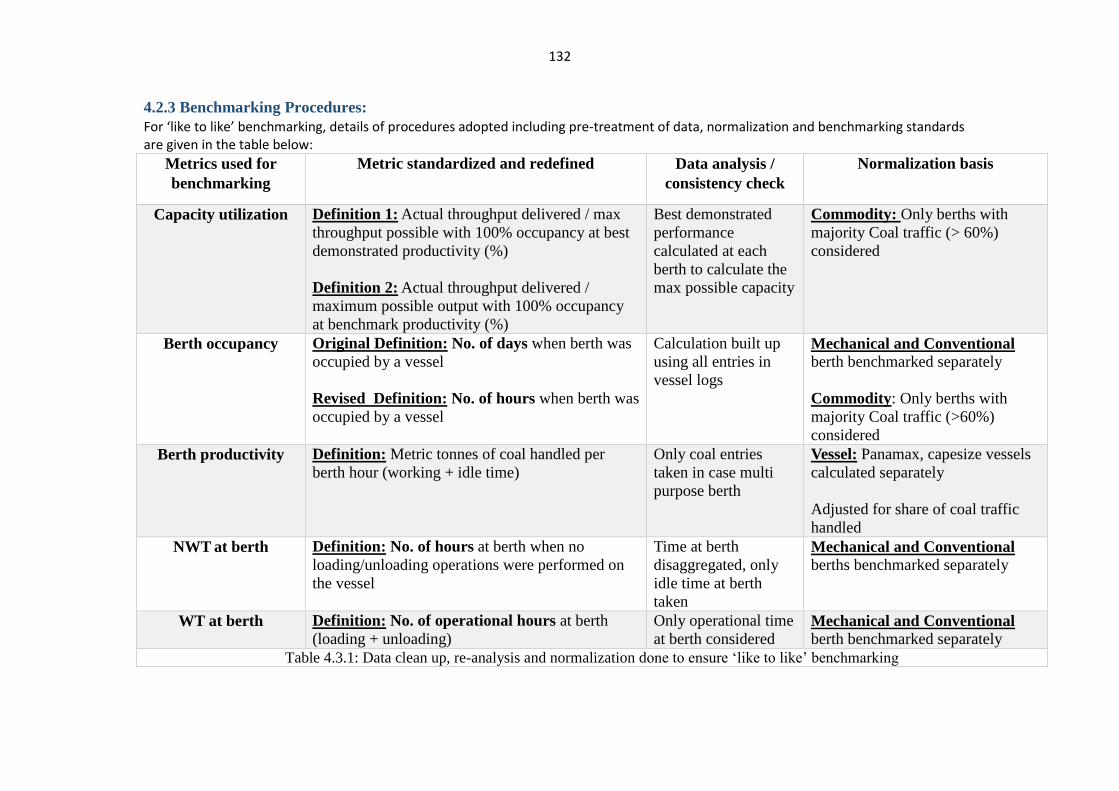
132
4.2.3 Benchmarking Procedures:
For ‘like to like’ benchmarking, details of procedures adopted including pre-treatment of data, normalization and benchmarking standards are given in the table below:
Metrics used for
benchmarking
Metric standardized and redefined Data analysis /
consistency check
Normalization basis
Capacity utilization Definition 1: Actual throughput delivered / max
throughput possible with 100% occupancy at best
demonstrated productivity (%)
Definition 2: Actual throughput delivered /
maximum possible output with 100% occupancy
at benchmark productivity (%)
Best demonstrated
performance
calculated at each
berth to calculate the
max possible capacity
Commodity: Only berths with
majority Coal traffic (> 60%)
considered
Berth occupancy Original Definition: No. of days when berth was
occupied by a vessel
Revised Definition: No. of hours when berth was
occupied by a vessel
Calculation built up
using all entries in
vessel logs
Mechanical and Conventional berth benchmarked separately
Commodity: Only berths with
majority Coal traffic (>60%)
considered
Berth productivity Definition: Metric tonnes of coal handled per
berth hour (working + idle time)
Only coal entries
taken in case multi
purpose berth
Vessel: Panamax, capesize vessels
calculated separately
Adjusted for share of coal traffic
handled
NWT at berth Definition: No. of hours at berth when no
loading/unloading operations were performed on
the vessel
Time at berth
disaggregated, only
idle time at berth
taken
Mechanical and Conventional berths benchmarked separately
WT at berth Definition: No. of operational hours at berth
(loading + unloading)
Only operational time
at berth considered Mechanical and Conventional berth benchmarked separately
Table 4.3.1: Data clean up, re-analysis and normalization done to ensure ‘like to like’ benchmarking
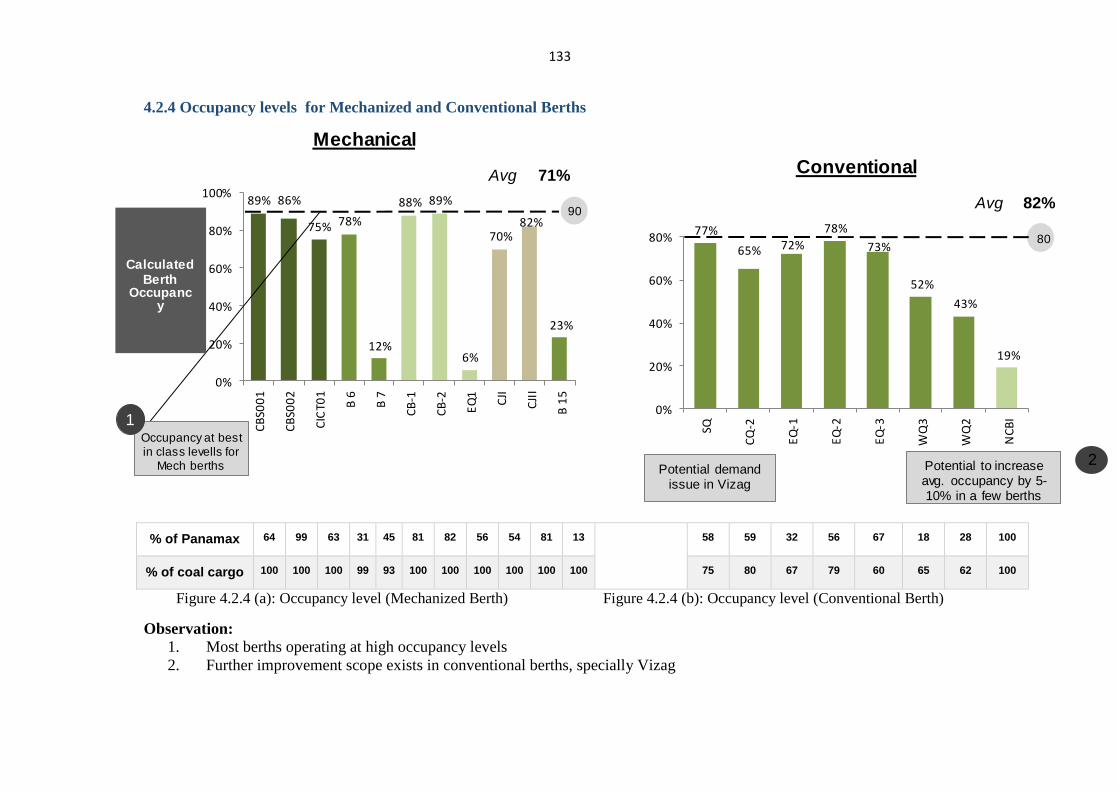
133
89% 86%
75% 78%
12%
23%
88% 89%
6%
70%82%
0%
20%
40%
60%
80%
100%
CB
S00
1
CB
S00
2
CIC
T01
B 6
B 7
CB
-1
CB
-2
EQ
1
CJI
CJI
I
B 1
5
Mechanical
Avg 71%
90
Occupancy at bestin class levells for
Mech berths
CalculatedBerth
Occupancy
1
77%
65% 72%
78%
73%
52%
43%
19%
0%
20%
40%
60%
80%
SQ
CQ
-2
EQ
-1
EQ
-2
EQ
-3
WQ
3
WQ
2
NC
BI
Conventional
Avg 82%
80
Potential demand issue in Vizag
Potential to increase avg. occupancy by 5-10% in a few berths
4.2.4 Occupancy levels for Mechanized and Conventional Berths
% of Panamax 64 99 63 31 45 81 82 56 54 81 13
58 59 32 56 67 18 28 100
% of coal cargo 100 100 100 99 93 100 100 100 100 100 100 75 80 67 79 60 65 62 100
Figure 4.2.4 (a): Occupancy level (Mechanized Berth) Figure 4.2.4 (b): Occupancy level (Conventional Berth)
Observation:
1. Most berths operating at high occupancy levels
2. Further improvement scope exists in conventional berths, specially Vizag
2
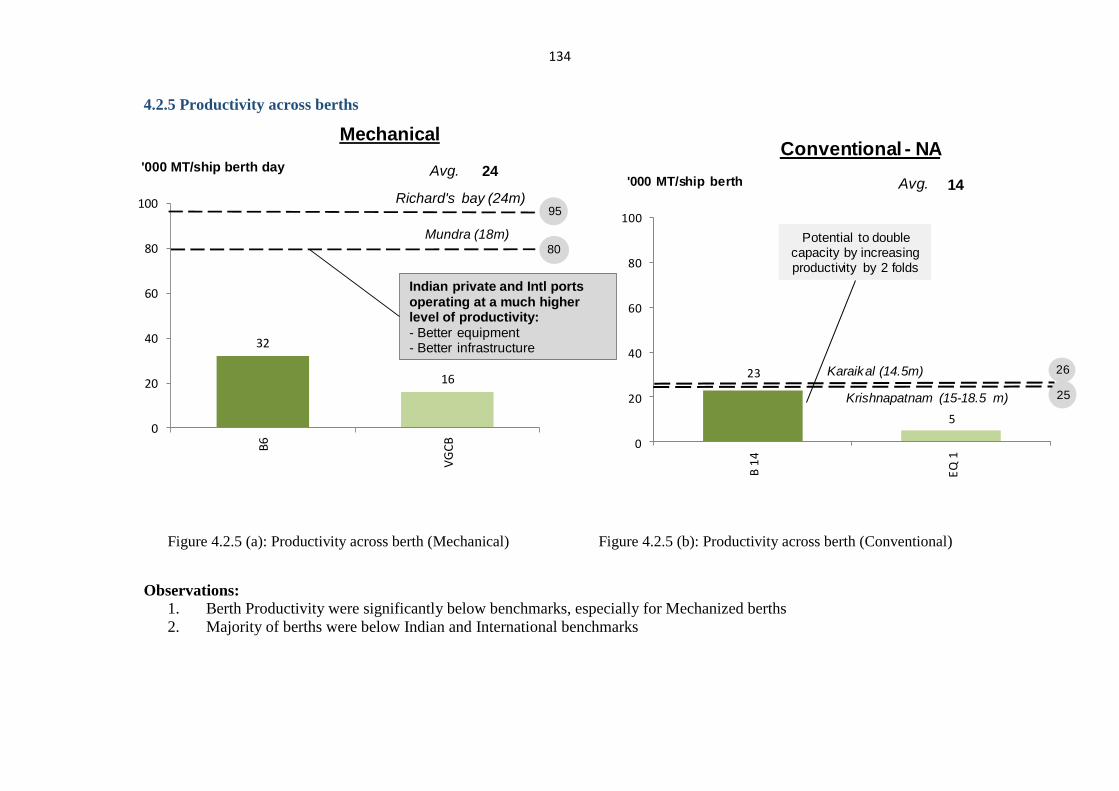
134
32
16
0
20
40
60
80
100
B6
VG
CB
Mechanical
'000 MT/ship berth day
95
Indian private and Intl ports operating at a much higher level of productivity:- Better equipment- Better infrastructure
80
Mundra (18m)
Richard's bay (24m)
Avg. 24
23
5
0
20
40
60
80
100
B 1
4
EQ
1
Conventional - NA
'000 MT/ship berth
26
Potential to double capacity by increasing productivity by 2 folds
25Krishnapatnam (15-18.5 m)
Karaikal (14.5m)
Avg. 14
4.2.5 Productivity across berths
Figure 4.2.5 (a): Productivity across berth (Mechanical) Figure 4.2.5 (b): Productivity across berth (Conventional)
Observations:
1. Berth Productivity were significantly below benchmarks, especially for Mechanized berths
2. Majority of berths were below Indian and International benchmarks
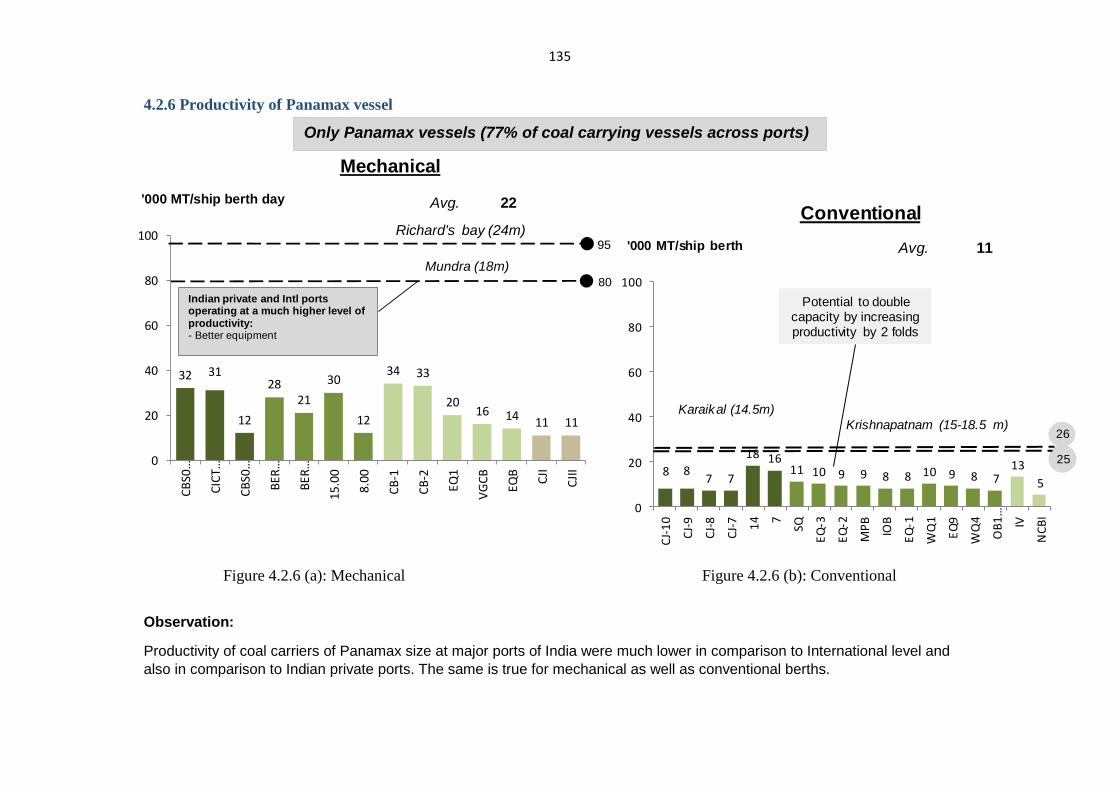
135
32 31
12
2821
30
12
34 33
2016 14
11 11
0
20
40
60
80
100
CB
S0…
CIC
T…
CB
S0…
BE
R…
BER
…
15
.00
8.00
CB
-1
CB
-2
EQ1
VG
CB
EQB
CJI
CJI
I
Mechanical
'000 MT/ship berth day
95
Indian private and Intl ports operating at a much higher level of productivity:- Better equipment
80
Mundra (18m)
Richard's bay (24m)
Avg. 22
8 87 7
18 1611 10 9 9 8 8 10 9 8 7
13
5
0
20
40
60
80
100
CJ-
10
CJ-
9
CJ-
8
CJ-
7 14 7
SQ
EQ
-3
EQ
-2
MP
B
IOB
EQ
-1
WQ
1
EQ
9
WQ
4
OB
1…
IV
NC
BI
Conventional
'000 MT/ship berth
26
Potential to double capacity by increasing productivity by 2 folds
25
Krishnapatnam (15-18.5 m)
Karaikal (14.5m)
Avg. 11
4.2.6 Productivity of Panamax vessel
Figure 4.2.6 (a): Mechanical Figure 4.2.6 (b): Conventional
Observation:
Productivity of coal carriers of Panamax size at major ports of India were much lower in comparison to International level and
also in comparison to Indian private ports. The same is true for mechanical as well as conventional berths.
Only Panamax vessels (77% of coal carrying vessels across ports)
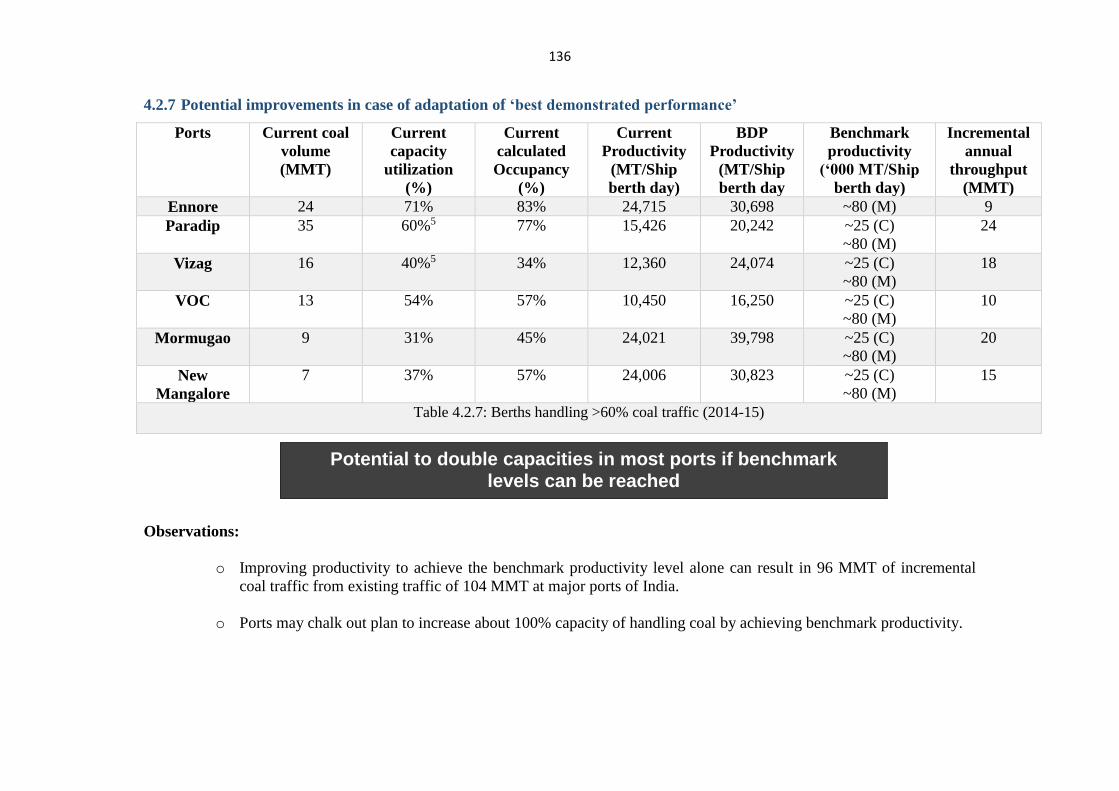
136
4.2.7 Potential improvements in case of adaptation of ‘best demonstrated performance’
Ports Current coal
volume
(MMT)
Current
capacity
utilization
(%)
Current
calculated
Occupancy
(%)
Current
Productivity
(MT/Ship
berth day)
BDP
Productivity
(MT/Ship
berth day
Benchmark
productivity
(‘000 MT/Ship
berth day)
Incremental
annual
throughput
(MMT)
Ennore 24 71% 83% 24,715 30,698 ~80 (M) 9
Paradip 35 60%5 77% 15,426 20,242 ~25 (C)
~80 (M)
24
Vizag 16 40%5 34% 12,360 24,074 ~25 (C)
~80 (M)
18
VOC 13 54% 57% 10,450 16,250 ~25 (C)
~80 (M)
10
Mormugao 9 31% 45% 24,021 39,798 ~25 (C)
~80 (M)
20
New
Mangalore
7 37% 57% 24,006 30,823 ~25 (C)
~80 (M)
15
Table 4.2.7: Berths handling >60% coal traffic (2014-15)
Observations:
o Improving productivity to achieve the benchmark productivity level alone can result in 96 MMT of incremental
coal traffic from existing traffic of 104 MMT at major ports of India.
o Ports may chalk out plan to increase about 100% capacity of handling coal by achieving benchmark productivity.
Potential to double capacities in most ports if benchmark levels can be reached
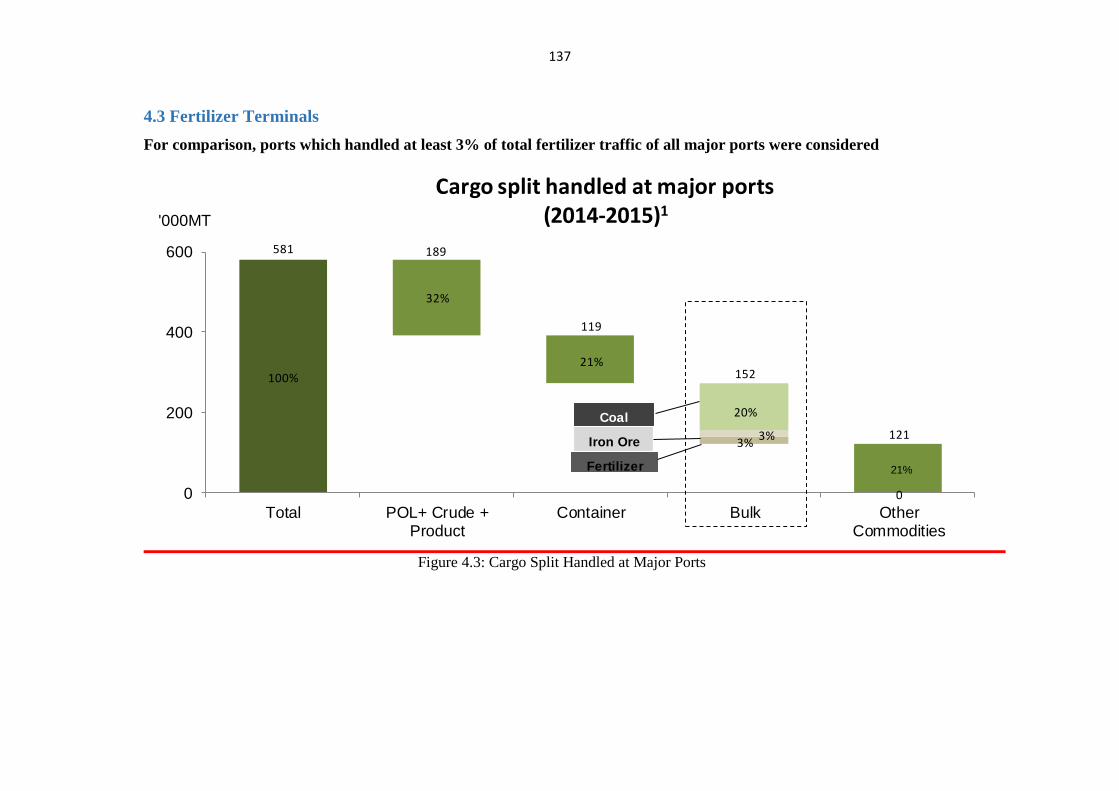
137
4.3 Fertilizer Terminals
For comparison, ports which handled at least 3% of total fertilizer traffic of all major ports were considered
100%
0
581
32%
21%
20%
3%3%
152
189
119
121
0
200
400
600
Total POL+ Crude +Product
Container Bulk OtherCommodities
Cargo split handled at major ports(2014-2015)1
21%
'000MT
Coal
Iron Ore
Fertilizer
Figure 4.3: Cargo Split Handled at Major Ports
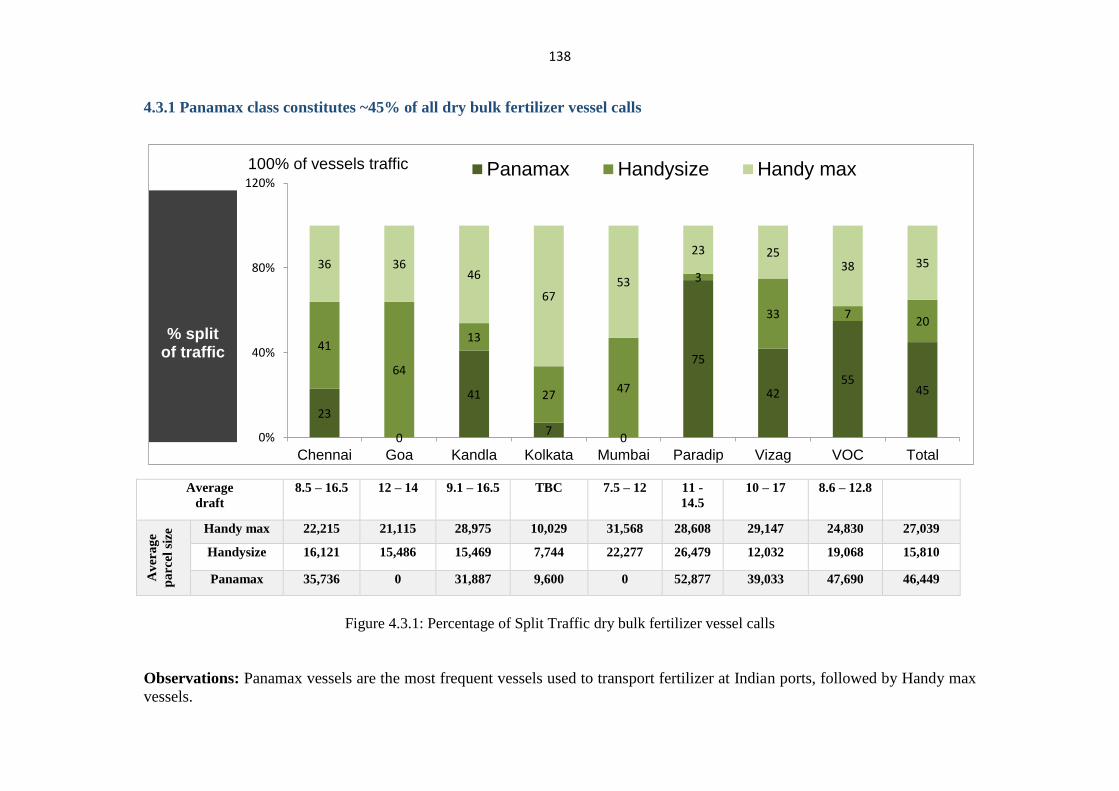
138
4.3.1 Panamax class constitutes ~45% of all dry bulk fertilizer vessel calls
23
0
41
70
75
4255
45
41
64
13
2747
3
33 720
36 3646
6753
23 2538 35
0%
40%
80%
120%
Chennai Goa Kandla Kolkata Mumbai Paradip Vizag VOC Total
100% of vessels traffic Panamax Handysize Handy max
% split of traffic
Average
draft
8.5 – 16.5 12 – 14 9.1 – 16.5 TBC 7.5 – 12 11 -
14.5
10 – 17 8.6 – 12.8
Av
era
ge
pa
rcel
siz
e Handy max 22,215 21,115 28,975 10,029 31,568 28,608 29,147 24,830 27,039
Handysize 16,121 15,486 15,469 7,744 22,277 26,479 12,032 19,068 15,810
Panamax 35,736 0 31,887 9,600 0 52,877 39,033 47,690 46,449
Figure 4.3.1: Percentage of Split Traffic dry bulk fertilizer vessel calls
Observations: Panamax vessels are the most frequent vessels used to transport fertilizer at Indian ports, followed by Handy max
vessels.
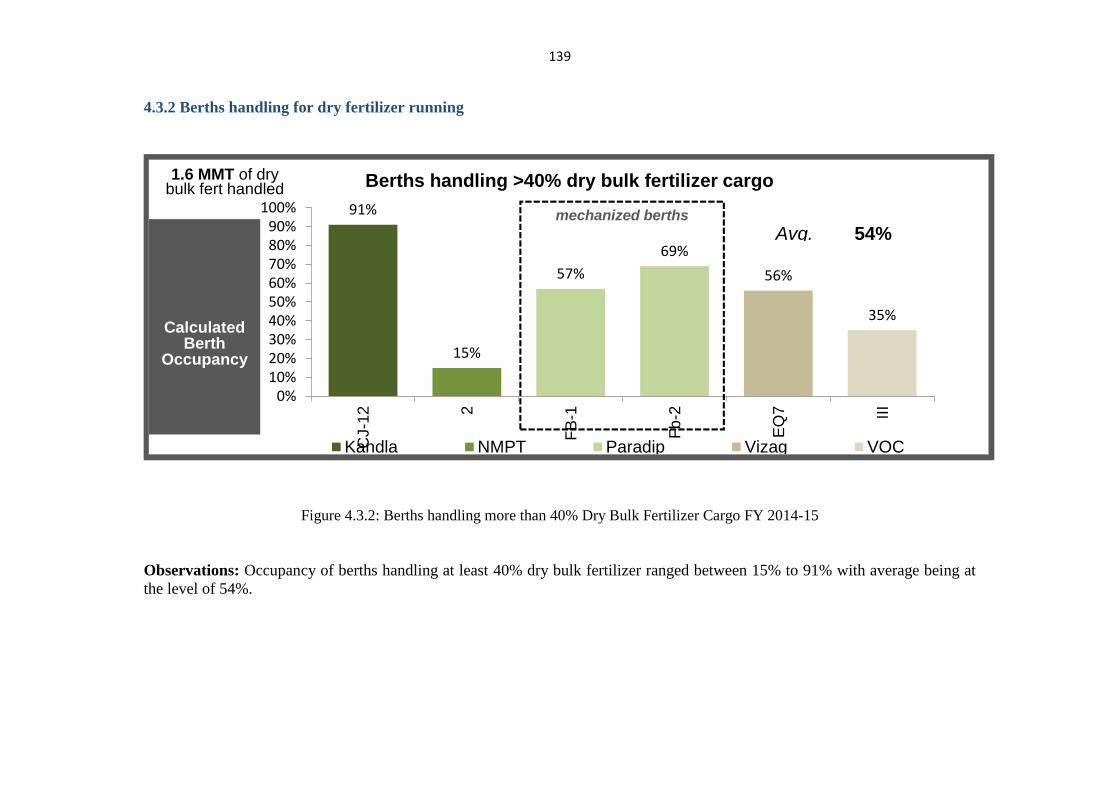
139
4.3.2 Berths handling for dry fertilizer running
91%
15%
57%
69%
56%
35%
0%10%20%30%40%50%60%70%80%90%
100%
CJ-1
2 2
FB
-1
Fb
-2
EQ
7 III
Berths handling >40% dry bulk fertilizer cargo
Kandla NMPT Paradip Vizag VOC
Avg. 54%
Calculated Berth
Calculated Berth
Occupancy
1.6 MMT of drybulk fert handled
mechanized berths
Figure 4.3.2: Berths handling more than 40% Dry Bulk Fertilizer Cargo FY 2014-15
Observations: Occupancy of berths handling at least 40% dry bulk fertilizer ranged between 15% to 91% with average being at
the level of 54%.
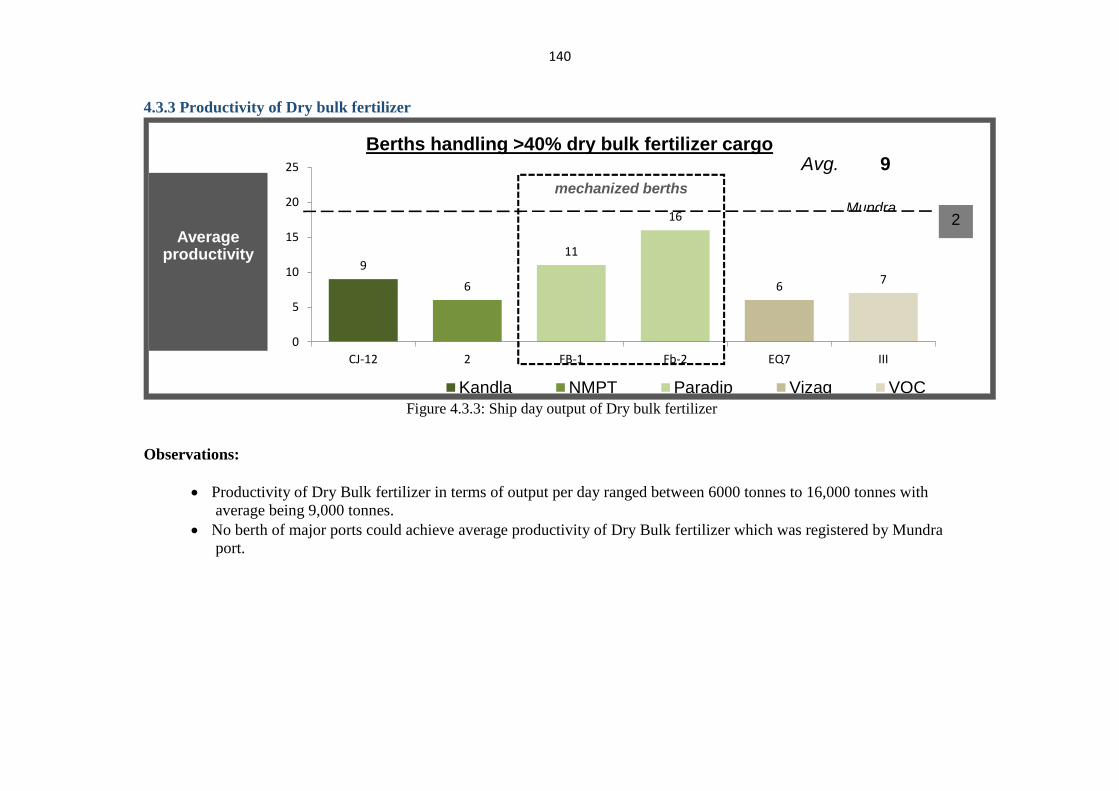
140
4.3.3 Productivity of Dry bulk fertilizer
9
6
11
16
67
0
5
10
15
20
25
CJ-12 2 FB-1 Fb-2 EQ7 III
Berths handling >40% dry bulk fertilizer cargo
Kandla NMPT Paradip Vizag VOC
Avg. 9
Calculated Berth
Average productivity
mechanized berths
2Mundra
Figure 4.3.3: Ship day output of Dry bulk fertilizer
Observations:
Productivity of Dry Bulk fertilizer in terms of output per day ranged between 6000 tonnes to 16,000 tonnes with
average being 9,000 tonnes.
No berth of major ports could achieve average productivity of Dry Bulk fertilizer which was registered by Mundra
port.
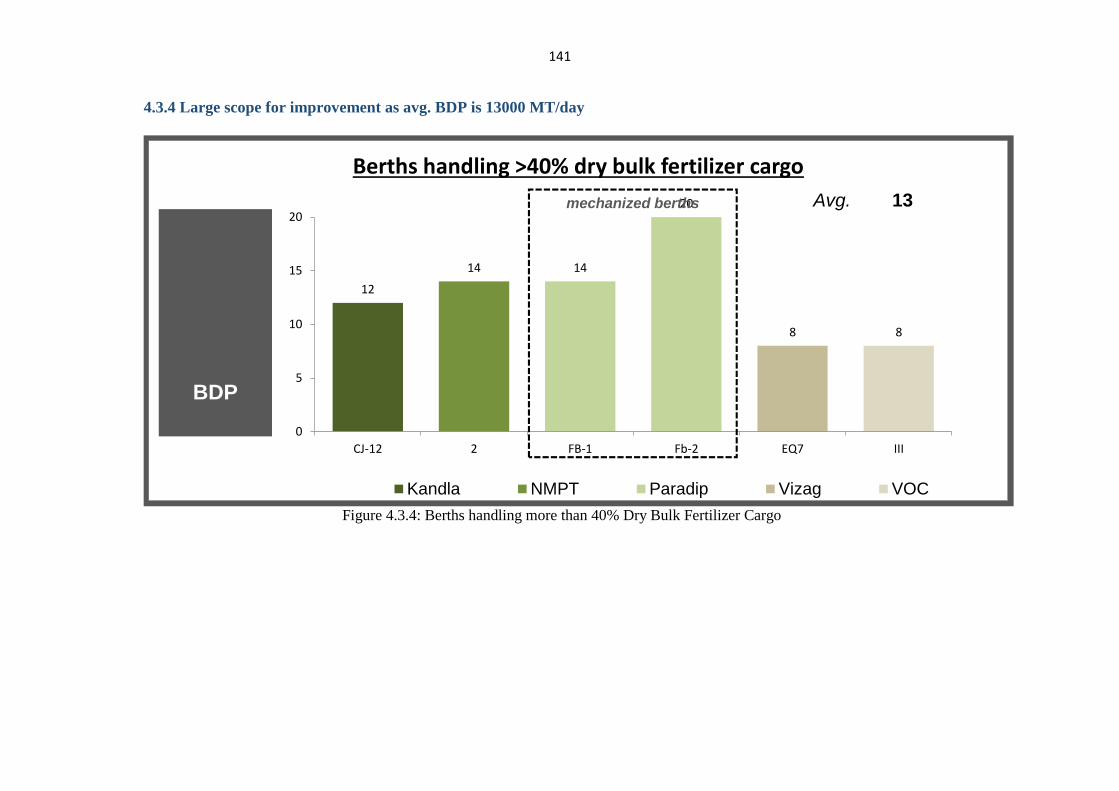
141
4.3.4 Large scope for improvement as avg. BDP is 13000 MT/day
12
14 14
20
8 8
0
5
10
15
20
CJ-12 2 FB-1 Fb-2 EQ7 III
Berths handling >40% dry bulk fertilizer cargo
Kandla NMPT Paradip Vizag VOC
Avg. 13
Calculated Berth
Occupancy
BDP
mechanized berths
Figure 4.3.4: Berths handling more than 40% Dry Bulk Fertilizer Cargo
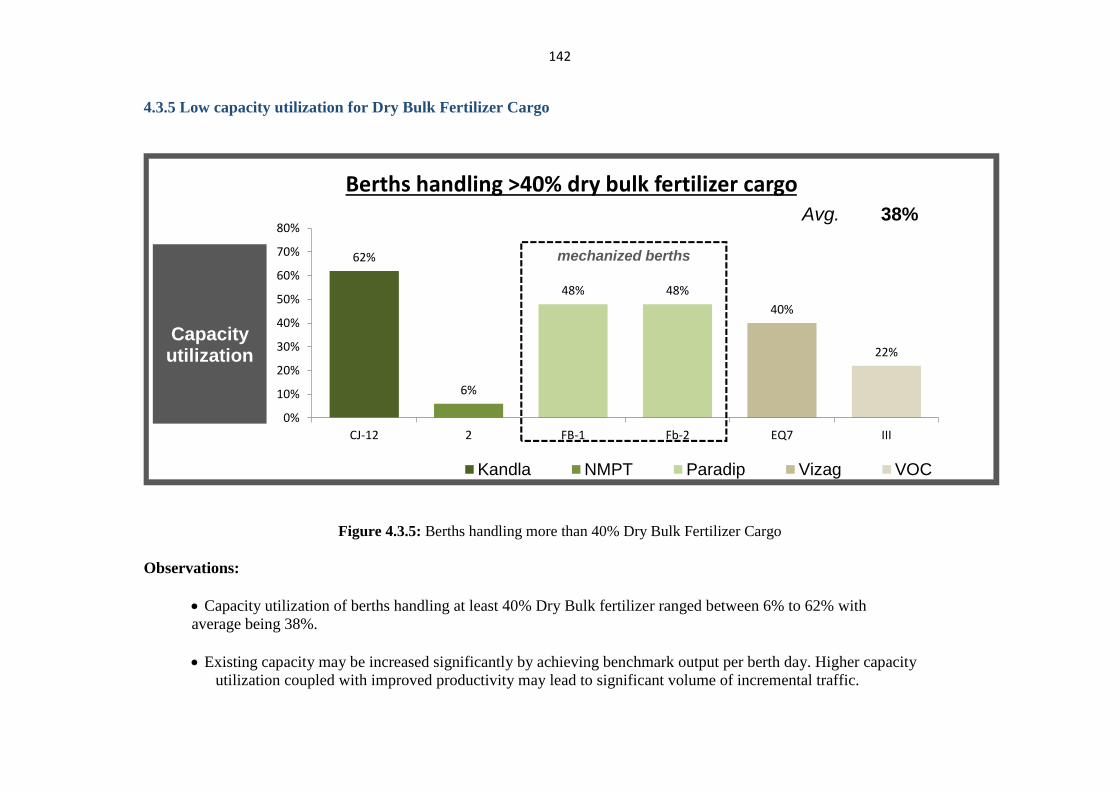
142
4.3.5 Low capacity utilization for Dry Bulk Fertilizer Cargo
62%
6%
48% 48%
40%
22%
0%
10%
20%
30%
40%
50%
60%
70%
80%
CJ-12 2 FB-1 Fb-2 EQ7 III
Berths handling >40% dry bulk fertilizer cargo
Kandla NMPT Paradip Vizag VOC
Avg. 38%
Calculated Berth
Occupancy
Capacity utilization
mechanized berths
Figure 4.3.5: Berths handling more than 40% Dry Bulk Fertilizer Cargo
Observations:
Capacity utilization of berths handling at least 40% Dry Bulk fertilizer ranged between 6% to 62% with
average being 38%.
Existing capacity may be increased significantly by achieving benchmark output per berth day. Higher capacity
utilization coupled with improved productivity may lead to significant volume of incremental traffic.
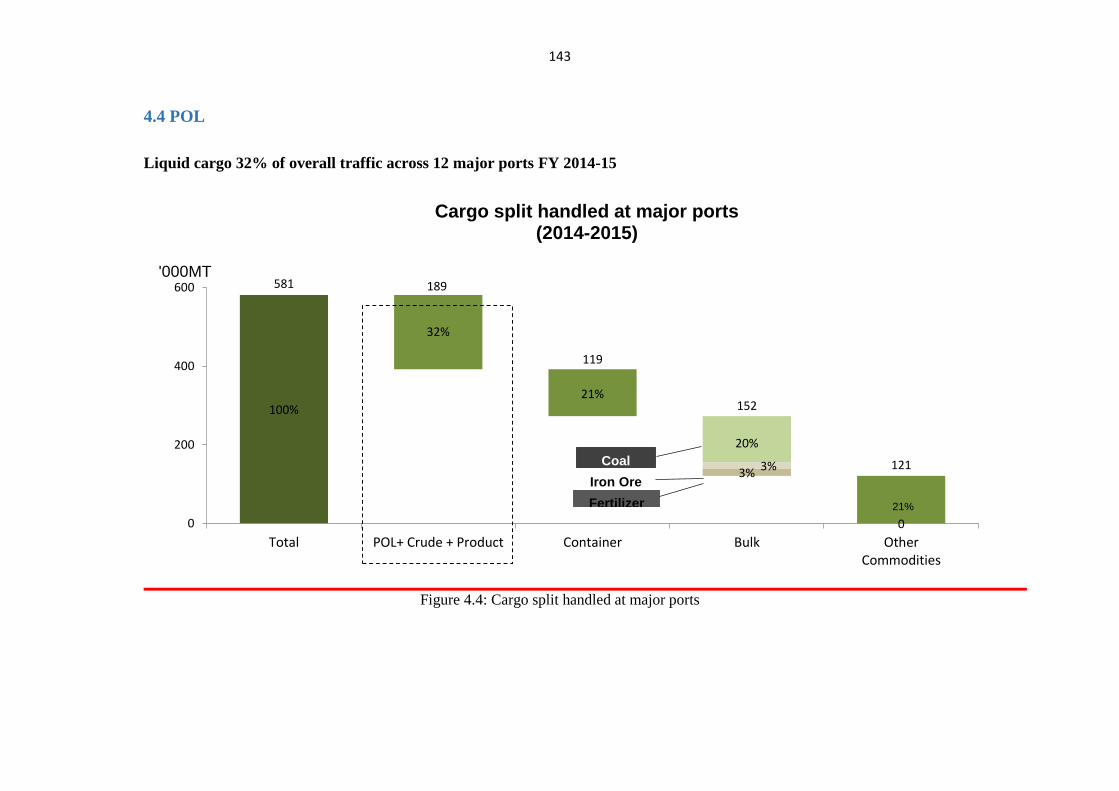
143
4.4 POL
Liquid cargo 32% of overall traffic across 12 major ports FY 2014-15
100%
0
581
32%
21%
20%
3%3%
152
189
119
121
0
200
400
600
Total POL+ Crude + Product Container Bulk OtherCommodities
Cargo split handled at major ports(2014-2015)
21%
'000MT
Coal
Iron Ore
Fertilizer
Figure 4.4: Cargo split handled at major ports
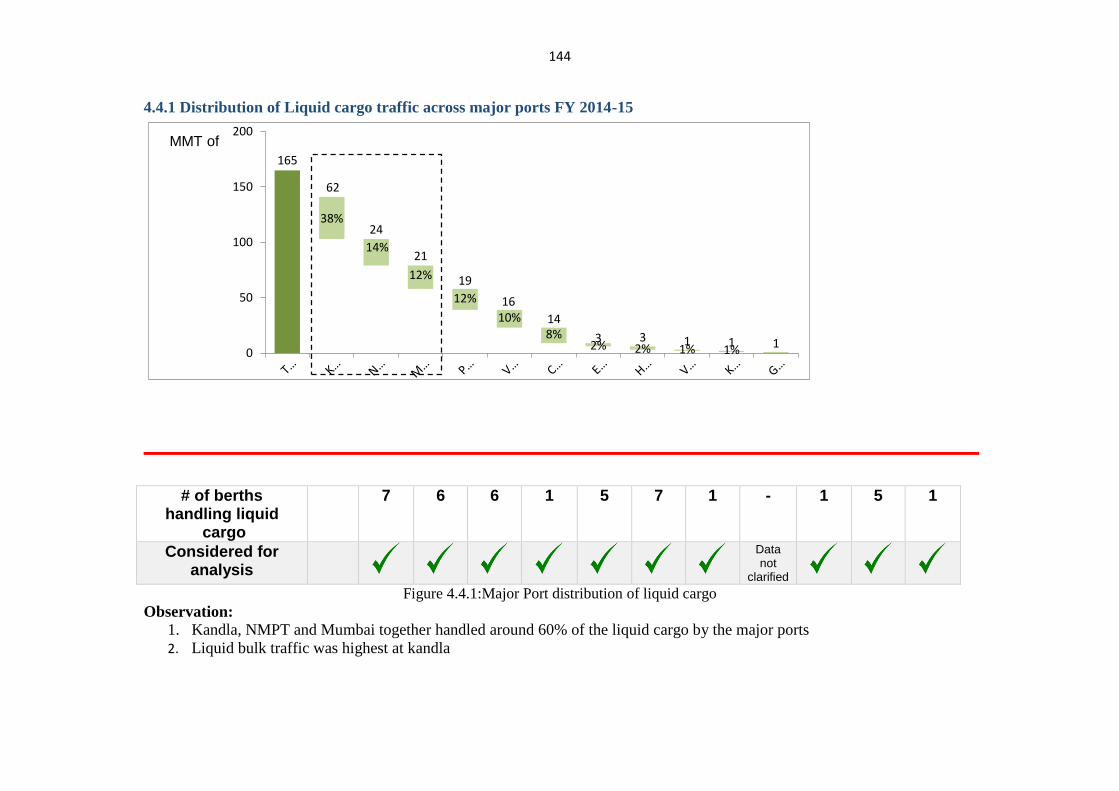
144
4.4.1 Distribution of Liquid cargo traffic across major ports FY 2014-15
165
62
14%
12%
12%
10%
8%2% 2% 1% 1%
38%24
21
19
16
14
3 3 1 1 10
50
100
150
200MMT of
# of berths
handling liquid cargo
7 6 6 1 5 7 1 - 1 5 1
Considered for analysis
Data not
clarified
Figure 4.4.1:Major Port distribution of liquid cargo
Observation:
1. Kandla, NMPT and Mumbai together handled around 60% of the liquid cargo by the major ports
2. Liquid bulk traffic was highest at kandla
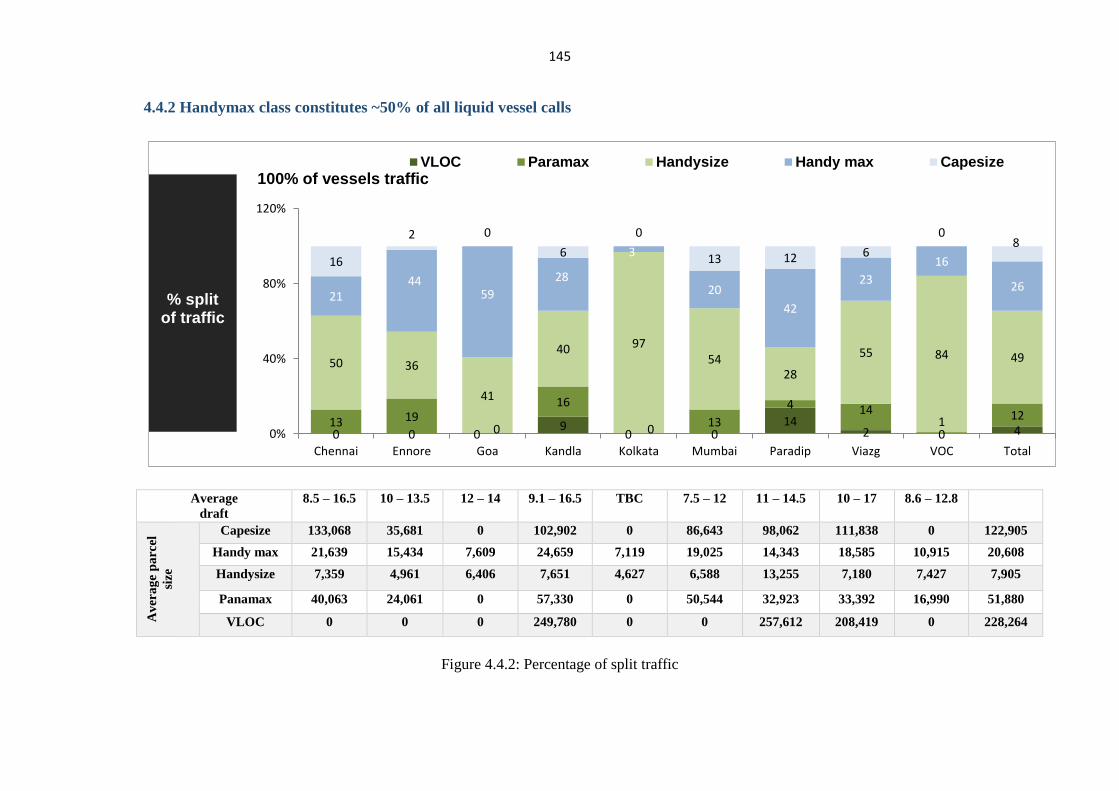
145
4.4.2 Handymax class constitutes ~50% of all liquid vessel calls
0 0 0 90 0
142 0 4
13 19
0
16
013
4 141 12
50 36
41
40 9754
28
55 84 49
2144
59
28
3
20
42
23
16
26
16
2 0
6
0
13 12 6
08
0%
40%
80%
120%
Chennai Ennore Goa Kandla Kolkata Mumbai Paradip Viazg VOC Total
100% of vessels traffic VLOC Paramax Handysize Handy max Capesize
% splitof traffic
Average
draft
8.5 – 16.5 10 – 13.5 12 – 14 9.1 – 16.5 TBC 7.5 – 12 11 – 14.5 10 – 17 8.6 – 12.8
Av
era
ge
pa
rcel
size
Capesize 133,068 35,681 0 102,902 0 86,643 98,062 111,838 0 122,905
Handy max 21,639 15,434 7,609 24,659 7,119 19,025 14,343 18,585 10,915 20,608
Handysize 7,359 4,961 6,406 7,651 4,627 6,588 13,255 7,180 7,427 7,905
Panamax 40,063 24,061 0 57,330 0 50,544 32,923 33,392 16,990 51,880
VLOC 0 0 0 249,780 0 0 257,612 208,419 0 228,264
Figure 4.4.2: Percentage of split traffic
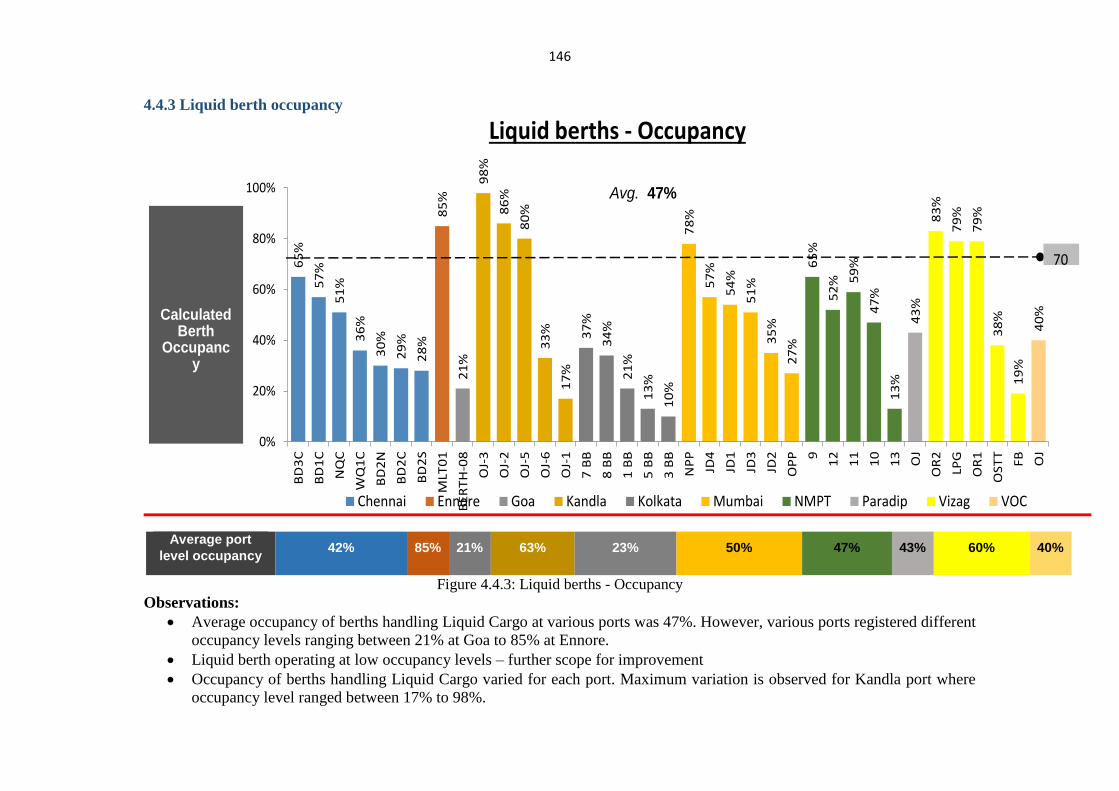
146
4.4.3 Liquid berth occupancy
65
%
57
%
51
%
36
%
30
%
29
%
28
%
85
%
21
%
98
%
86
%
80
%
33
%
17
%
37
%
34
%
21
%
13
%
10
%
78
%
57
%
54
%
51
%
35
%
27
%
65
%
52
% 59
%
47
%
13
%
43
%
83
%
79
%
79
%
38
%
19
%
40
%
0%
20%
40%
60%
80%
100%
BD
3C
BD
1C
NQ
C
WQ
1C
BD
2N
BD
2C
BD
2S
MLT
01
BE
RT
H-0
8
OJ-
3
OJ-
2
OJ-
5
OJ-
6
OJ-
1
7 B
B
8 B
B
1 B
B
5 B
B
3 B
B
NP
P
JD4
JD1
JD3
JD2
OP
P 9
12
11
10
13
OJ
OR
2
LPG
OR
1
OS
TT
FB OJ
Liquid berths - Occupancy
Chennai Ennore Goa Kandla Kolkata Mumbai NMPT Paradip Vizag VOC
Calculated Berth
Occupancy
Avg. 47%
70
Average port
level occupancy 42% 85% 21% 63% 23% 50% 47% 43% 60% 40%
Figure 4.4.3: Liquid berths - Occupancy
Observations:
Average occupancy of berths handling Liquid Cargo at various ports was 47%. However, various ports registered different
occupancy levels ranging between 21% at Goa to 85% at Ennore.
Liquid berth operating at low occupancy levels – further scope for improvement
Occupancy of berths handling Liquid Cargo varied for each port. Maximum variation is observed for Kandla port where
occupancy level ranged between 17% to 98%.
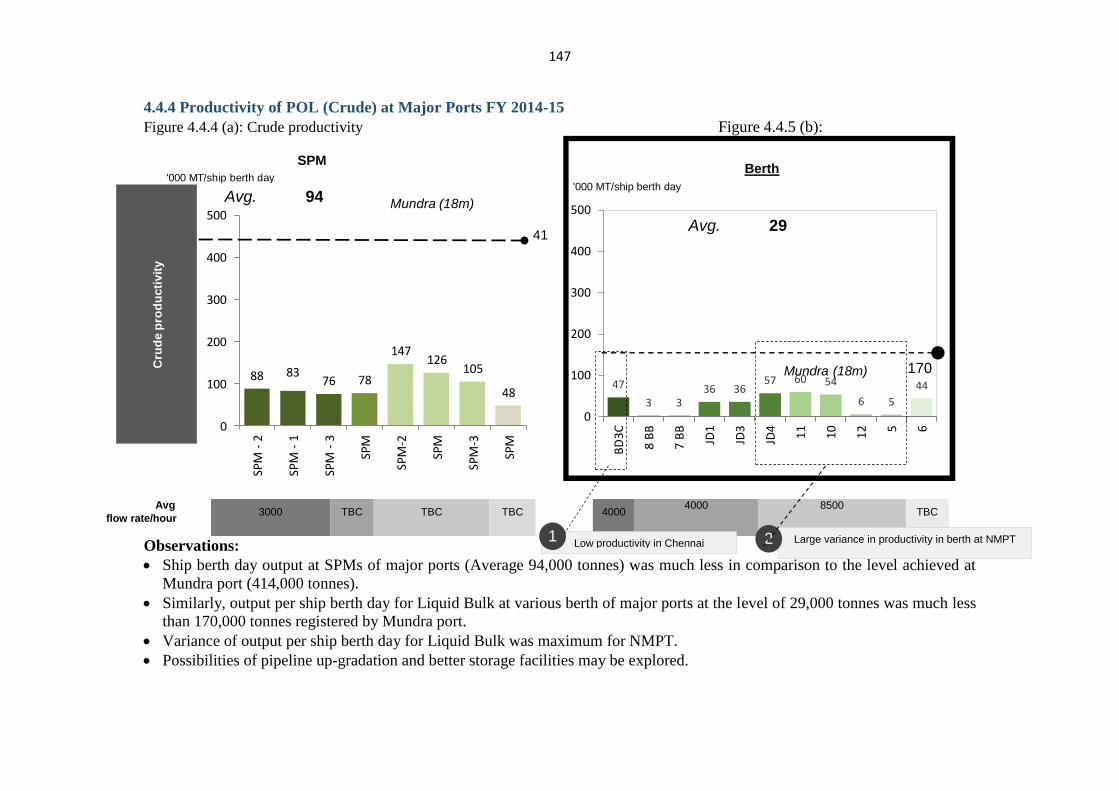
147
88 8376 78
147126
105
48
0
100
200
300
400
500
SPM
- 2
SPM
- 1
SPM
- 3
SPM
SPM
-2
SPM
SPM
-3
SPM
SPM
Avg. 94
Cru
de
pro
du
cti
vit
y
41
Mundra (18m)
'000 MT/ship berth day
4.4.4 Productivity of POL (Crude) at Major Ports FY 2014-15
Figure 4.4.4 (a): Crude productivity Figure 4.4.5 (b):
47
3 336 36
57 60 54
6 5
44
0
100
200
300
400
500
BD
3C
8 B
B
7 B
B
JD1
JD3
JD4
11
10
12 5 6
'000 MT/ship berth day
170Mundra (18m)
Berth
Avg
flow rate/hour
3000 TBC TBC TBC
4000
4000 8500 TBC
Observations:
Ship berth day output at SPMs of major ports (Average 94,000 tonnes) was much less in comparison to the level achieved at
Mundra port (414,000 tonnes).
Similarly, output per ship berth day for Liquid Bulk at various berth of major ports at the level of 29,000 tonnes was much less
than 170,000 tonnes registered by Mundra port.
Variance of output per ship berth day for Liquid Bulk was maximum for NMPT.
Possibilities of pipeline up-gradation and better storage facilities may be explored.
Low productivity in Chennai 1 Large variance in productivity in berth at NMPT 2
Avg. 29
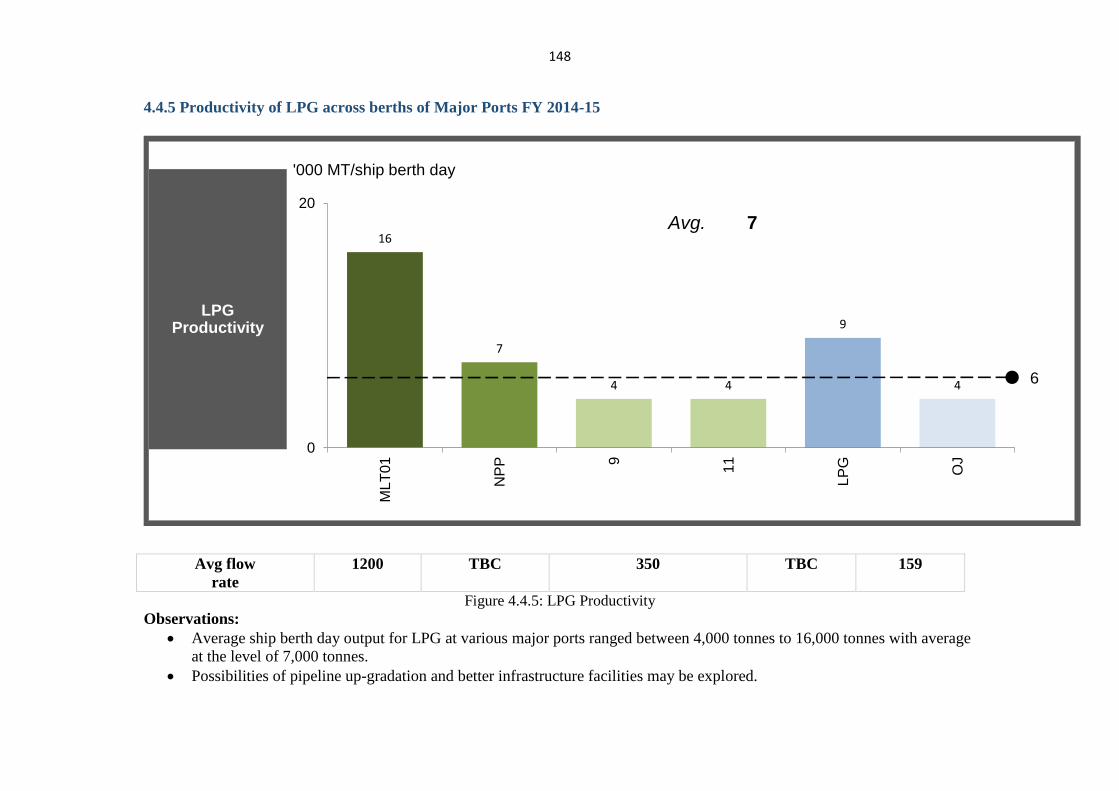
148
4.4.5 Productivity of LPG across berths of Major Ports FY 2014-15
16
7
4 4
9
4
0
20
MLT
01
NP
P 9
11
LP
G
OJ
'000 MT/ship berth day
Avg. 7
Calculated Berth
Occupancy
LPG Productivity
6
Avg flow
rate
1200 TBC 350 TBC 159
Figure 4.4.5: LPG Productivity
Observations:
Average ship berth day output for LPG at various major ports ranged between 4,000 tonnes to 16,000 tonnes with average
at the level of 7,000 tonnes.
Possibilities of pipeline up-gradation and better infrastructure facilities may be explored.
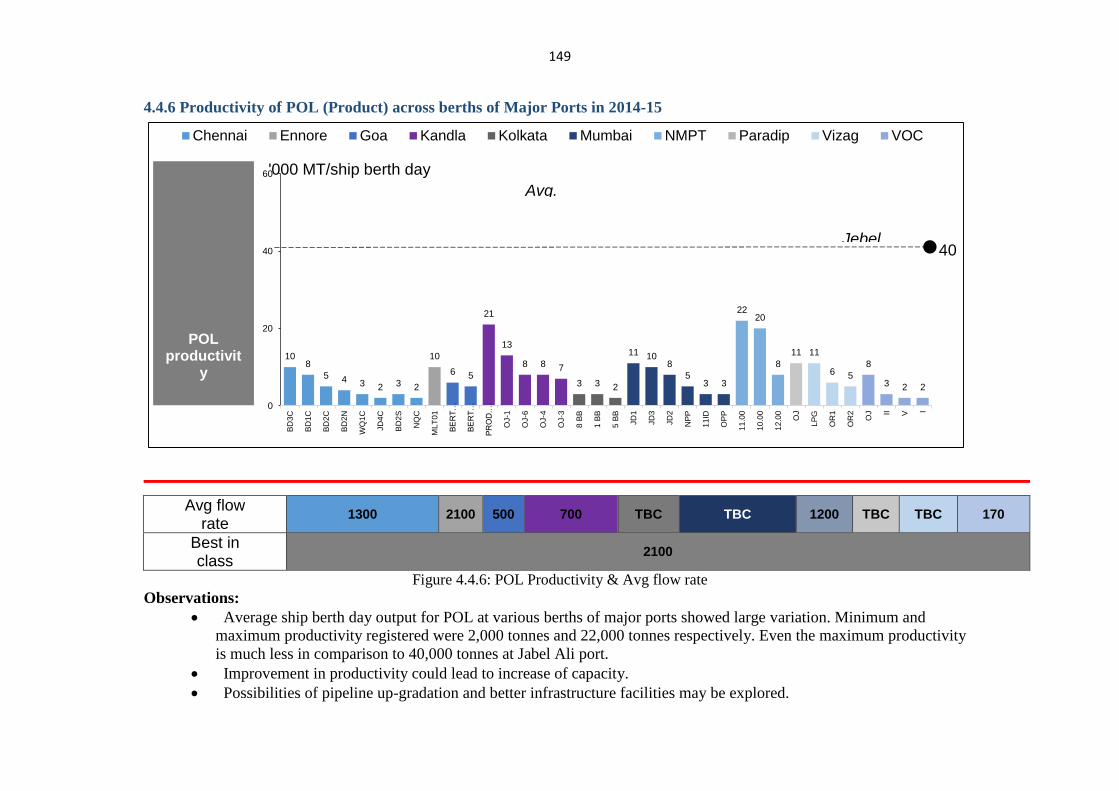
149
4.4.6 Productivity of POL (Product) across berths of Major Ports in 2014-15
108
5 4 3 2 3 2
10
6 5
21
13
8 8 7
3 3 2
11 108
53 3
2220
8
11 11
6 5
8
3 2 2
0
20
40
60
BD
3C
BD
1C
BD
2C
BD
2N
WQ
1C
JD
4C
BD
2S
NQ
C
MLT
01
BERT…
BERT…
PROD.…
OJ-1
OJ-6
OJ-4
OJ-3
8 B
B
1 B
B
5 B
B
JD
1
JD
3
JD
2
NP
P
11
ID
OP
P
11
.00
10
.00
12
.00
OJ
LP
G
OR
1
OR
2
OJ II V I
'000 MT/ship berth day
Chennai Ennore Goa Kandla Kolkata Mumbai NMPT Paradip Vizag VOC
40
Avg.
Jebel
POLproductivit
y
Avg flow rate
1300 2100 500 700 TBC TBC 1200 TBC TBC 170
Best in class
2100
Figure 4.4.6: POL Productivity & Avg flow rate
Observations:
Average ship berth day output for POL at various berths of major ports showed large variation. Minimum and
maximum productivity registered were 2,000 tonnes and 22,000 tonnes respectively. Even the maximum productivity
is much less in comparison to 40,000 tonnes at Jabel Ali port.
Improvement in productivity could lead to increase of capacity.
Possibilities of pipeline up-gradation and better infrastructure facilities may be explored.
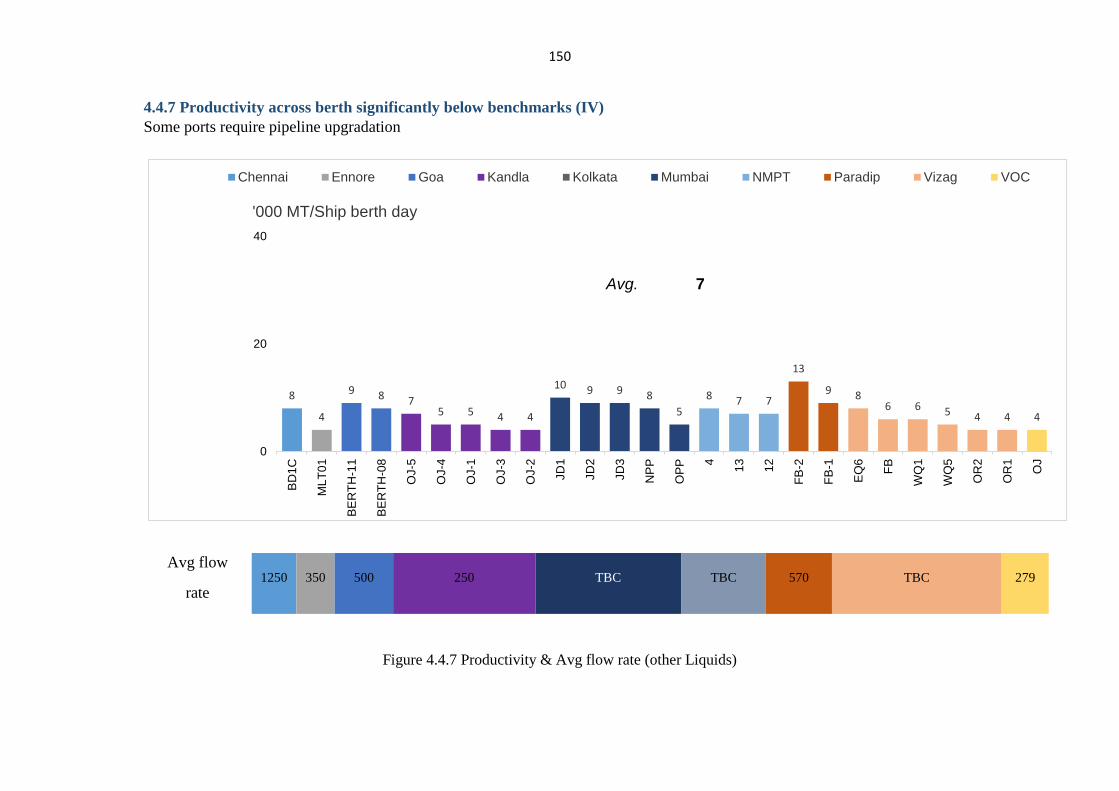
150
4.4.7 Productivity across berth significantly below benchmarks (IV)
Some ports require pipeline upgradation
8
4
9 8 75 5 4 4
10 9 9 8
5
8 7 7
13
9 86 6 5 4 4 4
0
20
40
BD
1C
ML
T0
1
BE
RT
H-1
1
BE
RT
H-0
8
OJ-5
OJ-4
OJ-1
OJ-3
OJ-2
JD
1
JD
2
JD
3
NP
P
OP
P 4
13
12
FB
-2
FB
-1
EQ
6
FB
WQ
1
WQ
5
OR
2
OR
1
OJ
'000 MT/Ship berth day
Chennai Ennore Goa Kandla Kolkata Mumbai NMPT Paradip Vizag VOC
Avg. 7
Avg flow
rate 1250 350 500 250 TBC TBC 570 TBC 279
Figure 4.4.7 Productivity & Avg flow rate (other Liquids)
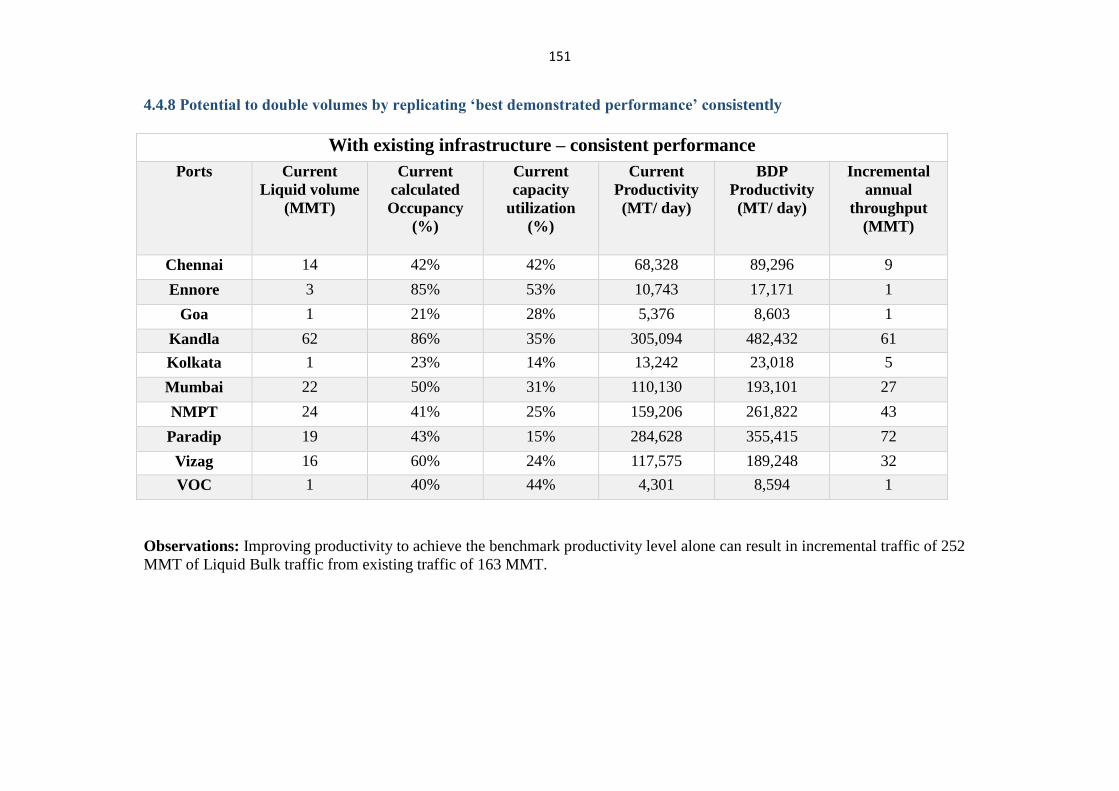
151
4.4.8 Potential to double volumes by replicating ‘best demonstrated performance’ consistently
With existing infrastructure – consistent performance
Ports Current
Liquid volume
(MMT)
Current
calculated
Occupancy
(%)
Current
capacity
utilization
(%)
Current
Productivity
(MT/ day)
BDP
Productivity
(MT/ day)
Incremental
annual
throughput
(MMT)
Chennai 14 42% 42% 68,328 89,296 9
Ennore 3 85% 53% 10,743 17,171 1
Goa 1 21% 28% 5,376 8,603 1
Kandla 62 86% 35% 305,094 482,432 61
Kolkata 1 23% 14% 13,242 23,018 5
Mumbai 22 50% 31% 110,130 193,101 27
NMPT 24 41% 25% 159,206 261,822 43
Paradip 19 43% 15% 284,628 355,415 72
Vizag 16 60% 24% 117,575 189,248 32
VOC 1 40% 44% 4,301 8,594 1
Observations: Improving productivity to achieve the benchmark productivity level alone can result in incremental traffic of 252
MMT of Liquid Bulk traffic from existing traffic of 163 MMT.
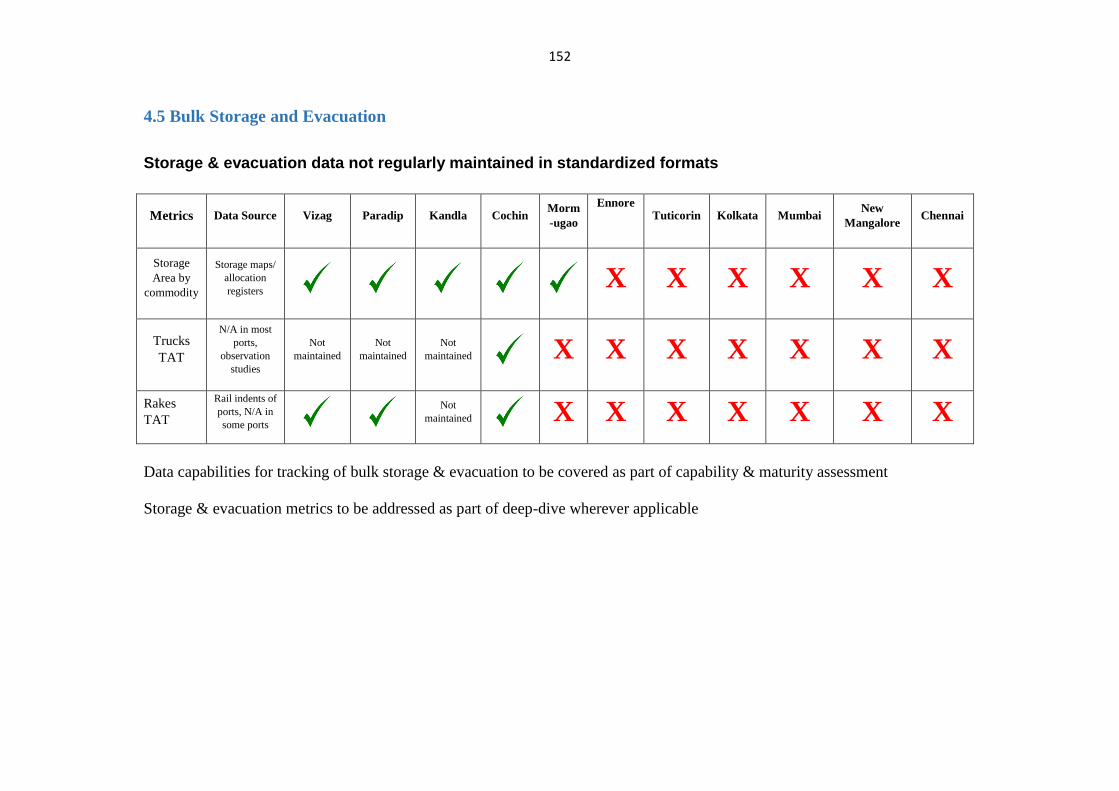
152
4.5 Bulk Storage and Evacuation
Storage & evacuation data not regularly maintained in standardized formats
Data capabilities for tracking of bulk storage & evacuation to be covered as part of capability & maturity assessment
Storage & evacuation metrics to be addressed as part of deep-dive wherever applicable
Metrics Data Source Vizag Paradip Kandla Cochin Morm
-ugao
Ennore
Tuticorin Kolkata Mumbai
New
Mangalore Chennai
Storage
Area by
commodity
Storage maps/
allocation
registers X X X X X X
Trucks
TAT
N/A in most
ports,
observation
studies
Not
maintained
Not
maintained
Not
maintained X X X X X X X
Rakes
TAT
Rail indents of
ports, N/A in
some ports
Not
maintained X X X X X X X
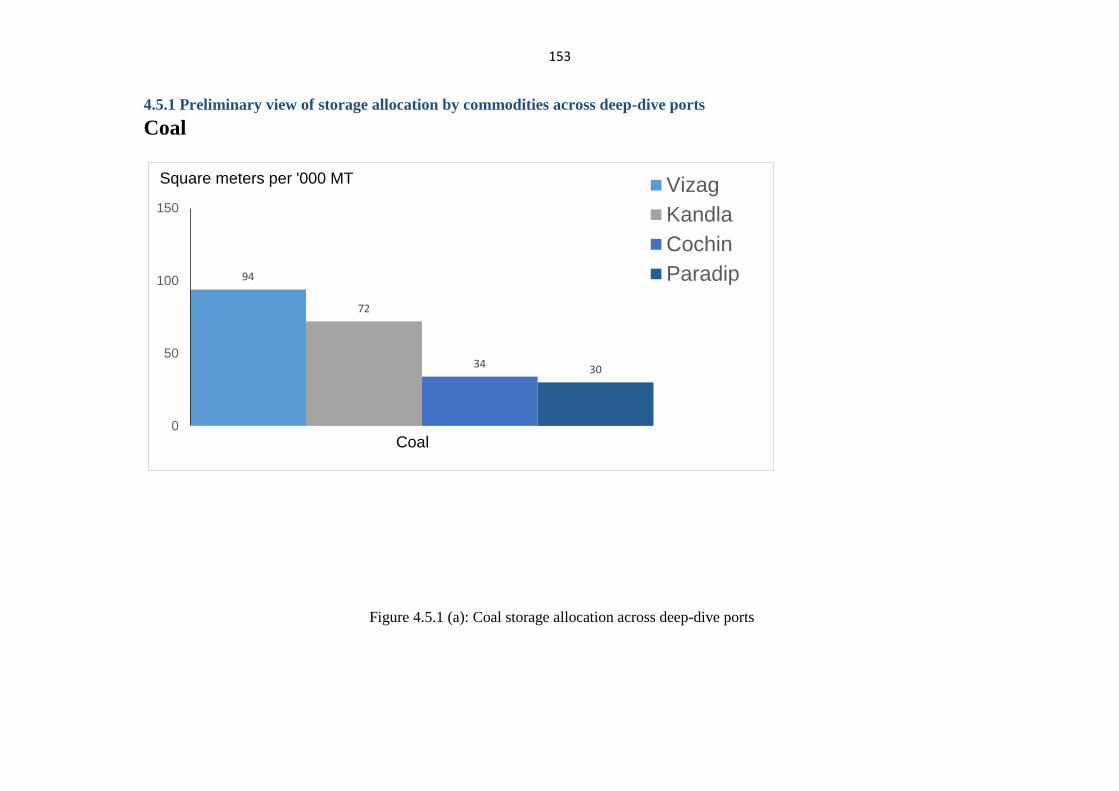
153
4.5.1 Preliminary view of storage allocation by commodities across deep-dive ports
Coal
94
72
34 30
0
50
100
150
Square meters per '000 MT Vizag
Kandla
Cochin
Paradip
Coal
Figure 4.5.1 (a): Coal storage allocation across deep-dive ports
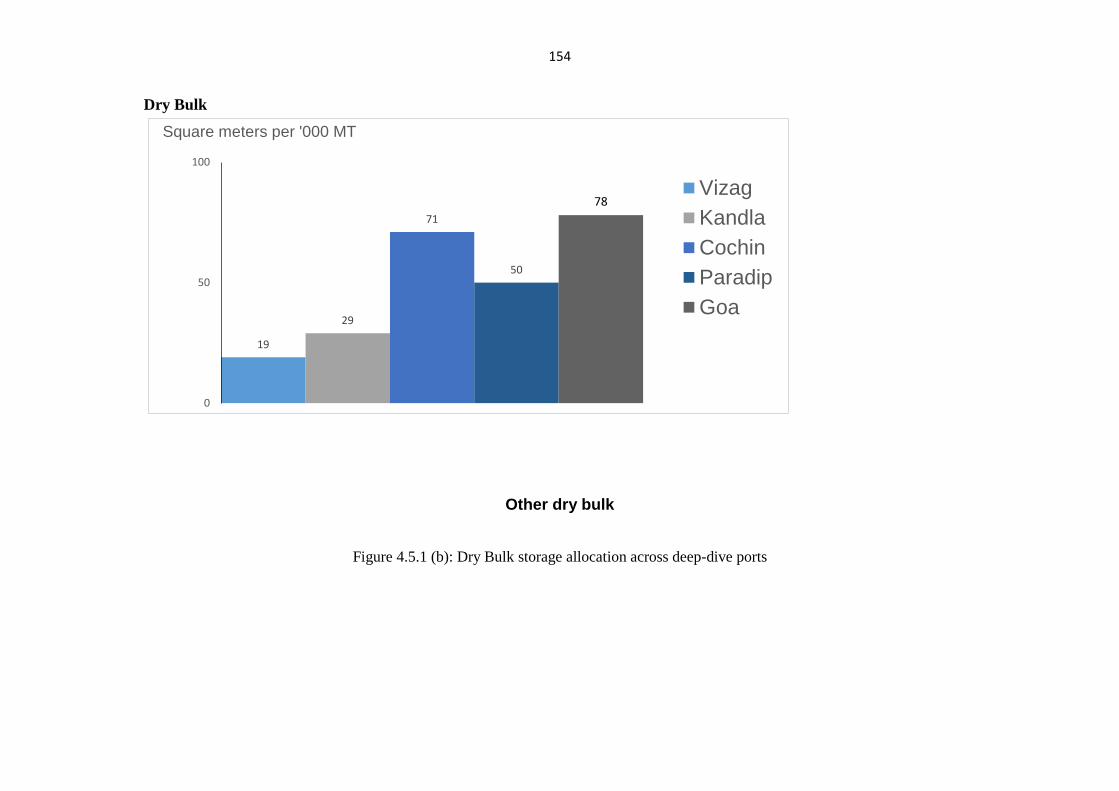
154
Dry Bulk
19
29
71
50
78
0
50
100
Square meters per '000 MT
Vizag
Kandla
Cochin
Paradip
Goa
Figure 4.5.1 (b): Dry Bulk storage allocation across deep-dive ports
Other dry bulk
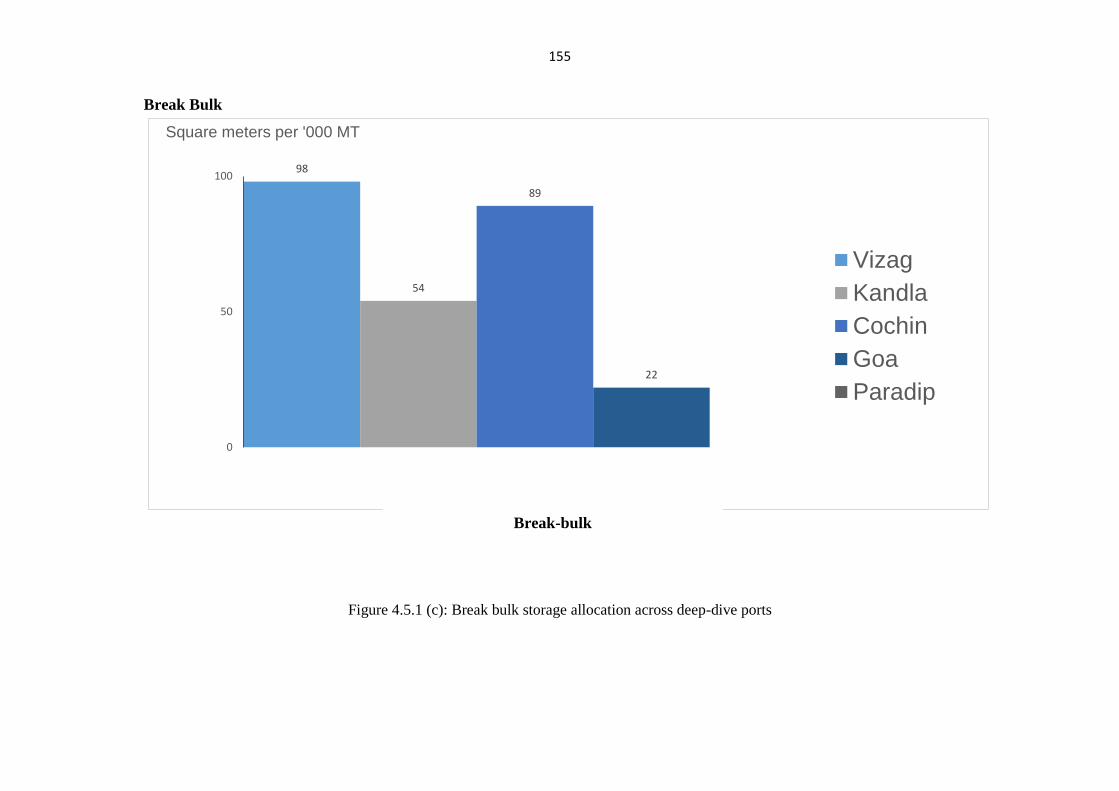
155
Break Bulk
98
54
89
22
0
50
100
Square meters per '000 MT
Vizag
Kandla
Cochin
Goa
Paradip
Figure 4.5.1 (c): Break bulk storage allocation across deep-dive ports
Break-bulk
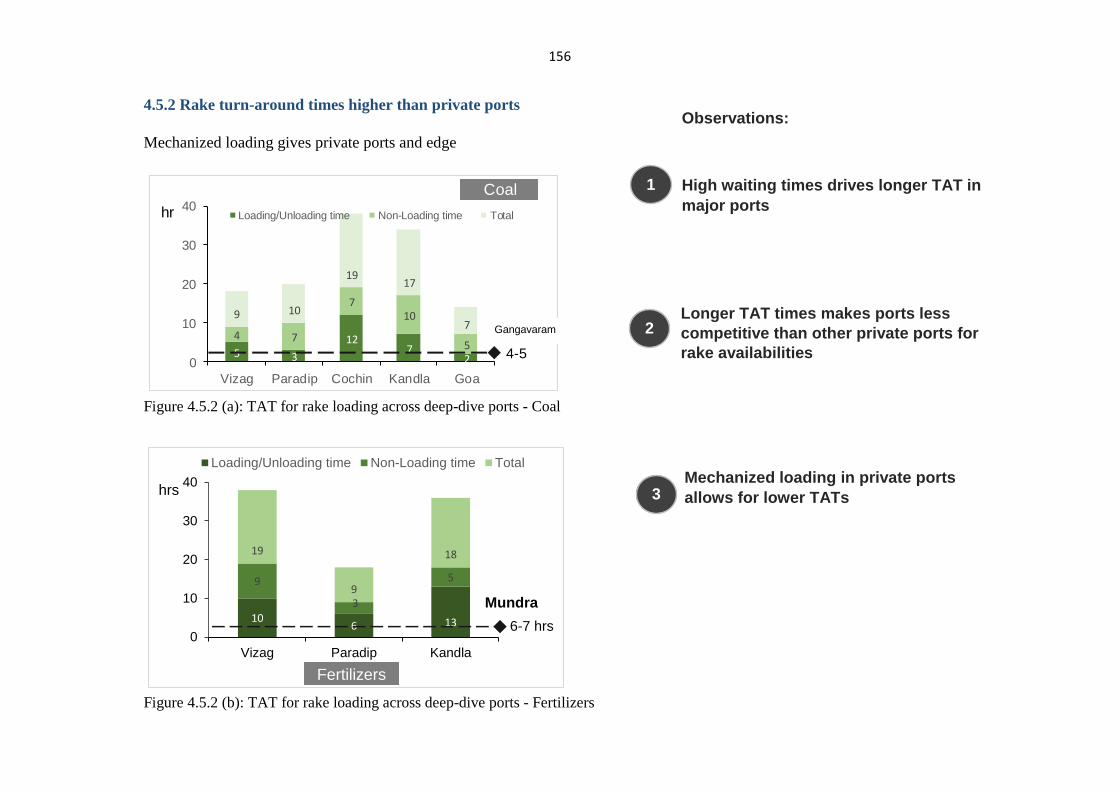
156
4.5.2 Rake turn-around times higher than private ports
Mechanized loading gives private ports and edge
5 3
127
2
4 7
710
5
9 10
1917
7
0
10
20
30
40
Vizag Paradip Cochin Kandla Goa
Loading/Unloading time Non-Loading time Total
Coal
4-5
hr
Figure 4.5.2 (a): TAT for rake loading across deep-dive ports - Coal
106 13
9
3
5
19
9
18
0
10
20
30
40
Vizag Paradip Kandla
Loading/Unloading time Non-Loading time Total
Fertilizers
6-7 hrs
hrs
Mundra
Figure 4.5.2 (b): TAT for rake loading across deep-dive ports - Fertilizers
Gangavaram
High waiting times drives longer TAT in
major ports
Longer TAT times makes ports less
competitive than other private ports for
rake availabilities
Mechanized loading in private ports
allows for lower TATs
1
2
3
Observations:
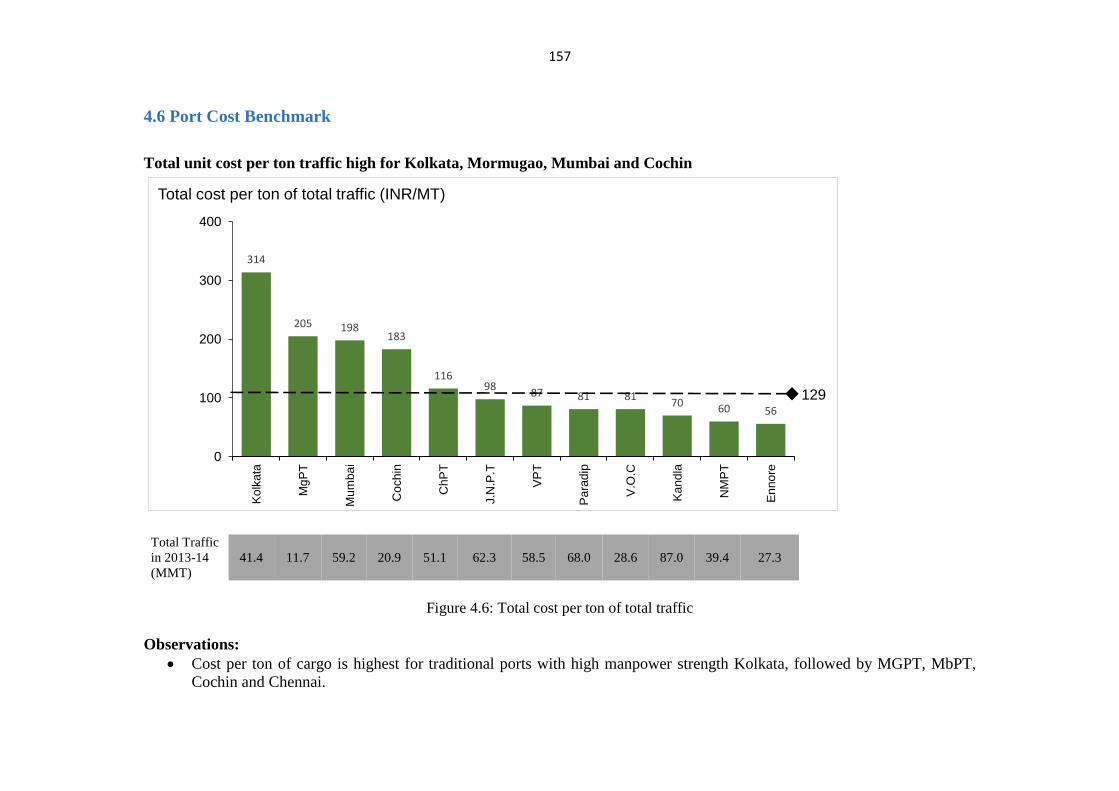
157
4.6 Port Cost Benchmark
Total unit cost per ton traffic high for Kolkata, Mormugao, Mumbai and Cochin
314
205 198183
11698
87 81 8170 60 56
0
100
200
300
400
Ko
lka
ta
Mg
PT
Mu
mba
i
Co
ch
in
Ch
PT
J.N
.P.T
VP
T
Pa
rad
ip
V.O
.C
Ka
nd
la
NM
PT
En
no
re
Total cost per ton of total traffic (INR/MT)
129
Total Traffic
in 2013-14
(MMT)
41.4 11.7 59.2 20.9 51.1 62.3 58.5 68.0 28.6 87.0 39.4 27.3
Figure 4.6: Total cost per ton of total traffic
Observations:
Cost per ton of cargo is highest for traditional ports with high manpower strength Kolkata, followed by MGPT, MbPT,
Cochin and Chennai.
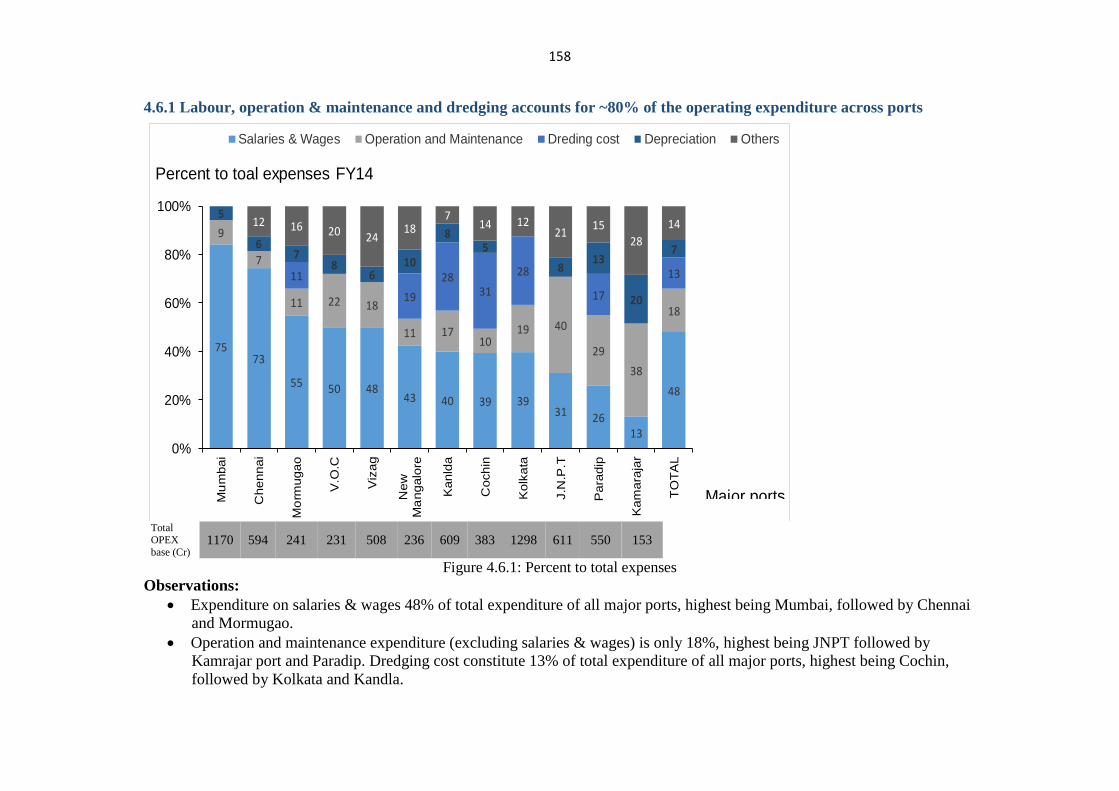
158
4.6.1 Labour, operation & maintenance and dredging accounts for ~80% of the operating expenditure across ports
7573
55 50 4843 40 39 39
31 2613
48
9
7
11 22 18
11 1710
19 40
29
38
18
11
19
2831
28
17
13
5
67
86
10
85
813
20
7
12 16 20 2418
714 12
2115
28
14
0%
20%
40%
60%
80%
100%M
um
ba
i
Che
nn
ai
Mo
rmugao
V.O
.C
Viz
ag
New
Ma
ngalo
re
Kanld
a
Cochin
Kolk
ata
J.N
.P.T
Para
dip
Ka
ma
raja
r
TO
TA
L
Percent to toal expenses FY14
Salaries & Wages Operation and Maintenance Dreding cost Depreciation Others
Major ports
Total OPEX
base (Cr) 1170 594 241 231 508 236 609 383 1298 611 550 153
Figure 4.6.1: Percent to total expenses
Observations:
Expenditure on salaries & wages 48% of total expenditure of all major ports, highest being Mumbai, followed by Chennai
and Mormugao.
Operation and maintenance expenditure (excluding salaries & wages) is only 18%, highest being JNPT followed by
Kamrajar port and Paradip. Dredging cost constitute 13% of total expenditure of all major ports, highest being Cochin,
followed by Kolkata and Kandla.
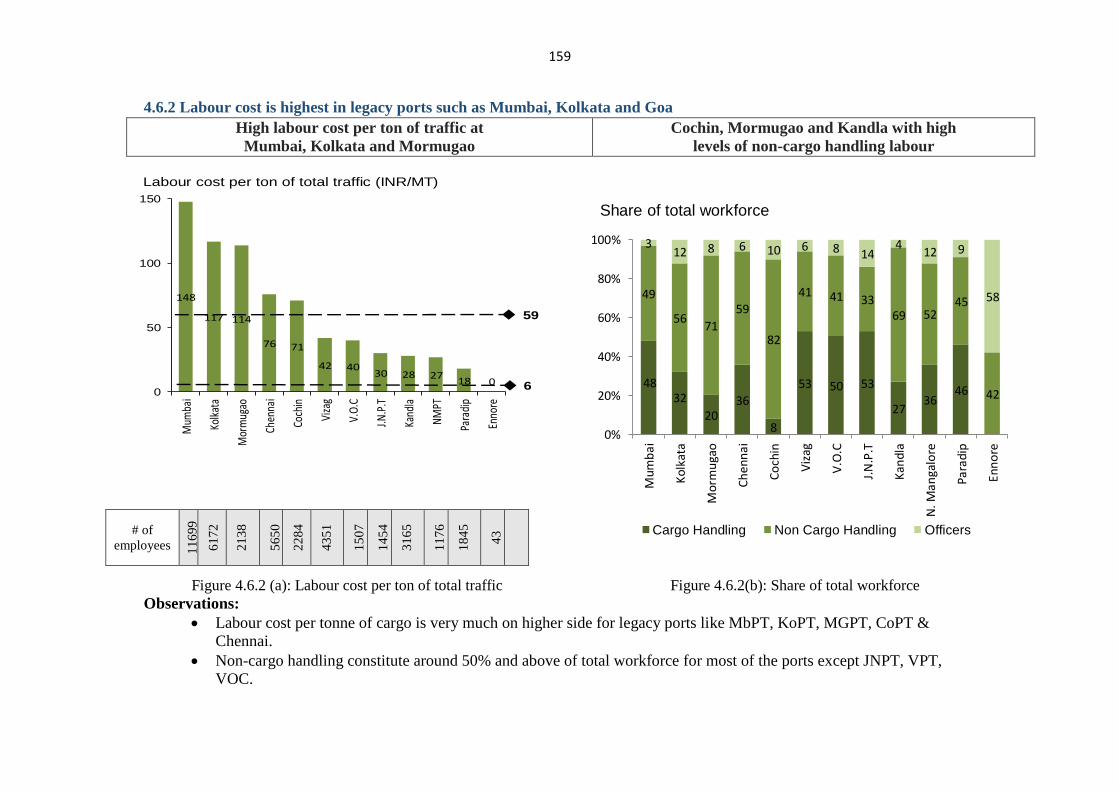
159
148
117 114
76 71
42 4030 28 27
18 00
50
100
150
Mum
bai
Kolk
ata
Mor
mug
ao
Chen
nai
Coch
in
Viza
g
V.O
.C
J.N.P
.T
Kand
la
NM
PT
Para
dip
Enno
re
Labour cost per ton of total traffic (INR/MT)
59
6 4832
2036
8
53 50 53
2736
46
49
5671
59
82
41 41 3369 52
45
42
312 8 6 10 6 8 14
412 9
58
0%
20%
40%
60%
80%
100%
Mum
bai
Ko
lkat
a
Mor
mu
gao
Ch
enn
ai
Co
chin
Viz
ag
V.O
.C
J.N
.P.T
Kan
dla
N. M
anga
lore
Para
dip
Enn
ore
Cargo Handling Non Cargo Handling Officers
Share of total workforce
4.6.2 Labour cost is highest in legacy ports such as Mumbai, Kolkata and Goa
High labour cost per ton of traffic at
Mumbai, Kolkata and Mormugao
Cochin, Mormugao and Kandla with high
levels of non-cargo handling labour
Figure 4.6.2 (a): Labour cost per ton of total traffic Figure 4.6.2(b): Share of total workforce
Observations:
Labour cost per tonne of cargo is very much on higher side for legacy ports like MbPT, KoPT, MGPT, CoPT &
Chennai.
Non-cargo handling constitute around 50% and above of total workforce for most of the ports except JNPT, VPT,
VOC.
# of
employees 11
699
61
72
21
38
56
50
22
84
43
51
15
07
14
54
31
65
11
76
18
45
43
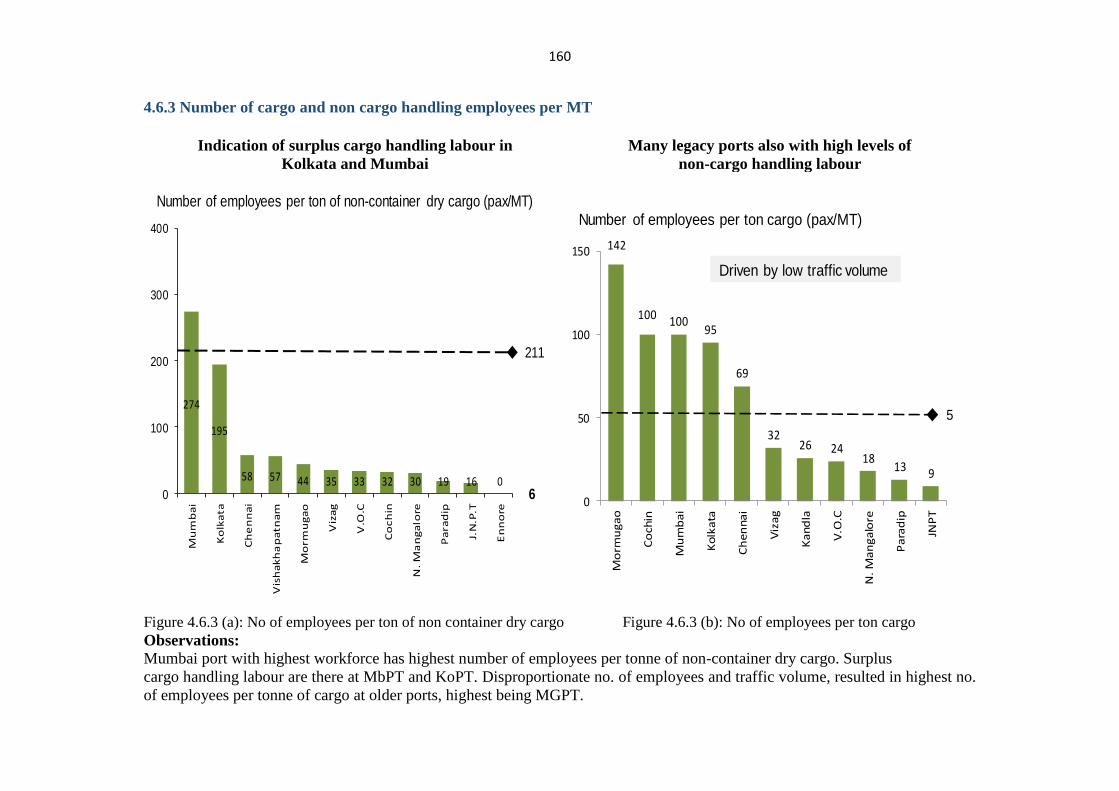
160
274
195
58 57 44 35 33 32 30 19 16 00
100
200
300
400
Mu
mb
ai
Ko
lka
ta
Ch
en
na
i
Vis
ha
kh
ap
atn
am
Mo
rmu
ga
o
Viz
ag
V.O
.C
Co
ch
in
N.
Ma
ng
alo
re
Pa
rad
ip
J.N
.P.T
En
no
re
Number of employees per ton of non-container dry cargo (pax/MT)
211
6
142
100 10095
69
3226 24
1813 9
0
50
100
150
Mo
rmu
ga
o
Co
chin
Mu
mb
ai
Ko
lka
ta
Ch
en
na
i
Viz
ag
Ka
nd
la
V.O
.C
N.
Ma
ng
alo
re
Pa
rad
ip
JNP
T
Number of employees per ton cargo (pax/MT)
Driven by low traffic volume
5
4.6.3 Number of cargo and non cargo handling employees per MT
Indication of surplus cargo handling labour in
Kolkata and Mumbai
Many legacy ports also with high levels of
non-cargo handling labour
Figure 4.6.3 (a): No of employees per ton of non container dry cargo Figure 4.6.3 (b): No of employees per ton cargo
Observations:
Mumbai port with highest workforce has highest number of employees per tonne of non-container dry cargo. Surplus
cargo handling labour are there at MbPT and KoPT. Disproportionate no. of employees and traffic volume, resulted in highest no.
of employees per tonne of cargo at older ports, highest being MGPT.
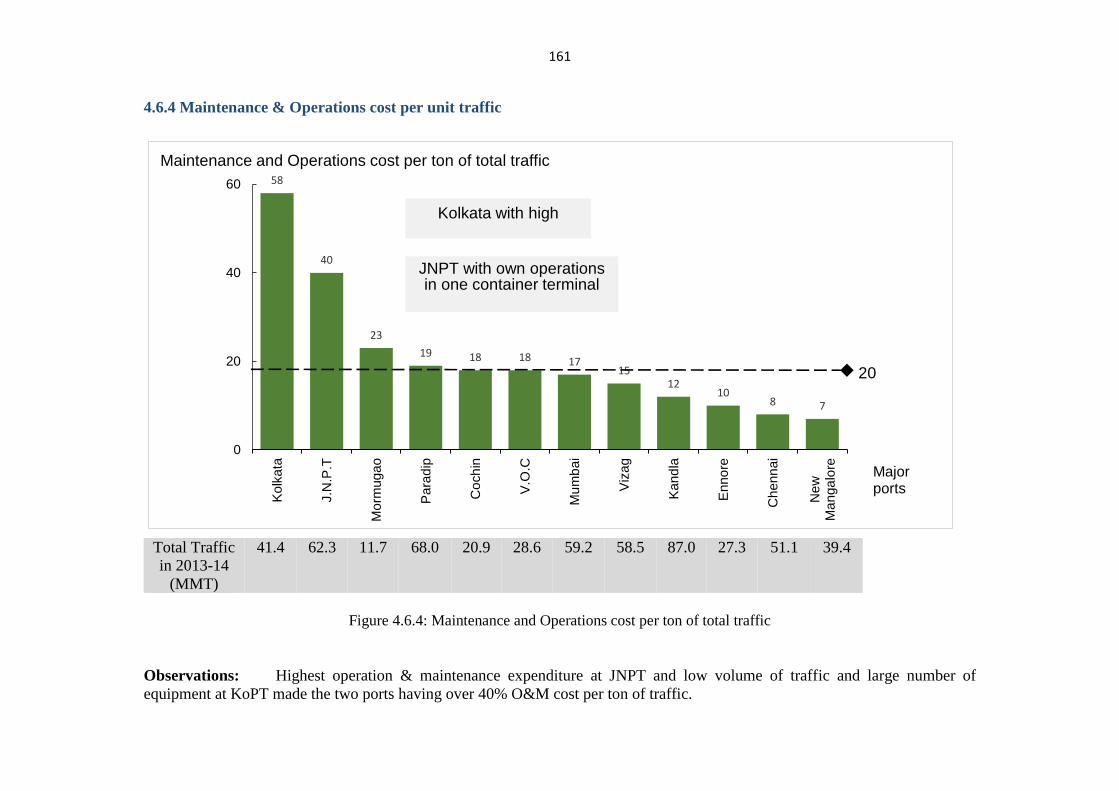
161
4.6.4 Maintenance & Operations cost per unit traffic
58
40
23
19 18 18 1715
1210
8 7
0
20
40
60
Kolk
ata
J.N
.P.T
Mo
rmug
ao
Para
dip
Co
ch
in
V.O
.C
Mu
mb
ai
Viz
ag
Kand
la
Enno
re
Ch
enn
ai
Ne
wM
anga
lore
Maintenance and Operations cost per ton of total traffic
Kolkata with high
JNPT with own operations in one container terminal
20
Major ports
Total Traffic
in 2013-14
(MMT)
41.4 62.3 11.7 68.0 20.9 28.6 59.2 58.5 87.0 27.3 51.1 39.4
Figure 4.6.4: Maintenance and Operations cost per ton of total traffic
Observations: Highest operation & maintenance expenditure at JNPT and low volume of traffic and large number of
equipment at KoPT made the two ports having over 40% O&M cost per ton of traffic.
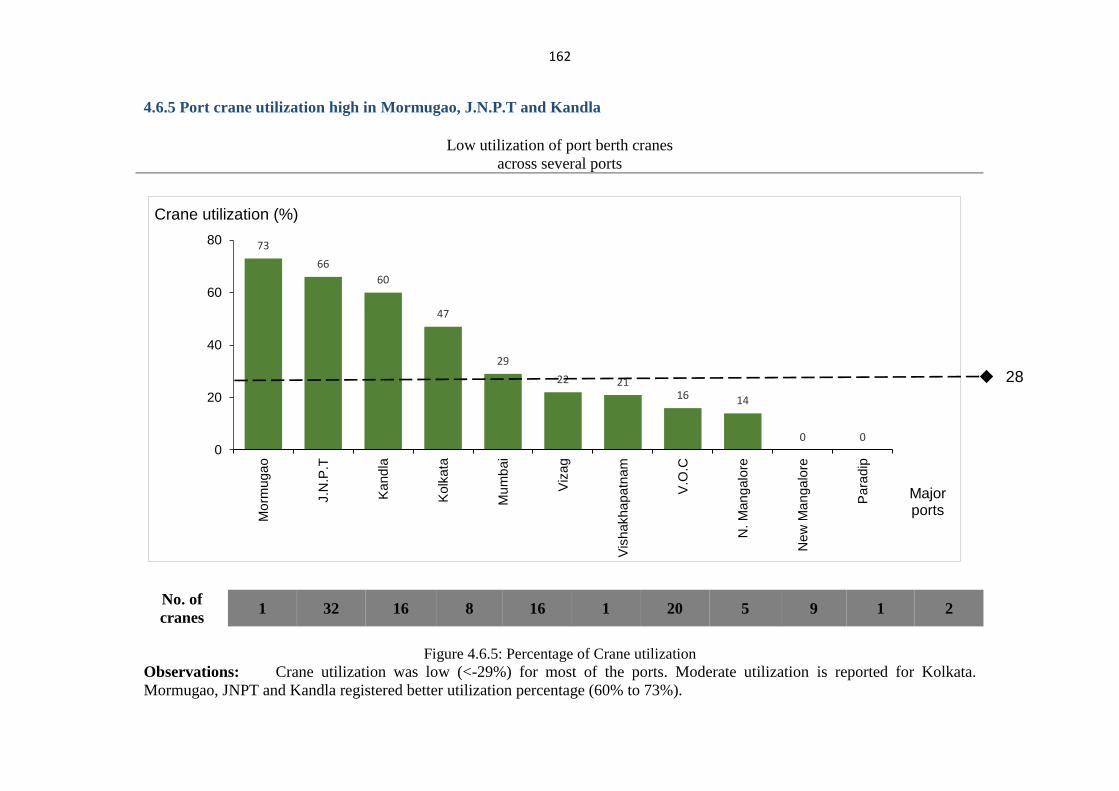
162
4.6.5 Port crane utilization high in Mormugao, J.N.P.T and Kandla
Low utilization of port berth cranes
across several ports
73
66
60
47
29
22 2116 14
0 00
20
40
60
80
Mo
rmug
ao
J.N
.P.T
Kand
la
Kolk
ata
Mu
mb
ai
Viz
ag
Vis
hakha
patn
am
V.O
.C
N.
Man
galo
re
Ne
w M
anga
lore
Para
dip
Crane utilization (%)
Major ports
No. of
cranes 1 32 16 8 16 1 20 5 9 1 2
Figure 4.6.5: Percentage of Crane utilization
Observations: Crane utilization was low (<-29%) for most of the ports. Moderate utilization is reported for Kolkata.
Mormugao, JNPT and Kandla registered better utilization percentage (60% to 73%).
28
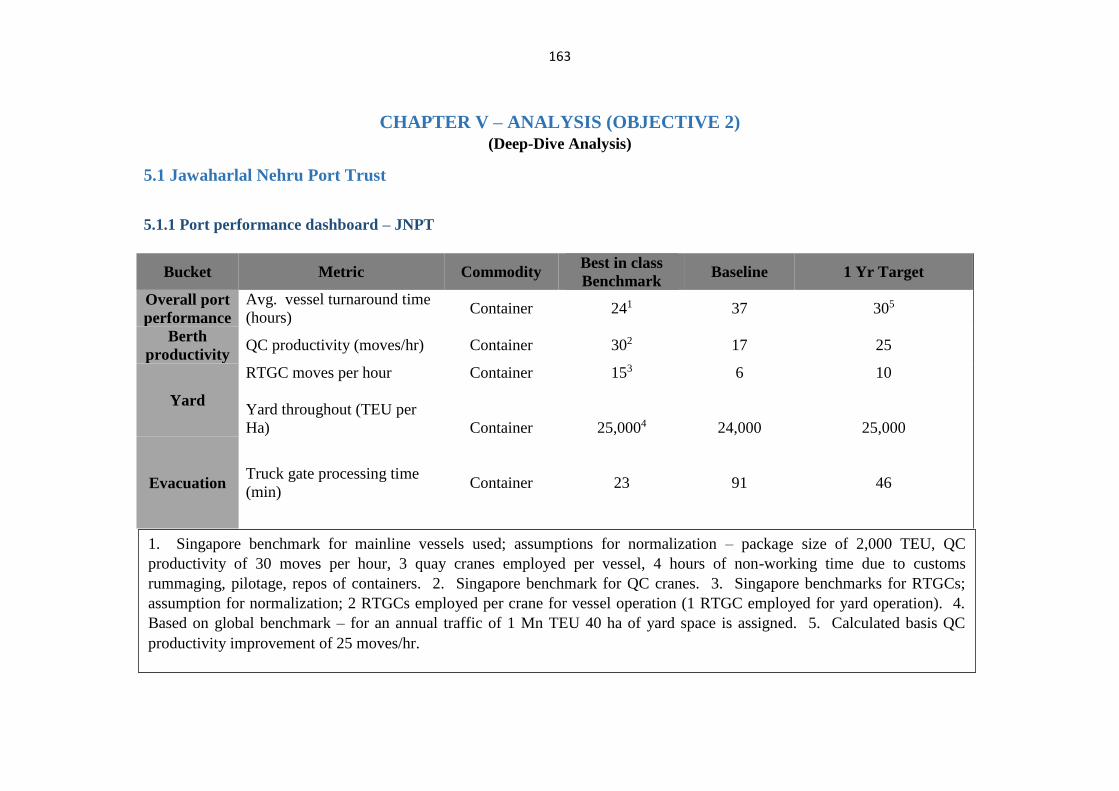
163
CHAPTER V – ANALYSIS (OBJECTIVE 2) (Deep-Dive Analysis)
5.1 Jawaharlal Nehru Port Trust
5.1.1 Port performance dashboard – JNPT
Bucket Metric Commodity Best in class
Benchmark Baseline 1 Yr Target
Overall port
performance
Avg. vessel turnaround time
(hours) Container 241 37 305
Berth
productivity QC productivity (moves/hr) Container 302 17 25
Yard
RTGC moves per hour
Yard throughout (TEU per
Ha)
Container
Container
153
25,0004
6
24,000
10
25,000
Evacuation Truck gate processing time
(min)
Container
23 91 46
1. Singapore benchmark for mainline vessels used; assumptions for normalization – package size of 2,000 TEU, QC
productivity of 30 moves per hour, 3 quay cranes employed per vessel, 4 hours of non-working time due to customs
rummaging, pilotage, repos of containers. 2. Singapore benchmark for QC cranes. 3. Singapore benchmarks for RTGCs;
assumption for normalization; 2 RTGCs employed per crane for vessel operation (1 RTGC employed for yard operation). 4.
Based on global benchmark – for an annual traffic of 1 Mn TEU 40 ha of yard space is assigned. 5. Calculated basis QC
productivity improvement of 25 moves/hr.
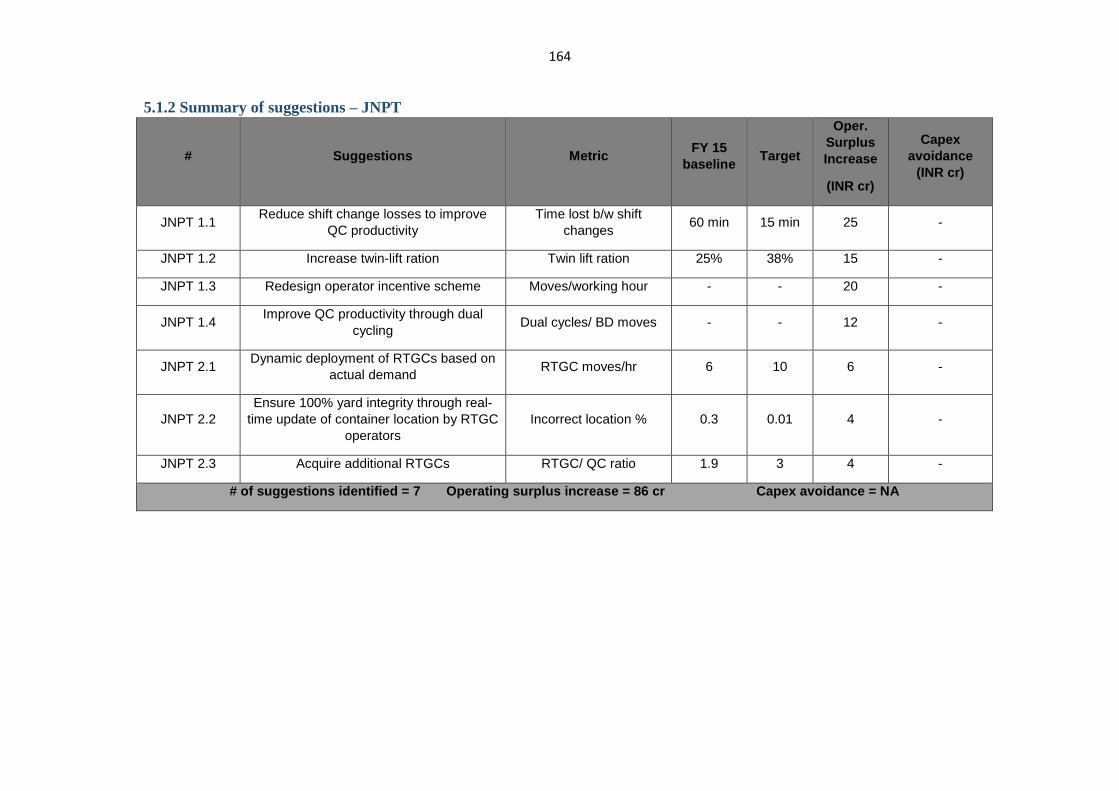
164
5.1.2 Summary of suggestions – JNPT
# Suggestions Metric FY 15
baseline Target
Oper.
Surplus
Increase
(INR cr)
Capex
avoidance
(INR cr)
JNPT 1.1 Reduce shift change losses to improve
QC productivity
Time lost b/w shift
changes 60 min 15 min 25 -
JNPT 1.2 Increase twin-lift ration Twin lift ration 25% 38% 15 -
JNPT 1.3 Redesign operator incentive scheme Moves/working hour - - 20 -
JNPT 1.4 Improve QC productivity through dual
cycling Dual cycles/ BD moves - - 12 -
JNPT 2.1 Dynamic deployment of RTGCs based on
actual demand RTGC moves/hr 6 10 6 -
JNPT 2.2
Ensure 100% yard integrity through real-
time update of container location by RTGC
operators
Incorrect location % 0.3 0.01 4 -
JNPT 2.3 Acquire additional RTGCs RTGC/ QC ratio 1.9 3 4 -
# of suggestions identified = 7 Operating surplus increase = 86 cr Capex avoidance = NA
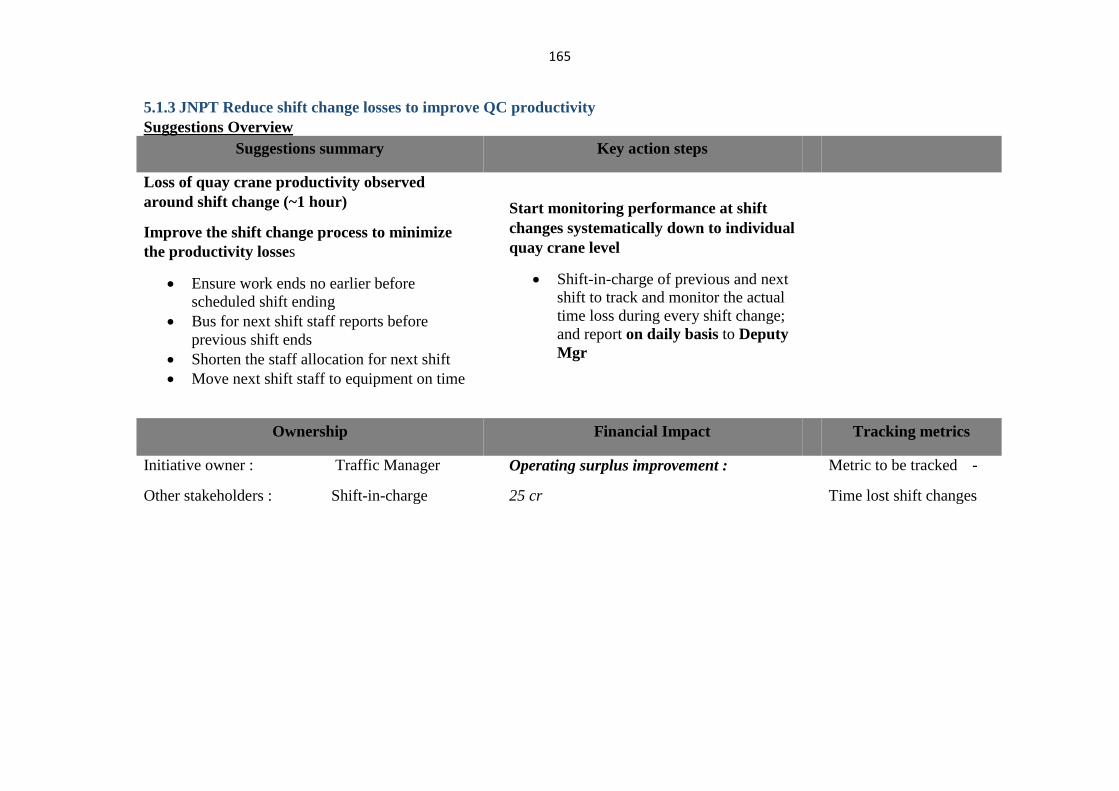
165
5.1.3 JNPT Reduce shift change losses to improve QC productivity
Suggestions Overview
Suggestions summary Key action steps
Loss of quay crane productivity observed
around shift change (~1 hour)
Improve the shift change process to minimize
the productivity losses
Ensure work ends no earlier before
scheduled shift ending
Bus for next shift staff reports before
previous shift ends
Shorten the staff allocation for next shift
Move next shift staff to equipment on time
Start monitoring performance at shift
changes systematically down to individual
quay crane level
Shift-in-charge of previous and next
shift to track and monitor the actual
time loss during every shift change;
and report on daily basis to Deputy
Mgr
Ownership Financial Impact Tracking metrics
Initiative owner : Traffic Manager
Other stakeholders : Shift-in-charge
Operating surplus improvement :
25 cr
Metric to be tracked -
Time lost shift changes
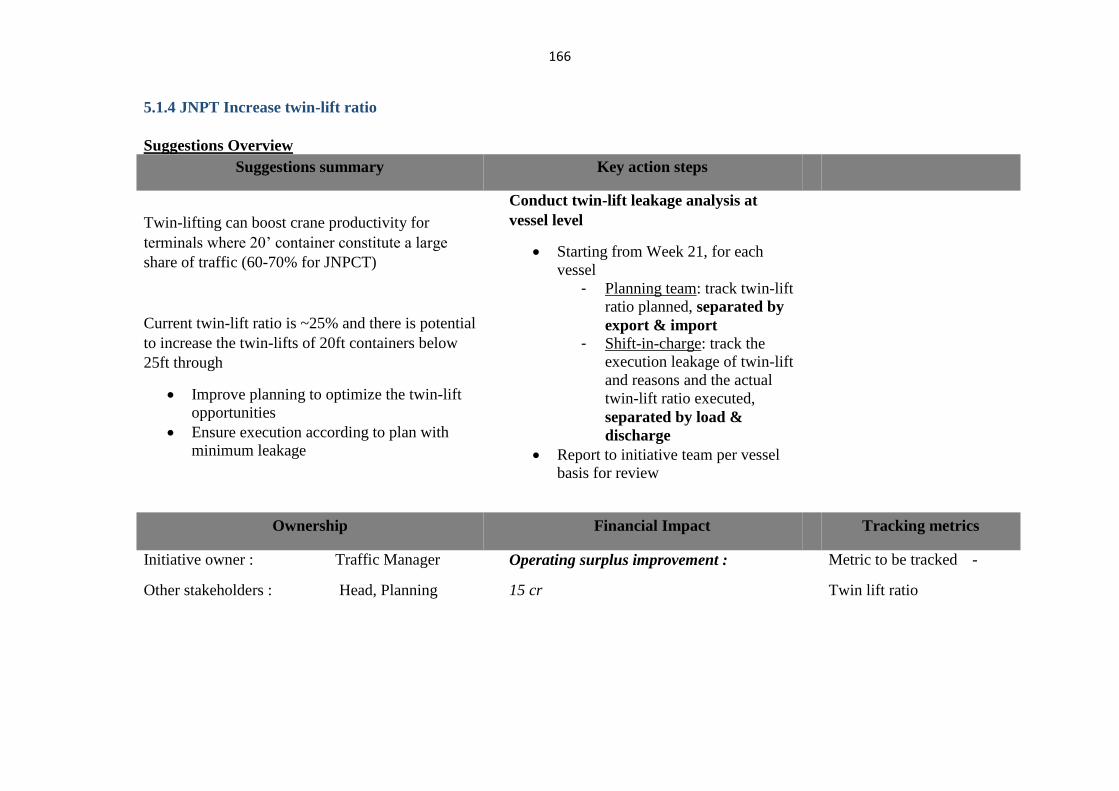
166
5.1.4 JNPT Increase twin-lift ratio
Suggestions Overview
Suggestions summary Key action steps
Twin-lifting can boost crane productivity for
terminals where 20’ container constitute a large
share of traffic (60-70% for JNPCT)
Current twin-lift ratio is ~25% and there is potential
to increase the twin-lifts of 20ft containers below
25ft through
Improve planning to optimize the twin-lift
opportunities
Ensure execution according to plan with
minimum leakage
Conduct twin-lift leakage analysis at
vessel level
Starting from Week 21, for each
vessel
- Planning team: track twin-lift
ratio planned, separated by
export & import
- Shift-in-charge: track the
execution leakage of twin-lift
and reasons and the actual
twin-lift ratio executed,
separated by load &
discharge
Report to initiative team per vessel
basis for review
Ownership Financial Impact Tracking metrics
Initiative owner : Traffic Manager
Other stakeholders : Head, Planning
Operating surplus improvement :
15 cr
Metric to be tracked -
Twin lift ratio
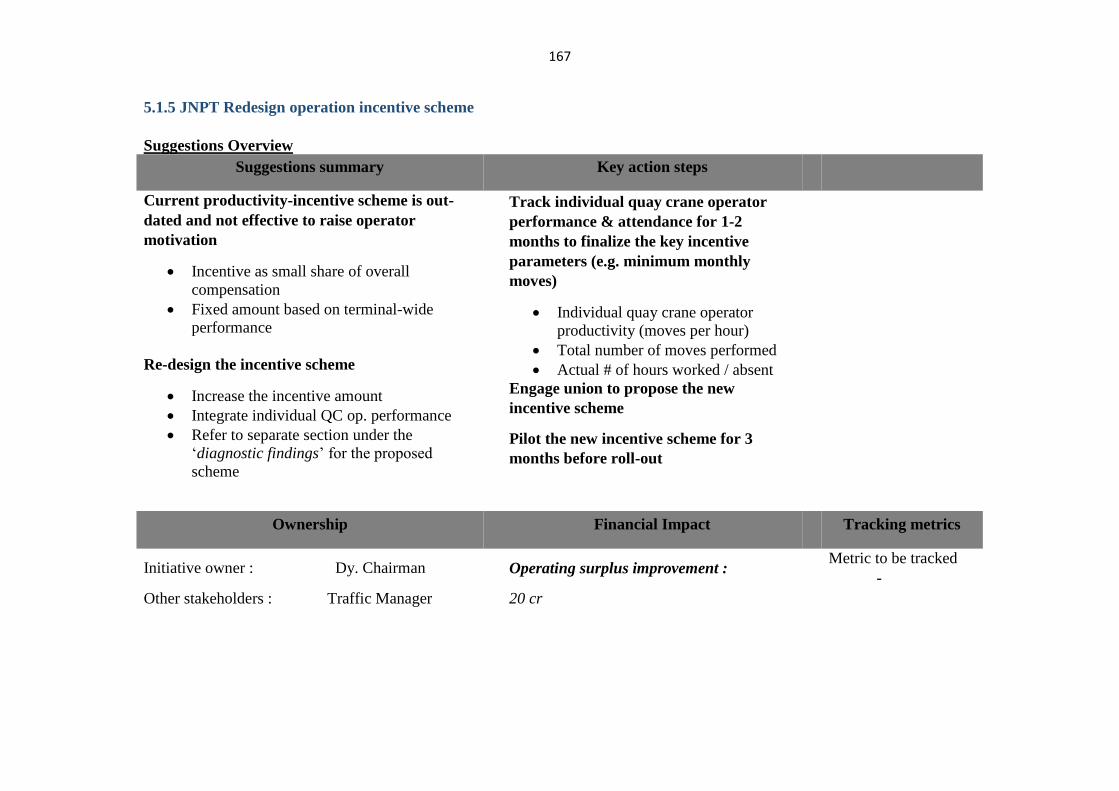
167
5.1.5 JNPT Redesign operation incentive scheme
Suggestions Overview Suggestions summary Key action steps
Current productivity-incentive scheme is out-
dated and not effective to raise operator
motivation
Incentive as small share of overall
compensation
Fixed amount based on terminal-wide
performance
Re-design the incentive scheme
Increase the incentive amount
Integrate individual QC op. performance
Refer to separate section under the
‘diagnostic findings’ for the proposed
scheme
Track individual quay crane operator
performance & attendance for 1-2
months to finalize the key incentive
parameters (e.g. minimum monthly
moves)
Individual quay crane operator
productivity (moves per hour)
Total number of moves performed
Actual # of hours worked / absent
Engage union to propose the new
incentive scheme
Pilot the new incentive scheme for 3
months before roll-out
Ownership Financial Impact Tracking metrics
Initiative owner : Dy. Chairman
Other stakeholders : Traffic Manager
Operating surplus improvement :
20 cr
Metric to be tracked
-
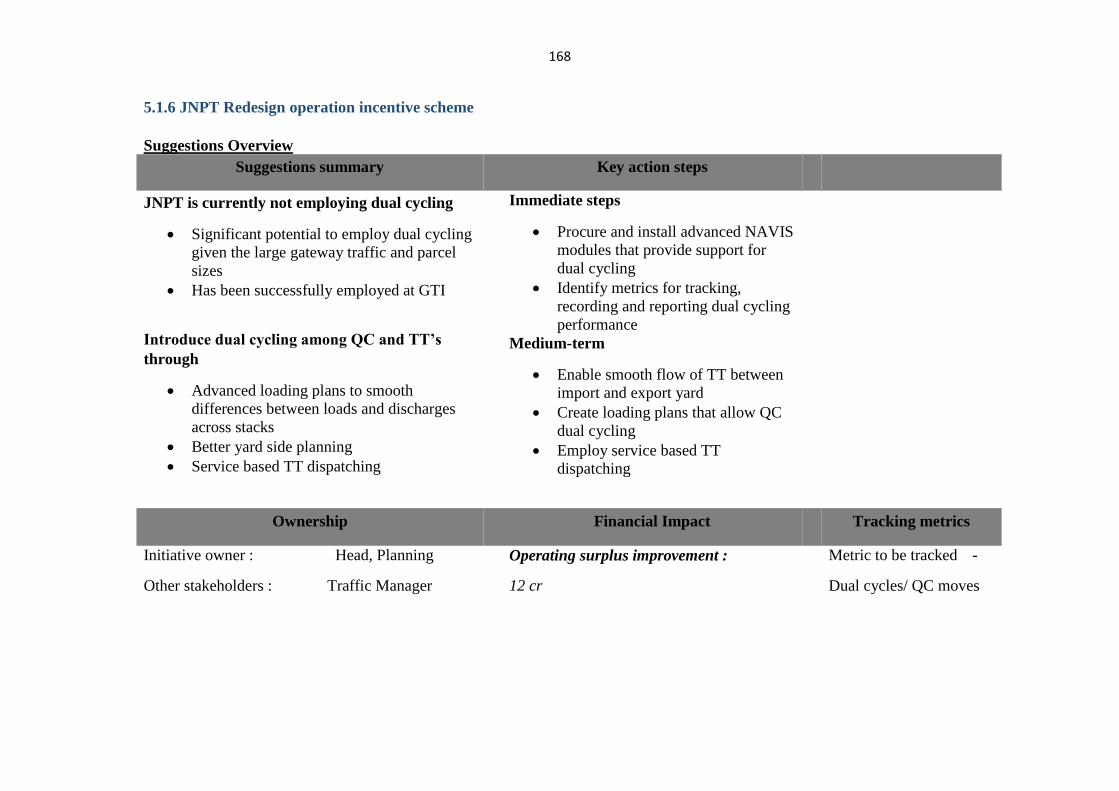
168
5.1.6 JNPT Redesign operation incentive scheme
Suggestions Overview
Suggestions summary Key action steps
JNPT is currently not employing dual cycling
Significant potential to employ dual cycling
given the large gateway traffic and parcel
sizes
Has been successfully employed at GTI
Introduce dual cycling among QC and TT’s
through
Advanced loading plans to smooth
differences between loads and discharges
across stacks
Better yard side planning
Service based TT dispatching
Immediate steps
Procure and install advanced NAVIS
modules that provide support for
dual cycling
Identify metrics for tracking,
recording and reporting dual cycling
performance
Medium-term
Enable smooth flow of TT between
import and export yard
Create loading plans that allow QC
dual cycling
Employ service based TT
dispatching
Ownership Financial Impact Tracking metrics
Initiative owner : Head, Planning
Other stakeholders : Traffic Manager
Operating surplus improvement :
12 cr
Metric to be tracked -
Dual cycles/ QC moves
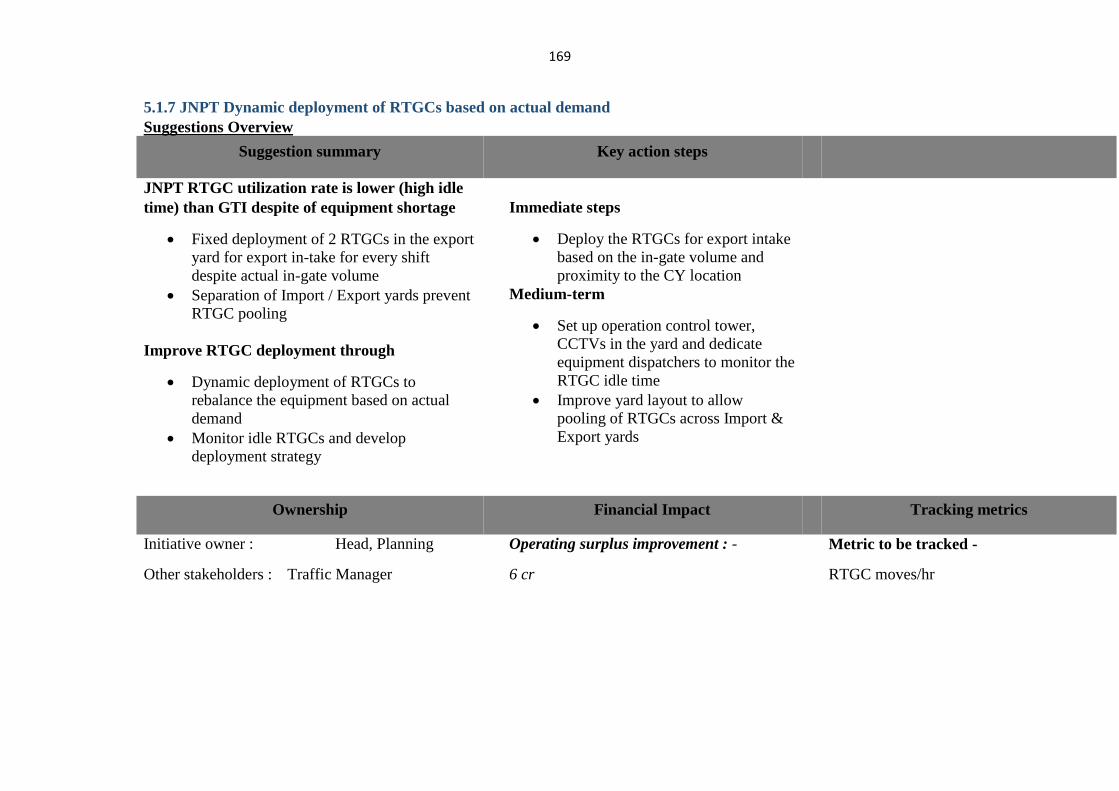
169
5.1.7 JNPT Dynamic deployment of RTGCs based on actual demand
Suggestions Overview
Suggestion summary Key action steps
JNPT RTGC utilization rate is lower (high idle
time) than GTI despite of equipment shortage
Fixed deployment of 2 RTGCs in the export
yard for export in-take for every shift
despite actual in-gate volume
Separation of Import / Export yards prevent
RTGC pooling
Improve RTGC deployment through
Dynamic deployment of RTGCs to
rebalance the equipment based on actual
demand
Monitor idle RTGCs and develop
deployment strategy
Immediate steps
Deploy the RTGCs for export intake
based on the in-gate volume and
proximity to the CY location
Medium-term
Set up operation control tower,
CCTVs in the yard and dedicate
equipment dispatchers to monitor the
RTGC idle time
Improve yard layout to allow
pooling of RTGCs across Import &
Export yards
Ownership Financial Impact Tracking metrics
Initiative owner : Head, Planning
Other stakeholders : Traffic Manager
Operating surplus improvement : -
6 cr
Metric to be tracked -
RTGC moves/hr
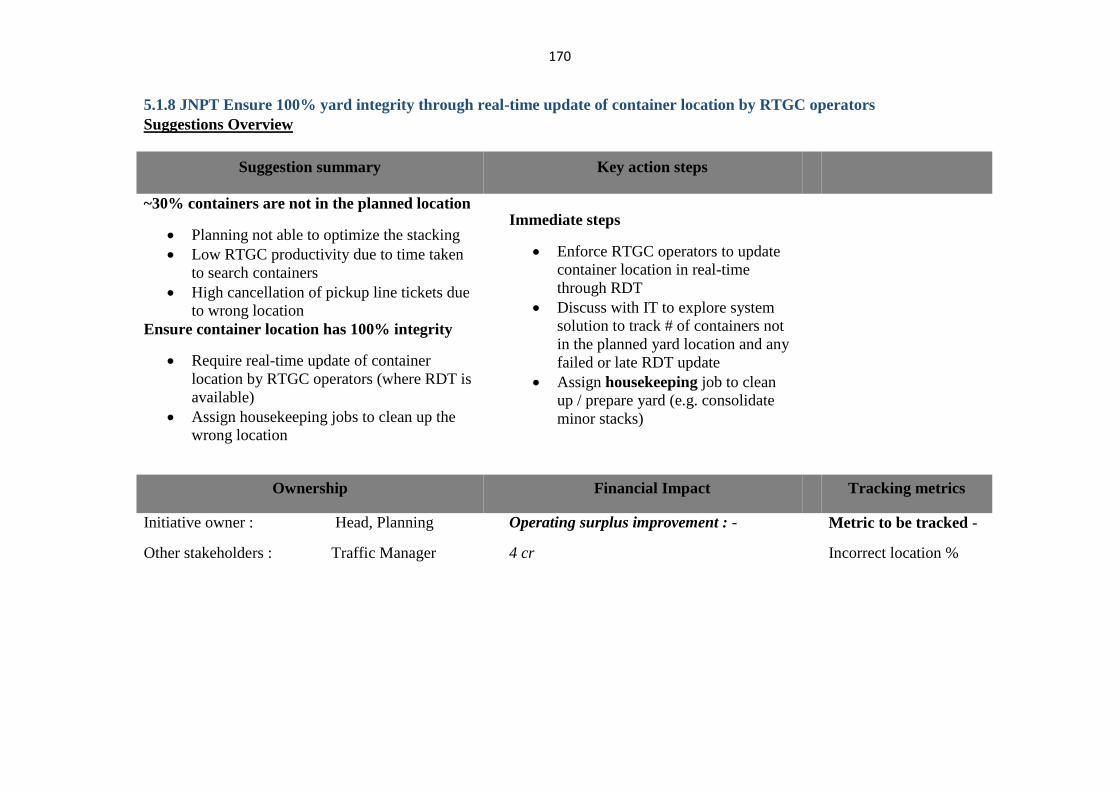
170
5.1.8 JNPT Ensure 100% yard integrity through real-time update of container location by RTGC operators
Suggestions Overview
Suggestion summary Key action steps
~30% containers are not in the planned location
Planning not able to optimize the stacking
Low RTGC productivity due to time taken
to search containers
High cancellation of pickup line tickets due
to wrong location
Ensure container location has 100% integrity
Require real-time update of container
location by RTGC operators (where RDT is
available)
Assign housekeeping jobs to clean up the
wrong location
Immediate steps
Enforce RTGC operators to update
container location in real-time
through RDT
Discuss with IT to explore system
solution to track # of containers not
in the planned yard location and any
failed or late RDT update
Assign housekeeping job to clean
up / prepare yard (e.g. consolidate
minor stacks)
Ownership Financial Impact Tracking metrics
Initiative owner : Head, Planning
Other stakeholders : Traffic Manager
Operating surplus improvement : -
4 cr
Metric to be tracked -
Incorrect location %
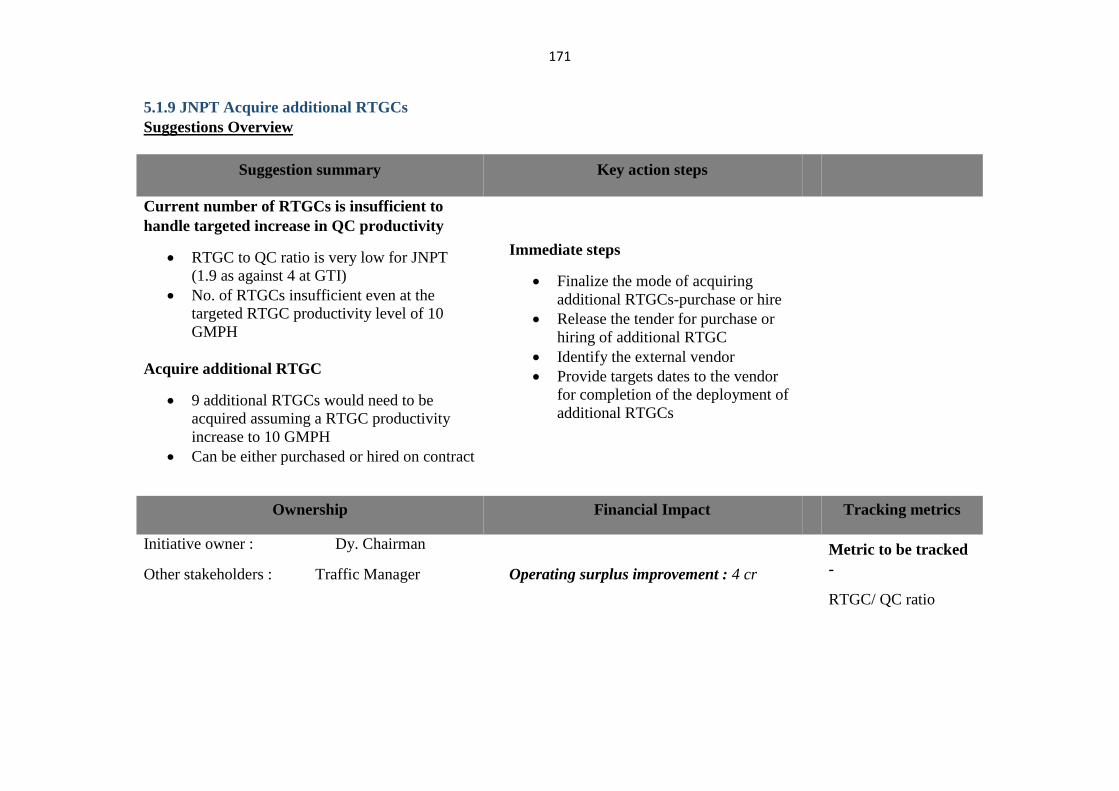
171
5.1.9 JNPT Acquire additional RTGCs
Suggestions Overview
Suggestion summary Key action steps
Current number of RTGCs is insufficient to
handle targeted increase in QC productivity
RTGC to QC ratio is very low for JNPT
(1.9 as against 4 at GTI)
No. of RTGCs insufficient even at the
targeted RTGC productivity level of 10
GMPH
Acquire additional RTGC
9 additional RTGCs would need to be
acquired assuming a RTGC productivity
increase to 10 GMPH
Can be either purchased or hired on contract
Immediate steps
Finalize the mode of acquiring
additional RTGCs-purchase or hire
Release the tender for purchase or
hiring of additional RTGC
Identify the external vendor
Provide targets dates to the vendor
for completion of the deployment of
additional RTGCs
Ownership Financial Impact Tracking metrics
Initiative owner : Dy. Chairman
Other stakeholders : Traffic Manager
Operating surplus improvement : 4 cr
Metric to be tracked
-
RTGC/ QC ratio
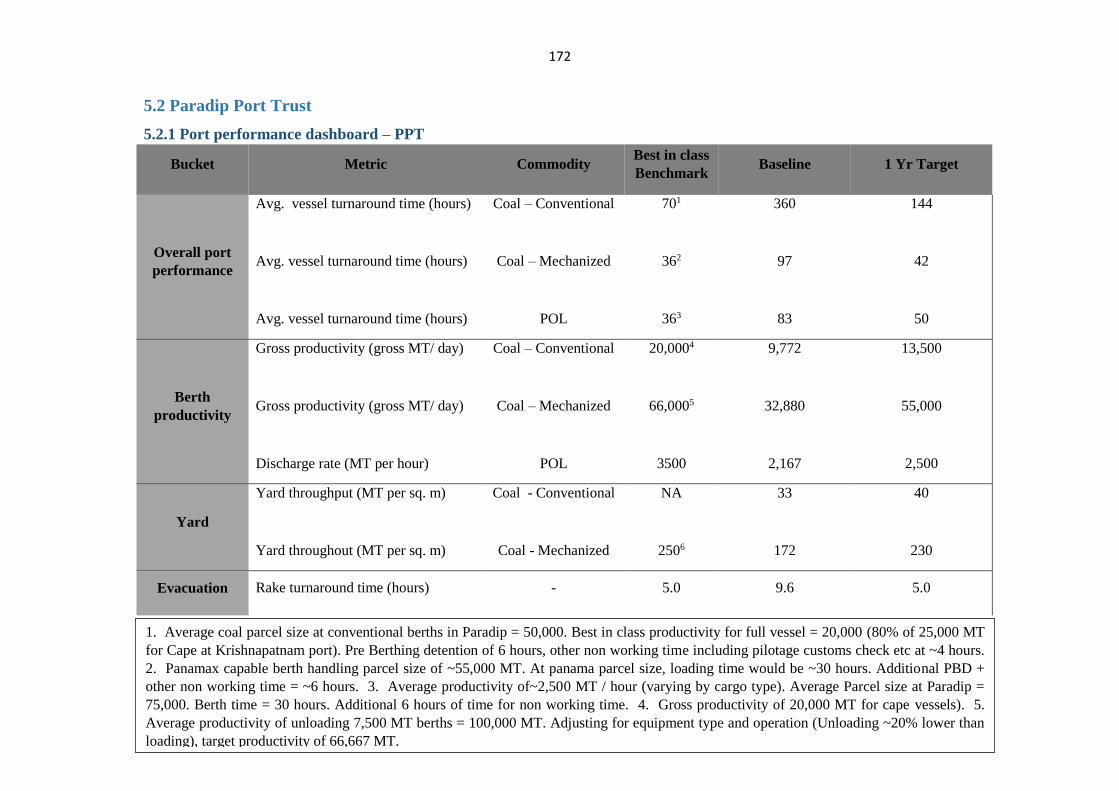
172
5.2 Paradip Port Trust
5.2.1 Port performance dashboard – PPT
Bucket Metric Commodity Best in class
Benchmark Baseline 1 Yr Target
Overall port
performance
Avg. vessel turnaround time (hours)
Avg. vessel turnaround time (hours)
Avg. vessel turnaround time (hours)
Coal – Conventional
Coal – Mechanized
POL
701
362
363
360
97
83
144
42
50
Berth
productivity
Gross productivity (gross MT/ day)
Gross productivity (gross MT/ day)
Discharge rate (MT per hour)
Coal – Conventional
Coal – Mechanized
POL
20,0004
66,0005
3500
9,772
32,880
2,167
13,500
55,000
2,500
Yard
Yard throughput (MT per sq. m)
Yard throughout (MT per sq. m)
Coal - Conventional
Coal - Mechanized
NA
2506
33
172
40
230
Evacuation Rake turnaround time (hours) - 5.0 9.6 5.0
)
1. Average coal parcel size at conventional berths in Paradip = 50,000. Best in class productivity for full vessel = 20,000 (80% of 25,000 MT
for Cape at Krishnapatnam port). Pre Berthing detention of 6 hours, other non working time including pilotage customs check etc at ~4 hours.
2. Panamax capable berth handling parcel size of ~55,000 MT. At panama parcel size, loading time would be ~30 hours. Additional PBD +
other non working time = ~6 hours. 3. Average productivity of~2,500 MT / hour (varying by cargo type). Average Parcel size at Paradip =
75,000. Berth time = 30 hours. Additional 6 hours of time for non working time. 4. Gross productivity of 20,000 MT for cape vessels). 5.
Average productivity of unloading 7,500 MT berths = 100,000 MT. Adjusting for equipment type and operation (Unloading ~20% lower than
loading), target productivity of 66,667 MT.
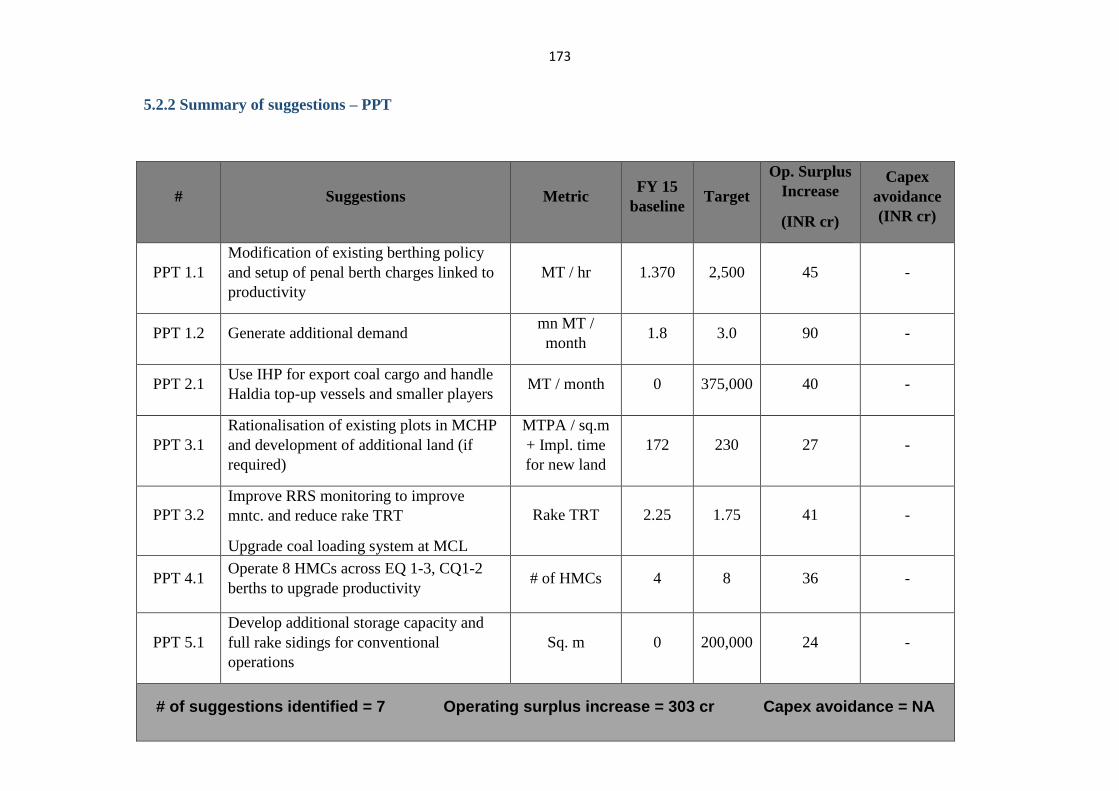
173
5.2.2 Summary of suggestions – PPT
# Suggestions Metric FY 15
baseline Target
Op. Surplus
Increase
(INR cr)
Capex
avoidance
(INR cr)
PPT 1.1
Modification of existing berthing policy
and setup of penal berth charges linked to
productivity
MT / hr 1.370 2,500 45 -
PPT 1.2 Generate additional demand mn MT /
month 1.8 3.0 90 -
PPT 2.1 Use IHP for export coal cargo and handle
Haldia top-up vessels and smaller players MT / month 0 375,000 40 -
PPT 3.1
Rationalisation of existing plots in MCHP
and development of additional land (if
required)
MTPA / sq.m
+ Impl. time
for new land
172 230 27 -
PPT 3.2
Improve RRS monitoring to improve
mntc. and reduce rake TRT
Upgrade coal loading system at MCL
Rake TRT 2.25 1.75 41 -
PPT 4.1 Operate 8 HMCs across EQ 1-3, CQ1-2
berths to upgrade productivity # of HMCs 4 8 36 -
PPT 5.1
Develop additional storage capacity and
full rake sidings for conventional
operations
Sq. m 0 200,000 24 -
# of suggestions identified = 7 Operating surplus increase = 303 cr Capex avoidance = NA
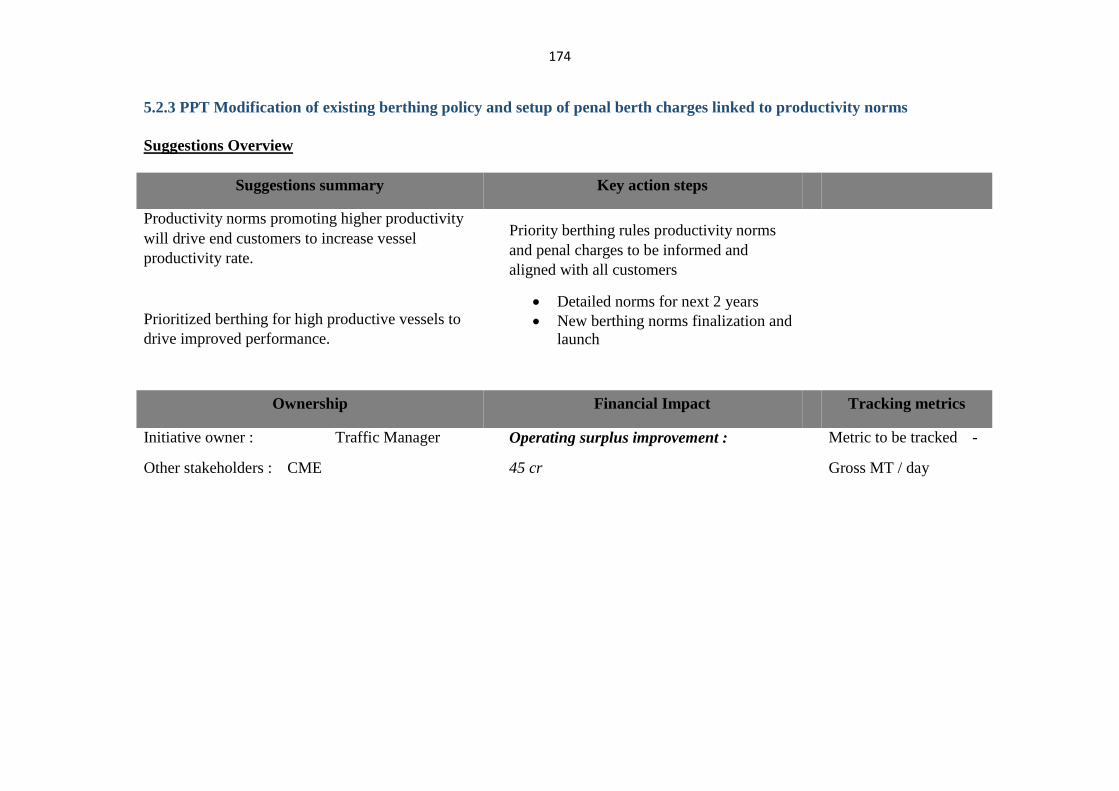
174
5.2.3 PPT Modification of existing berthing policy and setup of penal berth charges linked to productivity norms
Suggestions Overview
Suggestions summary Key action steps
Productivity norms promoting higher productivity
will drive end customers to increase vessel
productivity rate.
Prioritized berthing for high productive vessels to
drive improved performance.
Priority berthing rules productivity norms
and penal charges to be informed and
aligned with all customers
Detailed norms for next 2 years
New berthing norms finalization and
launch
Ownership Financial Impact Tracking metrics
Initiative owner : Traffic Manager
Other stakeholders : CME
Operating surplus improvement :
45 cr
Metric to be tracked -
Gross MT / day
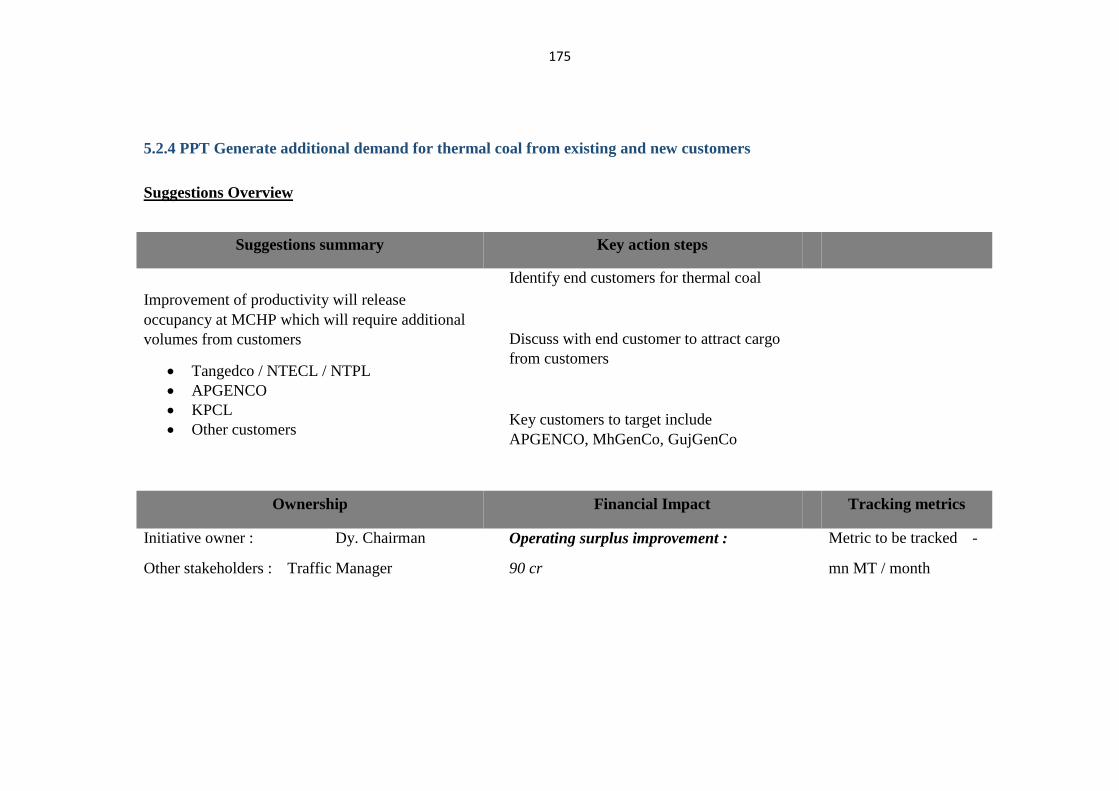
175
5.2.4 PPT Generate additional demand for thermal coal from existing and new customers
Suggestions Overview
Suggestions summary Key action steps
Improvement of productivity will release
occupancy at MCHP which will require additional
volumes from customers
Tangedco / NTECL / NTPL
APGENCO
KPCL
Other customers
Identify end customers for thermal coal
Discuss with end customer to attract cargo
from customers
Key customers to target include
APGENCO, MhGenCo, GujGenCo
Ownership Financial Impact Tracking metrics
Initiative owner : Dy. Chairman
Other stakeholders : Traffic Manager
Operating surplus improvement :
90 cr
Metric to be tracked -
mn MT / month
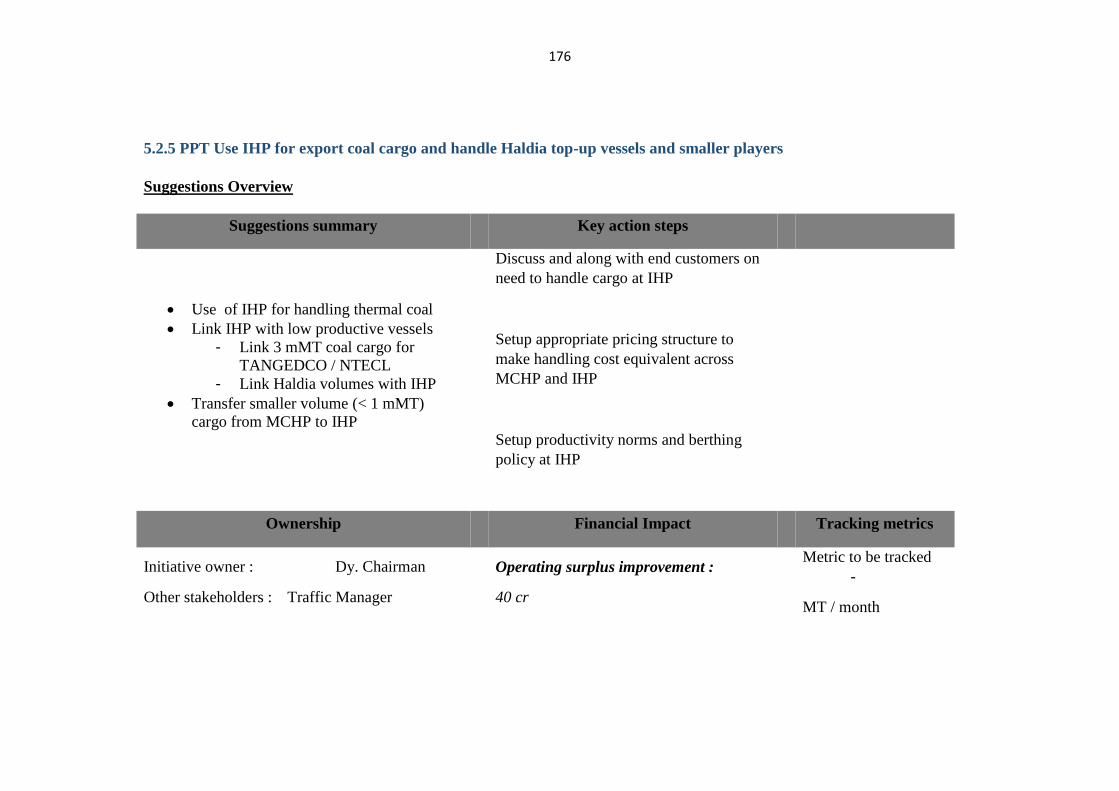
176
5.2.5 PPT Use IHP for export coal cargo and handle Haldia top-up vessels and smaller players
Suggestions Overview
Suggestions summary Key action steps
Use of IHP for handling thermal coal
Link IHP with low productive vessels
- Link 3 mMT coal cargo for
TANGEDCO / NTECL
- Link Haldia volumes with IHP
Transfer smaller volume (< 1 mMT)
cargo from MCHP to IHP
Discuss and along with end customers on
need to handle cargo at IHP
Setup appropriate pricing structure to
make handling cost equivalent across
MCHP and IHP
Setup productivity norms and berthing
policy at IHP
Ownership Financial Impact Tracking metrics
Initiative owner : Dy. Chairman
Other stakeholders : Traffic Manager
Operating surplus improvement :
40 cr
Metric to be tracked
-
MT / month
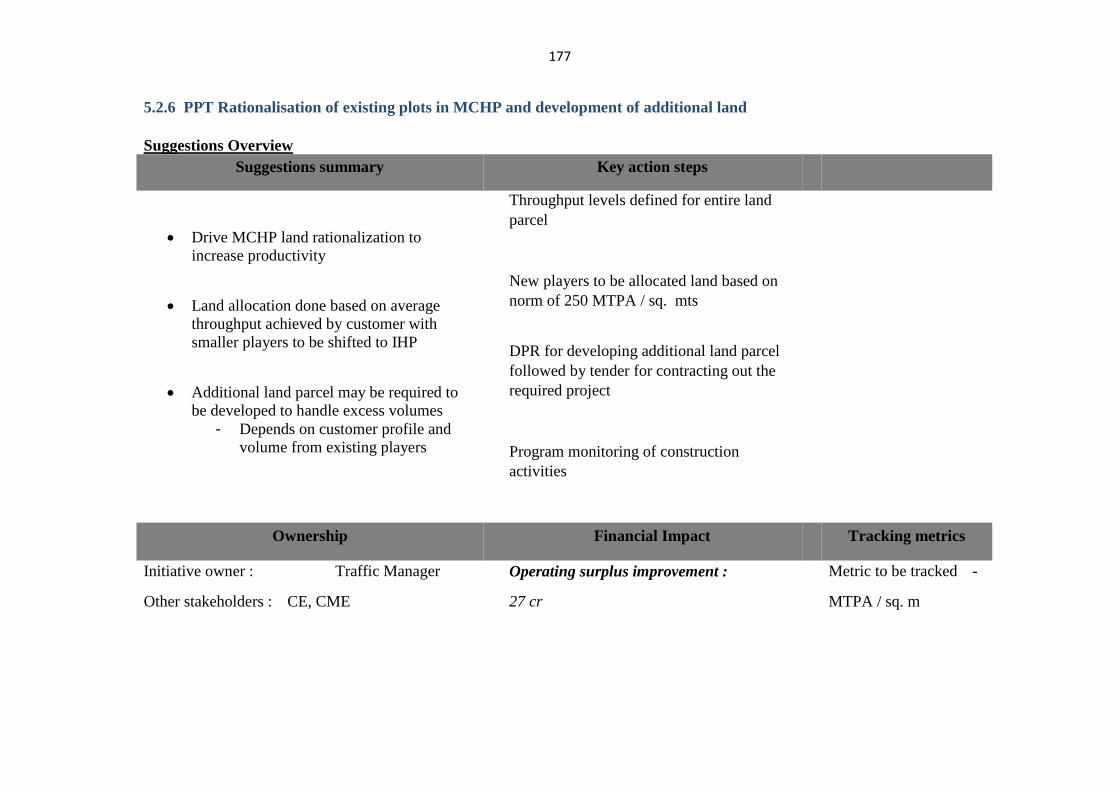
177
5.2.6 PPT Rationalisation of existing plots in MCHP and development of additional land
Suggestions Overview
Suggestions summary Key action steps
Drive MCHP land rationalization to
increase productivity
Land allocation done based on average
throughput achieved by customer with
smaller players to be shifted to IHP
Additional land parcel may be required to
be developed to handle excess volumes
- Depends on customer profile and
volume from existing players
Throughput levels defined for entire land
parcel
New players to be allocated land based on
norm of 250 MTPA / sq. mts
DPR for developing additional land parcel
followed by tender for contracting out the
required project
Program monitoring of construction
activities
Ownership Financial Impact Tracking metrics
Initiative owner : Traffic Manager
Other stakeholders : CE, CME
Operating surplus improvement :
27 cr
Metric to be tracked -
MTPA / sq. m
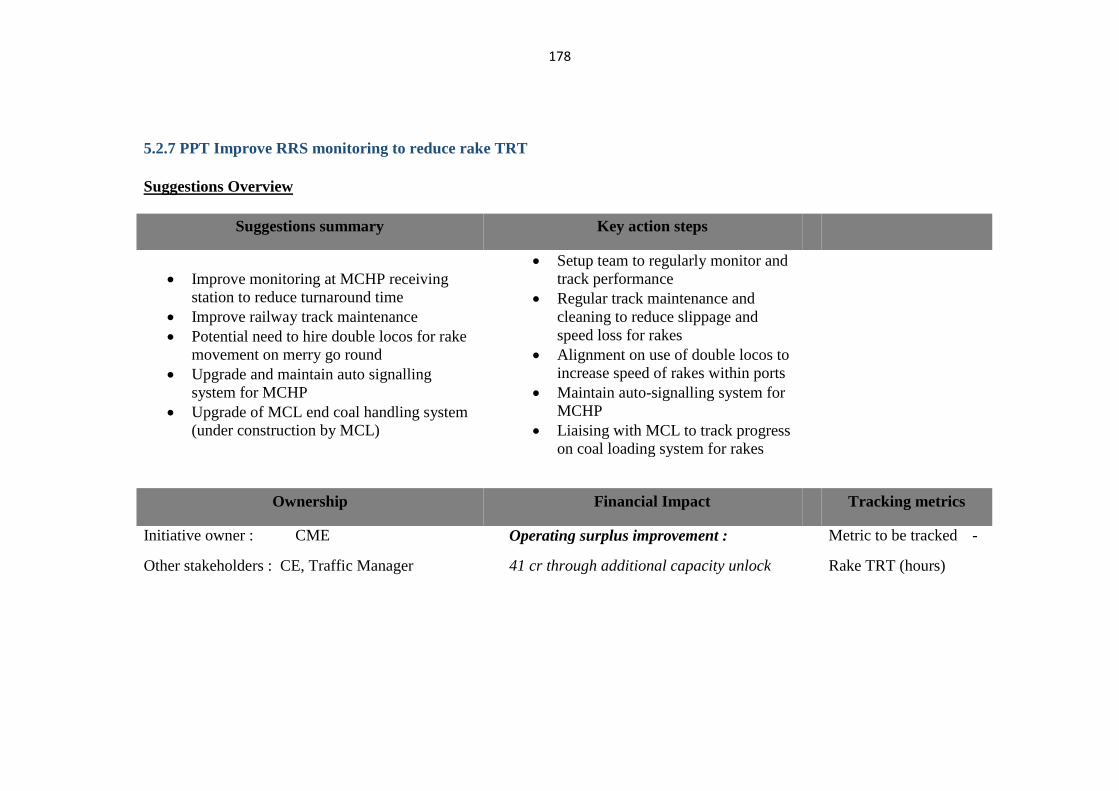
178
5.2.7 PPT Improve RRS monitoring to reduce rake TRT
Suggestions Overview
Suggestions summary Key action steps
Improve monitoring at MCHP receiving
station to reduce turnaround time
Improve railway track maintenance
Potential need to hire double locos for rake
movement on merry go round
Upgrade and maintain auto signalling
system for MCHP
Upgrade of MCL end coal handling system
(under construction by MCL)
Setup team to regularly monitor and
track performance
Regular track maintenance and
cleaning to reduce slippage and
speed loss for rakes
Alignment on use of double locos to
increase speed of rakes within ports
Maintain auto-signalling system for
MCHP
Liaising with MCL to track progress
on coal loading system for rakes
Ownership Financial Impact Tracking metrics
Initiative owner : CME
Other stakeholders : CE, Traffic Manager
Operating surplus improvement :
41 cr through additional capacity unlock
Metric to be tracked -
Rake TRT (hours)
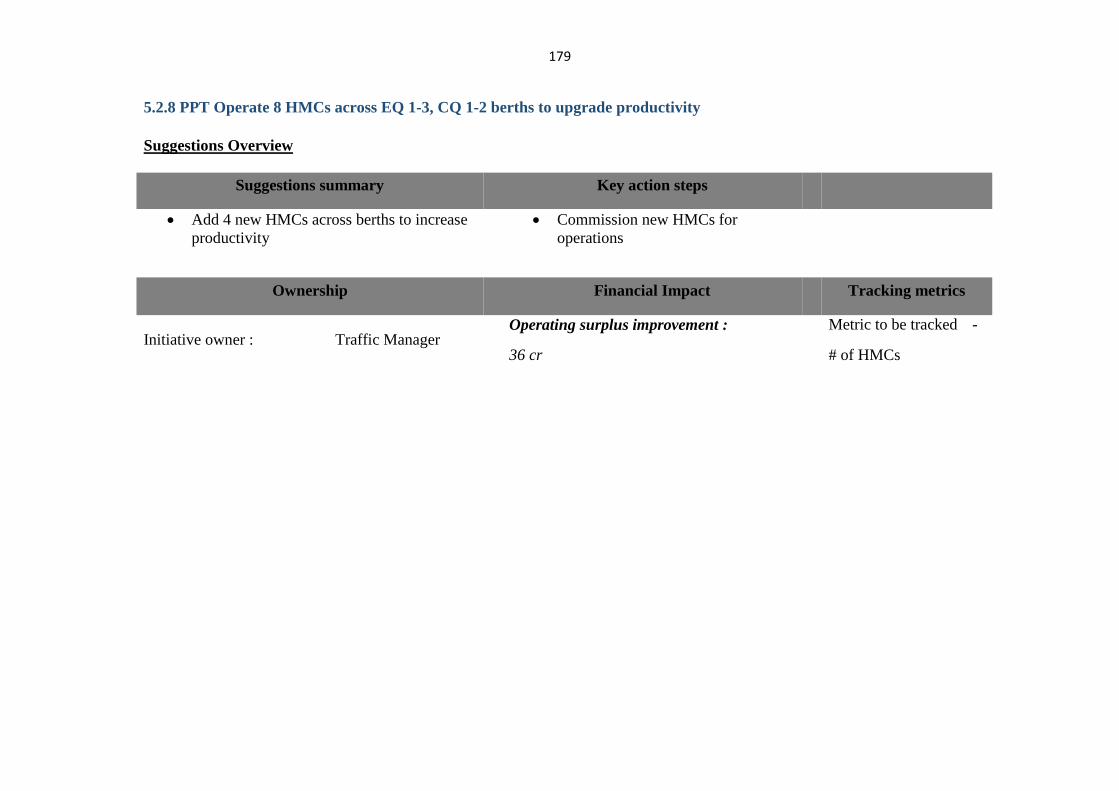
179
5.2.8 PPT Operate 8 HMCs across EQ 1-3, CQ 1-2 berths to upgrade productivity
Suggestions Overview
Suggestions summary Key action steps
Add 4 new HMCs across berths to increase
productivity Commission new HMCs for
operations
Ownership Financial Impact Tracking metrics
Initiative owner : Traffic Manager Operating surplus improvement :
36 cr
Metric to be tracked -
# of HMCs
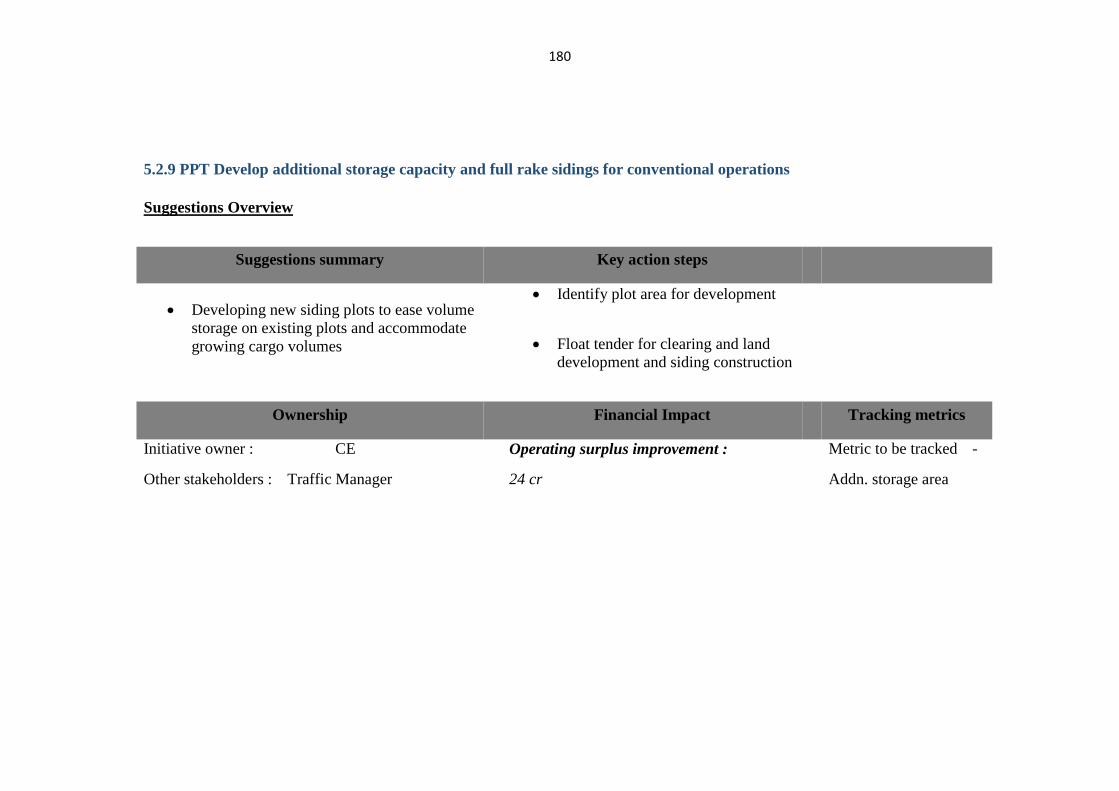
180
5.2.9 PPT Develop additional storage capacity and full rake sidings for conventional operations
Suggestions Overview
Suggestions summary Key action steps
Developing new siding plots to ease volume
storage on existing plots and accommodate
growing cargo volumes
Identify plot area for development
Float tender for clearing and land
development and siding construction
Ownership Financial Impact Tracking metrics
Initiative owner : CE
Other stakeholders : Traffic Manager
Operating surplus improvement :
24 cr
Metric to be tracked -
Addn. storage area
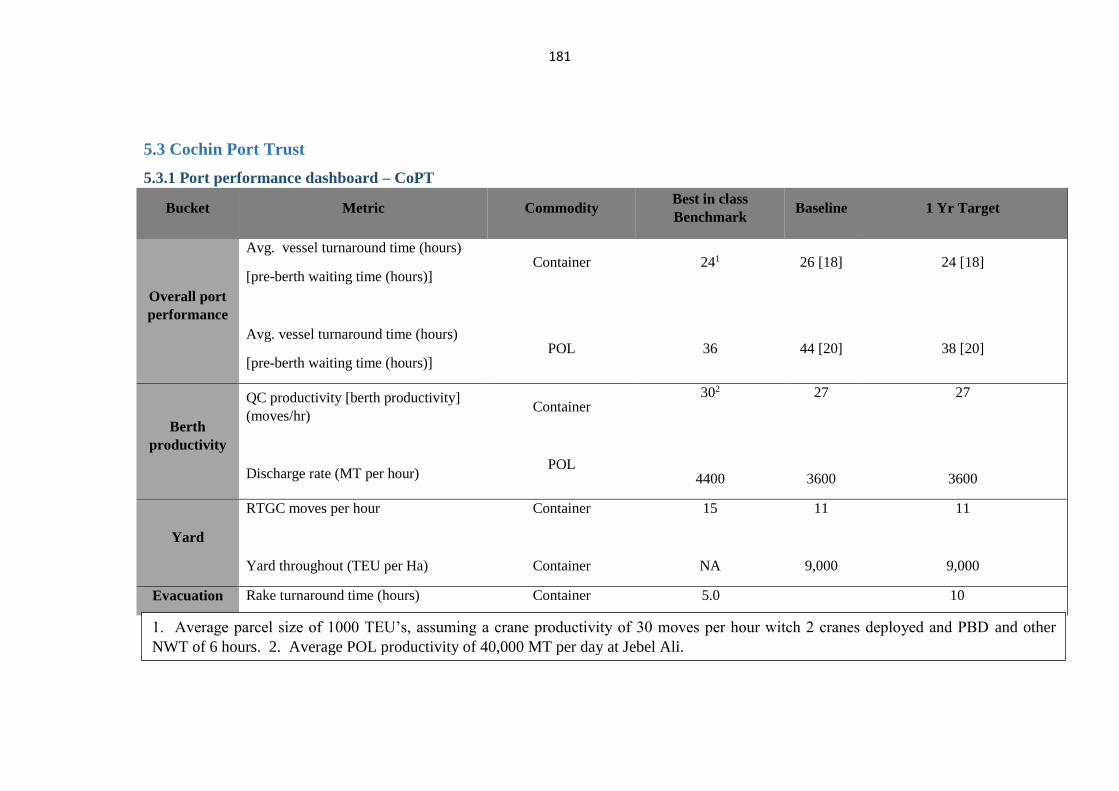
181
5.3 Cochin Port Trust
5.3.1 Port performance dashboard – CoPT
Bucket Metric Commodity Best in class
Benchmark Baseline 1 Yr Target
Overall port
performance
Avg. vessel turnaround time (hours)
[pre-berth waiting time (hours)]
Avg. vessel turnaround time (hours)
[pre-berth waiting time (hours)]
Container
POL
241
36
26 [18]
44 [20]
24 [18]
38 [20]
Berth
productivity
QC productivity [berth productivity]
(moves/hr)
Discharge rate (MT per hour)
Container
POL
302
4400
27
3600
27
3600
Yard
RTGC moves per hour
Yard throughout (TEU per Ha)
Container
Container
15
NA
11
9,000
11
9,000
Evacuation Rake turnaround time (hours) Container 5.0 10 10
1. Average parcel size of 1000 TEU’s, assuming a crane productivity of 30 moves per hour witch 2 cranes deployed and PBD and other
NWT of 6 hours. 2. Average POL productivity of 40,000 MT per day at Jebel Ali.
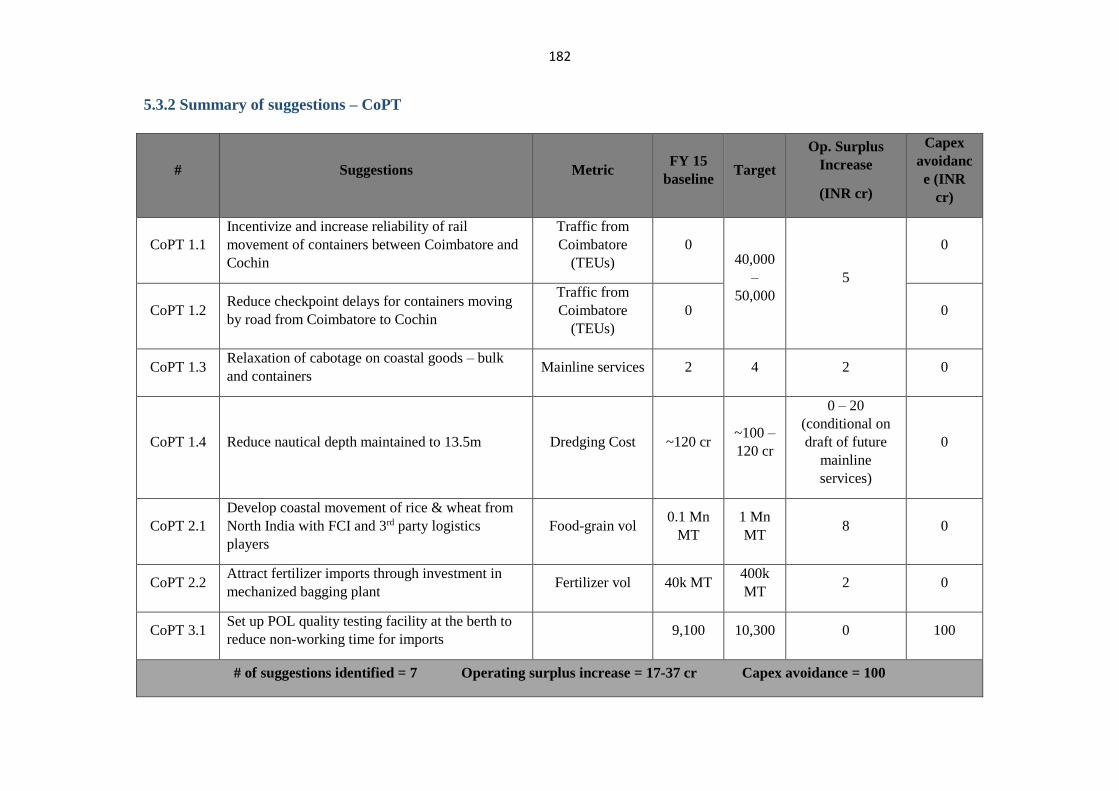
182
5.3.2 Summary of suggestions – CoPT
# Suggestions Metric FY 15
baseline Target
Op. Surplus
Increase
(INR cr)
Capex
avoidanc
e (INR
cr)
CoPT 1.1
Incentivize and increase reliability of rail
movement of containers between Coimbatore and
Cochin
Traffic from
Coimbatore
(TEUs)
0 40,000
–
50,000
5
0
CoPT 1.2 Reduce checkpoint delays for containers moving
by road from Coimbatore to Cochin
Traffic from
Coimbatore
(TEUs)
0 0
CoPT 1.3 Relaxation of cabotage on coastal goods – bulk
and containers Mainline services 2 4 2 0
CoPT 1.4 Reduce nautical depth maintained to 13.5m Dredging Cost ~120 cr ~100 –
120 cr
0 – 20
(conditional on
draft of future
mainline
services)
0
CoPT 2.1
Develop coastal movement of rice & wheat from
North India with FCI and 3rd party logistics
players
Food-grain vol 0.1 Mn
MT
1 Mn
MT 8 0
CoPT 2.2 Attract fertilizer imports through investment in
mechanized bagging plant Fertilizer vol 40k MT
400k
MT 2 0
CoPT 3.1 Set up POL quality testing facility at the berth to
reduce non-working time for imports 9,100 10,300 0 100
# of suggestions identified = 7 Operating surplus increase = 17-37 cr Capex avoidance = 100
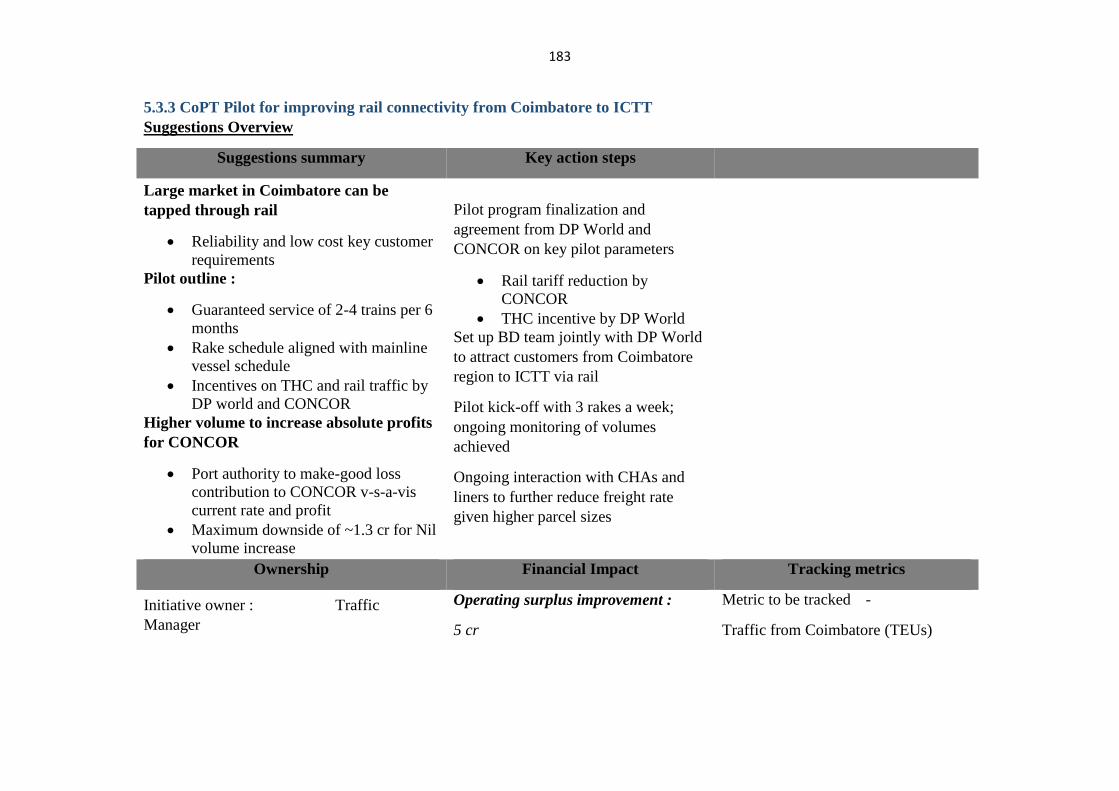
183
5.3.3 CoPT Pilot for improving rail connectivity from Coimbatore to ICTT
Suggestions Overview
Suggestions summary Key action steps
Large market in Coimbatore can be
tapped through rail
Reliability and low cost key customer
requirements
Pilot outline :
Guaranteed service of 2-4 trains per 6
months
Rake schedule aligned with mainline
vessel schedule
Incentives on THC and rail traffic by
DP world and CONCOR
Higher volume to increase absolute profits
for CONCOR
Port authority to make-good loss
contribution to CONCOR v-s-a-vis
current rate and profit
Maximum downside of ~1.3 cr for Nil
volume increase
Pilot program finalization and
agreement from DP World and
CONCOR on key pilot parameters
Rail tariff reduction by
CONCOR
THC incentive by DP World
Set up BD team jointly with DP World
to attract customers from Coimbatore
region to ICTT via rail
Pilot kick-off with 3 rakes a week;
ongoing monitoring of volumes
achieved
Ongoing interaction with CHAs and
liners to further reduce freight rate
given higher parcel sizes
Ownership Financial Impact Tracking metrics
Initiative owner : Traffic
Manager
Operating surplus improvement :
5 cr
Metric to be tracked -
Traffic from Coimbatore (TEUs)
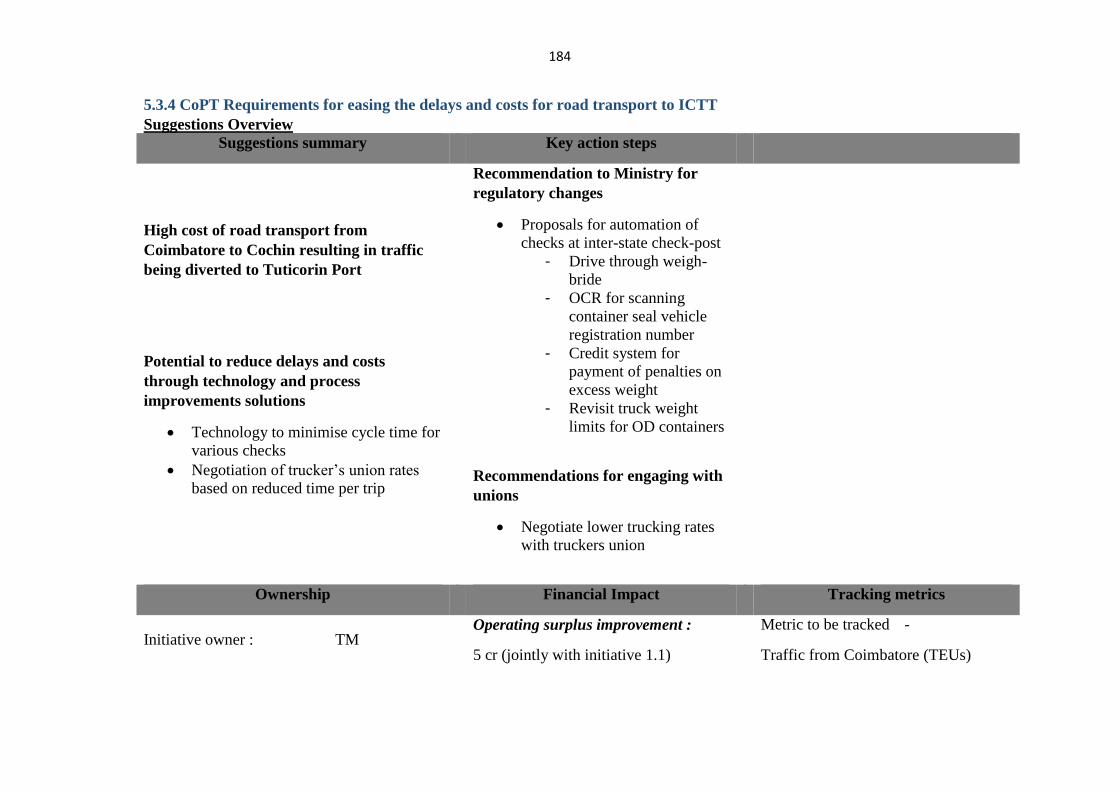
184
5.3.4 CoPT Requirements for easing the delays and costs for road transport to ICTT
Suggestions Overview
Suggestions summary Key action steps
High cost of road transport from
Coimbatore to Cochin resulting in traffic
being diverted to Tuticorin Port
Potential to reduce delays and costs
through technology and process
improvements solutions
Technology to minimise cycle time for
various checks
Negotiation of trucker’s union rates
based on reduced time per trip
Recommendation to Ministry for
regulatory changes
Proposals for automation of
checks at inter-state check-post
- Drive through weigh-
bride
- OCR for scanning
container seal vehicle
registration number
- Credit system for
payment of penalties on
excess weight
- Revisit truck weight
limits for OD containers
Recommendations for engaging with
unions
Negotiate lower trucking rates
with truckers union
Ownership Financial Impact Tracking metrics
Initiative owner : TM Operating surplus improvement :
5 cr (jointly with initiative 1.1)
Metric to be tracked -
Traffic from Coimbatore (TEUs)
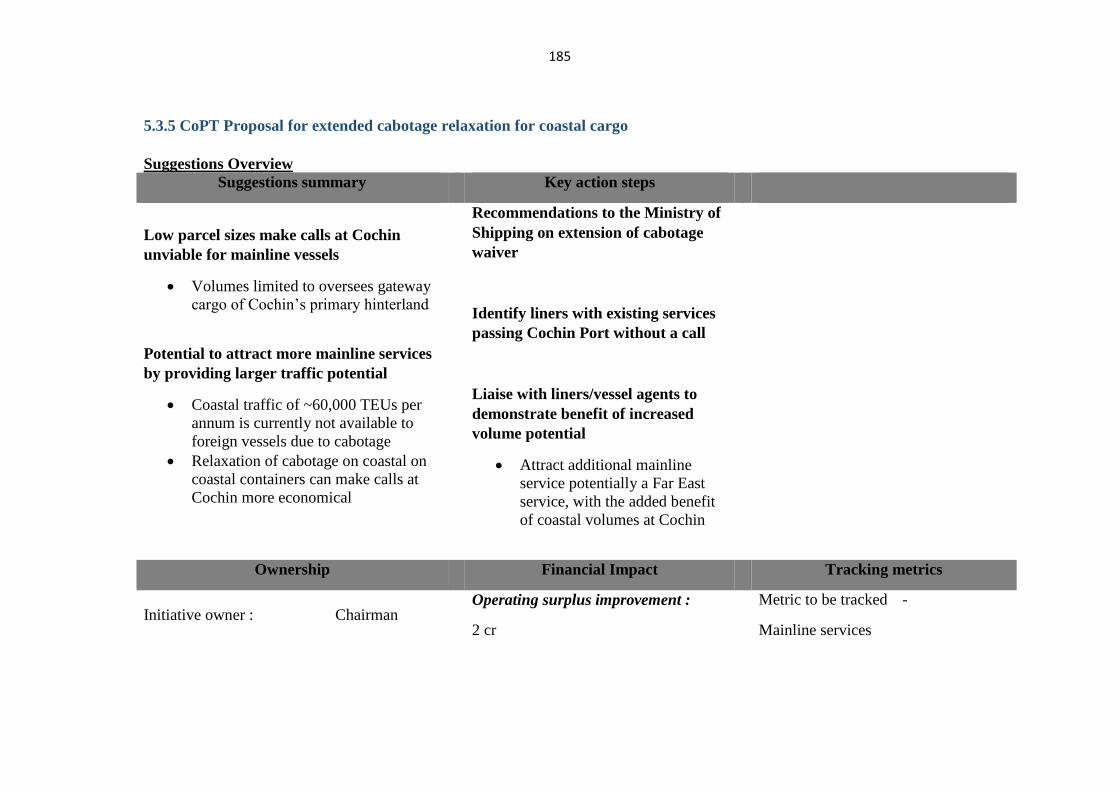
185
5.3.5 CoPT Proposal for extended cabotage relaxation for coastal cargo
Suggestions Overview
Suggestions summary Key action steps
Low parcel sizes make calls at Cochin
unviable for mainline vessels
Volumes limited to oversees gateway
cargo of Cochin’s primary hinterland
Potential to attract more mainline services
by providing larger traffic potential
Coastal traffic of ~60,000 TEUs per
annum is currently not available to
foreign vessels due to cabotage
Relaxation of cabotage on coastal on
coastal containers can make calls at
Cochin more economical
Recommendations to the Ministry of
Shipping on extension of cabotage
waiver
Identify liners with existing services
passing Cochin Port without a call
Liaise with liners/vessel agents to
demonstrate benefit of increased
volume potential
Attract additional mainline
service potentially a Far East
service, with the added benefit
of coastal volumes at Cochin
Ownership Financial Impact Tracking metrics
Initiative owner : Chairman Operating surplus improvement :
2 cr
Metric to be tracked -
Mainline services
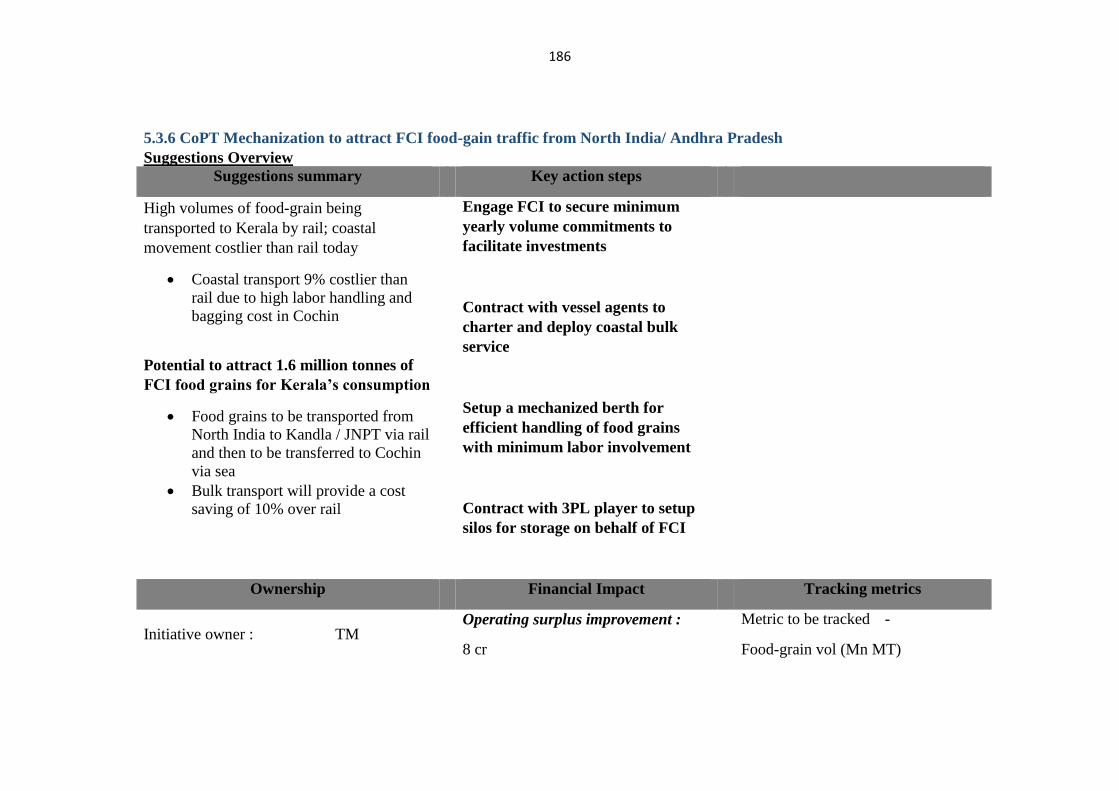
186
5.3.6 CoPT Mechanization to attract FCI food-gain traffic from North India/ Andhra Pradesh
Suggestions Overview
Suggestions summary Key action steps
High volumes of food-grain being
transported to Kerala by rail; coastal
movement costlier than rail today
Coastal transport 9% costlier than
rail due to high labor handling and
bagging cost in Cochin
Potential to attract 1.6 million tonnes of
FCI food grains for Kerala’s consumption
Food grains to be transported from
North India to Kandla / JNPT via rail
and then to be transferred to Cochin
via sea
Bulk transport will provide a cost
saving of 10% over rail
Engage FCI to secure minimum
yearly volume commitments to
facilitate investments
Contract with vessel agents to
charter and deploy coastal bulk
service
Setup a mechanized berth for
efficient handling of food grains
with minimum labor involvement
Contract with 3PL player to setup
silos for storage on behalf of FCI
Ownership Financial Impact Tracking metrics
Initiative owner : TM Operating surplus improvement :
8 cr
Metric to be tracked -
Food-grain vol (Mn MT)
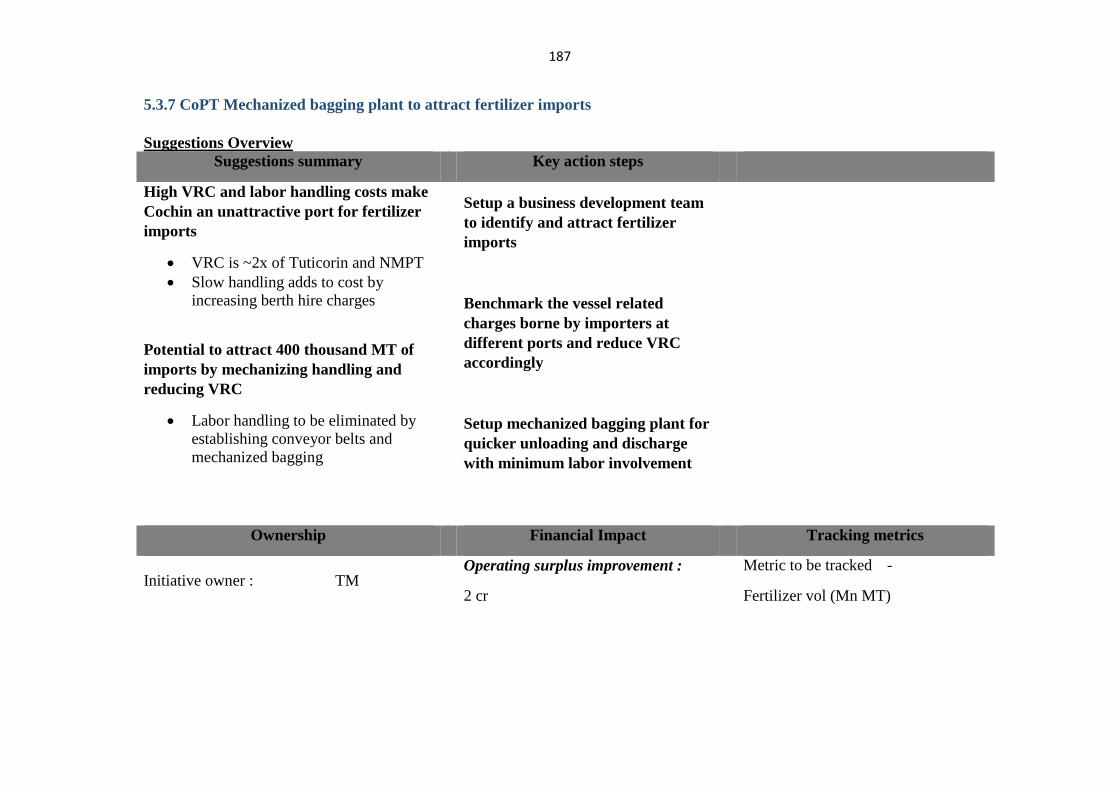
187
5.3.7 CoPT Mechanized bagging plant to attract fertilizer imports
Suggestions Overview
Suggestions summary Key action steps
High VRC and labor handling costs make
Cochin an unattractive port for fertilizer
imports
VRC is ~2x of Tuticorin and NMPT
Slow handling adds to cost by
increasing berth hire charges
Potential to attract 400 thousand MT of
imports by mechanizing handling and
reducing VRC
Labor handling to be eliminated by
establishing conveyor belts and
mechanized bagging
Setup a business development team
to identify and attract fertilizer
imports
Benchmark the vessel related
charges borne by importers at
different ports and reduce VRC
accordingly
Setup mechanized bagging plant for
quicker unloading and discharge
with minimum labor involvement
Ownership Financial Impact Tracking metrics
Initiative owner : TM Operating surplus improvement :
2 cr
Metric to be tracked -
Fertilizer vol (Mn MT)
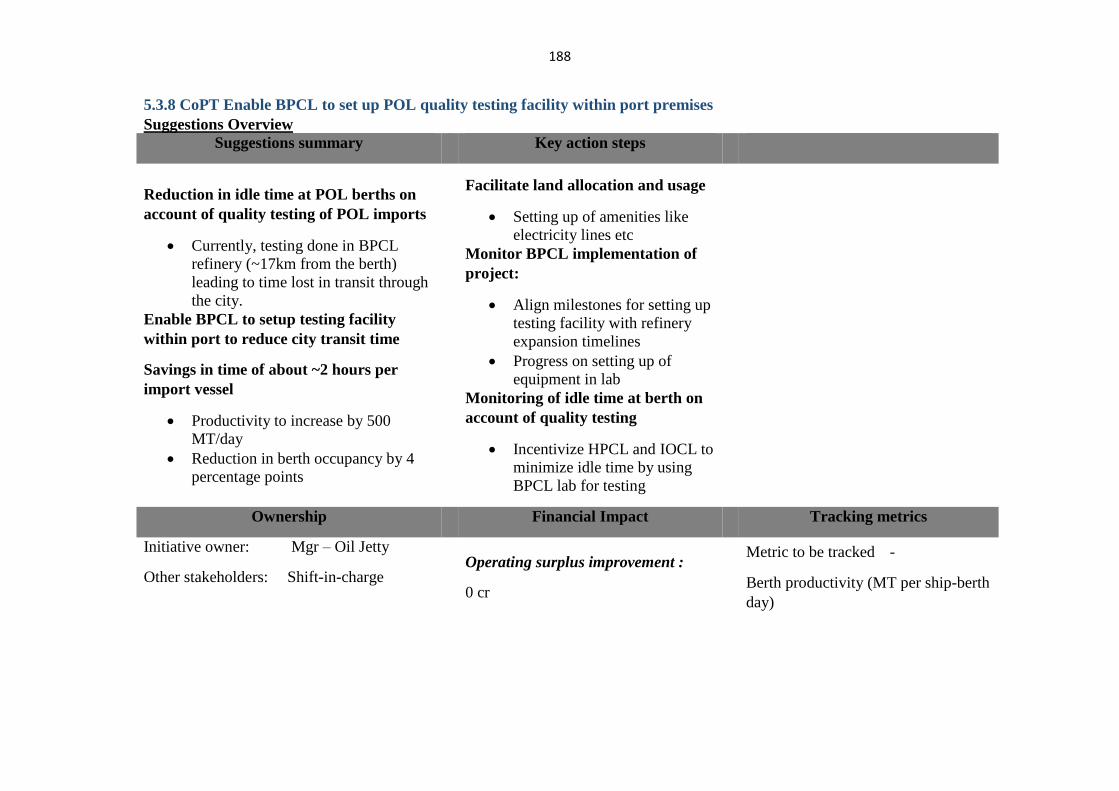
188
5.3.8 CoPT Enable BPCL to set up POL quality testing facility within port premises
Suggestions Overview
Suggestions summary Key action steps
Reduction in idle time at POL berths on
account of quality testing of POL imports
Currently, testing done in BPCL
refinery (~17km from the berth)
leading to time lost in transit through
the city.
Enable BPCL to setup testing facility
within port to reduce city transit time
Savings in time of about ~2 hours per
import vessel
Productivity to increase by 500
MT/day
Reduction in berth occupancy by 4
percentage points
Facilitate land allocation and usage
Setting up of amenities like
electricity lines etc
Monitor BPCL implementation of
project:
Align milestones for setting up
testing facility with refinery
expansion timelines
Progress on setting up of
equipment in lab
Monitoring of idle time at berth on
account of quality testing
Incentivize HPCL and IOCL to
minimize idle time by using
BPCL lab for testing
Ownership Financial Impact Tracking metrics
Initiative owner: Mgr – Oil Jetty
Other stakeholders: Shift-in-charge
Operating surplus improvement :
0 cr
Metric to be tracked -
Berth productivity (MT per ship-berth
day)
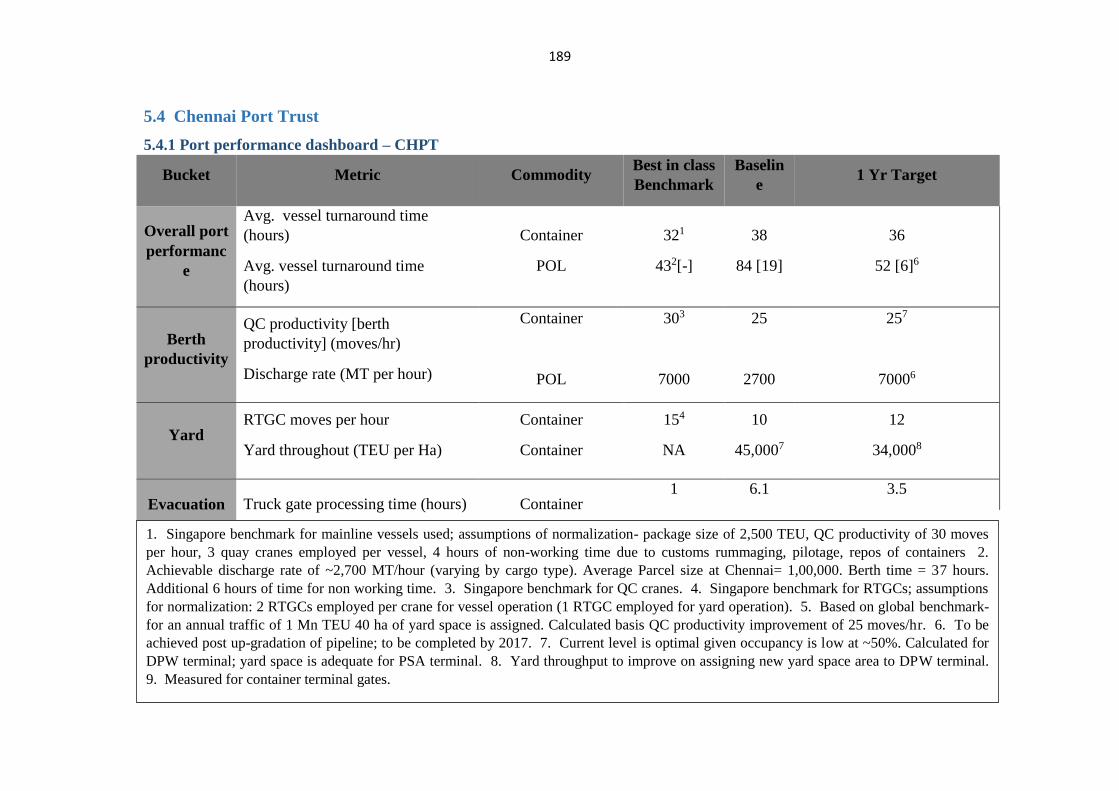
189
5.4 Chennai Port Trust
5.4.1 Port performance dashboard – CHPT
Bucket Metric Commodity Best in class
Benchmark
Baselin
e 1 Yr Target
Overall port
performanc
e
Avg. vessel turnaround time
(hours)
Avg. vessel turnaround time
(hours)
Container
POL
321
432[-]
38
84 [19]
36
52 [6]6
Berth
productivity
QC productivity [berth
productivity] (moves/hr)
Discharge rate (MT per hour)
Container
POL
303
7000
25
2700
257
70006
Yard RTGC moves per hour
Yard throughout (TEU per Ha)
Container
Container
154
NA
10
45,0007
12
34,0008
Evacuation Truck gate processing time (hours) Container 1 6.1 3.5
1. Singapore benchmark for mainline vessels used; assumptions of normalization- package size of 2,500 TEU, QC productivity of 30 moves
per hour, 3 quay cranes employed per vessel, 4 hours of non-working time due to customs rummaging, pilotage, repos of containers 2.
Achievable discharge rate of ~2,700 MT/hour (varying by cargo type). Average Parcel size at Chennai= 1,00,000. Berth time = 37 hours.
Additional 6 hours of time for non working time. 3. Singapore benchmark for QC cranes. 4. Singapore benchmark for RTGCs; assumptions
for normalization: 2 RTGCs employed per crane for vessel operation (1 RTGC employed for yard operation). 5. Based on global benchmark-
for an annual traffic of 1 Mn TEU 40 ha of yard space is assigned. Calculated basis QC productivity improvement of 25 moves/hr. 6. To be
achieved post up-gradation of pipeline; to be completed by 2017. 7. Current level is optimal given occupancy is low at ~50%. Calculated for
DPW terminal; yard space is adequate for PSA terminal. 8. Yard throughput to improve on assigning new yard space area to DPW terminal.
9. Measured for container terminal gates.
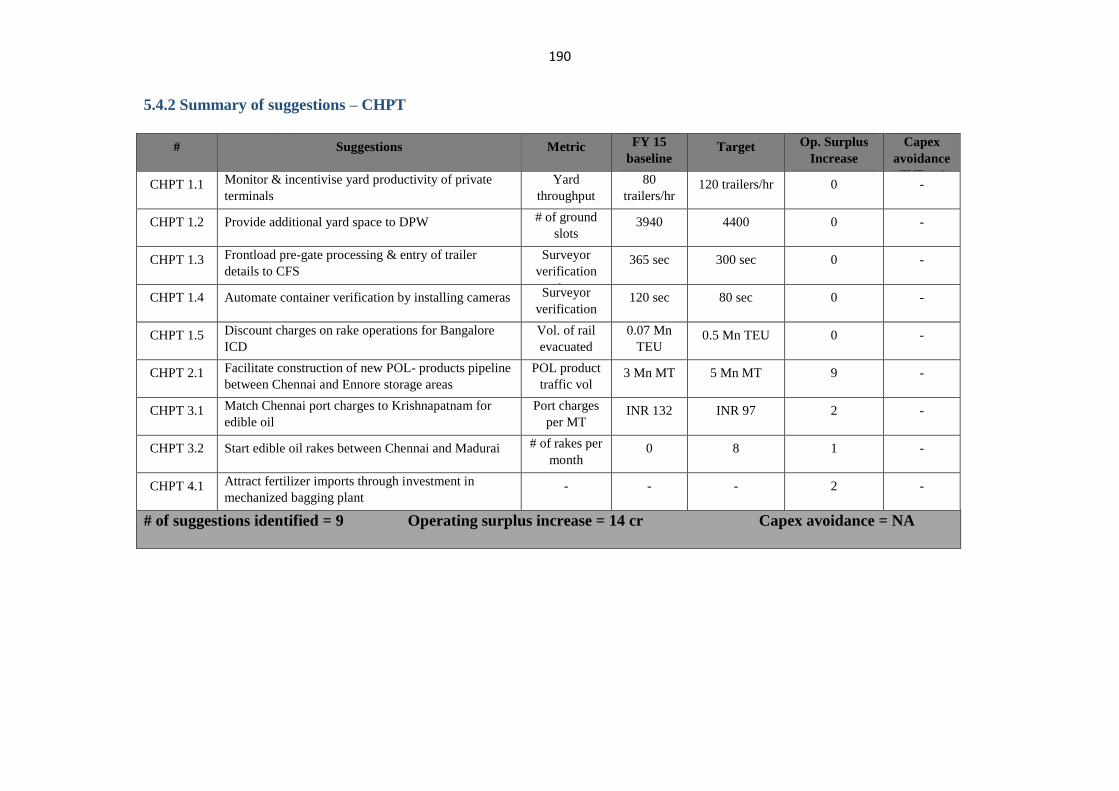
190
5.4.2 Summary of suggestions – CHPT
# Suggestions Metric FY 15
baseline Target Op. Surplus
Increase
(INR cr)
Capex
avoidance
(INR cr) CHPT 1.1 Monitor & incentivise yard productivity of private
terminals
Yard
throughput
80
trailers/hr 120 trailers/hr 0 -
CHPT 1.2 Provide additional yard space to DPW # of ground
slots 3940 4400 0 -
CHPT 1.3 Frontload pre-gate processing & entry of trailer
details to CFS
Surveyor
verification
time
365 sec 300 sec 0 -
CHPT 1.4 Automate container verification by installing cameras Surveyor
verification
time
120 sec 80 sec 0 -
CHPT 1.5 Discount charges on rake operations for Bangalore
ICD
Vol. of rail
evacuated
cargo
0.07 Mn
TEU 0.5 Mn TEU 0 -
CHPT 2.1 Facilitate construction of new POL- products pipeline
between Chennai and Ennore storage areas
POL product
traffic vol 3 Mn MT 5 Mn MT 9 -
CHPT 3.1 Match Chennai port charges to Krishnapatnam for
edible oil
Port charges
per MT INR 132 INR 97 2 -
CHPT 3.2 Start edible oil rakes between Chennai and Madurai # of rakes per
month 0 8 1 -
CHPT 4.1 Attract fertilizer imports through investment in
mechanized bagging plant - - - 2 -
# of suggestions identified = 9 Operating surplus increase = 14 cr Capex avoidance = NA
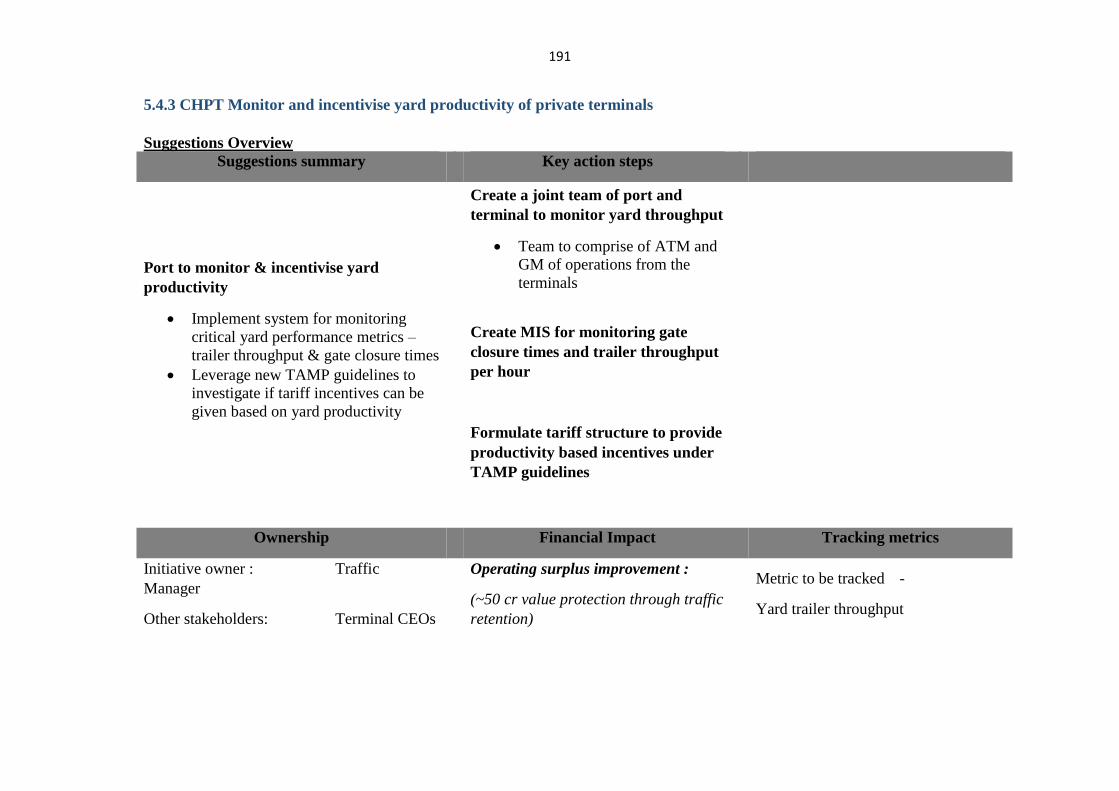
191
5.4.3 CHPT Monitor and incentivise yard productivity of private terminals
Suggestions Overview
Suggestions summary Key action steps
Port to monitor & incentivise yard
productivity
Implement system for monitoring
critical yard performance metrics –
trailer throughput & gate closure times
Leverage new TAMP guidelines to
investigate if tariff incentives can be
given based on yard productivity
Create a joint team of port and
terminal to monitor yard throughput
Team to comprise of ATM and
GM of operations from the
terminals
Create MIS for monitoring gate
closure times and trailer throughput
per hour
Formulate tariff structure to provide
productivity based incentives under
TAMP guidelines
Ownership Financial Impact Tracking metrics
Initiative owner : Traffic
Manager
Other stakeholders: Terminal CEOs
Operating surplus improvement :
(~50 cr value protection through traffic
retention)
Metric to be tracked -
Yard trailer throughput
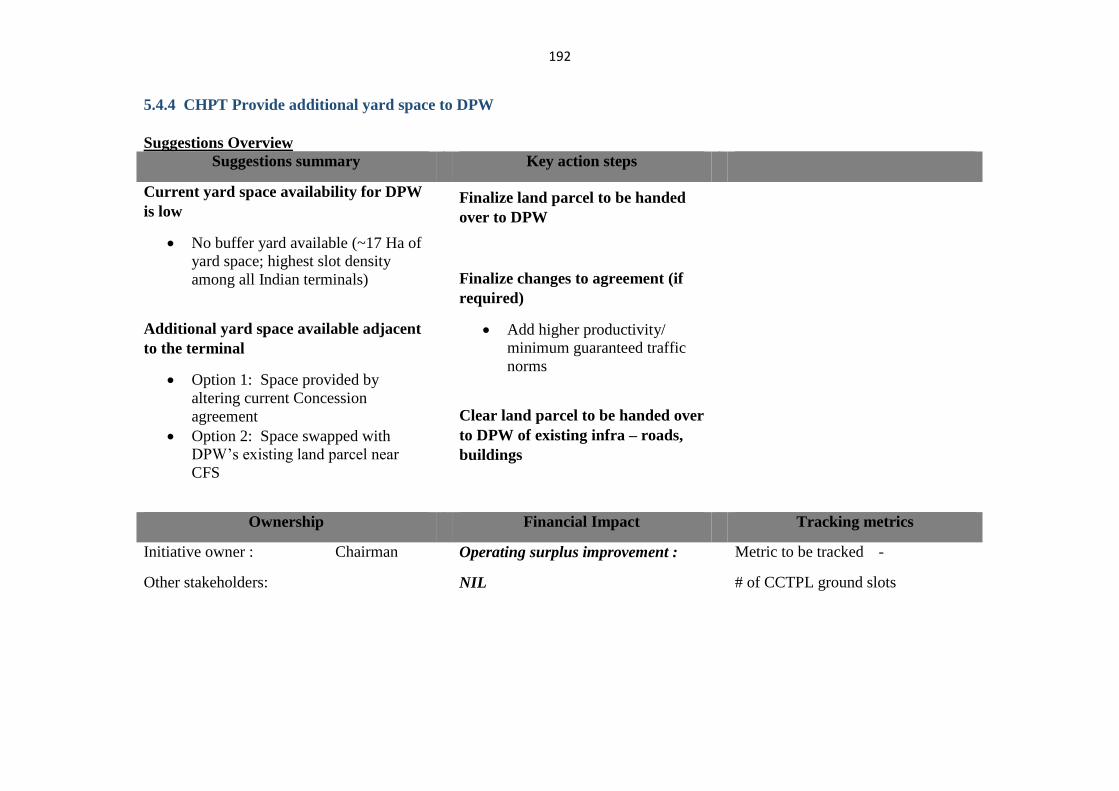
192
5.4.4 CHPT Provide additional yard space to DPW
Suggestions Overview
Suggestions summary Key action steps
Current yard space availability for DPW
is low
No buffer yard available (~17 Ha of
yard space; highest slot density
among all Indian terminals)
Additional yard space available adjacent
to the terminal
Option 1: Space provided by
altering current Concession
agreement
Option 2: Space swapped with
DPW’s existing land parcel near
CFS
Finalize land parcel to be handed
over to DPW
Finalize changes to agreement (if
required)
Add higher productivity/
minimum guaranteed traffic
norms
Clear land parcel to be handed over
to DPW of existing infra – roads,
buildings
Ownership Financial Impact Tracking metrics
Initiative owner : Chairman
Other stakeholders:
Operating surplus improvement :
NIL
Metric to be tracked -
# of CCTPL ground slots
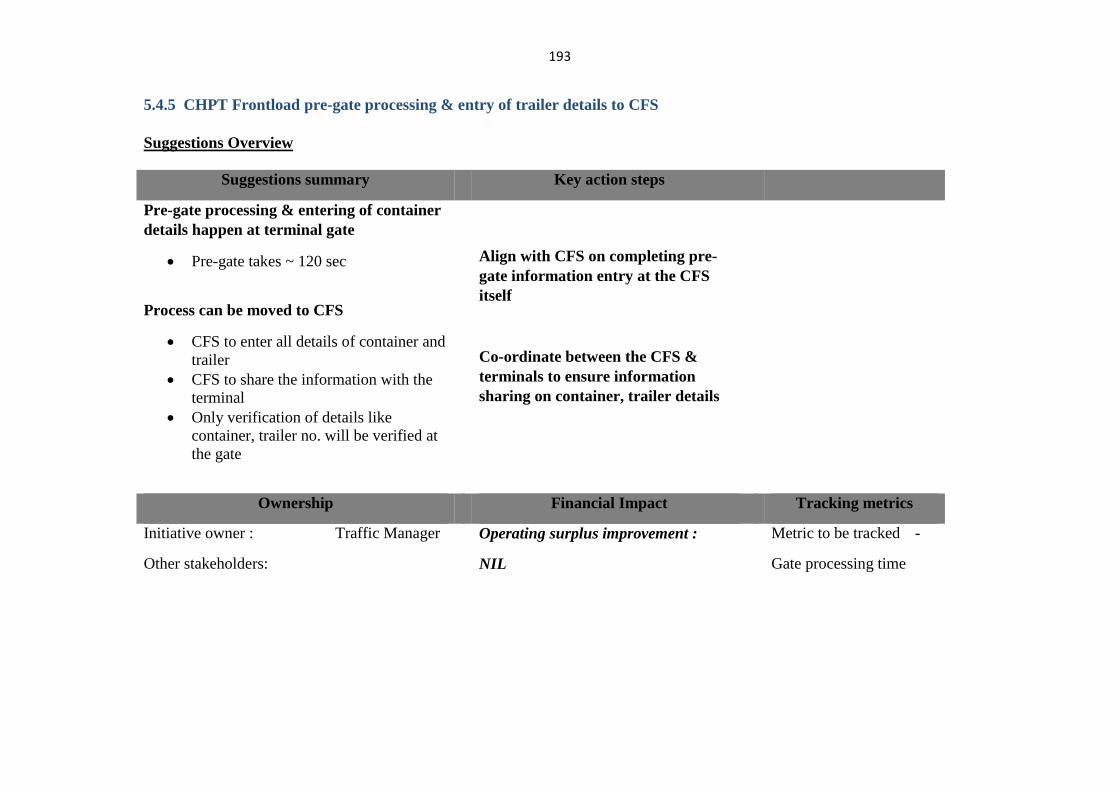
193
5.4.5 CHPT Frontload pre-gate processing & entry of trailer details to CFS
Suggestions Overview
Suggestions summary Key action steps
Pre-gate processing & entering of container
details happen at terminal gate
Pre-gate takes ~ 120 sec
Process can be moved to CFS
CFS to enter all details of container and
trailer
CFS to share the information with the
terminal
Only verification of details like
container, trailer no. will be verified at
the gate
Align with CFS on completing pre-
gate information entry at the CFS
itself
Co-ordinate between the CFS &
terminals to ensure information
sharing on container, trailer details
Ownership Financial Impact Tracking metrics
Initiative owner : Traffic Manager
Other stakeholders:
Operating surplus improvement :
NIL
Metric to be tracked -
Gate processing time
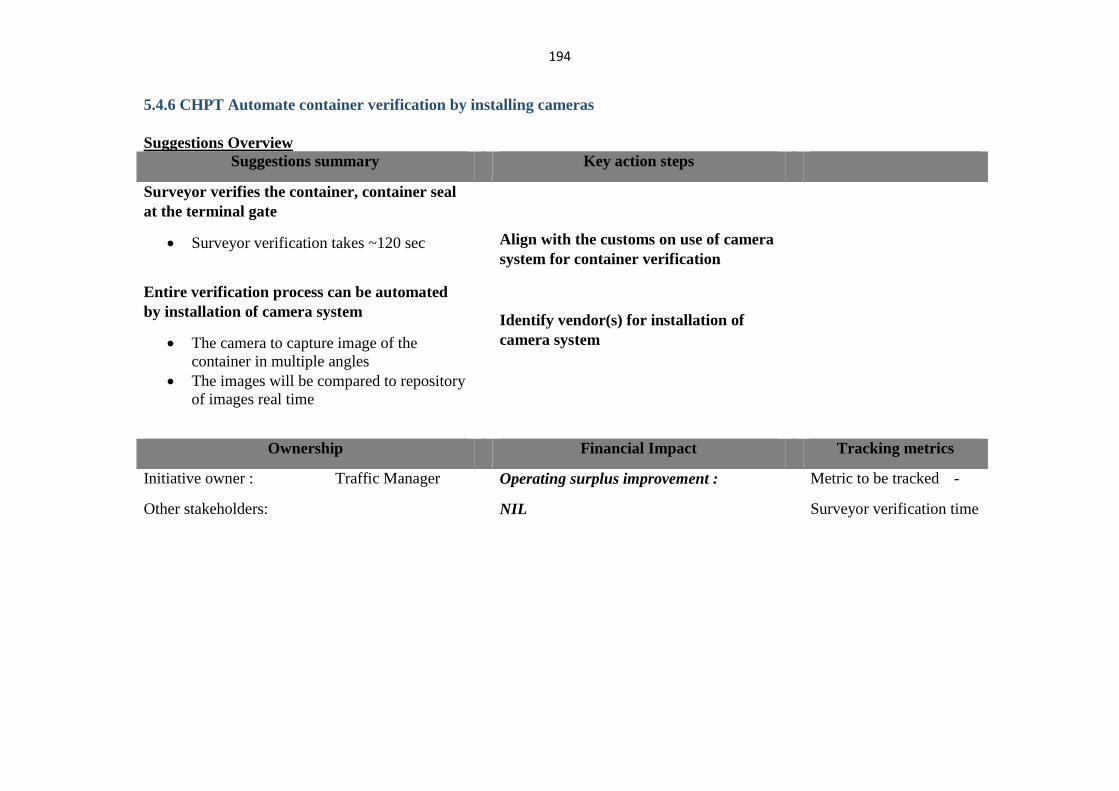
194
5.4.6 CHPT Automate container verification by installing cameras
Suggestions Overview
Suggestions summary Key action steps
Surveyor verifies the container, container seal
at the terminal gate
Surveyor verification takes ~120 sec
Entire verification process can be automated
by installation of camera system
The camera to capture image of the
container in multiple angles
The images will be compared to repository
of images real time
Align with the customs on use of camera
system for container verification
Identify vendor(s) for installation of
camera system
Ownership Financial Impact Tracking metrics
Initiative owner : Traffic Manager
Other stakeholders:
Operating surplus improvement :
NIL
Metric to be tracked -
Surveyor verification time
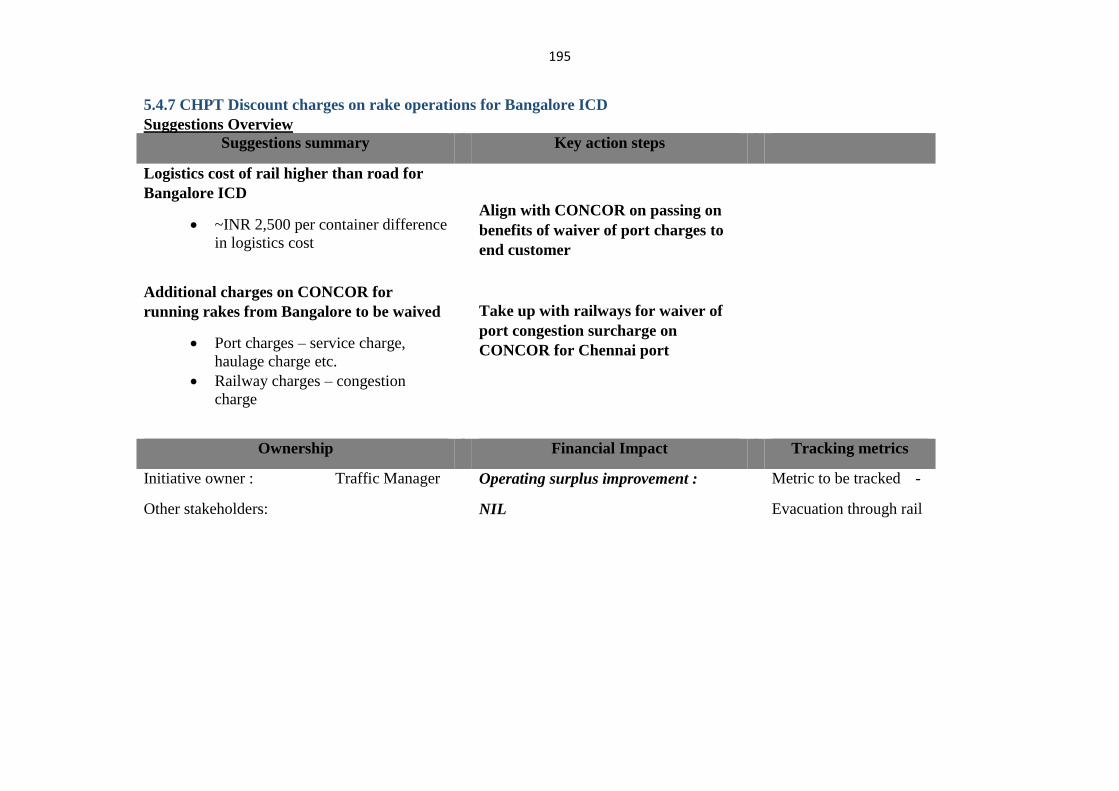
195
5.4.7 CHPT Discount charges on rake operations for Bangalore ICD
Suggestions Overview
Suggestions summary Key action steps
Logistics cost of rail higher than road for
Bangalore ICD
~INR 2,500 per container difference
in logistics cost
Additional charges on CONCOR for
running rakes from Bangalore to be waived
Port charges – service charge,
haulage charge etc.
Railway charges – congestion
charge
Align with CONCOR on passing on
benefits of waiver of port charges to
end customer
Take up with railways for waiver of
port congestion surcharge on
CONCOR for Chennai port
Ownership Financial Impact Tracking metrics
Initiative owner : Traffic Manager
Other stakeholders:
Operating surplus improvement :
NIL
Metric to be tracked -
Evacuation through rail
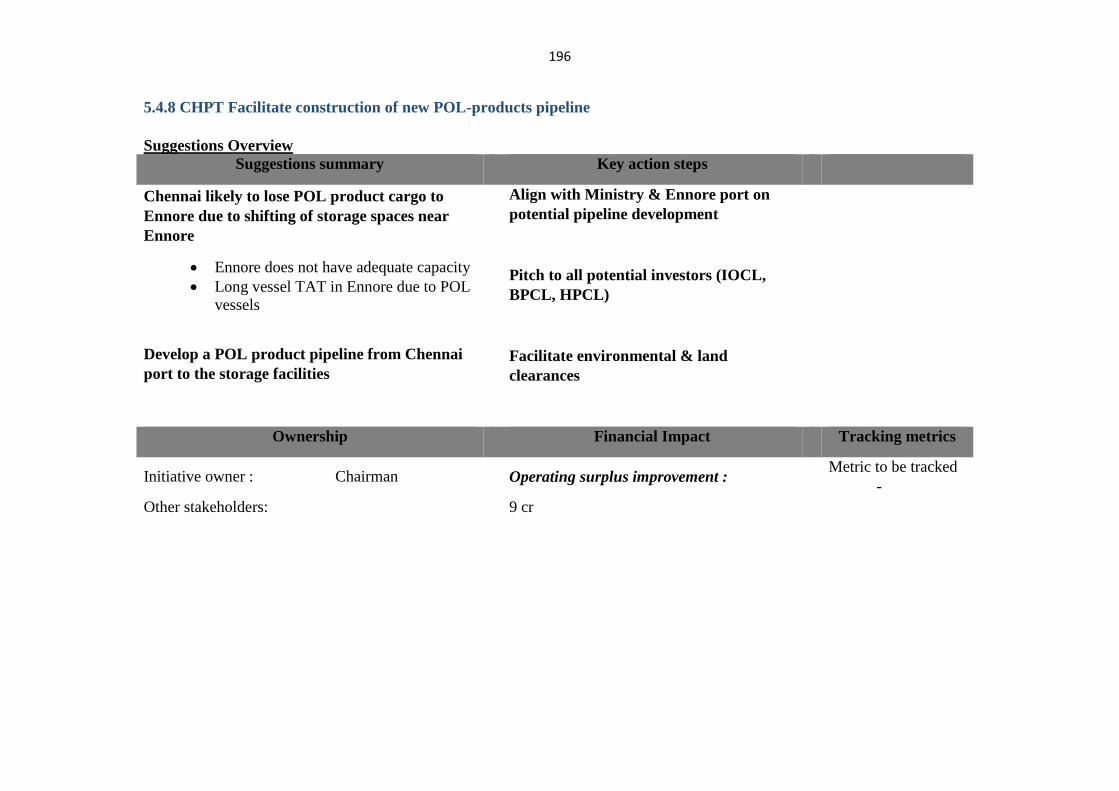
196
5.4.8 CHPT Facilitate construction of new POL-products pipeline
Suggestions Overview
Suggestions summary Key action steps
Chennai likely to lose POL product cargo to
Ennore due to shifting of storage spaces near
Ennore
Ennore does not have adequate capacity
Long vessel TAT in Ennore due to POL
vessels
Develop a POL product pipeline from Chennai
port to the storage facilities
Align with Ministry & Ennore port on
potential pipeline development
Pitch to all potential investors (IOCL,
BPCL, HPCL)
Facilitate environmental & land
clearances
Ownership Financial Impact Tracking metrics
Initiative owner : Chairman
Other stakeholders:
Operating surplus improvement :
9 cr
Metric to be tracked
-
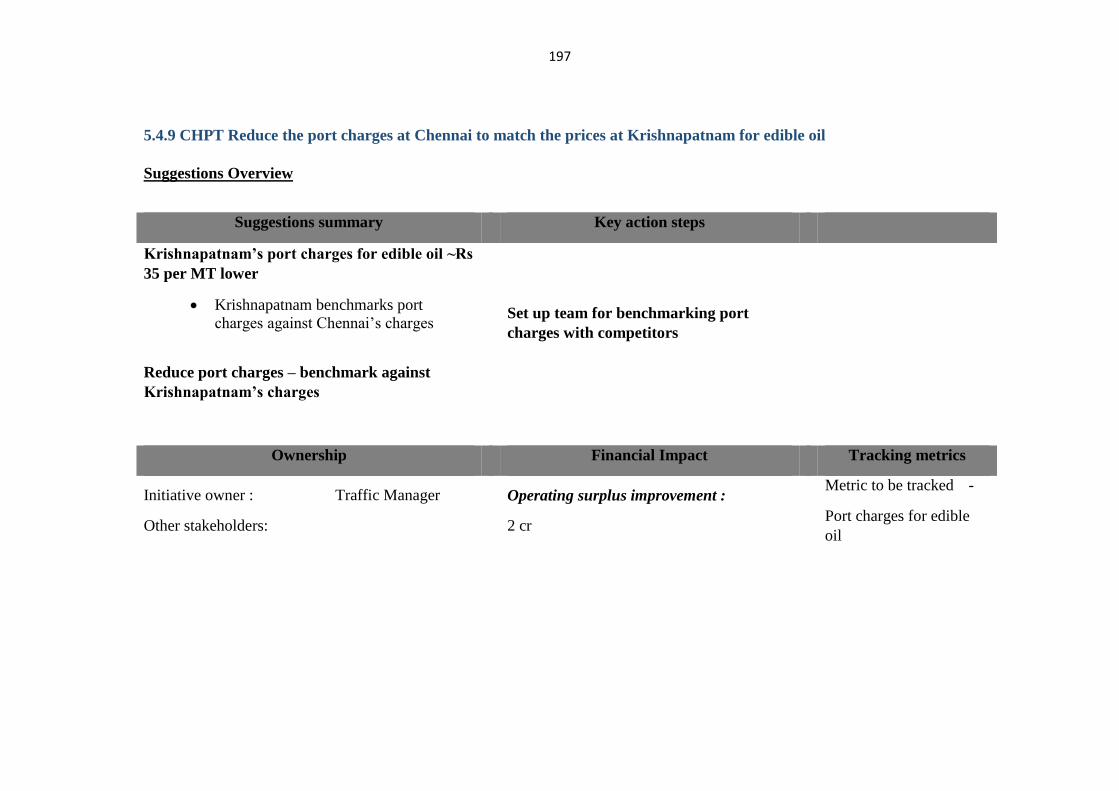
197
5.4.9 CHPT Reduce the port charges at Chennai to match the prices at Krishnapatnam for edible oil
Suggestions Overview
Suggestions summary Key action steps
Krishnapatnam’s port charges for edible oil ~Rs
35 per MT lower
Krishnapatnam benchmarks port
charges against Chennai’s charges
Reduce port charges – benchmark against
Krishnapatnam’s charges
Set up team for benchmarking port
charges with competitors
Ownership Financial Impact Tracking metrics
Initiative owner : Traffic Manager
Other stakeholders:
Operating surplus improvement :
2 cr
Metric to be tracked -
Port charges for edible
oil
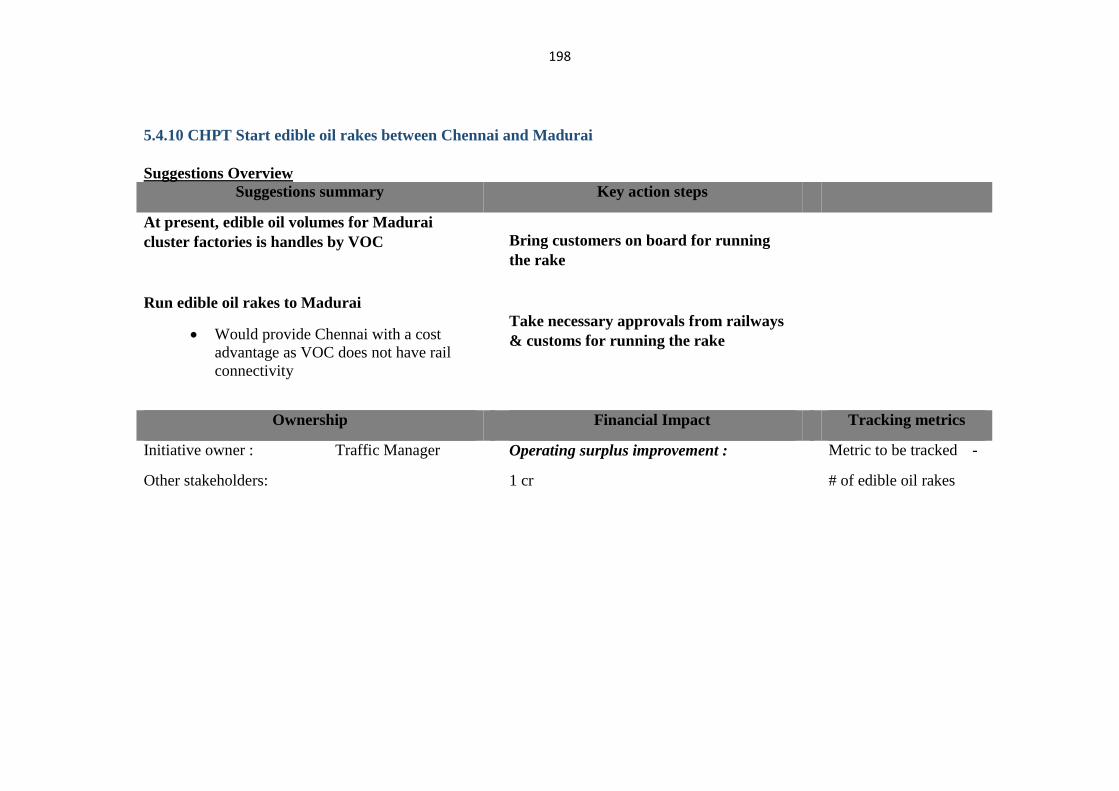
198
5.4.10 CHPT Start edible oil rakes between Chennai and Madurai
Suggestions Overview
Suggestions summary Key action steps
At present, edible oil volumes for Madurai
cluster factories is handles by VOC
Run edible oil rakes to Madurai
Would provide Chennai with a cost
advantage as VOC does not have rail
connectivity
Bring customers on board for running
the rake
Take necessary approvals from railways
& customs for running the rake
Ownership Financial Impact Tracking metrics
Initiative owner : Traffic Manager
Other stakeholders:
Operating surplus improvement :
1 cr
Metric to be tracked -
# of edible oil rakes
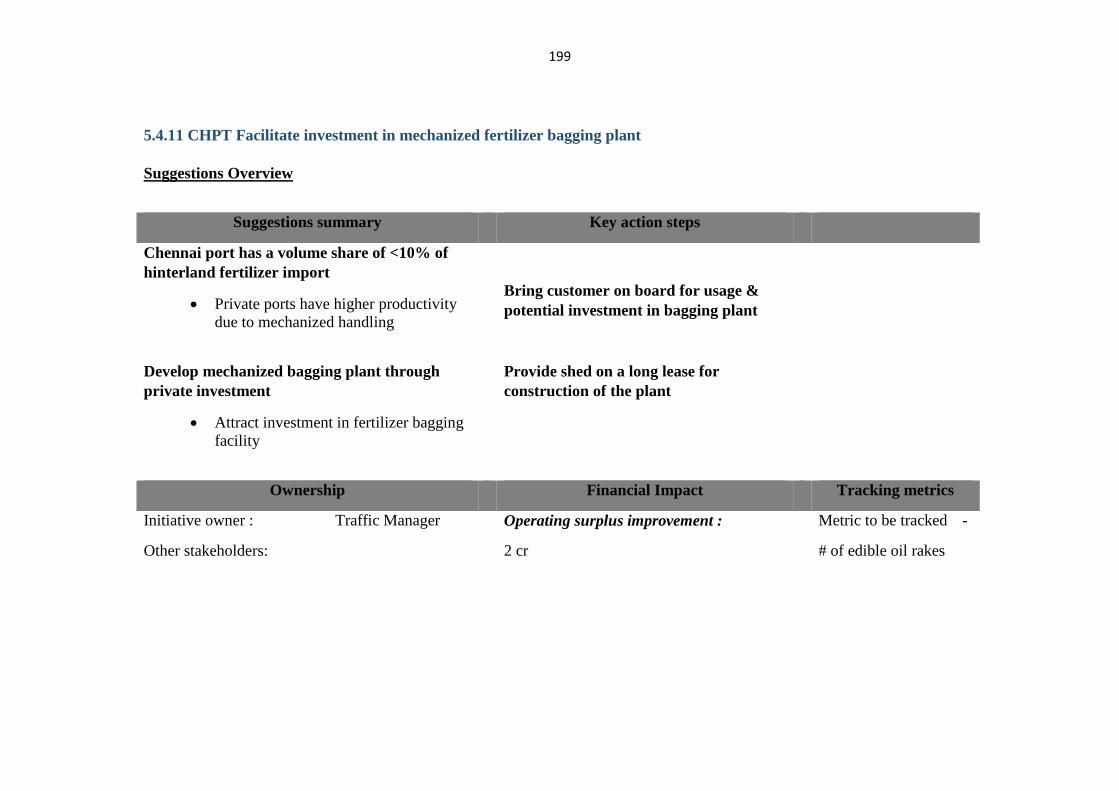
199
5.4.11 CHPT Facilitate investment in mechanized fertilizer bagging plant
Suggestions Overview
Suggestions summary Key action steps
Chennai port has a volume share of <10% of
hinterland fertilizer import
Private ports have higher productivity
due to mechanized handling
Develop mechanized bagging plant through
private investment
Attract investment in fertilizer bagging
facility
Bring customer on board for usage &
potential investment in bagging plant
Provide shed on a long lease for
construction of the plant
Ownership Financial Impact Tracking metrics
Initiative owner : Traffic Manager
Other stakeholders:
Operating surplus improvement :
2 cr
Metric to be tracked -
# of edible oil rakes
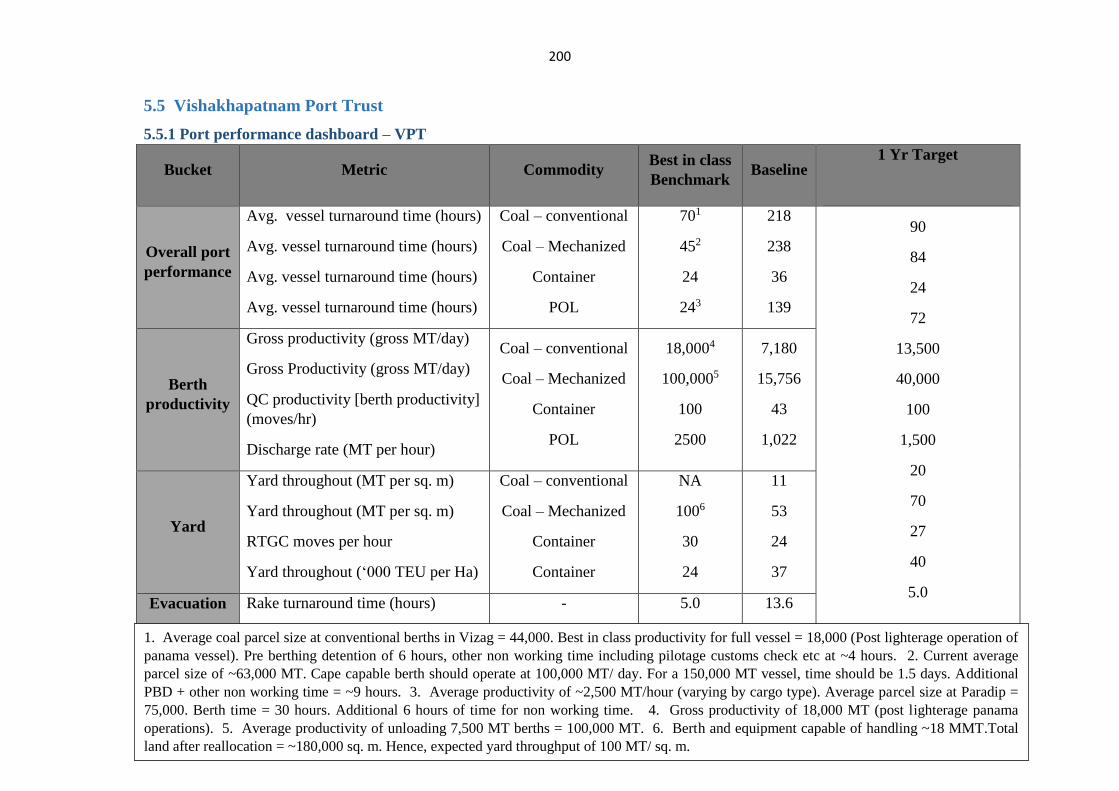
200
5.5 Vishakhapatnam Port Trust
5.5.1 Port performance dashboard – VPT
Bucket Metric Commodity Best in class
Benchmark Baseline
1 Yr Target
Overall port
performance
Avg. vessel turnaround time (hours)
Avg. vessel turnaround time (hours)
Avg. vessel turnaround time (hours)
Avg. vessel turnaround time (hours)
Coal – conventional
Coal – Mechanized
Container
POL
701
452
24
243
218
238
36
139
90
84
24
72
13,500
40,000
100
1,500
20
70
27
40
5.0
Berth
productivity
Gross productivity (gross MT/day)
Gross Productivity (gross MT/day)
QC productivity [berth productivity]
(moves/hr)
Discharge rate (MT per hour)
Coal – conventional
Coal – Mechanized
Container
POL
18,0004
100,0005
100
2500
7,180
15,756
43
1,022
Yard
Yard throughout (MT per sq. m)
Yard throughout (MT per sq. m)
RTGC moves per hour
Yard throughout (‘000 TEU per Ha)
Coal – conventional
Coal – Mechanized
Container
Container
NA
1006
30
24
11
53
24
37
Evacuation Rake turnaround time (hours) - 5.0 13.6
1. Average coal parcel size at conventional berths in Vizag = 44,000. Best in class productivity for full vessel = 18,000 (Post lighterage operation of
panama vessel). Pre berthing detention of 6 hours, other non working time including pilotage customs check etc at ~4 hours. 2. Current average
parcel size of ~63,000 MT. Cape capable berth should operate at 100,000 MT/ day. For a 150,000 MT vessel, time should be 1.5 days. Additional
PBD + other non working time = ~9 hours. 3. Average productivity of ~2,500 MT/hour (varying by cargo type). Average parcel size at Paradip =
75,000. Berth time = 30 hours. Additional 6 hours of time for non working time. 4. Gross productivity of 18,000 MT (post lighterage panama
operations). 5. Average productivity of unloading 7,500 MT berths = 100,000 MT. 6. Berth and equipment capable of handling ~18 MMT.Total
land after reallocation = ~180,000 sq. m. Hence, expected yard throughput of 100 MT/ sq. m.
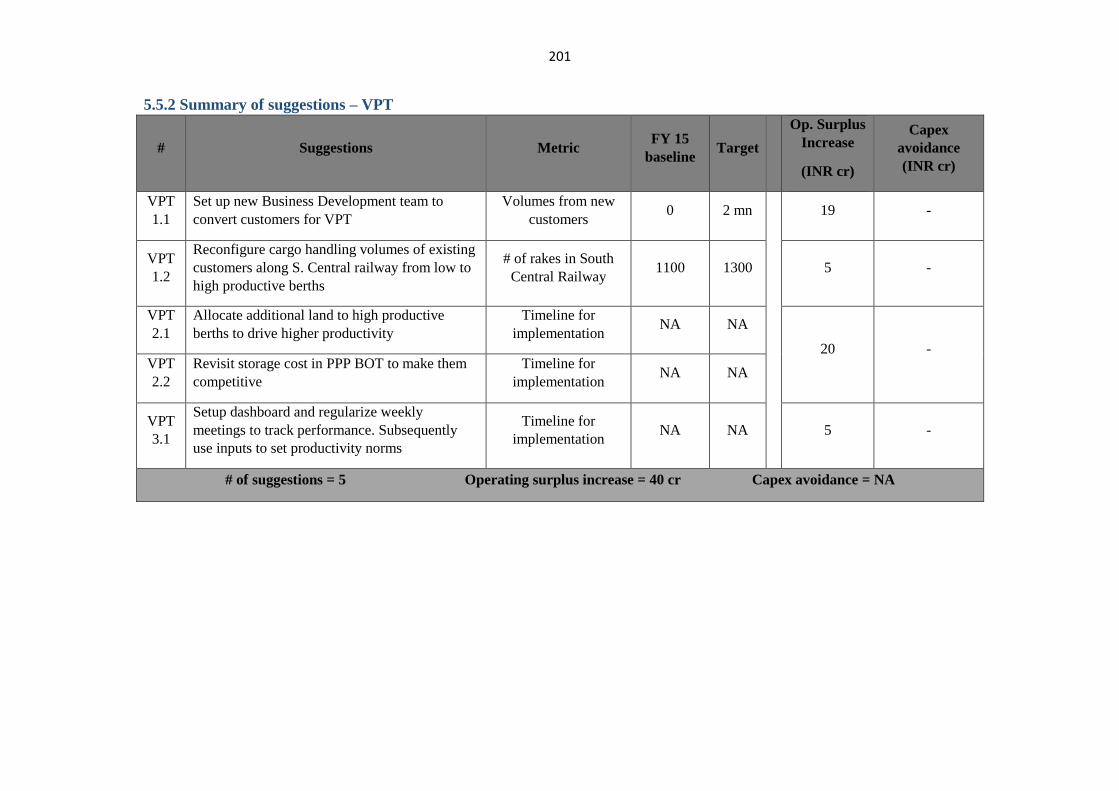
201
5.5.2 Summary of suggestions – VPT
# Suggestions Metric FY 15
baseline Target
Op. Surplus
Increase
(INR cr)
Capex
avoidance
(INR cr)
VPT
1.1
Set up new Business Development team to
convert customers for VPT
Volumes from new
customers 0 2 mn
19 -
VPT
1.2
Reconfigure cargo handling volumes of existing
customers along S. Central railway from low to
high productive berths
# of rakes in South
Central Railway 1100 1300 5 -
VPT
2.1
Allocate additional land to high productive
berths to drive higher productivity
Timeline for
implementation NA NA
20 - VPT
2.2
Revisit storage cost in PPP BOT to make them
competitive
Timeline for
implementation NA NA
VPT
3.1
Setup dashboard and regularize weekly
meetings to track performance. Subsequently
use inputs to set productivity norms
Timeline for
implementation NA NA 5 -
# of suggestions = 5 Operating surplus increase = 40 cr Capex avoidance = NA
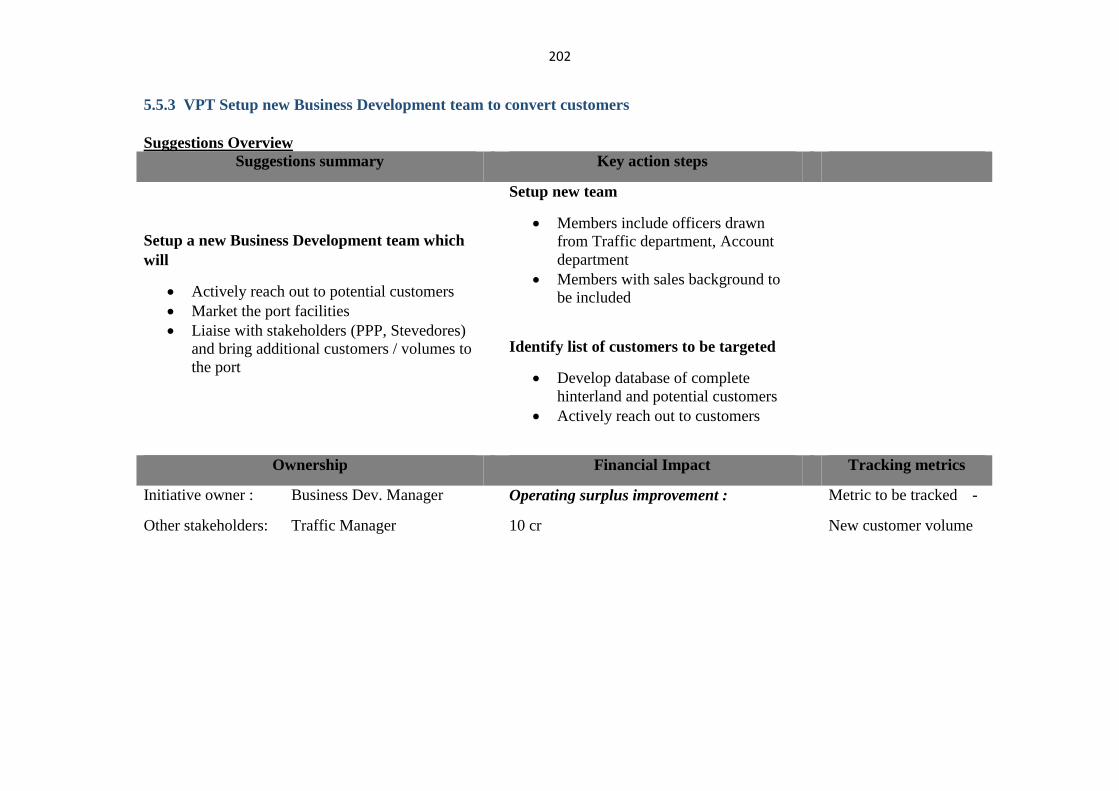
202
5.5.3 VPT Setup new Business Development team to convert customers
Suggestions Overview
Suggestions summary Key action steps
Setup a new Business Development team which
will
Actively reach out to potential customers
Market the port facilities
Liaise with stakeholders (PPP, Stevedores)
and bring additional customers / volumes to
the port
Setup new team
Members include officers drawn
from Traffic department, Account
department
Members with sales background to
be included
Identify list of customers to be targeted
Develop database of complete
hinterland and potential customers
Actively reach out to customers
Ownership Financial Impact Tracking metrics
Initiative owner : Business Dev. Manager
Other stakeholders: Traffic Manager
Operating surplus improvement :
10 cr
Metric to be tracked -
New customer volume
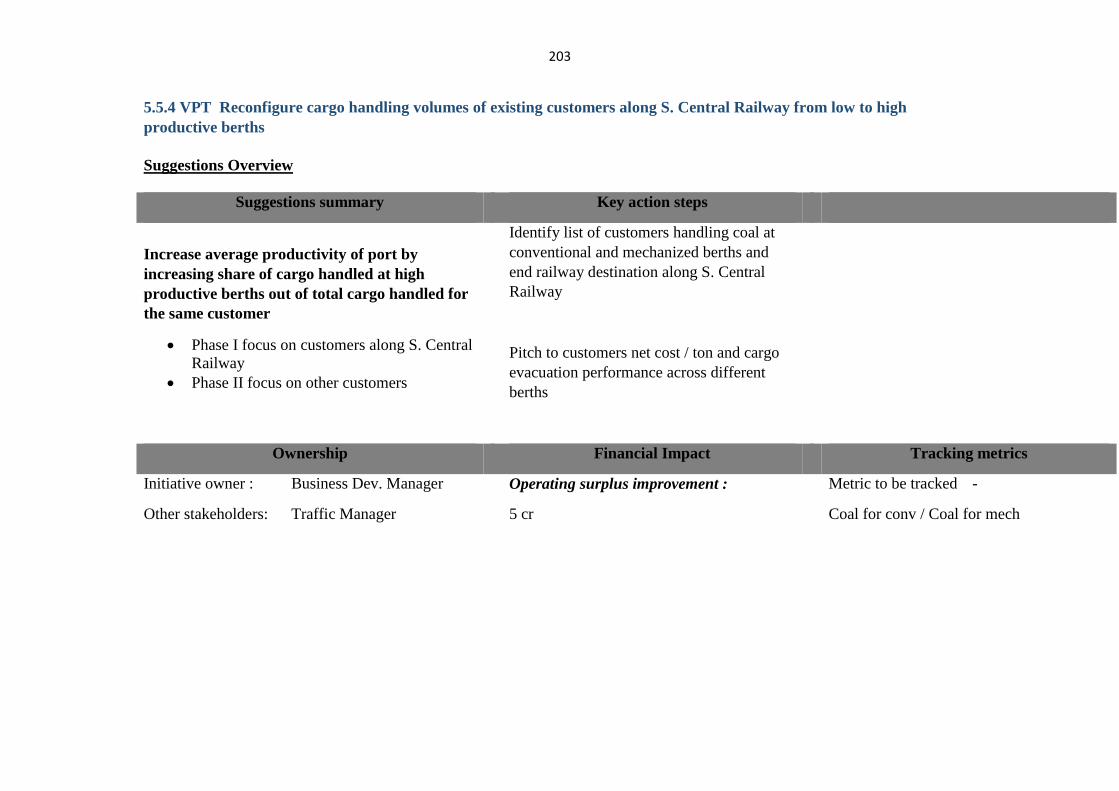
203
5.5.4 VPT Reconfigure cargo handling volumes of existing customers along S. Central Railway from low to high
productive berths
Suggestions Overview
Suggestions summary Key action steps
Increase average productivity of port by
increasing share of cargo handled at high
productive berths out of total cargo handled for
the same customer
Phase I focus on customers along S. Central
Railway
Phase II focus on other customers
Identify list of customers handling coal at
conventional and mechanized berths and
end railway destination along S. Central
Railway
Pitch to customers net cost / ton and cargo
evacuation performance across different
berths
Ownership Financial Impact Tracking metrics
Initiative owner : Business Dev. Manager
Other stakeholders: Traffic Manager
Operating surplus improvement :
5 cr
Metric to be tracked -
Coal for conv / Coal for mech
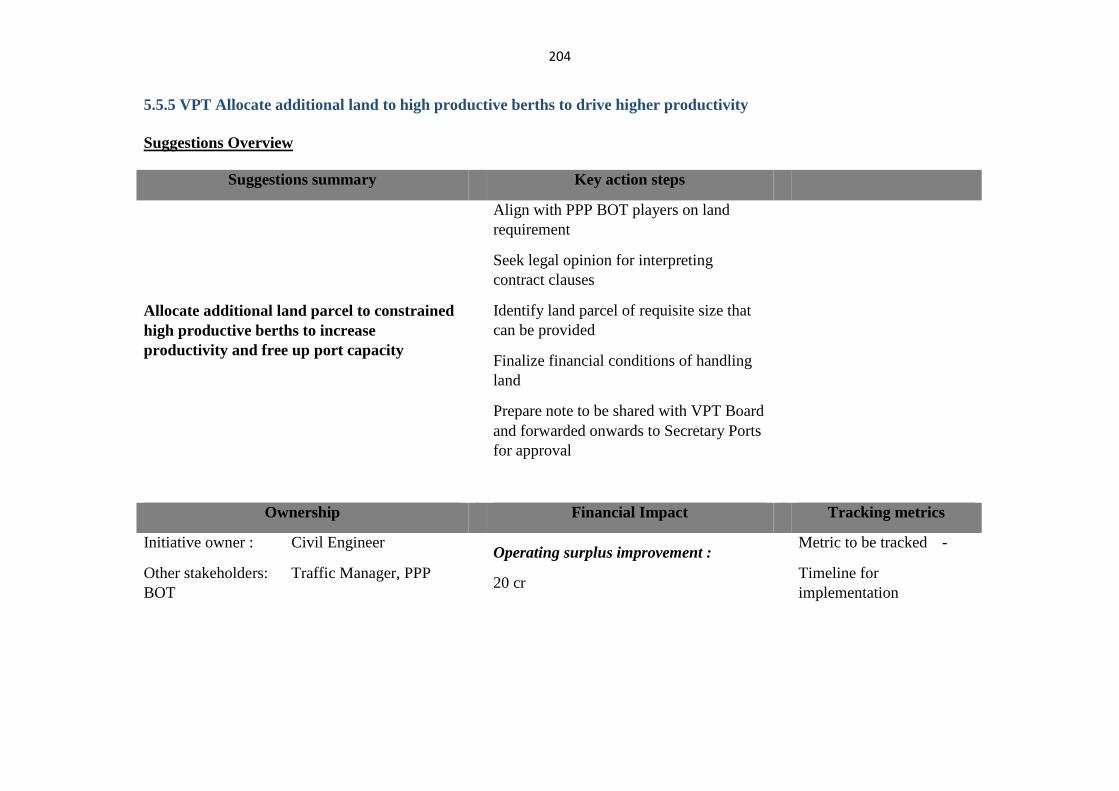
204
5.5.5 VPT Allocate additional land to high productive berths to drive higher productivity
Suggestions Overview
Suggestions summary Key action steps
Allocate additional land parcel to constrained
high productive berths to increase
productivity and free up port capacity
Align with PPP BOT players on land
requirement
Seek legal opinion for interpreting
contract clauses
Identify land parcel of requisite size that
can be provided
Finalize financial conditions of handling
land
Prepare note to be shared with VPT Board
and forwarded onwards to Secretary Ports
for approval
Ownership Financial Impact Tracking metrics
Initiative owner : Civil Engineer
Other stakeholders: Traffic Manager, PPP
BOT
Operating surplus improvement :
20 cr
Metric to be tracked -
Timeline for
implementation
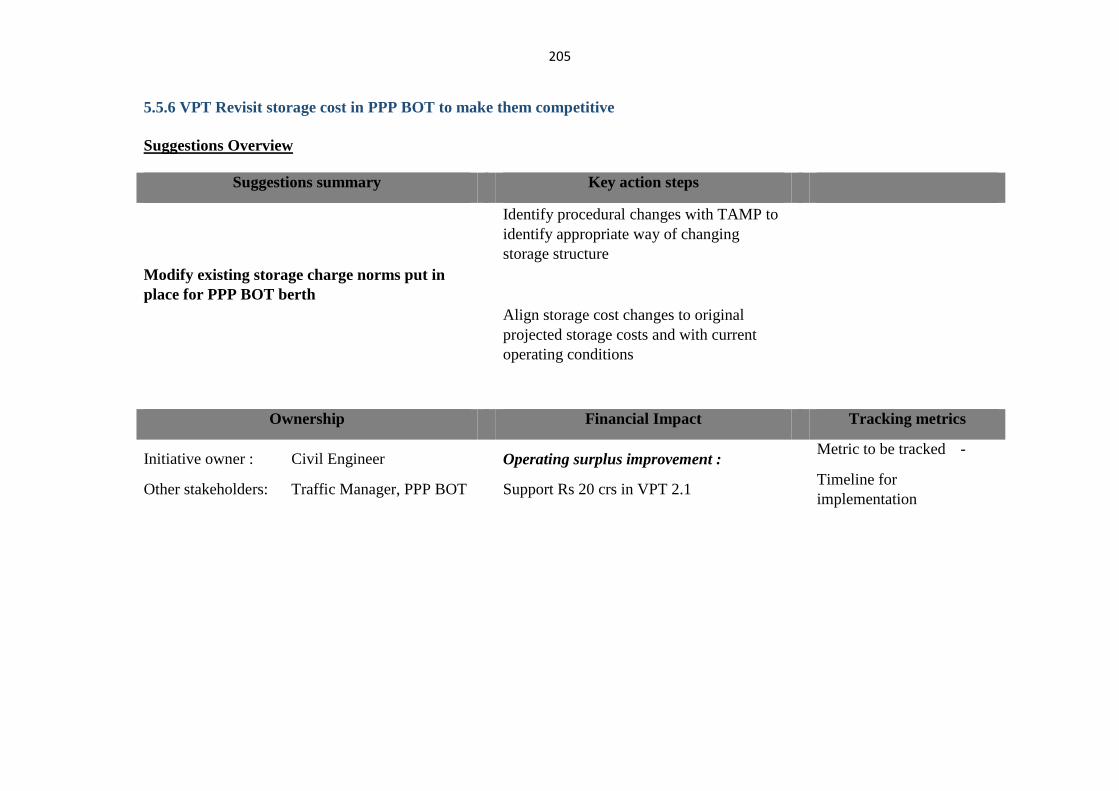
205
5.5.6 VPT Revisit storage cost in PPP BOT to make them competitive
Suggestions Overview
Suggestions summary Key action steps
Modify existing storage charge norms put in
place for PPP BOT berth
Identify procedural changes with TAMP to
identify appropriate way of changing
storage structure
Align storage cost changes to original
projected storage costs and with current
operating conditions
Ownership Financial Impact Tracking metrics
Initiative owner : Civil Engineer
Other stakeholders: Traffic Manager, PPP BOT
Operating surplus improvement :
Support Rs 20 crs in VPT 2.1
Metric to be tracked -
Timeline for
implementation
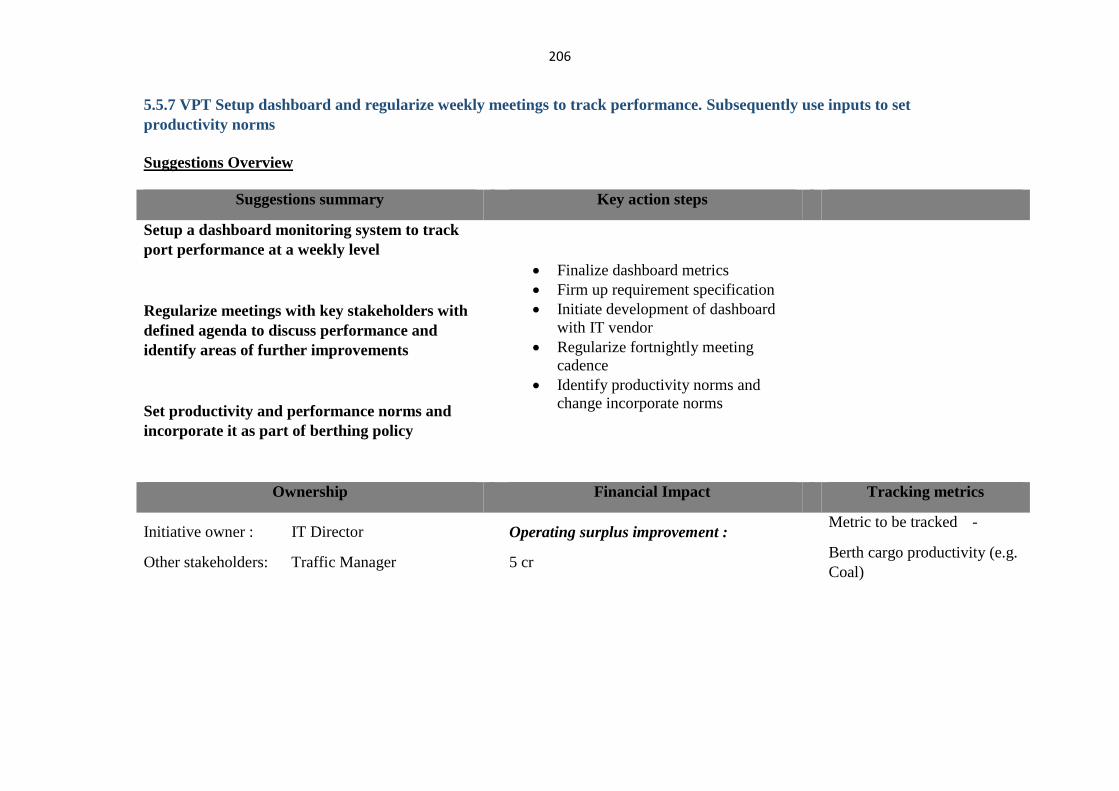
206
5.5.7 VPT Setup dashboard and regularize weekly meetings to track performance. Subsequently use inputs to set
productivity norms
Suggestions Overview
Suggestions summary Key action steps
Setup a dashboard monitoring system to track
port performance at a weekly level
Regularize meetings with key stakeholders with
defined agenda to discuss performance and
identify areas of further improvements
Set productivity and performance norms and
incorporate it as part of berthing policy
Finalize dashboard metrics
Firm up requirement specification
Initiate development of dashboard
with IT vendor
Regularize fortnightly meeting
cadence
Identify productivity norms and
change incorporate norms
Ownership Financial Impact Tracking metrics
Initiative owner : IT Director
Other stakeholders: Traffic Manager
Operating surplus improvement :
5 cr
Metric to be tracked -
Berth cargo productivity (e.g.
Coal)
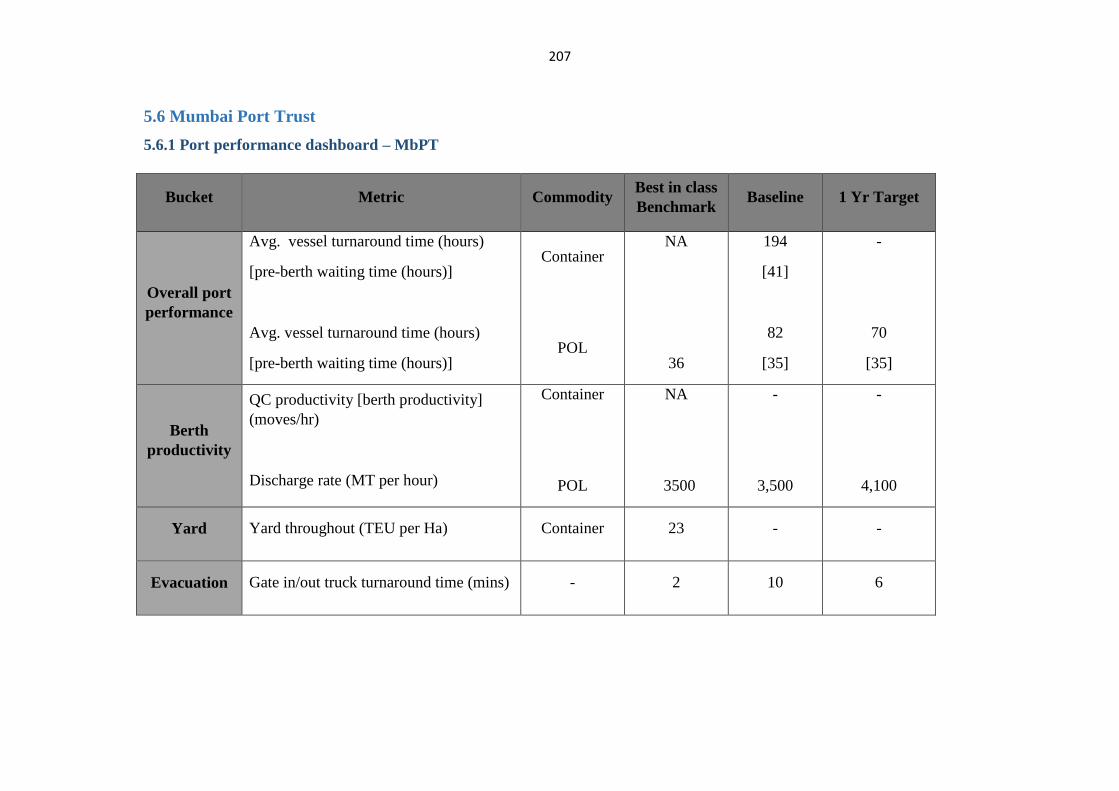
207
5.6 Mumbai Port Trust
5.6.1 Port performance dashboard – MbPT
Bucket Metric Commodity Best in class
Benchmark Baseline 1 Yr Target
Overall port
performance
Avg. vessel turnaround time (hours)
[pre-berth waiting time (hours)]
Avg. vessel turnaround time (hours)
[pre-berth waiting time (hours)]
Container
POL
NA
36
194
[41]
82
[35]
-
70
[35]
Berth
productivity
QC productivity [berth productivity]
(moves/hr)
Discharge rate (MT per hour)
Container
POL
NA
3500
-
3,500
-
4,100
Yard Yard throughout (TEU per Ha) Container 23 - -
Evacuation Gate in/out truck turnaround time (mins) - 2 10 6
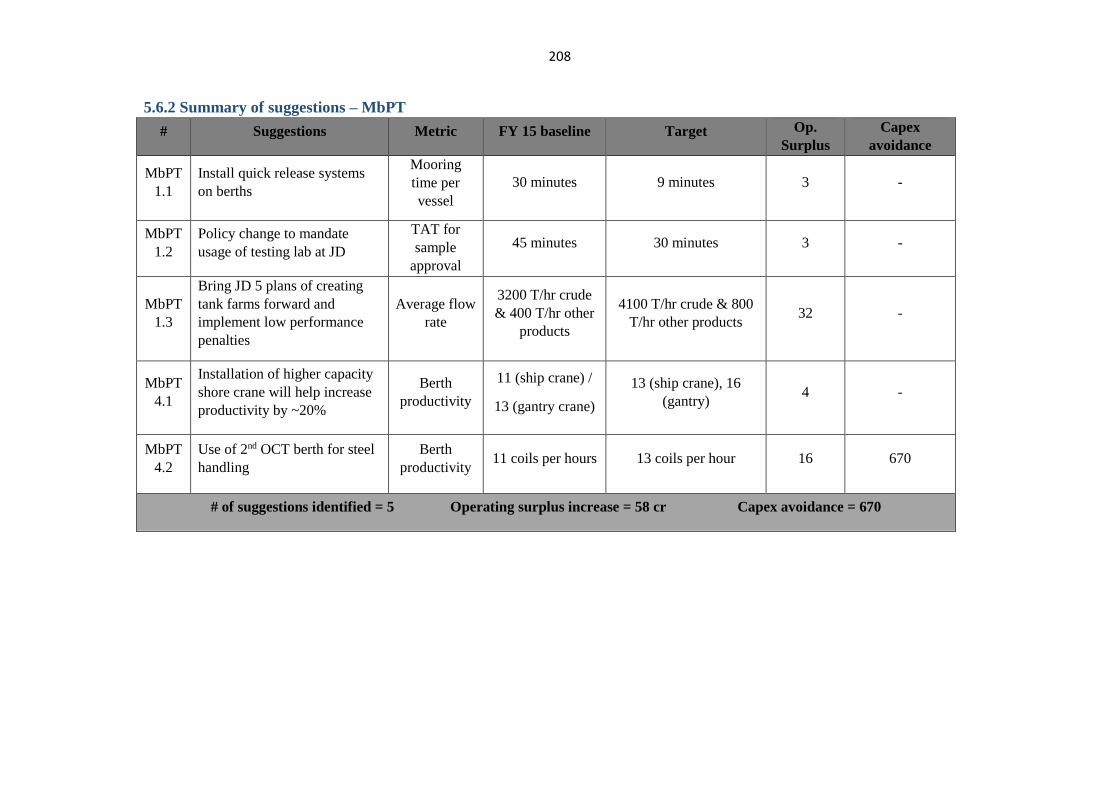
208
5.6.2 Summary of suggestions – MbPT
# Suggestions Metric FY 15 baseline Target Op.
Surplus
Increase
(INR cr)
Capex
avoidance
(INR cr) MbPT
1.1
Install quick release systems
on berths
Mooring
time per
vessel
30 minutes 9 minutes 3 -
MbPT
1.2
Policy change to mandate
usage of testing lab at JD
TAT for
sample
approval
45 minutes 30 minutes 3 -
MbPT
1.3
Bring JD 5 plans of creating
tank farms forward and
implement low performance
penalties
Average flow
rate
3200 T/hr crude
& 400 T/hr other
products
4100 T/hr crude & 800
T/hr other products 32 -
MbPT
4.1
Installation of higher capacity
shore crane will help increase
productivity by ~20%
Berth
productivity
11 (ship crane) /
13 (gantry crane)
13 (ship crane), 16
(gantry) 4 -
MbPT
4.2
Use of 2nd OCT berth for steel
handling
Berth
productivity 11 coils per hours 13 coils per hour 16 670
# of suggestions identified = 5 Operating surplus increase = 58 cr Capex avoidance = 670
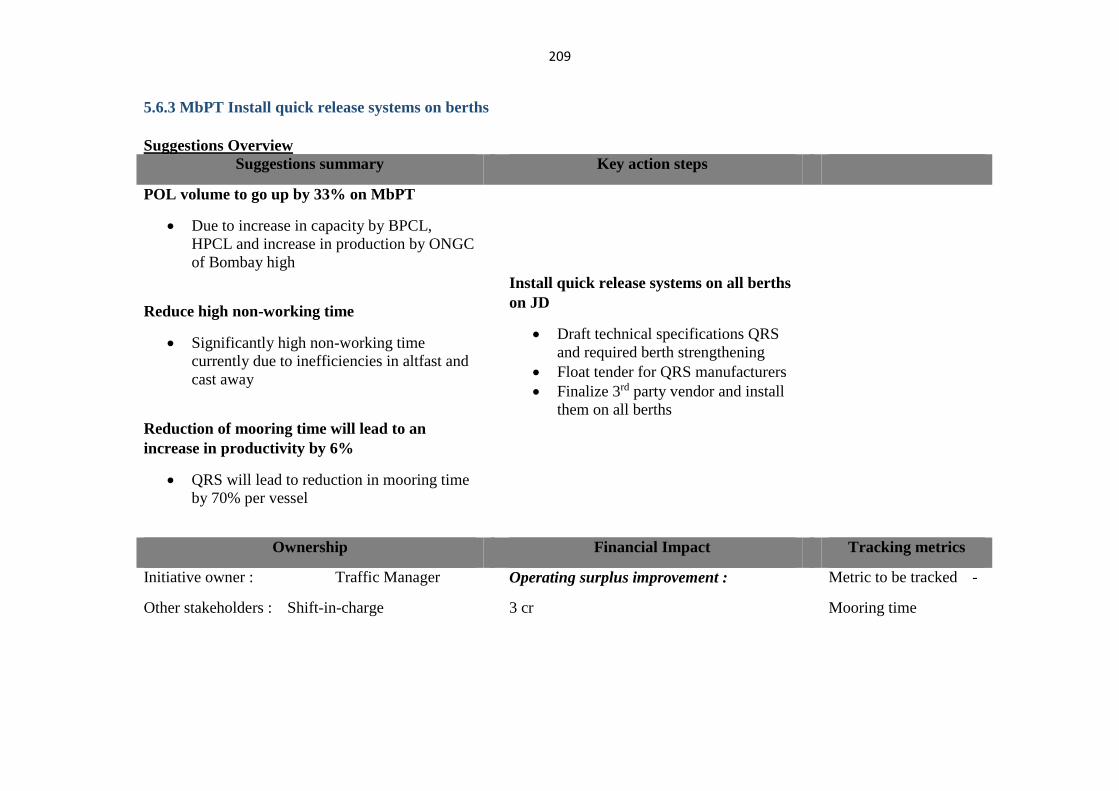
209
5.6.3 MbPT Install quick release systems on berths
Suggestions Overview Suggestions summary Key action steps
POL volume to go up by 33% on MbPT
Due to increase in capacity by BPCL,
HPCL and increase in production by ONGC
of Bombay high
Reduce high non-working time
Significantly high non-working time
currently due to inefficiencies in altfast and
cast away
Reduction of mooring time will lead to an
increase in productivity by 6%
QRS will lead to reduction in mooring time
by 70% per vessel
Install quick release systems on all berths
on JD
Draft technical specifications QRS
and required berth strengthening
Float tender for QRS manufacturers
Finalize 3rd party vendor and install
them on all berths
Ownership Financial Impact Tracking metrics
Initiative owner : Traffic Manager
Other stakeholders : Shift-in-charge
Operating surplus improvement :
3 cr
Metric to be tracked -
Mooring time
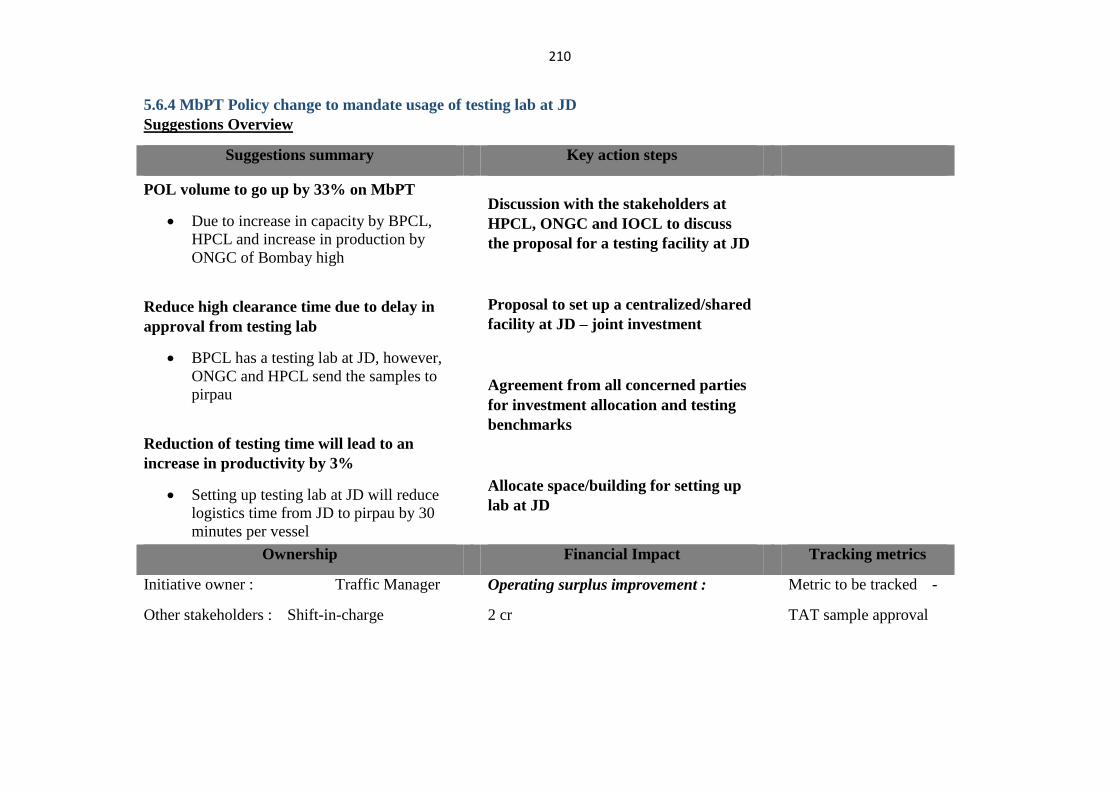
210
5.6.4 MbPT Policy change to mandate usage of testing lab at JD
Suggestions Overview
Suggestions summary Key action steps
POL volume to go up by 33% on MbPT
Due to increase in capacity by BPCL,
HPCL and increase in production by
ONGC of Bombay high
Reduce high clearance time due to delay in
approval from testing lab
BPCL has a testing lab at JD, however,
ONGC and HPCL send the samples to
pirpau
Reduction of testing time will lead to an
increase in productivity by 3%
Setting up testing lab at JD will reduce
logistics time from JD to pirpau by 30
minutes per vessel
Discussion with the stakeholders at
HPCL, ONGC and IOCL to discuss
the proposal for a testing facility at JD
Proposal to set up a centralized/shared
facility at JD – joint investment
Agreement from all concerned parties
for investment allocation and testing
benchmarks
Allocate space/building for setting up
lab at JD
Ownership Financial Impact Tracking metrics
Initiative owner : Traffic Manager
Other stakeholders : Shift-in-charge
Operating surplus improvement :
2 cr
Metric to be tracked -
TAT sample approval
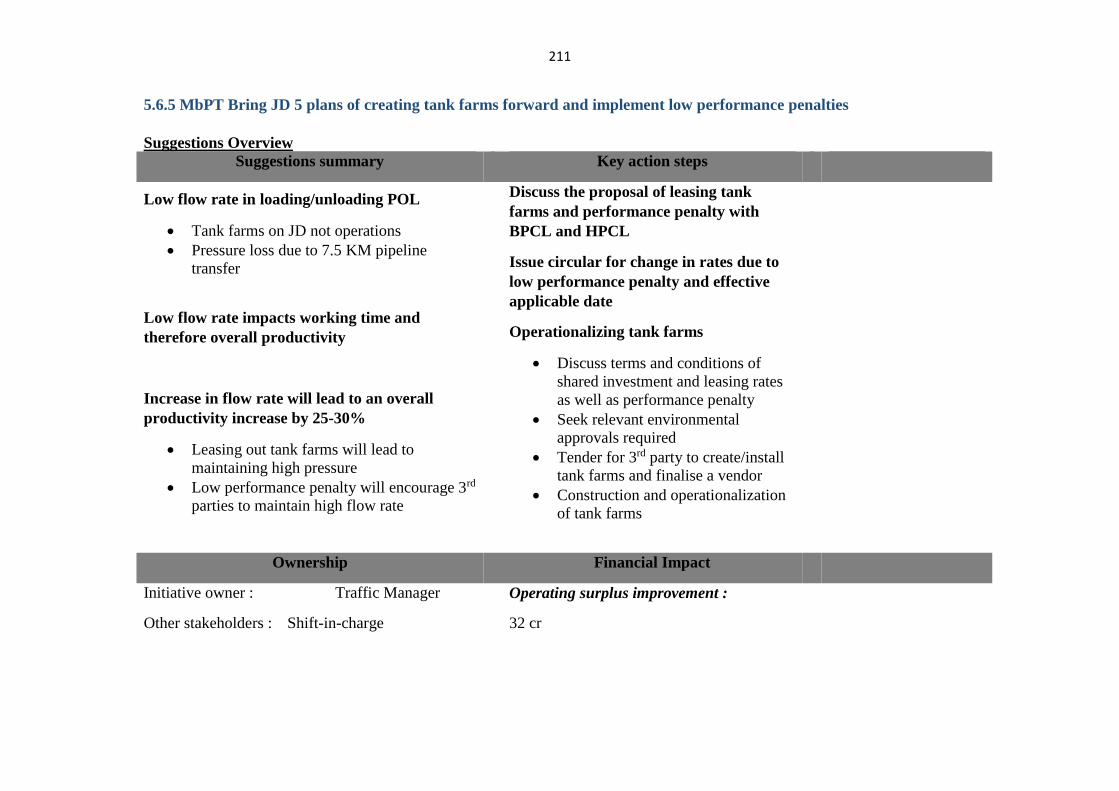
211
5.6.5 MbPT Bring JD 5 plans of creating tank farms forward and implement low performance penalties
Suggestions Overview
Suggestions summary Key action steps
Low flow rate in loading/unloading POL
Tank farms on JD not operations
Pressure loss due to 7.5 KM pipeline
transfer
Low flow rate impacts working time and
therefore overall productivity
Increase in flow rate will lead to an overall
productivity increase by 25-30%
Leasing out tank farms will lead to
maintaining high pressure
Low performance penalty will encourage 3rd
parties to maintain high flow rate
Discuss the proposal of leasing tank
farms and performance penalty with
BPCL and HPCL
Issue circular for change in rates due to
low performance penalty and effective
applicable date
Operationalizing tank farms
Discuss terms and conditions of
shared investment and leasing rates
as well as performance penalty
Seek relevant environmental
approvals required
Tender for 3rd party to create/install
tank farms and finalise a vendor
Construction and operationalization
of tank farms
Ownership Financial Impact
Initiative owner : Traffic Manager
Other stakeholders : Shift-in-charge
Operating surplus improvement :
32 cr
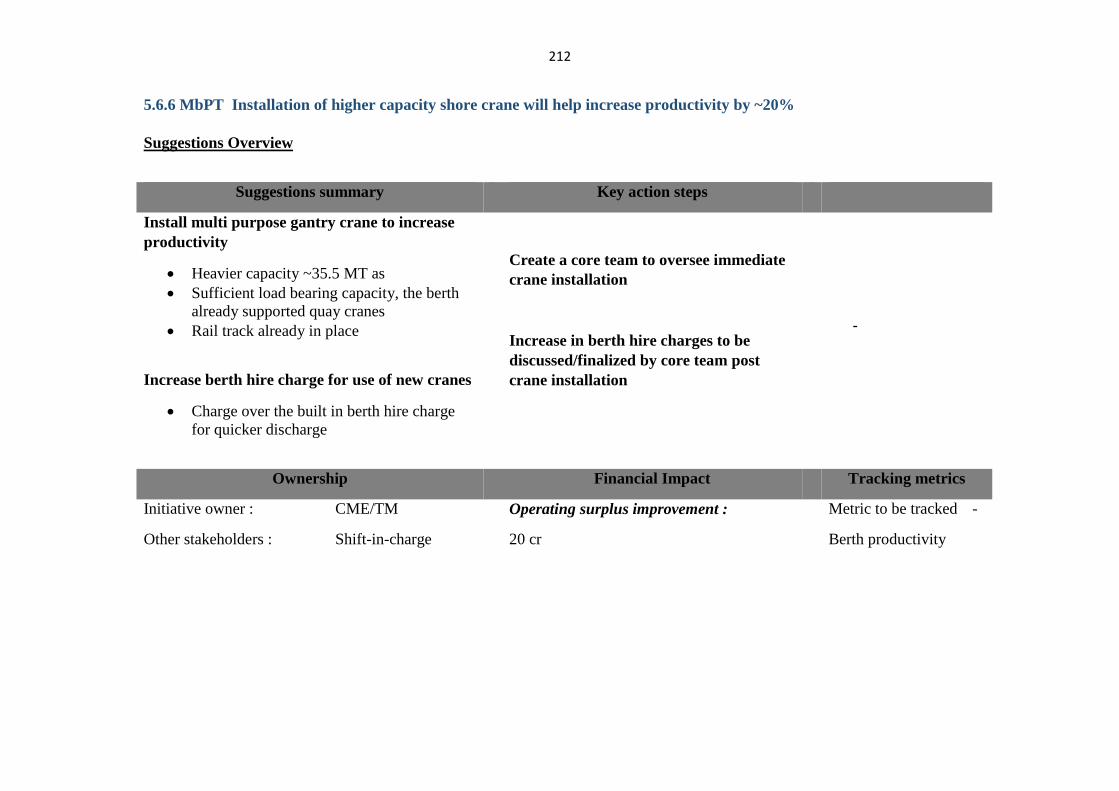
212
5.6.6 MbPT Installation of higher capacity shore crane will help increase productivity by ~20%
Suggestions Overview
Suggestions summary Key action steps
Install multi purpose gantry crane to increase
productivity
Heavier capacity ~35.5 MT as
Sufficient load bearing capacity, the berth
already supported quay cranes
Rail track already in place
Increase berth hire charge for use of new cranes
Charge over the built in berth hire charge
for quicker discharge
Create a core team to oversee immediate
crane installation
Increase in berth hire charges to be
discussed/finalized by core team post
crane installation
-
Ownership Financial Impact Tracking metrics
Initiative owner : CME/TM
Other stakeholders : Shift-in-charge
Operating surplus improvement :
20 cr
Metric to be tracked -
Berth productivity
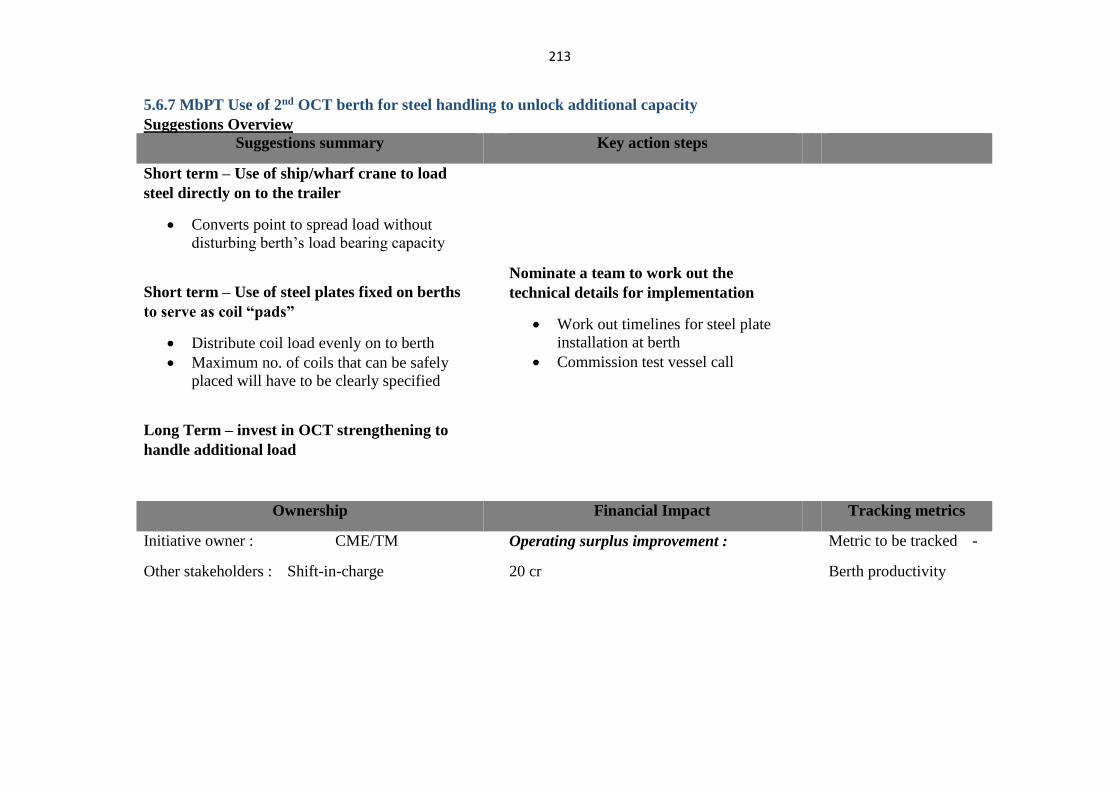
213
5.6.7 MbPT Use of 2nd OCT berth for steel handling to unlock additional capacity
Suggestions Overview Suggestions summary Key action steps
Short term – Use of ship/wharf crane to load
steel directly on to the trailer
Converts point to spread load without
disturbing berth’s load bearing capacity
Short term – Use of steel plates fixed on berths
to serve as coil “pads”
Distribute coil load evenly on to berth
Maximum no. of coils that can be safely
placed will have to be clearly specified
Long Term – invest in OCT strengthening to
handle additional load
Nominate a team to work out the
technical details for implementation
Work out timelines for steel plate
installation at berth
Commission test vessel call
Ownership Financial Impact Tracking metrics
Initiative owner : CME/TM
Other stakeholders : Shift-in-charge
Operating surplus improvement :
20 cr
Metric to be tracked -
Berth productivity
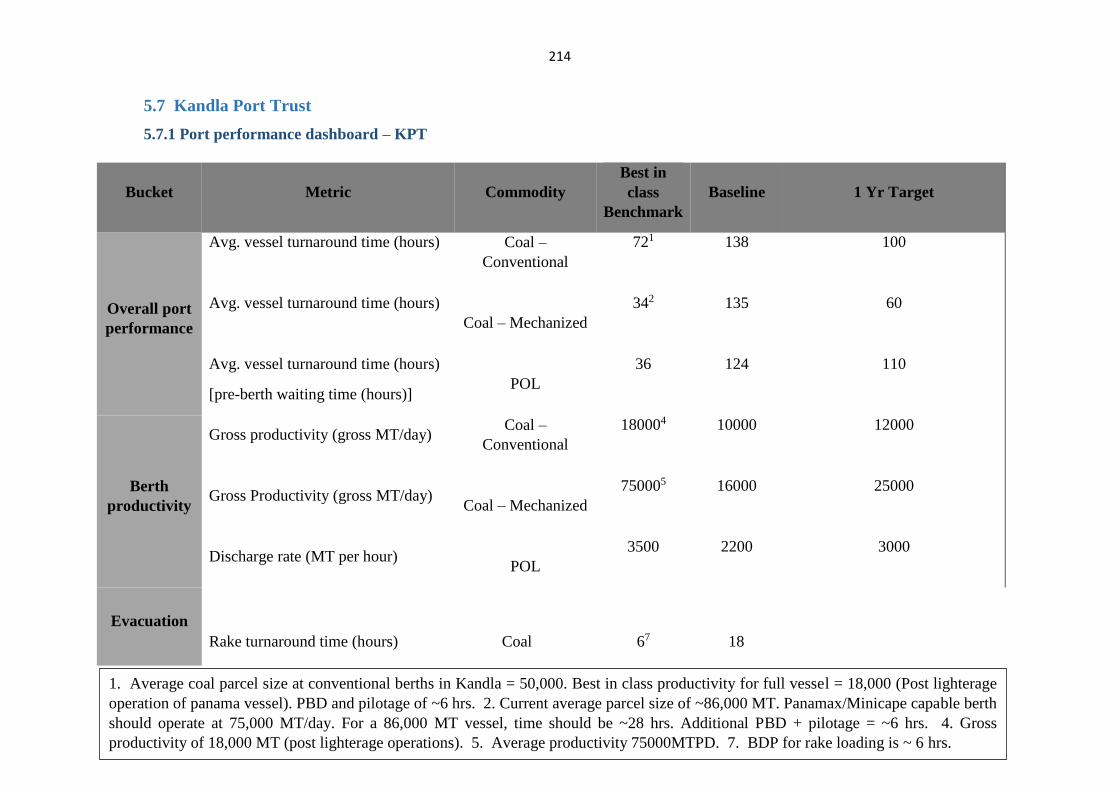
214
5.7 Kandla Port Trust
5.7.1 Port performance dashboard – KPT
Bucket Metric Commodity
Best in
class
Benchmark
Baseline 1 Yr Target
Overall port
performance
Avg. vessel turnaround time (hours)
Avg. vessel turnaround time (hours)
Avg. vessel turnaround time (hours)
[pre-berth waiting time (hours)]
Coal –
Conventional
Coal – Mechanized
POL
721
342
36
138
135
124
100
60
110
Berth
productivity
Gross productivity (gross MT/day)
Gross Productivity (gross MT/day)
Discharge rate (MT per hour)
Coal –
Conventional
Coal – Mechanized
POL
180004
750005
3500
10000
16000
2200
12000
25000
3000
Evacuation
Rake turnaround time (hours) Coal 67 18
1. Average coal parcel size at conventional berths in Kandla = 50,000. Best in class productivity for full vessel = 18,000 (Post lighterage
operation of panama vessel). PBD and pilotage of ~6 hrs. 2. Current average parcel size of ~86,000 MT. Panamax/Minicape capable berth
should operate at 75,000 MT/day. For a 86,000 MT vessel, time should be ~28 hrs. Additional PBD + pilotage = ~6 hrs. 4. Gross
productivity of 18,000 MT (post lighterage operations). 5. Average productivity 75000MTPD. 7. BDP for rake loading is ~ 6 hrs.
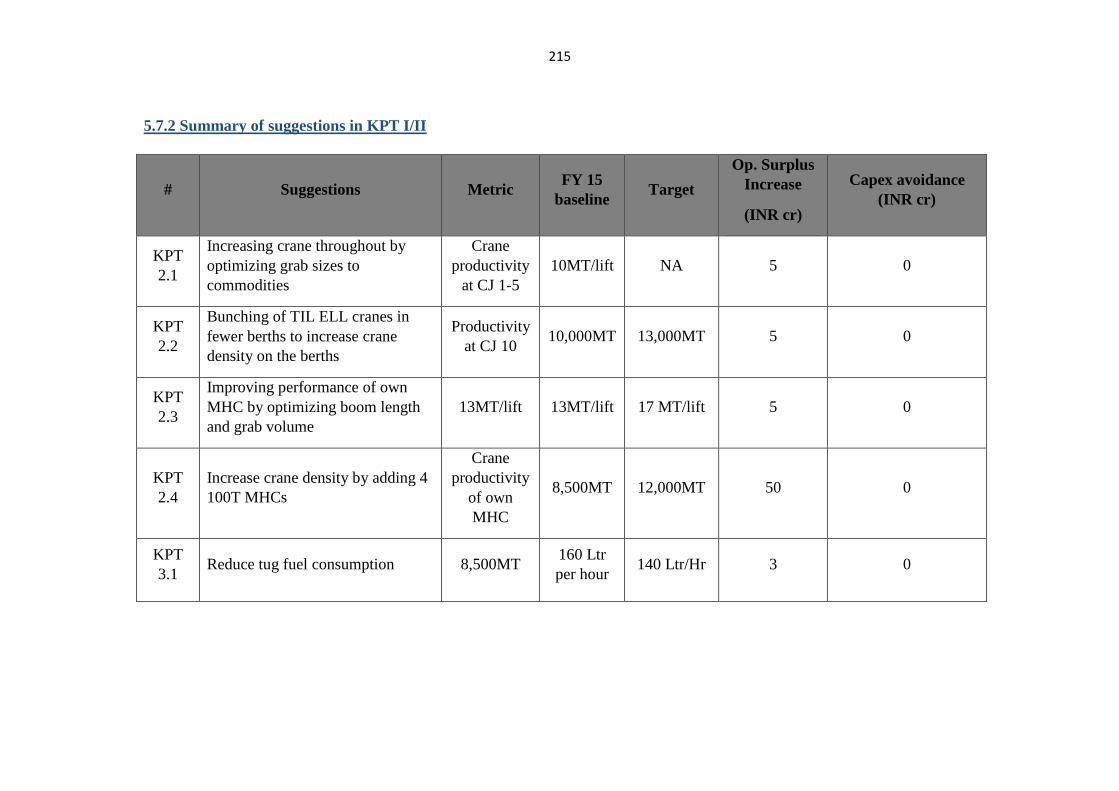
215
5.7.2 Summary of suggestions in KPT I/II
# Suggestions Metric FY 15
baseline Target
Op. Surplus
Increase
(INR cr)
Capex avoidance
(INR cr)
KPT
2.1
Increasing crane throughout by
optimizing grab sizes to
commodities
Crane
productivity
at CJ 1-5
10MT/lift NA 5 0
KPT
2.2
Bunching of TIL ELL cranes in
fewer berths to increase crane
density on the berths
Productivity
at CJ 10 10,000MT 13,000MT 5 0
KPT
2.3
Improving performance of own
MHC by optimizing boom length
and grab volume
13MT/lift 13MT/lift 17 MT/lift 5 0
KPT
2.4
Increase crane density by adding 4
100T MHCs
Crane
productivity
of own
MHC
8,500MT 12,000MT 50 0
KPT
3.1 Reduce tug fuel consumption 8,500MT
160 Ltr
per hour 140 Ltr/Hr 3 0
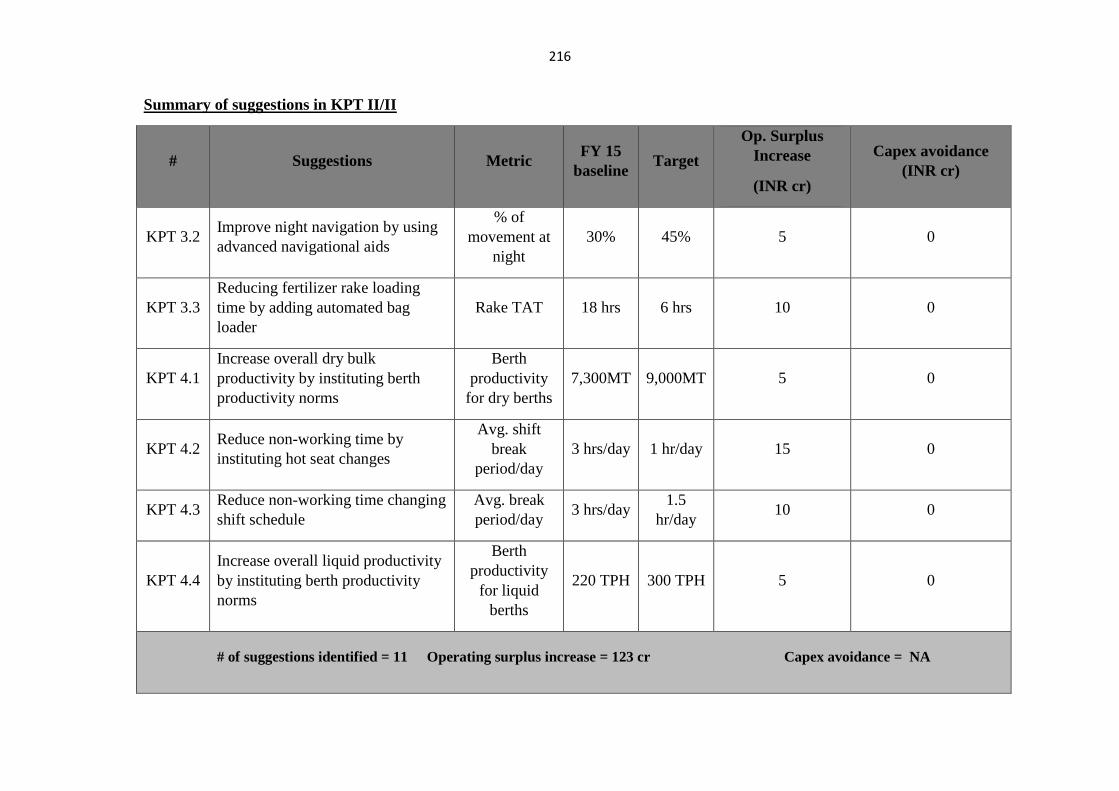
216
Summary of suggestions in KPT II/II
# Suggestions Metric FY 15
baseline Target
Op. Surplus
Increase
(INR cr)
Capex avoidance
(INR cr)
KPT 3.2 Improve night navigation by using
advanced navigational aids
% of
movement at
night
30% 45% 5 0
KPT 3.3
Reducing fertilizer rake loading
time by adding automated bag
loader
Rake TAT 18 hrs 6 hrs 10 0
KPT 4.1
Increase overall dry bulk
productivity by instituting berth
productivity norms
Berth
productivity
for dry berths
7,300MT 9,000MT 5 0
KPT 4.2 Reduce non-working time by
instituting hot seat changes
Avg. shift
break
period/day
3 hrs/day 1 hr/day 15 0
KPT 4.3 Reduce non-working time changing
shift schedule
Avg. break
period/day 3 hrs/day
1.5
hr/day 10 0
KPT 4.4
Increase overall liquid productivity
by instituting berth productivity
norms
Berth
productivity
for liquid
berths
220 TPH 300 TPH 5 0
# of suggestions identified = 11 Operating surplus increase = 123 cr Capex avoidance = NA
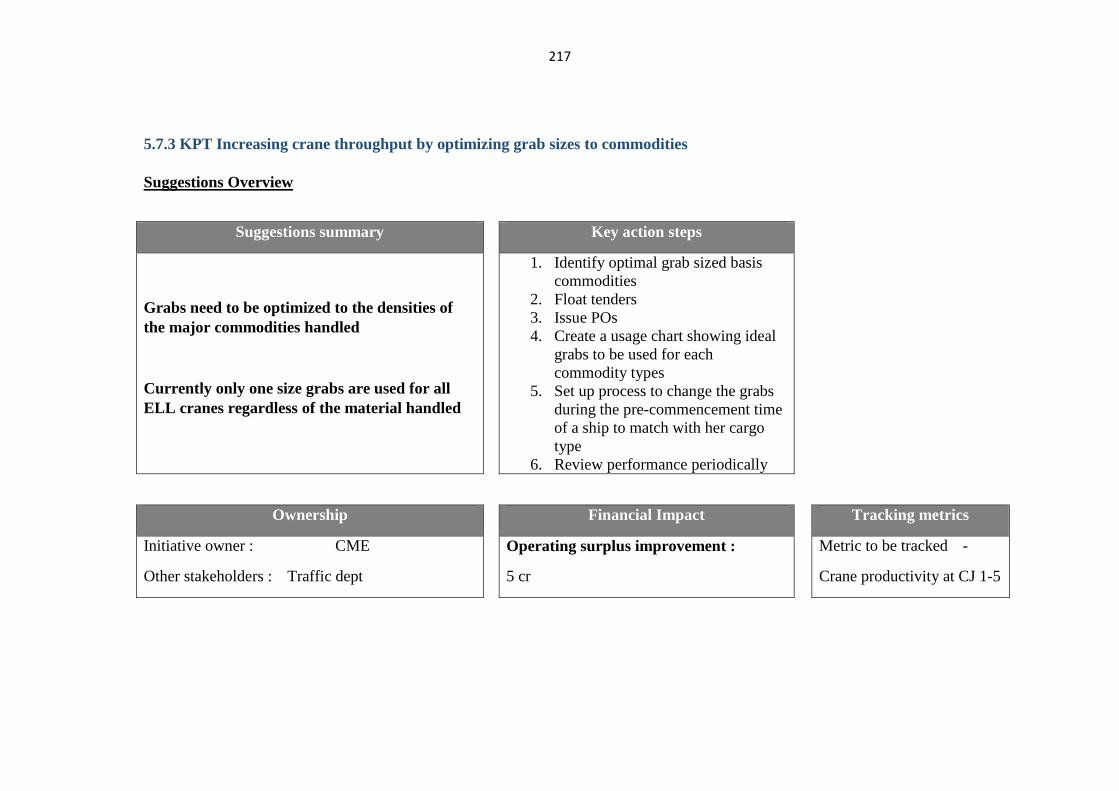
217
5.7.3 KPT Increasing crane throughput by optimizing grab sizes to commodities
Suggestions Overview
Suggestions summary Key action steps
Grabs need to be optimized to the densities of
the major commodities handled
Currently only one size grabs are used for all
ELL cranes regardless of the material handled
1. Identify optimal grab sized basis
commodities
2. Float tenders
3. Issue POs
4. Create a usage chart showing ideal
grabs to be used for each
commodity types
5. Set up process to change the grabs
during the pre-commencement time
of a ship to match with her cargo
type
6. Review performance periodically
Ownership Financial Impact Tracking metrics
Initiative owner : CME
Other stakeholders : Traffic dept
Operating surplus improvement :
5 cr
Metric to be tracked -
Crane productivity at CJ 1-5
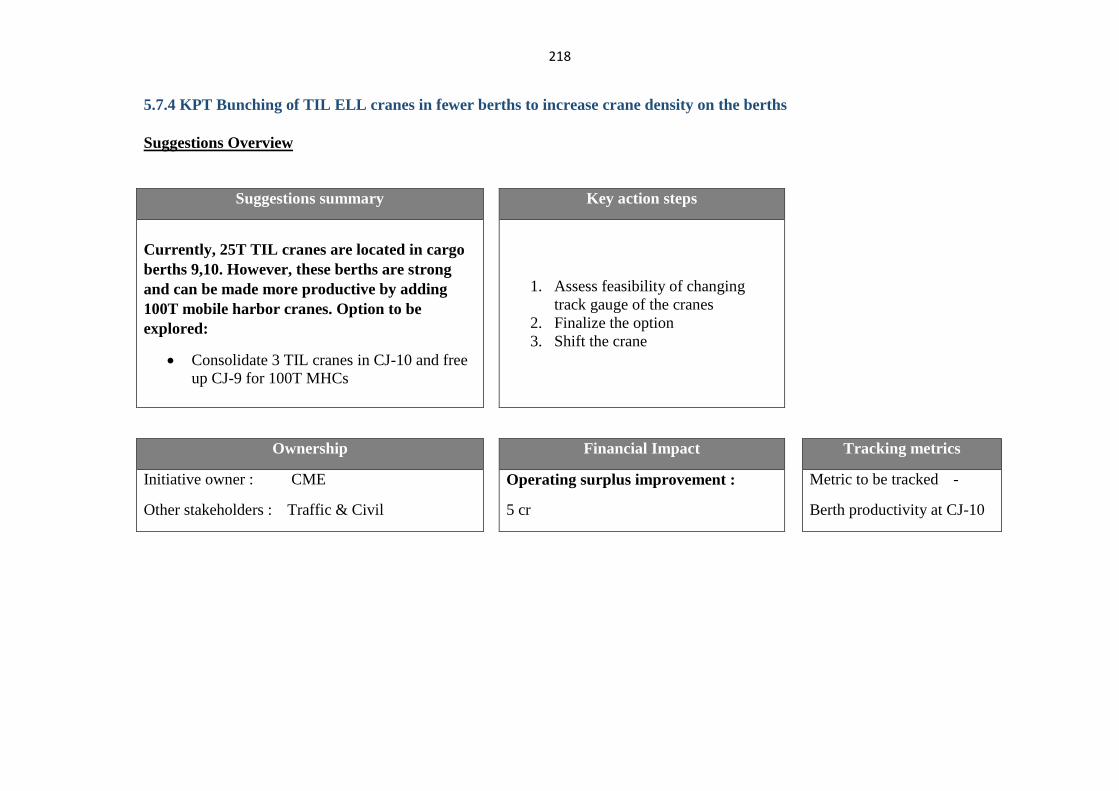
218
5.7.4 KPT Bunching of TIL ELL cranes in fewer berths to increase crane density on the berths
Suggestions Overview
Suggestions summary Key action steps
Currently, 25T TIL cranes are located in cargo
berths 9,10. However, these berths are strong
and can be made more productive by adding
100T mobile harbor cranes. Option to be
explored:
Consolidate 3 TIL cranes in CJ-10 and free
up CJ-9 for 100T MHCs
1. Assess feasibility of changing
track gauge of the cranes
2. Finalize the option
3. Shift the crane
Ownership Financial Impact Tracking metrics
Initiative owner : CME
Other stakeholders : Traffic & Civil
Operating surplus improvement :
5 cr
Metric to be tracked -
Berth productivity at CJ-10
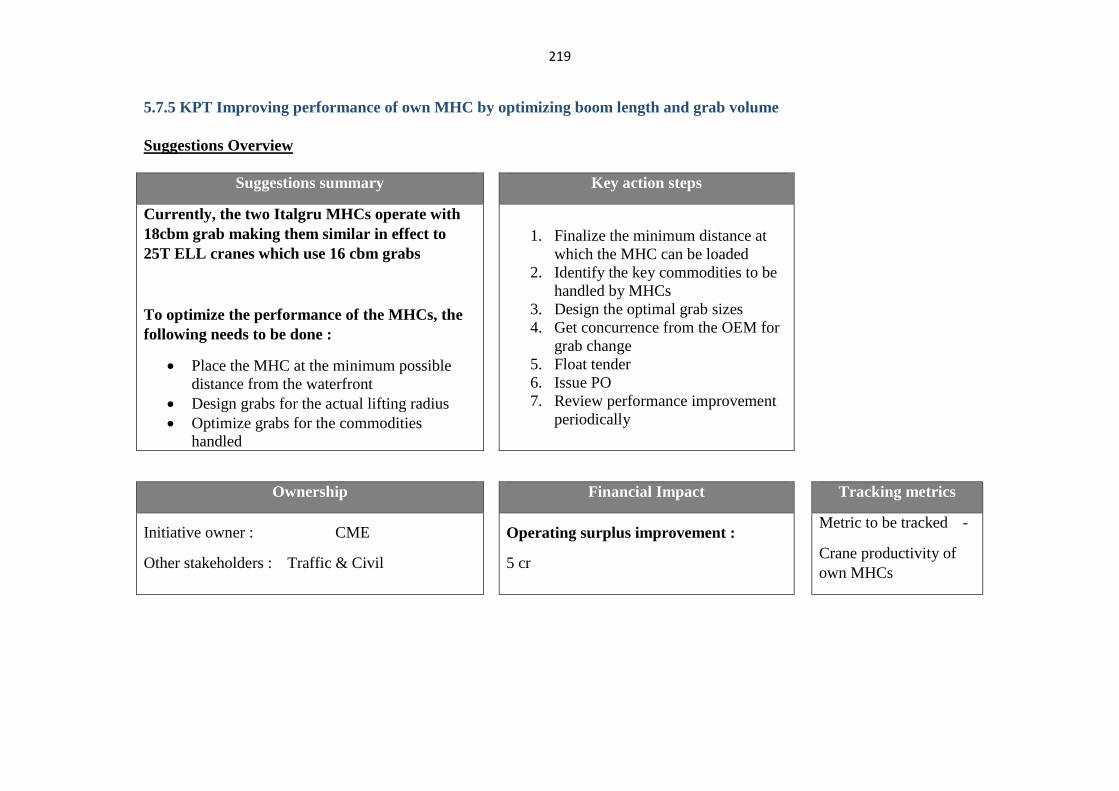
219
5.7.5 KPT Improving performance of own MHC by optimizing boom length and grab volume
Suggestions Overview
Suggestions summary Key action steps
Currently, the two Italgru MHCs operate with
18cbm grab making them similar in effect to
25T ELL cranes which use 16 cbm grabs
To optimize the performance of the MHCs, the
following needs to be done :
Place the MHC at the minimum possible
distance from the waterfront
Design grabs for the actual lifting radius
Optimize grabs for the commodities
handled
1. Finalize the minimum distance at
which the MHC can be loaded
2. Identify the key commodities to be
handled by MHCs
3. Design the optimal grab sizes
4. Get concurrence from the OEM for
grab change
5. Float tender
6. Issue PO
7. Review performance improvement
periodically
Ownership Financial Impact Tracking metrics
Initiative owner : CME
Other stakeholders : Traffic & Civil
Operating surplus improvement :
5 cr
Metric to be tracked -
Crane productivity of
own MHCs
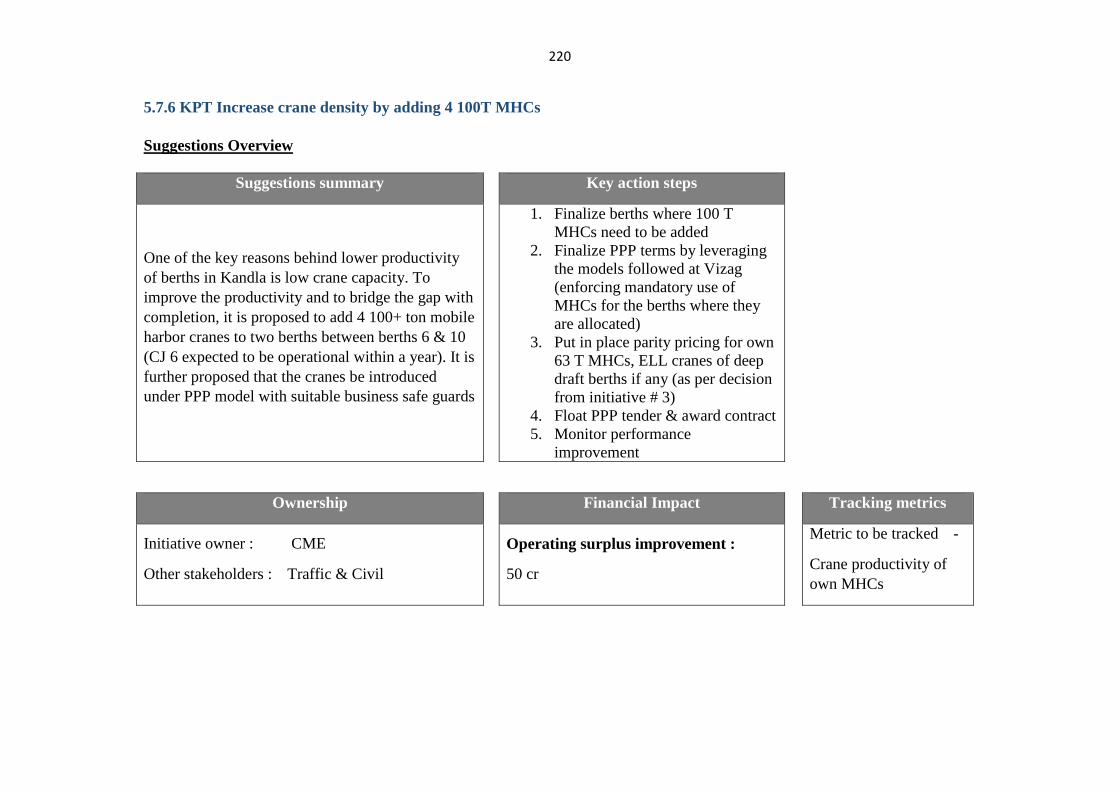
220
5.7.6 KPT Increase crane density by adding 4 100T MHCs
Suggestions Overview
Suggestions summary Key action steps
One of the key reasons behind lower productivity
of berths in Kandla is low crane capacity. To
improve the productivity and to bridge the gap with
completion, it is proposed to add 4 100+ ton mobile
harbor cranes to two berths between berths 6 & 10
(CJ 6 expected to be operational within a year). It is
further proposed that the cranes be introduced
under PPP model with suitable business safe guards
1. Finalize berths where 100 T
MHCs need to be added
2. Finalize PPP terms by leveraging
the models followed at Vizag
(enforcing mandatory use of
MHCs for the berths where they
are allocated)
3. Put in place parity pricing for own
63 T MHCs, ELL cranes of deep
draft berths if any (as per decision
from initiative # 3)
4. Float PPP tender & award contract
5. Monitor performance
improvement
Ownership Financial Impact Tracking metrics
Initiative owner : CME
Other stakeholders : Traffic & Civil
Operating surplus improvement :
50 cr
Metric to be tracked -
Crane productivity of
own MHCs
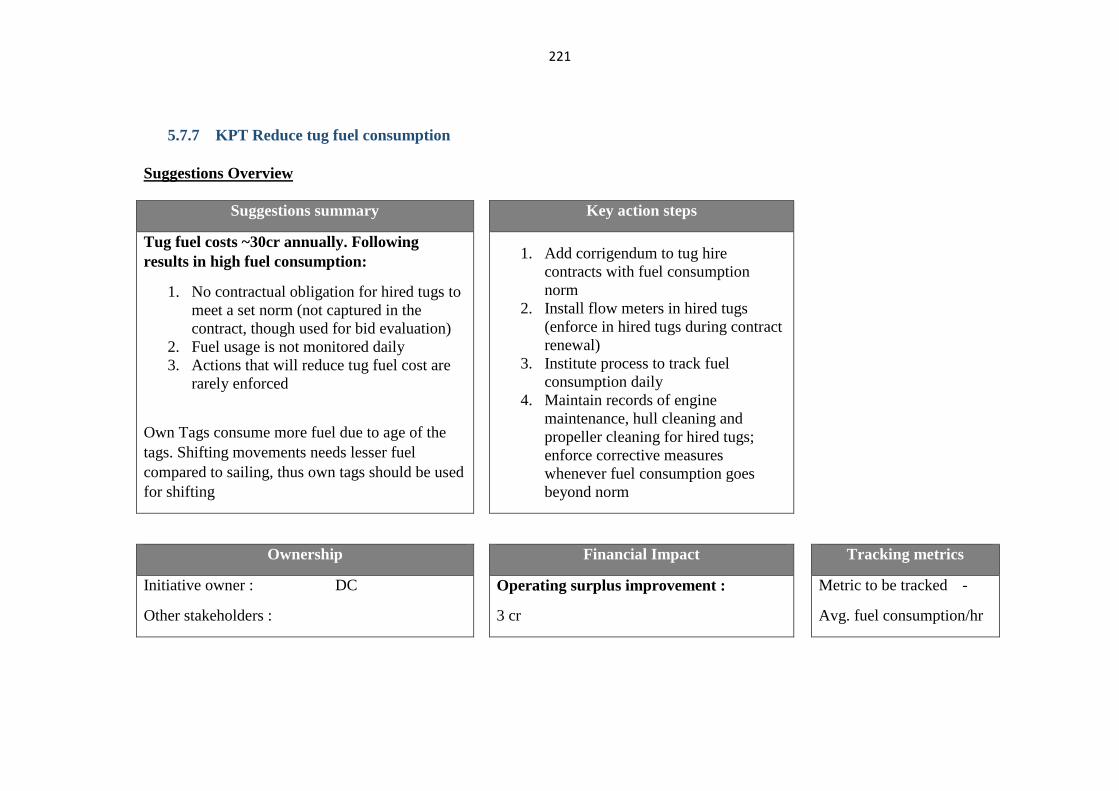
221
5.7.7 KPT Reduce tug fuel consumption
Suggestions Overview
Suggestions summary Key action steps
Tug fuel costs ~30cr annually. Following
results in high fuel consumption:
1. No contractual obligation for hired tugs to
meet a set norm (not captured in the
contract, though used for bid evaluation)
2. Fuel usage is not monitored daily
3. Actions that will reduce tug fuel cost are
rarely enforced
Own Tags consume more fuel due to age of the
tags. Shifting movements needs lesser fuel
compared to sailing, thus own tags should be used
for shifting
1. Add corrigendum to tug hire
contracts with fuel consumption
norm
2. Install flow meters in hired tugs
(enforce in hired tugs during contract
renewal)
3. Institute process to track fuel
consumption daily
4. Maintain records of engine
maintenance, hull cleaning and
propeller cleaning for hired tugs;
enforce corrective measures
whenever fuel consumption goes
beyond norm
Ownership Financial Impact Tracking metrics
Initiative owner : DC
Other stakeholders :
Operating surplus improvement :
3 cr
Metric to be tracked -
Avg. fuel consumption/hr
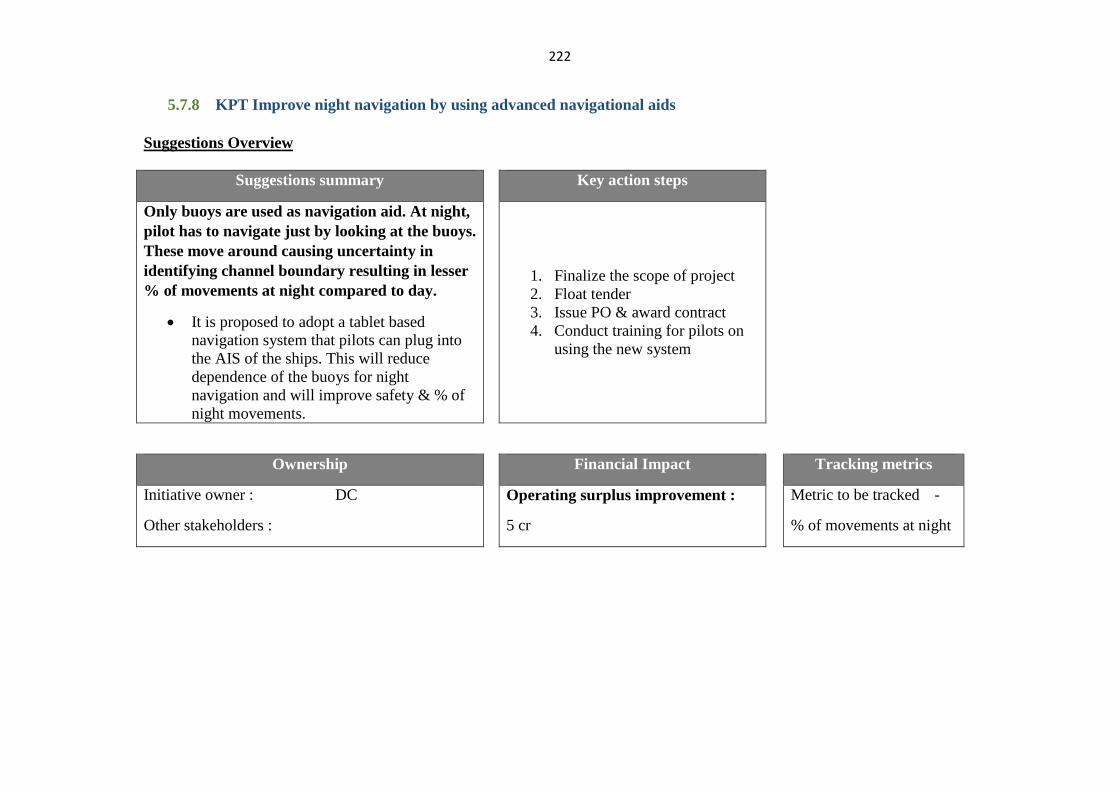
222
5.7.8 KPT Improve night navigation by using advanced navigational aids
Suggestions Overview
Suggestions summary Key action steps
Only buoys are used as navigation aid. At night,
pilot has to navigate just by looking at the buoys.
These move around causing uncertainty in
identifying channel boundary resulting in lesser
% of movements at night compared to day.
It is proposed to adopt a tablet based
navigation system that pilots can plug into
the AIS of the ships. This will reduce
dependence of the buoys for night
navigation and will improve safety & % of
night movements.
1. Finalize the scope of project
2. Float tender
3. Issue PO & award contract
4. Conduct training for pilots on
using the new system
Ownership Financial Impact Tracking metrics
Initiative owner : DC
Other stakeholders :
Operating surplus improvement :
5 cr
Metric to be tracked -
% of movements at night
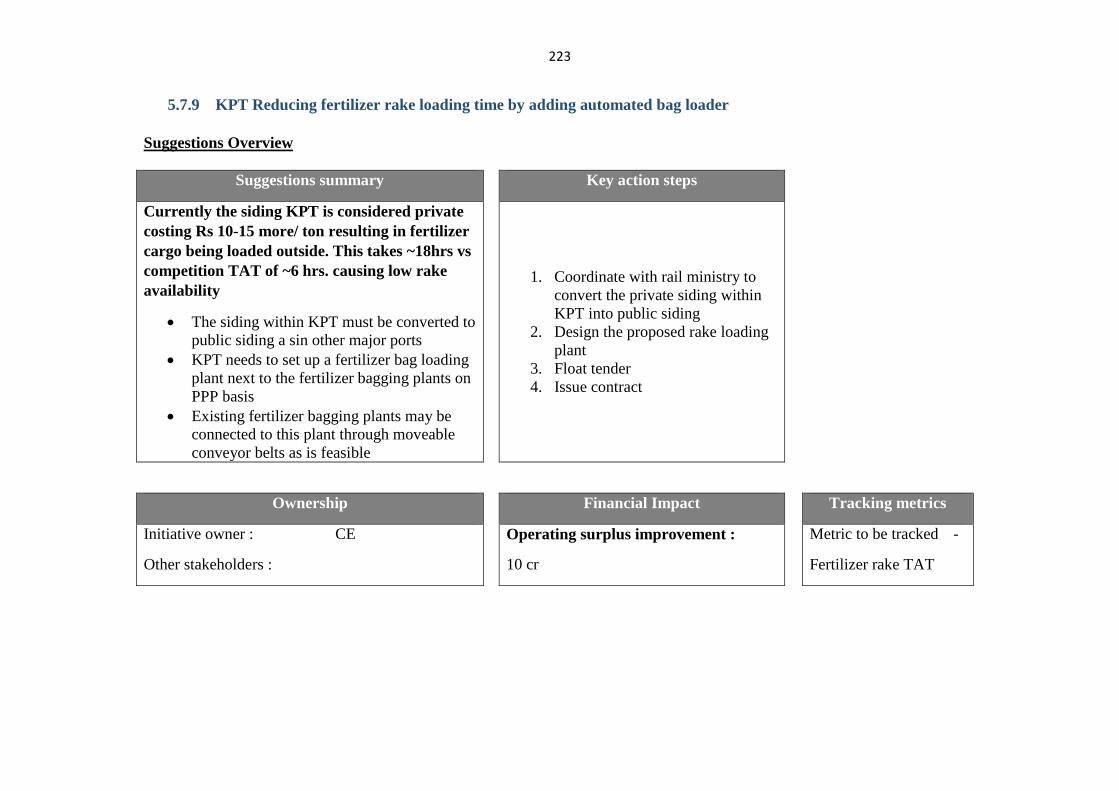
223
5.7.9 KPT Reducing fertilizer rake loading time by adding automated bag loader
Suggestions Overview
Suggestions summary Key action steps
Currently the siding KPT is considered private
costing Rs 10-15 more/ ton resulting in fertilizer
cargo being loaded outside. This takes ~18hrs vs
competition TAT of ~6 hrs. causing low rake
availability
The siding within KPT must be converted to
public siding a sin other major ports
KPT needs to set up a fertilizer bag loading
plant next to the fertilizer bagging plants on
PPP basis
Existing fertilizer bagging plants may be
connected to this plant through moveable
conveyor belts as is feasible
1. Coordinate with rail ministry to
convert the private siding within
KPT into public siding
2. Design the proposed rake loading
plant
3. Float tender
4. Issue contract
Ownership Financial Impact Tracking metrics
Initiative owner : CE
Other stakeholders :
Operating surplus improvement :
10 cr
Metric to be tracked -
Fertilizer rake TAT
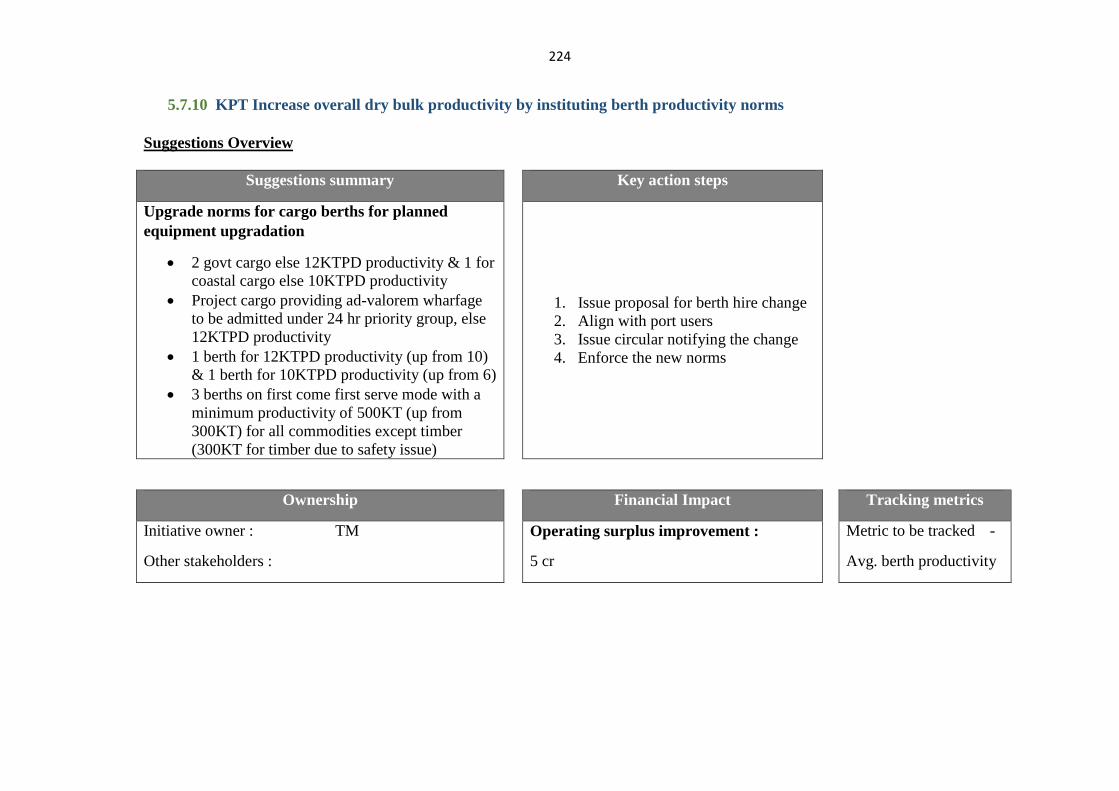
224
5.7.10 KPT Increase overall dry bulk productivity by instituting berth productivity norms
Suggestions Overview
Suggestions summary Key action steps
Upgrade norms for cargo berths for planned
equipment upgradation
2 govt cargo else 12KTPD productivity & 1 for
coastal cargo else 10KTPD productivity
Project cargo providing ad-valorem wharfage
to be admitted under 24 hr priority group, else
12KTPD productivity
1 berth for 12KTPD productivity (up from 10)
& 1 berth for 10KTPD productivity (up from 6)
3 berths on first come first serve mode with a
minimum productivity of 500KT (up from
300KT) for all commodities except timber
(300KT for timber due to safety issue)
1. Issue proposal for berth hire change
2. Align with port users
3. Issue circular notifying the change
4. Enforce the new norms
Ownership Financial Impact Tracking metrics
Initiative owner : TM
Other stakeholders :
Operating surplus improvement :
5 cr
Metric to be tracked -
Avg. berth productivity
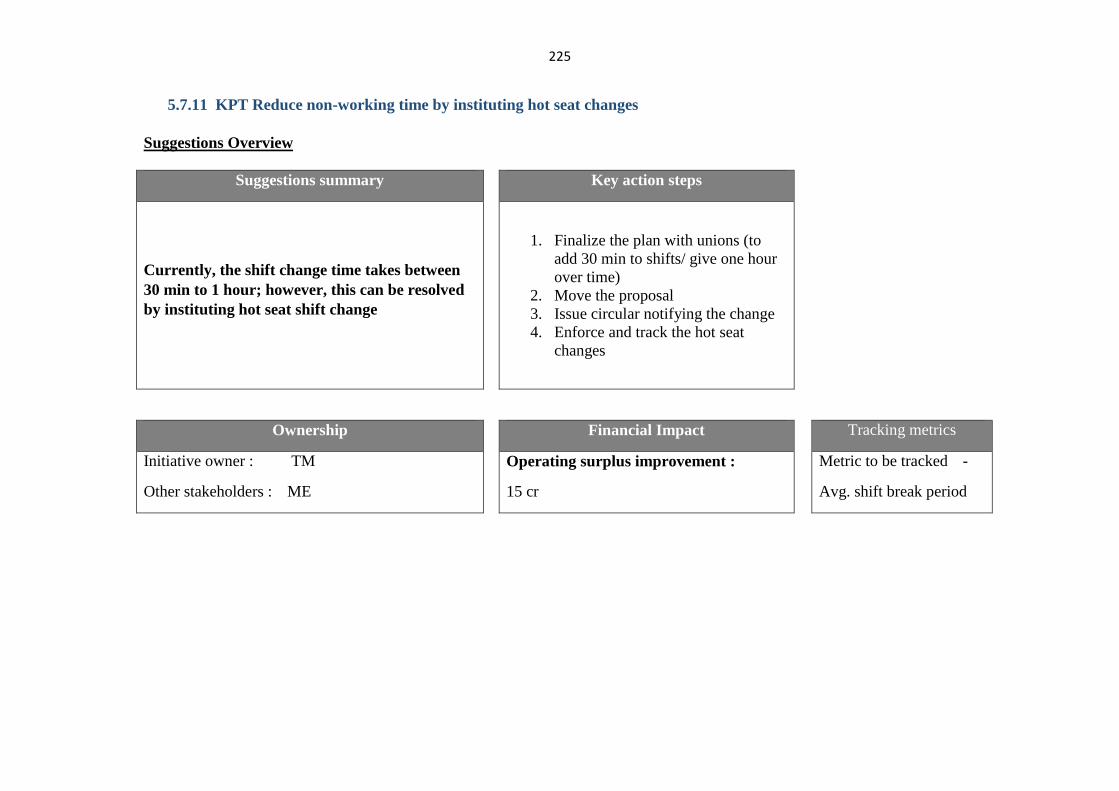
225
5.7.11 KPT Reduce non-working time by instituting hot seat changes
Suggestions Overview
Suggestions summary Key action steps
Currently, the shift change time takes between
30 min to 1 hour; however, this can be resolved
by instituting hot seat shift change
1. Finalize the plan with unions (to
add 30 min to shifts/ give one hour
over time)
2. Move the proposal
3. Issue circular notifying the change
4. Enforce and track the hot seat
changes
Ownership Financial Impact Tracking metrics
Initiative owner : TM
Other stakeholders : ME
Operating surplus improvement :
15 cr
Metric to be tracked -
Avg. shift break period
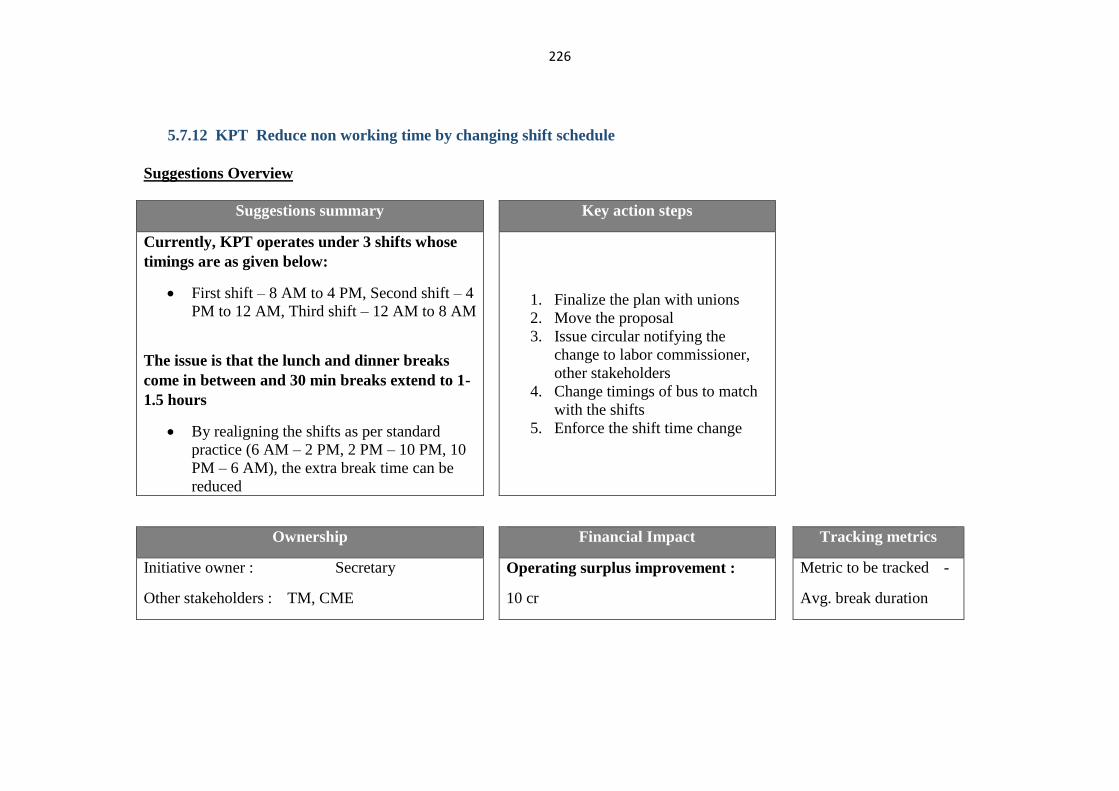
226
5.7.12 KPT Reduce non working time by changing shift schedule
Suggestions Overview
Suggestions summary Key action steps
Currently, KPT operates under 3 shifts whose
timings are as given below:
First shift – 8 AM to 4 PM, Second shift – 4
PM to 12 AM, Third shift – 12 AM to 8 AM
The issue is that the lunch and dinner breaks
come in between and 30 min breaks extend to 1-
1.5 hours
By realigning the shifts as per standard
practice (6 AM – 2 PM, 2 PM – 10 PM, 10
PM – 6 AM), the extra break time can be
reduced
1. Finalize the plan with unions
2. Move the proposal
3. Issue circular notifying the
change to labor commissioner,
other stakeholders
4. Change timings of bus to match
with the shifts
5. Enforce the shift time change
Ownership Financial Impact Tracking metrics
Initiative owner : Secretary
Other stakeholders : TM, CME
Operating surplus improvement :
10 cr
Metric to be tracked -
Avg. break duration
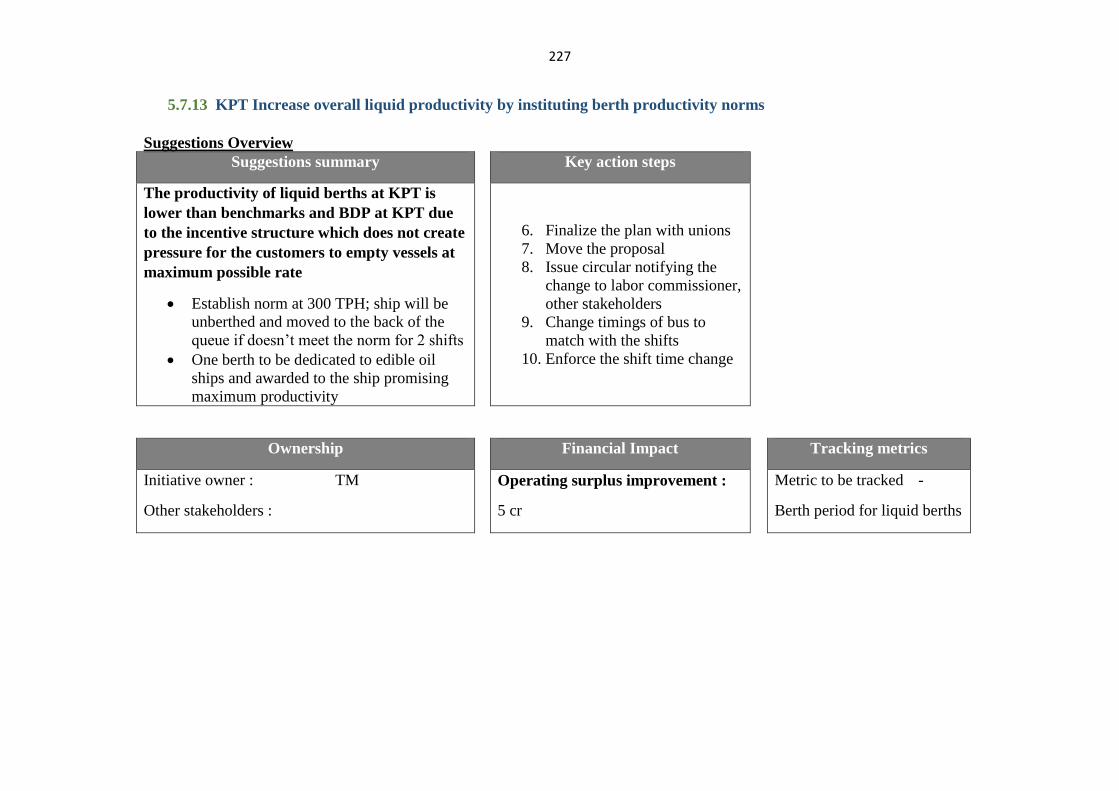
227
5.7.13 KPT Increase overall liquid productivity by instituting berth productivity norms
Suggestions Overview
Suggestions summary Key action steps
The productivity of liquid berths at KPT is
lower than benchmarks and BDP at KPT due
to the incentive structure which does not create
pressure for the customers to empty vessels at
maximum possible rate
Establish norm at 300 TPH; ship will be
unberthed and moved to the back of the
queue if doesn’t meet the norm for 2 shifts
One berth to be dedicated to edible oil
ships and awarded to the ship promising
maximum productivity
6. Finalize the plan with unions
7. Move the proposal
8. Issue circular notifying the
change to labor commissioner,
other stakeholders
9. Change timings of bus to
match with the shifts
10. Enforce the shift time change
Ownership Financial Impact Tracking metrics
Initiative owner : TM
Other stakeholders :
Operating surplus improvement :
5 cr
Metric to be tracked -
Berth period for liquid berths
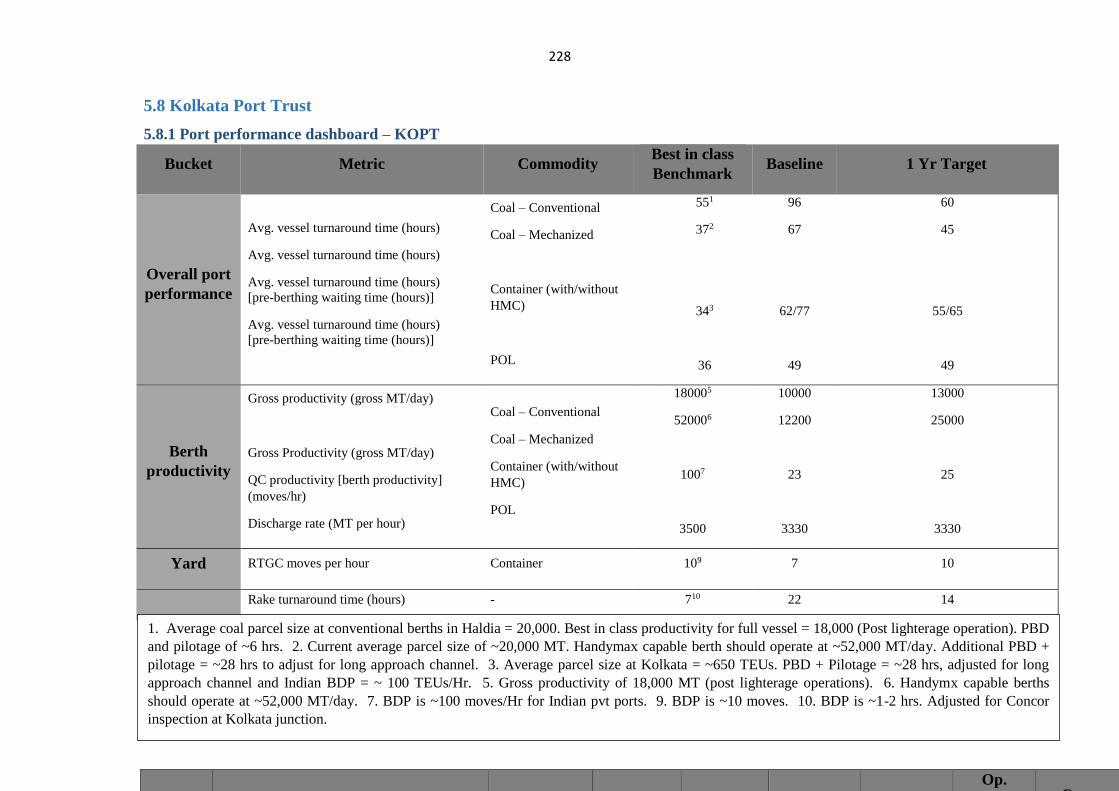
228
5.8 Kolkata Port Trust
5.8.1 Port performance dashboard – KOPT
Bucket Metric Commodity Best in class
Benchmark Baseline 1 Yr Target
Overall port
performance
Avg. vessel turnaround time (hours)
Avg. vessel turnaround time (hours)
Avg. vessel turnaround time (hours)
[pre-berthing waiting time (hours)]
Avg. vessel turnaround time (hours)
[pre-berthing waiting time (hours)]
Coal – Conventional
Coal – Mechanized
Container (with/without
HMC)
POL
551
372
343
36
96
67
62/77
49
60
45
55/65
49
Berth
productivity
Gross productivity (gross MT/day)
Gross Productivity (gross MT/day)
QC productivity [berth productivity]
(moves/hr)
Discharge rate (MT per hour)
Coal – Conventional
Coal – Mechanized
Container (with/without
HMC)
POL
180005
520006
1007
3500
10000
12200
23
3330
13000
25000
25
3330
Yard RTGC moves per hour Container 109 7 10
Rake turnaround time (hours) - 710 22 14
1. Average coal parcel size at conventional berths in Haldia = 20,000. Best in class productivity for full vessel = 18,000 (Post lighterage operation). PBD
and pilotage of ~6 hrs. 2. Current average parcel size of ~20,000 MT. Handymax capable berth should operate at ~52,000 MT/day. Additional PBD +
pilotage = ~28 hrs to adjust for long approach channel. 3. Average parcel size at Kolkata = ~650 TEUs. PBD + Pilotage = ~28 hrs, adjusted for long
approach channel and Indian BDP = ~ 100 TEUs/Hr. 5. Gross productivity of 18,000 MT (post lighterage operations). 6. Handymx capable berths
should operate at ~52,000 MT/day. 7. BDP is ~100 moves/Hr for Indian pvt ports. 9. BDP is ~10 moves. 10. BDP is ~1-2 hrs. Adjusted for Concor
inspection at Kolkata junction.
Bench
Op.
Surplus Capex
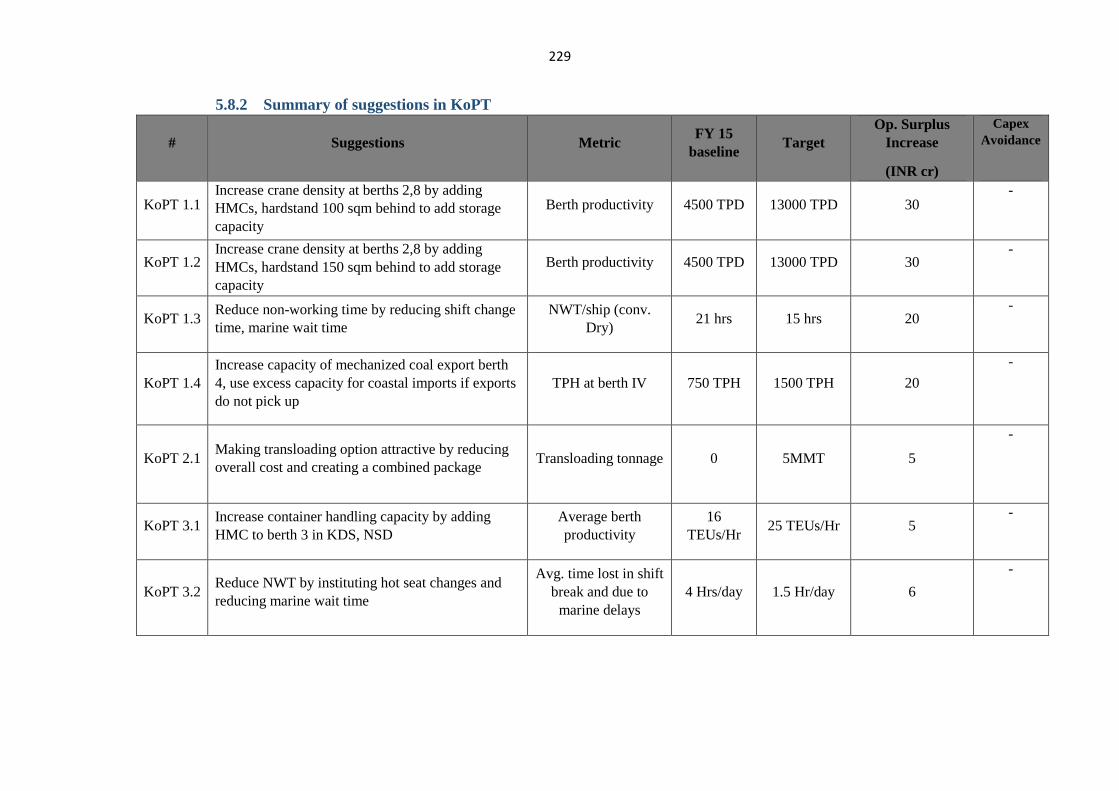
229
5.8.2 Summary of suggestions in KoPT
# Suggestions Metric FY 15
baseline Target
Op. Surplus
Increase
(INR cr)
Capex
Avoidance
KoPT 1.1 Increase crane density at berths 2,8 by adding
HMCs, hardstand 100 sqm behind to add storage
capacity
Berth productivity 4500 TPD 13000 TPD 30 -
KoPT 1.2 Increase crane density at berths 2,8 by adding
HMCs, hardstand 150 sqm behind to add storage
capacity
Berth productivity 4500 TPD 13000 TPD 30 -
KoPT 1.3 Reduce non-working time by reducing shift change
time, marine wait time
NWT/ship (conv.
Dry) 21 hrs 15 hrs 20
-
KoPT 1.4
Increase capacity of mechanized coal export berth
4, use excess capacity for coastal imports if exports
do not pick up
TPH at berth IV 750 TPH 1500 TPH 20
-
KoPT 2.1 Making transloading option attractive by reducing
overall cost and creating a combined package Transloading tonnage 0 5MMT 5
-
KoPT 3.1 Increase container handling capacity by adding
HMC to berth 3 in KDS, NSD
Average berth
productivity
16
TEUs/Hr 25 TEUs/Hr 5
-
KoPT 3.2 Reduce NWT by instituting hot seat changes and
reducing marine wait time
Avg. time lost in shift
break and due to
marine delays
4 Hrs/day 1.5 Hr/day 6
-
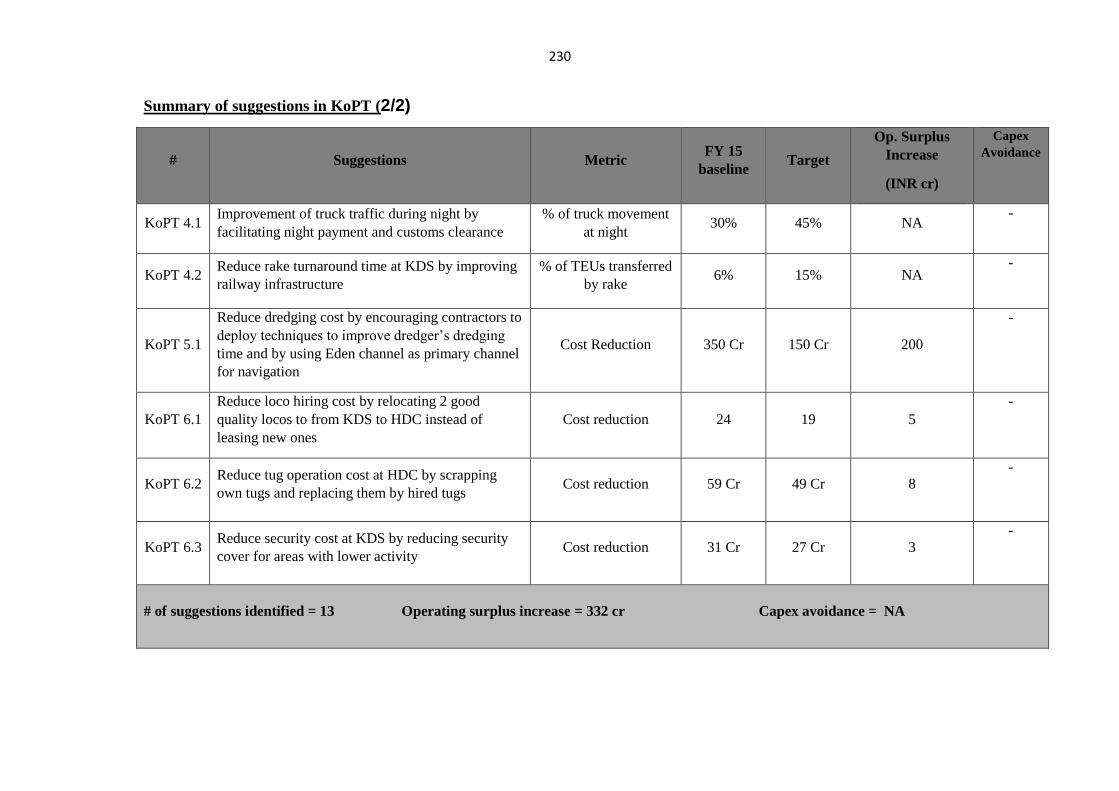
230
Summary of suggestions in KoPT (2/2)
# Suggestions Metric FY 15
baseline Target
Op. Surplus
Increase
(INR cr)
Capex
Avoidance
KoPT 4.1 Improvement of truck traffic during night by
facilitating night payment and customs clearance
% of truck movement
at night 30% 45% NA
-
KoPT 4.2 Reduce rake turnaround time at KDS by improving
railway infrastructure
% of TEUs transferred
by rake 6% 15% NA
-
KoPT 5.1
Reduce dredging cost by encouraging contractors to
deploy techniques to improve dredger’s dredging
time and by using Eden channel as primary channel
for navigation
Cost Reduction 350 Cr 150 Cr 200
-
KoPT 6.1
Reduce loco hiring cost by relocating 2 good
quality locos to from KDS to HDC instead of
leasing new ones
Cost reduction 24 19 5
-
KoPT 6.2 Reduce tug operation cost at HDC by scrapping
own tugs and replacing them by hired tugs Cost reduction 59 Cr 49 Cr 8
-
KoPT 6.3 Reduce security cost at KDS by reducing security
cover for areas with lower activity Cost reduction 31 Cr 27 Cr 3
-
# of suggestions identified = 13 Operating surplus increase = 332 cr Capex avoidance = NA
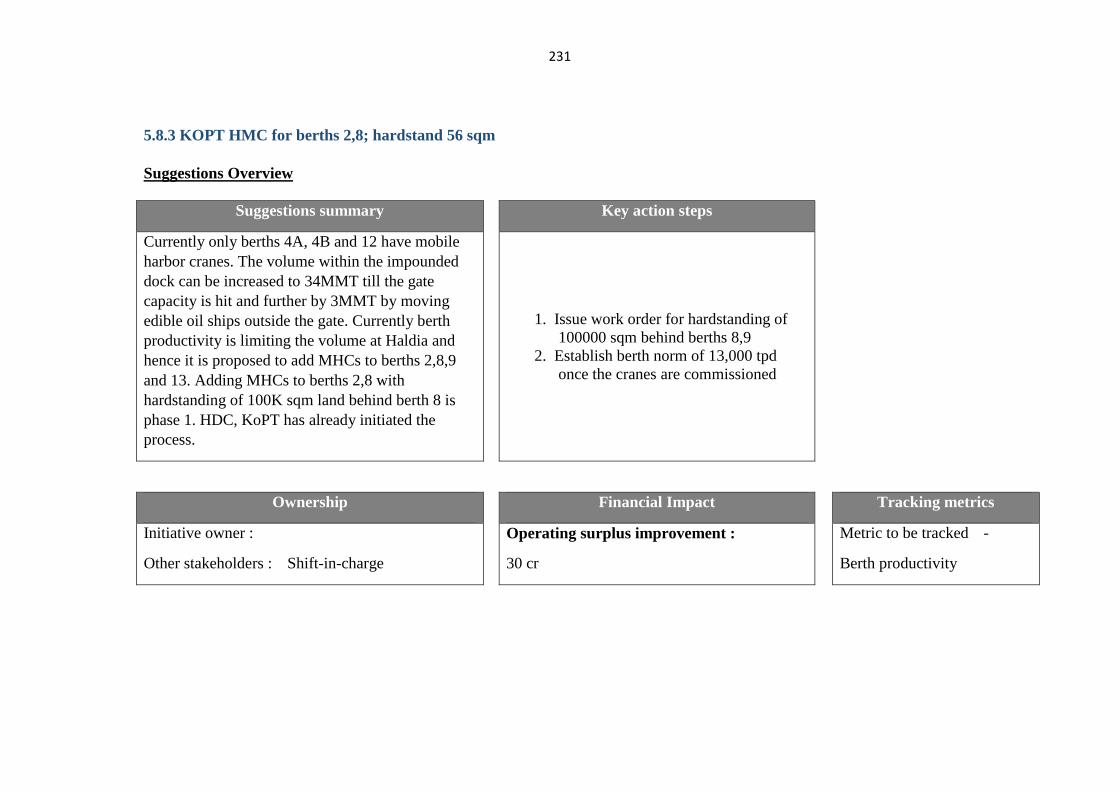
231
5.8.3 KOPT HMC for berths 2,8; hardstand 56 sqm
Suggestions Overview
Suggestions summary Key action steps
Currently only berths 4A, 4B and 12 have mobile
harbor cranes. The volume within the impounded
dock can be increased to 34MMT till the gate
capacity is hit and further by 3MMT by moving
edible oil ships outside the gate. Currently berth
productivity is limiting the volume at Haldia and
hence it is proposed to add MHCs to berths 2,8,9
and 13. Adding MHCs to berths 2,8 with
hardstanding of 100K sqm land behind berth 8 is
phase 1. HDC, KoPT has already initiated the
process.
1. Issue work order for hardstanding of
100000 sqm behind berths 8,9
2. Establish berth norm of 13,000 tpd
once the cranes are commissioned
Ownership Financial Impact Tracking metrics
Initiative owner :
Other stakeholders : Shift-in-charge
Operating surplus improvement :
30 cr
Metric to be tracked -
Berth productivity
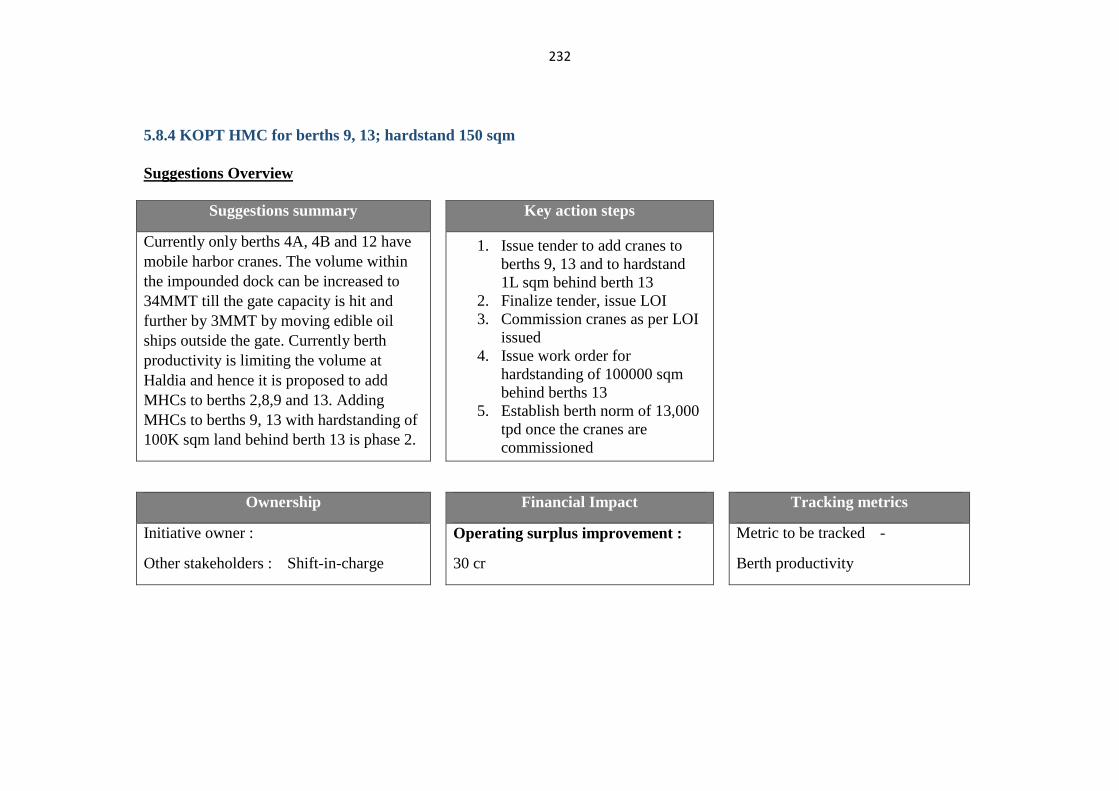
232
5.8.4 KOPT HMC for berths 9, 13; hardstand 150 sqm
Suggestions Overview
Suggestions summary Key action steps
Currently only berths 4A, 4B and 12 have
mobile harbor cranes. The volume within
the impounded dock can be increased to
34MMT till the gate capacity is hit and
further by 3MMT by moving edible oil
ships outside the gate. Currently berth
productivity is limiting the volume at
Haldia and hence it is proposed to add
MHCs to berths 2,8,9 and 13. Adding
MHCs to berths 9, 13 with hardstanding of
100K sqm land behind berth 13 is phase 2.
1. Issue tender to add cranes to
berths 9, 13 and to hardstand
1L sqm behind berth 13
2. Finalize tender, issue LOI
3. Commission cranes as per LOI
issued
4. Issue work order for
hardstanding of 100000 sqm
behind berths 13
5. Establish berth norm of 13,000
tpd once the cranes are
commissioned
Ownership Financial Impact Tracking metrics
Initiative owner :
Other stakeholders : Shift-in-charge
Operating surplus improvement :
30 cr
Metric to be tracked -
Berth productivity
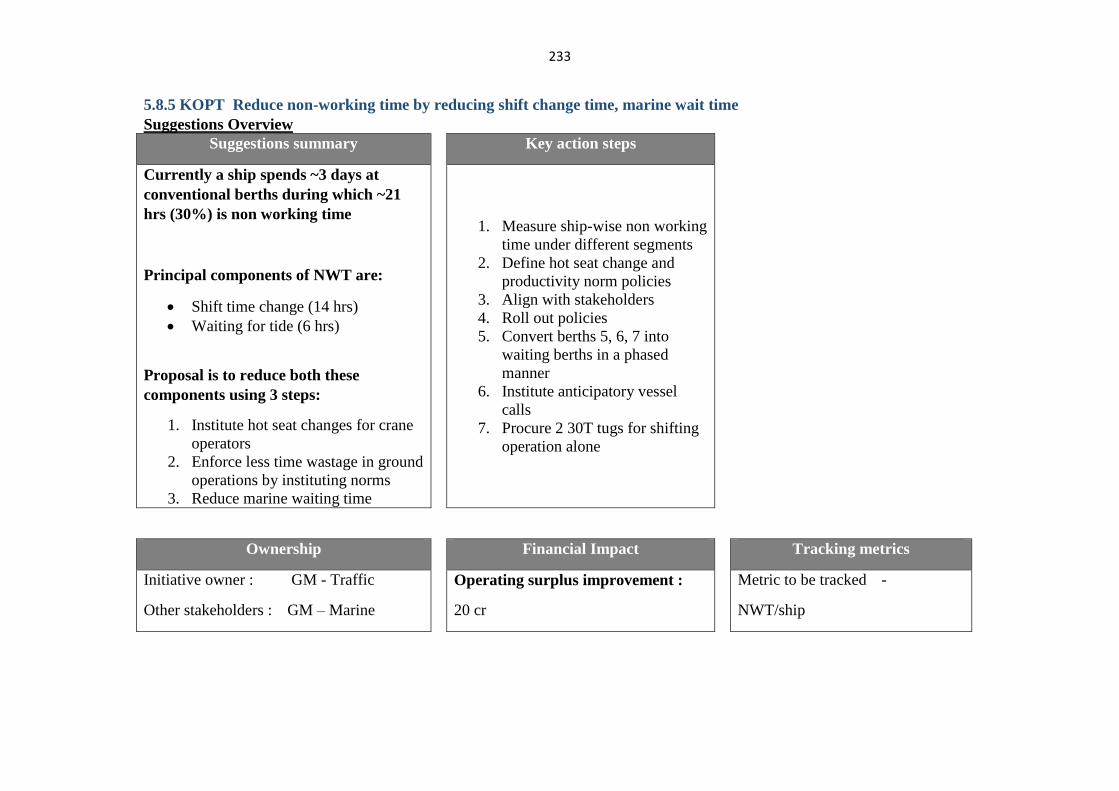
233
5.8.5 KOPT Reduce non-working time by reducing shift change time, marine wait time
Suggestions Overview
Suggestions summary Key action steps
Currently a ship spends ~3 days at
conventional berths during which ~21
hrs (30%) is non working time
Principal components of NWT are:
Shift time change (14 hrs)
Waiting for tide (6 hrs)
Proposal is to reduce both these
components using 3 steps:
1. Institute hot seat changes for crane
operators
2. Enforce less time wastage in ground
operations by instituting norms
3. Reduce marine waiting time
1. Measure ship-wise non working
time under different segments
2. Define hot seat change and
productivity norm policies
3. Align with stakeholders
4. Roll out policies
5. Convert berths 5, 6, 7 into
waiting berths in a phased
manner
6. Institute anticipatory vessel
calls
7. Procure 2 30T tugs for shifting
operation alone
Ownership Financial Impact Tracking metrics
Initiative owner : GM - Traffic
Other stakeholders : GM – Marine
Operating surplus improvement :
20 cr
Metric to be tracked -
NWT/ship
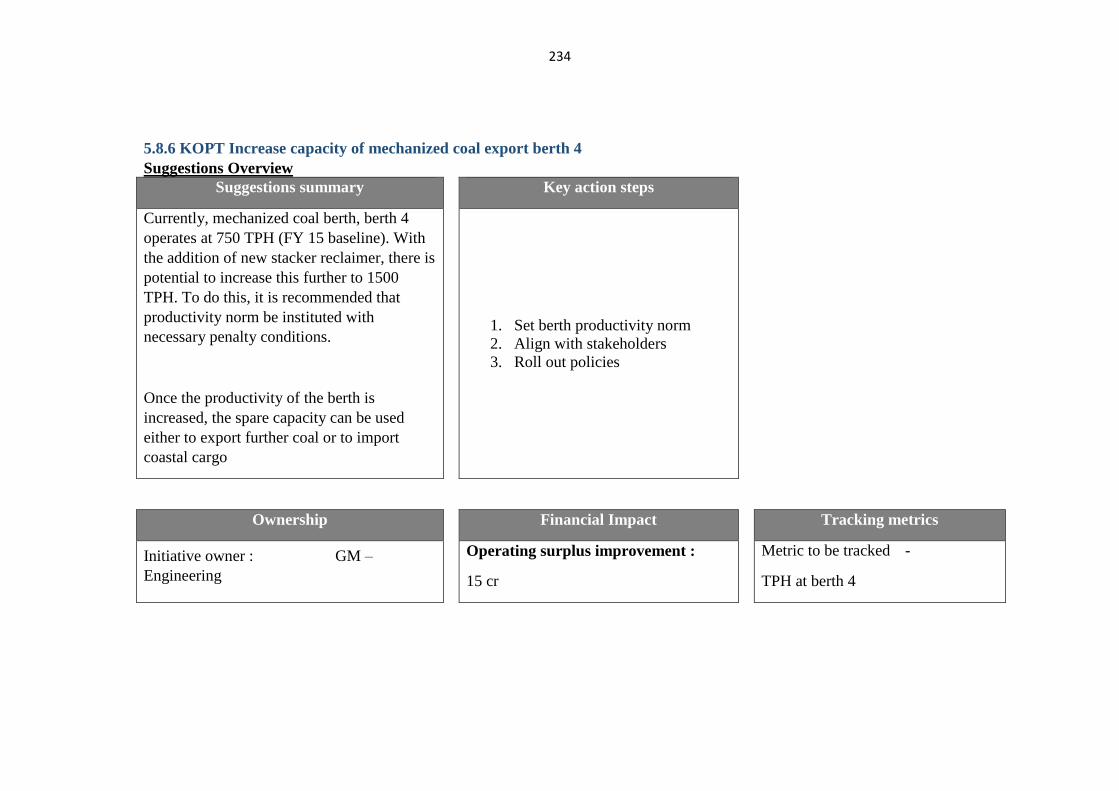
234
5.8.6 KOPT Increase capacity of mechanized coal export berth 4
Suggestions Overview
Suggestions summary Key action steps
Currently, mechanized coal berth, berth 4
operates at 750 TPH (FY 15 baseline). With
the addition of new stacker reclaimer, there is
potential to increase this further to 1500
TPH. To do this, it is recommended that
productivity norm be instituted with
necessary penalty conditions.
Once the productivity of the berth is
increased, the spare capacity can be used
either to export further coal or to import
coastal cargo
1. Set berth productivity norm
2. Align with stakeholders
3. Roll out policies
Ownership Financial Impact Tracking metrics
Initiative owner : GM –
Engineering
Operating surplus improvement :
15 cr
Metric to be tracked -
TPH at berth 4
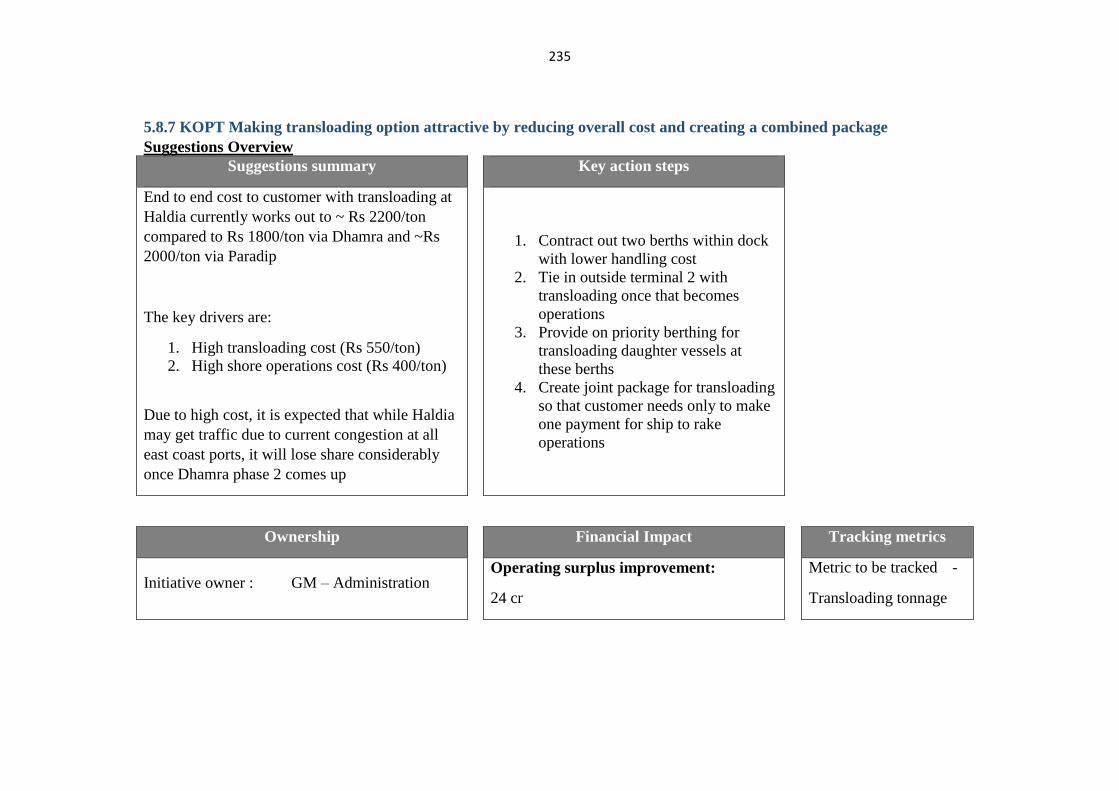
235
5.8.7 KOPT Making transloading option attractive by reducing overall cost and creating a combined package
Suggestions Overview
Suggestions summary Key action steps
End to end cost to customer with transloading at
Haldia currently works out to ~ Rs 2200/ton
compared to Rs 1800/ton via Dhamra and ~Rs
2000/ton via Paradip
The key drivers are:
1. High transloading cost (Rs 550/ton)
2. High shore operations cost (Rs 400/ton)
Due to high cost, it is expected that while Haldia
may get traffic due to current congestion at all
east coast ports, it will lose share considerably
once Dhamra phase 2 comes up
1. Contract out two berths within dock
with lower handling cost
2. Tie in outside terminal 2 with
transloading once that becomes
operations
3. Provide on priority berthing for
transloading daughter vessels at
these berths
4. Create joint package for transloading
so that customer needs only to make
one payment for ship to rake
operations
Ownership Financial Impact Tracking metrics
Initiative owner : GM – Administration Operating surplus improvement:
24 cr
Metric to be tracked -
Transloading tonnage
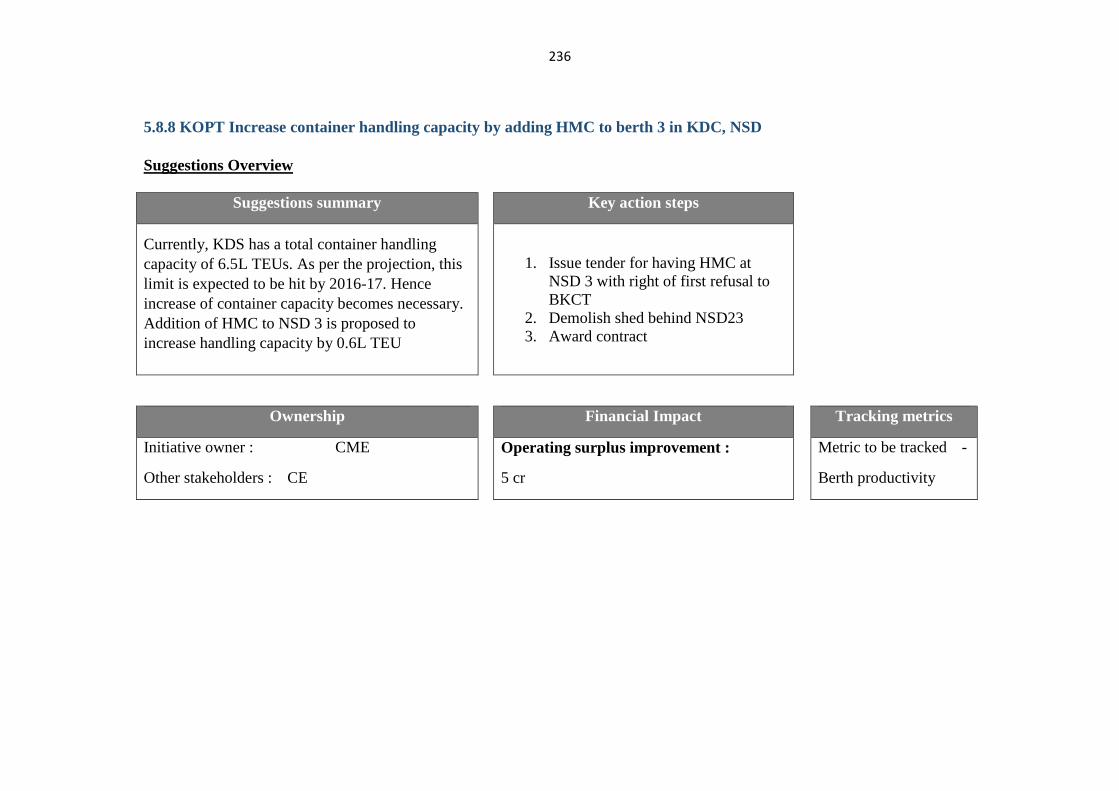
236
5.8.8 KOPT Increase container handling capacity by adding HMC to berth 3 in KDC, NSD
Suggestions Overview
Suggestions summary Key action steps
Currently, KDS has a total container handling
capacity of 6.5L TEUs. As per the projection, this
limit is expected to be hit by 2016-17. Hence
increase of container capacity becomes necessary.
Addition of HMC to NSD 3 is proposed to
increase handling capacity by 0.6L TEU
1. Issue tender for having HMC at
NSD 3 with right of first refusal to
BKCT
2. Demolish shed behind NSD23
3. Award contract
Ownership Financial Impact Tracking metrics
Initiative owner : CME
Other stakeholders : CE
Operating surplus improvement :
5 cr
Metric to be tracked -
Berth productivity
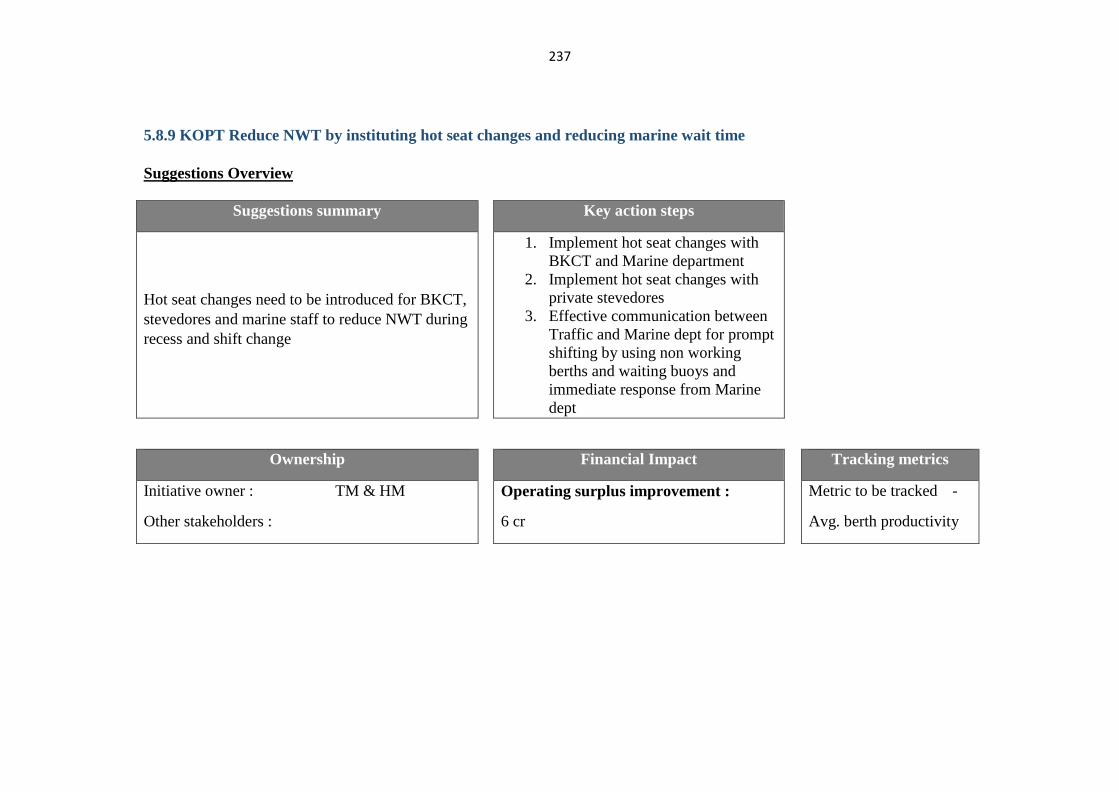
237
5.8.9 KOPT Reduce NWT by instituting hot seat changes and reducing marine wait time
Suggestions Overview
Suggestions summary Key action steps
Hot seat changes need to be introduced for BKCT,
stevedores and marine staff to reduce NWT during
recess and shift change
1. Implement hot seat changes with
BKCT and Marine department
2. Implement hot seat changes with
private stevedores
3. Effective communication between
Traffic and Marine dept for prompt
shifting by using non working
berths and waiting buoys and
immediate response from Marine
dept
Ownership Financial Impact Tracking metrics
Initiative owner : TM & HM
Other stakeholders :
Operating surplus improvement :
6 cr
Metric to be tracked -
Avg. berth productivity
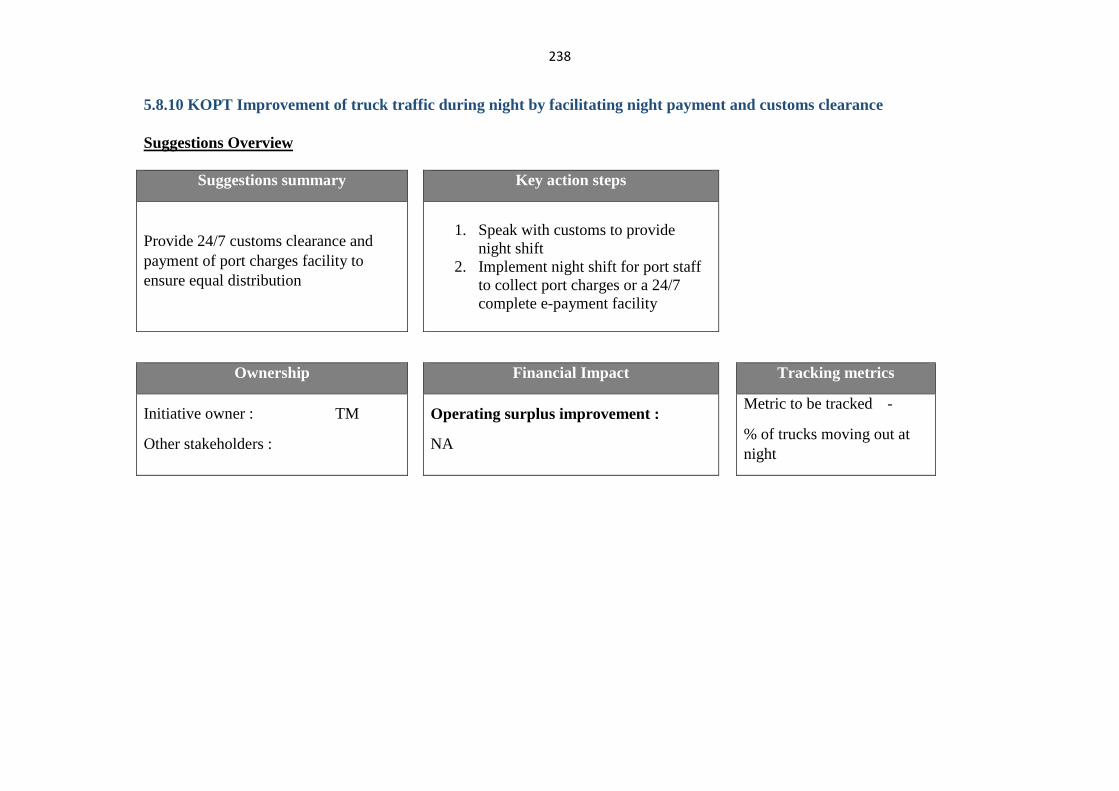
238
5.8.10 KOPT Improvement of truck traffic during night by facilitating night payment and customs clearance
Suggestions Overview
Suggestions summary Key action steps
Provide 24/7 customs clearance and
payment of port charges facility to
ensure equal distribution
1. Speak with customs to provide
night shift
2. Implement night shift for port staff
to collect port charges or a 24/7
complete e-payment facility
Ownership Financial Impact Tracking metrics
Initiative owner : TM
Other stakeholders :
Operating surplus improvement :
NA
Metric to be tracked -
% of trucks moving out at
night
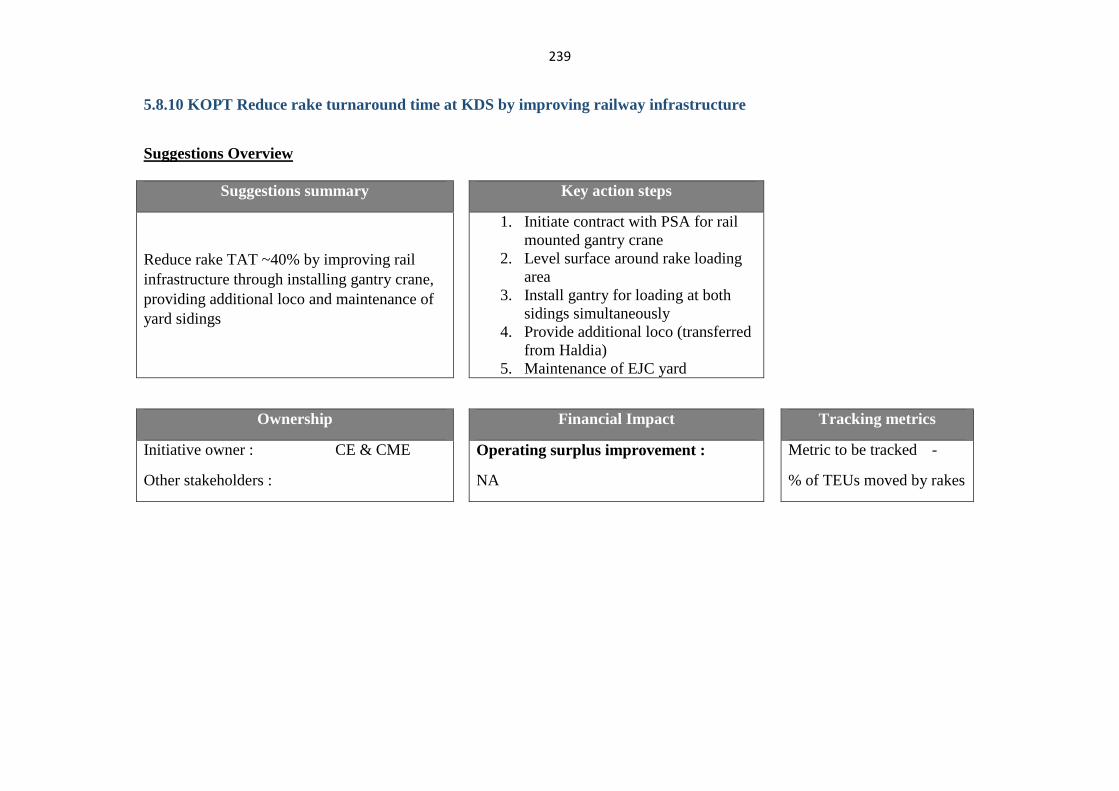
239
5.8.10 KOPT Reduce rake turnaround time at KDS by improving railway infrastructure
Suggestions Overview
Suggestions summary Key action steps
Reduce rake TAT ~40% by improving rail
infrastructure through installing gantry crane,
providing additional loco and maintenance of
yard sidings
1. Initiate contract with PSA for rail
mounted gantry crane
2. Level surface around rake loading
area
3. Install gantry for loading at both
sidings simultaneously
4. Provide additional loco (transferred
from Haldia)
5. Maintenance of EJC yard
Ownership Financial Impact Tracking metrics
Initiative owner : CE & CME
Other stakeholders :
Operating surplus improvement :
NA
Metric to be tracked -
% of TEUs moved by rakes
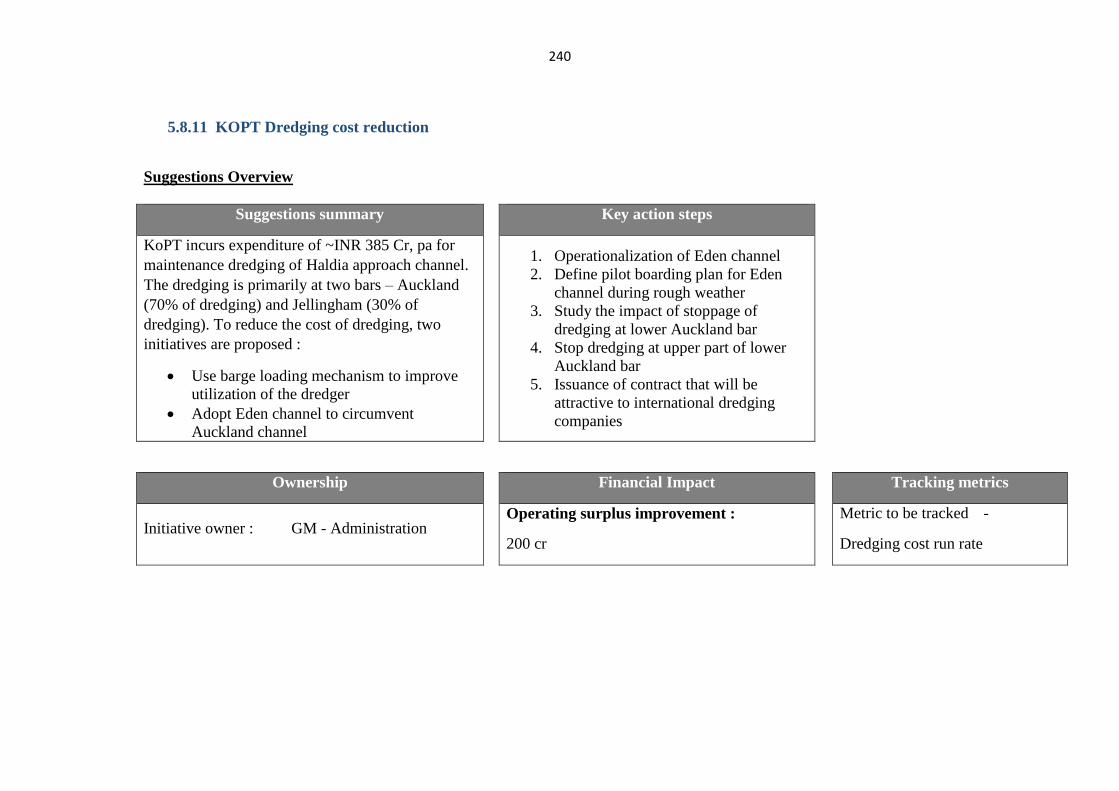
240
5.8.11 KOPT Dredging cost reduction
Suggestions Overview
Suggestions summary Key action steps
KoPT incurs expenditure of ~INR 385 Cr, pa for
maintenance dredging of Haldia approach channel.
The dredging is primarily at two bars – Auckland
(70% of dredging) and Jellingham (30% of
dredging). To reduce the cost of dredging, two
initiatives are proposed :
Use barge loading mechanism to improve
utilization of the dredger
Adopt Eden channel to circumvent
Auckland channel
1. Operationalization of Eden channel
2. Define pilot boarding plan for Eden
channel during rough weather
3. Study the impact of stoppage of
dredging at lower Auckland bar
4. Stop dredging at upper part of lower
Auckland bar
5. Issuance of contract that will be
attractive to international dredging
companies
Ownership Financial Impact Tracking metrics
Initiative owner : GM - Administration Operating surplus improvement :
200 cr
Metric to be tracked -
Dredging cost run rate
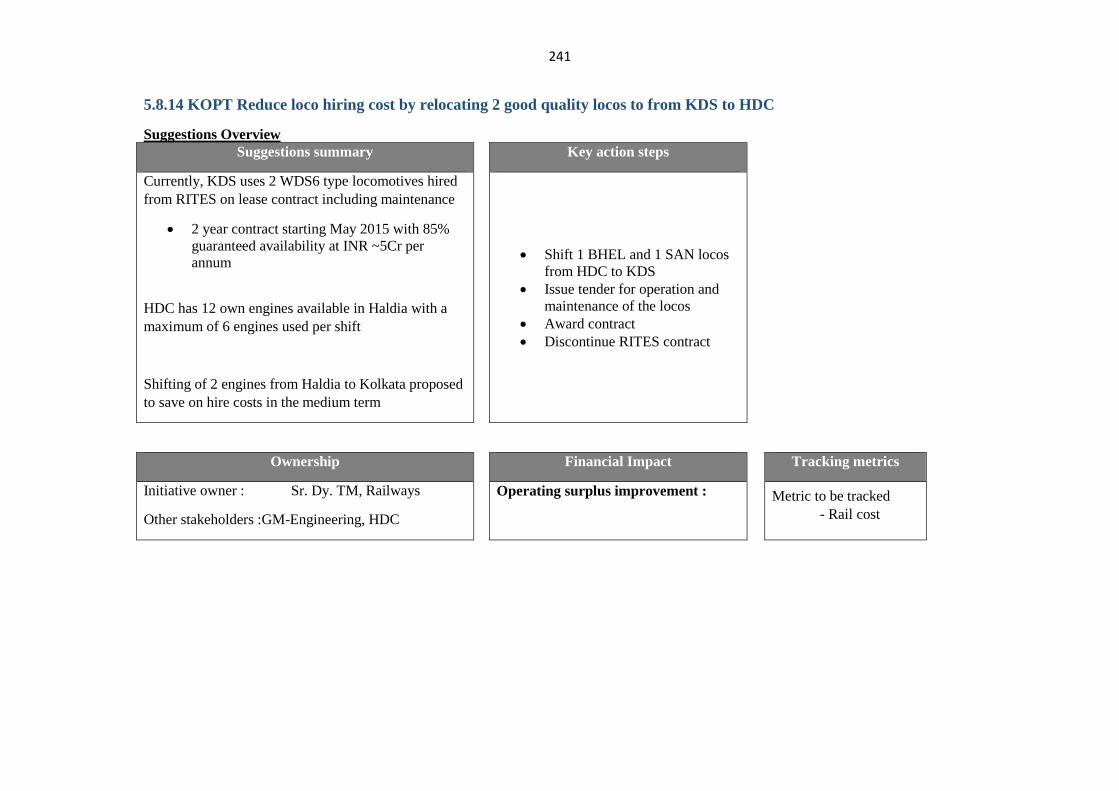
241
5.8.14 KOPT Reduce loco hiring cost by relocating 2 good quality locos to from KDS to HDC
Suggestions Overview
Suggestions summary Key action steps
Currently, KDS uses 2 WDS6 type locomotives hired
from RITES on lease contract including maintenance
2 year contract starting May 2015 with 85%
guaranteed availability at INR ~5Cr per
annum
HDC has 12 own engines available in Haldia with a
maximum of 6 engines used per shift
Shifting of 2 engines from Haldia to Kolkata proposed
to save on hire costs in the medium term
Shift 1 BHEL and 1 SAN locos
from HDC to KDS
Issue tender for operation and
maintenance of the locos
Award contract
Discontinue RITES contract
Ownership Financial Impact Tracking metrics
Initiative owner : Sr. Dy. TM, Railways
Other stakeholders :GM-Engineering, HDC
Operating surplus improvement :
Metric to be tracked
- Rail cost
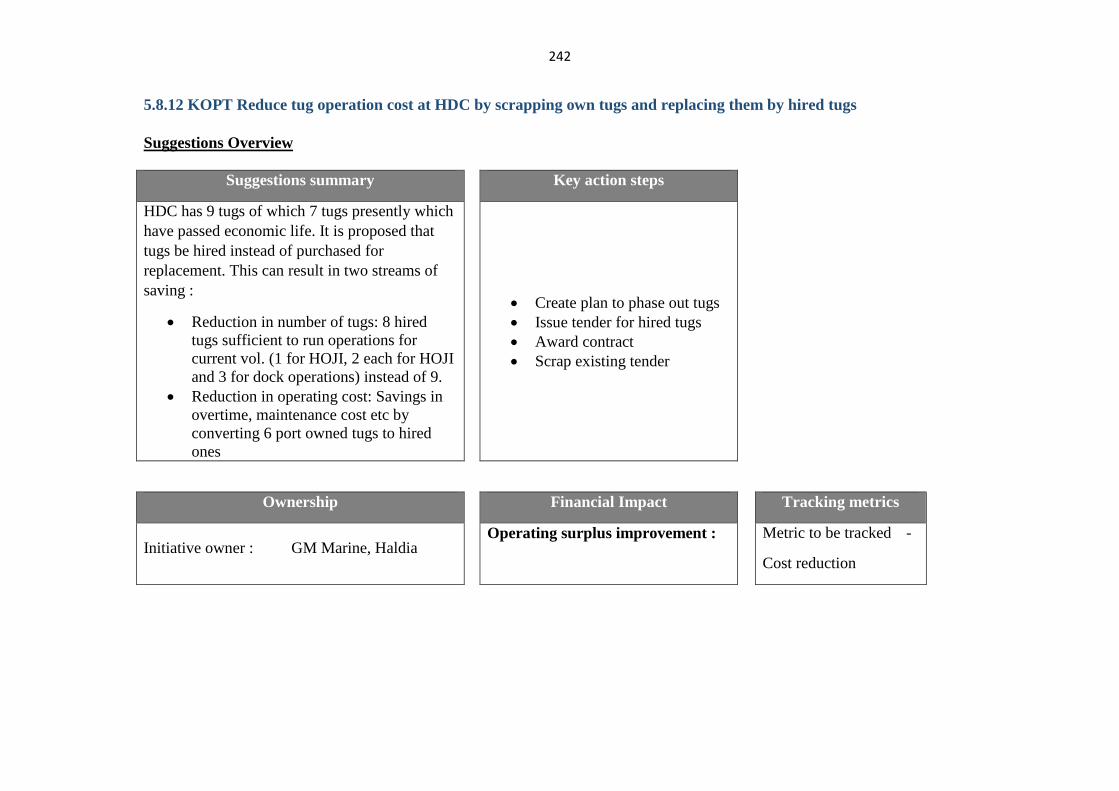
242
5.8.12 KOPT Reduce tug operation cost at HDC by scrapping own tugs and replacing them by hired tugs
Suggestions Overview
Suggestions summary Key action steps
HDC has 9 tugs of which 7 tugs presently which
have passed economic life. It is proposed that
tugs be hired instead of purchased for
replacement. This can result in two streams of
saving :
Reduction in number of tugs: 8 hired
tugs sufficient to run operations for
current vol. (1 for HOJI, 2 each for HOJI
and 3 for dock operations) instead of 9.
Reduction in operating cost: Savings in
overtime, maintenance cost etc by
converting 6 port owned tugs to hired
ones
Create plan to phase out tugs
Issue tender for hired tugs
Award contract
Scrap existing tender
Ownership Financial Impact Tracking metrics
Initiative owner : GM Marine, Haldia Operating surplus improvement :
Metric to be tracked -
Cost reduction
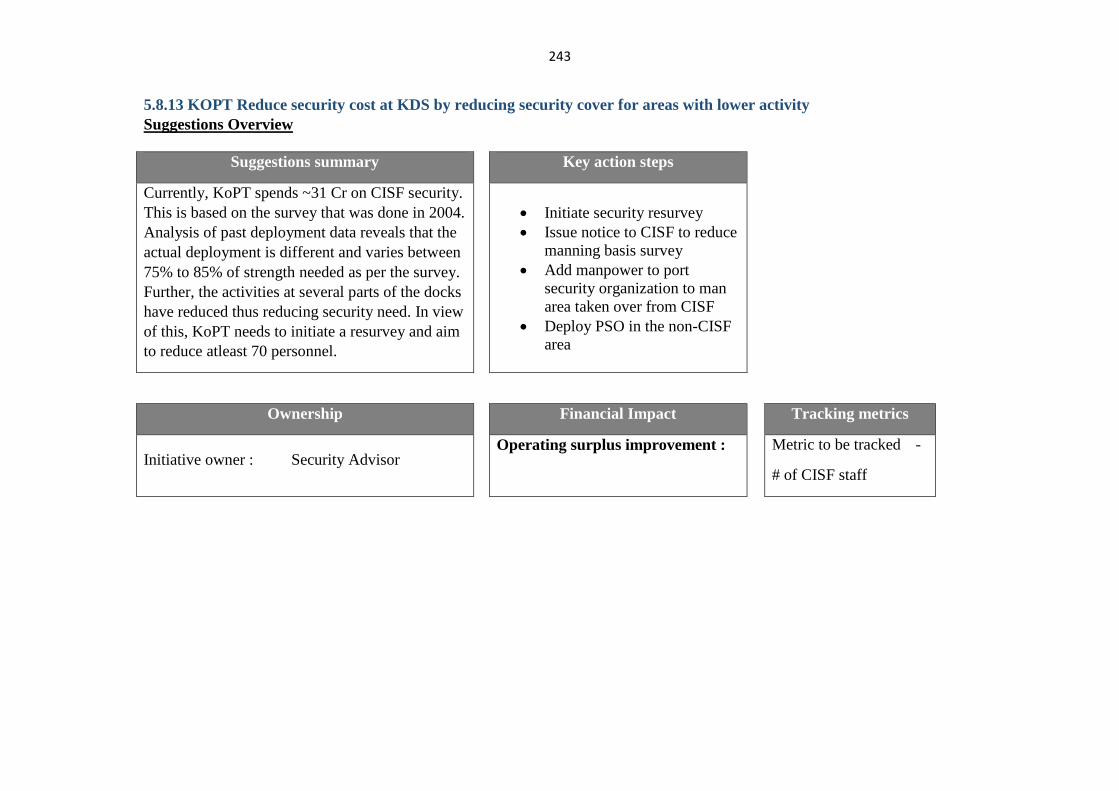
243
5.8.13 KOPT Reduce security cost at KDS by reducing security cover for areas with lower activity
Suggestions Overview
Suggestions summary Key action steps
Currently, KoPT spends ~31 Cr on CISF security.
This is based on the survey that was done in 2004.
Analysis of past deployment data reveals that the
actual deployment is different and varies between
75% to 85% of strength needed as per the survey.
Further, the activities at several parts of the docks
have reduced thus reducing security need. In view
of this, KoPT needs to initiate a resurvey and aim
to reduce atleast 70 personnel.
Initiate security resurvey
Issue notice to CISF to reduce
manning basis survey
Add manpower to port
security organization to man
area taken over from CISF
Deploy PSO in the non-CISF
area
Ownership Financial Impact Tracking metrics
Initiative owner : Security Advisor Operating surplus improvement :
Metric to be tracked -
# of CISF staff
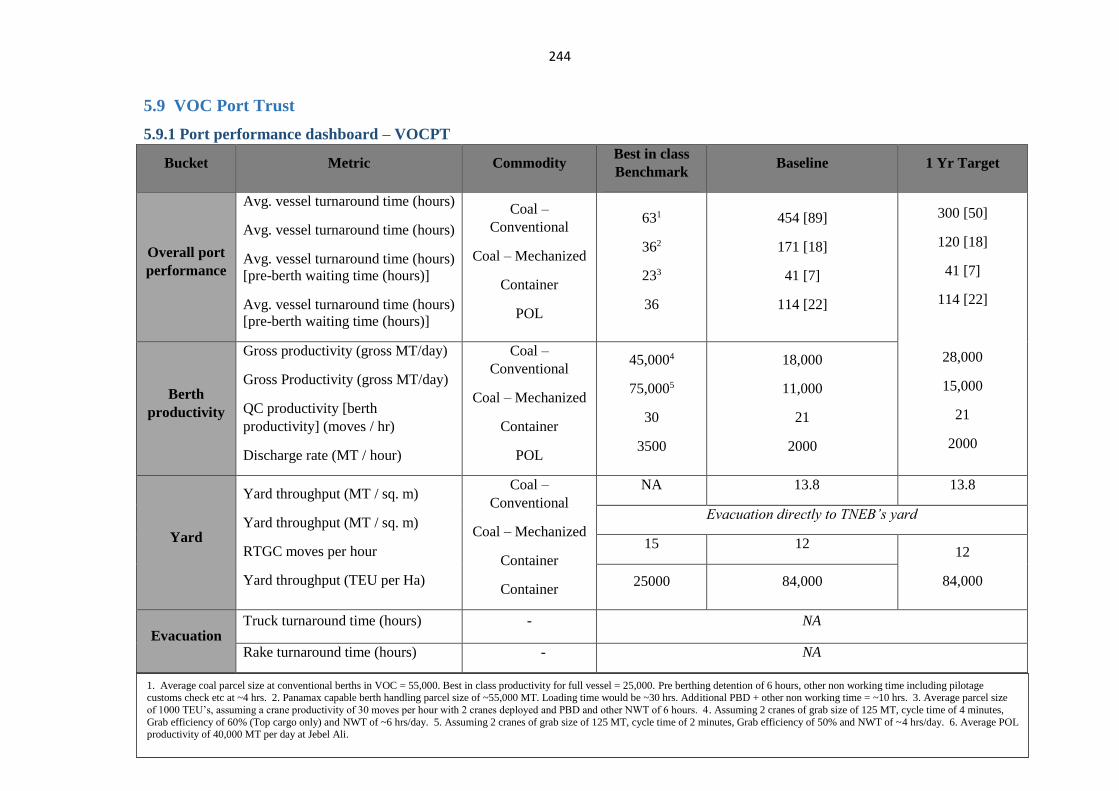
244
5.9 VOC Port Trust
5.9.1 Port performance dashboard – VOCPT
Bucket Metric Commodity Best in class
Benchmark Baseline 1 Yr Target
Overall port
performance
Avg. vessel turnaround time (hours)
Avg. vessel turnaround time (hours)
Avg. vessel turnaround time (hours)
[pre-berth waiting time (hours)]
Avg. vessel turnaround time (hours)
[pre-berth waiting time (hours)]
Coal –
Conventional
Coal – Mechanized
Container
POL
631
362
233
36
454 [89]
171 [18]
41 [7]
114 [22]
300 [50]
120 [18]
41 [7]
114 [22]
28,000
15,000
21
2000
Berth
productivity
Gross productivity (gross MT/day)
Gross Productivity (gross MT/day)
QC productivity [berth
productivity] (moves / hr)
Discharge rate (MT / hour)
Coal –
Conventional
Coal – Mechanized
Container
POL
45,0004
75,0005
30
3500
18,000
11,000
21
2000
Yard
Yard throughput (MT / sq. m)
Yard throughput (MT / sq. m)
RTGC moves per hour
Yard throughput (TEU per Ha)
Coal –
Conventional
Coal – Mechanized
Container
Container
NA 13.8 13.8
Evacuation directly to TNEB’s yard
15 12 12
84,000 25000 84,000
Evacuation Truck turnaround time (hours) - NA
Rake turnaround time (hours) - NA
1. Average coal parcel size at conventional berths in VOC = 55,000. Best in class productivity for full vessel = 25,000. Pre berthing detention of 6 hours, other non working time including pilotage customs check etc at ~4 hrs. 2. Panamax capable berth handling parcel size of ~55,000 MT. Loading time would be ~30 hrs. Additional PBD + other non working time = ~10 hrs. 3. Average parcel size
of 1000 TEU’s, assuming a crane productivity of 30 moves per hour with 2 cranes deployed and PBD and other NWT of 6 hours. 4. Assuming 2 cranes of grab size of 125 MT, cycle time of 4 minutes,
Grab efficiency of 60% (Top cargo only) and NWT of ~6 hrs/day. 5. Assuming 2 cranes of grab size of 125 MT, cycle time of 2 minutes, Grab efficiency of 50% and NWT of ~4 hrs/day. 6. Average POL productivity of 40,000 MT per day at Jebel Ali.
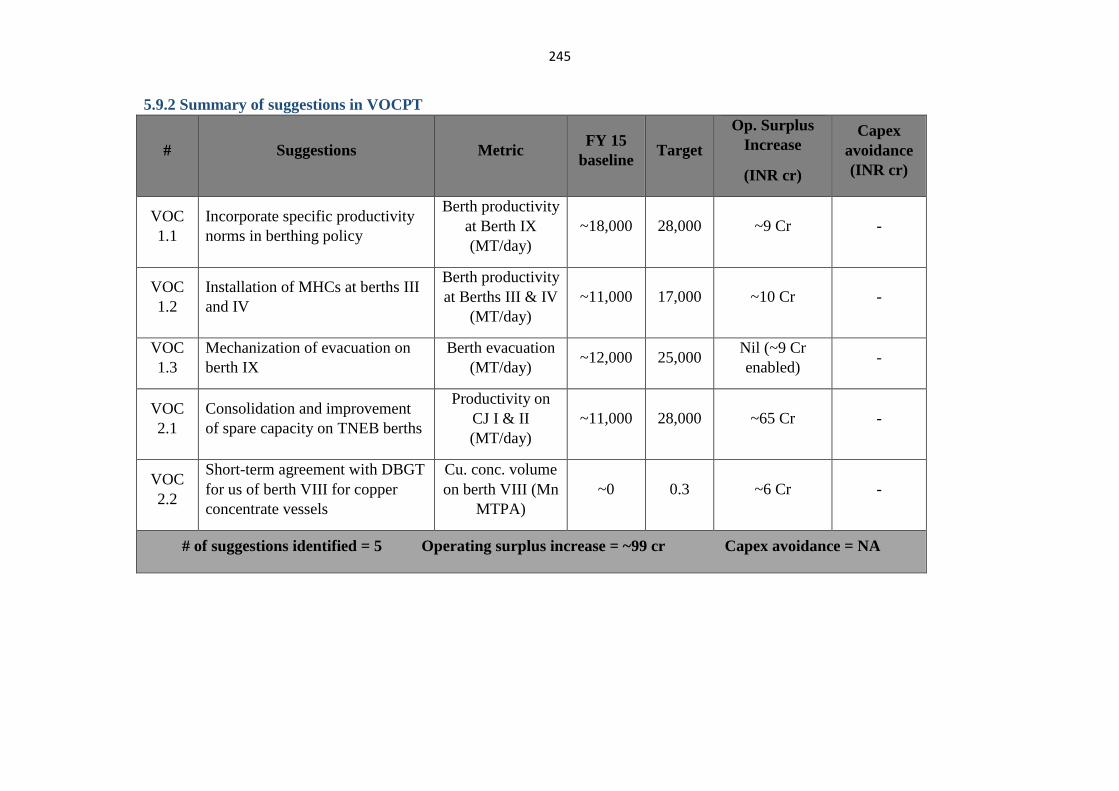
245
5.9.2 Summary of suggestions in VOCPT
# Suggestions Metric FY 15
baseline Target
Op. Surplus
Increase
(INR cr)
Capex
avoidance
(INR cr)
VOC
1.1
Incorporate specific productivity
norms in berthing policy
Berth productivity
at Berth IX
(MT/day)
~18,000 28,000 ~9 Cr -
VOC
1.2
Installation of MHCs at berths III
and IV
Berth productivity
at Berths III & IV
(MT/day)
~11,000 17,000 ~10 Cr -
VOC
1.3
Mechanization of evacuation on
berth IX
Berth evacuation
(MT/day) ~12,000 25,000
Nil (~9 Cr
enabled) -
VOC
2.1
Consolidation and improvement
of spare capacity on TNEB berths
Productivity on
CJ I & II
(MT/day)
~11,000 28,000 ~65 Cr -
VOC
2.2
Short-term agreement with DBGT
for us of berth VIII for copper
concentrate vessels
Cu. conc. volume
on berth VIII (Mn
MTPA)
~0 0.3 ~6 Cr -
# of suggestions identified = 5 Operating surplus increase = ~99 cr Capex avoidance = NA
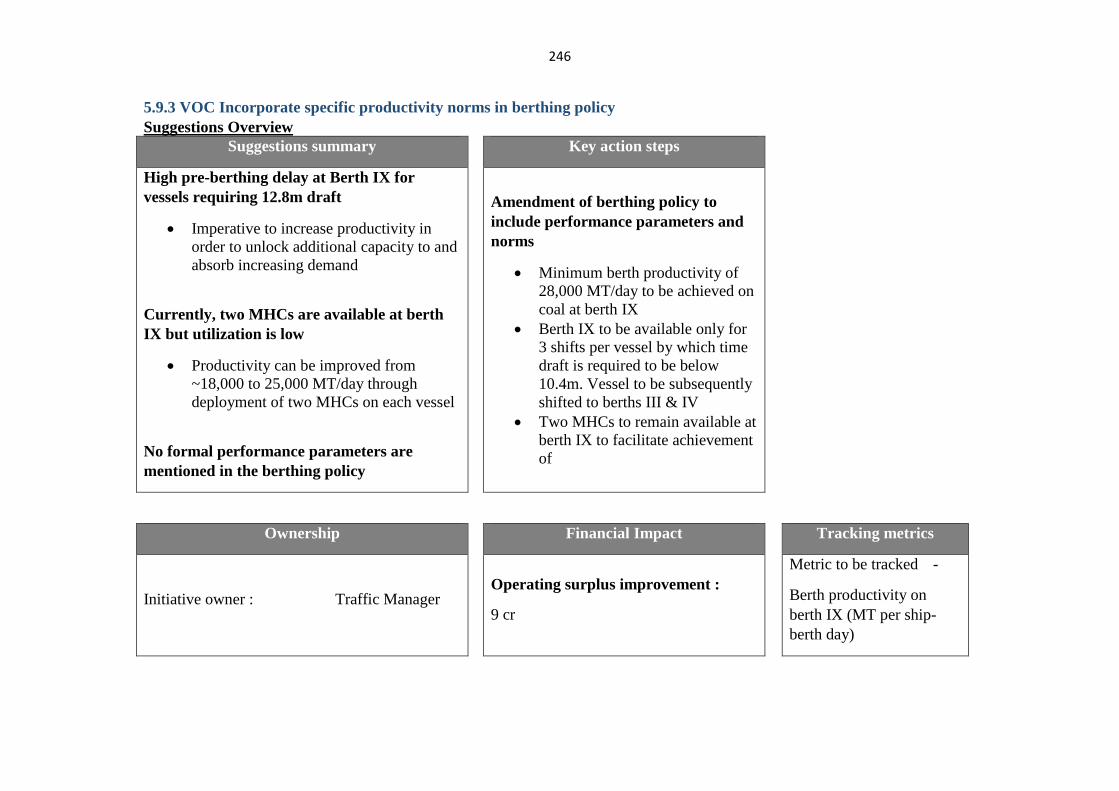
246
5.9.3 VOC Incorporate specific productivity norms in berthing policy
Suggestions Overview
Suggestions summary Key action steps
High pre-berthing delay at Berth IX for
vessels requiring 12.8m draft
Imperative to increase productivity in
order to unlock additional capacity to and
absorb increasing demand
Currently, two MHCs are available at berth
IX but utilization is low
Productivity can be improved from
~18,000 to 25,000 MT/day through
deployment of two MHCs on each vessel
No formal performance parameters are
mentioned in the berthing policy
Amendment of berthing policy to
include performance parameters and
norms
Minimum berth productivity of
28,000 MT/day to be achieved on
coal at berth IX
Berth IX to be available only for
3 shifts per vessel by which time
draft is required to be below
10.4m. Vessel to be subsequently
shifted to berths III & IV
Two MHCs to remain available at
berth IX to facilitate achievement
of
Ownership Financial Impact Tracking metrics
Initiative owner : Traffic Manager Operating surplus improvement :
9 cr
Metric to be tracked -
Berth productivity on
berth IX (MT per ship-
berth day)
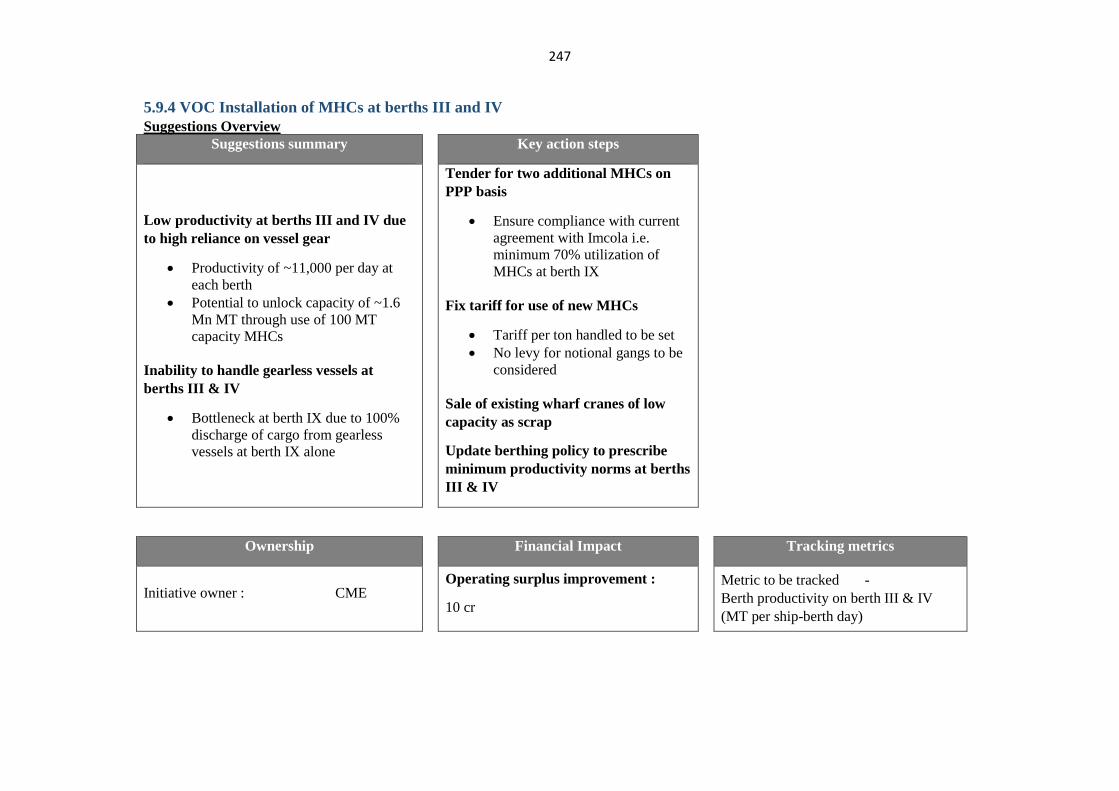
247
5.9.4 VOC Installation of MHCs at berths III and IV
Suggestions Overview
Suggestions summary Key action steps
Low productivity at berths III and IV due
to high reliance on vessel gear
Productivity of ~11,000 per day at
each berth
Potential to unlock capacity of ~1.6
Mn MT through use of 100 MT
capacity MHCs
Inability to handle gearless vessels at
berths III & IV
Bottleneck at berth IX due to 100%
discharge of cargo from gearless
vessels at berth IX alone
Tender for two additional MHCs on
PPP basis
Ensure compliance with current
agreement with Imcola i.e.
minimum 70% utilization of
MHCs at berth IX
Fix tariff for use of new MHCs
Tariff per ton handled to be set
No levy for notional gangs to be
considered
Sale of existing wharf cranes of low
capacity as scrap
Update berthing policy to prescribe
minimum productivity norms at berths
III & IV
Ownership Financial Impact Tracking metrics
Initiative owner : CME Operating surplus improvement :
10 cr
Metric to be tracked -
Berth productivity on berth III & IV
(MT per ship-berth day)
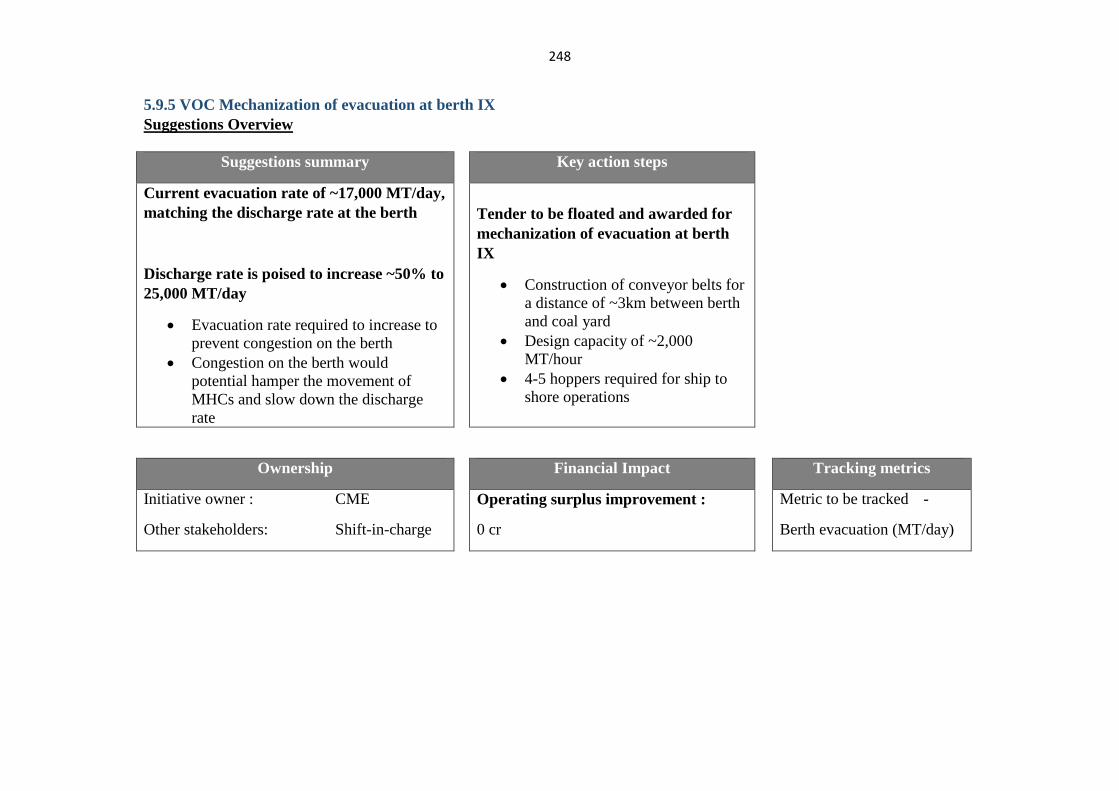
248
5.9.5 VOC Mechanization of evacuation at berth IX
Suggestions Overview
Suggestions summary Key action steps
Current evacuation rate of ~17,000 MT/day,
matching the discharge rate at the berth
Discharge rate is poised to increase ~50% to
25,000 MT/day
Evacuation rate required to increase to
prevent congestion on the berth
Congestion on the berth would
potential hamper the movement of
MHCs and slow down the discharge
rate
Tender to be floated and awarded for
mechanization of evacuation at berth
IX
Construction of conveyor belts for
a distance of ~3km between berth
and coal yard
Design capacity of ~2,000
MT/hour
4-5 hoppers required for ship to
shore operations
Ownership Financial Impact Tracking metrics
Initiative owner : CME
Other stakeholders: Shift-in-charge
Operating surplus improvement :
0 cr
Metric to be tracked -
Berth evacuation (MT/day)
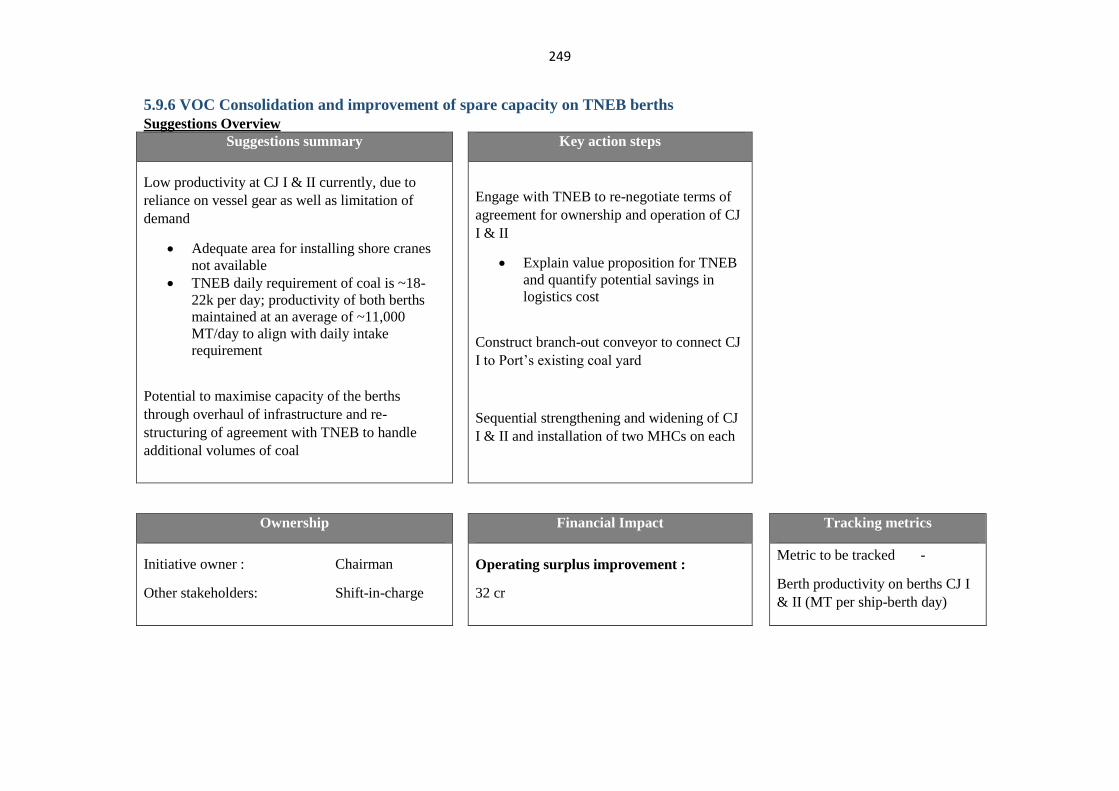
249
5.9.6 VOC Consolidation and improvement of spare capacity on TNEB berths
Suggestions Overview
Suggestions summary Key action steps
Low productivity at CJ I & II currently, due to
reliance on vessel gear as well as limitation of
demand
Adequate area for installing shore cranes
not available
TNEB daily requirement of coal is ~18-
22k per day; productivity of both berths
maintained at an average of ~11,000
MT/day to align with daily intake
requirement
Potential to maximise capacity of the berths
through overhaul of infrastructure and re-
structuring of agreement with TNEB to handle
additional volumes of coal
Engage with TNEB to re-negotiate terms of
agreement for ownership and operation of CJ
I & II
Explain value proposition for TNEB
and quantify potential savings in
logistics cost
Construct branch-out conveyor to connect CJ
I to Port’s existing coal yard
Sequential strengthening and widening of CJ
I & II and installation of two MHCs on each
Ownership Financial Impact Tracking metrics
Initiative owner : Chairman
Other stakeholders: Shift-in-charge
Operating surplus improvement :
32 cr
Metric to be tracked -
Berth productivity on berths CJ I
& II (MT per ship-berth day)
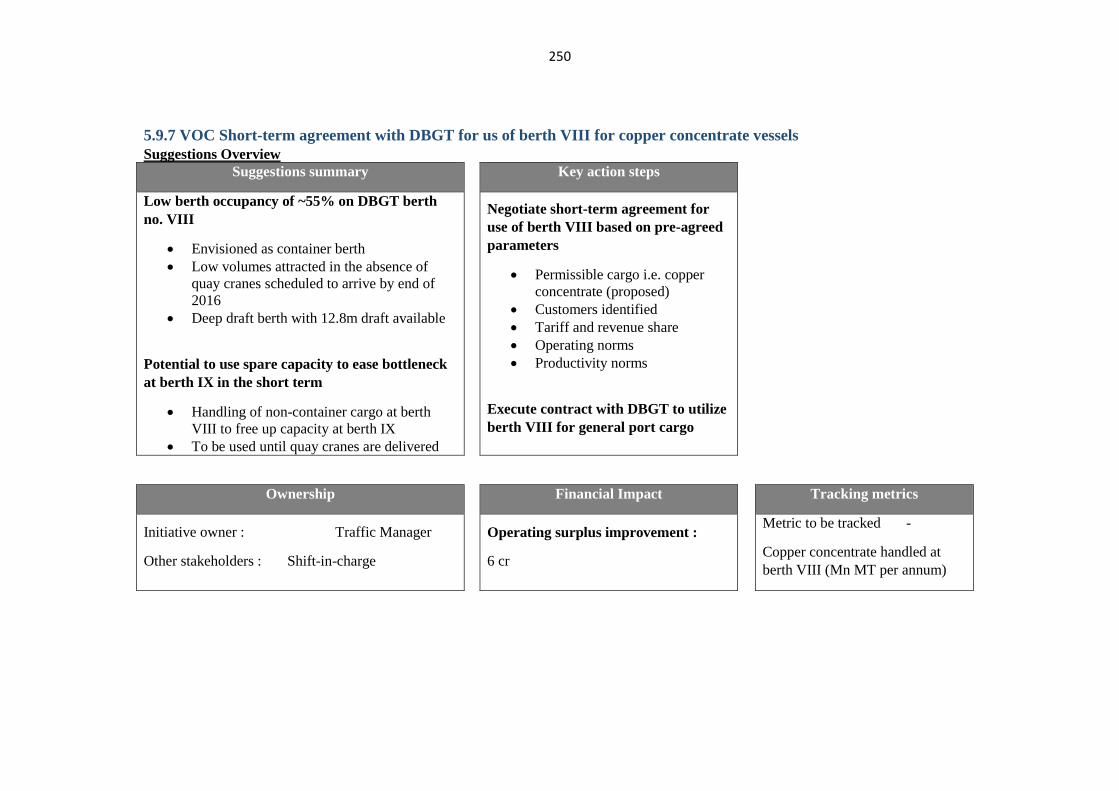
250
5.9.7 VOC Short-term agreement with DBGT for us of berth VIII for copper concentrate vessels
Suggestions Overview
Suggestions summary Key action steps
Low berth occupancy of ~55% on DBGT berth
no. VIII
Envisioned as container berth
Low volumes attracted in the absence of
quay cranes scheduled to arrive by end of
2016
Deep draft berth with 12.8m draft available
Potential to use spare capacity to ease bottleneck
at berth IX in the short term
Handling of non-container cargo at berth
VIII to free up capacity at berth IX
To be used until quay cranes are delivered
Negotiate short-term agreement for
use of berth VIII based on pre-agreed
parameters
Permissible cargo i.e. copper
concentrate (proposed)
Customers identified
Tariff and revenue share
Operating norms
Productivity norms
Execute contract with DBGT to utilize
berth VIII for general port cargo
Ownership Financial Impact Tracking metrics
Initiative owner : Traffic Manager
Other stakeholders : Shift-in-charge
Operating surplus improvement :
6 cr
Metric to be tracked -
Copper concentrate handled at
berth VIII (Mn MT per annum)
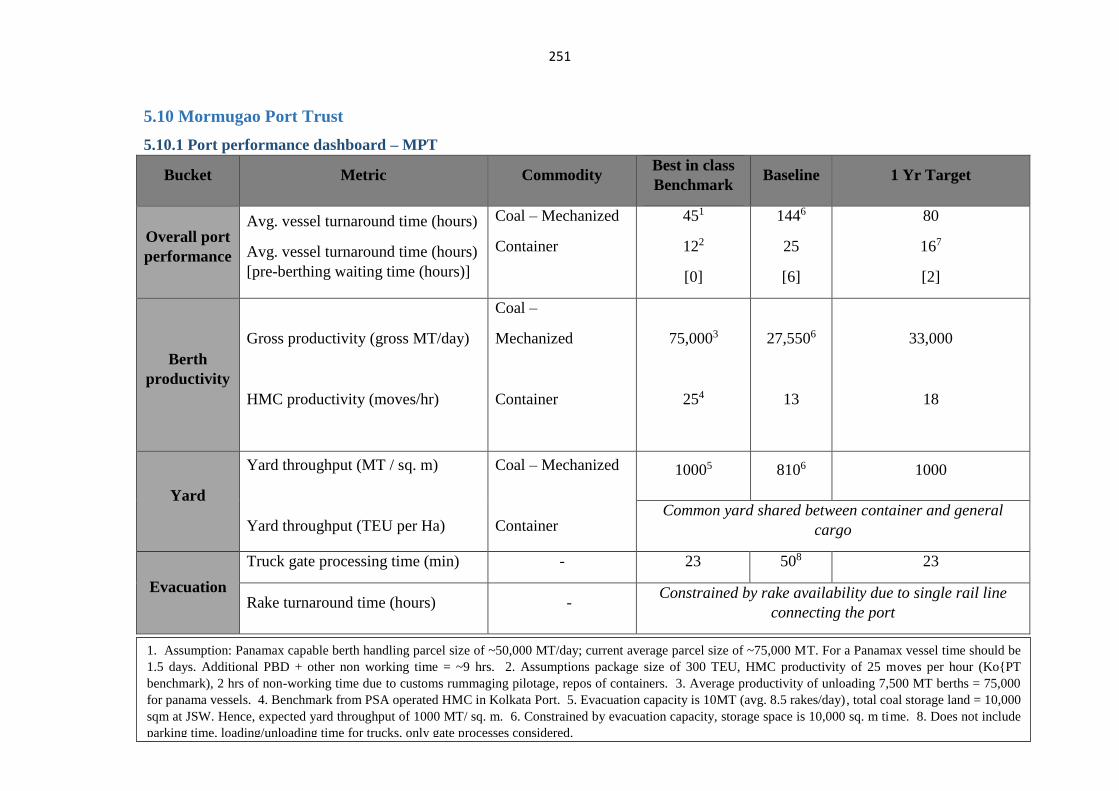
251
5.10 Mormugao Port Trust
5.10.1 Port performance dashboard – MPT
Bucket Metric Commodity Best in class
Benchmark Baseline 1 Yr Target
Overall port
performance
Avg. vessel turnaround time (hours)
Avg. vessel turnaround time (hours)
[pre-berthing waiting time (hours)]
Coal – Mechanized
Container
451
122
[0]
1446
25
[6]
80
167
[2]
Berth
productivity
Gross productivity (gross MT/day)
HMC productivity (moves/hr)
Coal –
Mechanized
Container
75,0003
254
27,5506
13
33,000
18
Yard
Yard throughput (MT / sq. m)
Yard throughput (TEU per Ha)
Coal – Mechanized
Container
10005 8106 1000
Common yard shared between container and general
cargo
Evacuation
Truck gate processing time (min) - 23 508 23
Rake turnaround time (hours) - Constrained by rake availability due to single rail line
connecting the port
5.10.2 Summary of suggestions in MPTPT
1. Assumption: Panamax capable berth handling parcel size of ~50,000 MT/day; current average parcel size of ~75,000 MT. For a Panamax vessel time should be
1.5 days. Additional PBD + other non working time = ~9 hrs. 2. Assumptions package size of 300 TEU, HMC productivity of 25 moves per hour (Ko{PT
benchmark), 2 hrs of non-working time due to customs rummaging pilotage, repos of containers. 3. Average productivity of unloading 7,500 MT berths = 75,000
for panama vessels. 4. Benchmark from PSA operated HMC in Kolkata Port. 5. Evacuation capacity is 10MT (avg. 8.5 rakes/day), total coal storage land = 10,000
sqm at JSW. Hence, expected yard throughput of 1000 MT/ sq. m. 6. Constrained by evacuation capacity, storage space is 10,000 sq. m time. 8. Does not include
parking time, loading/unloading time for trucks, only gate processes considered.
1. Assumption: Panamax capable berth handling parcel size of ~50,000 MT/day; current average parcel size of ~75,000 MT. For a
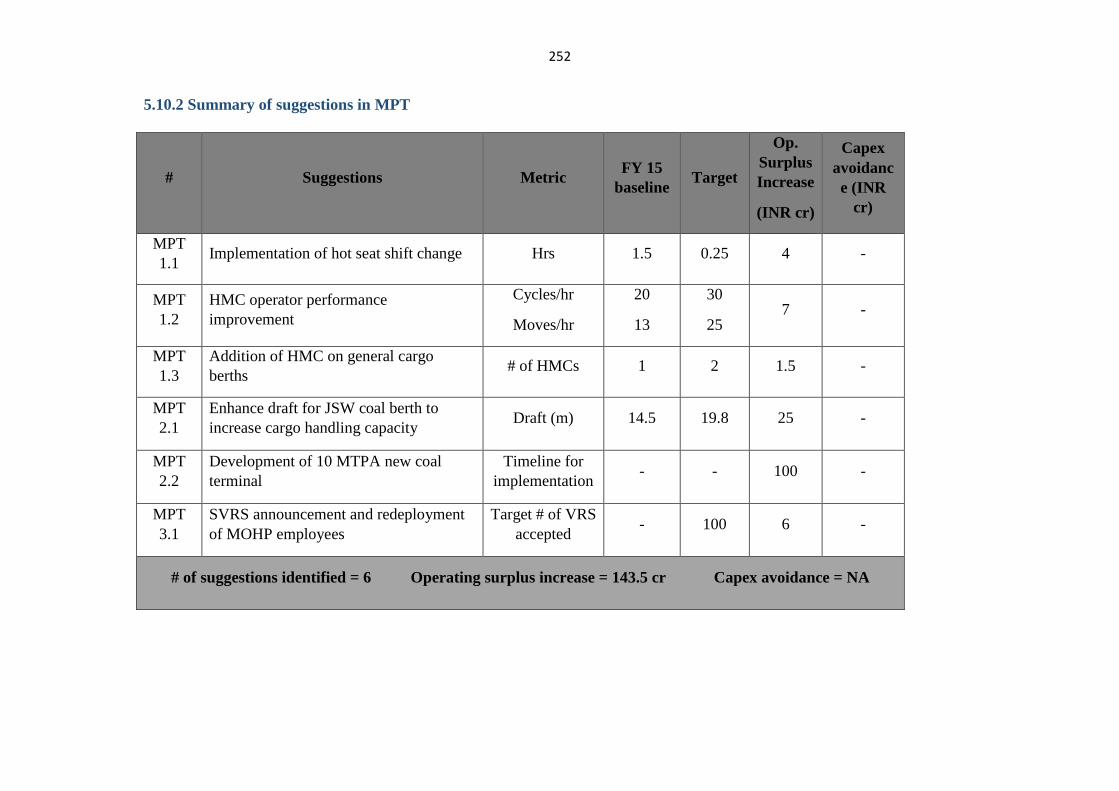
252
5.10.2 Summary of suggestions in MPT
# Suggestions Metric FY 15
baseline Target
Op.
Surplus
Increase
(INR cr)
Capex
avoidanc
e (INR
cr)
MPT
1.1 Implementation of hot seat shift change Hrs 1.5 0.25 4 -
MPT
1.2
HMC operator performance
improvement
Cycles/hr
Moves/hr
20
13
30
25 7 -
MPT
1.3
Addition of HMC on general cargo
berths # of HMCs 1 2 1.5 -
MPT
2.1
Enhance draft for JSW coal berth to
increase cargo handling capacity Draft (m) 14.5 19.8 25 -
MPT
2.2
Development of 10 MTPA new coal
terminal
Timeline for
implementation - - 100 -
MPT
3.1
SVRS announcement and redeployment
of MOHP employees
Target # of VRS
accepted - 100 6 -
# of suggestions identified = 6 Operating surplus increase = 143.5 cr Capex avoidance = NA
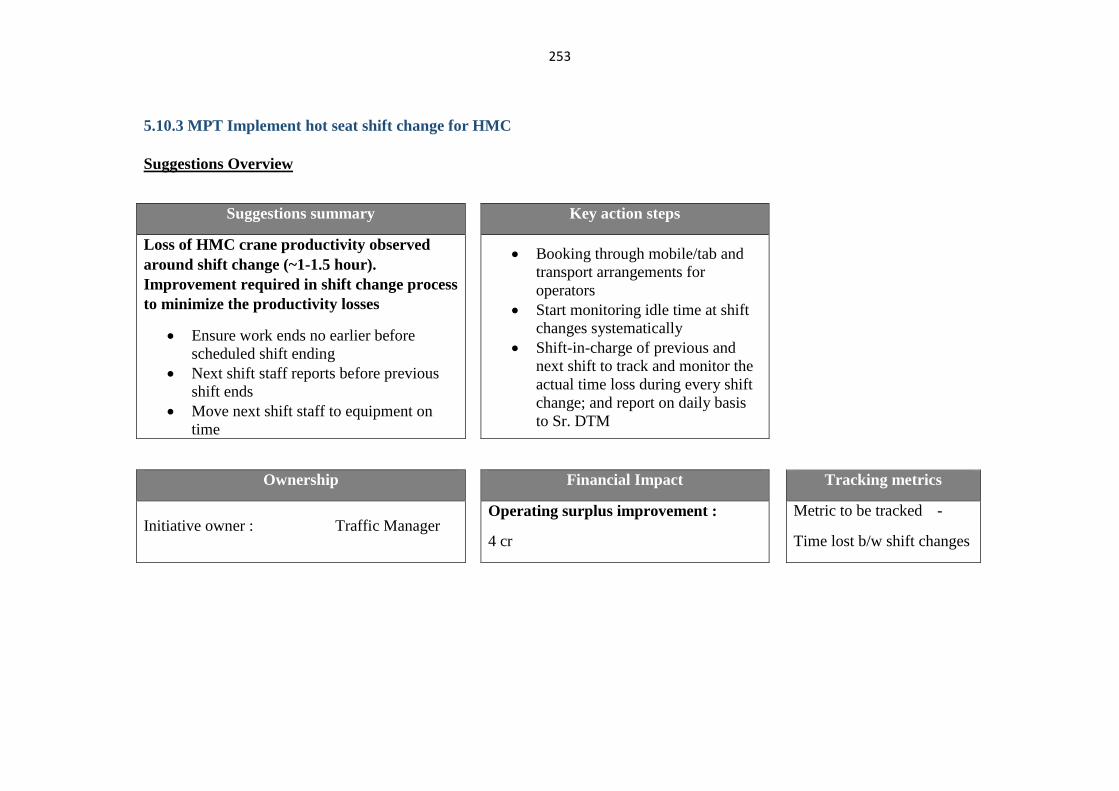
253
5.10.3 MPT Implement hot seat shift change for HMC
Suggestions Overview
Suggestions summary Key action steps
Loss of HMC crane productivity observed
around shift change (~1-1.5 hour).
Improvement required in shift change process
to minimize the productivity losses
Ensure work ends no earlier before
scheduled shift ending
Next shift staff reports before previous
shift ends
Move next shift staff to equipment on
time
Booking through mobile/tab and
transport arrangements for
operators
Start monitoring idle time at shift
changes systematically
Shift-in-charge of previous and
next shift to track and monitor the
actual time loss during every shift
change; and report on daily basis
to Sr. DTM
Ownership Financial Impact Tracking metrics
Initiative owner : Traffic Manager Operating surplus improvement :
4 cr
Metric to be tracked -
Time lost b/w shift changes
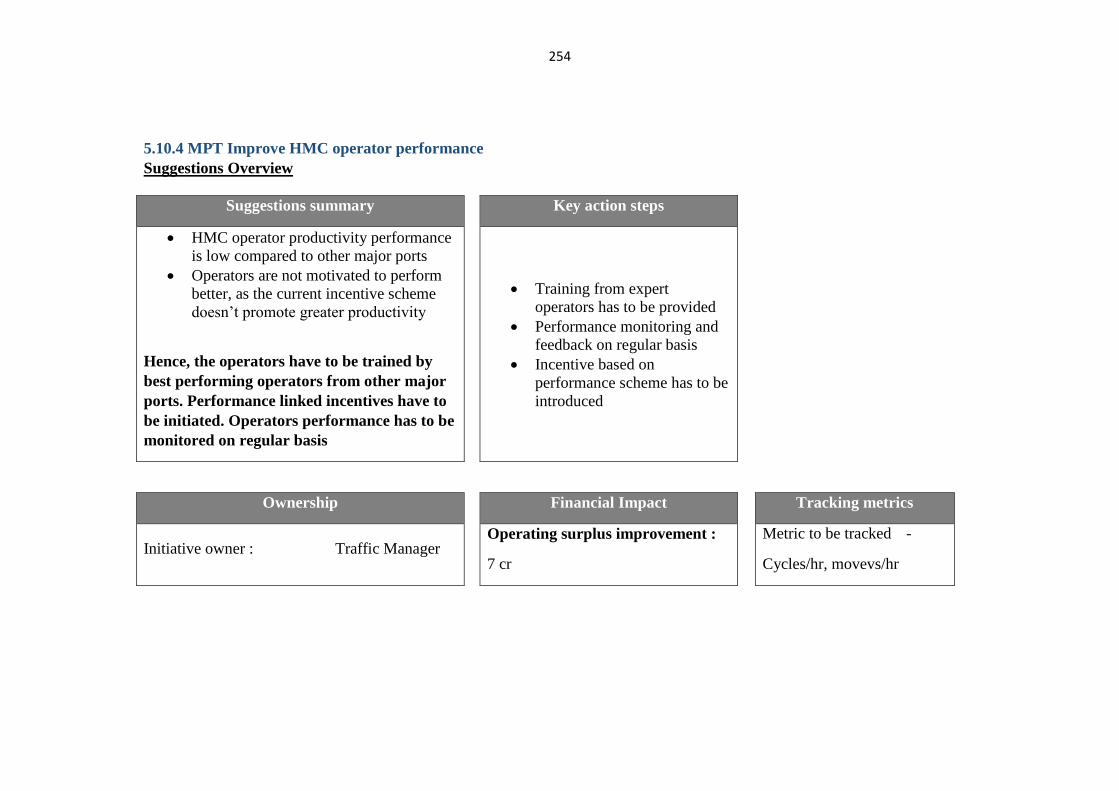
254
5.10.4 MPT Improve HMC operator performance
Suggestions Overview
Suggestions summary Key action steps
HMC operator productivity performance
is low compared to other major ports
Operators are not motivated to perform
better, as the current incentive scheme
doesn’t promote greater productivity
Hence, the operators have to be trained by
best performing operators from other major
ports. Performance linked incentives have to
be initiated. Operators performance has to be
monitored on regular basis
Training from expert
operators has to be provided
Performance monitoring and
feedback on regular basis
Incentive based on
performance scheme has to be
introduced
Ownership Financial Impact Tracking metrics
Initiative owner : Traffic Manager Operating surplus improvement :
7 cr
Metric to be tracked -
Cycles/hr, movevs/hr
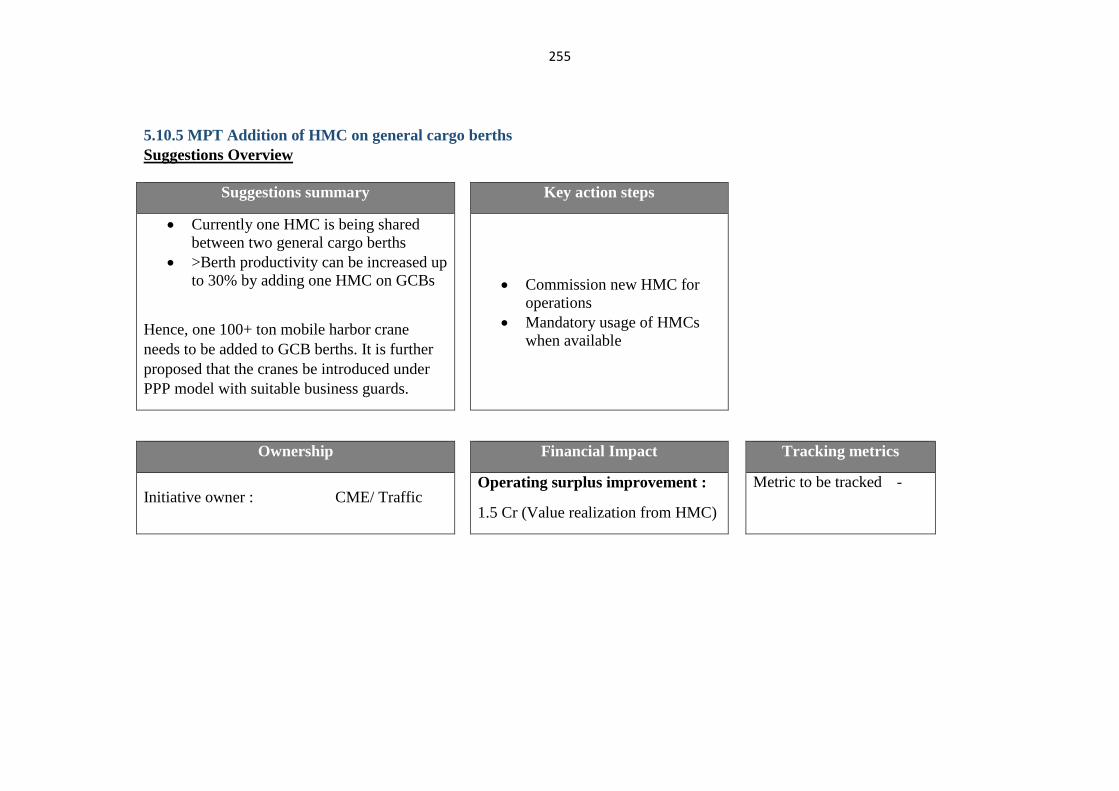
255
5.10.5 MPT Addition of HMC on general cargo berths
Suggestions Overview
Suggestions summary Key action steps
Currently one HMC is being shared
between two general cargo berths
>Berth productivity can be increased up
to 30% by adding one HMC on GCBs
Hence, one 100+ ton mobile harbor crane
needs to be added to GCB berths. It is further
proposed that the cranes be introduced under
PPP model with suitable business guards.
Commission new HMC for
operations
Mandatory usage of HMCs
when available
Ownership Financial Impact Tracking metrics
Initiative owner : CME/ Traffic Operating surplus improvement :
1.5 Cr (Value realization from HMC)
Metric to be tracked -
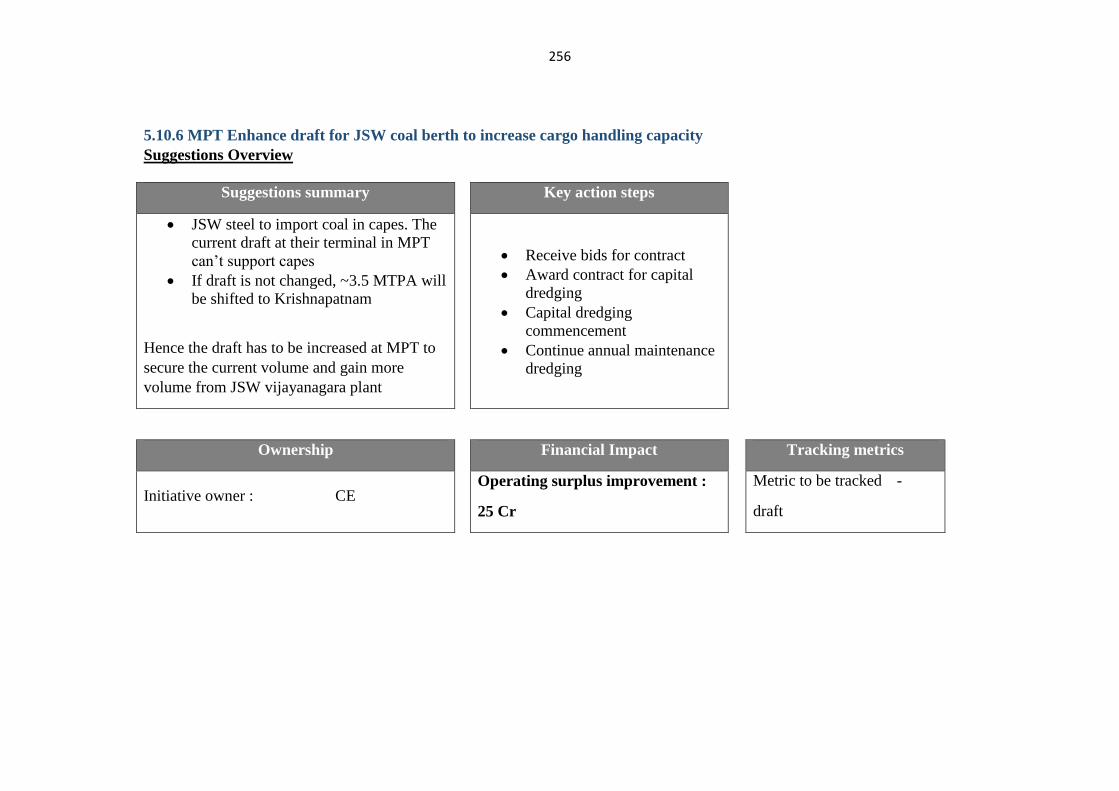
256
5.10.6 MPT Enhance draft for JSW coal berth to increase cargo handling capacity
Suggestions Overview
Suggestions summary Key action steps
JSW steel to import coal in capes. The
current draft at their terminal in MPT
can’t support capes
If draft is not changed, ~3.5 MTPA will
be shifted to Krishnapatnam
Hence the draft has to be increased at MPT to
secure the current volume and gain more
volume from JSW vijayanagara plant
Receive bids for contract
Award contract for capital
dredging
Capital dredging
commencement
Continue annual maintenance
dredging
Ownership Financial Impact Tracking metrics
Initiative owner : CE Operating surplus improvement :
25 Cr
Metric to be tracked -
draft
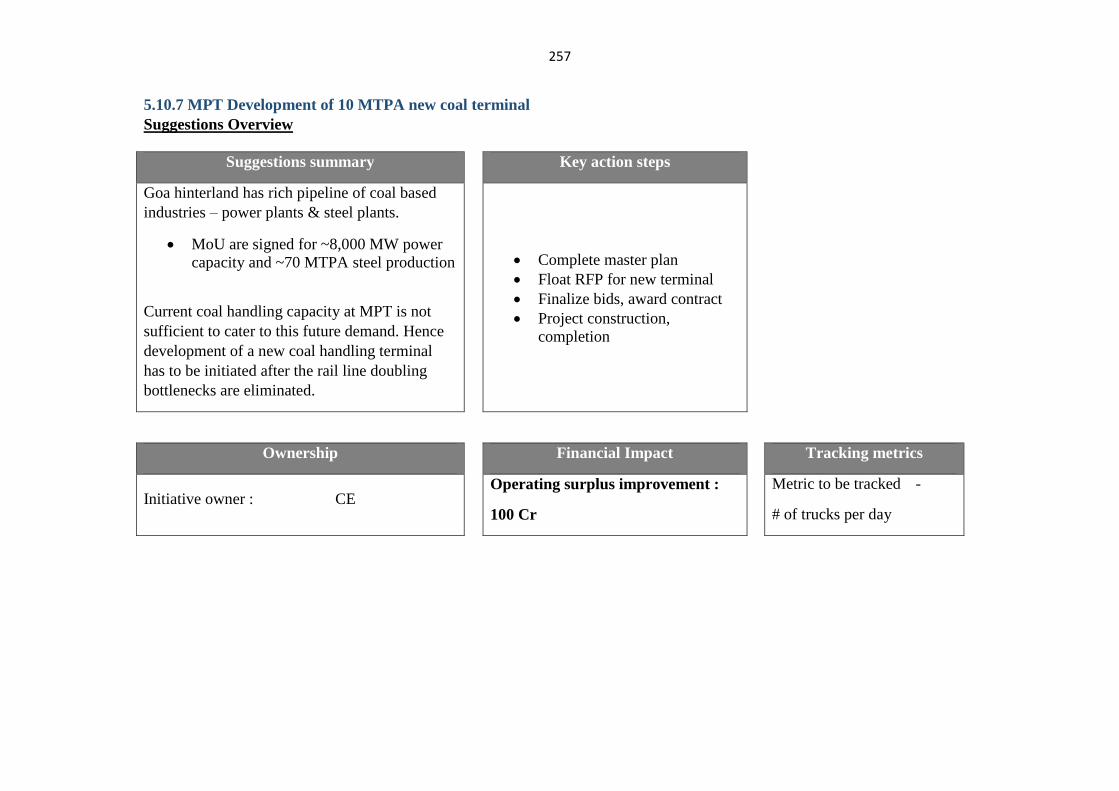
257
5.10.7 MPT Development of 10 MTPA new coal terminal
Suggestions Overview
Suggestions summary Key action steps
Goa hinterland has rich pipeline of coal based
industries – power plants & steel plants.
MoU are signed for ~8,000 MW power
capacity and ~70 MTPA steel production
Current coal handling capacity at MPT is not
sufficient to cater to this future demand. Hence
development of a new coal handling terminal
has to be initiated after the rail line doubling
bottlenecks are eliminated.
Complete master plan
Float RFP for new terminal
Finalize bids, award contract
Project construction,
completion
Ownership Financial Impact Tracking metrics
Initiative owner : CE Operating surplus improvement :
100 Cr
Metric to be tracked -
# of trucks per day
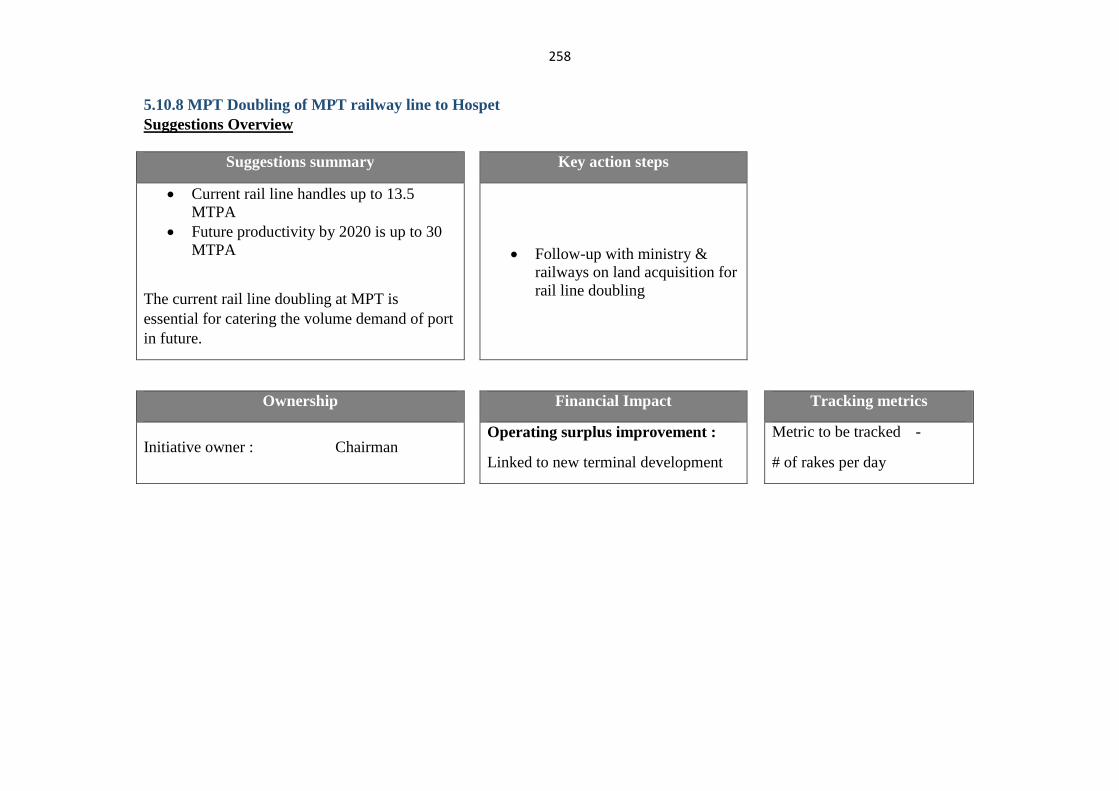
258
5.10.8 MPT Doubling of MPT railway line to Hospet
Suggestions Overview
Suggestions summary Key action steps
Current rail line handles up to 13.5
MTPA
Future productivity by 2020 is up to 30
MTPA
The current rail line doubling at MPT is
essential for catering the volume demand of port
in future.
Follow-up with ministry &
railways on land acquisition for
rail line doubling
Ownership Financial Impact Tracking metrics
Initiative owner : Chairman Operating surplus improvement :
Linked to new terminal development
Metric to be tracked -
# of rakes per day
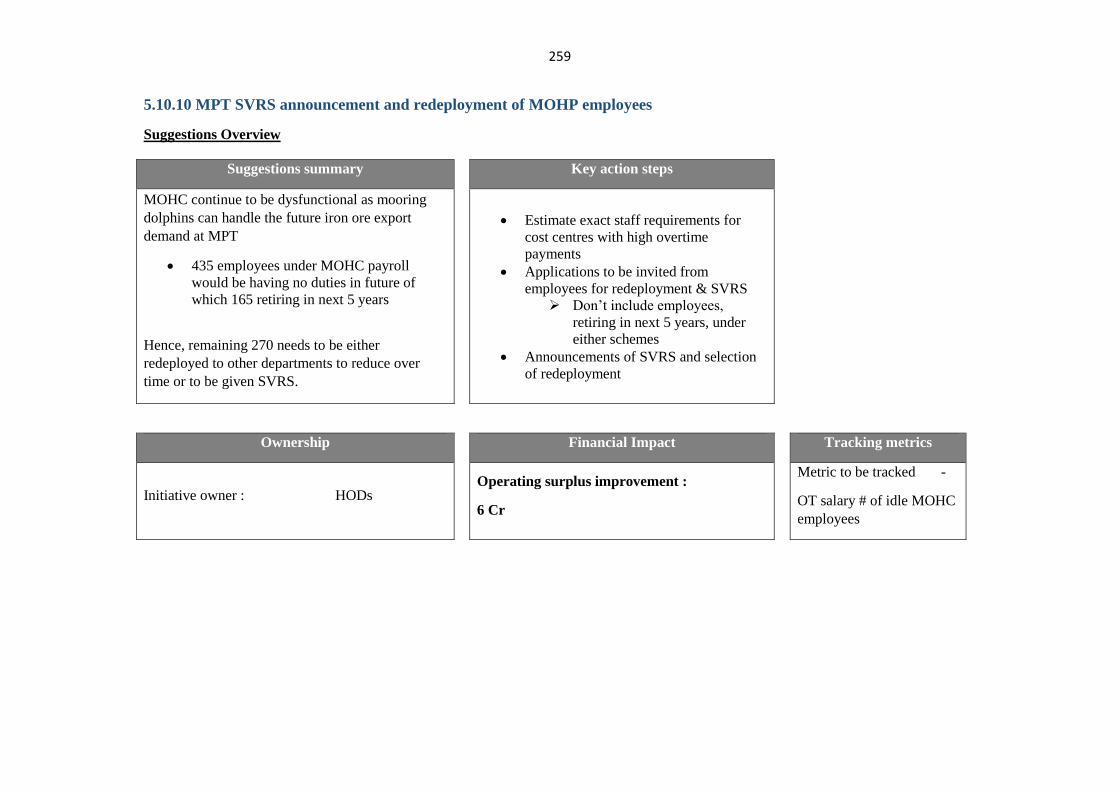
259
5.10.10 MPT SVRS announcement and redeployment of MOHP employees
Suggestions Overview
Suggestions summary Key action steps
MOHC continue to be dysfunctional as mooring
dolphins can handle the future iron ore export
demand at MPT
435 employees under MOHC payroll
would be having no duties in future of
which 165 retiring in next 5 years
Hence, remaining 270 needs to be either
redeployed to other departments to reduce over
time or to be given SVRS.
Estimate exact staff requirements for
cost centres with high overtime
payments
Applications to be invited from
employees for redeployment & SVRS
Don’t include employees,
retiring in next 5 years, under
either schemes
Announcements of SVRS and selection
of redeployment
Ownership Financial Impact Tracking metrics
Initiative owner : HODs Operating surplus improvement :
6 Cr
Metric to be tracked -
OT salary # of idle MOHC
employees
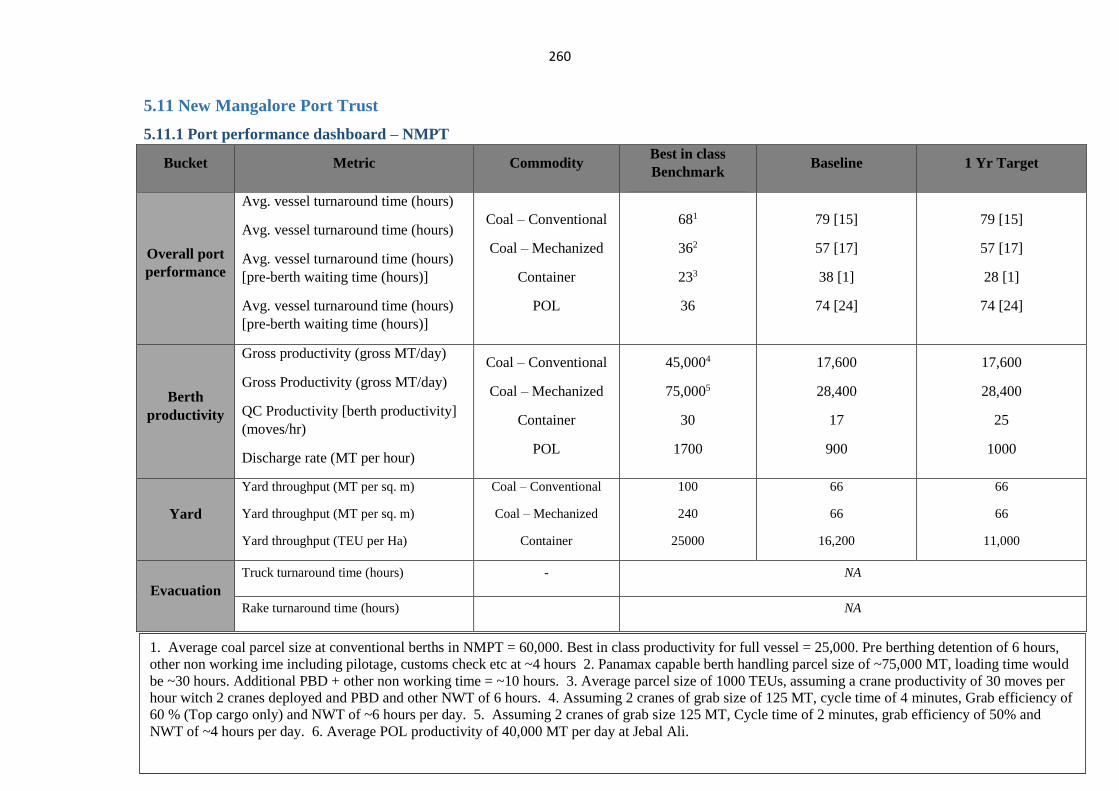
260
5.11 New Mangalore Port Trust
5.11.1 Port performance dashboard – NMPT
Bucket Metric Commodity Best in class
Benchmark Baseline 1 Yr Target
Overall port
performance
Avg. vessel turnaround time (hours)
Avg. vessel turnaround time (hours)
Avg. vessel turnaround time (hours)
[pre-berth waiting time (hours)]
Avg. vessel turnaround time (hours)
[pre-berth waiting time (hours)]
Coal – Conventional
Coal – Mechanized
Container
POL
681
362
233
36
79 [15]
57 [17]
38 [1]
74 [24]
79 [15]
57 [17]
28 [1]
74 [24]
Berth
productivity
Gross productivity (gross MT/day)
Gross Productivity (gross MT/day)
QC Productivity [berth productivity]
(moves/hr)
Discharge rate (MT per hour)
Coal – Conventional
Coal – Mechanized
Container
POL
45,0004
75,0005
30
1700
17,600
28,400
17
900
17,600
28,400
25
1000
Yard
Yard throughput (MT per sq. m)
Yard throughput (MT per sq. m)
Yard throughput (TEU per Ha)
Coal – Conventional
Coal – Mechanized
Container
100
240
25000
66
66
16,200
66
66
11,000
Evacuation
Truck turnaround time (hours) - NA
Rake turnaround time (hours) NA
1. Average coal parcel size at conventional berths in NMPT = 60,000. Best in class productivity for full vessel = 25,000. Pre berthing detention of 6 hours,
other non working ime including pilotage, customs check etc at ~4 hours 2. Panamax capable berth handling parcel size of ~75,000 MT, loading time would
be ~30 hours. Additional PBD + other non working time = ~10 hours. 3. Average parcel size of 1000 TEUs, assuming a crane productivity of 30 moves per
hour witch 2 cranes deployed and PBD and other NWT of 6 hours. 4. Assuming 2 cranes of grab size of 125 MT, cycle time of 4 minutes, Grab efficiency of
60 % (Top cargo only) and NWT of ~6 hours per day. 5. Assuming 2 cranes of grab size 125 MT, Cycle time of 2 minutes, grab efficiency of 50% and
NWT of ~4 hours per day. 6. Average POL productivity of 40,000 MT per day at Jebal Ali.
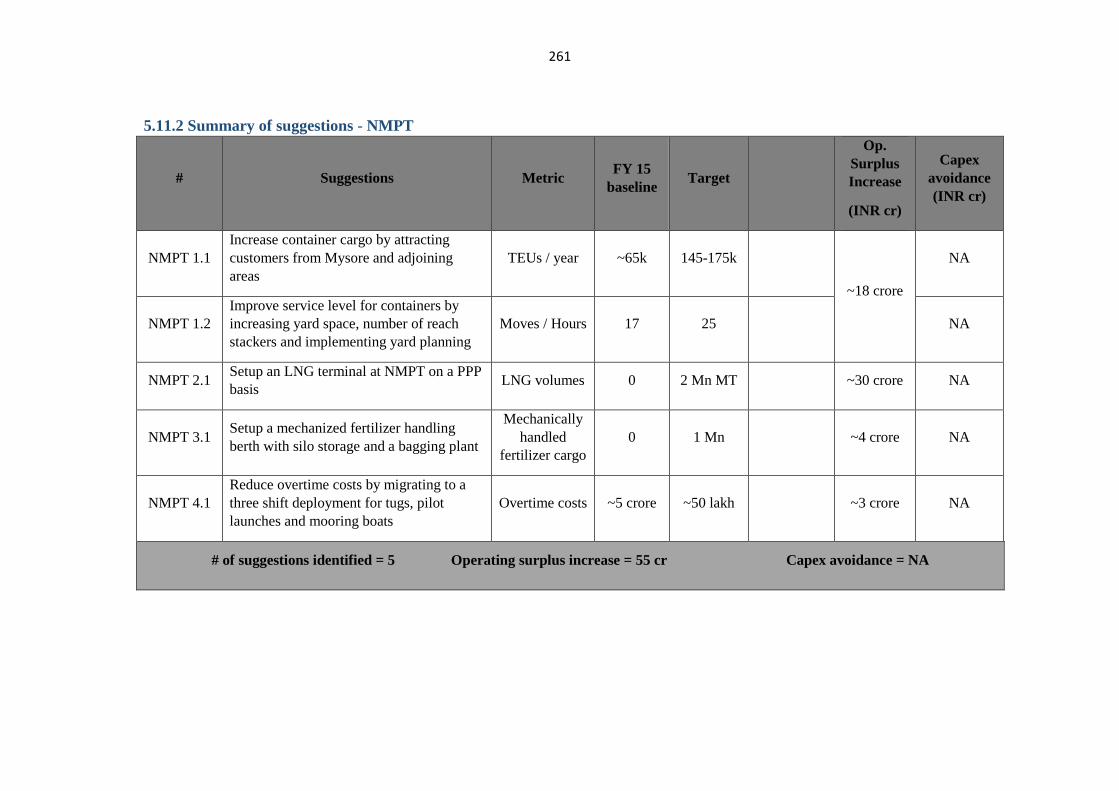
261
5.11.2 Summary of suggestions - NMPT
# Suggestions Metric FY 15
baseline Target
Op.
Surplus
Increase
(INR cr)
Capex
avoidance
(INR cr)
NMPT 1.1
Increase container cargo by attracting
customers from Mysore and adjoining
areas
TEUs / year ~65k 145-175k
~18 crore
NA
NMPT 1.2
Improve service level for containers by
increasing yard space, number of reach
stackers and implementing yard planning
Moves / Hours 17 25 NA
NMPT 2.1 Setup an LNG terminal at NMPT on a PPP
basis LNG volumes 0 2 Mn MT ~30 crore NA
NMPT 3.1 Setup a mechanized fertilizer handling
berth with silo storage and a bagging plant
Mechanically
handled
fertilizer cargo
0 1 Mn ~4 crore NA
NMPT 4.1
Reduce overtime costs by migrating to a
three shift deployment for tugs, pilot
launches and mooring boats
Overtime costs ~5 crore ~50 lakh ~3 crore NA
# of suggestions identified = 5 Operating surplus increase = 55 cr Capex avoidance = NA
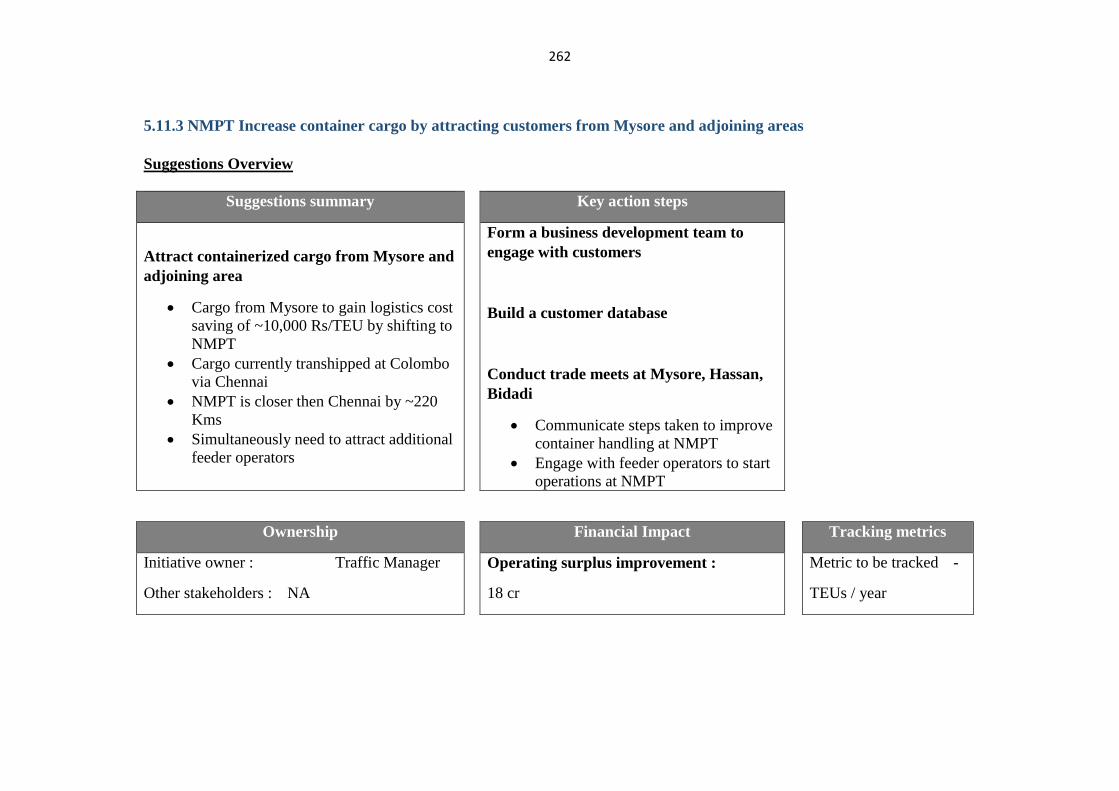
262
5.11.3 NMPT Increase container cargo by attracting customers from Mysore and adjoining areas
Suggestions Overview
Suggestions summary Key action steps
Attract containerized cargo from Mysore and
adjoining area
Cargo from Mysore to gain logistics cost
saving of ~10,000 Rs/TEU by shifting to
NMPT
Cargo currently transhipped at Colombo
via Chennai
NMPT is closer then Chennai by ~220
Kms
Simultaneously need to attract additional
feeder operators
Form a business development team to
engage with customers
Build a customer database
Conduct trade meets at Mysore, Hassan,
Bidadi
Communicate steps taken to improve
container handling at NMPT
Engage with feeder operators to start
operations at NMPT
Ownership Financial Impact Tracking metrics
Initiative owner : Traffic Manager
Other stakeholders : NA
Operating surplus improvement :
18 cr
Metric to be tracked -
TEUs / year
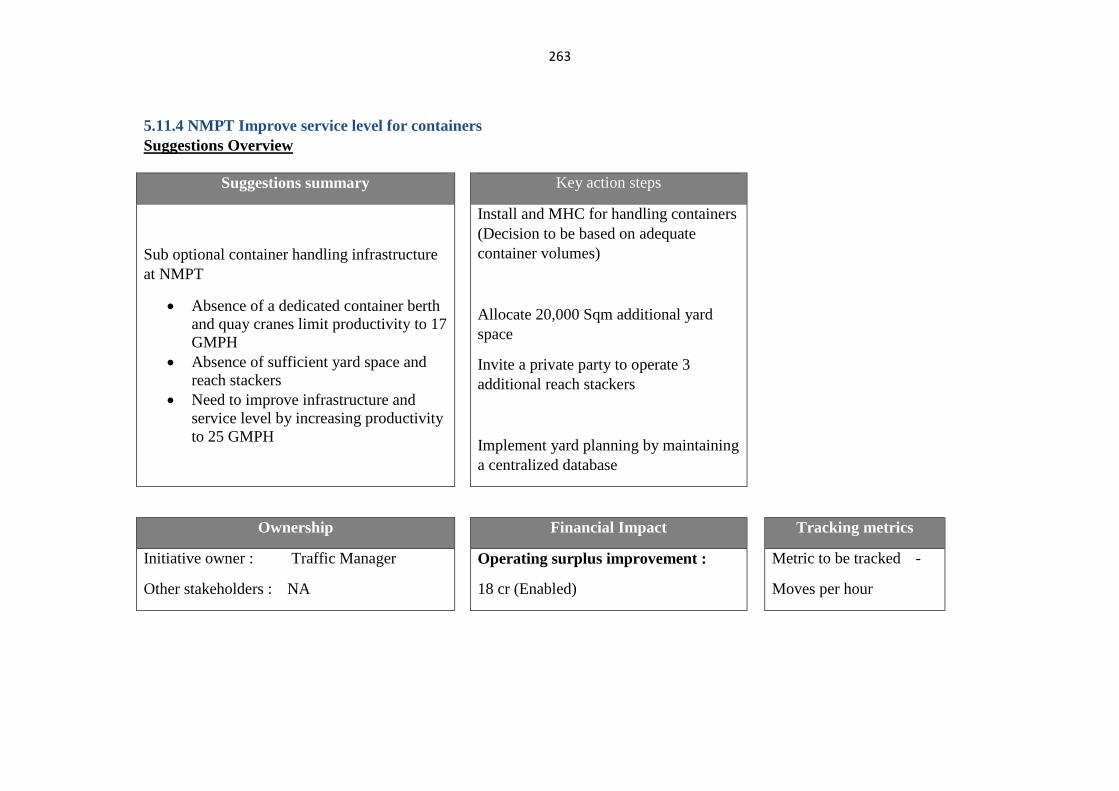
263
5.11.4 NMPT Improve service level for containers
Suggestions Overview
Suggestions summary Key action steps
Sub optional container handling infrastructure
at NMPT
Absence of a dedicated container berth
and quay cranes limit productivity to 17
GMPH
Absence of sufficient yard space and
reach stackers
Need to improve infrastructure and
service level by increasing productivity
to 25 GMPH
Install and MHC for handling containers
(Decision to be based on adequate
container volumes)
Allocate 20,000 Sqm additional yard
space
Invite a private party to operate 3
additional reach stackers
Implement yard planning by maintaining
a centralized database
Ownership Financial Impact Tracking metrics
Initiative owner : Traffic Manager
Other stakeholders : NA
Operating surplus improvement :
18 cr (Enabled)
Metric to be tracked -
Moves per hour
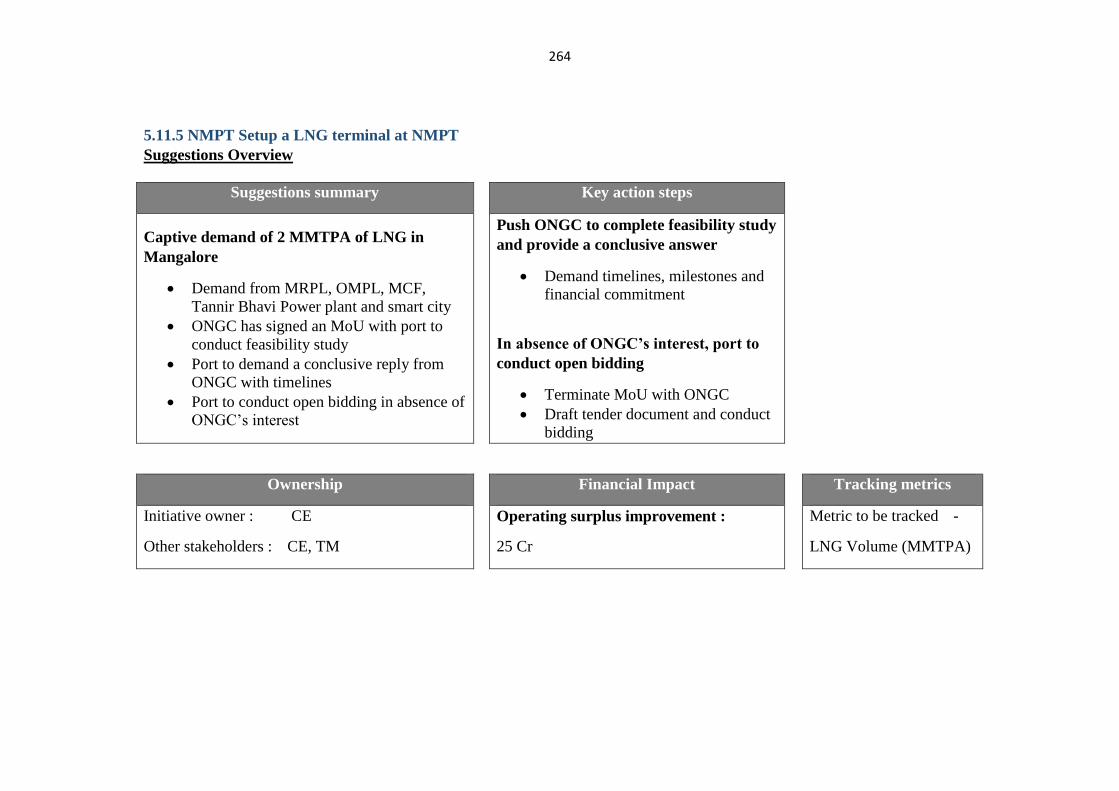
264
5.11.5 NMPT Setup a LNG terminal at NMPT
Suggestions Overview
Suggestions summary Key action steps
Captive demand of 2 MMTPA of LNG in
Mangalore
Demand from MRPL, OMPL, MCF,
Tannir Bhavi Power plant and smart city
ONGC has signed an MoU with port to
conduct feasibility study
Port to demand a conclusive reply from
ONGC with timelines
Port to conduct open bidding in absence of
ONGC’s interest
Push ONGC to complete feasibility study
and provide a conclusive answer
Demand timelines, milestones and
financial commitment
In absence of ONGC’s interest, port to
conduct open bidding
Terminate MoU with ONGC
Draft tender document and conduct
bidding
Ownership Financial Impact Tracking metrics
Initiative owner : CE
Other stakeholders : CE, TM
Operating surplus improvement :
25 Cr
Metric to be tracked -
LNG Volume (MMTPA)
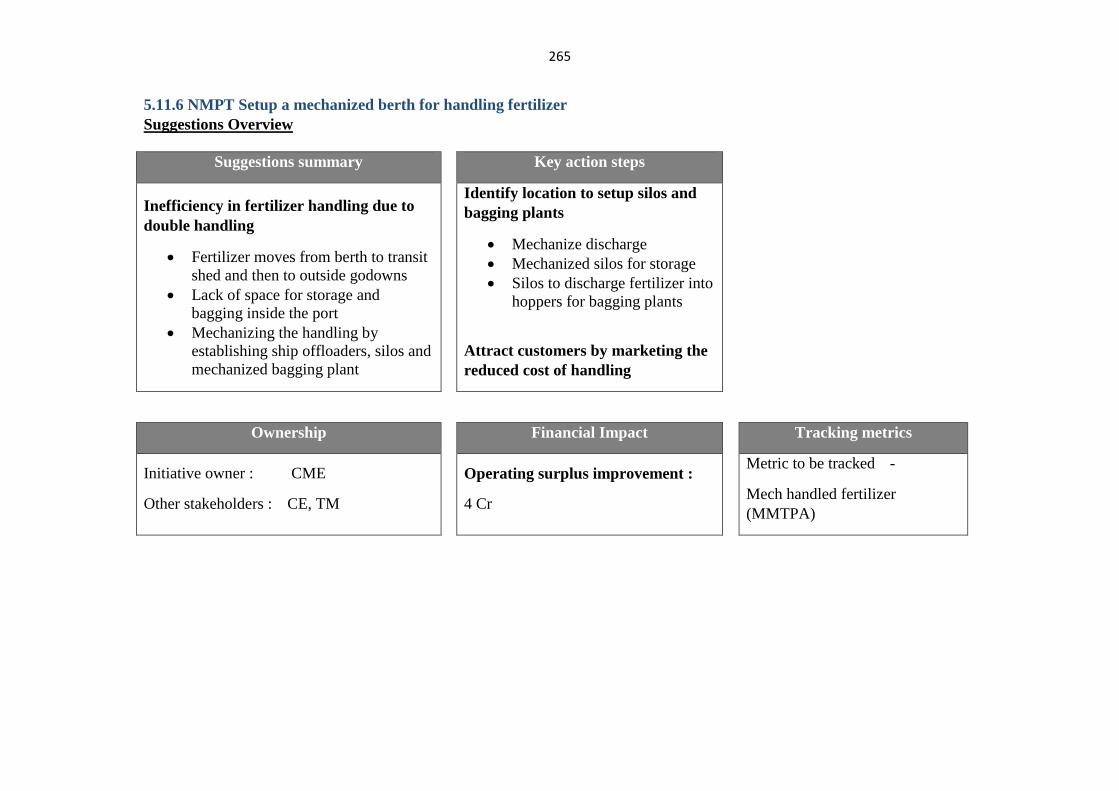
265
5.11.6 NMPT Setup a mechanized berth for handling fertilizer
Suggestions Overview
Suggestions summary Key action steps
Inefficiency in fertilizer handling due to
double handling
Fertilizer moves from berth to transit
shed and then to outside godowns
Lack of space for storage and
bagging inside the port
Mechanizing the handling by
establishing ship offloaders, silos and
mechanized bagging plant
Identify location to setup silos and
bagging plants
Mechanize discharge
Mechanized silos for storage
Silos to discharge fertilizer into
hoppers for bagging plants
Attract customers by marketing the
reduced cost of handling
Ownership Financial Impact Tracking metrics
Initiative owner : CME
Other stakeholders : CE, TM
Operating surplus improvement :
4 Cr
Metric to be tracked -
Mech handled fertilizer
(MMTPA)
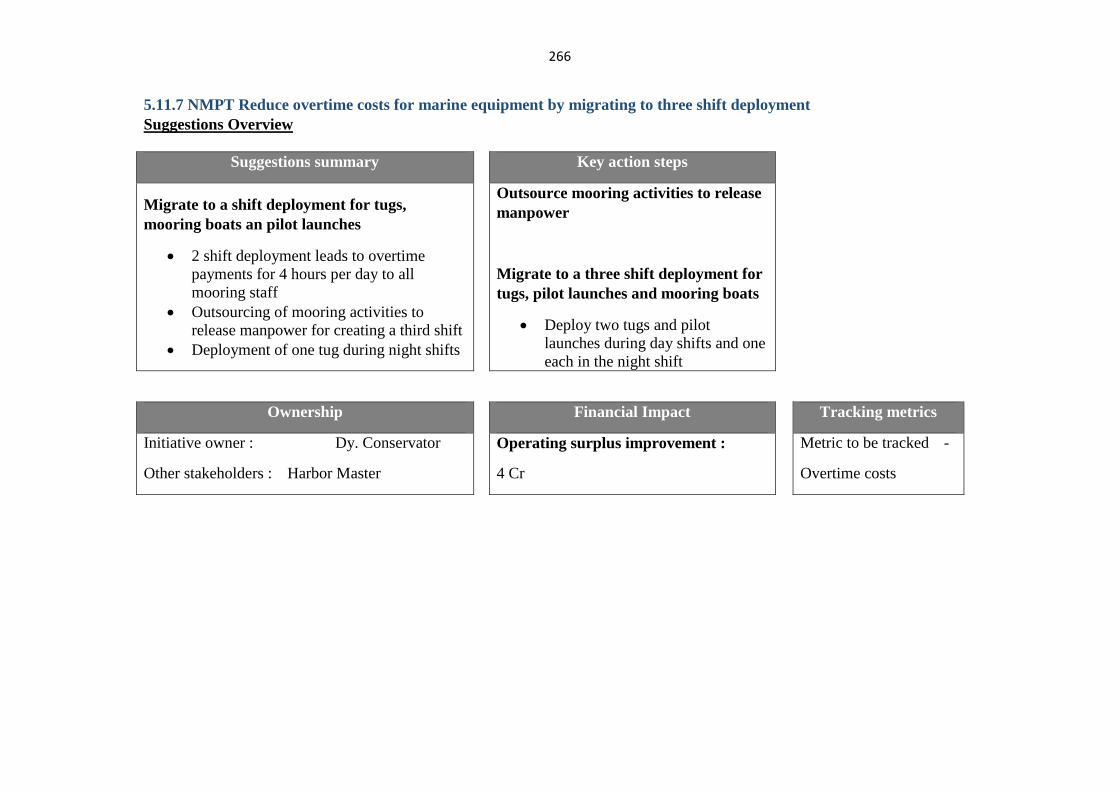
266
5.11.7 NMPT Reduce overtime costs for marine equipment by migrating to three shift deployment
Suggestions Overview
Suggestions summary Key action steps
Migrate to a shift deployment for tugs,
mooring boats an pilot launches
2 shift deployment leads to overtime
payments for 4 hours per day to all
mooring staff
Outsourcing of mooring activities to
release manpower for creating a third shift
Deployment of one tug during night shifts
Outsource mooring activities to release
manpower
Migrate to a three shift deployment for
tugs, pilot launches and mooring boats
Deploy two tugs and pilot
launches during day shifts and one
each in the night shift
Ownership Financial Impact Tracking metrics
Initiative owner : Dy. Conservator
Other stakeholders : Harbor Master
Operating surplus improvement :
4 Cr
Metric to be tracked -
Overtime costs
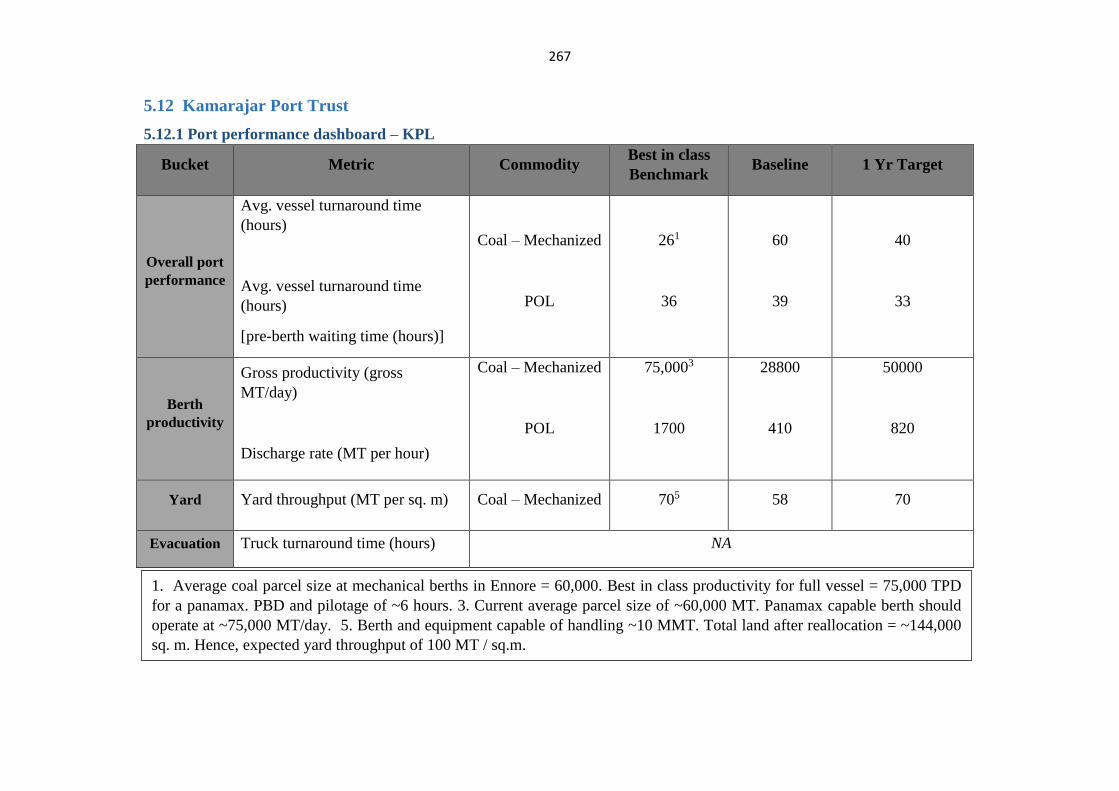
267
5.12 Kamarajar Port Trust
5.12.1 Port performance dashboard – KPL
Bucket Metric Commodity Best in class
Benchmark Baseline 1 Yr Target
Overall port
performance
Avg. vessel turnaround time
(hours)
Avg. vessel turnaround time
(hours)
[pre-berth waiting time (hours)]
Coal – Mechanized
POL
261
36
60
39
40
33
Berth
productivity
Gross productivity (gross
MT/day)
Discharge rate (MT per hour)
Coal – Mechanized
POL
75,0003
1700
28800
410
50000
820
Yard Yard throughput (MT per sq. m) Coal – Mechanized 705 58 70
Evacuation Truck turnaround time (hours) NA
1. Average coal parcel size at mechanical berths in Ennore = 60,000. Best in class productivity for full vessel = 75,000 TPD
for a panamax. PBD and pilotage of ~6 hours. 3. Current average parcel size of ~60,000 MT. Panamax capable berth should
operate at ~75,000 MT/day. 5. Berth and equipment capable of handling ~10 MMT. Total land after reallocation = ~144,000
sq. m. Hence, expected yard throughput of 100 MT / sq.m.
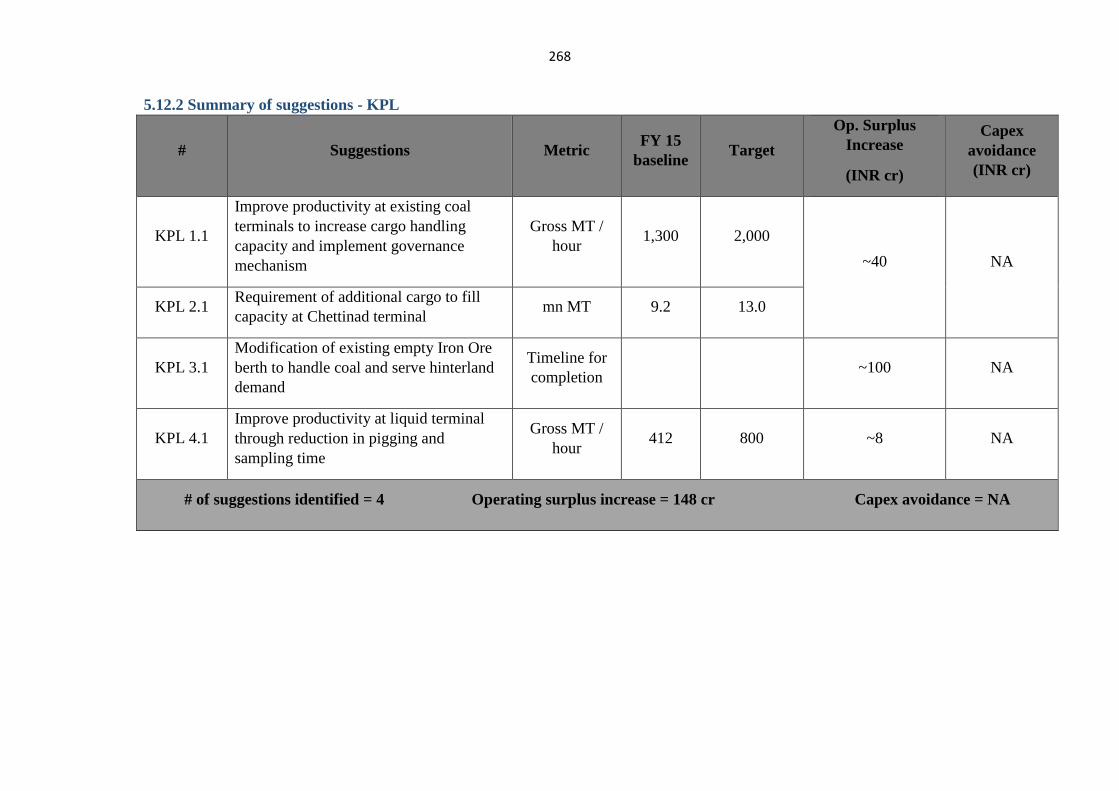
268
5.12.2 Summary of suggestions - KPL
# Suggestions Metric FY 15
baseline Target
Op. Surplus
Increase
(INR cr)
Capex
avoidance
(INR cr)
KPL 1.1
Improve productivity at existing coal
terminals to increase cargo handling
capacity and implement governance
mechanism
Gross MT /
hour 1,300 2,000
~40 NA
KPL 2.1 Requirement of additional cargo to fill
capacity at Chettinad terminal mn MT 9.2 13.0
KPL 3.1
Modification of existing empty Iron Ore
berth to handle coal and serve hinterland
demand
Timeline for
completion ~100 NA
KPL 4.1
Improve productivity at liquid terminal
through reduction in pigging and
sampling time
Gross MT /
hour 412 800 ~8 NA
# of suggestions identified = 4 Operating surplus increase = 148 cr Capex avoidance = NA
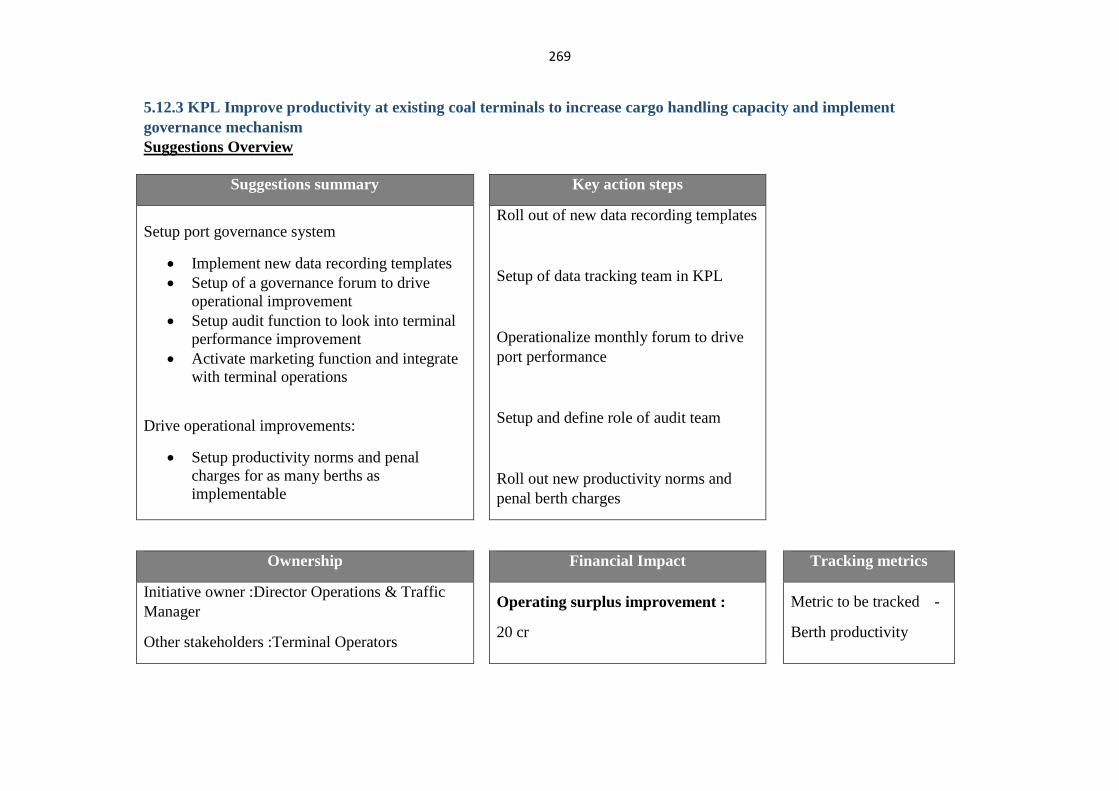
269
5.12.3 KPL Improve productivity at existing coal terminals to increase cargo handling capacity and implement
governance mechanism
Suggestions Overview
Suggestions summary Key action steps
Setup port governance system
Implement new data recording templates
Setup of a governance forum to drive
operational improvement
Setup audit function to look into terminal
performance improvement
Activate marketing function and integrate
with terminal operations
Drive operational improvements:
Setup productivity norms and penal
charges for as many berths as
implementable
Roll out of new data recording templates
Setup of data tracking team in KPL
Operationalize monthly forum to drive
port performance
Setup and define role of audit team
Roll out new productivity norms and
penal berth charges
Ownership Financial Impact Tracking metrics
Initiative owner :Director Operations & Traffic
Manager
Other stakeholders :Terminal Operators
Operating surplus improvement :
20 cr
Metric to be tracked -
Berth productivity
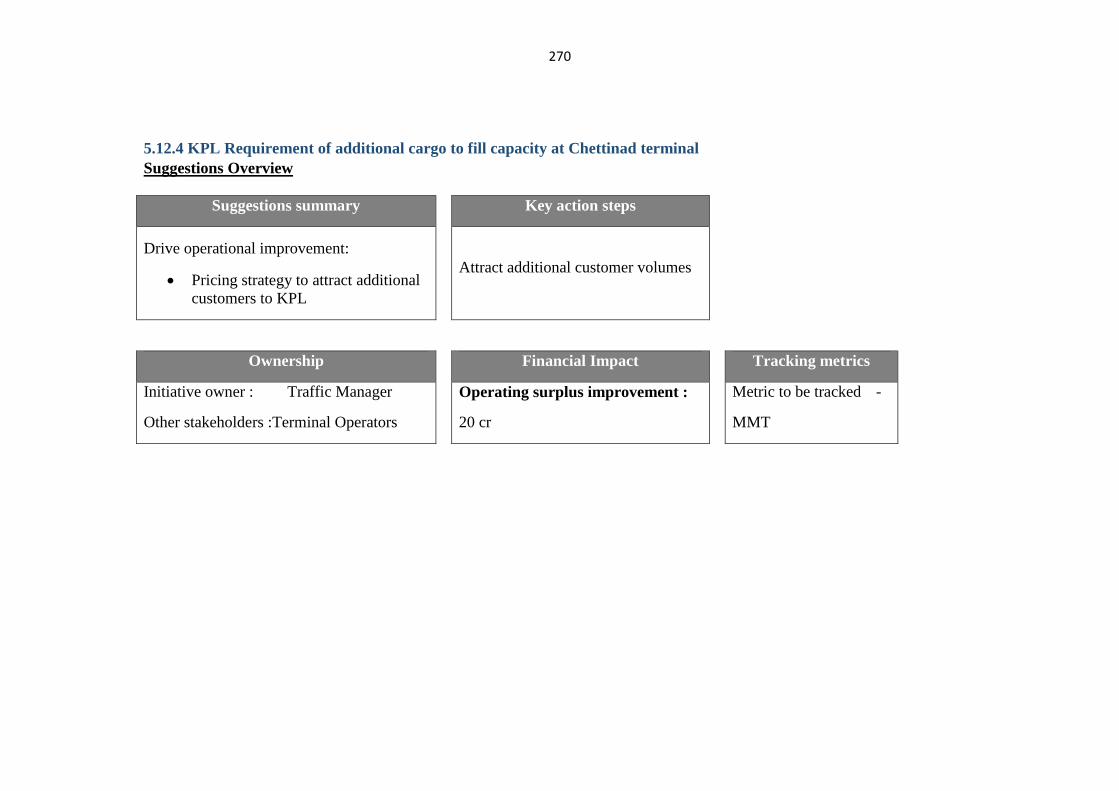
270
5.12.4 KPL Requirement of additional cargo to fill capacity at Chettinad terminal
Suggestions Overview
Suggestions summary Key action steps
Drive operational improvement:
Pricing strategy to attract additional
customers to KPL
Attract additional customer volumes
Ownership Financial Impact Tracking metrics
Initiative owner : Traffic Manager
Other stakeholders :Terminal Operators
Operating surplus improvement :
20 cr
Metric to be tracked -
MMT
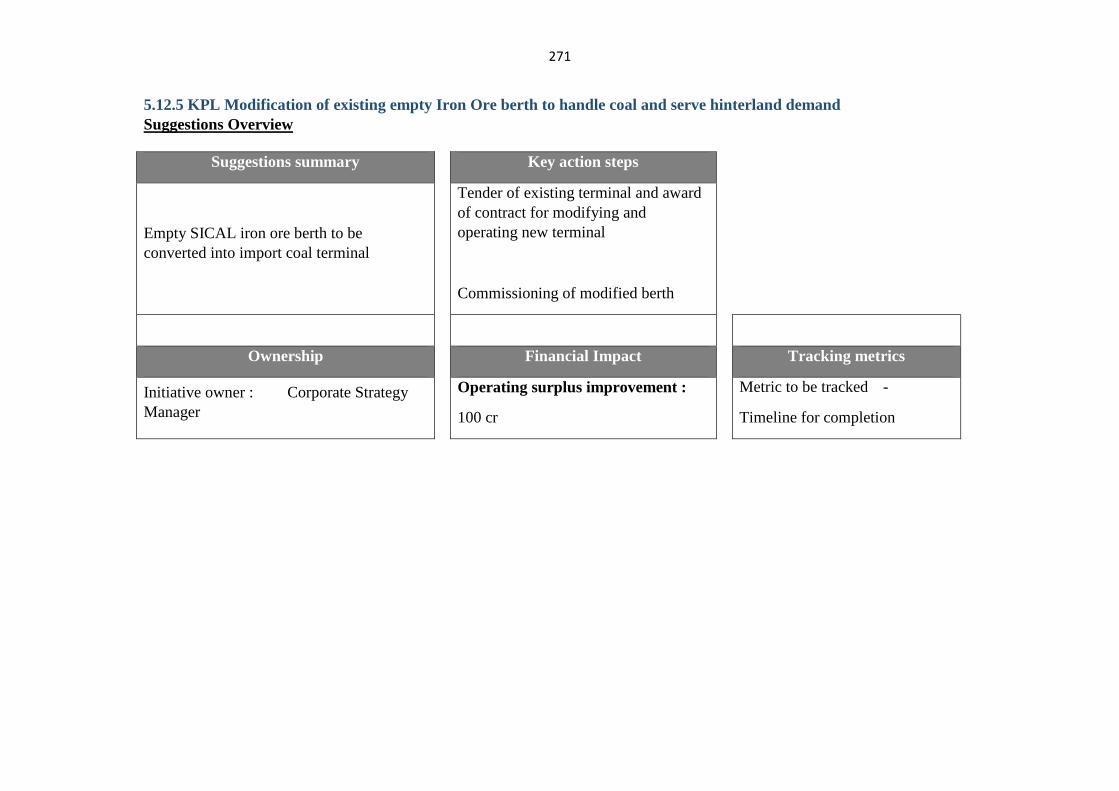
271
5.12.5 KPL Modification of existing empty Iron Ore berth to handle coal and serve hinterland demand
Suggestions Overview
Suggestions summary Key action steps
Empty SICAL iron ore berth to be
converted into import coal terminal
Tender of existing terminal and award
of contract for modifying and
operating new terminal
Commissioning of modified berth
Ownership Financial Impact Tracking metrics
Initiative owner : Corporate Strategy
Manager
Operating surplus improvement :
100 cr
Metric to be tracked -
Timeline for completion
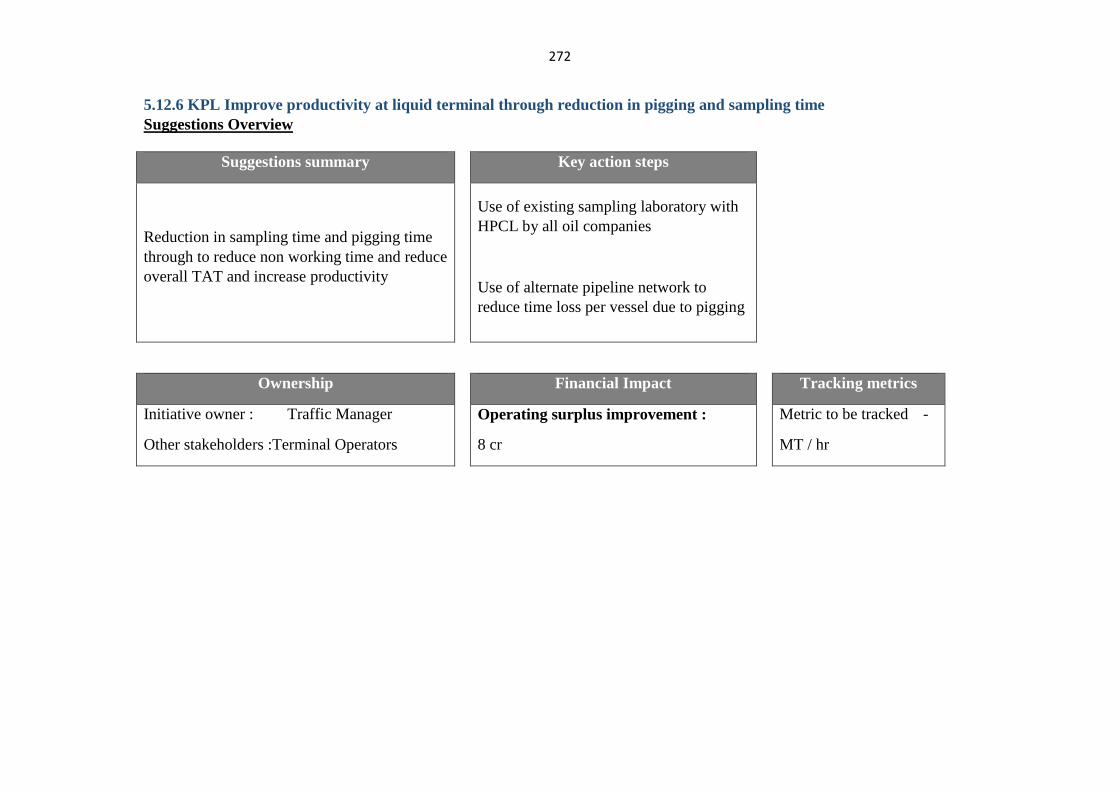
272
5.12.6 KPL Improve productivity at liquid terminal through reduction in pigging and sampling time
Suggestions Overview
Suggestions summary Key action steps
Reduction in sampling time and pigging time
through to reduce non working time and reduce
overall TAT and increase productivity
Use of existing sampling laboratory with
HPCL by all oil companies
Use of alternate pipeline network to
reduce time loss per vessel due to pigging
Ownership Financial Impact Tracking metrics
Initiative owner : Traffic Manager
Other stakeholders :Terminal Operators
Operating surplus improvement :
8 cr
Metric to be tracked -
MT / hr
273
CHAPTER VI - SUGGESTIONS AND CONCLUSIONS
This is stated that this research encompasses a unique exercise of exploring solutions
after deep dive analysis into the real productivity issues in Major Ports by taking into
consideration the aspirations of stakeholders and it is what distinguishes from other
research studies. These solutions are vividly described under various heads.
6.1 Technology upgrade
(a) Barge based dredging (Kolkata) - The current navigation channel to
Haldia Dock System passes through two major sand bars—Auckland and Jellingham,
which currently limit the draft of the channel. The bars, which are currently at
approximately 4.5m (Auckland) and 4m (Jellingham) below chart datum, need dredging
around the year for maintenance. Barge based technology for dredging can be used at
Jellingham bar. This technology, as per initial studies, can complement the two
techniques that KoPT has already successfully deployed (side casting and short
dumping) and result in substantial operational savings
(b) Dual loading of vessels (Paradip) - Dual loading will help in saving non-
working time of the vessel as the second idle berth is used for de-ballasting of vessels.
Due to dual loading, more than 50% reduction in non-working time and 33% reduction
in time spent at the berth for vessel could be achieved. Dual loading of vessels will help
in lowering working time, Reduction in non-working time at berth due to lesser number
/ simultaneous hatch changes, Higher berth productivity for port could be achieved and
savings for customer through reduced TRT.
(c) Night navigation system implementation (Kandla)- Currently, only
buoys are used as navigation aid. During night, the pilot has to navigate just by looking
274
at the buoys. The buoys move around the mooring causing uncertainty in identifying
channel boundary. This has resulted in lesser number of movements at night compared
to day. It is therefore suggested to use Navigation aids to make night navigation easier
and safer, thereby increasing the % of movements at night.
(d) Quick release system implementation (Mumbai) - the non-working time
at Mumbai port is significantly higher in comparison to the 12 major ports in India. In
order to reduce the mooring time, installation of ‘Quick Release System’ can be a
potential solution. Benefits of installing quick release system (QRS) are - reduction in
mooring time, reduction in overturning movement, reduction in mooring crew’s
exposure to risk, benefit for oil companies due to faster turnaround time for vessels and
less labor and no tugs required in operations.
6.2 Process optimization
(a) Evacuation time reduction (JNPT) - The Vehicle Booking System is
suggested to be implemented at JNPT as it will help streamline the flow of trailers in
JNPT. In JNPT, moving export containers from CFS to Port gate takes 8-10 hours due
to heavy congestion of trailers near the port gates. The high evacuation time results in
increased logistic costs for customer and affects ease of doing business. Vehicle
Booking System is designed to decrease the waiting time of trailers.
(b) Hot seat change implementation (JNPT, Kandla, Goa, Haldia etc) -
Currently, the shift change time takes between 30 minutes to 1 hour per shift per day.
However, this can be resolved by instituting hot seat shift change. It is proposed to
275
implement hot seat changes by finalizing the plan with unions to add 30 minutes to each
shift, or give one-hour overtime.
(c) Hatch change optimization (Paradip)- Absence of norms for number
of hatch changes and draft checks results in little control over non-working time for the
vessels. In order to improve berth performance, there is a need to put in place a stringent
set of productivity norms and penal charges so as to optimize the hatch change.
(d) Twin lift optimization (JNPT) - Strong yard planning is recommended to
support maximization of export twin-lift ratio. Twin-lifting can boost crane productivity
for terminals where 20' container constitute a large share of traffic (60-70% for JNPCT).
Current twin-lift ratio is ~25% and there is potential to increase the twin-lifts of 20ft
containers below 25t through improved planning to optimize the twin-lift opportunities
and ensuring execution according to plan with minimum leakage.
6.3 Pricing & incentive alignment
(a) Liquid norms in Kandla & JNPT - Currently, there is low incentive for
customer tank farm operator to increase throughput because of the tariff structure.
Incentive can be created through establishing targets for berth performance, and penal
actions may be implemented if these performance targets are not achieved. Lack of
incentives for customers in Kandla Port to discharge liquid cargo at the maximum rate
had led to a situation where customers found it cheaper to store edible oil in a vessel
than hire additional tank for storage. The norms at Kandla port were revised to
incentivize faster discharge of liquid cargo. The norms made idle stay at berth costlier,
encouraged sharing of pipelines and encouraged customers to shift to larger parcel sizes.
276
(b) SoR revision for to incentive HMC utilization (Paradip, Kandla) - Add
new HMCs to lead to improved productivity of vessels. Productivity norms should be
set to increase productivity and reduce non-working time. Norms have to be set for both
HMC operations and vessel operations.
(c) Trans-loading package in Kolkata - Transloading option should be
made attractive by reducing overall cost and creating a combined package. Transloading
cost can be reduced by eliminating cargo loss by installation of weighbridge inside yard
(already planned), reducing shore handling through licensing/ BOT-mechanized berths,
combined discount from both JITF and port-end to be provided. It will be critical to map
transloading to cheaper sub-contracted/BOT berth to ensure cost-effective transloading
(d) Bulk productivity norms across ports - Berth productivity norms for
cargo berths needs to be upgraded per the planned equipment upgrade. These norms are
necessary to ensure that the planned upgraded equipment is put to full use for achieving
higher productivity.
6.4 Equipment upgrade
(a) Cranes: 20 new MHCs & 15 RTGCs – New MHCs and RTGCs need to
be installed across ports to fully utilize the capacity at the berths.
(b) Conveyor: Upgrade agreed with captive customers (VOC, Ennore) – At
VOC constructing a branch-out conveyor to handle non-TNEB coal evacuation to the
port's storage yard can help in increasing productivity. At Ennore, the conveyor system
at the NCTPS plant of Tangedco leads from the berth to the yard and then directly to the
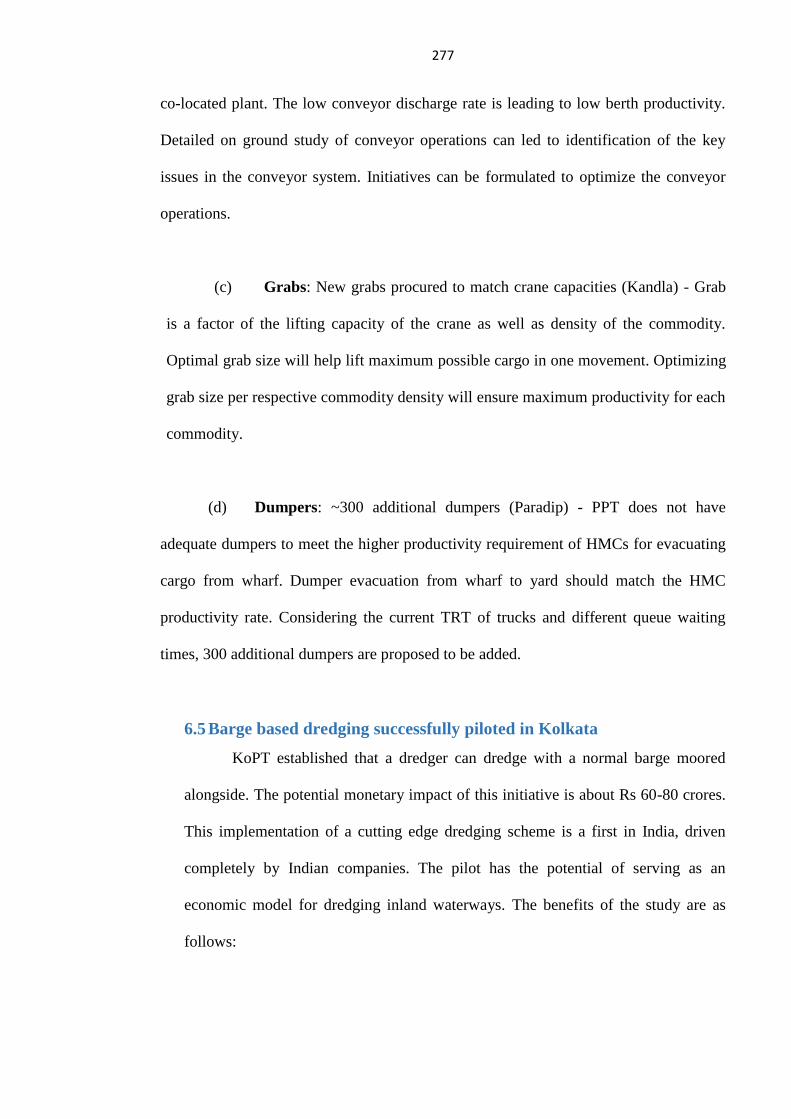
277
co-located plant. The low conveyor discharge rate is leading to low berth productivity.
Detailed on ground study of conveyor operations can led to identification of the key
issues in the conveyor system. Initiatives can be formulated to optimize the conveyor
operations.
(c) Grabs: New grabs procured to match crane capacities (Kandla) - Grab
is a factor of the lifting capacity of the crane as well as density of the commodity.
Optimal grab size will help lift maximum possible cargo in one movement. Optimizing
grab size per respective commodity density will ensure maximum productivity for each
commodity.
(d) Dumpers: ~300 additional dumpers (Paradip) - PPT does not have
adequate dumpers to meet the higher productivity requirement of HMCs for evacuating
cargo from wharf. Dumper evacuation from wharf to yard should match the HMC
productivity rate. Considering the current TRT of trucks and different queue waiting
times, 300 additional dumpers are proposed to be added.
6.5 Barge based dredging successfully piloted in Kolkata
KoPT established that a dredger can dredge with a normal barge moored
alongside. The potential monetary impact of this initiative is about Rs 60-80 crores.
This implementation of a cutting edge dredging scheme is a first in India, driven
completely by Indian companies. The pilot has the potential of serving as an
economic model for dredging inland waterways. The benefits of the study are as
follows:
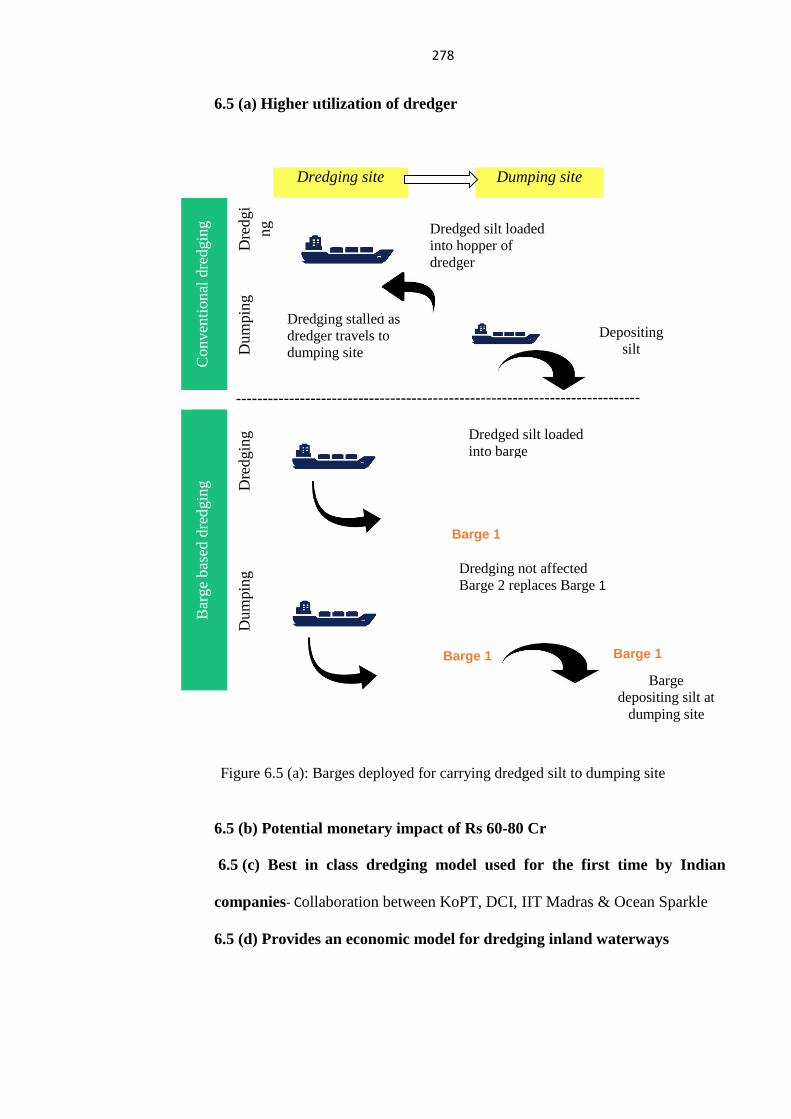
278
6.5 (a) Higher utilization of dredger
Dredging site Dumping site
Conven
tional
dre
dgin
g
Dre
dgi
ng
Dum
pin
g
B
arge
bas
ed d
redgin
g
Dre
dgin
g
Dum
pin
g
Figure 6.5 (a): Barges deployed for carrying dredged silt to dumping site
6.5 (b) Potential monetary impact of Rs 60-80 Cr
6.5 (c) Best in class dredging model used for the first time by Indian
companies- Collaboration between KoPT, DCI, IIT Madras & Ocean Sparkle
6.5 (d) Provides an economic model for dredging inland waterways
Dredged silt loaded
into hopper of
dredger
Dredged silt loaded into hopper of dredger Dredging stalled as
dredger travels to
dumping site
Dredging stalled as dredger travels to dumping site
Depositing
silt
Depositing silt
Dredged silt loaded
into barge
Dredged silt loaded into barge
Barge 1
Barge 1
Dredging not affected
Barge 2 replaces Barge 1
Dredging not affected Barge 2 replaces Barge 1
Barge 1
Barge 1
Barge 1
Barge 1
Barge
depositing silt at
dumping site
Barge depositing
silt at dumping site
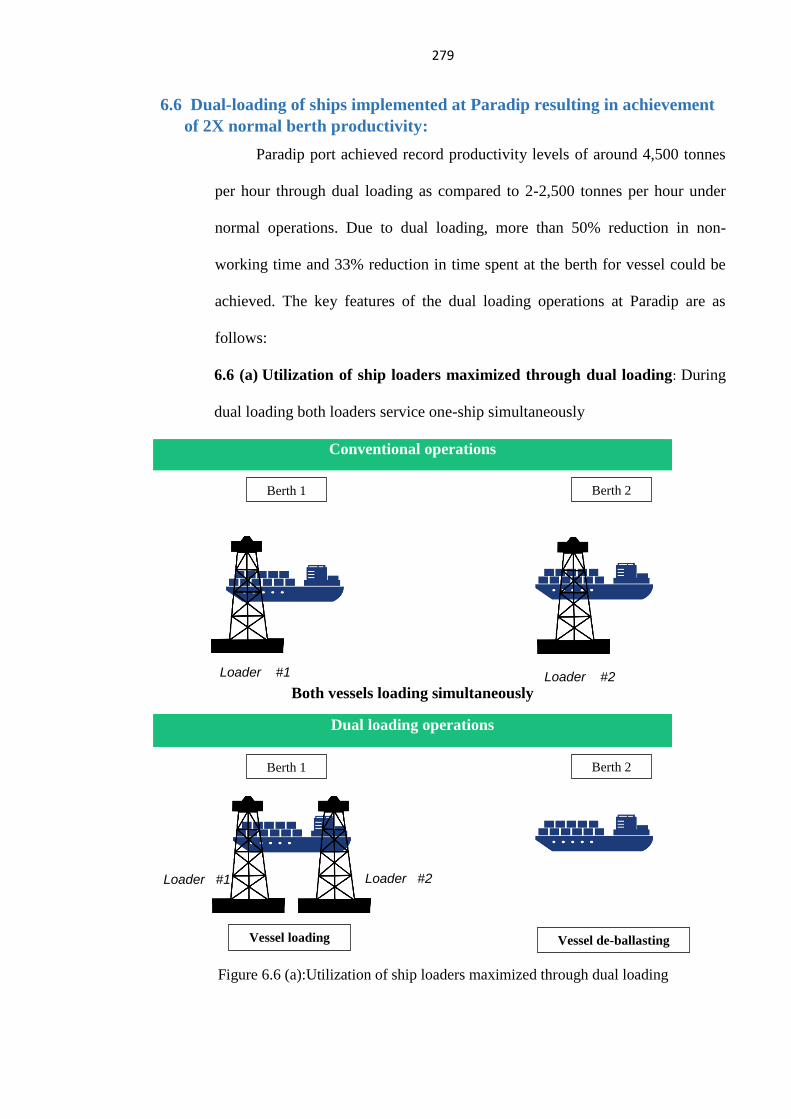
279
6.6 Dual-loading of ships implemented at Paradip resulting in achievement
of 2X normal berth productivity:
Paradip port achieved record productivity levels of around 4,500 tonnes
per hour through dual loading as compared to 2-2,500 tonnes per hour under
normal operations. Due to dual loading, more than 50% reduction in non-
working time and 33% reduction in time spent at the berth for vessel could be
achieved. The key features of the dual loading operations at Paradip are as
follows:
6.6 (a) Utilization of ship loaders maximized through dual loading: During
dual loading both loaders service one-ship simultaneously
Conventional operations
Both vessels loading simultaneously
Dual loading operations
Figure 6.6 (a):Utilization of ship loaders maximized through dual loading
Berth 1
Berth 1
Berth 2
Berth 2
Loader #1
Loader #1
Loader #2
Loader #2
Berth 1
Berth 1
Berth 2
Berth 2
Loader #1
Loader #1
Loader #2
Loader #2 Vessel loading
Vessel loading
Vessel de-ballasting
Vessel de-ballasting
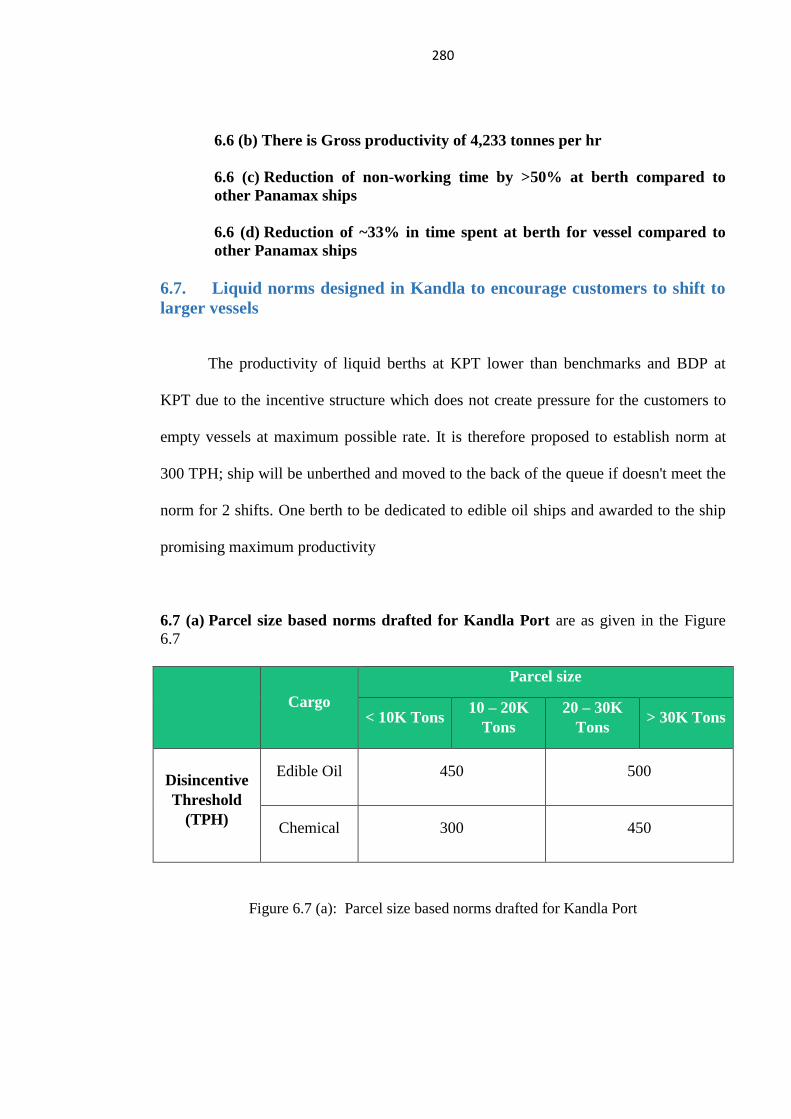
280
6.6 (b) There is Gross productivity of 4,233 tonnes per hr
6.6 (c) Reduction of non-working time by >50% at berth compared to
other Panamax ships 6.6 (d) Reduction of ~33% in time spent at berth for vessel compared to
other Panamax ships
6.7. Liquid norms designed in Kandla to encourage customers to shift to
larger vessels
The productivity of liquid berths at KPT lower than benchmarks and BDP at
KPT due to the incentive structure which does not create pressure for the customers to
empty vessels at maximum possible rate. It is therefore proposed to establish norm at
300 TPH; ship will be unberthed and moved to the back of the queue if doesn't meet the
norm for 2 shifts. One berth to be dedicated to edible oil ships and awarded to the ship
promising maximum productivity
6.7 (a) Parcel size based norms drafted for Kandla Port are as given in the Figure
6.7
Cargo
Parcel size
< 10K Tons 10 – 20K
Tons
20 – 30K
Tons > 30K Tons
Disincentive
Threshold
(TPH)
Edible Oil 450 500
Chemical 300 450
Figure 6.7 (a): Parcel size based norms drafted for Kandla Port
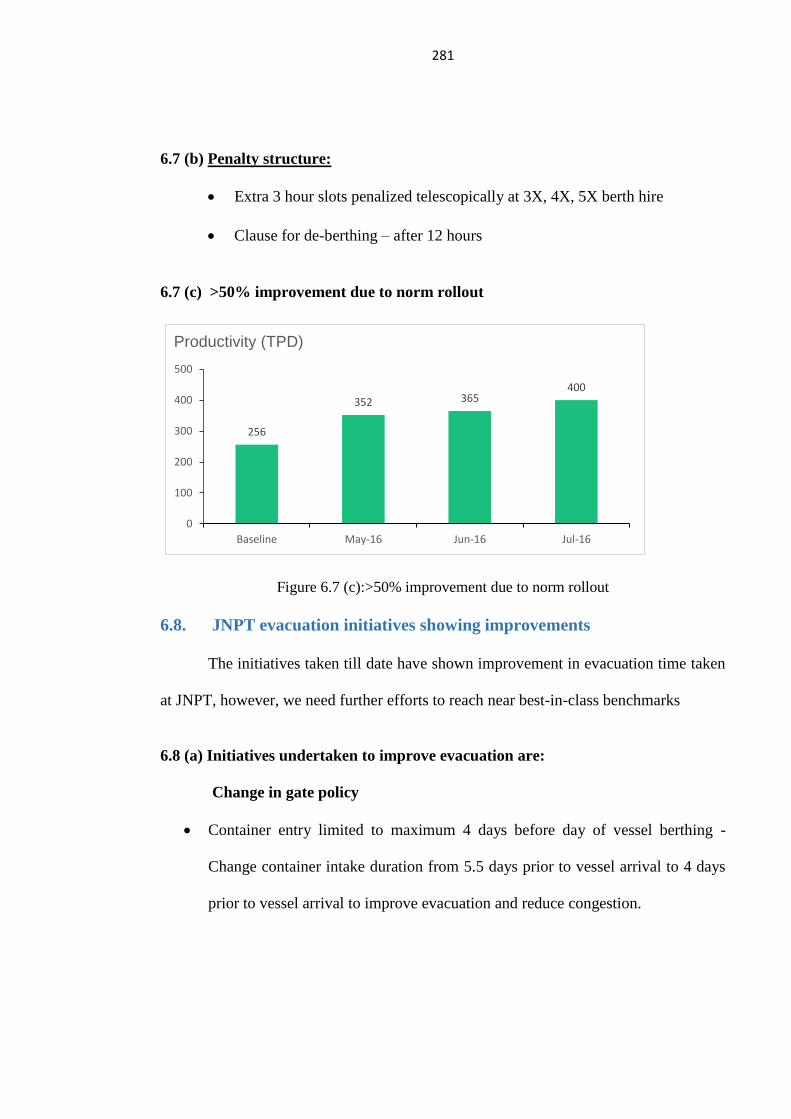
281
6.7 (b) Penalty structure:
Extra 3 hour slots penalized telescopically at 3X, 4X, 5X berth hire
Clause for de-berthing – after 12 hours
6.7 (c) >50% improvement due to norm rollout
256
352 365400
0
100
200
300
400
500
Baseline May-16 Jun-16 Jul-16
Productivity (TPD)
Figure 6.7 (c):>50% improvement due to norm rollout
6.8. JNPT evacuation initiatives showing improvements
The initiatives taken till date have shown improvement in evacuation time taken
at JNPT, however, we need further efforts to reach near best-in-class benchmarks
6.8 (a) Initiatives undertaken to improve evacuation are:
Change in gate policy
Container entry limited to maximum 4 days before day of vessel berthing -
Change container intake duration from 5.5 days prior to vessel arrival to 4 days
prior to vessel arrival to improve evacuation and reduce congestion.
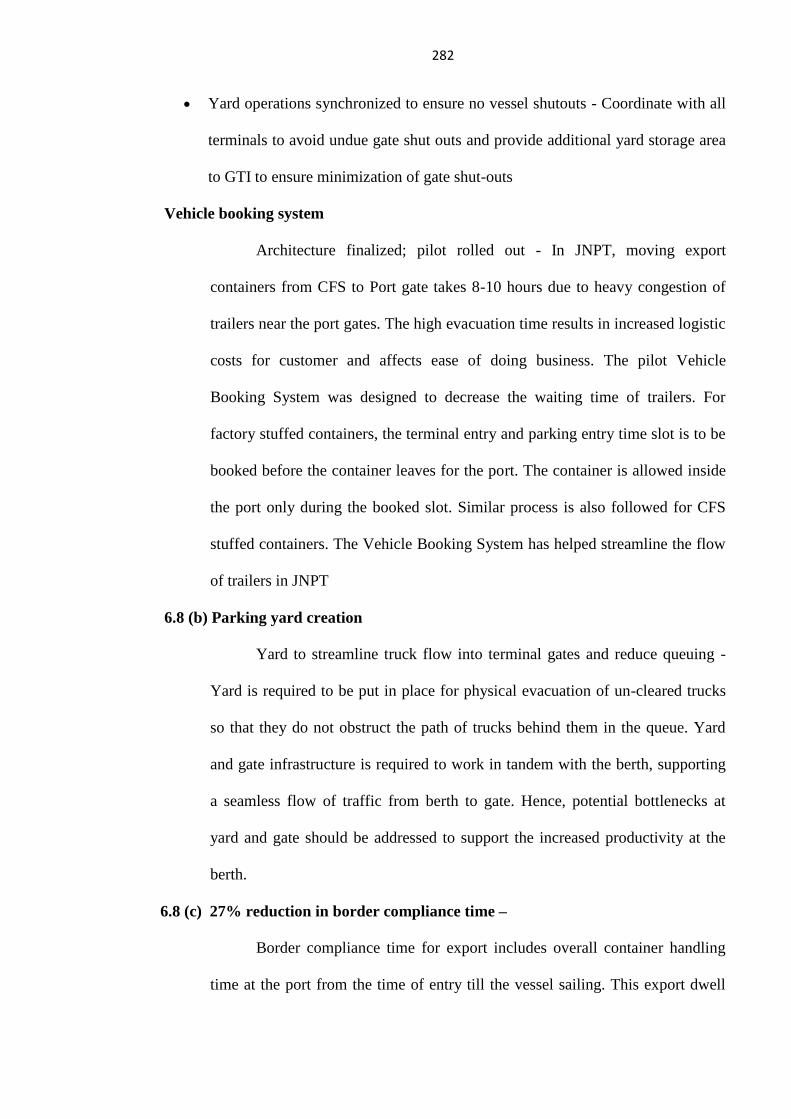
282
Yard operations synchronized to ensure no vessel shutouts - Coordinate with all
terminals to avoid undue gate shut outs and provide additional yard storage area
to GTI to ensure minimization of gate shut-outs
Vehicle booking system
Architecture finalized; pilot rolled out - In JNPT, moving export
containers from CFS to Port gate takes 8-10 hours due to heavy congestion of
trailers near the port gates. The high evacuation time results in increased logistic
costs for customer and affects ease of doing business. The pilot Vehicle
Booking System was designed to decrease the waiting time of trailers. For
factory stuffed containers, the terminal entry and parking entry time slot is to be
booked before the container leaves for the port. The container is allowed inside
the port only during the booked slot. Similar process is also followed for CFS
stuffed containers. The Vehicle Booking System has helped streamline the flow
of trailers in JNPT
6.8 (b) Parking yard creation
Yard to streamline truck flow into terminal gates and reduce queuing -
Yard is required to be put in place for physical evacuation of un-cleared trucks
so that they do not obstruct the path of trucks behind them in the queue. Yard
and gate infrastructure is required to work in tandem with the berth, supporting
a seamless flow of traffic from berth to gate. Hence, potential bottlenecks at
yard and gate should be addressed to support the increased productivity at the
berth.
6.8 (c) 27% reduction in border compliance time –
Border compliance time for export includes overall container handling
time at the port from the time of entry till the vessel sailing. This export dwell
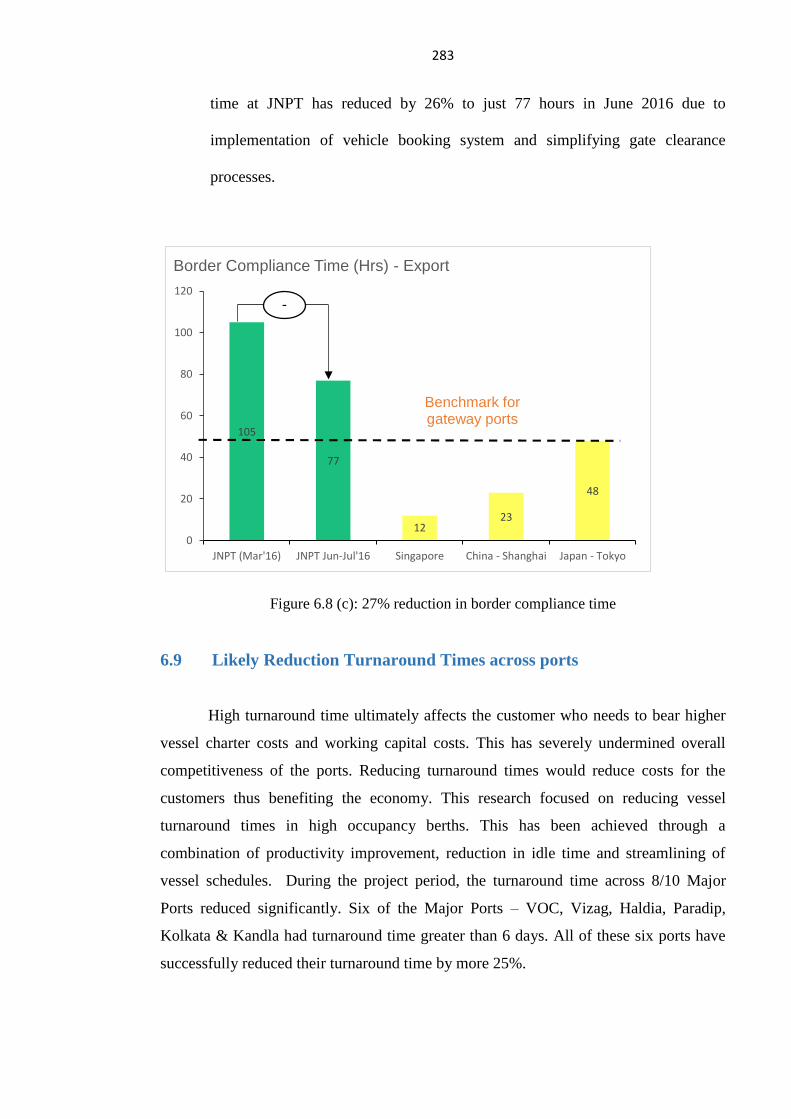
283
time at JNPT has reduced by 26% to just 77 hours in June 2016 due to
implementation of vehicle booking system and simplifying gate clearance
processes.
105
77
1223
48
0
20
40
60
80
100
120
JNPT (Mar'16) JNPT Jun-Jul'16 Singapore China - Shanghai Japan - Tokyo
Border Compliance Time (Hrs) - Export
Benchmark for gateway ports
-
Figure 6.8 (c): 27% reduction in border compliance time
6.9 Likely Reduction Turnaround Times across ports
High turnaround time ultimately affects the customer who needs to bear higher
vessel charter costs and working capital costs. This has severely undermined overall
competitiveness of the ports. Reducing turnaround times would reduce costs for the
customers thus benefiting the economy. This research focused on reducing vessel
turnaround times in high occupancy berths. This has been achieved through a
combination of productivity improvement, reduction in idle time and streamlining of
vessel schedules. During the project period, the turnaround time across 8/10 Major
Ports reduced significantly. Six of the Major Ports – VOC, Vizag, Haldia, Paradip,
Kolkata & Kandla had turnaround time greater than 6 days. All of these six ports have
successfully reduced their turnaround time by more 25%.
284
Vessel TAT (in days) FY 15-16 FY 16-17 YTD FY 17-18 Reduction
VOC 8.1 5.5 4.3 47%
Vizag 6.1 3.8 3.7 40%
Haldia 7.5 7.8 5.1 32%
Paradip 7.5 4.5 5.2 (4.3) 31%
Kolkata 6.3 4.8 4.5 27%
Kandla 6.5 4.8 4.8 26%
Mumbai 3.9 4.5 3.2 17%
Ennore 4.5 7.0 3.9 13%
NMPT 2.6 2.8 2.4 8%
JNPT 2.0 2.0 2.0 2%
Cochin 2.2 2.3 2.2 2%
Chennai 2.5 2.5 2.8 -8%
Goa 3.5 5.3 7.5 -117%
Figure 6.9: Likely Reduction Turnaround Times across ports
6.9 (b) There would be Sharp jump in productivity across high occupancy berths-
The benchmarking study of ports' performance identified significant scope for
improvement in productivity levels. The average productivity for Major Ports was
almost ~60% lower than the best in class benchmarks for conventional berths and
~120% lower in mechanized berths. The focus of the project was to unlock capacity in
the high occupancy berths with significant cargo potential. The key capacity
constrained berths were the mechanized and conventional coal handling berths in
Paradip & Haldia, the edible oil berths and dry bulk berths in Kandla, the container
terminal in JNPT. The productivity of conventional & mechanized coal berths in
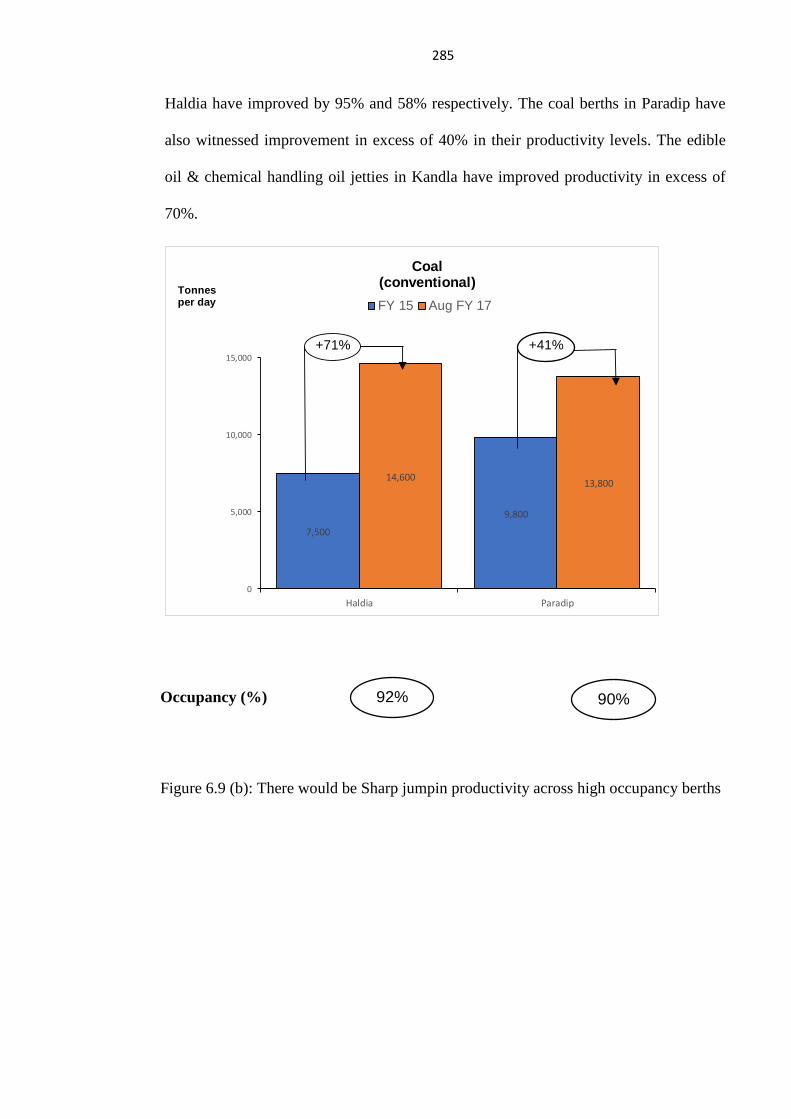
285
Haldia have improved by 95% and 58% respectively. The coal berths in Paradip have
also witnessed improvement in excess of 40% in their productivity levels. The edible
oil & chemical handling oil jetties in Kandla have improved productivity in excess of
70%.
7,500
9,800
14,60013,800
0
5,000
10,000
15,000
Haldia Paradip
Tonnes per day FY 15 Aug FY 17
+71%
Coal(conventional)
+41%
Occupancy (%)
Figure 6.9 (b): There would be Sharp jumpin productivity across high occupancy berths
92%
92%
90%
90%
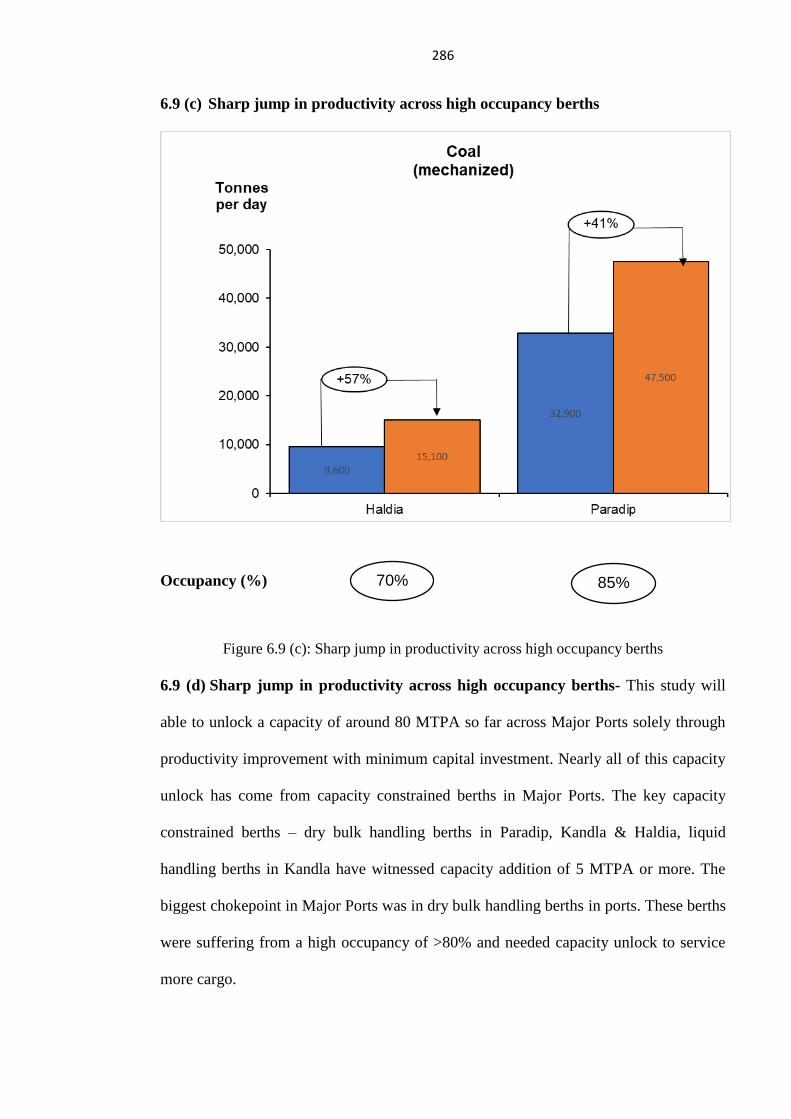
286
6.9 (c) Sharp jump in productivity across high occupancy berths
Occupancy (%)
Figure 6.9 (c): Sharp jump in productivity across high occupancy berths
6.9 (d) Sharp jump in productivity across high occupancy berths- This study will
able to unlock a capacity of around 80 MTPA so far across Major Ports solely through
productivity improvement with minimum capital investment. Nearly all of this capacity
unlock has come from capacity constrained berths in Major Ports. The key capacity
constrained berths – dry bulk handling berths in Paradip, Kandla & Haldia, liquid
handling berths in Kandla have witnessed capacity addition of 5 MTPA or more. The
biggest chokepoint in Major Ports was in dry bulk handling berths in ports. These berths
were suffering from a high occupancy of >80% and needed capacity unlock to service
more cargo.
70%
70%
85%
85%
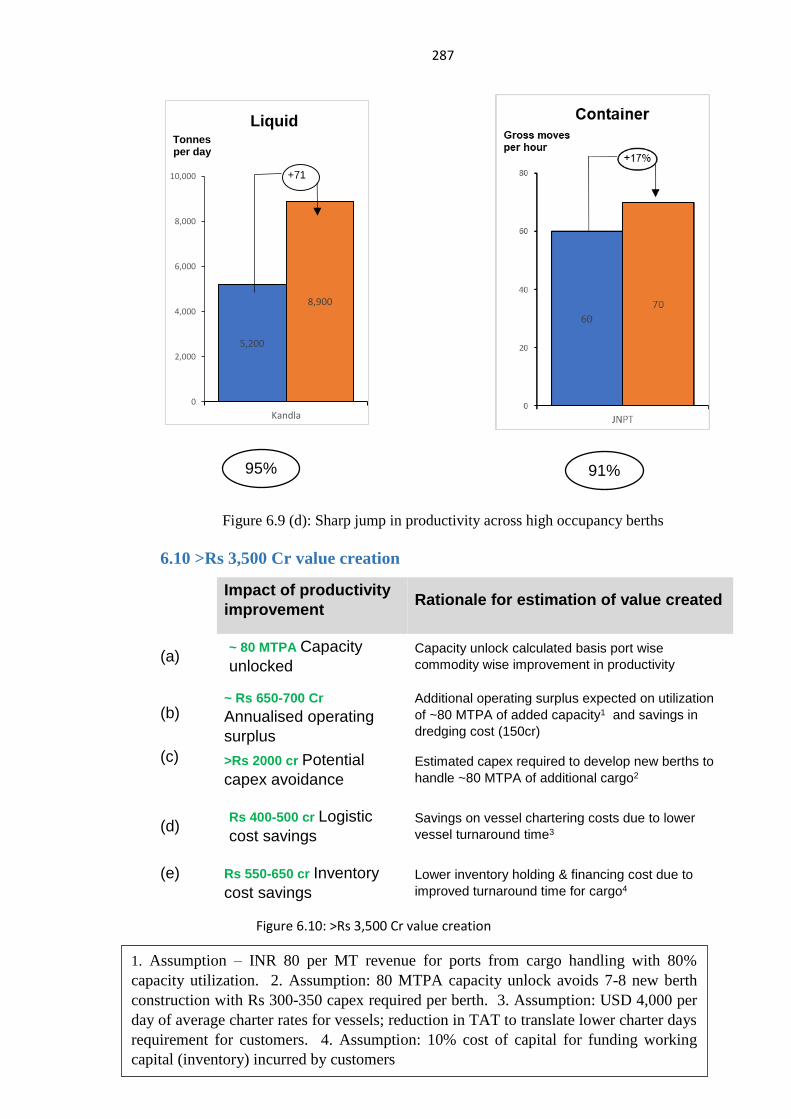
287
5,200
8,900
0
2,000
4,000
6,000
8,000
10,000
Kandla
Tonnes per day
+71
Liquid
Figure 6.9 (d): Sharp jump in productivity across high occupancy berths
6.10 >Rs 3,500 Cr value creation
Impact of productivity
improvement Rationale for estimation of value created
(a) ~ 80 MTPA Capacity
unlocked
Capacity unlock calculated basis port wise
commodity wise improvement in productivity
(b) ~ Rs 650-700 Cr
Annualised operating
surplus
Additional operating surplus expected on utilization
of ~80 MTPA of added capacity1 and savings in
dredging cost (150cr)
(c)
>Rs 2000 cr Potential
capex avoidance
Estimated capex required to develop new berths to
handle ~80 MTPA of additional cargo2
(d) Rs 400-500 cr Logistic
cost savings
Savings on vessel chartering costs due to lower
vessel turnaround time3
(e)
Rs 550-650 cr Inventory
cost savings
Lower inventory holding & financing cost due to
improved turnaround time for cargo4
Figure 6.10: >Rs 3,500 Cr value creation
95%
95%
91%
91%
1. Assumption – INR 80 per MT revenue for ports from cargo handling with 80%
capacity utilization. 2. Assumption: 80 MTPA capacity unlock avoids 7-8 new berth
construction with Rs 300-350 capex required per berth. 3. Assumption: USD 4,000 per
day of average charter rates for vessels; reduction in TAT to translate lower charter days
requirement for customers. 4. Assumption: 10% cost of capital for funding working
capital (inventory) incurred by customers
1. Assumption – INR 80 per MT revenue for ports from cargo handling with 80%
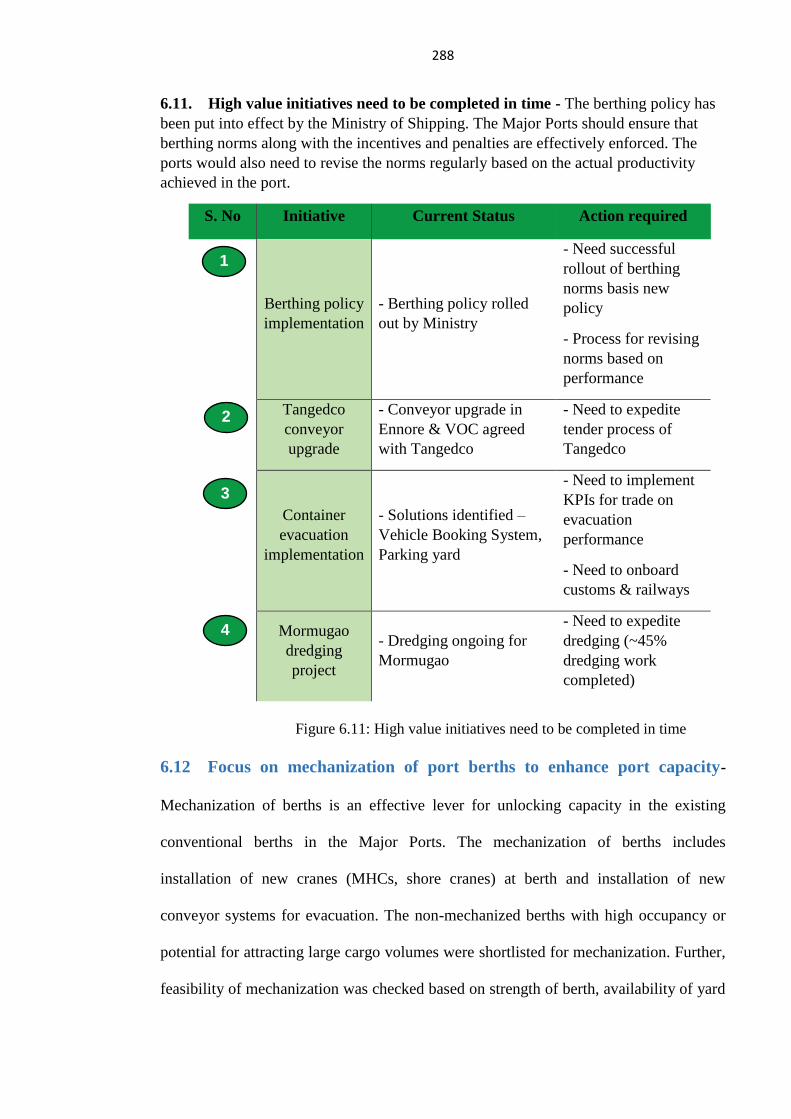
288
6.11. High value initiatives need to be completed in time - The berthing policy has
been put into effect by the Ministry of Shipping. The Major Ports should ensure that
berthing norms along with the incentives and penalties are effectively enforced. The
ports would also need to revise the norms regularly based on the actual productivity
achieved in the port.
S. No Initiative Current Status Action required
Berthing policy
implementation
- Berthing policy rolled
out by Ministry
- Need successful
rollout of berthing
norms basis new
policy
- Process for revising
norms based on
performance
Tangedco
conveyor
upgrade
- Conveyor upgrade in
Ennore & VOC agreed
with Tangedco
- Need to expedite
tender process of
Tangedco
Container
evacuation
implementation
- Solutions identified –
Vehicle Booking System,
Parking yard
- Need to implement
KPIs for trade on
evacuation
performance
- Need to onboard
customs & railways
Mormugao
dredging
project
- Dredging ongoing for
Mormugao
- Need to expedite
dredging (~45%
dredging work
completed)
Figure 6.11: High value initiatives need to be completed in time
6.12 Focus on mechanization of port berths to enhance port capacity-
Mechanization of berths is an effective lever for unlocking capacity in the existing
conventional berths in the Major Ports. The mechanization of berths includes
installation of new cranes (MHCs, shore cranes) at berth and installation of new
conveyor systems for evacuation. The non-mechanized berths with high occupancy or
potential for attracting large cargo volumes were shortlisted for mechanization. Further,
feasibility of mechanization was checked based on strength of berth, availability of yard
1
1
2
2 3
3
4
4
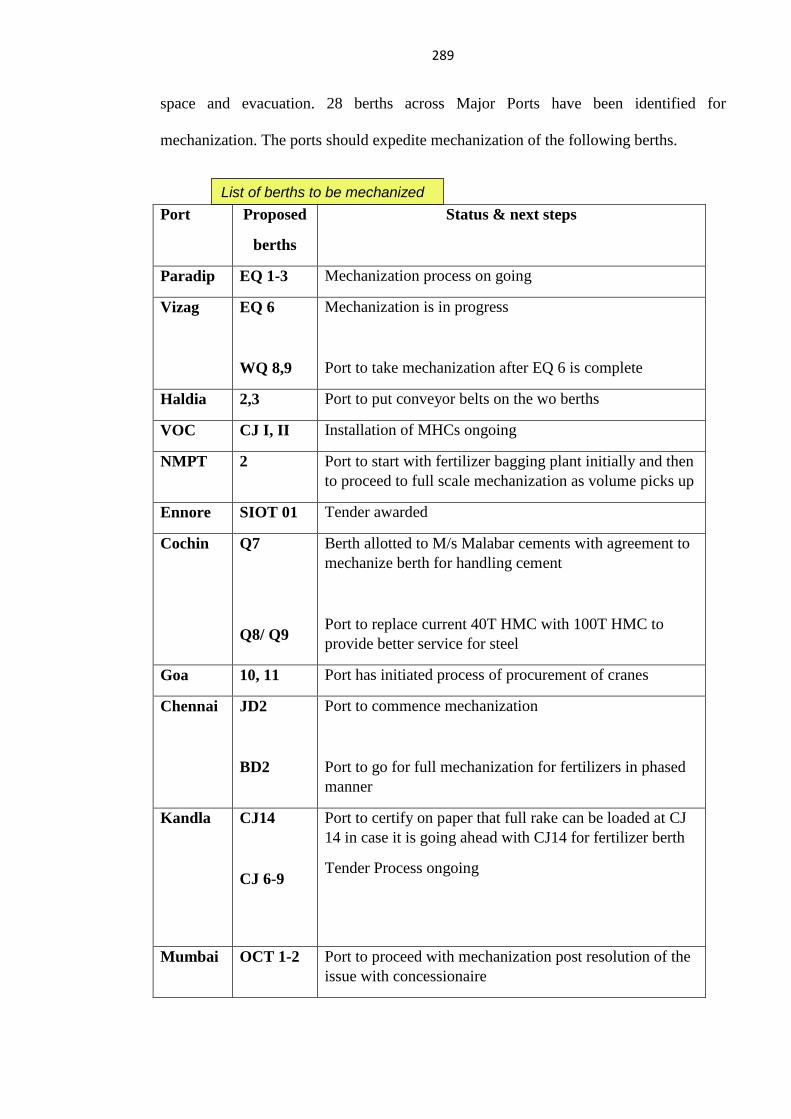
289
space and evacuation. 28 berths across Major Ports have been identified for
mechanization. The ports should expedite mechanization of the following berths.
Port Proposed
berths
Status & next steps
Paradip EQ 1-3 Mechanization process on going
Vizag EQ 6
WQ 8,9
Mechanization is in progress
Port to take mechanization after EQ 6 is complete
Haldia 2,3 Port to put conveyor belts on the wo berths
VOC CJ I, II Installation of MHCs ongoing
NMPT 2 Port to start with fertilizer bagging plant initially and then
to proceed to full scale mechanization as volume picks up
Ennore SIOT 01 Tender awarded
Cochin Q7
Q8/ Q9
Berth allotted to M/s Malabar cements with agreement to
mechanize berth for handling cement
Port to replace current 40T HMC with 100T HMC to
provide better service for steel
Goa 10, 11 Port has initiated process of procurement of cranes
Chennai JD2
BD2
Port to commence mechanization
Port to go for full mechanization for fertilizers in phased
manner
Kandla CJ14
CJ 6-9
Port to certify on paper that full rake can be loaded at CJ
14 in case it is going ahead with CJ14 for fertilizer berth
Tender Process ongoing
Mumbai OCT 1-2 Port to proceed with mechanization post resolution of the
issue with concessionaire
List of berths to be mechanized
List of berths to be mechanized
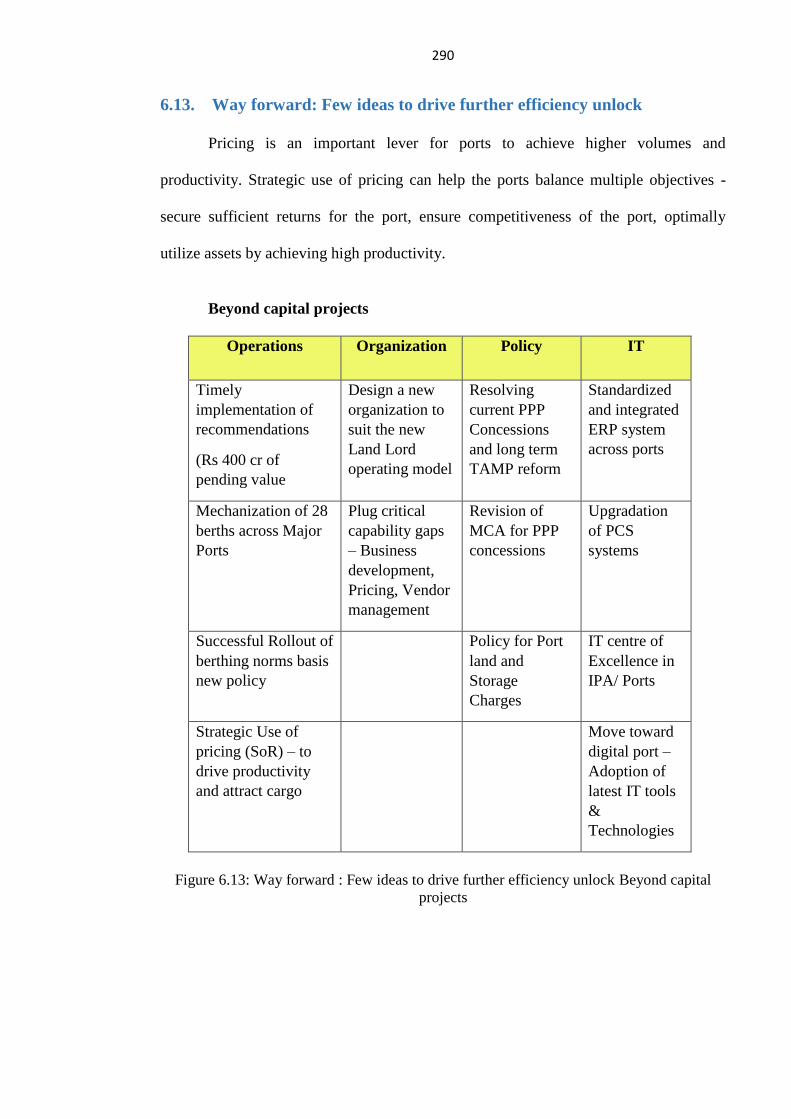
290
6.13. Way forward: Few ideas to drive further efficiency unlock
Pricing is an important lever for ports to achieve higher volumes and
productivity. Strategic use of pricing can help the ports balance multiple objectives -
secure sufficient returns for the port, ensure competitiveness of the port, optimally
utilize assets by achieving high productivity.
Beyond capital projects
Operations Organization Policy IT
Timely
implementation of
recommendations
(Rs 400 cr of
pending value
Design a new
organization to
suit the new
Land Lord
operating model
Resolving
current PPP
Concessions
and long term
TAMP reform
Standardized
and integrated
ERP system
across ports
Mechanization of 28
berths across Major
Ports
Plug critical
capability gaps
– Business
development,
Pricing, Vendor
management
Revision of
MCA for PPP
concessions
Upgradation
of PCS
systems
Successful Rollout of
berthing norms basis
new policy
Policy for Port
land and
Storage
Charges
IT centre of
Excellence in
IPA/ Ports
Strategic Use of
pricing (SoR) – to
drive productivity
and attract cargo
Move toward
digital port –
Adoption of
latest IT tools
&
Technologies
Figure 6.13: Way forward : Few ideas to drive further efficiency unlock Beyond capital
projects
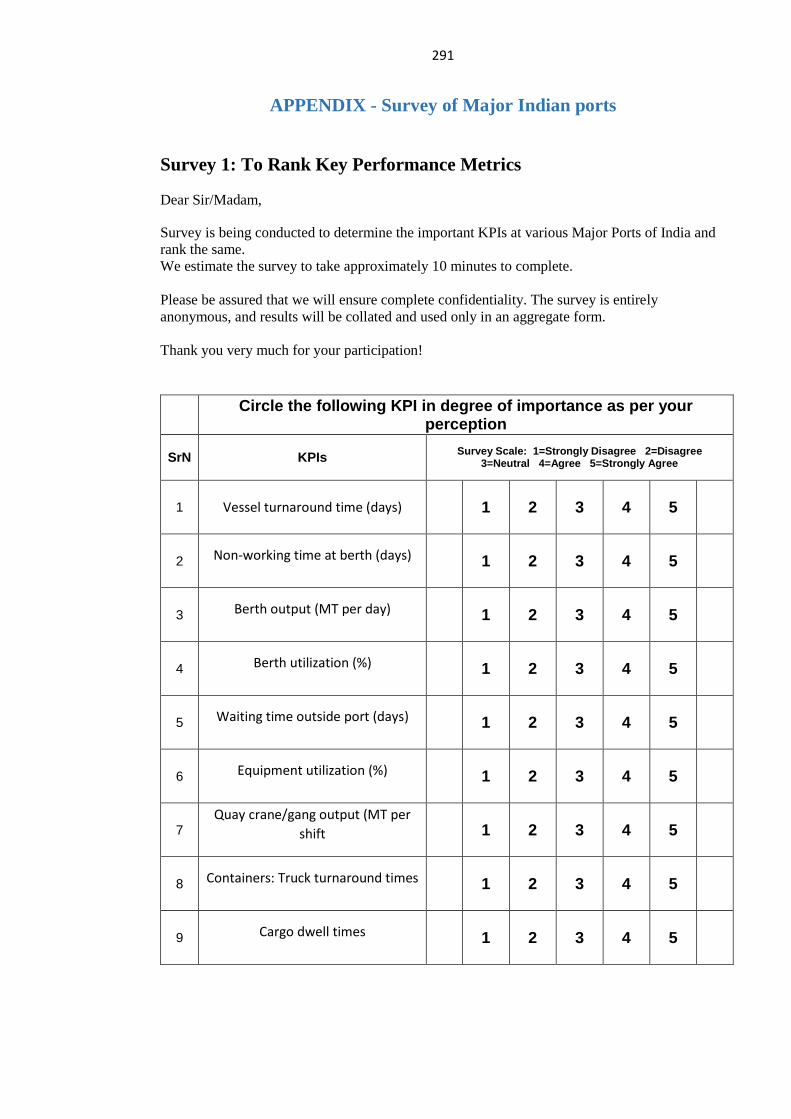
291
APPENDIX - Survey of Major Indian ports
Survey 1: To Rank Key Performance Metrics
Dear Sir/Madam,
Survey is being conducted to determine the important KPIs at various Major Ports of India and
rank the same.
We estimate the survey to take approximately 10 minutes to complete.
Please be assured that we will ensure complete confidentiality. The survey is entirely
anonymous, and results will be collated and used only in an aggregate form.
Thank you very much for your participation!
Circle the following KPI in degree of importance as per your
perception
SrN KPIs Survey Scale: 1=Strongly Disagree 2=Disagree
3=Neutral 4=Agree 5=Strongly Agree
1 Vessel turnaround time (days) 1 2 3 4 5
2 Non-working time at berth (days) 1 2 3 4 5
3 Berth output (MT per day) 1 2 3 4 5
4 Berth utilization (%) 1 2 3 4 5
5 Waiting time outside port (days) 1 2 3 4 5
6 Equipment utilization (%) 1 2 3 4 5
7 Quay crane/gang output (MT per
shift 1 2 3 4 5
8 Containers: Truck turnaround times 1 2 3 4 5
9 Cargo dwell times 1 2 3 4 5
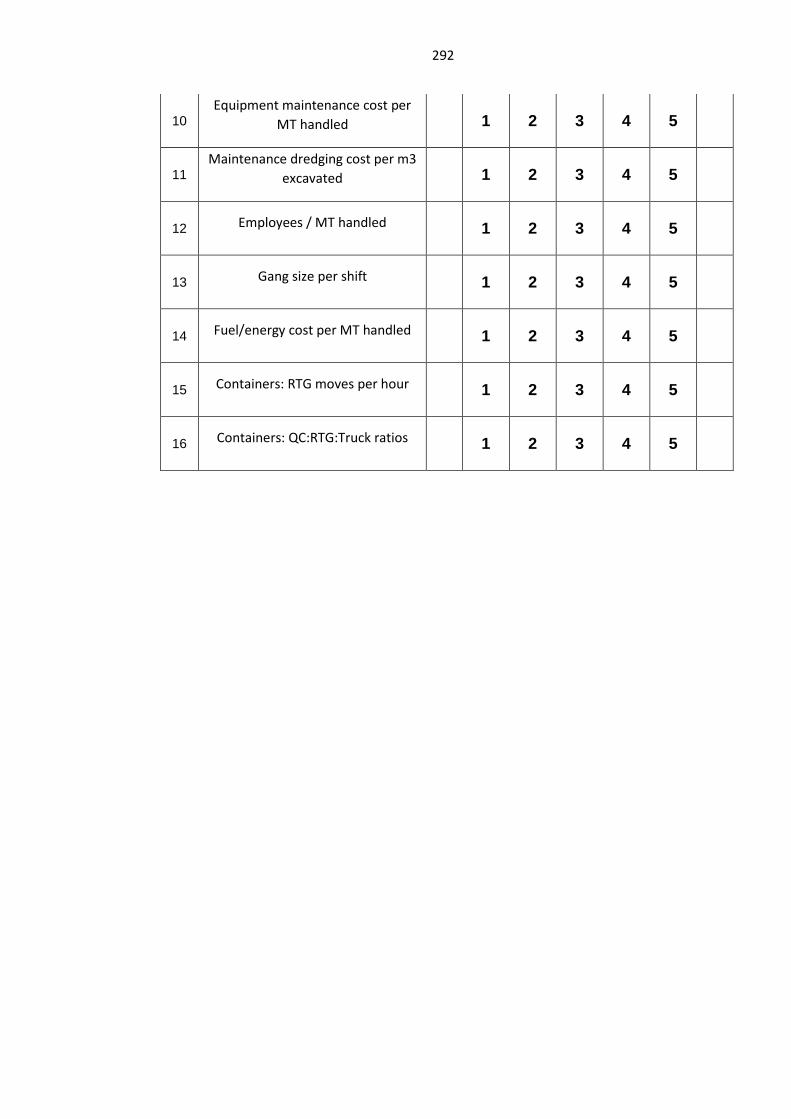
292
10
Equipment maintenance cost per
MT handled 1 2 3 4 5
11
Maintenance dredging cost per m3
excavated 1 2 3 4 5
12 Employees / MT handled 1 2 3 4 5
13 Gang size per shift 1 2 3 4 5
14 Fuel/energy cost per MT handled 1 2 3 4 5
15 Containers: RTG moves per hour 1 2 3 4 5
16 Containers: QC:RTG:Truck ratios 1 2 3 4 5
293
Survey 2: Customer Satisfaction Survey
Dear Sir/Madam,
The survey is being conducted to assess the satisfaction level of the stakeholders and also to
identify and prioritize areas of improvement for the port.
We estimate the survey to take approximately 30 minutes to complete.
Please be assured that we will ensure complete confidentiality. The survey is entirely
anonymous, and results will be collated and used only in an aggregate form.
Thank you very much for your participation!
Section 1. Introduction
In this section we would like to understand your profile and overall experience while dealing
with the port. Please answer the following information before you start this survey, and
remember that all information will be handled completely anonymously.
1) Which of the following types of main port stakeholders do you work for (or have
worked for in the past 2 years)
a) Vessel operator
b) Vessel handling agent
c) Bulk cargo handling agent
d) Container freight station
e) Private berth operator, e.g. dedicated coal berth
f) End user – importer/ exporter
g) None of above
Terminate if respondent selects option g.
2) Which of the following commodities represent your largest business interest at
(Name) Port?
a) Containers
b) Dry bulk
c) Liquid bulk
d) Project Cargo
3) Generally, which of the following terminals do you work with? (Please select up to
four terminals)
a)
b)
c)
d)
4) Apart from (Name) Port, do you frequently work with any other international port?
Please mention up to three
a)
b)
c)
5) What is your role in the company?
294
a) Senior management, i.e. CEO, COO, VPs etc
b) Operations
c) Business development
d) Others, please specify
6) How often does the port interact with you to resolve your issues?
a) Once a week
b) Once a fortnight
c) Once a month
d) Once a quarter
e) None of the above
7) How strongly do you believe that your overall business experience with port has
improved in past six months?
a) Strong improvement
b) Somewhat improvement
c) No improvement
d) Somewhat deterioration
e) Definitely deterioration
8) Generally, how do you access information about any changes/ new procedures/
clarifications in the port operating procedures?
a) It is present over internet
b) It is provided to me as hard copy
c) I have to discuss with port officers
d) I have to discuss with my colleagues
e) I am generally not aware about any changes/ new procedures/ clarification
9) Do you believe that the port is trade friendly?
a) Yes
b) Probably yes
c) Probably no
d) No
10) What are the Top Two improvements required in port ecosystem (Including -
terminal, port, transporter, CFS, CHA, Customs, Banks, Infrastructure, Law & Order,
Skill, IT Systems OR any other related areas)?
1.
2.
11) What are the Top Two achievements of port ecosystem (Including - terminal, port,
transporter, CFS, CHA, Customs, Banks, Infrastructure, Law & Order, Skill, IT
Systems OR any other related areas)?
Section 2. Documentation
12) Does preparation and approval of EXIM documentation take a lot of time for you?
a) No, it is fairly straight forward
b) It takes manageable time
c) Yes, it takes a lot of time
d) Not applicable
295
13) Generally, for a frequent exporter, how long does it take to prepare customs
mandated documents?
a) <1 Day
b) 1-2 Days
c) 2-3 Days
d) 3-4 Days
e) 4 Days+
f) Not applicable for me
14) How long does it generally take to receive all customs approvals for export?
a) <1 Day
b) 1-2 Days
c) 2-3 Days
d) 3-4 Days
e) 4 Days+
f) Not applicable for me
15) Generally, for a frequent importer, how long does it take to prepare/collect customs
mandated documents?
a) <1 Day
b) 1-2 Days
c) 2-3 Days
d) 3-4 Days
e) 4 Days+
f) Not applicable for me
16) How long does it generally take to receive all customs approvals for import?
a) <1 Day
b) 1-2 Days
c) 2-3 Days
d) 3-4 Days
e) 4 Days+
f) Not applicable for me
17) For the other international ports that you deal with, how long does it generally take
to secure customs approval? Please provide up to three -
Name of Port Document Approval
time by Customs
(Hours)
18) Can you collect, prepare and submit export related customs documents
electronically?
a) Mostly all the documents
b) Some of the documents
c) Rarely any document
d) Never, all documents are manually collected and prepared
296
19) Can you collect, prepare and submit port related documents electronically?
a) Mostly all the documents
b) Some of the documents
c) Rarely any document
d) Never, all documents are manually collected and prepared
20) How frequently do you have to manually transfer documents from shipping lines to
customs and vice versa?
a) Always
b) Sometimes
c) Never
21) How frequently do you have to manually transfer documents from ports to customs
and vice versa?
d) Always
e) Sometimes
f) Never
22) How frequently do you have to manually transfer documents from ports to shipping
lines and vice versa?
g) Always
h) Sometimes
i) Never
23) Generally, which documents are manually processed? (Include documents
submitted /approved /obtained manually by agencies or involving manual
movement by handling agents/ other stakeholders)
Name of Agency Manually Processed Documents
Customs
Port
Shipping line
24) How long does it take to prepare all documents required by shipping lines?
a) <1 Day
b) 1-2 Days
c) 2-3 Days
d) 3-4 Days
e) 4 Days+
f) Not applicable for me
25) How long does it take to prepare all documents required by shipping lines?
a) <1 Day
b) 1-2 Days
c) 2-3 Days
d) 3-4 Days
e) 4 Days+
26) How can the Government improve documentation procedures/ approval?
297
________________________________________________________________
Section 3. Cost
27) Are all handling charges, duties and taxes to import and export clearly understood
and consistently levied?
a) Clear and consistent
b) Clear but not consistent
c) Generally consistent, but I am not clear how to verify if I paid as per rules
d) I am not clear and they are not consistent
e) I do not manage EXIM cost related matters
28) Which of the following EXIM charges need further clarity?
a) Port charges
b) Customs duties
c) Other taxes
d) All EXIM charges are clearly understood
e) None of the above, please specify
29) Do you receive receipts for all expenses incurred for export/ import transaction?
a) Yes
b) No
30) Do you receive receipts for all expenses incurred inside of port premises?
a) Yes
b) No
Section 4. Border handling time at Port
31) How long does it generally take for the truck to get into the port entry queue from
the time it leaves CFS/ parking yard?
a) 1-2 Hours
b) 2-4 Hours
c) 4-6 Hours
d) 6 Hours +
e) I do not deal with truck movements in and out of the port
32) How long does it generally take for the truck to enter the port premises once it
reaches the port gate queue
a) < 15 Minutes
b) 15 – 30 Minutes
c) 30 – 60 Minutes
d) 60 – 90 Minutes
e) 90 Minutes +
f) I do not deal with truck movements in and out of the port
33) What is the typical truck turnaround time in the port
298
a) < 60 Minutes
b) 60 – 90 Minutes
c) 90– 120 Minutes
d) 120 – 180 Minutes
e) 180 Minutes +
f) I do not deal with truck movements in and out of the port
34) On a scale from most to least satisfied, please rate your satisfaction level of the
following attributes with ports in general?
Scale from 1 to 5: 5 is the very satisfied and 1 is the very dissatisfied. Not
applicable option also provided.
[Depending on the importance of various capabilities selected above, the sequence
and number of questions will vary]
Turnaround time
How satisfied are you with pre-berthing delays?
How satisfied are you with the vessel turnaround times at the port?
35) What is the typical vessel turnaround time for the other international ports that you
deal with? Please provide up to three -
Name of Port Most Frequently
Handled Cargo
Type for You
Most
Frequently
Handled Cargo
Size
Turn Around
Time (Hours)
Section 5. Port operations
36) On a scale from most to least satisfied, please rate your satisfaction level of the
following attributes with ports in general?
Scale from 1 to 5: 5 is the very satisfied and 1 is the very dissatisfied. Not
applicable option also provided.
[Depending on the importance of various capabilities selected above, the sequence
and number of questions will vary]
Availability of berths suitable for your purposes
How satisfied are you with the berths available at the port, incl. number and
draft?
How satisfied are you with the availability of berths upon arrival?
How satisfied are you with the time it takes for the port to assign you a berth?

299
How satisfied are you with the time it takes to evacuate your cargo from port?
How satisfied are you with the time it takes for your cargo to reach to yard once
it enters the port are?
Thank you very much for participating in the survey!
Please provide any other feedback that you may have for the port –
______________________________________________________________________
300
References
Adebanjo, D., Abbas, A., & Mann, R. (2010). An investigation of the adoption and
implementation of benchmarking. International Journal of Operations & Production
Management, 30(11), 1140–1169. http://doi.org/10.1108/01443571011087369
Ajelabi, I., & Tang, Y. (2010). The Adoption of Benchmarking Principles for Project
Management Performance Improvement. International Journal of Public Sector
Management, 1(2), 1–8. Retrieved from
http://airccse.org/journal/mpict/papers/1210ijmpict01.pdf
Al-Eraqi, A. S., Mustafa, A., & Khader, A. T. (2010). An extended DEA windows
analysis: Middle East and East African seaports. Journal of Economic Studies, 37(2),
208–218. http://doi.org/10.1108/01443581011043591
Andersen, B., & Moen, R. M. (1999). Integrating benchmarking and poor quality cost
measurement for assisting the quality management work. Benchmarking: An
International Journal, 6(4), 291–301. http://doi.org/10.1108/14635779910288541
Anderson, K., & McAdam, R. (2005). An empirical analysis of lead benchmarking and
performance measurement: Guidance for qualitative research. International Journal of
Quality & Reliability Management, 22(4), 354–375.
http://doi.org/10.1108/02656710510591200
Anfindsen, O. J., Løvoll, G., & Mestl, T. (2012). Benchmarking of marine bunker fuel
suppliers: the good, the bad, the ugly. Benchmarking: An International Journal, 19(1),
109–125. http://doi.org/10.1108/14635771211218399 artigo4.pdf. (n.d.).
Austin, L. M. (2005). Benchmarking to economic value added: The case of Airways
Corporation of New Zealand Limited. Benchmarking: An International Journal, 12(2),
138–150. http://doi.org/10.1108/14635770510593086
301
Bagchi, P. K. (1996a). Role of benchmarking as a competitive strategy: the logistics
experience. International Journal of Physical Distribution & Logistics Management,
26, 4–22. http://doi.org/10.1108/09600039610113173
Bagchi, P. K. (1996b). Role of benchmarking as a competitive strategy: the logistics
experience. International Journal of Physical Distribution & Logistics Management,
26(1), 4–22. http://doi.org/10.1108/09600039610113173
Bagchi, P. K., & Paik, S.-K. (2001). The role of public-private partnership in port
information systems development. International Journal of Public Sector
Management, 14, 482–499. http://doi.org/10.1108/EUM0000000005965
Bauer, J., Tanner, S. J., & Neely, A. (2004). Developing a performance measurement
audit template - A benchmarking study. Measuring Business Excellence, 8(4), 17–25.
http://doi.org/10.1108/13683040410569370
Benchmarking. (n.d.). Retrieved December 3, 2015, from
http://www.adi.pt/docs/innoregio_benchmarking-en.pdf
Benchmarking, S. (2003). Speaker : Gordon Rankine CEng FICE MIStructE , Director
Beckett Rankine Partnership , UK. New York, (February), 1–18.
Benchmarking South African Ports : container and automotive terminals Table of
Contents 2 . Container benchmarking : global trends with container traffic ...... 8
Figures and Tables. (2014).
Bergantino, A. S., & Musso, E. (2011). The role of external factors versus managerial
ability in determining seaports' relative efficiency: An input-by-input analysis through
a multi-step approach on a panel of Southern European Ports. Maritime Economics &
Logistics, 121-141.
Bhanot, N., & Singh, H. (2014). Benchmarking the performance indicators of Indian
Railway container business using data envelopment analysis.
http://doi.org/10.1108/BIJ-05-2012-0031
302
Bhutta, K. S., & Huq, F. (1999). Benchmarking – best practices: an integrated
approach. Benchmarking: An International Journal, 6(3), 254–268.
http://doi.org/10.1108/14635779910289261
Björklund, M. (2010). Benchmarking tool for improved corporate social responsibility
in purchasing. Benchmarking: An International Journal, 17(3), 340–362.
http://doi.org/10.1108/14635771080001427
Blanchard, C., Comm, C. L., & Mathaisel, D. F. X. (2008). Adding value to service
providers: benchmarking Wal-Mart. Benchmarking: An International Journal, 15(2),
166–177. http://doi.org/10.1108/14635770810864875
Boulter, L. (2003). Legal issues in benchmarking. Benchmarking: An International
Journal, 10(6), 528–537. http://doi.org/10.1108/14635770310505166
Briceño-garmendia, C., & Bofinger, H. C. (2015). OECS Ports An Efficiency and
Performance Assessment, (January).
Cao, X. R. (2006). A Framework for Benchmarking Haptic Systems. Retrieved from
http://www2.fas.sfu.ca/ftp/pub/cs/theses/2006/XiaoRuiCaoMSc.pdf
Cappelli, L., Guglielmetti, R., Mattia, G., Merli, R., & Renzi, M. F. (2011). Peer
evaluation to develop benchmarking in the public sector. Benchmarking: An
International Journal, 18(4), 490–509. http://doi.org/10.1108/14635771111147605
Chambers, A. (2006). Assurance of performance. Measuring Business Excellence,
10(3), 41–55. http://doi.org/10.1108/13683040610685784
Chan, F. T. S., Chan, H. K., Lau, H. C. W., & Ip, R. W. L. (2006). An AHP approach
in benchmarking logistics performance of the postal industry. Benchmarking: An
International Journal, 13, 636–661. http://doi.org/10.1108/14635770610709031
Chen, H.-L. (2005). A competence-based strategic management model factoring in key
success factors and benchmarking. Benchmarking: An International Journal, 12(4),
364–382. http://doi.org/10.1108/14635770510609033
303
Cheon, S. (2007). World port institutions and productivity. Zhurnal Eksperimental’noi
I Teoreticheskoi Fiziki. Retrieved from
http://scholar.google.com/scholar?hl=en&btnG=Search&q=intitle:No+Title#0
Chung, W., Hui, Y. V., & Lam, Y. M. (2006). Benchmarking the energy efficiency of
commercial buildings. http://doi.org/10.1016/j.apenergy.2004.11.003
Chung, W. K. (2014). Benchmarking Singapore ’ s high-TQM maturity organisations.
Codling, B. S. (1997). Dynamics of best practice - a multidimensional perspective.
Benchmarking for Quality Management & Technology, 4(2), 96–103.
http://doi.org/10.1108/14635779710174936
Commission, E. (2013). Final Report, 1–186.
Cross, R., & Iqbal, A. (1995). Benchmarking: Theory and practice. Retrieved
December 3, 2015, from http://www.aqa.ac.nz/sites/all/files/asq5.pdf
Cuadrado, M., Frasquet, M., & Cervera, A. (2004a). Benchmarking the port services: a
customer oriented proposal. Benchmarking: An International Journal, 11(3), 320–330.
http://doi.org/10.1108/14635770410538781
Cuadrado, M., Frasquet, M., & Cervera, A. (2004b). Benchmarking the port services: a
customer oriented proposal. Benchmarking: An International Journal, 11(3), 320–330.
http://doi.org/10.1108/14635770410538781
Danish Shipowners Association. (2014). Benchmark of Maritime Nations : A
comparison of Denmark with Singapore and Hong Kong.
Dattakumar, R., & Jagadeesh, R. (2003). A review of literature on benchmarking.
Benchmarking: An International Journal (Vol. 10).
http://doi.org/10.1108/14635770310477744
Defoe, D. (2003). The Storm.
304
Deshpande, P. J., Yalcin, A., Zayas-Castro, J., & Herrera, L. E. (2007). Simulating
less-than-truckload terminal operations. Benchmarking: An International Journal,
14(1), 92–101. http://doi.org/http://dx.doi.org/10.1108/14635770710730955
Dias, J. C. Q., Azevedo, S. G., Ferreira, J., & Palma, S. F. (2009). A comparative
benchmarking analysis of main Iberian container terminals: a DEA approach.
International Journal of Shipping and Transport Logistics, 1(3), 260–275.
http://doi.org/10.1504/IJSTL.2009.027534
Dolan, E. D., & Moré, J. J. (2002). Benchmarking optimization software
with performance profiles. http://doi.org/10.1007/s101070100263
Dubey, R., Singh, T., Samar Ali, S., Venkatesh, V. G., & K. Gupta, O. (2014).
Exploring dimensions of firm competencies and their impact on performance.
Benchmarking, 21(6), 1003. http://doi.org/10.1108/BIJ-03-2013-0027
Ducruet, C., Itoh, H., & Merk, O. (2014). Time Efficiency at World Container Ports.
International Transport Forum Discussion Papers, (2014-08). Retrieved from
www.internationaltransportforum.org/jtrc/DiscussionPapers/jtrcpapers.html\nwww.inte
rnationaltransportforum.org
Elmuti, D., & Kathawala, Y. (1997). An overview of benchmarking process: a tool for
continuous improvement and competitive advantage. Benchmarking: An International
Journal, 4(4), 229–243. http://doi.org/10.1108/14635779710195087
Erasmus, D. K., & Rotterdam, U. (2015). the Applicability of Data Envelopment
Analysis To the Benchmarking of Container Terminals, (October).
Feng, M., Mangan, J., & Lalwani, C. (2012). Comparing port performance: Western
European versus Eastern Asian ports. International Journal of Physical Distribution &
Logistics Management, 42(5), 490–512. http://doi.org/10.1108/09600031211246537
Festel, G., & W??rmseher, M. (2014). Benchmarking of energy and utility
infrastructures in industrial parks. Journal of Cleaner Production (Vol. 70).
http://doi.org/10.1016/j.jclepro.2014.01.101
305
Fhoilsiu, A., Dhi, O., Alliance, T. S. U. N., Ranno, A. N., By, P., Stationery, T. H. E.,
… Section, P. T. (2002). Report of the Public Service Benchmarking Body. Personnel,
(June).
Fong, S. W., Cheng, E. W. L., & Ho, D. C. K. (1998). Benchmarking: a general
reading for management practitioners. Management Decision, 36(6), 407–418.
http://doi.org/10.1108/00251749810223646
Freytag, P. V., & Hollensen, S. (2001). The process of benchmarking, benchlearning
and benchaction. The TQM Magazine, 13(1), 25–34.
http://doi.org/10.1108/09544780110360624
Fry, J., Humphreys, I., & Francis, G. (2005). Benchmarking in civil aviation: some
empirical evidence. Benchmarking: An International Journal, 12(2), 125–137.
http://doi.org/10.1108/14635770510593077
Fuchs, M., & Weiermair, K. (2004). Destination Benchmarking: An Indicator-
System’s Potential for Exploring Guest Satisfaction. Journal of Travel Research,
42(3), 212–225. http://doi.org/10.1177/0047287503258827
Fuente, J. D. La, Santiago, J., Román, A., Dumitrache, C., & Casasanto, D. (2014).
When you think about it, your past is in front of you: How culture shapes spatial
conceptions of time. Psychological Science, 25(9), 1682–1690.
http://doi.org/10.1007/s13398-014-0173-7.2
Gammelgaard, B., Sornn-friese, H., Hansen, J., Jessen, M., & Larsen, M. (2013).
Competencies in the Danish Maritime Cluster : A benchmarking-analysis.
Gebauer, H., Friedli, T., & Fleisch, E. (2006). Success factors for achieving high
service revenues in manufacturing companies. Benchmarking: An International
Journal, 13(3), 374–386. http://doi.org/10.1108/14635770610668848
Goncharuk, A. G. (2008). Performance benchmarking in gas distribution industry.
Benchmarking: An International Journal, 15(5), 548–559.
http://doi.org/10.1108/14635770810903141
306
Graham, A. (2005). Airport benchmarking: a review of the current situation.
Benchmarking: An International Journal, 12(2), 99–111.
http://doi.org/10.1108/14635770510593059
Griffin, A. (1997). PDMA Research on New Product Development Practices: Updating
Trends and Benchmarking Best Practices. http://doi.org/10.1111/1540-5885.1460429
Grove, S. J., Fisk, R. P., Pickett, G. M., & Kangun, N. (1996). Going green in the
service sector: Social responsibility issues, implications and implementation.
http://doi.org/10.1108/03090569610118777
Haugland, S. A., Myrtveit, I., & Nygaard, A. (2007). Market orientation and
performance in the service industry: A data envelopment analysis. Journal of Business
Research, 60(11), 1191–1197. http://doi.org/10.1016/j.jbusres.2007.03.005
Henderson-Smart, C., Winning, T., Gerzina, T., King, S., & Hyde, S. (2006).
Benchmarking learning and teaching: Developing a method. Quality Assurance in
Education, 14(2), 143–155. http://doi.org/10.1108/09684880610662024
Higher Education Statistics Agency. (2010). Benchmarking to improve efficiency
Status Report. Higher Education Statistics Agency, (November).
Hilmola, O.-P. (2011). Benchmarking efficiency of public passenger transport in larger
cities. Benchmarking: An International Journal, 18, 23–41.
http://doi.org/10.1108/14635771111109805
Hinton, M., Francis, G., & Holloway, J. (2000). Best practice benchmarking in the UK.
Benchmarking: An International Journal, 7(1), 52–61.
http://doi.org/10.1108/14635770010314954
Holloway, J., & Hinton, M. (1908). Why Benchmark? Understanding the Process of
Best Practice Benchmarking, 1–19.
http://www.tanzania.go.tz/egov_uploads/documents/
portsperformanceindicatorsandbenchmarks_sw.pdf. (n.d.).
307
Islam, S., & Olsen, T. (2014). Truck-sharing challenges for hinterland trucking
companies: A case of the empty container truck trips problem. Business Process
Management Journal (Vol. 20). http://doi.org/10.1108/BPMJ-03-2013-0042
Jackson, N. (2001). Benchmarking in UK HE: an overview. Quality Assurance in
Education, 9(4), 218–235. http://doi.org/10.1108/09684880110411955
Jaques, M., & Povey, B. (2007). Assessing the Changing Role, Attitudes and
Knowledge of UK Business Advisors to the Benefits of Benchmarking and
Benchmarking Tools. Benchmarking: An International Journal, 14(5), 639–661.
http://doi.org/10.1108/14635770710819308
Jeanette, R. (2008). Benchmarking in public procurement. Benchmarking: An
International Journal, 15(6), 782–793. http://doi.org/10.1108/14635770810915940
Jiang, B., & Li, J. (2009). DEA-based performance measurement of seaports in
northeast Asia: Radial and non-radial approach. Asian Journal of Shipping and
Logistics, 25(2), 219–236. http://doi.org/10.1016/S2092-5212(09)80003-5
Jim Wu, Y., & Lin, C. (2008a). National port competitiveness: implications for India.
Management Decision, 46(10), 1482–1507.
http://doi.org/10.1108/00251740810920001
Jim Wu, Y., & Lin, C. (2008b). National port competitiveness: implications for India.
Management Decision, 46(10), 1482–1507.
http://doi.org/10.1108/00251740810920001
Joo, S.-J., & L. Fowler, K. (2014). Exploring comparative efficiency and determinants
of efficiency for major world airlines. Benchmarking: An International Journal, 21(4),
675–687. http://doi.org/10.1108/BIJ-09-2012-0054
Kannan, V. (2010). Benchmarking the service quality of ocean container carriers using
AHP. Benchmarking: An International Journal, 17(5), 637–656.
http://doi.org/10.1108/14635771011076416
308
Kannan, V., Bose, S. K., & Kannan, N. G. (2012). Improving the service quality of
ocean container carriers: an Indian case study. Benchmarking: An International
Journal, 19(6), 709–729. http://doi.org/10.1108/14635771211284288
Kendall, K., & Sigma, S. (1999). Benchmarking from A to Z Benchmark ( n .),
(November). Retrieved from http://www.orau.gov/pbm/presentation/kendall.pdf
Kia, M., Shayan, E., & Ghotb, F. (2000). The importance of information technology in
port terminal operations. International Journal of Physical Distribution & Logistics
Management, 30(3/4), 331–344. http://doi.org/10.1108/09600030010326118
Koster, M. B. M. De, Balk, B. M., & Nus, W. T. I. Van. (2009). On using DEA for
benchmarking container terminals. International Journal of Operations & Production
Management, 29(11), 1140–1155. http://doi.org/10.1108/01443570911000168
Kouzmin, A., Löffler, E., Klages, H., & Korac-Kakabadse, N. (1999). Benchmarking
and performance measurement in public sectors: Towards learning for agency
effectiveness. International Journal of Public Sector Management, 12(2), 121–144.
http://doi.org/10.1108/09513559910263462
KPMG. (2012). UK Banks : Performance Benchmarking Report, 62.
Kyrö, P. (2003). Revising the concept and forms of benchmarking. Benchmarking: An
International Journal, 10(3), 210–225. http://doi.org/10.1108/14635770310477753
Laisi, M., Hilmola, O.-P., & Sutela, M. (2012). North European
companies\textbackslashtextbar!\textbackslashtextbar#39; relation with Russia and
China: future outlook on transport flows. Benchmarking: An International Journal,
19(1), 11–31. http://doi.org/http://dx.doi.org/10.1108/14635771211218326
Landscape, R. M. (2011). South African Maritime Safety Authority ( SAMSA )
Maritime Sector Skills Development Study, (September).
Lee, W.-S. (2008). Benchmarking the energy efficiency of government buildings with
data envelopment analysis. http://doi.org/10.1016/j.enbuild.2007.07.001
309
Lee, Y. P., Zailani, S., & Soh, K. L. (2006). Understanding factors for benchmarking
adoption: New evidence from Malaysia. Benchmarking: An International Journal,
13(5), 548–565. http://doi.org/10.1108/14635770610690401
Lin, C. (2005). Service quality and prospects for benchmarking: Evidence from the
Peru water sector. Utilities Policy, 13(3), 230–239.
http://doi.org/10.1016/j.jup.2005.04.002
Lobo, I., & Zairi, M. (1999). Competitive benchmarking in the air cargo industry: Part
III. Benchmarking: An International Journal, 6(4), 302–309.
http://doi.org/10.1108/14635779910297406
Longbottom, D. (2000). Benchmarking in the UK: An empirical study of practitioner
\nand academics. Benchmarking, 7(7), 98–117.
López, R. C., & Poole, N. (1998). Quality assurance in the maritime port logistics
chain: the case of Valencia, Spain. Supply Chain Management: An International
Journal, 3(1), 33–44. http://doi.org/10.1108/13598549810200915
Love, R., Bunney, H. S., Smith, M., & Dale, B. G. (1998a). Benchmarking in water
supply services: the lessons learnt. Benchmarking for Quality Management &
Technology, 5(1), 59–70. http://doi.org/10.1108/14635779810206812
Love, R., Bunney, H. S., Smith, M., & Dale, B. G. (1998b). Benchmarking in water
supply services: the lessons learnt. Benchmarking for Quality Management &
Technology, 5(1), 59–70. http://doi.org/10.1108/14635779810206812
Lu, Y. (2014). Port Performance Benchmarking and Efficiency Analysis.
Lu, B., & Wang, X. (2012). Application of DEA on the measurement of operating
efficiencies for east-Asia major container terminals, 2(1), 1–18.
Luecke, G. R., Li, Y., & Cuma, M. (2007). Using benchmarking to determine efficient
usage of nodes in a cluster. Benchmarking: An International Journal, 14(6), 728–749.
http://doi.org/10.1108/14635770710834518
310
Magd. (2003). Benchmarking: achieving best value in public-sector organisations.
Benchmarking: An International Journal, 10(3), 261–286.
http://doi.org/10.1108/14635770310477780
Magnan, G. M., Fawcett, S. E., & Birou, L. M. (2006). Benchmarking manufacturing
practice using the product life cycle.
Maguire, S., Koh, S. C. L., & Magrys, A. (2007). The adoption of e‐business and
knowledge management in SMEs. Benchmarking: An International Journal, 14(1), 37–
58. http://doi.org/10.1108/14635770710730928
Major International Ports. (2006), (December).
Mangan, J., Lalwani, C., & Gardner, B. (2004). Combining quantitative and qualitative
methodologies in logistics research. International Journal of Physical Distribution &
Logistics Management, 34(7), 565–578. http://doi.org/10.1108/09600030410552258
Mann, S. W., Welch, S., & Mann, R. (2008). benchmarking and performance
improvement resource.
Mark, G., & Argus, A. (2000). Some logistics realities in Indochina. International
Journal of Physical Distribution & Logistics Management, 30(10), 887–911.
http://doi.org/10.1108/09600030010351273
Martins, A., Jorge, S., & Sá, P. (2013). Price regulation and cost accounting: the case
of the Portuguese seaport sector. International Journal of Law and Management,
55(2007), 444–463. http://doi.org/10.1108/IJLMA-08-2012-0030
Mason-Jones, R. and Towill, D. R. (1999). Article information : Int J Logistics
Management.
Meade, P. H. (1994). A guide to benchmarking. Retrieved December 3, 2015, from
http://quality.curtin.edu.au/local/docs/Guide_to_Benchmarking_Oct2007.pdf
311
Min, H., & Joo, S.-J. (2009). Benchmarking third-party logistics providers using data
envelopment analysis: an update. Benchmarking: An International Journal, 16(5),
572–587. http://doi.org/10.1108/14635770910987814
Ministry of Urban Development Government of India. (2010). Improving urban
services through Service Level Benchmarking.
Mitchell, W. (2006). When two Worlds collide. The New Scientist, 192(January 2010),
45–45. http://doi.org/10.1016/S0262-4079(06)61403-6
Mitra Debnath, R., & Shankar, R. (2008). Benchmarking telecommunication service in
India. http://doi.org/10.1108/14635770810903169
Moffett, S., Anderson‐Gillespie, K., & McAdam, R. (2008). Benchmarking and
performance measurement: a statistical analysis. Benchmarking: An International
Journal, 15(4), 368–381. http://doi.org/10.1108/14635770810887203
Monteiro, P., de Noronha, T., & Neto, P. (2013). A differentiation framework for
maritime clusters: Comparisons across Europe. http://doi.org/10.3390/su5094076
Moriarty, J. P. (2011). A theory of benchmarking.
http://doi.org/10.1108/14635771111147650
Moriarty, J. P., & Smallman, C. (2009). En route to a theory of benchmarking.
http://doi.org/10.1108/14635770910972423
Munisamy, S., & Singh, G. (2011). Benchmarking the efficiency of Asian container
ports. African Journal of Business Management, 5(4), 1397–1407.
http://doi.org/10.5897/AJBM10.1312
Nao, Audit Commission, Niao, & Wales Audit Office. (2007). Value For Money in
public sector corporate services.
No, R. (2013). Maritime sector developments in the global markets. Retrieved
December 4, 2015, from
312
https://www.utu.fi/en/units/tse/units/PEI/research/Documents/SmartComp Research
Report October 2013 final.pdf
Norzaidi, M. D., Chong, S. C., & Salwani, M. I. (2008). Perceived resistance, user
resistance and managers’ performance in the Malaysian port industry. Aslib
Proceedings, 60(3), 242–264. http://doi.org/10.1108/00012530810879114
Notteboom *, T. E., & Rodrigue, J.-P. (2005). Port regionalization: towards a new
phase in port development. Maritime Policy & Management, 32(3), 297–313.
http://doi.org/10.1080/03088830500139885
Nwanosike F, T. N.-S. (2012, Aug 10). EPrints. Retrieved from eprints web page:
http://eprints.hud.ac.uk/1574
Nunes, B., & Bennett, D. (2010). Green operations initiatives in the automotive
industry: An environmental reports analysis and benchmarking study. Benchmarking:
An International Journal, 17(3), 396–420. http://doi.org/10.1108/14635771011049362
Oecd, O. for E. C.-O. and D. (2002). Benchmarking Intermodal Freight Transport, 148.
http://doi.org/10.1787/9789264175129-en
Office, H. (2015). DRY DOCKING PERFORMANCE BENCHMARKING STUDY
Dry Docking Performance : New Challenges.
Omar Sharifuddin bin Syed‐Ikhsan, S., & Rowland, F. (2004). Benchmarking
knowledge management in a public organisation in Malaysia. Benchmarking: An
International Journal, 11(3), 238–266. http://doi.org/10.1108/14635770410538745
Paixão, A. C., & Bernard Marlow, P. (2003). Fourth generation ports – a question of
agility? International Journal of Physical Distribution & Logistics Management, 33(4),
355–376. http://doi.org/10.1108/09600030310478810
Panayides, P. M., Maxoulis, C. N., Wang, T.-F., & Ng, K. Y. A. (2009). A Critical
Analysis of DEA Applications to Seaport Economic Efficiency Measurement.
Transport Reviews: A Transnational Transdisciplinary Journal, 29(2), 183–206.
http://doi.org/10.1080/01441640802260354
313
Panayides, P. M., & Song, D.-W. (2008). Evaluating the integration of seaport
container terminals in supply chains. International Journal of Physical Distribution &
Logistics Management, 38(7), 562–584. http://doi.org/10.1108/09600030810900969
Pandya, Chudasama, K., & Kiran. (2008). Measuring Efficiency of Indian Ports: An
Application of Data Envelopment Analysis. IUP Journal of Infrastructure, 20.
Panwar, A., Nepal, B., Jain, R., & Yadav, O. P. (2013). Implementation of
benchmarking concepts in Indian automobile industry – an empirical study.
Benchmarking: An International Journal, 20(6), 777–804. http://doi.org/10.1108/BIJ-
03-2012-0015
Paper, C., Ant, P., & Techn, G. I. (2015). Benchmarking analysis of European Ports
and Terminals, (October).
Park, J. ., Lim, S. ., & Bae, H. . (2012). DEA-based port efficiency improvement and
stepwise benchmarking target selection. Information (Japan), 15(12 C), 6155–6171.
Retrieved from http://www.scopus.com/inward/record.url?eid=2-s2.0-
84897538901&partnerID=40&md5=5d8dbd7e96f1cebeee33bfad57092aff
Peng Wong, W., & Yew Wong, K. (2008). A review on benchmarking of supply chain
performance measures. Benchmarking: An International Journal (Vol. 15).
http://doi.org/10.1108/14635770810854335
Ports, W., Planning, S., Analysis, S., Practices, B., & America, N. (2014). Wisconsin
Commercial Ports Association Port Planning Benchmarking Study Wisconsin Ports
Strategic Planning a Structural Analysis of Best Practices in North America, (August).
Presley, A., & Meade, L. (2010). Benchmarking for sustainability: an application to the
sustainable construction industry. Benchmarking: An International Journal, 17(3),
435–451. http://doi.org/10.1108/14635771080001426
Putkiranta, A. (2012). Benchmarking: a longitudinal study. Baltic Journal of
Management, 7(3), 333–348. http://doi.org/10.1108/17465261211245481
314
Report, A. S. (n.d.). Benchmarking_to_improve_efficiency_Nov2010.pdf. Retrieved
December 3, 2015, from
https://www.hesa.ac.uk/dox/benchmarking_to_improve_efficiency_nov2010.pdf
Roso, V. (2008). Factors influencing implementation of a dry port. International
Journal of Physical Distribution & Logistics Management, 38(10), 782–798.
http://doi.org/10.1108/09600030810926493S2092521209800035.pdf. (n.d.).
Sajjad, F., & Amjad, S. (2012). Role of Benchmarking in Total Quality Management :
Case of Telecom Services Sector of Pakistan © Society for Business and Management
Dynamics © Society for Business and Management Dynamics, 1(8), 34–44.
Salem, M. S. M., & Administration, B. (2013). A Review of Benchmarking
Implementation Problems : The Case of UAE Industrial Companies. Retrieved
December 3, 2015, from http://www.jimsjournal.org/16 Mohamed S. M.pdf
Sarriera, J. M., Araya, G., Serebrisky, T., Briceño-Garmendía, C., & Schwartz, J.
(2013). Benchmarking Container Port Technical Efficiency in Latin America and the
Caribbean, (December). Retrieved from
http://publications.iadb.org/bitstream/handle/11319/4702/intB0B9.PDF?sequence=1\nh
ttp://publications.iadb.org/bitstream/handle/11319/4702/intB0B9.PDF?sequence=1
Saygin, D., Patel, M. K., & Gielen, D. J. (2010). Global Industrial Energy Efficiency
Benchmarking. An Energy Policy Tool, (November). Retrieved from
papers3://publication/uuid/D9FCA294-0A3B-44FD-9013-58ACB7510C4E
Shetty, S., Pitti, V., Satish Babu, C. L., Surendra Kumar, G. P., & Deepthi, B. C.
(2010). Bruxism: A Literature Review. http://doi.org/10.1007/s13191-011-0041-5
Shipbuilding : Productivity & Efficiency Benchmarking. (2007), 26–29.
Shober, A. F., & Cutler, T. (2013). Benchmarking for improvement Editor ’ s note,
(November), 1–57.
315
Simões, P., & Marques, R. C. (2010). Seaport performance analysis using robust non-
parametric efficiency estimators. Transportation Planning and Technology, 33(5), 435–
451. http://doi.org/10.1080/03081060.2010.502375
Smith, A. M. (2000). Using consumer benchmarking criteria to improve service sector
competitiveness. http://doi.org/10.1108/14635770010379728
Society, E. A., & Studies, T. (2013). Container Port Operational Performance
Assessment – A Rational Approach based on Internet Website Port Data Longjia CHU,
9(2009), 1–13.
Souza, R. De, Tan, A. W. K., Othman, H., & Garg, M. (2011). A proposed framework
for managing service parts in automotive and aerospace industries. Benchmarking: An
International Journal, 18(6), 769–782. http://doi.org/10.1108/14635771111180699
Stainer, A. (1997). Logistics - a productivity and performance perspective. Supply
Chain Management: An International Journal, 2(2), 53–62.
http://doi.org/10.1108/13598549710166104
Strojny, J. (2015). Implementation of the AHP and Benchmarking in Strategic Analysis
of Polish Regions. Procedia - Social and Behavioral Sciences, 213, 229–235.
http://doi.org/10.1016/j.sbspro.2015.11.530
Talib, F., Rahman, Z., & Qureshi, M. N. (2010). The relationship between total quality
management and quality performance in the service industry : a theoretical model.
Social Sciences, 1(1), 113–128.
Teeratansirikool, L., Siengthai, S., Badir, Y., & Charoenngam, C. (2013). Competitive
strategies and firm performance: the mediating role of performance measurement.
International Journal of Productivity and Performance Management, 62(2), 168–184.
http://doi.org/10.1108/17410401311295722
Tongzon, J. L. (2006). Systematizing international benchmarking for ports. Maritime
Policy & Management, 8839(July 2012), 37–41.
http://doi.org/10.1080/03088839500000048
316
Tongzon, J. L. (2009). Port choice and freight forwarders. Transportation Research
Part E: Logistics and Transportation Review, 45(1), 186–195.
http://doi.org/10.1016/j.tre.2008.02.004
Ugboma, C., Ibe, C., & Ogwude, I. C. (2004). Service quality measurements in ports of
a developing economy: Nigerian ports survey. Managing Service Quality: An
International Journal, 14(6), 487–495. http://doi.org/10.1108/09604520410569829
Universidade, S. A., Interior, B., Universidade, M. F., & Interior, B. (2002).
Performance Evaluation of the Main Terminal Containers in the Iberian Seaports : a
Benchmarking Approach, (October 2015).
Vagnoni, E., & Maran, L. (2008). Public sector benchmarking: an application to Italian
health district activity plans. Benchmarking: An International Journal, 15(3), 193–211.
http://doi.org/10.1108/14635770810876557
Vorhies, D. W., & Morgan, N. a. (2005). Benchmarking Marketing Capabilities for
Sustainable Competitive Advantage. Journal of Marketing, 69(1), 80–94.
http://doi.org/10.1509/jmkg.69.1.80.55505
Walter, C. K., & Poist, R. F. (2004). North American inland port development:
international vs domestic shipper preferences. International Journal of Physical
Distribution & Logistics Management, 34(7), 579–597.
http://doi.org/10.1108/09600030410552267
Wanke, P. F., Barbastefano, R. G., & Hijjar, M. F. (2011). Determinants of Efficiency at
Major Brazilian Port Terminals. Transport Reviews, 31(5), 653–677.
http://doi.org/10.1080/01441647.2010.547635
White, D. S., Gunasekaran, A., & Roy, M. H. (2012). Performance measures and
metrics for the creative economy. Benchmarking: An International Journal, 21(1), 46–
61. http://doi.org/10.1108/BIJ-03-2012-0017
Williams, J., Brown, C., & Springer, A. (2012). Overcoming benchmarking reluctance:
a literature review. Benchmarking: An International Journal, 19, 255–276.
http://doi.org/10.1108/14635771211224563
317
Woon, K. C. (2000). Assessment of TQM implementation productivity leaders.
Business Process Management Journal, 6(4), 314–33–.
Wu, Y. C. J., & Goh, M. (2010). Container port efficiency in emerging and more
advanced markets. Transportation Research Part E: Logistics and Transportation
Review, 46(6), 1030–1042. http://doi.org/10.1016/j.tre.2010.01.002
Wynn-Williams, & K.L.H. (2005). Performance assessment and benchmarking in the
public sector: An example from New Zealand. Benchmarking: An International
Journal, 12(5), 482–492. http://doi.org/10.1108/14635770510619393
Yasin, M. M. (2002). The theory and practice of benchmarking: then and now.
Benchmarking: An International Journal (Vol. 9).
http://doi.org/10.1108/14635770210428992
Yasin, M. M., Wafa, M., & Small, M. H. (2004). Benchmarking JIT. Benchmarking:
An International Journal, 11(1), 74–92. http://doi.org/10.1108/14635770410520311
Yeo, G.-T., Roe, M., & Dinwoodie, J. (2011a). Measuring the Competitiveness of
Container Ports: Logisticians’ Perspectives. European Journal of Marketing, 45(3),
455–470. http://doi.org/10.1108/03090561111107276
Yeo, G.-T., Roe, M., & Dinwoodie, J. (2011b). Measuring the Competitiveness of
Container Ports: Logisticians’ Perspectives. European Journal of Marketing, 45(3),
455–470. http://doi.org/10.1108/03090561111107276
Zairi, M. (1996). Effective Benchmarking. Retrieved December 4, 2015, from
http://www.imanet.org/docs/default-
source/thought_leadership/management_control_systems/effective_benchmarking.pdf?
sfvrsn=2
Zairi, M., & Youssef, M. A. (1996). A review of key publications on benchmarking:
part II. Benchmarking for Quality Management & Technology, 3(1), 45–49.
http://doi.org/10.1108/14635779610112458
Zhu, W., & Erikstad, S. O. (2011). Performance Indicators in Benchmarking of
Maritime Logistics Chains. Low Carbon Shipping, (7491)

318
PROFILE OF THE AUTHOR
Shri A. Janardhana Rao obtained Master’s Degree in Commerce and Law Degree from
Andhra University. After completing F.I.C.W.A, he did his MBA from International
Management Institute of India, New Delhi. He also did his Intermediate in Company
Secretaryship and later he did Diploma in Labour Laws with Administrative Law from
Annamalai University, Chennai. Currently, he is pursuing PhD in Ports & Shipping
from the University of Petroleum and Energy Studies, Dehradun.
Shri Rao has a rich experience working in various capacities in MMTC Ltd. and
Bharat Earth Movers Ltd. Presently, he is holding the post of Managing Director,
Indian Ports Association, an apex body formed by the Major Ports of India since August
2008. At the age of 30 years, he became the youngest Head of Department of a Major
Port. He served as Financial Adviser & Chief Accounts Officer of Kandla Port Trust for
seven years, He was elevated and posted as Dy. Chairman of Cochin Port Trust where
he served the Port for five years, and finally at the age of 42 years, he became the
Chairman of Kandla Port Trust. He visited Ports far and wide in the world namely
Europe, U.S., Singapore, South Africa, Iran & Euro-Asia. He was either Chairman or a
member of several Committees of national importance. Major projects of port
319
development were formulated and executed under his expertise and guidance in
different Ports.
Illustratively, ICTT, LNG Project, SBM in Cochin, Bulk Terminals, Container
Terminals, Satellite Port Tuna-Tekra in Kandla, PCS, ERP, Container Scanners for
Major Ports in IPA apart from many Port infrastructure projects have been executed by
him.
He also served as an Adviser (Sagarmala) for the Sagarmala Division of
Ministry of Shipping during December 2015 to September 2016.
He is closely involved in policy decision making process in the maritime sector
in the country. He is also instrumental in bringing out a vision document for Indian Port
Sector viz. Maritime Agenda-2010 by the Ministry of Shipping. He is associated with
various working groups on Ports & Shipping for the National Transport Development
Policy Committee in formulating long term policy for transport sector of the country as
a whole. He is involved in the conceptualizing, launching and in the implementation of
a National Maritime Programme viz. “Sagarmala – a Coastal & Port led Development
of India”.
He is instrumental in all path breaking initiatives being taken by Ministry of
Shipping, GOI. He is an expert in all Port matters. With his vast, rich and varied
experience, he attained respectable stature in Indian Ports Sector. He is Chief Editor of
port sector magazine ‘Indian Ports’ and also a member of Editorial Advisory Board of
‘Maritime Gateway’ magazine.
Although he started as a Finance executive, he gained insights in all other
disciplines of management especially in Port Management, having served more than 26
years in Ports. He excelled in every post that he worked. He is solely a task and result
oriented person and always delivers results related to any field.
320
He believes in decision making on time after evaluating the pros and cons and
alternatives in any given situation. With his problem solving approach, he never fails in
undertaking any complex issues. He has always excelled in executing all projects on
time with precision. His vision is to build an ideal Port Sector in the county with
international standards.
Research Paper Publication
"A Systematic Review of Literature on Bench-marking with an Aim to Probe
Scope of the Applicability at Major Seaports of India” published in SCMS
journal of Indian Management.
"GST in India - Impact on India's Growth and International Trade" published in
FINANCIA - A Cross Functional International Journal of Finance UPES ISSN- 2456-
9763
*****************************************