112 montreal road & 314 gardner road transportation
TRANSCRIPT
112 Montreal Road & 314 Gardner Road
Transportation Impact Assessment Step 1 Screening Report
Step 2 Scoping Report
Step 3 Forecasting Report
Prepared for:
2705460 Ontario Inc.
Prepared by:
13 Markham Avenue
Nepean, ON K2G 3Z1
February 2020
PN: 2019‐69
112 Montreal Road & 314 Gardner Road Transportation Impact Assessment
Page i
Table of Contents 1 Screening ...................................................................................................................................................... 1
2 Existing and Planned Conditions .................................................................................................................. 1
2.1 Proposed Development ............................................................................................................................. 1
2.2 Existing Conditions .................................................................................................................................... 3
2.2.1 Area Road Network ........................................................................................................................... 3
2.2.2 Existing Intersections ......................................................................................................................... 4
2.2.3 Existing Driveways ............................................................................................................................. 5
2.2.4 Cycling and Pedestrian Facilities ........................................................................................................ 6
2.2.5 Existing Transit ................................................................................................................................... 7
2.2.6 Existing Area Traffic Management Measures .................................................................................... 8
2.2.7 Existing Peak Hour Travel Demand .................................................................................................... 8
2.2.8 Collision Analysis ............................................................................................................................. 11
2.3 Planned Conditions .................................................................................................................................. 17
2.3.1 Changes to the Area Transportation Network ................................................................................ 17
2.3.2 Other Study Area Developments ..................................................................................................... 18
3 Study Area and Time Periods ..................................................................................................................... 19
3.1 Study Area ............................................................................................................................................... 19
3.2 Time Periods ............................................................................................................................................ 19
3.3 Horizon Years ........................................................................................................................................... 19
4 Exemption Review ...................................................................................................................................... 19
5 Development Generated Travel Demand .................................................................................................. 20
5.1 Trip Generation and Travel Modes .......................................................................................................... 20
5.2 Trip Distribution ....................................................................................................................................... 21
5.3 Trip Assignment ....................................................................................................................................... 21
6 Background Network Travel Demand ........................................................................................................ 22
6.1 Transportation Network Plans ................................................................................................................ 22
6.2 Background Growth ................................................................................................................................. 22
6.3 Other Developments ............................................................................................................................... 22
7 Demand Rationalization ............................................................................................................................. 22
7.1 2024 Future Background Intersection Operations .................................................................................. 22
7.2 2029 Future Background Intersection Operations .................................................................................. 24
8 Next Steps ................................................................................................................................................... 26
List of Figures Figure 1: Area Context Plan ....................................................................................................................................... 1
Figure 2: Concept Plan ............................................................................................................................................... 2
Figure 3: Study Area Pedestrian Facilities ................................................................................................................. 6
Figure 4: Study Area Cycling Facilities ....................................................................................................................... 7
Figure 5: Existing Transit Service ............................................................................................................................... 8
Figure 6: Existing Study Area Transit Stops ............................................................................................................... 8
Figure 7: Existing Traffic Counts ................................................................................................................................ 9
112 Montreal Road & 314 Gardner Road Transportation Impact Assessment
Page ii
Figure 8:Study Area Collision Records – Representation of 2014‐2016 .................................................................. 12
Figure 9: Montreal Road Revitalization ................................................................................................................... 18
Figure 10: New Site Generation Auto Volumes ....................................................................................................... 21
Figure 11: 2024 Future Background Volumes ......................................................................................................... 23
Figure 12: 2029 Future Background Volumes ......................................................................................................... 25
Table of Tables Table 1: Intersection Count Date............................................................................................................................... 9
Table 2: Existing Intersection Operations ................................................................................................................ 10
Table 3: Study Area Collision Summary, 2014‐2018 ............................................................................................... 12
Table 4: Summary of Collision Locations, 2014‐2018 ............................................................................................. 13
Table 5: Montreal Road at North River Road Collision Summary ........................................................................... 14
Table 6: Montreal Road at Vanier Parkway Collision Summary .............................................................................. 14
Table 7: Montreal Road at Hannah Street at Cody Avenue Collision Summary ..................................................... 15
Table 8: McArthur Avenue at Vanier Parkway Collision Summary ......................................................................... 16
Table 9: Montreal Road Segments between Montgomery Street and Vanier Parkway Collision Summary .......... 16
Table 10: Vanier Parkway Southbound between Montreal Road and McArthur Avenue Collision Summary ....... 17
Table 11: Exemption Review ................................................................................................................................... 19
Table 12: Trip Generation Person Trip Rates .......................................................................................................... 20
Table 13: Total Person Trip Generation .................................................................................................................. 20
Table 14: Mode Share – Ottawa East ...................................................................................................................... 20
Table 15: Trip Generation by Mode ........................................................................................................................ 20
Table 16: OD Survey Existing Mode Share – Ottawa East ....................................................................................... 21
Table 17: TRANS Regional Model Projections – 3Study Area Growth Rates ........................................................... 22
Table 18: 2024 Future Background Intersection Operations .................................................................................. 23
Table 19: 2029 Future Background Intersection Operations .................................................................................. 25
List of Appendices Appendix A – TIA Screening Form and Certification Form Appendix B – Turning Movement Count Data Appendix C – Synchro Intersection Worksheets – Existing Conditions Appendix D – Collision Data Appendix E – TRANS Background Projection Plots Appendix F – Synchro Intersection Worksheets – 2024 Background Conditions
Appendix G – Synchro Intersection Worksheets – 2029 Background Conditions
112 Montreal Road & 314 Gardner Road Transportation Impact Assessment
Page 1
1 Screening This study has been prepared according to the City of Ottawa’s 2017 Transportation Impact Assessment (TIA)
Guidelines. Accordingly, a Step 1 Screening Form has been prepared and is included as Appendix A, along with the
Certification Form for TIA Study PM. As shown in the Screening Form, the trip generation, location and safety
triggers were met, and a TIA is required including the Design Review component and the Network Impact
Component.
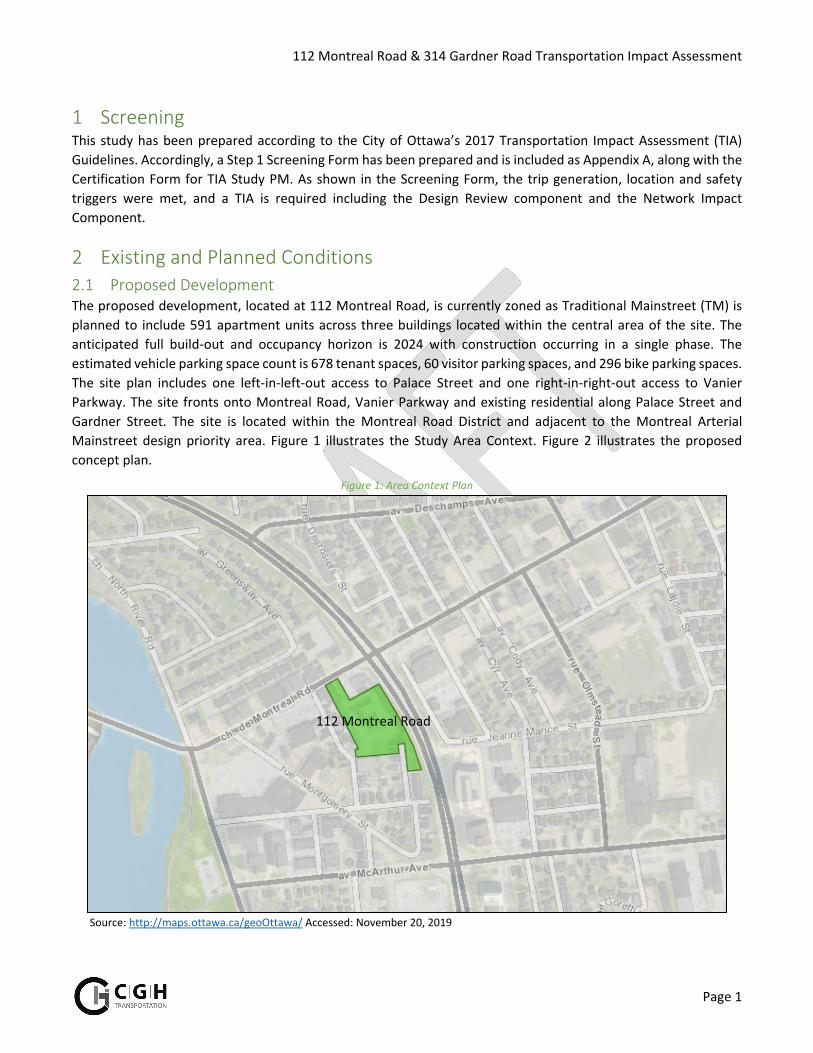
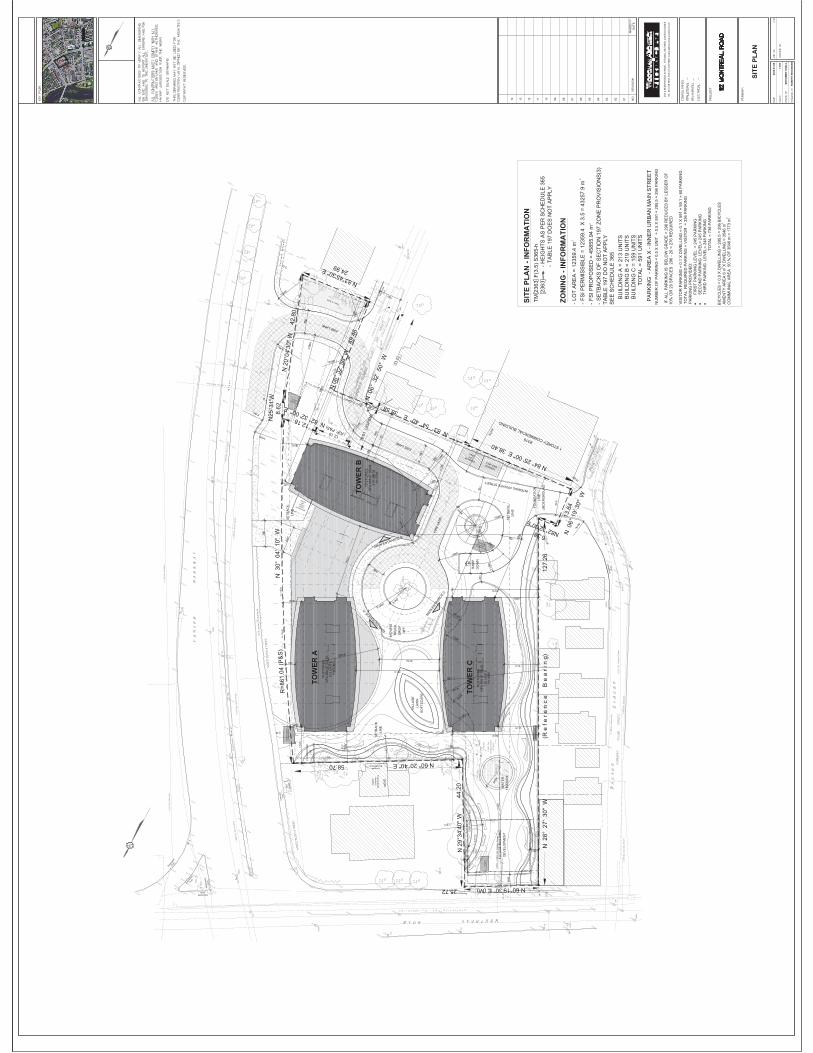
2 Existing and Planned Conditions 2.1 Proposed Development The proposed development, located at 112 Montreal Road, is currently zoned as Traditional Mainstreet (TM) is
planned to include 591 apartment units across three buildings located within the central area of the site. The
anticipated full build‐out and occupancy horizon is 2024 with construction occurring in a single phase. The
estimated vehicle parking space count is 678 tenant spaces, 60 visitor parking spaces, and 296 bike parking spaces.
The site plan includes one left‐in‐left‐out access to Palace Street and one right‐in‐right‐out access to Vanier
Parkway. The site fronts onto Montreal Road, Vanier Parkway and existing residential along Palace Street and
Gardner Street. The site is located within the Montreal Road District and adjacent to the Montreal Arterial
Mainstreet design priority area. Figure 1 illustrates the Study Area Context. Figure 2 illustrates the proposed
concept plan.
Figure 1: Area Context Plan
Source: http://maps.ottawa.ca/geoOttawa/ Accessed: November 20, 2019
112 Montreal Road
GGGGGGGGGGGGGGGGGGGGGGGGGGGGGGGGGGGGGGGGGGGGGGGGGGGGGGGGGGGGGGGGGGGGGGGGGGGGGGGGGGG
GG
GG
G
N 2
9°34
'40"
W
44.2
0
N 2
8° 2
7' 3
0" W
(R e
f e
r e n
c e
B
e a
r i n
g)
1
27.2
6
6.38 N82°32'00"E
N 06
° 32'
50"
W
49.
46
N 2
0°04
'30"
W
42.
80
8.62
N25
°31'
W
R=8
61.0
4 (P
&S)
A=11
8.96
C=1
18.8
6N
30°
04'
10"
W
UP
Cedar Hedge 2.0 Wide
Ced
ar H
edge
1.2
Wid
e
12.18 N 82° 32' 00" E
13.8
4N
06°
19'
30"
W
WW
WW
WW
WW
WW
WW
MH
#7
0.33
Dia
.
0.33
Dia
.
0.26
Dia
.
Bus
Shel
ter
Con
cret
ePa
dC
o n
c r
e t e
S
i d
e w
a l
k
C o
n c
r e
t e
S i
d e
w a
l k
CB#
5
CB#
6
0.40
Dia
.
0.27
Dia
.0.
18D
ia.
0.30
Dia
.
CB
MH
#4
MH
#3
MH
#2
0.18
Dia
.
WM
H
MH
WM
H
CB
FH
CBU
P
CB
MH
#1
CB
WM
H
CB
0.20
Dia
.0.
30 D
ia.
0.20
Dia
.0.
30 D
ia.0.
25D
ia.
0.27
Dia
.
0.80
Dia
.
0.45
Dia
.
0.45
Dia
.0.
17 D
ia.
ConcreteBlock Building
"ESS
O"
Con
cret
eBl
ock
Build
ing
CB
56.50
56.64
56.35
56.86
56.77
56.58
56.63
56.1956.33 56.23
56.32
56.23
56.50
56.59 56.20
56.94
56.0956.04
56.94
56.10
56.17
56.18
56.6356.6956.81
56.25
56.0956.12
56.1456.17
56.37
56.3956.49
56.44
56.50
56.52
56.51
56.28
56.38
56.43
56.50
56.3556.49
56.13
56.17
56.50
56.48
56.54
56.69 56.35
56.50
56.4256.40
56.42
56.37
56.34
56.29
56.41
56.66
56.4756.3656.58
56.4856.44
56.70
56.58
57.01
57.01
56.94
57.03
57.02
56.77
56.93
57.05
57.28
56.99
56.92
57.08
57.22
57.18
57.42
57.22
57.26
57.2557.42
57.4957.34
57.60
57.76
57.45
57.67
57.69
57.71
56.50
56.49
56.3656.41
56.51
56.29
56.31
56.33
56.91
56.35 56.38
56.52
56.4256.39
56.3856.42
56.3856.30
56.28 56.29 56.32
56.5356.52
56.5256.48
56.5256.59
56.7556.98
56.45
56.52
56.48 56.53 56.52
56.4856.47
56.61
56.59
56.52 56.62
56.56
56.57
56.60
56.58
56.4556.46
56.80
56.54
56.62
56.57
56.64
56.79
56.93
56.30
56.75
56.59
56.59
56.67
56.68
56.6356.69
57.00
56.94
57.02
56.97
56.63
56.96
56.9856.63
57.08
57.22
57.27
57.48
57.18
57.24
57.40
57.44
57.54
57.62
57.71
56.64
56.11
56.0056.11
56.06
57.70
58.07
57.5157.55
57.58
57.3257.9857.81
57.9458.02
57.27
57.31
58.0557.86
58.0257.50
57.42
57.30
57.8957.75
57.68
57.31
57.49
57.75
57.7257.18
57.04
57.69
56.80
57.82
57.51
56.4656.45
56.57 56.57
56.62
56.35
56.34
56.40
56.27
56.46
56.62
56.57 56.60
Depressed Curb
Trees & Bush
GGGGGGGGGGGGGGGGGGGGGGGGGG
GG
GG
GG
GG
GG
GG
GG
GG
GG
GG
GG
GG
GG
GG
GG
GG
GG
GGGGGGGGGGGGGGGG
GG
GG
GG
GG
UH UH UH UH UH UH UH UH UH UH UH UH UHUH UH UH UH UH UH UH UH UH UH UH UH UH UH UH UH UH UH UH UH
UH
UH
UH
UH
UH
UH
UH
UH
UH
UH
UH
UH
UH
UH
UH
UH
UH
UH
UH
UH
UH
UH
UH
UH
UH
UH
UH
UH
UH
UH
UH
UH
UH
GG
GG
GG
GG
GG
GG
GG
GG
GG
GG
GG
GG
GG
GG
GG
GG
GG
GG
UH
UH
UH
UH
UH
UH
UH
UH
UH
UH
UH
UH
UH
UH
UH
UH
UH
UH
UH
UH
UH
UH
UH
UH
UH
UH
UH
UH
UH
UH
UH
UH
UH
UH
UH
UH
UH
UH
UH
UH
UH
UH
UH
UH
UH
UH
UHUHUHUHUHUHUHUHUHUHUHUHUHUHUHUHUHUHUHUHUHUH
CB#
12
CB#
13
CB#
15
CB#
17
CB#
20
MH
#18
MH
#19
MH
#16
MH
#14
UP
UP
FH
FH
Dep
ress
ed
Cur
b
Depr
esse
dCu
rb
56.62
56.67
56.63
56.58
56.54
56.68
56.41
56.59
56.73
56.81
56.90
57.45
57.31
57.17
57.09
57.01
56.92
56.80
57.03
57.1657.25
57.12
57.34
57.88
57.93
57.98
57.93
57.21
57.28
57.28
57.32
56.71
56.86
56.77
56.71
56.67
56.58
56.57
56.47
56.45
56.39
56.43
56.44
56.45
56.45
56.50
56.50
56.53
56.55
56.59
56.63
56.68
56.74
56.9056.97
56.80
56.71
56.67
56.59
56.54
56.51
56.48
56.50
56.65
56.65
56.75
56.7456.95
56.65
56.74
56.63
56.35
56.33 56.44
56.90
56.74
56.57
56.56
56.54
56.50
56.69
56.92
56.81
56.81
56.3556.34
WWWWWWWWWWWWWWWWWWWWWWWWWWWWWWWWWWWWWWWWWWWWWWWWWWWWWWWWWWWWWWWWWWWWWWWWWWWWWWWWWWWWWWWWWWWWWWWWWWWWWWWWWWWWWWWWWWWWWWWWWWWWWWWWWWW
SS
SS
SS
SS
SS
SS
SS
SS
SS
SS
SS
SS
SS
SS
SS
SS
SS
SS
SS
SS
SS
SS
SS
SS
SS
SS
SS
SS
WW
WW
WW
WW
WW
WW
WW
WW
WW
WW
WW
WW
WW
WW
WW
WW
WW
WW
WW
WW
WW
WW
WW
WW
WW
WW
WW
WW
WW
WW
WW
WW
WW
WW
WW
WW
WW
WW
WW
WW
WW
WW
WW
WW
WW
WW
WW
WW
WW
WW
WW
WW
WW
WW
WW
WW
WW
WW
WW
WW
WW
WW
WW
WW
WW
WW
WW
WW
WW
WW
WW
WW
W
W
W
W
W
W
W
W
W
W
W
W
W
W
W
W
W
W
W
W
W
W
W
W
W
W
W
W
W
W
W
W
W
W
W
W
WW
W
W
W
W
W
W
W
W
W
W
W
W
W
W
SSSSSSSSSSSSSSSSSSSSSSSSSSSSSSSSSSSSSSSSSSSSSSSSSSSSSSSSSSSSSSSSSSSSSSSSSSSSSSSSSSSSSSSSSSSSSSSSSSSSSSSSSSSSSSSSSSSSSSSSSSSSSSSSSS
STSTSTSTSTSTSTSTSTSTSTSTSTSTSTSTSTSTSTSTSTSTSTSTSTSTSTSTSTSTSTSTSTSTSTSTSTSTSTSTSTSTSTSTSTSTSTSTSTSTSTSTSTSTSTSTSTSTSTSTSTSTSTSTSTSTSTSTSTSTSTSTSTSTSTSTSTSTSTSTSTSTSTSTSTSTSTSTSTSTSTSTSTSTSTSTSTSTSTSTSTSTSTSTSTSTSTSTSTSTSTSTSTSTSTSTSTSTSTSTSTSTSTSTST
GGGGGGGGGGGGGGGGGGGGGGGGGGGGGGGGGGGGGGGGGGGGGGGGGGGGGGGGGGGGGGGGGGGGGGGGGGGGGGGGGGGGGGGGGGGGGGGGGGGGGGGGGGGGGGGGGGGGGGGGGGGGGGGGGGG
RRRRRRRRRRRRRRRRRRRRRRRRRRRRRRRRRRRRRRRRRRRRRRRRRR
RR
RR
R
RR
RR
RR
RR
RR
RR
RR
RR
RR
RR
RR
RR
RR
RR
RR
RR
RR
RR
RR
RR
RR
R
UBUBUBUBUBUBUBUBUBUBUBUBUBUBUBUBUBUBUBUBUBUBUBUBUBUBUBUBUBUBUBUBUBUBUBUBUBUBUBUBUBUBUBUBUBUBUBUBUBUBUBUBUBUBUBUBUBUBUBUBUBUBUBUBUBUBUBUBUBUBUBUBUBUBUBUBUBUBUBUBUBUBUBUBUBUBUBUBUBUBUBUBUBUBUBUBUBUBUBUBUBUBUBUBUBUBUBUBUBUBUBUBUBUBUBUBUBUBUBUBUB
UB
UB
UB
UB
UB
UB
UBU
BU
BU
BU
BUB
UB
UB
UB
UBUBUBUBUBUBUBUBUBUBUBUBUBUBUBUBUBUBUBUBUBUBUBUBUBUBUBUBUBUBUBUBUBUBUBUBUBUBUBUBUBUBUBUBUBUBUBUBUBUBUBUBUBUBUBUBUBUBUBUBUBUBUBUBUBUBUBUBUBUBUBUBUBUBUBUBUBUBUBUBUBUBUBUBUBUBUBUBUBUBUBUBUBUBUBUBUBUBUBUBUBUBUBUBUBUBUBUBUBUBUBUBUBUBUB
UB
UB
UB
UB
UB
UB
UB
UB
UB
UB
UB
UB
UB
UB
UB
UB
UB
UB
UB
UB
UB
UB
UB
UB
UB
UB
UB
UB
UB
UB
UB
UB
UB
UB
UB
UB
UB
UB
UB
SS
SS
SS
SS
SS
SS
SS
SS
SS
SS
SS
SS
SS
SS
SS
SS
SS
SS
SS
SS
SS
SS
SS
SS
SS
SS
SS
SS
SS
SS
SS
SS
SS
SS
SS
SS
SS
SS
SS
SS
SS
SS
SS
SS
SS
SS
SS
SS
SS
SS
SS
SS
SS
SS
SS
SS
SS
SS
SS
SS
SS
SS
SS
GG
GG
GG
GG
GG
GG
GG
GG
GG
GG
GG
GG
GG
GG
GG
GG
GG
GG
GG
GG
GG
GG
GG
GG
GG
GG
GG
GG
GG
GG
GG
GG
GG
GG
GG
GG
GG
GG
GG
GG
GG
GG
GG
GG
GG
GG
GG
GG
GG
GG
GG
GG
GG
GG
GG
GG
GG
GG
GG
GG
GG
GG
GG
GG
GG
G
G
G
G
G
G
G
G
G
G
G
G
G
G
G
G
G
G
G
G
GG
GG
GG
GG
G
G
G
G
G
G
G
G
G
G
G
G
G
UHUHUHUHUHUHUHUHUHUHUHUHUHUHUHUHUHUHUHUHUHUHUHUHUHUHUHUHUHUHUHUHUHUHUHUHUHUHUHUHUHUHUHUHUHUHUHUHUHUHUHUHUHUHUHUHUHUHUHUHUHUHUHUHUHUHUHUHUHUHUHUHUHUHUHUHUHUHUHUHUHUHUHUHUHUHUHUHUHUHUHUHUHUHUHUHUHUHUHUHUHUHUHUHUHUHUHUHUHUHUHUHUHUHUHUHUHUHUHUHUH
UB
UB
UB
UB
UB
UB
UB
UB
UB
UB
UB
UB
UB
UB
UB
UB
UB
UB
UB
UB
UB
UB
UB
UB
UB
UB
UB
UB
UB
UB
UB
UB
UB
UB
UB
UB
UB UB UB UB UB UB UB UB UB UB UB UB UB UB UB UB UB UB
UBUBUBUBUBUBUBUBUBUBUBUBUBUBUBUBUBUB
SS
SS
SS
SS
SS
S
S
S
S
S
S
S
S
S
S
S
S
S
S
S
S
S
S
S
S
S
S
S
S
S
S
S
S
S
S
S
S
S
S
S
SS
S
S
S
S
S
S
S
S
S
S
S
S
S
S
S
S
S
S
S
W
R
R
R
R
R
R
R
R
R
R
R
R
R
R
R
R
R
R
R
R
R
R
R
R
R
R
R
R
R
R
R
R
R
R
R
R
R
R
R
R
R
R
R
R
R
R
R
RR
R
R
R
R
R
UB
UB
UB
UB
UB
UB
UB
UB
UB
UB
UB
UB
UB
UB
UB
UB
UB
UB
UB
UB
UB
UB
UB
UB
UB
UB
UB
UB
UB
UB
UB
UB
UB
UB
UB
UB
UB
UB
UB
UB
UB
UB
UB
UB
UB
UB
UB
UB
UB
UB
UB
UB
UB
UB
UB
UB
UB
UB
UB
UB
UB
UB
UB
UB
UB
UB
UB
UB
ST
ST
ST
ST
ST
ST
ST
ST
ST
ST
ST
ST
ST
ST
ST
ST
ST
ST
ST
ST
ST
ST
ST
ST
ST
ST
ST
ST
ST
ST
ST
ST
ST
ST
ST
ST
ST
ST
ST
ST
ST
ST
ST
ST
ST
ST
ST
ST
ST
ST
ST
ST
ST
ST
ST
ST
ST
ST
ST
ST
ST
ST
ST
ST
ST
ST
ST
ST
ST
ST
ST
ST
ST
ST
ST
ST
ST
S
S
S
S
S
S
S
S
S
S
S
S
S
S
S
S
S
S
S
S
S
S
S
S
S
S
S
S
S
S
S
S
S
S
S
S
S
S
S
S
S
S
S
S
S
S
S
S
S
S
S
S
S
S
S
S
S
S
S
S
S
S
S
S
S
S
S
S
S
S
S
W
W
W
W
W
W
W
W
W
W
W
W
W
W
W
W
W
W
W
W
W
W
W
W
W
W
W
W
W
W
W
W
W
W
W
W
W
W
W
W
W
W
W
W
W
W
W
W
W
W
W
W
W
W
W
W
W
W
W
W
W
W
W
W
W
W
W
W
W
W
W
W
W
W
W
W
W
W
W
G
G
G
G
G
G
G
G
G
G
G
G
G
G
G
G
G
G
G
G
G
G
G
G
G
G
G
G
G
G
G
G
G
G
G
G
G
G
G
G
G
G
G
G
G
G
G
G
G
G
G
G
G
G
G
G
G
G
G
G
G
G
G
G
G
G
G
G
G
G
G
G
G
G
0.37
5 Di
a. S
torm
Sew
er
0.25
0 Di
a. S
anitr
y Se
wer
0.15
2 Di
a. W
ater
nmai
n
0.03
2 Di
a. G
asm
ain
0.15
2 D
ia.
Wat
erm
ain
0.30
0 Di
a. S
anita
ry S
ewer
0.03
5 Di
a. G
asm
ain
0.15
2 D
ia. W
ater
mai
n
0.37
5 D
ia. S
anita
ry S
ewer
0.03
5 Di
a. G
asm
in0.
152
Dia
. Wat
erm
ain
0.37
5 D
ia. S
anita
ry S
ewer
0.03
5 D
ia. G
asm
ain
0.37
5 D
ia. S
anita
ry S
ewer
SSSSSSSSSSSS
ST
ST
ST
ST
ST
ST
ST
ST
ST
ST
ST
ST
SS
SS
SS
SS
SS
SS
S
0.28
Dia
.
2(30
)D
ia.
WWWWWWWWWWWWWWWWWWWWWWWWWWWWWWWWWWWWWWWWWWWWWWWWWWWWWWW
SSSSSSSSSSSSSSSSSSSSSSSSSSSSSSSSSSSSSSSSSSSSSSSSSSSSS
STSTSTSTSTSTSTSTSTSTSTSTSTSTSTSTST
GGGGGGGGGGGGGGGGGGGGGGGGGGGGGGGGGGGGGGGGGGGGGG
G
UBUBUBUBUBUBUBUBUBUBUBUBUBUBUBUBUBUBUBUBUB
STST
STST
STST
STST
STST
STSTST
STST
STST
STSTSTSTSTSTSTSTSTSTSTSTSTSTSTSTSTSTSTSTSTSTSTSTSTSTSTSTSTSTSTSTSTSTST
UB
UB
UB
UB
UB
UB
UB
UB
UB
UB
UB
UB
UB
UB
UB
UB
UB
UB
UB
UB
UB
UB
UB
UB
UB
UB
UB
UB
UB
UBUBUB
UB
UHUHUHUHUHUHUHUHUHUHUHUHUHUHUHUHUHUHUHUHUHUHUHUHUHUHUHUHUHUHUH
UH
UH
UH
UH
UH
UH
UH
UH
UH
UH
UH
UH
UH
UH
UH
UH
UH
UH
UH
UH
UH
UH
UH
UH
UH
UH
UH
UH
UH
UH
UH
UH
UH
UH
UH
UH
UH
UH
UH
UH
UH
UH
UH
UH
UH
UH
UH
UH
UH
UH
UH
UH
UH
UH
UH
UH
UH
UH
UH
UH
UH
UH
UH
UH
UH
UH
UH
UH
UH
UH
UH
UH
UH
UH
UH
UH
UH
UH
UH
UH
UH
UH
UH
UH
UH
UH
UH
UH
UH
UH
UH
UH
UH
UH
UH
UH
UH
UH
UH
UH
UH
UH
UH
UH
UH
UH
UH
UH
UH
UH
UH
UH
UH
UH
UH
UH
UH
UH
UH
UH
UH
UH
UH
UH
UH
UH
UH
UH
UH
UH
UH
UH
UH
UH
UH
UH
UH
UH
UH
UH
UH
UH
UH
UH
UH
UH
UH
UH
UH
UH
UH
UH
UH
UH
UH
UH
UH
UH
UH
UH
UH
UH
UH
UH
UH
UH
UH
UH
UH
UH
UH
UH
UH
UH
UH
UH
UH
UH
UH
UH
UH
UH
UH
UH
UH
UH
UH
UH
UH
UH
UH
UH
UH
UH
UH
UH
UH
UH
UH
UH
UH
UH
UH
UH
UH
UH
UH
UH
STST
STST
STST
STST
ST
ST
ST
ST
ST
ST
ST
ST
ST
ST
ST
ST
ST
ST
ST
ST
ST
ST
ST
W
W
W
W
W
W
W
W
W
W
W
W
W
W
W
W
W
W
W
W
W
W
W
W
W
W
W
W
W
W
W
W
W
W
W
W
W
W
W
W
W
WW
WW
WW
WW
WW
WW
WW
WW
WW
WW
WW
WW
WW
WW
WW
WW
WW
WW
WW
WW
WW
WW
WW
WW
WW
WW
WW
WW
WW
WW
WW
WW
WW
WW
WW
WW
WW
WW
WW
WW
WW
WW
WW
WW
WW
WW
WW
WW
WW
WW
WW
WW
WW
WW
WW
WW
WW
WW
WW
WW
WW
WW
WW
WW
WW
WW
WW
WW
WW
WW
WW
WW
WW
WW
WW
WW
WW
WW
WW
WW
WW
WW
WW
WW
WW
WW
WW
WW
WW
WW
WW
WW
WW
WW
WW
WW
WW
WW
WW
WW
WW
WW
WW
W
W
W
W
W
W
W
W
W
W
W
W
W
W
W
W
W
W
W
W
W
W
W
W
W
W
W
W
ST
ST
ST
ST
ST
ST
ST
ST
ST
ST
ST
ST
STST
ST
ST
STST
ST
STST
ST
ST
STST
ST
STST
ST
ST
STST
ST
ST
ST
ST
ST
STST
ST
ST
ST
ST
ST
STST
ST
ST
ST
ST
ST
STST
ST
ST
ST
ST
ST
STST
ST
ST
ST
STST
STST
STST
STST
STST
STST
STST
STST
STST
STST
STST
STST
STST
STST
STST
STST
STST
STST
STST
STST
STST
STST
STST
STST
STST
STST
STST
STST
STST
STST
STST
STST
STST
STST
STST
STST
STST
STST
STST
STST
STST
STST
STST
STST
STST
STST
STST
STST
STST
STST
STST
STST
STST
STST
STST
STST
STST
STST
STST
STST
STST
STST
STST
STST
STST
STST
STST
STST
STST
STST
STST
STST
STST
STST
STST
ST
STST
STST
STST
STST
STST
STST
STST
STST
STST
STST
STST
STST
STST
STST
STST
STST
STST
ST
ST
ST
ST
ST
ST
ST
ST
ST
ST
ST
ST
STST
ST
ST
ST
ST
STST
ST
ST
ST
ST
STST
STST
STST
STST
STST
STST
STST
STST
STST
STST
STST
STST
STST
ST
STST
STST
STST
STST
STST
STST
STST
STST
STST
STST
STST
STST
STST
STST
STST
STST
STST
STST
STST
STST
STST
STST
STST
STST
STST
STST
STST
STST
STST
STST
STST
STST
STST
STST
STST
STST
STST
STST
STST
STST
STST
STST
STST
STST
STST
STST
STST
STST
STST
STST
STST
STST
STST
STST
STST
STST
STST
STST
STST
STST
STST
STST
STST
STST
STST
STST
STST
STST
STST
STST
STST
STST
STST
STST
STST
STST
ST
ST
ST
ST
ST
ST
ST
ST
ST
ST
ST
ST
ST
ST
ST
ST
ST
ST
ST
ST
ST
ST
ST
ST
ST
ST
ST
ST
ST
ST
ST
ST
ST
ST
ST
ST
ST
ST
ST
ST
ST
ST
ST
ST
ST
ST
ST
ST
ST
ST
UH
UH
UH
UH
UH
UH
UH
UH
UH
UH
UH
WW
WW
WW
WW
WW
WW
WW
WW
WW
WW
WW
WW
WW
WW
WW
WW
WW
UH
UH
UH
UH
UH
UH
UH
UH
UH
UH
UH
UH
UH
UH
UH
UH
UH
UH
UH
UH
UH
UH
UH
UH
UH
UH
UH
UH
UH
UH
UH
UH
UH
UH
UH
UH
UH
UH
UH
UH
UH
UH
UH
UH
UH
G
G
G
G
G
G
G
G
G
G
G
G
G
G
G
G
G
G
GG
GG
GG
GG
GG
GG
GG
GG
GG
GG
GG
GG
GG
GG
GG
GG
GG
GG
GG
GG
GG
GG
GG
GG
GG
GG
GG
GG
GG
GG
GG
GG
GG
GG
GG
GG
GG
GG
GG
GG
GG
GG
GG
GG
GG
GG
GG
GG
GG
GG
GG
GG
GG
GG
GG
GG
GG
GG
GG
GG
GG
GG
GG
GG
GG
GG
GG
GG
GG
GG
GG
GG
GG
GG
GG
GG
GG
GG
GG
GG
GG
GG
GG
GG
UH
UHUHUHUHUHUHUHUHUH
UH
UH
UH
UH
UHUH
UH
UH
UH
UH
UH UH
1.80
0 D
ia. S
torm
Sew
er
0.37
5 D
ia. S
torm
Sew
er
0.100 Dia. Watermain
0.45
0 D
ia. S
torm
Sew
er0.
375
Dia
. Sto
rm S
ewer
1.80
0 D
ia. S
torm
Sew
er
0.15
0 D
ia. G
asm
ain
0.15
0 D
ia. G
asm
ain
SSSSSSSSSSSSSSSSSSSS
STST
STST
STST
STST
STST
STST
0.200± Dia.
Storm Sewer 0.250± Dia.Sanitary Sewer
0.30
0± D
ia.
Sani
tary
Sew
er
0.30
0± D
ia.
Stor
m S
ewer
SS
SS
0.20
0± D
ia.
Sani
tary
Sew
er(2
Pip
es)
0.20
0± -
0.25
0± D
ia. S
anita
ry S
ewer
MH
CB
CB
MH
TMH
HM
H
CB
CB
WM
HW
V
TMH
TMH
TMH
MH
MH
HM
H
WM
H
MH
CB
CB
CB
CB
CB C
B
LS
LS
LS
56.79
56.92
56.8856.88
56.91
56.84
56.78
56.87
56.84 56.98
56.96
56.88
56.58
56.51
56.60
56.77
56.4456.74
56.48
56.37
56.57
56.44
57.70
57.47
57.53
57.6157.57
57.5957.58
57.59
57.56
57.59
57.58
57.58
57.54
57.52
57.42
57.43
57.4657.53
56.98
57.21
57.18
57.41
57.3457.64
57.53
57.43
57.45
57.35
57.34
57.31
57.27
57.18
57.14
57.07
57.08
57.14
57.13
57.19
57.19
57.12
57.08
57.15
57.20
57.30
57.33
57.34
57.39
57.31
57.15
57.11
57.72
57.28
57.67
57.44
57.49
57.16
57.16
57.20
57.28
57.31
57.42
57.57
57.62
57.63
57.93
57.87
57.85
57.72
57.68
57.68
57.69
57.04
57.15
57.01
57.81
57.70
57.65
57.58
57.45
57.43
57.36
57.16
57.10
57.13
57.68
57.68
57.69
57.93
57.50
57.84
57.72
57.36
57.29
57.15
57.46
57.34
57.60
57.84
57.68
58.21
57.54
57.87
57.78
58.12
58.07
58.18
58.30
58.02
57.70
57.63
57.8057.85
57.77
57.27
57.20
57.42
57.32
57.80
57.74
57.65
57.56
57.54
57.60
56.74
C o
n c
r e
t e
M e
d i
a n
G r
a s
s
Depre
ssed
Curb
Depre
ssed
Curb
Dep
ress
edC
urb
DepressedCurb
0.65
Dia
.
0.23
Dia
.
0.22
Dia
.
0.23
Dia
.
0.25
Dia
.
N 83° 54' 40" E 38.58
16.0
1 (J
GP&
M)
12.19 (JGP, P&S)
33.2
2
N 0
6° 3
2' 5
0" W
57.36
57.22
57.30
57.35
57.40
57.85
58.00
58.07
57.37
57.22
GARBAGE BINS AREA
N 84° 25' 00" E 38.40
N 83°45'30" E 24.99
N 60° 20' 40" E 58.70
N 60°19'30" E (M) 25.72
0.20
Dia
.0.
20 D
ia.
0.23
Dia
.
INTERNAL PRIVATE STREET
FIRE
LAN
E
SITE
PLA
N -
INFO
RM
ATI
ON
TM 2
363
F(3
.5) S
365-
h
23
63
- HEI
GH
TS A
S PE
R S
CH
EDU
LE 3
65-
TABL
E 19
7 D
OES
NO
T AP
PLY
ZON
ING
- IN
FOR
MA
TIO
N-L
OT
AREA
= 1
2359
.4 m
-FSI
PER
MIS
SIBL
E =
1235
9.4
X 3
.5 =
432
57.9
m-F
SI P
RO
POSE
D =
458
55.9
4 m
2
2
2
-SE
TBAC
KS O
F SE
CTI
ON
197
ZO
NE
PRO
VISI
ON
S(3)
TABL
E 19
7 D
O N
OT
APPL
YSE
E SC
HED
ULE
365
BU
ILD
ING
A =
213
UN
ITS
BU
ILD
ING
B =
219
UN
ITS
BU
ILD
ING
C =
159
UN
ITS
T
OTA
L =
591
UN
ITS
PAR
KIN
G -
AR
EA X
- IN
NER
UR
BAN
MAI
N S
TREE
TN
UM
BER
OF
PAR
KIN
G =
0.5
X U
NIT
= 0
.5 X
591
= 2
95.5
= 2
96 P
ARKI
NG
IF A
LL P
ARKI
NG
IS B
ELO
W G
RAD
E =
296
RED
UC
ES B
Y LE
SSER
OF
10%
OR
20
SPAC
ES 2
96 -
20 =
276
REQ
UIR
ED
VISI
TOR
PAR
KIN
G =
0.1
X D
WEL
LIN
G =
0.1
X 5
91 =
59.
1 =
60 P
ARKI
NG
TO
TAL
REQ
UIR
ED P
ARKI
NG
+ V
ISIT
OR
= 3
36 P
ARKI
NG
PA
RKI
NG
PR
OVI
DED
: F
IRST
PAR
KIN
G L
EVEL
= 2
45 P
ARKI
NG
SEC
ON
D P
ARKI
NG
LEV
EL=
245
PAR
KIN
G T
HIR
D P
ARKI
NG
LEV
EL=
248
PAR
KIN
G
TO
TAL
= 73
8 PA
RKI
NG
BIC
YCLE
S =
0.5
X D
WEL
LIN
G =
295
.5 =
296
BIC
YCLE
SAM
ENTY
AR
EA 6
m X
DW
ELLI
NG
= 3
546
mC
OM
MU
NAL
AR
EA 5
0 %
OF
3546
m =
177
3 m
2
0.17
Dia
.
0.3
Dia
.
0.3
Dia
.
0.3
Dia
.
0.3
Dia
.
0.3
Dia
.0.3
Dia
.
0.3
Dia
.
0.3
Dia
.
0.3
Dia
.
0.3
Dia
.
MIX
ED B
USH &
TREE
S
MIX
ED B
USH &
TRE
ES
#319
1 STOREY COMMERCIAL BUILDING
FIRE LANE
FIRE LANE
RAM
PD
OW
N
FOU
ND
ATIO
NLI
NE
UN
DER
GR
OU
ND
WAT
ERFE
ATU
RE
FOU
ND
ATIO
NLI
NE
UN
DER
GR
OU
ND
SETB
ACK
LIN
E
SET
BAC
KLI
NE
SETB
ACK
LIN
E
SETB
ACK
LIN
E
MO
VIN
GTR
UC
KD
RO
PO
FF
MAIN E
NTRAN
CE C
MAIN ENTRANCE A
FUTU
RE
BUIL
DIN
GD
EVEL
OPM
ENT
2
2
TOW
ER A
TOW
ER B
TOW
ER C
19 S
TOR
IES
GFA
868
.87
SQ.M
.21
3 U
NIT
SH
= 57
M
19 S
TOR
IES
GFA
868
.87
SQ.M
.21
9 U
NIT
SH
= 57
M
16 S
TOR
IES
GFA
868
.87
SQ.M
.15
9 U
NIT
SH
= 49
M
MAIN ENTRANCE B
GARBAGE LIFT AREA
MEC
HAN
ICAL
SH
AFT
FRES
H A
IR IN
TAKE
MECHANICAL SHAFT EXHAUST
MEC
HAN
ICAL
SH
AFT
FRES
H A
IR IN
TAKE
MECHANICAL SHAFT EXHAUST
MECHANICAL SHAFT FRESH AIR INTAKE
STAI
RS
0.20
Dia
.0.
20 D
ia.
0.23
Dia
.
0.28
Dia
.
0.28
Dia
.
0.28
Dia
.VI
LLAG
ELA
WN
SOFT
SCAP
E
SITE
PLA
N
1:30
0
NO
.R
EVIS
ION
01
DAT
EM
M/D
D/Y
Y
020304050607080910111213
201-
4 BE
ECHW
OO
D AV
ENUE
, O
TTAW
A, O
NTAR
IO, C
ANAD
A K1
L8L9
TEL:
613
228
985
0. F
AX 6
13 2
28 9
848.
mai
lbox
@w
oodm
anar
chite
ct.c
om
14
2020
-01-
06
MO
HA
MED
KH
ALI
L
RO
BER
T W
OO
DM
AN
112 Montreal Road & 314 Gardner Road Transportation Impact Assessment
Page 3
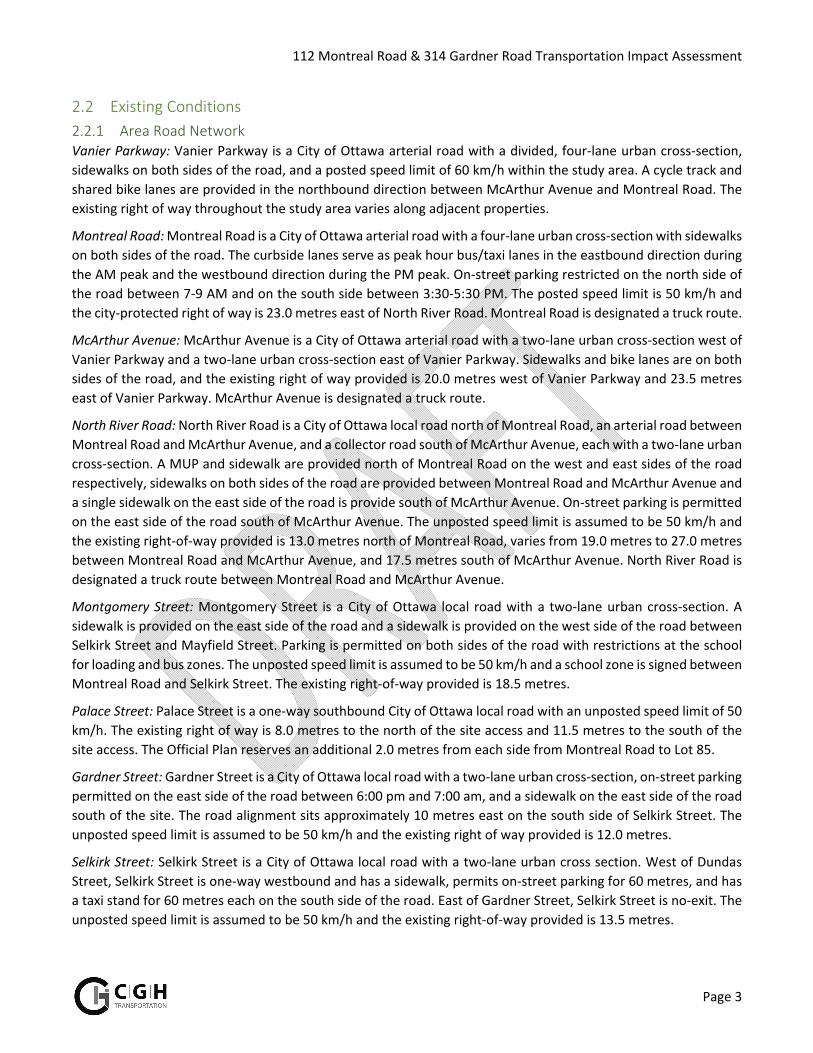
2.2 Existing Conditions
2.2.1 Area Road Network Vanier Parkway: Vanier Parkway is a City of Ottawa arterial road with a divided, four‐lane urban cross‐section,
sidewalks on both sides of the road, and a posted speed limit of 60 km/h within the study area. A cycle track and
shared bike lanes are provided in the northbound direction between McArthur Avenue and Montreal Road. The
existing right of way throughout the study area varies along adjacent properties.
Montreal Road: Montreal Road is a City of Ottawa arterial road with a four‐lane urban cross‐section with sidewalks
on both sides of the road. The curbside lanes serve as peak hour bus/taxi lanes in the eastbound direction during
the AM peak and the westbound direction during the PM peak. On‐street parking restricted on the north side of
the road between 7‐9 AM and on the south side between 3:30‐5:30 PM. The posted speed limit is 50 km/h and
the city‐protected right of way is 23.0 metres east of North River Road. Montreal Road is designated a truck route.
McArthur Avenue: McArthur Avenue is a City of Ottawa arterial road with a two‐lane urban cross‐section west of
Vanier Parkway and a two‐lane urban cross‐section east of Vanier Parkway. Sidewalks and bike lanes are on both
sides of the road, and the existing right of way provided is 20.0 metres west of Vanier Parkway and 23.5 metres
east of Vanier Parkway. McArthur Avenue is designated a truck route.
North River Road: North River Road is a City of Ottawa local road north of Montreal Road, an arterial road between
Montreal Road and McArthur Avenue, and a collector road south of McArthur Avenue, each with a two‐lane urban
cross‐section. A MUP and sidewalk are provided north of Montreal Road on the west and east sides of the road
respectively, sidewalks on both sides of the road are provided between Montreal Road and McArthur Avenue and
a single sidewalk on the east side of the road is provide south of McArthur Avenue. On‐street parking is permitted
on the east side of the road south of McArthur Avenue. The unposted speed limit is assumed to be 50 km/h and
the existing right‐of‐way provided is 13.0 metres north of Montreal Road, varies from 19.0 metres to 27.0 metres
between Montreal Road and McArthur Avenue, and 17.5 metres south of McArthur Avenue. North River Road is
designated a truck route between Montreal Road and McArthur Avenue.
Montgomery Street: Montgomery Street is a City of Ottawa local road with a two‐lane urban cross‐section. A
sidewalk is provided on the east side of the road and a sidewalk is provided on the west side of the road between
Selkirk Street and Mayfield Street. Parking is permitted on both sides of the road with restrictions at the school
for loading and bus zones. The unposted speed limit is assumed to be 50 km/h and a school zone is signed between
Montreal Road and Selkirk Street. The existing right‐of‐way provided is 18.5 metres.
Palace Street: Palace Street is a one‐way southbound City of Ottawa local road with an unposted speed limit of 50
km/h. The existing right of way is 8.0 metres to the north of the site access and 11.5 metres to the south of the
site access. The Official Plan reserves an additional 2.0 metres from each side from Montreal Road to Lot 85.
Gardner Street: Gardner Street is a City of Ottawa local road with a two‐lane urban cross‐section, on‐street parking
permitted on the east side of the road between 6:00 pm and 7:00 am, and a sidewalk on the east side of the road
south of the site. The road alignment sits approximately 10 metres east on the south side of Selkirk Street. The
unposted speed limit is assumed to be 50 km/h and the existing right of way provided is 12.0 metres.
Selkirk Street: Selkirk Street is a City of Ottawa local road with a two‐lane urban cross section. West of Dundas
Street, Selkirk Street is one‐way westbound and has a sidewalk, permits on‐street parking for 60 metres, and has
a taxi stand for 60 metres each on the south side of the road. East of Gardner Street, Selkirk Street is no‐exit. The
unposted speed limit is assumed to be 50 km/h and the existing right‐of‐way provided is 13.5 metres.
112 Montreal Road & 314 Gardner Road Transportation Impact Assessment
Page 4
Dundas Street: Dundas Street is a City of Ottawa local road with a two‐lane urban cross‐section and a sidewalk on
the west side of the road. The unposted speed limit is assumed to be 50 km/h and the existing right of way
provided is 12.0 metres. No on‐street parking is permitted.
Mayfield Street: Mayfield Street is a one‐way southbound City of Ottawa local road with a sidewalk of the west
side of the road. The unposted speed limit is assumed to be 50 km/h and the existing right of way provided is 12.0
metres. No on‐street parking is permitted.
Marguerite Avenue: Marguerite Avenue is a City of Ottawa local road with a two‐lane urban cross‐section, a
sidewalk on the west side of the road and on‐street parking permitted on the east side of the road. The unposted
speed limit is assumed to be 50 km/h and the existing right of way within the study area provided is 15.0 metres.
Hannah Street: Hannah Street is a City of Ottawa local road with a two‐lane urban cross‐section and sidewalks on
both sides of the road. The unposted speed limit is assumed to be 50 km/h and the existing right of way provided
is 12.0 metres. No on‐street parking is permitted.
Cody Avenue: Cody Avenue is a one‐way southbound City of Ottawa local road with a sidewalk on the west side
of the road, and on‐street parking permitted in layby areas on both sides of the road. South of Montreal Road, the
roadway permits 2‐way traffic. The unposted speed limit is assumed to be 50 km/h and the existing right of way
provided is 12.0 metres.
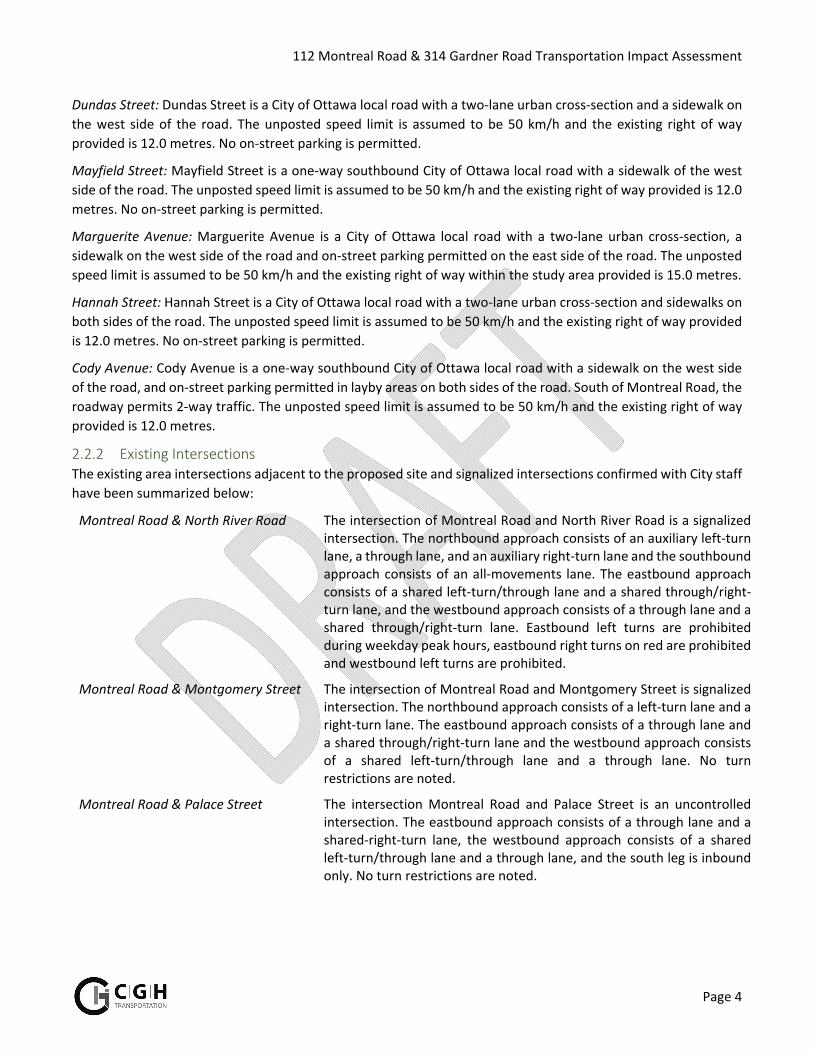
2.2.2 Existing Intersections The existing area intersections adjacent to the proposed site and signalized intersections confirmed with City staff
have been summarized below:
Montreal Road & North River Road The intersection of Montreal Road and North River Road is a signalized intersection. The northbound approach consists of an auxiliary left‐turn lane, a through lane, and an auxiliary right‐turn lane and the southbound approach consists of an all‐movements lane. The eastbound approach consists of a shared left‐turn/through lane and a shared through/right‐turn lane, and the westbound approach consists of a through lane and a shared through/right‐turn lane. Eastbound left turns are prohibited during weekday peak hours, eastbound right turns on red are prohibited and westbound left turns are prohibited.
Montreal Road & Montgomery Street The intersection of Montreal Road and Montgomery Street is signalized intersection. The northbound approach consists of a left‐turn lane and a right‐turn lane. The eastbound approach consists of a through lane and a shared through/right‐turn lane and the westbound approach consists of a shared left‐turn/through lane and a through lane. No turn restrictions are noted.
Montreal Road & Palace Street The intersection Montreal Road and Palace Street is an uncontrolled intersection. The eastbound approach consists of a through lane and a shared‐right‐turn lane, the westbound approach consists of a shared left‐turn/through lane and a through lane, and the south leg is inbound only. No turn restrictions are noted.
112 Montreal Road & 314 Gardner Road Transportation Impact Assessment
Page 5
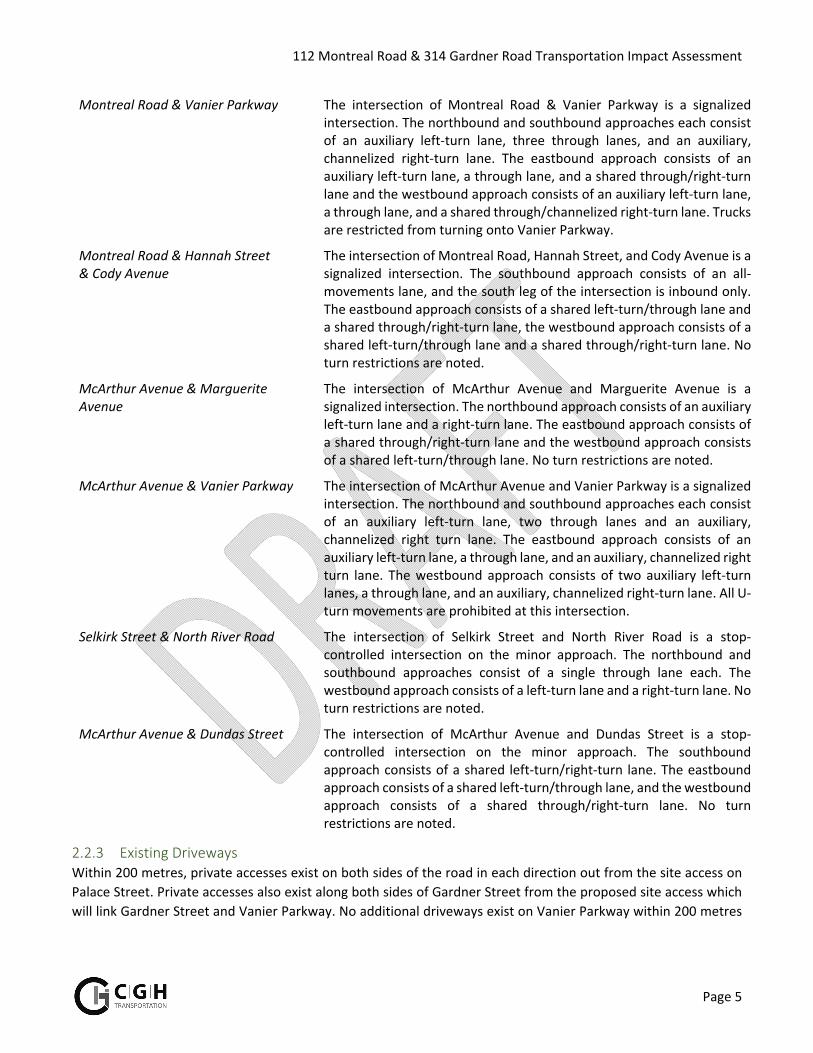
Montreal Road & Vanier Parkway The intersection of Montreal Road & Vanier Parkway is a signalized intersection. The northbound and southbound approaches each consist of an auxiliary left‐turn lane, three through lanes, and an auxiliary, channelized right‐turn lane. The eastbound approach consists of an auxiliary left‐turn lane, a through lane, and a shared through/right‐turn lane and the westbound approach consists of an auxiliary left‐turn lane, a through lane, and a shared through/channelized right‐turn lane. Trucks are restricted from turning onto Vanier Parkway.
Montreal Road & Hannah Street & Cody Avenue
The intersection of Montreal Road, Hannah Street, and Cody Avenue is a signalized intersection. The southbound approach consists of an all‐movements lane, and the south leg of the intersection is inbound only. The eastbound approach consists of a shared left‐turn/through lane and a shared through/right‐turn lane, the westbound approach consists of a shared left‐turn/through lane and a shared through/right‐turn lane. No turn restrictions are noted.
McArthur Avenue & Marguerite Avenue
The intersection of McArthur Avenue and Marguerite Avenue is a signalized intersection. The northbound approach consists of an auxiliary left‐turn lane and a right‐turn lane. The eastbound approach consists of a shared through/right‐turn lane and the westbound approach consists of a shared left‐turn/through lane. No turn restrictions are noted.
McArthur Avenue & Vanier Parkway The intersection of McArthur Avenue and Vanier Parkway is a signalized intersection. The northbound and southbound approaches each consist of an auxiliary left‐turn lane, two through lanes and an auxiliary, channelized right turn lane. The eastbound approach consists of an auxiliary left‐turn lane, a through lane, and an auxiliary, channelized right turn lane. The westbound approach consists of two auxiliary left‐turn lanes, a through lane, and an auxiliary, channelized right‐turn lane. All U‐turn movements are prohibited at this intersection.
Selkirk Street & North River Road The intersection of Selkirk Street and North River Road is a stop‐controlled intersection on the minor approach. The northbound and southbound approaches consist of a single through lane each. The westbound approach consists of a left‐turn lane and a right‐turn lane. No turn restrictions are noted.
McArthur Avenue & Dundas Street The intersection of McArthur Avenue and Dundas Street is a stop‐controlled intersection on the minor approach. The southbound approach consists of a shared left‐turn/right‐turn lane. The eastbound approach consists of a shared left‐turn/through lane, and the westbound approach consists of a shared through/right‐turn lane. No turn restrictions are noted.
2.2.3 Existing Driveways Within 200 metres, private accesses exist on both sides of the road in each direction out from the site access on
Palace Street. Private accesses also exist along both sides of Gardner Street from the proposed site access which
will link Gardner Street and Vanier Parkway. No additional driveways exist on Vanier Parkway within 200 metres
112 Montreal Road & 314 Gardner Road Transportation Impact Assessment
Page 6
of the proposed site access. None of the driveways within the area of consideration are significant traffic
generators.
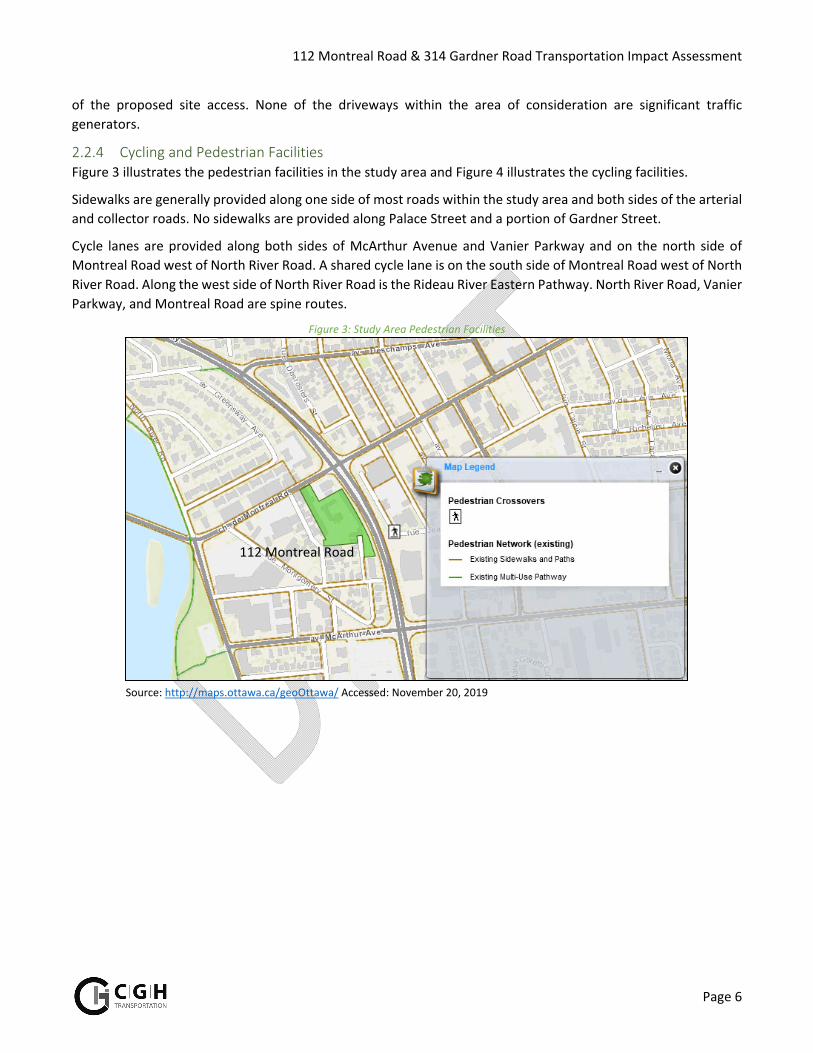
2.2.4 Cycling and Pedestrian Facilities Figure 3 illustrates the pedestrian facilities in the study area and Figure 4 illustrates the cycling facilities.
Sidewalks are generally provided along one side of most roads within the study area and both sides of the arterial
and collector roads. No sidewalks are provided along Palace Street and a portion of Gardner Street.
Cycle lanes are provided along both sides of McArthur Avenue and Vanier Parkway and on the north side of
Montreal Road west of North River Road. A shared cycle lane is on the south side of Montreal Road west of North
River Road. Along the west side of North River Road is the Rideau River Eastern Pathway. North River Road, Vanier
Parkway, and Montreal Road are spine routes.
Figure 3: Study Area Pedestrian Facilities
Source: http://maps.ottawa.ca/geoOttawa/ Accessed: November 20, 2019
112 Montreal Road
112 Montreal Road & 314 Gardner Road Transportation Impact Assessment
Page 7
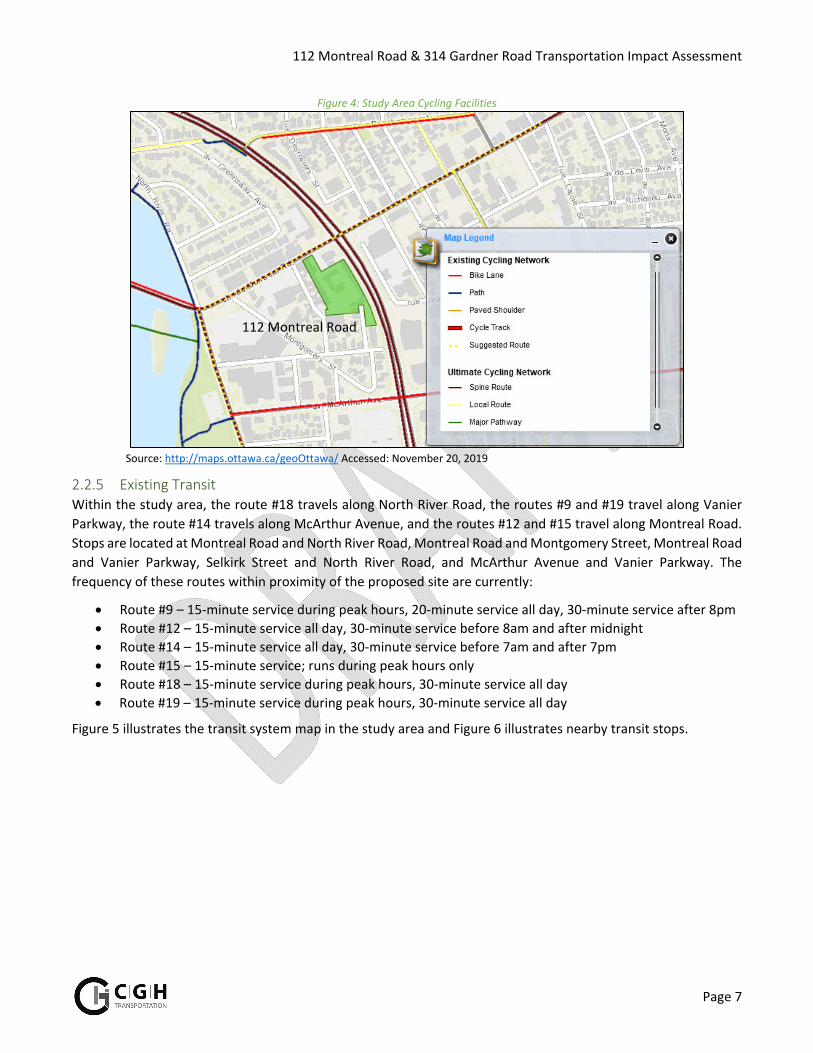
Figure 4: Study Area Cycling Facilities
Source: http://maps.ottawa.ca/geoOttawa/ Accessed: November 20, 2019
2.2.5 Existing Transit Within the study area, the route #18 travels along North River Road, the routes #9 and #19 travel along Vanier
Parkway, the route #14 travels along McArthur Avenue, and the routes #12 and #15 travel along Montreal Road.
Stops are located at Montreal Road and North River Road, Montreal Road and Montgomery Street, Montreal Road
and Vanier Parkway, Selkirk Street and North River Road, and McArthur Avenue and Vanier Parkway. The
frequency of these routes within proximity of the proposed site are currently:
Route #9 – 15‐minute service during peak hours, 20‐minute service all day, 30‐minute service after 8pm
Route #12 – 15‐minute service all day, 30‐minute service before 8am and after midnight
Route #14 – 15‐minute service all day, 30‐minute service before 7am and after 7pm
Route #15 – 15‐minute service; runs during peak hours only
Route #18 – 15‐minute service during peak hours, 30‐minute service all day
Route #19 – 15‐minute service during peak hours, 30‐minute service all day
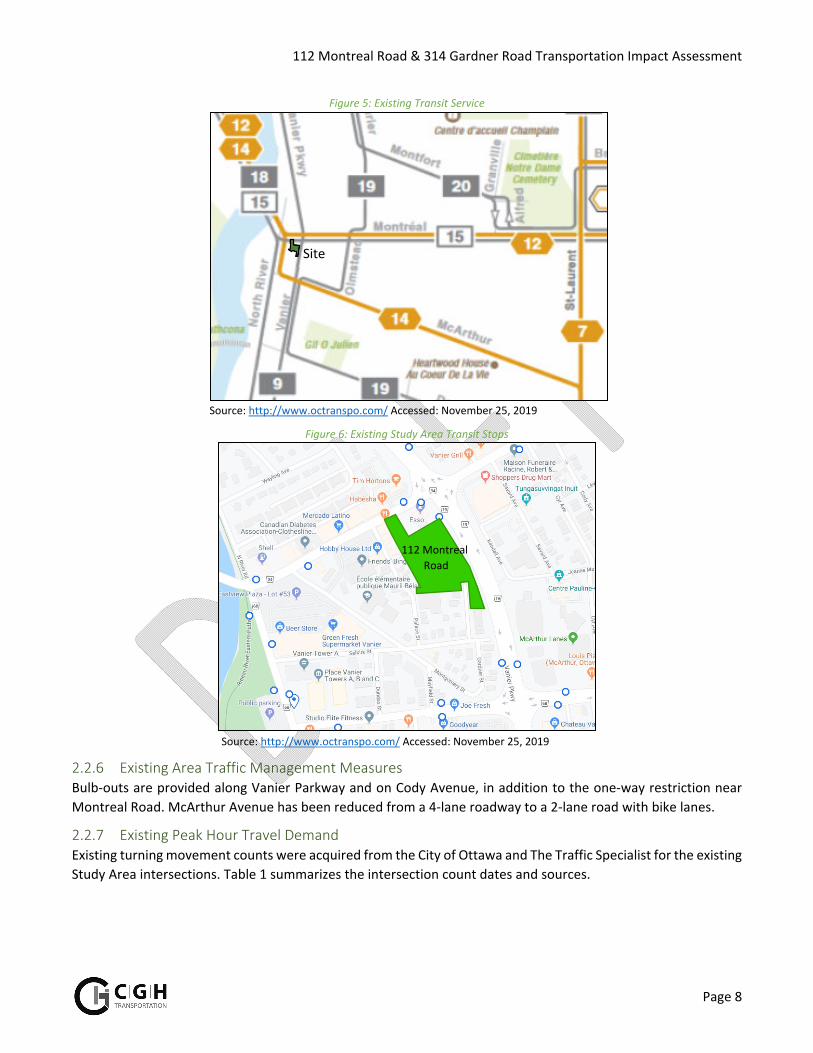
Figure 5 illustrates the transit system map in the study area and Figure 6 illustrates nearby transit stops.
112 Montreal Road
112 Montreal Road & 314 Gardner Road Transportation Impact Assessment
Page 8
Figure 5: Existing Transit Service
Source: http://www.octranspo.com/ Accessed: November 25, 2019
Figure 6: Existing Study Area Transit Stops
Source: http://www.octranspo.com/ Accessed: November 25, 2019
2.2.6 Existing Area Traffic Management Measures Bulb‐outs are provided along Vanier Parkway and on Cody Avenue, in addition to the one‐way restriction near
Montreal Road. McArthur Avenue has been reduced from a 4‐lane roadway to a 2‐lane road with bike lanes.
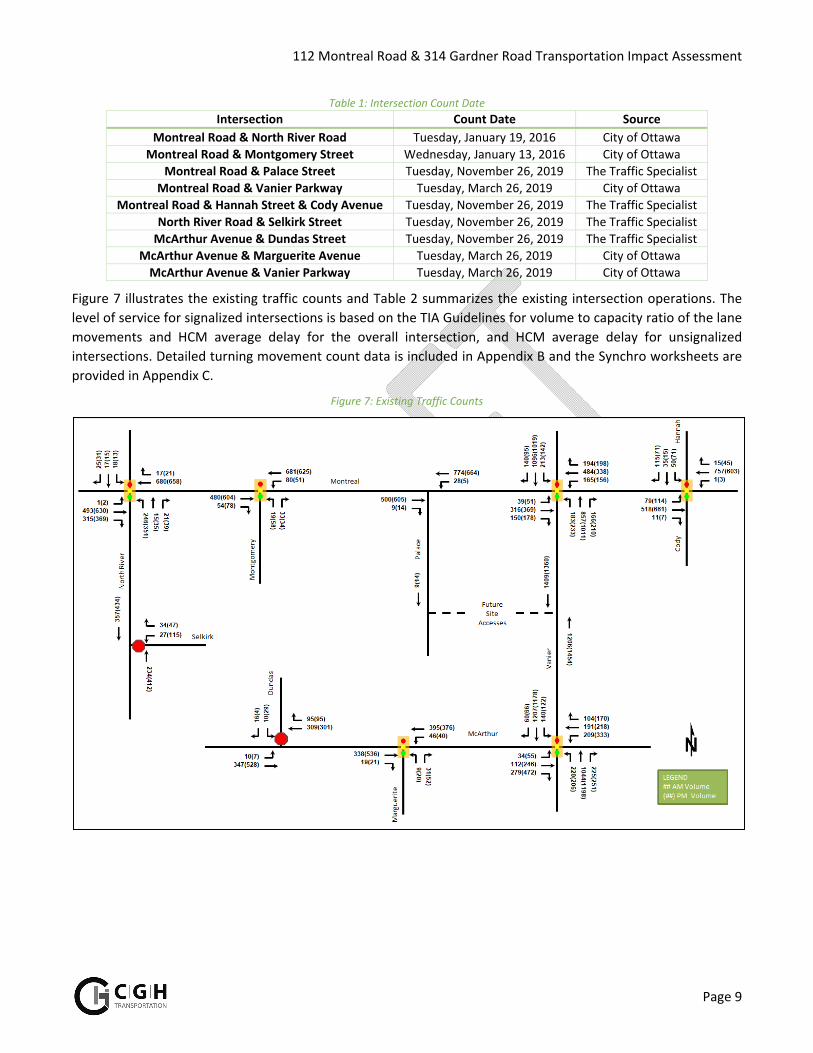
2.2.7 Existing Peak Hour Travel Demand Existing turning movement counts were acquired from the City of Ottawa and The Traffic Specialist for the existing
Study Area intersections. Table 1 summarizes the intersection count dates and sources.
Site
112 Montreal
Road
112 Montreal Road & 314 Gardner Road Transportation Impact Assessment
Page 9
Table 1: Intersection Count Date
Intersection Count Date Source
Montreal Road & North River Road Tuesday, January 19, 2016 City of Ottawa
Montreal Road & Montgomery Street Wednesday, January 13, 2016 City of Ottawa
Montreal Road & Palace Street Tuesday, November 26, 2019 The Traffic Specialist
Montreal Road & Vanier Parkway Tuesday, March 26, 2019 City of Ottawa
Montreal Road & Hannah Street & Cody Avenue Tuesday, November 26, 2019 The Traffic Specialist
North River Road & Selkirk Street Tuesday, November 26, 2019 The Traffic Specialist
McArthur Avenue & Dundas Street Tuesday, November 26, 2019 The Traffic Specialist
McArthur Avenue & Marguerite Avenue Tuesday, March 26, 2019 City of Ottawa
McArthur Avenue & Vanier Parkway Tuesday, March 26, 2019 City of Ottawa
Figure 7 illustrates the existing traffic counts and Table 2 summarizes the existing intersection operations. The
level of service for signalized intersections is based on the TIA Guidelines for volume to capacity ratio of the lane
movements and HCM average delay for the overall intersection, and HCM average delay for unsignalized
intersections. Detailed turning movement count data is included in Appendix B and the Synchro worksheets are
provided in Appendix C.
Figure 7: Existing Traffic Counts
112 Montreal Road & 314 Gardner Road Transportation Impact Assessment
Page 10
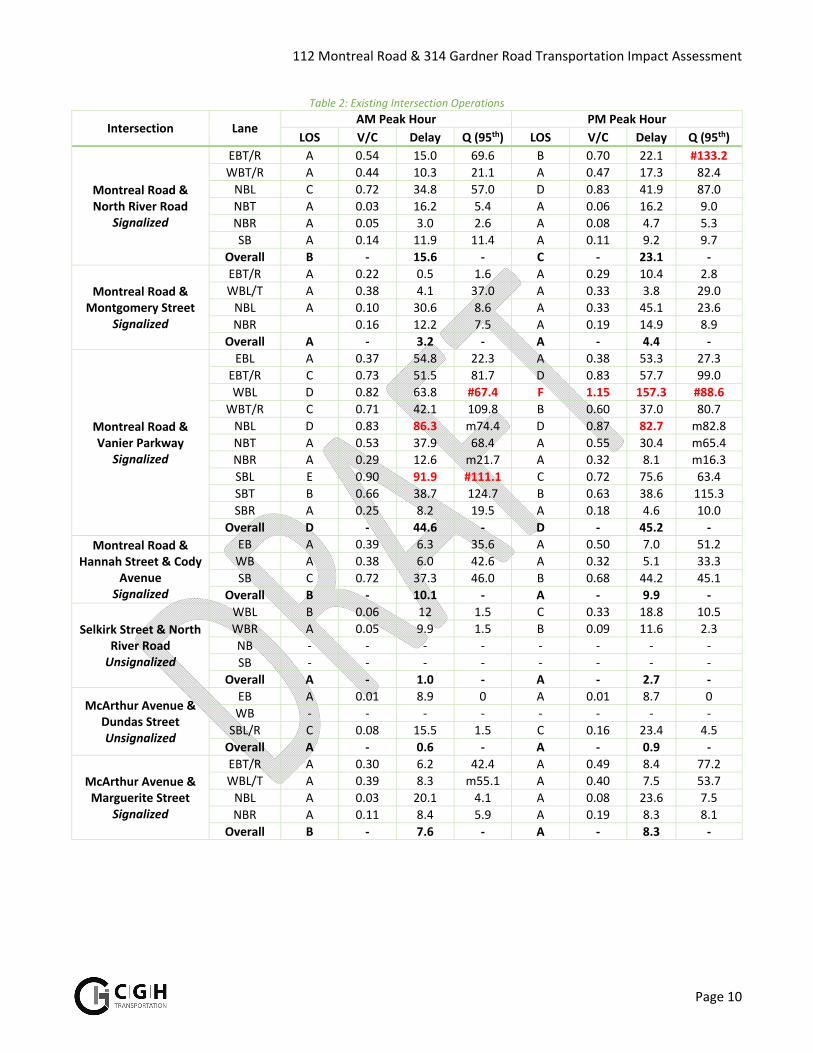
Table 2: Existing Intersection Operations
Intersection Lane AM Peak Hour PM Peak Hour
LOS V/C Delay Q (95th) LOS V/C Delay Q (95th)
Montreal Road & North River Road
Signalized
EBT/R A 0.54 15.0 69.6 B 0.70 22.1 #133.2
WBT/R A 0.44 10.3 21.1 A 0.47 17.3 82.4
NBL C 0.72 34.8 57.0 D 0.83 41.9 87.0
NBT A 0.03 16.2 5.4 A 0.06 16.2 9.0
NBR A 0.05 3.0 2.6 A 0.08 4.7 5.3
SB A 0.14 11.9 11.4 A 0.11 9.2 9.7
Overall B ‐ 15.6 ‐ C ‐ 23.1 ‐
Montreal Road & Montgomery Street
Signalized
EBT/R A 0.22 0.5 1.6 A 0.29 10.4 2.8
WBL/T A 0.38 4.1 37.0 A 0.33 3.8 29.0
NBL A 0.10 30.6 8.6 A 0.33 45.1 23.6
NBR 0.16 12.2 7.5 A 0.19 14.9 8.9
Overall A ‐ 3.2 ‐ A ‐ 4.4 ‐
Montreal Road & Vanier Parkway
Signalized
EBL A 0.37 54.8 22.3 A 0.38 53.3 27.3
EBT/R C 0.73 51.5 81.7 D 0.83 57.7 99.0
WBL D 0.82 63.8 #67.4 F 1.15 157.3 #88.6
WBT/R C 0.71 42.1 109.8 B 0.60 37.0 80.7
NBL D 0.83 86.3 m74.4 D 0.87 82.7 m82.8
NBT A 0.53 37.9 68.4 A 0.55 30.4 m65.4
NBR A 0.29 12.6 m21.7 A 0.32 8.1 m16.3
SBL E 0.90 91.9 #111.1 C 0.72 75.6 63.4
SBT B 0.66 38.7 124.7 B 0.63 38.6 115.3
SBR A 0.25 8.2 19.5 A 0.18 4.6 10.0
Overall D ‐ 44.6 ‐ D ‐ 45.2 ‐
Montreal Road & Hannah Street & Cody
Avenue Signalized
EB A 0.39 6.3 35.6 A 0.50 7.0 51.2
WB A 0.38 6.0 42.6 A 0.32 5.1 33.3
SB C 0.72 37.3 46.0 B 0.68 44.2 45.1
Overall B ‐ 10.1 ‐ A ‐ 9.9 ‐
Selkirk Street & North River Road Unsignalized
WBL B 0.06 12 1.5 C 0.33 18.8 10.5
WBR A 0.05 9.9 1.5 B 0.09 11.6 2.3
NB ‐ ‐ ‐ ‐ ‐ ‐ ‐ ‐
SB ‐ ‐ ‐ ‐ ‐ ‐ ‐ ‐
Overall A ‐ 1.0 ‐ A ‐ 2.7 ‐
McArthur Avenue & Dundas Street Unsignalized
EB A 0.01 8.9 0 A 0.01 8.7 0
WB ‐ ‐ ‐ ‐ ‐ ‐ ‐ ‐
SBL/R C 0.08 15.5 1.5 C 0.16 23.4 4.5
Overall A ‐ 0.6 ‐ A ‐ 0.9 ‐
McArthur Avenue & Marguerite Street
Signalized
EBT/R A 0.30 6.2 42.4 A 0.49 8.4 77.2
WBL/T A 0.39 8.3 m55.1 A 0.40 7.5 53.7
NBL A 0.03 20.1 4.1 A 0.08 23.6 7.5
NBR A 0.11 8.4 5.9 A 0.19 8.3 8.1
Overall B ‐ 7.6 ‐ A ‐ 8.3 ‐
112 Montreal Road & 314 Gardner Road Transportation Impact Assessment
Page 11
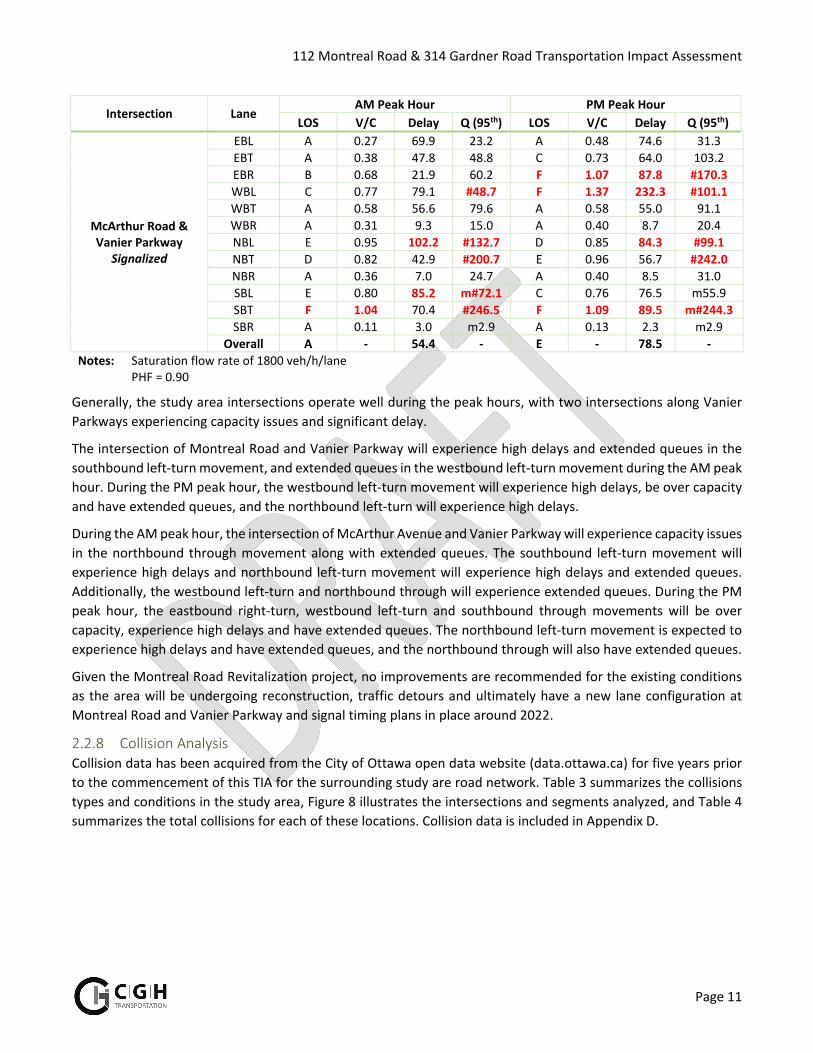
Intersection Lane AM Peak Hour PM Peak Hour
LOS V/C Delay Q (95th) LOS V/C Delay Q (95th)
McArthur Road & Vanier Parkway
Signalized
EBL A 0.27 69.9 23.2 A 0.48 74.6 31.3
EBT A 0.38 47.8 48.8 C 0.73 64.0 103.2
EBR B 0.68 21.9 60.2 F 1.07 87.8 #170.3
WBL C 0.77 79.1 #48.7 F 1.37 232.3 #101.1
WBT A 0.58 56.6 79.6 A 0.58 55.0 91.1
WBR A 0.31 9.3 15.0 A 0.40 8.7 20.4
NBL E 0.95 102.2 #132.7 D 0.85 84.3 #99.1
NBT D 0.82 42.9 #200.7 E 0.96 56.7 #242.0
NBR A 0.36 7.0 24.7 A 0.40 8.5 31.0
SBL E 0.80 85.2 m#72.1 C 0.76 76.5 m55.9
SBT F 1.04 70.4 #246.5 F 1.09 89.5 m#244.3
SBR A 0.11 3.0 m2.9 A 0.13 2.3 m2.9
Overall A ‐ 54.4 ‐ E ‐ 78.5 ‐
Notes: Saturation flow rate of 1800 veh/h/lane PHF = 0.90
Generally, the study area intersections operate well during the peak hours, with two intersections along Vanier
Parkways experiencing capacity issues and significant delay.
The intersection of Montreal Road and Vanier Parkway will experience high delays and extended queues in the
southbound left‐turn movement, and extended queues in the westbound left‐turn movement during the AM peak
hour. During the PM peak hour, the westbound left‐turn movement will experience high delays, be over capacity
and have extended queues, and the northbound left‐turn will experience high delays.
During the AM peak hour, the intersection of McArthur Avenue and Vanier Parkway will experience capacity issues
in the northbound through movement along with extended queues. The southbound left‐turn movement will
experience high delays and northbound left‐turn movement will experience high delays and extended queues.
Additionally, the westbound left‐turn and northbound through will experience extended queues. During the PM
peak hour, the eastbound right‐turn, westbound left‐turn and southbound through movements will be over
capacity, experience high delays and have extended queues. The northbound left‐turn movement is expected to
experience high delays and have extended queues, and the northbound through will also have extended queues.
Given the Montreal Road Revitalization project, no improvements are recommended for the existing conditions
as the area will be undergoing reconstruction, traffic detours and ultimately have a new lane configuration at
Montreal Road and Vanier Parkway and signal timing plans in place around 2022.
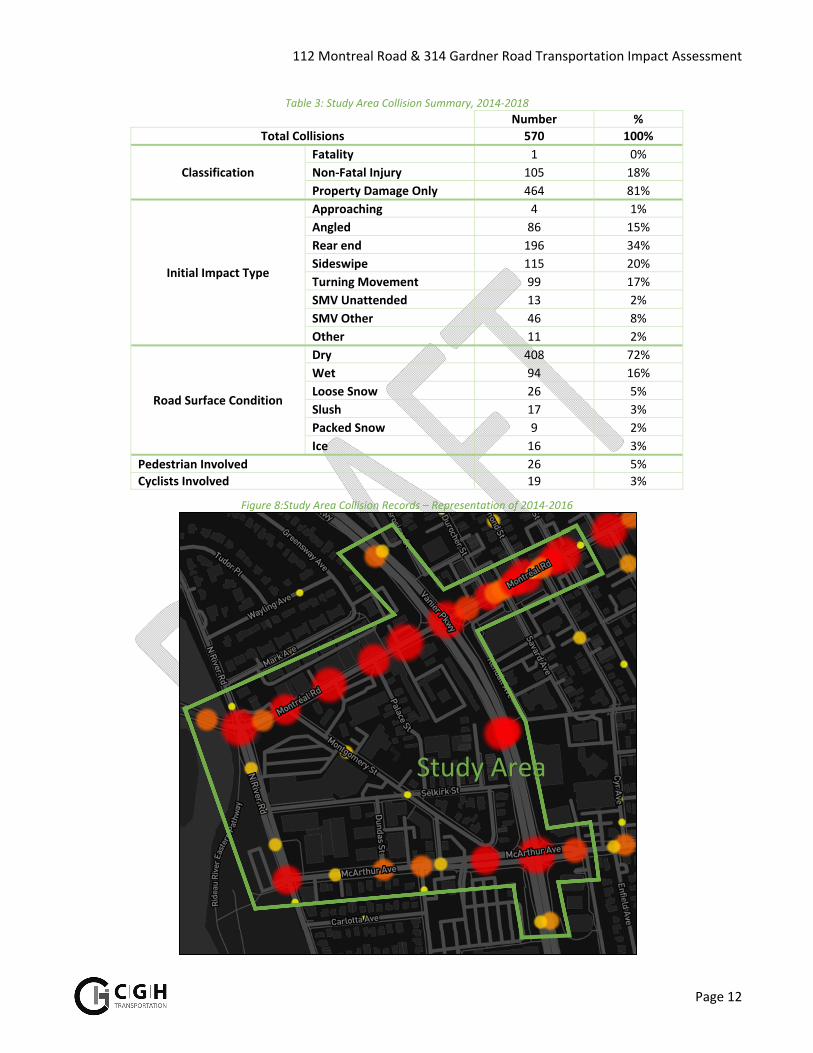
2.2.8 Collision Analysis Collision data has been acquired from the City of Ottawa open data website (data.ottawa.ca) for five years prior
to the commencement of this TIA for the surrounding study are road network. Table 3 summarizes the collisions
types and conditions in the study area, Figure 8 illustrates the intersections and segments analyzed, and Table 4
summarizes the total collisions for each of these locations. Collision data is included in Appendix D.
112 Montreal Road & 314 Gardner Road Transportation Impact Assessment
Page 12
Table 3: Study Area Collision Summary, 2014‐2018
Number %
Total Collisions 570 100%
Classification
Fatality 1 0%
Non‐Fatal Injury 105 18%
Property Damage Only 464 81%
Initial Impact Type
Approaching 4 1%
Angled 86 15%
Rear end 196 34%
Sideswipe 115 20%
Turning Movement 99 17%
SMV Unattended 13 2%
SMV Other 46 8%
Other 11 2%
Road Surface Condition
Dry 408 72%
Wet 94 16%
Loose Snow 26 5%
Slush 17 3%
Packed Snow 9 2%
Ice 16 3%
Pedestrian Involved 26 5%
Cyclists Involved 19 3%
Figure 8:Study Area Collision Records – Representation of 2014‐2016
Study Area
112 Montreal Road & 314 Gardner Road Transportation Impact Assessment
Page 13
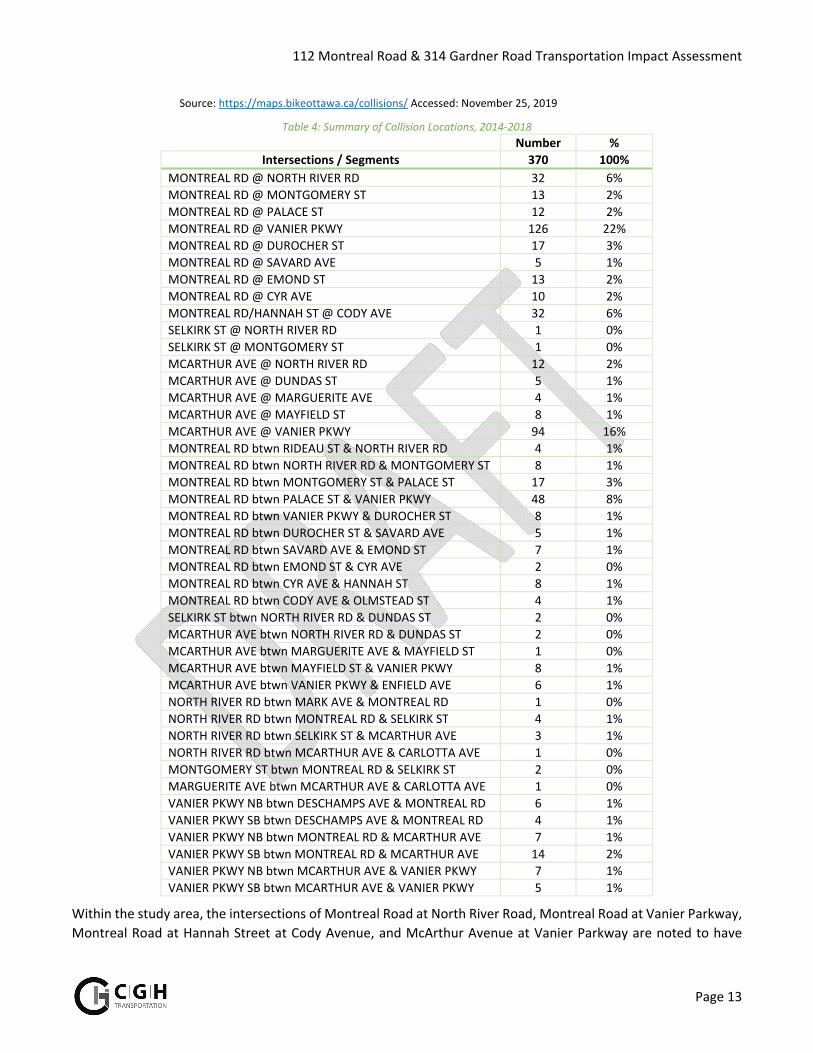
Source: https://maps.bikeottawa.ca/collisions/ Accessed: November 25, 2019
Table 4: Summary of Collision Locations, 2014‐2018 Number %
Intersections / Segments 370 100%
MONTREAL RD @ NORTH RIVER RD 32 6%
MONTREAL RD @ MONTGOMERY ST 13 2%
MONTREAL RD @ PALACE ST 12 2%
MONTREAL RD @ VANIER PKWY 126 22%
MONTREAL RD @ DUROCHER ST 17 3%
MONTREAL RD @ SAVARD AVE 5 1%
MONTREAL RD @ EMOND ST 13 2%
MONTREAL RD @ CYR AVE 10 2%
MONTREAL RD/HANNAH ST @ CODY AVE 32 6%
SELKIRK ST @ NORTH RIVER RD 1 0%
SELKIRK ST @ MONTGOMERY ST 1 0%
MCARTHUR AVE @ NORTH RIVER RD 12 2%
MCARTHUR AVE @ DUNDAS ST 5 1%
MCARTHUR AVE @ MARGUERITE AVE 4 1%
MCARTHUR AVE @ MAYFIELD ST 8 1%
MCARTHUR AVE @ VANIER PKWY 94 16%
MONTREAL RD btwn RIDEAU ST & NORTH RIVER RD 4 1%
MONTREAL RD btwn NORTH RIVER RD & MONTGOMERY ST 8 1%
MONTREAL RD btwn MONTGOMERY ST & PALACE ST 17 3%
MONTREAL RD btwn PALACE ST & VANIER PKWY 48 8%
MONTREAL RD btwn VANIER PKWY & DUROCHER ST 8 1%
MONTREAL RD btwn DUROCHER ST & SAVARD AVE 5 1%
MONTREAL RD btwn SAVARD AVE & EMOND ST 7 1%
MONTREAL RD btwn EMOND ST & CYR AVE 2 0%
MONTREAL RD btwn CYR AVE & HANNAH ST 8 1%
MONTREAL RD btwn CODY AVE & OLMSTEAD ST 4 1%
SELKIRK ST btwn NORTH RIVER RD & DUNDAS ST 2 0%
MCARTHUR AVE btwn NORTH RIVER RD & DUNDAS ST 2 0%
MCARTHUR AVE btwn MARGUERITE AVE & MAYFIELD ST 1 0%
MCARTHUR AVE btwn MAYFIELD ST & VANIER PKWY 8 1%
MCARTHUR AVE btwn VANIER PKWY & ENFIELD AVE 6 1%
NORTH RIVER RD btwn MARK AVE & MONTREAL RD 1 0%
NORTH RIVER RD btwn MONTREAL RD & SELKIRK ST 4 1%
NORTH RIVER RD btwn SELKIRK ST & MCARTHUR AVE 3 1%
NORTH RIVER RD btwn MCARTHUR AVE & CARLOTTA AVE 1 0%
MONTGOMERY ST btwn MONTREAL RD & SELKIRK ST 2 0%
MARGUERITE AVE btwn MCARTHUR AVE & CARLOTTA AVE 1 0%
VANIER PKWY NB btwn DESCHAMPS AVE & MONTREAL RD 6 1%
VANIER PKWY SB btwn DESCHAMPS AVE & MONTREAL RD 4 1%
VANIER PKWY NB btwn MONTREAL RD & MCARTHUR AVE 7 1%
VANIER PKWY SB btwn MONTREAL RD & MCARTHUR AVE 14 2%
VANIER PKWY NB btwn MCARTHUR AVE & VANIER PKWY 7 1%
VANIER PKWY SB btwn MCARTHUR AVE & VANIER PKWY 5 1%
Within the study area, the intersections of Montreal Road at North River Road, Montreal Road at Vanier Parkway,
Montreal Road at Hannah Street at Cody Avenue, and McArthur Avenue at Vanier Parkway are noted to have
112 Montreal Road & 314 Gardner Road Transportation Impact Assessment
Page 14
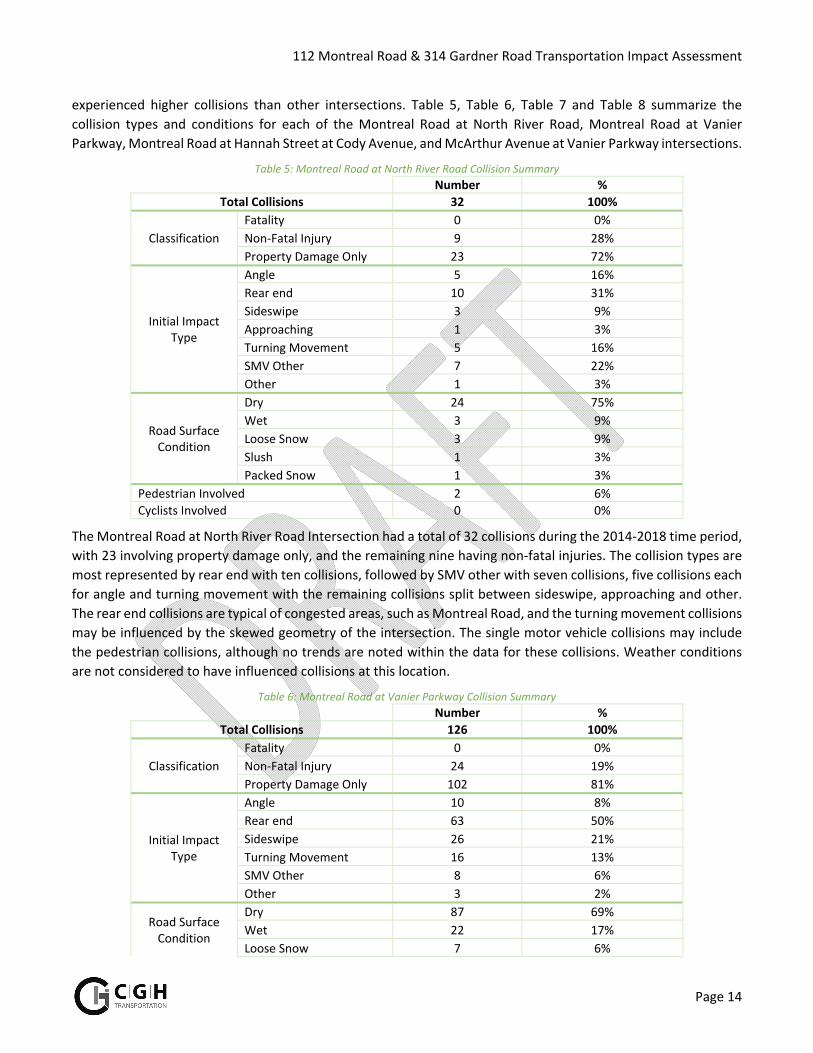
experienced higher collisions than other intersections. Table 5, Table 6, Table 7 and Table 8 summarize the
collision types and conditions for each of the Montreal Road at North River Road, Montreal Road at Vanier
Parkway, Montreal Road at Hannah Street at Cody Avenue, and McArthur Avenue at Vanier Parkway intersections.
Table 5: Montreal Road at North River Road Collision Summary
Number %
Total Collisions 32 100%
Classification
Fatality 0 0%
Non‐Fatal Injury 9 28%
Property Damage Only 23 72%
Initial Impact Type
Angle 5 16%
Rear end 10 31%
Sideswipe 3 9%
Approaching 1 3%
Turning Movement 5 16%
SMV Other 7 22%
Other 1 3%
Road Surface Condition
Dry 24 75%
Wet 3 9%
Loose Snow 3 9%
Slush 1 3%
Packed Snow 1 3%
Pedestrian Involved 2 6%
Cyclists Involved 0 0%
The Montreal Road at North River Road Intersection had a total of 32 collisions during the 2014‐2018 time period,
with 23 involving property damage only, and the remaining nine having non‐fatal injuries. The collision types are
most represented by rear end with ten collisions, followed by SMV other with seven collisions, five collisions each
for angle and turning movement with the remaining collisions split between sideswipe, approaching and other.
The rear end collisions are typical of congested areas, such as Montreal Road, and the turning movement collisions
may be influenced by the skewed geometry of the intersection. The single motor vehicle collisions may include
the pedestrian collisions, although no trends are noted within the data for these collisions. Weather conditions
are not considered to have influenced collisions at this location.
Table 6: Montreal Road at Vanier Parkway Collision Summary
Number %
Total Collisions 126 100%
Classification
Fatality 0 0%
Non‐Fatal Injury 24 19%
Property Damage Only 102 81%
Initial Impact Type
Angle 10 8%
Rear end 63 50%
Sideswipe 26 21%
Turning Movement 16 13%
SMV Other 8 6%
Other 3 2%
Road Surface Condition
Dry 87 69%
Wet 22 17%
Loose Snow 7 6%
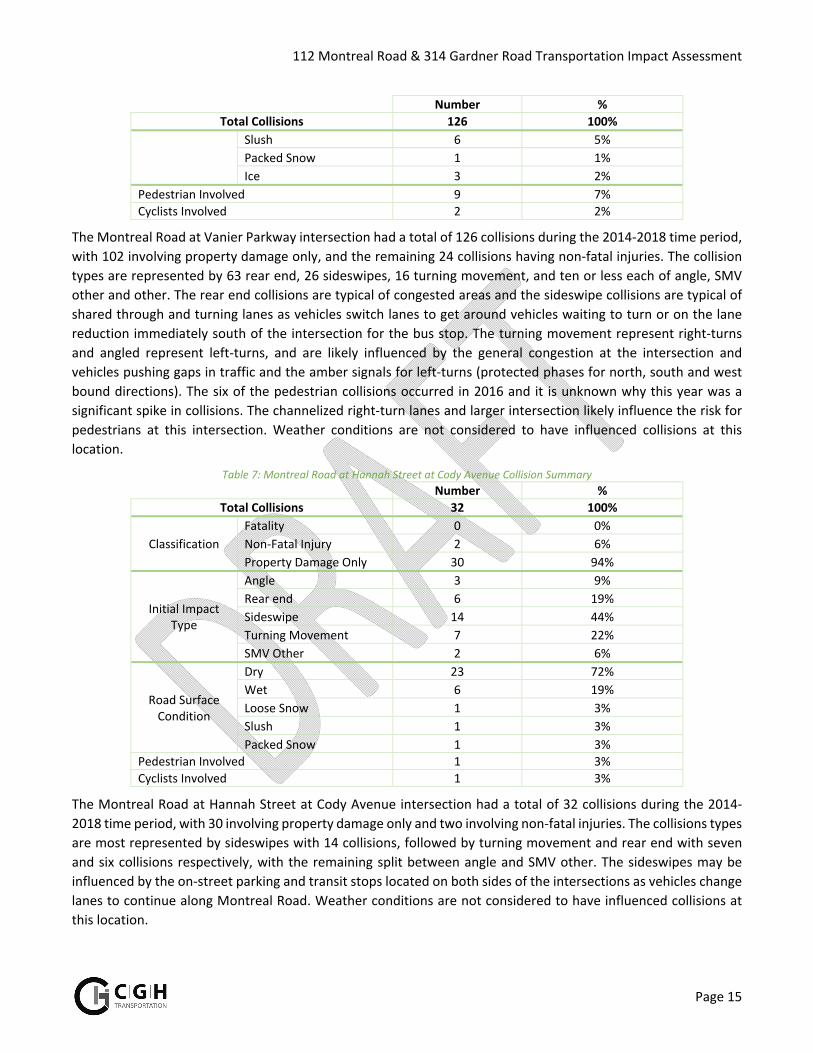
112 Montreal Road & 314 Gardner Road Transportation Impact Assessment
Page 15
Number %
Total Collisions 126 100%
Slush 6 5%
Packed Snow 1 1%
Ice 3 2%
Pedestrian Involved 9 7%
Cyclists Involved 2 2%
The Montreal Road at Vanier Parkway intersection had a total of 126 collisions during the 2014‐2018 time period,
with 102 involving property damage only, and the remaining 24 collisions having non‐fatal injuries. The collision
types are represented by 63 rear end, 26 sideswipes, 16 turning movement, and ten or less each of angle, SMV
other and other. The rear end collisions are typical of congested areas and the sideswipe collisions are typical of
shared through and turning lanes as vehicles switch lanes to get around vehicles waiting to turn or on the lane
reduction immediately south of the intersection for the bus stop. The turning movement represent right‐turns
and angled represent left‐turns, and are likely influenced by the general congestion at the intersection and
vehicles pushing gaps in traffic and the amber signals for left‐turns (protected phases for north, south and west
bound directions). The six of the pedestrian collisions occurred in 2016 and it is unknown why this year was a
significant spike in collisions. The channelized right‐turn lanes and larger intersection likely influence the risk for
pedestrians at this intersection. Weather conditions are not considered to have influenced collisions at this
location.
Table 7: Montreal Road at Hannah Street at Cody Avenue Collision Summary
Number %
Total Collisions 32 100%
Classification
Fatality 0 0%
Non‐Fatal Injury 2 6%
Property Damage Only 30 94%
Initial Impact Type
Angle 3 9%
Rear end 6 19%
Sideswipe 14 44%
Turning Movement 7 22%
SMV Other 2 6%
Road Surface Condition
Dry 23 72%
Wet 6 19%
Loose Snow 1 3%
Slush 1 3%
Packed Snow 1 3%
Pedestrian Involved 1 3%
Cyclists Involved 1 3%
The Montreal Road at Hannah Street at Cody Avenue intersection had a total of 32 collisions during the 2014‐
2018 time period, with 30 involving property damage only and two involving non‐fatal injuries. The collisions types
are most represented by sideswipes with 14 collisions, followed by turning movement and rear end with seven
and six collisions respectively, with the remaining split between angle and SMV other. The sideswipes may be
influenced by the on‐street parking and transit stops located on both sides of the intersections as vehicles change
lanes to continue along Montreal Road. Weather conditions are not considered to have influenced collisions at
this location.
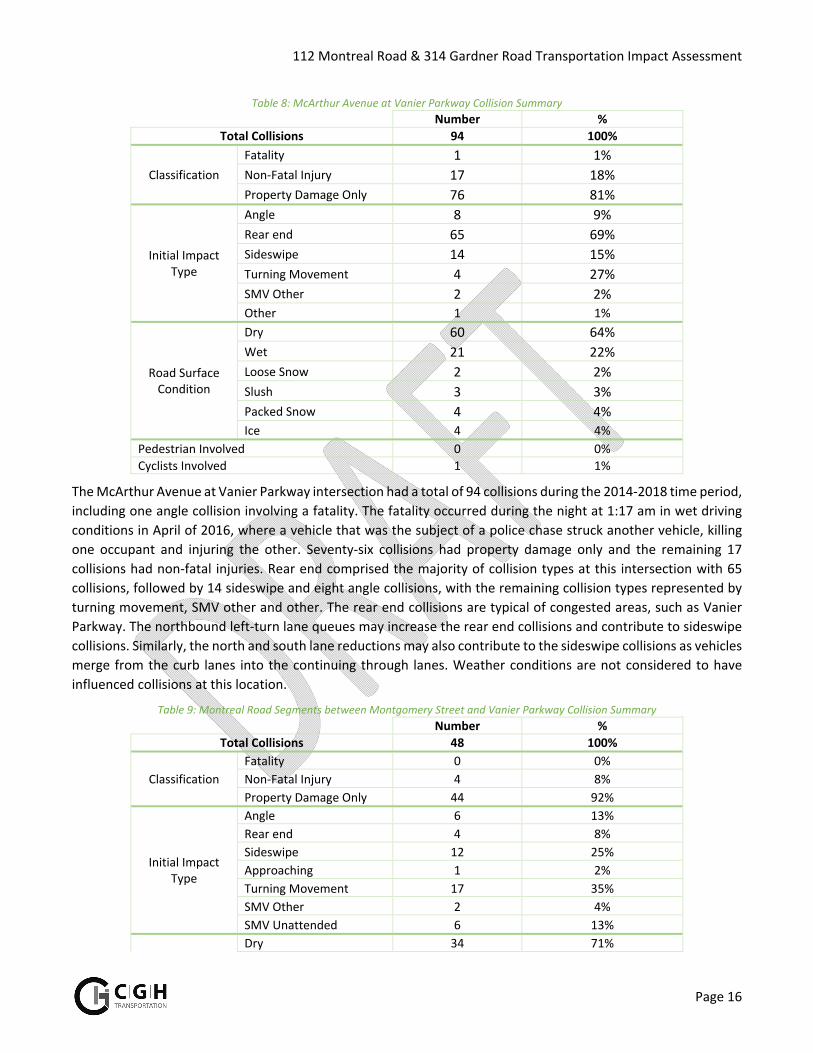
112 Montreal Road & 314 Gardner Road Transportation Impact Assessment
Page 16
Table 8: McArthur Avenue at Vanier Parkway Collision Summary
Number %
Total Collisions 94 100%
Classification
Fatality 1 1%
Non‐Fatal Injury 17 18%
Property Damage Only 76 81%
Initial Impact Type
Angle 8 9%
Rear end 65 69%
Sideswipe 14 15%
Turning Movement 4 27%
SMV Other 2 2%
Other 1 1%
Road Surface Condition
Dry 60 64%
Wet 21 22%
Loose Snow 2 2%
Slush 3 3%
Packed Snow 4 4%
Ice 4 4%
Pedestrian Involved 0 0%
Cyclists Involved 1 1%
The McArthur Avenue at Vanier Parkway intersection had a total of 94 collisions during the 2014‐2018 time period,
including one angle collision involving a fatality. The fatality occurred during the night at 1:17 am in wet driving
conditions in April of 2016, where a vehicle that was the subject of a police chase struck another vehicle, killing
one occupant and injuring the other. Seventy‐six collisions had property damage only and the remaining 17
collisions had non‐fatal injuries. Rear end comprised the majority of collision types at this intersection with 65
collisions, followed by 14 sideswipe and eight angle collisions, with the remaining collision types represented by
turning movement, SMV other and other. The rear end collisions are typical of congested areas, such as Vanier
Parkway. The northbound left‐turn lane queues may increase the rear end collisions and contribute to sideswipe
collisions. Similarly, the north and south lane reductions may also contribute to the sideswipe collisions as vehicles
merge from the curb lanes into the continuing through lanes. Weather conditions are not considered to have
influenced collisions at this location.
Table 9: Montreal Road Segments between Montgomery Street and Vanier Parkway Collision Summary
Number %
Total Collisions 48 100%
Classification
Fatality 0 0%
Non‐Fatal Injury 4 8%
Property Damage Only 44 92%
Initial Impact Type
Angle 6 13%
Rear end 4 8%
Sideswipe 12 25%
Approaching 1 2%
Turning Movement 17 35%
SMV Other 2 4%
SMV Unattended 6 13%
Dry 34 71%
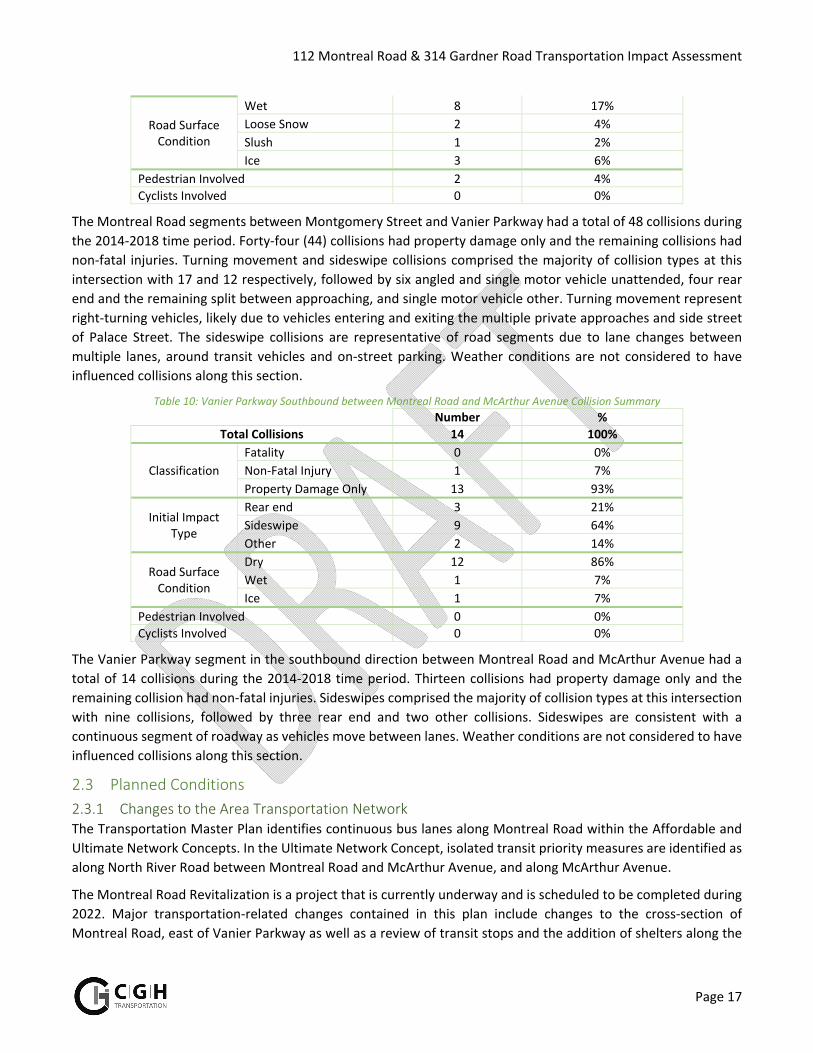
112 Montreal Road & 314 Gardner Road Transportation Impact Assessment
Page 17
Road Surface Condition
Wet 8 17%
Loose Snow 2 4%
Slush 1 2%
Ice 3 6%
Pedestrian Involved 2 4%
Cyclists Involved 0 0%
The Montreal Road segments between Montgomery Street and Vanier Parkway had a total of 48 collisions during
the 2014‐2018 time period. Forty‐four (44) collisions had property damage only and the remaining collisions had
non‐fatal injuries. Turning movement and sideswipe collisions comprised the majority of collision types at this
intersection with 17 and 12 respectively, followed by six angled and single motor vehicle unattended, four rear
end and the remaining split between approaching, and single motor vehicle other. Turning movement represent
right‐turning vehicles, likely due to vehicles entering and exiting the multiple private approaches and side street
of Palace Street. The sideswipe collisions are representative of road segments due to lane changes between
multiple lanes, around transit vehicles and on‐street parking. Weather conditions are not considered to have
influenced collisions along this section.
Table 10: Vanier Parkway Southbound between Montreal Road and McArthur Avenue Collision Summary
Number %
Total Collisions 14 100%
Classification
Fatality 0 0%
Non‐Fatal Injury 1 7%
Property Damage Only 13 93%
Initial Impact Type
Rear end 3 21%
Sideswipe 9 64%
Other 2 14%
Road Surface Condition
Dry 12 86%
Wet 1 7%
Ice 1 7%
Pedestrian Involved 0 0%
Cyclists Involved 0 0%
The Vanier Parkway segment in the southbound direction between Montreal Road and McArthur Avenue had a
total of 14 collisions during the 2014‐2018 time period. Thirteen collisions had property damage only and the
remaining collision had non‐fatal injuries. Sideswipes comprised the majority of collision types at this intersection
with nine collisions, followed by three rear end and two other collisions. Sideswipes are consistent with a
continuous segment of roadway as vehicles move between lanes. Weather conditions are not considered to have
influenced collisions along this section.
2.3 Planned Conditions
2.3.1 Changes to the Area Transportation Network The Transportation Master Plan identifies continuous bus lanes along Montreal Road within the Affordable and
Ultimate Network Concepts. In the Ultimate Network Concept, isolated transit priority measures are identified as
along North River Road between Montreal Road and McArthur Avenue, and along McArthur Avenue.
The Montreal Road Revitalization is a project that is currently underway and is scheduled to be completed during
2022. Major transportation‐related changes contained in this plan include changes to the cross‐section of
Montreal Road, east of Vanier Parkway as well as a review of transit stops and the addition of shelters along the
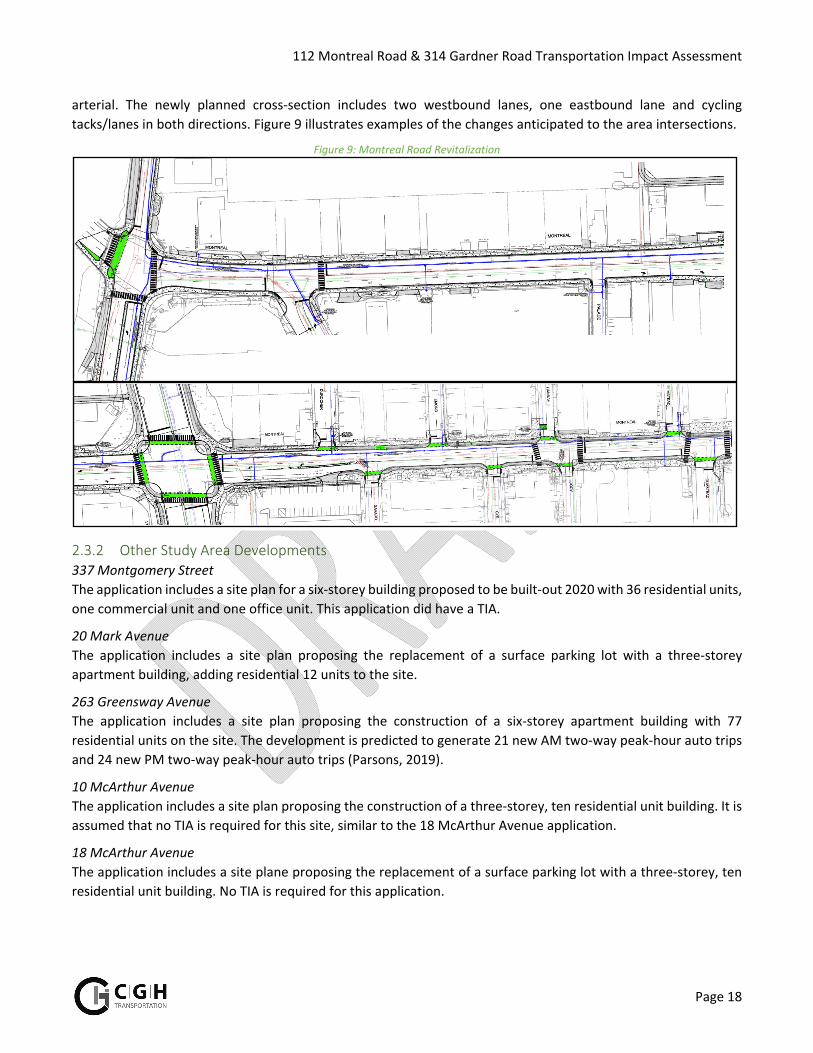
112 Montreal Road & 314 Gardner Road Transportation Impact Assessment
Page 18
arterial. The newly planned cross‐section includes two westbound lanes, one eastbound lane and cycling
tacks/lanes in both directions. Figure 9 illustrates examples of the changes anticipated to the area intersections.
Figure 9: Montreal Road Revitalization
2.3.2 Other Study Area Developments 337 Montgomery Street
The application includes a site plan for a six‐storey building proposed to be built‐out 2020 with 36 residential units,
one commercial unit and one office unit. This application did have a TIA.
20 Mark Avenue
The application includes a site plan proposing the replacement of a surface parking lot with a three‐storey
apartment building, adding residential 12 units to the site.
263 Greensway Avenue
The application includes a site plan proposing the construction of a six‐storey apartment building with 77
residential units on the site. The development is predicted to generate 21 new AM two‐way peak‐hour auto trips
and 24 new PM two‐way peak‐hour auto trips (Parsons, 2019).
10 McArthur Avenue
The application includes a site plan proposing the construction of a three‐storey, ten residential unit building. It is
assumed that no TIA is required for this site, similar to the 18 McArthur Avenue application.
18 McArthur Avenue
The application includes a site plane proposing the replacement of a surface parking lot with a three‐storey, ten
residential unit building. No TIA is required for this application.
112 Montreal Road & 314 Gardner Road Transportation Impact Assessment
Page 19
3 Study Area and Time Periods 3.1 Study Area The study area will include the intersections of:
Montreal Road at: o North River Road o Montgomery Street o Palace Street o Vanier Parkway o Hannah Street/Cody Avenue
Selkirk Street at North River Road
McArthur Avenue at: o Dundas Street o Marguerite Avenue o Vanier Parkway
The newly proposed site accesses
The intersections of Montreal Road at Olmstead Street, McArthur Avenue at North River Road, and Deschamps
Avenue at Vanier Parkway have been excluded from the analysis prescribed within the TIA Guidelines. While they
are within 400 metres of the site, the traffic impacts from the proposed development will be captured by the
upstream intersections examined and/or will only be impacted by through traffic from the proposed site.
3.2 Time Periods As the proposed development is composed entirely of residential units the AM and PM peak hours will be
examined.
3.3 Horizon Years The anticipated build‐out year is 2024. As a result, the full build‐out plus five years horizon year is 2029.
4 Exemption Review Table 11 summarizes the exemptions for this TIA.
Table 11: Exemption Review
Module Element Explanation Exempt/Required
Design Review Component
4.1 Development Design
4.1.2 Circulation and Access
Only required for site plans Required
4.2.3 New Street Networks
Only required for plans of subdivision Exempt
4.2 Parking 4.2.1 Parking Supply Only required for site plans Required
4.2.2 Spillover Parking Only required for site plans where parking supply is 15% below unconstrained demand
Exempt
Network Impact Component
4.5 Transportation Demand Management
All Elements Not required for site plans expected to have fewer than 60 employees and/or students on location at any given time
Required
4.6 Neighbourhood Traffic Management
4.6.1 Adjacent Neighbourhoods
Only required when the development relies on local or collector streets for access and total volumes exceed ATM capacity thresholds
Exempt
112 Montreal Road & 314 Gardner Road Transportation Impact Assessment
Page 20
Module Element Explanation Exempt/Required
4.8 Network Concept
Only required when proposed development generates more than 200 person‐trips during the peak hour in excess of equivalent volume permitted by established zoning
Exempt
5 Development Generated Travel Demand 5.1 Trip Generation and Travel Modes This TIA has been prepared using the vehicle and person trip rates for the high‐rise apartments using the TRANS
Trip Generation Study Report (2009).Table 12 summarizes the person trip rates for the proposed land use.
Table 12: Trip Generation Person Trip Rates
Dwelling Type Land Use Code
Peak Hour
Vehicle Trip Rate
Person Trip Rates
High‐rise Apartments 222
(TRANS)
AM 0.24 0.65
PM 0.27 0.68
Using the above Person Trip rates, the total person trip generation has been estimated. Table 13 below illustrates
the total person trip generation.
Table 13: Total Person Trip Generation
Land Use Units/ sq ft
AM Peak Hour PM Peak Hour
In Out Total In Out Total
High‐rise Apartments 591 92 292 384 249 153 402
Using the most recent National Capital Region Origin‐Destination survey (OD Survey), the existing mode shares
for Ottawa Inner have been summarized in Table 14.
Table 14: Mode Share – Ottawa East
Travel Mode Ottawa East
Auto Driver 55%
Auto Passenger 15%
Transit 20%
Cycling 4%
Walking 6%
Total 100%
Using the above mode shares and person trip rates the person trips by mode have been projected. Table 15
summarizes the trip generation by mode.
Table 15: Trip Generation by Mode
Travel Mode Mode Share AM Peak Hour PM Peak Hour
In Out Total In Out Total
Auto Driver 55% 51 161 211 137 84 221
Auto Passenger 15% 14 44 58 37 23 60
Transit 20% 18 58 77 50 31 80
Cycling 4% 4 12 15 10 6 16
Walking 6% 6 18 23 15 9 24
Total 100% 92 292 384 249 153 402
As shown above, 211 AM and 221 PM new peak hour two‐way vehicle trips are projected as a result of the
proposed development.
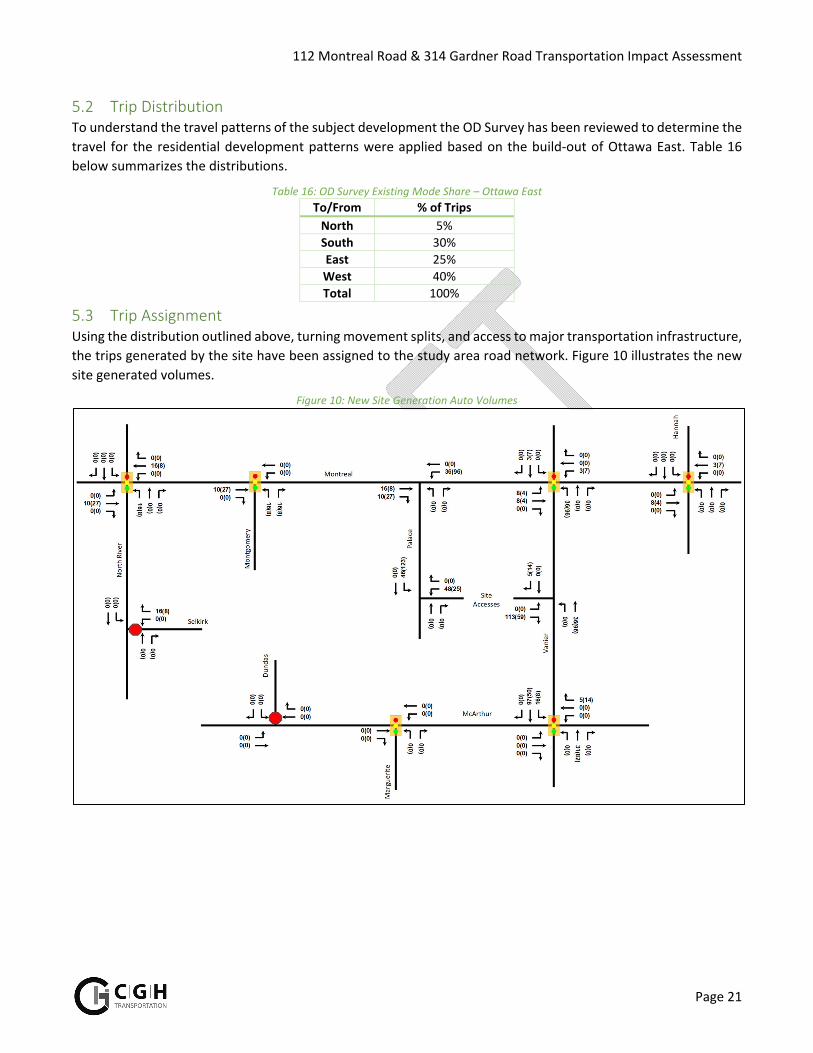
112 Montreal Road & 314 Gardner Road Transportation Impact Assessment
Page 21
5.2 Trip Distribution To understand the travel patterns of the subject development the OD Survey has been reviewed to determine the
travel for the residential development patterns were applied based on the build‐out of Ottawa East. Table 16
below summarizes the distributions.
Table 16: OD Survey Existing Mode Share – Ottawa East
To/From % of Trips
North 5%
South 30%
East 25%
West 40%
Total 100%
5.3 Trip Assignment Using the distribution outlined above, turning movement splits, and access to major transportation infrastructure,
the trips generated by the site have been assigned to the study area road network. Figure 10 illustrates the new
site generated volumes.
Figure 10: New Site Generation Auto Volumes
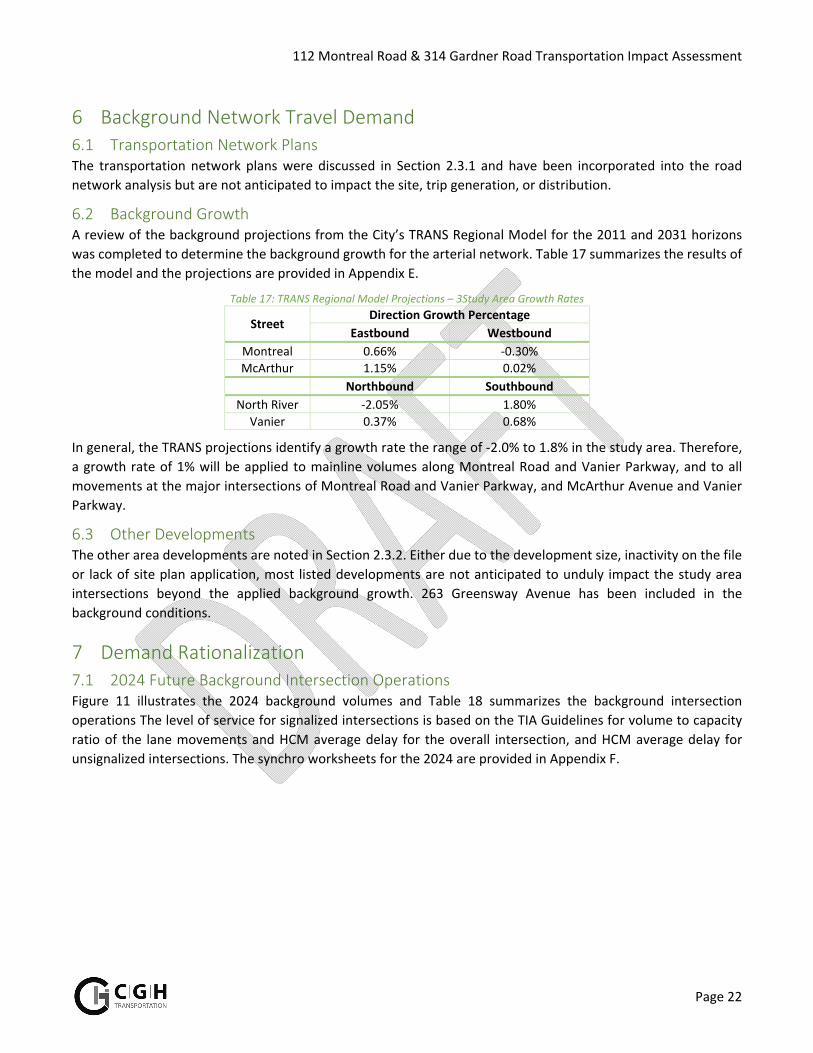
112 Montreal Road & 314 Gardner Road Transportation Impact Assessment
Page 22
6 Background Network Travel Demand 6.1 Transportation Network Plans The transportation network plans were discussed in Section 2.3.1 and have been incorporated into the road
network analysis but are not anticipated to impact the site, trip generation, or distribution.
6.2 Background Growth A review of the background projections from the City’s TRANS Regional Model for the 2011 and 2031 horizons
was completed to determine the background growth for the arterial network. Table 17 summarizes the results of
the model and the projections are provided in Appendix E.
Table 17: TRANS Regional Model Projections – 3Study Area Growth Rates
Street Direction Growth Percentage
Eastbound Westbound
Montreal 0.66% ‐0.30%
McArthur 1.15% 0.02%
Northbound Southbound
North River ‐2.05% 1.80%
Vanier 0.37% 0.68%
In general, the TRANS projections identify a growth rate the range of ‐2.0% to 1.8% in the study area. Therefore,
a growth rate of 1% will be applied to mainline volumes along Montreal Road and Vanier Parkway, and to all
movements at the major intersections of Montreal Road and Vanier Parkway, and McArthur Avenue and Vanier
Parkway.
6.3 Other Developments The other area developments are noted in Section 2.3.2. Either due to the development size, inactivity on the file
or lack of site plan application, most listed developments are not anticipated to unduly impact the study area
intersections beyond the applied background growth. 263 Greensway Avenue has been included in the
background conditions.
7 Demand Rationalization 7.1 2024 Future Background Intersection Operations Figure 11 illustrates the 2024 background volumes and Table 18 summarizes the background intersection
operations The level of service for signalized intersections is based on the TIA Guidelines for volume to capacity
ratio of the lane movements and HCM average delay for the overall intersection, and HCM average delay for
unsignalized intersections. The synchro worksheets for the 2024 are provided in Appendix F.
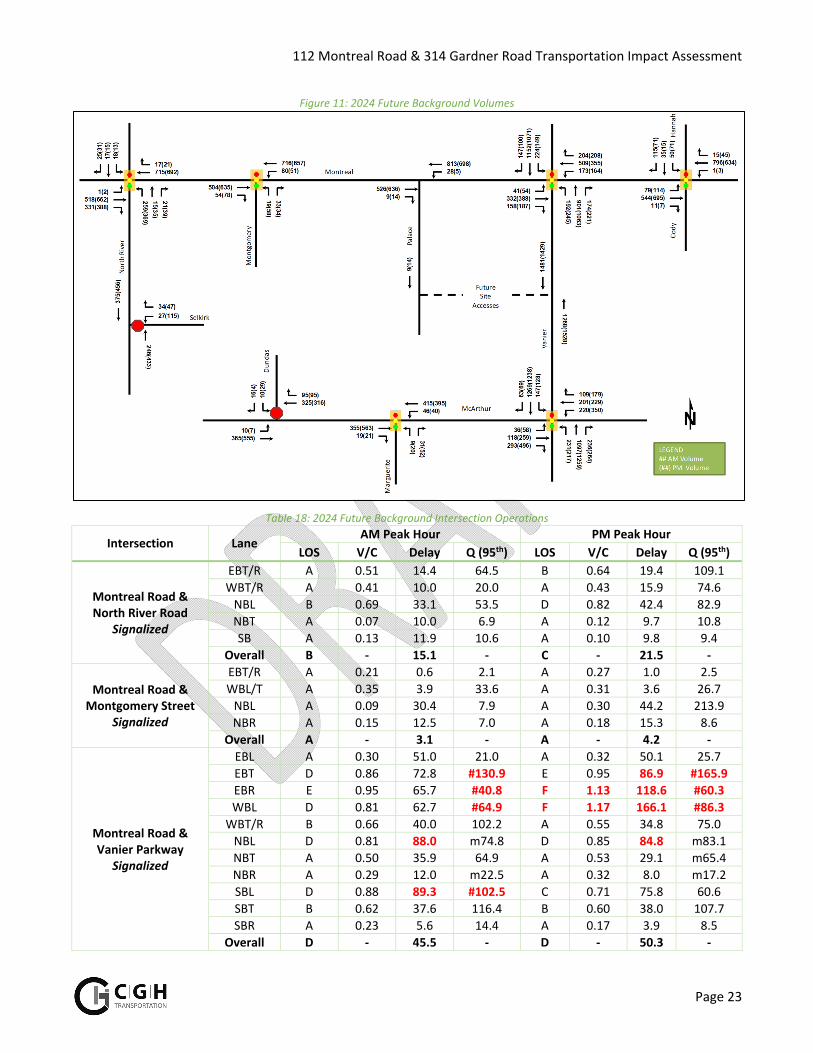
112 Montreal Road & 314 Gardner Road Transportation Impact Assessment
Page 23
Figure 11: 2024 Future Background Volumes
Table 18: 2024 Future Background Intersection Operations
Intersection Lane AM Peak Hour PM Peak Hour
LOS V/C Delay Q (95th) LOS V/C Delay Q (95th)
Montreal Road & North River Road
Signalized
EBT/R A 0.51 14.4 64.5 B 0.64 19.4 109.1
WBT/R A 0.41 10.0 20.0 A 0.43 15.9 74.6
NBL B 0.69 33.1 53.5 D 0.82 42.4 82.9
NBT A 0.07 10.0 6.9 A 0.12 9.7 10.8
SB A 0.13 11.9 10.6 A 0.10 9.8 9.4
Overall B ‐ 15.1 ‐ C ‐ 21.5 ‐
Montreal Road & Montgomery Street
Signalized
EBT/R A 0.21 0.6 2.1 A 0.27 1.0 2.5
WBL/T A 0.35 3.9 33.6 A 0.31 3.6 26.7
NBL A 0.09 30.4 7.9 A 0.30 44.2 213.9
NBR A 0.15 12.5 7.0 A 0.18 15.3 8.6
Overall A ‐ 3.1 ‐ A ‐ 4.2 ‐
Montreal Road & Vanier Parkway
Signalized
EBL A 0.30 51.0 21.0 A 0.32 50.1 25.7
EBT D 0.86 72.8 #130.9 E 0.95 86.9 #165.9
EBR E 0.95 65.7 #40.8 F 1.13 118.6 #60.3
WBL D 0.81 62.7 #64.9 F 1.17 166.1 #86.3
WBT/R B 0.66 40.0 102.2 A 0.55 34.8 75.0
NBL D 0.81 88.0 m74.8 D 0.85 84.8 m83.1
NBT A 0.50 35.9 64.9 A 0.53 29.1 m65.4
NBR A 0.29 12.0 m22.5 A 0.32 8.0 m17.2
SBL D 0.88 89.3 #102.5 C 0.71 75.8 60.6
SBT B 0.62 37.6 116.4 B 0.60 38.0 107.7
SBR A 0.23 5.6 14.4 A 0.17 3.9 8.5
Overall D ‐ 45.5 ‐ D ‐ 50.3 ‐
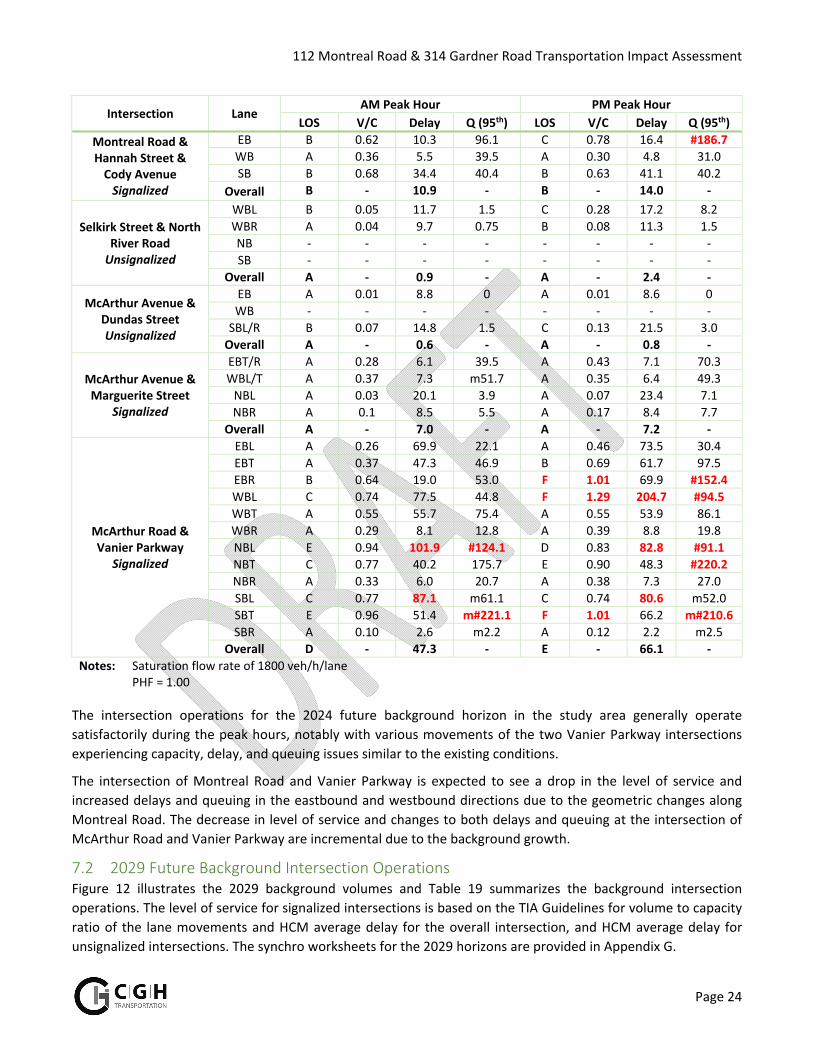
112 Montreal Road & 314 Gardner Road Transportation Impact Assessment
Page 24
Intersection Lane AM Peak Hour PM Peak Hour
LOS V/C Delay Q (95th) LOS V/C Delay Q (95th)
Montreal Road & Hannah Street & Cody Avenue Signalized
EB B 0.62 10.3 96.1 C 0.78 16.4 #186.7
WB A 0.36 5.5 39.5 A 0.30 4.8 31.0
SB B 0.68 34.4 40.4 B 0.63 41.1 40.2
Overall B ‐ 10.9 ‐ B ‐ 14.0 ‐
Selkirk Street & North River Road Unsignalized
WBL B 0.05 11.7 1.5 C 0.28 17.2 8.2
WBR A 0.04 9.7 0.75 B 0.08 11.3 1.5
NB ‐ ‐ ‐ ‐ ‐ ‐ ‐ ‐
SB ‐ ‐ ‐ ‐ ‐ ‐ ‐ ‐
Overall A ‐ 0.9 ‐ A ‐ 2.4 ‐
McArthur Avenue & Dundas Street Unsignalized
EB A 0.01 8.8 0 A 0.01 8.6 0
WB ‐ ‐ ‐ ‐ ‐ ‐ ‐ ‐
SBL/R B 0.07 14.8 1.5 C 0.13 21.5 3.0
Overall A ‐ 0.6 ‐ A ‐ 0.8 ‐
McArthur Avenue & Marguerite Street
Signalized
EBT/R A 0.28 6.1 39.5 A 0.43 7.1 70.3
WBL/T A 0.37 7.3 m51.7 A 0.35 6.4 49.3
NBL A 0.03 20.1 3.9 A 0.07 23.4 7.1
NBR A 0.1 8.5 5.5 A 0.17 8.4 7.7
Overall A ‐ 7.0 ‐ A ‐ 7.2 ‐
McArthur Road & Vanier Parkway
Signalized
EBL A 0.26 69.9 22.1 A 0.46 73.5 30.4
EBT A 0.37 47.3 46.9 B 0.69 61.7 97.5
EBR B 0.64 19.0 53.0 F 1.01 69.9 #152.4
WBL C 0.74 77.5 44.8 F 1.29 204.7 #94.5
WBT A 0.55 55.7 75.4 A 0.55 53.9 86.1
WBR A 0.29 8.1 12.8 A 0.39 8.8 19.8
NBL E 0.94 101.9 #124.1 D 0.83 82.8 #91.1
NBT C 0.77 40.2 175.7 E 0.90 48.3 #220.2
NBR A 0.33 6.0 20.7 A 0.38 7.3 27.0
SBL C 0.77 87.1 m61.1 C 0.74 80.6 m52.0
SBT E 0.96 51.4 m#221.1 F 1.01 66.2 m#210.6
SBR A 0.10 2.6 m2.2 A 0.12 2.2 m2.5
Overall D ‐ 47.3 ‐ E ‐ 66.1 ‐
Notes: Saturation flow rate of 1800 veh/h/lane PHF = 1.00
The intersection operations for the 2024 future background horizon in the study area generally operate
satisfactorily during the peak hours, notably with various movements of the two Vanier Parkway intersections
experiencing capacity, delay, and queuing issues similar to the existing conditions.
The intersection of Montreal Road and Vanier Parkway is expected to see a drop in the level of service and
increased delays and queuing in the eastbound and westbound directions due to the geometric changes along
Montreal Road. The decrease in level of service and changes to both delays and queuing at the intersection of
McArthur Road and Vanier Parkway are incremental due to the background growth.
7.2 2029 Future Background Intersection Operations Figure 12 illustrates the 2029 background volumes and Table 19 summarizes the background intersection
operations. The level of service for signalized intersections is based on the TIA Guidelines for volume to capacity
ratio of the lane movements and HCM average delay for the overall intersection, and HCM average delay for
unsignalized intersections. The synchro worksheets for the 2029 horizons are provided in Appendix G.
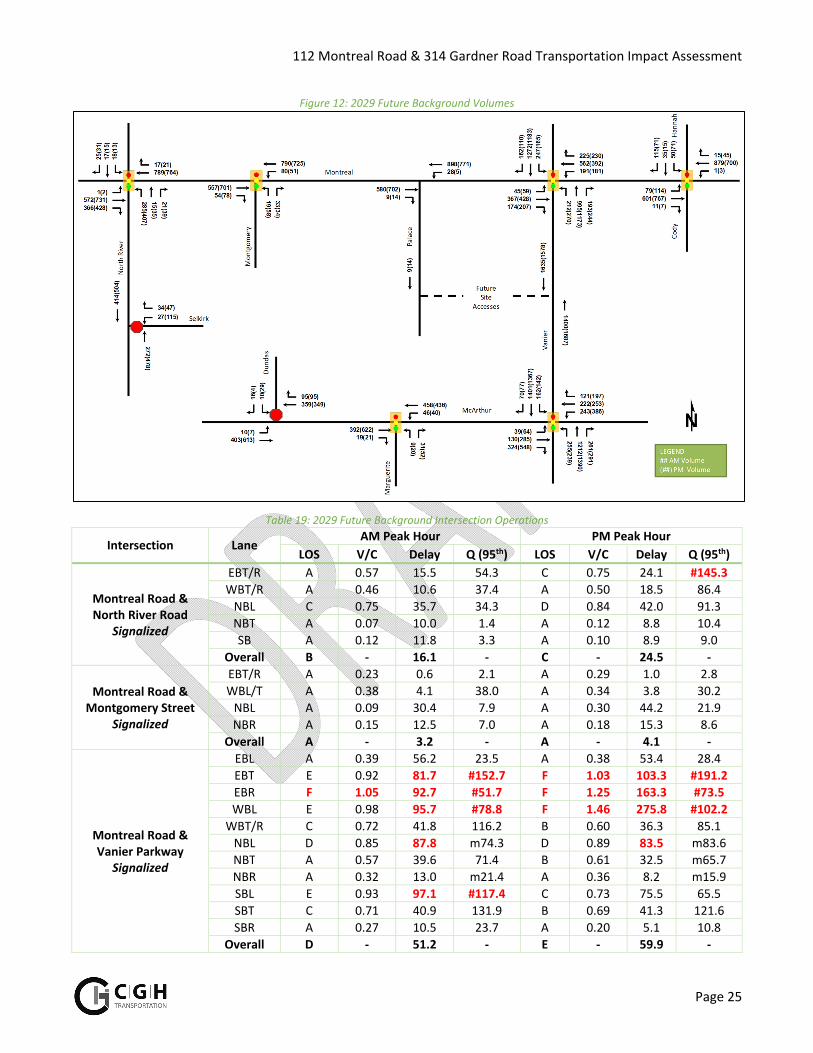
112 Montreal Road & 314 Gardner Road Transportation Impact Assessment
Page 25
Figure 12: 2029 Future Background Volumes
Table 19: 2029 Future Background Intersection Operations
Intersection Lane AM Peak Hour PM Peak Hour
LOS V/C Delay Q (95th) LOS V/C Delay Q (95th)
Montreal Road & North River Road
Signalized
EBT/R A 0.57 15.5 54.3 C 0.75 24.1 #145.3
WBT/R A 0.46 10.6 37.4 A 0.50 18.5 86.4
NBL C 0.75 35.7 34.3 D 0.84 42.0 91.3
NBT A 0.07 10.0 1.4 A 0.12 8.8 10.4
SB A 0.12 11.8 3.3 A 0.10 8.9 9.0
Overall B ‐ 16.1 ‐ C ‐ 24.5 ‐
Montreal Road & Montgomery Street
Signalized
EBT/R A 0.23 0.6 2.1 A 0.29 1.0 2.8
WBL/T A 0.38 4.1 38.0 A 0.34 3.8 30.2
NBL A 0.09 30.4 7.9 A 0.30 44.2 21.9
NBR A 0.15 12.5 7.0 A 0.18 15.3 8.6
Overall A ‐ 3.2 ‐ A ‐ 4.1 ‐
Montreal Road & Vanier Parkway
Signalized
EBL A 0.39 56.2 23.5 A 0.38 53.4 28.4
EBT E 0.92 81.7 #152.7 F 1.03 103.3 #191.2
EBR F 1.05 92.7 #51.7 F 1.25 163.3 #73.5
WBL E 0.98 95.7 #78.8 F 1.46 275.8 #102.2
WBT/R C 0.72 41.8 116.2 B 0.60 36.3 85.1
NBL D 0.85 87.8 m74.3 D 0.89 83.5 m83.6
NBT A 0.57 39.6 71.4 B 0.61 32.5 m65.7
NBR A 0.32 13.0 m21.4 A 0.36 8.2 m15.9
SBL E 0.93 97.1 #117.4 C 0.73 75.5 65.5
SBT C 0.71 40.9 131.9 B 0.69 41.3 121.6
SBR A 0.27 10.5 23.7 A 0.20 5.1 10.8
Overall D ‐ 51.2 ‐ E ‐ 59.9 ‐
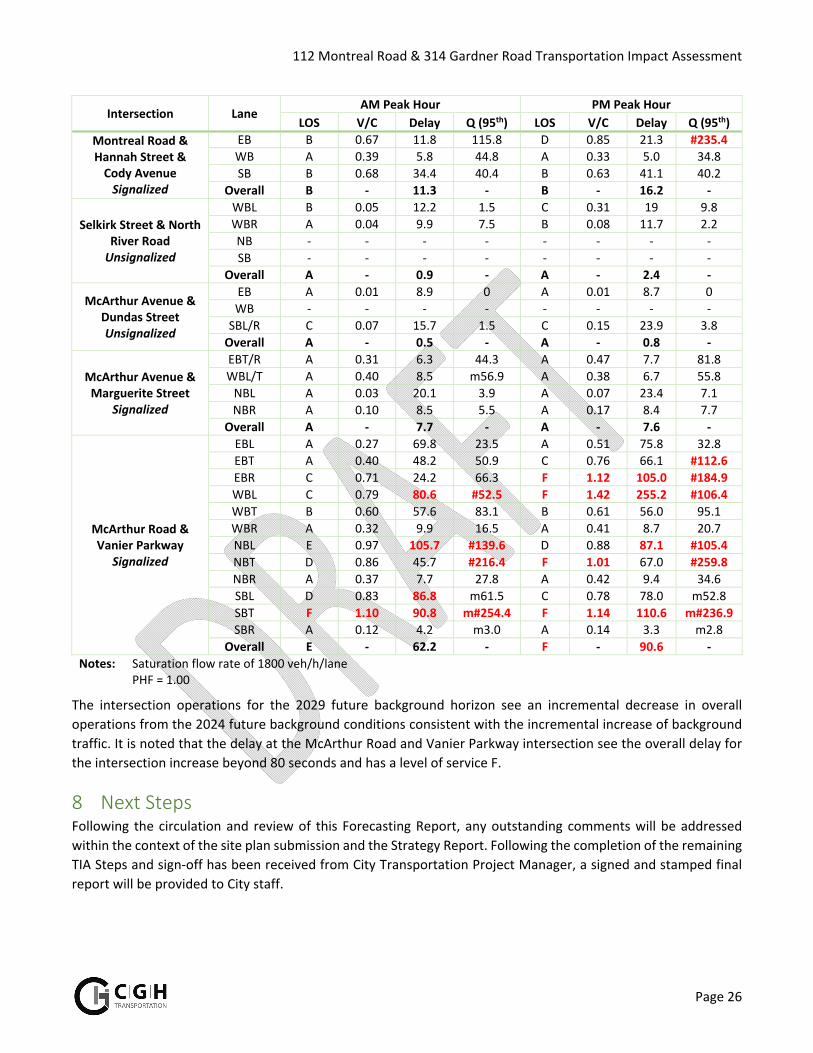
112 Montreal Road & 314 Gardner Road Transportation Impact Assessment
Page 26
Intersection Lane AM Peak Hour PM Peak Hour
LOS V/C Delay Q (95th) LOS V/C Delay Q (95th)
Montreal Road & Hannah Street & Cody Avenue Signalized
EB B 0.67 11.8 115.8 D 0.85 21.3 #235.4
WB A 0.39 5.8 44.8 A 0.33 5.0 34.8
SB B 0.68 34.4 40.4 B 0.63 41.1 40.2
Overall B ‐ 11.3 ‐ B ‐ 16.2 ‐
Selkirk Street & North River Road Unsignalized
WBL B 0.05 12.2 1.5 C 0.31 19 9.8
WBR A 0.04 9.9 7.5 B 0.08 11.7 2.2
NB ‐ ‐ ‐ ‐ ‐ ‐ ‐ ‐
SB ‐ ‐ ‐ ‐ ‐ ‐ ‐ ‐
Overall A ‐ 0.9 ‐ A ‐ 2.4 ‐
McArthur Avenue & Dundas Street Unsignalized
EB A 0.01 8.9 0 A 0.01 8.7 0
WB ‐ ‐ ‐ ‐ ‐ ‐ ‐ ‐
SBL/R C 0.07 15.7 1.5 C 0.15 23.9 3.8
Overall A ‐ 0.5 ‐ A ‐ 0.8 ‐
McArthur Avenue & Marguerite Street
Signalized
EBT/R A 0.31 6.3 44.3 A 0.47 7.7 81.8
WBL/T A 0.40 8.5 m56.9 A 0.38 6.7 55.8
NBL A 0.03 20.1 3.9 A 0.07 23.4 7.1
NBR A 0.10 8.5 5.5 A 0.17 8.4 7.7
Overall A ‐ 7.7 ‐ A ‐ 7.6 ‐
McArthur Road & Vanier Parkway
Signalized
EBL A 0.27 69.8 23.5 A 0.51 75.8 32.8
EBT A 0.40 48.2 50.9 C 0.76 66.1 #112.6
EBR C 0.71 24.2 66.3 F 1.12 105.0 #184.9
WBL C 0.79 80.6 #52.5 F 1.42 255.2 #106.4
WBT B 0.60 57.6 83.1 B 0.61 56.0 95.1
WBR A 0.32 9.9 16.5 A 0.41 8.7 20.7
NBL E 0.97 105.7 #139.6 D 0.88 87.1 #105.4
NBT D 0.86 45.7 #216.4 F 1.01 67.0 #259.8
NBR A 0.37 7.7 27.8 A 0.42 9.4 34.6
SBL D 0.83 86.8 m61.5 C 0.78 78.0 m52.8
SBT F 1.10 90.8 m#254.4 F 1.14 110.6 m#236.9
SBR A 0.12 4.2 m3.0 A 0.14 3.3 m2.8
Overall E ‐ 62.2 ‐ F ‐ 90.6 ‐
Notes: Saturation flow rate of 1800 veh/h/lane PHF = 1.00
The intersection operations for the 2029 future background horizon see an incremental decrease in overall
operations from the 2024 future background conditions consistent with the incremental increase of background
traffic. It is noted that the delay at the McArthur Road and Vanier Parkway intersection see the overall delay for
the intersection increase beyond 80 seconds and has a level of service F.
8 Next Steps Following the circulation and review of this Forecasting Report, any outstanding comments will be addressed
within the context of the site plan submission and the Strategy Report. Following the completion of the remaining
TIA Steps and sign‐off has been received from City Transportation Project Manager, a signed and stamped final
report will be provided to City staff.

Appendix A
TIA Screening Form and PM Certification Form
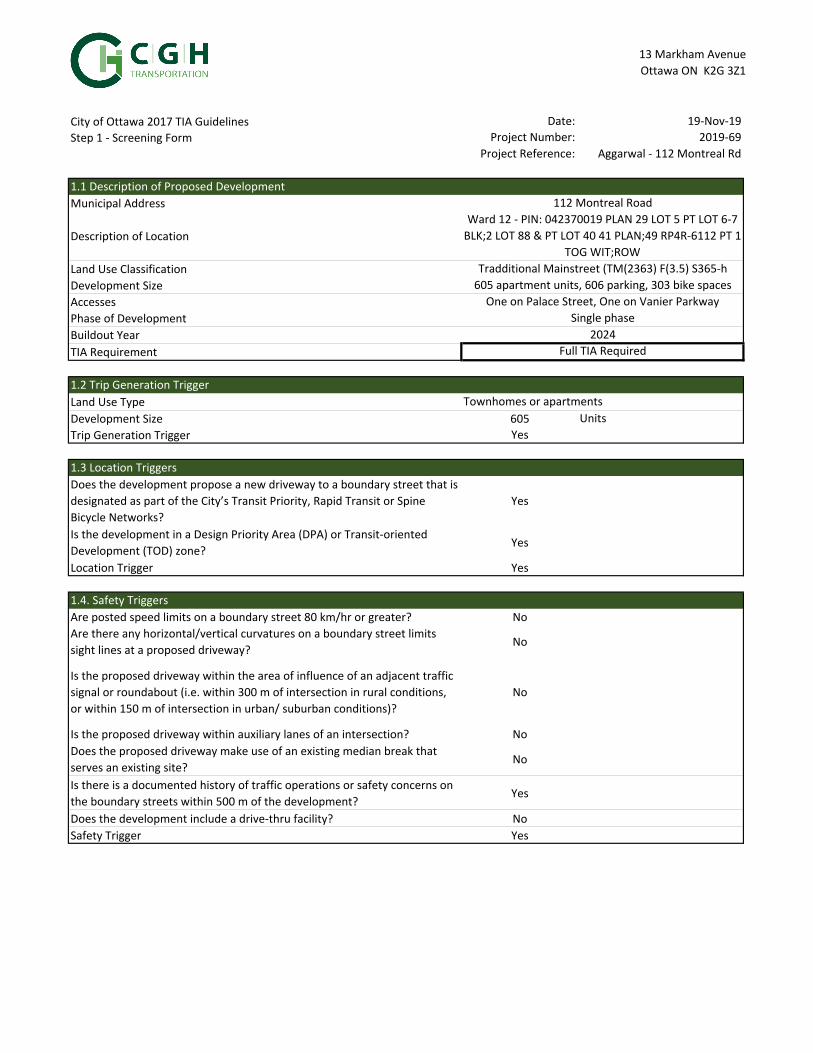
13 Markham Avenue
Ottawa ON K2G 3Z1
City of Ottawa 2017 TIA Guidelines Date: 19‐Nov‐19
Step 1 ‐ Screening Form Project Number: 2019‐69
Project Reference: Aggarwal ‐ 112 Montreal Rd
Municipal Address
Description of Location
Land Use Classification
Development Size
Accesses
Phase of Development
Buildout Year
TIA Requirement
Land Use Type
Development Size 605 Units
Trip Generation Trigger Yes
Does the development propose a new driveway to a boundary street that is
designated as part of the City’s Transit Priority, Rapid Transit or Spine
Bicycle Networks?
Yes
Is the development in a Design Priority Area (DPA) or Transit‐oriented
Development (TOD) zone?Yes
Location Trigger Yes
Are posted speed limits on a boundary street 80 km/hr or greater? No
Are there any horizontal/vertical curvatures on a boundary street limits
sight lines at a proposed driveway?No
Is the proposed driveway within the area of influence of an adjacent traffic
signal or roundabout (i.e. within 300 m of intersection in rural conditions,
or within 150 m of intersection in urban/ suburban conditions)?
No
Is the proposed driveway within auxiliary lanes of an intersection? No
Does the proposed driveway make use of an existing median break that
serves an existing site?No
Is there is a documented history of traffic operations or safety concerns on
the boundary streets within 500 m of the development?Yes
Does the development include a drive‐thru facility? No
Safety Trigger Yes
1.1 Description of Proposed Development
1.2 Trip Generation Trigger
112 Montreal Road
Ward 12 ‐ PIN: 042370019 PLAN 29 LOT 5 PT LOT 6‐7
BLK;2 LOT 88 & PT LOT 40 41 PLAN;49 RP4R‐6112 PT 1
TOG WIT;ROW
Tradditional Mainstreet (TM(2363) F(3.5) S365‐h
1.3 Location Triggers
605 apartment units, 606 parking, 303 bike spaces
1.4. Safety Triggers
Full TIA Required
One on Palace Street, One on Vanier Parkway
Single phase
2024
Townhomes or apartments
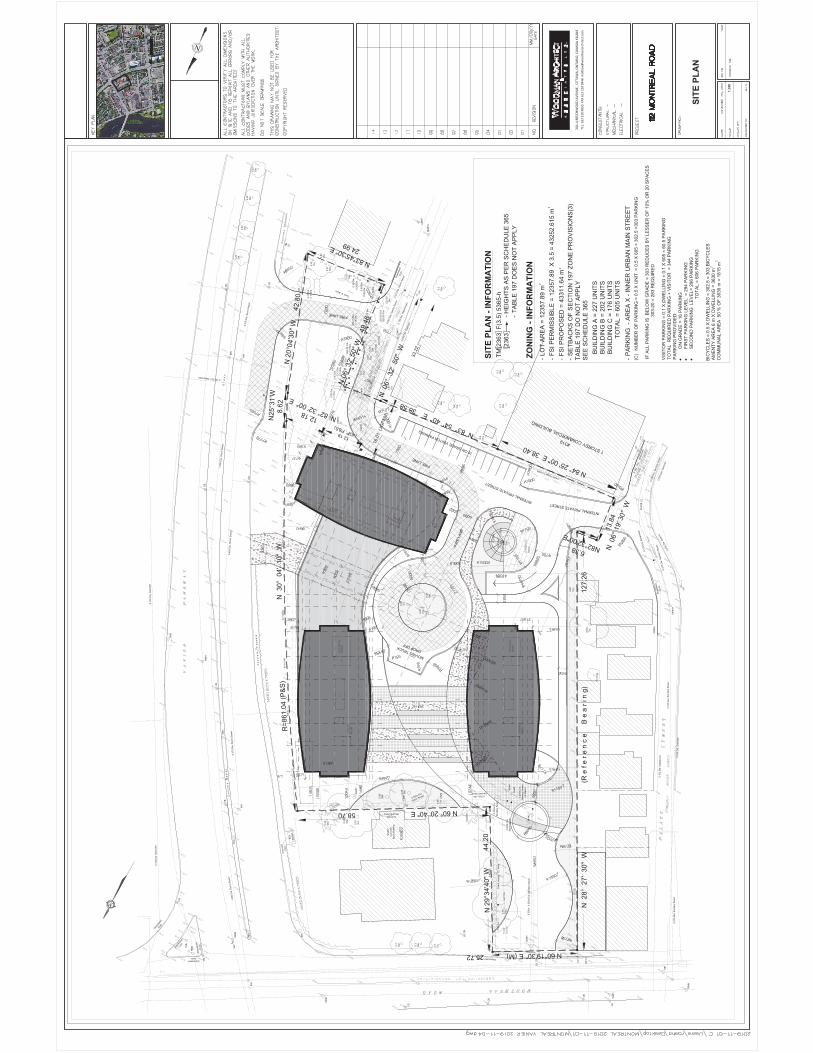
GGGGGGGGGGGGGGGGGGGGGGGGGGGGGGGGGGGGGGGGGGGGGGGGGGGGGGGGGGGGGGGGGGGGGGGG
GG
GG
N 2
9°34
'40"
W
44.2
0
N 2
8° 2
7' 3
0" W
(R e
f e
r e n
c e
B
e a
r i n
g)
1
27.2
6
6.38 N82°32'00"E
N 06
° 32'
50"
W
49.
46
N 2
0°04
'30"
W
42.
80
8.62
N25
°31'
W
R=8
61.0
4 (P
&S)
A=11
8.96
C=1
18.8
6N
30°
04'
10"
W
UP
Cedar Hedge 2.0 Wide
Ced
ar H
edge
1.2
Wid
e
12.18 N 82° 32' 00" E
13.8
4N
06°
19'
30"
W
WW
WW
WW
WW
WW
MH
#7
0.33
Dia
.
0.33
Dia
.
0.26
Dia
.
Bus
Shel
ter
Con
cret
ePa
dC
o n
c r
e t e
S
i d
e w
a l
k
C o
n c
r e
t e
S i
d e
w a
l k
CB#
5
CB#
6
0.40
Dia
.
0.27
Dia
.0.
18D
ia.
0.30
Dia
.
CB
MH
#4
MH
#3
MH
#2
0.18
Dia
.
CB#
10
WM
H
MH
WM
H
CB
FH
CBU
P
CB
MH
#1
CB
WM
H
CB
0.14
Dia
.0.
20 D
ia.
0.13
Dia
.0.
14 D
ia.
0.30
Dia
.
0.20
Dia
.
0.13
Dia
.0.
15 D
ia.
0.16
Dia
.
(2)0
.20
Dia
.0.
17 D
ia.
0.20
Dia
.0.
10 D
ia. 0.20
Dia
.
(2)0
.15
Dia
.0.
10 D
ia. 0.20
Dia
.
(2)0
.20
Dia
.(2
)0.3
0 D
ia.
(2)0
.20
Dia
.
0.24
Dia
.
0.20
Dia
.0.
30 D
ia.
0.20
Dia
.0.
30 D
ia.0.
25D
ia.
0.27
Dia
.
0.80
Dia
.
0.45
Dia
.
0.45
Dia
.0.
17 D
ia.
ConcreteBlock Building
"ESS
O"
Con
cret
eBl
ock
Build
ing
CB
56.50
56.64
56.59
56.18
56.35
56.86
56.77
56.58
56.63
56.19
56.14
56.33 56.23
56.32
56.23
56.50
56.59 56.20
56.94
56.0956.04
56.94
56.10
56.17
56.18
56.6356.6956.81
56.06
56.25
56.0956.12
56.1456.17
56.37
56.3956.49
56.44
56.50
56.52
56.51
56.28
56.38
56.43
56.50
56.3556.49
56.13
56.02
56.17
56.50
56.48
56.54
56.69 56.35
56.50
56.4256.40
56.42
56.37
56.34
56.29
56.41
56.66
56.4756.3656.58
56.4856.44
56.70
56.58
55.82
56.99
57.01
57.01
56.94
57.03
57.02
56.77
56.93
57.05
57.28
57.07
56.99
56.92
57.08
57.22
57.18
57.42
57.22
57.26
57.2557.42
57.4957.34
57.60
57.76
57.45
57.67
57.69
57.71
56.50
56.49
56.3656.41
56.51
56.29
56.31
56.33
56.91
56.35 56.38
56.52
56.4256.39
56.3856.42
56.3856.30
56.28 56.29 56.32
56.5356.52
56.5256.48
56.5256.59
56.7556.98
56.45
56.52
56.48 56.53 56.52
56.4856.47
56.61
56.59
56.52 56.62
56.56
56.57
56.60
56.58
56.4556.46
56.80
56.54
56.62
56.57
56.64
56.79
56.93
56.30
56.75
56.59
56.59
56.67
56.68
56.6356.69
57.00
56.94
57.02
56.97
56.63
56.96
56.9856.63
57.08
57.22
57.27
57.48
57.18
57.24
57.40
57.44
57.54
57.62
57.71
56.64
56.11
56.0056.11
56.06
57.70
58.07
57.5157.55
57.58
57.3257.9857.81
57.9458.02
57.27
57.31
58.0557.86
58.0257.50
57.42
57.30
57.8957.75
57.68
57.31
57.49
57.75
57.7257.18
57.04
57.69
56.80
57.82
57.51
56.4656.45
56.57 56.57
56.62
56.35
56.34
56.40
56.27
56.46
56.62
56.57 56.60
Depressed Curb
Trees & Bush
GGGGGGGGGGGGGGGGGGGGGG
GG
GG
GG
GG
GG
GG
GG
GG
GG
GG
GG
GG
GG
GG
G
GGGGGGGGGGGGGG
GG
GG
GG
G
UH UH UH UH UH UH UH UH UH UH UH UH UH UH UH UH UH UH UH UH UH UH UH UH UH UH UH UH UH
UH
UH
UH
UH
UH
UH
UH
UH
UH
UH
UH
UH
UH
UH
UH
UH
UH
UH
UH
UH
UH
UH
UH
UH
UH
UH
UH
GG
GG
GG
GG
GG
GG
GG
GG
GG
GG
GG
GG
GG
GG
GG
G
UH
UH
UH
UH
UH
UH
UH
UH
UH
UH
UH
UH
UH
UH
UH
UH
UH
UH
UH
UH
UH
UH
UH
UH
UH
UH
UH
UH
UH
UH
UH
UH
UH
UH
UH
UH
UH
UH
UH
UHUHUHUHUHUHUHUHUHUHUHUHUHUHUHUHUHUHUH
CB#
12
CB#
13
CB#
15
CB#
17
CB#
20
MH
#18
MH
#19
MH
#16
MH
#14
UP
UP
FH
FH
Dep
ress
ed
Cur
b
Depr
esse
dCu
rb
0.15
Dia
.
56.62
56.67
56.63
56.58
56.54
56.68
56.41
56.59
56.73
56.81
56.90
57.45
57.31
57.17
57.09
57.01
56.92
56.80
57.03
57.1657.25
57.12
57.34
57.88
57.93
57.98
57.93
57.21
57.28
57.28
57.32
57.08
56.71
56.86
56.77
56.71
56.67
56.58
56.57
56.47
56.45
56.39
56.43
56.44
56.45
56.45
56.50
56.50
56.53
56.55
56.59
56.63
56.68
56.74
56.9056.97
56.80
56.71
56.67
56.59
56.54
56.51
56.48
56.50
56.65
56.65
56.75
56.7456.95
56.65
56.74
56.63
56.35
56.33 56.44
56.90
56.74
56.57
56.56
56.54
56.50
56.69
56.92
56.81
56.81
56.3556.34
WWWWWWWWWWWWWWWWWWWWWWWWWWWWWWWWWWWWWWWWWWWWWWWWWWWWWWWWWWWWWWWWWWWWWWWWWWWWWWWWWWWWWWWWWWWWWWWWWWWWWWWWWWWWWWWW
SS
SS
SS
SS
SS
SS
SS
SS
SS
SS
SS
SS
SS
SS
SS
SS
SS
SS
SS
SS
SS
SS
SS
S
WW
WW
WW
WW
W
WW
WW
WW
WW
WW
WW
WW
WW
WW
WW
WW
WW
WW
WW
WW
WW
WW
WW
WW
WW
WW
WW
WW
WW
WW
WW
WW
WW
WW
WW
WW
WW
WW
WW
WW
WW
WW
WW
WW
WW
WW
WW
WW
WW
WW
WW
WW
WW
WW
WW
WW
WW
WW
WW
WW
WW
WW
WW
W
W
W
W
W
W
W
W
W
W
W
W
W
W
W
W
W
W
W
W
W
W
W
W
W
W
W
W
W
W
W
W
W
W
W
W
W
W
W
W
W
W
W
SSSSSSSSSSSSSSSSSSSSSSSSSSSSSSSSSSSSSSSSSSSSSSSSSSSSSSSSSSSSSSSSSSSSSSSSSSSSSSSSSSSSSSSSSSSSSSSSSSSSSSSSSSSSSSSS
STSTSTSTSTSTSTSTSTSTSTSTSTSTSTSTSTSTSTSTSTSTSTSTSTSTSTSTSTSTSTSTSTSTSTSTSTSTSTSTSTSTSTSTSTSTSTSTSTSTSTSTSTSTSTSTSTSTSTSTSTSTSTSTSTSTSTSTSTSTSTSTSTSTSTSTSTSTSTSTSTSTSTSTSTSTSTSTSTSTSTSTSTSTSTSTSTSTSTSTSTSTSTSTSTSTST
GGGGGGGGGGGGGGGGGGGGGGGGGGGGGGGGGGGGGGGGGGGGGGGGGGGGGGGGGGGGGGGGGGGGGGGGGGGGGGGGGGGGGGGGGGGGGGGGGGGGGGGGGGGGGGGG
RRRRRRRRRRRRRRRRRRRRRRRRRRRRRRRRRRRRRRRRRRR
RR
RR
RR
RR
RR
RR
RR
RR
RR
RR
RR
RR
RR
RR
RR
RR
RR
RR
RR
RR
R
UBUBUBUBUBUBUBUBUBUBUBUBUBUBUBUBUBUBUBUBUBUBUBUBUBUBUBUBUBUBUBUBUBUBUBUBUBUBUBUBUBUBUBUBUBUBUBUBUBUBUBUBUBUBUBUBUBUBUBUBUBUBUBUBUBUBUBUBUBUBUBUBUBUBUBUBUBUBUBUBUBUBUBUBUBUBUBUBUBUBUBUBUBUBUBUBUBUBUBUBUBUBUB
UB
UB
UB
UB
UB
UB
UB
UB
UB
UB
UB
UB
UBUBUBUBUBUBUBUBUBUBUBUBUBUBUBUBUBUBUBUBUBUBUBUBUBUBUBUBUBUBUBUBUBUBUBUBUBUBUBUBUBUBUBUBUBUBUBUBUBUBUBUBUBUBUBUBUBUBUBUBUBUBUBUBUBUBUBUBUBUBUBUBUBUBUBUBUBUBUBUBUBUBUBUBUBUBUBUBUBUBUBUBUBUBUBUBUBUB
UB
UB
UB
UB
UB
UB
UB
UB
UB
UB
UB
UB
UB
UB
UB
UB
UB
UB
UB
UB
UB
UB
UB
UB
UB
UB
UB
UB
UB
UB
UB
UB
UB
SS
SS
SS
SS
SS
SS
SS
SS
SS
SS
SS
SS
SS
SS
SS
SS
SS
SS
SS
SS
SS
SS
SS
SS
SS
SS
SS
SS
SS
SS
SS
SS
SS
SS
SS
SS
SS
SS
SS
SS
SS
SS
SS
SS
SS
SS
SS
SS
SS
SS
SS
SS
SS
SS
GG
GG
GG
GG
GG
GG
GG
GG
GG
GG
GG
GG
GG
GG
GG
GG
GG
GG
GG
GG
GG
GG
GG
GG
GG
GG
GG
GG
GG
GG
GG
GG
GG
GG
GG
GG
GG
GG
GG
GG
GG
GG
GG
GG
GG
GG
GG
GG
GG
GG
GG
GG
GG
GG
GG
G
G
G
G
G
G
G
G
G
G
G
G
G
G
G
G
G
GG
GG
GG
G
G
G
G
G
G
G
G
G
G
G
G
G
UHUHUHUHUHUHUHUHUHUHUHUHUHUHUHUHUHUHUHUHUHUHUHUHUHUHUHUHUHUHUHUHUHUHUHUHUHUHUHUHUHUHUHUHUHUHUHUHUHUHUHUHUHUHUHUHUHUHUHUHUHUHUHUHUHUHUHUHUHUHUHUHUHUHUHUHUHUHUHUHUHUHUHUHUHUHUHUHUHUHUHUHUHUHUHUHUHUHUHUHUHUHUHUH
UB
UB
UB
UB
UB
UB
UB
UB
UB
UB
UB
UB
UB
UB
UB
UB
UB
UB
UB
UB
UB
UB
UB
UB
UB
UB
UB
UB
UB
UB
UB
UB UB UB UB UB UB UB UB UB UB UB UB UB UB UB
UBUBUBUBUBUBUBUBUBUBUBUBUBUBUB
SS
SS
SS
SS
S
S
S
S
S
S
S
S
S
S
S
S
S
S
S
S
S
S
S
S
S
S
S
S
S
S
S
S
S
S
S
SS
S
S
S
S
S
S
S
S
S
S
S
S
S
S
S
S
W
R
R
R
R
R
R
R
R
R
R
R
R
R
R
R
R
R
R
R
R
R
R
R
R
R
R
R
R
R
R
R
R
R
R
R
R
R
R
R
R
RR
R
R
R
R
UB
UB
UB
UB
UB
UB
UB
UB
UB
UB
UB
UB
UB
UB
UB
UB
UB
UB
UB
UB
UB
UB
UB
UB
UB
UB
UB
UB
UB
UB
UB
UB
UB
UB
UB
UB
UB
UB
UB
UB
UB
UB
UB
UB
UB
UB
UB
UB
UB
UB
UB
UB
UB
UB
UB
UB
UB
ST
ST
ST
ST
ST
ST
ST
ST
ST
ST
ST
ST
ST
ST
ST
ST
ST
ST
ST
ST
ST
ST
ST
ST
ST
ST
ST
ST
ST
ST
ST
ST
ST
ST
ST
ST
ST
ST
ST
ST
ST
ST
ST
ST
ST
ST
ST
ST
ST
ST
ST
ST
ST
ST
ST
ST
ST
ST
ST
ST
ST
ST
ST
ST
ST
ST
S
S
S
S
S
S
S
S
S
S
S
S
S
S
S
S
S
S
S
S
S
S
S
S
S
S
S
S
S
S
S
S
S
S
S
S
S
S
S
S
S
S
S
S
S
S
S
S
S
S
S
S
S
S
S
S
S
S
S
S
S
W
W
W
W
W
W
W
W
W
W
W
W
W
W
W
W
W
W
W
W
W
W
W
W
W
W
W
W
W
W
W
W
W
W
W
W
W
W
W
W
W
W
W
W
W
W
W
W
W
W
W
W
W
W
W
W
W
W
W
W
W
W
W
W
W
W
W
G
G
G
G
G
G
G
G
G
G
G
G
G
G
G
G
G
G
G
G
G
G
G
G
G
G
G
G
G
G
G
G
G
G
G
G
G
G
G
G
G
G
G
G
G
G
G
G
G
G
G
G
G
G
G
G
G
G
G
G
G
G
G
0.37
5 Di
a. S
torm
Sew
er
0.25
0 Di
a. S
anitr
y Se
wer
0.15
2 Di
a. W
ater
nmai
n
0.03
2 Di
a. G
asm
ain
0.15
2 D
ia.
Wat
erm
ain
0.30
0 Di
a. S
anita
ry S
ewer
0.03
5 Di
a. G
asm
ain
0.15
2 D
ia. W
ater
mai
n
0.37
5 D
ia. S
anita
ry S
ewer
0.03
5 Di
a. G
asm
in0.
152
Dia
. Wat
erm
ain
0.37
5 D
ia. S
anita
ry S
ewer
0.03
5 D
ia. G
asm
ain
0.37
5 D
ia. S
anita
ry S
ewer
SSSSSSSSSS
ST
ST
ST
ST
ST
ST
ST
ST
ST
ST
SS
SS
SS
SS
SS
S
0.28
Dia
.
2(30
)D
ia.
WWWWWWWWWWWWWWWWWWWWWWWWWWWWWWWWWWWWWWWWWWWWWW
SSSSSSSSSSSSSSSSSSSSSSSSSSSSSSSSSSSSSSSSSSSSS
STSTSTSTSTSTSTSTSTSTSTSTSTSTST
GGGGGGGGGGGGGGGGGGGGGGGGGGGGGGGGGGGGGGGG
UBUBUBUBUBUBUBUBUBUBUBUBUBUBUBUBUBUB
STST
STST
STST
STST
STSTST
STST
ST
STSTSTSTSTSTSTSTSTSTSTSTSTSTSTSTSTSTSTSTSTSTSTSTSTSTSTSTSTST
UB
UB
UB
UB
UB
UB
UB
UB
UB
UB
UB
UB
UB
UB
UB
UB
UB
UB
UB
UB
UB
UB
UB
UB
UB
UBUBUB
UB
UHUHUHUHUHUHUHUHUHUHUHUHUHUHUHUHUHUHUHUHUHUHUHUHUHUH
UH
UH
UH
UH
UH
UH
UH
UH
UH
UH
UH
UH
UH
UH
UH
UH
UH
UH
UH
UH
UH
UH
UH
UH
UH
UH
UH
UH
UH
UH
UH
UH
UH
UH
UH
UH
UH
UH
UH
UH
UH
UH
UH
UH
UH
UH
UH
UH
UH
UH
UH
UH
UH
UH
UH
UH
UH
UH
UH
UH
UH
UH
UH
UH
UH
UH
UH
UH
UH
UH
UH
UH
UH
UH
UH
UH
UH
UH
UH
UH
UH
UH
UH
UH
UH
UH
UH
UH
UH
UH
UH
UH
UH
UH
UH
UH
UH
UH
UH
UH
UH
UH
UH
UH
UH
UH
UH
UH
UH
UH
UH
UH
UH
UH
UH
UH
UH
UH
UH
UH
UH
UH
UH
UH
UH
UH
UH
UH
UH
UH
UH
UH
UH
UH
UH
UH
UH
UH
UH
UH
UH
UH
UH
UH
UH
UH
UH
UH
UH
UH
UH
UH
UH
UH
UH
UH
UH
UH
UH
UH
UH
UH
UH
UH
UH
UH
UH
UH
UH
UH
UH
UH
UH
UH
UH
UH
UH
UH
STST
STST
STST
ST
ST
ST
ST
ST
ST
ST
ST
ST
ST
ST
ST
ST
ST
ST
ST
ST
W
W
W
W
W
W
W
W
W
W
W
W
W
W
W
W
W
W
W
W
W
W
W
W
W
W
W
W
W
W
W
W
W
W
W
W
WW
WW
WW
WW
WW
WW
WW
WW
WW
WW
WW
WW
WW
WW
WW
W
WW
WW
WW
WW
WW
WW
WW
WW
WW
WW
WW
WW
WW
WW
WW
WW
WW
WW
WW
WW
WW
WW
WW
WW
WW
WW
WW
WW
WW
WW
WW
WW
WW
WW
WW
WW
WW
WW
WW
WW
WW
WW
WW
WW
WW
WW
WW
WW
WW
WW
WW
WW
WW
WW
WW
WW
WW
WW
WW
WW
WW
WW
WW
WW
WW
WW
WW
WW
WW
WW
WW
WW
W
W
W
W
W
W
W
W
W
W
W
W
W
W
W
W
W
W
W
W
W
W
W
W
ST
ST
ST
ST
ST
ST
ST
ST
ST
ST
STST
ST
ST
ST
ST
ST
STST
ST
STST
ST
STST
ST
ST
ST
ST
ST
STST
ST
STST
ST
STST
ST
ST
ST
ST
ST
STST
ST
STST
ST
ST
ST
ST
ST
STST
STST
STST
STST
STST
STST
STST
STST
STST
STST
STST
STST
STST
STST
STST
STST
STST
STST
STST
STST
STST
STST
STST
STST
STST
STST
STST
STST
STST
STST
STST
STST
STST
STST
STST
STST
STST
STST
STST
STST
STST
STST
STST
STST
STST
STST
STST
STST
STST
STST
STST
STST
STST
STST
STST
STST
STST
STST
STST
STST
STST
STST
STST
STST
ST
STST
STST
STST
STST
STST
STST
STST
STST
STST
STST
STST
STST
STST
STST
ST
ST
ST
ST
ST
ST
ST
ST
ST
ST
STST
ST
ST
ST
ST
STST
ST
ST
ST
STST
STST
STST
STST
STST
STST
STST
STST
STST
ST
STST
STST
STST
STST
STST
ST
STST
STST
STST
STST
STST
STST
STST
STST
STST
STST
STST
STST
STST
STST
STST
STST
STST
STST
STST
STST
STST
STST
STST
STST
STST
STST
STST
STST
STST
STST
STST
STST
STST
STST
STST
STST
STST
STST
STST
STST
STST
STST
STST
STST
STST
STST
STST
STST
STST
STST
STST
STST
STST
STST
STST
STST
STST
STST
STST
STST
STST
STST
ST
ST
ST
ST
ST
ST
ST
ST
ST
ST
ST
ST
ST
ST
ST
ST
ST
ST
ST
ST
ST
ST
ST
ST
ST
ST
ST
ST
ST
ST
ST
ST
ST
ST
ST
ST
ST
ST
ST
ST
ST
ST
UH
UH
UH
UH
UH
UH
UH
UH
UH
UH
WW
WW
WW
WW
WW
WW
WW
WW
WW
WW
WW
WW
WW
WW
W
UH
UH
UH
UH
UH
UH
UH
UH
UH
UH
UH
UH
UH
UH
UH
UH
UH
UH
UH
UH
UH
UH
UH
UH
UH
UH
UH
UH
UH
UH
UH
UH
UH
UH
UH
UH
UH
G
G
G
G
G
G
G
G
G
G
G
G
G
G
G
GG
GG
GG
GG
GG
GG
GG
GG
GG
GG
GG
GG
GG
GG
GG
GG
GG
GG
GG
GG
GG
GG
GG
GG
GG
GG
GG
GG
GG
GG
GG
GG
GG
GG
GG
GG
GG
GG
GG
GG
GG
GG
GG
GG
GG
GG
GG
GG
GG
GG
GG
GG
GG
GG
GG
GG
GG
GG
GG
GG
GG
GG
GG
GG
GG
GG
GG
GG
GG
GG
GG
GG
UH
UHUHUHUHUHUHUHUH
UH
UH
UH
UHUH
UH
UH
UH
UH UH
1.80
0 D
ia. S
torm
Sew
er
0.37
5 D
ia. S
torm
Sew
er
0.100 Dia. Watermain
0.45
0 D
ia. S
torm
Sew
er0.
375
Dia
. Sto
rm S
ewer
1.80
0 D
ia. S
torm
Sew
er
0.15
0 D
ia. G
asm
ain
0.15
0 D
ia. G
asm
ain
SSSSSSSSSSSSSSSSS
STST
STST
STST
STST
STST
0.200± Dia.
Storm Sewer 0.250± Dia.Sanitary Sewer
0.30
0± D
ia.
Sani
tary
Sew
er
0.30
0± D
ia.
Stor
m S
ewer
SS
S
0.20
0± D
ia.
Sani
tary
Sew
er(2
Pip
es)
0.20
0± -
0.25
0± D
ia. S
anita
ry S
ewer
MH
CB
CB
MH
TMH
HM
H
CB
CB
WM
HW
V
TMH
TMH
TMH
MH
MH
HM
H
WM
H
MH
CB
CB
CB
CB
CB C
B
LS
LS
LS
56.79
56.92
56.88
56.85
56.88
56.91
56.84
56.78
56.87
56.84 56.98
56.96
56.88
56.58
56.51
56.60
56.77
56.4456.74
56.48
56.37
56.57
56.44
57.70
57.47
57.53
57.6157.57
57.5957.58
57.59
57.56
57.59
57.58
57.58
57.54
57.52
57.42
57.43
57.4657.53
56.98
57.21
57.18
57.41
57.3457.64
57.53
57.43
57.45
57.35
57.34
57.31
57.27
57.18
57.14
57.07
57.08
57.14
57.13
57.19
57.19
57.12
57.08
57.15
57.20
57.30
57.33
57.34
57.39
57.31
57.15
57.11
57.72
57.28
57.67
57.44
57.49
57.16
57.16
57.20
57.28
57.31
57.42
57.57
57.62
57.63
57.93
57.87
57.85
57.72
57.68
57.68
57.69
57.04
57.15
57.01
57.81
57.70
57.65
57.58
57.45
57.43
57.36
57.16
57.10
57.13
57.68
57.68
57.69
57.93
57.50
57.84
57.72
57.36
57.29
57.15
57.46
57.34
57.60
57.84
57.68
58.21
57.54
57.87
57.78
58.12
58.07
58.18
58.02
57.70
57.63
57.8057.85
57.77
57.27
57.2057.36
57.42
57.32
57.80
57.74
57.65
57.56
57.54
57.60
56.74
C o
n c
r e
t e
M e
d i
a n
G r
a s
s
Depre
ssed
Curb
Depre
ssed
Curb
Dep
ress
ed
Cur
b
DepressedCurb
0.65
Dia
.
0.23
Dia
.
0.22
Dia
.
0.23
Dia
.
0.25
Dia
.
N 83° 54' 40" E 38.58
16.0
1 (J
GP&
M)
12.19 (JGP, P&S)
33.2
2
N 0
6° 3
2' 5
0" W
57.22
57.30
57.35
57.40
57.85
58.00
58.07
57.37
57.22
GARB.
CHUTE
ELEV
ATO
RS
STA
IRS
STA
IRS
GARB.
CHUTE
ELEV
ATO
RS
STA
IRS
STA
IRS
GARB. CHUTE
ELEVATORS
STAIRS
STAIRS
GARBAG
ERO
OM
GARBAG
ERO
OM
GARBAGE ROOM
GARBAG
EBIN
S
ELEC
TRIC
AL
RO
OM
ELEC
TRIC
AL
RO
OM
ELECTRICAL
ROOM
PUM
PRO
OM
N 84° 25' 00" E 38.4016 ON GRADE VISITOR PARKING
MECHANICALROOM
N 83°45'30" E 24.99
N 60° 20' 40" E 58.70
N 60°19'30" E (M) 25.72
0.28
Dia
.
0.28
Dia
.
0.28
Dia
.
0.20
Dia
.
0.20
Dia
.
0.20
Dia
.0.
23D
ia.
0.28
Dia
. 0.28
Dia
.
0.28
Dia
.
INTERNAL PRIVATE STREET
INTERNAL PRIVATE STREET
FIRE
LAN
E
SITE
PLA
N -
INFO
RM
ATI
ON
TM 2
363
F(3
.5) 5
365-
h
23
63
- HEI
GH
TS A
S PE
R S
CH
EDU
LE 3
65-
TABL
E 19
7 D
OES
NO
T AP
PLY
ZON
ING
- IN
FOR
MA
TIO
N-L
OT
AREA
= 1
2357
.89
m-F
SI P
ERM
ISSI
BLE
= 12
357.
89 X
3.5
= 4
3252
.615
m-F
SI P
RO
POSE
D =
433
11.6
4 m
2
2
2
-SE
TBAC
KS O
F SE
CTI
ON
197
ZO
NE
PRO
VISI
ON
S(3)
TABL
E 19
7 D
O N
OT
APPL
YSE
E SC
HED
ULE
365
BU
ILD
ING
A =
227
UN
ITS
BU
ILD
ING
B =
202
UN
ITS
BU
ILD
ING
C =
176
UN
ITS
T
OTA
L =
605
UN
ITS
-PAR
KIN
G -
AR
EA X
- IN
NER
UR
BAN
MAI
N S
TREE
T(C
)N
UM
BER
OF
PAR
KIN
G =
0.5
X U
NIT
= 0
.5 X
605
= 3
02.5
=30
3 PA
RKI
NG
IF A
LL P
ARKI
NG
IS B
ELO
W G
RAD
E =
303
RED
UC
ES B
Y LE
SSER
OF
10%
OR
20
SPAC
ES
.
.303
-20
= 28
3 R
EQU
IRED
VISI
TOR
PAR
KIN
G =
0.1
X D
WEL
LIN
G =
0.1
X 6
05 =
60.
5 PA
RKI
NG
TO
TAL
REQ
UIR
ED P
ARKI
NG
+ V
ISIT
OR
= 3
44 P
ARKI
NG
PA
RKI
NG
PR
OVI
DED
: O
N G
RAD
E =
16 P
ARKI
NG
FIR
ST P
ARKI
NG
LEV
EL =
294
PAR
KIN
G S
ECO
ND
PAR
KIN
G L
EVEL
= 29
6 PA
RKI
NG
TOTA
L =
606
PAR
KIN
G
BIC
YCLE
S =
0.5
X D
WEL
LIN
G =
302
.5 =
303
BIC
YCLE
SAM
ENTY
AR
EA 6
m X
DW
ELLI
NG
= 3
630
mC
OM
MU
NAL
AR
EA 5
0 %
OF
3630
m =
181
5 m
2
.
2
0.17
Dia
.
0.3
Dia
.
0.3
Dia
.
0.3
Dia
.
0.3
Dia
.
0.3
Dia
.0.3
Dia
.
0.3
Dia
.
0.3
Dia
.
0.3
Dia
.
0.3
Dia
.
MIX
ED B
USH &
TREE
S
MIX
ED B
USH &
TRE
ES
#319
1 STOREY COMMERCIAL BUILDING
FIRE LANE
FIRE LANE
MOVING TRUCKDROP OFF
201-
4 BE
ECHW
OO
D AV
ENUE
, O
TTAW
A, O
NTAR
IO, C
ANAD
A K1
L8L9
TEL:
613
228
985
0. F
AX 6
13 2
28 9
848.
mai
lbox
@w
oodm
anar
chite
ct.c
om
N
SITE
PLA
N
1:35
0
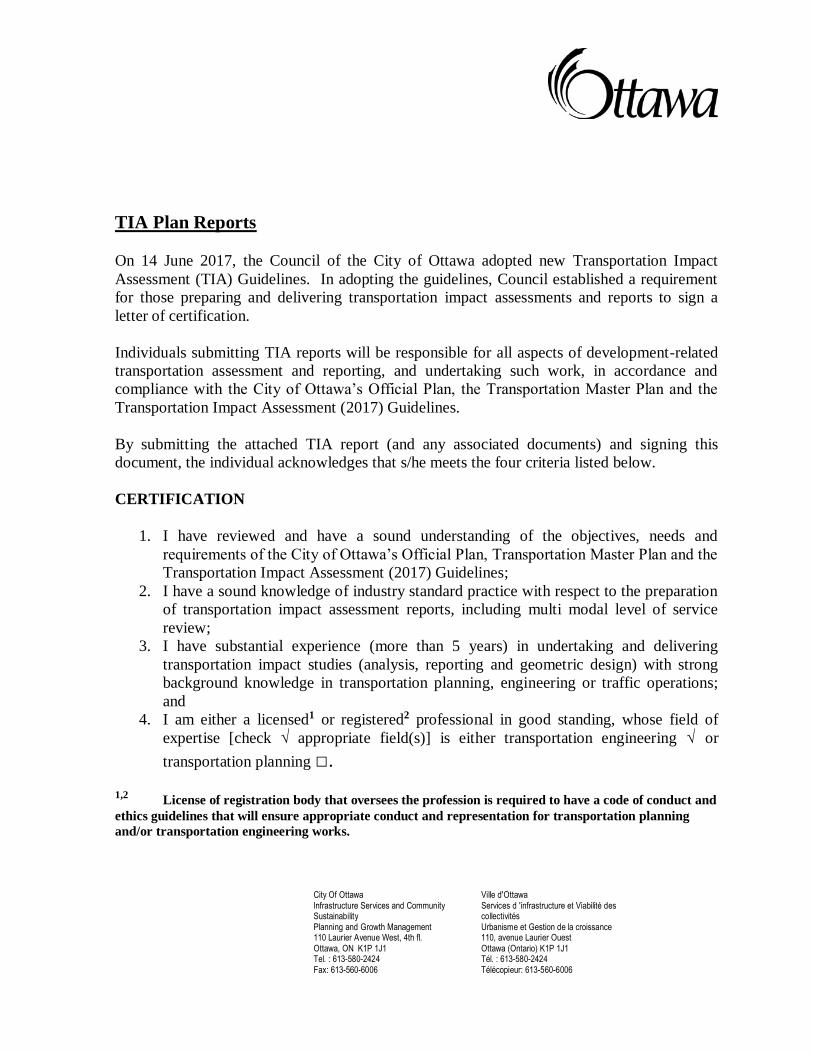
City Of Ottawa Infrastructure Services and Community Sustainability
Planning and Growth Management 110 Laurier Avenue West, 4th fl.
Ottawa, ON K1P 1J1 Tel. : 613-580-2424 Fax: 613-560-6006
Ville d'Ottawa Services d 'infrastructure et Viabilité des collectivités
Urbanisme et Gestion de la croissance 110, avenue Laurier Ouest
Ottawa (Ontario) K1P 1J1 Tél. : 613-580-2424 Télécopieur: 613-560-6006
TIA Plan Reports
On 14 June 2017, the Council of the City of Ottawa adopted new Transportation Impact
Assessment (TIA) Guidelines. In adopting the guidelines, Council established a requirement
for those preparing and delivering transportation impact assessments and reports to sign a
letter of certification.
Individuals submitting TIA reports will be responsible for all aspects of development-related
transportation assessment and reporting, and undertaking such work, in accordance and
compliance with the City of Ottawa’s Official Plan, the Transportation Master Plan and the
Transportation Impact Assessment (2017) Guidelines.
By submitting the attached TIA report (and any associated documents) and signing this
document, the individual acknowledges that s/he meets the four criteria listed below.
CERTIFICATION
1. I have reviewed and have a sound understanding of the objectives, needs and
requirements of the City of Ottawa’s Official Plan, Transportation Master Plan and the
Transportation Impact Assessment (2017) Guidelines;
2. I have a sound knowledge of industry standard practice with respect to the preparation
of transportation impact assessment reports, including multi modal level of service
review;
3. I have substantial experience (more than 5 years) in undertaking and delivering
transportation impact studies (analysis, reporting and geometric design) with strong
background knowledge in transportation planning, engineering or traffic operations;
and 4. I am either a licensed1 or registered2 professional in good standing, whose field of
expertise [check √ appropriate field(s)] is either transportation engineering √ or
transportation planning □. 1,2 License of registration body that oversees the profession is required to have a code of conduct and
ethics guidelines that will ensure appropriate conduct and representation for transportation planning
and/or transportation engineering works.
TIS REPORTS-PreQualification Letter/rc
Dated at ___Ottawa__________ this __20__ day of ________September________, 2018.
(City)
Name: ___________Andrew Harte_____________________________
(Please Print)
Professional Title: _________Professional Engineer___________________________
___________________________________________________________
Signature of Individual certifier that s/he meets the above four criteria
Office Contact Information (Please Print)
Address: 13 Markham Avenue
City / Postal Code: Ottawa / K2G 3Z1
Telephone / Extension: (613) 697-3797
E-Mail Address: [email protected]

Appendix B
Turning Movement Counts
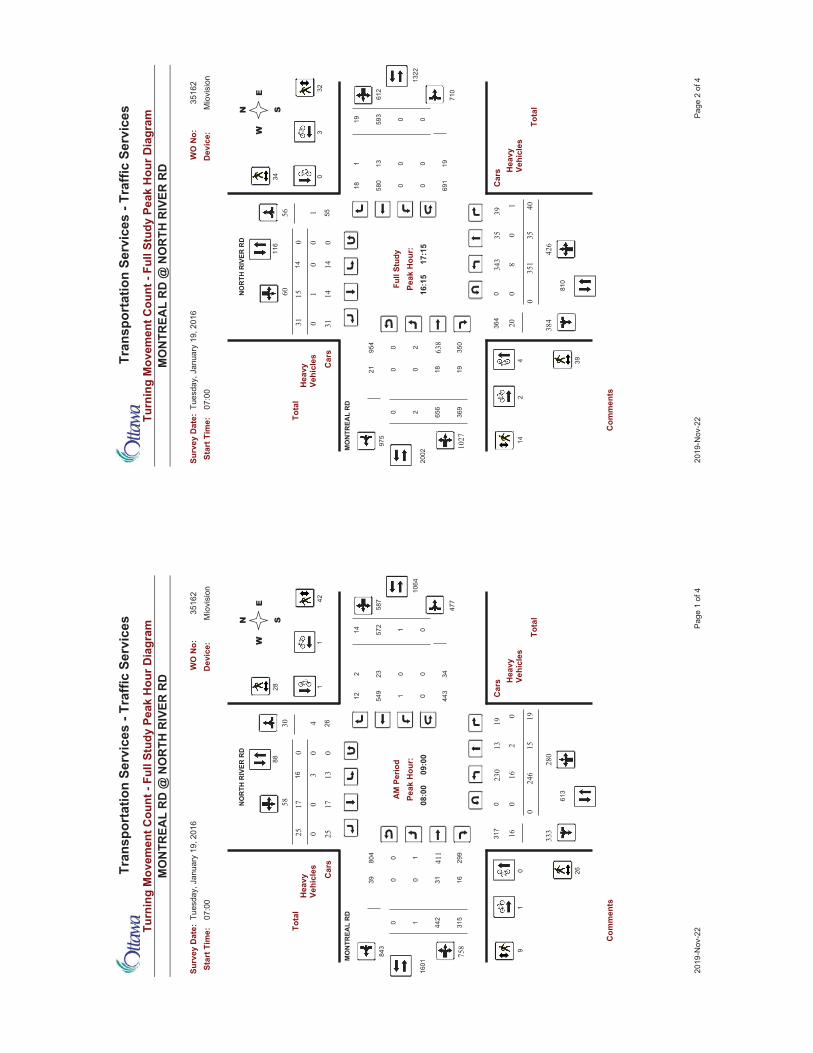
Turn
ing
Mov
emen
t Cou
nt -
Full
Stud
y Pe
ak H
our D
iagr
am
Tra
nspo
rtat
ion
Serv
ices
- Tr
affic
Ser
vice
s
Star
t Tim
e:Su
rvey
Dat
e:
MO
NTR
EAL
RD
@ N
OR
TH R
IVER
RD
07:0
0Tu
esda
y, J
anua
ry 1
9, 2
016
WO
No:
3516
2D
evic
e:M
iovi
sion
Peak
Hou
r:A
M P
erio
d
804
843
39
317
613
Tota
l
1601
1
16
110
64
31
315
442
299
0
30 4058
16
246
280
333
17
42
28
26
9
25 0
16 3
477
Car
s
EW
SN
Car
s
1572
212 44
334
14
587
0
88
Tota
l
26
23
1549
Com
men
ts
01
11
758
411
2 15
MO
NTR
EAL
RD
NO
RTH
RIV
ER R
D 13
1725
1613
190
230
19
00
0
0
0
0
00
00
0
0
08:0
009
:00
Hea
vyVe
hicl
es
Hea
vyVe
hicl
es
Page
1 o
f 420
19-N
ov-2
2
Turn
ing
Mov
emen
t Cou
nt -
Full
Stud
y Pe
ak H
our D
iagr
am
Tra
nspo
rtat
ion
Serv
ices
- Tr
affic
Ser
vice
s
Star
t Tim
e:Su
rvey
Dat
e:
MO
NTR
EAL
RD
@ N
OR
TH R
IVER
RD
07:0
0Tu
esda
y, J
anua
ry 1
9, 2
016
WO
No:
3516
2D
evic
e:M
iovi
sion
Peak
Hou
r:Fu
ll St
udy
954
975
21
364
810
Tota
l
2002
2
19
213
22
18
369
656
350
0
56 1160
20
351
426
384
15
32
34
39
14
31 0
14 0
710
Car
s
EW
SN
Car
s
0593
118 69
119
19
612
0
116
Tota
l
55
13
0580
Com
men
ts
42
03
1027
638
0 35
MO
NTR
EAL
RD
NO
RTH
RIV
ER R
D 35
1431
814
401
343
39
00
0
0
0
0
00
00
0
0
16:1
517
:15
Hea
vyVe
hicl
es
Hea
vyVe
hicl
es
Page
2 o
f 420
19-N
ov-2
2
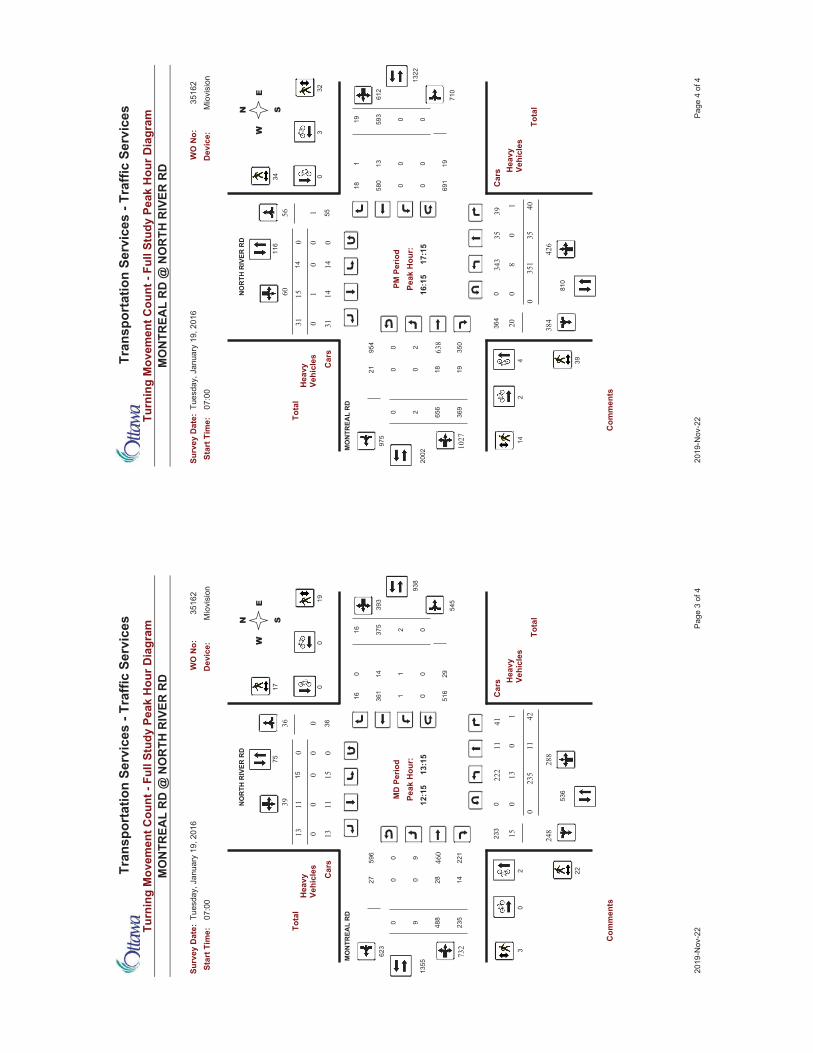
Turn
ing
Mov
emen
t Cou
nt -
Full
Stud
y Pe
ak H
our D
iagr
am
Tra
nspo
rtat
ion
Serv
ices
- Tr
affic
Ser
vice
s
Star
t Tim
e:Su
rvey
Dat
e:
MO
NTR
EAL
RD
@ N
OR
TH R
IVER
RD
07:0
0Tu
esda
y, J
anua
ry 1
9, 2
016
WO
No:
3516
2D
evic
e:M
iovi
sion
Peak
Hou
r:M
D P
erio
d
596
623
27
233
536
Tota
l
1355
9
14
993
8
28
235
488
221
0
36 0039
15
235
288
248
11
19
17
22
3
13 0
15 0
545
Car
s
EW
SN
Car
s
2375
016 51
629
16
393
1
75
Tota
l
36
14
1361
Com
men
ts
20
00
732
460
0 11
MO
NTR
EAL
RD
NO
RTH
RIV
ER R
D 11
1113
1315
421
222
41
00
0
0
0
0
00
00
0
0
12:1
513
:15
Hea
vyVe
hicl
es
Hea
vyVe
hicl
es
Page
3 o
f 420
19-N
ov-2
2
Turn
ing
Mov
emen
t Cou
nt -
Full
Stud
y Pe
ak H
our D
iagr
am
Tra
nspo
rtat
ion
Serv
ices
- Tr
affic
Ser
vice
s
Star
t Tim
e:Su
rvey
Dat
e:
MO
NTR
EAL
RD
@ N
OR
TH R
IVER
RD
07:0
0Tu
esda
y, J
anua
ry 1
9, 2
016
WO
No:
3516
2D
evic
e:M
iovi
sion
Peak
Hou
r:PM
Per
iod
954
975
21
364
810
Tota
l
2002
2
19
213
22
18
369
656
350
0
56 1160
20
351
426
384
15
32
34
39
14
31 0
14 0
710
Car
s
EW
SN
Car
s
0593
118 69
119
19
612
0
116
Tota
l
55
13
0580
Com
men
ts
42
03
1027
638
0 35
MO
NTR
EAL
RD
NO
RTH
RIV
ER R
D 35
1431
814
401
343
39
00
0
0
0
0
00
00
0
0
16:1
517
:15
Hea
vyVe
hicl
es
Hea
vyVe
hicl
es
Page
4 o
f 420
19-N
ov-2
2
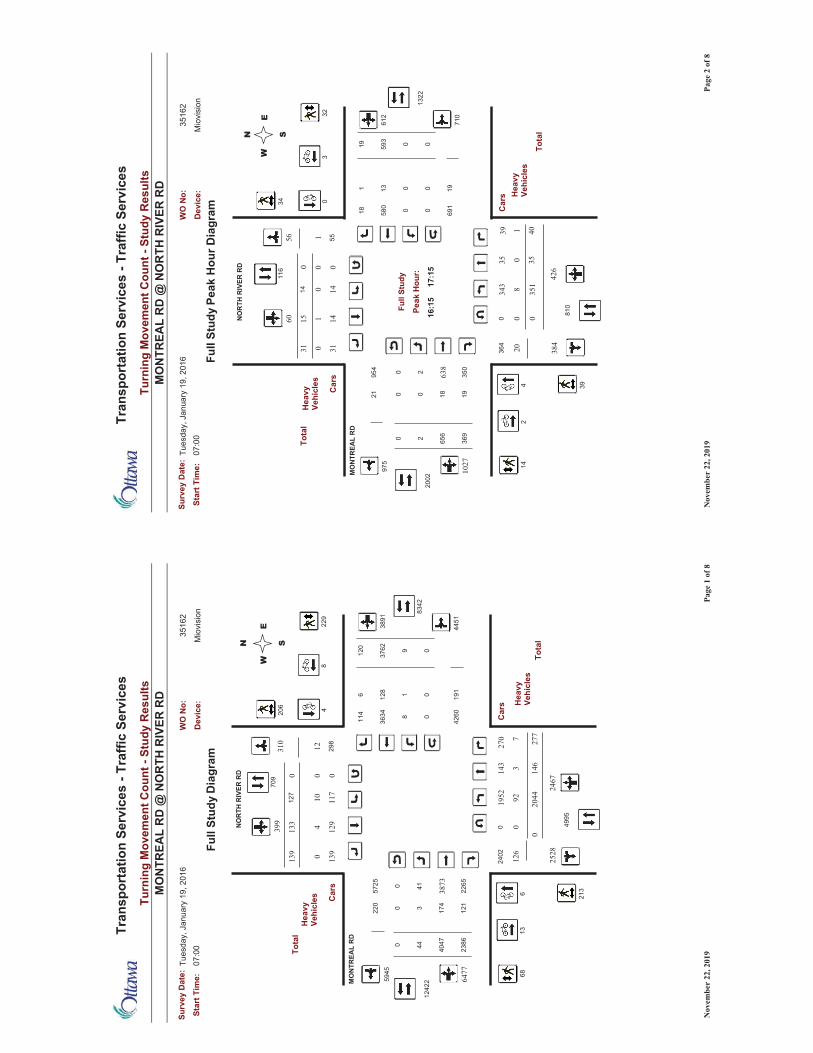
Turn
ing
Mov
emen
t Cou
nt -
Stud
y R
esul
ts
Tra
nspo
rtat
ion
Serv
ices
- Tr
affic
Ser
vice
s
07:0
0
Surv
ey D
ate:
MO
NTR
EAL
RD
@ N
OR
TH R
IVER
RD
Star
t Tim
e:Tu
esda
y, J
anua
ry 1
9, 2
016
WO
No:
Dev
ice:
Mio
visi
on
3516
2
220
5725
4412
422
2402
5945
Tota
l
121
4183
42
174
2386
4047
2265
3
4995
399
310
133 4
2528
126
12
2467
229
206
213
68
139 0
127
10
4451
Car
s
EW
SN
Hea
vyVe
hicl
es Car
s
9
3762
611
4
4260
191
120
3891
Tota
l
298
709
81
3634
128
2044
Hea
vyVe
hicl
es6
13
48
146
6477
143 3
NO
RTH
RIV
ER R
D
3873
MO
NTR
EAL
RD
129
139
92117
2777
1952
270
0
0
00
00
00
00
0
0
Dia
gram
Full
Stud
y
Page
1 o
f 8N
ovem
ber
22, 2
019
Turn
ing
Mov
emen
t Cou
nt -
Stud
y R
esul
ts
Tra
nspo
rtat
ion
Serv
ices
- Tr
affic
Ser
vice
s
07:0
0
Surv
ey D
ate:
MO
NTR
EAL
RD
@ N
OR
TH R
IVER
RD
Star
t Tim
e:Tu
esda
y, J
anua
ry 1
9, 2
016
WO
No:
Dev
ice:
Mio
visi
on
3516
2
Car
s
N
Car
s
0
710
W
S
E
55
116
Tota
l
580
13
001
18
0593
19
612
691
19
14
19
220
022 369
656
1322
18
Tota
l
954
975
Peak
Hou
r:
Full
Stud
y
364
810
21
32
34
384
1531 0
39
14
426
56 1
350
0
20
351
160
1
343
14
40
0
039
0
8
MO
NTR
EAL
RD
35
1431
NO
RTH
RIV
ER R
D 35
0
00
0
Hea
vyVe
hicl
es
Hea
vyVe
hicl
es
16:1
517
:150
0
0
0
0
02
0
4
1027
638
3
Peak
Hou
r Dia
gram
Full
Stud
y
Page
2 o
f 8N
ovem
ber
22, 2
019

Turn
ing
Mov
emen
t Cou
nt -
Stud
y R
esul
ts
Tra
nspo
rtat
ion
Serv
ices
- Tr
affic
Ser
vice
s
07:0
0
Surv
ey D
ate:
MO
NTR
EAL
RD
@ N
OR
TH R
IVER
RD
Star
t Tim
e:Tu
esda
y, J
anua
ry 1
9, 2
016
WO
No:
Dev
ice:
Mio
visi
on
3516
2
Sum
mar
y (8
HR
Sta
ndar
d)Fu
ll St
udy
0 00
AA
DT
Fact
orSu
rvey
Dat
e:0
Nor
thbo
und:
Sout
hbou
nd:
1.53
Tues
day,
Jan
uary
19,
201
6To
tal O
bser
ved
U-T
urns
East
boun
d:W
estb
ound
:
MO
NTR
EAL
RD
Nor
thbo
und
Sout
hbou
ndN
OR
TH R
IVER
RD
East
boun
dGr
and
Tota
lST
RTO
TW
BTO
TRT
STLT
EB TOT
RTST
LTST
RTO
TSB TO
TRT
STLT
NB TOT
RTST
LTPe
riod
Wes
tbou
nd
1332
1113
419
641
21
694
284
408
221
932
69
1718
725
415
808
:0007
:00
1683
1345
587
1457
21
758
315
442
133
858
2517
1628
019
1524
609
:0008
:00
1300
1042
373
1036
12
669
245
419
525
832
218
1222
626
1218
810
:0009
:00
1432
1106
398
1538
03
708
246
455
732
648
1022
1627
840
1122
712
:3011
:30
1443
1123
381
1336
80
742
238
494
1032
041
1314
1427
942
1222
513
:3012
:30
2019
1547
596
2457
02
951
374
567
1047
268
2324
2140
435
2834
116
:0015
:00
2119
1612
623
1660
70
989
350
637
250
763
3413
1644
447
3935
817
:0016
:00
1906
1480
514
2249
20
966
334
625
742
657
2616
1536
943
2530
118
:0017
:00
1323
410
368
3891
120
3762
964
7723
8640
4744
2866
399
139
133
127
2467
277
146
2044
Sub
Tota
l
0U
Turn
s
1323
410
368
3891
120
3762
964
7723
8640
4744
2866
399
139
133
127
2467
277
146
2044
Tota
l
00
00
00
1.1
Not
e: T
hese
vol
umes
are
cal
cula
ted
by m
ultip
lyin
g th
e Eq
uiva
lent
12
hr. t
otal
s by
the
AAD
T fa
ctor
.
1.31
Not
e: T
hese
vol
umes
are
cal
cula
ted
by m
ultip
lyin
g th
e Av
erag
e D
aily
12
hr. t
otal
s by
12
to 2
4 ex
pans
ion
fact
or.
1.39
2650
720
767
7794
240
7535
1812
973
4779
8106
8857
4079
927
826
625
449
4155
529
240
94AV
G 24
Hr
2023
415
853
5949
183
5752
1499
0336
4861
8867
4382
610
213
203
194
3772
424
223
3125
AVG
12Hr
Not
e: T
hese
val
ues
are
calc
ulat
ed b
y m
ultip
lyin
g th
e to
tals
by
the
appr
opria
te e
xpan
sion
fact
or.
1839
514
412
5408
167
5229
1390
0333
1756
2561
3984
555
193
185
177
3429
385
203
2841
EQ 12
Hr
Not
e: U
-Tur
ns p
rovi
ded
for a
ppro
ach
tota
ls. R
efer
to 'U
-Tur
n' R
epor
t for
spe
cific
bre
akdo
wn.
Page
3 o
f 8N
ovem
ber
22, 2
019
Turn
ing
Mov
emen
t Cou
nt -
Stud
y R
esul
ts
Tra
nspo
rtat
ion
Serv
ices
- Tr
affic
Ser
vice
s
07:0
0
Surv
ey D
ate:
MO
NTR
EAL
RD
@ N
OR
TH R
IVER
RD
Star
t Tim
e:Tu
esda
y, J
anua
ry 1
9, 2
016
WO
No:
Dev
ice:
Mio
visi
on
3516
2
Gra
ndTo
tal
STR
TOT
W TOT
RT
STLT
E TOT
RT
STLT
STR
TOT
S TOT
RT
STLT
N TOT
RT
STLT
Tim
e Pe
riod
East
boun
dW
estb
ound
NO
RTH
RIV
ER R
DM
ON
TREA
L R
DN
orth
boun
dSo
uthb
ound
15
Min
ute
Incr
emen
tsFu
ll St
udy
298
125
843
810
166
6898
012
59
04
539
72
3007
:15
07:0
028
112
976
175
015
676
791
129
84
22
413
038
07:3
007
:15
365
146
117
111
51
181
7110
91
146
112
36
569
245
07:4
507
:30
388
125
142
114
10
191
6912
20
125
40
04
516
045
08:0
007
:45
400
169
129
212
61
185
7011
50
169
154
65
718
459
08:1
508
:00
406
181
155
614
90
164
8084
018
117
85
470
33
6408
:30
08:1
545
418
616
54
161
020
083
117
018
618
115
271
45
6208
:45
08:3
042
316
513
82
136
020
982
126
116
58
21
568
43
6109
:00
08:4
534
413
911
64
112
016
562
102
113
99
05
454
74
4309
:15
09:0
029
913
080
079
115
964
941
130
61
41
547
047
09:3
009
:15
317
124
976
901
160
4911
01
124
70
34
533
446
09:4
509
:30
340
157
800
800
185
7011
32
157
101
63
659
452
10:0
009
:45
353
155
107
110
60
167
6898
115
510
26
269
80
6111
:45
11:3
036
615
010
57
980
184
5412
82
150
174
76
6012
345
12:0
011
:45
371
182
902
871
191
7211
63
182
152
85
7510
659
12:1
512
:00
342
143
965
892
166
5211
31
143
62
13
7410
262
12:3
012
:15
346
140
984
940
171
5111
73
140
112
36
669
255
12:4
512
:30
391
171
102
210
00
197
6512
84
171
135
44
799
466
13:0
012
:45
373
157
975
920
198
6713
01
157
94
32
6914
352
13:1
513
:00
333
139
842
820
176
5511
92
139
82
42
6510
352
13:3
013
:15
454
222
121
311
80
211
8012
56
222
196
76
103
114
8815
:15
15:0
052
623
014
42
141
127
510
017
14
230
155
55
924
1177
15:3
015
:15
542
224
186
717
81
248
9415
40
224
174
85
919
676
15:4
515
:30
497
258
145
1213
30
217
100
117
025
817
84
511
811
710
016
:00
15:4
552
521
815
23
149
024
878
170
021
816
82
610
917
1082
16:1
516
:00
532
247
169
716
20
227
8314
22
247
2212
55
114
714
9316
:30
16:1
553
323
117
02
168
023
999
140
023
17
50
211
712
699
16:4
516
:30
529
231
132
412
80
275
9018
50
231
189
63
104
119
8417
:00
16:4
553
121
714
16
135
028
697
189
021
713
54
491
106
7517
:15
17:0
050
019
615
27
145
024
780
167
019
613
72
488
146
6817
:30
17:1
542
019
711
73
114
018
868
120
019
715
76
210
011
584
17:4
517
:30
455
220
104
698
024
589
149
722
016
74
590
88
7418
:00
17:4
5
Not
e: U
-Tur
ns a
re in
clud
ed in
Tot
als.
13,2
3457
0438
9112
037
629
6477
2386
4047
4457
0439
913
913
312
724
6727
714
620
44To
tal:
Page
4 o
f 8N
ovem
ber
22, 2
019

Turn
ing
Mov
emen
t Cou
nt -
Stud
y R
esul
ts
Tra
nspo
rtat
ion
Serv
ices
- Tr
affic
Ser
vice
s
07:0
0
Surv
ey D
ate:
MO
NTR
EAL
RD
@ N
OR
TH R
IVER
RD
Star
t Tim
e:Tu
esda
y, J
anua
ry 1
9, 2
016
WO
No:
Dev
ice:
Mio
visi
on
3516
2
MO
NTR
EAL
RD
NO
RTH
RIV
ER R
DG
rand
Tot
alSt
reet
Tot
alW
estb
ound
East
boun
dSt
reet
Tot
alSo
uthb
ound
Nor
thbo
und
Tim
e Pe
riod
Cyc
list V
olum
eFu
ll St
udy
00
00
00
007
:15
07:0
02
00
02
20
07:3
007
:15
10
00
11
007
:45
07:3
00
00
00
00
08:0
007
:45
00
00
00
008
:15
08:0
02
11
01
10
08:3
008
:15
00
00
00
008
:45
08:3
01
10
10
00
09:0
008
:45
22
11
00
009
:15
09:0
00
00
00
00
09:3
009
:15
00
00
00
009
:45
09:3
02
22
00
00
10:0
009
:45
11
01
00
011
:45
11:3
00
00
00
00
12:0
011
:45
00
00
00
012
:15
12:0
02
00
02
02
12:3
012
:15
00
00
00
012
:45
12:3
00
00
00
00
13:0
012
:45
00
00
00
013
:15
13:0
01
10
10
00
13:3
013
:15
11
01
00
015
:15
15:0
02
20
20
00
15:3
015
:15
11
01
00
015
:45
15:3
00
00
00
00
16:0
015
:45
22
02
00
016
:15
16:0
01
10
10
00
16:3
016
:15
11
01
00
016
:45
16:3
05
22
03
03
17:0
016
:45
21
10
10
117
:15
17:0
01
11
00
00
17:3
017
:15
11
01
00
017
:45
17:3
00
00
00
00
18:0
017
:45
3121
813
104
6To
tal
Page
5 o
f 8N
ovem
ber
22, 2
019
Turn
ing
Mov
emen
t Cou
nt -
Stud
y R
esul
ts
Tra
nspo
rtat
ion
Serv
ices
- Tr
affic
Ser
vice
s
07:0
0
Surv
ey D
ate:
MO
NTR
EAL
RD
@ N
OR
TH R
IVER
RD
Star
t Tim
e:Tu
esda
y, J
anua
ry 1
9, 2
016
WO
No:
Dev
ice:
Mio
visi
on
3516
2
MO
NTR
EAL
RD
NO
RTH
RIV
ER R
DPe
dest
rian
Volu
me
Full
Stud
y
Gra
nd T
otal
Tota
lW
B Ap
proa
ch(N
or S
Cro
ssin
g)EB
App
roac
h(N
or S
Cro
ssin
g)To
tal
SB A
ppro
ach
(E o
r W C
ross
ing)
NB
Appr
oach
(E o
r W C
ross
ing)
Tim
e Pe
riod
123
30
94
507
:15
07:0
09
00
09
63
07:3
007
:15
155
32
104
607
:45
07:3
024
1111
013
58
08:0
007
:45
3117
161
146
808
:15
08:0
034
1611
518
99
08:3
008
:15
209
72
116
508
:45
08:3
020
98
111
74
09:0
008
:45
168
62
85
309
:15
09:0
013
54
18
44
09:3
009
:15
146
51
83
509
:45
09:3
011
32
18
26
10:0
009
:45
2214
113
87
111
:45
11:3
023
1312
110
64
12:0
011
:45
188
71
106
412
:15
12:0
014
55
09
54
12:3
012
:15
185
50
133
1012
:45
12:3
016
64
210
46
13:0
012
:45
136
51
75
213
:15
13:0
012
75
25
23
13:3
013
:15
248
53
1610
615
:15
15:0
031
1310
318
99
15:3
015
:15
3112
111
197
1215
:45
15:3
025
87
117
413
16:0
015
:45
2916
115
139
416
:15
16:0
024
107
314
95
16:3
016
:15
3112
93
1910
916
:45
16:3
038
169
722
814
17:0
016
:45
268
71
187
1117
:15
17:0
037
138
524
168
17:3
017
:15
3313
85
208
1217
:45
17:3
032
127
520
1010
18:0
017
:45
716
297
229
6841
920
621
3...
......
.To
tal
Page
6 o
f 8N
ovem
ber
22, 2
019
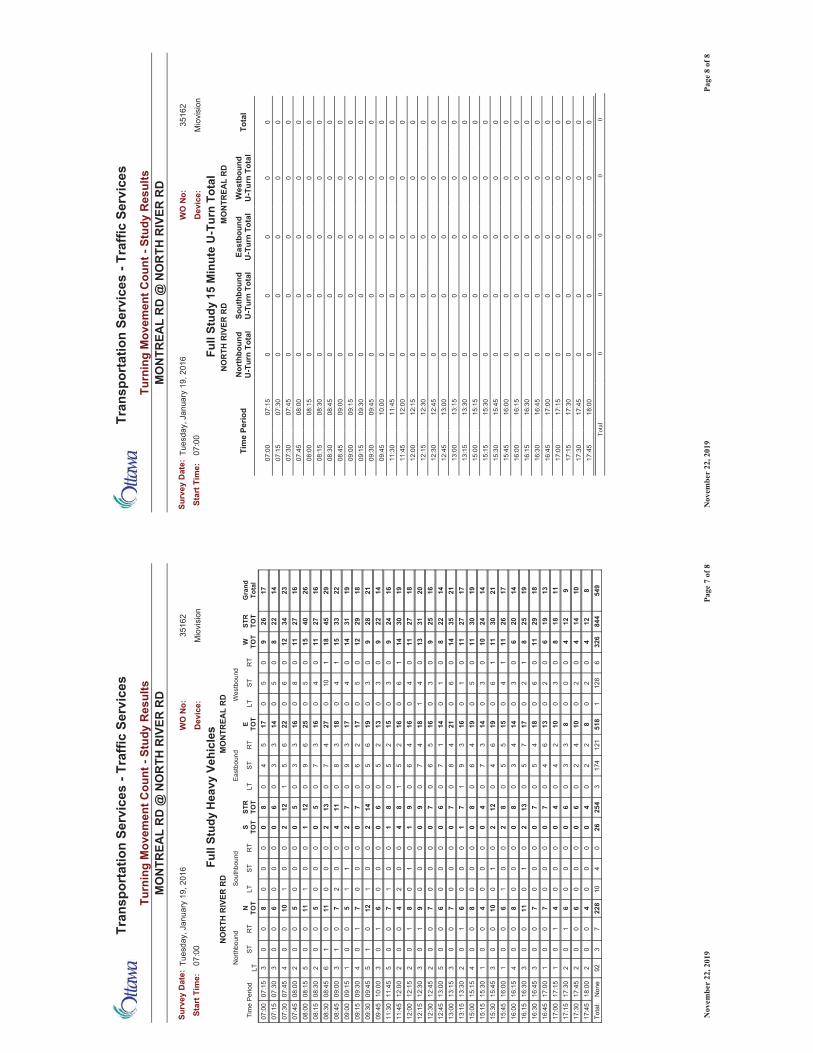
Turn
ing
Mov
emen
t Cou
nt -
Stud
y R
esul
ts
Tra
nspo
rtat
ion
Serv
ices
- Tr
affic
Ser
vice
s
07:0
0
Surv
ey D
ate:
MO
NTR
EAL
RD
@ N
OR
TH R
IVER
RD
Star
t Tim
e:Tu
esda
y, J
anua
ry 1
9, 2
016
WO
No:
Dev
ice:
Mio
visi
on
3516
2
Gra
ndTo
tal
STR
TOT
W TOT
RT
STLT
E TOT
RT
STLT
STR
TOT
S TOT
RT
STLT
N TOT
RT
STLT
Tim
e Pe
riod
MO
NTR
EAL
RD
Nor
thbo
und
Sout
hbou
nd
NO
RTH
RIV
ER R
DH
eavy
Veh
icle
s
East
boun
dW
estb
ound
Full
Stud
y
1726
90
50
175
40
80
00
08
00
307
:15
07:0
014
228
05
014
33
06
00
00
60
03
07:3
007
:15
2334
120
60
226
51
122
00
110
00
407
:45
07:3
016
2711
08
016
33
05
00
00
50
02
08:0
007
:45
2640
150
50
256
90
121
00
111
00
508
:15
08:0
016
2711
04
016
37
05
00
00
50
02
08:3
008
:15
2945
181
100
274
70
132
00
011
01
608
:45
08:3
022
3315
14
018
38
011
40
02
70
13
09:0
008
:45
1931
140
40
173
90
72
01
15
00
109
:15
09:0
018
2912
05
017
26
07
00
00
71
04
09:3
009
:15
2128
90
30
196
50
142
00
112
01
509
:45
09:3
014
229
03
013
25
06
00
00
61
03
10:0
009
:45
1624
90
30
152
50
81
00
17
00
511
:45
11:3
019
3014
16
016
25
18
40
02
40
02
12:0
011
:45
1827
110
40
164
60
91
01
08
10
212
:15
12:0
020
3113
04
118
47
09
00
00
91
03
12:3
012
:15
1625
90
30
165
60
70
00
07
00
212
:45
12:3
014
228
01
014
17
06
00
00
60
05
13:0
012
:45
2135
140
60
214
80
70
00
07
00
313
:15
13:0
017
2711
01
016
39
17
10
00
61
02
13:3
013
:15
1930
110
50
194
60
80
00
08
00
415
:15
15:0
014
2410
03
014
37
04
00
00
40
01
15:3
015
:15
2130
111
60
196
40
122
01
010
00
315
:45
15:3
017
2611
14
015
55
08
20
01
60
01
16:0
015
:45
1420
60
30
144
30
80
00
08
00
416
:15
16:0
019
258
12
017
75
013
20
10
110
03
16:3
016
:15
1829
110
60
184
50
70
00
07
00
316
:45
16:3
013
196
02
013
64
07
00
00
70
01
17:0
016
:45
1118
80
30
102
40
40
00
04
10
117
:15
17:0
09
124
00
08
33
06
00
00
61
02
17:3
017
:15
1014
40
20
104
20
60
00
06
00
217
:45
17:3
08
124
02
08
22
04
00
00
40
02
18:0
017
:45
549
844
326
612
81
518
121
174
325
426
04
1022
87
392
Non
eTo
tal:
Page
7 o
f 8N
ovem
ber
22, 2
019
Turn
ing
Mov
emen
t Cou
nt -
Stud
y R
esul
ts
Tra
nspo
rtat
ion
Serv
ices
- Tr
affic
Ser
vice
s
07:0
0
Surv
ey D
ate:
MO
NTR
EAL
RD
@ N
OR
TH R
IVER
RD
Star
t Tim
e:Tu
esda
y, J
anua
ry 1
9, 2
016
WO
No:
Dev
ice:
Mio
visi
on
3516
2
NO
RTH
RIV
ER R
DM
ON
TREA
L R
DFu
ll St
udy
15 M
inut
e U
-Tur
n To
tal
Tota
lW
estb
ound
U-T
urn
Tota
lEa
stbo
und
U-T
urn
Tota
lSo
uthb
ound
U-T
urn
Tota
lN
orth
boun
dU
-Tur
n To
tal
Tim
e Pe
riod
00
00
007
:15
07:0
00
00
00
07:3
007
:15
00
00
007
:45
07:3
00
00
00
08:0
007
:45
00
00
008
:15
08:0
00
00
00
08:3
008
:15
00
00
008
:45
08:3
00
00
00
09:0
008
:45
00
00
009
:15
09:0
00
00
00
09:3
009
:15
00
00
009
:45
09:3
00
00
00
10:0
009
:45
00
00
011
:45
11:3
00
00
00
12:0
011
:45
00
00
012
:15
12:0
00
00
00
12:3
012
:15
00
00
012
:45
12:3
00
00
00
13:0
012
:45
00
00
013
:15
13:0
00
00
00
13:3
013
:15
00
00
015
:15
15:0
00
00
00
15:3
015
:15
00
00
015
:45
15:3
00
00
00
16:0
015
:45
00
00
016
:15
16:0
00
00
00
16:3
016
:15
00
00
016
:45
16:3
00
00
00
17:0
016
:45
00
00
017
:15
17:0
00
00
00
17:3
017
:15
00
00
017
:45
17:3
00
00
00
18:0
017
:45
00
00
0Total
Page
8 o
f 8N
ovem
ber
22, 2
019
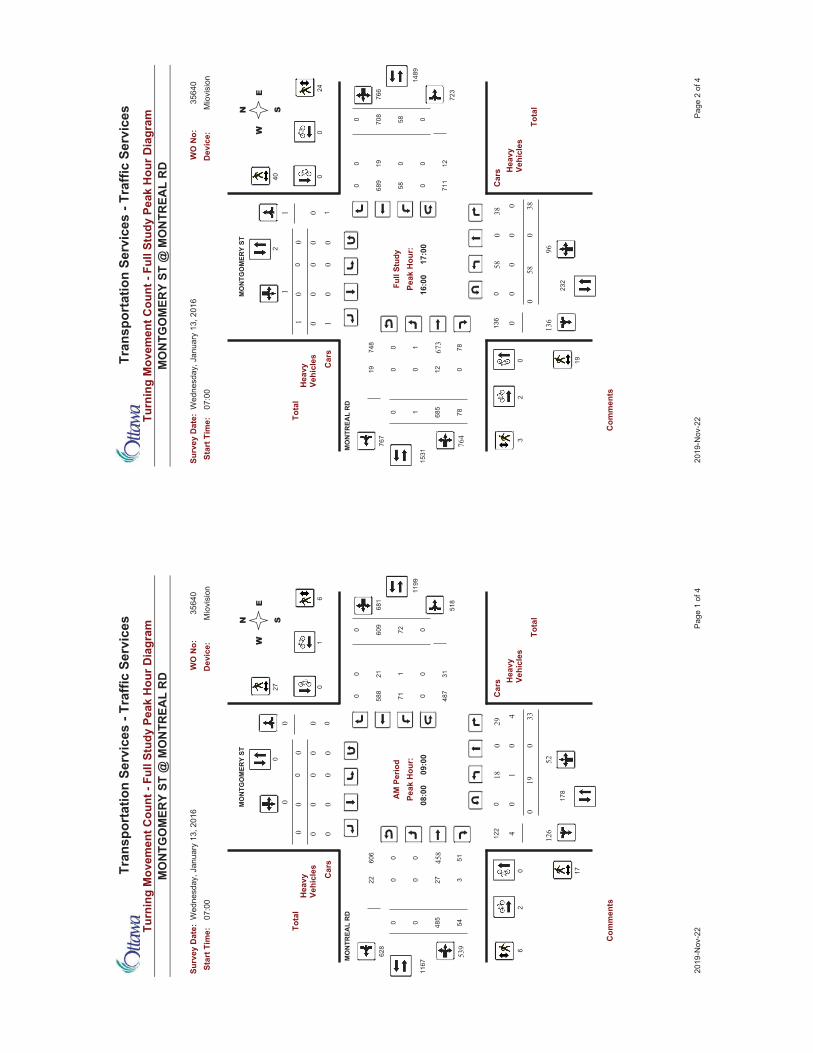
Turn
ing
Mov
emen
t Cou
nt -
Full
Stud
y Pe
ak H
our D
iagr
am
Tra
nspo
rtat
ion
Serv
ices
- Tr
affic
Ser
vice
s
Star
t Tim
e:Su
rvey
Dat
e:
MO
NTG
OM
ERY
ST @
MO
NTR
EAL
RD
07:0
0W
edne
sday
, Jan
uary
13,
201
6W
O N
o:35
640
Dev
ice:
Mio
visi
on
Peak
Hou
r:A
M P
erio
d
606
628
22
122
178
Tota
l
1167
0
3
011
99
27
54485
51
0
0 000
4
19
52126
0
6
27
17
6
0 0
0 0
518
Car
s
EW
SN
Car
s
72609
00 487
31
0
681
1
0
Tota
l
0
21
71588
Com
men
ts
02
01
539
458
0 0
MO
NTR
EAL
RD
MO
NTG
OM
ERY
ST
0
00
10
334
1829
00
0
0
0
0
00
00
0
0
08:0
009
:00
Hea
vyVe
hicl
es
Hea
vyVe
hicl
es
Page
1 o
f 420
19-N
ov-2
2
Turn
ing
Mov
emen
t Cou
nt -
Full
Stud
y Pe
ak H
our D
iagr
am
Tra
nspo
rtat
ion
Serv
ices
- Tr
affic
Ser
vice
s
Star
t Tim
e:Su
rvey
Dat
e:
MO
NTG
OM
ERY
ST @
MO
NTR
EAL
RD
07:0
0W
edne
sday
, Jan
uary
13,
201
6W
O N
o:35
640
Dev
ice:
Mio
visi
on
Peak
Hou
r:Fu
ll St
udy
748
767
19
136
232
Tota
l
1531
1
0
114
89
12
78685
78
0
1 001
0
58
96136
0
24
40
19
3
1 0
0 0
723
Car
s
EW
SN
Car
s
58708
00 711
12
0
766
0
2
Tota
l
1
19
58689
Com
men
ts
02
00
764
673
0 0
MO
NTR
EAL
RD
MO
NTG
OM
ERY
ST
0
01
00
380
5838
00
0
0
0
0
00
00
0
0
16:0
017
:00
Hea
vyVe
hicl
es
Hea
vyVe
hicl
es
Page
2 o
f 420
19-N
ov-2
2
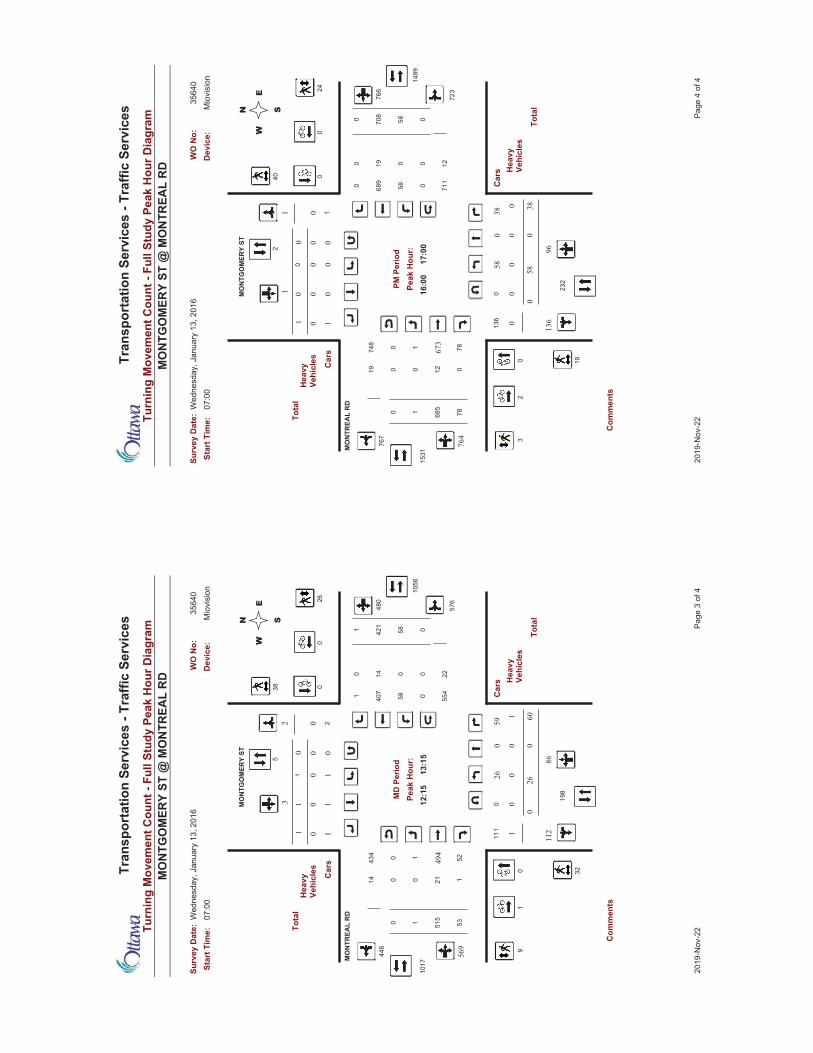
Turn
ing
Mov
emen
t Cou
nt -
Full
Stud
y Pe
ak H
our D
iagr
am
Tra
nspo
rtat
ion
Serv
ices
- Tr
affic
Ser
vice
s
Star
t Tim
e:Su
rvey
Dat
e:
MO
NTG
OM
ERY
ST @
MO
NTR
EAL
RD
07:0
0W
edne
sday
, Jan
uary
13,
201
6W
O N
o:35
640
Dev
ice:
Mio
visi
on
Peak
Hou
r:M
D P
erio
d
434
448
14
111
198
Tota
l
1017
1
1
110
56
21
53515
52
0
2 003
1
26
86112
1
26
38
32
9
1 0
1 0
576
Car
s
EW
SN
Car
s
58421
01 554
22
1
480
0
5
Tota
l
2
14
58407
Com
men
ts
01
00
569
494
0 0
MO
NTR
EAL
RD
MO
NTG
OM
ERY
ST
0
11
01
601
2659
00
0
0
0
0
00
00
0
0
12:1
513
:15
Hea
vyVe
hicl
es
Hea
vyVe
hicl
es
Page
3 o
f 420
19-N
ov-2
2
Turn
ing
Mov
emen
t Cou
nt -
Full
Stud
y Pe
ak H
our D
iagr
am
Tra
nspo
rtat
ion
Serv
ices
- Tr
affic
Ser
vice
s
Star
t Tim
e:Su
rvey
Dat
e:
MO
NTG
OM
ERY
ST @
MO
NTR
EAL
RD
07:0
0W
edne
sday
, Jan
uary
13,
201
6W
O N
o:35
640
Dev
ice:
Mio
visi
on
Peak
Hou
r:PM
Per
iod
748
767
19
136
232
Tota
l
1531
1
0
114
89
12
78685
78
0
1 001
0
58
96136
0
24
40
19
3
1 0
0 0
723
Car
s
EW
SN
Car
s
58708
00 711
12
0
766
0
2
Tota
l
1
19
58689
Com
men
ts
02
00
764
673
0 0
MO
NTR
EAL
RD
MO
NTG
OM
ERY
ST
0
01
00
380
5838
00
0
0
0
0
00
00
0
0
16:0
017
:00
Hea
vyVe
hicl
es
Hea
vyVe
hicl
es
Page
4 o
f 420
19-N
ov-2
2
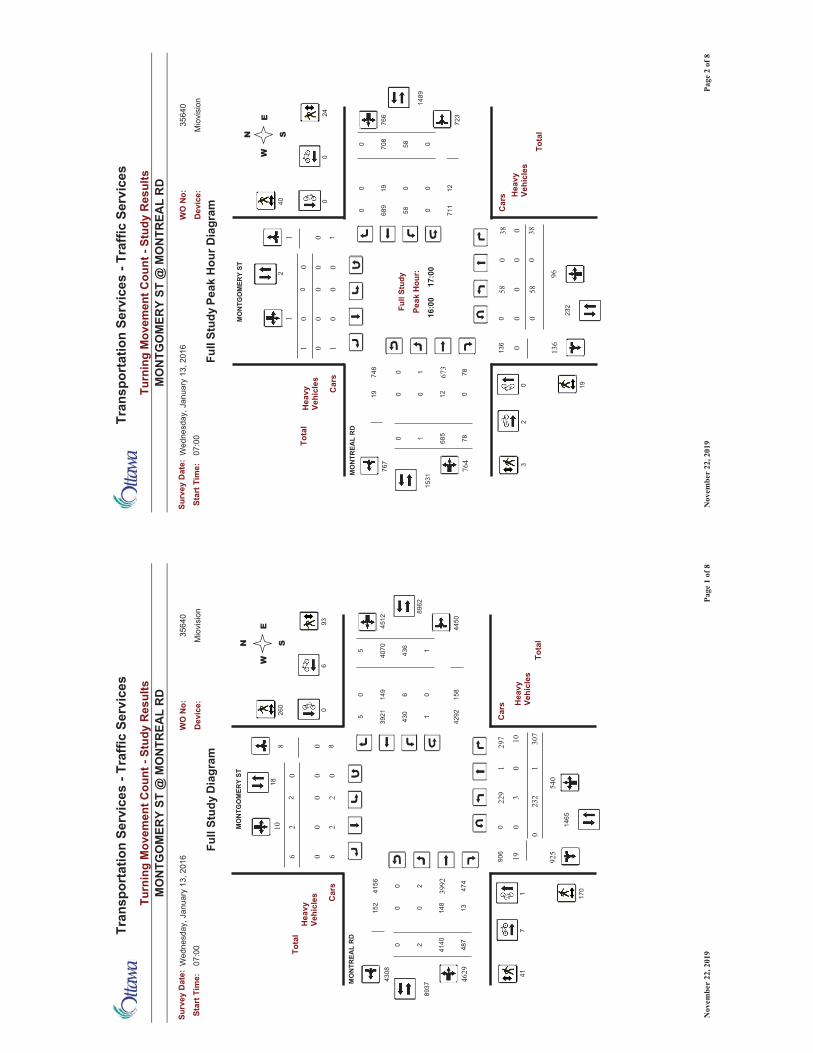
Turn
ing
Mov
emen
t Cou
nt -
Stud
y R
esul
ts
Tra
nspo
rtat
ion
Serv
ices
- Tr
affic
Ser
vice
s
07:0
0
Surv
ey D
ate:
MO
NTG
OM
ERY
ST @
MO
NTR
EAL
RD
Star
t Tim
e:W
edne
sday
, Jan
uary
13,
201
6W
O N
o:
Dev
ice:
Mio
visi
on
3564
0
152
4156
289
37
906
4308
Tota
l
13
289
62
148
487
4140
474
0
1465
108
2 0
92519
0
540
93
260
170
41
6 0
2 0
4450
Car
s
EW
SN
Hea
vyVe
hicl
es Car
s
436
4070
05
4292
158
5
4512
Tota
l
8
18
430
6
3921
149
232
Hea
vyVe
hicl
es1
7
06
1
4629
1 0
MO
NTG
OM
ERY
ST
3992
MO
NTR
EAL
RD
26
32
307
10
229
297
0
0
00
00
01
00
1
0
Dia
gram
Full
Stud
y
Page
1 o
f 8N
ovem
ber
22, 2
019
Turn
ing
Mov
emen
t Cou
nt -
Stud
y R
esul
ts
Tra
nspo
rtat
ion
Serv
ices
- Tr
affic
Ser
vice
s
07:0
0
Surv
ey D
ate:
MO
NTG
OM
ERY
ST @
MO
NTR
EAL
RD
Star
t Tim
e:W
edne
sday
, Jan
uary
13,
201
6W
O N
o:
Dev
ice:
Mio
visi
on
3564
0
Car
s
N
Car
s
0
723
W
S
E
1
2
Tota
l
689
19
5800
0
587080
766
711
12
0
0
115
311 78685
1489
12
Tota
l
748
767
Peak
Hou
r:
Full
Stud
y
136
232
19
24
40
136
01 0
19
3
96
1 0
78
0
0
58
01
0
580
38
0
038
0
0
MO
NTR
EAL
RD
0
01
MO
NTG
OM
ERY
ST
0
0
00
0
Hea
vyVe
hicl
es
Hea
vyVe
hicl
es
16:0
017
:000
0
0
0
0
02
0
0
764
673
0
Peak
Hou
r Dia
gram
Full
Stud
y
Page
2 o
f 8N
ovem
ber
22, 2
019
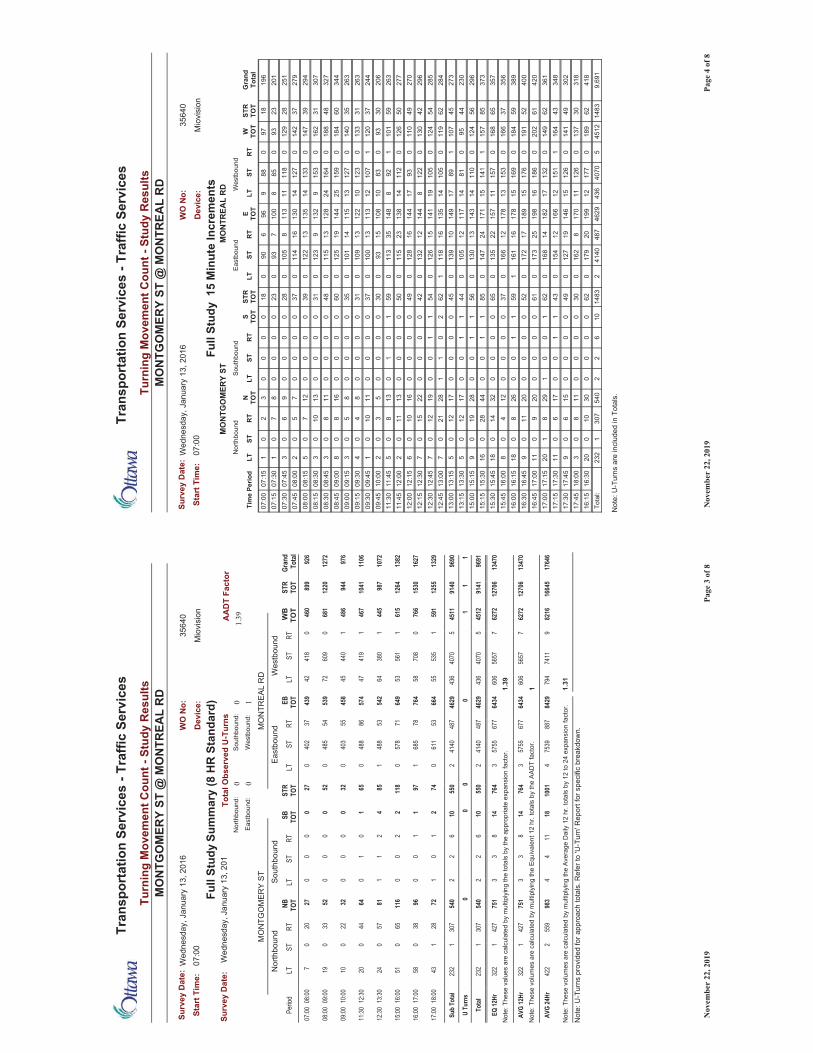
Turn
ing
Mov
emen
t Cou
nt -
Stud
y R
esul
ts
Tra
nspo
rtat
ion
Serv
ices
- Tr
affic
Ser
vice
s
07:0
0
Surv
ey D
ate:
MO
NTG
OM
ERY
ST @
MO
NTR
EAL
RD
Star
t Tim
e:W
edne
sday
, Jan
uary
13,
201
6W
O N
o:
Dev
ice:
Mio
visi
on
3564
0
Sum
mar
y (8
HR
Sta
ndar
d)Fu
ll St
udy
0 10
AA
DT
Fact
orSu
rvey
Dat
e:0
Nor
thbo
und:
Sout
hbou
nd:
1.39
Wed
nesd
ay, J
anua
ry 1
3, 2
01To
tal O
bser
ved
U-T
urns
East
boun
d:W
estb
ound
:
MO
NTR
EAL
RD
Nor
thbo
und
Sout
hbou
ndM
ON
TGO
MER
Y ST
East
boun
dGr
and
Tota
lST
RTO
TW
BTO
TRT
STLT
EB TOT
RTST
LTST
RTO
TSB TO
TRT
STLT
NB TOT
RTST
LTPe
riod
Wes
tbou
nd
926
899
460
041
842
439
3740
20
270
00
027
200
708
:0007
:00
1272
1220
681
060
972
539
5448
50
520
00
052
330
1909
:0008
:00
976
944
486
144
045
458
5540
30
320
00
032
220
1010
:0009
:00
1106
1041
467
141
947
574
8648
80
651
01
064
440
2012
:3011
:30
1072
987
445
138
064
542
5348
81
854
21
181
570
2413
:3012
:30
1382
1264
615
156
153
649
7157
80
118
22
00
116
650
5116
:0015
:00
1627
1530
766
070
858
764
7868
51
971
10
096
380
5817
:0016
:00
1329
1255
591
153
555
664
5361
10
742
10
172
281
4318
:0017
:00
9690
9140
4511
540
7043
646
2948
741
402
550
106
22
540
307
123
2Su
b To
tal
0U
Turn
s
9691
9141
4512
540
7043
646
2948
741
402
550
106
22
540
307
123
2To
tal
11
01
00
1N
ote:
The
se v
olum
es a
re c
alcu
late
d by
mul
tiply
ing
the
Equi
vale
nt 1
2 hr
. tot
als
by th
e AA
DT
fact
or.
1.31
Not
e: T
hese
vol
umes
are
cal
cula
ted
by m
ultip
lyin
g th
e Av
erag
e D
aily
12
hr. t
otal
s by
12
to 2
4 ex
pans
ion
fact
or.
1.39
1764
616
645
8216
974
1179
484
2988
775
394
1001
1811
44
983
559
242
2AV
G 24
Hr
1347
012
706
6272
756
5760
664
3467
757
553
764
148
33
751
427
132
2AV
G 12
Hr
Not
e: T
hese
val
ues
are
calc
ulat
ed b
y m
ultip
lyin
g th
e to
tals
by
the
appr
opria
te e
xpan
sion
fact
or.
1347
012
706
6272
756
5760
664
3467
757
553
764
148
33
751
427
132
2EQ
12Hr
Not
e: U
-Tur
ns p
rovi
ded
for a
ppro
ach
tota
ls. R
efer
to 'U
-Tur
n' R
epor
t for
spe
cific
bre
akdo
wn.
Page
3 o
f 8N
ovem
ber
22, 2
019
Turn
ing
Mov
emen
t Cou
nt -
Stud
y R
esul
ts
Tra
nspo
rtat
ion
Serv
ices
- Tr
affic
Ser
vice
s
07:0
0
Surv
ey D
ate:
MO
NTG
OM
ERY
ST @
MO
NTR
EAL
RD
Star
t Tim
e:W
edne
sday
, Jan
uary
13,
201
6W
O N
o:
Dev
ice:
Mio
visi
on
3564
0
Gra
ndTo
tal
STR
TOT
W TOT
RT
STLT
E TOT
RT
STLT
STR
TOT
S TOT
RT
STLT
N TOT
RT
STLT
Tim
e Pe
riod
East
boun
dW
estb
ound
MO
NTG
OM
ERY
STM
ON
TREA
L R
DN
orth
boun
dSo
uthb
ound
15
Min
ute
Incr
emen
tsFu
ll St
udy
196
1897
088
996
690
018
00
00
32
01
07:1
507
:00
201
2393
085
810
07
930
230
00
08
70
107
:30
07:1
525
128
129
011
811
113
810
50
280
00
09
60
307
:45
07:3
027
937
142
012
714
130
1611
40
370
00
07
50
208
:00
07:4
529
439
147
013
314
135
1312
20
390
00
012
70
508
:15
08:0
030
731
162
015
39
132
912
30
310
00
013
100
308
:30
08:1
532
748
188
016
424
128
1311
50
480
00
011
80
308
:45
08:3
034
460
184
015
925
144
1912
50
600
00
016
80
809
:00
08:4
526
335
140
012
713
115
1410
10
350
00
08
50
309
:15
09:0
026
331
133
012
310
122
1310
90
310
00
08
40
409
:30
09:1
524
437
120
110
712
113
1310
00
370
00
011
100
109
:45
09:3
020
630
930
8310
108
1593
030
00
00
53
02
10:0
009
:45
263
5910
11
928
148
3511
30
591
01
013
80
511
:45
11:3
027
750
126
011
214
138
2311
50
500
00
013
110
212
:00
11:4
527
049
110
093
1714
416
128
049
00
00
1610
06
12:1
512
:00
296
4213
00
122
814
412
132
042
00
00
2215
07
12:3
012
:15
285
5412
40
105
1914
115
126
054
11
00
1912
07
12:4
512
:30
284
6211
90
105
1413
516
118
162
20
11
2821
07
13:0
012
:45
273
4510
71
8917
149
1013
90
450
00
017
120
513
:15
13:0
023
044
950
8114
117
1210
50
441
10
017
120
513
:30
13:1
529
656
124
011
014
143
1313
00
561
10
028
190
915
:15
15:0
037
385
157
114
115
171
2414
70
851
10
044
280
1615
:30
15:1
535
765
168
015
711
157
2213
50
650
00
032
140
1815
:45
15:3
035
637
166
015
313
178
1216
60
370
00
012
40
816
:00
15:4
538
959
184
016
915
178
1616
11
591
10
026
80
1816
:15
16:0
040
052
191
017
615
189
1717
20
520
00
020
110
916
:45
16:3
042
061
202
018
616
198
2517
30
610
00
020
90
1117
:00
16:4
536
162
149
013
217
182
1416
80
621
00
129
81
2017
:15
17:0
034
843
164
115
112
166
1215
40
431
10
017
60
1117
:30
17:1
530
249
141
012
615
146
1912
70
490
00
015
60
917
:45
17:3
031
830
137
012
611
170
816
20
300
00
011
80
318
:00
17:4
541
862
189
017
712
199
2017
90
620
00
030
100
2016
:30
16:1
5
Not
e: U
-Tur
ns a
re in
clud
ed in
Tot
als.
9,69
114
8345
125
4070
436
4629
487
4140
214
8310
62
254
030
71
232
Tota
l:
Page
4 o
f 8N
ovem
ber
22, 2
019
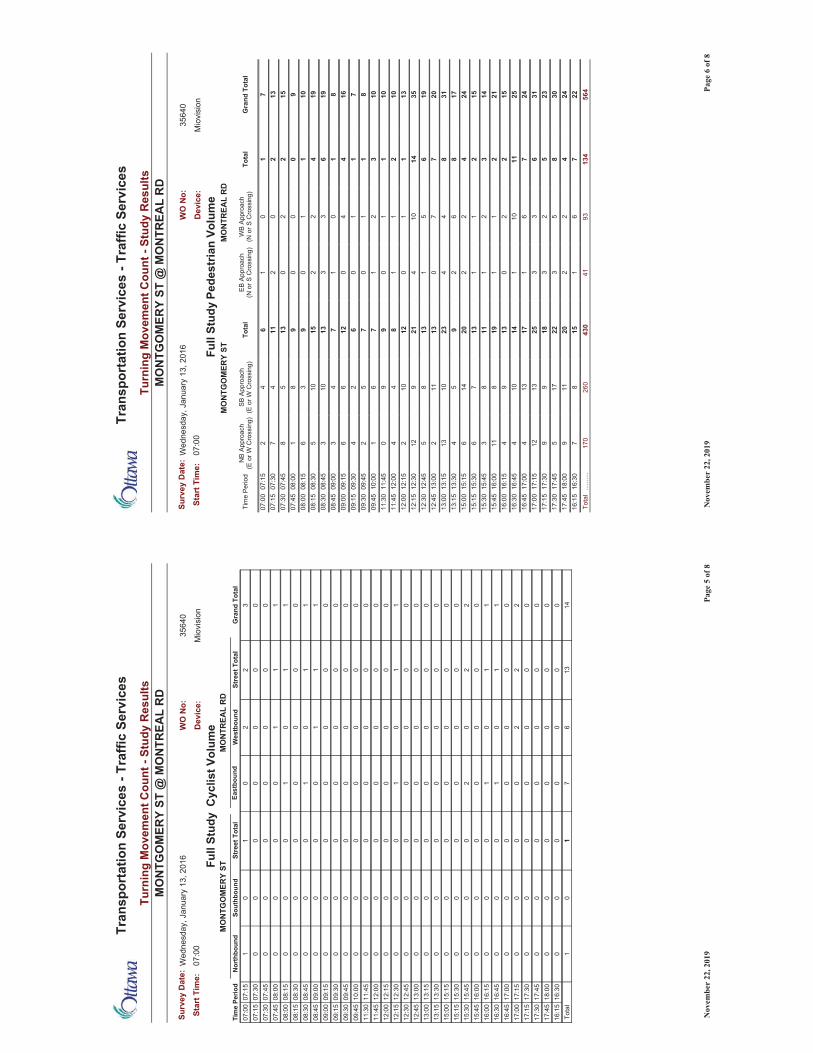
Turn
ing
Mov
emen
t Cou
nt -
Stud
y R
esul
ts
Tra
nspo
rtat
ion
Serv
ices
- Tr
affic
Ser
vice
s
07:0
0
Surv
ey D
ate:
MO
NTG
OM
ERY
ST @
MO
NTR
EAL
RD
Star
t Tim
e:W
edne
sday
, Jan
uary
13,
201
6W
O N
o:
Dev
ice:
Mio
visi
on
3564
0
MO
NTR
EAL
RD
MO
NTG
OM
ERY
STG
rand
Tot
alSt
reet
Tot
alW
estb
ound
East
boun
dSt
reet
Tot
alSo
uthb
ound
Nor
thbo
und
Tim
e Pe
riod
Cyc
list V
olum
eFu
ll St
udy
32
20
10
107
:15
07:0
00
00
00
00
07:3
007
:15
00
00
00
007
:45
07:3
01
11
00
00
08:0
007
:45
11
01
00
008
:15
08:0
00
00
00
00
08:3
008
:15
11
01
00
008
:45
08:3
01
11
00
00
09:0
008
:45
00
00
00
009
:15
09:0
00
00
00
00
09:3
009
:15
00
00
00
009
:45
09:3
00
00
00
00
10:0
009
:45
00
00
00
011
:45
11:3
00
00
00
00
12:0
011
:45
00
00
00
012
:15
12:0
01
10
10
00
12:3
012
:15
00
00
00
012
:45
12:3
00
00
00
00
13:0
012
:45
00
00
00
013
:15
13:0
00
00
00
00
13:3
013
:15
00
00
00
015
:15
15:0
00
00
00
00
15:3
015
:15
22
02
00
015
:45
15:3
00
00
00
00
16:0
015
:45
11
01
00
016
:15
16:0
01
10
10
00
16:4
516
:30
00
00
00
017
:00
16:4
52
22
00
00
17:1
517
:00
00
00
00
017
:30
17:1
50
00
00
00
17:4
517
:30
00
00
00
018
:00
17:4
50
00
00
00
16:3
016
:15
1413
67
10
1To
tal
Page
5 o
f 8N
ovem
ber
22, 2
019
Turn
ing
Mov
emen
t Cou
nt -
Stud
y R
esul
ts
Tra
nspo
rtat
ion
Serv
ices
- Tr
affic
Ser
vice
s
07:0
0
Surv
ey D
ate:
MO
NTG
OM
ERY
ST @
MO
NTR
EAL
RD
Star
t Tim
e:W
edne
sday
, Jan
uary
13,
201
6W
O N
o:
Dev
ice:
Mio
visi
on
3564
0
MO
NTR
EAL
RD
MO
NTG
OM
ERY
STPe
dest
rian
Volu
me
Full
Stud
y
Gra
nd T
otal
Tota
lW
B Ap
proa
ch(N
or S
Cro
ssin
g)EB
App
roac
h(N
or S
Cro
ssin
g)To
tal
SB A
ppro
ach
(E o
r W C
ross
ing)
NB
Appr
oach
(E o
r W C
ross
ing)
Tim
e Pe
riod
71
01
64
207
:15
07:0
013
20
211
47
07:3
007
:15
152
20
135
807
:45
07:3
09
00
09
81
08:0
007
:45
101
10
93
608
:15
08:0
019
42
215
105
08:3
008
:15
196
33
1310
308
:45
08:3
08
10
17
43
09:0
008
:45
164
40
126
609
:15
09:0
07
11
06
24
09:3
009
:15
81
10
75
209
:45
09:3
010
32
17
61
10:0
009
:45
101
10
99
011
:45
11:3
010
21
18
44
12:0
011
:45
131
10
1210
212
:15
12:0
035
1410
421
912
12:3
012
:15
196
51
138
512
:45
12:3
020
77
013
112
13:0
012
:45
318
44
2310
1313
:15
13:0
017
86
29
54
13:3
013
:15
244
22
2014
615
:15
15:0
015
21
113
76
15:3
015
:15
143
21
118
315
:45
15:3
021
21
119
811
16:0
015
:45
152
20
139
416
:15
16:0
025
1110
114
104
16:4
516
:30
247
61
1713
417
:00
16:4
531
63
325
1312
17:1
517
:00
235
23
189
917
:30
17:1
530
85
322
175
17:4
517
:30
244
22
2011
918
:00
17:4
522
76
115
87
16:3
016
:15
564
134
9341
430
260
170
......
....
Tota
l
Page
6 o
f 8N
ovem
ber
22, 2
019
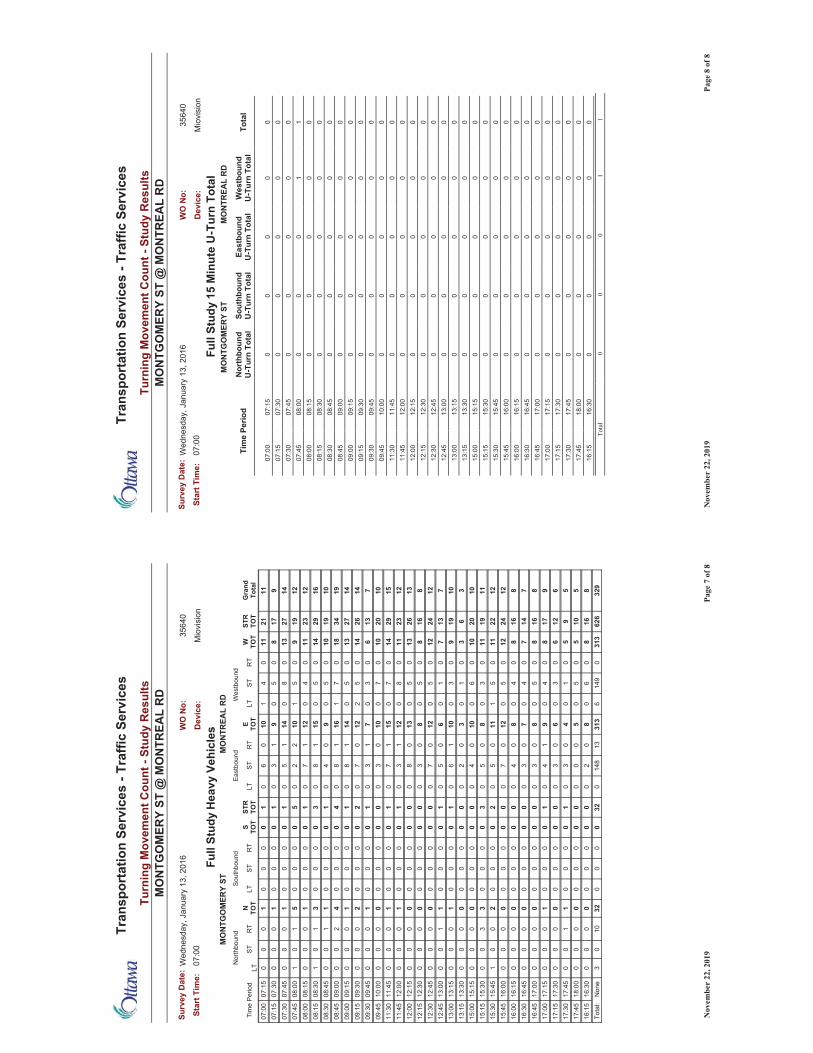
Turn
ing
Mov
emen
t Cou
nt -
Stud
y R
esul
ts
Tra
nspo
rtat
ion
Serv
ices
- Tr
affic
Ser
vice
s
07:0
0
Surv
ey D
ate:
MO
NTG
OM
ERY
ST @
MO
NTR
EAL
RD
Star
t Tim
e:W
edne
sday
, Jan
uary
13,
201
6W
O N
o:
Dev
ice:
Mio
visi
on
3564
0
Gra
ndTo
tal
STR
TOT
W TOT
RT
STLT
E TOT
RT
STLT
STR
TOT
S TOT
RT
STLT
N TOT
RT
STLT
Tim
e Pe
riod
MO
NTR
EAL
RD
Nor
thbo
und
Sout
hbou
nd
MO
NTG
OM
ERY
STH
eavy
Veh
icle
s
East
boun
dW
estb
ound
Full
Stud
y
1121
110
41
100
60
10
00
01
00
007
:15
07:0
09
178
05
09
13
01
00
00
10
00
07:3
007
:15
1427
130
80
141
50
10
00
01
00
007
:45
07:3
012
199
05
110
22
05
00
00
51
01
08:0
007
:45
1223
110
40
121
70
10
00
01
00
008
:15
08:0
016
2914
05
015
18
03
00
00
31
01
08:3
008
:15
1019
100
50
90
40
10
00
01
10
008
:45
08:3
019
3418
07
116
18
04
00
00
42
00
09:0
008
:45
1427
130
50
141
80
10
00
01
00
009
:15
09:0
014
2614
05
212
07
02
00
00
20
00
09:3
009
:15
713
60
30
71
30
10
00
01
00
009
:45
09:3
010
2010
07
010
03
00
00
00
00
00
10:0
009
:45
1529
140
70
151
70
10
00
01
00
011
:45
11:3
012
2311
08
012
13
01
00
00
10
00
12:0
011
:45
1326
130
50
130
80
00
00
00
00
012
:15
12:0
08
168
05
08
03
00
00
00
00
00
12:3
012
:15
1224
120
50
120
70
00
00
00
00
012
:45
12:3
07
137
01
06
05
01
00
00
11
00
13:0
012
:45
1019
90
30
101
60
10
00
01
00
013
:15
13:0
03
63
01
03
02
00
00
00
00
00
13:3
013
:15
1020
100
60
100
40
00
00
00
00
015
:15
15:0
011
1911
03
08
05
03
00
00
33
00
15:3
015
:15
1222
110
51
110
50
20
00
02
00
115
:45
15:3
012
2412
05
012
07
00
00
00
00
00
16:0
015
:45
816
80
40
80
40
00
00
00
00
016
:15
16:0
07
147
04
07
03
00
00
00
00
00
16:4
516
:30
816
80
50
80
30
00
00
00
00
017
:00
16:4
59
178
04
09
14
01
00
00
10
00
17:1
517
:00
612
60
30
60
30
00
00
00
00
017
:30
17:1
55
95
01
04
03
01
00
00
11
00
17:4
517
:30
510
50
50
50
00
00
00
00
00
018
:00
17:4
58
168
06
08
02
00
00
00
00
00
16:3
016
:15
329
626
313
014
96
313
1314
80
320
00
032
100
3N
one
Tota
l:
Page
7 o
f 8N
ovem
ber
22, 2
019
Turn
ing
Mov
emen
t Cou
nt -
Stud
y R
esul
ts
Tra
nspo
rtat
ion
Serv
ices
- Tr
affic
Ser
vice
s
07:0
0
Surv
ey D
ate:
MO
NTG
OM
ERY
ST @
MO
NTR
EAL
RD
Star
t Tim
e:W
edne
sday
, Jan
uary
13,
201
6W
O N
o:
Dev
ice:
Mio
visi
on
3564
0
MO
NTG
OM
ERY
STM
ON
TREA
L R
DFu
ll St
udy
15 M
inut
e U
-Tur
n To
tal
Tota
lW
estb
ound
U-T
urn
Tota
lEa
stbo
und
U-T
urn
Tota
lSo
uthb
ound
U-T
urn
Tota
lN
orth
boun
dU
-Tur
n To
tal
Tim
e Pe
riod
00
00
007
:15
07:0
00
00
00
07:3
007
:15
00
00
007
:45
07:3
01
10
00
08:0
007
:45
00
00
008
:15
08:0
00
00
00
08:3
008
:15
00
00
008
:45
08:3
00
00
00
09:0
008
:45
00
00
009
:15
09:0
00
00
00
09:3
009
:15
00
00
009
:45
09:3
00
00
00
10:0
009
:45
00
00
011
:45
11:3
00
00
00
12:0
011
:45
00
00
012
:15
12:0
00
00
00
12:3
012
:15
00
00
012
:45
12:3
00
00
00
13:0
012
:45
00
00
013
:15
13:0
00
00
00
13:3
013
:15
00
00
015
:15
15:0
00
00
00
15:3
015
:15
00
00
015
:45
15:3
00
00
00
16:0
015
:45
00
00
016
:15
16:0
00
00
00
16:4
516
:30
00
00
017
:00
16:4
50
00
00
17:1
517
:00
00
00
017
:30
17:1
50
00
00
17:4
517
:30
00
00
018
:00
17:4
50
00
00
16:3
016
:15
11
00
0Total
Page
8 o
f 8N
ovem
ber
22, 2
019
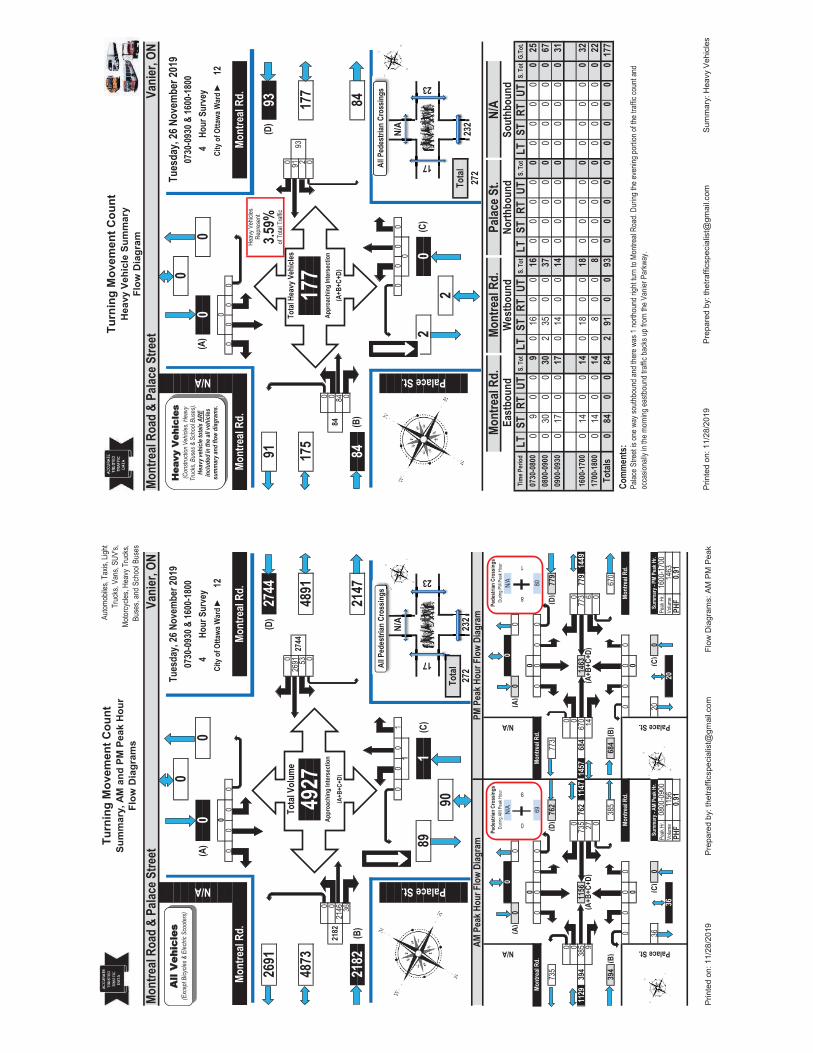
Turn
ing
Mov
emen
t Cou
ntSu
mm
ary,
AM
and
PM
Pea
k H
our
Flow
Dia
gram
s
Autom
obile
s, Ta
xis, L
ight
Truc
ks, V
ans,
SUV'
s,Mo
torcy
cles,
Heav
y Tru
cks,
Buse
s, an
d Sch
ool B
uses
00
00
026
91 53 0
0 021
46 36
00
01
N/A
N/A
N/A
(A)
00
(A)
00
00
00
00
690
00
080
735
(D)
762
773
(D)
779
00
00
00
1129
394
385
1156
735
762
1147
1457
684
670
1463
773
779
1449
927
146
00
394
(B)
385
684
(B)
670
00
00
00
00
00
36(C
)0
20(C
)0
Peak
Hr.
Peak
Hr.
Volum
eVo
lume
PHF
PHF
8
1Pe
dest
rian
Cros
sings
Pede
stria
n Cr
ossin
gsDu
ring A
M Pe
ak H
our
Durin
g PM
Peak
Hou
r
1463
0.91
0.91
Palace St.
Mont
real
Rd.
Sum
mar
y - A
M Pe
ak H
r.Su
mm
ary -
PM
Peak
Hr.
0800
-090
016
00-1
700
Palace St.
0
Mont
real
Rd.
Mont
real
Rd.
(A+B
+C+D
)
Mont
real
Rd.
(A+B
+C+D
)
3611
5620
N/A
N/A
0
0
9
AM P
eak H
our F
low
Diag
ram
PM P
eak H
our F
low
Diag
ram
Palace St.
1
891
(C)
17
23
90To
tal
272
232
2147
2691
(D)
2744
Tota
l Vol
ume
2744
4873
4927
4891
Appr
oach
ing
Inte
rsec
tion
2182
(A+B
+C+D
)
2182
(B)
Mont
real
Rd.
Mont
real
Road
& P
alace
Stre
etVa
nier
, ON
N/ATu
esda
y, 26
Nov
embe
r 201
90
0730
-093
0 & 16
00-1
800
(A)
00
4Ho
ur S
urve
yCi
ty o
f Otta
wa W
ard ►
120
Mont
real
Rd.
All P
edes
trian
Cro
ssin
gs
23
All
Veh
icle
s (E
xcep
t Bicy
cles &
Elec
tric S
coot
ers)
232
Prin
ted
on: 1
1/28
/201
9Pr
epar
ed b
y: th
etra
ffics
peci
alis
t@gm
ail.c
omFl
ow D
iagr
ams:
AM
PM
Pea
k
Turn
ing
Mov
emen
t Cou
ntH
eavy
Veh
icle
Sum
mar
yFl
ow D
iagr
am
00
00
0 91 2 0
0 0 84 0
00
00
N/A
LTST
RTUT
S. T
otLT
STRT
UTS.
Tot
LTST
RTUT
S. T
otLT
ST
RTUT
S. T
otG.
Tot.
09
00
90
160
016
00
00
00
00
00
250
300
030
235
00
370
00
00
00
00
067
017
00
170
140
014
00
00
00
00
00
31
014
00
140
180
018
00
00
00
00
00
320
140
014
08
00
80
00
00
00
00
022
084
00
842
910
093
00
00
00
00
00
177
Heav
y Veh
icles
Repr
esen
t
3.59%
of To
tal T
raffic
0800
-090
009
00-0
930
23
2To
tal
232
272
Palace St.
0
20
(C)
17
Palac
e Stre
et is
one w
ay so
uthbo
und a
nd th
ere w
as 1
north
ound
right
turn t
o Mon
treal
Road
. Dur
ing th
e eve
ning p
ortio
n of th
e tra
ffic co
unt a
nd
occa
siona
lly in
the m
ornin
g eas
tboun
d tra
ffic ba
cks u
p fro
m the
Van
ier P
arkw
ay.
Mont
real
Rd.
Mont
real
Rd.
Palac
e St.
N/A
East
boun
dW
estb
ound
North
boun
dSo
uthb
ound
1600
-170
017
00-1
800
Tota
lsCo
mm
ents
:
Tim
e Per
iod
0730
-080
0
84
91(D
)93
Tota
l Hea
vy V
ehicl
es93
175
177
177
Appr
oach
ing
Inte
rsec
tion
84(A
+B+C
+D)
84(B
)
Mont
real
Road
& P
alace
Stre
etVa
nier
, ON
N/A
Tues
day,
26 N
ovem
ber 2
019
007
30-0
930 &
1600
-180
0(A
)0
04
Hour
Sur
vey
City
of O
ttawa
War
d ►
120
Mont
real
Rd.
Mont
real
Rd.
All P
edes
trian
Cro
ssin
gs
17
23
Hea
vy V
ehic
les
(Con
struc
tion V
ehicl
es, H
eavy
Tr
ucks
, Bus
es &
Sch
ool B
uses
). He
avy v
ehicl
e tot
als A
RE
inclu
ded i
n th
e all v
ehicl
es
sum
mar
y and
flow
diag
ram
s.
232
Prin
ted
on: 1
1/28
/201
9Pr
epar
ed b
y: th
etra
ffics
peci
alis
t@gm
ail.c
omSu
mm
ary:
Hea
vy V
ehic
les
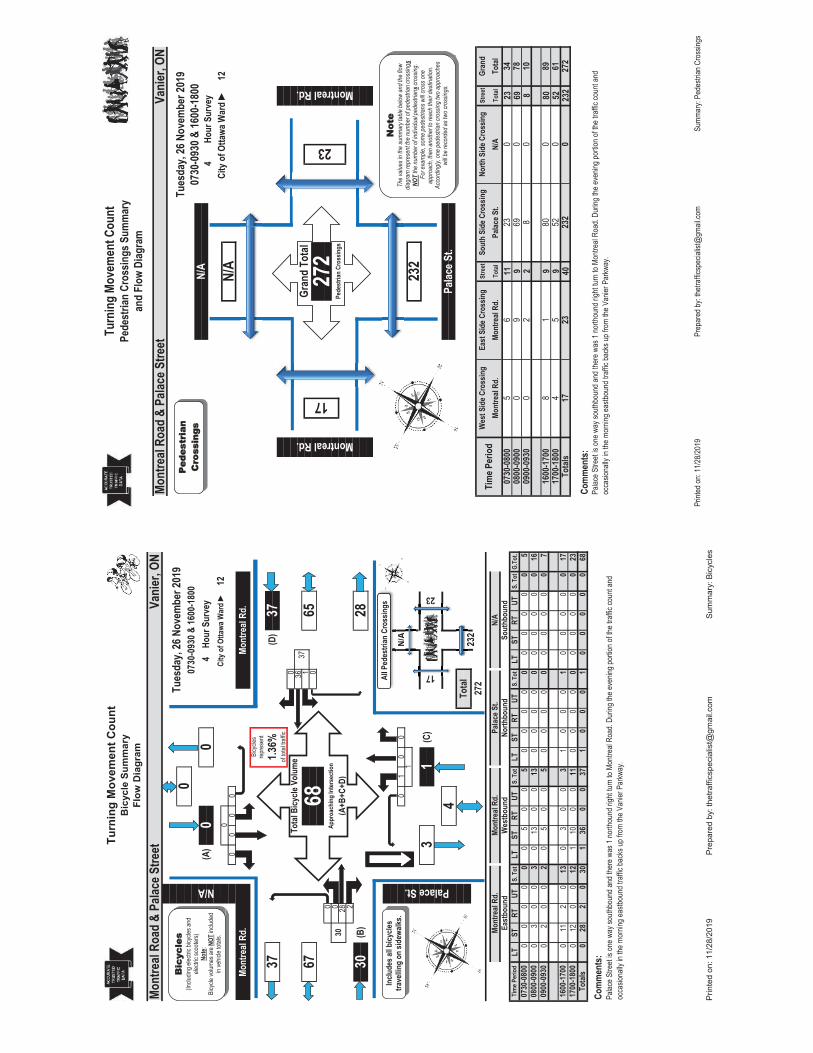
Turn
ing
Mov
emen
t Cou
ntB
icyc
le S
umm
ary
Flow
Dia
gram
00
00
0 36 1 0
0 0 28 2
01
00
N/A
LTST
RTUT
S. T
otLT
STRT
UTS.
Tot
LTST
RTUT
S. T
otLT
ST
RTUT
S. T
otG.
Tot.
00
00
00
50
05
00
00
00
00
00
50
30
03
013
00
130
00
00
00
00
016
02
00
20
50
05
00
00
00
00
00
7
011
20
130
30
03
10
00
10
00
00
170
120
012
110
00
110
00
00
00
00
023
028
20
301
360
037
10
00
10
00
00
68
0730
-080
0
23
East
boun
dW
estb
ound
North
boun
dSo
uthb
ound
Tim
e Per
iod
4To
tal
232
272
Mont
real
Rd.
Mont
real
Rd.
Palac
e St.
N/A
Palace St.
1700
-180
0To
tals
Com
men
ts:
Palac
e Stre
et is
one w
ay so
uthbo
und a
nd th
ere w
as 1
north
ound
right
turn t
o Mon
treal
Road
. Dur
ing th
e eve
ning p
ortio
n of th
e tra
ffic co
unt a
nd
occa
siona
lly in
the m
ornin
g eas
tboun
d tra
ffic ba
cks u
p fro
m the
Van
ier P
arkw
ay.
0800
-090
009
00-0
930
1600
-170
0
17
of tot
al tra
ffic1.3
6%
1
31
(C)
Mont
real
Rd.
Mont
real
Rd. 28
37(D
)37
Tota
l Bicy
cle V
olum
e37
6768
65Ap
proa
chin
g In
ters
ectio
n30
(A+B
+C+D
)
30(B
)
repr
esen
tBi
cycle
s
Mont
real
Road
& P
alace
Stre
etVa
nier
, ON
N/ATu
esda
y, 26
Nov
embe
r 201
90
0730
-093
0 & 16
00-1
800
(A)
00
4Ho
ur S
urve
yCi
ty o
f Otta
wa W
ard ►
120
17
23
Bic
ycle
s (In
cludin
g elec
tric b
icycle
s and
ele
ctric
scoo
ters)
Note
: Bi
cycle
volum
es ar
e NOT
inclu
ded
in ve
hicle
totals
.
Inclu
des a
ll bicy
cles
trave
lling
on si
dewa
lks.
All P
edes
trian
Cro
ssin
gs
232
Prin
ted
on: 1
1/28
/201
9Pr
epar
ed b
y: th
etra
ffics
peci
alis
t@gm
ail.c
omSu
mm
ary:
Bic
ycle
s
Turn
ing
Move
men
t Cou
ntPe
dest
rian
Cros
sings
Sum
mar
yan
d Fl
ow D
iagra
m
Stre
etSt
reet
Tota
lTo
tal
1123
969
28
980
952
4023
2
02
61
Com
men
ts:
Tota
ls17
2323
20
272
1700
-180
04
552
089
1600
-170
08
180
0
80
7807
30-0
800
56
230
3408
00-0
900
09
690
1009
00-0
930
Tota
lTi
me P
erio
dW
est S
ide C
ross
ing
East
Sid
e Cro
ssin
gSo
uth
Side
Cro
ssin
gNo
rth S
ide C
ross
ing
Gran
dMo
ntre
al Rd
.Mo
ntre
al Rd
.Pa
lace S
t.N/
A
N/A
Montreal Rd.
Montreal Rd.
Gran
d To
tal
17
23
272
Pede
stria
n Cr
ossin
gs
Palac
e Stre
et is
one w
ay so
uthbo
und a
nd th
ere w
as 1
north
ound
right
turn t
o Mon
treal
Road
. Dur
ing th
e eve
ning p
ortio
n of th
e tra
ffic co
unt a
nd
occa
siona
lly in
the m
ornin
g eas
tboun
d tra
ffic ba
cks u
p fro
m the
Van
ier P
arkw
ay.
Mont
real
Road
& P
alace
Stre
etVa
nier
, ON
Tues
day,
26 N
ovem
ber 2
019
0730
-093
0 & 16
00-1
800
N/A
4Ho
ur S
urve
y
232
Palac
e St.
City
of O
ttawa
War
d ►
12
Ped
estr
ian
C Cro
ssin
gs
Not
e Th
e valu
es in
the
sum
mar
y tab
le be
low an
d the
flow
diagr
am re
pres
ent th
e num
ber o
f ped
estria
n cro
ssings
NOT
the n
umbe
r of in
dividu
al pe
destr
ians c
ross
ing.
For
exam
ple, s
ome p
edes
trians
will
cross
one
ap
proa
ch, th
en an
othe
r to
reac
h the
ir des
tinat
ion.
Acco
rding
ly, on
e ped
estria
n cro
ssing
two a
ppro
ache
s wi
ll be r
ecor
ded a
s two
cros
sings
.
ed on
: 11/2
8/201
9Pr
epar
ed by
: thetr
affics
pecia
list@
gmail
.com
Summ
ary:
Pede
strian
Cro
ssing
s
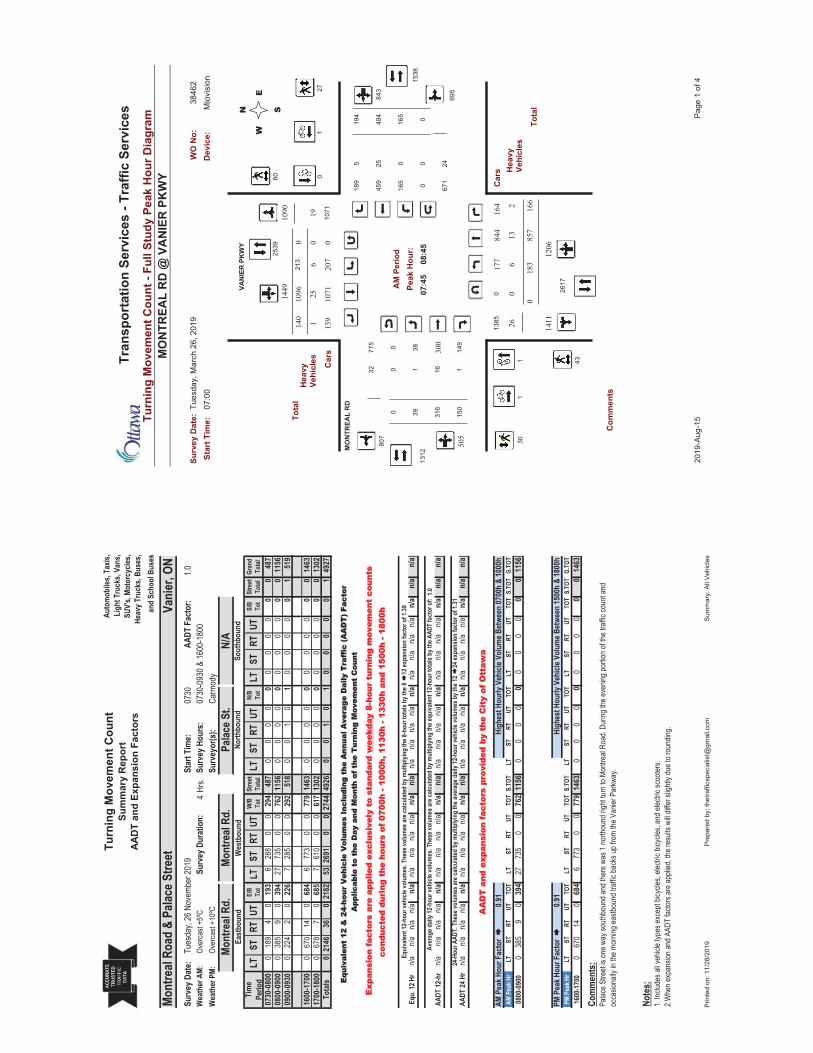
Turn
ing
Mov
emen
t Cou
ntSu
mm
ary
Rep
ort
AAD
T an
d Ex
pans
ion
Fact
ors
Auto
mob
iles,
Taxis
,Li
ght T
ruck
s, Va
ns,
SUV'
s, Mo
torc
ycles
,He
avy T
ruck
s, Bu
ses,
and
Scho
ol B
uses
1.04
Hrs.
Tim
e Pe
riod
LTST
RTUT
E/B
Tot
LTST
RTUT
W/B
To
tSt
reet
To
tal
LTST
RTUT
N/B
Tot
LT
STRT
UTS/
B To
tSt
reet
To
tal
Gran
d To
tal
0730
-080
00
189
40
193
628
80
029
448
70
00
00
00
00
00
487
0800
-090
00
385
90
394
2773
50
076
211
560
00
00
00
00
00
1156
0900
-093
00
224
20
226
728
50
029
251
80
01
01
00
00
01
519
1600
-170
00
670
140
684
677
30
077
914
630
00
00
00
00
00
1463
1700
-180
00
678
70
685
761
00
061
713
020
00
00
00
00
00
1302
Tota
ls0
2146
360
2182
5326
910
027
4449
260
01
01
00
00
01
4927
Equ.
12 H
rn/a
n/an/a
n/an/
an/a
n/an/a
n/an/
an/
an/a
n/an/a
n/an/
an/a
n/an/a
n/an/
an/
an/
a
1.0AA
DT 12
-hr
n/an/a
n/an/a
n/a
n/an/a
n/an/a
n/a
n/a
n/an/a
n/an/a
n/a
n/an/a
n/an/a
n/a
n/a
n/a
AADT
24 H
rn/a
n/an/a
n/an/
an/a
n/an/a
n/an/
an/
an/a
n/an/a
n/an/
an/a
n/an/a
n/an/
an/
an/
a
AM P
eak H
rLT
STRT
UTTO
TLT
STRT
UTTO
TS.
TOT
LTST
RTUT
TOT
LTST
RTUT
TOT
S.TO
TG.
TOT
0800
-090
00
385
90
394
2773
50
076
211
560
00
00
00
00
00
1156
PM P
eak H
rLT
STRT
UTTO
TLT
STRT
UTTO
TS.
TOT
LTST
RTUT
TOT
LTST
RTUT
TOT
S.TO
TG.
TOT
1600
-170
00
670
140
684
677
30
077
914
630
00
00
00
00
00
1463
Note
s:
East
boun
dW
estb
ound
North
boun
dSo
uthb
ound
24-H
our A
ADT.
The
se vo
lum
es ar
e calc
ulat
ed b
y mul
tiplyi
ng th
e ave
rage
dail
y 12-
hour
vehi
cle vo
lum
es b
y the
12
24 ex
pans
ion
fact
or o
f 1.31
EEqu
ival
ent
12 &
24-
hour
Veh
icle
Vol
umes
Inc
ludi
ng t
he A
nnua
l Ave
rage
Dai
ly T
raff
ic (
AA
DT
) Fa
ctor
AA
pplic
able
to
the
Day
and
Mon
th o
f th
e T
urni
ng M
ovem
ent
Cou
nt
Exp
ansi
on f
acto
rs a
re a
pplie
d ex
clus
ivel
y to
sta
ndar
d w
eekd
ay 8
-hou
r tu
rnin
g m
ovem
ent
coun
ts
cond
ucte
d du
ring
the
hou
rs o
f 07
00h
- 100
0h, 1
130h
- 13
30h
and
1500
h - 1
800h
Equi
valen
t 12-
hour
vehi
cle vo
lum
es. T
hese
volu
mes
are c
alcul
ated
by m
ultip
lying
the 8
-hou
r tot
als b
y the
8 12
expa
nsio
n fa
ctor
of 1
.39
2.Whe
n exp
ansio
n and
AAD
T fac
tors a
re ap
plied
, the r
esult
s will
differ
sligh
tly du
e to r
ound
ing.
PM P
eak H
our F
acto
r Hi
ghes
t Hou
rly V
ehicl
e Vol
ume B
etwe
en 15
00h
& 18
00h
Com
men
ts:
Palac
e Stre
et is
one w
ay so
uthbo
und a
nd th
ere w
as 1
north
ound
right
turn t
o Mon
treal
Road
. Dur
ing th
e eve
ning p
ortio
n of th
e tra
ffic co
unt a
nd
occa
siona
lly in
the m
ornin
g eas
tboun
d tra
ffic ba
cks u
p fro
m the
Van
ier P
arkw
ay.
0.91
0.91
Aver
age d
aily 1
2-ho
ur ve
hicle
volu
mes
. The
se vo
lum
es ar
e calc
ulat
ed b
y mul
tiplyi
ng th
e equ
ivalen
t 12-
hour
tota
ls by
the A
ADT
fact
or o
f:
1. Inc
ludes
all v
ehicl
e typ
es ex
cept
bicyc
les, e
lectric
bicy
cles,
and e
lectric
scoo
ters.
AM P
eak H
our F
acto
r Hi
ghes
t Hou
rly V
ehicl
e Vol
ume B
etwe
en 07
00h
& 10
00h
AAA
DT
and
exp
ansi
on f
acto
rs p
rovi
ded
by t
he C
ity
of O
ttaw
a
Mont
real
Road
& P
alace
Stre
etVa
nier
, ON
Surv
ey D
ate:
Tu
esda
y, 26
Nov
embe
r 201
9St
art T
ime:
0730
AADT
Fac
tor:
N/A
Over
cast
+10º
CW
eath
er P
M:W
eath
er A
M:Ov
erca
st +5
ºCSu
rvey
Dur
atio
n:Su
rvey
Hou
rs:
0730
-093
0 & 16
00-1
800
Surv
eyor
(s):
Carm
ody
Mont
real
Rd.
Mont
real
Rd.
Palac
e St.
Prin
ted
on: 1
1/28
/201
9Pr
epar
ed b
y: th
etra
ffics
peci
alis
t@gm
ail.c
omSu
mm
ary:
All
Vehi
cles
Turn
ing
Mov
emen
t Cou
nt -
Full
Stud
y Pe
ak H
our D
iagr
am
Tra
nspo
rtat
ion
Serv
ices
- Tr
affic
Ser
vice
s
Star
t Tim
e:Su
rvey
Dat
e:
MO
NTR
EAL
RD
@ V
AN
IER
PK
WY
07:0
0Tu
esda
y, M
arch
26,
201
9W
O N
o:38
462
Dev
ice:
Mio
visi
on
Peak
Hou
r:A
M P
erio
d
775
807
32
1385
2617
Tota
l
1312
39
1
3815
38
16
150
316
149
1
1090 19
251449
26
183
1206
1411
1096
27
60
43
30
140
1
213 6
695
Car
s
EW
SN
Car
s
165
484
518
9
671
24
194
843
0
2539
Tota
l
1071
25
165
459
Com
men
ts
11
01
505
300
13 857
MO
NTR
EAL
RD
VAN
IER
PK
WY
844
1071
139
6207
1662
177
164
00
0
0
0
0
00
00
0
0
07:4
508
:45
Hea
vyVe
hicl
es
Hea
vyVe
hicl
es
Page
1 o
f 420
19-A
ug-1
5
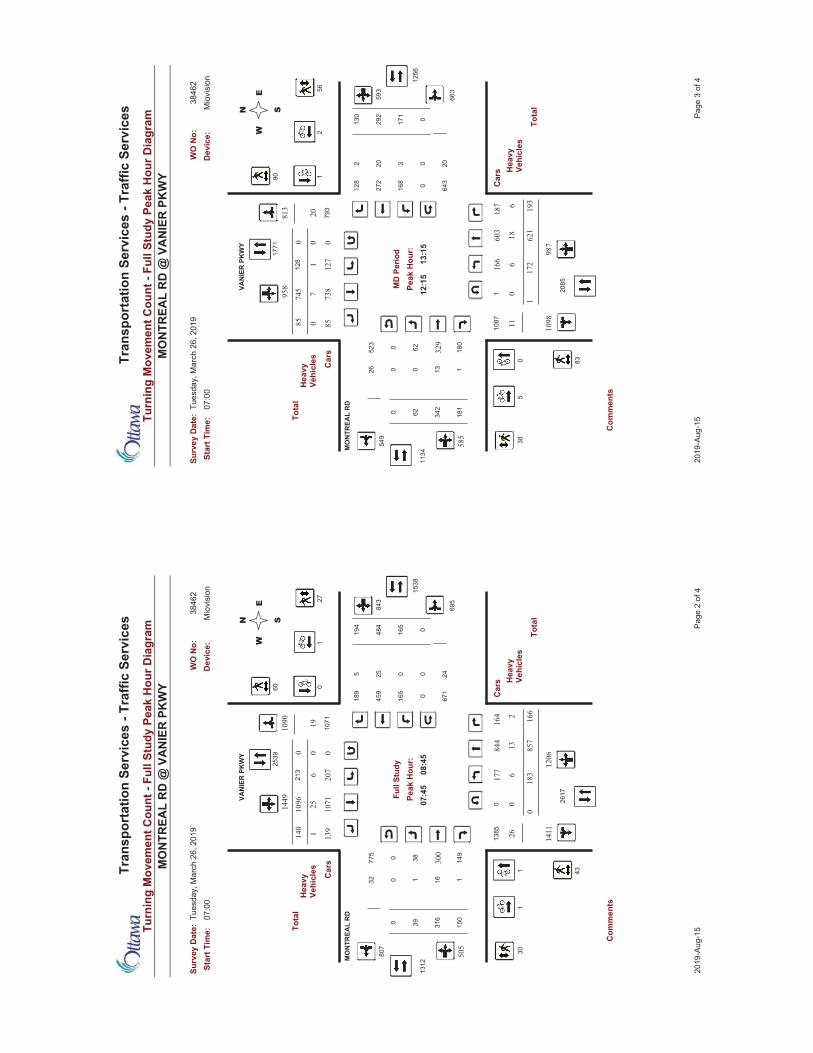
Turn
ing
Mov
emen
t Cou
nt -
Full
Stud
y Pe
ak H
our D
iagr
am
Tra
nspo
rtat
ion
Serv
ices
- Tr
affic
Ser
vice
s
Star
t Tim
e:Su
rvey
Dat
e:
MO
NTR
EAL
RD
@ V
AN
IER
PK
WY
07:0
0Tu
esda
y, M
arch
26,
201
9W
O N
o:38
462
Dev
ice:
Mio
visi
on
Peak
Hou
r:Fu
ll St
udy
775
807
32
1385
2617
Tota
l
1312
39
1
3815
38
16
150
316
149
1
1090 19
251449
26
183
1206
1411
1096
27
60
43
30
140
1
213 6
695
Car
s
EW
SN
Car
s
165
484
518
9
671
24
194
843
0
2539
Tota
l
1071
25
165
459
Com
men
ts
11
01
505
300
13 857
MO
NTR
EAL
RD
VAN
IER
PK
WY
844
1071
139
6207
1662
177
164
00
0
0
0
0
00
00
0
0
07:4
508
:45
Hea
vyVe
hicl
es
Hea
vyVe
hicl
es
Page
2 o
f 420
19-A
ug-1
5
Turn
ing
Mov
emen
t Cou
nt -
Full
Stud
y Pe
ak H
our D
iagr
am
Tra
nspo
rtat
ion
Serv
ices
- Tr
affic
Ser
vice
s
Star
t Tim
e:Su
rvey
Dat
e:
MO
NTR
EAL
RD
@ V
AN
IER
PK
WY
07:0
0Tu
esda
y, M
arch
26,
201
9W
O N
o:38
462
Dev
ice:
Mio
visi
on
Peak
Hou
r:M
D P
erio
d
523
549
26
1087
2085
Tota
l
1134
62
1
6212
56
13
181
342
180
0
813
207958
11
172
987
1098
745
56
90
83
38
85 0
128 1
663
Car
s
EW
SN
Car
s
171
292
212
8
643
20
130
593
3
1771
Tota
l
793
20
168
272
Com
men
ts
05
12
585
329
18 621
MO
NTR
EAL
RD
VAN
IER
PK
WY
603
738
85
6127
1936
166
187
00
1
1
0
0
00
00
0
0
12:1
513
:15
Hea
vyVe
hicl
es
Hea
vyVe
hicl
es
Page
3 o
f 420
19-A
ug-1
5
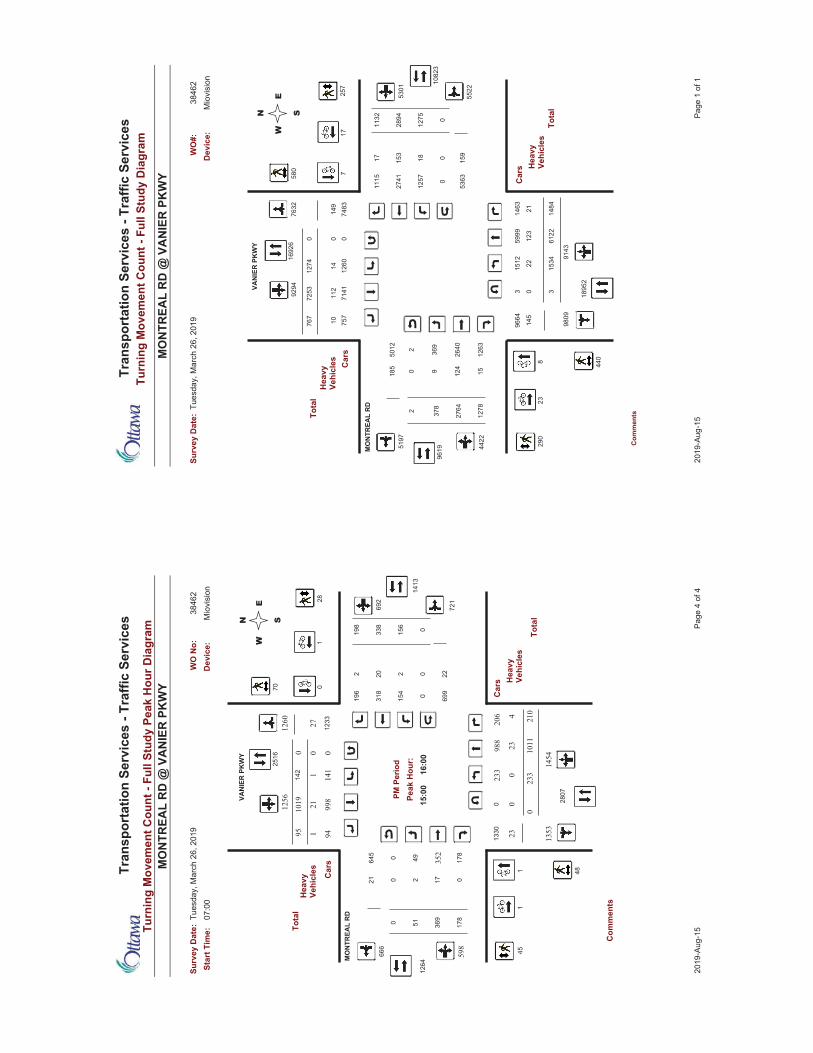
Turn
ing
Mov
emen
t Cou
nt -
Full
Stud
y Pe
ak H
our D
iagr
am
Tra
nspo
rtat
ion
Serv
ices
- Tr
affic
Ser
vice
s
Star
t Tim
e:Su
rvey
Dat
e:
MO
NTR
EAL
RD
@ V
AN
IER
PK
WY
07:0
0Tu
esda
y, M
arch
26,
201
9W
O N
o:38
462
Dev
ice:
Mio
visi
on
Peak
Hou
r:PM
Per
iod
645
666
21
1330
2807
Tota
l
1264
51
0
4914
13
17
178
369
178
2
1260 27
211256
23
233
1454
1353
1019
28
70
48
45
95 1
142 1
721
Car
s
EW
SN
Car
s
156
338
219
6
699
22
198
692
2
2516
Tota
l
1233
20
154
318
Com
men
ts
11
01
598
352
23 1011
MO
NTR
EAL
RD
VAN
IER
PK
WY
988
998
94
0141
2104
233
206
00
0
0
0
0
00
00
0
0
15:0
016
:00
Hea
vyVe
hicl
es
Hea
vyVe
hicl
es
Page
4 o
f 420
19-A
ug-1
5
Turn
ing
Mov
emen
t Cou
nt -
Full
Stud
y D
iagr
am T
rans
port
atio
n Se
rvic
es -
Traf
fic S
ervi
ces
Surv
ey D
ate:
MO
NTR
EAL
RD
@ V
AN
IER
PK
WY
Tues
day,
Mar
ch 2
6, 2
019
WO
#:38
462
Dev
ice:
Mio
visi
on
Hea
vyVe
hicl
es Car
s
Car
s
SN
EW
7483
1692
6
Tota
l
2741
153
1257
181711
15
1275
2894
1132
5301
5363
159
5522
1082
3
124
15
369
1263
9
1278
2764
378
185
5012
5197
Tota
l
9619
9664
1895
2
440
290
257
580
1274 14
767
10
7253
112
9294
7632
149
9143
9809
145
153422
1260
7141
757
1512
1463
148421
5999
123
6122
4422
2640
MO
NTR
EAL
RD
VAN
IER
PK
WY
00
0
20
2
03 3
000
717
823
Com
men
ts
Hea
vyVe
hicl
es
Page
1 o
f 120
19-A
ug-1
5
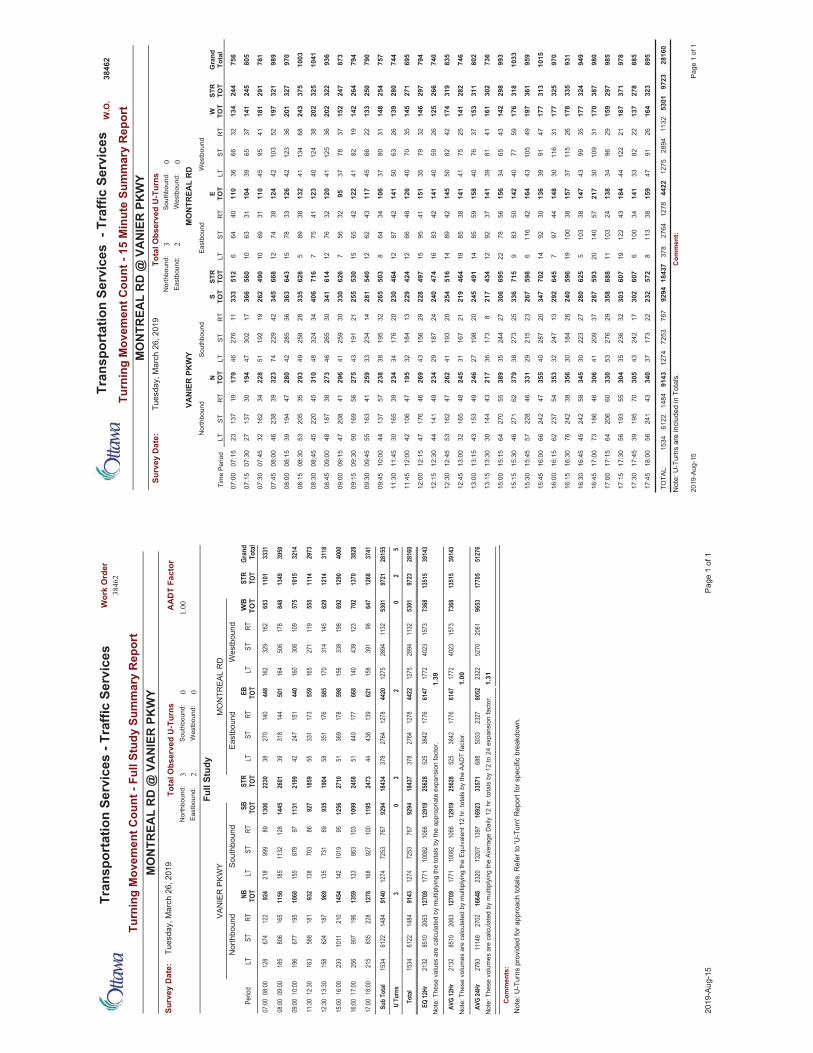
Tra
nspo
rtat
ion
Serv
ices
- Tr
affic
Ser
vice
sW
ork
Ord
er
Turn
ing
Mov
emen
t Cou
nt -
Full
Stud
y Su
mm
ary
Rep
ort
38462
MO
NTR
EAL
RD
@ V
AN
IER
PK
WY
AA
DT
Fact
orSu
rvey
Dat
e:3
0 02
Nor
thbo
und:To
tal O
bser
ved
U-T
urns
East
boun
d:W
estb
ound
:So
uthb
ound
:1.00
Tues
day,
Mar
ch 2
6, 2
019 So
uthb
ound
Nor
thbo
und
MO
NTR
EAL
RD
VAN
IER
PKW
YW
estb
ound
Gran
dTo
tal
STR
TOT
WB
TOT
RTST
LTEB TO
TRT
STLT
STR
TOT
SB TOT
RTST
LTNB TO
TRT
STLT
Perio
d
East
boun
d
Full
Stud
y
3331
1101
653
162
329
162
448
140
270
3822
3013
0689
999
218
924
122
674
128
08:00
07:00
3950
1349
848
178
506
164
501
144
318
3926
0114
4512
811
3218
511
5616
580
618
509
:0008
:00
3214
1015
575
109
306
160
440
151
247
4221
9911
3197
879
155
1068
195
677
196
10:00
09:00
2973
1114
555
119
271
165
559
173
331
5518
5992
786
703
138
932
181
588
163
12:30
11:30
3118
1214
629
145
314
170
585
176
351
5819
0493
569
731
135
969
187
624
158
13:30
12:30
4000
1290
692
198
338
156
598
178
369
5127
1012
5695
1019
142
1454
210
1011
233
16:00
15:00
3828
1370
702
123
439
140
668
177
440
5124
5810
9910
386
313
313
5919
690
725
617
:0016
:00
3741
1268
647
9839
115
862
113
943
844
2473
1195
100
927
168
1278
228
835
215
18:00
17:00
2815
597
2153
0111
3228
9412
7544
2012
7827
6437
818
434
9294
767
7253
1274
9140
1484
6122
1534
Sub
Tota
l
53
02
0U
Turn
s3
2
2816
097
2353
0111
3228
9412
7544
2212
7827
6437
818
437
9294
767
7253
1274
9143
1484
6122
1534
Tota
l
1.31
Not
e: T
hese
vol
umes
are
cal
cula
ted
by m
ultip
lyin
g th
e Av
erag
e D
aily
12
hr. t
otal
s by
12
to 2
4 ex
pans
ion
fact
or.
1.00
Not
e: T
hese
vol
umes
are
cal
cula
ted
by m
ultip
lyin
g th
e Eq
uiva
lent
12
hr. t
otal
s by
the
AAD
T fa
ctor
.
1.39
Not
e: T
hese
val
ues
are
calc
ulat
ed b
y m
ultip
lyin
g th
e to
tals
by
the
appr
opria
te e
xpan
sion
fact
or.
3914
313
515
7368
1573
4023
1772
6147
1776
3842
525
2562
812
919
1066
1008
217
7112
709
2063
8510
2132
EQ 12
Hr
3914
313
515
7368
1573
4023
1772
6147
1776
3842
525
2562
812
919
1066
1008
217
7112
709
2063
8510
2132
AVG
12Hr
5127
617
705
9653
2061
5270
2322
8052
2327
5033
688
3357
116
923
1397
1320
723
2016
648
2702
1114
827
93AV
G 24
Hr
Com
men
ts:
Not
e: U
-Tur
ns p
rovi
ded
for a
ppro
ach
tota
ls. R
efer
to 'U
-Tur
n' R
epor
t for
spe
cific
bre
akdo
wn.
Page
1 o
f 120
19-A
ug-1
5
Turn
ing
Mov
emen
t Cou
nt -
15 M
inut
e Su
mm
ary
Rep
ort
Surv
ey D
ate:
MO
NTR
EAL
RD
@ V
AN
IER
PK
WY
Tues
day,
Mar
ch 2
6, 2
019
3846
2
Tota
l Obs
erve
d U
-Tur
nsN
orth
boun
d:Ea
stbo
und:
Sout
hbou
nd:
Wes
tbou
nd:0
30
2
Tran
spor
tatio
n Se
rvic
es -
Tra
ffic
Serv
ices
W.O
.
Gra
ndTo
tal
STR
TOT
W TOT
RT
STLT
E TOT
RT
STLT
STR
TOT
S TOT
RT
STLT
N TOT
RT
STLT
Tim
e Pe
riod
Nor
thbo
und
Sout
hbou
ndEa
stbo
und
Wes
tbou
nd
VAN
IER
PK
WY
MO
NTR
EAL
RD
756
244
134
3266
3611
040
646
512
333
1127
646
179
1913
723
07:1
507
:00
805
245
141
3765
3910
431
6310
560
366
1730
247
194
3013
727
07:3
007
:15
781
291
181
4195
4511
031
6910
490
262
1919
251
228
3416
232
07:4
507
:30
989
321
197
5210
342
124
3874
1266
834
542
229
7432
339
238
4608
:00
07:4
5
970
327
201
3612
342
126
3378
1564
336
336
285
4228
047
194
3908
:15
08:0
0
1003
375
243
6813
441
132
3889
562
833
528
258
4929
335
205
5308
:30
08:1
5
1041
325
202
3812
440
123
4175
771
640
634
324
4831
045
220
4508
:45
08:3
0
936
322
202
3612
541
120
3276
1261
434
130
265
4627
338
187
4809
:00
08:4
5
873
247
152
3778
3795
3256
762
633
030
259
4129
641
208
4709
:15
09:0
0
794
264
142
1982
4112
242
6515
530
255
2119
143
275
5616
950
09:3
009
:15
790
250
133
2266
4511
743
6212
540
281
1423
433
259
4116
355
09:4
509
:30
757
254
148
3180
3710
634
648
503
265
3219
538
238
5713
744
10:0
009
:45
744
280
139
2663
5014
142
8712
464
230
2017
634
234
3916
530
11:4
511
:30
695
271
145
3570
4012
648
6612
424
229
1318
432
195
4710
642
12:0
011
:45
794
297
146
3279
3515
141
9515
497
228
2915
643
269
4617
647
12:1
512
:00
740
266
125
2659
4014
142
8316
474
240
2418
729
234
4914
144
12:3
012
:15
835
319
174
4282
5014
542
8914
516
254
2019
341
262
4716
253
12:4
512
:30
746
282
141
2575
4114
138
8518
464
219
2116
731
245
4816
532
13:0
012
:45
802
311
153
3776
4015
859
8514
491
245
2019
827
246
4915
343
13:1
513
:00
736
302
161
4181
3914
137
9212
434
217
817
336
217
4314
430
13:3
013
:15
993
298
142
4365
3415
656
7822
695
306
2724
435
389
5527
064
15:1
515
:00
1033
318
176
5977
4014
250
839
715
336
2527
338
379
6227
146
15:3
015
:15
959
361
197
4910
543
164
4211
66
598
267
2321
529
331
4622
857
15:4
515
:30
1015
313
177
4791
3913
630
9214
702
347
2028
740
355
4724
266
16:0
015
:45
970
325
177
3111
630
148
4497
764
529
213
247
3235
354
237
6216
:15
16:0
0
931
335
178
2611
537
157
3810
019
596
240
2618
430
356
3824
276
16:3
016
:15
949
324
177
3599
4314
738
103
562
528
027
223
3034
558
242
4516
:45
16:3
0
980
387
170
3110
930
217
5714
020
593
287
3720
941
306
4618
673
17:0
016
:45
985
297
159
2996
3413
824
103
1168
835
829
276
5333
060
206
6417
:15
17:0
0
978
371
187
2112
244
184
4312
219
607
303
3223
635
304
5519
356
17:3
017
:15
885
278
137
2282
3314
134
100
660
730
217
242
4330
570
195
3917
:45
17:3
0
895
323
164
2691
4715
938
113
857
223
222
173
3734
043
241
5618
:00
17:4
5
Com
men
t:N
ote:
U-T
urns
are
incl
uded
in T
otal
s.15
3461
2214
8491
4312
7472
5376
792
9418
437
378
2764
1278
4422
1275
2894
1132
5301
9723
2816
0TO
TAL:
Page
1 o
f 120
19-A
ug-1
5
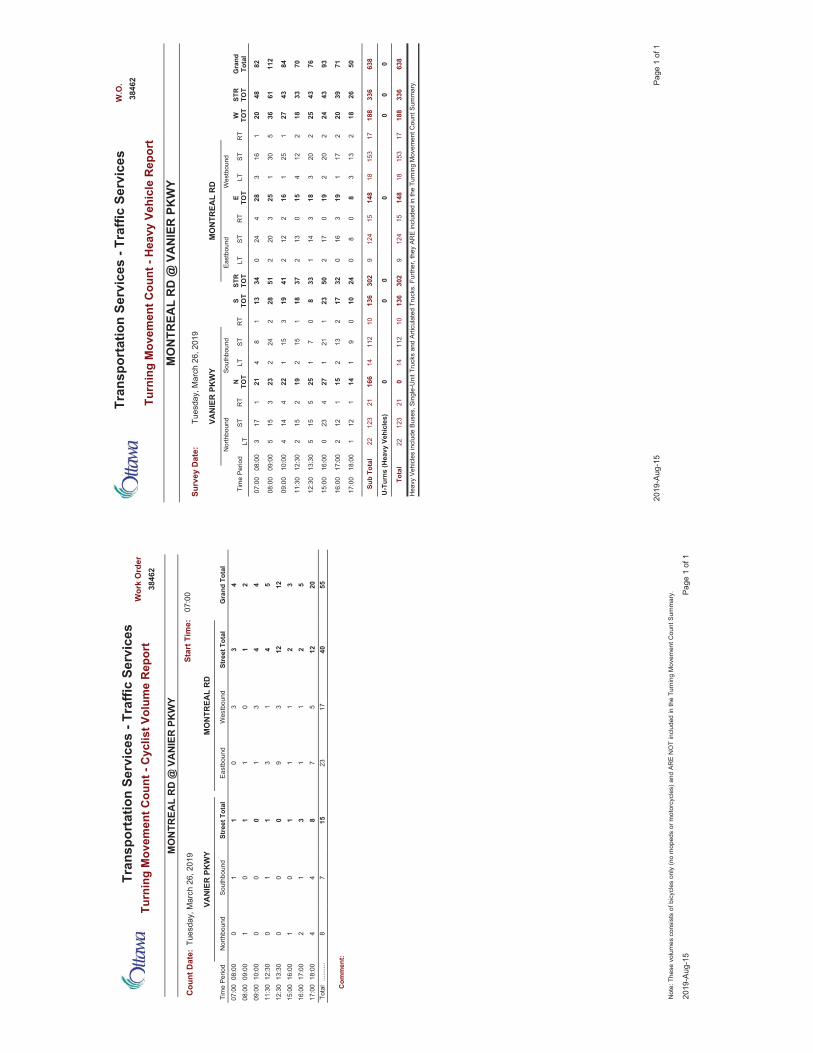
Turn
ing
Mov
emen
t Cou
nt -
Cyc
list V
olum
e R
epor
t
Cou
nt D
ate:
MO
NTR
EAL
RD
@ V
AN
IER
PK
WY
Tues
day,
Mar
ch 2
6, 2
019
3846
2
07:0
0St
art T
ime:
Wor
k O
rder
Tra
nspo
rtat
ion
Serv
ices
- Tr
affic
Ser
vice
s
MO
NTR
EAL
RD
VAN
IER
PK
WY
Gra
nd T
otal
Stre
et T
otal
Wes
tbou
ndEa
stbo
und
Stre
et T
otal
Sout
hbou
ndN
orth
boun
dTi
me
Perio
d
43
30
11
008
:00
07:0
0
21
01
10
109
:00
08:0
0
44
31
00
010
:00
09:0
0
54
13
11
012
:30
11:3
0
1212
39
00
013
:30
12:3
0
32
11
10
116
:00
15:0
0
52
11
31
217
:00
16:0
0
2012
57
84
418
:00
17:0
0 Com
men
t:
5540
1723
157
8...
......
.To
tal
Page
1 o
f 120
19-A
ug-1
5
Not
e: T
hese
vol
umes
con
sist
s of
bic
ycle
s on
ly (n
o m
oped
s or
mot
orcy
cles
) and
AR
E N
OT
incl
uded
in th
e Tu
rnin
g M
ovem
ent C
ount
Sum
mar
y.
3846
2
Tues
day,
Mar
ch 2
6, 2
019
Turn
ing
Mov
emen
t Cou
nt -
Hea
vy V
ehic
le R
epor
t
MO
NTR
EAL
RD
@ V
AN
IER
PK
WY
Surv
ey D
ate:
W.O
. T
rans
port
atio
n Se
rvic
es -
Traf
fic S
ervi
ces
Gra
ndTo
tal
STR
TOT
W TOT
RT
STLT
E TOT
RT
STLT
STR
TOT
S TOT
RT
STLT
N TOT
RT
STLT
Tim
e Pe
riod
East
boun
dW
estb
ound
VAN
IER
PK
WY
MO
NTR
EAL
RD
Nor
thbo
und
Sout
hbou
nd
8248
201
163
284
240
3413
18
421
117
308
:00
07:0
0
112
6136
530
125
320
251
282
242
233
155
09:0
008
:00
8443
271
251
162
122
4119
315
122
414
410
:00
09:0
0
7033
182
124
150
132
3718
115
219
215
212
:30
11:3
0
7643
252
203
183
141
338
07
125
515
513
:30
12:3
0
9343
242
202
190
172
5023
121
127
423
016
:00
15:0
0
7139
202
171
193
160
3217
213
215
112
217
:00
16:0
0
5026
182
133
80
80
2410
09
114
112
118
:00
17:0
0
638
336
188
1715
318
148
1512
49
302
136
1011
214
166
2112
322
Sub
Tota
l
Hea
vy V
ehic
les
incl
ude
Buse
s, S
ingl
e-U
nit T
ruck
s an
d Ar
ticul
ated
Tru
cks.
Fur
ther
, the
y AR
E in
clud
ed in
the
Turn
ing
Mov
emen
t Cou
nt S
umm
ary.
00
00
638
336
188
1715
318
148
1512
49
302
136
1011
214
021
123
22To
tal
U-T
urns
(Hea
vy V
ehic
les)
00
0
Page
1 o
f 120
19-A
ug-1
5
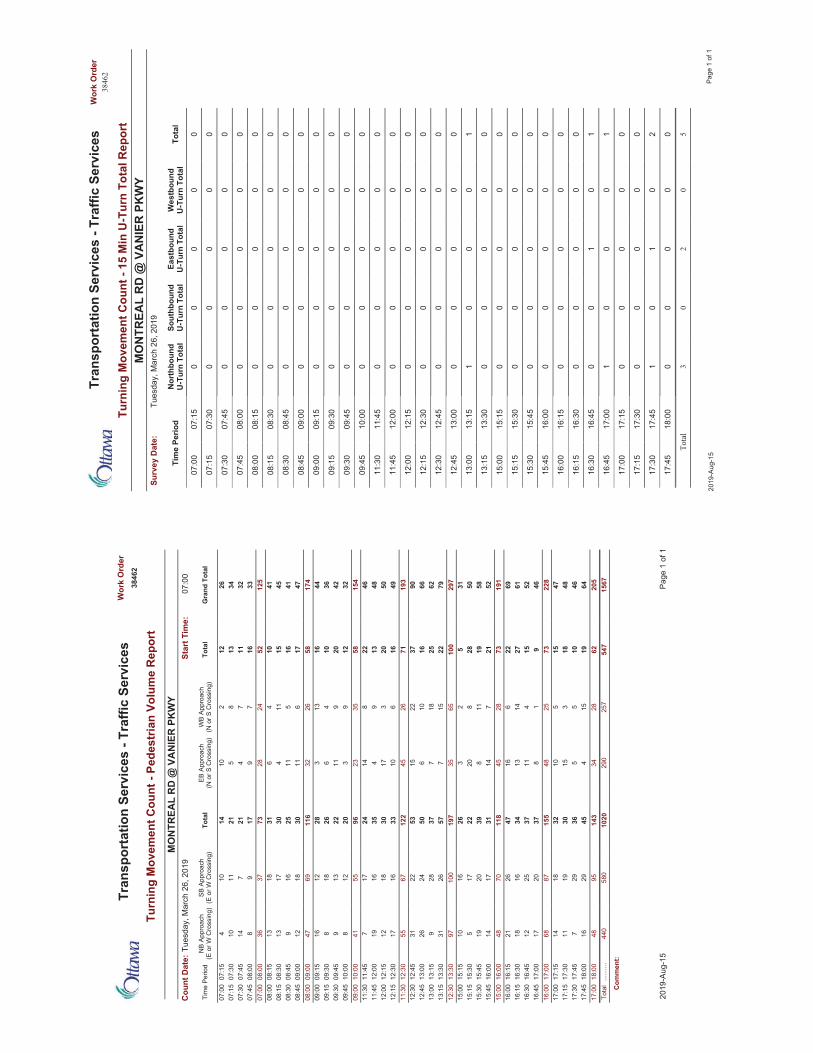
Turn
ing
Mov
emen
t Cou
nt -
Pede
stria
n Vo
lum
e R
epor
t
Cou
nt D
ate:
MO
NTR
EAL
RD
@ V
AN
IER
PK
WY
Tues
day,
Mar
ch 2
6, 2
019
07:0
0St
art T
ime:
3846
2
Wor
k O
rder
Tra
nspo
rtat
ion
Serv
ices
- Tr
affic
Ser
vice
s
Gra
nd T
otal
Tota
lW
B Ap
proa
ch(N
or S
Cro
ssin
g)EB
App
roac
h(N
or S
Cro
ssin
g)To
tal
SB A
ppro
ach
(E o
r W C
ross
ing)
NB
Appr
oach
(E o
r W C
ross
ing)
Tim
e Pe
riod
2612
210
1410
407
:15
07:0
034
138
521
1110
07:3
007
:15
3211
74
217
1407
:45
07:3
033
167
917
98
08:0
007
:45
125
5224
2873
3736
08:0
007
:00
4110
46
3118
1308
:15
08:0
045
1511
430
1713
08:3
008
:15
4116
511
2516
908
:45
08:3
047
176
1130
1812
09:0
008
:45
174
5826
3211
669
4709
:00
08:0
044
1613
328
1216
09:1
509
:00
3610
46
2618
809
:30
09:1
542
209
1122
139
09:4
509
:30
3212
93
2012
810
:00
09:4
515
458
3523
9655
4110
:00
09:0
046
228
1424
177
11:4
511
:30
4813
94
3516
1912
:00
11:4
550
203
1730
1812
12:1
512
:00
4916
610
3316
1712
:30
12:1
519
371
2645
122
6755
12:3
011
:30
9037
2215
5322
3112
:45
12:3
066
1610
650
2426
13:0
012
:45
6225
187
3728
913
:15
13:0
079
2215
757
2631
13:3
013
:15
297
100
6535
197
100
9713
:30
12:3
031
52
326
1610
15:1
515
:00
5028
820
2217
515
:30
15:1
558
1911
839
2019
15:4
515
:30
5221
714
3117
1416
:00
15:4
519
173
2845
118
7048
16:0
015
:00
6922
616
4726
2116
:15
16:0
061
2714
1334
1618
16:3
016
:15
5215
411
3725
1216
:45
16:3
046
91
837
2017
17:0
016
:45
228
7325
4815
587
6817
:00
16:0
047
155
1032
1814
17:1
517
:00
4818
315
3019
1117
:30
17:1
546
105
536
297
17:4
517
:30
6419
154
4529
1618
:00
17:4
520
562
2834
143
9548
18:0
017
:00 Com
men
t:
1567
547
257
290
1020
580
440
......
....
Tota
l
Page
1 o
f 120
19-A
ug-1
5
Turn
ing
Mov
emen
t Cou
nt -
15 M
in U
-Tur
n To
tal R
epor
t
Wor
k O
rder
Tra
nspo
rtat
ion
Serv
ices
- Tr
affic
Ser
vice
s
MO
NTR
EAL
RD
@ V
AN
IER
PK
WY
38462
Tues
day,
Mar
ch 2
6, 2
019
Surv
ey D
ate:
Tota
lW
estb
ound
U-T
urn
Tota
lEa
stbo
und
U-T
urn
Tota
lSo
uthb
ound
U-T
urn
Tota
lN
orth
boun
dU
-Tur
n To
tal
Tim
e Pe
riod
00
00
007
:15
07:0
0
00
00
007
:30
07:1
5
00
00
007
:45
07:3
0
00
00
008
:00
07:4
5
00
00
008
:15
08:0
0
00
00
008
:30
08:1
5
00
00
008
:45
08:3
0
00
00
009
:00
08:4
5
00
00
009
:15
09:0
0
00
00
009
:30
09:1
5
00
00
009
:45
09:3
0
00
00
010
:00
09:4
5
00
00
011
:45
11:3
0
00
00
012
:00
11:4
5
00
00
012
:15
12:0
0
00
00
012
:30
12:1
5
00
00
012
:45
12:3
0
00
00
013
:00
12:4
5
10
00
113
:15
13:0
0
00
00
013
:30
13:1
5
00
00
015
:15
15:0
0
00
00
015
:30
15:1
5
00
00
015
:45
15:3
0
00
00
016
:00
15:4
5
00
00
016
:15
16:0
0
00
00
016
:30
16:1
5
10
10
016
:45
16:3
0
10
00
117
:00
16:4
5
00
00
017
:15
17:0
0
00
00
017
:30
17:1
5
20
10
117
:45
17:3
0
00
00
018
:00
17:4
5
50
20
3Total
2019
-Aug
-15
Page
1 o
f 1
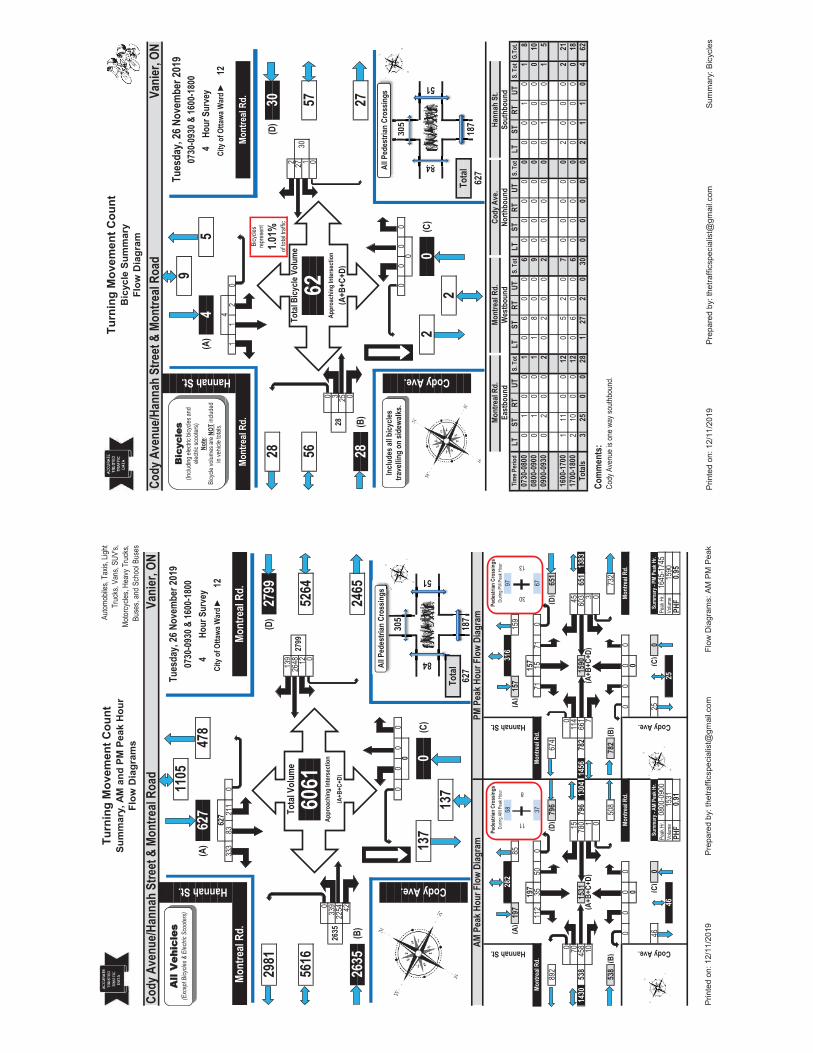
Turn
ing
Mov
emen
t Cou
ntSu
mm
ary,
AM
and
PM
Pea
k H
our
Flow
Dia
gram
s
Autom
obile
s, Ta
xis, L
ight
Truc
ks, V
ans,
SUV'
s,Mo
torcy
cles,
Heav
y Tru
cks,
Buse
s, an
d Sch
ool B
uses
333
8321
10
139
2648 12 0
033
922
54 42
00
00
305
5897
(A)
197
85(A
)15
715
9
197
157
112
3550
037
7115
710
67
892
(D)
796
674
(D)
651
00
7015
114
4514
3053
845
815
3178
079
613
0414
5678
266
115
9060
365
113
8310
17
30
0
538
(B)
508
782
(B)
732
00
00
00
00
00
46(C
)0
25(C
)0
Peak
Hr.
Peak
Hr.
Volum
eVo
lume
PHF
PHF
30
13Pe
dest
rian
Cros
sings
Pede
stria
n Cr
ossin
gsDu
ring A
M Pe
ak H
our
Durin
g PM
Peak
Hou
r
1590
0.91
0.95
Cody Ave.
Mont
real
Rd.
Sum
mar
y - A
M Pe
ak H
r.Su
mm
ary -
PM
Peak
Hr.
0800
-090
016
45-1
745
Cody Ave.
282
Mont
real
Rd.
Mont
real
Rd.
(A+B
+C+D
)
Mont
real
Rd.
(A+B
+C+D
)
4615
3125
Hannah St.
Hannah St.
316
11
8
AM P
eak H
our F
low
Diag
ram
PM P
eak H
our F
low
Diag
ram
Cody Ave.
0
137
0(C
)
84
51
137
Tota
l62
718
7
2465
2981
(D)
2799
Tota
l Vol
ume
2799
5616
6061
5264
Appr
oach
ing
Inte
rsec
tion
2635
(A+B
+C+D
)
2635
(B)
Mont
real
Rd.
Cody
Ave
nue/H
anna
h St
reet
& M
ontre
al Ro
adVa
nier
, ON
Hannah St.Tu
esda
y, 26
Nov
embe
r 201
911
0507
30-0
930 &
1600
-180
0(A
)62
747
84
Hour
Sur
vey
City
of O
ttawa
War
d ►
1262
7
Mont
real
Rd.
All P
edes
trian
Cro
ssin
gs
51
All
Veh
icle
s (E
xcep
t Bicy
cles &
Elec
tric S
coot
ers)
187
Prin
ted
on: 1
2/11
/201
9Pr
epar
ed b
y: th
etra
ffics
peci
alis
t@gm
ail.c
omFl
ow D
iagr
ams:
AM
PM
Pea
k
Turn
ing
Mov
emen
t Cou
ntB
icyc
le S
umm
ary
Flow
Dia
gram
11
20
2 27 1 0
0 3 25 0
00
00
305
LTST
RTUT
S. T
otLT
STRT
UTS.
Tot
LTST
RTUT
S. T
otLT
ST
RTUT
S. T
otG.
Tot.
01
00
10
60
06
00
00
00
01
01
80
10
01
18
00
90
00
00
00
00
010
02
00
20
20
02
00
00
00
10
01
5
111
00
120
52
07
00
00
02
00
02
212
100
012
06
00
60
00
00
00
00
018
325
00
281
272
030
00
00
02
11
04
62
repr
esen
tBi
cycle
s
Cody
Ave
nue/H
anna
h St
reet
& M
ontre
al Ro
adVa
nier
, ON
Hannah St.
Tues
day,
26 N
ovem
ber 2
019
907
30-0
930 &
1600
-180
0(A
)4
54
Hour
Sur
vey
City
of O
ttawa
War
d ►
124
Mont
real
Rd.
Mont
real
Rd. 27
28(D
)30
Tota
l Bicy
cle V
olum
e30
5662
57Ap
proa
chin
g In
ters
ectio
n28
(A+B
+C+D
)
28(B
)
84
of tot
al tra
ffic1.0
1%
0
20
(C)
1700
-180
0To
tals
Com
men
ts:
Cody
Ave
nue i
s one
way
south
boun
d.
0800
-090
009
00-0
930
1600
-170
0
0730
-080
0
51
East
boun
dW
estb
ound
North
boun
dSo
uthb
ound
Tim
e Per
iod
2To
tal
187
627
Mont
real
Rd.
Mont
real
Rd.
Cody
Ave
.Ha
nnah
St.
Cody Ave.
84
51
Bic
ycle
s (In
cludin
g elec
tric b
icycle
s and
ele
ctric
scoo
ters)
Note
: Bi
cycle
volum
es ar
e NOT
inclu
ded
in ve
hicle
totals
.
Inclu
des a
ll bicy
cles
trave
lling
on si
dewa
lks.
All P
edes
trian
Cro
ssin
gs
187
Prin
ted
on: 1
2/11
/201
9Pr
epar
ed b
y: th
etra
ffics
peci
alis
t@gm
ail.c
omSu
mm
ary:
Bic
ycle
s
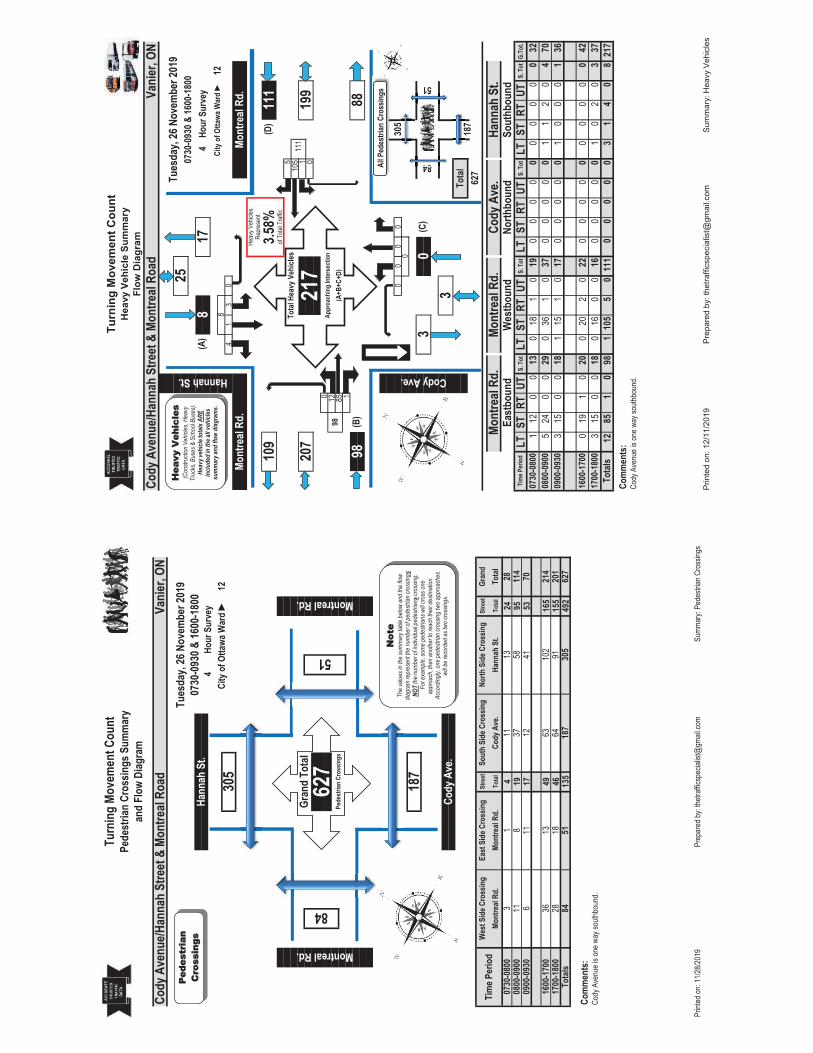
Turn
ing
Move
men
t Cou
ntPe
dest
rian
Cros
sings
Sum
mar
yan
d Fl
ow D
iagra
m
Stre
etSt
reet
Tota
lTo
tal
424
1995
1753
4916
546
155
135
492
611
201
Com
men
ts:
Tota
ls84
5118
730
562
717
00-1
800
2818
6491
214
1600
-170
036
1363
102
1241
114
0730
-080
03
111
1328
0800
-090
011
837
5870
0900
-093
0
Tota
lTi
me P
erio
dW
est S
ide C
ross
ing
East
Sid
e Cro
ssin
gSo
uth
Side
Cro
ssin
gNo
rth S
ide C
ross
ing
Gran
dMo
ntre
al Rd
.Mo
ntre
al Rd
.Co
dy A
ve.
Hann
ah S
t.
305
Montreal Rd.
Montreal Rd.
Gran
d To
tal
84
51
627
Pede
stria
n Cr
ossin
gs
Cody
Ave
nue i
s one
way
south
boun
d.
Cody
Ave
nue/H
anna
h St
reet
& M
ontre
al Ro
adVa
nier
, ON
Tues
day,
26 N
ovem
ber 2
019
0730
-093
0 & 16
00-1
800
Hann
ah S
t.4
Hour
Sur
vey
187
Cody
Ave
.
City
of O
ttawa
War
d ►
12
Ped
estr
ian
C Cro
ssin
gs
Not
e Th
e valu
es in
the
sum
mar
y tab
le be
low an
d the
flow
diagr
am re
pres
ent th
e num
ber o
f ped
estria
n cro
ssings
NOT
the n
umbe
r of in
dividu
al pe
destr
ians c
ross
ing.
For
exam
ple, s
ome p
edes
trians
will
cross
one
ap
proa
ch, th
en an
othe
r to
reac
h the
ir des
tinat
ion.
Acco
rding
ly, on
e ped
estria
n cro
ssing
two a
ppro
ache
s wi
ll be r
ecor
ded a
s two
cros
sings
.
ed on
: 11/2
8/201
9Pr
epar
ed by
: thetr
affics
pecia
list@
gmail
.com
Summ
ary:
Pede
strian
Cro
ssing
s
Turn
ing
Mov
emen
t Cou
ntH
eavy
Veh
icle
Sum
mar
yFl
ow D
iagr
am
41
30
510
5 1 0
0 12 85 1
00
00
305
LTST
RTUT
S. T
otLT
STRT
UTS.
Tot
LTST
RTUT
S. T
otLT
ST
RTUT
S. T
otG.
Tot.
112
00
130
181
019
00
00
00
00
00
325
240
029
036
10
370
00
00
11
20
470
315
00
181
151
017
00
00
01
00
01
36
019
10
200
202
022
00
00
00
00
00
423
150
018
016
00
160
00
00
10
20
337
1285
10
981
105
50
111
00
00
03
14
08
217
Heav
y Veh
icles
Repr
esen
t
3.58%
of To
tal T
raffic
0800
-090
009
00-0
930
51
3To
tal
187
627
Cody Ave.
0
30
(C)
84
Cody
Ave
nue i
s one
way
south
boun
d.
Mont
real
Rd.
Mont
real
Rd.
Cody
Ave
.Ha
nnah
St.
East
boun
dW
estb
ound
North
boun
dSo
uthb
ound
1600
-170
017
00-1
800
Tota
lsCo
mm
ents
:
Tim
e Per
iod
0730
-080
0
88
109
(D)
111
Tota
l Hea
vy V
ehicl
es11
120
721
719
9Ap
proa
chin
g In
ters
ectio
n98
(A+B
+C+D
)
98(B
)
Cody
Ave
nue/H
anna
h St
reet
& M
ontre
al Ro
adVa
nier
, ON
Hannah St.
Tues
day,
26 N
ovem
ber 2
019
2507
30-0
930 &
1600
-180
0(A
)8
174
Hour
Sur
vey
City
of O
ttawa
War
d ►
128
Mont
real
Rd.
Mont
real
Rd.
All P
edes
trian
Cro
ssin
gs
84
51
Hea
vy V
ehic
les
(Con
struc
tion V
ehicl
es, H
eavy
Tr
ucks
, Bus
es &
Sch
ool B
uses
). He
avy v
ehicl
e tot
als A
RE
inclu
ded i
n th
e all v
ehicl
es
sum
mar
y and
flow
diag
ram
s.
187
Prin
ted
on: 1
2/11
/201
9Pr
epar
ed b
y: th
etra
ffics
peci
alis
t@gm
ail.c
omSu
mm
ary:
Hea
vy V
ehic
les
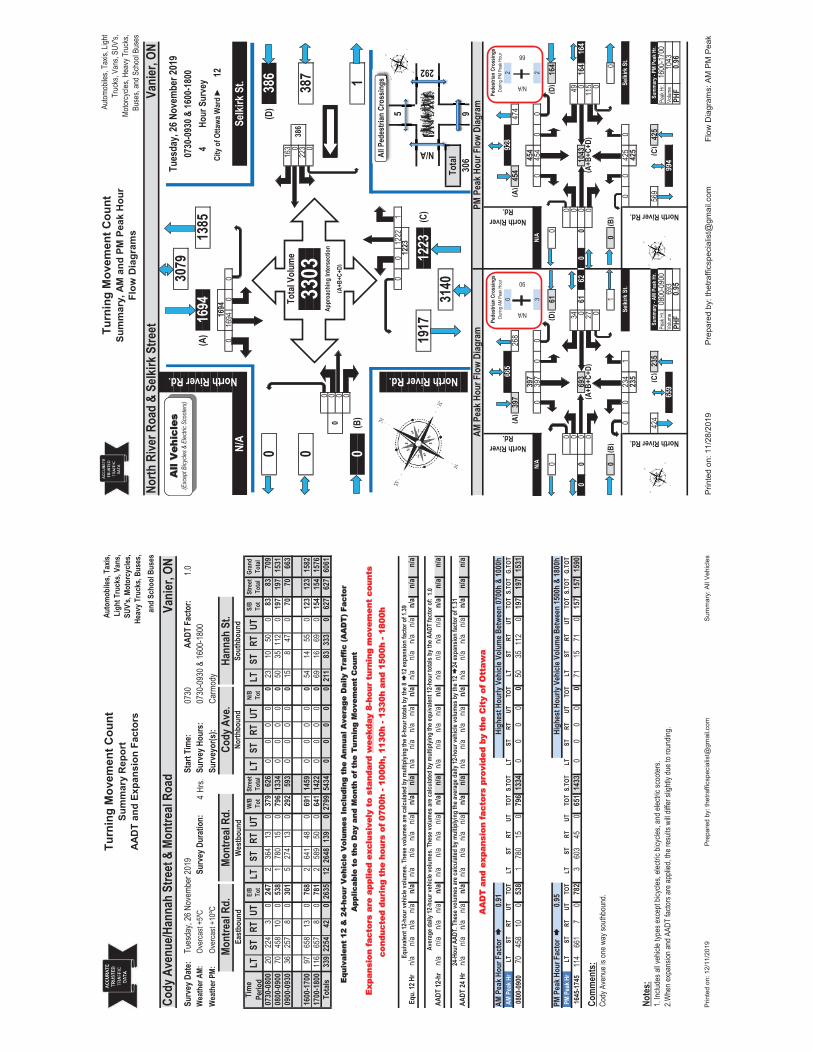
Turn
ing
Mov
emen
t Cou
ntSu
mm
ary
Rep
ort
AAD
T an
d Ex
pans
ion
Fact
ors
Auto
mob
iles,
Taxis
,Li
ght T
ruck
s, Va
ns,
SUV'
s, Mo
torc
ycles
,He
avy T
ruck
s, Bu
ses,
and
Scho
ol B
uses
1.04
Hrs.
Tim
e Pe
riod
LTST
RTUT
E/B
Tot
LTST
RTUT
W/B
To
tSt
reet
To
tal
LTST
RTUT
N/B
Tot
LT
STRT
UTS/
B To
tSt
reet
To
tal
Gran
d To
tal
0730
-080
020
224
30
247
236
413
037
962
60
00
00
2310
500
8383
709
0800
-090
070
458
100
538
178
015
079
613
340
00
00
5035
112
019
719
715
3109
00-0
930
3625
78
030
15
274
130
292
593
00
00
015
847
070
7066
3
1600
-170
097
658
130
768
264
148
069
114
590
00
00
5414
550
123
123
1582
1700
-180
011
665
78
078
12
589
500
641
1422
00
00
069
1669
015
415
415
76To
tals
339
2254
420
2635
1226
4813
90
2799
5434
00
00
021
183
333
062
762
760
61
Equ.
12 H
rn/a
n/an/a
n/an/
an/a
n/an/a
n/an/
an/
an/a
n/an/a
n/an/
an/a
n/an/a
n/an/
an/
an/
a
1.0AA
DT 12
-hr
n/an/a
n/an/a
n/a
n/an/a
n/an/a
n/a
n/a
n/an/a
n/an/a
n/a
n/an/a
n/an/a
n/a
n/a
n/a
AADT
24 H
rn/a
n/an/a
n/an/
an/a
n/an/a
n/an/
an/
an/a
n/an/a
n/an/
an/a
n/an/a
n/an/
an/
an/
a
AM P
eak H
rLT
STRT
UTTO
TLT
STRT
UTTO
TS.
TOT
LTST
RTUT
TOT
LTST
RTUT
TOT
S.TO
TG.
TOT
0800
-090
070
458
100
538
178
015
079
613
340
00
00
5035
112
019
719
715
31
PM P
eak H
rLT
STRT
UTTO
TLT
STRT
UTTO
TS.
TOT
LTST
RTUT
TOT
LTST
RTUT
TOT
S.TO
TG.
TOT
1645
-174
511
466
17
078
23
603
450
651
1433
00
00
071
1571
015
715
715
90
Note
s:
East
boun
dW
estb
ound
North
boun
dSo
uthb
ound
24-H
our A
ADT.
The
se vo
lum
es ar
e calc
ulat
ed b
y mul
tiplyi
ng th
e ave
rage
dail
y 12-
hour
vehi
cle vo
lum
es b
y the
12
24 ex
pans
ion
fact
or o
f 1.31
EEqu
ival
ent
12 &
24-
hour
Veh
icle
Vol
umes
Inc
ludi
ng t
he A
nnua
l Ave
rage
Dai
ly T
raff
ic (
AA
DT
) Fa
ctor
AA
pplic
able
to
the
Day
and
Mon
th o
f th
e T
urni
ng M
ovem
ent
Cou
nt
Exp
ansi
on f
acto
rs a
re a
pplie
d ex
clus
ivel
y to
sta
ndar
d w
eekd
ay 8
-hou
r tu
rnin
g m
ovem
ent
coun
ts
cond
ucte
d du
ring
the
hou
rs o
f 07
00h
- 100
0h, 1
130h
- 13
30h
and
1500
h - 1
800h
Equi
valen
t 12-
hour
vehi
cle vo
lum
es. T
hese
volu
mes
are c
alcul
ated
by m
ultip
lying
the 8
-hou
r tot
als b
y the
8 12
expa
nsio
n fa
ctor
of 1
.39
2.Whe
n exp
ansio
n and
AAD
T fac
tors a
re ap
plied
, the r
esult
s will
differ
sligh
tly du
e to r
ound
ing.
PM P
eak H
our F
acto
r Hi
ghes
t Hou
rly V
ehicl
e Vol
ume B
etwe
en 15
00h
& 18
00h
Com
men
ts:
Cody
Ave
nue i
s one
way
south
boun
d.
0.91
0.95
Aver
age d
aily 1
2-ho
ur ve
hicle
volu
mes
. The
se vo
lum
es ar
e calc
ulat
ed b
y mul
tiplyi
ng th
e equ
ivalen
t 12-
hour
tota
ls by
the A
ADT
fact
or o
f:
1. Inc
ludes
all v
ehicl
e typ
es ex
cept
bicyc
les, e
lectric
bicy
cles,
and e
lectric
scoo
ters.
AM P
eak H
our F
acto
r Hi
ghes
t Hou
rly V
ehicl
e Vol
ume B
etwe
en 07
00h
& 10
00h
AAA
DT
and
exp
ansi
on f
acto
rs p
rovi
ded
by t
he C
ity
of O
ttaw
a
Cody
Ave
nue/H
anna
h St
reet
& M
ontre
al Ro
adVa
nier
, ON
Surv
ey D
ate:
Tu
esda
y, 26
Nov
embe
r 201
9St
art T
ime:
0730
AADT
Fac
tor:
Hann
ah S
t.Ov
erca
st +1
0ºC
Wea
ther
PM:
Wea
ther
AM:
Over
cast
+5ºC
Surv
ey D
urat
ion:
Surv
ey H
ours
:07
30-0
930 &
1600
-180
0Su
rvey
or(s
):Ca
rmod
yMo
ntre
al Rd
.Mo
ntre
al Rd
.Co
dy A
ve.
Prin
ted
on: 1
2/11
/201
9Pr
epar
ed b
y: th
etra
ffics
peci
alis
t@gm
ail.c
omSu
mm
ary:
All
Vehi
cles
Turn
ing
Mov
emen
t Cou
ntSu
mm
ary,
AM
and
PM
Pea
k H
our
Flow
Dia
gram
s
Autom
obile
s, Ta
xis, L
ight
Truc
ks, V
ans,
SUV'
s,Mo
torcy
cles,
Heav
y Tru
cks,
Buse
s, an
d Sch
ool B
uses
016
940
0
163 0
223 0
0 0 0 0
00
1222
15
02
(A)
397
268
(A)
454
474
397
454
039
70
03
045
40
02
0(D
)61
0(D
)16
4
00
034
049
00
069
30
6162
00
010
430
164
164
027
011
50
0
0(B
)1
0(B
)0
00
234
10
042
50
235
425
424
(C)
235
569
(C)
425
Peak
Hr.
Peak
Hr.
Volum
eVo
lume
PHF
PHF
Selki
rk S
t.
North
Rive
r Roa
d &
Selki
rk S
treet
Vani
er, O
N
North River Rd.
Tues
day,
26 N
ovem
ber 2
019
3079
0730
-093
0 & 16
00-1
800
(A)
1694
1385
4Ho
ur S
urve
yCi
ty o
f Otta
wa W
ard ►
1216
94
N/A
1
0(D
)38
6To
tal V
olum
e38
60
3303
387
Appr
oach
ing
Inte
rsec
tion
0(A
+B+C
+D)
0(B
)
AM P
eak H
our F
low
Diag
ram
PM P
eak H
our F
low
Diag
ram
North River Rd.
1223
1917
1223
(C)
N/A
292
3140
Tota
l30
69
North River Rd.
665
N/A
N/A
(A+B
+C+D
)
Selki
rk S
t.
(A+B
+C+D
)
659
693
994
North River Rd.
North River Rd.
928
N/A
90
1043
0.95
0.96
North River Rd.
Selki
rk S
t.
Sum
mar
y - A
M Pe
ak H
r.Su
mm
ary -
PM
Peak
Hr.
0800
-090
016
00-1
700
N/A
66
Pede
stria
n Cr
ossin
gsPe
dest
rian
Cros
sings
Durin
g AM
Peak
Hou
rDu
ring P
M Pe
ak H
our
All P
edes
trian
Cro
ssin
gs
292
All
Veh
icle
s (E
xcep
t Bicy
cles &
Elec
tric S
coot
ers)
9
Prin
ted
on: 1
1/28
/201
9Pr
epar
ed b
y: th
etra
ffics
peci
alis
t@gm
ail.c
omFl
ow D
iagr
ams:
AM
PM
Pea
k
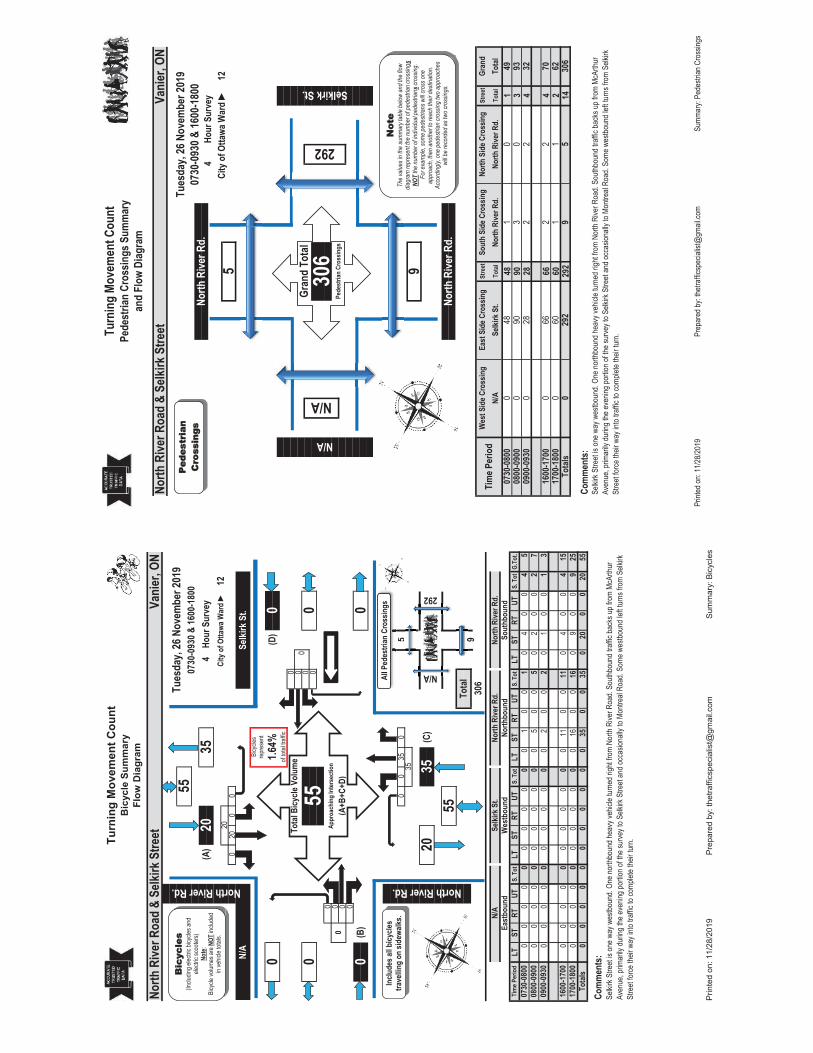
Turn
ing
Mov
emen
t Cou
ntB
icyc
le S
umm
ary
Flow
Dia
gram
020
00
0 0 0 0
0 0 0 0
00
350
5
LTST
RTUT
S. T
otLT
STRT
UTS.
Tot
LTST
RTUT
S. T
otLT
ST
RTUT
S. T
otG.
Tot.
00
00
00
00
00
01
00
10
40
04
50
00
00
00
00
00
50
05
02
00
27
00
00
00
00
00
02
00
20
10
01
3
00
00
00
00
00
011
00
110
40
04
150
00
00
00
00
00
160
016
09
00
925
00
00
00
00
00
035
00
350
200
020
55
0730
-080
0
292
East
boun
dW
estb
ound
North
boun
dSo
uthb
ound
Tim
e Per
iod
55To
tal
930
6N/
ASe
lkirk
St.
North
Rive
r Rd.
North
Rive
r Rd.
North River Rd.
1700
-180
0To
tals
Com
men
ts:
Selki
rk St
reet
is on
e way
wes
tboun
d. On
e nor
thbou
nd he
avy v
ehicl
e tur
ned r
ight fr
om N
orth
Rive
r Roa
d. So
uthbo
und t
raffic
back
s up f
rom
McAr
thur
Aven
ue, p
rimar
ily du
ring t
he ev
ening
portio
n of th
e sur
vey t
o Selk
irk S
treet
and o
ccas
ionall
y to M
ontre
al Ro
ad. S
ome w
estbo
und l
eft tu
rns f
rom
Selki
rk St
reet
force
their
way
into
traffic
to co
mplet
e the
ir tur
n.
0800
-090
009
00-0
930
1600
-170
0
N/A
of tot
al tra
ffic1.6
4%
35
2035
(C)
N/A
Selki
rk S
t. 0
0(D
)0
Tota
l Bicy
cle V
olum
e0
055
0Ap
proa
chin
g In
ters
ectio
n0
(A+B
+C+D
)
0(B
)
repr
esen
tBi
cycle
s
North
Rive
r Roa
d &
Selki
rk S
treet
Vani
er, O
NNorth River Rd.
Tues
day,
26 N
ovem
ber 2
019
5507
30-0
930 &
1600
-180
0(A
)20
354
Hour
Sur
vey
City
of O
ttawa
War
d ►
1220
N/A
292
Bic
ycle
s (In
cludin
g elec
tric b
icycle
s and
ele
ctric
scoo
ters)
Note
: Bi
cycle
volum
es ar
e NOT
inclu
ded
in ve
hicle
totals
.
Inclu
des a
ll bicy
cles
trave
lling
on si
dewa
lks.
All P
edes
trian
Cro
ssin
gs
9
Prin
ted
on: 1
1/28
/201
9Pr
epar
ed b
y: th
etra
ffics
peci
alis
t@gm
ail.c
omSu
mm
ary:
Bic
ycle
s
Turn
ing
Move
men
t Cou
ntPe
dest
rian
Cros
sings
Sum
mar
yan
d Fl
ow D
iagra
m
Stre
etSt
reet
Tota
lTo
tal
481
903
284
664
602
292
14
028
62
Com
men
ts:
Tota
ls0
292
95
306
1700
-180
00
601
170
1600
-170
00
662
2
22
9307
30-0
800
048
10
4908
00-0
900
090
30
3209
00-0
930
Tota
lTi
me P
erio
dW
est S
ide C
ross
ing
East
Sid
e Cro
ssin
gSo
uth
Side
Cro
ssin
gNo
rth S
ide C
ross
ing
Gran
dN/
ASe
lkirk
St.
North
Rive
r Rd.
North
Rive
r Rd.
5
N/A
Selkirk St.
Gran
d To
tal
N/A
292
306
Pede
stria
n Cr
ossin
gs
Selki
rk St
reet
is on
e way
wes
tboun
d. On
e nor
thbou
nd he
avy v
ehicl
e tur
ned r
ight fr
om N
orth
Rive
r Roa
d. So
uthbo
und t
raffic
back
s up f
rom
McAr
thur
Aven
ue, p
rimar
ily du
ring t
he ev
ening
portio
n of th
e sur
vey t
o Selk
irk S
treet
and o
ccas
ionall
y to M
ontre
al Ro
ad. S
ome w
estbo
und l
eft tu
rns f
rom
Selki
rk St
reet
force
their
way
into
traffic
to co
mplet
e the
ir tur
n.
North
Rive
r Roa
d &
Selki
rk S
treet
Vani
er, O
NTu
esda
y, 26
Nov
embe
r 201
907
30-0
930 &
1600
-180
0No
rth R
iver R
d.4
Hour
Sur
vey
9
North
Rive
r Rd.
City
of O
ttawa
War
d ►
12
Ped
estr
ian
C Cro
ssin
gs
Not
e Th
e valu
es in
the
sum
mar
y tab
le be
low an
d the
flow
diagr
am re
pres
ent th
e num
ber o
f ped
estria
n cro
ssings
NOT
the n
umbe
r of in
dividu
al pe
destr
ians c
ross
ing.
For
exam
ple, s
ome p
edes
trians
will
cross
one
ap
proa
ch, th
en an
othe
r to
reac
h the
ir des
tinat
ion.
Acco
rding
ly, on
e ped
estria
n cro
ssing
two a
ppro
ache
s wi
ll be r
ecor
ded a
s two
cros
sings
.
ed on
: 11/2
8/201
9Pr
epar
ed by
: thetr
affics
pecia
list@
gmail
.com
Summ
ary:
Pede
strian
Cro
ssing
s
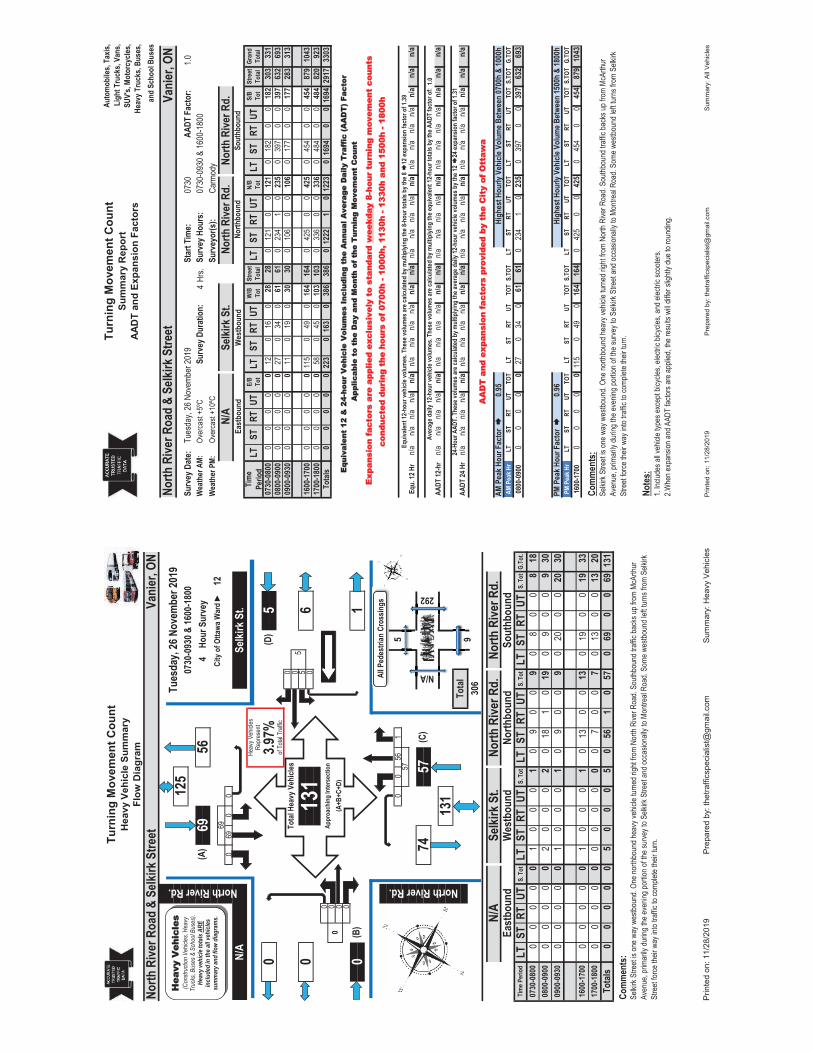
Turn
ing
Mov
emen
t Cou
ntH
eavy
Veh
icle
Sum
mar
yFl
ow D
iagr
am
069
00
0 0 5 0
0 0 0 0
00
561
5
LTST
RTUT
S. T
otLT
STRT
UTS.
Tot
LTST
RTUT
S. T
otLT
ST
RTUT
S. T
otG.
Tot.
00
00
01
00
01
09
00
90
80
08
180
00
00
20
00
20
181
019
09
00
930
00
00
01
00
01
09
00
90
200
020
30
00
00
01
00
01
013
00
130
190
019
330
00
00
00
00
00
70
07
013
00
1320
00
00
05
00
05
056
10
570
690
069
131
Heav
y Veh
icles
Repr
esen
t
3.97%
of To
tal T
raffic
0800
-090
009
00-0
930
29213
1To
tal
930
6
North River Rd.
57
7457
(C)
N/A
Selki
rk St
reet
is on
e way
wes
tboun
d. On
e nor
thbou
nd he
avy v
ehicl
e tur
ned r
ight fr
om N
orth
Rive
r Roa
d. So
uthbo
und t
raffic
back
s up f
rom
McAr
thur
Aven
ue, p
rimar
ily du
ring t
he ev
ening
portio
n of th
e sur
vey t
o Selk
irk S
treet
and o
ccas
ionall
y to M
ontre
al Ro
ad. S
ome w
estbo
und l
eft tu
rns f
rom
Selki
rk St
reet
force
their
way
into
traffic
to co
mplet
e the
ir tur
n.
N/A
Selki
rk S
t.No
rth R
iver R
d.No
rth R
iver R
d.Ea
stbo
und
Wes
tbou
ndNo
rthbo
und
Sout
hbou
nd
1600
-170
017
00-1
800
Tota
lsCo
mm
ents
:
Tim
e Per
iod
0730
-080
0
1
0(D
)5
Tota
l Hea
vy V
ehicl
es5
013
16
Appr
oach
ing
Inte
rsec
tion
0(A
+B+C
+D)
0(B
)
North
Rive
r Roa
d &
Selki
rk S
treet
Vani
er, O
NNorth River Rd.
Tues
day,
26 N
ovem
ber 2
019
125
0730
-093
0 & 16
00-1
800
(A)
6956
4Ho
ur S
urve
yCi
ty o
f Otta
wa W
ard ►
1269
N/A
Selki
rk S
t.
All P
edes
trian
Cro
ssin
gs
N/A
292
Hea
vy V
ehic
les
(Con
struc
tion V
ehicl
es, H
eavy
Tr
ucks
, Bus
es &
Sch
ool B
uses
). He
avy v
ehicl
e tot
als A
RE
inclu
ded i
n th
e all v
ehicl
es
sum
mar
y and
flow
diag
ram
s.
9
Prin
ted
on: 1
1/28
/201
9Pr
epar
ed b
y: th
etra
ffics
peci
alis
t@gm
ail.c
omSu
mm
ary:
Hea
vy V
ehic
les
Turn
ing
Mov
emen
t Cou
ntSu
mm
ary
Rep
ort
AAD
T an
d Ex
pans
ion
Fact
ors
Auto
mob
iles,
Taxis
,Li
ght T
ruck
s, Va
ns,
SUV'
s, Mo
torc
ycles
,He
avy T
ruck
s, Bu
ses,
and
Scho
ol B
uses
1.04
Hrs.
Tim
e Pe
riod
LTST
RTUT
E/B
Tot
LTST
RTUT
W/B
To
tSt
reet
To
tal
LTST
RTUT
N/B
Tot
LT
STRT
UTS/
B To
tSt
reet
To
tal
Gran
d To
tal
0730
-080
00
00
00
120
160
2828
012
10
012
10
182
00
182
303
331
0800
-090
00
00
00
270
340
6161
023
41
023
50
397
00
397
632
693
0900
-093
00
00
00
110
190
3030
010
60
010
60
177
00
177
283
313
1600
-170
00
00
00
115
049
016
416
40
425
00
425
045
40
045
487
910
4317
00-1
800
00
00
058
045
010
310
30
336
00
336
048
40
048
482
092
3To
tals
00
00
022
30
163
038
638
60
1222
10
1223
016
940
016
9429
1733
03
Equ.
12 H
rn/a
n/an/a
n/an/
an/a
n/an/a
n/an/
an/
an/a
n/an/a
n/an/
an/a
n/an/a
n/an/
an/
an/
a
1.0AA
DT 12
-hr
n/an/a
n/an/a
n/a
n/an/a
n/an/a
n/a
n/a
n/an/a
n/an/a
n/a
n/an/a
n/an/a
n/a
n/a
n/a
AADT
24 H
rn/a
n/an/a
n/an/
an/a
n/an/a
n/an/
an/
an/a
n/an/a
n/an/
an/a
n/an/a
n/an/
an/
an/
a
AM P
eak H
rLT
STRT
UTTO
TLT
STRT
UTTO
TS.
TOT
LTST
RTUT
TOT
LTST
RTUT
TOT
S.TO
TG.
TOT
0800
-090
00
00
00
270
340
6161
023
41
023
50
397
00
397
632
693
PM P
eak H
rLT
STRT
UTTO
TLT
STRT
UTTO
TS.
TOT
LTST
RTUT
TOT
LTST
RTUT
TOT
S.TO
TG.
TOT
1600
-170
00
00
00
115
049
016
416
40
425
00
425
045
40
045
487
910
43
Note
s:
East
boun
dW
estb
ound
North
boun
dSo
uthb
ound
24-H
our A
ADT.
The
se vo
lum
es ar
e calc
ulat
ed b
y mul
tiplyi
ng th
e ave
rage
dail
y 12-
hour
vehi
cle vo
lum
es b
y the
12
24 ex
pans
ion
fact
or o
f 1.31
EEqu
ival
ent
12 &
24-
hour
Veh
icle
Vol
umes
Inc
ludi
ng t
he A
nnua
l Ave
rage
Dai
ly T
raff
ic (
AA
DT
) Fa
ctor
AA
pplic
able
to
the
Day
and
Mon
th o
f th
e T
urni
ng M
ovem
ent
Cou
nt
Exp
ansi
on f
acto
rs a
re a
pplie
d ex
clus
ivel
y to
sta
ndar
d w
eekd
ay 8
-hou
r tu
rnin
g m
ovem
ent
coun
ts
cond
ucte
d du
ring
the
hou
rs o
f 07
00h
- 100
0h, 1
130h
- 13
30h
and
1500
h - 1
800h
Equi
valen
t 12-
hour
vehi
cle vo
lum
es. T
hese
volu
mes
are c
alcul
ated
by m
ultip
lying
the 8
-hou
r tot
als b
y the
8 12
expa
nsio
n fa
ctor
of 1
.39
2.Whe
n exp
ansio
n and
AAD
T fac
tors a
re ap
plied
, the r
esult
s will
differ
sligh
tly du
e to r
ound
ing.
PM P
eak H
our F
acto
r Hi
ghes
t Hou
rly V
ehicl
e Vol
ume B
etwe
en 15
00h
& 18
00h
Com
men
ts:
Selki
rk St
reet
is on
e way
wes
tboun
d. On
e nor
thbou
nd he
avy v
ehicl
e tur
ned r
ight fr
om N
orth
Rive
r Roa
d. So
uthbo
und t
raffic
back
s up f
rom
McAr
thur
Aven
ue, p
rimar
ily du
ring t
he ev
ening
portio
n of th
e sur
vey t
o Selk
irk S
treet
and o
ccas
ionall
y to M
ontre
al Ro
ad. S
ome w
estbo
und l
eft tu
rns f
rom
Selki
rk St
reet
force
their
way
into
traffic
to co
mplet
e the
ir tur
n.
0.95
0.96
Aver
age d
aily 1
2-ho
ur ve
hicle
volu
mes
. The
se vo
lum
es ar
e calc
ulat
ed b
y mul
tiplyi
ng th
e equ
ivalen
t 12-
hour
tota
ls by
the A
ADT
fact
or o
f:
1. Inc
ludes
all v
ehicl
e typ
es ex
cept
bicyc
les, e
lectric
bicy
cles,
and e
lectric
scoo
ters.
AM P
eak H
our F
acto
r Hi
ghes
t Hou
rly V
ehicl
e Vol
ume B
etwe
en 07
00h
& 10
00h
AAA
DT
and
exp
ansi
on f
acto
rs p
rovi
ded
by t
he C
ity
of O
ttaw
a
North
Rive
r Roa
d &
Selki
rk S
treet
Vani
er, O
NSu
rvey
Dat
e:
Tues
day,
26 N
ovem
ber 2
019
Star
t Tim
e:07
30AA
DT F
acto
r:
North
Rive
r Rd.
Over
cast
+10º
CW
eath
er P
M:W
eath
er A
M:Ov
erca
st +5
ºCSu
rvey
Dur
atio
n:Su
rvey
Hou
rs:
0730
-093
0 & 16
00-1
800
Surv
eyor
(s):
Carm
ody
N/A
Selki
rk S
t.No
rth R
iver R
d.
Prin
ted
on: 1
1/28
/201
9Pr
epar
ed b
y: th
etra
ffics
peci
alis
t@gm
ail.c
omSu
mm
ary:
All
Vehi
cles
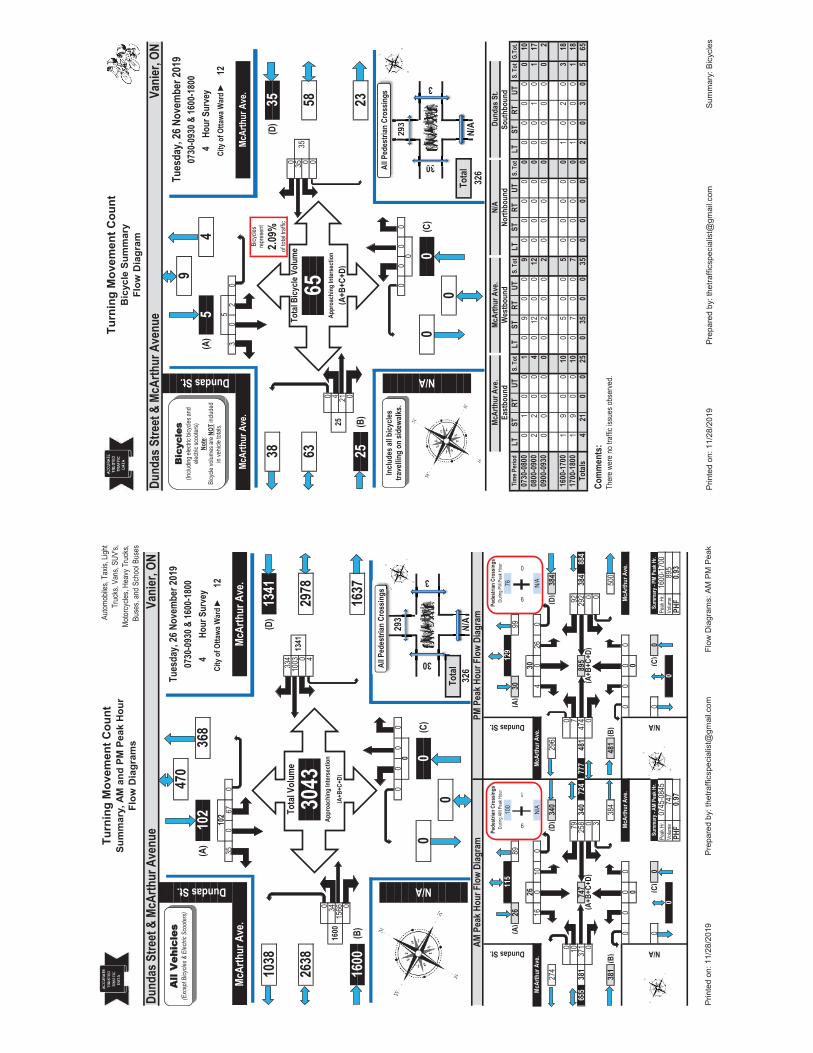
Turn
ing
Mov
emen
t Cou
ntSu
mm
ary,
AM
and
PM
Pea
k H
our
Flow
Dia
gram
s
Autom
obile
s, Ta
xis, L
ight
Truc
ks, V
ans,
SUV'
s,Mo
torcy
cles,
Heav
y Tru
cks,
Buse
s, an
d Sch
ool B
uses
350
670
334
1003 0 4
0 3415
66 0
00
00
293
100
76(A
)26
89(A
)30
99
2630
160
100
N/A
40
260
N/A
274
(D)
340
296
(D)
384
00
1079
792
655
381
371
747
258
340
724
777
481
474
895
292
384
884
00
00
30
381
(B)
384
481
(B)
500
00
00
00
00
00
0(C
)0
0(C
)0
Peak
Hr.
Peak
Hr.
Volum
eVo
lume
PHF
PHF
9
0Pe
dest
rian
Cros
sings
Pede
stria
n Cr
ossin
gsDu
ring A
M Pe
ak H
our
Durin
g PM
Peak
Hou
r
895
0.97
0.93
N/A
McAr
thur
Ave
.
Sum
mar
y - A
M Pe
ak H
r.Su
mm
ary -
PM
Peak
Hr.
0745
-084
516
00-1
700
N/A
115
McAr
thur
Ave
.Mc
Arth
ur A
ve.
(A+B
+C+D
)
McAr
thur
Ave
.
(A+B
+C+D
)
074
70
Dundas St.
Dundas St.
129
9
1
AM P
eak H
our F
low
Diag
ram
PM P
eak H
our F
low
Diag
ram
N/A
0
00
(C)
30
3
0To
tal
326
N/A
1637
1038
(D)
1341
Tota
l Vol
ume
1341
2638
3043
2978
Appr
oach
ing
Inte
rsec
tion
1600
(A+B
+C+D
)
1600
(B)
McAr
thur
Ave
.
Dund
as S
treet
& M
cArth
ur A
venu
eVa
nier
, ON
Dundas St.Tu
esda
y, 26
Nov
embe
r 201
947
007
30-0
930 &
1600
-180
0(A
)10
236
84
Hour
Sur
vey
City
of O
ttawa
War
d ►
1210
2
McAr
thur
Ave
.
All P
edes
trian
Cro
ssin
gs
3
All
Veh
icle
s (E
xcep
t Bicy
cles &
Elec
tric S
coot
ers)
N/A
Prin
ted
on: 1
1/28
/201
9Pr
epar
ed b
y: th
etra
ffics
peci
alis
t@gm
ail.c
omFl
ow D
iagr
ams:
AM
PM
Pea
k
Turn
ing
Mov
emen
t Cou
ntB
icyc
le S
umm
ary
Flow
Dia
gram
30
20
0 35 0 0
0 4 21 0
00
00
293
LTST
RTUT
S. T
otLT
STRT
UTS.
Tot
LTST
RTUT
S. T
otLT
ST
RTUT
S. T
otG.
Tot.
01
00
10
90
09
00
00
00
00
00
102
20
04
012
00
120
00
00
00
10
117
00
00
00
20
02
00
00
00
00
00
2
19
00
100
50
05
00
00
01
02
03
181
90
010
07
00
70
00
00
10
00
118
421
00
250
350
035
00
00
02
03
05
65
repr
esen
tBi
cycle
s
Dund
as S
treet
& M
cArth
ur A
venu
eVa
nier
, ON
Dundas St.
Tues
day,
26 N
ovem
ber 2
019
907
30-0
930 &
1600
-180
0(A
)5
44
Hour
Sur
vey
City
of O
ttawa
War
d ►
125
McAr
thur
Ave
.Mc
Arth
ur A
ve.
23
38(D
)35
Tota
l Bicy
cle V
olum
e35
6365
58Ap
proa
chin
g In
ters
ectio
n25
(A+B
+C+D
)
25(B
)
30
of tot
al tra
ffic2.0
9%
0
00
(C)
1700
-180
0To
tals
Com
men
ts:
Ther
e wer
e no t
raffic
issu
es ob
serve
d.
0800
-090
009
00-0
930
1600
-170
0
0730
-080
0
3
East
boun
dW
estb
ound
North
boun
dSo
uthb
ound
Tim
e Per
iod
0To
tal
N/A
326
McAr
thur
Ave
.Mc
Arth
ur A
ve.
N/A
Dun
das S
t.
N/A
30
3
Bic
ycle
s (In
cludin
g elec
tric b
icycle
s and
ele
ctric
scoo
ters)
Note
: Bi
cycle
volum
es ar
e NOT
inclu
ded
in ve
hicle
totals
.
Inclu
des a
ll bicy
cles
trave
lling
on si
dewa
lks.
All P
edes
trian
Cro
ssin
gs
N/A
Prin
ted
on: 1
1/28
/201
9Pr
epar
ed b
y: th
etra
ffics
peci
alis
t@gm
ail.c
omSu
mm
ary:
Bic
ycle
s
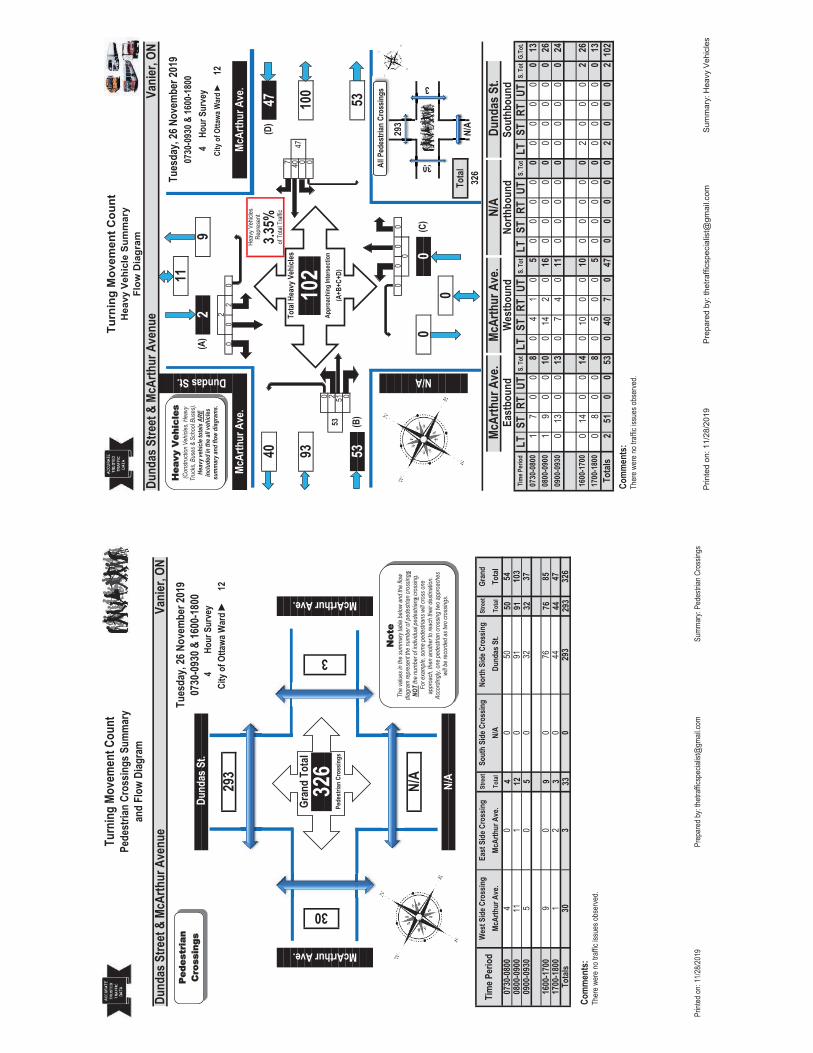
Turn
ing
Move
men
t Cou
ntPe
dest
rian
Cros
sings
Sum
mar
yan
d Fl
ow D
iagra
m
Stre
etSt
reet
Tota
lTo
tal
450
1291
532
976
344
3329
3
50
47
Com
men
ts:
Tota
ls30
30
293
326
1700
-180
01
20
4485
1600
-170
09
00
76
032
103
0730
-080
04
00
5054
0800
-090
011
10
9137
0900
-093
0
Tota
lTi
me P
erio
dW
est S
ide C
ross
ing
East
Sid
e Cro
ssin
gSo
uth
Side
Cro
ssin
gNo
rth S
ide C
ross
ing
Gran
dMc
Arth
ur A
ve.
McAr
thur
Ave
.N/
A D
unda
s St.
293
McArthur Ave.
McArthur Ave.
Gran
d To
tal
30
3
326
Pede
stria
n Cr
ossin
gs
Ther
e wer
e no t
raffic
issu
es ob
serve
d.
Dund
as S
treet
& M
cArth
ur A
venu
eVa
nier
, ON
Tues
day,
26 N
ovem
ber 2
019
0730
-093
0 & 16
00-1
800
Dun
das S
t.4
Hour
Sur
vey
N/A
N/A
City
of O
ttawa
War
d ►
12
Ped
estr
ian
C Cro
ssin
gs
Not
e Th
e valu
es in
the
sum
mar
y tab
le be
low an
d the
flow
diagr
am re
pres
ent th
e num
ber o
f ped
estria
n cro
ssings
NOT
the n
umbe
r of in
dividu
al pe
destr
ians c
ross
ing.
For
exam
ple, s
ome p
edes
trians
will
cross
one
ap
proa
ch, th
en an
othe
r to
reac
h the
ir des
tinat
ion.
Acco
rding
ly, on
e ped
estria
n cro
ssing
two a
ppro
ache
s wi
ll be r
ecor
ded a
s two
cros
sings
.
ed on
: 11/2
8/201
9Pr
epar
ed by
: thetr
affics
pecia
list@
gmail
.com
Summ
ary:
Pede
strian
Cro
ssing
s
Turn
ing
Mov
emen
t Cou
ntH
eavy
Veh
icle
Sum
mar
yFl
ow D
iagr
am
00
20
7 40 0 0
0 2 51 0
00
00
293
LTST
RTUT
S. T
otLT
STRT
UTS.
Tot
LTST
RTUT
S. T
otLT
ST
RTUT
S. T
otG.
Tot.
17
00
80
41
05
00
00
00
00
00
131
90
010
014
20
160
00
00
00
00
026
013
00
130
74
011
00
00
00
00
00
24
014
00
140
100
010
00
00
02
00
02
260
80
08
05
00
50
00
00
00
00
013
251
00
530
407
047
00
00
02
00
02
102
Dund
as S
treet
& M
cArth
ur A
venu
eVa
nier
, ON
Dundas St.
Tues
day,
26 N
ovem
ber 2
019
1107
30-0
930 &
1600
-180
0(A
)2
94
Hour
Sur
vey
City
of O
ttawa
War
d ►
122
McAr
thur
Ave
.Mc
Arth
ur A
ve.
53
40(D
)47
Tota
l Hea
vy V
ehicl
es47
9310
210
0Ap
proa
chin
g In
ters
ectio
n53
(A+B
+C+D
)
53(B
)
Ther
e wer
e no t
raffic
issu
es ob
serve
d.
McAr
thur
Ave
.Mc
Arth
ur A
ve.
N/A
Dun
das S
t.Ea
stbo
und
Wes
tbou
ndNo
rthbo
und
Sout
hbou
nd
1600
-170
017
00-1
800
Tota
lsCo
mm
ents
:
Tim
e Per
iod
0730
-080
0
0900
-093
0
3
0To
tal
N/A
326
N/A
0
00
(C)
30
Heav
y Veh
icles
Repr
esen
t
3.35%
of To
tal T
raffic
0800
-090
0
All P
edes
trian
Cro
ssin
gs
30
3
Hea
vy V
ehic
les
(Con
struc
tion V
ehicl
es, H
eavy
Tr
ucks
, Bus
es &
Sch
ool B
uses
). He
avy v
ehicl
e tot
als A
RE
inclu
ded i
n th
e all v
ehicl
es
sum
mar
y and
flow
diag
ram
s.
N/A
Prin
ted
on: 1
1/28
/201
9Pr
epar
ed b
y: th
etra
ffics
peci
alis
t@gm
ail.c
omSu
mm
ary:
Hea
vy V
ehic
les

Turn
ing
Mov
emen
t Cou
ntSu
mm
ary
Rep
ort
AAD
T an
d Ex
pans
ion
Fact
ors
Auto
mob
iles,
Taxis
,Li
ght T
ruck
s, Va
ns,
SUV'
s, Mo
torc
ycles
,He
avy T
ruck
s, Bu
ses,
and
Scho
ol B
uses
1.04
Hrs.
Tim
e Pe
riod
LTST
RTUT
E/B
Tot
LTST
RTUT
W/B
To
tSt
reet
To
tal
LTST
RTUT
N/B
Tot
LT
STRT
UTS/
B To
tSt
reet
To
tal
Gran
d To
tal
0730
-080
04
181
00
185
013
932
017
135
60
00
00
50
120
1717
373
0800
-090
015
354
00
369
025
892
335
372
20
00
00
110
130
2424
746
0900
-093
05
133
00
138
010
549
115
529
30
00
00
20
20
44
297
1600
-170
07
474
00
481
029
292
038
486
50
00
00
260
40
3030
895
1700
-180
03
424
00
427
020
969
027
870
50
00
00
230
40
2727
732
Tota
ls34
1566
00
1600
010
0333
44
1341
2941
00
00
067
035
010
210
230
43
Equ.
12 H
rn/a
n/an/a
n/an/
an/a
n/an/a
n/an/
an/
an/a
n/an/a
n/an/
an/a
n/an/a
n/an/
an/
an/
a
1.0AA
DT 12
-hr
n/an/a
n/an/a
n/a
n/an/a
n/an/a
n/a
n/a
n/an/a
n/an/a
n/a
n/an/a
n/an/a
n/a
n/a
n/a
AADT
24 H
rn/a
n/an/a
n/an/
an/a
n/an/a
n/an/
an/
an/a
n/an/a
n/an/
an/a
n/an/a
n/an/
an/
an/
a
AM P
eak H
rLT
STRT
UTTO
TLT
STRT
UTTO
TS.
TOT
LTST
RTUT
TOT
LTST
RTUT
TOT
S.TO
TG.
TOT
0745
-084
510
371
00
381
025
879
334
072
10
00
00
100
160
2626
747
PM P
eak H
rLT
STRT
UTTO
TLT
STRT
UTTO
TS.
TOT
LTST
RTUT
TOT
LTST
RTUT
TOT
S.TO
TG.
TOT
1600
-170
07
474
00
481
029
292
038
486
50
00
00
260
40
3030
895
Note
s:
East
boun
dW
estb
ound
North
boun
dSo
uthb
ound
24-H
our A
ADT.
The
se vo
lum
es ar
e calc
ulat
ed b
y mul
tiplyi
ng th
e ave
rage
dail
y 12-
hour
vehi
cle vo
lum
es b
y the
12
24 ex
pans
ion
fact
or o
f 1.31
EEqu
ival
ent
12 &
24-
hour
Veh
icle
Vol
umes
Inc
ludi
ng t
he A
nnua
l Ave
rage
Dai
ly T
raff
ic (
AA
DT
) Fa
ctor
AA
pplic
able
to
the
Day
and
Mon
th o
f th
e T
urni
ng M
ovem
ent
Cou
nt
Exp
ansi
on f
acto
rs a
re a
pplie
d ex
clus
ivel
y to
sta
ndar
d w
eekd
ay 8
-hou
r tu
rnin
g m
ovem
ent
coun
ts
cond
ucte
d du
ring
the
hou
rs o
f 07
00h
- 100
0h, 1
130h
- 13
30h
and
1500
h - 1
800h
Equi
valen
t 12-
hour
vehi
cle vo
lum
es. T
hese
volu
mes
are c
alcul
ated
by m
ultip
lying
the 8
-hou
r tot
als b
y the
8 12
expa
nsio
n fa
ctor
of 1
.39
2.Whe
n exp
ansio
n and
AAD
T fac
tors a
re ap
plied
, the r
esult
s will
differ
sligh
tly du
e to r
ound
ing.
PM P
eak H
our F
acto
r Hi
ghes
t Hou
rly V
ehicl
e Vol
ume B
etwe
en 15
00h
& 18
00h
Com
men
ts:
Ther
e wer
e no t
raffic
issu
es ob
serve
d.
0.97
0.93
Aver
age d
aily 1
2-ho
ur ve
hicle
volu
mes
. The
se vo
lum
es ar
e calc
ulat
ed b
y mul
tiplyi
ng th
e equ
ivalen
t 12-
hour
tota
ls by
the A
ADT
fact
or o
f:
1. Inc
ludes
all v
ehicl
e typ
es ex
cept
bicyc
les, e
lectric
bicy
cles,
and e
lectric
scoo
ters.
AM P
eak H
our F
acto
r Hi
ghes
t Hou
rly V
ehicl
e Vol
ume B
etwe
en 07
00h
& 10
00h
AAA
DT
and
exp
ansi
on f
acto
rs p
rovi
ded
by t
he C
ity
of O
ttaw
a
Dund
as S
treet
& M
cArth
ur A
venu
eVa
nier
, ON
Surv
ey D
ate:
Tu
esda
y, 26
Nov
embe
r 201
9St
art T
ime:
0730
AADT
Fac
tor:
Dun
das S
t.Ov
erca
st +1
0ºC
Wea
ther
PM:
Wea
ther
AM:
Over
cast
+5ºC
Surv
ey D
urat
ion:
Surv
ey H
ours
:07
30-0
930 &
1600
-180
0Su
rvey
or(s
):Me
rrett/M
ouss
eau
McAr
thur
Ave
.Mc
Arth
ur A
ve.
N/A
Prin
ted
on: 1
1/28
/201
9Pr
epar
ed b
y: th
etra
ffics
peci
alis
t@gm
ail.c
omSu
mm
ary:
All
Vehi
cles
Turn
ing
Mov
emen
t Cou
nt -
Full
Stud
y Pe
ak H
our D
iagr
am
Tra
nspo
rtat
ion
Serv
ices
- Tr
affic
Ser
vice
s
Star
t Tim
e:Su
rvey
Dat
e:
MA
RG
UER
ITE
AVE
@ M
CA
RTH
UR
AVE
07:0
0Tu
esda
y, M
arch
26,
201
9W
O N
o:38
444
Dev
ice:
Mio
visi
on
Peak
Hou
r:A
M P
erio
d
391
404
13
64
105
Tota
l
761
0
0
081
3
8
19338
19
0
3 000
1
9
4065
0
9
74
21
35
0 0
0 0
369
Car
s
EW
SN
Car
s
46395
03 361
8
3
444
1
3
Tota
l
3
12
45383
Com
men
ts
21
04
357
330
0 0
MC
AR
THU
R A
VE
MA
RG
UER
ITE
AVE
0
00
10
310
831
00
0
0
0
0
00
00
0
0
08:0
009
:00
Hea
vyVe
hicl
es
Hea
vyVe
hicl
es
Page
1 o
f 420
19-N
ov-2
2
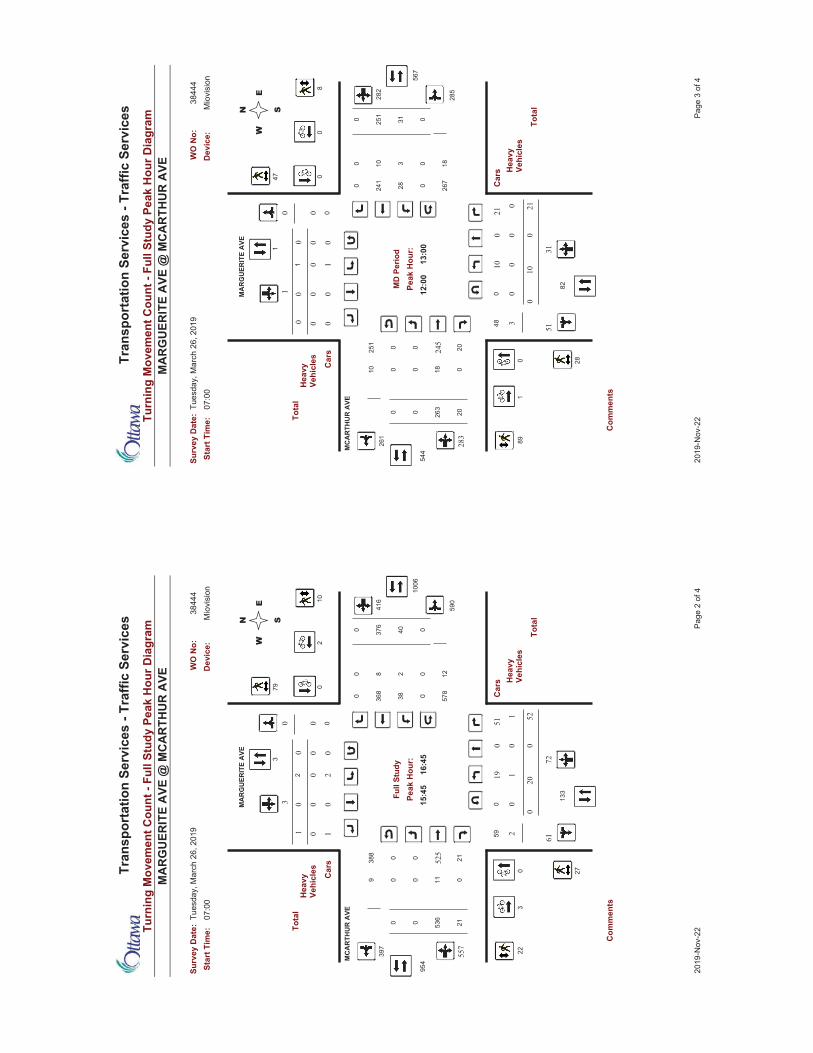
Turn
ing
Mov
emen
t Cou
nt -
Full
Stud
y Pe
ak H
our D
iagr
am
Tra
nspo
rtat
ion
Serv
ices
- Tr
affic
Ser
vice
s
Star
t Tim
e:Su
rvey
Dat
e:
MA
RG
UER
ITE
AVE
@ M
CA
RTH
UR
AVE
07:0
0Tu
esda
y, M
arch
26,
201
9W
O N
o:38
444
Dev
ice:
Mio
visi
on
Peak
Hou
r:Fu
ll St
udy
388
397
9
59
133
Tota
l
954
0
0
010
06
11
21536
21
0
0 003
2
20
7261
0
10
79
27
22
1 0
2 0
590
Car
s
EW
SN
Car
s
40376
00 578
12
0
416
2
3
Tota
l
0
8
38368
Com
men
ts
03
02
557
525
0 0
MC
AR
THU
R A
VE
MA
RG
UER
ITE
AVE
0
01
12
521
1951
00
0
0
0
0
00
00
0
0
15:4
516
:45
Hea
vyVe
hicl
es
Hea
vyVe
hicl
es
Page
2 o
f 420
19-N
ov-2
2
Turn
ing
Mov
emen
t Cou
nt -
Full
Stud
y Pe
ak H
our D
iagr
am
Tra
nspo
rtat
ion
Serv
ices
- Tr
affic
Ser
vice
s
Star
t Tim
e:Su
rvey
Dat
e:
MA
RG
UER
ITE
AVE
@ M
CA
RTH
UR
AVE
07:0
0Tu
esda
y, M
arch
26,
201
9W
O N
o:38
444
Dev
ice:
Mio
visi
on
Peak
Hou
r:M
D P
erio
d
251
261
10
48
82
Tota
l
544
0
0
056
7
18
20263
20
0
0 001
3
10
3151
0
8
47
28
89
0 0
1 0
285
Car
s
EW
SN
Car
s
31251
00 267
18
0
282
3
1
Tota
l
0
10
28241
Com
men
ts
01
00
283
245
0 0
MC
AR
THU
R A
VE
MA
RG
UER
ITE
AVE
0
00
01
210
1021
00
0
0
0
0
00
00
0
0
12:0
013
:00
Hea
vyVe
hicl
es
Hea
vyVe
hicl
es
Page
3 o
f 420
19-N
ov-2
2
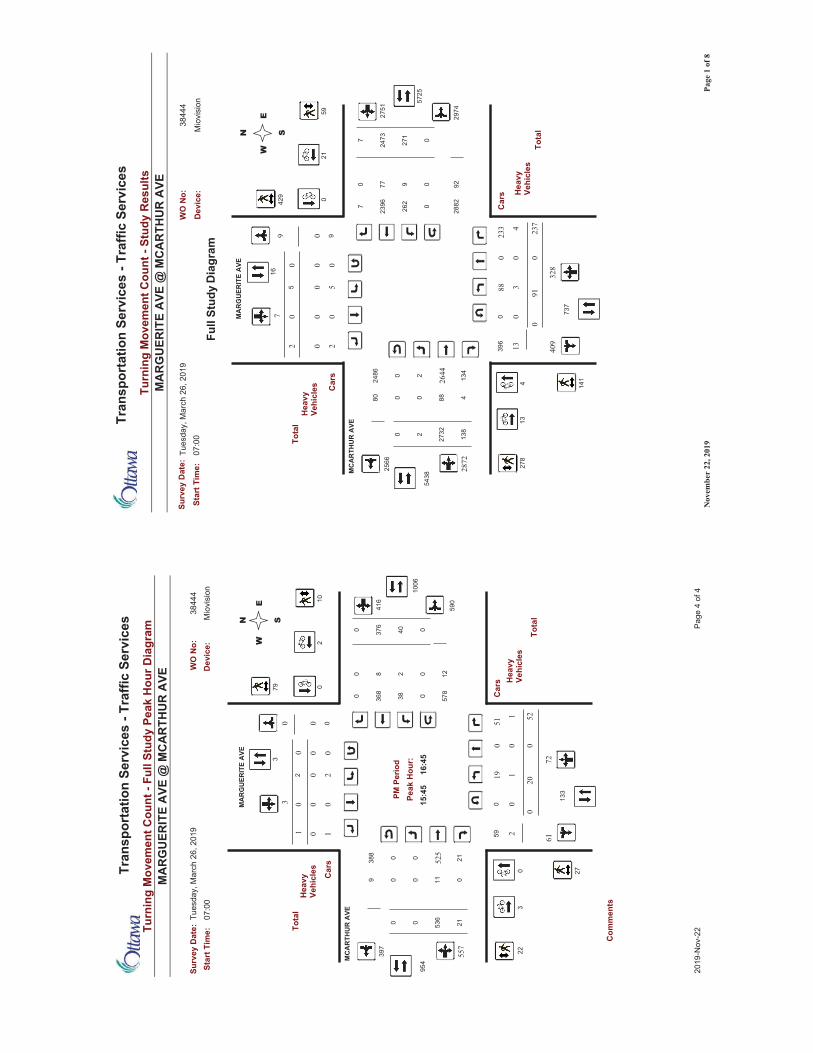
Turn
ing
Mov
emen
t Cou
nt -
Full
Stud
y Pe
ak H
our D
iagr
am
Tra
nspo
rtat
ion
Serv
ices
- Tr
affic
Ser
vice
s
Star
t Tim
e:Su
rvey
Dat
e:
MA
RG
UER
ITE
AVE
@ M
CA
RTH
UR
AVE
07:0
0Tu
esda
y, M
arch
26,
201
9W
O N
o:38
444
Dev
ice:
Mio
visi
on
Peak
Hou
r:PM
Per
iod
388
397
9
59
133
Tota
l
954
0
0
010
06
11
21536
21
0
0 003
2
20
7261
0
10
79
27
22
1 0
2 0
590
Car
s
EW
SN
Car
s
40376
00 578
12
0
416
2
3
Tota
l
0
8
38368
Com
men
ts
03
02
557
525
0 0
MC
AR
THU
R A
VE
MA
RG
UER
ITE
AVE
0
01
12
521
1951
00
0
0
0
0
00
00
0
0
15:4
516
:45
Hea
vyVe
hicl
es
Hea
vyVe
hicl
es
Page
4 o
f 420
19-N
ov-2
2
Turn
ing
Mov
emen
t Cou
nt -
Stud
y R
esul
ts
Tra
nspo
rtat
ion
Serv
ices
- Tr
affic
Ser
vice
s
07:0
0
Surv
ey D
ate:
MA
RG
UER
ITE
AVE
@ M
CA
RTH
UR
AVE
Star
t Tim
e:Tu
esda
y, M
arch
26,
201
9W
O N
o:
Dev
ice:
Mio
visi
on
3844
4
8024
86
254
38
396
2566
Tota
l
4
257
25
88
138
2732
134
0
737
79
0 0
40913
0
328
59
429
141
278
2 0
5 0
2974
Car
s
EW
SN
Hea
vyVe
hicl
es Car
s
271
2473
07
2882
92
7
2751
Tota
l
9
16
262
9
2396
77
91
Hea
vyVe
hicl
es4
13
021
0
2872
0 0
MA
RG
UER
ITE
AVE
2644
MC
AR
THU
R A
VE
02
35
2374
88233
0
0
00
00
00
00
0
0
Dia
gram
Full
Stud
y
Page
1 o
f 8N
ovem
ber
22, 2
019
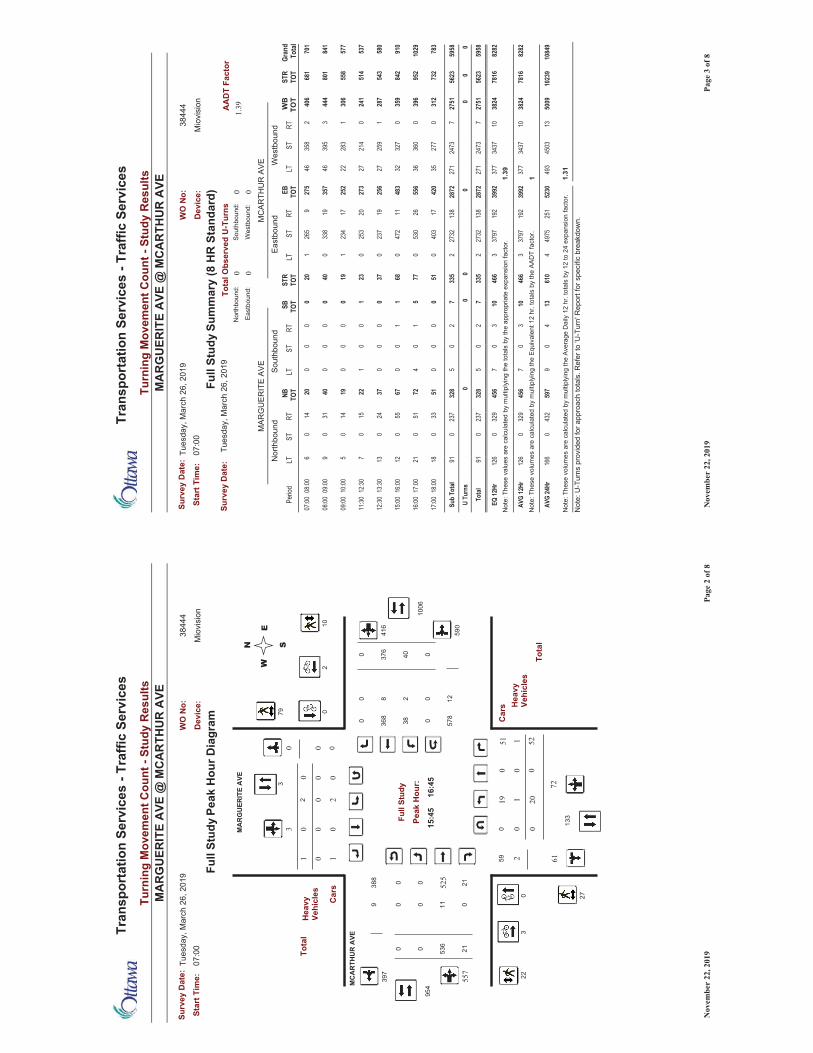
Turn
ing
Mov
emen
t Cou
nt -
Stud
y R
esul
ts
Tra
nspo
rtat
ion
Serv
ices
- Tr
affic
Ser
vice
s
07:0
0
Surv
ey D
ate:
MA
RG
UER
ITE
AVE
@ M
CA
RTH
UR
AVE
Star
t Tim
e:Tu
esda
y, M
arch
26,
201
9W
O N
o:
Dev
ice:
Mio
visi
on
3844
4
Car
s
N
Car
s
0
590
W
S
E
0
3
Tota
l
368
8
3820
0
403760
416
578
12
2
0
095
40 21536
1006
11
Tota
l
388
397
Peak
Hou
r:
Full
Stud
y
59
133
9
10
79
61
01 0
27
22
72
0 0
21
0
2
20
03
1
192
52
0
051
0
1
MC
AR
THU
R A
VE
0
01
MA
RG
UER
ITE
AVE
0
0
00
0
Hea
vyVe
hicl
es
Hea
vyVe
hicl
es
15:4
516
:450
0
0
0
0
03
0
0
557
525
2
Peak
Hou
r Dia
gram
Full
Stud
y
Page
2 o
f 8N
ovem
ber
22, 2
019
Turn
ing
Mov
emen
t Cou
nt -
Stud
y R
esul
ts
Tra
nspo
rtat
ion
Serv
ices
- Tr
affic
Ser
vice
s
07:0
0
Surv
ey D
ate:
MA
RG
UER
ITE
AVE
@ M
CA
RTH
UR
AVE
Star
t Tim
e:Tu
esda
y, M
arch
26,
201
9W
O N
o:
Dev
ice:
Mio
visi
on
3844
4
Sum
mar
y (8
HR
Sta
ndar
d)Fu
ll St
udy
0 00
AA
DT
Fact
orSu
rvey
Dat
e:0
Nor
thbo
und:
Sout
hbou
nd:
1.39
Tues
day,
Mar
ch 2
6, 2
019
Tota
l Obs
erve
d U
-Tur
ns
East
boun
d:W
estb
ound
:
MC
ARTH
UR
AVE
Nor
thbo
und
Sout
hbou
ndM
ARG
UER
ITE
AVE
East
boun
dGr
and
Tota
lST
RTO
TW
BTO
TRT
STLT
EB TOT
RTST
LTST
RTO
TSB TO
TRT
STLT
NB TOT
RTST
LTPe
riod
Wes
tbou
nd
701
681
406
235
846
275
926
51
200
00
020
140
608
:0007
:00
841
801
444
339
546
357
1933
80
400
00
040
310
909
:0008
:00
577
558
306
128
322
252
1723
41
190
00
019
140
510
:0009
:00
537
514
241
021
427
273
2025
30
231
00
122
150
712
:3011
:30
580
543
287
125
927
256
1923
70
370
00
037
240
1313
:3012
:30
910
842
359
032
732
483
1147
20
681
10
067
550
1216
:0015
:00
1029
952
396
036
036
556
2653
00
775
10
472
510
2117
:0016
:00
783
732
312
027
735
420
1740
30
510
00
051
330
1818
:0017
:00
5958
5623
2751
724
7327
128
7213
827
322
335
72
05
328
237
091
Sub
Tota
l
0U
Turn
s
5958
5623
2751
724
7327
128
7213
827
322
335
72
05
328
237
091
Tota
l
00
00
00
1N
ote:
The
se v
olum
es a
re c
alcu
late
d by
mul
tiply
ing
the
Equi
vale
nt 1
2 hr
. tot
als
by th
e AA
DT
fact
or.
1.31
Not
e: T
hese
vol
umes
are
cal
cula
ted
by m
ultip
lyin
g th
e Av
erag
e D
aily
12
hr. t
otal
s by
12
to 2
4 ex
pans
ion
fact
or.
1.39
1084
910
239
5009
1345
0349
352
3025
149
754
610
134
09
597
432
016
6AV
G 24
Hr
8282
7816
3824
1034
3737
739
9219
237
973
466
103
07
456
329
012
6AV
G 12
Hr
Not
e: T
hese
val
ues
are
calc
ulat
ed b
y m
ultip
lyin
g th
e to
tals
by
the
appr
opria
te e
xpan
sion
fact
or.
8282
7816
3824
1034
3737
739
9219
237
973
466
103
07
456
329
012
6EQ
12Hr
Not
e: U
-Tur
ns p
rovi
ded
for a
ppro
ach
tota
ls. R
efer
to 'U
-Tur
n' R
epor
t for
spe
cific
bre
akdo
wn.
Page
3 o
f 8N
ovem
ber
22, 2
019
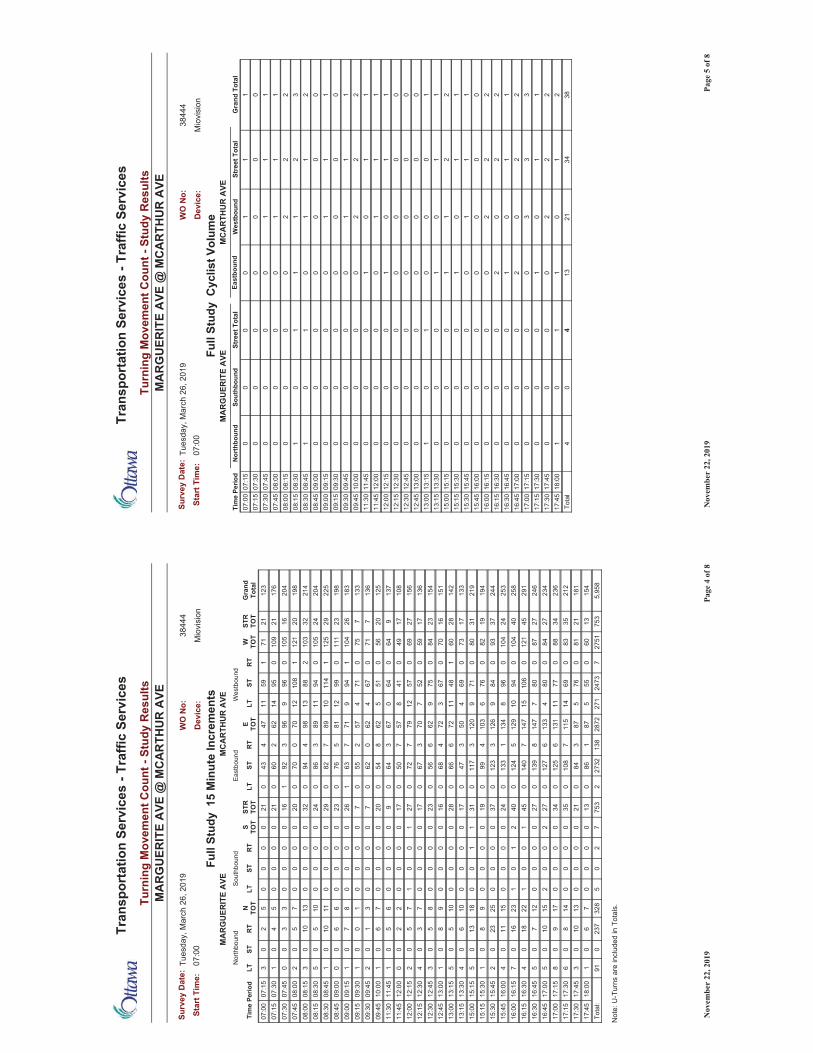
Turn
ing
Mov
emen
t Cou
nt -
Stud
y R
esul
ts
Tra
nspo
rtat
ion
Serv
ices
- Tr
affic
Ser
vice
s
07:0
0
Surv
ey D
ate:
MA
RG
UER
ITE
AVE
@ M
CA
RTH
UR
AVE
Star
t Tim
e:Tu
esda
y, M
arch
26,
201
9W
O N
o:
Dev
ice:
Mio
visi
on
3844
4
Gra
ndTo
tal
STR
TOT
W TOT
RT
STLT
E TOT
RT
STLT
STR
TOT
S TOT
RT
STLT
N TOT
RT
STLT
Tim
e Pe
riod
East
boun
dW
estb
ound
MA
RG
UER
ITE
AVE
MC
AR
THU
R A
VEN
orth
boun
dSo
uthb
ound
15
Min
ute
Incr
emen
tsFu
ll St
udy
123
2171
159
1147
443
021
00
00
52
03
07:1
507
:00
176
2110
90
9514
622
600
210
00
05
40
107
:30
07:1
520
416
105
096
996
392
116
00
00
33
00
07:4
507
:30
198
2012
11
108
1270
070
020
00
00
75
02
08:0
007
:45
214
3210
32
8813
984
940
320
00
013
100
308
:15
08:0
020
424
105
094
1189
386
024
00
00
105
05
08:3
008
:15
225
2912
51
114
1089
782
029
00
00
1110
01
08:4
508
:30
198
2311
10
9912
815
760
230
00
06
60
009
:00
08:4
518
326
104
194
971
763
126
00
00
87
01
09:1
509
:00
133
775
071
457
255
07
00
00
10
01
09:3
009
:15
136
771
067
462
062
07
00
00
31
02
09:4
509
:30
125
2056
051
562
854
020
00
00
76
01
10:0
009
:45
137
964
064
067
364
09
00
00
65
01
11:4
511
:30
108
1749
041
857
750
017
00
00
22
00
12:0
011
:45
156
2769
057
1279
772
027
10
01
75
02
12:1
512
:00
136
1759
052
770
367
017
00
00
73
04
12:3
012
:15
154
2384
075
962
656
023
00
00
85
03
12:4
512
:30
151
1670
067
372
468
016
00
00
98
01
13:0
012
:45
142
2860
148
1172
666
028
00
00
105
05
13:1
513
:00
133
1773
069
450
347
017
00
00
106
04
13:3
013
:15
219
3180
071
912
03
117
031
11
00
1813
05
15:1
515
:00
194
1982
076
610
34
990
190
00
09
80
115
:30
15:1
524
437
930
849
126
312
30
370
00
025
230
215
:45
15:3
025
324
104
096
813
41
133
024
00
00
1511
04
16:0
015
:45
258
4010
40
9410
129
512
40
402
10
123
160
716
:15
16:0
029
145
121
010
615
147
714
00
451
00
122
180
416
:30
16:1
524
627
870
807
147
813
90
270
00
012
70
516
:45
16:3
023
427
840
804
133
612
70
272
00
215
100
517
:00
16:4
523
634
880
7711
131
612
50
340
00
017
90
817
:15
17:0
021
235
830
6914
115
710
80
350
00
014
80
617
:30
17:1
518
121
810
765
873
840
210
00
013
100
317
:45
17:3
015
413
600
555
871
860
130
00
07
60
118
:00
17:4
5
Not
e: U
-Tur
ns a
re in
clud
ed in
Tot
als.
5,95
875
327
517
2473
271
2872
138
2732
275
37
20
532
823
70
91To
tal:
Page
4 o
f 8N
ovem
ber
22, 2
019
Turn
ing
Mov
emen
t Cou
nt -
Stud
y R
esul
ts
Tra
nspo
rtat
ion
Serv
ices
- Tr
affic
Ser
vice
s
07:0
0
Surv
ey D
ate:
MA
RG
UER
ITE
AVE
@ M
CA
RTH
UR
AVE
Star
t Tim
e:Tu
esda
y, M
arch
26,
201
9W
O N
o:
Dev
ice:
Mio
visi
on
3844
4
MC
AR
THU
R A
VEM
AR
GU
ERIT
E A
VEG
rand
Tot
alSt
reet
Tot
alW
estb
ound
East
boun
dSt
reet
Tot
alSo
uthb
ound
Nor
thbo
und
Tim
e Pe
riod
Cyc
list V
olum
eFu
ll St
udy
11
10
00
007
:15
07:0
00
00
00
00
07:3
007
:15
11
10
00
007
:45
07:3
01
11
00
00
08:0
007
:45
22
20
00
008
:15
08:0
03
21
11
01
08:3
008
:15
21
10
10
108
:45
08:3
00
00
00
00
09:0
008
:45
11
10
00
009
:15
09:0
00
00
00
00
09:3
009
:15
11
10
00
009
:45
09:3
02
22
00
00
10:0
009
:45
11
01
00
011
:45
11:3
01
11
00
00
12:0
011
:45
11
01
00
012
:15
12:0
00
00
00
00
12:3
012
:15
00
00
00
012
:45
12:3
00
00
00
00
13:0
012
:45
10
00
10
113
:15
13:0
01
10
10
00
13:3
013
:15
22
11
00
015
:15
15:0
01
10
10
00
15:3
015
:15
11
10
00
015
:45
15:3
00
00
00
00
16:0
015
:45
22
20
00
016
:15
16:0
02
20
20
00
16:3
016
:15
11
01
00
016
:45
16:3
02
20
20
00
17:0
016
:45
33
30
00
017
:15
17:0
01
10
10
00
17:3
017
:15
22
20
00
017
:45
17:3
02
10
11
01
18:0
017
:45
3834
2113
40
4To
tal
Page
5 o
f 8N
ovem
ber
22, 2
019
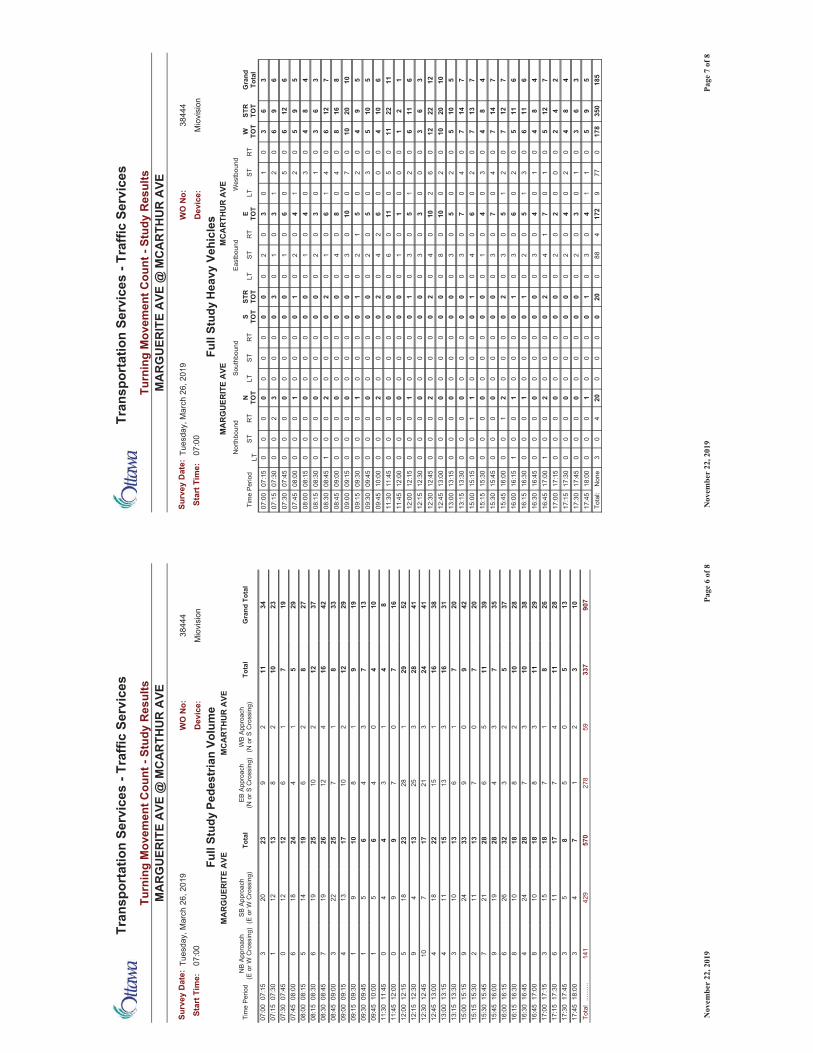
Turn
ing
Mov
emen
t Cou
nt -
Stud
y R
esul
ts
Tra
nspo
rtat
ion
Serv
ices
- Tr
affic
Ser
vice
s
07:0
0
Surv
ey D
ate:
MA
RG
UER
ITE
AVE
@ M
CA
RTH
UR
AVE
Star
t Tim
e:Tu
esda
y, M
arch
26,
201
9W
O N
o:
Dev
ice:
Mio
visi
on
3844
4
MC
AR
THU
R A
VEM
AR
GU
ERIT
E A
VEPe
dest
rian
Volu
me
Full
Stud
y
Gra
nd T
otal
Tota
lW
B Ap
proa
ch(N
or S
Cro
ssin
g)EB
App
roac
h(N
or S
Cro
ssin
g)To
tal
SB A
ppro
ach
(E o
r W C
ross
ing)
NB
Appr
oach
(E o
r W C
ross
ing)
Tim
e Pe
riod
3411
29
2320
307
:15
07:0
023
102
813
121
07:3
007
:15
197
16
1212
007
:45
07:3
029
51
424
186
08:0
007
:45
278
26
1914
508
:15
08:0
037
122
1025
196
08:3
008
:15
4216
412
2619
708
:45
08:3
033
81
725
223
09:0
008
:45
2912
210
1713
409
:15
09:0
019
91
810
91
09:3
009
:15
137
34
65
109
:45
09:3
010
40
46
51
10:0
009
:45
84
13
44
011
:45
11:3
016
70
79
90
12:0
011
:45
5229
128
2318
512
:15
12:0
041
283
2513
49
12:3
012
:15
4124
321
177
1012
:45
12:3
038
161
1522
184
13:0
012
:45
3116
313
1511
413
:15
13:0
020
71
613
103
13:3
013
:15
429
09
3324
915
:15
15:0
020
70
713
112
15:3
015
:15
3911
56
2821
715
:45
15:3
035
73
428
199
16:0
015
:45
375
23
3226
616
:15
16:0
028
102
818
108
16:3
016
:15
3810
37
2824
416
:45
16:3
029
113
818
108
17:0
016
:45
268
17
1815
317
:15
17:0
028
114
717
116
17:3
017
:15
135
05
85
317
:45
17:3
010
32
17
43
18:0
017
:45
907
337
5927
857
042
914
1...
......
.To
tal
Page
6 o
f 8N
ovem
ber
22, 2
019
Turn
ing
Mov
emen
t Cou
nt -
Stud
y R
esul
ts
Tra
nspo
rtat
ion
Serv
ices
- Tr
affic
Ser
vice
s
07:0
0
Surv
ey D
ate:
MA
RG
UER
ITE
AVE
@ M
CA
RTH
UR
AVE
Star
t Tim
e:Tu
esda
y, M
arch
26,
201
9W
O N
o:
Dev
ice:
Mio
visi
on
3844
4
Gra
ndTo
tal
STR
TOT
W TOT
RT
STLT
E TOT
RT
STLT
STR
TOT
S TOT
RT
STLT
N TOT
RT
STLT
Tim
e Pe
riod
MC
AR
THU
R A
VEN
orth
boun
dSo
uthb
ound
MA
RG
UER
ITE
AVE
Hea
vy V
ehic
les
East
boun
dW
estb
ound
Full
Stud
y
36
30
10
30
20
00
00
00
00
007
:15
07:0
06
96
02
13
01
03
00
00
32
00
07:3
007
:15
612
60
50
60
10
00
00
00
00
007
:45
07:3
05
95
02
14
02
01
00
00
10
00
08:0
007
:45
48
40
30
40
10
00
00
00
00
008
:15
08:0
03
63
01
03
02
00
00
00
00
00
08:3
008
:15
712
60
41
60
10
20
00
02
00
108
:45
08:3
08
168
04
08
04
00
00
00
00
00
09:0
008
:45
1020
100
70
100
30
00
00
00
00
009
:15
09:0
05
94
02
05
12
01
00
00
10
00
09:3
009
:15
510
50
30
50
20
00
00
00
00
009
:45
09:3
06
104
00
06
24
02
00
00
20
00
10:0
009
:45
1122
110
50
110
60
00
00
00
00
011
:45
11:3
01
21
00
01
01
00
00
00
00
00
12:0
011
:45
611
60
21
50
30
10
00
01
00
012
:15
12:0
03
63
00
03
03
00
00
00
00
00
12:3
012
:15
1222
120
62
100
40
20
00
02
00
012
:45
12:3
010
2010
02
010
08
00
00
00
00
00
13:0
012
:45
510
50
20
50
30
00
00
00
00
013
:15
13:0
07
147
04
07
03
00
00
00
00
00
13:3
013
:15
713
70
20
60
40
10
00
01
10
015
:15
15:0
04
84
03
04
01
00
00
00
00
00
15:3
015
:15
714
70
40
70
30
00
00
00
00
015
:45
15:3
07
127
02
15
03
02
00
00
21
00
16:0
015
:45
611
50
20
60
30
10
00
01
00
116
:15
16:0
06
116
03
15
02
01
00
00
10
00
16:3
016
:15
48
40
10
40
30
00
00
00
00
016
:45
16:3
07
125
01
07
14
02
00
00
20
01
17:0
016
:45
24
20
00
20
20
00
00
00
00
017
:15
17:0
04
84
02
04
02
00
00
00
00
00
17:3
017
:15
36
30
10
30
20
00
00
00
00
017
:45
17:3
05
95
01
14
03
01
00
00
10
00
18:0
017
:45
185
350
178
077
917
24
880
200
00
020
40
3N
one
Tota
l:
Page
7 o
f 8N
ovem
ber
22, 2
019
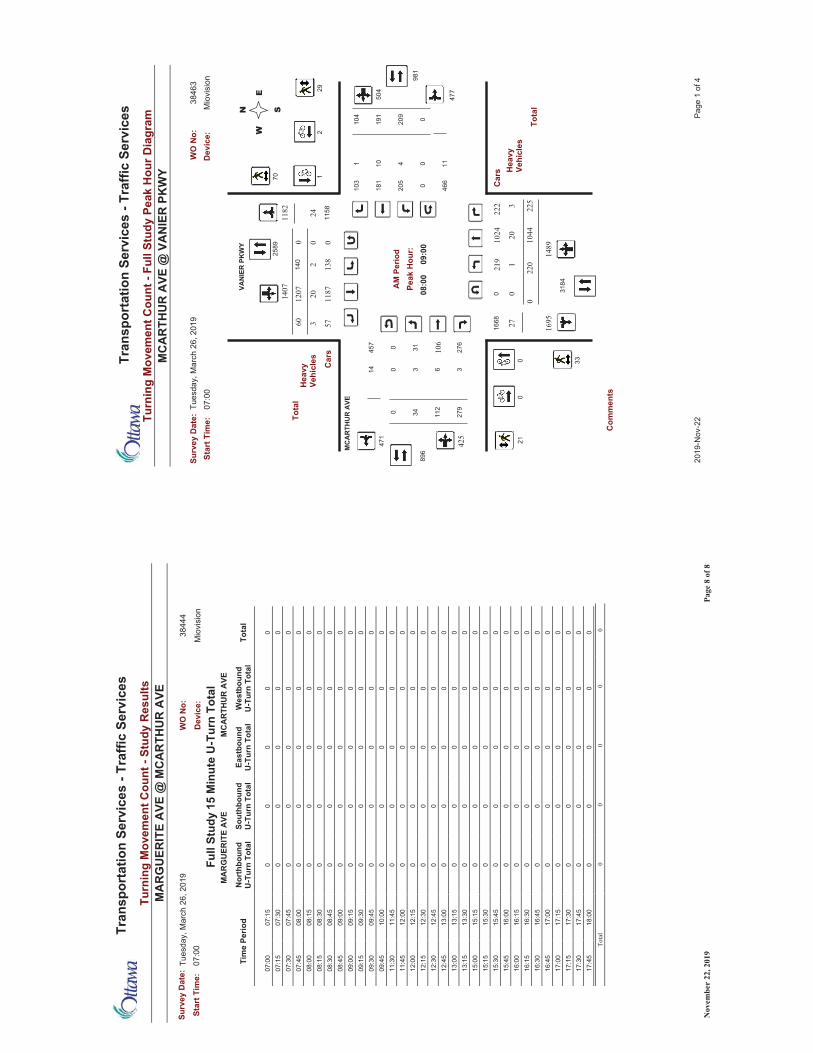
Turn
ing
Mov
emen
t Cou
nt -
Stud
y R
esul
ts
Tra
nspo
rtat
ion
Serv
ices
- Tr
affic
Ser
vice
s
07:0
0
Surv
ey D
ate:
MA
RG
UER
ITE
AVE
@ M
CA
RTH
UR
AVE
Star
t Tim
e:Tu
esda
y, M
arch
26,
201
9W
O N
o:
Dev
ice:
Mio
visi
on
3844
4
MA
RG
UER
ITE
AVE
MC
AR
THU
R A
VEFu
ll St
udy
15 M
inut
e U
-Tur
n To
tal
Tota
lW
estb
ound
U-T
urn
Tota
lEa
stbo
und
U-T
urn
Tota
lSo
uthb
ound
U-T
urn
Tota
lN
orth
boun
dU
-Tur
n To
tal
Tim
e Pe
riod
00
00
007
:15
07:0
00
00
00
07:3
007
:15
00
00
007
:45
07:3
00
00
00
08:0
007
:45
00
00
008
:15
08:0
00
00
00
08:3
008
:15
00
00
008
:45
08:3
00
00
00
09:0
008
:45
00
00
009
:15
09:0
00
00
00
09:3
009
:15
00
00
009
:45
09:3
00
00
00
10:0
009
:45
00
00
011
:45
11:3
00
00
00
12:0
011
:45
00
00
012
:15
12:0
00
00
00
12:3
012
:15
00
00
012
:45
12:3
00
00
00
13:0
012
:45
00
00
013
:15
13:0
00
00
00
13:3
013
:15
00
00
015
:15
15:0
00
00
00
15:3
015
:15
00
00
015
:45
15:3
00
00
00
16:0
015
:45
00
00
016
:15
16:0
00
00
00
16:3
016
:15
00
00
016
:45
16:3
00
00
00
17:0
016
:45
00
00
017
:15
17:0
00
00
00
17:3
017
:15
00
00
017
:45
17:3
00
00
00
18:0
017
:45
00
00
0Total
Page
8 o
f 8N
ovem
ber
22, 2
019
Turn
ing
Mov
emen
t Cou
nt -
Full
Stud
y Pe
ak H
our D
iagr
am
Tra
nspo
rtat
ion
Serv
ices
- Tr
affic
Ser
vice
s
Star
t Tim
e:Su
rvey
Dat
e:
MC
AR
THU
R A
VE @
VA
NIE
R P
KW
Y
07:0
0Tu
esda
y, M
arch
26,
201
9W
O N
o:38
463
Dev
ice:
Mio
visi
on
Peak
Hou
r:A
M P
erio
d
457
471
14
1668
3184
Tota
l
896
34
3
3198
1
6
279
112
276
3
1182 24
201407
27
220
1489
1695
1207
29
70
33
21
60 3
140 2
477
Car
s
EW
SN
Car
s
209
191
110
3
466
11
104
504
4
2589
Tota
l
1158
10
205
181
Com
men
ts
00
12
425
106
20 1044
MC
AR
THU
R A
VE
VAN
IER
PK
WY 1024
1187
57
1138
2253
219
222
00
0
0
0
0
00
00
0
0
08:0
009
:00
Hea
vyVe
hicl
es
Hea
vyVe
hicl
es
Page
1 o
f 420
19-N
ov-2
2
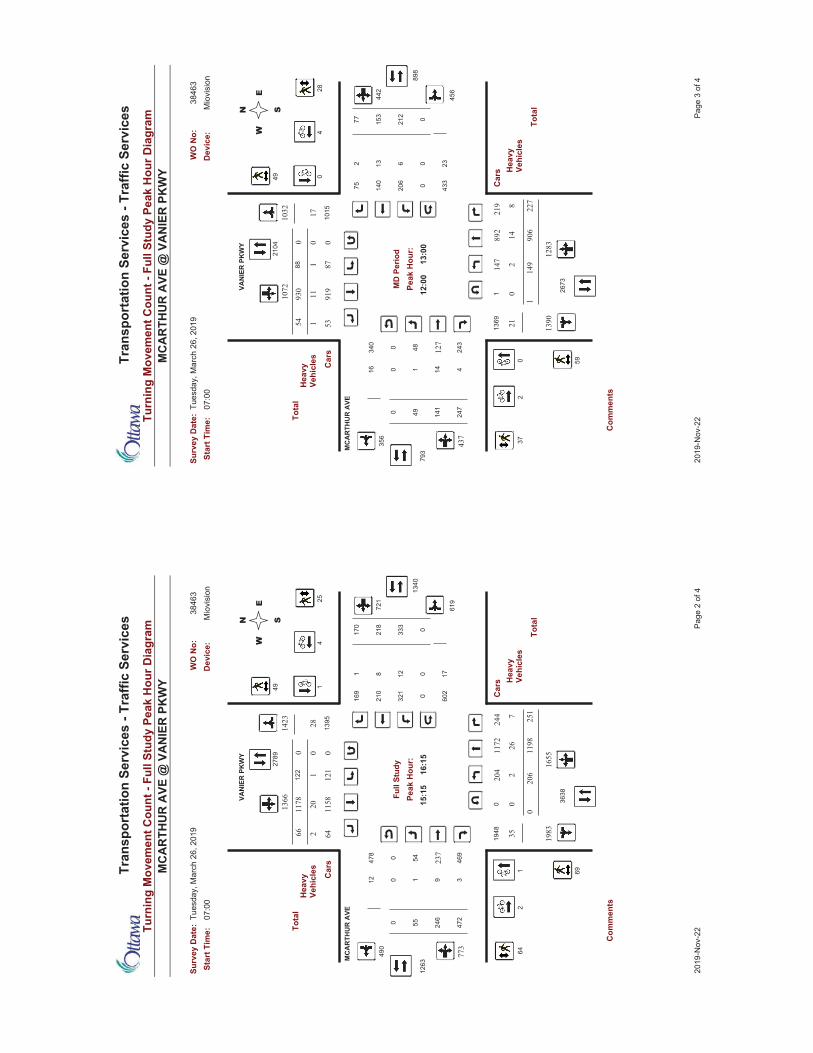
Turn
ing
Mov
emen
t Cou
nt -
Full
Stud
y Pe
ak H
our D
iagr
am
Tra
nspo
rtat
ion
Serv
ices
- Tr
affic
Ser
vice
s
Star
t Tim
e:Su
rvey
Dat
e:
MC
AR
THU
R A
VE @
VA
NIE
R P
KW
Y
07:0
0Tu
esda
y, M
arch
26,
201
9W
O N
o:38
463
Dev
ice:
Mio
visi
on
Peak
Hou
r:Fu
ll St
udy
478
490
12
1948
3638
Tota
l
1263
55
3
5413
40
9
472
246
469
1
1423 28
201366
35
206
1655
1983
1178
25
49
69
64
66 2
122 1
619
Car
s
EW
SN
Car
s
333
218
116
9
602
17
170
721
12
2789
Tota
l
1395
8
321
210
Com
men
ts
12
14
773
237
26 1198
MC
AR
THU
R A
VE
VAN
IER
PK
WY 1172
1158
64
2121
2517
204
244
00
0
0
0
0
00
00
0
0
15:1
516
:15
Hea
vyVe
hicl
es
Hea
vyVe
hicl
es
Page
2 o
f 420
19-N
ov-2
2
Turn
ing
Mov
emen
t Cou
nt -
Full
Stud
y Pe
ak H
our D
iagr
am
Tra
nspo
rtat
ion
Serv
ices
- Tr
affic
Ser
vice
s
Star
t Tim
e:Su
rvey
Dat
e:
MC
AR
THU
R A
VE @
VA
NIE
R P
KW
Y
07:0
0Tu
esda
y, M
arch
26,
201
9W
O N
o:38
463
Dev
ice:
Mio
visi
on
Peak
Hou
r:M
D P
erio
d
340
356
16
1369
2673
Tota
l
793
49
4
4889
8
14
247
141
243
1
1032 17
111072
21
149
1283
1390
930
28
49
59
37
54 1
88 1
456
Car
s
EW
SN
Car
s
212
153
275 43
323
77
442
6
2104
Tota
l
1015
13
206
140
Com
men
ts
02
04
437
127
14 906
MC
AR
THU
R A
VE
VAN
IER
PK
WY
892
919
53
287
2278
147
219
00
1
1
0
0
00
00
0
0
12:0
013
:00
Hea
vyVe
hicl
es
Hea
vyVe
hicl
es
Page
3 o
f 420
19-N
ov-2
2
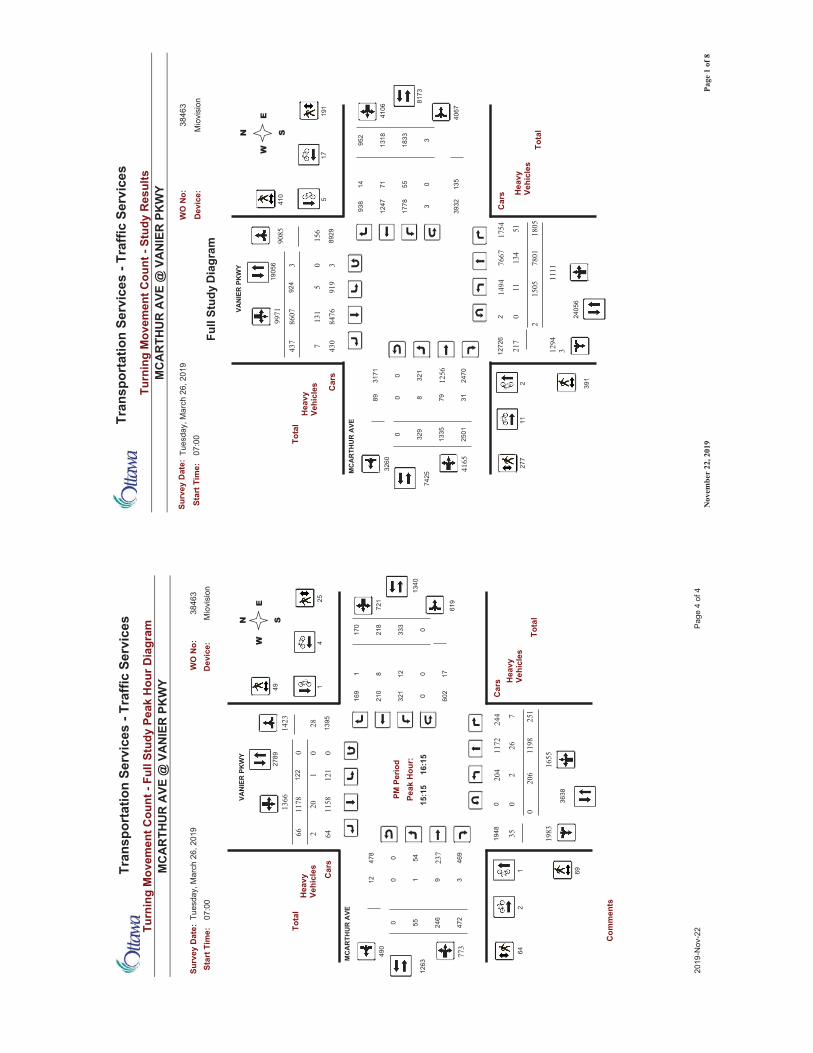
Turn
ing
Mov
emen
t Cou
nt -
Full
Stud
y Pe
ak H
our D
iagr
am
Tra
nspo
rtat
ion
Serv
ices
- Tr
affic
Ser
vice
s
Star
t Tim
e:Su
rvey
Dat
e:
MC
AR
THU
R A
VE @
VA
NIE
R P
KW
Y
07:0
0Tu
esda
y, M
arch
26,
201
9W
O N
o:38
463
Dev
ice:
Mio
visi
on
Peak
Hou
r:PM
Per
iod
478
490
12
1948
3638
Tota
l
1263
55
3
5413
40
9
472
246
469
1
1423 28
201366
35
206
1655
1983
1178
25
49
69
64
66 2
122 1
619
Car
s
EW
SN
Car
s
333
218
116
9
602
17
170
721
12
2789
Tota
l
1395
8
321
210
Com
men
ts
12
14
773
237
26 1198
MC
AR
THU
R A
VE
VAN
IER
PK
WY 1172
1158
64
2121
2517
204
244
00
0
0
0
0
00
00
0
0
15:1
516
:15
Hea
vyVe
hicl
es
Hea
vyVe
hicl
es
Page
4 o
f 420
19-N
ov-2
2
Turn
ing
Mov
emen
t Cou
nt -
Stud
y R
esul
ts
Tra
nspo
rtat
ion
Serv
ices
- Tr
affic
Ser
vice
s
07:0
0
Surv
ey D
ate:
MC
AR
THU
R A
VE @
VA
NIE
R P
KW
Y
Star
t Tim
e:Tu
esda
y, M
arch
26,
201
9W
O N
o:
Dev
ice:
Mio
visi
on
3846
3
8931
71
329
7425
1272
6
3260
Tota
l
31
321
8173
79
2501
1335
2470
8
2405
6
9971
9085
8607
131
1294
3217
156
1111
191
410
391
277
437 7
924 5
4067
Car
s
EW
SN
Hea
vyVe
hicl
es Car
s
1833
1318
1493
8
3932
135
952
4106
Tota
l
8929
1905
6
1778
55
1247
71
1505
Hea
vyVe
hicl
es2
11
517
7801
4165
7667
134
VAN
IER
PK
WY
1256
MC
AR
THU
R A
VE
8476
430
11919
180551
1494
1754
2
3
02
03
03
00
3
0
Dia
gram
Full
Stud
y
Page
1 o
f 8N
ovem
ber
22, 2
019
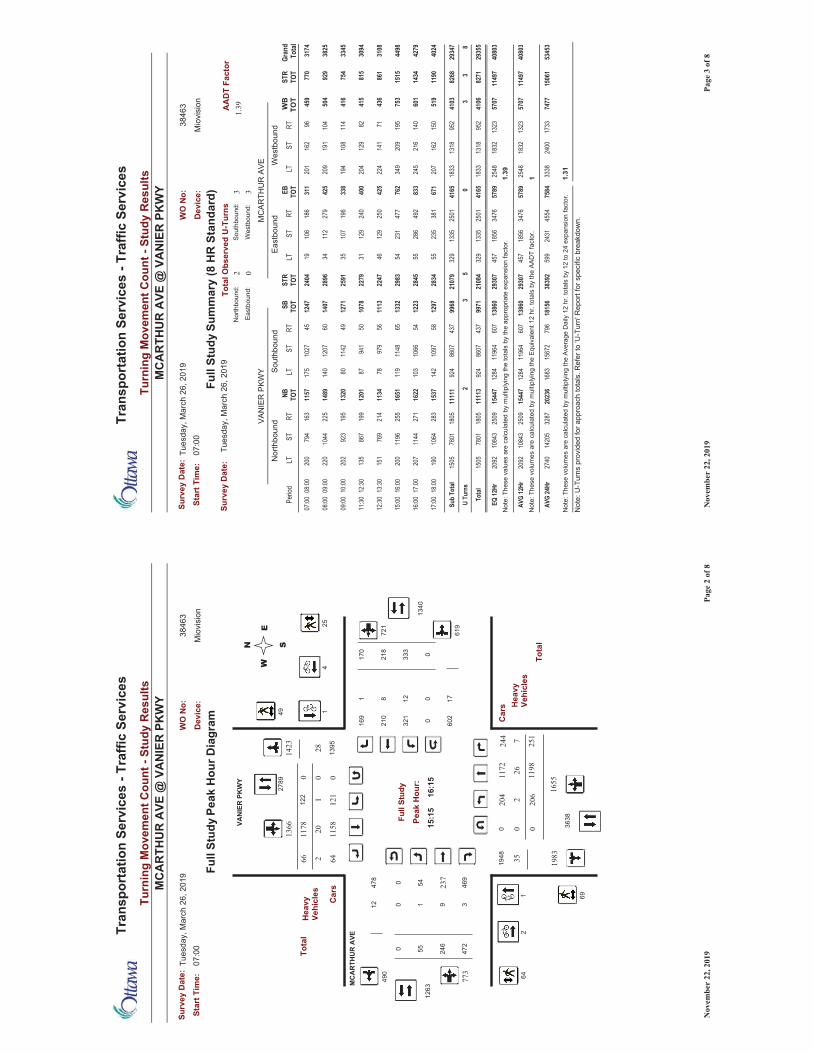
Turn
ing
Mov
emen
t Cou
nt -
Stud
y R
esul
ts
Tra
nspo
rtat
ion
Serv
ices
- Tr
affic
Ser
vice
s
07:0
0
Surv
ey D
ate:
MC
AR
THU
R A
VE @
VA
NIE
R P
KW
Y
Star
t Tim
e:Tu
esda
y, M
arch
26,
201
9W
O N
o:
Dev
ice:
Mio
visi
on
3846
3
Car
s
N
Car
s
1
619
W
S
E
1395
2789
Tota
l
210
8
321
12116
9
333
218
170
721
602
17
122
3
5412
6355 47
2
246
1340
9
Tota
l
478
490
Peak
Hou
r:
Full
Stud
y
1948
3638
12
25
49
1983
1178
66 2
69
64
1655
1423 28
469
1
35
206
201366
7
204
121
251
0
0244
0
2
MC
AR
THU
R A
VE
1198
1158
64
VAN
IER
PK
WY 11
72
0
00
0
Hea
vyVe
hicl
es
Hea
vyVe
hicl
es
15:1
516
:150
0
0
0
0
262
1
1
773
237
4
Peak
Hou
r Dia
gram
Full
Stud
y
Page
2 o
f 8N
ovem
ber
22, 2
019
Turn
ing
Mov
emen
t Cou
nt -
Stud
y R
esul
ts
Tra
nspo
rtat
ion
Serv
ices
- Tr
affic
Ser
vice
s
07:0
0
Surv
ey D
ate:
MC
AR
THU
R A
VE @
VA
NIE
R P
KW
Y
Star
t Tim
e:Tu
esda
y, M
arch
26,
201
9W
O N
o:
Dev
ice:
Mio
visi
on
3846
3
Sum
mar
y (8
HR
Sta
ndar
d)Fu
ll St
udy
3 30
AA
DT
Fact
orSu
rvey
Dat
e:2
Nor
thbo
und:
Sout
hbou
nd:
1.39
Tues
day,
Mar
ch 2
6, 2
019
Tota
l Obs
erve
d U
-Tur
ns
East
boun
d:W
estb
ound
:
MC
ARTH
UR
AVE
Nor
thbo
und
Sout
hbou
ndVA
NIE
R P
KWY
East
boun
dGr
and
Tota
lST
RTO
TW
BTO
TRT
STLT
EB TOT
RTST
LTST
RTO
TSB TO
TRT
STLT
NB TOT
RTST
LTPe
riod
Wes
tbou
nd
3174
770
459
9616
220
131
118
610
619
2404
1247
4510
2717
511
5716
379
420
008
:0007
:00
3825
929
504
104
191
209
425
279
112
3428
9614
0760
1207
140
1489
225
1044
220
09:00
08:00
3345
754
416
114
108
194
338
196
107
3525
9112
7149
1142
8013
2019
592
320
210
:0009
:00
3094
815
415
8212
920
440
024
012
931
2279
1078
5094
187
1201
199
867
135
12:30
11:30
3108
861
436
7114
122
442
525
012
946
2247
1113
5697
978
1134
214
769
151
13:30
12:30
4498
1515
753
195
209
349
762
477
231
5429
8313
3265
1148
119
1651
255
1196
200
16:00
15:00
4279
1434
601
140
216
245
833
492
286
5528
4512
2354
1066
103
1622
271
1144
207
17:00
16:00
4024
1190
519
150
162
207
671
381
235
5528
3412
9758
1097
142
1537
283
1064
190
18:00
17:00
2934
782
6841
0395
213
1818
3341
6525
0113
3532
921
079
9968
437
8607
924
1111
118
0578
0115
05Su
b To
tal
5U
Turn
s
2935
582
7141
0695
213
1818
3341
6525
0113
3532
921
084
9971
437
8607
924
1111
318
0578
0115
05To
tal
33
28
03
1N
ote:
The
se v
olum
es a
re c
alcu
late
d by
mul
tiply
ing
the
Equi
vale
nt 1
2 hr
. tot
als
by th
e AA
DT
fact
or.
1.31
Not
e: T
hese
vol
umes
are
cal
cula
ted
by m
ultip
lyin
g th
e Av
erag
e D
aily
12
hr. t
otal
s by
12
to 2
4 ex
pans
ion
fact
or.
1.39
5345
315
061
7477
1733
2400
3338
7584
4554
2431
599
3839
218
156
796
1567
216
8320
236
3287
1420
527
40AV
G 24
Hr
4080
311
497
5707
1323
1832
2548
5789
3476
1856
457
2930
713
860
607
1196
412
8415
447
2509
1084
320
92AV
G 12
Hr
Not
e: T
hese
val
ues
are
calc
ulat
ed b
y m
ultip
lyin
g th
e to
tals
by
the
appr
opria
te e
xpan
sion
fact
or.
4080
311
497
5707
1323
1832
2548
5789
3476
1856
457
2930
713
860
607
1196
412
8415
447
2509
1084
320
92EQ
12Hr
Not
e: U
-Tur
ns p
rovi
ded
for a
ppro
ach
tota
ls. R
efer
to 'U
-Tur
n' R
epor
t for
spe
cific
bre
akdo
wn.
Page
3 o
f 8N
ovem
ber
22, 2
019
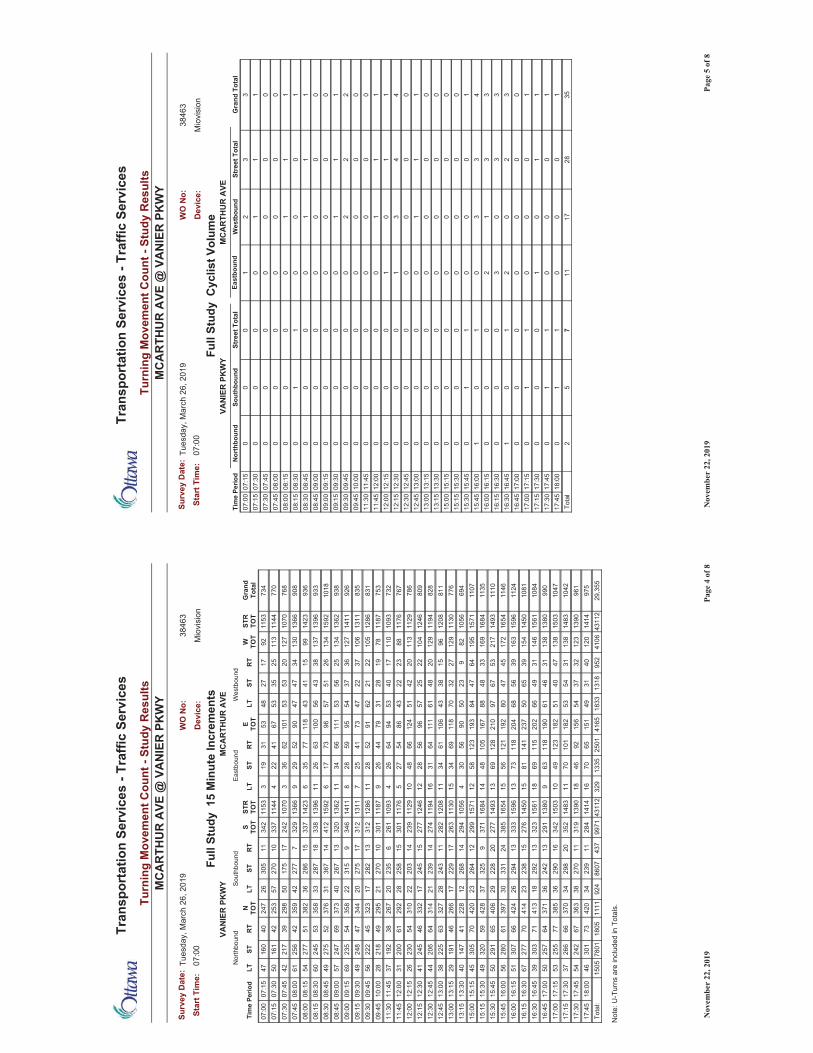
Turn
ing
Mov
emen
t Cou
nt -
Stud
y R
esul
ts
Tra
nspo
rtat
ion
Serv
ices
- Tr
affic
Ser
vice
s
07:0
0
Surv
ey D
ate:
MC
AR
THU
R A
VE @
VA
NIE
R P
KW
Y
Star
t Tim
e:Tu
esda
y, M
arch
26,
201
9W
O N
o:
Dev
ice:
Mio
visi
on
3846
3
Gra
ndTo
tal
STR
TOT
W TOT
RT
STLT
E TOT
RT
STLT
STR
TOT
S TOT
RT
STLT
N TOT
RT
STLT
Tim
e Pe
riod
East
boun
dW
estb
ound
VAN
IER
PK
WY
MC
AR
THU
R A
VEN
orth
boun
dSo
uthb
ound
15
Min
ute
Incr
emen
tsFu
ll St
udy
734
1153
9217
2748
5331
193
1153
342
1130
526
247
4016
047
07:1
507
:00
770
1144
113
2535
5367
4122
411
4433
710
270
5725
342
161
5007
:30
07:1
576
810
7012
720
5353
101
6236
310
7024
217
175
5029
839
217
4207
:45
07:3
090
813
6613
034
4747
9052
299
1366
329
727
742
359
4225
661
08:0
007
:45
936
1423
9915
4143
118
7735
614
2333
715
286
3638
251
277
5408
:15
08:0
093
313
9613
738
4356
100
6326
1113
9633
818
287
3335
853
245
6008
:30
08:1
510
1815
9213
426
5157
9673
176
1592
412
1436
731
376
5227
549
08:4
508
:30
938
1362
134
2556
5311
166
3411
1362
320
1326
740
373
6924
757
09:0
008
:45
926
1411
127
3637
5495
5928
814
1134
69
315
2235
854
235
6909
:15
09:0
083
513
1110
637
2247
7341
257
1311
312
1727
520
344
4724
849
09:3
009
:15
831
1286
105
2221
6291
5228
1112
8631
213
282
1732
345
222
5609
:45
09:3
075
311
8778
1928
3179
4426
911
8730
110
270
2129
549
218
2810
:00
09:4
573
210
9311
017
4053
9464
264
1093
261
623
520
267
3819
237
11:4
511
:30
767
1176
8823
2243
8654
275
1176
301
1525
828
292
6120
031
12:0
011
:45
786
1129
113
2042
5112
466
4810
1129
239
1420
322
310
5423
026
12:1
512
:00
809
1246
104
2225
5796
5628
1212
4627
715
245
1733
246
245
4112
:30
12:1
582
811
9412
920
4861
111
6431
1611
9427
414
239
2131
464
206
4412
:45
12:3
081
112
0896
1538
4310
661
3411
1208
282
1124
328
327
6322
538
13:0
012
:45
776
1130
129
2732
7011
869
3415
1130
263
1722
917
266
4619
129
13:1
513
:00
694
1056
829
2350
9056
304
1056
294
1426
812
228
4114
740
13:3
013
:15
1107
1571
195
6447
8419
312
358
1215
7129
912
264
2342
070
305
4515
:15
15:0
011
3516
8416
933
4888
167
105
4814
1684
371
932
537
428
5932
049
15:3
015
:15
1110
1493
217
5367
9721
012
869
1314
9327
720
228
2940
665
291
5015
:45
15:3
011
4616
5417
245
4780
192
121
5615
1654
385
2433
130
397
6128
056
16:0
015
:45
1124
1596
163
3956
6820
411
873
1315
9633
313
294
2642
466
307
5116
:15
16:0
010
8114
5015
439
6550
237
141
8115
1450
276
1523
823
414
7027
767
16:3
016
:15
1084
1561
146
3149
6620
211
569
1815
6132
313
292
1841
371
303
3916
:45
16:3
099
013
8013
831
4661
190
118
639
1380
291
1324
236
371
6425
750
17:0
016
:45
1047
1503
138
4740
5118
212
349
1015
0334
216
290
3638
577
255
5317
:15
17:0
010
4214
8313
831
5453
182
101
7011
1483
352
2029
834
370
6626
637
17:3
017
:15
961
1390
123
3237
5415
692
4618
1390
319
1127
038
363
6724
254
17:4
517
:30
975
1414
120
4031
4915
165
7016
1414
284
1123
934
420
7330
146
18:0
017
:45
Not
e: U
-Tur
ns a
re in
clud
ed in
Tot
als.
29,3
5543
112
4106
952
1318
1833
4165
2501
1335
329
4311
299
7143
786
0792
411
1118
0578
0115
05To
tal:
Page
4 o
f 8N
ovem
ber
22, 2
019
Turn
ing
Mov
emen
t Cou
nt -
Stud
y R
esul
ts
Tra
nspo
rtat
ion
Serv
ices
- Tr
affic
Ser
vice
s
07:0
0
Surv
ey D
ate:
MC
AR
THU
R A
VE @
VA
NIE
R P
KW
Y
Star
t Tim
e:Tu
esda
y, M
arch
26,
201
9W
O N
o:
Dev
ice:
Mio
visi
on
3846
3
MC
AR
THU
R A
VEVA
NIE
R P
KW
YG
rand
Tot
alSt
reet
Tot
alW
estb
ound
East
boun
dSt
reet
Tot
alSo
uthb
ound
Nor
thbo
und
Tim
e Pe
riod
Cyc
list V
olum
eFu
ll St
udy
33
21
00
007
:15
07:0
01
11
00
00
07:3
007
:15
00
00
00
007
:45
07:3
00
00
00
00
08:0
007
:45
11
10
00
008
:15
08:0
01
00
01
10
08:3
008
:15
11
10
00
008
:45
08:3
00
00
00
00
09:0
008
:45
00
00
00
009
:15
09:0
01
11
00
00
09:3
009
:15
22
20
00
009
:45
09:3
00
00
00
00
10:0
009
:45
00
00
00
011
:45
11:3
01
11
00
00
12:0
011
:45
11
01
00
012
:15
12:0
04
43
10
00
12:3
012
:15
00
00
00
012
:45
12:3
01
11
00
00
13:0
012
:45
00
00
00
013
:15
13:0
00
00
00
00
13:3
013
:15
00
00
00
015
:15
15:0
00
00
00
00
15:3
015
:15
10
00
11
015
:45
15:3
04
33
01
01
16:0
015
:45
33
12
00
016
:15
16:0
03
30
30
00
16:3
016
:15
32
02
10
116
:45
16:3
00
00
00
00
17:0
016
:45
10
00
11
017
:15
17:0
01
10
10
00
17:3
017
:15
10
00
11
017
:45
17:3
01
00
01
10
18:0
017
:45
3528
1711
75
2To
tal
Page
5 o
f 8N
ovem
ber
22, 2
019
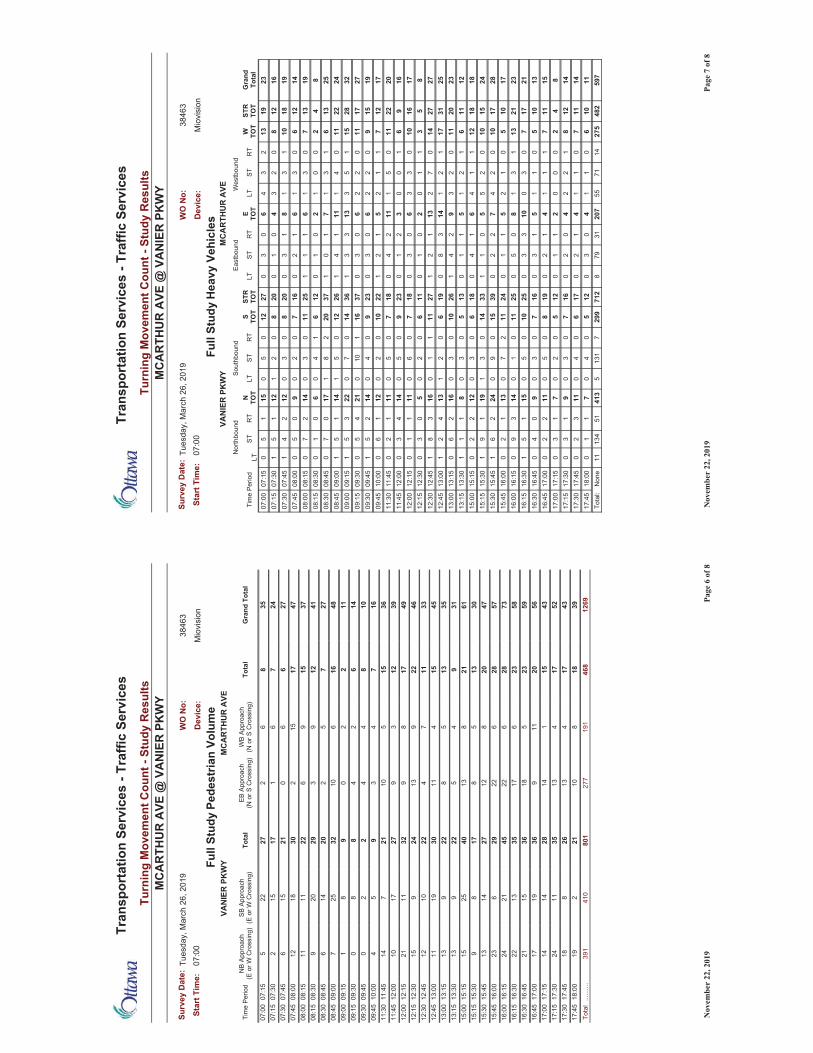
Turn
ing
Mov
emen
t Cou
nt -
Stud
y R
esul
ts
Tra
nspo
rtat
ion
Serv
ices
- Tr
affic
Ser
vice
s
07:0
0
Surv
ey D
ate:
MC
AR
THU
R A
VE @
VA
NIE
R P
KW
Y
Star
t Tim
e:Tu
esda
y, M
arch
26,
201
9W
O N
o:
Dev
ice:
Mio
visi
on
3846
3
MC
AR
THU
R A
VEVA
NIE
R P
KW
YPe
dest
rian
Volu
me
Full
Stud
y
Gra
nd T
otal
Tota
lW
B Ap
proa
ch(N
or S
Cro
ssin
g)EB
App
roac
h(N
or S
Cro
ssin
g)To
tal
SB A
ppro
ach
(E o
r W C
ross
ing)
NB
Appr
oach
(E o
r W C
ross
ing)
Tim
e Pe
riod
358
62
2722
507
:15
07:0
024
76
117
152
07:3
007
:15
276
60
2115
607
:45
07:3
047
1715
230
1812
08:0
007
:45
3715
96
2211
1108
:15
08:0
041
129
329
209
08:3
008
:15
277
52
2014
608
:45
08:3
048
166
1032
257
09:0
008
:45
112
20
98
109
:15
09:0
014
62
48
80
09:3
009
:15
108
44
22
009
:45
09:3
016
74
39
54
10:0
009
:45
3615
510
217
1411
:45
11:3
039
123
927
1710
12:0
011
:45
4917
89
3211
2112
:15
12:0
046
229
1324
915
12:3
012
:15
3311
74
2210
1212
:45
12:3
045
154
1130
1911
13:0
012
:45
3513
58
229
1313
:15
13:0
031
94
522
913
13:3
013
:15
6121
813
4025
1515
:15
15:0
030
135
817
89
15:3
015
:15
4720
812
2714
1315
:45
15:3
057
286
2229
623
16:0
015
:45
7328
622
4521
2416
:15
16:0
058
236
1735
1322
16:3
016
:15
5923
518
3615
2116
:45
16:3
056
2011
936
1917
17:0
016
:45
4315
114
2814
1417
:15
17:0
052
174
1335
1124
17:3
017
:15
4317
413
268
1817
:45
17:3
039
188
1021
219
18:0
017
:45
1269
468
191
277
801
410
391
......
....
Tota
l
Page
6 o
f 8N
ovem
ber
22, 2
019
Turn
ing
Mov
emen
t Cou
nt -
Stud
y R
esul
ts
Tra
nspo
rtat
ion
Serv
ices
- Tr
affic
Ser
vice
s
07:0
0
Surv
ey D
ate:
MC
AR
THU
R A
VE @
VA
NIE
R P
KW
Y
Star
t Tim
e:Tu
esda
y, M
arch
26,
201
9W
O N
o:
Dev
ice:
Mio
visi
on
3846
3
Gra
ndTo
tal
STR
TOT
W TOT
RT
STLT
E TOT
RT
STLT
STR
TOT
S TOT
RT
STLT
N TOT
RT
STLT
Tim
e Pe
riod
MC
AR
THU
R A
VEN
orth
boun
dSo
uthb
ound
VAN
IER
PK
WY
Hea
vy V
ehic
les
East
boun
dW
estb
ound
Full
Stud
y
2319
132
34
60
30
2712
05
015
15
007
:15
07:0
016
128
02
34
01
020
80
21
121
51
07:3
007
:15
1918
101
31
81
30
208
03
012
24
107
:45
07:3
014
126
03
16
12
016
70
20
90
50
08:0
007
:45
1913
70
31
61
11
2511
03
014
27
008
:15
08:0
08
42
00
12
01
012
61
40
60
10
08:3
008
:15
2513
61
31
71
01
3720
28
117
07
008
:45
08:3
024
2211
04
111
14
126
120
51
141
51
09:0
008
:45
3228
151
53
133
31
3614
07
022
35
109
:15
09:0
027
1711
02
26
03
037
161
100
214
50
09:3
009
:15
1915
90
22
60
30
239
04
014
25
109
:45
09:3
017
127
11
25
12
122
100
20
121
60
10:0
009
:45
2022
110
51
112
40
187
05
011
12
011
:45
11:3
016
96
10
03
21
023
90
50
144
30
12:0
011
:45
1716
100
33
60
30
187
06
011
11
012
:15
12:0
08
53
11
02
01
011
60
20
50
30
12:3
012
:15
2727
140
72
131
21
2711
11
016
38
112
:45
12:3
025
3117
12
114
38
019
60
21
134
21
13:0
012
:45
2320
110
23
92
41
2610
03
016
26
013
:15
13:0
012
116
12
15
11
013
50
30
81
11
13:3
013
:15
1818
121
14
61
40
186
03
012
22
015
:15
15:0
024
1510
02
55
01
133
140
31
191
91
15:3
015
:15
2817
100
24
72
20
3915
09
024
26
115
:45
15:3
017
105
01
25
11
024
112
70
131
20
16:0
015
:45
2321
131
31
80
50
2511
01
014
39
016
:15
16:0
021
177
03
010
33
025
100
50
151
51
16:3
016
:15
1310
50
11
51
30
167
03
09
04
016
:45
16:3
015
117
11
14
12
019
80
50
112
20
17:0
016
:45
84
20
00
21
10
125
02
07
13
017
:15
17:0
014
128
12
24
02
016
70
30
91
30
17:3
017
:15
1411
70
11
41
20
176
04
011
32
017
:45
17:3
011
106
01
14
03
012
50
40
71
10
18:0
017
:45
597
482
275
1471
5520
731
798
712
299
713
15
413
5113
411
Non
eTo
tal:
Page
7 o
f 8N
ovem
ber
22, 2
019
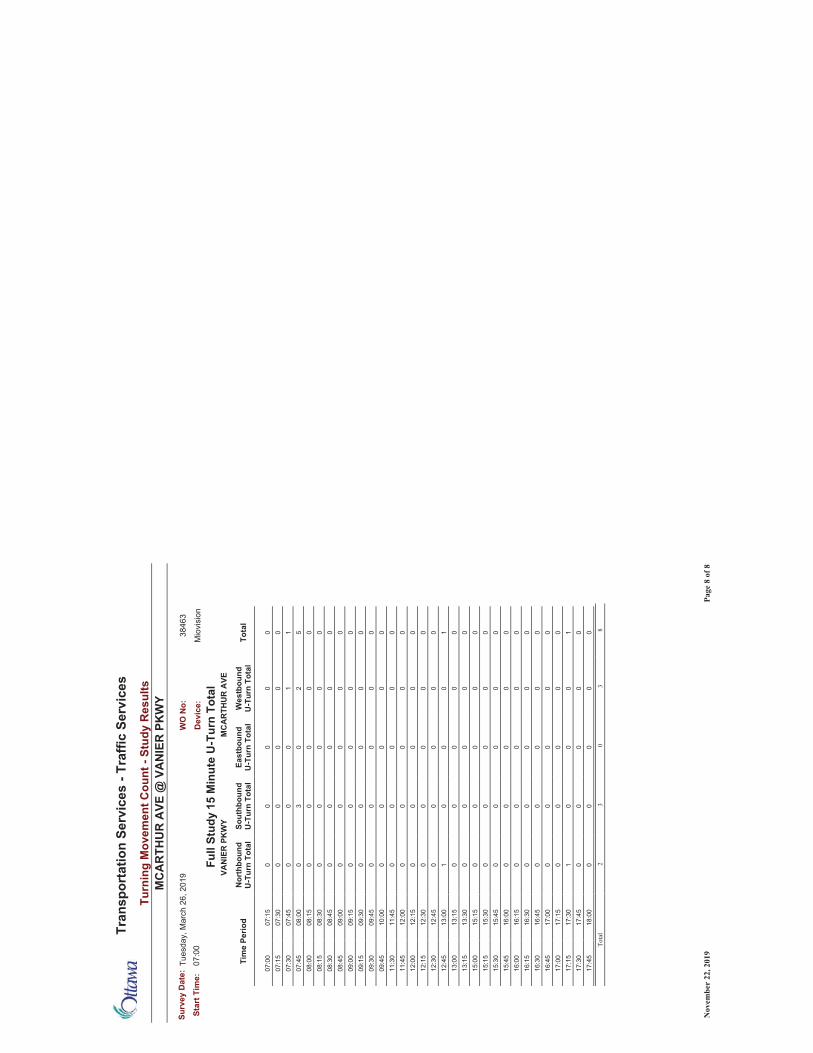
Turn
ing
Mov
emen
t Cou
nt -
Stud
y R
esul
ts
Tra
nspo
rtat
ion
Serv
ices
- Tr
affic
Ser
vice
s
07:0
0
Surv
ey D
ate:
MC
AR
THU
R A
VE @
VA
NIE
R P
KW
Y
Star
t Tim
e:Tu
esda
y, M
arch
26,
201
9W
O N
o:
Dev
ice:
Mio
visi
on
3846
3
VAN
IER
PK
WY
MC
AR
THU
R A
VEFu
ll St
udy
15 M
inut
e U
-Tur
n To
tal
Tota
lW
estb
ound
U-T
urn
Tota
lEa
stbo
und
U-T
urn
Tota
lSo
uthb
ound
U-T
urn
Tota
lN
orth
boun
dU
-Tur
n To
tal
Tim
e Pe
riod
00
00
007
:15
07:0
00
00
00
07:3
007
:15
11
00
007
:45
07:3
05
20
30
08:0
007
:45
00
00
008
:15
08:0
00
00
00
08:3
008
:15
00
00
008
:45
08:3
00
00
00
09:0
008
:45
00
00
009
:15
09:0
00
00
00
09:3
009
:15
00
00
009
:45
09:3
00
00
00
10:0
009
:45
00
00
011
:45
11:3
00
00
00
12:0
011
:45
00
00
012
:15
12:0
00
00
00
12:3
012
:15
00
00
012
:45
12:3
01
00
01
13:0
012
:45
00
00
013
:15
13:0
00
00
00
13:3
013
:15
00
00
015
:15
15:0
00
00
00
15:3
015
:15
00
00
015
:45
15:3
00
00
00
16:0
015
:45
00
00
016
:15
16:0
00
00
00
16:3
016
:15
00
00
016
:45
16:3
00
00
00
17:0
016
:45
00
00
017
:15
17:0
01
00
01
17:3
017
:15
00
00
017
:45
17:3
00
00
00
18:0
017
:45
83
03
2Total
Page
8 o
f 8N
ovem
ber
22, 2
019

Appendix C
Synchro Intersection Worksheets – Existing Conditions
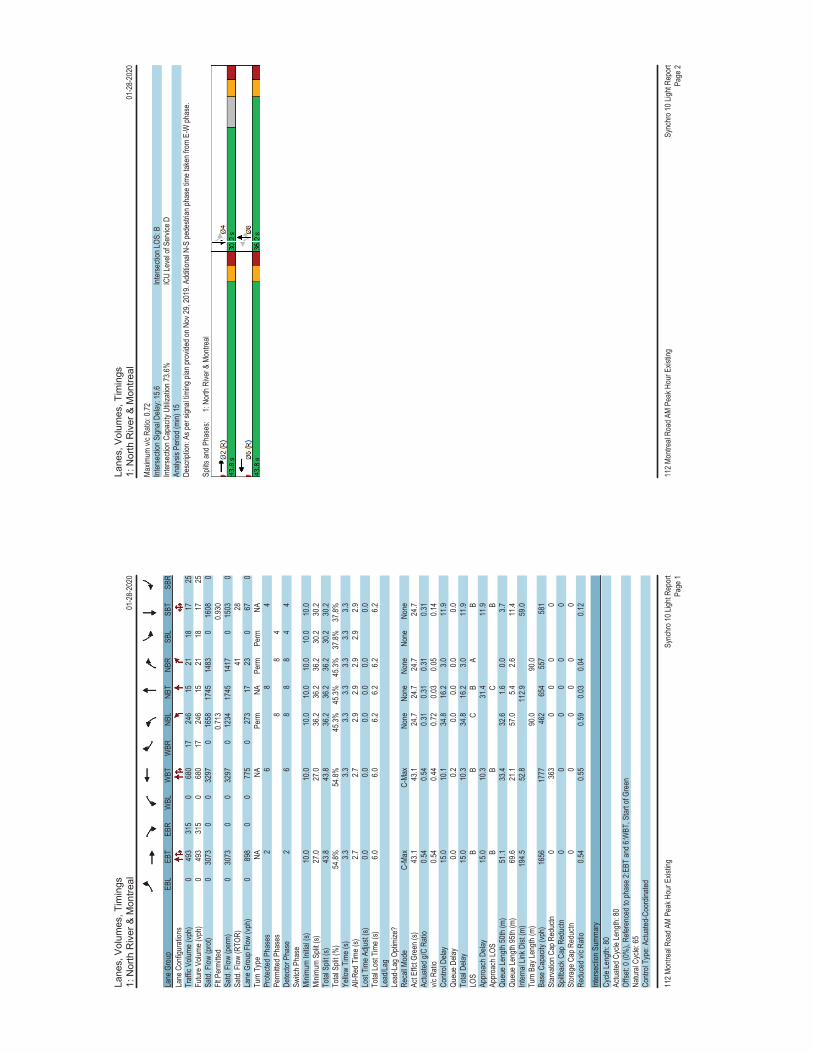
Lane
s, V
olum
es, T
imin
gs1:
Nor
th R
iver
& M
ontr
eal
01-2
8-20
20
112 M
ontre
al Ro
ad A
M Pe
ak H
our E
xistin
gSy
nchr
o 10 L
ight R
epor
tPa
ge 1
Lane
Gro
upEB
LEB
TEB
RW
BLW
BTW
BRNB
LNB
TNB
RSB
LSB
TSB
RLa
ne C
onfig
urati
ons
Traff
ic Vo
lume (
vph)
049
331
50
680
1724
615
2118
1725
Futur
e Volu
me (v
ph)
049
331
50
680
1724
615
2118
1725
Satd.
Flow
(pro
t)0
3073
00
3297
016
5817
4514
830
1608
0Flt
Per
mitte
d0.7
130.9
30Sa
td. F
low (p
erm)
030
730
032
970
1234
1745
1417
015
030
Satd.
Flow
(RTO
R)41
28La
ne G
roup
Flow
(vph
)0
898
00
775
027
317
230
670
Turn
Typ
eNA
NAPe
rmNA
Perm
Perm
NAPr
otecte
d Pha
ses
26
84
Perm
itted P
hase
s8
84
Detec
tor P
hase
26
88
84
4Sw
itch P
hase
Minim
um In
itial (s
)10
.010
.010
.010
.010
.010
.010
.0Mi
nimum
Spli
t (s)
27.0
27.0
36.2
36.2
36.2
30.2
30.2
Total
Spli
t (s)
43.8
43.8
36.2
36.2
36.2
30.2
30.2
Total
Spli
t (%
)54
.8%54
.8%45
.3%45
.3%45
.3%37
.8%37
.8%Ye
llow
Time (
s)3.3
3.33.3
3.33.3
3.33.3
All-R
ed T
ime (
s)2.7
2.72.9
2.92.9
2.92.9
Lost
Time A
djust
(s)0.0
0.00.0
0.00.0
0.0To
tal Lo
st Tim
e (s)
6.06.0
6.26.2
6.26.2
Lead
/Lag
Lead
-Lag
Opti
mize
?Re
call M
ode
C-Ma
xC-
Max
None
None
None
None
None
Act E
ffct G
reen
(s)
43.1
43.1
24.7
24.7
24.7
24.7
Actua
ted g/
C Ra
tio0.5
40.5
40.3
10.3
10.3
10.3
1v/c
Rati
o0.5
40.4
40.7
20.0
30.0
50.1
4Co
ntrol
Delay
15.0
10.1
34.8
16.2
3.011
.9Qu
eue D
elay
0.00.2
0.00.0
0.00.0
Total
Dela
y15
.010
.334
.816
.23.0
11.9
LOS
BB
CB
AB
Appr
oach
Dela
y15
.010
.331
.411
.9Ap
proa
ch LO
SB
BC
BQu
eue L
ength
50th
(m)
51.1
33.4
32.6
1.60.0
3.7Qu
eue L
ength
95th
(m)
69.6
21.1
57.0
5.42.6
11.4
Inter
nal L
ink D
ist (m
)19
4.552
.811
2.959
.0Tu
rn B
ay Le
ngth
(m)
90.0
90.0
Base
Cap
acity
(vph
)16
5617
7746
265
455
758
1St
arva
tion C
ap R
educ
tn0
363
00
00
Spillb
ack C
ap R
educ
tn0
00
00
0St
orag
e Cap
Red
uctn
00
00
00
Redu
ced v
/c Ra
tio0.5
40.5
50.5
90.0
30.0
40.1
2
Inter
secti
on S
umma
ryCy
cle Le
ngth:
80Ac
tuated
Cyc
le Le
ngth:
80Of
fset: 0
(0%
), Re
feren
ced t
o pha
se 2:
EBT
and 6
:WBT
, Star
t of G
reen
Natur
al Cy
cle: 6
5Co
ntrol
Type
: Actu
ated-
Coor
dinate
d
Lane
s, V
olum
es, T
imin
gs1:
Nor
th R
iver
& M
ontr
eal
01-2
8-20
20
112 M
ontre
al Ro
ad A
M Pe
ak H
our E
xistin
gSy
nchr
o 10 L
ight R
epor
tPa
ge 2
Maxim
um v/
c Rati
o: 0.7
2Int
erse
ction
Sign
al De
lay: 1
5.6Int
erse
ction
LOS:
BInt
erse
ction
Cap
acity
Utili
zatio
n 73.6
%IC
U Le
vel o
f Ser
vice D
Analy
sis P
eriod
(min)
15De
scrip
tion:
As pe
r sign
al tim
ing pl
an pr
ovide
d on N
ov 29
, 201
9. Ad
dition
al N-
S pe
destr
ian ph
ase t
ime t
aken
from
E-W
phas
e.
Splits
and P
hase
s:
1: No
rth R
iver &
Mon
treal

Lane
s, V
olum
es, T
imin
gs2:
Mon
tgom
ery
& M
ontr
eal
01-2
8-20
20
112 M
ontre
al Ro
ad A
M Pe
ak H
our E
xistin
gSy
nchr
o 10 L
ight R
epor
tPa
ge 3
Lane
Gro
upEB
TEB
RW
BLW
BTNB
LNB
RLa
ne C
onfig
urati
ons
Traff
ic Vo
lume (
vph)
480
5480
681
1933
Futur
e Volu
me (v
ph)
480
5480
681
1933
Satd.
Flow
(pro
t)32
520
032
9916
5814
83Flt
Per
mitte
d0.8
160.9
50Sa
td. F
low (p
erm)
3252
00
2703
1641
1451
Satd.
Flow
(RTO
R)29
37La
ne G
roup
Flow
(vph
)59
30
084
621
37Tu
rn T
ype
NAPe
rmNA
Perm
Perm
Prote
cted P
hase
s2
6Pe
rmitte
d Pha
ses
64
4De
tector
Pha
se2
66
44
Switc
h Pha
seMi
nimum
Initia
l (s)
10.0
10.0
10.0
10.0
10.0
Minim
um S
plit (
s)39
.915
.915
.919
.519
.5To
tal S
plit (
s)56
.056
.056
.024
.024
.0To
tal S
plit (
%)
70.0%
70.0%
70.0%
30.0%
30.0%
Yello
w Tim
e (s)
3.33.3
3.33.3
3.3Al
l-Red
Tim
e (s)
2.62.6
2.62.2
2.2Lo
st Tim
e Adju
st (s)
0.00.0
0.00.0
Total
Lost
Time (
s)5.9
5.95.5
5.5Le
ad/La
gLe
ad-L
ag O
ptimi
ze?
Reca
ll Mod
eC-
Max
C-Ma
xC-
Max
None
None
Act E
ffct G
reen
(s)
66.4
66.4
10.8
10.8
Actua
ted g/
C Ra
tio0.8
30.8
30.1
40.1
4v/c
Rati
o0.2
20.3
80.1
00.1
6Co
ntrol
Delay
0.44.1
30.6
12.2
Queu
e Dela
y0.1
0.00.0
0.0To
tal D
elay
0.54.1
30.6
12.2
LOS
AA
CB
Appr
oach
Dela
y0.5
4.118
.8Ap
proa
ch LO
SA
AB
Queu
e Len
gth 50
th (m
)0.5
21.1
2.90.0
Queu
e Len
gth 95
th (m
)1.6
37.0
8.67.5
Inter
nal L
ink D
ist (m
)52
.813
8.913
7.9Tu
rn B
ay Le
ngth
(m)
Base
Cap
acity
(vph
)27
0222
4237
936
3St
arva
tion C
ap R
educ
tn90
80
00
Spillb
ack C
ap R
educ
tn0
340
0St
orag
e Cap
Red
uctn
00
00
Redu
ced v
/c Ra
tio0.3
30.3
80.0
60.1
0
Inter
secti
on S
umma
ryCy
cle Le
ngth:
80Ac
tuated
Cyc
le Le
ngth:
80Of
fset: 0
(0%
), Re
feren
ced t
o pha
se 2:
EBT
and 6
:WBT
L, St
art o
f Gre
enNa
tural
Cycle
: 60
Contr
ol Ty
pe: A
ctuate
d-Co
ordin
ated
Lane
s, V
olum
es, T
imin
gs2:
Mon
tgom
ery
& M
ontr
eal
01-2
8-20
20
112 M
ontre
al Ro
ad A
M Pe
ak H
our E
xistin
gSy
nchr
o 10 L
ight R
epor
tPa
ge 4
Maxim
um v/
c Rati
o: 0.3
8Int
erse
ction
Sign
al De
lay: 3
.2Int
erse
ction
LOS:
AInt
erse
ction
Cap
acity
Utili
zatio
n 74.0
%IC
U Le
vel o
f Ser
vice D
Analy
sis P
eriod
(min)
15De
scrip
tion:
As pe
r sign
al tim
ing pl
an pr
ovide
d on N
ov 29
, 201
9.
Splits
and P
hase
s:
2: Mo
ntgom
ery &
Mon
treal
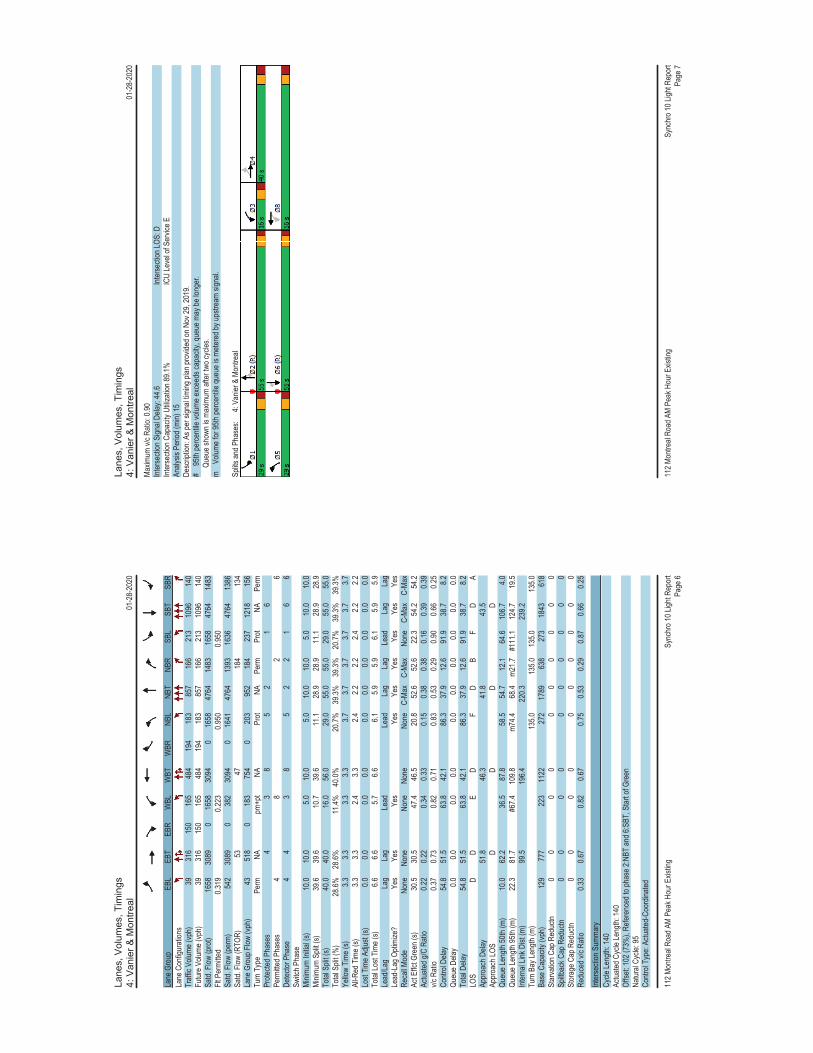
Lane
s, V
olum
es, T
imin
gs4:
Van
ier
& M
ontr
eal
01-2
8-20
20
112 M
ontre
al Ro
ad A
M Pe
ak H
our E
xistin
gSy
nchr
o 10 L
ight R
epor
tPa
ge 6
Lane
Gro
upEB
LEB
TEB
RW
BLW
BTW
BRNB
LNB
TNB
RSB
LSB
TSB
RLa
ne C
onfig
urati
ons
Traff
ic Vo
lume (
vph)
3931
615
016
548
419
418
385
716
621
310
9614
0Fu
ture V
olume
(vph
)39
316
150
165
484
194
183
857
166
213
1096
140
Satd.
Flow
(pro
t)16
5830
890
1658
3094
016
5847
6414
8316
5847
6414
83Flt
Per
mitte
d0.3
190.2
230.9
500.9
50Sa
td. F
low (p
erm)
542
3089
038
230
940
1641
4764
1393
1636
4764
1386
Satd.
Flow
(RTO
R)53
4718
413
4La
ne G
roup
Flow
(vph
)43
518
018
375
40
203
952
184
237
1218
156
Turn
Typ
ePe
rmNA
pm+p
tNA
Prot
NAPe
rmPr
otNA
Perm
Prote
cted P
hase
s4
38
52
16
Perm
itted P
hase
s4
82
6De
tector
Pha
se4
43
85
22
16
6Sw
itch P
hase
Minim
um In
itial (s
)10
.010
.05.0
10.0
5.010
.010
.05.0
10.0
10.0
Minim
um S
plit (
s)39
.639
.610
.739
.611
.128
.928
.911
.128
.928
.9To
tal S
plit (
s)40
.040
.016
.056
.029
.055
.055
.029
.055
.055
.0To
tal S
plit (
%)
28.6%
28.6%
11.4%
40.0%
20.7%
39.3%
39.3%
20.7%
39.3%
39.3%
Yello
w Tim
e (s)
3.33.3
3.33.3
3.73.7
3.73.7
3.73.7
All-R
ed T
ime (
s)3.3
3.32.4
3.32.4
2.22.2
2.42.2
2.2Lo
st Tim
e Adju
st (s)
0.00.0
0.00.0
0.00.0
0.00.0
0.00.0
Total
Lost
Time (
s)6.6
6.65.7
6.66.1
5.95.9
6.15.9
5.9Le
ad/La
gLa
gLa
gLe
adLe
adLa
gLa
gLe
adLa
gLa
gLe
ad-L
ag O
ptimi
ze?
Yes
Yes
Yes
Yes
Yes
Yes
Yes
Yes
Yes
Reca
ll Mod
eNo
neNo
neNo
neNo
neNo
neC-
Max
C-Ma
xNo
neC-
Max
C-Ma
xAc
t Effc
t Gre
en (s
)30
.530
.547
.446
.520
.852
.652
.622
.354
.254
.2Ac
tuated
g/C
Ratio
0.22
0.22
0.34
0.33
0.15
0.38
0.38
0.16
0.39
0.39
v/c R
atio
0.37
0.73
0.82
0.71
0.83
0.53
0.29
0.90
0.66
0.25
Contr
ol De
lay54
.851
.563
.842
.186
.337
.912
.691
.938
.78.2
Queu
e Dela
y0.0
0.00.0
0.00.0
0.00.0
0.00.0
0.0To
tal D
elay
54.8
51.5
63.8
42.1
86.3
37.9
12.6
91.9
38.7
8.2LO
SD
DE
DF
DB
FD
AAp
proa
ch D
elay
51.8
46.3
41.8
43.5
Appr
oach
LOS
DD
DD
Queu
e Len
gth 50
th (m
)10
.062
.236
.587
.858
.554
.712
.164
.610
6.74.0
Queu
e Len
gth 95
th (m
)22
.381
.7#6
7.410
9.8m7
4.468
.4m2
1.7#1
11.1
124.7
19.5
Inter
nal L
ink D
ist (m
)99
.519
6.422
0.323
9.2Tu
rn B
ay Le
ngth
(m)
135.0
135.0
135.0
135.0
Base
Cap
acity
(vph
)12
977
722
311
2227
217
8963
827
318
4361
8St
arva
tion C
ap R
educ
tn0
00
00
00
00
0Sp
illbac
k Cap
Red
uctn
00
00
00
00
00
Stor
age C
ap R
educ
tn0
00
00
00
00
0Re
duce
d v/c
Ratio
0.33
0.67
0.82
0.67
0.75
0.53
0.29
0.87
0.66
0.25
Inter
secti
on S
umma
ryCy
cle Le
ngth:
140
Actua
ted C
ycle
Leng
th: 14
0Of
fset: 1
02 (7
3%),
Refer
ence
d to p
hase
2:NB
T an
d 6:S
BT, S
tart o
f Gre
enNa
tural
Cycle
: 95
Contr
ol Ty
pe: A
ctuate
d-Co
ordin
ated
Lane
s, V
olum
es, T
imin
gs4:
Van
ier
& M
ontr
eal
01-2
8-20
20
112 M
ontre
al Ro
ad A
M Pe
ak H
our E
xistin
gSy
nchr
o 10 L
ight R
epor
tPa
ge 7
Maxim
um v/
c Rati
o: 0.9
0Int
erse
ction
Sign
al De
lay: 4
4.6Int
erse
ction
LOS:
DInt
erse
ction
Cap
acity
Utili
zatio
n 89.1
%IC
U Le
vel o
f Ser
vice E
Analy
sis P
eriod
(min)
15De
scrip
tion:
As pe
r sign
al tim
ing pl
an pr
ovide
d on N
ov 29
, 201
9.#
95th
perce
ntile
volum
e exc
eeds
capa
city,
queu
e may
be lo
nger
.
Que
ue sh
own i
s max
imum
after
two c
ycles
.m
Volu
me fo
r 95th
perce
ntile
queu
e is m
etere
d by u
pstre
am si
gnal.
Splits
and P
hase
s:
4: Va
nier &
Mon
treal

Lane
s, V
olum
es, T
imin
gs5:
Cod
y/H
anna
h &
Mon
trea
l01
-28-
2020
112 M
ontre
al Ro
ad A
M Pe
ak H
our E
xistin
gSy
nchr
o 10 L
ight R
epor
tPa
ge 8
Lane
Gro
upEB
LEB
TEB
RW
BLW
BTW
BRNB
LNB
TNB
RSB
LSB
TSB
RLa
ne C
onfig
urati
ons
Traff
ic Vo
lume (
vph)
7951
811
175
715
00
050
3511
5Fu
ture V
olume
(vph
)79
518
111
757
150
00
5035
115
Satd.
Flow
(pro
t)0
3280
00
3296
00
00
015
640
Flt P
ermi
tted
0.735
0.955
0.988
Satd.
Flow
(per
m)0
2414
00
3147
00
00
015
590
Satd.
Flow
(RTO
R)4
569
Lane
Gro
up F
low (v
ph)
067
60
085
90
00
00
223
0Tu
rn T
ype
Perm
NAPe
rmNA
Perm
NAPr
otecte
d Pha
ses
26
7Pe
rmitte
d Pha
ses
26
7De
tector
Pha
se2
26
67
7Sw
itch P
hase
Minim
um In
itial (s
)10
.010
.010
.010
.010
.010
.0Mi
nimum
Spli
t (s)
25.5
25.5
25.5
25.5
21.5
21.5
Total
Spli
t (s)
65.0
65.0
65.0
65.0
25.0
25.0
Total
Spli
t (%
)72
.2%72
.2%72
.2%72
.2%27
.8%27
.8%Ye
llow
Time (
s)3.3
3.33.3
3.33.3
3.3Al
l-Red
Tim
e (s)
2.22.2
2.22.2
2.22.2
Lost
Time A
djust
(s)0.0
0.00.0
Total
Lost
Time (
s)5.5
5.55.5
Lead
/Lag
Lead
-Lag
Opti
mize
?Re
call M
ode
C-Ma
xC-
Max
C-Ma
xC-
Max
None
None
Act E
ffct G
reen
(s)
64.4
64.4
14.6
Actua
ted g/
C Ra
tio0.7
20.7
20.1
6v/c
Rati
o0.3
90.3
80.7
2Co
ntrol
Delay
6.36.0
37.3
Queu
e Dela
y0.0
0.00.0
Total
Dela
y6.3
6.037
.3LO
SA
AD
Appr
oach
Dela
y6.3
6.037
.3Ap
proa
ch LO
SA
AD
Queu
e Len
gth 50
th (m
)20
.225
.425
.4Qu
eue L
ength
95th
(m)
35.6
42.6
46.0
Inter
nal L
ink D
ist (m
)19
6.487
.112
7.910
6.3Tu
rn B
ay Le
ngth
(m)
Base
Cap
acity
(vph
)17
2822
5339
1St
arva
tion C
ap R
educ
tn0
00
Spillb
ack C
ap R
educ
tn0
00
Stor
age C
ap R
educ
tn0
00
Redu
ced v
/c Ra
tio0.3
90.3
80.5
7
Inter
secti
on S
umma
ryCy
cle Le
ngth:
90Ac
tuated
Cyc
le Le
ngth:
90Of
fset: 7
0 (78
%),
Refer
ence
d to p
hase
2:EB
TL an
d 6:W
BTL,
Star
t of G
reen
Natur
al Cy
cle: 5
0Co
ntrol
Type
: Actu
ated-
Coor
dinate
d
Lane
s, V
olum
es, T
imin
gs5:
Cod
y/H
anna
h &
Mon
trea
l01
-28-
2020
112 M
ontre
al Ro
ad A
M Pe
ak H
our E
xistin
gSy
nchr
o 10 L
ight R
epor
tPa
ge 9
Maxim
um v/
c Rati
o: 0.7
2Int
erse
ction
Sign
al De
lay: 1
0.1Int
erse
ction
LOS:
BInt
erse
ction
Cap
acity
Utili
zatio
n 74.1
%IC
U Le
vel o
f Ser
vice D
Analy
sis P
eriod
(min)
15De
scrip
tion:
As pe
r sign
al tim
ing pl
an pr
ovide
d on N
ov 29
, 201
9.
Splits
and P
hase
s:
5: Co
dy/H
anna
h & M
ontre
al

HC
M 2
010
TW
SC
6: N
orth
Riv
er &
Sel
kirk
01-2
8-20
20
112 M
ontre
al Ro
ad A
M Pe
ak H
our E
xistin
gSy
nchr
o 10 L
ight R
epor
tPa
ge 11
Inter
secti
onInt
Dela
y, s/v
eh1
Move
ment
WBL
WBR
NBT
NBR
SBL
SBT
Lane
Con
figur
ation
sTr
affic
Vol, v
eh/h
2734
234
00
357
Futur
e Vol,
veh/h
2734
234
00
357
Confl
icting
Ped
s, #/h
r3
00
9090
0Si
gn C
ontro
l St
opSt
opFr
eeFr
eeFr
eeFr
eeRT
Cha
nneli
zed
-No
ne-
None
-No
neSt
orag
e Len
gth0
0-
--
-Ve
h in M
edian
Stor
age,
#0
-0
--
0Gr
ade,
%0
-0
--
0Pe
ak H
our F
actor
9090
9090
9090
Heav
y Veh
icles
, %2
22
22
2Mv
mt F
low30
3826
00
039
7 Ma
jor/M
inor
Mino
r1Ma
jor1
Major
2Co
nflict
ing F
low A
ll46
226
00
--
-
S
tage 1
260
--
--
-
S
tage 2
202
--
--
-Cr
itical
Hdwy
6.63
6.23
--
--
Critic
al Hd
wy S
tg 1
5.43
--
--
-Cr
itical
Hdwy
Stg
25.8
3-
--
--
Follo
w-up
Hdw
y3.5
193.3
19-
--
-Po
t Cap
-1 M
aneu
ver
543
778
-0
0-
Stag
e 178
3-
-0
0-
Stag
e 281
3-
-0
0-
Plato
on bl
ocke
d, %
--
Mov C
ap-1
Man
euve
r54
277
8-
--
-Mo
v Cap
-2 M
aneu
ver
542
--
--
-
S
tage 1
783
--
--
-
S
tage 2
811
--
--
- Ap
proa
chW
BNB
SBHC
M Co
ntrol
Delay
, s10
.80
0HC
M LO
SB
Mino
r Lan
e/Majo
r Mvm
tNB
TWBL
n1W
BLn2
SBT
Capa
city (
veh/h
)-
542
778
-HC
M La
ne V
/C R
atio
-0.0
550.0
49-
HCM
Contr
ol De
lay (s
)-
129.9
-HC
M La
ne LO
S-
BA
-HC
M 95
th %
tile Q
(veh)
-0.2
0.2-
HC
M 2
010
TW
SC
7: M
cArt
hur
& D
unda
s01
-28-
2020
112 M
ontre
al Ro
ad A
M Pe
ak H
our E
xistin
gSy
nchr
o 10 L
ight R
epor
tPa
ge 13
Inter
secti
onInt
Dela
y, s/v
eh0.6
Move
ment
EBL
EBT
WBT
WBR
SBL
SBR
Lane
Con
figur
ation
sTr
affic
Vol, v
eh/h
1034
730
995
1016
Futur
e Vol,
veh/h
1034
730
995
1016
Confl
icting
Ped
s, #/h
r10
00
010
01
9Si
gn C
ontro
l Fr
eeFr
eeFr
eeFr
eeSt
opSt
opRT
Cha
nneli
zed
-No
ne-
None
-No
neSt
orag
e Len
gth-
--
-0
-Ve
h in M
edian
Stor
age,
#-
00
-0
-Gr
ade,
%-
00
-0
-Pe
ak H
our F
actor
9090
9090
9090
Heav
y Veh
icles
, %2
22
22
2Mv
mt F
low11
386
343
106
1118
Major
/Mino
rMa
jor1
Major
2Mi
nor2
Confl
icting
Flow
All
549
0-
090
550
5
S
tage 1
--
--
496
-
S
tage 2
--
--
409
-Cr
itical
Hdwy
4.12
--
-6.4
26.2
2Cr
itical
Hdwy
Stg
1-
--
-5.4
2-
Critic
al Hd
wy S
tg 2
--
--
5.42
-Fo
llow-
up H
dwy
2.218
--
-3.5
183.3
18Po
t Cap
-1 M
aneu
ver
1021
--
-30
756
7
S
tage 1
--
--
612
-
S
tage 2
--
--
671
-Pl
atoon
bloc
ked,
%-
--
Mov C
ap-1
Man
euve
r94
2-
--
257
519
Mov C
ap-2
Man
euve
r-
--
-25
7-
Stag
e 1-
--
-55
6-
Stag
e 2-
--
-61
9-
Appr
oach
EBW
BSB
HCM
Contr
ol De
lay, s
0.20
15.5
HCM
LOS
C Mi
nor L
ane/M
ajor M
vmt
EBL
EBT
WBT
WBR
SBLn
1Ca
pacit
y (ve
h/h)
942
--
-37
3HC
M La
ne V
/C R
atio
0.012
--
-0.0
77HC
M Co
ntrol
Delay
(s)
8.90
--
15.5
HCM
Lane
LOS
AA
--
CHC
M 95
th %
tile Q
(veh)
0-
--
0.2
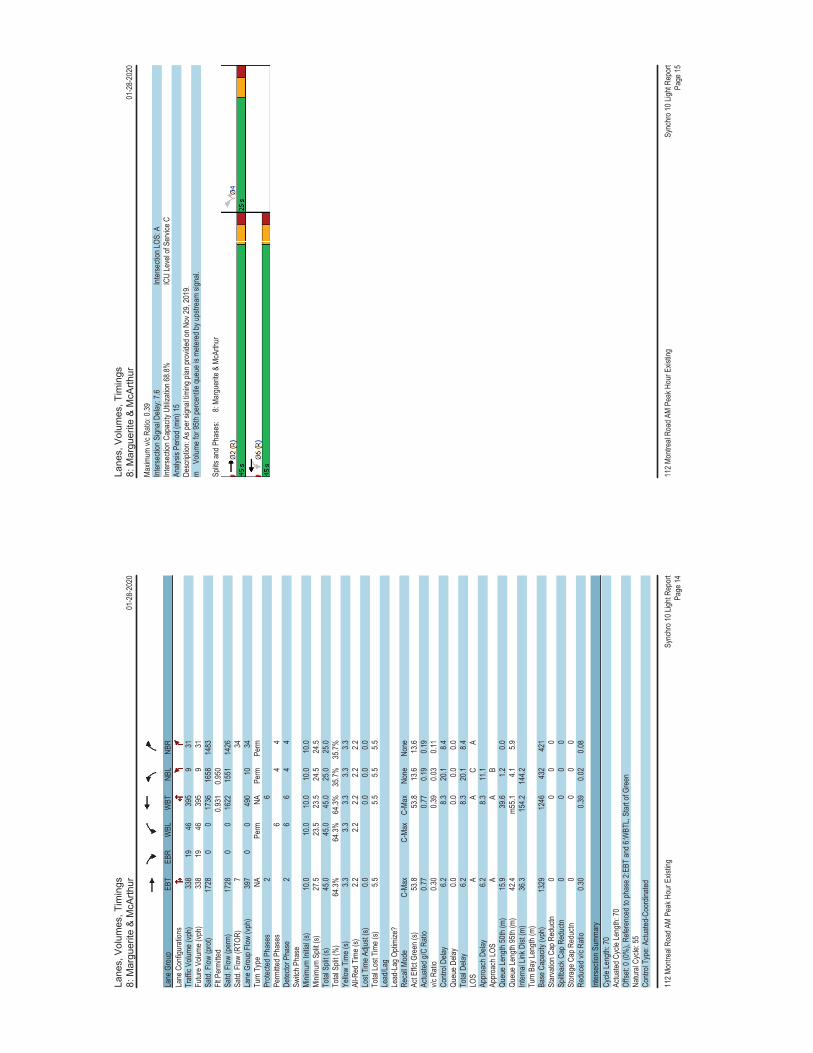
Lane
s, V
olum
es, T
imin
gs8:
Mar
guer
ite &
McA
rthu
r01
-28-
2020
112 M
ontre
al Ro
ad A
M Pe
ak H
our E
xistin
gSy
nchr
o 10 L
ight R
epor
tPa
ge 14
Lane
Gro
upEB
TEB
RW
BLW
BTNB
LNB
RLa
ne C
onfig
urati
ons
Traff
ic Vo
lume (
vph)
338
1946
395
931
Futur
e Volu
me (v
ph)
338
1946
395
931
Satd.
Flow
(pro
t)17
280
017
3616
5814
83Flt
Per
mitte
d0.9
310.9
50Sa
td. F
low (p
erm)
1728
00
1622
1551
1426
Satd.
Flow
(RTO
R)7
34La
ne G
roup
Flow
(vph
)39
70
049
010
34Tu
rn T
ype
NAPe
rmNA
Perm
Perm
Prote
cted P
hase
s2
6Pe
rmitte
d Pha
ses
64
4De
tector
Pha
se2
66
44
Switc
h Pha
seMi
nimum
Initia
l (s)
10.0
10.0
10.0
10.0
10.0
Minim
um S
plit (
s)27
.523
.523
.524
.524
.5To
tal S
plit (
s)45
.045
.045
.025
.025
.0To
tal S
plit (
%)
64.3%
64.3%
64.3%
35.7%
35.7%
Yello
w Tim
e (s)
3.33.3
3.33.3
3.3Al
l-Red
Tim
e (s)
2.22.2
2.22.2
2.2Lo
st Tim
e Adju
st (s)
0.00.0
0.00.0
Total
Lost
Time (
s)5.5
5.55.5
5.5Le
ad/La
gLe
ad-L
ag O
ptimi
ze?
Reca
ll Mod
eC-
Max
C-Ma
xC-
Max
None
None
Act E
ffct G
reen
(s)
53.8
53.8
13.6
13.6
Actua
ted g/
C Ra
tio0.7
70.7
70.1
90.1
9v/c
Rati
o0.3
00.3
90.0
30.1
1Co
ntrol
Delay
6.28.3
20.1
8.4Qu
eue D
elay
0.00.0
0.00.0
Total
Dela
y6.2
8.320
.18.4
LOS
AA
CA
Appr
oach
Dela
y6.2
8.311
.1Ap
proa
ch LO
SA
AB
Queu
e Len
gth 50
th (m
)15
.939
.61.2
0.0Qu
eue L
ength
95th
(m)
42.4
m55.1
4.15.9
Inter
nal L
ink D
ist (m
)36
.315
4.214
4.2Tu
rn B
ay Le
ngth
(m)
Base
Cap
acity
(vph
)13
2912
4643
242
1St
arva
tion C
ap R
educ
tn0
00
0Sp
illbac
k Cap
Red
uctn
00
00
Stor
age C
ap R
educ
tn0
00
0Re
duce
d v/c
Ratio
0.30
0.39
0.02
0.08
Inter
secti
on S
umma
ryCy
cle Le
ngth:
70Ac
tuated
Cyc
le Le
ngth:
70Of
fset: 0
(0%
), Re
feren
ced t
o pha
se 2:
EBT
and 6
:WBT
L, St
art o
f Gre
enNa
tural
Cycle
: 55
Contr
ol Ty
pe: A
ctuate
d-Co
ordin
ated
Lane
s, V
olum
es, T
imin
gs8:
Mar
guer
ite &
McA
rthu
r01
-28-
2020
112 M
ontre
al Ro
ad A
M Pe
ak H
our E
xistin
gSy
nchr
o 10 L
ight R
epor
tPa
ge 15
Maxim
um v/
c Rati
o: 0.3
9Int
erse
ction
Sign
al De
lay: 7
.6Int
erse
ction
LOS:
AInt
erse
ction
Cap
acity
Utili
zatio
n 68.8
%IC
U Le
vel o
f Ser
vice C
Analy
sis P
eriod
(min)
15De
scrip
tion:
As pe
r sign
al tim
ing pl
an pr
ovide
d on N
ov 29
, 201
9.m
Volu
me fo
r 95th
perce
ntile
queu
e is m
etere
d by u
pstre
am si
gnal.
Splits
and P
hase
s:
8: Ma
rgue
rite &
McA
rthur
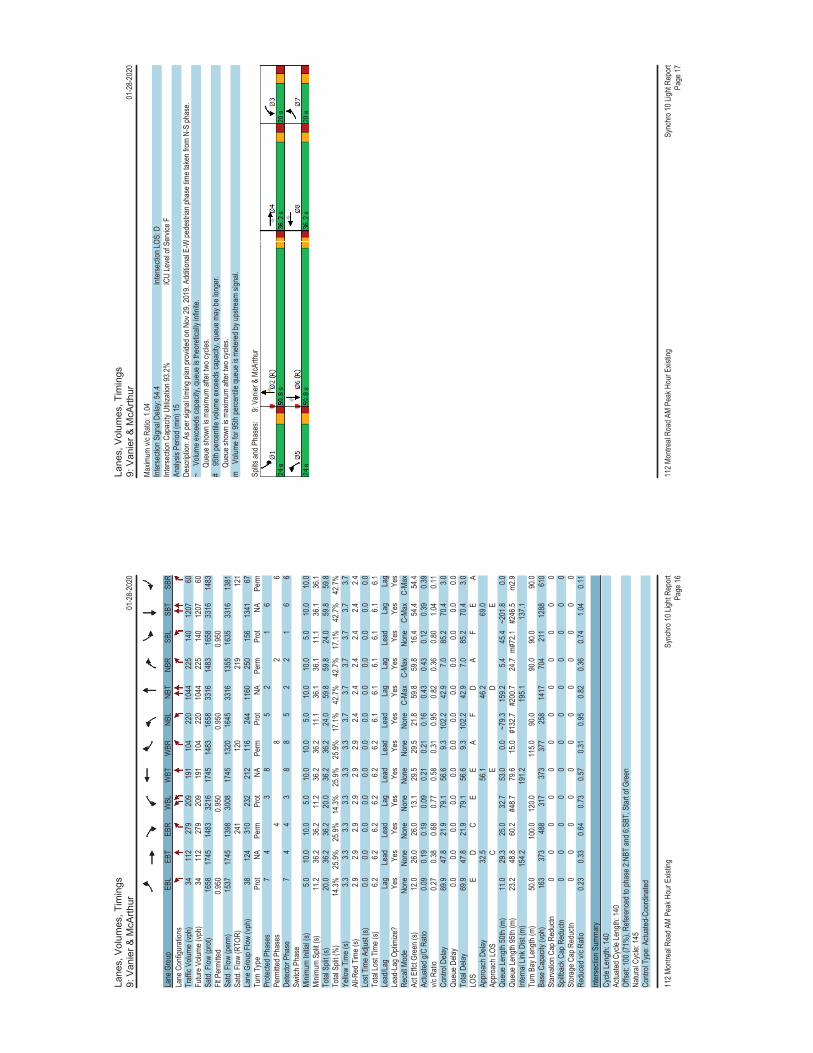
Lane
s, V
olum
es, T
imin
gs9:
Van
ier
& M
cArt
hur
01-2
8-20
20
112 M
ontre
al Ro
ad A
M Pe
ak H
our E
xistin
gSy
nchr
o 10 L
ight R
epor
tPa
ge 16
Lane
Gro
upEB
LEB
TEB
RW
BLW
BTW
BRNB
LNB
TNB
RSB
LSB
TSB
RLa
ne C
onfig
urati
ons
Traff
ic Vo
lume (
vph)
3411
227
920
919
110
422
010
4422
514
012
0760
Futur
e Volu
me (v
ph)
3411
227
920
919
110
422
010
4422
514
012
0760
Satd.
Flow
(pro
t)16
5817
4514
8332
1617
4514
8316
5833
1614
8316
5833
1614
83Flt
Per
mitte
d0.9
500.9
500.9
500.9
50Sa
td. F
low (p
erm)
1537
1745
1398
3008
1745
1320
1645
3316
1355
1635
3316
1381
Satd.
Flow
(RTO
R)24
112
021
912
1La
ne G
roup
Flow
(vph
)38
124
310
232
212
116
244
1160
250
156
1341
67Tu
rn T
ype
Prot
NAPe
rmPr
otNA
Perm
Prot
NAPe
rmPr
otNA
Perm
Prote
cted P
hase
s7
43
85
21
6Pe
rmitte
d Pha
ses
48
26
Detec
tor P
hase
74
43
88
52
21
66
Switc
h Pha
seMi
nimum
Initia
l (s)
5.010
.010
.05.0
10.0
10.0
5.010
.010
.05.0
10.0
10.0
Minim
um S
plit (
s)11
.236
.236
.211
.236
.236
.211
.136
.136
.111
.136
.136
.1To
tal S
plit (
s)20
.036
.236
.220
.036
.236
.224
.059
.859
.824
.059
.859
.8To
tal S
plit (
%)
14.3%
25.9%
25.9%
14.3%
25.9%
25.9%
17.1%
42.7%
42.7%
17.1%
42.7%
42.7%
Yello
w Tim
e (s)
3.33.3
3.33.3
3.33.3
3.73.7
3.73.7
3.73.7
All-R
ed T
ime (
s)2.9
2.92.9
2.92.9
2.92.4
2.42.4
2.42.4
2.4Lo
st Tim
e Adju
st (s)
0.00.0
0.00.0
0.00.0
0.00.0
0.00.0
0.00.0
Total
Lost
Time (
s)6.2
6.26.2
6.26.2
6.26.1
6.16.1
6.16.1
6.1Le
ad/La
gLa
gLe
adLe
adLa
gLe
adLe
adLe
adLa
gLa
gLe
adLa
gLa
gLe
ad-L
ag O
ptimi
ze?
Yes
Yes
Yes
Yes
Yes
Yes
Yes
Yes
Yes
Yes
Yes
Yes
Reca
ll Mod
eNo
neNo
neNo
neNo
neNo
neNo
neNo
neC-
Max
C-Ma
xNo
neC-
Max
C-Ma
xAc
t Effc
t Gre
en (s
)12
.026
.026
.013
.129
.529
.521
.859
.859
.816
.454
.454
.4Ac
tuated
g/C
Ratio
0.09
0.19
0.19
0.09
0.21
0.21
0.16
0.43
0.43
0.12
0.39
0.39
v/c R
atio
0.27
0.38
0.68
0.77
0.58
0.31
0.95
0.82
0.36
0.80
1.04
0.11
Contr
ol De
lay69
.947
.821
.979
.156
.69.3
102.2
42.9
7.085
.270
.43.0
Queu
e Dela
y0.0
0.00.0
0.00.0
0.00.0
0.00.0
0.00.0
0.0To
tal D
elay
69.9
47.8
21.9
79.1
56.6
9.310
2.242
.97.0
85.2
70.4
3.0LO
SE
DC
EE
AF
DA
FE
AAp
proa
ch D
elay
32.5
56.1
46.2
69.0
Appr
oach
LOS
CE
DE
Queu
e Len
gth 50
th (m
)11
.029
.325
.032
.753
.00.0
~79.3
159.2
5.445
.4~2
01.8
0.0Qu
eue L
ength
95th
(m)
23.2
48.8
60.2
#48.7
79.6
15.0
#132
.7#2
00.7
24.7
m#72
.1#2
46.5
m2.9
Inter
nal L
ink D
ist (m
)15
4.219
1.219
5.113
7.1Tu
rn B
ay Le
ngth
(m)
50.0
100.0
120.0
115.0
90.0
90.0
90.0
90.0
Base
Cap
acity
(vph
)16
337
348
831
737
337
725
814
1770
421
112
8861
0St
arva
tion C
ap R
educ
tn0
00
00
00
00
00
0Sp
illbac
k Cap
Red
uctn
00
00
00
00
00
00
Stor
age C
ap R
educ
tn0
00
00
00
00
00
0Re
duce
d v/c
Ratio
0.23
0.33
0.64
0.73
0.57
0.31
0.95
0.82
0.36
0.74
1.04
0.11
Inter
secti
on S
umma
ryCy
cle Le
ngth:
140
Actua
ted C
ycle
Leng
th: 14
0Of
fset: 1
00 (7
1%),
Refer
ence
d to p
hase
2:NB
T an
d 6:S
BT, S
tart o
f Gre
enNa
tural
Cycle
: 145
Contr
ol Ty
pe: A
ctuate
d-Co
ordin
ated
Lane
s, V
olum
es, T
imin
gs9:
Van
ier
& M
cArt
hur
01-2
8-20
20
112 M
ontre
al Ro
ad A
M Pe
ak H
our E
xistin
gSy
nchr
o 10 L
ight R
epor
tPa
ge 17
Maxim
um v/
c Rati
o: 1.0
4Int
erse
ction
Sign
al De
lay: 5
4.4Int
erse
ction
LOS:
DInt
erse
ction
Cap
acity
Utili
zatio
n 93.2
%IC
U Le
vel o
f Ser
vice F
Analy
sis P
eriod
(min)
15De
scrip
tion:
As pe
r sign
al tim
ing pl
an pr
ovide
d on N
ov 29
, 201
9. Ad
dition
al E-
W pe
destr
ian ph
ase t
ime t
aken
from
N-S
phas
e.~
Volu
me ex
ceed
s cap
acity
, que
ue is
theo
retic
ally i
nfinit
e.
Que
ue sh
own i
s max
imum
after
two c
ycles
.#
95th
perce
ntile
volum
e exc
eeds
capa
city,
queu
e may
be lo
nger
.
Que
ue sh
own i
s max
imum
after
two c
ycles
.m
Volu
me fo
r 95th
perce
ntile
queu
e is m
etere
d by u
pstre
am si
gnal.
Splits
and P
hase
s:
9: Va
nier &
McA
rthur
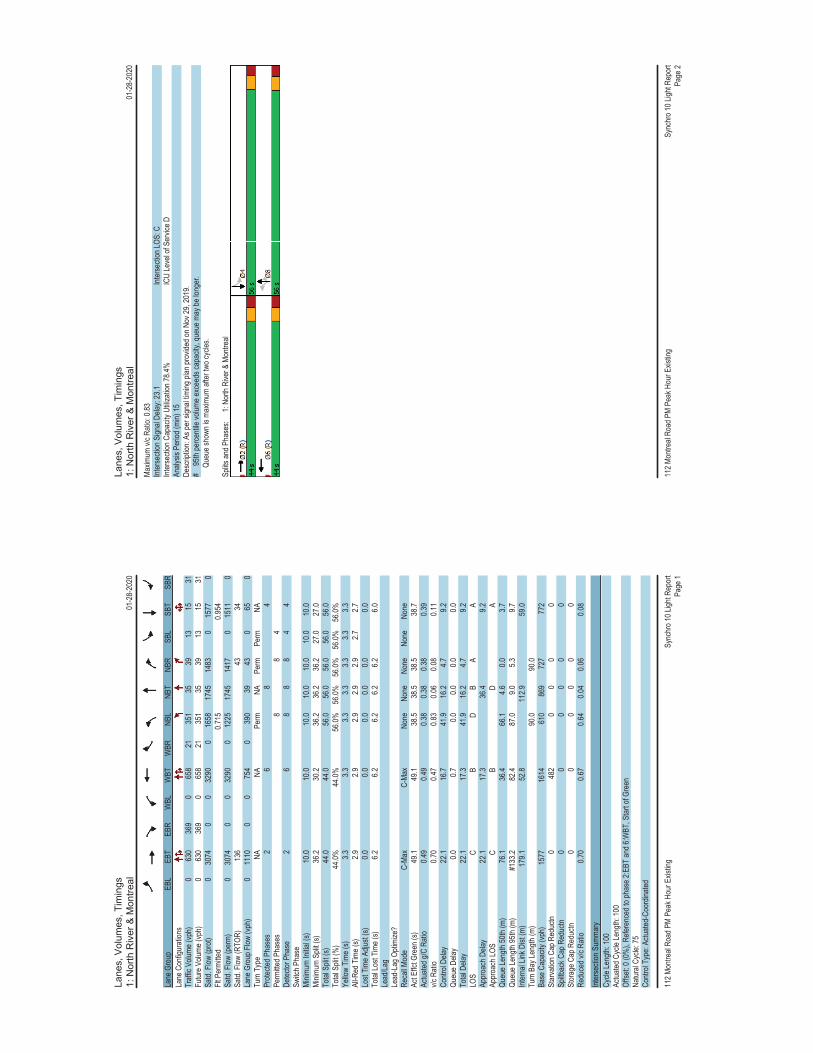
Lane
s, V
olum
es, T
imin
gs1:
Nor
th R
iver
& M
ontr
eal
01-2
8-20
20
112 M
ontre
al Ro
ad P
M Pe
ak H
our E
xistin
gSy
nchr
o 10 L
ight R
epor
tPa
ge 1
Lane
Gro
upEB
LEB
TEB
RW
BLW
BTW
BRNB
LNB
TNB
RSB
LSB
TSB
RLa
ne C
onfig
urati
ons
Traff
ic Vo
lume (
vph)
063
036
90
658
2135
135
3913
1531
Futur
e Volu
me (v
ph)
063
036
90
658
2135
135
3913
1531
Satd.
Flow
(pro
t)0
3074
00
3290
016
5817
4514
830
1577
0Flt
Per
mitte
d0.7
150.9
54Sa
td. F
low (p
erm)
030
740
032
900
1225
1745
1417
015
110
Satd.
Flow
(RTO
R)13
643
34La
ne G
roup
Flow
(vph
)0
1110
00
754
039
039
430
650
Turn
Typ
eNA
NAPe
rmNA
Perm
Perm
NAPr
otecte
d Pha
ses
26
84
Perm
itted P
hase
s8
84
Detec
tor P
hase
26
88
84
4Sw
itch P
hase
Minim
um In
itial (s
)10
.010
.010
.010
.010
.010
.010
.0Mi
nimum
Spli
t (s)
36.2
30.2
36.2
36.2
36.2
27.0
27.0
Total
Spli
t (s)
44.0
44.0
56.0
56.0
56.0
56.0
56.0
Total
Spli
t (%
)44
.0%44
.0%56
.0%56
.0%56
.0%56
.0%56
.0%Ye
llow
Time (
s)3.3
3.33.3
3.33.3
3.33.3
All-R
ed T
ime (
s)2.9
2.92.9
2.92.9
2.72.7
Lost
Time A
djust
(s)0.0
0.00.0
0.00.0
0.0To
tal Lo
st Tim
e (s)
6.26.2
6.26.2
6.26.0
Lead
/Lag
Lead
-Lag
Opti
mize
?Re
call M
ode
C-Ma
xC-
Max
None
None
None
None
None
Act E
ffct G
reen
(s)
49.1
49.1
38.5
38.5
38.5
38.7
Actua
ted g/
C Ra
tio0.4
90.4
90.3
80.3
80.3
80.3
9v/c
Rati
o0.7
00.4
70.8
30.0
60.0
80.1
1Co
ntrol
Delay
22.1
16.7
41.9
16.2
4.79.2
Queu
e Dela
y0.0
0.70.0
0.00.0
0.0To
tal D
elay
22.1
17.3
41.9
16.2
4.79.2
LOS
CB
DB
AA
Appr
oach
Dela
y22
.117
.336
.49.2
Appr
oach
LOS
CB
DA
Queu
e Len
gth 50
th (m
)76
.136
.466
.14.6
0.03.7
Queu
e Len
gth 95
th (m
)#1
33.2
82.4
87.0
9.05.3
9.7Int
erna
l Link
Dist
(m)
179.1
52.8
112.9
59.0
Turn
Bay
Leng
th (m
)90
.090
.0Ba
se C
apac
ity (v
ph)
1577
1614
610
869
727
772
Star
vatio
n Cap
Red
uctn
048
20
00
0Sp
illbac
k Cap
Red
uctn
00
00
00
Stor
age C
ap R
educ
tn0
00
00
0Re
duce
d v/c
Ratio
0.70
0.67
0.64
0.04
0.06
0.08
Inter
secti
on S
umma
ryCy
cle Le
ngth:
100
Actua
ted C
ycle
Leng
th: 10
0Of
fset: 0
(0%
), Re
feren
ced t
o pha
se 2:
EBT
and 6
:WBT
, Star
t of G
reen
Natur
al Cy
cle: 7
5Co
ntrol
Type
: Actu
ated-
Coor
dinate
d
Lane
s, V
olum
es, T
imin
gs1:
Nor
th R
iver
& M
ontr
eal
01-2
8-20
20
112 M
ontre
al Ro
ad P
M Pe
ak H
our E
xistin
gSy
nchr
o 10 L
ight R
epor
tPa
ge 2
Maxim
um v/
c Rati
o: 0.8
3Int
erse
ction
Sign
al De
lay: 2
3.1Int
erse
ction
LOS:
CInt
erse
ction
Cap
acity
Utili
zatio
n 78.4
%IC
U Le
vel o
f Ser
vice D
Analy
sis P
eriod
(min)
15De
scrip
tion:
As pe
r sign
al tim
ing pl
an pr
ovide
d on N
ov 29
, 201
9.#
95th
perce
ntile
volum
e exc
eeds
capa
city,
queu
e may
be lo
nger
.
Que
ue sh
own i
s max
imum
after
two c
ycles
.
Splits
and P
hase
s:
1: No
rth R
iver &
Mon
treal

Lane
s, V
olum
es, T
imin
gs2:
Mon
tgom
ery
& M
ontr
eal
01-2
8-20
20
112 M
ontre
al Ro
ad P
M Pe
ak H
our E
xistin
gSy
nchr
o 10 L
ight R
epor
tPa
ge 3
Lane
Gro
upEB
TEB
RW
BLW
BTNB
LNB
RLa
ne C
onfig
urati
ons
Traff
ic Vo
lume (
vph)
604
7851
625
5834
Futur
e Volu
me (v
ph)
604
7851
625
5834
Satd.
Flow
(pro
t)32
270
033
0216
5814
83Flt
Per
mitte
d0.8
340.9
50Sa
td. F
low (p
erm)
3227
00
2761
1647
1391
Satd.
Flow
(RTO
R)34
38La
ne G
roup
Flow
(vph
)75
80
075
164
38Tu
rn T
ype
NAPe
rmNA
Prot
Perm
Prote
cted P
hase
s2
68
Perm
itted P
hase
s6
8De
tector
Pha
se2
66
88
Switc
h Pha
seMi
nimum
Initia
l (s)
10.0
10.0
10.0
10.0
10.0
Minim
um S
plit (
s)19
.523
.523
.519
.519
.5To
tal S
plit (
s)76
.076
.076
.024
.024
.0To
tal S
plit (
%)
76.0%
76.0%
76.0%
24.0%
24.0%
Yello
w Tim
e (s)
3.33.3
3.33.3
3.3Al
l-Red
Tim
e (s)
2.22.2
2.22.2
2.2Lo
st Tim
e Adju
st (s)
0.00.0
0.00.0
Total
Lost
Time (
s)5.5
5.55.5
5.5Le
ad/La
gLe
ad-L
ag O
ptimi
ze?
Reca
ll Mod
eC-
Max
C-Ma
xC-
Max
None
None
Act E
ffct G
reen
(s)
81.6
81.6
11.6
11.6
Actua
ted g/
C Ra
tio0.8
20.8
20.1
20.1
2v/c
Rati
o0.2
90.3
30.3
30.1
9Co
ntrol
Delay
0.63.7
45.0
14.9
Queu
e Dela
y0.4
0.00.0
0.0To
tal D
elay
1.03.8
45.0
14.9
LOS
AA
DB
Appr
oach
Dela
y1.0
3.833
.7Ap
proa
ch LO
SA
AC
Queu
e Len
gth 50
th (m
)1.8
17.2
11.8
0.0Qu
eue L
ength
95th
(m)
2.829
.023
.68.9
Inter
nal L
ink D
ist (m
)52
.813
8.913
7.9Tu
rn B
ay Le
ngth
(m)
Base
Cap
acity
(vph
)26
3922
5330
628
8St
arva
tion C
ap R
educ
tn12
710
00
Spillb
ack C
ap R
educ
tn0
131
00
Stor
age C
ap R
educ
tn0
00
0Re
duce
d v/c
Ratio
0.55
0.35
0.21
0.13
Inter
secti
on S
umma
ryCy
cle Le
ngth:
100
Actua
ted C
ycle
Leng
th: 10
0Of
fset: 0
(0%
), Re
feren
ced t
o pha
se 2:
EBT
and 6
:WBT
L, St
art o
f Gre
enNa
tural
Cycle
: 45
Contr
ol Ty
pe: A
ctuate
d-Co
ordin
ated
Lane
s, V
olum
es, T
imin
gs2:
Mon
tgom
ery
& M
ontr
eal
01-2
8-20
20
112 M
ontre
al Ro
ad P
M Pe
ak H
our E
xistin
gSy
nchr
o 10 L
ight R
epor
tPa
ge 4
Maxim
um v/
c Rati
o: 0.3
3Int
erse
ction
Sign
al De
lay: 4
.4Int
erse
ction
LOS:
AInt
erse
ction
Cap
acity
Utili
zatio
n 64.2
%IC
U Le
vel o
f Ser
vice C
Analy
sis P
eriod
(min)
15De
scrip
tion:
As pe
r sign
al tim
ing pl
an pr
ovide
d on N
ov 29
, 201
9.
Splits
and P
hase
s:
2: Mo
ntgom
ery &
Mon
treal
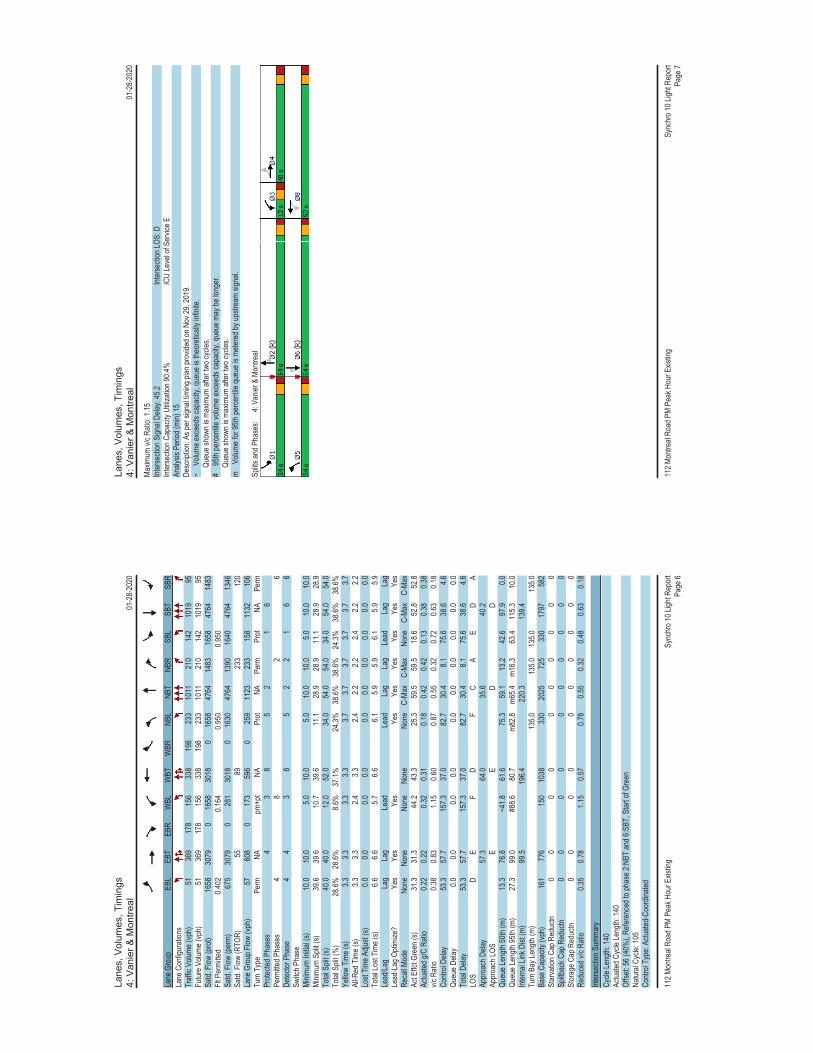
Lane
s, V
olum
es, T
imin
gs4:
Van
ier
& M
ontr
eal
01-2
8-20
20
112 M
ontre
al Ro
ad P
M Pe
ak H
our E
xistin
gSy
nchr
o 10 L
ight R
epor
tPa
ge 6
Lane
Gro
upEB
LEB
TEB
RW
BLW
BTW
BRNB
LNB
TNB
RSB
LSB
TSB
RLa
ne C
onfig
urati
ons
Traff
ic Vo
lume (
vph)
5136
917
815
633
819
823
310
1121
014
210
1995
Futur
e Volu
me (v
ph)
5136
917
815
633
819
823
310
1121
014
210
1995
Satd.
Flow
(pro
t)16
5830
790
1658
3018
016
5847
6414
8316
5847
6414
83Flt
Per
mitte
d0.4
020.1
640.9
500.9
50Sa
td. F
low (p
erm)
675
3079
028
130
180
1630
4764
1390
1640
4764
1346
Satd.
Flow
(RTO
R)55
8923
312
0La
ne G
roup
Flow
(vph
)57
608
017
359
60
259
1123
233
158
1132
106
Turn
Typ
ePe
rmNA
pm+p
tNA
Prot
NAPe
rmPr
otNA
Perm
Prote
cted P
hase
s4
38
52
16
Perm
itted P
hase
s4
82
6De
tector
Pha
se4
43
85
22
16
6Sw
itch P
hase
Minim
um In
itial (s
)10
.010
.05.0
10.0
5.010
.010
.05.0
10.0
10.0
Minim
um S
plit (
s)39
.639
.610
.739
.611
.128
.928
.911
.128
.928
.9To
tal S
plit (
s)40
.040
.012
.052
.034
.054
.054
.034
.054
.054
.0To
tal S
plit (
%)
28.6%
28.6%
8.6%
37.1%
24.3%
38.6%
38.6%
24.3%
38.6%
38.6%
Yello
w Tim
e (s)
3.33.3
3.33.3
3.73.7
3.73.7
3.73.7
All-R
ed T
ime (
s)3.3
3.32.4
3.32.4
2.22.2
2.42.2
2.2Lo
st Tim
e Adju
st (s)
0.00.0
0.00.0
0.00.0
0.00.0
0.00.0
Total
Lost
Time (
s)6.6
6.65.7
6.66.1
5.95.9
6.15.9
5.9Le
ad/La
gLa
gLa
gLe
adLe
adLa
gLa
gLe
adLa
gLa
gLe
ad-L
ag O
ptimi
ze?
Yes
Yes
Yes
Yes
Yes
Yes
Yes
Yes
Yes
Reca
ll Mod
eNo
neNo
neNo
neNo
neNo
neC-
Max
C-Ma
xNo
neC-
Max
C-Ma
xAc
t Effc
t Gre
en (s
)31
.331
.344
.243
.325
.359
.559
.518
.652
.852
.8Ac
tuated
g/C
Ratio
0.22
0.22
0.32
0.31
0.18
0.42
0.42
0.13
0.38
0.38
v/c R
atio
0.38
0.83
1.15
0.60
0.87
0.55
0.32
0.72
0.63
0.18
Contr
ol De
lay53
.357
.715
7.337
.082
.730
.48.1
75.6
38.6
4.6Qu
eue D
elay
0.00.0
0.00.0
0.00.0
0.00.0
0.00.0
Total
Dela
y53
.357
.715
7.337
.082
.730
.48.1
75.6
38.6
4.6LO
SD
EF
DF
CA
ED
AAp
proa
ch D
elay
57.3
64.0
35.6
40.2
Appr
oach
LOS
EE
DD
Queu
e Len
gth 50
th (m
)13
.376
.8~4
1.861
.675
.359
.113
.242
.697
.90.0
Queu
e Len
gth 95
th (m
)27
.399
.0#8
8.680
.7m8
2.8m6
5.4m1
6.363
.411
5.310
.0Int
erna
l Link
Dist
(m)
99.5
196.4
220.3
139.4
Turn
Bay
Leng
th (m
)13
5.013
5.013
5.013
5.0Ba
se C
apac
ity (v
ph)
161
776
150
1038
330
2025
725
330
1797
582
Star
vatio
n Cap
Red
uctn
00
00
00
00
00
Spillb
ack C
ap R
educ
tn0
00
00
00
00
0St
orag
e Cap
Red
uctn
00
00
00
00
00
Redu
ced v
/c Ra
tio0.3
50.7
81.1
50.5
70.7
80.5
50.3
20.4
80.6
30.1
8
Inter
secti
on S
umma
ryCy
cle Le
ngth:
140
Actua
ted C
ycle
Leng
th: 14
0Of
fset: 5
6 (40
%),
Refer
ence
d to p
hase
2:NB
T an
d 6:S
BT, S
tart o
f Gre
enNa
tural
Cycle
: 105
Contr
ol Ty
pe: A
ctuate
d-Co
ordin
ated
Lane
s, V
olum
es, T
imin
gs4:
Van
ier
& M
ontr
eal
01-2
8-20
20
112 M
ontre
al Ro
ad P
M Pe
ak H
our E
xistin
gSy
nchr
o 10 L
ight R
epor
tPa
ge 7
Maxim
um v/
c Rati
o: 1.1
5Int
erse
ction
Sign
al De
lay: 4
5.2Int
erse
ction
LOS:
DInt
erse
ction
Cap
acity
Utili
zatio
n 90.4
%IC
U Le
vel o
f Ser
vice E
Analy
sis P
eriod
(min)
15De
scrip
tion:
As pe
r sign
al tim
ing pl
an pr
ovide
d on N
ov 29
, 201
9.~
Volu
me ex
ceed
s cap
acity
, que
ue is
theo
retic
ally i
nfinit
e.
Que
ue sh
own i
s max
imum
after
two c
ycles
.#
95th
perce
ntile
volum
e exc
eeds
capa
city,
queu
e may
be lo
nger
.
Que
ue sh
own i
s max
imum
after
two c
ycles
.m
Volu
me fo
r 95th
perce
ntile
queu
e is m
etere
d by u
pstre
am si
gnal.
Splits
and P
hase
s:
4: Va
nier &
Mon
treal

Lane
s, V
olum
es, T
imin
gs5:
Cod
y/H
anna
h &
Mon
trea
l01
-28-
2020
112 M
ontre
al Ro
ad P
M Pe
ak H
our E
xistin
gSy
nchr
o 10 L
ight R
epor
tPa
ge 8
Lane
Gro
upEB
LEB
TEB
RW
BLW
BTW
BRNB
LNB
TNB
RSB
LSB
TSB
RLa
ne C
onfig
urati
ons
Traff
ic Vo
lume (
vph)
114
661
73
603
450
00
7115
71Fu
ture V
olume
(vph
)11
466
17
360
345
00
071
1571
Satd.
Flow
(pro
t)0
3283
00
3210
00
00
015
530
Flt P
ermi
tted
0.718
0.953
0.978
Satd.
Flow
(per
m)0
2339
00
3059
00
00
015
350
Satd.
Flow
(RTO
R)2
1837
Lane
Gro
up F
low (v
ph)
086
90
072
30
00
00
175
0Tu
rn T
ype
Perm
NAPe
rmNA
Perm
NAPr
otecte
d Pha
ses
26
8Pe
rmitte
d Pha
ses
26
8De
tector
Pha
se2
26
68
8Sw
itch P
hase
Minim
um In
itial (s
)10
.010
.010
.010
.010
.010
.0Mi
nimum
Spli
t (s)
25.5
25.5
21.5
21.5
21.5
21.5
Total
Spli
t (s)
75.0
75.0
75.0
75.0
25.0
25.0
Total
Spli
t (%
)75
.0%75
.0%75
.0%75
.0%25
.0%25
.0%Ye
llow
Time (
s)3.3
3.33.3
3.33.3
3.3Al
l-Red
Tim
e (s)
2.22.2
2.22.2
2.22.2
Lost
Time A
djust
(s)0.0
0.00.0
Total
Lost
Time (
s)5.5
5.55.5
Lead
/Lag
Lead
-Lag
Opti
mize
?Re
call M
ode
C-Ma
xC-
Max
C-Ma
xC-
Max
None
None
Act E
ffct G
reen
(s)
74.1
74.1
14.9
Actua
ted g/
C Ra
tio0.7
40.7
40.1
5v/c
Rati
o0.5
00.3
20.6
8Co
ntrol
Delay
7.05.1
44.2
Queu
e Dela
y0.0
0.00.0
Total
Dela
y7.0
5.144
.2LO
SA
AD
Appr
oach
Dela
y7.0
5.144
.2Ap
proa
ch LO
SA
AD
Queu
e Len
gth 50
th (m
)32
.221
.425
.1Qu
eue L
ength
95th
(m)
51.2
33.3
45.1
Inter
nal L
ink D
ist (m
)19
6.487
.112
7.910
6.3Tu
rn B
ay Le
ngth
(m)
Base
Cap
acity
(vph
)17
3422
7132
9St
arva
tion C
ap R
educ
tn0
00
Spillb
ack C
ap R
educ
tn0
00
Stor
age C
ap R
educ
tn0
00
Redu
ced v
/c Ra
tio0.5
00.3
20.5
3
Inter
secti
on S
umma
ryCy
cle Le
ngth:
100
Actua
ted C
ycle
Leng
th: 10
0Of
fset: 1
0 (10
%),
Refer
ence
d to p
hase
2:EB
TL an
d 6:W
BTL,
Star
t of G
reen
Natur
al Cy
cle: 5
5Co
ntrol
Type
: Actu
ated-
Coor
dinate
d
Lane
s, V
olum
es, T
imin
gs5:
Cod
y/H
anna
h &
Mon
trea
l01
-28-
2020
112 M
ontre
al Ro
ad P
M Pe
ak H
our E
xistin
gSy
nchr
o 10 L
ight R
epor
tPa
ge 9
Maxim
um v/
c Rati
o: 0.6
8Int
erse
ction
Sign
al De
lay: 9
.9Int
erse
ction
LOS:
AInt
erse
ction
Cap
acity
Utili
zatio
n 73.9
%IC
U Le
vel o
f Ser
vice D
Analy
sis P
eriod
(min)
15De
scrip
tion:
As pe
r sign
al tim
ing pl
an pr
ovide
d on N
ov 29
, 201
9.
Splits
and P
hase
s:
5: Co
dy/H
anna
h & M
ontre
al
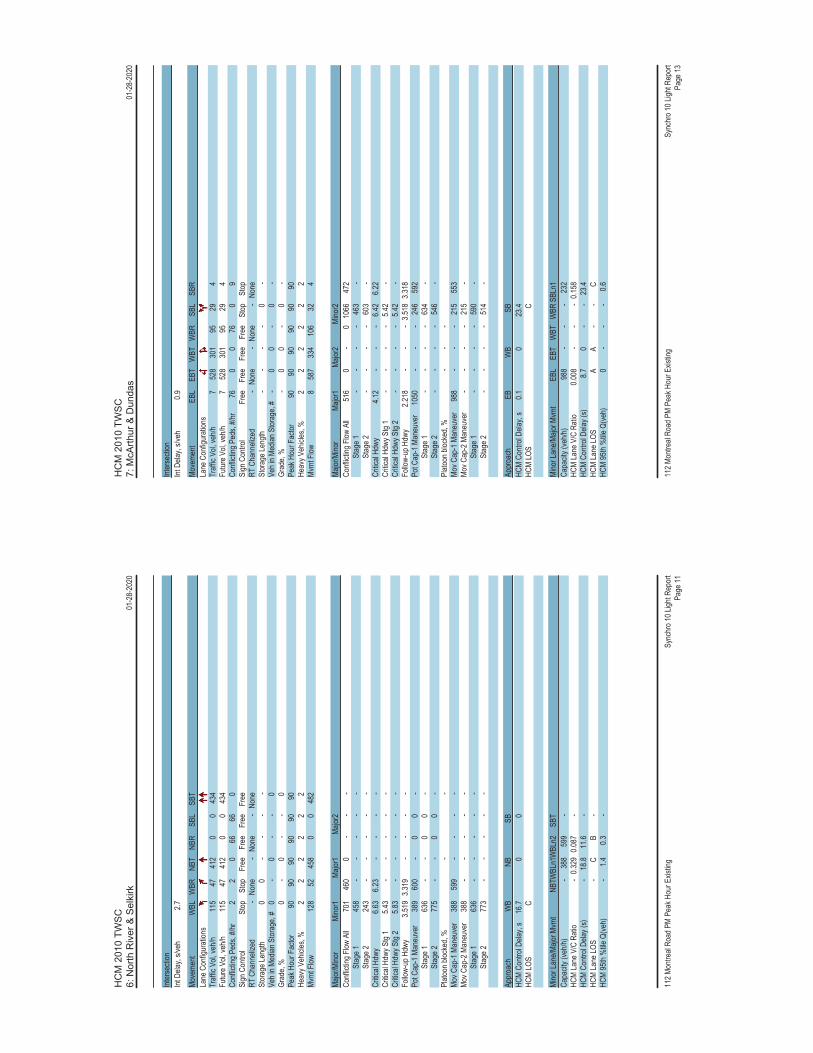
HC
M 2
010
TW
SC
6: N
orth
Riv
er &
Sel
kirk
01-2
8-20
20
112 M
ontre
al Ro
ad P
M Pe
ak H
our E
xistin
gSy
nchr
o 10 L
ight R
epor
tPa
ge 11
Inter
secti
onInt
Dela
y, s/v
eh2.7
Move
ment
WBL
WBR
NBT
NBR
SBL
SBT
Lane
Con
figur
ation
sTr
affic
Vol, v
eh/h
115
4741
20
043
4Fu
ture V
ol, ve
h/h11
547
412
00
434
Confl
icting
Ped
s, #/h
r2
20
6666
0Si
gn C
ontro
l St
opSt
opFr
eeFr
eeFr
eeFr
eeRT
Cha
nneli
zed
-No
ne-
None
-No
neSt
orag
e Len
gth0
0-
--
-Ve
h in M
edian
Stor
age,
#0
-0
--
0Gr
ade,
%0
-0
--
0Pe
ak H
our F
actor
9090
9090
9090
Heav
y Veh
icles
, %2
22
22
2Mv
mt F
low12
852
458
00
482
Major
/Mino
rMi
nor1
Major
1Ma
jor2
Confl
icting
Flow
All
701
460
0-
--
Stag
e 145
8-
--
--
Stag
e 224
3-
--
--
Critic
al Hd
wy6.6
36.2
3-
--
-Cr
itical
Hdwy
Stg
15.4
3-
--
--
Critic
al Hd
wy S
tg 2
5.83
--
--
-Fo
llow-
up H
dwy
3.519
3.319
--
--
Pot C
ap-1
Man
euve
r38
960
0-
00
-
S
tage 1
636
--
00
-
S
tage 2
775
--
00
-Pl
atoon
bloc
ked,
%-
-Mo
v Cap
-1 M
aneu
ver
388
599
--
--
Mov C
ap-2
Man
euve
r38
8-
--
--
Stag
e 163
6-
--
--
Stag
e 277
3-
--
--
Appr
oach
WB
NBSB
HCM
Contr
ol De
lay, s
16.7
00
HCM
LOS
C Mi
nor L
ane/M
ajor M
vmt
NBTW
BLn1
WBL
n2SB
TCa
pacit
y (ve
h/h)
-38
859
9-
HCM
Lane
V/C
Rati
o-
0.329
0.087
-HC
M Co
ntrol
Delay
(s)
-18
.811
.6-
HCM
Lane
LOS
-C
B-
HCM
95th
%tile
Q(ve
h)-
1.40.3
-
HC
M 2
010
TW
SC
7: M
cArt
hur
& D
unda
s01
-28-
2020
112 M
ontre
al Ro
ad P
M Pe
ak H
our E
xistin
gSy
nchr
o 10 L
ight R
epor
tPa
ge 13
Inter
secti
onInt
Dela
y, s/v
eh0.9
Move
ment
EBL
EBT
WBT
WBR
SBL
SBR
Lane
Con
figur
ation
sTr
affic
Vol, v
eh/h
752
830
195
294
Futur
e Vol,
veh/h
752
830
195
294
Confl
icting
Ped
s, #/h
r76
00
760
9Si
gn C
ontro
l Fr
eeFr
eeFr
eeFr
eeSt
opSt
opRT
Cha
nneli
zed
-No
ne-
None
-No
neSt
orag
e Len
gth-
--
-0
-Ve
h in M
edian
Stor
age,
#-
00
-0
-Gr
ade,
%-
00
-0
-Pe
ak H
our F
actor
9090
9090
9090
Heav
y Veh
icles
, %2
22
22
2Mv
mt F
low8
587
334
106
324
Major
/Mino
rMa
jor1
Major
2Mi
nor2
Confl
icting
Flow
All
516
0-
010
6647
2
S
tage 1
--
--
463
-
S
tage 2
--
--
603
-Cr
itical
Hdwy
4.12
--
-6.4
26.2
2Cr
itical
Hdwy
Stg
1-
--
-5.4
2-
Critic
al Hd
wy S
tg 2
--
--
5.42
-Fo
llow-
up H
dwy
2.218
--
-3.5
183.3
18Po
t Cap
-1 M
aneu
ver
1050
--
-24
659
2
S
tage 1
--
--
634
-
S
tage 2
--
--
546
-Pl
atoon
bloc
ked,
%-
--
Mov C
ap-1
Man
euve
r98
8-
--
215
553
Mov C
ap-2
Man
euve
r-
--
-21
5-
Stag
e 1-
--
-59
0-
Stag
e 2-
--
-51
4-
Appr
oach
EBW
BSB
HCM
Contr
ol De
lay, s
0.10
23.4
HCM
LOS
C Mi
nor L
ane/M
ajor M
vmt
EBL
EBT
WBT
WBR
SBLn
1Ca
pacit
y (ve
h/h)
988
--
-23
2HC
M La
ne V
/C R
atio
0.008
--
-0.1
58HC
M Co
ntrol
Delay
(s)
8.70
--
23.4
HCM
Lane
LOS
AA
--
CHC
M 95
th %
tile Q
(veh)
0-
--
0.6

Lane
s, V
olum
es, T
imin
gs8:
Mar
guer
ite &
McA
rthu
r01
-28-
2020
112 M
ontre
al Ro
ad P
M Pe
ak H
our E
xistin
gSy
nchr
o 10 L
ight R
epor
tPa
ge 14
Lane
Gro
upEB
TEB
RW
BLW
BTNB
LNB
RLa
ne C
onfig
urati
ons
Traff
ic Vo
lume (
vph)
536
2140
376
2052
Futur
e Volu
me (v
ph)
536
2140
376
2052
Satd.
Flow
(pro
t)17
320
017
3616
5814
83Flt
Per
mitte
d0.9
130.9
50Sa
td. F
low (p
erm)
1732
00
1591
1586
1425
Satd.
Flow
(RTO
R)5
58La
ne G
roup
Flow
(vph
)61
90
046
222
58Tu
rn T
ype
NAPe
rmNA
Perm
Perm
Prote
cted P
hase
s2
6Pe
rmitte
d Pha
ses
64
4De
tector
Pha
se2
66
44
Switc
h Pha
seMi
nimum
Initia
l (s)
10.0
10.0
10.0
10.0
10.0
Minim
um S
plit (
s)27
.523
.523
.524
.524
.5To
tal S
plit (
s)50
.050
.050
.025
.025
.0To
tal S
plit (
%)
66.7%
66.7%
66.7%
33.3%
33.3%
Yello
w Tim
e (s)
3.33.3
3.33.3
3.3Al
l-Red
Tim
e (s)
2.22.2
2.22.2
2.2Lo
st Tim
e Adju
st (s)
0.00.0
0.00.0
Total
Lost
Time (
s)5.5
5.55.5
5.5Le
ad/La
gLe
ad-L
ag O
ptimi
ze?
Reca
ll Mod
eC-
Max
C-Ma
xC-
Max
None
None
Act E
ffct G
reen
(s)
54.6
54.6
13.6
13.6
Actua
ted g/
C Ra
tio0.7
30.7
30.1
80.1
8v/c
Rati
o0.4
90.4
00.0
80.1
9Co
ntrol
Delay
8.47.5
23.6
8.3Qu
eue D
elay
0.00.0
0.00.0
Total
Dela
y8.4
7.523
.68.3
LOS
AA
CA
Appr
oach
Dela
y8.4
7.512
.5Ap
proa
ch LO
SA
AB
Queu
e Len
gth 50
th (m
)30
.220
.62.8
0.0Qu
eue L
ength
95th
(m)
77.2
53.7
7.58.1
Inter
nal L
ink D
ist (m
)36
.315
4.214
4.2Tu
rn B
ay Le
ngth
(m)
Base
Cap
acity
(vph
)12
6211
5841
241
3St
arva
tion C
ap R
educ
tn0
00
0Sp
illbac
k Cap
Red
uctn
00
00
Stor
age C
ap R
educ
tn0
00
0Re
duce
d v/c
Ratio
0.49
0.40
0.05
0.14
Inter
secti
on S
umma
ryCy
cle Le
ngth:
75Ac
tuated
Cyc
le Le
ngth:
75Of
fset: 0
(0%
), Re
feren
ced t
o pha
se 2:
EBT
and 6
:WBT
L, St
art o
f Gre
enNa
tural
Cycle
: 60
Contr
ol Ty
pe: A
ctuate
d-Co
ordin
ated
Lane
s, V
olum
es, T
imin
gs8:
Mar
guer
ite &
McA
rthu
r01
-28-
2020
112 M
ontre
al Ro
ad P
M Pe
ak H
our E
xistin
gSy
nchr
o 10 L
ight R
epor
tPa
ge 15
Maxim
um v/
c Rati
o: 0.4
9Int
erse
ction
Sign
al De
lay: 8
.3Int
erse
ction
LOS:
AInt
erse
ction
Cap
acity
Utili
zatio
n 75.7
%IC
U Le
vel o
f Ser
vice D
Analy
sis P
eriod
(min)
15De
scrip
tion:
As pe
r sign
al tim
ing pl
an pr
ovide
d on N
ov 29
, 201
9.
Splits
and P
hase
s:
8: Ma
rgue
rite &
McA
rthur

Lane
s, V
olum
es, T
imin
gs9:
Van
ier
& M
cArt
hur
01-2
8-20
20
112 M
ontre
al Ro
ad P
M Pe
ak H
our E
xistin
gSy
nchr
o 10 L
ight R
epor
tPa
ge 16
Lane
Gro
upEB
LEB
TEB
RW
BLW
BTW
BRNB
LNB
TNB
RSB
LSB
TSB
RLa
ne C
onfig
urati
ons
Traff
ic Vo
lume (
vph)
5524
647
233
321
817
020
611
9825
112
211
7866
Futur
e Volu
me (v
ph)
5524
647
233
321
817
020
611
9825
112
211
7866
Satd.
Flow
(pro
t)16
5817
4514
8332
1617
4514
8316
5833
1614
8316
5833
1614
83Flt
Per
mitte
d0.9
500.9
500.9
500.9
50Sa
td. F
low (p
erm)
1577
1745
1323
2862
1745
1360
1618
3316
1368
1643
3316
1235
Satd.
Flow
(RTO
R)26
118
922
116
8La
ne G
roup
Flow
(vph
)61
273
524
370
242
189
229
1331
279
136
1309
73Tu
rn T
ype
Prot
NAPe
rmPr
otNA
Perm
Prot
NAPe
rmPr
otNA
Perm
Prote
cted P
hase
s7
43
85
21
6Pe
rmitte
d Pha
ses
48
26
Detec
tor P
hase
74
43
88
52
21
66
Switc
h Pha
seMi
nimum
Initia
l (s)
5.010
.010
.05.0
10.0
10.0
5.010
.010
.05.0
10.0
10.0
Minim
um S
plit (
s)11
.236
.236
.211
.236
.236
.211
.136
.136
.111
.136
.136
.1To
tal S
plit (
s)18
.036
.236
.218
.036
.236
.231
.062
.862
.823
.054
.854
.8To
tal S
plit (
%)
12.9%
25.9%
25.9%
12.9%
25.9%
25.9%
22.1%
44.9%
44.9%
16.4%
39.1%
39.1%
Yello
w Tim
e (s)
3.33.3
3.33.3
3.33.3
3.73.7
3.73.7
3.73.7
All-R
ed T
ime (
s)2.9
2.92.9
2.92.9
2.92.4
2.42.4
2.42.4
2.4Lo
st Tim
e Adju
st (s)
0.00.0
0.00.0
0.00.0
0.00.0
0.00.0
0.00.0
Total
Lost
Time (
s)6.2
6.26.2
6.26.2
6.26.1
6.16.1
6.16.1
6.1Le
ad/La
gLa
gLe
adLe
adLa
gLe
adLe
adLe
adLa
gLa
gLe
adLa
gLa
gLe
ad-L
ag O
ptimi
ze?
Yes
Yes
Yes
Yes
Yes
Yes
Yes
Yes
Yes
Yes
Yes
Yes
Reca
ll Mod
eNo
neNo
neNo
neNo
neNo
neNo
neNo
neC-
Max
C-Ma
xNo
neC-
Max
C-Ma
xAc
t Effc
t Gre
en (s
)10
.730
.030
.011
.833
.633
.622
.758
.458
.415
.250
.950
.9Ac
tuated
g/C
Ratio
0.08
0.21
0.21
0.08
0.24
0.24
0.16
0.42
0.42
0.11
0.36
0.36
v/c R
atio
0.48
0.73
1.07
1.37
0.58
0.40
0.85
0.96
0.40
0.76
1.09
0.13
Contr
ol De
lay74
.664
.087
.823
2.355
.08.7
84.3
56.7
8.576
.589
.52.3
Queu
e Dela
y0.0
0.00.0
0.00.0
0.00.0
0.00.0
0.00.0
0.0To
tal D
elay
74.6
64.0
87.8
232.3
55.0
8.784
.356
.78.5
76.5
89.5
2.3LO
SE
EF
FE
AF
EA
EF
AAp
proa
ch D
elay
79.3
126.0
52.8
84.2
Appr
oach
LOS
EF
DF
Queu
e Len
gth 50
th (m
)16
.371
.1~1
00.4
~69.4
61.7
0.061
.219
1.09.9
38.2
~209
.90.3
Queu
e Len
gth 95
th (m
)31
.310
3.2#1
70.3
#101
.191
.120
.4#9
9.1#2
42.0
31.0
m55.9
m#24
4.3m2
.9Int
erna
l Link
Dist
(m)
154.2
174.6
77.0
137.1
Turn
Bay
Leng
th (m
)50
.010
0.012
0.011
5.090
.090
.090
.090
.0Ba
se C
apac
ity (v
ph)
139
373
488
271
418
469
294
1383
699
200
1205
556
Star
vatio
n Cap
Red
uctn
00
00
00
00
00
00
Spillb
ack C
ap R
educ
tn0
00
00
00
00
00
0St
orag
e Cap
Red
uctn
00
00
00
00
00
00
Redu
ced v
/c Ra
tio0.4
40.7
31.0
71.3
70.5
80.4
00.7
80.9
60.4
00.6
81.0
90.1
3
Inter
secti
on S
umma
ryCy
cle Le
ngth:
140
Actua
ted C
ycle
Leng
th: 14
0Of
fset: 5
4 (39
%),
Refer
ence
d to p
hase
2:NB
T an
d 6:S
BT, S
tart o
f Gre
enNa
tural
Cycle
: 135
Contr
ol Ty
pe: A
ctuate
d-Co
ordin
ated
Lane
s, V
olum
es, T
imin
gs9:
Van
ier
& M
cArt
hur
01-2
8-20
20
112 M
ontre
al Ro
ad P
M Pe
ak H
our E
xistin
gSy
nchr
o 10 L
ight R
epor
tPa
ge 17
Maxim
um v/
c Rati
o: 1.3
7Int
erse
ction
Sign
al De
lay: 7
8.5Int
erse
ction
LOS:
EInt
erse
ction
Cap
acity
Utili
zatio
n 100
.8%IC
U Le
vel o
f Ser
vice G
Analy
sis P
eriod
(min)
15De
scrip
tion:
As pe
r sign
al tim
ing pl
an pr
ovide
d on N
ov 29
, 201
9. Ad
dition
al E-
W pe
destr
ian ph
ase t
ime t
aken
from
N-S
phas
e.~
Volu
me ex
ceed
s cap
acity
, que
ue is
theo
retic
ally i
nfinit
e.
Que
ue sh
own i
s max
imum
after
two c
ycles
.#
95th
perce
ntile
volum
e exc
eeds
capa
city,
queu
e may
be lo
nger
.
Que
ue sh
own i
s max
imum
after
two c
ycles
.m
Volu
me fo
r 95th
perce
ntile
queu
e is m
etere
d by u
pstre
am si
gnal.
Splits
and P
hase
s:
9: Va
nier &
McA
rthur

Appendix D
Collision Data
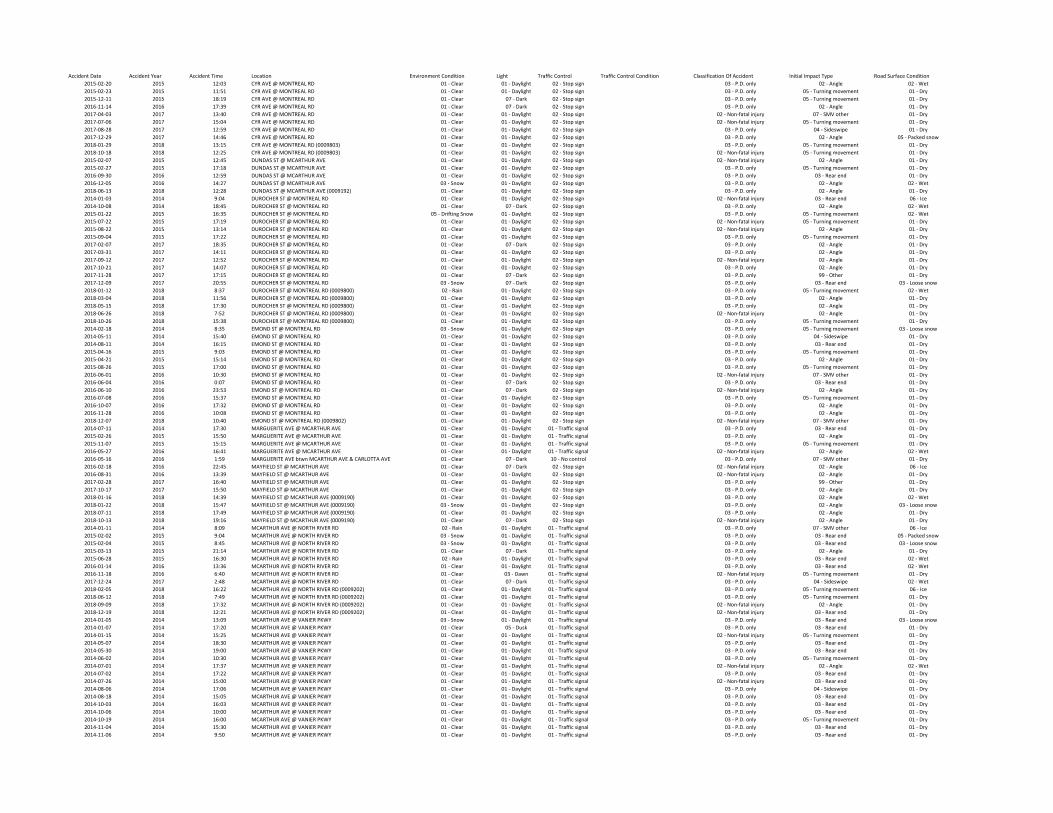
Accident Date Accident Year Accident Time Location Environment Condition Light Traffic Control Traffic Control Condition Classification Of Accident Initial Impact Type Road Surface Condition2015‐02‐20 2015 12:03 CYR AVE @ MONTREAL RD 01 ‐ Clear 01 ‐ Daylight 02 ‐ Stop sign 03 ‐ P.D. only 02 ‐ Angle 02 ‐ Wet2015‐02‐23 2015 11:51 CYR AVE @ MONTREAL RD 01 ‐ Clear 01 ‐ Daylight 02 ‐ Stop sign 03 ‐ P.D. only 05 ‐ Turning movement 01 ‐ Dry2015‐12‐11 2015 18:19 CYR AVE @ MONTREAL RD 01 ‐ Clear 07 ‐ Dark 02 ‐ Stop sign 03 ‐ P.D. only 05 ‐ Turning movement 01 ‐ Dry2016‐11‐14 2016 17:39 CYR AVE @ MONTREAL RD 01 ‐ Clear 07 ‐ Dark 02 ‐ Stop sign 03 ‐ P.D. only 02 ‐ Angle 01 ‐ Dry2017‐04‐03 2017 13:40 CYR AVE @ MONTREAL RD 01 ‐ Clear 01 ‐ Daylight 02 ‐ Stop sign 02 ‐ Non‐fatal injury 07 ‐ SMV other 01 ‐ Dry2017‐07‐06 2017 15:04 CYR AVE @ MONTREAL RD 01 ‐ Clear 01 ‐ Daylight 02 ‐ Stop sign 02 ‐ Non‐fatal injury 05 ‐ Turning movement 01 ‐ Dry2017‐08‐28 2017 12:59 CYR AVE @ MONTREAL RD 01 ‐ Clear 01 ‐ Daylight 02 ‐ Stop sign 03 ‐ P.D. only 04 ‐ Sideswipe 01 ‐ Dry2017‐12‐29 2017 14:46 CYR AVE @ MONTREAL RD 01 ‐ Clear 01 ‐ Daylight 02 ‐ Stop sign 03 ‐ P.D. only 02 ‐ Angle 05 ‐ Packed snow2018‐01‐29 2018 13:15 CYR AVE @ MONTREAL RD (0009803) 01 ‐ Clear 01 ‐ Daylight 02 ‐ Stop sign 03 ‐ P.D. only 05 ‐ Turning movement 01 ‐ Dry2018‐10‐18 2018 12:25 CYR AVE @ MONTREAL RD (0009803) 01 ‐ Clear 01 ‐ Daylight 02 ‐ Stop sign 02 ‐ Non‐fatal injury 05 ‐ Turning movement 01 ‐ Dry2015‐02‐07 2015 12:45 DUNDAS ST @ MCARTHUR AVE 01 ‐ Clear 01 ‐ Daylight 02 ‐ Stop sign 02 ‐ Non‐fatal injury 02 ‐ Angle 01 ‐ Dry2015‐02‐27 2015 17:18 DUNDAS ST @ MCARTHUR AVE 01 ‐ Clear 01 ‐ Daylight 02 ‐ Stop sign 03 ‐ P.D. only 05 ‐ Turning movement 01 ‐ Dry2016‐09‐30 2016 12:59 DUNDAS ST @ MCARTHUR AVE 01 ‐ Clear 01 ‐ Daylight 02 ‐ Stop sign 03 ‐ P.D. only 03 ‐ Rear end 01 ‐ Dry2016‐12‐05 2016 14:27 DUNDAS ST @ MCARTHUR AVE 03 ‐ Snow 01 ‐ Daylight 02 ‐ Stop sign 03 ‐ P.D. only 02 ‐ Angle 02 ‐ Wet2018‐06‐13 2018 12:28 DUNDAS ST @ MCARTHUR AVE (0009192) 01 ‐ Clear 01 ‐ Daylight 02 ‐ Stop sign 03 ‐ P.D. only 02 ‐ Angle 01 ‐ Dry2014‐01‐03 2014 9:04 DUROCHER ST @ MONTREAL RD 01 ‐ Clear 01 ‐ Daylight 02 ‐ Stop sign 02 ‐ Non‐fatal injury 03 ‐ Rear end 06 ‐ Ice2014‐10‐08 2014 18:45 DUROCHER ST @ MONTREAL RD 01 ‐ Clear 07 ‐ Dark 02 ‐ Stop sign 03 ‐ P.D. only 02 ‐ Angle 02 ‐ Wet2015‐01‐22 2015 16:35 DUROCHER ST @ MONTREAL RD 05 ‐ Drifting Snow 01 ‐ Daylight 02 ‐ Stop sign 03 ‐ P.D. only 05 ‐ Turning movement 02 ‐ Wet2015‐07‐22 2015 17:19 DUROCHER ST @ MONTREAL RD 01 ‐ Clear 01 ‐ Daylight 02 ‐ Stop sign 02 ‐ Non‐fatal injury 05 ‐ Turning movement 01 ‐ Dry2015‐08‐22 2015 13:14 DUROCHER ST @ MONTREAL RD 01 ‐ Clear 01 ‐ Daylight 02 ‐ Stop sign 02 ‐ Non‐fatal injury 02 ‐ Angle 01 ‐ Dry2015‐09‐04 2015 17:22 DUROCHER ST @ MONTREAL RD 01 ‐ Clear 01 ‐ Daylight 02 ‐ Stop sign 03 ‐ P.D. only 05 ‐ Turning movement 01 ‐ Dry2017‐02‐07 2017 18:35 DUROCHER ST @ MONTREAL RD 01 ‐ Clear 07 ‐ Dark 02 ‐ Stop sign 03 ‐ P.D. only 02 ‐ Angle 01 ‐ Dry2017‐03‐31 2017 14:11 DUROCHER ST @ MONTREAL RD 01 ‐ Clear 01 ‐ Daylight 02 ‐ Stop sign 03 ‐ P.D. only 02 ‐ Angle 01 ‐ Dry2017‐09‐12 2017 12:52 DUROCHER ST @ MONTREAL RD 01 ‐ Clear 01 ‐ Daylight 02 ‐ Stop sign 02 ‐ Non‐fatal injury 02 ‐ Angle 01 ‐ Dry2017‐10‐21 2017 14:07 DUROCHER ST @ MONTREAL RD 01 ‐ Clear 01 ‐ Daylight 02 ‐ Stop sign 03 ‐ P.D. only 02 ‐ Angle 01 ‐ Dry2017‐11‐28 2017 17:15 DUROCHER ST @ MONTREAL RD 01 ‐ Clear 07 ‐ Dark 02 ‐ Stop sign 03 ‐ P.D. only 99 ‐ Other 01 ‐ Dry2017‐12‐09 2017 20:55 DUROCHER ST @ MONTREAL RD 03 ‐ Snow 07 ‐ Dark 02 ‐ Stop sign 03 ‐ P.D. only 03 ‐ Rear end 03 ‐ Loose snow2018‐01‐12 2018 8:37 DUROCHER ST @ MONTREAL RD (0009800) 02 ‐ Rain 01 ‐ Daylight 02 ‐ Stop sign 03 ‐ P.D. only 05 ‐ Turning movement 02 ‐ Wet2018‐03‐04 2018 11:56 DUROCHER ST @ MONTREAL RD (0009800) 01 ‐ Clear 01 ‐ Daylight 02 ‐ Stop sign 03 ‐ P.D. only 02 ‐ Angle 01 ‐ Dry2018‐05‐15 2018 17:30 DUROCHER ST @ MONTREAL RD (0009800) 01 ‐ Clear 01 ‐ Daylight 02 ‐ Stop sign 03 ‐ P.D. only 02 ‐ Angle 01 ‐ Dry2018‐06‐26 2018 7:52 DUROCHER ST @ MONTREAL RD (0009800) 01 ‐ Clear 01 ‐ Daylight 02 ‐ Stop sign 02 ‐ Non‐fatal injury 02 ‐ Angle 01 ‐ Dry2018‐10‐26 2018 15:38 DUROCHER ST @ MONTREAL RD (0009800) 01 ‐ Clear 01 ‐ Daylight 02 ‐ Stop sign 03 ‐ P.D. only 05 ‐ Turning movement 01 ‐ Dry2014‐02‐18 2014 8:35 EMOND ST @ MONTREAL RD 03 ‐ Snow 01 ‐ Daylight 02 ‐ Stop sign 03 ‐ P.D. only 05 ‐ Turning movement 03 ‐ Loose snow2014‐05‐11 2014 15:40 EMOND ST @ MONTREAL RD 01 ‐ Clear 01 ‐ Daylight 02 ‐ Stop sign 03 ‐ P.D. only 04 ‐ Sideswipe 01 ‐ Dry2014‐08‐11 2014 16:15 EMOND ST @ MONTREAL RD 01 ‐ Clear 01 ‐ Daylight 02 ‐ Stop sign 03 ‐ P.D. only 03 ‐ Rear end 01 ‐ Dry2015‐04‐16 2015 9:03 EMOND ST @ MONTREAL RD 01 ‐ Clear 01 ‐ Daylight 02 ‐ Stop sign 03 ‐ P.D. only 05 ‐ Turning movement 01 ‐ Dry2015‐04‐21 2015 15:14 EMOND ST @ MONTREAL RD 01 ‐ Clear 01 ‐ Daylight 02 ‐ Stop sign 03 ‐ P.D. only 02 ‐ Angle 01 ‐ Dry2015‐08‐26 2015 17:00 EMOND ST @ MONTREAL RD 01 ‐ Clear 01 ‐ Daylight 02 ‐ Stop sign 03 ‐ P.D. only 05 ‐ Turning movement 01 ‐ Dry2016‐06‐01 2016 10:30 EMOND ST @ MONTREAL RD 01 ‐ Clear 01 ‐ Daylight 02 ‐ Stop sign 02 ‐ Non‐fatal injury 07 ‐ SMV other 01 ‐ Dry2016‐06‐04 2016 0:07 EMOND ST @ MONTREAL RD 01 ‐ Clear 07 ‐ Dark 02 ‐ Stop sign 03 ‐ P.D. only 03 ‐ Rear end 01 ‐ Dry2016‐06‐10 2016 23:53 EMOND ST @ MONTREAL RD 01 ‐ Clear 07 ‐ Dark 02 ‐ Stop sign 02 ‐ Non‐fatal injury 02 ‐ Angle 01 ‐ Dry2016‐07‐08 2016 15:37 EMOND ST @ MONTREAL RD 01 ‐ Clear 01 ‐ Daylight 02 ‐ Stop sign 03 ‐ P.D. only 05 ‐ Turning movement 01 ‐ Dry2016‐10‐07 2016 17:32 EMOND ST @ MONTREAL RD 01 ‐ Clear 01 ‐ Daylight 02 ‐ Stop sign 03 ‐ P.D. only 02 ‐ Angle 01 ‐ Dry2016‐11‐28 2016 10:08 EMOND ST @ MONTREAL RD 01 ‐ Clear 01 ‐ Daylight 02 ‐ Stop sign 03 ‐ P.D. only 02 ‐ Angle 01 ‐ Dry2018‐12‐07 2018 10:40 EMOND ST @ MONTREAL RD (0009802) 01 ‐ Clear 01 ‐ Daylight 02 ‐ Stop sign 02 ‐ Non‐fatal injury 07 ‐ SMV other 01 ‐ Dry2014‐07‐11 2014 17:30 MARGUERITE AVE @ MCARTHUR AVE 01 ‐ Clear 01 ‐ Daylight 01 ‐ Traffic signal 03 ‐ P.D. only 03 ‐ Rear end 01 ‐ Dry2015‐02‐26 2015 15:50 MARGUERITE AVE @ MCARTHUR AVE 01 ‐ Clear 01 ‐ Daylight 01 ‐ Traffic signal 03 ‐ P.D. only 02 ‐ Angle 01 ‐ Dry2015‐11‐07 2015 15:15 MARGUERITE AVE @ MCARTHUR AVE 01 ‐ Clear 01 ‐ Daylight 01 ‐ Traffic signal 03 ‐ P.D. only 05 ‐ Turning movement 01 ‐ Dry2016‐05‐27 2016 16:41 MARGUERITE AVE @ MCARTHUR AVE 01 ‐ Clear 01 ‐ Daylight 01 ‐ Traffic signal 02 ‐ Non‐fatal injury 02 ‐ Angle 02 ‐ Wet2016‐05‐16 2016 1:59 MARGUERITE AVE btwn MCARTHUR AVE & CARLOTTA AVE 01 ‐ Clear 07 ‐ Dark 10 ‐ No control 03 ‐ P.D. only 07 ‐ SMV other 01 ‐ Dry2016‐02‐18 2016 22:45 MAYFIELD ST @ MCARTHUR AVE 01 ‐ Clear 07 ‐ Dark 02 ‐ Stop sign 02 ‐ Non‐fatal injury 02 ‐ Angle 06 ‐ Ice2016‐08‐31 2016 13:39 MAYFIELD ST @ MCARTHUR AVE 01 ‐ Clear 01 ‐ Daylight 02 ‐ Stop sign 02 ‐ Non‐fatal injury 02 ‐ Angle 01 ‐ Dry2017‐02‐28 2017 16:40 MAYFIELD ST @ MCARTHUR AVE 01 ‐ Clear 01 ‐ Daylight 02 ‐ Stop sign 03 ‐ P.D. only 99 ‐ Other 01 ‐ Dry2017‐10‐17 2017 15:50 MAYFIELD ST @ MCARTHUR AVE 01 ‐ Clear 01 ‐ Daylight 02 ‐ Stop sign 03 ‐ P.D. only 02 ‐ Angle 01 ‐ Dry2018‐01‐16 2018 14:39 MAYFIELD ST @ MCARTHUR AVE (0009190) 01 ‐ Clear 01 ‐ Daylight 02 ‐ Stop sign 03 ‐ P.D. only 02 ‐ Angle 02 ‐ Wet2018‐01‐22 2018 15:47 MAYFIELD ST @ MCARTHUR AVE (0009190) 03 ‐ Snow 01 ‐ Daylight 02 ‐ Stop sign 03 ‐ P.D. only 02 ‐ Angle 03 ‐ Loose snow2018‐07‐11 2018 17:49 MAYFIELD ST @ MCARTHUR AVE (0009190) 01 ‐ Clear 01 ‐ Daylight 02 ‐ Stop sign 03 ‐ P.D. only 02 ‐ Angle 01 ‐ Dry2018‐10‐13 2018 19:16 MAYFIELD ST @ MCARTHUR AVE (0009190) 01 ‐ Clear 07 ‐ Dark 02 ‐ Stop sign 02 ‐ Non‐fatal injury 02 ‐ Angle 01 ‐ Dry2014‐01‐11 2014 8:09 MCARTHUR AVE @ NORTH RIVER RD 02 ‐ Rain 01 ‐ Daylight 01 ‐ Traffic signal 03 ‐ P.D. only 07 ‐ SMV other 06 ‐ Ice2015‐02‐02 2015 9:04 MCARTHUR AVE @ NORTH RIVER RD 03 ‐ Snow 01 ‐ Daylight 01 ‐ Traffic signal 03 ‐ P.D. only 03 ‐ Rear end 05 ‐ Packed snow2015‐02‐04 2015 8:45 MCARTHUR AVE @ NORTH RIVER RD 03 ‐ Snow 01 ‐ Daylight 01 ‐ Traffic signal 03 ‐ P.D. only 03 ‐ Rear end 03 ‐ Loose snow2015‐03‐13 2015 21:14 MCARTHUR AVE @ NORTH RIVER RD 01 ‐ Clear 07 ‐ Dark 01 ‐ Traffic signal 03 ‐ P.D. only 02 ‐ Angle 01 ‐ Dry2015‐06‐28 2015 16:30 MCARTHUR AVE @ NORTH RIVER RD 02 ‐ Rain 01 ‐ Daylight 01 ‐ Traffic signal 03 ‐ P.D. only 03 ‐ Rear end 02 ‐ Wet2016‐01‐14 2016 13:36 MCARTHUR AVE @ NORTH RIVER RD 01 ‐ Clear 01 ‐ Daylight 01 ‐ Traffic signal 03 ‐ P.D. only 03 ‐ Rear end 02 ‐ Wet2016‐11‐18 2016 6:40 MCARTHUR AVE @ NORTH RIVER RD 01 ‐ Clear 03 ‐ Dawn 01 ‐ Traffic signal 02 ‐ Non‐fatal injury 05 ‐ Turning movement 01 ‐ Dry2017‐12‐24 2017 2:48 MCARTHUR AVE @ NORTH RIVER RD 01 ‐ Clear 07 ‐ Dark 01 ‐ Traffic signal 03 ‐ P.D. only 04 ‐ Sideswipe 02 ‐ Wet2018‐02‐05 2018 16:22 MCARTHUR AVE @ NORTH RIVER RD (0009202) 01 ‐ Clear 01 ‐ Daylight 01 ‐ Traffic signal 03 ‐ P.D. only 05 ‐ Turning movement 06 ‐ Ice2018‐06‐12 2018 7:49 MCARTHUR AVE @ NORTH RIVER RD (0009202) 01 ‐ Clear 01 ‐ Daylight 01 ‐ Traffic signal 03 ‐ P.D. only 05 ‐ Turning movement 01 ‐ Dry2018‐09‐09 2018 17:32 MCARTHUR AVE @ NORTH RIVER RD (0009202) 01 ‐ Clear 01 ‐ Daylight 01 ‐ Traffic signal 02 ‐ Non‐fatal injury 02 ‐ Angle 01 ‐ Dry2018‐12‐19 2018 12:21 MCARTHUR AVE @ NORTH RIVER RD (0009202) 01 ‐ Clear 01 ‐ Daylight 01 ‐ Traffic signal 02 ‐ Non‐fatal injury 03 ‐ Rear end 01 ‐ Dry2014‐01‐05 2014 13:09 MCARTHUR AVE @ VANIER PKWY 03 ‐ Snow 01 ‐ Daylight 01 ‐ Traffic signal 03 ‐ P.D. only 03 ‐ Rear end 03 ‐ Loose snow2014‐01‐07 2014 17:20 MCARTHUR AVE @ VANIER PKWY 01 ‐ Clear 05 ‐ Dusk 01 ‐ Traffic signal 03 ‐ P.D. only 03 ‐ Rear end 01 ‐ Dry2014‐01‐15 2014 15:25 MCARTHUR AVE @ VANIER PKWY 01 ‐ Clear 01 ‐ Daylight 01 ‐ Traffic signal 02 ‐ Non‐fatal injury 05 ‐ Turning movement 01 ‐ Dry2014‐05‐07 2014 18:30 MCARTHUR AVE @ VANIER PKWY 01 ‐ Clear 01 ‐ Daylight 01 ‐ Traffic signal 03 ‐ P.D. only 03 ‐ Rear end 01 ‐ Dry2014‐05‐30 2014 19:00 MCARTHUR AVE @ VANIER PKWY 01 ‐ Clear 01 ‐ Daylight 01 ‐ Traffic signal 03 ‐ P.D. only 03 ‐ Rear end 01 ‐ Dry2014‐06‐02 2014 10:30 MCARTHUR AVE @ VANIER PKWY 01 ‐ Clear 01 ‐ Daylight 01 ‐ Traffic signal 03 ‐ P.D. only 05 ‐ Turning movement 01 ‐ Dry2014‐07‐01 2014 17:37 MCARTHUR AVE @ VANIER PKWY 01 ‐ Clear 01 ‐ Daylight 01 ‐ Traffic signal 02 ‐ Non‐fatal injury 02 ‐ Angle 02 ‐ Wet2014‐07‐02 2014 17:22 MCARTHUR AVE @ VANIER PKWY 01 ‐ Clear 01 ‐ Daylight 01 ‐ Traffic signal 03 ‐ P.D. only 03 ‐ Rear end 01 ‐ Dry2014‐07‐26 2014 15:00 MCARTHUR AVE @ VANIER PKWY 01 ‐ Clear 01 ‐ Daylight 01 ‐ Traffic signal 02 ‐ Non‐fatal injury 03 ‐ Rear end 01 ‐ Dry2014‐08‐06 2014 17:06 MCARTHUR AVE @ VANIER PKWY 01 ‐ Clear 01 ‐ Daylight 01 ‐ Traffic signal 03 ‐ P.D. only 04 ‐ Sideswipe 01 ‐ Dry2014‐08‐18 2014 15:05 MCARTHUR AVE @ VANIER PKWY 01 ‐ Clear 01 ‐ Daylight 01 ‐ Traffic signal 03 ‐ P.D. only 03 ‐ Rear end 01 ‐ Dry2014‐10‐03 2014 16:03 MCARTHUR AVE @ VANIER PKWY 01 ‐ Clear 01 ‐ Daylight 01 ‐ Traffic signal 03 ‐ P.D. only 03 ‐ Rear end 01 ‐ Dry2014‐10‐06 2014 10:00 MCARTHUR AVE @ VANIER PKWY 01 ‐ Clear 01 ‐ Daylight 01 ‐ Traffic signal 03 ‐ P.D. only 03 ‐ Rear end 01 ‐ Dry2014‐10‐19 2014 16:00 MCARTHUR AVE @ VANIER PKWY 01 ‐ Clear 01 ‐ Daylight 01 ‐ Traffic signal 03 ‐ P.D. only 05 ‐ Turning movement 01 ‐ Dry2014‐11‐04 2014 15:30 MCARTHUR AVE @ VANIER PKWY 01 ‐ Clear 01 ‐ Daylight 01 ‐ Traffic signal 03 ‐ P.D. only 03 ‐ Rear end 01 ‐ Dry2014‐11‐06 2014 9:50 MCARTHUR AVE @ VANIER PKWY 01 ‐ Clear 01 ‐ Daylight 01 ‐ Traffic signal 03 ‐ P.D. only 03 ‐ Rear end 01 ‐ Dry
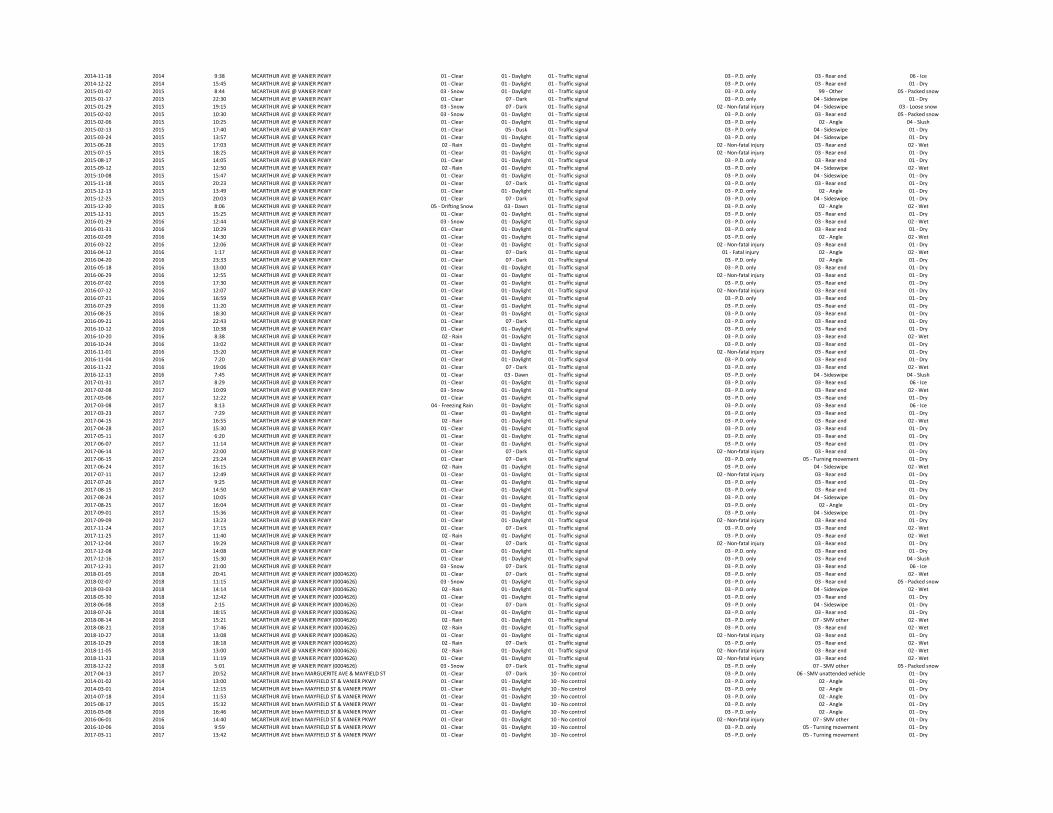
2014‐11‐18 2014 9:38 MCARTHUR AVE @ VANIER PKWY 01 ‐ Clear 01 ‐ Daylight 01 ‐ Traffic signal 03 ‐ P.D. only 03 ‐ Rear end 06 ‐ Ice2014‐12‐22 2014 15:45 MCARTHUR AVE @ VANIER PKWY 01 ‐ Clear 01 ‐ Daylight 01 ‐ Traffic signal 03 ‐ P.D. only 03 ‐ Rear end 01 ‐ Dry2015‐01‐07 2015 8:44 MCARTHUR AVE @ VANIER PKWY 03 ‐ Snow 01 ‐ Daylight 01 ‐ Traffic signal 03 ‐ P.D. only 99 ‐ Other 05 ‐ Packed snow2015‐01‐17 2015 22:30 MCARTHUR AVE @ VANIER PKWY 01 ‐ Clear 07 ‐ Dark 01 ‐ Traffic signal 03 ‐ P.D. only 04 ‐ Sideswipe 01 ‐ Dry2015‐01‐29 2015 19:15 MCARTHUR AVE @ VANIER PKWY 03 ‐ Snow 07 ‐ Dark 01 ‐ Traffic signal 02 ‐ Non‐fatal injury 04 ‐ Sideswipe 03 ‐ Loose snow2015‐02‐02 2015 10:30 MCARTHUR AVE @ VANIER PKWY 03 ‐ Snow 01 ‐ Daylight 01 ‐ Traffic signal 03 ‐ P.D. only 03 ‐ Rear end 05 ‐ Packed snow2015‐02‐06 2015 10:25 MCARTHUR AVE @ VANIER PKWY 01 ‐ Clear 01 ‐ Daylight 01 ‐ Traffic signal 03 ‐ P.D. only 02 ‐ Angle 04 ‐ Slush2015‐02‐13 2015 17:40 MCARTHUR AVE @ VANIER PKWY 01 ‐ Clear 05 ‐ Dusk 01 ‐ Traffic signal 03 ‐ P.D. only 04 ‐ Sideswipe 01 ‐ Dry2015‐03‐24 2015 13:57 MCARTHUR AVE @ VANIER PKWY 01 ‐ Clear 01 ‐ Daylight 01 ‐ Traffic signal 03 ‐ P.D. only 04 ‐ Sideswipe 01 ‐ Dry2015‐06‐28 2015 17:03 MCARTHUR AVE @ VANIER PKWY 02 ‐ Rain 01 ‐ Daylight 01 ‐ Traffic signal 02 ‐ Non‐fatal injury 03 ‐ Rear end 02 ‐ Wet2015‐07‐15 2015 18:25 MCARTHUR AVE @ VANIER PKWY 01 ‐ Clear 01 ‐ Daylight 01 ‐ Traffic signal 02 ‐ Non‐fatal injury 03 ‐ Rear end 01 ‐ Dry2015‐08‐17 2015 14:05 MCARTHUR AVE @ VANIER PKWY 01 ‐ Clear 01 ‐ Daylight 01 ‐ Traffic signal 03 ‐ P.D. only 03 ‐ Rear end 01 ‐ Dry2015‐09‐12 2015 12:50 MCARTHUR AVE @ VANIER PKWY 02 ‐ Rain 01 ‐ Daylight 01 ‐ Traffic signal 03 ‐ P.D. only 04 ‐ Sideswipe 02 ‐ Wet2015‐10‐08 2015 15:47 MCARTHUR AVE @ VANIER PKWY 01 ‐ Clear 01 ‐ Daylight 01 ‐ Traffic signal 03 ‐ P.D. only 04 ‐ Sideswipe 01 ‐ Dry2015‐11‐18 2015 20:23 MCARTHUR AVE @ VANIER PKWY 01 ‐ Clear 07 ‐ Dark 01 ‐ Traffic signal 03 ‐ P.D. only 03 ‐ Rear end 01 ‐ Dry2015‐12‐13 2015 13:49 MCARTHUR AVE @ VANIER PKWY 01 ‐ Clear 01 ‐ Daylight 01 ‐ Traffic signal 03 ‐ P.D. only 02 ‐ Angle 01 ‐ Dry2015‐12‐25 2015 20:03 MCARTHUR AVE @ VANIER PKWY 01 ‐ Clear 07 ‐ Dark 01 ‐ Traffic signal 03 ‐ P.D. only 04 ‐ Sideswipe 01 ‐ Dry2015‐12‐30 2015 8:06 MCARTHUR AVE @ VANIER PKWY 05 ‐ Drifting Snow 03 ‐ Dawn 01 ‐ Traffic signal 03 ‐ P.D. only 02 ‐ Angle 02 ‐ Wet2015‐12‐31 2015 15:25 MCARTHUR AVE @ VANIER PKWY 01 ‐ Clear 01 ‐ Daylight 01 ‐ Traffic signal 03 ‐ P.D. only 03 ‐ Rear end 01 ‐ Dry2016‐01‐29 2016 12:44 MCARTHUR AVE @ VANIER PKWY 03 ‐ Snow 01 ‐ Daylight 01 ‐ Traffic signal 03 ‐ P.D. only 03 ‐ Rear end 02 ‐ Wet2016‐01‐31 2016 10:29 MCARTHUR AVE @ VANIER PKWY 01 ‐ Clear 01 ‐ Daylight 01 ‐ Traffic signal 03 ‐ P.D. only 03 ‐ Rear end 01 ‐ Dry2016‐02‐09 2016 14:30 MCARTHUR AVE @ VANIER PKWY 01 ‐ Clear 01 ‐ Daylight 01 ‐ Traffic signal 03 ‐ P.D. only 02 ‐ Angle 02 ‐ Wet2016‐03‐22 2016 12:06 MCARTHUR AVE @ VANIER PKWY 01 ‐ Clear 01 ‐ Daylight 01 ‐ Traffic signal 02 ‐ Non‐fatal injury 03 ‐ Rear end 01 ‐ Dry2016‐04‐12 2016 1:17 MCARTHUR AVE @ VANIER PKWY 01 ‐ Clear 07 ‐ Dark 01 ‐ Traffic signal 01 ‐ Fatal injury 02 ‐ Angle 02 ‐ Wet2016‐04‐20 2016 23:33 MCARTHUR AVE @ VANIER PKWY 01 ‐ Clear 07 ‐ Dark 01 ‐ Traffic signal 03 ‐ P.D. only 02 ‐ Angle 01 ‐ Dry2016‐05‐18 2016 13:00 MCARTHUR AVE @ VANIER PKWY 01 ‐ Clear 01 ‐ Daylight 01 ‐ Traffic signal 03 ‐ P.D. only 03 ‐ Rear end 01 ‐ Dry2016‐06‐29 2016 12:55 MCARTHUR AVE @ VANIER PKWY 01 ‐ Clear 01 ‐ Daylight 01 ‐ Traffic signal 02 ‐ Non‐fatal injury 03 ‐ Rear end 01 ‐ Dry2016‐07‐02 2016 17:30 MCARTHUR AVE @ VANIER PKWY 01 ‐ Clear 01 ‐ Daylight 01 ‐ Traffic signal 03 ‐ P.D. only 03 ‐ Rear end 01 ‐ Dry2016‐07‐12 2016 12:07 MCARTHUR AVE @ VANIER PKWY 01 ‐ Clear 01 ‐ Daylight 01 ‐ Traffic signal 02 ‐ Non‐fatal injury 03 ‐ Rear end 01 ‐ Dry2016‐07‐21 2016 16:59 MCARTHUR AVE @ VANIER PKWY 01 ‐ Clear 01 ‐ Daylight 01 ‐ Traffic signal 03 ‐ P.D. only 03 ‐ Rear end 01 ‐ Dry2016‐07‐29 2016 11:20 MCARTHUR AVE @ VANIER PKWY 01 ‐ Clear 01 ‐ Daylight 01 ‐ Traffic signal 03 ‐ P.D. only 03 ‐ Rear end 01 ‐ Dry2016‐08‐25 2016 18:30 MCARTHUR AVE @ VANIER PKWY 01 ‐ Clear 01 ‐ Daylight 01 ‐ Traffic signal 03 ‐ P.D. only 03 ‐ Rear end 01 ‐ Dry2016‐09‐21 2016 22:43 MCARTHUR AVE @ VANIER PKWY 01 ‐ Clear 07 ‐ Dark 01 ‐ Traffic signal 03 ‐ P.D. only 03 ‐ Rear end 01 ‐ Dry2016‐10‐12 2016 10:38 MCARTHUR AVE @ VANIER PKWY 01 ‐ Clear 01 ‐ Daylight 01 ‐ Traffic signal 03 ‐ P.D. only 03 ‐ Rear end 01 ‐ Dry2016‐10‐20 2016 8:38 MCARTHUR AVE @ VANIER PKWY 02 ‐ Rain 01 ‐ Daylight 01 ‐ Traffic signal 03 ‐ P.D. only 03 ‐ Rear end 02 ‐ Wet2016‐10‐24 2016 13:02 MCARTHUR AVE @ VANIER PKWY 01 ‐ Clear 01 ‐ Daylight 01 ‐ Traffic signal 03 ‐ P.D. only 03 ‐ Rear end 01 ‐ Dry2016‐11‐01 2016 15:20 MCARTHUR AVE @ VANIER PKWY 01 ‐ Clear 01 ‐ Daylight 01 ‐ Traffic signal 02 ‐ Non‐fatal injury 03 ‐ Rear end 01 ‐ Dry2016‐11‐04 2016 7:20 MCARTHUR AVE @ VANIER PKWY 01 ‐ Clear 01 ‐ Daylight 01 ‐ Traffic signal 03 ‐ P.D. only 03 ‐ Rear end 01 ‐ Dry2016‐11‐22 2016 19:06 MCARTHUR AVE @ VANIER PKWY 01 ‐ Clear 07 ‐ Dark 01 ‐ Traffic signal 03 ‐ P.D. only 03 ‐ Rear end 02 ‐ Wet2016‐12‐13 2016 7:45 MCARTHUR AVE @ VANIER PKWY 01 ‐ Clear 03 ‐ Dawn 01 ‐ Traffic signal 03 ‐ P.D. only 04 ‐ Sideswipe 04 ‐ Slush2017‐01‐31 2017 8:29 MCARTHUR AVE @ VANIER PKWY 01 ‐ Clear 01 ‐ Daylight 01 ‐ Traffic signal 03 ‐ P.D. only 03 ‐ Rear end 06 ‐ Ice2017‐02‐08 2017 10:09 MCARTHUR AVE @ VANIER PKWY 03 ‐ Snow 01 ‐ Daylight 01 ‐ Traffic signal 03 ‐ P.D. only 03 ‐ Rear end 02 ‐ Wet2017‐03‐06 2017 12:22 MCARTHUR AVE @ VANIER PKWY 01 ‐ Clear 01 ‐ Daylight 01 ‐ Traffic signal 03 ‐ P.D. only 03 ‐ Rear end 01 ‐ Dry2017‐03‐08 2017 8:13 MCARTHUR AVE @ VANIER PKWY 04 ‐ Freezing Rain 01 ‐ Daylight 01 ‐ Traffic signal 03 ‐ P.D. only 03 ‐ Rear end 06 ‐ Ice2017‐03‐23 2017 7:29 MCARTHUR AVE @ VANIER PKWY 01 ‐ Clear 01 ‐ Daylight 01 ‐ Traffic signal 03 ‐ P.D. only 03 ‐ Rear end 01 ‐ Dry2017‐04‐15 2017 16:55 MCARTHUR AVE @ VANIER PKWY 02 ‐ Rain 01 ‐ Daylight 01 ‐ Traffic signal 03 ‐ P.D. only 03 ‐ Rear end 02 ‐ Wet2017‐04‐28 2017 15:30 MCARTHUR AVE @ VANIER PKWY 01 ‐ Clear 01 ‐ Daylight 01 ‐ Traffic signal 03 ‐ P.D. only 03 ‐ Rear end 01 ‐ Dry2017‐05‐11 2017 6:20 MCARTHUR AVE @ VANIER PKWY 01 ‐ Clear 01 ‐ Daylight 01 ‐ Traffic signal 03 ‐ P.D. only 03 ‐ Rear end 01 ‐ Dry2017‐06‐07 2017 11:14 MCARTHUR AVE @ VANIER PKWY 01 ‐ Clear 01 ‐ Daylight 01 ‐ Traffic signal 03 ‐ P.D. only 03 ‐ Rear end 01 ‐ Dry2017‐06‐14 2017 22:00 MCARTHUR AVE @ VANIER PKWY 01 ‐ Clear 07 ‐ Dark 01 ‐ Traffic signal 02 ‐ Non‐fatal injury 03 ‐ Rear end 01 ‐ Dry2017‐06‐15 2017 23:24 MCARTHUR AVE @ VANIER PKWY 01 ‐ Clear 07 ‐ Dark 01 ‐ Traffic signal 03 ‐ P.D. only 05 ‐ Turning movement 01 ‐ Dry2017‐06‐24 2017 16:15 MCARTHUR AVE @ VANIER PKWY 02 ‐ Rain 01 ‐ Daylight 01 ‐ Traffic signal 03 ‐ P.D. only 04 ‐ Sideswipe 02 ‐ Wet2017‐07‐11 2017 12:49 MCARTHUR AVE @ VANIER PKWY 01 ‐ Clear 01 ‐ Daylight 01 ‐ Traffic signal 02 ‐ Non‐fatal injury 03 ‐ Rear end 01 ‐ Dry2017‐07‐26 2017 9:25 MCARTHUR AVE @ VANIER PKWY 01 ‐ Clear 01 ‐ Daylight 01 ‐ Traffic signal 03 ‐ P.D. only 03 ‐ Rear end 01 ‐ Dry2017‐08‐15 2017 14:50 MCARTHUR AVE @ VANIER PKWY 01 ‐ Clear 01 ‐ Daylight 01 ‐ Traffic signal 03 ‐ P.D. only 03 ‐ Rear end 01 ‐ Dry2017‐08‐24 2017 10:05 MCARTHUR AVE @ VANIER PKWY 01 ‐ Clear 01 ‐ Daylight 01 ‐ Traffic signal 03 ‐ P.D. only 04 ‐ Sideswipe 01 ‐ Dry2017‐08‐25 2017 16:04 MCARTHUR AVE @ VANIER PKWY 01 ‐ Clear 01 ‐ Daylight 01 ‐ Traffic signal 03 ‐ P.D. only 02 ‐ Angle 01 ‐ Dry2017‐09‐01 2017 15:36 MCARTHUR AVE @ VANIER PKWY 01 ‐ Clear 01 ‐ Daylight 01 ‐ Traffic signal 03 ‐ P.D. only 04 ‐ Sideswipe 01 ‐ Dry2017‐09‐09 2017 13:23 MCARTHUR AVE @ VANIER PKWY 01 ‐ Clear 01 ‐ Daylight 01 ‐ Traffic signal 02 ‐ Non‐fatal injury 03 ‐ Rear end 01 ‐ Dry2017‐11‐24 2017 17:15 MCARTHUR AVE @ VANIER PKWY 01 ‐ Clear 07 ‐ Dark 01 ‐ Traffic signal 03 ‐ P.D. only 03 ‐ Rear end 02 ‐ Wet2017‐11‐25 2017 11:40 MCARTHUR AVE @ VANIER PKWY 02 ‐ Rain 01 ‐ Daylight 01 ‐ Traffic signal 03 ‐ P.D. only 03 ‐ Rear end 02 ‐ Wet2017‐12‐04 2017 19:29 MCARTHUR AVE @ VANIER PKWY 01 ‐ Clear 07 ‐ Dark 01 ‐ Traffic signal 02 ‐ Non‐fatal injury 03 ‐ Rear end 01 ‐ Dry2017‐12‐08 2017 14:08 MCARTHUR AVE @ VANIER PKWY 01 ‐ Clear 01 ‐ Daylight 01 ‐ Traffic signal 03 ‐ P.D. only 03 ‐ Rear end 01 ‐ Dry2017‐12‐16 2017 15:30 MCARTHUR AVE @ VANIER PKWY 01 ‐ Clear 01 ‐ Daylight 01 ‐ Traffic signal 03 ‐ P.D. only 03 ‐ Rear end 04 ‐ Slush2017‐12‐31 2017 21:00 MCARTHUR AVE @ VANIER PKWY 03 ‐ Snow 07 ‐ Dark 01 ‐ Traffic signal 03 ‐ P.D. only 03 ‐ Rear end 06 ‐ Ice2018‐01‐05 2018 20:41 MCARTHUR AVE @ VANIER PKWY (0004626) 01 ‐ Clear 07 ‐ Dark 01 ‐ Traffic signal 03 ‐ P.D. only 03 ‐ Rear end 02 ‐ Wet2018‐02‐07 2018 11:15 MCARTHUR AVE @ VANIER PKWY (0004626) 03 ‐ Snow 01 ‐ Daylight 01 ‐ Traffic signal 03 ‐ P.D. only 03 ‐ Rear end 05 ‐ Packed snow2018‐03‐03 2018 14:14 MCARTHUR AVE @ VANIER PKWY (0004626) 02 ‐ Rain 01 ‐ Daylight 01 ‐ Traffic signal 03 ‐ P.D. only 04 ‐ Sideswipe 02 ‐ Wet2018‐05‐30 2018 12:42 MCARTHUR AVE @ VANIER PKWY (0004626) 01 ‐ Clear 01 ‐ Daylight 01 ‐ Traffic signal 03 ‐ P.D. only 03 ‐ Rear end 01 ‐ Dry2018‐06‐08 2018 2:15 MCARTHUR AVE @ VANIER PKWY (0004626) 01 ‐ Clear 07 ‐ Dark 01 ‐ Traffic signal 03 ‐ P.D. only 04 ‐ Sideswipe 01 ‐ Dry2018‐07‐26 2018 18:15 MCARTHUR AVE @ VANIER PKWY (0004626) 01 ‐ Clear 01 ‐ Daylight 01 ‐ Traffic signal 03 ‐ P.D. only 03 ‐ Rear end 01 ‐ Dry2018‐08‐14 2018 15:21 MCARTHUR AVE @ VANIER PKWY (0004626) 02 ‐ Rain 01 ‐ Daylight 01 ‐ Traffic signal 03 ‐ P.D. only 07 ‐ SMV other 02 ‐ Wet2018‐08‐21 2018 17:46 MCARTHUR AVE @ VANIER PKWY (0004626) 02 ‐ Rain 01 ‐ Daylight 01 ‐ Traffic signal 03 ‐ P.D. only 03 ‐ Rear end 02 ‐ Wet2018‐10‐27 2018 13:08 MCARTHUR AVE @ VANIER PKWY (0004626) 01 ‐ Clear 01 ‐ Daylight 01 ‐ Traffic signal 02 ‐ Non‐fatal injury 03 ‐ Rear end 01 ‐ Dry2018‐10‐29 2018 18:18 MCARTHUR AVE @ VANIER PKWY (0004626) 02 ‐ Rain 07 ‐ Dark 01 ‐ Traffic signal 03 ‐ P.D. only 03 ‐ Rear end 02 ‐ Wet2018‐11‐05 2018 13:00 MCARTHUR AVE @ VANIER PKWY (0004626) 02 ‐ Rain 01 ‐ Daylight 01 ‐ Traffic signal 02 ‐ Non‐fatal injury 03 ‐ Rear end 02 ‐ Wet2018‐11‐23 2018 11:19 MCARTHUR AVE @ VANIER PKWY (0004626) 01 ‐ Clear 01 ‐ Daylight 01 ‐ Traffic signal 02 ‐ Non‐fatal injury 03 ‐ Rear end 02 ‐ Wet2018‐12‐22 2018 5:01 MCARTHUR AVE @ VANIER PKWY (0004626) 03 ‐ Snow 07 ‐ Dark 01 ‐ Traffic signal 03 ‐ P.D. only 07 ‐ SMV other 05 ‐ Packed snow2017‐04‐13 2017 20:52 MCARTHUR AVE btwn MARGUERITE AVE & MAYFIELD ST 01 ‐ Clear 07 ‐ Dark 10 ‐ No control 03 ‐ P.D. only 06 ‐ SMV unattended vehicle 01 ‐ Dry2014‐01‐02 2014 13:00 MCARTHUR AVE btwn MAYFIELD ST & VANIER PKWY 01 ‐ Clear 01 ‐ Daylight 10 ‐ No control 03 ‐ P.D. only 02 ‐ Angle 01 ‐ Dry2014‐03‐01 2014 12:15 MCARTHUR AVE btwn MAYFIELD ST & VANIER PKWY 01 ‐ Clear 01 ‐ Daylight 10 ‐ No control 03 ‐ P.D. only 02 ‐ Angle 01 ‐ Dry2014‐07‐18 2014 11:53 MCARTHUR AVE btwn MAYFIELD ST & VANIER PKWY 01 ‐ Clear 01 ‐ Daylight 10 ‐ No control 03 ‐ P.D. only 02 ‐ Angle 01 ‐ Dry2015‐08‐17 2015 15:32 MCARTHUR AVE btwn MAYFIELD ST & VANIER PKWY 01 ‐ Clear 01 ‐ Daylight 10 ‐ No control 03 ‐ P.D. only 02 ‐ Angle 01 ‐ Dry2016‐03‐08 2016 16:46 MCARTHUR AVE btwn MAYFIELD ST & VANIER PKWY 01 ‐ Clear 01 ‐ Daylight 10 ‐ No control 03 ‐ P.D. only 02 ‐ Angle 01 ‐ Dry2016‐06‐01 2016 14:40 MCARTHUR AVE btwn MAYFIELD ST & VANIER PKWY 01 ‐ Clear 01 ‐ Daylight 10 ‐ No control 02 ‐ Non‐fatal injury 07 ‐ SMV other 01 ‐ Dry2016‐10‐06 2016 9:59 MCARTHUR AVE btwn MAYFIELD ST & VANIER PKWY 01 ‐ Clear 01 ‐ Daylight 10 ‐ No control 03 ‐ P.D. only 05 ‐ Turning movement 01 ‐ Dry2017‐03‐11 2017 13:42 MCARTHUR AVE btwn MAYFIELD ST & VANIER PKWY 01 ‐ Clear 01 ‐ Daylight 10 ‐ No control 03 ‐ P.D. only 05 ‐ Turning movement 01 ‐ Dry
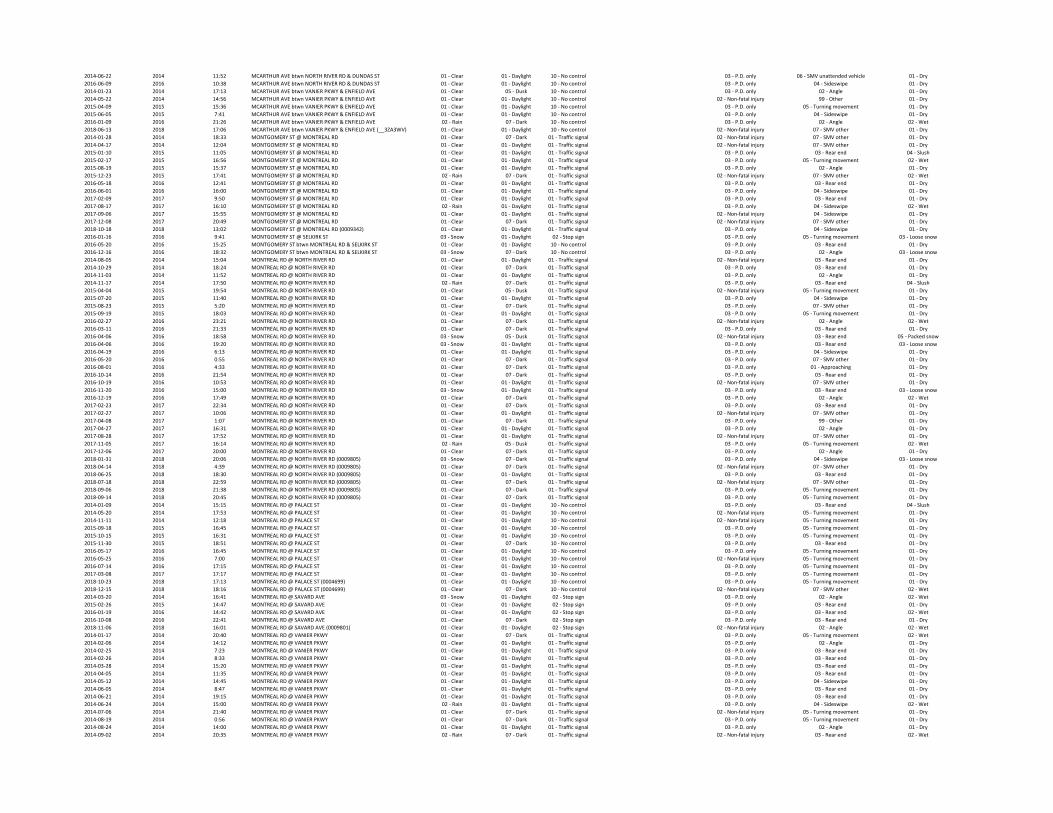
2014‐06‐22 2014 11:52 MCARTHUR AVE btwn NORTH RIVER RD & DUNDAS ST 01 ‐ Clear 01 ‐ Daylight 10 ‐ No control 03 ‐ P.D. only 06 ‐ SMV unattended vehicle 01 ‐ Dry2016‐06‐09 2016 10:38 MCARTHUR AVE btwn NORTH RIVER RD & DUNDAS ST 01 ‐ Clear 01 ‐ Daylight 10 ‐ No control 03 ‐ P.D. only 04 ‐ Sideswipe 01 ‐ Dry2014‐01‐23 2014 17:13 MCARTHUR AVE btwn VANIER PKWY & ENFIELD AVE 01 ‐ Clear 05 ‐ Dusk 10 ‐ No control 03 ‐ P.D. only 02 ‐ Angle 01 ‐ Dry2014‐05‐22 2014 14:56 MCARTHUR AVE btwn VANIER PKWY & ENFIELD AVE 01 ‐ Clear 01 ‐ Daylight 10 ‐ No control 02 ‐ Non‐fatal injury 99 ‐ Other 01 ‐ Dry2015‐04‐09 2015 15:36 MCARTHUR AVE btwn VANIER PKWY & ENFIELD AVE 01 ‐ Clear 01 ‐ Daylight 10 ‐ No control 03 ‐ P.D. only 05 ‐ Turning movement 01 ‐ Dry2015‐06‐05 2015 7:41 MCARTHUR AVE btwn VANIER PKWY & ENFIELD AVE 01 ‐ Clear 01 ‐ Daylight 10 ‐ No control 03 ‐ P.D. only 04 ‐ Sideswipe 01 ‐ Dry2016‐01‐09 2016 21:26 MCARTHUR AVE btwn VANIER PKWY & ENFIELD AVE 02 ‐ Rain 07 ‐ Dark 10 ‐ No control 03 ‐ P.D. only 02 ‐ Angle 02 ‐ Wet2018‐06‐13 2018 17:06 MCARTHUR AVE btwn VANIER PKWY & ENFIELD AVE (__3ZA3WV) 01 ‐ Clear 01 ‐ Daylight 10 ‐ No control 02 ‐ Non‐fatal injury 07 ‐ SMV other 01 ‐ Dry2014‐01‐28 2014 18:33 MONTGOMERY ST @ MONTREAL RD 01 ‐ Clear 07 ‐ Dark 01 ‐ Traffic signal 02 ‐ Non‐fatal injury 07 ‐ SMV other 01 ‐ Dry2014‐04‐17 2014 12:04 MONTGOMERY ST @ MONTREAL RD 01 ‐ Clear 01 ‐ Daylight 01 ‐ Traffic signal 02 ‐ Non‐fatal injury 07 ‐ SMV other 01 ‐ Dry2015‐01‐10 2015 11:05 MONTGOMERY ST @ MONTREAL RD 01 ‐ Clear 01 ‐ Daylight 01 ‐ Traffic signal 03 ‐ P.D. only 03 ‐ Rear end 04 ‐ Slush2015‐02‐17 2015 16:56 MONTGOMERY ST @ MONTREAL RD 01 ‐ Clear 01 ‐ Daylight 01 ‐ Traffic signal 03 ‐ P.D. only 05 ‐ Turning movement 02 ‐ Wet2015‐08‐19 2015 15:37 MONTGOMERY ST @ MONTREAL RD 01 ‐ Clear 01 ‐ Daylight 01 ‐ Traffic signal 03 ‐ P.D. only 02 ‐ Angle 01 ‐ Dry2015‐12‐23 2015 17:41 MONTGOMERY ST @ MONTREAL RD 02 ‐ Rain 07 ‐ Dark 01 ‐ Traffic signal 02 ‐ Non‐fatal injury 07 ‐ SMV other 02 ‐ Wet2016‐05‐18 2016 12:41 MONTGOMERY ST @ MONTREAL RD 01 ‐ Clear 01 ‐ Daylight 01 ‐ Traffic signal 03 ‐ P.D. only 03 ‐ Rear end 01 ‐ Dry2016‐06‐01 2016 16:00 MONTGOMERY ST @ MONTREAL RD 01 ‐ Clear 01 ‐ Daylight 01 ‐ Traffic signal 03 ‐ P.D. only 04 ‐ Sideswipe 01 ‐ Dry2017‐02‐09 2017 9:50 MONTGOMERY ST @ MONTREAL RD 01 ‐ Clear 01 ‐ Daylight 01 ‐ Traffic signal 03 ‐ P.D. only 03 ‐ Rear end 01 ‐ Dry2017‐08‐17 2017 16:10 MONTGOMERY ST @ MONTREAL RD 02 ‐ Rain 01 ‐ Daylight 01 ‐ Traffic signal 03 ‐ P.D. only 04 ‐ Sideswipe 02 ‐ Wet2017‐09‐06 2017 15:55 MONTGOMERY ST @ MONTREAL RD 01 ‐ Clear 01 ‐ Daylight 01 ‐ Traffic signal 02 ‐ Non‐fatal injury 04 ‐ Sideswipe 01 ‐ Dry2017‐12‐08 2017 20:49 MONTGOMERY ST @ MONTREAL RD 01 ‐ Clear 07 ‐ Dark 01 ‐ Traffic signal 02 ‐ Non‐fatal injury 07 ‐ SMV other 01 ‐ Dry2018‐10‐18 2018 13:02 MONTGOMERY ST @ MONTREAL RD (0009342) 01 ‐ Clear 01 ‐ Daylight 01 ‐ Traffic signal 03 ‐ P.D. only 04 ‐ Sideswipe 01 ‐ Dry2016‐01‐16 2016 9:41 MONTGOMERY ST @ SELKIRK ST 03 ‐ Snow 01 ‐ Daylight 02 ‐ Stop sign 03 ‐ P.D. only 05 ‐ Turning movement 03 ‐ Loose snow2016‐05‐20 2016 15:25 MONTGOMERY ST btwn MONTREAL RD & SELKIRK ST 01 ‐ Clear 01 ‐ Daylight 10 ‐ No control 03 ‐ P.D. only 03 ‐ Rear end 01 ‐ Dry2016‐12‐16 2016 18:32 MONTGOMERY ST btwn MONTREAL RD & SELKIRK ST 03 ‐ Snow 07 ‐ Dark 10 ‐ No control 03 ‐ P.D. only 02 ‐ Angle 03 ‐ Loose snow2014‐08‐05 2014 15:04 MONTREAL RD @ NORTH RIVER RD 01 ‐ Clear 01 ‐ Daylight 01 ‐ Traffic signal 02 ‐ Non‐fatal injury 03 ‐ Rear end 01 ‐ Dry2014‐10‐29 2014 18:24 MONTREAL RD @ NORTH RIVER RD 01 ‐ Clear 07 ‐ Dark 01 ‐ Traffic signal 03 ‐ P.D. only 03 ‐ Rear end 01 ‐ Dry2014‐11‐03 2014 11:52 MONTREAL RD @ NORTH RIVER RD 01 ‐ Clear 01 ‐ Daylight 01 ‐ Traffic signal 03 ‐ P.D. only 02 ‐ Angle 01 ‐ Dry2014‐11‐17 2014 17:50 MONTREAL RD @ NORTH RIVER RD 02 ‐ Rain 07 ‐ Dark 01 ‐ Traffic signal 03 ‐ P.D. only 03 ‐ Rear end 04 ‐ Slush2015‐04‐04 2015 19:54 MONTREAL RD @ NORTH RIVER RD 01 ‐ Clear 05 ‐ Dusk 01 ‐ Traffic signal 02 ‐ Non‐fatal injury 05 ‐ Turning movement 01 ‐ Dry2015‐07‐20 2015 11:40 MONTREAL RD @ NORTH RIVER RD 01 ‐ Clear 01 ‐ Daylight 01 ‐ Traffic signal 03 ‐ P.D. only 04 ‐ Sideswipe 01 ‐ Dry2015‐08‐23 2015 5:20 MONTREAL RD @ NORTH RIVER RD 01 ‐ Clear 07 ‐ Dark 01 ‐ Traffic signal 03 ‐ P.D. only 07 ‐ SMV other 01 ‐ Dry2015‐09‐19 2015 18:03 MONTREAL RD @ NORTH RIVER RD 01 ‐ Clear 01 ‐ Daylight 01 ‐ Traffic signal 03 ‐ P.D. only 05 ‐ Turning movement 01 ‐ Dry2016‐02‐27 2016 23:21 MONTREAL RD @ NORTH RIVER RD 01 ‐ Clear 07 ‐ Dark 01 ‐ Traffic signal 02 ‐ Non‐fatal injury 02 ‐ Angle 02 ‐ Wet2016‐03‐11 2016 21:33 MONTREAL RD @ NORTH RIVER RD 01 ‐ Clear 07 ‐ Dark 01 ‐ Traffic signal 03 ‐ P.D. only 03 ‐ Rear end 01 ‐ Dry2016‐04‐06 2016 18:58 MONTREAL RD @ NORTH RIVER RD 03 ‐ Snow 05 ‐ Dusk 01 ‐ Traffic signal 02 ‐ Non‐fatal injury 03 ‐ Rear end 05 ‐ Packed snow2016‐04‐06 2016 19:20 MONTREAL RD @ NORTH RIVER RD 03 ‐ Snow 01 ‐ Daylight 01 ‐ Traffic signal 03 ‐ P.D. only 03 ‐ Rear end 03 ‐ Loose snow2016‐04‐19 2016 6:13 MONTREAL RD @ NORTH RIVER RD 01 ‐ Clear 01 ‐ Daylight 01 ‐ Traffic signal 03 ‐ P.D. only 04 ‐ Sideswipe 01 ‐ Dry2016‐05‐20 2016 0:55 MONTREAL RD @ NORTH RIVER RD 01 ‐ Clear 07 ‐ Dark 01 ‐ Traffic signal 03 ‐ P.D. only 07 ‐ SMV other 01 ‐ Dry2016‐08‐01 2016 4:33 MONTREAL RD @ NORTH RIVER RD 01 ‐ Clear 07 ‐ Dark 01 ‐ Traffic signal 03 ‐ P.D. only 01 ‐ Approaching 01 ‐ Dry2016‐10‐14 2016 21:54 MONTREAL RD @ NORTH RIVER RD 01 ‐ Clear 07 ‐ Dark 01 ‐ Traffic signal 03 ‐ P.D. only 03 ‐ Rear end 01 ‐ Dry2016‐10‐19 2016 10:53 MONTREAL RD @ NORTH RIVER RD 01 ‐ Clear 01 ‐ Daylight 01 ‐ Traffic signal 02 ‐ Non‐fatal injury 07 ‐ SMV other 01 ‐ Dry2016‐11‐20 2016 15:00 MONTREAL RD @ NORTH RIVER RD 03 ‐ Snow 01 ‐ Daylight 01 ‐ Traffic signal 03 ‐ P.D. only 03 ‐ Rear end 03 ‐ Loose snow2016‐12‐19 2016 17:49 MONTREAL RD @ NORTH RIVER RD 01 ‐ Clear 07 ‐ Dark 01 ‐ Traffic signal 03 ‐ P.D. only 02 ‐ Angle 02 ‐ Wet2017‐02‐23 2017 22:34 MONTREAL RD @ NORTH RIVER RD 01 ‐ Clear 07 ‐ Dark 01 ‐ Traffic signal 03 ‐ P.D. only 03 ‐ Rear end 01 ‐ Dry2017‐02‐27 2017 10:06 MONTREAL RD @ NORTH RIVER RD 01 ‐ Clear 01 ‐ Daylight 01 ‐ Traffic signal 02 ‐ Non‐fatal injury 07 ‐ SMV other 01 ‐ Dry2017‐04‐08 2017 1:07 MONTREAL RD @ NORTH RIVER RD 01 ‐ Clear 07 ‐ Dark 01 ‐ Traffic signal 03 ‐ P.D. only 99 ‐ Other 01 ‐ Dry2017‐04‐27 2017 16:31 MONTREAL RD @ NORTH RIVER RD 01 ‐ Clear 01 ‐ Daylight 01 ‐ Traffic signal 03 ‐ P.D. only 02 ‐ Angle 01 ‐ Dry2017‐08‐28 2017 17:52 MONTREAL RD @ NORTH RIVER RD 01 ‐ Clear 01 ‐ Daylight 01 ‐ Traffic signal 02 ‐ Non‐fatal injury 07 ‐ SMV other 01 ‐ Dry2017‐11‐05 2017 16:14 MONTREAL RD @ NORTH RIVER RD 02 ‐ Rain 05 ‐ Dusk 01 ‐ Traffic signal 03 ‐ P.D. only 05 ‐ Turning movement 02 ‐ Wet2017‐12‐06 2017 20:00 MONTREAL RD @ NORTH RIVER RD 01 ‐ Clear 07 ‐ Dark 01 ‐ Traffic signal 03 ‐ P.D. only 02 ‐ Angle 01 ‐ Dry2018‐01‐31 2018 20:06 MONTREAL RD @ NORTH RIVER RD (0009805) 03 ‐ Snow 07 ‐ Dark 01 ‐ Traffic signal 03 ‐ P.D. only 04 ‐ Sideswipe 03 ‐ Loose snow2018‐04‐14 2018 4:39 MONTREAL RD @ NORTH RIVER RD (0009805) 01 ‐ Clear 07 ‐ Dark 01 ‐ Traffic signal 02 ‐ Non‐fatal injury 07 ‐ SMV other 01 ‐ Dry2018‐06‐25 2018 18:30 MONTREAL RD @ NORTH RIVER RD (0009805) 01 ‐ Clear 01 ‐ Daylight 01 ‐ Traffic signal 03 ‐ P.D. only 03 ‐ Rear end 01 ‐ Dry2018‐07‐18 2018 22:59 MONTREAL RD @ NORTH RIVER RD (0009805) 01 ‐ Clear 07 ‐ Dark 01 ‐ Traffic signal 02 ‐ Non‐fatal injury 07 ‐ SMV other 01 ‐ Dry2018‐09‐06 2018 21:38 MONTREAL RD @ NORTH RIVER RD (0009805) 01 ‐ Clear 07 ‐ Dark 01 ‐ Traffic signal 03 ‐ P.D. only 05 ‐ Turning movement 01 ‐ Dry2018‐09‐14 2018 20:45 MONTREAL RD @ NORTH RIVER RD (0009805) 01 ‐ Clear 07 ‐ Dark 01 ‐ Traffic signal 03 ‐ P.D. only 05 ‐ Turning movement 01 ‐ Dry2014‐01‐09 2014 15:15 MONTREAL RD @ PALACE ST 01 ‐ Clear 01 ‐ Daylight 10 ‐ No control 03 ‐ P.D. only 03 ‐ Rear end 04 ‐ Slush2014‐05‐20 2014 17:53 MONTREAL RD @ PALACE ST 01 ‐ Clear 01 ‐ Daylight 10 ‐ No control 02 ‐ Non‐fatal injury 05 ‐ Turning movement 01 ‐ Dry2014‐11‐11 2014 12:18 MONTREAL RD @ PALACE ST 01 ‐ Clear 01 ‐ Daylight 10 ‐ No control 02 ‐ Non‐fatal injury 05 ‐ Turning movement 01 ‐ Dry2015‐09‐18 2015 16:45 MONTREAL RD @ PALACE ST 01 ‐ Clear 01 ‐ Daylight 10 ‐ No control 03 ‐ P.D. only 05 ‐ Turning movement 01 ‐ Dry2015‐10‐15 2015 16:31 MONTREAL RD @ PALACE ST 01 ‐ Clear 01 ‐ Daylight 10 ‐ No control 03 ‐ P.D. only 05 ‐ Turning movement 01 ‐ Dry2015‐11‐30 2015 18:51 MONTREAL RD @ PALACE ST 01 ‐ Clear 07 ‐ Dark 10 ‐ No control 03 ‐ P.D. only 03 ‐ Rear end 01 ‐ Dry2016‐05‐17 2016 16:45 MONTREAL RD @ PALACE ST 01 ‐ Clear 01 ‐ Daylight 10 ‐ No control 03 ‐ P.D. only 05 ‐ Turning movement 01 ‐ Dry2016‐05‐25 2016 7:00 MONTREAL RD @ PALACE ST 01 ‐ Clear 01 ‐ Daylight 10 ‐ No control 02 ‐ Non‐fatal injury 05 ‐ Turning movement 01 ‐ Dry2016‐07‐14 2016 17:15 MONTREAL RD @ PALACE ST 01 ‐ Clear 01 ‐ Daylight 10 ‐ No control 03 ‐ P.D. only 05 ‐ Turning movement 01 ‐ Dry2017‐03‐08 2017 17:17 MONTREAL RD @ PALACE ST 01 ‐ Clear 01 ‐ Daylight 10 ‐ No control 03 ‐ P.D. only 05 ‐ Turning movement 01 ‐ Dry2018‐10‐23 2018 17:13 MONTREAL RD @ PALACE ST (0004699) 01 ‐ Clear 01 ‐ Daylight 10 ‐ No control 03 ‐ P.D. only 05 ‐ Turning movement 01 ‐ Dry2018‐12‐15 2018 18:16 MONTREAL RD @ PALACE ST (0004699) 01 ‐ Clear 07 ‐ Dark 10 ‐ No control 02 ‐ Non‐fatal injury 07 ‐ SMV other 02 ‐ Wet2014‐03‐20 2014 16:41 MONTREAL RD @ SAVARD AVE 03 ‐ Snow 01 ‐ Daylight 02 ‐ Stop sign 03 ‐ P.D. only 02 ‐ Angle 02 ‐ Wet2015‐02‐26 2015 14:47 MONTREAL RD @ SAVARD AVE 01 ‐ Clear 01 ‐ Daylight 02 ‐ Stop sign 03 ‐ P.D. only 03 ‐ Rear end 01 ‐ Dry2016‐01‐19 2016 14:42 MONTREAL RD @ SAVARD AVE 01 ‐ Clear 01 ‐ Daylight 02 ‐ Stop sign 03 ‐ P.D. only 03 ‐ Rear end 02 ‐ Wet2016‐10‐08 2016 22:41 MONTREAL RD @ SAVARD AVE 01 ‐ Clear 07 ‐ Dark 02 ‐ Stop sign 03 ‐ P.D. only 03 ‐ Rear end 01 ‐ Dry2018‐11‐06 2018 16:01 MONTREAL RD @ SAVARD AVE (0009801) 01 ‐ Clear 01 ‐ Daylight 02 ‐ Stop sign 02 ‐ Non‐fatal injury 02 ‐ Angle 02 ‐ Wet2014‐01‐17 2014 20:40 MONTREAL RD @ VANIER PKWY 01 ‐ Clear 07 ‐ Dark 01 ‐ Traffic signal 03 ‐ P.D. only 05 ‐ Turning movement 02 ‐ Wet2014‐02‐06 2014 14:12 MONTREAL RD @ VANIER PKWY 01 ‐ Clear 01 ‐ Daylight 01 ‐ Traffic signal 03 ‐ P.D. only 02 ‐ Angle 01 ‐ Dry2014‐02‐25 2014 7:23 MONTREAL RD @ VANIER PKWY 01 ‐ Clear 01 ‐ Daylight 01 ‐ Traffic signal 03 ‐ P.D. only 03 ‐ Rear end 01 ‐ Dry2014‐02‐26 2014 8:33 MONTREAL RD @ VANIER PKWY 01 ‐ Clear 01 ‐ Daylight 01 ‐ Traffic signal 03 ‐ P.D. only 03 ‐ Rear end 01 ‐ Dry2014‐03‐28 2014 15:20 MONTREAL RD @ VANIER PKWY 01 ‐ Clear 01 ‐ Daylight 01 ‐ Traffic signal 03 ‐ P.D. only 03 ‐ Rear end 01 ‐ Dry2014‐04‐05 2014 11:35 MONTREAL RD @ VANIER PKWY 01 ‐ Clear 01 ‐ Daylight 01 ‐ Traffic signal 03 ‐ P.D. only 03 ‐ Rear end 01 ‐ Dry2014‐05‐12 2014 14:45 MONTREAL RD @ VANIER PKWY 01 ‐ Clear 01 ‐ Daylight 01 ‐ Traffic signal 03 ‐ P.D. only 04 ‐ Sideswipe 01 ‐ Dry2014‐06‐05 2014 8:47 MONTREAL RD @ VANIER PKWY 01 ‐ Clear 01 ‐ Daylight 01 ‐ Traffic signal 03 ‐ P.D. only 03 ‐ Rear end 01 ‐ Dry2014‐06‐21 2014 19:15 MONTREAL RD @ VANIER PKWY 01 ‐ Clear 01 ‐ Daylight 01 ‐ Traffic signal 03 ‐ P.D. only 03 ‐ Rear end 01 ‐ Dry2014‐06‐24 2014 15:00 MONTREAL RD @ VANIER PKWY 02 ‐ Rain 01 ‐ Daylight 01 ‐ Traffic signal 03 ‐ P.D. only 04 ‐ Sideswipe 02 ‐ Wet2014‐07‐06 2014 21:40 MONTREAL RD @ VANIER PKWY 01 ‐ Clear 07 ‐ Dark 01 ‐ Traffic signal 02 ‐ Non‐fatal injury 05 ‐ Turning movement 01 ‐ Dry2014‐08‐19 2014 0:56 MONTREAL RD @ VANIER PKWY 01 ‐ Clear 07 ‐ Dark 01 ‐ Traffic signal 03 ‐ P.D. only 05 ‐ Turning movement 01 ‐ Dry2014‐08‐24 2014 14:00 MONTREAL RD @ VANIER PKWY 01 ‐ Clear 01 ‐ Daylight 01 ‐ Traffic signal 03 ‐ P.D. only 02 ‐ Angle 01 ‐ Dry2014‐09‐02 2014 20:35 MONTREAL RD @ VANIER PKWY 02 ‐ Rain 07 ‐ Dark 01 ‐ Traffic signal 02 ‐ Non‐fatal injury 03 ‐ Rear end 02 ‐ Wet
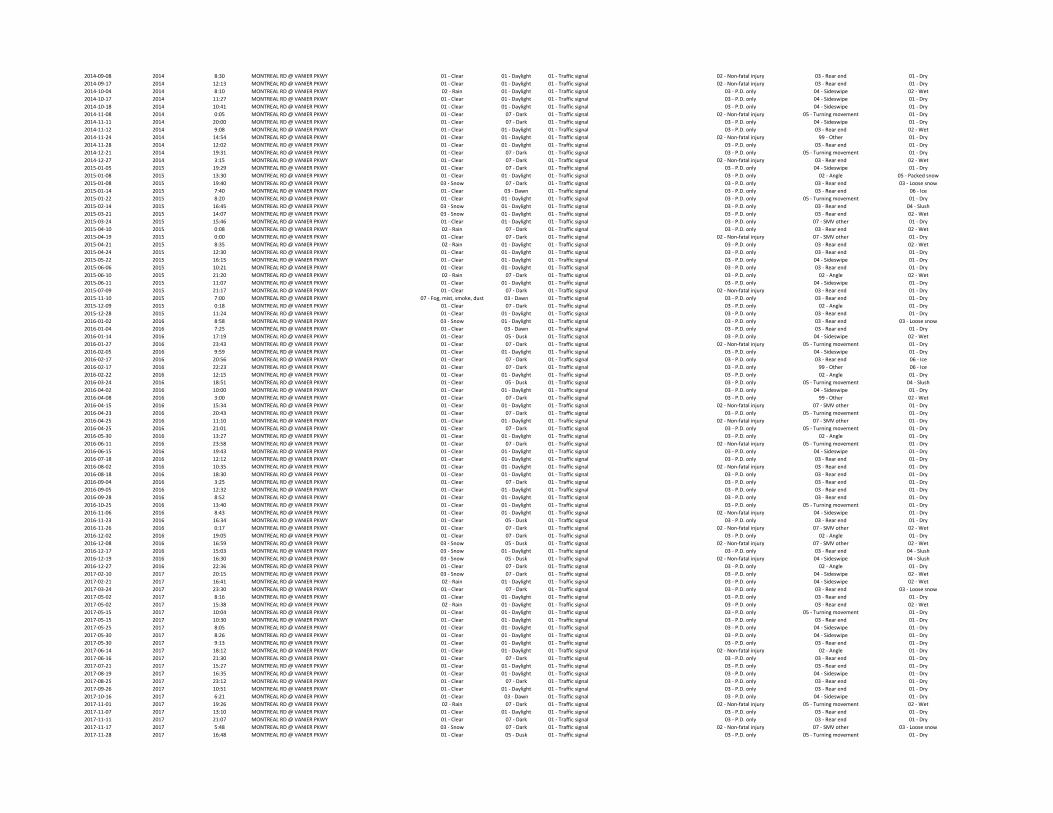
2014‐09‐08 2014 8:30 MONTREAL RD @ VANIER PKWY 01 ‐ Clear 01 ‐ Daylight 01 ‐ Traffic signal 02 ‐ Non‐fatal injury 03 ‐ Rear end 01 ‐ Dry2014‐09‐17 2014 12:13 MONTREAL RD @ VANIER PKWY 01 ‐ Clear 01 ‐ Daylight 01 ‐ Traffic signal 02 ‐ Non‐fatal injury 03 ‐ Rear end 01 ‐ Dry2014‐10‐04 2014 8:10 MONTREAL RD @ VANIER PKWY 02 ‐ Rain 01 ‐ Daylight 01 ‐ Traffic signal 03 ‐ P.D. only 04 ‐ Sideswipe 02 ‐ Wet2014‐10‐17 2014 11:27 MONTREAL RD @ VANIER PKWY 01 ‐ Clear 01 ‐ Daylight 01 ‐ Traffic signal 03 ‐ P.D. only 04 ‐ Sideswipe 01 ‐ Dry2014‐10‐18 2014 10:41 MONTREAL RD @ VANIER PKWY 01 ‐ Clear 01 ‐ Daylight 01 ‐ Traffic signal 03 ‐ P.D. only 04 ‐ Sideswipe 01 ‐ Dry2014‐11‐08 2014 0:05 MONTREAL RD @ VANIER PKWY 01 ‐ Clear 07 ‐ Dark 01 ‐ Traffic signal 02 ‐ Non‐fatal injury 05 ‐ Turning movement 01 ‐ Dry2014‐11‐11 2014 20:00 MONTREAL RD @ VANIER PKWY 01 ‐ Clear 07 ‐ Dark 01 ‐ Traffic signal 03 ‐ P.D. only 04 ‐ Sideswipe 01 ‐ Dry2014‐11‐12 2014 9:08 MONTREAL RD @ VANIER PKWY 01 ‐ Clear 01 ‐ Daylight 01 ‐ Traffic signal 03 ‐ P.D. only 03 ‐ Rear end 02 ‐ Wet2014‐11‐24 2014 14:54 MONTREAL RD @ VANIER PKWY 01 ‐ Clear 01 ‐ Daylight 01 ‐ Traffic signal 02 ‐ Non‐fatal injury 99 ‐ Other 01 ‐ Dry2014‐11‐28 2014 12:02 MONTREAL RD @ VANIER PKWY 01 ‐ Clear 01 ‐ Daylight 01 ‐ Traffic signal 03 ‐ P.D. only 03 ‐ Rear end 01 ‐ Dry2014‐12‐21 2014 19:31 MONTREAL RD @ VANIER PKWY 01 ‐ Clear 07 ‐ Dark 01 ‐ Traffic signal 03 ‐ P.D. only 05 ‐ Turning movement 01 ‐ Dry2014‐12‐27 2014 3:15 MONTREAL RD @ VANIER PKWY 01 ‐ Clear 07 ‐ Dark 01 ‐ Traffic signal 02 ‐ Non‐fatal injury 03 ‐ Rear end 02 ‐ Wet2015‐01‐05 2015 19:29 MONTREAL RD @ VANIER PKWY 01 ‐ Clear 07 ‐ Dark 01 ‐ Traffic signal 03 ‐ P.D. only 04 ‐ Sideswipe 01 ‐ Dry2015‐01‐08 2015 13:30 MONTREAL RD @ VANIER PKWY 01 ‐ Clear 01 ‐ Daylight 01 ‐ Traffic signal 03 ‐ P.D. only 02 ‐ Angle 05 ‐ Packed snow2015‐01‐08 2015 19:40 MONTREAL RD @ VANIER PKWY 03 ‐ Snow 07 ‐ Dark 01 ‐ Traffic signal 03 ‐ P.D. only 03 ‐ Rear end 03 ‐ Loose snow2015‐01‐14 2015 7:40 MONTREAL RD @ VANIER PKWY 01 ‐ Clear 03 ‐ Dawn 01 ‐ Traffic signal 03 ‐ P.D. only 03 ‐ Rear end 06 ‐ Ice2015‐01‐22 2015 8:20 MONTREAL RD @ VANIER PKWY 01 ‐ Clear 01 ‐ Daylight 01 ‐ Traffic signal 03 ‐ P.D. only 05 ‐ Turning movement 01 ‐ Dry2015‐02‐14 2015 16:45 MONTREAL RD @ VANIER PKWY 03 ‐ Snow 01 ‐ Daylight 01 ‐ Traffic signal 03 ‐ P.D. only 03 ‐ Rear end 04 ‐ Slush2015‐03‐21 2015 14:07 MONTREAL RD @ VANIER PKWY 03 ‐ Snow 01 ‐ Daylight 01 ‐ Traffic signal 03 ‐ P.D. only 03 ‐ Rear end 02 ‐ Wet2015‐03‐24 2015 15:46 MONTREAL RD @ VANIER PKWY 01 ‐ Clear 01 ‐ Daylight 01 ‐ Traffic signal 03 ‐ P.D. only 07 ‐ SMV other 01 ‐ Dry2015‐04‐10 2015 0:08 MONTREAL RD @ VANIER PKWY 02 ‐ Rain 07 ‐ Dark 01 ‐ Traffic signal 03 ‐ P.D. only 03 ‐ Rear end 02 ‐ Wet2015‐04‐19 2015 0:00 MONTREAL RD @ VANIER PKWY 01 ‐ Clear 07 ‐ Dark 01 ‐ Traffic signal 02 ‐ Non‐fatal injury 07 ‐ SMV other 01 ‐ Dry2015‐04‐21 2015 8:35 MONTREAL RD @ VANIER PKWY 02 ‐ Rain 01 ‐ Daylight 01 ‐ Traffic signal 03 ‐ P.D. only 03 ‐ Rear end 02 ‐ Wet2015‐04‐24 2015 12:30 MONTREAL RD @ VANIER PKWY 01 ‐ Clear 01 ‐ Daylight 01 ‐ Traffic signal 03 ‐ P.D. only 03 ‐ Rear end 01 ‐ Dry2015‐05‐22 2015 16:15 MONTREAL RD @ VANIER PKWY 01 ‐ Clear 01 ‐ Daylight 01 ‐ Traffic signal 03 ‐ P.D. only 04 ‐ Sideswipe 01 ‐ Dry2015‐06‐06 2015 10:21 MONTREAL RD @ VANIER PKWY 01 ‐ Clear 01 ‐ Daylight 01 ‐ Traffic signal 03 ‐ P.D. only 03 ‐ Rear end 01 ‐ Dry2015‐06‐10 2015 21:20 MONTREAL RD @ VANIER PKWY 02 ‐ Rain 07 ‐ Dark 01 ‐ Traffic signal 03 ‐ P.D. only 02 ‐ Angle 02 ‐ Wet2015‐06‐11 2015 11:07 MONTREAL RD @ VANIER PKWY 01 ‐ Clear 01 ‐ Daylight 01 ‐ Traffic signal 03 ‐ P.D. only 04 ‐ Sideswipe 01 ‐ Dry2015‐07‐09 2015 21:17 MONTREAL RD @ VANIER PKWY 01 ‐ Clear 07 ‐ Dark 01 ‐ Traffic signal 02 ‐ Non‐fatal injury 03 ‐ Rear end 01 ‐ Dry2015‐11‐10 2015 7:00 MONTREAL RD @ VANIER PKWY 07 ‐ Fog, mist, smoke, dust 03 ‐ Dawn 01 ‐ Traffic signal 03 ‐ P.D. only 03 ‐ Rear end 01 ‐ Dry2015‐12‐09 2015 0:18 MONTREAL RD @ VANIER PKWY 01 ‐ Clear 07 ‐ Dark 01 ‐ Traffic signal 03 ‐ P.D. only 02 ‐ Angle 01 ‐ Dry2015‐12‐28 2015 11:24 MONTREAL RD @ VANIER PKWY 01 ‐ Clear 01 ‐ Daylight 01 ‐ Traffic signal 03 ‐ P.D. only 03 ‐ Rear end 01 ‐ Dry2016‐01‐02 2016 8:58 MONTREAL RD @ VANIER PKWY 03 ‐ Snow 01 ‐ Daylight 01 ‐ Traffic signal 03 ‐ P.D. only 03 ‐ Rear end 03 ‐ Loose snow2016‐01‐04 2016 7:25 MONTREAL RD @ VANIER PKWY 01 ‐ Clear 03 ‐ Dawn 01 ‐ Traffic signal 03 ‐ P.D. only 03 ‐ Rear end 01 ‐ Dry2016‐01‐14 2016 17:19 MONTREAL RD @ VANIER PKWY 01 ‐ Clear 05 ‐ Dusk 01 ‐ Traffic signal 03 ‐ P.D. only 04 ‐ Sideswipe 02 ‐ Wet2016‐01‐27 2016 23:43 MONTREAL RD @ VANIER PKWY 01 ‐ Clear 07 ‐ Dark 01 ‐ Traffic signal 02 ‐ Non‐fatal injury 05 ‐ Turning movement 01 ‐ Dry2016‐02‐05 2016 9:59 MONTREAL RD @ VANIER PKWY 01 ‐ Clear 01 ‐ Daylight 01 ‐ Traffic signal 03 ‐ P.D. only 04 ‐ Sideswipe 01 ‐ Dry2016‐02‐17 2016 20:56 MONTREAL RD @ VANIER PKWY 01 ‐ Clear 07 ‐ Dark 01 ‐ Traffic signal 03 ‐ P.D. only 03 ‐ Rear end 06 ‐ Ice2016‐02‐17 2016 22:23 MONTREAL RD @ VANIER PKWY 01 ‐ Clear 07 ‐ Dark 01 ‐ Traffic signal 03 ‐ P.D. only 99 ‐ Other 06 ‐ Ice2016‐02‐22 2016 12:15 MONTREAL RD @ VANIER PKWY 01 ‐ Clear 01 ‐ Daylight 01 ‐ Traffic signal 03 ‐ P.D. only 02 ‐ Angle 01 ‐ Dry2016‐03‐24 2016 18:51 MONTREAL RD @ VANIER PKWY 01 ‐ Clear 05 ‐ Dusk 01 ‐ Traffic signal 03 ‐ P.D. only 05 ‐ Turning movement 04 ‐ Slush2016‐04‐02 2016 10:00 MONTREAL RD @ VANIER PKWY 01 ‐ Clear 01 ‐ Daylight 01 ‐ Traffic signal 03 ‐ P.D. only 04 ‐ Sideswipe 01 ‐ Dry2016‐04‐08 2016 3:00 MONTREAL RD @ VANIER PKWY 01 ‐ Clear 07 ‐ Dark 01 ‐ Traffic signal 03 ‐ P.D. only 99 ‐ Other 02 ‐ Wet2016‐04‐15 2016 15:34 MONTREAL RD @ VANIER PKWY 01 ‐ Clear 01 ‐ Daylight 01 ‐ Traffic signal 02 ‐ Non‐fatal injury 07 ‐ SMV other 01 ‐ Dry2016‐04‐23 2016 20:43 MONTREAL RD @ VANIER PKWY 01 ‐ Clear 07 ‐ Dark 01 ‐ Traffic signal 03 ‐ P.D. only 05 ‐ Turning movement 01 ‐ Dry2016‐04‐25 2016 11:10 MONTREAL RD @ VANIER PKWY 01 ‐ Clear 01 ‐ Daylight 01 ‐ Traffic signal 02 ‐ Non‐fatal injury 07 ‐ SMV other 01 ‐ Dry2016‐04‐25 2016 21:01 MONTREAL RD @ VANIER PKWY 01 ‐ Clear 07 ‐ Dark 01 ‐ Traffic signal 03 ‐ P.D. only 05 ‐ Turning movement 01 ‐ Dry2016‐05‐30 2016 13:27 MONTREAL RD @ VANIER PKWY 01 ‐ Clear 01 ‐ Daylight 01 ‐ Traffic signal 03 ‐ P.D. only 02 ‐ Angle 01 ‐ Dry2016‐06‐11 2016 23:58 MONTREAL RD @ VANIER PKWY 01 ‐ Clear 07 ‐ Dark 01 ‐ Traffic signal 02 ‐ Non‐fatal injury 05 ‐ Turning movement 01 ‐ Dry2016‐06‐15 2016 19:43 MONTREAL RD @ VANIER PKWY 01 ‐ Clear 01 ‐ Daylight 01 ‐ Traffic signal 03 ‐ P.D. only 04 ‐ Sideswipe 01 ‐ Dry2016‐07‐18 2016 12:12 MONTREAL RD @ VANIER PKWY 01 ‐ Clear 01 ‐ Daylight 01 ‐ Traffic signal 03 ‐ P.D. only 03 ‐ Rear end 01 ‐ Dry2016‐08‐02 2016 10:35 MONTREAL RD @ VANIER PKWY 01 ‐ Clear 01 ‐ Daylight 01 ‐ Traffic signal 02 ‐ Non‐fatal injury 03 ‐ Rear end 01 ‐ Dry2016‐08‐18 2016 18:30 MONTREAL RD @ VANIER PKWY 01 ‐ Clear 01 ‐ Daylight 01 ‐ Traffic signal 03 ‐ P.D. only 03 ‐ Rear end 01 ‐ Dry2016‐09‐04 2016 3:25 MONTREAL RD @ VANIER PKWY 01 ‐ Clear 07 ‐ Dark 01 ‐ Traffic signal 03 ‐ P.D. only 03 ‐ Rear end 01 ‐ Dry2016‐09‐05 2016 12:32 MONTREAL RD @ VANIER PKWY 01 ‐ Clear 01 ‐ Daylight 01 ‐ Traffic signal 03 ‐ P.D. only 03 ‐ Rear end 01 ‐ Dry2016‐09‐28 2016 8:52 MONTREAL RD @ VANIER PKWY 01 ‐ Clear 01 ‐ Daylight 01 ‐ Traffic signal 03 ‐ P.D. only 03 ‐ Rear end 01 ‐ Dry2016‐10‐25 2016 13:40 MONTREAL RD @ VANIER PKWY 01 ‐ Clear 01 ‐ Daylight 01 ‐ Traffic signal 03 ‐ P.D. only 05 ‐ Turning movement 01 ‐ Dry2016‐11‐06 2016 8:43 MONTREAL RD @ VANIER PKWY 01 ‐ Clear 01 ‐ Daylight 01 ‐ Traffic signal 02 ‐ Non‐fatal injury 04 ‐ Sideswipe 01 ‐ Dry2016‐11‐23 2016 16:34 MONTREAL RD @ VANIER PKWY 01 ‐ Clear 05 ‐ Dusk 01 ‐ Traffic signal 03 ‐ P.D. only 03 ‐ Rear end 01 ‐ Dry2016‐11‐26 2016 0:17 MONTREAL RD @ VANIER PKWY 01 ‐ Clear 07 ‐ Dark 01 ‐ Traffic signal 02 ‐ Non‐fatal injury 07 ‐ SMV other 02 ‐ Wet2016‐12‐02 2016 19:05 MONTREAL RD @ VANIER PKWY 01 ‐ Clear 07 ‐ Dark 01 ‐ Traffic signal 03 ‐ P.D. only 02 ‐ Angle 01 ‐ Dry2016‐12‐08 2016 16:59 MONTREAL RD @ VANIER PKWY 03 ‐ Snow 05 ‐ Dusk 01 ‐ Traffic signal 02 ‐ Non‐fatal injury 07 ‐ SMV other 02 ‐ Wet2016‐12‐17 2016 15:03 MONTREAL RD @ VANIER PKWY 03 ‐ Snow 01 ‐ Daylight 01 ‐ Traffic signal 03 ‐ P.D. only 03 ‐ Rear end 04 ‐ Slush2016‐12‐19 2016 16:30 MONTREAL RD @ VANIER PKWY 03 ‐ Snow 05 ‐ Dusk 01 ‐ Traffic signal 02 ‐ Non‐fatal injury 04 ‐ Sideswipe 04 ‐ Slush2016‐12‐27 2016 22:36 MONTREAL RD @ VANIER PKWY 01 ‐ Clear 07 ‐ Dark 01 ‐ Traffic signal 03 ‐ P.D. only 02 ‐ Angle 01 ‐ Dry2017‐02‐10 2017 20:15 MONTREAL RD @ VANIER PKWY 03 ‐ Snow 07 ‐ Dark 01 ‐ Traffic signal 03 ‐ P.D. only 04 ‐ Sideswipe 02 ‐ Wet2017‐02‐21 2017 16:41 MONTREAL RD @ VANIER PKWY 02 ‐ Rain 01 ‐ Daylight 01 ‐ Traffic signal 03 ‐ P.D. only 04 ‐ Sideswipe 02 ‐ Wet2017‐03‐24 2017 23:30 MONTREAL RD @ VANIER PKWY 01 ‐ Clear 07 ‐ Dark 01 ‐ Traffic signal 03 ‐ P.D. only 03 ‐ Rear end 03 ‐ Loose snow2017‐05‐02 2017 8:16 MONTREAL RD @ VANIER PKWY 01 ‐ Clear 01 ‐ Daylight 01 ‐ Traffic signal 03 ‐ P.D. only 03 ‐ Rear end 01 ‐ Dry2017‐05‐02 2017 15:38 MONTREAL RD @ VANIER PKWY 02 ‐ Rain 01 ‐ Daylight 01 ‐ Traffic signal 03 ‐ P.D. only 03 ‐ Rear end 02 ‐ Wet2017‐05‐15 2017 10:04 MONTREAL RD @ VANIER PKWY 01 ‐ Clear 01 ‐ Daylight 01 ‐ Traffic signal 03 ‐ P.D. only 05 ‐ Turning movement 01 ‐ Dry2017‐05‐15 2017 10:30 MONTREAL RD @ VANIER PKWY 01 ‐ Clear 01 ‐ Daylight 01 ‐ Traffic signal 03 ‐ P.D. only 03 ‐ Rear end 01 ‐ Dry2017‐05‐25 2017 8:05 MONTREAL RD @ VANIER PKWY 01 ‐ Clear 01 ‐ Daylight 01 ‐ Traffic signal 03 ‐ P.D. only 04 ‐ Sideswipe 01 ‐ Dry2017‐05‐30 2017 8:26 MONTREAL RD @ VANIER PKWY 01 ‐ Clear 01 ‐ Daylight 01 ‐ Traffic signal 03 ‐ P.D. only 04 ‐ Sideswipe 01 ‐ Dry2017‐05‐30 2017 9:13 MONTREAL RD @ VANIER PKWY 01 ‐ Clear 01 ‐ Daylight 01 ‐ Traffic signal 03 ‐ P.D. only 03 ‐ Rear end 01 ‐ Dry2017‐06‐14 2017 18:12 MONTREAL RD @ VANIER PKWY 01 ‐ Clear 01 ‐ Daylight 01 ‐ Traffic signal 02 ‐ Non‐fatal injury 02 ‐ Angle 01 ‐ Dry2017‐06‐16 2017 21:30 MONTREAL RD @ VANIER PKWY 01 ‐ Clear 07 ‐ Dark 01 ‐ Traffic signal 03 ‐ P.D. only 03 ‐ Rear end 01 ‐ Dry2017‐07‐21 2017 15:27 MONTREAL RD @ VANIER PKWY 01 ‐ Clear 01 ‐ Daylight 01 ‐ Traffic signal 03 ‐ P.D. only 03 ‐ Rear end 01 ‐ Dry2017‐08‐19 2017 16:35 MONTREAL RD @ VANIER PKWY 01 ‐ Clear 01 ‐ Daylight 01 ‐ Traffic signal 03 ‐ P.D. only 04 ‐ Sideswipe 01 ‐ Dry2017‐08‐25 2017 23:12 MONTREAL RD @ VANIER PKWY 01 ‐ Clear 07 ‐ Dark 01 ‐ Traffic signal 03 ‐ P.D. only 03 ‐ Rear end 01 ‐ Dry2017‐09‐26 2017 10:51 MONTREAL RD @ VANIER PKWY 01 ‐ Clear 01 ‐ Daylight 01 ‐ Traffic signal 03 ‐ P.D. only 03 ‐ Rear end 01 ‐ Dry2017‐10‐16 2017 6:21 MONTREAL RD @ VANIER PKWY 01 ‐ Clear 03 ‐ Dawn 01 ‐ Traffic signal 03 ‐ P.D. only 04 ‐ Sideswipe 01 ‐ Dry2017‐11‐01 2017 19:26 MONTREAL RD @ VANIER PKWY 02 ‐ Rain 07 ‐ Dark 01 ‐ Traffic signal 02 ‐ Non‐fatal injury 05 ‐ Turning movement 02 ‐ Wet2017‐11‐07 2017 13:10 MONTREAL RD @ VANIER PKWY 01 ‐ Clear 01 ‐ Daylight 01 ‐ Traffic signal 03 ‐ P.D. only 03 ‐ Rear end 01 ‐ Dry2017‐11‐11 2017 21:07 MONTREAL RD @ VANIER PKWY 01 ‐ Clear 07 ‐ Dark 01 ‐ Traffic signal 03 ‐ P.D. only 03 ‐ Rear end 01 ‐ Dry2017‐11‐17 2017 5:48 MONTREAL RD @ VANIER PKWY 03 ‐ Snow 07 ‐ Dark 01 ‐ Traffic signal 02 ‐ Non‐fatal injury 07 ‐ SMV other 03 ‐ Loose snow2017‐11‐28 2017 16:48 MONTREAL RD @ VANIER PKWY 01 ‐ Clear 05 ‐ Dusk 01 ‐ Traffic signal 03 ‐ P.D. only 05 ‐ Turning movement 01 ‐ Dry
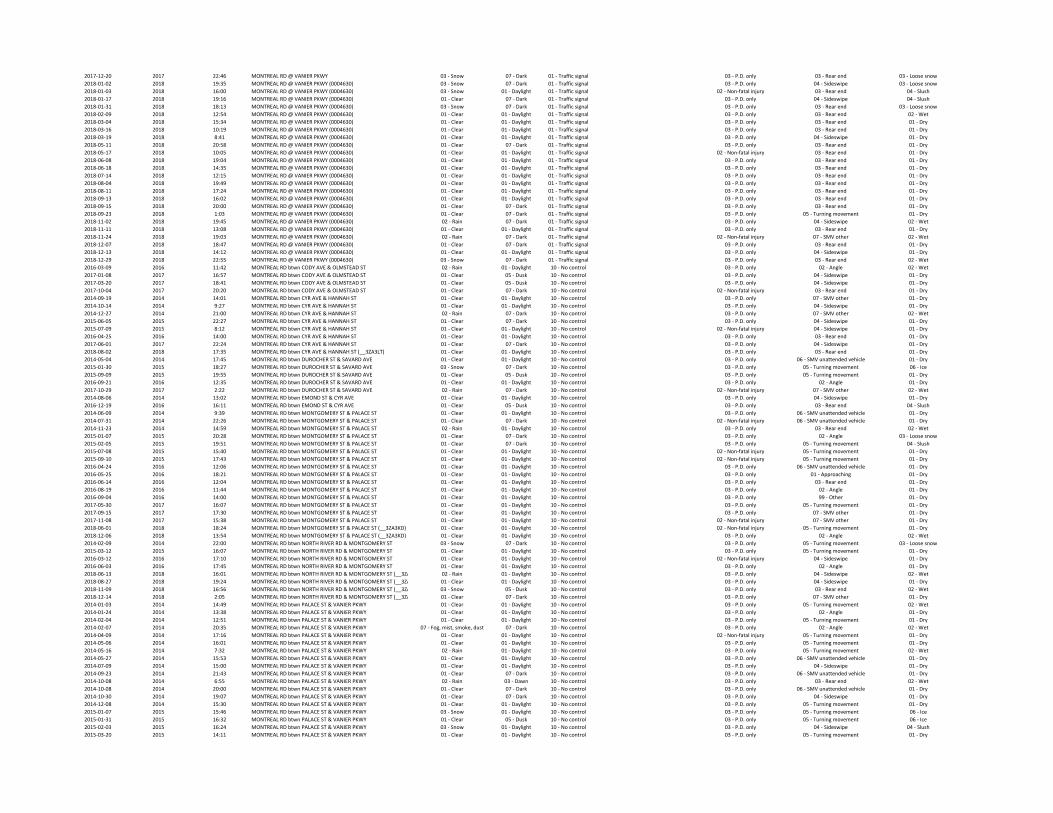
2017‐12‐20 2017 22:46 MONTREAL RD @ VANIER PKWY 03 ‐ Snow 07 ‐ Dark 01 ‐ Traffic signal 03 ‐ P.D. only 03 ‐ Rear end 03 ‐ Loose snow2018‐01‐02 2018 19:35 MONTREAL RD @ VANIER PKWY (0004630) 03 ‐ Snow 07 ‐ Dark 01 ‐ Traffic signal 03 ‐ P.D. only 04 ‐ Sideswipe 03 ‐ Loose snow2018‐01‐03 2018 16:00 MONTREAL RD @ VANIER PKWY (0004630) 03 ‐ Snow 01 ‐ Daylight 01 ‐ Traffic signal 02 ‐ Non‐fatal injury 03 ‐ Rear end 04 ‐ Slush2018‐01‐17 2018 19:16 MONTREAL RD @ VANIER PKWY (0004630) 01 ‐ Clear 07 ‐ Dark 01 ‐ Traffic signal 03 ‐ P.D. only 04 ‐ Sideswipe 04 ‐ Slush2018‐01‐31 2018 18:13 MONTREAL RD @ VANIER PKWY (0004630) 03 ‐ Snow 07 ‐ Dark 01 ‐ Traffic signal 03 ‐ P.D. only 03 ‐ Rear end 03 ‐ Loose snow2018‐02‐09 2018 12:54 MONTREAL RD @ VANIER PKWY (0004630) 01 ‐ Clear 01 ‐ Daylight 01 ‐ Traffic signal 03 ‐ P.D. only 03 ‐ Rear end 02 ‐ Wet2018‐03‐04 2018 15:34 MONTREAL RD @ VANIER PKWY (0004630) 01 ‐ Clear 01 ‐ Daylight 01 ‐ Traffic signal 03 ‐ P.D. only 03 ‐ Rear end 01 ‐ Dry2018‐03‐16 2018 10:19 MONTREAL RD @ VANIER PKWY (0004630) 01 ‐ Clear 01 ‐ Daylight 01 ‐ Traffic signal 03 ‐ P.D. only 03 ‐ Rear end 01 ‐ Dry2018‐03‐19 2018 8:41 MONTREAL RD @ VANIER PKWY (0004630) 01 ‐ Clear 01 ‐ Daylight 01 ‐ Traffic signal 03 ‐ P.D. only 04 ‐ Sideswipe 01 ‐ Dry2018‐05‐11 2018 20:58 MONTREAL RD @ VANIER PKWY (0004630) 01 ‐ Clear 07 ‐ Dark 01 ‐ Traffic signal 03 ‐ P.D. only 03 ‐ Rear end 01 ‐ Dry2018‐05‐17 2018 10:05 MONTREAL RD @ VANIER PKWY (0004630) 01 ‐ Clear 01 ‐ Daylight 01 ‐ Traffic signal 02 ‐ Non‐fatal injury 03 ‐ Rear end 01 ‐ Dry2018‐06‐08 2018 19:04 MONTREAL RD @ VANIER PKWY (0004630) 01 ‐ Clear 01 ‐ Daylight 01 ‐ Traffic signal 03 ‐ P.D. only 03 ‐ Rear end 01 ‐ Dry2018‐06‐18 2018 14:35 MONTREAL RD @ VANIER PKWY (0004630) 01 ‐ Clear 01 ‐ Daylight 01 ‐ Traffic signal 03 ‐ P.D. only 03 ‐ Rear end 01 ‐ Dry2018‐07‐14 2018 12:15 MONTREAL RD @ VANIER PKWY (0004630) 01 ‐ Clear 01 ‐ Daylight 01 ‐ Traffic signal 03 ‐ P.D. only 03 ‐ Rear end 01 ‐ Dry2018‐08‐04 2018 19:49 MONTREAL RD @ VANIER PKWY (0004630) 01 ‐ Clear 01 ‐ Daylight 01 ‐ Traffic signal 03 ‐ P.D. only 03 ‐ Rear end 01 ‐ Dry2018‐08‐11 2018 17:24 MONTREAL RD @ VANIER PKWY (0004630) 01 ‐ Clear 01 ‐ Daylight 01 ‐ Traffic signal 03 ‐ P.D. only 03 ‐ Rear end 01 ‐ Dry2018‐09‐13 2018 16:02 MONTREAL RD @ VANIER PKWY (0004630) 01 ‐ Clear 01 ‐ Daylight 01 ‐ Traffic signal 03 ‐ P.D. only 03 ‐ Rear end 01 ‐ Dry2018‐09‐15 2018 20:00 MONTREAL RD @ VANIER PKWY (0004630) 01 ‐ Clear 07 ‐ Dark 01 ‐ Traffic signal 03 ‐ P.D. only 03 ‐ Rear end 01 ‐ Dry2018‐09‐23 2018 1:03 MONTREAL RD @ VANIER PKWY (0004630) 01 ‐ Clear 07 ‐ Dark 01 ‐ Traffic signal 03 ‐ P.D. only 05 ‐ Turning movement 01 ‐ Dry2018‐11‐02 2018 19:45 MONTREAL RD @ VANIER PKWY (0004630) 02 ‐ Rain 07 ‐ Dark 01 ‐ Traffic signal 03 ‐ P.D. only 04 ‐ Sideswipe 02 ‐ Wet2018‐11‐11 2018 13:08 MONTREAL RD @ VANIER PKWY (0004630) 01 ‐ Clear 01 ‐ Daylight 01 ‐ Traffic signal 03 ‐ P.D. only 03 ‐ Rear end 01 ‐ Dry2018‐11‐24 2018 19:03 MONTREAL RD @ VANIER PKWY (0004630) 02 ‐ Rain 07 ‐ Dark 01 ‐ Traffic signal 02 ‐ Non‐fatal injury 07 ‐ SMV other 02 ‐ Wet2018‐12‐07 2018 18:47 MONTREAL RD @ VANIER PKWY (0004630) 01 ‐ Clear 07 ‐ Dark 01 ‐ Traffic signal 03 ‐ P.D. only 03 ‐ Rear end 01 ‐ Dry2018‐12‐13 2018 14:12 MONTREAL RD @ VANIER PKWY (0004630) 01 ‐ Clear 01 ‐ Daylight 01 ‐ Traffic signal 03 ‐ P.D. only 04 ‐ Sideswipe 01 ‐ Dry2018‐12‐29 2018 22:55 MONTREAL RD @ VANIER PKWY (0004630) 03 ‐ Snow 07 ‐ Dark 01 ‐ Traffic signal 03 ‐ P.D. only 03 ‐ Rear end 02 ‐ Wet2016‐03‐09 2016 11:42 MONTREAL RD btwn CODY AVE & OLMSTEAD ST 02 ‐ Rain 01 ‐ Daylight 10 ‐ No control 03 ‐ P.D. only 02 ‐ Angle 02 ‐ Wet2017‐01‐08 2017 16:57 MONTREAL RD btwn CODY AVE & OLMSTEAD ST 01 ‐ Clear 05 ‐ Dusk 10 ‐ No control 03 ‐ P.D. only 04 ‐ Sideswipe 01 ‐ Dry2017‐03‐20 2017 18:41 MONTREAL RD btwn CODY AVE & OLMSTEAD ST 01 ‐ Clear 05 ‐ Dusk 10 ‐ No control 03 ‐ P.D. only 04 ‐ Sideswipe 01 ‐ Dry2017‐10‐04 2017 20:20 MONTREAL RD btwn CODY AVE & OLMSTEAD ST 01 ‐ Clear 07 ‐ Dark 10 ‐ No control 02 ‐ Non‐fatal injury 03 ‐ Rear end 01 ‐ Dry2014‐09‐19 2014 14:01 MONTREAL RD btwn CYR AVE & HANNAH ST 01 ‐ Clear 01 ‐ Daylight 10 ‐ No control 03 ‐ P.D. only 07 ‐ SMV other 01 ‐ Dry2014‐10‐14 2014 9:27 MONTREAL RD btwn CYR AVE & HANNAH ST 01 ‐ Clear 01 ‐ Daylight 10 ‐ No control 03 ‐ P.D. only 04 ‐ Sideswipe 01 ‐ Dry2014‐12‐27 2014 21:00 MONTREAL RD btwn CYR AVE & HANNAH ST 02 ‐ Rain 07 ‐ Dark 10 ‐ No control 03 ‐ P.D. only 07 ‐ SMV other 02 ‐ Wet2015‐06‐05 2015 22:27 MONTREAL RD btwn CYR AVE & HANNAH ST 01 ‐ Clear 07 ‐ Dark 10 ‐ No control 03 ‐ P.D. only 04 ‐ Sideswipe 01 ‐ Dry2015‐07‐09 2015 8:12 MONTREAL RD btwn CYR AVE & HANNAH ST 01 ‐ Clear 01 ‐ Daylight 10 ‐ No control 02 ‐ Non‐fatal injury 04 ‐ Sideswipe 01 ‐ Dry2016‐04‐25 2016 14:00 MONTREAL RD btwn CYR AVE & HANNAH ST 01 ‐ Clear 01 ‐ Daylight 10 ‐ No control 03 ‐ P.D. only 03 ‐ Rear end 01 ‐ Dry2017‐06‐01 2017 22:24 MONTREAL RD btwn CYR AVE & HANNAH ST 01 ‐ Clear 07 ‐ Dark 10 ‐ No control 03 ‐ P.D. only 04 ‐ Sideswipe 01 ‐ Dry2018‐08‐02 2018 17:35 MONTREAL RD btwn CYR AVE & HANNAH ST (__3ZA3LT) 01 ‐ Clear 01 ‐ Daylight 10 ‐ No control 03 ‐ P.D. only 03 ‐ Rear end 01 ‐ Dry2014‐05‐04 2014 17:45 MONTREAL RD btwn DUROCHER ST & SAVARD AVE 01 ‐ Clear 01 ‐ Daylight 10 ‐ No control 03 ‐ P.D. only 06 ‐ SMV unattended vehicle 01 ‐ Dry2015‐01‐30 2015 18:27 MONTREAL RD btwn DUROCHER ST & SAVARD AVE 03 ‐ Snow 07 ‐ Dark 10 ‐ No control 03 ‐ P.D. only 05 ‐ Turning movement 06 ‐ Ice2015‐09‐09 2015 19:55 MONTREAL RD btwn DUROCHER ST & SAVARD AVE 01 ‐ Clear 05 ‐ Dusk 10 ‐ No control 03 ‐ P.D. only 05 ‐ Turning movement 01 ‐ Dry2016‐09‐21 2016 12:35 MONTREAL RD btwn DUROCHER ST & SAVARD AVE 01 ‐ Clear 01 ‐ Daylight 10 ‐ No control 03 ‐ P.D. only 02 ‐ Angle 01 ‐ Dry2017‐10‐29 2017 2:22 MONTREAL RD btwn DUROCHER ST & SAVARD AVE 02 ‐ Rain 07 ‐ Dark 10 ‐ No control 02 ‐ Non‐fatal injury 07 ‐ SMV other 02 ‐ Wet2014‐08‐06 2014 13:02 MONTREAL RD btwn EMOND ST & CYR AVE 01 ‐ Clear 01 ‐ Daylight 10 ‐ No control 03 ‐ P.D. only 04 ‐ Sideswipe 01 ‐ Dry2016‐12‐19 2016 16:11 MONTREAL RD btwn EMOND ST & CYR AVE 01 ‐ Clear 05 ‐ Dusk 10 ‐ No control 03 ‐ P.D. only 03 ‐ Rear end 04 ‐ Slush2014‐06‐09 2014 9:39 MONTREAL RD btwn MONTGOMERY ST & PALACE ST 01 ‐ Clear 01 ‐ Daylight 10 ‐ No control 03 ‐ P.D. only 06 ‐ SMV unattended vehicle 01 ‐ Dry2014‐07‐31 2014 22:26 MONTREAL RD btwn MONTGOMERY ST & PALACE ST 01 ‐ Clear 07 ‐ Dark 10 ‐ No control 02 ‐ Non‐fatal injury 06 ‐ SMV unattended vehicle 01 ‐ Dry2014‐11‐23 2014 14:59 MONTREAL RD btwn MONTGOMERY ST & PALACE ST 02 ‐ Rain 01 ‐ Daylight 10 ‐ No control 03 ‐ P.D. only 03 ‐ Rear end 02 ‐ Wet2015‐01‐07 2015 20:28 MONTREAL RD btwn MONTGOMERY ST & PALACE ST 01 ‐ Clear 07 ‐ Dark 10 ‐ No control 03 ‐ P.D. only 02 ‐ Angle 03 ‐ Loose snow2015‐02‐05 2015 19:51 MONTREAL RD btwn MONTGOMERY ST & PALACE ST 01 ‐ Clear 07 ‐ Dark 10 ‐ No control 03 ‐ P.D. only 05 ‐ Turning movement 04 ‐ Slush2015‐07‐08 2015 15:40 MONTREAL RD btwn MONTGOMERY ST & PALACE ST 01 ‐ Clear 01 ‐ Daylight 10 ‐ No control 02 ‐ Non‐fatal injury 05 ‐ Turning movement 01 ‐ Dry2015‐09‐10 2015 17:43 MONTREAL RD btwn MONTGOMERY ST & PALACE ST 01 ‐ Clear 01 ‐ Daylight 10 ‐ No control 02 ‐ Non‐fatal injury 05 ‐ Turning movement 01 ‐ Dry2016‐04‐24 2016 12:06 MONTREAL RD btwn MONTGOMERY ST & PALACE ST 01 ‐ Clear 01 ‐ Daylight 10 ‐ No control 03 ‐ P.D. only 06 ‐ SMV unattended vehicle 01 ‐ Dry2016‐05‐25 2016 18:21 MONTREAL RD btwn MONTGOMERY ST & PALACE ST 01 ‐ Clear 01 ‐ Daylight 10 ‐ No control 03 ‐ P.D. only 01 ‐ Approaching 01 ‐ Dry2016‐06‐14 2016 12:04 MONTREAL RD btwn MONTGOMERY ST & PALACE ST 01 ‐ Clear 01 ‐ Daylight 10 ‐ No control 03 ‐ P.D. only 03 ‐ Rear end 01 ‐ Dry2016‐08‐19 2016 11:44 MONTREAL RD btwn MONTGOMERY ST & PALACE ST 01 ‐ Clear 01 ‐ Daylight 10 ‐ No control 03 ‐ P.D. only 02 ‐ Angle 01 ‐ Dry2016‐09‐04 2016 14:00 MONTREAL RD btwn MONTGOMERY ST & PALACE ST 01 ‐ Clear 01 ‐ Daylight 10 ‐ No control 03 ‐ P.D. only 99 ‐ Other 01 ‐ Dry2017‐05‐30 2017 16:07 MONTREAL RD btwn MONTGOMERY ST & PALACE ST 01 ‐ Clear 01 ‐ Daylight 10 ‐ No control 03 ‐ P.D. only 05 ‐ Turning movement 01 ‐ Dry2017‐09‐15 2017 17:30 MONTREAL RD btwn MONTGOMERY ST & PALACE ST 01 ‐ Clear 01 ‐ Daylight 10 ‐ No control 03 ‐ P.D. only 07 ‐ SMV other 01 ‐ Dry2017‐11‐08 2017 15:38 MONTREAL RD btwn MONTGOMERY ST & PALACE ST 01 ‐ Clear 01 ‐ Daylight 10 ‐ No control 02 ‐ Non‐fatal injury 07 ‐ SMV other 01 ‐ Dry2018‐06‐01 2018 18:24 MONTREAL RD btwn MONTGOMERY ST & PALACE ST (__3ZA3KD) 01 ‐ Clear 01 ‐ Daylight 10 ‐ No control 02 ‐ Non‐fatal injury 05 ‐ Turning movement 01 ‐ Dry2018‐12‐06 2018 13:54 MONTREAL RD btwn MONTGOMERY ST & PALACE ST (__3ZA3KD) 01 ‐ Clear 01 ‐ Daylight 10 ‐ No control 03 ‐ P.D. only 02 ‐ Angle 02 ‐ Wet2014‐02‐09 2014 22:00 MONTREAL RD btwn NORTH RIVER RD & MONTGOMERY ST 03 ‐ Snow 07 ‐ Dark 10 ‐ No control 03 ‐ P.D. only 05 ‐ Turning movement 03 ‐ Loose snow2015‐03‐12 2015 16:07 MONTREAL RD btwn NORTH RIVER RD & MONTGOMERY ST 01 ‐ Clear 01 ‐ Daylight 10 ‐ No control 03 ‐ P.D. only 05 ‐ Turning movement 01 ‐ Dry2016‐03‐12 2016 17:10 MONTREAL RD btwn NORTH RIVER RD & MONTGOMERY ST 01 ‐ Clear 01 ‐ Daylight 10 ‐ No control 02 ‐ Non‐fatal injury 04 ‐ Sideswipe 01 ‐ Dry2016‐06‐03 2016 17:45 MONTREAL RD btwn NORTH RIVER RD & MONTGOMERY ST 01 ‐ Clear 01 ‐ Daylight 10 ‐ No control 03 ‐ P.D. only 02 ‐ Angle 01 ‐ Dry2018‐06‐13 2018 16:01 MONTREAL RD btwn NORTH RIVER RD & MONTGOMERY ST (__3ZA 02 ‐ Rain 01 ‐ Daylight 10 ‐ No control 03 ‐ P.D. only 04 ‐ Sideswipe 02 ‐ Wet2018‐08‐27 2018 19:24 MONTREAL RD btwn NORTH RIVER RD & MONTGOMERY ST (__3ZA 01 ‐ Clear 01 ‐ Daylight 10 ‐ No control 03 ‐ P.D. only 04 ‐ Sideswipe 01 ‐ Dry2018‐11‐09 2018 16:56 MONTREAL RD btwn NORTH RIVER RD & MONTGOMERY ST (__3ZA 03 ‐ Snow 05 ‐ Dusk 10 ‐ No control 03 ‐ P.D. only 03 ‐ Rear end 02 ‐ Wet2018‐12‐14 2018 2:05 MONTREAL RD btwn NORTH RIVER RD & MONTGOMERY ST (__3ZA 01 ‐ Clear 07 ‐ Dark 10 ‐ No control 03 ‐ P.D. only 07 ‐ SMV other 01 ‐ Dry2014‐01‐03 2014 14:49 MONTREAL RD btwn PALACE ST & VANIER PKWY 01 ‐ Clear 01 ‐ Daylight 10 ‐ No control 03 ‐ P.D. only 05 ‐ Turning movement 02 ‐ Wet2014‐01‐24 2014 13:38 MONTREAL RD btwn PALACE ST & VANIER PKWY 01 ‐ Clear 01 ‐ Daylight 10 ‐ No control 03 ‐ P.D. only 02 ‐ Angle 01 ‐ Dry2014‐02‐04 2014 12:51 MONTREAL RD btwn PALACE ST & VANIER PKWY 01 ‐ Clear 01 ‐ Daylight 10 ‐ No control 03 ‐ P.D. only 05 ‐ Turning movement 01 ‐ Dry2014‐02‐07 2014 20:35 MONTREAL RD btwn PALACE ST & VANIER PKWY 07 ‐ Fog, mist, smoke, dust 07 ‐ Dark 10 ‐ No control 03 ‐ P.D. only 02 ‐ Angle 02 ‐ Wet2014‐04‐09 2014 17:16 MONTREAL RD btwn PALACE ST & VANIER PKWY 01 ‐ Clear 01 ‐ Daylight 10 ‐ No control 02 ‐ Non‐fatal injury 05 ‐ Turning movement 01 ‐ Dry2014‐05‐06 2014 16:01 MONTREAL RD btwn PALACE ST & VANIER PKWY 01 ‐ Clear 01 ‐ Daylight 10 ‐ No control 03 ‐ P.D. only 05 ‐ Turning movement 01 ‐ Dry2014‐05‐16 2014 7:32 MONTREAL RD btwn PALACE ST & VANIER PKWY 02 ‐ Rain 01 ‐ Daylight 10 ‐ No control 03 ‐ P.D. only 05 ‐ Turning movement 02 ‐ Wet2014‐05‐27 2014 15:53 MONTREAL RD btwn PALACE ST & VANIER PKWY 01 ‐ Clear 01 ‐ Daylight 10 ‐ No control 03 ‐ P.D. only 06 ‐ SMV unattended vehicle 01 ‐ Dry2014‐07‐09 2014 15:00 MONTREAL RD btwn PALACE ST & VANIER PKWY 01 ‐ Clear 01 ‐ Daylight 10 ‐ No control 03 ‐ P.D. only 04 ‐ Sideswipe 01 ‐ Dry2014‐09‐23 2014 21:43 MONTREAL RD btwn PALACE ST & VANIER PKWY 01 ‐ Clear 07 ‐ Dark 10 ‐ No control 03 ‐ P.D. only 06 ‐ SMV unattended vehicle 01 ‐ Dry2014‐10‐08 2014 6:55 MONTREAL RD btwn PALACE ST & VANIER PKWY 02 ‐ Rain 03 ‐ Dawn 10 ‐ No control 03 ‐ P.D. only 03 ‐ Rear end 02 ‐ Wet2014‐10‐08 2014 20:00 MONTREAL RD btwn PALACE ST & VANIER PKWY 01 ‐ Clear 07 ‐ Dark 10 ‐ No control 03 ‐ P.D. only 06 ‐ SMV unattended vehicle 01 ‐ Dry2014‐10‐30 2014 19:07 MONTREAL RD btwn PALACE ST & VANIER PKWY 01 ‐ Clear 07 ‐ Dark 10 ‐ No control 03 ‐ P.D. only 04 ‐ Sideswipe 01 ‐ Dry2014‐12‐08 2014 15:30 MONTREAL RD btwn PALACE ST & VANIER PKWY 01 ‐ Clear 01 ‐ Daylight 10 ‐ No control 03 ‐ P.D. only 05 ‐ Turning movement 01 ‐ Dry2015‐01‐07 2015 15:46 MONTREAL RD btwn PALACE ST & VANIER PKWY 03 ‐ Snow 01 ‐ Daylight 10 ‐ No control 03 ‐ P.D. only 05 ‐ Turning movement 06 ‐ Ice2015‐01‐31 2015 16:32 MONTREAL RD btwn PALACE ST & VANIER PKWY 01 ‐ Clear 05 ‐ Dusk 10 ‐ No control 03 ‐ P.D. only 05 ‐ Turning movement 06 ‐ Ice2015‐02‐03 2015 16:24 MONTREAL RD btwn PALACE ST & VANIER PKWY 03 ‐ Snow 01 ‐ Daylight 10 ‐ No control 03 ‐ P.D. only 04 ‐ Sideswipe 04 ‐ Slush2015‐03‐20 2015 14:11 MONTREAL RD btwn PALACE ST & VANIER PKWY 01 ‐ Clear 01 ‐ Daylight 10 ‐ No control 03 ‐ P.D. only 05 ‐ Turning movement 01 ‐ Dry
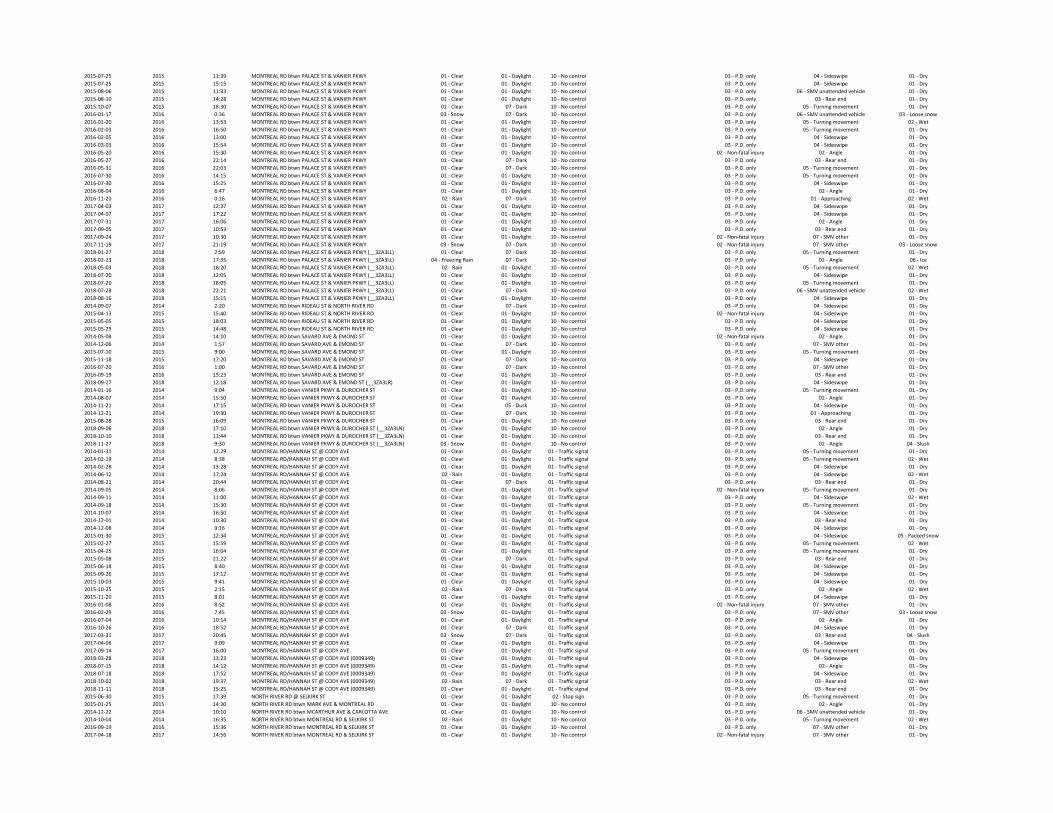
2015‐07‐25 2015 11:39 MONTREAL RD btwn PALACE ST & VANIER PKWY 01 ‐ Clear 01 ‐ Daylight 10 ‐ No control 03 ‐ P.D. only 04 ‐ Sideswipe 01 ‐ Dry2015‐07‐25 2015 15:15 MONTREAL RD btwn PALACE ST & VANIER PKWY 01 ‐ Clear 01 ‐ Daylight 10 ‐ No control 03 ‐ P.D. only 04 ‐ Sideswipe 01 ‐ Dry2015‐08‐06 2015 11:33 MONTREAL RD btwn PALACE ST & VANIER PKWY 01 ‐ Clear 01 ‐ Daylight 10 ‐ No control 03 ‐ P.D. only 06 ‐ SMV unattended vehicle 01 ‐ Dry2015‐08‐10 2015 14:28 MONTREAL RD btwn PALACE ST & VANIER PKWY 01 ‐ Clear 01 ‐ Daylight 10 ‐ No control 03 ‐ P.D. only 03 ‐ Rear end 01 ‐ Dry2015‐10‐07 2015 18:30 MONTREAL RD btwn PALACE ST & VANIER PKWY 01 ‐ Clear 07 ‐ Dark 10 ‐ No control 03 ‐ P.D. only 05 ‐ Turning movement 01 ‐ Dry2016‐01‐17 2016 0:36 MONTREAL RD btwn PALACE ST & VANIER PKWY 03 ‐ Snow 07 ‐ Dark 10 ‐ No control 03 ‐ P.D. only 06 ‐ SMV unattended vehicle 03 ‐ Loose snow2016‐01‐20 2016 13:53 MONTREAL RD btwn PALACE ST & VANIER PKWY 01 ‐ Clear 01 ‐ Daylight 10 ‐ No control 03 ‐ P.D. only 05 ‐ Turning movement 02 ‐ Wet2016‐02‐03 2016 16:50 MONTREAL RD btwn PALACE ST & VANIER PKWY 01 ‐ Clear 01 ‐ Daylight 10 ‐ No control 03 ‐ P.D. only 05 ‐ Turning movement 01 ‐ Dry2016‐02‐05 2016 13:00 MONTREAL RD btwn PALACE ST & VANIER PKWY 01 ‐ Clear 01 ‐ Daylight 10 ‐ No control 03 ‐ P.D. only 04 ‐ Sideswipe 01 ‐ Dry2016‐03‐03 2016 15:54 MONTREAL RD btwn PALACE ST & VANIER PKWY 01 ‐ Clear 01 ‐ Daylight 10 ‐ No control 03 ‐ P.D. only 04 ‐ Sideswipe 01 ‐ Dry2016‐05‐20 2016 15:30 MONTREAL RD btwn PALACE ST & VANIER PKWY 01 ‐ Clear 01 ‐ Daylight 10 ‐ No control 02 ‐ Non‐fatal injury 02 ‐ Angle 01 ‐ Dry2016‐05‐27 2016 22:14 MONTREAL RD btwn PALACE ST & VANIER PKWY 01 ‐ Clear 07 ‐ Dark 10 ‐ No control 03 ‐ P.D. only 03 ‐ Rear end 01 ‐ Dry2016‐05‐31 2016 22:03 MONTREAL RD btwn PALACE ST & VANIER PKWY 01 ‐ Clear 07 ‐ Dark 10 ‐ No control 03 ‐ P.D. only 05 ‐ Turning movement 01 ‐ Dry2016‐07‐30 2016 14:15 MONTREAL RD btwn PALACE ST & VANIER PKWY 01 ‐ Clear 01 ‐ Daylight 10 ‐ No control 03 ‐ P.D. only 05 ‐ Turning movement 01 ‐ Dry2016‐07‐30 2016 15:25 MONTREAL RD btwn PALACE ST & VANIER PKWY 01 ‐ Clear 01 ‐ Daylight 10 ‐ No control 03 ‐ P.D. only 04 ‐ Sideswipe 01 ‐ Dry2016‐08‐04 2016 6:47 MONTREAL RD btwn PALACE ST & VANIER PKWY 01 ‐ Clear 01 ‐ Daylight 10 ‐ No control 03 ‐ P.D. only 02 ‐ Angle 01 ‐ Dry2016‐11‐20 2016 0:16 MONTREAL RD btwn PALACE ST & VANIER PKWY 02 ‐ Rain 07 ‐ Dark 10 ‐ No control 03 ‐ P.D. only 01 ‐ Approaching 02 ‐ Wet2017‐04‐03 2017 12:37 MONTREAL RD btwn PALACE ST & VANIER PKWY 01 ‐ Clear 01 ‐ Daylight 10 ‐ No control 03 ‐ P.D. only 04 ‐ Sideswipe 01 ‐ Dry2017‐04‐07 2017 17:22 MONTREAL RD btwn PALACE ST & VANIER PKWY 01 ‐ Clear 01 ‐ Daylight 10 ‐ No control 03 ‐ P.D. only 04 ‐ Sideswipe 01 ‐ Dry2017‐07‐31 2017 16:06 MONTREAL RD btwn PALACE ST & VANIER PKWY 01 ‐ Clear 01 ‐ Daylight 10 ‐ No control 03 ‐ P.D. only 02 ‐ Angle 01 ‐ Dry2017‐09‐05 2017 10:53 MONTREAL RD btwn PALACE ST & VANIER PKWY 01 ‐ Clear 01 ‐ Daylight 10 ‐ No control 03 ‐ P.D. only 03 ‐ Rear end 01 ‐ Dry2017‐09‐24 2017 10:30 MONTREAL RD btwn PALACE ST & VANIER PKWY 01 ‐ Clear 01 ‐ Daylight 10 ‐ No control 02 ‐ Non‐fatal injury 07 ‐ SMV other 01 ‐ Dry2017‐11‐19 2017 21:19 MONTREAL RD btwn PALACE ST & VANIER PKWY 03 ‐ Snow 07 ‐ Dark 10 ‐ No control 02 ‐ Non‐fatal injury 07 ‐ SMV other 03 ‐ Loose snow2018‐01‐27 2018 2:59 MONTREAL RD btwn PALACE ST & VANIER PKWY (__3ZA3LL) 01 ‐ Clear 07 ‐ Dark 10 ‐ No control 03 ‐ P.D. only 05 ‐ Turning movement 01 ‐ Dry2018‐02‐23 2018 17:35 MONTREAL RD btwn PALACE ST & VANIER PKWY (__3ZA3LL) 04 ‐ Freezing Rain 07 ‐ Dark 10 ‐ No control 03 ‐ P.D. only 02 ‐ Angle 06 ‐ Ice2018‐05‐03 2018 18:20 MONTREAL RD btwn PALACE ST & VANIER PKWY (__3ZA3LL) 02 ‐ Rain 01 ‐ Daylight 10 ‐ No control 03 ‐ P.D. only 05 ‐ Turning movement 02 ‐ Wet2018‐07‐20 2018 12:05 MONTREAL RD btwn PALACE ST & VANIER PKWY (__3ZA3LL) 01 ‐ Clear 01 ‐ Daylight 10 ‐ No control 03 ‐ P.D. only 04 ‐ Sideswipe 01 ‐ Dry2018‐07‐20 2018 18:05 MONTREAL RD btwn PALACE ST & VANIER PKWY (__3ZA3LL) 01 ‐ Clear 01 ‐ Daylight 10 ‐ No control 03 ‐ P.D. only 05 ‐ Turning movement 01 ‐ Dry2018‐07‐28 2018 22:21 MONTREAL RD btwn PALACE ST & VANIER PKWY (__3ZA3LL) 01 ‐ Clear 07 ‐ Dark 10 ‐ No control 03 ‐ P.D. only 06 ‐ SMV unattended vehicle 02 ‐ Wet2018‐08‐16 2018 15:15 MONTREAL RD btwn PALACE ST & VANIER PKWY (__3ZA3LL) 01 ‐ Clear 01 ‐ Daylight 10 ‐ No control 03 ‐ P.D. only 04 ‐ Sideswipe 01 ‐ Dry2014‐09‐07 2014 2:20 MONTREAL RD btwn RIDEAU ST & NORTH RIVER RD 01 ‐ Clear 07 ‐ Dark 10 ‐ No control 03 ‐ P.D. only 04 ‐ Sideswipe 01 ‐ Dry2015‐04‐13 2015 15:40 MONTREAL RD btwn RIDEAU ST & NORTH RIVER RD 01 ‐ Clear 01 ‐ Daylight 10 ‐ No control 02 ‐ Non‐fatal injury 04 ‐ Sideswipe 01 ‐ Dry2015‐05‐05 2015 18:03 MONTREAL RD btwn RIDEAU ST & NORTH RIVER RD 01 ‐ Clear 01 ‐ Daylight 10 ‐ No control 03 ‐ P.D. only 04 ‐ Sideswipe 01 ‐ Dry2015‐05‐29 2015 14:48 MONTREAL RD btwn RIDEAU ST & NORTH RIVER RD 01 ‐ Clear 01 ‐ Daylight 10 ‐ No control 03 ‐ P.D. only 04 ‐ Sideswipe 01 ‐ Dry2014‐05‐08 2014 14:10 MONTREAL RD btwn SAVARD AVE & EMOND ST 01 ‐ Clear 01 ‐ Daylight 10 ‐ No control 02 ‐ Non‐fatal injury 02 ‐ Angle 01 ‐ Dry2014‐12‐06 2014 1:57 MONTREAL RD btwn SAVARD AVE & EMOND ST 01 ‐ Clear 07 ‐ Dark 10 ‐ No control 03 ‐ P.D. only 07 ‐ SMV other 01 ‐ Dry2015‐07‐10 2015 9:00 MONTREAL RD btwn SAVARD AVE & EMOND ST 01 ‐ Clear 01 ‐ Daylight 10 ‐ No control 03 ‐ P.D. only 05 ‐ Turning movement 01 ‐ Dry2015‐11‐18 2015 17:20 MONTREAL RD btwn SAVARD AVE & EMOND ST 01 ‐ Clear 07 ‐ Dark 10 ‐ No control 03 ‐ P.D. only 04 ‐ Sideswipe 01 ‐ Dry2016‐07‐20 2016 1:00 MONTREAL RD btwn SAVARD AVE & EMOND ST 01 ‐ Clear 07 ‐ Dark 10 ‐ No control 03 ‐ P.D. only 07 ‐ SMV other 01 ‐ Dry2016‐09‐19 2016 15:23 MONTREAL RD btwn SAVARD AVE & EMOND ST 01 ‐ Clear 01 ‐ Daylight 10 ‐ No control 03 ‐ P.D. only 03 ‐ Rear end 01 ‐ Dry2018‐09‐27 2018 12:18 MONTREAL RD btwn SAVARD AVE & EMOND ST (__3ZA3LR) 01 ‐ Clear 01 ‐ Daylight 10 ‐ No control 03 ‐ P.D. only 04 ‐ Sideswipe 01 ‐ Dry2014‐01‐16 2014 9:04 MONTREAL RD btwn VANIER PKWY & DUROCHER ST 01 ‐ Clear 01 ‐ Daylight 10 ‐ No control 03 ‐ P.D. only 05 ‐ Turning movement 01 ‐ Dry2014‐08‐07 2014 15:50 MONTREAL RD btwn VANIER PKWY & DUROCHER ST 01 ‐ Clear 01 ‐ Daylight 10 ‐ No control 03 ‐ P.D. only 02 ‐ Angle 01 ‐ Dry2014‐11‐21 2014 17:15 MONTREAL RD btwn VANIER PKWY & DUROCHER ST 01 ‐ Clear 05 ‐ Dusk 10 ‐ No control 03 ‐ P.D. only 04 ‐ Sideswipe 01 ‐ Dry2014‐12‐21 2014 19:30 MONTREAL RD btwn VANIER PKWY & DUROCHER ST 01 ‐ Clear 07 ‐ Dark 10 ‐ No control 03 ‐ P.D. only 01 ‐ Approaching 01 ‐ Dry2015‐08‐28 2015 16:09 MONTREAL RD btwn VANIER PKWY & DUROCHER ST 01 ‐ Clear 01 ‐ Daylight 10 ‐ No control 03 ‐ P.D. only 03 ‐ Rear end 01 ‐ Dry2018‐09‐06 2018 17:10 MONTREAL RD btwn VANIER PKWY & DUROCHER ST (__3ZA3LN) 01 ‐ Clear 01 ‐ Daylight 10 ‐ No control 03 ‐ P.D. only 02 ‐ Angle 01 ‐ Dry2018‐10‐10 2018 11:44 MONTREAL RD btwn VANIER PKWY & DUROCHER ST (__3ZA3LN) 01 ‐ Clear 01 ‐ Daylight 10 ‐ No control 03 ‐ P.D. only 03 ‐ Rear end 01 ‐ Dry2018‐11‐27 2018 9:30 MONTREAL RD btwn VANIER PKWY & DUROCHER ST (__3ZA3LN) 03 ‐ Snow 01 ‐ Daylight 10 ‐ No control 03 ‐ P.D. only 02 ‐ Angle 04 ‐ Slush2014‐01‐31 2014 12:29 MONTREAL RD/HANNAH ST @ CODY AVE 01 ‐ Clear 01 ‐ Daylight 01 ‐ Traffic signal 03 ‐ P.D. only 05 ‐ Turning movement 01 ‐ Dry2014‐02‐19 2014 8:38 MONTREAL RD/HANNAH ST @ CODY AVE 01 ‐ Clear 01 ‐ Daylight 01 ‐ Traffic signal 03 ‐ P.D. only 05 ‐ Turning movement 02 ‐ Wet2014‐02‐28 2014 13:28 MONTREAL RD/HANNAH ST @ CODY AVE 01 ‐ Clear 01 ‐ Daylight 01 ‐ Traffic signal 03 ‐ P.D. only 04 ‐ Sideswipe 01 ‐ Dry2014‐06‐12 2014 17:24 MONTREAL RD/HANNAH ST @ CODY AVE 02 ‐ Rain 01 ‐ Daylight 01 ‐ Traffic signal 03 ‐ P.D. only 04 ‐ Sideswipe 02 ‐ Wet2014‐08‐21 2014 20:44 MONTREAL RD/HANNAH ST @ CODY AVE 01 ‐ Clear 07 ‐ Dark 01 ‐ Traffic signal 03 ‐ P.D. only 03 ‐ Rear end 01 ‐ Dry2014‐09‐05 2014 8:06 MONTREAL RD/HANNAH ST @ CODY AVE 01 ‐ Clear 01 ‐ Daylight 01 ‐ Traffic signal 02 ‐ Non‐fatal injury 05 ‐ Turning movement 01 ‐ Dry2014‐09‐11 2014 11:00 MONTREAL RD/HANNAH ST @ CODY AVE 01 ‐ Clear 01 ‐ Daylight 01 ‐ Traffic signal 03 ‐ P.D. only 04 ‐ Sideswipe 02 ‐ Wet2014‐09‐18 2014 15:30 MONTREAL RD/HANNAH ST @ CODY AVE 01 ‐ Clear 01 ‐ Daylight 01 ‐ Traffic signal 03 ‐ P.D. only 05 ‐ Turning movement 01 ‐ Dry2014‐10‐07 2014 16:50 MONTREAL RD/HANNAH ST @ CODY AVE 01 ‐ Clear 01 ‐ Daylight 01 ‐ Traffic signal 03 ‐ P.D. only 04 ‐ Sideswipe 01 ‐ Dry2014‐12‐01 2014 10:30 MONTREAL RD/HANNAH ST @ CODY AVE 01 ‐ Clear 01 ‐ Daylight 01 ‐ Traffic signal 03 ‐ P.D. only 03 ‐ Rear end 01 ‐ Dry2014‐12‐08 2014 9:16 MONTREAL RD/HANNAH ST @ CODY AVE 01 ‐ Clear 01 ‐ Daylight 01 ‐ Traffic signal 03 ‐ P.D. only 04 ‐ Sideswipe 01 ‐ Dry2015‐01‐30 2015 12:34 MONTREAL RD/HANNAH ST @ CODY AVE 01 ‐ Clear 01 ‐ Daylight 01 ‐ Traffic signal 03 ‐ P.D. only 04 ‐ Sideswipe 05 ‐ Packed snow2015‐02‐27 2015 15:59 MONTREAL RD/HANNAH ST @ CODY AVE 01 ‐ Clear 01 ‐ Daylight 01 ‐ Traffic signal 03 ‐ P.D. only 05 ‐ Turning movement 02 ‐ Wet2015‐04‐25 2015 16:04 MONTREAL RD/HANNAH ST @ CODY AVE 01 ‐ Clear 01 ‐ Daylight 01 ‐ Traffic signal 03 ‐ P.D. only 05 ‐ Turning movement 01 ‐ Dry2015‐05‐08 2015 21:22 MONTREAL RD/HANNAH ST @ CODY AVE 01 ‐ Clear 07 ‐ Dark 01 ‐ Traffic signal 03 ‐ P.D. only 03 ‐ Rear end 01 ‐ Dry2015‐06‐18 2015 8:40 MONTREAL RD/HANNAH ST @ CODY AVE 01 ‐ Clear 01 ‐ Daylight 01 ‐ Traffic signal 03 ‐ P.D. only 04 ‐ Sideswipe 01 ‐ Dry2015‐09‐26 2015 17:12 MONTREAL RD/HANNAH ST @ CODY AVE 01 ‐ Clear 01 ‐ Daylight 01 ‐ Traffic signal 03 ‐ P.D. only 04 ‐ Sideswipe 01 ‐ Dry2015‐10‐03 2015 9:41 MONTREAL RD/HANNAH ST @ CODY AVE 01 ‐ Clear 01 ‐ Daylight 01 ‐ Traffic signal 03 ‐ P.D. only 04 ‐ Sideswipe 01 ‐ Dry2015‐10‐25 2015 2:15 MONTREAL RD/HANNAH ST @ CODY AVE 02 ‐ Rain 07 ‐ Dark 01 ‐ Traffic signal 03 ‐ P.D. only 02 ‐ Angle 02 ‐ Wet2015‐11‐20 2015 8:01 MONTREAL RD/HANNAH ST @ CODY AVE 01 ‐ Clear 01 ‐ Daylight 01 ‐ Traffic signal 03 ‐ P.D. only 04 ‐ Sideswipe 01 ‐ Dry2016‐01‐08 2016 8:52 MONTREAL RD/HANNAH ST @ CODY AVE 01 ‐ Clear 01 ‐ Daylight 01 ‐ Traffic signal 02 ‐ Non‐fatal injury 07 ‐ SMV other 01 ‐ Dry2016‐02‐29 2016 7:45 MONTREAL RD/HANNAH ST @ CODY AVE 03 ‐ Snow 01 ‐ Daylight 01 ‐ Traffic signal 03 ‐ P.D. only 07 ‐ SMV other 03 ‐ Loose snow2016‐07‐04 2016 10:14 MONTREAL RD/HANNAH ST @ CODY AVE 01 ‐ Clear 01 ‐ Daylight 01 ‐ Traffic signal 03 ‐ P.D. only 02 ‐ Angle 01 ‐ Dry2016‐10‐26 2016 18:52 MONTREAL RD/HANNAH ST @ CODY AVE 01 ‐ Clear 07 ‐ Dark 01 ‐ Traffic signal 03 ‐ P.D. only 04 ‐ Sideswipe 01 ‐ Dry2017‐03‐31 2017 20:45 MONTREAL RD/HANNAH ST @ CODY AVE 03 ‐ Snow 07 ‐ Dark 01 ‐ Traffic signal 03 ‐ P.D. only 03 ‐ Rear end 04 ‐ Slush2017‐04‐06 2017 9:09 MONTREAL RD/HANNAH ST @ CODY AVE 01 ‐ Clear 01 ‐ Daylight 01 ‐ Traffic signal 03 ‐ P.D. only 04 ‐ Sideswipe 01 ‐ Dry2017‐09‐14 2017 16:00 MONTREAL RD/HANNAH ST @ CODY AVE 01 ‐ Clear 01 ‐ Daylight 01 ‐ Traffic signal 03 ‐ P.D. only 05 ‐ Turning movement 01 ‐ Dry2018‐03‐28 2018 13:23 MONTREAL RD/HANNAH ST @ CODY AVE (0009349) 01 ‐ Clear 01 ‐ Daylight 01 ‐ Traffic signal 03 ‐ P.D. only 04 ‐ Sideswipe 01 ‐ Dry2018‐07‐15 2018 14:12 MONTREAL RD/HANNAH ST @ CODY AVE (0009349) 01 ‐ Clear 01 ‐ Daylight 01 ‐ Traffic signal 03 ‐ P.D. only 02 ‐ Angle 01 ‐ Dry2018‐07‐18 2018 17:52 MONTREAL RD/HANNAH ST @ CODY AVE (0009349) 01 ‐ Clear 01 ‐ Daylight 01 ‐ Traffic signal 03 ‐ P.D. only 04 ‐ Sideswipe 01 ‐ Dry2018‐10‐02 2018 19:37 MONTREAL RD/HANNAH ST @ CODY AVE (0009349) 02 ‐ Rain 07 ‐ Dark 01 ‐ Traffic signal 03 ‐ P.D. only 03 ‐ Rear end 02 ‐ Wet2018‐11‐11 2018 15:25 MONTREAL RD/HANNAH ST @ CODY AVE (0009349) 01 ‐ Clear 01 ‐ Daylight 01 ‐ Traffic signal 03 ‐ P.D. only 03 ‐ Rear end 01 ‐ Dry2015‐06‐30 2015 17:39 NORTH RIVER RD @ SELKIRK ST 01 ‐ Clear 01 ‐ Daylight 02 ‐ Stop sign 03 ‐ P.D. only 05 ‐ Turning movement 01 ‐ Dry2015‐01‐25 2015 14:30 NORTH RIVER RD btwn MARK AVE & MONTREAL RD 01 ‐ Clear 01 ‐ Daylight 10 ‐ No control 03 ‐ P.D. only 02 ‐ Angle 01 ‐ Dry2014‐12‐22 2014 10:10 NORTH RIVER RD btwn MCARTHUR AVE & CARLOTTA AVE 01 ‐ Clear 01 ‐ Daylight 10 ‐ No control 03 ‐ P.D. only 06 ‐ SMV unattended vehicle 01 ‐ Dry2014‐10‐04 2014 16:35 NORTH RIVER RD btwn MONTREAL RD & SELKIRK ST 02 ‐ Rain 01 ‐ Daylight 10 ‐ No control 03 ‐ P.D. only 05 ‐ Turning movement 02 ‐ Wet2016‐09‐19 2016 15:36 NORTH RIVER RD btwn MONTREAL RD & SELKIRK ST 01 ‐ Clear 01 ‐ Daylight 10 ‐ No control 03 ‐ P.D. only 07 ‐ SMV other 01 ‐ Dry2017‐04‐18 2017 14:56 NORTH RIVER RD btwn MONTREAL RD & SELKIRK ST 01 ‐ Clear 01 ‐ Daylight 10 ‐ No control 02 ‐ Non‐fatal injury 07 ‐ SMV other 01 ‐ Dry
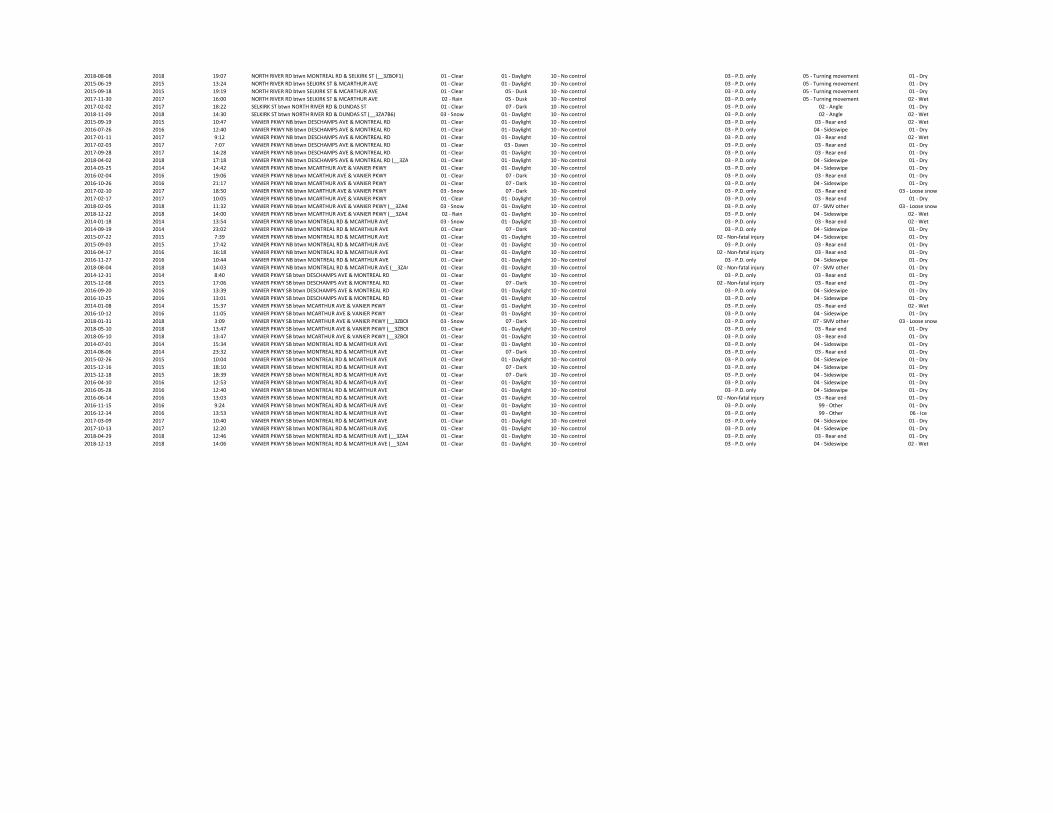
2018‐08‐08 2018 19:07 NORTH RIVER RD btwn MONTREAL RD & SELKIRK ST (__3ZBOF1) 01 ‐ Clear 01 ‐ Daylight 10 ‐ No control 03 ‐ P.D. only 05 ‐ Turning movement 01 ‐ Dry2015‐06‐19 2015 13:24 NORTH RIVER RD btwn SELKIRK ST & MCARTHUR AVE 01 ‐ Clear 01 ‐ Daylight 10 ‐ No control 03 ‐ P.D. only 05 ‐ Turning movement 01 ‐ Dry2015‐09‐18 2015 19:19 NORTH RIVER RD btwn SELKIRK ST & MCARTHUR AVE 01 ‐ Clear 05 ‐ Dusk 10 ‐ No control 03 ‐ P.D. only 05 ‐ Turning movement 01 ‐ Dry2017‐11‐30 2017 16:00 NORTH RIVER RD btwn SELKIRK ST & MCARTHUR AVE 02 ‐ Rain 05 ‐ Dusk 10 ‐ No control 03 ‐ P.D. only 05 ‐ Turning movement 02 ‐ Wet2017‐02‐02 2017 18:22 SELKIRK ST btwn NORTH RIVER RD & DUNDAS ST 01 ‐ Clear 07 ‐ Dark 10 ‐ No control 03 ‐ P.D. only 02 ‐ Angle 01 ‐ Dry2018‐11‐09 2018 14:30 SELKIRK ST btwn NORTH RIVER RD & DUNDAS ST (__3ZA7B6) 03 ‐ Snow 01 ‐ Daylight 10 ‐ No control 03 ‐ P.D. only 02 ‐ Angle 02 ‐ Wet2015‐09‐19 2015 10:47 VANIER PKWY NB btwn DESCHAMPS AVE & MONTREAL RD 01 ‐ Clear 01 ‐ Daylight 10 ‐ No control 03 ‐ P.D. only 03 ‐ Rear end 02 ‐ Wet2016‐07‐26 2016 12:40 VANIER PKWY NB btwn DESCHAMPS AVE & MONTREAL RD 01 ‐ Clear 01 ‐ Daylight 10 ‐ No control 03 ‐ P.D. only 04 ‐ Sideswipe 01 ‐ Dry2017‐01‐11 2017 9:12 VANIER PKWY NB btwn DESCHAMPS AVE & MONTREAL RD 01 ‐ Clear 01 ‐ Daylight 10 ‐ No control 03 ‐ P.D. only 03 ‐ Rear end 02 ‐ Wet2017‐02‐03 2017 7:07 VANIER PKWY NB btwn DESCHAMPS AVE & MONTREAL RD 01 ‐ Clear 03 ‐ Dawn 10 ‐ No control 03 ‐ P.D. only 03 ‐ Rear end 01 ‐ Dry2017‐09‐28 2017 14:28 VANIER PKWY NB btwn DESCHAMPS AVE & MONTREAL RD 01 ‐ Clear 01 ‐ Daylight 10 ‐ No control 03 ‐ P.D. only 03 ‐ Rear end 01 ‐ Dry2018‐04‐02 2018 17:18 VANIER PKWY NB btwn DESCHAMPS AVE & MONTREAL RD (__3ZA 01 ‐ Clear 01 ‐ Daylight 10 ‐ No control 03 ‐ P.D. only 04 ‐ Sideswipe 01 ‐ Dry2014‐03‐25 2014 14:42 VANIER PKWY NB btwn MCARTHUR AVE & VANIER PKWY 01 ‐ Clear 01 ‐ Daylight 10 ‐ No control 03 ‐ P.D. only 04 ‐ Sideswipe 01 ‐ Dry2016‐02‐04 2016 19:06 VANIER PKWY NB btwn MCARTHUR AVE & VANIER PKWY 01 ‐ Clear 07 ‐ Dark 10 ‐ No control 03 ‐ P.D. only 03 ‐ Rear end 01 ‐ Dry2016‐10‐26 2016 21:17 VANIER PKWY NB btwn MCARTHUR AVE & VANIER PKWY 01 ‐ Clear 07 ‐ Dark 10 ‐ No control 03 ‐ P.D. only 04 ‐ Sideswipe 01 ‐ Dry2017‐02‐10 2017 18:50 VANIER PKWY NB btwn MCARTHUR AVE & VANIER PKWY 03 ‐ Snow 07 ‐ Dark 10 ‐ No control 03 ‐ P.D. only 03 ‐ Rear end 03 ‐ Loose snow2017‐02‐17 2017 10:05 VANIER PKWY NB btwn MCARTHUR AVE & VANIER PKWY 01 ‐ Clear 01 ‐ Daylight 10 ‐ No control 03 ‐ P.D. only 03 ‐ Rear end 01 ‐ Dry2018‐02‐05 2018 11:32 VANIER PKWY NB btwn MCARTHUR AVE & VANIER PKWY (__3ZA4S 03 ‐ Snow 01 ‐ Daylight 10 ‐ No control 03 ‐ P.D. only 07 ‐ SMV other 03 ‐ Loose snow2018‐12‐22 2018 14:00 VANIER PKWY NB btwn MCARTHUR AVE & VANIER PKWY (__3ZA4S 02 ‐ Rain 01 ‐ Daylight 10 ‐ No control 03 ‐ P.D. only 04 ‐ Sideswipe 02 ‐ Wet2014‐01‐18 2014 13:54 VANIER PKWY NB btwn MONTREAL RD & MCARTHUR AVE 03 ‐ Snow 01 ‐ Daylight 10 ‐ No control 03 ‐ P.D. only 03 ‐ Rear end 02 ‐ Wet2014‐09‐19 2014 23:02 VANIER PKWY NB btwn MONTREAL RD & MCARTHUR AVE 01 ‐ Clear 07 ‐ Dark 10 ‐ No control 03 ‐ P.D. only 04 ‐ Sideswipe 01 ‐ Dry2015‐07‐22 2015 7:39 VANIER PKWY NB btwn MONTREAL RD & MCARTHUR AVE 01 ‐ Clear 01 ‐ Daylight 10 ‐ No control 02 ‐ Non‐fatal injury 04 ‐ Sideswipe 01 ‐ Dry2015‐09‐03 2015 17:42 VANIER PKWY NB btwn MONTREAL RD & MCARTHUR AVE 01 ‐ Clear 01 ‐ Daylight 10 ‐ No control 03 ‐ P.D. only 03 ‐ Rear end 01 ‐ Dry2016‐04‐17 2016 16:18 VANIER PKWY NB btwn MONTREAL RD & MCARTHUR AVE 01 ‐ Clear 01 ‐ Daylight 10 ‐ No control 02 ‐ Non‐fatal injury 03 ‐ Rear end 01 ‐ Dry2016‐11‐27 2016 10:44 VANIER PKWY NB btwn MONTREAL RD & MCARTHUR AVE 01 ‐ Clear 01 ‐ Daylight 10 ‐ No control 03 ‐ P.D. only 04 ‐ Sideswipe 01 ‐ Dry2018‐08‐04 2018 14:03 VANIER PKWY NB btwn MONTREAL RD & MCARTHUR AVE (__3ZA4 01 ‐ Clear 01 ‐ Daylight 10 ‐ No control 02 ‐ Non‐fatal injury 07 ‐ SMV other 01 ‐ Dry2014‐12‐31 2014 8:40 VANIER PKWY SB btwn DESCHAMPS AVE & MONTREAL RD 01 ‐ Clear 01 ‐ Daylight 10 ‐ No control 03 ‐ P.D. only 03 ‐ Rear end 01 ‐ Dry2015‐12‐08 2015 17:06 VANIER PKWY SB btwn DESCHAMPS AVE & MONTREAL RD 01 ‐ Clear 07 ‐ Dark 10 ‐ No control 02 ‐ Non‐fatal injury 03 ‐ Rear end 01 ‐ Dry2016‐09‐20 2016 13:39 VANIER PKWY SB btwn DESCHAMPS AVE & MONTREAL RD 01 ‐ Clear 01 ‐ Daylight 10 ‐ No control 03 ‐ P.D. only 04 ‐ Sideswipe 01 ‐ Dry2016‐10‐25 2016 13:01 VANIER PKWY SB btwn DESCHAMPS AVE & MONTREAL RD 01 ‐ Clear 01 ‐ Daylight 10 ‐ No control 03 ‐ P.D. only 04 ‐ Sideswipe 01 ‐ Dry2014‐01‐08 2014 15:37 VANIER PKWY SB btwn MCARTHUR AVE & VANIER PKWY 01 ‐ Clear 01 ‐ Daylight 10 ‐ No control 03 ‐ P.D. only 03 ‐ Rear end 02 ‐ Wet2016‐10‐12 2016 11:05 VANIER PKWY SB btwn MCARTHUR AVE & VANIER PKWY 01 ‐ Clear 01 ‐ Daylight 10 ‐ No control 03 ‐ P.D. only 04 ‐ Sideswipe 01 ‐ Dry2018‐01‐31 2018 3:09 VANIER PKWY SB btwn MCARTHUR AVE & VANIER PKWY (__3ZBOB 03 ‐ Snow 07 ‐ Dark 10 ‐ No control 03 ‐ P.D. only 07 ‐ SMV other 03 ‐ Loose snow2018‐05‐10 2018 13:47 VANIER PKWY SB btwn MCARTHUR AVE & VANIER PKWY (__3ZBOB 01 ‐ Clear 01 ‐ Daylight 10 ‐ No control 03 ‐ P.D. only 03 ‐ Rear end 01 ‐ Dry2018‐05‐10 2018 13:47 VANIER PKWY SB btwn MCARTHUR AVE & VANIER PKWY (__3ZBOB 01 ‐ Clear 01 ‐ Daylight 10 ‐ No control 03 ‐ P.D. only 03 ‐ Rear end 01 ‐ Dry2014‐07‐01 2014 15:34 VANIER PKWY SB btwn MONTREAL RD & MCARTHUR AVE 01 ‐ Clear 01 ‐ Daylight 10 ‐ No control 03 ‐ P.D. only 04 ‐ Sideswipe 01 ‐ Dry2014‐08‐06 2014 23:32 VANIER PKWY SB btwn MONTREAL RD & MCARTHUR AVE 01 ‐ Clear 07 ‐ Dark 10 ‐ No control 03 ‐ P.D. only 03 ‐ Rear end 01 ‐ Dry2015‐02‐26 2015 10:04 VANIER PKWY SB btwn MONTREAL RD & MCARTHUR AVE 01 ‐ Clear 01 ‐ Daylight 10 ‐ No control 03 ‐ P.D. only 04 ‐ Sideswipe 01 ‐ Dry2015‐12‐16 2015 18:10 VANIER PKWY SB btwn MONTREAL RD & MCARTHUR AVE 01 ‐ Clear 07 ‐ Dark 10 ‐ No control 03 ‐ P.D. only 04 ‐ Sideswipe 01 ‐ Dry2015‐12‐18 2015 18:39 VANIER PKWY SB btwn MONTREAL RD & MCARTHUR AVE 01 ‐ Clear 07 ‐ Dark 10 ‐ No control 03 ‐ P.D. only 04 ‐ Sideswipe 01 ‐ Dry2016‐04‐10 2016 12:53 VANIER PKWY SB btwn MONTREAL RD & MCARTHUR AVE 01 ‐ Clear 01 ‐ Daylight 10 ‐ No control 03 ‐ P.D. only 04 ‐ Sideswipe 01 ‐ Dry2016‐05‐28 2016 12:40 VANIER PKWY SB btwn MONTREAL RD & MCARTHUR AVE 01 ‐ Clear 01 ‐ Daylight 10 ‐ No control 03 ‐ P.D. only 04 ‐ Sideswipe 01 ‐ Dry2016‐06‐14 2016 13:03 VANIER PKWY SB btwn MONTREAL RD & MCARTHUR AVE 01 ‐ Clear 01 ‐ Daylight 10 ‐ No control 02 ‐ Non‐fatal injury 03 ‐ Rear end 01 ‐ Dry2016‐11‐15 2016 9:24 VANIER PKWY SB btwn MONTREAL RD & MCARTHUR AVE 01 ‐ Clear 01 ‐ Daylight 10 ‐ No control 03 ‐ P.D. only 99 ‐ Other 01 ‐ Dry2016‐12‐14 2016 13:53 VANIER PKWY SB btwn MONTREAL RD & MCARTHUR AVE 01 ‐ Clear 01 ‐ Daylight 10 ‐ No control 03 ‐ P.D. only 99 ‐ Other 06 ‐ Ice2017‐03‐09 2017 10:40 VANIER PKWY SB btwn MONTREAL RD & MCARTHUR AVE 01 ‐ Clear 01 ‐ Daylight 10 ‐ No control 03 ‐ P.D. only 04 ‐ Sideswipe 01 ‐ Dry2017‐10‐13 2017 12:20 VANIER PKWY SB btwn MONTREAL RD & MCARTHUR AVE 01 ‐ Clear 01 ‐ Daylight 10 ‐ No control 03 ‐ P.D. only 04 ‐ Sideswipe 01 ‐ Dry2018‐04‐29 2018 12:46 VANIER PKWY SB btwn MONTREAL RD & MCARTHUR AVE (__3ZA4 01 ‐ Clear 01 ‐ Daylight 10 ‐ No control 03 ‐ P.D. only 03 ‐ Rear end 01 ‐ Dry2018‐12‐13 2018 14:06 VANIER PKWY SB btwn MONTREAL RD & MCARTHUR AVE (__3ZA4 01 ‐ Clear 01 ‐ Daylight 10 ‐ No control 03 ‐ P.D. only 04 ‐ Sideswipe 02 ‐ Wet

Appendix E
TRANS Background Projection Plots
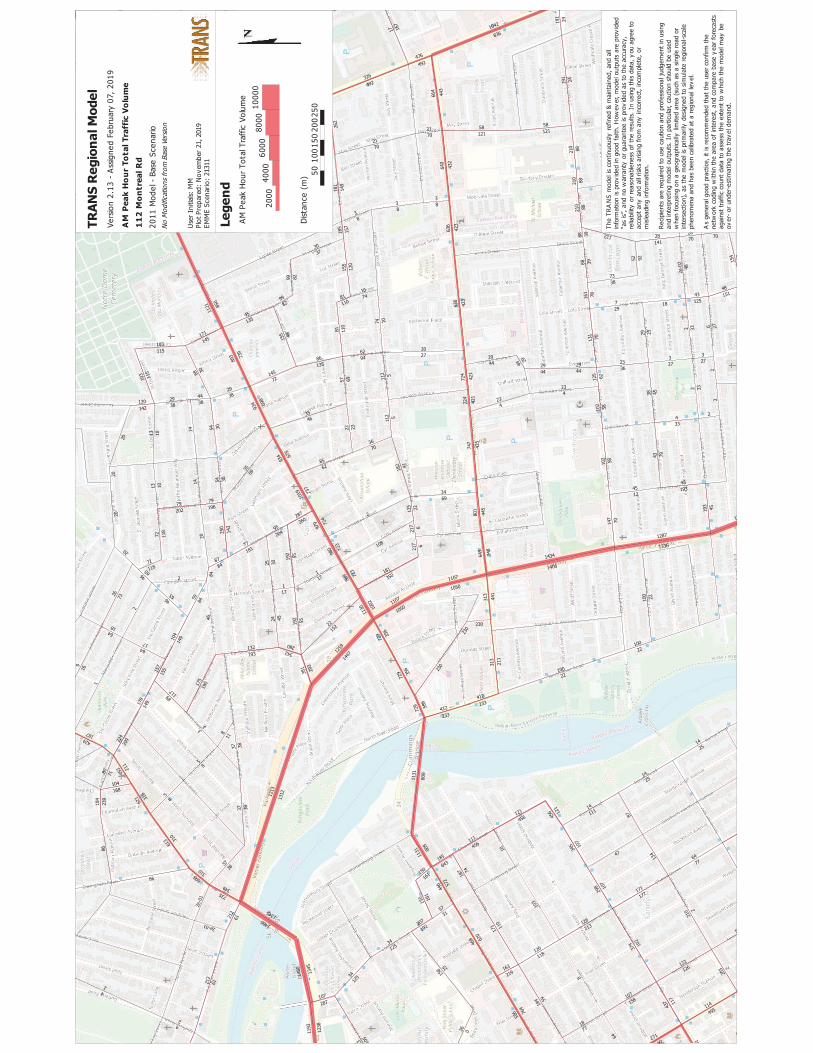
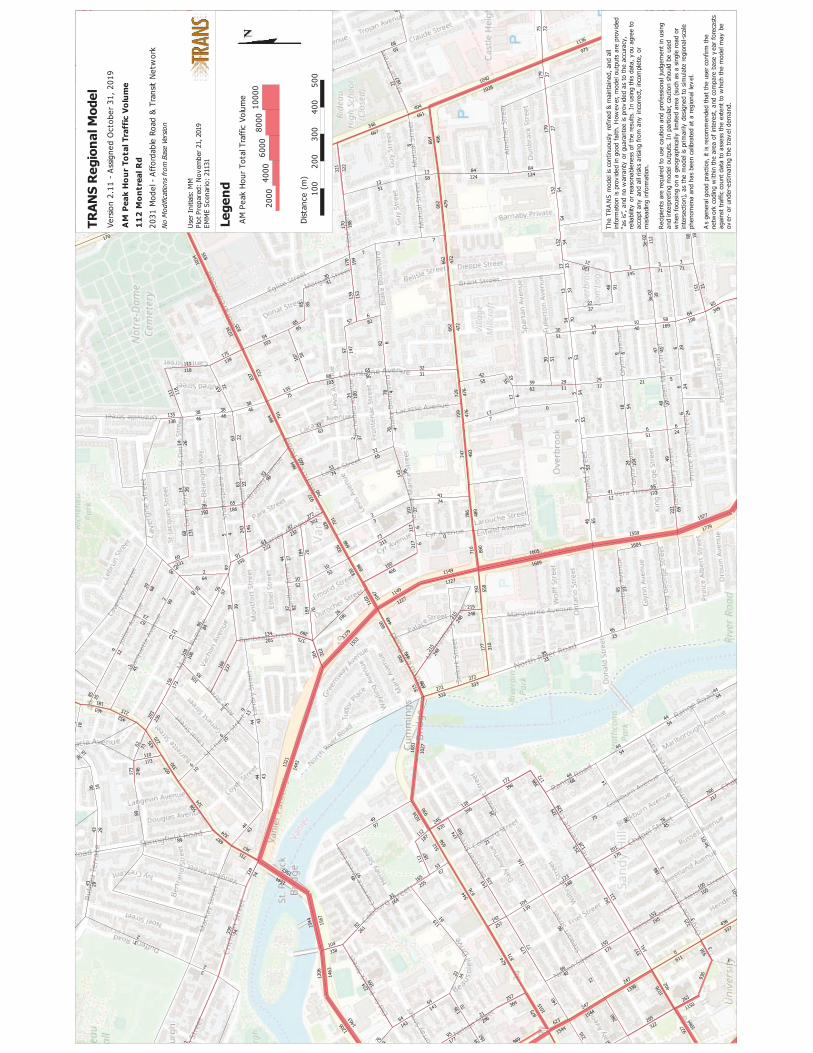

Appendix F
Synchro Intersection Worksheets – 2024 Background Conditions

Lane
s, V
olum
es, T
imin
gs1:
Nor
th R
iver
& M
ontr
eal
02-1
9-20
20
112 M
ontre
al Ro
ad A
M Pe
ak H
our 2
024 F
uture
Bac
kgro
und
Sync
hro 1
0 Ligh
t Rep
ort
Page
1
Lane
Gro
upEB
LEB
TEB
RW
BLW
BTW
BRNB
LNB
TNB
RSB
LSB
TSB
RLa
ne C
onfig
urati
ons
Traff
ic Vo
lume (
vph)
051
833
10
715
1725
915
2118
1725
Futur
e Volu
me (v
ph)
051
833
10
715
1725
915
2118
1725
Satd.
Flow
(pro
t)0
3073
00
3300
016
5815
500
016
080
Flt P
ermi
tted
0.718
0.927
Satd.
Flow
(per
m)0
3073
00
3300
012
4315
500
014
990
Satd.
Flow
(RTO
R)21
25La
ne G
roup
Flow
(vph
)0
849
00
732
025
936
00
600
Turn
Typ
eNA
NAPe
rmNA
Perm
NAPr
otecte
d Pha
ses
26
84
Perm
itted P
hase
s8
4De
tector
Pha
se2
68
84
4Sw
itch P
hase
Minim
um In
itial (s
)10
.010
.010
.010
.010
.010
.0Mi
nimum
Spli
t (s)
27.0
27.0
36.2
36.2
30.2
30.2
Total
Spli
t (s)
43.8
43.8
36.2
36.2
30.2
30.2
Total
Spli
t (%
)54
.8%54
.8%45
.3%45
.3%37
.8%37
.8%Ye
llow
Time (
s)3.3
3.33.3
3.33.3
3.3Al
l-Red
Tim
e (s)
2.72.7
2.92.9
2.92.9
Lost
Time A
djust
(s)0.0
0.00.0
0.00.0
Total
Lost
Time (
s)6.0
6.06.2
6.26.2
Lead
/Lag
Lead
-Lag
Opti
mize
?Re
call M
ode
C-Ma
xC-
Max
None
None
None
None
Act E
ffct G
reen
(s)
43.5
43.5
24.3
24.3
24.3
Actua
ted g/
C Ra
tio0.5
40.5
40.3
00.3
00.3
0v/c
Rati
o0.5
10.4
10.6
90.0
70.1
3Co
ntrol
Delay
14.4
9.833
.110
.011
.9Qu
eue D
elay
0.00.2
0.00.0
0.0To
tal D
elay
14.4
10.0
33.1
10.0
11.9
LOS
BB
CB
BAp
proa
ch D
elay
14.4
10.0
30.3
11.9
Appr
oach
LOS
BB
CB
Queu
e Len
gth 50
th (m
)47
.230
.830
.41.4
3.3Qu
eue L
ength
95th
(m)
64.5
20.0
53.5
6.910
.6Int
erna
l Link
Dist
(m)
194.5
52.8
112.9
59.0
Turn
Bay
Leng
th (m
)90
.0Ba
se C
apac
ity (v
ph)
1669
1793
466
594
577
Star
vatio
n Cap
Red
uctn
040
00
00
Spillb
ack C
ap R
educ
tn0
00
00
Stor
age C
ap R
educ
tn0
00
00
Redu
ced v
/c Ra
tio0.5
10.5
30.5
60.0
60.1
0
Inter
secti
on S
umma
ryCy
cle Le
ngth:
80Ac
tuated
Cyc
le Le
ngth:
80Of
fset: 0
(0%
), Re
feren
ced t
o pha
se 2:
EBT
and 6
:WBT
, Star
t of G
reen
Natur
al Cy
cle: 6
5Co
ntrol
Type
: Actu
ated-
Coor
dinate
d
Lane
s, V
olum
es, T
imin
gs1:
Nor
th R
iver
& M
ontr
eal
02-1
9-20
20
112 M
ontre
al Ro
ad A
M Pe
ak H
our 2
024 F
uture
Bac
kgro
und
Sync
hro 1
0 Ligh
t Rep
ort
Page
2
Maxim
um v/
c Rati
o: 0.6
9Int
erse
ction
Sign
al De
lay: 1
5.1Int
erse
ction
LOS:
BInt
erse
ction
Cap
acity
Utili
zatio
n 61.6
%IC
U Le
vel o
f Ser
vice B
Analy
sis P
eriod
(min)
15De
scrip
tion:
As pe
r sign
al tim
ing pl
an pr
ovide
d on N
ov 29
, 201
9. Ad
dition
al N-
S pe
destr
ian ph
ase t
ime t
aken
from
E-W
phas
e.
Splits
and P
hase
s:
1: No
rth R
iver &
Mon
treal
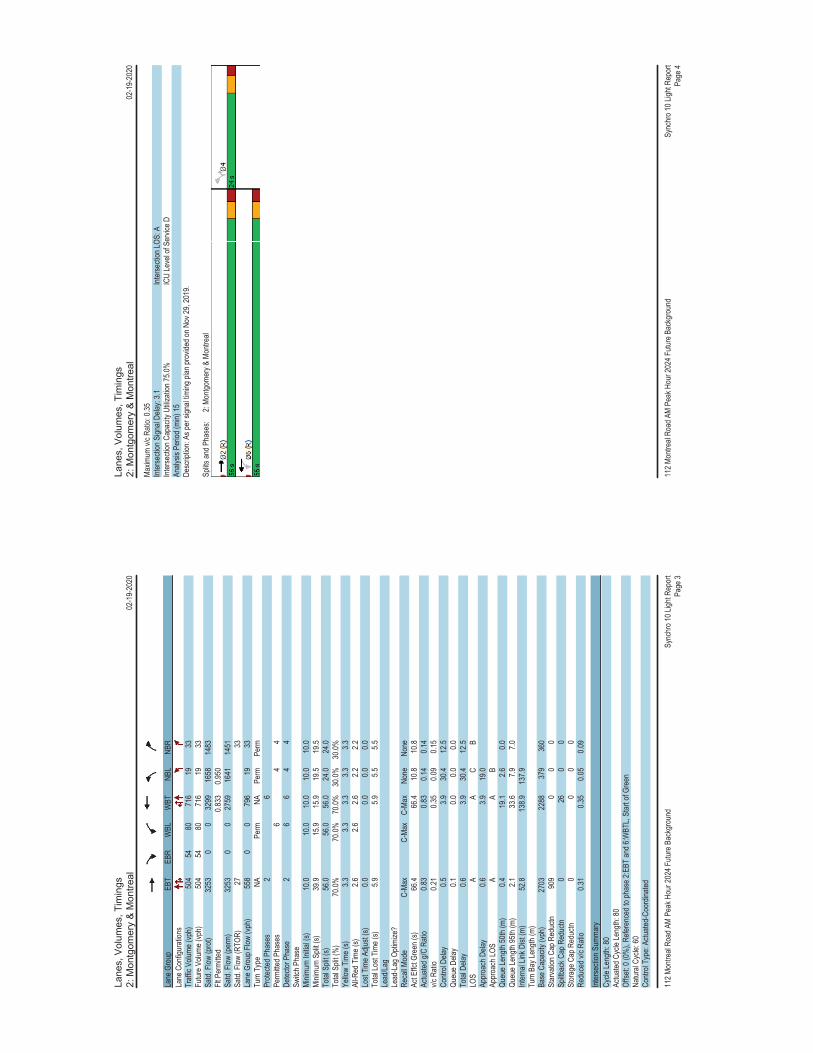
Lane
s, V
olum
es, T
imin
gs2:
Mon
tgom
ery
& M
ontr
eal
02-1
9-20
20
112 M
ontre
al Ro
ad A
M Pe
ak H
our 2
024 F
uture
Bac
kgro
und
Sync
hro 1
0 Ligh
t Rep
ort
Page
3
Lane
Gro
upEB
TEB
RW
BLW
BTNB
LNB
RLa
ne C
onfig
urati
ons
Traff
ic Vo
lume (
vph)
504
5480
716
1933
Futur
e Volu
me (v
ph)
504
5480
716
1933
Satd.
Flow
(pro
t)32
530
032
9916
5814
83Flt
Per
mitte
d0.8
330.9
50Sa
td. F
low (p
erm)
3253
00
2759
1641
1451
Satd.
Flow
(RTO
R)27
33La
ne G
roup
Flow
(vph
)55
80
079
619
33Tu
rn T
ype
NAPe
rmNA
Perm
Perm
Prote
cted P
hase
s2
6Pe
rmitte
d Pha
ses
64
4De
tector
Pha
se2
66
44
Switc
h Pha
seMi
nimum
Initia
l (s)
10.0
10.0
10.0
10.0
10.0
Minim
um S
plit (
s)39
.915
.915
.919
.519
.5To
tal S
plit (
s)56
.056
.056
.024
.024
.0To
tal S
plit (
%)
70.0%
70.0%
70.0%
30.0%
30.0%
Yello
w Tim
e (s)
3.33.3
3.33.3
3.3Al
l-Red
Tim
e (s)
2.62.6
2.62.2
2.2Lo
st Tim
e Adju
st (s)
0.00.0
0.00.0
Total
Lost
Time (
s)5.9
5.95.5
5.5Le
ad/La
gLe
ad-L
ag O
ptimi
ze?
Reca
ll Mod
eC-
Max
C-Ma
xC-
Max
None
None
Act E
ffct G
reen
(s)
66.4
66.4
10.8
10.8
Actua
ted g/
C Ra
tio0.8
30.8
30.1
40.1
4v/c
Rati
o0.2
10.3
50.0
90.1
5Co
ntrol
Delay
0.53.9
30.4
12.5
Queu
e Dela
y0.1
0.00.0
0.0To
tal D
elay
0.63.9
30.4
12.5
LOS
AA
CB
Appr
oach
Dela
y0.6
3.919
.0Ap
proa
ch LO
SA
AB
Queu
e Len
gth 50
th (m
)0.4
19.1
2.60.0
Queu
e Len
gth 95
th (m
)2.1
33.6
7.97.0
Inter
nal L
ink D
ist (m
)52
.813
8.913
7.9Tu
rn B
ay Le
ngth
(m)
Base
Cap
acity
(vph
)27
0322
8837
936
0St
arva
tion C
ap R
educ
tn90
90
00
Spillb
ack C
ap R
educ
tn0
260
0St
orag
e Cap
Red
uctn
00
00
Redu
ced v
/c Ra
tio0.3
10.3
50.0
50.0
9
Inter
secti
on S
umma
ryCy
cle Le
ngth:
80Ac
tuated
Cyc
le Le
ngth:
80Of
fset: 0
(0%
), Re
feren
ced t
o pha
se 2:
EBT
and 6
:WBT
L, St
art o
f Gre
enNa
tural
Cycle
: 60
Contr
ol Ty
pe: A
ctuate
d-Co
ordin
ated
Lane
s, V
olum
es, T
imin
gs2:
Mon
tgom
ery
& M
ontr
eal
02-1
9-20
20
112 M
ontre
al Ro
ad A
M Pe
ak H
our 2
024 F
uture
Bac
kgro
und
Sync
hro 1
0 Ligh
t Rep
ort
Page
4
Maxim
um v/
c Rati
o: 0.3
5Int
erse
ction
Sign
al De
lay: 3
.1Int
erse
ction
LOS:
AInt
erse
ction
Cap
acity
Utili
zatio
n 75.0
%IC
U Le
vel o
f Ser
vice D
Analy
sis P
eriod
(min)
15De
scrip
tion:
As pe
r sign
al tim
ing pl
an pr
ovide
d on N
ov 29
, 201
9.
Splits
and P
hase
s:
2: Mo
ntgom
ery &
Mon
treal

Lane
s, V
olum
es, T
imin
gs3:
Pal
ace
& M
ontr
eal
02-1
9-20
20
112 M
ontre
al Ro
ad A
M Pe
ak H
our 2
024 F
uture
Bac
kgro
und
Sync
hro 1
0 Ligh
t Rep
ort
Page
5
Lane
Gro
upEB
TEB
RW
BLW
BTNB
LNB
RLa
ne C
onfig
urati
ons
Traff
ic Vo
lume (
vph)
526
928
813
00
Futur
e Volu
me (v
ph)
526
928
813
00
Satd.
Flow
(pro
t)33
060
033
090
0Flt
Per
mitte
d0.9
98Sa
td. F
low (p
erm)
3306
00
3309
00
Lane
Gro
up F
low (v
ph)
535
00
841
00
Sign
Con
trol
Free
Free
Free
Inter
secti
on S
umma
ryCo
ntrol
Type
: Uns
ignali
zed
Inter
secti
on C
apac
ity U
tiliza
tion 5
6.2%
ICU
Leve
l of S
ervic
e BAn
alysis
Per
iod (m
in) 15
Lane
s, V
olum
es, T
imin
gs4:
Van
ier
& M
ontr
eal
02-1
9-20
20
112 M
ontre
al Ro
ad A
M Pe
ak H
our 2
024 F
uture
Bac
kgro
und
Sync
hro 1
0 Ligh
t Rep
ort
Page
6
Lane
Gro
upEB
LEB
TEB
RW
BLW
BTW
BRNB
LNB
TNB
RSB
LSB
TSB
RLa
ne C
onfig
urati
ons
Traff
ic Vo
lume (
vph)
4133
215
817
350
920
419
290
117
422
411
5214
7Fu
ture V
olume
(vph
)41
332
158
173
509
204
192
901
174
224
1152
147
Satd.
Flow
(pro
t)16
5817
4514
8316
5830
940
1658
4764
1483
1658
4764
1483
Flt P
ermi
tted
0.358
0.200
0.950
0.950
Satd.
Flow
(per
m)60
717
4514
8334
130
940
1640
4764
1333
1619
4764
1386
Satd.
Flow
(RTO
R)16
647
174
147
Lane
Gro
up F
low (v
ph)
4133
215
817
371
30
192
901
174
224
1152
147
Turn
Typ
ePe
rmNA
NApm
+pt
NAPr
otNA
Perm
Prot
NAPe
rmPr
otecte
d Pha
ses
43
85
21
6Pe
rmitte
d Pha
ses
48
26
Detec
tor P
hase
44
38
52
21
66
Switc
h Pha
seMi
nimum
Initia
l (s)
10.0
10.0
5.010
.05.0
10.0
10.0
5.010
.010
.0Mi
nimum
Spli
t (s)
39.6
39.6
10.7
39.6
11.1
28.9
28.9
11.1
28.9
28.9
Total
Spli
t (s)
40.0
40.0
16.0
56.0
29.0
55.0
55.0
29.0
55.0
55.0
Total
Spli
t (%
)28
.6%28
.6%11
.4%40
.0%20
.7%39
.3%39
.3%20
.7%39
.3%39
.3%Ye
llow
Time (
s)3.3
3.33.3
3.33.7
3.73.7
3.73.7
3.7Al
l-Red
Tim
e (s)
3.33.3
2.43.3
2.42.2
2.22.4
2.22.2
Lost
Time A
djust
(s)0.0
0.00.0
0.00.0
0.00.0
0.00.0
0.0To
tal Lo
st Tim
e (s)
6.66.6
5.76.6
6.15.9
5.96.1
5.95.9
Lead
/Lag
Lag
Lag
Lead
Lead
Lag
Lag
Lead
Lag
Lag
Lead
-Lag
Opti
mize
?Ye
sYe
sYe
sYe
sYe
sYe
sYe
sYe
sYe
sRe
call M
ode
None
None
None
None
None
C-Ma
xC-
Max
None
C-Ma
xC-
Max
Act E
ffct G
reen
(s)
31.2
31.2
0.048
.147
.220
.052
.652
.621
.654
.254
.2Ac
tuated
g/C
Ratio
0.22
0.22
0.00
0.34
0.34
0.14
0.38
0.38
0.15
0.39
0.39
v/c R
atio
0.30
0.86
0.95
0.81
0.66
0.81
0.50
0.29
0.88
0.62
0.23
Contr
ol De
lay51
.072
.865
.762
.740
.088
.035
.912
.089
.337
.65.6
Queu
e Dela
y0.0
0.00.0
0.00.0
0.00.0
0.00.0
0.00.0
Total
Dela
y51
.072
.865
.762
.740
.088
.035
.912
.089
.337
.65.6
LOS
DE
EE
DF
DB
FD
AAp
proa
ch D
elay
69.0
44.4
40.5
42.1
Appr
oach
LOS
ED
DD
Queu
e Len
gth 50
th (m
)9.4
87.4
0.034
.381
.354
.949
.39.7
60.6
97.7
0.0Qu
eue L
ength
95th
(m)
21.0
#130
.9#4
0.8#6
4.910
2.2m7
4.864
.9m2
2.5#1
02.5
116.4
14.4
Inter
nal L
ink D
ist (m
)99
.519
6.422
0.323
9.2Tu
rn B
ay Le
ngth
(m)
35.0
50.0
135.0
135.0
135.0
135.0
Base
Cap
acity
(vph
)14
441
616
621
411
2227
117
8960
927
218
4462
6St
arva
tion C
ap R
educ
tn0
00
00
00
00
00
Spillb
ack C
ap R
educ
tn0
00
00
00
00
00
Stor
age C
ap R
educ
tn0
00
00
00
00
00
Redu
ced v
/c Ra
tio0.2
80.8
00.9
50.8
10.6
40.7
10.5
00.2
90.8
20.6
20.2
3
Inter
secti
on S
umma
ryCy
cle Le
ngth:
140
Actua
ted C
ycle
Leng
th: 14
0Of
fset: 1
02 (7
3%),
Refer
ence
d to p
hase
2:NB
T an
d 6:S
BT, S
tart o
f Gre
enNa
tural
Cycle
: 95
Contr
ol Ty
pe: A
ctuate
d-Co
ordin
ated
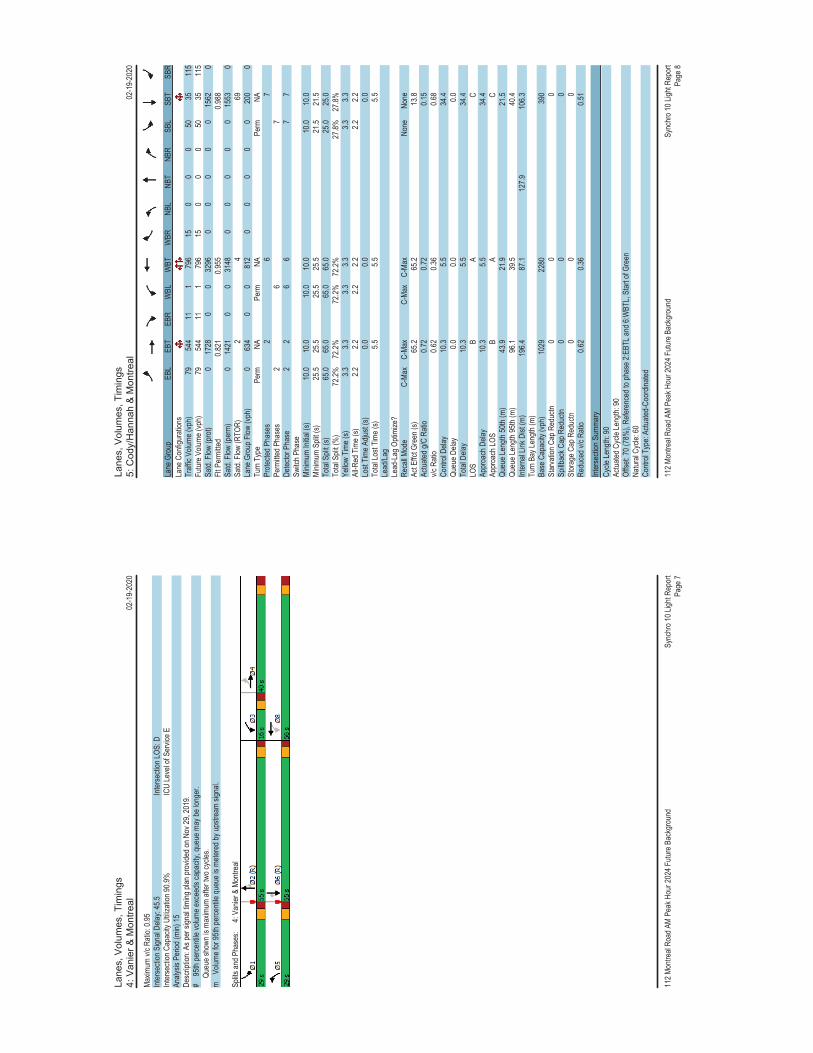
Lane
s, V
olum
es, T
imin
gs4:
Van
ier
& M
ontr
eal
02-1
9-20
20
112 M
ontre
al Ro
ad A
M Pe
ak H
our 2
024 F
uture
Bac
kgro
und
Sync
hro 1
0 Ligh
t Rep
ort
Page
7
Maxim
um v/
c Rati
o: 0.9
5Int
erse
ction
Sign
al De
lay: 4
5.5Int
erse
ction
LOS:
DInt
erse
ction
Cap
acity
Utili
zatio
n 90.9
%IC
U Le
vel o
f Ser
vice E
Analy
sis P
eriod
(min)
15De
scrip
tion:
As pe
r sign
al tim
ing pl
an pr
ovide
d on N
ov 29
, 201
9.#
95th
perce
ntile
volum
e exc
eeds
capa
city,
queu
e may
be lo
nger
.
Que
ue sh
own i
s max
imum
after
two c
ycles
.m
Volu
me fo
r 95th
perce
ntile
queu
e is m
etere
d by u
pstre
am si
gnal.
Splits
and P
hase
s:
4: Va
nier &
Mon
treal
Lane
s, V
olum
es, T
imin
gs5:
Cod
y/H
anna
h &
Mon
trea
l02
-19-
2020
112 M
ontre
al Ro
ad A
M Pe
ak H
our 2
024 F
uture
Bac
kgro
und
Sync
hro 1
0 Ligh
t Rep
ort
Page
8
Lane
Gro
upEB
LEB
TEB
RW
BLW
BTW
BRNB
LNB
TNB
RSB
LSB
TSB
RLa
ne C
onfig
urati
ons
Traff
ic Vo
lume (
vph)
7954
411
179
615
00
050
3511
5Fu
ture V
olume
(vph
)79
544
111
796
150
00
5035
115
Satd.
Flow
(pro
t)0
1728
00
3296
00
00
015
620
Flt P
ermi
tted
0.821
0.955
0.988
Satd.
Flow
(per
m)0
1421
00
3148
00
00
015
530
Satd.
Flow
(RTO
R)2
469
Lane
Gro
up F
low (v
ph)
063
40
081
20
00
00
200
0Tu
rn T
ype
Perm
NAPe
rmNA
Perm
NAPr
otecte
d Pha
ses
26
7Pe
rmitte
d Pha
ses
26
7De
tector
Pha
se2
26
67
7Sw
itch P
hase
Minim
um In
itial (s
)10
.010
.010
.010
.010
.010
.0Mi
nimum
Spli
t (s)
25.5
25.5
25.5
25.5
21.5
21.5
Total
Spli
t (s)
65.0
65.0
65.0
65.0
25.0
25.0
Total
Spli
t (%
)72
.2%72
.2%72
.2%72
.2%27
.8%27
.8%Ye
llow
Time (
s)3.3
3.33.3
3.33.3
3.3Al
l-Red
Tim
e (s)
2.22.2
2.22.2
2.22.2
Lost
Time A
djust
(s)0.0
0.00.0
Total
Lost
Time (
s)5.5
5.55.5
Lead
/Lag
Lead
-Lag
Opti
mize
?Re
call M
ode
C-Ma
xC-
Max
C-Ma
xC-
Max
None
None
Act E
ffct G
reen
(s)
65.2
65.2
13.8
Actua
ted g/
C Ra
tio0.7
20.7
20.1
5v/c
Rati
o0.6
20.3
60.6
8Co
ntrol
Delay
10.3
5.534
.4Qu
eue D
elay
0.00.0
0.0To
tal D
elay
10.3
5.534
.4LO
SB
AC
Appr
oach
Dela
y10
.35.5
34.4
Appr
oach
LOS
BA
CQu
eue L
ength
50th
(m)
43.9
21.9
21.5
Queu
e Len
gth 95
th (m
)96
.139
.540
.4Int
erna
l Link
Dist
(m)
196.4
87.1
127.9
106.3
Turn
Bay
Leng
th (m
)Ba
se C
apac
ity (v
ph)
1029
2280
390
Star
vatio
n Cap
Red
uctn
00
0Sp
illbac
k Cap
Red
uctn
00
0St
orag
e Cap
Red
uctn
00
0Re
duce
d v/c
Ratio
0.62
0.36
0.51
Inter
secti
on S
umma
ryCy
cle Le
ngth:
90Ac
tuated
Cyc
le Le
ngth:
90Of
fset: 7
0 (78
%),
Refer
ence
d to p
hase
2:EB
TL an
d 6:W
BTL,
Star
t of G
reen
Natur
al Cy
cle: 6
0Co
ntrol
Type
: Actu
ated-
Coor
dinate
d

Lane
s, V
olum
es, T
imin
gs5:
Cod
y/H
anna
h &
Mon
trea
l02
-19-
2020
112 M
ontre
al Ro
ad A
M Pe
ak H
our 2
024 F
uture
Bac
kgro
und
Sync
hro 1
0 Ligh
t Rep
ort
Page
9
Maxim
um v/
c Rati
o: 0.6
8Int
erse
ction
Sign
al De
lay: 1
0.9Int
erse
ction
LOS:
BInt
erse
ction
Cap
acity
Utili
zatio
n 92.8
%IC
U Le
vel o
f Ser
vice F
Analy
sis P
eriod
(min)
15De
scrip
tion:
As pe
r sign
al tim
ing pl
an pr
ovide
d on N
ov 29
, 201
9.
Splits
and P
hase
s:
5: Co
dy/H
anna
h & M
ontre
al
Lane
s, V
olum
es, T
imin
gs6:
Nor
th R
iver
& S
elki
rk02
-19-
2020
112 M
ontre
al Ro
ad A
M Pe
ak H
our 2
024 F
uture
Bac
kgro
und
Sync
hro 1
0 Ligh
t Rep
ort
Page
10
Lane
Gro
upW
BLW
BRNB
TNB
RSB
LSB
TLa
ne C
onfig
urati
ons
Traff
ic Vo
lume (
vph)
2734
246
00
375
Futur
e Volu
me (v
ph)
2734
246
00
375
Satd.
Flow
(pro
t)16
5814
8317
450
033
16Flt
Per
mitte
d0.9
50Sa
td. F
low (p
erm)
1658
1483
1745
00
3316
Lane
Gro
up F
low (v
ph)
2734
246
00
375
Sign
Con
trol
Stop
Free
Free
Inter
secti
on S
umma
ryCo
ntrol
Type
: Uns
ignali
zed
Inter
secti
on C
apac
ity U
tiliza
tion 2
3.7%
ICU
Leve
l of S
ervic
e AAn
alysis
Per
iod (m
in) 15
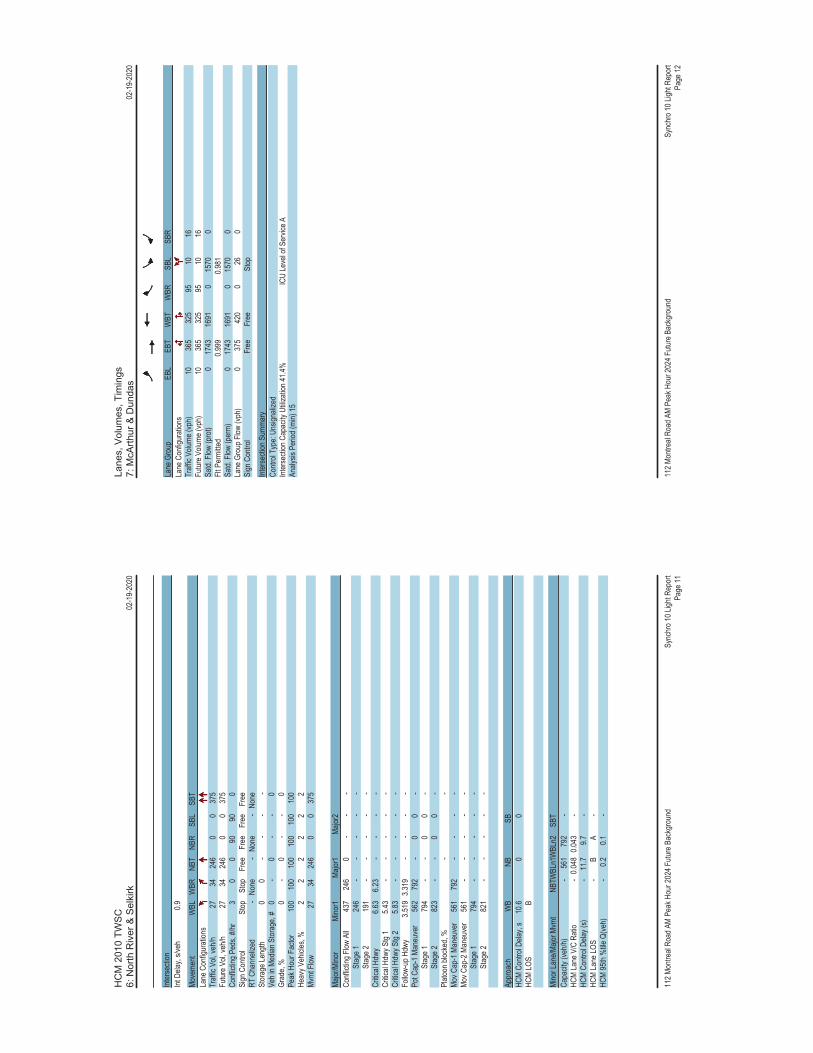
HC
M 2
010
TW
SC
6: N
orth
Riv
er &
Sel
kirk
02-1
9-20
20
112 M
ontre
al Ro
ad A
M Pe
ak H
our 2
024 F
uture
Bac
kgro
und
Sync
hro 1
0 Ligh
t Rep
ort
Page
11
Inter
secti
onInt
Dela
y, s/v
eh0.9
Move
ment
WBL
WBR
NBT
NBR
SBL
SBT
Lane
Con
figur
ation
sTr
affic
Vol, v
eh/h
2734
246
00
375
Futur
e Vol,
veh/h
2734
246
00
375
Confl
icting
Ped
s, #/h
r3
00
9090
0Si
gn C
ontro
l St
opSt
opFr
eeFr
eeFr
eeFr
eeRT
Cha
nneli
zed
-No
ne-
None
-No
neSt
orag
e Len
gth0
0-
--
-Ve
h in M
edian
Stor
age,
#0
-0
--
0Gr
ade,
%0
-0
--
0Pe
ak H
our F
actor
100
100
100
100
100
100
Heav
y Veh
icles
, %2
22
22
2Mv
mt F
low27
3424
60
037
5 Ma
jor/M
inor
Mino
r1Ma
jor1
Major
2Co
nflict
ing F
low A
ll43
724
60
--
-
S
tage 1
246
--
--
-
S
tage 2
191
--
--
-Cr
itical
Hdwy
6.63
6.23
--
--
Critic
al Hd
wy S
tg 1
5.43
--
--
-Cr
itical
Hdwy
Stg
25.8
3-
--
--
Follo
w-up
Hdw
y3.5
193.3
19-
--
-Po
t Cap
-1 M
aneu
ver
562
792
-0
0-
Stag
e 179
4-
-0
0-
Stag
e 282
3-
-0
0-
Plato
on bl
ocke
d, %
--
Mov C
ap-1
Man
euve
r56
179
2-
--
-Mo
v Cap
-2 M
aneu
ver
561
--
--
-
S
tage 1
794
--
--
-
S
tage 2
821
--
--
- Ap
proa
chW
BNB
SBHC
M Co
ntrol
Delay
, s10
.60
0HC
M LO
SB
Mino
r Lan
e/Majo
r Mvm
tNB
TWBL
n1W
BLn2
SBT
Capa
city (
veh/h
)-
561
792
-HC
M La
ne V
/C R
atio
-0.0
480.0
43-
HCM
Contr
ol De
lay (s
)-
11.7
9.7-
HCM
Lane
LOS
-B
A-
HCM
95th
%tile
Q(ve
h)-
0.20.1
-
Lane
s, V
olum
es, T
imin
gs7:
McA
rthu
r &
Dun
das
02-1
9-20
20
112 M
ontre
al Ro
ad A
M Pe
ak H
our 2
024 F
uture
Bac
kgro
und
Sync
hro 1
0 Ligh
t Rep
ort
Page
12
Lane
Gro
upEB
LEB
TW
BTW
BRSB
LSB
RLa
ne C
onfig
urati
ons
Traff
ic Vo
lume (
vph)
1036
532
595
1016
Futur
e Volu
me (v
ph)
1036
532
595
1016
Satd.
Flow
(pro
t)0
1743
1691
015
700
Flt P
ermi
tted
0.999
0.981
Satd.
Flow
(per
m)0
1743
1691
015
700
Lane
Gro
up F
low (v
ph)
037
542
00
260
Sign
Con
trol
Free
Free
Stop
Inter
secti
on S
umma
ryCo
ntrol
Type
: Uns
ignali
zed
Inter
secti
on C
apac
ity U
tiliza
tion 4
1.4%
ICU
Leve
l of S
ervic
e AAn
alysis
Per
iod (m
in) 15
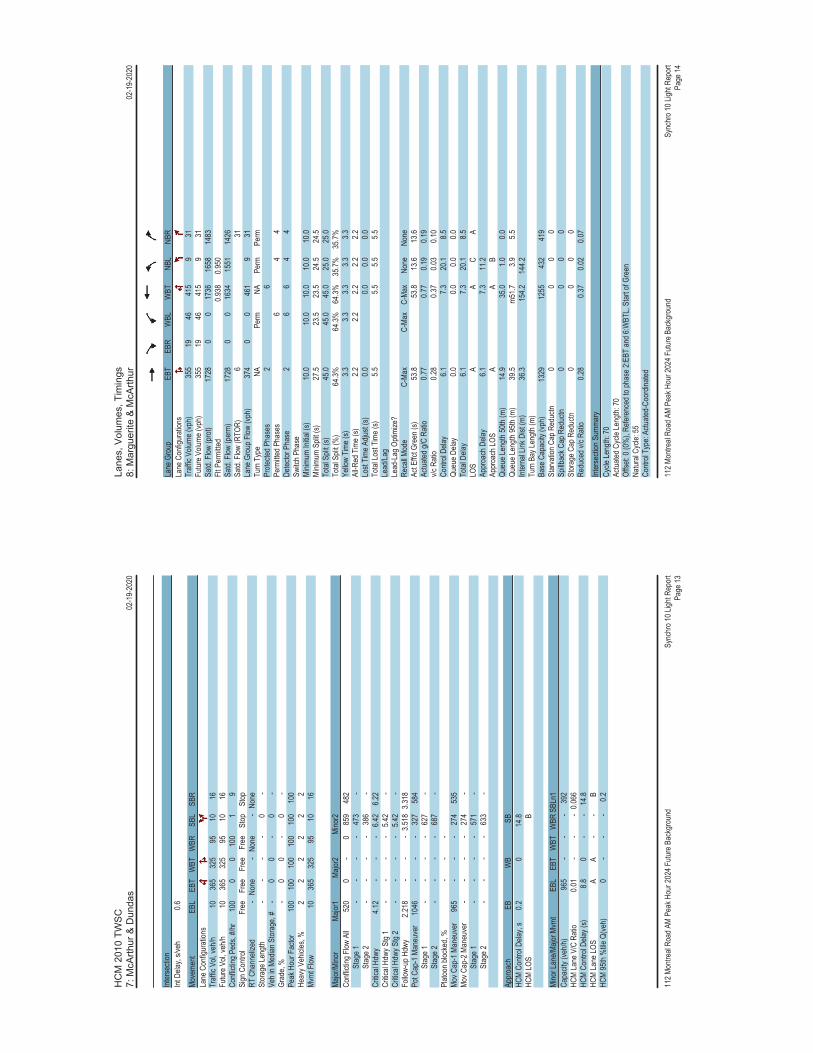
HC
M 2
010
TW
SC
7: M
cArt
hur
& D
unda
s02
-19-
2020
112 M
ontre
al Ro
ad A
M Pe
ak H
our 2
024 F
uture
Bac
kgro
und
Sync
hro 1
0 Ligh
t Rep
ort
Page
13
Inter
secti
onInt
Dela
y, s/v
eh0.6
Move
ment
EBL
EBT
WBT
WBR
SBL
SBR
Lane
Con
figur
ation
sTr
affic
Vol, v
eh/h
1036
532
595
1016
Futur
e Vol,
veh/h
1036
532
595
1016
Confl
icting
Ped
s, #/h
r10
00
010
01
9Si
gn C
ontro
l Fr
eeFr
eeFr
eeFr
eeSt
opSt
opRT
Cha
nneli
zed
-No
ne-
None
-No
neSt
orag
e Len
gth-
--
-0
-Ve
h in M
edian
Stor
age,
#-
00
-0
-Gr
ade,
%-
00
-0
-Pe
ak H
our F
actor
100
100
100
100
100
100
Heav
y Veh
icles
, %2
22
22
2Mv
mt F
low10
365
325
9510
16 Ma
jor/M
inor
Major
1Ma
jor2
Mino
r2Co
nflict
ing F
low A
ll52
00
-0
859
482
Stag
e 1-
--
-47
3-
Stag
e 2-
--
-38
6-
Critic
al Hd
wy4.1
2-
--
6.42
6.22
Critic
al Hd
wy S
tg 1
--
--
5.42
-Cr
itical
Hdwy
Stg
2-
--
-5.4
2-
Follo
w-up
Hdw
y2.2
18-
--
3.518
3.318
Pot C
ap-1
Man
euve
r10
46-
--
327
584
Stag
e 1-
--
-62
7-
Stag
e 2-
--
-68
7-
Plato
on bl
ocke
d, %
--
-Mo
v Cap
-1 M
aneu
ver
965
--
-27
453
5Mo
v Cap
-2 M
aneu
ver
--
--
274
-
S
tage 1
--
--
571
-
S
tage 2
--
--
633
- Ap
proa
chEB
WB
SBHC
M Co
ntrol
Delay
, s0.2
014
.8HC
M LO
SB
Mino
r Lan
e/Majo
r Mvm
tEB
LEB
TW
BTW
BRSB
Ln1
Capa
city (
veh/h
)96
5-
--
392
HCM
Lane
V/C
Rati
o0.0
1-
--
0.066
HCM
Contr
ol De
lay (s
)8.8
0-
-14
.8HC
M La
ne LO
SA
A-
-B
HCM
95th
%tile
Q(ve
h)0
--
-0.2
Lane
s, V
olum
es, T
imin
gs8:
Mar
guer
ite &
McA
rthu
r02
-19-
2020
112 M
ontre
al Ro
ad A
M Pe
ak H
our 2
024 F
uture
Bac
kgro
und
Sync
hro 1
0 Ligh
t Rep
ort
Page
14
Lane
Gro
upEB
TEB
RW
BLW
BTNB
LNB
RLa
ne C
onfig
urati
ons
Traff
ic Vo
lume (
vph)
355
1946
415
931
Futur
e Volu
me (v
ph)
355
1946
415
931
Satd.
Flow
(pro
t)17
280
017
3616
5814
83Flt
Per
mitte
d0.9
380.9
50Sa
td. F
low (p
erm)
1728
00
1634
1551
1426
Satd.
Flow
(RTO
R)6
31La
ne G
roup
Flow
(vph
)37
40
046
19
31Tu
rn T
ype
NAPe
rmNA
Perm
Perm
Prote
cted P
hase
s2
6Pe
rmitte
d Pha
ses
64
4De
tector
Pha
se2
66
44
Switc
h Pha
seMi
nimum
Initia
l (s)
10.0
10.0
10.0
10.0
10.0
Minim
um S
plit (
s)27
.523
.523
.524
.524
.5To
tal S
plit (
s)45
.045
.045
.025
.025
.0To
tal S
plit (
%)
64.3%
64.3%
64.3%
35.7%
35.7%
Yello
w Tim
e (s)
3.33.3
3.33.3
3.3Al
l-Red
Tim
e (s)
2.22.2
2.22.2
2.2Lo
st Tim
e Adju
st (s)
0.00.0
0.00.0
Total
Lost
Time (
s)5.5
5.55.5
5.5Le
ad/La
gLe
ad-L
ag O
ptimi
ze?
Reca
ll Mod
eC-
Max
C-Ma
xC-
Max
None
None
Act E
ffct G
reen
(s)
53.8
53.8
13.6
13.6
Actua
ted g/
C Ra
tio0.7
70.7
70.1
90.1
9v/c
Rati
o0.2
80.3
70.0
30.1
0Co
ntrol
Delay
6.17.3
20.1
8.5Qu
eue D
elay
0.00.0
0.00.0
Total
Dela
y6.1
7.320
.18.5
LOS
AA
CA
Appr
oach
Dela
y6.1
7.311
.2Ap
proa
ch LO
SA
AB
Queu
e Len
gth 50
th (m
)14
.935
.01.0
0.0Qu
eue L
ength
95th
(m)
39.5
m51.7
3.95.5
Inter
nal L
ink D
ist (m
)36
.315
4.214
4.2Tu
rn B
ay Le
ngth
(m)
Base
Cap
acity
(vph
)13
2912
5543
241
9St
arva
tion C
ap R
educ
tn0
00
0Sp
illbac
k Cap
Red
uctn
00
00
Stor
age C
ap R
educ
tn0
00
0Re
duce
d v/c
Ratio
0.28
0.37
0.02
0.07
Inter
secti
on S
umma
ryCy
cle Le
ngth:
70Ac
tuated
Cyc
le Le
ngth:
70Of
fset: 0
(0%
), Re
feren
ced t
o pha
se 2:
EBT
and 6
:WBT
L, St
art o
f Gre
enNa
tural
Cycle
: 55
Contr
ol Ty
pe: A
ctuate
d-Co
ordin
ated
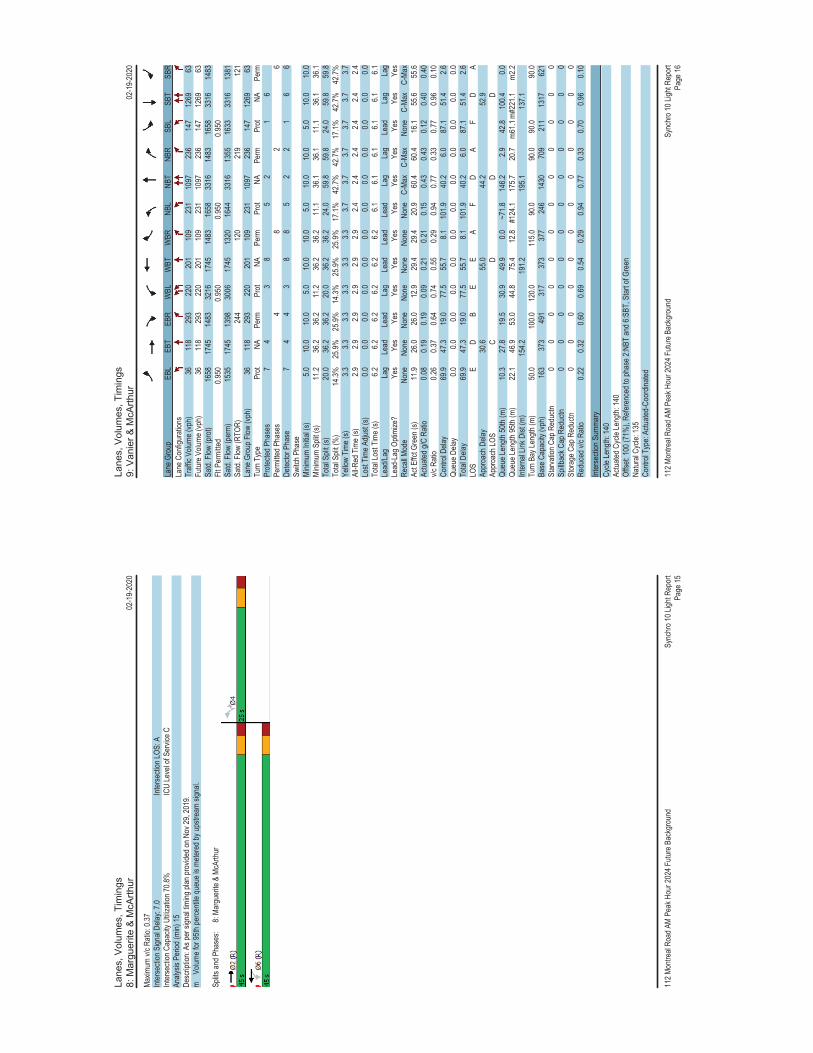
Lane
s, V
olum
es, T
imin
gs8:
Mar
guer
ite &
McA
rthu
r02
-19-
2020
112 M
ontre
al Ro
ad A
M Pe
ak H
our 2
024 F
uture
Bac
kgro
und
Sync
hro 1
0 Ligh
t Rep
ort
Page
15
Maxim
um v/
c Rati
o: 0.3
7Int
erse
ction
Sign
al De
lay: 7
.0Int
erse
ction
LOS:
AInt
erse
ction
Cap
acity
Utili
zatio
n 70.8
%IC
U Le
vel o
f Ser
vice C
Analy
sis P
eriod
(min)
15De
scrip
tion:
As pe
r sign
al tim
ing pl
an pr
ovide
d on N
ov 29
, 201
9.m
Volu
me fo
r 95th
perce
ntile
queu
e is m
etere
d by u
pstre
am si
gnal.
Splits
and P
hase
s:
8: Ma
rgue
rite &
McA
rthur
Lane
s, V
olum
es, T
imin
gs9:
Van
ier
& M
cArt
hur
02-1
9-20
20
112 M
ontre
al Ro
ad A
M Pe
ak H
our 2
024 F
uture
Bac
kgro
und
Sync
hro 1
0 Ligh
t Rep
ort
Page
16
Lane
Gro
upEB
LEB
TEB
RW
BLW
BTW
BRNB
LNB
TNB
RSB
LSB
TSB
RLa
ne C
onfig
urati
ons
Traff
ic Vo
lume (
vph)
3611
829
322
020
110
923
110
9723
614
712
6963
Futur
e Volu
me (v
ph)
3611
829
322
020
110
923
110
9723
614
712
6963
Satd.
Flow
(pro
t)16
5817
4514
8332
1617
4514
8316
5833
1614
8316
5833
1614
83Flt
Per
mitte
d0.9
500.9
500.9
500.9
50Sa
td. F
low (p
erm)
1535
1745
1398
3006
1745
1320
1644
3316
1355
1633
3316
1381
Satd.
Flow
(RTO
R)24
412
021
912
1La
ne G
roup
Flow
(vph
)36
118
293
220
201
109
231
1097
236
147
1269
63Tu
rn T
ype
Prot
NAPe
rmPr
otNA
Perm
Prot
NAPe
rmPr
otNA
Perm
Prote
cted P
hase
s7
43
85
21
6Pe
rmitte
d Pha
ses
48
26
Detec
tor P
hase
74
43
88
52
21
66
Switc
h Pha
seMi
nimum
Initia
l (s)
5.010
.010
.05.0
10.0
10.0
5.010
.010
.05.0
10.0
10.0
Minim
um S
plit (
s)11
.236
.236
.211
.236
.236
.211
.136
.136
.111
.136
.136
.1To
tal S
plit (
s)20
.036
.236
.220
.036
.236
.224
.059
.859
.824
.059
.859
.8To
tal S
plit (
%)
14.3%
25.9%
25.9%
14.3%
25.9%
25.9%
17.1%
42.7%
42.7%
17.1%
42.7%
42.7%
Yello
w Tim
e (s)
3.33.3
3.33.3
3.33.3
3.73.7
3.73.7
3.73.7
All-R
ed T
ime (
s)2.9
2.92.9
2.92.9
2.92.4
2.42.4
2.42.4
2.4Lo
st Tim
e Adju
st (s)
0.00.0
0.00.0
0.00.0
0.00.0
0.00.0
0.00.0
Total
Lost
Time (
s)6.2
6.26.2
6.26.2
6.26.1
6.16.1
6.16.1
6.1Le
ad/La
gLa
gLe
adLe
adLa
gLe
adLe
adLe
adLa
gLa
gLe
adLa
gLa
gLe
ad-L
ag O
ptimi
ze?
Yes
Yes
Yes
Yes
Yes
Yes
Yes
Yes
Yes
Yes
Yes
Yes
Reca
ll Mod
eNo
neNo
neNo
neNo
neNo
neNo
neNo
neC-
Max
C-Ma
xNo
neC-
Max
C-Ma
xAc
t Effc
t Gre
en (s
)11
.926
.026
.012
.929
.429
.420
.960
.460
.416
.155
.655
.6Ac
tuated
g/C
Ratio
0.08
0.19
0.19
0.09
0.21
0.21
0.15
0.43
0.43
0.12
0.40
0.40
v/c R
atio
0.26
0.37
0.64
0.74
0.55
0.29
0.94
0.77
0.33
0.77
0.96
0.10
Contr
ol De
lay69
.947
.319
.077
.555
.78.1
101.9
40.2
6.087
.151
.42.6
Queu
e Dela
y0.0
0.00.0
0.00.0
0.00.0
0.00.0
0.00.0
0.0To
tal D
elay
69.9
47.3
19.0
77.5
55.7
8.110
1.940
.26.0
87.1
51.4
2.6LO
SE
DB
EE
AF
DA
FD
AAp
proa
ch D
elay
30.6
55.0
44.2
52.9
Appr
oach
LOS
CD
DD
Queu
e Len
gth 50
th (m
)10
.327
.819
.530
.949
.90.0
~71.8
146.2
2.942
.810
0.40.0
Queu
e Len
gth 95
th (m
)22
.146
.953
.044
.875
.412
.8#1
24.1
175.7
20.7
m61.1
m#22
1.1m2
.2Int
erna
l Link
Dist
(m)
154.2
191.2
195.1
137.1
Turn
Bay
Leng
th (m
)50
.010
0.012
0.011
5.090
.090
.090
.090
.0Ba
se C
apac
ity (v
ph)
163
373
491
317
373
377
246
1430
709
211
1317
621
Star
vatio
n Cap
Red
uctn
00
00
00
00
00
00
Spillb
ack C
ap R
educ
tn0
00
00
00
00
00
0St
orag
e Cap
Red
uctn
00
00
00
00
00
00
Redu
ced v
/c Ra
tio0.2
20.3
20.6
00.6
90.5
40.2
90.9
40.7
70.3
30.7
00.9
60.1
0
Inter
secti
on S
umma
ryCy
cle Le
ngth:
140
Actua
ted C
ycle
Leng
th: 14
0Of
fset: 1
00 (7
1%),
Refer
ence
d to p
hase
2:NB
T an
d 6:S
BT, S
tart o
f Gre
enNa
tural
Cycle
: 135
Contr
ol Ty
pe: A
ctuate
d-Co
ordin
ated
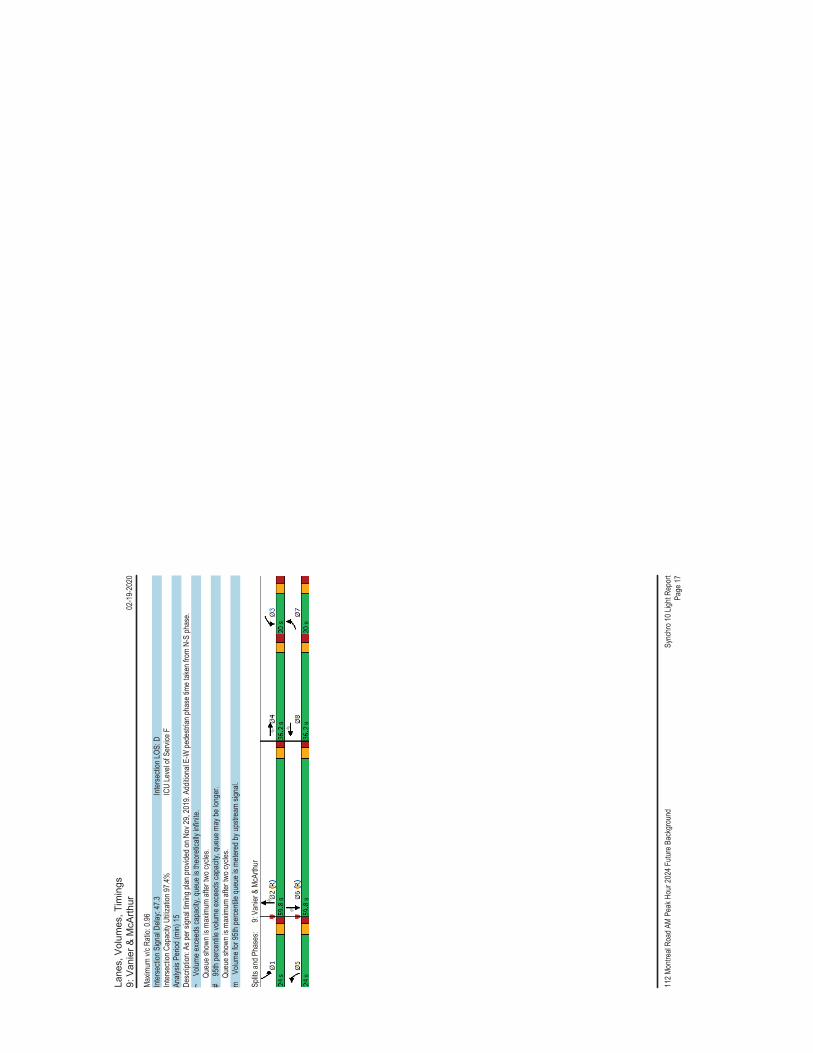
Lane
s, V
olum
es, T
imin
gs9:
Van
ier
& M
cArt
hur
02-1
9-20
20
112 M
ontre
al Ro
ad A
M Pe
ak H
our 2
024 F
uture
Bac
kgro
und
Sync
hro 1
0 Ligh
t Rep
ort
Page
17
Maxim
um v/
c Rati
o: 0.9
6Int
erse
ction
Sign
al De
lay: 4
7.3Int
erse
ction
LOS:
DInt
erse
ction
Cap
acity
Utili
zatio
n 97.4
%IC
U Le
vel o
f Ser
vice F
Analy
sis P
eriod
(min)
15De
scrip
tion:
As pe
r sign
al tim
ing pl
an pr
ovide
d on N
ov 29
, 201
9. Ad
dition
al E-
W pe
destr
ian ph
ase t
ime t
aken
from
N-S
phas
e.~
Volu
me ex
ceed
s cap
acity
, que
ue is
theo
retic
ally i
nfinit
e.
Que
ue sh
own i
s max
imum
after
two c
ycles
.#
95th
perce
ntile
volum
e exc
eeds
capa
city,
queu
e may
be lo
nger
.
Que
ue sh
own i
s max
imum
after
two c
ycles
.m
Volu
me fo
r 95th
perce
ntile
queu
e is m
etere
d by u
pstre
am si
gnal.
Splits
and P
hase
s:
9: Va
nier &
McA
rthur

Lane
s, V
olum
es, T
imin
gs1:
Nor
th R
iver
& M
ontr
eal
02-1
9-20
20
112 M
ontre
al Ro
ad P
M Pe
ak H
our 2
024 F
uture
Bac
kgro
und
Sync
hro 1
0 Ligh
t Rep
ort
Page
1
Lane
Gro
upEB
LEB
TEB
RW
BLW
BTW
BRNB
LNB
TNB
RSB
LSB
TSB
RLa
ne C
onfig
urati
ons
Traff
ic Vo
lume (
vph)
066
238
80
692
2136
935
3913
1531
Futur
e Volu
me (v
ph)
066
238
80
692
2136
935
3913
1531
Satd.
Flow
(pro
t)0
3074
00
3293
016
5815
690
015
770
Flt P
ermi
tted
0.719
0.949
Satd.
Flow
(per
m)0
3074
00
3293
012
3215
690
015
030
Satd.
Flow
(RTO
R)13
639
31La
ne G
roup
Flow
(vph
)0
1050
00
713
036
974
00
590
Turn
Typ
eNA
NAPe
rmNA
Perm
NAPr
otecte
d Pha
ses
26
84
Perm
itted P
hase
s8
4De
tector
Pha
se2
68
84
4Sw
itch P
hase
Minim
um In
itial (s
)10
.010
.010
.010
.010
.010
.0Mi
nimum
Spli
t (s)
36.2
30.2
36.2
36.2
27.0
27.0
Total
Spli
t (s)
44.0
44.0
56.0
56.0
56.0
56.0
Total
Spli
t (%
)44
.0%44
.0%56
.0%56
.0%56
.0%56
.0%Ye
llow
Time (
s)3.3
3.33.3
3.33.3
3.3Al
l-Red
Tim
e (s)
2.92.9
2.92.9
2.72.7
Lost
Time A
djust
(s)0.0
0.00.0
0.00.0
Total
Lost
Time (
s)6.2
6.26.2
6.26.0
Lead
/Lag
Lead
-Lag
Opti
mize
?Re
call M
ode
C-Ma
xC-
Max
None
None
None
None
Act E
ffct G
reen
(s)
50.9
50.9
36.7
36.7
36.9
Actua
ted g/
C Ra
tio0.5
10.5
10.3
70.3
70.3
7v/c
Rati
o0.6
40.4
30.8
20.1
20.1
0Co
ntrol
Delay
19.4
15.4
42.4
9.79.8
Queu
e Dela
y0.0
0.60.0
0.00.0
Total
Dela
y19
.415
.942
.49.7
9.8LO
SB
BD
AA
Appr
oach
Dela
y19
.415
.936
.99.8
Appr
oach
LOS
BB
DA
Queu
e Len
gth 50
th (m
)66
.034
.263
.14.3
3.4Qu
eue L
ength
95th
(m)
109.1
74.6
82.6
10.8
9.4Int
erna
l Link
Dist
(m)
179.1
52.8
112.9
59.0
Turn
Bay
Leng
th (m
)90
.0Ba
se C
apac
ity (v
ph)
1630
1674
613
800
767
Star
vatio
n Cap
Red
uctn
054
10
00
Spillb
ack C
ap R
educ
tn0
00
00
Stor
age C
ap R
educ
tn0
00
00
Redu
ced v
/c Ra
tio0.6
40.6
30.6
00.0
90.0
8
Inter
secti
on S
umma
ryCy
cle Le
ngth:
100
Actua
ted C
ycle
Leng
th: 10
0Of
fset: 0
(0%
), Re
feren
ced t
o pha
se 2:
EBT
and 6
:WBT
, Star
t of G
reen
Natur
al Cy
cle: 7
5Co
ntrol
Type
: Actu
ated-
Coor
dinate
d
Lane
s, V
olum
es, T
imin
gs1:
Nor
th R
iver
& M
ontr
eal
02-1
9-20
20
112 M
ontre
al Ro
ad P
M Pe
ak H
our 2
024 F
uture
Bac
kgro
und
Sync
hro 1
0 Ligh
t Rep
ort
Page
2
Maxim
um v/
c Rati
o: 0.8
2Int
erse
ction
Sign
al De
lay: 2
1.5Int
erse
ction
LOS:
CInt
erse
ction
Cap
acity
Utili
zatio
n 72.2
%IC
U Le
vel o
f Ser
vice C
Analy
sis P
eriod
(min)
15De
scrip
tion:
As pe
r sign
al tim
ing pl
an pr
ovide
d on N
ov 29
, 201
9.
Splits
and P
hase
s:
1: No
rth R
iver &
Mon
treal

Lane
s, V
olum
es, T
imin
gs2:
Mon
tgom
ery
& M
ontr
eal
02-1
9-20
20
112 M
ontre
al Ro
ad P
M Pe
ak H
our 2
024 F
uture
Bac
kgro
und
Sync
hro 1
0 Ligh
t Rep
ort
Page
3
Lane
Gro
upEB
TEB
RW
BLW
BTNB
LNB
RLa
ne C
onfig
urati
ons
Traff
ic Vo
lume (
vph)
635
7851
657
5834
Futur
e Volu
me (v
ph)
635
7851
657
5834
Satd.
Flow
(pro
t)32
320
033
0216
5814
83Flt
Per
mitte
d0.8
510.9
50Sa
td. F
low (p
erm)
3232
00
2817
1647
1391
Satd.
Flow
(RTO
R)32
34La
ne G
roup
Flow
(vph
)71
30
070
858
34Tu
rn T
ype
NAPe
rmNA
Prot
Perm
Prote
cted P
hase
s2
68
Perm
itted P
hase
s6
8De
tector
Pha
se2
66
88
Switc
h Pha
seMi
nimum
Initia
l (s)
10.0
10.0
10.0
10.0
10.0
Minim
um S
plit (
s)19
.523
.523
.519
.519
.5To
tal S
plit (
s)76
.076
.076
.024
.024
.0To
tal S
plit (
%)
76.0%
76.0%
76.0%
24.0%
24.0%
Yello
w Tim
e (s)
3.33.3
3.33.3
3.3Al
l-Red
Tim
e (s)
2.22.2
2.22.2
2.2Lo
st Tim
e Adju
st (s)
0.00.0
0.00.0
Total
Lost
Time (
s)5.5
5.55.5
5.5Le
ad/La
gLe
ad-L
ag O
ptimi
ze?
Reca
ll Mod
eC-
Max
C-Ma
xC-
Max
None
None
Act E
ffct G
reen
(s)
81.6
81.6
11.6
11.6
Actua
ted g/
C Ra
tio0.8
20.8
20.1
20.1
2v/c
Rati
o0.2
70.3
10.3
00.1
8Co
ntrol
Delay
0.73.6
44.2
15.3
Queu
e Dela
y0.4
0.00.0
0.0To
tal D
elay
1.03.6
44.2
15.3
LOS
AA
DB
Appr
oach
Dela
y1.0
3.633
.5Ap
proa
ch LO
SA
AC
Queu
e Len
gth 50
th (m
)1.8
15.7
10.7
0.0Qu
eue L
ength
95th
(m)
2.526
.721
.98.6
Inter
nal L
ink D
ist (m
)52
.813
8.913
7.9Tu
rn B
ay Le
ngth
(m)
Base
Cap
acity
(vph
)26
4322
9830
628
5St
arva
tion C
ap R
educ
tn12
770
00
Spillb
ack C
ap R
educ
tn0
840
0St
orag
e Cap
Red
uctn
00
00
Redu
ced v
/c Ra
tio0.5
20.3
20.1
90.1
2
Inter
secti
on S
umma
ryCy
cle Le
ngth:
100
Actua
ted C
ycle
Leng
th: 10
0Of
fset: 0
(0%
), Re
feren
ced t
o pha
se 2:
EBT
and 6
:WBT
L, St
art o
f Gre
enNa
tural
Cycle
: 45
Contr
ol Ty
pe: A
ctuate
d-Co
ordin
ated
Lane
s, V
olum
es, T
imin
gs2:
Mon
tgom
ery
& M
ontr
eal
02-1
9-20
20
112 M
ontre
al Ro
ad P
M Pe
ak H
our 2
024 F
uture
Bac
kgro
und
Sync
hro 1
0 Ligh
t Rep
ort
Page
4
Maxim
um v/
c Rati
o: 0.3
1Int
erse
ction
Sign
al De
lay: 4
.2Int
erse
ction
LOS:
AInt
erse
ction
Cap
acity
Utili
zatio
n 66.0
%IC
U Le
vel o
f Ser
vice C
Analy
sis P
eriod
(min)
15De
scrip
tion:
As pe
r sign
al tim
ing pl
an pr
ovide
d on N
ov 29
, 201
9.
Splits
and P
hase
s:
2: Mo
ntgom
ery &
Mon
treal
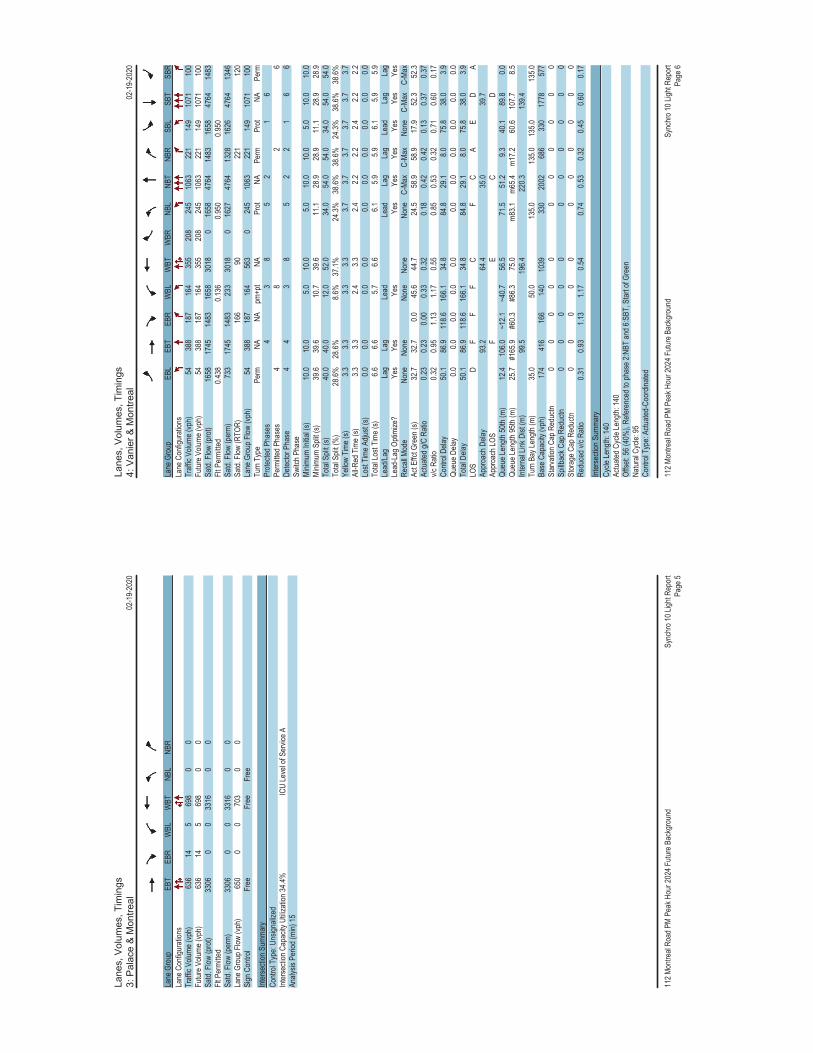
Lane
s, V
olum
es, T
imin
gs3:
Pal
ace
& M
ontr
eal
02-1
9-20
20
112 M
ontre
al Ro
ad P
M Pe
ak H
our 2
024 F
uture
Bac
kgro
und
Sync
hro 1
0 Ligh
t Rep
ort
Page
5
Lane
Gro
upEB
TEB
RW
BLW
BTNB
LNB
RLa
ne C
onfig
urati
ons
Traff
ic Vo
lume (
vph)
636
145
698
00
Futur
e Volu
me (v
ph)
636
145
698
00
Satd.
Flow
(pro
t)33
060
033
160
0Flt
Per
mitte
dSa
td. F
low (p
erm)
3306
00
3316
00
Lane
Gro
up F
low (v
ph)
650
00
703
00
Sign
Con
trol
Free
Free
Free
Inter
secti
on S
umma
ryCo
ntrol
Type
: Uns
ignali
zed
Inter
secti
on C
apac
ity U
tiliza
tion 3
4.4%
ICU
Leve
l of S
ervic
e AAn
alysis
Per
iod (m
in) 15
Lane
s, V
olum
es, T
imin
gs4:
Van
ier
& M
ontr
eal
02-1
9-20
20
112 M
ontre
al Ro
ad P
M Pe
ak H
our 2
024 F
uture
Bac
kgro
und
Sync
hro 1
0 Ligh
t Rep
ort
Page
6
Lane
Gro
upEB
LEB
TEB
RW
BLW
BTW
BRNB
LNB
TNB
RSB
LSB
TSB
RLa
ne C
onfig
urati
ons
Traff
ic Vo
lume (
vph)
5438
818
716
435
520
824
510
6322
114
910
7110
0Fu
ture V
olume
(vph
)54
388
187
164
355
208
245
1063
221
149
1071
100
Satd.
Flow
(pro
t)16
5817
4514
8316
5830
180
1658
4764
1483
1658
4764
1483
Flt P
ermi
tted
0.438
0.136
0.950
0.950
Satd.
Flow
(per
m)73
317
4514
8323
330
180
1627
4764
1328
1626
4764
1346
Satd.
Flow
(RTO
R)16
690
221
120
Lane
Gro
up F
low (v
ph)
5438
818
716
456
30
245
1063
221
149
1071
100
Turn
Typ
ePe
rmNA
NApm
+pt
NAPr
otNA
Perm
Prot
NAPe
rmPr
otecte
d Pha
ses
43
85
21
6Pe
rmitte
d Pha
ses
48
26
Detec
tor P
hase
44
38
52
21
66
Switc
h Pha
seMi
nimum
Initia
l (s)
10.0
10.0
5.010
.05.0
10.0
10.0
5.010
.010
.0Mi
nimum
Spli
t (s)
39.6
39.6
10.7
39.6
11.1
28.9
28.9
11.1
28.9
28.9
Total
Spli
t (s)
40.0
40.0
12.0
52.0
34.0
54.0
54.0
34.0
54.0
54.0
Total
Spli
t (%
)28
.6%28
.6%8.6
%37
.1%24
.3%38
.6%38
.6%24
.3%38
.6%38
.6%Ye
llow
Time (
s)3.3
3.33.3
3.33.7
3.73.7
3.73.7
3.7Al
l-Red
Tim
e (s)
3.33.3
2.43.3
2.42.2
2.22.4
2.22.2
Lost
Time A
djust
(s)0.0
0.00.0
0.00.0
0.00.0
0.00.0
0.0To
tal Lo
st Tim
e (s)
6.66.6
5.76.6
6.15.9
5.96.1
5.95.9
Lead
/Lag
Lag
Lag
Lead
Lead
Lag
Lag
Lead
Lag
Lag
Lead
-Lag
Opti
mize
?Ye
sYe
sYe
sYe
sYe
sYe
sYe
sYe
sYe
sRe
call M
ode
None
None
None
None
None
C-Ma
xC-
Max
None
C-Ma
xC-
Max
Act E
ffct G
reen
(s)
32.7
32.7
0.045
.644
.724
.558
.958
.917
.952
.352
.3Ac
tuated
g/C
Ratio
0.23
0.23
0.00
0.33
0.32
0.18
0.42
0.42
0.13
0.37
0.37
v/c R
atio
0.32
0.95
1.13
1.17
0.55
0.85
0.53
0.32
0.71
0.60
0.17
Contr
ol De
lay50
.186
.911
8.616
6.134
.884
.829
.18.0
75.8
38.0
3.9Qu
eue D
elay
0.00.0
0.00.0
0.00.0
0.00.0
0.00.0
0.0To
tal D
elay
50.1
86.9
118.6
166.1
34.8
84.8
29.1
8.075
.838
.03.9
LOS
DF
FF
CF
CA
ED
AAp
proa
ch D
elay
93.2
64.4
35.0
39.7
Appr
oach
LOS
FE
CD
Queu
e Len
gth 50
th (m
)12
.410
6.0~1
2.1~4
0.756
.571
.551
.29.3
40.1
89.8
0.0Qu
eue L
ength
95th
(m)
25.7
#165
.9#6
0.3#8
6.375
.0m8
3.1m6
5.4m1
7.260
.610
7.78.5
Inter
nal L
ink D
ist (m
)99
.519
6.422
0.313
9.4Tu
rn B
ay Le
ngth
(m)
35.0
50.0
135.0
135.0
135.0
135.0
Base
Cap
acity
(vph
)17
441
616
614
010
3933
020
0268
633
017
7857
7St
arva
tion C
ap R
educ
tn0
00
00
00
00
00
Spillb
ack C
ap R
educ
tn0
00
00
00
00
00
Stor
age C
ap R
educ
tn0
00
00
00
00
00
Redu
ced v
/c Ra
tio0.3
10.9
31.1
31.1
70.5
40.7
40.5
30.3
20.4
50.6
00.1
7
Inter
secti
on S
umma
ryCy
cle Le
ngth:
140
Actua
ted C
ycle
Leng
th: 14
0Of
fset: 5
6 (40
%),
Refer
ence
d to p
hase
2:NB
T an
d 6:S
BT, S
tart o
f Gre
enNa
tural
Cycle
: 95
Contr
ol Ty
pe: A
ctuate
d-Co
ordin
ated
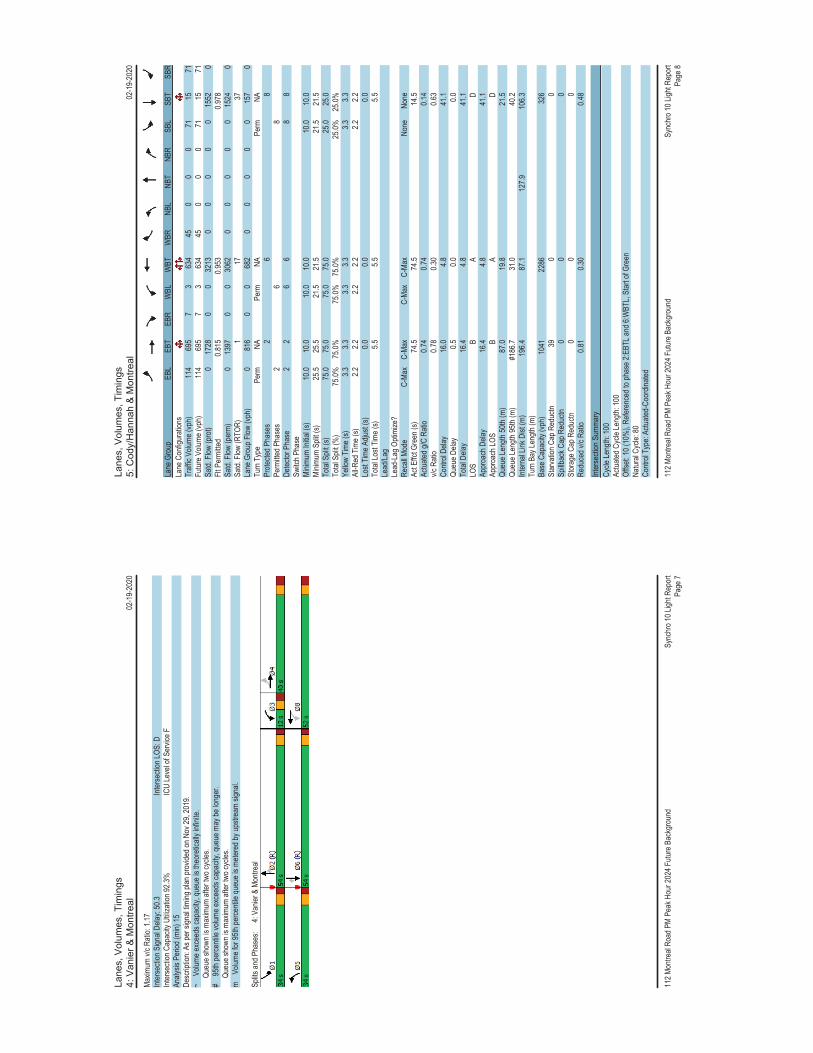
Lane
s, V
olum
es, T
imin
gs4:
Van
ier
& M
ontr
eal
02-1
9-20
20
112 M
ontre
al Ro
ad P
M Pe
ak H
our 2
024 F
uture
Bac
kgro
und
Sync
hro 1
0 Ligh
t Rep
ort
Page
7
Maxim
um v/
c Rati
o: 1.1
7Int
erse
ction
Sign
al De
lay: 5
0.3Int
erse
ction
LOS:
DInt
erse
ction
Cap
acity
Utili
zatio
n 92.3
%IC
U Le
vel o
f Ser
vice F
Analy
sis P
eriod
(min)
15De
scrip
tion:
As pe
r sign
al tim
ing pl
an pr
ovide
d on N
ov 29
, 201
9.~
Volu
me ex
ceed
s cap
acity
, que
ue is
theo
retic
ally i
nfinit
e.
Que
ue sh
own i
s max
imum
after
two c
ycles
.#
95th
perce
ntile
volum
e exc
eeds
capa
city,
queu
e may
be lo
nger
.
Que
ue sh
own i
s max
imum
after
two c
ycles
.m
Volu
me fo
r 95th
perce
ntile
queu
e is m
etere
d by u
pstre
am si
gnal.
Splits
and P
hase
s:
4: Va
nier &
Mon
treal
Lane
s, V
olum
es, T
imin
gs5:
Cod
y/H
anna
h &
Mon
trea
l02
-19-
2020
112 M
ontre
al Ro
ad P
M Pe
ak H
our 2
024 F
uture
Bac
kgro
und
Sync
hro 1
0 Ligh
t Rep
ort
Page
8
Lane
Gro
upEB
LEB
TEB
RW
BLW
BTW
BRNB
LNB
TNB
RSB
LSB
TSB
RLa
ne C
onfig
urati
ons
Traff
ic Vo
lume (
vph)
114
695
73
634
450
00
7115
71Fu
ture V
olume
(vph
)11
469
57
363
445
00
071
1571
Satd.
Flow
(pro
t)0
1728
00
3213
00
00
015
520
Flt P
ermi
tted
0.815
0.953
0.978
Satd.
Flow
(per
m)0
1397
00
3062
00
00
015
240
Satd.
Flow
(RTO
R)1
1737
Lane
Gro
up F
low (v
ph)
081
60
068
20
00
00
157
0Tu
rn T
ype
Perm
NAPe
rmNA
Perm
NAPr
otecte
d Pha
ses
26
8Pe
rmitte
d Pha
ses
26
8De
tector
Pha
se2
26
68
8Sw
itch P
hase
Minim
um In
itial (s
)10
.010
.010
.010
.010
.010
.0Mi
nimum
Spli
t (s)
25.5
25.5
21.5
21.5
21.5
21.5
Total
Spli
t (s)
75.0
75.0
75.0
75.0
25.0
25.0
Total
Spli
t (%
)75
.0%75
.0%75
.0%75
.0%25
.0%25
.0%Ye
llow
Time (
s)3.3
3.33.3
3.33.3
3.3Al
l-Red
Tim
e (s)
2.22.2
2.22.2
2.22.2
Lost
Time A
djust
(s)0.0
0.00.0
Total
Lost
Time (
s)5.5
5.55.5
Lead
/Lag
Lead
-Lag
Opti
mize
?Re
call M
ode
C-Ma
xC-
Max
C-Ma
xC-
Max
None
None
Act E
ffct G
reen
(s)
74.5
74.5
14.5
Actua
ted g/
C Ra
tio0.7
40.7
40.1
4v/c
Rati
o0.7
80.3
00.6
3Co
ntrol
Delay
16.0
4.841
.1Qu
eue D
elay
0.50.0
0.0To
tal D
elay
16.4
4.841
.1LO
SB
AD
Appr
oach
Dela
y16
.44.8
41.1
Appr
oach
LOS
BA
DQu
eue L
ength
50th
(m)
87.0
19.8
21.5
Queu
e Len
gth 95
th (m
)#1
86.7
31.0
40.2
Inter
nal L
ink D
ist (m
)19
6.487
.112
7.910
6.3Tu
rn B
ay Le
ngth
(m)
Base
Cap
acity
(vph
)10
4122
8632
6St
arva
tion C
ap R
educ
tn39
00
Spillb
ack C
ap R
educ
tn0
00
Stor
age C
ap R
educ
tn0
00
Redu
ced v
/c Ra
tio0.8
10.3
00.4
8
Inter
secti
on S
umma
ryCy
cle Le
ngth:
100
Actua
ted C
ycle
Leng
th: 10
0Of
fset: 1
0 (10
%),
Refer
ence
d to p
hase
2:EB
TL an
d 6:W
BTL,
Star
t of G
reen
Natur
al Cy
cle: 8
0Co
ntrol
Type
: Actu
ated-
Coor
dinate
d
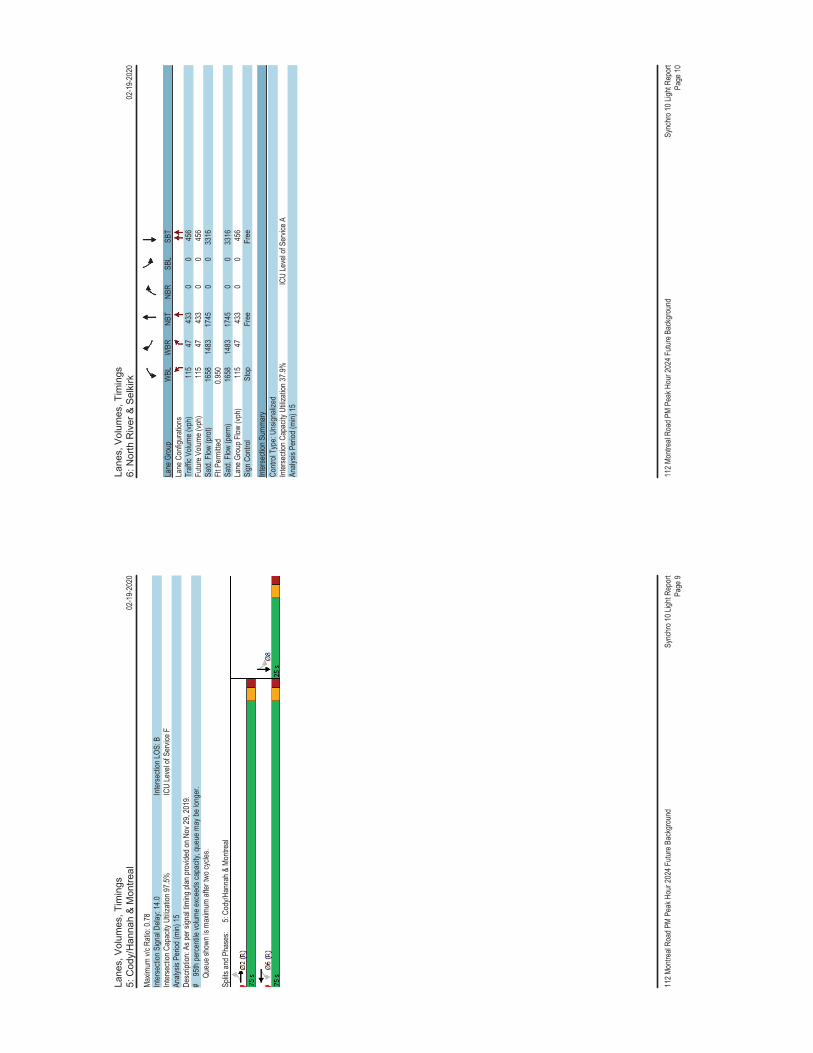
Lane
s, V
olum
es, T
imin
gs5:
Cod
y/H
anna
h &
Mon
trea
l02
-19-
2020
112 M
ontre
al Ro
ad P
M Pe
ak H
our 2
024 F
uture
Bac
kgro
und
Sync
hro 1
0 Ligh
t Rep
ort
Page
9
Maxim
um v/
c Rati
o: 0.7
8Int
erse
ction
Sign
al De
lay: 1
4.0Int
erse
ction
LOS:
BInt
erse
ction
Cap
acity
Utili
zatio
n 97.5
%IC
U Le
vel o
f Ser
vice F
Analy
sis P
eriod
(min)
15De
scrip
tion:
As pe
r sign
al tim
ing pl
an pr
ovide
d on N
ov 29
, 201
9.#
95th
perce
ntile
volum
e exc
eeds
capa
city,
queu
e may
be lo
nger
.
Que
ue sh
own i
s max
imum
after
two c
ycles
.
Splits
and P
hase
s:
5: Co
dy/H
anna
h & M
ontre
al
Lane
s, V
olum
es, T
imin
gs6:
Nor
th R
iver
& S
elki
rk02
-19-
2020
112 M
ontre
al Ro
ad P
M Pe
ak H
our 2
024 F
uture
Bac
kgro
und
Sync
hro 1
0 Ligh
t Rep
ort
Page
10
Lane
Gro
upW
BLW
BRNB
TNB
RSB
LSB
TLa
ne C
onfig
urati
ons
Traff
ic Vo
lume (
vph)
115
4743
30
045
6Fu
ture V
olume
(vph
)11
547
433
00
456
Satd.
Flow
(pro
t)16
5814
8317
450
033
16Flt
Per
mitte
d0.9
50Sa
td. F
low (p
erm)
1658
1483
1745
00
3316
Lane
Gro
up F
low (v
ph)
115
4743
30
045
6Si
gn C
ontro
lSt
opFr
eeFr
ee
Inter
secti
on S
umma
ryCo
ntrol
Type
: Uns
ignali
zed
Inter
secti
on C
apac
ity U
tiliza
tion 3
7.9%
ICU
Leve
l of S
ervic
e AAn
alysis
Per
iod (m
in) 15

HC
M 2
010
TW
SC
6: N
orth
Riv
er &
Sel
kirk
02-1
9-20
20
112 M
ontre
al Ro
ad P
M Pe
ak H
our 2
024 F
uture
Bac
kgro
und
Sync
hro 1
0 Ligh
t Rep
ort
Page
11
Inter
secti
onInt
Dela
y, s/v
eh2.4
Move
ment
WBL
WBR
NBT
NBR
SBL
SBT
Lane
Con
figur
ation
sTr
affic
Vol, v
eh/h
115
4743
30
045
6Fu
ture V
ol, ve
h/h11
547
433
00
456
Confl
icting
Ped
s, #/h
r2
20
6666
0Si
gn C
ontro
l St
opSt
opFr
eeFr
eeFr
eeFr
eeRT
Cha
nneli
zed
-No
ne-
None
-No
neSt
orag
e Len
gth0
0-
--
-Ve
h in M
edian
Stor
age,
#0
-0
--
0Gr
ade,
%0
-0
--
0Pe
ak H
our F
actor
100
100
100
100
100
100
Heav
y Veh
icles
, %2
22
22
2Mv
mt F
low11
547
433
00
456
Major
/Mino
rMi
nor1
Major
1Ma
jor2
Confl
icting
Flow
All
663
435
0-
--
Stag
e 143
3-
--
--
Stag
e 223
0-
--
--
Critic
al Hd
wy6.6
36.2
3-
--
-Cr
itical
Hdwy
Stg
15.4
3-
--
--
Critic
al Hd
wy S
tg 2
5.83
--
--
-Fo
llow-
up H
dwy
3.519
3.319
--
--
Pot C
ap-1
Man
euve
r41
062
0-
00
-
S
tage 1
653
--
00
-
S
tage 2
787
--
00
-Pl
atoon
bloc
ked,
%-
-Mo
v Cap
-1 M
aneu
ver
409
619
--
--
Mov C
ap-2
Man
euve
r40
9-
--
--
Stag
e 165
3-
--
--
Stag
e 278
5-
--
--
Appr
oach
WB
NBSB
HCM
Contr
ol De
lay, s
15.5
00
HCM
LOS
C Mi
nor L
ane/M
ajor M
vmt
NBTW
BLn1
WBL
n2SB
TCa
pacit
y (ve
h/h)
-40
961
9-
HCM
Lane
V/C
Rati
o-
0.281
0.076
-HC
M Co
ntrol
Delay
(s)
-17
.211
.3-
HCM
Lane
LOS
-C
B-
HCM
95th
%tile
Q(ve
h)-
1.10.2
-
Lane
s, V
olum
es, T
imin
gs7:
McA
rthu
r &
Dun
das
02-1
9-20
20
112 M
ontre
al Ro
ad P
M Pe
ak H
our 2
024 F
uture
Bac
kgro
und
Sync
hro 1
0 Ligh
t Rep
ort
Page
12
Lane
Gro
upEB
LEB
TW
BTW
BRSB
LSB
RLa
ne C
onfig
urati
ons
Traff
ic Vo
lume (
vph)
755
531
695
294
Futur
e Volu
me (v
ph)
755
531
695
294
Satd.
Flow
(pro
t)0
1743
1691
016
450
Flt P
ermi
tted
0.999
0.958
Satd.
Flow
(per
m)0
1743
1691
016
450
Lane
Gro
up F
low (v
ph)
056
241
10
330
Sign
Con
trol
Free
Free
Stop
Inter
secti
on S
umma
ryCo
ntrol
Type
: Uns
ignali
zed
Inter
secti
on C
apac
ity U
tiliza
tion 4
9.3%
ICU
Leve
l of S
ervic
e AAn
alysis
Per
iod (m
in) 15

HC
M 2
010
TW
SC
7: M
cArt
hur
& D
unda
s02
-19-
2020
112 M
ontre
al Ro
ad P
M Pe
ak H
our 2
024 F
uture
Bac
kgro
und
Sync
hro 1
0 Ligh
t Rep
ort
Page
13
Inter
secti
onInt
Dela
y, s/v
eh0.8
Move
ment
EBL
EBT
WBT
WBR
SBL
SBR
Lane
Con
figur
ation
sTr
affic
Vol, v
eh/h
755
531
695
294
Futur
e Vol,
veh/h
755
531
695
294
Confl
icting
Ped
s, #/h
r76
00
760
9Si
gn C
ontro
l Fr
eeFr
eeFr
eeFr
eeSt
opSt
opRT
Cha
nneli
zed
-No
ne-
None
-No
neSt
orag
e Len
gth-
--
-0
-Ve
h in M
edian
Stor
age,
#-
00
-0
-Gr
ade,
%-
00
-0
-Pe
ak H
our F
actor
100
100
100
100
100
100
Heav
y Veh
icles
, %2
22
22
2Mv
mt F
low7
555
316
9529
4 Ma
jor/M
inor
Major
1Ma
jor2
Mino
r2Co
nflict
ing F
low A
ll48
70
-0
1009
449
Stag
e 1-
--
-44
0-
Stag
e 2-
--
-56
9-
Critic
al Hd
wy4.1
2-
--
6.42
6.22
Critic
al Hd
wy S
tg 1
--
--
5.42
-Cr
itical
Hdwy
Stg
2-
--
-5.4
2-
Follo
w-up
Hdw
y2.2
18-
--
3.518
3.318
Pot C
ap-1
Man
euve
r10
76-
--
266
610
Stag
e 1-
--
-64
9-
Stag
e 2-
--
-56
6-
Plato
on bl
ocke
d, %
--
-Mo
v Cap
-1 M
aneu
ver
1013
--
-23
357
0Mo
v Cap
-2 M
aneu
ver
--
--
233
-
S
tage 1
--
--
605
-
S
tage 2
--
--
533
- Ap
proa
chEB
WB
SBHC
M Co
ntrol
Delay
, s0.1
021
.5HC
M LO
SC
Mino
r Lan
e/Majo
r Mvm
tEB
LEB
TW
BTW
BRSB
Ln1
Capa
city (
veh/h
)10
13-
--
251
HCM
Lane
V/C
Rati
o0.0
07-
--
0.131
HCM
Contr
ol De
lay (s
)8.6
0-
-21
.5HC
M La
ne LO
SA
A-
-C
HCM
95th
%tile
Q(ve
h)0
--
-0.4
Lane
s, V
olum
es, T
imin
gs8:
Mar
guer
ite &
McA
rthu
r02
-19-
2020
112 M
ontre
al Ro
ad P
M Pe
ak H
our 2
024 F
uture
Bac
kgro
und
Sync
hro 1
0 Ligh
t Rep
ort
Page
14
Lane
Gro
upEB
TEB
RW
BLW
BTNB
LNB
RLa
ne C
onfig
urati
ons
Traff
ic Vo
lume (
vph)
563
2140
395
2052
Futur
e Volu
me (v
ph)
563
2140
395
2052
Satd.
Flow
(pro
t)17
320
017
3616
5814
83Flt
Per
mitte
d0.9
230.9
50Sa
td. F
low (p
erm)
1732
00
1608
1586
1425
Satd.
Flow
(RTO
R)4
52La
ne G
roup
Flow
(vph
)58
40
043
520
52Tu
rn T
ype
NAPe
rmNA
Perm
Perm
Prote
cted P
hase
s2
6Pe
rmitte
d Pha
ses
64
4De
tector
Pha
se2
66
44
Switc
h Pha
seMi
nimum
Initia
l (s)
10.0
10.0
10.0
10.0
10.0
Minim
um S
plit (
s)27
.523
.523
.524
.524
.5To
tal S
plit (
s)50
.050
.050
.025
.025
.0To
tal S
plit (
%)
66.7%
66.7%
66.7%
33.3%
33.3%
Yello
w Tim
e (s)
3.33.3
3.33.3
3.3Al
l-Red
Tim
e (s)
2.22.2
2.22.2
2.2Lo
st Tim
e Adju
st (s)
0.00.0
0.00.0
Total
Lost
Time (
s)5.5
5.55.5
5.5Le
ad/La
gLe
ad-L
ag O
ptimi
ze?
Reca
ll Mod
eC-
Max
C-Ma
xC-
Max
None
None
Act E
ffct G
reen
(s)
58.8
58.8
13.6
13.6
Actua
ted g/
C Ra
tio0.7
80.7
80.1
80.1
8v/c
Rati
o0.4
30.3
50.0
70.1
7Co
ntrol
Delay
7.16.4
23.4
8.4Qu
eue D
elay
0.00.0
0.00.0
Total
Dela
y7.1
6.423
.48.4
LOS
AA
CA
Appr
oach
Dela
y7.1
6.412
.6Ap
proa
ch LO
SA
AB
Queu
e Len
gth 50
th (m
)27
.818
.92.5
0.0Qu
eue L
ength
95th
(m)
70.3
49.3
7.17.7
Inter
nal L
ink D
ist (m
)36
.315
4.214
4.2Tu
rn B
ay Le
ngth
(m)
Base
Cap
acity
(vph
)13
5812
6041
240
8St
arva
tion C
ap R
educ
tn0
00
0Sp
illbac
k Cap
Red
uctn
00
00
Stor
age C
ap R
educ
tn0
00
0Re
duce
d v/c
Ratio
0.43
0.35
0.05
0.13
Inter
secti
on S
umma
ryCy
cle Le
ngth:
75Ac
tuated
Cyc
le Le
ngth:
75Of
fset: 0
(0%
), Re
feren
ced t
o pha
se 2:
EBT
and 6
:WBT
L, St
art o
f Gre
enNa
tural
Cycle
: 60
Contr
ol Ty
pe: A
ctuate
d-Co
ordin
ated

Lane
s, V
olum
es, T
imin
gs8:
Mar
guer
ite &
McA
rthu
r02
-19-
2020
112 M
ontre
al Ro
ad P
M Pe
ak H
our 2
024 F
uture
Bac
kgro
und
Sync
hro 1
0 Ligh
t Rep
ort
Page
15
Maxim
um v/
c Rati
o: 0.4
3Int
erse
ction
Sign
al De
lay: 7
.2Int
erse
ction
LOS:
AInt
erse
ction
Cap
acity
Utili
zatio
n 76.7
%IC
U Le
vel o
f Ser
vice D
Analy
sis P
eriod
(min)
15De
scrip
tion:
As pe
r sign
al tim
ing pl
an pr
ovide
d on N
ov 29
, 201
9.
Splits
and P
hase
s:
8: Ma
rgue
rite &
McA
rthur
Lane
s, V
olum
es, T
imin
gs9:
Van
ier
& M
cArt
hur
02-1
9-20
20
112 M
ontre
al Ro
ad P
M Pe
ak H
our 2
024 F
uture
Bac
kgro
und
Sync
hro 1
0 Ligh
t Rep
ort
Page
16
Lane
Gro
upEB
LEB
TEB
RW
BLW
BTW
BRNB
LNB
TNB
RSB
LSB
TSB
RLa
ne C
onfig
urati
ons
Traff
ic Vo
lume (
vph)
5825
949
635
022
917
921
712
5926
412
812
3869
Futur
e Volu
me (v
ph)
5825
949
635
022
917
921
712
5926
412
812
3869
Satd.
Flow
(pro
t)16
5817
4514
8332
1617
4514
8316
5833
1614
8316
5833
1614
83Flt
Per
mitte
d0.9
500.9
500.9
500.9
50Sa
td. F
low (p
erm)
1575
1745
1323
2855
1745
1360
1613
3316
1368
1641
3316
1235
Satd.
Flow
(RTO
R)26
217
922
116
8La
ne G
roup
Flow
(vph
)58
259
496
350
229
179
217
1259
264
128
1238
69Tu
rn T
ype
Prot
NAPe
rmPr
otNA
Perm
Prot
NAPe
rmPr
otNA
Perm
Prote
cted P
hase
s7
43
85
21
6Pe
rmitte
d Pha
ses
48
26
Detec
tor P
hase
74
43
88
52
21
66
Switc
h Pha
seMi
nimum
Initia
l (s)
5.010
.010
.05.0
10.0
10.0
5.010
.010
.05.0
10.0
10.0
Minim
um S
plit (
s)11
.236
.236
.211
.236
.236
.211
.136
.136
.111
.136
.136
.1To
tal S
plit (
s)18
.036
.236
.218
.036
.236
.231
.062
.862
.823
.054
.854
.8To
tal S
plit (
%)
12.9%
25.9%
25.9%
12.9%
25.9%
25.9%
22.1%
44.9%
44.9%
16.4%
39.1%
39.1%
Yello
w Tim
e (s)
3.33.3
3.33.3
3.33.3
3.73.7
3.73.7
3.73.7
All-R
ed T
ime (
s)2.9
2.92.9
2.92.9
2.92.4
2.42.4
2.42.4
2.4Lo
st Tim
e Adju
st (s)
0.00.0
0.00.0
0.00.0
0.00.0
0.00.0
0.00.0
Total
Lost
Time (
s)6.2
6.26.2
6.26.2
6.26.1
6.16.1
6.16.1
6.1Le
ad/La
gLa
gLe
adLe
adLa
gLe
adLe
adLe
adLa
gLa
gLe
adLa
gLa
gLe
ad-L
ag O
ptimi
ze?
Yes
Yes
Yes
Yes
Yes
Yes
Yes
Yes
Yes
Yes
Yes
Yes
Reca
ll Mod
eNo
neNo
neNo
neNo
neNo
neNo
neNo
neC-
Max
C-Ma
xNo
neC-
Max
C-Ma
xAc
t Effc
t Gre
en (s
)10
.730
.030
.011
.833
.633
.622
.058
.958
.914
.751
.651
.6Ac
tuated
g/C
Ratio
0.08
0.21
0.21
0.08
0.24
0.24
0.16
0.42
0.42
0.10
0.37
0.37
v/c R
atio
0.46
0.69
1.01
1.29
0.55
0.39
0.83
0.90
0.38
0.74
1.01
0.12
Contr
ol De
lay73
.561
.769
.920
4.753
.98.8
82.8
48.3
7.380
.666
.22.2
Queu
e Dela
y0.0
0.00.0
0.00.0
0.00.0
0.00.0
0.00.0
0.0To
tal D
elay
73.5
61.7
69.9
204.7
53.9
8.882
.848
.37.3
80.6
66.2
2.2LO
SE
EE
FD
AF
DA
FE
AAp
proa
ch D
elay
67.5
112.9
46.4
64.4
Appr
oach
LOS
EF
DE
Queu
e Len
gth 50
th (m
)15
.566
.8~8
0.1~6
3.557
.90.0
58.1
172.5
7.236
.9~1
23.1
0.0Qu
eue L
ength
95th
(m)
30.4
97.5
#152
.4#9
4.586
.119
.8#9
1.1#2
20.2
27.0
m52.0
m#21
0.6m2
.5Int
erna
l Link
Dist
(m)
154.2
174.6
77.0
137.1
Turn
Bay
Leng
th (m
)50
.010
0.012
0.011
5.090
.090
.090
.090
.0Ba
se C
apac
ity (v
ph)
139
373
489
271
418
462
294
1394
703
200
1221
561
Star
vatio
n Cap
Red
uctn
00
00
00
00
00
00
Spillb
ack C
ap R
educ
tn0
00
00
00
00
00
0St
orag
e Cap
Red
uctn
00
00
00
00
00
00
Redu
ced v
/c Ra
tio0.4
20.6
91.0
11.2
90.5
50.3
90.7
40.9
00.3
80.6
41.0
10.1
2
Inter
secti
on S
umma
ryCy
cle Le
ngth:
140
Actua
ted C
ycle
Leng
th: 14
0Of
fset: 5
4 (39
%),
Refer
ence
d to p
hase
2:NB
T an
d 6:S
BT, S
tart o
f Gre
enNa
tural
Cycle
: 145
Contr
ol Ty
pe: A
ctuate
d-Co
ordin
ated

Lane
s, V
olum
es, T
imin
gs9:
Van
ier
& M
cArt
hur
02-1
9-20
20
112 M
ontre
al Ro
ad P
M Pe
ak H
our 2
024 F
uture
Bac
kgro
und
Sync
hro 1
0 Ligh
t Rep
ort
Page
17
Maxim
um v/
c Rati
o: 1.2
9Int
erse
ction
Sign
al De
lay: 6
6.1Int
erse
ction
LOS:
EInt
erse
ction
Cap
acity
Utili
zatio
n 103
.8%IC
U Le
vel o
f Ser
vice G
Analy
sis P
eriod
(min)
15De
scrip
tion:
As pe
r sign
al tim
ing pl
an pr
ovide
d on N
ov 29
, 201
9. Ad
dition
al E-
W pe
destr
ian ph
ase t
ime t
aken
from
N-S
phas
e.~
Volu
me ex
ceed
s cap
acity
, que
ue is
theo
retic
ally i
nfinit
e.
Que
ue sh
own i
s max
imum
after
two c
ycles
.#
95th
perce
ntile
volum
e exc
eeds
capa
city,
queu
e may
be lo
nger
.
Que
ue sh
own i
s max
imum
after
two c
ycles
.m
Volu
me fo
r 95th
perce
ntile
queu
e is m
etere
d by u
pstre
am si
gnal.
Splits
and P
hase
s:
9: Va
nier &
McA
rthur

Appendix G
Synchro Intersection Worksheets – 2029 Background Conditions

Lane
s, V
olum
es, T
imin
gs1:
Nor
th R
iver
& M
ontr
eal
02-1
9-20
20
112 M
ontre
al Ro
ad A
M Pe
ak H
our 2
029 F
uture
Bac
kgro
und
Sync
hro 1
0 Ligh
t Rep
ort
Page
1
Lane
Gro
upEB
LEB
TEB
RW
BLW
BTW
BRNB
LNB
TNB
RSB
LSB
TSB
RLa
ne C
onfig
urati
ons
Traff
ic Vo
lume (
vph)
057
236
60
789
1728
515
2118
1725
Futur
e Volu
me (v
ph)
057
236
60
789
1728
515
2118
1725
Satd.
Flow
(pro
t)0
3069
00
3301
016
5815
500
016
080
Flt P
ermi
tted
0.718
0.928
Satd.
Flow
(per
m)0
3069
00
3301
012
4315
500
015
010
Satd.
Flow
(RTO
R)21
25La
ne G
roup
Flow
(vph
)0
938
00
806
028
536
00
600
Turn
Typ
eNA
NAPe
rmNA
Perm
NAPr
otecte
d Pha
ses
26
84
Perm
itted P
hase
s8
4De
tector
Pha
se2
68
84
4Sw
itch P
hase
Minim
um In
itial (s
)10
.010
.010
.010
.010
.010
.0Mi
nimum
Spli
t (s)
27.0
27.0
36.2
36.2
30.2
30.2
Total
Spli
t (s)
43.8
43.8
36.2
36.2
30.2
30.2
Total
Spli
t (%
)54
.8%54
.8%45
.3%45
.3%37
.8%37
.8%Ye
llow
Time (
s)3.3
3.33.3
3.33.3
3.3Al
l-Red
Tim
e (s)
2.72.7
2.92.9
2.92.9
Lost
Time A
djust
(s)0.0
0.00.0
0.00.0
Total
Lost
Time (
s)6.0
6.06.2
6.26.2
Lead
/Lag
Lead
-Lag
Opti
mize
?Re
call M
ode
C-Ma
xC-
Max
None
None
None
None
Act E
ffct G
reen
(s)
42.9
42.9
24.9
24.9
24.9
Actua
ted g/
C Ra
tio0.5
40.5
40.3
10.3
10.3
1v/c
Rati
o0.5
70.4
60.7
40.0
70.1
2Co
ntrol
Delay
15.5
10.3
35.7
10.0
11.8
Queu
e Dela
y0.0
0.20.0
0.00.0
Total
Dela
y15
.510
.635
.710
.011
.8LO
SB
BD
AB
Appr
oach
Dela
y15
.510
.632
.811
.8Ap
proa
ch LO
SB
BC
BQu
eue L
ength
50th
(m)
54.3
37.4
34.3
1.43.3
Queu
e Len
gth 95
th (m
)73
.921
.559
.86.9
10.6
Inter
nal L
ink D
ist (m
)19
4.552
.811
2.959
.0Tu
rn B
ay Le
ngth
(m)
90.0
Base
Cap
acity
(vph
)16
4617
7046
659
457
8St
arva
tion C
ap R
educ
tn0
337
00
0Sp
illbac
k Cap
Red
uctn
00
00
0St
orag
e Cap
Red
uctn
00
00
0Re
duce
d v/c
Ratio
0.57
0.56
0.61
0.06
0.10
Inter
secti
on S
umma
ryCy
cle Le
ngth:
80Ac
tuated
Cyc
le Le
ngth:
80Of
fset: 0
(0%
), Re
feren
ced t
o pha
se 2:
EBT
and 6
:WBT
, Star
t of G
reen
Natur
al Cy
cle: 6
5Co
ntrol
Type
: Actu
ated-
Coor
dinate
d
Lane
s, V
olum
es, T
imin
gs1:
Nor
th R
iver
& M
ontr
eal
02-1
9-20
20
112 M
ontre
al Ro
ad A
M Pe
ak H
our 2
029 F
uture
Bac
kgro
und
Sync
hro 1
0 Ligh
t Rep
ort
Page
2
Maxim
um v/
c Rati
o: 0.7
4Int
erse
ction
Sign
al De
lay: 1
6.1Int
erse
ction
LOS:
BInt
erse
ction
Cap
acity
Utili
zatio
n 64.8
%IC
U Le
vel o
f Ser
vice C
Analy
sis P
eriod
(min)
15De
scrip
tion:
As pe
r sign
al tim
ing pl
an pr
ovide
d on N
ov 29
, 201
9. Ad
dition
al N-
S pe
destr
ian ph
ase t
ime t
aken
from
E-W
phas
e.
Splits
and P
hase
s:
1: No
rth R
iver &
Mon
treal

Lane
s, V
olum
es, T
imin
gs2:
Mon
tgom
ery
& M
ontr
eal
02-1
9-20
20
112 M
ontre
al Ro
ad A
M Pe
ak H
our 2
029 F
uture
Bac
kgro
und
Sync
hro 1
0 Ligh
t Rep
ort
Page
3
Lane
Gro
upEB
TEB
RW
BLW
BTNB
LNB
RLa
ne C
onfig
urati
ons
Traff
ic Vo
lume (
vph)
557
5480
790
1933
Futur
e Volu
me (v
ph)
557
5480
790
1933
Satd.
Flow
(pro
t)32
610
032
9916
5814
83Flt
Per
mitte
d0.8
310.9
50Sa
td. F
low (p
erm)
3261
00
2753
1641
1451
Satd.
Flow
(RTO
R)24
33La
ne G
roup
Flow
(vph
)61
10
087
019
33Tu
rn T
ype
NAPe
rmNA
Perm
Perm
Prote
cted P
hase
s2
6Pe
rmitte
d Pha
ses
64
4De
tector
Pha
se2
66
44
Switc
h Pha
seMi
nimum
Initia
l (s)
10.0
10.0
10.0
10.0
10.0
Minim
um S
plit (
s)39
.915
.915
.919
.519
.5To
tal S
plit (
s)56
.056
.056
.024
.024
.0To
tal S
plit (
%)
70.0%
70.0%
70.0%
30.0%
30.0%
Yello
w Tim
e (s)
3.33.3
3.33.3
3.3Al
l-Red
Tim
e (s)
2.62.6
2.62.2
2.2Lo
st Tim
e Adju
st (s)
0.00.0
0.00.0
Total
Lost
Time (
s)5.9
5.95.5
5.5Le
ad/La
gLe
ad-L
ag O
ptimi
ze?
Reca
ll Mod
eC-
Max
C-Ma
xC-
Max
None
None
Act E
ffct G
reen
(s)
66.4
66.4
10.8
10.8
Actua
ted g/
C Ra
tio0.8
30.8
30.1
40.1
4v/c
Rati
o0.2
30.3
80.0
90.1
5Co
ntrol
Delay
0.54.1
30.4
12.5
Queu
e Dela
y0.1
0.00.0
0.0To
tal D
elay
0.64.1
30.4
12.5
LOS
AA
CB
Appr
oach
Dela
y0.6
4.119
.0Ap
proa
ch LO
SA
AB
Queu
e Len
gth 50
th (m
)0.4
21.7
2.60.0
Queu
e Len
gth 95
th (m
)2.1
38.0
7.97.0
Inter
nal L
ink D
ist (m
)52
.813
8.913
7.9Tu
rn B
ay Le
ngth
(m)
Base
Cap
acity
(vph
)27
0922
8337
936
0St
arva
tion C
ap R
educ
tn91
90
00
Spillb
ack C
ap R
educ
tn0
870
0St
orag
e Cap
Red
uctn
00
00
Redu
ced v
/c Ra
tio0.3
40.4
00.0
50.0
9
Inter
secti
on S
umma
ryCy
cle Le
ngth:
80Ac
tuated
Cyc
le Le
ngth:
80Of
fset: 0
(0%
), Re
feren
ced t
o pha
se 2:
EBT
and 6
:WBT
L, St
art o
f Gre
enNa
tural
Cycle
: 60
Contr
ol Ty
pe: A
ctuate
d-Co
ordin
ated
Lane
s, V
olum
es, T
imin
gs2:
Mon
tgom
ery
& M
ontr
eal
02-1
9-20
20
112 M
ontre
al Ro
ad A
M Pe
ak H
our 2
029 F
uture
Bac
kgro
und
Sync
hro 1
0 Ligh
t Rep
ort
Page
4
Maxim
um v/
c Rati
o: 0.3
8Int
erse
ction
Sign
al De
lay: 3
.2Int
erse
ction
LOS:
AInt
erse
ction
Cap
acity
Utili
zatio
n 77.2
%IC
U Le
vel o
f Ser
vice D
Analy
sis P
eriod
(min)
15De
scrip
tion:
As pe
r sign
al tim
ing pl
an pr
ovide
d on N
ov 29
, 201
9.
Splits
and P
hase
s:
2: Mo
ntgom
ery &
Mon
treal

Lane
s, V
olum
es, T
imin
gs3:
Pal
ace
& M
ontr
eal
02-1
9-20
20
112 M
ontre
al Ro
ad A
M Pe
ak H
our 2
029 F
uture
Bac
kgro
und
Sync
hro 1
0 Ligh
t Rep
ort
Page
5
Lane
Gro
upEB
TEB
RW
BLW
BTNB
LNB
RLa
ne C
onfig
urati
ons
Traff
ic Vo
lume (
vph)
580
928
898
00
Futur
e Volu
me (v
ph)
580
928
898
00
Satd.
Flow
(pro
t)33
090
033
090
0Flt
Per
mitte
d0.9
98Sa
td. F
low (p
erm)
3309
00
3309
00
Lane
Gro
up F
low (v
ph)
589
00
926
00
Sign
Con
trol
Free
Free
Free
Inter
secti
on S
umma
ryCo
ntrol
Type
: Uns
ignali
zed
Inter
secti
on C
apac
ity U
tiliza
tion 6
0.2%
ICU
Leve
l of S
ervic
e BAn
alysis
Per
iod (m
in) 15
Lane
s, V
olum
es, T
imin
gs4:
Van
ier
& M
ontr
eal
02-1
9-20
20
112 M
ontre
al Ro
ad A
M Pe
ak H
our 2
029 F
uture
Bac
kgro
und
Sync
hro 1
0 Ligh
t Rep
ort
Page
6
Lane
Gro
upEB
LEB
TEB
RW
BLW
BTW
BRNB
LNB
TNB
RSB
LSB
TSB
RLa
ne C
onfig
urati
ons
Traff
ic Vo
lume (
vph)
4536
717
419
156
222
521
299
519
324
712
7216
2Fu
ture V
olume
(vph
)45
367
174
191
562
225
212
995
193
247
1272
162
Satd.
Flow
(pro
t)16
5817
4514
8316
5830
940
1658
4764
1483
1658
4764
1483
Flt P
ermi
tted
0.300
0.157
0.950
0.950
Satd.
Flow
(per
m)51
117
4514
8326
930
940
1642
4764
1333
1624
4764
1386
Satd.
Flow
(RTO
R)16
647
193
123
Lane
Gro
up F
low (v
ph)
4536
717
419
178
70
212
995
193
247
1272
162
Turn
Typ
ePe
rmNA
NApm
+pt
NAPr
otNA
Perm
Prot
NAPe
rmPr
otecte
d Pha
ses
43
85
21
6Pe
rmitte
d Pha
ses
48
26
Detec
tor P
hase
44
38
52
21
66
Switc
h Pha
seMi
nimum
Initia
l (s)
10.0
10.0
5.010
.05.0
10.0
10.0
5.010
.010
.0Mi
nimum
Spli
t (s)
39.6
39.6
10.7
39.6
11.1
28.9
28.9
11.1
28.9
28.9
Total
Spli
t (s)
40.0
40.0
16.0
56.0
29.0
55.0
55.0
29.0
55.0
55.0
Total
Spli
t (%
)28
.6%28
.6%11
.4%40
.0%20
.7%39
.3%39
.3%20
.7%39
.3%39
.3%Ye
llow
Time (
s)3.3
3.33.3
3.33.7
3.73.7
3.73.7
3.7Al
l-Red
Tim
e (s)
3.33.3
2.43.3
2.42.2
2.22.4
2.22.2
Lost
Time A
djust
(s)0.0
0.00.0
0.00.0
0.00.0
0.00.0
0.0To
tal Lo
st Tim
e (s)
6.66.6
5.76.6
6.15.9
5.96.1
5.95.9
Lead
/Lag
Lag
Lag
Lead
Lead
Lag
Lag
Lead
Lag
Lag
Lead
-Lag
Opti
mize
?Ye
sYe
sYe
sYe
sYe
sYe
sYe
sYe
sYe
sRe
call M
ode
None
None
None
None
None
C-Ma
xC-
Max
None
C-Ma
xC-
Max
Act E
ffct G
reen
(s)
32.0
32.0
0.048
.948
.021
.050
.950
.922
.552
.452
.4Ac
tuated
g/C
Ratio
0.23
0.23
0.00
0.35
0.34
0.15
0.36
0.36
0.16
0.37
0.37
v/c R
atio
0.39
0.92
1.05
0.98
0.72
0.85
0.57
0.32
0.93
0.71
0.27
Contr
ol De
lay56
.281
.792
.795
.741
.887
.839
.613
.097
.140
.910
.5Qu
eue D
elay
0.00.0
0.00.0
0.00.0
0.00.0
0.00.0
0.0To
tal D
elay
56.2
81.7
92.7
95.7
41.8
87.8
39.6
13.0
97.1
40.9
10.5
LOS
EF
FF
DF
DB
FD
BAp
proa
ch D
elay
83.0
52.3
43.2
46.2
Appr
oach
LOS
FD
DD
Queu
e Len
gth 50
th (m
)10
.598
.7~4
.638
.292
.861
.659
.414
.568
.111
3.97.2
Queu
e Len
gth 95
th (m
)23
.5#1
52.7
#51.7
#78.8
116.2
m74.3
71.4
m21.4
#117
.413
1.923
.7Int
erna
l Link
Dist
(m)
99.5
196.4
220.3
239.2
Turn
Bay
Leng
th (m
)35
.050
.013
5.013
5.013
5.013
5.0Ba
se C
apac
ity (v
ph)
121
416
166
195
1122
271
1732
607
272
1782
595
Star
vatio
n Cap
Red
uctn
00
00
00
00
00
0Sp
illbac
k Cap
Red
uctn
00
00
00
00
00
0St
orag
e Cap
Red
uctn
00
00
00
00
00
0Re
duce
d v/c
Ratio
0.37
0.88
1.05
0.98
0.70
0.78
0.57
0.32
0.91
0.71
0.27
Inter
secti
on S
umma
ryCy
cle Le
ngth:
140
Actua
ted C
ycle
Leng
th: 14
0Of
fset: 1
02 (7
3%),
Refer
ence
d to p
hase
2:NB
T an
d 6:S
BT, S
tart o
f Gre
enNa
tural
Cycle
: 105
Contr
ol Ty
pe: A
ctuate
d-Co
ordin
ated

Lane
s, V
olum
es, T
imin
gs4:
Van
ier
& M
ontr
eal
02-1
9-20
20
112 M
ontre
al Ro
ad A
M Pe
ak H
our 2
029 F
uture
Bac
kgro
und
Sync
hro 1
0 Ligh
t Rep
ort
Page
7
Maxim
um v/
c Rati
o: 1.0
5Int
erse
ction
Sign
al De
lay: 5
1.2Int
erse
ction
LOS:
DInt
erse
ction
Cap
acity
Utili
zatio
n 95.6
%IC
U Le
vel o
f Ser
vice F
Analy
sis P
eriod
(min)
15De
scrip
tion:
As pe
r sign
al tim
ing pl
an pr
ovide
d on N
ov 29
, 201
9.~
Volu
me ex
ceed
s cap
acity
, que
ue is
theo
retic
ally i
nfinit
e.
Que
ue sh
own i
s max
imum
after
two c
ycles
.#
95th
perce
ntile
volum
e exc
eeds
capa
city,
queu
e may
be lo
nger
.
Que
ue sh
own i
s max
imum
after
two c
ycles
.m
Volu
me fo
r 95th
perce
ntile
queu
e is m
etere
d by u
pstre
am si
gnal.
Splits
and P
hase
s:
4: Va
nier &
Mon
treal
Lane
s, V
olum
es, T
imin
gs5:
Cod
y/H
anna
h &
Mon
trea
l02
-19-
2020
112 M
ontre
al Ro
ad A
M Pe
ak H
our 2
029 F
uture
Bac
kgro
und
Sync
hro 1
0 Ligh
t Rep
ort
Page
8
Lane
Gro
upEB
LEB
TEB
RW
BLW
BTW
BRNB
LNB
TNB
RSB
LSB
TSB
RLa
ne C
onfig
urati
ons
Traff
ic Vo
lume (
vph)
7960
111
187
915
00
050
3511
5Fu
ture V
olume
(vph
)79
601
111
879
150
00
5035
115
Satd.
Flow
(pro
t)0
1728
00
3297
00
00
015
620
Flt P
ermi
tted
0.817
0.955
0.988
Satd.
Flow
(per
m)0
1415
00
3149
00
00
015
530
Satd.
Flow
(RTO
R)2
469
Lane
Gro
up F
low (v
ph)
069
10
089
50
00
00
200
0Tu
rn T
ype
Perm
NAPe
rmNA
Perm
NAPr
otecte
d Pha
ses
26
7Pe
rmitte
d Pha
ses
26
7De
tector
Pha
se2
26
67
7Sw
itch P
hase
Minim
um In
itial (s
)10
.010
.010
.010
.010
.010
.0Mi
nimum
Spli
t (s)
25.5
25.5
25.5
25.5
21.5
21.5
Total
Spli
t (s)
65.0
65.0
65.0
65.0
25.0
25.0
Total
Spli
t (%
)72
.2%72
.2%72
.2%72
.2%27
.8%27
.8%Ye
llow
Time (
s)3.3
3.33.3
3.33.3
3.3Al
l-Red
Tim
e (s)
2.22.2
2.22.2
2.22.2
Lost
Time A
djust
(s)0.0
0.00.0
Total
Lost
Time (
s)5.5
5.55.5
Lead
/Lag
Lead
-Lag
Opti
mize
?Re
call M
ode
C-Ma
xC-
Max
C-Ma
xC-
Max
None
None
Act E
ffct G
reen
(s)
65.2
65.2
13.8
Actua
ted g/
C Ra
tio0.7
20.7
20.1
5v/c
Rati
o0.6
70.3
90.6
8Co
ntrol
Delay
11.8
5.834
.4Qu
eue D
elay
0.00.0
0.0To
tal D
elay
11.8
5.834
.4LO
SB
AC
Appr
oach
Dela
y11
.85.8
34.4
Appr
oach
LOS
BA
CQu
eue L
ength
50th
(m)
51.8
25.2
21.5
Queu
e Len
gth 95
th (m
)11
5.844
.840
.4Int
erna
l Link
Dist
(m)
196.4
87.1
127.9
106.3
Turn
Bay
Leng
th (m
)Ba
se C
apac
ity (v
ph)
1025
2281
390
Star
vatio
n Cap
Red
uctn
00
0Sp
illbac
k Cap
Red
uctn
00
0St
orag
e Cap
Red
uctn
00
0Re
duce
d v/c
Ratio
0.67
0.39
0.51
Inter
secti
on S
umma
ryCy
cle Le
ngth:
90Ac
tuated
Cyc
le Le
ngth:
90Of
fset: 7
0 (78
%),
Refer
ence
d to p
hase
2:EB
TL an
d 6:W
BTL,
Star
t of G
reen
Natur
al Cy
cle: 6
0Co
ntrol
Type
: Actu
ated-
Coor
dinate
d
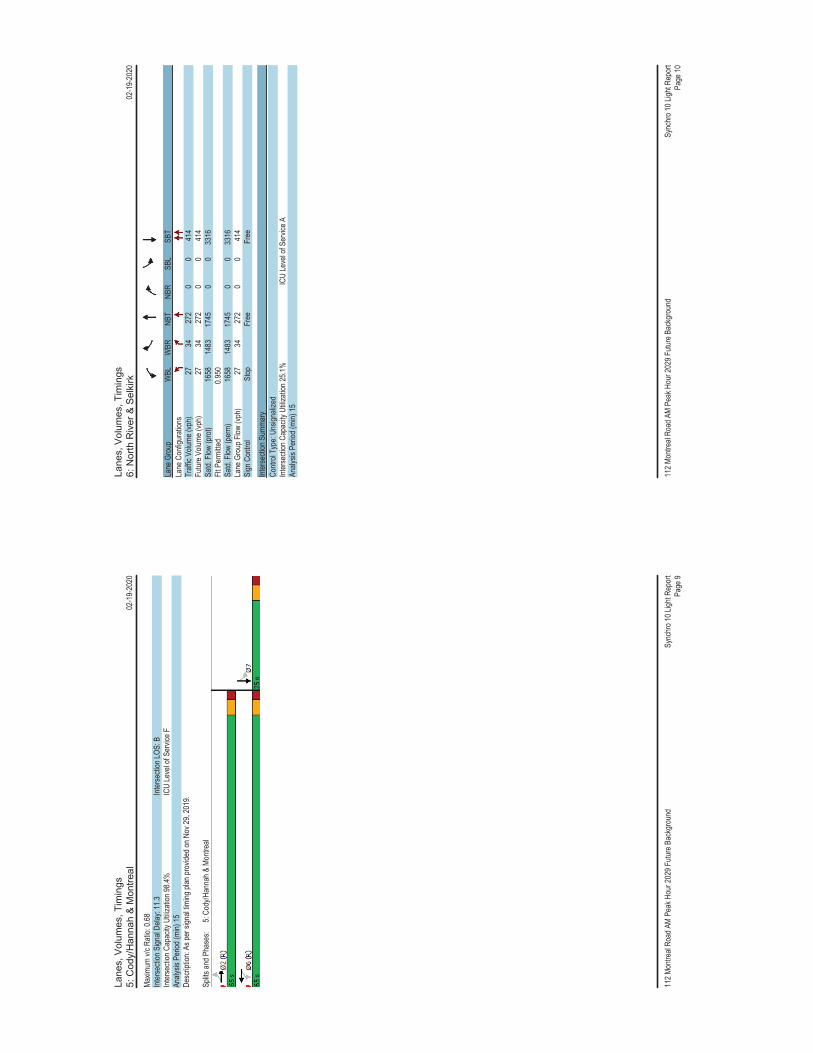
Lane
s, V
olum
es, T
imin
gs5:
Cod
y/H
anna
h &
Mon
trea
l02
-19-
2020
112 M
ontre
al Ro
ad A
M Pe
ak H
our 2
029 F
uture
Bac
kgro
und
Sync
hro 1
0 Ligh
t Rep
ort
Page
9
Maxim
um v/
c Rati
o: 0.6
8Int
erse
ction
Sign
al De
lay: 1
1.3Int
erse
ction
LOS:
BInt
erse
ction
Cap
acity
Utili
zatio
n 98.4
%IC
U Le
vel o
f Ser
vice F
Analy
sis P
eriod
(min)
15De
scrip
tion:
As pe
r sign
al tim
ing pl
an pr
ovide
d on N
ov 29
, 201
9.
Splits
and P
hase
s:
5: Co
dy/H
anna
h & M
ontre
al
Lane
s, V
olum
es, T
imin
gs6:
Nor
th R
iver
& S
elki
rk02
-19-
2020
112 M
ontre
al Ro
ad A
M Pe
ak H
our 2
029 F
uture
Bac
kgro
und
Sync
hro 1
0 Ligh
t Rep
ort
Page
10
Lane
Gro
upW
BLW
BRNB
TNB
RSB
LSB
TLa
ne C
onfig
urati
ons
Traff
ic Vo
lume (
vph)
2734
272
00
414
Futur
e Volu
me (v
ph)
2734
272
00
414
Satd.
Flow
(pro
t)16
5814
8317
450
033
16Flt
Per
mitte
d0.9
50Sa
td. F
low (p
erm)
1658
1483
1745
00
3316
Lane
Gro
up F
low (v
ph)
2734
272
00
414
Sign
Con
trol
Stop
Free
Free
Inter
secti
on S
umma
ryCo
ntrol
Type
: Uns
ignali
zed
Inter
secti
on C
apac
ity U
tiliza
tion 2
5.1%
ICU
Leve
l of S
ervic
e AAn
alysis
Per
iod (m
in) 15

HC
M 2
010
TW
SC
6: N
orth
Riv
er &
Sel
kirk
02-1
9-20
20
112 M
ontre
al Ro
ad A
M Pe
ak H
our 2
029 F
uture
Bac
kgro
und
Sync
hro 1
0 Ligh
t Rep
ort
Page
11
Inter
secti
onInt
Dela
y, s/v
eh0.9
Move
ment
WBL
WBR
NBT
NBR
SBL
SBT
Lane
Con
figur
ation
sTr
affic
Vol, v
eh/h
2734
272
00
414
Futur
e Vol,
veh/h
2734
272
00
414
Confl
icting
Ped
s, #/h
r3
00
9090
0Si
gn C
ontro
l St
opSt
opFr
eeFr
eeFr
eeFr
eeRT
Cha
nneli
zed
-No
ne-
None
-No
neSt
orag
e Len
gth0
0-
--
-Ve
h in M
edian
Stor
age,
#0
-0
--
0Gr
ade,
%0
-0
--
0Pe
ak H
our F
actor
100
100
100
100
100
100
Heav
y Veh
icles
, %2
22
22
2Mv
mt F
low27
3427
20
041
4 Ma
jor/M
inor
Mino
r1Ma
jor1
Major
2Co
nflict
ing F
low A
ll48
227
20
--
-
S
tage 1
272
--
--
-
S
tage 2
210
--
--
-Cr
itical
Hdwy
6.63
6.23
--
--
Critic
al Hd
wy S
tg 1
5.43
--
--
-Cr
itical
Hdwy
Stg
25.8
3-
--
--
Follo
w-up
Hdw
y3.5
193.3
19-
--
-Po
t Cap
-1 M
aneu
ver
528
766
-0
0-
Stag
e 177
3-
-0
0-
Stag
e 280
5-
-0
0-
Plato
on bl
ocke
d, %
--
Mov C
ap-1
Man
euve
r52
776
6-
--
-Mo
v Cap
-2 M
aneu
ver
527
--
--
-
S
tage 1
773
--
--
-
S
tage 2
803
--
--
- Ap
proa
chW
BNB
SBHC
M Co
ntrol
Delay
, s10
.90
0HC
M LO
SB
Mino
r Lan
e/Majo
r Mvm
tNB
TWBL
n1W
BLn2
SBT
Capa
city (
veh/h
)-
527
766
-HC
M La
ne V
/C R
atio
-0.0
510.0
44-
HCM
Contr
ol De
lay (s
)-
12.2
9.9-
HCM
Lane
LOS
-B
A-
HCM
95th
%tile
Q(ve
h)-
0.20.1
-
Lane
s, V
olum
es, T
imin
gs7:
McA
rthu
r &
Dun
das
02-1
9-20
20
112 M
ontre
al Ro
ad A
M Pe
ak H
our 2
029 F
uture
Bac
kgro
und
Sync
hro 1
0 Ligh
t Rep
ort
Page
12
Lane
Gro
upEB
LEB
TW
BTW
BRSB
LSB
RLa
ne C
onfig
urati
ons
Traff
ic Vo
lume (
vph)
1040
335
995
1016
Futur
e Volu
me (v
ph)
1040
335
995
1016
Satd.
Flow
(pro
t)0
1743
1696
015
700
Flt P
ermi
tted
0.999
0.981
Satd.
Flow
(per
m)0
1743
1696
015
700
Lane
Gro
up F
low (v
ph)
041
345
40
260
Sign
Con
trol
Free
Free
Stop
Inter
secti
on S
umma
ryCo
ntrol
Type
: Uns
ignali
zed
Inter
secti
on C
apac
ity U
tiliza
tion 4
3.5%
ICU
Leve
l of S
ervic
e AAn
alysis
Per
iod (m
in) 15

HC
M 2
010
TW
SC
7: M
cArt
hur
& D
unda
s02
-19-
2020
112 M
ontre
al Ro
ad A
M Pe
ak H
our 2
029 F
uture
Bac
kgro
und
Sync
hro 1
0 Ligh
t Rep
ort
Page
13
Inter
secti
onInt
Dela
y, s/v
eh0.5
Move
ment
EBL
EBT
WBT
WBR
SBL
SBR
Lane
Con
figur
ation
sTr
affic
Vol, v
eh/h
1040
335
995
1016
Futur
e Vol,
veh/h
1040
335
995
1016
Confl
icting
Ped
s, #/h
r10
00
010
01
9Si
gn C
ontro
l Fr
eeFr
eeFr
eeFr
eeSt
opSt
opRT
Cha
nneli
zed
-No
ne-
None
-No
neSt
orag
e Len
gth-
--
-0
-Ve
h in M
edian
Stor
age,
#-
00
-0
-Gr
ade,
%-
00
-0
-Pe
ak H
our F
actor
100
100
100
100
100
100
Heav
y Veh
icles
, %2
22
22
2Mv
mt F
low10
403
359
9510
16 Ma
jor/M
inor
Major
1Ma
jor2
Mino
r2Co
nflict
ing F
low A
ll55
40
-0
931
516
Stag
e 1-
--
-50
7-
Stag
e 2-
--
-42
4-
Critic
al Hd
wy4.1
2-
--
6.42
6.22
Critic
al Hd
wy S
tg 1
--
--
5.42
-Cr
itical
Hdwy
Stg
2-
--
-5.4
2-
Follo
w-up
Hdw
y2.2
18-
--
3.518
3.318
Pot C
ap-1
Man
euve
r10
16-
--
296
559
Stag
e 1-
--
-60
5-
Stag
e 2-
--
-66
0-
Plato
on bl
ocke
d, %
--
-Mo
v Cap
-1 M
aneu
ver
937
--
-24
851
2Mo
v Cap
-2 M
aneu
ver
--
--
248
-
S
tage 1
--
--
550
-
S
tage 2
--
--
609
- Ap
proa
chEB
WB
SBHC
M Co
ntrol
Delay
, s0.2
015
.7HC
M LO
SC
Mino
r Lan
e/Majo
r Mvm
tEB
LEB
TW
BTW
BRSB
Ln1
Capa
city (
veh/h
)93
7-
--
363
HCM
Lane
V/C
Rati
o0.0
11-
--
0.072
HCM
Contr
ol De
lay (s
)8.9
0-
-15
.7HC
M La
ne LO
SA
A-
-C
HCM
95th
%tile
Q(ve
h)0
--
-0.2
Lane
s, V
olum
es, T
imin
gs8:
Mar
guer
ite &
McA
rthu
r02
-19-
2020
112 M
ontre
al Ro
ad A
M Pe
ak H
our 2
029 F
uture
Bac
kgro
und
Sync
hro 1
0 Ligh
t Rep
ort
Page
14
Lane
Gro
upEB
TEB
RW
BLW
BTNB
LNB
RLa
ne C
onfig
urati
ons
Traff
ic Vo
lume (
vph)
392
1946
458
931
Futur
e Volu
me (v
ph)
392
1946
458
931
Satd.
Flow
(pro
t)17
300
017
3616
5814
83Flt
Per
mitte
d0.9
390.9
50Sa
td. F
low (p
erm)
1730
00
1636
1551
1426
Satd.
Flow
(RTO
R)6
31La
ne G
roup
Flow
(vph
)41
10
050
49
31Tu
rn T
ype
NAPe
rmNA
Perm
Perm
Prote
cted P
hase
s2
6Pe
rmitte
d Pha
ses
64
4De
tector
Pha
se2
66
44
Switc
h Pha
seMi
nimum
Initia
l (s)
10.0
10.0
10.0
10.0
10.0
Minim
um S
plit (
s)27
.523
.523
.524
.524
.5To
tal S
plit (
s)45
.045
.045
.025
.025
.0To
tal S
plit (
%)
64.3%
64.3%
64.3%
35.7%
35.7%
Yello
w Tim
e (s)
3.33.3
3.33.3
3.3Al
l-Red
Tim
e (s)
2.22.2
2.22.2
2.2Lo
st Tim
e Adju
st (s)
0.00.0
0.00.0
Total
Lost
Time (
s)5.5
5.55.5
5.5Le
ad/La
gLe
ad-L
ag O
ptimi
ze?
Reca
ll Mod
eC-
Max
C-Ma
xC-
Max
None
None
Act E
ffct G
reen
(s)
53.8
53.8
13.6
13.6
Actua
ted g/
C Ra
tio0.7
70.7
70.1
90.1
9v/c
Rati
o0.3
10.4
00.0
30.1
0Co
ntrol
Delay
6.38.5
20.1
8.5Qu
eue D
elay
0.00.0
0.00.0
Total
Dela
y6.3
8.520
.18.5
LOS
AA
CA
Appr
oach
Dela
y6.3
8.511
.2Ap
proa
ch LO
SA
AB
Queu
e Len
gth 50
th (m
)16
.842
.41.0
0.0Qu
eue L
ength
95th
(m)
44.3
m56.9
3.95.5
Inter
nal L
ink D
ist (m
)36
.315
4.214
4.2Tu
rn B
ay Le
ngth
(m)
Base
Cap
acity
(vph
)13
3112
5743
241
9St
arva
tion C
ap R
educ
tn0
00
0Sp
illbac
k Cap
Red
uctn
00
00
Stor
age C
ap R
educ
tn0
00
0Re
duce
d v/c
Ratio
0.31
0.40
0.02
0.07
Inter
secti
on S
umma
ryCy
cle Le
ngth:
70Ac
tuated
Cyc
le Le
ngth:
70Of
fset: 0
(0%
), Re
feren
ced t
o pha
se 2:
EBT
and 6
:WBT
L, St
art o
f Gre
enNa
tural
Cycle
: 55
Contr
ol Ty
pe: A
ctuate
d-Co
ordin
ated

Lane
s, V
olum
es, T
imin
gs8:
Mar
guer
ite &
McA
rthu
r02
-19-
2020
112 M
ontre
al Ro
ad A
M Pe
ak H
our 2
029 F
uture
Bac
kgro
und
Sync
hro 1
0 Ligh
t Rep
ort
Page
15
Maxim
um v/
c Rati
o: 0.4
0Int
erse
ction
Sign
al De
lay: 7
.7Int
erse
ction
LOS:
AInt
erse
ction
Cap
acity
Utili
zatio
n 75.2
%IC
U Le
vel o
f Ser
vice D
Analy
sis P
eriod
(min)
15De
scrip
tion:
As pe
r sign
al tim
ing pl
an pr
ovide
d on N
ov 29
, 201
9.m
Volu
me fo
r 95th
perce
ntile
queu
e is m
etere
d by u
pstre
am si
gnal.
Splits
and P
hase
s:
8: Ma
rgue
rite &
McA
rthur
Lane
s, V
olum
es, T
imin
gs9:
Van
ier
& M
cArt
hur
02-1
9-20
20
112 M
ontre
al Ro
ad A
M Pe
ak H
our 2
029 F
uture
Bac
kgro
und
Sync
hro 1
0 Ligh
t Rep
ort
Page
16
Lane
Gro
upEB
LEB
TEB
RW
BLW
BTW
BRNB
LNB
TNB
RSB
LSB
TSB
RLa
ne C
onfig
urati
ons
Traff
ic Vo
lume (
vph)
3913
032
424
322
212
125
512
1226
116
214
0170
Futur
e Volu
me (v
ph)
3913
032
424
322
212
125
512
1226
116
214
0170
Satd.
Flow
(pro
t)16
5817
4514
8332
1617
4514
8316
5833
1614
8316
5833
1614
83Flt
Per
mitte
d0.9
500.9
500.9
500.9
50Sa
td. F
low (p
erm)
1538
1745
1398
3009
1745
1320
1646
3316
1355
1637
3316
1381
Satd.
Flow
(RTO
R)23
912
121
912
1La
ne G
roup
Flow
(vph
)39
130
324
243
222
121
255
1212
261
162
1401
70Tu
rn T
ype
Prot
NAPe
rmPr
otNA
Perm
Prot
NAPe
rmPr
otNA
Perm
Prote
cted P
hase
s7
43
85
21
6Pe
rmitte
d Pha
ses
48
26
Detec
tor P
hase
74
43
88
52
21
66
Switc
h Pha
seMi
nimum
Initia
l (s)
5.010
.010
.05.0
10.0
10.0
5.010
.010
.05.0
10.0
10.0
Minim
um S
plit (
s)11
.236
.236
.211
.236
.236
.211
.136
.136
.111
.136
.136
.1To
tal S
plit (
s)20
.036
.236
.220
.036
.236
.224
.059
.859
.824
.059
.859
.8To
tal S
plit (
%)
14.3%
25.9%
25.9%
14.3%
25.9%
25.9%
17.1%
42.7%
42.7%
17.1%
42.7%
42.7%
Yello
w Tim
e (s)
3.33.3
3.33.3
3.33.3
3.73.7
3.73.7
3.73.7
All-R
ed T
ime (
s)2.9
2.92.9
2.92.9
2.92.4
2.42.4
2.42.4
2.4Lo
st Tim
e Adju
st (s)
0.00.0
0.00.0
0.00.0
0.00.0
0.00.0
0.00.0
Total
Lost
Time (
s)6.2
6.26.2
6.26.2
6.26.1
6.16.1
6.16.1
6.1Le
ad/La
gLa
gLe
adLe
adLa
gLe
adLe
adLe
adLa
gLa
gLe
adLa
gLa
gLe
ad-L
ag O
ptimi
ze?
Yes
Yes
Yes
Yes
Yes
Yes
Yes
Yes
Yes
Yes
Yes
Yes
Reca
ll Mod
eNo
neNo
neNo
neNo
neNo
neNo
neNo
neC-
Max
C-Ma
xNo
neC-
Max
C-Ma
xAc
t Effc
t Gre
en (s
)12
.126
.026
.013
.429
.629
.622
.359
.459
.416
.653
.753
.7Ac
tuated
g/C
Ratio
0.09
0.19
0.19
0.10
0.21
0.21
0.16
0.42
0.42
0.12
0.38
0.38
v/c R
atio
0.27
0.40
0.71
0.79
0.60
0.32
0.97
0.86
0.37
0.83
1.10
0.12
Contr
ol De
lay69
.848
.224
.280
.657
.69.9
105.7
45.7
7.786
.890
.84.2
Queu
e Dela
y0.0
0.00.0
0.00.0
0.00.0
0.00.0
0.00.0
0.0To
tal D
elay
69.8
48.2
24.2
80.6
57.6
9.910
5.745
.77.7
86.8
90.8
4.2LO
SE
DC
FE
AF
DA
FF
AAp
proa
ch D
elay
34.2
57.3
48.8
86.7
Appr
oach
LOS
CE
DF
Queu
e Len
gth 50
th (m
)11
.230
.829
.434
.355
.80.0
~85.6
170.5
7.447
.1~2
19.8
0.6Qu
eue L
ength
95th
(m)
23.5
50.9
66.3
#52.5
83.1
16.5
#139
.6#2
16.4
27.8
m61.5
m#25
4.4m3
.0Int
erna
l Link
Dist
(m)
154.2
191.2
195.1
137.1
Turn
Bay
Leng
th (m
)50
.010
0.012
0.011
5.090
.090
.090
.090
.0Ba
se C
apac
ity (v
ph)
163
373
487
317
373
377
264
1406
700
211
1271
604
Star
vatio
n Cap
Red
uctn
00
00
00
00
00
00
Spillb
ack C
ap R
educ
tn0
00
00
00
00
00
0St
orag
e Cap
Red
uctn
00
00
00
00
00
00
Redu
ced v
/c Ra
tio0.2
40.3
50.6
70.7
70.6
00.3
20.9
70.8
60.3
70.7
71.1
00.1
2
Inter
secti
on S
umma
ryCy
cle Le
ngth:
140
Actua
ted C
ycle
Leng
th: 14
0Of
fset: 1
00 (7
1%),
Refer
ence
d to p
hase
2:NB
T an
d 6:S
BT, S
tart o
f Gre
enNa
tural
Cycle
: 145
Contr
ol Ty
pe: A
ctuate
d-Co
ordin
ated

Lane
s, V
olum
es, T
imin
gs9:
Van
ier
& M
cArt
hur
02-1
9-20
20
112 M
ontre
al Ro
ad A
M Pe
ak H
our 2
029 F
uture
Bac
kgro
und
Sync
hro 1
0 Ligh
t Rep
ort
Page
17
Maxim
um v/
c Rati
o: 1.1
0Int
erse
ction
Sign
al De
lay: 6
2.2Int
erse
ction
LOS:
EInt
erse
ction
Cap
acity
Utili
zatio
n 104
.2%IC
U Le
vel o
f Ser
vice G
Analy
sis P
eriod
(min)
15De
scrip
tion:
As pe
r sign
al tim
ing pl
an pr
ovide
d on N
ov 29
, 201
9. Ad
dition
al E-
W pe
destr
ian ph
ase t
ime t
aken
from
N-S
phas
e.~
Volu
me ex
ceed
s cap
acity
, que
ue is
theo
retic
ally i
nfinit
e.
Que
ue sh
own i
s max
imum
after
two c
ycles
.#
95th
perce
ntile
volum
e exc
eeds
capa
city,
queu
e may
be lo
nger
.
Que
ue sh
own i
s max
imum
after
two c
ycles
.m
Volu
me fo
r 95th
perce
ntile
queu
e is m
etere
d by u
pstre
am si
gnal.
Splits
and P
hase
s:
9: Va
nier &
McA
rthur
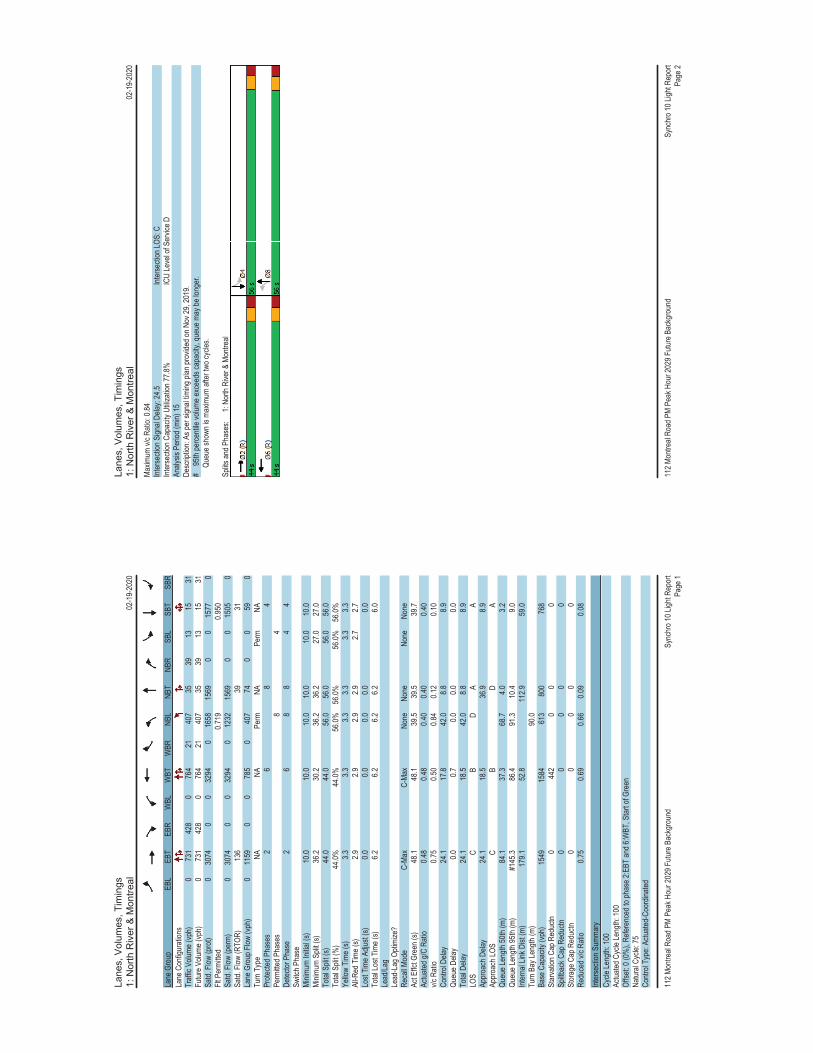
Lane
s, V
olum
es, T
imin
gs1:
Nor
th R
iver
& M
ontr
eal
02-1
9-20
20
112 M
ontre
al Ro
ad P
M Pe
ak H
our 2
029 F
uture
Bac
kgro
und
Sync
hro 1
0 Ligh
t Rep
ort
Page
1
Lane
Gro
upEB
LEB
TEB
RW
BLW
BTW
BRNB
LNB
TNB
RSB
LSB
TSB
RLa
ne C
onfig
urati
ons
Traff
ic Vo
lume (
vph)
073
142
80
764
2140
735
3913
1531
Futur
e Volu
me (v
ph)
073
142
80
764
2140
735
3913
1531
Satd.
Flow
(pro
t)0
3074
00
3294
016
5815
690
015
770
Flt P
ermi
tted
0.719
0.950
Satd.
Flow
(per
m)0
3074
00
3294
012
3215
690
015
050
Satd.
Flow
(RTO
R)13
639
31La
ne G
roup
Flow
(vph
)0
1159
00
785
040
774
00
590
Turn
Typ
eNA
NAPe
rmNA
Perm
NAPr
otecte
d Pha
ses
26
84
Perm
itted P
hase
s8
4De
tector
Pha
se2
68
84
4Sw
itch P
hase
Minim
um In
itial (s
)10
.010
.010
.010
.010
.010
.0Mi
nimum
Spli
t (s)
36.2
30.2
36.2
36.2
27.0
27.0
Total
Spli
t (s)
44.0
44.0
56.0
56.0
56.0
56.0
Total
Spli
t (%
)44
.0%44
.0%56
.0%56
.0%56
.0%56
.0%Ye
llow
Time (
s)3.3
3.33.3
3.33.3
3.3Al
l-Red
Tim
e (s)
2.92.9
2.92.9
2.72.7
Lost
Time A
djust
(s)0.0
0.00.0
0.00.0
Total
Lost
Time (
s)6.2
6.26.2
6.26.0
Lead
/Lag
Lead
-Lag
Opti
mize
?Re
call M
ode
C-Ma
xC-
Max
None
None
None
None
Act E
ffct G
reen
(s)
48.1
48.1
39.5
39.5
39.7
Actua
ted g/
C Ra
tio0.4
80.4
80.4
00.4
00.4
0v/c
Rati
o0.7
50.5
00.8
40.1
20.1
0Co
ntrol
Delay
24.1
17.8
42.0
8.88.9
Queu
e Dela
y0.0
0.70.0
0.00.0
Total
Dela
y24
.118
.542
.08.8
8.9LO
SC
BD
AA
Appr
oach
Dela
y24
.118
.536
.98.9
Appr
oach
LOS
CB
DA
Queu
e Len
gth 50
th (m
)84
.137
.368
.74.0
3.2Qu
eue L
ength
95th
(m)
#145
.386
.491
.310
.49.0
Inter
nal L
ink D
ist (m
)17
9.152
.811
2.959
.0Tu
rn B
ay Le
ngth
(m)
90.0
Base
Cap
acity
(vph
)15
4915
8461
380
076
8St
arva
tion C
ap R
educ
tn0
442
00
0Sp
illbac
k Cap
Red
uctn
00
00
0St
orag
e Cap
Red
uctn
00
00
0Re
duce
d v/c
Ratio
0.75
0.69
0.66
0.09
0.08
Inter
secti
on S
umma
ryCy
cle Le
ngth:
100
Actua
ted C
ycle
Leng
th: 10
0Of
fset: 0
(0%
), Re
feren
ced t
o pha
se 2:
EBT
and 6
:WBT
, Star
t of G
reen
Natur
al Cy
cle: 7
5Co
ntrol
Type
: Actu
ated-
Coor
dinate
d
Lane
s, V
olum
es, T
imin
gs1:
Nor
th R
iver
& M
ontr
eal
02-1
9-20
20
112 M
ontre
al Ro
ad P
M Pe
ak H
our 2
029 F
uture
Bac
kgro
und
Sync
hro 1
0 Ligh
t Rep
ort
Page
2
Maxim
um v/
c Rati
o: 0.8
4Int
erse
ction
Sign
al De
lay: 2
4.5Int
erse
ction
LOS:
CInt
erse
ction
Cap
acity
Utili
zatio
n 77.8
%IC
U Le
vel o
f Ser
vice D
Analy
sis P
eriod
(min)
15De
scrip
tion:
As pe
r sign
al tim
ing pl
an pr
ovide
d on N
ov 29
, 201
9.#
95th
perce
ntile
volum
e exc
eeds
capa
city,
queu
e may
be lo
nger
.
Que
ue sh
own i
s max
imum
after
two c
ycles
.
Splits
and P
hase
s:
1: No
rth R
iver &
Mon
treal
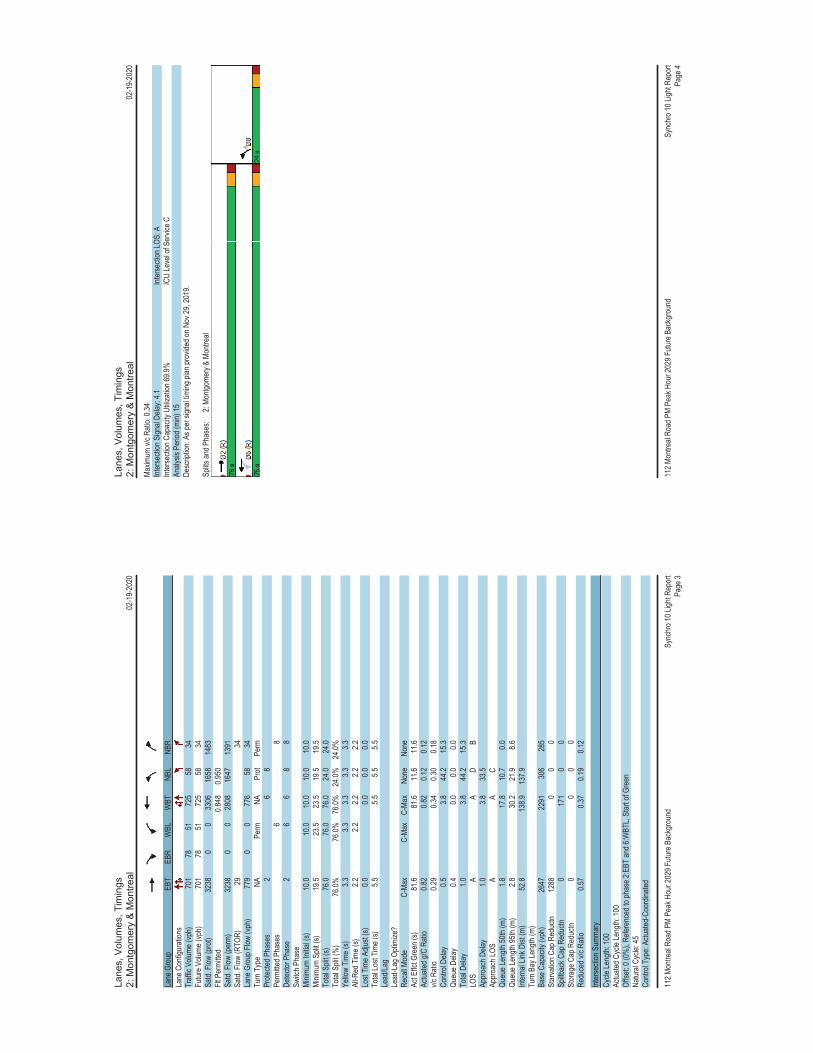
Lane
s, V
olum
es, T
imin
gs2:
Mon
tgom
ery
& M
ontr
eal
02-1
9-20
20
112 M
ontre
al Ro
ad P
M Pe
ak H
our 2
029 F
uture
Bac
kgro
und
Sync
hro 1
0 Ligh
t Rep
ort
Page
3
Lane
Gro
upEB
TEB
RW
BLW
BTNB
LNB
RLa
ne C
onfig
urati
ons
Traff
ic Vo
lume (
vph)
701
7851
725
5834
Futur
e Volu
me (v
ph)
701
7851
725
5834
Satd.
Flow
(pro
t)32
380
033
0616
5814
83Flt
Per
mitte
d0.8
480.9
50Sa
td. F
low (p
erm)
3238
00
2808
1647
1391
Satd.
Flow
(RTO
R)29
34La
ne G
roup
Flow
(vph
)77
90
077
658
34Tu
rn T
ype
NAPe
rmNA
Prot
Perm
Prote
cted P
hase
s2
68
Perm
itted P
hase
s6
8De
tector
Pha
se2
66
88
Switc
h Pha
seMi
nimum
Initia
l (s)
10.0
10.0
10.0
10.0
10.0
Minim
um S
plit (
s)19
.523
.523
.519
.519
.5To
tal S
plit (
s)76
.076
.076
.024
.024
.0To
tal S
plit (
%)
76.0%
76.0%
76.0%
24.0%
24.0%
Yello
w Tim
e (s)
3.33.3
3.33.3
3.3Al
l-Red
Tim
e (s)
2.22.2
2.22.2
2.2Lo
st Tim
e Adju
st (s)
0.00.0
0.00.0
Total
Lost
Time (
s)5.5
5.55.5
5.5Le
ad/La
gLe
ad-L
ag O
ptimi
ze?
Reca
ll Mod
eC-
Max
C-Ma
xC-
Max
None
None
Act E
ffct G
reen
(s)
81.6
81.6
11.6
11.6
Actua
ted g/
C Ra
tio0.8
20.8
20.1
20.1
2v/c
Rati
o0.2
90.3
40.3
00.1
8Co
ntrol
Delay
0.53.8
44.2
15.3
Queu
e Dela
y0.4
0.00.0
0.0To
tal D
elay
1.03.8
44.2
15.3
LOS
AA
DB
Appr
oach
Dela
y1.0
3.833
.5Ap
proa
ch LO
SA
AC
Queu
e Len
gth 50
th (m
)1.8
17.8
10.7
0.0Qu
eue L
ength
95th
(m)
2.830
.221
.98.6
Inter
nal L
ink D
ist (m
)52
.813
8.913
7.9Tu
rn B
ay Le
ngth
(m)
Base
Cap
acity
(vph
)26
4722
9130
628
5St
arva
tion C
ap R
educ
tn12
880
00
Spillb
ack C
ap R
educ
tn0
171
00
Stor
age C
ap R
educ
tn0
00
0Re
duce
d v/c
Ratio
0.57
0.37
0.19
0.12
Inter
secti
on S
umma
ryCy
cle Le
ngth:
100
Actua
ted C
ycle
Leng
th: 10
0Of
fset: 0
(0%
), Re
feren
ced t
o pha
se 2:
EBT
and 6
:WBT
L, St
art o
f Gre
enNa
tural
Cycle
: 45
Contr
ol Ty
pe: A
ctuate
d-Co
ordin
ated
Lane
s, V
olum
es, T
imin
gs2:
Mon
tgom
ery
& M
ontr
eal
02-1
9-20
20
112 M
ontre
al Ro
ad P
M Pe
ak H
our 2
029 F
uture
Bac
kgro
und
Sync
hro 1
0 Ligh
t Rep
ort
Page
4
Maxim
um v/
c Rati
o: 0.3
4Int
erse
ction
Sign
al De
lay: 4
.1Int
erse
ction
LOS:
AInt
erse
ction
Cap
acity
Utili
zatio
n 69.9
%IC
U Le
vel o
f Ser
vice C
Analy
sis P
eriod
(min)
15De
scrip
tion:
As pe
r sign
al tim
ing pl
an pr
ovide
d on N
ov 29
, 201
9.
Splits
and P
hase
s:
2: Mo
ntgom
ery &
Mon
treal
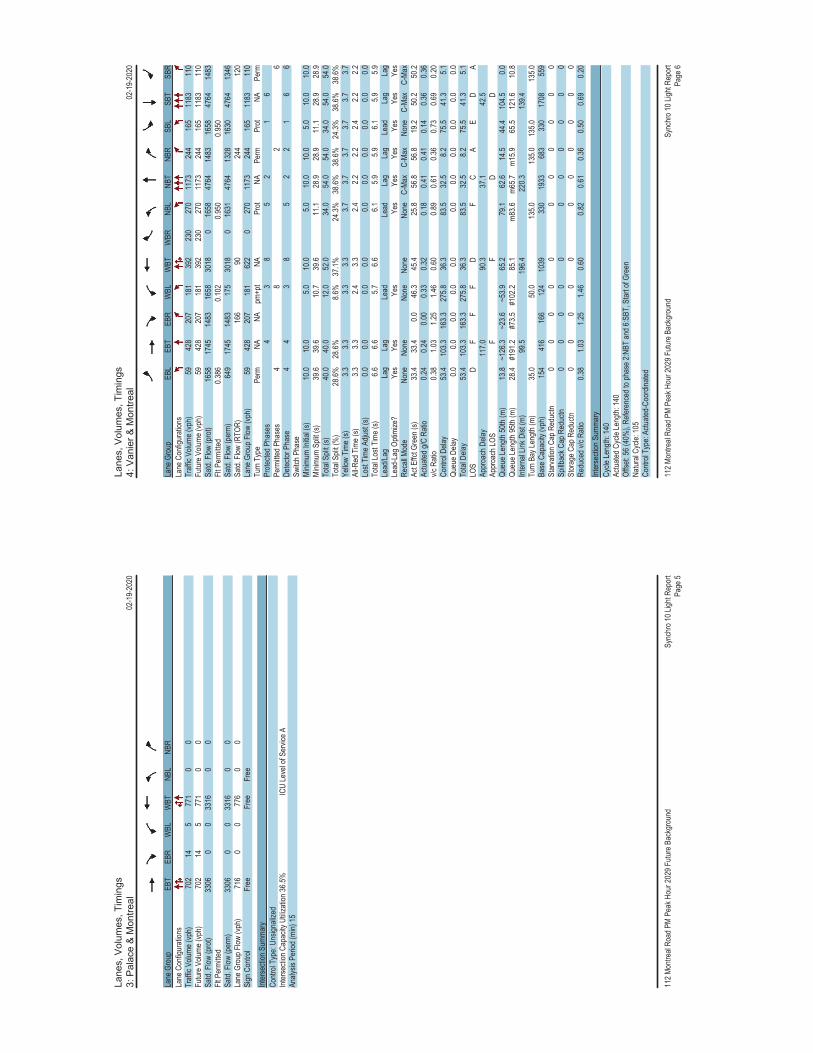
Lane
s, V
olum
es, T
imin
gs3:
Pal
ace
& M
ontr
eal
02-1
9-20
20
112 M
ontre
al Ro
ad P
M Pe
ak H
our 2
029 F
uture
Bac
kgro
und
Sync
hro 1
0 Ligh
t Rep
ort
Page
5
Lane
Gro
upEB
TEB
RW
BLW
BTNB
LNB
RLa
ne C
onfig
urati
ons
Traff
ic Vo
lume (
vph)
702
145
771
00
Futur
e Volu
me (v
ph)
702
145
771
00
Satd.
Flow
(pro
t)33
060
033
160
0Flt
Per
mitte
dSa
td. F
low (p
erm)
3306
00
3316
00
Lane
Gro
up F
low (v
ph)
716
00
776
00
Sign
Con
trol
Free
Free
Free
Inter
secti
on S
umma
ryCo
ntrol
Type
: Uns
ignali
zed
Inter
secti
on C
apac
ity U
tiliza
tion 3
6.5%
ICU
Leve
l of S
ervic
e AAn
alysis
Per
iod (m
in) 15
Lane
s, V
olum
es, T
imin
gs4:
Van
ier
& M
ontr
eal
02-1
9-20
20
112 M
ontre
al Ro
ad P
M Pe
ak H
our 2
029 F
uture
Bac
kgro
und
Sync
hro 1
0 Ligh
t Rep
ort
Page
6
Lane
Gro
upEB
LEB
TEB
RW
BLW
BTW
BRNB
LNB
TNB
RSB
LSB
TSB
RLa
ne C
onfig
urati
ons
Traff
ic Vo
lume (
vph)
5942
820
718
139
223
027
011
7324
416
511
8311
0Fu
ture V
olume
(vph
)59
428
207
181
392
230
270
1173
244
165
1183
110
Satd.
Flow
(pro
t)16
5817
4514
8316
5830
180
1658
4764
1483
1658
4764
1483
Flt P
ermi
tted
0.386
0.102
0.950
0.950
Satd.
Flow
(per
m)64
917
4514
8317
530
180
1631
4764
1328
1630
4764
1346
Satd.
Flow
(RTO
R)16
690
244
120
Lane
Gro
up F
low (v
ph)
5942
820
718
162
20
270
1173
244
165
1183
110
Turn
Typ
ePe
rmNA
NApm
+pt
NAPr
otNA
Perm
Prot
NAPe
rmPr
otecte
d Pha
ses
43
85
21
6Pe
rmitte
d Pha
ses
48
26
Detec
tor P
hase
44
38
52
21
66
Switc
h Pha
seMi
nimum
Initia
l (s)
10.0
10.0
5.010
.05.0
10.0
10.0
5.010
.010
.0Mi
nimum
Spli
t (s)
39.6
39.6
10.7
39.6
11.1
28.9
28.9
11.1
28.9
28.9
Total
Spli
t (s)
40.0
40.0
12.0
52.0
34.0
54.0
54.0
34.0
54.0
54.0
Total
Spli
t (%
)28
.6%28
.6%8.6
%37
.1%24
.3%38
.6%38
.6%24
.3%38
.6%38
.6%Ye
llow
Time (
s)3.3
3.33.3
3.33.7
3.73.7
3.73.7
3.7Al
l-Red
Tim
e (s)
3.33.3
2.43.3
2.42.2
2.22.4
2.22.2
Lost
Time A
djust
(s)0.0
0.00.0
0.00.0
0.00.0
0.00.0
0.0To
tal Lo
st Tim
e (s)
6.66.6
5.76.6
6.15.9
5.96.1
5.95.9
Lead
/Lag
Lag
Lag
Lead
Lead
Lag
Lag
Lead
Lag
Lag
Lead
-Lag
Opti
mize
?Ye
sYe
sYe
sYe
sYe
sYe
sYe
sYe
sYe
sRe
call M
ode
None
None
None
None
None
C-Ma
xC-
Max
None
C-Ma
xC-
Max
Act E
ffct G
reen
(s)
33.4
33.4
0.046
.345
.425
.856
.856
.819
.250
.250
.2Ac
tuated
g/C
Ratio
0.24
0.24
0.00
0.33
0.32
0.18
0.41
0.41
0.14
0.36
0.36
v/c R
atio
0.38
1.03
1.25
1.46
0.60
0.89
0.61
0.36
0.73
0.69
0.20
Contr
ol De
lay53
.410
3.316
3.327
5.836
.383
.532
.58.2
75.5
41.3
5.1Qu
eue D
elay
0.00.0
0.00.0
0.00.0
0.00.0
0.00.0
0.0To
tal D
elay
53.4
103.3
163.3
275.8
36.3
83.5
32.5
8.275
.541
.35.1
LOS
DF
FF
DF
CA
ED
AAp
proa
ch D
elay
117.0
90.3
37.1
42.5
Appr
oach
LOS
FF
DD
Queu
e Len
gth 50
th (m
)13
.8~1
26.3
~23.6
~53.9
65.2
79.1
62.6
14.5
44.4
104.5
0.0Qu
eue L
ength
95th
(m)
28.4
#191
.2#7
3.5#1
02.2
85.1
m83.6
m65.7
m15.9
65.5
121.6
10.8
Inter
nal L
ink D
ist (m
)99
.519
6.422
0.313
9.4Tu
rn B
ay Le
ngth
(m)
35.0
50.0
135.0
135.0
135.0
135.0
Base
Cap
acity
(vph
)15
441
616
612
410
3933
019
3368
333
017
0855
9St
arva
tion C
ap R
educ
tn0
00
00
00
00
00
Spillb
ack C
ap R
educ
tn0
00
00
00
00
00
Stor
age C
ap R
educ
tn0
00
00
00
00
00
Redu
ced v
/c Ra
tio0.3
81.0
31.2
51.4
60.6
00.8
20.6
10.3
60.5
00.6
90.2
0
Inter
secti
on S
umma
ryCy
cle Le
ngth:
140
Actua
ted C
ycle
Leng
th: 14
0Of
fset: 5
6 (40
%),
Refer
ence
d to p
hase
2:NB
T an
d 6:S
BT, S
tart o
f Gre
enNa
tural
Cycle
: 105
Contr
ol Ty
pe: A
ctuate
d-Co
ordin
ated

Lane
s, V
olum
es, T
imin
gs4:
Van
ier
& M
ontr
eal
02-1
9-20
20
112 M
ontre
al Ro
ad P
M Pe
ak H
our 2
029 F
uture
Bac
kgro
und
Sync
hro 1
0 Ligh
t Rep
ort
Page
7
Maxim
um v/
c Rati
o: 1.4
6Int
erse
ction
Sign
al De
lay: 5
9.9Int
erse
ction
LOS:
EInt
erse
ction
Cap
acity
Utili
zatio
n 97.5
%IC
U Le
vel o
f Ser
vice F
Analy
sis P
eriod
(min)
15De
scrip
tion:
As pe
r sign
al tim
ing pl
an pr
ovide
d on N
ov 29
, 201
9.~
Volu
me ex
ceed
s cap
acity
, que
ue is
theo
retic
ally i
nfinit
e.
Que
ue sh
own i
s max
imum
after
two c
ycles
.#
95th
perce
ntile
volum
e exc
eeds
capa
city,
queu
e may
be lo
nger
.
Que
ue sh
own i
s max
imum
after
two c
ycles
.m
Volu
me fo
r 95th
perce
ntile
queu
e is m
etere
d by u
pstre
am si
gnal.
Splits
and P
hase
s:
4: Va
nier &
Mon
treal
Lane
s, V
olum
es, T
imin
gs5:
Cod
y/H
anna
h &
Mon
trea
l02
-19-
2020
112 M
ontre
al Ro
ad P
M Pe
ak H
our 2
029 F
uture
Bac
kgro
und
Sync
hro 1
0 Ligh
t Rep
ort
Page
8
Lane
Gro
upEB
LEB
TEB
RW
BLW
BTW
BRNB
LNB
TNB
RSB
LSB
TSB
RLa
ne C
onfig
urati
ons
Traff
ic Vo
lume (
vph)
114
767
73
700
450
00
7115
71Fu
ture V
olume
(vph
)11
476
77
370
045
00
071
1571
Satd.
Flow
(pro
t)0
1730
00
3223
00
00
015
520
Flt P
ermi
tted
0.812
0.953
0.978
Satd.
Flow
(per
m)0
1396
00
3071
00
00
015
240
Satd.
Flow
(RTO
R)1
1537
Lane
Gro
up F
low (v
ph)
088
80
074
80
00
00
157
0Tu
rn T
ype
Perm
NAPe
rmNA
Perm
NAPr
otecte
d Pha
ses
26
8Pe
rmitte
d Pha
ses
26
8De
tector
Pha
se2
26
68
8Sw
itch P
hase
Minim
um In
itial (s
)10
.010
.010
.010
.010
.010
.0Mi
nimum
Spli
t (s)
25.5
25.5
21.5
21.5
21.5
21.5
Total
Spli
t (s)
75.0
75.0
75.0
75.0
25.0
25.0
Total
Spli
t (%
)75
.0%75
.0%75
.0%75
.0%25
.0%25
.0%Ye
llow
Time (
s)3.3
3.33.3
3.33.3
3.3Al
l-Red
Tim
e (s)
2.22.2
2.22.2
2.22.2
Lost
Time A
djust
(s)0.0
0.00.0
Total
Lost
Time (
s)5.5
5.55.5
Lead
/Lag
Lead
-Lag
Opti
mize
?Re
call M
ode
C-Ma
xC-
Max
C-Ma
xC-
Max
None
None
Act E
ffct G
reen
(s)
74.5
74.5
14.5
Actua
ted g/
C Ra
tio0.7
40.7
40.1
4v/c
Rati
o0.8
50.3
30.6
3Co
ntrol
Delay
20.5
5.041
.1Qu
eue D
elay
0.80.0
0.0To
tal D
elay
21.3
5.041
.1LO
SC
AD
Appr
oach
Dela
y21
.35.0
41.1
Appr
oach
LOS
CA
DQu
eue L
ength
50th
(m)
108.0
22.5
21.5
Queu
e Len
gth 95
th (m
)#2
35.4
34.8
40.2
Inter
nal L
ink D
ist (m
)19
6.487
.112
7.910
6.3Tu
rn B
ay Le
ngth
(m)
Base
Cap
acity
(vph
)10
4022
9232
6St
arva
tion C
ap R
educ
tn33
00
Spillb
ack C
ap R
educ
tn0
00
Stor
age C
ap R
educ
tn0
00
Redu
ced v
/c Ra
tio0.8
80.3
30.4
8
Inter
secti
on S
umma
ryCy
cle Le
ngth:
100
Actua
ted C
ycle
Leng
th: 10
0Of
fset: 1
0 (10
%),
Refer
ence
d to p
hase
2:EB
TL an
d 6:W
BTL,
Star
t of G
reen
Natur
al Cy
cle: 9
0Co
ntrol
Type
: Actu
ated-
Coor
dinate
d

Lane
s, V
olum
es, T
imin
gs5:
Cod
y/H
anna
h &
Mon
trea
l02
-19-
2020
112 M
ontre
al Ro
ad P
M Pe
ak H
our 2
029 F
uture
Bac
kgro
und
Sync
hro 1
0 Ligh
t Rep
ort
Page
9
Maxim
um v/
c Rati
o: 0.8
5Int
erse
ction
Sign
al De
lay: 1
6.2Int
erse
ction
LOS:
BInt
erse
ction
Cap
acity
Utili
zatio
n 103
.3%IC
U Le
vel o
f Ser
vice G
Analy
sis P
eriod
(min)
15De
scrip
tion:
As pe
r sign
al tim
ing pl
an pr
ovide
d on N
ov 29
, 201
9.#
95th
perce
ntile
volum
e exc
eeds
capa
city,
queu
e may
be lo
nger
.
Que
ue sh
own i
s max
imum
after
two c
ycles
.
Splits
and P
hase
s:
5: Co
dy/H
anna
h & M
ontre
al
Lane
s, V
olum
es, T
imin
gs6:
Nor
th R
iver
& S
elki
rk02
-19-
2020
112 M
ontre
al Ro
ad P
M Pe
ak H
our 2
029 F
uture
Bac
kgro
und
Sync
hro 1
0 Ligh
t Rep
ort
Page
10
Lane
Gro
upW
BLW
BRNB
TNB
RSB
LSB
TLa
ne C
onfig
urati
ons
Traff
ic Vo
lume (
vph)
115
4747
80
050
4Fu
ture V
olume
(vph
)11
547
478
00
504
Satd.
Flow
(pro
t)16
5814
8317
450
033
16Flt
Per
mitte
d0.9
50Sa
td. F
low (p
erm)
1658
1483
1745
00
3316
Lane
Gro
up F
low (v
ph)
115
4747
80
050
4Si
gn C
ontro
lSt
opFr
eeFr
ee
Inter
secti
on S
umma
ryCo
ntrol
Type
: Uns
ignali
zed
Inter
secti
on C
apac
ity U
tiliza
tion 4
0.4%
ICU
Leve
l of S
ervic
e AAn
alysis
Per
iod (m
in) 15

HC
M 2
010
TW
SC
6: N
orth
Riv
er &
Sel
kirk
02-1
9-20
20
112 M
ontre
al Ro
ad P
M Pe
ak H
our 2
029 F
uture
Bac
kgro
und
Sync
hro 1
0 Ligh
t Rep
ort
Page
11
Inter
secti
onInt
Dela
y, s/v
eh2.4
Move
ment
WBL
WBR
NBT
NBR
SBL
SBT
Lane
Con
figur
ation
sTr
affic
Vol, v
eh/h
115
4747
80
050
4Fu
ture V
ol, ve
h/h11
547
478
00
504
Confl
icting
Ped
s, #/h
r2
20
6666
0Si
gn C
ontro
l St
opSt
opFr
eeFr
eeFr
eeFr
eeRT
Cha
nneli
zed
-No
ne-
None
-No
neSt
orag
e Len
gth0
0-
--
-Ve
h in M
edian
Stor
age,
#0
-0
--
0Gr
ade,
%0
-0
--
0Pe
ak H
our F
actor
100
100
100
100
100
100
Heav
y Veh
icles
, %2
22
22
2Mv
mt F
low11
547
478
00
504
Major
/Mino
rMi
nor1
Major
1Ma
jor2
Confl
icting
Flow
All
732
480
0-
--
Stag
e 147
8-
--
--
Stag
e 225
4-
--
--
Critic
al Hd
wy6.6
36.2
3-
--
-Cr
itical
Hdwy
Stg
15.4
3-
--
--
Critic
al Hd
wy S
tg 2
5.83
--
--
-Fo
llow-
up H
dwy
3.519
3.319
--
--
Pot C
ap-1
Man
euve
r37
258
5-
00
-
S
tage 1
623
--
00
-
S
tage 2
766
--
00
-Pl
atoon
bloc
ked,
%-
-Mo
v Cap
-1 M
aneu
ver
371
584
--
--
Mov C
ap-2
Man
euve
r37
1-
--
--
Stag
e 162
3-
--
--
Stag
e 276
4-
--
--
Appr
oach
WB
NBSB
HCM
Contr
ol De
lay, s
16.9
00
HCM
LOS
C Mi
nor L
ane/M
ajor M
vmt
NBTW
BLn1
WBL
n2SB
TCa
pacit
y (ve
h/h)
-37
158
4-
HCM
Lane
V/C
Rati
o-
0.31
0.08
-HC
M Co
ntrol
Delay
(s)
-19
11.7
-HC
M La
ne LO
S-
CB
-HC
M 95
th %
tile Q
(veh)
-1.3
0.3-
Lane
s, V
olum
es, T
imin
gs7:
McA
rthu
r &
Dun
das
02-1
9-20
20
112 M
ontre
al Ro
ad P
M Pe
ak H
our 2
029 F
uture
Bac
kgro
und
Sync
hro 1
0 Ligh
t Rep
ort
Page
12
Lane
Gro
upEB
LEB
TW
BTW
BRSB
LSB
RLa
ne C
onfig
urati
ons
Traff
ic Vo
lume (
vph)
761
334
995
294
Futur
e Volu
me (v
ph)
761
334
995
294
Satd.
Flow
(pro
t)0
1743
1694
016
450
Flt P
ermi
tted
0.999
0.958
Satd.
Flow
(per
m)0
1743
1694
016
450
Lane
Gro
up F
low (v
ph)
062
044
40
330
Sign
Con
trol
Free
Free
Stop
Inter
secti
on S
umma
ryCo
ntrol
Type
: Uns
ignali
zed
Inter
secti
on C
apac
ity U
tiliza
tion 5
2.5%
ICU
Leve
l of S
ervic
e AAn
alysis
Per
iod (m
in) 15

HC
M 2
010
TW
SC
7: M
cArt
hur
& D
unda
s02
-19-
2020
112 M
ontre
al Ro
ad P
M Pe
ak H
our 2
029 F
uture
Bac
kgro
und
Sync
hro 1
0 Ligh
t Rep
ort
Page
13
Inter
secti
onInt
Dela
y, s/v
eh0.8
Move
ment
EBL
EBT
WBT
WBR
SBL
SBR
Lane
Con
figur
ation
sTr
affic
Vol, v
eh/h
761
334
995
294
Futur
e Vol,
veh/h
761
334
995
294
Confl
icting
Ped
s, #/h
r76
00
760
9Si
gn C
ontro
l Fr
eeFr
eeFr
eeFr
eeSt
opSt
opRT
Cha
nneli
zed
-No
ne-
None
-No
neSt
orag
e Len
gth-
--
-0
-Ve
h in M
edian
Stor
age,
#-
00
-0
-Gr
ade,
%-
00
-0
-Pe
ak H
our F
actor
100
100
100
100
100
100
Heav
y Veh
icles
, %2
22
22
2Mv
mt F
low7
613
349
9529
4 Ma
jor/M
inor
Major
1Ma
jor2
Mino
r2Co
nflict
ing F
low A
ll52
00
-0
1100
482
Stag
e 1-
--
-47
3-
Stag
e 2-
--
-62
7-
Critic
al Hd
wy4.1
2-
--
6.42
6.22
Critic
al Hd
wy S
tg 1
--
--
5.42
-Cr
itical
Hdwy
Stg
2-
--
-5.4
2-
Follo
w-up
Hdw
y2.2
18-
--
3.518
3.318
Pot C
ap-1
Man
euve
r10
46-
--
235
584
Stag
e 1-
--
-62
7-
Stag
e 2-
--
-53
2-
Plato
on bl
ocke
d, %
--
-Mo
v Cap
-1 M
aneu
ver
984
--
-20
654
6Mo
v Cap
-2 M
aneu
ver
--
--
206
-
S
tage 1
--
--
584
-
S
tage 2
--
--
501
- Ap
proa
chEB
WB
SBHC
M Co
ntrol
Delay
, s0.1
023
.9HC
M LO
SC
Mino
r Lan
e/Majo
r Mvm
tEB
LEB
TW
BTW
BRSB
Ln1
Capa
city (
veh/h
)98
4-
--
223
HCM
Lane
V/C
Rati
o0.0
07-
--
0.148
HCM
Contr
ol De
lay (s
)8.7
0-
-23
.9HC
M La
ne LO
SA
A-
-C
HCM
95th
%tile
Q(ve
h)0
--
-0.5
Lane
s, V
olum
es, T
imin
gs8:
Mar
guer
ite &
McA
rthu
r02
-19-
2020
112 M
ontre
al Ro
ad P
M Pe
ak H
our 2
029 F
uture
Bac
kgro
und
Sync
hro 1
0 Ligh
t Rep
ort
Page
14
Lane
Gro
upEB
TEB
RW
BLW
BTNB
LNB
RLa
ne C
onfig
urati
ons
Traff
ic Vo
lume (
vph)
622
2140
436
2052
Futur
e Volu
me (v
ph)
622
2140
436
2052
Satd.
Flow
(pro
t)17
340
017
3816
5814
83Flt
Per
mitte
d0.9
230.9
50Sa
td. F
low (p
erm)
1734
00
1609
1586
1425
Satd.
Flow
(RTO
R)4
52La
ne G
roup
Flow
(vph
)64
30
047
620
52Tu
rn T
ype
NAPe
rmNA
Perm
Perm
Prote
cted P
hase
s2
6Pe
rmitte
d Pha
ses
64
4De
tector
Pha
se2
66
44
Switc
h Pha
seMi
nimum
Initia
l (s)
10.0
10.0
10.0
10.0
10.0
Minim
um S
plit (
s)27
.523
.523
.524
.524
.5To
tal S
plit (
s)50
.050
.050
.025
.025
.0To
tal S
plit (
%)
66.7%
66.7%
66.7%
33.3%
33.3%
Yello
w Tim
e (s)
3.33.3
3.33.3
3.3Al
l-Red
Tim
e (s)
2.22.2
2.22.2
2.2Lo
st Tim
e Adju
st (s)
0.00.0
0.00.0
Total
Lost
Time (
s)5.5
5.55.5
5.5Le
ad/La
gLe
ad-L
ag O
ptimi
ze?
Reca
ll Mod
eC-
Max
C-Ma
xC-
Max
None
None
Act E
ffct G
reen
(s)
58.8
58.8
13.6
13.6
Actua
ted g/
C Ra
tio0.7
80.7
80.1
80.1
8v/c
Rati
o0.4
70.3
80.0
70.1
7Co
ntrol
Delay
7.76.7
23.4
8.4Qu
eue D
elay
0.00.0
0.00.0
Total
Dela
y7.7
6.723
.48.4
LOS
AA
CA
Appr
oach
Dela
y7.7
6.712
.6Ap
proa
ch LO
SA
AB
Queu
e Len
gth 50
th (m
)32
.121
.52.5
0.0Qu
eue L
ength
95th
(m)
81.8
55.8
7.17.7
Inter
nal L
ink D
ist (m
)36
.315
4.214
4.2Tu
rn B
ay Le
ngth
(m)
Base
Cap
acity
(vph
)13
6012
6141
240
8St
arva
tion C
ap R
educ
tn0
00
0Sp
illbac
k Cap
Red
uctn
00
00
Stor
age C
ap R
educ
tn0
00
0Re
duce
d v/c
Ratio
0.47
0.38
0.05
0.13
Inter
secti
on S
umma
ryCy
cle Le
ngth:
75Ac
tuated
Cyc
le Le
ngth:
75Of
fset: 0
(0%
), Re
feren
ced t
o pha
se 2:
EBT
and 6
:WBT
L, St
art o
f Gre
enNa
tural
Cycle
: 60
Contr
ol Ty
pe: A
ctuate
d-Co
ordin
ated

Lane
s, V
olum
es, T
imin
gs8:
Mar
guer
ite &
McA
rthu
r02
-19-
2020
112 M
ontre
al Ro
ad P
M Pe
ak H
our 2
029 F
uture
Bac
kgro
und
Sync
hro 1
0 Ligh
t Rep
ort
Page
15
Maxim
um v/
c Rati
o: 0.4
7Int
erse
ction
Sign
al De
lay: 7
.6Int
erse
ction
LOS:
AInt
erse
ction
Cap
acity
Utili
zatio
n 78.9
%IC
U Le
vel o
f Ser
vice D
Analy
sis P
eriod
(min)
15De
scrip
tion:
As pe
r sign
al tim
ing pl
an pr
ovide
d on N
ov 29
, 201
9.
Splits
and P
hase
s:
8: Ma
rgue
rite &
McA
rthur
Lane
s, V
olum
es, T
imin
gs9:
Van
ier
& M
cArt
hur
02-1
9-20
20
112 M
ontre
al Ro
ad P
M Pe
ak H
our 2
029 F
uture
Bac
kgro
und
Sync
hro 1
0 Ligh
t Rep
ort
Page
16
Lane
Gro
upEB
LEB
TEB
RW
BLW
BTW
BRNB
LNB
TNB
RSB
LSB
TSB
RLa
ne C
onfig
urati
ons
Traff
ic Vo
lume (
vph)
6428
554
838
625
319
723
913
9029
114
213
6777
Futur
e Volu
me (v
ph)
6428
554
838
625
319
723
913
9029
114
213
6777
Satd.
Flow
(pro
t)16
5817
4514
8332
1617
4514
8316
5833
1614
8316
5833
1614
83Flt
Per
mitte
d0.9
500.9
500.9
500.9
50Sa
td. F
low (p
erm)
1578
1745
1323
2868
1745
1360
1621
3316
1368
1644
3316
1235
Satd.
Flow
(RTO
R)26
119
722
116
8La
ne G
roup
Flow
(vph
)64
285
548
386
253
197
239
1390
291
142
1367
77Tu
rn T
ype
Prot
NAPe
rmPr
otNA
Perm
Prot
NAPe
rmPr
otNA
Perm
Prote
cted P
hase
s7
43
85
21
6Pe
rmitte
d Pha
ses
48
26
Detec
tor P
hase
74
43
88
52
21
66
Switc
h Pha
seMi
nimum
Initia
l (s)
5.010
.010
.05.0
10.0
10.0
5.010
.010
.05.0
10.0
10.0
Minim
um S
plit (
s)11
.236
.236
.211
.236
.236
.211
.136
.136
.111
.136
.136
.1To
tal S
plit (
s)18
.036
.236
.218
.036
.236
.231
.062
.862
.823
.054
.854
.8To
tal S
plit (
%)
12.9%
25.9%
25.9%
12.9%
25.9%
25.9%
22.1%
44.9%
44.9%
16.4%
39.1%
39.1%
Yello
w Tim
e (s)
3.33.3
3.33.3
3.33.3
3.73.7
3.73.7
3.73.7
All-R
ed T
ime (
s)2.9
2.92.9
2.92.9
2.92.4
2.42.4
2.42.4
2.4Lo
st Tim
e Adju
st (s)
0.00.0
0.00.0
0.00.0
0.00.0
0.00.0
0.00.0
Total
Lost
Time (
s)6.2
6.26.2
6.26.2
6.26.1
6.16.1
6.16.1
6.1Le
ad/La
gLa
gLe
adLe
adLa
gLe
adLe
adLe
adLa
gLa
gLe
adLa
gLa
gLe
ad-L
ag O
ptimi
ze?
Yes
Yes
Yes
Yes
Yes
Yes
Yes
Yes
Yes
Yes
Yes
Yes
Reca
ll Mod
eNo
neNo
neNo
neNo
neNo
neNo
neNo
neC-
Max
C-Ma
xNo
neC-
Max
C-Ma
xAc
t Effc
t Gre
en (s
)10
.730
.030
.011
.833
.633
.623
.158
.258
.215
.450
.550
.5Ac
tuated
g/C
Ratio
0.08
0.21
0.21
0.08
0.24
0.24
0.16
0.42
0.42
0.11
0.36
0.36
v/c R
atio
0.51
0.76
1.12
1.42
0.61
0.41
0.88
1.01
0.42
0.78
1.14
0.14
Contr
ol De
lay75
.866
.110
5.025
5.256
.08.7
87.1
67.0
9.478
.011
0.63.3
Queu
e Dela
y0.0
0.00.0
0.00.0
0.00.0
0.00.0
0.00.0
0.0To
tal D
elay
75.8
66.1
105.0
255.2
56.0
8.787
.167
.09.4
78.0
110.6
3.3LO
SE
EF
FE
AF
EA
EF
AAp
proa
ch D
elay
90.5
136.8
60.7
102.4
Appr
oach
LOS
FF
EF
Queu
e Len
gth 50
th (m
)17
.274
.8~1
14.4
~74.1
65.0
0.064
.3~2
17.2
12.1
41.0
~227
.20.8
Queu
e Len
gth 95
th (m
)32
.8#1
12.6
#184
.9#1
06.4
95.1
20.7
#105
.4#2
59.8
34.6
m52.8
m#23
6.9m2
.8Int
erna
l Link
Dist
(m)
154.2
174.6
77.0
137.1
Turn
Bay
Leng
th (m
)50
.010
0.012
0.011
5.090
.090
.090
.090
.0Ba
se C
apac
ity (v
ph)
139
373
488
271
418
476
294
1378
698
200
1196
553
Star
vatio
n Cap
Red
uctn
00
00
00
00
00
00
Spillb
ack C
ap R
educ
tn0
00
00
00
00
00
0St
orag
e Cap
Red
uctn
00
00
00
00
00
00
Redu
ced v
/c Ra
tio0.4
60.7
61.1
21.4
20.6
10.4
10.8
11.0
10.4
20.7
11.1
40.1
4
Inter
secti
on S
umma
ryCy
cle Le
ngth:
140
Actua
ted C
ycle
Leng
th: 14
0Of
fset: 5
4 (39
%),
Refer
ence
d to p
hase
2:NB
T an
d 6:S
BT, S
tart o
f Gre
enNa
tural
Cycle
: 145
Contr
ol Ty
pe: A
ctuate
d-Co
ordin
ated

Lane
s, V
olum
es, T
imin
gs9:
Van
ier
& M
cArt
hur
02-1
9-20
20
112 M
ontre
al Ro
ad P
M Pe
ak H
our 2
029 F
uture
Bac
kgro
und
Sync
hro 1
0 Ligh
t Rep
ort
Page
17
Maxim
um v/
c Rati
o: 1.4
2Int
erse
ction
Sign
al De
lay: 9
0.6Int
erse
ction
LOS:
FInt
erse
ction
Cap
acity
Utili
zatio
n 110
.1%IC
U Le
vel o
f Ser
vice H
Analy
sis P
eriod
(min)
15De
scrip
tion:
As pe
r sign
al tim
ing pl
an pr
ovide
d on N
ov 29
, 201
9. Ad
dition
al E-
W pe
destr
ian ph
ase t
ime t
aken
from
N-S
phas
e.~
Volu
me ex
ceed
s cap
acity
, que
ue is
theo
retic
ally i
nfinit
e.
Que
ue sh
own i
s max
imum
after
two c
ycles
.#
95th
perce
ntile
volum
e exc
eeds
capa
city,
queu
e may
be lo
nger
.
Que
ue sh
own i
s max
imum
after
two c
ycles
.m
Volu
me fo
r 95th
perce
ntile
queu
e is m
etere
d by u
pstre
am si
gnal.
Splits
and P
hase
s:
9: Va
nier &
McA
rthur