10009 indonesia - world bank documents & reports
TRANSCRIPT
A WORLD BANK,O1QNTRY STUD1 10009
IndonesiaStrategy for a Sustained Reduction in Poverty
Report No 1 0(9
t_,~Af
Archi ves/R.ecor-ds Center-,HElBi-_o1
ULW ~~~~~~~~~~~1raeiQ.
Pub
lic D
iscl
osur
e A
utho
rized
Pub
lic D
iscl
osur
e A
utho
rized
Pub
lic D
iscl
osur
e A
utho
rized
Pub
lic D
iscl
osur
e A
utho
rized
A WORLD BANK COUNTRY STUDY
IndonesiaStrategy for a Sustained Reduction in Poverty
fI
The World BankWashington, D.C.
Copyright i 1990The International Bank for Reconstructionand Development/THE WORLD BANK1818 H Street, N.W.Washington, D.C. 20433, U.S.A.
All rights reservedManufactured in the United States of AmericaFirst printing November 1990
World Bank Country Studies are among the many reports originally prepared for internal useas part of the continuing analysis by the Bank of the economic and related conditions of itsdeveloping member countries and of its dialogues with the governments. Some of the reports arepublished in this series with the least possible delay for the use of governments and theacademic, business and financial, and development communities. The typescript of this papertherefore has not been prepared in accordance with the procedures appropriate to formal printedtexts, and the World Bank accepts no responsibility for errors.
The World Bank does not guarantee the accuracy of the data included in this publication andaccepts no responsibility whatsoever for any consequence of their use. Any maps that accompanythe text have been prepared solely for the convenience of readers; the designations andpresentation of material in them do not imply the expression of any opinion whatsoever on thepart of the World Bank, its affiliates, or its Board or member countries concerning the legal statusof any country, territory, city, or area or of tit authorities thereof or concerning the delimitationof its boundaries or its national affiliation.
The material in this publication is copyrighted. Requests for permission to reproduce portionsof it should be sent to Director, Publications Department, at the address shown in the copyrightnotice above. The World Bank encourages dissemination of its work and will normally givepermission promptly and, when the reproduction is for noncommercial purposes, without askinga fee. Permission to photocopy portions for classroom use is not required, though notification ofsuch use having been made will be appreciated.
The complete backlist of publications from the World Bank is shown in the annual Index ofPublications, which contains an alphabetical title list (with full ordering information) and indexesof subjects, authors, and countries and regions. The latest edition is available free of charge fromthe Publications Sales Unit, Department F, The World Bank, 1818 H Street, N.W., Washington,D.C. 20433, U.S.A., or from Publications, The World Bank, 66, avenue d'I6na, 75116 Paris, France.
ISSN: 0253-2123
Library of Congress Cataloging-in-Publication Data
Indonesia, strategy for a sustained reduction in poverty.p. cm. -- (A World Bank country study)
ISBN 0-8213-1698-21. Indonesia--Economic conditions--1945- 2. Indonesia--Economic
policy. 3. Poor--Indonesia. I. International Bank forReconstruction and Development. II. Series.HC450.P6I55 1990338.9598--dc20 90-20379
CIP
- iii -
PREFACE
This work on poverty issues in Indonesia was initiated in 1988 toprovide background information for the Fifth Five-Year Plan (REPELITA V) andthe World Bank's Task Force on Poverty Alleviation. This report was preparedsubsequently as the principal document for the discussion of the specialtopic, "Sustainable Poverty Reduction", at the 1990 Inter-Governmental Groupon Indonesia (IGGI), which was held at the Hague, Netherlands during June12-13, 1990.
Indonesia has been remarkably successful in the last two decades inreducing the incidence of poverty. At the beginning of the 1970s, Indonesiawas one of the poorest countries in the world. Ea,rly estimates of poverty bythe World Bank indicate that 60% of the population or about 70 millionIndonesians were living in absolute poverty. The Government's developmentstrategy, which focused on achieving broad-based economic growth, particularlyrural development, was critical in achieving both rapid growth and, beginningin the late 1970s, significant reductions in the incidence of poverty. Duringthe 1980s, despite the sharp drops in the price of oil and other adversechanges in the international economy, this study finds that poverty continuedto decline, with falls in both the percentage of the population in poverty andthe absolute number of the poor. The Government's response to the externalshocks of the 1980s was a key element in the reduction of poverty achievedduring this period. By undertaking both prompt macroeconomic adjustmentmeasures and comprehensive structural reforms, the Government was able toachieve significant progress in economic adjustment, while maintainingeconomic growth and reducing the incidence of poverty.
The report also outlines a strategy to achieve further povertyreduction during the 1990s. This requires a continuation of the Government'smacroeconomic policies designed to sustain economic growth, as well assectoral policies aimed at improving private sector profitability. Whilethese policies will help achieve the economic growth necessary for povertyreduction, the benefits of economic growth may accrue only slowly to certaingroups of the poor or certain disadvantaged areas of the country. Thereforespecific policies in the agricultural sector, which contains the bulk of thepoor, and in social and basic services are also examined as ways to meet theneeds of the poor more effectively.
The World Bank would like to express its thanks to His Excellency,Dr. Saleh Afiff, the Minister of State for National Development Planning/Chairman of BAPPENAS, for providing the full support of his institution forthis review; and, to Dr. Boediono, Deputy for Fiscal and Monetary Affairs, andDr. Soekirman, Deputy for Social and Cultural Affairs, in BAPPENAS for theirguidance and assistance in all phases of the work. Special thanks are also
- iv -
due to Mr. Sugito, Deputy, Planning and Statistical Analysis, in the CentralBureau of Statistics, for providing access to the socio-economic data used inthis report and to the technical assistance provided by him and his staff tothe World Bank Team in the use of these data. Unfortunately, it is notpossible to thank individually all of the officials and Indonesians whoprovided information, help and support, and without whose assistance thisreport would not be possible.
This report is based on the findings of two World Bank missions toIndonesia in November 1988 and February/March 1989. Discussions with theGovernment were concluded in May 1990. The report was prepared by a team ledby R. Kyle Peters, Jr. The principal contributors were David Beckmann,John Burrows, Michael Mertaugh, Erdogan Pancaroglu, Nicholas Prescott, MartinRavallion, Paul Stott, Cyrus Talati and John Wilton. Other contributors wereAlain Bertaud, Mark Brooks (consultant), Julie Viloria and Dennis Whittle. AWorld Bank Research Project, "Policy Analysis and Poverty: Applicable Methodsand Case Studies" (RPO 675-04), based in the Agriculture and Rural DevelopmentDepartment, provided extensive support for the analysis.
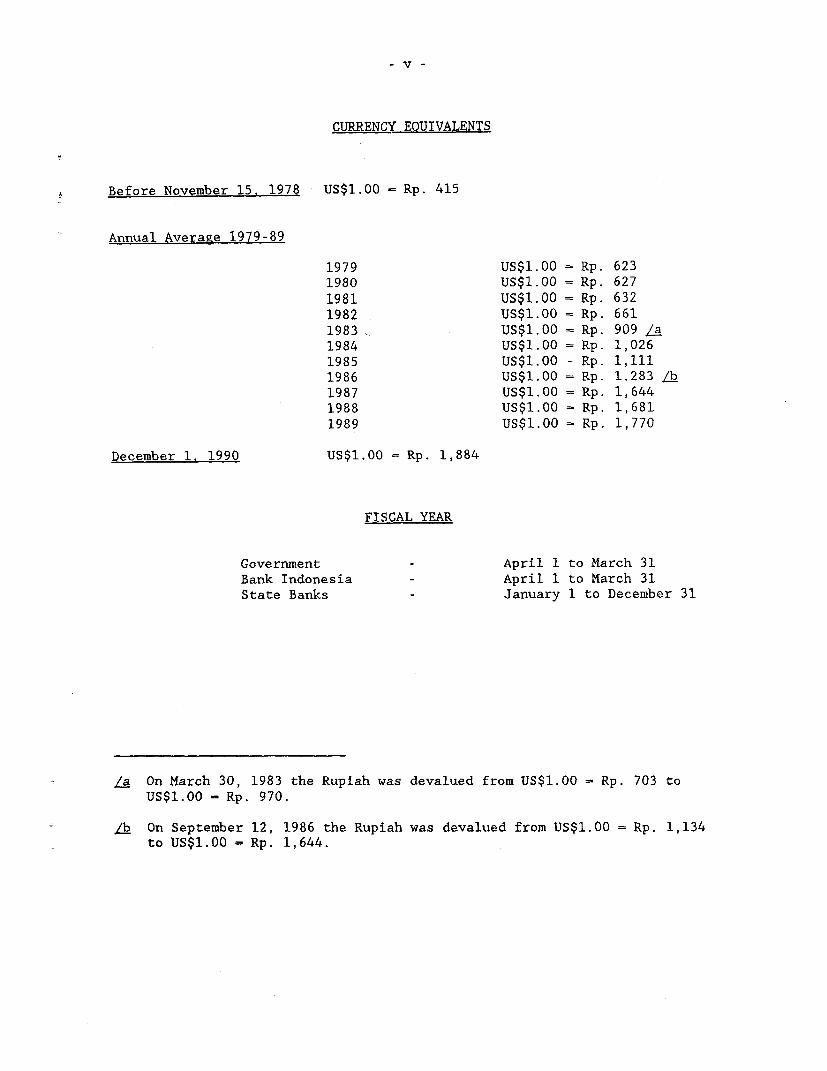
CURRENCY EOUIVALENTS
Before November 15, 1978 US$1.00 - Rp. 415
Annual Average 1979-89
1979 US$1.00 = Rp. 6231980 US$1.00 = Rp. 6271981 US$1.00 = Rp. 6321982 US$1.00 = Rp. 6611983 US$1.00 = Rp. 909 La1984 US$1.00 = Rp. 1,0261985 US$1.00 - Rp. 1,1111986 US$1.00 Rp. 1.283 /b1987 US$1.00 = Rp. 1,6441988 US$1.00 Rp. 1,6811989 US$1.00 Rp. 1,770
December 1. 1990 US$1.00 - Rp. 1,884
FISCAL YEAR
Government - April 1 to March 31Bank Indonesia - April 1 to March 31State Banks - January 1 to December 31
/a On March 30, 1983 the Rupiah was devalued from US$1.00 - Rp. 703 toUS$1.00 = Rp. 970.
/b On September 12, 1986 the Rupiah was devalued from US$1.00 = Rp. 1,134to US$1.00 = Rp. 1,644.
- vi -
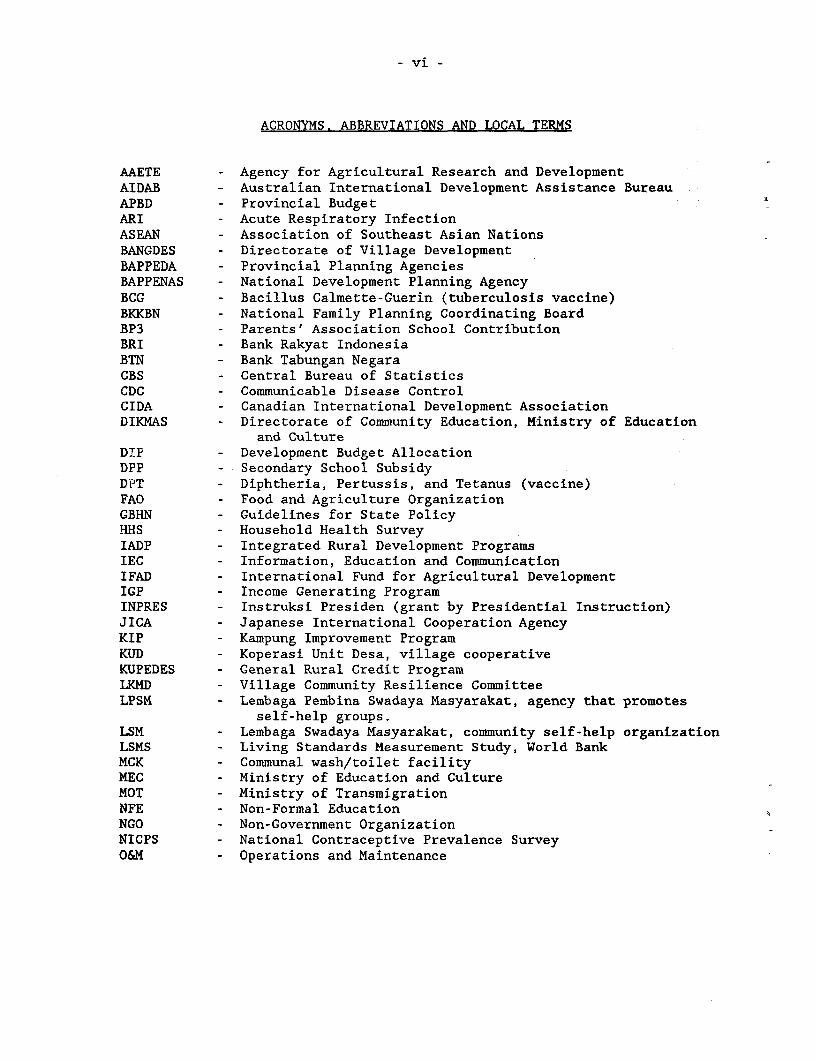
ACRONYMS. ABBREVIATIONS AND LOCAL TERMS
AAETE - Agency for Agricultural Research and DevelopmentAIDAB - Australian International Development Assistance BureauAPBD - Provincial Budget -ARI - Acute Respiratory InfectionASEAN - Association of Southeast Asian NationsBANGDES - Directorate of Village DevelopmentBAPPEDA - Provincial Planning AgenciesBAPPENAS - National Development Planning AgencyBCG - Bacillus Calmette-Guerin (tuberculosis vaccine)BKKBN - National Family Planning Coordinating BoardBP3 - Parents' Association School ContributionBRI - Bank Rakyat IndonesiaBTN - Bank Tabungan NegaraCBS - Central Bureau of StatisticsCDC - Communicable Disease ControlCIDA - Canadian International Development AssociationDIKMAS - Directorate of Community Education, Ministry of Education
and CultureDIP - Development Budget AllocationDPP - Secondary School SubsidyDPT - Diphtheria, Pertussis, and Tetanus (vaccine)FAO - Food and Agriculture OrganizationGBHN - Guidelines for State PolicyHHS - Household Health SurveyIADP - Integrated Rural Development ProgramsIEC - Information, Education and CommunicationIFAD - International Fund for Agricultural DevelopmentIGP - Income Generating ProgramINPRES - Instruksi Presiden (grant by Presidential Instruction)JICA - Japanese International Cooperation AgencyKIP - Kampung Improvement ProgramKUD - Koperasi Unit Desa, village cooperativeKUPEDES - General Rural Credit ProgramLKMD - Village Community Resilience CommitteeLPSM - Lembaga Pembina Swadaya Masyarakat, agency that promotes
self-help groups.LSM - Lembaga Swadaya Masyarakat, community self-help organizationLSMS - Living Standards Measurement Study, World BankMCK - Communal wash/toilet facilityMEC - Ministry of Education and CultureMOT - Ministry of TransmigrationNFE - Non-Formal EducationNGO - Non-Government OrganizationNICPS - National Contraceptive Prevalence SurveyO&M - Operations and Maintenance
- vii -
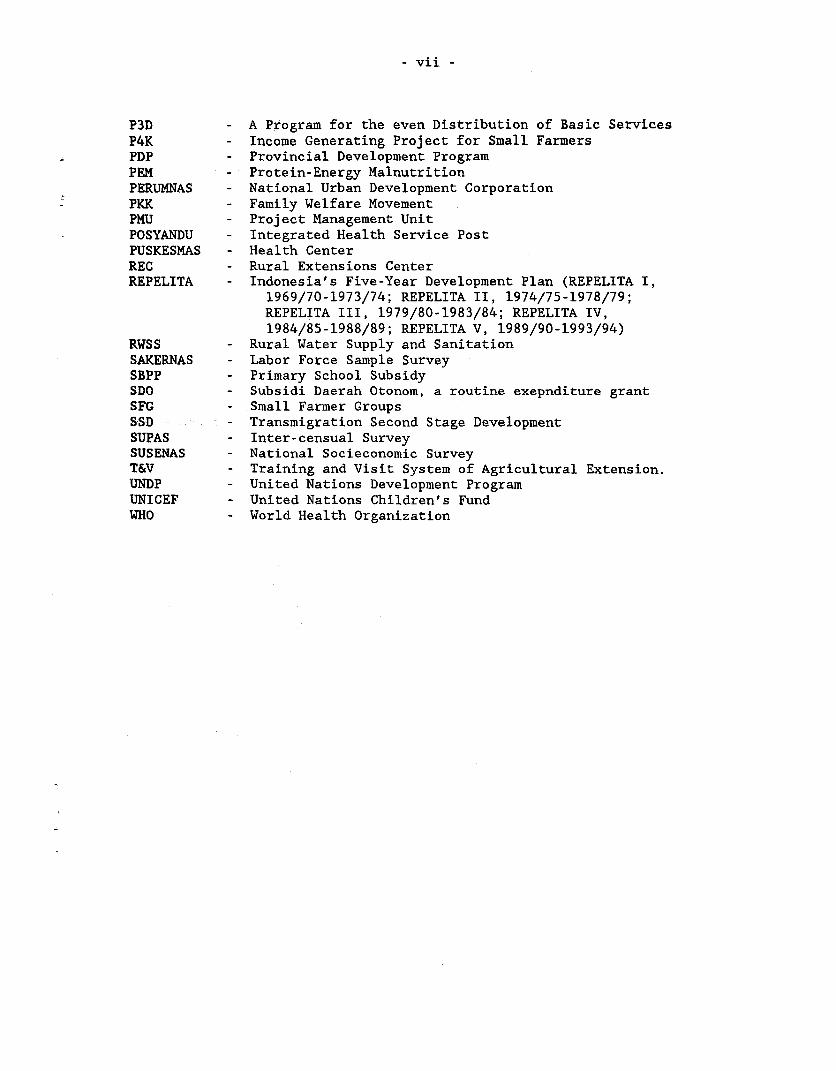
P3D - A Program for the even Distribution of Basic Services
P4K - Income Generating Project for Small Farmers
PDP - Provincial Development Program
PEM - Protein-Energy Malnutrition
PERUMNAS - National Urban Development Corporation
PKK - Family Welfare Movement
PMU - Project Management Unit
POSYANDU - Integrated Health Service Post
PUSKESMAS - Health CenterREC - Rural Extensions Center
REPELITA - Indonesia's Five-Year Development Plan (REPELITA I,
1969/70-1973/74; REPELITA II, 1974/75-1978/79;
REPELITA III, 1979/80-1983/84; REPELITA IV,
1984/85-1988/89; REPELITA V, 1989/90-1993/94)
RWSS - Rural Water Supply and Sanitation
SAKERNAS - Labor Force Sample Survey
SBPP - Primary School Subsidy
SDO - Subsidi Daerah Otonom, a routine exepnditure grant
SFG - Small Farmer Groups
SSD - Transmigration Second Stage Development
SUPAS - Inter-censual Survey
SUSENAS - National Socieconomic Survey
T&V - Training and Visit System of Agricultural Extension.
UNDP - United Nations Development Program
UNICEF - United Nations Children's Fund
WHO - World Health Organization

I I I I I , I 4
- ix -
TABLE OF CONTENTS
Page No.
SUMMARY AND CONCLUSIONS .............................................. xv-xxv
CHAPTER I: ASSESSMENT OF POVERTY IN INDONESIA .............. 1
A. Overview ........................................... 1
B. Poverty Reduction Prior to the Adjustment Period ... 3
C. Trends in the Incidence of Poverty during theAdjustment Period ............................... 7Trends in Income and Consumption .... ........... 7Trends in the Incidence of Poverty .10Alternative Estimates of the Incidence of
Poverty .11The "Near" Poor .13Incidence of Poverty by Province .14Incidence of Poverty by Principal Source ofHousehold Income .15
Trends in Food Expenditures and Caloric
Intake Levels .17Summary .19
D. Factors Underlying the Reduction in Poverty .19
CHAPTER II: A STRATEGIC OVERVIEW .. 27
A. Overview .27
B. The Nature of the Poverty Problem .28Introduction .28Regional Characteristics of the PovertyProblem .29
Household Characteristics of the Poor .33
C. A Strategy for Poverty Reduction .35Introduction .35Targeted Income Generating Programs for
the Poor .37Small-scale Credit Schemes .40Improving the Human Assets of the Poor .43
D. Poverty Initiatives for REPELITA V .44
x
Page No.
CHAPTER III: SUSTAINING AGRICULTURE'S ROLE IN POVERTY REDUCTION ..... 49
A. Introduction ....................................... 49
B. Profile of Rural Poverty ........................... 50
C. The Role of Agriculture in Reducing Poverty .... .... 55
D. Reducing Poverty through Growth ......... ........... 58Introduction ............... .. ................... 58A Strategy for Accelerated Growth ....... ........ 58Ensuring more Equitable Growth ........ .......... 60
E. Expanding the Reach of Agricultural DevelopmentPrograms ................... ..................... 60Introduction ............. 60Agricultural Support Services ........ .......... 61Commodity Development Programs ........ ......... 65
F. Targeted Poverty-Reduction Programs ....... ......... 69Introduction ............... .. .................. 69Area Development Programs ........ .. ............ 69Targeting Poverty Groups: The P4K Program 72The Transmigration Program ........ .. ........... 73
CHAPTER IV: HUMAN RESOURCE DEVELOPMENT FOR THE POOR:PART I - THE SOCIAL SERVICES ......................... 77
A. Introduction ....................................... 77
B. Education .................... ...................... 77Introduction ................. .................. 77Basic Education ............... ................. 78Non-Formal Education ........... .. .............. 85
C. Health ............................................. 88Introduction ................. .................. 88Performance Indicators .......... .. ............. 89Access and Consumption Indicators .............. . 92Targeting Health Programs to the Poor .......... 95Financing Health Programs for the Poor .. ..... 98An Agenda for REPELITA V ............... 100
D. Nutrition ................. ................. 100Performance Indicators ............. I.......... 100The Targeting and Financing of Nutrition
Programs ......................... 101An Agenda for REPELITA V ....................... 104
-xi -
Page No.
CHAPTER V: HUMAN RESOURCE DEVELOPMENT FOR THE POOR:PART II - OTHER BASIC SERVICES ....................... 105
A. Introduction ....................................... 105
B. Rural Water Supply and Sanitation .... .............. 105RWSS Service Levels ............................ 106Past RWSS Programs and their Effectiveness ..... 109An Agenda for REPELITA V ....................... 111
C. Basic Services for the Poor in Urban Areas .... ..... 112Introduction ................................... 112Water Supply for the Urban Poor .... ............ 114Human Waste Disposal ........................... 119Kampung Improvement Program .................... 122Government Housing Programs and the Poor ....... 126
CHAPTER VI: DEVELOPING AN INSTITUTIONAL FRAMEWORK FOR POVERTYREDUCTION ............................................ 131
A. Overview ........................................... 131
B. Government Institutions ............................ 131
C. The Role of Community Groups in Poverty Programs ... 134Community Organizations in Indonesia .... ....... 135Role of Community Groups in Existing Development
Programs ..................................... 138Enhancing the Role of Community Groups inPoverty Programs ............................. 140
ANNEX I : THE NATIONAL SOCIOECONOMIC SURVEY (SUSENAS) .... .......... 143
ANNEX II : ISSUES IN PRICE DEFLATION ................................ 147
ANNEX III: ESTIMATES OF THE INCIDENCE OF POVERTY IN INDONESIA ....... 151
ANNEX IV : TRENDS IN REAL WAGES DURING THE ADJUSTMENT PERIOD ........ 167
Text Tables
Table No.
ChaDter I
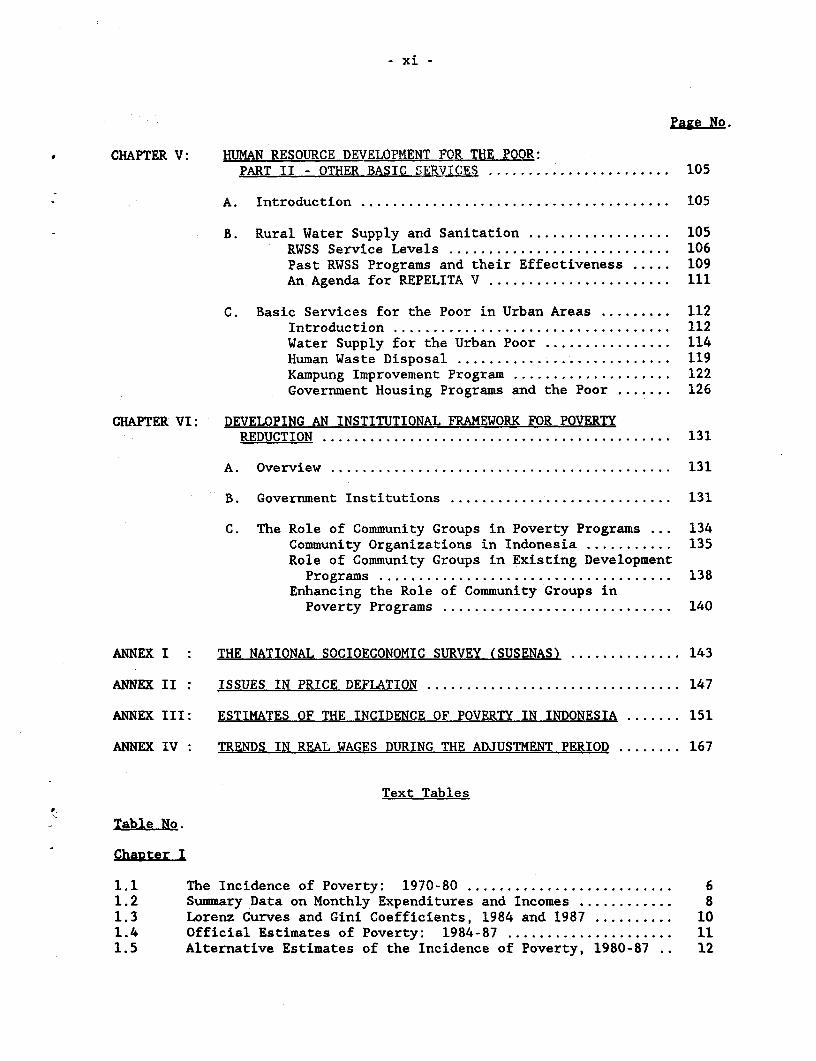
1.1 The Incidence of Poverty: 1970-80 .......................... 61.2 Summary Data on Monthly Expenditures and Incomes .... ........ 81.3 Lorenz Curves and Gini Coefficients, 1984 and 1987 .... ...... 101.4 Official Estimates of Poverty: 1984-87 ..................... 111.5 Alternative Estimates of the Incidence of Poverty, 1980-87 .. 12
- xii -
Table No. Page No.
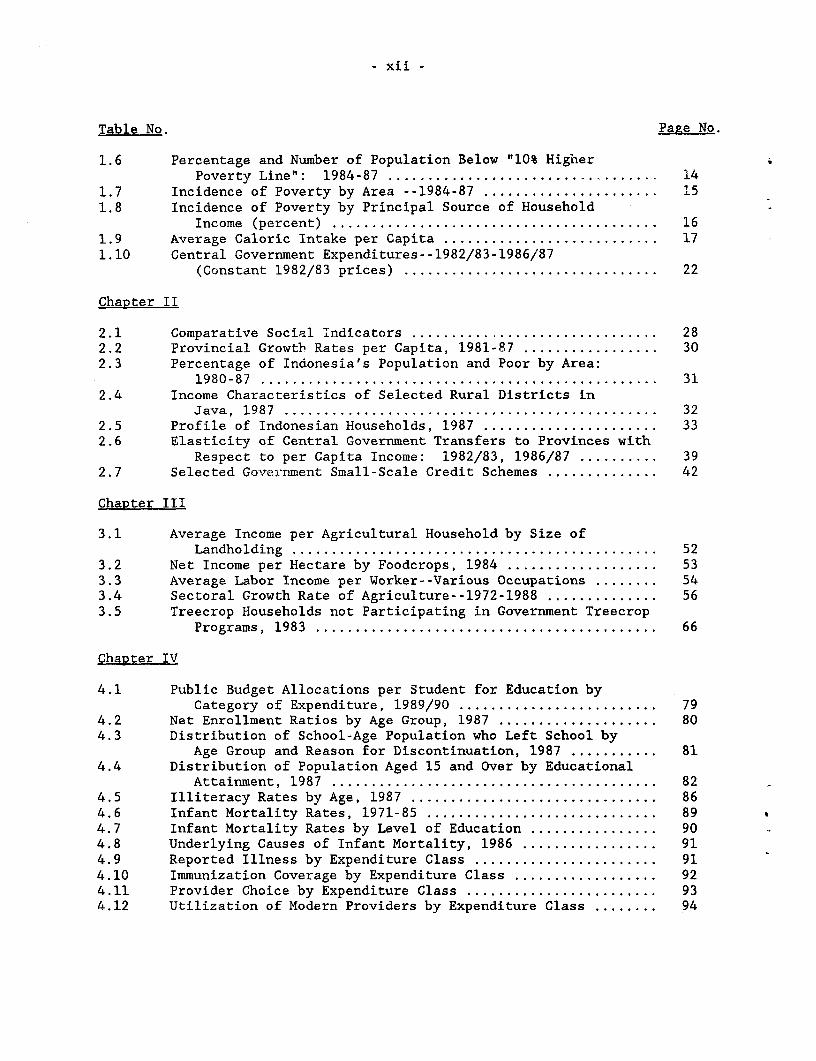
1.6 Percentage and Number of Population Below "10% HigherPoverty Line": 1984-87 .................................. 14
1.7 Incidence of Poverty by Area --1984-87 .. 1. 15
1.8 Incidence of Poverty by Principal Source of HouseholdIncome (percent) .16
1.9 Average Caloric Intake per Capita .171.10 Central Government Expenditures--1982/83-1986/87
(Constant 1982/83 prices) ............................... 22
Chapter II
2.1 Comparative Social Indicators ........... .................... 282.2 Provincial Growtb Rates per Capita, 1981-87 .... ............. 302.3 Percentage of Indonesia's Population and Poor by Area:
1980-87 .312.4 Income Characteristics of Selected Rural Districts in
Java, 1987 ............................................... 322.5 Profile of Indonesian Households, 1987 ...................... 332.6 Elasticity of Central Government Transfers to Provinces with
Respect to per Capita Income: 1982/83, 1986/87 .392.7 Selected Government Small-Scale Credit Schemes .... .......... 42
Chapter III
3.1 Average Income per Agricultural Household by Size ofLandholding . .............................................. 52
3.2 Net Income per Hectare by Foodcrops, 1984 ..... .............. 533.3 Average Labor Income per Worker--Various Occupations ........ 543.4 Sectoral Growth Rate of Agriculture--1972-1988 .... .......... 563.5 Treecrop Households not Participating in Government Treecrop
Programs, 1983 .66
ChaRter IV
4.1 Public Budget Allocations per Student for Education byCategory of Expenditure, 1989/90 ......................... 79
4.2 Net Enrollment Ratios by Age Group, 1987 .... ................ 804.3 Distribution of School-Age Population who Left School by
Age Group and Reason for Discontinuation, 1987 .814.4 Distribution of Population Aged 15 and Over by Educational
Attainment, 1987 .824.5 Illiteracy Rates by Age, 1987 .864.6 Infant Mortality Rates, 1971-85 .894.7 Infant Mortality Rates by Level of Education .904.8 Underlying Causes of Infant Mortality, 1986 .914.9 Reported Illness by Expenditure Class .914.10 Immunization Coverage by Expenditure Class .924.11 Provider Choice by Expenditure Class .934.12 Utilization of Modern Providers by Expenditure Class .94
- xiii -
Page No.
4.13 Comparative Hospital Admission Rates by ConsumptionQuintile: Results from LSMS Survey .......... ............ 94
4.14 Distance to Modern Treatment by Expenditure Class ........... 954.15 Provincial Distribution of Health Resources, 1987 ........... 974.16 Prevalence of Protein-Energy Malnutrition (PEM)
by Country, 1985 ........................................ 1014.17 Prevalence of PEM by Region, 1986/87 ........................ 1024.18 Prevalence of PEM by Expenditure Class . ............. 1034.19 Trends in Central Development Budget Allocations for
Nutrition ................................................ 104
Chapter V
5.1 Drinking Water Supply Service Levels in Rural Areas ......... 1075.2 Sanitation Service Levels in Rural Areas .................... 1075.3 Access to RWSS by Education Level of Head of Household ...... 1085.4 Distribution of Urban Households by Income Classes, 1988 .... 1135.5 Source of Drinking Water -- Urban Households, 1988 .......... 1155.6 Water Supply Service Levels in Major Cities--1988 ........... 1165.7 Type of Sanitation Facility: Urban Households-1988 ......... 1195.8 Household Toilet Facilities: Shared vs Private--1.988 ....... 1215.9 Tenure Status of Urban Households, 1988 ......... ............ 128
Chapter VI
6.1 Estimates of Foreign Funding for Community Organizations .... 136
Figures
Figures No. Page No.
Chapter 1
1.1 Consumption Distributions .. 91.2 Distribution of Caloric Intake .. 181.3 Agricultural Output, 1970-88 .. 201.4 Composition of Development Expenditures .. 24
Chapter 4
4.1 Protein-Energy Malnutrition Prevalence .. 102
Boxes
Boxes No.
Chapter 11.1 Other Measures of Poverty ......................... 13
- xiv -
Annex Tables
Page No.
Table No.
1 Provincial Rates of Inflation,Feb. 1984 - Jan. 1987 ..................................... 171
2 Aggregate Poverty Measures, 1984-87 ......................... 1723 Sources of Finance for Public Expenditures at
Lower Levels of Government: 1982/83-1987/88 .1734 Profile of Projects Financed under INPRES DATI II .... ....... 1745 Distribution of Central Government Transfers
by Province: 1982/83-1986/87 .......... ................... 1756 Import and Employment Coefficients ........ .................. 1767 Allocation of Development Expenditures ....... ............... 1778 Trends in Employment: 1971-85 ........... ................... 1789 Estimates in Social Rates of Return by Level of
Education, 1982 and 1986 ........................ 17910 Utilization of Modern Providers by Level of Eduation ........ 18011 Prevalence of PEM by Subdistrict in Three Provinces ......... 181
- xv -
Summary and Conclusions
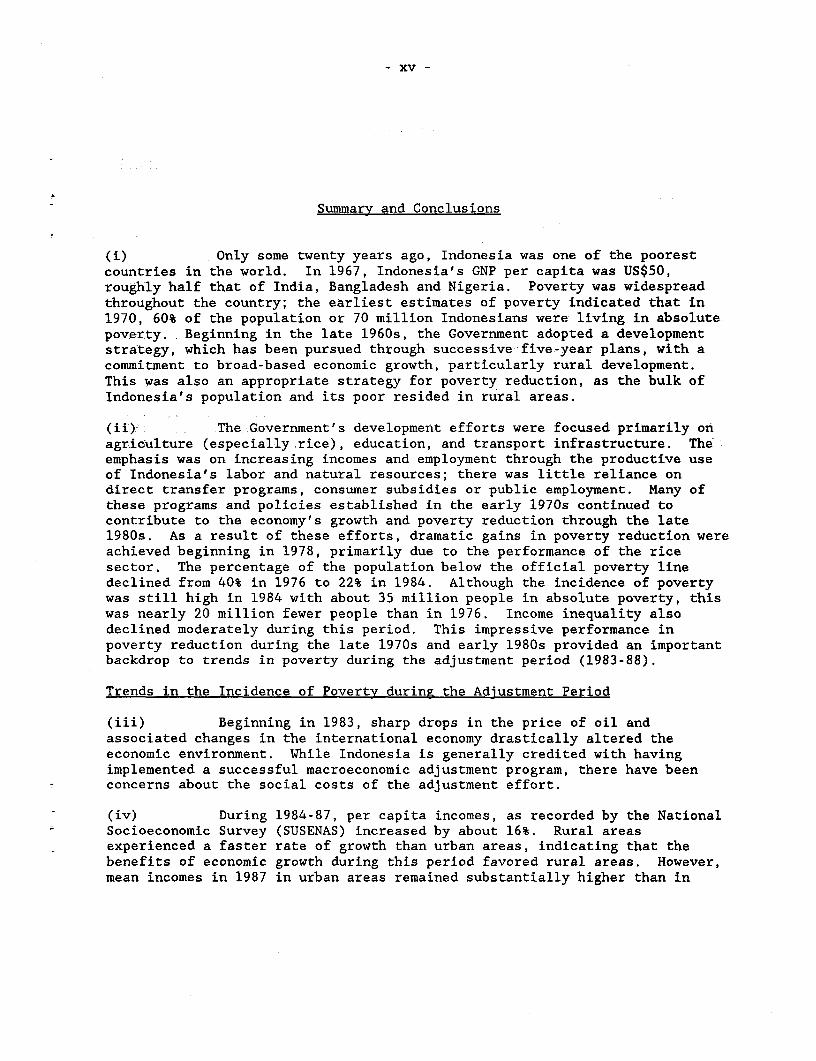
(i) Only some twenty years ago, Indonesia was one of the poorestcountries in the world. In 1967, Indonesia's GNP per capita was US$50,roughly half that of India, Bangladesh and Nigeria. Poverty was widespreadthroughout the country; the earliest estimates of poverty indicated that in1970, 60% of the population or 70 million Indonesians were living in absolutepoverty. Beginning in the late 1960s, the Government adopted a developmentstrategy, which has been pursued through successive five-year plans, with acommitment to broad-based economic growth, particularly rural development.This was also an appropriate strategy for poverty reduction, as the bulk ofIndonesia's population and its poor resided in rural areas.
(ii) The Government's development efforts were focused primarily onagriculture (especially rice), education, and transport infrastructure. The S
emphasis was on increasing incomes and employment through the productive useof Indonesia's labor and natural resources; there was little reliance ondirect transfer programs, consumer subsidies or public employment. Many ofthese programs and policies established in the early 1970s continued tocontribute to the economy's growth and poverty reduction through the late1980s. As a result of these efforts, dramatic gains in poverty reduction wereachieved beginning in 1978, primarily due to the performance of the ricesector. The percentage of the population below the official poverty linedeclined from 40% in 1976 to 22% in 1984. Although the incidence of povertywas still high in 1984 with about 35 million people in absolute poverty, thiswas nearly 20 million fewer people than in 1976. Income inequality alsodeclined moderately during this period. This impressive performance inpoverty reduction during the late 1970s and early 1980s provided an importantbackdrop to trends in poverty during the adjustment period (1983-88).
Trends in the Incidence of Poverty during the Adjustment Period
(iii) Beginning in 1983, sharp drops in the price of oil andassociated changes in the international economy drastically altered theeconomic environment. While Indonesia is generally credited with havingimplemented a successful macroeconomic adjustment program, there have beenconcerns about the social costs of the adjustment effort.
(iv) During 1984-87, per capita incomes, as recorded by the NationalSocioeconomic Survey (SUSENAS) increased by about 16%. Rural areasexperienced a faster rate of growth than urban areas, indicating that thebenefits of economic growth during this period favored rural areas. However,mean incomes in 1987 in urban areas remained substantially higher than in
- xvi -
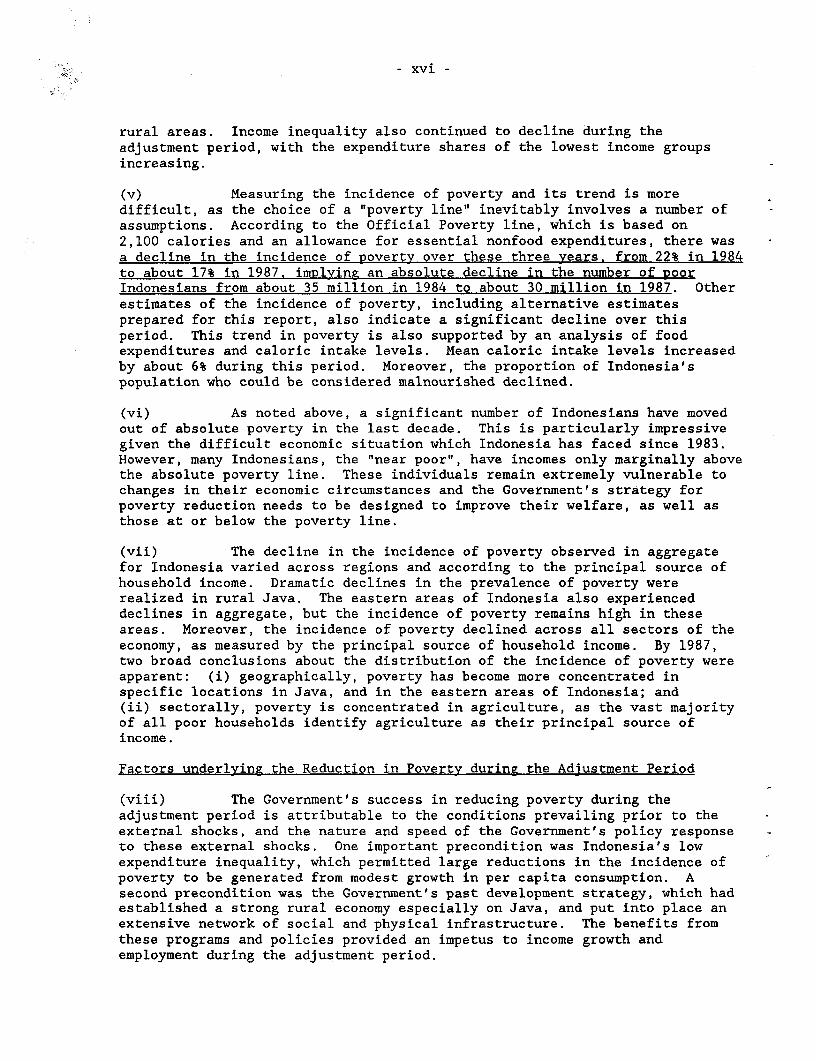
rural areas. Income inequality also continued to decline during theadjustment period, with the expenditure shares of the lowest income groupsincreasing.
(v) Measuring the incidence of poverty and its trend is moredifficult, as the choice of a "poverty line" inevitably involves a number ofassumptions. According to the Official Poverty line, which is based on2,100 calories and an allowance for essential nonfood expenditures, there wasa decline in the incidence of poverty over these three years. from 22% in 1984to about 17% in 1987. implving an absolute decline in the number of poorIndonesians from about 35 million in 1984 to about 30 million in 1987. Otherestimates of the incidence of poverty, including alternative estimatesprepared for this report, also indicate a significant decline over thisperiod. This trend in poverty is also supported by an analysis of foodexpenditures and caloric intake levels. Mean caloric intake levels increasedby about 6% during this period. Moreover, the proportion of Indonesia'spopulation who could be considered malnourished declined.
(vi) As noted above, a significant number of Indonesians have movedout of absolute poverty in the last decade. This is particularly impressivegiven the difficult economic situation which Indonesia has faced since 1983.However, many Indonesians, the "near poor", have incomes only marginally abovethe absolute poverty line. These individuals remain extremely vulnerable tochanges in their economic circumstances and the Government's strategy forpoverty reduction needs to be designed to improve their welfare, as well asthose at or below the poverty line.
(vii) The decline in the incidence of poverty observed in aggregatefor Indonesia varied across regions and according to the principal source ofhousehold income. Dramatic declines in the prevalence of poverty wererealized in rural Java. The eastern areas of Indonesia also experienceddeclines in aggregate, but the incidence of poverty remains high in theseareas. Moreover, the incidence of poverty declined across all sectors of theeconomy, as measured by the principal source of household income. By 1987,two broad conclusions about the distribution of the incidence of poverty wereapparent: (i) geographically, poverty has become more concentrated inspecific locations in Java, and in the eastern areas of Indonesia; and(ii) sectorally, poverty is concentrated in agriculture, as the vast majorityof all poor households identify agriculture as their principal source ofincome.
Factors underlving the Reduction in Poverty during the Adjustment Period
(viii) The Government's success in reducing poverty during theadjustment period is attributable to the conditions prevailing prior to theexternal shocks, and the nature and speed of the Government's policy responseto these external shocks. One important precondition was Indonesia's lowexpenditure inequality, which permitted large reductions in the incidence ofpoverty to be generated from modest growth in per capita consumption. Asecond precondition was the Government's past development strategy, which hadestablished a strong rural economy especially on Java, and put into place anextensive network of social and physical infrastructure. The benefits fromthese programs and policies provided an impetus to income growth andemployment during the adjustment period.
- xvii -
(ix) The Government's response to the external shocks was also a keyelement in the reduction of poverty achieved during this period. Byundertaking both prompt macroeconomic adjustment measures and comprehensivestructural reforms, the Government was able to achieve significant progress ineconomic adjustment, while maintaining positive growth rates throughout theperiod. At the same time, the evidence is that poverty declined. This waspossible because the adjustment program contained elements which were gearedtowards sustaining progress on poverty reduction. Two elements wereparticularly important. First, the pace and pattern of economic growth wassufficiently robust to allow improvements in real earnings for most workers inlower income groups. In the agricultural sector, the adjustment burden waslessened by the exchange rate depreciations which largely offset loweragricultural export prices, agricultural pricing policies, and somediversification away from rice towards more profitable nonrice crops. In themanufacturing and service sectors, the combination of trade and industrialderegulation and real exchange rate adjustments led to a surge in non-oilexports and a rapid recovery in manufacturing growth and investment, as wellas an increase in real wages and employment levels. Second, the Government'smanagement of the public expenditure program ameliorated the effects on thepoor of the expenditure reductions. The overall strategy was to cut publicinvestment and preserve public consumption, allowing the productive use ofmuch of the infrastructure created during the 1970s and early 1980s.Furthermore in reducing development expenditures, expenditures in "poverty-related" sectors--agriculture, human resource development and transfers tolower-level governments--were protected relative to public expenditures ofless benefit to the poor, notably in industry and mining.
The Nature of the Poverty Problem
(x) Despite the progress made in the past two decades, povertyreduction remains a Government priority for several reasons:
(a) the number of poor remains high. There are about 30 millionIndonesians still living in absolute poverty and a large portionof the population, the "near poor", have incomes only slightlyabove the poverty line;
(b) the regional variance in the incidence of poverty is also high.*Large proportions of the population are still poor in a numberof areas, particularly in the eastern areas of Indonesia;
(c) Indonesia still lags behind other Asian countries in a number ofsocial indicators, such as life expectancy, infant mortality andnutritional status;
(d) labor force growth will be high during the 1990s, with about2.4 million people p.a. expected to enter the labor marketduring the decade.
Designing a program to achieve further poverty reduction and more balancedregional development will be a key challenge to the Government during the1990s. Moreover, the changed nature of the poverty problem necessitates some
- xviii -
changes in the Government's approach to poverty reduction, as recognized inREPELITA V, in order to reach those groups and areas of the country which havebenefitted relatively less in the past.
(xi) One important aspect of the changed nature of the povertyproblem is the shift in the spatial incidence of poverty. An analysis of theregional incidence of poverty in Indonesia and its trend indicates twoimportant characteristics. First, income gains during the 1980s in Indonesiahave not been evenly distributed across the provinces, with correspondingvariations in the reduction of poverty. Moreover, the incidence of povertyremains high in the eastern part of Indonesia. Second, the bulk of the poor,about 66%, still reside on Java. However, unlike the situation in the 1970swhere poverty was widespread in Java, it is now concentrated in specific areasthat could be more effectively reached by existing Government programs.
A Strategy for a Sustained Reduction in Poverty
(xii) The first thrust of a poverty-reduction strategy is sustainedeconomic growth. Economies with sustained economic growth and increasedefficiency of resource use have generally experienced significant reductionsin poverty. Indonesia's own experience demonstrates that growth and povertyreduction are largely complementary. Further reductions in poverty,therefore, require a continuation of the Government's macroeconomic policiesdesigned to maintain a high rate of economic growth as well as sectoralpolicies aimed at improving private sector profitability. This entailsimplementation of the Government's program of deregulation of trade,industrial and agricultural policies, and efforts to strengthen supportservices, especially in finance and transport.
(xiii) While these general macro-policies will help sustain theeconomic growth necessary for poverty reduction, the benefits of economicgrowth may accrue only slowly to certain groups of the poor or certaindisadvantaged areas of the country. This is demonstrated by the regionalvariations in growth and hence, poverty reduction which has occurred inIndonesia during the 1980s. As the Government recognizes in REPELITA V,macroeconomic policies, therefore, need to be supplemented by additionalmeasures in order to reach disadvantaged groups and areas more effectively.
(xiv) In this regard, several measures could be considered by theGovernment. First, providing the poor and underemployed with greater accessto Indonesia's available land resources and improved agricultural technologycan make an important contribution. In the Outer Islands, there is asubstantial amount of underutilized and degraded land that could potentiallybe made available. Much of this land is suitable only for activities such astree crops, which require a relatively high degree of infrastructure andinputs, including appropriate financing. Second, Central Government transfersto local governments are another vehicle to stimulate income-generatingactivities and employment particularly in poorer areas. The INPRES program isa potentially important instrument in this regard, and there may be scope fortargeting these expenditures more effectively to poorer areas. In the 1990/91budget, the Government made important steps in this direction throughmodifications in the allocation criteria for the General INPRES. Third,increasing the effectiveness of small-scale credit schemes to raise incomes
- xix -
and employment in agriculture, micro-enterprises, and the informal sector canalso make a contribution to poverty reduction. The many existing programsneed to be rationalized, with an emphasis on improving the access of the poorto these schemes rather than on providing "subsidized" credit. The KUPEDESprogram administered by Bank Rakyat Indonesia could serve as a model in thisregard. Finally, as the Government recognizes in REPELITA V, measures totarget human resource development towards the poor are needed. This wouldhave both an investment effect, in the form of augmenting the human capital ofthe poor leading to increased productivity and incomes, and a consumptioneffect, by improving present welfare. This is true for the social services--health, education and nutrition--as well as other basic services--watersupply, sanitation and related infrastructure--which directly affect livingconditions and hence health status.
(xv) In REPELITA V, the Government recognized the magnitude of thepoverty problem in Indonesia and the need to mount an intensified effort toreduce poverty. First, the Government reiterated its commitment to a processof growth and structural change with an emphasis on developing an efficientmanufacturing sector, supporting the agriculture sector and providing theinfrastructure necessary for sustaining a rapid rate of economic growth.Second, in order to address more directly the needs of the poor, theGovernment is undertaking a number of poverty-related programs during theREPELITA V period, some are new programs being initiated and others areexisting programs which are being strengthened. The Government will:(i) promote the even distribution of social and basic services; (ii) providewater to lower-income groups in water-stressed urban slum areas and in ruralareas; and (iii) stimulate development in poorer areas through a series ofintegrated area development projects. These programs constitute an importanteffort at poverty alleviation for the REPELITA V period. The success of theseinitiatives will depend upon the Government's ability to identify the needs ofthe poor, particularly in agriculture and in the social and basic services,and target the programs towards these needs. In addition, the development ofan appropriate institutional setting for coordinating and complementing theseprograms will also assist in achieving the Government's objectives.
Sustaining Agriculture's Role in Poverty Reduction
(xvi) The agriculture sector has made a major contribution toIndonesia's economic development and the reduction in poverty. Agricultureremains central to the Government's growth and poverty reduction strategy.This is because poverty is still heavily concentrated in agriculture, withabout three quarters of all poor households in Indonesia deriving theirprincipal source of income from agriculture. Achieving further reductions inthe incidence of poverty in rural areas, however, will be more difficultbecause rice is unlikely to provide the same impetus to economic growth andemployment generation as in the past.
(xvii) During REPELITA V, the Government, therefore, is making aconcerted effort to foster new sources of growth in nonrice food crops,smallholder treecrops and nonfood farm activities, especially in the OuterIslands and to strengthen the poverty content of existing agricultural
- xx -
programs. The first thrust of a poverty reduction strategy in agriculture isto maintain a high rate of agriculture growth and thus alleviate povertydirectly through raising the productivity and hence, incomes of small farmers,as well as producing affordable food for domestic consumers. Achieving thisgoal will entail a progressive deregulation of area and production controls topermit farmers greater latitude in choosing their crop patterns in response tomarket signals; encouraging more private sector participation in agriculturalproduction, processing and marketing; and, improving the economic andfinancial efficiency of sector operations. This growth strategy will benefitthe poor, since the greatest potential for growth is locked up among the leastproductive and poorest smallholders who cultivate secondary crops andtreecrops.
(xviii) The second thrust of a poverty reduction strategy in agricultureis to ensure that mainline agricultural programs reach the poor moreeffectively. Currently, many agricultural programs are still primarilyfocussed on irrigated rice farmers and treecrop farmers in Government-sponsored schemes. Building a more deliberate focus on other crops and poorfarmers in agricultural support services and commodity development programswill make an important contribution to further reductions in poverty. Asdemonstrated in Indonesia during the 1970s and 1980s, the most importantcontribution that the Government can make is to offer small farmers a mix oftechnology through research and extension, financing through rural credit, andinfrastructure particularly irrigation, to expand their productivity andincomes. Broadening these Government programs into nonrice food crops andnonfood farm activities is, therefore, a key challenge for the Governmentduring REPELITA V. Similarly in treecrop development, past programs havebenefitted only a small proportion of existing estate crop producers. Tounlock the potential of the mass of unassisted smallholders, there is a needto develop, test and disseminate technical packages that can be applied on alarger scale. Another important priority of the Government is fishingfamilies, as they probably constitute the poorest segment of Indonesiansociety. A strategy to reach these fishermen would increase their efficiencythrough better boats, fishing gear and supporting services in areas where fishare plentiful, but in other areas aquaculture and other area developmentinitiatives would be a more appropriate strategy.
(xix) Despite the scope for improving agricultural growth and thepoverty focus of existing agricultural programs, some of the pooresthouseholds will still not be reached, due to their lack of capital(particularly land), illiteracy, or geographical isolation. The Governmenthas therefore recognized the need to supplement ongoing subsectoral programswith special programs specifically targeted at the poor. There are two basicapproaches. The Government is targeting areas through an area developmentapproach. In this regard, Government efforts to ensure the sustainability ofthese programs through strengthening the implementation capacity of localgovernments and developing techniques that can be replicated through regularsectoral programs will be important. The Government is also targeting povertygroups through an ongoing pilot project supported by FAO/UNDP, IncomeGenerating Project for Small Farmers (P4K). The P4K has much to offer as aninstrument for reaching the poor, and therefore, merits support.
- xxi -
Improving Social and Basic Services for the Poor
(xx) Improving access to and the consumption of basic services(education, health, family planning and water supply and sanitation) is anecessary condition for the Government's poverty reduction programs to besuccessful in the long run. These interventions address the most severeconsequences of being poor. But they also constitute investments in humancapital which provide the basis for long-term poverty reduction.
(xxi) Education plays an important role in reducing poverty over thelong term, by providing the poor with the skills necessary to raise theirproductivity and incomes. Primary education or its equivalent are criticalfor this, as shown by the high social rates of return to primary schooleducation in Indonesia. In the past decade, the Government has made aconcerted effort to improve the availability of education. This program hassucceeded in providing access to primary schooling to virtually all Indonesianchildren of primary school age. This expansion of primary schooling is one ofthe most successful cases of large-scale school system expansion on record.
(xxii) The nearly complete coverage of primary schooling leaves littleroom for differentials in enrollment by income class. Equalizing educationalopportunities at primary level is, therefore, principally an issue ofequalizing the quality of education. Income-related quality differentialsstill remain in both primary and secondary education. One indicator isprimary school repetition rates, which vary across provinces. The differencesin quality arise from differences in the capacity of individual communities tosupplement limited budgetary resources. Thus, those communities orindividuals that cannot afford to pay higher fees face a lower quality ofeducation because their schools do not have the complementary inputs necessaryto improve education quality. The problem is that the allocation of CentralGovernment funds for primary education does not currently compensate for theinability of poor areas to mobilize local resources.
(xxiii) The Government has stated its commitment to raising the qualityof basic education under REPELITA V. Two policy measures would help improvethe access of the poor to the full benefits of education. First, whileprimary school enrollment is virtually complete, there is evidence thatinability to pay the costs of schooling increases primary school drop-outrates among the poor and is a deterrent to school attendance among the poor athigher levels of schooling. The Government might consider providing financialsupport to the poor for this purpose. Second, there is scope to improve thequality of primary and secondary education provided to poor children and inpoor areas. The most important needs are for adequate financing of essentialsupplies such as textbooks, teacher's manuals and chalk together withimproving teacher quality through in-service training. Some reorientation ofbudgetary priorities within the education sector would therefore beappropriate. In particular, increasing budgetary outlays for improving thequality of primary education, while restraining the growth of publicexpenditures and increasing cost recovery for higher education, would improvethe efficiency and equity of the system. In addition, it will be essential todevelop a proper mechanism for directing larger subsidies to primary schoolsin poor communities.
- xxii -
(xxiv) Non-formal education (NFE) also has a role to play in povertyreduction. First, there is a close association between illiteracy andpoverty. About one third of the poor are illiterate and almost 50% of thepoor above the age of 29 are illiterate. Second, since the rapid expansion inprimary school enrollments occurred only in the early 1980s, many olderIndonesians have not had the opportunity to acquire the basic education skillsneeded to participate actively in the labor market. The Government has anumber of programs designed to teach basic literacy and numeracy, raisecommunity awareness, and support local income generating activities. Theoptions to improve NFE during the REPELITA V period include: (a) expandingthe resources available to these NFE programs; (b) increasing the number ofextension workers, as well as improve their training in the income generatingaspects of NFE programs; and (c) targeting NFE activities to those areas wherepoverty is the highest.
(xxv) Indonesia's record of mortality reduction has been solid andimpressive. A key indicator is infant mortality, which has been roughlyhalved in the past two decades. However, the poor have benefited less fromthe progress in mortality reduction than the nonpoor. In addition, the sickpoor use fewer modern curative health services than the nonpoor. Most of thisdifference in outpatient visits is due to the higher use of high-qualityproviders (doctors and hospitals) among the nonpoor. Hospital admission ratesfor the nonpoor average three times those of the poor. Moreover, overallthese rates are extremely low in Indonesia, even for the nonpoor, compared tolevels prevailing in other countries.
(xxvi) The low level of utilization of health services by the poor inIndonesia indicates a need to improve access by enhancing both the quality andquantity of available services. High priority needs to be given to raisingrecurrent expenditure on operations and maintenance inputs necessary toprovide adequate service through fixed facilities and to improve thelogistical support to preventive health facilities in the villages (POSYANDU).Key components of the effort to raise quality include: redistribution ofspecialist doctors from tertiary to lower level hospitals; increasing thesupply of medical and paramedical staff to understaffed health centers;increasing the supply of health center drugs, which presently cover aboutthree-quarters of annual requirements; and increasing the operational budgetof health centers to ensure sufficient funds for travel in support of POSYANDUactivities. On the investment side, priority could be given to increasing thesupply of community health centers and subcenters in order to reduce traveltime in poorer areas with more dispersed populations. Important steps weretaken in this direction in the 1990/91 Budget; ensuring the implementation ofthese plans and adequate funding for operations and maintenance to newfacilities will be important to the success of the effort.
(xxvi) Malnutrition increases the susceptibility to disease; it alsoaffects school attendance and performance among children and laborproductivity among adults. During the last decade, the incidence ofmalnutrition has declined throughout Indonesia, although it still remains highin some areas. The Government's nutrition program, which is now administeredprimarily through the POSYANDU, has two basic components: (i) a monthlyweighing program; and (ii) IEC (information, education, and communication)
- xxiii -
activities. During REPELITA V, the Government is committed to enhancing the
effectiveness of its nutrition program. The most important improvement in the
nutrition program would be the introduction of more effective supplementalfeeding for children who suffer from severe malnutrition. Also, theGovernment's program could be better targeted by concentrating availableresources and staff support on those areas where the incidence of malnutritionis high. Ensuring adequate logistical support from the health center network
in these areas would make an important contribution to strengthening theprogram.
(xxviii) Improved water supply and sanitation in rural areas can havewide-ranging health, economic, social and environmental benefits. The
greatest effect on health from the provision of rural water supply andsanitation (RWSS) is likely to come from improved sanitation facilities and an
increase in water quantity. Furthermore, the benefits of RWSS can beespecially important for women and children, as they play a major role in
carrying water. RWSS service levels are low in Indonesia, with available
coverage favoring water supply over sanitation and the nonpoor over the poor.The Government has committed itself to making an intensified effort inREPELITA V to increase substantially the coverage of RWSS. Options toincrease coverage include: (a) a clear definition of institutionalresponsibilities and an effective coordinating mechanism; (b) the use of low-cost appropriate technology; (c) the use of a cost recovery mechanism toprovide funds for the operations and maintenance of these systems with thecapital cost provided through the INPRES program; and (d) the use ofcommunity-based groups in implementation to encourage local acceptance,provide education about health benefits, and help overcome the financial andstaffing constraints of the Government.
(xxix) Progress has been made in improving access to safe drinkingwater in urban areas but disparities remain in the access between poor andnonpoor households. The situation for the poor is becoming critical,especially in the larger cities and the role of standpipes or a viable
alternative has become increasingly important. Recognizing this, theGovernment has recently embarked on a major initiative to improve the accessof the urban poor to water at affordable prices, involving a dramatic increasein the number of standpipes and deregulating the sale of water in Jakarta.Consolidating these initiatives into a long term solution to the water needsof the poor requires a further increase in the number of public standpipes, astrengthening of procedures for their operations and maintenance, and changesin the financing mechanism for the public standpipes program.
(xxx) Human waste disposal is generally unsanitary in Indonesiancities. This can have adverse effects upon human health, especially incrowded and congested urban areas. As with water, there is a disparitybetween the poor and the nonpoor, with almost one third of poor householdsindicating that they do not use formal sanitation facilities. Despite theneed for and availability of appropriate technology, public expenditures onsanitation have lagged. The Government plans to give greater priority to theimprovement of urban sanitation during REPELITA V. The focus will need to be
on providing more and better toilets for poor households with on-sitedisposal. This could include the adoption of appropriate technologies on a
larger scale, clarification of institutional roles, formulation of a list of
- xxiv -
priority areas within cities, and greater involvement of the community. It isalso important to improve the knowledge of poor urban residents about thebenefits of sanitary disposal of human waste.
(xxxi) The Kampung Improvement Program (KIP) is a nationwide programfor upgrading urban villages, particularly in lower-income communities and is,therefore an important mechanism for improving basic services for the urbanpoor. It provides a range of infrastructure at minimal standards includinglocal roads, footpaths, drainage, water supply, public sanitation facilitiesand solid waste collection. In the past, this program has successfullyfocused on badly serviced areas in a number of cities. Recognizing itspotential to address the needs of lower income groups, the Government isincreasing its expenditures on the KIP program during REPELITA V. Theeffectiveness of expenditures in this area could be raised by more fullyaddressing community priorities, which is likely to result in more fundingbeing allocated to sanitation, solid waste or water supply where the needs ofthe poor are the greatest. In order to improve the performance of thesecomponents, it will also be important to make complementary improvements toprimary systems outside the kampung and to provide adequate funding foroperations and maintenance.
(xxxii) Since the formation of the National Urban DevelopmentCorporation (PERUMNAS) to produce low cost housing and a home ownershipfinancing program through the State Savings and Housing Bank (BTN) in 1974,Government housing programs have evolved from a relatively marginal activityto an important part of the housing market. During the REPELITA V period, theGovernment is undertaking efforts to target Government housing expendituresand in particular, subsidies more effectively to the poor. Several factorswill be important to this effort. First, consideration could be given toexpanding the range of housing products to make them more affordable andaccessible to lower-income groups. Second, Government financing of low-cost/low-income rental housing also would assist the poor. Third, whilesignificant steps have been taken to lower interest rate subsidies, thesubsidies are not well targeted to the poor and need to be eliminated. Toreach the poor, Government efforts could be directed towards the KIP program,which could be better targeted on low-income households. Finally, changes inthe regulatory environment affecting the housing sector, such as improvingland administration and adopting appropriate design and constructionstandards, would also serve to help the poor.
Developing an Institutional Framework for Poverty Reduction
(xxxiii) Given that the causes and consequences of poverty are multi-dimensional, antipoverty programs are by nature intersectoral. Formulatingand implementing these programs necessarily entails the active involvement ofmany individual ministries, Government agencies, local-level governments, andcommunity groups. International experience indicates that coordination isamong the most difficult of government functions. Therefore, minimizing theneed for intersectoral coordination during implementation will be an importantfactor in the success of antipoverty programs. Ex-ante planning for thisshould be an explicit objective of the Government in order to minimizedifficulties in the execution of its poverty programs. In this regard, the
- xxv -
Government could establish a focal point in BAPPENAS to undertake thesefunctions. Also in the line agencies, incorporating poverty reductionexplicitly into a number of sectoral programs would help to ensure thatmainline programs reach the poor more effectively. Finally in lower-levelgovernments, there is a need to raise awareness of the Government's overallpoverty-reduction strategy and in many cases strengthen planning andimplementation capacity.
(xxxiv) This report has also identified a number of areas wherecommunity group could play a larger role in the design and implementation ofpoverty programs. Currently, there are a wide variety of communityorganizations in Indonesia: community self-help organizations; agencies thatpromote community self-help groups; religious, university, service andprofessional associations; and semigovernmental organizations. Theseorganizations have already made important contributions to nationaldevelopment, which could serve as models for future collaboration with theGovernment in antipoverty programs. In family planning, private agencies haveplayed a significant innovative role. Semigovernmental and socialorganizations have also made important contributions in improving health; mostnotably, the POSYANDU network relies almost exclusively on the Family WelfareMovement (PKK) at the village level. In irrigation, water users'associations, supported by the Ministry of Public Works, are beginning to playa larger role in maintaining and improving small-scale irrigation systems.
(xxxv) The Government has begun to recognize the importance ofinvolving community groups more actively in its development programs. Boththe Guidelines for State Policy (GBHN) and REPELITA V stress the need for morecommunity participation. The Government could consider several initiativesduring the REPELITA V period to foster community participation in the designand delivery of its poverty reduction programs: (i) allowing theseorganizations more scope for initiative is an important first step;(ii) continuing Government efforts to strengthen the Village CommunityResilience Committee (LKMD) and PKK and make them more participatory; and(iii) expanding the use of community groups as consultants for training andassistance in community development, which will also help to educateGovernment officials about these groups and their potential usefulness. Inthe 1990/91 Budget, the Government took steps to strengthen village-levelgroups and foster more community participation.
I. ASSESSMENT OF POVERTY IN INDONESIA
A. Overview
1.1 Only some twenty years ago, Indonesia was one of the poorestcountries in the world. In 1967, Indonesia's GNP per capita was only US$50,
roughly half that of India, Bangladesh and Nigeria. Poverty was widespreadthroughout the country. The earliest estimates of poverty, in 1970, indicatedthat 60% of the population or about 70 million Indonesians were living inabsolute poverty. Initially, the Government's approach was based on a strongcommitment to broad-based economic growth, particularly rural development. In
the first phase of development, which corresponded roughly with the FirstFive-Year Plan Period (1969/70-1973/74), the Government concentrated onestablishing the basic institutions for rural development and the design of a
replicable rural development strategy. This was appropriate as the vastmajority of Indonesia's population was in rural areas and the bulk of the poor
were concentrated in rural Java.
1.2 Beginning in 1974, when public resources increased substantially due
to the first increase in the international price of oil, the Governmentundertook substantial investments in physical and social infrastructure. Bythe late 1970s, these investments began to pay off both in terms of a rapidrate of economic growth and more slowly, declines in the incidence of poverty.By the early 1980s, poverty had begun to decline dramatically and incomeinequality was also on a downward trend. However, commencing in 1983, sharpdrops in the price of oil and assocl!ated changes in the international economydrastically altered the economic environment. While Indonesia is generally
credited with having implemented a very successful macroeconomic adjustment
program in response to this external challenge, so far little systematicevidence has been presented on the effect of this adjustment program on thepoor. This report reviews the evidence regarding how the poor have faredduring this adjustment period, and then draws on the characteristics of thepoor to outline a strategy for further reducing poverty through the 1990s.
1.3 An assessment of recent poverty trends during the adjustment perioddemonstrates that in aggregate both the percentage of the population inpoverty and the absolute number of the Roor declined during the 1980s. Incomeinequality has also declined during the 1980s, indicating that the poor did
not bear a disproportionate share of the adjustment burden. The Government'ssuccess in reducing poverty and inequality during the adjustment period isattributable to the development strategy adopted in the 1970s, and the natureand speed of the Government's policy response to the external shocks of the1980s.
1.4 Throughout the adjustment period, the Government by undertaking bothprompt macroeconomic adjustment measures and comprehensive structural reformsmaintained a positive rate of economic growth. Three aspects of theGovernment's adjustment program were important in sustaining the momentum of
- 2 -
poverty reduction. First, despite a deceleration in agricultural growth dueto a slowdown in rice production, farm incomes, upon which the bulk of thepoor depend, were protected by the exchange rate adjustments and pricingpolicies. There was also some diversification towards more profitable nonricecrops. Second, the combination of exchange rate adjustments and trade andindustrial deregulation succeeded in not only containing the adverse effectsof the slowdown, but also helped achieve a rapid recovery in manufacturinggrowth. Due to this and the absorption of workers into the agriculturalsector, employment per unit of output grew faster during the 1980s than the1970s, offsetting to some extent the slower rate of economic growth. Andfinally, while public expenditures were reduced substantially, publicconsumption was protected relative to investment; and public spending in"poverty-related" sectors--agriculture, human resource development, andregional transfers--was protected relative to other sectors.
1.5 Despite the progress made in the past two decades, poverty reductionremains a key priority of the Government for several reasons. First, whileall Indonesians have experienced income gains, at least 30 millionIndonesians. or about 17% of the population remain in absolute poverty.Moreover, many Indonesians have incomes only slightly above the estimated"poverty line" and thus, remain vulnerable to changes in their economiccircumstances. Second, the variance in the regional incidence of poverty isquite high. During the 1980s, substantial reductions in the incidence ofpoverty in some areas, particularly Java, have occurred alongside lessprogress in other areas of the country, particularly the eastern areas. Thisis primarily the result of differential rates of growth among the provinces.And finally, Indonesia's labor force is expected to grow by about 2.4 millionpersons p.a. during the 1990s, suggesting that in the absence of a concertedeffort to raise economic growth and the incomes of the poor, the progress madein reducing poverty could reverse itself.
1.6 Continuing the Government's present policy course of sustaining ahigher level of economic growth through a program of structural reform is thefirst component of a poverty reduction strategy. Without economic growth, itis not possible to achieve a reduction in poverty over the long term. Whilethis approach is likely to ultimately benefit all groups within the country,the effects of these policies may be slow in reaching certain disadvantagedgroups and certain areas of the country. Reaching these groups moreeffectively in order to speed up the pace of poverty reduction will requireimproved targeting of poverty programs. This can be achieved primarilythrough three avenues: utilizing, to a greater extent, the INPRES program andother Government small-scale development projects to stimulate employment andcreate infrastructure in disadvantaged areas or sectors;i/ raising the povertycontent of agriculture programs, as the bulk of the poor are in rural areasand depend upon agriculture to a large extent for their incomes; and,orienting social and other basic services--water supply, sanitation, and
I/ The INPRES program is a series of Central Government transfers tolower-level governments, which normally fund small-scale investments inphysical and social infrastructure; see footnote 31.
other basic infrastructure--towards the poor. The combination of theseprograms with policies aimed at sustaining a higher rate of growth will leadto a further reduction in poverty during the 1990s.
1.7 The report is organized as follows. This chapter assesses trends inthe incidence of poverty. First, trends prior to the adjustment period arebriefly discussed to highlight aspects of particular relevance to the eventsduring the adjustment period (Section B). This is followed by a detailedanalysis of poverty during the adjustment period. Trends in the level and theregional incidence of poverty are examined, and changes in income inequalityare also highlighted (Section C). The last section describes the factorsunderlying the reduction in poverty achieved during the adjustment period(Section D).
1.8 Chapter II examines the characteristics of the poor and outlines ageneral strategy for continuing poverty reduction in the 1990s. In addition,recent Government initiatives to reduce poverty are analyzed in the context ofthe proposed general strategic approach. Then, the report discusses in detailsectoral issues in designing and implementing antipoverty programs in threeareas that are critical to the needs of the poor--agricultural programs(Chapter III), and human resource development in the social services(Chapter IV) and other basic services, such as water supply, sanitation andother basic infrastructure (Chapter V). Within these sectors, the reportidentifies those areas of most benefit to the poor and outlines appropriatepolicies and programs to shift a larger portion of resources to these areas.Finally, implementing the strategy outlined in this report will requirechanges in the Government's current institutional arrangements for identifyingand implementing poverty programs. The report concludes with a discussion ofinstitutional arrangements and responsibilities that could increase theefficiency of the Government's efforts (Chapter VI). There is also adiscussion of the role that community groups could play, in addition toGovernment institutions, in reaching and delivering services more effectivelyto the poor.
B. Poverty Reduction Prior to the Adjustment Period
1.9 When the New Order Government came to power about twenty years ago,the economy was in considerable disrepair. Indonesia was one of the poorestcountries in the world with per capita GNP at only US$50 in 1967, roughly onehalf the level of India, Bangladesh and Nigeria. Poverty was ubiquitousthroughout the archipelago; it is estimated that almost 60% of the population,or nearly 70 million people, were living in absolute poverty in 1970.2/ Onceeconomic stability was achieved, the first of several Five-Year Plans wasformulated. Since development started from a very low level, these plans gavelittle explicit attention to poverty alleviation. Instead, the Government's
2/ See, Indonesia: Policies and Prospects for Economic Growth andTransformation, The World Bank, Report No. 5066-IND, April 26, 1984,pp. 130-131.
- 4-
approach--which continued through succeeding Five Year Plans--involved a verystrong commitment to broad-based economic growth, particularly ruraldevelopment, with concern for the equitable distribution of the benefits ofthat growth.
1.10 During the first five-year development plan (REPELITA I),1969/70-1973/74, the Government concentrated on establishing the basicinstitutions necessary for economic development. As Indonesia waspredominantly a rural society, the primary focus of its strategy was improvingthe productivity of the rural economy and in particular, the attainment ofrice self-sufficiency. Agriculture, including irrigation, constituted overone-third of the development budget during the REPELITA I period. Most ofthis effort was directed towards Java and Bali, where the largest number ofIndonesia's poor were located. This period was basically a learning phase inthe design and replication of many rural development programs.
1.11 Starting about 1974, when public resources increased substantially,the Government intensified and expanded this development program. From1973/74 to 1977/78, the Government allocated 49% of the windfall in miningvalue added to development outlays, as measured by the rise in developmentexpenditures over the level of the early 1970s.VX The Government'sdevelopment efforts were focused primarily on agriculture, particularly rice,education, and transport infrastructure. The emphasis of the developmentprograms and policies during this period was on increasing incomes andemployment through the productive use of Indonesia's labor and substantialnatural resources. There was relatively little reliance on income transfers,consumer subsidies, or public employment.
1.12 One important component of the Government's development program forcreating social and physical infrastructure and the reduction of poverty wasthe establishment of the INPRES expenditure program. INPRES established ameans of sharing Central Government revenues with lower level governmentsthrough a system of flexible direct subsidies with the aim of reducinginterregional disparity and building and supporting infrastructure in theprovinces. There are both general INPRES grants to the provincial, districtand village-level governments, and sectoral INPRES grants for the constructionof roads, elementary schools, health facilities and reforestation, as well astheir operations and maintenance. The infrastructure created by theseprojects-- primary schools, health facilities, roads--provided importantbenefits to Indonesia's rural population. Moreover, the small-scaleinfrastructure projects funded under the INPRES program provided substantialemployment for unskilled labor in rural areas, growing from an estimatedquarter of a million man-years of work in 1970 to about 1.5 million by 1982(about 2.7% of the labor force).i/
.i. See, Alan Gelb and Associates, Oil Windfalls: Blessing or Curse?, AWorld Bank Research Publication, Oxford University Press, October 1988,Chapter 12.
See, Gelb, 1988, ibid, p. 220.
- 5 -
1.13 The Government was relatively successful in attaining its twinobjectives of achieving a rapid rate of economic growth and ensuring a moreequitable distribution of income. Real GDP grew by about 6.5% p.a. during1974-78, with agriculture growing by about 4% p.a. Per capita privateconsumption also increased. While the momentum for this growth was clearlyprovided by the oil boom of the mid-1970s, much credit must also be given toIndonesia's economic policymakers for channeling these windfall gains intoproductive uses in critical sectors, and for efforts to achieve equity in thedistribution of those gains.
1.14 The reduction in the rate of poverty in rural areas was, however,modest during 1970-76, especially compared to the level of economic growthattained over this period. Although official estimates of poverty are notavailable prior to 1976, earlier estimates by the World Bank indicate thatduring 1970-76, the incidence of poverty in rural areas declined by only 4%.V/Due to the rapid rate of population growth during this period, the number ofrural poor actually increased. The primary reason was the sluggishperformance of the rice economy, the main source of income of the bulk of therural poor; rice production rose slowly in the early 1970s and was basicallyflat from 1973-78.V/ A second reason was that, in rural areas, much of thephysical and social infrastructure was just beginning to be put into place andthe benefits from these investments were not realized until later. As aresult of these factors, the absolute number of the rural poor did not changesignificantly during 1970-76.
1.15 Urban areas benefitted relatively more from the economic growth ofthe 1970-76 period, as indicated by a sharper decline in urban poverty.]]This was largely the result of substantial growth in public sector employmentin the 1970s, with related positive benefits throughout the urban areas.Moreover, infrastructure, both physical and social, was more developed inurban areas, which allowed urban income earners to take greater advantage ofthe expanding economic opportunities. Inequality also worsened between 1976and 1978, as indicated by the rise in the Gini coefficient from 0.34 in 1976to 0.38 in 1978 and a 9% decline in the consumption share of the lowest decileof the population. This deterioration was largely due to the performance ofthe rice sector and the faster growth of incomes in the relatively better-offurban areas.
1.16 Significant reductions in the incidence of rural poverty wereachieved beginning in 1978 (see Table 1.1). The most important contributionto poverty reduction came from the rice sector, which started to grow rapidlyin 1978 due to a variety of factors including the introduction of ricevarieties resistant to the brown plant-hopper. Furthermore, the substantialpublic infrastructure constructed throughout the 1970s began to yield benefitsto rural Java. The percentage of the population in poverty in rural areas
2/ See, World Bank, 1984, oR.cit., and Annex III.
i./ See, Chris Manning, "Public Policy, Rice Production and IncomeDistribution: A review of Indonesia's Rice Self-Sufficiency Program",Southeast Asian Journal of Social Science, Vol. 15, No. 1, 1987, p. 69.
/ See, World Bank, 1984, op.cit.
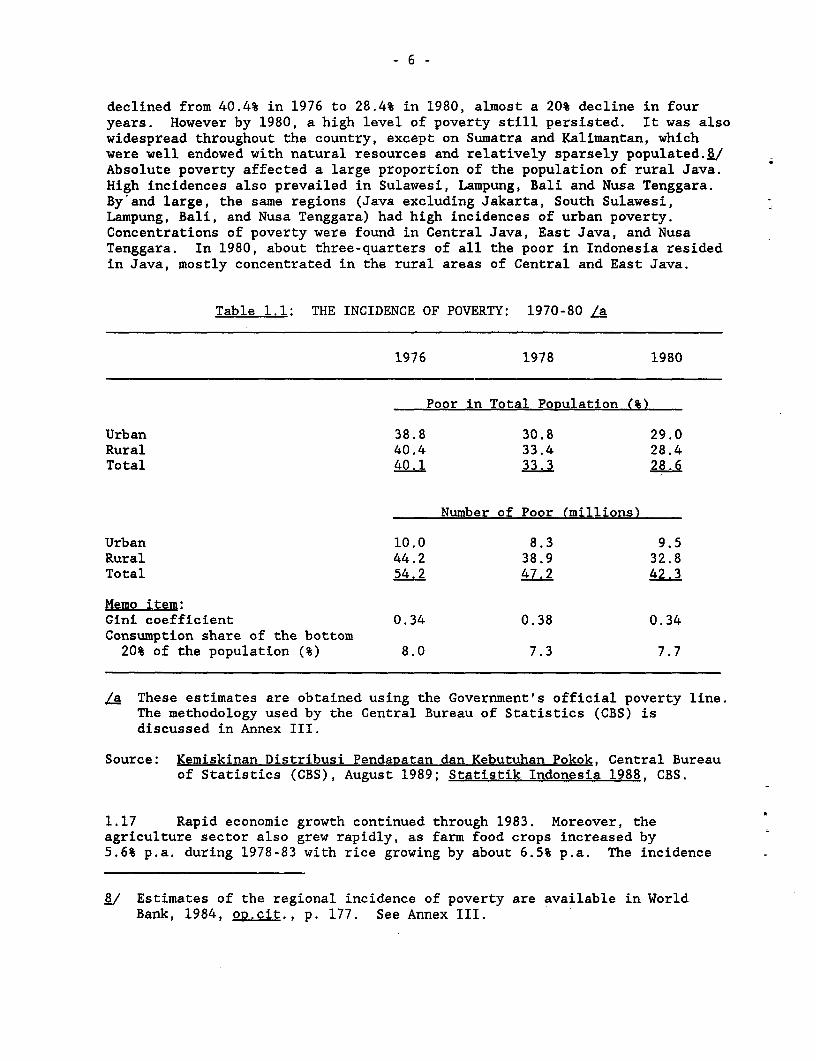
declined from 40.4% in 1976 to 28.4% in 1980, almost a 20% decline in fouryears. However by 1980, a high level of poverty still persisted. It was alsowidespread throughout the country, except on Sumatra and Kalimantan, whichwere well endowed with natural resources and relatively sparsely populated.t./Absolute poverty affected a large proportion of the population of rural Java.High incidences also prevailed in Sulawesi, Lampung, Bali and Nusa Tenggara.By and large, the same regions (Java excluding Jakarta, South Sulawesi,Lampung, Bali, and Nusa Tenggara) had high incidences of urban poverty.Concentrations of poverty were found in Central Java, East Java, and NusaTenggara. In 1980, about three-quarters of all the poor in Indonesia residedin Java, mostly concentrated in the rural areas of Central and East Java.
Table 1.1: THE INCIDENCE OF POVERTY: 1970-80 /a
1976 1978 1980
Poor in Total PoRulation (%)
Urban 38.8 30.8 29.0Rural 40.4 33.4 28.4Total 40.1 33.3 28.6
Number of Poor (millions)
Urban 10.0 8.3 9.5Rural 44.2 38.9 32.8Total 54.2 47.2 42.3
Memo item:Gini coefficient 0.34 0.38 0.34Consumption share of the bottom
20% of the population (%) 8.0 7.3 7.7
/a These estimates are obtained using the Government's official poverty line.The methodology used by the Central Bureau of Statistics (CBS) isdiscussed in Annex III.
Source: Kemiskinan Distribusi Pendapatan dan Kebutuhan Pokok, Central Bureauof Statistics (CBS), August 1989; Statistik Indonesia 1988, CBS.
1.17 Rapid economic growth continued through 1983. Moreover, theagriculture sector also grew rapidly, as farm food crops increased by5.6% p.a. during 1978-83 with rice growing by about 6.5% p.a. The incidence
.. / Estimates of the regional incidence of poverty are available in WorldBank, 1984, oR.cit., p. 177. See Annex III.
- 7 -
of poverty also continued to decline. In aggregate during the 1976-84 period,the percentage of the population in poverty declined by nearly 50%, and theabsolute number of poor in Indonesia fell by almost 20 million people (seeTables 1.1 and 1.4). Income inequality was also on a slight downward trendafter rising in 1978; the Gini coefficient declined from 0.34 in 1976 to 0.33in 1984. This impressive performance provided an important backdrop to trendsin poverty reduction during the adjustment period.
C. Trends in the Incidence of Poverty during the Adjustment Period 2/
1.18 As discussed in the preceding section, Indonesia experienced a rapidrate of economic growth and achieved a sustained reduction in the incidence ofpoverty through the early 1980s. This section discusses how the poor havefared and whether their numbers have increased during the period since 1983,when Indonesia suffered a severe deterioration in its external terms of tradeand as a consequence, experienced a slower rate of economic growth. Thisanalysis uses household consumption expenditures per capita from the latesttwo rounds (1984 and 1987) of the National Socioeconomic Survey (SUSENAS: seeAnnex I).
Trends in Income and Consumption 10/
1.19 Real per capita consumer expenditures, as measured by the SUSENASsurveys, increased by 15.7% over the three year period, 1984-87 (seeTable 1.2).li/ The benefits of economic growth favored rural areas, as percapita expenditures in rural areas increased at a faster rate (14.6%) than
9/ This section draws from, "Poverty and Undernutrition In IndonesiaDuring the 1980s", Martin Ravallion and Monika Huppi, The World Bank,Policy. Planning. and Research Working Papers, No. 286, September 1989.This paper was prepared under a World Bank research project entitled,"Policy Analysis In Poverty: Applicable Methods and Case Studies"(RPO 675-04) and in conjunction with this report.
1i/ In deflating SUSENAS incomes and expenditures, the CPI has beenreweighted to reflect more accurately the consumption pattern of thepoor (see Annex II); See Annex Table 1 for the provincial rates ofinflation, over the period February 1984-January 1987. An allowancefor urban-rural price differentials has been incorporated into thisindex, using previously estimated cost of living differentials inIndonesia; the assumed differential is 10%. See, Martin Ravallion andDominique van de Walle, "Cost-of-Living Differences between Urban andRural Areas in Indonesia", The World Bank, Policy. Planning andResearch Working Papers, No. 341, December 1989.
II/ See Annex I for a discussion of the relationship between the SUSENASdata and the private consumption component of the national accounts.
- 8 -
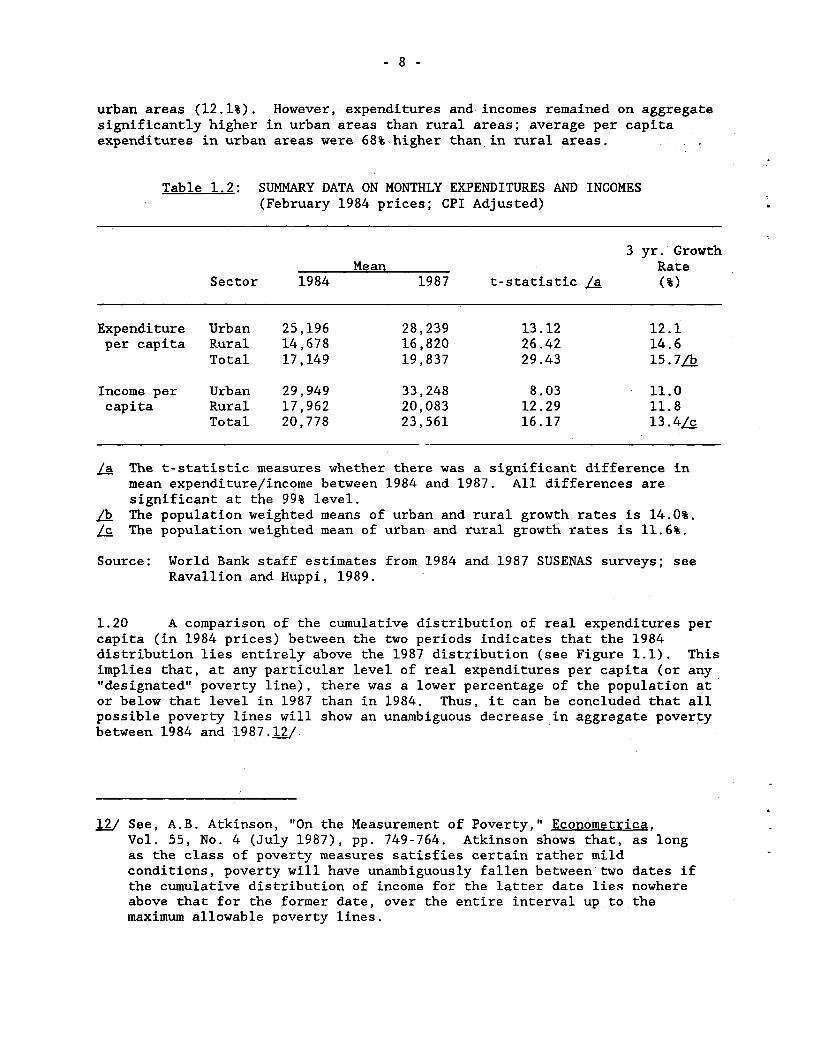
urban areas (12.1%). However, expenditures and incomes remained on aggregatesignificantly higher in urban areas than rural areas; average per capitaexpenditures in urban areas were 68% higher than in rural areas.
Table 1.2: SUMMARY DATA ON MONTHLY EXPENDITURES AND INCOMES(February 1984 prices; CPI Adjusted)
3 yr. GrowthMean Rate
Sector 1984 1987 t-statistic a (%)
Expenditure Urban 25,196 28,239 13.12 12.1per capita Rural 14,678 16,820 26.42 14.6
Total 17,149 19,837 29.43 15.7/b
Income per Urban 29,949 33,248 8.03 11.0capita Rural 17,962 20,083 12.29 11.8
Total 20,778 23,561 16.17 13.4/c
La The t-statistic measures whether there was a significant difference inmean expenditure/income between 1984 and 1987. All differences aresignificant at the 99% level.
/ The population weighted means of urban and rural growth rates is 14.0%.Lc The population weighted mean of urban and rural growth rates is 11.6%.
Source: World Bank staff estimates from 1984 and 1987 SUSENAS surveys; seeRavallion and Huppi, 1989.
1.20 A comparison of the cumulative distribution of real expenditures percapita (in 1984 prices) between the two periods indicates that the 1984distribution lies entirely above the 1987 distribution (see Figure 1.1). Thisimplies that, at any particular level of real expenditures per capita (or any"designated" poverty line), there was a lower percentage of the population ator below that level in 1987 than in 1984. Thus, it can be concluded that allpossible poverty lines will show an unambiguous decrease in aggregate povertybetween 1984 and 1987.12/
12/ See, A.B. Atkinson, "On the Measurement of Poverty," Econometrica,Vol. 55, No. 4 (July 1987), pp. 749-764. Atkinson shows that, as longas the class of poverty measures satisfies certain rather mildconditions, poverty will have unambiguously fallen between two dates ifthe cumulative distribution of income for the latter date lies nowhereabove that for the former date, over the entire interval up to themaximum allowable poverty lines.
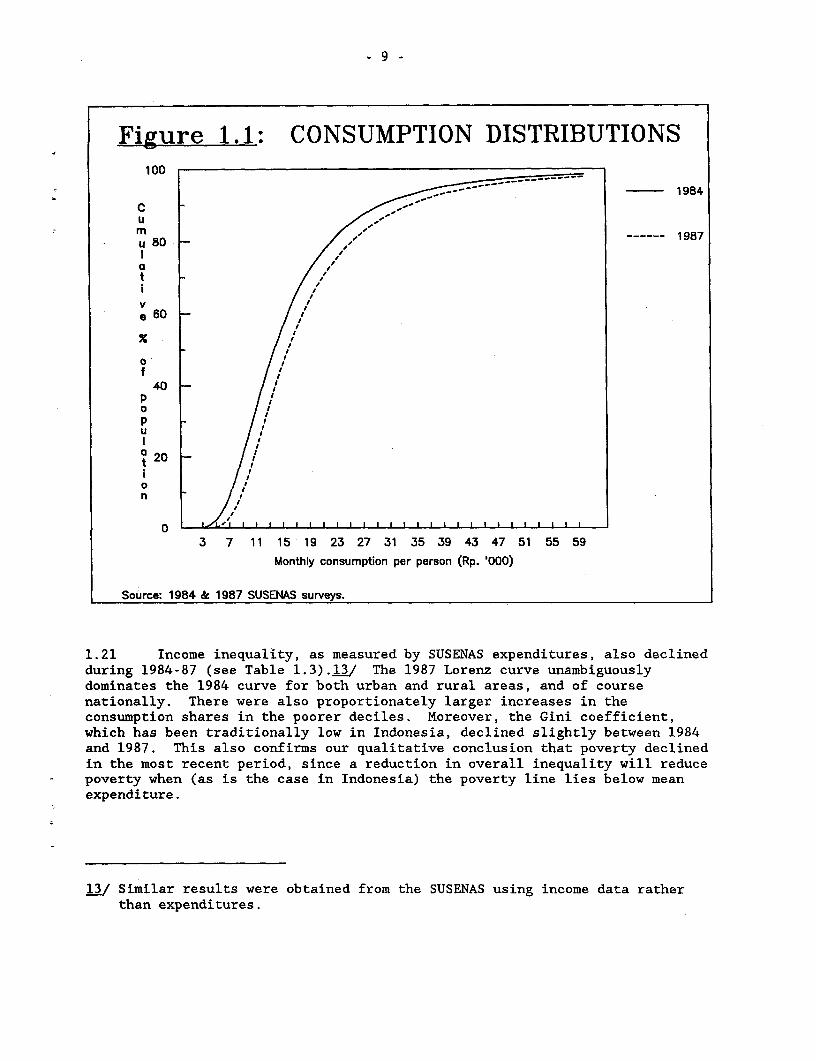
-9-
Figure 1.1: CONSUMPTION DISTRIBUTIONS100
1 9841C
duin 194887e al .)1 h 97Loezcreunmiuul
u 8
dointe ----- 19987efr ohubnad ua ra, n fcus
at
V
*60
0f
40P0P
0 3 7 11 15 19 23 27 31 35 39 43 47 51 55 59
Monthly consumption per person (Rp. '000)
Source: 1984 & 1987 SUSENAS surveys.
1.21 Income inequality, as measured by SUSENAS expenditures, also declinedduring 1984-87 (see Table 1.3).13/ The 1987 Lorenz curve unambiguouslydominates the 1984 curve for both urban and rural areas, and of coursenationally. There were also proportionately larger increases in theconsumption shares in the poorer deciles. Moreover, the Gini coefficient,which has been traditionally low in Indonesia, declined slightly between 1984and 1987. This also confirms our qualitative conclusion that poverty declinedin the most recent period, since a reduction in overall inequality will reducepoverty when (as is the case in Indonesia) the poverty line lies below meanexpenditure.
12/ Similar results were obtained from the SUSENAS using income data ratherthan expenditures.
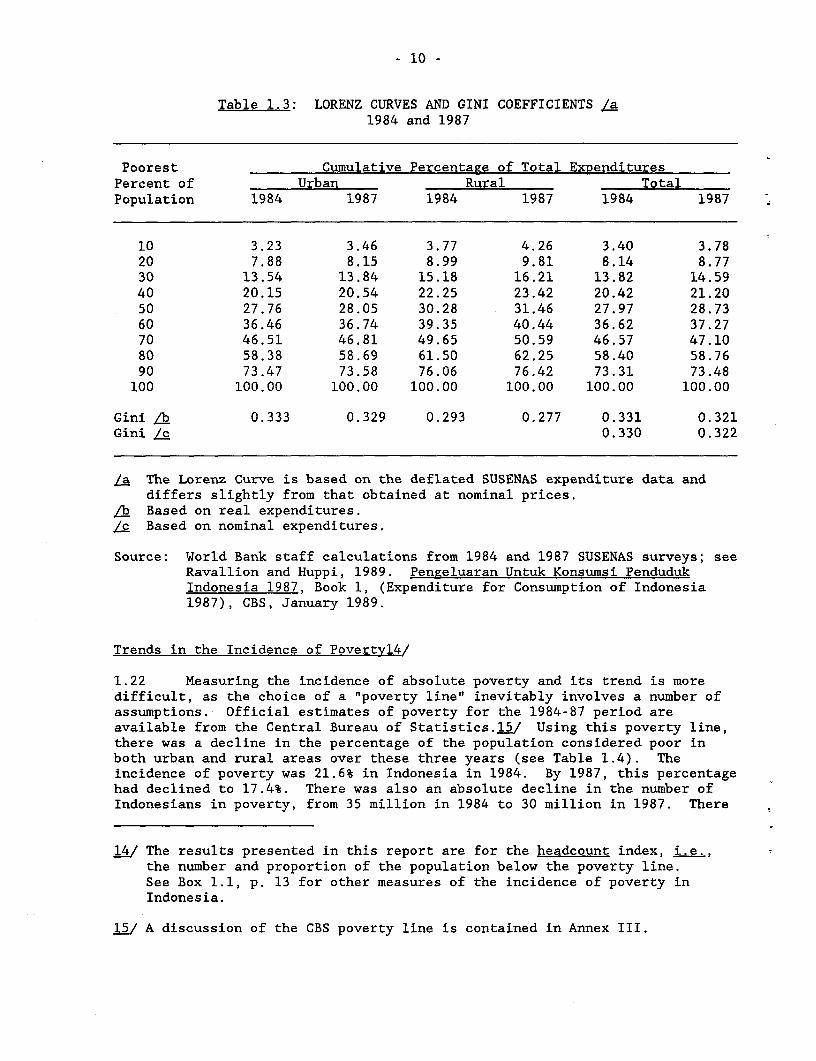
- 10 -
Table 1.3: LORENZ CURVES AND GINI COEFFICIENTS /a1984 and 1987
Poorest Cumulative Percentage of Total ExpendituresPercent of Urban Rural TotalPopulation 1984 1987 1984 1987 1984 1987
10 3.23 3.46 3.77 4.26 3.40 3.7820 7.88 8.15 8.99 9.81 8.14 8.7730 13.54 13.84 15.18 16.21 13.82 14.5940 20.15 20.54 22.25 23.42 20.42 21.2050 27.76 28.05 30.28 31.46 27.97 28.7360 36.46 36.74 39.35 40.44 36.62 37.2770 46.51 46.81 49.65 50.59 46.57 47.1080 58.38 58.69 61.50 62.25 58.40 58.7690 73.47 73.58 76.06 76.42 73.31 73.48
100 100.00 100.00 100.00 100.00 100.00 100.00
Gini L 0.333 0.329 0.293 0.277 0.331 0.321Gini X.L 0.330 0.322
a The Lorenz Curve is based on the deflated SUSENAS expenditure data anddiffers slightly from that obtained at nominal prices.
/ Based on real expenditures./c Based on nominal expenditures.
Source: World Bank staff calculations from 1984 and 1987 SUSENAS surveys; seeRavallion and Huppi, 1989. Pengeluaran Untuk Konsumsi PendudukIndonesia 1987, Book 1, (Expenditure for Consumption of Indonesia1987), CBS, January 1989.
Trends in the Incidence of Povertvl4/
1.22 Measuring the incidence of absolute poverty and its trend is moredifficult, as the choice of a "poverty line" inevitably involves a number ofassumptions. Official estimates of poverty for the 1984-87 period areavailable from the Central Bureau of Statistics.j5/ Using this poverty line,there was a decline in the percentage of the population considered poor inboth urban and rural areas over these three years (see Table 1.4). Theincidence of poverty was 21.6% in Indonesia in 1984. By 1987, this percentagehad declined to 17.4%. There was also an absolute decline in the number ofIndonesians in poverty, from 35 million in 1984 to 30 million in 1987. There
1.4/ The results presented in this report are for the headcount index, i.e.,the number and proportion of the population below the poverty line.See Box 1.1, p. 13 for other measures of the incidence of poverty inIndonesia.
j5/ A discussion of the CBS poverty line is contained in Annex III.
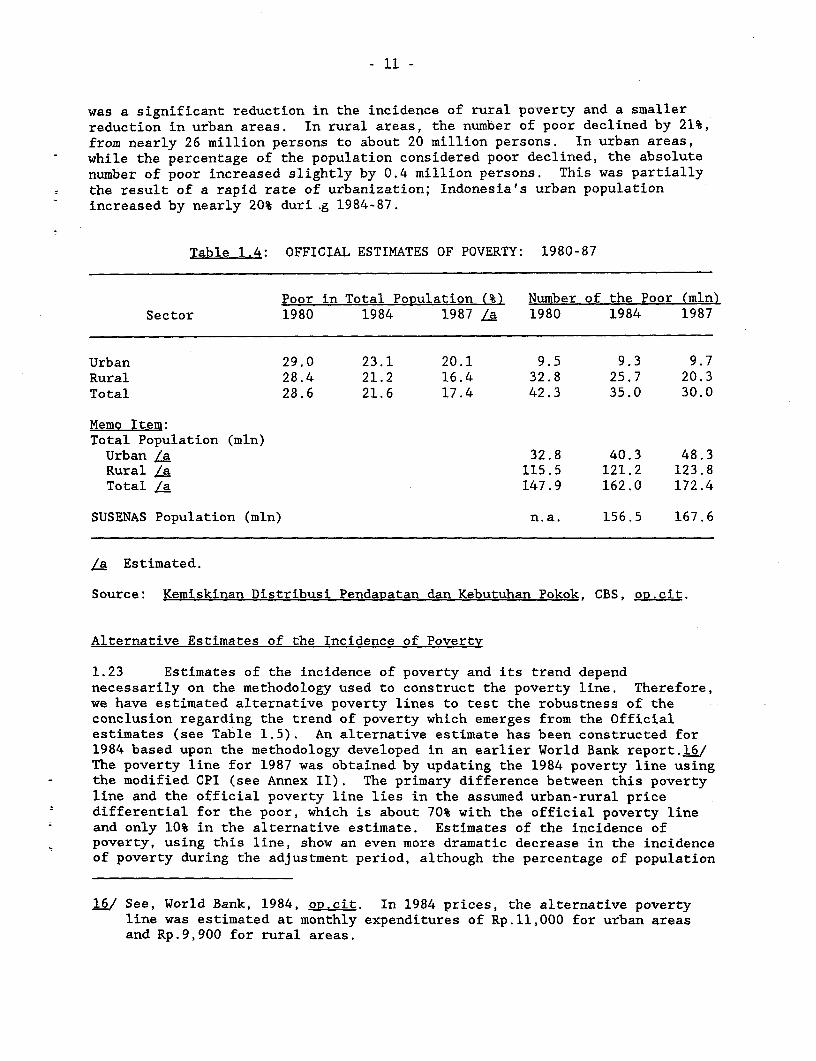
- 11 -
was a significant reduction in the incidence of rural poverty and a smallerreduction in urban areas. In rural areas, the number of poor declined by 21%,from nearly 26 million persons to about 20 million persons. In urban areas,while the percentage of the population considered poor declined, the absolutenumber of poor increased slightly by 0.4 million persons. This was partiallythe result of a rapid rate of urbanization; Indonesia's urban populationincreased by nearly 20% duri..g 1984-87.
Table 1.4: OFFICIAL ESTIMATES OF POVERTY: 1980-87
Poor in Total Population (%) Number of the Poor (mln)Sector 1980 1984 1987 La 1980 1984 1987
Urban 29.0 23.1 20.1 9.5 9.3 9.7Rural 28.4 21.2 16.4 32.8 25.7 20.3Total 28.6 21.6 17.4 42.3 35.0 30.0
Memo Item:Total Population (mln)Urban /a 32.8 40.3 48.3Rural La 115.5 121.2 123.8Total /a 147.9 162.0 172.4
SUSENAS Population (mln) n.a. 156.5 167.6
La Estimated.
Source: Kemiskinan Distribusi Pendapatan dan Kebutuhan Pokok, CBS, op.cit.
Alternative Estimates of the Incidence of Poverty
1.23 Estimates of the incidence of poverty and its trend dependnecessarily on the methodology used to construct the poverty line. Therefore,we have estimated alternative poverty lines to test the robustness of theconclusion regarding the trend of poverty which emerges from the Officialestimates (see Table 1.5). An alternative estimate has been constructed for1984 based upon the methodology developed in an earlier World Bank report.16/The poverty line for 1987 was obtained by updating the 1984 poverty line usingthe modified CPI (see Annex II). The primary difference between this povertyline and the official poverty line lies in the assumed urban-rural pricedifferential for the poor, which is about 70% with the official poverty lineand only 10% in the alternative estimate. Estimates of the incidence ofpoverty, using this line, show an even more dramatic decrease in the incidenceof poverty during the adjustment period, although the percentage of population
1i_/ See, World Bank, 1984, op.cit. In 1984 prices, the alternative povertyline was estimated at monthly expenditures of Rp.ll,000 for urban areasand Rp.9,900 for rural areas.
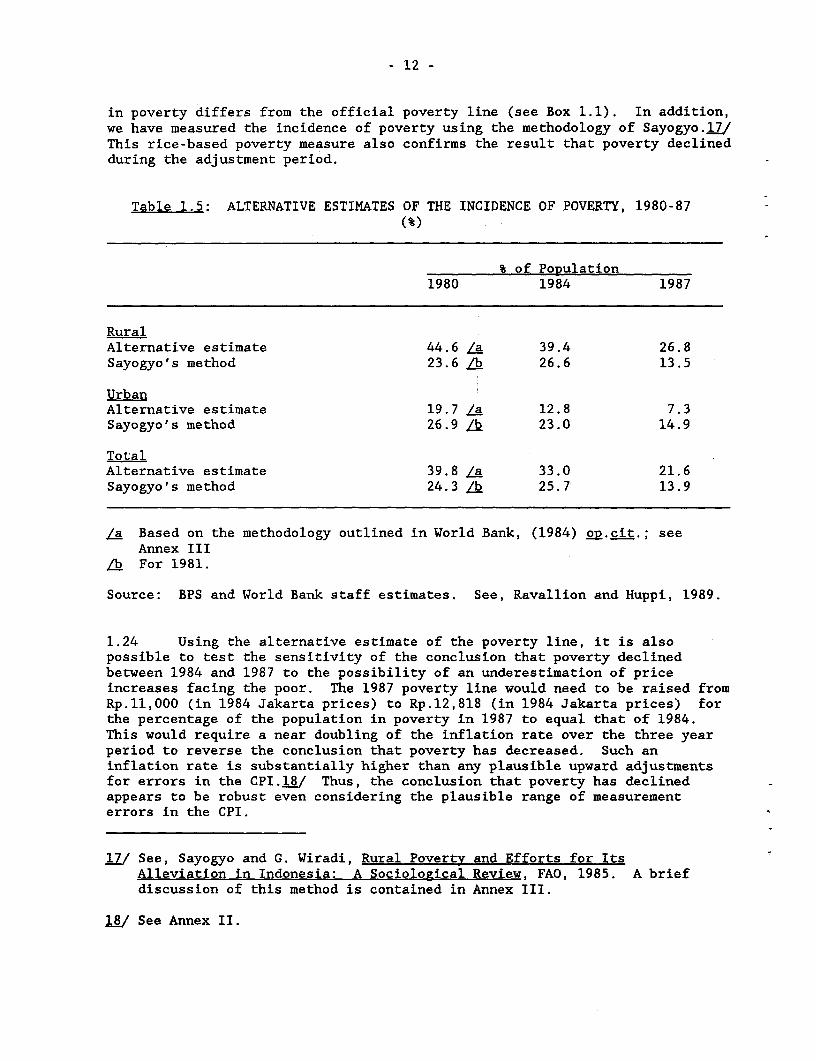
- 12 -
in poverty differs from the official poverty line (see Box 1.1). In addition,we have measured the incidence of poverty using the methodology of Sayogyo. JDThis rice-based poverty measure also confirms the result that poverty declinedduring the adjustment period.
Table 1.5: ALTERNATIVE ESTIMATES OF THE INCIDENCE OF POVERTY, 1980-87(%)
% of Population1980 1984 1987
RuralAlternative estimate 44.6 /a 39.4 26.8Sayogyo's method 23.6 $ 26.6 13.5
UrbanAlternative estimate 19.7 La 12.8 7.3Sayogyo's method 26.9 /b 23.0 14.9
TotalAlternative estimate 39.8 la 33.0 21.6Sayogyo's method 24.3 /b 25.7 13.9
/a Based on the methodology outlined in World Bank, (1984) op.cit.; seeAnnex III
ib For 1981.
Source: BPS and World Bank staff estimates. See, Ravallion and Huppi, 1989.
1.24 Using the alternative estimate of the poverty line, it is alsopossible to test the sensitivity of the conclusion that poverty declinedbetween 1984 and 1987 to the possibility of an underestimation of priceincreases facing the poor. The 1987 poverty line would need to be raised fromRp.11,000 (in 1984 Jakarta prices) to Rp.12,818 (in 1984 Jakarta prices) forthe percentage of the population in poverty in 1987 to equal that of 1984.This would require a near doubling of the inflation rate over the three yearperiod to reverse the conclusion that poverty has decreased. Such aninflation rate is substantially higher than any plausible upward adjustmentsfor errors in the CPI.18/ Thus, the conclusion that poverty has declinedappears to be robust even considering the plausible range of measurementerrors in the CPI.
11/ See, Sayogyo and G. Wiradi, Rural Poverty and Efforts for ItsAlleviation in Indonesia: A Sociological Review, FAO, 1985. A briefdiscussion of this method is contained in Annex III.
jfi/ See Annex II.
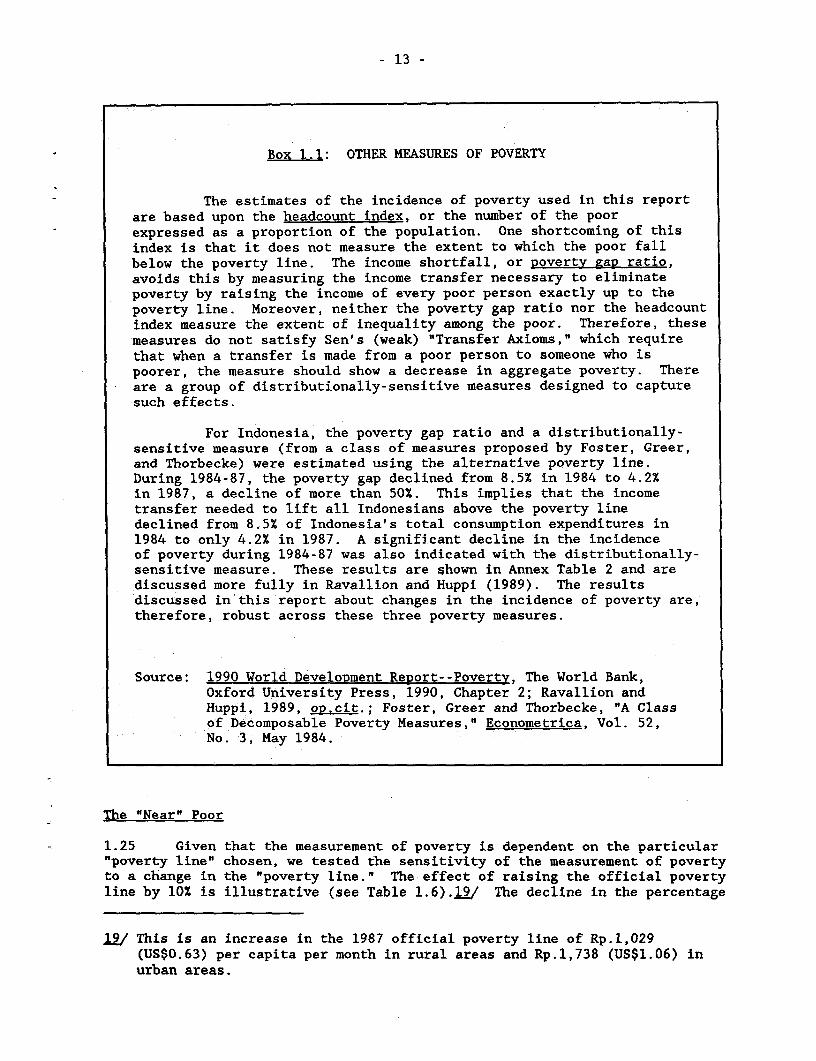
- 13 -
Box 1.1: OTHER MEASURES OF POVERTY
The estimates of the incidence of poverty used in this reportare based upon the headcount index, or the number of the poorexpressed as a proportion of the population. One shortcoming of thisindex is that it does not measure the extent to which the poor fallbelow the poverty line. The income shortfall, or Rovertv gap ratio,avoids this by measuring the income transfer necessary to eliminatepoverty by raising the income of every poor person exactly up to thepoverty line. Moreover, neither the poverty gap ratio nor the headcountindex measure the extent of inequality among the poor. Therefore, thesemeasures do not satisfy Sen's (weak) "Transfer Axioms," which requirethat when a transfer is made from a poor person to someone who ispoorer, the measure should show a decrease in aggregate poverty. Thereare a group of distributionally-sensitive measures designed to capturesuch effects.
For Indonesia, the poverty gap ratio and a distributionally-sensitive measure (from a class of measures proposed by Foster, Greer,and Thorbecke) were estimated using the alternative poverty line.During 1984-87, the poverty gap declined from 8.5% in 1984 to 4.2%in 1987, a decline of more than 50%. This implies that the incometransfer needed to lift all Indonesians above the poverty linedeclined from 8.5% of Indonesia's total consumption expenditures in1984 to only 4.2% in 1987. A significant decline in the incidenceof poverty during 1984-87 was also indicated with the distributionally-sensitive measure. These results are shown in Annex Table 2 and arediscussed more fully in Ravallion and Huppi (1989). The resultsdiscussed in this report about changes in the incidence of poverty are,therefore, robust across these three poverty measures.
Source: 1990 World Development Report--Poverty, The World Bank,Oxford University Press, 1990, Chapter 2; Ravallion andHuppi, 1989, op.cit.; Foster, Greer and Thorbecke, "A Classof Decomposable Poverty Measures," Econometrica, Vol. 52,No. 3, May 1984.
The "Near" Poor
1.25 Given that the measurement of poverty is dependent on the particular"poverty line" chosen, we tested the sensitivity of the measurement of povertyto a change in the "poverty line." The effect of raising the official povertyline by 10% is illustrative (see Table 1.6).19/ The decline in the percentage
.19 This is an increase in the 1987 official poverty line of Rp.1,029(US$0.63) per capita per month in rural areas and Rp.1,738 (US$1.06) inurban areas.
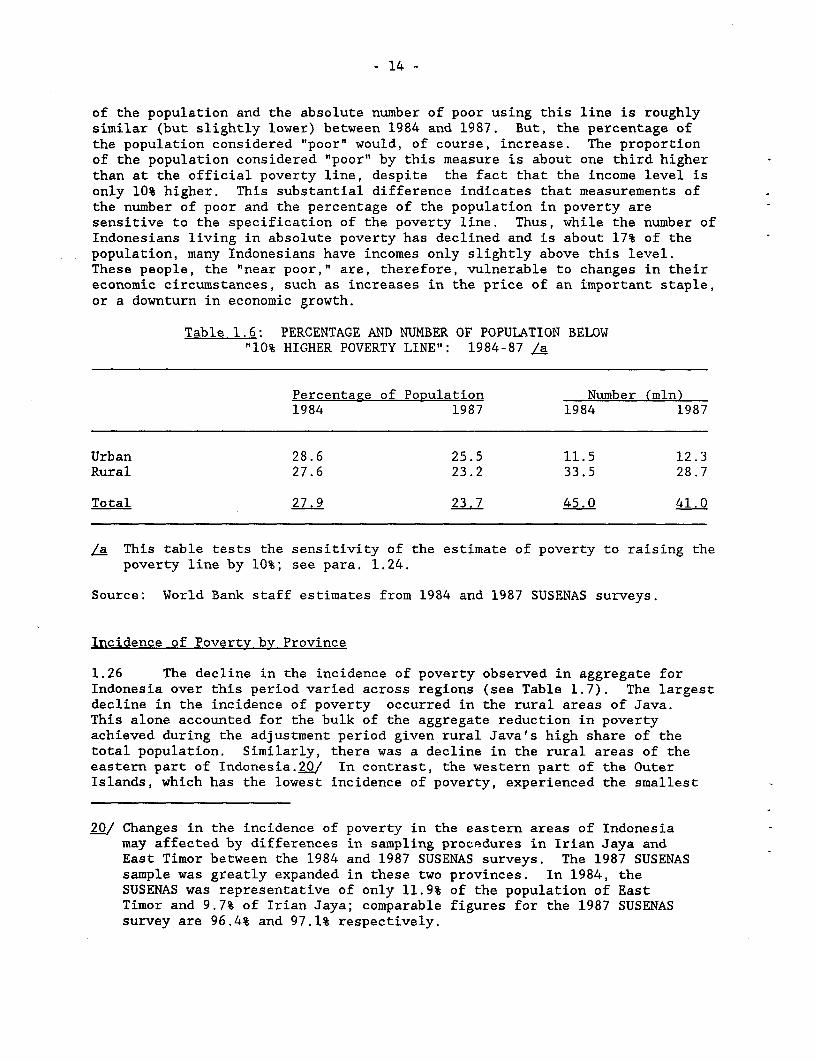
- 14 -
of the population and the absolute number of poor using this line is roughlysimilar (but slightly lower) between 1984 and 1987. But, the percentage ofthe population considered "poor" would, of course, increase. The proportionof the population considered "poor" by this measure is about one third higherthan at the official poverty line, despite the fact that the income level isonly 10% higher. This substantial difference indicates that measurements ofthe number of poor and the percentage of the population in poverty aresensitive to the specification of the poverty line. Thus, while the number ofIndonesians living in absolute poverty has declined and is about 17% of thepopulation, many Indonesians have incomes only slightly above this level.These people, the "near poor," are, therefore, vulnerable to changes in theireconomic circumstances, such as increases in the price of an important staple,or a downturn in economic growth.
Table 1.6: PERCENTAGE AND NUMBER OF POPULATION BELOW"10% HIGHER POVERTY LINE": 1984-87 /a
Percentage of Population Number (mln)1984 1987 1984 1987
Urban 28.6 25.5 11.5 12.3Rural 27.6 23.2 33.5 28.7
Total 27.9 23.7 45.0 41.0
/a This table tests the sensitivity of the estimate of poverty to raising thepoverty line by 10%; see para. 1.24.
Source: World Bank staff estimates from 1984 and 1987 SUSENAS surveys.
Incidence of Poverty by Province
1.26 The decline in the incidence of poverty observed in aggregate forIndonesia over this period varied across regions (see Table 1.7). The largestdecline in the incidence of poverty occurred in the rural areas of Java.This alone accounted for the bulk of the aggregate reduction in povertyachieved during the adjustment period given rural Java's high share of thetotal population. Similarly, there was a decline in the rural areas of theeastern part of Indonesia.20/ In contrast, the western part of the OuterIslands, which has the lowest incidence of poverty, experienced the smallest
20/ Changes in the incidence of poverty in the eastern areas of Indonesiamay affected by differences in sampling procedures in Irian Jaya andEast Timor between the 1984 and 1987 SUSENAS surveys. The 1987 SUSENASsample was greatly expanded in these two provinces. In 1984, theSUSENAS was representative of only 11.9% of the population of EastTimor and 9.7% of Irian Jaya; comparable figures for the 1987 SUSENASsurvey are 96.4% and 97.1% respectively.
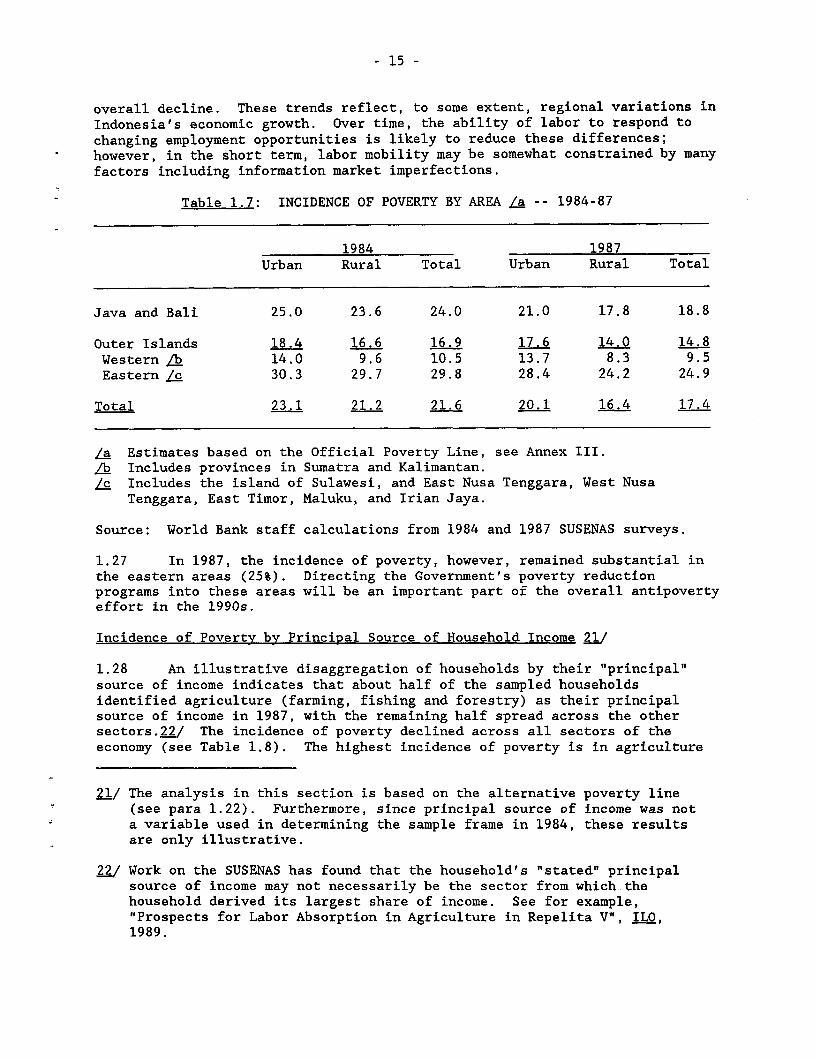
- 15 -
overall decline. These trends reflect, to some extent, regional variations inIndonesia's economic growth. Over time, the ability of labor to respond tochanging employment opportunities is likely to reduce these differences;however, in the short term, labor mobility may be somewhat constrained by manyfactors including information market imperfections.
Table 1.7: INCIDENCE OF POVERTY BY AREA /a -- 1984-87
1984 1987Urban Rural Total Urban Rural Total
Java and Bali 25.0 23.6 24.0 21.0 17.8 18.8
Outer Islands 18.4 16.6 16.9 17.6 14.0 14.8Western Ab 14.0 9.6 10.5 13.7 8.3 9.5Eastern /c 30.3 29.7 29.8 28.4 24.2 24.9
Total 23.1 21.2 21.6 20.1 16.4 17.4
/a Estimates based on the Official Poverty Line, see Annex III.A Includes provinces in Sumatra and Kalimantan./c Includes the island of Sulawesi, and East Nusa Tenggara, West Nusa
Tenggara, East Timor, Maluku, and Irian Jaya.
Source: World Bank staff calculations from 1984 and 1987 SUSENAS surveys.
1.27 In 1987, the incidence of poverty, however, remained substantial inthe eastern areas (25%). Directing the Government's poverty reductionprograms into these areas will be an important part of the overall antipovertyeffort in the 1990s.
Incidence of Poverty by Principal Source of Household Income 21J
1.28 An illustrative disaggregation of households by their "principal"source of income indicates that about half of the sampled householdsidentified agriculture (farming, fishing and forestry) as their principalsource of income in 1987, with the remaining half spread across the othersectors.22/ The incidence of poverty declined across all sectors of theeconomy (see Table 1.8). The highest incidence of poverty is in agriculture
21/ The analysis in this section is based on the alternative poverty line(see para 1.22). Furthermore, since principal source of income was nota variable used in determining the sample frame in 1984, these resultsare only illustrative.
2./ Work on the SUSENAS has found that the household's "stated" principalsource of income may not necessarily be the sector from which thehousehold derived its largest share of income. See for example,"Prospects for Labor Absorption in Agriculture in Repelita V", ILO,1989.
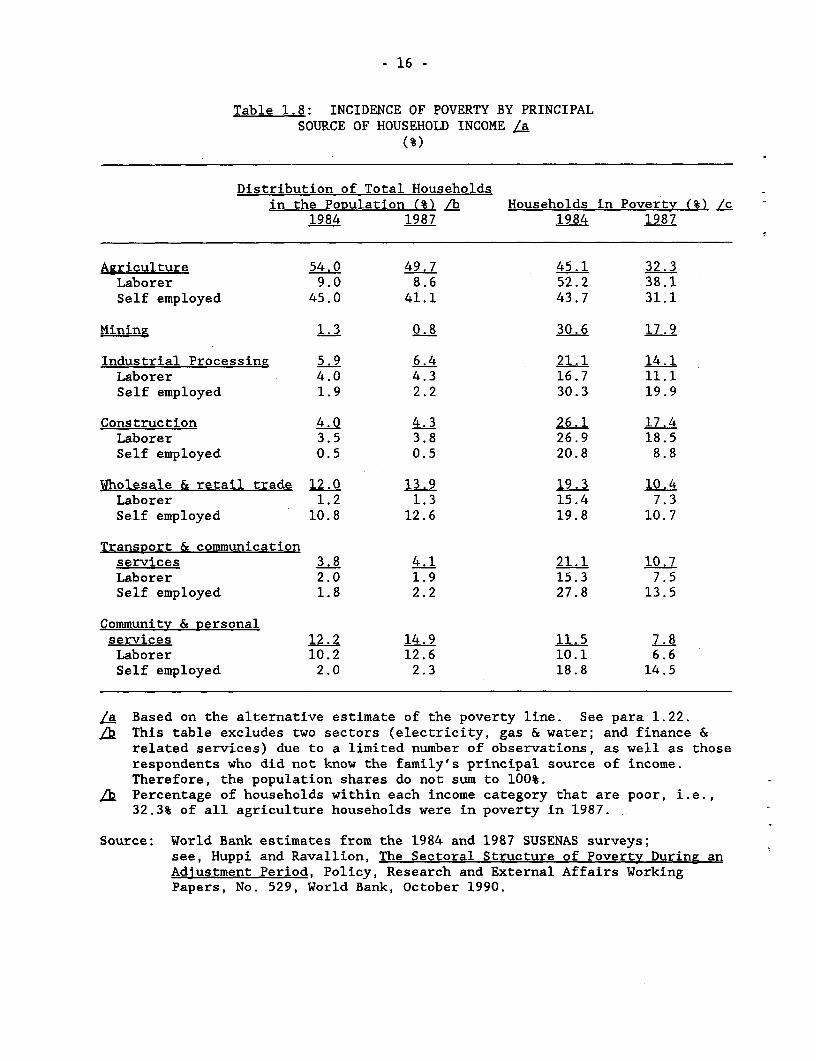
- 16 -
Table 1.8: INCIDENCE OF POVERTY BY PRINCIPALSOURCE OF HOUSEHOLD INCOME La
(%)
Distribution of Total Householdsin the Population (%) /b Households in Poverty (%' /c
1984 1987 1984 1987
Agriculture 54.0 49.7 45.1 32.3Laborer 9.0 8.6 52.2 38.1Self employed 45.0 41.1 43.7 31.1
Mining 1.3 0.8 30.6 17.9
Industrial Processing 5.9 6.4 21.1 14.1Laborer 4.0 4.3 16.7 11.1Self employed 1.9 2.2 30.3 19.9
Construction 4.0 4.3 26.1 17.4Laborer 3.5 3.8 26.9 18.5Self employed 0.5 0.5 20.8 8.8
Wholesale & retail trade 12.0 13.9 19.3 10.4Laborer 1.2 1.3 15.4 7.3Self employed 10.8 12.6 19.8 10.7
TransRort & communicationservices 3.8 4.1 21.1 10.7Laborer 2.0 1.9 15.3 7.5Self employed 1.8 2.2 27.8 13.5
Community & personalservices 12.2 14.9 11.5 7.8Laborer 10.2 12.6 10.1 6.6Self employed 2.0 2.3 18.8 14.5
la Based on the alternative estimate of the poverty line. See para 1.22.a This table excludes two sectors (electricity, gas & water; and finance &
related services) due to a limited number of observations, as well as thoserespondents who did not know the family's principal source of income.Therefore, the population shares do not sum to 100%.
Ab Percentage of households within each income category that are poor, i.e.,32.3% of all agriculture households were in poverty in 1987.
Source: World Bank estimates from the 1984 and 1987 SUSENAS surveys;see, Huppi and Ravallion, The Sectoral Structure of Poverty During anAdjustment Period, Policy, Research and External Affairs WorkingPapers, No. 529, World Bank, October 1990.
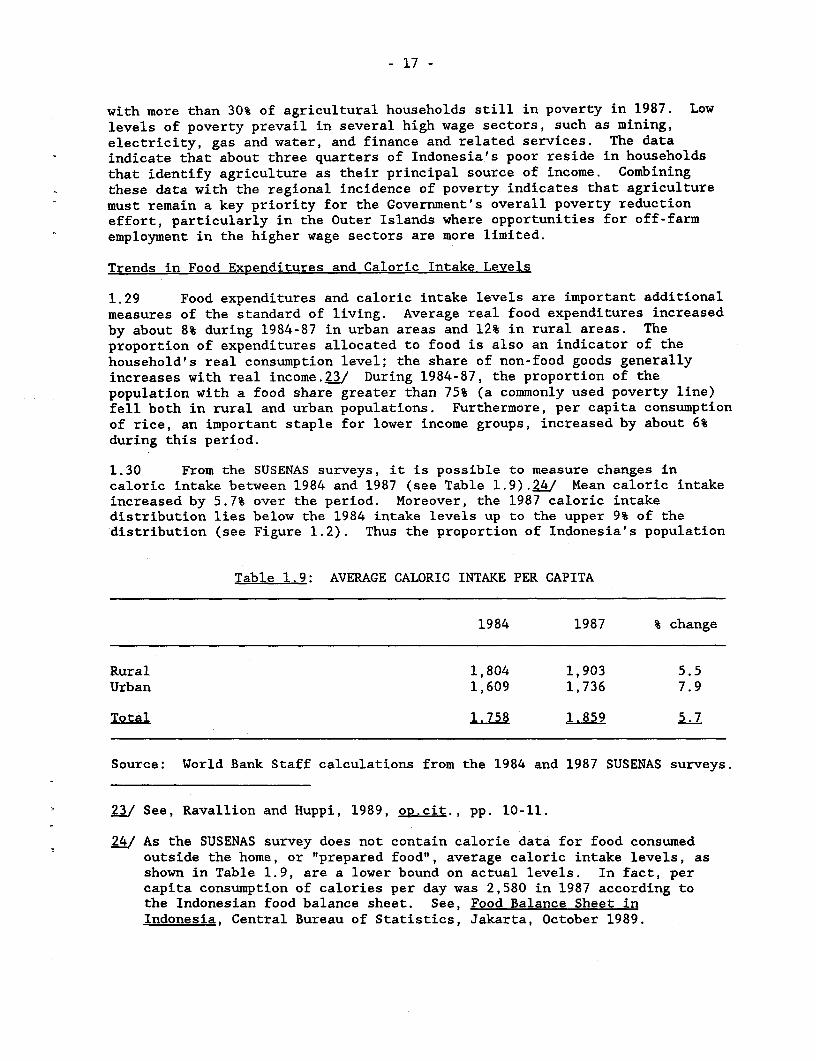
- 17 -
with more than 30% of agricultural households still in poverty in 1987. Low
levels of poverty prevail in several high wage sectors, such as mining,electricity, gas and water, and finance and related services. The dataindicate that about three quarters of Indonesia's poor reside in householdsthat identify agriculture as their principal source of income. Combiningthese data with the regional incidence of poverty indicates that agriculturemust remain a key priority for the Government's overall poverty reductioneffort, particularly in the Outer Islands where opportunities for off-farmemployment in the higher wage sectors are more limited.
Trends in Food Expenditures and Caloric Intake Levels
1.29 Food expenditures and caloric intake levels are important additionalmeasures of the standard of living. Average real food expenditures increasedby about 8% during 1984-87 in urban areas and 12% in rural areas. Theproportion of expenditures allocated to food is also an indicator of thehousehold's real consumption level; the share of non-food goods generallyincreases with real income.23/ During 1984-87, the proportion of thepopulation with a food share greater than 75% (a commonly used poverty line)fell both in rural and urban populations. Furthermore, per capita consumptionof rice, an important staple for lower income groups, increased by about 6%during this period.
1.30 From the SUSENAS surveys, it is possible to measure changes incaloric intake between 1984 and 1987 (see Table 1.9).4/ Mean caloric intakeincreased by 5.7% over the period. Moreover, the 1987 caloric intakedistribution lies below the 1984 intake levels up to the upper 9% of thedistribution (see Figure 1.2). Thus the proportion of Indonesia's population
Table 1.9: AVERAGE CALORIC INTAKE PER CAPITA
1984 1987 % change
Rural 1,804 1,903 5.5Urban 1,609 1,736 7.9
Total 1.758 1.859 5.7
Source: World Bank Staff calculations from the 1984 and 1987 SUSENAS surveys.
2J/ See, Ravallion and Huppi, 1989, op.cit., pp. 10-11.
24/ As the SUSENAS survey does not contain calorie data for food consumedoutside the home, or "prepared food", average caloric intake levels, asshown in Table 1.9, are a lower bound on actual levels. In fact, percapita consumption of calories per day was 2,580 in 1987 according tothe Indonesian food balance sheet. See, Food Balance Sheet inIndonesia, Central Bureau of Statistics, Jakarta, October 1989.
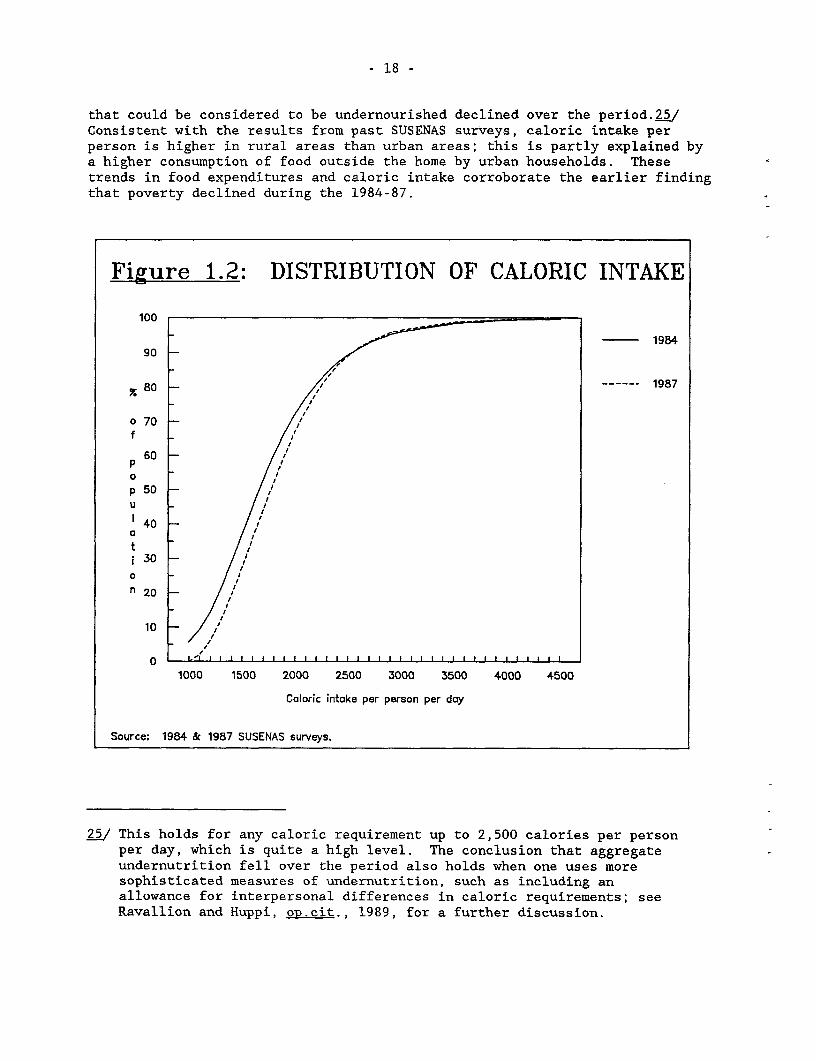
- 18 -
that could be considered to be undernourished declined over the period.5/Consistent with the results from past SUSENAS surveys, caloric intake perperson is higher in rural areas than urban areas; this is partly explained bya higher consumption of food outside the home by urban households. Thesetrends in food expenditures and caloric intake corroborate the earlier findingthat poverty declined during the 1984-87.
Figure 1.2: DISTRIBUTION OF CALORIC INTAKE
1001984
90
%80 - 1987
° 70f
60p
u /
3 0 /i40
n 20
10
01000 1500 2000 2500 3000 3500 4000 4500
Caloric intake per person per day
Source: 1984 & 1987 SUSENAS surveys.
25/ This holds for any caloric requirement up to 2,500 calories per personper day, which is quite a high level. The conclusion that aggregateundernutrition fell over the period also holds when one uses moresophisticated measures of undernutrition, such as including anallowance for interpersonal differences in caloric requirements; seeRavallion and Huppi, op.cit., 1989, for a further discussion.
- 19 -
Summary
1.31 Recognizing the inherent difficulties in measuring poverty both atone point in time and over time, we examined the incidence of poverty inIndonesia and how it has changed over time. This analysis includedalternative poverty lines, and alternative poverty measures, as well as anexamination of the sensitivity of the results to plausible measurement errorsin the CPI. The basic conclusions are:
(a) the percentage of the population in poverty has decreased during the1980s in both urban and rural areas. This conclusion is robust toalternative specifications of the poverty line and is also supportedby an analysis of food expenditures and caloric intake;
(b) the above result is robust throughout the entire distribution ofconsumption, i.e., irrespective of the particular poverty linechosen; and
(c) the result is robust to plausible measurement errors in the rate ofinflation.
D. Factors Underlying the Reduction in Poverty
1.32 In spite of the magnitude of the external shocks that the Indonesianeconomy experienced since 1983, poverty declined during the 1984-87 period.The Government's success in reducing poverty during the adjustment period isattributable to the conditions prevailing prior to the external shocks, andthe nature and speed of the Government's policy response to these externalshocks. Two elements of the Government's past development strategyestablished important preconditions for the reduction which occurred during1984-87. One important precondition was Indonesia's relatively low incomeinequality; this created a situation where large reductions in poverty couldbe generated from modest growth in per capita consumption. A second was thenature of the development strategy pursued by the New Order Government duringthe 1970s and early 1980s. Two elements of this strategy were especiallyimportant:
(a) the Government's past programs and policies to support theagricultural sector and rural areas had established a solid base forrural incomes and employment. The agricultural sector, particularlyrice and treecrops, experienced rapid growth during the late 1970sand early 1980s (see Figure 1.3). The momentum of this growth inagriculture continued into the mid-1980s; and
(b) the Government had made substantial investments in socialinfrastructure (for example, primary schools and health facilities).These facilities were largely in place, particularly in rural Javawhere the bulk of Indonesia's poor live, prior to the onset of theadjustment process. The benefits from this infrastructure in theform of human resource development began to be realized only in the1980s.
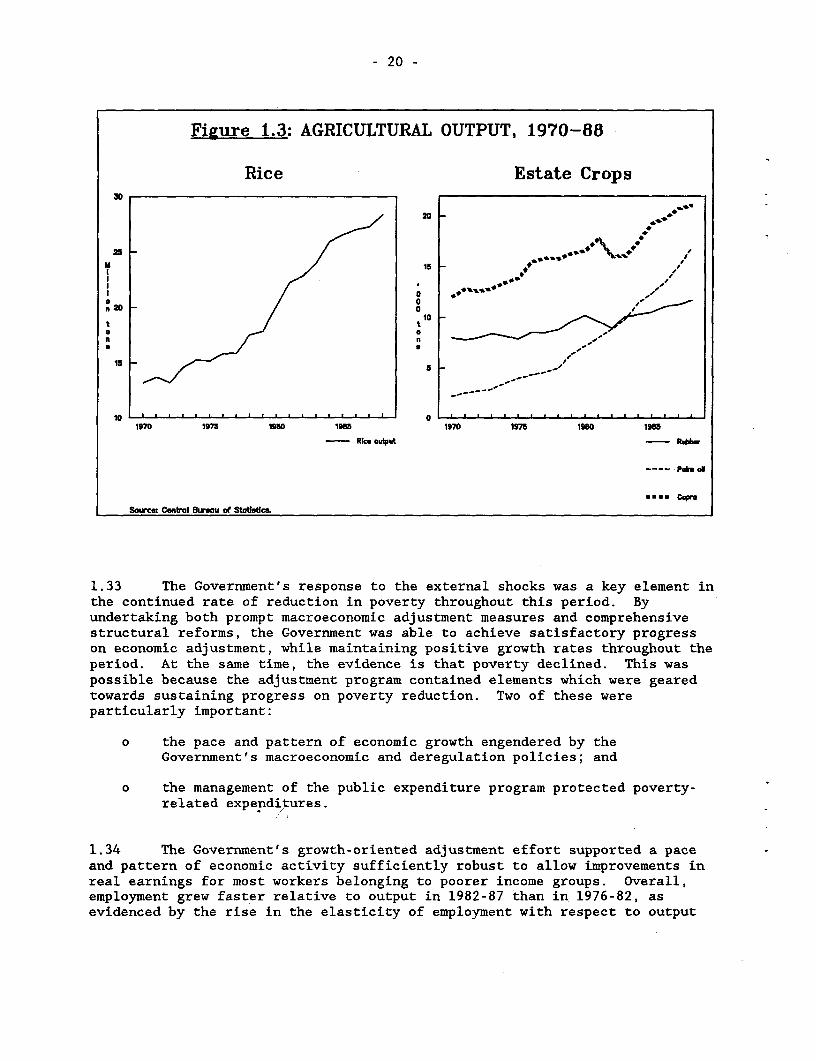
- 20 -
Figure 1.3: AGRICULTURAL OUTPUT, 1970-88
Rice Estate Crops
20-
ttX 4; . . . , .. ., .. O t . oe1S70 9#5 1980 1985 1970 1975 1Z S1
- Rice output -Rd
---- Pdin am
*--- CO*
Sourc. CtnVl Buru of SUttflc
1.33 The Government's response to the external shocks was a key element inthe continued rate of reduction in poverty throughout this period. Byundertaking both prompt macroeconomic adjustment measures and comprehensivestructural reforms, the Government was able to achieve satisfactory progresson economic adjustment, while maintaining positive growth rates throughout theperiod. At the same time, the evidence is that poverty declined. This waspossible because the adjustment program contained elements which were gearedtowards sustaining progress on poverty reduction. Two of these wereparticularly important:
o the pace and pattern of economic growth engendered by theGovernLment's macroeconomic and deregulation policies; and
o the management of the public expenditure program protected poverty-related expendi,tures.
1.34 The Governme-nt's growth-oriented adjustment effort supported a paceand pattern of economic activity sufficiently robust to allow improvements inreal earnings for most workers belonging to poorer income groups. Overall,employment grew faster relative to output in 1982-87 than in 1976-82, asevidenced by th se in the elasticity of employment with respect to output
- 21 -
from 0.44 in 1976-82 to 0.65 in 1982-87.26/ An important factor contributingto this was the change in the composition of output during the adjustmentperiod. In rural areas, despite a slowing of rice production, which began in1984, the adjustment burden was lessened. The real exchange ratedepreciations largely offset lower agricultural export prices. Moreover,there was some diversification into more profitable nonrice crops, especiallyfruits and vegetables. The importance of these factors in aggregate povertyreduction during the adjustment period is illustrated by the decline in theincidence of rural poverty in East and Central Java, where most of the gainswere realized by self-employed farmers.27/ This was critical to the overallreduction in poverty, because the bulk of Indonesia's poor reside in the ruralareas of Java and depend upon agriculture for an important part of theirlivelihood.
1.35 In manufacturing, the combination of trade and industrialderegulation, and real exchange rate adjustments led to a rapid recovery inmanufacturing growth and investment. Private investment declined noticeablyup to 1985, but has recovered sharply since then. The non-oil industrialexpansion triggered by these policy reforms, and the associated largeinvestment outlays led to an increase in the employment of unskilled andsemiskilled labor in manufacturing industries.28/
1.36 There is also evidence that real wages for unskilled agricultureworkers in Java and for industrial workers grew, albeit modestly, during theadjustment period (see Annex IV). As a result, real earnings of workers inagriculture and industry continued to grow, as both the level of employmentand real wages increased. Therefore, the Government's ability to sustain areasonable pace of economic growth, based on higher economic efficiency and amore labor-intensive pattern of production, was a key factor in Indonesia'sability to reduce poverty even as major adjustments were implemented torestore financial stability. This has important implications for Indonesia'sdevelopment strategy in the 1990s.
1.37 Public expenditure policies were also critical in lessening theeffect of economic adjustment on lower income groups. The brunt of theadjustment program fell on the public sector. Total real public expenditureswere cut by about 19% between 1982/83 and 1986/87; after 1986/87, publicexpenditures increased modestly in real terms (see Table 1.10). One of thenoteworthy achievements of the Government's management of this reduction inpublic expenditures and an important reason for the decline in poverty
2§6/ These elasticities are calculated from the 1976 and 1987 Labor Forcesurveys (SAKERNAS) and labor force data collected as part of the 1982SUSENAS survey.
27/ Data from the SUSENAS survey indicates that between 1984 and 1987, theincidence of poverty among self-employed farm households fell from 65%to 41% in Central Java, 46% to 25% in Yogyakarta and 54% to 39% in EastJava, between 1984 and 1987. See, 1990 World Development Report,op.cit., Box 3.1, p. 41 for a discussion of changes in one East Javavillage in the past two decades.
2.fi/ The available evidence suggests that manufacturing employment inenterprises with more than 15 employees increased by 9.9% p.a. during1985-88, compared to only only 5.1% p.a. during 1982-85.
- 22 -
achieved during this period, is that the effect of the reduction in publicexpenditures on the poor was moderated. Three basic elements of theGovernment's expenditure management were responsible for this outcome:
(a) the reductions fell most heavily on development expenditures, whileroutine expenditures were protected;
(b) transfers to the provinces were protected relative to otherexpenditures; and
(c) development expenditures were reallocated into sectors of thegreatest potential benefit to the poor.
Table 1.10: CENTRAL GOVERNMENT EXPENDITURES--1982/83-1986/87(Constant 1983/84 prices)
Growth1982/83-86
-------------- Rp. billion ------------ Per Cumulative1982/83 1983/84 1984/85 1985/86 1986/87 Annum Total
Routine expenditures /a 9.295 8.333 9.099 10.197 9.977 1.2 7.3Transfers 1,617 1,547 1,745 2,194 2,198 5.2 35.9Interest 1,033 1,145 1,565 1,579 1,798 9.7 74.0Other 6,645 5,641 5,789 6,424 5,981 -1.7 -10.0
DeveloRment expenditures /b 9,873 8.743 7,876 8.538 5.645 -8.9 -42.8Transfers 1,247 1,315 1,228 1,124 994 -3.7 -20.3General INPRES 678 539 485 478 435 -7.1 -35.8INPRES SD 338 549 513 447 381 2.0 12.5Other INPRES 231 227 230 199 178 -4.2 -22.9
Project aid 2,638 3,106 3,113 3,003 2,782 0.9 5.4Other 5,988 4,322 3,535 4,411 1,869 -17.6 -68.8
Total expenditures /c 19.168 17.076 16,975 18.735 15622 -3.3 -18.0Transfers 2,864 2,862 2,973 3,318 3,192 1.8 11.4Other 16,304 14,214 14,002 15,417 12,430 -4.3 -23.2
Memo Items:Development expenditures
(excluding Project Aid) 7.235 5.637 4.763 5.535 2.863 -14.3 -60.4Transfers 1,247 1,315 1,228 1,124 994 -3.7 -20.3Other 5,988 4,322 3,535 4,411 1,869 -17.6 -68.8
/a Excludes amortization but includes fertilizer subsidy and defense spending.Data on interest are obtained from the World Bank's Debt Reporting System.
Lb Residual.Zc Based on estimates of resources availability from domestic revenues and
grants, external borrowing (net), and domestic borrowing (net).
Source: Ministry of Finance and World Bank Staff calculations.
- 23 -
1.38 The Government's overall expenditure reduction strategy was to cutdevelopment expenditures and preserve public consumption. Between 1982/83 and1986/87, routine expenditures grew by about 7.3% in real terms, whiledevelopment expenditures were reduced by about 43%. By allowing routineexpenditures to rise, the Government was able to fund many essentialoperations and maintenance expenditures and thereby, continue many of itsongoing programs, including those in agriculture and the social sectors. Thispermitted the productive use of much of the physical and social infrastructurecreated in the late 1970s and early 1980s.29/ Moreover, the Government alsoinstituted a freeze on civil service wages and salaries during this period,which freed some resources for other complementary inputs.
1.39 Transfers to the local governments were also protected. Theseremained basically constant in real terms, while all other public expendituresdeclined by 3% p.a.30/ Excluding interest payments and projectaid, the share of total Central Government expenditures allocated to transferswas increased from 19% in 1982/83 to 29% in 1986/87. These transfers financeover two thirds of total public expenditures by local governments and thus,they are an important factor in determining local aggregate demand.1 vRoutine transfers from the Central Government are used by local governments,primarily to finance staff salaries, many of which are in important socialsectors (approximately 60% of the salary component is spent on teachers andabout 5% on health care employees). Transfers for development expenditures--the General and Sectoral INPRES--also provide an important instrument to help
2/ The overall level of O&M continues to be a problem, reflecting a lackof balance between current and capital spending during the oil boomperiod of the late 1970s. The Government recognizes that raising O&Mexpenditures to a more appropriate level is a priority for the 1990s.
3LQ/ The Central Government transfers resources to local governments mainlyvia three programs: (i) the SDO (Subsidi Daerah Otonom), a regionaltransfer, included under routine expenditures, which finances salaries,mostly in the education and health sectors, and some goods andservices; (ii) the General INPRES, which provides budgetary support tothe three tiers of local government (provincial, district and village)to finance both routine and development expenditures, and is includedunder development expenditures; and (iii) the Sectoral INPRES, whichallocates resources for projects within five specific sectors (Health,Schools, Roads, Reforestation and Regreening, and Markets) and is alsoincluded under development expenditures. The PBB (formerly IPEDA), aproperty tax is also classified as a transfer by the Government, but itis not treated as such here.
!I/ See Annex Table 3.
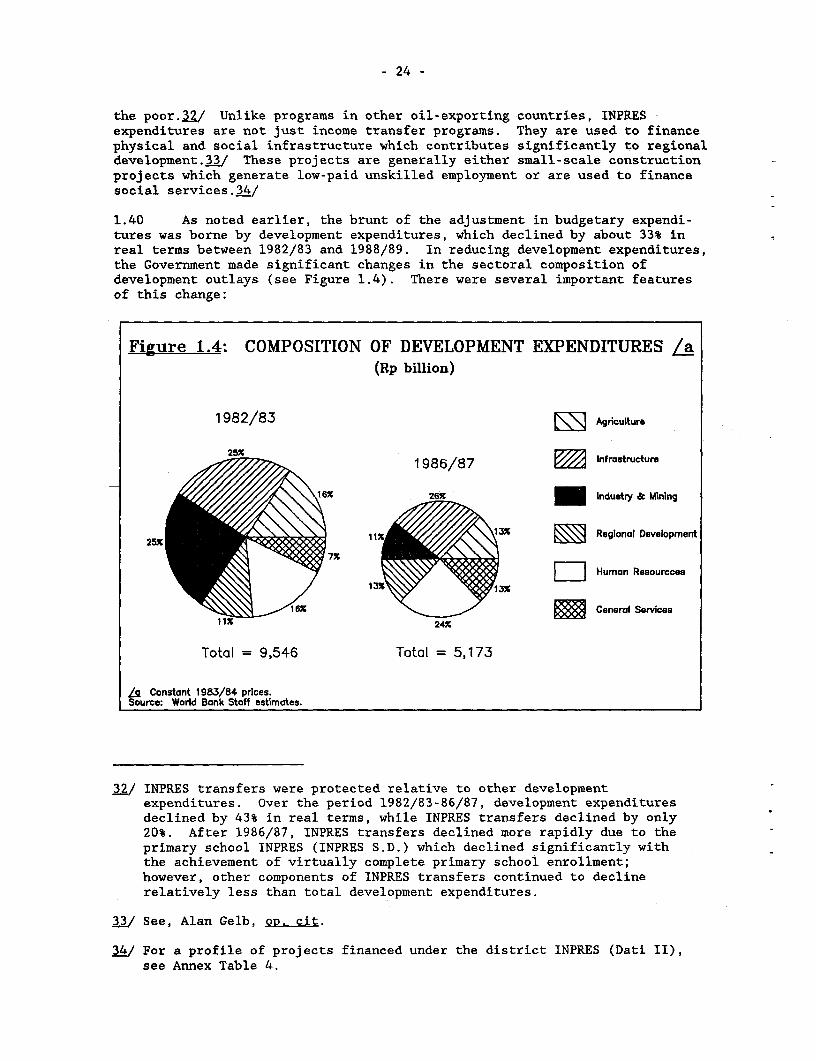
- 24 -
the poor.12/ Unlike programs in other oil-exporting countries, INPRESexpenditures are not just income transfer programs. They are used to financephysical and social infrastructure which contributes significantly to regionaldevelopment.13/ These projects are generally either small-scale constructionprojects which generate low-paid unskilled employment or are used to financesocial services.134/
1.40 As noted earlier, the brunt of the adjustment in budgetary expendi-tures was borne by development expenditures, which declined by about 33% inreal terms between 1982/83 and 1988/89. In reducing development expenditures,the Government made significant changes in the sectoral composition ofdevelopment outlays (see Figure 1.4). There were several important featuresof this change:
Figure 1.4: COMPOSITION OF DEVELOPMENT EXPENDITURES /a(Rp billion)
1982/83 Agriculture
25X 1986/87 m Infrastructure
26X ~~~ - Industry & Wining
Y'\ N, 1\ 13% ~~~~~~~~~~~Regional Development
eWI Human Resourcces
24X General Services
Total = 9,546 Total = 5,173
/a Constant 1983/84 prices.Source: World Bank Staff estimates.
32/ INPRES transfers were protected relative to other developmentexpenditures. Over the period 1982/83-86/87, development expendituresdeclined by 43% in real terms, while INPRES transfers declined by only20%. After 1986/87, INPRES transfers declined more rapidly due to theprimary school INPRES (INPRES S.D.) which declined significantly withthe achievement of virtually complete primary school enrollment;however, other components of INPRES transfers continued to declinerelatively less than total development expenditures.
Dl/ See, Alan Gelb, op. cit.
34/ For a profile of projects financed under the district INPRES (Dati II),see Annex Table 4.
- 25 -
(a) the share devoted to industry and mining was reduced sharply. Manylarge capital-intensive industrial projects, which were initiatedduring the second oil price boom, were dropped, and in the miningsector, several major projects were eventually developed by theprivate sector;
(b) the share of development expenditures was also substantially reducedin areas where implementation constraints or environmental concernswere severe. For example, the proportion of expenditures allocatedto the transmigration program was reduced substantially;
(c) a larger share was allocated to poverty-related sectors, such as foodand export agriculture, and human resource development;l5/ and
(d) the share of expenditures on regional development, primarily thegeneral INPRES program, was increased.
1.41 This reallocation of development expenditures had two importanteffects in ameliorating the social costs of adjustment for the poor. First,there was an expenditure-switching effect, as the employment coefficients werehigher in those sectors into which development expenditures were reallocated. 3/A rough analysis using these coefficients suggests that employment levelsresulting from development expenditures were about 20% higher in 1986/87 thanif the composition of development expenditures had remained unchanged from1982/83. Second, expenditures were switched to sectors--agriculture and humanresource development--where development expenditures are of the greatestpotential benefit to lower income groups. There remains scope to improve theeffectiveness of development expenditures for poverty alleviation by focussingthem more sharply on the main intrasectoral priorities and by enhancing theefficiency of the delivery systems of many social programs. Overall, however,these changes in expenditure priorities did cushion the poor from the effectsof the reduction in public expenditures.
25/ A notable exception was the health sector, where the proportion ofdevelopment expenditures devoted to the sector actually declinedslightly. This is discussed further in Chapter IV.
16/ Estimates of the employment coefficients of development expendituresfor various sectors are shown on Annex Table 6.

I R l I IAl
- 27 -
II. A STRATEGIC OVERVIEW
A. Overview
2.1 As noted in Chapter I, the Government has made substantial progressin reducing poverty in the last two decades; this performance has beenparticularly impressive since 1983, given the magnitude of the external shockthat the economy has suffered. Nevertheless, the Government recognizes thatprograms and policies for poverty reduction remain a priority for theREPELITA V period and beyond. There are at least three reasons why povertyremains a key challenge for Indonesia in the 1990s:
(a) the number of Indonesians living in absolute poverty is still highand a significant proportion of the population, the "near poor", haveincomes only slightly above the poverty line;
(b) the percentage of people in absolute poverty and its rate of changevaries significantly across different areas; and,
(c) the rate of growth of the labor force is expected to be highthroughout the 1990s.
Moreover, the changing nature of the poverty problem--the relatively largerdecline of poverty in Java, slower growth of incomes in some of the OuterIslands, and regional disparities in the availability of social and basicservices, which are in turn closely associated with income differentials--necessitates some change in the Government's past approach to povertyreduction, as broadly recognized in REPELITA V.
2.2 This Chapter first discusses in detail the characteristics of thepoor, which are relevant to designing a strategy for poverty reduction duringthe REPELITA V period and beyond (Section B). Then a general strategy forpoverty reduction is outlined (Section C). The strategy contains three basicingredients: (i) programs and policies to increase incomes and raiseproductivity; (ii) programs and policies to improve the availability of andaccess to social and basic services; and, (iii) the use of narrowly targetedmicro-relief programs to provide immediate assistance to those most in need.This strategy is consistent with the broad thrust of the Government's growthand poverty reduction objectives as outlined in REPELITA V. Several newGovernment initiatives specifically introduced in REPELITA V for reducingpoverty are then discussed (Section D). This then sets the stage for thedetailed discussions of sectoral poverty programs and policies in agriculturo,and human resource development which follow (Chapters III, IV and V), as wellas a discussion of institutional arrangements for poverty reduction(Chapter VI).
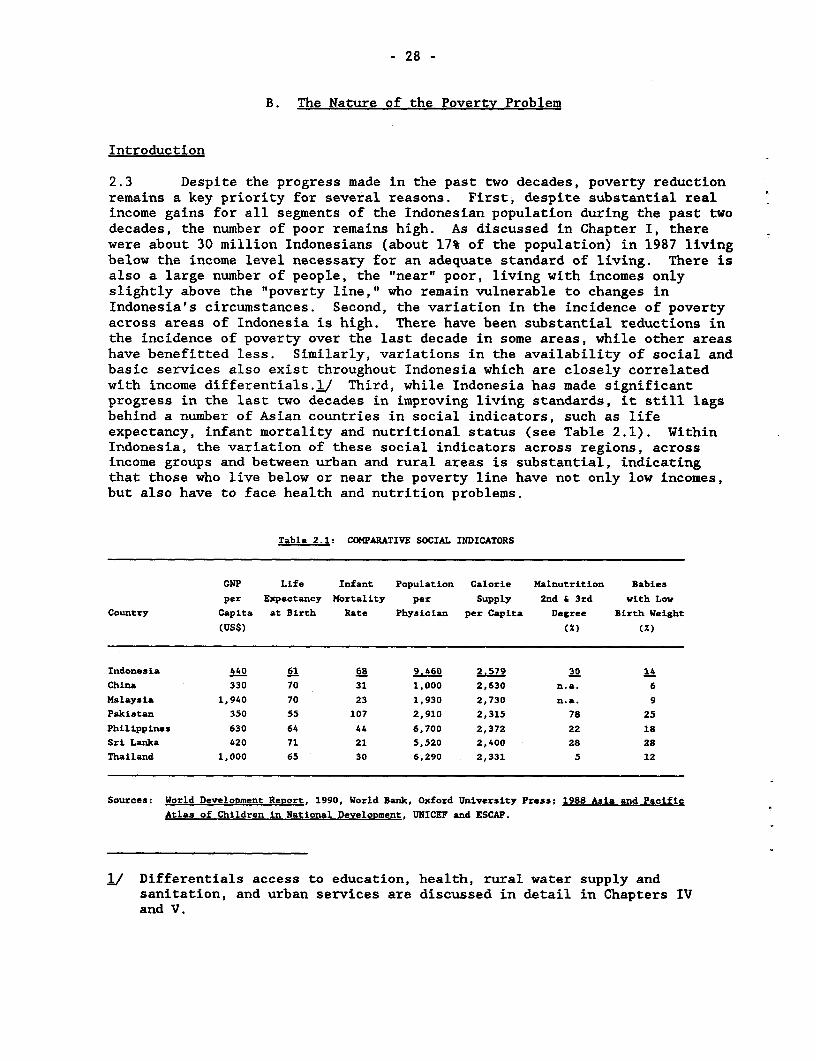
- 28 -
B. The Nature of the Poverty Problem
Introduction
2.3 Despite the progress made in the past two decades, poverty reductionremains a key priority for several reasons. First, despite substantial realincome gains for all segments of the Indonesian population during the past twodecades, the number of poor remains high. As discussed in Chapter I, therewere about 30 million Indonesians (about 17% of the population) in 1987 livingbelow the income level necessary for an adequate standard of living. There isalso a large number of people, the "near" poor, living with incomes onlyslightly above the "poverty line," who remain vulnerable to changes inIndonesia's circumstances. Second, the variation in the incidence of povertyacross areas of Indonesia is high. There have been substantial reductions inthe incidence of poverty over the last decade in some areas, while other areashave benefitted less. Similarly, variations in the availability of social andbasic services also exist throughout Indonesia which are closely correlatedwith income differentials.j/ Third, while Indonesia has made significantprogress in the last two decades in improving living standards, it still lagsbehind a number of Asian countries in social indicators, such as lifeexpectancy, infant mortality and nutritional status (see Table 2.1). WithinIndonesia, the variation of these social indicators across regions, acrossincome groups and between urban and rural areas is substantial, indicatingthat those who live below or near the poverty line have not only low incomes,but also have to face health and nutrition problems.
Table 2.1: COMPARATIVE SOCIAL INDICATORS
GNP Life Infant Population Calorie Malnutrition Babies
per Expectancy Mortality per Supply 2nd & 3rd with Low
Country Capita at Birth Rate Physician per Capita Degree Birth Weight
(US$) (X) (X)
Indonesia 440 61 68 9,460 2.579 30 14
China 330 70 31 1,000 2,630 n.a. 6
Malaysia 1,940 70 23 1,930 2,730 n.&. 9
Pakistan 350 55 107 2,910 2,315 78 25
Philippines 630 64 44 6,700 2,372 22 10
Sri Lanka 420 71 21 5,520 2,400 28 28
Thailand 1,000 65 30 6,290 2,331 5 12
Sources: World DeveloDment Report, 1990, World Bank, Oxford University Press; 1988 Asia and Pacific
Atlas of Children in National Development, UNICEF and ESCAP.
.1/ Differentials access to education, health, rural water supply andsanitation, and urban services are discussed in detail in Chapters IVand V.
- 29 -
2.4 And finally, reducing further the number of poor in Indonesia will bemade more difficult by the expected growth rate of the population and thelabor force. The labor force is expected to grow by about 2.4 million personsp.a. through the year 2000, with the Outer Islands growing faster than Java,and urban areas expanding more rapidly than rural areas. The absorption ofthese new entrants and improvements in the earnings of existing workers willbe complicated by a changing economic structure. The rice sector, whichprovided an important source of income growth and employment in the past, isexpected to absorb only limited amounts of additional labor. The pattern ofeconomic growth, and hence employment generation and income growth, willdepend largely upon the development of secondary food crops, nonfood exportagriculture, the non-oil manufacturing sector, and the creation of productiveopportunities in the service sector.
2.5 The Government is aware that designing a program to achieve furtherpoverty reduction and more balanced regional development in Indonesia will bea key challenge during the 1990s. While the Government's past growth-orientedapproach has been generally successful in reducing both the number andpercentage of poor Indonesians, the reduction of poverty has been uneventhroughout the country implying that some areas have benefitted more thanothers. The remainder of this section identifies the changed nature of thepoverty problem, in terms of regional and household characteristics, which isrelevant for designing a poverty strategy for the 1990s.
Regional Characteristics of the Poverty Problem
2.6 During the 1980s, there have been important changes in the spatialincidence of poverty in Indonesia. These stem from the variation in thedecline of poverty across regions. Two changes are particularly noteworthy:(i) the dramatic decline in the number and percentage of poor in Java; and,(ii) the slower decline in the Outer Islands. In 1987, the highest incidenceof poverty is in the eastern part of Indonesia, in contrast to 1980 whenprovinces on Java had the highest incidences of poverty..Z/ This outcomeoccurred because of a dramatic drop in the incidence of poverty in rural Java,particularly Central Java, East Java, and Yogyakarta.
2.7 One important reason for this change is the variation in growth ratesamong different areas of Indonesia (see Table 2.2). The growth of realconsumption expenditures during 1981-87 ranged from nearly 4% p.a. on Java, toless than 1% on Sulawesi. Similar variations are evident in the growth ratesof regional non-oil CDP. This indicates that the economy's growth, which wasbased on non-oil manufacturing, export agriculture and rice, benefitted someareas, particularly Java and Sumatra. Moreover, some areas in the easternprovinces also experienced reasonable rate of growth, particularly in NusaTenggara. However, income levels in other areas were affected more by the
2.! This compares the provincial incidence of poverty in 1987 using theOfficial Poverty Line with 1980 estimates by the World Bank (see, WorldBank, 1984, op.cit).
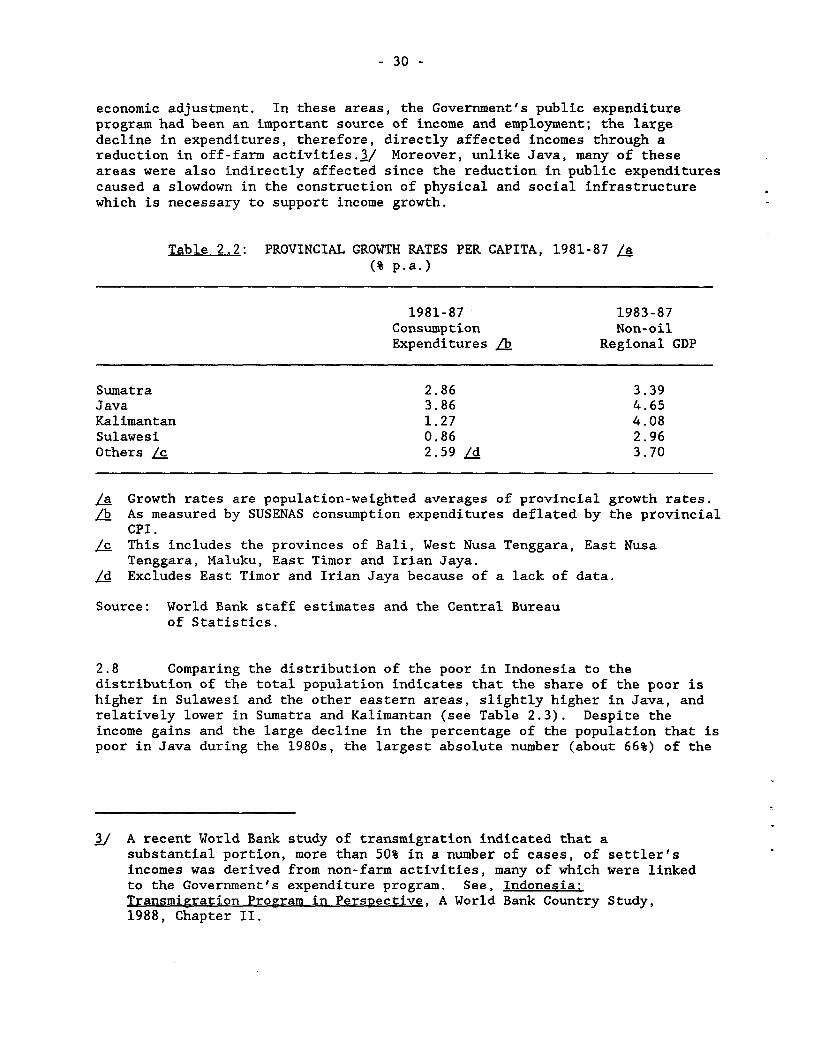
- 30 -
economic adjustment. In these areas, the Government's public expenditureprogram had been an important source of income and employment; the largedecline in expenditures, therefore, directly affected incomes through areduction in off-farm activities.i./ Moreover, unlike Java, many of theseareas were also indirectly affected since the reduction in public expenditurescaused a slowdown in the construction of physical and social infrastructurewhich is necessary to support income growth.
Table 2.2: PROVINCIAL GROWTH RATES PER CAPITA, 1981-87 /a(% p.a.)
1981-87 1983-87Consumption Non-oilExpenditures /b Regional GDP
Sumatra 2.86 3.39Java 3.86 4.65Kalimantan 1.27 4.08Sulawesi 0.86 2.96Others /c 2.59 /d 3.70
/a Growth rates are population-weighted averages of provincial growth rates./b As measured by SUSENAS consumption expenditures deflated by the provincial
CPI./c This includes the provinces of Bali, West Nusa Tenggara, East Nusa
Tenggara, Maluku, East Timor and Irian Jaya./d Excludes East Timor and Irian Jaya because of a lack of data.
Source: World Bank staff estimates and the Central Bureauof Statistics.
2.8 Comparing the distribution of the poor in Indonesia to thedistribution of the total population indicates that the share of the poor ishigher in Sulawesi and the other eastern areas, slightly higher in Java, andrelatively lower in Sumatra and Kalimantan (see Table 2.3). Despite theincome gains and the large decline in the percentage of the population that ispoor in Java during the 1980s, the largest absolute number (about 66%) of the
3/ A recent World Bank study of transmigration indicated that asubstantial portion, more than 50% in a number of cases, of settler'sincomes was derived from non-farm activities, many of which were linkedto the Government's expenditure program. See, Indonesia:Transmigration Program in Perspective, A World Bank Country Study,1988, Chapter II.
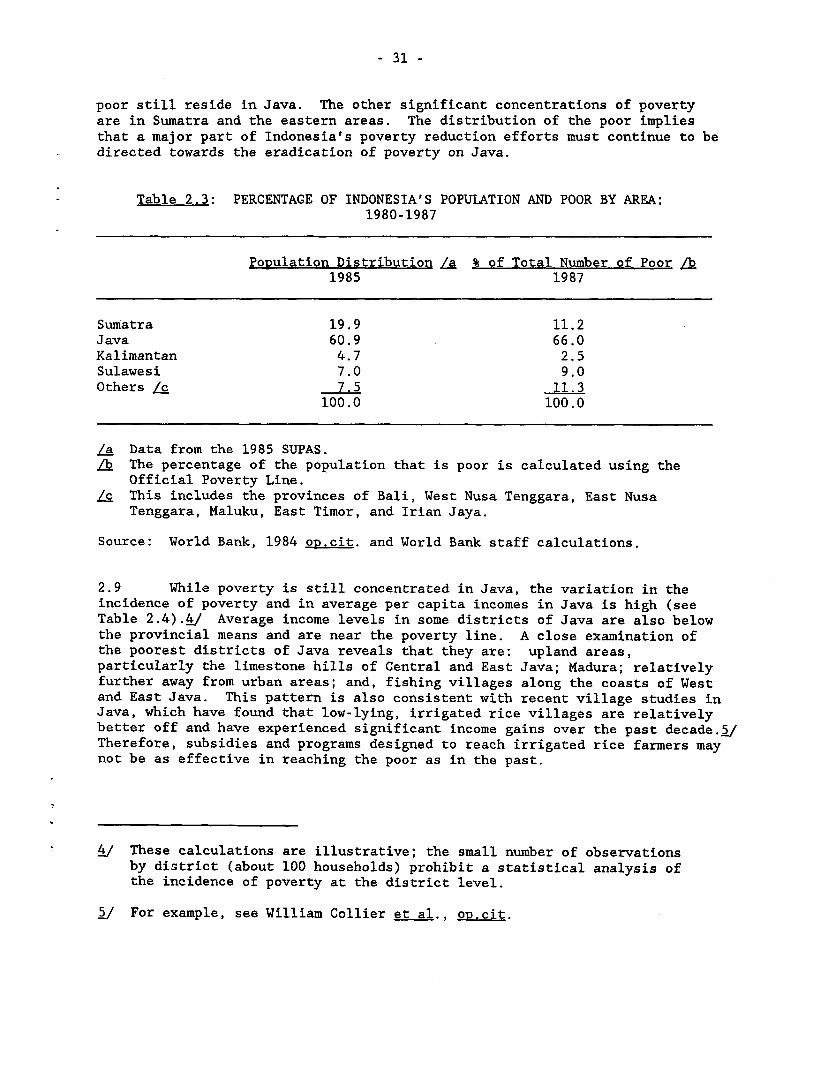
- 31 -
poor still reside in Java. The other significant concentrations of povertyare in Sumatra and the eastern areas. The distribution of the poor impliesthat a major part of Indonesia's poverty reduction efforts must continue to bedirected towards the eradication of poverty on Java.
Table 2.3: PERCENTAGE OF INDONESIA'S POPULATION AND POOR BY AREA:1980-1987
PoRulation Distribution /a % of Total Number of Poor /b1985 1987
Sumatra 19.9 11.2Java 60.9 66.0Kalimantan 4.7 2.5Sulawesi 7.0 9.0Others / 7.5 11.3
100.0 100.0
/a Data from the 1985 SUPAS.Lh The percentage of the population that is poor is calculated using the
Official Poverty Line.Lc This includes the provinces of Bali, West Nusa Tenggara, East Nusa
Tenggara, Maluku, East Timor, and Irian Jaya.
Source: World Bank, 1984 o.cit. and World Bank staff calculations.
2.9 While poverty is still concentrated in Java, the variation in theincidence of poverty and in average per capita incomes in Java is high (seeTable 2.4).V/ Average income levels in some districts of Java are also belowthe provincial means and are near the poverty line. A close examination ofthe poorest districts of Java reveals that they are: upland areas,particularly the limestone hills of Central and East Java; Madura; relativelyfurther away from urban areas; and, fishing villages along the coasts of Westand East Java. This pattern is also consistent with recent village studies inJava, which have found that low-lying, irrigated rice villages are relativelybetter off and have experienced significant income gains over the past decade.v/Therefore, subsidies and programs designed to reach irrigated rice farmers maynot be as effective in reaching the poor as in the past.
4. These calculations are illustrative; the small number of observationsby district (about 100 households) prohibit a statistical analysis ofthe incidence of poverty at the district level.
2/ For example, see William Collier et al., op.cit.
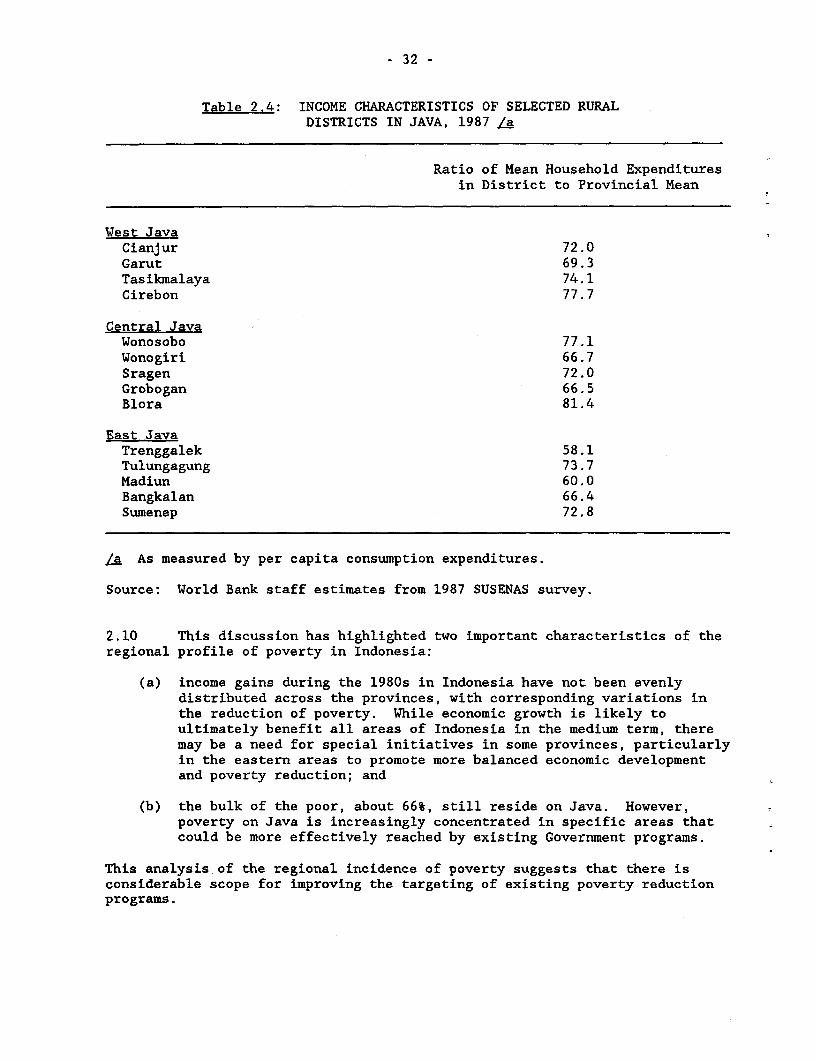
- 32 -
Table 2.4: INCOME CHARACTERISTICS OF SELECTED RURALDISTRICTS IN JAVA, 1987 La
Ratio of Mean Household Expendituresin District to Provincial Mean
West JavaCianjur 72.0Garut 69.3Tasikmalaya 74.1Cirebon 77.7
Central JavaWonosobo 77.1Wonogiri 66.7Sragen 72.0Grobogan 66.5Blora 81.4
East JavaTrenggalek 58.1Tulungagung 73.7Madiun 60.0Bangkalan 66.4Sumenep 72.8
la As measured by per capita consumption expenditures.
Source: World Bank staff estimates from 1987 SUSENAS survey.
2.10 This discussion has highlighted two important characteristics of theregional profile of poverty in Indonesia:
(a) income gains during the 1980s in Indonesia have not been evenlydistributed across the provinces, with corresponding variations inthe reduction of poverty. While economic growth is likely toultimately benefit all areas of Indonesia in the medium term, theremay be a need for special initiatives in some provinces, particularlyin the eastern areas to promote more balanced economic developmentand poverty reduction; and
(b) the bulk of the poor, about 66%, still reside on Java. However,poverty on Java is increasingly concentrated in specific areas thatcould be more effectively reached by existing Government programs.
This analysis of the regional incidence of poverty suggests that there isconsiderable scope for improving the targeting of existing poverty reductionprograms.
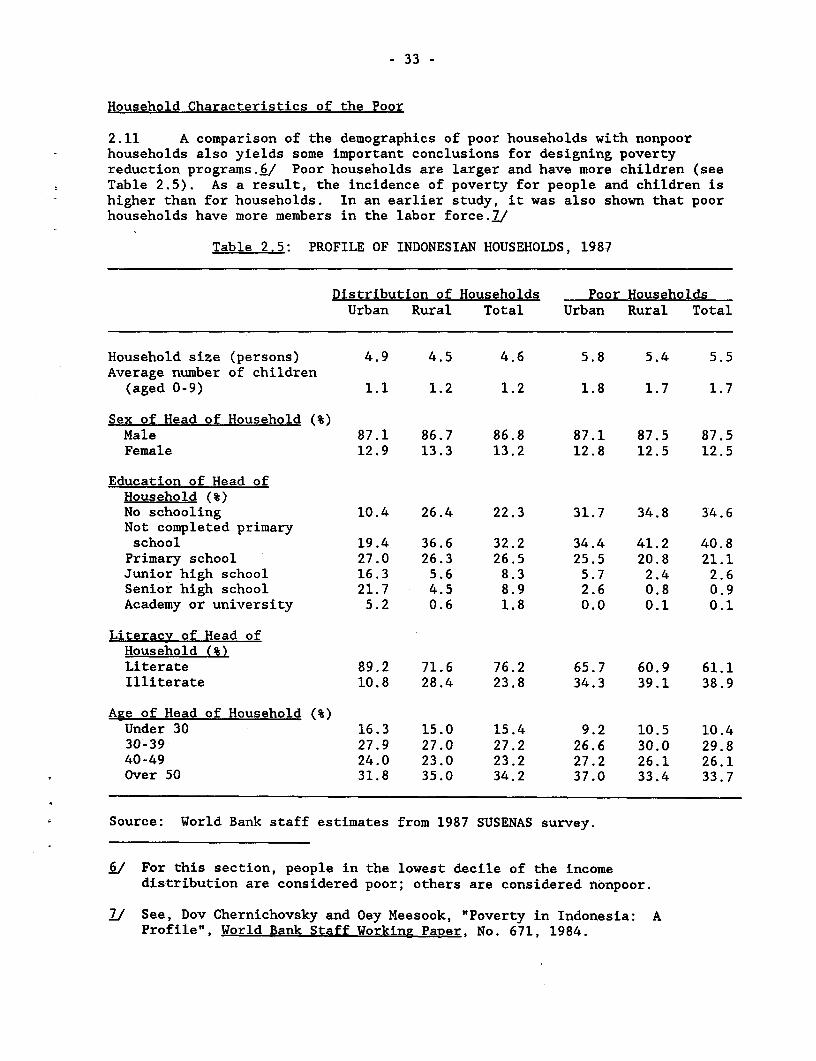
- 33 -
Household Characteristics of the Poor
2.11 A comparison of the demographics of poor households with nonpoorhouseholds also yields some important conclusions for designing povertyreduction programs.i./ Poor households are larger and have more children (seeTable 2.5). As a result, the incidence of poverty for people and children ishigher than for households. In an earlier study, it was also shown that poorhouseholds have more members in the labor force.]]
Table 2.5: PROFILE OF INDONESIAN HOUSEHOLDS, 1987
Distribution of Households Poor HouseholdsUrban Rural Total Urban Rural Total
Household size (persons) 4.9 4.5 4.6 5.8 5.4 5.5Average number of children
(aged 0-9) 1.1 1.2 1.2 1.8 1.7 1.7
Sex of Head of Household (%)Male 87.1 86.7 86.8 87.1 87.5 87.5Female 12.9 13.3 13.2 12.8 12.5 12.5
Education of Head ofHousehold (%)No schooling 10.4 26.4 22.3 31.7 34.8 34.6Not completed primaryschool 19.4 36.6 32.2 34.4 41.2 40.8Primary school 27.0 26.3 26.5 25.5 20.8 21.1Junior high school 16.3 5.6 8.3 5.7 2.4 2.6Senior high school 21.7 4.5 8.9 2.6 0.8 0.9Academy or university 5.2 0.6 1.8 0.0 0.1 0.1
Literacy of Head ofHousehold (%)Literate 89.2 71.6 76.2 65.7 60.9 61.1Illiterate 10.8 28.4 23.8 34.3 39.1 38.9
Age of Head of Household (%)Under 30 16.3 15.0 15.4 9.2 10.5 10.430-39 27.9 27.0 27.2 26.6 30.0 29.840-49 24.0 23.0 23.2 27.2 26.1 26.1Over 50 31.8 35.0 34.2 37.0 33.4 33.7
Source: World Bank staff estimates from 1987 SUSENAS survey.
§/ For this section, people in the lowest decile of the incomedistribution are considered poor; others are considered nonpoor.
7/ See, Dov Chernichovsky and Oey Meesook, "Poverty in Indonesia: AProfile", World Bank Staff Working PaDer, No. 671, 1984.
- 34 -
2.12 The classification of households by the characteristics of householdheads also provides information for understanding the reasons households arein poverty, as well as for targeting poverty programs more effectively. Aclassification of households by the sex of the head of the household indicatesthat about 87% of households in both urban and rural areas are headed bymales../ This represents a small increase from a decade earlier, when about84% of households were headed by males. A striking finding is that theincidence of poverty in male-headed households is slightly higher than infemale-headed households, although statistically the difference isinsignificant.9/
2.13 The incidence of poverty in households whose head is less than 30 isslightly lower than the proportion of all households headed by someone underthe age of 30. However, the distribution of poverty by age category of thehousehold head very closely resembles the distribution of all households,indicating no significant link between the age of the household head andpoverty.
2.14 The educational attainment of the head of the household is closelyassociated with the income status of households. Virtually all poorhouseholds (96.5%) in Indonesia are headed by a person with no more than aprimary school education and three quarters of poor household heads have lessthan a primary school education. This is particularly striking in urban areaswhere less than one third of all urban households have less than a primaryschool education, but two thirds of poor urban households have thischaracteristic. The existing differential between education levels ofhousehold heads in urban and rural areas is one important reason fordifferences in the incidence of poverty. This indicates that the Government'semphasis on raising primary school enrollments has been appropriate and overthe long term is likely to have a positive effect on reducing poverty.
2.15 Also closely linked to the poverty status of the household is whetherthe head of the household is literate (i.e., can read and write). About threequarters of all heads of households in Indonesia are literate; in urban areas,the percentage is almost 90%. However, the rate of illiteracy is almost twiceas high among the heads of poor households, indicating that the ability toread and write is an important correlate of a household's economic status.Since the large expansion in primary school infrastructure has largelyoccurred since 1978, many Indonesians, particularly in rural areas, who were
8/ By social convention, a woman is seldom recognized as the head of ahousehold in Indonesia, if there is an adult male in the household.Also, male-household heads constitute a larger proportion of "circular"migrants to urban areas and therefore, may be absent from the householdfor long periods. For these reasons, more rural households may be defacto headed by women than indicated by the SUSENAS survey.
9/ The null hypothesis that female-headed households are poorer than male-headed households in Indonesia is not substantiated by the 1987SUSENAS. It is not possible from the SUSENAS data to identify issuesof the intrahousehold distribution of consumption. Women may bedisadvantaged within households relative to men and therefore, sufferdisproportionately from lower incomes.
- 35 -
of primary school age prior to the late 1970s did not have an opportunity toobtain a primary school education. This is reflected in their literacy ratesand hence, their economic status. Programs in non-formal education to combatilliteracy thus appear to be an important component of a poverty reductionstrategy.
2.16 This brief discussion of the characteristics of Indonesian householdsin general and poor households in particular has several implications fordesigning a poverty reduction strategy:
(a) the poor have larger families, more children and higher dependencyratios than the nonpoor;
(b) the educational attainment of the head of the household and theability to read and write are closely correlated with the economicstatus of the household. This implies that education level andliteracy could be useful in identifying the poor especially in urbanareas;
(c) the sex of the household head is not a good indicator of the incomestatus of a household, as the incidence of poverty is roughly thesame between female and male-headed households; and
(d) age of the household head is also not a good indicator of theeconomic status of the household.
C. A Strategy for Poverty Reduction
Introduction
2.17 The first thrust of a poverty reduction strategy is the achievementof sustained economic growth. A review of evidence across developingcountries suggests that economic growth is a major factor in the reduction ofpoverty.10/ Economies with sustained economic growth and increased efficiencyof resource use have generally experienced significant reductions in poverty.Without economic growth, it is not possible to alleviate poverty over the longterm. Furthermore, antipoverty programs need a supportive policy environment--i.e., appropriate price incentives, public expenditures and exchange ratemanagement--to succeed. In Indonesia, growth and poverty reduction arelargely complementary, because of the flexible nature of Indonesia's labormarkets. This linkage between economic growth and poverty reduction has beendemonstrated during the 1970s and the much more difficult 1980s.
JQ/ See, Report of the Task Force on Poverty Alleviation, World Bank,Volume I - Report and Annexes, June 1988.
- 36 -
2.18 The continuation of macroeconomic policies in Indonesia aimed atachieving a sustainable recovery in growth, while maintaining stability willbe an important prerequisite to further reductions in poverty.1j/ The levelof investment in labor-intensive, export-oriented production, supportinginfrastructure and the social sectors will have to rise. Carefully managedpublic expenditures will support economic growth, raise the efficiency ofpublic investment and contribute to a reduction in poverty. In order tofinance these public expenditures while improving the fiscal balance, theGovernment's program to increase further domestic resource mobilization willneed to be maintained.
2.19 Achieving a more rapid rate of economic growth could have a dramaticeffect on the incidence of absolute poverty in Indonesia. For example,assuming that the elasticity of poverty reduction with respect to economicgrowth remained unchanged in the 1990s from its level in the 1976-87 period,and the growth rate of the non-oil economy was sustained at 6-7% p.a.throughout the 1990s, the incidence of poverty would decline from 17% in 1987to less than 9% by the year 2000. As a result, the number of absolute poor inIndonesia would be about 20 million in 2000. While this projection is onlyillustrative, it does indicate the role that sustained, broad-based economicgrowth could have in reducing the number of poor in Indonesia. As the povertyproblem has become more concentrated in resource-poor areas and amongparticular groups who lack the resources to benefit from economic growth, theelasticity of poverty reduction with respect to economic growth is likely todecline in the next decade. This suggests that these will also be a need forpoverty programs, which are carefully targeted at particular areas or groupsto allow them to participate more fully in the process of economic growth.But, macroeconomic policies designed to achieve a faster rate of growth willbe an extremely important component of the overall poverty reduction program.In this regard, sectoral policies in the manufacturing, agricultural, andservice sectors continue to be needed to maintain a rapid rate of economicgrowth and absorb Indonesia's burgeoning labor force.
2.20 During the 1990s, the principal sources of growth will be non-oilexports, especially manufactured exports, and non-rice agriculturalproduction, supported by increased private investment and complementary publicinvestment in infrastructure. The manufacturing sector will continue to be animportant source of economic growth and employment generation over the mediumterm. The most promising route for employment expansion in the manufacturingsector is to enhance profitability in export industries, since theseindustries are relatively labor intensive and have the best prospects formarket growth. This will require that an appropriate framework be put inplace to boost manufactured exports. The key elements of this framework arethe maintenance of a competitive exchange rate and continued progress on tradeand industrial sector reforms, in order to reduce the domestic cost ofproduction. The effect of these policies has been demonstrated by the growth
11/ For a complete discussion of Indonesia's medium-term growth prospectsand the policies needed to support them, see, Indonesia: Foundationsfor Sustained Growth, World Bank, Report No. 8455-IND, May 4, 1990,Chapter 2.
- 37 -
in non-oil exports and employment achieved since 1986 in the manufacturingsector, when the Government committed itself to a process of trade andindustrial deregulation.
2.21 Similarly, agriculture will continue to play a critical role inproviding better income opportunities to farmers, and support the developmentof rural off-farm employment by stimulating production in nonrice crops,smallholder tree crops and nonfood farm activities. Although the food cropsubsector, especially rice, will continue to be the main source of output andemployment, nonfood activities will need to provide the bulk of additionalemployment in agriculture over the medium term. Agriculture growth,therefore, is to be supported by policies that encourage farmers to raisetheir productivity and diversify their production within an efficient croppingsystem. This involves intensifying the Government's efforts to bring thepattern of input and output prices more closely in line with world prices,improve rural infrastructure, provide more responsive research and extensionservices, and reduce regulatory restrictions.
2.22 Finally, more rapid and efficient growth in agriculture anclmanufacturing will also spur growth in the services sector. The experience ofother countries in East Asia, such as Korea and Thailand, indicates thatproductivity in the service sector is closely linked to progress in industryand agriculture. Higher growth is, therefore, likely to lead to improvedearnings for workers currently engaged in low-wage activities, as well asgenerate additional productive employment opportunities in the sector.Continued reforms in transport and other services, as well as strengtheningthe financial sector, will be critical in this regard. Furthermore, theattitude of local governments towards service sector activities will. also beimportant, as regulations and restrictions on informal traders andtransportation is likely to inhibit growth in services. This would have anadverse effect upon the poor.
2.23 While these general macro-policies will help to maintain a high rateof economic growth which is necessary for sustained poverty reduction, thebenefits of economic growth may accrue only slowly to certain groups of thepoor or in certain disadvantaged areas of the country. This is illustrated bythe variation in income growth in Indonesia during the 1980s (see para. 2.7above). In many instances, the poor do not possess the physical and humanassets necessary to participate in the growth process. Therefore, asrecognized in REPELITA V, a poverty reduction strategy would need to besupplemented with two additional components: specific initiatives to generateincome earning opportunities for the poor; and programs to endow the poor withthe human capital needed to exploit these opportunities.
Targeted Income Generating Programs for the Poor
2.24 On the basis of experiences in various countries, the introduction ofincome-generating programs specifically designed to reach the poor are moreeffective if guided by several factors. First, over the long term, incomegenerating programs should be sustainable and direct income transfers areoften not sustainable. Second, targeting is necessary to ensure that theprograms actually reach the poor, thereby minimizing the leakage of benefitsto the nonpoor. And finally, these programs are likely to be most effective
- 38 -
if they are an integral part of an overall development strategy. Two types ofpolicies could be designed: (i) providing the poor with access to physicalassets in order to ensure a permanent flow of income; and, (ii) providing thepoor with increased employment opportunities.
2.25 The most important physical asset, which is an overridingconsideration in the incidence of poverty in both rural and urban areas, isaccess to land. The poor in rural areas generally do not have access to landor have holdings which are too small to generate an adequate income; moreover,limited access to land is an important factor in the migration of unskilled,low-income rural dwellers to urban areas, contributing significantly to theproblems of urban poverty. Unlike many other developing countries, Indonesiadoes not have a skewed distribution of land. Virtually all cultivators aresmall by international standards. Furthermore in the Outer Islands, land isrelatively plentiful, although there would need to be substantial investmentsin infrastructure before it could be utilized to a large extent and there arepotentially severe environmental implications arising from its exploitation.L2/
2.26 Easing the access of small farmers to Indonesia's land resources inthe Outer Islands is, therefore, an important component of a poverty reductionstrategy. This could be accomplished by two steps: (i) identifyingunderutilized and degraded land suitable for agriculture while ensuringadequate safeguards for Indonesia's forestry resources; and (ii) establishingprocedures to facilitate the transfer of this land to the landless or the nearlandless. In particular, simplifying land registration and titling, andmaking credit more readily available to those small farmers who purchase theland will be critical to this effort.
2.27 Access to land, however, does not ensure its productive use.Therefore, ongoing efforts to increase the productivity of the land and hence,raise the incomes of farmers from their existing assets will complement thisstrategy. The technology appropriate for the size of holdings and the type ofcrops cultivated by low-income farmers, the provision of irrigation fromsurface or groundwater schemes, and rural credit for small, low-income farmersto purchase agricultural inputs will all serve to assist farmers in makingmore profitable use of the land.i3/ Access to markets and marketinginformation would also raise income levels from the land.
2.28 As noted above, the major factor in any strategy for generatingemployment opportunities in Indonesia must be the achievement of a rapid rateof economic growth. The success of an export-led growth strategy in absorbinglabor and hence, reducing poverty during the adjustment period indicates thatthere is, currently, no need to initiate public employment programs on a largescale. However, while all sectors and areas of the country should ultimatelybenefit from macro policies designed to stimulate growth and employment, the
12/ For a discussion of land issues and the environment in the OuterIslands, see Indonesia: Forest. Land and Water: Issues in SustainableDevelopment, World Bank, Report No. 7822-IND, June 5, 1989.
13/ Programs and policies to reach the poor more effectively throughagriculture are discussed in detail in Chapter III.
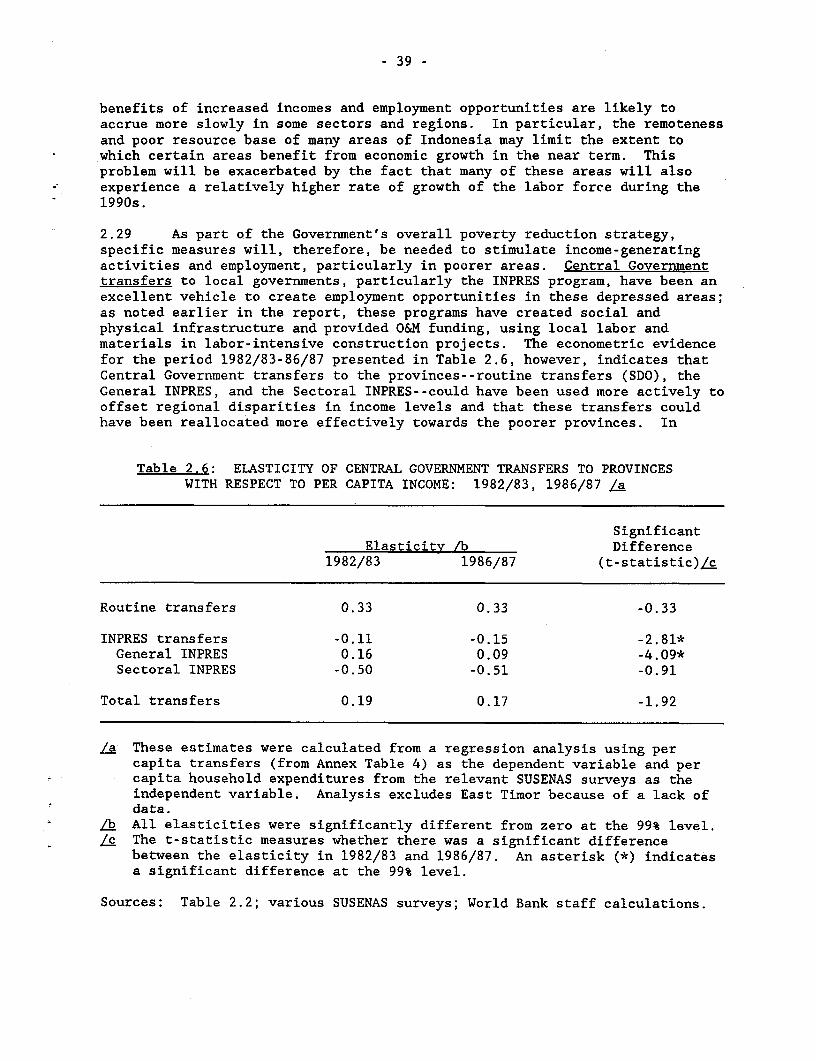
- 39 -
benefits of increased incomes and employment opportunities are likely toaccrue more slowly in some sectors and regions. In particular, the remotenessand poor resource base of many areas of Indonesia may limit the extent towhich certain areas benefit from economic growth in the near term. Thisproblem will be exacerbated by the fact that many of these areas will alsoexperience a relatively higher rate of growth of the labor force during the1990s.
2.29 As part of the Government's overall poverty reduction strategy,specific measures will, therefore, be needed to stimulate income-generatingactivities and employment, particularly in poorer areas. Central Governmenttransfers to local governments, particularly the INPRES program, have been anexcellent vehicle to create employment opportunities in these depressed areas;as noted earlier in the report, these programs have created social andphysical infrastructure and provided O&M funding, using local labor andmaterials in labor-intensive construction projects. The econometric evidencefor the period 1982/83-86/87 presented in Table 2.6, however, indicates thatCentral Government transfers to the provinces--routine transfers (SDO), theGeneral INPRES, and the Sectoral INPRES--could have been used more actively tooffset regional disparities in income levels and that these transfers couldhave been reallocated more effectively towards the poorer provinces. In
Table 2.6: ELASTICITY OF CENTRAL GOVERNMENT TRANSFERS TO PROVINCESWITH RESPECT TO PER CAPITA INCOME: 1982/83, 1986/87 /a
SignificantElasticity /b Difference
1982/83 1986/87 (t-statistic)/c
Routine transfers 0.33 0.33 -0.33
INPRES transfers -0.11 -0.15 -2.81*General INPRES 0.16 0.09 -4.09*Sectoral INPRES -0.50 -0.51 -0.91
Total transfers 0.19 0.17 -1.92
La These estimates were calculated from a regression analysis using percapita transfers (from Annex Table 4) as the dependent variable and percapita household expenditures from the relevant SUSENAS surveys as theindependent variable. Analysis excludes East Timor because of a lack ofdata.
/b All elasticities were significantly different from zero at the 99% level./c The t-statistic measures whether there was a significant difference
between the elasticity in 1982/83 and 1986/87. An asterisk (*) indicatesa significant difference at the 99% level.
Sources: Table 2.2; various SUSENAS surveys; World Bank staff calculations.
- 40 -
aggregate, while there is a wide variation in the level of Central Governmenttransfers per capita by province,.4/ the allocations of total transfers,routine transfers and the General INPRES tend to increase with provincialincomes. To some extent, this reflects the allocation criteria of theprovincial, district and village INPRES programs which are based upon equalallocations, population size and the number of villages, respectively.
2.30 Concentrating and augmenting the General INPRES funding in therelatively disadvantaged areas--a process which the Government initiated inthe 1990/91 Budget--would contribute to an acceleration in poverty reductionin three ways.15/ First, these programs will directly provide employment tounskilled and semiskilled workers at low wages in those areas where problemsof poverty exist. Second, these programs will be an important factor inraising aggregate demand in poorer areas where private sector activity isrelatively small and the ability of local governments to generate their ownresources is extremely limited. Thus, INPRES funds will also indirectlycontribute to raising employment in the selected areas. Finally and moreimportantly, physical and social infrastructure will be created in theseareas. This infrastructure, in turn, will spur income-generating activitiesand lead to the human resource development of the poor.
2.31 Further refinements to the alcieation criteria for the INPRESprograms may be warranted given Indonesia's changed economic structure, inparticular the provincial incidence of poverty. For the General INPRESprogram, incorporating a measure of relative income level or the incidence ofpoverty at the province, district and preferably, village level in theallocation criteria would more directly address regional income disparities.This could also be linked with an assessment of the potential local revenuebase relative to actual receipts so as to encourage resource mobilizationwithin provinces. An alternative approach is to create a new INPRES fundingchannel, based entirely upon need, to supplement the existing General INPRESprogram, but this could lead to a further fragmentation of budgetary channels.For the Sectoral INPRES programs, further refinements to the sector specificcriteria may be needed to reflect current priorities. In some areas, theconstruction of additional physical and social infrastructure (such as roads,small-scale irrigation schemes, storage facilities, health centers andsubcenters, and water supply and sanitation facilities) would make thesefacilities more accessible to the poor. The Government is already takingappropriate steps in this direction through the construction of additionalhealth facilities in the 1990/91 Budget. Moreover, the quality of servicesfor the poor, particularly in education and health, can be improved throughthe use of INPRES funding to provide the necessary quality-enhancing inputs.
Small-scale Credit Schemes
2.32 Small-scale credit schemes offer a second potential, albeit morelimited, avenue to reach low-income groups by stimulating productiveactivities and generating employment opportunities, as well as financing
14/ See Annex Table 5.
15/ Modifications to the INPRES program undertaken in the 1990/91 Budgetare described in para 2.43.
- 41 -
improvements in water supply, sanitation and housing. These schemes can alsobe an effective vehicle for reaching women, as they are heavily concentratedin informal activities, such as petty trading and handicrafts. Internationalexperience with these types of programs, however, is quite mixed. The GrameenBank in Bangladesh is generally cited as one of the most successful examplesof the delivery of small-scale credit to the poor on a national scale. TheWorld Bank and the Government of India have also developed a successfulprogram for supporting micro-enterprise development and reaching the urbanpoor under the Second and Third Calcutta Urban Development Projects.i6/ Thesetwo programs demonstrate that carefully developed small-scale credit schemes,which focus on providing access to credit, can generate substantial returns interms of employment and income for the poor. One other feature of theseprograms which contributed to their success was the involvement of communitygroups in the prescreening of borrowers, follow-up activities and loancollection.
2.33 Currently, there is a plethora of small-scale credit schemes,administered by the Government and private cooperative groups in Indonesia(Table 2.7 shows the characteristics of some of the larger Governmentprograms). These programs operate under a variety of terms and conditions(interest rates range from highly subsidized to market rates; and repaymentperiods range from only one month up to five years). Moreover, the capacityof the various Government agencies to implement credit schemes is also verydiverse. As a result, the performance of these programs in terms of reachingthe poor and stimulating income-generating activities is quite varied. Thegeneral rural credit program (KUPEDES) initiated in 1983 by Bank RakyatIndonesia is probably the most successful program operating on a large scale.L/Improving the performance of existing small-scale credit schemes couldtherefore, make a contribution to poverty reduction. Two initiatives willserve to improve the effectiveness of existing programs. First, ongoingefforts to expand the KUPEDES program in rural areas and to introduce it inurban areas, particularly in connection with the expanded Kampung ImprovementProgram will help to reach lower-income groups. Second, a rationalization ofother Government programs would help to target better the beneficiaries,rationalize the loan conditions across the various programs, and improve theimplementation capacity of the agencies involved. In some cases, this mayentail the elimination of existing programs. In all cases, forging closerlinks between the Government agencies implementing these programs andfinancial institutions with experience in credit provision would lead to moreeffective programs. Also, increased involvement of community groups couldraise further the efficiency of these schemes.L8/ The overall emphasis ofthese efforts needs to be on improving the access of the poor to credit, andnot on providing "subsidized" credit.
16/ See, Friedrich Kahnert, "The Small-Scale Enterprise Credit Program(SSEP) under the Second and Third Calcutta Urban Development Projects(CUDP II and CUDP III): An Assessment", Asia Regional Series, March1989.
17/ For an evaluation of this program, see, "The Impact of UnsubsidizedRural Credit Programs on Employment Generation in Indonesia," ILO,January 1989.
18/ The role that community groups could play in the Government's povertyprograms is discussed in detail in Chapter VI.
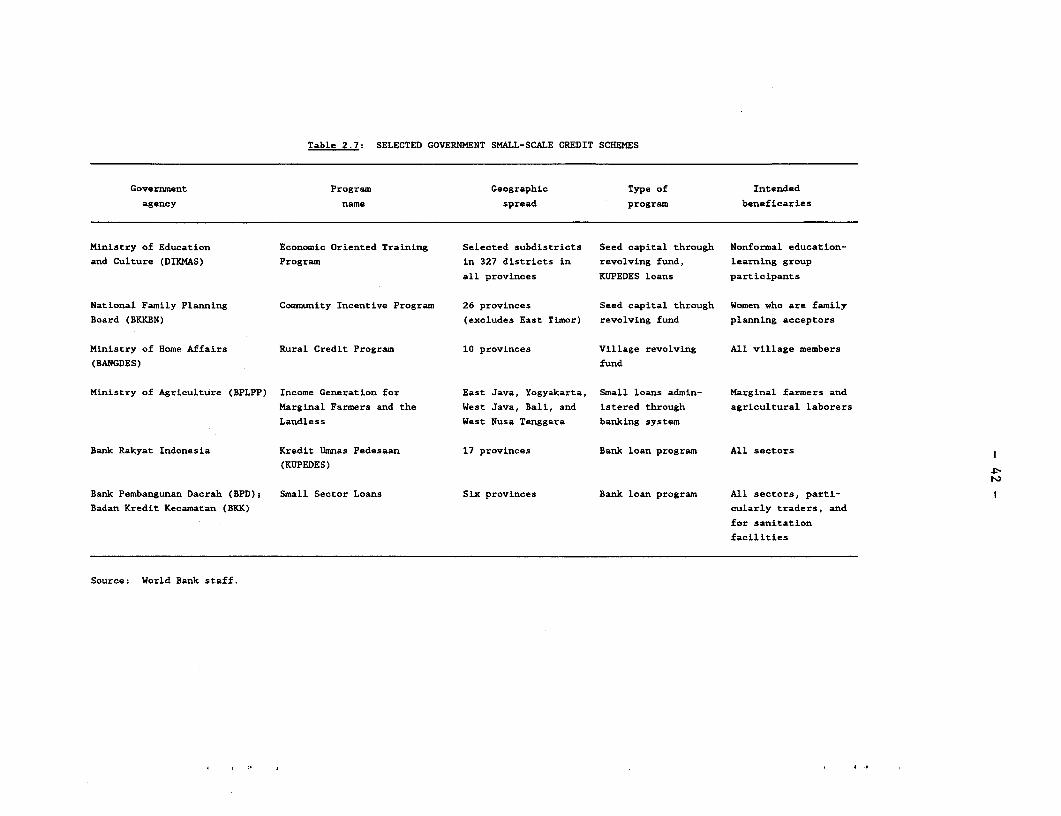
Table 2.7: SELECTED GOVERNMENT SMALL-SCALE CREDIT SCHEMES
Government Program Geographic Type of Intended
agency name spread program beneficaries
Ministry of Education Economic Oriented Training Selected subdistricts Seed capital through Nonformal education-
and Culture (DIKMAS) Program in 327 districts in revolving fund, learning group
all provinces KUPEDES loans participants
National Family Planning Community Incentive Program 26 provinces Seed capital through Women who are family
Board (BKKBN) (excludes East Timor) revolving fund planning acceptors
Ministry of Home Affairs Rural Credit Program 10 provinces Village revolving All village members
(BANGDES) fund
Ministry of Agriculture (BPLPP) Income Generation for East Java, Yogyakarta, Small loans admin- Marginal farmers and
Marginal Farmers and the West Java, Bali, and istered through agricultural laborers
Landless West Nusa Tenggara banking system
Bank Rakyat Indonesia Kredit Umnas Pedesaan 17 provinces Bank loan program All sectors
(KUPEDES)
Bank Pembangunan Dacrah (BPD); Small Sector Loans Six provinces Bank loan program All sectors, parti-
Badan Kredit Kecamatan (BKK) cularly traders, and
for sanitation
facilities
Source: World Bank staff.
- 43 -
Improving the Human Assets of the Poor
2.34 Endowing the poor with the human assets necessary to participate inthe growth process is another important component of a poverty reductionstrategy. Human resource development for the poor would have both aninvestment effect, in the form of augmenting the human capital of the poorleading to increased productivity and incomes, and a consumption effect, byimproving the present welfare of the poor. This is true for the socialservices--health, education and nutrition--as well as other basic services--water supply, sanitation and related infrastructure--which directly affectthe living conditions of the poor and hence their health status. These areasare particularly important, as Indonesia lags somewhat behind other ASEANcountries in a number of social indicators. An effective poverty reductionstrategy in human resource development would have three basic thrusts. First,it would direct public expenditures towards these sectors and also prioritizeintrasectoral allocations, such as preventive versus curative health care,basic education versus higher education, and water supply and sanitationversus large urban transit systems. Second, institutional changes may beneeded to ensure that delivery systems are effective in reaching the poor.Third, it would involve community groups more actively in the planning andimplementation of these social programs, in order to increase participationand to reach the poor more effectively.
2.35 In the social services, past investments have focused on an expansionof facilities. This emphasis has paid off. Primary school enrollments arenow about 92%, a substantial increase from 15 years earlier. The infantmortality rate has declined substantially from 132 in the late 1960s to about70 in the mid-1980s, and the last decade has witnessed some improvements inthe incidence of malnutrition. While all segments of society have benefittedfrom improvements in social services, the poor are still disadvantaged interms of availability of these services. Large variations still exist betweenthe poor and the nonpoor and between the better-off and the poorer provinces.Reducing these disparities could have a significant effect on reducingpoverty.1./ As noted earlier, in about three-quarters of all poor householdsin Indonesia, the head of the household has less than a primary schooleducation and in another 20%, has completed only primary school.
2.36 In the past, the provision of other basic services to the poor,particularly water supply and sanitation, has received relatively lessattention in Indonesia. However, these programs are equally important to thehealth status, and hence the productivity and earning capacity, of the poor.These are especially important in urban areas, as the poor in urban areasgenerally suffer the worst in terms of environmental degradation andunsanitary living conditions. Improving the availability of these basicservices to the poor can lead to a reduction in morbidity, which will in turnlead to increased productivity.20/
19/ Programs and policies to reach the poor more effectively in the socialsectors are discussed in Chapter IV.
ZQ/ Programs and policies for the poor in basic services and infrastructureare discussed in Chapter V.
- 44 -
2.37 And finally, providing assistance to the poorest of the poor whosuffer prolonged periods of inadequate food intake implies the need for micro-targeted programs. These programs will be mostly aimed at satisfying theimmediate consumption needs of those individuals whose caloric intake is wellbelow the poverty threshold. These individuals will be extremely difficult toreach with Government programs, especially large-scale expenditure programs.Community groups and other private sector organizations will be needed to helpthe Government identify and reach these individuals. One important role forGovernment in improving the effectiveness of these activities will be toprovide logistical support to these community groups and coordinate theiractivities.
D. Poverty Initiatives for REPELITA V
2.38 In REPELITA V, the Government recognized the need to mount anintensified effort to reduce poverty. First, it reiterated its commitment toa process of growth and structural change with an emphasis on developing anefficient manufacturing sector, supporting the agriculture sector andproviding the infrastructure necessary to support a more rapid rate ofeconomic growth. Second, in order to more directly address the needs of thepoor, the Government is undertaking a number of poverty-related programsduring the REPELITA V period; some are new programs being initiated and othersare existing programs which are being strengthened. These programs are beingcoordinated by the National Development Planning Agency (BAPPENAS) andexecuted by the relevant line agencies. These initiatives are:
(a) a program to promote the even distribution of services to the poor(P3D);
(b) a program of water provision to urban areas;
(c) rural water supply and sanitation; and
(d) a series of integrated area development projects (IADPs).
2.39 The program to promote the even distribution of basic services (P3D)is designed to direct Government social services, such as health, nutrition,and education, to poorer communities where service levels are significantlybelow national averages. The program will be implemented in about 1,000villages initially; these villages have been identified by an interministerialsteering committee which ranked all districts by five readily availablecorrelates of "poverty''.2/ This program will contain four components: (i) a
21/ The indicators used by the committee in the first report were:population density; population growth; dependency ratio; employmentlevel; and illiteracy. These indicators were readily available fromthe 1980 census for all districts.
- 45 -
strengthening and expansion of the POSYANDU system;22/ (ii) a food andnutrition system; (iii) social welfare activities; and (iv) nonformaleducation. In the first years of the REPELITA V period, the first twocomponents would be implemented. The POSYANDU component would ensure thateach identified village had an operating POSYANDU with adequately trainedstaff. The food and nutrition program involves the establishment of villagedemonstration plots managed by the women's association in each village (PKK)with technical assistance to be provided by the Ministry of Agriculture. Theproduce of these village gardens would be used for educational supplementalfeeding in the nutritional program administered by the village POSYANDU. Theother two components would be initiated in later years. The idea for thesetwo components would be to intensify the activities of the Ministry of SocialWelfare and the nonformal education program in these villages. These programswill be coordinated by the BAPPEDAs and implemented by the relevant lineagencies. It is also planned to include village-level NGOs in theimplementation of the program. Extra funding will be provided throughexisting budget channels. An intensive program of monitoring and supervisionis also being developed.
2.40 The second program is an effort to provide water to lower-incomegroups in water-stressed urban slum areas. The cities chosen initially forthe program are Jakarta, Bandung, and Semarang. The program will providepublic standpipes through funds channeled through the local water authorities.There will be an explicit grant for the capital costs of the standpipes, butcost recovery mechanisms will be instituted to recover funds for theiroperation and maintenance. Initially, the money will be provided judiciouslyin order to monitor implementation, particularly the ability of the program tocircumvent the costly distribution system now prevailing at most standpipes.23/
2.41 A renewed effort to provide rural water supply and sanitation (RWSS)is the third program being developed during the REPELITA V period. About5,000 pilot villages will be selected for a renewal of the Government's RWSSprogram. The approach will be community-based with the formation of "watersupply clubs" in each pilot village; these clubs will be responsible foroperations and maintenance. Institutional arrangements will involve theMinistries of Home Affairs, Health and Public Works. Resources for thisprogram will be channeled through the INPRES Health for water supply andsanitation; funding levels will be increased from the depressed levels of thepast several years.
2.42 The fourth, a program of integrated area development proiects, isalso a modification of an old program, the provincial area development program(PDP). These IADPs will focus on income-generating activities, such as
22/ The POSYANDU is an integrated health service post, which offers fivecore preventive health services: family planning; nutrition; antenatalcare; immunization; and diarrheal disease control. The POSYANDU systemis discussed in Chapter IV.
23/ This system is discussed in detail in Chapter V.
- 46 -
agriculture, storage facilities, small-scale irrigation and roads. During theREPELITA V period, a limited number of sites will be selected; the sites arepoor villages, selected on the basis of a number of regional developmentstudies undertaken in conjunction with donors over the last several years .24/This program will be coordinated with the basic services program (para. 2.39above), but will differ from this program in its concentration on income-generating activities. The IADPs will be funded mainly by developmentallocations and the village INPRES, possibly through a supplemental INPRESonly available to selected villages. Actual implementation will be theresponsibility of the line agencies at the local level, which tends to lead toa greater local commitment to the success of these programs.
2.43 The Government took further steps to address the poverty problem inthe 1990/91 Budget. There were several important poverty reduction effortswhich were to be initiated or strengthened during 1990/91. First, developmentexpenditures for health were increased by almost 50%, with a significantexpansion in the number of health centers, subcenters, mobile health centersand houses for medical personnel in remote areas. Second, developmentexpenditures for agriculture and irrigation were also increased substantially,about 20%. Third, the program to provide clean water as a basic human needwill be strengthened by "building thousands of public hydrants and hundreds ofwater depots in 500 cities." Finally, the resources transferred under theINPRES program were raised significantly: INPRES Dati I (provincial level)was raised from Rp.12 billion to Rp.14 billion per province; INPRES Dati II(district level) was increased from Rp.1,450 per person to Rp.2,000 and theminimum assistance was raised from Rp.200 million to Rp.500 million; and,INPRES Desa was raised from Rp.1.5 million per village to Rp.2.5 million, withan increased allocation for the Family Welfare Promotion campaign (PKK).Moreover, the INPRES Dati I allocation was supplemented based on the size ofthe land area of the respective provinces. In aggregate, these measures makesignificant progress towards augmenting the existing INPRES program, asexpenditures on the General INPRES are projected to grow by 50% in 1990/91.However, the effect of these increased allocations in offsetting existingregional income disparities needs to be closely monitored.
2.44 These programs constitute an important effort at poverty reduction bythe Government during the REPELITA V period. These programs embody the basictenets of the strategy for reducing poverty outlined in the previous section.They are targeted at poverty areas. The programs contain an element of incomegeneration with the IADPs, as well as several initiatives to improve theaccess and the quality of social and other basic services to the poor. Thedesign of the individual sectoral programs and the ability of these revisedprograms to overcome the constraints which have hindered past programs and,the development of an appropriate institutional setting for coordinating the
24/ Sites in Irian Jaya, North Sulawesi, South Sulawesi, West Java, Aceh,and Yogyakarta are being considered initially. In REPELITA V, it isstated that these programs will be undertaken in at least 30 sites.
- 47 -
Government's poverty reduction effort will be important factors in the successof these programs. The design of individual sectoral programs, their abilityto reach the poor and other sectoral priorities for poverty reduction arediscussed in more detail in the following Chapters: IADPs and reaching thepoor through agriculture are discussed in Chapter III; social sector programs--nutrition, education and health--are discussed in Chapter IV and, other basicservices--rural water supply and sanitation and urban infrastructuralprograms--for the poor are discussed in Chapter V. The development of anappropriate institutional setting for addressing poverty issues andincorporating this concern into ongoing Government programs is discussed inChapter VI.

I
I
- 49 -
III. SUSTAINING AGRICULTURE'S ROLE IN POVERTY REDUCTION
A. Introduction
3.1 The agriculture sector has made a major contribution to Indonesia'seconomic development and the reduction in poverty. The performance of thesector has been impressive: agricultural value added has grown by an averageof over 4% p.a., in real terms, during the last decade. A large part of thisgrowth was due to a rapid expansion in rice production, but there was also asteady growth in cash crops, fisheries and livestock production. Agriculturehas also spearheaded the progress made in reducing rural poverty. Many farmfamilies have succeeded in substantially increasing their agriculturalproduction and incomes, and as a result many have moved out of poverty.During the adjustment period, agriculture's role in contributing to theoverall reduction in poverty was substantial; households principally employedas farm laborers and as self-employed farmers accounted for about threequarters of the decline in aggregate poverty over the period.!/ In addition,agriculture's rapid growth has stimulated development in other sectors ofrural areas.
3.2 In particular, three aspects of agricultural development have mademajor contributions to the reduction of poverty in rural areas. The greatestsingle contribution to rural income generation and the reduction of ruralpoverty has resulted from the technological revolution in rice, includingirrigation development. The profitability of rice production increased byabout two thirds (in real terms) between 1969 and 1987, as high-yieldingvarieties replaced traditional varieties. After allowing for the increase incropping intensity, annual rice farming incomes were estimated to have morethan doubled, from some Rp.34,000 per ha to over Rp.82,000, in 1969 prices..Z/Another major contribution has come from Government programs to promotetreecrop production. For example, over 200,000 farmers mostly in the OuterIslands have been assisted to plant rubber, coconuts and oil palm undervarious government-sponsored schemes. Depending on the level of inputs andmanagement practices, these farmers have earned net incomes ofRp.750,000-1,200,000 per ha (1988 prices). And finally, Outer Islanddevelopment was also geared to relieving poverty on Java, through agriculturaldevelopment in transmigration areas.
3.3 This Chapter discusses how the agriculture sector, including treecrops, livestock and fisheries, can contribute to a further reduction in ruralpoverty during the REPELITA V period; First, a profile of rural poverty andthe sources of rural incomes are developed, in order to indicate the areaswhere a poverty reduction strategy in the agriculture sector should bedirected (Section B). Second, the role that agriculture has played inreducing poverty is examined and a general strategy is outlined to maximizethe contribution of the agricultural sector in reducing poverty (Section C).
See, Huppi and Ravallion, 1989, op.cit.
2 See Rural Income and Employment Effects of Rice Policy in Indonesia,Food Policy and Rural Income Generation Project Team, Food ResearchInstitute, Stanford University, October 1988.
- 50 -
And finally, three components of this strategy for the agriculture sector arediscussed in detail: reducing poverty through agricultural growth(Section D); maximizing the reach of sectoral programs (Section E); and,supporting specifically-targeted agricultural programs (Section F).
B. Profile of Rural Poverty
3.4 This section briefly focuses on some of the characteristics of ruralpoverty that are of particular relevance to the role of agriculture inreducing poverty. This chapter is concerned with poverty in rural areas,where most of the poor live, and more particularly with those poor householdsthat depend upon farming or fishing as their principal livelihood. Severalconclusions stand out as important to the subsequent analysis. First, inabsolute terms, the poor are heavily concentrated in the rural areas and inJava. Thus about 90% of Indonesia's poor people are in rural areas, and 60%are in the rural areas of Java alone. Second, the percentage of thepopulation in poverty is greater in the rural areas of Java (35%) than in theOuter Islands (25%) or in urban areas (8%). But on some Outer Islands,particularly in the eastern areas where the soils are generally poorer andwater is scarce, the incidence of poverty has not declined in line with thedecline in the nation incidence of poverty.
3.5 It is clear that poverty is heavily concentrated in agriculture. Arough calculation from the 1987 SUSENAS survey indicates that three quartersof the poor households in Indonesia derive their principal source of incomefrom agriculture. Small farmers and agricultural laborers are, therefore, themost obvious target groups for any poverty reduction strategy, since they arenot only poor but can also be reached through agriculture-based programs,either directly or, in the case of the landless, indirectly by increasing farmproductivity and the demand for labor. Studies in a number of countries showthat increased agricultural production and incomes can also have a very large"multiplier" effect on the rural economy as a whole.
3.6 A closer analysis of available data shows that most rural households,including the poor, typically earn their livelihood from a variety of sources,both on-farm and off-farm. In 1980, small farmers and farm laborers earned30-35% of their incomes from nonfarm sources, including off-farm employment,earnings on capital, and transfers.3./ Other studies suggest that theimportance of off-farm sources of incomes is increasing, especially on Java.Sample surveys of West Java households, for example, indicated that, while 87%of low-income households were engaged in agriculture in 1983, 81% also earnedincomes from nonagricultural sources, mainly wage labor. These nonfarmincomes had increased by 68% since a survey carried out seven years earlier.V/Another recent study of employment trends in Central and East Java reportedthat employment in village enterprises, such as construction, brick/tile
i/ See, Report of the IFAD Special Programming Mission to Indonesia, IFAD,Report No. 0055-ID, May 1988.
4/ See "Structural Changes in Employment and Income of Low Income RuralHouseholds in West Java, Indonesia", Yusuf Saefudin and Faisal Kasryno,Voices from the Culture of Silence, Table 6.14.
- 51 -
making or food processing, has greatly increased over the past ten years. Ofthe thirteen villages surveyed, village enterprises now account for 6-55% ofthe labor force, with seven villages averaging more than 15%. The number ofpeople leaving the villages on a daily or seasonal basis (to work in factoriesor as petty traders, laborers or servants) has also greatly increased.5/ Thesame study points out that occupational multiplicity has characterizedJavanese society for a long time. While data are limited to sample surveyresults, it would appear that rural households, including the poor, areallocating their labor efficiently between a variety of occupations, dependingon availability and the relative returns to their labor. Since the small sizeof most holdings limits how much labor can be productively employed on theland, farm families have turned to other occupations to supplement theirincomes.
3.7 Given that the typical poor household in rural areas already derivesincome from a variety of sources, the determinants of income (and hence thecauses of poverty) are both varied and to some extent interrelated. The mostobvious single determinant of farm incomes is the amount of land the familycultivates (see Table 3.1). In determining income, it is access to land, notnecessarily land ownership, that is important (the 1983 Agricultural Censusfound that only 4% of agricultural households cultivated no land at allcompared to around 20% who owned no land). "Large" farm families have percapita incomes that are almost four times those of small farm families.6/ Animportant caveat to this is that households operating less than 0.1 ha are notthe poorest households. The poorest households operate holdings between 0.1and 0.5 ha; this seems to be related to a higher level of income earned fromnonfarm activities for the smallest farm families.7/
3.8 Given the generally small size of holdings, household incomes arealso particularly sensitive to the intensity and efficiency with which theland is used. Per hectare earning power is, therefore, determined by land use(crop mix), yields and prices. These variables are in turn influenced by thefarmers' access to technology, infrastructure (such as irrigation), credit andmarkets. Since these determinants of productivity necessarily dominate anystrategy for reducing rural poverty through agricultural programs, it isuseful to consider their contribution in more detail.
.. / See "Employment Trends in Lowland Javanese Villages", William Collieret al., April 1988.
i/ It is important to bear in mind that, while we may refer to small,medium, or large farmers, these terms are all relative, since virtuallyall farms in Indonesia are very small by most standards. According to1985 SUPAS data, 23% of agricultural households in rural Java owned noland, and another 63% owned less than 1 ha; only 4% owned more than2 ha. Even on the Outer Islands, where land holdings are much larger,12% owned no land, 37% owned less than 1 ha, and only 23% owned morethan 2 ha.
.Z/ See, Emplovment Trends and Policy Issues for REPELITA V, ILO, June-July1988, p. 105.
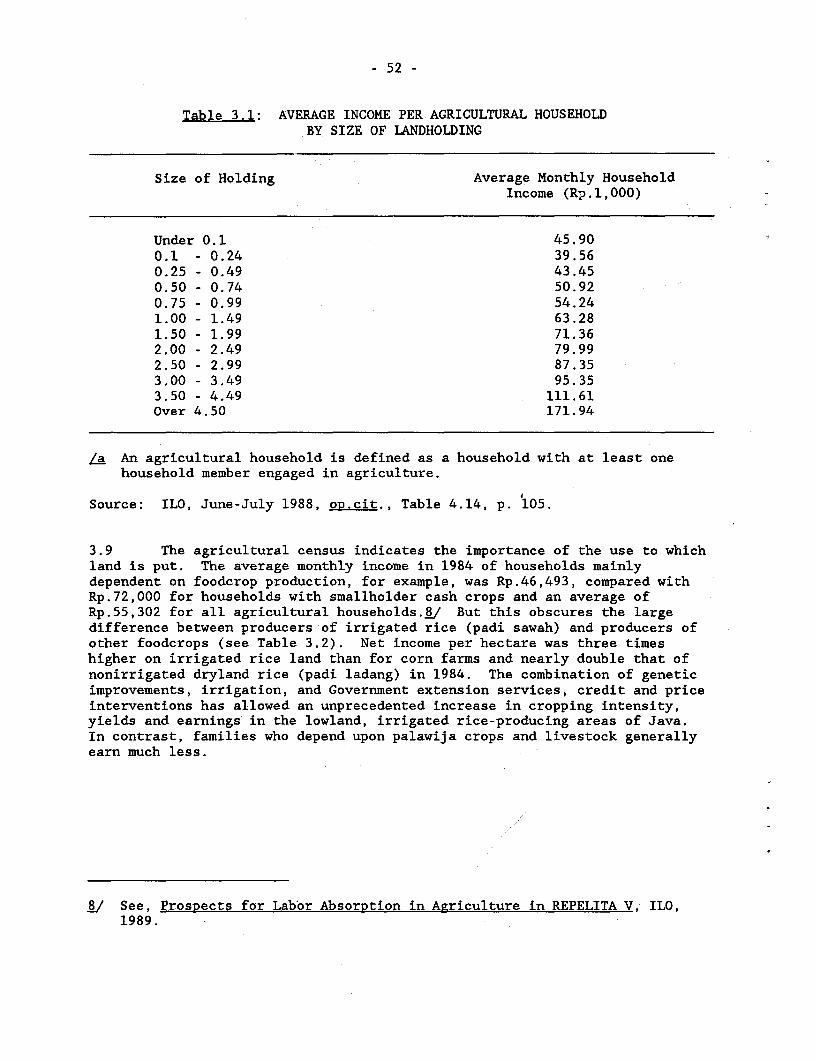
- 52 -
Table 3.1: AVERAGE INCOME PER AGRICULTURAL HOUSEHOLDBY SIZE OF LANDHOLDING
Size of Holding Average Monthly HouseholdIncome (Rp.1,000)
Under 0.1 45.900.1 - 0.24 39.560.25 - 0.49 43.450.50 - 0.74 50.920.75 - 0.99 54.241.00 - 1.49 63.281.50 - 1.99 71.362.00 - 2.49 79.992.50 - 2.99 87.353.00 - 3.49 95.353.50 - 4.49 111.61Over 4.50 171.94
/a An agricultural household is defined as a household with at least onehousehold member engaged in agriculture.
Source: ILO, June-July 1988, op.cit., Table 4.14, p. 105.
3.9 The agricultural census indicates the importance of the use to whichland is put. The average monthly income in 1984 of households mainlydependent on foodcrop production, for example, was Rp.46,493, compared withRp.72,000 for households with smallholder cash crops and an average ofRp.55,302 for all agricultural households.B./ But this obscures the largedifference between producers of irrigated rice (padi sawah) and producers ofother foodcrops (see Table 3.2). Net income per hectare was three timeshigher on irrigated rice land than for corn farms and nearly double that ofnonirrigated dryland rice (padi ladang) in 1984. The combination of geneticimprovements, irrigation, and Government extension services, credit and priceinterventions has allowed an unprecedented increase in cropping intensity,yields and earnings in the lowland, irrigated rice-producing areas of Java.In contrast, families who depend upon palawija crops and livestock generallyearn much less.
t. See, Prospects for Labor Absorption in Agriculture in REPELITA V, ILO,1989.
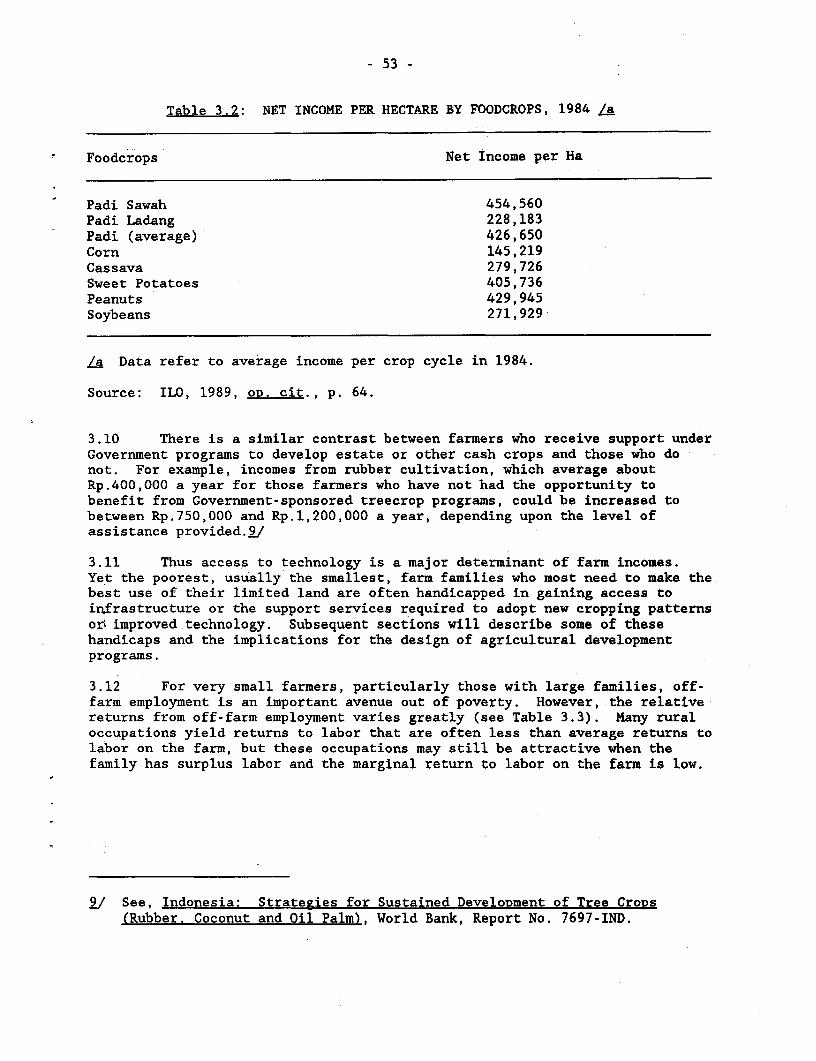
- 53 -
Table 3.2: NET INCOME PER HECTARE BY FOODCROPS, 1984 La
Foodcrops Net Income per Ha
Padi Sawah 454,560Padi Ladang 228,183Padi (average) 426,650Corn 145,219Cassava 279,726Sweet Potatoes 405,736Peanuts 429,945Soybeans 271,929
,a Data refer to average income per crop cycle in 1984.
Source: ILO, 1989, oD. cit., p. 64.
3.10 There is a similar contrast between farmers who receive support underGovernment programs to develop estate or other cash crops and those who donot. For example, incomes from rubber cultivation, which average aboutRp.400,000 a year for those farmers who have not had the opportunity tobenefit from Government-sponsored treecrop programs, could be increased tobetween Rp.750,000 and Rp.1,200,000 a year, depending upon the level ofassistance provided.9/
3.11 Thus access to technology is a major determinant of farm incomes.Yet the poorest, usually the smallest, farm families who most need to make thebest use of their limited land are often handicapped in gaining access toirnfrastructure or the support services required to adopt new cropping patternsor; improved technology. Subsequent sections will describe some of thesehandicaps and the implications for the design of agricultural developmentprograms.
3.12 For very small farmers, particularly those with large families, off-farm employment is an important avenue out of poverty. However, the relativereturns from off-farm employment varies greatly (see Table 3.3). Many ruraloccupations yield returns to labor that are often less than average returns tolabor on the farm, but these occupations may still be attractive when thefamily has surplus labor and the marginal return to labor on the farm is low.
i./ See, Indonesia: Strategies for Sustained Development of Tree CroRs(Rubber. Coconut and Oil Palm), World Bank, Report No. 7697-IND.
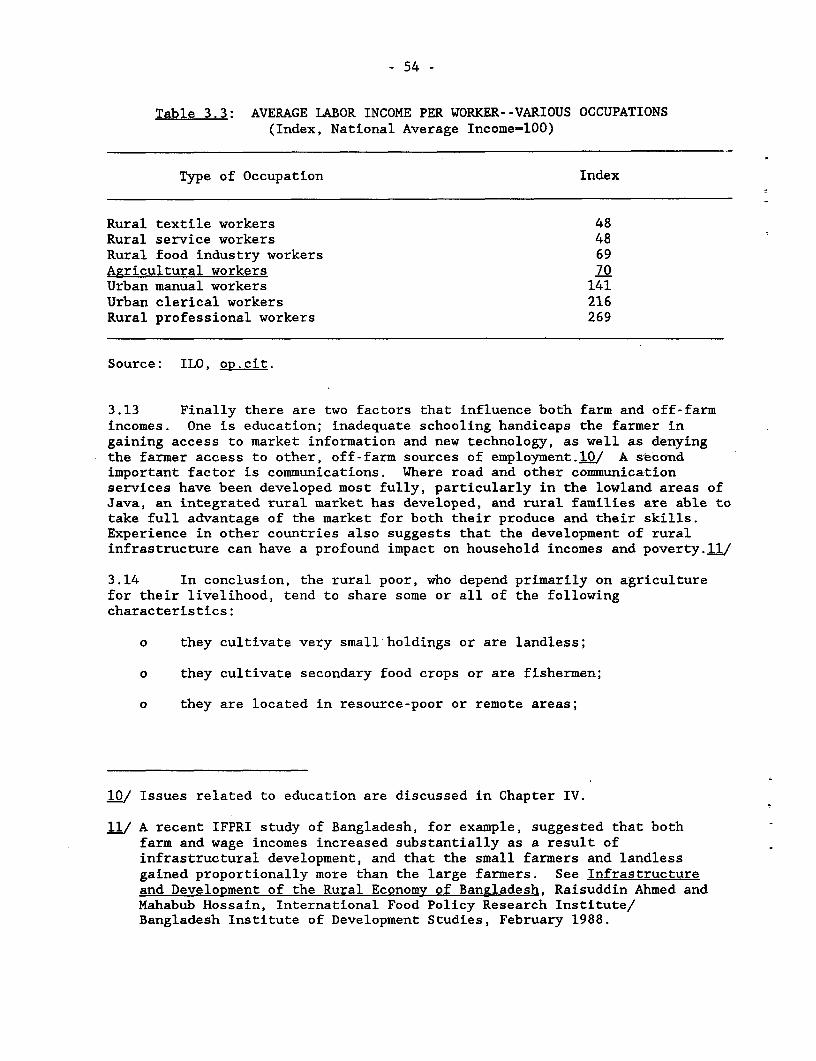
- 54 -
Table 3.3: AVERAGE LABOR INCOME PER WORKER--VARIOUS OCCUPATIONS(Index, National Average Income-100)
Type of Occupation Index
Rural textile workers 48Rural service workers 48Rural food industry workers 69Agricultural workers 70Urban manual workers 141Urban clerical workers 216Rural professional workers 269
Source: ILO, op.cit.
3.13 Finally there are two factors that influence both farm and off-farmincomes. One is education; inadequate schooling handicaps the farmer ingaining access to market information and new technology, as well as denyingthe farmer access to other, off-farm sources of employment.1Q/ A secondimportant factor is communications. Where road and other communicationservices have been developed most fully, particularly in the lowland areas ofJava, an integrated rural market has developed, and rural families are able totake full advantage of the market for both their produce and their skills.Experience in other countries also suggests that the development of ruralinfrastructure can have a profound impact on household incomes and poverty.i./
3.14 In conclusion, the rural poor, who depend primarily on agriculturefor their livelihood, tend to share some or all of the followingcharacteristics:
o they cultivate very small holdings or are landless;
o they cultivate secondary food crops or are fishermen;
o they are located in resource-poor or remote areas;
LO/ Issues related to education are discussed in Chapter IV.
tl/ A recent IFPRI study of Bangladesh, for example, suggested that bothfarm and wage incomes increased substantially as a result ofinfrastructural development, and that the small farmers and landlessgained proportionally more than the large farmers. See Infrastructureand Development of the Rural Economy of Bangladesh, Raisuddin Ahmed andMahabub Hossain, International Food Policy Research Institute/Bangladesh Institute of Development Studies, February 1988.
- 55 -
o they have not been included in either technical irrigation orgovernment-sponsored treecrop development schemes;
o they lack the education and skills to secure higher paying off-farmemployment.
A particularly important target group are women. While the incidence ofpoverty is about the same between female-headed and male-headed households,there is evidence to suggest that the poorest households are headed byfemales. Part of the reason for this is that households headed by women aresmaller and therefore have less labor available to work. For this reason,other households, such as those headed by older people, may also face the sameproblem. But it would appear that women face greater handicaps than menbecause they have fewer hours available to work on the farm, have lower levelsof education and less experience than men in looking for employment, and maybe discriminated against in the services provided to farmers. Females arealso affected disproportionately by the ongoing process of farm mechanization,particularly in rice. There has been a substantial displacement of femalelabor due to the introduction of small rice hullers which replaced thetraditional system of handpounding. In fact during the 1980s, femaleemployment in agriculture has declined by about 3% p.a.12/
C. The Role of Agriculture in Reducing Poverty
3.15 In formulating a strategy for poverty reduction within theagriculture sector, several features of the past history of agriculturaldevelopment in Indonesia have important implications. First, in recent yearsthe momentum of growth in agriculture has slowed significantly (seeTable 3.4). Agriculture sector growth (excluding forestry) fell from5.4% p.a. in the late 1970s and early 1980s to 3.7% from 1984-88. The majorfactor behind this sharp drop was the slowdown in the growth rate of riceproduction. During the years 1978-84, rice output grew by an average of over7% p.a., but from 1985-88, average annual growth was under 3% p.a., a levelwhich is expected to continue through the 1990s. With respect to forestry,after strong growth in the early 1970s, production actually began to fall in1979, and it subsequently plunged in the early 1980s after the ban on logexports.i./ Although growth turned positive once again in 1986, by 1988forestry production was still less than 50% of the level at its peak in 1978.Rice and forestry production are thus not likely to provide the momentum ofgrowth in the rural economy in years ahead. By contrast, growth in certainsecondary and estate crops, along with livestock and fisheries, has thepotential to continue strong. As these subsectors account for only about athird of agricultural value added, however, growth in sectors outside ofagriculture will be essential to ensure a buoyant rural economy.
12/ ILO, June-July 1988, op.cit., p. 51.
iJ/ This illustrates the magnitude of the income effects which can arisefrom changes in the trade regime. Recent regulations involving rattanand rubber could have similar effects with significant adverseimplications for the rural poor.
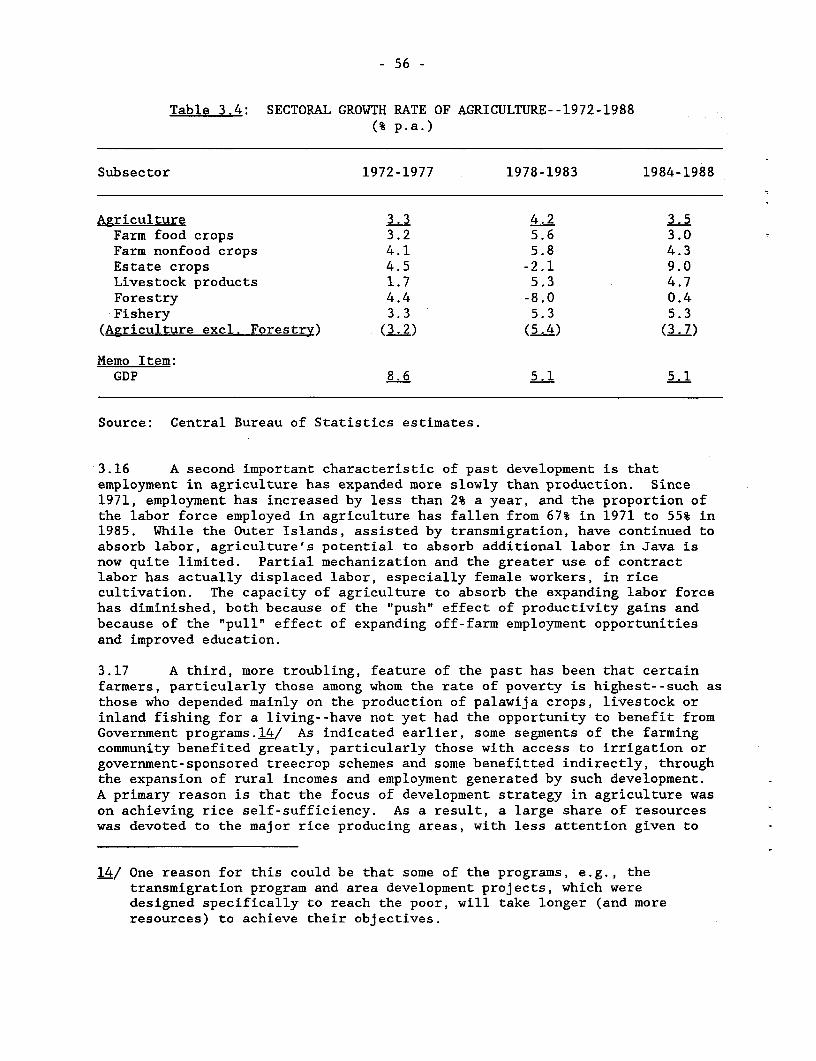
- 56 -
Table 3.4: SECTORAL GROWTH RATE OF AGRICULTURE--1972-1988(% p.a.)
Subsector 1972-1977 1978-1983 1984-1988
Agriculture 3.3 4.2 3.5Farm food crops 3.2 5.6 3.0Farm nonfood crops 4.1 5.8 4.3Estate crops 4.5 -2.1 9.0Livestock products 1.7 5.3 4.7Forestry 4.4 -8.0 0.4Fishery 3.3 5.3 5.3
(Agriculture excl. Forestry) (3.2) (5.4) (3.7)
Memo Item:GDP 8.6 5.1 5.1
Source: Central Bureau of Statistics estimates.
3.16 A second important characteristic of past development is thatemployment in agriculture has expanded more slowly than production. Since1971, employment has increased by less than 2% a year, and the proportion ofthe labor force employed in agriculture has fallen from 67% in 1971 to 55% in1985. While the Outer Islands, assisted by transmigration, have continued toabsorb labor, agriculture's potential to absorb additional labor in Java isnow quite limited. Partial mechanization and the greater use of contractlabor has actually displaced labor, especially female workers, in ricecultivation. The capacity of agriculture to absorb the expanding labor forcehas diminished, both because of the "push" effect of productivity gains andbecause of the "pull" effect of expanding off-farm employment opportunitiesand improved education.
3.17 A third, more troubling, feature of the past has been that certainfarmers, particularly those among whom the rate of poverty is highest--such asthose who depended mainly on the production of palawija crops, livestock orinland fishing for a living--have not yet had the opportunity to benefit fromGovernment programs.l4/ As indicated earlier, some segments of the farmingcommunity benefited greatly, particularly those with access to irrigation orgovernment-sponsored treecrop schemes and some benefitted indirectly, throughthe expansion of rural incomes and employment generated by such development.A primary reason is that the focus of development strategy in agriculture wason achieving rice self-sufficiency. As a result, a large share of resourceswas devoted to the major rice producing areas, with less attention given to
14/ One reason for this could be that some of the programs, e.g., thetransmigration program and area development projects, which weredesigned specifically to reach the poor, will take longer (and moreresources) to achieve their objectives.
- 57 -
other commodities and areas. While greater attention has been given todiversifying production in recent years, about 71% of development expendituresfor agriculture in the 1987/88 budget was allocated to irrigation and inputsubsidies, which mainly benefit rice. The emphasis of past research,extension and credit programs has also been heavily concentrated on rice.
3.18 The potential of the agriculture sector in reducing poverty will,therefore, be limited by three factors:
(a) rice production is likely to grow in line with consumption but atless than half the rate experienced in the late 1970s and early 1980swhen the surge in rice production took place;
(b) agriculture's capacity to generate employment has dwindled as landhas become more scarce and productivity has increased, and thereforeagriculture alone cannot carry the burden of absorbing the expandinglabor force, especially on Java; and,
(c) many farms are too small to offer a family a decent living and thereis simply not enough available land for agriculture to eliminatepoverty in rural Java.
These limitations imply that industry and services will need to absorb anincreasing share of Indonesia's growing rural labor force. Nevertheless, theagriculture sector must continue to play a major role in stimulating ruraldevelopment and reducing poverty. While land is limited on Java and theresource base is poor in many other areas, there is scope for increasingproduction and incomes on existing land, since the majority of smallholdersoutside irrigation areas and Government-sponsored schemes obtain yields wellbelow the technological potential.
3.19 A strategy to maximize agriculture's contribution to the reduction ofpoverty, while ensuring that it continues to contribute fully to economicgrowth, would contain three basic thrusts.
(a) Reducing poverty through growth. A necessary condition for fasterpoverty reduction is more rapid agricultural growth. This involvesboth a change in the policy environment to accelerate growth and anefficient allocation of public resources.
(b) Expanding the reach of sectoral programs. Since rapid growth alonewill not ensure poverty reduction, a range of actions will berequired, at the subsectoral level, to ensure that the benefits ofgrowth and Government programs are shared more equitably and reachpoor farmers. In particular, the poor need to be given better accessto technology, credit and infrastructure.
(c) Supporting specifically-targeted programs. Since sectoral programswill never reach all the poor, there will be a need for more programsthat are specifically designed to reach disadvantaged groups orareas.
These three areas are discussed in detail in the following sections.
- 58 -
D. Reducing Poverty through Growth
Introduction
3.20 A rapidly expanding and efficient agricultural sector is a necessarycondition for a further reduction in rural poverty. Agricultural growth candirectly alleviate poverty by increasing the production and hence incomes ofthe mass of small farmers and reduce poverty indirectly by increasing thedemand for agricultural labor, increasing rural incomes and producingaffordable foods for domestic consumers. Therefore, the Government strategyin agriculture as set out in REPELITA V to maintain the momentum ofagricultural growth is appropriate both from a poverty perspective and agrowth perspective.
3.21 During the REPELITA V period, the Government projects a growth rateof agriculture of 3.6% p.a. This rate of growth could be achieved, even iffooderop production expands at only 2.5% a year, provided that: (i) otheragricultural commodities continue to expand at about the same rate they haveso far recorded during the 1980s and (ii) there is a resumption of(sustainable) growth in forestry GDP. A 3.6% growth rate would also becompatible with a much slower growth in rice production and merely requiresthat the past progress made in diversifying production be maintained.Combined with an assumed rate of growth in agricultural employment of about1.5% p.a., this would imply a 30% expansion in average value-added per workerduring this period.
3.22 In fact, a determined pursuit of the policies outlined in REPELITA Vcould lead to a higher level of agricultural growth, perhaps 4% p.a. Assumingthe same rate of growth in the agricultural labor force (1.5% p.a.), thiswould increase average value-added per worker by nearly 40% between 1986 and2000, making a substantial contribution to raising rural incomes. Thepotential for accelerated production undoubtedly exists. There is anexpanding local market, and Indonesia is a competitive producer of many exportproducts, even at world market prices. On the production side, there is scopefor increasing productivity of land use, on the basis of existingtechnologies, since average smallholder yields fall far below potentialyields, especially for commodities such as cassava, sweet potato, coconuts,coffee and rubber.i,5/ There is also, in the longer term, the potential forincreasing the productivity of these crops through further research.
A Strategy for Accelerated Growth
3.23 As outlined in REPELITA V, accelerating agricultural growth in the1990s will require three important strategic emphases. The first is toencourage further horizontal diversification of production, by fosteringgreater diversity at the farm level, and vertical integration of production,by encouraging agroprocessing. This is especially important, since futuregrowth will no longer be driven by one commodity, but will need to be morebroadly-based. The need to move towards a more diversified growth pattern inthe future will necessitate supporting smallholder production by shifting thefocus of research and extension toward a farming systems approach and by
125/ See Staff Appraisal Report, Agricultural Research Management Project,Report No. 7504-IND, para. 6.2.
- 59 -
ensuring that more heretofore unassisted farmers receive extension assistance.It will also require continued investments outside the sector, in areas suchas infrastructure, communications, and education.
3.24 A second requirement for accelerated growth is a change in the policyenvironment facing the sector. Because of financial and implementationconstraints, agricultural growth can no longer be sustained by the samepolicies that were used for rice in the past. Instead, the Government willhave to rely primarily on the private sector, by unlocking the potential ofthe mass of small farmers and encouraging domestic and foreign businessmen toinvest in new production and processing activities. This will require aprogressive deregulation of area and production controls and the removal ofmarket distortions to create an environment that will encourage the farmingcommunity to allocate their farm resources and adjust their farming systems onthe basis of their comparative advantage and the requirements of the market.The need to support greater vertical integration may also require Governmentto forge more effective linkages between smallholders and private processors,so that the agricultural sector itself becomes a more responsive and efficientsupplier of raw materials for the manufacturing sector. Diversification oftenmeans that smallholder production is scattered and that a potential investormay have difficulty in securing sufficient reliable supplies to justify hisinvestment. This is an area where Government may be able intervene in acataleptic role. However, the emphasis would not be on the regulation of landuse and licensing of processing capacity, but on finding innovative policiesand mechanisms that can safeguard the interests of both the investor and thesmallholders. The positive and negative lessons learned both within Indonesia(with the NES/PIR model) and in other countries (with other models and withcontract farming) might be drawn upon in formulating an approach.
3.25 Third, a growth-oriented strategy will also call for significantimprovements in the economic and financial efficiency of sector operations.Under conditions of resource stringency, improved efficiency could contributemuch to growth--both directly, by making better use of available resources,and indirectly, by lowering costs of production and thereby increasingIndonesia's competitiveness in international markets.
3.26 The Government has recently taken a series of steps to improveefficiency in several key subsectors. First, the Government announced inDecember 1988 its intention to eliminate subsidies on pesticides.16/ Second,during the REPELITA V period, the Government intends to devote a substantiallylarger share of budgetary resources to O&M and rehabilitation expenditures inagriculture and irrigation, which will lead to efficiency gains from thesubstantial past investments in treecrop development, transmigration projectsand irrigation. Further improvements in sector efficiency could also involvepolicy changes in other areas: the phasing out of subsidies on fertilizersand credit; withdrawing special support programs, as well as area andproduction controls, for inefficient crops such as sugarcane or soybeans onirrigated land in Java and cotton on unsuitable land in the Outer Islands;and, seeking more cost-effective ways for promoting smallholder treecropdevelopment.
j-6/ The elimination of pesticide subsidies will also help to reduce waterpollution and therefore, will also have favorable effects upon the poorwho are forced to obtain their drinking water from surface sources.
- 60 -
Ensuring more Eguitable Growth
3.27 In Indonesia, there need be no conflict between rapid agriculturalgrowth and an accelerated attack on poverty; the main features of a strategyto accelerate growth are quite compatible with a strategy to reduce povertyfor two reasons. First, the changes in the structure of production requiredto achieve a faster rate of growth will favor lower-income farmers. This isbecause much of the future growth in agriculture must come from nonrice cropsand from nonirrigated areas, i.e., from those farmers and areas that have beenrelatively neglected in the past. Second, the greatest potential for growthis locked up among the least-productive and poorest smallholders, who are alsothe largest target group in any strategy for reducing rural poverty.
3.28 However, at the subsectoral level, trade-offs between equity andefficiency could arise and would need to be resolved. One potential area ofconflict between efficiency and equity arises from the allocation of resourcesbetween consolidation and expansion, in programs such as treecrop production,transmigration and irrigation. Arguments for efficient resource use generallyfavor consolidation, but it is not always clear how the interests of the poorare best served. For example, in irrigation, greater expenditure on O&M isprobably favorable to the poor within the project area, not only because theystand to gain most from an improvement in irrigation and other infrastructure,but also because it provides a valuable source of wage employment. But thesame resources could be devoted to reaching other farmers, in different areas,that had not previously benefitted at all. In situations such as this, it isimportant that appropriate cost recovery mechanisms are instituted in orderthat beneficiaries who can pay do pay, thereby releasing resources for otherpriority subsectors.
3.29 A second area involves the implementation of policy reforms. Theeffect of policy reforms on the poor needs to be carefully monitored. Forexample, the present subsidies on fertilizers, pesticides, irrigation andcredit have not been an efficient way to reach the poor, because most of thebenefits have gone to larger farmers or irrigated rice farmers who need themleast. The phasing out of these subsidies, however, could adversely affectthe poor in some locations, and therefore data on the effect of policy changesneed to be gathered and analyzed. If necessary, other more precisely-targetedtypes of assistance could be considered to protect the poor. For example,very small irrigators might be exempted from paying water user fees.
E. Expanding the Reach of Agricultural Development Programs
Introduction
3.30 Currently, many agricultural development programs, such asagricultural extension, credit or cooperative development, are focused onlarger farmers, irrigated rice areas and Government-sponsored treecropschemes. Many changes are already under way or being considered to improveand expand the reach of these programs. To achieve the Government's objectiveof reducing poverty and a more equitable distribution of the benefits ofdevelopment, it will be important to build a more deliberate focus on povertyalleviation into the design and operation of the mainstream, existing
- 61 -
programs. This section reviews the scope for reaching the poor throughongoing smallholder support services (research and extension, credit, and
irrigation), and existing commodity development programs (estate crops,livestock and fisheries). It concludes that there is much potential toincrease the poverty effect of Government programs by building in a strongerfocus on low-cost and low-risk solutions and by introducing specific measures
to reach the poor.
Agricultural Support Services
3.31 Research and extension. One of the single most important functionsthat Government can perform in helping to overcome rural poverty is to offer
small farmers the technology to expand their productivity and incomes. Thetremendous success of the green revolution in rice in Java bears testament to
this. A major research program was undertaken, in collaboration with IRRI, tobreed and release new varieties, develop improved agronomic and pest controlpractices, and train local research scientists. The research effort was backedup by a sharply-focused fooderop extension service under the aegis of theBIMAS program, which built up a strong training-and-visits system.
3.32 Despite this success, the current system of research and extensionsuffers from several weaknesses which constrain its effectiveness as a povertyalleviation tool. First, many farmers have not been reached. It has beenestimated that only half of the farmers are reached by extension.17/ Second,since research and extension have been targeted primarily at monocropped (andlargely genetically homogeneous) irrigated rice farms, similar attention has
not been paid to palawija foodcrops, cash crops, livestock or fisheries andthe diversity of farming systems followed by farmers in other areas. Third,little attention was given in research to the special needs of poor farmers,who are often unable to adopt the optimum (but higher cost and higher risk)recommendations, which are appropriate for the more progressive farmers. Andfinally, any extension system--and particularly the Training and Visit (T&V)system that relies on contact farmers to pass on extension advice--tends to bebiased in favor of the more progressive (and wealthier) male farmers, for whommost recommendations are framed, and who being more creditworthy are able tobenefit most from extension and credit programs.18/
3.33 Recognizing these issues, the Government is already undertaking anumber of steps to overcome these deficiencies and to broaden the reach oftechnology. In particular, Government is beginning to shift the focus ofresearch and extension from a commodity-based approach to a farming systemsapproach. The farming systems approach involves developing the most efficientmixed cropping patterns based on the different soil, water, and otherconditions in various parts of the country. But funds spent on actualresearch have been constrained by the overall GOI budgetary situation. Overthe last decade a considerable expansion in research facilities and trained
D.2. See, IFAD report, op.cit., p. 250.
L8./ For a good analysis of this situation, see S. Tjondronegoro, "SocialOrganization and Planned Development in Rural Java: A Study ofOrganizational Phenomena in two Kecamatan of West and Central Java",1984.
- 62 -
staff within AARD19/ has enabled much more attention to be given to secondaryfoodcrops, estate and industrial crops, livestock and fisheries. Furthermore,the new emphasis on conducting farming systems research in the main agro-ecological zones is helping to make research scientists more aware of problemsat the farm level. However, expenditures on actual research have fallendramatically--by about 70% in real terms over the period 1982/83 to 1988/89.In extension, a unified service has been set up over the past six years,covering all four technical departments of the Ministry of Agriculture--foodcrops, estate crops, livestock and fisheries. Foodcrop extension centershave been turned into multipurpose rural extensions centers (RECs) andadditional centers are being constructed, with the goal of reaching 90% of allfarmers. Many of these new RECs are in upland, swamp, transmigration orcoastal areas that were not well served before, and are where poor farmers areconcentrated. Thus, a fully integrated system for disseminating newtechnology to the mass of farmers is being developed with the followingcomponents: a well-staffed research system increasingly focused on thediverse needs and potential of different agro-ecological zones; a unifiedextension service operating out of a network of multifarious RECs todisseminate research recommendations; and, the T&V methodology, workingthrough contact farmers.
3.34 The additional challenge is to ensure that the expanding research/extension network effectively reaches the poor. In this regard, two measurescould have a significant effect in making the system more sensitive to theneeds of poor farmers:
(a) more emphasis could be given to the design and dissemination oftechnical packages that involve lower input costs. While suchpackages would not necessarily result in the highest possible yields,they would reduce risk and could be more readily adopted by thepoorest households. For example, families who have no access tocredit may only be able to follow recommended practices that requirelittle or no cash outlays or hired labor; and
(b) recommended practices for poor farmers could follow a step-by-stepapproach, starting with the minimum package that gives a significantreturn, and building up to higher levels over a period of years. Anexample is a program recommending a progressive buildup of fertilizerrates as a farmer gains experience and is able to accept greaterrisks.
3.35 Rural credit. While poor farmers can increase their incomes byadopting new crops or improved technology, they may lack access to thefinancial resources necessary to purchase them. The poor have little capitalof their own to invest in their farm operations and are usually notcreditworthy to borrow from rural credit institutions. There have beenattempts in Indonesia, as in many other countries, to increase the flow ofcredit to the poor through a range of government interventions, includingdirected credit schemes and subsidized interest rates. Evidence in Indonesia
.9/ Agency for Agricultural Research and Development.
- 63 -
as elsewhere suggests that most formal credit goes to the larger and moreprogressive farmers, who will also benefit the most from any subsidiesinjected into the system.20/
3.36 In defining the appropriate role of rural credit in a povertyreductions strategy, the adoption of four basic principles will be animportant first step. First, since the poor are unlikely to have access tocredit on a sufficient scale, it is important that recommended practicesminimize the need for credit among small farmers, by avoiding input-intensive/high-cost production systems that precipitate a need for credit. Instead, theemphasis could be on more appropriate low-cost production systems that requirefewer purchased inputs, avoid risky investments, and spread investment costsover a longer period. Second, the general lessons learned from the moresuccessful rural credit programs in Indonesia and elsewhere have demonstratedthat: (i) small farmers are more interested in having access to credit andsimple lending procedures than in receiving subsidized interest rates;(ii) the way to broaden access to credit is to set interest rates at a levelthat covers the cost of lending to the rural poor; and, (iii) collateral canbe dispensed with, provided smallholders receive adequate technical assistanceand supervision. Third, community-based, revolving fund programs at thevillage level have in some cases demonstrated success in helping poor familiesfinance productive activities, with only modest financial support fromexternal sources. This is an area in which community groups and cooperativescan play a greater role. Fourth, grants and indirect mechanisms may benecessary to reach the poorest of *the poor. And finally, despite efforts toextend the formal credit system, the rural poor are still likely to borrowpredominantly from informal sources within the village. This is becauseinformal credit is often more attractive, in terms of easier access, lack ofcollateral requirements, simple procedures and greater flexibility in use.Regulations and other restrictions which impede the operation of informalcredit markets need to be avoided.
3.37 Irrigation. Irrigation is perhaps the most powerful single tool forreaching poor farmers, since it is the only way in which the earning power ofvery small plots of land, over a large area of the country, can be dramati-cally increased. Irrigation affords the small farmer an opportunity toincrease cropping intensity--and thereby to double or triple the effectivesize of his holding. Irrigation has also been the key to the green revolutionin rice through the introduction of high-yielding varieties and the heavy useof chemicals. Thus the small farmer who finds himself on an irrigation schemeis indeed fortunate, compared with the majority of farmers who have to rely onseasonal and often inadequate rainfall. In the late 1970s, earnings fromirrigated land were 22% higher than average incomes from all cultivated landin the smallest size category.21/
2Q0 See Indonesia: Rural Credit Sector Review, World Bank, 1988, ReportNo. 6917-IND, pp. 9-20.
21/ See, Hananto Sigit, "Income Distribution And HouseholdCharacteristics", Bulletin of Indonesian Economic Studies, Vol. XXI,No. 3, December 1985, p. 66.
- 64 -
3.38 Expenditures on surface irrigation need to be carefully programmed tomaximize poverty reduction while ensuring reasonable economic returns. Thebest way to do this would be to concentrate on completing land and canaldevelopment of existing command areas. Currently there are about500,000 hectares of potentially irrigable but undeveloped land within existingcommand areas, and the relatively small amount of investment needed toirrigate this land would have a dramatic impact on the income of farmers inthese areas, who currently get little on no water delivery. An increasedemphasis on better operation and maintenance (O&M) of existing schemes alsowould improve water delivery to the farmers at the tail-end of the systems,who often get inadequate water delivery and thus tend to be poorer thanfarmers closer to the headworks. Recognizing this, the Government isembarking on a program to improve O&M by increasing budgetary allocations andinstituting an irrigation service fee, and by progressively devolvingresponsibility for O&M management onto farmers groups.
3.39 The completion of existing command areas and the improvement of O&Mnot only cost far less per hectare than new system development, but they alsoyield much higher economic returns. Most of the locations suitable forsurface irrigation have already been at least partially developed, and studiesindicate that returns to investments in most new schemes are likely to be lessthan 10%. It is therefore important that current plans to develop substantialnew command areas be reviewed to ensure that investments are made only wheretechnically and economically justified. In some cases, it might be moreefficient (both in economic and poverty-reduction terms) to reallocate fundingtoward completion of existing command areas and toward improved O&M.
3.40 The Government should also consider reallocating some of these fundsfor groundwater development, which has both a greater potential for povertyreduction and yields higher economic returns than new surface schemes.It offers the same breakthrough in land use and productivity for small farmersas surface schemes, and it can be better targetted to selected groups offarmers or particular areas. Groundwater schemes also permit greaterflexibility in location, more individual control over water management, and agreater range in scale, from individual wells serving less than 1 ha to largecommunity wells covering 100 ha or more. For the rural poor, who cannotafford their own schemes, there is also the potential for water-sharing, andthus cost-sharing, arrangements. In most cases, groundwater development canbe left largely to the private sector. The main functions of the Governmentwould be to accelerate groundwater exploration and the development and testingof technology, ensure that the legal framework for groundwater exploitation,water sharing, etc. is in place, and provide the necessary support to theprivate sector to facilitate its involvement. However, in the interests ofpoverty reduction, in some areas the Government might wish to become moredirectly involved in groundwater development by subsidizing the capital costsof installing tubewells. As with surface schemes, however, operation andmaintenance of these groundwater systems could be funded and managed largelyby the farmers themselves.
- 65 -
Commodity Development Programs
3.41 The major thrust of the proposed poverty reduction strategy is toprovide all farmers with access to the support services they need to increasetheir production and incomes. The essential feature of these support servicesis that they are functional in nature--that is that they provide a singleservice that in principle reaches all farmers and covers all commodities.However, experience has shown that the functional approach is not alwayssufficient to induce the small farmer to adopt new technology, especially whenit calls for a major change in land use, a substantial investment, and anintensive injection of technical assistance. In such cases, the functionalprograms need to be complemented with more specific commodity-orientedinterventions. This section analyzes three commodity subsectors--estatecrops, livestock and fisheries--which are particularly important for povertyreduction.
3.42 Estate crops. This section deals with three tree crops (rubber, oilpalm and coconuts) and three beverage crops (coffee, cocoa and tea). Whilethe estate crops make a minor contribution to agricultural production inIndonesia compared with foodcrops, their potential for poverty reduction isconsiderable. First, there is a large investment already made in estate cropdevelopment and the accumulated experience of millions of growers. While dataare limited, it is estimated that there are probably at least 11 millionsmallholders who grow at least one of the estate crops. Second, the existinglevel of productivity is generally very low, and substantial improvementscould be obtained through the application of fairly simple, known techniqueswithout having to wait for further research. For example, unassisted rubbersmallholder yields, which average 500 kg per ha, could be raised by 50% withimproved planting materials and a minimal package of technical inputs. Andfinally, Indonesia is generally competitive in estate crops, which are alsoenvironmentally sound for large areas of the country.
3.43 In the past, the country has invested substantial resources indeveloping smallholder production of estate crops. Most of the publicexpenditures were ih organized (NES/PIR and PMU) schemes, where mainly newfarmers were introduced to these crops for the first time, through blockplantings combined with an integrated package of technical and financialassistance. As indicated earlier, those farmers who were able to participatein these schemes were able to increase their incomes considerably.
3.44 From a poverty point of view, however, the main disadvantage of pastdevelopment programs has been that they have served only a small minority ofexisting estate crop producers--and an even smaller proportion of the ruralfamilies who would choose to plant these crops if assistance were available(see Table 3.5). The low coverage rate can be attributed to several factors:the priority accorded to new settlement areas, the high administrative cost ofreaching dispersed smallholders, the reluctance of commercial banks to providelong-term credit to farmers in remote areas, and the limited managementcapacity of the projects themselves. Nevertheless, even in the absence offormal support programs, many smallholders have gone ahead on their own, withonly partial help from the Government (e.g., seedlings). But there have beenonly meager gains in productivity over the past decade among the mass ofunassisted smallholdings, which are typically planted with unselected material
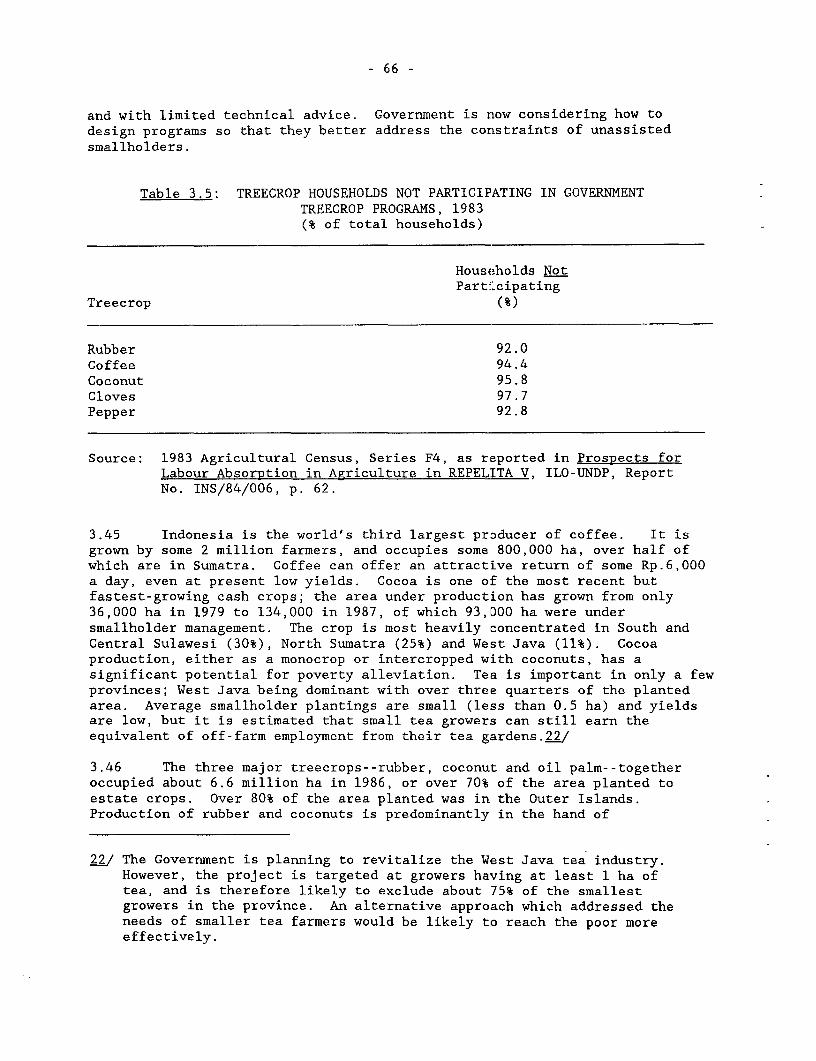
- 66 -
and with limited technical advice. Government is now considering how todesign programs so that they better address the constraints of unassistedsmallholders.
Table 3.5: TREECROP HOUSEHOLDS NOT PARTICIPATING IN GOVERNMENTTREECROP PROGRAMS, 1983(% of total households)
Households NotParticipating
Treecrop (%)
Rubber 92.0Coffee 94.4Coconut 95.8Cloves 97.7Pepper 92.8
Source: 1983 Agricultural Census, Series F4, as reported in Prospects forLabour Absorption in Agriculture in REPELITA V, ILO-UNDP, ReportNo. INS/84/006, p. 62.
3.45 Indonesia is the world's third largest producer of coffee. It isgrown by some 2 million farmers, and occupies some 800,000 ha, over half ofwhich are in Sumatra. Coffee can offer an attractive return of some Rp.6,000a day, even at present low yields. Cocoa is one of the most recent butfastest-growing cash crops; the area under production has grown from only36,000 ha in 1979 to 134,000 in 1987, of which 93,000 ha were undersmallholder management. The crop is most heavily concentrated in South andCentral Sulawesi (30%), North Sumatra (25%) and West Java (11%). Cocoaproduction, either as a monocrop or intercropped with coconuts, has asignificant potential for poverty alleviation. Tea is important in only a fewprovinces; West Java being dominant with over three quarters of the plantedarea. Average smallholder plantings are small (less than 0.5 ha) and yieldsare low, but it is estimated that small tea growers can still earn theequivalent of off-farm employment from their tea gardens.22/
3.46 The three major treecrops--rubber, coconut and oil palm--togetheroccupied about 6.6 million ha in 1986, or over 70% of the area planted toestate crops. Over 80% of the area planted was in the Outer Islands.Production of rubber and coconuts is predominantly in the hand of
2/ The Government is planning to revitalize the West Java tea industry.However, the project is targeted at growers having at least 1 ha oftea, and is therefore likely to exclude about 75% of the smallestgrowers in the province. An alternative approach which addressed theneeds of smaller tea farmers would be likely to reach the poor moreeffectively.
- 67 -
smallholders, but oil palm is still produced primarily on estates. It appearsthat these three crops provided employment equivalent to over 3 million jobsin 1986, and that this employment has grown faster than total employment onboth Java and the Outer Islands. In relative terms, the crops provided about10% of agricultural employment in Indonesia and 20% in the Outer Islands.These crops are also clearly associated with reduced poverty in the ruralareas. For example, smallholder households who had rubber as a primary sourceof income had an average annual income of about Rp.970,00O in 1984, which wasin excess of the poverty line.
3.47 In REPELITA V, the Government recognizes the potential of treecropprograms in reducing poverty and committed itself to develop smallholderinvestment programs that are efficient, sustainable, and replicable. From apoverty-reduction point of view, the priority is to direct more attention andresources towards the mass of unassisted smallho:Lders who, to date, have notbenefitted from past programs.
3.48 There is a need to develop, test and disseminate technical packagesthat are appropriate to the needs of these dispersed, unassisted smallholders.These packages would involve technologies that are relatively low-cost andlow-risk for the farmers. The smallholders will also need a package ofsupporting services to help them adopt improved technology. As a minimum,this should include extension advice and arrangements for the provision ofimproved planting materials. In this regard, the relatively successful PMU-based schemes could give increased emphasis to setting up dispersed nurseriesto supply good quality planting materials, together with advice on recommendedpractices to farmers on the periphery of existing smallholder schemes.23/ Toaddress the financing problem for rubber, the Government is now considering asystem of providing at least part of the inputs on a grant basis and thenrecovering costs through a small subsector development cess levied on exports.
3.49 Fisheries. Although it accounts for only 2% of GDP, the fisheriessector provides employment for about 2.3 million workers in fishing andaquaculture. Most of these are concentrated in the densely populated areas ofJava, South Sulawesi and Sumatra. While reliable statistics are notavailable, fishing families probably constitute the poorest segment ofIndonesian society, and therefore they warrant priority in a poverty-reductionstrategy. The average income of households whose main occupation was inlandfisheries was 90% of the average of all agricultural households, but incomeinequality among inland fishing households was very high with the Ginicoeficient estimated at 0.58 24/ --indicating a probable high incidence ofpoverty within the group. Moreover, analysis fcr a recent Bank-supportedproject indicated that about 90% of fishermen in the provinces of Aceh,Southeast Sulawesi, South Sulawesi and East Nusa Tenggara had incomes belowthe poverty line (in 1985).25/
2-./ For a more detailed discussion of this model. to address the needs ofunassisted smallholders, see Indonesia: Strategies for SustainedDevelopment of Tree Crops (Rubber. Coconut. Oil Palm), World Bank,op.cit.
24/ ILO, 1989, op.cit., p. 85.
25/ See, Staff Apraisal Report: Indonesia-Fisheries Support ServicesProject, November 19, 1986.
- 68 -
3.50 Many earlier fisheries development programs were unsuccessful inraising the incomes of poor fishermen for several reasons. The first is thelimitation in the natural resource. Most fishermen are engaged in marinefishing, and it would appear that fishing serves a function as a residualsource of income to many families in the coastal areas. However, the majorwestern coastal areas are already overfished, and therefore attempts toincrease efficiency through better boats, fishing gear and extension supporthave been self-defeating, since they serve to increase overfishing and reduceeach worker's catch. While the Government has taken some measures to protectsmall fishermen by instituting a trawling ban in western coastal waters, thesemeasures have proven to be insufficient in the face of limited naturalresources. A second factor has been the development of state fishingenterprises. These enterprises have tended to invest in large-scale vessels,contributing to the overfishing problem and also have had a limited employmentand poverty effect.
3.51 In looking to the future, the basic focus of government programs infisheries should be on supporting small fishermen, leaving commercial fishingenterprise to the private sector. The appropriate strategy for povertyreduction among fishermen will differ according to resource availability. Inwestern Indonesia, where there may be severe resource constraints, theemphasis should not be on fishing programs at all, but on providingalternative income-generating activities. In eastern Indonesia, whereresources are more abundant, Government programs to increase efficiency aremore appropriate. Moreover, since marketing infrastructure and supportservices such as extension, input supply and credit are weak, there is a needfor a concerted program to develop these areas (such as within the context ofthe Government's integrated area development projects). Aquaculture offersgood prospects for both growth and poverty reduction. Recent experiencesuggests that aquaculture can be successfully developed among the poor,particularly with the help of village groups. This experience shows that itis possible to provide employment and income to a large number of subsistencefish farmers, and that even the poorest fishermen, not normally creditworthy,can be reached through innovative, risk-sharing credit approaches.26/However, the introduction of poor coastal fisherman to aquaculture may need tobe gradual, starting with low stocking rates of less risky milkfish before theadoption of more sophisticated technologies such as prawn production.
3.52 Livestock. The livestock subsector can also play an important rolein reducing rural poverty, particularly in areas where crop cultivation isdifficult due to a poor resource base. While foodcrops primarily meet thesubsistence needs of poor farm families, animal production provides high-quality food for the household, helps to generate cash income, provides draft
26/ Under the ongoing Fisheries Support Services Project, funds areprovided to an NGO to provide purchased inputs for aquaculture to poorfishermen in the coastal areas of Java. If the crop fails, fishermendo not have to repay anything. If the venture succeeds, the fishermencontribute 50% of their profit to a revolving fund to assist other poorfishermen. So far the experiment has been successful, with no problemsof repayment.
- 69 -
power to supplement human effort, and produces manure for crop production. Ingeneral, livestock can best contribute to poverty reduction as part of anintegrated farming system, rather than through the addition of free-standingintensive enterprises. Experience under recent Smallholder Cattle DevelopmentProjects indicates that incomes of farmers with cattle were higher thanothers, primarily because they had the draft power to cultivate larger areas.The livestock component would usually comprise one or two large ruminants fordraft and a larger number of small ruminants, so that the total number ofanimals would balance the feed resources available to the farmer. Poultryproduction also has an important place in smallholder production systems. Infact poultry production is one of the few agricultural enterprises that can beused to reach the landless target group, since virtually no land is required.
3.53 A livestock program for poverty reduction might comprise threecomponents: (i) a mechanism for supplying and financing livestock, forexample, gadohan schemes, through which credit is repaid in terms of produce,progeny or weight gain; (ii) marketing systems, including transport andprocessing; and (iii) animal production support systems, especially extension,input supply and veterinary services.
F. Targeted Poverty-Reduction Programs
Introduction
3.54 Despite the scope for improving the poverty focus of existingagricultural programs, many of the poorest households will still not bereached, particularly in the most poverty-stricken areas, partly because ofthe very reasons that keep them in poverty, such as landlessness, lack ofcapital, illiteracy, or geographical isolation. The Government has thereforerecognized the need to supplement ongoing subsectoral programs with specialprograms specifically targeted at the poor. There are two basic approaches totargeting that will be discussed below. The first is to target identifiedpoverty areas for special attention. The second approach is to targetspecific poverty groups, such as marginal farmers, the landless and women. Athird approach, which combines elements of the other two, is transmigration.Since this approach has been so extensively used in Indonesia it clearlywarrants a separate discussion.
Area Development Programs
3.55 In Indonesia, the incidence of poverty and provincial growth ratesvary significantly across different regions (see Chapter I). Therefore, theGovernment has been implementing pilot area development projects in severalareas to promote balanced regional development and to tackle rural poverty.Under REPELITA V, Government plans to expand this effort significantly.Targeting specific areas for poverty reduction programs can be effective inIndonesia because of the sharp regional disparities in the percentage of thepoor. Of course, there will be leakages from this approach, but areadevelopment projects have the potential to be much more cost effective inreaching the poor than untargeted programs.
- 70 -
3.56 During REPELITAs III and IV, the Government undertook the ProvincialDevelopment Program (PDP), which combined a series of integrated areadevelopment projects (IADPs), implemented with assistance from several donors,and a USAID-financed program to strengthen the BAPPEDAs at provincial andkabupaten levels. The PDP was implemented in Jakarta, in eight provinces, and44 kabuIatens (rural districts), and by the end of 1987/88 had had a directeconomic impact upon more than 600,000 families. The PDP had two basicobjectives: to raise the incomes of the poor in the target area and toimprove the capabilities of local governments to undertake rural development.An evaluation of the economic effect of the program indicated that: (i)between 56% and 80% of the beneficiaries of the program were in the bottomhalf of the income distribution; (ii) the average real net income gain bybeneficiaries was between 11% and 18% p.a.; and (iii) 58% of the beneficiarieswere sustaining the economic activities introduced by the project.27/
3.57 The PDP has encountered a number of problems, which are similar toproblems experienced with IADPs in other countries. First, the IADP approachis costly, in terms of both resources and management, and for this reason hasusually been limited to projects for which external funding is available. Itis therefore difficult to replicate as a general instrument for reaching alarge number of poor areas. Second, IADPs can raise incomes substantially inan area because they are associated with a heavy concentration of resources,Government commitment and external assistance. However, unless the projectsucceeds in strengthening local capacity for planning, implementation andresource mobilization, the momentum of development is unlikely to besustainable when the assistance ends. Finally, it appears that while IADPscan accelerate the overall pace of development in "poor" areas, they are notnecessarily an effective way of reaching the poorest groups within such areas.In fact, it was found that provinces which realized the largest return fromPDPs tended to do less well at actually reaching low-income groups.28/
3.58 In reformulating the PDP for the REPELITA V period, the Governmenthas made several key changes in its approach to address these problems. Themost important of these changes may be the modified institutional arrangementsfor implementation of the new IADPs. For example, in some cases under ongoingprojects, centralized PMUs have been responsible for all aspects of the PDPprograms. Under the new approach, the Ministry of Home Affairs willcoordinate and supervise the efforts at the national level, and the BAPPEDAswill be in charge of planning at the provincial level. Actual implementation,however, will be the responsibility of the line agencies at the local level.This should lead to a greater local commitment to the success of theseprograms. This model has been followed recently in IADP projects in East NusaTenggara with good results.
27/ See, Jim Schiller, "Rural Development Strategy: Learning from theProvincial Development Program", National Conference on AreaDevelopment Program, September 1988, pp. 61-78.
28/ See, Jim Schiller, ibid.
- 71 -
3.59 In the past, the budgetary allocations for specific components of thePDP were only program agreements with the line ministries. In many cases,funds were diverted to other projects and key components of the PDP were notfully funded, leading to poor project performance. During REPELITA V,budgetary allocations will be earmarked for specific projects in support ofthe IADPs. This should ensure that IADPs are properly funded and allcomponents are implemented. Furthermore, recent studies, such as thatfinanced by UNDP to look at several eastern provinces, have been undertaken tostrengthen planning for regional development.
3.60 As noted in Chapter II, an area development approach needs to be animportant component of the Government's poverty reduction strategy. An areadevelopment approach would entail a program to strengthen planning andimplementation capacities in local-level governments, to concentrate nationaldevelopment programs in poorer areas, and to augment local resources fordevelopment. It also needs to be both sustainable, in order that when theconcentration of Central Government and donor resources ends, the developmentmomentum continues, and replicable, in order that a substantial number of poorareas can benefit from the approach. The IADPs can make an importantcontribution to this approach by testing out and demonstrating new techniqueswhich are then replicated--not necessarily through additional IADPs but alsothrough regular sectoral programs--in cther areas with similarcharacteristics. In designing IADPs, the following recommendations wouldserve to improve the poverty focus of these programs and enhance their overallcontribution to the broader poverty reduction effort:
(a) areas with a high concentration of poor households are the mostappropriate for IADPs. From an agricultural point of view, thehighest priority for IADPs is in areas that have largely untappedpotential, such as the rainfed zones of Java, the highlands ofSumatra, fishing communities in eastern Indonesia and swamps. Suchareas in Indonesia not only have a high incidence of poverty, butoffer an obvious opportunity to readily achieve both growth andequity goals. The design of appropriate technical packages anddelivery systems for these areas would have wide applicability inexisting sectoral programs;
(b) the development strategy for individual areas needs to encompass thefull range of development possibilities, including industrialdevelopment and services, and not rely exclusively on agriculture.This applies particularly in areas of low agricultural potential,including many upland areas, where it may be difficult to achieveprofitable farm systems on a sustainable basis;
(c) if poverty is to be an important criterion for determining areadevelopment strategy and resource allocation, then a greater focus onpoverty alleviation techniques must be built into local planningprocedures and program design; and,
(d) emphasis needs to be placed on sustainability by strengthening thecapacity of the local agencies to plan and coordinate activities,with special reference to poverty-targeted programs.
- 72 -
Targeting Poverty Groups: The P4K Program
3.61 A regional survey of rural development in different Asian countriescarried out by UNDP/FAO in the mid-1970s suggested a method of reaching poorfarmers through the establishment of Small Farmer Groups (SFG).29/ Twoinitiatives were taken in Indonesia as a result of this work.
3.62 The first was a pilot project, supported by FAO/UNDP, which wasdesigned to reach poor farmers in a few of the poorest districts of Java. Theproject, Income Generating Project for Small Farmers (or P4K it/ for short),formed small groups of 10-15 people from among resource-poor farmers orlandless laborers, utilizing strict poverty criteria for eligibility. Theobjective was to assist members, either as individuals or as a group, to setup income-generating activities both in agriculture and in other economicsectors. The program was carried out principally by specially trained staffattached to the Agency for Agricultural Education, Training and Extension(AAETE), assisted by revolving credit from BRI and support for nonagriculturalsmall-scale business enterprises by field staff of the Ministry of Industry.
3.63 The initial program involved the formation of some 2,150 SFGs andtrained over 240 extension staff to support them. The project was largelysuccessful, although there were ditriiIties associated with the creditcomponent, and the rate of formation of SFGs was slowed due to the intensityof training and supervision required to ensure their success. A modifiedversion of this approach is now being replicated under an expanded program,covering 54 districts in Java, Bali and West Nusa Tengara, involving a targetof 9,250 SFGs. The program is being supported by an IFAD/UNDP project.i1/
3.64 The P4K has much to offer as an instrument for targeting the poor.In particular, it: (a) provides a potentially replicable means foridentifying and reaching important target groups, including women;(b) provides for grassroots participation and training; (c) recognizes thatthe target group needs diversified income-earning opportunities, even thoughmost of them are farmers; and (d) has had some success in extending credit(often in small amounts) to poor people who were not creditworthy for normalcommercial credit.
3.65 Therefore, the P4K merits strong support and could be expanded.However, expansion of the program needs to be geared to the Government'slimited capacity to form groups, to train group members, and to process andsupport the enterprises formed by the groups and their members. Under theoriginal pilot project, special group organizers were trained for full-time
29/ FAO: "Small Farmer Development Projects in Asia", RADA, Bangkok, 1987.
20/ P4K is the acronym for the Indonesian title, Proyek PembinaanPeningkatan Pendapatan Petani Kecil.
lj/ IFAD/UNDP: "Income Generating Project for Small Farmers and Landless(P4K)n, Project Document, October 1988.
- 73 -
operation, and were overwhelmed by the magnitude of the task, necessitating aslowing of the program. Yet under the new program, the task of setting up andsupporting SFGs is only one of the duties of the field extension workers ofAAETE. While extension staff will need to be enlisted to provide technicaladvice to SFGs, along with field staff of the Ministry of Industry and BRI,problems may be encountered if extension staff are responsible for groupformation. There is a real risk that both the P4K program and agriculturalextension will suffer if these two tasks are merged. The task of groupformation, training and support needs full-time and well-trained specializedstaff.
3.66 The second initiative was a similar, but narrower, program. Thisprogram seeks to set up subgroups of the existing extension farmer groups,specifically for the very small farmers, so that appropriate messages can bedeveloped and disseminated to meet their particular needs. This narrowerprogram could be more readily expanded than the more elaborate P4K programbecause: (a) it merely constitutes an expansion of the existing farmer groupsset up under the extension service; and (b) the setting up, training andsupport of agricultural extension groups is the essential core of theextension worker's job.
3.67 However, it would not be appropriate to merge these two approaches,since the functions of the group leaders under the P4K program are muchbroader than that of an agricultural extension worker. An appropriatestrategy would be to continue to test and evaluate the use of extensionsubgroups, as a means of reaching resource-poor farmers. Eventually, theresults of this program could be incorporated into the national T&V extensionsystem. Furthermore, it is also desirable to expand the more ambitious P4Kprogram as quickly as possible. However, it is suggested that theresponsibility for establishing and supporting multipurpose groups beseparated from the agricultural extension function, either by again providingMAETE with a separate cadre of group organizers or, possibly by giving theresponsibility to another, more appropriate agency, such as BANGDES.
The Transmigration Program
3.68 The transmigration program in Indonesia has been the largestresettlement program in the world. Since 1950, over 750,000 families (or over2.5 million people) have been resettled under various sponsored programs. Inaddition, the Ministry of Transmigration (MOT) estimates that another 500,000families have moved spontaneously, as a result of the sponsored program. Inall, some 1.3 million families, or about 6.5 million people, have moved fromthe heavily populated inner islands to the outer islands, most of them overthe past fifteen years.
3.69 Although the transmigration program is generally well documented,information is incomplete and fragmented on its contribution to povertyreduction, mainly because detailed research on migrants' incomes and theeconomic conditions in sending and receiving areas has not been done on asystematic and comprehensive basis. The limited data available suggest thatmost migrants are (or feel themselves to be) better off after their move,indicating that the program probably has had a positive effect in relievingpoverty on Java. This tends to be corroborated by observed improvements in
- 74 -
nutrition and by the fact that in 1985 50% were above the poverty level.2./However, anecdotal evidence suggests that declining soil fertility at sometransmigration sites may have adversely affected transmigrant welfare in theyears since 1985, as has the decline in public expenditures.
3.70 Whatever its overall effect on the reduction of poverty, there is nodoubt that a large number of settlers are still below the poverty line, andmany live in considerable distress. In the past, the emphasis was on meetinghigh settlement targets at minimum cost, with less focus on the economicviability and sustainability of the agricultural systems that smallholdersadopted. As a result, some sites were wrongly selected, recommended croppingpatterns and agricultural practices were often not suited to the areas, andthe necessary support services for extension, input supply, credit andmarketing were not developed adequately.
3.71 GOI has recognized the shortcomings of previous programs, and is nowplanning to address poverty in existing transmigration sites by givingpriority to "second stage development" (SSD) during the REPELITA V period.Emphasis will be given to increasing the income levels of existing settlerfamilies through intensified agricultural development, including estate cropsand livestock, and improved infrastructure, services and interagencycoordination. The SSD program, by building upon the considerable resourcesinvested in first stage development, offers the prospects of a more efficientuse of resources. It can also contribute to poverty reduction by assistingpoor transmigrants to improve their productivity and incomes, and byattracting spontaneous settlers to sites that have been upgraded and receivebetter services.
3.72 The emphasis on SSD and spontaneous migration during the REPELITA Vperiod raises three issues from a poverty reduction perspective. First,little has been done to acquire or develop land for spontaneous migrants or tointegrate them into regional plans. Yet many poor families will continue tomove voluntarily, particularly if SSD is successful. Effective, but low-cost,programs are therefore urgently needed to ensure that spontaneous migrants canbe settled under minimally acceptable social and environmental conditions.3/
3.73 Second, to maximize the poverty reduction potential of SSD, priorityneeds to be given to the poorest areas in its SSD program, provided they havethe potential for development and this principle is being generally followed.However, while SSD can contribute to poverty reduction by raising the incomesof all the settlers on poor sites, it does not now have a specific povertyfocus, in the sense of building in mechanisms for favoring the poorestfamilies within such sites. Unless this is done, the benefits of SSD may
)2/ Since transmigrants are generally selected from the poorest groups, itcan be assumed that the proportion of households falling under thepoverty line before transmigration was much higher than 50%.
3./ This warrants priority attention because of its poverty implicationsand the Government will address this under SSD studies duringREPELITA V.
- 75 -
accrue largely to the more progressive farmers. Thus, there is the same needfor institutionalizing a sharper focus on poverty reduction in thetransmigration programs, for both sponsored and spontaneous migrants, as inother subsectoral programs discussed earlier.
3.74 Finally, there are some important issues of institutionalresponsibility and capacity that may need further study. The Ministry ofTransmigration's experience lies primarily in resettling people and helping toestablish new communities. Yet under SSD, MOT is expected to take over muchbroader functions, including the responsibility for interagency coordinationin agriculture and the provision of infrastructure and services. Essentially,the plight of the many transmigrants who remain in poverty is merely areflection of the general problem afflicting other small farmers, and the needfor intensification of agricultural production and for better planning andcoordination applies throughout the country, not just in transmigrationreceiving areas. Ultimately, many of the broad functions of MOT could bedevolved to provincial authorities, provided their capacity and financialresources were sufficiently strengthened.

I
- 77 -
IV. HUMAN RESOURCE DEVELOPMENT FOR THE POOR:
PART I - THE SOCIAL SERVICES
A. Introduction
4.1 Improving access to and consumption of social services (education,health and nutrition) is an important policy instrument in the Government'soverall strategy to alleviate poverty and improve the welfare of theIndonesian population.l/ Expanding coverage and quality of these basic
services constitutes an investment in human capital leading to future yields
in increased productivity among the poor. At the same time, these services
satisfy directly a basic consumption need which is an important social policygoal in itself. This Chapter assesses Indonesia's progress in social serviceprovision and its effectiveness in targeting improved access to the poor.Section B analyses patterns of school enrollment, emphasizing Indonesia'sachievement of nearly complete primary school enrollment and the need to focuspolicy attention on equalizing the quality of education. Section C shows theconsequences for the poor of differential access to the health system and of
a low level of service to the population. Finally, Section D assessesprogress in nutrition status and the need to strengthen the Government'snutrition program.
B. Education
Introduction
4.2 In Indonesia, as elsewhere, education can play a key role in reducing
poverty over the long term, both indirectly through improving the productivityand efficiency of the work force, in general, which will lead to faster ratesof economic growth, and directly by inculcating the poor with the skillsnecessary to raise their productivity and hence, incomes. For the latter,primary education or its equivalency are of critical importance. As noted inChapter II, there is a strong positive association between education, literacyand personal income. This reflects the fact that education is both a causeand a consequence of higher income.
j/ Family planning programs are also an important component of humanresource development for the poor. These are discussed in Indonesia:Family Planning Perspectives in the 1990s, A World Bank Country Study,The World Bank, Washington, D.C., April 25, 1990.
- 78 -
4.3 The results of the causal relationship between education and incomecan best be summarized in the social rates of return to education.2/Estimated social rates of return for primary and secondary education rangefrom 10% to over 20%, with lower rates for university education.3/ Moreover,the rates for primary education, in particular, are an underestimate in thatthey exclude the (public-good) external benefits of education. The highestimated rates of return to primary education are consistent with findingsfrom other countries both as to rates of return to different levels ofschooling,A/ and as to the productivity enhancing effects of primaryeducation.5/ There are two important implications of these findings. First,basic education, particularly primary education, merits priority attention bythe Government both on equity and efficiency grounds. Second, because virtualuniversal coverage of primary education was not achieved until the early1980s, there also remains an important role for non-formal education inIndonesia to provide basic literacy and low-level skill training to thoseIndonesians who did not have the opportunity to attain a primary schooleducation.
Basic Education
4.4 The current allocation of public budgets in the education sectorfavors higher levels of education (see Table 4.1). Because levels ofcompleted education are positively associated with household income (see Table4.4), this pattern of public expenditures in the education sector tends tobenefit the better-off.
4.5 Higher income also increases the demand for education. Expendituredata for urban households from the 1984 SUSENAS survey show a very high (3.6)average expenditure elasticity of demand for education. Together with theincome-enhancing effects of education referred to above, this implies thateducated parents tend to seek education for their children, or that, in theaggregate, the privileges associated with education tend to replicatethemselves across generations. Therefore, an important objective of public
2/ The formula for social rates of return to education differs from theprivate rate of return in that it includes the publicly borne cost, butnot the external benefits, of education. Such social rates of returnare thus always equal to or lower than private rates of return.
3./ See Annex Table 9.
4/ A recent survey of social rates of return to education in numerouscountries consistently found the highest rates of return at the primarylevel. See Psacharopoulos, Tan and Jimenez, Financing Education inDeveloping Countries, World Bank EDI Research Report, 1986.
2/ For example, a multicountry study of farmer productivity found thatfarmers with four years or more of primary schooling were, on average,at least 7% more productive than farmers with no primary education.See Lockheed, Jamison, and Lau, "Farmer Education and Farm Efficiency:A Survey;" in "Education and Income", World Bank Staff Working PaperNo. 402; 1980.
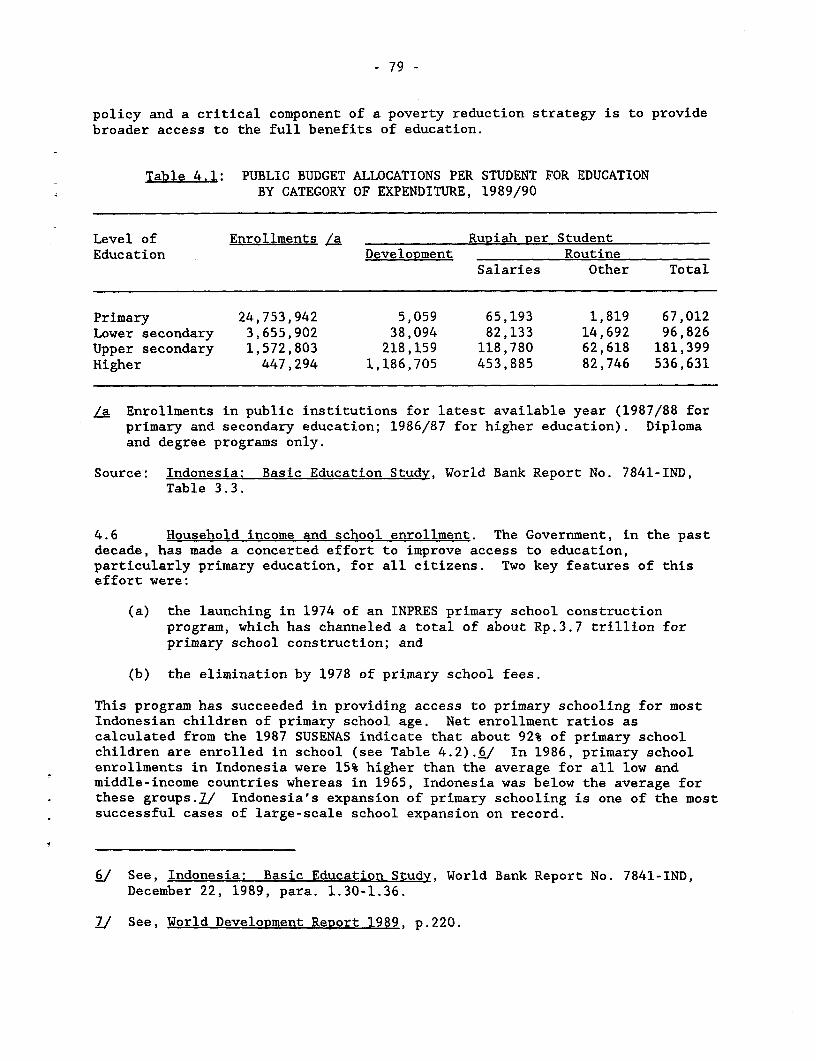
- 79 -
policy and a critical component of a poverty reduction strategy is to providebroader access to the full benefits of education.
Table 4.1: PUBLIC BUDGET ALLOCATIONS PER STUDENT FOR EDUCATIONBY CATEGORY OF EXPENDITURE, 1989/90
Level of Enrollments /a Rupiah per StudentEducation Development Routine
Salaries Other Total
Primary 24,753,942 5,059 65,193 1,819 67,012Lower secondary 3,655,902 38,094 82,133 14,692 96,826Upper secondary 1,572,803 218,159 118,780 62,618 181,399Higher 447,294 1,186,705 453,885 82,746 536,631
/a Enrollments in public institutions for latest available year (1987/88 forprimary and secondary education; 1986/87 for higher education). Diplomaand degree programs only.
Source: Indonesia: Basic Education Study, World Bank Report No. 7841-IND,Table 3.3.
4.6 Household income and school enrollment. The Government, in the pastdecade, has made a concerted effort to improve access to education,particularly primary education, for all citizens. Two key features of thiseffort were:
(a) the launching in 1974 of an INPRES primary school constructionprogram, which has channeled a total of about Rp.3.7 trillion forprimary school construction; and
(b) the elimination by 1978 of primary school fees.
This program has succeeded in providing access to primary schooling for mostIndonesian children of primary school age. Net enrollment ratios ascalculated from the 1987 SUSENAS indicate that about 92% of primary schoolchildren are enrolled in school (see Table 4.2).6/ In 1986, primary schoolenrollments in Indonesia were 15% higher than the average for all low andmiddle-income countries whereas in 1965, Indonesia was below the average forthese groups.]./ Indonesia's expansion of primary schooling is one of the mostsuccessful cases of large-scale school expansion on record.
i/ See, Indonesia: Basic Education Study, World Bank Report No. 7841-IND,December 22, 1989, para. 1.30-1.36.
/ See, World Development Report 1989, p.220.
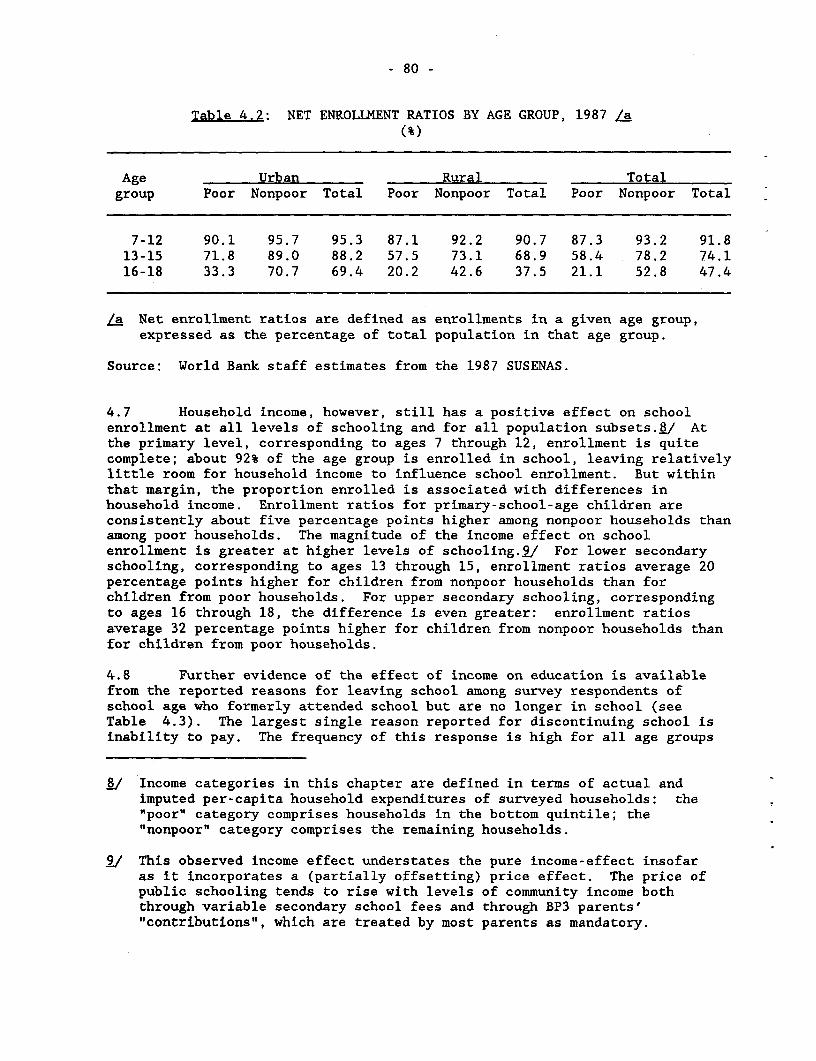
- 80 -
Table 4.2: NET ENROLLMENT RATIOS BY AGE GROUP, 1987 La(%)
Age Urban Rural Totalgroup Poor Nonpoor Total Poor Nonpoor Total Poor Nonpoor Total
7-12 90.1 95.7 95.3 87.1 92.2 90.7 87.3 93.2 91.813-15 71.8 89.0 88.2 57.5 73.1 68.9 58.4 78.2 74.116-18 33.3 70.7 69.4 20.2 42.6 37.5 21.1 52.8 47.4
/a Net enrollment ratios are defined as enrollments in a given age group,expressed as the percentage of total population in that age group.
Source: World Bank staff estimates from the 1987 SUSENAS.
4.7 Household income, however, still has a positive effect on schoolenrollment at all levels of schooling and for all population subsets..V/ Atthe primary level, corresponding to ages 7 through 12, enrollment is quitecomplete; about 92% of the age group is enrolled in school, leaving relativelylittle room for household income to influence school enrollment. But withinthat margin, the proportion enrolled is associated with differences inhousehold income. Enrollment ratios for primary-school-age children areconsistently about five percentage points higher among nonpoor households thanamong poor households. The magnitude of the income effect on schoolenrollment is greater at higher levels of schooling.2/ For lower secondaryschooling, corresponding to ages 13 through 15, enrollment ratios average 20percentage points higher for children from nonpoor households than forchildren from poor households. For upper secondary schooling, correspondingto ages 16 through 18, the difference is even greater: enrollment ratiosaverage 32 percentage points higher for children from nonpoor households thanfor children from poor households.
4.8 Further evidence of the effect of income on education is availablefrom the reported reasons for leaving school among survey respondents ofschool age who formerly attended school but are no longer in school (seeTable 4.3). The largest single reason reported for discontinuing school isinability to pay. The frequency of this response is high for all age groups
j/ Income categories in this chapter are defined in terms of actual andimputed per-capita household expenditures of surveyed households: the"poor" category comprises households in the bottom quintile; the"nonpoor" category comprises the remaining households.
i/ This observed income effect understates the pure income-effect insofaras it incorporates a (partially offsetting) price effect. The price ofpublic schooling tends to rise with levels of community income boththrough variable secondary school fees and through BP3 parents'"contributions", which are treated by most parents as mandatory.
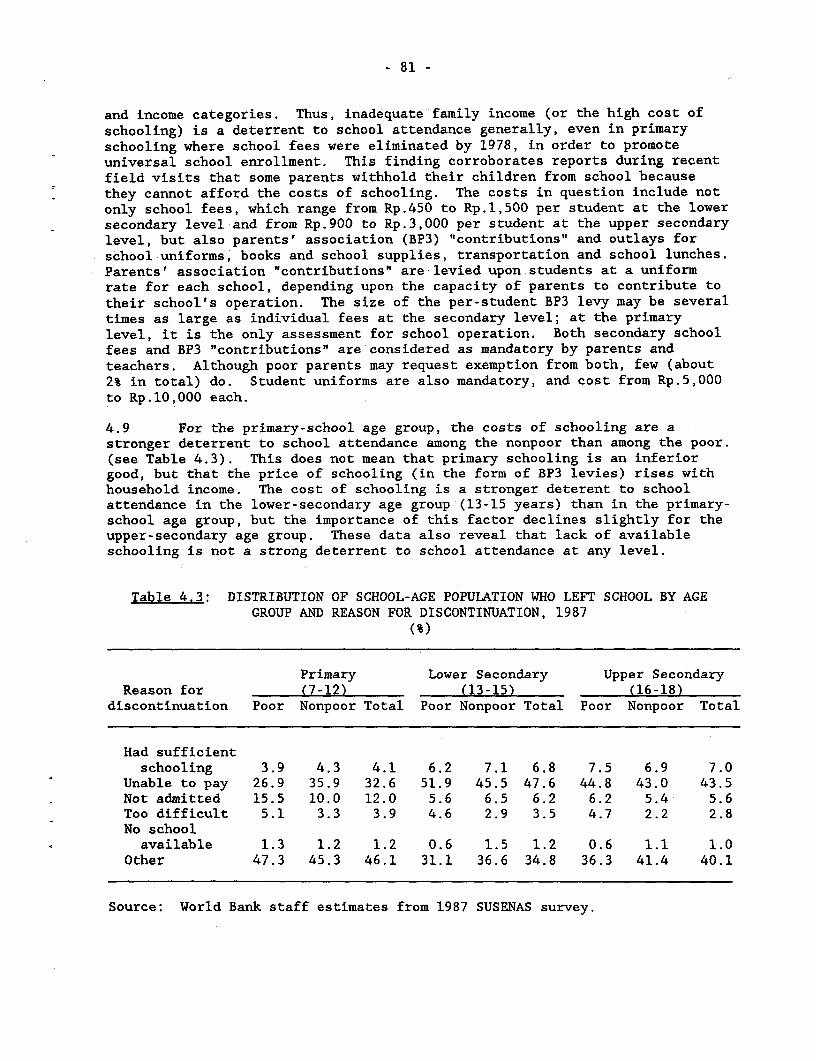
- 81 -
and income categories. Thus, inadequate family income (or the high cost ofschooling) is a deterrent to school attendance generally, even in primaryschooling where school fees were eliminated by 1978, in order to promoteuniversal school enrollment. This finding corroborates reports during recentfield visits that some parents withhold their children from school becausethey cannot afford the costs of schooling. The costs in question include notonly school fees, which range from Rp.450 to Rp.1,500 per student at the lowersecondary level and from Rp.900 to Rp.3,000 per student at the upper secondarylevel, but also parents' association (BP3) "contributions" and outlays forschool uniforms, books and school supplies, transportation and school lunches.Parents' association "contributions" are levied upon students at a uniformrate for each school, depending upon the capacity of parents to contribute totheir school's operation. The size of the per-student BP3 levy may be severaltimes as large as individual fees at the secondary level; at the primarylevel, it is the only assessment for school operation. Both secondary schoolfees and BP3 "contributions" are considered as mandatory by parents andteachers. Although poor parents may request exemption from both, few (about2% in total) do. Student uniforms are also mandatory, and cost from Rp.5,000to Rp.10,000 each.
4.9 For the primary-school age group, the costs of schooling are astronger deterrent to school attendance among the nonpoor than among the poor.(see Table 4.3). This does not mean that primary schooling is an inferiorgood, but that the price of schooling (in the form of BP3 levies) rises withhousehold income. The cost of schooling is a stronger deterent to schoolattendance in the lower-secondary age group (13-15 years) than in the primary-school age group, but the importance of this factor declines slightly for theupper-secondary age group. These data also reveal that lack of availableschooling is not a strong deterrent to school attendance at any level.
Table 4.3: DISTRIBUTION OF SCHOOL-AGE POPULATION WHO LEFT SCHOOL BY AGEGROUP AND REASON FOR DISCONTINUATION, 1987
(%)
Primary Lower Secondary Upper SecondaryReason for (7-12) (13-15) (16-18)
discontinuation Poor Nonpoor Total Poor Nonpoor Total Poor Nonpoor Total
Had sufficientschooling 3.9 4.3 4.1 6.2 7.1 6.8 7.5 6.9 7.0
Unable to pay 26.9 35.9 32.6 51.9 45.5 47.6 44.8 43.0 43.5Not admitted 15.5 10.0 12.0 5.6 6.5 6.2 6.2 5.4 5.6Too difficult 5.1 3.3 3.9 4.6 2.9 3.5 4.7 2.2 2.8No school
available 1.3 1.2 1.2 0.6 1.5 1.2 0.6 1.1 1.0Other 47.3 45.3 46.1 31.1 36.6 34.8 36.3 41.4 40.1
Source: World Bank staff estimates from 1987 SUSENAS survey.
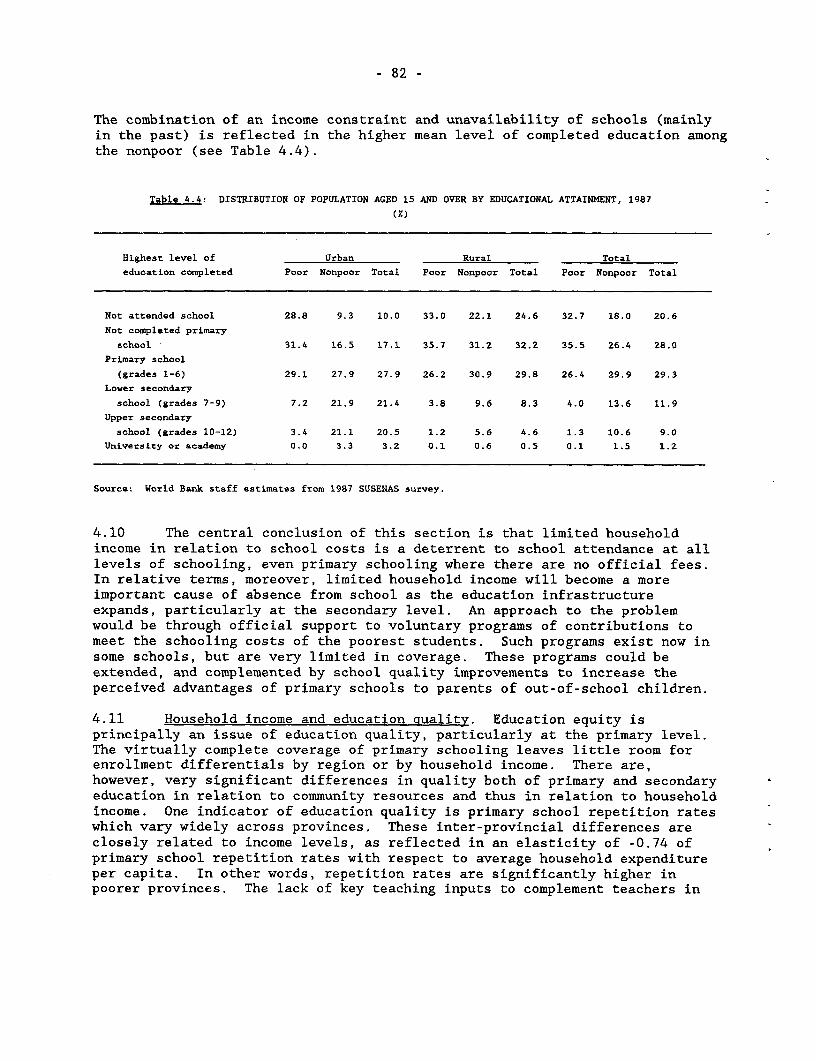
- 82 -
The combination of an income constraint and unavailability of schools (mainlyin the past) is reflected in the higher mean level of completed education amongthe nonpoor (see Table 4.4).
Table 4.4: DISTRIBUTION OP POPULATION AGED 15 AND OVER BY EDUCATIONAL ATTAINMENT, 1987
Highest level of Urban Rural Total
education completed Poor Nonpoor Total Poor Nonpoor Total Poor Nonpoor Total
Not attended school 28.8 9.3 10.0 33.0 22.1 24.6 32.7 18.0 20.6
Not completed primary
school 31.4 16.5 17.1 35.7 31.2 32.2 35.5 26.4 28.0
Primary school
(grades 1-6) 29.1 27.9 27.9 26.2 30.9 29.8 26.4 29.9 29.3
Lower secondary
school (grades 7-9) 7.2 21.9 21.4 3.8 9.6 8.3 4.0 13.6 11.9
Upper secondary
school (grades 10-12) 3.4 21.1 20.5 1.2 5.6 4.6 1.3 10.6 9.0
University or academy 0.0 3.3 3.2 0.1 0.6 0.5 0.1 1.5 1.2
Source: World Bank staff estimates from 1987 SUSENAS survey.
4.10 The central conclusion of this section is that limited householdincome in relation to school costs is a deterrent to school attendance at alllevels of schooling, even primary schooling where there are no official fees.In relative terms, moreover, limited household income will become a moreimportant cause of absence from school as the education infrastructureexpands, particularly at the secondary level. An approach to the problemwould be through official support to voluntary programs of contributions tomeet the schooling costs of the poorest students. Such programs exist now insome schools, but are very limited in coverage. These programs could beextended, and complemented by school quality improvements to increase theperceived advantages of primary schools to parents of out-of-school children.
4.11 Household income and education quality. Education equity isprincipally an issue of education quality, particularly at the primary level.The virtually complete coverage of primary schooling leaves little room forenrollment differentials by region or by household income. There are,however, very significant differences in quality both of primary and secondaryeducation in relation to community resources and thus in relation to householdincome. One indicator of education quality is primary school repetition rateswhich vary widely across provinces. These inter-provincial differences areclosely related to income levels, as reflected in an elasticity of -0.74 ofprimary school repetition rates with respect to average household expenditureper capita. In other words, repetition rates are significantly higher inpoorer provinces. The lack of key teaching inputs to complement teachers in
- 83 -
producing quality education in many Indonesian primary schools suggests that apolicy of providing these missing inputs would yield very sizeable returns interms of school effectiveness and eventual earnings of students.L/
4.12 Differences in the quality of public primary and secondary educationarise from differences in the capacity of individual communities to supplementCentral Government budget resources for operations and maintenance (O&M) ofschools. O&M needs of public primary and secondary schools are providedprincipally through two public sources: routine budget allocations forsalaries of teachers and other school staff, and routine-budget allocationsunder various unit entitlement instruments for other non-salary O&M needs.Li/For public primary schools, salaries account for 95% of these funds. Theremaining 5% is intended to meet all non-salary O&M needs, and is apportionedto schools according to a uniform entitlement formula (the SBPP) based largelyon the number of students and teachers in individual schools. As the fundsreceived by schools under the SBPP are inadequate to support qualityeducation, more affluent communities supplement school resources throughparental "contributions" (BP3) to schools. These BP3 contributions areretained by the school and are used for a broad range of educationalexpenditures according to priorities agreed by parents and school principals.The amount of per-student BP3 contributions is set by parents' associationsfor individual schools; payment of the contribution is considered mandatory,although parents who cannot afford it can (but rarely do) request an exemptionfrom the school principal. In affluent, urban communities, schools oftenreceive under the BP3 contribution an amount several times as large as theSBPP grant. The additional educational inputs which such privileged schoolsprovide for themselves in this fashion yield, in general, a much higherquality of education than is possible in schools which rely only upon the SBPPgrant. The quality of education in such public primary schools is comparableto the best private schools. Few communities, however, can afford to levysuch lavish supplementary contributions for their schools. Most publicprimary schools receive little from this source.
4.13 Non-salary operations and maintenance needs for public secondaryschools are provided through an entitlement formula, the DPP, which is similarin format to the primary-school formula. However, the DPP differs from theSBPP in two significant respects: (i) it is funded in the aggregate throughstudent fees, the amount of which differs for individual schools depending onthe general level of income in the community; and (ii) it is province-specific, with separate unit entitlement coefficients for each province. Thisfeature of the entitlement formula is ostensibly designed to allow DPPfinancing to favor poorer provinces, but there is, in fact, little variation
iO/ Research results show higher rates of return to education qualityimprovement than for expanded quantity. See, for example Behrman, J.and Birdsall, N., "The Quality of Schooling: Quantity Alone isMisleading", American Economic Review, December, 1983, No. 73). TheIndonesia: Basic Education Study, op.cit., describes specific needsfor improving basic education quality, and estimates the costs ofproviding these needs.
11/ See, Indonesia: Basic Education Study, World Bank, op.cit., pp. 77-83.
- 84 -
in unit entitlement coefficients across provinces. Another importantdifference between public primary and secondary schools is that secondaryschools have public sources of nonsalary O&M financing other than the DPPallocation. These take the form of routine budget allocations Rer se and somedevelopment budget allocations for what are, in fact, routine activities. Bycontrast, public primary schools receive only the SBPP allocation. Publicprimary schools are thus more vulnerable to the inadequacies of the SBPPallocations because they lack access to other public sources of financing.
4.14 Because of the enormous differences in the quality and effectivenessof public primary and secondary education depending upon the availability ofsupplementary financing from the community, equality of access to qualityprimary education has not yet been achieved. Success in meeting theGovernment's stated goal of improving the quality of basic education willrequire, above all, that additional public resources be provided to schools inpoor communities. There is ample evidence that cost recovery is already doingall that it reasonably can do to assist in financing of public primary andsecondary schools. Targeting the SBPP and DPP allocations to schools in thepoorest communities could provide some of the necessary additional financing,but it is clear that more resources will be required. To ensuresustainability of needed quality improvements, it is important that theinfusion of funds to support them be provided under a permanent budgetarymechanism. The simplest means of doing so would be to augment the unitcoefficients in the existing SBPP entitlement formula for primary schools, andthe corresponding formulae for secondary schools.
4.15 An agenda for REPELITA V. The Government acknowledges that therecent quantitative expansion of primary education has been accompanied by adeterioration of education quality, and has identified primary educationquality improvement as one of its key education objectives for REPELITA V.This goal is also appropriate as an instrument of poverty alleviation, sincethe quality of education is intimately related to its effectiveness inincreasing productivity and incomes. The most important need for povertyalleviation in formal education is to improve the quality of education,particularly primary education, provided to children of the pooresthouseholds. In this regard, the Government could provide more adequatefinancing for textbooks, teachers' manuals, chalk, and other essential inputsto the educational process itself. Because the outlays required arerecurrent, financing needs to be provided through permanent budgetaryinstruments such as the SBPP subsidy (under the SDO regional autonomy grant)for primary school operation. Targeting of such subsidies to schools in thepoorest areas could relieve some of the budgetary cost of this action, but anyplans for targeting of subsidies should be carefully considered, first, so asnot to risk depriving any school in need, and, second, to ensure that theywould be practical and cost effective to administer. To finance thesequality-enhancing inputs, there is a need for increased budgetary outlays onprimary education relative to higher levels of education. This could beaccomplished by restraining the growth of public expenditures on highereducation facilities and increasing cost recovery in higher education throughstudent fees, while improving the access of poorer students to the studentloan program.
- 85 -
4.16 While improved supplies of educational materials are a necessarycondition for improved quality of education, they are not a sufficientcondition. Meaningful improvements in education quality imply the need forcomplementary actions in order to ensure that improved supplies of educationalmaterials actually lead to improved teaching. First, there is a need toincrease the supply of teachers in underserved areas. Although in aggregatethe supply of primary school teachers exceeds demand, pupil-teacher ratiosvary significantly from subdistrict to subdistrict, with the consequence thatpoorer areas are likely to have higher ratios than better-off areas. Changingthe distribution of primary school teachers may require providing incentivesto teachers in certain disadvantaged areas. Other important initiatives thatcould be considered are:
(a) improve teacher competence by raising the level of preserviceeducation and training for primary teachers and providing classroom-based, in-service training and regular pedagogical supervision;
(b) improve teacher motivations by providing promotion opportunitieslinked to performance and qualifications;
(c) devote more of teachers' time to actual instruction, particularly inthe Indonesian language, math and science;
(d) strengthen the instructional leadership and developmental managementroles of school principals and supervisors; and
(e) separate and strengthen the role of supervisors in providingprofessional support to teachers, and transfer supervisors' currentmonitoring roles to the MOEC Inspectorate General and to schoolprincipals themselves.
4.17 The needs of school-age children who are not in school because ofinability to pay could be supported by expanding the program to provideincome-earning opportunities for students from very poor households whereschool costs are a problem (para. 4.10), or by encouraging private voluntaryefforts. The effectiveness of private contributions to defray schooling costsfor poor students and thus reduce the likelihood of poor students dropping outof school is limited by the community nature of such contributions. Poorcommunities have the greatest needs for such contributions, but the leastcapacity to contribute meaningfully. Targeted support from central sources,including foreign grants, would help meet these needs.
Non-Formal Education
4.18 Introduction. As noted earlier, non-formal education also remains apriority for poverty reduction, because of the high correlation betweenliteracy and income. Despite the rapid expansion of the formal school system,about 20% of the total population above the age of seven were illiterate
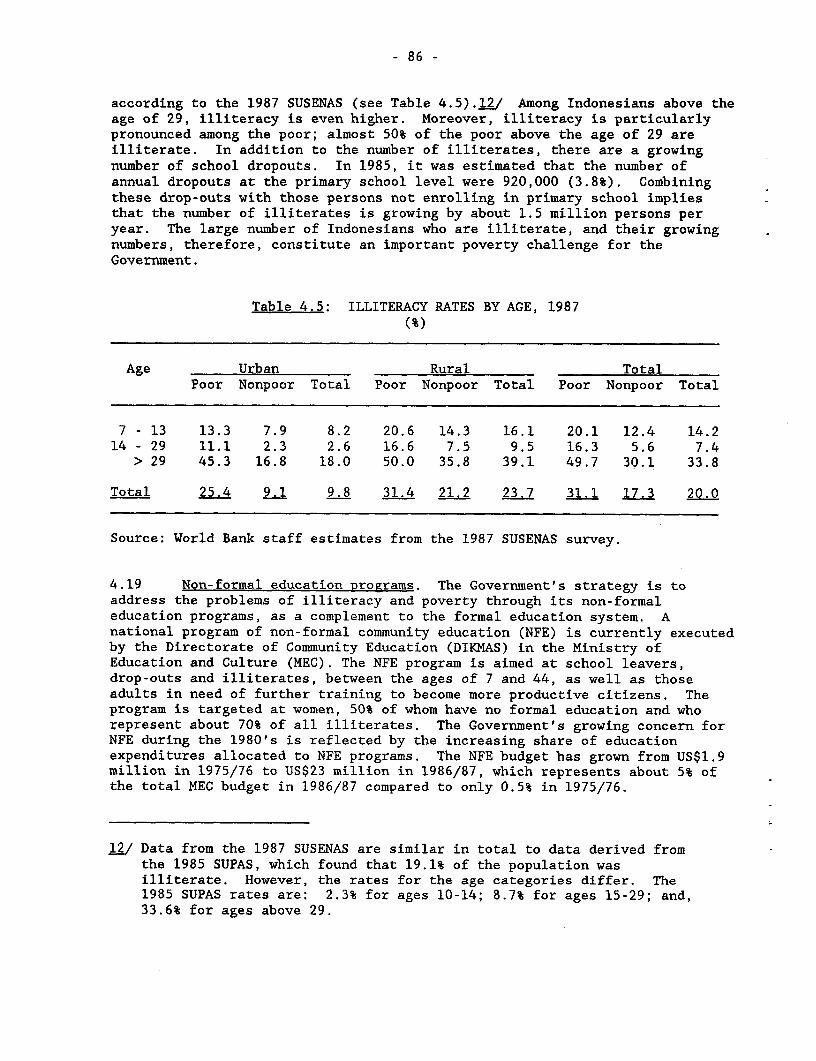
- 86 -
according to the 1987 SUSENAS (see Table 4.5).12/ Among Indonesians above theage of 29, illiteracy is even higher. Moreover, illiteracy is particularlypronounced among the poor; almost 50% of the poor above the age of 29 areilliterate. In addition to the number of illiterates, there are a growingnumber of school dropouts. In 1985, it was estimated that the number ofannual dropouts at the primary school level were 920,000 (3.8%). Combiningthese drop-outs with those persons not enrolling in primary school impliesthat the number of illiterates is growing by about 1.5 million persons peryear. The large number of Indonesians who are illiterate, and their growingnumbers, therefore, constitute an important poverty challenge for theGovernment.
Table 4.5: ILLITERACY RATES BY AGE, 1987(%)
Age Urban Rural TotalPoor Nonpoor Total Poor Nonpoor Total Poor Nonpoor Total
7 - 13 13.3 7.9 8.2 20.6 14.3 16.1 20.1 12.4 14.214 - 29 11.1 2.3 2.6 16.6 7.5 9.5 16.3 5.6 7.4
> 29 45.3 16.8 18.0 50.0 35.8 39.1 49.7 30.1 33.8
Total 25.4 9.1 9.8 31.4 21.2 23.7 31.1 17.3 20.0
Source: World Bank staff estimates from the 1987 SUSENAS survey.
4.19 Non-formal education programs. The Government's strategy is toaddress the problems of illiteracy and poverty through its non-formaleducation programs, as a complement to the formal education system. Anational program of non-formal community education (NFE) is currently executedby the Directorate of Community Education (DIKMAS) in the Ministry ofEducation and Culture (MEC). The NFE program is aimed at school leavers,drop-outs and illiterates, between the ages of 7 and 44, as well as thoseadults in need of further training to become more productive citizens. Theprogram is targeted at women, 50% of whom have no formal education and whorepresent about 70% of all illiterates. The Government's growing concern forNFE during the 1980's is reflected by the increasing share of educationexpenditures allocated to NFE programs. The NFE budget has grown from US$1.9million in 1975/76 to US$23 million in 1986/87, which represents about 5% ofthe total MEC budget in 1986/87 compared to only 0.5% in 1975/76.
12/ Data from the 1987 SUSENAS are similar in total to data derived fromthe 1985 SUPAS, which found that 19.1% of the population wasilliterate. However, the rates for the age categories differ. The1985 SUPAS rates are: 2.3% for ages 10-14; 8.7% for ages 15-29; and,33.6% for ages above 29.
- 87 -
4.20 In general, the NFE programs are designed to provide an opportunityfor acquiring basic literacy, improving productive skills, and raisingawareness of community health and associated Government programs. The NFEprograms are delivered through small groups which are established at thecommunity level, with volunteer tutors or facilitators, under the supervisionof subdistrict field workers. An advantage of this approach is the ability tocustom-design individual programs from among a range of topics to reflectlocal conditions, skills and needs, and the use of peer mutual teachingtechniques. There are two main program thrusts:
(a) NFE as a basic service in human resource development. The originaland still largest component of the NFE programs is the basic literacyprogram (Paket A), which is aimed at persons who have not completedprimary school. Paket A provides not only training in literacy andnumeracy, but also information on health, nutrition, family planning,and on simple skills useful in community life. This program reachedabout 8 million persons during REPELITA IV, of which close to two-thirds were women. A similar program (Paket B) is being developedfor dropouts from junior secondary schools, in view of the governmentpolicy of providing nine years of basic education to all children.
(b) NFE as a means of improving productivity and incomes in the informalsector. Skill training for the informal sector has been found inmany countries to be more effective when linked to actual income-earning activities. As part of NFE activities to support post-literacy, the "Kejar Usaha" or Income-Generating Program (IGP) wasdeveloped, to provide technical assistance and seed capital tocommunity-based groups as a way of increasing their skills andincome. The program reached about 550,000 persons (95,000 groups)during REPELITA IV. In addition, about 25,000 unemployed youths weresponsored as trainees in private vocational courses or as apprenticesin small enterprises. Most of the seed capital has been provideddirectly by DIKMAS on a revolving fund basis; however, a pilotprogram providing the funds through BRI using the KUPEDES creditprogram has had promising results.
4.21 The wide outreach of the DIKNAS NFE programs and their community-based approach makes them a potential vehicle for poverty alleviation.Several field evaluations indicate that at the micro-level, the programs arewell-received, reach low-income and disadvantaged persons, and have hadbeneficial effects on participants' skills and incomes. About 20% of Paket Alearners during REPELITA IV completed a stage in the program considered torepresent full literacy, and of these, about half passed the primary schoolequivalency examination. Successful IGP groups reported average increases of7-10% in real incomes. However, about one-quarter of the IGP groups hadfailed or were having difficulties in repaying the revolving funds.
4.22 While the NFE programs have been generally successful, a number ofimprovements can be made in their design and implementation to enhance theireffectiveness. First, the programs are insufficiently targeted, both in termsof geographic areas and beneficiary groups. Although areas with largeabsolute numbers of illiterates were well covered during REPELITA IV (East,Central and West Java, South Sulawesi and West Nusa Tenggara), some provinces
- 88 -
with high incidence of illiteracy such as East Nusa Tenggara, West and SouthKalimantan, East Timor and Irian Jaya received less priority. In addition,while beneficiaries have generally come from lower-income groups, they havenot necessarily been among the poorest members of the community. Second,DIKMAS has insufficient experience in the financial aspects of managing theIGP revolving funds. Consequently, endeavoring to manage these aspects hasdistracted DIKMAS from providing the technical assistance and training neededto ensure the viability of the group enterprises supported under the IGP.Third, DIKMAS field workers are handling areas and workloads beyond theircapacity, which is exacerbated by insufficient resources for travel andoperating expenses. Moreover, the qualifications of current field staff,particularly in the field of IGPs, are uneven. This is having an adverseeffect on program performance, especially as regards the appraisal andtechnical follow-up of IGP activities. Finally, cooperation between DIKMASand other sectoral agencies, local governments and NGOs needs strengthening sothat DIKMAS can catalyze technical assistance inputs as part of its role ascommunity development facilitator.
4.23 An agenda for REPELITA V. Given the close relationship betweenpoverty and low educational attainment and the large percentage of the poorwho are illiterate or who have not completed primary school, nonformaleducation programs constitute a secouiU priority area in education for povertyreduction. Several areas could be given more attention during REPELITA V.First, while Government expenditures on NFE have increased significantlyduring REPELITAs III and IV, financing of NFE programs is still low,especially in light of the qualitative improvements which are needed. Second,if NFE is to constitute an important component of the Government's povertyreduction strategy, NFE programs need to be targeted to the areas whereilliteracy and poverty are highest, and reach the poor within those areasstrengthening DIKMAS capacity for supervision, monitoring and evaluation willbe crucial to improved targeting. Third, the basic literacy program (Paket A)could be strengthened and complemented by the new program for junior secondarydropouts (Paket B). Fourth, in order to improve the financial management ofits IGP support, DIKMAS is exploring ways for banks or other financialinstitutions to handle the funds for all of its IGPs, including an expansionof the arrangements already piloted with BRI. And finally, there appears tobe scope to improve many operational aspects of ongoing NFE programs:increasing the number of field staff and rationalizing their workloads andareas of operation; strengthening the capacity for effective technicalassistance for IGPs; and developing a greater role for local authorities andspecialist staff from sectoral agencies in program delivery.
C. Health
Introduction
4.24 Interventions to improve health are an important policy instrument inthe Government's overall strategy to alleviate poverty and improve the welfareof the Indonesian population. Three main factors justify this policy concernwith the health sector. First, relief from the burden of illness satisfiesdirectly a basic consumption need which is an important social policy goal in
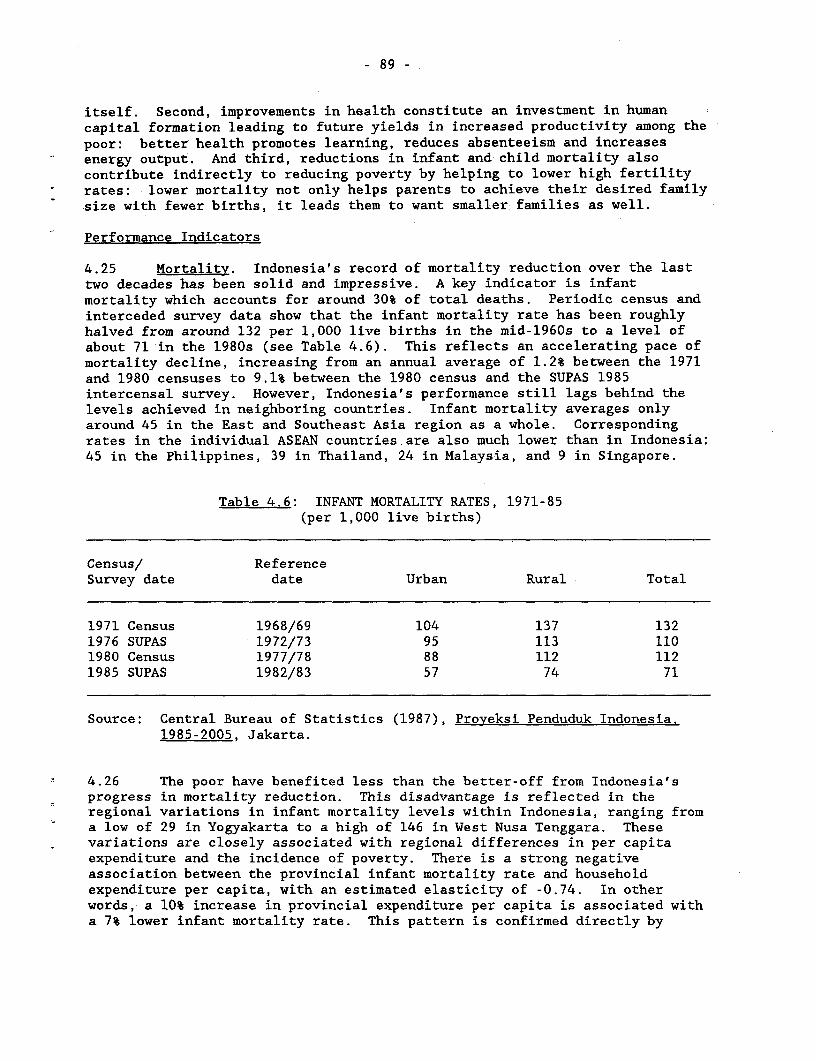
- 89 -
itself. Second, improvements in health constitute an investment in humancapital formation leading to future yields in increased productivity among thepoor: better health promotes learning, reduces absenteeism and increasesenergy output. And third, reductions in infant and child mortality alsocontribute indirectly to reducing poverty by helping to lower high fertilityrates: lower mortality not only helps parents to achieve their desired familysize with fewer births, it leads them to want smaller families as well.
Performance Indicators
4.25 Mortality. Indonesia's record of mortality reduction over the lasttwo decades has been solid and impressive. A key indicator is infantmortality which accounts for around 30% of total deaths. Periodic census andinterceded survey data show that the infant mortality rate has been roughlyhalved from around 132 per 1,000 live births in the mid-1960s to a level ofabout 71 in the 1980s (see Table 4.6). This reflects an accelerating pace ofmortality decline, increasing from an annual average of 1.2% between the 1971and 1980 censuses to 9.1% between the 1980 census and the SUPAS 1985intercensal survey. However, Indonesia's performance still lags behind thelevels achieved in neighboring countries. Infant mortality averages onlyaround 45 in the East and Southeast Asia region as a whole. Correspondingrates in the individual ASEAN countries are also much lower than in Indonesia:45 in the Philippines, 39 in Thailand, 24 in Malaysia, and 9 in Singapore.
Table 4.6: INFANT MORTALITY RATES, 1971-85(per 1,000 live births)
Census/ ReferenceSurvey date date Urban Rural Total
1971 Census 1968/69 104 137 1321976 SUPAS 1972/73 95 113 1101980 Census 1977/78 88 112 1121985 SUPAS 1982/83 57 74 71
Source: Central Bureau of Statistics (1987), Proyeksi Penduduk Indonesia.1985-2005, Jakarta.
4.26 The poor have benefited less than the better-off from Indonesia'sprogress in mortality reduction. This disadvantage is reflected in theregional variations in infant mortality levels within Indonesia, ranging froma low of 29 in Yogyakarta to a high of 146 in West Nusa Tenggara. Thesevariations are closely associated with regional differences in per capitaexpenditure and the incidence of poverty. There is a strong negativeassociation between the provincial infant mortality rate and householdexpenditure per capita, with an estimated elasticity of -0.74. In otherwords, a 10% increase in provincial expenditure per capita is associated witha 7% lower infant mortality rate. This pattern is confirmed directly by
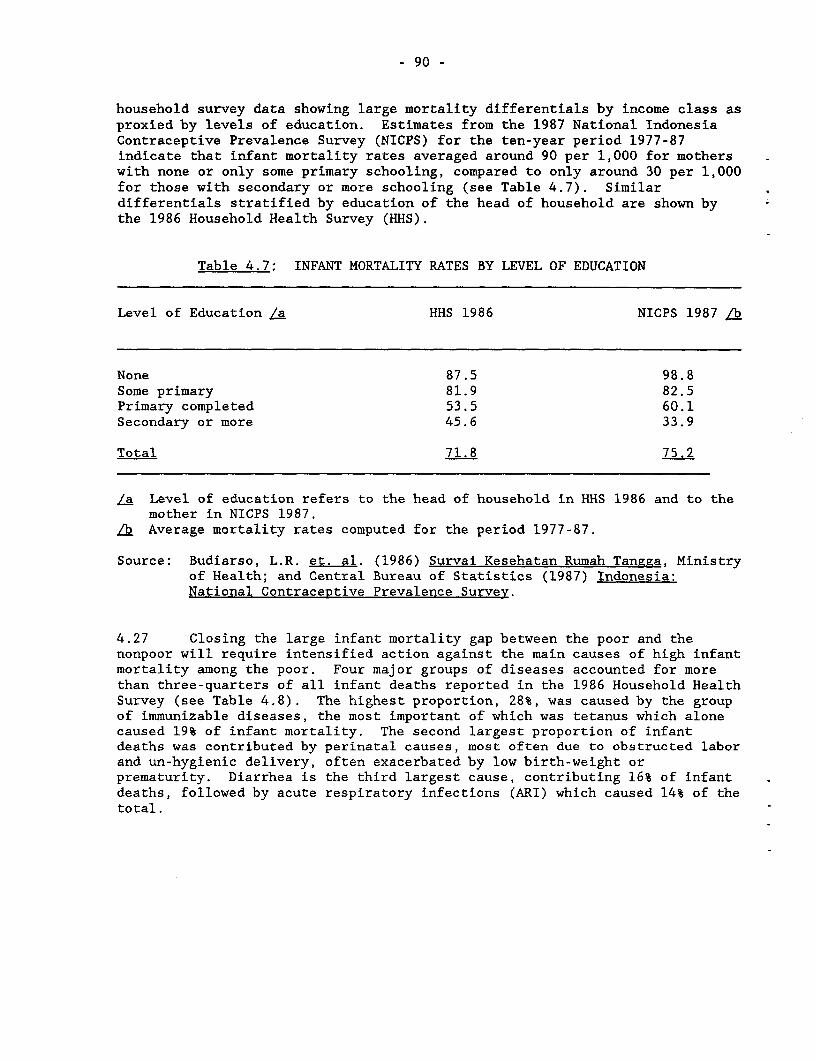
- 90 -
household survey data showing large mortality differentials by income class asproxied by levels of education. Estimates from the 1987 National IndonesiaContraceptive Prevalence Survey (NICPS) for the ten-year period 1977-87indicate that infant mortality rates averaged around 90 per 1,000 for motherswith none or only some primary schooling, compared to only around 30 per 1,000for those with secondary or more schooling (see Table 4.7). Similardifferentials stratified by education of the head of household are shown bythe 1986 Household Health Survey (HHS).
Table 4.7: INFANT MORTALITY RATES BY LEVEL OF EDUCATION
Level of Education /a HHS 1986 NICPS 1987 /b
None 87.5 98.8Some primary 81.9 82.5Primary completed 53.5 60.1Secondary or more 45.6 33.9
Total 71.8 75.2
/a Level of education refers to the head of household in HHS 1986 and to themother in NICPS 1987.
/b Average mortality rates computed for the period 1977-87.
Source: Budiarso, L.R. et. al. (1986) Survai Kesehatan Rumah Tangga, Ministryof Health; and Central Bureau of Statistics (1987) Indonesia:National Contraceptive Prevalence Survey.
4.27 Closing the large infant mortality gap between the poor and thenonpoor will require intensified action against the main causes of high infantmortality among the poor. Four major groups of diseases accounted for morethan three-quarters of all infant deaths reported in the 1986 Household HealthSurvey (see Table 4.8). The highest proportion, 28%, was caused by the groupof immunizable diseases, the most important of which was tetanus which alonecaused 19% of infant mortality. The second largest proportion of infantdeaths was contributed by perinatal causes, most often due to obstructed laborand un-hygienic delivery, often exacerbated by low birth-weight orprematurity. Diarrhea is the third largest cause, contributing 16% of infantdeaths, followed by acute respiratory infections (ARI) which caused 14% of thetotal.

- 91 -
Table 4.8: UNDERLYING CAUSES OF INFANT MORTALITY, 1986(% of deaths)
Neonatal Post-neonatal All Infants
Immunizable Diseases 40.9 19.9 28.0Tetanus 39.5 6.6 19.4Measles, diptheria & pertussis 1.4 13.3 8.6
Perinatal causes 42.3 2.9 18.4Diarrhea 2.3 24.3 15.6Acute respiratory infection 2.3 21.7 14.4Other 12.2 31.2 23.6
Total 100.0 100.0 100.0
Source: Government of Indonesia - UNICEF (1989) Situation Analysis ofChildren and Women in Indonesia, Tables 3.6 and 3.7.
4.28 Morbidity. In contrast to mortality, data on morbidity rates do notshow sharp differences between the poor and the nonpoor, but this reflects thefact that the poor are less likely to perceive and report illness. The poorreport a lower incidence of sickness than the nonpoor (see Table 4.9). Thepoor also report a lower severity of illness as measured by the duration ofillness. However, the severity of illness appears to be higher among theurban poor than the rural poor. Combining these two measures shows thatoverall the poor averaged only 4.3 days of illness per year in comparison to5.1 for the nonpoor. However, in urban areas, the poor do report a highermorbidity burden than the nonpoor.
Table 4.9: REPORTED ILLNESS BY EXPENDITURE CLASS /a
Urban Rural Total
Poor Nonpoor Total Poor Nonpoor Total Poor Nonpoor Total
Percent ill 10.5 11.4 11.4 11.8 14.8 14.0 11.7 13.7 13.3
Duration (days)
Per illness 12.9 9.4 9.6 8.9 9.2 9.2 9.1 9.2 9.2
Per person per year 5.4 4.3 4.4 4.2 5.4 5.1 4.3 5.1 4.9
/a Based on three-month recall.
Source: World Bank staff estimates from 1987 SUSENAS survey.
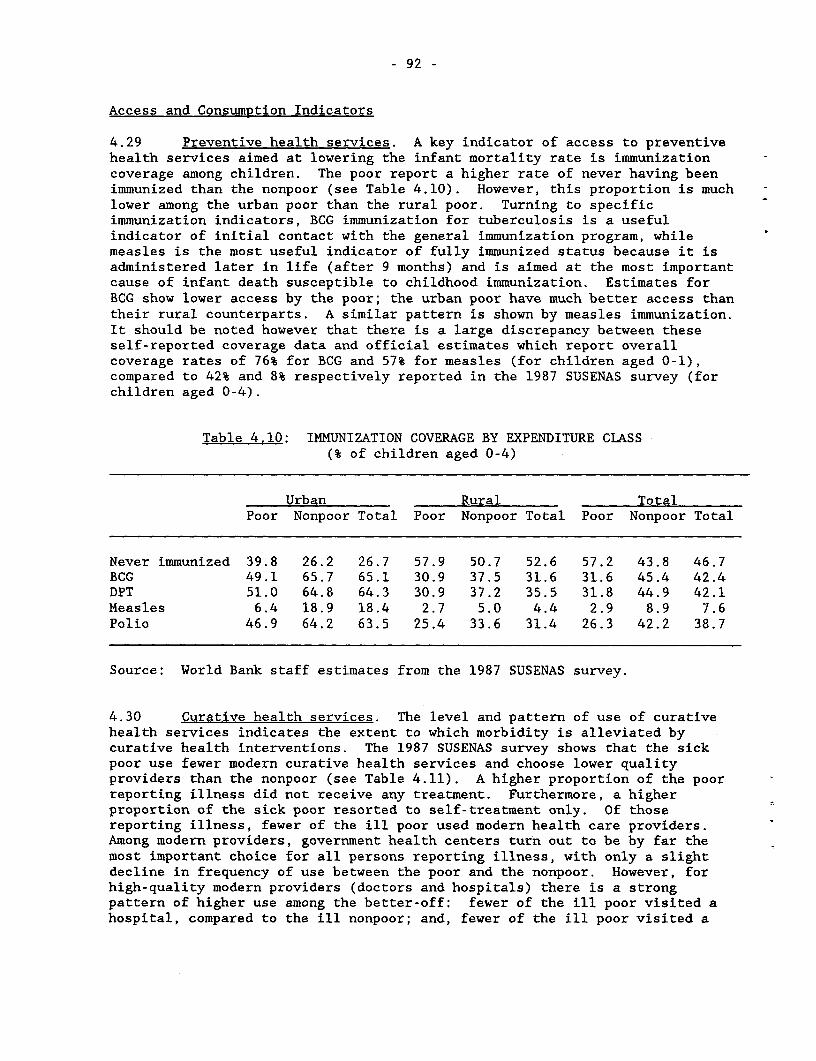
- 92 -
Access and Consumption Indicators
4.29 Preventive health services. A key indicator of access to preventivehealth services aimed at lowering the infant mortality rate is immunizationcoverage among children. The poor report a higher rate of never having beenimmunized than the nonpoor (see Table 4.10). However, this proportion is muchlower among the urban poor than the rural poor. Turning to specificimmunization indicators, BCG immunization for tuberculosis is a usefulindicator of initial contact with the general immunization program, whilemeasles is the most useful indicator of fully immunized status because it isadministered later in life (after 9 months) and is aimed at the most importantcause of infant death susceptible to childhood immunization. Estimates forBCG show lower access by the poor; the urban poor have much better access thantheir rural counterparts. A similar pattern is shown by measles immunization.It should be noted however that there is a large discrepancy between theseself-reported coverage data and official estimates which report overallcoverage rates of 76% for BCG and 57% for measles (for children aged 0-1),compared to 42% and 8% respectively reported in the 1987 SUSENAS survey (forchildren aged 0-4).
Table 4.10: IMMUNIZATION COVERAGE BY EXPENDITURE CLASS(% of children aged 0-4)
Urban Rural TotalPoor Nonpoor Total Poor Nonpoor Total Poor Nonpoor Total
Never immunized 39.8 26.2 26.7 57.9 50.7 52.6 57.2 43.8 46.7BCG 49.1 65.7 65.1 30.9 37.5 31.6 31.6 45.4 42.4DPT 51.0 64.8 64.3 30.9 37.2 35.5 31.8 44.9 42.1Measles 6.4 18.9 18.4 2.7 5.0 4.4 2.9 8.9 7.6Polio 46.9 64.2 63.5 25.4 33.6 31.4 26.3 42.2 38.7
Source: World Bank staff estimates from the 1987 SUSENAS survey.
4.30 Curative health services. The level and pattern of use of curativehealth services indicates the extent to which morbidity is alleviated bycurative health interventions. The 1987 SUSENAS survey shows that the sickpoor use fewer modern curative health services and choose lower qualityproviders than the nonpoor (see Table 4.11). A higher proportion of the poorreporting illness did not receive any treatment. Furthermore, a higherproportion of the sick poor resorted to self-treatment only. Of thosereporting illness, fewer of the ill poor used modern health care providers.Among modern providers, government health centers turn out to be by far themost important choice for all persons reporting illness, with only a slightdecline in frequency of use between the poor and the nonpoor. However, forhigh-quality modern providers (doctors and hospitals) there is a strongpattern of higher use among the better-off: fewer of the ill poor visited ahospital, compared to the ill nonpoor; and, fewer of the ill poor visited a
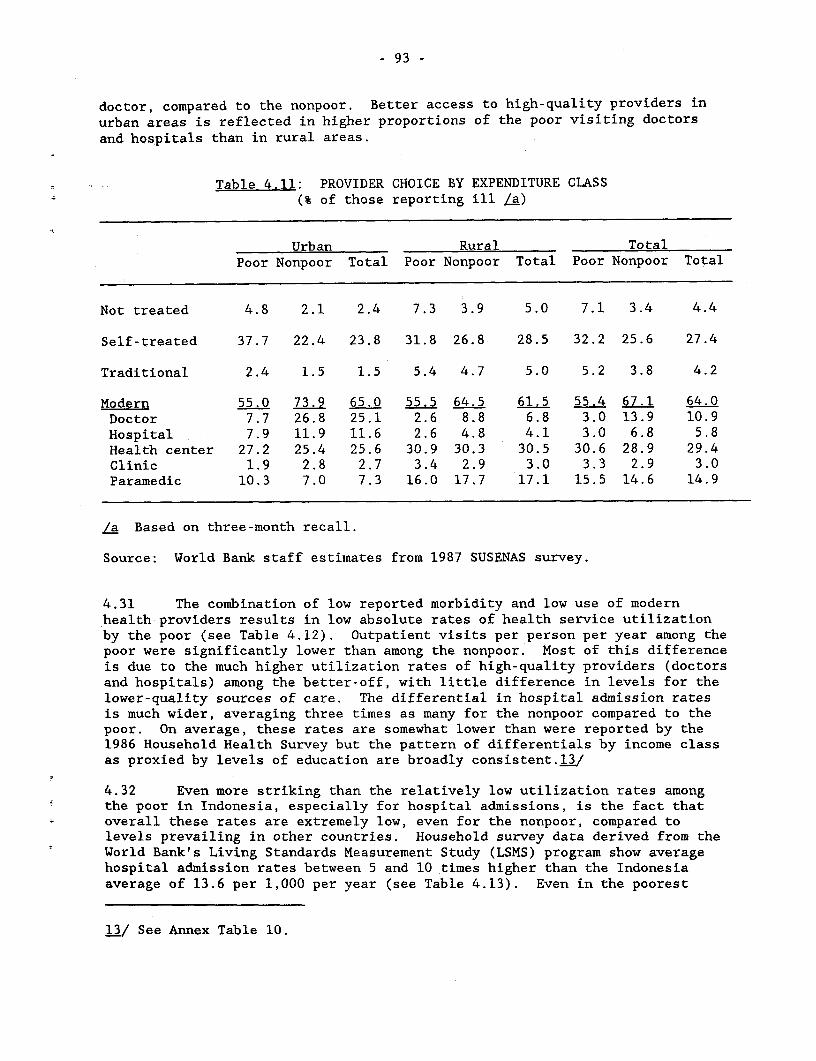
- 93 -
doctor, compared to the nonpoor. Better access to high-quality providers inurban areas is reflected in higher proportions of the poor visiting doctorsand hospitals than in rural areas.
Table 4.11: PROVIDER CHOICE BY EXPENDITURE CLASS(% of those reporting ill La)
Urban Rural TotalPoor Nonpoor Total Poor Nonpoor Total Poor Nonpoor Total
Not treated 4.8 2.1 2.4 7.3 3.9 5.0 7.1 3.4 4.4
Self-treated 37.7 22.4 23.8 31.8 26.8 28.5 32.2 25.6 27.4
Traditional 2.4 1.5 1.5 5.4 4.7 5.0 5.2 3.8 4.2
Modern 55.0 73.9 65.0 55.5 64.5 61.5 55.4 67.1 64.0Doctor 7.7 26.8 25.1 2.6 8.8 6.8 3.0 13.9 10.9Hospital 7.9 11.9 11.6 2.6 4.8 4.1 3.0 6.8 5.8Health center 27.2 25.4 25.6 30.9 30.3 30.5 30.6 28.9 29.4Clinic 1.9 2.8 2.7 3.4 2.9 3.0 3.3 2.9 3.0Paramedic 10.3 7.0 7.3 16.0 17.7 17.1 15.5 14.6 14.9
/a Based on three-month recall.
Source: World Bank staff estimates from 1987 SUSENAS survey.
4.31 The combination of low reported morbidity and low use of modernhealth providers results in low absolute rates of health service utilizationby the poor (see Table 4.12). Outpatient visits per person per year among thepoor were significantly lower than among the nonpoor. Most of this differenceis due to the much higher utilization rates of high-quality providers (doctorsand hospitals) among the better-off, with little difference in levels for thelower-quality sources of care. The differential in hospital admission ratesis much wider, averaging three times as many for the nonpoor compared to thepoor. On average, these rates are somewhat lower than were reported by the1986 Household Health Survey but the pattern of differentials by income classas proxied by levels of education are broadly consistent.13/
4.32 Even more striking than the relatively low utilization rates amongthe poor in Indonesia, especially for hospital admissions, is the fact thatoverall these rates are extremely low, even for the nonpoor, compared tolevels prevailing in other countries. Household survey data derived from theWorld Bank's Living Standards Measurement Study (LSMS) program show averagehospital admission rates between 5 and 10 times higher than the Indonesiaaverage of 13.6 per 1,000 per year (see Table 4.13). Even in the poorest
iI./ See Annex Table 10.
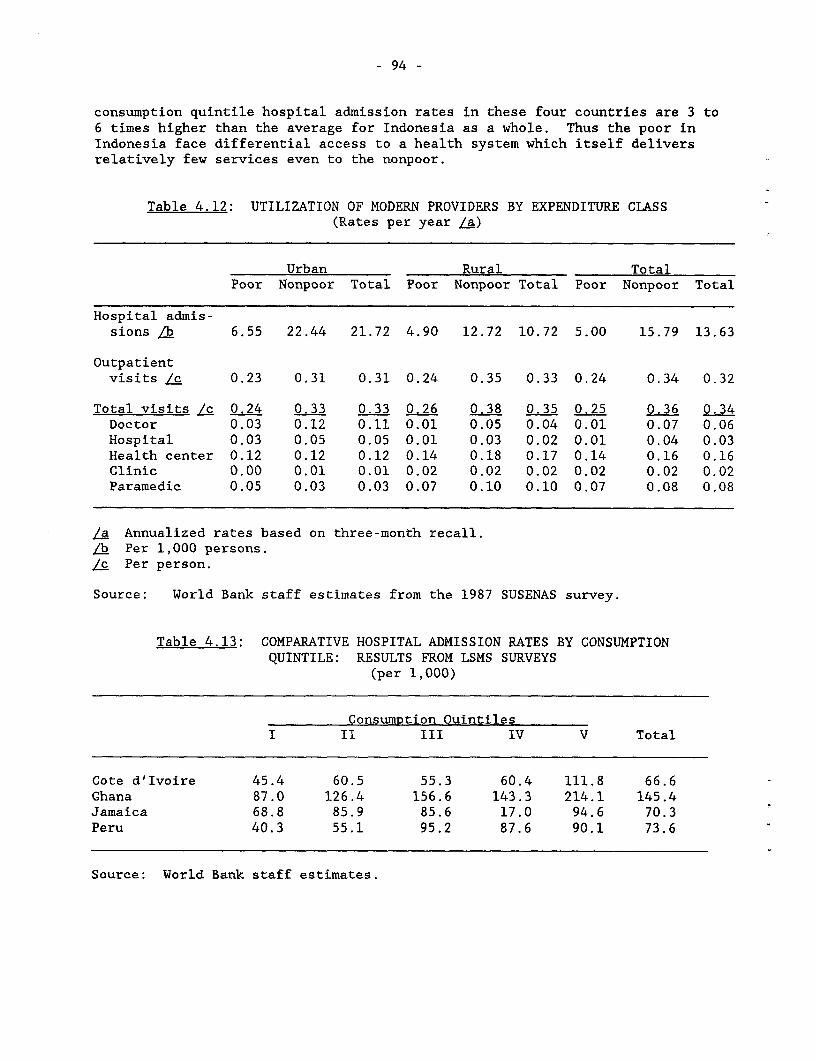
- 94 -
consumption quintile hospital admission rates in these four countries are 3 to6 times higher than the average for Indonesia as a whole. Thus the poor inIndonesia face differential access to a health system which itself deliversrelatively few services even to the nonpoor.
Table 4.12: UTILIZATION OF MODERN PROVIDERS BY EXPENDITURE CLASS(Rates per year a)
Urban Rural TotalPoor Nonpoor Total Poor Nonpoor Total Poor Nonpoor Total
Hospital admis-sions a 6.55 22.44 21.72 4.90 12.72 10.72 5.00 15.79 13.63
Outpatientvisits Lc 0.23 0.31 0.31 0.24 0.35 0.33 0.24 0.34 0.32
Total visits /c 0.24 0.33 0.33 0.26 0.38 0.35 0.25 0.36 0.34Doctor 0.03 0.12 0.11 0.01 0.05 0.04 0.01 0.07 0.06Hospital 0.03 0.05 0.05 0.01 0.03 0.02 0.01 0.04 0.03Health center 0.12 0.12 0.12 0.14 0.18 0.17 0.14 0.16 0.16Clinic 0.00 0.01 0.01 0.02 0.02 0.02 0.02 0.02 0.02Paramedic 0.05 0.03 0.03 0.07 0.10 0.10 0.07 0.08 0.08
La Annualized rates based on three-month recall.Lb Per 1,000 persons.Lc Per person.
Source: World Bank staff estimates from the 1987 SUSENAS survey.
Table 4.13: COMPARATIVE HOSPITAL ADMISSION RATES BY CONSUMPTIONQUINTILE: RESULTS FROM LSMS SURVEYS
(per 1,000)
Consumption QuintilesI II III IV V Total
Cote d'Ivoire 45.4 60.5 55.3 60.4 111.8 66.6Ghana 87.0 126.4 156.6 143.3 214.1 145.4Jamaica 68.8 85.9 85.6 17.0 94.6 70.3Peru 40.3 55.1 95.2 87.6 90.1 73.6
Source: World Bank staff estimates.
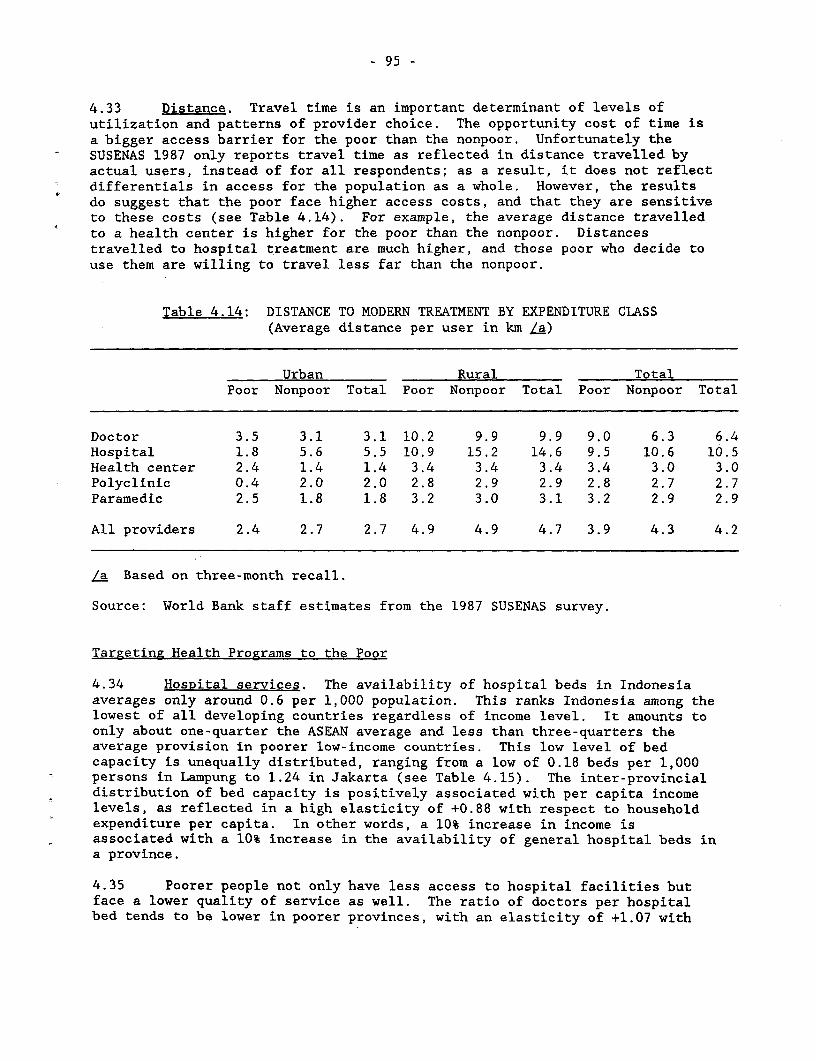
- 95 -
4.33 Distance. Travel time is an important determinant of levels ofutilization and patterns of provider choice. The opportunity cost of time isa bigger access barrier for the poor than the nonpoor. Unfortunately theSUSENAS 1987 only reports travel time as reflected in distance travelled byactual users, instead of for all respondents; as a result, it does not reflectdifferentials in access for the population as a whole. However, the resultsdo suggest that the poor face higher access costs, and that they are sensitiveto these costs (see Table 4.14). For example, the average distance travelledto a health center is higher for the poor than the nonpoor. Distancestravelled to hospital treatment are much higher, and those poor who decide touse them are willing to travel less far than the nonpoor.
Table 4.14: DISTANCE TO MODERN TREATMENT BY EXPENDITURE CLASS(Average distance per user in km La)
Urban Rural TotalPoor Nonpoor Total Poor Nonpoor Total Poor Nonpoor Total
Doctor 3.5 3.1 3.1 10.2 9.9 9.9 9.0 6.3 6.4Hospital 1.8 5.6 5.5 10.9 15.2 14.6 9.5 10.6 10.5Health center 2.4 1.4 1.4 3.4 3.4 3.4 3.4 3.0 3.0Polyclinic 0.4 2.0 2.0 2.8 2.9 2.9 2.8 2.7 2.7Paramedic 2.5 1.8 1.8 3.2 3.0 3.1 3.2 2.9 2.9
All providers 2.4 2.7 2.7 4.9 4.9 4.7 3.9 4.3 4.2
/a Based on three-month recall.
Source: World Bank staff estimates from the 1987 SUSENAS survey.
Targeting Health Programs to the Poor
4.34 Hospital services. The availability of hospital beds in Indonesiaaverages only around 0.6 per 1,000 population. This ranks Indonesia among thelowest of all developing countries regardless of income level. It amounts toonly about one-quarter the ASEAN average and less than three-quarters theaverage provision in poorer low-income countries. This low level of bedcapacity is unequally distributed, ranging from a low of 0.18 beds per 1,000persons in Lampung to 1.24 in Jakarta (see Table 4.15). The inter-provincialdistribution of bed capacity is positively associated with per capita incomelevels, as reflected in a high elasticity of +0.88 with respect to householdexpenditure per capita. In other words, a 10% increase in income isassociated with a 10% increase in the availability of general hospital beds ina province.
4.35 Poorer people not only have less access to hospital facilities butface a lower quality of service as well. The ratio of doctors per hospitalbed tends to be lower in poorer provinces, with an elasticity of +1.07 with
- 96 -
respect to household expenditure per capita. This reflects a manpowerallocation problem within the hospital system. In general the higher levelClass A and Class B hospitals are overstaffed with doctors, while the lowerlevel Class C and D hospitals which serve most of the population, and inparticular the poor, are understaffed. This implies a priority need toimprove the quality of available services in lower level Class C and Dhospitals serving poorer rural beneficiaries. This will require substantialincreases in O&M funding to strengthen the provision of hospital manpower(particularly specialists and technicians for supporting diagnostic services),drugs and laboratory reagents, equipment maintenance and transport for patientreferrals. Estimates based on 1985/86 figures suggest that adequate O&Mfunding for all general hospitals would require an increase from Rp.141billion to Rp.359 billion.L4/ Most of this increment would be required toraise O&M expenditures in Class C and D hospitals from around Rp.67 billion toRp.211 billion.
4.36 Health centers and subcenters. The community health infrastructureplays a critical role in delivering curative outpatient and preventive healthservices to poor people living in Indonesia. The health center networkservices more than half of the modern provider visits made by the poor.REPELITA IV planning targets specified ratios of 1 health center per 30,000people and 3 to 4 satellite subcenters per health center, depending on theregion. There has been substantial progress in expanding this infrastructureover the past decade. Nevertheless, the provision of peripheral capacityremains low compared to other developing countries. For example, in 1981China had an average of 63 health centers per million people or roughly doubleIndonesia's average of 32 per million. In Thailand, the availability ofhealth centers is nearly five times higher at around 141 per million. Thesignificance of these availability ratios lies in their implications foraverage distance to and consequently for utilization of the facility. Asnoted above, the majority of users are drawn from within a narrow radius ofhealth centers. Recognizing the need to expand the physical accessibility ofperipheral facilities to raise utilization rates, the Government hasconstructed through the INPRES program a large number of small healthsubcenters designed to be staffed with a nurse and one or two auxiliaries.However, to improve their effectiveness in reaching the poor these facilitiesneed to be provided with adequate staffing and other O&M inputs.
4.37 The effective coverage of community health facilities dependsprimarily on the service area to be covered. Measuring access in terms ofdistance (radius of the service area) shows enormous interprovincialvariations in accessibility to health centers, ranging from 0.8 km in Jakartato 32.6 km in Irian Jaya (see Table 4.15). These differentials in access areclosely associated with income differences between provinces, as reflected inan elasticity of -1.15 with respect to household expenditure per capita. Inother words, a 10% increase in income is associated with a 12% decrease inaverage distance to a health center. These variations in access to physical
14/ For details see Indonesia: Issues in Health Planning and Budgeting,World Bank Report No. 7291-IND, February 28, 1989.
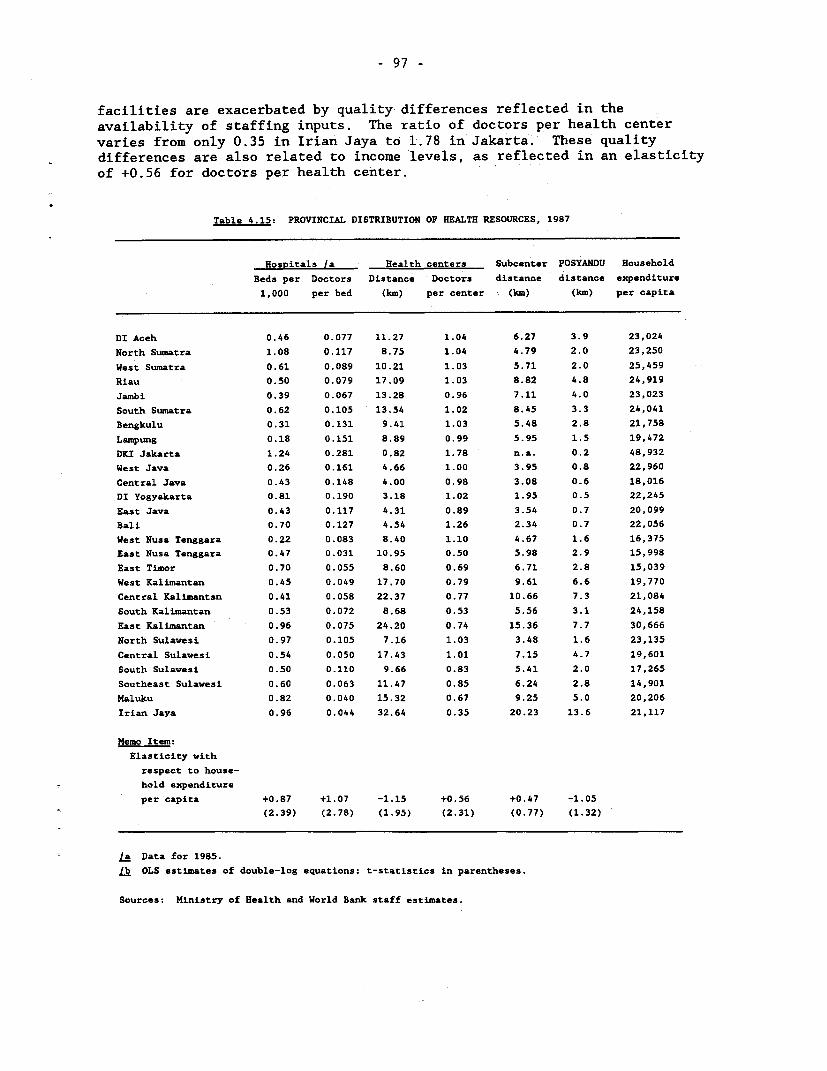
- 97 -
facilities are exacerbated by quality differences reflected in theavailability of staffing inputs. The ratio of doctors per health centervaries from only 0.35 in Irian Jaya to 1.78 in Jakarta. These qualitydifferences are also related to income levels, as reflected in an elasticityof +0.56 for doctors per health center.
Table 4.15: PROVINCIAL DISTRIBUTION OF HEALTH RESOURCES, 1987
Hospitals /a Health centers Subeenter POSYANDU Household
Beds per Doctors Distance Doctors distance distance expenditure
1,000 per bed (km) per center (km) (km) per capita
DI Aceh 0.46 0.077 11.27 1.04 6.27 3.9 23,024
North Sumatra 1.08 0.117 8.75 1.04 4.79 2.0 23,250
West Sumatra 0.61 0.089 10.21 1.03 5.71 2.0 25,459
Riau 0.50 0.079 17.09 1.03 8.82 4.8 24,919
Jambi 0.39 0.067 13.28 0.96 7.11 4.0 23,023
South Sumatra 0.62 0.105 13.54 1.02 8.45 3.3 24,041
Bengkulu 0.31 0.131 9.41 1.03 5.48 2.8 21,758
Lampung 0.18 0.151 8.89 0.99 5.95 1.5 19,472
DKI Jakarta 1.24 0.281 0.82 1.78 n.a. 0.2 48,932
West Java 0.26 0.161 4.66 1.00 3.95 0.8 22,960
Central Java 0.43 0.148 4.00 0.98 3.08 0.6 18,016
DI Yogyakarta 0.81 0.190 3.18 1.02 1.95 0.5 22,245
East Java 0.43 0.117 4.31 0.89 3.54 0.7 20,099
Bali 0.70 0.127 4.54 1.26 2.34 0.7 22,056
West Nusa Tenggara 0.22 0.083 8.40 1.10 4.67 1.6 16,375
East Nusa Tenggara 0.47 0.031 10.95 0.50 5.98 2.9 15,998
East Timor 0.70 0.055 8.60 0.69 6.71 2.8 15,039
West Kalimantan 0.45 0.049 17.70 0.79 9.61 6.6 19,770
Central Kalimantan 0.41 0.058 22.37 0.77 10.66 7.3 21,084
South Kalimantan 0.53 0.072 8.68 0.53 5.56 3.1 24,158
East Kalimantan 0.96 0.075 24.20 0.74 15.36 7.7 30,666
North Sulawesi 0.97 0.105 7.16 1.03 3.48 1.6 23,135
Central Sulawesi 0.54 0.050 17.43 1.01 7.15 4.7 19,601
South Sulawesi 0.50 0.110 9.66 0.83 5.41 2.0 17,265
Southeast Sulawesi 0.60 0.063 11.47 0.85 6.24 2.8 14,901
Maluku 0.82 0.040 15.32 0.67 9.25 5.0 20,206
Irian Jaya 0.96 0.044 32.64 0.35 20.23 13.6 21,117
Memo Item:
Elasticity with
respect to house-
hold expenditure
per capita +0.87 +1.07 -1.15 +0.56 +0.47 -1.05
(2.39) (2.78) (1.95) (2.31) (0.77) (1.32)
a Data for 1985.
Lb OLS estimates of double-log equations; t-statistics in parentheses.
Sources: Ministry of Health and World Bank staff estimates.
- 98 -
4.38 POSYANDU. An important new development in REPELITA IV was thecreation of integrated service posts (or POSYANDU) at village level. Theseare intended to provide five core preventive health interventions on a monthlyoutreach basis: nutrition weighing and education program, immunization,family planning, diarrheal disease control through ORT, and maternal care. Assuch they represent a potentially powerful instrument for reaching the poorwho otherwise would remain beyond the effective reach of fixed facilities.Planning targets call for the establishment of one POSYANDU per 100 childrenunder five, implying a total requirement of around 200,000 to reach fullcoverage. By June 1988 there was a reported number of 133,984 POSYANDU withinthe catchment area served by the 63% of all health centers which provided areport. One problem, as with health centers, is that there is less access toPOSYANDU in poorer provinces, as reflected in higher average distances (seeTable 4.15).
4.39 Despite the significant expansion in coverage with POSYANDU, itseffectiveness could be strengthened. First, a large number of reportedPOSYANDU are not fully operational because they provide fewer than five of theplanned services; for reporting purposes any post offering at least two of thefive services is counted as a POSYANDU. This partly reflects the difficultyof providing adequate logistical support in the form of skilled manpower andmaterials from the community health infrastructure. Second, actual complianceof the target population with POSYANDU is often low: regular attendance hasbeen found to be as low as 20%. Thus effective coverage of the POSYANDUsystem is substantially lower than nominal reported coverage. And third, evenwith full coverage and compliance, the effectiveness of the POSYANDU wouldremain limited by problems such as, the absence of referral for nutritionalsupplementation (see para. 4.52); and, the exclusion of basic curative care,particularly the lack of antibiotic therapy for acute respiratory infectionswhich are a major cause of infant mortality.
4.40 The low average level and differential access to health centers andrelated facilities provides an indication of the need to improve theeffectiveness of community health programs in providing health services to thepoor in Indonesia. This is reinforced by evidence of underfunding of the O&Mrequirements of these programs. Estimates suggest that adequate O&M budgetsmight be around Rp.50 million for a health center and Rp.3 million for asubcenter. This implies a total requirement of about Rp.300 billion for theexisting stock of health centers and subcenters. Additional requirements aresuperimposed by the accelerating establishment of village level outreachservices through the POSYANDU. Estimates indicate a unit cost of aboutRp.500,000 per POSYANDU, implying that full coverage would entail additionalO&M costs of around Rp.110 billion. Thus total O&M requirements for communityhealth might be of the order of Rp.410 billion, compared with presentrecurrent expenditures of perhaps Rp.140 billion. These figures suggest thatthere may be a need to raise O&M outlays by an additional Rp.270 billion inorder to provide adequate funding for the existing poverty-oriented communityhealth services.
Financing Health Programs for the Poor
4.41 The health sector's performance has been constrained by thedeteriorating economic environment in the early 1980s. These trends have had
- 99 -
serious implications for improving the effectiveness of the health sector inpoverty reduction. During REPELITA IV four major problems emerged.15/
4.42 First, an overall resource mobilization problem resulted from thesector's heavy fiscal dependence on a low budget share of Central Governmentexpenditure. In the mid-1980s expenditures on health were about 2.3% ofCentral Government spending in Indonesia, compared to an average of 5.6% inthe other ASEAN countries. Expressed as a proportion of GDP, Governmentexpenditures on health are about 0.6% in Indonesia compared to around 1.3%elsewhere in the region. In other words, Indonesia's sectoral expenditureeffort is only about half the norm prevailing in neighboring countries. As aresult of this low expenditure effort, the decline in Central Governmentspending led to a large reduction in real health expenditures (excludingroutine transfers and foreign aid).
4.43 Second, an equity problem reflected in spending by the CentralGovernment not reducing inter-regional inequalities in per capita spending onhealth. The allocations of central spending have an estimated elasticity of+0.72 with respect to per capita household income. This partly reflects theinfluence of population size in budgetary allocations. Similarly striking isthe positive association between per capita central spending and local fiscalcapacity (current receipts minus SDO plus IPEDA), with an estimated elasticityof +0.54.
4.44 Third, an internal efficiency problem, reflected in inadequate levelsof overall recurrent expenditure (including the O&M component of developmentexpenditure), and in a growing imbalance between personnel and non-personnelexpenditures such as materials, transport and maintenance which are criticalto making health staff productive. At the same time the switch in expenditurepriorities away from investment towards recurrent expenditure funding had asevere effect on planned expansion of the low provision of sectoral capacity.
4.45 Finally, an allocation problem emerged. This appeared to bemanifested in a reallocation of spending priorities away from communicabledisease control (CDC) activities in favor of curative services deliveredthrough hospitals and health centers. The adverse distributional effect ofthese trends is clear from the fact that the poor are dependent on publicfinance for preventive health services while hospital services primarilybenefit the better-off.
4.46 The Government is planning to address these problems by raising thehealth sector share of the budget. The REPELITA V plan calls for an increasein the health sector share of the Central Government development budget (DIPplus INPRES) from the 2.0% average for REPELITA IV to 2.5% in REPELITA V. The1990/91 budget provides for a sharp increase to 2.5% compared to 1.9% in1989/90.
15/ For details see Issues in Health Planning and Budgeting, World BankReport No. 7291-IND, February 28, 1989.
- 100 -
An Agenda for REPELITA V
4.47 The low level of utilization of health services by the poor inIndonesia indicates a need to lower existing barriers to access by improvingboth the quantity and quality of available services. On the investment side,priority could be given to increasing the supply of community health centersand subcenters in order to reduce travel time in poorer areas with moredispersed populations. This priority is reflected in the 1990/91 Budget whichplans to increase significantly the number of these facilities. It will beimportant to ensure full implementation and to provide sufficient O&M fundsfor these additional facilities. At the same time, high priority needs to begiven to raising recurrent expenditure on operations and maintenance inputsnecessary to provide adequate service through fixed facilities, and to supportthe mobile outreach inputs to the village-level POSYANDU. Key components ofthe effort to raise quality may include: redistribution of specialist medicaland paramedical personnel from tertiary to lower level hospitals; increasingthe supply of doctors to understaffed health centers; increasing the supply ofhealth center drugs, which presently cover only about three-quarters of annualrequirements; and increasing the operational budget of health centers toensure sufficient funds for travel in support of POSYANDU activities.
4.48 The need to improve both the quantity and quality of health servicesfor the poor presents a potentially sharp trade-off between investment andrecurrent expenditure from constrained budgetary resources. Resolving thistrade-off will require a stronger resource mobilization effort both toincrease the low health sector budget share and to raise the low level of costrecovery in the sector. On the budgetary side, it will be particularlyimportant to channel proportionately more government resources in favor ofpoorer regions. On the cost recovery side, a key element will be to raisereimbursement levels from the ASKES health insurance scheme in order toreallocate subsidies channelled from the better-off government employees withinsurance to the uninsured poor.
D. Nutrition
Performance Indicators
4.49 Malnutrition has important adverse effects on health by increasingsusceptibility to infectious diseases; it also affects school attendance andperformance among children, and labor productivity among adults. An importantindicator of nutrition status is the prevalence of protein-energy malnutrition(PEN) caused by inadequate consumption of calories or protein and reflected instunting (shorter than normal) and wasting (thinner than normal).International comparisons suggest that the prevalence of PEN in Indonesia ishigher than a number of comparator countries in Asia (see Table 4.16).
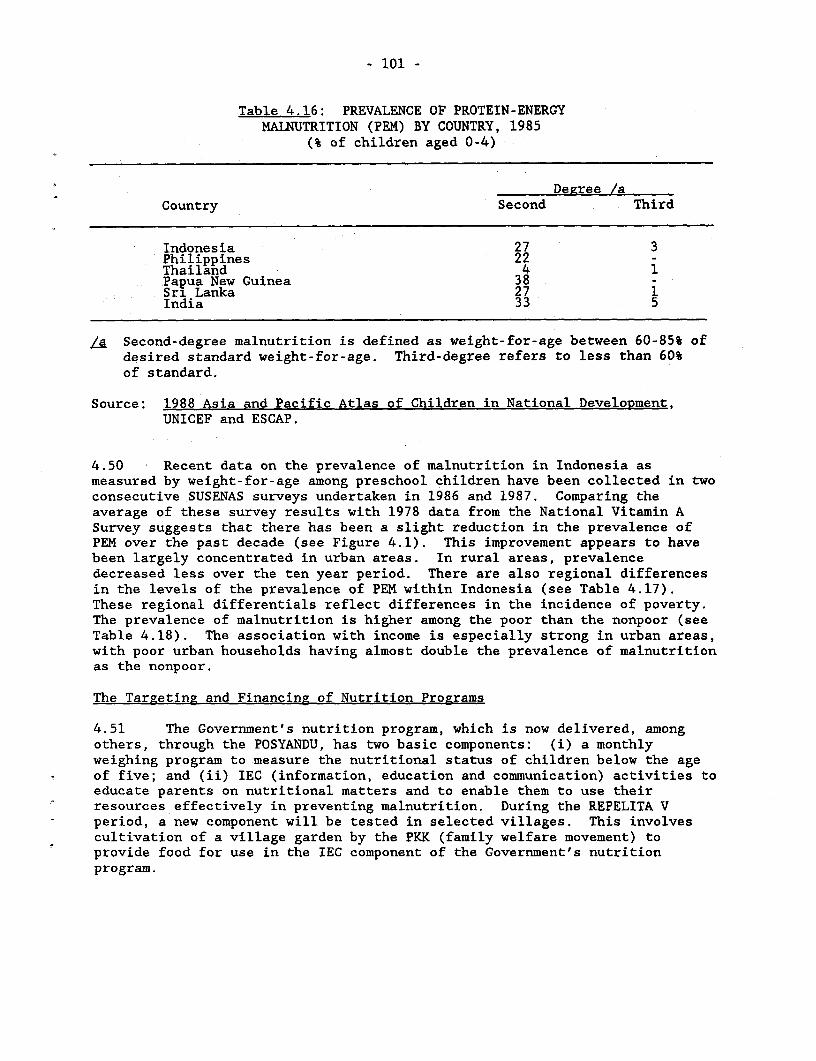
- 101 -
Table 4.16: PREVALENCE OF PROTEIN-ENERGYMALNUTRITION (PEM) BY COUNTRY, 1985
(% of children aged 0-4)
Degree /aCountry Second Third
Indonesia 27 3Philippines 22 -Thailand 4 1Papua New Guinea 38 -Sri Lanka 27 1India 33 5
/a Second-degree malnutrition is defined as weight-for-age between 60-85% ofdesired standard weight-for-age. Third-degree refers to less than 60%of standard.
Source: 1988 Asia and Pacific Atlas of Children in National Development,UNICEF and ESCAP.
4.50 Recent data on the prevalence of malnutrition in Indonesia asmeasured by weight-for-age among preschool children have been collected in twoconsecutive SUSENAS surveys undertaken in 1986 and 1987. Comparing theaverage of these survey results with 1978 data from the National Vitamin ASurvey suggests that there has been a slight reduction in the prevalence ofPEM over the past decade (see Figure 4.1). This improvement appears to havebeen largely concentrated in urban areas. In rural areas, prevalencedecreased less over the ten year period. There are also regional differencesin the levels of the prevalence of PEM within Indonesia (see Table 4.17).These regional differentials reflect differences in the incidence of poverty.The prevalence of malnutrition is higher among the poor than the nonpoor (seeTable 4.18). The association with income is especially strong in urban areas,with poor urban households having almost double the prevalence of malnutritionas the nonpoor.
The Targeting and Financing of Nutrition Programs
4.51 The Government's nutrition program, which is now delivered, amongothers, through the POSYANDU, has two basic components: (i) a monthlyweighing program to measure the nutritional status of children below the ageof five; and (ii) IEC (information, education and communication) activities toeducate parents on nutritional matters and to enable them to use theirresources effectively in preventing malnutrition. During the REPELITA Vperiod, a new component will be tested in selected villages. This involvescultivation of a village garden by the PKK (family welfare movement) toprovide food for use in the IEC component of the Government's nutritionprogram.
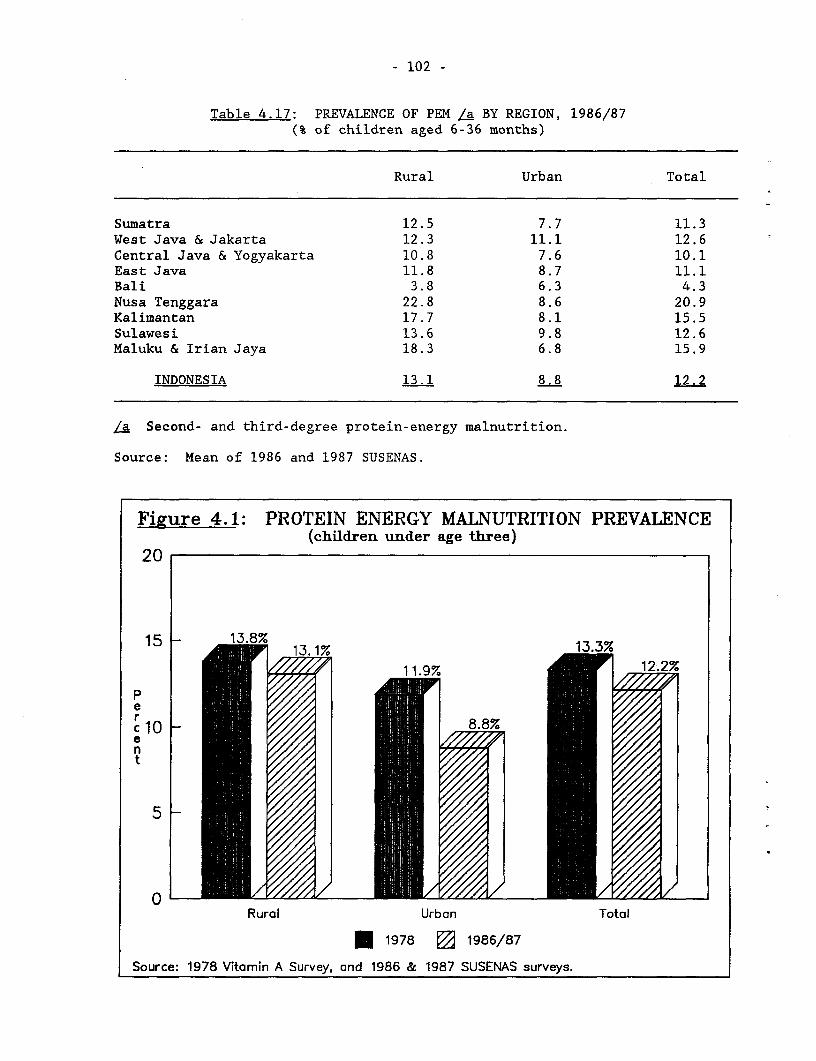
- 102 -
Table 4.17: PREVALENCE OF PEM La BY REGION, 1986/87(% of children aged 6-36 months)
Rural Urban Total
Sumatra 12.5 7.7 11.3West Java & Jakarta 12.3 11.1 12.6Central Java & Yogyakarta 10.8 7.6 10.1East Java 11.8 8.7 11.1Bali 3.8 6.3 4.3Nusa Tenggara 22.8 8.6 20.9Kalimantan 17.7 8.1 15.5Sulawesi 13.6 9.8 12.6Maluku & Irian Jaya 18.3 6.8 15.9
INDONESIA 13.1 8.8 12.2
/a Second- and third-degree protein-energy malnutrition.
Source: Mean of 1986 and 1987 SUSENAS.
Figure 4.1: PROTEIN ENERGY MALNUTRITION PREVALENCE(children under age three)
20
13.8% 13.1% ~~~~~~13.3%
eP15 ~ ffgz 11.9% 122%
pe
c~~~ ~ ~ 197 186/87
nt
5
0Rural Urban Total
*1978 E 1986/87
Source: 1978 Vitamin A Survey, and 1986 & 1987 SUSENAS surveys.
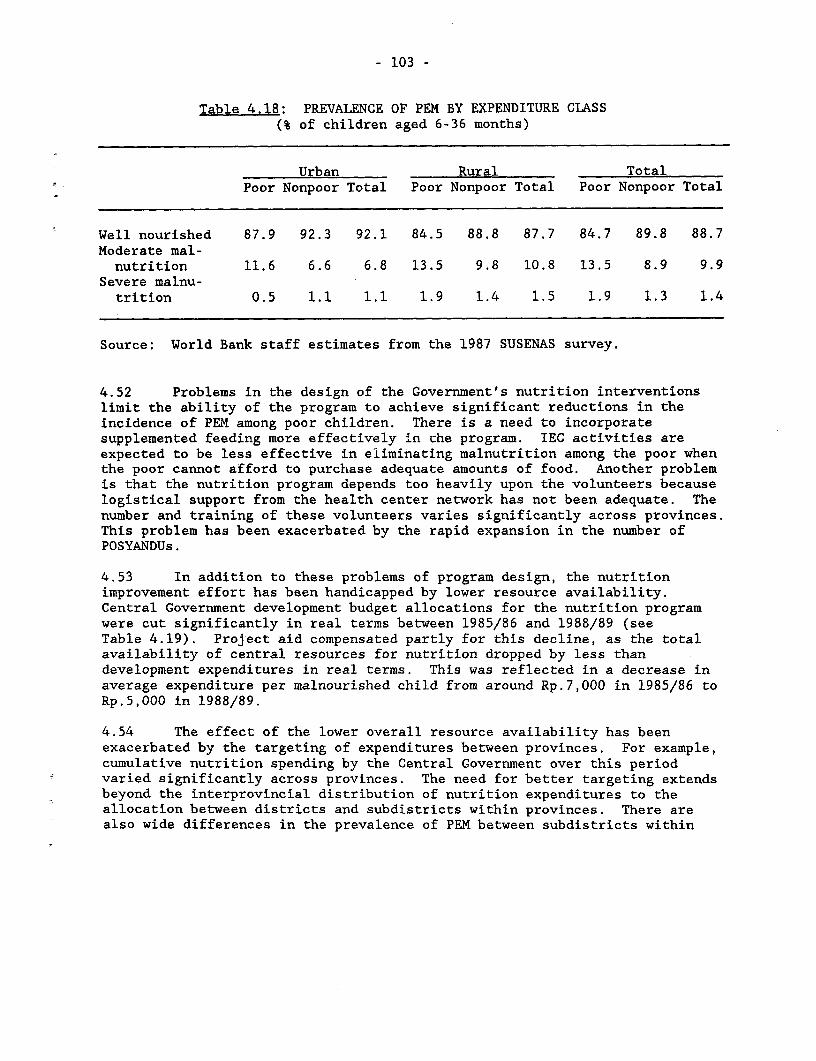
- 103 -
Table 4.18: PREVALENCE OF PEM BY EXPENDITURE CLASS(% of children aged 6-36 months)
Urban Rural TotalPoor Nonpoor Total Poor Nonpoor Total Poor Nonpoor Total
Well nourished 87.9 92.3 92.1 84.5 88.8 87.7 84.7 89.8 88.7Moderate mal-nutrition 11.6 6.6 6.8 13.5 9.8 10.8 13.5 8.9 9.9
Severe malnu-trition 0.5 1.1 1.1 1.9 1.4 1.5 1.9 1.3 1.4
Source: World Bank staff estimates from the 1987 SUSENAS survey.
4.52 Problems in the design of the Government's nutrition interventionslimit the ability of the program to achieve significant reductions in theincidence of PEM among poor children. There is a need to incorporatesupplemented feeding more effectively in the program. IEC activities areexpected to be less effective in eiiminating malnutrition among the poor whenthe poor cannot afford to purchase adequate amounts of food. Another problemis that the nutrition program depends too heavily upon the volunteers becauselogistical support from the health center network has not been adequate. Thenumber and training of these volunteers varies significantly across provinces.This problem has been exacerbated by the rapid expansion in the number ofPOSYANDUs.
4.53 In addition to these problems of program design, the nutritionimprovement effort has been handicapped by lower resource availability.Central Government development budget allocations for the nutrition programwere cut significantly in real terms between 1985/86 and 1988/89 (seeTable 4.19). Project aid compensated partly for this decline, as the totalavailability of central resources for nutrition dropped by less thandevelopment expenditures in real terms. This was reflected in a decrease inaverage expenditure per malnourished child from around Rp.7,000 in 1985/86 toRp.5,000 in 1988/89.
4.54 The effect of the lower overall resource availability has beenexacerbated by the targeting of expenditures between provinces. For example,cumulative nutrition spending by the Central Government over this periodvaried significantly across provinces. The need for better targeting extendsbeyond the interprovincial distribution of nutrition expenditures to theallocation between districts and subdistricts within provinces. There arealso wide differences in the prevalence of PEM between subdistricts within
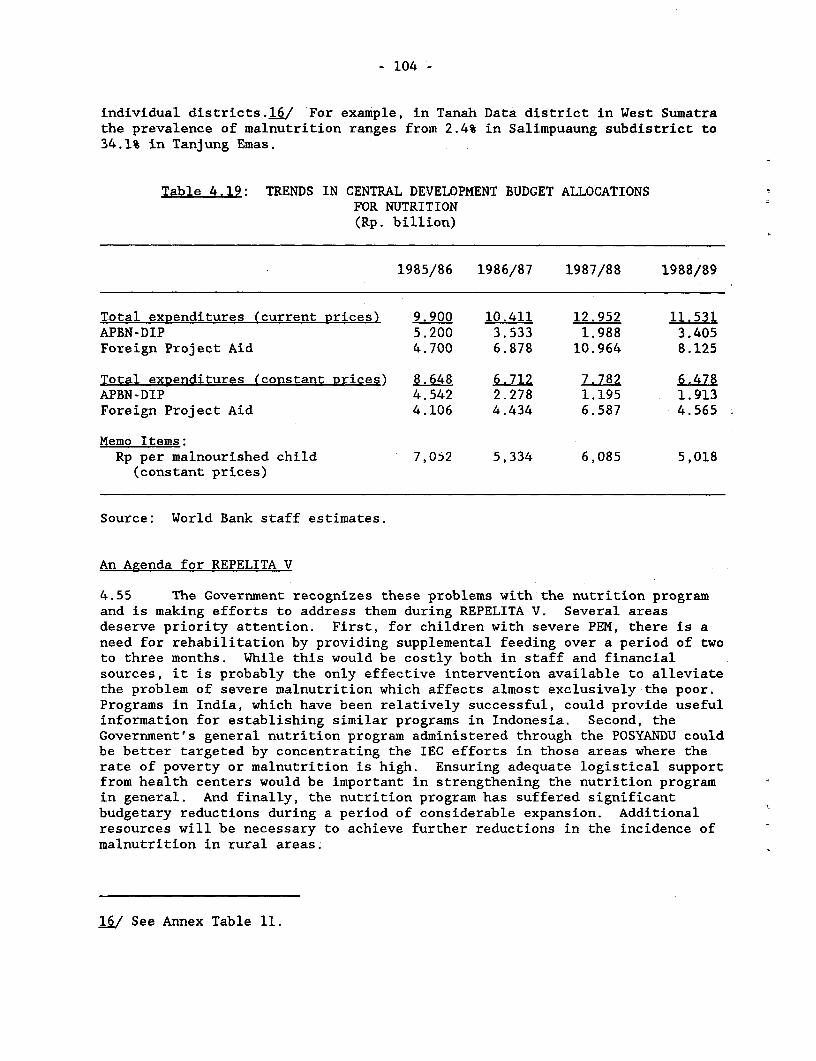
- 104 -
individual districts.L6/ For example, in Tanah Data district in West Sumatrathe prevalence of malnutrition ranges from 2.4% in Salimpuaung subdistrict to34.1% in Tanjung Emas.
Table 4.19: TRENDS IN CENTRAL DEVELOPMENT BUDGET ALLOCATIONSFOR NUTRITION(Rp. billion)
1985/86 1986/87 1987/88 1988/89
Total expenditures (current prices) 9.900 10.411 12.952 11.531APBN-DIP 5.200 3.533 1.988 3.405Foreign Project Aid 4.700 6.878 10.964 8.125
Total expenditures (constant prices) 8.648 6.712 7.782 6.478APBN-DIP 4.542 2.278 1.195 1.913Foreign Project Aid 4.106 4.434 6.587 4.565
Memo Items:Rp per malnourished child 7,052 5,334 6,085 5,018
(constant prices)
Source: World Bank staff estimates.
An Agenda for REPELITA V
4.55 The Government recognizes these problems with the nutrition programand is making efforts to address them during REPELITA V. Several areasdeserve priority attention. First, for children with severe PEM, there is aneed for rehabilitation by providing supplemental feeding over a period of twoto three months. While this would be costly both in staff and financialsources, it is probably the only effective intervention available to alleviatethe problem of severe malnutrition which affects almost exclusively the poor.Programs in India, which have been relatively successful, could provide usefulinformation for establishing similar programs in Indonesia. Second, theGovernment's general nutrition program administered through the POSYANDU couldbe better targeted by concentrating the IEC efforts in those areas where therate of poverty or malnutrition is high. Ensuring adequate logistical supportfrom health centers would be important in strengthening the nutrition programin general. And finally, the nutrition program has suffered significantbudgetary reductions during a period of considerable expansion. Additionalresources will be necessary to achieve further reductions in the incidence ofmalnutrition in rural areas.
j6/ See Annex Table 11.
- 105 -
V. HUMAN RESOURCE DEVELOPMENT FOR THE POOR
PART II - OTHER BASIC SERVICES
A. Introduction
5.1 Basic services such as water supply, waste disposal, housing andother community services are essential to the poor. Without progress inimproving the poor's access to basic services, the effectiveness of anyimprovements in the social services, such as health and education, could beseriously impaired. Although the basic goals are the same, Governmentstrategies and priorities necessarily differ between rural and urban areas,because of different needs and institutional frameworks. In rural areas, thecritical need is water supply and sanitation. Other basic services are lesscritical, as living conditions are less cramped and housing conditions aregenerally better. In urban areas a broader program of basic service provisionis required to address the needs of the urban poor. Therefore, it would bedesirable for urban development policies to shift towards the activepreparation and accommodation of the accelerating urban population,particularly of lower income groups. Issues in rural water supply andsanitation are discussed in Section B, and the provision of basic services forthe poor in urban areas are discussed in Section C.
B. Rural Water SUpply and Sanitation
5.2 Introduction. Improved water supply and sanitation in rural areascan have wide ranging health, economic, social and environmental benefits.!/While the extent of the health benefits from rural water supply and sanitation(RWSS) have been the subject of considerable debate, a recent review foundthat diarrhea is typically reduced when water supply and sanitation areimproved and mortality from these diseases is somewhat less.2/ This isimportant for Indonesia, as health statistics indicate that diarrhea is themain cause of post-neonatal mortality and the second leading cause of deathamong children..2/ The most significant improvements in health are usuallyachieved through a combination of water supply and sanitation, and personaland household hygienic practices, illustrating the need to develop watersupply and sanitation in less-privileged rural areas in combination withsupport programs such as health education.
j/ For a discussion of the benefits and costs of RWSS as well as aframework for developing a new approach, see Anthony Churchill et al.,"Rural Water Supply and Sanitation: A Time For A Change", World BankDiscussion Papers, No. 18, Washington, D.C., September 1987.
ZI See, John Briscoe and David de Ferranti, Water for Rural Communities:Helping People Help Themselves, The World Bank, Washington D.C., March1988.
i./ See, A Situation Analysis for Women and Children in Indonesia,Government of Indonesia - UNICEF, April 1989.
- 106 -
5.3 The greatest effect on health from the provision of RWSS is likely tocome from improved sanitation facilities and an increase in water quantity. 4/In a number of countries studied, it has been noted that diarrhea wasprimarily reduced because of the availability of water rather than thequality.2/ The low per capita consumption levels currently prevailing in manyrural areas in Indonesia may, therefore, have an adverse effect upon healthstatus. Furthermore, the benefits of RWSS on women and children can beespecially important, as they play a major role in carrying water. The timeand energy saved can be put to more productive use and relief from thephysical burden of carrying water can have salutary effects upon their health,especially the poor who suffer from inadequate caloric intake.
RWSS Service Levels
5.4 There is little reliable information about the sources of RWSS inIndonesia or the proportion of the rural population with access to reasonably"clean" water supply or to "proper" sanitation facilities. In 1986, theMinistry of Health carried out a Household Health survey covering sevenprovinces in Indonesia.6/ In addition to surveying health indicators, datawere collected on the source of drinking water supply and the type ofsanitation facility by areas (urban and rural) and by provinces. Therefore,it gives an indication of the adequacy of the coverage of RWSS. By source,nearly one-half of all Indonesians living in rural areas obtain their drinkingwater from ground water sources (i.e., pumped or dug/open wells) and another27% from rivers (see Table 5.1). It can be assumed that only 20% of the dugwells in rural areas yield a "clean" supply of drinking water.2/ River waterand other sources can not be considered as safe sources of drinking watersupply in most provinces. Therefore, the proportion of rural households with
4/ This applies equally to urban water supply and sanitation. In fact,given the crowded conditions prevailing in most urban areas inIndonesia, there may be even greater benefits to improved water supplyand sanitation facilities in urban areas. Issues in urban areas arediscussed in paras 5.18-5.40 below.
5/ By tradition, many Indonesians both in urban and rural areas boil theirwater before drinking, which reduces the risks of infectious diseases.No study or research has been done on the economic side of thistradition, but to the extent that this is a widespread phenomena inIndonesia the benefits from the provision of clean water will bereduced.
i/ The provinces covered were: D.I. Yogyakarta, Bali, North Sulawesi,Bengkulu, West Kalimantan and West Nusa Tenggara.
7/ This assumption is based on the findings of two independent studies:(i) a GOI/WHO study on drinking water quality carried out in 1987 inYogyakarta, in which about 80% of all the open wells sampled were foundto be contaminated with faecal coliforms and therefore, unfit fordrinking water; and, (ii) a study which measures the quality of watersamples from handpumps in eight provinces tested in 1987 in which about75 percent of the samples were not bacteriologically safe. See, ASituation Analysis of Women and Children in Indonesia, op.cit.
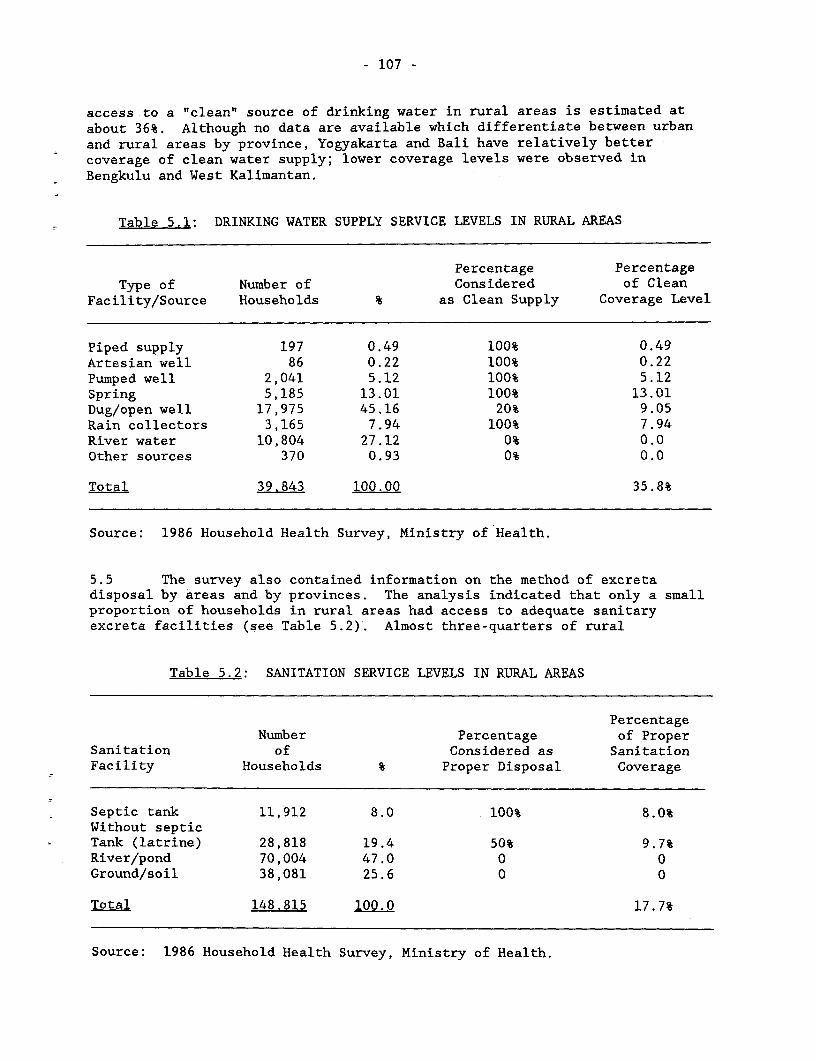
- 107 -
access to a "clean" source of drinking water in rural areas is estimated atabout 36%. Although no data are available which differentiate between urbanand rural areas by province, Yogyakarta and Bali have relatively bettercoverage of clean water supply; lower coverage levels were observed inBengkulu and West Kalimantan.
Table 5.1: DRINKING WATER SUPPLY SERVICE LEVELS IN RURAL AREAS
Percentage PercentageType of Number of Considered of Clean
Facility/Source Households % as Clean Supply Coverage Level
Piped supply 197 0.49 100% 0.49Artesian well 86 0.22 100% 0.22Pumped well 2,041 5.12 100% 5.12Spring 5,185 13.01 100% 13.01Dug/open well 17,975 45.16 20% 9.05Rain collectors 3,165 7.94 100% 7.94River water 10,804 27.12 0% 0.0Other sources 370 0.93 0% 0.0
Total 39.843 100.00 35.8%
Source: 1986 Household Health Survey, Ministry of Health.
5.5 The survey also contained information on the method of excretadisposal by areas and by provinces. The analysis indicated that only a smallproportion of households in rural areas had access to adequate sanitaryexcreta facilities (see Table 5.2). Almost three-quarters of rural
Table 5.2: SANITATION SERVICE LEVELS IN RURAL AREAS
PercentageNumber Percentage of Proper
Sanitation of Considered as SanitationFacility Households % Proper Disposal Coverage
Septic tank 11,912 8.0 100% 8.0%Without septicTank (latrine) 28,818 19.4 50% 9.7%River/pond 70,004 47.0 0 0Ground/soil 38,081 25.6 0 0
Total 148.815 100.0 17.7%
Source: 1986 Household Health Survey, Ministry of Health.
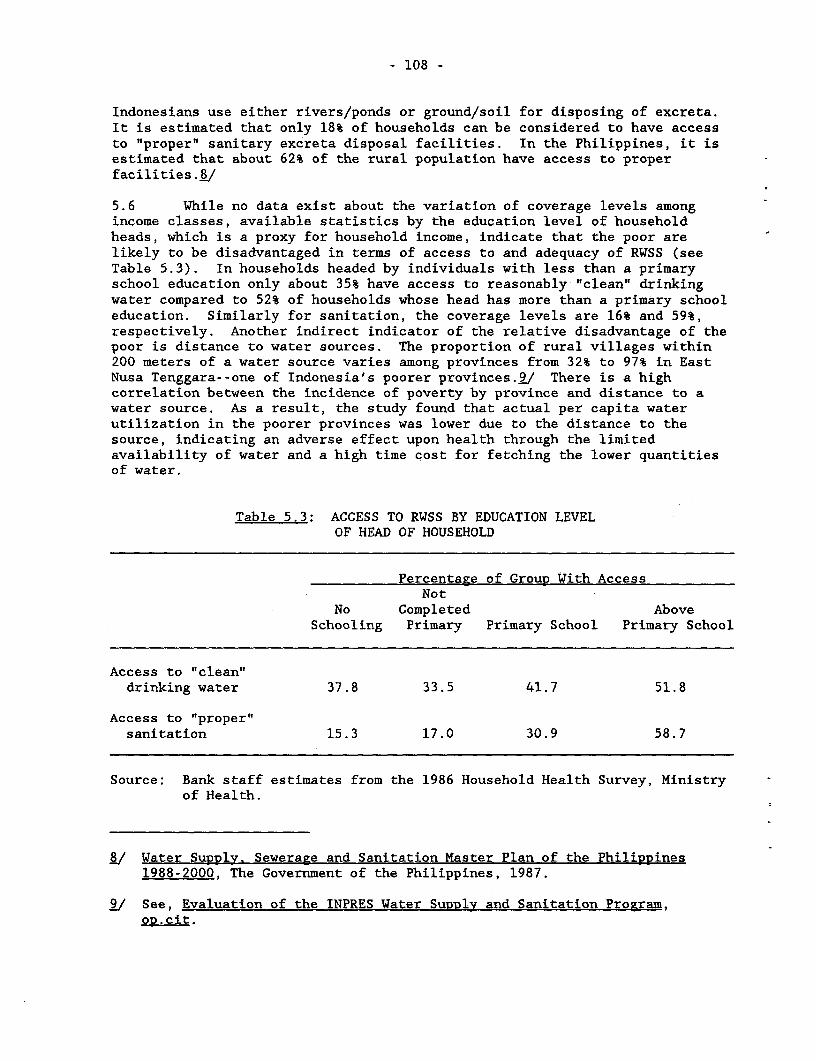
- 108 -
Indonesians use either rivers/ponds or ground/soil for disposing of excreta.It is estimated that only 18% of households can be considered to have accessto "proper" sanitary excreta disposal facilities. In the Philippines, it isestimated that about 62% of the rural population have access to properfacilities.3/
5.6 While no data exist about the variation of coverage levels amongincome classes, available statistics by the education level of householdheads, which is a proxy for household income, indicate that the poor arelikely to be disadvantaged in terms of access to and adequacy of RWSS (seeTable 5.3). In households headed by individuals with less than a primaryschool education only about 35% have access to reasonably "clean" drinkingwater compared to 52% of households whose head has more than a primary schooleducation. Similarly for sanitation, the coverage levels are 16% and 59%,respectively. Another indirect indicator of the relative disadvantage of thepoor is distance to water sources. The proportion of rural villages within200 meters of a water source varies among provinces from 32% to 97% in EastNusa Tenggara--one of Indonesia's poorer provinces.92 There is a highcorrelation between the incidence of poverty by province and distance to awater source. As a result, the study found that actual per capita waterutilization in the poorer provinces was lower due to the distance to thesource, indicating an adverse effect upon health through the limitedavailability of water and a high time cost for fetching the lower quantitiesof water.
Table 5.3: ACCESS TO RWSS BY EDUCATION LEVELOF HEAD OF HOUSEHOLD
Percentage of Group With AccessNot
No Completed AboveSchooling Primary Primary School Primary School
Access to "clean"drinking water 37.8 33.5 41.7 51.8
Access to "proper"
sanitation 15.3 17.0 30.9 58.7
Source: Bank staff estimates from the 1986 Household Health Survey, Ministryof Health.
$./ Water SuPplY. Sewerage and Sanitation Master Plan of the Philippines1988-2000, The Government of the Philippines, 1987.
9/ See, Evaluation of the INPRES Water Supply and Sanitation Program,op.cit.
- 109 -
5.7 This analysis of coverage levels indicates the following:
(a) service levels in Indonesia are low relative to other developingcountries in the ASEAN region;
(b) there is an imbalance between water supply coverage and sanitationcoverage with sanitation service levels far lower than water supplyservice levels, yet the available evidence suggests that the healthbenefits of sanitation are higher;
(c) there has been a bias in the efforts to provide water supply andsanitation between urban and rural areas, which favors urban areas;and
(d) more importantly, there is indirect evidence of an apparent imbalancebetween the poor and the nonpoor.
As a result of these factors, the current situation may pose risks to thehealth status of rural communities, particularly the rural poor and currentGovernment efforts, as broadly outlined in REPELITA V, to redress the existingsituation are clearly warranted.
Past RWSS Programs and Their Effectiveness
5.8 The Government's RWSS program started in 1969 with the inception ofIndonesia's first Five-Year Development Plan (REPELITA). However, there wasvery little provision for implementation until 1974, the beginning ofREPELITA II, when significant allocations were made from INPRES for RWSSdevelopment.l0/ Provision of water supply and sanitation in Indonesia isprimarily the responsibility of local governments, but since they did not havethe technical capacity to implement RWSS, the following institutionalresponsibilities were established: Ministry of Home Affairs: institutionaland organizational development, community participation, and operations andmaintenance; Ministry of Health: assistance for planning and implementationof RWSS, technical development of simple water supply and sanitation schemesin rural areas, and health education; and, Ministry of Public Works: simplepiped water supply schemes in rural areas. This program consisted of theinstallation of water supply facilities (dug wells, handpumps, raincollectors, etc.) and sanitation facilities (family latrines and waste waterdisposal).
5.9 Total expenditures on RWSS from GOI resources totalled aboutRp.170 billion through the third year of the REPELITA IV period. Externalassistance during REPELITA III amounted to about US$30 million, whichrepresented only 9% of total external assistance to water supply and
QO/ There have been four funding channels for RWSS: (i) INPRES allocations;(ii) National Development Budget (DIP); (iii) Provincial GovernmentBudget (APBD); and (iv) external assistance. INPRES resourcesconstituted by far the largest funding amounting to about 85% of thetotal national budget to the subsector; DIP and APBD contributions havebeen small.
- 110 -
sanitation. During REPELITA IV, this assistance is estimated to have remainedabout the same in nominal terms. Virtually all of the aid provided bymultilateral financial institutions was to the urban sector. Amongbilaterals, the Dutch Government assisted RWSS development in West Java, AIDAB(Australian International Development Assistance Bureau) in West Nusa Tenggaraand JICA in North Sumatra (as a component of the Asahan Power Supply Project).The UN agencies active in the RWSS subsector are UNDP, UNICEF and WHO. UNICEFcontributed the largest proportion of all external assistance to the RWSSsubsector. Moreover, UNICEF plays a rather unique role by executing watersupply and sanitation projects (both rural and urban) in combination withhealth education and information, communication and motivation programs.
5.10 In response to a number of implementation problems with theGovernment's INPRES-funded RWSS program, an analysis of the program wasundertaken by the Government in conjunction with UNICEF and WHO. The studyrevealed that the life expectancy of the facilities was much shorter thanplanned, and frequent breakdowns and inadequate maintenance have resulted in acoverage of 50% less than planned in the surveyed provinces (West Sumatra andWest Java). In addition to low coverage, the lack of management skillsresulted in little accountability for implementation and financialperformance. Moreover, the INPRES guidelines did not clearly define the areasof responsibility and accountability, which led to planning and fundingdelays, the supply of inappropriate and inadequate materials, and poor designand construction works.
5.11 As a result of this evaluation, the Government appropriately scaleddown the RWSS program. Beginning in 1987/88, the allocation of INPRES fundsfor RWSS declined drastically. INPRES allocations for water supply dropped toabout Rp.0.5 billion during the last two years of REPELITA IV, a 95% cut inthe allocation. Allocations were made only as counterpart funds forexternally assisted projects. The sanitation program suffered similarreductions with the INPRES allocation cut by almost 87% to Rp.0.1 billionannually, as compared to an average of Rp.0.8 billion a year in the firstthree years.
5.12 During REPELITA IV, the Ministry of Health and some external agenciesdeveloped their own community-based approaches to find appropriate RWSStechnologies that the communities would accept and could afford. Several ofthese programs were in conjunction with community-based organizations activein the rural areas of Indonesia. Although there were a number of pilotprograms with successful results, these have yet to be incorporated fully intothe Government-funded INPRES program.
5.13 Among the many pilot projects that were undertaken, three programsdeserve close attention with a view towards wider replication:
(a) one is the UNDP/WHO assisted Bengkulu/Lampung RWSS project. Theproject's objective was to train the concerned units at the districtand village levels with a community based approach. Village levelorganizations (LKMD) were trained by PUSKESMAS staff (sanitation),PKK and BANGDES Village Developer to participate in every phase fromplanning to operations and maintenance. "Task forces" wereestablished at the district level for hydrogeological surveys, welldrilling and handpump installation. This proved to be an effectivemeans for large-scale implementation of RWSS.
- ll -
(b) the AIDAB-funded RWSS Project in West Nusa Tenggara (NTB) is anothermodel again relying heavily on community participation. Inputsprovided by the project resulted in the construction and better useof simple schemes. Interventions, on the other hand, have motivatedand ensured the participation of the villagers to operate andmaintain these facilities.
(c) the Ministry of Health also developed a pilot program, whichemphasized the linkages between health education, communityparticipation and the provision of RWSS hardware. The approach formotivating community participation was built around the POSYANDU(Integrated Health Services Post) system. A demonstration area wasselected in South Sulawesi and the pilot was carried out with fundsfrom UNDP/WHO South Sulawesi RWSS Project. The POSYANDU leaders weretrained by district and PUSKESMAS staff (health workers andsanitarians) and by PKK officials to organize, educate and motivatethe village mothers. A cost recovery mechanism and a revolving fundwere also established. This pilot was relatively successful and infour villages in the Patampanua district, the number of usablefacilities increased almost three fold.
An Agenda for REPELITA V
5.14 RWSS remains critical to the livelihood and the quality of life ofrural Indonesians, particularly the poor. Access to a "clean" source of watersupply and "proper" sanitation facilities are currently available to only afew in rural areas. Therefore, RWSS is an important priority for Governmentexpenditure and staff resources during the REPELITA V period.
5.15 The Government recognized this priority and committed itself to makean intensified effort during the REPELITA V period to increase substantiallythe coverage of RWSS over the medium term. First, the Government reorganizedresponsibilities for RWSS. The Governor will be in overall charge of theprovision of RWSS and, in conjunction with the Ministry of Home Affairs, willcoordinate the efforts of both the Ministries of Public Works and Health. TheMinistry of Public Works will be responsible for all facility construction inrural water supply and sanitation, including low technology systems such ashandpumps, rain water collectors, and sanitary latrines. The Ministry ofHealth will be responsible for water quality, community participation andhealth education through the health center sanitarians. This represents animproved organizational structure over that which prevailed in the past, sincethe Ministry of Health has a comparative advantage in organizing communityparticipation and health education as has been done through the POSYANDUprogram.
5.16 During the REPELITA V period, a new RWSS scheme will be implementedwith INPRES funds in a large number of villages. In selecting these villages,priority will be given to water scarce areas, endemic diarrhea areas,fisherman's villages and transmigration sites. The approach will be acommunity-based approach with the sanitarian organizing a "rural water supplyclub" in each village to assist in the planning, implementation, operation and
- 112 -
rehabilitation of the RWSS facilities. Surveillance of drinking water qualityand the operation of the sanitation facilities will also receive specialemphasis and quality control systems will be established in every Kabupaten.
5.17 With this new program outlined in REPELITA V, the Government hasclearly recognized the benefits which can be derived from improved watersupply and sanitation facilities in rural areas, particularly in lower incomeareas, and is taking steps to raise service levels. Several factors will becritical to the success of this program:
(a) a clearer definition of institutional responsibilities, as well as amechanism established to coordinate the various ministries involvedin implementation. In particular, institutional responsibilities fornon-piped water systems need to be clearly established and theappropriate staff trained in the application of this technology;
(b) the use of low-cost appropriate technology. The experience inIndonesia and other countries indicates that simple handpumps andrain collection systems hold the highest potential, because of theavailability of groundwater;
(c) the availability of trained sanitarians in each of the villagesselected for demonstration systems. In the past, the RWSS programhas suffered from an insufficient number of trained personnel;
(d) the use of a cost recovery mechanism to provide funds for theoperations and maintenance of these systems with the capital costprovided through the INPRES program. The success of many pilotsindicate that cost recovery is feasible and unlikely to affectadversely the access of lower income groups; and
(e) the use of community-based groups in the implementation of the RWSS.This will help to: increase village acceptance of RWSS systems;organize water supply "clubs"; and lessen the financial and staffingconstraints of the Government.
C. Basic Services for the Poor in Urban Areas
Introduction
5.18 Some 45 million or about one quarter of Indonesia's total populationare urban residents. Net migration and natural growth have combined toproduce an overall population growth rate in Indonesia's cities of about4.7% p.a. during the 1980s, more than double the national population growthrate. Urban areas are projected to continue to grow rapidly at about4.4% p.a. throughout the 1990s. Many of the migrants into urban areas will beunskilled rural laborers from lower income groups and shifting urban policiestowards the accommodation of this expansion will be a priority in urban areas.In designing and implementing a strategy for the provision of basic servicesfor the urban poor, two factors will be important. First, the average urbandweller is unambiguously better off than the average rural dweller in terms of
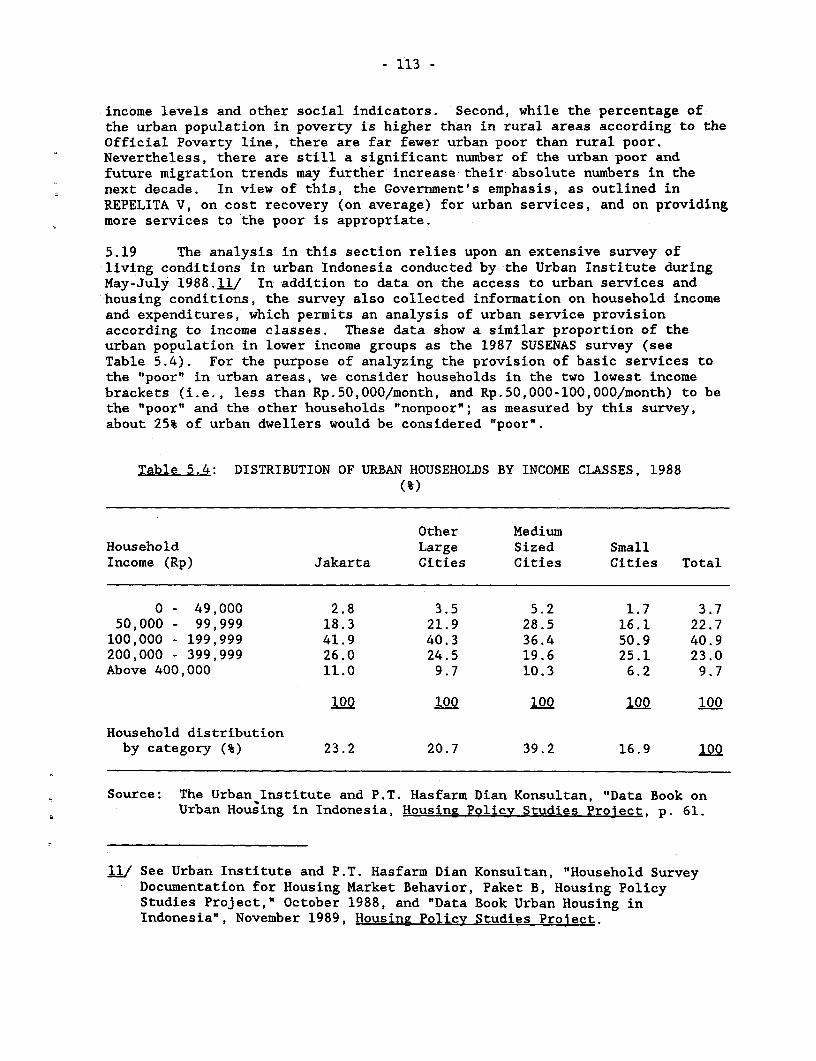
- 113 -
income levels and other social indicators. Second, while the percentage ofthe urban population in poverty is higher than in rural areas according to theOfficial Poverty line, there are far fewer urban poor than rural poor.Nevertheless, there are still a significant number of the urban poor andfuture migration trends may further increase their absolute numbers in thenext decade. In view of this, the Government's emphasis, as outlined inREPELITA V, on cost recovery (on average) for urban services, and on providingmore services to the poor is appropriate.
5.19 The analysis in this section relies upon an extensive survey ofliving conditions in urban Indonesia conducted by the Urban Institute duringMay-July 1988.11/ In addition to data on the access to urban services andhousing conditions, the survey also collected information on household incomeand expenditures, which permits an analysis of urban service provisionaccording to income classes. These data show a similar proportion of theurban population in lower income groups as the 1987 SUSENAS survey (seeTable 5.4). For the purpose of analyzing the provision of basic services tothe "poor" in urban areas, we consider households in the two lowest incomebrackets (i.e., less than Rp.50,000/month, and Rp.50,000-100,000/month) to bethe "poor" and the other households "nonpoor"; as measured by this survey,about 25% of urban dwellers would be considered "poor".
Table 5.4: DISTRIBUTION OF URBAN HOUSEHOLDS BY INCOME CIASSES, 1988(%)
Other MediumHousehold Large Sized SmallIncome (Rp) Jakarta Cities Cities Cities Total
0 - 49,000 2.8 3.5 5.2 1.7 3.750,000 - 99,999 18.3 21.9 28.5 16.1 22.7100,000 - 199,999 41.9 40.3 36.4 50.9 40.9200,000 - 399,999 26.0 24.5 19.6 25.1 23.0Above 400,000 11.0 9.7 10.3 6.2 9.7
100 100 100 100 100
Household distributionby category (%) 23.2 20.7 39.2 16.9 100
Source: The Urban Institute and P.T. Hasfarm Dian Konsultan, "Data Book onUrban Housing in Indonesia, Housing Policy Studies Project, p. 61.
11/ See Urban Institute and P.T. Hasfarm Dian Konsultan, "Household SurveyDocumentation for Housing Market Behavior, Paket B, Housing PolicyStudies Project," October 1988, and "Data Book Urban Housing inIndonesia", November 1989, Housing Policy Studies Project.
- 114 -
5.20 The provision of subsidized basic services and infrastructure to meetthe basic needs of the urban population has been a longstanding policy of theGovernment as a means of poverty alleviation. This policy has recognized thatthe urban poor are situated in two types of locations. First, they can befound in clearly identified places such as on the periphery of towns, alongrailways, canals and open drains, and in low lying and swampy areas. Reachingthis group will require specific, subsidized interventions. The second groupis dispersed among the general population, side-by-side in kampungs with muchmore affluent households. From the standpoint of assisting the poor, this hasdisadvantages and advantages. On the one hand, the poor are harder toidentify and thus it is extremely difficult to target programs; the better-offtend to get most of the benefits of poverty programs. On the other, it canpermit cross-subsidies between rich and poor in the provision of basicservices. However, reaching the urban poor is made more difficult by the factthat the poor are also highly mobile. There are probably four million"circular migrants" on Java who spend a substantial part of each year in urbanareas. These are not included in the urban population data (they would addabout 10% to the urban population). They are also disproportionately poorcompared to other urban dwellers.
5.21 The remainder of this Chapter discusses interventions to improvebasic service provision for the poor in urban areas. First, this wouldinvolve improved sectoral programs, particularly water supply and sanitation.Water supply and sanitation sectoral programs, which are discussed in the nexttwo sections, have important implications for health status; the benefits aresimilar to those outlined for the rural poor in the previous section of thisChapter, but the health effects are likely to be greater in urban areasbecause of existing crowded and unsanitary conditions. Second, the urban poorhave additional infrastructural needs stemming from the high density of urbanareas compared to rural areas and the fact that many cities in Indonesia arein low-lying, flood prone areas. Second, the Kampung Improvement Program(KIP), which is discussed in the third section, is a Government program of on-site upgrading of urban "villages", (i.e., areas where the poor are heavilyconcentrated) through the provision of basic infrastructure and socioeconomicprograms to improve the living conditions of low-income urban dwellers.Finally, there is a discussion of issues in providing for the shelter needs ofthe poor, both through Government programs and a reform of the regulatoryenvironment.
Water Supply for the Urban Poor
5.22 Progress has been made in the 1980s in providing reasonably safedrinking water to urban areas. The proportion of urban dwellers with accessto piped water and pumped wells is about 46% in 1987 compared to 39% in 1980.12/This progress can be attributed to a major effort by the Government beginningduring REPELITA III and continued through REPELITA IV to provide piped watersufficient for the basic needs of at least 60% of all urban dwellers. In1988, it was estimated that 24% of urban households obtain their drinkingwater from piped water, 22% from pumped wells, 41% from open wells, 11% fromwater vendors (presumably public standpipes) and a very small remainder from a
1/ This calculation compares the 1980 Census data with results from the1988 Urban Institute study.
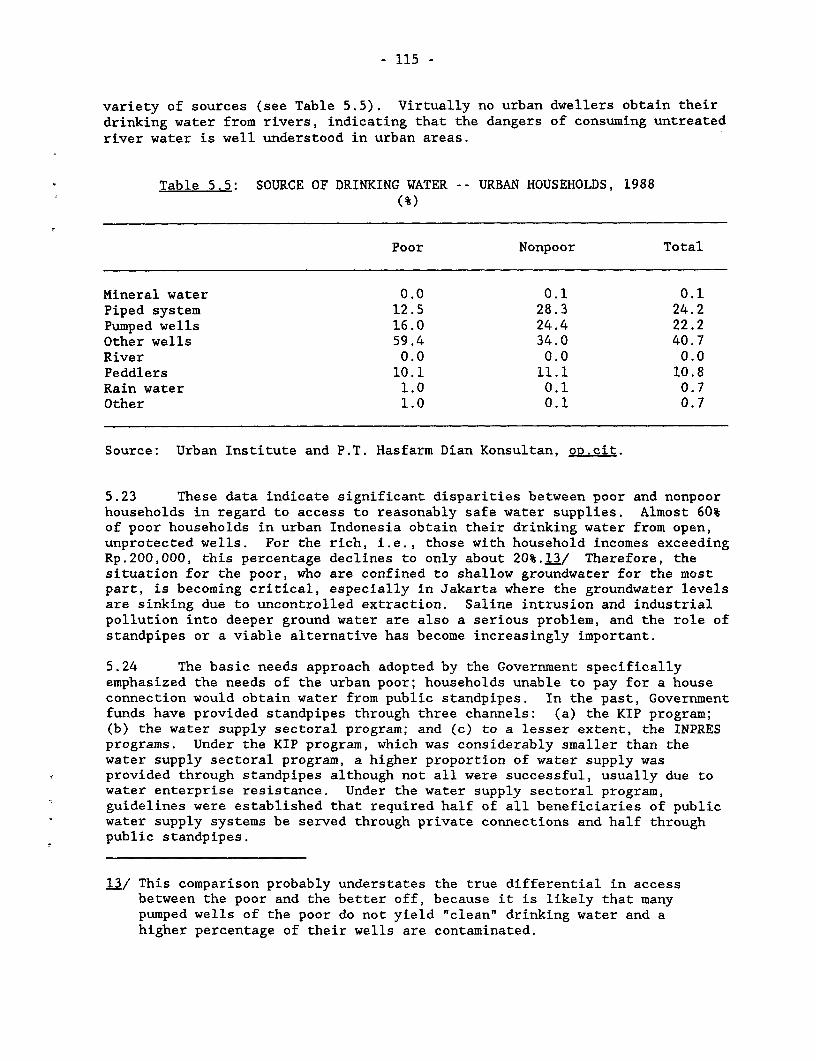
- 115 -
variety of sources (see Table 5.5). Virtually no urban dwellers obtain theirdrinking water from rivers, indicating that the dangers of consuming untreatedriver water is well understood in urban areas.
Table 5.5: SOURCE OF DRINKING WATER -- URBAN HOUSEHOLDS, 1988
(%)
Poor Nonpoor Total
Mineral water 0.0 0.1 0.1Piped system 12.5 28.3 24.2Pumped wells 16.0 24.4 22.2Other wells 59.4 34.0 40.7River 0.0 0.0 0.0Peddlers 10.1 11.1 10.8Rain water 1.0 0.1 0.7Other 1.0 0.1 0.7
Source: Urban Institute and P.T. Hasfarm Dian Konsultan, oD.cit.
5.23 These data indicate significant disparities between poor and nonpoorhouseholds in regard to access to reasonably safe water supplies. Almost 60%of poor households in urban Indonesia obtain their drinking water from open,unprotected wells. For the rich, i.e., those with household incomes exceedingRp.200,000, this percentage declines to only about 20%.13/ Therefore, thesituation for the poor, who are confined to shallow groundwater for the mostpart, is becoming critical, especially in Jakarta where the groundwater levelsare sinking due to uncontrolled extraction. Saline intrusion and industrialpollution into deeper ground water are also a serious problem, and the role ofstandpipes or a viable alternative has become increasingly important.
5.24 The basic needs approach adopted by the Government specificallyemphasized the needs of the urban poor; households unable to pay for a houseconnection would obtain water from public standpipes. In the past, Governmentfunds have provided standpipes through three channels: (a) the KIP program;(b) the water supply sectoral program; and (c) to a lesser extent, the INPRESprograms. Under the KIP program, which was considerably smaller than thewater supply sectoral program, a higher proportion of water supply wasprovided through standpipes although not all were successful, usually due towater enterprise resistance. Under the water supply sectoral program,guidelines were established that required half of all beneficiaries of publicwater supply systems be served through private connections and half throughpublic standpipes.
13/ This comparison probably understates the true differential in accessbetween the poor and the better off, because it is likely that manypumped wells of the poor do not yield "clean" drinking water and ahigher percentage of their wells are contaminated.
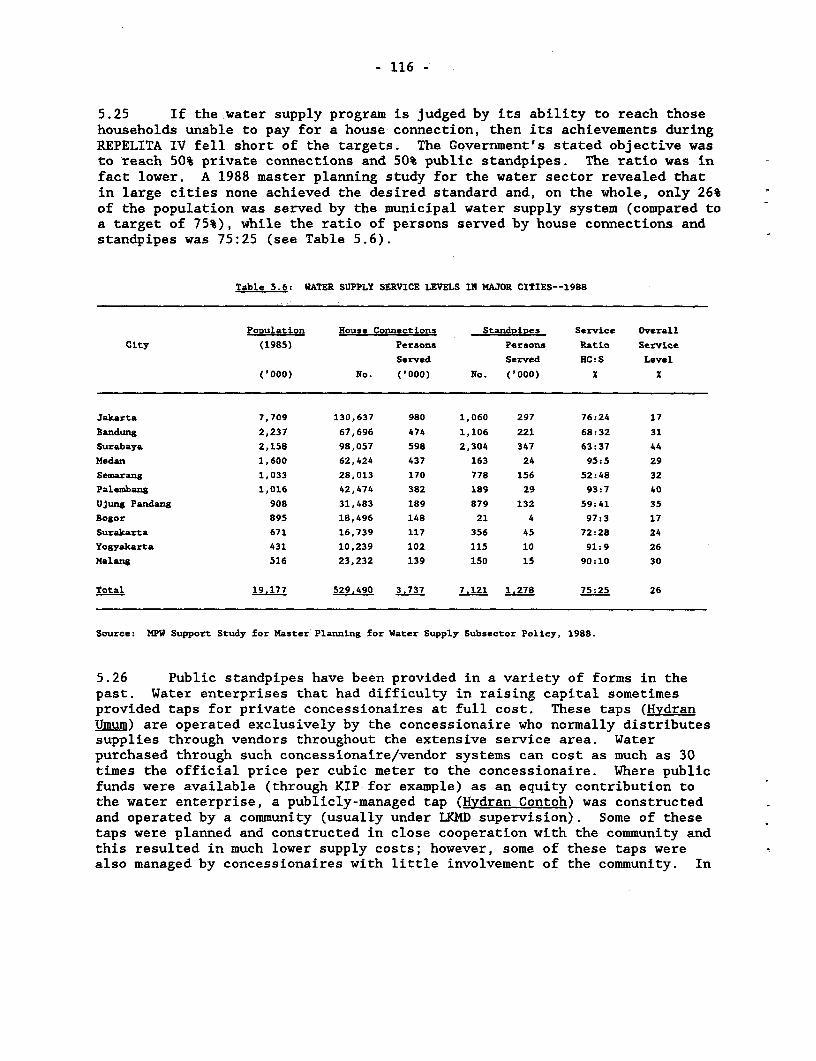
- 116 -
5.25 If the water supply program is judged by its ability to reach thosehouseholds unable to pay for a house connection, then its achievements duringREPELITA IV fell short of the targets. The Government's stated objective wasto reach 50% private connections and 50% public standpipes. The ratio was infact lower. A 1988 master planning study for the water sector revealed thatin large cities none achieved the desired standard and, on the whole, only 26%of the population was served by the municipal water supply system (compared toa target of 75%), while the ratio of persons served by house connections andstandpipes was 75:25 (see Table 5.6).
Table 5.6: WATER SUPPLY SERVICE LEVELS IN MAJOR CITIES--1988
Population House Connections Standoi3,es Service Overall
City (1985) Persons Persons Ratio Service
Served Served HC:S Level
('000) No. ('000) No. ('000) X z
Jakarta 7,709 130,637 980 1,060 297 76:24 17
Bandung 2,237 67,696 474 1,106 221 68:32 31
Surabaya 2,158 98,057 598 2,304 347 63:37 44
Medan 1,600 62,424 437 163 24 95:5 29
Semarang 1,033 28,013 170 778 156 52:48 32
Palembang 1,016 42,474 382 189 29 93:7 40
Ujung Pandang 908 31,483 189 879 132 59:41 35
Bogor 895 18,496 148 21 4 97:3 17
Surakarta 671 16,739 117 356 45 72:28 24
Yogyakarta 431 10,239 102 115 10 91:9 26
Malang 516 23,232 139 150 15 90:10 30
Total 19.177 529.490 3,737 7.121 1.278 75:25 26
Source: MPW Support Study for Master Planning for Water Supply Subsector Policy, 1988.
5.26 Public standpipes have been provided in a variety of forms in thepast. Water enterprises that had difficulty in raising capital sometimesprovided taps for private concessionaires at full cost. These taps (HvdranUmum) are operated exclusively by the concessionaire who normally distributessupplies through vendors throughout the extensive service area. Waterpurchased through such concessionaire/vendor systems can cost as much as 30times the official price per cubic meter to the concessionaire. Where publicfunds were available (through KIP for example) as an equity contribution tothe water enterprise, a publicly-managed tap (Hydran Contoh) was constructedand operated by a community (usually under LKMD supervision). Some of thesetaps were planned and constructed in close cooperation with the community andthis resulted in much lower supply costs; however, some of these taps werealso managed by concessionaires with little involvement of the community. In
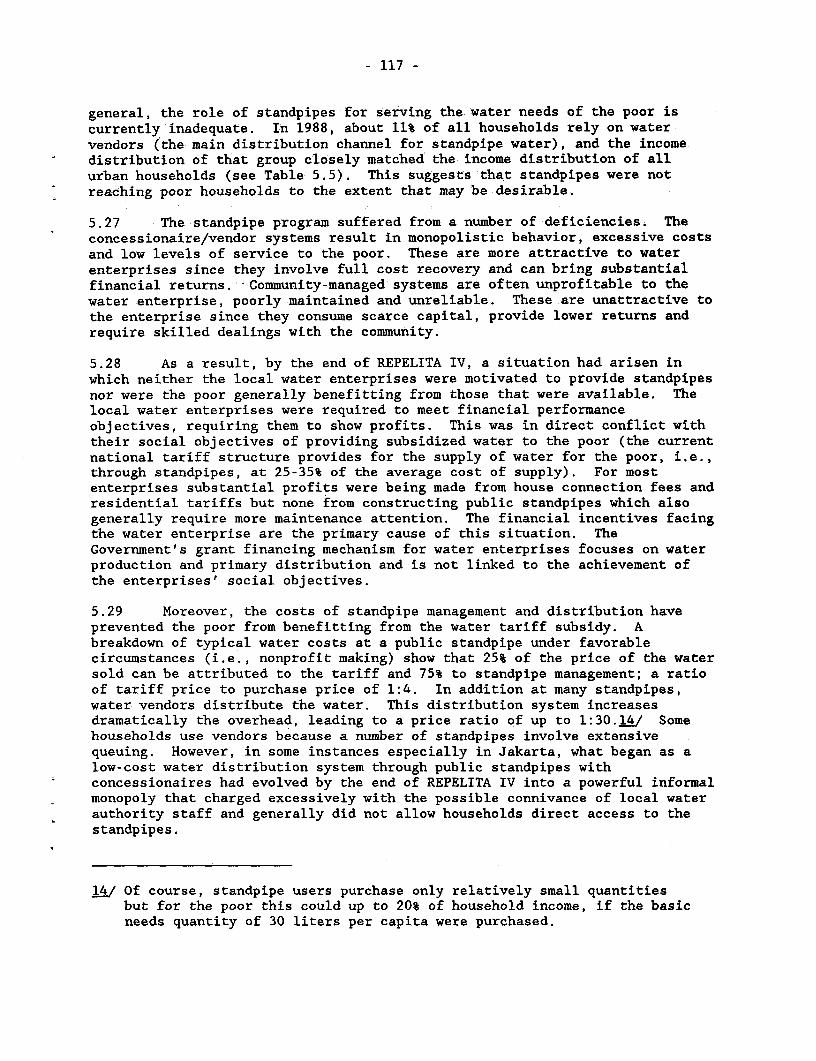
- 117 -
general, the role of standpipes for serving the water needs of the poor iscurrently inadequate. In 1988, about 11% of all households rely on watervendors (the main distribution channel for standpipe water), and the incomedistribution of that group closely matched the income distribution of allurban households (see Table 5.5). This suggests that standpipes were notreaching poor households to the extent that may be desirable.
5.27 The standpipe program suffered from a number of deficiencies. Theconcessionaire/vendor systems result in monopolistic behavior, excessive costsand low levels of service to the poor. These are more attractive to waterenterprises since they involve full cost recovery and can bring substantialfinancial returns. Community-managed systems are often unprofitable to thewater enterprise, poorly maintained and unreliable. These are unattractive tothe enterprise since they consume scarce capital, provide lower returns andrequire skilled dealings with the community.
5.28 As a result, by the end of REPELITA IV, a situation had arisen inwhich neither the local water enterprises were motivated to provide standpipesnor were the poor generally benefitting from those that were available. Thelocal water enterprises were required to meet financial performanceobjectives, requiring them to show profits. This was in direct conflict withtheir social objectives of providing subsidized water to the poor (the currentnational tariff structure provides for the supply of water for the poor, i.e.,through standpipes, at 25-35% of the average cost of supply). For mostenterprises substantial profits were being made from house connection fees andresidential tariffs but none from constructing public standpipes which alsogenerally require more maintenance attention. The financial incentives facingthe water enterprise are the primary cause of this situation. TheGovernment's grant financing mechanism for water enterprises focuses on waterproduction and primary distribution and is not linked to the achievement ofthe enterprises' social objectives.
5.29 Moreover, the costs of standpipe management and distribution haveprevented the poor from benefitting from the water tariff subsidy. Abreakdown of typical water costs at a public standpipe under favorablecircumstances (i.e., nonprofit making) show that 25% of the price of the watersold can be attributed to the tariff and 75% to standpipe management; a ratioof tariff price to purchase price of 1:4. In addition at many standpipes,water vendors distribute the water. This distribution system increasesdramatically the overhead, leading to a price ratio of up to 1:30. J/ Somehouseholds use vendors because a number of standpipes involve extensivequeuing. However, in some instances especially in Jakarta, what began as alow-cost water distribution system through public standpipes withconcessionaires had evolved by the end of REPELITA IV into a powerful informalmonopoly that charged excessively with the possible connivance of local waterauthority staff and generally did not allow households direct access to thestandpipes.
1i/ Of course, standpipe users purchase only relatively small quantitiesbut for the poor this could up to 20% of household income, if the basicneeds quantity of 30 liters per capita were purchased.
- 118 -
5.30 An agenda for REPELITA V. The problems with public standpipes andthe resulting inability of the water supply system to reach the poor is wellknown and the Government has begun to address the issues in REPELITA V. Acrash program of expanding water supply outlets for the poor was undertakenduring 1989/90, the first year of REPELITA V. The supply of public standpipeswas increased by 3,854. In Jakarta, where the problem was the most severe,655 additional standpipes were installed, implying more than a 60% increase inone year. Moreover, 758 new temporary facilities, terminal air, were alsobuilt to distribute water, in areas not reached by the distribution network.An important objective of this expansion has been to break the concessionaire/vendor monopoly and establish a more intensive network of standpipes. Thepreliminary evidence on water prices indicates that this is being accomplishedas prices in Jakarta have fallen by an average of 40%.
5.31 Consolidating this effort into a long term solution to the waterneeds of the poor requires addressing the threefold problem of: (i) the needfor more public tap outlets in proximity to the poor and the establishment ofprocedures for their operations and maintenance; (ii) the drain of public tapson water enterprise finances; and, (iii) the excessive cost of water to theconsumer. Changing the financial incentives facing water enterprises byallocating Central Government grant funds for urban infrastructure for bothconstruction of standpipes and their operation would serve to reduce the drainon their finances in two ways: (i) capital grants to the water enterprisescould be explicitly linked to the construction of standpipes and distributionsystems to poorer areas of the cities. The KIP program could be an importantmeans to accomplish this as well as the sectoral program. The remainingcapital costs of water enterprise operations could be recovered directly fromthe beneficiaries of private connections (thereby permitting the use of loanfinance for expansion); and (ii) the allocation of an operating subsidy to thewater enterprises by the local government directly related to waterconsumption by the poor. The subsidy could be related to the volume of watersupplied through standpipes at concessionary rates.il5/ The local governmentfunds for this purpose could be obtained from the district or health INPRESallocations or the KIP DIP allocation. The INPRES and KIP funds could beaugmented for this purpose if necessary by reallocation of funds from watersupply DIPs.
5.32 A second important initiative involves the full deregulation of waterdistribution. In parallel with expanding the supply of standpipes, the costof standpipe water could be reduced by allowing anyone with a house or yardconnection to sell water, thereby increasing significantly the number ofpublic outlets by just one deregulatory action. The Government made a majorstep in this direction recently when it issued a regulation permitting anyindividual in Jakarta with a private connection to sell water on a trial
15/ For illustration purposes it is useful to consider the budgetaryimplications of such a subsidy. On the basis of a subsidy of Rp.100/m3
and a consumption of 30 liters per day by the 10 million urban dwellersin the bottom 25% of the income distribution, the total annualoperating subsidy required would be about Rp.ll billion/year.
- 119 -
basis. This action could prove extremely effective in eliminating theexcessive rents currently being received by individuals managing anddistributing water. The results of the trial in Jakarta need to be closelymonitored with a view towards wider replication.
5.33 Finding a viable system of managing and maintaining standpipes is athird important area. As the Government has attempted in 1989/90, the cost ofstandpipe management can be reduced by the use of community groups, such asLKMD, to carry out this function. The involvement of the community first inplanning of its water supply system and house connection/standpipearrangements is an important consideration. Effective community participationand consultation requires particular skills and approaches that, while adoptedin KIP, have not often featured in sectoral programs in the past. Finally,efforts to increase the availability of water will be more effective ifaccompanied by a campaign to educate the poor on the benefits of "clean"water.
Human Waste Disposal
5.34 Human wastes are disposed of in a variety of ways in Indonesiancities, most of which are unhealthy. The improper disposal of human waste canlead to severe effects upon human healtn, especially in crowded and congestedareas as found in most Indonesian cities. A recent study of water qualityissues in Java found that the most excessive pollutant was human excreta asindicated by fecal coliform, which in places exceeds conventional standards by1,000 times and more.16/ In 1988, 70% of urban households reported using aflush water closet for defecation with only 17% indicating that no sanitationfacilities were used (see Table 5.7). However, it is reasonable to assume
Table 5.7: TYPE OF SANITATION FACILITY: URBAN HOUSEHOLDS-1988(%)
Poor Nonpoor Total
Flush water 55.0 75.4 70.0Open pit latrine 7.6 7.9 7.8Sanitary block (MCK) 7.1 4.1 4.9None 30.3 12.7 17.3
Total 100 100 100
Source: Urban Institute and P.T. Hasfarm Dian Konsultan, op.cit.
i.6/ See, Indonesia: Forest. Land and Water: Issues in SustainableDevelopment, The World Bank, Report No. 7822-IND, June 5, 1989, p. 106.
- 120 -
that this is an upper bound on the percentage of the urban population withaccess to proper disposal of human waste.i7/ As with water, there is asignificant disparity between the poor and the nonpoor, with almost one thirdof poor households indicating that no formal sanitation facilities were used.
5.35 The Government is involved in providing facilities for human wastedisposal in three ways. First, the construction of communal wash/toiletfacilities (MCKs) as one component of the Kampung Improvement Program in verycongested areas. This component has received a low priority within theprogram, despite apparent needs often due to a lack of suitable space.Indicative of the limited effort made in building MCKs is the fact that only5% of urban households and 7% of poor urban households reported using thistype of facility. Pilot sewerage schemes are also being tried in severalurban areas (Jakarta, Bandung, Medan, Cirebon) in Indonesia. However, theseschemes typically cover only a small percentage of the population, areprohibitively expensive, and hardly ever are capable of addressing thesanitation needs of the poor. Finally with external assistance, there havebeen pilot projects based on low-cost sanitation approaches.
5.36 Recent attempts to deliver conventional sewerage systems haveencountered installation difficulties and problems in achieving adequateoperation and maintenance or appropriate levels of cost recovery. Therefore,a key factor in the Government's ability to provide adequate sanitation,especially for the poor, and to address Indonesia's water pollution problemswill be the selection of appropriate, low cost technology, accompanied byfunding and delivery arrangements. Since these systems cost about one-tenththat of sewerage systems (that do not reach the poor), the choice oftechnology has important investment and maintenance implications for theGovernment. The prevailing perceptions are that these low-cost facilities,limited mainly to public toilet/ bathing/laundering facilities (MCKs), are notpopular and that most families prefer individual toilet facilities. Howeverin 1988, more than two-thirds of poor urban households use shared facilitiesoutside of the home (see Table 5.8). This indicates that appropriate, wellmaintained facilities are likely to be used by the poor.
I/! These data are derived from questionnaires and are very likely tooverstate access to private toilet facilities, both because people tendto be embarrassed to acknowledge using informal facilities such asdrains, ditches and canals, and because respondents are generally headsof households and their answers omit the fact that children tend to useless formal facilities.
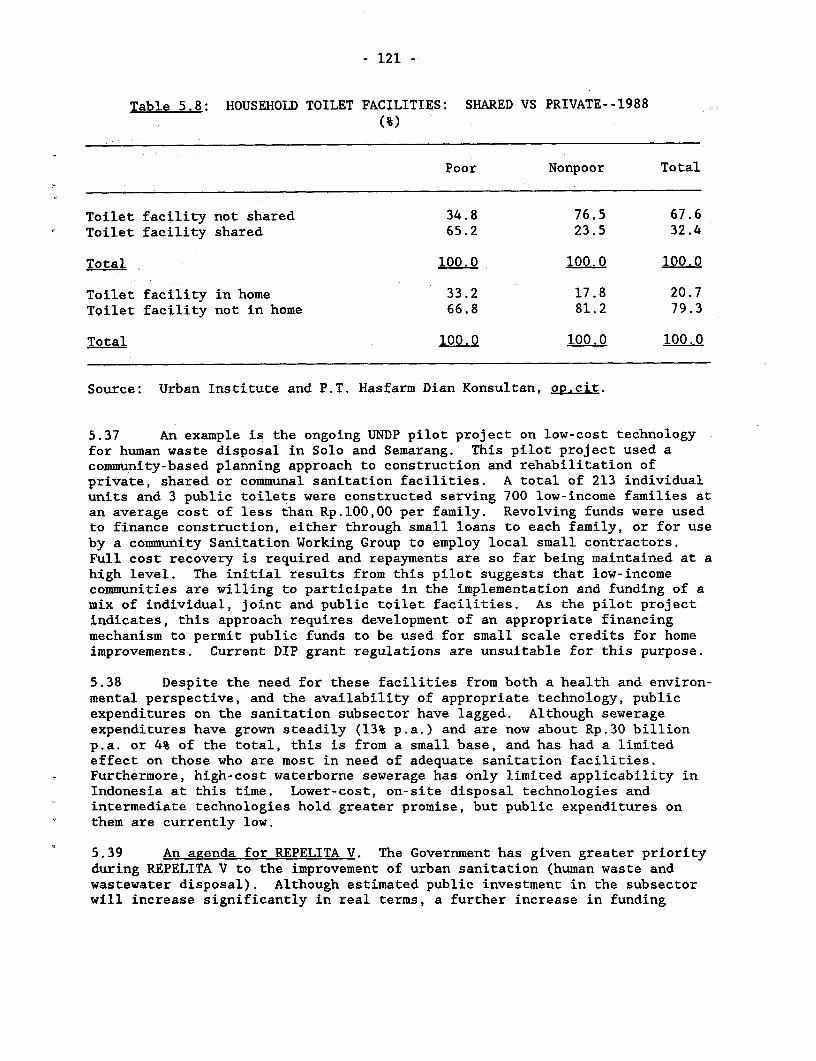
- 121 -
Table 5.8: HOUSEHOLD TOILET FACILITIES: SHARED VS PRIVATE--1988
(%)
Poor Nonpoor Total
Toilet facility not shared 34.8 76.5 67.6Toilet facility shared 65.2 23.5 32.4
Total 100.0 100.0 100.0
Toilet facility in home 33.2 17.8 20.7Toilet facility not in home 66.8 81.2 79.3
Total 100.0 100.0 100.0
Source: Urban Institute and P.T. Hasfarm Dian Konsultan, op.cit.
5.37 An example is the ongoing UNDP pilot project on low-cost technologyfor human waste disposal in Solo and Semarang. This pilot project used acommunity-based planning approach to construction and rehabilitation ofprivate, shared or communal sanitation facilities. A total of 213 individualunits and 3 public toilets were constructed serving 700 low-income families atan average cost of less than Rp.100,00 per family. Revolving funds were usedto finance construction, either through small loans to each family, or for useby a community Sanitation Working Group to employ local small contractors.Full cost recovery is required and repayments are so far being maintained at ahigh level. The initial results from this pilot suggests that low-incomecommunities are willing to participate in the implementation and funding of amix of individual, joint and public toilet facilities. As the pilot projectindicates, this approach requires development of an appropriate financingmechanism to permit public funds to be used for small scale credits for homeimprovements. Current DIP grant regulations are unsuitable for this purpose.
5.38 Despite the need for these facilities from both a health and environ-mental perspective, and the availability of appropriate technology, publicexpenditures on the sanitation subsector have lagged. Although sewerageexpenditures have grown steadily (13% p.a.) and are now about Rp.30 billionp.a. or 4% of the total, this is from a small base, and has had a limitedeffect on those who are most in need of adequate sanitation facilities.Furthermore, high-cost waterborne sewerage has only limited applicability inIndonesia at this time. Lower-cost, on-site disposal technologies andintermediate technologies hold greater promise, but public expenditures onthem are currently low.
5.39 An agenda for REPELITA V. The Government has given greater priorityduring REPELITA V to the improvement of urban sanitation (human waste andwastewater disposal). Although estimated public investment in the subsectorwill increase significantly in real terms, a further increase in funding
- 122 -
levels may be necessary to address adequately overall needs. In view of thelimited public sector resources, the overall strategy of the Government couldseek to provide more and better toilets for poor households with on-sitedisposal and in making better use of them.
5.40 Accomplishing these objectives during the REPELITA V period willinvolve the three following components:
(a) appropriate technologies for large-scale, low-cost programs could bepromoted as has been attempted in the UNDP pilot projects. Ingeneral, it would appear that in most poor kampung areas acombination of small MCKs (two to four-seat units) and where possiblethe construction of individual pour-flush toilets and leaching pitsare the most appropriate solution. Arrangements for financingoperation and maintenance of these sanitation facilities could bestrengthened;
(b) institutional roles and capacities of central, provincial and localgovernments in promoting sanitation need to be clarified, with theappropriate agencies strengthened to carry out their respectiveroles; and
(c) the involvement of the community in the delivery of suitable programswill also be important in gaining acceptance of the facilities, aswell as ensuring their proper maintenance and operation.
As with water supply, it will be important to raise the understanding of poorkampung residents of the benefits of sanitary disposal of human waste. Mostof the problems outlined above cannot be solved only by Government investment,but health education is also needed. In this regard, there is greater scopefor promotional activities within low-income communities, in particular theuse of television, radio and other media to emphasize the benefits of propersanitation practices.
Kampung Improvement Program
5.41 In terms of the human environment in cities, the majority of urbanresidents (50%-70% depending on city size) live in poorly serviced Kampungs or"urban villages", mainly located close to the city's commercial and industrialcenters.18/ Although kampungs contain a wide range of income groups, the poorgenerally suffer the worst living conditions in terms of overcrowding (5%-10%of kampungs depending on city size have densities of 500-800 persons/ha andmore) and lesser access to water and sanitation and other key services eitherpublicly or privately provided. The Kampung Improvement Program (KIP), whichwas originally initiated in Jakarta in 1969, is a nationwide program forupgrading these informal, unplanned and unserviced "urban villages",particularly in lower-income communities.
1i/ As employment has decentralized and transport improved somewhat,kampungs (and new formal housing developments) are now alsoconcentrating in the urban fringe areas where land is more readilyavailable.
- 123 -
5.42 The KIP program provides a range of infrastructure at minimalstandards including local roads, footpaths, drainage, water supply, publicsanitation facilities and solid waste collection, combined in some instanceswith social services (schools and health facilities). The program also has
direct economic benefits as most materials for the KIP are locally producedand the direct labor input is high. It has been estimated that 560 man-daysof direct labor is required per ha in an average kampung to achieve reasonableKIP standards. The program has been financed from numerous sources: CentralGovernment funds, about 50% of the total, through sectoral projects (Ministryof Public Work's KIP PERINTIS) and through grants to local governments (INPRES
Dati I); local government's own funds, including borrowing, about 35%; and,
foreign assistance from multilateral and bilateral donors for the remaining15%. Some 7,000 ha of kampungs were upgraded during REPELITA II, increasingto about 12,000 ha during the REPELITA III period. While the program isestimated to have covered about 24,000 ha during REPELITA IV, budgetaryreductions limited the components implemented in each KIP village. At thebeginning of REPELITA V, more than 300 cities have implemented some form of
KIP development, benefitting about six million people.19/
5.43 KIP performance. There have been a number of evaluations of the KIPprogram, particularly in the late 1970s and early 1980s. These studiesindicate that the KIP has generally focused on badly serviced areas with poorenvironmental conditions in a number of cities. Access, particularlyvehicular access and footpaths, has been improved in almost all KIP schemes.Drainage has been improved in most KIP schemes with substantial reductions inflooding. Success in solid waste disposal, maintenance of drains andfootpaths, and water supply improvements have been variable. Sanitationimprovements have been generally poor. Community support for the physicalimprovements introduced by the KIP program has been strong. Footpaths areparticularly popular; roads less so, especially among the nonmotorizedmajority of the population. There has been a "stimulus" effect of KIP onprivate home improvements, which have been found to be twice as high as innonimproved areas.20/ Land values and rents have risen markedly in KIP areasin comparison with unimproved areas. Low rents have risen more than highrents so that the overall distribution of rents has narrowed. However, therehas apparently been little out-migration due to excessive rent increases.This has been partly avoided by increased house sharing. Moreover, directdisplacement of residents due to physical works has been very low--less than2% of the population. The relative success of KIP might also be judged fromthe fact that those local governments that were able, mainly the largercities, have used their own funds (including substantial borrowing) eitherdirectly or in providing matching funds to the GOI stimulus grants to increasethe scope and coverage of their KIP efforts.
j%/ Measurements in terms of people served can be misleading however, asofficial statistics are based on total service area populationirrespective of the degree of infrastructure coverage.
XQ/ It has been estimated that every Rp.l million invested in KIPencourages an additional Rp.l.9 million in private improvements. See,An Evaluation of Selected Impacts of Jakarta's Kampuna ImprovementProgram, J. Taylor, PhD dissertation, UCLA, 1983.
- 124 -
5.44 The KIP program, therefore, has tremendous potential as a mechanismto address the needs of the lower income urban residents. There is noinformation available on the economic status of kampungs in which the KIP wasimplemented, although the KIP program was not limited to "low-income"kampungs. Higher income villages also benefitted from KIP activities.
5.45 In spite of the KIP potential to reach the urban poor, severalfactors have inhibited its effectiveness. First, public investment in kampungmicro-infrastructure has been small, less than 0.25% of annual publicexpenditures to date. Moreover, levels of funding (mainly central grants)have been declining in relative terms. During REPELITA III, KIP representedabout 6% of urban infrastructure expenditures, but during REPELITA IV itdeclined to only 4% of total expenditures. Second, there has been a tendencyto maximize the area covered by the KIP, in spite of the level of funding.Comprehensive servicing at typical standards is estimated to cost aboutRp.12-20 million/ha in 1989 prices depending on physical conditions, whereasactual funding in many instances has generally not exceeded the currentlyavailable central grants from the PERINTIS (stimulus) KIP amounting to aboutRp.2.8 million/ha. Therefore, although the target in terms of the number ofcities and hectarage areas is achieved, it was difficult to implement the fullrange of components.
5.46 Third, community priorities have not always been addressed andexpenditures within the KIP have favored roads, footpaths and drainage, withrelatively less funding allocated to sanitation, solid waste or water supply.During the REPELITA IV period as cutbacks were necessitated in the program,the human waste and small-scale drainage achievements were less than 25% oftargets, and solid waste only 42% of target, while 78% of the target forvehicular access was achieved. Studies have shown that vehicular access tendsto benefit the better-off, possibly at the expense of the poor. These dataare for the KIP PERINTIS program, so these decisions concerning prioritiesduring REPELITA IV were ultimately Central Government decisions. Fourth,implementation and performance of the various components have been variable.Some high priority investments such as water supply, drainage or solid wastecollection did not work well in the absence of commensurate improvements toprimary systems outside the kampung. Moreover, O&M has typically been weakwhere community contributions were not or could not be mobilized and wherecommunities were not actively involved in planning and implementation. Thishas adversely affected water supply and sanitation infrastructure, inparticular.
5.47 And finally, in contrast to the increase in property values generallyfollowing KIP implementation, individual and household incomes were reportednot to have increased measurably. The absence of appropriate creditmechanisms has also been a major impediment to the stimulus effect of the KIPon home improvements and small-scale enterprise development. The recentsuccessful experience with rural credit systems offers some promise fordevelopment of similar schemes in urban areas.
5.48 An agenda for REPELITA V. As the Government recognizes inREPELITA V, needs are still great for basic services, especially as the urbanpopulation continues to grow. Many kampungs, mostly new, are yet untouchedand many of the earlier, upgraded kampungs are now in need of rehabilitation
- 125 -
or infilling. The Urban Institute survey concluded that more than 50% of poorhouseholds have inadequate infrastructure quality, measured in terms of accessto proper sanitation, clean water supply and lighting; about one third ofother households also had inadequate infrastructure. As a result of thesefactors, the KIP remains a high-priority, poverty-alleviation expenditure forthe Government during REPELITA V.
5.49 In designing the program for REPELITA V, the Government is takingsteps to revitalize the KIP program and correct for past weaknesses. Thisrevitalized KIP could contain three components.
(a) The traditional KIP infrastructure of roads, footpaths, drainage,waste disposal and water supply would continue to be the mainstays ofthe KIP. However, through close consultation with the communitiesconcerned, it is expected that new road construction would beminimized and small footpaths and micro-drainage extended to reachless accessible (and usually poorer) areas of the kampung. The watersupply networks would be expanded to provide water to a greaternumber of public standpipes and group family toilets, as well asincreasing the number of individual household connections incollaboration with sectoral programs where available. Much greaterattention would need to be given to sanitation and solid wastedisposal, raising significantly the proportion of expendituresdevoted to these components. A greater effect will be achieved bypreceding implementation with an intensive campaign of healtheducation. One possibility, which could be considered, is theformation of user's associations to help ensure effective operationand maintenance and adequate cost recovery for public toilets.Experience with user associations gained with the UNDP-assistedproject in Semarang and Surakarta yielded a demand for thesefacilities and willingness to take up and pay loans for constructionmaterials.
(b) More community participation in facilities planning, construction,monitoring and operations and maintenance would help ensure aneffective program. Community interest and commitment to the KIPprogram will be heightened if each community is allowed to selectcomponents which are high priority and relevant to local needs. Amenu (range) of subcomponents, but with a core program of basicinfrastructure and services, could be presented to each communityprior to KIP implementation. This approach is perceived asfundamental for community acceptance of the services, and in orderfor the community's to fulfill its responsibilities for operationsand maintenance.
(c) Experimentation could also be undertaken with economic developmentcomponents. Two types of small-scale credit schemes may beappropriate: (i) home materials loans (HML); and (ii) incomegenerating loans. There appears to be strong demand for a homematerial's loan program which would permit individual households totake up cash loans to purchase building materials in order to improvetheir homes. Access to small informal business and employment loans
- 126 -
has also been a problem for small entrepreneurs and could help spureconomic activities. Small business and the potential fordevelopment proliferate in Indonesian kampungs and can make acontribution to employment generation among the poor. As discussedin Chapter II, these small-scale credit schemes need to focus onproviding access to credit through existing financial institutions,and not on directed, subsidized credit.
Government Housing Programs and the Poor
5.50 Introduction. The basic policy framework for housing established in1974 was that the Kampung Improvement Program (KIP) would address the need forshelter-related services for those urban households below the 20th percentile,and the Government would build or provide mortgage financing for housing aimedat households between the 20th and the 80th percentile of the urban incomedistribution (equivalent to monthly incomes of about Rp.90,000 and Rp.200,000respectively in 1988). The Government's first policy initiatives in thehousing sector were the establishment of the National Urban DevelopmentCorporation (PERUMNAS) to produce low-cost housing, the National HousingPolicy Board (BKPN) to coordinate housing policy, and a homeownershipfinancing program (KPR) for purchasers of PERUMNAS housing, through the StateSavings and Housing Bank (Bank Tabungan Negara or BTN). Since theseinstitutions and policies were established, governmental housing policies andprograms have evolved from a relatively marginal activity to an importantcomponent of social policy.
5.51 In general terms, PERUMNAS housing was aimed at households below themedian income and the privately built units financed by BTN catered to theneeds of those above the median income. In accordance with Government policy,BTN initially provided mortgage loans for up to 90-95% of the value of housingunits at highly concessionary interest rates ranging from 5-9% over a 5-20year term. As a result of these policies, the interest rate subsidies impliedby BTN's lending terms were not closely targeted to the lowest income groups.From the outset, a wide range of income groups has had access to subsidizedmortgage finance. In fact, a recent study found that the median householdincome in 1988 for households currently residing in BTN-financed, privatelydeveloped units was Rp.325,000; residents in PERUMNAS, BTN-financed housingwas Rp.235,000; and, the median household income for all urban houseowners wasRp.160,000.2Z/ Moreover, it was found that nearly 71% of PERUMNAS units and49% of BTN-financed units are currently occupied by households headed byGovernment employees, compared to 19% of all urban households headed by
21/ See, "Post-Occupancy Evaluation of BTN-Financed Housing," HousingPolicy Studies Project, Interim Report, Urban Institute andP.T. Hasfarm Dian Konsultan. This comparison is for householdscurrently living in BTN-financed homes. These households may or maynot be the original occupants of these homes. Furthermore, if they arethe original occupants, these incomes could be substantially higherthan when the mortgage finance was obtained. Nevertheless, theseincomes are illustrative of the types of units and households financedby BTN.
- 127 -
Government employees. Since average civil servant compensation was estimatedat Rp.184,000 in 1988/89, the majority of subsidies from BTN mortgages arelikely to be accruing to households in the 50th percentile or above of theurban income distribution.
5.52 Although PERUMNAS expanded its low-cost housing program considerablyduring REPELITA III and the early years of REPELITA IV, BTN mortgage lendingfor privately constructed units increased much more rapidly, in response tothe strong demand for housing finance generated by developers building highlyprofitable larger units. Hence, BTN funds were increasingly directed towardsa narrower segment of the housing market (i.e., those with incomes above themedian).
5.53 Recent reforms. In 1985, the Government took several policyinitiatives designed to redirect BTN mortgage finance to lower income groups.These measures included: (i) an upward revision of mortgage lending rates toa range of 9-15%, implying significantly lower interest rate subsidies;(ii) raising downpayment requirements to 10-40% of house values; (iii) theexplicit redirection of BTN's lending program for the remaining three years ofREPELITA IV towards smaller mortgage loans affordable by lower and middle-income groups; (iv) the introduction of a fully blended system of fundingwhich limits low cost government funds for BTN and encourages BTN to mobilizenongovernment resources; (v) giving developers other than PERUMNAS permissionto build house types below 36 m2; and (vi) providing wider access togovernment-supported housing to any person whose income is below theprescribed ceiling (Rp.300,000 per month) without restrictions based onoccupational status.
5.54 These policy changes resulted in a significant expansion of housingsupply at lower cost. The private sector share of the Government's housingprogram increased from 53% in the early years of REPELITA IV to 75% in thelast year. It also led to higher efficiency in the private sector and awillingness to produce about 25,000 additional units (an increase of 8% overthe original plan). Moreover, the average cost per unit of housing provideddeclined by 13%. The financing of these houses continued to be at subsidizedinterest rates through the Government's housing bank (BTN), but the rate ofsubsidy has declined.
5.55 The reduction in the subsidy and the increased production of smallerhouses are likely to have led to better access of lower income groups tointerest rate subsidies through BTN, since the evidence does suggest thatsmaller units tend to be occupied by households with lower incomes. However,the bulk of the subsidies still do not accrue to poor urban households. Theseinterest rate subsidies on BTN-financed mortgages do, however, account for asignificant portion of public resources. The present value of BTN subsidiesin 1987 have been estimated to be roughly Rp.118 billion. In comparison, thecombined expenditures of central and local governments during 1987/88 on theKIP, which is supposed to serve the poorest segment of the urban population,was only Rp.37.5 billion.2V
i2/ See, "Post-Occupancy Evaluation of BTN-Financed Housing", op.cit.,p. 31.
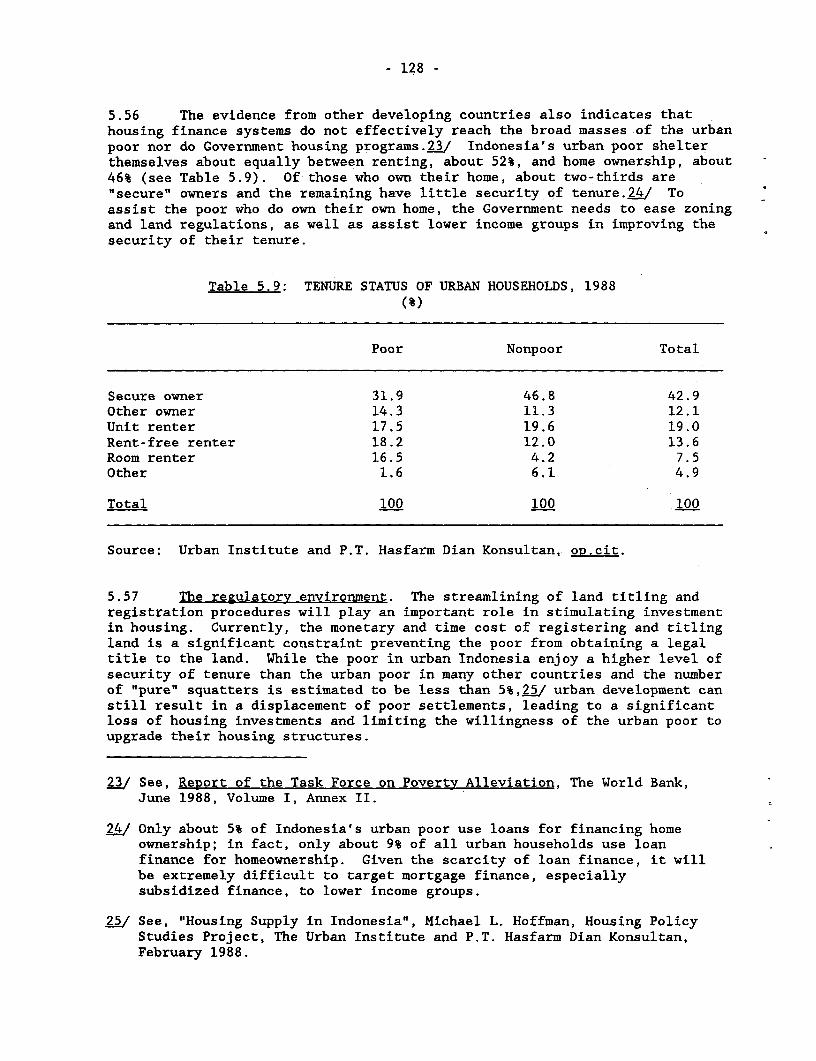
- 128 -
5.56 The evidence from other developing countries also indicates thathousing finance systems do not effectively reach the broad masses of the urbanpoor nor do Government housing programs.23/ Indonesia's urban poor shelterthemselves about equally between renting, about 52%, and home ownership, about46% (see Table 5.9). Of those who own their home, about two-thirds are"secure" owners and the remaining have little security of tenure.24/ Toassist the poor who do own their own home, the Government needs to ease zoningand land regulations, as well as assist lower income groups in improving thesecurity of their tenure.
Table 5.9: TENURE STATUS OF URBAN HOUSEHOLDS, 1988(%)
Poor Nonpoor Total
Secure owner 31.9 46.8 42.9Other owner 14.3 11.3 12.1Unit renter 17.5 19.6 19.0Rent-free renter 18.2 12.0 13.6Room renter 16.5 4.2 7.5Other 1.6 6.1 4.9
Total 100 100 100
Source: Urban Institute and P.T. Hasfarm Dian Konsultan, op.cit.
5.57 The regulatory environment. The streamlining of land titling andregistration procedures will play an important role in stimulating investmentin housing. Currently, the monetary and time cost of registering and titlingland is a significant constraint preventing the poor from obtaining a legaltitle to the land. While the poor in urban Indonesia enjoy a higher level ofsecurity of tenure than the urban poor in many other countries and the numberof "pure" squatters is estimated to be less than 5%,25/ urban development canstill result in a displacement of poor settlements, leading to a significantloss of housing investments and limiting the willingness of the urban poor toupgrade their housing structures.
_/ See, Report of the Task Force on Poverty Alleviation, The World Bank,June 1988, Volume I, Annex II.
24/ Only about 5% of Indonesia's urban poor use loans for financing homeownership; in fact, only about 9% of all urban households use loanfinance for homeownership. Given the scarcity of loan finance, it willbe extremely difficult to target mortgage finance, especiallysubsidized finance, to lower income groups.
5J/ See, "Housing Supply in Indonesia", Michael L. Hoffman, Housing PolicyStudies Project, The Urban Institute and P.T. Hasfarm Dian Konsultan,February 1988.
- 129 -
5.58 Minimum standards, zoning regulations, and maximum densitiesestablished by local governments also result in costs which falldisproportionately upon the poor. For example, minimum plot size regulationsincrease the costs of housing to households who may have opted for smallersizes. In the Jakarta area, the minimum legal standards for a dwelling unitresult in a minimum cost of Rp.4 million per unit. Through fixing theseminimum standards, the law establishes implicitly a minimum income below whichhouseholds have to obtain shelter "illegally" through the informal sector.Zoning regulations, which artificially designate areas as residential/nonresidential or set densities, can result in infrastructure provisioninconsistent with settlement patterns or densities. This may lead to a levelof urban services inadequate for population levels; this affects the poorerkampungs relatively more due to their higher densities.
5.59 An agenda for REPELITA V. During the REPELITA V period, theGovernment is making a renewed effort to target housing expenditures and inparticular, subsidies more effectively to the poor. Several initiatives willserve to improve the effect of these programs on lower income groups. First,consideration could be given to expanding the range of housing products tomake them more affordable and accessible to lower income groups. Currently,the lowest cost product remains the 15 m2 core house on a 60 m2 plot.Experimentation with other options such as serviced plots, as currentlyplanned during the REPELITA V period, is an important step in this direction.Second, Government financing of low-cost/low-income rental housing wouldassist the poor who rent their accommodations in Indonesia. Third, whilerecent reforms to the Government's program of subsidized, directed creditshave further reduced interest rate subsidies, implementation of theGovernment's policy to eliminate these subsidies is still important as theyare not well targeted to the poor. To reach the poor, the budgetary savingscould be allocated to the KIP program, which can be better targeted on low-income households. If it remains necessary to provide a subsidy, the use ofmore transparent and better targeted mechanisms, such as direct grants tobeneficiaries, would be more appropriate. Finally, changes in the regulatoryenvironment affecting the housing sector, such as improving landadministration to lower land costs and adopting appropriate design andconstruction standards, will also serve to lower barriers facing the poor.

. I
- 131 -
VI. DEVELOPING AN INSTITUTIONAL FRAMEWORK FOR POVERTY REDUCTION
A. Overview
6.1 This report has discussed a number of critical areas for designingand implementing an appropriate poverty reduction strategy for the 1990s.Because the causes and consequences of poverty are multidimensional, thesepoverty reduction programs are by nature intersectoral. For example:improving the health status of the poor in rural areas will require acombination of health services (both preventive and curative) and basicservices, such as rural water supply and sanitation; and implementing areadevelopment projects in poor areas will involve a combination of roads,storage facilities, agricultural projects as well as social and basicservices. Planning, implementing, and supervising these types of activitiesrequires building a more deliberate focus on poverty at all levels ofGovernment. Increasing the efficiency of these programs and reaching thepoor, who may be illiterate or in isolated locations, also implies thatcommunity self-help groups take a greater role in helping the Government withits antipoverty programs. The institutional areas that are discussed in thisChapter are: (i) the establishment of a focal point in BAPPENAS to overseeand coordinate the Government's poverty programs; (ii) institution building inthe line agencies in order to ensure that ongoing development programs reachthe poor more effectively; (iii) enhancing the effectiveness of local-levelGovernment officials, since the implementation of many programs will be theirresponsibility; and (iv) a larger role for community self-help groups. villagecooperatives and NGOs in the Government's antipoverty programs.
B. Government Institutions
6.2 Given that the causes and consequences of poverty are multi-dimensional, antipoverty programs are by nature intersectoral. Formulatingand implementing these programs necessarily entails the active involvement ofmany individual ministries, government agencies, local-level governments, andcommunity groups. The international experience with rural development ingeneral and poverty reduction programs in particular, as well as the WorldBank's experience in rural development projects, shows that coordination isamong the most difficult of government functions. Minimizing the need forcoordination should, therefore, be an explicit objective in poverty work.Poverty reduction strategies need to be sensitive to the risk of intersectoralcoordination failing by undertaking ex-ante planning that minimizes the needfor coordination during implementation. Thus, activities can be planned inadvance, responsibilities assigned and resources allocated to the relevantline agencies. During implementation, these line agencies could then carryout their tasks for the most part without having to coordinate with otheragencies. The coordinating agency could then monitor and evaluate progress,but not intervene in operations.
- 132 -
6.3 This ex-ante planning role and coordination of other agencies andgroups could be achieved by establishing a focal point for poverty programs inBAPPENAS. To some extent, it is already performing this role, as indicated by,the poverty reduction initiatives discussed in Chapter II. However, with theexisting institutional arrangements within BAPPENAS, antipoverty programs aredistributed under several deputies: Regional Development (with primaryresponsibility for area development projects and INPRES funding), Social andCultural Affairs (with primary responsibility for social and other basicservices), Human and Natural Resources Development (with primaryresponsibility for employment generating initiatives and the environment); andEconomic Affairs (for agricultural programs and policies). Many programsoutlined in REPELITA V and recommended in this report naturally cut acrossthese areas. Therefore, coordinating these activities and liaising with otheragencies may require establishing a focal point. Recently, a SteeringCommittee of relevant staff from BAPPENAS and other line agencies was formedto assist the Government in planning and implementing its integrated areadevelopment programs. This is a positive development which could help toavoid the types of problems which have been typically encountered inimplementing rural development projects.
6.4 Establishing such a focal point for poverty reduction, similar instructure to the Steering Committee recently formed, would help ensure thatthe ex-ante planning function is fully carried out in order to avoidimplementation difficulties. Such a coordinated effort is required in order:
(a) to identify the poor in order to target effectively any povertyinitiatives which are undertaken;
(b) to develop and refine a strategy for poverty reduction, drawing uponthe rich experience already available in Indonesia (from variousinitiatives of the Government and cooperative groups) as well asother countries;
(c) to provide technical assistance to line agencies and the lower levelsof government in revising their sectoral programs to enhance theirpoverty content; and
(d) to guide the poverty-oriented activities of various multilateral andbilateral agencies.
6.5 In identifying the poor, additional knowledge of the location,characteristics, and needs of the poor is the first step in better targetingprograms. Further primary data collection in conjunction with BPS may berequired to pinpoint more precisely pockets of poverty, since the availabledata do not permit a robust disaggregation below the provincial level.District and subdistrict data will be important, especially for the design ofrural development programs, and relief efforts. This may require additionalsurvey work.
6.6 A focal point is also necessary to monitor the performance of povertyprograms, particularly small pilot schemes. Many innovative pilot schemeshave been implemented in Indonesia and other countries over the last decade;some have been successful, some not. This review could include programs
- 133 -
implemented by community groups and NGOs, as well as Government programs. Afocal point is also required to advocate poverty programs to the lineagencies, as well as ensure that the activities of the various line agenciesare complimentary.
6.7 Finally, a number of multilateral and bilateral agencies are activelyinvolved in poverty programs. UNICEF has a long-standing relationship withthe Government in establishing, implementing and monitoring poverty programs,particularly in the areas of child and maternal health and water supply andsanitation. The UNDP has recently established a "task force" of internationalagencies and government departments to address poverty issues. Somemultilateral agencies--the World Bank, IFAD, and the Asian Development Bank--are identifying poverty projects to support the Government's antipovertyeffort. In addition, a number of bilateral agencies are actively fundingprograms in critical areas, such as rural water supply and sanitation andnutrition. These multifarious activities also need to be coordinated andfully incorporated into the Government's overall efforts. The assignment of afocal point in BAPPENAS would provide both a natural counterpart to theseactivities, as well as a mechanism for coordination.
6.8 The majority of the effort in designing, implementing and monitoringan expanded antipoverty effort will be borne by the individual line agenciesand lower level governments. Instilling a commitment towards povertyreduction throughout these agencies will, therefore, be critical to thesuccess of the Government's strategy. In this area much work remains to bedone. The mission noted that, while central agencies are committed to arenewed effort at poverty reduction and this is echoed strongly in REPELITA V,there is less commitment and understanding of this goal in other parts of theGovernment. To some extent this is understandable, as line agencies and localgovernments are implementing sectoral programs and policies, some aspects ofwhich may involve different priorities. However for the program proposed inREPELITA V to be successful, the full cooperation and commitment of lineagencies and local governments will be necessary. Strong signals from thecore agencies, particularly BAPPENAS, will be important in this regard.
6.9 Within the line ministries, there is much to do to extend theoutreach of ongoing programs and possibly identify new programs specificallytargeted at the poor. In many instances, this will require the revision ofexisting programs, alternative financing mechanisms, and the adoption ofinnovative low-cost technology. For example in the Ministry of Public Works,new responsibilities for the hardware aspects of rural water supply andsanitation will require a reorientation of technicians towards low cost andsimple technology for poor communities. Also, staff training in low-cost,appropriate technology may be required before the RWSS program can besuccessful. In agriculture, a particular need is to expand services to thosefarmers, mainly the poor, who have not had the opportunity to benefit frompast programs; this will entail broadening the ambit of research and extensioninto secondary crops, where the experience of researchers and extensionofficers is quite limited. Similarly for tree crops, developing a program toreach the mass of unassisted smallholders. through the provision of awidespread network of nurseries and technical advice will require a majorchange in the organization and delivery of tree crop support services. There
- 134 -
may also be a need to resolve conflicts which arise between poverty reductionand other sectoral objectives. These functions will require strengthening ofinstitutional support for poverty programs in the relevant line agencies.
6.10 As discussed in the preceding Chapters of this report, theinformation on the needs of the poor and on service delivery to the poor isvery limited. For sectoral antipoverty programs to be effective, informationneeds to be collected and analyzed. There are numerous potential sources ofthis information. The SUSENAS survey is one. But, there needs to be moreinteraction between planners in the line agencies and the Central Bureau ofStatistics to ensure that the data collected are relevant to the design ofsectoral policies and programs.!/ Other special surveys financed by donors orthrough project loans can also be used for this purpose. Assisting in thedesign, implementation and analysis of these surveys and incorporating thefindings of this analysis into program design is an important function of theline agencies.
6.11 Similarly, local governments need to be active contributors to thepoverty reduction program. Local governments are at the front line of theattack on poverty. Local governments have the best knowledge of who the poorare, and what their needs are. Local government officials are, therefore, thecritical link between the plans and concerns of the Central Government and thepoor. While numerous training programs already exist for local levelofficials, there appears to remain a need, however, for additional training onthe assessment and alleviation of poverty. Local government officials havelittle knowledge of activities in other areas. Training courses on thelessons learned from the numerous pilot programs in other areas need to bedeveloped and disseminated widely. As the competence of local governments ispositively correlated with income levels, institutional strengthening needs tobe concentrated in relatively poorer areas. This would be a naturalcomplement to increased sectoral programs in these areas. Furthermore, theCentral Government could consider providing additional financial resources tothose local governments which develop and implement effective povertyprograms. This would encourage the innovation and initiative, which are vitalto sustaining the momentum of poverty reduction programs.
C. The Role of Community Groups in Poverty Programs
6.12 This report has identified a number of areas where community groupscould play a larger role in the design and implementation of poverty programs.Due to their flexibility and knowledge of the community, such groups can in
1/ The analysis of the education, health and nutrition module of the 1987SUSENAS for this report highlighted a number of areas where inadequatesurvey design limited the usefulness of the data for designing sectoralprograms. For example, the question on distance to a health facilitywas asked only of those who actually sought treatment, not all surveyrespondents, obviously precluding a complete analysis of theaccessibility of health facilities.
- 135 -
many instances reach the poor more effectively than large Government programs.Moreover, the active involvement of these groups in Government programs tendsto increase village acceptance of government programs and thus, increaseparticipation. Involvement of community groups can also ease the financialand staff costs of implementing labor-intensive poverty programs. This lastsection describes the multitude of community groups in Indonesia, highlights afew of their contributions to national development, and suggests severalapproaches to enhance their engagement in Government poverty programs.
Community Organizations in Indonesia
6.13 The plethora of community organizations./ in Indonesia can be dividedinto four categories:
(a) LSM (Lembaga Swadaya Masyarakat), that is, community self-helporganizations such as village-level precooperatives;
(b) LPSM (Lembaga Pembina Swadaya Masyarakat), that is, agencies thatpromote self-help groups;
(c) other community-service and social organizations; and
(d) semigovernmental organizations.
The characteristics and functions of organizations in each category arebriefly discussed below.
6.14 Community self-help organizations. There are many traditional groupsat the village level: mosque committees, rudimentary cooperative savingsgroups (such as arisan), and reciprocal work arrangements and traditions (suchas zotong royong). There are also a scattering of formal organizations thatare not subsidiary to the official village structures: some water users'associations, for example, or LPSM-organized cooperatives. Finally, there area growing number of government-sponsored village-level groups. These areoften promoted by local volunteers (kaders). Local family planning groups andnonformal education groups have both proven effective in reaching the poorwith social services and income-generating programs. The number ofofficially-promoted groups is difficult to judge, as one group may drawresources from and be counted by various sectoral ministries.
6.15 Agencies that promote self-help. There are over two hundred privateIndonesian LPSMs, including networks. Most Indonesian LPSMs started in the1970s or 1980s. The biggest has only about 250 staff members, which is smallin comparison to local NGOs in some other Asian countries.2/ The LPSMs are
21 What are here called community organizations are called"nongovernmental organizations (NGOs)" in many countries. "LSM" and"LPSM" are a uniquely Indonesian terminology.
21 For example, BRAC in Bangladesh has 6,000 staff.
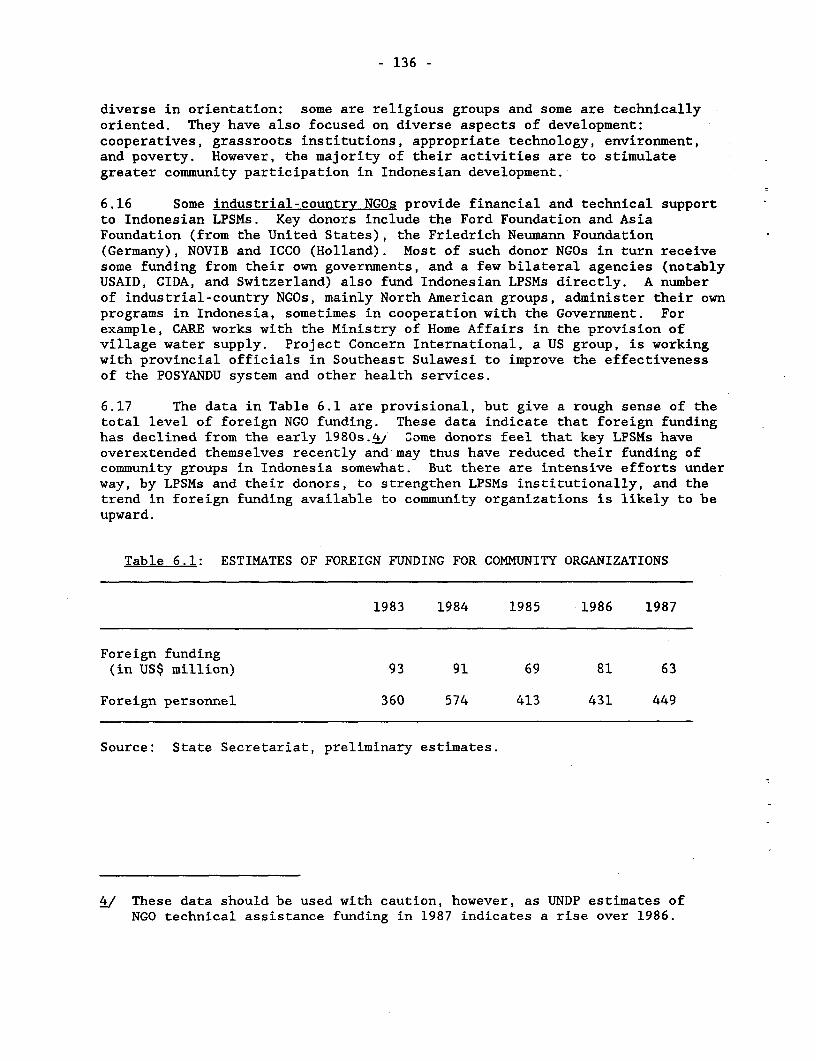
- 136 -
diverse in orientation: some are religious groups and some are technicallyoriented. They have also focused on diverse aspects of development:cooperatives, grassroots institutions, appropriate technology, environment,and poverty. However, the majority of their activities are to stimulategreater community participation in Indonesian development.
6.16 Some industrial-country NGOs provide financial and technical supportto Indonesian LPSMs. Key donors include the Ford Foundation and AsiaFoundation (from the United States), the Friedrich Neumann Foundation(Germany), NOVIB and ICCO (Holland). Most of such donor NGOs in turn receivesome funding from their own governments, and a few bilateral agencies (notablyUSAID, CIDA, and Switzerland) also fund Indonesian LPSMs directly. A numberof industrial-country NCOs, mainly North American groups, administer their ownprograms in Indonesia, sometimes in cooperation with the Government. Forexample, CARE works with the Ministry of Home Affairs in the provision ofvillage water supply. Project Concern International, a US group, is workingwith provincial officials in Southeast Sulawesi to improve the effectivenessof the POSYANDU system and other health services.
6.17 The data in Table 6.1 are provisional, but give a rough sense of thetotal level of foreign NGO funding. These data indicate that foreign fundinghas declined from the early 1980s.W/ Some donors feel that key LPSMs haveoverextended themselves recently and may thus have reduced their funding ofcommunity groups in Indonesia somewhat. But there are intensive efforts underway, by LPSMs and their donors, to strengthen LPSMs institutionally, and thetrend in foreign funding available to community organizations is likely to beupward.
Table 6.1: ESTIMATES OF FOREIGN FUNDING FOR COMMUNITY ORGANIZATIONS
1983 1984 1985 1986 1987
Foreign funding(in US$ million) 93 91 69 81 63
Foreign personnel 360 574 413 431 449
Source: State Secretariat, preliminary estimates.
i/ These data should be used with caution, however, as UNDP estimates ofNGO technical assistance funding in 1987 indicates a rise over 1986.
- 137 -
6.18 Other community-service and social organizations. The IndonesianLPSMs and industrial-country NGOs are complemented by a much wider array ofnongovernmental institutions. These include religious institutions,university-related institutions, local foundations, and associations. Themost extensive of these are religious institutions. There are myriad Mosleminstitutions, many of which are actively involved in development activities.For example, the evolution of Indonesia's estimated 6,000 nesantren seems tobe a development success story. In the 1960s, an LPSM called LP3ES (withfunding from the Friedrich Neumann Foundation) began to help pesantren engagein community development activities. LP3ES and others succeeded inintroducing new elements into the curricula of some pesantren (instruction inagricultural methods, for example). Some 300-400 pesantren now have communitydevelopment outreach activities, especially for the rural poor. Christianchurches also provide social services on a significant scale; church-relateddevelopment activities are especially important in several of the OuterIslands.
6.19 Universities also contribute. All university students must spend twomonths in a village doing community development work, and this program (calledKKN) is administered by the universities. Many private universities areadministered as foundations (yavasans), and public universities oftenestablish yayasans (institutes of social research, for example). Finally,various professional and interest groups maintain associations. TheTuberculosis Association used to concentrate on public information, butcutbacks in the official health budget have led the Association to getinvolved in service delivery too. Youth and hiking groups have added strengthto Indonesia's environmental movement.
6.20 Semigovernmental organizations. At the end of the 1970s, theGovernment recognized the need for greater community participation indevelopment and activated two semigovernmental organizations, the LKMD andPKK. The LKMD (Village Community Resilience Institution) is an officialcommunity development forum. The PKK (Family Welfare Movement) is anationwide women's organization, which serves at the local level as thewomen's auxiliary to the LKMD. The LKMD and PKK are intended to help villageleaders mobilize the population to take part in government programs and arecurrently serving as the basic units for "bottom-up planning." Each LKMD ischaired by the village headman and includes other village leaders. The PKK ischaired by the headman's wife. At the district, provincial, and nationallevel, the PKK is chaired by the wife of the highest-ranking officer in theMinistry of Home Affairs.
6.21 It is a substantial achievement that the LKMD and PKK can be found inat least rudimentary form in virtually every Indonesian village. The PKKestimates its membership as two million nationwide. In many villages, theLKMD and PKK do significant work. During the 1980s, numerous Governmentprograms have been launched that depend on village kaders, normally members ofthe PKK. An anthropological study of kaders in five villages found that manyof them spend as much as 20 hours a week in community activities, atconsiderable cost in terms of lost income and time away from household work.The quality of the services performed by the LKMD and PKK varies considerablyfrom area to area. Similar to some official programs, the LKMD and PKK areweakest in relatively remote and poor areas where they are needed most. Thus,
- 138 -
any efforts to strengthen Government programs in poor areas would need toinclude a component to also strengthen the LKMD and PKK, if they are involvedin service delivery.
6.22 Indonesia has a uniquely strong tradition of women's associations,now dominated by the PKK, Dharma Pertiwi (military wives), and Dharma Wanita(wives of civil servants). The national council of women's associations(KOWANI) includes 64 women's associations. These associations serve a numberof functions, including development work.
6.23 Village cooperatives are aggregated together into one KUD (KoperasiUnit Desa). These KUDs serve as middlemen in the marketing of agriculturalinputs and rural credit provision. However, only a small proportion of KUDsare self-sufficient and financially sound.j/ In addition, there is somequestion about to what extent the KUDs benefit lower income groups..i/REPELITA V envisions a growing role and increasing independence for KUDs.Current plans aim to encourage independence among cooperatives mainly throughadditional training of cooperative managers. Over the long run, the subsidiesand special treatments accorded to the KUDs need to be reviewed.
6.24 In aggregate, there is a significant involvement of community groupsin Indonesia. A joint study by the Ministry of Home Affairs and a NGO ofcommunity participation in 12 villages of Java found that about half of thoseinterviewed actively participated in LKMD, PKK, or other semigovernmentalactivities. About a third were involved in more strictly governmentalprograms (KUD, an official development project, family planning, agriculturalextension, etc.). About a third said they were involved in an NGO activity (aself-help group, voluntary social organization, irrigation association, etc.).There was probably much overlap, with less participation among lower-incomefamilies.
Role of Community Groups in Existing Development Programs
6.25 Community groups have been actively participating with the Governmentin a number of development programs. Government officials have realized thatmany projects can be wasteful and ineffectual without the involvement of thecommunity, and the fiscal constraints of the 1980s have provided an additionalimpetus in seeking greater community participation. LPSMs have long workedmore closely with Government agencies in Indonesia than do NGOs in manydeveloping countries. The paragraphs below describe how community groups areassisting the Government in the implementation of development activities infamily planning, health, irrigation, and the KIP; these are all programs whichfigure prominently in a poverty reduction strategy, as discussed in thepreceding Chapters.
5/ See, Indonesia: Rural Credit Sector Review, op.cit., Annex 6, p. 4.
i./ See, Rural Indonesia: Socio-Economic Development in a ChangingEnvironment, IFAD Report No. 0055-IND, May 1988, p. 248.
- 139 -
6.26 Family planning. The Indonesia Family Planning Association advocatedfamily planning and provided some services long before family planning becameofficial policy. In the late 1960s, the Government's family planning program(BKKBN) was launched by a semigovernmental agency which included the FamilyPlanning Association; the Association initially trained several thousandofficial family-planning workers. Collaborating with religious groups hasbeen a key reason for the success of the Government's family planning program.Women's associations have also played an important role.
6.27 BKKBN now dominates Indonesia's family planning efforts. Communitygroups serve a small percentage of family planning acceptors; estimates rangeup to only 10%. But BKKBN has consistently promoted family-planning groups,sometimes with grant funding. These groups have assisted in service provisionand the testing of innovative approaches. For example, when BKKBN discoveredthat the proportion of acceptors was lower in cities than in rural areas, itencouraged several NGOs to study the problem and then try out new approaches(better and more personalized services, charging for services, longer hours of
operation). The initiative of these groups has been an important element ofthe Government's recent success in raising the percentage of acceptors inurban areas. BKKBN has also worked with LPSMs that are not primarilydedicated to family planning; it has, for example, relied on a NGO to helpdesign and provide training for BKKBN staff to introduce income-generatingactivities into family-planning acceptor groups.
6.28 Health. In the health sector, the PKK has mobilized local volunteersto assist in the operation of the POSYANDUs. The PKK, too, has turned toLPSMs to help train its leadership and kaders. Furthermore, in 1986 UNICEFand the Ministry of Religious Affairs invited 12 religious women'sorganizations (Moslem, Christian, and Hindu) to share child-survivalinformation with their members. UNICEF helped prepare separate trainingbooklets about child survival for each of these groups, so that the messagewas relevant to each religious group. By January 1988, the groups togetherhad reached some 7 million women with basic child-survival information at acost of US$0.10 per woman. Preliminary indications are that the program hassubstantially increased attendance at POSYANDUs, and UNICEF is planning anevaluation through PUSKESMAS doctors.
6.29 Irrigation. Traditional irrigation systems were often managed bylocal organizations of farmers. But the dramatic expansion and improvement ofirrigation over the last two decades weakened these water users' groups, withPublic Works officials assuming more responsibility for the design, operation,and maintenance of irrigation systems. In many cases, irrigation engineerstend to be somewhat insensitive to farmers' needs and suggestions. Also,farmers have come to look to government officials to pay for, operate, andmaintain irrigation systems. But because of the expansion of the system,Public Works officials were not able to operate and maintain all parts of thesystem, particularly at the tertiary level.
6.30 In 1981, the Ford Foundation began financing research on this issueby universities and a NGO. Experimentation was also undertaken by a NGO withthe strengthening of water users' associations. This action researchdemonstrated that farmers could maintain and improve small-scale irrigationsystems. This effort involved the Ministry of Public Works at an early stage
- 140 -
and helped to promote a learning process among officials in which the NGOplayed a significant role. This culminated in a 1986 Government decision toturn over all irrigation systems smaller than 500 ha to water users'associations.7/ This will be one of the most important delegations ofresponsibility to rural citizens since the New Order was established. Fullimplementation of this policy still requires the resolution of a number ofissues, including the status of the water users' associations that are toassume responsibility for small irrigation systems.
6.31 Urban development. A study of the Kampung Improvement Program inSurabaya documents the beginnings of Indonesia's KIP at the end of the l960s.V.Initially, community associations played a large role, covering much of thecost themselves and soliciting assistance for specific projects fromofficials. During the mid-1970s, the pace of kampung improvement wasincreased, but community participation was limited mainly to LKMD approval ofplans. UNDP then experimented with participatory improvement projects inSemarang and Surakarta, and this approach is now also being introduced inJakarta. LPSMs are involved in the planning and in helping to stimulatecommunity participation and improve the functioning of LKMD. Kampungimprovement is now focusing on those aspects of neighborhood development inwhich community participation is crucial: home improvement, latrines, andhealth.
Enhancing the Role of Community Groups in Poverty Programs
6.32 In the past, official policy toward community groups was verycautious. But as discussed above, community participation has come to featuremore prominently in Government thinking. The development of the LKMD and thePKK in the 1980s has been intended to elicit broader and more active socialparticipation in development. Meetings and consultative mechanisms betweenofficials and LPSMs have become increasingly frequent. The Guidelines forState Policy (GBHN) and REPELITA V both stress the need for greater communityparticipation in development.
6.33 There are several ways in which community groups can contribute toofficial poverty reduction programs.2/ First, LPSMs and other communitygroups can increase the poor's participation in poverty programs. Many of thepoor are illiterate or live in isolated areas, so the job of reaching the poorand educating them about existing Government programs is a difficult task.Community groups can be encouraged to mobilize the poor and thereby help them
1 This policy is being supported under the World Bank's IrrigationSubsector Loan.
t/ See Johan Silas, "Community Participation and Urban Development"(prepared for the Asian seminar on Community Participation organized byAPDC/EDI/UNCRD, Kuala Lumpur, 9 July 1988).
i/ For a fuller discussion, see Samuel Paul, "Poverty Alleviation andParticipation: The Case for Government-Grassroots AgencyCollaboration," Economic and Political Weekly, January 14, 1989.
- 141 -
to benefit more from poverty programs. Second, community groups can beinvolved in the planning and delivery of poverty programs. Examples of thisare PKK involvement in POSYANDUs and the community participation component ofthe KIP currently envisioned during the REPELITA V period. Moreover, theGovernment is planning to delegate responsibility for implementing a watersupply project under a World Bank loan to a leading NGO. This would representa major step in allowing these groups more participation in the developmentprocess. Third, community groups can monitor the implementation andeffectiveness of Government development programs. Recently, a leading NGO hasbeen assisting the Government in monitoring the results of the expandedstandpipe program, discussed in the previous Chapter. Finally, the Governmentcan draw upon the initiatives of community groups to develop a nationalprogram. Frequently, LPSMs will develop an effective approach for assistingthe poor and test it on a small scale. The Government can learn from theexperience and support replication of the program on a wider scale. A recentUSAID study lists 20 lines of development activity in which community groupsin Indonesia have helped to develop innovations.
6.34 The Government could consider several initiatives during theREPELITA V period to foster community participation in the design and deliveryof its poverty reduction programs, thereby enhancing their effectiveness andexpanding their reach.
(a) Most important would be steps to allow LPSMs more scope forinitiative. Although key high-level officials appreciate many LPSMcontributions, there is less receptivity at the provincial and locallevels. Government staff, especially Ministry of Home Affairsofficials at provincial and local levels, could be encouraged tolearn about the activities of community groups within their areas.Meetings at the provincial level would broaden official understandingof LPSMs and might also be an opportunity to share information andimprove LPSM understanding of official perspectives and plans. Oneor two national-level LPSMs might be engaged by GOI to helpprovincial officials plan such meetings, to enhance the effectivenessof these contacts.
(b) As advocated in REPELITA V, the Government will continue tostrengthen the LKMD and PKK as they are performing importantfunctions in the delivery of a number of social services. Thisprocess was facilitated in the 1990/91 Budget when funding for thePKK was increased substantially. Efforts and experiments are alsoalready underway to make LKMD and PKK more participatory. For thepurpose of poverty reduction, it is especially important tostrengthen the LKMD and PKK in remote, lower-income parts ofIndonesia. LPSMs might be contracted to help in this process. Thereis also a promising new initiative being developed by the PKK toreach families in extreme poverty by organizing village women intogroups of 10-20. Kaders would be asked to identify the neediestfamilies represented in each of these groups and to help them getappropriate assistance.
- 142 -
(c) Various Government agencies have been expanding their use of LPSMs asconsultants for training and assistance on the community developmentaspects of official programs. Future expansion of foreign fundingfor Indonesian LPSMs could help Government achieve its povertyreduction objectives. The Government itself might find grants toLPSMs an effective approach in certain sectors or provinces. But inother situations, Government grant funding to LPSMs might workagainst the tentative trend toward greater community initiative.
6.35 The Government and donors need to be realistic about the role thatcommunity groups can play in poverty reduction programs. LPSMs are very smallin Indonesia. Their geographical coverage is uneven, and they are weak insome of the areas characterized by a high incidence of poverty. Some LPSMs,especially local groups, suffer from the same problems as many localgovernments: a lack of management skills, qualified staff, and equipment andfacilities. LPSMs and semigovernmental organizations cannot substitute forkey Government services; for example, the POSYANDU program has clearlysuffered in some areas from too little logistical support from theGovernment's own health staff. But at the margin, community groups can have apositive effect on reaching the poor and improving the efficiency ofGovernment programs.
- 143 - ANNEX IPage I of 4
INDONESIA
STRATEGY FOR A SUSTAINED REDUCTION IN POVERTY
The National Socioeconomic Survey (SUSENAS)
Introduction
1. The Central Bureau of Statistics (CBS) has conducted periodically,since 1963/64, a National Socioeconomic Survey; it is generally referred to asthe SUSENAS, which is the abbreviation for the Indonesian title, Survey SosialEkonomi Nasional.l/ The SUSENAS is a household consumption survey rather thanan expenditure survey. It provides detailed household expenditure data forboth food and nonfood items and for food items, data on quantities consumed.This is an advantage over the expenditure surveys carried out in a number ofdeveloping countries because it does not just ask how much was spent on foodexpenditures, but also asks how much was actually consumed from varioussources, including market expenditure, consumption from own production andtransfers.
2. The analysis in this report is based primarily upon the 1984 and 1987SUSENAS surveys. The 1984 survey was conducted in February 1984 and the 1987survey was conducted in January 1987. Both surveys involved slightly morethan 50,000 households. The 1987 SUSENAS also contained a socioeconomicmodule which surveyed the educational status of the individual members of eachhousehold, their health status including information about the type oftreatment received, and nutritional information on children under the age offive..2/
Reliability of the SUSENAS
3. It is difficult to assess the reliability of the SUSENAS surveys.One indicator of reliability is its coverage of the population. This can bemeasured by comparing the SUSENAS with the national accounts consumption data.In constructing the private consumption component of the national accounts,CBS uses the various SUSENAS surveys (primarily to estimate incomeelasticities), in conjunction with the food balance sheets and the Input-
1/ For a thorough discussion of the SUSENAS and its use for modellingconsumer behavior, see Dominique van de Walle, "On the Use of theSUSENAS for Modelling Consumer Behavior", Bulletin of IndonesianStudies, Vol. 24, No. 2, August 1988, pp. 107-122.
/ This information forms the basis of the analysis contained inChapter IV.
- 144 - ANNEX IPage 2 of 4
Output (I0) tables..2/ Evidence from the food balance sheets and the I0 tablesindicate that the SUSENAS surveys underestimate private consumption of bothfood and non-food items and therefore, total private consumption.V/ Thiscorroborates the discussion in Chapter 1 on the underestimation of averagecaloric intake in the SUSENAS. Moreover, preliminary information from CBSindicates that the SUSENAS underestimation may be increasing over time.However, since the distribution of the underestimation across income classesis not known (see para. 4 below), the effect on the aggregate povertydistributions is unclear.
4. There are several possible sources of this discrepancy. First,services and/or transfers provided by the Government to private households arenot generally covered by the SUSENAS. But, the magnitude of the discrepancyis too large to be accounted for solely by this omission. Second, it isprobable that SUSENAS surveys do not adequately cover consumption by upper-income groups, in particular, their expenditures on consumer durables, real,estate rentals, and consumption of luxury goods and services. Third, it isinherently difficult to survey certain types of households--tribal peoples,people living in remote and isolated areas and individuals without a fixedabode. A disproportionate number of these may be poor. For example, it isnot implausible that the itinerant urban poor in large cities, such as Jakartaare not well represented in the SUSENAS survey.5/ Moreover, it also seemslikely that SUSENAS data do not reflect some aspects of consumption by lower-income groups, such as meals provided by employers.
5. Another potential source of measurement error in the SUSENAS surveyis from recall error. To measure the extent of recall error in the SUSENAS,BPS conducted a reliability survey of the 1987 SUSENAS. For this reliabilitysurvey, about 1,200 SUSENAS families were selected and their food consumptionwas recorded daily in the week preceding the regular SUSENAS enumeration. Acomparison of the daily enumeration with the results from the SUSENASinterview gives an indication of the amount of recall error in the SUSENAS.The results of this exercise for 1987 suggest that food consumption of lower-
3/ The methodology for constructing the private consumption component ofthe national accounts is currently under review and the estimates ofprivate consumption expenditures in the most recent national accountseries are likely to be modified.
4/ See D. Dapice, "Trends in Income Distribution and Levels of Living1970-75", in G. Papanek (ed.), The Indonesian Economy, 1980, Praeger,New York.
5/ However, a recent survey of housing in urban Indonesia, financed underthe Bank's Housing Sector Loan, found a roughly similar proportion ofurban residents in lower income brackets as the 1987 SUSENAS; seeChapter V for details of this survey.
- 145 - ANNEX IPage 3 of 4
income families is overestimated and of higher-income families underestimated.A regression analysis between weekly food expenditures recorded by the 1987SUSENAS and the 1987 reliability survey yielded the following equation:
Food expenditures - 3404.13 + 0.765819 x Food Expenditures1987 SUSENAS (0.022) Reliability Survey
adj. R2 = 0.51(the standard error of the estimate is in parenthesis)
Use of SUSENAS to Measure Poverty
6. Virtually all studies of poverty in Indonesia have used SUSENAS dataas the measure of the standard of living. In this report, the 1984 and 1987SUSENAS surveys are also used in the assessment of poverty and its trend.Hence, the view taken here is that while the SUSENAS data may not beappropriate for measuring changes in overall consumption shares, the data areuseful in assessing trends in average consumption of the poorest 40% and instudying trends in poverty incidence and the characteristics of the poor.
7. The following points should be noted about the SUSENAS survey and ouranalysis:
(a) The SUSENAS aims to provide a random sample (about 50,000 householdsin each year) of the entire population. However, given that it isdifficult to survey certain types of households and adisproportionate number of these may be poor, there may be somedownward bias in the absolute number of the poor as calculated fromthe SUSENAS. The trend will be unaffected as long as there has beenno increase in the proportion of these individuals.
(b) Following past practice, consumption per capita is calculated bydividing by the size of the household which makes no allowance forthe likely variation in consumption needs between different persons,according to (for example) age or gender. There is a largeliterature on the construction of equivalence scales which allow thenormalization to take account of such differences in householdcomposition, though there is no single ideal method for dealing withthis issue.V/ Future work on measuring poverty in Indonesia mightfruitfully address this issue, but for present purposes we shallfollow past practice.
i./ For a recent discussion and some evidence for Indonesia, see AngusDeaton and John Muellbauer, "On Measuring Child Costs: WithApplication to Poor Countries," Journal of Political Economy, 1986,94: 720-744.
- 146 - ANNEX IPage 4 of 4
(c) The SUSENAS provides only a single "snapshot" of the distribution ofconsumption. The estimates obtained will depend in part on the dateof interview, particularly in rural areas where past work has foundevidence of seasonality in consumption (as well as incomes).jZ/ The1984 and 1987 SUSENAS surveys used here were done at approximatelythe same time of the year in roughly comparable agricultural years,and so this is unlikely to be a problem for comparisons between thoseyears.8/
(d) The SUSENAS survey contains information on both income andconsumption expenditures. We have used consumption expenditures tomeasure the standard of living. The use of consumption rather thanincome is generally desirable in this setting, since income is moredifficult to measure, income fluctuates more due for example toseasonality, and households can save. It can be argued thatconsumption expenditures for a single date will, therefore, provide abetter measure of a household's standard of living.
(e) Income or expenditure based poverty assessments typically ignorepublicly provided goods, as these cannot be easily valued in terms ofmoney. Public services to the poor are clearly relevant to povertyassessments, but they are unlikely to be reflected in the consumptionexpenditure distributions used in the present study. Theavailability of these publicly provided services to the poor isdiscussed in Chapters IV and V of this report.
(f) The SUSENAS estimates household caloric intake by applying fixedcaloric food values to observed consumptions of about 170 categoriesof food and beverage for each household, based on seven-day recall bythe respondent. Caloric intakes are almost certainly underestimated,mainly because the quantity of food consumed outside the home,e.g., in street-side stalls and restaurants, is not recorded 9/(although expenditures on these items are classified elsewhere in thesurvey). This is more likely to bias the urban caloric distributionsthan those for rural areas. However, there is no obvious reason whythe problem should bias comparisons over time.
7/ This was found in a study of poverty in East Java based on the 1981SUSENAS which spanned the entire year. See, Martin Ravallion, "Povertyin East Java: Sectoral, Regional and Seasonal Profiles." in H. Dick,et al. (eds), The Development of East Java under the New Order, TheResearch School of Pacific Studies, The Australian National University,1988.
8/ The poor rice harvest of 1987 occurred after the SUSENAS interviews.
9/ See Dominique van de Walle, 1988, oR.cit., pp. 117-119.
- 147 - ANNEX IIPage 1 of 4
INDONESIA
STRATEGY FOR A SUSTAINED REDUCTION IN POVERTY
Issues in Price Deflation
Introduction
1. An important problem in comparing consumption levels across space andtime is that prices are not constant. For Indonesia the interregionaldifferences in prices at one point in time may be just as important as theusual intertemporal differences associated with inflation. The consumer priceindex (CPI) for Indonesia monitors price changes over time for bundles ofgoods which are predetermined in composition for each of a number of cities(spanning the archipelago), but are not, however, strictly comparable betweencities.l/ Nor can it be convincingly argued that the differences in goodscomposition across regions solely reflect consumer substitution effects. Itis quite likely that the bundle of goods is more "generous" in richer cities;therefore, the implicit reference utility level cannot be assumed to beconstant.
Construction of an Appropriate Price Index
2. In the absence of an ideal price deflator, we have based alldistributional comparisons in this report on the Ordinary CPI which ignoresspatial price variability in the base period, and simply adjusts prices forJanuary 1987 in each province to the corresponding February 1984 prices usingthe price index for its capital city (although with higher weights on foodexpenditure; see para. 8 below). The use of this index may, however, lead tosome overestimation of the regional disparities in living standards, since itignores spatial price variability which is likely to be positively correlatedwith nominal expenditures.
3. To construct a spatial distribution of prices, there are twoalternatives. The first is a spatially adjusted CPI, which uses theexpenditure data by city underlying the CPI to construct an index normalizingall 1987 consumptions to 1984 Jakarta prices. As noted in para. 1, this hasthe disadvantage that it reflects both price differences and incomedifferences between cities. A second alternative is the "Minimum PhysicalRequirements Index" (KFM) compiled by the Ministry of Manpower, whichreportedly is based upon the same urban expenditure basket for each province.
/ The index tracks changes in the cost of an average consumption bundlein each of 17 provincial capital cities; for other capital cities,shares are used for the city among the 17 provincial capital citieswhich is considered to be most similar in this respect (usually theclosest).
- 148 - ANNEX IIPage 2 of 4
These data, while published by the Central Bureau of Statistics, are collectedby Ministry of Manpower staff in the provincial offices. We were unable toobtain details of the expenditure basket, or the method of collection.Furthermore, the rate of inflation implied by this index is significantlyhigher than the CPI, as well as all other inflation measures in Indonesia.Therefore, this method of deflation was not used in our analysis.
4. Alternative analysis was undertaken with the spatially-adjusted CPI,realizing that this index was likely to lead to an underestimate of theregional disparities in living standards, because the implicit bundles ofgoods are not spatially constant. It turned out, however, that the choicebetween this deflator and the unadjusted CPI had a negligible effect upon thealternative estimates of aggregate poverty. Therefore, the results reportedfor the alternative poverty line are for the unadjusted CPI only.
Rural-Urban Price Differentials
5. No price index is, however, available for rural areas. Past practicehas been to make some assumption about the urban/rural cost-of-livingdifferential, reflecting the fact that the prices for most goods (particularlyfood and housing) tend to be higher in urban areas. For example, onIndonesia's most populous island, Java, it has been estimated that averagedwelling rents in 1981 were six times greater in urban areas than rural areas,while the price of the main food staple, rice, was on average only 10% higherin urban areas. Observations of this sort have often led investigators to usesubstantially different poverty lines for urban and rural areas of Indonesia.This practice has implications for the urban/rural disaggregation of thepopulation below the poverty line.
6. A proper treatment of these issues would require a demand systemanalysis to construct a true spatial cost-of-living index or money metricutility function. This is beyond the resources of the present inquiry.Nonetheless we can still learn something from recent research along theselines. One of the potentially most important lessons is that past workappears to have considerably overestimated the urban-rural cost-of-livingdifferential for Indonesia; a differential of about 10% appears to beplausible for the poor.2/
7. A comparison of the rate of inflation between urban areas and ruralareas indicates that there was not a significant difference between the twoareas (see Table 1). The best available indicator for rural inflation is thehousehold consumption component of the farmer's terms of trade index, which isbased upon household weights from the 1984 SUSENAS. However, this index isonly available for four provinces in Java. Except for Central Java, it showsa slightly lower rate of inflation in rural areas than shown by the CPI forurban areas. For the Outer Islands, the only available index is the Nine
2/ See, Martin Ravallion and Dominique van de Walle, op.cit.
- 149 - ANNEX IIPage 3 of 4
Essential Commodities Index. This index shows a lower rate of inflation thanthe CPI, but it is based on 1971 weights and its reliability is subject todebate. Therefore given the similarities in the rate of inflation, theconstruction of the real income and consumption distributions and thealternative estimates of poverty assumed a 10% differential in price levelsbetween rural and urban areas. The differential was also assumed to remainconstant between 1984 and 1987.
Measurement Errors in the CPI
8. A further potential source of error in the assessment of poverty isimprecision in the underlying price index. There are two problems with theCPI. First, the goods composition of the index is not ideal for measuring thestandard of living of the poor; the weight on food (particularly rice) isundoubtedly too low..2/ This does not, of course, mean that the CPI willunderestimate inflation for the poor; that also depends on how relative priceschanged. On disaggregating the CPI by commodity group we have found that therate of inflation between February 1984 and January 1987 was slightly higherfor the food group than the nonfood group in most provinces, though thedifference is small. There is, however, no reason why one need be confined tothe expenditure weights implicit in the CPI. For the purposes of this studywe have recalculated the price index using a higher food share, correspondingto the average expenditure share of the poorest 30% of urban households in1984 which was calculated to be 0.68, substantially higher than the CPI weightof about 0.45. Since the relative price between food and non-food changedlittle during the study period, this reweighting did not have much effect onthe poverty assessments.
9. Second, there is also some doubt about the methods used for compilingrice prices in the CPI. Average market prices are used. Though there doesnot appear to be any hard evidence, it is widely thought that average ricequality generally declined over the last ten years or so (with theintroduction of the new high-yielding varieties). Thus the use of averagemarket prices tends to put a downward bias on estimates of the cost of a givenquality of rice. World Bank staff have compared rates of rice price inflationimplied by the CPI with that of a specific grade of rice over the period1986-88. The results suggest that the recent rates of rice price increase foran approximately uniform quality of rice are higher than those implicit in theCPI. However the divergence has mainly occurred since mid-1987, seeminglyassociated with high rates of rice price increases as a result of that year'spoor harvest. The implicit rice price in the CPI tracks well with the monthlymarket price of a uniform quality of rice over the period of the presentstudy. Therefore, no adjustment has been made for rice price changes in thisstudy.
3/ See, Mulijanto, Consumer Price Index as an Indicator to AssessInflation: The Case of Indonesia, unpublished Master's thesis,Institute of Social Studies, The Hague, 1989.
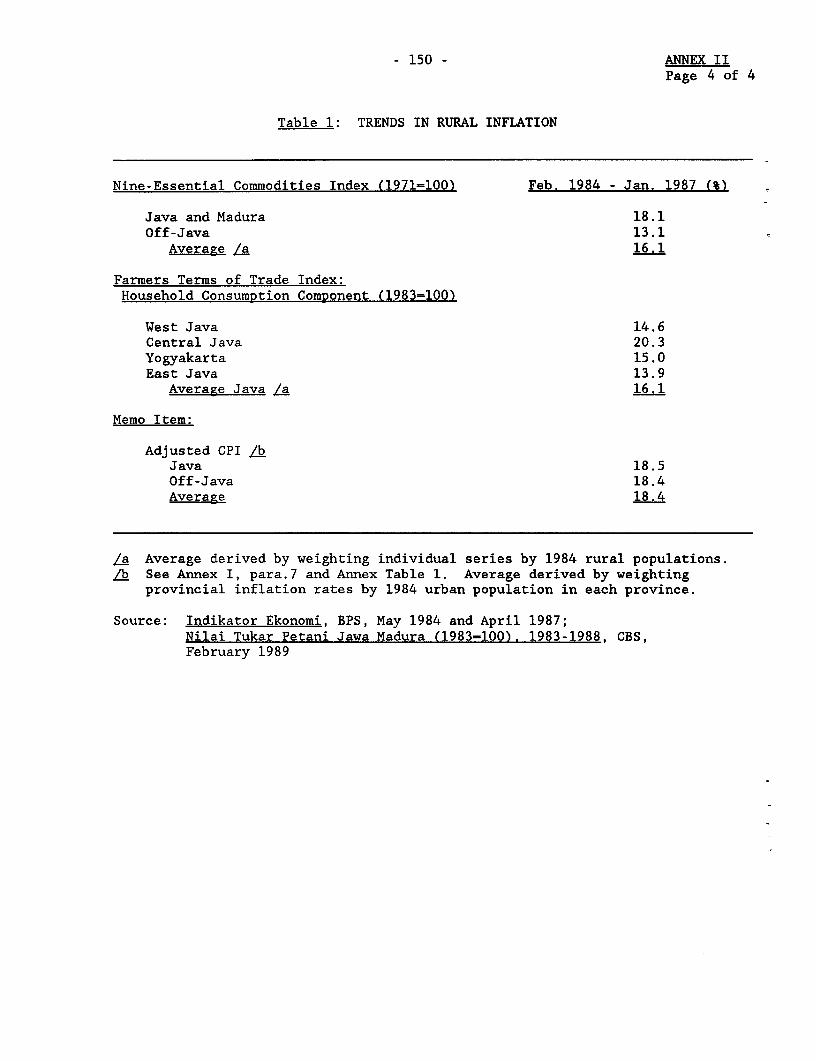
- 150 - ANNEX IIPage 4 of 4
Table 1: TRENDS IN RURAL INFLATION
Nine-Essential Commodities Index (1971=100) Feb. 1984 - Jan. 1987 (%)
Java and Madura 18.1Off-Java 13.1
Average /a 16.1
Farmers Terms of Trade Index:Household Consumption Component (1983=100)
West Java 14.6Central Java 20.3Yogyakarta 15.0East Java 13.9
Average Java /a 16.1
Memo Item:
Adjusted CPI /bJava 18.5Off-Java 18.4Average 18.4
,La Average derived by weighting individual series by 1984 rural populations./b See Annex I, para.7 and Annex Table 1. Average derived by weighting
provincial inflation rates by 1984 urban population in each province.
Source: Indikator Ekonomi, BPS, May 1984 and April 1987;Nilai Tukar Petani Jawa Madura (1983=100). 1983-1988, CBS,February 1989
- 151 - ANNEX IIIPage 1 of 15
INDONESIA
STRATEGY FOR A SUSTAINED REDUCTION IN POVERTY
Estimates of the Incidence of Poverty in Indonesia
Official Estimates of Poverty
1. The Central Bureau of Statistics (CBS) has calculated since 1976 anofficial poverty line for Indonesia disaggregated into urban and rural areas.The methodology underlying this estimate is based on two elements--a minimumdaily caloric intake and an allowance for other non-food basic necessities.The minimum daily caloric intake is set at 2,100 calories, the RecommendedDaily Dietary Allowance (RDA) by the 1978 National Workshop on Food andNutrition. There is no allowance for protein intake. In calculating theexpenditure level necessary to reach the RDA, the CBS divides lower incomehouseholds into several expenditures categories for both rural and urbanhouseholds. Then, the implicit SUSENAS "calorie price" is calculated bydividing food expenditures by the actual calories consumed. The "calorieprice" for that group in which total expenditures are just sufficient topurchase the RDA is then used to calculate the food component of the povertyline.
2. The allowance for other basic necessities is the percentage ofexpenditure by households in the selected expenditure category on a set ofnon-food basic needs. These non-food basic needs are divided into fourcategories of items: (i) housing, fuel, light and water; (ii) miscellaneousgoods and services; (iii) clothing, footwear and headwear; and (iv) durablegoods (i.e., utensils and dishes). Within these categories, different itemsare used for urban and rural households, reflecting different consumptionpatterns.
3. The Official Poverty line is then obtained by inflating the foodcomponent of the poverty line by the percentage of expenditures on these non-food items. The official poverty line and the incidence of poverty are shownfor the period 1976-87 in Tables 1 and 2, respectively.
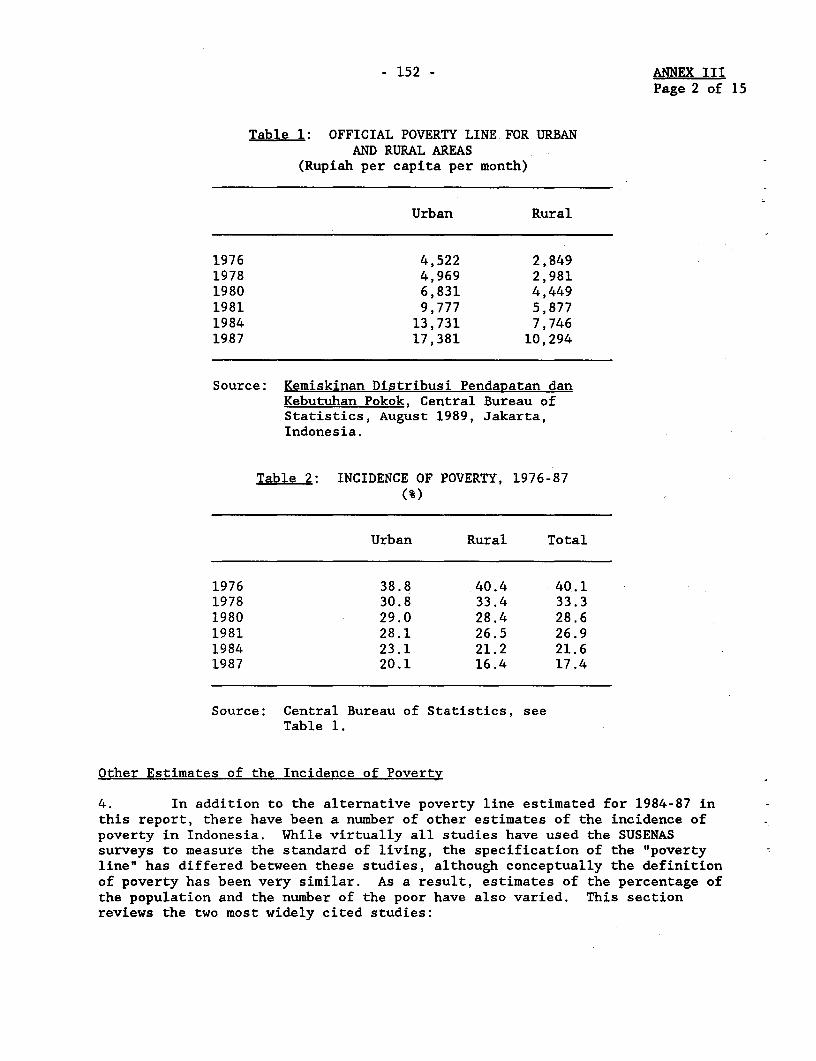
- 152 - ANNEX IIIPage 2 of 15
Table 1: OFFICIAL POVERTY LINE FOR URBANAND RURAL AREAS
(Rupiah per capita per month)
Urban Rural
1976 4,522 2,8491978 4,969 2,9811980 6,831 4,4491981 9,777 5,8771984 13,731 7,7461987 17,381 10,294
Source: Kemiskinan Distribusi PendaDatan danKebutuhan Pokok, Central Bureau ofStatistics, August 1989, Jakarta,Indonesia.
Table 2: INCIDENCE OF POVERTY, 1976-87
(%)
Urban Rural Total
1976 38.8 40.4 40.11978 30.8 33.4 33.31980 29.0 28.4 28.61981 28.1 26.5 26.91984 23.1 21.2 21.61987 20.1 16.4 17.4
Source: Central Bureau of Statistics, seeTable 1.
Other Estimates of the Incidence of Poverty
4. In addition to the alternative poverty line estimated for 1984-87 inthis report, there have been a number of other estimates of the incidence ofpoverty in Indonesia. While virtually all studies have used the SUSENASsurveys to measure the standard of living, the specification of the "povertyline" has differed between these studies, although conceptually the definitionof poverty has been very similar. As a result, estimates of the percentage ofthe population and the number of the poor have also varied. This sectionreviews the two most widely cited studies:
- 153 - ANNEX IIIPage 3 of 15
(a) Rao Estimate: An estimate calculated by V.V. Bhanoji Rao!/ and usedby the World Bank in previous studies.
(b) Sayogyo Estimate: An estimate by Professor Sayogyo2/ using rice asthe measure of the standard of living.
The following sections examine the methodology of these poverty estimates andupdate them through 1987. It is interesting to note that both of theseestimates show a significant decline in poverty over the adjustment period, asdoes the official line.
A. The Rao Method
5. This method uses the concept of a minimum daily caloric requirementnecessary to sustain life as a starting point, and then imputes the associatedcosts of basic social services (such as education, health care, etc.) toarrive at a Rupiah estimate of the poverty line.
6. The first step is to compute the value of food necessary to supplythe minimum energy level. The appropriate energy level for Indonesia is basedon FAO recommended levels for children and adults, and is 2,150 calories perperson per day. Rice and fish are two of the most common foods in Indonesia.Rao's investigation found that not only was rice consumption more widespread(than fish) throughout Indonesia, but rice also provided sufficient dietaryprotein (as prescribed by the FAO guidelines) to sustain life. In addition,rice is the cheapest source of both calories and protein. Thus, it wasselected as the principal source of calories. On this basis, a person wouldhave to consume about 17.6 kg of rice per month. Based on an analysis ofexpenditure patterns which suggest that other foods account for about 20% offood expenditure in 1980, it is inferred that rice only provides about 90% ofthe caloric requirement, with other foods accounting for the balance. Thusthe monthly rice consumption figure is revised downwards to 16 kg to accountfor the consumption of other foods. Once minimum food expenditures areestablished for each province by urban and rural areas, they are then inflatedby the average ratio of food to total expenditures to allow for other non-foodbasic expenditures. This adjustment is based on the average ratio of foodexpenditure to total expenditure on a provincial as well urban/rural basis. Aprovincial poverty line for both urban and rural areas is then calculated, onwhich the distribution of poverty is based. The calculation of the provincialpoverty line is summarized below:
1/ Poverty in Indonesia. 1970-80: Trends. Associated Characteristics andResearch Issues, V.V. Bhanoji Rao, mimeo, World Bank, 1984. Also see,Indonesia: Policies and Prospects for Economic Growth andTransformation, World Bank, Report No.5066-IND, April 26, 1984.
.2 Usaha Perbaikan Gizi Keluarga, Bogor Agriculture Institute, 1975; andRural Poverty and Efforts for Its Alleviation in Indonesia. ASociological Review, Sayogyo and C. Wiradi, FAO, 1985.
- 154 - ANNEX IIIPage 4 of 15
(i) Food expenditure for 90% of caloric requirement - Exp.rice(This is the value of 16 kg of rice)
(ii) Total food expenditure - (Exp.rice)xl.25(Rice expenditure inflated by 25%)
(iii) Average of food expenditure in total expenditure = X(This is estimated for each region)
(iv) Poverty line for province - (ExR.rice)1.25x
The estimation of this poverty line depends crucially on the price of rice,and the adjustments for nonrice food expenditures and nonfood expenditures.
7. Rice prices on a provincial basis are available from two sources--CBSprices and the implicit SUSENAS rice price. The implicit SUSENAS rice pricewas calculated for each household based on the reported consumption of eachtype of rice. Four types of rice are enumerated: locally-grown rice; hybridrice; imported rice; and glutinous rice. The respondents reported consumingrice received as a gift, as part of a ration allocation, which they purchasedand their own production. Consumption of rice grown in the household waslimited to rural areas only. In 1984 the average rice price was Rp.329 perkg, with the average urban price 10% higher than the average rural price.This had risen to Rp.410 per kg by 1987, with similar variations between urbanand rural prices.
8. The implicit SUSENAS rice price was preferred as it is a betterindicator of the actual inter- and intraregional quality differences in rice.CBS prices are available only for selected grades. Figure 1 compares averageurban rice prices implicit in the SUSENAS to CBS urban prices. The CBS priceis for a representative medium grade. While the mean rice price is roughlyequivalent between the two sources, there is a considerable variation inprices by province. The correlation coefficient between the provincial riceprices is only 0.45 in 1987.
9. Tables 3 and 4 show the provincial poverty lines by rural and urbanareas using implicit SUSENAS rice prices and the ratio of food to totalexpenditures, computed by Rao for February 1980. Tables 5-8 detail similarestimates of poverty lines for 1984 and 1987 based on the 1984 and 1987SUSENAS surveys. Table 9 presents estimates of the percentage of thepopulation considered poor using these poverty lines.
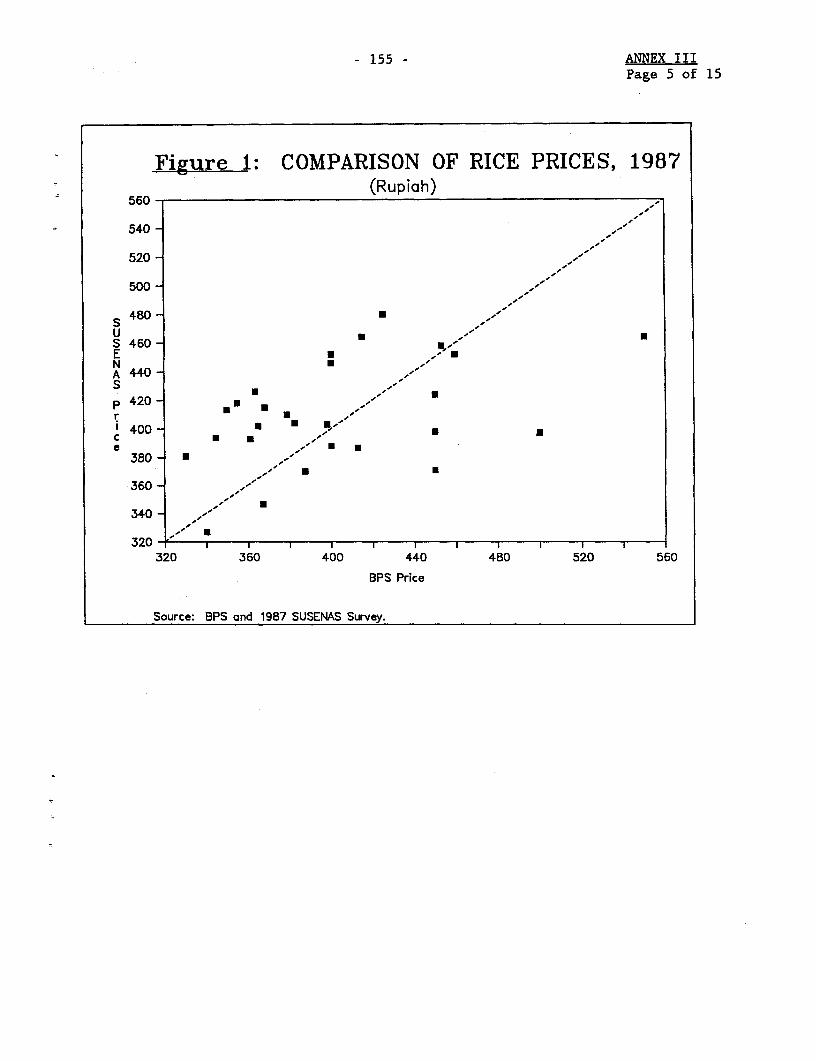
- 155 - ANNEX IIIPage 5 of 15
Figure 1: COMPARISON OF RICE PRICES, 1987(Rupiah)
560 -,
540 --
520 -
500-
480 -
S 460P-E -NA 440-Sp 4 2 0 7
1400 c m~~~~
eu380 3 -
360-
340-
320 - I
320 360 400 440 480 520 560
BPS Price
Source: BPS and 1987 SUSENAS Survey.
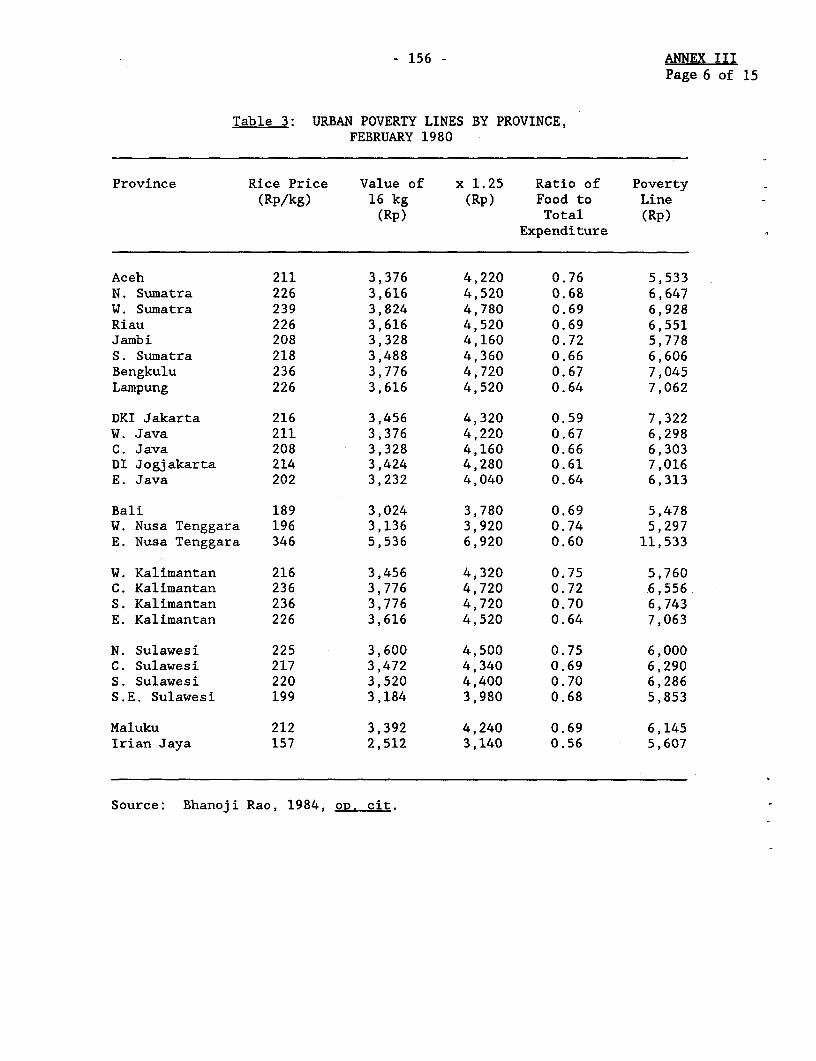
- 156 - ANNEX IIIPage 6 of 15
Table 3: URBAN POVERTY LINES BY PROVINCE,FEBRUARY 1980
Province Rice Price Value of x 1.25 Ratio of Poverty(Rp/kg) 16 kg (Rp) Food to Line
(Rp) Total (Rp)Expenditure
Aceh 211 3,376 4,220 0.76 5,533N. Sumatra 226 3,616 4,520 0.68 6,647W. Sumatra 239 3,824 4,780 0.69 6,928Riau 226 3,616 4,520 0.69 6,551Jambi 208 3,328 4,160 0.72 5,778S. Sumatra 218 3,488 4,360 0.66 6,606Bengkulu 236 3,776 4,720 0.67 7,045Lampung 226 3,616 4,520 0.64 7,062
DKI Jakarta 216 3,456 4,320 0.59 7,322W. Java 211 3,376 4,220 0.67 6,298C. Java 208 3,328 4,160 0.66 6,303DI Jogjakarta 214 3,424 4,280 0.61 7,016E. Java 202 3,232 4,040 0.64 6,313
Bali 189 3,024 3,780 0.69 5,478W. Nusa Tenggara 196 3,136 3,920 0.74 5,297E. Nusa Tenggara 346 5,536 6,920 0.60 11,533
W. Kalimantan 216 3,456 4,320 0.75 5,760C. Kalimantan 236 3,776 4,720 0.72 6,556S. Kalimantan 236 3,776 4,720 0.70 6,743E. Kalimantan 226 3,616 4,520 0.64 7,063
N. Sulawesi 225 3,600 4,500 0.75 6,000C. Sulawesi 217 3,472 4,340 0.69 6,290S. Sulawesi 220 3,520 4,400 0.70 6,286S.E. Sulawesi 199 3,184 3,980 0.68 5,853
Maluku 212 3,392 4,240 0.69 6,145Irian Jaya 157 2,512 3,140 0.56 5,607
Source: Bhanoji Rao, 1984, OR. cit.
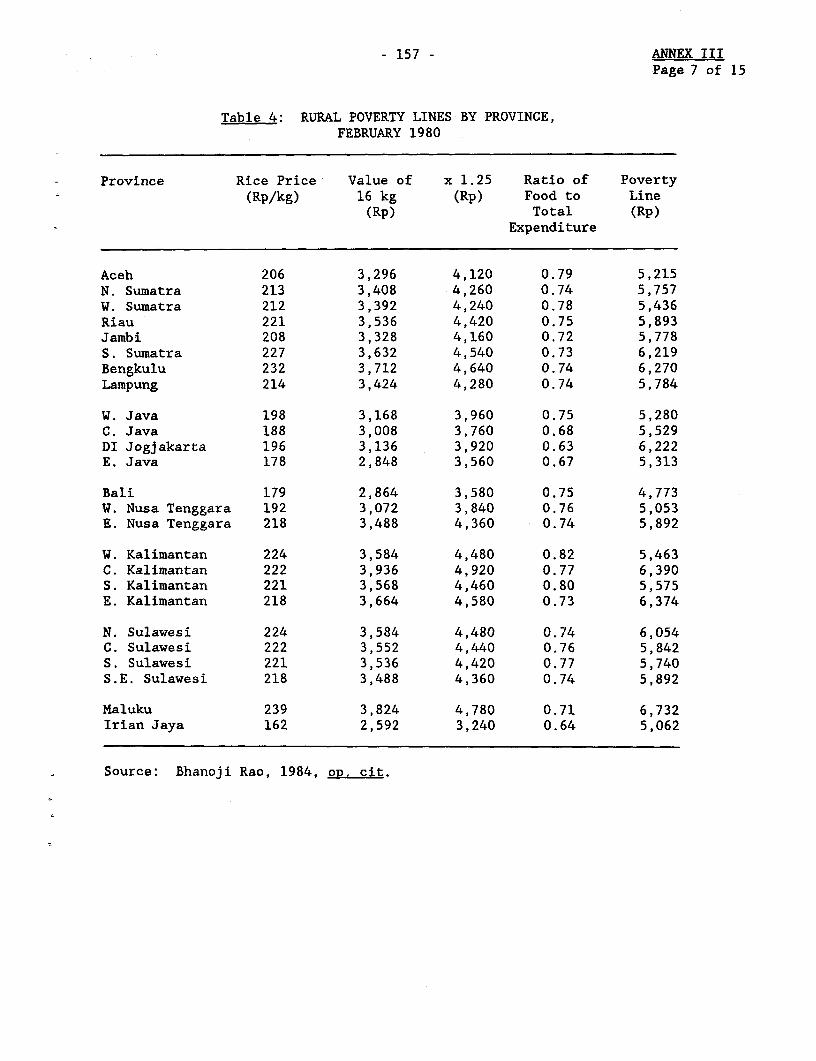
- 157 - ANNEX IIIPage 7 of 15
Table 4: RURAL POVERTY LINES BY PROVINCE,FEBRUARY 1980
Province Rice Price Value of x 1.25 Ratio of Poverty(Rp/kg) 16 kg (Rp) Food to Line
(Rp) Total (Rp)Expenditure
Aceh 206 3,296 4,120 0.79 5,215N. Sumatra 213 3,408 4,260 0.74 5,757W. Sumatra 212 3,392 4,240 0.78 5,436Riau 221 3,536 4,420 0.75 5,893Jambi 208 3,328 4,160 0.72 5,778S. Sumatra 227 3,632 4,540 0.73 6,219Bengkulu 232 3,712 4,640 0.74 6,270Lampung 214 3,424 4,280 0.74 5,784
W. Java 198 3,168 3,960 0.75 5,280C. Java 188 3,008 3,760 0.68 5,529DI Jogjakarta 196 3,136 3,920 0.63 6,222E. Java 178 2,848 3,560 0.67 5,313
Bali 179 2,864 3,580 0.75 4,773W. Nusa Tenggara 192 3,072 3,840 0.76 5,053E. Nusa Tenggara 218 3,488 4,360 0.74 5,892
W. Kalimantan 224 3,584 4,480 0.82 5,463C. Kalimantan 222 3,936 4,920 0.77 6,390S. Kalimantan 221 3,568 4,460 0.80 5,575E. Kalimantan 218 3,664 4,580 0.73 6,374
N. Sulawesi 224 3,584 4,480 0.74 6,054C. Sulawesi 222 3,552 4,440 0.76 5,842S. Sulawesi 221 3,536 4,420 0.77 5,740S.E. Sulawesi 218 3,488 4,360 0.74 5,892
Maluku 239 3,824 4,780 0.71 6,732Irian Jaya 162 2,592 3,240 0.64 5,062
Source: Bhanoji Rao, 1984, op. cit.
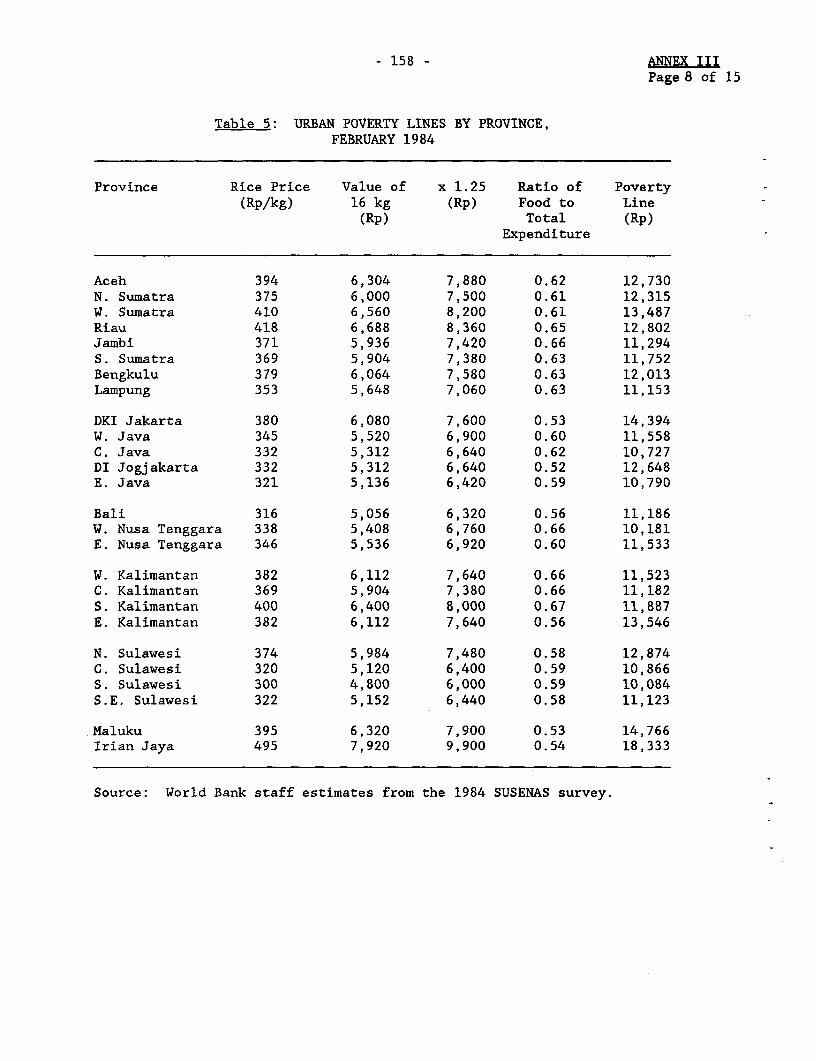
- 158 - ANNEX IIIPage 8 of 15
Table 5: URBAN POVERTY LINES BY PROVINCE,FEBRUARY 1984
Province Rice Price Value of x 1.25 Ratio of Poverty(Rp/kg) 16 kg (Rp) Food to Line
(Rp) Total (Rp)Expenditure
Aceh 394 6,304 7,880 0.62 12,730N. Sumatra 375 6,000 7,500 0.61 12,315W. Sumatra 410 6,560 8,200 0.61 13,487Riau 418 6,688 8,360 0.65 12,802Jambi 371 5,936 7,420 0.66 11,294S. Sumatra 369 5,904 7,380 0.63 11,752Bengkulu 379 6,064 7,580 0.63 12,013Lampung 353 5,648 7,060 0.63 11,153
DKI Jakarta 380 6,080 7,600 0.53 14,394W. Java 345 5,520 6,900 0.60 11,558C. Java 332 5,312 6,640 0.62 10,727DI Jogjakarta 332 5,312 6,640 0.52 12,648E. Java 321 5,136 6,420 0.59 10,790
Bali 316 5,056 6,320 0.56 11,186W. Nusa Tenggara 338 5,408 6,760 0.66 10,181E. Nusa Tenggara 346 5,536 6,920 0.60 11,533
W. Kalimantan 382 6,112 7,640 0.66 11,523C. Kalimantan 369 5,904 7,380 0.66 11,182S. Kalimantan 400 6,400 8,000 0.67 11,887E. Kalimantan 382 6,112 7,640 0.56 13,546
N. Sulawesi 374 5,984 7,480 0.58 12,874C. Sulawesi 320 5,120 6,400 0.59 10,866S. Sulawesi 300 4,800 6,000 0.59 10,084S.E. Sulawesi 322 5,152 6,440 0.58 11,123
Maluku 395 6,320 7,900 0.53 14,766Irian Jaya 495 7,920 9,900 0.54 18,333
Source: World Bank staff estimates from the 1984 SUSENAS survey.
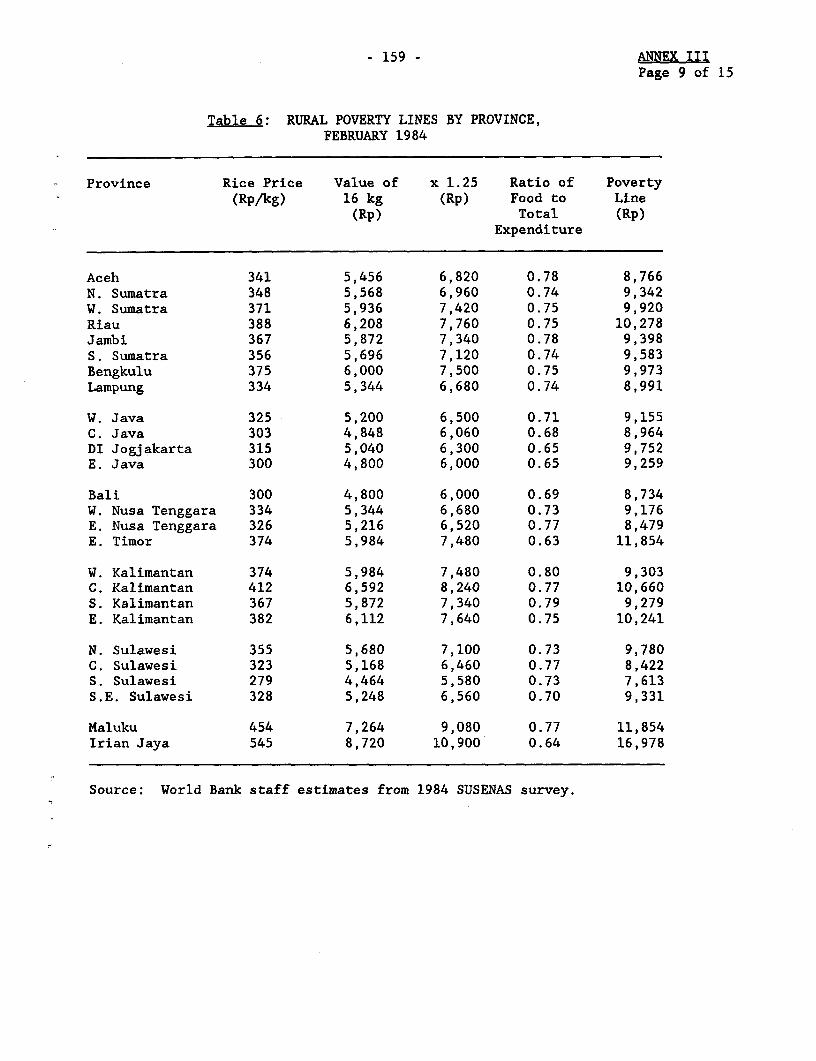
- 159 - ANNEX IIIPage 9 of 15
Table 6: RURAL POVERTY LINES BY PROVINCE,FEBRUARY 1984
Province Rice Price Value of x 1.25 Ratio of Poverty(Rp/kg) 16 kg (Rp) Food to Line
(Rp) Total (Rp)Expenditure
Aceh 341 5,456 6,820 0.78 8,766N. Sumatra 348 5,568 6,960 0.74 9,342W. Sumatra 371 5,936 7,420 0.75 9,920Riau 388 6,208 7,760 0.75 10,278Jambi 367 5,872 7,340 0.78 9,398S. Sumatra 356 5,696 7,120 0.74 9,583Bengkulu 375 6,000 7,500 0.75 9,973Lampung 334 5,344 6,680 0.74 8,991
W. Java 325 5,200 6,500 0.71 9,155C. Java 303 4,848 6,060 0.68 8,964DI Jogjakarta 315 5,040 6,300 0.65 9,752E. Java 300 4,800 6,000 0.65 9,259
Bali 300 4,800 6,000 0.69 8,734W. Nusa Tenggara 334 5,344 6,680 0.73 9,176E. Nusa Tenggara 326 5,216 6,520 0.77 8,479E. Timor 374 5,984 7,480 0.63 11,854
W. Kalimantan 374 5,984 7,480 0.80 9,303C. Kalimantan 412 6,592 8,240 0.77 10,660S. Kalimantan 367 5,872 7,340 0.79 9,279E. Kalimantan 382 6,112 7,640 0.75 10,241
N. Sulawesi 355 5,680 7,100 0.73 9,780C. Sulawesi 323 5,168 6,460 0.77 8,422S. Sulawesi 279 4,464 5,580 0.73 7,613S.E. Sulawesi 328 5,248 6,560 0.70 9,331
Maluku 454 7,264 9,080 0.77 11,854Irian Jaya 545 8,720 10,900 0.64 16,978
Source: World Bank staff estimates from 1984 SUSENAS survey.
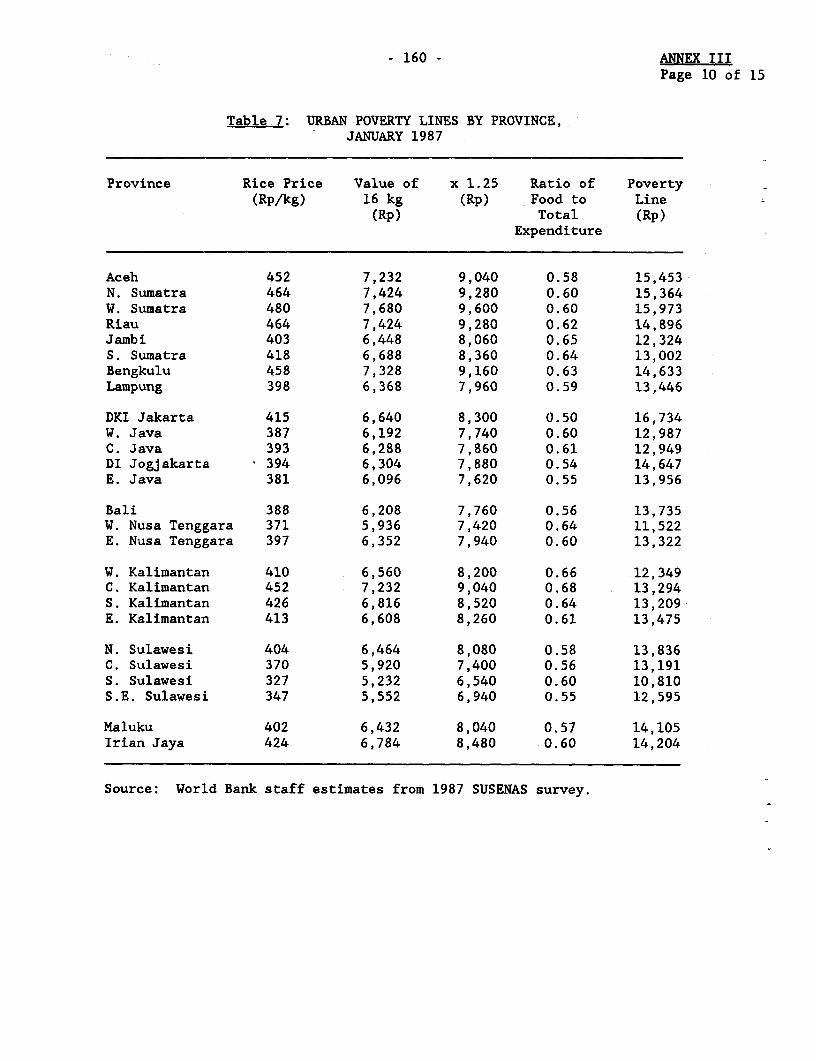
- 160 - ANNEX IIIPage 10 of 15
Table 7: URBAN POVERTY LINES BY PROVINCE,JANUARY 1987
Province Rice Price Value of x 1.25 Ratio of Poverty(Rp/kg) 16 kg (Rp) Food to Line
(Rp) Total (Rp)Expenditure
Aceh 452 7,232 9,040 0.58 15,453N. Sumatra 464 7,424 9,280 0.60 15,364W. Sumatra 480 7,680 9,600 0.60 15,973Riau 464 7,424 9,280 0.62 14,896Jambi 403 6,448 8,060 0.65 12,324S. Sumatra 418 6,688 8,360 0.64 13,002Bengkulu 458 7,328 9,160 0.63 14,633Lampung 398 6,368 7,960 0.59 13,446
DKI Jakarta 415 6,640 8,300 0.50 16,734W. Java 387 6,192 7,740 0.60 12,987C. Java 393 6,288 7,860 0.61 12,949DI Jogjakarta 394 6,304 7,880 0.54 14,647E. Java 381 6,096 7,620 0.55 13,956
Bali 388 6,208 7,760 0.56 13,735W. Nusa Tenggara 371 5,936 7,420 0.64 11,522E. Nusa Tenggara 397 6,352 7,940 0.60 13,322
W. Kalimantan 410 6,560 8,200 0.66 12,349C. Kalimantan 452 7,232 9,040 0.68 13,294S. Kalimantan 426 6,816 8,520 0.64 13,209E. Kalimantan 413 6,608 8,260 0.61 13,475
N. Sulawesi 404 6,464 8,080 0.58 13,836C. Sulawesi 370 5,920 7,400 0.56 13,191S. Sulawesi 327 5,232 6,540 0.60 10,810S.E. Sulawesi 347 5,552 6,940 0.55 12,595
Maluku 402 6,432 8,040 0.57 14,105Irian Jaya 424 6,784 8,480 0.60 14,204
Source: World Bank staff estimates from 1987 SUSENAS survey.
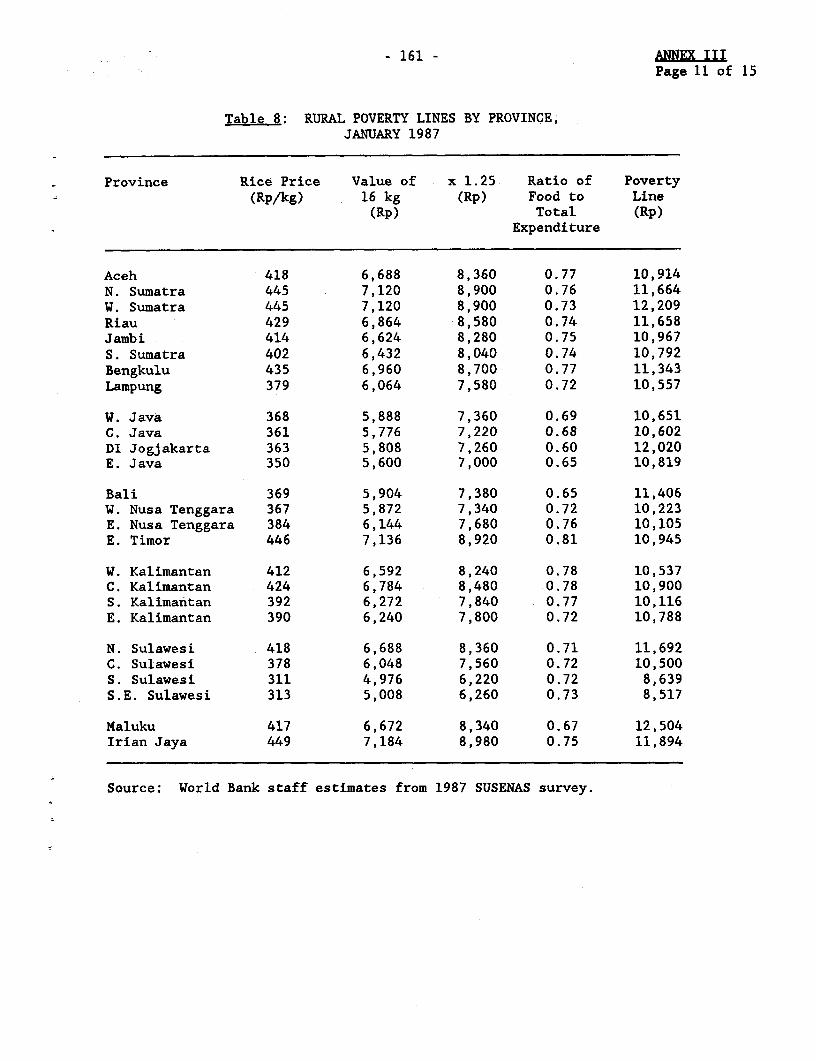
- 161 - ANNEX IIIPage 11 of 15
Table 8: RURAL POVERTY LINES BY PROVINCE,JANUARY 1987
Province Rice Price Value of x 1.25 Ratio of Poverty(Rp/kg) 16 kg (Rp) Food to Line
(Rp) Total (Rp)Expenditure
Aceh 418 6,688 8,360 0.77 10,914N. Sumatra 445 7,120 8,900 0.76 11,664W. Sumatra 445 7,120 8,900 0.73 12,209Riau 429 6,864 8,580 0.74 11,658Jambi 414 6,624 8,280 0.75 10,967S. Sumatra 402 6,432 8,040 0.74 10,792Bengkulu 435 6,960 8,700 0.77 11,343Lampung 379 6,064 7,580 0.72 10,557
W. Java 368 5,888 7,360 0.69 10,651C. Java 361 5,776 7,220 0.68 10,602DI Jogjakarta 363 5,808 7,260 0.60 12,020E. Java 350 5,600 7,000 0.65 10,819
Bali 369 5,904 7,380 0.65 11,406W. Nusa Tenggara 367 5,872 7,340 0.72 10,223E. Nusa Tenggara 384 6,144 7,680 0.76 10,105E. Timor 446 7,136 8,920 0.81 10,945
W. Kalimantan 412 6,592 8,240 0.78 10,537C. Kalimantan 424 6,784 8,480 0.78 10,900S. Kalimantan 392 6,272 7,840 0.77 10,116E. Kalimantan 390 6,240 7,800 0.72 10,788
N. Sulawesi 418 6,688 8,360 0.71 11,692C. Sulawesi 378 6,048 7,560 0.72 10,500S. Sulawesi 311 4,976 6,220 0.72 8,639S.E. Sulawesi 313 5,008 6,260 0.73 8,517
Maluku 417 6,672 8,340 0.67 12,504Irian Jaya 449 7,184 8,980 0.75 11,894
Source: World Bank staff estimates from 1987 SUSENAS survey.
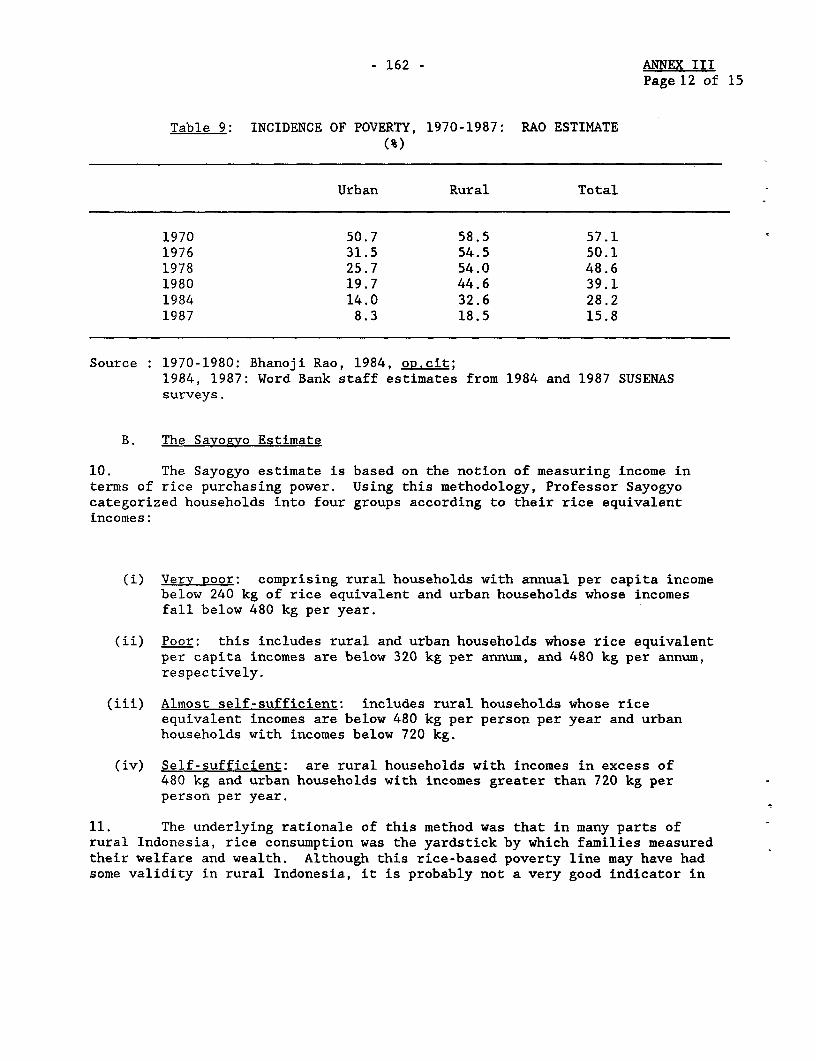
- 162 - ANNEX IIIPage 12 of 15
Table 9: INCIDENCE OF POVERTY, 1970-1987: RAO ESTIMATE(%)
Urban Rural Total
1970 50.7 58.5 57.11976 31.5 54.5 50.11978 25.7 54.0 48.61980 19.7 44.6 39.11984 14.0 32.6 28.21987 8.3 18.5 15.8
Source : 1970-1980: Bhanoji Rao, 1984, op.cit;1984, 1987: Word Bank staff estimates from 1984 and 1987 SUSENASsurveys.
B. The Sayozyo Estimate
10. The Sayogyo estimate is based on the notion of measuring income interms of rice purchasing power. Using this methodology, Professor Sayogyocategorized households into four groups according to their rice equivalentincomes:
(i) Very poor: comprising rural households with annual per capita incomebelow 240 kg of rice equivalent and urban households whose incomesfall below 480 kg per year.
(ii) Poor: this includes rural and urban households whose rice equivalentper capita incomes are below 320 kg per annum, and 480 kg per annum,respectively.
(iii) Almost self-sufficient: includes rural households whose riceequivalent incomes are below 480 kg per person per year and urbanhouseholds with incomes below 720 kg.
(iv) Self-sufficient: are rural households with incomes in excess of480 kg and urban households with incomes greater than 720 kg perperson per year.
11. The underlying rationale of this method was that in many parts ofrural Indonesia, rice consumption was the yardstick by which families measuredtheir welfare and wealth. Although this rice-based poverty line may have hadsome validity in rural Indonesia, it is probably not a very good indicator in
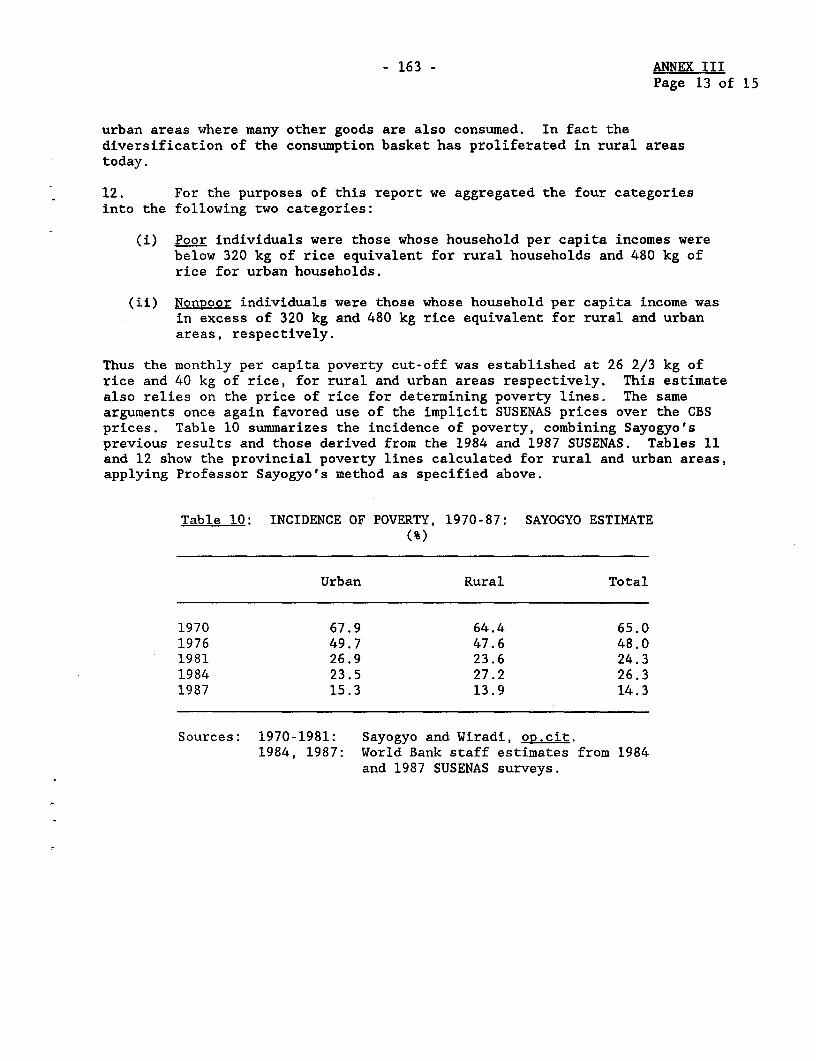
- 163 - ANNEX IIIPage 13 of 15
urban areas where many other goods are also consumed. In fact thediversification of the consumption basket has proliferated in rural areastoday.
12. For the purposes of this report we aggregated the four categoriesinto the following two categories:
(i) Poor individuals were those whose household per capita incomes werebelow 320 kg of rice equivalent for rural households and 480 kg ofrice for urban households.
(ii) NonRoor individuals were those whose household per capita income wasin excess of 320 kg and 480 kg rice equivalent for rural and urbanareas, respectively.
Thus the monthly per capita poverty cut-off was established at 26 2/3 kg ofrice and 40 kg of rice, for rural and urban areas respectively. This estimatealso relies on the price of rice for determining poverty lines. The samearguments once again favored use of the implicit SUSENAS prices over the CBSprices. Table 10 summarizes the incidence of poverty, combining Sayogyo'sprevious results and those derived from the 1984 and 1987 SUSENAS. Tables 11and 12 show the provincial poverty lines calculated for rural and urban areas,applying Professor Sayogyo's method as specified above.
Table 10: INCIDENCE OF POVERTY, 1970-87: SAYOGYO ESTIMATE(%)
Urban Rural Total
1970 67.9 64.4 65.01976 49.7 47.6 48.01981 26.9 23.6 24.31984 23.5 27.2 26.31987 15.3 13.9 14.3
Sources: 1970-1981: Sayogyo and Wiradi, op.cit.1984, 1987: World Bank staff estimates from 1984
and 1987 SUSENAS surveys.
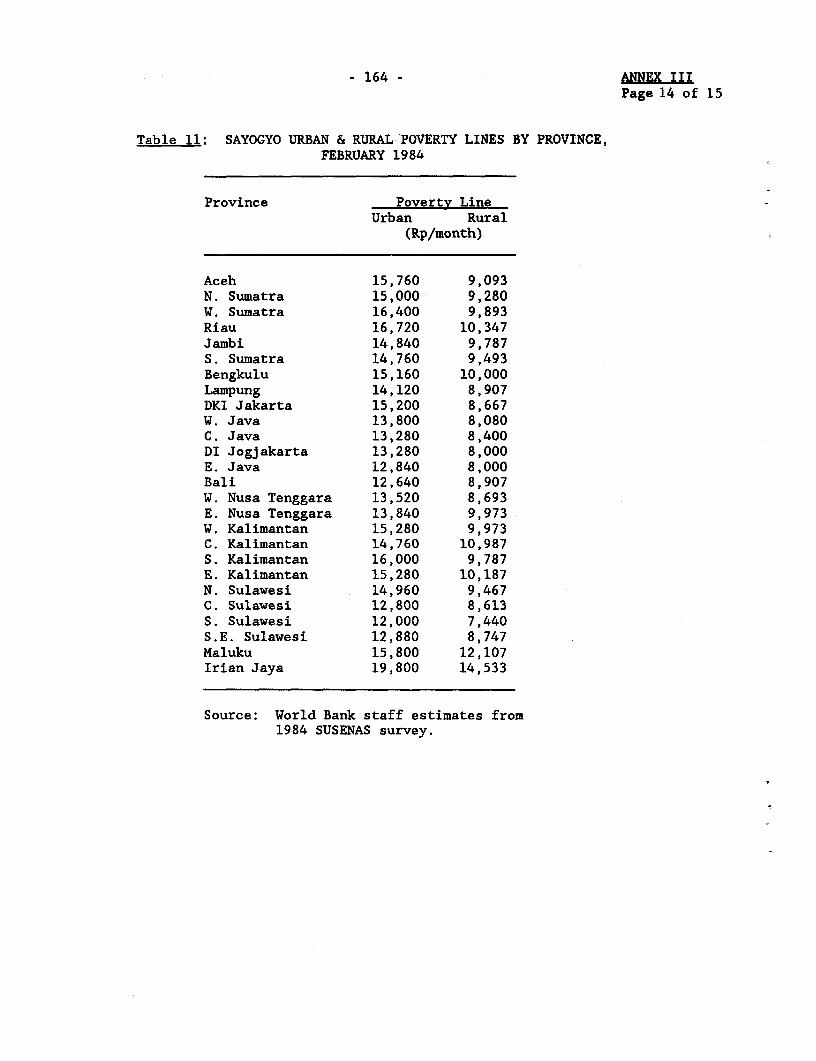
- 164 - ANNEX III
Page 14 of 15
Table 11: SAYOGYO URBAN & RURAL POVERTY LINES BY PROVINCE,FEBRUARY 1984
Province Poverty LineUrban Rural
(Rp/month)
Aceh 15,760 9,093N. Sumatra 15,000 9,280W. Sumatra 16,400 9,893Riau 16,720 10,347Jambi 14,840 9,787S. Sumatra 14,760 9,493Bengkulu 15,160 10,000Lampung 14,120 8,907DKI Jakarta 15,200 8,667W. Java 13,800 8,080C. Java 13,280 8,400DI Jogjakarta 13,280 8,000E. Java 12,840 8,000Bali 12,640 8,907W. Nusa Tenggara 13,520 8,693E. Nusa Tenggara 13,840 9,973W. Kalimantan 15,280 9,973C. Kalimantan 14,760 10,987S. Kalimantan 16,000 9,787E. Kalimantan 15,280 10,187N. Sulawesi 14,960 9,467C. Sulawesi 12,800 8,613S. Sulawesi 12,000 7,440S.E. Sulawesi 12,880 8,747Maluku 15,800 12,107Irian Jaya 19,800 14,533
Source: World Bank staff estimates from1984 SUSENAS survey.
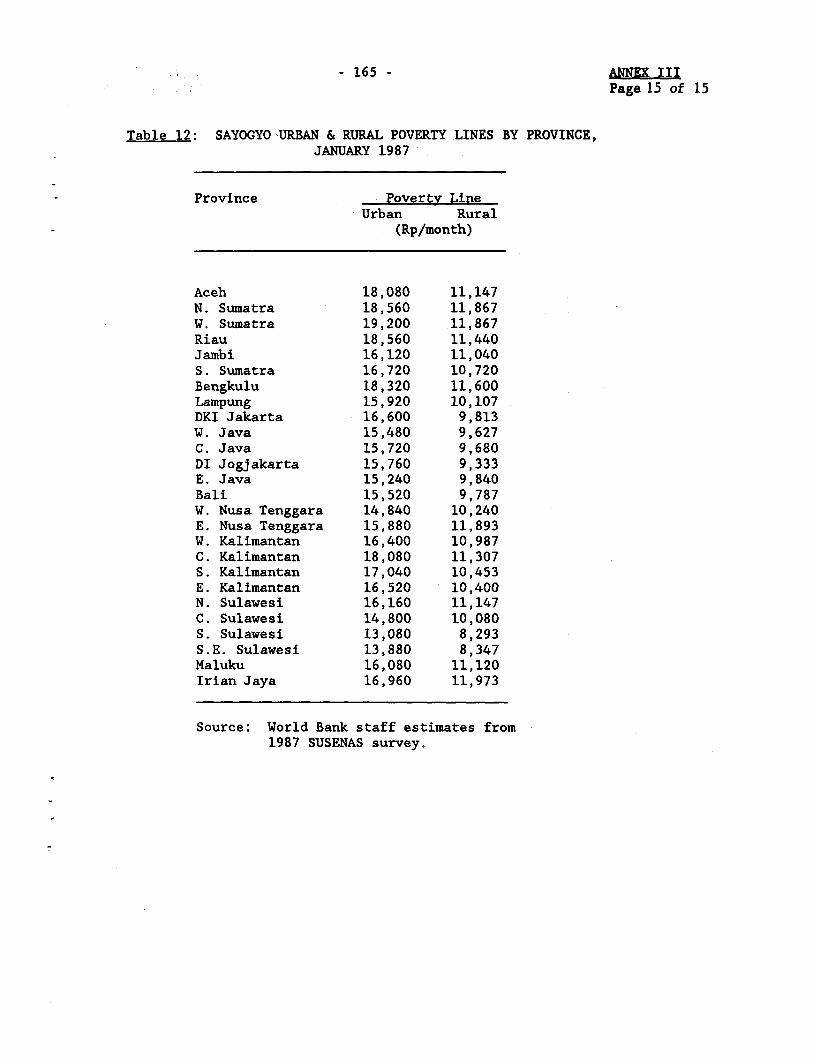
- 165 - ANNEX III
Page 15 of 15
Table 12: SAYOGYO URBAN & RURAL POVERTY LINES BY PROVINCE,JANUARY 1987
Province Poverty LineUrban Rural
(Rp/month)
Aceh 18,080 11,147N. Sumatra 18,560 11,867W. Sumatra 19,200 11,867Riau 18,560 11,440Jambi 16,120 11,040S. Sumatra 16,720 10,720Bengkulu 18,320 11,600Lampung 15,920 10,107DKI Jakarta 16,600 9,813W. Java 15,480 9,627C. Java 15,720 9,680DI Jogjakarta 15,760 9,333E. Java 15,240 9,840Bali 15,520 9,787W. Nusa Tenggara 14,840 10,240E. Nusa Tenggara 15,880 11,893W. Kalimantan 16,400 10,987C. Kalimantan 18,080 11,307S. Kalimantan 17,040 10,453E. Kalimantan 16,520 10,400N. Sulawesi 16,160 11,147C. Sulawesi 14,800 10,080S. Sulawesi 13,080 8,293S.E. Sulawesi 13,880 8,347Maluku 16,080 11,120Irian Jaya 16,960 11,973
Source: World Bank staff estimates from1987 SUSENAS survey.

$ I IIII
- 167 - ANNEX IVPage 1 of 4
INDONESIA
STRATEGY FOR A SUSTAINED REDUCTION IN POVERTY
Trends in Real Wages during the Adiustment Period
1. The movement of real wages during the adjustment period (1983-1988)has been the subject of considerable controversy.i/ This debate hasprincipally focussed on recent trends in the real wages of agricultural,unskilled laborers because of the large proportion of Indonesia's populationand its poor residing in rural areas and because movements in unskilled wagesacross occupational categories tend to be highly correlated. Regarding recenttrends in agricultural wages, the debate has revolved around the appropriateprice index for deflating nominal wages and the time period underconsideration. 2/
2. One study (Papanek, 1988) concludes that real wages fell noticeablyin agriculture during 1983-87, following significant increases in the 1976-83period. Declining real wages are attributed to the general slowdown ofeconomic activity and more importantly, to the lower capacity of theagricultural sector to absorb labor productively because of farm mechanizationand the reduced growth of rice output. A more recent study (Naylor, 1989)shows the sensitivity of real wages in agriculture to the choice of thedeflator used in calculating real wages. This study found that, after anadjustment to the rural cost of living index for an apparent error in thecalculation of vegetable prices (particularly chilies), real agriculturalwages in aggregate increased slightly in Java during 1983-88.1/
1/ See, Papanek, Changes in Real Wages: Employment. Poverty.Competitiveness, DSP Working Paper, Jakarta, Indonesia, 1988; Collier,William, et.al., "Employment Trends in Lowland Javanese Villages",mimeo, USAID, Jakarta, 1988; Manning and Jayasuriya, "Survey of RecentDevelopments, Bulletin of Indonesian Economic Studies, Vol. 24, No. 2,August 1988; and Naylor "Wage Trends in Rice Production on Java;1976-1988", Bulletin of Indonesian Economic Studies, Vol. 26, No. 2,August 1990.
2/! Most studies use the nominal wage data for weeding, hoeing and plantingin Java collected by the Central Bureau of Statistics. These data havebeen collected annually since 1976 on Java and since 1980 in otherprovinces. The wage data are for a half day's work excluding meals andcigarettes.
i./ Only real hoeing wages in Central Java declined during this period.
- 168 - ANNEX IVPage 2 of 4
3. Subsequent to these studies, the Farmer's Terms of Trade index, whichis used to collect data on agricultural wages and measure the rural cost ofliving, has been rebased in 1983 (the previous base was 1976) and revised.4/Using these revised data for 1983-89, real agricultural wages appear to havecontinued to rise until 1987 in West Java, Central Java and Yogyakarta(Table 1). Real wages did, however, decline in 1988, reflecting the increasein rice prices which occurred due to the 1987 drought. Nevertheless, for theentire period 1983-89, agricultural wages rose on average by about 1% p.a.,with the largest increase in Yogyakarta.../ These results are consistent withthe available evidence from village surveys,/ and also are closely correlatedwith changes in the incidence of poverty during the adjustment period (seeChapter I).
4. For the manufacturing sector, the Papanek study could not find anymeaningful trend in real wages for unskilled workers during the adjustmentperiod. However, other studies suggest that manufacturing real wagescontinued to increase, although at a slower pace than in the mid-1970s.]/Data compiled for this study support the result that industrial wagescontinued to rise, although at a much slower pace than average laborproductivity; real wages in the industrial sector are estimated to have risenby 3.5% p.a. during 1983-88.
5. Real wages, however, did decline for civil servants, as the realincomes of civil servants were reduced by the Government's decision toinstitute a wage freeze in 1985-88. This was an important adjustment responseto improve the fiscal balance. The real wages of rural construction workersalso stagnated, as wages were depressed until up to 1987 because of largecutbacks in public capital spending..fi/ However, real wages in ruralconstruction activities would have declined further without active policies toprotect labor intensive construction activities (through INPRES program). Thereturns to labor in the informal sector (unorganized trade and transport, andpersonal services) appears to have initially declined in response to reducedgrowth in aggregate demand (1982-85) but then seem to have recovered in1986-87, and are likely to have grown significantly in 1988.9y
ij The revision is based upon consumption weights calculated from the 1984SUSENAS survey.
./ This is confirmed by the analysis in Naylor (1990).
k/ See, Collier, et.al. (1988).
.Z/ See, Chris Manning, et.al., Indonesia: EmRlovment Problem. Prospect andPolicies, mimeo, World Bank, 1988.
t./ See, Manning and Jayasuriya (1989).
2/ There is little direct evidence on what happened to real returns ininformal activities. Input-output data show that average labor incomein transport and trade declined in 1985 as compared with 1980. On theother hand, the more rapid pace of growth of services value added,especially trade and transport, in 1986-88 suggests that real earningsmust have increased.
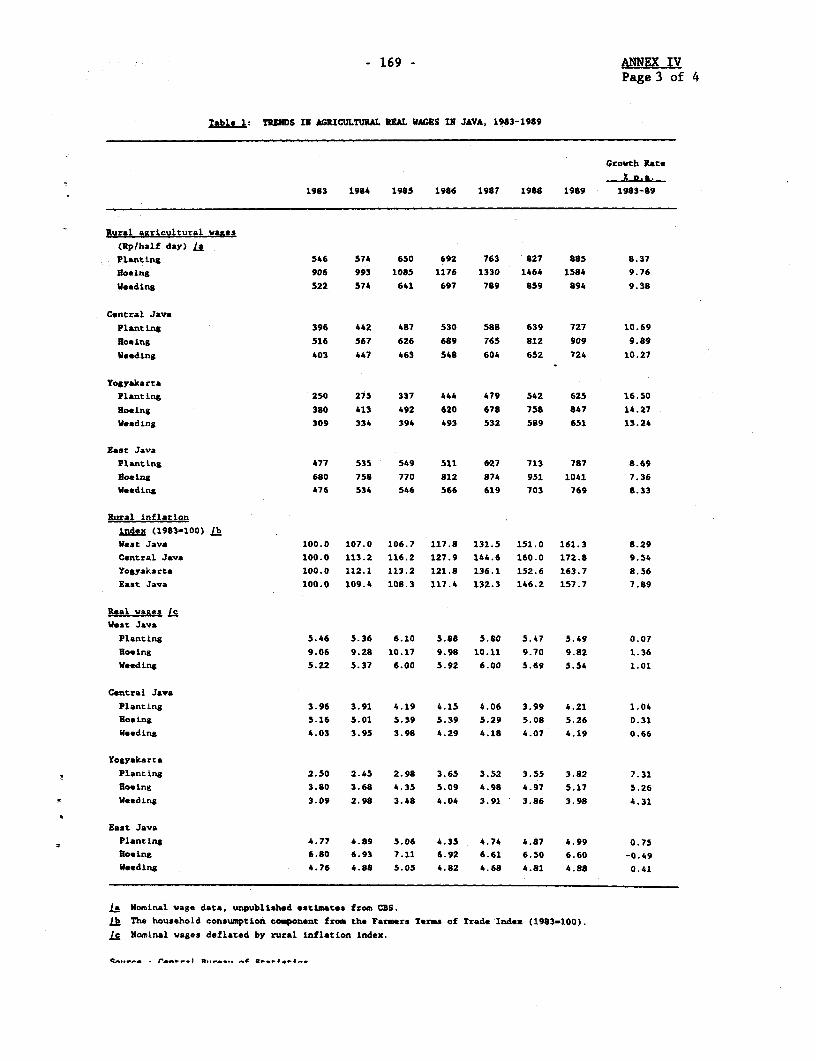
- 169 - ANEX IVPage 3 of 4
Table 1 TRhDIS IN AGRICULTURAL REAL WAGES IN JAVA, 1983-1989
Growth Rate
1983 1984 1985 1986 1987 1988 1989 1983-89
Rural agricultural waits
(Rp/half day) /a
Planting 546 574 650 692 763 827 885 8.37Hooing 906 993 1085 1176 1330 1464 1584 9.76
Weeding 522 574 641 697 789 859 894 9.38
Central Java
Planting 396 442 487 530 588 639 727 10.69
Hoing 516 567 626 689 765 812 909 9.89
Weeding 403 447 463 548 604 652 724 10.27
Yogyakarta
Planting 250 275 337 444 479 542 625 16.50
Hoeing 380 413 492 620 678 758 847 14.27
Weeding 309 334 394 493 532 589 651 13.24
East JavaPlanting 477 535 549 511 627 713 787 8.69
Hoeing 680 758 770 812 874 931 1041 7.36
Weeding 476 534 546 566 619 703 769 8.33
Rural inflation
Index (1983-100) lb
West Java 100.0 107.0 106.7 117.8 131.5 151.0 161.3 8.29
Central Java 100.0 113.2 116.2 127.9 144.6 160.0 172.8 9.54
Yogyakarta 100.0 112.1 113.2 121.8 136.1 152.6 163.7 8.56
East Java 100.0 109.4 108.3 117.4 132.3 146.2 157.7 7.89
Real wages le
West JavaPlanting 5.46 5.36 6.10 5.88 5.80 5.47 5.49 0.07
Hoeing 9.06 9.28 10.17 9.98 10.11 9.70 9.82 1.36
Weeding 5.22 5.37 6.00 5.92 6.00 5.69 5.54 1.01
Central Java
Planting 3.96 3.91 4.19 4.15 4.06 3.99 4.21 1.04hoeing 5.16 5.01 5.39 5.39 5.29 5.08 5.26 0.31
Weeding 4.03 3.95 3.98 4.29 4.18 4.07 4.19 0.66
Yogyakarta
Planting 2.50 2.45 2.98 3.65 3.52 3.55 3.82 7.31
Hoeing 3.80 3.68 4.35 5.09 4.98 4.97 5.17 5.26
Weeding 3.09 2.98 3.48 4.04 3.91 3.86 3.98 4.31
East Java
Planting 4.77 4.89 5.06 4.35 4.74 4.87 4.99 0.75
Hoeing 6.80 6.93 7.11 6.92 6.61 6.50 6.60 -0.49
Weeding 4.76 4.88 5.05 4.82 4.68 4.81 4.88 0.41
la Nominal wage data, unpublished estimtes from CBS.
lb The household consumption component from the Farmers Terms of Trade Index (1983-100).le Nominal vages deflated by rural inflation index.
Q. ^. r....l . C-4..4-
- 170 - ANNEX IVPage 4 of 4
6. What is the implication of this trend in real wages for the poor?Since the bulk of Indonesia's poor reside in rural areas, labor earnings inagriculture are an important determinant of progress in alleviating poverty.The evidence presented here suggests that real wages in agriculture grewmodestly during the adjustment period. Moreover, since the level ofemployment in agriculture also increased, it can be concluded that realearnings in the agriculture sector grew during the adjustment period. Outsideagriculture, employment expanded in rural non-farm activities, and workersemployed in the small-scale rural manufacturing enterprises also benefittedfrom the surge in non-oil exports. Moreover, the returns to some non-farmrural activities (trade and transport) may have declined initially (1982-85)but are also likely to have grown during 1986-88. Therefore, total laborincome for the rural poor continued to grow during the adjustment period. Inthe urban areas, both employment and real wages grew in the industrial sector;however, wages grew more slowly than productivity. In the urban informalsector, incomes may have stagnated or fallen in 1982-84 but are expected tohave risen during 1986-88. For the adjustment period as a whole, laborincomes for the urban poor also seem to have continued to increase.Therefore, trends in labor income broadly support the conclusion that absolutepoverty declined during the adjustment period, as discussed in Chapter I.
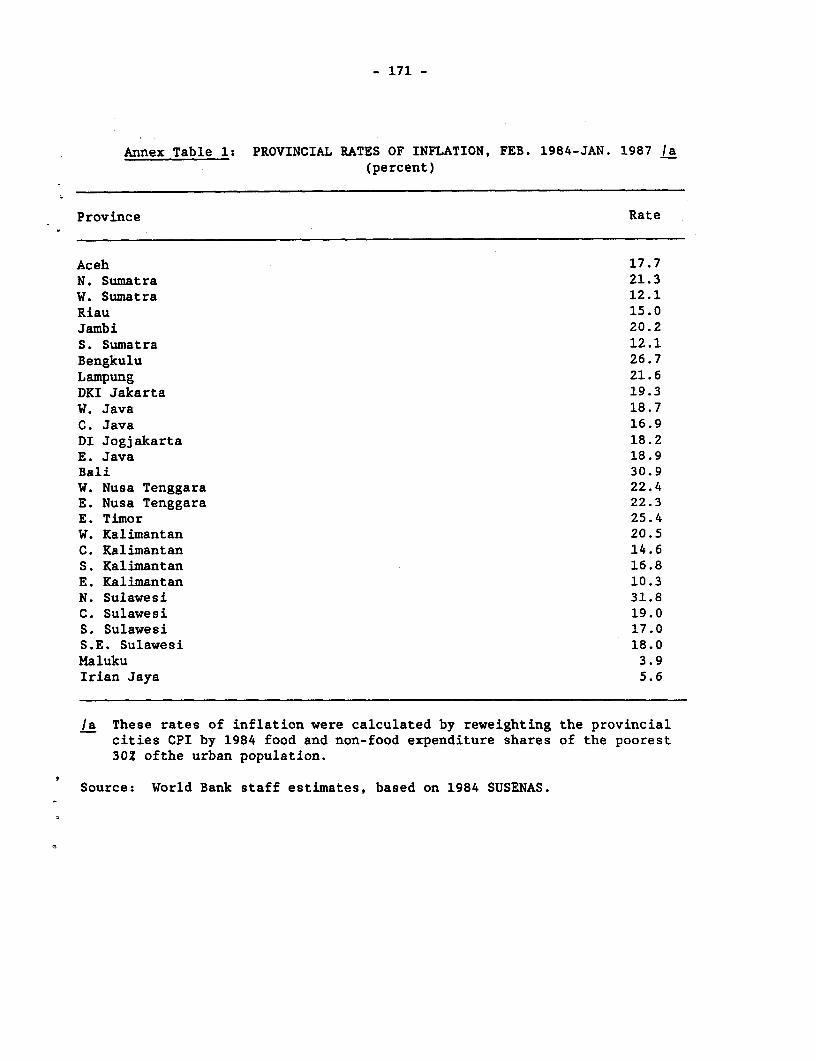
- 171 -
Annex Table 1: PROVINCIAL RATES OF INFLATION, FEB. 1984-JAN. 1987 la(percent)
Province Rate
Aceh 17.7N. Sumatra 21.3W. Sumatra 12.1Riau 15.0Jambi 20.2S. Sumatra 12.1Bengkulu 26.7Lampung 21.6DKI Jakarta 19.3W. Java 18.7C. Java 16.9DI Jogjakarta 18.2E. Java 18.9Bali 30.9W. Nusa Tenggara 22.4E. Nusa Tenggara 22.3E. Timor 25.4W. Kalimantan 20.5C. Kalimantan 14.6S. Kalimantan 16.8E. Kalimantan 10.3N. Sulawesi 31.8C. Sulawesi 19.0S. Sulawesi 17.0S.E. Sulawesi 18.0Maluku 3.9Irian Jaya 5.6
/a These rates of inflation were calculated by reweighting the provincialcities CPI by 1984 food and non-food expenditure shares of the poorest30X ofthe urban population.
Source: World Bank staff estimates, based on 1984 SUSENAS.
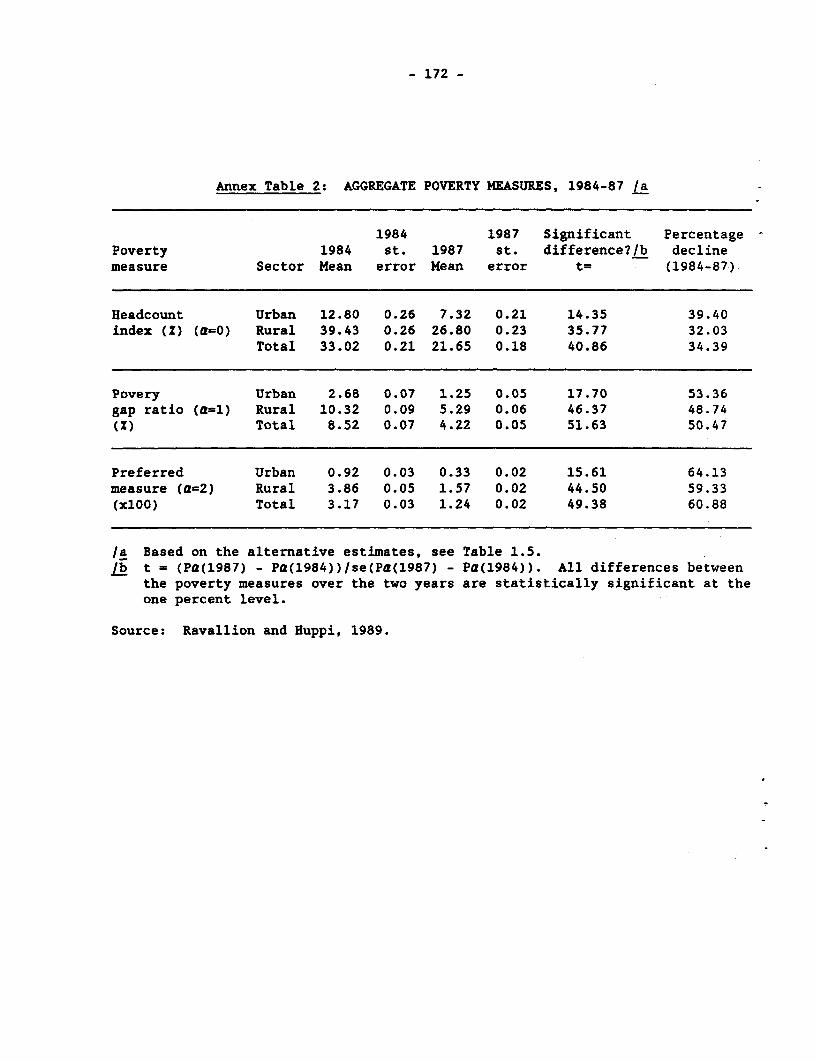
- 172 -
Annex Table 2: AGGREGATE POVERTY MEASURES, 1984-87 /a
1984 1987 Significant PercentagePoverty 1984 St. 1987 st. difference?/b declinemeasure Sector Mean error Mean error t= (1984-87)
Headcount Urban 12.80 0.26 7.32 0.21 14.35 39.40index (Z) (a=O) Rural 39.43 0.26 26.80 0.23 35.77 32.03
Total 33.02 0.21 21.65 0.18 40.86 34.39
Povery Urban 2.68 0.07 1.25 0.05 17.70 53.36gap ratio (a=l) Rural 10.32 0.09 5.29 0.06 46.37 48.74(Z) Total 8.52 0.07 4.22 0.05 51.63 50.47
Preferred Urban 0.92 0.03 0.33 0.02 15.61 64.13measure (a=2) Rural 3.86 0.05 1.57 0.02 44.50 59.33(x100) Total 3.17 0.03 1.24 0.02 49.38 60.88
/a Based on the alternative estimates, see Table 1.5./b t - (Pa(1987) - Pa(1984))/se(Pa(1987) - Pa(1984)). All differences between
the poverty measures over the two years are statistically significant at theone percent level.
Source: Ravallion and Huppi, 1989.
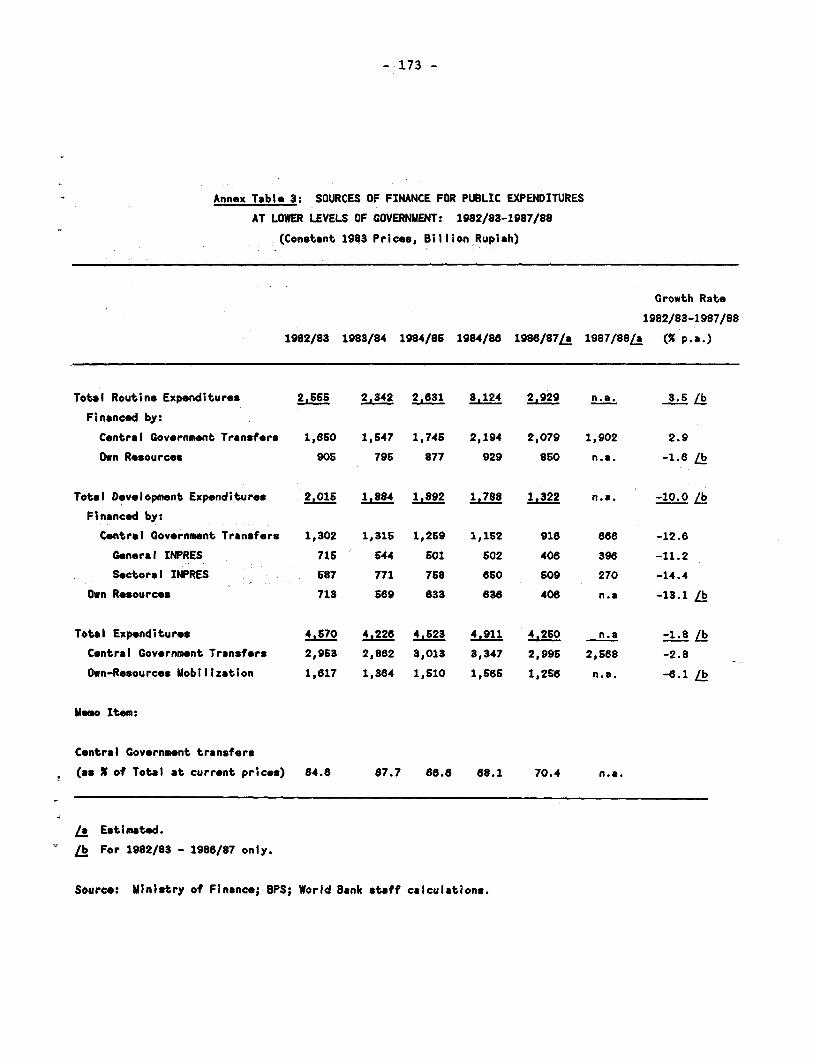
- 173 -
Annex Table 3: SOURCES OF FINANCE FOR PUBLIC EXPENDITURES
AT LOWER LEVELS OF GOVERNMENT: 1982/83-1987/88
(Constant 1983 Pricos, Billion Rupiah)
Growth Rate
1982/83-1987/88
1982/83 1983/84 1984/86 1984/88 1986/87L* 1987/88/5 (% p.a.)
Total Routine Expenditures 2,565 2.342 2.631 3.124 2.929 n.a. 3.5 /b
Financed by:
Central Government Transfers 1,B60 1,547 1,745 2,194 2,079 1,902 2.9
Own Resources 905 795 877 929 8SO n.a. -1.8 lb
Total Development Expenditures 2.016 1.884 1.892 1,788 1.322 n.a. -10.0 /b
Financed by:
Central Government Transfers 1,302 1,315 1,259 1,152 918 668 -12.8
General INPRES 716 544 601 602 408 396 -11.2
Sectoral INPRES 687 771 768 860 609 270 -14.4
Own Resources 713 569 833 638 406 n.a -13.1 l
Total Expenditures 4,670 4.226 4.523 4.911 4.260 n.a -1_8 __
Central Government Transfers 2,963 2,862 3,013 3,347 2,995 2,568 -2.8
Own-Resources Mobilization 1,617 1,384 1,510 1,565 1,256 n.a. -6.1 /
Memo Item:
Central Government transfors
(as X of Total at current prices) 84.6 87.7 86.6 68.1 70.4 n.a.
la Estimated.
/b For 1982/83 - 1986/87 only.
Source: Ministry of Finance; BPS; World Bank staff calculations.
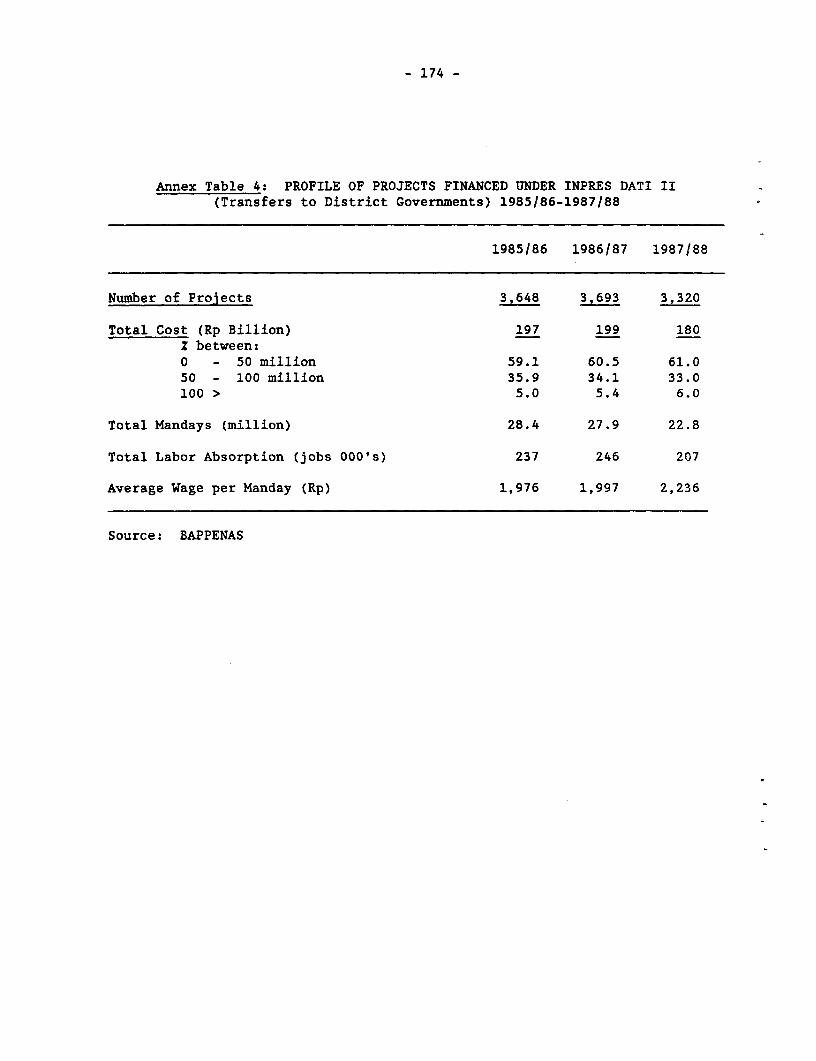
- 174 -
Annex Table 4: PROFILE OF PROJECTS FINANCED UNDER INPRES DATI II(Transfers to District Governments) 1985/86-1987/88
1985/86 1986/87 1987/88
Number of Projects 3,648 3,693 3,320
Total Cost (Rp Billion) 197 199 180Z between:0 - 50 million 59.1 60.5 61.050 - 100 million 35.9 34.1 33.0100 > 5.0 5.4 6.0
Total Mandays (million) 28.4 27.9 22.8
Total Labor Absorption (jobs 000's) 237 246 207
Average Wage per Manday (Rp) 1,976 1,997 2,236
Source: BAPPENAS
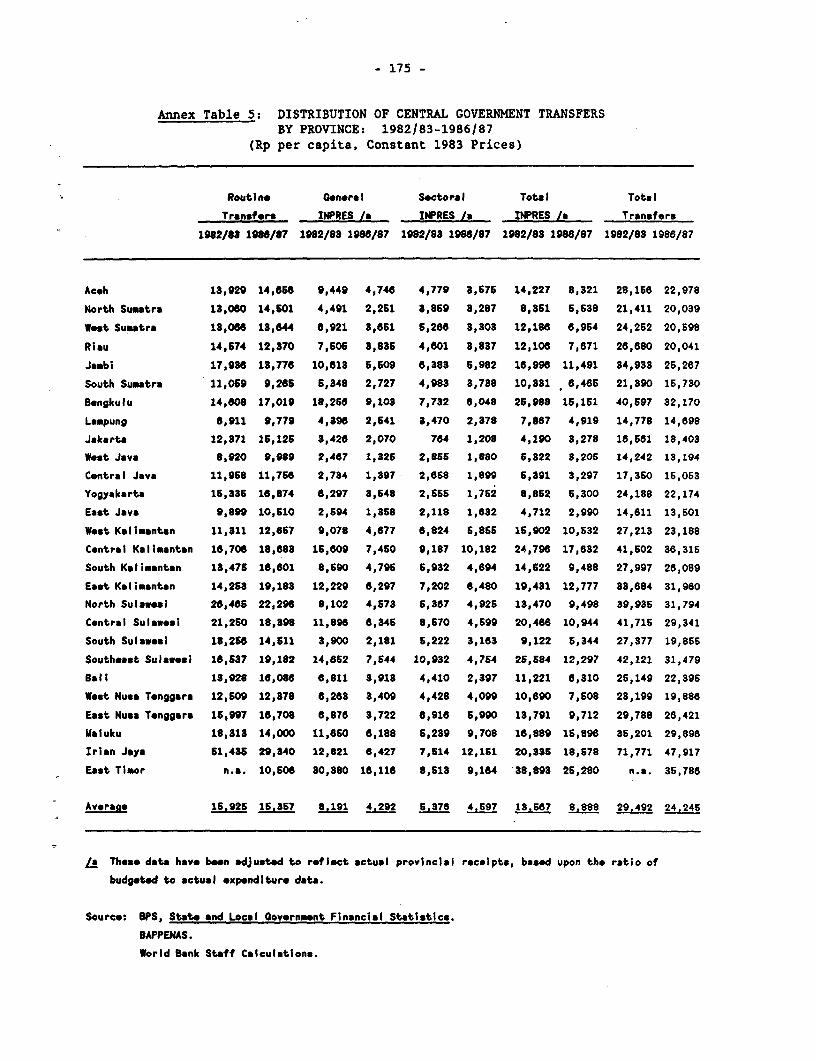
- 175 -
Annex Table 5: DISTRIBUTION OF CENTRAL GOVERNMENT TRANSFERSBY PROVINCE: 1982/83-1986/87
(Rp per capita, Constant 1983 Prices)
Routi no Gen-ral Sectoral Total Total
Transfeor INPRES /n INPRES /a INPRES /a Transfers
1982/88 1988/87 1982/83 1986/87 1982/83 1988/87 1982/83 1988/87 1982/83 1988/87
Ac.h 13,929 14,66S 9,449 4,748 4,779 3,676 14,227 8,321 28,156 22,978
North Sumtra 13,060 14,601 4,491 2,261 3,869 3,287 8,361 6,538 21,411 20,039
West Sumatra 13,066 18,644 6,921 3,651 5,266 3,303 12,186 6,964 24,252 20,698
Riau 14,574 12,370 7,506 3,835 4,601 3,837 12,106 7,671 26,680 20,041
Jambi 17,936 13,776 10,813 5,609 6,383 5,982 16,998 11,491 34,933 25,287
South Sumatra 11,059 9,266 5,348 2,727 4,983 3,738 10,331 6,465 21,390 15,730
Bengkulu 14,608 17,019 18,256 9,103 7,732 6,048 25,988 15,151 40,597 32,170
Lampung 6,911 9,779 4,398 2,641 3,470 2,378 7,887 4,919 14,778 14,698
Jakarta 12,871 15,125 3,426 2,070 784 1,208 4,190 3,278 16,581 18,403
West Java 8,920 9,989 2,467 1,825 2,855 1,880 5,322 3,206 14,242 13,194
Central Java 11,968 11,766 2,734 1,397 2,658 1,899 5,391 3,297 17,350 15,063
Yogyakarta 15,336 16,874 6,297 3,548 2,656 1,762 8,852 5,300 24,188 22,174
East Java 9,899 10,510 2,594 1,358 2,118 1,632 4,712 2,990 14,611 13,501
West Kalimantan 11,311 12,867 9,078 4,677 8,824 5,865 15,902 10,532 27,213 23,188
Contral Kalimantan 16,706 18,683 15,609 7,460 9,187 10,182 24,796 17,632 41,502 38,315
South Kalimantan 13,475 16,601 8,690 4,796 6,932 4,694 14,622 9,488 27,997 28,089
East Kalimantan 14,263 19,183 12,229 6,297 7,202 6,480 19,431 12,777 33,684 31,960
North Sulawesi 26,465 22,296 8,102 4,573 5,367 4,925 13,470 9,498 39,935 31,794
Central Sulawosi 21,250 18,398 11,896 6,345 8,570 4,599 20,466 10,944 41,715 29,341
South Sulawesi 18,256 14,611 3,900 2,181 5,222 3,163 9,122 5,344 27,377 19,865
Southeast Sulawesi 18,537 19,182 14,852 7,544 10,932 4,754 25,584 12,297 42,121 31,479
Ball 13,928 16,086 6,811 3,913 4,410 2,397 11,221 6,310 25,149 22,396
West Nu*s Tenggara 12,509 12,378 6,263 3,409 4,428 4,099 10,690 7,508 23,199 19,886
East Nusa Tenggara 15,997 16,708 6,876 3,722 8,916 5,990 13,791 9,712 29,788 26,421
Maluku 18,313 14,000 11,650 6,188 6,239 9,708 16,889 15,896 35,201 29,896
Irian Jaya 51,436 29,340 12,821 6,427 7,514 12,151 20,335 18,578 71,771 47,917
East Timor na. 10,606 30,380 16,116 8,613 9,164 38,893 25,280 na. 35,786
Average 15.925 16.357 8.191 4.292 5.376 4,597 13.567 8.888 29.492 24,245
La Thesn date have been adjusted to reflect actual provincial receipts, based upon the ratio of
budgeted to actual expenditure data.
Source: BPS, State and Local Government Financial Statistics.
BAPPENAS.
World Bank Staff Calculations.
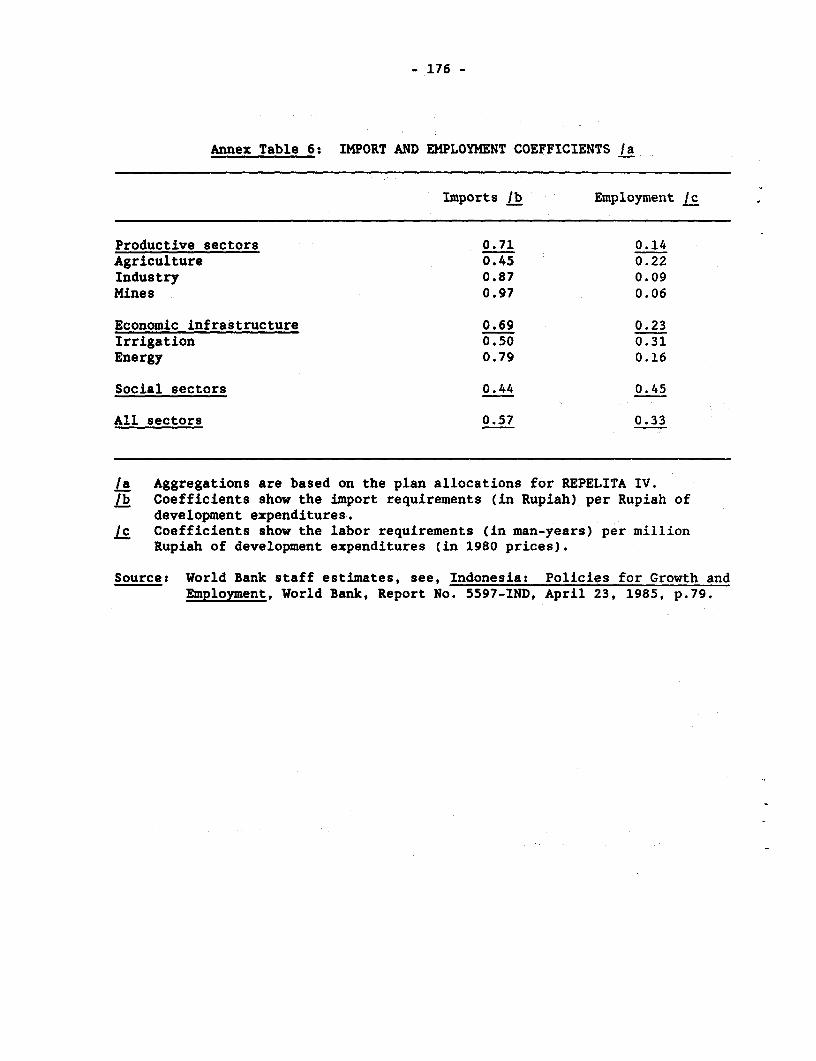
- 176 -
Annex Table 6: IMPORT AND EMPLOYMENT COEFFICIENTS /a
Imports /b Employment Ic
Productive sectors 0.71 0.14Agriculture 0.45 0.22Industry 0.87 0.09Mines 0.97 0.06
Economic infrastructure 0.69 0.23Irrigation 0.50 0.31Energy 0.79 0.16
Social sectors 0.44 0.45
All sectors 0.57 0.33
la Aggregations are based on the plan allocations for REPELITA IV./b Coefficients show the import requirements (in Rupiah) per Rupiah of
development expenditures.jc Coefficients show the labor requirements (in man-years) per million
Rupiah of development expenditures (in 1980 prices).
Source: World Bank staff estimates, see, Indonesia: Policies for Growth andEmployment, World Bank, Report No. 5597-IND, April 23, 1985, p.79.
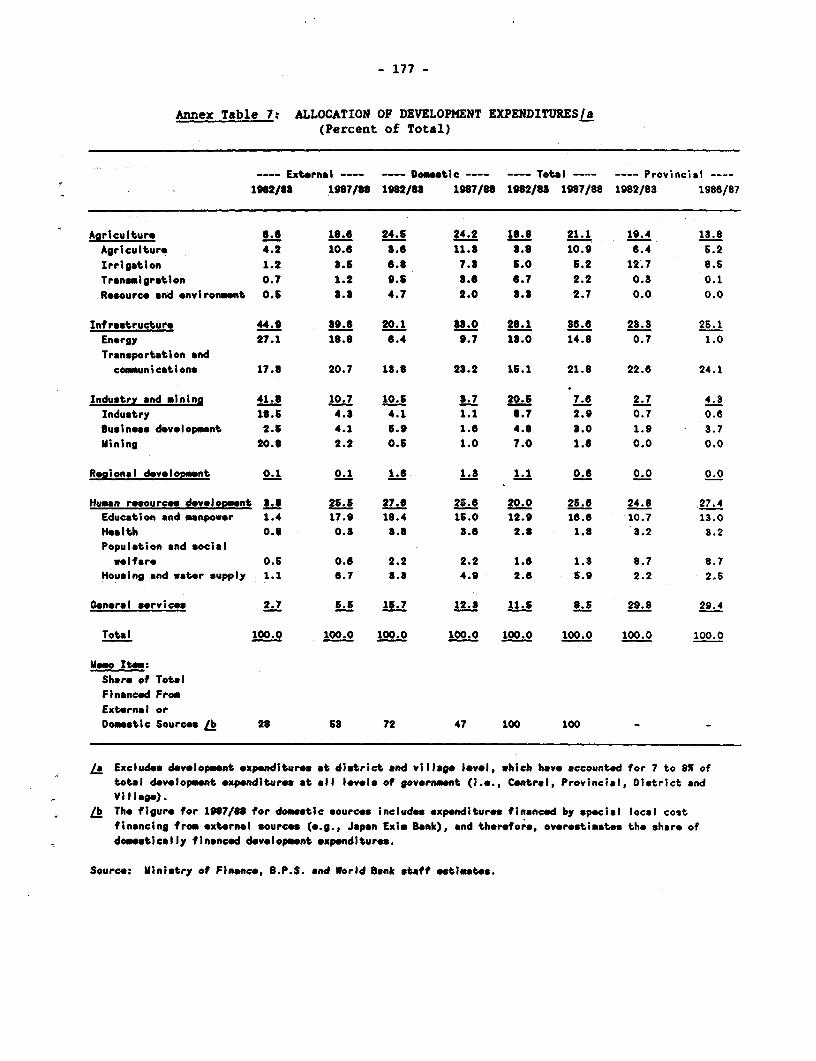
- 177 -
Annex Table 7: ALLOCATION OF DEVELOPMENT EXPENDITURES/a(Percent of Total)
---- External ---- ---- Doe4tic ---- ---- Total --- ---- Provincial ----1982/83 19N7/88 1N62/83 1987/38 1982/83 1967/88 1982/83 1986/87
Agriculture 6.6 16.6 24.5 24.2 16.3 21.1 19.4 13.8Agriculturo 4.2 10.6 3.6 11. 3.8 10.9 6. 4 6.2Irrigation 1.2 1.5 6.8 7.3 5.0 5.2 12.7 8.STransmigration 0.7 1.2 9.5 3.6 6.7 2.2 0.3 0.1Resource and environmnt 0.5 3.3 4.7 2.0 J.3 2.7 0.0 0.0
Infrastructure 44.9 39.8 20.1 33.0 26.1 36.6 23.3 26.1Energy 27.1 186. 6.4 9.7 13.0 14.8 0.7 1.0Transportation andcommunications 17.3 20.7 13.3 23.2 16.1 21.8 22.6 24.1
Industry and minins 41.3 10.7 10.6 3.7 20.5 7.6 2.7 4.3Industry 16.5 4.3 4.1 1.1 8.7 2.9 0.7 0.8Business dev-lopment 2.5 4.1 5.9 1.6 4.3 3.0 1.9 3.7Mining 20.8 2.2 0.5 1.0 7.0 1.6 0.0 0.0
Reaional dovelomont 0.1 0.1 1.6 1.3 1.1 0.6 0.0 0.0
Human resources development 3.8 25.5 27.6 25.6 20.0 25.68 24.8 27.4Education and manpower 1.4 17.9 18.4 15.0 12.9 16.6 10.7 13.0Health 0. 0.3 3.8 38.6 2.8 1.8 3.2 3.2Population and social
welfare 0.6 0.6 2.2 2.2 1.6 1.3 8.7 8.7Housing and water supply 1.1 6.7 3.3 4.9 2.6 8.9 2.2 2.5
General services 2.7 5.5 15.7 12.3 11.5 3.5 29.8 29.4
Total 100.0 100.0 100.0 100.0 100.0 100.0 100.0 100.0
Memo Item:Share of TotalFinanced FromExternal orDomestic Sources Lb 23 S3 72 47 100 100 -
/a Excludes development expenditures at district and vlllage level, which have accounted for 7 to 8% oftotal development expenditures at *a1 levels of government (i.e., Contral, Provincial, District andVillage).
/b The figure for 1987/66 for dometic sources includes expenditures financed by special local costfinancing from external source (e.g., Japan Exim Bank), and therefore, overestimates the sharo ofdomestically financed development expenditure.
Source: Ministry of Finance, B.P.S. and World Bank staff estimates.
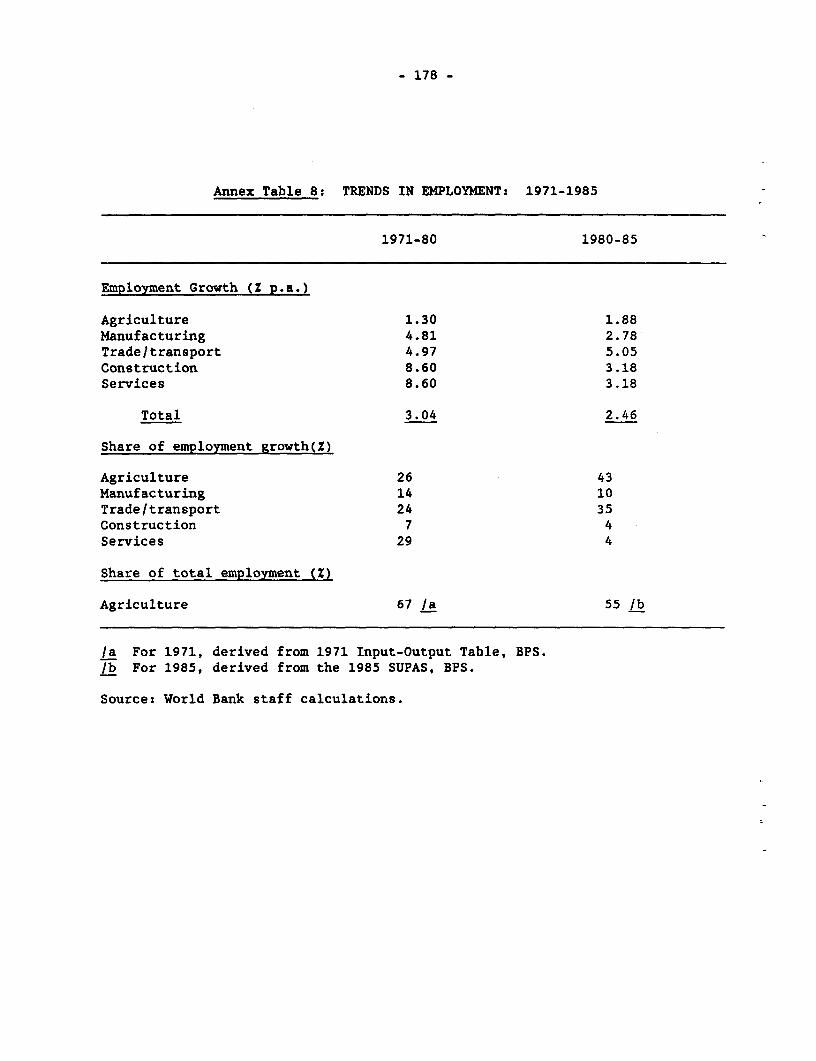
- 178 -
Annex Table 8: TRENDS IN EMPLOYMENT: 1971-1985
1971-80 1980-85
Employment Growth (Z p.a.)
Agriculture 1.30 1.88Manufacturing 4.81 2.78Trade/transport 4.97 5.05Construction 8.60 3.18Services 8.60 3.18
Total 3.04 2.46
Share of employment growth(Z)
Agriculture 26 43Manufacturing 14 10Trade/transport 24 35Construction 7 4Services 29 4
Share of total employment (Z)
Agriculture 67 /a 55 /b
/a For 1971, derived from 1971 Input-Output Table, BPS./b For 1985, derived from the 1985 SUPAS, BPS.
Source: World Bank staff calculations.
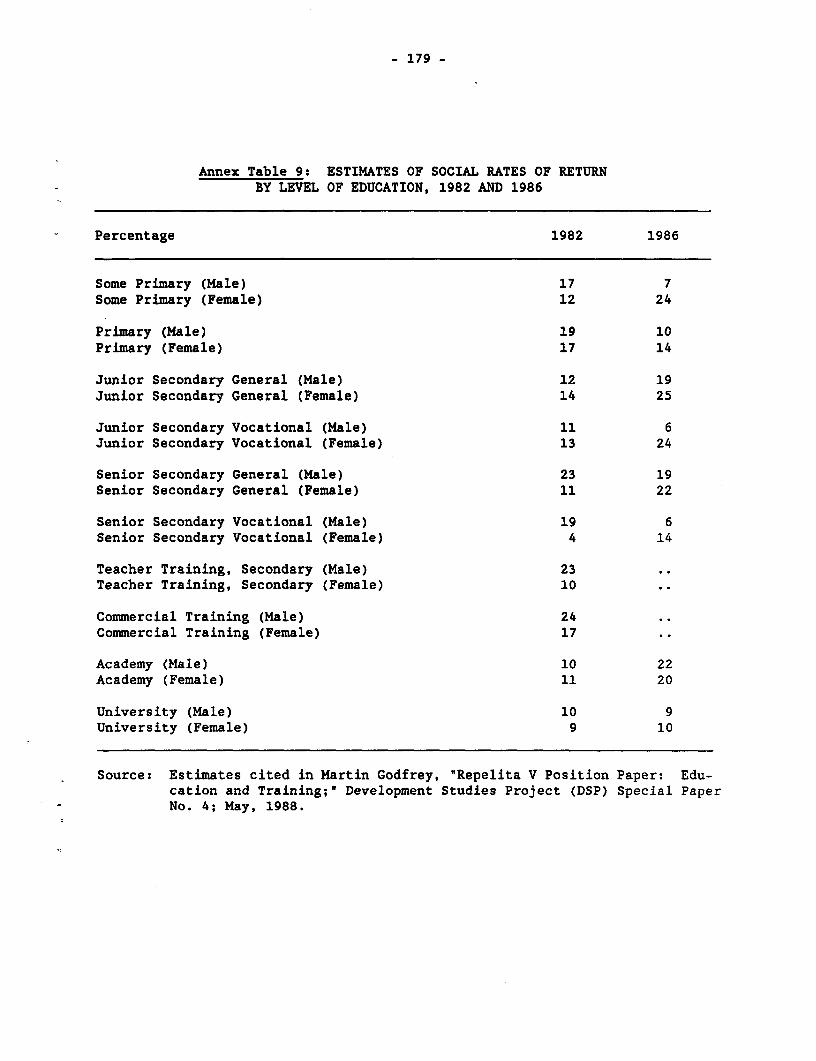
_ 179 -
Annex Table 9: ESTIMATES OF SOCIAL RATES OF RETURNBY LEVEL OF EDUCATION, 1982 AND 1986
Percentage 1982 1986
Some Primary (Male) 17 7Some Primary (Female) 12 24
Primary (Male) 19 10Primary (Female) 17 14
Junior Secondary General (Male) 12 19Junior Secondary General (Female) 14 25
Junior Secondary Vocational (Male) 11 6Junior Secondary Vocational (Female) 13 24
Senior Secondary General (Male) 23 19Senior Secondary General (Female) 11 22
Senior Secondary Vocational (Male) 19 6Senior Secondary Vocational (Female) 4 14
Teacher Training, Secondary (Male) 23Teacher Training, Secondary (Female) 10
Commercial Training (Male) 24Commercial Training (Female) 17
Academy (Male) 10 22Academy (Female) 11 20
University (Male) 10 9University (Female) 9 10
Source: Estimates cited in Martin Godfrey, "Repelita V Position Paper: Edu-cation and Training;" Development Studies Project (DSP) Special PaperNo. 4; May, 1988.
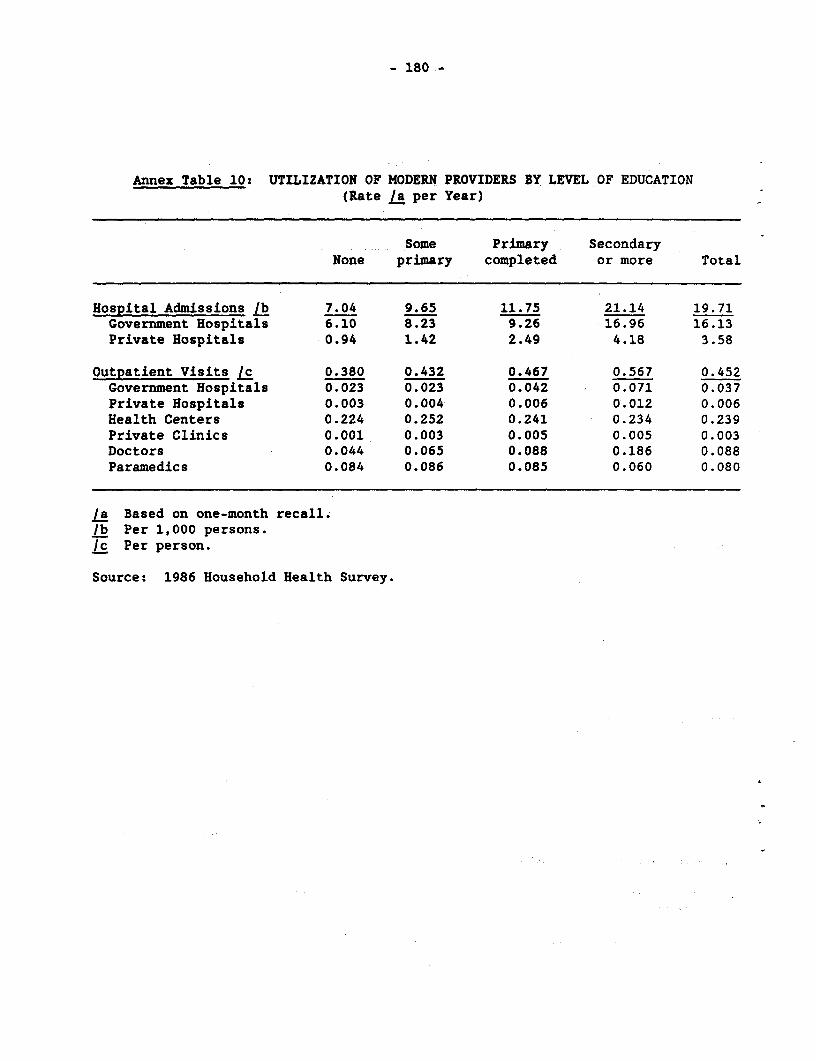
- 180 -
Annex Table 10: UTILIZATION OF MODERN PROVIDERS BY LEVEL OF EDUCATION(Rate /a per Year)
Some Primary SecondaryNone primary completed or more Total
Hospital Admissions lb 7.04 9.65 11.75 21.14 19.71Government Hospitals 6.10 8.23 9.26 16.96 16.13Private Hospitals 0.94 1.42 2.49 4.18 3.58
Outpatient Visits /c 0.380 0.432 0.467 0.567 0.452Government Hospitals 0.023 0.023 0.042 0.071 0.037Private Hospitals 0.003 0.004 0.006 0.012 0.006Health Centers 0.224 0.252 0.241 0.234 0.239Private Clinics 0.001 0.003 0.005 0.005 0.003Doctors 0.044 0.065 0.088 0.186 0.088Paramedics 0.084 0.086 0.085 0.060 0.080
/a Based on one-month recall./b Per 1,000 persons.Ic Per person.
Source: 1986 Household Health Survey.
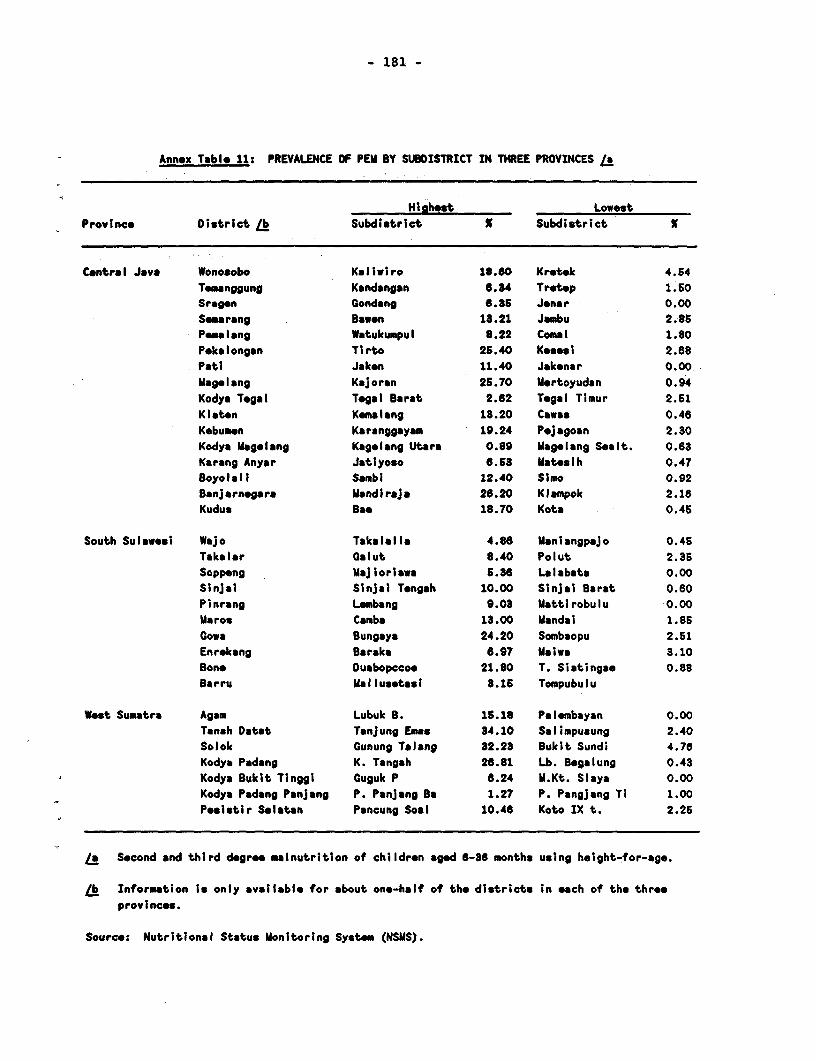
- 181 -
Annex Table 11: PREVALENCE OF PEM BY SUBDISTRICT IN THREE PROVINCES /a
Highest Lowest
Province District /b Subdistrict X Subdistrict X
Central Java Wonosobo Kaliwiro 18.60 Krot.k 4.54Temanggung Kandangan 6.84 Trotep 1.50Sragen Condang 6.36 Jonar 0.00Smareang Bawen 13.21 Jambu 2.85P-ealang Watukumpul 6.22 Comal 1.80Pekalongan Tirto 26.40 Kesesi 2.68Pati Jaken 11.40 Jakenar 0.00Magelang Kajoran 25.70 Mortoyudan 0.94Kodya Tegal Tegal Barat 2.62 Tegal Timur 2.51Kisten Kemalang 13.20 Cwas 0.46Kebumen Karanggayam 19.24 Pejagoan 2.30Kodys Magelang Kagelang Utara 0.89 Magelang Sealt. 0.63Karang Anyar Jatlyoso 6.53 Matesih 0.47Boyol.li Sambi 12.40 Simo 0.92Banjarnegars Mandiraja 28.20 Klampok 2.16Kudus Ban 18.70 Kota 0.45
South Sulawesi Wajo Takalalla 4.88 Maniangpajo 0.45Takalar Galut 8.40 Polut 2.36Soppeng Majioriawa 5.36 Lalabata 0.00Sinjai Sinjai Tongah 10.00 Sinjai Barat 0.60Pinrang Lembang 9.03 Mattirobulu 0.00Maros Canmb 13.00 Mandai 1.86Gowa Bungaya 24.20 Sombaopu 2.51Enrokang Baraka 6.97 Maiwa 3.10Bon- Duabopccoe 21.80 T. Siatingas 0.88Barru Mallusetasi 8.15 Tompubulu
West Sumatra Agam Lubuk B. 15.18 Pnlembiyan 0.00Tanah Datat Tanjung Emas 34.10 Salimpuaung 2.40Solok Gunung Talang 32.23 Buk;t Sundi 4.76Kodys Pndnng K. Tangah 26.81 Lb. Begalung 0.43Kodys Bukit Tinggi Guguk P 6.24 M.Kt. Slaya 0.00Kodya Padang Panjang P. Panjang Ba 1.27 P. Pangjang Ti 1.00Posistir Selatan Pancung Soal 10.46 Koto IX t. 2.25
/a Socond and third degree malnutrition of children aged 6-36 months using height-for-age.
/b Information is only available for about one-half of the districts in each of the throeprovincoc.
Source: Nutritional Status Monitoring System (NSMS).
Distributors of World Bank PublicationsARGENTINA FWILAND M Corm o'di eCad- }H.w SRL Akateneinen Klaja,ppp Da INB3EC Itenatioal Subascptio SavirG.le4aGuenes P.O. Box 128 Apaado Pota 224160 P.O. Box 41095Florida 16, 4th Floo.XOc 453/465 SF-00101 14060TI MeD)F. C1333 Bumo Aim Helsni 10 JohanneCBurg 2i24
AUSTRALIA, PAPUA NEW GUINEA. FRANCE MODRCCO M ne SPAINFPlL SOLOMON ISLANDS, World S PankPublicatirns 12 ,neMocazad. d'Anf a Mua&PremaULro SA.VANUATU, AND WESTERN SAMOA 6, avenue,d'I Cblana (37DA.Boks&Jowns 75116Cab 29001cMd3d649SW _iehomeRod NETIERLANDSMEIdum 3132 GERMANY, FEDERAL REPUBLIC OF InOrpFublltaimb v. Lfirdafanbtwnadoa AEDOSVictoi UNO-Vdjg P.O. Bo 14 CanD de Cent, 391
Pqod.de All-ee SS 7240 bA Lohmn 0=9BC0 calbonAUSTRIA D- a300 EBrD 1Gerad and Co. NEW ZEALAND SRI LANKA AND THE MALDIVESGeabeo3l GREECE Hills Ubmy ad Information Savio Lake HouseBookohopA-l0l1 Witn SICME ItvAt. B.g P.O. Box 244
24, Ippodamou Stt Platia PflaBtir New M *ar 103 S2r4htampalam A. Gwd4ineBAHRAIN Atha-11635 Audimd MawathaSabain Research ad Crnatangy
Amdat. Ltd. GUATEMALA NIGERIAPDO. Bnx 22103 L 9im Pkdn Santa Univaty PeM Limited SWEDENManama Town 317 Sa. Calle 7-55 Tme CrvWNBuildingJeicho FwsinskU
Zran I PrivateManllBagIO95 Fillze PaddklulforeftaetBANGLADESH GuaternalaCity PadMi Rogetggatn 12,FBt 1631Mioro hnduatitDevelopmnt S-1
03VSo nl7 a1
Assiance Sodety CMDAS) HONG XONG, MACAO NORWAYHoe 5, Road 16 Ada 20 Ltd. Narvem Wornwaion Canter Fowr0agk :E eiaDanmoedi R/Ana 6 FLP 146 Prince Edward Don eD aantt Wennwgroo-Wi_iamaABDhaka 1209 Road, W. P.O. BoK 6125 Eftertlad Bn 300D4
Koweon N4602 Olo 6 S-104 2 Stodnidn9 qoI,flc Hong IC"
156,NurAinmad Saak OMAN SWITZRLANDCOnttagn4aD0 HUNGARY M EMA orBatnSlo enk F eoraitian
Kl%itru P.O. Box 16135, SbAiport LibmraiePyaot76, KDA Avenue P.O. Box 140 Mmt 6,rueGromorKulna 1389 Budapeat 62 Caaenzalale381
BELGIUM ~~~~~~~~~~~~~~~~~~~~~~~PAIaSTAN CH1211 aneval11
jant DEoTnnoy Aled Publishers Privaie Ltd. Mi,S Bo cAv. du Ra 202 751 Mount Road PD. BoxNo.729 U lePapot
1OQB.naada ~~~~~~~~~Modeas-603002 L.ahmoe3 SmvlcedeeAimmnunntsCRIe B a:epo e3312
BRAZIL Bvdncfff.W PER 41032 LoauannePubiaccerTecrImntuenacnais ISJNH. redla Mag Edit6idDen noBoSA CA
lAda , Blard Estae Apbtado 3924 TANZANIARua Pedxoio Ginnlde 39 Enzmbay -400 MO8 Unt Ceford Unlvmty Prm
ciA4 sea Paul% SP 31 FdAiRa P.O. BOX SW t9CANADA ~ ~ ~ ~ ~ 1/4Aa AlRodPHILIPPNES Drsein
CANADA Nw Delhl- 11002 N taxulBookStoreLeDOfithaze I701 RIxa Avenue. THAILANDC.P.85, 150tB ue Anpare 17 Ctitt.anjn Avenue P.O. Box 1934 Centni D narent StoreBaudnwmlll Quebec CaIcutta -70072 MeroMana C6Sttan RoadJ4B 516 JydvHstBud Banalok
JCy devaHtelBuldin Innatoal Book CenterCHINAbl&EomusdcPubilbilk Sh Main Rad Gandhingar Fifhloor, Fillpinn Le Building TRIDAD &TOBAGO, ANTIGUAChina Floandal & EcOnnanc Publishing Boagalore.S560ODll Ay.la Avmun. Makalt BARBUDA, BARBADOS,
Howe Metro Manila DOMDNICA, GRENADA, GUYANA,9,D FoS1DongIie 3-5-1129 KadSguda Crue a JAMAICAMONTSERRAT,ST
Baljlng ~~~~~~~~~~~Hyderabad -103027 POLAND KITTS & NEVIS, ST. LUCIA.ORPAN ST. VINCENT &GREEPADINES
COLOMBIA PIathana Ft., 2nd Floor PalacKultu.yiNld SystantaticaStudieUnitWoel ceLida, NearThakoreBau& Navrangpura 1M WartbwaSttAprtadoAereo 34270 Ahmedabad -390 009Bogota DE. Patiab FPORTUGAL Trinidad,West Indi
Padata House ~~~~~~~Li-saia Pnet.gaCOTE DVIVOIRE 16-A Aahok Marg Rim Do Carno 70.74 TURKEYCantredEldltn etde Diffusion Lucdntow-226 001 12C0 Lisbo Hat KItLapevf, AS.
Africeln(CEDA)04 B.P. 541 INDONESIA SAUDI ARABIA. QATAR BeoluWCdem o 6Abidjn,m4PFlas. Pt Indira Limited jrsooiStore Gdded N
JL Sam Ratulangi 37 P.O. Box 3196CYPRUS PPO.O.IS Rl -dh419U6ND
P O B o x 2 0 9 9 ~~~~~~~~~ P D B o1= 1 8 R iy ad h 1 14 7 1 U G A N D AMEMRB Informatio Swavi Jakarta Puneat Uganda BookahepP.O. Bt 2AM MEMRE bInfrmaioxService P.O. Box 7145Nictiet rTALY SazkcAffim Kampal
Licoa Coantsainanria Sanunii SPA AlA StreDENMARK Via Beeadtto FC ti.n 120/10 Al Dahna Canto UNITED ARAB EMIRATESBannfundaULeran.Camett Postal. 552 Firstoor MEMRB Gulf Co.RosanormnAllfi 11 3125 Florence P.O. Box 7188 P.O. Box WMDK-1970 Frederiksbg C JAPAN Riyadh Shgeh
DOMINICAN RJEUBUIC Easia Book ServiceHatdnln izaBudigUTUKIGOYd _CnnraTalI~ ~ prA. ,37-3, Hongo3.cane, Bnkyo-ku 113 Hlon K lnald St.eet MknroinfoLid.
Radturacde e abebd l Catdlc 3G9 Tokyo P.O. Box 3969 P.O. Box 3Apwtado FYtal 2190 Denman Altan, HampdnreGU34 2PGSno" Deomingo KENYA England
FeL SALVADORAfri" Book Servie(EA.) Ltd. 33, Mohanmed Hasem Awad StreetEL SALVADOR ~~~~~~~~~P.O. Box 4S245 P.O. Box 3878 URUGUAY
PusadeM Nairobi Jeddeh bndtutoNdonadde dUboAvaidda Mannel Etnriquo Araujo 43S30 aJel6EoYdCSoSBSA.,ler. Fiso KOREA,REPUBUCOF SINGAPORE, TAIWAN, MYANMAR, MARtevideoSan Slvado Fn Korem Book Coporation BRUNEI
P.O. Bx 101. Kwangh.-n Ini-oaton Pubiitil VENEZUELAEGYPT, ARAB REPULIC OF Satid Private LAd. LUbreia dd BAteAl Arant 02-06 let Fl. Pet-Fu Industrial Aptdo. 60337Al Gaa S KUWAIT Bldg C- r106-ACairo MEMRB nformation Smvime. 24NewIndustilRd
TheMidcge EW Observer P.O. Box 5465 Sngapare1953 YUGOSLAVIAT hwheMdl Sia MALAYSIA Inol'venoika xinjiaS Cnanri Stt MAlAYSIA SOUTH AFRICA, BOTSWANA P.D. Box 36Cdiro Uidversity of Malaya Cooperative ForsletilortL Tg Rqublike
Booabop, Limited OAford Univmsily Pror Southern YL-11000 BelgadeP.O. BX 1127,J lannmts nBanr AhnnKnA Inopur P.O. Box 1141
CapeTown B0ow
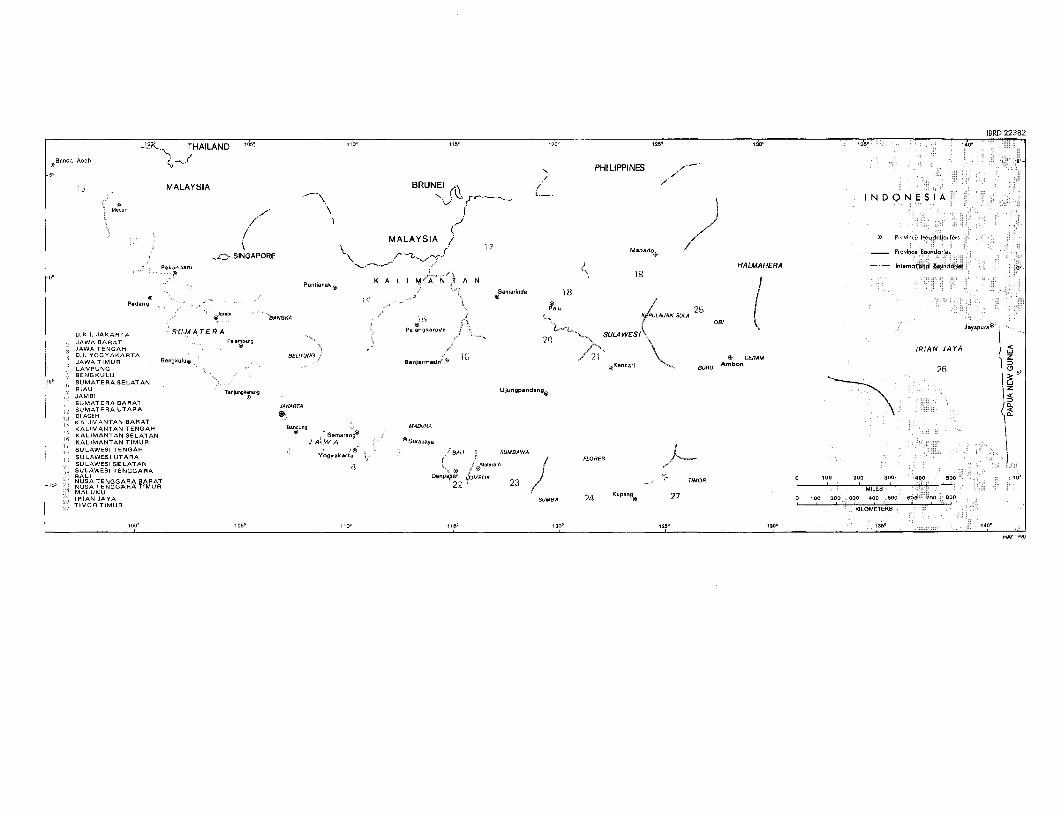
IBRD 22382
JAR.x THAILAND i0o 110 115 1i: l0 1 10 1o 1409 B 223
BsnBdu A-ch r _ o
PHILIPPINES z
MALAYSIA BRUNEI / /
Tt e ; f arffi I JN D N E S I AMeLsn ~ ~/ \ 2
/ ( 7i 'MALAYSIA / M, ® Pron.n- Headquarters
-..-SINGAPORE M - rP.k-nbaru ,, t - HALMAHERA - - In-ernatf-nal Boundaries o
P-Puntank K A L I M A N A Nj~ ~ ~ ~~ Sannmonda 18 /
Padene T 10l IJ?
0Jannl -OANOI , , t KfPULAUAII SULA
DK.I. JAKARTA SUMA TERA Plalngkar-ya t rL½ SULAWESA ,
JAWA BARAT PalembarsJAWATENGAH I r< IAIA JAYAD0. YOGYAKARTA BELITuNG e s 'a *g 21 Ab @ ERdMJAWA TIMUR SCngkuIu5 iKurDU o!
LAMPUNG 268BENGKULU I
-5' SLUMATERASELATAN R RIAU Tan,ungrorang UJu-gpadaag
0Z
JAMBI SUMATERA BARAT JAKRTASUMATERA UTARA
KALIMANTAN BARATKALIMANTAN TENGAH Banrjng MLADURAKALIMANTAN SELATAN S S-mur-og
10
KALIMANTAN TIMUR J A. WA 0Surabuya
1SULAWESI TENGAH , AL SU^W 1, ~~~~~ ~~~~~~~~~~~~~~~~~~~~~~BALI SUMBAAWA
SULAWESI UTARA Yagyskania / FLORESSULAWESI SE LATAN .,jj ~ aSULAWESI TENGGARA D
BALAA D..~~~~~~~~~~~~~~~~~~epiar LOMTIMROOO 200 300 400 500 0NUSA TENGGARA BARAT 22 23 / ,. r ____o ___200 __0 00 50 10NUSA TENGGARA TIMUR MILES
-MALUKU SUMBA 2,1 KuPeg 27 0 100 200 300 400 500 e00 700 b00
- TIMOR TIMUR KILOMETERSKILOMETERS
I1r0 1 0
d° 110 11
b° 1
20° 130
2 5°
NAY I sp
The World BankHeadquarters European Office Tokyo Office1818 H Street, N.W. 66, avenue d'I6na Kokusai BuildingWashington, D.C. 20433, U.S.A. 75116 Paris, France 1-1 Marunouchi 3-chome
Chiyoda-ku, Tokyo 100, JapanTelephone: (202) 477-1234 Telephone: (1) 40.69.30.00Facsimile: (202) 477-6391 Facsimile: (1) 47.20.19.66 Telephone: (3) 214-5001Telex: wui 64145 WORLDBANK Telex: 842-620628 Facsimile: (3) 214-3657
RCA 248423 WORLDBK Telex: 781-26838Cable Address: INTBAFRAD
WASHNGCTONDC